
Vanguard Investment Series plc
1145
Semiannual Report | 30 June 2021 Vanguard Investment Series plc
-
Upload
khangminh22 -
Category
Documents
-
view
2 -
download
0
Transcript of Vanguard Investment Series plc

Semiannual Report | 30 June 2021
Vanguard Investment Series plc

Contents
Tracking Error 1
Company Financial Statements for Vanguard Investment Series plc 3
Equity Fund Financial Statements:
Vanguard Emerging Markets Stock Index Fund 6
Vanguard ESG Developed World All Cap Equity Index Fund 30
Vanguard ESG Emerging Markets All Cap Equity Index Fund 77
Vanguard European Stock Index Fund 119
Vanguard Eurozone Stock Index Fund 129
Vanguard Global Enhanced Equity Fund 137
Vanguard Global Small-Cap Index Fund 140
Vanguard Global Stock Index Fund 188
Vanguard Japan Stock Index Fund 210
Vanguard Pacific ex-Japan Stock Index Fund 220
Vanguard SRI European Stock Fund 229
Vanguard U.S. 500 Stock Index Fund 241
Vanguard U.S. Opportunities Fund 252
Fixed Income Fund Financial Statements:
Vanguard 20+ Year Euro Treasury Index Fund 259
Vanguard Emerging Markets Bond Fund 264
Vanguard Euro Government Bond Index Fund 277
Vanguard Euro Investment Grade Bond Index Fund 296
Vanguard Eurozone Inflation-Linked Bond Index Fund 347
Vanguard Global Bond Index Fund 352
Vanguard Global Corporate Bond Index Fund 564
Vanguard Global Credit Bond Fund 704
Vanguard Global Short-Term Bond Index Fund 731
Vanguard Global Short-Term Corporate Bond Index Fund 796
Vanguard Japan Government Bond Index Fund 862
Vanguard SRI Euro Investment Grade Bond Index Fund 875
Vanguard U.K. Government Bond Index Fund 915
Vanguard U.K. Investment Grade Bond Index Fund 921
Vanguard U.K. Short-Term Investment Grade Bond Index Fund 943
Vanguard U.S. Government Bond Index Fund 954
Vanguard U.S. Investment Grade Credit Index Fund 967
Vanguard U.S. Treasury Inflation-Protected Securities Index Fund 1064
Notes to the Financial Statements 1073
Additional Information From the Directors 1133
Additional Information for Investors in the Federal Republic of Germany 1139

Tracking Error
1
Each of the Funds listed in the table employs a “passive” investment strategy designed to replicate the performance of its benchmark Index. Some of the Funds attempt to fully replicate the Index by holding all of the component securities, in approximately the same proportion as their weighting in the Index. Other Funds instead use an index sampling process, holding a representative sample of securities which approximates the full index in terms of key risk factors and other characteristics.
Tracking error measures the volatility of the return difference between the Fund and the Index. It is calculated as the standard deviation of the tracking difference between the Fund and the Index (gross of fees for the trailing 36-month period, or since the Fund’s inception if it does not have 36 months of performance history).
There are two types of tracking error displayed for the Funds, swung and unswung. The Funds may use swing pricing, which adjusts the net asset value (NAV) of a Fund on a daily basis to ensure that no transaction costs caused by investing or redeeming clients are borne by the existing shareholders in a Fund. As a result, the performance difference relative to the benchmark and therefore the tracking error will be higher on a swung basis. Unswung tracking error shows the underlying performance of a fund without swing pricing applied. Additional details regarding the swing pricing policy employed by the funds can be found in Note 3 of the Notes to the Financial Statements.
The table below excludes adjustments for swing pricing.
For the period ended 30 June 2021
Unswung Tracking Error
Fund Realised (%)EquityVanguard Emerging Markets Stock Index1 0.151Vanguard ESG Developed World All Cap Equity Index2,3 0.272Vanguard ESG Developed World All Cap Equity Index EUR-Hedged2,3 0.166Vanguard ESG Emerging Markets All Cap Equity Index2,4 0.233Vanguard European Stock Index2 0.162Vanguard Eurozone Stock Index2 0.248Vanguard Global Small-Cap Index2 0.065Vanguard Global Stock Index2 0.040Vanguard Global Stock Index EUR-Hedged2 0.099Vanguard Japan Stock Index2 0.045Vanguard Pacific ex-Japan Stock Index2 0.092Vanguard SRI European Stock1 0.656Vanguard U.S. 500 Stock Index2 0.018Vanguard U.S. 500 Stock Index EUR-Hedged2 0.109
Unswung Tracking Error
Fund Realised (%)Fixed IncomeVanguard 20+ Year Euro Treasury Index1 0.316Vanguard Euro Government Bond Index1 0.093Vanguard Euro Government Bond Index GBP-Hedged1 0.094Vanguard Euro Investment Grade Bond Index1 0.088Vanguard Euro Investment Grade Bond Index GBP-Hedged1 0.088Vanguard Eurozone Inflation-Linked Bond Index1 0.138Vanguard Global Bond Index USD-Hedged1 0.131Vanguard Global Bond Index CHF-Hedged1 0.131Vanguard Global Bond Index EUR-Hedged1 0.133Vanguard Global Bond Index GBP-Hedged1 0.136Vanguard Global Bond Index JPY-Hedged1 0.129Vanguard Global Corporate Bond Index USD-Hedged1 0.530Vanguard Global Corporate Bond Index CHF-Hedged1 0.071Vanguard Global Corporate Bond Index EUR-Hedged1 0.503
Unswung Tracking Error
Fund Realised (%)Fixed IncomeVanguard Global Corporate Bond Index GBP-Hedged1 0.374Vanguard Global Short-Term Bond Index USD-Hedged1 0.066Vanguard Global Short-Term Bond Index CHF-Hedged1 0.105Vanguard Global Short-Term Bond Index EUR-Hedged1 0.062Vanguard Global Short-Term Bond Index GBP-Hedged1 0.066Vanguard Global Short-Term Corporate Bond Index USD-Hedged1 0.270Vanguard Global Short-Term Corporate Bond Index EUR-Hedged1 0.335Vanguard Global Short-Term Corporate Bond Index GBP-Hedged1 0.305Vanguard Japan Government Bond Index1 0.104Vanguard Japan Government Bond Index EUR-Hedged1 0.091Vanguard Japan Government Bond Index GBP-Hedged1 0.109Vanguard Japan Government Bond Index USD-Hedged1 0.089Vanguard SRI Euro Investment Grade Bond Index1 0.118Vanguard U.K. Government Bond Index1 0.098Vanguard U.K. Government Bond Index EUR-Hedged1 0.052Vanguard U.K. Investment Grade Bond Index1 0.195Vanguard U.K. Short-Term Investment Grade Bond Index1 0.085Vanguard U.S. Government Bond Index1 0.246Vanguard U.S. Government Bond Index EUR-Hedged1 0.249Vanguard U.S. Government Bond Index GBP-Hedged1 0.230Vanguard U.S. Investment Grade Credit Index1 0.407Vanguard U.S. Investment Grade Credit Index EUR-Hedged1 0.414Vanguard U.S. Investment Grade Credit Index GBP-Hedged1 0.397Vanguard U.S. Treasury Inflation-Protected Securities Index1 0.145Vanguard U.S. Treasury Inflation-Protected Securities Index CHF-Hedged1 0.141Vanguard U.S. Treasury Inflation-Protected Securities Index EUR-Hedged1 0.130Vanguard U.S. Treasury Inflation-Protected Securities Index GBP-Hedged1 0.143Vanguard U.S. Treasury Inflation-Protected Securities Index SGD-Hedged1 0.141
1 The fund attempts to select those securities that will create the representative sample that tracks the performance of the index as closely as possible.2 The fund seeks to replicate the index by investing all, or substantially all, of its assets in the securities that make up the index, holding each in approximately the same proportion as its weighting
in the index.3 The fund's benchmark was the FTSE Developed Index through 13 May 2020, and the FTSE Developed World All Cap Choice Index thereafter.4 The fund was launched on 9 June 2020.

2
The table below includes adjustments for swing pricing.
For the period ended 30 June 2021
Swung Tracking ErrorFund Realised (%)EquityVanguard Emerging Markets Stock Index1 1.046Vanguard ESG Developed World All Cap Equity Index2 0.296Vanguard ESG Developed World All Cap Equity Index EUR-Hedged2,3 0.273Vanguard ESG Emerging Markets All Cap Equity Index2 0.511Vanguard European Stock Index2 0.393Vanguard Eurozone Stock Index2 0.377Vanguard Global Small-Cap Index2 0.110Vanguard Global Stock Index2 0.092Vanguard Global Stock Index EUR-Hedged2 0.134Vanguard Japan Stock Index2 0.057Vanguard Pacific ex-Japan Stock Index2 0.222Vanguard SRI European Stock1 0.670Vanguard U.S. 500 Stock Index2 0.018Vanguard U.S. 500 Stock Index EUR-Hedged2 0.109
Swung Tracking ErrorFund Realised (%)Fixed IncomeVanguard 20+ Year Euro Treasury Index1 0.496Vanguard Euro Government Bond Index1 0.184Vanguard Euro Government Bond Index GBP-Hedged1 0.183Vanguard Euro Investment Grade Bond Index1 0.425Vanguard Euro Investment Grade Bond Index GBP-Hedged1 0.421Vanguard Eurozone Inflation-Linked Bond Index1 0.208Vanguard Global Bond Index USD-Hedged1 0.202Vanguard Global Bond Index CHF-Hedged1 0.205Vanguard Global Bond Index EUR-Hedged1 0.203Vanguard Global Bond Index GBP-Hedged1 0.202Vanguard Global Bond Index JPY-Hedged1 0.198Vanguard Global Corporate Bond Index USD-Hedged1 0.840Vanguard Global Corporate Bond Index CHF-Hedged1 0.660Vanguard Global Corporate Bond Index EUR-Hedged1 0.818Vanguard Global Corporate Bond Index GBP-Hedged1 0.752Vanguard Global Short-Term Bond Index USD-Hedged1 0.141Vanguard Global Short-Term Bond Index CHF-Hedged1 0.151Vanguard Global Short-Term Bond Index EUR-Hedged1 0.141Vanguard Global Short-Term Bond Index GBP-Hedged1 0.140Vanguard Global Short-Term Corporate Bond Index USD-Hedged1 0.490Vanguard Global Short-Term Corporate Bond Index EUR-Hedged1 0.571Vanguard Global Short-Term Corporate Bond Index GBP-Hedged1 0.452Vanguard Japan Government Bond Index1 0.289Vanguard Japan Government Bond Index EUR-Hedged1 0.288Vanguard Japan Government Bond Index GBP-Hedged1 0.301Vanguard Japan Government Bond Index USD-Hedged1 0.299Vanguard SRI Euro Investment Grade Bond Index1 0.335Vanguard U.K. Government Bond Index1 0.172Vanguard U.K. Government Bond Index EUR-Hedged1 0.052Vanguard U.K. Investment Grade Bond Index1 1.275Vanguard U.K. Short-Term Investment Grade Bond Index1 0.564Vanguard U.S. Government Bond Index1 0.240Vanguard U.S. Government Bond Index EUR-Hedged1 0.243Vanguard U.S. Government Bond Index GBP-Hedged1 0.225Vanguard U.S. Investment Grade Credit Index1 0.564Vanguard U.S. Investment Grade Credit Index EUR-Hedged1 0.569Vanguard U.S. Investment Grade Credit Index GBP-Hedged1 0.570Vanguard U.S. Treasury Inflation-Protected Securities Index1 0.172Vanguard U.S. Treasury Inflation-Protected Securities Index CHF-Hedged1 0.173Vanguard U.S. Treasury Inflation-Protected Securities Index EUR-Hedged1 0.175Vanguard U.S. Treasury Inflation-Protected Securities Index GBP-Hedged1 0.166Vanguard U.S. Treasury Inflation-Protected Securities Index SGD-Hedged1 0.173
1 The fund attempts to select those securities that will create the representative sample that tracks the performance of the index as closely as possible.2 The fund seeks to replicate the index by investing all, or substantially all, of its assets in the securities that make up the index, holding each in approximately the same proportion as its weighting
in the index.3 The fund's benchmark was the FTSE Developed Index through 13 May 2020, and the FTSE Developed World All Cap Choice Index thereafter.4 The fund was launched on 9 June 2020.

Company Financial Statements for Vanguard Investment Series plc
The accompanying notes form an integral part of the financial statements.
3
Company Statement of Assets and Liabilities
Total US Dollars ($)
As at 30 June 2021
Total US Dollars ($)
As at 31 December 2020
Current AssetsFinancial Assets at Fair Value Through Profit or Loss 127,467,728,130 118,246,441,804 Financial Derivative Instruments 386,766,471 770,119,155 Cash 1,860,912,020 1,618,893,148 Unrealised Appreciation on Spot Currency Contracts 120,268 92,308 Receivables: Interest and Dividends 493,557,104 476,938,938 Capital Shares Issued 419,956,904 332,812,159 Investments Sold 727,374,546 347,803,411 Futures Margin Cash 42,117,788 44,454,012 Cash Collateral 65,208,723 4,160,006 Other Receivables 13,326 55,000
Total Current Assets 131,463,755,280 121,841,769,941
Current LiabilitiesFinancial Derivative Instruments 975,067,528 335,964,212 Bank Overdraft 12,951,054 210,875 Unrealised Depreciation on Spot Currency Contracts 893,106 4,472,229 Payables and Other Liabilities: Investments Purchased 1,056,110,899 925,187,478 Income Distribution Payable 28,763,910 50,154,770 Interest 11,855 2,287 Capital Shares Redeemed 276,553,736 164,874,529 Futures Margin Cash Due to Broker 110,453 414,471 Management Fees Payable 16,355,020 15,058,890 Deferred Capital Gains Tax 84,687,791 65,315,841 Other Payables 22,644 1,950
Total Current Liabilities 2,451,527,996 1,561,657,532
Net Assets Attributable to Holders of Redeemable Participating Shares (“Net Assets”) 129,012,227,284 120,280,112,409
On behalf of the Board,
Sean P. HagertyPeter Blessing26 August 2021

The accompanying notes form an integral part of the financial statements.
4
Company Statement of Operations
Total US Dollars ($)
Six Months Ended 30 June 2021
Total US Dollars ($)
Six Months Ended 30 June 2020
Investment Income/(Loss) Interest Income 491,596,450 425,924,075 Dividend Income 692,613,326 559,904,298 Securities Lending Income 3,778,130 5,607,809 Other Income 1,523,508 1,274,885 Net Gain/(Loss) on Financial Instruments 3,914,396,966 (3,880,436,209)
Total Investment Income/(Loss) 5,103,908,380 (2,887,725,142)
Expenses Management Fees 95,137,891 74,300,421 Transaction Fees and Commissions 5,817,961 4,979,977 Other Expenses 104,480 27,798 Negative Yield on Financial Assets — 3,996,617
Total Expenses 101,060,332 83,304,813
Finance Costs Interest Expense 1,441,614 1,301,959 Distribution Paid 53,291,799 45,820,228 Income Equalisation (1,078,603) (252,363)
Total Finance Costs 53,654,810 46,869,824
Net Investment Income/(Loss) 4,949,193,238 (3,017,899,779)
Foreign Withholding Tax (110,127,515) (85,499,686)
Net Increase/(Decrease) in Net Assets 4,839,065,723 (3,103,399,465)

The accompanying notes form an integral part of the financial statements.
5
Company Statement of Changes in Net Assets
Total
US Dollars ($)Total
US Dollars ($)Six Months Ended Six Months Ended
30 June 2021 30 June 2020Increase/(Decrease) in Net Assets
Net Increase/(Decrease) in Net Assets From Operations 4,839,065,723 (3,103,399,465)
Capital Transactions Subscriptions 40,022,940,769 26,922,541,433 Redemptions (35,467,484,364) (25,795,512,697) Reinvestments 359,749 925,827
Total Capital Transactions 4,555,816,154 1,127,954,563
Total Increase/(Decrease) for the Period1 9,394,881,877 (1,975,444,902)
Net AssetsBeginning of Period 120,280,112,409 105,456,916,967
Foreign Exchange Translation Adjustment2 (662,767,002) (797,374,808)
End of Period 129,012,227,284 102,684,097,257
1 Capital Transactions include income equalisation adjustments as shown in the Statement of Operations.2 Individual sub-fund financial statements are presented in the base currency of each sub-fund. For the purpose of calculating the consolidated Vanguard Investment Series plc US dollar total, the EUR-
based sub-funds, the JPY-based sub-fund and the GBP-based sub-funds have been translated into US dollars at following exchange rates:
Daily exchange rate as at
30 June 2021
Daily exchange rate as at
31 December 2020
Average rate for the period ended
30 June 2021
Average rate for the period ended
30 June 2020EUR-based sub-funds 0.8432 0.8173 0.8298 0.9074JPY-based sub-fund 110.9900 103.2450 107.7006 108.2368GBP-based sub-funds 0.7239 0.7316 0.7200 0.7935
The resulting translation adjustment represents the difference in exchange rates applied to the net assets at the beginning of the period and an exchange rate differential in consolidating the Statement of Operations at the average rate for the period.This adjustment is solely for the purposes of reporting Company totals in US dollars and has no effect on any individual sub-fund.

Vanguard Emerging Markets Stock Index FundManaged by Vanguard Global Advisers, LLC.
6
Investment ObjectiveThe fund seeks to track the performance of the MSCI Emerging Markets Index, a market-capitalisation-weighted index of companies in emerging markets.
Performance SummaryThe Performance Summary does not form part of the Financial Statements.
• As the six months ended 30 June 2021 came to a close, macroeconomic indicators signalled a faster global economic rebound than many had expected after the sharpest contraction in modern history. Yet the recovery has been uneven. Countries that have contained the virus more successfully, whether through vaccinations, lockdowns or both, generally have fared better economically. And the COVID-19 pandemic remained far from over, with new variants of the virus surfacing where vaccination rates have lagged and the human toll continuing to mount, especially in less developed economies.
• Swift and extensive support from governments and central banks has been a key to the rebound. So far in 2021, it has included fiscal stimulus – including the $1.9 trillion American Rescue Plan in the United States and the €673 billion Recovery and Resilience Facility in Europe – and pledges by a number of central banks to keep interest rates low for some time.
• Fixed income prices worldwide generally fell and longer-term yields rose amid concerns about inflation during the half year. Bonds returned about –3% in US dollars, as measured by the Bloomberg Barclays Global Aggregate Bond Index.
• Stock markets continued the rally that began in 2020, bolstered by reopening economies, more consumer spending and rising corporate profits. The FTSE Global All Cap Index returned roughly 13% in US dollars for the half year. Returns in the United States and Europe outpaced those in emerging markets and especially the Pacific region.
• For the period, the fund’s benchmark returned 7.45%. Of the benchmark’s 11 industry sectors, information technology, financials and materials contributed the most to return. Real estate, the only sector with a negative return, detracted.
• Among markets, Taiwan and India contributed most to the index return. China, the largest market in the index, and South Korea also made strong contributions.
All returns in the commentary above are in US dollars.
Benchmark: MSCI Emerging Markets Index
Total ReturnsPeriods Ended 30 June 2021
(Annualised for periods over one year)
Six Months Five YearsTen Years or
Since Inception1
Institutional Plus CHF Acc 12.25 % 11.64 % 7.15 %
Benchmark 12.36 11.85 7.32
Tracking Difference* -0.11
EUR Acc 10.72 % 11.29 % 9.35 %
Benchmark 10.86 11.56 9.59
Tracking Difference* -0.14
Investor EUR 10.72 % 11.19 % 6.01 %
Benchmark 10.86 11.56 6.40
Tracking Difference* -0.14
Institutional Plus EUR Acc 10.76 % 11.35 % 8.58 %
Benchmark 10.86 11.56 8.76
Tracking Difference* -0.10
GBP Acc 6.18 % 12.01 % 5.57 %
Benchmark 6.32 12.29 5.86
Tracking Difference* -0.14
GBP Dist 6.18 % 12.01 % 5.57 %
Benchmark 6.32 12.29 5.86
Tracking Difference* -0.14
Institutional Plus GBP Acc 6.22 % 12.08 % 8.52 %
Benchmark 6.32 12.29 8.69
Tracking Difference* -0.10
Institutional Plus GBP Dist 6.22 % 12.08 % 8.52 %
Benchmark 6.32 12.29 8.69
Tracking Difference* -0.10

7
Vanguard Emerging Markets Stock Index Fund
Total ReturnsPeriods Ended 30 June 2021
(Annualised for periods over one year)
Six Months Five YearsTen Years or
Since Inception1
USD Acc 7.31 % 12.75 % 7.24 %
Benchmark 7.45 13.03 7.47
Tracking Difference* -0.14
Investor USD 7.31 % 12.66 % 3.90 %
Benchmark 7.45 13.03 4.28
Tracking Difference* -0.14
Institutional Plus USD Acc 7.35 % 12.82 % 6.54 %
Benchmark 7.45 13.03 6.72
Tracking Difference* -0.10
Each benchmark is in its respective currency.Sources: Vanguard Global Advisers, LLC, and MSCI.Performance is based on NAV with net income reinvested.
All of the returns in this report represent past performance, which is not a guarantee of future results that may be achieved by the fund. For performance data current to the most recent month-end, which may be higher or lower than that cited, visit our website at http://global.vanguard.com. Note, too, that both investment returns and principal value can fluctuate widely, so an investor's shares, when sold, could be worth more or less than their original cost.* The tracking difference between the fund return and the index return over a stated period of time can be attributed to a number of factors, including, without limitation, small differences in
weightings, trading activity, transaction costs and differences in the valuation and withholding tax treatment between the fund and the index vendor.1 Since-inception returns: Institutional Plus CHF Acc, 10 March 2015; EUR Acc, 27 February 2014; Institutional Plus EUR Acc, 6 December 2013; Institutional Plus GBP Acc and Institutional Plus GBP
Dist, 2 September 2014; USD Acc, 27 February 2014; Instiutional Plus USD Acc, 6 December 2013.

Significant Portfolio ChangesFor the Six Months Ended 30 June 2021
8
Vanguard Emerging Markets Stock Index Fund
The Central Bank of Ireland requires a schedule of material changes in the composition of the portfolio during the period. These are defined as aggregate purchases of a security exceeding 1% of the total value of purchases for the period and aggregate disposals greater than 1% of the total value of sales. At a minimum, the largest 20 purchases and 20 sales must be shown; all purchases and sales must be shown if there are fewer than 20. A full listing of the portfolio changes for the period is available, upon request, at no extra cost from the Administrator.
SharesCost
US Dollars ($)
Purchases
Tencent Holdings Ltd. 287,500 25,945,148Alibaba Group Holding Ltd. ADR 94,492 24,556,321KE Holdings, Inc. ADR 425,460 22,260,484HMM Co., Ltd. 414,590 18,678,665Li Auto, Inc. ADR 755,954 18,313,004Taiwan Semiconductor
Manufacturing Co., Ltd. 784,000 16,965,182Samsung Electronics Co., Ltd. 193,331 15,105,361Kuaishou Technology Class B 434,843 15,006,608Bharti Airtel Ltd. 1,956,898 14,904,721Pinduoduo, Inc. ADR 89,194 12,537,424First Abu Dhabi Bank PJSC 2,662,512 11,762,696China Feihe Ltd. 3,897,000 10,623,040TCS Group Holding plc GDR 190,170 9,911,096Yang Ming Marine Transport Corp. 2,538,000 9,378,815Vale SA 469,600 9,189,639BYD Co. Ltd. Class H 272,000 9,067,236Meituan Class B 179,200 8,995,907Daqo New Energy Corp. ADR 85,163 8,878,243Adani Transmission Ltd. 440,869 8,770,998Adani Total Gas Ltd. 440,064 8,262,239
SharesProceeds
US Dollars ($)
Sales
China Mobile Ltd. 10,167,940 53,669,173Tencent Holdings Ltd. 537,400 45,472,211Alibaba Group Holding Ltd. ADR 176,300 41,050,661Taiwan Semiconductor
Manufacturing Co., Ltd. 1,908,000 40,997,917CNOOC Ltd. 29,668,891 29,707,204Samsung Electronics Co., Ltd. 402,257 29,266,939Meituan Class B 336,000 14,202,505Semiconductor Manufacturing
International Corp. 5,038,300 14,199,404Kasikornbank PCL 2,501,388 9,839,483Naspers Ltd. Class N 41,596 9,600,747Samsung Electronics Co., Ltd. -
Preference Shares 134,125 8,873,765Baidu, Inc. ADR 31,785 7,825,669Reliance Industries Ltd. 274,533 7,499,822NetEase, Inc. ADR 62,232 7,236,802JD.com, Inc. ADR 82,727 6,967,019Hangzhou Hikvision Digital
Technology Co., Ltd. 923,054 6,936,024Industrial & Commercial Bank of
China Ltd. Class H 10,660,000 6,908,981Hyundai Motor Co. 34,163 6,870,415Infosys Ltd. 330,301 6,093,352China Construction Bank Corp.
Class H 7,520,000 5,970,238

Financial StatementsStatement of Investments30 June 2021
9
Vanguard Emerging Markets Stock Index Fund
.Number of
SharesFair Value
US Dollars ($)% of Total
Net AssetsEquities 97.50% (2020: 98.27%)Argentina 0.12% (2020: 0.12%)Globant SA 63,577 13,934,807 0.10%Adecoagro SA 158,670 1,593,047 0.01%YPF SA ADR 288,502 1,350,189 0.01%test test 16,878,043 0.12%Brazil 5.13% (2020: 5.02%)Vale SA 6,351,525 143,350,281 1.01%Itau Unibanco Holding SA - Preference Shares 7,786,139 46,240,311 0.33%
Petroleo Brasileiro SA - Preference Shares 7,546,703 44,261,879 0.31%
Banco Bradesco SA - Preference Shares 7,617,683 39,061,148 0.28%
Petroleo Brasileiro SA 6,072,665 36,657,338 0.26%B3 SA - Brasil Bolsa Balcao 9,951,012 33,356,123 0.24%Ambev SA 7,595,299 25,838,109 0.18%Magazine Luiza SA 4,693,612 19,783,352 0.14%WEG SA 2,697,724 18,112,602 0.13%Natura & Co. Holding SA 1,457,881 16,485,182 0.12%Itausa SA - Preference Shares 7,320,340 16,266,288 0.11%
Suzano SA 1,200,391 14,307,998 0.10%Notre Dame Intermedica Participacoes SA 843,636 14,279,025 0.10%
Lojas Renner SA 1,459,982 12,869,058 0.09%Localiza Rent a Car SA 977,982 12,473,639 0.09%Banco BTG Pactual SA 481,048 11,701,569 0.08%Banco Bradesco SA 2,615,087 11,392,489 0.08%Gerdau SA - Preference Shares 1,842,887 10,874,754 0.08%
Compania Siderurgica Nacional SA 1,130,576 9,911,424 0.07%
JBS SA 1,690,121 9,801,513 0.07%Banco do Brasil SA 1,380,744 8,841,098 0.06%Raia Drogasil SA 1,751,800 8,626,599 0.06%Cosan SA 1,708,496 8,157,989 0.06%Rumo SA 2,127,923 8,120,953 0.06%Banco Inter SA (BVMF) 481,400 7,462,978 0.05%Equatorial Energia SA 1,460,100 7,216,334 0.05%Telefonica Brasil SA 800,254 6,698,221 0.05%Petrobras Distribuidora SA 1,254,303 6,669,152 0.05%Via Varejo SA 2,096,700 6,597,824 0.05%Lojas Americanas SA - Preference Shares 1,479,552 6,363,030 0.05%
TOTVS SA 815,600 6,119,621 0.04%Klabin SA 1,165,097 6,115,897 0.04%Hapvida Participacoes e Investimentos SA 1,846,490 5,670,638 0.04%
BRF SA 1,033,016 5,626,379 0.04%Banco Santander Brasil SA 692,400 5,588,489 0.04%Bradespar SA - Preference Shares 371,000 5,495,666 0.04%
CCR SA 2,029,926 5,441,076 0.04%BB Seguridade Participacoes SA 1,162,712 5,352,621 0.04%
Rede D'Or Sao Luiz SA 373,827 5,142,696 0.04%B2W Compania Digital 363,643 4,801,854 0.03%Centrais Eletricas Brasileiras SA 526,325 4,528,125 0.03%
Hypera SA 639,696 4,394,376 0.03%Ultrapar Participacoes SA 1,189,180 4,358,245 0.03%Compania Energetica de Minas Gerais - Preference Shares 1,747,427 4,224,178 0.03%
.Number of
SharesFair Value
US Dollars ($)% of Total
Net AssetsCompania de Saneamento Basico do Estado de Sao Paulo 553,675 4,036,277 0.03%
Centrais Eletricas Brasileiras SA - Preference Shares 419,473 3,617,206 0.03%
Braskem SA - Preference Shares Class A 299,500 3,554,356 0.03%
Atacadao SA 777,700 3,254,721 0.02%TIM SA 1,385,488 3,183,570 0.02%Alpargatas SA - Preference Shares 311,100 3,111,713 0.02%
Energisa SA 310,900 2,887,280 0.02%Engie Brasil Energia SA 330,543 2,578,945 0.02%CPFL Energia SA 373,700 2,004,099 0.01%Compania Paranaense de Energia - Preference Shares 1,644,000 1,942,848 0.01%
Banco Inter SA 119,944 588,742 0.00%Banco BTG Pactual SA (BVMF) - Preference Shares 66,012 381,113 0.00%
Banco Inter SA - BRL 59,972 290,427 0.00%Ultrapar Participacoes SA - Rights Issue 28/9/2021 1,466,882 3 0.00%
test test 726,069,421 5.13%Chile 0.43% (2020: 0.49%)Sociedad Quimica y Minera de Chile SA - Preference Shares 215,229 10,227,745 0.07%
Banco de Chile 74,426,819 7,409,869 0.05%Empresas COPEC SA 611,844 6,075,500 0.04%Banco Santander Chile 107,304,880 5,351,170 0.04%Falabella SA 1,168,657 5,246,766 0.04%Enel Americas SA 34,243,429 5,069,895 0.04%Cencosud SA 2,347,867 4,711,470 0.03%Empresas CMPC SA 1,836,501 4,413,999 0.03%Banco de Credito e Inversiones SA 84,961 3,617,415 0.03%
Enel Chile SA 45,090,630 2,616,472 0.02%Compania Cervecerias Unidas SA 243,919 2,479,055 0.02%
Colbun SA 12,791,416 1,802,650 0.01%Cencosud Shopping SA 850,217 1,402,413 0.01%test test 60,424,419 0.43%China 36.59% (2020: 38.38%)Tencent Holdings Ltd. 9,231,836 694,243,672 4.90%Alibaba Group Holding Ltd. 24,310,936 688,708,373 4.86%Meituan Class B 5,784,000 238,633,710 1.69%China Construction Bank Corp. Class H 154,225,397 121,341,151 0.86%
NIO, Inc. ADR 2,072,239 110,243,115 0.78%JD.com, Inc. ADR 1,350,013 107,744,538 0.76%Wuxi Biologics Cayman, Inc. 5,398,243 98,916,407 0.70%Ping An Insurance Group Co. of China Ltd. Class H 9,783,744 95,810,984 0.68%
Pinduoduo, Inc. ADR 702,864 89,277,785 0.63%Baidu, Inc. ADR 432,273 88,140,465 0.62%Xiaomi Corp. Class B 23,027,195 80,060,040 0.57%NetEase, Inc. ADR 639,134 73,660,194 0.52%Industrial & Commercial Bank of China Ltd. Class H 89,679,703 52,658,685 0.37%
China Merchants Bank Co., Ltd. Class H 6,160,418 52,554,156 0.37%
Bank of China Ltd. Class H 126,374,891 45,402,106 0.32%Yum China Holdings, Inc. 667,030 44,190,738 0.31%Li Ning Co., Ltd. 3,583,500 43,744,832 0.31%ANTA Sports Products Ltd. 1,734,516 40,828,695 0.29%BYD Co., Ltd. Class H 1,292,935 38,658,937 0.27%
10
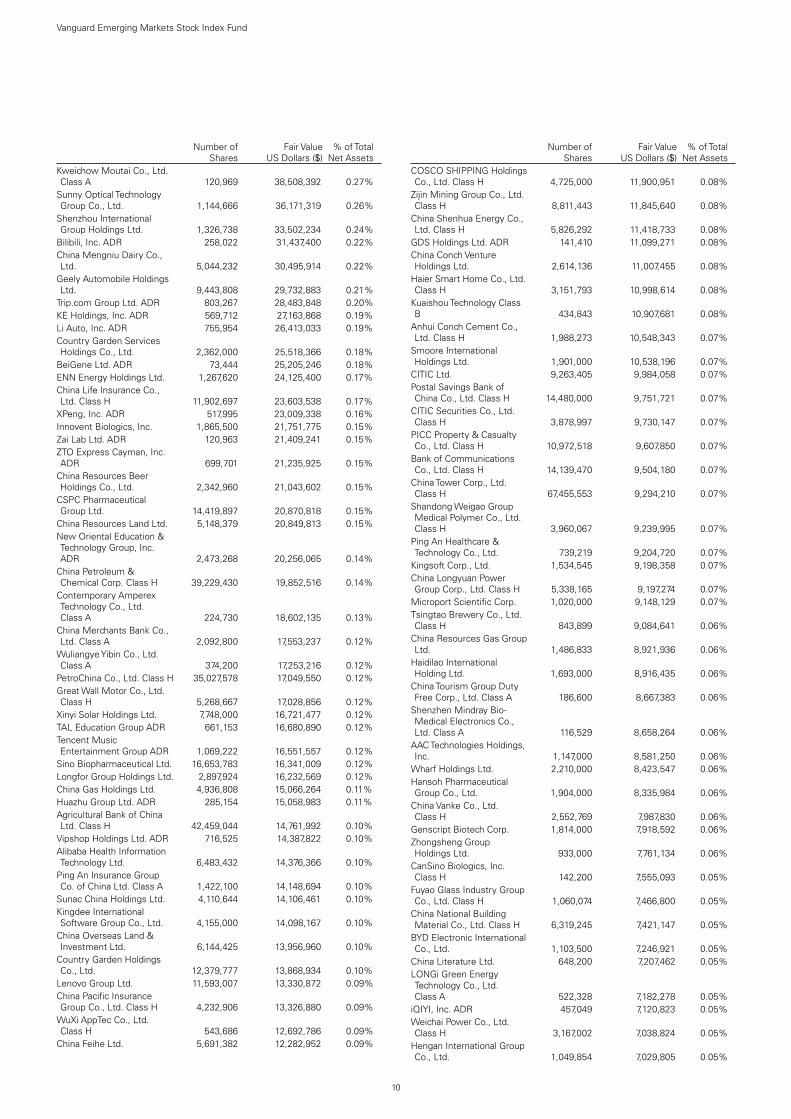
Vanguard Emerging Markets Stock Index Fund
.Number of
SharesFair Value
US Dollars ($)% of Total
Net AssetsKweichow Moutai Co., Ltd. Class A 120,969 38,508,392 0.27%
Sunny Optical Technology Group Co., Ltd. 1,144,666 36,171,319 0.26%
Shenzhou International Group Holdings Ltd. 1,326,738 33,502,234 0.24%
Bilibili, Inc. ADR 258,022 31,437,400 0.22%China Mengniu Dairy Co., Ltd. 5,044,232 30,495,914 0.22%
Geely Automobile Holdings Ltd. 9,443,808 29,732,883 0.21%
Trip.com Group Ltd. ADR 803,267 28,483,848 0.20%KE Holdings, Inc. ADR 569,712 27,163,868 0.19%Li Auto, Inc. ADR 755,954 26,413,033 0.19%Country Garden Services Holdings Co., Ltd. 2,362,000 25,518,366 0.18%
BeiGene Ltd. ADR 73,444 25,205,246 0.18%ENN Energy Holdings Ltd. 1,267,620 24,125,400 0.17%China Life Insurance Co., Ltd. Class H 11,902,697 23,603,538 0.17%
XPeng, Inc. ADR 517,995 23,009,338 0.16%Innovent Biologics, Inc. 1,865,500 21,751,775 0.15%Zai Lab Ltd. ADR 120,963 21,409,241 0.15%ZTO Express Cayman, Inc. ADR 699,701 21,235,925 0.15%
China Resources Beer Holdings Co., Ltd. 2,342,960 21,043,602 0.15%
CSPC Pharmaceutical Group Ltd. 14,419,897 20,870,818 0.15%
China Resources Land Ltd. 5,148,379 20,849,813 0.15%New Oriental Education & Technology Group, Inc. ADR 2,473,268 20,256,065 0.14%
China Petroleum & Chemical Corp. Class H 39,229,430 19,852,516 0.14%
Contemporary Amperex Technology Co., Ltd. Class A 224,730 18,602,135 0.13%
China Merchants Bank Co., Ltd. Class A 2,092,800 17,553,237 0.12%
Wuliangye Yibin Co., Ltd. Class A 374,200 17,253,216 0.12%
PetroChina Co., Ltd. Class H 35,027,578 17,049,550 0.12%Great Wall Motor Co., Ltd. Class H 5,268,667 17,028,856 0.12%
Xinyi Solar Holdings Ltd. 7,748,000 16,721,477 0.12%TAL Education Group ADR 661,153 16,680,890 0.12%Tencent Music Entertainment Group ADR 1,069,222 16,551,557 0.12%
Sino Biopharmaceutical Ltd. 16,653,783 16,341,009 0.12%Longfor Group Holdings Ltd. 2,897,924 16,232,569 0.12%China Gas Holdings Ltd. 4,936,808 15,066,264 0.11%Huazhu Group Ltd. ADR 285,154 15,058,983 0.11%Agricultural Bank of China Ltd. Class H 42,459,044 14,761,992 0.10%
Vipshop Holdings Ltd. ADR 716,525 14,387,822 0.10%Alibaba Health Information Technology Ltd. 6,483,432 14,376,366 0.10%
Ping An Insurance Group Co. of China Ltd. Class A 1,422,100 14,148,694 0.10%
Sunac China Holdings Ltd. 4,110,644 14,106,461 0.10%Kingdee International Software Group Co., Ltd. 4,155,000 14,098,167 0.10%
China Overseas Land & Investment Ltd. 6,144,425 13,956,960 0.10%
Country Garden Holdings Co., Ltd. 12,379,777 13,868,934 0.10%
Lenovo Group Ltd. 11,593,007 13,330,872 0.09%China Pacific Insurance Group Co., Ltd. Class H 4,232,906 13,326,880 0.09%
WuXi AppTec Co., Ltd. Class H 543,686 12,692,786 0.09%
China Feihe Ltd. 5,691,382 12,282,952 0.09%
.Number of
SharesFair Value
US Dollars ($)% of Total
Net AssetsCOSCO SHIPPING Holdings Co., Ltd. Class H 4,725,000 11,900,951 0.08%
Zijin Mining Group Co., Ltd. Class H 8,811,443 11,845,640 0.08%
China Shenhua Energy Co., Ltd. Class H 5,826,292 11,418,733 0.08%
GDS Holdings Ltd. ADR 141,410 11,099,271 0.08%China Conch Venture Holdings Ltd. 2,614,136 11,007,455 0.08%
Haier Smart Home Co., Ltd. Class H 3,151,793 10,998,614 0.08%
Kuaishou Technology Class B 434,843 10,907,681 0.08%
Anhui Conch Cement Co., Ltd. Class H 1,988,273 10,548,343 0.07%
Smoore International Holdings Ltd. 1,901,000 10,538,196 0.07%
CITIC Ltd. 9,263,405 9,984,058 0.07%Postal Savings Bank of China Co., Ltd. Class H 14,480,000 9,751,721 0.07%
CITIC Securities Co., Ltd. Class H 3,878,997 9,730,147 0.07%
PICC Property & Casualty Co., Ltd. Class H 10,972,518 9,607,850 0.07%
Bank of Communications Co., Ltd. Class H 14,139,470 9,504,180 0.07%
China Tower Corp., Ltd. Class H 67,455,553 9,294,210 0.07%
Shandong Weigao Group Medical Polymer Co., Ltd. Class H 3,960,067 9,239,995 0.07%
Ping An Healthcare & Technology Co., Ltd. 739,219 9,204,720 0.07%
Kingsoft Corp., Ltd. 1,534,545 9,198,358 0.07%China Longyuan Power Group Corp., Ltd. Class H 5,338,165 9,197,274 0.07%
Microport Scientific Corp. 1,020,000 9,148,129 0.07%Tsingtao Brewery Co., Ltd. Class H 843,899 9,084,641 0.06%
China Resources Gas Group Ltd. 1,486,833 8,921,936 0.06%
Haidilao International Holding Ltd. 1,693,000 8,916,435 0.06%
China Tourism Group Duty Free Corp., Ltd. Class A 186,600 8,667,383 0.06%
Shenzhen Mindray Bio-Medical Electronics Co., Ltd. Class A 116,529 8,658,264 0.06%
AAC Technologies Holdings, Inc. 1,147,000 8,581,250 0.06%
Wharf Holdings Ltd. 2,210,000 8,423,547 0.06%Hansoh Pharmaceutical Group Co., Ltd. 1,904,000 8,335,984 0.06%
China Vanke Co., Ltd. Class H 2,552,769 7,987,830 0.06%
Genscript Biotech Corp. 1,814,000 7,918,592 0.06%Zhongsheng Group Holdings Ltd. 933,000 7,761,134 0.06%
CanSino Biologics, Inc. Class H 142,200 7,555,093 0.05%
Fuyao Glass Industry Group Co., Ltd. Class H 1,060,074 7,466,800 0.05%
China National Building Material Co., Ltd. Class H 6,319,245 7,421,147 0.05%
BYD Electronic International Co., Ltd. 1,103,500 7,246,921 0.05%
China Literature Ltd. 648,200 7,207,462 0.05%LONGi Green Energy Technology Co., Ltd. Class A 522,328 7,182,278 0.05%
iQIYI, Inc. ADR 457,049 7,120,823 0.05%Weichai Power Co., Ltd. Class H 3,167,002 7,038,824 0.05%
Hengan International Group Co., Ltd. 1,049,854 7,029,805 0.05%

11
Vanguard Emerging Markets Stock Index Fund
.Number of
SharesFair Value
US Dollars ($)% of Total
Net AssetsShanghai Fosun Pharmaceutical Group Co., Ltd. Class H 858,773 6,933,570 0.05%
China Yangtze Power Co., Ltd. Class A 2,168,137 6,926,387 0.05%
Foshan Haitian Flavouring & Food Co., Ltd. Class A 345,358 6,892,888 0.05%
Guangdong Investment Ltd. 4,729,582 6,796,698 0.05%Autohome, Inc. ADR 104,430 6,679,343 0.05%Ping An Bank Co., Ltd. Class A 1,896,234 6,638,881 0.05%
Sinopharm Group Co., Ltd. Class H 2,224,304 6,616,329 0.05%
China CITIC Bank Corp., Ltd. Class H 13,866,881 6,571,093 0.05%
JD Health International, Inc. 455,951 6,534,680 0.05%Industrial Bank Co., Ltd. Class A 2,046,639 6,509,737 0.05%
Jiangsu Hengrui Medicine Co., Ltd. Class A 617,242 6,493,563 0.05%
China International Capital Corp., Ltd. Class H 2,359,200 6,349,244 0.05%
Tingyi Cayman Islands Holding Corp. 3,158,166 6,303,440 0.05%
WuXi AppTec Co., Ltd. Class A 257,482 6,240,527 0.04%
Ganfeng Lithium Co., Ltd. Class H 415,200 6,201,923 0.04%
JOYY, Inc. ADR 93,459 6,165,490 0.04%Weimob, Inc. 2,731,000 6,020,554 0.04%Shanxi Xinghuacun Fen Wine Factory Co., Ltd. Class A 85,300 5,914,764 0.04%
Kingboard Holdings Ltd. 1,055,000 5,855,186 0.04%Fosun International Ltd. 4,057,257 5,840,975 0.04%BYD Co., Ltd. Class A 150,300 5,839,061 0.04%Pharmaron Beijing Co., Ltd. Class H 216,000 5,757,515 0.04%
360 DigiTech, Inc. ADR 137,455 5,751,117 0.04%Minth Group Ltd. 1,202,000 5,711,390 0.04%Kunlun Energy Co., Ltd. 6,190,434 5,707,490 0.04%Aier Eye Hospital Group Co., Ltd. Class A 518,737 5,698,933 0.04%
China Medical System Holdings Ltd. 2,149,067 5,659,190 0.04%
Daqo New Energy Corp. ADR 85,163 5,537,298 0.04%
Want Want China Holdings Ltd. 7,807,440 5,529,455 0.04%
New China Life Insurance Co., Ltd. Class H 1,606,733 5,482,777 0.04%
Industrial & Commercial Bank of China Ltd. Class A 6,750,000 5,401,379 0.04%
Weibo Corp. ADR 102,020 5,368,292 0.04%Hutchmed China Ltd. ADR 136,096 5,344,490 0.04%Luzhou Laojiao Co., Ltd. Class A 143,900 5,255,000 0.04%
Wanhua Chemical Group Co., Ltd. Class A 309,151 5,207,026 0.04%
Jinxin Fertility Group Ltd. 2,030,000 5,123,457 0.04%Yihai International Holding Ltd. 754,000 5,063,335 0.04%
Zhuzhou CRRC Times Electric Co., Ltd. Class H 851,876 5,035,007 0.04%
East Money Information Co., Ltd. Class A 986,524 5,006,790 0.04%
Shimao Group Holdings Ltd. 2,030,216 4,977,602 0.04%Hopson Development Holdings Ltd. 1,078,000 4,941,739 0.04%
China Hongqiao Group Ltd. 3,631,500 4,919,407 0.04%Luxshare Precision Industry Co., Ltd. Class A 688,663 4,903,147 0.04%
Muyuan Foods Co., Ltd. Class A 515,104 4,848,994 0.03%
.Number of
SharesFair Value
US Dollars ($)% of Total
Net AssetsChina Meidong Auto Holdings Ltd. 880,000 4,798,960 0.03%
Jiangsu Yanghe Brewery Joint-Stock Co., Ltd. Class A 149,019 4,779,052 0.03%
Brilliance China Automotive Holdings Ltd. 5,046,474 4,743,751 0.03%
Jiumaojiu International Holdings Ltd. 1,156,000 4,726,205 0.03%
China Minsheng Banking Corp., Ltd. Class H 9,735,748 4,663,621 0.03%
Hua Hong Semiconductor Ltd. 841,519 4,648,707 0.03%
People's Insurance Co. Group of China Ltd. Class H 13,794,213 4,600,528 0.03%
SF Holding Co., Ltd. Class A 438,278 4,592,495 0.03%A-Living Smart City Services Co., Ltd. 911,250 4,535,217 0.03%
Chongqing Zhifei Biological Products Co., Ltd. Class A 156,000 4,508,676 0.03%
Shanghai Pudong Development Bank Co., Ltd. Class A 2,902,200 4,491,979 0.03%
ZhongAn Online P&C Insurance Co., Ltd. Class H 791,100 4,477,146 0.03%
Haitong Securities Co., Ltd. Class H 5,064,185 4,434,345 0.03%
Will Semiconductor Co., Ltd. Shanghai Class A 87,700 4,370,849 0.03%
China Lesso Group Holdings Ltd. 1,762,000 4,347,228 0.03%
I-Mab ADR 51,773 4,346,343 0.03%China Taiping Insurance Holdings Co., Ltd. 2,598,223 4,322,649 0.03%
China Resources Power Holdings Co., Ltd. 3,110,473 4,245,641 0.03%
China Evergrande Group 3,196,511 4,165,506 0.03%China Youzan Ltd. 21,736,000 4,142,403 0.03%Yadea Group Holdings Ltd. 1,922,000 4,133,147 0.03%Zhangzhou Pientzehuang Pharmaceutical Co., Ltd. Class A 59,462 4,125,899 0.03%
CIFI Holdings Group Co., Ltd. 5,226,000 4,078,055 0.03%
China Vanke Co., Ltd. Class A 1,093,500 4,029,847 0.03%
Topsports International Holdings Ltd. 2,452,000 4,016,230 0.03%
Guangzhou Automobile Group Co., Ltd. Class H 4,431,179 3,977,069 0.03%
Jiangxi Copper Co., Ltd. Class H 1,932,605 3,956,865 0.03%
Dongfeng Motor Group Co., Ltd. Class H 4,349,067 3,908,972 0.03%
Tongcheng-Elong Holdings Ltd. 1,557,600 3,899,089 0.03%
Aluminum Corp. of China Ltd. Class H 6,382,186 3,805,059 0.03%
51job, Inc. ADR 48,596 3,779,311 0.03%Momo, Inc. ADR 245,825 3,763,581 0.03%Sany Heavy Industry Co., Ltd. Class A 830,400 3,736,308 0.03%
China Resources Mixc Lifestyle Services Ltd. 544,800 3,728,648 0.03%
China Resources Cement Holdings Ltd. 3,914,000 3,719,531 0.03%
Bosideng International Holdings Ltd. 5,190,000 3,709,124 0.03%
Akeso, Inc. 457,000 3,686,789 0.03%Midea Group Co., Ltd. Class A 333,100 3,679,601 0.03%
Up Fintech Holding Ltd. ADR 126,732 3,672,693 0.03%

12
Vanguard Emerging Markets Stock Index Fund
.Number of
SharesFair Value
US Dollars ($)% of Total
Net AssetsSunac Services Holdings Ltd. 986,000 3,662,973 0.03%
Huatai Securities Co., Ltd. Class H 2,488,846 3,653,540 0.03%
Greentown Service Group Co., Ltd. 2,346,000 3,643,228 0.03%
China Galaxy Securities Co., Ltd. Class H 6,090,301 3,631,038 0.03%
Yanzhou Coal Mining Co., Ltd. Class H 2,692,375 3,619,487 0.03%
HengTen Networks Group Ltd. 4,436,000 3,547,269 0.03%
ZTE Corp. Class H 1,127,818 3,521,776 0.03%Hangzhou Tigermed Consulting Co., Ltd. Class A 116,978 3,499,825 0.03%
China Molybdenum Co., Ltd. Class H 5,892,000 3,497,636 0.03%
Bank of Ningbo Co., Ltd. Class A 579,300 3,494,172 0.03%
Logan Group Co., Ltd. 2,312,000 3,459,433 0.02%Inner Mongolia Yili Industrial Group Co., Ltd. Class A 603,139 3,438,187 0.02%
Haitian International Holdings Ltd. 1,024,699 3,437,281 0.02%
Zijin Mining Group Co., Ltd. Class A 2,278,200 3,416,850 0.02%
CGN Power Co., Ltd. Class H 15,336,589 3,416,535 0.02%
China Everbright Environment Group Ltd. 6,015,618 3,408,348 0.02%
China Merchants Port Holdings Co., Ltd. 2,327,633 3,398,901 0.02%
Kingboard Laminates Holdings Ltd. 1,509,000 3,384,920 0.02%
Nine Dragons Paper Holdings Ltd. 2,616,319 3,355,529 0.02%
Anhui Gujing Distillery Co., Ltd. Class A 90,476 3,353,893 0.02%
China Railway Group Ltd. Class H 6,426,589 3,351,557 0.02%
21Vianet Group, Inc. ADR 145,601 3,341,543 0.02%CITIC Securities Co., Ltd. Class A 861,300 3,324,767 0.02%
Agora, Inc. ADR 77,096 3,234,948 0.02%Shimao Services Holdings Ltd. 935,000 3,232,711 0.02%
Seazen Group Ltd. 3,396,000 3,218,522 0.02%BOE Technology Group Co., Ltd. Class A 3,316,900 3,203,519 0.02%
Flat Glass Group Co., Ltd. Class H 777,000 3,201,710 0.02%
Nongfu Spring Co., Ltd. Class H 634,600 3,182,867 0.02%
Agricultural Bank of China Ltd. Class A 6,775,700 3,177,658 0.02%
China Jinmao Holdings Group Ltd. 9,435,769 3,159,087 0.02%
Lufax Holding Ltd. ADR 279,307 3,156,169 0.02%TravelSky Technology Ltd. Class H 1,460,258 3,151,480 0.02%
Yunnan Energy New Material Co., Ltd. Class A 86,300 3,126,962 0.02%
Beijing-Shanghai High Speed Railway Co., Ltd. Class A 3,774,800 3,090,722 0.02%
China Traditional Chinese Medicine Holdings Co., Ltd. 4,476,000 3,066,286 0.02%
Guangzhou R&F Properties Co., Ltd. Class H 2,670,795 3,047,090 0.02%
Tongwei Co., Ltd. Class A 450,661 3,018,194 0.02%Beijing Enterprises Holdings Ltd. 841,820 2,986,427 0.02%
Baozun, Inc. ADR 83,811 2,970,262 0.02%
.Number of
SharesFair Value
US Dollars ($)% of Total
Net AssetsEver Sunshine Lifestyle Services Group Ltd. 1,194,000 2,964,301 0.02%
China Pacific Insurance Group Co., Ltd. Class A 657,100 2,946,390 0.02%
Shanghai Pharmaceuticals Holding Co., Ltd. Class H 1,346,098 2,939,771 0.02%
Ming Yuan Cloud Group Holdings Ltd. 587,000 2,913,892 0.02%
Gaotu Techedu, Inc. ADR 196,650 2,904,521 0.02%Eve Energy Co., Ltd. Class A 179,062 2,880,413 0.02%
JD.com, Inc. Class A 72,870 2,865,687 0.02%Kingsoft Cloud Holdings Ltd. ADR 84,412 2,864,099 0.02%
Venus MedTech Hangzhou, Inc. Class H 343,000 2,859,861 0.02%
Zoomlion Heavy Industry Science & Technology Co., Ltd. Class A 1,988,500 2,843,858 0.02%
Far East Horizon Ltd. 2,719,235 2,843,242 0.02%BOC Aviation Ltd. 336,300 2,836,476 0.02%China State Construction Engineering Corp., Ltd. Class A 3,934,830 2,831,974 0.02%
China Education Group Holdings Ltd. 1,256,000 2,801,228 0.02%
Beijing Enterprises Water Group Ltd. 7,360,019 2,786,360 0.02%
COSCO SHIPPING Holdings Co., Ltd. Class A 579,601 2,739,735 0.02%
KWG Group Holdings Ltd. 2,045,000 2,738,657 0.02%Dada Nexus Ltd. ADR 94,162 2,731,640 0.02%Shenzhen Inovance Technology Co., Ltd. Class A 237,450 2,729,213 0.02%
Bank of Communications Co., Ltd. Class A 3,596,100 2,727,333 0.02%
Alibaba Pictures Group Ltd. 19,451,692 2,705,155 0.02%China Cinda Asset Management Co., Ltd. Class H 14,116,588 2,690,311 0.02%
China Everbright Bank Co., Ltd. Class A 4,595,100 2,688,420 0.02%
China Oilfield Services Ltd. Class H 2,988,005 2,677,944 0.02%
SAIC Motor Corp., Ltd. Class A 781,100 2,656,116 0.02%
Maxscend Microelectronics Co., Ltd. Class A 31,620 2,630,575 0.02%
3SBio, Inc. 2,067,166 2,555,392 0.02%Rongsheng Petrochemical Co., Ltd. Class A 955,072 2,552,929 0.02%
Baoshan Iron & Steel Co., Ltd. Class A 2,157,100 2,550,786 0.02%
GOME Retail Holdings Ltd. 19,734,469 2,541,186 0.02%Noah Holdings Ltd. ADR 53,805 2,539,596 0.02%AviChina Industry & Technology Co., Ltd. Class H 3,809,464 2,521,378 0.02%
Shenzhen International Holdings Ltd. 1,805,000 2,496,275 0.02%
Agile Group Holdings Ltd. 1,902,000 2,463,880 0.02%Sungrow Power Supply Co., Ltd. Class A 137,200 2,443,368 0.02%
Huaneng Power International, Inc. Class H 6,226,037 2,437,229 0.02%
China Huarong Asset Management Co., Ltd. Class H 18,536,948 2,434,722 0.02%
Haier Smart Home Co., Ltd. Class A 607,000 2,434,257 0.02%
Sun Art Retail Group Ltd. 3,259,000 2,425,622 0.02%Uni-President China Holdings Ltd. 2,193,000 2,420,084 0.02%
Yuexiu Property Co., Ltd. 2,294,400 2,416,760 0.02%

13
Vanguard Emerging Markets Stock Index Fund
.Number of
SharesFair Value
US Dollars ($)% of Total
Net AssetsAnhui Conch Cement Co., Ltd. Class A 378,271 2,403,403 0.02%
Sinotruk Hong Kong Ltd. 1,109,000 2,376,270 0.02%Air China Ltd. Class H 3,217,186 2,365,502 0.02%Jiangsu Expressway Co., Ltd. Class H 2,077,635 2,351,631 0.02%
China Overseas Property Holdings Ltd. 2,185,000 2,335,288 0.02%
Hengli Petrochemical Co., Ltd. Class A 574,875 2,334,789 0.02%
Changchun High & New Technology Industry Group, Inc. Class A 38,900 2,330,080 0.02%
COSCO SHIPPING Ports Ltd. 2,972,114 2,319,258 0.02%
Greentown China Holdings Ltd. 1,490,500 2,295,483 0.02%
AECC Aviation Power Co., Ltd. Class A 275,800 2,270,568 0.02%
Iflytek Co., Ltd. Class A 217,000 2,269,804 0.02%Yunnan Baiyao Group Co., Ltd. Class A 126,189 2,260,166 0.02%
NAURA Technology Group Co., Ltd. Class A 52,400 2,249,659 0.02%
OneConnect Financial Technology Co., Ltd. ADR 186,104 2,236,970 0.02%
HUYA, Inc. ADR 125,802 2,220,405 0.02%China Merchants Securities Co., Ltd. Class A 750,360 2,208,974 0.02%
Poly Developments & Holdings Group Co., Ltd. Class A 1,176,700 2,192,818 0.02%
Lens Technology Co., Ltd. Class A 477,198 2,172,221 0.02%
China Yuhua Education Corp., Ltd. 2,380,000 2,154,484 0.02%
China State Construction International Holdings Ltd. 3,153,692 2,152,317 0.02%
MMG Ltd. 4,848,000 2,135,009 0.02%Focus Media Information Technology Co., Ltd. Class A 1,460,700 2,127,458 0.02%
SSY Group Ltd. 2,380,000 2,126,902 0.02%Zhejiang Huayou Cobalt Co., Ltd. Class A 120,150 2,123,734 0.02%
Dali Foods Group Co., Ltd. 3,512,500 2,094,153 0.02%Bank of China Ltd. Class A 4,382,700 2,089,310 0.02%Pharmaron Beijing Co., Ltd. Class A 62,200 2,089,010 0.02%
GoerTek, Inc. Class A 315,600 2,087,766 0.02%Sanan Optoelectronics Co., Ltd. Class A 418,500 2,076,031 0.02%
Chindata Group Holdings Ltd. ADR 136,214 2,055,469 0.02%
Burning Rock Biotech Ltd. ADR 69,740 2,054,540 0.02%
ZTE Corp. Class A 398,700 2,050,628 0.01%China Minsheng Banking Corp., Ltd. Class A 2,995,300 2,044,510 0.01%
Zhejiang Expressway Co., Ltd. Class H 2,291,861 2,039,282 0.01%
Ganfeng Lithium Co., Ltd. Class A 108,100 2,026,023 0.01%
Beijing Capital International Airport Co., Ltd. Class H 3,050,649 2,023,068 0.01%
Topchoice Medical Corp. Class A 31,797 2,022,732 0.01%
GF Securities Co., Ltd. Class H 1,541,486 1,996,864 0.01%
Guangdong Haid Group Co., Ltd. Class A 157,587 1,990,311 0.01%
NARI Technology Co., Ltd. Class A 549,120 1,975,212 0.01%
CSC Financial Co., Ltd. Class A 404,231 1,966,456 0.01%
.Number of
SharesFair Value
US Dollars ($)% of Total
Net AssetsPowerlong Real Estate Holdings Ltd. 2,271,000 1,950,536 0.01%
RLX Technology, Inc. ADR 222,393 1,941,491 0.01%Mango Excellent Media Co., Ltd. Class A 182,610 1,938,916 0.01%
Shandong Gold Mining Co., Ltd. Class H 1,074,750 1,901,539 0.01%
China Communications Services Corp., Ltd. Class H 3,796,223 1,896,682 0.01%
Wingtech Technology Co., Ltd. Class A 126,379 1,895,436 0.01%
Guotai Junan Securities Co., Ltd. Class A 703,460 1,866,210 0.01%
Bank of Shanghai Co., Ltd. Class A 1,445,136 1,834,142 0.01%
Chongqing Changan Automobile Co., Ltd. Class A 447,600 1,820,647 0.01%
Vinda International Holdings Ltd. 590,000 1,815,770 0.01%
China Everbright Ltd. 1,537,756 1,809,859 0.01%Hangzhou Tigermed Consulting Co., Ltd. Class H 76,700 1,797,537 0.01%
Gigadevice Semiconductor Beijing, Inc. Class A 61,544 1,789,876 0.01%
Shanghai Lujiazui Finance & Trade Zone Development Co., Ltd. Class B 1,924,421 1,787,787 0.01%
Xinjiang Goldwind Science & Technology Co., Ltd. Class H 1,135,760 1,775,482 0.01%
GF Securities Co., Ltd. Class A 757,300 1,774,615 0.01%
China Southern Airlines Co., Ltd. Class H 2,825,982 1,753,991 0.01%
Sany Heavy Equipment International Holdings Co., Ltd. 1,730,000 1,753,202 0.01%
China Petroleum & Chemical Corp. Class A 2,583,800 1,743,636 0.01%
Sangfor Technologies, Inc. Class A 43,000 1,726,962 0.01%
Kaisa Group Holdings Ltd. 4,555,662 1,724,685 0.01%Jiangsu Hengli Hydraulic Co., Ltd. Class A 126,907 1,687,680 0.01%
Huatai Securities Co., Ltd. Class A 687,900 1,682,259 0.01%
Lee & Man Paper Manufacturing Ltd. 2,197,000 1,671,970 0.01%
China Everbright Bank Co., Ltd. Class H 4,083,146 1,666,730 0.01%
Bank of Nanjing Co., Ltd. Class A 1,018,000 1,657,578 0.01%
Tianjin Zhonghuan Semiconductor Co., Ltd. Class A 275,700 1,647,155 0.01%
AVIC Shenyang Aircraft Co., Ltd. Class A 176,353 1,645,927 0.01%
Zhaojin Mining Industry Co., Ltd. Class H 1,727,000 1,641,193 0.01%
Yonyou Network Technology Co., Ltd. Class A 317,733 1,635,667 0.01%
China Aoyuan Group Ltd. 1,931,000 1,628,676 0.01%Shaanxi Coal Industry Co., Ltd. Class A 878,500 1,611,278 0.01%
Chongqing Rural Commercial Bank Co., Ltd. Class H 4,040,214 1,597,180 0.01%
TCL Technology Group Corp. Class A 1,336,800 1,582,844 0.01%
Ecovacs Robotics Co., Ltd. Class A 44,800 1,581,523 0.01%
China Resources Pharmaceutical Group Ltd. 2,516,000 1,568,076 0.01%

14
Vanguard Emerging Markets Stock Index Fund
.Number of
SharesFair Value
US Dollars ($)% of Total
Net AssetsShanghai Fosun Pharmaceutical Group Co., Ltd. Class A 138,400 1,545,121 0.01%
China Life Insurance Co., Ltd. Class A 288,500 1,513,309 0.01%
Bank of Beijing Co., Ltd. Class A 1,998,349 1,506,297 0.01%
Chongqing Brewery Co., Ltd. Class A 48,900 1,498,217 0.01%
Yihai Kerry Arawana Holdings Co., Ltd. Class A 113,700 1,495,152 0.01%
Hundsun Technologies, Inc. Class A 101,868 1,470,270 0.01%
China Railway Group Ltd. Class A 1,809,583 1,467,642 0.01%
Shenzhen Kangtai Biological Products Co., Ltd. Class A 63,300 1,459,823 0.01%
Shenwan Hongyuan Group Co., Ltd. Class A 2,003,600 1,451,333 0.01%
Bank of Jiangsu Co., Ltd. Class A 1,316,100 1,446,297 0.01%
Hangzhou First Applied Material Co., Ltd. Class A 88,560 1,441,035 0.01%
China Shipbuilding Industry Co., Ltd. Class A 2,253,143 1,436,800 0.01%
Seazen Holdings Co., Ltd. Class A 222,500 1,432,629 0.01%
China East Education Holdings Ltd. 906,500 1,424,094 0.01%
Unigroup Guoxin Microelectronics Co., Ltd. Class A 59,200 1,412,825 0.01%
Shanghai Putailai New Energy Technology Co., Ltd. Class A 66,817 1,412,694 0.01%
China Power International Development Ltd. 6,339,000 1,387,652 0.01%
Walvax Biotechnology Co., Ltd. Class A 144,300 1,378,040 0.01%
Weichai Power Co., Ltd. Class A 497,200 1,375,200 0.01%
China Bohai Bank Co., Ltd. Class H 3,945,500 1,366,675 0.01%
Wens Foodstuffs Group Co., Ltd. Class A 606,840 1,349,713 0.01%
Ovctek China, Inc. Class A 84,013 1,346,502 0.01%Henan Shuanghui Investment & Development Co., Ltd. Class A 270,870 1,333,209 0.01%
Guangzhou Tinci Materials Technology Co., Ltd. Class A 80,580 1,329,270 0.01%
Zhejiang Sanhua Intelligent Controls Co., Ltd. Class A 356,070 1,321,584 0.01%
Fuyao Glass Industry Group Co., Ltd. Class A 150,441 1,300,468 0.01%
Asymchem Laboratories Tianjin Co., Ltd. Class A 22,438 1,294,009 0.01%
AVIC Jonhon Optronic Technology Co., Ltd. Class A 104,574 1,279,002 0.01%
Huadong Medicine Co., Ltd. Class A 179,332 1,277,087 0.01%
Poly Property Services Co., Ltd. Class H 187,600 1,273,076 0.01%
Shenzhen Investment Ltd. 4,136,000 1,272,886 0.01%Huayu Automotive Systems Co., Ltd. Class A 311,350 1,265,958 0.01%
Bank of Hangzhou Co., Ltd. Class A 550,624 1,257,064 0.01%
Founder Securities Co., Ltd. Class A 843,156 1,221,502 0.01%
Guangzhou Shiyuan Electronic Technology Co., Ltd. Class A 63,077 1,213,438 0.01%
.Number of
SharesFair Value
US Dollars ($)% of Total
Net AssetsShanghai M&G Stationery, Inc. Class A 92,600 1,211,954 0.01%
Zhejiang Jingsheng Mechanical & Electrical Co., Ltd. Class A 153,500 1,199,803 0.01%
Ningxia Baofeng Energy Group Co., Ltd. Class A 564,871 1,196,040 0.01%
Zhenro Properties Group Ltd. 2,121,000 1,185,336 0.01%
Shanghai Bairun Investment Holding Group Co., Ltd. Class A 80,640 1,183,105 0.01%
DouYu International Holdings Ltd. ADR 169,832 1,161,651 0.01%
PetroChina Co., Ltd. Class A 1,418,100 1,161,109 0.01%Oppein Home Group, Inc. Class A 51,660 1,135,091 0.01%
Zhejiang NHU Co., Ltd. Class A 253,680 1,126,097 0.01%
Zhejiang Chint Electrics Co., Ltd. Class A 217,800 1,125,264 0.01%
Lomon Billions Group Co., Ltd. Class A 210,200 1,125,040 0.01%
Foxconn Industrial Internet Co., Ltd. Class A 585,200 1,124,052 0.01%
Everbright Securities Co., Ltd. Class A 405,200 1,121,993 0.01%
JiuGui Liquor Co., Ltd. Class A 28,200 1,115,630 0.01%
China Shenhua Energy Co., Ltd. Class A 366,400 1,106,995 0.01%
Tsingtao Brewery Co., Ltd. Class A 61,800 1,106,228 0.01%
China Merchants Shekou Industrial Zone Holdings Co., Ltd. Class A 652,300 1,105,533 0.01%
Guangzhou Kingmed Diagnostics Group Co., Ltd. Class A 44,600 1,102,911 0.01%
China Molybdenum Co., Ltd. Class A 1,379,700 1,101,906 0.01%
Hangzhou Silan Microelectronics Co., Ltd. Class A 126,100 1,099,814 0.01%
Inner Mongolia BaoTou Steel Union Co., Ltd. Class A 4,578,800 1,098,484 0.01%
Skshu Paint Co., Ltd. Class A 40,063 1,091,356 0.01%
China National Nuclear Power Co., Ltd. Class A 1,376,400 1,077,967 0.01%
Chaozhou Three-Circle Group Co., Ltd. Class A 163,800 1,075,462 0.01%
Aluminum Corp. of China Ltd. Class A 1,308,100 1,073,068 0.01%
Shandong Gold Mining Co., Ltd. Class A 357,392 1,063,184 0.01%
Huaxia Bank Co., Ltd. Class A 1,105,065 1,058,739 0.01%
Jafron Biomedical Co., Ltd. Class A 78,850 1,053,961 0.01%
Beijing New Building Materials plc Class A 172,400 1,047,339 0.01%
China CSSC Holdings Ltd. Class A 407,700 1,041,833 0.01%
AVIC Xi'an Aircraft Industry Group Co., Ltd. Class A 255,700 1,040,079 0.01%
Industrial Securities Co., Ltd. Class A 695,500 1,039,883 0.01%
XPeng, Inc. Class A 48,799 1,036,826 0.01%Jiangsu King's Luck Brewery JSC Ltd. Class A 123,600 1,036,114 0.01%
Hualan Biological Engineering, Inc. Class A 182,390 1,035,478 0.01%

15
Vanguard Emerging Markets Stock Index Fund
.Number of
SharesFair Value
US Dollars ($)% of Total
Net AssetsShandong Hualu Hengsheng Chemical Co., Ltd. Class A 216,060 1,035,012 0.01%
China Northern Rare Earth Group High-Tech Co., Ltd. Class A 319,100 1,022,369 0.01%
JCET Group Co., Ltd. Class A 175,200 1,021,775 0.01%
Haitong Securities Co., Ltd. Class A 574,000 1,021,692 0.01%
360 Security Technology, Inc. 537,840 1,016,434 0.01%
SDIC Power Holdings Co., Ltd. Class A 683,100 1,016,057 0.01%
China Jushi Co., Ltd. Class A 415,709 997,956 0.01%
Changzhou Xingyu Automotive Lighting Systems Co., Ltd. Class A 28,100 981,718 0.01%
Jiangsu Eastern Shenghong Co., Ltd. Class A 303,400 981,459 0.01%
Guosen Securities Co., Ltd. Class A 589,400 980,684 0.01%
Shenzhen Overseas Chinese Town Co., Ltd. Class A 850,900 979,855 0.01%
DiDi Global, Inc. 68,800 972,832 0.01%Orient Securities Co., Ltd. Class A 627,798 970,724 0.01%
Zhejiang Dahua Technology Co., Ltd. Class A 295,600 965,378 0.01%
Shandong Linglong Tyre Co., Ltd. Class A 142,200 962,695 0.01%
Shenzhen Goodix Technology Co., Ltd. Class A 47,559 954,220 0.01%
Sichuan Swellfun Co., Ltd. Class A 48,431 947,129 0.01%
Yealink Network Technology Corp., Ltd. Class A 72,900 945,544 0.01%
Kingfa Sci & Tech Co., Ltd. Class A 291,700 941,805 0.01%
China Construction Bank Corp. Class A 911,700 938,391 0.01%
Zhejiang Satellite Petrochemical Co., Ltd. Class A 154,280 935,826 0.01%
New Hope Liuhe Co., Ltd. Class A 411,200 933,670 0.01%
Huafon Chemical Co., Ltd. Class A 422,700 929,033 0.01%
Wuhan Guide Infrared Co., Ltd. Class A 214,877 917,264 0.01%
Hithink RoyalFlush Information Network Co., Ltd. Class A 52,300 912,944 0.01%
Thunder Software Technology Co., Ltd. Class A 36,500 887,297 0.01%
Lepu Medical Technology Beijing Co., Ltd. Class A 176,500 877,467 0.01%
Ingenic Semiconductor Co., Ltd. Class A 55,700 870,047 0.01%
Power Construction Corp. of China Ltd. Class A 1,440,137 862,631 0.01%
SG Micro Corp. Class A 22,050 862,533 0.01%By-health Co., Ltd. Class A 165,700 843,779 0.01%Shanghai Baosight Software Co., Ltd. Class A 106,860 841,867 0.01%
Suning.com Co., Ltd. Class A 948,750 820,869 0.01%
Sinoma Science & Technology Co., Ltd. Class A 202,400 819,831 0.01%
Fu Jian Anjoy Foods Co., Ltd. Class A 20,700 813,858 0.01%
.Number of
SharesFair Value
US Dollars ($)% of Total
Net AssetsShengyi Technology Co., Ltd. Class A 221,800 803,662 0.01%
Guangdong Kinlong Hardware Products Co., Ltd. Class A 26,600 798,924 0.01%
Shennan Circuits Co., Ltd. Class A 46,340 797,072 0.01%
Lingyi iTech Guangdong Co. Class A 555,500 790,151 0.01%
Unisplendour Corp., Ltd. Class A 232,775 788,304 0.01%
Gotion High-tech Co., Ltd. Class A 115,900 781,415 0.01%
Wuhu Sanqi Interactive Entertainment Network Technology Group Co., Ltd. Class A 209,074 777,291 0.01%
Xinjiang Goldwind Science & Technology Co., Ltd. Class A 409,478 770,681 0.01%
Metallurgical Corp. of China Ltd. Class A 1,668,900 769,763 0.01%
New China Life Insurance Co., Ltd. Class A 107,700 765,303 0.01%
XCMG Construction Machinery Co., Ltd. Class A 771,200 760,356 0.01%
Sunwoda Electronic Co., Ltd. Class A 150,500 758,457 0.01%
Juewei Food Co., Ltd. Class A 57,653 752,157 0.01%
Offcn Education Technology Co., Ltd. Class A 232,500 751,747 0.01%
Guangzhou Baiyunshan Pharmaceutical Holdings Co., Ltd. Class A 143,300 750,784 0.01%
China National Chemical Engineering Co., Ltd. Class A 552,900 749,654 0.01%
Sichuan Chuantou Energy Co., Ltd. Class A 391,157 746,491 0.01%
BGI Genomics Co., Ltd. Class A 40,642 746,054 0.01%
Shanxi Taigang Stainless Steel Co., Ltd. Class A 639,800 741,714 0.01%
Avary Holding Shenzhen Co., Ltd. Class A 132,800 737,498 0.01%
China Zheshang Bank Co., Ltd. Class A 1,198,900 736,688 0.01%
Hongfa Technology Co., Ltd. Class A 75,800 735,609 0.01%
Intco Medical Technology Co., Ltd. Class A 38,000 734,021 0.01%
Shandong Nanshan Aluminum Co., Ltd. Class A 1,314,600 732,498 0.01%
Postal Savings Bank of China Co., Ltd. Class A 938,100 728,892 0.01%
Spring Airlines Co., Ltd. Class A 82,564 727,132 0.01%
Bank of Chengdu Co., Ltd. Class A 369,578 723,042 0.01%
Greenland Holdings Corp., Ltd. Class A 855,900 721,988 0.01%
Huizhou Desay Sv Automotive Co., Ltd. Class A 42,300 720,708 0.01%
Gemdale Corp. Class A 454,000 719,559 0.01%Zhongjin Gold Corp., Ltd. Class A 538,758 718,805 0.01%
Shanghai Electric Group Co., Ltd. Class A 1,093,872 717,865 0.01%
Shanghai International Airport Co., Ltd. Class A 96,197 716,618 0.01%

16
Vanguard Emerging Markets Stock Index Fund
.Number of
SharesFair Value
US Dollars ($)% of Total
Net AssetsInner Mongolia Junzheng Energy & Chemical Industry Group Co., Ltd. Class A 908,000 715,342 0.01%
China Southern Airlines Co., Ltd. Class A 766,700 714,385 0.01%
Perfect World Co., Ltd. Class A 192,300 711,655 0.01%
Shandong Sinocera Functional Material Co., Ltd. Class A 94,119 710,170 0.01%
SDIC Capital Co., Ltd. Class A 538,992 708,272 0.01%
Wuxi Shangji Automation Co., Ltd. Class A 25,500 706,289 0.01%
DaShenLin Pharmaceutical Group Co., Ltd. Class A 88,800 702,472 0.01%
Yonghui Superstores Co., Ltd. Class A 956,400 700,182 0.01%
Zhuzhou Kibing Group Co., Ltd. Class A 243,400 699,212 0.01%
Zhejiang Century Huatong Group Co., Ltd. Class A 700,360 695,932 0.01%
Avic Aviation High-Technology Co., Ltd. Class A 145,600 693,650 0.01%
Tongkun Group Co., Ltd. Class A 185,400 691,285 0.01%
Angel Yeast Co., Ltd. Class A 81,854 688,953 0.01%
Jason Furniture Hangzhou Co., Ltd. Class A 57,300 685,381 0.01%
Hangzhou Robam Appliances Co., Ltd. Class A 94,900 683,014 0.01%
Sinolink Securities Co., Ltd. Class A 346,000 679,592 0.01%
Wuxi Lead Intelligent Equipment Co., Ltd. Class A 72,800 677,650 0.01%
China Eastern Airlines Corp., Ltd. Class A 858,200 674,781 0.01%
Wuchan Zhongda Group Co., Ltd. Class A 553,900 674,709 0.01%
Beijing Tiantan Biological Products Corp., Ltd. Class A 126,600 671,127 0.01%
Suzhou Maxwell Technologies Co., Ltd. Class A 9,522 670,137 0.01%
Shanghai Jinjiang International Hotels Co., Ltd. Class A 76,025 670,132 0.01%
Ningbo Tuopu Group Co., Ltd. Class A 115,600 669,712 0.01%
Yantai Eddie Precision Machinery Co., Ltd. Class A 99,733 661,763 0.01%
Betta Pharmaceuticals Co., Ltd. Class A 39,400 660,077 0.01%
Humanwell Healthcare Group Co., Ltd. Class A 150,200 657,213 0.01%
JA Solar Technology Co., Ltd. Class A 86,400 655,270 0.01%
Hengyi Petrochemical Co., Ltd. Class A 352,866 652,662 0.01%
Yantai Jereh Oilfield Services Group Co., Ltd. Class A 93,900 649,656 0.01%
China Greatwall Technology Group Co., Ltd. Class A 285,700 645,615 0.01%
Shanghai Jahwa United Co., Ltd. Class A 69,097 643,181 0.01%
Yunda Holding Co., Ltd. Class A 306,880 642,653 0.01%
.Number of
SharesFair Value
US Dollars ($)% of Total
Net AssetsMontage Technology Co., Ltd. Class A 66,341 640,527 0.01%
Raytron Technology Co., Ltd. Class A 41,400 639,693 0.01%
NetEase, Inc. 27,886 631,630 0.00%Shanghai International Port Group Co., Ltd. Class A 855,100 631,314 0.00%
Songcheng Performance Development Co., Ltd. Class A 241,380 627,655 0.00%
Zhejiang Longsheng Group Co., Ltd. Class A 293,900 625,024 0.00%
Jiangsu Yuyue Medical Equipment & Supply Co., Ltd. Class A 105,600 623,220 0.00%
Anhui Kouzi Distillery Co., Ltd. Class A 59,463 622,991 0.00%
Inspur Electronic Information Industry Co., Ltd. Class A 142,576 620,764 0.00%
Kuang-Chi Technologies Co., Ltd. Class A 192,600 620,353 0.00%
Autobio Diagnostics Co., Ltd. Class A 52,341 613,832 0.00%
Shanghai Yuyuan Tourist Mart Group Co., Ltd. Class A 340,600 610,996 0.00%
GEM Co., Ltd. Class A 422,100 610,854 0.00%Zheshang Securities Co., Ltd. Class A 298,300 603,909 0.00%
AVIC Electromechanical Systems Co., Ltd. Class A 386,500 602,406 0.00%
Anhui Gujing Distillery Co., Ltd. Class B 43,500 602,156 0.00%
Weihai Guangwei Composites Co., Ltd. Class A 51,100 600,702 0.00%
AVIC Industry-Finance Holdings Co., Ltd. Class A 991,713 594,029 0.00%
FAW Jiefang Group Co., Ltd. Class A 353,600 592,175 0.00%
TBEA Co., Ltd. Class A 297,500 591,698 0.00%Guoyuan Securities Co., Ltd. Class A 479,570 591,590 0.00%
Yifeng Pharmacy Chain Co., Ltd. Class A 67,886 589,354 0.00%
Joinn Laboratories China Co., Ltd. Class A 20,700 588,719 0.00%
Hefei Meiya Optoelectronic Technology, Inc. Class A 67,666 583,988 0.00%
Shijiazhuang Yiling Pharmaceutical Co., Ltd. Class A 128,700 580,867 0.00%
YTO Express Group Co., Ltd. Class A 370,300 573,718 0.00%
Tianshui Huatian Technology Co., Ltd. Class A 239,000 569,307 0.00%
G-bits Network Technology Xiamen Co., Ltd. Class A 6,900 566,025 0.00%
Great Wall Motor Co., Ltd. Class A 83,700 564,706 0.00%
Changjiang Securities Co., Ltd. Class A 498,400 564,676 0.00%
Zhejiang Jiuzhou Pharmaceutical Co., Ltd. Class A 74,400 559,424 0.00%
Jiangsu Yangnong Chemical Co., Ltd. Class A 32,200 557,047 0.00%
China Common 19,974,000 556,433 0.00%Shandong Sun Paper Industry JSC Ltd. Class A 267,800 553,353 0.00%
Zhejiang Supor Co., Ltd. Class A 55,000 543,032 0.00%
Caitong Securities Co., Ltd. Class A 334,100 542,453 0.00%
17
Vanguard Emerging Markets Stock Index Fund
.Number of
SharesFair Value
US Dollars ($)% of Total
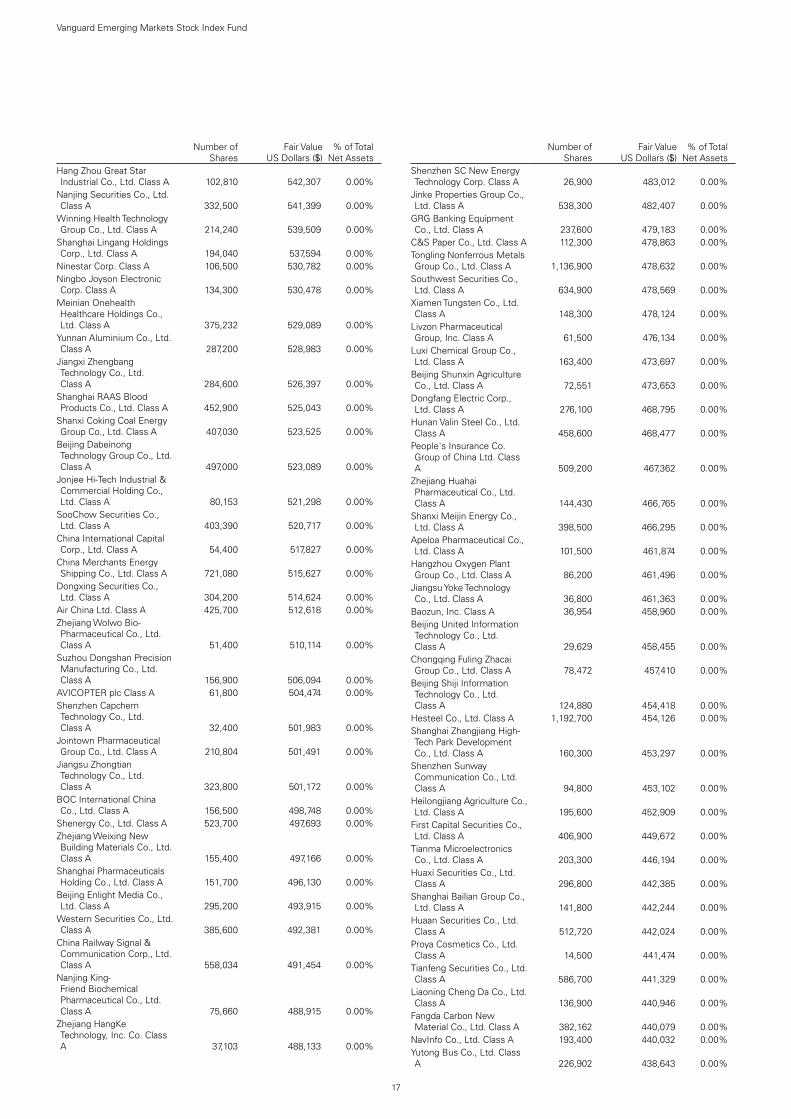
Net AssetsHang Zhou Great Star Industrial Co., Ltd. Class A 102,810 542,307 0.00%
Nanjing Securities Co., Ltd. Class A 332,500 541,399 0.00%
Winning Health Technology Group Co., Ltd. Class A 214,240 539,509 0.00%
Shanghai Lingang Holdings Corp., Ltd. Class A 194,040 537,594 0.00%
Ninestar Corp. Class A 106,500 530,782 0.00%Ningbo Joyson Electronic Corp. Class A 134,300 530,478 0.00%
Meinian Onehealth Healthcare Holdings Co., Ltd. Class A 375,232 529,089 0.00%
Yunnan Aluminium Co., Ltd. Class A 287,200 528,983 0.00%
Jiangxi Zhengbang Technology Co., Ltd. Class A 284,600 526,397 0.00%
Shanghai RAAS Blood Products Co., Ltd. Class A 452,900 525,043 0.00%
Shanxi Coking Coal Energy Group Co., Ltd. Class A 407,030 523,525 0.00%
Beijing Dabeinong Technology Group Co., Ltd. Class A 497,000 523,089 0.00%
Jonjee Hi-Tech Industrial & Commercial Holding Co., Ltd. Class A 80,153 521,298 0.00%
SooChow Securities Co., Ltd. Class A 403,390 520,717 0.00%
China International Capital Corp., Ltd. Class A 54,400 517,827 0.00%
China Merchants Energy Shipping Co., Ltd. Class A 721,080 515,627 0.00%
Dongxing Securities Co., Ltd. Class A 304,200 514,624 0.00%
Air China Ltd. Class A 425,700 512,618 0.00%Zhejiang Wolwo Bio-Pharmaceutical Co., Ltd. Class A 51,400 510,114 0.00%
Suzhou Dongshan Precision Manufacturing Co., Ltd. Class A 156,900 506,094 0.00%
AVICOPTER plc Class A 61,800 504,474 0.00%Shenzhen Capchem Technology Co., Ltd. Class A 32,400 501,983 0.00%
Jointown Pharmaceutical Group Co., Ltd. Class A 210,804 501,491 0.00%
Jiangsu Zhongtian Technology Co., Ltd. Class A 323,800 501,172 0.00%
BOC International China Co., Ltd. Class A 156,500 498,748 0.00%
Shenergy Co., Ltd. Class A 523,700 497,693 0.00%Zhejiang Weixing New Building Materials Co., Ltd. Class A 155,400 497,166 0.00%
Shanghai Pharmaceuticals Holding Co., Ltd. Class A 151,700 496,130 0.00%
Beijing Enlight Media Co., Ltd. Class A 295,200 493,915 0.00%
Western Securities Co., Ltd. Class A 385,600 492,381 0.00%
China Railway Signal & Communication Corp., Ltd. Class A 558,034 491,454 0.00%
Nanjing King-Friend Biochemical Pharmaceutical Co., Ltd. Class A 75,660 488,915 0.00%
Zhejiang HangKe Technology, Inc. Co. Class A 37,103 488,133 0.00%
.Number of
SharesFair Value
US Dollars ($)% of Total
Net AssetsShenzhen SC New Energy Technology Corp. Class A 26,900 483,012 0.00%
Jinke Properties Group Co., Ltd. Class A 538,300 482,407 0.00%
GRG Banking Equipment Co., Ltd. Class A 237,600 479,183 0.00%
C&S Paper Co., Ltd. Class A 112,300 478,863 0.00%Tongling Nonferrous Metals Group Co., Ltd. Class A 1,136,900 478,632 0.00%
Southwest Securities Co., Ltd. Class A 634,900 478,569 0.00%
Xiamen Tungsten Co., Ltd. Class A 148,300 478,124 0.00%
Livzon Pharmaceutical Group, Inc. Class A 61,500 476,134 0.00%
Luxi Chemical Group Co., Ltd. Class A 163,400 473,697 0.00%
Beijing Shunxin Agriculture Co., Ltd. Class A 72,551 473,653 0.00%
Dongfang Electric Corp., Ltd. Class A 276,100 468,795 0.00%
Hunan Valin Steel Co., Ltd. Class A 458,600 468,477 0.00%
People's Insurance Co. Group of China Ltd. Class A 509,200 467,362 0.00%
Zhejiang Huahai Pharmaceutical Co., Ltd. Class A 144,430 466,765 0.00%
Shanxi Meijin Energy Co., Ltd. Class A 398,500 466,295 0.00%
Apeloa Pharmaceutical Co., Ltd. Class A 101,500 461,874 0.00%
Hangzhou Oxygen Plant Group Co., Ltd. Class A 86,200 461,496 0.00%
Jiangsu Yoke Technology Co., Ltd. Class A 36,800 461,363 0.00%
Baozun, Inc. Class A 36,954 458,960 0.00%Beijing United Information Technology Co., Ltd. Class A 29,629 458,455 0.00%
Chongqing Fuling Zhacai Group Co., Ltd. Class A 78,472 457,410 0.00%
Beijing Shiji Information Technology Co., Ltd. Class A 124,880 454,418 0.00%
Hesteel Co., Ltd. Class A 1,192,700 454,126 0.00%Shanghai Zhangjiang High-Tech Park Development Co., Ltd. Class A 160,300 453,297 0.00%
Shenzhen Sunway Communication Co., Ltd. Class A 94,800 453,102 0.00%
Heilongjiang Agriculture Co., Ltd. Class A 195,600 452,909 0.00%
First Capital Securities Co., Ltd. Class A 406,900 449,672 0.00%
Tianma Microelectronics Co., Ltd. Class A 203,300 446,194 0.00%
Huaxi Securities Co., Ltd. Class A 296,800 442,385 0.00%
Shanghai Bailian Group Co., Ltd. Class A 141,800 442,244 0.00%
Huaan Securities Co., Ltd. Class A 512,720 442,024 0.00%
Proya Cosmetics Co., Ltd. Class A 14,500 441,474 0.00%
Tianfeng Securities Co., Ltd. Class A 586,700 441,329 0.00%
Liaoning Cheng Da Co., Ltd. Class A 136,900 440,946 0.00%
Fangda Carbon New Material Co., Ltd. Class A 382,162 440,079 0.00%
NavInfo Co., Ltd. Class A 193,400 440,032 0.00%Yutong Bus Co., Ltd. Class A 226,902 438,643 0.00%

18
Vanguard Emerging Markets Stock Index Fund
.Number of
SharesFair Value
US Dollars ($)% of Total
Net AssetsShanxi Lu'an Environmental Energy Development Co., Ltd. Class A 238,700 436,328 0.00%
Topsec Technologies Group, Inc. Class A 142,400 435,740 0.00%
Shenzhen Energy Group Co., Ltd. Class A 306,960 435,674 0.00%
Huadian Power International Corp., Ltd. Class A 815,548 434,228 0.00%
Zhejiang Dingli Machinery Co., Ltd. Class A 47,740 433,667 0.00%
Guangzhou Wondfo Biotech Co., Ltd. Class A 42,871 429,251 0.00%
China National Software & Service Co., Ltd. Class A 48,400 426,478 0.00%
Sailun Group Co., Ltd. Class A 275,440 425,895 0.00%
Shanghai Construction Group Co., Ltd. Class A 995,763 425,378 0.00%
China National Medicines Corp., Ltd. Class A 83,000 424,709 0.00%
Addsino Co., Ltd. Class A 145,300 424,373 0.00%Ming Yang Smart Energy Group Ltd. Class A 169,300 424,242 0.00%
Shenghe Resources Holding Co., Ltd. Class A 157,600 423,464 0.00%
Anhui Honglu Steel Construction Group Co., Ltd. Class A 46,828 422,919 0.00%
Sichuan Road & Bridge Co., Ltd. Class A 432,500 419,724 0.00%
Shandong Buchang Pharmaceuticals Co., Ltd. Class A 120,280 418,691 0.00%
Joincare Pharmaceutical Group Industry Co., Ltd. Class A 196,600 417,796 0.00%
DHC Software Co., Ltd. Class A 339,700 416,945 0.00%
Autohome, Inc. Class A 25,316 415,639 0.00%Guanghui Energy Co., Ltd. Class A 806,100 415,474 0.00%
Beijing Yuanliu Hongyuan Electronic Technology Co., Ltd. Class A 20,900 413,804 0.00%
Shanxi Securities Co., Ltd. Class A 395,200 410,440 0.00%
ENN Natural Gas Co., Ltd. Class A 160,400 409,885 0.00%
Xiamen Intretech, Inc. Class A 68,000 409,525 0.00%
Shenzhen Salubris Pharmaceuticals Co., Ltd. Class A 80,000 407,377 0.00%
China Resources Sanjiu Medical & Pharmaceutical Co., Ltd. Class A 98,243 406,758 0.00%
Yintai Gold Co., Ltd. Class A 275,240 405,137 0.00%Daan Gene Co., Ltd. Class A 123,024 404,441 0.00%WUS Printed Circuit Kunshan Co., Ltd. Class A 167,538 401,157 0.00%
Chacha Food Co., Ltd. Class A 60,000 400,257 0.00%
Transfar Zhilian Co., Ltd. Class A 335,200 400,008 0.00%
Sinopec Shanghai Petrochemical Co., Ltd. Class A 687,100 399,869 0.00%
Shenzhen Kaifa Technology Co., Ltd. Class A 133,000 394,007 0.00%
Zhejiang Juhua Co., Ltd. Class A 286,800 392,412 0.00%
Sichuan Kelun Pharmaceutical Co., Ltd. Class A 126,606 390,938 0.00%
.Number of
SharesFair Value
US Dollars ($)% of Total
Net AssetsOFILM Group Co., Ltd. Class A 283,700 389,926 0.00%
Toly Bread Co., Ltd. Class A 78,988 381,440 0.00%China TransInfo Technology Co., Ltd. Class A 146,500 378,673 0.00%
Sealand Securities Co., Ltd. Class A 576,420 378,282 0.00%
COSCO SHIPPING Energy Transportation Co., Ltd. Class H 810,000 377,576 0.00%
AECC Aero-Engine Control Co., Ltd. Class A 117,100 377,534 0.00%
Beijing Originwater Technology Co., Ltd. Class A 332,300 375,974 0.00%
Dong-E-E-Jiao Co., Ltd. Class A 67,600 375,727 0.00%
Shenzhen Sunlord Electronics Co., Ltd. Class A 62,500 375,047 0.00%
Zhejiang China Commodities City Group Co., Ltd. Class A 465,600 371,134 0.00%
Universal Scientific Industrial Shanghai Co., Ltd. Class A 142,300 370,240 0.00%
Trip.com Group Ltd. 10,409 369,938 0.00%Tonghua Dongbao Pharmaceutical Co., Ltd. Class A 199,961 369,539 0.00%
Jiangxi Copper Co., Ltd. Class A 106,400 368,563 0.00%
Fujian Sunner Development Co., Ltd. Class A 99,621 368,210 0.00%
Huaxin Cement Co., Ltd. Class A 135,366 368,122 0.00%
Pacific Securities Co., Ltd. Class A 701,200 367,919 0.00%
NanJi E-Commerce Co., Ltd. Class A 242,300 366,402 0.00%
TongFu Microelectronics Co., Ltd. Class A 97,500 362,785 0.00%
Zhefu Holding Group Co., Ltd. Class A 469,300 362,461 0.00%
Financial Street Holdings Co., Ltd. Class A 345,442 360,902 0.00%
Sinotrans Ltd. Class A 458,500 358,378 0.00%China Avionics Systems Co., Ltd. Class A 139,200 356,572 0.00%
Youngor Group Co., Ltd. Class A 347,837 354,790 0.00%
Jilin Aodong Pharmaceutical Group Co., Ltd. Class A 147,600 353,874 0.00%
Yuan Longping High-tech Agriculture Co., Ltd. Class A 141,800 352,039 0.00%
Qingdao Rural Commercial Bank Corp. Class A 529,900 351,033 0.00%
Beijing Yanjing Brewery Co., Ltd. Class A 312,400 350,074 0.00%
Zhongji Innolight Co., Ltd. Class A 58,600 349,377 0.00%
China Aerospace Times Electronics Co., Ltd. Class A 299,700 348,831 0.00%
Fiberhome Telecommunication Technologies Co., Ltd. Class A 120,800 348,329 0.00%
Riyue Heavy Industry Co., Ltd. Class A 82,400 345,371 0.00%
Jiangsu Zhongnan Construction Group Co., Ltd. Class A 374,300 342,967 0.00%

19
Vanguard Emerging Markets Stock Index Fund
.Number of
SharesFair Value
US Dollars ($)% of Total
Net AssetsChongqing Rural Commercial Bank Co., Ltd. Class A 554,800 342,626 0.00%
Yum China Holdings, Inc. (XHKG) 5,235 341,434 0.00%
Joyoung Co., Ltd. Class A 67,803 340,964 0.00%RiseSun Real Estate Development Co., Ltd. Class A 390,500 340,887 0.00%
Guolian Securities Co., Ltd. Class A 142,100 338,708 0.00%
Beijing Sinnet Technology Co., Ltd. Class A 151,700 337,876 0.00%
Laobaixing Pharmacy Chain JSC Class A 41,020 334,466 0.00%
Northeast Securities Co., Ltd. Class A 255,600 334,293 0.00%
Yango Group Co., Ltd. Class A 412,100 331,678 0.00%
Yifan Pharmaceutical Co., Ltd. Class A 123,800 330,537 0.00%
Leyard Optoelectronic Co., Ltd. Class A 266,200 322,200 0.00%
China Fortune Land Development Co., Ltd. Class A 395,850 321,050 0.00%
Offshore Oil Engineering Co., Ltd. Class A 460,300 320,600 0.00%
Pangang Group Vanadium Titanium & Resources Co., Ltd. Class A 891,792 316,089 0.00%
Jiangsu Shagang Co., Ltd. Class A 184,189 311,027 0.00%
Chifeng Jilong Gold Mining Co., Ltd. Class A 132,700 307,881 0.00%
Tianjin 712 Communication & Broadcasting Co., Ltd. Class A 54,281 303,295 0.00%
Huagong Tech Co., Ltd. Class A 83,300 303,244 0.00%
Perennial Energy Holdings Ltd. 1,275,000 302,092 0.00%
Giant Network Group Co., Ltd. Class A 145,800 300,137 0.00%
China Great Wall Securities Co., Ltd. Class A 173,645 299,135 0.00%
Shenzhen MTC Co., Ltd. Class A 317,100 297,917 0.00%
Wangfujing Group Co., Ltd. Class A 66,300 296,361 0.00%
Guangzhou Haige Communications Group, Inc. Co. Class A 197,500 289,180 0.00%
Hubei Biocause Pharmaceutical Co., Ltd. Class A 507,800 284,519 0.00%
Maccura Biotechnology Co., Ltd. Class A 42,800 278,826 0.00%
GCL System Integration Technology Co., Ltd. Class A 509,700 274,539 0.00%
China South Publishing & Media Group Co., Ltd. Class A 200,800 274,121 0.00%
Zhongtian Financial Group Co., Ltd. Class A 642,000 271,274 0.00%
Yixintang Pharmaceutical Group Co., Ltd. Class A 52,900 271,097 0.00%
Beijing BDStar Navigation Co., Ltd. Class A 40,600 270,652 0.00%
Guangzhou Yuexiu Financial Holdings Group Co., Ltd. Class A 138,000 270,410 0.00%
Jiangsu Changshu Rural Commercial Bank Co., Ltd. Class A 280,900 269,559 0.00%
.Number of
SharesFair Value
US Dollars ($)% of Total
Net AssetsChina Galaxy Securities Co., Ltd. Class A 161,500 269,465 0.00%
Xiamen C & D, Inc. Class A 214,400 268,794 0.00%Shenzhen Hepalink Pharmaceutical Group Co., Ltd. Class A 107,900 266,040 0.00%
Weifu High-Technology Group Co., Ltd. Class A 80,500 259,535 0.00%
Qianhe Condiment & Food Co., Ltd. Class A 62,880 255,867 0.00%
Huaneng Power International, Inc. Class A 386,800 252,644 0.00%
Tangshan Jidong Cement Co., Ltd. Class A 131,500 251,364 0.00%
Zhejiang Semir Garment Co., Ltd. Class A 133,800 247,477 0.00%
Lakala Payment Co., Ltd. Class A 55,100 240,754 0.00%
Guangzhou Automobile Group Co., Ltd. Class A 117,000 234,512 0.00%
Shandong Pharmaceutical Glass Co., Ltd. Class A 44,100 231,733 0.00%
Suzhou Gold Mantis Construction Decoration Co., Ltd. Class A 188,500 231,072 0.00%
Guangdong Hongda Blasting Co., Ltd. Class A 53,700 230,813 0.00%
Wuhu Token Science Co., Ltd. Class A 171,700 219,513 0.00%
BBMG Corp. Class A 521,661 217,196 0.00%Guangdong Xinbao Electrical Appliances Holdings Co., Ltd. Class A 53,200 216,148 0.00%
Zoomlion Heavy Industry Science & Technology Co., Ltd. Class H 204,800 214,403 0.00%
China Merchants Property Operation & Service Co., Ltd. Class A 77,400 205,814 0.00%
Leo Group Co., Ltd. Class A 524,100 189,819 0.00%China CITIC Bank Corp., Ltd. Class A 239,200 188,817 0.00%
Kunlun Tech Co., Ltd. Class A 73,500 186,342 0.00%
Beijing E-Hualu Information Technology Co., Ltd. Class A 38,880 161,939 0.00%
Bilibili, Inc. Class Z 1,200 147,724 0.00%ZTO Express Cayman, Inc. 4,131 124,475 0.00%Suofeiya Home Collection Co., Ltd. Class A 25,700 96,263 0.00%
China Huishan Dairy Holdings Co., Ltd. 7,428,000 10 0.00%
test test 5,181,813,461 36.59%Colombia 0.14% (2020: 0.19%)Ecopetrol SA 7,714,011 5,623,336 0.04%Bancolombia SA - Preference Shares 744,590 5,348,126 0.04%
Interconexion Electrica SA ESP 711,817 4,222,482 0.03%
Bancolombia SA 383,868 2,714,011 0.02%Grupo de Inversiones Suramericana SA 379,855 1,881,981 0.01%
test test 19,789,936 0.14%Czech Republic 0.10% (2020: 0.10%)CEZ A.S. 261,868 7,767,691 0.06%Komercni banka A.S. 123,970 4,363,162 0.03%Moneta Money Bank A.S. 522,202 1,983,579 0.01%test test 14,114,432 0.10%Egypt 0.06% (2020: 0.08%)Commercial International Bank Egypt SAE GDR 2,022,554 6,765,472 0.05%
Eastern Co. SAE 1,450,433 1,095,102 0.01%

20
Vanguard Emerging Markets Stock Index Fund
.Number of
SharesFair Value
US Dollars ($)% of Total
Net AssetsFawry for Banking & Payment Technology Services SAE 805,894 969,435 0.00%
test test 8,830,009 0.06%Greece 0.13% (2020: 0.11%)Hellenic Telecommunications Organization SA 367,710 6,170,352 0.04%
OPAP SA 337,410 5,085,710 0.04%Eurobank Ergasias Services & Holdings SA 4,023,659 4,055,909 0.03%
JUMBO SA 180,755 3,041,731 0.02%FF Group 65,807 374,594 0.00%test test 18,728,296 0.13%Hungary 0.22% (2020: 0.21%)OTP Bank Nyrt 360,344 19,423,072 0.14%Richter Gedeon Nyrt 230,232 6,136,864 0.04%MOL Hungarian Oil & Gas plc 664,510 5,293,576 0.04%
test test 30,853,512 0.22%India 9.64% (2020: 9.09%)Reliance Industries Ltd. 4,577,186 129,972,254 0.92%Infosys Ltd. 5,469,882 116,329,739 0.82%Housing Development Finance Corp., Ltd. 2,749,339 91,555,245 0.65%
ICICI Bank Ltd. 8,207,374 69,662,751 0.49%Tata Consultancy Services Ltd. 1,485,255 66,854,459 0.47%
Hindustan Unilever Ltd. 1,319,190 43,860,006 0.31%Axis Bank Ltd. 3,638,857 36,633,347 0.26%Bajaj Finance Ltd. 435,316 35,232,016 0.25%Bharti Airtel Ltd. 3,934,282 27,822,620 0.20%Asian Paints Ltd. 615,591 24,785,136 0.17%HCL Technologies Ltd. 1,745,815 23,099,812 0.16%Larsen & Toubro Ltd. 1,107,484 22,357,529 0.16%Maruti Suzuki India Ltd. 218,103 22,053,550 0.16%Kotak Mahindra Bank Ltd. 891,041 20,449,109 0.14%State Bank of India 2,863,140 16,147,293 0.11%Wipro Ltd. 2,186,145 16,048,298 0.11%Tata Steel Ltd. 993,574 15,594,019 0.11%Tech Mahindra Ltd. 1,010,263 14,888,909 0.11%UltraTech Cement Ltd. 162,554 14,818,591 0.10%Mahindra & Mahindra Ltd. 1,381,482 14,454,171 0.10%Dr Reddy's Laboratories Ltd. 186,763 13,626,061 0.10%
Titan Co., Ltd. 570,192 13,290,161 0.09%ITC Ltd. 4,746,877 12,944,867 0.09%Divi's Laboratories Ltd. 216,836 12,859,778 0.09%Nestle India Ltd. 53,544 12,702,023 0.09%Hindalco Industries Ltd. 2,524,706 12,637,116 0.09%JSW Steel Ltd. 1,352,381 12,443,070 0.09%Sun Pharmaceutical Industries Ltd. 1,353,012 12,295,062 0.09%
Tata Motors Ltd. 2,661,980 12,162,093 0.09%NTPC Ltd. 7,704,032 12,064,433 0.09%Power Grid Corp. of India Ltd. 3,746,704 11,714,436 0.08%
HDFC Life Insurance Co., Ltd. 1,264,139 11,671,984 0.08%
Avenue Supermarts Ltd. 258,235 11,617,969 0.08%Bajaj Finserv Ltd. 61,601 10,035,377 0.07%Cipla Ltd. 762,225 9,966,453 0.07%SBI Life Insurance Co., Ltd. 715,759 9,707,957 0.07%Tata Consumer Products Ltd. 951,417 9,656,249 0.07%
Adani Green Energy Ltd. 626,035 9,474,328 0.07%Adani Enterprises Ltd. 439,097 8,905,700 0.06%Bharat Petroleum Corp., Ltd. 1,377,670 8,676,003 0.06%
Britannia Industries Ltd. 175,599 8,622,022 0.06%Grasim Industries Ltd. 425,124 8,571,971 0.06%UPL Ltd. 796,892 8,500,146 0.06%Info Edge India Ltd. 122,928 8,129,737 0.06%
.Number of
SharesFair Value
US Dollars ($)% of Total
Net AssetsEicher Motors Ltd. 219,954 7,904,347 0.06%Adani Ports & Special Economic Zone Ltd. 831,854 7,875,362 0.06%
Apollo Hospitals Enterprise Ltd. 161,251 7,852,878 0.06%
ICICI Lombard General Insurance Co., Ltd. 351,614 7,412,608 0.05%
Hero MotoCorp Ltd. 188,399 7,357,015 0.05%Dabur India Ltd. 941,242 7,202,090 0.05%Pidilite Industries Ltd. 248,318 7,195,810 0.05%Godrej Consumer Products Ltd. 575,286 6,735,405 0.05%
Shree Cement Ltd. 17,816 6,592,519 0.05%Motherson Sumi Systems Ltd. 1,997,363 6,505,604 0.05%
Vedanta Ltd. 1,829,987 6,471,305 0.05%Oil & Natural Gas Corp., Ltd. 4,054,973 6,420,965 0.05%Bajaj Auto Ltd. 113,181 6,294,542 0.04%Adani Transmission Ltd. 440,869 6,283,851 0.04%Aurobindo Pharma Ltd. 478,391 6,212,068 0.04%Adani Total Gas Ltd. 440,064 6,037,929 0.04%Marico Ltd. 834,264 5,957,585 0.04%Shriram Transport Finance Co., Ltd. 319,976 5,779,844 0.04%
Lupin Ltd. 370,241 5,723,718 0.04%PI Industries Ltd. 137,392 5,379,600 0.04%Jubilant Foodworks Ltd. 126,435 5,239,407 0.04%Ambuja Cements Ltd. 1,134,733 5,200,414 0.04%GAIL India Ltd. 2,578,254 5,190,848 0.04%Piramal Enterprises Ltd. 159,512 5,146,639 0.04%Coal India Ltd. 2,435,908 4,805,945 0.03%ICICI Prudential Life Insurance Co., Ltd. 567,174 4,675,199 0.03%
Bharat Electronics Ltd. 1,924,398 4,608,406 0.03%Bandhan Bank Ltd. 1,032,712 4,588,365 0.03%Havells India Ltd. 345,891 4,561,312 0.03%Larsen & Toubro Infotech Ltd. 82,724 4,531,067 0.03%
Cholamandalam Investment & Finance Co., Ltd. 655,507 4,526,288 0.03%
Colgate-Palmolive India Ltd. 198,724 4,507,049 0.03%Hindustan Petroleum Corp., Ltd. 1,119,417 4,415,620 0.03%
Indian Oil Corp., Ltd. 2,988,999 4,338,934 0.03%United Spirits Ltd. 475,038 4,228,560 0.03%Berger Paints India Ltd. 389,401 4,217,769 0.03%Balkrishna Industries Ltd. 135,889 4,093,672 0.03%SBI Cards & Payment Services Ltd. 300,528 3,923,481 0.03%
Bharat Forge Ltd. 382,379 3,919,475 0.03%Muthoot Finance Ltd. 190,170 3,790,736 0.03%DLF Ltd. 986,164 3,729,459 0.03%Petronet LNG Ltd. 1,227,362 3,728,486 0.03%Container Corp. Of India Ltd. 391,050 3,674,018 0.03%
Page Industries Ltd. 9,113 3,619,454 0.03%Biocon Ltd. 653,504 3,555,895 0.03%InterGlobe Aviation Ltd. 149,966 3,464,067 0.02%MRF Ltd. 3,132 3,374,263 0.02%Yes Bank Ltd. 18,461,415 3,365,427 0.02%Indraprastha Gas Ltd. 447,292 3,356,345 0.02%Indus Towers Ltd. 1,044,339 3,353,041 0.02%Trent Ltd. 288,555 3,299,186 0.02%Torrent Pharmaceuticals Ltd. 83,297 3,251,642 0.02%
HDFC Asset Management Co., Ltd. 82,699 3,245,933 0.02%
ACC Ltd. 115,911 3,141,901 0.02%REC Ltd. 1,521,863 3,041,474 0.02%Siemens Ltd. 111,401 3,029,019 0.02%Ipca Laboratories Ltd. 110,817 3,021,116 0.02%test test 1,365,848,807 9.64%

21
Vanguard Emerging Markets Stock Index Fund
.Number of
SharesFair Value
US Dollars ($)% of Total
Net AssetsIndonesia 1.07% (2020: 1.31%)Bank Central Asia Tbk PT 17,721,950 36,818,879 0.26%Bank Rakyat Indonesia Persero Tbk PT 89,240,900 24,248,907 0.17%
Telkom Indonesia Persero Tbk PT 79,682,108 17,310,251 0.12%
Bank Mandiri Persero Tbk PT 30,067,488 12,234,357 0.09%
Astra International Tbk PT 32,875,645 11,200,392 0.08%Charoen Pokphand Indonesia Tbk PT 11,626,899 5,011,594 0.04%
Unilever Indonesia Tbk PT 11,856,665 4,047,620 0.03%United Tractors Tbk PT 2,692,793 3,760,625 0.03%Bank Negara Indonesia Persero Tbk PT 11,763,439 3,756,188 0.03%
Merdeka Copper Gold Tbk PT 16,488,000 3,343,084 0.02%
Kalbe Farma Tbk PT 34,326,975 3,314,329 0.02%Sarana Menara Nusantara Tbk PT 37,878,500 3,239,265 0.02%
Semen Indonesia Persero Tbk PT 4,849,439 3,177,219 0.02%
Indofood Sukses Makmur Tbk PT 7,135,948 3,038,929 0.02%
Tower Bersama Infrastructure Tbk PT 12,630,100 2,796,043 0.02%
Barito Pacific Tbk PT 44,527,700 2,625,599 0.02%Gudang Garam Tbk PT 786,943 2,398,819 0.02%Indah Kiat Pulp & Paper Tbk PT 4,464,900 2,294,035 0.02%
Indofood CBP Sukses Makmur Tbk PT 3,737,808 2,100,906 0.01%
Aneka Tambang Tbk 12,740,000 2,020,827 0.01%Adaro Energy Tbk PT 23,435,922 1,947,606 0.01%Indocement Tunggal Prakarsa Tbk PT 2,391,142 1,698,535 0.01%
test test 152,384,009 1.07%Kuwait 0.49% (2020: 0.48%)National Bank of Kuwait SAKP 10,979,007 30,936,531 0.22%
Kuwait Finance House KSCP 7,472,689 18,824,331 0.13%
Mobile Telecommunications Co. KSCP 3,409,080 6,664,282 0.05%
Agility Public Warehousing Co. KSC 1,982,104 6,039,069 0.04%
Boubyan Bank KSCP 1,751,214 4,254,526 0.03%Mabanee Co. KPSC 907,157 2,158,751 0.02%test test 68,877,490 0.49%Malaysia 1.20% (2020: 1.49%)Public Bank Bhd 23,349,880 23,116,466 0.16%Malayan Banking Bhd 6,375,297 12,454,211 0.09%CIMB Group Holdings Bhd 10,312,800 11,451,766 0.08%Tenaga Nasional Bhd 3,711,725 8,752,930 0.06%Top Glove Corp. Bhd 8,517,600 8,555,556 0.06%Petronas Chemicals Group Bhd 3,889,344 7,551,033 0.05%
Press Metal Aluminium Holdings Bhd 5,084,100 5,853,787 0.04%
DiGi.Com Bhd 5,109,940 5,083,476 0.04%Hartalega Holdings Bhd 2,737,900 4,847,300 0.03%Hong Leong Bank Bhd 1,055,769 4,760,688 0.03%Petronas Gas Bhd 1,268,700 4,736,806 0.03%PPB Group Bhd 1,048,280 4,620,866 0.03%Dialog Group Bhd 6,189,850 4,308,965 0.03%Genting Bhd 3,525,400 4,186,492 0.03%Axiata Group Bhd 4,433,237 3,993,811 0.03%Maxis Bhd 3,695,800 3,908,120 0.03%IHH Healthcare Bhd 2,893,301 3,812,202 0.03%IOI Corp. Bhd 4,085,650 3,700,360 0.03%Nestle Malaysia Bhd 114,500 3,676,466 0.03%MISC Bhd 2,112,886 3,450,649 0.03%Kuala Lumpur Kepong Bhd 700,550 3,435,673 0.03%RHB Bank Bhd 2,630,100 3,421,062 0.02%
.Number of
SharesFair Value
US Dollars ($)% of Total
Net AssetsGenting Malaysia Bhd 4,814,100 3,212,106 0.02%Telekom Malaysia Bhd 1,843,600 2,695,568 0.02%Sime Darby Plantation Bhd 2,737,184 2,624,110 0.02%Malaysia Airports Holdings Bhd 1,754,360 2,535,508 0.02%
QL Resources Bhd 1,849,700 2,517,356 0.02%Sime Darby Bhd 4,447,184 2,335,267 0.02%Petronas Dagangan Bhd 485,600 2,175,638 0.02%Supermax Corp. Bhd 2,535,622 2,015,549 0.01%AMMB Holdings Bhd 2,697,300 1,916,665 0.01%HAP Seng Consolidated Bhd 1,015,400 1,907,773 0.01%
Hong Leong Financial Group Bhd 385,623 1,653,400 0.01%
Kossan Rubber Industries 2,105,800 1,633,308 0.01%Westports Holdings Bhd 1,377,100 1,396,505 0.01%Fraser & Neave Holdings Bhd 190,800 1,213,325 0.01%
test test 169,510,763 1.20%Mexico 1.70% (2020: 1.70%)America Movil SAB de CV 54,981,681 41,421,622 0.29%Wal-Mart de Mexico SAB de CV 8,405,484 27,487,058 0.19%
Grupo Financiero Banorte SAB de CV Class O 4,166,407 26,860,200 0.19%
Fomento Economico Mexicano SAB de CV 3,119,197 26,414,596 0.19%
Grupo Mexico SAB de CV 4,995,081 23,572,377 0.17%Cemex SAB de CV 24,294,667 20,474,851 0.14%Grupo Televisa SAB 3,815,153 10,914,398 0.08%Grupo Aeroportuario del Pacifico SAB de CV Class B 642,230 6,884,042 0.05%
Grupo Aeroportuario del Sureste SAB de CV Class B 328,142 6,048,637 0.04%
Grupo Bimbo SAB de CV 2,545,710 5,612,951 0.04%Fibra Uno Administracion SA de CV REIT 5,022,248 5,423,185 0.04%
Orbia Advance Corp. SAB de CV 1,708,189 4,470,693 0.03%
Kimberly-Clark de Mexico SAB de CV Class A 2,474,734 4,401,212 0.03%
Coca-Cola Femsa SAB de CV 815,443 4,320,797 0.03%
Arca Continental SAB de CV 734,478 4,255,513 0.03%Gruma SAB de CV Class B 336,111 3,782,378 0.03%Grupo Financiero Inbursa SAB de CV Class O 3,753,319 3,702,327 0.03%
Industrias Penoles SAB de CV 214,913 2,979,023 0.02%
Promotora y Operadora de Infraestructura SAB de CV 371,237 2,967,770 0.02%
Becle SAB de CV 897,500 2,374,642 0.02%Grupo Carso SAB de CV 747,042 2,328,491 0.02%Telesites SAB de CV 2,198,900 2,039,812 0.01%Megacable Holdings SAB de CV 486,800 1,731,263 0.01%
test test 240,467,838 1.70%Pakistan 0.02% (2020: 0.02%)Lucky Cement Ltd. 193,620 1,062,686 0.01%Habib Bank Ltd. 1,061,400 822,316 0.01%MCB Bank Ltd. 661,600 675,873 0.00%test test 2,560,875 0.02%Peru 0.18% (2020: 0.24%)Credicorp Ltd. 108,115 13,093,808 0.10%Southern Copper Corp. 135,482 8,714,202 0.06%Compania de Minas Buenaventura SAA ADR 351,138 3,177,799 0.02%
test test 24,985,809 0.18%Philippines 0.60% (2020: 0.73%)SM Prime Holdings, Inc. 16,254,567 12,153,881 0.09%Ayala Land, Inc. 13,125,400 9,693,141 0.07%SM Investments Corp. 377,295 7,725,215 0.06%BDO Unibank, Inc. 3,194,049 7,406,870 0.05%Ayala Corp. 440,900 7,225,648 0.05%
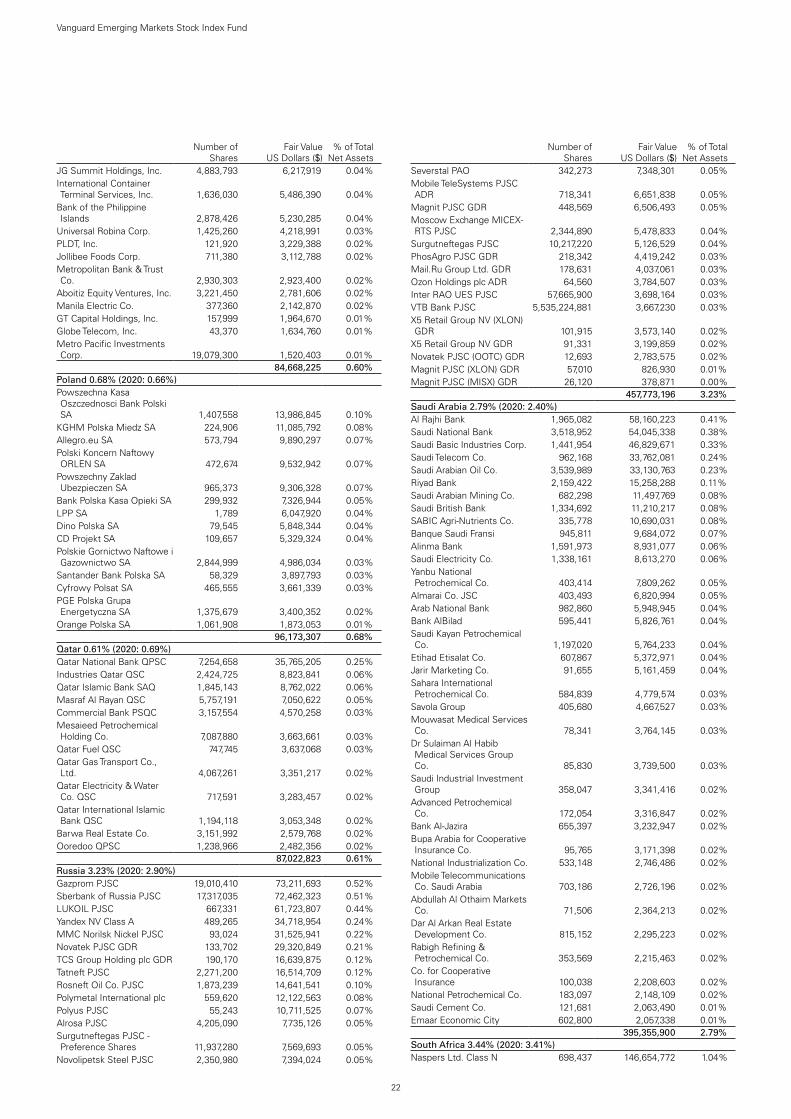
22
Vanguard Emerging Markets Stock Index Fund
.Number of
SharesFair Value
US Dollars ($)% of Total
Net AssetsJG Summit Holdings, Inc. 4,883,793 6,217,919 0.04%International Container Terminal Services, Inc. 1,636,030 5,486,390 0.04%
Bank of the Philippine Islands 2,878,426 5,230,285 0.04%
Universal Robina Corp. 1,425,260 4,218,991 0.03%PLDT, Inc. 121,920 3,229,388 0.02%Jollibee Foods Corp. 711,380 3,112,788 0.02%Metropolitan Bank & Trust Co. 2,930,303 2,923,400 0.02%
Aboitiz Equity Ventures, Inc. 3,221,450 2,781,606 0.02%Manila Electric Co. 377,360 2,142,870 0.02%GT Capital Holdings, Inc. 157,999 1,964,670 0.01%Globe Telecom, Inc. 43,370 1,634,760 0.01%Metro Pacific Investments Corp. 19,079,300 1,520,403 0.01%
test test 84,668,225 0.60%Poland 0.68% (2020: 0.66%)Powszechna Kasa Oszczednosci Bank Polski SA 1,407,558 13,986,845 0.10%
KGHM Polska Miedz SA 224,906 11,085,792 0.08%Allegro.eu SA 573,794 9,890,297 0.07%Polski Koncern Naftowy ORLEN SA 472,674 9,532,942 0.07%
Powszechny Zaklad Ubezpieczen SA 965,373 9,306,328 0.07%
Bank Polska Kasa Opieki SA 299,932 7,326,944 0.05%LPP SA 1,789 6,047,920 0.04%Dino Polska SA 79,545 5,848,344 0.04%CD Projekt SA 109,657 5,329,324 0.04%Polskie Gornictwo Naftowe i Gazownictwo SA 2,844,999 4,986,034 0.03%
Santander Bank Polska SA 58,329 3,897,793 0.03%Cyfrowy Polsat SA 465,555 3,661,339 0.03%PGE Polska Grupa Energetyczna SA 1,375,679 3,400,352 0.02%
Orange Polska SA 1,061,908 1,873,053 0.01%test test 96,173,307 0.68%Qatar 0.61% (2020: 0.69%)Qatar National Bank QPSC 7,254,658 35,765,205 0.25%Industries Qatar QSC 2,424,725 8,823,841 0.06%Qatar Islamic Bank SAQ 1,845,143 8,762,022 0.06%Masraf Al Rayan QSC 5,757,191 7,050,622 0.05%Commercial Bank PSQC 3,157,554 4,570,258 0.03%Mesaieed Petrochemical Holding Co. 7,087,880 3,663,661 0.03%
Qatar Fuel QSC 747,745 3,637,068 0.03%Qatar Gas Transport Co., Ltd. 4,067,261 3,351,217 0.02%
Qatar Electricity & Water Co. QSC 717,591 3,283,457 0.02%
Qatar International Islamic Bank QSC 1,194,118 3,053,348 0.02%
Barwa Real Estate Co. 3,151,992 2,579,768 0.02%Ooredoo QPSC 1,238,966 2,482,356 0.02%test test 87,022,823 0.61%Russia 3.23% (2020: 2.90%)Gazprom PJSC 19,010,410 73,211,693 0.52%Sberbank of Russia PJSC 17,317,035 72,462,323 0.51%LUKOIL PJSC 667,331 61,723,807 0.44%Yandex NV Class A 489,265 34,718,954 0.24%MMC Norilsk Nickel PJSC 93,024 31,525,941 0.22%Novatek PJSC GDR 133,702 29,320,849 0.21%TCS Group Holding plc GDR 190,170 16,639,875 0.12%Tatneft PJSC 2,271,200 16,514,709 0.12%Rosneft Oil Co. PJSC 1,873,239 14,641,541 0.10%Polymetal International plc 559,620 12,122,563 0.08%Polyus PJSC 55,243 10,711,525 0.07%Alrosa PJSC 4,205,090 7,735,126 0.05%Surgutneftegas PJSC - Preference Shares 11,937,280 7,569,693 0.05%
Novolipetsk Steel PJSC 2,350,980 7,394,024 0.05%
.Number of
SharesFair Value
US Dollars ($)% of Total
Net AssetsSeverstal PAO 342,273 7,348,301 0.05%Mobile TeleSystems PJSC ADR 718,341 6,651,838 0.05%
Magnit PJSC GDR 448,569 6,506,493 0.05%Moscow Exchange MICEX-RTS PJSC 2,344,890 5,478,833 0.04%
Surgutneftegas PJSC 10,217,220 5,126,529 0.04%PhosAgro PJSC GDR 218,342 4,419,242 0.03%Mail.Ru Group Ltd. GDR 178,631 4,037,061 0.03%Ozon Holdings plc ADR 64,560 3,784,507 0.03%Inter RAO UES PJSC 57,665,900 3,698,164 0.03%VTB Bank PJSC 5,535,224,881 3,667,230 0.03%X5 Retail Group NV (XLON) GDR 101,915 3,573,140 0.02%
X5 Retail Group NV GDR 91,331 3,199,859 0.02%Novatek PJSC (OOTC) GDR 12,693 2,783,575 0.02%Magnit PJSC (XLON) GDR 57,010 826,930 0.01%Magnit PJSC (MISX) GDR 26,120 378,871 0.00%test test 457,773,196 3.23%Saudi Arabia 2.79% (2020: 2.40%)Al Rajhi Bank 1,965,082 58,160,223 0.41%Saudi National Bank 3,518,952 54,045,338 0.38%Saudi Basic Industries Corp. 1,441,954 46,829,671 0.33%Saudi Telecom Co. 962,168 33,762,081 0.24%Saudi Arabian Oil Co. 3,539,989 33,130,763 0.23%Riyad Bank 2,159,422 15,258,288 0.11%Saudi Arabian Mining Co. 682,298 11,497,769 0.08%Saudi British Bank 1,334,692 11,210,217 0.08%SABIC Agri-Nutrients Co. 335,778 10,690,031 0.08%Banque Saudi Fransi 945,811 9,684,072 0.07%Alinma Bank 1,591,973 8,931,077 0.06%Saudi Electricity Co. 1,338,161 8,613,270 0.06%Yanbu National Petrochemical Co. 403,414 7,809,262 0.05%
Almarai Co. JSC 403,493 6,820,994 0.05%Arab National Bank 982,860 5,948,945 0.04%Bank AlBilad 595,441 5,826,761 0.04%Saudi Kayan Petrochemical Co. 1,197,020 5,764,233 0.04%
Etihad Etisalat Co. 607,867 5,372,971 0.04%Jarir Marketing Co. 91,655 5,161,459 0.04%Sahara International Petrochemical Co. 584,839 4,779,574 0.03%
Savola Group 405,680 4,667,527 0.03%Mouwasat Medical Services Co. 78,341 3,764,145 0.03%
Dr Sulaiman Al Habib Medical Services Group Co. 85,830 3,739,500 0.03%
Saudi Industrial Investment Group 358,047 3,341,416 0.02%
Advanced Petrochemical Co. 172,054 3,316,847 0.02%
Bank Al-Jazira 655,397 3,232,947 0.02%Bupa Arabia for Cooperative Insurance Co. 95,765 3,171,398 0.02%
National Industrialization Co. 533,148 2,746,486 0.02%Mobile Telecommunications Co. Saudi Arabia 703,186 2,726,196 0.02%
Abdullah Al Othaim Markets Co. 71,506 2,364,213 0.02%
Dar Al Arkan Real Estate Development Co. 815,152 2,295,223 0.02%
Rabigh Refining & Petrochemical Co. 353,569 2,215,463 0.02%
Co. for Cooperative Insurance 100,038 2,208,603 0.02%
National Petrochemical Co. 183,097 2,148,109 0.02%Saudi Cement Co. 121,681 2,063,490 0.01%Emaar Economic City 602,800 2,057,338 0.01%test test 395,355,900 2.79%South Africa 3.44% (2020: 3.41%)Naspers Ltd. Class N 698,437 146,654,772 1.04%

23
Vanguard Emerging Markets Stock Index Fund
.Number of
SharesFair Value
US Dollars ($)% of Total
Net AssetsFirstRand Ltd. 8,063,057 30,261,698 0.21%Impala Platinum Holdings Ltd. 1,264,041 20,846,994 0.15%
MTN Group 2,722,839 19,685,103 0.14%Standard Bank Group Ltd. 2,086,818 18,650,011 0.13%Sibanye Stillwater Ltd. 4,453,507 18,607,807 0.13%Capitec Bank Holdings Ltd. 128,849 15,218,507 0.11%Sasol Ltd. 905,811 13,830,052 0.10%Gold Fields Ltd. 1,424,956 12,813,751 0.09%Sanlam Ltd. 2,977,079 12,795,472 0.09%AngloGold Ashanti Ltd. 669,048 12,439,853 0.09%Bid Corp., Ltd. 534,130 11,581,685 0.08%Absa Group Ltd. 1,141,640 10,851,327 0.08%Anglo American Platinum Ltd. 85,132 9,834,024 0.07%
Vodacom Group Ltd. 1,032,133 9,308,081 0.07%Shoprite Holdings Ltd. 803,624 8,748,337 0.06%Northam Platinum Ltd. 569,095 8,645,979 0.06%Nedbank Group Ltd. 611,151 7,313,481 0.05%Aspen Pharmacare Holdings Ltd. 631,663 7,170,534 0.05%
Old Mutual Ltd. 7,525,063 7,114,653 0.05%Remgro Ltd. 867,284 6,960,746 0.05%Clicks Group Ltd. 397,499 6,839,641 0.05%Bidvest Group Ltd. 471,400 6,287,865 0.05%Woolworths Holdings Ltd. 1,630,631 6,156,514 0.04%Mr Price Group Ltd. 415,749 6,129,632 0.04%Discovery Ltd. 686,137 6,067,654 0.04%Growthpoint Properties Ltd. REIT 5,583,214 5,826,133 0.04%
MultiChoice Group 611,772 5,027,424 0.04%Exxaro Resources Ltd. 410,388 4,840,588 0.03%NEPI Rockcastle plc 671,843 4,762,598 0.03%Kumba Iron Ore Ltd. 104,722 4,698,161 0.03%Reinet Investments SCA 220,320 4,323,927 0.03%SPAR Group Ltd. 317,168 4,018,035 0.03%Tiger Brands Ltd. 263,104 3,851,089 0.03%Harmony Gold Mining Co., Ltd. 885,670 3,272,552 0.02%
African Rainbow Minerals Ltd. 181,651 3,248,505 0.02%
Rand Merchant Investment Holdings Ltd. 1,249,095 2,741,601 0.02%
test test 487,424,786 3.44%South Korea 12.88% (2020: 13.24%)Samsung Electronics Co., Ltd. 7,652,987 548,413,667 3.87%
SK Hynix, Inc. 875,144 99,081,703 0.70%Samsung Electronics Co., Ltd. - Preference Shares 1,324,448 86,677,456 0.61%
NAVER Corp. 197,655 73,277,061 0.52%Kakao Corp. 496,853 71,914,966 0.51%LG Chem Ltd. 73,553 55,516,627 0.39%Samsung SDI Co., Ltd. 88,229 54,685,292 0.39%Hyundai Motor Co. 222,983 47,422,127 0.33%Celltrion, Inc. 154,574 36,853,988 0.26%POSCO 118,763 36,699,839 0.26%Kia Corp. 422,329 33,601,810 0.24%KB Financial Group, Inc. 633,147 31,372,022 0.22%Hyundai Mobis Co., Ltd. 106,605 27,641,664 0.20%Shinhan Financial Group Co., Ltd. 703,534 25,363,833 0.18%
LG Electronics, Inc. 170,565 24,763,466 0.17%LG Household & Health Care Ltd. 14,930 23,359,819 0.17%
SK Innovation Co., Ltd. 81,559 21,400,954 0.15%Samsung Biologics Co., Ltd. 26,556 19,831,813 0.14%Hana Financial Group, Inc. 480,871 19,663,552 0.14%NCSoft Corp. 26,386 19,212,822 0.14%SK Telecom Co., Ltd. 63,386 18,011,384 0.13%Samsung C&T Corp. 134,792 16,338,062 0.12%HMM Co., Ltd. 414,590 16,161,702 0.11%
.Number of
SharesFair Value
US Dollars ($)% of Total
Net AssetsSamsung Electro-Mechanics Co., Ltd. 89,595 14,081,885 0.10%
KT&G Corp. 186,697 13,992,121 0.10%Celltrion Healthcare Co., Ltd. 133,789 13,745,405 0.10%
SK Holdings Co., Ltd. 50,743 12,729,119 0.09%LG Corp. 138,811 12,634,309 0.09%Amorepacific Corp. 51,566 11,538,989 0.08%Samsung Fire & Marine Insurance Co., Ltd. 49,942 9,778,636 0.07%
Samsung SDS Co., Ltd. 54,987 9,033,073 0.06%Korea Electric Power Corp. 404,432 8,924,331 0.06%Woori Financial Group, Inc. 806,765 8,202,690 0.06%LG Display Co., Ltd. 370,673 8,064,191 0.06%Samsung Life Insurance Co., Ltd. 111,154 7,876,472 0.06%
Hanwha Solutions Corp. 196,566 7,776,065 0.06%Korea Shipbuilding & Offshore Engineering Co., Ltd. 63,173 7,516,922 0.05%
Korean Air Lines Co., Ltd. 253,518 7,091,255 0.05%Doosan Heavy Industries & Construction Co., Ltd. 327,033 6,926,020 0.05%
Hyundai Steel Co. 140,764 6,712,274 0.05%S-Oil Corp. 72,988 6,643,227 0.05%Lotte Chemical Corp. 27,963 6,518,037 0.05%Hyundai Engineering & Construction Co., Ltd. 121,697 6,300,169 0.04%
POSCO Chemical Co., Ltd. 49,187 6,289,507 0.04%Korea Investment Holdings Co., Ltd. 67,933 6,213,292 0.04%
Coway Co., Ltd. 87,280 6,099,486 0.04%Hyundai Motor Co. - Preference Shares 59,253 6,050,788 0.04%
Kumho Petrochemical Co., Ltd. 29,709 5,777,446 0.04%
Hyundai Glovis Co., Ltd. 30,410 5,643,733 0.04%Hankook Tire & Technology Co., Ltd. 121,349 5,570,966 0.04%
CJ CheilJedang Corp. 13,511 5,530,854 0.04%Samsung Engineering Co., Ltd. 255,076 5,413,414 0.04%
Korea Zinc Co., Ltd. 13,852 5,307,586 0.04%HYBE Co., Ltd. 19,492 5,062,745 0.04%LG Uplus Corp. 350,291 4,774,645 0.03%SK Biopharmaceuticals Co., Ltd. 42,774 4,671,848 0.03%
Samsung Heavy Industries Co., Ltd. 776,900 4,629,045 0.03%
Hyundai Heavy Industries Holdings Co., Ltd. 73,295 4,607,988 0.03%
SKC Co., Ltd. 32,599 4,588,147 0.03%LG Innotek Co., Ltd. 23,001 4,554,653 0.03%Yuhan Corp. 81,123 4,545,452 0.03%E-MART, Inc. 31,675 4,500,289 0.03%Seegene, Inc. 61,234 4,496,783 0.03%Hanon Systems 301,677 4,433,472 0.03%HLB, Inc. 146,510 4,345,277 0.03%LG Chem Ltd. - Preference Shares 12,336 4,200,911 0.03%
Hotel Shilla Co., Ltd. 48,469 4,174,837 0.03%Netmarble Corp. 34,831 4,144,523 0.03%Fila Holdings Corp. 79,524 4,109,840 0.03%Shin Poong Pharmaceutical Co., Ltd. 53,345 4,073,765 0.03%
Samsung Securities Co., Ltd. 100,574 4,014,386 0.03%
Mirae Asset Securities Co., Ltd. 471,190 3,945,586 0.03%
Orion Corp. 36,301 3,819,801 0.03%GS Engineering & Construction Corp. 99,295 3,782,583 0.03%
Industrial Bank of Korea 397,360 3,704,906 0.03%

24
Vanguard Emerging Markets Stock Index Fund
.Number of
SharesFair Value
US Dollars ($)% of Total
Net AssetsHyundai Motor Co. (XKRX) - Preference Shares 35,738 3,665,355 0.03%
Kangwon Land, Inc. 152,952 3,653,518 0.03%DB Insurance Co., Ltd. 73,060 3,555,200 0.03%Celltrion Pharm, Inc. 25,009 3,491,022 0.02%Doosan Bobcat, Inc. 81,289 3,464,789 0.02%Alteogen, Inc. 45,873 3,409,466 0.02%Korea Aerospace Industries Ltd. 113,113 3,304,549 0.02%
Pan Ocean Co., Ltd. 432,345 3,278,627 0.02%Pearl Abyss Corp. 47,570 3,197,664 0.02%Hanmi Pharm Co., Ltd. 10,652 3,163,960 0.02%GS Holdings Corp. 74,740 3,069,507 0.02%Shinsegae, Inc. 11,913 3,020,167 0.02%SK Chemicals Co., Ltd. 12,755 2,944,812 0.02%CJ ENM Co., Ltd. 17,251 2,798,702 0.02%Amorepacific Group 47,840 2,718,785 0.02%Green Cross Corp. 9,261 2,701,451 0.02%NH Investment & Securities Co., Ltd. 219,778 2,517,548 0.02%
Cheil Worldwide, Inc. 112,201 2,505,754 0.02%CJ Logistics Corp. 14,767 2,320,969 0.02%LG Household & Health Care Ltd. - Preference Shares 3,415 2,319,829 0.02%
Douzone Bizon Co., Ltd. 31,398 2,314,109 0.02%CJ Corp. 23,474 2,230,358 0.02%BGF retail Co., Ltd. 13,082 2,085,174 0.01%Meritz Securities Co., Ltd. 487,777 2,050,903 0.01%S-1 Corp. 27,829 2,023,882 0.01%Daewoo Shipbuilding & Marine Engineering Co., Ltd. 63,072 2,005,042 0.01%
KMW Co., Ltd. 41,731 2,004,748 0.01%Lotte Shopping Co., Ltd. 19,027 1,951,444 0.01%test test 1,824,196,707 12.88%Taiwan 13.58% (2020: 12.54%)Taiwan Semiconductor Manufacturing Co., Ltd. 39,499,618 843,509,115 5.96%
MediaTek, Inc. 2,421,629 83,610,842 0.59%Hon Hai Precision Industry Co., Ltd. 20,008,616 80,429,430 0.57%
United Microelectronics Corp. 18,908,366 36,035,325 0.25%
Delta Electronics, Inc. 3,126,766 34,003,054 0.24%Evergreen Marine Corp. Taiwan Ltd. 4,182,325 29,570,858 0.21%
Fubon Financial Holding Co., Ltd. 10,672,666 28,307,224 0.20%
China Steel Corp. 18,903,354 26,866,678 0.19%Chunghwa Telecom Co., Ltd. 6,097,668 24,948,736 0.18%
Nan Ya Plastics Corp. 8,250,410 24,636,487 0.17%Cathay Financial Holding Co., Ltd. 12,668,494 24,507,199 0.17%
CTBC Financial Holding Co., Ltd. 29,273,328 23,849,423 0.17%
Formosa Plastics Corp. 6,114,072 22,602,043 0.16%ASE Technology Holding Co., Ltd. 5,229,517 21,021,298 0.15%
Mega Financial Holding Co., Ltd. 17,472,865 20,600,578 0.15%
Uni-President Enterprises Corp. 7,742,602 20,341,264 0.14%
Largan Precision Co., Ltd. 161,280 17,944,118 0.13%Silergy Corp. 126,000 17,139,166 0.12%E.Sun Financial Holding Co., Ltd. 18,135,633 17,118,606 0.12%
Formosa Chemicals & Fibre Corp. 5,619,047 17,081,499 0.12%
Yang Ming Marine Transport Corp. 2,538,000 16,623,957 0.12%
Novatek Microelectronics Corp. 925,344 16,572,334 0.12%
.Number of
SharesFair Value
US Dollars ($)% of Total
Net AssetsAsustek Computer, Inc. 1,131,344 15,084,587 0.11%Yuanta Financial Holding Co., Ltd. 15,543,737 14,978,891 0.11%
Chailease Holding Co., Ltd. 2,003,606 14,561,874 0.10%Taiwan Cement Corp. 7,916,984 14,491,384 0.10%Quanta Computer, Inc. 4,338,982 13,626,233 0.10%First Financial Holding Co., Ltd. 16,468,125 13,416,830 0.09%
Realtek Semiconductor Corp. 735,648 13,333,414 0.09%
Globalwafers Co., Ltd. 357,000 11,775,074 0.08%Taiwan Cooperative Financial Holding Co., Ltd. 14,817,708 11,301,078 0.08%
AU Optronics Corp. 13,108,696 10,656,329 0.08%Yageo Corp. 532,661 10,610,206 0.08%Hotai Motor Co., Ltd. 477,000 10,511,548 0.07%Innolux Corp. 13,959,513 10,396,048 0.07%China Development Financial Holding Corp. 21,613,846 10,200,882 0.07%
Wan Hai Lines Ltd. 872,000 10,046,191 0.07%Taiwan Mobile Co., Ltd. 2,657,128 9,727,306 0.07%Accton Technology Corp. 810,000 9,608,075 0.07%Shanghai Commercial & Savings Bank Ltd. 5,528,869 8,979,141 0.06%
Unimicron Technology Corp. 1,913,000 8,856,958 0.06%Hua Nan Financial Holdings Co., Ltd. 13,310,652 8,814,052 0.06%
President Chain Store Corp. 918,328 8,668,291 0.06%Taishin Financial Holding Co., Ltd. 15,639,499 8,559,977 0.06%
Airtac International Group 211,000 8,140,870 0.06%SinoPac Financial Holdings Co., Ltd. 16,250,214 8,019,397 0.06%
Pegatron Corp. 3,237,737 7,994,843 0.06%Advantech Co., Ltd. 632,553 7,832,419 0.06%Win Semiconductors Corp. 558,000 7,510,094 0.05%Eclat Textile Co., Ltd. 308,191 7,256,107 0.05%Formosa Petrochemical Corp. 1,893,750 7,238,560 0.05%
Catcher Technology Co., Ltd. 1,079,318 7,050,188 0.05%Lite-On Technology Corp. ADR 3,399,890 7,028,575 0.05%
Asia Cement Corp. 3,554,337 6,467,650 0.05%Micro-Star International Co., Ltd. 1,111,000 6,280,215 0.04%
Winbond Electronics Corp. 4,876,000 6,098,828 0.04%Vanguard International Semiconductor Corp. 1,436,000 6,081,579 0.04%
Shin Kong Financial Holding Co., Ltd. 17,772,313 6,078,785 0.04%
Hiwin Technologies Corp. 426,021 6,039,598 0.04%Feng TAY Enterprise Co., Ltd. 685,326 6,013,897 0.04%
Far EasTone Telecommunications Co., Ltd. 2,547,829 5,907,214 0.04%
Nanya Technology Corp. 2,014,000 5,760,998 0.04%Far Eastern New Century Corp. 4,895,457 5,622,418 0.04%
Compal Electronics, Inc. 6,816,201 5,467,639 0.04%Giant Manufacturing Co., Ltd. 469,286 5,364,472 0.04%
Pou Chen Corp. 3,726,078 5,255,625 0.04%Nan Ya Printed Circuit Board Corp. 359,000 5,018,591 0.04%
Acer, Inc. 4,746,650 4,991,542 0.04%WPG Holdings Ltd. 2,654,651 4,868,647 0.03%Wistron Corp. 4,305,208 4,790,003 0.03%Cheng Shin Rubber Industry Co., Ltd. 2,848,139 4,778,842 0.03%
Wiwynn Corp. 126,000 4,508,641 0.03%Phison Electronics Corp. 257,213 4,431,126 0.03%Powertech Technology, Inc. 1,110,769 4,285,605 0.03%Walsin Technology Corp. 515,000 4,205,025 0.03%

25
Vanguard Emerging Markets Stock Index Fund
.Number of
SharesFair Value
US Dollars ($)% of Total
Net AssetsNien Made Enterprise Co., Ltd. 271,000 4,021,839 0.03%
Synnex Technology International Corp. 2,183,127 3,988,198 0.03%
Inventec Corp. 4,144,255 3,904,412 0.03%Zhen Ding Technology Holding Ltd. 1,026,605 3,868,767 0.03%
Chang Hwa Commercial Bank Ltd. 6,649,855 3,854,470 0.03%
Foxconn Technology Co., Ltd. 1,492,414 3,519,124 0.02%
Taiwan High Speed Rail Corp. 3,040,000 3,262,306 0.02%
Taiwan Business Bank 9,127,919 3,095,876 0.02%China Life Insurance Co., Ltd. 3,181,028 3,008,348 0.02%
Oneness Biotech Co., Ltd. 358,000 2,980,924 0.02%Ruentex Development Co., Ltd. 1,348,360 2,739,064 0.02%
ASMedia Technology, Inc. 45,000 2,172,275 0.02%Yageo Corp. GDR 12,200 1,215,074 0.01%Ya Hsin Industrial Co., Ltd. 146,498 — 0.00%test test 1,923,542,273 13.58%Thailand 1.56% (2020: 1.79%)PTT PCL 15,888,350 19,457,652 0.14%CP ALL PCL 8,997,863 16,844,673 0.12%Siam Cement PCL 1,087,560 14,659,155 0.10%Airports of Thailand PCL 7,208,855 13,945,367 0.10%Bangkok Dusit Medical Services PCL Class F 15,922,764 11,426,633 0.08%
Advanced Info Service PCL 1,867,322 9,962,935 0.07%Delta Electronics Thailand PCL 479,400 8,645,654 0.06%
PTT Exploration & Production PCL 2,049,457 7,481,637 0.05%
PTT Global Chemical PCL 3,750,917 6,904,964 0.05%Central Pattana PCL 3,487,377 5,712,552 0.04%Intouch Holdings PCL 2,711,100 5,498,331 0.04%Charoen Pokphand Foods PCL 6,137,396 5,074,602 0.04%
Minor International PCL 5,091,855 4,766,167 0.03%Home Product Center PCL 10,079,207 4,528,567 0.03%PTT Oil & Retail Business PCL 4,738,200 4,509,051 0.03%
Energy Absolute PCL 2,328,466 4,431,714 0.03%Gulf Energy Development PCL 4,089,300 4,370,001 0.03%
Siam Commercial Bank PCL 1,310,475 4,007,069 0.03%SCG Packaging PCL 2,054,400 3,974,190 0.03%Indorama Ventures PCL 3,092,368 3,931,794 0.03%BTS Group Holdings PCL 12,000,730 3,500,993 0.03%Bumrungrad Hospital PCL 810,546 3,249,771 0.02%Bangkok Expressway & Metro PCL (XBKK) 12,597,220 3,203,349 0.02%
Land & Houses PCL 12,859,800 3,189,872 0.02%Central Retail Corp. PCL 2,979,438 3,114,233 0.02%Thai Union Group PCL Class F 4,729,173 2,921,611 0.02%
Thai Oil PCL 1,694,914 2,882,147 0.02%Global Power Synergy PCL Class F 1,184,700 2,698,381 0.02%
Krungthai Card PCL 1,269,600 2,654,078 0.02%
.Number of
SharesFair Value
US Dollars ($)% of Total
Net AssetsSri Trang Gloves Thailand PCL 1,949,200 2,539,130 0.02%
Electricity Generating PCL 446,830 2,439,789 0.02%Siam Cement PCL NVDR 170,790 2,302,068 0.02%Srisawad Corp. PCL 1,040,900 2,232,820 0.02%Osotspa PCL 1,882,200 2,216,944 0.02%Muangthai Capital PCL 1,200,600 2,153,963 0.02%Carabao Group PCL Class F 471,700 2,082,544 0.02%True Corp. PCL 20,769,219 2,060,721 0.01%Berli Jucker PCL 1,792,561 1,943,572 0.01%Asset World Corp. PCL 13,335,800 1,805,846 0.01%Ratch Group PCL 1,262,300 1,801,879 0.01%Bangkok Bank PCL NVDR 500,500 1,764,633 0.01%Krung Thai Bank PCL 5,279,071 1,762,436 0.01%B Grimm Power PCL 1,317,000 1,725,866 0.01%Bangkok Bank PCL 442,779 1,561,124 0.01%Bangkok Commercial Asset Management PCL 2,677,000 1,553,579 0.01%
Intouch Holdings PCL Class F 459,400 931,700 0.01%
Minor International PCL - Warrants 5/5/2023 196,091 31,815 0.00%
Minor International PCL - Warrants 15/2/2024 177,707 25,506 0.00%
Minor International PCL - Warrants 30/9/2021 200,752 3,257 0.00%
test test 220,486,335 1.56%Turkey 0.23% (2020: 0.37%)BIM Birlesik Magazalar A.S. 712,297 5,095,742 0.04%Eregli Demir ve Celik Fabrikalari TAS 2,259,542 4,681,641 0.03%
Turkcell Iletisim Hizmetleri A.S. 1,980,023 3,669,453 0.03%
Turkiye Garanti Bankasi A.S. 3,598,932 3,438,404 0.02%Akbank T.A.S. 5,131,450 3,118,740 0.02%KOC Holding A.S. 1,134,853 2,394,458 0.02%Ford Otomotiv Sanayi A.S. 117,370 2,299,439 0.02%Turkiye Petrol Rafinerileri A.S. 202,812 2,211,964 0.02%
Aselsan Elektronik Sanayi Ve Ticaret A.S. 1,153,624 1,954,687 0.01%
Turkiye Sise ve Cam Fabrikalari A.S. 2,204,541 1,938,727 0.01%
Turkiye Is Bankasi A.S. Class C 2,560,589 1,503,195 0.01%
test test 32,306,450 0.23%United Arab Emirates 0.68% (2020: 0.51%)First Abu Dhabi Bank PJSC 6,981,595 31,741,866 0.22%Emirates Telecommunications Group Co. PJSC 2,800,154 16,771,269 0.12%
Emirates NBD Bank PJSC 4,075,005 14,699,595 0.10%Abu Dhabi Commercial Bank PJSC 4,465,654 8,352,243 0.06%
Emaar Properties PJSC 5,764,946 6,529,049 0.05%Aldar Properties PJSC 6,094,136 6,337,775 0.05%Abu Dhabi National Oil Co. for Distribution PJSC 3,852,822 4,541,802 0.03%
Dubai Islamic Bank PJSC 2,957,543 3,880,963 0.03%Abu Dhabi Islamic Bank PJSC 2,339,175 3,489,833 0.02%
test test 96,344,395 0.68%Total Equities 13,807,431,517 97.50%
Principal CouponMaturity
DateFair Value
US Dollars ($)% of Total
Net AssetsBonds 0.00% (2020: 0.00%)India 0.00% (2020: 0.00%)Britannia Industries Ltd. INR5,092,371 5.50% 3/6/2024 67,987 0.00%Total Bonds 67,987 0.00%Financial Assets at Fair Value Through Profit or Loss 13,807,499,504 97.50%

26
Vanguard Emerging Markets Stock Index Fund
testNumber of Contracts
Notional Amount
Unrealised Gain/(Loss)
US Dollars ($)% of Total
Net AssetsFinancial Derivative InstrumentsFutures (0.00%) (2020: 0.05%)MSCI Emerging Markets Index September 2021 5,820 $397,546,777 (389,977 ) (0.00 %)test test test (389,977 ) (0.00 %)
CurrencyBuy
Amount Currency(Sell)
Amount CounterpartySettlement
Date
Unrealised Gain/(Loss)
US Dollars ($)% of Total
Net AssetsForward Currency Exchange Contracts 0.00% (2020: (0.00%))USD 17,180,812 HKD (133,303,720) UBS AG 15/9/2021 12,813 0.00 %USD 1,719,710 EUR (1,450,000) Citibank NA 6/7/2021 10 0.00 %test 12,823 0.00 %Total Financial Derivative Instruments (377,154 ) (0.00 %)
Fair Value US Dollars ($)
% of Total Net Assets
Other Assets and Liabilities 354,384,444 2.50 %Net Assets 14,161,506,794 100.00 %
Analysis of Total Net Assets US Dollars ($)% of Total
Net Assets(a) Transferable securities admitted to an official stock exchange listing 13,794,976,565 97.41 %(b) Transferable securities dealt in on another regulated market 12,454,952 0.09 %(c) Transferable securities other than those admitted to an official stock exchange listing or dealt in on another regulated
market 67,987 0.00 %
(d) Financial derivative instruments (377,154 ) (0.00 %)(e) Other assets and liabilities 354,384,444 2.50 %Total Net Assets 14,161,506,794 100.00 %

The accompanying notes form an integral part of the financial statements.
27
Vanguard Emerging Markets Stock Index Fund
Statement of Assets and Liabilities
US Dollars ($)
As at 30 June 2021
US Dollars ($)
As at 31 December 2020
Current AssetsFinancial Assets at Fair Value Through Profit or Loss 13,807,499,504 12,993,288,770 Financial Derivative Instruments 12,823 6,778,031 Cash 373,159,388 267,220,496 Unrealised Appreciation on Spot Currency Contracts 53 — Receivables: Interest and Dividends 39,639,593 23,823,729 Capital Shares Issued 14,553,935 12,123,703 Investments Sold 3,237,029 8,066,466 Futures Margin Cash 22,022,464 14,376,373
Total Current Assets 14,260,124,789 13,325,677,568
Current LiabilitiesFinancial Derivative Instruments 389,977 506 Bank Overdraft 137,087 239 Unrealised Depreciation on Spot Currency Contracts — 14,014 Payables and Other Liabilities: Investments Purchased 4,607,490 1,526,029 Income Distribution Payable — 20,256,105 Capital Shares Redeemed 6,650,813 14,915,306 Management Fees Payable 2,420,525 2,211,385 Deferred Capital Gains Tax 84,412,103 65,213,726
Total Current Liabilities 98,617,995 104,137,310
Net Assets Attributable to Holders of Redeemable Participating Shares (“Net Assets”) 14,161,506,794 13,221,540,258

28
Vanguard Emerging Markets Stock Index Fund
The accompanying notes form an integral part of the financial statements.
Net Asset Value Per Share
.As at
30 June 2021As at
31 December 2020As at
31 December 2019Institutional Plus CHF AccUS ($) Equivalent 65,288,131 96,121,492 125,339,815Net Assets 60,349,084 84,966,593 121,372,810Number of Shares Outstanding 391,531 618,811 954,099Net Asset Value Per Share1 154.14 137.31 127.21
EUR AccUS ($) Equivalent 2,460,176,034 2,006,207,470 1,440,257,652Net Assets 2,074,522,347 1,639,661,232 1,283,080,324Number of Shares Outstanding 9,578,046 8,381,878 7,109,989Net Asset Value Per Share1 216.59 195.62 180.46
Investor EUR US ($) Equivalent 432,382,761 390,708,153 445,250,314Net Assets 364,603,056 319,323,410 396,659,526Number of Shares Outstanding 1,694,837 1,643,487 2,212,999Net Asset Value Per Share1 215.13 194.30 179.24
Institutional Plus EUR AccUS ($) Equivalent 1,701,101,890 1,968,854,947 1,574,853,248Net Assets 1,434,439,584 1,609,133,241 1,402,987,314Number of Shares Outstanding 7,718,699 9,590,313 9,070,400Net Asset Value Per Share1 185.84 167.79 154.68
GBP AccUS ($) Equivalent 4,811,859,733 3,864,774,619 2,686,110,334Net Assets 3,483,195,114 2,827,297,815 2,027,635,727Number of Shares Outstanding 12,174,579 10,493,509 8,617,563Net Asset Value Per Share1 286.10 269.43 235.29
GBP DistUS ($) Equivalent 449,129,098 365,470,074 267,568,115Net Assets 325,114,273 267,361,708 201,976,316Number of Shares Outstanding 1,437,715 1,255,543 1,068,922Net Asset Value Per Share1 226.13 212.95 188.95
Institutional Plus GBP AccUS ($) Equivalent 529,096,451 538,359,546 410,486,542Net Assets 383,000,810 393,839,982 309,859,639Number of Shares Outstanding 2,198,926 2,402,010 2,165,449Net Asset Value Per Share1 174.18 163.96 143.09
Institutional Plus GBP DistUS ($) Equivalent 820,544,681 853,360,584 394,754,023Net Assets 593,973,512 624,280,780 297,983,798Number of Shares Outstanding 3,925,580 4,382,897 2,357,973Net Asset Value Per Share1 151.31 142.44 126.37
USD AccNet Assets 689,160,021 666,563,037 915,005,764Number of Shares Outstanding 2,682,485 2,784,282 4,516,054Net Asset Value Per Share1 256.91 239.40 202.61
Investor USD Net Assets 1,023,914,654 1,407,413,215 1,007,042,907Number of Shares Outstanding 4,013,474 5,920,172 5,005,214Net Asset Value Per Share1 255.12 237.73 201.20
Institutional Plus USD AccNet Assets 1,178,853,340 1,063,707,121 746,136,867Number of Shares Outstanding 7,319,759 7,090,303 5,880,691Net Asset Value Per Share1 161.05 150.02 126.88
1 The net asset value per share shown may diverge from the net asset value per share used for dealing purposes because of any adjustments for swing pricing and trade date accounting.
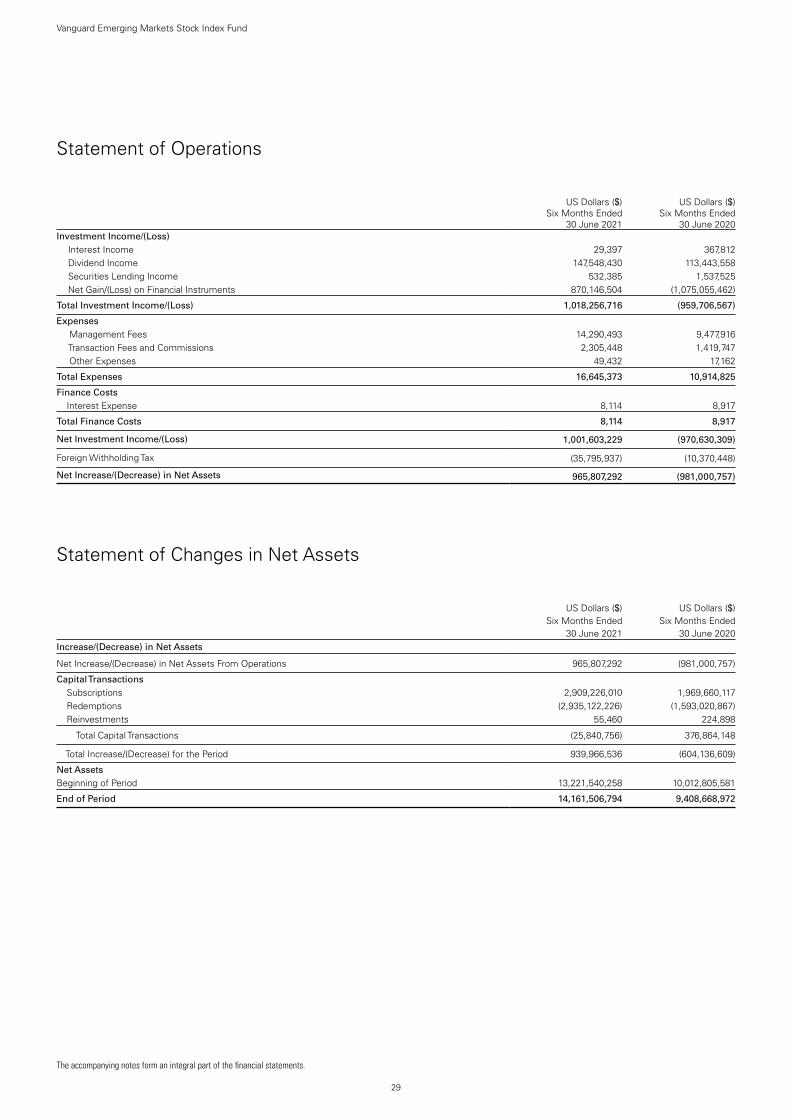
29
Vanguard Emerging Markets Stock Index Fund
The accompanying notes form an integral part of the financial statements.
Statement of Operations
US Dollars ($)
Six Months Ended 30 June 2021
US Dollars ($)
Six Months Ended 30 June 2020
Investment Income/(Loss) Interest Income 29,397 367,812 Dividend Income 147,548,430 113,443,558 Securities Lending Income 532,385 1,537,525 Net Gain/(Loss) on Financial Instruments 870,146,504 (1,075,055,462)
Total Investment Income/(Loss) 1,018,256,716 (959,706,567)
Expenses Management Fees 14,290,493 9,477,916 Transaction Fees and Commissions 2,305,448 1,419,747 Other Expenses 49,432 17,162
Total Expenses 16,645,373 10,914,825
Finance Costs Interest Expense 8,114 8,917
Total Finance Costs 8,114 8,917
Net Investment Income/(Loss) 1,001,603,229 (970,630,309)
Foreign Withholding Tax (35,795,937) (10,370,448)
Net Increase/(Decrease) in Net Assets 965,807,292 (981,000,757)
Statement of Changes in Net Assets
US Dollars ($)
US Dollars ($)
Six Months Ended Six Months Ended30 June 2021 30 June 2020
Increase/(Decrease) in Net Assets
Net Increase/(Decrease) in Net Assets From Operations 965,807,292 (981,000,757)
Capital Transactions Subscriptions 2,909,226,010 1,969,660,117 Redemptions (2,935,122,226) (1,593,020,867) Reinvestments 55,460 224,898
Total Capital Transactions (25,840,756) 376,864,148
Total Increase/(Decrease) for the Period 939,966,536 (604,136,609)
Net AssetsBeginning of Period 13,221,540,258 10,012,805,581
End of Period 14,161,506,794 9,408,668,972

Vanguard ESG Developed World All Cap Equity Index Fund Managed by Vanguard Global Advisers, LLC.
30
Investment ObjectiveThe Fund seeks to provide long-term growth of capital by seeking to achieve the performance of the FTSE Developed All Cap Choice Index.
Performance SummaryThe Performance Summary does not form part of the Financial Statements.
• As the six months ended 30 June 2021 came to a close, macroeconomic indicators signalled a faster global economic rebound than many had expected after the sharpest contraction in modern history. Yet the recovery has been uneven. Countries that have contained the virus more successfully, whether through vaccinations, lockdowns or both, generally have fared better economically. And the COVID-19 pandemic remained far from over, with new variants of the virus surfacing where vaccination rates have lagged and the human toll continuing to mount, especially in less developed economies.
• Swift and extensive support from governments and central banks has been a key to the rebound. So far in 2021, it has included fiscal stimulus – including the $1.9 trillion American Rescue Plan in the United States and the €673 billion Recovery and Resilience Facility in Europe – and pledges by a number of central banks to keep interest rates low for some time.
• Fixed income prices worldwide generally fell and longer-term yields rose amid concerns about inflation during the half year. Bonds returned about –3% in US dollars, as measured by the Bloomberg Barclays Global Aggregate Bond Index.
• Stock markets continued the rally that began in 2020, bolstered by reopening economies, more consumer spending and rising corporate profits. The FTSE Global All Cap Index returned roughly 13% in US dollars for the half year. Returns in the United States and Europe outpaced those in emerging markets and especially the Pacific region.
• In this environment, the fund’s benchmark index returned 12.58%. The fund employs a passive management, or indexing, investment strategy designed to track the performance of the index by investing in all, or a representative sample of, index securities. The index is constructed from the FTSE Developed All Cap Index, which is then screened for certain environmental, social and corporate governance criteria by the sponsor of the index, which is independent of Vanguard.
• Stocks in the index performed well generally, with all sectors except energy producing positive returns. Performance benefited in particular from double-digit returns from five sectors, notably technology and financials.
• US stocks, which account for more than two-thirds of the index, had double-digit returns and contributed most to the benchmark’s results.
Benchmark returns in the commentary above are in US dollars.

31
Vanguard ESG Developed World All Cap Equity Index Fund
Benchmark: FTSE Developed All Cap Choice Index
Total ReturnsPeriods Ended 30 June 2021
(Annualised for periods over one year)
Six Months Five YearsTen Years or
Since Inception1
EUR Acc 16.09 % 13.32 % 12.56 %
Benchmark 16.15 13.66 12.94
Tracking Difference* -0.06
Institutional Plus EUR Acc 16.13 % 13.43 % 12.70 %
Benchmark 16.15 13.66 12.95
Tracking Difference* -0.02
Institutional Plus EUR Hedged Acc — — 10.96 %
Benchmark — — 10.98
Tracking Difference* -0.02
GBP Acc 11.34 % 14.06 % 13.61 %
Benchmark 11.40 14.40 13.97
Tracking Difference* -0.06
GBP Dist 11.34 % 14.06 % 13.61 %
Benchmark 11.40 14.40 13.97
Tracking Difference* -0.06
Institutional Plus GBP Acc 11.38 % 14.16 % 13.18 %
Benchmark 11.40 14.40 13.47
Tracking Difference* -0.02
USD Acc 12.52 % 14.81 % 10.17 %
Benchmark 12.58 15.15 10.55
Tracking Difference* -0.06
Each benchmark is in its respective currency.Sources: Vanguard Global Advisers, LLC, and FTSE.Performance is based on NAV with net income reinvested.
All of the returns in this report represent past performance, which is not a guarantee of future results that may be achieved by the fund. For performance data current to the most recent month-end, which may be higher or lower than that cited, visit our website at http://global.vanguard.com. Note, too, that both investment returns and principal value can fluctuate widely, so an investor's shares, when sold, could be worth more or less than their original cost.* The tracking difference between the fund return and the index return over a stated period of time can be attributed to a number of factors, including, without limitation, small differences in
weightings, trading activity, transaction costs and differences in the valuation and withholding tax treatment between the fund and the index vendor.1 Since-inception returns: Institutional Plus EUR Acc, 6 December 2013; Institutional Plus EUR Hedged Acc, 3 March 2021; GBP Acc and GBP Dist, 25 October 2011; Institutional Plus GBP Acc and USD
Acc, 2 September 2014.

Significant Portfolio ChangesFor the Six Months Ended 30 June 2021
32
Vanguard ESG Developed World All Cap Equity Index Fund
The Central Bank of Ireland requires a schedule of material changes in the composition of the portfolio during the period. These are defined as aggregate purchases of a security exceeding 1% of the total value of purchases for the period and aggregate disposals greater than 1% of the total value of sales. At a minimum, the largest 20 purchases and 20 sales must be shown; all purchases and sales must be shown if there are fewer than 20. A full listing of the portfolio changes for the period is available, upon request, at no extra cost from the Administrator.
SharesCost
US Dollars ($)
Purchases
Apple, Inc. 215,718 27,723,531Microsoft Corp. 104,153 25,323,986Amazon.com, Inc. 6,220 20,314,793Facebook, Inc. Class A 33,052 9,753,838Alphabet, Inc. Class A 4,190 8,980,836Alphabet, Inc. Class C 3,931 8,570,079Tesla, Inc. 11,185 7,819,568JPMorgan Chase & Co. 41,349 6,195,085Visa, Inc. Class A 23,203 5,096,323NVIDIA Corp. 8,415 4,897,794UnitedHealth Group, Inc. 12,921 4,858,736Nestle SA 39,004 4,544,093Walt Disney Co. 24,713 4,488,241Home Depot, Inc. 14,831 4,445,085Procter & Gamble Co. 32,928 4,388,013Mastercard, Inc. Class A 12,101 4,387,621Samsung Electronics Co., Ltd. 57,038 4,185,460PayPal Holdings, Inc. 16,154 4,100,052Bank of America Corp. 105,759 3,980,587ASML Holding NV 5,545 3,379,174
SharesProceeds
US Dollars ($)
Sales
International Business Machines Corp. 40,403 5,782,477
Allianz SE 18,326 4,722,262Banco Santander SA 797,761 3,105,465Apple, Inc. 15,854 1,988,144Volvo AB Class B 57,237 1,460,724Oriental Land Co., Ltd. 8,600 1,255,359Assicurazioni Generali SpA 57,244 1,146,299Alphabet, Inc. 375 941,746Zalando SE 8,026 921,812Credit Agricole SA 54,152 757,462Porsche Automobil Holding SE 6,707 732,681CK Asset Holdings Ltd. 96,237 654,524Canadian National Railway Co. 5,673 591,928Coca-Cola European Partners plc 9,216 567,982Volvo AB Class A 19,836 523,683News Corp. Class A 19,181 482,019Deere & Co. 1,417 466,150PRA Health Sciences, Inc. 2,763 456,475Oracle Corp. 5,535 414,034Charter Communications, Inc. Class
A 578 387,236

Financial StatementsStatement of Investments30 June 2021
33
Vanguard ESG Developed World All Cap Equity Index Fund
.Number of
SharesFair Value
US Dollars ($)% of Total
Net AssetsEquities 97.77% (2020: 97.40%)Australia 2.14% (2020: 2.17%)Commonwealth Bank of Australia 80,689 6,049,851 0.24%
CSL Ltd. 20,676 4,426,864 0.18%Westpac Banking Corp. 167,416 3,243,996 0.13%National Australia Bank Ltd. 148,262 2,918,488 0.12%Australia & New Zealand Banking Group Ltd. 127,833 2,701,573 0.11%
Wesfarmers Ltd. 52,004 2,307,382 0.09%Macquarie Group Ltd. 14,981 1,759,366 0.07%Goodman Group REIT 84,207 1,338,334 0.05%Transurban Group 125,161 1,337,117 0.05%Fortescue Metals Group Ltd. 72,707 1,274,009 0.05%
Afterpay Ltd. 10,315 915,107 0.04%Amcor plc 70,520 801,026 0.03%Newcrest Mining Ltd. 39,055 741,223 0.03%James Hardie Industries plc 19,926 677,214 0.03%Sonic Healthcare Ltd. 21,293 613,852 0.03%Brambles Ltd. 68,919 591,916 0.02%Xero Ltd. 5,499 566,000 0.02%Telstra Corp., Ltd. 197,836 558,455 0.02%Cochlear Ltd. 2,808 530,547 0.02%ASX Ltd. 9,037 527,226 0.02%QBE Insurance Group Ltd. 64,701 524,116 0.02%Suncorp Group Ltd. 60,447 504,178 0.02%Scentre Group REIT 232,113 477,469 0.02%Insurance Australia Group Ltd. 115,576 447,726 0.02%
Stockland REIT 121,919 426,533 0.02%Dexus REIT 53,165 425,878 0.02%GPT Group REIT 106,885 393,195 0.02%BlueScope Steel Ltd. 23,475 387,020 0.02%Ramsay Health Care Ltd. 8,125 383,985 0.02%Mirvac Group REIT 171,531 376,029 0.02%Seek Ltd. 14,860 369,715 0.02%Northern Star Resources Ltd. 48,600 356,837 0.02%
Boral Ltd. 63,238 348,948 0.01%REA Group Ltd. 2,423 307,477 0.01%Computershare Ltd. 23,736 301,155 0.01%Charter Hall Group REIT 25,603 298,317 0.01%Medibank Pvt Ltd. 118,100 280,177 0.01%Sydney Airport 61,964 269,348 0.01%Lendlease Corp., Ltd. 29,472 253,565 0.01%OZ Minerals Ltd. 14,918 251,769 0.01%Evolution Mining Ltd. 71,092 240,175 0.01%NEXTDC Ltd. 26,748 238,161 0.01%Atlas Arteria Ltd. 48,568 232,266 0.01%ALS Ltd. 23,383 228,914 0.01%JB Hi-Fi Ltd. 6,021 228,635 0.01%Mineral Resources Ltd. 5,602 225,972 0.01%Domino's Pizza Enterprises Ltd. 2,478 224,192 0.01%
Qube Holdings Ltd. 93,999 223,706 0.01%Magellan Financial Group Ltd. 5,453 220,494 0.01%
Orica Ltd. 20,557 204,952 0.01%Ansell Ltd. 6,237 203,732 0.01%Reece Ltd. 11,302 200,330 0.01%Bank of Queensland Ltd. 28,859 197,376 0.01%Aurizon Holdings Ltd. 69,539 194,208 0.01%Vicinity Centres REIT 166,544 193,176 0.01%Breville Group Ltd. 8,458 189,924 0.01%carsales.com Ltd. 11,940 177,128 0.01%
.Number of
SharesFair Value
US Dollars ($)% of Total
Net AssetsBendigo & Adelaide Bank Ltd. 21,783 171,549 0.01%
Reliance Worldwide Corp., Ltd. 43,264 170,847 0.01%
National Storage REIT 112,900 167,824 0.01%Altium Ltd. 6,066 167,088 0.01%Alumina Ltd. 128,251 158,388 0.01%Incitec Pivot Ltd. 88,357 157,875 0.01%Lynas Rare Earths Ltd. 35,777 153,368 0.01%Downer EDI Ltd. 34,784 145,978 0.01%Pilbara Minerals Ltd. 133,008 144,791 0.01%Zip Co., Ltd. 24,961 141,858 0.01%Metcash Ltd. 44,566 133,497 0.01%IGO Ltd. 23,011 131,812 0.01%Cleanaway Waste Management Ltd. 65,478 129,776 0.01%
Challenger Ltd. 31,937 129,714 0.01%Nine Entertainment Co. Holdings Ltd. 58,365 127,509 0.01%
AusNet Services Ltd. 95,334 125,251 0.01%IOOF Holdings Ltd. 38,491 123,391 0.01%Steadfast Group Ltd. 37,211 122,919 0.01%IRESS Ltd. 12,398 120,164 0.01%ARB Corp., Ltd. 3,678 119,259 0.01%AMP Ltd. 139,728 118,013 0.01%Qantas Airways Ltd. 33,400 116,850 0.01%Perseus Mining Ltd. 102,280 112,109 0.01%Iluka Resources Ltd. 16,268 111,751 0.01%Vocus Group Ltd. 26,508 109,455 0.01%Harvey Norman Holdings Ltd. 26,341 108,370 0.01%
Megaport Ltd. 7,611 105,308 0.01%Regis Resources Ltd. 59,380 105,208 0.01%Champion Iron Ltd. 20,942 100,308 0.01%Pro Medicus Ltd. 2,260 99,630 0.01%BWP Trust REIT 31,104 99,477 0.00%IDP Education Ltd. 5,349 98,547 0.00%Uniti Group Ltd. 39,544 98,266 0.00%Premier Investments Ltd. 4,457 95,531 0.00%Super Retail Group Ltd. 9,850 95,468 0.00%Sims Ltd. 7,660 95,462 0.00%Healius Ltd. 27,124 94,282 0.00%nib holdings Ltd. 19,002 92,870 0.00%Charter Hall Retail REIT 32,269 92,059 0.00%Pendal Group Ltd. 15,189 91,909 0.00%Perpetual Ltd. 3,052 91,766 0.00%Eagers Automotive Ltd. 7,370 91,627 0.00%Orora Ltd. 35,093 87,732 0.00%InvoCare Ltd. 9,428 81,893 0.00%Ramelius Resources Ltd. 61,125 77,783 0.00%CSR Ltd. 17,897 77,392 0.00%Corporate Travel Management Ltd. 4,781 77,135 0.00%
Bapcor Ltd. 11,761 75,051 0.00%Charter Hall Long Wale REIT 20,722 73,896 0.00%Chalice Mining Ltd. 13,017 72,512 0.00%Link Administration Holdings Ltd. 19,053 72,092 0.00%
Elders Ltd. 8,191 71,026 0.00%Bega Cheese Ltd. 15,896 70,291 0.00%PolyNovo Ltd. 32,976 69,814 0.00%SeaLink Travel Group Ltd. 9,789 69,669 0.00%De Grey Mining Ltd. 74,645 69,209 0.00%Deterra Royalties Ltd. 20,470 69,155 0.00%WiseTech Global Ltd. 2,786 66,784 0.00%
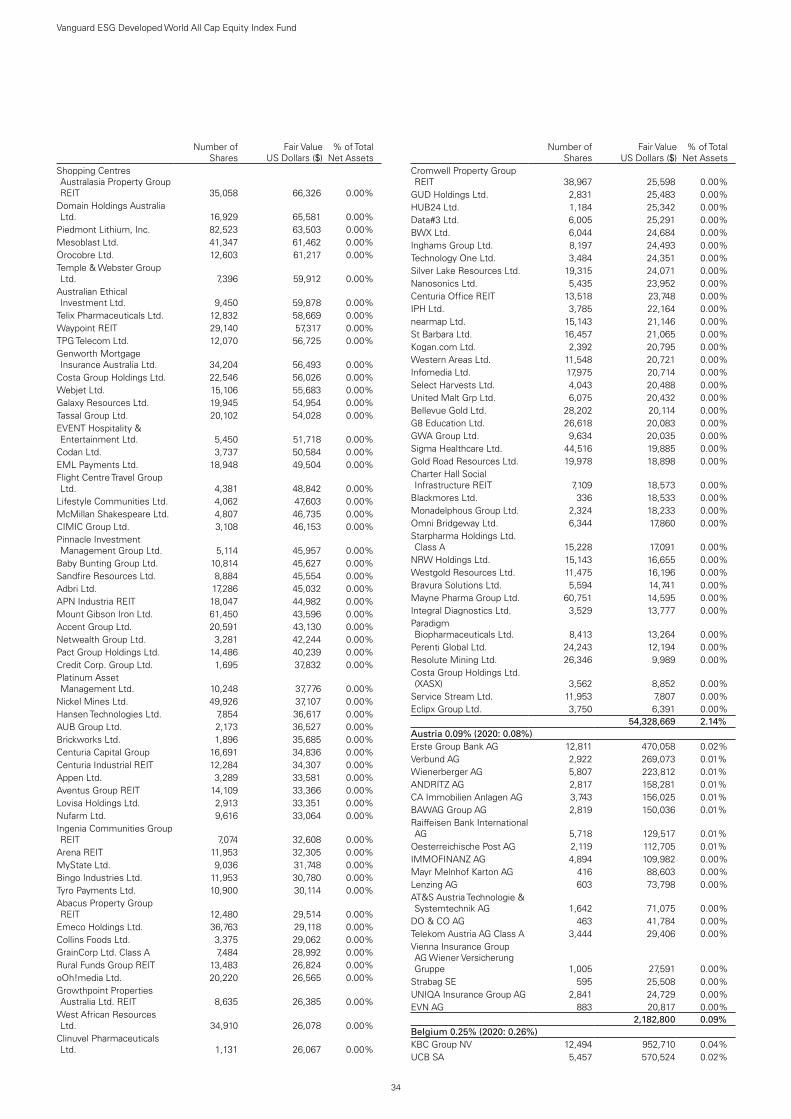
34
Vanguard ESG Developed World All Cap Equity Index Fund
.Number of
SharesFair Value
US Dollars ($)% of Total
Net AssetsShopping Centres Australasia Property Group REIT 35,058 66,326 0.00%
Domain Holdings Australia Ltd. 16,929 65,581 0.00%
Piedmont Lithium, Inc. 82,523 63,503 0.00%Mesoblast Ltd. 41,347 61,462 0.00%Orocobre Ltd. 12,603 61,217 0.00%Temple & Webster Group Ltd. 7,396 59,912 0.00%
Australian Ethical Investment Ltd. 9,450 59,878 0.00%
Telix Pharmaceuticals Ltd. 12,832 58,669 0.00%Waypoint REIT 29,140 57,317 0.00%TPG Telecom Ltd. 12,070 56,725 0.00%Genworth Mortgage Insurance Australia Ltd. 34,204 56,493 0.00%
Costa Group Holdings Ltd. 22,546 56,026 0.00%Webjet Ltd. 15,106 55,683 0.00%Galaxy Resources Ltd. 19,945 54,954 0.00%Tassal Group Ltd. 20,102 54,028 0.00%EVENT Hospitality & Entertainment Ltd. 5,450 51,718 0.00%
Codan Ltd. 3,737 50,584 0.00%EML Payments Ltd. 18,948 49,504 0.00%Flight Centre Travel Group Ltd. 4,381 48,842 0.00%
Lifestyle Communities Ltd. 4,062 47,603 0.00%McMillan Shakespeare Ltd. 4,807 46,735 0.00%CIMIC Group Ltd. 3,108 46,153 0.00%Pinnacle Investment Management Group Ltd. 5,114 45,957 0.00%
Baby Bunting Group Ltd. 10,814 45,627 0.00%Sandfire Resources Ltd. 8,884 45,554 0.00%Adbri Ltd. 17,286 45,032 0.00%APN Industria REIT 18,047 44,982 0.00%Mount Gibson Iron Ltd. 61,450 43,596 0.00%Accent Group Ltd. 20,591 43,130 0.00%Netwealth Group Ltd. 3,281 42,244 0.00%Pact Group Holdings Ltd. 14,486 40,239 0.00%Credit Corp. Group Ltd. 1,695 37,832 0.00%Platinum Asset Management Ltd. 10,248 37,776 0.00%
Nickel Mines Ltd. 49,926 37,107 0.00%Hansen Technologies Ltd. 7,854 36,617 0.00%AUB Group Ltd. 2,173 36,527 0.00%Brickworks Ltd. 1,896 35,685 0.00%Centuria Capital Group 16,691 34,836 0.00%Centuria Industrial REIT 12,284 34,307 0.00%Appen Ltd. 3,289 33,581 0.00%Aventus Group REIT 14,109 33,366 0.00%Lovisa Holdings Ltd. 2,913 33,351 0.00%Nufarm Ltd. 9,616 33,064 0.00%Ingenia Communities Group REIT 7,074 32,608 0.00%
Arena REIT 11,953 32,305 0.00%MyState Ltd. 9,036 31,748 0.00%Bingo Industries Ltd. 11,953 30,780 0.00%Tyro Payments Ltd. 10,900 30,114 0.00%Abacus Property Group REIT 12,480 29,514 0.00%
Emeco Holdings Ltd. 36,763 29,118 0.00%Collins Foods Ltd. 3,375 29,062 0.00%GrainCorp Ltd. Class A 7,484 28,992 0.00%Rural Funds Group REIT 13,483 26,824 0.00%oOh!media Ltd. 20,220 26,565 0.00%Growthpoint Properties Australia Ltd. REIT 8,635 26,385 0.00%
West African Resources Ltd. 34,910 26,078 0.00%
Clinuvel Pharmaceuticals Ltd. 1,131 26,067 0.00%
.Number of
SharesFair Value
US Dollars ($)% of Total
Net AssetsCromwell Property Group REIT 38,967 25,598 0.00%
GUD Holdings Ltd. 2,831 25,483 0.00%HUB24 Ltd. 1,184 25,342 0.00%Data#3 Ltd. 6,005 25,291 0.00%BWX Ltd. 6,044 24,684 0.00%Inghams Group Ltd. 8,197 24,493 0.00%Technology One Ltd. 3,484 24,351 0.00%Silver Lake Resources Ltd. 19,315 24,071 0.00%Nanosonics Ltd. 5,435 23,952 0.00%Centuria Office REIT 13,518 23,748 0.00%IPH Ltd. 3,785 22,164 0.00%nearmap Ltd. 15,143 21,146 0.00%St Barbara Ltd. 16,457 21,065 0.00%Kogan.com Ltd. 2,392 20,795 0.00%Western Areas Ltd. 11,548 20,721 0.00%Infomedia Ltd. 17,975 20,714 0.00%Select Harvests Ltd. 4,043 20,488 0.00%United Malt Grp Ltd. 6,075 20,432 0.00%Bellevue Gold Ltd. 28,202 20,114 0.00%G8 Education Ltd. 26,618 20,083 0.00%GWA Group Ltd. 9,634 20,035 0.00%Sigma Healthcare Ltd. 44,516 19,885 0.00%Gold Road Resources Ltd. 19,978 18,898 0.00%Charter Hall Social Infrastructure REIT 7,109 18,573 0.00%
Blackmores Ltd. 336 18,533 0.00%Monadelphous Group Ltd. 2,324 18,233 0.00%Omni Bridgeway Ltd. 6,344 17,860 0.00%Starpharma Holdings Ltd. Class A 15,228 17,091 0.00%
NRW Holdings Ltd. 15,143 16,655 0.00%Westgold Resources Ltd. 11,475 16,196 0.00%Bravura Solutions Ltd. 5,594 14,741 0.00%Mayne Pharma Group Ltd. 60,751 14,595 0.00%Integral Diagnostics Ltd. 3,529 13,777 0.00%Paradigm Biopharmaceuticals Ltd. 8,413 13,264 0.00%
Perenti Global Ltd. 24,243 12,194 0.00%Resolute Mining Ltd. 26,346 9,989 0.00%Costa Group Holdings Ltd. (XASX) 3,562 8,852 0.00%
Service Stream Ltd. 11,953 7,807 0.00%Eclipx Group Ltd. 3,750 6,391 0.00%test test 54,328,669 2.14%Austria 0.09% (2020: 0.08%)Erste Group Bank AG 12,811 470,058 0.02%Verbund AG 2,922 269,073 0.01%Wienerberger AG 5,807 223,812 0.01%ANDRITZ AG 2,817 158,281 0.01%CA Immobilien Anlagen AG 3,743 156,025 0.01%BAWAG Group AG 2,819 150,036 0.01%Raiffeisen Bank International AG 5,718 129,517 0.01%
Oesterreichische Post AG 2,119 112,705 0.01%IMMOFINANZ AG 4,894 109,982 0.00%Mayr Melnhof Karton AG 416 88,603 0.00%Lenzing AG 603 73,798 0.00%AT&S Austria Technologie & Systemtechnik AG 1,642 71,075 0.00%
DO & CO AG 463 41,784 0.00%Telekom Austria AG Class A 3,444 29,406 0.00%Vienna Insurance Group AG Wiener Versicherung Gruppe 1,005 27,591 0.00%
Strabag SE 595 25,508 0.00%UNIQA Insurance Group AG 2,841 24,729 0.00%EVN AG 883 20,817 0.00%test test 2,182,800 0.09%Belgium 0.25% (2020: 0.26%)KBC Group NV 12,494 952,710 0.04%UCB SA 5,457 570,524 0.02%

35
Vanguard ESG Developed World All Cap Equity Index Fund
.Number of
SharesFair Value
US Dollars ($)% of Total
Net AssetsArgenx SE 1,641 496,440 0.02%Groupe Bruxelles Lambert SA 4,375 489,465 0.02%
Ageas SA 8,119 450,605 0.02%Solvay SA 3,035 385,835 0.02%Sofina SA 698 301,138 0.01%Warehouses de Pauw CVA REIT 6,074 231,942 0.01%
Ackermans & van Haaren NV 1,356 228,991 0.01%
Elia Group SA 2,087 220,273 0.01%Aedifica SA REIT 1,598 210,921 0.01%Argenx SE (XBRU) 645 195,127 0.01%Cofinimmo SA REIT 1,158 176,328 0.01%Proximus SADP 8,667 167,432 0.01%Etablissements Franz Colruyt NV 2,419 135,287 0.01%
Euronav NV 13,043 121,267 0.01%D'ieteren Group 923 111,648 0.01%KBC Ancora 2,584 110,256 0.00%Barco NV 3,066 83,918 0.00%Bekaert SA 1,797 80,085 0.00%Melexis NV 755 78,388 0.00%VGP NV 365 72,027 0.00%bpost SA 5,716 68,396 0.00%Montea NV REIT 580 68,232 0.00%Telenet Group Holding NV 1,596 60,074 0.00%Fagron 2,031 45,353 0.00%Retail Estates NV REIT 533 43,298 0.00%Shurgard Self Storage SA 793 38,275 0.00%Xior Student Housing NV REIT 619 37,291 0.00%
Econocom Group SA 9,502 36,059 0.00%Gimv NV 417 26,704 0.00%Tessenderlo Group SA 609 25,711 0.00%Cie d'Entreprises CFE 240 25,046 0.00%Kinepolis Group NV 458 24,724 0.00%Orange Belgium SA 1,050 23,559 0.00%Ontex Group NV 1,886 23,484 0.00%Befimmo SA REIT 497 19,745 0.00%Mithra Pharmaceuticals SA 682 19,209 0.00%AGFA-Gevaert NV 4,107 19,068 0.00%test test 6,474,835 0.25%Canada 3.02% (2020: 2.86%)Shopify, Inc. Class A 5,122 7,498,540 0.30%Royal Bank of Canada 63,794 6,470,071 0.25%Toronto-Dominion Bank 81,539 5,720,175 0.23%Bank of Nova Scotia 53,481 3,481,901 0.14%Bank of Montreal 29,055 2,981,287 0.12%Canadian National Railway Co. 26,963 2,847,848 0.11%
Canadian Pacific Railway Ltd. 30,505 2,348,168 0.09%
Canadian Imperial Bank of Commerce 20,024 2,281,827 0.09%
Manulife Financial Corp. 88,945 1,752,611 0.07%Nutrien Ltd. 26,109 1,583,661 0.06%Waste Connections, Inc. 12,516 1,496,907 0.06%Sun Life Financial, Inc. 26,603 1,373,224 0.05%Alimentation Couche-Tard, Inc. Class B 36,157 1,330,010 0.05%
Constellation Software, Inc. 850 1,288,701 0.05%Franco-Nevada Corp. 8,607 1,250,354 0.05%Magna International, Inc. 12,368 1,146,310 0.05%National Bank of Canada 14,640 1,096,788 0.04%Fortis, Inc. 20,984 929,817 0.04%Intact Financial Corp. 6,818 927,255 0.04%Restaurant Brands International, Inc. 14,173 914,154 0.04%
Wheaton Precious Metals Corp. 20,502 904,651 0.04%
CGI, Inc. 9,957 903,712 0.04%
.Number of
SharesFair Value
US Dollars ($)% of Total
Net AssetsRogers Communications, Inc. Class B 16,737 890,712 0.04%
Thomson Reuters Corp. 7,382 734,027 0.03%Agnico Eagle Mines Ltd. 11,712 708,981 0.03%Open Text Corp. 13,728 697,874 0.03%Dollarama, Inc. 14,182 649,832 0.03%BCE, Inc. 12,709 627,393 0.02%First Quantum Minerals Ltd. 26,471 610,738 0.02%Shaw Communications, Inc. Class B 19,568 567,461 0.02%
Metro, Inc. 11,405 547,363 0.02%Fairfax Financial Holdings Ltd. 1,191 522,836 0.02%
Kirkland Lake Gold Ltd. 12,475 481,249 0.02%Emera, Inc. 10,437 474,018 0.02%Loblaw Cos Ltd. 7,415 456,828 0.02%Bausch Health Cos, Inc. 15,198 446,502 0.02%Telus Corp., Ltd. 18,776 421,524 0.02%CAE, Inc. 12,609 388,768 0.02%Algonquin Power & Utilities Corp. 25,953 387,105 0.02%
Canadian Tire Corp., Ltd. Class A 2,411 381,928 0.02%
TFI International, Inc. 4,149 379,183 0.02%West Fraser Timber Co., Ltd. 5,240 376,571 0.01%
Canadian Apartment Properties REIT 7,911 371,305 0.01%
CCL Industries, Inc. Class B 6,618 364,864 0.01%Great-West Lifeco, Inc. 12,246 364,126 0.01%Northland Power, Inc. 10,458 357,158 0.01%Hydro One Ltd. 14,437 349,295 0.01%Kinross Gold Corp. 54,752 347,533 0.01%George Weston Ltd. 3,436 327,839 0.01%Saputo, Inc. 10,926 326,201 0.01%Lightspeed POS, Inc. 3,851 322,653 0.01%Gildan Activewear, Inc. Class A 8,715 321,912 0.01%
Descartes Systems Group, Inc. 4,596 318,190 0.01%
Ritchie Bros Auctioneers, Inc. 5,132 304,571 0.01%
FirstService Corp. 1,728 296,689 0.01%Toromont Industries Ltd. 3,331 290,518 0.01%BlackBerry Ltd. 23,311 285,199 0.01%Empire Co., Ltd. 8,893 280,801 0.01%RioCan REIT 15,660 279,232 0.01%Element Fleet Management Corp. 22,241 259,715 0.01%
Lundin Mining Corp. 27,891 251,814 0.01%SmartCentres REIT 10,404 246,762 0.01%TMX Group Ltd. 2,312 244,475 0.01%Quebecor, Inc. Class B 9,074 242,257 0.01%B2Gold Corp. 57,622 241,972 0.01%iA Financial Corp., Inc. 4,386 239,046 0.01%Brookfield Renewable Corp. Class A 5,669 238,425 0.01%
AltaGas Ltd. 11,174 234,796 0.01%Finning International, Inc. 8,768 229,768 0.01%Ballard Power Systems, Inc. 12,383 224,800 0.01%Yamana Gold, Inc. 52,467 221,172 0.01%Granite REIT 3,295 219,472 0.01%IGM Financial, Inc. 5,276 186,447 0.01%Premium Brands Holdings Corp. 1,832 186,307 0.01%
Allied Properties REIT 5,018 182,557 0.01%Kinaxis, Inc. 1,381 181,862 0.01%Endeavour Mining plc 8,256 177,481 0.01%GFL Environmental, Inc. 5,511 176,327 0.01%Stella-Jones, Inc. 4,866 175,377 0.01%First Capital REIT 11,995 170,485 0.01%First Majestic Silver Corp. 10,484 165,773 0.01%Ivanhoe Mines Ltd. Class A 22,819 164,928 0.01%

36
Vanguard ESG Developed World All Cap Equity Index Fund
.Number of
SharesFair Value
US Dollars ($)% of Total
Net AssetsCanadian Utilities Ltd. Class A 5,928 164,680 0.01%
Boyd Group Services, Inc. 867 157,941 0.01%BRP, Inc. 1,982 155,256 0.01%Alamos Gold, Inc. Class A 19,409 148,432 0.01%Atco Ltd. Class I 4,122 146,332 0.01%SSR Mining, Inc. 9,093 142,163 0.01%Colliers International Group, Inc. 1,219 136,656 0.01%
CI Financial Corp. 7,433 136,559 0.01%Boralex, Inc. Class A 4,258 129,807 0.01%Primo Water Corp. 7,693 128,848 0.01%North West Co., Inc. 4,511 128,194 0.01%Innergex Renewable Energy, Inc. 7,240 125,997 0.01%
H&R REIT 9,751 125,992 0.01%Air Canada 6,035 124,277 0.01%Capital Power Corp. 3,737 123,581 0.01%Laurentian Bank of Canada 3,484 122,923 0.01%Equinox Gold Corp. 17,307 120,337 0.00%Novagold Resources, Inc. 14,471 116,161 0.00%Brookfield Infrastructure Corp. Class A 1,469 110,836 0.00%
Osisko Gold Royalties Ltd. 7,614 104,467 0.00%Canadian Western Bank 3,694 103,813 0.00%Linamar Corp. 1,624 101,967 0.00%Choice Properties REIT 8,662 99,960 0.00%Chartwell Retirement Residences 9,171 98,131 0.00%
Canada Goose Holdings, Inc. 2,230 97,570 0.00%
Bombardier, Inc. Class B 102,904 97,228 0.00%Cargojet, Inc. 634 94,222 0.00%Superior Plus Corp. 7,381 91,018 0.00%NFI Group, Inc. 3,987 90,700 0.00%Methanex Corp. 2,693 89,361 0.00%Eldorado Gold Corp. 8,921 88,684 0.00%Russel Metals, Inc. 3,220 88,073 0.00%OceanaGold Corp. 44,129 83,746 0.00%Torex Gold Resources, Inc. 6,624 76,388 0.00%Maple Leaf Foods, Inc. 3,481 72,330 0.00%Centerra Gold, Inc. 9,418 71,569 0.00%IAMGOLD Corp. 22,729 66,996 0.00%Pretium Resources, Inc. 6,681 63,988 0.00%Cascades, Inc. 4,788 59,004 0.00%Enghouse Systems Ltd. 1,310 58,386 0.00%Dye & Durham Ltd. 1,478 56,850 0.00%Canfor Corp. 2,451 56,134 0.00%ECN Capital Corp. 6,415 48,179 0.00%Hudbay Minerals, Inc. 7,115 47,403 0.00%Mullen Group Ltd. 4,185 45,152 0.00%Home Capital Group, Inc. Class B 1,301 39,084 0.00%
Transcontinental, Inc. Class A 2,012 37,826 0.00%
Cominar REIT 4,264 37,637 0.00%Martinrea International, Inc. 2,884 30,440 0.00%Boardwalk REIT 897 29,613 0.00%Artis REIT 2,999 27,149 0.00%Cogeco Communications, Inc. 263 25,744 0.00%
Celestica, Inc. 2,946 23,125 0.00%Winpak Ltd. 707 22,078 0.00%Dream Office REIT 1,162 21,545 0.00%Westshore Terminals Investment Corp. 1,544 21,297 0.00%
First National Financial Corp. 372 14,783 0.00%test test 76,575,581 3.02%Denmark 0.68% (2020: 0.68%)Novo Nordisk A/S Class B 73,782 6,182,083 0.24%DSV PANALPINA A/S 9,067 2,114,725 0.08%Vestas Wind Systems A/S 46,114 1,800,274 0.07%
.Number of
SharesFair Value
US Dollars ($)% of Total
Net AssetsGenmab A/S 2,754 1,126,977 0.05%Coloplast A/S Class B 6,333 1,039,248 0.04%Novozymes A/S Class B 9,057 682,754 0.03%Pandora A/S 4,231 568,807 0.02%GN Store Nord A/S 6,373 556,750 0.02%Chr Hansen Holding A/S 4,564 411,961 0.02%Tryg A/S 15,255 374,530 0.02%Demant A/S 5,196 292,508 0.01%Ambu A/S Class B 7,416 285,142 0.01%SimCorp A/S 2,034 255,347 0.01%ISS A/S 8,536 200,381 0.01%Netcompany Group A/S 1,588 180,439 0.01%ALK-Abello A/S 328 156,506 0.01%ROCKWOOL International A/S Class B 305 148,498 0.01%
Jyske Bank A/S 2,371 114,721 0.01%Bavarian Nordic A/S 2,688 110,940 0.01%Ringkjoebing Landbobank A/S 1,026 104,064 0.00%
NKT A/S 2,027 93,033 0.00%Sydbank A/S 2,816 86,718 0.00%H Lundbeck A/S 2,521 80,207 0.00%Topdanmark A/S 1,442 75,060 0.00%Schouw & Co. A/S 504 55,298 0.00%Chemometec A/S 347 46,678 0.00%Nilfisk Holding A/S 1,278 44,736 0.00%D/S Norden A/S 1,283 40,819 0.00%Zealand Pharma A/S 1,276 37,686 0.00%Spar Nord Bank A/S 2,429 27,348 0.00%Alm Brand A/S 2,214 16,030 0.00%test test 17,310,268 0.68%Finland 0.37% (2020: 0.35%)Nordea Bank Abp 157,784 1,758,517 0.07%Kone OYJ Class B 17,950 1,464,539 0.06%Nokia OYJ 253,036 1,354,990 0.05%Sampo OYJ Class A 22,658 1,041,486 0.04%Stora Enso OYJ Class R 25,283 461,290 0.02%Kesko OYJ Class B 11,473 423,822 0.02%Elisa OYJ 6,495 387,586 0.02%Wartsila OYJ Abp 23,826 353,614 0.02%Valmet OYJ 5,934 258,826 0.01%Nokian Renkaat OYJ 6,255 252,576 0.01%Orion OYJ Class B 5,078 218,298 0.01%Huhtamaki OYJ 4,399 208,410 0.01%Kojamo OYJ 8,410 192,188 0.01%Cargotec OYJ Class B 3,100 160,286 0.01%TietoEVRY OYJ 4,936 155,940 0.01%QT Group OYJ 768 89,893 0.00%Uponor OYJ 3,012 87,298 0.00%Sanoma OYJ 5,198 86,177 0.00%Revenio Group OYJ 1,061 80,402 0.00%Kemira OYJ 4,377 68,932 0.00%Metsa Board OYJ 6,016 61,891 0.00%Terveystalo OYJ 3,865 52,252 0.00%YIT OYJ 3,749 22,963 0.00%Citycon OYJ 2,596 22,120 0.00%Raisio OYJ Class V 4,414 19,708 0.00%F-Secure OYJ 3,588 17,126 0.00%Finnair OYJ 19,168 15,812 0.00%test test 9,316,942 0.37%France 1.87% (2020: 1.93%)Sanofi 49,466 5,183,350 0.21%BNP Paribas SA 49,519 3,104,769 0.12%Kering SA 3,370 2,945,408 0.12%L'Oreal SA (XPAR) 5,675 2,529,127 0.10%EssilorLuxottica SA 13,342 2,462,579 0.10%AXA SA 85,983 2,180,569 0.09%Hermes International 1,381 2,011,949 0.08%Danone SA 26,919 1,895,283 0.08%L’Oreal SA (Prime De Fidelite) 4,151 1,849,940 0.07%

37
Vanguard ESG Developed World All Cap Equity Index Fund
.Number of
SharesFair Value
US Dollars ($)% of Total
Net AssetsCie Generale des Etablissements Michelin SCA 8,229 1,312,555 0.05%
Legrand SA 12,227 1,294,270 0.05%Vivendi SE 35,056 1,177,761 0.05%Societe Generale SA 36,632 1,079,965 0.04%Teleperformance 2,612 1,060,298 0.04%Worldline SA 11,299 1,057,755 0.04%STMicroelectronics NV 28,646 1,039,691 0.04%Orange SA 85,546 975,432 0.04%Veolia Environnement SA 23,052 696,283 0.03%Publicis Groupe SA 10,664 682,149 0.03%Alstom SA 12,826 647,809 0.03%Eurofins Scientific SE 5,580 637,910 0.03%Edenred 10,891 620,596 0.03%Carrefour SA 27,425 539,399 0.02%Sartorius Stedim Biotech 1,043 493,397 0.02%Euronext NV 4,062 441,730 0.02%L’Oreal SA 952 424,269 0.02%Getlink SE 22,979 358,348 0.02%Arkema SA 2,815 353,193 0.02%Suez SA 14,571 346,459 0.01%Gecina SA REIT 2,251 344,894 0.01%Valeo SA 11,172 336,124 0.01%Renault SA 7,717 311,932 0.01%Ubisoft Entertainment SA 4,285 300,017 0.01%Rexel SA 13,877 290,297 0.01%Sodexo SA (XPAR) 2,874 268,231 0.01%Orpea SA 2,108 268,112 0.01%Faurecia SE (XPAR) 4,989 244,764 0.01%SCOR SE 7,381 234,759 0.01%BioMerieux 1,920 223,139 0.01%Amundi SA 2,527 222,810 0.01%SOITEC 985 217,152 0.01%Klepierre SA REIT 8,387 216,130 0.01%Wendel SE 1,512 203,335 0.01%Covivio REIT 2,360 201,844 0.01%Rubis SCA 4,377 194,599 0.01%Elis SA 9,797 184,614 0.01%Sopra Steria Group SACA 921 177,157 0.01%Aeroports de Paris 1,289 167,919 0.01%Ipsen SA 1,513 157,393 0.01%SES SA Class A 19,875 151,836 0.01%SEB SA (XPAR) 781 141,151 0.01%Korian SA 3,441 127,072 0.01%CNP Assurances 7,084 120,553 0.01%ICADE REIT 1,339 115,601 0.01%Eurazeo SE 1,297 113,051 0.01%Lagardere SCA 4,528 111,906 0.01%IPSOS 2,279 96,080 0.00%Sodexo SA 1,023 95,477 0.00%JCDecaux SA 3,416 94,713 0.00%Eutelsat Communications SA 8,001 93,499 0.00%
Nexity SA 1,844 92,239 0.00%Trigano SA 440 90,897 0.00%Verallia SA 2,316 85,857 0.00%Iliad SA 561 82,097 0.00%Casino Guichard Perrachon SA 2,536 80,449 0.00%
Virbac SA 232 79,512 0.00%Metropole Television SA 3,588 75,484 0.00%Cie Plastic Omnium SA 2,389 74,624 0.00%Societe BIC SA 1,050 72,968 0.00%SEB SA 396 71,570 0.00%Neoen SA 1,518 68,191 0.00%Air France-KLM 13,306 64,223 0.00%Imerys SA 1,361 63,592 0.00%Faurecia SE 1,239 60,610 0.00%Beneteau SA 3,431 54,278 0.00%Maisons du Monde SA 1,966 48,728 0.00%Eurazeo SE (XPAR) 556 48,463 0.00%
.Number of
SharesFair Value
US Dollars ($)% of Total
Net AssetsX-Fab Silicon Foundries SE 4,561 43,271 0.00%Tarkett SA 1,691 40,107 0.00%Interparfums SA 611 39,707 0.00%SEB SA (Prime De Fidelite) 213 38,496 0.00%Sodexo SA-PF 394 36,772 0.00%Eramet SA 556 36,298 0.00%Quadient SA 1,194 35,881 0.00%Rothschild & Co. 921 35,770 0.00%Television Francaise 1 3,529 35,678 0.00%Coface SA 2,941 35,645 0.00%Fnac Darty SA 551 35,449 0.00%ALD SA 2,303 34,521 0.00%PEUGEOT INVEST 239 32,141 0.00%Robertet SA 26 32,067 0.00%Voltalia SA 1,136 30,312 0.00%Vicat SA 619 29,913 0.00%Vilmorin & Cie SA 445 29,553 0.00%Mercialys SA REIT 2,373 28,732 0.00%Solutions 30 SE 3,606 24,931 0.00%Elior Group SA 2,566 19,171 0.00%Akka Technologies 669 18,660 0.00%Pharmagest Interactive 167 18,398 0.00%Lisi SA 563 18,394 0.00%Albioma SA 448 18,340 0.00%Carmila SA REIT 1,329 18,219 0.00%Bonduelle SCA 718 18,009 0.00%SEB SA - EUR 79 14,278 0.00%Sodexo SA - EU 87 8,120 0.00%LISI 242 7,907 0.00%Albioma SA (XPAR) 193 7,901 0.00%test test 47,464,827 1.87%Germany 2.24% (2020: 2.53%)SAP SE 50,344 7,095,099 0.28%Daimler AG 38,322 3,422,088 0.14%Adidas AG 8,810 3,279,558 0.13%Deutsche Post AG 44,721 3,042,067 0.12%Bayer AG 45,225 2,746,511 0.11%Infineon Technologies AG 59,739 2,395,960 0.10%Muenchener Rueckversicherungs-Gesellschaft AG in Muenchen 6,335 1,735,053 0.07%
Vonovia SE 26,024 1,682,589 0.07%Deutsche Boerse AG 8,450 1,475,070 0.06%Bayerische Motoren Werke AG 13,536 1,433,635 0.06%
Deutsche Bank AG 95,187 1,240,125 0.05%Zalando SE 9,781 1,182,548 0.05%Delivery Hero SE 8,724 1,152,521 0.05%Merck KGaA 5,850 1,121,796 0.05%Deutsche Wohnen SE 15,566 952,152 0.04%Fresenius SE & Co. KGaA 18,227 950,970 0.04%Henkel AG & Co. KGaA - Preference Shares 8,028 847,697 0.03%
Symrise AG Class A 5,973 832,297 0.03%Continental AG 5,129 754,106 0.03%Siemens Healthineers AG 12,249 750,708 0.03%Fresenius Medical Care AG & Co. KGaA 8,766 728,108 0.03%
HelloFresh SE 6,971 677,721 0.03%Brenntag SE 6,603 614,068 0.03%HeidelbergCement AG 6,996 600,173 0.02%Sartorius AG - Preference Shares 1,129 587,769 0.02%
Puma SE 4,613 550,065 0.02%Covestro AG 8,372 540,698 0.02%Beiersdorf AG 4,289 517,534 0.02%Siemens Energy AG 16,670 502,527 0.02%Hannover Rueck SE 2,823 472,374 0.02%QIAGEN NV 9,706 469,162 0.02%Aroundtown SA 58,083 453,235 0.02%LEG Immobilien SE 3,059 440,580 0.02%

38
Vanguard ESG Developed World All Cap Equity Index Fund
.Number of
SharesFair Value
US Dollars ($)% of Total
Net AssetsHenkel AG & Co. KGaA 4,455 410,239 0.02%Scout24 AG 4,517 380,969 0.02%KION Group AG 3,396 361,975 0.02%Bayerische Motoren Werke AG - Preference Shares 3,945 354,621 0.01%
Knorr-Bremse AG 2,891 332,558 0.01%Commerzbank AG 46,474 329,689 0.01%Carl Zeiss Meditec AG 1,688 326,193 0.01%LANXESS AG 4,613 316,308 0.01%GEA Group AG 7,439 301,356 0.01%Evotec SE 6,514 295,325 0.01%Evonik Industries AG 8,523 285,838 0.01%TeamViewer AG 6,550 246,390 0.01%Dialog Semiconductor plc 3,132 243,506 0.01%United Internet AG 5,083 207,843 0.01%Bechtle AG 1,096 203,605 0.01%Nemetschek SE 2,566 196,336 0.01%alstria office AG REIT 10,512 194,348 0.01%Fuchs Petrolub SE - Preference Shares 3,922 190,788 0.01%
TAG Immobilien AG 5,556 176,318 0.01%Gerresheimer AG 1,576 174,282 0.01%Grand City Properties SA 6,036 163,061 0.01%Aurubis AG 1,703 157,851 0.01%Siltronic AG (XETR) 915 152,456 0.01%Auto1 Group SE 3,426 150,530 0.01%CTS Eventim AG & Co. KGaA 2,365 147,805 0.01%
HUGO BOSS AG 2,615 142,280 0.01%Deutsche Lufthansa AG 12,429 139,878 0.01%Hella GmbH & Co. KGaA 2,004 137,269 0.01%Aixtron SE 4,976 134,839 0.01%Rational AG 148 134,092 0.01%Freenet AG 5,550 131,108 0.01%CompuGroup Medical SE & Co. KgaA 1,665 130,417 0.01%
ProSiebenSat.1 Media SE 6,258 124,493 0.01%Varta AG 772 119,017 0.01%K+S AG 7,829 106,585 0.01%Befesa SA 1,352 103,896 0.01%Traton SE 3,238 102,680 0.01%Hypoport SE 197 101,859 0.01%zooplus AG 303 98,168 0.00%MorphoSys AG 1,229 95,348 0.00%Fielmann AG 1,215 95,025 0.00%RTL Group SA 1,571 93,618 0.00%Fraport AG Frankfurt Airport Services Worldwide 1,334 90,901 0.00%
DWS Group GmbH & Co. KGaA 1,995 90,424 0.00%
Telefonica Deutschland Holding AG 34,124 90,041 0.00%
Cancom SE 1,454 87,939 0.00%Encavis AG 4,581 86,596 0.00%Jungheinrich AG - Preference Shares 1,771 86,571 0.00%
Deutsche Pfandbriefbank AG 8,675 85,779 0.00%
ADLER Group SA 3,239 85,196 0.00%Stabilus SA 1,040 84,545 0.00%Nordex SE 3,399 82,552 0.00%Wacker Chemie AG 528 81,432 0.00%Sixt SE - Preference Shares 1,009 81,367 0.00%Global Fashion Group SA 5,362 81,202 0.00%Duerr AG 2,120 80,653 0.00%Instone Real Estate Group AG 2,653 79,913 0.00%
Suedzucker AG 4,899 78,431 0.00%Norma Group SE 1,497 76,657 0.00%Aareal Bank AG 3,279 75,710 0.00%Software AG 1,672 75,228 0.00%Stroeer SE & Co. KGaA 930 74,500 0.00%
.Number of
SharesFair Value
US Dollars ($)% of Total
Net AssetsS&T AG 3,189 72,989 0.00%Pfeiffer Vacuum Technology AG 381 72,383 0.00%
Sixt SE 533 71,805 0.00%GRENKE AG 1,621 71,127 0.00%Draegerwerk AG & Co. KGaA - Preference Shares 751 71,071 0.00%
Dermapharm Holding SE 874 69,703 0.00%1&1 AG 2,249 68,811 0.00%Talanx AG 1,657 67,754 0.00%Shop Apotheke Europe NV 337 63,304 0.00%Salzgitter AG 2,051 60,953 0.00%Kloeckner & Co. SE 4,304 58,901 0.00%METRO AG 4,275 52,928 0.00%VERBIO Vereinigte BioEnergie AG 983 49,800 0.00%
Siltronic AG 276 46,543 0.00%Atoss Software AG 209 46,200 0.00%Secunet Security Networks AG 95 42,248 0.00%
Hornbach Holding AG & Co. KGaA 363 41,369 0.00%
Koenig & Bauer AG 1,185 39,559 0.00%Deutz AG 4,474 36,185 0.00%Wuestenrot & Wuerttembergische AG 1,426 32,672 0.00%
Ceconomy AG 6,501 31,732 0.00%Deutsche Beteiligungs AG 772 31,219 0.00%Krones AG 337 30,114 0.00%Deutsche EuroShop AG 1,220 28,936 0.00%Wacker Neuson SE 1,002 28,804 0.00%ElringKlinger AG 1,584 28,196 0.00%STRATEC SE 198 27,660 0.00%Washtec AG 439 27,228 0.00%PATRIZIA AG 1,039 27,107 0.00%Hamburger Hafen und Logistik AG 1,054 26,499 0.00%
KWS Saat SE & Co. KGaA 297 24,444 0.00%BayWa AG 561 24,217 0.00%Takkt AG 1,350 22,446 0.00%DIC Asset AG 1,294 22,358 0.00%Schaeffler AG - Preference Shares 2,380 21,959 0.00%
New Work SE 66 20,741 0.00%Vossloh AG 410 20,689 0.00%SMA Solar Technology AG 342 19,622 0.00%test test 56,793,239 2.24%Hong Kong 0.93% (2020: 0.96%)AIA Group Ltd. 550,000 6,834,410 0.27%Hong Kong Exchanges & Clearing Ltd. 58,300 3,474,345 0.14%
Sun Hung Kai Properties Ltd. 67,000 998,204 0.04%
Techtronic Industries Co., Ltd. 56,000 977,820 0.04%
Link REIT 97,900 948,637 0.04%Hang Seng Bank Ltd. 34,800 695,028 0.03%BOC Hong Kong Holdings Ltd. 172,000 583,606 0.02%
Wharf Real Estate Investment Co., Ltd. 72,700 422,672 0.02%
Lenovo Group Ltd. 328,000 377,169 0.02%Power Assets Holdings Ltd. 60,500 371,218 0.02%MTR Corp., Ltd. 65,000 362,002 0.02%Xinyi Glass Holdings Ltd. 88,000 358,647 0.02%WH Group Ltd. 391,201 351,614 0.02%New World Development Co., Ltd. 67,435 350,380 0.01%
Henderson Land Development Co., Ltd. 71,364 338,172 0.01%
AAC Technologies Holdings, Inc. 36,500 273,074 0.01%
Wharf Holdings Ltd. 67,700 258,043 0.01%

39
Vanguard ESG Developed World All Cap Equity Index Fund
.Number of
SharesFair Value
US Dollars ($)% of Total
Net AssetsSino Land Co., Ltd. 162,200 255,649 0.01%Hongkong Land Holdings Ltd. 52,800 251,328 0.01%
Hang Lung Properties Ltd. 90,000 218,572 0.01%Chow Tai Fook Jewellery Group Ltd. 93,400 213,359 0.01%
SITC International Holdings Co., Ltd. 48,000 200,570 0.01%
Man Wah Holdings Ltd. 82,800 198,954 0.01%Microport Scientific Corp. 22,000 197,313 0.01%ASM Pacific Technology Ltd. 13,700 185,587 0.01%Tingyi Cayman Islands Holding Corp. 86,000 171,649 0.01%
Prada SpA 20,900 158,650 0.01%CK Infrastructure Holdings Ltd. 25,000 149,050 0.01%
Swire Properties Ltd. 49,500 147,560 0.01%Swire Pacific Ltd. Class A 21,500 145,763 0.01%Vitasoy International Holdings Ltd. 34,000 126,309 0.01%
Minth Group Ltd. 26,000 123,541 0.01%Samsonite International SA 58,800 120,237 0.01%Hang Lung Group Ltd. 44,000 112,183 0.01%Kerry Properties Ltd. 31,000 102,191 0.01%Fortune REIT 92,000 98,565 0.01%Yue Yuen Industrial Holdings Ltd. 38,000 93,852 0.00%
Hysan Development Co., Ltd. 23,000 91,664 0.00%
VTech Holdings Ltd. 8,700 91,584 0.00%JS Global Lifestyle Co., Ltd. 31,500 88,628 0.00%Bank of East Asia Ltd. 47,600 88,386 0.00%NWS Holdings Ltd. 80,000 85,090 0.00%L'Occitane International SA 23,000 84,112 0.00%PCCW Ltd. 152,078 79,702 0.00%Kerry Logistics Network Ltd. 25,500 77,329 0.00%
Uni-President China Holdings Ltd. 70,000 77,248 0.00%
BOC Aviation Ltd. 8,900 75,066 0.00%Champion REIT 129,000 72,591 0.00%Vobile Group Ltd. 15,000 67,797 0.00%Dairy Farm International Holdings Ltd. 15,500 65,720 0.00%
Frontage Holdings Corp. 58,000 61,616 0.00%Lifestyle International Holdings Ltd. 78,500 60,246 0.00%
Television Broadcasts Ltd. 59,800 56,983 0.00%Pacific Basin Shipping Ltd. 138,000 55,620 0.00%HKBN Ltd. 45,500 55,074 0.00%AsiaInfo Technologies Ltd. 31,200 53,032 0.00%MMG Ltd. 96,000 42,277 0.00%Swire Pacific Ltd. Class B 37,500 42,156 0.00%Nexteer Automotive Group Ltd. 29,000 40,330 0.00%
Sun Art Retail Group Ltd. 50,500 37,586 0.00%Great Eagle Holdings Ltd. 11,000 37,395 0.00%Stella International Holdings Ltd. 23,500 36,313 0.00%
Lee & Man Paper Manufacturing Ltd. 45,000 34,246 0.00%
IGG, Inc. 25,000 33,029 0.00%Razer, Inc. 121,000 32,876 0.00%Luk Fook Holdings International Ltd. 9,000 31,059 0.00%
First Pacific Co., Ltd. 84,000 28,664 0.00%Towngas China Co., Ltd. 37,000 27,348 0.00%Value Partners Group Ltd. 41,000 26,186 0.00%VSTECS Holdings Ltd. 32,000 25,836 0.00%Johnson Electric Holdings Ltd. 10,000 25,818 0.00%
Canvest Environmental Protection Group Co., Ltd. 43,000 25,028 0.00%
.Number of
SharesFair Value
US Dollars ($)% of Total
Net AssetsSUNeVision Holdings Ltd. 24,000 24,569 0.00%FIH Mobile Ltd. 143,000 23,570 0.00%Glory Sun Financial Group Ltd. 804,000 21,638 0.00%
Vinda International Holdings Ltd. 7,000 21,543 0.00%
Guotai Junan International Holdings Ltd. 130,000 20,758 0.00%
Prosperity REIT 53,000 20,270 0.00%China Travel International Investment Hong Kong Ltd. 120,000 19,933 0.00%
Pou Sheng International Holdings Ltd. 83,000 19,559 0.00%
Sunlight REIT 33,000 19,080 0.00%K Wah International Holdings Ltd. 37,000 17,962 0.00%
Dah Sing Financial Holdings Ltd. 5,200 17,778 0.00%
Shui On Land Ltd. 109,333 17,739 0.00%Hong Kong Television Network Ltd. 14,000 17,577 0.00%
Dah Sing Banking Group Ltd. 15,600 17,215 0.00%
Cathay Pacific Airways Ltd. 19,636 16,587 0.00%Cafe de Coral Holdings Ltd. 8,000 16,441 0.00%CITIC Telecom International Holdings Ltd. 45,000 14,892 0.00%
United Laboratories International Holdings Ltd. 18,000 14,765 0.00%
Road King Infrastructure Ltd. 11,000 13,683 0.00%
FIT Hon Teng Ltd. 46,000 12,617 0.00%Haitong International Securities Group Ltd. 42,000 11,574 0.00%
Xiabuxiabu Catering Management China Holdings Co., Ltd. 10,500 11,006 0.00%
Asia Cement China Holdings Corp. 14,000 10,961 0.00%
Brightoil Petroleum Holdings Ltd. 74,418 1,917 0.00%
test test 23,563,192 0.93%Ireland 0.12% (2020: 0.11%)Kerry Group plc Class A 7,136 996,892 0.04%ICON plc ADR 3,568 737,541 0.03%Kingspan Group plc 6,690 631,838 0.03%Bank of Ireland Group plc 44,011 235,754 0.01%Glanbia plc 9,988 162,155 0.01%AIB Group plc 36,878 95,033 0.00%Hibernia plc REIT 32,844 48,298 0.00%Dalata Hotel Group plc 5,773 26,255 0.00%Irish Continental Group plc 4,550 23,310 0.00%Cairn Homes plc 18,138 22,930 0.00%test test 2,980,006 0.12%Israel 0.18% (2020: 0.17%)Nice Ltd. 2,818 688,566 0.03%Bank Leumi Le-Israel BM 65,945 501,089 0.02%Bank Hapoalim BM 52,990 425,416 0.02%Israel Discount Bank Ltd. Class A 55,518 264,428 0.01%
ICL Group Ltd. 33,644 228,286 0.01%Mizrahi Tefahot Bank Ltd. 6,276 193,374 0.01%Tower Semiconductor Ltd. 5,681 167,754 0.01%Nova Measuring Instruments Ltd. 1,190 122,232 0.01%
Enlight Renewable Energy Ltd. 56,181 120,603 0.01%
Azrieli Group Ltd. 1,450 102,125 0.01%Electra Ltd. 176 99,869 0.01%Danel Adir Yeoshua Ltd. 455 95,371 0.01%Bezeq The Israeli Telecommunication Corp., Ltd. 80,536 87,741 0.01%
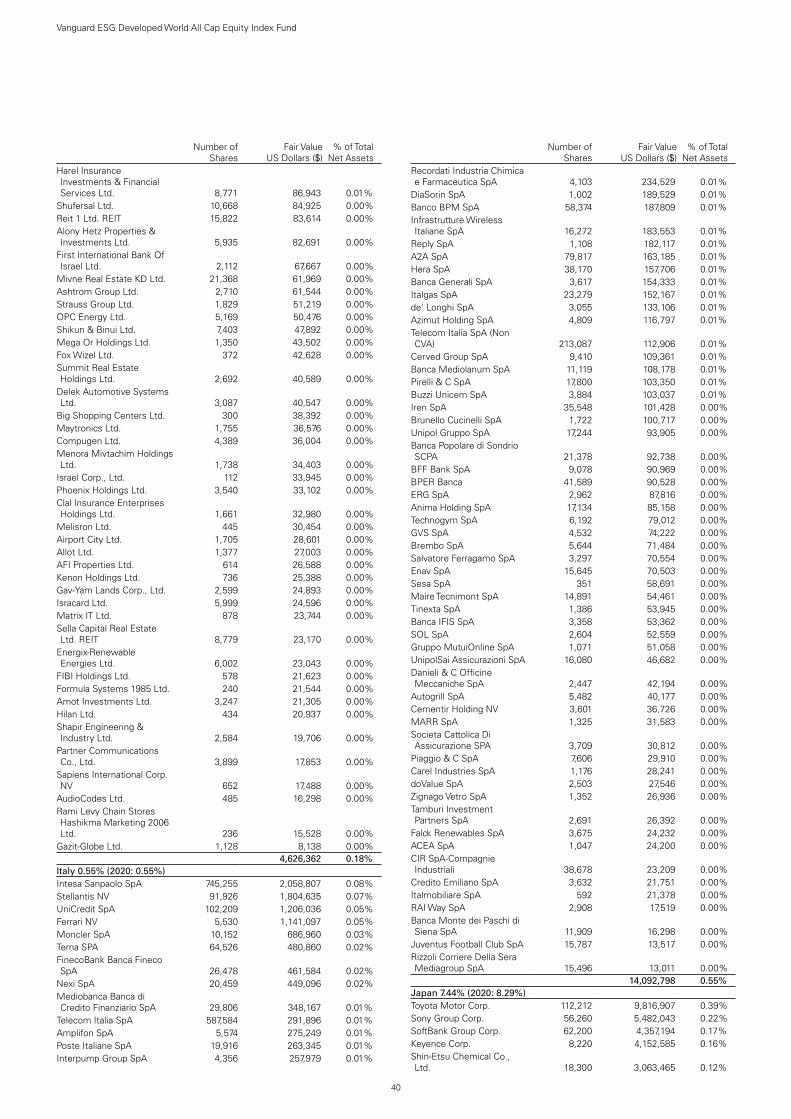
40
Vanguard ESG Developed World All Cap Equity Index Fund
.Number of
SharesFair Value
US Dollars ($)% of Total
Net AssetsHarel Insurance Investments & Financial Services Ltd. 8,771 86,943 0.01%
Shufersal Ltd. 10,668 84,925 0.00%Reit 1 Ltd. REIT 15,822 83,614 0.00%Alony Hetz Properties & Investments Ltd. 5,935 82,691 0.00%
First International Bank Of Israel Ltd. 2,112 67,667 0.00%
Mivne Real Estate KD Ltd. 21,368 61,969 0.00%Ashtrom Group Ltd. 2,710 61,544 0.00%Strauss Group Ltd. 1,829 51,219 0.00%OPC Energy Ltd. 5,169 50,476 0.00%Shikun & Binui Ltd. 7,403 47,892 0.00%Mega Or Holdings Ltd. 1,350 43,502 0.00%Fox Wizel Ltd. 372 42,628 0.00%Summit Real Estate Holdings Ltd. 2,692 40,589 0.00%
Delek Automotive Systems Ltd. 3,087 40,547 0.00%
Big Shopping Centers Ltd. 300 38,392 0.00%Maytronics Ltd. 1,755 36,576 0.00%Compugen Ltd. 4,389 36,004 0.00%Menora Mivtachim Holdings Ltd. 1,738 34,403 0.00%
Israel Corp., Ltd. 112 33,945 0.00%Phoenix Holdings Ltd. 3,540 33,102 0.00%Clal Insurance Enterprises Holdings Ltd. 1,661 32,980 0.00%
Melisron Ltd. 445 30,454 0.00%Airport City Ltd. 1,705 28,601 0.00%Allot Ltd. 1,377 27,003 0.00%AFI Properties Ltd. 614 26,588 0.00%Kenon Holdings Ltd. 736 25,388 0.00%Gav-Yam Lands Corp., Ltd. 2,599 24,893 0.00%Isracard Ltd. 5,999 24,596 0.00%Matrix IT Ltd. 878 23,744 0.00%Sella Capital Real Estate Ltd. REIT 8,779 23,170 0.00%
Energix-Renewable Energies Ltd. 6,002 23,043 0.00%
FIBI Holdings Ltd. 578 21,623 0.00%Formula Systems 1985 Ltd. 240 21,544 0.00%Amot Investments Ltd. 3,247 21,305 0.00%Hilan Ltd. 434 20,937 0.00%Shapir Engineering & Industry Ltd. 2,584 19,706 0.00%
Partner Communications Co., Ltd. 3,899 17,853 0.00%
Sapiens International Corp. NV 652 17,488 0.00%
AudioCodes Ltd. 485 16,298 0.00%Rami Levy Chain Stores Hashikma Marketing 2006 Ltd. 236 15,528 0.00%
Gazit-Globe Ltd. 1,128 8,138 0.00%test test 4,626,362 0.18%Italy 0.55% (2020: 0.55%)Intesa Sanpaolo SpA 745,255 2,058,807 0.08%Stellantis NV 91,926 1,804,635 0.07%UniCredit SpA 102,209 1,206,036 0.05%Ferrari NV 5,530 1,141,097 0.05%Moncler SpA 10,152 686,960 0.03%Terna SPA 64,526 480,860 0.02%FinecoBank Banca Fineco SpA 26,478 461,584 0.02%
Nexi SpA 20,459 449,096 0.02%Mediobanca Banca di Credito Finanziario SpA 29,806 348,167 0.01%
Telecom Italia SpA 587,584 291,896 0.01%Amplifon SpA 5,574 275,249 0.01%Poste Italiane SpA 19,916 263,345 0.01%Interpump Group SpA 4,356 257,979 0.01%
.Number of
SharesFair Value
US Dollars ($)% of Total
Net AssetsRecordati Industria Chimica e Farmaceutica SpA 4,103 234,529 0.01%
DiaSorin SpA 1,002 189,529 0.01%Banco BPM SpA 58,374 187,809 0.01%Infrastrutture Wireless Italiane SpA 16,272 183,553 0.01%
Reply SpA 1,108 182,117 0.01%A2A SpA 79,817 163,185 0.01%Hera SpA 38,170 157,706 0.01%Banca Generali SpA 3,617 154,333 0.01%Italgas SpA 23,279 152,167 0.01%de' Longhi SpA 3,055 133,106 0.01%Azimut Holding SpA 4,809 116,797 0.01%Telecom Italia SpA (Non CVA) 213,087 112,906 0.01%
Cerved Group SpA 9,410 109,361 0.01%Banca Mediolanum SpA 11,119 108,178 0.01%Pirelli & C SpA 17,800 103,350 0.01%Buzzi Unicem SpA 3,884 103,037 0.01%Iren SpA 35,548 101,428 0.00%Brunello Cucinelli SpA 1,722 100,717 0.00%Unipol Gruppo SpA 17,244 93,905 0.00%Banca Popolare di Sondrio SCPA 21,378 92,738 0.00%
BFF Bank SpA 9,078 90,969 0.00%BPER Banca 41,589 90,528 0.00%ERG SpA 2,962 87,816 0.00%Anima Holding SpA 17,134 85,158 0.00%Technogym SpA 6,192 79,012 0.00%GVS SpA 4,532 74,222 0.00%Brembo SpA 5,644 71,484 0.00%Salvatore Ferragamo SpA 3,297 70,554 0.00%Enav SpA 15,645 70,503 0.00%Sesa SpA 351 58,691 0.00%Maire Tecnimont SpA 14,891 54,461 0.00%Tinexta SpA 1,386 53,945 0.00%Banca IFIS SpA 3,358 53,362 0.00%SOL SpA 2,604 52,559 0.00%Gruppo MutuiOnline SpA 1,071 51,058 0.00%UnipolSai Assicurazioni SpA 16,080 46,682 0.00%Danieli & C Officine Meccaniche SpA 2,447 42,194 0.00%
Autogrill SpA 5,482 40,177 0.00%Cementir Holding NV 3,601 36,726 0.00%MARR SpA 1,325 31,583 0.00%Societa Cattolica Di Assicurazione SPA 3,709 30,812 0.00%
Piaggio & C SpA 7,606 29,910 0.00%Carel Industries SpA 1,176 28,241 0.00%doValue SpA 2,503 27,546 0.00%Zignago Vetro SpA 1,352 26,936 0.00%Tamburi Investment Partners SpA 2,691 26,392 0.00%
Falck Renewables SpA 3,675 24,232 0.00%ACEA SpA 1,047 24,200 0.00%CIR SpA-Compagnie Industriali 38,678 23,209 0.00%
Credito Emiliano SpA 3,632 21,751 0.00%Italmobiliare SpA 592 21,378 0.00%RAI Way SpA 2,908 17,519 0.00%Banca Monte dei Paschi di Siena SpA 11,909 16,298 0.00%
Juventus Football Club SpA 15,787 13,517 0.00%Rizzoli Corriere Della Sera Mediagroup SpA 15,496 13,011 0.00%
test test 14,092,798 0.55%Japan 7.44% (2020: 8.29%)Toyota Motor Corp. 112,212 9,816,907 0.39%Sony Group Corp. 56,260 5,482,043 0.22%SoftBank Group Corp. 62,200 4,357,194 0.17%Keyence Corp. 8,220 4,152,585 0.16%Shin-Etsu Chemical Co., Ltd. 18,300 3,063,465 0.12%

41
Vanguard ESG Developed World All Cap Equity Index Fund
.Number of
SharesFair Value
US Dollars ($)% of Total
Net AssetsMitsubishi UFJ Financial Group, Inc. 564,300 3,051,054 0.12%
Recruit Holdings Co., Ltd. 61,021 3,007,342 0.12%Tokyo Electron Ltd. 6,700 2,902,388 0.12%Nintendo Co., Ltd. 4,900 2,852,852 0.11%Honda Motor Co., Ltd. 78,300 2,504,415 0.10%Nidec Corp. 21,400 2,482,431 0.10%KDDI Corp. 78,000 2,435,084 0.10%Takeda Pharmaceutical Co., Ltd. 69,300 2,322,071 0.09%
Hoya Corp. 16,300 2,163,249 0.09%FANUC Corp. 8,800 2,124,480 0.08%Sumitomo Mitsui Financial Group, Inc. 58,800 2,029,048 0.08%
Murata Manufacturing Co., Ltd. 26,400 2,017,522 0.08%
Daiichi Sankyo Co., Ltd. 86,900 1,874,782 0.08%Fast Retailing Co., Ltd. 2,300 1,733,030 0.07%Seven & i Holdings Co., Ltd. 35,900 1,713,328 0.07%SoftBank Corp. 127,184 1,665,573 0.07%Mizuho Financial Group, Inc. 114,562 1,638,591 0.07%Fujitsu Ltd. 8,540 1,600,432 0.06%SMC Corp. 2,600 1,537,886 0.06%Astellas Pharma, Inc. 85,900 1,497,194 0.06%Nippon Telegraph & Telephone Corp. 55,400 1,444,772 0.06%
Denso Corp. 20,800 1,420,337 0.06%M3, Inc. 19,402 1,418,222 0.06%Tokio Marine Holdings, Inc. 29,700 1,366,858 0.06%Shiseido Co., Ltd. 18,200 1,339,870 0.05%Kao Corp. 21,300 1,311,699 0.05%Central Japan Railway Co. 8,300 1,260,068 0.05%Terumo Corp. 30,100 1,220,923 0.05%FUJIFILM Holdings Corp. 16,400 1,217,403 0.05%Bridgestone Corp. 26,500 1,206,933 0.05%Eisai Co., Ltd. 12,100 1,191,031 0.05%Chugai Pharmaceutical Co., Ltd. 29,800 1,181,905 0.05%
East Japan Railway Co. 16,500 1,178,444 0.05%Panasonic Corp. 97,830 1,133,079 0.05%Sysmex Corp. 8,900 1,058,474 0.04%Canon, Inc. 45,600 1,032,461 0.04%Kubota Corp. 50,800 1,028,449 0.04%Mitsui Fudosan Co., Ltd. 42,900 994,519 0.04%Olympus Corp. 49,200 978,769 0.04%Kyocera Corp. 15,100 934,380 0.04%ORIX Corp. 54,300 917,068 0.04%Dai-ichi Life Holdings, Inc. 48,700 892,475 0.04%Daiwa House Industry Co., Ltd. 29,600 889,413 0.04%
Aeon Co., Ltd. 32,800 882,134 0.04%Suzuki Motor Corp. 20,700 876,752 0.04%Mitsubishi Estate Co., Ltd. 51,400 831,968 0.03%Shimano, Inc. 3,500 830,931 0.03%Advantest Corp. 9,200 829,732 0.03%Unicharm Corp. 17,900 720,903 0.03%Nomura Holdings, Inc. 138,900 710,581 0.03%Lasertec Corp. 3,600 700,279 0.03%Omron Corp. 8,800 698,513 0.03%TDK Corp. 5,500 668,484 0.03%Secom Co., Ltd. 8,700 661,887 0.03%Shionogi & Co., Ltd. 12,300 641,763 0.03%NEC Corp. 12,400 639,049 0.03%Z Holdings Corp. 127,200 638,120 0.03%Nitori Holdings Co., Ltd. 3,600 637,679 0.03%Sumitomo Realty & Development Co., Ltd. 17,600 629,534 0.03%
Bandai Namco Holdings, Inc. 8,900 618,085 0.03%
Toyota Industries Corp. 7,100 614,749 0.03%Ajinomoto Co., Inc. 23,600 613,230 0.03%Asahi Kasei Corp. 55,100 605,906 0.03%
.Number of
SharesFair Value
US Dollars ($)% of Total
Net AssetsMS&AD Insurance Group Holdings, Inc. 20,900 604,083 0.03%
Obic Co., Ltd. 3,200 597,099 0.02%Japan Exchange Group, Inc. 26,100 580,836 0.02%Yaskawa Electric Corp. 11,800 577,295 0.02%Makita Corp. 11,800 556,032 0.02%Sompo Holdings, Inc. 14,850 549,366 0.02%Nitto Denko Corp. 7,300 545,247 0.02%Sumitomo Mitsui Trust Holdings, Inc. 17,143 544,918 0.02%
Sumitomo Electric Industries Ltd. 35,600 525,709 0.02%
Japan Post Holdings Co., Ltd. 63,817 523,404 0.02%
Renesas Electronics Corp. 47,864 517,927 0.02%Sekisui House Ltd. 24,900 511,169 0.02%MINEBEA MITSUMI, Inc. 18,800 497,821 0.02%SG Holdings Co., Ltd. 18,800 493,417 0.02%Mitsubishi Chemical Holdings Corp. 56,800 477,726 0.02%
Nippon Paint Holdings Co., Ltd. 34,400 467,386 0.02%
Yamato Holdings Co., Ltd. 16,400 466,925 0.02%Pan Pacific International Holdings Corp. 22,400 465,397 0.02%
West Japan Railway Co. 8,000 456,546 0.02%Shimadzu Corp. 11,700 452,757 0.02%MISUMI Group, Inc. 13,300 450,563 0.02%NTT Data Corp. 28,300 441,877 0.02%Nexon Co., Ltd. 19,700 439,474 0.02%Ono Pharmaceutical Co., Ltd. 19,600 437,773 0.02%
Nippon Building Fund, Inc. REIT 70 437,066 0.02%
Toray Industries, Inc. 65,600 436,841 0.02%Nissan Motor Co., Ltd. 87,600 435,119 0.02%Kyowa Kirin Co., Ltd. 12,200 433,084 0.02%Disco Corp. 1,400 428,237 0.02%Nomura Research Institute Ltd. 12,641 418,557 0.02%
Resona Holdings, Inc. 106,800 411,073 0.02%CyberAgent, Inc. 19,000 408,280 0.02%Sumitomo Chemical Co., Ltd. 75,700 401,724 0.02%
Yamaha Corp. 7,200 391,170 0.02%Daifuku Co., Ltd. 4,300 390,909 0.02%Japan Real Estate Investment Corp. REIT 62 381,530 0.02%
Dentsu Group, Inc. 10,384 371,893 0.02%Daiwa Securities Group, Inc. 67,400 370,490 0.02%Aisin Corp. 8,400 359,492 0.02%MEIJI Holdings Co., Ltd. 6,000 359,492 0.02%Japan Metropolitan Fund Invest REIT 330 357,978 0.02%
Odakyu Electric Railway Co., Ltd. 13,700 346,357 0.01%
Hamamatsu Photonics KK 5,700 344,085 0.01%Nippon Prologis, Inc. REIT 108 343,977 0.01%Nomura Real Estate Master Fund, Inc. REIT 214 343,395 0.01%
GLP J-Reit REIT 197 340,077 0.01%Daito Trust Construction Co., Ltd. 3,100 339,355 0.01%
Yamaha Motor Co., Ltd. 12,400 337,400 0.01%TOTO Ltd. 6,500 336,742 0.01%Ricoh Co., Ltd. 29,800 334,810 0.01%Rohm Co., Ltd. 3,600 333,111 0.01%Yakult Honsha Co., Ltd. 5,802 328,810 0.01%T&D Holdings, Inc. 25,400 328,628 0.01%Keio Corp. 5,500 323,588 0.01%Mitsui Chemicals, Inc. 9,100 314,429 0.01%Tokyu Corp. 23,000 313,118 0.01%Isuzu Motors Ltd. 23,500 310,609 0.01%
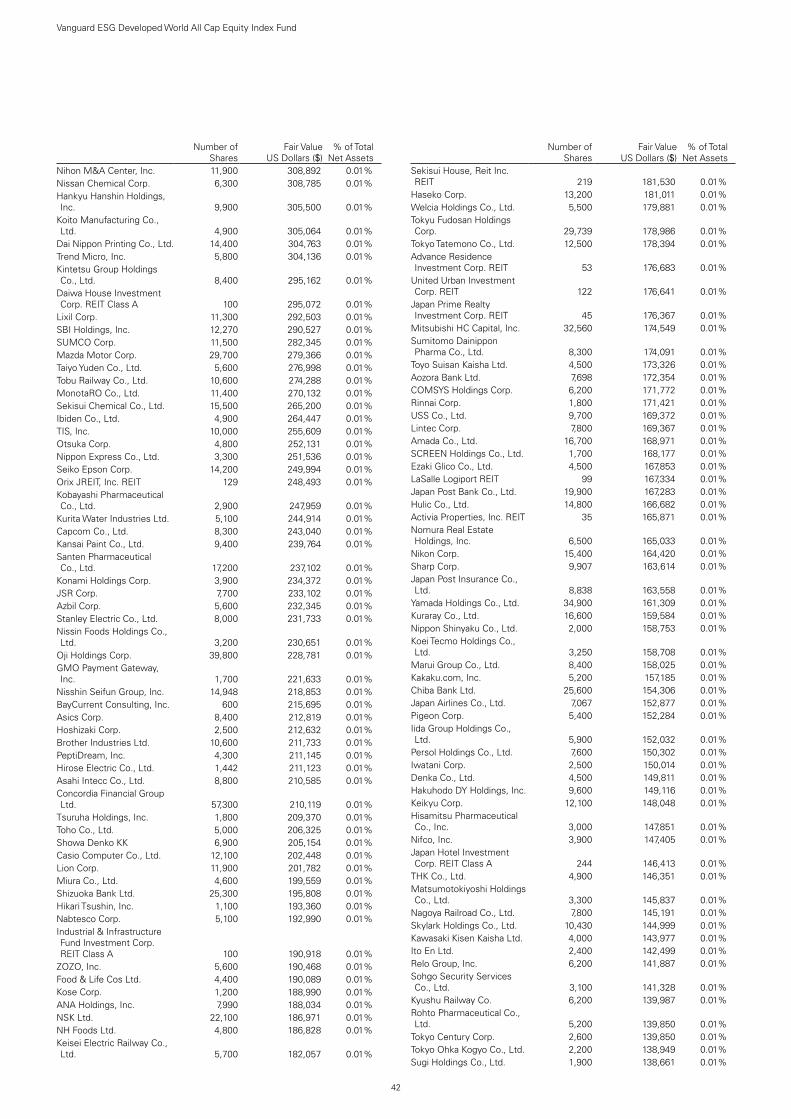
42
Vanguard ESG Developed World All Cap Equity Index Fund
.Number of
SharesFair Value
US Dollars ($)% of Total
Net AssetsNihon M&A Center, Inc. 11,900 308,892 0.01%Nissan Chemical Corp. 6,300 308,785 0.01%Hankyu Hanshin Holdings, Inc. 9,900 305,500 0.01%
Koito Manufacturing Co., Ltd. 4,900 305,064 0.01%
Dai Nippon Printing Co., Ltd. 14,400 304,763 0.01%Trend Micro, Inc. 5,800 304,136 0.01%Kintetsu Group Holdings Co., Ltd. 8,400 295,162 0.01%
Daiwa House Investment Corp. REIT Class A 100 295,072 0.01%
Lixil Corp. 11,300 292,503 0.01%SBI Holdings, Inc. 12,270 290,527 0.01%SUMCO Corp. 11,500 282,345 0.01%Mazda Motor Corp. 29,700 279,366 0.01%Taiyo Yuden Co., Ltd. 5,600 276,998 0.01%Tobu Railway Co., Ltd. 10,600 274,288 0.01%MonotaRO Co., Ltd. 11,400 270,132 0.01%Sekisui Chemical Co., Ltd. 15,500 265,200 0.01%Ibiden Co., Ltd. 4,900 264,447 0.01%TIS, Inc. 10,000 255,609 0.01%Otsuka Corp. 4,800 252,131 0.01%Nippon Express Co., Ltd. 3,300 251,536 0.01%Seiko Epson Corp. 14,200 249,994 0.01%Orix JREIT, Inc. REIT 129 248,493 0.01%Kobayashi Pharmaceutical Co., Ltd. 2,900 247,959 0.01%
Kurita Water Industries Ltd. 5,100 244,914 0.01%Capcom Co., Ltd. 8,300 243,040 0.01%Kansai Paint Co., Ltd. 9,400 239,764 0.01%Santen Pharmaceutical Co., Ltd. 17,200 237,102 0.01%
Konami Holdings Corp. 3,900 234,372 0.01%JSR Corp. 7,700 233,102 0.01%Azbil Corp. 5,600 232,345 0.01%Stanley Electric Co., Ltd. 8,000 231,733 0.01%Nissin Foods Holdings Co., Ltd. 3,200 230,651 0.01%
Oji Holdings Corp. 39,800 228,781 0.01%GMO Payment Gateway, Inc. 1,700 221,633 0.01%
Nisshin Seifun Group, Inc. 14,948 218,853 0.01%BayCurrent Consulting, Inc. 600 215,695 0.01%Asics Corp. 8,400 212,819 0.01%Hoshizaki Corp. 2,500 212,632 0.01%Brother Industries Ltd. 10,600 211,733 0.01%PeptiDream, Inc. 4,300 211,145 0.01%Hirose Electric Co., Ltd. 1,442 211,123 0.01%Asahi Intecc Co., Ltd. 8,800 210,585 0.01%Concordia Financial Group Ltd. 57,300 210,119 0.01%
Tsuruha Holdings, Inc. 1,800 209,370 0.01%Toho Co., Ltd. 5,000 206,325 0.01%Showa Denko KK 6,900 205,154 0.01%Casio Computer Co., Ltd. 12,100 202,448 0.01%Lion Corp. 11,900 201,782 0.01%Miura Co., Ltd. 4,600 199,559 0.01%Shizuoka Bank Ltd. 25,300 195,808 0.01%Hikari Tsushin, Inc. 1,100 193,360 0.01%Nabtesco Corp. 5,100 192,990 0.01%Industrial & Infrastructure Fund Investment Corp. REIT Class A 100 190,918 0.01%
ZOZO, Inc. 5,600 190,468 0.01%Food & Life Cos Ltd. 4,400 190,089 0.01%Kose Corp. 1,200 188,990 0.01%ANA Holdings, Inc. 7,990 188,034 0.01%NSK Ltd. 22,100 186,971 0.01%NH Foods Ltd. 4,800 186,828 0.01%Keisei Electric Railway Co., Ltd. 5,700 182,057 0.01%
.Number of
SharesFair Value
US Dollars ($)% of Total
Net AssetsSekisui House, Reit Inc. REIT 219 181,530 0.01%
Haseko Corp. 13,200 181,011 0.01%Welcia Holdings Co., Ltd. 5,500 179,881 0.01%Tokyu Fudosan Holdings Corp. 29,739 178,986 0.01%
Tokyo Tatemono Co., Ltd. 12,500 178,394 0.01%Advance Residence Investment Corp. REIT 53 176,683 0.01%
United Urban Investment Corp. REIT 122 176,641 0.01%
Japan Prime Realty Investment Corp. REIT 45 176,367 0.01%
Mitsubishi HC Capital, Inc. 32,560 174,549 0.01%Sumitomo Dainippon Pharma Co., Ltd. 8,300 174,091 0.01%
Toyo Suisan Kaisha Ltd. 4,500 173,326 0.01%Aozora Bank Ltd. 7,698 172,354 0.01%COMSYS Holdings Corp. 6,200 171,772 0.01%Rinnai Corp. 1,800 171,421 0.01%USS Co., Ltd. 9,700 169,372 0.01%Lintec Corp. 7,800 169,367 0.01%Amada Co., Ltd. 16,700 168,971 0.01%SCREEN Holdings Co., Ltd. 1,700 168,177 0.01%Ezaki Glico Co., Ltd. 4,500 167,853 0.01%LaSalle Logiport REIT 99 167,334 0.01%Japan Post Bank Co., Ltd. 19,900 167,283 0.01%Hulic Co., Ltd. 14,800 166,682 0.01%Activia Properties, Inc. REIT 35 165,871 0.01%Nomura Real Estate Holdings, Inc. 6,500 165,033 0.01%
Nikon Corp. 15,400 164,420 0.01%Sharp Corp. 9,907 163,614 0.01%Japan Post Insurance Co., Ltd. 8,838 163,558 0.01%
Yamada Holdings Co., Ltd. 34,900 161,309 0.01%Kuraray Co., Ltd. 16,600 159,584 0.01%Nippon Shinyaku Co., Ltd. 2,000 158,753 0.01%Koei Tecmo Holdings Co., Ltd. 3,250 158,708 0.01%
Marui Group Co., Ltd. 8,400 158,025 0.01%Kakaku.com, Inc. 5,200 157,185 0.01%Chiba Bank Ltd. 25,600 154,306 0.01%Japan Airlines Co., Ltd. 7,067 152,877 0.01%Pigeon Corp. 5,400 152,284 0.01%Iida Group Holdings Co., Ltd. 5,900 152,032 0.01%
Persol Holdings Co., Ltd. 7,600 150,302 0.01%Iwatani Corp. 2,500 150,014 0.01%Denka Co., Ltd. 4,500 149,811 0.01%Hakuhodo DY Holdings, Inc. 9,600 149,116 0.01%Keikyu Corp. 12,100 148,048 0.01%Hisamitsu Pharmaceutical Co., Inc. 3,000 147,851 0.01%
Nifco, Inc. 3,900 147,405 0.01%Japan Hotel Investment Corp. REIT Class A 244 146,413 0.01%
THK Co., Ltd. 4,900 146,351 0.01%Matsumotokiyoshi Holdings Co., Ltd. 3,300 145,837 0.01%
Nagoya Railroad Co., Ltd. 7,800 145,191 0.01%Skylark Holdings Co., Ltd. 10,430 144,999 0.01%Kawasaki Kisen Kaisha Ltd. 4,000 143,977 0.01%Ito En Ltd. 2,400 142,499 0.01%Relo Group, Inc. 6,200 141,887 0.01%Sohgo Security Services Co., Ltd. 3,100 141,328 0.01%
Kyushu Railway Co. 6,200 139,987 0.01%Rohto Pharmaceutical Co., Ltd. 5,200 139,850 0.01%
Tokyo Century Corp. 2,600 139,850 0.01%Tokyo Ohka Kogyo Co., Ltd. 2,200 138,949 0.01%Sugi Holdings Co., Ltd. 1,900 138,661 0.01%

43
Vanguard ESG Developed World All Cap Equity Index Fund
.Number of
SharesFair Value
US Dollars ($)% of Total
Net AssetsNankai Electric Railway Co., Ltd. 6,400 136,834 0.01%
Open House Co., Ltd. 2,900 136,391 0.01%Bank of Kyoto Ltd. 3,000 136,228 0.01%Taiheiyo Cement Corp. 6,100 133,937 0.01%Air Water, Inc. 8,700 133,882 0.01%Alfresa Holdings Corp. 8,900 133,031 0.01%Keihan Holdings Co., Ltd. 4,300 130,174 0.01%Kagome Co., Ltd. 4,900 129,398 0.01%Sanwa Holdings Corp. 10,300 126,581 0.01%Nihon Unisys Ltd. 4,200 126,390 0.01%Anritsu Corp. 6,700 125,018 0.01%Nippon Sanso Holdings Corp. 6,000 123,092 0.01%
Daiwa Securities Living Investments Corp. REIT Class A 113 122,988 0.01%
Fukuoka Financial Group, Inc. 7,000 122,290 0.01%
Sanki Engineering Co., Ltd. 9,600 121,524 0.01%Kenedix Residential Next Investment Corp. REIT 56 121,142 0.01%
Itochu Techno-Solutions Corp. 3,900 120,876 0.01%
TechnoPro Holdings, Inc. 5,100 120,757 0.01%Isetan Mitsukoshi Holdings Ltd. 17,300 120,643 0.01%
DIC Corp. 4,700 118,781 0.01%NGK Spark Plug Co., Ltd. 8,000 118,641 0.01%Mizuho Leasing Co., Ltd. 3,500 118,096 0.01%Frontier Real Estate Investment Corp. REIT 25 116,902 0.01%
Japan Airport Terminal Co., Ltd. 2,600 116,893 0.01%
Teijin Ltd. 7,600 115,928 0.01%Sumitomo Forestry Co., Ltd. 6,300 115,510 0.01%Shimamura Co., Ltd. 1,200 115,254 0.01%Mitsubishi Estate Logistics Investment Corp. REIT 26 115,137 0.01%
Morinaga Milk Industry Co., Ltd. 2,200 114,767 0.01%
Sumitomo Rubber Industries Ltd. 8,300 114,640 0.01%
Shinko Electric Industries Co., Ltd. 3,100 113,537 0.01%
Nippn Corp. 8,000 113,091 0.01%Medipal Holdings Corp. 5,900 112,801 0.01%Yamaguchi Financial Group, Inc. 19,700 112,531 0.01%
Mitsui Fudosan Logistics Park, Inc. REIT 21 112,010 0.01%
Ushio, Inc. 6,100 111,569 0.01%Iyo Bank Ltd. 22,400 110,194 0.01%Shinsei Bank Ltd. 8,369 109,862 0.01%Tokai Carbon Co., Ltd. 7,900 109,044 0.01%Nichirei Corp. 4,100 107,829 0.01%Kewpie Corp. 4,800 107,815 0.01%Acom Co., Ltd. 24,700 107,711 0.01%SCSK Corp. 1,800 107,361 0.01%Oracle Corp. Japan 1,400 107,217 0.01%Sawai Group Holdings Co., Ltd. 2,400 107,037 0.01%
Ain Holdings, Inc. 1,700 106,145 0.01%Nagase & Co., Ltd. 7,100 106,062 0.01%Kyudenko Corp. 3,300 105,996 0.01%Kenedix Office Investment Corp. REIT Class A 15 105,820 0.01%
NET One Systems Co., Ltd. 3,200 105,667 0.01%Konica Minolta, Inc. 19,100 105,662 0.01%Jeol Ltd. 1,800 105,415 0.01%Invincible Investment Corp. REIT 273 105,274 0.01%
Tokyu, Inc. REIT 57 105,228 0.01%
.Number of
SharesFair Value
US Dollars ($)% of Total
Net AssetsSeibu Holdings, Inc. 8,956 105,061 0.01%Hino Motors Ltd. 11,900 104,751 0.01%Sankyu, Inc. 2,400 104,117 0.01%Nippon Accommodations Fund, Inc. REIT Class A 18 103,955 0.01%
Ube Industries Ltd. 5,100 103,342 0.01%Kaken Pharmaceutical Co., Ltd. 2,400 102,928 0.01%
Nihon Kohden Corp. 3,600 102,820 0.01%Zensho Holdings Co., Ltd. 4,000 102,820 0.01%Cosmos Pharmaceutical Corp. 700 102,802 0.01%
Matsuyafoods Holdings Co., Ltd. 3,200 101,631 0.01%
Toyo Tire Corp. 4,800 101,544 0.01%Key Coffee, Inc. 5,400 101,490 0.01%Ulvac, Inc. 2,000 101,451 0.01%Alps Alpine Co., Ltd. 9,500 100,401 0.01%Justsystems Corp. 1,700 100,171 0.01%Outsourcing, Inc. 5,500 100,050 0.01%Nippon Paper Industries Co., Ltd. 8,900 99,753 0.01%
Nippon Electric Glass Co., Ltd. 4,200 98,766 0.01%
Toyo Seikan Group Holdings Ltd. 7,100 97,042 0.01%
Taisho Pharmaceutical Holdings Co., Ltd. 1,800 96,495 0.01%
Seino Holdings Co., Ltd. 7,500 96,225 0.01%NTT UD Investment Corp. REIT 65 96,103 0.01%
Suzuken Co., Ltd. 3,270 95,899 0.00%Glory Ltd. 4,600 95,448 0.00%Sundrug Co., Ltd. 3,000 95,414 0.00%Tsumura & Co. 3,000 94,468 0.00%Hazama Ando Corp. 12,800 94,336 0.00%Kyowa Exeo Corp. 3,800 93,639 0.00%DeNA Co., Ltd. 4,400 93,598 0.00%Japan Logistics Fund, Inc. REIT 31 93,288 0.00%
SHIFT, Inc. 600 93,035 0.00%Nihon Parkerizing Co., Ltd. 9,300 92,925 0.00%Itochu Advance Logistics Investment Corp. REIT 65 92,765 0.00%
Mitsubishi Logistics Corp. 3,100 91,891 0.00%Amano Corp. 3,600 90,851 0.00%Dowa Holdings Co., Ltd. 2,300 90,661 0.00%Mebuki Financial Group, Inc. 43,000 90,657 0.00%NIPPON Investment Corp. REIT 22 90,486 0.00%
Izumi Co., Ltd. 2,400 90,387 0.00%Pola Orbis Holdings, Inc. 3,400 89,878 0.00%Kadokawa Corp. 2,200 89,395 0.00%Trusco Nakayama Corp. 3,500 89,305 0.00%Kanematsu Corp. 6,700 89,160 0.00%Daido Steel Co., Ltd. 1,800 89,035 0.00%J Front Retailing Co., Ltd. 10,000 88,747 0.00%House Foods Group, Inc. 2,900 88,706 0.00%Kaneka Corp. 2,200 88,702 0.00%Inaba Denki Sangyo Co., Ltd. 3,800 88,538 0.00%
Takasago Thermal Engineering Co., Ltd. 5,300 88,437 0.00%
PALTAC Corp. 1,700 88,224 0.00%Daicel Corp. 10,700 88,114 0.00%DMG Mori Co., Ltd. 4,900 88,031 0.00%Lawson, Inc. 1,900 87,990 0.00%Kusuri no Aoki Holdings Co., Ltd. 1,200 87,575 0.00%
Nishimatsu Construction Co., Ltd. 2,800 87,287 0.00%
Park24 Co., Ltd. 4,800 87,273 0.00%Internet Initiative Japan, Inc. 2,800 87,035 0.00%

44
Vanguard ESG Developed World All Cap Equity Index Fund
.Number of
SharesFair Value
US Dollars ($)% of Total
Net AssetsHeiwa Real Estate Co., Ltd. 2,300 86,828 0.00%K's Holdings Corp. 7,500 86,292 0.00%Zenkoku Hosho Co., Ltd. 2,000 86,044 0.00%Fudo Tetra Corp. 5,400 85,970 0.00%Digital Garage, Inc. 1,900 85,508 0.00%FP Corp. 2,300 85,481 0.00%Nishi-Nippon Railroad Co., Ltd. 3,500 84,891 0.00%
Toyota Boshoku Corp. 4,100 84,852 0.00%Daishi Hokuetsu Financial Group, Inc. 3,900 84,789 0.00%
Zeon Corp. 6,100 84,473 0.00%Menicon Co., Ltd. 1,200 84,332 0.00%Toho Holdings Co., Ltd. 5,200 83,723 0.00%Topcon Corp. 5,600 83,654 0.00%Mirait Holdings Corp. 4,700 83,464 0.00%Yamazaki Baking Co., Ltd. 5,900 83,245 0.00%JTEKT Corp. 8,100 83,124 0.00%Rengo Co., Ltd. 9,900 82,507 0.00%Goldwin, Inc. 1,400 82,368 0.00%Nippon Kayaku Co., Ltd. 8,700 82,305 0.00%Benesse Holdings, Inc. 3,300 82,151 0.00%Benefit One, Inc. 2,600 81,872 0.00%Yokohama Rubber Co., Ltd. 3,800 81,451 0.00%Hokuto Corp. 4,700 81,262 0.00%Aeon Mall Co., Ltd. 5,250 80,933 0.00%Sotetsu Holdings, Inc. 4,100 80,862 0.00%TS Tech Co., Ltd. 5,200 80,350 0.00%SOSiLA Logistics, Inc. REIT 56 79,517 0.00%Mabuchi Motor Co., Ltd. 2,100 79,467 0.00%CRE Logistics, Inc. REIT 47 79,399 0.00%Hulic Reit, Inc. REIT 47 79,230 0.00%GS Yuasa Corp. 3,100 79,183 0.00%Mitsubishi Motors Corp. 28,100 78,991 0.00%Sumitomo Osaka Cement Co., Ltd. 2,900 78,908 0.00%
AEON Investment Corp. REIT 53 78,552 0.00%
en-japan, Inc. 2,200 78,295 0.00%Toshiba TEC Corp. 1,900 78,232 0.00%NHK Spring Co., Ltd. 9,500 78,061 0.00%Mori Hills Investment Corp. REIT Class A 52 78,054 0.00%
Fancl Corp. 2,400 77,845 0.00%Fujikura Ltd. 16,700 77,639 0.00%Maruichi Steel Tube Ltd. 3,300 77,572 0.00%Ringer Hut Co., Ltd. 3,600 77,229 0.00%Nipro Corp. 6,500 76,894 0.00%Canon Marketing Japan, Inc. 3,300 76,799 0.00%Nippon Gas Co., Ltd. 4,500 76,547 0.00%JDC Corp. 14,900 76,520 0.00%Toyoda Gosei Co., Ltd. 3,100 76,390 0.00%Starts Proceed Investment Corp. REIT Class A 35 76,313 0.00%
Nikkon Holdings Co., Ltd. 3,500 76,250 0.00%Meitec Corp. 1,400 75,809 0.00%Mani, Inc. 3,300 75,699 0.00%Comforia Residential, Inc. REIT 24 75,682 0.00%
Osaka Organic Chemical Industry Ltd. 1,900 75,322 0.00%
Sumitomo Bakelite Co., Ltd. 1,700 75,205 0.00%SHO-BOND Holdings Co., Ltd. 1,800 75,007 0.00%
Ship Healthcare Holdings, Inc. 3,200 74,760 0.00%
Pilot Corp. 2,200 74,529 0.00%Fujitsu General Ltd. 2,800 74,345 0.00%JCR Pharmaceuticals Co., Ltd. 2,200 74,133 0.00%
ADEKA Corp. 3,900 73,263 0.00%Daiichikosho Co., Ltd. 1,900 73,011 0.00%
.Number of
SharesFair Value
US Dollars ($)% of Total
Net AssetsHachijuni Bank Ltd. 22,600 72,897 0.00%Yoshinoya Holdings Co., Ltd. 3,800 72,686 0.00%Kobe Bussan Co., Ltd. 2,300 72,529 0.00%Tokyo Seimitsu Co., Ltd. 1,600 72,511 0.00%Furukawa Electric Co., Ltd. 2,900 72,297 0.00%Japan Elevator Service Holdings Co., Ltd. 3,100 72,116 0.00%
Daiseki Co., Ltd. 1,600 71,934 0.00%Kokuyo Co., Ltd. 4,600 71,907 0.00%Japan Excellent, Inc. REIT 50 71,538 0.00%Fuji Corp. 3,100 70,999 0.00%Takashimaya Co., Ltd. 6,500 70,745 0.00%Infomart Corp. 8,600 70,588 0.00%Aica Kogyo Co., Ltd. 2,000 70,367 0.00%Nippon Suisan Kaisha Ltd. 14,500 69,110 0.00%SMS Co., Ltd. 2,300 68,903 0.00%Daiwabo Holdings Co., Ltd. 4,000 68,727 0.00%Bic Camera, Inc. 6,800 68,558 0.00%JAFCO Group Co., ltd. 1,100 68,484 0.00%GMO internet, Inc. 2,500 68,249 0.00%Wacoal Holdings Corp. 3,000 67,979 0.00%Senko Group Holdings Co., Ltd. 6,900 67,390 0.00%
cocokara fine, Inc. 900 67,303 0.00%AEON Financial Service Co., Ltd. 5,700 67,225 0.00%
Takara Bio, Inc. 2,500 66,785 0.00%As One Corp. 500 65,366 0.00%CKD Corp. 3,100 65,357 0.00%Seven Bank Ltd. 30,400 64,640 0.00%NOK Corp. 5,200 64,561 0.00%H.U. Group Holdings, Inc. 2,500 64,510 0.00%Nissin Sugar Co., Ltd. 4,200 64,330 0.00%Hokuhoku Financial Group, Inc. 8,800 64,301 0.00%
Ryobi Ltd. 4,600 64,281 0.00%OKUMA Corp. 1,300 63,600 0.00%Hirogin Holdings, Inc. 12,000 63,249 0.00%IR Japan Holdings Ltd. 500 63,024 0.00%Kumiai Chemical Industry Co., Ltd. 8,200 62,798 0.00%
Daiwa Office Investment Corp. REIT 9 62,681 0.00%
Nippon Shokubai Co., Ltd. 1,300 62,546 0.00%OSG Corp. 3,600 62,470 0.00%Katitas Co., Ltd. 2,200 61,843 0.00%Systena Corp. 3,200 61,382 0.00%JINS Holdings, Inc. 800 61,339 0.00%Toagosei Co., Ltd. 6,000 61,033 0.00%Fuji Soft, Inc. 1,200 60,222 0.00%Fujitec Co., Ltd. 2,700 59,941 0.00%BeNext-Yumeshin Group Co. 5,200 59,735 0.00%
Sakata Seed Corp. 1,800 59,195 0.00%Fuji Seal International, Inc. 2,800 58,755 0.00%One, Inc. REIT 20 58,294 0.00%Kotobuki Spirits Co., Ltd. 900 58,221 0.00%Samty Residential Investment Corp. REIT 51 58,127 0.00%
Daio Paper Corp. 3,500 57,992 0.00%ABC-Mart, Inc. 1,000 57,393 0.00%Yaoko Co., Ltd. 1,000 57,393 0.00%Calbee, Inc. 2,400 55,400 0.00%DCM Holdings Co., Ltd. 5,800 55,288 0.00%Oisix ra daichi, Inc. 1,500 55,140 0.00%Dexerials Corp. 2,600 54,909 0.00%Fuji Oil Holdings, Inc. 2,300 54,770 0.00%Nippo Corp. 1,900 54,181 0.00%KOMEDA Holdings Co., Ltd. 2,900 54,086 0.00%Tokuyama Corp. 2,600 52,989 0.00%Mixi, Inc. 2,000 52,798 0.00%Monex Group, Inc. 7,800 52,567 0.00%

45
Vanguard ESG Developed World All Cap Equity Index Fund
.Number of
SharesFair Value
US Dollars ($)% of Total
Net AssetsInvesco Office J-Reit, Inc. REIT 257 52,539 0.00%
Elecom Co., Ltd. 2,800 52,524 0.00%Earth Corp. 900 52,302 0.00%Kureha Corp. 900 52,140 0.00%Toyobo Co., Ltd. 4,300 51,643 0.00%RENOVA, Inc. 1,300 51,243 0.00%Morinaga & Co., Ltd. 1,600 51,176 0.00%Nishio Rent All Co., Ltd. 1,800 50,275 0.00%Ichigo Office Investment REIT 56 49,850 0.00%
Hitachi Transport System Ltd. 1,200 49,788 0.00%
Mori Trust Sogo, Inc. REIT 35 49,540 0.00%NSD Co., Ltd. 2,900 48,494 0.00%Nishi-Nippon Financial Holdings, Inc. 8,500 48,401 0.00%
Kyushu Financial Group, Inc. 13,500 47,680 0.00%Pharma Foods International Co., Ltd. 1,900 47,641 0.00%
Chudenko Corp. 2,300 47,268 0.00%Tokai Tokyo Financial Holdings, Inc. 13,200 46,858 0.00%
Koa Corp. 3,000 46,842 0.00%Nitto Boseki Co., Ltd. 1,500 46,356 0.00%Hanwa Co., Ltd. 1,600 46,274 0.00%Shochiku Co., Ltd. 400 46,166 0.00%Takuma Co., Ltd. 3,000 45,382 0.00%Maeda Road Construction Co., Ltd. 2,300 45,217 0.00%
Oki Electric Industry Co., Ltd. 4,900 44,943 0.00%
Musashi Seimitsu Industry Co., Ltd. 2,000 44,581 0.00%
Fukuoka Corp. REIT 26 43,806 0.00%HI-LEX CORP 2,900 43,504 0.00%Intage Holdings, Inc. 3,100 43,320 0.00%Kenedix Retail Corp. REIT 16 43,319 0.00%Mitsui-Soko Holdings Co., Ltd. 1,900 43,242 0.00%
Star Asia Investment Corp. REIT 76 42,591 0.00%
Tsubaki Nakashima Co., Ltd. 2,700 41,550 0.00%Nippon Sheet Glass Co., Ltd. 7,200 41,193 0.00%
Mirai Corp. REIT 88 41,150 0.00%Heiwa Real Estate, Inc. REIT 26 40,995 0.00%
Asahi Holdings, Inc. 2,000 40,833 0.00%Nisshinbo Holdings, Inc. 4,700 40,610 0.00%Global One Corp. REIT 36 40,609 0.00%Hankyu Hanshin, Inc. REIT Class A 28 40,591 0.00%
Mitsui High-Tec, Inc. 700 40,301 0.00%Sanken Electric Co., Ltd. 800 39,859 0.00%NEC Networks & System Integration Corp. 2,500 39,531 0.00%
Toyo Construction Co., Ltd. 7,700 39,336 0.00%Maeda Corp. 4,500 39,044 0.00%Sinko Industries Ltd. 2,300 38,855 0.00%NTN Corp. 14,800 38,670 0.00%Gunma Bank Ltd. 12,200 38,472 0.00%S-Pool, Inc. 4,200 37,879 0.00%St Marc Holdings Co., Ltd. 2,600 37,340 0.00%Chugoku Bank Ltd. 4,900 37,261 0.00%Fukuyama Transporting Co., Ltd. 1,000 37,166 0.00%
Sumitomo Densetsu Co., Ltd. 1,800 37,074 0.00%
Hoshino Resorts, Inc. REIT 6 36,490 0.00%Yodogawa Steel Works Ltd. 1,800 36,311 0.00%Descente Ltd. 1,300 36,251 0.00%
.Number of
SharesFair Value
US Dollars ($)% of Total
Net AssetsTri Chemical Laboratories, Inc. 1,200 35,571 0.00%
Rorze Corp. 400 35,246 0.00%Zenrin Co., Ltd. 3,400 34,891 0.00%Aeon Hokkaido Corp. 3,300 33,687 0.00%Kura Sushi, Inc. 800 33,517 0.00%Tadano Ltd. 3,200 33,444 0.00%Nissha Co., Ltd. 2,200 33,122 0.00%Information Services International-Dentsu Ltd. 800 33,012 0.00%
Resorttrust, Inc. 2,000 32,688 0.00%Poletowin Pitcrew Holdings, Inc. 3,300 32,408 0.00%
Yukiguni Maitake Co., Ltd. 2,100 31,957 0.00%Fuyo General Lease Co., Ltd. 500 31,624 0.00%
Komori Corp. 4,300 31,497 0.00%Shoei Co., Ltd. 800 30,237 0.00%FAN Communications, Inc. 8,400 29,970 0.00%Yamato Kogyo Co., Ltd. 900 29,800 0.00%Okamura Corp. 2,200 29,792 0.00%Raksul, Inc. 600 29,354 0.00%Tamura Corp. 3,900 29,270 0.00%eRex Co., Ltd. 1,200 29,213 0.00%UT Group Co., Ltd. 1,000 29,192 0.00%Daiho Corp. 800 29,012 0.00%Macnica Fuji Electronics Holdings, Inc. 1,200 28,878 0.00%
Fuji Kyuko Co., Ltd. 600 28,759 0.00%Megachips Corp. 1,000 28,696 0.00%Nishimatsuya Chain Co., Ltd. 2,100 28,513 0.00%
Maeda Kosen Co., Ltd. 900 28,300 0.00%Curves Holdings Co., Ltd. 3,400 28,091 0.00%MCJ Co., Ltd. 2,500 27,908 0.00%MedPeer, Inc. 700 27,782 0.00%Tsugami Corp. 1,800 27,716 0.00%Sanyo Denki Co., Ltd. 400 27,678 0.00%Seiren Co., Ltd. 1,400 27,675 0.00%Retail Partners Co., Ltd. 2,600 27,478 0.00%Takeuchi Manufacturing Co., Ltd. 1,100 27,423 0.00%
Kisoji Co., Ltd. 1,300 27,408 0.00%Fujimi, Inc. 600 27,354 0.00%KYB Corp. 800 27,102 0.00%Japan Securities Finance Co., Ltd. 3,700 27,036 0.00%
Nichicon Corp. 2,500 26,917 0.00%Shiga Bank Ltd. 1,500 26,246 0.00%EPS Holdings, Inc. 1,600 25,919 0.00%GungHo Online Entertainment, Inc. 1,300 25,897 0.00%
Nippon Light Metal Holdings Co., Ltd. 1,530 25,778 0.00%
Ai Holdings Corp. 1,300 25,651 0.00%Aiful Corp. 7,400 25,536 0.00%Nextage Co., Ltd. 1,500 25,435 0.00%Kintetsu World Express, Inc. 1,200 25,278 0.00%77 Bank Ltd. 2,300 25,240 0.00%UACJ Corp. 1,000 25,074 0.00%Daihen Corp. 600 25,002 0.00%Infocom Corp. 900 24,854 0.00%Ariake Japan Co., Ltd. 400 24,831 0.00%Wacom Co., Ltd. 3,900 24,808 0.00%Sanrio Co., Ltd. 1,400 24,799 0.00%M&A Capital Partners Co., Ltd. 500 24,417 0.00%
Fujibo Holdings, Inc. 700 24,408 0.00%TKC Corp. 800 24,254 0.00%Kaga Electronics Co., Ltd. 900 24,148 0.00%Iriso Electronics Co., Ltd. 500 24,146 0.00%Fukushima Galilei Co., Ltd. 600 24,137 0.00%

46
Vanguard ESG Developed World All Cap Equity Index Fund
.Number of
SharesFair Value
US Dollars ($)% of Total
Net AssetsKohnan Shoji Co., Ltd. 700 24,092 0.00%YAMABIKO Corp. 2,200 24,083 0.00%S Foods, Inc. 800 23,714 0.00%Nippon Ceramic Co., Ltd. 900 23,686 0.00%Okumura Corp. 900 23,686 0.00%Citizen Watch Co., Ltd. 6,400 23,642 0.00%Micronics Japan Co., Ltd. 1,700 23,588 0.00%Mitsui DM Sugar Holdings Co., Ltd. 1,400 23,550 0.00%
Noritsu Koki Co., Ltd. 1,100 23,548 0.00%Noritz Corp. 1,400 23,436 0.00%Jaccs Co., Ltd. 1,000 23,426 0.00%Optex Group Co., Ltd. 1,400 23,411 0.00%Colowide Co., Ltd. 1,300 23,203 0.00%OBIC Business Consultants Co., Ltd. 400 23,137 0.00%
Inabata & Co., Ltd. 1,500 23,124 0.00%Starts Corp., Inc. 900 23,053 0.00%Siix Corp. 1,800 23,045 0.00%SAMTY Co., Ltd. 1,200 23,040 0.00%Tokyo Steel Manufacturing Co., Ltd. 2,300 22,961 0.00%
Star Micronics Co., Ltd. 1,500 22,853 0.00%Tsubakimoto Chain Co. 800 22,849 0.00%Duskin Co., Ltd. 1,000 22,831 0.00%TOKAI Holdings Corp. 2,800 22,831 0.00%Daibiru Corp. 1,800 22,737 0.00%Japan Cash Machine Co., Ltd. 4,500 22,705 0.00%
Milbon Co., Ltd. 400 22,633 0.00%Eizo Corp. 500 22,367 0.00%Aida Engineering Ltd. 2,500 22,277 0.00%Nojima Corp. 900 22,267 0.00%euglena Co., Ltd. 2,700 22,234 0.00%Transcosmos, Inc. 800 22,128 0.00%Toridoll Holdings Corp. 1,300 22,067 0.00%Bell System24 Holdings, Inc. 1,400 22,049 0.00%
Plenus Co., Ltd. 1,200 22,002 0.00%Tokyu Construction Co., Ltd. 3,100 21,981 0.00%Bunka Shutter Co., Ltd. 2,200 21,962 0.00%Hokuetsu Corp. 4,200 21,834 0.00%Gree, Inc. 4,100 21,721 0.00%HIS Co., Ltd. 1,000 21,687 0.00%Dip Corp. 700 21,664 0.00%Sumitomo Warehouse Co., Ltd. 1,500 21,583 0.00%
Trancom Co., Ltd. 300 21,542 0.00%Change, Inc. 800 21,515 0.00%DTS Corp. 900 21,448 0.00%Hosokawa Micron Corp. 400 21,443 0.00%Kyokuto Kaihatsu Kogyo Co., Ltd. 1,500 21,313 0.00%
Yellow Hat Ltd. 1,200 21,278 0.00%Japan Aviation Electronics Industry Ltd. 1,200 21,224 0.00%
eGuarantee, Inc. 1,000 21,164 0.00%Raito Kogyo Co., Ltd. 1,300 21,153 0.00%Maruzen Showa Unyu Co., Ltd. 700 21,065 0.00%
Nitta Corp. 900 21,059 0.00%KH Neochem Co., Ltd. 900 20,929 0.00%Taikisha Ltd. 700 20,907 0.00%Nippon Road Co., Ltd. 300 20,840 0.00%Gunze Ltd. 500 20,835 0.00%Idec Corp. 1,100 20,823 0.00%Okasan Securities Group, Inc. 5,500 20,614 0.00%
Obara Group, Inc. 600 20,596 0.00%EDION Corp. 2,100 20,529 0.00%BML, Inc. 600 20,488 0.00%ValueCommerce Co., Ltd. 700 20,434 0.00%
.Number of
SharesFair Value
US Dollars ($)% of Total
Net AssetsValor Holdings Co., Ltd. 1,000 20,398 0.00%Nichiha Corp. 800 20,348 0.00%Noevir Holdings Co., Ltd. 400 20,326 0.00%Solasto Corp. 1,600 20,268 0.00%Nissin Electric Co., Ltd. 1,600 20,225 0.00%Tocalo Co., Ltd. 1,600 20,225 0.00%North Pacific Bank Ltd. 9,500 20,200 0.00%Makino Milling Machine Co., Ltd. 500 20,182 0.00%
Maruwa Co., Ltd. 200 20,164 0.00%Maxell Holdings Ltd. 1,800 20,142 0.00%Adastria Co., Ltd. 1,100 20,119 0.00%Topre Corp. 1,400 20,068 0.00%Shikoku Chemicals Corp. 1,700 20,065 0.00%Heiwado Co., Ltd. 1,000 19,984 0.00%Ichigo, Inc. 6,300 19,980 0.00%Autobacs Seven Co., Ltd. 1,500 19,975 0.00%Seiko Holdings Corp. 1,000 19,975 0.00%Itoham Yonekyu Holdings, Inc. 3,100 19,970 0.00%
T Hasegawa Co., Ltd. 900 19,948 0.00%TechMatrix Corp. 1,200 19,904 0.00%Daikyonishikawa Corp. 3,200 19,894 0.00%Gecoss Corp. 2,500 19,777 0.00%Create Restaurants Holdings, Inc. 2,400 19,721 0.00%
Nippon Steel Trading Corp. 500 19,686 0.00%Mochida Pharmaceutical Co., Ltd. 600 19,677 0.00%
Sato Holdings Corp. 800 19,634 0.00%Orient Corp. 14,900 19,600 0.00%Arcs Co., Ltd. 900 19,591 0.00%Shibuya Corp. 700 19,583 0.00%Kyoritsu Maintenance Co., Ltd. 600 19,569 0.00%
Musashino Bank Ltd. 1,300 19,560 0.00%Sangetsu Corp. 1,400 19,526 0.00%Aoyama Trading Co., Ltd. 2,800 19,501 0.00%Sanyo Chemical Industries Ltd. 400 19,497 0.00%
Towa Pharmaceutical Co., Ltd. 800 19,490 0.00%
Hiday Hidaka Corp. 1,200 19,483 0.00%Japan Lifeline Co., Ltd. 1,600 19,476 0.00%Kiyo Bank Ltd. 1,500 19,421 0.00%Pacific Industrial Co., Ltd. 1,800 19,413 0.00%Joshin Denki Co., Ltd. 800 19,389 0.00%Fuji Co., Ltd. 1,100 19,386 0.00%United Arrows Ltd. 1,000 19,380 0.00%Eiken Chemical Co., Ltd. 1,000 19,362 0.00%JCU Corp. 600 19,353 0.00%Tokai Rika Co., Ltd. 1,200 19,256 0.00%V Technology Co., Ltd. 400 19,245 0.00%Saizeriya Co., Ltd. 800 19,209 0.00%Central Glass Co., Ltd. 1,000 19,173 0.00%Mizuno Corp. 900 19,153 0.00%Maruha Nichiro Corp. 900 19,145 0.00%Life Corp. 600 19,056 0.00%Megmilk Snow Brand Co., Ltd. 1,000 19,047 0.00%
Noritake Co., Ltd. 500 19,011 0.00%Yokogawa Bridge Holdings Corp. 1,000 18,966 0.00%
Prima Meat Packers Ltd. 700 18,952 0.00%Taiyo Holdings Co., Ltd. 400 18,921 0.00%Komeri Co., Ltd. 800 18,870 0.00%Tomy Co., Ltd. 2,200 18,870 0.00%YA-MAN Ltd. 1,400 18,845 0.00%Aeon Delight Co., Ltd. 600 18,840 0.00%Shima Seiki Manufacturing Ltd. 1,100 18,821 0.00%
Ricoh Leasing Co., Ltd. 600 18,623 0.00%

47
Vanguard ESG Developed World All Cap Equity Index Fund
.Number of
SharesFair Value
US Dollars ($)% of Total
Net AssetsSan-Ai Oil Co., Ltd. 1,600 18,539 0.00%Toppan Forms Co., Ltd. 1,900 18,522 0.00%Belluna Co., Ltd. 2,100 18,485 0.00%Fuso Chemical Co., Ltd. 500 18,470 0.00%Elan Corp. 1,600 18,467 0.00%Kanamoto Co., Ltd. 800 18,438 0.00%Ichibanya Co., Ltd. 400 18,344 0.00%Relia, Inc. 1,500 18,339 0.00%Joyful Honda Co., Ltd. 1,500 18,299 0.00%Fujimori Kogyo Co., Ltd. 500 18,290 0.00%Token Corp. 200 18,290 0.00%Kyokuyo Co., Ltd. 700 18,258 0.00%Oiles Corp. 1,300 18,131 0.00%Future Corp. 1,000 18,128 0.00%Nomura Co., Ltd. 2,100 18,069 0.00%Vital KSK Holdings, Inc. 2,800 18,063 0.00%Max Co., Ltd. 1,100 18,057 0.00%Hibiya Engineering Ltd. 1,100 17,998 0.00%DyDo Group Holdings, Inc. 400 17,984 0.00%Hosiden Corp. 2,000 17,930 0.00%Hirata Corp. 300 17,893 0.00%Kanto Denka Kogyo Co., Ltd. 2,000 17,857 0.00%
Bank of Nagoya Ltd. 800 17,839 0.00%Create SD Holdings Co., Ltd. 600 17,839 0.00%
Paramount Bed Holdings Co., Ltd. 1,000 17,830 0.00%
KFC Holdings Japan Ltd. 700 17,823 0.00%Fuji Media Holdings, Inc. 1,600 17,789 0.00%Nissei ASB Machine Co., Ltd. 400 17,785 0.00%
Mitsubishi Shokuhin Co., Ltd. 700 17,716 0.00%
Shibaura Machine Co., Ltd. 800 17,681 0.00%Royal Holdings Co., Ltd. 900 17,637 0.00%Okuwa Co., Ltd. 1,800 17,629 0.00%Nachi-Fujikoshi Corp. 500 17,614 0.00%United Super Markets Holdings, Inc. 1,800 17,596 0.00%
San-In Godo Bank Ltd. 3,600 17,483 0.00%TV Asahi Holdings Corp. 1,100 17,453 0.00%Konishi Co., Ltd. 1,200 17,450 0.00%Nippon Soda Co., Ltd. 600 17,380 0.00%Hamakyorex Co., Ltd. 600 17,245 0.00%Yamazen Corp. 1,900 17,119 0.00%Comture Corp. 800 17,090 0.00%Nippon Seiki Co., Ltd. 1,600 17,083 0.00%Yondoshi Holdings, Inc. 1,000 17,074 0.00%H2O Retailing Corp. 2,100 17,047 0.00%Japan Material Co., Ltd. 1,400 17,041 0.00%Shizuoka Gas Co., Ltd. 1,900 17,033 0.00%Sintokogio Ltd. 2,300 17,013 0.00%Chugoku Marine Paints Ltd. 2,200 17,007 0.00%Kitz Corp. 2,500 17,006 0.00%Cybozu, Inc. 800 17,003 0.00%Nohmi Bosai Ltd. 900 16,996 0.00%Restar Holdings Corp. 1,000 16,993 0.00%ZERIA Pharmaceutical Co., Ltd. 900 16,988 0.00%
Doutor Nichires Holdings Co., Ltd. 1,100 16,987 0.00%
Shoei Foods Corp. 500 16,916 0.00%TBS Holdings, Inc. 1,100 16,908 0.00%Axial Retailing, Inc. 500 16,893 0.00%Nagaileben Co., Ltd. 700 16,871 0.00%Mitsubishi Pencil Co., Ltd. 1,300 16,843 0.00%Organo Corp. 300 16,839 0.00%Mandom Corp. 900 16,785 0.00%Matsui Securities Co., Ltd. 2,300 16,785 0.00%Aruhi Corp. 1,300 16,773 0.00%Tonami Holdings Co., Ltd. 400 16,758 0.00%
.Number of
SharesFair Value
US Dollars ($)% of Total
Net AssetsNippon Koei Co., Ltd. 600 16,677 0.00%Wakita & Co., Ltd. 1,800 16,607 0.00%Sumitomo Mitsui Construction Co., Ltd. 3,900 16,585 0.00%
Japan Wool Textile Co., Ltd. 1,900 16,554 0.00%Nitto Kogyo Corp. 1,000 16,425 0.00%Zojirushi Corp. 1,100 16,412 0.00%MOS Food Services, Inc. 600 16,407 0.00%Arcland Sakamoto Co., Ltd. 1,200 16,401 0.00%Ryoyo Electro Corp. 700 16,385 0.00%Nippon Yakin Kogyo Co., Ltd. 800 16,362 0.00%
Giken Ltd. 400 16,326 0.00%Awa Bank Ltd. 900 16,299 0.00%LEC, Inc. 1,600 16,290 0.00%Yuasa Trading Co., Ltd. 600 16,272 0.00%Hyakugo Bank Ltd. 5,900 16,266 0.00%Kanematsu Electronics Ltd. 500 16,173 0.00%Showa Sangyo Co., Ltd. 600 16,153 0.00%Exedy Corp. 1,100 16,145 0.00%SKY Perfect JSAT Holdings, Inc. 4,400 16,055 0.00%
FCC Co., Ltd. 1,100 16,036 0.00%Anicom Holdings, Inc. 2,000 16,019 0.00%Onoken Co., Ltd. 1,400 16,007 0.00%Yokowo Co., Ltd. 700 16,007 0.00%Strike Co., Ltd. 400 15,983 0.00%Kameda Seika Co., Ltd. 400 15,965 0.00%Mitsuuroko Group Holdings Co., Ltd. 1,500 15,961 0.00%
Toyo Ink SC Holdings Co., Ltd. 900 15,958 0.00%
Japan Pulp & Paper Co., Ltd. 500 15,902 0.00%
Yokohama Reito Co., Ltd. 2,000 15,893 0.00%Juroku Bank Ltd. 900 15,861 0.00%Morita Holdings Corp. 1,100 15,847 0.00%Onward Holdings Co., Ltd. 5,200 15,742 0.00%Computer Engineering & Consulting Ltd. 1,100 15,709 0.00%
Tsurumi Manufacturing Co., Ltd. 1,000 15,632 0.00%
ASKUL Corp. 1,000 15,605 0.00%Seikagaku Corp. 1,600 15,583 0.00%Mitsubishi Logisnext Co., Ltd. 1,700 15,577 0.00%
Sakai Moving Service Co., Ltd. 300 15,569 0.00%
SMK Corp. 700 15,546 0.00%Arata Corp. 400 15,533 0.00%Tokushu Tokai Paper Co., Ltd. 400 15,461 0.00%
Hogy Medical Co., Ltd. 500 15,384 0.00%Broadleaf Co., Ltd. 3,300 15,372 0.00%Saibu Gas Holdings Co., Ltd. 700 15,351 0.00%
Tokai Corp. 700 15,338 0.00%Osaka Soda Co., Ltd. 700 15,319 0.00%Kato Sangyo Co., Ltd. 500 15,249 0.00%Digital Arts, Inc. 200 15,245 0.00%San-A Co., Ltd. 400 15,209 0.00%Sekisui Jushi Corp. 800 15,209 0.00%METAWATER Co., Ltd. 800 15,201 0.00%Funai Soken Holdings, Inc. 700 15,187 0.00%Daito Pharmaceutical Co., Ltd. 500 15,182 0.00%
Piolax, Inc. 1,100 15,144 0.00%Ohsho Food Service Corp. 300 15,136 0.00%Nippon Carbon Co., Ltd. 400 15,100 0.00%Teikoku Sen-I Co., Ltd. 800 15,079 0.00%Takara Standard Co., Ltd. 1,100 15,064 0.00%Senshu Ikeda Holdings, Inc. 10,500 15,042 0.00%Ogaki Kyoritsu Bank Ltd. 900 15,034 0.00%

48
Vanguard ESG Developed World All Cap Equity Index Fund
.Number of
SharesFair Value
US Dollars ($)% of Total
Net AssetsArgo Graphics, Inc. 500 15,024 0.00%SBS Holdings, Inc. 500 15,001 0.00%Unipres Corp. 1,800 14,807 0.00%Aomori Bank Ltd. 800 14,798 0.00%Okamoto Industries, Inc. 400 14,740 0.00%Keihanshin Building Co., Ltd. 1,200 14,726 0.00%
KYORIN Holdings, Inc. 900 14,693 0.00%Atom Corp. 2,100 14,645 0.00%Furukawa Co., Ltd. 1,300 14,641 0.00%San ju San Financial Group, Inc. 1,200 14,596 0.00%
Inageya Co., Ltd. 1,100 14,589 0.00%Tsukishima Kikai Co., Ltd. 1,400 14,581 0.00%Takamatsu Construction Group Co., Ltd. 800 14,574 0.00%
Belc Co., Ltd. 300 14,488 0.00%Chofu Seisakusho Co., Ltd. 800 14,416 0.00%Geo Holdings Corp. 1,300 14,407 0.00%Riken Keiki Co., Ltd. 600 14,353 0.00%Miyazaki Bank Ltd. 800 14,272 0.00%Maruwa Unyu Kikan Co., Ltd. 1,000 14,227 0.00%
COLOPL, Inc. 1,900 14,157 0.00%T-Gaia Corp. 800 14,077 0.00%Nippon Signal Co., Ltd. 1,700 14,030 0.00%TOMONY Holdings, Inc. 5,300 13,991 0.00%DKK Co., Ltd. 700 13,976 0.00%Toho Bank Ltd. 7,600 13,969 0.00%Nisshin Oillio Group Ltd. 500 13,830 0.00%Shinmaywa Industries Ltd. 1,600 13,825 0.00%Dai-Dan Co., Ltd. 600 13,796 0.00%Shikoku Bank Ltd. 2,200 13,796 0.00%Marudai Food Co., Ltd. 900 13,744 0.00%Sanyo Electric Railway Co., Ltd. 800 13,652 0.00%
Kissei Pharmaceutical Co., Ltd. 700 13,579 0.00%
J-Oil Mills, Inc. 800 13,544 0.00%Monogatari Corp. 200 13,461 0.00%Pressance Corp. 1,000 13,461 0.00%Fukui Bank Ltd. 1,100 13,370 0.00%Bank of Okinawa Ltd. 600 13,363 0.00%Yamashin-Filter Corp. 2,100 13,358 0.00%Prestige International, Inc. 2,100 13,301 0.00%Uchida Yoko Co., Ltd. 300 13,298 0.00%Nanto Bank Ltd. 800 13,241 0.00%Torii Pharmaceutical Co., Ltd. 600 13,142 0.00%
Okinawa Electric Power Co., Inc. 1,050 13,103 0.00%
ARTERIA Networks Corp. 800 13,017 0.00%Nippon Densetsu Kogyo Co., Ltd. 800 13,010 0.00%
Icom, Inc. 600 12,947 0.00%Nissan Shatai Co., Ltd. 2,000 12,920 0.00%Keiyo Bank Ltd. 3,500 12,834 0.00%Ryosan Co., Ltd. 700 12,734 0.00%Futaba Corp. 1,800 12,601 0.00%Doshisha Co., Ltd. 800 12,462 0.00%Mimasu Semiconductor Industry Co., Ltd. 500 12,348 0.00%
Media Do Co., Ltd. 300 12,312 0.00%Optim Corp. 600 12,277 0.00%Iino Kaiun Kaisha Ltd. 3,100 12,234 0.00%TSI Holdings Co., Ltd. 4,100 12,227 0.00%Pack Corp. 500 12,172 0.00%Totetsu Kogyo Co., Ltd. 600 12,152 0.00%Oita Bank Ltd. 800 12,073 0.00%Kurabo Industries Ltd. 700 11,996 0.00%Hokkoku Bank Ltd. 600 11,963 0.00%Hyakujushi Bank Ltd. 900 11,823 0.00%
.Number of
SharesFair Value
US Dollars ($)% of Total
Net AssetsBank of the Ryukyus Ltd. 1,800 11,644 0.00%Chubu Shiryo Co., Ltd. 1,100 11,160 0.00%Aichi Steel Corp. 400 10,992 0.00%Bank of Iwate Ltd. 700 10,722 0.00%TPR Co., Ltd. 800 10,646 0.00%Ehime Bank Ltd. 1,500 10,555 0.00%Yamagata Bank Ltd. 1,400 10,457 0.00%Xebio Holdings Co., Ltd. 1,200 10,455 0.00%Miroku Jyoho Service Co., Ltd. 700 10,059 0.00%
Sakata INX Corp. 1,100 10,020 0.00%JM Holdings Co., Ltd. 500 9,929 0.00%Nichi-iko Pharmaceutical Co., Ltd. 1,200 9,622 0.00%
Taiko Pharmaceutical Co., Ltd. 1,000 9,172 0.00%
Leopalace21 Corp. 7,000 8,767 0.00%Zuken, Inc. 300 8,406 0.00%Fujio Food Group, Inc. 700 7,865 0.00%Riso Kagaku Corp. 400 6,401 0.00%Airport Facilities Co., Ltd. 1,100 5,847 0.00%Cleanup Corp. 1,200 5,828 0.00%Riken Vitamin Co., Ltd. 400 5,608 0.00%Nakayama Steel Works Ltd. 1,500 5,460 0.00%GMO GlobalSign Holdings KK 100 4,239 0.00%
test test 188,919,292 7.44%Netherlands 1.30% (2020: 1.21%)ASML Holding NV 17,970 12,347,375 0.49%Adyen NV 1,317 3,218,151 0.13%ING Groep NV 178,815 2,362,312 0.09%Koninklijke Philips NV 41,581 2,060,703 0.08%Prosus NV 20,074 1,963,261 0.08%Koninklijke DSM NV 7,804 1,456,700 0.06%Koninklijke Ahold Delhaize NV 43,960 1,306,953 0.05%
Wolters Kluwer NV 11,974 1,203,021 0.05%Akzo Nobel NV 8,488 1,048,869 0.04%ASM International NV 2,293 753,237 0.03%NN Group NV 14,494 683,756 0.03%Koninklijke KPN NV 147,133 459,594 0.02%IMCD NV 2,563 407,592 0.02%Randstad NV 4,850 370,979 0.01%Aegon NV 83,085 344,758 0.01%Signify NV 5,354 338,672 0.01%ASR Nederland NV 6,446 249,128 0.01%BE Semiconductor Industries NV 2,814 238,738 0.01%
ABN AMRO Bank NV GDR 18,526 223,918 0.01%InPost SA 10,224 205,222 0.01%Just Eat Takeaway.com NV ADR 9,752 178,071 0.01%
Galapagos NV 2,352 163,115 0.01%Koninklijke Vopak NV 3,465 157,380 0.01%Corbion NV 2,485 142,043 0.01%OCI NV 5,567 135,471 0.01%JDE Peet's NV 3,480 126,284 0.01%APERAM SA 2,217 113,605 0.00%PostNL NV 19,823 107,479 0.00%Boskalis Westminster 2,987 95,854 0.00%TKH Group NV 1,773 89,445 0.00%Basic-Fit NV 1,811 77,445 0.00%GrandVision NV 2,168 72,503 0.00%Flow Traders 1,658 71,335 0.00%Intertrust NV 3,878 69,812 0.00%Alfen Beheer BV 564 52,672 0.00%Accell Group NV 787 42,279 0.00%Eurocommercial Properties NV 1,617 40,231 0.00%
Sligro Food Group NV 1,199 35,192 0.00%Wereldhave NV REIT 1,970 33,571 0.00%Vastned Retail NV REIT 838 24,546 0.00%

49
Vanguard ESG Developed World All Cap Equity Index Fund
.Number of
SharesFair Value
US Dollars ($)% of Total
Net AssetsNSI NV REIT 463 17,872 0.00%TomTom NV 2,112 17,695 0.00%test test 33,106,839 1.30%New Zealand 0.12% (2020: 0.15%)Fisher & Paykel Healthcare Corp., Ltd. 24,909 541,649 0.02%
Spark New Zealand Ltd. 103,401 346,807 0.01%Auckland International Airport Ltd. 54,173 275,194 0.01%
Contact Energy Ltd. 38,811 224,547 0.01%Fletcher Building Ltd. 39,156 205,749 0.01%Meridian Energy Ltd. 54,816 204,153 0.01%Mercury NZ Ltd. 37,888 176,583 0.01%a2 Milk Co., Ltd. 37,834 170,251 0.01%Ryman Healthcare Ltd. 15,724 144,261 0.01%Infratil Ltd. 22,295 119,955 0.01%EBOS Group Ltd. 4,502 101,608 0.01%Goodman Property Trust REIT 53,646 86,403 0.00%
Summerset Group Holdings Ltd. 7,096 66,491 0.00%
Kiwi Property Group Ltd. 80,162 65,255 0.00%Chorus Ltd. 13,906 62,188 0.00%Arvida Group Ltd. 32,482 46,302 0.00%Skellerup Holdings Ltd. 12,396 43,309 0.00%Freightways Ltd. 4,143 36,476 0.00%Heartland Group Holdings Ltd. 21,086 30,499 0.00%
Argosy Property Ltd. 26,236 28,599 0.00%Precinct Properties New Zealand Ltd. 25,252 28,232 0.00%
Kathmandu Holdings Ltd. 24,028 27,031 0.00%Vital Healthcare Property Trust REIT 11,747 25,404 0.00%
Vector Ltd. 7,674 21,717 0.00%Pushpay Holdings Ltd. 17,204 21,638 0.00%Air New Zealand Ltd. 19,378 20,988 0.00%Scales Corp., Ltd. 5,482 18,348 0.00%Synlait Milk Ltd. 3,748 9,533 0.00%test test 3,149,170 0.12%Norway 0.24% (2020: 0.23%)DNB A.S.A 45,797 998,410 0.04%Mowi A.S.A 20,076 510,929 0.02%Telenor A.S.A 28,436 479,485 0.02%Yara International A.S.A 7,862 414,059 0.02%Norsk Hydro A.S.A 62,375 398,234 0.02%TOMRA Systems A.S.A 5,765 318,223 0.01%Storebrand A.S.A 27,398 248,343 0.01%Schibsted A.S.A Class A 4,387 211,876 0.01%Adevinta A.S.A Class B 10,396 199,338 0.01%Nordic Semiconductor A.S.A 7,814 198,138 0.01%Entra A.S.A 7,702 176,144 0.01%Scatec A.S.A 6,297 166,843 0.01%SpareBank 1 SR-Bank A.S.A 12,253 161,898 0.01%Bakkafrost P/F 1,899 156,904 0.01%Gjensidige Forsikring A.S.A 6,754 148,969 0.01%Salmar A.S.A 2,192 145,502 0.01%Borregaard A.S.A 5,627 122,934 0.01%NEL A.S.A 51,654 120,533 0.00%Schibsted A.S.A Class B 2,735 113,974 0.00%Veidekke A.S.A 7,789 104,273 0.00%Leroy Seafood Group A.S.A 11,558 101,380 0.00%Atea A.S.A 4,905 95,419 0.00%Aker A.S.A Class A 1,221 90,101 0.00%Norwegian Finans Holding A.S.A 6,777 76,353 0.00%
SpareBank 1 SMN 4,292 59,453 0.00%Norway Royal Salmon A.S.A 2,457 49,224 0.00%Sbanken A.S.A 3,127 38,955 0.00%Crayon Group Holding A.S.A 2,519 36,855 0.00%Elkem A.S.A 9,562 34,802 0.00%Hexagon Composites A.S.A 6,361 27,572 0.00%
.Number of
SharesFair Value
US Dollars ($)% of Total
Net AssetsAustevoll Seafood A.S.A 2,192 27,205 0.00%BW LPG Ltd. 4,113 26,575 0.00%Frontline Ltd. 2,195 19,825 0.00%Grieg Seafood A.S.A 1,816 18,719 0.00%test test 6,097,447 0.24%Poland 0.10% (2020: 0.08%)Powszechna Kasa Oszczednosci Bank Polski SA 36,631 364,001 0.02%
Allegro.eu SA 18,695 322,240 0.01%KGHM Polska Miedz SA 5,823 287,020 0.01%Powszechny Zaklad Ubezpieczen SA 28,158 271,447 0.01%
LPP SA 53 179,173 0.01%Bank Polska Kasa Opieki SA 7,275 177,719 0.01%CD Projekt SA 3,378 164,171 0.01%Dino Polska SA 2,056 151,162 0.01%Santander Bank Polska SA 1,861 124,360 0.01%Cyfrowy Polsat SA 12,267 96,473 0.00%Alior Bank SA 5,366 46,979 0.00%KRUK SA 608 40,118 0.00%Eurocash SA 9,640 35,982 0.00%CCC SA 1,191 35,148 0.00%Bank Millennium SA 25,974 31,794 0.00%Orange Polska SA 17,553 30,961 0.00%Asseco Poland SA 1,456 29,506 0.00%Kernel Holding SA 1,843 26,481 0.00%mBank SA 283 24,159 0.00%AmRest Holdings SE 2,840 19,291 0.00%test test 2,458,185 0.10%Portugal 0.03% (2020: 0.03%)EDP Renovaveis SA 12,871 298,253 0.01%Jeronimo Martins SGPS SA 11,635 212,212 0.01%Banco Comercial Portugues SA Class R 511,513 81,891 0.01%
CTT-Correios de Portugal SA 7,510 42,927 0.00%Altri SGPS SA 6,444 40,044 0.00%REN - Redes Energeticas Nacionais SGPS SA 9,054 25,125 0.00%
Navigator Co., SA 6,888 23,542 0.00%Sonae SGPS SA 22,829 21,658 0.00%Corticeira Amorim SGPS SA 1,649 20,729 0.00%NOS SGPS SA 5,232 18,341 0.00%Banco Espirito Santo SA 66,429 1 0.00%test test 784,723 0.03%Singapore 0.39% (2020: 0.40%)DBS Group Holdings Ltd. 81,100 1,798,535 0.07%Oversea-Chinese Banking Corp., Ltd. 157,885 1,403,605 0.06%
United Overseas Bank Ltd. 61,900 1,189,003 0.05%Singapore Telecommunications Ltd. 331,000 563,897 0.02%
CapitaLand Ltd. 129,500 357,421 0.02%CapitaLand Integrated Commercial Trust REIT 200,696 312,048 0.01%
Ascendas REIT 140,655 308,683 0.01%Wilmar International Ltd. 88,690 296,909 0.01%Singapore Exchange Ltd. 35,200 292,766 0.01%Mapletree Logistics Trust REIT 140,480 214,242 0.01%
UOL Group Ltd. 39,000 211,799 0.01%Mapletree Industrial Trust REIT 98,285 206,923 0.01%
Singapore Airlines Ltd. 56,960 205,517 0.01%Mapletree Commercial Trust REIT 104,100 167,279 0.01%
Frasers Logistics & Commercial Trust REIT 148,500 159,083 0.01%
Keppel DC REIT 80,400 148,933 0.01%Venture Corp., Ltd. 9,300 132,907 0.01%Parkway Life REIT 36,700 125,318 0.01%Haw Par Corp., Ltd. 10,500 107,015 0.01%
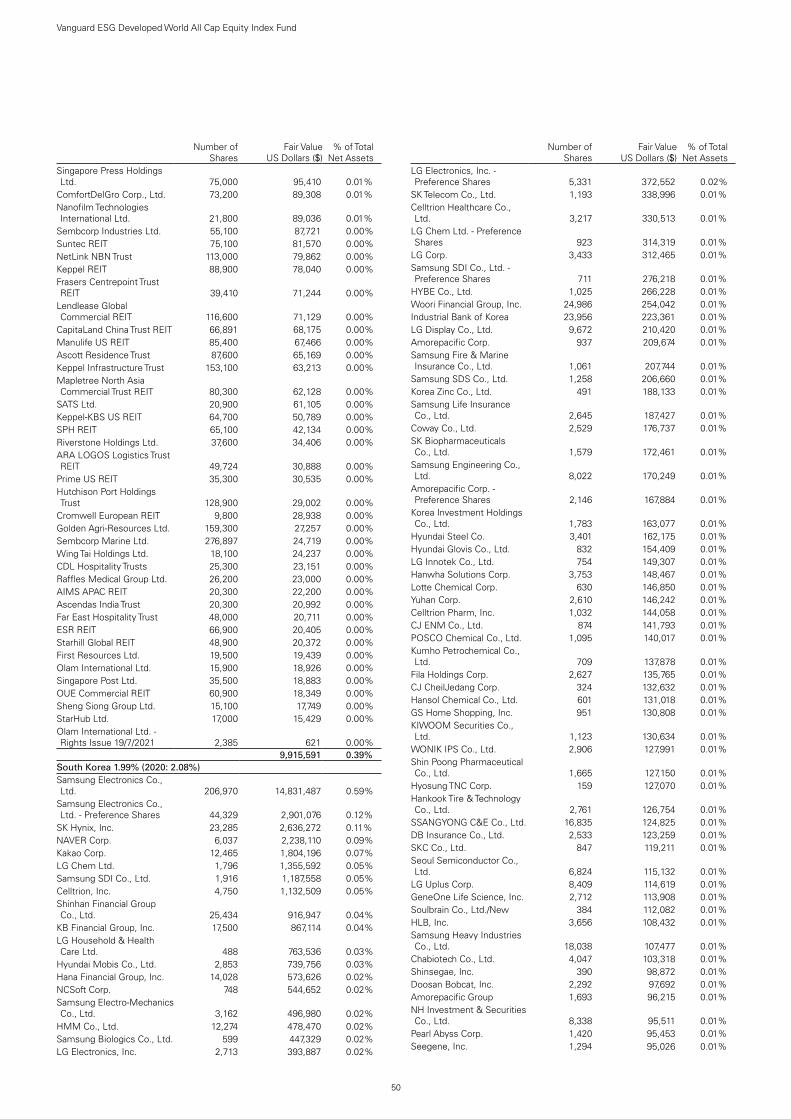
50
Vanguard ESG Developed World All Cap Equity Index Fund
.Number of
SharesFair Value
US Dollars ($)% of Total
Net AssetsSingapore Press Holdings Ltd. 75,000 95,410 0.01%
ComfortDelGro Corp., Ltd. 73,200 89,308 0.01%Nanofilm Technologies International Ltd. 21,800 89,036 0.01%
Sembcorp Industries Ltd. 55,100 87,721 0.00%Suntec REIT 75,100 81,570 0.00%NetLink NBN Trust 113,000 79,862 0.00%Keppel REIT 88,900 78,040 0.00%Frasers Centrepoint Trust REIT 39,410 71,244 0.00%
Lendlease Global Commercial REIT 116,600 71,129 0.00%
CapitaLand China Trust REIT 66,891 68,175 0.00%Manulife US REIT 85,400 67,466 0.00%Ascott Residence Trust 87,600 65,169 0.00%Keppel Infrastructure Trust 153,100 63,213 0.00%Mapletree North Asia Commercial Trust REIT 80,300 62,128 0.00%
SATS Ltd. 20,900 61,105 0.00%Keppel-KBS US REIT 64,700 50,789 0.00%SPH REIT 65,100 42,134 0.00%Riverstone Holdings Ltd. 37,600 34,406 0.00%ARA LOGOS Logistics Trust REIT 49,724 30,888 0.00%
Prime US REIT 35,300 30,535 0.00%Hutchison Port Holdings Trust 128,900 29,002 0.00%
Cromwell European REIT 9,800 28,938 0.00%Golden Agri-Resources Ltd. 159,300 27,257 0.00%Sembcorp Marine Ltd. 276,897 24,719 0.00%Wing Tai Holdings Ltd. 18,100 24,237 0.00%CDL Hospitality Trusts 25,300 23,151 0.00%Raffles Medical Group Ltd. 26,200 23,000 0.00%AIMS APAC REIT 20,300 22,200 0.00%Ascendas India Trust 20,300 20,992 0.00%Far East Hospitality Trust 48,000 20,711 0.00%ESR REIT 66,900 20,405 0.00%Starhill Global REIT 48,900 20,372 0.00%First Resources Ltd. 19,500 19,439 0.00%Olam International Ltd. 15,900 18,926 0.00%Singapore Post Ltd. 35,500 18,883 0.00%OUE Commercial REIT 60,900 18,349 0.00%Sheng Siong Group Ltd. 15,100 17,749 0.00%StarHub Ltd. 17,000 15,429 0.00%Olam International Ltd. - Rights Issue 19/7/2021 2,385 621 0.00%
test test 9,915,591 0.39%South Korea 1.99% (2020: 2.08%)Samsung Electronics Co., Ltd. 206,970 14,831,487 0.59%
Samsung Electronics Co., Ltd. - Preference Shares 44,329 2,901,076 0.12%
SK Hynix, Inc. 23,285 2,636,272 0.11%NAVER Corp. 6,037 2,238,110 0.09%Kakao Corp. 12,465 1,804,196 0.07%LG Chem Ltd. 1,796 1,355,592 0.05%Samsung SDI Co., Ltd. 1,916 1,187,558 0.05%Celltrion, Inc. 4,750 1,132,509 0.05%Shinhan Financial Group Co., Ltd. 25,434 916,947 0.04%
KB Financial Group, Inc. 17,500 867,114 0.04%LG Household & Health Care Ltd. 488 763,536 0.03%
Hyundai Mobis Co., Ltd. 2,853 739,756 0.03%Hana Financial Group, Inc. 14,028 573,626 0.02%NCSoft Corp. 748 544,652 0.02%Samsung Electro-Mechanics Co., Ltd. 3,162 496,980 0.02%
HMM Co., Ltd. 12,274 478,470 0.02%Samsung Biologics Co., Ltd. 599 447,329 0.02%LG Electronics, Inc. 2,713 393,887 0.02%
.Number of
SharesFair Value
US Dollars ($)% of Total
Net AssetsLG Electronics, Inc. - Preference Shares 5,331 372,552 0.02%
SK Telecom Co., Ltd. 1,193 338,996 0.01%Celltrion Healthcare Co., Ltd. 3,217 330,513 0.01%
LG Chem Ltd. - Preference Shares 923 314,319 0.01%
LG Corp. 3,433 312,465 0.01%Samsung SDI Co., Ltd. - Preference Shares 711 276,218 0.01%
HYBE Co., Ltd. 1,025 266,228 0.01%Woori Financial Group, Inc. 24,986 254,042 0.01%Industrial Bank of Korea 23,956 223,361 0.01%LG Display Co., Ltd. 9,672 210,420 0.01%Amorepacific Corp. 937 209,674 0.01%Samsung Fire & Marine Insurance Co., Ltd. 1,061 207,744 0.01%
Samsung SDS Co., Ltd. 1,258 206,660 0.01%Korea Zinc Co., Ltd. 491 188,133 0.01%Samsung Life Insurance Co., Ltd. 2,645 187,427 0.01%
Coway Co., Ltd. 2,529 176,737 0.01%SK Biopharmaceuticals Co., Ltd. 1,579 172,461 0.01%
Samsung Engineering Co., Ltd. 8,022 170,249 0.01%
Amorepacific Corp. - Preference Shares 2,146 167,884 0.01%
Korea Investment Holdings Co., Ltd. 1,783 163,077 0.01%
Hyundai Steel Co. 3,401 162,175 0.01%Hyundai Glovis Co., Ltd. 832 154,409 0.01%LG Innotek Co., Ltd. 754 149,307 0.01%Hanwha Solutions Corp. 3,753 148,467 0.01%Lotte Chemical Corp. 630 146,850 0.01%Yuhan Corp. 2,610 146,242 0.01%Celltrion Pharm, Inc. 1,032 144,058 0.01%CJ ENM Co., Ltd. 874 141,793 0.01%POSCO Chemical Co., Ltd. 1,095 140,017 0.01%Kumho Petrochemical Co., Ltd. 709 137,878 0.01%
Fila Holdings Corp. 2,627 135,765 0.01%CJ CheilJedang Corp. 324 132,632 0.01%Hansol Chemical Co., Ltd. 601 131,018 0.01%GS Home Shopping, Inc. 951 130,808 0.01%KIWOOM Securities Co., Ltd. 1,123 130,634 0.01%
WONIK IPS Co., Ltd. 2,906 127,991 0.01%Shin Poong Pharmaceutical Co., Ltd. 1,665 127,150 0.01%
Hyosung TNC Corp. 159 127,070 0.01%Hankook Tire & Technology Co., Ltd. 2,761 126,754 0.01%
SSANGYONG C&E Co., Ltd. 16,835 124,825 0.01%DB Insurance Co., Ltd. 2,533 123,259 0.01%SKC Co., Ltd. 847 119,211 0.01%Seoul Semiconductor Co., Ltd. 6,824 115,132 0.01%
LG Uplus Corp. 8,409 114,619 0.01%GeneOne Life Science, Inc. 2,712 113,908 0.01%Soulbrain Co., Ltd./New 384 112,082 0.01%HLB, Inc. 3,656 108,432 0.01%Samsung Heavy Industries Co., Ltd. 18,038 107,477 0.01%
Chabiotech Co., Ltd. 4,047 103,318 0.01%Shinsegae, Inc. 390 98,872 0.01%Doosan Bobcat, Inc. 2,292 97,692 0.01%Amorepacific Group 1,693 96,215 0.01%NH Investment & Securities Co., Ltd. 8,338 95,511 0.01%
Pearl Abyss Corp. 1,420 95,453 0.01%Seegene, Inc. 1,294 95,026 0.01%
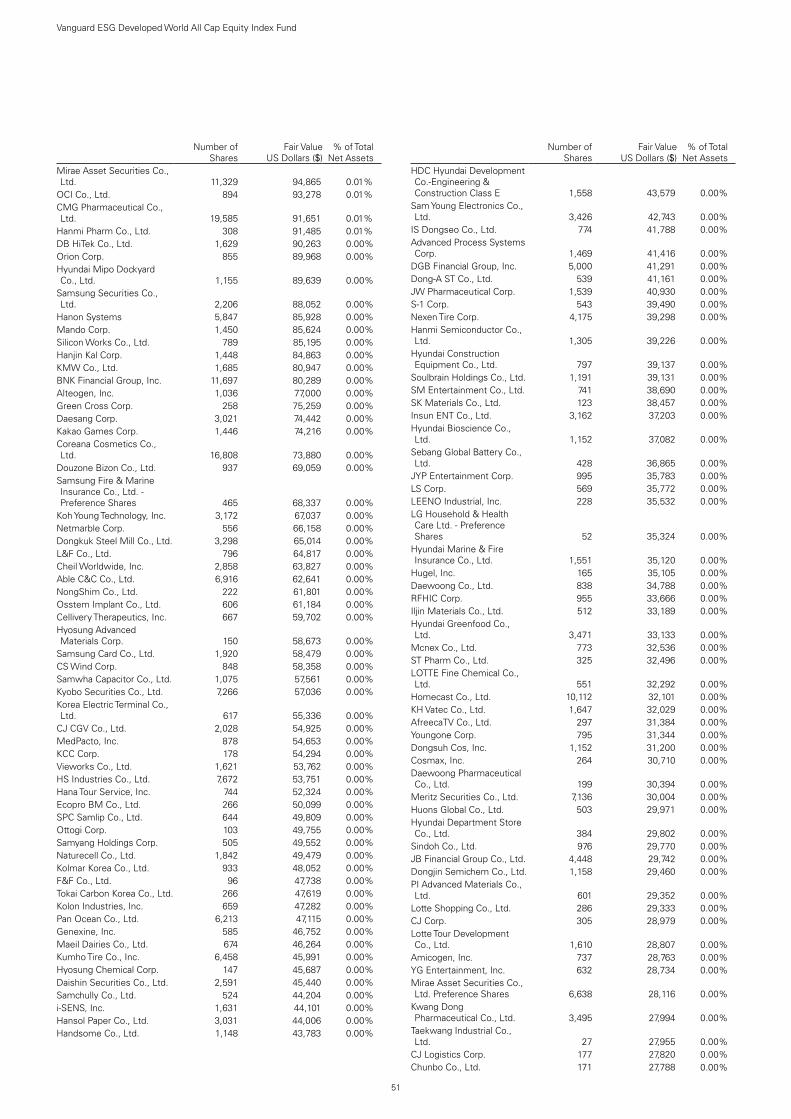
51
Vanguard ESG Developed World All Cap Equity Index Fund
.Number of
SharesFair Value
US Dollars ($)% of Total
Net AssetsMirae Asset Securities Co., Ltd. 11,329 94,865 0.01%
OCI Co., Ltd. 894 93,278 0.01%CMG Pharmaceutical Co., Ltd. 19,585 91,651 0.01%
Hanmi Pharm Co., Ltd. 308 91,485 0.01%DB HiTek Co., Ltd. 1,629 90,263 0.00%Orion Corp. 855 89,968 0.00%Hyundai Mipo Dockyard Co., Ltd. 1,155 89,639 0.00%
Samsung Securities Co., Ltd. 2,206 88,052 0.00%
Hanon Systems 5,847 85,928 0.00%Mando Corp. 1,450 85,624 0.00%Silicon Works Co., Ltd. 789 85,195 0.00%Hanjin Kal Corp. 1,448 84,863 0.00%KMW Co., Ltd. 1,685 80,947 0.00%BNK Financial Group, Inc. 11,697 80,289 0.00%Alteogen, Inc. 1,036 77,000 0.00%Green Cross Corp. 258 75,259 0.00%Daesang Corp. 3,021 74,442 0.00%Kakao Games Corp. 1,446 74,216 0.00%Coreana Cosmetics Co., Ltd. 16,808 73,880 0.00%
Douzone Bizon Co., Ltd. 937 69,059 0.00%Samsung Fire & Marine Insurance Co., Ltd. - Preference Shares 465 68,337 0.00%
Koh Young Technology, Inc. 3,172 67,037 0.00%Netmarble Corp. 556 66,158 0.00%Dongkuk Steel Mill Co., Ltd. 3,298 65,014 0.00%L&F Co., Ltd. 796 64,817 0.00%Cheil Worldwide, Inc. 2,858 63,827 0.00%Able C&C Co., Ltd. 6,916 62,641 0.00%NongShim Co., Ltd. 222 61,801 0.00%Osstem Implant Co., Ltd. 606 61,184 0.00%Cellivery Therapeutics, Inc. 667 59,702 0.00%Hyosung Advanced Materials Corp. 150 58,673 0.00%
Samsung Card Co., Ltd. 1,920 58,479 0.00%CS Wind Corp. 848 58,358 0.00%Samwha Capacitor Co., Ltd. 1,075 57,561 0.00%Kyobo Securities Co., Ltd. 7,266 57,036 0.00%Korea Electric Terminal Co., Ltd. 617 55,336 0.00%
CJ CGV Co., Ltd. 2,028 54,925 0.00%MedPacto, Inc. 878 54,653 0.00%KCC Corp. 178 54,294 0.00%Vieworks Co., Ltd. 1,621 53,762 0.00%HS Industries Co., Ltd. 7,672 53,751 0.00%Hana Tour Service, Inc. 744 52,324 0.00%Ecopro BM Co., Ltd. 266 50,099 0.00%SPC Samlip Co., Ltd. 644 49,809 0.00%Ottogi Corp. 103 49,755 0.00%Samyang Holdings Corp. 505 49,552 0.00%Naturecell Co., Ltd. 1,842 49,479 0.00%Kolmar Korea Co., Ltd. 933 48,052 0.00%F&F Co., Ltd. 96 47,738 0.00%Tokai Carbon Korea Co., Ltd. 266 47,619 0.00%Kolon Industries, Inc. 659 47,282 0.00%Pan Ocean Co., Ltd. 6,213 47,115 0.00%Genexine, Inc. 585 46,752 0.00%Maeil Dairies Co., Ltd. 674 46,264 0.00%Kumho Tire Co., Inc. 6,458 45,991 0.00%Hyosung Chemical Corp. 147 45,687 0.00%Daishin Securities Co., Ltd. 2,591 45,440 0.00%Samchully Co., Ltd. 524 44,204 0.00%i-SENS, Inc. 1,631 44,101 0.00%Hansol Paper Co., Ltd. 3,031 44,006 0.00%Handsome Co., Ltd. 1,148 43,783 0.00%
.Number of
SharesFair Value
US Dollars ($)% of Total
Net AssetsHDC Hyundai Development Co.-Engineering & Construction Class E 1,558 43,579 0.00%
Sam Young Electronics Co., Ltd. 3,426 42,743 0.00%
IS Dongseo Co., Ltd. 774 41,788 0.00%Advanced Process Systems Corp. 1,469 41,416 0.00%
DGB Financial Group, Inc. 5,000 41,291 0.00%Dong-A ST Co., Ltd. 539 41,161 0.00%JW Pharmaceutical Corp. 1,539 40,930 0.00%S-1 Corp. 543 39,490 0.00%Nexen Tire Corp. 4,175 39,298 0.00%Hanmi Semiconductor Co., Ltd. 1,305 39,226 0.00%
Hyundai Construction Equipment Co., Ltd. 797 39,137 0.00%
Soulbrain Holdings Co., Ltd. 1,191 39,131 0.00%SM Entertainment Co., Ltd. 741 38,690 0.00%SK Materials Co., Ltd. 123 38,457 0.00%Insun ENT Co., Ltd. 3,162 37,203 0.00%Hyundai Bioscience Co., Ltd. 1,152 37,082 0.00%
Sebang Global Battery Co., Ltd. 428 36,865 0.00%
JYP Entertainment Corp. 995 35,783 0.00%LS Corp. 569 35,772 0.00%LEENO Industrial, Inc. 228 35,532 0.00%LG Household & Health Care Ltd. - Preference Shares 52 35,324 0.00%
Hyundai Marine & Fire Insurance Co., Ltd. 1,551 35,120 0.00%
Hugel, Inc. 165 35,105 0.00%Daewoong Co., Ltd. 838 34,788 0.00%RFHIC Corp. 955 33,666 0.00%Iljin Materials Co., Ltd. 512 33,189 0.00%Hyundai Greenfood Co., Ltd. 3,471 33,133 0.00%
Mcnex Co., Ltd. 773 32,536 0.00%ST Pharm Co., Ltd. 325 32,496 0.00%LOTTE Fine Chemical Co., Ltd. 551 32,292 0.00%
Homecast Co., Ltd. 10,112 32,101 0.00%KH Vatec Co., Ltd. 1,647 32,029 0.00%AfreecaTV Co., Ltd. 297 31,384 0.00%Youngone Corp. 795 31,344 0.00%Dongsuh Cos, Inc. 1,152 31,200 0.00%Cosmax, Inc. 264 30,710 0.00%Daewoong Pharmaceutical Co., Ltd. 199 30,394 0.00%
Meritz Securities Co., Ltd. 7,136 30,004 0.00%Huons Global Co., Ltd. 503 29,971 0.00%Hyundai Department Store Co., Ltd. 384 29,802 0.00%
Sindoh Co., Ltd. 976 29,770 0.00%JB Financial Group Co., Ltd. 4,448 29,742 0.00%Dongjin Semichem Co., Ltd. 1,158 29,460 0.00%PI Advanced Materials Co., Ltd. 601 29,352 0.00%
Lotte Shopping Co., Ltd. 286 29,333 0.00%CJ Corp. 305 28,979 0.00%Lotte Tour Development Co., Ltd. 1,610 28,807 0.00%
Amicogen, Inc. 737 28,763 0.00%YG Entertainment, Inc. 632 28,734 0.00%Mirae Asset Securities Co., Ltd. Preference Shares 6,638 28,116 0.00%
Kwang Dong Pharmaceutical Co., Ltd. 3,495 27,994 0.00%
Taekwang Industrial Co., Ltd. 27 27,955 0.00%
CJ Logistics Corp. 177 27,820 0.00%Chunbo Co., Ltd. 171 27,788 0.00%
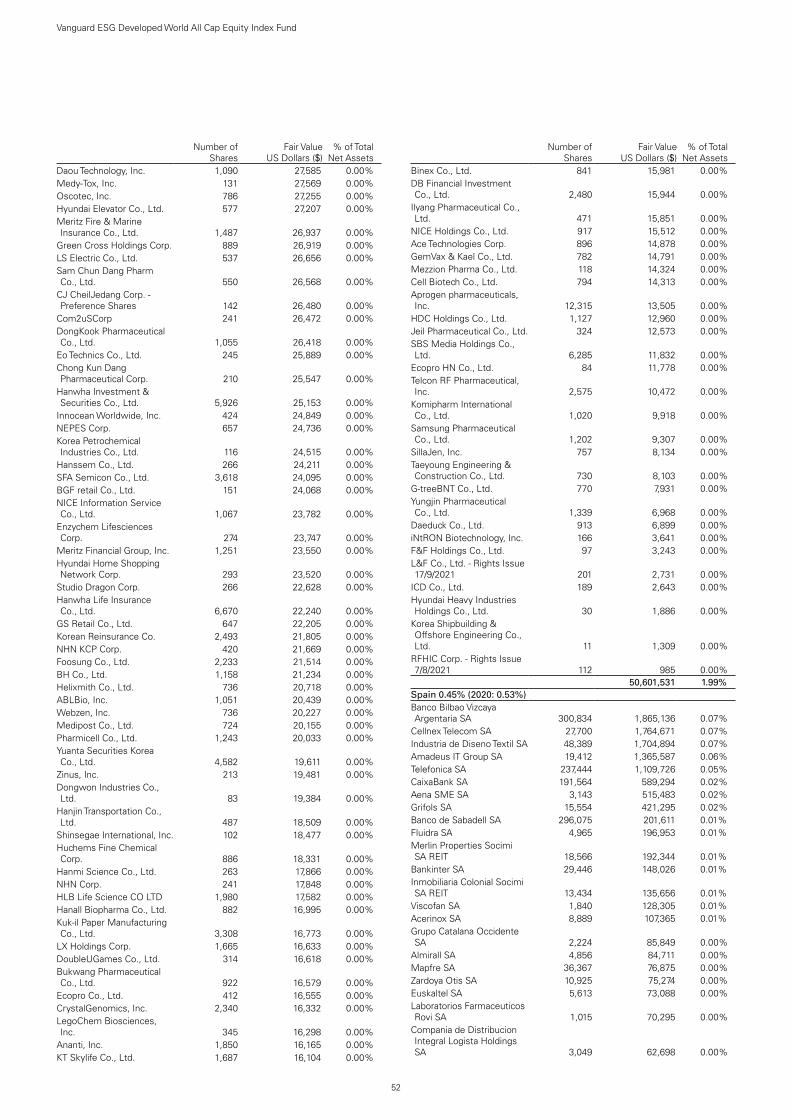
52
Vanguard ESG Developed World All Cap Equity Index Fund
.Number of
SharesFair Value
US Dollars ($)% of Total
Net AssetsDaou Technology, Inc. 1,090 27,585 0.00%Medy-Tox, Inc. 131 27,569 0.00%Oscotec, Inc. 786 27,255 0.00%Hyundai Elevator Co., Ltd. 577 27,207 0.00%Meritz Fire & Marine Insurance Co., Ltd. 1,487 26,937 0.00%
Green Cross Holdings Corp. 889 26,919 0.00%LS Electric Co., Ltd. 537 26,656 0.00%Sam Chun Dang Pharm Co., Ltd. 550 26,568 0.00%
CJ CheilJedang Corp. - Preference Shares 142 26,480 0.00%
Com2uSCorp 241 26,472 0.00%DongKook Pharmaceutical Co., Ltd. 1,055 26,418 0.00%
Eo Technics Co., Ltd. 245 25,889 0.00%Chong Kun Dang Pharmaceutical Corp. 210 25,547 0.00%
Hanwha Investment & Securities Co., Ltd. 5,926 25,153 0.00%
Innocean Worldwide, Inc. 424 24,849 0.00%NEPES Corp. 657 24,736 0.00%Korea Petrochemical Industries Co., Ltd. 116 24,515 0.00%
Hanssem Co., Ltd. 266 24,211 0.00%SFA Semicon Co., Ltd. 3,618 24,095 0.00%BGF retail Co., Ltd. 151 24,068 0.00%NICE Information Service Co., Ltd. 1,067 23,782 0.00%
Enzychem Lifesciences Corp. 274 23,747 0.00%
Meritz Financial Group, Inc. 1,251 23,550 0.00%Hyundai Home Shopping Network Corp. 293 23,520 0.00%
Studio Dragon Corp. 266 22,628 0.00%Hanwha Life Insurance Co., Ltd. 6,670 22,240 0.00%
GS Retail Co., Ltd. 647 22,205 0.00%Korean Reinsurance Co. 2,493 21,805 0.00%NHN KCP Corp. 420 21,669 0.00%Foosung Co., Ltd. 2,233 21,514 0.00%BH Co., Ltd. 1,158 21,234 0.00%Helixmith Co., Ltd. 736 20,718 0.00%ABLBio, Inc. 1,051 20,439 0.00%Webzen, Inc. 736 20,227 0.00%Medipost Co., Ltd. 724 20,155 0.00%Pharmicell Co., Ltd. 1,243 20,033 0.00%Yuanta Securities Korea Co., Ltd. 4,582 19,611 0.00%
Zinus, Inc. 213 19,481 0.00%Dongwon Industries Co., Ltd. 83 19,384 0.00%
Hanjin Transportation Co., Ltd. 487 18,509 0.00%
Shinsegae International, Inc. 102 18,477 0.00%Huchems Fine Chemical Corp. 886 18,331 0.00%
Hanmi Science Co., Ltd. 263 17,866 0.00%NHN Corp. 241 17,848 0.00%HLB Life Science CO LTD 1,980 17,582 0.00%Hanall Biopharma Co., Ltd. 882 16,995 0.00%Kuk-il Paper Manufacturing Co., Ltd. 3,308 16,773 0.00%
LX Holdings Corp. 1,665 16,633 0.00%DoubleUGames Co., Ltd. 314 16,618 0.00%Bukwang Pharmaceutical Co., Ltd. 922 16,579 0.00%
Ecopro Co., Ltd. 412 16,555 0.00%CrystalGenomics, Inc. 2,340 16,332 0.00%LegoChem Biosciences, Inc. 345 16,298 0.00%
Ananti, Inc. 1,850 16,165 0.00%KT Skylife Co., Ltd. 1,687 16,104 0.00%
.Number of
SharesFair Value
US Dollars ($)% of Total
Net AssetsBinex Co., Ltd. 841 15,981 0.00%DB Financial Investment Co., Ltd. 2,480 15,944 0.00%
Ilyang Pharmaceutical Co., Ltd. 471 15,851 0.00%
NICE Holdings Co., Ltd. 917 15,512 0.00%Ace Technologies Corp. 896 14,878 0.00%GemVax & Kael Co., Ltd. 782 14,791 0.00%Mezzion Pharma Co., Ltd. 118 14,324 0.00%Cell Biotech Co., Ltd. 794 14,313 0.00%Aprogen pharmaceuticals, Inc. 12,315 13,505 0.00%
HDC Holdings Co., Ltd. 1,127 12,960 0.00%Jeil Pharmaceutical Co., Ltd. 324 12,573 0.00%SBS Media Holdings Co., Ltd. 6,285 11,832 0.00%
Ecopro HN Co., Ltd. 84 11,778 0.00%Telcon RF Pharmaceutical, Inc. 2,575 10,472 0.00%
Komipharm International Co., Ltd. 1,020 9,918 0.00%
Samsung Pharmaceutical Co., Ltd. 1,202 9,307 0.00%
SillaJen, Inc. 757 8,134 0.00%Taeyoung Engineering & Construction Co., Ltd. 730 8,103 0.00%
G-treeBNT Co., Ltd. 770 7,931 0.00%Yungjin Pharmaceutical Co., Ltd. 1,339 6,968 0.00%
Daeduck Co., Ltd. 913 6,899 0.00%iNtRON Biotechnology, Inc. 166 3,641 0.00%F&F Holdings Co., Ltd. 97 3,243 0.00%L&F Co., Ltd. - Rights Issue 17/9/2021 201 2,731 0.00%
ICD Co., Ltd. 189 2,643 0.00%Hyundai Heavy Industries Holdings Co., Ltd. 30 1,886 0.00%
Korea Shipbuilding & Offshore Engineering Co., Ltd. 11 1,309 0.00%
RFHIC Corp. - Rights Issue 7/8/2021 112 985 0.00%
test test 50,601,531 1.99%Spain 0.45% (2020: 0.53%)Banco Bilbao Vizcaya Argentaria SA 300,834 1,865,136 0.07%
Cellnex Telecom SA 27,700 1,764,671 0.07%Industria de Diseno Textil SA 48,389 1,704,894 0.07%Amadeus IT Group SA 19,412 1,365,587 0.06%Telefonica SA 237,444 1,109,726 0.05%CaixaBank SA 191,564 589,294 0.02%Aena SME SA 3,143 515,483 0.02%Grifols SA 15,554 421,295 0.02%Banco de Sabadell SA 296,075 201,611 0.01%Fluidra SA 4,965 196,953 0.01%Merlin Properties Socimi SA REIT 18,566 192,344 0.01%
Bankinter SA 29,446 148,026 0.01%Inmobiliaria Colonial Socimi SA REIT 13,434 135,656 0.01%
Viscofan SA 1,840 128,305 0.01%Acerinox SA 8,889 107,365 0.01%Grupo Catalana Occidente SA 2,224 85,849 0.00%
Almirall SA 4,856 84,711 0.00%Mapfre SA 36,367 76,875 0.00%Zardoya Otis SA 10,925 75,274 0.00%Euskaltel SA 5,613 73,088 0.00%Laboratorios Farmaceuticos Rovi SA 1,015 70,295 0.00%
Compania de Distribucion Integral Logista Holdings SA 3,049 62,698 0.00%
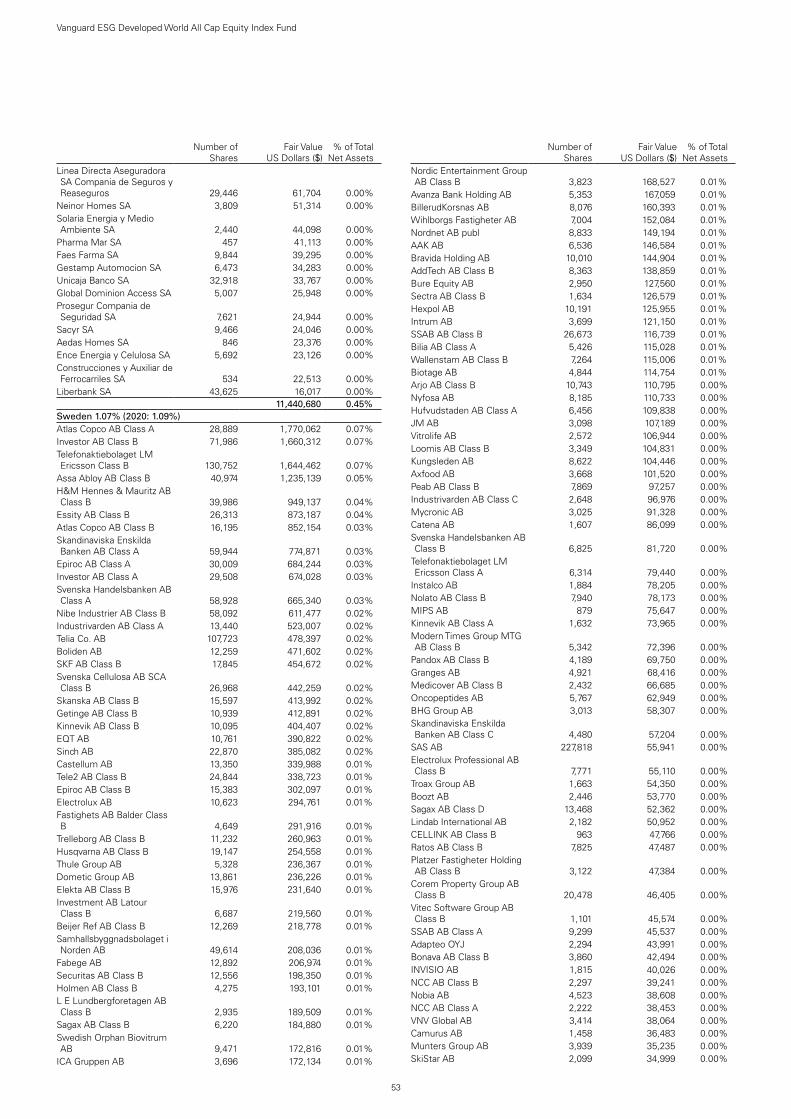
53
Vanguard ESG Developed World All Cap Equity Index Fund
.Number of
SharesFair Value
US Dollars ($)% of Total
Net AssetsLinea Directa Aseguradora SA Compania de Seguros y Reaseguros 29,446 61,704 0.00%
Neinor Homes SA 3,809 51,314 0.00%Solaria Energia y Medio Ambiente SA 2,440 44,098 0.00%
Pharma Mar SA 457 41,113 0.00%Faes Farma SA 9,844 39,295 0.00%Gestamp Automocion SA 6,473 34,283 0.00%Unicaja Banco SA 32,918 33,767 0.00%Global Dominion Access SA 5,007 25,948 0.00%Prosegur Compania de Seguridad SA 7,621 24,944 0.00%
Sacyr SA 9,466 24,046 0.00%Aedas Homes SA 846 23,376 0.00%Ence Energia y Celulosa SA 5,692 23,126 0.00%Construcciones y Auxiliar de Ferrocarriles SA 534 22,513 0.00%
Liberbank SA 43,625 16,017 0.00%test test 11,440,680 0.45%Sweden 1.07% (2020: 1.09%)Atlas Copco AB Class A 28,889 1,770,062 0.07%Investor AB Class B 71,986 1,660,312 0.07%Telefonaktiebolaget LM Ericsson Class B 130,752 1,644,462 0.07%
Assa Abloy AB Class B 40,974 1,235,139 0.05%H&M Hennes & Mauritz AB Class B 39,986 949,137 0.04%
Essity AB Class B 26,313 873,187 0.04%Atlas Copco AB Class B 16,195 852,154 0.03%Skandinaviska Enskilda Banken AB Class A 59,944 774,871 0.03%
Epiroc AB Class A 30,009 684,244 0.03%Investor AB Class A 29,508 674,028 0.03%Svenska Handelsbanken AB Class A 58,928 665,340 0.03%
Nibe Industrier AB Class B 58,092 611,477 0.02%Industrivarden AB Class A 13,440 523,007 0.02%Telia Co. AB 107,723 478,397 0.02%Boliden AB 12,259 471,602 0.02%SKF AB Class B 17,845 454,672 0.02%Svenska Cellulosa AB SCA Class B 26,968 442,259 0.02%
Skanska AB Class B 15,597 413,992 0.02%Getinge AB Class B 10,939 412,891 0.02%Kinnevik AB Class B 10,095 404,407 0.02%EQT AB 10,761 390,822 0.02%Sinch AB 22,870 385,082 0.02%Castellum AB 13,350 339,988 0.01%Tele2 AB Class B 24,844 338,723 0.01%Epiroc AB Class B 15,383 302,097 0.01%Electrolux AB 10,623 294,761 0.01%Fastighets AB Balder Class B 4,649 291,916 0.01%
Trelleborg AB Class B 11,232 260,963 0.01%Husqvarna AB Class B 19,147 254,558 0.01%Thule Group AB 5,328 236,367 0.01%Dometic Group AB 13,861 236,226 0.01%Elekta AB Class B 15,976 231,640 0.01%Investment AB Latour Class B 6,687 219,560 0.01%
Beijer Ref AB Class B 12,269 218,778 0.01%Samhallsbyggnadsbolaget i Norden AB 49,614 208,036 0.01%
Fabege AB 12,892 206,974 0.01%Securitas AB Class B 12,556 198,350 0.01%Holmen AB Class B 4,275 193,101 0.01%L E Lundbergforetagen AB Class B 2,935 189,509 0.01%
Sagax AB Class B 6,220 184,880 0.01%Swedish Orphan Biovitrum AB 9,471 172,816 0.01%
ICA Gruppen AB 3,696 172,134 0.01%
.Number of
SharesFair Value
US Dollars ($)% of Total
Net AssetsNordic Entertainment Group AB Class B 3,823 168,527 0.01%
Avanza Bank Holding AB 5,353 167,059 0.01%BillerudKorsnas AB 8,076 160,393 0.01%Wihlborgs Fastigheter AB 7,004 152,084 0.01%Nordnet AB publ 8,833 149,194 0.01%AAK AB 6,536 146,584 0.01%Bravida Holding AB 10,010 144,904 0.01%AddTech AB Class B 8,363 138,859 0.01%Bure Equity AB 2,950 127,560 0.01%Sectra AB Class B 1,634 126,579 0.01%Hexpol AB 10,191 125,955 0.01%Intrum AB 3,699 121,150 0.01%SSAB AB Class B 26,673 116,739 0.01%Bilia AB Class A 5,426 115,028 0.01%Wallenstam AB Class B 7,264 115,006 0.01%Biotage AB 4,844 114,754 0.01%Arjo AB Class B 10,743 110,795 0.00%Nyfosa AB 8,185 110,733 0.00%Hufvudstaden AB Class A 6,456 109,838 0.00%JM AB 3,098 107,189 0.00%Vitrolife AB 2,572 106,944 0.00%Loomis AB Class B 3,349 104,831 0.00%Kungsleden AB 8,622 104,446 0.00%Axfood AB 3,668 101,520 0.00%Peab AB Class B 7,869 97,257 0.00%Industrivarden AB Class C 2,648 96,976 0.00%Mycronic AB 3,025 91,328 0.00%Catena AB 1,607 86,099 0.00%Svenska Handelsbanken AB Class B 6,825 81,720 0.00%
Telefonaktiebolaget LM Ericsson Class A 6,314 79,440 0.00%
Instalco AB 1,884 78,205 0.00%Nolato AB Class B 7,940 78,173 0.00%MIPS AB 879 75,647 0.00%Kinnevik AB Class A 1,632 73,965 0.00%Modern Times Group MTG AB Class B 5,342 72,396 0.00%
Pandox AB Class B 4,189 69,750 0.00%Granges AB 4,921 68,416 0.00%Medicover AB Class B 2,432 66,685 0.00%Oncopeptides AB 5,767 62,949 0.00%BHG Group AB 3,013 58,307 0.00%Skandinaviska Enskilda Banken AB Class C 4,480 57,204 0.00%
SAS AB 227,818 55,941 0.00%Electrolux Professional AB Class B 7,771 55,110 0.00%
Troax Group AB 1,663 54,350 0.00%Boozt AB 2,446 53,770 0.00%Sagax AB Class D 13,468 52,362 0.00%Lindab International AB 2,182 50,952 0.00%CELLINK AB Class B 963 47,766 0.00%Ratos AB Class B 7,825 47,487 0.00%Platzer Fastigheter Holding AB Class B 3,122 47,384 0.00%
Corem Property Group AB Class B 20,478 46,405 0.00%
Vitec Software Group AB Class B 1,101 45,574 0.00%
SSAB AB Class A 9,299 45,537 0.00%Adapteo OYJ 2,294 43,991 0.00%Bonava AB Class B 3,860 42,494 0.00%INVISIO AB 1,815 40,026 0.00%NCC AB Class B 2,297 39,241 0.00%Nobia AB 4,523 38,608 0.00%NCC AB Class A 2,222 38,453 0.00%VNV Global AB 3,414 38,064 0.00%Camurus AB 1,458 36,483 0.00%Munters Group AB 3,939 35,235 0.00%SkiStar AB 2,099 34,999 0.00%

54
Vanguard ESG Developed World All Cap Equity Index Fund
.Number of
SharesFair Value
US Dollars ($)% of Total
Net AssetsInvestment AB Oresund 1,801 31,294 0.00%Mekonomen AB 1,785 29,513 0.00%Dios Fastigheter AB 2,774 28,755 0.00%Atrium Ljungberg AB Class B 1,236 28,168 0.00%
Concentric AB 1,330 27,340 0.00%Karo Pharma AB 3,708 23,760 0.00%Resurs Holding AB 4,786 23,661 0.00%Hansa Biopharma AB 1,288 22,591 0.00%Cloetta AB Class B 6,878 20,540 0.00%Scandic Hotels Group AB 5,215 20,385 0.00%Attendo AB 4,032 18,462 0.00%Svenska Cellulosa AB SCA Class A 836 13,783 0.00%
Clas Ohlson AB Class B 1,240 12,796 0.00%Corem Property Group AB - Preference Shares 337 12,491 0.00%
test test 27,167,880 1.07%Switzerland 2.41% (2020: 2.50%)Nestle SA 127,167 15,851,335 0.62%Roche Holding AG 30,518 11,507,599 0.45%Zurich Insurance Group AG 6,645 2,668,496 0.11%Lonza Group AG 3,347 2,374,601 0.09%UBS Group AG 151,270 2,317,286 0.09%Givaudan SA 416 1,936,548 0.08%Partners Group Holding AG 1,039 1,575,332 0.06%Alcon, Inc. 21,163 1,483,139 0.06%Geberit AG 1,603 1,203,529 0.05%Swiss Re AG 12,741 1,150,667 0.05%Credit Suisse Group AG 108,137 1,133,839 0.05%Sonova Holding AG 2,405 905,436 0.04%Logitech International SA 7,038 853,529 0.03%Roche Holding AG BR 2,076 844,010 0.03%Kuehne + Nagel International AG 2,377 814,149 0.03%
Straumann Holding AG 466 743,604 0.03%Swiss Life Holding AG 1,419 690,196 0.03%Swisscom AG 1,157 661,143 0.03%Julius Baer Group Ltd. 9,591 626,499 0.03%Chocoladefabriken Lindt & Spruengli AG 55 547,709 0.02%
Schindler Holding AG 1,628 498,430 0.02%Adecco Group AG 7,261 493,781 0.02%Temenos AG 2,897 465,726 0.02%VAT Group AG 1,350 449,245 0.02%Chocoladefabriken Lindt & Spruengli AG (XSWX) 4 419,322 0.02%
SIG Combibloc Group AG 14,019 381,282 0.02%Barry Callebaut AG 155 360,524 0.01%Schindler Holding AG (XSWX) 1,176 344,015 0.01%
Swiss Prime Site AG 3,353 332,997 0.01%Baloise Holding AG 1,983 309,565 0.01%Vifor Pharma AG 2,319 300,428 0.01%EMS-Chemie Holding AG 293 288,134 0.01%Swatch Group AG REG 4,248 280,565 0.01%Swatch Group AG 804 276,075 0.01%Tecan Group AG 545 270,274 0.01%Georg Fischer AG 175 259,939 0.01%PSP Swiss Property AG 2,018 256,521 0.01%ams AG 11,608 233,077 0.01%Clariant AG 11,592 230,749 0.01%Siegfried Holding AG 232 217,731 0.01%Helvetia Holding AG 1,893 203,769 0.01%Galenica AG 2,754 194,554 0.01%Flughafen Zurich AG 1,115 184,557 0.01%Belimo Holding AG 400 183,048 0.01%Bucher Industries AG 341 178,478 0.01%Bachem Holding AG Class B 299 177,262 0.01%Cembra Money Bank AG 1,437 161,213 0.01%DKSH Holding AG 2,084 159,623 0.01%OC Oerlikon Corp. AG 13,562 150,534 0.01%
.Number of
SharesFair Value
US Dollars ($)% of Total
Net AssetsZur Rose Group AG 365 139,982 0.01%Dufry AG 2,287 135,585 0.01%Allreal Holding AG 686 135,218 0.01%Softwareone Holding AG 5,706 134,880 0.01%Banque Cantonale Vaudoise 1,344 120,827 0.01%Stadler Rail AG 2,676 117,769 0.01%Vontobel Holding AG 1,472 114,817 0.01%Idorsia Ltd. 4,132 113,721 0.01%Interroll Holding AG 28 111,170 0.00%Daetwyler Holding AG 281 94,999 0.00%dormakaba Holding AG ADR 137 93,448 0.00%SFS Group AG 644 92,732 0.00%Mobimo Holding AG 275 90,442 0.00%Valiant Holding AG 876 86,903 0.00%Bystronic AG 62 83,843 0.00%Inficon Holding AG 71 82,187 0.00%Forbo Holding AG 42 79,606 0.00%Kardex Holding AG 335 77,557 0.00%Landis+Gyr Group AG 1,072 74,919 0.00%Comet Holding AG 249 68,557 0.00%Schweiter Technologies AG 46 67,481 0.00%Emmi AG 62 63,653 0.00%Bossard Holding AG 199 60,818 0.00%Aryzta AG 43,803 59,804 0.00%Arbonia AG 2,042 39,057 0.00%Swissquote Group Holding SA 250 37,810 0.00%
Ascom Holding AG 2,154 35,607 0.00%Burckhardt Compression Holding AG 86 34,843 0.00%
Komax Holding AG 118 29,821 0.00%Autoneum Holding AG 158 29,520 0.00%St Galler Kantonalbank AG 65 28,901 0.00%Medacta Group SA 217 28,500 0.00%Leonteq AG 472 28,238 0.00%Zehnder Group AG 287 27,385 0.00%VZ Holding AG 309 26,208 0.00%LEM Holding SA 12 25,185 0.00%EFG International AG 3,002 24,650 0.00%Bobst Group SA 301 24,097 0.00%ALSO Holding AG 81 23,353 0.00%Intershop Holding AG 33 21,706 0.00%Valora Holding AG 101 21,263 0.00%Bell Food Group AG 67 20,549 0.00%COSMO Pharmaceuticals NV 204 18,825 0.00%
Ypsomed Holding AG 116 18,096 0.00%Vetropack Holding AG 298 17,989 0.00%u-blox Holding AG 236 17,361 0.00%Basilea Pharmaceutica AG 333 16,283 0.00%GAM Holding AG 7,085 15,406 0.00%Implenia AG 428 11,150 0.00%test test 61,072,785 2.41%Taiwan 0.00% (2020: 0.00%)Vaxcell-Bio Therapeutics Co., Ltd. 573 46,048 0.00%
test test 46,048 0.00%United Kingdom 3.47% (2020: 3.55%)AstraZeneca plc 59,888 7,183,643 0.28%Unilever plc 117,783 6,883,502 0.27%GlaxoSmithKline plc 223,589 4,384,200 0.17%Reckitt Benckiser Group plc 28,874 2,551,634 0.10%Prudential plc 119,358 2,264,724 0.09%RELX plc 84,220 2,232,674 0.09%Vodafone Group plc 1,278,923 2,143,796 0.09%Lloyds Banking Group plc 3,225,197 2,080,249 0.08%National Grid plc 162,279 2,064,252 0.08%Barclays plc 775,083 1,832,248 0.07%London Stock Exchange Group plc 16,622 1,830,108 0.07%
CRH plc 35,469 1,791,881 0.07%Compass Group plc 81,556 1,714,769 0.07%
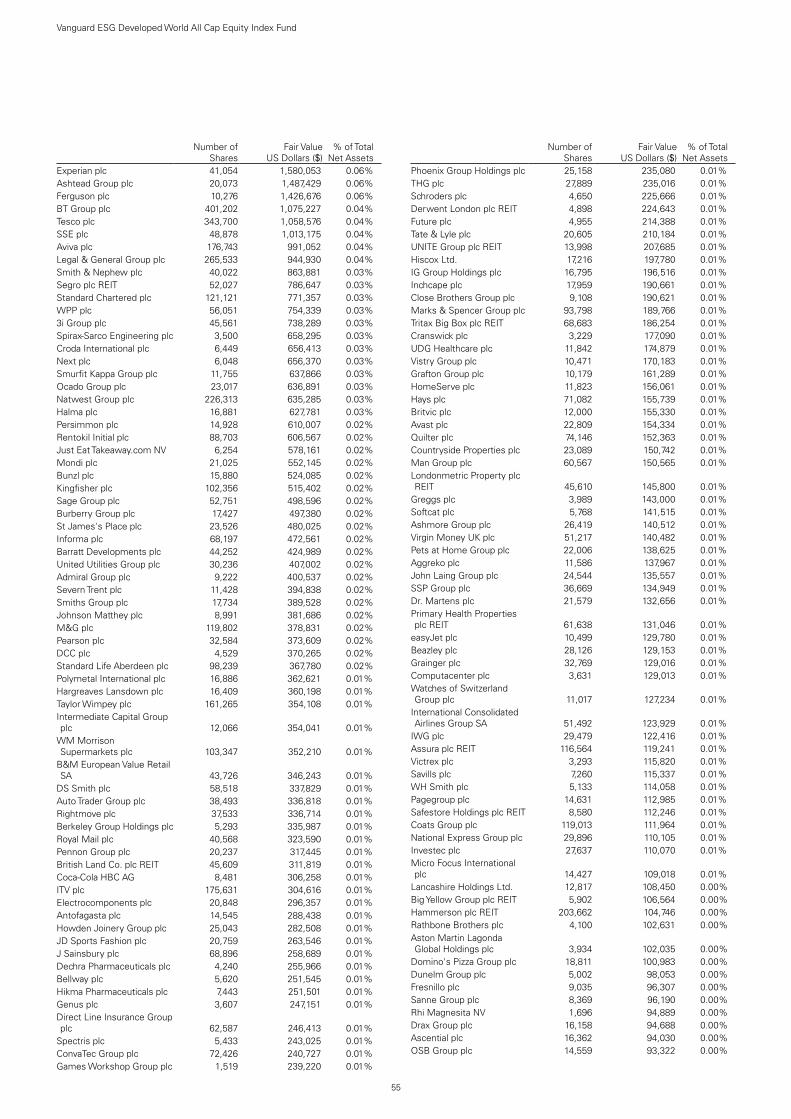
55
Vanguard ESG Developed World All Cap Equity Index Fund
.Number of
SharesFair Value
US Dollars ($)% of Total
Net AssetsExperian plc 41,054 1,580,053 0.06%Ashtead Group plc 20,073 1,487,429 0.06%Ferguson plc 10,276 1,426,676 0.06%BT Group plc 401,202 1,075,227 0.04%Tesco plc 343,700 1,058,576 0.04%SSE plc 48,878 1,013,175 0.04%Aviva plc 176,743 991,052 0.04%Legal & General Group plc 265,533 944,930 0.04%Smith & Nephew plc 40,022 863,881 0.03%Segro plc REIT 52,027 786,647 0.03%Standard Chartered plc 121,121 771,357 0.03%WPP plc 56,051 754,339 0.03%3i Group plc 45,561 738,289 0.03%Spirax-Sarco Engineering plc 3,500 658,295 0.03%Croda International plc 6,449 656,413 0.03%Next plc 6,048 656,370 0.03%Smurfit Kappa Group plc 11,755 637,866 0.03%Ocado Group plc 23,017 636,891 0.03%Natwest Group plc 226,313 635,285 0.03%Halma plc 16,881 627,781 0.03%Persimmon plc 14,928 610,007 0.02%Rentokil Initial plc 88,703 606,567 0.02%Just Eat Takeaway.com NV 6,254 578,161 0.02%Mondi plc 21,025 552,145 0.02%Bunzl plc 15,880 524,085 0.02%Kingfisher plc 102,356 515,402 0.02%Sage Group plc 52,751 498,596 0.02%Burberry Group plc 17,427 497,380 0.02%St James's Place plc 23,526 480,025 0.02%Informa plc 68,197 472,561 0.02%Barratt Developments plc 44,252 424,989 0.02%United Utilities Group plc 30,236 407,002 0.02%Admiral Group plc 9,222 400,537 0.02%Severn Trent plc 11,428 394,838 0.02%Smiths Group plc 17,734 389,528 0.02%Johnson Matthey plc 8,991 381,686 0.02%M&G plc 119,802 378,831 0.02%Pearson plc 32,584 373,609 0.02%DCC plc 4,529 370,265 0.02%Standard Life Aberdeen plc 98,239 367,780 0.02%Polymetal International plc 16,886 362,621 0.01%Hargreaves Lansdown plc 16,409 360,198 0.01%Taylor Wimpey plc 161,265 354,108 0.01%Intermediate Capital Group plc 12,066 354,041 0.01%
WM Morrison Supermarkets plc 103,347 352,210 0.01%
B&M European Value Retail SA 43,726 346,243 0.01%
DS Smith plc 58,518 337,829 0.01%Auto Trader Group plc 38,493 336,818 0.01%Rightmove plc 37,533 336,714 0.01%Berkeley Group Holdings plc 5,293 335,987 0.01%Royal Mail plc 40,568 323,590 0.01%Pennon Group plc 20,237 317,445 0.01%British Land Co. plc REIT 45,609 311,819 0.01%Coca-Cola HBC AG 8,481 306,258 0.01%ITV plc 175,631 304,616 0.01%Electrocomponents plc 20,848 296,357 0.01%Antofagasta plc 14,545 288,438 0.01%Howden Joinery Group plc 25,043 282,508 0.01%JD Sports Fashion plc 20,759 263,546 0.01%J Sainsbury plc 68,896 258,689 0.01%Dechra Pharmaceuticals plc 4,240 255,966 0.01%Bellway plc 5,620 251,545 0.01%Hikma Pharmaceuticals plc 7,443 251,501 0.01%Genus plc 3,607 247,151 0.01%Direct Line Insurance Group plc 62,587 246,413 0.01%
Spectris plc 5,433 243,025 0.01%ConvaTec Group plc 72,426 240,727 0.01%Games Workshop Group plc 1,519 239,220 0.01%
.Number of
SharesFair Value
US Dollars ($)% of Total
Net AssetsPhoenix Group Holdings plc 25,158 235,080 0.01%THG plc 27,889 235,016 0.01%Schroders plc 4,650 225,666 0.01%Derwent London plc REIT 4,898 224,643 0.01%Future plc 4,955 214,388 0.01%Tate & Lyle plc 20,605 210,184 0.01%UNITE Group plc REIT 13,998 207,685 0.01%Hiscox Ltd. 17,216 197,780 0.01%IG Group Holdings plc 16,795 196,516 0.01%Inchcape plc 17,959 190,661 0.01%Close Brothers Group plc 9,108 190,621 0.01%Marks & Spencer Group plc 93,798 189,766 0.01%Tritax Big Box plc REIT 68,683 186,254 0.01%Cranswick plc 3,229 177,090 0.01%UDG Healthcare plc 11,842 174,879 0.01%Vistry Group plc 10,471 170,183 0.01%Grafton Group plc 10,179 161,289 0.01%HomeServe plc 11,823 156,061 0.01%Hays plc 71,082 155,739 0.01%Britvic plc 12,000 155,330 0.01%Avast plc 22,809 154,334 0.01%Quilter plc 74,146 152,363 0.01%Countryside Properties plc 23,089 150,742 0.01%Man Group plc 60,567 150,565 0.01%Londonmetric Property plc REIT 45,610 145,800 0.01%
Greggs plc 3,989 143,000 0.01%Softcat plc 5,768 141,515 0.01%Ashmore Group plc 26,419 140,512 0.01%Virgin Money UK plc 51,217 140,482 0.01%Pets at Home Group plc 22,006 138,625 0.01%Aggreko plc 11,586 137,967 0.01%John Laing Group plc 24,544 135,557 0.01%SSP Group plc 36,669 134,949 0.01%Dr. Martens plc 21,579 132,656 0.01%Primary Health Properties plc REIT 61,638 131,046 0.01%
easyJet plc 10,499 129,780 0.01%Beazley plc 28,126 129,153 0.01%Grainger plc 32,769 129,016 0.01%Computacenter plc 3,631 129,013 0.01%Watches of Switzerland Group plc 11,017 127,234 0.01%
International Consolidated Airlines Group SA 51,492 123,929 0.01%
IWG plc 29,479 122,416 0.01%Assura plc REIT 116,564 119,241 0.01%Victrex plc 3,293 115,820 0.01%Savills plc 7,260 115,337 0.01%WH Smith plc 5,133 114,058 0.01%Pagegroup plc 14,631 112,985 0.01%Safestore Holdings plc REIT 8,580 112,246 0.01%Coats Group plc 119,013 111,964 0.01%National Express Group plc 29,896 110,105 0.01%Investec plc 27,637 110,070 0.01%Micro Focus International plc 14,427 109,018 0.01%
Lancashire Holdings Ltd. 12,817 108,450 0.00%Big Yellow Group plc REIT 5,902 106,564 0.00%Hammerson plc REIT 203,662 104,746 0.00%Rathbone Brothers plc 4,100 102,631 0.00%Aston Martin Lagonda Global Holdings plc 3,934 102,035 0.00%
Domino's Pizza Group plc 18,811 100,983 0.00%Dunelm Group plc 5,002 98,053 0.00%Fresnillo plc 9,035 96,307 0.00%Sanne Group plc 8,369 96,190 0.00%Rhi Magnesita NV 1,696 94,889 0.00%Drax Group plc 16,158 94,688 0.00%Ascential plc 16,362 94,030 0.00%OSB Group plc 14,559 93,322 0.00%

56
Vanguard ESG Developed World All Cap Equity Index Fund
.Number of
SharesFair Value
US Dollars ($)% of Total
Net AssetsGreat Portland Estates plc REIT 9,221 90,379 0.00%
Network International Holdings plc 17,849 90,172 0.00%
Trainline plc 22,108 89,669 0.00%Synthomer plc 13,060 88,693 0.00%TP ICAP Group plc 32,781 88,487 0.00%Sirius Real Estate Ltd. 57,764 88,257 0.00%Workspace Group plc REIT 7,590 87,447 0.00%Brewin Dolphin Holdings plc 18,213 87,432 0.00%Wizz Air Holdings plc 1,342 86,559 0.00%Moneysupermarket.com Group plc 23,975 84,987 0.00%
Paragon Banking Group plc 11,932 83,983 0.00%Clarkson plc 1,865 82,187 0.00%IntegraFin Holdings plc 11,524 81,987 0.00%Shaftesbury plc REIT 10,371 81,592 0.00%Redrow plc 9,641 81,483 0.00%Jupiter Fund Management plc 20,118 78,373 0.00%
Vesuvius plc 10,681 77,908 0.00%Dixons Carphone plc 42,734 76,863 0.00%Ibstock plc 25,621 75,531 0.00%St Modwen Properties plc 9,730 74,869 0.00%IP Group plc 46,377 74,575 0.00%Marshalls plc 7,736 73,312 0.00%Crest Nicholson Holdings plc 12,545 72,683 0.00%
Mediclinic International plc 17,590 72,219 0.00%Centamin plc 50,923 71,192 0.00%Genuit Group plc 8,410 71,102 0.00%Capital & Counties Properties plc REIT 31,134 69,375 0.00%
Essentra plc 16,111 68,773 0.00%Euromoney Institutional Investor plc 4,776 67,166 0.00%
Just Group plc 50,821 65,398 0.00%Spirent Communications plc 19,119 65,079 0.00%Firstgroup plc 56,931 64,412 0.00%Plus500 Ltd. 3,426 63,184 0.00%Bytes Technology Group plc 9,557 61,128 0.00%AJ Bell plc 10,014 60,011 0.00%Ferrexpo plc 10,115 59,778 0.00%XP Power Ltd. 717 55,270 0.00%Avon Rubber plc 1,446 52,257 0.00%Greencore Group plc 27,161 47,127 0.00%Telecom Plus plc 2,959 46,436 0.00%Frasers Group plc 5,537 46,086 0.00%Spire Healthcare Group plc 13,506 45,898 0.00%Hilton Food Group plc 2,988 45,158 0.00%Elementis plc 21,195 44,125 0.00%Mitie Group plc 46,710 43,879 0.00%Redde Northgate plc 7,862 43,335 0.00%Halfords Group plc 7,202 42,901 0.00%AO World plc 11,625 40,630 0.00%Restaurant Group plc 22,675 40,158 0.00%CLS Holdings plc 11,544 38,354 0.00%ContourGlobal plc 14,263 38,028 0.00%Airtel Africa plc 34,099 36,295 0.00%NCC Group plc 8,745 35,518 0.00%Cineworld Group plc 32,808 35,098 0.00%Kainos Group plc 1,718 35,007 0.00%PureTech Health plc 7,422 34,963 0.00%FDM Group Holdings plc 2,448 34,494 0.00%TI Fluid Systems plc Class B 7,701 32,660 0.00%Stagecoach Group plc 27,723 31,443 0.00%Bank of Georgia Group plc 1,532 28,444 0.00%Vectura Group plc 15,060 28,378 0.00%BMO Commercial Property Trust Ltd. REIT 21,212 26,549 0.00%
Provident Financial plc 8,121 26,028 0.00%
.Number of
SharesFair Value
US Dollars ($)% of Total
Net AssetsPicton Property Income Ltd. REIT 21,515 25,858 0.00%
TBC Bank Group plc 1,600 25,640 0.00%PZ Cussons plc 7,572 25,576 0.00%Helical plc 4,236 25,455 0.00%Petropavlovsk plc 77,782 25,423 0.00%Keller Group plc 2,274 25,194 0.00%UK Commercial Property Ltd. REIT 22,934 24,237 0.00%
Ninety One plc 7,862 23,916 0.00%Equiniti Group plc 8,906 22,097 0.00%AG Barr plc 2,915 20,859 0.00%Hochschild Mining plc 8,959 18,985 0.00%Devro plc 6,736 17,941 0.00%Go-Ahead Group plc 1,101 17,005 0.00%NMC Health plc 2,034 — 0.00%test test 87,995,956 3.47%United States 66.32% (2020: 64.61%)Apple, Inc. 712,941 97,644,399 3.85%Microsoft Corp. 342,000 92,647,800 3.65%Amazon.com, Inc. 19,699 67,767,712 2.67%Facebook, Inc. Class A 108,687 37,791,557 1.49%Alphabet, Inc. Class C 13,119 32,880,412 1.30%Alphabet, Inc. Class A 13,400 32,719,986 1.29%Tesla, Inc. 35,232 23,947,190 0.94%NVIDIA Corp. 27,162 21,732,316 0.86%JPMorgan Chase & Co. 136,043 21,160,128 0.83%Visa, Inc. Class A 76,621 17,915,522 0.71%UnitedHealth Group, Inc. 42,804 17,140,434 0.68%PayPal Holdings, Inc. 53,511 15,597,386 0.61%Home Depot, Inc. 48,804 15,563,108 0.61%Procter & Gamble Co. 109,981 14,839,736 0.58%Mastercard, Inc. Class A 39,674 14,484,581 0.57%Walt Disney Co. 82,215 14,450,931 0.57%Bank of America Corp. 341,334 14,073,201 0.55%Adobe, Inc. 21,574 12,634,597 0.50%Comcast Corp. Class A 206,231 11,759,292 0.46%Verizon Communications, Inc. 187,515 10,506,465 0.41%
Netflix, Inc. 19,582 10,343,408 0.41%Intel Corp. 183,636 10,309,325 0.41%Cisco Systems, Inc. 192,557 10,205,521 0.40%Pfizer, Inc. 252,503 9,888,017 0.39%Salesforce.com, Inc. 40,000 9,770,800 0.38%Coca-Cola Co. 174,547 9,444,738 0.37%AT&T, Inc. 324,832 9,348,665 0.37%PepsiCo, Inc. 62,842 9,311,299 0.37%Abbott Laboratories 78,589 9,110,823 0.36%AbbVie, Inc. 80,386 9,054,679 0.36%Thermo Fisher Scientific, Inc. 17,790 8,974,521 0.35%
Merck & Co., Inc. 114,899 8,935,695 0.35%Eli Lilly & Co. 38,370 8,806,682 0.35%NIKE, Inc. Class B 56,505 8,729,457 0.34%Broadcom, Inc. 17,974 8,570,722 0.34%Accenture plc Class A 28,693 8,458,409 0.33%Texas Instruments, Inc. 41,676 8,014,295 0.32%Costco Wholesale Corp. 20,005 7,915,378 0.31%McDonald's Corp. 33,694 7,782,977 0.31%Danaher Corp. 28,638 7,685,294 0.30%Medtronic plc 60,379 7,494,845 0.30%QUALCOMM, Inc. 51,274 7,328,593 0.29%Linde plc 23,724 6,858,608 0.27%Bristol-Myers Squibb Co. 101,440 6,778,221 0.27%United Parcel Service, Inc. Class B 32,551 6,769,631 0.27%
Citigroup, Inc. 94,384 6,677,668 0.26%Union Pacific Corp. 29,964 6,589,983 0.26%Amgen, Inc. 26,107 6,363,581 0.25%Lowe's Cos, Inc. 32,492 6,302,473 0.25%Oracle Corp. 79,046 6,152,941 0.24%Applied Materials, Inc. 41,842 5,958,301 0.23%

57
Vanguard ESG Developed World All Cap Equity Index Fund
.Number of
SharesFair Value
US Dollars ($)% of Total
Net AssetsStarbucks Corp. 53,232 5,951,870 0.23%Morgan Stanley 62,897 5,767,026 0.23%Goldman Sachs Group, Inc. 15,088 5,726,349 0.23%Intuit, Inc. 11,510 5,641,857 0.22%BlackRock, Inc. Class A 6,441 5,635,682 0.22%American Tower Corp. REIT 20,439 5,521,391 0.22%Target Corp. 22,698 5,487,015 0.22%Caterpillar, Inc. 24,504 5,332,806 0.21%Charles Schwab Corp. 71,023 5,171,185 0.20%Advanced Micro Devices, Inc. 54,788 5,146,237 0.20%
CVS Health Corp. 59,463 4,961,593 0.20%Intuitive Surgical, Inc. 5,340 4,910,878 0.19%ServiceNow, Inc. 8,911 4,897,040 0.19%American Express Co. 29,604 4,891,469 0.19%Deere & Co. 12,779 4,507,281 0.18%S&P Global, Inc. 10,947 4,493,196 0.18%Micron Technology, Inc. 50,970 4,331,431 0.17%Square, Inc. Class A 17,728 4,322,086 0.17%Charter Communications, Inc. Class A 5,985 4,317,878 0.17%
Anthem, Inc. 11,053 4,220,035 0.17%Lam Research Corp. 6,460 4,203,522 0.17%Booking Holdings, Inc. 1,874 4,100,481 0.16%Stryker Corp. 15,596 4,050,749 0.16%Zoetis, Inc. Class A 21,673 4,038,980 0.16%Fidelity National Information Services, Inc. 28,078 3,977,810 0.16%
Prologis, Inc. REIT 33,180 3,966,005 0.16%Gilead Sciences, Inc. 56,944 3,921,164 0.15%Mondelez International, Inc. Class A 62,158 3,881,146 0.15%
Automatic Data Processing, Inc. 19,495 3,872,097 0.15%
T-Mobile US, Inc. 26,657 3,860,733 0.15%Zoom Video Communications, Inc. Class A 9,683 3,747,611 0.15%
Crown Castle International Corp. REIT 19,155 3,737,140 0.15%
TJX Cos, Inc. 54,889 3,700,616 0.15%Cigna Corp. 15,598 3,697,818 0.15%PNC Financial Services Group, Inc. 19,357 3,692,541 0.15%
Uber Technologies, Inc. 73,291 3,673,345 0.14%Moderna, Inc. 15,373 3,612,348 0.14%US Bancorp 61,912 3,527,127 0.14%CME Group, Inc. Class A 16,139 3,432,443 0.14%Truist Financial Corp. 61,663 3,422,297 0.13%FedEx Corp. 11,197 3,340,401 0.13%Activision Blizzard, Inc. 34,889 3,329,806 0.13%CSX Corp. 102,387 3,284,575 0.13%Estee Lauder Cos, Inc. Class A 10,292 3,273,679 0.13%
Chubb Ltd. 20,498 3,257,952 0.13%Equinix, Inc. REIT 4,054 3,253,740 0.13%MercadoLibre, Inc. 2,069 3,223,068 0.13%Marsh & McLennan Cos, Inc. 22,601 3,179,509 0.13%
Becton Dickinson & Co. 13,065 3,177,277 0.13%Illumina, Inc. 6,614 3,129,811 0.12%Capital One Financial Corp. 20,229 3,129,224 0.12%Illinois Tool Works, Inc. 13,992 3,128,052 0.12%Sherwin-Williams Co. 11,212 3,054,709 0.12%Colgate-Palmolive Co. 37,495 3,050,218 0.12%Intercontinental Exchange, Inc. 25,118 2,981,507 0.12%
Autodesk, Inc. 10,132 2,957,531 0.12%Analog Devices, Inc. 16,990 2,924,998 0.12%Edwards Lifesciences Corp. 28,149 2,915,392 0.11%Twilio, Inc. Class A 7,372 2,905,748 0.11%Air Products & Chemicals, Inc. 10,054 2,892,335 0.11%
.Number of
SharesFair Value
US Dollars ($)% of Total
Net AssetsFiserv, Inc. 26,762 2,860,590 0.11%Boston Scientific Corp. 64,974 2,778,288 0.11%Moody's Corp. 7,401 2,681,900 0.11%Ford Motor Co. 179,474 2,666,984 0.11%Waste Management, Inc. 18,811 2,635,609 0.10%Progressive Corp. 26,665 2,618,770 0.10%Humana, Inc. 5,896 2,610,277 0.10%NXP Semiconductors NV 12,522 2,576,026 0.10%Regeneron Pharmaceuticals, Inc. 4,581 2,558,672 0.10%
Global Payments, Inc. 13,310 2,496,157 0.10%Twitter, Inc. 35,916 2,471,380 0.10%Aon plc Class A 10,257 2,448,961 0.10%HCA Healthcare, Inc. 11,764 2,432,089 0.10%DocuSign, Inc. Class A 8,664 2,422,194 0.10%Roku, Inc. Class A 5,247 2,409,685 0.10%IDEXX Laboratories, Inc. 3,783 2,389,154 0.09%Biogen, Inc. 6,828 2,364,332 0.09%Vertex Pharmaceuticals, Inc. 11,676 2,354,232 0.09%Newmont Corp. 36,857 2,335,997 0.09%Dollar General Corp. 10,788 2,334,415 0.09%KLA Corp. 7,004 2,270,767 0.09%Johnson Controls International plc 32,045 2,199,248 0.09%
Align Technology, Inc. 3,586 2,191,046 0.09%eBay, Inc. 31,028 2,178,476 0.09%Dow, Inc. 34,250 2,167,340 0.09%Marvell Technology, Inc. 36,837 2,148,702 0.08%IQVIA Holdings, Inc. 8,680 2,103,338 0.08%Public Storage REIT 6,923 2,081,677 0.08%MetLife, Inc. 34,588 2,070,092 0.08%Agilent Technologies, Inc. 13,981 2,066,532 0.08%Kimberly-Clark Corp. 15,260 2,041,483 0.08%T Rowe Price Group, Inc. 10,133 2,006,030 0.08%Trane Technologies plc 10,876 2,002,707 0.08%Ross Stores, Inc. 16,140 2,001,360 0.08%Match Group, Inc. 12,358 1,992,727 0.08%Workday, Inc. Class A 8,278 1,976,290 0.08%Pinterest, Inc. Class A 24,898 1,965,697 0.08%Chipotle Mexican Grill, Inc. Class A 1,262 1,956,529 0.08%
Synopsys, Inc. 7,081 1,952,869 0.08%Veeva Systems, Inc. Class A 6,258 1,945,925 0.08%MSCI, Inc. Class A 3,624 1,931,882 0.08%Digital Realty Trust, Inc. REIT 12,810 1,927,393 0.08%
Aptiv plc 12,199 1,919,269 0.08%Lululemon Athletica, Inc. 5,257 1,918,647 0.08%IHS Markit Ltd. 17,023 1,917,811 0.08%American International Group, Inc. 40,096 1,908,570 0.08%
Centene Corp. 25,724 1,876,051 0.07%Baxter International, Inc. 23,235 1,870,417 0.07%Prudential Financial, Inc. 18,249 1,869,975 0.07%Dexcom, Inc. 4,373 1,867,271 0.07%DuPont de Nemours, Inc. 24,109 1,866,278 0.07%Sempra Energy 13,953 1,848,493 0.07%Electronic Arts, Inc. 12,825 1,844,620 0.07%Bank of New York Mellon Corp. 35,805 1,834,290 0.07%
Crowdstrike Holdings, Inc. Class A 7,292 1,832,553 0.07%
Alexion Pharmaceuticals, Inc. 9,937 1,825,526 0.07%
Allstate Corp. 13,872 1,809,464 0.07%O'Reilly Automotive, Inc. 3,159 1,788,657 0.07%Sysco Corp. 22,384 1,740,356 0.07%Spotify Technology SA 6,279 1,730,430 0.07%HP, Inc. 56,888 1,717,449 0.07%Walgreens Boots Alliance, Inc. 32,623 1,716,296 0.07%
Microchip Technology, Inc. 11,445 1,713,774 0.07%

58
Vanguard ESG Developed World All Cap Equity Index Fund
.Number of
SharesFair Value
US Dollars ($)% of Total
Net AssetsCadence Design Systems, Inc. 12,503 1,710,660 0.07%
Travelers Cos, Inc. 11,392 1,705,496 0.07%International Flavors & Fragrances, Inc. 11,366 1,698,080 0.07%
Cognizant Technology Solutions Corp. Class A 24,308 1,683,572 0.07%
General Mills, Inc. 27,280 1,662,170 0.07%Motorola Solutions, Inc. 7,556 1,638,519 0.06%Palo Alto Networks, Inc. 4,409 1,635,959 0.06%Discover Financial Services 13,747 1,626,133 0.06%ResMed, Inc. 6,580 1,622,102 0.06%Xilinx, Inc. 11,105 1,606,227 0.06%Aflac, Inc. 29,872 1,602,932 0.06%Welltower, Inc. REIT 19,207 1,596,102 0.06%SBA Communications Corp. REIT Class A 4,974 1,585,214 0.06%
Yum! Brands, Inc. 13,776 1,584,653 0.06%Monster Beverage Corp. 16,930 1,546,555 0.06%Paychex, Inc. 14,398 1,544,905 0.06%Atlassian Corp. plc Class A 6,001 1,541,417 0.06%AutoZone, Inc. 1,030 1,536,987 0.06%Corteva, Inc. 34,517 1,530,829 0.06%Trade Desk, Inc. Class A 19,700 1,523,992 0.06%Cintas Corp. 3,986 1,522,652 0.06%Rockwell Automation, Inc. 5,286 1,511,902 0.06%Zimmer Biomet Holdings, Inc. 9,343 1,502,541 0.06%
Peloton Interactive, Inc. Class A 12,043 1,493,573 0.06%
Mettler-Toledo International, Inc. 1,074 1,487,855 0.06%
First Republic Bank 7,794 1,458,803 0.06%CoStar Group, Inc. 17,590 1,456,804 0.06%KKR & Co., Inc. 24,413 1,446,226 0.06%Skyworks Solutions, Inc. 7,474 1,433,140 0.06%Fortinet, Inc. 6,001 1,429,378 0.06%Stanley Black & Decker, Inc. 6,945 1,423,656 0.06%Okta, Inc. Class A 5,675 1,388,559 0.05%McKesson Corp. 7,240 1,384,578 0.05%PACCAR, Inc. 15,322 1,367,488 0.05%Willis Towers Watson plc 5,938 1,365,859 0.05%DR Horton, Inc. 15,087 1,363,412 0.05%SVB Financial Group 2,431 1,352,681 0.05%AvalonBay Communities, Inc. REIT 6,411 1,337,912 0.05%
Fastenal Co. 25,655 1,334,060 0.05%Ameriprise Financial, Inc. 5,347 1,330,761 0.05%Best Buy Co., Inc. 11,430 1,314,221 0.05%State Street Corp. 15,948 1,312,201 0.05%Nucor Corp. 13,642 1,308,677 0.05%Kroger Co. 34,137 1,307,788 0.05%Keysight Technologies, Inc. 8,458 1,306,000 0.05%Equifax, Inc. 5,442 1,303,413 0.05%Synchrony Financial 26,707 1,295,824 0.05%Yum China Holdings, Inc. 19,558 1,295,718 0.05%CBRE Group, Inc. Class A 14,950 1,281,663 0.05%American Water Works Co., Inc. 8,313 1,281,283 0.05%
Maxim Integrated Products, Inc. 12,086 1,273,381 0.05%
Equity Residential REIT 16,452 1,266,804 0.05%Zebra Technologies Corp. Class A 2,371 1,255,421 0.05%
Arthur J Gallagher & Co. 8,961 1,255,257 0.05%Fifth Third Bancorp 32,642 1,247,904 0.05%Verisk Analytics, Inc. Class A 7,111 1,242,434 0.05%
Laboratory Corp. of America Holdings 4,463 1,231,119 0.05%
EPAM Systems, Inc. 2,396 1,224,260 0.05%Copart, Inc. 9,251 1,219,559 0.05%Cloudflare, Inc. Class A 11,480 1,215,043 0.05%
.Number of
SharesFair Value
US Dollars ($)% of Total
Net AssetsLyondellBasell Industries NV Class A 11,745 1,208,208 0.05%
Dell Technologies, Inc. Class C 12,122 1,208,200 0.05%
ViacomCBS, Inc. Class B 26,680 1,205,936 0.05%VF Corp. 14,680 1,204,347 0.05%Etsy, Inc. 5,780 1,189,755 0.05%HubSpot, Inc. 2,032 1,184,087 0.05%West Pharmaceutical Services, Inc. 3,297 1,183,953 0.05%
Kraft Heinz Co. 28,816 1,175,116 0.05%Generac Holdings, Inc. 2,809 1,166,156 0.05%Alexandria Real Estate Equities, Inc. REIT 6,349 1,155,137 0.05%
Kansas City Southern 4,067 1,152,466 0.05%Consolidated Edison, Inc. 15,844 1,136,332 0.04%Hershey Co. 6,499 1,131,996 0.04%CDW Corp. 6,474 1,130,684 0.04%Teladoc Health, Inc. 6,752 1,122,790 0.04%DoorDash, Inc. Class A 6,294 1,122,409 0.04%Realty Income Corp. REIT 16,696 1,114,291 0.04%Enphase Energy, Inc. 6,008 1,103,249 0.04%Keurig Dr Pepper, Inc. 31,236 1,100,757 0.04%Old Dominion Freight Line, Inc. 4,335 1,100,223 0.04%
Wayfair, Inc. Class A 3,430 1,082,885 0.04%Datadog, Inc. Class A 10,368 1,079,101 0.04%International Paper Co. 17,589 1,078,382 0.04%Liberty Broadband Corp. Class C 6,209 1,078,255 0.04%
VeriSign, Inc. 4,700 1,070,143 0.04%Cerner Corp. 13,686 1,069,698 0.04%Splunk, Inc. 7,365 1,064,832 0.04%Carvana Co. Class A 3,525 1,063,915 0.04%Republic Services, Inc. Class A 9,656 1,062,257 0.04%
RingCentral, Inc. Class A 3,625 1,053,353 0.04%Dollar Tree, Inc. 10,551 1,049,824 0.04%Clorox Co. 5,800 1,043,478 0.04%Vulcan Materials Co. 5,970 1,039,198 0.04%Expedia Group, Inc. 6,342 1,038,249 0.04%Qorvo, Inc. 5,282 1,033,423 0.04%Novocure Ltd. 4,656 1,032,794 0.04%Martin Marietta Materials, Inc. 2,898 1,019,545 0.04%
Northern Trust Corp. 8,720 1,008,206 0.04%Slack Technologies, Inc. Class A 22,737 1,007,249 0.04%
Hartford Financial Services Group, Inc. 16,141 1,000,258 0.04%
Waters Corp. 2,892 999,504 0.04%Teradyne, Inc. 7,445 997,332 0.04%Yandex NV Class A 14,080 996,160 0.04%Western Digital Corp. 13,969 994,174 0.04%McCormick & Co., Inc. 11,207 989,802 0.04%Xylem, Inc. 8,234 987,751 0.04%Tractor Supply Co. 5,262 979,048 0.04%Dover Corp. 6,497 978,448 0.04%Exact Sciences Corp. 7,858 976,828 0.04%Trimble, Inc. 11,937 976,805 0.04%Garmin Ltd. 6,740 974,874 0.04%Church & Dwight Co., Inc. 11,392 970,826 0.04%Expeditors International of Washington, Inc. 7,651 968,617 0.04%
Tyson Foods, Inc. Class A 13,126 968,174 0.04%PPL Corp. 34,609 968,014 0.04%FleetCor Technologies, Inc. 3,736 956,640 0.04%Ventas, Inc. REIT 16,692 953,113 0.04%TransUnion 8,639 948,649 0.04%Edison International 16,356 945,704 0.04%Arista Networks, Inc. 2,604 943,455 0.04%Horizon Therapeutics plc 10,019 938,179 0.04%

59
Vanguard ESG Developed World All Cap Equity Index Fund
.Number of
SharesFair Value
US Dollars ($)% of Total
Net AssetsKeyCorp 45,299 935,424 0.04%Avantor, Inc. 26,228 931,356 0.04%CarMax, Inc. 7,191 928,718 0.04%Burlington Stores, Inc. 2,884 928,619 0.04%Extra Space Storage, Inc. REIT 5,655 926,402 0.04%
Seagen, Inc. 5,851 923,756 0.04%Alnylam Pharmaceuticals, Inc. 5,439 922,019 0.04%
Huntington Bancshares, Inc. 64,506 920,501 0.04%Invitation Homes, Inc. REIT 24,601 917,371 0.04%Gartner, Inc. 3,778 915,032 0.04%Lennar Corp. Class A 9,144 908,456 0.04%Darden Restaurants, Inc. 6,200 905,138 0.04%Essex Property Trust, Inc. REIT 2,996 898,830 0.04%
Take-Two Interactive Software, Inc. 5,050 893,951 0.04%
Cooper Cos, Inc. 2,254 893,193 0.04%Nasdaq, Inc. 5,061 889,724 0.04%STERIS plc 4,311 889,359 0.04%Citizens Financial Group, Inc. 19,386 889,236 0.04%
Regions Financial Corp. 44,035 888,626 0.04%Ulta Beauty, Inc. 2,564 886,554 0.04%Hewlett Packard Enterprise Co. 60,790 886,318 0.04%
Coupa Software, Inc. 3,356 879,641 0.03%Teleflex, Inc. 2,180 875,902 0.03%MongoDB, Inc. Class A 2,409 870,902 0.03%Albemarle Corp. 5,160 869,254 0.03%Akamai Technologies, Inc. 7,453 869,020 0.03%WW Grainger, Inc. 1,972 863,736 0.03%M&T Bank Corp. 5,944 863,723 0.03%Domino's Pizza, Inc. 1,849 862,540 0.03%Ally Financial, Inc. 17,090 851,766 0.03%NetApp, Inc. 10,350 846,837 0.03%Mid-America Apartment Communities, Inc. REIT 5,002 842,437 0.03%
Sun Communities, Inc. REIT 4,900 839,860 0.03%Broadridge Financial Solutions, Inc. 5,170 835,110 0.03%
Bio-Techne Corp. 1,854 834,782 0.03%Paycom Software, Inc. 2,282 829,439 0.03%Genuine Parts Co. 6,550 828,378 0.03%Catalent, Inc. 7,624 824,307 0.03%Conagra Brands, Inc. 22,594 821,970 0.03%Insulet Corp. 2,987 819,961 0.03%Healthpeak Properties, Inc. REIT 24,405 812,442 0.03%
Omnicom Group, Inc. 10,078 806,139 0.03%Celanese Corp. Class A 5,306 804,390 0.03%Tyler Technologies, Inc. 1,778 804,314 0.03%Pool Corp. 1,753 804,031 0.03%MarketAxess Holdings, Inc. 1,731 802,474 0.03%Boston Properties, Inc. REIT 6,997 801,786 0.03%AES Corp. 30,710 800,610 0.03%Charles River Laboratories International, Inc. 2,162 799,767 0.03%
Quest Diagnostics, Inc. 6,044 797,627 0.03%Cardinal Health, Inc. 13,922 794,807 0.03%Zendesk, Inc. 5,499 793,726 0.03%Ingersoll Rand, Inc. 16,216 791,503 0.03%Avery Dennison Corp. 3,763 791,133 0.03%Seagate Technology Holdings plc 8,976 789,260 0.03%
PerkinElmer, Inc. 5,106 788,417 0.03%Cincinnati Financial Corp. 6,757 788,001 0.03%NVR, Inc. 157 780,808 0.03%Plug Power, Inc. 22,809 779,840 0.03%Lyft, Inc. Class A 12,891 779,648 0.03%Entegris, Inc. 6,329 778,277 0.03%
.Number of
SharesFair Value
US Dollars ($)% of Total
Net AssetsZscaler, Inc. 3,583 774,143 0.03%Hologic, Inc. 11,503 767,480 0.03%Viatris, Inc. 53,699 767,359 0.03%ON Semiconductor Corp. 19,743 755,762 0.03%Duke Realty Corp. REIT 15,954 755,422 0.03%L Brands, Inc. 10,464 754,036 0.03%10X Genomics, Inc. Class A 3,845 752,928 0.03%Kellogg Co. 11,693 752,211 0.03%Principal Financial Group, Inc. 11,892 751,455 0.03%
IDEX Corp. 3,387 745,309 0.03%CMS Energy Corp. 12,549 741,395 0.03%Unity Software, Inc. 6,734 739,595 0.03%AmerisourceBergen Corp. Class A 6,439 737,201 0.03%
Markel Corp. 611 725,080 0.03%Farfetch Ltd. Class A 14,391 724,731 0.03%BioMarin Pharmaceutical, Inc. 8,680 724,259 0.03%
SS&C Technologies Holdings, Inc. 10,013 721,537 0.03%
Raymond James Financial, Inc. 5,535 718,997 0.03%
Novavax, Inc. 3,375 716,546 0.03%Eastman Chemical Co. 6,134 716,144 0.03%Monolithic Power Systems, Inc. 1,914 714,783 0.03%
Nuance Communications, Inc. 13,001 707,774 0.03%
Wix.com Ltd. 2,435 706,832 0.03%GoDaddy, Inc. Class A 8,120 706,115 0.03%Incyte Corp. 8,332 700,971 0.03%Westinghouse Air Brake Technologies Corp. 8,491 698,809 0.03%
Molina Healthcare, Inc. 2,745 694,650 0.03%Elanco Animal Health, Inc. 20,023 694,598 0.03%Fair Isaac Corp. 1,379 693,196 0.03%Lumen Technologies, Inc. 50,631 688,075 0.03%Zillow Group, Inc. Class C 5,591 683,332 0.03%StoneCo Ltd. Class A 10,157 681,128 0.03%LKQ Corp. 13,774 677,956 0.03%NortonLifeLock, Inc. 24,792 674,838 0.03%FMC Corp. 6,216 672,571 0.03%Arch Capital Group Ltd. 17,271 672,533 0.03%Masco Corp. 11,380 670,396 0.03%Cognex Corp. 7,868 661,305 0.03%ABIOMED, Inc. 2,091 652,622 0.03%Westrock Co. 12,250 651,945 0.03%PTC, Inc. 4,605 650,502 0.03%Citrix Systems, Inc. 5,545 650,262 0.03%JM Smucker Co. 5,011 649,275 0.03%Signature Bank 2,640 648,516 0.03%Bill.com Holdings, Inc. 3,537 647,908 0.03%PulteGroup, Inc. 11,853 646,818 0.03%Bio-Rad Laboratories, Inc. Class A 991 638,491 0.03%
Avalara, Inc. 3,945 638,301 0.03%SolarEdge Technologies, Inc. 2,302 636,204 0.03%CenterPoint Energy, Inc. 25,902 635,117 0.03%DENTSPLY SIRONA, Inc. 9,964 630,323 0.02%Alliant Energy Corp. 11,238 626,631 0.02%Fortune Brands Home & Security, Inc. 6,290 626,547 0.02%
UDR, Inc. REIT 12,791 626,503 0.02%Whirlpool Corp. 2,867 625,063 0.02%JB Hunt Transport Services, Inc. 3,807 620,351 0.02%
Royalty Pharma plc Class A 15,100 618,949 0.02%FactSet Research Systems, Inc. 1,805 605,776 0.02%
Fox Corp. Class A 16,280 604,476 0.02%CH Robinson Worldwide, Inc. 6,421 601,455 0.02%
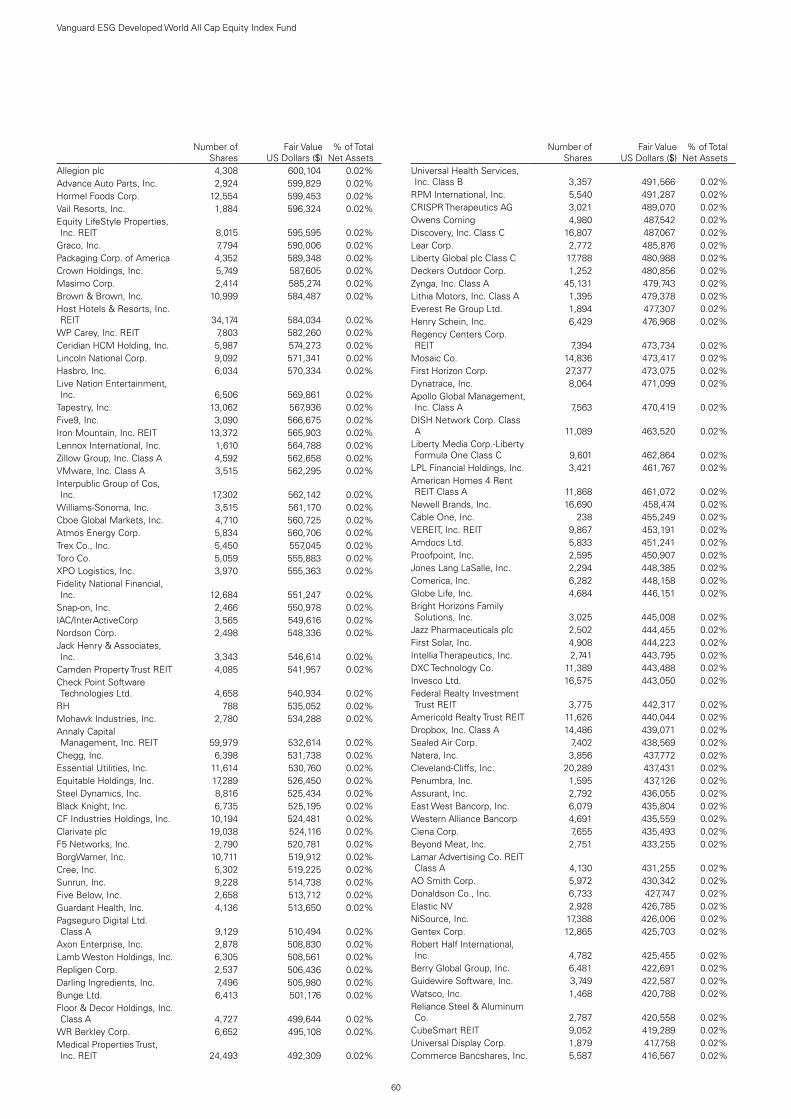
60
Vanguard ESG Developed World All Cap Equity Index Fund
.Number of
SharesFair Value
US Dollars ($)% of Total
Net AssetsAllegion plc 4,308 600,104 0.02%Advance Auto Parts, Inc. 2,924 599,829 0.02%Hormel Foods Corp. 12,554 599,453 0.02%Vail Resorts, Inc. 1,884 596,324 0.02%Equity LifeStyle Properties, Inc. REIT 8,015 595,595 0.02%
Graco, Inc. 7,794 590,006 0.02%Packaging Corp. of America 4,352 589,348 0.02%Crown Holdings, Inc. 5,749 587,605 0.02%Masimo Corp. 2,414 585,274 0.02%Brown & Brown, Inc. 10,999 584,487 0.02%Host Hotels & Resorts, Inc. REIT 34,174 584,034 0.02%
WP Carey, Inc. REIT 7,803 582,260 0.02%Ceridian HCM Holding, Inc. 5,987 574,273 0.02%Lincoln National Corp. 9,092 571,341 0.02%Hasbro, Inc. 6,034 570,334 0.02%Live Nation Entertainment, Inc. 6,506 569,861 0.02%
Tapestry, Inc. 13,062 567,936 0.02%Five9, Inc. 3,090 566,675 0.02%Iron Mountain, Inc. REIT 13,372 565,903 0.02%Lennox International, Inc. 1,610 564,788 0.02%Zillow Group, Inc. Class A 4,592 562,658 0.02%VMware, Inc. Class A 3,515 562,295 0.02%Interpublic Group of Cos, Inc. 17,302 562,142 0.02%
Williams-Sonoma, Inc. 3,515 561,170 0.02%Cboe Global Markets, Inc. 4,710 560,725 0.02%Atmos Energy Corp. 5,834 560,706 0.02%Trex Co., Inc. 5,450 557,045 0.02%Toro Co. 5,059 555,883 0.02%XPO Logistics, Inc. 3,970 555,363 0.02%Fidelity National Financial, Inc. 12,684 551,247 0.02%
Snap-on, Inc. 2,466 550,978 0.02%IAC/InterActiveCorp 3,565 549,616 0.02%Nordson Corp. 2,498 548,336 0.02%Jack Henry & Associates, Inc. 3,343 546,614 0.02%
Camden Property Trust REIT 4,085 541,957 0.02%Check Point Software Technologies Ltd. 4,658 540,934 0.02%
RH 788 535,052 0.02%Mohawk Industries, Inc. 2,780 534,288 0.02%Annaly Capital Management, Inc. REIT 59,979 532,614 0.02%
Chegg, Inc. 6,398 531,738 0.02%Essential Utilities, Inc. 11,614 530,760 0.02%Equitable Holdings, Inc. 17,289 526,450 0.02%Steel Dynamics, Inc. 8,816 525,434 0.02%Black Knight, Inc. 6,735 525,195 0.02%CF Industries Holdings, Inc. 10,194 524,481 0.02%Clarivate plc 19,038 524,116 0.02%F5 Networks, Inc. 2,790 520,781 0.02%BorgWarner, Inc. 10,711 519,912 0.02%Cree, Inc. 5,302 519,225 0.02%Sunrun, Inc. 9,228 514,738 0.02%Five Below, Inc. 2,658 513,712 0.02%Guardant Health, Inc. 4,136 513,650 0.02%Pagseguro Digital Ltd. Class A 9,129 510,494 0.02%
Axon Enterprise, Inc. 2,878 508,830 0.02%Lamb Weston Holdings, Inc. 6,305 508,561 0.02%Repligen Corp. 2,537 506,436 0.02%Darling Ingredients, Inc. 7,496 505,980 0.02%Bunge Ltd. 6,413 501,176 0.02%Floor & Decor Holdings, Inc. Class A 4,727 499,644 0.02%
WR Berkley Corp. 6,652 495,108 0.02%Medical Properties Trust, Inc. REIT 24,493 492,309 0.02%
.Number of
SharesFair Value
US Dollars ($)% of Total
Net AssetsUniversal Health Services, Inc. Class B 3,357 491,566 0.02%
RPM International, Inc. 5,540 491,287 0.02%CRISPR Therapeutics AG 3,021 489,070 0.02%Owens Corning 4,980 487,542 0.02%Discovery, Inc. Class C 16,807 487,067 0.02%Lear Corp. 2,772 485,876 0.02%Liberty Global plc Class C 17,788 480,988 0.02%Deckers Outdoor Corp. 1,252 480,856 0.02%Zynga, Inc. Class A 45,131 479,743 0.02%Lithia Motors, Inc. Class A 1,395 479,378 0.02%Everest Re Group Ltd. 1,894 477,307 0.02%Henry Schein, Inc. 6,429 476,968 0.02%Regency Centers Corp. REIT 7,394 473,734 0.02%
Mosaic Co. 14,836 473,417 0.02%First Horizon Corp. 27,377 473,075 0.02%Dynatrace, Inc. 8,064 471,099 0.02%Apollo Global Management, Inc. Class A 7,563 470,419 0.02%
DISH Network Corp. Class A 11,089 463,520 0.02%
Liberty Media Corp.-Liberty Formula One Class C 9,601 462,864 0.02%
LPL Financial Holdings, Inc. 3,421 461,767 0.02%American Homes 4 Rent REIT Class A 11,868 461,072 0.02%
Newell Brands, Inc. 16,690 458,474 0.02%Cable One, Inc. 238 455,249 0.02%VEREIT, Inc. REIT 9,867 453,191 0.02%Amdocs Ltd. 5,833 451,241 0.02%Proofpoint, Inc. 2,595 450,907 0.02%Jones Lang LaSalle, Inc. 2,294 448,385 0.02%Comerica, Inc. 6,282 448,158 0.02%Globe Life, Inc. 4,684 446,151 0.02%Bright Horizons Family Solutions, Inc. 3,025 445,008 0.02%
Jazz Pharmaceuticals plc 2,502 444,455 0.02%First Solar, Inc. 4,908 444,223 0.02%Intellia Therapeutics, Inc. 2,741 443,795 0.02%DXC Technology Co. 11,389 443,488 0.02%Invesco Ltd. 16,575 443,050 0.02%Federal Realty Investment Trust REIT 3,775 442,317 0.02%
Americold Realty Trust REIT 11,626 440,044 0.02%Dropbox, Inc. Class A 14,486 439,071 0.02%Sealed Air Corp. 7,402 438,569 0.02%Natera, Inc. 3,856 437,772 0.02%Cleveland-Cliffs, Inc. 20,289 437,431 0.02%Penumbra, Inc. 1,595 437,126 0.02%Assurant, Inc. 2,792 436,055 0.02%East West Bancorp, Inc. 6,079 435,804 0.02%Western Alliance Bancorp 4,691 435,559 0.02%Ciena Corp. 7,655 435,493 0.02%Beyond Meat, Inc. 2,751 433,255 0.02%Lamar Advertising Co. REIT Class A 4,130 431,255 0.02%
AO Smith Corp. 5,972 430,342 0.02%Donaldson Co., Inc. 6,733 427,747 0.02%Elastic NV 2,928 426,785 0.02%NiSource, Inc. 17,388 426,006 0.02%Gentex Corp. 12,865 425,703 0.02%Robert Half International, Inc. 4,782 425,455 0.02%
Berry Global Group, Inc. 6,481 422,691 0.02%Guidewire Software, Inc. 3,749 422,587 0.02%Watsco, Inc. 1,468 420,788 0.02%Reliance Steel & Aluminum Co. 2,787 420,558 0.02%
CubeSmart REIT 9,052 419,289 0.02%Universal Display Corp. 1,879 417,758 0.02%Commerce Bancshares, Inc. 5,587 416,567 0.02%

61
Vanguard ESG Developed World All Cap Equity Index Fund
.Number of
SharesFair Value
US Dollars ($)% of Total
Net AssetsUGI Corp. 8,969 415,354 0.02%Middleby Corp. 2,396 415,131 0.02%Western Union Co. 18,006 413,598 0.02%Ares Management Corp. Class A 6,485 412,381 0.02%
CyrusOne, Inc. REIT 5,750 411,240 0.02%Aramark 10,950 407,887 0.02%Neurocrine Biosciences, Inc. 4,170 405,824 0.02%
Alleghany Corp. 608 405,579 0.02%Flex Ltd. 22,671 405,131 0.02%Vornado Realty Trust REIT 8,661 404,209 0.02%Smartsheet, Inc. Class A 5,586 403,980 0.02%Franklin Resources, Inc. 12,624 403,842 0.02%Genpact Ltd. 8,843 401,737 0.02%Service Corp. International 7,496 401,711 0.02%Nielsen Holdings plc 16,266 401,282 0.02%Capri Holdings Ltd. 7,016 401,245 0.02%AptarGroup, Inc. 2,845 400,690 0.02%Aspen Technology, Inc. 2,907 399,829 0.02%Manhattan Associates, Inc. 2,752 398,600 0.02%National Retail Properties, Inc. REIT 8,477 397,402 0.02%
Kilroy Realty Corp. REIT 5,670 394,859 0.02%Tradeweb Markets, Inc. Class A 4,642 392,528 0.02%
Juniper Networks, Inc. 14,345 392,336 0.02%Campbell Soup Co. 8,605 392,302 0.02%Arrowhead Pharmaceuticals, Inc. 4,723 391,159 0.02%
Amedisys, Inc. 1,594 390,418 0.02%AGNC Investment Corp. REIT 23,050 389,314 0.02%
Arrow Electronics, Inc. 3,417 388,957 0.02%Autoliv, Inc. 3,975 388,596 0.02%Credicorp Ltd. 3,205 388,158 0.02%STORE Capital Corp. REIT 11,243 387,996 0.02%DaVita, Inc. 3,216 387,303 0.02%American Financial Group, Inc. 3,078 383,888 0.02%
Lennar Corp. Class B 4,709 383,548 0.02%Kohl's Corp. 6,940 382,463 0.02%Builders FirstSource, Inc. 8,943 381,508 0.02%Liberty Media Corp.-Liberty SiriusXM Class C 8,214 381,047 0.02%
WEX, Inc. 1,952 378,493 0.02%Delta Air Lines, Inc. 8,730 377,660 0.02%Kimco Realty Corp. REIT 17,998 375,258 0.01%Paylocity Holding Corp. 1,961 374,159 0.01%Syneos Health, Inc. Class A 4,180 374,068 0.01%US Foods Holding Corp. 9,704 372,245 0.01%SiteOne Landscape Supply, Inc. 2,196 371,695 0.01%
Globant SA 1,690 370,414 0.01%AGCO Corp. 2,824 368,193 0.01%Nutanix, Inc. Class A 9,614 367,447 0.01%XP, Inc. Class A 8,362 364,165 0.01%RenaissanceRe Holdings Ltd. 2,437 362,674 0.01%
Royal Gold, Inc. 3,156 360,100 0.01%Altice USA, Inc. Class A 10,532 359,562 0.01%Brunswick Corp. 3,608 359,429 0.01%Southwest Airlines Co. 6,696 355,491 0.01%Zions Bancorp NA 6,717 355,061 0.01%Vertiv Holdings Co. Class A 12,995 354,764 0.01%Tempur Sealy International, Inc. 9,027 353,768 0.01%
Silicon Laboratories, Inc. 2,306 353,395 0.01%SEI Investments Co. 5,692 352,733 0.01%Envista Holdings Corp. 8,154 352,334 0.01%PVH Corp. 3,257 350,421 0.01%Casey's General Stores, Inc. 1,794 349,184 0.01%
.Number of
SharesFair Value
US Dollars ($)% of Total
Net AssetsSynovus Financial Corp. 7,925 347,749 0.01%Omega Healthcare Investors, Inc. REIT 9,579 347,622 0.01%
Rollins, Inc. 10,159 347,438 0.01%Reinsurance Group of America, Inc. 3,045 347,130 0.01%
Fiverr International Ltd. 1,431 347,003 0.01%Life Storage, Inc. REIT 3,231 346,848 0.01%IAA, Inc. 6,332 345,347 0.01%First Industrial Realty Trust, Inc. REIT 6,587 344,039 0.01%
Encompass Health Corp. 4,371 341,069 0.01%United Therapeutics Corp. 1,897 340,341 0.01%Organon & Co. 11,242 340,183 0.01%Omnicell, Inc. 2,243 339,702 0.01%Athene Holding Ltd. Class A 5,019 338,783 0.01%Harley-Davidson, Inc. 7,337 336,181 0.01%Scotts Miracle-Gro Co. 1,751 336,052 0.01%Chemed Corp. 708 335,946 0.01%TopBuild Corp. 1,688 333,853 0.01%Old Republic International Corp. 13,369 333,022 0.01%
Crocs, Inc. 2,853 332,432 0.01%Voya Financial, Inc. 5,398 331,977 0.01%Rexford Industrial Realty, Inc. REIT 5,817 331,278 0.01%
Bruker Corp. 4,360 331,273 0.01%Denali Therapeutics, Inc. 4,190 328,664 0.01%YETI Holdings, Inc. 3,572 327,981 0.01%Pinnacle Financial Partners, Inc. 3,701 326,761 0.01%
Apartment Income Corp. REIT 6,876 326,129 0.01%
PPD, Inc. 7,061 325,441 0.01%Liberty Broadband Corp. Class A 1,932 324,904 0.01%
Dick's Sporting Goods, Inc. 3,211 321,710 0.01%People's United Financial, Inc. 18,750 321,375 0.01%
Fate Therapeutics, Inc. 3,700 321,123 0.01%Hill-Rom Holdings, Inc. 2,827 321,119 0.01%Lattice Semiconductor Corp. 5,714 321,013 0.01%Leggett & Platt, Inc. 6,179 320,134 0.01%Performance Food Group Co. 6,580 319,064 0.01%
ManpowerGroup, Inc. 2,683 319,036 0.01%Upwork, Inc. 5,451 317,739 0.01%New York Times Co. Class A 7,263 316,304 0.01%Brooks Automation, Inc. 3,312 315,567 0.01%Anaplan, Inc. 5,890 313,937 0.01%AerCap Holdings NV 6,102 312,483 0.01%Concentrix Corp. 1,942 312,274 0.01%Brixmor Property Group, Inc. REIT 13,634 312,082 0.01%
First Financial Bankshares, Inc. 6,330 310,993 0.01%
Starwood Property Trust, Inc. REIT 11,850 310,115 0.01%
Hanesbrands, Inc. 16,605 310,015 0.01%Bridgebio Pharma, Inc. 5,080 309,677 0.01%Shockwave Medical, Inc. 1,624 308,122 0.01%Virgin Galactic Holdings, Inc. 6,680 307,280 0.01%HealthEquity, Inc. 3,815 307,031 0.01%SLM Corp. 14,624 306,227 0.01%Affiliated Managers Group, Inc. 1,978 305,027 0.01%
Tenet Healthcare Corp. 4,537 303,934 0.01%Advanced Drainage Systems, Inc. 2,600 303,082 0.01%
Mattel, Inc. 15,076 303,028 0.01%Axalta Coating Systems Ltd. 9,923 302,552 0.01%Alcoa Corp. 8,191 301,756 0.01%
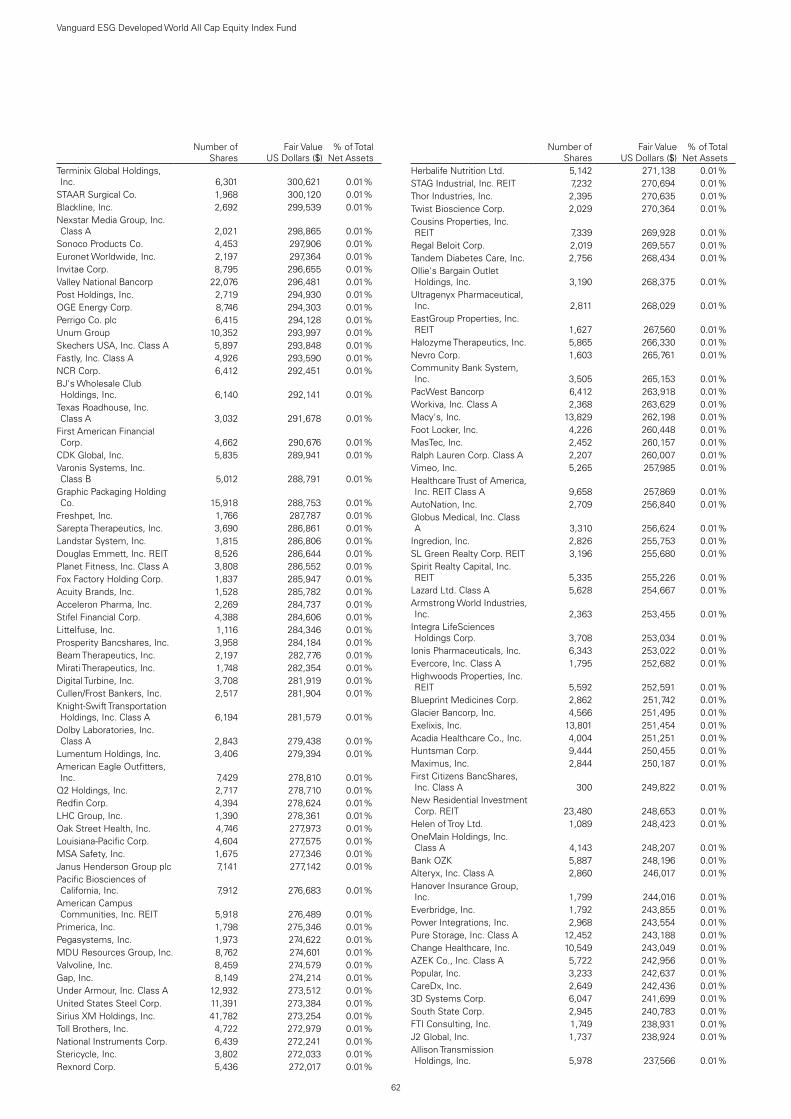
62
Vanguard ESG Developed World All Cap Equity Index Fund
.Number of
SharesFair Value
US Dollars ($)% of Total
Net AssetsTerminix Global Holdings, Inc. 6,301 300,621 0.01%
STAAR Surgical Co. 1,968 300,120 0.01%Blackline, Inc. 2,692 299,539 0.01%Nexstar Media Group, Inc. Class A 2,021 298,865 0.01%
Sonoco Products Co. 4,453 297,906 0.01%Euronet Worldwide, Inc. 2,197 297,364 0.01%Invitae Corp. 8,795 296,655 0.01%Valley National Bancorp 22,076 296,481 0.01%Post Holdings, Inc. 2,719 294,930 0.01%OGE Energy Corp. 8,746 294,303 0.01%Perrigo Co. plc 6,415 294,128 0.01%Unum Group 10,352 293,997 0.01%Skechers USA, Inc. Class A 5,897 293,848 0.01%Fastly, Inc. Class A 4,926 293,590 0.01%NCR Corp. 6,412 292,451 0.01%BJ's Wholesale Club Holdings, Inc. 6,140 292,141 0.01%
Texas Roadhouse, Inc. Class A 3,032 291,678 0.01%
First American Financial Corp. 4,662 290,676 0.01%
CDK Global, Inc. 5,835 289,941 0.01%Varonis Systems, Inc. Class B 5,012 288,791 0.01%
Graphic Packaging Holding Co. 15,918 288,753 0.01%
Freshpet, Inc. 1,766 287,787 0.01%Sarepta Therapeutics, Inc. 3,690 286,861 0.01%Landstar System, Inc. 1,815 286,806 0.01%Douglas Emmett, Inc. REIT 8,526 286,644 0.01%Planet Fitness, Inc. Class A 3,808 286,552 0.01%Fox Factory Holding Corp. 1,837 285,947 0.01%Acuity Brands, Inc. 1,528 285,782 0.01%Acceleron Pharma, Inc. 2,269 284,737 0.01%Stifel Financial Corp. 4,388 284,606 0.01%Littelfuse, Inc. 1,116 284,346 0.01%Prosperity Bancshares, Inc. 3,958 284,184 0.01%Beam Therapeutics, Inc. 2,197 282,776 0.01%Mirati Therapeutics, Inc. 1,748 282,354 0.01%Digital Turbine, Inc. 3,708 281,919 0.01%Cullen/Frost Bankers, Inc. 2,517 281,904 0.01%Knight-Swift Transportation Holdings, Inc. Class A 6,194 281,579 0.01%
Dolby Laboratories, Inc. Class A 2,843 279,438 0.01%
Lumentum Holdings, Inc. 3,406 279,394 0.01%American Eagle Outfitters, Inc. 7,429 278,810 0.01%
Q2 Holdings, Inc. 2,717 278,710 0.01%Redfin Corp. 4,394 278,624 0.01%LHC Group, Inc. 1,390 278,361 0.01%Oak Street Health, Inc. 4,746 277,973 0.01%Louisiana-Pacific Corp. 4,604 277,575 0.01%MSA Safety, Inc. 1,675 277,346 0.01%Janus Henderson Group plc 7,141 277,142 0.01%Pacific Biosciences of California, Inc. 7,912 276,683 0.01%
American Campus Communities, Inc. REIT 5,918 276,489 0.01%
Primerica, Inc. 1,798 275,346 0.01%Pegasystems, Inc. 1,973 274,622 0.01%MDU Resources Group, Inc. 8,762 274,601 0.01%Valvoline, Inc. 8,459 274,579 0.01%Gap, Inc. 8,149 274,214 0.01%Under Armour, Inc. Class A 12,932 273,512 0.01%United States Steel Corp. 11,391 273,384 0.01%Sirius XM Holdings, Inc. 41,782 273,254 0.01%Toll Brothers, Inc. 4,722 272,979 0.01%National Instruments Corp. 6,439 272,241 0.01%Stericycle, Inc. 3,802 272,033 0.01%Rexnord Corp. 5,436 272,017 0.01%
.Number of
SharesFair Value
US Dollars ($)% of Total
Net AssetsHerbalife Nutrition Ltd. 5,142 271,138 0.01%STAG Industrial, Inc. REIT 7,232 270,694 0.01%Thor Industries, Inc. 2,395 270,635 0.01%Twist Bioscience Corp. 2,029 270,364 0.01%Cousins Properties, Inc. REIT 7,339 269,928 0.01%
Regal Beloit Corp. 2,019 269,557 0.01%Tandem Diabetes Care, Inc. 2,756 268,434 0.01%Ollie's Bargain Outlet Holdings, Inc. 3,190 268,375 0.01%
Ultragenyx Pharmaceutical, Inc. 2,811 268,029 0.01%
EastGroup Properties, Inc. REIT 1,627 267,560 0.01%
Halozyme Therapeutics, Inc. 5,865 266,330 0.01%Nevro Corp. 1,603 265,761 0.01%Community Bank System, Inc. 3,505 265,153 0.01%
PacWest Bancorp 6,412 263,918 0.01%Workiva, Inc. Class A 2,368 263,629 0.01%Macy's, Inc. 13,829 262,198 0.01%Foot Locker, Inc. 4,226 260,448 0.01%MasTec, Inc. 2,452 260,157 0.01%Ralph Lauren Corp. Class A 2,207 260,007 0.01%Vimeo, Inc. 5,265 257,985 0.01%Healthcare Trust of America, Inc. REIT Class A 9,658 257,869 0.01%
AutoNation, Inc. 2,709 256,840 0.01%Globus Medical, Inc. Class A 3,310 256,624 0.01%
Ingredion, Inc. 2,826 255,753 0.01%SL Green Realty Corp. REIT 3,196 255,680 0.01%Spirit Realty Capital, Inc. REIT 5,335 255,226 0.01%
Lazard Ltd. Class A 5,628 254,667 0.01%Armstrong World Industries, Inc. 2,363 253,455 0.01%
Integra LifeSciences Holdings Corp. 3,708 253,034 0.01%
Ionis Pharmaceuticals, Inc. 6,343 253,022 0.01%Evercore, Inc. Class A 1,795 252,682 0.01%Highwoods Properties, Inc. REIT 5,592 252,591 0.01%
Blueprint Medicines Corp. 2,862 251,742 0.01%Glacier Bancorp, Inc. 4,566 251,495 0.01%Exelixis, Inc. 13,801 251,454 0.01%Acadia Healthcare Co., Inc. 4,004 251,251 0.01%Huntsman Corp. 9,444 250,455 0.01%Maximus, Inc. 2,844 250,187 0.01%First Citizens BancShares, Inc. Class A 300 249,822 0.01%
New Residential Investment Corp. REIT 23,480 248,653 0.01%
Helen of Troy Ltd. 1,089 248,423 0.01%OneMain Holdings, Inc. Class A 4,143 248,207 0.01%
Bank OZK 5,887 248,196 0.01%Alteryx, Inc. Class A 2,860 246,017 0.01%Hanover Insurance Group, Inc. 1,799 244,016 0.01%
Everbridge, Inc. 1,792 243,855 0.01%Power Integrations, Inc. 2,968 243,554 0.01%Pure Storage, Inc. Class A 12,452 243,188 0.01%Change Healthcare, Inc. 10,549 243,049 0.01%AZEK Co., Inc. Class A 5,722 242,956 0.01%Popular, Inc. 3,233 242,637 0.01%CareDx, Inc. 2,649 242,436 0.01%3D Systems Corp. 6,047 241,699 0.01%South State Corp. 2,945 240,783 0.01%FTI Consulting, Inc. 1,749 238,931 0.01%J2 Global, Inc. 1,737 238,924 0.01%Allison Transmission Holdings, Inc. 5,978 237,566 0.01%
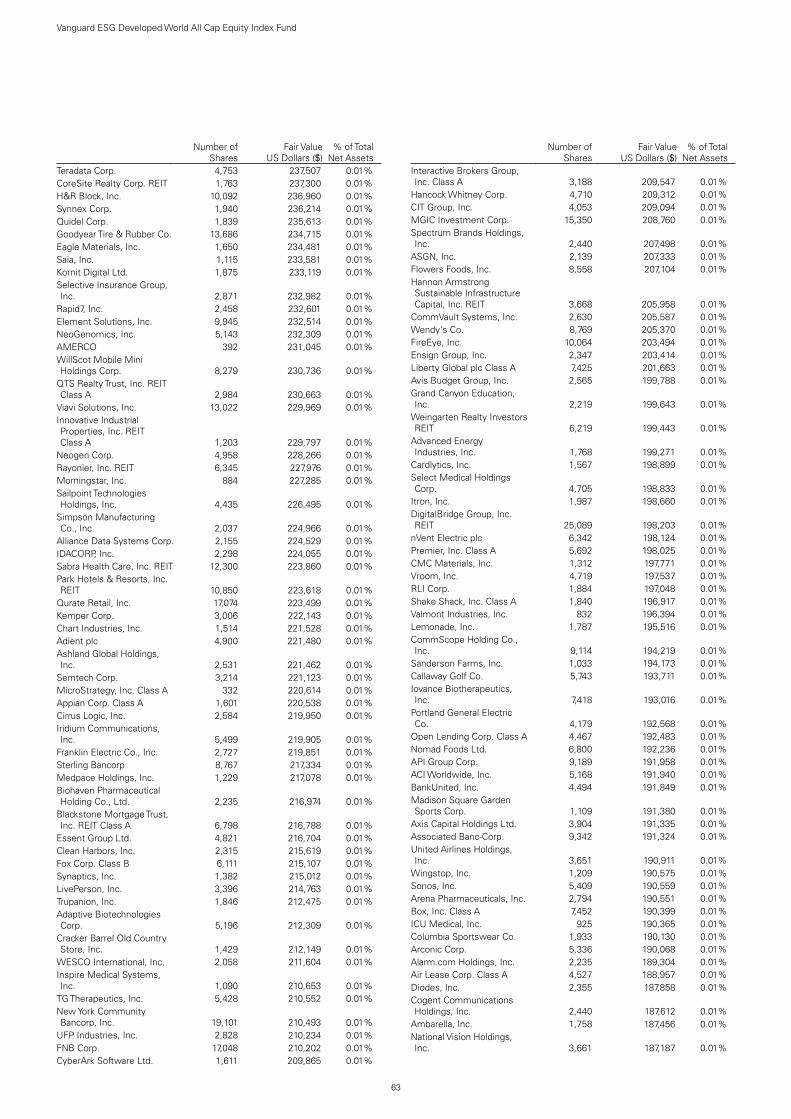
63
Vanguard ESG Developed World All Cap Equity Index Fund
.Number of
SharesFair Value
US Dollars ($)% of Total
Net AssetsTeradata Corp. 4,753 237,507 0.01%CoreSite Realty Corp. REIT 1,763 237,300 0.01%H&R Block, Inc. 10,092 236,960 0.01%Synnex Corp. 1,940 236,214 0.01%Quidel Corp. 1,839 235,613 0.01%Goodyear Tire & Rubber Co. 13,686 234,715 0.01%Eagle Materials, Inc. 1,650 234,481 0.01%Saia, Inc. 1,115 233,581 0.01%Kornit Digital Ltd. 1,875 233,119 0.01%Selective Insurance Group, Inc. 2,871 232,982 0.01%
Rapid7, Inc. 2,458 232,601 0.01%Element Solutions, Inc. 9,945 232,514 0.01%NeoGenomics, Inc. 5,143 232,309 0.01%AMERCO 392 231,045 0.01%WillScot Mobile Mini Holdings Corp. 8,279 230,736 0.01%
QTS Realty Trust, Inc. REIT Class A 2,984 230,663 0.01%
Viavi Solutions, Inc. 13,022 229,969 0.01%Innovative Industrial Properties, Inc. REIT Class A 1,203 229,797 0.01%
Neogen Corp. 4,958 228,266 0.01%Rayonier, Inc. REIT 6,345 227,976 0.01%Morningstar, Inc. 884 227,285 0.01%Sailpoint Technologies Holdings, Inc. 4,435 226,495 0.01%
Simpson Manufacturing Co., Inc. 2,037 224,966 0.01%
Alliance Data Systems Corp. 2,155 224,529 0.01%IDACORP, Inc. 2,298 224,055 0.01%Sabra Health Care, Inc. REIT 12,300 223,860 0.01%Park Hotels & Resorts, Inc. REIT 10,850 223,618 0.01%
Qurate Retail, Inc. 17,074 223,499 0.01%Kemper Corp. 3,006 222,143 0.01%Chart Industries, Inc. 1,514 221,528 0.01%Adient plc 4,900 221,480 0.01%Ashland Global Holdings, Inc. 2,531 221,462 0.01%
Semtech Corp. 3,214 221,123 0.01%MicroStrategy, Inc. Class A 332 220,614 0.01%Appian Corp. Class A 1,601 220,538 0.01%Cirrus Logic, Inc. 2,584 219,950 0.01%Iridium Communications, Inc. 5,499 219,905 0.01%
Franklin Electric Co., Inc. 2,727 219,851 0.01%Sterling Bancorp 8,767 217,334 0.01%Medpace Holdings, Inc. 1,229 217,078 0.01%Biohaven Pharmaceutical Holding Co., Ltd. 2,235 216,974 0.01%
Blackstone Mortgage Trust, Inc. REIT Class A 6,798 216,788 0.01%
Essent Group Ltd. 4,821 216,704 0.01%Clean Harbors, Inc. 2,315 215,619 0.01%Fox Corp. Class B 6,111 215,107 0.01%Synaptics, Inc. 1,382 215,012 0.01%LivePerson, Inc. 3,396 214,763 0.01%Trupanion, Inc. 1,846 212,475 0.01%Adaptive Biotechnologies Corp. 5,196 212,309 0.01%
Cracker Barrel Old Country Store, Inc. 1,429 212,149 0.01%
WESCO International, Inc. 2,058 211,604 0.01%Inspire Medical Systems, Inc. 1,090 210,653 0.01%
TG Therapeutics, Inc. 5,428 210,552 0.01%New York Community Bancorp, Inc. 19,101 210,493 0.01%
UFP Industries, Inc. 2,828 210,234 0.01%FNB Corp. 17,048 210,202 0.01%CyberArk Software Ltd. 1,611 209,865 0.01%
.Number of
SharesFair Value
US Dollars ($)% of Total
Net AssetsInteractive Brokers Group, Inc. Class A 3,188 209,547 0.01%
Hancock Whitney Corp. 4,710 209,312 0.01%CIT Group, Inc. 4,053 209,094 0.01%MGIC Investment Corp. 15,350 208,760 0.01%Spectrum Brands Holdings, Inc. 2,440 207,498 0.01%
ASGN, Inc. 2,139 207,333 0.01%Flowers Foods, Inc. 8,558 207,104 0.01%Hannon Armstrong Sustainable Infrastructure Capital, Inc. REIT 3,668 205,958 0.01%
CommVault Systems, Inc. 2,630 205,587 0.01%Wendy's Co. 8,769 205,370 0.01%FireEye, Inc. 10,064 203,494 0.01%Ensign Group, Inc. 2,347 203,414 0.01%Liberty Global plc Class A 7,425 201,663 0.01%Avis Budget Group, Inc. 2,565 199,788 0.01%Grand Canyon Education, Inc. 2,219 199,643 0.01%
Weingarten Realty Investors REIT 6,219 199,443 0.01%
Advanced Energy Industries, Inc. 1,768 199,271 0.01%
Cardlytics, Inc. 1,567 198,899 0.01%Select Medical Holdings Corp. 4,705 198,833 0.01%
Itron, Inc. 1,987 198,660 0.01%DigitalBridge Group, Inc. REIT 25,089 198,203 0.01%
nVent Electric plc 6,342 198,124 0.01%Premier, Inc. Class A 5,692 198,025 0.01%CMC Materials, Inc. 1,312 197,771 0.01%Vroom, Inc. 4,719 197,537 0.01%RLI Corp. 1,884 197,048 0.01%Shake Shack, Inc. Class A 1,840 196,917 0.01%Valmont Industries, Inc. 832 196,394 0.01%Lemonade, Inc. 1,787 195,516 0.01%CommScope Holding Co., Inc. 9,114 194,219 0.01%
Sanderson Farms, Inc. 1,033 194,173 0.01%Callaway Golf Co. 5,743 193,711 0.01%Iovance Biotherapeutics, Inc. 7,418 193,016 0.01%
Portland General Electric Co. 4,179 192,568 0.01%
Open Lending Corp. Class A 4,467 192,483 0.01%Nomad Foods Ltd. 6,800 192,236 0.01%API Group Corp. 9,189 191,958 0.01%ACI Worldwide, Inc. 5,168 191,940 0.01%BankUnited, Inc. 4,494 191,849 0.01%Madison Square Garden Sports Corp. 1,109 191,380 0.01%
Axis Capital Holdings Ltd. 3,904 191,335 0.01%Associated Banc-Corp. 9,342 191,324 0.01%United Airlines Holdings, Inc. 3,651 190,911 0.01%
Wingstop, Inc. 1,209 190,575 0.01%Sonos, Inc. 5,409 190,559 0.01%Arena Pharmaceuticals, Inc. 2,794 190,551 0.01%Box, Inc. Class A 7,452 190,399 0.01%ICU Medical, Inc. 925 190,365 0.01%Columbia Sportswear Co. 1,933 190,130 0.01%Arconic Corp. 5,336 190,068 0.01%Alarm.com Holdings, Inc. 2,235 189,304 0.01%Air Lease Corp. Class A 4,527 188,957 0.01%Diodes, Inc. 2,355 187,858 0.01%Cogent Communications Holdings, Inc. 2,440 187,612 0.01%
Ambarella, Inc. 1,758 187,456 0.01%National Vision Holdings, Inc. 3,661 187,187 0.01%
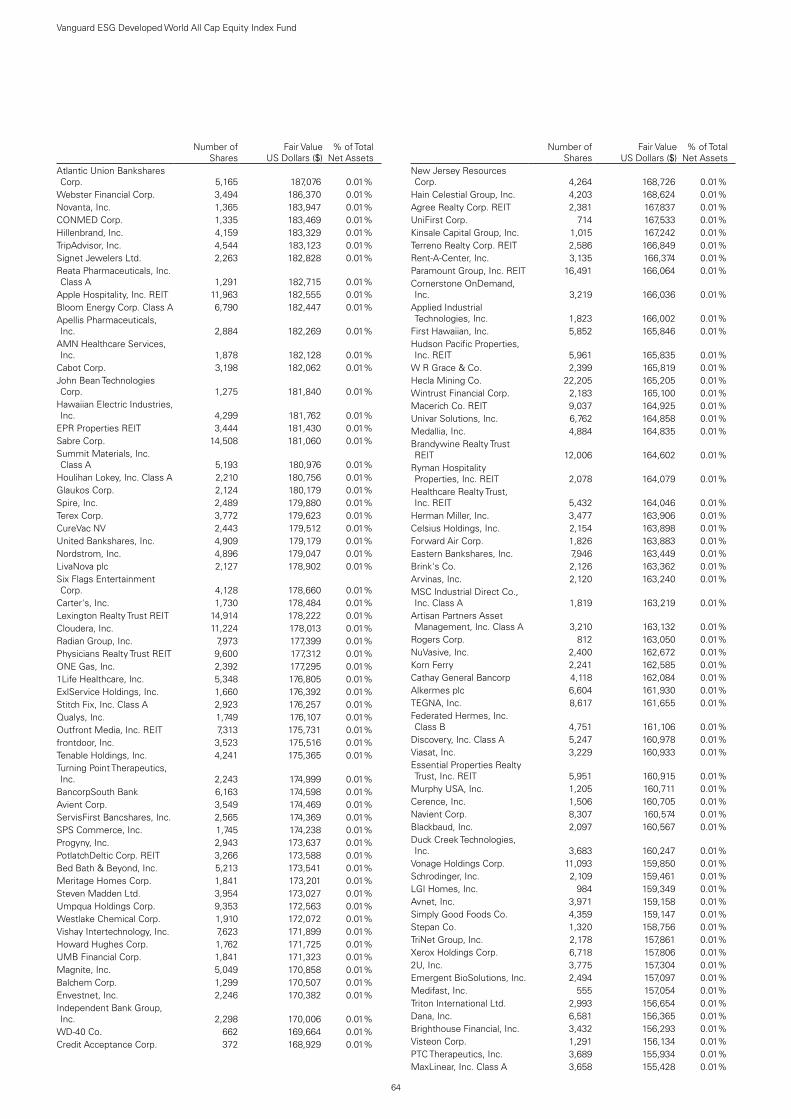
64
Vanguard ESG Developed World All Cap Equity Index Fund
.Number of
SharesFair Value
US Dollars ($)% of Total
Net AssetsAtlantic Union Bankshares Corp. 5,165 187,076 0.01%
Webster Financial Corp. 3,494 186,370 0.01%Novanta, Inc. 1,365 183,947 0.01%CONMED Corp. 1,335 183,469 0.01%Hillenbrand, Inc. 4,159 183,329 0.01%TripAdvisor, Inc. 4,544 183,123 0.01%Signet Jewelers Ltd. 2,263 182,828 0.01%Reata Pharmaceuticals, Inc. Class A 1,291 182,715 0.01%
Apple Hospitality, Inc. REIT 11,963 182,555 0.01%Bloom Energy Corp. Class A 6,790 182,447 0.01%Apellis Pharmaceuticals, Inc. 2,884 182,269 0.01%
AMN Healthcare Services, Inc. 1,878 182,128 0.01%
Cabot Corp. 3,198 182,062 0.01%John Bean Technologies Corp. 1,275 181,840 0.01%
Hawaiian Electric Industries, Inc. 4,299 181,762 0.01%
EPR Properties REIT 3,444 181,430 0.01%Sabre Corp. 14,508 181,060 0.01%Summit Materials, Inc. Class A 5,193 180,976 0.01%
Houlihan Lokey, Inc. Class A 2,210 180,756 0.01%Glaukos Corp. 2,124 180,179 0.01%Spire, Inc. 2,489 179,880 0.01%Terex Corp. 3,772 179,623 0.01%CureVac NV 2,443 179,512 0.01%United Bankshares, Inc. 4,909 179,179 0.01%Nordstrom, Inc. 4,896 179,047 0.01%LivaNova plc 2,127 178,902 0.01%Six Flags Entertainment Corp. 4,128 178,660 0.01%
Carter's, Inc. 1,730 178,484 0.01%Lexington Realty Trust REIT 14,914 178,222 0.01%Cloudera, Inc. 11,224 178,013 0.01%Radian Group, Inc. 7,973 177,399 0.01%Physicians Realty Trust REIT 9,600 177,312 0.01%ONE Gas, Inc. 2,392 177,295 0.01%1Life Healthcare, Inc. 5,348 176,805 0.01%ExlService Holdings, Inc. 1,660 176,392 0.01%Stitch Fix, Inc. Class A 2,923 176,257 0.01%Qualys, Inc. 1,749 176,107 0.01%Outfront Media, Inc. REIT 7,313 175,731 0.01%frontdoor, Inc. 3,523 175,516 0.01%Tenable Holdings, Inc. 4,241 175,365 0.01%Turning Point Therapeutics, Inc. 2,243 174,999 0.01%
BancorpSouth Bank 6,163 174,598 0.01%Avient Corp. 3,549 174,469 0.01%ServisFirst Bancshares, Inc. 2,565 174,369 0.01%SPS Commerce, Inc. 1,745 174,238 0.01%Progyny, Inc. 2,943 173,637 0.01%PotlatchDeltic Corp. REIT 3,266 173,588 0.01%Bed Bath & Beyond, Inc. 5,213 173,541 0.01%Meritage Homes Corp. 1,841 173,201 0.01%Steven Madden Ltd. 3,954 173,027 0.01%Umpqua Holdings Corp. 9,353 172,563 0.01%Westlake Chemical Corp. 1,910 172,072 0.01%Vishay Intertechnology, Inc. 7,623 171,899 0.01%Howard Hughes Corp. 1,762 171,725 0.01%UMB Financial Corp. 1,841 171,323 0.01%Magnite, Inc. 5,049 170,858 0.01%Balchem Corp. 1,299 170,507 0.01%Envestnet, Inc. 2,246 170,382 0.01%Independent Bank Group, Inc. 2,298 170,006 0.01%
WD-40 Co. 662 169,664 0.01%Credit Acceptance Corp. 372 168,929 0.01%
.Number of
SharesFair Value
US Dollars ($)% of Total
Net AssetsNew Jersey Resources Corp. 4,264 168,726 0.01%
Hain Celestial Group, Inc. 4,203 168,624 0.01%Agree Realty Corp. REIT 2,381 167,837 0.01%UniFirst Corp. 714 167,533 0.01%Kinsale Capital Group, Inc. 1,015 167,242 0.01%Terreno Realty Corp. REIT 2,586 166,849 0.01%Rent-A-Center, Inc. 3,135 166,374 0.01%Paramount Group, Inc. REIT 16,491 166,064 0.01%Cornerstone OnDemand, Inc. 3,219 166,036 0.01%
Applied Industrial Technologies, Inc. 1,823 166,002 0.01%
First Hawaiian, Inc. 5,852 165,846 0.01%Hudson Pacific Properties, Inc. REIT 5,961 165,835 0.01%
W R Grace & Co. 2,399 165,819 0.01%Hecla Mining Co. 22,205 165,205 0.01%Wintrust Financial Corp. 2,183 165,100 0.01%Macerich Co. REIT 9,037 164,925 0.01%Univar Solutions, Inc. 6,762 164,858 0.01%Medallia, Inc. 4,884 164,835 0.01%Brandywine Realty Trust REIT 12,006 164,602 0.01%
Ryman Hospitality Properties, Inc. REIT 2,078 164,079 0.01%
Healthcare Realty Trust, Inc. REIT 5,432 164,046 0.01%
Herman Miller, Inc. 3,477 163,906 0.01%Celsius Holdings, Inc. 2,154 163,898 0.01%Forward Air Corp. 1,826 163,883 0.01%Eastern Bankshares, Inc. 7,946 163,449 0.01%Brink's Co. 2,126 163,362 0.01%Arvinas, Inc. 2,120 163,240 0.01%MSC Industrial Direct Co., Inc. Class A 1,819 163,219 0.01%
Artisan Partners Asset Management, Inc. Class A 3,210 163,132 0.01%
Rogers Corp. 812 163,050 0.01%NuVasive, Inc. 2,400 162,672 0.01%Korn Ferry 2,241 162,585 0.01%Cathay General Bancorp 4,118 162,084 0.01%Alkermes plc 6,604 161,930 0.01%TEGNA, Inc. 8,617 161,655 0.01%Federated Hermes, Inc. Class B 4,751 161,106 0.01%
Discovery, Inc. Class A 5,247 160,978 0.01%Viasat, Inc. 3,229 160,933 0.01%Essential Properties Realty Trust, Inc. REIT 5,951 160,915 0.01%
Murphy USA, Inc. 1,205 160,711 0.01%Cerence, Inc. 1,506 160,705 0.01%Navient Corp. 8,307 160,574 0.01%Blackbaud, Inc. 2,097 160,567 0.01%Duck Creek Technologies, Inc. 3,683 160,247 0.01%
Vonage Holdings Corp. 11,093 159,850 0.01%Schrodinger, Inc. 2,109 159,461 0.01%LGI Homes, Inc. 984 159,349 0.01%Avnet, Inc. 3,971 159,158 0.01%Simply Good Foods Co. 4,359 159,147 0.01%Stepan Co. 1,320 158,756 0.01%TriNet Group, Inc. 2,178 157,861 0.01%Xerox Holdings Corp. 6,718 157,806 0.01%2U, Inc. 3,775 157,304 0.01%Emergent BioSolutions, Inc. 2,494 157,097 0.01%Medifast, Inc. 555 157,054 0.01%Triton International Ltd. 2,993 156,654 0.01%Dana, Inc. 6,581 156,365 0.01%Brighthouse Financial, Inc. 3,432 156,293 0.01%Visteon Corp. 1,291 156,134 0.01%PTC Therapeutics, Inc. 3,689 155,934 0.01%MaxLinear, Inc. Class A 3,658 155,428 0.01%

65
Vanguard ESG Developed World All Cap Equity Index Fund
.Number of
SharesFair Value
US Dollars ($)% of Total
Net AssetsSunnova Energy International, Inc. 4,126 155,385 0.01%
Kirby Corp. 2,561 155,299 0.01%Ryder System, Inc. 2,088 155,201 0.01%Evoqua Water Technologies Corp. 4,567 154,273 0.01%
Editas Medicine, Inc. Class A 2,709 153,438 0.01%
National Storage Affiliates Trust REIT 3,032 153,298 0.01%
Southwest Gas Holdings, Inc. 2,314 153,164 0.01%
JBG SMITH Properties REIT 4,849 152,792 0.01%Allakos, Inc. 1,783 152,215 0.01%J & J Snack Foods Corp. 872 152,086 0.01%National Health Investors, Inc. REIT 2,265 151,868 0.01%
Texas Capital Bancshares, Inc. 2,385 151,424 0.01%
Watts Water Technologies, Inc. Class A 1,030 150,287 0.01%
Cannae Holdings, Inc. 4,426 150,086 0.01%Lancaster Colony Corp. 773 149,583 0.01%Clearway Energy, Inc. Class C 5,646 149,506 0.01%
Home BancShares, Inc. 6,052 149,363 0.01%ACADIA Pharmaceuticals, Inc. 6,110 149,023 0.01%
Assured Guaranty Ltd. 3,128 148,517 0.01%United Community Banks, Inc. 4,637 148,430 0.01%
Maravai LifeSciences Holdings, Inc. Class A 3,553 148,267 0.01%
Sensient Technologies Corp. 1,708 147,844 0.01%FormFactor, Inc. 4,051 147,699 0.01%Sage Therapeutics, Inc. 2,595 147,422 0.01%Leslie's, Inc. 5,354 147,181 0.01%Lions Gate Entertainment Corp. Class B 8,035 147,040 0.01%
Renewable Energy Group, Inc. 2,358 146,998 0.01%
Covetrus, Inc. 5,438 146,826 0.01%Mimecast Ltd. 2,767 146,789 0.01%Insperity, Inc. 1,618 146,219 0.01%Badger Meter, Inc. 1,488 146,003 0.01%Hilton Grand Vacations, Inc. 3,525 145,900 0.01%Kulicke & Soffa Industries, Inc. 2,381 145,717 0.01%
Merit Medical Systems, Inc. 2,253 145,679 0.01%Allscripts Healthcare Solutions, Inc. 7,844 145,192 0.01%
R1 RCM, Inc. 6,503 144,627 0.01%LiveRamp Holdings, Inc. 3,074 144,017 0.01%New Relic, Inc. 2,142 143,450 0.01%FirstCash, Inc. 1,872 143,096 0.01%Minerals Technologies, Inc. 1,812 142,550 0.01%White Mountains Insurance Group Ltd. 124 142,356 0.01%
LCI Industries 1,082 142,196 0.01%American States Water Co. 1,785 142,015 0.01%Enstar Group Ltd. 594 141,918 0.01%Agios Pharmaceuticals, Inc. 2,573 141,798 0.01%Inari Medical, Inc. 1,520 141,786 0.01%Momentive Global, Inc. 6,697 141,106 0.01%Asbury Automotive Group, Inc. 823 141,038 0.01%
Avista Corp. 3,303 140,939 0.01%AtriCure, Inc. 1,771 140,493 0.01%Quaker Chemical Corp. 592 140,416 0.01%Sprouts Farmers Market, Inc. 5,648 140,353 0.01%
Northwest Bancshares, Inc. 10,264 140,001 0.01%Masonite International Corp. 1,249 139,626 0.01%
.Number of
SharesFair Value
US Dollars ($)% of Total
Net AssetsBandwidth, Inc. Class A 1,012 139,575 0.01%KB Home 3,418 139,181 0.01%Wolverine World Wide, Inc. 4,123 138,698 0.01%Towne Bank 4,554 138,533 0.01%Papa John's International, Inc. 1,326 138,487 0.01%
FuelCell Energy, Inc. 15,558 138,466 0.01%Stamps.com, Inc. 689 138,000 0.01%Uniti Group, Inc. REIT 12,969 137,342 0.01%Kodiak Sciences, Inc. 1,476 137,268 0.01%Urban Outfitters, Inc. 3,322 136,933 0.01%PROG Holdings, Inc. 2,833 136,352 0.01%Insight Enterprises, Inc. 1,363 136,314 0.01%Liberty Media Corp.-Liberty SiriusXM Class A 2,924 136,200 0.01%
Nu Skin Enterprises, Inc. Class A 2,403 136,130 0.01%
MDC Holdings, Inc. 2,681 135,659 0.01%Ameris Bancorp 2,675 135,435 0.01%Haemonetics Corp. 2,027 135,079 0.01%Insmed, Inc. 4,741 134,929 0.01%Intra-Cellular Therapies, Inc. 3,294 134,461 0.01%HB Fuller Co. 2,109 134,153 0.01%Taylor Morrison Home Corp. Class A 5,073 134,029 0.01%
WesBanco, Inc. 3,746 133,470 0.01%First Merchants Corp. 3,194 133,094 0.01%Fabrinet 1,383 132,588 0.01%Sandy Spring Bancorp, Inc. 3,001 132,434 0.01%OSI Systems, Inc. 1,302 132,335 0.01%Investors Bancorp, Inc. 9,276 132,276 0.01%EVERTEC, Inc. 3,026 132,085 0.01%California Water Service Group 2,377 132,019 0.01%
Arcosa, Inc. 2,239 131,519 0.01%Kontoor Brands, Inc. 2,320 130,871 0.01%Casella Waste Systems, Inc. Class A 2,063 130,856 0.01%
American Airlines Group, Inc. 6,159 130,632 0.01%
Cheesecake Factory, Inc. 2,411 130,628 0.01%Silgan Holdings, Inc. 3,147 130,601 0.01%Avangrid, Inc. 2,536 130,426 0.01%Columbia Banking System, Inc. 3,373 130,063 0.01%
Sunstone Hotel Investors, Inc. REIT 10,464 129,963 0.01%
CNO Financial Group, Inc. 5,499 129,886 0.01%Independent Bank Corp. 1,718 129,709 0.01%Patterson Cos, Inc. 4,239 128,823 0.01%Amicus Therapeutics, Inc. 13,361 128,800 0.01%Tri Pointe Homes, Inc. 6,004 128,666 0.01%Santander Consumer USA Holdings, Inc. 3,539 128,536 0.01%
SpringWorks Therapeutics, Inc. 1,557 128,312 0.01%
Xperi Holding Corp. 5,755 127,991 0.01%Welbilt, Inc. 5,506 127,464 0.01%Domtar Corp. 2,316 127,287 0.01%Karuna Therapeutics, Inc. 1,115 127,099 0.01%LendingTree, Inc. 598 126,704 0.01%Chimera Investment Corp. REIT 8,403 126,549 0.01%
Corporate Office Properties Trust REIT 4,511 126,263 0.01%
Werner Enterprises, Inc. 2,835 126,214 0.01%Pacific Premier Bancorp, Inc. 2,983 126,151 0.01%
Moelis & Co. Class A 2,214 125,954 0.01%NewMarket Corp. 391 125,894 0.01%Cavco Industries, Inc. 566 125,760 0.01%Rambus, Inc. 5,298 125,616 0.01%NBT Bancorp, Inc. 3,488 125,463 0.01%

66
Vanguard ESG Developed World All Cap Equity Index Fund
.Number of
SharesFair Value
US Dollars ($)% of Total
Net AssetsDorman Products, Inc. 1,210 125,441 0.01%Herc Holdings, Inc. 1,119 125,406 0.01%NorthWestern Corp. 2,081 125,318 0.01%Mack-Cali Realty Corp. REIT 7,270 124,680 0.01%eXp World Holdings, Inc. 3,215 124,646 0.01%Altair Engineering, Inc. Class A 1,807 124,629 0.01%
Shutterstock, Inc. 1,268 124,480 0.01%American Equity Investment Life Holding Co. 3,850 124,432 0.01%
8x8, Inc. 4,464 123,921 0.01%Academy Sports & Outdoors, Inc. 2,991 123,349 0.00%
Bank of Hawaii Corp. 1,462 123,130 0.00%Bloomin' Brands, Inc. 4,499 122,103 0.00%Ingevity Corp. 1,494 121,552 0.00%Nektar Therapeutics Class A 7,062 121,184 0.00%ODP Corp. 2,522 121,081 0.00%TreeHouse Foods, Inc. 2,718 121,005 0.00%First Commonwealth Financial Corp. 8,599 120,988 0.00%
Pebblebrook Hotel Trust REIT 5,133 120,882 0.00%
John Wiley & Sons, Inc. Class A 2,007 120,781 0.00%
Dun & Bradstreet Holdings, Inc. 5,644 120,612 0.00%
Equity Commonwealth REIT 4,601 120,546 0.00%Verint Systems, Inc. 2,674 120,517 0.00%Simmons First National Corp. Class A 4,106 120,470 0.00%
Plexus Corp. 1,316 120,296 0.00%Shenandoah Telecommunications Co. 2,460 119,335 0.00%
Relay Therapeutics, Inc. 3,256 119,137 0.00%Bluebird Bio, Inc. 3,725 119,125 0.00%American Well Corp. Class A 9,416 118,453 0.00%
TTM Technologies, Inc. 8,281 118,418 0.00%CBIZ, Inc. 3,596 117,841 0.00%Ormat Technologies, Inc. 1,692 117,645 0.00%Abercrombie & Fitch Co. Class A 2,530 117,468 0.00%
GATX Corp. 1,327 117,400 0.00%Prestige Consumer Healthcare, Inc. 2,237 116,548 0.00%
Energizer Holdings, Inc. 2,705 116,261 0.00%Xencor, Inc. 3,370 116,231 0.00%Installed Building Products, Inc. 948 115,997 0.00%
Encore Wire Corp. 1,530 115,959 0.00%Walker & Dunlop, Inc. 1,109 115,757 0.00%Beacon Roofing Supply, Inc. 2,170 115,552 0.00%KAR Auction Services, Inc. 6,577 115,426 0.00%Albany International Corp. Class A 1,291 115,235 0.00%
Cargurus, Inc. Class A 4,373 114,704 0.00%Macquarie Infrastructure Corp. 2,989 114,389 0.00%
Playtika Holding Corp. 4,798 114,384 0.00%Pacira BioSciences, Inc. 1,881 114,139 0.00%MACOM Technology Solutions Holdings, Inc. 1,779 113,998 0.00%
Integer Holdings Corp. 1,209 113,888 0.00%Tennant Co. 1,423 113,627 0.00%O-I Glass, Inc. 6,951 113,510 0.00%Workhorse Group, Inc. 6,831 113,326 0.00%NanoString Technologies, Inc. 1,740 112,735 0.00%
Ironwood Pharmaceuticals, Inc. Class A 8,754 112,664 0.00%
Mueller Industries, Inc. 2,596 112,433 0.00%First BanCorp 9,409 112,155 0.00%
.Number of
SharesFair Value
US Dollars ($)% of Total
Net AssetsAAON, Inc. 1,791 112,099 0.00%Brady Corp. Class A 2,000 112,080 0.00%Belden, Inc. 2,215 112,013 0.00%Dycom Industries, Inc. 1,501 111,870 0.00%Coeur Mining, Inc. 12,555 111,488 0.00%BOK Financial Corp. 1,278 110,675 0.00%PennyMac Financial Services, Inc. 1,787 110,294 0.00%
Grocery Outlet Holding Corp. 3,171 109,907 0.00%
PS Business Parks, Inc. REIT 742 109,875 0.00%
Comfort Systems USA, Inc. 1,394 109,833 0.00%Gibraltar Industries, Inc. 1,438 109,734 0.00%NetScout Systems, Inc. 3,844 109,708 0.00%Vir Biotechnology, Inc. 2,318 109,595 0.00%Group 1 Automotive, Inc. 704 108,719 0.00%Sanmina Corp. 2,778 108,231 0.00%Sleep Number Corp. 983 108,081 0.00%Hamilton Lane, Inc. Class A 1,184 107,886 0.00%nCino, Inc. 1,799 107,796 0.00%Graham Holdings Co. Class B 170 107,763 0.00%
Livent Corp. 5,543 107,312 0.00%Brinker International, Inc. 1,734 107,248 0.00%Magellan Health, Inc. 1,132 106,634 0.00%Kite Realty Group Trust REIT 4,791 105,450 0.00%Washington Federal, Inc. 3,304 105,001 0.00%Perficient, Inc. 1,305 104,948 0.00%Yelp, Inc. Class A 2,622 104,775 0.00%Fulton Financial Corp. 6,629 104,606 0.00%Helios Technologies, Inc. 1,337 104,353 0.00%South Jersey Industries, Inc. 4,003 103,798 0.00%Coty, Inc. Class A 11,096 103,637 0.00%Berkeley Lights, Inc. 2,302 103,153 0.00%First Midwest Bancorp, Inc. 5,199 103,096 0.00%First Financial Bancorp 4,362 103,074 0.00%SeaWorld Entertainment, Inc. 2,058 102,777 0.00%
Array Technologies, Inc. 6,588 102,773 0.00%International Bancshares Corp. 2,392 102,712 0.00%
Global Blood Therapeutics, Inc. 2,932 102,679 0.00%
Office Properties Income Trust REIT 3,486 102,175 0.00%
Green Dot Corp. Class A 2,179 102,086 0.00%Axos Financial, Inc. 2,199 102,012 0.00%Edgewell Personal Care Co. 2,313 101,541 0.00%CareTrust, Inc. REIT 4,363 101,352 0.00%SunPower Corp. Class A 3,451 100,838 0.00%Sally Beauty Holdings, Inc. 4,566 100,772 0.00%Veracyte, Inc. 2,512 100,430 0.00%Jack in the Box, Inc. 901 100,407 0.00%Old National Bancorp 5,684 100,095 0.00%Tanger Factory Outlet Centers, Inc. REIT 5,305 99,999 0.00%
Genworth Financial, Inc. Class A 25,604 99,856 0.00%
Retail Properties of America, Inc. REIT Class A 8,709 99,718 0.00%
CSG Systems International, Inc. 2,113 99,691 0.00%
Allogene Therapeutics, Inc. 3,821 99,652 0.00%REVOLUTION Medicines, Inc. 3,139 99,632 0.00%
Tronox Holdings plc Class A 4,412 98,829 0.00%MEDNAX, Inc. 3,273 98,681 0.00%Cadence BanCorp Class A 4,725 98,658 0.00%CVB Financial Corp. 4,782 98,461 0.00%Strategic Education, Inc. 1,293 98,346 0.00%Trinity Industries, Inc. 3,654 98,256 0.00%

67
Vanguard ESG Developed World All Cap Equity Index Fund
.Number of
SharesFair Value
US Dollars ($)% of Total
Net AssetsApollo Commercial Real Estate Finance, Inc. REIT 6,160 98,252 0.00%
Ubiquiti, Inc. 314 98,028 0.00%Gentherm Inc. 1,373 97,552 0.00%Community Trust Bancorp, Inc. 2,415 97,518 0.00%
Constellium SE Class A 5,133 97,270 0.00%Hub Group, Inc. Class A 1,471 97,057 0.00%RLJ Lodging Trust REIT 6,350 96,710 0.00%Under Armour, Inc. Class C 5,164 95,895 0.00%Global Net Lease, Inc. REIT 5,180 95,830 0.00%SITE Centers Corp. REIT 6,343 95,526 0.00%iRobot Corp. 1,022 95,445 0.00%Trinseo SA 1,591 95,205 0.00%Cognyte Software Ltd. 3,878 95,011 0.00%World Wrestling Entertainment, Inc. Class A 1,640 94,940 0.00%
Innospec, Inc. 1,046 94,778 0.00%Penske Automotive Group, Inc. 1,255 94,740 0.00%
Amkor Technology, Inc. 3,991 94,467 0.00%ESCO Technologies, Inc. 1,004 94,185 0.00%Washington REIT 4,093 94,139 0.00%WSFS Financial Corp. 2,008 93,553 0.00%Steelcase, Inc. Class A 6,191 93,546 0.00%Sykes Enterprises, Inc. 1,738 93,331 0.00%Gray Television, Inc. 3,985 93,249 0.00%Ladder Capital Corp. REIT Class A 8,072 93,151 0.00%
Urban Edge Properties REIT 4,873 93,074 0.00%Ferro Corp. 4,309 92,945 0.00%Coca-Cola Consolidated, Inc. 231 92,892 0.00%
Monro, Inc. 1,461 92,788 0.00%Proto Labs, Inc. 1,010 92,718 0.00%Appfolio, Inc. Class A 655 92,486 0.00%Veoneer, Inc. 4,012 92,477 0.00%Cinemark Holdings, Inc. 4,209 92,388 0.00%SPX Corp. 1,512 92,353 0.00%Trustmark Corp. 2,990 92,092 0.00%Avaya Holdings Corp. 3,417 91,917 0.00%Kaiser Aluminum Corp. 742 91,630 0.00%Deluxe Corp. 1,916 91,527 0.00%Covanta Holding Corp. 5,190 91,396 0.00%Newmark Group, Inc. Class A 7,591 91,168 0.00%
Virtus Investment Partners, Inc. 327 90,831 0.00%
Myriad Genetics, Inc. 2,967 90,731 0.00%Renasant Corp. 2,263 90,520 0.00%HNI Corp. 2,054 90,314 0.00%Alexander & Baldwin, Inc. REIT 4,929 90,299 0.00%
Virtu Financial, Inc. Class A 3,263 90,157 0.00%Columbia Property Trust, Inc. REIT 5,178 90,045 0.00%
FibroGen, Inc. 3,381 90,036 0.00%Ortho Clinical Diagnostics Holdings plc 4,199 89,901 0.00%
Healthcare Services Group, Inc. 2,845 89,817 0.00%
Core-Mark Holding Co., Inc. 1,992 89,660 0.00%1st Source Corp. 1,912 88,832 0.00%Sotera Health Co. 3,665 88,803 0.00%MakeMyTrip Ltd. 2,955 88,798 0.00%Mr Cooper Group, Inc. 2,678 88,535 0.00%McGrath RentCorp 1,084 88,422 0.00%Nelnet, Inc. Class A 1,175 88,395 0.00%Greif, Inc. Class A 1,459 88,342 0.00%Hilltop Holdings, Inc. 2,415 87,906 0.00%Boise Cascade Co. 1,503 87,700 0.00%PennyMac Mortgage Investment Trust REIT 4,162 87,652 0.00%
.Number of
SharesFair Value
US Dollars ($)% of Total
Net AssetsMGE Energy, Inc. 1,174 87,393 0.00%Kennedy-Wilson Holdings, Inc. 4,384 87,110 0.00%
Retail Opportunity Investments Corp. REIT 4,932 87,099 0.00%
BGC Partners, Inc. Class A 15,354 87,057 0.00%Dine Brands Global, Inc. 974 86,929 0.00%Banner Corp. 1,599 86,682 0.00%Xenia Hotels & Resorts, Inc. REIT 4,626 86,645 0.00%
Flagstar Bancorp, Inc. 2,047 86,527 0.00%Cimpress plc 795 86,186 0.00%Dave & Buster's Entertainment, Inc. 2,121 86,113 0.00%
Safehold, Inc. REIT 1,096 86,036 0.00%Atlantica Sustainable Infrastructure plc 2,310 85,978 0.00%
Oxford Industries, Inc. 867 85,694 0.00%B&G Foods, Inc. 2,609 85,575 0.00%Two Harbors Investment Corp. REIT 11,310 85,504 0.00%
Big Lots, Inc. 1,292 85,285 0.00%Compass Minerals International, Inc. 1,438 85,216 0.00%
TTEC Holdings, Inc. 826 85,152 0.00%Granite Construction, Inc. 2,044 84,887 0.00%Cushman & Wakefield plc 4,854 84,799 0.00%Knowles Corp. 4,293 84,744 0.00%TriMas Corp. 2,786 84,499 0.00%Otter Tail Corp. 1,726 84,246 0.00%Hope Bancorp, Inc. 5,919 83,931 0.00%Verra Mobility Corp. Class A 5,453 83,813 0.00%Hostess Brands, Inc. Class A 5,170 83,702 0.00%
Allegro MicroSystems, Inc. 3,019 83,626 0.00%Lindsay Corp. 505 83,466 0.00%Matthews International Corp. Class A 2,320 83,427 0.00%
Acushnet Holdings Corp. 1,686 83,288 0.00%Central Garden & Pet Co. Class A 1,718 82,979 0.00%
Federal Signal Corp. 2,061 82,914 0.00%Acadia Realty Trust REIT 3,770 82,789 0.00%St Joe Co. 1,852 82,618 0.00%Great Western Bancorp, Inc. 2,512 82,368 0.00%Deciphera Pharmaceuticals, Inc. 2,247 82,263 0.00%
Petco Health & Wellness Co., Inc. Class A 3,666 82,155 0.00%
Piedmont Office Realty Trust, Inc. REIT Class A 4,434 81,896 0.00%
Ligand Pharmaceuticals, Inc. 624 81,863 0.00%
DiamondRock Hospitality Co. REIT 8,428 81,752 0.00%
MFA Financial, Inc. REIT 17,779 81,606 0.00%iRhythm Technologies, Inc. 1,228 81,478 0.00%Winnebago Industries, Inc. 1,196 81,280 0.00%Harsco Corp. 3,978 81,231 0.00%S&T Bancorp, Inc. 2,593 81,161 0.00%Luminex Corp. 2,189 80,555 0.00%Provident Financial Services, Inc. 3,498 80,069 0.00%
Adtalem Global Education, Inc. 2,241 79,869 0.00%
Encore Capital Group, Inc. 1,669 79,094 0.00%USANA Health Sciences, Inc. 770 78,871 0.00%
SJW Group 1,244 78,745 0.00%PriceSmart, Inc. 861 78,360 0.00%Piper Sandler Cos 604 78,254 0.00%WW International, Inc. 2,161 78,099 0.00%InterDigital, Inc. 1,069 78,069 0.00%

68
Vanguard ESG Developed World All Cap Equity Index Fund
.Number of
SharesFair Value
US Dollars ($)% of Total
Net AssetsCohen & Steers, Inc. 951 78,068 0.00%Rush Enterprises, Inc. Class A 1,796 77,659 0.00%
Telephone & Data Systems, Inc. 3,410 77,271 0.00%
Four Corners Property Trust, Inc. REIT 2,797 77,225 0.00%
Bank of NT Butterfield & Son Ltd. 2,169 76,891 0.00%
Supernus Pharmaceuticals, Inc. 2,474 76,174 0.00%
Corcept Therapeutics, Inc. 3,456 76,032 0.00%Argo Group International Holdings Ltd. 1,449 75,102 0.00%
Schweitzer-Mauduit International, Inc. 1,844 74,461 0.00%
Centerspace REIT 934 73,693 0.00%Northwest Natural Holding Co. 1,398 73,423 0.00%
Scorpio Tankers, Inc. 3,325 73,316 0.00%Realogy Holdings Corp. 3,997 72,825 0.00%Westamerica BanCorp 1,253 72,712 0.00%Capitol Federal Financial, Inc. 6,169 72,671 0.00%
JELD-WEN Holding, Inc. 2,756 72,373 0.00%Inogen, Inc. 1,108 72,208 0.00%Laureate Education, Inc. Class A 4,970 72,115 0.00%
Upstart Holdings, Inc. 571 71,318 0.00%Bottomline Technologies DE, Inc. 1,917 71,082 0.00%
Inovio Pharmaceuticals, Inc. 7,650 70,915 0.00%REGENXBIO, Inc. 1,804 70,085 0.00%eHealth, Inc. 1,198 69,963 0.00%Schneider National, Inc. Class B 3,203 69,729 0.00%
Inter Parfums, Inc. 967 69,624 0.00%Horace Mann Educators Corp. 1,859 69,564 0.00%
Getty Realty Corp. REIT 2,220 69,153 0.00%Progress Software Corp. 1,495 69,144 0.00%La-Z-Boy, Inc. 1,856 68,746 0.00%CNA Financial Corp. 1,511 68,735 0.00%Meritor, Inc. 2,915 68,269 0.00%Patrick Industries, Inc. 932 68,036 0.00%Vicor Corp. 643 67,991 0.00%ProAssurance Corp. 2,968 67,522 0.00%AMC Networks, Inc. Class A 995 66,466 0.00%
Rocket Pharmaceuticals, Inc. 1,492 66,081 0.00%
NMI Holdings, Inc. Class A 2,937 66,024 0.00%SolarWinds Corp. 3,877 65,483 0.00%Madrigal Pharmaceuticals, Inc. 668 65,070 0.00%
Eagle Bancorp, Inc. 1,158 64,941 0.00%Heron Therapeutics, Inc. 4,155 64,486 0.00%Huron Consulting Group, Inc. 1,301 63,944 0.00%
PROS Holdings, Inc. 1,401 63,844 0.00%Afya Ltd. Class A 2,476 63,831 0.00%Palomar Holdings, Inc. 842 63,537 0.00%Astec Industries, Inc. 1,007 63,381 0.00%Primoris Services Corp. 2,153 63,363 0.00%OPKO Health, Inc. 15,583 63,111 0.00%FARO Technologies, Inc. 805 62,605 0.00%TFS Financial Corp. 3,044 61,793 0.00%American Woodmark Corp. 755 61,676 0.00%American Assets Trust, Inc. REIT 1,624 60,559 0.00%
PRA Group, Inc. 1,573 60,513 0.00%Mercury General Corp. 928 60,274 0.00%Axsome Therapeutics, Inc. 892 60,174 0.00%
.Number of
SharesFair Value
US Dollars ($)% of Total
Net AssetsStratasys Ltd. 2,250 58,185 0.00%Liberty Latin America Ltd. Class A 4,142 57,408 0.00%
Liberty Latin America Ltd. Class C 4,064 57,302 0.00%
G-III Apparel Group Ltd. 1,727 56,749 0.00%Avanos Medical, Inc. 1,559 56,701 0.00%ADT, Inc. 5,252 56,669 0.00%Cal-Maine Foods, Inc. 1,545 55,944 0.00%Empire State Realty Trust, Inc. REIT Class A 4,620 55,440 0.00%
Alaska Air Group, Inc. 908 54,761 0.00%Buckle, Inc. 1,097 54,576 0.00%Calavo Growers, Inc. 834 52,892 0.00%US Ecology, Inc. 1,406 52,753 0.00%Children's Place, Inc. 560 52,114 0.00%Meredith Corp. 1,193 51,824 0.00%Certara, Inc. 1,828 51,787 0.00%JetBlue Airways Corp. 3,074 51,582 0.00%Guess?, Inc. 1,920 50,688 0.00%Plantronics, Inc. 1,212 50,577 0.00%Evolent Health, Inc. Class A 2,389 50,456 0.00%Redwood Trust, Inc. REIT 4,177 50,416 0.00%Brightsphere Investment Group, Inc. 2,086 48,875 0.00%
Sinclair Broadcast Group, Inc. Class A 1,438 47,770 0.00%
Yext, Inc. 3,309 47,286 0.00%Tivity Health, Inc. 1,787 47,016 0.00%Atara Biotherapeutics, Inc. 2,906 45,188 0.00%Brookdale Senior Living, Inc. 5,677 44,848 0.00%
CorVel Corp. 326 43,782 0.00%Greenbrier Cos, Inc. 991 43,188 0.00%Reynolds Consumer Products, Inc. 1,379 41,853 0.00%
Berkshire Hills Bancorp, Inc. 1,512 41,444 0.00%Knoll, Inc. 1,571 40,830 0.00%Myovant Sciences Ltd. 1,785 40,644 0.00%Endo International plc 8,612 40,304 0.00%Orion Engineered Carbons SA 2,083 39,556 0.00%
Alector, Inc. 1,893 39,431 0.00%Pennant Group, Inc. 959 39,223 0.00%Apartment Investment & Management Co. REIT Class A 5,838 39,173 0.00%
GCP Applied Technologies, Inc. 1,678 39,030 0.00%
uniQure NV 1,266 38,993 0.00%Saul Centers, Inc. REIT 853 38,769 0.00%H&E Equipment Services, Inc. 1,162 38,660 0.00%
EW Scripps Co. Class A 1,880 38,333 0.00%Atlas Corp. 2,678 38,162 0.00%iStar, Inc. REIT 1,840 38,143 0.00%Washington Trust Bancorp, Inc. 740 37,999 0.00%
Heartland Financial USA, Inc. 808 37,968 0.00%
Kraton Corp. 1,175 37,941 0.00%AAR Corp. 966 37,432 0.00%Boston Private Financial Holdings, Inc. 2,518 37,140 0.00%
RPT Realty REIT 2,829 36,720 0.00%WisdomTree Investments, Inc. 5,687 35,259 0.00%
Stock Yards Bancorp, Inc. 690 35,114 0.00%LTC Properties, Inc. REIT 905 34,743 0.00%Apogee Enterprises, Inc. 848 34,539 0.00%BrightSpire Capital, Inc. REIT 3,579 33,643 0.00%

69
Vanguard ESG Developed World All Cap Equity Index Fund
.Number of
SharesFair Value
US Dollars ($)% of Total
Net AssetsAmerican National Group, Inc. 224 33,275 0.00%
TrueBlue, Inc. 1,164 32,720 0.00%Allegiant Travel Co. 163 31,622 0.00%Aaron's Co., Inc. 984 31,478 0.00%Employers Holdings, Inc. 733 31,372 0.00%Kelly Services, Inc. Class A 1,288 30,873 0.00%American Axle & Manufacturing Holdings, Inc. 2,980 30,843 0.00%
Liberty Media Corp.-Liberty Formula One Class A 717 30,566 0.00%
Liberty Media Corp.-Liberty Braves Class C 1,094 30,380 0.00%
Century Aluminum Co. 2,339 30,150 0.00%National Beverage Corp. 638 30,133 0.00%BancFirst Corp. 482 30,091 0.00%IMAX Corp. 1,381 29,691 0.00%Summit Hotel Properties, Inc. REIT 3,178 29,651 0.00%
CTS Corp. 780 28,985 0.00%EchoStar Corp. Class A 1,189 28,881 0.00%Spirit Airlines, Inc. 946 28,796 0.00%NextGen Healthcare, Inc. 1,721 28,551 0.00%Ebix, Inc. 830 28,137 0.00%Zogenix, Inc. 1,610 27,821 0.00%Brookline Bancorp, Inc. 1,851 27,672 0.00%City Holding Co. 365 27,463 0.00%NETGEAR, Inc. 706 27,054 0.00%ChemoCentryx, Inc. 2,019 27,034 0.00%Safety Insurance Group, Inc. 343 26,850 0.00%Matson, Inc. 412 26,368 0.00%Scholastic Corp. 695 26,334 0.00%Copa Holdings SA Class A 342 25,763 0.00%ARMOUR Residential, Inc. REIT 2,236 25,535 0.00%
SiriusPoint Ltd. 2,500 25,175 0.00%Benchmark Electronics, Inc. 868 24,703 0.00%Forrester Research, Inc. 523 23,953 0.00%ACCO Brands Corp. 2,773 23,931 0.00%Marcus & Millichap, Inc. 613 23,827 0.00%Varex Imaging Corp. 888 23,816 0.00%Kearny Financial Corp. 1,989 23,769 0.00%Blucora, Inc. 1,363 23,594 0.00%
.Number of
SharesFair Value
US Dollars ($)% of Total
Net AssetsTutor Perini Corp. 1,698 23,517 0.00%Immunovant, Inc. 2,219 23,455 0.00%Fresh Del Monte Produce, Inc. 711 23,378 0.00%
Precigen, Inc. 3,547 23,126 0.00%Diversified Healthcare Trust REIT 5,526 23,099 0.00%
SkyWest, Inc. 504 21,707 0.00%Orthofix Medical, Inc. 538 21,579 0.00%Columbia Financial, Inc. 1,253 21,577 0.00%Radius Health, Inc. 1,132 20,648 0.00%Natus Medical, Inc. 788 20,472 0.00%United States Cellular Corp. 556 20,188 0.00%Innoviva, Inc. 1,480 19,847 0.00%Enanta Pharmaceuticals, Inc. 437 19,232 0.00%
Neenah, Inc. 377 18,914 0.00%Amneal Pharmaceuticals, Inc. 3,673 18,806 0.00%
ScanSource, Inc. 661 18,594 0.00%Universal Health Realty Income Trust REIT 297 18,280 0.00%
Taro Pharmaceutical Industries Ltd. 252 18,134 0.00%
Alexander's, Inc. REIT 67 17,953 0.00%Republic Bancorp, Inc. Class A 386 17,806 0.00%
Heartland Express, Inc. 1,020 17,473 0.00%Theravance Biopharma, Inc. 1,141 16,567 0.00%Tootsie Roll Industries, Inc. 471 15,972 0.00%Epizyme, Inc. 1,797 14,933 0.00%SFL Corp., Ltd. 1,942 14,856 0.00%Weis Markets, Inc. 286 14,775 0.00%ATN International, Inc. 296 13,465 0.00%Esperion Therapeutics, Inc. 586 12,394 0.00%Intercept Pharmaceuticals, Inc. 580 11,583 0.00%
Liberty Media Corp.-Liberty Braves Class A 358 10,103 0.00%
Clearway Energy, Inc. Class A 120 3,026 0.00%
test test 1,684,068,966 66.32%Total Equities 2,482,534,612 97.77%Financial Assets at Fair Value Through Profit or Loss 2,482,534,612 97.77%
testNumber of Contracts
Notional Amount
Unrealised Gain/(Loss)
US Dollars ($)% of Total
Net AssetsFinancial Derivative InstrumentsFutures 0.02% (2020: 0.04%)S&P 500 E-mini September 2021 193 $40,898,684 485,341 0.02 %Topix Index September 2021 31 ¥607,234,554 (44,189 ) (0.00 %)Euro Stoxx 600 Index September 2021 386 €8,779,515 (84,619 ) (0.00 %)test test test 356,533 0.02 %
CurrencyBuy
Amount Currency(Sell)
Amount CounterpartySettlement
Date
Unrealised Gain/(Loss)
US Dollars ($)% of Total
Net AssetsForward Currency Exchange Contracts (0.01%) (2020: 0.01%)USD 9,470,790 EUR (7,766,820) JPMorgan Chase Bank 15/9/2021 245,553 0.01 %USD 4,632,506 JPY (507,390,000) JPMorgan Chase Bank 15/9/2021 58,003 0.00 %USD 594,520 GBP (421,383) JPMorgan Chase Bank 15/9/2021 12,302 0.00 %USD 1,358,164 EUR (1,137,000) Citibank NA 15/9/2021 7,663 0.00 %USD 172,649 JPY (18,730,000) BNP Paribas 2/7/2021 3,895 0.00 %EUR 755,040 USD (896,700) BNP Paribas 15/9/2021 118 0.00 %USD 189,016 EUR (159,145) Morgan Stanley 15/9/2021 (13 ) (0.00 %)JPY 19,440,000 USD (175,485) Citibank NA 15/9/2021 (219 ) (0.00 %)JPY 38,860,000 USD (351,039) Citibank NA 15/9/2021 (687 ) (0.00 %)JPY 38,000,000 USD (343,430) Citibank NA 15/9/2021 (831 ) (0.00 %)JPY 39,170,000 USD (354,309) Morgan Stanley 15/9/2021 (1,162 ) (0.00 %)JPY 19,710,000 USD (178,944) JPMorgan Chase Bank 15/9/2021 (1,243 ) (0.00 %)JPY 19,410,000 USD (176,279) JPMorgan Chase Bank 15/9/2021 (1,283 ) (0.00 %)

70
Vanguard ESG Developed World All Cap Equity Index Fund
CurrencyBuy
Amount Currency(Sell)
Amount CounterpartySettlement
Date
Unrealised Gain/(Loss)
US Dollars ($)% of Total
Net AssetsEUR 158,585 USD (189,789) BNP Paribas 15/9/2021 (1,426 ) (0.00 %)JPY 39,160,000 USD (354,601) Morgan Stanley 15/9/2021 (1,544 ) (0.00 %)EUR 471,765 USD (562,280) Citibank NA 15/9/2021 (1,929 ) (0.00 %)EUR 455,900 USD (543,582) Morgan Stanley 15/9/2021 (2,075 ) (0.00 %)EUR 434,055 USD (517,878) JPMorgan Chase Bank 15/9/2021 (2,318 ) (0.00 %)JPY 39,250,000 USD (356,296) BNP Paribas 15/9/2021 (2,428 ) (0.00 %)JPY 39,160,000 USD (355,970) BNP Paribas 15/9/2021 (2,913 ) (0.00 %)EUR 523,365 USD (625,170) Morgan Stanley 15/9/2021 (3,530 ) (0.00 %)EUR 433,580 USD (518,663) JPMorgan Chase Bank 15/9/2021 (3,667 ) (0.00 %)JPY 39,030,000 USD (355,840) JPMorgan Chase Bank 15/9/2021 (3,955 ) (0.00 %)JPY 18,730,000 USD (173,244) Goldman Sachs International 2/7/2021 (4,490 ) (0.00 %)JPY 39,290,000 USD (358,763) JPMorgan Chase Bank 15/9/2021 (4,534 ) (0.00 %)EUR 541,680 USD (648,395) Citibank NA 15/9/2021 (5,001 ) (0.00 %)JPY 58,725,000 USD (537,068) Citibank NA 15/9/2021 (7,618 ) (0.00 %)EUR 433,295 USD (526,012) JPMorgan Chase Bank 15/9/2021 (11,355 ) (0.00 %)EUR 452,200 USD (548,618) JPMorgan Chase Bank 15/9/2021 (11,506 ) (0.00 %)EUR 477,960 USD (580,602) BNP Paribas 15/9/2021 (12,893 ) (0.00 %)JPY 157,800,000 USD (1,436,295) JPMorgan Chase Bank 15/9/2021 (13,609 ) (0.00 %)EUR 612,495 USD (747,743) Morgan Stanley 15/9/2021 (20,237 ) (0.00 %)JPY 307,889,658 USD (2,810,622) Bank of America 15/9/2021 (34,765 ) (0.00 %)EUR 1,085,520 USD (1,325,387) Citibank NA 15/9/2021 (36,034 ) (0.00 %)EUR 2,578,680 USD (3,132,072) JPMorgan Chase Bank 15/9/2021 (69,180 ) (0.01 %)EUR 7,514,380 USD (9,144,013) Standard Chartered Bank 15/9/2021 (218,617 ) (0.01 %)test (153,528 ) (0.01 %)Hedge Share Class Level Forward Currency Exchange Contracts (0.04%) (2020: 0.00%)KRW 1,301,116,910 EUR (965,379) BNP Paribas 2/7/2021 10,523 0.00 %KRW 1,006,570,258 EUR (751,467) BNP Paribas 2/7/2021 2,651 0.00 %EUR 32,131,318 USD (38,129,432) Morgan Stanley 3/8/2021 892 0.00 %EUR 50,582 NZD (85,045) Morgan Stanley 2/7/2021 560 0.00 %EUR 57,770 CHF (62,934) BNP Paribas 2/7/2021 425 0.00 %EUR 65,423 GBP (55,964) BNP Paribas 2/7/2021 275 0.00 %EUR 33,566 PLN (150,572) Morgan Stanley 2/7/2021 255 0.00 %EUR 48,290 CHF (52,709) BNP Paribas 2/7/2021 244 0.00 %EUR 91,203 NOK (928,806) Morgan Stanley 2/7/2021 222 0.00 %EUR 53,373 AUD (84,043) BNP Paribas 2/7/2021 200 0.00 %KRW 64,792,399 EUR (48,372) BNP Paribas 2/7/2021 171 0.00 %KRW 57,024,872 EUR (42,573) BNP Paribas 2/7/2021 150 0.00 %EUR 26,502 SEK (267,602) Morgan Stanley 2/7/2021 138 0.00 %KRW 50,774,767 EUR (37,907) BNP Paribas 2/7/2021 134 0.00 %KRW 49,525,581 EUR (36,974) BNP Paribas 2/7/2021 130 0.00 %EUR 37,858 AUD (59,648) Morgan Stanley 2/7/2021 115 0.00 %EUR 13,167 SEK (132,601) Morgan Stanley 2/7/2021 110 0.00 %KRW 35,842,507 EUR (26,759) BNP Paribas 2/7/2021 94 0.00 %EUR 22,231 SEK (224,682) BNP Paribas 2/7/2021 92 0.00 %EUR 42,588 AUD (67,154) Morgan Stanley 2/7/2021 90 0.00 %EUR 450,818 SEK (4,571,637) Morgan Stanley 2/7/2021 66 0.00 %KRW 22,863,121 EUR (17,069) BNP Paribas 2/7/2021 60 0.00 %EUR 17,641 AUD (27,791) BNP Paribas 2/7/2021 57 0.00 %EUR 1,706,655 GBP (1,465,893) Morgan Stanley 3/8/2021 53 0.00 %EUR 4,751 NOK (48,036) BNP Paribas 2/7/2021 52 0.00 %EUR 451,889 HKD (4,163,831) Morgan Stanley 3/8/2021 49 0.00 %EUR 3,600 NOK (36,316) Morgan Stanley 2/7/2021 49 0.00 %EUR 3,646,586 JPY (480,163,520) Morgan Stanley 3/8/2021 47 0.00 %EUR 53,611 CHF (58,727) BNP Paribas 2/7/2021 43 0.00 %EUR 1,465,952 CAD (2,154,183) BNP Paribas 3/8/2021 43 0.00 %EUR 11,179 AUD (17,608) BNP Paribas 2/7/2021 38 0.00 %EUR 5,625 NOK (57,088) Morgan Stanley 2/7/2021 37 0.00 %KRW 13,723,405 EUR (10,245) BNP Paribas 2/7/2021 36 0.00 %EUR 2,002 PLN (8,924) Morgan Stanley 2/7/2021 30 0.00 %EUR 3,072 NZD (5,178) Morgan Stanley 2/7/2021 24 0.00 %EUR 58,044 CAD (85,211) BNP Paribas 2/7/2021 22 0.00 %EUR 4,415 NOK (44,877) BNP Paribas 2/7/2021 21 0.00 %EUR 6,116 SEK (61,858) BNP Paribas 2/7/2021 20 0.00 %HKD 17,458 EUR (1,881) BNP Paribas 6/7/2021 17 0.00 %EUR 2,309 PLN (10,359) BNP Paribas 2/7/2021 17 0.00 %EUR 40,997 AUD (64,741) BNP Paribas 2/7/2021 14 0.00 %EUR 4,178 NOK (42,516) BNP Paribas 2/7/2021 14 0.00 %EUR 1,041,704 AUD (1,646,356) Morgan Stanley 4/8/2021 14 0.00 %EUR 12,310 CHF (13,483) BNP Paribas 2/7/2021 13 0.00 %EUR 1,009 PLN (4,507) Morgan Stanley 2/7/2021 13 0.00 %

71
Vanguard ESG Developed World All Cap Equity Index Fund
CurrencyBuy
Amount Currency(Sell)
Amount CounterpartySettlement
Date
Unrealised Gain/(Loss)
US Dollars ($)% of Total
Net AssetsEUR 682 NZD (1,142) BNP Paribas 2/7/2021 12 0.00 %EUR 2,859 PLN (12,870) BNP Paribas 2/7/2021 10 0.00 %EUR 3,299 NOK (33,598) BNP Paribas 2/7/2021 8 0.00 %EUR 520,894 SEK (5,284,796) Morgan Stanley 3/8/2021 7 0.00 %EUR 510,755 USD (606,108) BNP Paribas 3/8/2021 6 0.00 %EUR 1,890 NZD (3,201) BNP Paribas 2/7/2021 5 0.00 %EUR 3,035 NZD (5,143) BNP Paribas 2/7/2021 5 0.00 %EUR 1,251 NOK (12,732) BNP Paribas 2/7/2021 4 0.00 %CHF 1,289,403 EUR (1,176,259) Morgan Stanley 2/7/2021 4 0.00 %EUR 465 PLN (2,087) BNP Paribas 2/7/2021 3 0.00 %EUR 184,118 SGD (293,719) Morgan Stanley 3/8/2021 2 0.00 %EUR 13,874 GBP (11,917) BNP Paribas 3/8/2021 1 0.00 %EUR 10,727 SEK (108,785) BNP Paribas 2/7/2021 1 0.00 %EUR 906,575 USD (1,075,108)Brown Brothers Harriman & Co. 2/7/2021 1 0.00 %EUR 62,826 NZD (106,704) Morgan Stanley 3/8/2021 1 0.00 %EUR 117,920 NOK (1,203,968) Morgan Stanley 3/8/2021 1 0.00 %EUR 50,030 PLN (225,986) Morgan Stanley 3/8/2021 1 0.00 %EUR 33,485 CHF (36,706) BNP Paribas 2/7/2021 — 0.00 %EUR 20,777 JPY (2,735,837) BNP Paribas 3/8/2021 — 0.00 %EUR 8,487 DKK (63,119) BNP Paribas 3/8/2021 — 0.00 %EUR 14,182 CAD (20,841) BNP Paribas 3/8/2021 — 0.00 %EUR 384 HKD (3,538) BNP Paribas 3/8/2021 — 0.00 %EUR 96 PLN (433) BNP Paribas 3/8/2021 — 0.00 %EUR 9,420 AUD (14,888) BNP Paribas 4/8/2021 — 0.00 %EUR 340 SGD (543) BNP Paribas 3/8/2021 — 0.00 %EUR 1,075 ILS (4,154) BNP Paribas 3/8/2021 — 0.00 %EUR 310 NOK (3,163) BNP Paribas 3/8/2021 — 0.00 %EUR 746 NZD (1,266) BNP Paribas 3/8/2021 — 0.00 %EUR 10,863 SEK (110,212) BNP Paribas 3/8/2021 — 0.00 %DKK 2,412,928 EUR (324,482) Morgan Stanley 2/7/2021 — 0.00 %NOK 1,203,968 EUR (117,979) Morgan Stanley 2/7/2021 — 0.00 %SGD 293,719 EUR (184,256) Morgan Stanley 2/7/2021 — 0.00 %PLN 225,986 EUR (50,055) Morgan Stanley 2/7/2021 — 0.00 %ILS 347,447 EUR (89,913) Morgan Stanley 2/7/2021 — 0.00 %NZD 106,704 EUR (62,871) Morgan Stanley 2/7/2021 — 0.00 %CAD 2,154,183 EUR (1,466,928) BNP Paribas 2/7/2021 (1 ) (0.00 %)EUR 9,082 DKK (67,538) BNP Paribas 2/7/2021 (1 ) (0.00 %)EUR 11,819 DKK (87,893) BNP Paribas 2/7/2021 (1 ) (0.00 %)EUR 5,180 DKK (38,530) BNP Paribas 2/7/2021 (1 ) (0.00 %)EUR 3,485 DKK (25,920) BNP Paribas 2/7/2021 (1 ) (0.00 %)NZD 199 EUR (118) BNP Paribas 2/7/2021 (1 ) (0.00 %)EUR 16,216 CHF (17,774) BNP Paribas 3/8/2021 (1 ) (0.00 %)AUD 1,646,356 EUR (1,042,248) Morgan Stanley 2/7/2021 (1 ) (0.00 %)EUR 9,762 DKK (72,597) Morgan Stanley 2/7/2021 (1 ) (0.00 %)EUR 89,877 ILS (347,447) Morgan Stanley 3/8/2021 (1 ) (0.00 %)SEK 5,284,796 EUR (521,081) Morgan Stanley 2/7/2021 (1 ) (0.00 %)EUR 17,433 DKK (129,644) BNP Paribas 2/7/2021 (2 ) (0.00 %)EUR 13,579 DKK (100,992) Morgan Stanley 2/7/2021 (2 ) (0.00 %)JPY 480,163,520 EUR (3,648,020) Morgan Stanley 2/7/2021 (2 ) (0.00 %)EUR 1,741 NZD (2,958) Morgan Stanley 2/7/2021 (2 ) (0.00 %)EUR 891,775 CHF (977,556) Morgan Stanley 2/7/2021 (3 ) (0.00 %)EUR 324,461 DKK (2,412,928) Morgan Stanley 3/8/2021 (3 ) (0.00 %)EUR 34,328 CHF (37,635) BNP Paribas 2/7/2021 (6 ) (0.00 %)EUR 2,002 PLN (9,075) BNP Paribas 2/7/2021 (10 ) (0.00 %)EUR 1,176,481 CHF (1,289,403) Morgan Stanley 3/8/2021 (10 ) (0.00 %)GBP 1,465,893 EUR (1,707,622) Morgan Stanley 2/7/2021 (12 ) (0.00 %)EUR 2,485 NZD (4,237) BNP Paribas 2/7/2021 (13 ) (0.00 %)EUR 2,456 ILS (9,548) BNP Paribas 2/7/2021 (18 ) (0.00 %)USD 38,129,432 EUR (32,152,316) Morgan Stanley 2/7/2021 (19 ) (0.00 %)EUR 6,094 PLN (27,592) BNP Paribas 2/7/2021 (21 ) (0.00 %)EUR 45,278 CHF (49,653) Morgan Stanley 2/7/2021 (21 ) (0.00 %)EUR 46,789 GBP (40,184) BNP Paribas 2/7/2021 (26 ) (0.00 %)EUR 13,817 SEK (140,350) BNP Paribas 2/7/2021 (26 ) (0.00 %)SEK 222,719 EUR (21,984) BNP Paribas 2/7/2021 (28 ) (0.00 %)EUR 955 ILS (3,782) BNP Paribas 2/7/2021 (28 ) (0.00 %)EUR 6,684 KRW (8,966,920) BNP Paribas 3/8/2021 (29 ) (0.00 %)EUR 4,500 ILS (17,482) BNP Paribas 2/7/2021 (29 ) (0.00 %)EUR 5,109 SGD (8,184) BNP Paribas 2/7/2021 (29 ) (0.00 %)EUR 32,215 AUD (50,927) BNP Paribas 2/7/2021 (30 ) (0.00 %)EUR 3,194 SGD (5,131) BNP Paribas 2/7/2021 (30 ) (0.00 %)

72
Vanguard ESG Developed World All Cap Equity Index Fund
CurrencyBuy
Amount Currency(Sell)
Amount CounterpartySettlement
Date
Unrealised Gain/(Loss)
US Dollars ($)% of Total
Net AssetsEUR 2,025 SGD (3,274) BNP Paribas 2/7/2021 (34 ) (0.00 %)EUR 21,992 GBP (18,904) BNP Paribas 2/7/2021 (35 ) (0.00 %)HKD 4,163,831 EUR (452,122) Morgan Stanley 6/7/2021 (41 ) (0.00 %)EUR 1,872 ILS (7,397) Morgan Stanley 2/7/2021 (50 ) (0.00 %)EUR 254,084 DKK (1,889,813) Morgan Stanley 2/7/2021 (61 ) (0.00 %)EUR 4,050 SGD (6,540) Morgan Stanley 2/7/2021 (63 ) (0.00 %)EUR 2,124 ILS (8,430) Morgan Stanley 2/7/2021 (68 ) (0.00 %)EUR 6,115 SGD (9,848) BNP Paribas 2/7/2021 (75 ) (0.00 %)EUR 15,866 CAD (23,396) BNP Paribas 2/7/2021 (78 ) (0.00 %)EUR 18,460 GBP (15,905) BNP Paribas 2/7/2021 (81 ) (0.00 %)EUR 2,882 ILS (11,412) BNP Paribas 2/7/2021 (85 ) (0.00 %)EUR 4,086 ILS (16,066) BNP Paribas 2/7/2021 (85 ) (0.00 %)EUR 6,222 SGD (10,036) BNP Paribas 2/7/2021 (87 ) (0.00 %)EUR 36,917 CAD (54,326) BNP Paribas 2/7/2021 (92 ) (0.00 %)EUR 7,804 SGD (12,607) Morgan Stanley 2/7/2021 (123 ) (0.00 %)EUR 39,915 CAD (58,776) BNP Paribas 2/7/2021 (130 ) (0.00 %)EUR 20,795 HKD (192,532) BNP Paribas 6/7/2021 (130 ) (0.00 %)EUR 35,983 CAD (53,038) Morgan Stanley 2/7/2021 (158 ) (0.00 %)EUR 4,935 HKD (46,683) Morgan Stanley 6/7/2021 (159 ) (0.00 %)EUR 5,041 HKD (47,755) BNP Paribas 6/7/2021 (171 ) (0.00 %)EUR 57,467 CAD (84,658) Morgan Stanley 2/7/2021 (216 ) (0.00 %)EUR 10,063 KRW (13,723,405) BNP Paribas 2/7/2021 (253 ) (0.00 %)EUR 74,206 GBP (63,894) BNP Paribas 2/7/2021 (265 ) (0.00 %)EUR 44,863 GBP (38,717) BNP Paribas 2/7/2021 (283 ) (0.00 %)EUR 98,345 JPY (12,976,219) BNP Paribas 2/7/2021 (285 ) (0.00 %)EUR 65,596 GBP (56,556) Morgan Stanley 2/7/2021 (339 ) (0.00 %)EUR 16,828 KRW (22,863,121) BNP Paribas 2/7/2021 (345 ) (0.00 %)EUR 37,670 KRW (50,774,767) BNP Paribas 2/7/2021 (414 ) (0.00 %)EUR 60,533 CAD (89,439) BNP Paribas 2/7/2021 (441 ) (0.00 %)EUR 16,891 HKD (159,053) BNP Paribas 6/7/2021 (448 ) (0.00 %)EUR 13,758 HKD (130,385) Morgan Stanley 6/7/2021 (473 ) (0.00 %)EUR 17,663 HKD (167,103) BNP Paribas 6/7/2021 (569 ) (0.00 %)EUR 26,359 KRW (35,842,507) BNP Paribas 2/7/2021 (569 ) (0.00 %)EUR 36,498 KRW (49,525,581) BNP Paribas 2/7/2021 (695 ) (0.00 %)EUR 806,189 AUD (1,274,443) Morgan Stanley 2/7/2021 (728 ) (0.00 %)EUR 42,022 KRW (57,024,872) BNP Paribas 2/7/2021 (803 ) (0.00 %)EUR 38,659 JPY (5,177,883) BNP Paribas 2/7/2021 (806 ) (0.00 %)EUR 47,778 KRW (64,792,399) BNP Paribas 2/7/2021 (874 ) (0.00 %)EUR 131,410 JPY (17,398,089) BNP Paribas 2/7/2021 (915 ) (0.00 %)EUR 89,569 JPY (12,003,630) BNP Paribas 2/7/2021 (1,931 ) (0.00 %)EUR 69,021 ILS (273,328) Morgan Stanley 2/7/2021 (2,029 ) (0.00 %)EUR 147,615 SGD (238,100) Morgan Stanley 2/7/2021 (2,074 ) (0.00 %)EUR 1,367,782 GBP (1,175,769) Morgan Stanley 2/7/2021 (2,213 ) (0.00 %)EUR 130,745 JPY (17,456,948) BNP Paribas 2/7/2021 (2,234 ) (0.00 %)EUR 151,470 JPY (20,233,997) Morgan Stanley 2/7/2021 (2,677 ) (0.00 %)EUR 141,488 JPY (18,937,724) Morgan Stanley 2/7/2021 (2,835 ) (0.00 %)EUR 971,364 KRW (1,301,116,910) BNP Paribas 2/7/2021 (3,426 ) (0.00 %)EUR 1,158,131 CAD (1,705,341) Morgan Stanley 2/7/2021 (3,735 ) (0.00 %)EUR 1,124,579 USD (1,341,315) BNP Paribas 2/7/2021 (7,677 ) (0.00 %)EUR 964,458 KRW (1,301,116,910) BNP Paribas 3/8/2021 (10,631 ) (0.00 %)EUR 333,493 USD (407,151) BNP Paribas 2/7/2021 (11,662 ) (0.00 %)EUR 363,387 HKD (3,437,776) Morgan Stanley 6/7/2021 (11,706 ) (0.00 %)EUR 1,361,715 USD (1,627,212) BNP Paribas 2/7/2021 (12,354 ) (0.00 %)EUR 737,967 KRW (1,006,570,258) BNP Paribas 2/7/2021 (18,660 ) (0.00 %)EUR 836,397 USD (1,019,455) BNP Paribas 2/7/2021 (27,572 ) (0.00 %)EUR 942,286 USD (1,148,690) Morgan Stanley 2/7/2021 (31,233 ) (0.00 %)EUR 1,017,545 USD (1,242,771) Morgan Stanley 2/7/2021 (36,064 ) (0.00 %)EUR 1,391,589 USD (1,688,010) BNP Paribas 2/7/2021 (37,724 ) (0.00 %)EUR 2,805,525 JPY (375,979,030) Morgan Stanley 2/7/2021 (60,430 ) (0.01 %)EUR 24,329,671 USD (29,654,827) Morgan Stanley 2/7/2021 (802,256 ) (0.03 %)test (1,084,668 ) (0.04 %)Total Financial Derivative Instruments (881,663 ) (0.03 %)
Fair Value US Dollars ($)
% of Total Net Assets
Other Assets and Liabilities 57,565,478 2.26 %Net Assets 2,539,218,427 100.00 %ok

73
Vanguard ESG Developed World All Cap Equity Index Fund
Analysis of Total Net Assets US Dollars ($)% of Total
Net Assets(a) Transferable securities admitted to an official stock exchange listing 2,468,068,976 97.20 %(b) Transferable securities dealt in on another regulated market 13,450,279 0.53 %(c) Transferable securities other than those admitted to an official stock exchange listing or dealt in on another regulated
market 1,015,357 0.04 %
(d) Financial derivative instruments (881,663 ) (0.03 %)(e) Other assets and liabilities 57,565,478 2.26 %Total Net Assets 2,539,218,427 100.00 %

The accompanying notes form an integral part of the financial statements.
74
Vanguard ESG Developed World All Cap Equity Index Fund
Statement of Assets and Liabilities
US Dollars ($)
As at 30 June 2021
US Dollars ($)
As at 31 December 2020
Current AssetsFinancial Assets at Fair Value Through Profit or Loss 2,482,534,612 1,544,327,737 Financial Derivative Instruments 831,267 2,050,331 Cash 49,470,951 31,944,589 Unrealised Appreciation on Spot Currency Contracts 6,318 5,512 Receivables: Interest and Dividends 2,161,673 1,545,279 Capital Shares Issued 7,504,418 7,679,163 Investments Sold 747,062 223,406 Futures Margin Cash 2,740,096 2,298,298 Cash Collateral — 580,000
Total Current Assets 2,545,996,397 1,590,654,315
Current LiabilitiesFinancial Derivative Instruments 1,712,930 1,378,732 Bank Overdraft 1,670 426 Payables and Other Liabilities: Investments Purchased 292,781 38,290 Income Distribution Payable 667,635 435,819 Capital Shares Redeemed 3,704,946 2,938,349 Management Fees Payable 398,008 245,784
Total Current Liabilities 6,777,970 5,037,400
Net Assets Attributable to Holders of Redeemable Participating Shares (“Net Assets”) 2,539,218,427 1,585,616,915

75
Vanguard ESG Developed World All Cap Equity Index Fund
The accompanying notes form an integral part of the financial statements.
Net Asset Value Per Share
.As at
30 June 2021As at
31 December 2020As at
31 December 2019EUR AccUS ($) Equivalent 896,918,724 450,832,908 330,074,349Net Assets 756,319,024 368,463,009 294,052,874Number of Shares Outstanding 2,469,762 1,396,812 1,204,657Net Asset Value Per Share1 306.23 263.79 244.10
Institutional Plus EUR AccUS ($) Equivalent 78,398,583 71,420,527 70,883,738Net Assets 66,108,933 58,371,565 63,148,097Number of Shares Outstanding 267,537 274,328 320,940Net Asset Value Per Share1 247.10 212.78 196.76
Institutional Plus EUR Hedged Acc2
US ($) Equivalent 56,850,939 — —Net Assets 47,939,067 — —Number of Shares Outstanding 432,046 — —Net Asset Value Per Share1 110.96 — —
GBP AccUS ($) Equivalent 1,040,767,972 665,219,172 283,136,918Net Assets 753,388,111 486,644,862 213,728,574Number of Shares Outstanding 2,190,978 1,575,684 789,986Net Asset Value Per Share1 343.86 308.85 270.55
GBP DistUS ($) Equivalent 196,015,438 186,062,108 175,933,393Net Assets 141,891,089 136,114,791 132,804,982Number of Shares Outstanding 486,559 516,331 567,056Net Asset Value Per Share1 291.62 263.62 234.20
Institutional Plus GBP AccUS ($) Equivalent 53,904,867 49,250,671 12,121Net Assets 39,020,499 36,029,608 9,150Number of Shares Outstanding 167,586 172,343 50Net Asset Value Per Share1 232.84 209.06 183.00
USD AccNet Assets 216,361,904 162,831,529 36,435,691Number of Shares Outstanding 1,117,261 946,091 249,374Net Asset Value Per Share1 193.65 172.11 146.11
1 The net asset value per share shown may diverge from the net asset value per share used for dealing purposes because of any adjustments for swing pricing and trade date accounting.2 The share class was launched on 3 March 2021.

76
Vanguard ESG Developed World All Cap Equity Index Fund
The accompanying notes form an integral part of the financial statements.
Statement of Operations
US Dollars ($)
Six Months Ended 30 June 2021
US Dollars ($)
Six Months Ended 30 June 2020
Investment Income/(Loss) Interest Income 730 41,249 Dividend Income 19,061,089 10,031,636 Securities Lending Income 105,232 54,858 Net Gain/(Loss) on Financial Instruments 223,549,213 (54,495,802)
Total Investment Income/(Loss) 242,716,264 (44,368,059)
Expenses Management Fees 1,962,544 899,108 Transaction Fees and Commissions 289,003 167,111 Other Expenses 1,149 —
Total Expenses 2,252,696 1,066,219
Finance Costs Interest Expense 5,702 5,762 Distribution Paid 1,202,605 1,242,678 Income Equalisation 5,209 (13,789)
Total Finance Costs 1,213,516 1,234,651
Net Investment Income/(Loss) 239,250,052 (46,668,929)
Foreign Withholding Tax (3,521,927) (2,042,755)
Net Increase/(Decrease) in Net Assets 235,728,125 (48,711,684)
Statement of Changes in Net Assets
US Dollars ($)
US Dollars ($)
Six Months Ended Six Months Ended30 June 2021 30 June 2020
Increase/(Decrease) in Net Assets
Net Increase/(Decrease) in Net Assets From Operations 235,728,125 (48,711,684)
Capital Transactions Subscriptions 945,596,742 260,991,579 Redemptions (227,723,483) (150,537,930) Reinvestments 128 439
Total Capital Transactions1 717,873,387 110,454,088
Total Increase/(Decrease) for the Period 953,601,512 61,742,404
Net AssetsBeginning of Period 1,585,616,915 905,446,023
End of Period 2,539,218,427 967,188,427
1 Capital Transactions include income equalisation adjustments as shown in the Statement of Operations.

Vanguard ESG Emerging Markets All Cap Equity Index FundManaged by Vanguard Global Advisers, LLC.
77
Investment ObjectiveThe fund seeks to track the performance of the FTSE Emerging All Cap Choice Index.
Performance SummaryThe Performance Summary does not form part of the Financial Statements.
• As the six months ended 30 June 2021 came to a close, macroeconomic indicators signalled a faster global economic rebound than many had expected after the sharpest contraction in modern history. Yet the recovery has been uneven. Countries that have contained the virus more successfully, whether through vaccinations, lockdowns, or both, generally have fared better economically. And the COVID-19 pandemic remained far from over, with new variants of the virus surfacing where vaccination rates have lagged and the human toll continuing to mount, especially in less developed economies.
• Swift and extensive support from governments and central banks has been a key to the rebound. So far in 2021, it has included fiscal stimulus – including the $1.9 trillion American Rescue Plan in the United States and the €673 billion Recovery and Resilience Facility in Europe – and pledges by a number of central banks to keep interest rates low for some time.
• Fixed income prices worldwide generally fell and longer-term yields rose amid concerns about inflation during the half year. Bonds returned about –3% in US dollars, as measured by the Bloomberg Barclays Global Aggregate Bond Index.
• Stock markets continued the rally that began in 2020, bolstered by reopening economies, more consumer spending and rising corporate profits. The FTSE Global All Cap Index returned roughly 13% in US dollars for the half year. Returns in the United States and Europe outpaced those in emerging markets and especially the Pacific region.
• For the period, the fund’s benchmark returned 7.74%. Of the benchmark’s 11 industry sectors, technology made the largest contribution to return, followed by financials and industrials. Telecommunications was the only sector with a negative return.
• Among markets, Taiwan contributed most to the index return. Malaysia and Indonesia detracted the most.
All returns in the commentary above are in US dollars.

78
Vanguard ESG Emerging Markets All Cap Equity Index Fund
Benchmark: FTSE Emerging All Cap Choice Index
Total ReturnsPeriods Ended 30 June 2021
(Annualised for periods over one year)
Six MonthsTen Years or
Since Inception1
EUR Acc 11.31 % 29.34 %
Benchmark 11.16 30.07
Tracking Difference* 0.15
Institutional Plus EUR Acc — 2.02 %
Benchmark — 1.63
Tracking Difference* 0.39
GBP Acc 6.75 % 24.63 %
Benchmark 6.61 25.37
Tracking Difference* 0.14
GBP Dist 6.75 % 24.66 %
Benchmark 6.61 25.37
Tracking Difference* 0.14
Institutional Plus GBP Dist 6.79 % 24.75 %
Benchmark 6.61 25.37
Tracking Difference* 0.18
USD Acc 7.89 % 34.77 %
Benchmark 7.74 35.53
Tracking Difference* 0.15
Each benchmark is in its respective currency.Sources: Vanguard Global Advisers, LLC, and FTSE.Performance is based on NAV with net income reinvested.
All of the returns in this report represent past performance, which is not a guarantee of future results that may be achieved by the fund. For performance data current to the most recent month-end, which may be higher or lower than that cited, visit our website at http://global.vanguard.com. Note, too, that both investment returns and principal value can fluctuate widely, so an investor's shares, when sold, could be worth more or less than their original cost.* The tracking difference between the fund return and the index return over a stated period of time can be attributed to a number of factors, including, without limitation, small differences in
weightings, trading activity, transaction costs and differences in the valuation and withholding tax treatment between the fund and the index vendor.1 Since-inception returns: EUR Acc, 9 June 2020; Institutional Plus EUR Acc, 3 March 2021; GBP Acc, GBP Dist, Institutional Plus GBP and USD Acc, 9 June 2020.

Significant Portfolio ChangesFor the Six Months Ended 30 June 2021
79
Vanguard ESG Emerging Markets All Cap Equity Index Fund
The Central Bank of Ireland requires a schedule of material changes in the composition of the portfolio during the period. These are defined as aggregate purchases of a security exceeding 1% of the total value of purchases for the period and aggregate disposals greater than 1% of the total value of sales. At a minimum, the largest 20 purchases and 20 sales must be shown; all purchases and sales must be shown if there are fewer than 20. A full listing of the portfolio changes for the period is available, upon request, at no extra cost from the Administrator.
SharesCost
US Dollars ($)
Purchases
Taiwan Semiconductor Manufacturing Co., Ltd. 458,000 9,836,007
Tencent Holdings Ltd. 116,064 9,386,797Alibaba Group Holding Ltd. 201,300 5,575,522Meituan Class B 76,215 3,079,393Alibaba Group Holding Ltd. ADR 8,885 2,242,716Naspers Ltd. Class N 7,706 1,746,320Xiaomi Corp. Class B 402,800 1,504,092China Construction Bank Corp.
Class H 1,801,000 1,448,315Infosys Ltd. 68,541 1,306,347Ping An Insurance Group Co. of
China Ltd. Class H 111,500 1,244,608NIO, Inc. ADR 25,975 1,185,628Baidu, Inc. ADR 5,350 1,155,723Housing Development Finance
Corp., Ltd. 33,383 1,145,684JD.com, Inc. ADR 12,851 1,066,065Pinduoduo, Inc. ADR 7,649 1,045,092Industrial & Commercial Bank of
China Ltd. Class H 1,532,000 1,008,904Wuxi Biologics Cayman, Inc. 63,500 952,702MediaTek, Inc. 28,000 948,699Hon Hai Precision Industry Co., Ltd. 227,000 932,532Sberbank of Russia PJSC 194,500 773,119
SharesProceeds
US Dollars ($)
Sales
Xiaomi Corp. Class B 150,423 423,503China Mobile Ltd. 37,500 197,929JD.com, Inc. ADR 2,476 177,331ZTO Express Cayman, Inc. ADR 5,067 146,538Com7 PCL 65,200 144,375Ping An Insurance Group Co. of
China Ltd. Class H 8,800 103,964China Construction Bank Corp.
Class H 96,400 100,770Central Retail Corp. PCL 81,100 94,292Krungthai Card PCL 36,900 81,697Bank of China Ltd. Class H 139,600 68,778Semiconductor Manufacturing
International Corp. 25,000 68,004Digital Telecommunications
Infrastructure Fund 162,200 65,173Itau Unibanco Holding SA 13,600 63,505NetEase, Inc. ADR 588 63,157Global Power Synergy PCL 21,500 52,094Bangkok Expressway & Metro PCL
(XBKK) 179,500 49,551HengTen Networks Group Ltd. 24,000 49,406KCE Electronics PCL 18,800 43,231Muangthai Capital PCL (XBKK) 20,900 42,450China Life Insurance Co., Ltd. Class
H 8,300 42,320
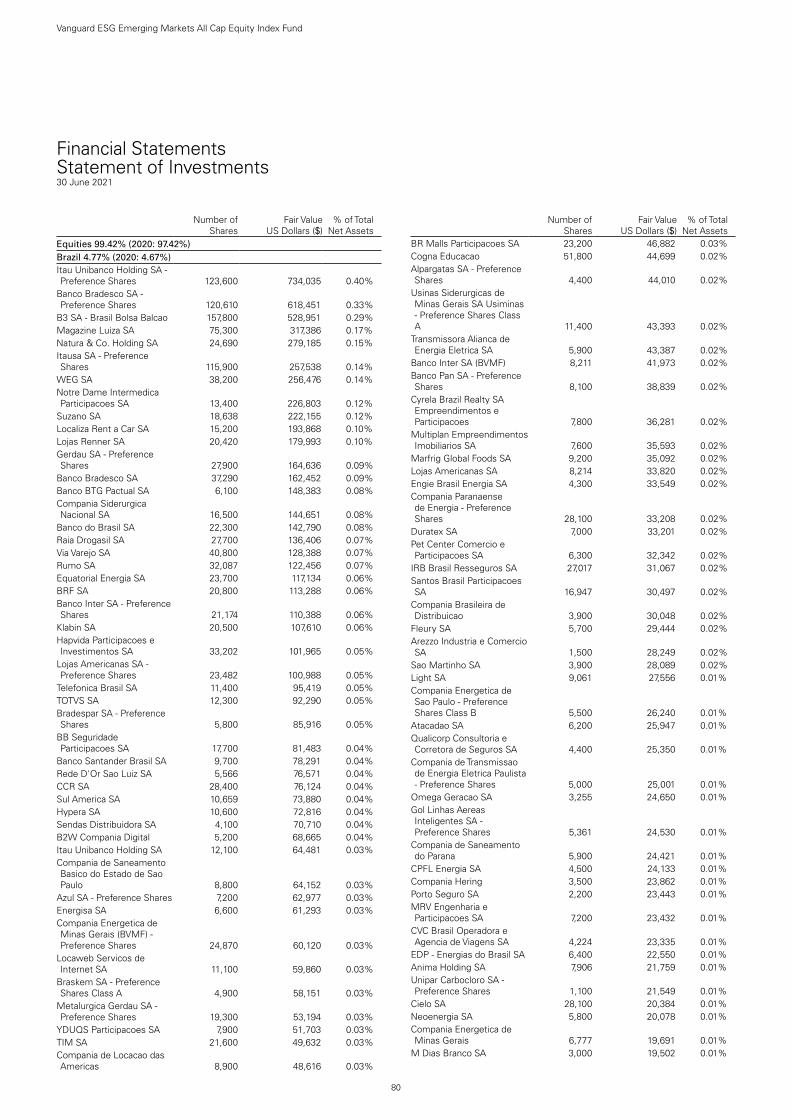
Financial StatementsStatement of Investments30 June 2021
80
Vanguard ESG Emerging Markets All Cap Equity Index Fund
.Number of
SharesFair Value
US Dollars ($)% of Total
Net AssetsEquities 99.42% (2020: 97.42%)Brazil 4.77% (2020: 4.67%)Itau Unibanco Holding SA - Preference Shares 123,600 734,035 0.40%
Banco Bradesco SA - Preference Shares 120,610 618,451 0.33%
B3 SA - Brasil Bolsa Balcao 157,800 528,951 0.29%Magazine Luiza SA 75,300 317,386 0.17%Natura & Co. Holding SA 24,690 279,185 0.15%Itausa SA - Preference Shares 115,900 257,538 0.14%
WEG SA 38,200 256,476 0.14%Notre Dame Intermedica Participacoes SA 13,400 226,803 0.12%
Suzano SA 18,638 222,155 0.12%Localiza Rent a Car SA 15,200 193,868 0.10%Lojas Renner SA 20,420 179,993 0.10%Gerdau SA - Preference Shares 27,900 164,636 0.09%
Banco Bradesco SA 37,290 162,452 0.09%Banco BTG Pactual SA 6,100 148,383 0.08%Compania Siderurgica Nacional SA 16,500 144,651 0.08%
Banco do Brasil SA 22,300 142,790 0.08%Raia Drogasil SA 27,700 136,406 0.07%Via Varejo SA 40,800 128,388 0.07%Rumo SA 32,087 122,456 0.07%Equatorial Energia SA 23,700 117,134 0.06%BRF SA 20,800 113,288 0.06%Banco Inter SA - Preference Shares 21,174 110,388 0.06%
Klabin SA 20,500 107,610 0.06%Hapvida Participacoes e Investimentos SA 33,202 101,965 0.05%
Lojas Americanas SA - Preference Shares 23,482 100,988 0.05%
Telefonica Brasil SA 11,400 95,419 0.05%TOTVS SA 12,300 92,290 0.05%Bradespar SA - Preference Shares 5,800 85,916 0.05%
BB Seguridade Participacoes SA 17,700 81,483 0.04%
Banco Santander Brasil SA 9,700 78,291 0.04%Rede D'Or Sao Luiz SA 5,566 76,571 0.04%CCR SA 28,400 76,124 0.04%Sul America SA 10,659 73,880 0.04%Hypera SA 10,600 72,816 0.04%Sendas Distribuidora SA 4,100 70,710 0.04%B2W Compania Digital 5,200 68,665 0.04%Itau Unibanco Holding SA 12,100 64,481 0.03%Compania de Saneamento Basico do Estado de Sao Paulo 8,800 64,152 0.03%
Azul SA - Preference Shares 7,200 62,977 0.03%Energisa SA 6,600 61,293 0.03%Compania Energetica de Minas Gerais (BVMF) - Preference Shares 24,870 60,120 0.03%
Locaweb Servicos de Internet SA 11,100 59,860 0.03%
Braskem SA - Preference Shares Class A 4,900 58,151 0.03%
Metalurgica Gerdau SA - Preference Shares 19,300 53,194 0.03%
YDUQS Participacoes SA 7,900 51,703 0.03%TIM SA 21,600 49,632 0.03%Compania de Locacao das Americas 8,900 48,616 0.03%
.Number of
SharesFair Value
US Dollars ($)% of Total
Net AssetsBR Malls Participacoes SA 23,200 46,882 0.03%Cogna Educacao 51,800 44,699 0.02%Alpargatas SA - Preference Shares 4,400 44,010 0.02%
Usinas Siderurgicas de Minas Gerais SA Usiminas - Preference Shares Class A 11,400 43,393 0.02%
Transmissora Alianca de Energia Eletrica SA 5,900 43,387 0.02%
Banco Inter SA (BVMF) 8,211 41,973 0.02%Banco Pan SA - Preference Shares 8,100 38,839 0.02%
Cyrela Brazil Realty SA Empreendimentos e Participacoes 7,800 36,281 0.02%
Multiplan Empreendimentos Imobiliarios SA 7,600 35,593 0.02%
Marfrig Global Foods SA 9,200 35,092 0.02%Lojas Americanas SA 8,214 33,820 0.02%Engie Brasil Energia SA 4,300 33,549 0.02%Compania Paranaense de Energia - Preference Shares 28,100 33,208 0.02%
Duratex SA 7,000 33,201 0.02%Pet Center Comercio e Participacoes SA 6,300 32,342 0.02%
IRB Brasil Resseguros SA 27,017 31,067 0.02%Santos Brasil Participacoes SA 16,947 30,497 0.02%
Compania Brasileira de Distribuicao 3,900 30,048 0.02%
Fleury SA 5,700 29,444 0.02%Arezzo Industria e Comercio SA 1,500 28,249 0.02%
Sao Martinho SA 3,900 28,089 0.02%Light SA 9,061 27,556 0.01%Compania Energetica de Sao Paulo - Preference Shares Class B 5,500 26,240 0.01%
Atacadao SA 6,200 25,947 0.01%Qualicorp Consultoria e Corretora de Seguros SA 4,400 25,350 0.01%
Compania de Transmissao de Energia Eletrica Paulista - Preference Shares 5,000 25,001 0.01%
Omega Geracao SA 3,255 24,650 0.01%Gol Linhas Aereas Inteligentes SA - Preference Shares 5,361 24,530 0.01%
Compania de Saneamento do Parana 5,900 24,421 0.01%
CPFL Energia SA 4,500 24,133 0.01%Compania Hering 3,500 23,862 0.01%Porto Seguro SA 2,200 23,443 0.01%MRV Engenharia e Participacoes SA 7,200 23,432 0.01%
CVC Brasil Operadora e Agencia de Viagens SA 4,224 23,335 0.01%
EDP - Energias do Brasil SA 6,400 22,550 0.01%Anima Holding SA 7,906 21,759 0.01%Unipar Carbocloro SA - Preference Shares 1,100 21,549 0.01%
Cielo SA 28,100 20,384 0.01%Neoenergia SA 5,800 20,078 0.01%Compania Energetica de Minas Gerais 6,777 19,691 0.01%
M Dias Branco SA 3,000 19,502 0.01%

81
Vanguard ESG Emerging Markets All Cap Equity Index Fund
.Number of
SharesFair Value
US Dollars ($)% of Total
Net AssetsAliansce Sonae Shopping Centers sa 3,300 19,098 0.01%
Ez Tec Empreendimentos e Participacoes SA 3,000 18,600 0.01%
Iguatemi Empresa de Shopping Centers SA 2,300 18,541 0.01%
Odontoprev SA 6,900 17,917 0.01%Lojas Quero Quero S/A 3,700 16,893 0.01%Grupo SBF SA 2,200 16,775 0.01%Grendene SA 8,200 16,391 0.01%Compania Paranaense de Energia 14,100 15,595 0.01%
SIMPAR SA 1,400 15,518 0.01%Compania de Saneamento de Minas Gerais-COPASA 5,000 15,435 0.01%
Randon SA Implementos e Participacoes - Preference Shares 5,700 15,415 0.01%
Grupo Mateus SA 9,700 15,310 0.01%Usinas Siderurgicas de Minas Gerais SA Usiminas 3,700 14,563 0.01%
Vivara Participacoes SA 2,200 14,425 0.01%GRUPO DE MODA SOMA SA 4,400 13,977 0.01%
Banco do Estado do Rio Grande do Sul SA - Preference Shares 5,000 13,213 0.01%
BK Brasil Operacao e Assessoria a Restaurantes SA 5,482 13,023 0.01%
Movida Participacoes SA 3,300 12,949 0.01%Hidrovias do Brasil SA 9,900 12,686 0.01%Alupar Investimento SA 2,300 12,092 0.01%Construtora Tenda SA 2,400 11,981 0.01%Marcopolo SA - Preference Shares 17,700 11,958 0.01%
Minerva SA 6,300 11,764 0.01%Boa Vista Servicos SA 5,300 11,608 0.01%JHSF Participacoes SA 7,900 11,446 0.01%EcoRodovias Infraestrutura e Logistica SA 4,300 10,163 0.01%
Ambipar Participacoes e Empreendimentos S/A 1,100 9,974 0.01%
Guararapes Confeccoes SA 2,300 9,548 0.01%BR Properties SA 5,100 9,320 0.01%AES Brasil Energia SA 3,359 9,305 0.01%Iochpe Maxion SA 2,900 9,264 0.01%Tupy SA 1,900 8,989 0.00%Banco Inter SA 1,715 8,418 0.00%Even Construtora e Incorporadora SA 3,800 7,921 0.00%
C&A Modas Ltd.a 2,600 7,441 0.00%LOG Commercial Properties e Participacoes SA 1,100 6,967 0.00%
Wiz Solucoes e Corretagem de Seguros SA 1,900 6,687 0.00%
Camil Alimentos SA 3,500 6,654 0.00%Mahle-Metal Leve SA 900 5,978 0.00%Jereissati Participacoes SA 800 5,378 0.00%Instituto Hermes Pardini SA 1,200 5,022 0.00%Banco Inter SA - BRL 1,022 4,949 0.00%Ser Educacional SA 1,300 4,855 0.00%Direcional Engenharia SA 1,600 4,464 0.00%CVC Brasil Operadora e Agencia de Viagens SA - Right Issue 25/9/2021 527 900 0.00%
test test 8,853,166 4.77%Cayman Islands 0.01% (2020: 0.00%)XPeng, Inc. Class A 897 19,058 0.01%test test 19,058 0.01%Chile 0.53% (2020: 0.62%)Banco de Chile 1,115,168 111,025 0.06%
.Number of
SharesFair Value
US Dollars ($)% of Total
Net AssetsSociedad Quimica y Minera de Chile SA - Preference Shares 2,130 101,218 0.05%
Falabella SA 20,017 89,868 0.05%Banco Santander Chile 1,622,492 80,912 0.04%Enel Americas SA 506,265 74,955 0.04%Empresas CMPC SA 30,362 72,975 0.04%Cencosud SA 34,830 69,893 0.04%Banco de Credito e Inversiones SA 1,246 53,051 0.03%
Compania Sud Americana de Vapores SA 475,846 41,434 0.02%
Enel Chile SA 612,365 35,534 0.02%CAP SA 2,019 34,939 0.02%Colbun SA 180,615 25,453 0.01%Parque Arauco SA 16,492 23,330 0.01%Embotelladora Andina SA - Preference Shares Class B 9,161 21,393 0.01%
Empresa Nacional de Telecomunicaciones SA 3,506 19,453 0.01%
Cencosud Shopping SA 11,612 19,154 0.01%Latam Airlines Group SA 6,163 14,906 0.01%Aguas Andinas SA Class A 70,681 14,658 0.01%Itau CorpBanca Chile SA 4,738,668 13,146 0.01%Plaza SA 7,167 11,271 0.01%SMU SA 85,846 10,275 0.01%Engie Energia Chile SA 13,455 10,164 0.01%SONDA SA 16,072 9,163 0.01%Salfacorp SA 13,770 7,565 0.00%Ripley Corp. SA 25,209 6,544 0.00%Besalco SA 12,634 5,571 0.00%Inversiones Aguas Metropolitanas SA 10,081 5,552 0.00%
Inversiones La Construccion SA 454 2,133 0.00%
test test 985,535 0.53%China 43.27% (2020: 44.37%)Tencent Holdings Ltd. 154,364 11,608,333 6.26%Alibaba Group Holding Ltd. 366,516 10,383,090 5.60%Meituan Class B 100,215 4,134,626 2.23%China Construction Bank Corp. Class H 2,412,000 1,897,709 1.02%
NIO, Inc. ADR 33,405 1,777,146 0.96%Wuxi Biologics Cayman, Inc. 82,500 1,511,715 0.82%Ping An Insurance Group Co. of China Ltd. Class H 152,000 1,488,517 0.80%
Baidu, Inc. ADR 7,138 1,455,438 0.79%JD.com, Inc. ADR 16,255 1,297,312 0.70%Pinduoduo, Inc. ADR 9,570 1,215,581 0.66%Industrial & Commercial Bank of China Ltd. Class H 2,042,000 1,199,034 0.65%
Xiaomi Corp. Class B 340,800 1,184,880 0.64%NetEase, Inc. ADR 7,556 870,829 0.47%China Merchants Bank Co., Ltd. Class H 98,500 840,298 0.45%
Bilibili, Inc. ADR 6,452 786,112 0.42%Bank of China Ltd. Class H 1,926,000 691,945 0.37%ANTA Sports Products Ltd. 29,000 682,630 0.37%Li Ning Co., Ltd. 55,500 677,505 0.37%BYD Co., Ltd. Class H 20,000 598,003 0.32%Sunny Optical Technology Group Co., Ltd. 16,800 530,878 0.29%
Shenzhou International Group Holdings Ltd. 19,482 491,951 0.27%
China Mengniu Dairy Co., Ltd. 79,545 480,905 0.26%
Trip.com Group Ltd. ADR 13,423 475,980 0.26%XPeng, Inc. ADR 10,144 450,596 0.24%Geely Automobile Holdings Ltd. 137,000 431,331 0.23%
Li Auto, Inc. ADR 11,794 412,082 0.22%Innovent Biologics, Inc. 34,000 396,441 0.21%

82
Vanguard ESG Emerging Markets All Cap Equity Index Fund
.Number of
SharesFair Value
US Dollars ($)% of Total
Net AssetsCountry Garden Services Holdings Co., Ltd. 36,000 388,934 0.21%
China Life Insurance Co., Ltd. Class H 190,000 376,778 0.20%
ENN Energy Holdings Ltd. 19,600 373,028 0.20%New Oriental Education & Technology Group, Inc. ADR 38,669 316,699 0.17%
CSPC Pharmaceutical Group Ltd. 216,400 313,209 0.17%
China Merchants Bank Co., Ltd. Class A 36,100 302,787 0.16%
Huazhu Group Ltd. ADR 5,548 292,990 0.16%TAL Education Group ADR 11,415 288,000 0.16%KE Holdings, Inc. ADR 5,965 284,411 0.15%China Resources Land Ltd. 70,000 283,485 0.15%Agricultural Bank of China Ltd. Class H 814,000 283,008 0.15%
Alibaba Health Information Technology Ltd. 122,000 270,523 0.15%
Longfor Group Holdings Ltd. 47,500 266,069 0.14%Zai Lab Ltd. ADR 1,491 263,892 0.14%Great Wall Motor Co., Ltd. Class H 80,500 260,184 0.14%
Sino Biopharmaceutical Ltd. 251,500 246,777 0.13%China Gas Holdings Ltd. 77,707 237,148 0.13%Xinyi Solar Holdings Ltd. 108,000 233,082 0.13%GDS Holdings Ltd. ADR 2,965 232,723 0.13%Tencent Music Entertainment Group ADR 15,002 232,231 0.13%
Vipshop Holdings Ltd. ADR 11,344 227,788 0.12%Kingdee International Software Group Co., Ltd. 66,000 223,942 0.12%
China Overseas Land & Investment Ltd. 98,500 223,741 0.12%
Sunac China Holdings Ltd. 64,000 219,628 0.12%Country Garden Holdings Co., Ltd. 193,000 216,216 0.12%
Ping An Insurance Group Co. of China Ltd. Class A 21,400 212,912 0.12%
China Pacific Insurance Group Co., Ltd. Class H 67,600 212,832 0.12%
Haier Smart Home Co., Ltd. Class H 58,600 204,493 0.11%
WuXi AppTec Co., Ltd. Class H 8,620 201,241 0.11%
China Conch Venture Holdings Ltd. 41,500 174,746 0.10%
Kuaishou Technology Class B 6,900 173,081 0.09%
Anhui Conch Cement Co., Ltd. Class H 31,500 167,116 0.09%
China Tower Corp., Ltd. Class H 1,204,000 165,890 0.09%
Postal Savings Bank of China Co., Ltd. Class H 241,000 162,304 0.09%
Lufax Holding Ltd. ADR 14,295 161,534 0.09%China Tourism Group Duty Free Corp., Ltd. Class A 3,450 160,249 0.09%
China Vanke Co., Ltd. Class H 51,200 160,209 0.09%
COSCO SHIPPING Holdings Co., Ltd. Class H 60,500 152,383 0.08%
PICC Property & Casualty Co., Ltd. Class H 174,000 152,359 0.08%
China Longyuan Power Group Corp., Ltd. Class H 87,000 149,895 0.08%
China Feihe Ltd. 68,000 146,755 0.08%360 DigiTech, Inc. ADR 3,414 142,842 0.08%Shandong Weigao Group Medical Polymer Co., Ltd. Class H 60,000 139,998 0.08%
BYD Co., Ltd. Class A 3,500 135,973 0.07%Kingsoft Corp., Ltd. 22,600 135,469 0.07%
.Number of
SharesFair Value
US Dollars ($)% of Total
Net AssetsCITIC Securities Co., Ltd. Class H 53,500 134,200 0.07%
Zhongsheng Group Holdings Ltd. 16,000 133,096 0.07%
China Resources Gas Group Ltd. 22,000 132,014 0.07%
BYD Electronic International Co., Ltd. 20,000 131,344 0.07%
Haidilao International Holding Ltd. 24,000 126,400 0.07%
Bank of Communications Co., Ltd. Class H 188,000 126,369 0.07%
LONGi Green Energy Technology Co., Ltd. Class A 9,100 125,130 0.07%
Ping An Healthcare & Technology Co., Ltd. 9,980 124,270 0.07%
iQIYI, Inc. ADR 7,822 121,867 0.07%Hengan International Group Co., Ltd. 18,000 120,528 0.07%
Ping An Bank Co., Ltd. Class A 34,200 119,737 0.07%
Shenzhen Mindray Bio-Medical Electronics Co., Ltd. Class A 1,600 118,882 0.06%
China National Building Material Co., Ltd. Class H 100,000 117,437 0.06%
Industrial Bank Co., Ltd. Class A 36,800 117,050 0.06%
China CITIC Bank Corp., Ltd. Class H 247,000 117,046 0.06%
Contemporary Amperex Technology Co., Ltd. Class A 1,400 115,886 0.06%
China Literature Ltd. 10,400 115,640 0.06%Hansoh Pharmaceutical Group Co., Ltd. 26,000 113,832 0.06%
Jiangsu Hengrui Medicine Co., Ltd. Class A 10,768 113,282 0.06%
Fuyao Glass Industry Group Co., Ltd. Class H 16,000 112,699 0.06%
Weichai Power Co., Ltd. Class H 50,000 111,128 0.06%
Shanghai Fosun Pharmaceutical Group Co., Ltd. Class H 13,500 108,996 0.06%
Guangdong Investment Ltd. 74,000 106,343 0.06%Chinasoft International Ltd. 58,000 105,755 0.06%Kingboard Holdings Ltd. 19,000 105,449 0.06%Genscript Biotech Corp. 24,000 104,766 0.06%Agricultural Bank of China Ltd. Class A 223,200 104,676 0.06%
Aier Eye Hospital Group Co., Ltd. Class A 9,446 103,775 0.06%
Industrial & Commercial Bank of China Ltd. Class A 125,600 100,506 0.06%
China International Capital Corp., Ltd. Class H 37,200 100,115 0.05%
ZTO Express Cayman, Inc. ADR 3,230 98,030 0.05%
Autohome, Inc. ADR 1,522 97,347 0.05%Akeso, Inc. 12,000 96,808 0.05%Jinxin Fertility Group Ltd. 38,000 95,907 0.05%CanSino Biologics, Inc. Class H 1,800 95,634 0.05%
Sinopharm Group Co., Ltd. Class H 32,000 95,186 0.05%
Pharmaron Beijing Co., Ltd. Class H 3,500 93,293 0.05%
Daqo New Energy Corp. ADR 1,425 92,653 0.05%
JOYY, Inc. ADR 1,385 91,368 0.05%Shimao Group Holdings Ltd. 36,500 89,489 0.05%Wanhua Chemical Group Co., Ltd. Class A 5,300 89,268 0.05%

83
Vanguard ESG Emerging Markets All Cap Equity Index Fund
.Number of
SharesFair Value
US Dollars ($)% of Total
Net AssetsCITIC Securities Co., Ltd. Class A 23,100 89,170 0.05%
East Money Information Co., Ltd. Class A 17,400 88,308 0.05%
Luxshare Precision Industry Co., Ltd. Class A 11,849 84,363 0.05%
China Medical System Holdings Ltd. 32,000 84,266 0.05%
Haitong Securities Co., Ltd. Class H 94,000 82,309 0.05%
Hangzhou Tigermed Consulting Co., Ltd. Class H 3,500 82,026 0.05%
Hygeia Healthcare Holdings Co., Ltd. 6,200 81,433 0.04%
Kingsoft Cloud Holdings Ltd. ADR 2,395 81,262 0.04%
China Minsheng Banking Corp., Ltd. Class H 168,500 80,715 0.04%
Yihai International Holding Ltd. 12,000 80,584 0.04%
China Evergrande Group 61,000 79,492 0.04%Muyuan Foods Co., Ltd. Class A 8,420 79,263 0.04%
China Yangtze Power Co., Ltd. Class A 24,600 78,588 0.04%
Zhuzhou CRRC Times Electric Co., Ltd. Class H 13,200 78,018 0.04%
Bank of China Ltd. Class A 163,500 77,943 0.04%New China Life Insurance Co., Ltd. Class H 22,807 77,826 0.04%
Shanghai Pudong Development Bank Co., Ltd. Class A 49,400 76,461 0.04%
Weibo Corp. ADR 1,444 75,983 0.04%Topsports International Holdings Ltd. 46,000 75,345 0.04%
China Hongqiao Group Ltd. 55,000 74,506 0.04%People's Insurance Co. Group of China Ltd. Class H 219,000 73,039 0.04%
JD Health International, Inc. 5,050 72,376 0.04%COSCO SHIPPING Holdings Co., Ltd. Class A 15,300 72,322 0.04%
21Vianet Group, Inc. ADR 3,139 72,040 0.04%Hopson Development Holdings Ltd. 15,700 71,972 0.04%
Guangzhou Automobile Group Co., Ltd. Class H 80,000 71,802 0.04%
CIFI Holdings Group Co., Ltd. 92,000 71,791 0.04%
Ming Yuan Cloud Group Holdings Ltd. 14,000 69,497 0.04%
Zhangzhou Pientzehuang Pharmaceutical Co., Ltd. Class A 1,000 69,387 0.04%
Shimao Services Holdings Ltd. 20,000 69,149 0.04%
Hua Hong Semiconductor Ltd. 12,394 68,467 0.04%
China Resources Mixc Lifestyle Services Ltd. 9,600 65,703 0.04%
China Meidong Auto Holdings Ltd. 12,000 65,440 0.04%
Jiumaojiu International Holdings Ltd. 16,000 65,415 0.04%
Huatai Securities Co., Ltd. Class H 44,400 65,178 0.04%
Dongfeng Motor Group Co., Ltd. Class H 72,000 64,714 0.04%
Sany Heavy Industry Co., Ltd. Class A 14,300 64,342 0.04%
Weimob, Inc. 29,000 63,931 0.04%Momo, Inc. ADR 4,143 63,429 0.04%
.Number of
SharesFair Value
US Dollars ($)% of Total
Net AssetsGCL-Poly Energy Holdings Ltd. 247,212 63,030 0.03%
China Galaxy Securities Co., Ltd. Class H 105,500 62,899 0.03%
China Taiping Insurance Holdings Co., Ltd. 37,800 62,888 0.03%
Ganfeng Lithium Co., Ltd. Class H 4,200 62,736 0.03%
Bank of Ningbo Co., Ltd. Class A 10,100 60,920 0.03%
Chongqing Zhifei Biological Products Co., Ltd. Class A 2,100 60,694 0.03%
Kingboard Laminates Holdings Ltd. 27,000 60,565 0.03%
Far East Horizon Ltd. 57,000 59,599 0.03%BOE Technology Group Co., Ltd. Class A 61,500 59,398 0.03%
Jiangxi Copper Co., Ltd. Class H 29,000 59,375 0.03%
China Lesso Group Holdings Ltd. 24,000 59,213 0.03%
Inner Mongolia Yili Industrial Group Co., Ltd. Class A 10,300 58,715 0.03%
Venus MedTech Hangzhou, Inc. Class H 7,000 58,365 0.03%
China Vanke Co., Ltd. Class A 15,600 57,490 0.03%
51job, Inc. ADR 733 57,005 0.03%China Molybdenum Co., Ltd. Class H 96,000 56,988 0.03%
Yangzijiang Shipbuilding Holdings Ltd. 53,900 56,538 0.03%
Tongcheng-Elong Holdings Ltd. 22,400 56,073 0.03%
Xtep International Holdings Ltd. 29,500 55,613 0.03%
China Jinmao Holdings Group Ltd. 166,000 55,577 0.03%
China Merchants Port Holdings Co., Ltd. 38,000 55,489 0.03%
SAIC Motor Corp., Ltd. Class A 16,300 55,428 0.03%
InnoCare Pharma Ltd. 15,000 55,145 0.03%China Resources Cement Holdings Ltd. 58,000 55,118 0.03%
ZTE Corp. Class H 17,600 54,959 0.03%Beijing Enterprises Water Group Ltd. 144,000 54,516 0.03%
Gaotu Techedu. Inc. ADR 3,670 54,206 0.03%TravelSky Technology Ltd. Class H 25,000 53,954 0.03%
China Everbright Environment Group Ltd. 95,000 53,825 0.03%
Bank of Communications Co., Ltd. Class A 70,400 53,392 0.03%
Baozun, Inc. ADR 1,505 53,337 0.03%China Life Insurance Co., Ltd. Class A 10,100 52,979 0.03%
Nine Dragons Paper Holdings Ltd. 41,000 52,584 0.03%
China Pacific Insurance Group Co., Ltd. Class A 11,700 52,462 0.03%
Sunac Services Holdings Ltd. 14,000 52,010 0.03%
Yadea Group Holdings Ltd. 24,000 51,611 0.03%JinkoSolar Holding Co., Ltd. ADR 920 51,538 0.03%
Eve Energy Co., Ltd. Class A 3,200 51,476 0.03%
Peijia Medical Ltd. 11,000 51,205 0.03%Alphamab Oncology 16,000 51,199 0.03%XD, Inc. 5,800 51,160 0.03%Tongwei Co., Ltd. Class A 7,600 50,899 0.03%ZhongAn Online P&C Insurance Co., Ltd. Class H 8,900 50,369 0.03%

84
Vanguard ESG Emerging Markets All Cap Equity Index Fund
.Number of
SharesFair Value
US Dollars ($)% of Total
Net AssetsHaitian International Holdings Ltd. 15,000 50,316 0.03%
Foshan Haitian Flavouring & Food Co., Ltd. Class A 2,520 50,296 0.03%
Shenzhen Inovance Technology Co., Ltd. Class A 4,350 49,998 0.03%
Will Semiconductor Co., Ltd. Shanghai Class A 1,000 49,839 0.03%
Seazen Group Ltd. 52,000 49,282 0.03%Agile Group Holdings Ltd. 38,000 49,226 0.03%Dada Nexus Ltd. ADR 1,679 48,708 0.03%Alibaba Pictures Group Ltd. 350,000 48,675 0.03%HengTen Networks Group Ltd. 60,800 48,619 0.03%
CRRC Corp., Ltd. Class H 110,000 48,585 0.03%Guangzhou R&F Properties Co., Ltd. Class H 42,400 48,374 0.03%
GF Securities Co., Ltd. Class H 36,400 47,153 0.03%
Yunnan Energy New Material Co., Ltd. Class A 1,300 47,104 0.03%
Sihuan Pharmaceutical Holdings Group Ltd. 108,000 46,171 0.03%
SF Holding Co., Ltd. Class A 4,400 46,105 0.03%Shanghai Fosun Pharmaceutical Group Co., Ltd. Class A 4,100 45,773 0.03%
Bosideng International Holdings Ltd. 64,000 45,739 0.03%
China Yongda Automobiles Services Holdings Ltd. 25,500 45,642 0.03%
GOME Retail Holdings Ltd. 354,000 45,584 0.03%China Cinda Asset Management Co., Ltd. Class H 236,000 44,976 0.03%
KWG Group Holdings Ltd. 33,500 44,863 0.03%A-Living Smart City Services Co., Ltd. 9,000 44,792 0.03%
Haier Smart Home Co., Ltd. Class A 11,000 44,113 0.02%
China Traditional Chinese Medicine Holdings Co., Ltd. 64,000 43,843 0.02%
Huaneng Power International, Inc. Class H 112,000 43,843 0.02%
China Merchants Securities Co., Ltd. Class H 31,320 43,557 0.02%
China Everbright Bank Co., Ltd. Class A 73,500 43,002 0.02%
Noah Holdings Ltd. ADR 908 42,858 0.02%Sungrow Power Supply Co., Ltd. Class A 2,400 42,741 0.02%
ZTE Corp. Class A 8,300 42,689 0.02%China Education Group Holdings Ltd. 19,000 42,375 0.02%
Changchun High & New Technology Industry Group, Inc. Class A 700 41,929 0.02%
Logan Group Co., Ltd. 28,000 41,896 0.02%Zoomlion Heavy Industry Science & Technology Co., Ltd. Class H 39,800 41,666 0.02%
Maxscend Microelectronics Co., Ltd. Class A 500 41,597 0.02%
3SBio, Inc. 33,500 41,412 0.02%Flat Glass Group Co., Ltd. Class H 10,000 41,206 0.02%
COSCO SHIPPING Ports Ltd. 52,000 40,578 0.02%
China Minsheng Banking Corp., Ltd. Class A 59,400 40,545 0.02%
OneConnect Financial Technology Co., Ltd. ADR 3,325 39,966 0.02%
.Number of
SharesFair Value
US Dollars ($)% of Total
Net AssetsShanghai Junshi Biosciences Co., Ltd. Class H 4,800 39,867 0.02%
Lifetech Scientific Corp. 60,000 39,790 0.02%Ever Sunshine Lifestyle Services Group Ltd. 16,000 39,723 0.02%
Anhui Conch Cement Co., Ltd. Class A 6,200 39,393 0.02%
Ganfeng Lithium Co., Ltd. Class A 2,100 39,358 0.02%
MINISO Group Holding Ltd. ADR 1,888 39,252 0.02%
Iflytek Co., Ltd. Class A 3,700 38,702 0.02%Sinotruk Hong Kong Ltd. 18,000 38,569 0.02%Great Wall Motor Co., Ltd. Class A 5,700 38,457 0.02%
GoerTek, Inc. Class A 5,800 38,368 0.02%Lens Technology Co., Ltd. Class A 8,400 38,237 0.02%
Topchoice Medical Corp. Class A 600 38,168 0.02%
Pop Mart International Group Ltd. 3,800 37,678 0.02%
Poly Developments & Holdings Group Co., Ltd. Class A 20,200 37,643 0.02%
Shanghai Pharmaceuticals Holding Co., Ltd. Class H 17,200 37,563 0.02%
China Overseas Property Holdings Ltd. 35,000 37,407 0.02%
Sanan Optoelectronics Co., Ltd. Class A 7,500 37,205 0.02%
Baoshan Iron & Steel Co., Ltd. Class A 31,300 37,012 0.02%
LexinFintech Holdings Ltd. ADR 3,019 36,983 0.02%
China Merchants Securities Co., Ltd. Class A 12,520 36,857 0.02%
CRRC Corp., Ltd. Class A 39,000 36,701 0.02%China Grand Pharmaceutical & Healthcare Holdings Ltd. 39,000 36,460 0.02%
Focus Media Information Technology Co., Ltd. Class A 24,800 36,120 0.02%
Guotai Junan Securities Co., Ltd. Class A 13,600 36,079 0.02%
Hangzhou Tigermed Consulting Co., Ltd. Class A 1,200 35,902 0.02%
Yuexiu Property Co., Ltd. 34,000 35,813 0.02%Brilliance China Automotive Holdings Ltd. 38,000 35,720 0.02%
Zhejiang Expressway Co., Ltd. Class H 40,000 35,592 0.02%
Guangdong Haid Group Co., Ltd. Class A 2,800 35,364 0.02%
Zhejiang Huayou Cobalt Co., Ltd. Class A 2,000 35,351 0.02%
Ecovacs Robotics Co., Ltd. Class A 1,000 35,302 0.02%
China Everbright Bank Co., Ltd. Class H 86,000 35,105 0.02%
Dali Foods Group Co., Ltd. 58,000 34,580 0.02%NAURA Technology Group Co., Ltd. Class A 800 34,346 0.02%
Greentown Service Group Co., Ltd. 22,000 34,165 0.02%
Shandong Gold Mining Co., Ltd. Class H 19,300 34,147 0.02%
HUYA, Inc. ADR 1,933 34,117 0.02%Yunnan Baiyao Group Co., Ltd. Class A 1,900 34,031 0.02%
Jiangsu Expressway Co., Ltd. Class H 30,000 33,956 0.02%

85
Vanguard ESG Emerging Markets All Cap Equity Index Fund
.Number of
SharesFair Value
US Dollars ($)% of Total
Net AssetsWuXi AppTec Co., Ltd. Class A 1,400 33,931 0.02%
Gigadevice Semiconductor Beijing, Inc. Class A 1,140 33,154 0.02%
China State Construction International Holdings Ltd. 48,000 32,759 0.02%
Niu Technologies ADR 997 32,552 0.02%Air China Ltd. Class H 44,000 32,352 0.02%Greentown China Holdings Ltd. 21,000 32,342 0.02%
Fuyao Glass Industry Group Co., Ltd. Class A 3,700 31,984 0.02%
GF Securities Co., Ltd. Class A 13,600 31,869 0.02%
Chongqing Changan Automobile Co., Ltd. Class A 7,800 31,727 0.02%
Mango Excellent Media Co., Ltd. Class A 2,971 31,545 0.02%
Weichai Power Co., Ltd. Class A 11,400 31,531 0.02%
Wingtech Technology Co., Ltd. Class A 2,100 31,496 0.02%
New China Life Insurance Co., Ltd. Class A 4,400 31,266 0.02%
Shenzhen International Holdings Ltd. 22,500 31,117 0.02%
Tianjin Zhonghuan Semiconductor Co., Ltd. Class A 5,200 31,067 0.02%
China United Network Communications Ltd. Class A 46,000 30,758 0.02%
Bank of Shanghai Co., Ltd. Class A 24,100 30,587 0.02%
Shanghai Baosight Software Co., Ltd. Class B 9,270 30,498 0.02%
SSY Group Ltd. 34,000 30,384 0.02%Xinjiang Goldwind Science & Technology Co., Ltd. Class H 19,200 30,014 0.02%
Powerlong Real Estate Holdings Ltd. 34,000 29,202 0.02%
Beijing Capital International Airport Co., Ltd. Class H 44,000 29,179 0.02%
CanSino Biologics, Inc. Class A 241 29,012 0.02%
China Communications Services Corp., Ltd. Class H 58,000 28,978 0.02%
TCL Technology Group Corp. Class A 24,400 28,891 0.02%
Yonyou Network Technology Co., Ltd. Class A 5,500 28,314 0.02%
Guotai Junan Securities Co., Ltd. Class H 19,800 28,148 0.02%
Huatai Securities Co., Ltd. Class A 11,500 28,123 0.02%
Tianneng Power International Ltd. 16,000 27,979 0.02%
Luye Pharma Group Ltd. 42,500 27,965 0.02%Shenwan Hongyuan Group Co., Ltd. Class A 38,500 27,888 0.02%
Haitong Securities Co., Ltd. Class A 15,600 27,767 0.02%
Shenzhen Kangtai Biological Products Co., Ltd. Class A 1,200 27,674 0.02%
SOHO China Ltd. 51,500 27,654 0.02%Yihai Kerry Arawana Holdings Co., Ltd. Class A 2,100 27,615 0.02%
Bank of Nanjing Co., Ltd. Class A 16,800 27,355 0.02%
China Southern Airlines Co., Ltd. Class H 44,000 27,309 0.02%
Jiangsu Hengli Hydraulic Co., Ltd. Class A 2,048 27,235 0.02%
.Number of
SharesFair Value
US Dollars ($)% of Total
Net AssetsBank of Beijing Co., Ltd. Class A 36,100 27,211 0.02%
Citic Pacific Special Steel Group Co., Ltd. Class A 8,400 27,095 0.02%
Guangzhou Tinci Materials Technology Co., Ltd. Class A 1,620 26,724 0.02%
Chongqing Rural Commercial Bank Co., Ltd. Class A 43,200 26,679 0.02%
Henan Shuanghui Investment & Development Co., Ltd. Class A 5,400 26,579 0.02%
Shanghai Lujiazui Finance & Trade Zone Development Co., Ltd. Class B 28,600 26,569 0.02%
Zhou Hei Ya International Holdings Co., Ltd. 22,000 26,374 0.02%
China Aoyuan Group Ltd. 31,000 26,147 0.02%China Everbright Ltd. 22,000 25,893 0.01%China Resources Pharmaceutical Group Ltd. 41,500 25,865 0.01%
Hundsun Technologies, Inc. Class A 1,776 25,633 0.01%
Shanghai Putailai New Energy Technology Co., Ltd. Class A 1,200 25,371 0.01%
Yeahka Ltd. 4,000 25,161 0.01%Huaxia Bank Co., Ltd. Class A 26,200 25,102 0.01%
Hainan Meilan International Airport Co., Ltd. Class H 6,000 25,071 0.01%
China Power International Development Ltd. 114,000 24,955 0.01%
Walvax Biotechnology Co., Ltd. Class A 2,600 24,830 0.01%
Blue Moon Group Holdings Ltd. 17,500 24,743 0.01%
KWG Living Group Holdings Ltd. 19,213 24,641 0.01%
Shanghai International Airport Co., Ltd. Class A 3,300 24,583 0.01%
Seazen Holdings Co., Ltd. Class A 3,800 24,467 0.01%
AVIC Jonhon Optronic Technology Co., Ltd. Class A 2,000 24,461 0.01%
DouYu International Holdings Ltd. ADR 3,574 24,446 0.01%
CSC Financial Co., Ltd. Class H 20,000 24,234 0.01%
Unigroup Guoxin Microelectronics Co., Ltd. Class A 1,000 23,865 0.01%
Xinyi Energy Holdings Ltd. 40,000 23,848 0.01%Zhaojin Mining Industry Co., Ltd. Class H 25,000 23,758 0.01%
Sinopec Engineering Group Co., Ltd. Class H 36,500 23,641 0.01%
Fu Shou Yuan International Group Ltd. 24,000 23,426 0.01%
Kaisa Group Holdings Ltd. 61,018 23,100 0.01%Poly Property Services Co., Ltd. Class H 3,400 23,073 0.01%
Shanghai Pharmaceuticals Holding Co., Ltd. Class A 7,000 22,893 0.01%
Bank of Hangzhou Co., Ltd. Class A 10,000 22,830 0.01%
Ovctek China, Inc. Class A 1,420 22,759 0.01%Zhejiang Sanhua Intelligent Controls Co., Ltd. Class A 6,100 22,641 0.01%
Huayu Automotive Systems Co., Ltd. Class A 5,500 22,363 0.01%
Hengli Petrochemical Co., Ltd. Class A 5,500 22,338 0.01%
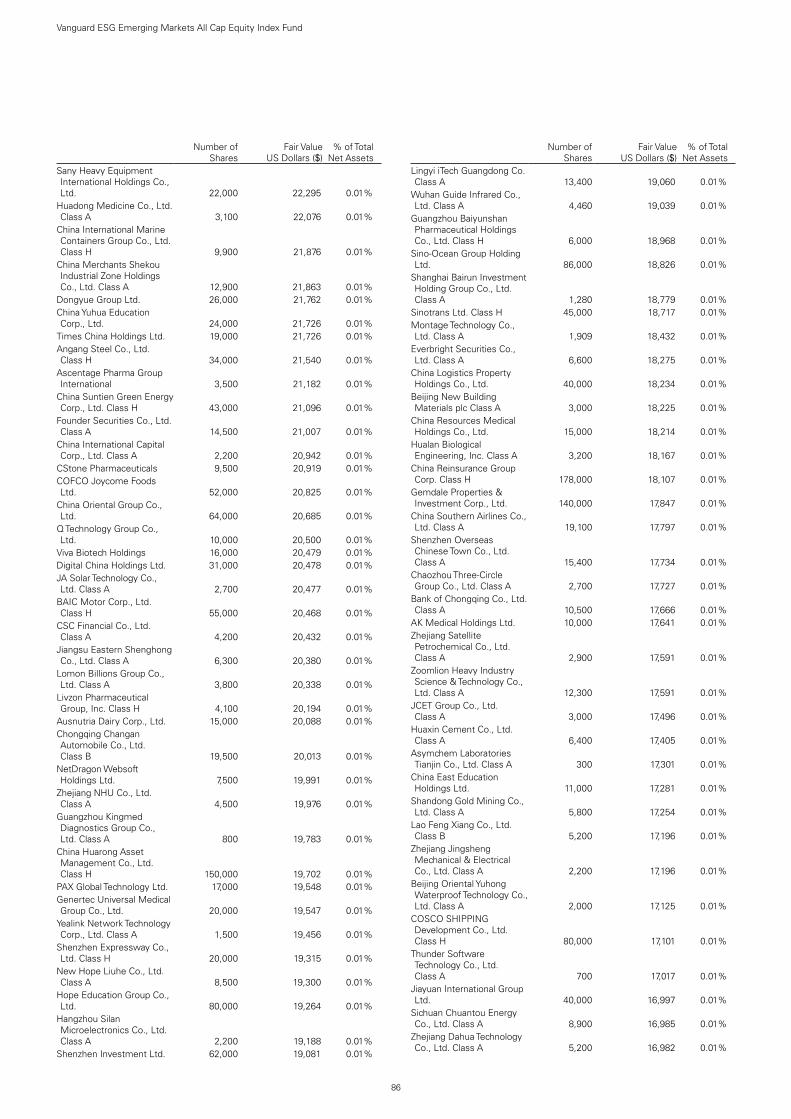
86
Vanguard ESG Emerging Markets All Cap Equity Index Fund
.Number of
SharesFair Value
US Dollars ($)% of Total
Net AssetsSany Heavy Equipment International Holdings Co., Ltd. 22,000 22,295 0.01%
Huadong Medicine Co., Ltd. Class A 3,100 22,076 0.01%
China International Marine Containers Group Co., Ltd. Class H 9,900 21,876 0.01%
China Merchants Shekou Industrial Zone Holdings Co., Ltd. Class A 12,900 21,863 0.01%
Dongyue Group Ltd. 26,000 21,762 0.01%China Yuhua Education Corp., Ltd. 24,000 21,726 0.01%
Times China Holdings Ltd. 19,000 21,726 0.01%Angang Steel Co., Ltd. Class H 34,000 21,540 0.01%
Ascentage Pharma Group International 3,500 21,182 0.01%
China Suntien Green Energy Corp., Ltd. Class H 43,000 21,096 0.01%
Founder Securities Co., Ltd. Class A 14,500 21,007 0.01%
China International Capital Corp., Ltd. Class A 2,200 20,942 0.01%
CStone Pharmaceuticals 9,500 20,919 0.01%COFCO Joycome Foods Ltd. 52,000 20,825 0.01%
China Oriental Group Co., Ltd. 64,000 20,685 0.01%
Q Technology Group Co., Ltd. 10,000 20,500 0.01%
Viva Biotech Holdings 16,000 20,479 0.01%Digital China Holdings Ltd. 31,000 20,478 0.01%JA Solar Technology Co., Ltd. Class A 2,700 20,477 0.01%
BAIC Motor Corp., Ltd. Class H 55,000 20,468 0.01%
CSC Financial Co., Ltd. Class A 4,200 20,432 0.01%
Jiangsu Eastern Shenghong Co., Ltd. Class A 6,300 20,380 0.01%
Lomon Billions Group Co., Ltd. Class A 3,800 20,338 0.01%
Livzon Pharmaceutical Group, Inc. Class H 4,100 20,194 0.01%
Ausnutria Dairy Corp., Ltd. 15,000 20,088 0.01%Chongqing Changan Automobile Co., Ltd. Class B 19,500 20,013 0.01%
NetDragon Websoft Holdings Ltd. 7,500 19,991 0.01%
Zhejiang NHU Co., Ltd. Class A 4,500 19,976 0.01%
Guangzhou Kingmed Diagnostics Group Co., Ltd. Class A 800 19,783 0.01%
China Huarong Asset Management Co., Ltd. Class H 150,000 19,702 0.01%
PAX Global Technology Ltd. 17,000 19,548 0.01%Genertec Universal Medical Group Co., Ltd. 20,000 19,547 0.01%
Yealink Network Technology Corp., Ltd. Class A 1,500 19,456 0.01%
Shenzhen Expressway Co., Ltd. Class H 20,000 19,315 0.01%
New Hope Liuhe Co., Ltd. Class A 8,500 19,300 0.01%
Hope Education Group Co., Ltd. 80,000 19,264 0.01%
Hangzhou Silan Microelectronics Co., Ltd. Class A 2,200 19,188 0.01%
Shenzhen Investment Ltd. 62,000 19,081 0.01%
.Number of
SharesFair Value
US Dollars ($)% of Total
Net AssetsLingyi iTech Guangdong Co. Class A 13,400 19,060 0.01%
Wuhan Guide Infrared Co., Ltd. Class A 4,460 19,039 0.01%
Guangzhou Baiyunshan Pharmaceutical Holdings Co., Ltd. Class H 6,000 18,968 0.01%
Sino-Ocean Group Holding Ltd. 86,000 18,826 0.01%
Shanghai Bairun Investment Holding Group Co., Ltd. Class A 1,280 18,779 0.01%
Sinotrans Ltd. Class H 45,000 18,717 0.01%Montage Technology Co., Ltd. Class A 1,909 18,432 0.01%
Everbright Securities Co., Ltd. Class A 6,600 18,275 0.01%
China Logistics Property Holdings Co., Ltd. 40,000 18,234 0.01%
Beijing New Building Materials plc Class A 3,000 18,225 0.01%
China Resources Medical Holdings Co., Ltd. 15,000 18,214 0.01%
Hualan Biological Engineering, Inc. Class A 3,200 18,167 0.01%
China Reinsurance Group Corp. Class H 178,000 18,107 0.01%
Gemdale Properties & Investment Corp., Ltd. 140,000 17,847 0.01%
China Southern Airlines Co., Ltd. Class A 19,100 17,797 0.01%
Shenzhen Overseas Chinese Town Co., Ltd. Class A 15,400 17,734 0.01%
Chaozhou Three-Circle Group Co., Ltd. Class A 2,700 17,727 0.01%
Bank of Chongqing Co., Ltd. Class A 10,500 17,666 0.01%
AK Medical Holdings Ltd. 10,000 17,641 0.01%Zhejiang Satellite Petrochemical Co., Ltd. Class A 2,900 17,591 0.01%
Zoomlion Heavy Industry Science & Technology Co., Ltd. Class A 12,300 17,591 0.01%
JCET Group Co., Ltd. Class A 3,000 17,496 0.01%
Huaxin Cement Co., Ltd. Class A 6,400 17,405 0.01%
Asymchem Laboratories Tianjin Co., Ltd. Class A 300 17,301 0.01%
China East Education Holdings Ltd. 11,000 17,281 0.01%
Shandong Gold Mining Co., Ltd. Class A 5,800 17,254 0.01%
Lao Feng Xiang Co., Ltd. Class B 5,200 17,196 0.01%
Zhejiang Jingsheng Mechanical & Electrical Co., Ltd. Class A 2,200 17,196 0.01%
Beijing Oriental Yuhong Waterproof Technology Co., Ltd. Class A 2,000 17,125 0.01%
COSCO SHIPPING Development Co., Ltd. Class H 80,000 17,101 0.01%
Thunder Software Technology Co., Ltd. Class A 700 17,017 0.01%
Jiayuan International Group Ltd. 40,000 16,997 0.01%
Sichuan Chuantou Energy Co., Ltd. Class A 8,900 16,985 0.01%
Zhejiang Dahua Technology Co., Ltd. Class A 5,200 16,982 0.01%

87
Vanguard ESG Emerging Markets All Cap Equity Index Fund
.Number of
SharesFair Value
US Dollars ($)% of Total
Net AssetsChina Water Affairs Group Ltd. 22,000 16,941 0.01%
Skshu Paint Co., Ltd. Class A 620 16,889 0.01%
China Overseas Grand Oceans Group Ltd. 29,000 16,879 0.01%
Orient Securities Co., Ltd. Class A 10,900 16,854 0.01%
China SCE Group Holdings Ltd. 41,000 16,842 0.01%
Shandong Hualu Hengsheng Chemical Co., Ltd. Class A 3,500 16,766 0.01%
Yuzhou Group Holdings Co., Ltd. 65,000 16,656 0.01%
China Molybdenum Co., Ltd. Class A 20,700 16,532 0.01%
Shoucheng Holdings Ltd. 68,000 16,287 0.01%China Eastern Airlines Corp., Ltd. Class H 38,000 16,099 0.01%
Beijing Wantai Biological Pharmacy Enterprise Co., Ltd. Class A 400 16,046 0.01%
Jafron Biomedical Co., Ltd. Class A 1,200 16,040 0.01%
Yanlord Land Group Ltd. 17,600 15,974 0.01%Jiangxi Copper Co., Ltd. Class A 4,600 15,934 0.01%
Fanhua, Inc. ADR 1,049 15,840 0.01%Lonking Holdings Ltd. 49,000 15,837 0.01%Powerlong Commercial Management Holdings Ltd. 4,500 15,819 0.01%
Fu Jian Anjoy Foods Co., Ltd. Class A 400 15,727 0.01%
Tongkun Group Co., Ltd. Class A 4,200 15,660 0.01%
SG Micro Corp. Class A 400 15,647 0.01%Yuexiu REIT 30,000 15,452 0.01%China Railway Signal & Communication Corp., Ltd. Class H 41,000 15,152 0.01%
Zhongyu Gas Holdings Ltd. 18,000 15,136 0.01%Rongsheng Petrochemical Co., Ltd. Class A 5,650 15,103 0.01%
China New Higher Education Group Ltd. 22,000 15,071 0.01%
Industrial Securities Co., Ltd. Class A 10,000 14,952 0.01%
Shanghai Fudan Microelectronics Group Co., Ltd. Class H 6,000 14,942 0.01%
China Eastern Airlines Corp., Ltd. Class A 19,000 14,939 0.01%
Shanghai Haohai Biological Technology Co., Ltd. Class H 1,200 14,726 0.01%
Yidu Tech, Inc. 2,800 14,711 0.01%Health & Happiness H&H International Holdings Ltd. 3,500 14,670 0.01%
Hangzhou First Applied Material Co., Ltd. Class A 900 14,645 0.01%
Guosen Securities Co., Ltd. Class A 8,800 14,642 0.01%
BOE Technology Group Co., Ltd. Class B 29,700 14,609 0.01%
Shengyi Technology Co., Ltd. Class A 4,000 14,493 0.01%
JW Cayman Therapeutics Co., Ltd. 4,500 14,458 0.01%
Red Star Macalline Group Corp., Ltd. Class H 20,420 14,383 0.01%
C&D International Investment Group Ltd. 8,000 14,381 0.01%
Zhuguang Holdings Group Co., Ltd. 62,000 14,371 0.01%
.Number of
SharesFair Value
US Dollars ($)% of Total
Net AssetsKingfa Sci & Tech Co., Ltd. Class A 4,400 14,206 0.01%
Humanwell Healthcare Group Co., Ltd. Class A 3,234 14,151 0.01%
Kangji Medical Holdings Ltd. 8,500 14,141 0.01%China Baoan Group Co., Ltd. Class A 5,000 14,139 0.01%
China Jushi Co., Ltd. Class A 5,886 14,130 0.01%
China Dongxiang Group Co., Ltd. 80,000 14,113 0.01%
Shanghai Jinjiang International Hotels Co., Ltd. Class A 1,600 14,103 0.01%
Suzhou Maxwell Technologies Co., Ltd. Class A 200 14,076 0.01%
China BlueChemical Ltd. Class H 48,000 14,031 0.01%
Changzhou Xingyu Automotive Lighting Systems Co., Ltd. Class A 400 13,975 0.01%
Hithink RoyalFlush Information Network Co., Ltd. Class A 800 13,965 0.01%
Shanghai International Port Group Co., Ltd. Class A 18,800 13,880 0.01%
Wuxi Shangji Automation Co., Ltd. Class A 500 13,849 0.01%
Hisense Home Appliances Group Co., Ltd. Class H 10,000 13,804 0.01%
Sinoma Science & Technology Co., Ltd. Class A 3,400 13,772 0.01%
By-health Co., Ltd. Class A 2,700 13,749 0.01%GEM Co., Ltd. Class A 9,500 13,748 0.01%XCMG Construction Machinery Co., Ltd. Class A 13,800 13,606 0.01%
Poly Property Group Co., Ltd. 52,000 13,526 0.01%
Pharmaron Beijing Co., Ltd. Class A 400 13,434 0.01%
Lepu Medical Technology Beijing Co., Ltd. Class A 2,700 13,423 0.01%
Air China Ltd. Class A 11,100 13,366 0.01%Trip.com Group Ltd. 373 13,257 0.01%Foxconn Industrial Internet Co., Ltd. Class A 6,900 13,254 0.01%
China CITIC Bank Corp., Ltd. Class A 16,600 13,104 0.01%
Orient Securities Co., Ltd. Class H 18,000 13,049 0.01%
Youdao, Inc. ADR 558 12,884 0.01%Tong Ren Tang Technologies Co., Ltd. Class H 14,000 12,854 0.01%
Flat Glass Group Co., Ltd. Class A 2,100 12,849 0.01%
Tiangong International Co., Ltd. 30,000 12,787 0.01%
Beijing-Shanghai High Speed Railway Co., Ltd. Class A 15,600 12,773 0.01%
Zhejiang Longsheng Group Co., Ltd. Class A 6,000 12,760 0.01%
Hongfa Technology Co., Ltd. Class A 1,300 12,616 0.01%
Dazhong Transportation Group Co., Ltd. Class B 44,300 12,581 0.01%
China Construction Bank Corp. Class A 12,200 12,557 0.01%
Shanghai Yuyuan Tourist Mart Group Co., Ltd. Class A 7,000 12,557 0.01%
Zhejiang Century Huatong Group Co., Ltd. Class A 12,600 12,520 0.01%

88
Vanguard ESG Emerging Markets All Cap Equity Index Fund
.Number of
SharesFair Value
US Dollars ($)% of Total
Net AssetsGongniu Group Co., Ltd. Class A 400 12,506 0.01%
China Maple Leaf Educational Systems Ltd. 46,000 12,439 0.01%
Beijing Tiantan Biological Products Corp., Ltd. Class A 2,340 12,405 0.01%
Jiangsu Yuyue Medical Equipment & Supply Co., Ltd. Class A 2,100 12,394 0.01%
Tianshui Huatian Technology Co., Ltd. Class A 5,200 12,387 0.01%
Sogou, Inc. ADR 1,451 12,377 0.01%Proya Cosmetics Co., Ltd. Class A 400 12,179 0.01%
Shanghai RAAS Blood Products Co., Ltd. Class A 10,500 12,173 0.01%
Shanxi Taigang Stainless Steel Co., Ltd. Class A 10,500 12,173 0.01%
Shanghai Jahwa United Co., Ltd. Class A 1,300 12,101 0.01%
Sunwoda Electronic Co., Ltd. Class A 2,400 12,095 0.01%
Guangdong Kinlong Hardware Products Co., Ltd. Class A 400 12,014 0.01%
Offcn Education Technology Co., Ltd. Class A 3,700 11,963 0.01%
China Modern Dairy Holdings Ltd. 54,000 11,960 0.01%
Huizhou Desay Sv Automotive Co., Ltd. Class A 700 11,927 0.01%
Zhejiang Chint Electrics Co., Ltd. Class A 2,300 11,883 0.01%
Hangzhou Steam Turbine Co., Ltd. Class B 7,400 11,844 0.01%
Shandong Nanshan Aluminum Co., Ltd. Class A 21,200 11,813 0.01%
Zhenro Properties Group Ltd. 21,000 11,736 0.01%
Raytron Technology Co., Ltd. Class A 759 11,728 0.01%
Sohu.com Ltd. ADR 624 11,606 0.01%Intco Medical Technology Co., Ltd. Class A 600 11,590 0.01%
CGN New Energy Holdings Co., Ltd. 28,000 11,574 0.01%
CSG Holding Co., Ltd. Class A 7,300 11,570 0.01%
China Kepei Education Group Ltd. 16,000 11,538 0.01%
Archosaur Games, Inc. 6,000 11,466 0.01%Spring Airlines Co., Ltd. Class A 1,300 11,449 0.01%
Avic Aviation High-Technology Co., Ltd. Class A 2,400 11,434 0.01%
Tianfeng Securities Co., Ltd. Class A 15,200 11,434 0.01%
Guangzhou Automobile Group Co., Ltd. Class A 5,700 11,425 0.01%
Tianli Education International Holdings Ltd. 30,000 11,396 0.01%
Apeloa Pharmaceutical Co., Ltd. Class A 2,500 11,376 0.01%
Beijing United Information Technology Co., Ltd. Class A 735 11,373 0.01%
Shenwan Hongyuan Group Co., Ltd. Class H 42,400 11,356 0.01%
Weifu High-Technology Group Co., Ltd. Class B 5,700 11,340 0.01%
China Merchants Energy Shipping Co., Ltd. Class A 15,840 11,327 0.01%
.Number of
SharesFair Value
US Dollars ($)% of Total
Net AssetsJiangsu Yoke Technology Co., Ltd. Class A 900 11,283 0.01%
Huafon Chemical Co., Ltd. Class A 5,100 11,209 0.01%
Meitu, Inc. 49,000 11,105 0.01%Shandong Chenming Paper Holdings Ltd. Class B 19,200 11,101 0.01%
Beijing Jingneng Clean Energy Co., Ltd. Class H 46,000 11,077 0.01%
Yonghui Superstores Co., Ltd. Class A 15,100 11,055 0.01%
Guangzhou Baiyunshan Pharmaceutical Holdings Co., Ltd. Class A 2,100 11,002 0.01%
Changjiang Securities Co., Ltd. Class A 9,700 10,990 0.01%
Oppein Home Group, Inc. Class A 500 10,986 0.01%
Kuang-Chi Technologies Co., Ltd. Class A 3,400 10,951 0.01%
Hengyi Petrochemical Co., Ltd. Class A 5,900 10,913 0.01%
Fufeng Group Ltd. 34,000 10,902 0.01%Yunnan Aluminium Co., Ltd. Class A 5,900 10,867 0.01%
Western Securities Co., Ltd. Class A 8,500 10,854 0.01%
Bank of Jiangsu Co., Ltd. Class A 9,870 10,846 0.01%
China Tian Lun Gas Holdings Ltd. 10,500 10,830 0.01%
Greatview Aseptic Packaging Co., Ltd. 24,000 10,817 0.01%
Suning.com Co., Ltd. Class A 12,500 10,815 0.01%
Zhongjin Gold Corp., Ltd. Class A 8,100 10,807 0.01%
Sinolink Securities Co., Ltd. Class A 5,500 10,803 0.01%
Gemdale Corp. Class A 6,800 10,778 0.01%Shenzhen SC New Energy Technology Corp. Class A 600 10,774 0.01%
BEST, Inc. ADR 6,044 10,758 0.01%Hunan Valin Steel Co., Ltd. Class A 10,500 10,726 0.01%
Luxi Chemical Group Co., Ltd. Class A 3,700 10,726 0.01%
GRG Banking Equipment Co., Ltd. Class A 5,300 10,689 0.01%
Dawning Information Industry Co., Ltd. Class A 2,500 10,684 0.01%
JNBY Design Ltd. 6,000 10,662 0.01%Guoyuan Securities Co., Ltd. Class A 8,600 10,609 0.01%
Weihai Guangwei Composites Co., Ltd. Class A 900 10,580 0.01%
Hang Zhou Great Star Industrial Co., Ltd. Class A 2,000 10,550 0.01%
Guangshen Railway Co., Ltd. Class H 54,000 10,500 0.01%
Shanghai M&G Stationery, Inc. Class A 800 10,470 0.01%
AVIC Industry-Finance Holdings Co., Ltd. Class A 17,400 10,422 0.01%
TongFu Microelectronics Co., Ltd. Class A 2,800 10,418 0.01%
Yifeng Pharmacy Chain Co., Ltd. Class A 1,200 10,418 0.01%
Ronshine China Holdings Ltd. 18,000 10,384 0.01%
Greenland Holdings Corp., Ltd. Class A 12,300 10,376 0.01%
Hefei Meiya Optoelectronic Technology, Inc. Class A 1,200 10,357 0.01%

89
Vanguard ESG Emerging Markets All Cap Equity Index Fund
.Number of
SharesFair Value
US Dollars ($)% of Total
Net AssetsJinke Properties Group Co., Ltd. Class A 11,500 10,306 0.01%
Winning Health Technology Group Co., Ltd. Class A 4,090 10,300 0.01%
Times Neighborhood Holdings Ltd. 12,000 10,291 0.01%
Southwest Securities Co., Ltd. Class A 13,600 10,251 0.01%
Wuxi Lead Intelligent Equipment Co., Ltd. Class A 1,100 10,239 0.01%
Shenzhen Sunlord Electronics Co., Ltd. Class A 1,700 10,201 0.01%
Midea Real Estate Holding Ltd. 4,800 10,161 0.01%
China International Marine Containers Group Co., Ltd. Class A 3,600 10,130 0.01%
Shandong Sun Paper Industry JSC Ltd. Class A 4,900 10,125 0.01%
Tianma Microelectronics Co., Ltd. Class A 4,600 10,096 0.01%
COSCO SHIPPING Development Co., Ltd. Class A 17,300 10,041 0.01%
Shenzhen Sunway Communication Co., Ltd. Class A 2,100 10,037 0.01%
Inspur Electronic Information Industry Co., Ltd. Class A 2,300 10,014 0.01%
E-House China Enterprise Holdings Ltd. 11,700 10,004 0.01%
Han's Laser Technology Industry Group Co., Ltd. Class A 1,600 10,002 0.01%
Xinjiang Goldwind Science & Technology Co., Ltd. Class A 5,300 9,975 0.01%
BBMG Corp. Class H 53,000 9,964 0.01%China Greatwall Technology Group Co., Ltd. Class A 4,400 9,943 0.01%
Shenghe Resources Holding Co., Ltd. Class A 3,700 9,942 0.01%
Songcheng Performance Development Co., Ltd. Class A 3,800 9,881 0.01%
Ningbo Joyson Electronic Corp. Class A 2,500 9,875 0.01%
Ningbo Tuopu Group Co., Ltd. Class A 1,700 9,849 0.01%
SooChow Securities Co., Ltd. Class A 7,600 9,810 0.01%
West China Cement Ltd. 64,000 9,807 0.01%Xiamen Faratronic Co., Ltd. Class A 400 9,804 0.01%
Consun Pharmaceutical Group Ltd. 15,000 9,793 0.01%
China Railway Signal & Communication Corp., Ltd. Class A 11,101 9,777 0.01%
Zhejiang Jiuzhou Pharmaceutical Co., Ltd. Class A 1,300 9,775 0.01%
Nanjing Securities Co., Ltd. Class A 6,000 9,770 0.01%
Jonjee Hi-Tech Industrial & Commercial Holding Co., Ltd. Class A 1,500 9,756 0.01%
Beijing Shiji Information Technology Co., Ltd. Class A 2,680 9,752 0.01%
Wuchan Zhongda Group Co., Ltd. Class A 8,000 9,745 0.01%
.Number of
SharesFair Value
US Dollars ($)% of Total
Net AssetsBeijing Enlight Media Co., Ltd. Class A 5,800 9,704 0.01%
Zhejiang Huahai Pharmaceutical Co., Ltd. Class A 3,000 9,695 0.01%
Suzhou Dongshan Precision Manufacturing Co., Ltd. Class A 3,000 9,677 0.01%
Wuhu Sanqi Interactive Entertainment Network Technology Group Co., Ltd. Class A 2,600 9,666 0.01%
SDIC Capital Co., Ltd. Class A 7,320 9,619 0.01%
Xinhua Winshare Publishing & Media Co., Ltd. Class A 7,100 9,583 0.01%
Jason Furniture Hangzhou Co., Ltd. Class A 800 9,569 0.01%
Maanshan Iron & Steel Co., Ltd. Class H 22,000 9,547 0.01%
Ginlong Technologies Co., Ltd. Class A 340 9,504 0.01%
Shenzhen MTC Co., Ltd. Class A 10,100 9,489 0.01%
Yutong Bus Co., Ltd. Class A 4,900 9,473 0.01%
China Zheshang Bank Co., Ltd. Class A 15,400 9,463 0.01%
Tongling Nonferrous Metals Group Co., Ltd. Class A 22,400 9,430 0.01%
Comba Telecom Systems Holdings Ltd. 36,000 9,410 0.01%
Hangzhou Robam Appliances Co., Ltd. Class A 1,300 9,356 0.01%
Chongqing Fuling Zhacai Group Co., Ltd. Class A 1,600 9,326 0.01%
Jiangsu Zhongtian Technology Co., Ltd. Class A 6,000 9,287 0.01%
Ming Yang Smart Energy Group Ltd. Class A 3,700 9,272 0.01%
China Machinery Engineering Corp. Class H 20,000 9,271 0.01%
Yuexiu Transport Infrastructure Ltd. 16,000 9,271 0.01%
Beijing Dabeinong Technology Group Co., Ltd. Class A 8,800 9,262 0.01%
Shanghai Baosight Software Co., Ltd. Class A 1,170 9,218 0.01%
Maoyan Entertainment 5,800 9,127 0.01%Concord New Energy Group Ltd. 120,000 9,117 0.01%
Hi Sun Technology China Ltd. 54,000 9,109 0.01%
Changsha Jingjia Microelectronics Co., Ltd. Class A 600 9,094 0.01%
Shandong Sinocera Functional Material Co., Ltd. Class A 1,200 9,055 0.01%
Sichuan Road & Bridge Co., Ltd. Class A 9,300 9,025 0.01%
TCL Electronics Holdings Ltd. 15,000 8,943 0.01%
Yunnan Tin Co., Ltd. Class A 3,600 8,932 0.01%Zhejiang Supor Co., Ltd. Class A 900 8,886 0.01%
Shanghai Jinqiao Export Processing Zone Development Co., Ltd. Class B 9,100 8,872 0.01%
WUS Printed Circuit Kunshan Co., Ltd. Class A 3,700 8,859 0.01%
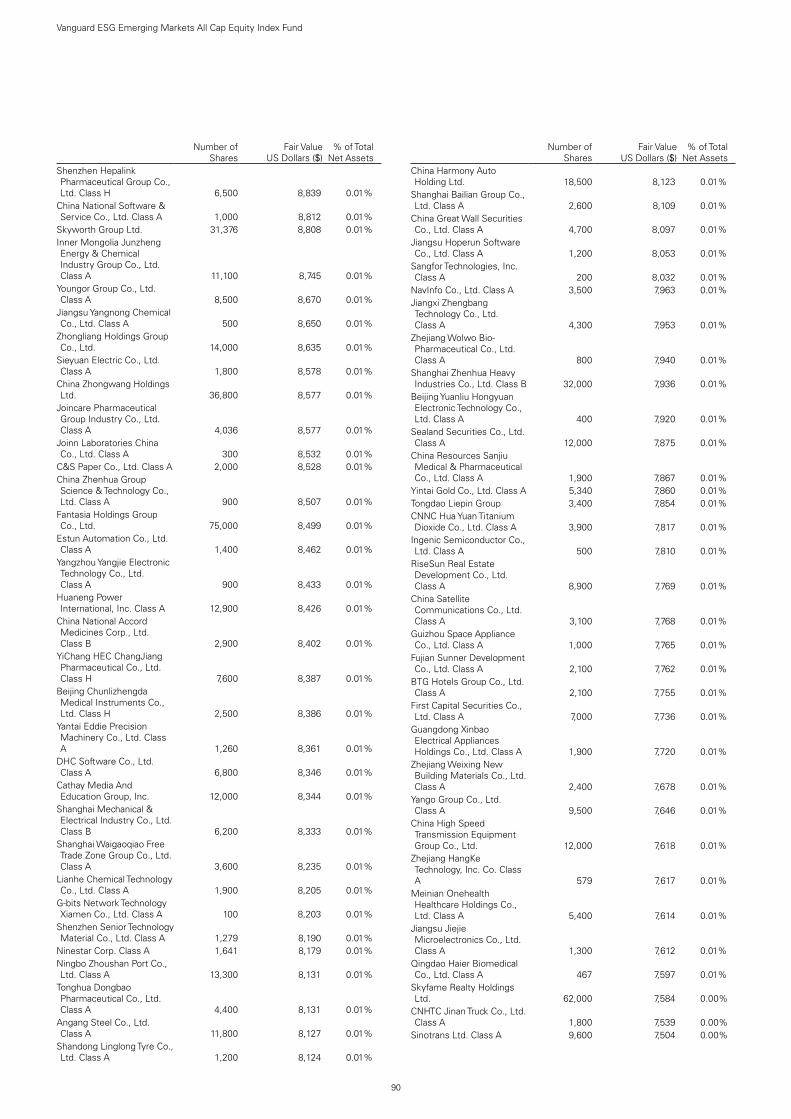
90
Vanguard ESG Emerging Markets All Cap Equity Index Fund
.Number of
SharesFair Value
US Dollars ($)% of Total
Net AssetsShenzhen Hepalink Pharmaceutical Group Co., Ltd. Class H 6,500 8,839 0.01%
China National Software & Service Co., Ltd. Class A 1,000 8,812 0.01%
Skyworth Group Ltd. 31,376 8,808 0.01%Inner Mongolia Junzheng Energy & Chemical Industry Group Co., Ltd. Class A 11,100 8,745 0.01%
Youngor Group Co., Ltd. Class A 8,500 8,670 0.01%
Jiangsu Yangnong Chemical Co., Ltd. Class A 500 8,650 0.01%
Zhongliang Holdings Group Co., Ltd. 14,000 8,635 0.01%
Sieyuan Electric Co., Ltd. Class A 1,800 8,578 0.01%
China Zhongwang Holdings Ltd. 36,800 8,577 0.01%
Joincare Pharmaceutical Group Industry Co., Ltd. Class A 4,036 8,577 0.01%
Joinn Laboratories China Co., Ltd. Class A 300 8,532 0.01%
C&S Paper Co., Ltd. Class A 2,000 8,528 0.01%China Zhenhua Group Science & Technology Co., Ltd. Class A 900 8,507 0.01%
Fantasia Holdings Group Co., Ltd. 75,000 8,499 0.01%
Estun Automation Co., Ltd. Class A 1,400 8,462 0.01%
Yangzhou Yangjie Electronic Technology Co., Ltd. Class A 900 8,433 0.01%
Huaneng Power International, Inc. Class A 12,900 8,426 0.01%
China National Accord Medicines Corp., Ltd. Class B 2,900 8,402 0.01%
YiChang HEC ChangJiang Pharmaceutical Co., Ltd. Class H 7,600 8,387 0.01%
Beijing Chunlizhengda Medical Instruments Co., Ltd. Class H 2,500 8,386 0.01%
Yantai Eddie Precision Machinery Co., Ltd. Class A 1,260 8,361 0.01%
DHC Software Co., Ltd. Class A 6,800 8,346 0.01%
Cathay Media And Education Group, Inc. 12,000 8,344 0.01%
Shanghai Mechanical & Electrical Industry Co., Ltd. Class B 6,200 8,333 0.01%
Shanghai Waigaoqiao Free Trade Zone Group Co., Ltd. Class A 3,600 8,235 0.01%
Lianhe Chemical Technology Co., Ltd. Class A 1,900 8,205 0.01%
G-bits Network Technology Xiamen Co., Ltd. Class A 100 8,203 0.01%
Shenzhen Senior Technology Material Co., Ltd. Class A 1,279 8,190 0.01%
Ninestar Corp. Class A 1,641 8,179 0.01%Ningbo Zhoushan Port Co., Ltd. Class A 13,300 8,131 0.01%
Tonghua Dongbao Pharmaceutical Co., Ltd. Class A 4,400 8,131 0.01%
Angang Steel Co., Ltd. Class A 11,800 8,127 0.01%
Shandong Linglong Tyre Co., Ltd. Class A 1,200 8,124 0.01%
.Number of
SharesFair Value
US Dollars ($)% of Total
Net AssetsChina Harmony Auto Holding Ltd. 18,500 8,123 0.01%
Shanghai Bailian Group Co., Ltd. Class A 2,600 8,109 0.01%
China Great Wall Securities Co., Ltd. Class A 4,700 8,097 0.01%
Jiangsu Hoperun Software Co., Ltd. Class A 1,200 8,053 0.01%
Sangfor Technologies, Inc. Class A 200 8,032 0.01%
NavInfo Co., Ltd. Class A 3,500 7,963 0.01%Jiangxi Zhengbang Technology Co., Ltd. Class A 4,300 7,953 0.01%
Zhejiang Wolwo Bio-Pharmaceutical Co., Ltd. Class A 800 7,940 0.01%
Shanghai Zhenhua Heavy Industries Co., Ltd. Class B 32,000 7,936 0.01%
Beijing Yuanliu Hongyuan Electronic Technology Co., Ltd. Class A 400 7,920 0.01%
Sealand Securities Co., Ltd. Class A 12,000 7,875 0.01%
China Resources Sanjiu Medical & Pharmaceutical Co., Ltd. Class A 1,900 7,867 0.01%
Yintai Gold Co., Ltd. Class A 5,340 7,860 0.01%Tongdao Liepin Group 3,400 7,854 0.01%CNNC Hua Yuan Titanium Dioxide Co., Ltd. Class A 3,900 7,817 0.01%
Ingenic Semiconductor Co., Ltd. Class A 500 7,810 0.01%
RiseSun Real Estate Development Co., Ltd. Class A 8,900 7,769 0.01%
China Satellite Communications Co., Ltd. Class A 3,100 7,768 0.01%
Guizhou Space Appliance Co., Ltd. Class A 1,000 7,765 0.01%
Fujian Sunner Development Co., Ltd. Class A 2,100 7,762 0.01%
BTG Hotels Group Co., Ltd. Class A 2,100 7,755 0.01%
First Capital Securities Co., Ltd. Class A 7,000 7,736 0.01%
Guangdong Xinbao Electrical Appliances Holdings Co., Ltd. Class A 1,900 7,720 0.01%
Zhejiang Weixing New Building Materials Co., Ltd. Class A 2,400 7,678 0.01%
Yango Group Co., Ltd. Class A 9,500 7,646 0.01%
China High Speed Transmission Equipment Group Co., Ltd. 12,000 7,618 0.01%
Zhejiang HangKe Technology, Inc. Co. Class A 579 7,617 0.01%
Meinian Onehealth Healthcare Holdings Co., Ltd. Class A 5,400 7,614 0.01%
Jiangsu Jiejie Microelectronics Co., Ltd. Class A 1,300 7,612 0.01%
Qingdao Haier Biomedical Co., Ltd. Class A 467 7,597 0.01%
Skyfame Realty Holdings Ltd. 62,000 7,584 0.00%
CNHTC Jinan Truck Co., Ltd. Class A 1,800 7,539 0.00%
Sinotrans Ltd. Class A 9,600 7,504 0.00%
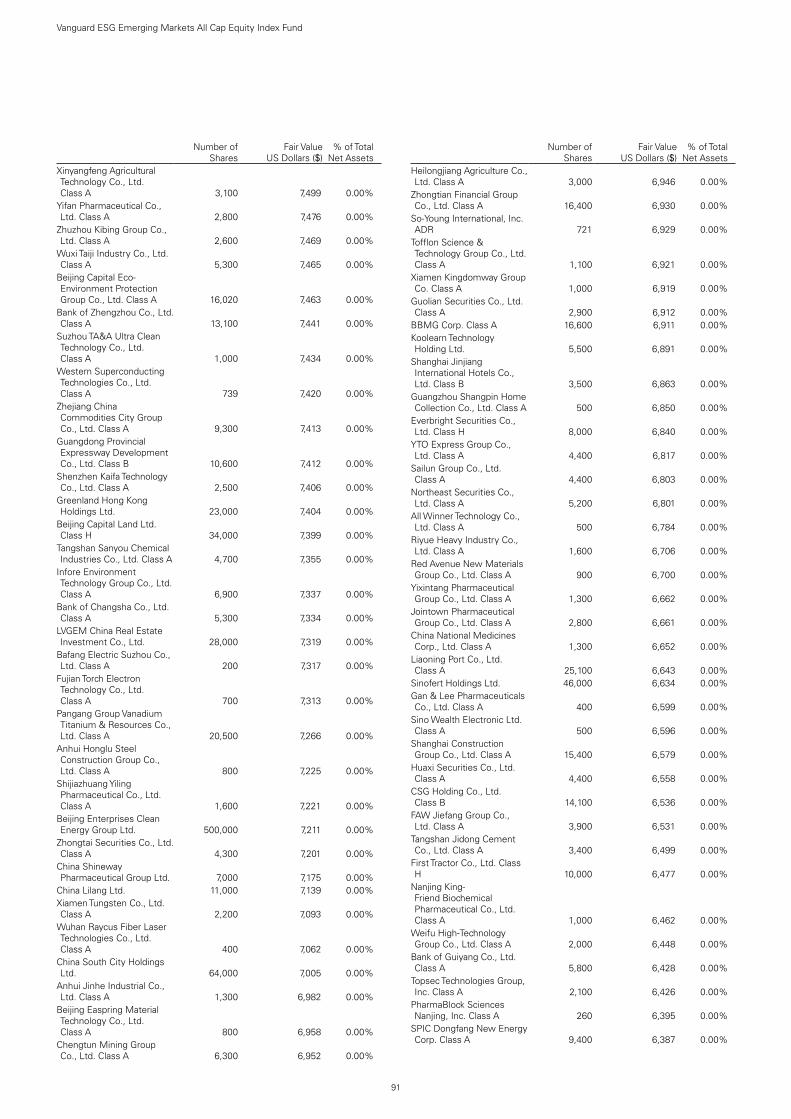
91
Vanguard ESG Emerging Markets All Cap Equity Index Fund
.Number of
SharesFair Value
US Dollars ($)% of Total
Net AssetsXinyangfeng Agricultural Technology Co., Ltd. Class A 3,100 7,499 0.00%
Yifan Pharmaceutical Co., Ltd. Class A 2,800 7,476 0.00%
Zhuzhou Kibing Group Co., Ltd. Class A 2,600 7,469 0.00%
Wuxi Taiji Industry Co., Ltd. Class A 5,300 7,465 0.00%
Beijing Capital Eco-Environment Protection Group Co., Ltd. Class A 16,020 7,463 0.00%
Bank of Zhengzhou Co., Ltd. Class A 13,100 7,441 0.00%
Suzhou TA&A Ultra Clean Technology Co., Ltd. Class A 1,000 7,434 0.00%
Western Superconducting Technologies Co., Ltd. Class A 739 7,420 0.00%
Zhejiang China Commodities City Group Co., Ltd. Class A 9,300 7,413 0.00%
Guangdong Provincial Expressway Development Co., Ltd. Class B 10,600 7,412 0.00%
Shenzhen Kaifa Technology Co., Ltd. Class A 2,500 7,406 0.00%
Greenland Hong Kong Holdings Ltd. 23,000 7,404 0.00%
Beijing Capital Land Ltd. Class H 34,000 7,399 0.00%
Tangshan Sanyou Chemical Industries Co., Ltd. Class A 4,700 7,355 0.00%
Infore Environment Technology Group Co., Ltd. Class A 6,900 7,337 0.00%
Bank of Changsha Co., Ltd. Class A 5,300 7,334 0.00%
LVGEM China Real Estate Investment Co., Ltd. 28,000 7,319 0.00%
Bafang Electric Suzhou Co., Ltd. Class A 200 7,317 0.00%
Fujian Torch Electron Technology Co., Ltd. Class A 700 7,313 0.00%
Pangang Group Vanadium Titanium & Resources Co., Ltd. Class A 20,500 7,266 0.00%
Anhui Honglu Steel Construction Group Co., Ltd. Class A 800 7,225 0.00%
Shijiazhuang Yiling Pharmaceutical Co., Ltd. Class A 1,600 7,221 0.00%
Beijing Enterprises Clean Energy Group Ltd. 500,000 7,211 0.00%
Zhongtai Securities Co., Ltd. Class A 4,300 7,201 0.00%
China Shineway Pharmaceutical Group Ltd. 7,000 7,175 0.00%
China Lilang Ltd. 11,000 7,139 0.00%Xiamen Tungsten Co., Ltd. Class A 2,200 7,093 0.00%
Wuhan Raycus Fiber Laser Technologies Co., Ltd. Class A 400 7,062 0.00%
China South City Holdings Ltd. 64,000 7,005 0.00%
Anhui Jinhe Industrial Co., Ltd. Class A 1,300 6,982 0.00%
Beijing Easpring Material Technology Co., Ltd. Class A 800 6,958 0.00%
Chengtun Mining Group Co., Ltd. Class A 6,300 6,952 0.00%
.Number of
SharesFair Value
US Dollars ($)% of Total
Net AssetsHeilongjiang Agriculture Co., Ltd. Class A 3,000 6,946 0.00%
Zhongtian Financial Group Co., Ltd. Class A 16,400 6,930 0.00%
So-Young International, Inc. ADR 721 6,929 0.00%
Tofflon Science & Technology Group Co., Ltd. Class A 1,100 6,921 0.00%
Xiamen Kingdomway Group Co. Class A 1,000 6,919 0.00%
Guolian Securities Co., Ltd. Class A 2,900 6,912 0.00%
BBMG Corp. Class A 16,600 6,911 0.00%Koolearn Technology Holding Ltd. 5,500 6,891 0.00%
Shanghai Jinjiang International Hotels Co., Ltd. Class B 3,500 6,863 0.00%
Guangzhou Shangpin Home Collection Co., Ltd. Class A 500 6,850 0.00%
Everbright Securities Co., Ltd. Class H 8,000 6,840 0.00%
YTO Express Group Co., Ltd. Class A 4,400 6,817 0.00%
Sailun Group Co., Ltd. Class A 4,400 6,803 0.00%
Northeast Securities Co., Ltd. Class A 5,200 6,801 0.00%
All Winner Technology Co., Ltd. Class A 500 6,784 0.00%
Riyue Heavy Industry Co., Ltd. Class A 1,600 6,706 0.00%
Red Avenue New Materials Group Co., Ltd. Class A 900 6,700 0.00%
Yixintang Pharmaceutical Group Co., Ltd. Class A 1,300 6,662 0.00%
Jointown Pharmaceutical Group Co., Ltd. Class A 2,800 6,661 0.00%
China National Medicines Corp., Ltd. Class A 1,300 6,652 0.00%
Liaoning Port Co., Ltd. Class A 25,100 6,643 0.00%
Sinofert Holdings Ltd. 46,000 6,634 0.00%Gan & Lee Pharmaceuticals Co., Ltd. Class A 400 6,599 0.00%
Sino Wealth Electronic Ltd. Class A 500 6,596 0.00%
Shanghai Construction Group Co., Ltd. Class A 15,400 6,579 0.00%
Huaxi Securities Co., Ltd. Class A 4,400 6,558 0.00%
CSG Holding Co., Ltd. Class B 14,100 6,536 0.00%
FAW Jiefang Group Co., Ltd. Class A 3,900 6,531 0.00%
Tangshan Jidong Cement Co., Ltd. Class A 3,400 6,499 0.00%
First Tractor Co., Ltd. Class H 10,000 6,477 0.00%
Nanjing King-Friend Biochemical Pharmaceutical Co., Ltd. Class A 1,000 6,462 0.00%
Weifu High-Technology Group Co., Ltd. Class A 2,000 6,448 0.00%
Bank of Guiyang Co., Ltd. Class A 5,800 6,428 0.00%
Topsec Technologies Group, Inc. Class A 2,100 6,426 0.00%
PharmaBlock Sciences Nanjing, Inc. Class A 260 6,395 0.00%
SPIC Dongfang New Energy Corp. Class A 9,400 6,387 0.00%

92
Vanguard ESG Emerging Markets All Cap Equity Index Fund
.Number of
SharesFair Value
US Dollars ($)% of Total
Net AssetsChongqing Rural Commercial Bank Co., Ltd. Class H 16,000 6,325 0.00%
Jiangsu Zhongnan Construction Group Co., Ltd. Class A 6,900 6,322 0.00%
Daan Gene Co., Ltd. Class A 1,920 6,312 0.00%Shanghai Liangxin Electrical Co., Ltd. Class A 1,800 6,280 0.00%
Siasun Robot & Automation Co., Ltd. Class A 3,800 6,276 0.00%
Pacific Shuanglin Bio-pharmacy Co., Ltd. Class A 1,300 6,262 0.00%
Shenzhen Jinjia Group Co., Ltd. Class A 3,800 6,258 0.00%
Beijing E-Hualu Information Technology Co., Ltd. Class A 1,500 6,248 0.00%
Jiangsu Shagang Co., Ltd. Class A 3,700 6,248 0.00%
Jilin Aodong Pharmaceutical Group Co., Ltd. Class A 2,600 6,234 0.00%
Shandong Chenming Paper Holdings Ltd. Class H 10,000 6,232 0.00%
Shenzhen Zhongjin Lingnan Nonfemet Co., Ltd. Class A 8,900 6,226 0.00%
NanJi E-Commerce Co., Ltd. Class A 4,100 6,200 0.00%
Livzon Pharmaceutical Group, Inc. Class A 800 6,194 0.00%
Zhejiang Juhua Co., Ltd. Class A 4,500 6,157 0.00%
Zibo Qixiang Tengda Chemical Co., Ltd. Class A 3,200 6,152 0.00%
Shenzhen Salubris Pharmaceuticals Co., Ltd. Class A 1,200 6,111 0.00%
Dongxing Securities Co., Ltd. Class A 3,600 6,090 0.00%
Grandblue Environment Co., Ltd. Class A 1,800 6,071 0.00%
Do-Fluoride New Materials Co., Ltd. Class A 1,100 6,051 0.00%
Beijing Bei Mo Gao Ke Friction Material Co., Ltd. Class A 400 6,036 0.00%
Zhejiang Xinan Chemical Industrial Group Co., Ltd. Class A 2,200 6,034 0.00%
Chifeng Jilong Gold Mining Co., Ltd. Class A 2,600 6,032 0.00%
Suning Universal Co., Ltd. Class A 4,700 6,031 0.00%
Shanghai Jin Jiang Capital Co., Ltd. Class H 28,000 6,021 0.00%
Wuhu Token Science Co., Ltd. Class A 4,700 6,009 0.00%
Beijing BDStar Navigation Co., Ltd. Class A 900 6,000 0.00%
Beijing Thunisoft Corp., Ltd. Class A 2,000 5,959 0.00%
Hoshine Silicon Industry Co., Ltd. Class A 500 5,952 0.00%
Huaan Securities Co., Ltd. Class A 6,890 5,940 0.00%
Jiangsu Nhwa Pharmaceutical Co., Ltd. Class A 2,500 5,940 0.00%
Ningbo Sanxing Medical Electric Co., Ltd. Class A 1,800 5,934 0.00%
Beijing Orient National Communication Science & Technology Co., Ltd. Class A 3,100 5,930 0.00%
Hesteel Co., Ltd. Class A 15,400 5,864 0.00%
.Number of
SharesFair Value
US Dollars ($)% of Total
Net AssetsChina National Accord Medicines Corp., Ltd. Class A 1,000 5,857 0.00%
Huangshan Tourism Development Co., Ltd. Class B 7,900 5,846 0.00%
GCL System Integration Technology Co., Ltd. Class A 10,800 5,817 0.00%
Beijing Sinnet Technology Co., Ltd. Class A 2,600 5,791 0.00%
Shandong Pharmaceutical Glass Co., Ltd. Class A 1,100 5,780 0.00%
Guangzhou Shiyuan Electronic Technology Co., Ltd. Class A 300 5,771 0.00%
Shanghai Bailian Group Co., Ltd. Class B 6,000 5,754 0.00%
Shanghai Huayi Group Co., Ltd. Class B 9,300 5,747 0.00%
Shenzhen Chengxin Lithium Group Co., Ltd. Class A 1,300 5,745 0.00%
Shanghai Junshi Biosciences Co., Ltd. Class A 457 5,744 0.00%
Jiangsu Expressway Co., Ltd. Class A 3,800 5,740 0.00%
BOC International China Co., Ltd. Class A 1,800 5,736 0.00%
Yangtze Optical Fibre & Cable Joint Stock Ltd. Co. Class H 4,500 5,719 0.00%
CECEP Solar Energy Co., Ltd. Class A 5,900 5,689 0.00%
Unisplendour Corp., Ltd. Class A 1,680 5,689 0.00%
Shanghai Belling Co., Ltd. Class A 1,200 5,652 0.00%
Chinese Universe Publishing & Media Group Co., Ltd. Class A 3,700 5,647 0.00%
Yantai Tayho Advanced Materials Co., Ltd. Class A 1,800 5,647 0.00%
Roshow Technology Co., Ltd. Class A 2,700 5,633 0.00%
Anji Microelectronics Technology Shanghai Co., Ltd. Class A 117 5,632 0.00%
Lier Chemical Co., Ltd. Class A 1,400 5,591 0.00%
Shanghai Environment Group Co., Ltd. Class A 3,000 5,558 0.00%
Sichuan Kelun Pharmaceutical Co., Ltd. Class A 1,800 5,558 0.00%
Avary Holding Shenzhen Co., Ltd. Class A 1,000 5,553 0.00%
Perfect World Co., Ltd. Class A 1,500 5,551 0.00%
Central China Securities Co., Ltd. Class H 29,000 5,527 0.00%
YongXing Special Materials Technology Co., Ltd. Class A 600 5,515 0.00%
Shenzhen YUTO Packaging Technology Co., Ltd. Class A 1,200 5,514 0.00%
BGI Genomics Co., Ltd. Class A 300 5,507 0.00%
Bohai Leasing Co., Ltd. Class A 14,700 5,506 0.00%
PCI Technology Group Co., Ltd. Class A 4,800 5,505 0.00%
Beijing Jetsen Technology Co., Ltd. Class A 7,100 5,484 0.00%

93
Vanguard ESG Emerging Markets All Cap Equity Index Fund
.Number of
SharesFair Value
US Dollars ($)% of Total
Net AssetsINESA Intelligent Tech, Inc. Class B 12,100 5,457 0.00%
Zhuhai Bojay Electronics Co., Ltd. Class A 400 5,448 0.00%
Huafa Industrial Co., Ltd. Zhuhai Class A 5,200 5,425 0.00%
Guangzhou GRG Metrology & Test Co., Ltd. Class A 800 5,423 0.00%
Shenzhen Kedali Industry Co., Ltd. Class A 400 5,411 0.00%
Shanghai Haohai Biological Technology Co., Ltd. Class A 167 5,410 0.00%
Maanshan Iron & Steel Co., Ltd. Class A 8,100 5,378 0.00%
Shanghai Zhangjiang High-Tech Park Development Co., Ltd. Class A 1,900 5,373 0.00%
Glarun Technology Co., Ltd. Class A 2,300 5,365 0.00%
Yunnan Copper Co., Ltd. Class A 2,700 5,362 0.00%
Keshun Waterproof Technologies Co., Ltd. Class A 1,100 5,353 0.00%
Chacha Food Co., Ltd. Class A 800 5,337 0.00%
People.cn Co., Ltd. Class A 2,000 5,321 0.00%Xi'an Triangle Defense Co., Ltd. Class A 900 5,321 0.00%
Shandong Jincheng Pharmaceutical Group Co., Ltd. Class A 1,200 5,293 0.00%
Xiamen Jihong Technology Co., Ltd. Class A 1,200 5,271 0.00%
Zhejiang Yongtai Technology Co., Ltd. Class A 1,700 5,260 0.00%
Xiamen Comfort Science & Technology Group Co., Ltd. Class A 1,500 5,254 0.00%
Shenzhen Huaqiang Industry Co., Ltd. Class A 2,000 5,235 0.00%
Beijing North Star Co., Ltd. Class H 28,000 5,228 0.00%
China Fangda Group Co., Ltd. Class B 13,800 5,224 0.00%
Juewei Food Co., Ltd. Class A 400 5,219 0.00%
Shenzhen World Union Group, Inc. Class A 5,500 5,218 0.00%
Guangzhou Wondfo Biotech Co., Ltd. Class A 520 5,207 0.00%
Anhui Expressway Co., Ltd. Class H 8,000 5,202 0.00%
Juneyao Airlines Co., Ltd. Class A 2,200 5,196 0.00%
Redco Properties Group Ltd. 16,000 5,192 0.00%Zhongshan Public Utilities Group Co., Ltd. Class A 4,100 5,178 0.00%
China Resources Double Crane Pharmaceutical Co., Ltd. Class A 2,800 5,162 0.00%
Shennan Circuits Co., Ltd. Class A 300 5,160 0.00%
Zhejiang Wanliyang Co., Ltd. Class A 4,100 5,147 0.00%
Sichuan Hebang Biotechnology Co., Ltd. Class A 15,900 5,119 0.00%
Beken Corp. Class A 400 5,095 0.00%OFILM Group Co., Ltd. Class A 3,700 5,085 0.00%
Shanghai Wanye Enterprises Co., Ltd. Class A 1,800 5,082 0.00%
Digital China Group Co., Ltd. Class A 1,500 5,073 0.00%
.Number of
SharesFair Value
US Dollars ($)% of Total
Net AssetsJilin Electric Power Co., Ltd. Class CO 5,700 5,064 0.00%
Fibocom Wireless, Inc. Class A 700 5,060 0.00%
Montnets Cloud Technology Group Co., Ltd. Class A 1,800 5,032 0.00%
Shandong Dongyue Organosilicon Material Co., Ltd. Class A 2,500 5,030 0.00%
Joyoung Co., Ltd. Class A 1,000 5,029 0.00%Guizhou Xinbang Pharmaceutical Co., Ltd. Class A 3,100 5,028 0.00%
Betta Pharmaceuticals Co., Ltd. Class A 300 5,026 0.00%
Milkyway Chemical Supply Chain Service Co., Ltd. Class A 300 5,014 0.00%
Hangzhou Binjiang Real Estate Group Co., Ltd. Class A 7,700 4,994 0.00%
Shijiazhuang Changshan BeiMing Technology Co., Ltd. Class A 2,800 4,980 0.00%
Shenzhen Everwin Precision Technology Co., Ltd. Class A 1,560 4,974 0.00%
Zhejiang Hailiang Co., Ltd. Class A 3,000 4,941 0.00%
Lao Feng Xiang Co., Ltd. Class A 600 4,919 0.00%
Shenzhen Infogem Technologies Co., Ltd. Class A 1,800 4,917 0.00%
Shanghai Chinafortune Co., Ltd. Class A 2,000 4,916 0.00%
Electric Connector Technology Co., Ltd. Class A 1,100 4,907 0.00%
Cinda Real Estate Co., Ltd. Class A 9,100 4,902 0.00%
Sinofibers Technology Co., Ltd. Class A 700 4,895 0.00%
Tibet Rhodiola Pharmaceutical Holding Co. Class A 500 4,882 0.00%
Nanjing Hanrui Cobalt Co., Ltd. Class A 400 4,881 0.00%
Talkweb Information System Co., Ltd. Class A 3,100 4,880 0.00%
Monalisa Group Co., Ltd. Class A 1,000 4,858 0.00%
East Group Co., Ltd. Class A 3,900 4,853 0.00%Guangdong Topstar Technology Co., Ltd. Class A 900 4,848 0.00%
Amoy Diagnostics Co., Ltd. Class A 300 4,833 0.00%
CSSC Offshore & Marine Engineering Group Co., Ltd. Class A 1,500 4,829 0.00%
Shanghai Jin Jiang Online Network Service Co., Ltd. Class B 6,700 4,824 0.00%
Kunlun Tech Co., Ltd. Class A 1,900 4,817 0.00%
Zhejiang Semir Garment Co., Ltd. Class A 2,600 4,809 0.00%
Wens Foodstuffs Group Co., Ltd. Class A 2,160 4,804 0.00%
Guangdong Golden Dragon Development, Inc. Class A 1,800 4,792 0.00%
Nantong Jianghai Capacitor Co., Ltd. Class A 2,000 4,792 0.00%

94
Vanguard ESG Emerging Markets All Cap Equity Index Fund
.Number of
SharesFair Value
US Dollars ($)% of Total
Net AssetsJiangsu Nata Opto-electronic Material Co., Ltd. Class A 800 4,789 0.00%
Shanghai Phichem Material Co., Ltd. Class A 1,700 4,770 0.00%
Zhongji Innolight Co., Ltd. Class A 800 4,770 0.00%
Shenzhen Fastprint Circuit Tech Co., Ltd. Class A 2,800 4,767 0.00%
Three's Co. Media Group Co., Ltd. Class A 200 4,747 0.00%
Dian Diagnostics Group Co., Ltd. Class A 800 4,742 0.00%
Huagong Tech Co., Ltd. Class A 1,300 4,732 0.00%
Shanghai AtHub Co., Ltd. Class A 840 4,707 0.00%
Anhui Anke Biotechnology Group Co., Ltd. Class A 2,040 4,705 0.00%
Zhejiang Jiecang Linear Motion Technology Co., Ltd. Class A 600 4,701 0.00%
Hongli Zhihui Group Co., Ltd. Class A 2,300 4,699 0.00%
CPMC Holdings Ltd. 8,000 4,687 0.00%Guangzhou Haige Communications Group, Inc. Co. Class A 3,200 4,685 0.00%
LianChuang Electronic Technology Co., Ltd. Class A 2,300 4,681 0.00%
Chengdu Leejun Industrial Co., Ltd. Class A 2,500 4,678 0.00%
Jiangsu Shuangxing Color Plastic New Materials Co., Ltd. Class A 1,500 4,674 0.00%
Keboda Technology Co., Ltd. Class A 400 4,674 0.00%
Shanxi Securities Co., Ltd. Class A 4,500 4,674 0.00%
Shanghai Fudan-Zhangjiang Bio-Pharmaceutical Co., Ltd. Class H 7,000 4,669 0.00%
Sai Micro Electronics, Inc. Class A 1,000 4,667 0.00%
Hubei Xingfa Chemicals Group Co., Ltd. Class A 1,600 4,663 0.00%
Shanghai Waigaoqiao Free Trade Zone Group Co., Ltd. Class B 4,800 4,637 0.00%
Wuhan DR Laser Technology Corp., Ltd. Class A 200 4,624 0.00%
Fiberhome Telecommunication Technologies Co., Ltd. Class A 1,600 4,614 0.00%
Jinduicheng Molybdenum Co., Ltd. Class A 4,600 4,614 0.00%
Beijing Shougang Co., Ltd. Class A 5,300 4,610 0.00%
COFCO Biotechnology Co., Ltd. Class LT 3,300 4,602 0.00%
Guangdong Hybribio Biotech Co., Ltd. Class A 900 4,598 0.00%
Anhui Truchum Advanced Materials & Technology Co., Ltd. Class A 3,400 4,594 0.00%
Xingda International Holdings Ltd. 19,000 4,575 0.00%
China Everbright Greentech Ltd. 12,000 4,574 0.00%
Shanghai Hanbell Precise Machinery Co., Ltd. Class A 1,100 4,571 0.00%
Sichuan Expressway Co., Ltd. Class H 20,000 4,558 0.00%
.Number of
SharesFair Value
US Dollars ($)% of Total
Net AssetsChongqing Sanfeng Environment Group Corp., Ltd. Class A 3,100 4,544 0.00%
GCI Science & Technology Co., Ltd. Class A 2,200 4,542 0.00%
Zhejiang Dingli Machinery Co., Ltd. Class A 500 4,542 0.00%
Quectel Wireless Solutions Co., Ltd. Class A 171 4,516 0.00%
Double Medical Technology, Inc. Class A 400 4,513 0.00%
State Grid Information & Communication Co., Ltd. Class A 2,200 4,508 0.00%
Chongqing Iron & Steel Co., Ltd. Class A 10,900 4,505 0.00%
Foran Energy Group Co., Ltd. Class A 3,100 4,505 0.00%
Lushang Health Industry Development Co., Ltd. Class A 1,800 4,497 0.00%
Hubei Feilihua Quartz Glass Co., Ltd. Class A 600 4,478 0.00%
Chongqing Zaisheng Technology Corp., Ltd. Class A 2,500 4,477 0.00%
Shenzhen H&T Intelligent Control Co., Ltd. Class A 1,200 4,452 0.00%
Dong-E-E-Jiao Co., Ltd. Class A 800 4,446 0.00%
ZheJiang Dali Technology Co., Ltd. Class A 1,500 4,444 0.00%
China Express Airlines Co., Ltd. Class A 1,900 4,441 0.00%
Shanghai Kehua Bio-Engineering Co., Ltd. Class A 1,600 4,435 0.00%
Hengdian Group DMEGC Magnetics Co., Ltd. Class A 2,200 4,427 0.00%
Dongguan Development Holdings Co., Ltd. Class A 2,400 4,424 0.00%
Vats Liquor Chain Store Management JSC Ltd. Class A 700 4,422 0.00%
Jiangsu Akcome Science & Technology Co., Ltd. Class A 12,000 4,420 0.00%
Shenzhen Leaguer Co., Ltd. Class A 3,000 4,416 0.00%
Long Yuan Construction Group Co., Ltd. Class A 5,300 4,413 0.00%
Sumavision Technologies Co., Ltd. Class A 3,700 4,410 0.00%
Guangdong Create Century Intelligent Equipment Group Corp., Ltd. Class A 2,600 4,407 0.00%
Guosheng Financial Holding, Inc. Class A 2,500 4,407 0.00%
Tongyu Heavy Industry Co., Ltd. Class A 9,300 4,405 0.00%
Edifier Technology Co., Ltd. Class A 2,100 4,401 0.00%
INKON Life Technology Co., Ltd. Class A 1,100 4,386 0.00%
Shenyang Xingqi Pharmaceutical Co., Ltd. Class A 200 4,366 0.00%
Ningbo Orient Wires & Cables Co., Ltd. Class A 1,400 4,364 0.00%
Shenzhen Laibao Hi-tech Co., Ltd. Class A 2,500 4,353 0.00%
Wuhan Department Store Group Co., Ltd. Class A 2,400 4,346 0.00%
China CAMC Engineering Co., Ltd. Class A 4,400 4,338 0.00%
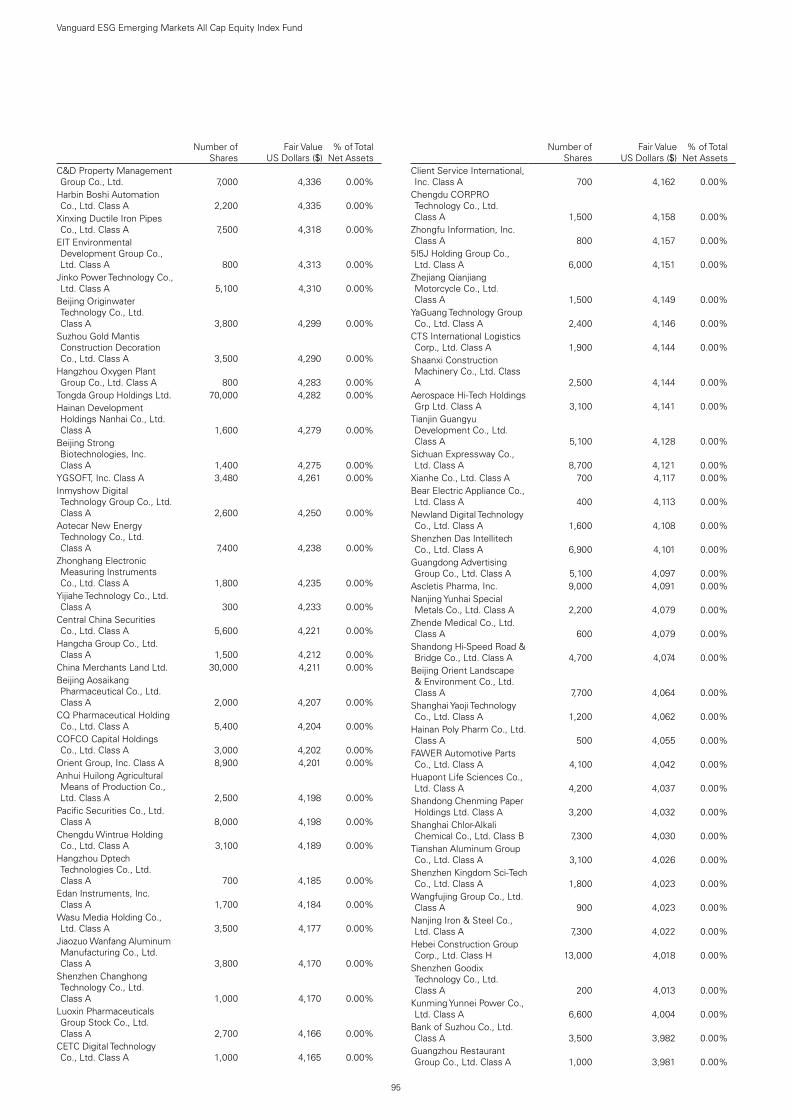
95
Vanguard ESG Emerging Markets All Cap Equity Index Fund
.Number of
SharesFair Value
US Dollars ($)% of Total
Net AssetsC&D Property Management Group Co., Ltd. 7,000 4,336 0.00%
Harbin Boshi Automation Co., Ltd. Class A 2,200 4,335 0.00%
Xinxing Ductile Iron Pipes Co., Ltd. Class A 7,500 4,318 0.00%
EIT Environmental Development Group Co., Ltd. Class A 800 4,313 0.00%
Jinko Power Technology Co., Ltd. Class A 5,100 4,310 0.00%
Beijing Originwater Technology Co., Ltd. Class A 3,800 4,299 0.00%
Suzhou Gold Mantis Construction Decoration Co., Ltd. Class A 3,500 4,290 0.00%
Hangzhou Oxygen Plant Group Co., Ltd. Class A 800 4,283 0.00%
Tongda Group Holdings Ltd. 70,000 4,282 0.00%Hainan Development Holdings Nanhai Co., Ltd. Class A 1,600 4,279 0.00%
Beijing Strong Biotechnologies, Inc. Class A 1,400 4,275 0.00%
YGSOFT, Inc. Class A 3,480 4,261 0.00%Inmyshow Digital Technology Group Co., Ltd. Class A 2,600 4,250 0.00%
Aotecar New Energy Technology Co., Ltd. Class A 7,400 4,238 0.00%
Zhonghang Electronic Measuring Instruments Co., Ltd. Class A 1,800 4,235 0.00%
Yijiahe Technology Co., Ltd. Class A 300 4,233 0.00%
Central China Securities Co., Ltd. Class A 5,600 4,221 0.00%
Hangcha Group Co., Ltd. Class A 1,500 4,212 0.00%
China Merchants Land Ltd. 30,000 4,211 0.00%Beijing Aosaikang Pharmaceutical Co., Ltd. Class A 2,000 4,207 0.00%
CQ Pharmaceutical Holding Co., Ltd. Class A 5,400 4,204 0.00%
COFCO Capital Holdings Co., Ltd. Class A 3,000 4,202 0.00%
Orient Group, Inc. Class A 8,900 4,201 0.00%Anhui Huilong Agricultural Means of Production Co., Ltd. Class A 2,500 4,198 0.00%
Pacific Securities Co., Ltd. Class A 8,000 4,198 0.00%
Chengdu Wintrue Holding Co., Ltd. Class A 3,100 4,189 0.00%
Hangzhou Dptech Technologies Co., Ltd. Class A 700 4,185 0.00%
Edan Instruments, Inc. Class A 1,700 4,184 0.00%
Wasu Media Holding Co., Ltd. Class A 3,500 4,177 0.00%
Jiaozuo Wanfang Aluminum Manufacturing Co., Ltd. Class A 3,800 4,170 0.00%
Shenzhen Changhong Technology Co., Ltd. Class A 1,000 4,170 0.00%
Luoxin Pharmaceuticals Group Stock Co., Ltd. Class A 2,700 4,166 0.00%
CETC Digital Technology Co., Ltd. Class A 1,000 4,165 0.00%
.Number of
SharesFair Value
US Dollars ($)% of Total
Net AssetsClient Service International, Inc. Class A 700 4,162 0.00%
Chengdu CORPRO Technology Co., Ltd. Class A 1,500 4,158 0.00%
Zhongfu Information, Inc. Class A 800 4,157 0.00%
5I5J Holding Group Co., Ltd. Class A 6,000 4,151 0.00%
Zhejiang Qianjiang Motorcycle Co., Ltd. Class A 1,500 4,149 0.00%
YaGuang Technology Group Co., Ltd. Class A 2,400 4,146 0.00%
CTS International Logistics Corp., Ltd. Class A 1,900 4,144 0.00%
Shaanxi Construction Machinery Co., Ltd. Class A 2,500 4,144 0.00%
Aerospace Hi-Tech Holdings Grp Ltd. Class A 3,100 4,141 0.00%
Tianjin Guangyu Development Co., Ltd. Class A 5,100 4,128 0.00%
Sichuan Expressway Co., Ltd. Class A 8,700 4,121 0.00%
Xianhe Co., Ltd. Class A 700 4,117 0.00%Bear Electric Appliance Co., Ltd. Class A 400 4,113 0.00%
Newland Digital Technology Co., Ltd. Class A 1,600 4,108 0.00%
Shenzhen Das Intellitech Co., Ltd. Class A 6,900 4,101 0.00%
Guangdong Advertising Group Co., Ltd. Class A 5,100 4,097 0.00%
Ascletis Pharma, Inc. 9,000 4,091 0.00%Nanjing Yunhai Special Metals Co., Ltd. Class A 2,200 4,079 0.00%
Zhende Medical Co., Ltd. Class A 600 4,079 0.00%
Shandong Hi-Speed Road & Bridge Co., Ltd. Class A 4,700 4,074 0.00%
Beijing Orient Landscape & Environment Co., Ltd. Class A 7,700 4,064 0.00%
Shanghai Yaoji Technology Co., Ltd. Class A 1,200 4,062 0.00%
Hainan Poly Pharm Co., Ltd. Class A 500 4,055 0.00%
FAWER Automotive Parts Co., Ltd. Class A 4,100 4,042 0.00%
Huapont Life Sciences Co., Ltd. Class A 4,200 4,037 0.00%
Shandong Chenming Paper Holdings Ltd. Class A 3,200 4,032 0.00%
Shanghai Chlor-Alkali Chemical Co., Ltd. Class B 7,300 4,030 0.00%
Tianshan Aluminum Group Co., Ltd. Class A 3,100 4,026 0.00%
Shenzhen Kingdom Sci-Tech Co., Ltd. Class A 1,800 4,023 0.00%
Wangfujing Group Co., Ltd. Class A 900 4,023 0.00%
Nanjing Iron & Steel Co., Ltd. Class A 7,300 4,022 0.00%
Hebei Construction Group Corp., Ltd. Class H 13,000 4,018 0.00%
Shenzhen Goodix Technology Co., Ltd. Class A 200 4,013 0.00%
Kunming Yunnei Power Co., Ltd. Class A 6,600 4,004 0.00%
Bank of Suzhou Co., Ltd. Class A 3,500 3,982 0.00%
Guangzhou Restaurant Group Co., Ltd. Class A 1,000 3,981 0.00%

96
Vanguard ESG Emerging Markets All Cap Equity Index Fund
.Number of
SharesFair Value
US Dollars ($)% of Total
Net AssetsYuan Longping High-tech Agriculture Co., Ltd. Class A 1,600 3,972 0.00%
IReader Technology Co., Ltd. Class A 900 3,970 0.00%
Inner Mongolia Xingye Mining Co., Ltd. Class A 3,400 3,963 0.00%
Zhejiang Huace Film & Television Co., Ltd. Class A 4,300 3,940 0.00%
Huabao Flavours & Fragrances Co., Ltd. Class A 500 3,925 0.00%
Fujian Green Pine Co., Ltd. Class A 1,200 3,919 0.00%
Shandong Longda Meat Foodstuff Co., Ltd. Class A 2,500 3,916 0.00%
Shenzhen Comix Group Co., Ltd. Class A 2,500 3,885 0.00%
Beibuwan Port Co., Ltd. Class A 3,000 3,854 0.00%
Zhejiang Cfmoto Power Co., Ltd. Class A 200 3,841 0.00%
Central China Management Co., Ltd. 13,000 3,833 0.00%
Qingling Motors Co., Ltd. Class H 18,000 3,824 0.00%
Zhejiang Starry Pharmaceutical Co., Ltd. Class A 400 3,817 0.00%
Shanghai Pret Composites Co., Ltd. Class A 2,100 3,803 0.00%
Dongjiang Environmental Co., Ltd. Class H 6,800 3,791 0.00%
360 Security Technology, Inc. 2,003 3,785 0.00%
Guangdong South New Media Co., Ltd. Class A 500 3,769 0.00%
CSSC Offshore & Marine Engineering Group Co., Ltd. Class H 4,000 3,750 0.00%
China Merchants Property Operation & Service Co., Ltd. Class A 1,400 3,723 0.00%
Shandong Himile Mechanical Science & Technology Co., Ltd. Class A 900 3,719 0.00%
Renhe Pharmacy Co., Ltd. Class A 2,200 3,718 0.00%
Bank of Chengdu Co., Ltd. Class A 1,900 3,717 0.00%
Shanghai Weaver Network Co., Ltd. Class A 360 3,708 0.00%
Shanghai Ganglian E-Commerce Holdings Co., Ltd. Class A 400 3,687 0.00%
Yankershop Food Co., Ltd. Class A 238 3,673 0.00%
Jiangsu Guotai International Group Co., Ltd. Class A 2,600 3,662 0.00%
Financial Street Holdings Co., Ltd. Class A 3,500 3,657 0.00%
Anhui Tatfook Technology Co., Ltd. Class A 2,100 3,644 0.00%
Jiuzhitang Co., Ltd. Class A 2,400 3,640 0.00%Zhejiang Crystal-Optech Co., Ltd. Class A 1,600 3,638 0.00%
Wondershare Technology Group Co., Ltd. Class A 400 3,627 0.00%
China World Trade Center Co., Ltd. Class A 1,300 3,614 0.00%
Laobaixing Pharmacy Chain JSC Class A 440 3,588 0.00%
China Fortune Land Development Co., Ltd. Class A 4,420 3,585 0.00%
.Number of
SharesFair Value
US Dollars ($)% of Total
Net AssetsChina Minmetals Rare Earth Co., Ltd. Class A 1,200 3,585 0.00%
Bright Dairy & Food Co., Ltd. Class A 1,600 3,569 0.00%
Hongta Securities Co., Ltd. Class A 1,700 3,568 0.00%
Zhejiang Yasha Decoration Co., Ltd. Class A 2,900 3,555 0.00%
MLS Co., Ltd. Class A 1,700 3,526 0.00%Chaowei Power Holdings Ltd. 11,000 3,442 0.00%
Accelink Technologies Co., Ltd. Class A 900 3,427 0.00%
Gree Real Estate Co., Ltd. Class A 3,000 3,422 0.00%
China South Publishing & Media Group Co., Ltd. Class A 2,500 3,413 0.00%
Haohua Chemical Science & Technology Co., Ltd. Class A 1,000 3,410 0.00%
Hainan Strait Shipping Co., Ltd. Class A 3,750 3,407 0.00%
Visionox Technology, Inc. Class A 2,100 3,390 0.00%
Leyard Optoelectronic Co., Ltd. Class A 2,800 3,389 0.00%
Longshine Technology Group Co., Ltd. Class A 1,300 3,384 0.00%
Shenzhen Megmeet Electrical Co., Ltd. Class A 700 3,384 0.00%
Beijing SuperMap Software Co., Ltd. Class A 1,000 3,383 0.00%
Central China Real Estate Ltd. 13,000 3,381 0.00%
Anhui Zhongding Sealing Parts Co., Ltd. Class A 1,800 3,365 0.00%
Hisense Home Appliances Group Co., Ltd. Class A 1,500 3,336 0.00%
Kaishan Group Co., Ltd. Class A 1,500 3,336 0.00%
Bethel Automotive Safety Systems Co., Ltd. Class A 600 3,320 0.00%
Westone Information Industry, Inc. Class A 1,100 3,317 0.00%
Chengdu Xingrong Environment Co., Ltd. Class A 4,100 3,306 0.00%
Fujian Star-net Communication Co., Ltd. Class A 1,000 3,305 0.00%
Anhui Expressway Co., Ltd. Class A 3,300 3,300 0.00%
Shanghai Lujiazui Finance & Trade Zone Development Co., Ltd. Class A 1,600 3,299 0.00%
ChemPartner PharmaTech Co., Ltd. Class A 1,100 3,284 0.00%
Oceanwide Holdings Co., Ltd. Class A 9,200 3,275 0.00%
Nanjing Xinjiekou Department Store Co., Ltd. Class A 2,100 3,270 0.00%
Hunan TV & Broadcast Intermediary Co., Ltd. Class A 4,300 3,268 0.00%
Yunda Holding Co., Ltd. Class A 1,560 3,267 0.00%
Sinoma International Engineering Co. Class A 2,300 3,264 0.00%
Maccura Biotechnology Co., Ltd. Class A 500 3,257 0.00%
Berry Genomics Co., Ltd. Class A 700 3,255 0.00%
Shenzhen Airport Co., Ltd. Class A 2,700 3,247 0.00%

97
Vanguard ESG Emerging Markets All Cap Equity Index Fund
.Number of
SharesFair Value
US Dollars ($)% of Total
Net AssetsGuocheng Mining Co., Ltd. Class A 2,400 3,243 0.00%
Blue Sail Medical Co., Ltd. Class A 1,000 3,227 0.00%
Zhejiang Medicine Co., Ltd. Class A 1,300 3,221 0.00%
Beijing GeoEnviron Engineering & Technology, Inc. Class A 1,430 3,205 0.00%
B-Soft Co., Ltd. Class A 2,340 3,202 0.00%Shanghai Shimao Co., Ltd. Class A 5,100 3,189 0.00%
CECEP Wind-Power Corp. Class A 5,500 3,184 0.00%
Huaxin Cement Co., Ltd. Class B 1,700 3,179 0.00%
Bluestar Adisseo Co. Class A 1,700 3,147 0.00%
Shanghai Runda Medical Technology Co., Ltd. Class A 1,800 3,129 0.00%
Beijing Capital Development Co., Ltd. Class A 3,600 3,120 0.00%
Hubei Dinglong Co., Ltd. Class A 1,100 3,107 0.00%
China TransInfo Technology Co., Ltd. Class A 1,200 3,102 0.00%
Xiamen Xiangyu Co., Ltd. Class A 3,200 3,096 0.00%
Tianjin Chase Sun Pharmaceutical Co., Ltd. Class A 4,700 3,092 0.00%
Jiangsu Linyang Energy Co., Ltd. Class A 2,400 3,079 0.00%
Titan Wind Energy Suzhou Co., Ltd. Class A 2,300 3,079 0.00%
Yunnan Lincang Xinyuan Germanium Industrial Co., Ltd. Class A 1,600 3,068 0.00%
Autobio Diagnostics Co., Ltd. Class A 260 3,049 0.00%
Victory Giant Technology Huizhou Co., Ltd. Class A 900 3,044 0.00%
Xinyu Iron & Steel Co., Ltd. Class A 3,500 3,023 0.00%
Shanghai Shibei Hi-Tech Co., Ltd. Class B 10,100 3,020 0.00%
Beijing VRV Software Corp., Ltd. Class A 2,800 3,016 0.00%
Zhejiang Orient Financial Holdings Group Co., Ltd. Class A 4,550 3,014 0.00%
Shanghai Sinyang Semiconductor Materials Co., Ltd. Class A 400 3,005 0.00%
Bluefocus Intelligent Communications Group Co., Ltd. Class A 3,200 2,997 0.00%
Chongqing Department Store Co., Ltd. Class A 700 2,974 0.00%
Xiamen Meiya Pico Information Co., Ltd. Class A 1,100 2,962 0.00%
Hebei Chengde Lolo Co. Class A 1,600 2,957 0.00%
Chengzhi Co., Ltd. Class A 1,500 2,955 0.00%Pengdu Agriculture & Animal Husbandry Co., Ltd. Class A 8,500 2,947 0.00%
Suzhou Anjie Technology Co., Ltd. Class A 1,300 2,944 0.00%
Yantai Dongcheng Pharmaceutical Co., Ltd. Class A 900 2,935 0.00%
Shanghai AJ Group Co., Ltd. Class A 2,700 2,917 0.00%
.Number of
SharesFair Value
US Dollars ($)% of Total
Net AssetsZhejiang Xianju Pharmaceutical Co., Ltd. Class A 1,500 2,911 0.00%
Zhejiang Jiemei Electronic & Technology Co., Ltd. Class A 600 2,904 0.00%
Jiangling Motors Corp., Ltd. Class A 800 2,901 0.00%
Luolai Lifestyle Technology Co., Ltd. Class A 1,400 2,901 0.00%
KingClean Electric Co., Ltd. Class A 300 2,890 0.00%
Zhejiang Wanfeng Auto Wheel Co., Ltd. Class A 3,300 2,860 0.00%
Tibet Summit Resources Co., Ltd. Class A 1,300 2,851 0.00%
Wuhan Jingce Electronic Group Co., Ltd. Class A 300 2,851 0.00%
Shenzhen Gas Corp., Ltd. Class A 2,800 2,843 0.00%
Shenzhen Sunline Tech Co., Ltd. Class A 1,000 2,832 0.00%
Xinjiang Tianshan Cement Co., Ltd. Class A 1,400 2,823 0.00%
Shanghai Industrial Urban Development Group Ltd. 30,000 2,820 0.00%
Shandong Denghai Seeds Co., Ltd. Class A 1,200 2,806 0.00%
CMST Development Co., Ltd. Class A 3,400 2,805 0.00%
Shinva Medical Instrument Co., Ltd. Class A 800 2,805 0.00%
Guangxi Liugong Machinery Co., Ltd. Class A 2,200 2,792 0.00%
Shandong Yisheng Livestock & Poultry Breeding Co., Ltd. Class A 1,800 2,778 0.00%
Shanying International Holding Co., Ltd. Class A 5,200 2,777 0.00%
Yusys Technologies Co., Ltd. Class A 960 2,777 0.00%
Shandong Hi-speed Co., Ltd. Class A 2,900 2,760 0.00%
Chow Tai Seng Jewellery Co., Ltd. Class A 900 2,754 0.00%
Valiant Co., Ltd. Class A 1,000 2,752 0.00%Colour Life Services Group Co., Ltd. 7,000 2,749 0.00%
Shenzhen Agricultural Products Group Co., Ltd. Class A 3,200 2,734 0.00%
Fangda Special Steel Technology Co., Ltd. Class A 2,600 2,728 0.00%
Shanghai Zijiang Enterprise Group Co., Ltd. Class A 3,700 2,720 0.00%
NSFOCUS Technologies Group Co., Ltd. Class A 1,100 2,716 0.00%
Guangdong HEC Technology Holding Co., Ltd. Class A 3,900 2,710 0.00%
Feitian Technologies Co., Ltd. Class A 1,000 2,667 0.00%
Eastern Communications Co., Ltd. Class B 5,600 2,666 0.00%
Haisco Pharmaceutical Group Co., Ltd. Class A 800 2,665 0.00%
IKD Co., Ltd. Class A 1,300 2,624 0.00%Shanghai Shyndec Pharmaceutical Co., Ltd. Class A 1,700 2,592 0.00%
Shanghai Kelai Mechatronics Engineering Co., Ltd. Class A 500 2,562 0.00%
Tianjin Capital Environmental Protection Group Co., Ltd. Class A 2,700 2,553 0.00%

98
Vanguard ESG Emerging Markets All Cap Equity Index Fund
.Number of
SharesFair Value
US Dollars ($)% of Total
Net AssetsGuangdong Tapai Group Co., Ltd. Class A 1,600 2,546 0.00%
Fullshare Holdings Ltd. 147,500 2,526 0.00%Goldenmax International Technology Ltd. Class A 1,000 2,511 0.00%
YanTai Shuangta Food Co., Ltd. Class A 1,400 2,505 0.00%
Ourpalm Co., Ltd. Class A 3,800 2,500 0.00%Zhejiang Hisoar Pharmaceutical Co., Ltd. Class A 2,000 2,498 0.00%
Eastern Communications Co., Ltd. Class A 1,300 2,495 0.00%
Beijing Cisri-Gaona Materials & Technology Co., Ltd. Class A 500 2,493 0.00%
Taiji Computer Corp., Ltd. Class A 800 2,484 0.00%
Digital China Information Service Co., Ltd. Class A 1,100 2,464 0.00%
Leo Group Co., Ltd. Class A 6,800 2,463 0.00%Shanghai Tunnel Engineering Co., Ltd. Class A 3,000 2,456 0.00%
China Meheco Co., Ltd. Class A 1,300 2,445 0.00%
Yotrio Group Co., Ltd. Class A 4,500 2,445 0.00%
Sonoscape Medical Corp. Class A 500 2,444 0.00%
Zheshang Securities Co., Ltd. Class A 1,200 2,429 0.00%
Sinocare, Inc. Class A 500 2,424 0.00%Jiajiayue Group Co., Ltd. Class A 900 2,420 0.00%
Risen Energy Co., Ltd. Class A 800 2,402 0.00%
Youzu Interactive Co., Ltd. Class A 900 2,392 0.00%
Biem.L.Fdlkk Garment Co., Ltd. Class A 600 2,376 0.00%
Luenmei Quantum Co., Ltd. Class A 1,700 2,350 0.00%
China Merchants Expressway Network & Technology Holdings Co., Ltd. Class A 2,100 2,347 0.00%
Universal Scientific Industrial Shanghai Co., Ltd. Class A 900 2,342 0.00%
Shenzhen Yan Tian Port Holding Co., Ltd. Class A 2,700 2,315 0.00%
Alpha Group Class A 2,300 2,307 0.00%CITIC Guoan Information Industry Co., Ltd. Class A 7,100 2,275 0.00%
Caitong Securities Co., Ltd. Class A 1,400 2,273 0.00%
Sunflower Pharmaceutical Group Co., Ltd. Class A 900 2,273 0.00%
Shanghai Mechanical & Electrical Industry Co., Ltd. Class A 900 2,264 0.00%
Yangtze Optical Fibre & Cable Joint Stock Ltd. Co. Class A 600 2,262 0.00%
Suofeiya Home Collection Co., Ltd. Class A 600 2,247 0.00%
Boya Bio-pharmaceutical Group Co., Ltd. Class A 400 2,238 0.00%
Beijing Zhong Ke San Huan High-Tech Co., Ltd. Class A 1,500 2,217 0.00%
Three Squirrels, Inc. Class A 300 2,199 0.00%Wisdom Education International Holdings Co., Ltd. 8,000 2,184 0.00%
.Number of
SharesFair Value
US Dollars ($)% of Total
Net AssetsShenzhen Woer Heat-Shrinkable Material Co., Ltd. Class A 2,200 2,176 0.00%
Xuji Electric Co., Ltd. Class A 1,100 2,155 0.00%
Shenzhen Yinghe Technology Co., Ltd. Class A 700 2,152 0.00%
Hubei Biocause Pharmaceutical Co., Ltd. Class A 3,800 2,129 0.00%
China High Speed Railway Technology Co., Ltd. Class A 6,100 2,096 0.00%
Jiangsu Provincial Agricultural Reclamation & Development Corp. 1,300 2,089 0.00%
CSG Smart Science&Technology Co., Ltd. Class A 1,100 2,087 0.00%
Wangsu Science & Technology Co., Ltd. Class A 2,300 2,083 0.00%
Hubei Kaile Science & Technology Co., Ltd. Class A 1,500 2,062 0.00%
Zhejiang Jingxin Pharmaceutical Co., Ltd. Class A 1,560 2,052 0.00%
CAR, Inc. 4,000 2,050 0.00%First Tractor Co., Ltd. Class A 800 2,043 0.00%
Eoptolink Technology, Inc. Ltd. Class A 420 2,031 0.00%
Zhongshan Broad Ocean Motor Co., Ltd. Class A 2,500 2,031 0.00%
Zhejiang Garden Bio-Chemical High-tech Co., Ltd. Class A 1,000 2,020 0.00%
Grandjoy Holdings Group Co., Ltd. Class A 3,600 2,006 0.00%
STO Express Co., Ltd. Class A 1,700 2,005 0.00%
Tibet Tianlu Co., Ltd. Class A 1,900 1,982 0.00%
Zhejiang Tianyu Pharmaceutical Co., Ltd. Class A 360 1,974 0.00%
Sanquan Food Co., Ltd. Class A 770 1,963 0.00%
Guangzhou Yuexiu Financial Holdings Group Co., Ltd. Class A 1,000 1,959 0.00%
Hytera Communications Corp., Ltd. Class A 2,500 1,950 0.00%
Hangzhou Century Co., Ltd. Class A 1,700 1,947 0.00%
Shanghai Jinqiao Export Processing Zone Development Co., Ltd. Class A 900 1,901 0.00%
DaShenLin Pharmaceutical Group Co., Ltd. Class A 240 1,899 0.00%
Huafu Fashion Co., Ltd. Class A 2,500 1,869 0.00%
Shanghai Tongji Science & Technology Industrial Co., Ltd. Class A 1,400 1,846 0.00%
Guangxi Liuzhou Pharmaceutical Co., Ltd. Class A 600 1,833 0.00%
Jiangsu Changshu Rural Commercial Bank Co., Ltd. Class A 1,900 1,823 0.00%
Tianjin Capital Environmental Protection Group Co., Ltd. Class H 4,000 1,782 0.00%
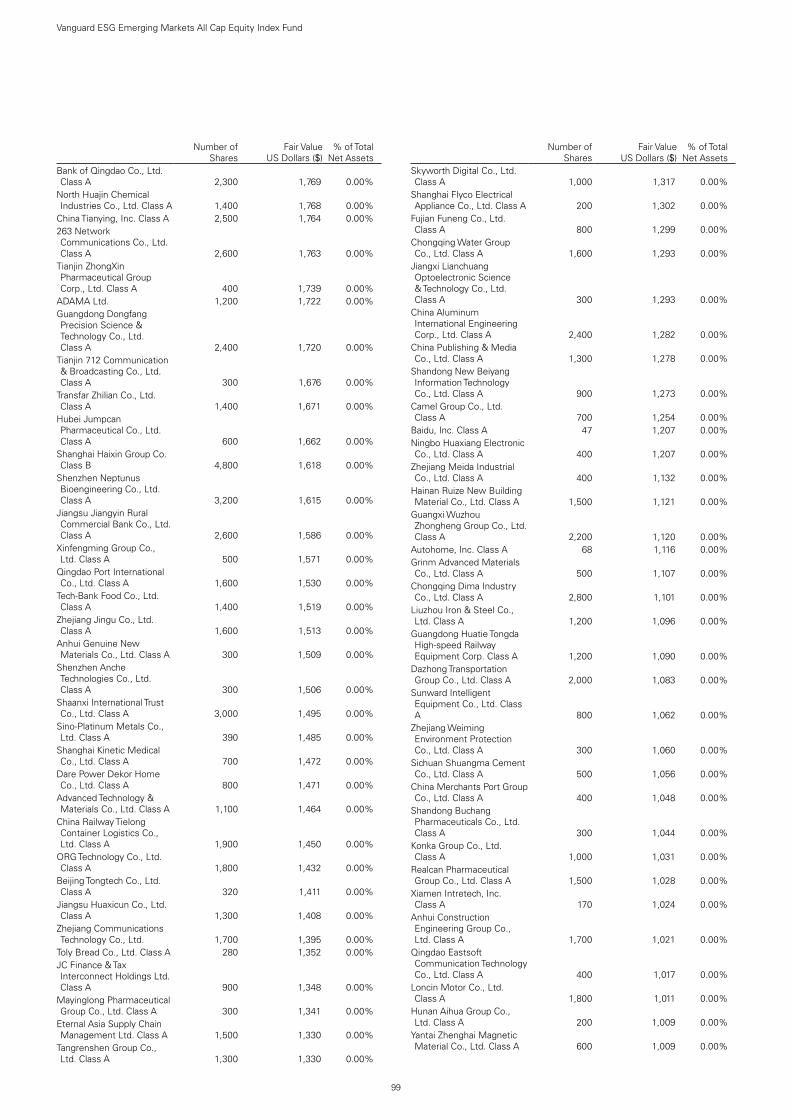
99
Vanguard ESG Emerging Markets All Cap Equity Index Fund
.Number of
SharesFair Value
US Dollars ($)% of Total
Net AssetsBank of Qingdao Co., Ltd. Class A 2,300 1,769 0.00%
North Huajin Chemical Industries Co., Ltd. Class A 1,400 1,768 0.00%
China Tianying, Inc. Class A 2,500 1,764 0.00%263 Network Communications Co., Ltd. Class A 2,600 1,763 0.00%
Tianjin ZhongXin Pharmaceutical Group Corp., Ltd. Class A 400 1,739 0.00%
ADAMA Ltd. 1,200 1,722 0.00%Guangdong Dongfang Precision Science & Technology Co., Ltd. Class A 2,400 1,720 0.00%
Tianjin 712 Communication & Broadcasting Co., Ltd. Class A 300 1,676 0.00%
Transfar Zhilian Co., Ltd. Class A 1,400 1,671 0.00%
Hubei Jumpcan Pharmaceutical Co., Ltd. Class A 600 1,662 0.00%
Shanghai Haixin Group Co. Class B 4,800 1,618 0.00%
Shenzhen Neptunus Bioengineering Co., Ltd. Class A 3,200 1,615 0.00%
Jiangsu Jiangyin Rural Commercial Bank Co., Ltd. Class A 2,600 1,586 0.00%
Xinfengming Group Co., Ltd. Class A 500 1,571 0.00%
Qingdao Port International Co., Ltd. Class A 1,600 1,530 0.00%
Tech-Bank Food Co., Ltd. Class A 1,400 1,519 0.00%
Zhejiang Jingu Co., Ltd. Class A 1,600 1,513 0.00%
Anhui Genuine New Materials Co., Ltd. Class A 300 1,509 0.00%
Shenzhen Anche Technologies Co., Ltd. Class A 300 1,506 0.00%
Shaanxi International Trust Co., Ltd. Class A 3,000 1,495 0.00%
Sino-Platinum Metals Co., Ltd. Class A 390 1,485 0.00%
Shanghai Kinetic Medical Co., Ltd. Class A 700 1,472 0.00%
Dare Power Dekor Home Co., Ltd. Class A 800 1,471 0.00%
Advanced Technology & Materials Co., Ltd. Class A 1,100 1,464 0.00%
China Railway Tielong Container Logistics Co., Ltd. Class A 1,900 1,450 0.00%
ORG Technology Co., Ltd. Class A 1,800 1,432 0.00%
Beijing Tongtech Co., Ltd. Class A 320 1,411 0.00%
Jiangsu Huaxicun Co., Ltd. Class A 1,300 1,408 0.00%
Zhejiang Communications Technology Co., Ltd. 1,700 1,395 0.00%
Toly Bread Co., Ltd. Class A 280 1,352 0.00%JC Finance & Tax Interconnect Holdings Ltd. Class A 900 1,348 0.00%
Mayinglong Pharmaceutical Group Co., Ltd. Class A 300 1,341 0.00%
Eternal Asia Supply Chain Management Ltd. Class A 1,500 1,330 0.00%
Tangrenshen Group Co., Ltd. Class A 1,300 1,330 0.00%
.Number of
SharesFair Value
US Dollars ($)% of Total
Net AssetsSkyworth Digital Co., Ltd. Class A 1,000 1,317 0.00%
Shanghai Flyco Electrical Appliance Co., Ltd. Class A 200 1,302 0.00%
Fujian Funeng Co., Ltd. Class A 800 1,299 0.00%
Chongqing Water Group Co., Ltd. Class A 1,600 1,293 0.00%
Jiangxi Lianchuang Optoelectronic Science & Technology Co., Ltd. Class A 300 1,293 0.00%
China Aluminum International Engineering Corp., Ltd. Class A 2,400 1,282 0.00%
China Publishing & Media Co., Ltd. Class A 1,300 1,278 0.00%
Shandong New Beiyang Information Technology Co., Ltd. Class A 900 1,273 0.00%
Camel Group Co., Ltd. Class A 700 1,254 0.00%
Baidu, Inc. Class A 47 1,207 0.00%Ningbo Huaxiang Electronic Co., Ltd. Class A 400 1,207 0.00%
Zhejiang Meida Industrial Co., Ltd. Class A 400 1,132 0.00%
Hainan Ruize New Building Material Co., Ltd. Class A 1,500 1,121 0.00%
Guangxi Wuzhou Zhongheng Group Co., Ltd. Class A 2,200 1,120 0.00%
Autohome, Inc. Class A 68 1,116 0.00%Grinm Advanced Materials Co., Ltd. Class A 500 1,107 0.00%
Chongqing Dima Industry Co., Ltd. Class A 2,800 1,101 0.00%
Liuzhou Iron & Steel Co., Ltd. Class A 1,200 1,096 0.00%
Guangdong Huatie Tongda High-speed Railway Equipment Corp. Class A 1,200 1,090 0.00%
Dazhong Transportation Group Co., Ltd. Class A 2,000 1,083 0.00%
Sunward Intelligent Equipment Co., Ltd. Class A 800 1,062 0.00%
Zhejiang Weiming Environment Protection Co., Ltd. Class A 300 1,060 0.00%
Sichuan Shuangma Cement Co., Ltd. Class A 500 1,056 0.00%
China Merchants Port Group Co., Ltd. Class A 400 1,048 0.00%
Shandong Buchang Pharmaceuticals Co., Ltd. Class A 300 1,044 0.00%
Konka Group Co., Ltd. Class A 1,000 1,031 0.00%
Realcan Pharmaceutical Group Co., Ltd. Class A 1,500 1,028 0.00%
Xiamen Intretech, Inc. Class A 170 1,024 0.00%
Anhui Construction Engineering Group Co., Ltd. Class A 1,700 1,021 0.00%
Qingdao Eastsoft Communication Technology Co., Ltd. Class A 400 1,017 0.00%
Loncin Motor Co., Ltd. Class A 1,800 1,011 0.00%
Hunan Aihua Group Co., Ltd. Class A 200 1,009 0.00%
Yantai Zhenghai Magnetic Material Co., Ltd. Class A 600 1,009 0.00%
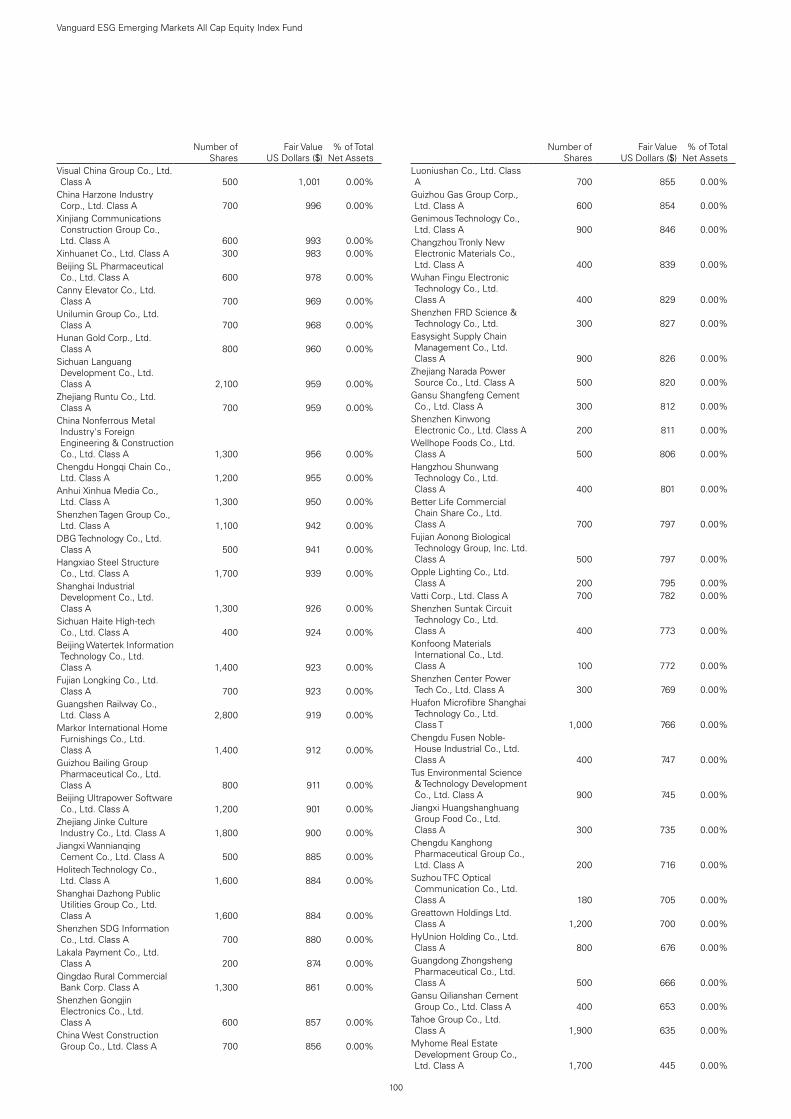
100
Vanguard ESG Emerging Markets All Cap Equity Index Fund
.Number of
SharesFair Value
US Dollars ($)% of Total
Net AssetsVisual China Group Co., Ltd. Class A 500 1,001 0.00%
China Harzone Industry Corp., Ltd. Class A 700 996 0.00%
Xinjiang Communications Construction Group Co., Ltd. Class A 600 993 0.00%
Xinhuanet Co., Ltd. Class A 300 983 0.00%Beijing SL Pharmaceutical Co., Ltd. Class A 600 978 0.00%
Canny Elevator Co., Ltd. Class A 700 969 0.00%
Unilumin Group Co., Ltd. Class A 700 968 0.00%
Hunan Gold Corp., Ltd. Class A 800 960 0.00%
Sichuan Languang Development Co., Ltd. Class A 2,100 959 0.00%
Zhejiang Runtu Co., Ltd. Class A 700 959 0.00%
China Nonferrous Metal Industry's Foreign Engineering & Construction Co., Ltd. Class A 1,300 956 0.00%
Chengdu Hongqi Chain Co., Ltd. Class A 1,200 955 0.00%
Anhui Xinhua Media Co., Ltd. Class A 1,300 950 0.00%
Shenzhen Tagen Group Co., Ltd. Class A 1,100 942 0.00%
DBG Technology Co., Ltd. Class A 500 941 0.00%
Hangxiao Steel Structure Co., Ltd. Class A 1,700 939 0.00%
Shanghai Industrial Development Co., Ltd. Class A 1,300 926 0.00%
Sichuan Haite High-tech Co., Ltd. Class A 400 924 0.00%
Beijing Watertek Information Technology Co., Ltd. Class A 1,400 923 0.00%
Fujian Longking Co., Ltd. Class A 700 923 0.00%
Guangshen Railway Co., Ltd. Class A 2,800 919 0.00%
Markor International Home Furnishings Co., Ltd. Class A 1,400 912 0.00%
Guizhou Bailing Group Pharmaceutical Co., Ltd. Class A 800 911 0.00%
Beijing Ultrapower Software Co., Ltd. Class A 1,200 901 0.00%
Zhejiang Jinke Culture Industry Co., Ltd. Class A 1,800 900 0.00%
Jiangxi Wannianqing Cement Co., Ltd. Class A 500 885 0.00%
Holitech Technology Co., Ltd. Class A 1,600 884 0.00%
Shanghai Dazhong Public Utilities Group Co., Ltd. Class A 1,600 884 0.00%
Shenzhen SDG Information Co., Ltd. Class A 700 880 0.00%
Lakala Payment Co., Ltd. Class A 200 874 0.00%
Qingdao Rural Commercial Bank Corp. Class A 1,300 861 0.00%
Shenzhen Gongjin Electronics Co., Ltd. Class A 600 857 0.00%
China West Construction Group Co., Ltd. Class A 700 856 0.00%
.Number of
SharesFair Value
US Dollars ($)% of Total
Net AssetsLuoniushan Co., Ltd. Class A 700 855 0.00%
Guizhou Gas Group Corp., Ltd. Class A 600 854 0.00%
Genimous Technology Co., Ltd. Class A 900 846 0.00%
Changzhou Tronly New Electronic Materials Co., Ltd. Class A 400 839 0.00%
Wuhan Fingu Electronic Technology Co., Ltd. Class A 400 829 0.00%
Shenzhen FRD Science & Technology Co., Ltd. 300 827 0.00%
Easysight Supply Chain Management Co., Ltd. Class A 900 826 0.00%
Zhejiang Narada Power Source Co., Ltd. Class A 500 820 0.00%
Gansu Shangfeng Cement Co., Ltd. Class A 300 812 0.00%
Shenzhen Kinwong Electronic Co., Ltd. Class A 200 811 0.00%
Wellhope Foods Co., Ltd. Class A 500 806 0.00%
Hangzhou Shunwang Technology Co., Ltd. Class A 400 801 0.00%
Better Life Commercial Chain Share Co., Ltd. Class A 700 797 0.00%
Fujian Aonong Biological Technology Group, Inc. Ltd. Class A 500 797 0.00%
Opple Lighting Co., Ltd. Class A 200 795 0.00%
Vatti Corp., Ltd. Class A 700 782 0.00%Shenzhen Suntak Circuit Technology Co., Ltd. Class A 400 773 0.00%
Konfoong Materials International Co., Ltd. Class A 100 772 0.00%
Shenzhen Center Power Tech Co., Ltd. Class A 300 769 0.00%
Huafon Microfibre Shanghai Technology Co., Ltd. Class T 1,000 766 0.00%
Chengdu Fusen Noble-House Industrial Co., Ltd. Class A 400 747 0.00%
Tus Environmental Science & Technology Development Co., Ltd. Class A 900 745 0.00%
Jiangxi Huangshanghuang Group Food Co., Ltd. Class A 300 735 0.00%
Chengdu Kanghong Pharmaceutical Group Co., Ltd. Class A 200 716 0.00%
Suzhou TFC Optical Communication Co., Ltd. Class A 180 705 0.00%
Greattown Holdings Ltd. Class A 1,200 700 0.00%
HyUnion Holding Co., Ltd. Class A 800 676 0.00%
Guangdong Zhongsheng Pharmaceutical Co., Ltd. Class A 500 666 0.00%
Gansu Qilianshan Cement Group Co., Ltd. Class A 400 653 0.00%
Tahoe Group Co., Ltd. Class A 1,900 635 0.00%
Myhome Real Estate Development Group Co., Ltd. Class A 1,700 445 0.00%
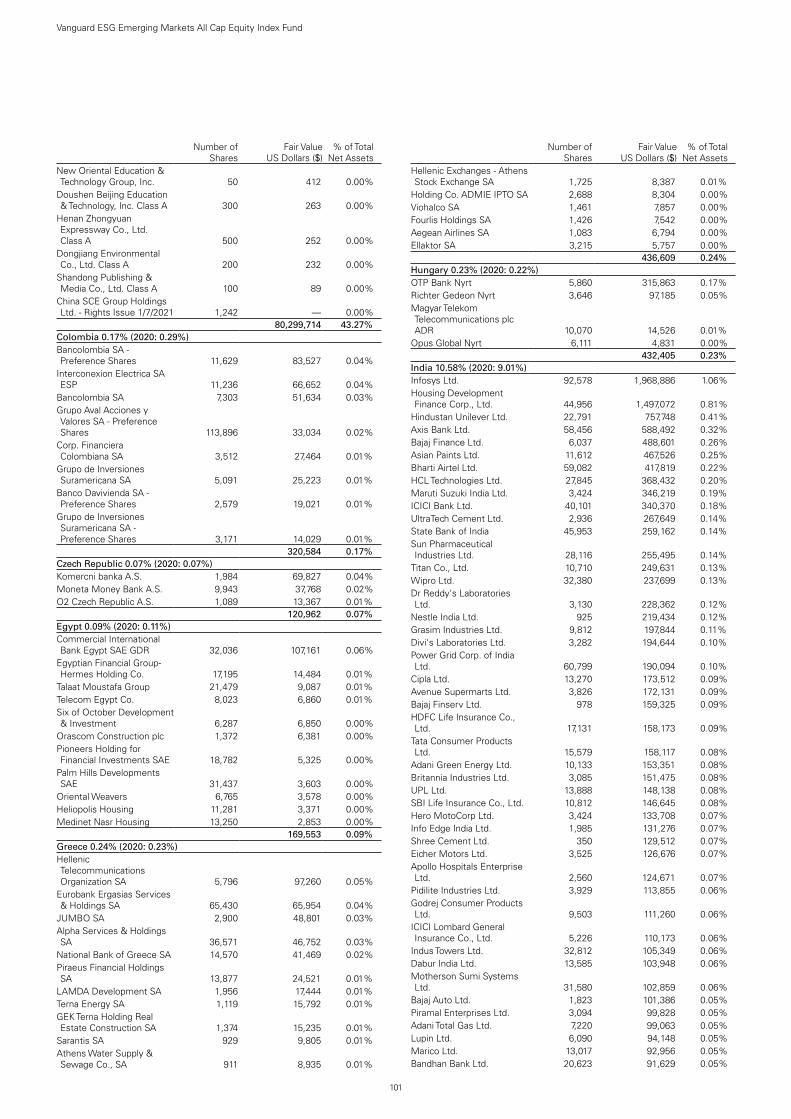
101
Vanguard ESG Emerging Markets All Cap Equity Index Fund
.Number of
SharesFair Value
US Dollars ($)% of Total
Net AssetsNew Oriental Education & Technology Group, Inc. 50 412 0.00%
Doushen Beijing Education & Technology, Inc. Class A 300 263 0.00%
Henan Zhongyuan Expressway Co., Ltd. Class A 500 252 0.00%
Dongjiang Environmental Co., Ltd. Class A 200 232 0.00%
Shandong Publishing & Media Co., Ltd. Class A 100 89 0.00%
China SCE Group Holdings Ltd. - Rights Issue 1/7/2021 1,242 — 0.00%
test test 80,299,714 43.27%Colombia 0.17% (2020: 0.29%)Bancolombia SA - Preference Shares 11,629 83,527 0.04%
Interconexion Electrica SA ESP 11,236 66,652 0.04%
Bancolombia SA 7,303 51,634 0.03%Grupo Aval Acciones y Valores SA - Preference Shares 113,896 33,034 0.02%
Corp. Financiera Colombiana SA 3,512 27,464 0.01%
Grupo de Inversiones Suramericana SA 5,091 25,223 0.01%
Banco Davivienda SA - Preference Shares 2,579 19,021 0.01%
Grupo de Inversiones Suramericana SA - Preference Shares 3,171 14,029 0.01%
test test 320,584 0.17%Czech Republic 0.07% (2020: 0.07%)Komercni banka A.S. 1,984 69,827 0.04%Moneta Money Bank A.S. 9,943 37,768 0.02%O2 Czech Republic A.S. 1,089 13,367 0.01%test test 120,962 0.07%Egypt 0.09% (2020: 0.11%)Commercial International Bank Egypt SAE GDR 32,036 107,161 0.06%
Egyptian Financial Group-Hermes Holding Co. 17,195 14,484 0.01%
Talaat Moustafa Group 21,479 9,087 0.01%Telecom Egypt Co. 8,023 6,860 0.01%Six of October Development & Investment 6,287 6,850 0.00%
Orascom Construction plc 1,372 6,381 0.00%Pioneers Holding for Financial Investments SAE 18,782 5,325 0.00%
Palm Hills Developments SAE 31,437 3,603 0.00%
Oriental Weavers 6,765 3,578 0.00%Heliopolis Housing 11,281 3,371 0.00%Medinet Nasr Housing 13,250 2,853 0.00%test test 169,553 0.09%Greece 0.24% (2020: 0.23%)Hellenic Telecommunications Organization SA 5,796 97,260 0.05%
Eurobank Ergasias Services & Holdings SA 65,430 65,954 0.04%
JUMBO SA 2,900 48,801 0.03%Alpha Services & Holdings SA 36,571 46,752 0.03%
National Bank of Greece SA 14,570 41,469 0.02%Piraeus Financial Holdings SA 13,877 24,521 0.01%
LAMDA Development SA 1,956 17,444 0.01%Terna Energy SA 1,119 15,792 0.01%GEK Terna Holding Real Estate Construction SA 1,374 15,235 0.01%
Sarantis SA 929 9,805 0.01%Athens Water Supply & Sewage Co., SA 911 8,935 0.01%
.Number of
SharesFair Value
US Dollars ($)% of Total
Net AssetsHellenic Exchanges - Athens Stock Exchange SA 1,725 8,387 0.01%
Holding Co. ADMIE IPTO SA 2,688 8,304 0.00%Viohalco SA 1,461 7,857 0.00%Fourlis Holdings SA 1,426 7,542 0.00%Aegean Airlines SA 1,083 6,794 0.00%Ellaktor SA 3,215 5,757 0.00%test test 436,609 0.24%Hungary 0.23% (2020: 0.22%)OTP Bank Nyrt 5,860 315,863 0.17%Richter Gedeon Nyrt 3,646 97,185 0.05%Magyar Telekom Telecommunications plc ADR 10,070 14,526 0.01%
Opus Global Nyrt 6,111 4,831 0.00%test test 432,405 0.23%India 10.58% (2020: 9.01%)Infosys Ltd. 92,578 1,968,886 1.06%Housing Development Finance Corp., Ltd. 44,956 1,497,072 0.81%
Hindustan Unilever Ltd. 22,791 757,748 0.41%Axis Bank Ltd. 58,456 588,492 0.32%Bajaj Finance Ltd. 6,037 488,601 0.26%Asian Paints Ltd. 11,612 467,526 0.25%Bharti Airtel Ltd. 59,082 417,819 0.22%HCL Technologies Ltd. 27,845 368,432 0.20%Maruti Suzuki India Ltd. 3,424 346,219 0.19%ICICI Bank Ltd. 40,101 340,370 0.18%UltraTech Cement Ltd. 2,936 267,649 0.14%State Bank of India 45,953 259,162 0.14%Sun Pharmaceutical Industries Ltd. 28,116 255,495 0.14%
Titan Co., Ltd. 10,710 249,631 0.13%Wipro Ltd. 32,380 237,699 0.13%Dr Reddy's Laboratories Ltd. 3,130 228,362 0.12%
Nestle India Ltd. 925 219,434 0.12%Grasim Industries Ltd. 9,812 197,844 0.11%Divi's Laboratories Ltd. 3,282 194,644 0.10%Power Grid Corp. of India Ltd. 60,799 190,094 0.10%
Cipla Ltd. 13,270 173,512 0.09%Avenue Supermarts Ltd. 3,826 172,131 0.09%Bajaj Finserv Ltd. 978 159,325 0.09%HDFC Life Insurance Co., Ltd. 17,131 158,173 0.09%
Tata Consumer Products Ltd. 15,579 158,117 0.08%
Adani Green Energy Ltd. 10,133 153,351 0.08%Britannia Industries Ltd. 3,085 151,475 0.08%UPL Ltd. 13,888 148,138 0.08%SBI Life Insurance Co., Ltd. 10,812 146,645 0.08%Hero MotoCorp Ltd. 3,424 133,708 0.07%Info Edge India Ltd. 1,985 131,276 0.07%Shree Cement Ltd. 350 129,512 0.07%Eicher Motors Ltd. 3,525 126,676 0.07%Apollo Hospitals Enterprise Ltd. 2,560 124,671 0.07%
Pidilite Industries Ltd. 3,929 113,855 0.06%Godrej Consumer Products Ltd. 9,503 111,260 0.06%
ICICI Lombard General Insurance Co., Ltd. 5,226 110,173 0.06%
Indus Towers Ltd. 32,812 105,349 0.06%Dabur India Ltd. 13,585 103,948 0.06%Motherson Sumi Systems Ltd. 31,580 102,859 0.06%
Bajaj Auto Ltd. 1,823 101,386 0.05%Piramal Enterprises Ltd. 3,094 99,828 0.05%Adani Total Gas Ltd. 7,220 99,063 0.05%Lupin Ltd. 6,090 94,148 0.05%Marico Ltd. 13,017 92,956 0.05%Bandhan Bank Ltd. 20,623 91,629 0.05%

102
Vanguard ESG Emerging Markets All Cap Equity Index Fund
.Number of
SharesFair Value
US Dollars ($)% of Total
Net AssetsAurobindo Pharma Ltd. 6,754 87,703 0.05%Max Financial Services Ltd. 6,115 87,237 0.05%Laurus Labs Ltd. 9,212 85,347 0.05%Shriram Transport Finance Co., Ltd. 4,711 85,097 0.05%
Havells India Ltd. 6,253 82,459 0.04%Voltas Ltd. 5,854 80,525 0.04%Ambuja Cements Ltd. 17,360 79,560 0.04%Jubilant Foodworks Ltd. 1,869 77,450 0.04%ICICI Prudential Life Insurance Co., Ltd. 9,378 77,303 0.04%
Colgate-Palmolive India Ltd. 3,371 76,454 0.04%SBI Cards & Payment Services Ltd. 5,739 74,924 0.04%
PI Industries Ltd. 1,903 74,512 0.04%MRF Ltd. 69 74,337 0.04%Crompton Greaves Consumer Electricals Ltd. 12,078 70,619 0.04%
Cholamandalam Investment & Finance Co., Ltd. 10,208 70,486 0.04%
SRF Ltd. 719 70,378 0.04%Indraprastha Gas Ltd. 9,219 69,177 0.04%Container Corp. Of India Ltd. 7,166 67,326 0.04%
Biocon Ltd. 12,315 67,009 0.04%Mphasis Ltd. 2,330 66,900 0.04%HDFC Asset Management Co., Ltd. 1,680 65,940 0.04%
Zee Entertainment Enterprises Ltd. 22,290 64,399 0.03%
Berger Paints India Ltd. 5,935 64,285 0.03%Balkrishna Industries Ltd. 2,115 63,715 0.03%Sundaram Finance Ltd. 1,758 63,259 0.03%ACC Ltd. 2,250 60,989 0.03%Astral Ltd. 2,277 60,947 0.03%Petronet LNG Ltd. 20,051 60,911 0.03%Embassy Office Parks REIT 12,600 59,394 0.03%Page Industries Ltd. 148 58,782 0.03%DLF Ltd. 15,534 58,746 0.03%IDFC First Bank Ltd. 80,324 58,571 0.03%NMDC Ltd. 23,583 58,410 0.03%InterGlobe Aviation Ltd. 2,472 57,101 0.03%Cadila Healthcare Ltd. 6,525 56,638 0.03%Aarti Industries Ltd. 4,794 56,225 0.03%AU Small Finance Bank Ltd. 4,028 56,134 0.03%Trent Ltd. 4,802 54,904 0.03%Dixon Technologies India Ltd. 912 54,245 0.03%
Tata Elxsi Ltd. 907 52,523 0.03%Atul Ltd. 434 52,420 0.03%Power Finance Corp., Ltd. 30,232 52,386 0.03%Tata Communications Ltd. 2,988 51,740 0.03%LIC Housing Finance Ltd. 8,117 51,325 0.03%Muthoot Finance Ltd. 2,532 50,471 0.03%Torrent Pharmaceuticals Ltd. 1,286 50,201 0.03%
Persistent Systems Ltd. 1,268 50,134 0.03%Ipca Laboratories Ltd. 1,825 49,754 0.03%REC Ltd. 24,544 49,052 0.03%Bosch Ltd. 241 48,716 0.03%Supreme Industries Ltd. 1,670 48,627 0.03%Deepak Nitrite Ltd. 1,956 47,592 0.03%Gujarat Gas Ltd. 5,312 47,221 0.03%Federal Bank Ltd. 40,149 47,047 0.03%Ramco Cements Ltd. 3,397 46,878 0.03%Navin Fluorine International Ltd. 915 46,153 0.02%
APL Apollo Tubes Ltd. 2,037 44,651 0.02%Godrej Properties Ltd. 2,327 43,760 0.02%TVS Motor Co., Ltd. 5,201 43,417 0.02%Fortis Healthcare Ltd. 13,119 42,959 0.02%Emami Ltd. 5,618 42,352 0.02%
.Number of
SharesFair Value
US Dollars ($)% of Total
Net AssetsTata Chemicals Ltd. 4,328 42,145 0.02%Dr Lal PathLabs Ltd. 939 41,340 0.02%Tube Investments of India Ltd. 2,628 41,317 0.02%
Indian Railway Catering & Tourism Corp., Ltd. 1,411 38,608 0.02%
Glenmark Pharmaceuticals Ltd. 4,211 36,969 0.02%
Natco Pharma Ltd. 2,432 36,951 0.02%Torrent Power Ltd. 5,945 36,799 0.02%Varun Beverages Ltd. 3,691 36,230 0.02%Indian Hotels Co., Ltd. 18,886 35,940 0.02%Coromandel International Ltd. 2,964 35,925 0.02%
Bata India Ltd. 1,667 35,810 0.02%Bajaj Holdings & Investment Ltd. 732 35,593 0.02%
Honeywell Automation India Ltd. 62 34,892 0.02%
Pfizer Ltd. 455 34,713 0.02%Mahindra & Mahindra Financial Services Ltd. 16,363 34,584 0.02%
JK Cement Ltd. 895 34,335 0.02%Manappuram Finance Ltd. 13,569 30,805 0.02%RBL Bank Ltd. 10,686 30,262 0.02%Kajaria Ceramics Ltd. 2,282 30,085 0.02%Amara Raja Batteries Ltd. 2,994 30,011 0.02%Escorts Ltd. 1,823 29,924 0.02%Alkem Laboratories Ltd. 693 29,828 0.02%Bank of Baroda 24,792 28,651 0.02%Indiabulls Housing Finance Ltd. 8,155 28,641 0.02%
Sundram Fasteners Ltd. 2,628 28,591 0.02%Dalmia Bharat Ltd. 1,098 27,936 0.01%Exide Industries Ltd. 11,229 27,548 0.01%Oracle Financial Services Software Ltd. 549 26,970 0.01%
AIA Engineering Ltd. 928 26,719 0.01%Relaxo Footwears Ltd. 1,712 26,532 0.01%Aditya Birla Fashion & Retail Ltd. 9,130 26,501 0.01%
Apollo Tyres Ltd. 8,745 26,471 0.01%Vodafone Idea Ltd. 196,541 26,309 0.01%Hindustan Zinc Ltd. 5,472 24,978 0.01%Redington India Ltd. 6,896 24,808 0.01%Rajesh Exports Ltd. 3,234 24,565 0.01%Bayer CropScience Ltd. 312 24,297 0.01%Aavas Financiers Ltd. 662 24,157 0.01%Coforge Ltd. 428 23,938 0.01%Cholamandalam Financial Holdings Ltd. 2,680 23,876 0.01%
Kansai Nerolac Paints Ltd. 3,077 23,811 0.01%Oberoi Realty Ltd. 2,792 23,653 0.01%Metropolis Healthcare Ltd. 600 22,891 0.01%National Aluminium Co., Ltd. 21,104 22,245 0.01%
Castrol India Ltd. 11,518 22,174 0.01%Whirlpool of India Ltd. 727 21,865 0.01%GlaxoSmithKline Pharmaceuticals Ltd. 1,080 21,827 0.01%
IDFC Ltd. 29,777 21,593 0.01%Syngene International Ltd. 2,751 21,588 0.01%IIFL Finance Ltd. 6,307 21,586 0.01%PVR Ltd. 1,193 21,421 0.01%Mahanagar Gas Ltd. 1,377 21,054 0.01%Intellect Design Arena Ltd. 2,120 20,648 0.01%Birlasoft Ltd. 3,831 20,596 0.01%NHPC Ltd. 58,275 20,541 0.01%Endurance Technologies Ltd. 917 20,051 0.01%City Union Bank Ltd. 8,742 19,594 0.01%Phoenix Mills Ltd. 1,775 19,466 0.01%Sonata Software Ltd. 1,924 19,331 0.01%Firstsource Solutions Ltd. 7,660 19,266 0.01%
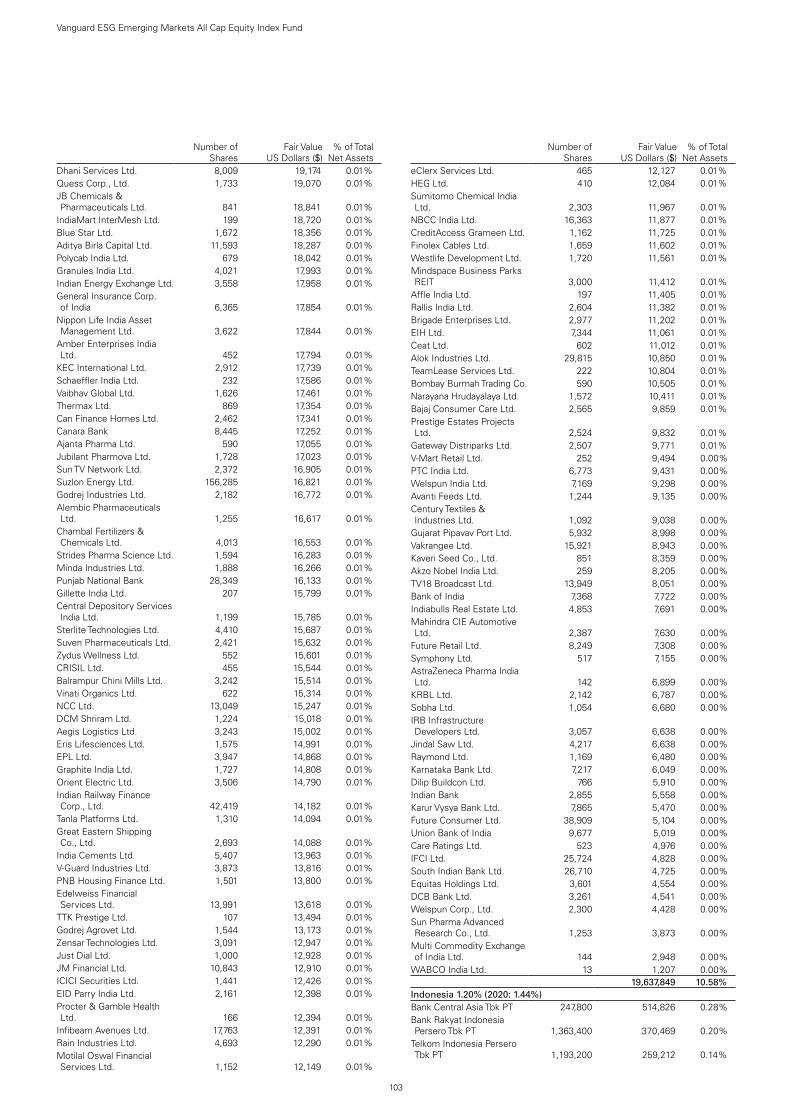
103
Vanguard ESG Emerging Markets All Cap Equity Index Fund
.Number of
SharesFair Value
US Dollars ($)% of Total
Net AssetsDhani Services Ltd. 8,009 19,174 0.01%Quess Corp., Ltd. 1,733 19,070 0.01%JB Chemicals & Pharmaceuticals Ltd. 841 18,841 0.01%
IndiaMart InterMesh Ltd. 199 18,720 0.01%Blue Star Ltd. 1,672 18,356 0.01%Aditya Birla Capital Ltd. 11,593 18,287 0.01%Polycab India Ltd. 679 18,042 0.01%Granules India Ltd. 4,021 17,993 0.01%Indian Energy Exchange Ltd. 3,558 17,958 0.01%General Insurance Corp. of India 6,365 17,854 0.01%
Nippon Life India Asset Management Ltd. 3,622 17,844 0.01%
Amber Enterprises India Ltd. 452 17,794 0.01%
KEC International Ltd. 2,912 17,739 0.01%Schaeffler India Ltd. 232 17,586 0.01%Vaibhav Global Ltd. 1,626 17,461 0.01%Thermax Ltd. 869 17,354 0.01%Can Finance Homes Ltd. 2,462 17,341 0.01%Canara Bank 8,445 17,252 0.01%Ajanta Pharma Ltd. 590 17,055 0.01%Jubilant Pharmova Ltd. 1,728 17,023 0.01%Sun TV Network Ltd. 2,372 16,905 0.01%Suzlon Energy Ltd. 156,285 16,821 0.01%Godrej Industries Ltd. 2,182 16,772 0.01%Alembic Pharmaceuticals Ltd. 1,255 16,617 0.01%
Chambal Fertilizers & Chemicals Ltd. 4,013 16,553 0.01%
Strides Pharma Science Ltd. 1,594 16,283 0.01%Minda Industries Ltd. 1,888 16,266 0.01%Punjab National Bank 28,349 16,133 0.01%Gillette India Ltd. 207 15,799 0.01%Central Depository Services India Ltd. 1,199 15,785 0.01%
Sterlite Technologies Ltd. 4,410 15,687 0.01%Suven Pharmaceuticals Ltd. 2,421 15,632 0.01%Zydus Wellness Ltd. 552 15,601 0.01%CRISIL Ltd. 455 15,544 0.01%Balrampur Chini Mills Ltd. 3,242 15,514 0.01%Vinati Organics Ltd. 622 15,314 0.01%NCC Ltd. 13,049 15,247 0.01%DCM Shriram Ltd. 1,224 15,018 0.01%Aegis Logistics Ltd. 3,243 15,002 0.01%Eris Lifesciences Ltd. 1,575 14,991 0.01%EPL Ltd. 3,947 14,868 0.01%Graphite India Ltd. 1,727 14,808 0.01%Orient Electric Ltd. 3,506 14,790 0.01%Indian Railway Finance Corp., Ltd. 42,419 14,182 0.01%
Tanla Platforms Ltd. 1,310 14,094 0.01%Great Eastern Shipping Co., Ltd. 2,693 14,088 0.01%
India Cements Ltd. 5,407 13,963 0.01%V-Guard Industries Ltd. 3,873 13,816 0.01%PNB Housing Finance Ltd. 1,501 13,800 0.01%Edelweiss Financial Services Ltd. 13,991 13,618 0.01%
TTK Prestige Ltd. 107 13,494 0.01%Godrej Agrovet Ltd. 1,544 13,173 0.01%Zensar Technologies Ltd. 3,091 12,947 0.01%Just Dial Ltd. 1,000 12,928 0.01%JM Financial Ltd. 10,843 12,910 0.01%ICICI Securities Ltd. 1,441 12,426 0.01%EID Parry India Ltd. 2,161 12,398 0.01%Procter & Gamble Health Ltd. 166 12,394 0.01%
Infibeam Avenues Ltd. 17,763 12,391 0.01%Rain Industries Ltd. 4,693 12,290 0.01%Motilal Oswal Financial Services Ltd. 1,152 12,149 0.01%
.Number of
SharesFair Value
US Dollars ($)% of Total
Net AssetseClerx Services Ltd. 465 12,127 0.01%HEG Ltd. 410 12,084 0.01%Sumitomo Chemical India Ltd. 2,303 11,967 0.01%
NBCC India Ltd. 16,363 11,877 0.01%CreditAccess Grameen Ltd. 1,162 11,725 0.01%Finolex Cables Ltd. 1,659 11,602 0.01%Westlife Development Ltd. 1,720 11,561 0.01%Mindspace Business Parks REIT 3,000 11,412 0.01%
Affle India Ltd. 197 11,405 0.01%Rallis India Ltd. 2,604 11,382 0.01%Brigade Enterprises Ltd. 2,977 11,202 0.01%EIH Ltd. 7,344 11,061 0.01%Ceat Ltd. 602 11,012 0.01%Alok Industries Ltd. 29,815 10,850 0.01%TeamLease Services Ltd. 222 10,804 0.01%Bombay Burmah Trading Co. 590 10,505 0.01%Narayana Hrudayalaya Ltd. 1,572 10,411 0.01%Bajaj Consumer Care Ltd. 2,565 9,859 0.01%Prestige Estates Projects Ltd. 2,524 9,832 0.01%
Gateway Distriparks Ltd. 2,507 9,771 0.01%V-Mart Retail Ltd. 252 9,494 0.00%PTC India Ltd. 6,773 9,431 0.00%Welspun India Ltd. 7,169 9,298 0.00%Avanti Feeds Ltd. 1,244 9,135 0.00%Century Textiles & Industries Ltd. 1,092 9,038 0.00%
Gujarat Pipavav Port Ltd. 5,932 8,998 0.00%Vakrangee Ltd. 15,921 8,943 0.00%Kaveri Seed Co., Ltd. 851 8,359 0.00%Akzo Nobel India Ltd. 259 8,205 0.00%TV18 Broadcast Ltd. 13,949 8,051 0.00%Bank of India 7,368 7,722 0.00%Indiabulls Real Estate Ltd. 4,853 7,691 0.00%Mahindra CIE Automotive Ltd. 2,387 7,630 0.00%
Future Retail Ltd. 8,249 7,308 0.00%Symphony Ltd. 517 7,155 0.00%AstraZeneca Pharma India Ltd. 142 6,899 0.00%
KRBL Ltd. 2,142 6,787 0.00%Sobha Ltd. 1,054 6,680 0.00%IRB Infrastructure Developers Ltd. 3,057 6,638 0.00%
Jindal Saw Ltd. 4,217 6,638 0.00%Raymond Ltd. 1,169 6,480 0.00%Karnataka Bank Ltd. 7,217 6,049 0.00%Dilip Buildcon Ltd. 766 5,910 0.00%Indian Bank 2,855 5,558 0.00%Karur Vysya Bank Ltd. 7,865 5,470 0.00%Future Consumer Ltd. 38,909 5,104 0.00%Union Bank of India 9,677 5,019 0.00%Care Ratings Ltd. 523 4,976 0.00%IFCI Ltd. 25,724 4,828 0.00%South Indian Bank Ltd. 26,710 4,725 0.00%Equitas Holdings Ltd. 3,601 4,554 0.00%DCB Bank Ltd. 3,261 4,541 0.00%Welspun Corp., Ltd. 2,300 4,428 0.00%Sun Pharma Advanced Research Co., Ltd. 1,253 3,873 0.00%
Multi Commodity Exchange of India Ltd. 144 2,948 0.00%
WABCO India Ltd. 13 1,207 0.00%test test 19,637,849 10.58%Indonesia 1.20% (2020: 1.44%)Bank Central Asia Tbk PT 247,800 514,826 0.28%Bank Rakyat Indonesia Persero Tbk PT 1,363,400 370,469 0.20%
Telkom Indonesia Persero Tbk PT 1,193,200 259,212 0.14%

104
Vanguard ESG Emerging Markets All Cap Equity Index Fund
.Number of
SharesFair Value
US Dollars ($)% of Total
Net AssetsBank Mandiri Persero Tbk PT 476,300 193,805 0.10%
Charoen Pokphand Indonesia Tbk PT 189,200 81,552 0.04%
Bank Negara Indonesia Persero Tbk PT 195,200 62,329 0.03%
Tower Bersama Infrastructure Tbk PT 258,800 57,293 0.03%
Sarana Menara Nusantara Tbk PT 666,100 56,963 0.03%
Unilever Indonesia Tbk PT 151,900 51,855 0.03%Indofood Sukses Makmur Tbk PT 117,300 49,954 0.03%
Kalbe Farma Tbk PT 499,800 48,257 0.03%Barito Pacific Tbk PT 675,500 39,831 0.02%Indah Kiat Pulp & Paper Tbk PT 71,800 36,890 0.02%
Indofood CBP Sukses Makmur Tbk PT 55,000 30,914 0.02%
Mitra Keluarga Karyasehat Tbk PT 136,200 26,301 0.01%
Indocement Tunggal Prakarsa Tbk PT 32,300 22,944 0.01%
Ciputra Development Tbk PT 333,200 21,371 0.01%Japfa Comfeed Indonesia Tbk PT 169,200 20,187 0.01%
Summarecon Agung Tbk PT 324,292 19,010 0.01%Pakuwon Jati Tbk PT 611,100 18,544 0.01%Smartfren Telecom Tbk PT 2,267,200 18,450 0.01%Surya Citra Media Tbk PT 146,300 18,262 0.01%XL Axiata Tbk PT 86,000 15,836 0.01%Ace Hardware Indonesia Tbk PT 174,900 15,078 0.01%
Bumi Serpong Damai Tbk PT 225,300 14,994 0.01%
Mayora Indah Tbk PT 93,000 14,816 0.01%Jasa Marga Persero Tbk PT 58,800 14,274 0.01%Indosat Tbk PT 28,900 13,653 0.01%Bank Syariah Indonesia Tbk PT 77,200 12,246 0.01%
Media Nusantara Citra Tbk PT 166,500 10,679 0.01%
Bank BTPN Syariah Tbk PT 49,300 9,792 0.01%Bank Tabungan Negara Persero Tbk PT 103,300 9,760 0.01%
Mitra Adiperkasa Tbk PT 209,800 9,043 0.01%Bank Bukopin Tbk PT 314,100 8,665 0.01%Wijaya Karya Persero Tbk PT 116,700 7,968 0.00%Waskita Karya Persero Tbk PT 107,500 6,524 0.00%
Matahari Department Store Tbk PT 39,400 5,312 0.00%
Panin Financial Tbk PT 395,300 5,125 0.00%Bank Pembangunan Daerah Jawa Barat Dan Banten Tbk PT 61,000 5,090 0.00%
Astra Agro Lestari Tbk PT 9,400 4,927 0.00%Bank Pan Indonesia Tbk PT 89,700 4,825 0.00%PP Persero Tbk PT 60,600 3,824 0.00%Krakatau Steel Persero Tbk PT 99,400 3,414 0.00%
Global Mediacom Tbk PT 175,400 3,339 0.00%Surya Semesta Internusa Tbk PT 93,000 2,796 0.00%
Ramayana Lestari Sentosa Tbk PT 54,100 2,518 0.00%
Alam Sutera Realty Tbk PT 194,200 2,143 0.00%Adhi Karya Persero Tbk PT 40,900 2,130 0.00%Kresna Graha Investama Tbk PT 156,900 1,461 0.00%
Bank Danamon Indonesia Tbk PT 6,600 929 0.00%
.Number of
SharesFair Value
US Dollars ($)% of Total
Net AssetsEagle High Plantations Tbk PT 106,900 634 0.00%
test test 2,231,014 1.20%Kuwait 0.77% (2020: 0.70%)National Bank of Kuwait SAKP 174,464 491,603 0.27%
Kuwait Finance House KSCP 113,447 285,783 0.15%
Ahli United Bank BSC 166,037 132,257 0.07%Mobile Telecommunications Co. KSCP 55,628 108,745 0.06%
Agility Public Warehousing Co. KSC 32,296 98,399 0.05%
Boubyan Bank KSCP 26,022 63,220 0.03%Mabanee Co. KPSC 15,388 36,619 0.02%Gulf Bank KSCP 40,684 34,162 0.02%Humansoft Holding Co. KSC 2,694 33,574 0.02%Boubyan Petrochemicals Co. KSCP 9,154 26,128 0.02%
National Industries Group Holding SAK 29,542 21,865 0.01%
Warba Bank KSCP 22,164 18,537 0.01%Qurain Petrochemical Industries Co. 14,153 18,320 0.01%
Kuwait International Bank KSCP 21,110 15,694 0.01%
Burgan Bank SAK 18,843 14,134 0.01%Kuwait Projects Co. Holding KSCP 19,862 10,613 0.01%
Integrated Holding Co. KCSC 5,901 7,344 0.00%
Alimtiaz Investment Group KSC 13,878 5,573 0.00%
test test 1,422,570 0.77%Malaysia 1.93% (2020: 2.29%)Public Bank Bhd 398,500 394,516 0.21%Malayan Banking Bhd 153,600 300,059 0.16%Tenaga Nasional Bhd 100,900 237,941 0.13%CIMB Group Holdings Bhd 181,200 201,212 0.11%Petronas Chemicals Group Bhd 72,800 141,339 0.08%
Top Glove Corp. Bhd 136,700 137,309 0.07%Press Metal Aluminium Holdings Bhd 99,300 114,333 0.06%
IHH Healthcare Bhd 77,900 102,641 0.06%Axiata Group Bhd 113,000 101,799 0.06%DiGi.Com Bhd 92,100 91,623 0.05%Sime Darby Plantation Bhd 90,500 86,761 0.05%PPB Group Bhd 17,900 78,904 0.04%Maxis Bhd 74,600 78,886 0.04%IOI Corp. Bhd 84,500 76,531 0.04%MISC Bhd 44,270 72,299 0.04%Hong Leong Bank Bhd 16,000 72,147 0.04%Hartalega Holdings Bhd 39,200 69,401 0.04%Kuala Lumpur Kepong Bhd 12,200 59,832 0.03%Petronas Gas Bhd 15,000 56,004 0.03%RHB Bank Bhd 40,800 53,070 0.03%Nestle Malaysia Bhd 1,600 51,374 0.03%Sime Darby Bhd 93,300 48,993 0.03%Inari Amertron Bhd 59,800 45,662 0.03%Gamuda Bhd 60,300 45,463 0.02%Telekom Malaysia Bhd 30,600 44,741 0.02%AMMB Holdings Bhd 57,200 40,646 0.02%QL Resources Bhd 29,500 40,148 0.02%IJM Corp. Bhd 76,200 32,855 0.02%Malaysia Airports Holdings Bhd 21,200 30,640 0.02%
Supermax Corp. Bhd 38,295 30,440 0.02%HAP Seng Consolidated Bhd 15,600 29,310 0.02%
VS Industry Bhd 81,500 27,091 0.02%MR DIY Group M Bhd 31,100 26,894 0.01%TIME dotCom Bhd 7,800 26,417 0.01%

105
Vanguard ESG Emerging Markets All Cap Equity Index Fund
.Number of
SharesFair Value
US Dollars ($)% of Total
Net AssetsBursa Malaysia Bhd 13,800 26,360 0.01%Westports Holdings Bhd 25,900 26,265 0.01%Hong Leong Financial Group Bhd 5,600 24,011 0.01%
Kossan Rubber Industries 30,800 23,889 0.01%My EG Services Bhd 51,000 21,867 0.01%Malaysian Pacific Industries Bhd 2,200 20,561 0.01%
Sunway REIT 57,800 19,909 0.01%Pentamaster Corp. Bhd 16,550 18,458 0.01%D&O Green Technologies Bhd 16,200 18,301 0.01%
Frontken Corp. Bhd 26,400 18,251 0.01%Genting Plantations Bhd 10,500 18,059 0.01%YTL Corp. Bhd 112,960 17,822 0.01%IGB REIT 42,700 17,588 0.01%Alliance Bank Malaysia Bhd 28,900 16,777 0.01%Fraser & Neave Holdings Bhd 2,600 16,534 0.01%
Sunway Bhd 38,300 16,053 0.01%Scientex Bhd 15,000 15,103 0.01%IOI Properties Group Bhd 55,700 15,027 0.01%KPJ Healthcare Bhd 61,200 14,889 0.01%YTL Power International Bhd 76,000 12,723 0.01%Mega First Corp. Bhd 15,000 12,610 0.01%Yinson Holdings Bhd 10,400 12,551 0.01%Sime Darby Property Bhd 86,700 12,530 0.01%Axis REIT 23,900 10,996 0.01%Malakoff Corp. Bhd 55,500 10,895 0.01%Astro Malaysia Holdings Bhd 36,300 10,055 0.01%
ViTrox Corp. Bhd 2,800 9,874 0.01%UWC Bhd 6,900 8,476 0.00%Padini Holdings Bhd 11,800 7,902 0.00%SP Setia Bhd Group 29,200 7,456 0.00%Syarikat Takaful Malaysia Keluarga Bhd 6,900 7,230 0.00%
Malaysian Resources Corp. Bhd 72,200 7,043 0.00%
AirAsia Group Bhd 31,400 6,732 0.00%AEON Credit Service M Bhd 2,400 6,718 0.00%Malaysia Building Society Bhd 40,800 5,946 0.00%
Bermaz Auto Bhd 15,400 5,676 0.00%FGV Holdings Bhd 16,900 5,333 0.00%Leong Hup International Bhd 23,900 4,030 0.00%
UEM Sunrise Bhd 24,700 2,320 0.00%Cahya Mata Sarawak Bhd 7,800 2,142 0.00%Muhibbah Engineering M Bhd 7,900 1,760 0.00%
WCT Holdings Bhd 8,484 1,052 0.00%Pos Malaysia Bhd 3,600 694 0.00%VS Industry Bhd - Warrants 14/6/2024 4,558 291 0.00%
test test 3,586,040 1.93%Mexico 2.10% (2020: 2.09%)America Movil SAB de CV 779,600 587,328 0.32%Grupo Financiero Banorte SAB de CV Class O 74,500 480,290 0.26%
Wal-Mart de Mexico SAB de CV 132,500 433,293 0.23%
Fomento Economico Mexicano SAB de CV 47,000 398,015 0.21%
Cemex SAB de CV 380,000 320,253 0.17%Grupo Elektra SAB de CV 1,670 135,341 0.07%Grupo Bimbo SAB de CV 57,100 125,898 0.07%Grupo Aeroportuario del Pacifico SAB de CV Class B 9,400 100,758 0.05%
Grupo Aeroportuario del Sureste SAB de CV Class B 5,020 92,534 0.05%
Fibra Uno Administracion SA de CV REIT 77,000 83,147 0.05%
.Number of
SharesFair Value
US Dollars ($)% of Total
Net AssetsCoca-Cola Femsa SAB de CV 14,000 74,182 0.04%
Orbia Advance Corp. SAB de CV 26,000 68,048 0.04%
Arca Continental SAB de CV 11,400 66,051 0.04%Gruma SAB de CV Class B 5,385 60,599 0.03%Grupo Aeroportuario del Centro Norte SAB de CV Class B 9,000 59,025 0.03%
Grupo Financiero Inbursa SAB de CV Class O 55,200 54,450 0.03%
Promotora y Operadora de Infraestructura SAB de CV 5,855 46,807 0.03%
Controladora Vuela Compania de Aviacion SAB de CV Class A 24,100 46,335 0.03%
Industrias Penoles SAB de CV 3,320 46,020 0.02%
Kimberly-Clark de Mexico SAB de CV Class A 22,800 40,549 0.02%
Grupo Carso SAB de CV 12,200 38,027 0.02%Grupo Cementos de Chihuahua SAB de CV 4,500 36,223 0.02%
Banco del Bajio SA 19,500 35,052 0.02%Regional SAB de CV 5,700 33,818 0.02%Corp. Inmobiliaria Vesta SAB de CV 15,700 30,627 0.02%
PLA Administradora Industrial S de RL de CV REIT 19,100 29,047 0.02%
Telesites SAB de CV 30,300 28,108 0.02%Megacable Holdings SAB de CV 7,300 25,962 0.01%
Bolsa Mexicana de Valores SAB de CV 11,600 25,635 0.01%
La Comer SAB de CV 11,600 24,475 0.01%Prologis Property Mexico SA de CV REIT 10,900 24,405 0.01%
Alsea SAB de CV 12,900 23,130 0.01%Macquarie Mexico Real Estate Management SA de CV REIT 18,000 22,294 0.01%
El Puerto de Liverpool SAB de CV 4,800 21,275 0.01%
Qualitas Controladora SAB de CV 4,400 20,629 0.01%
Genomma Lab Internacional SAB de CV Class B 18,700 19,207 0.01%
Grupo Comercial Chedraui SA de CV 11,400 18,276 0.01%
Banco Santander Mexico SA Institucion de Banca Multiple Grupo Financiero Santand 14,100 17,775 0.01%
Gentera SAB de CV 28,100 16,512 0.01%Industrias Bachoco SAB de CV 4,200 15,871 0.01%
Alpek SAB de CV Class A 10,500 12,931 0.01%Grupo Herdez SAB de CV 5,000 11,363 0.01%Grupo Lala SAB de CV Class B 13,000 10,695 0.01%
Axtel SAB de CV 30,100 9,071 0.01%Unifin Financiera SAB de CV 5,277 8,084 0.00%Concentradora Fibra Danhos SA de CV REIT 6,900 7,700 0.00%
Nemak SAB de CV 17,900 6,284 0.00%Grupo Rotoplas SAB de CV 3,350 5,569 0.00%Credito Real SAB de CV SOFOM ER 5,100 2,559 0.00%
test test 3,899,527 2.10%Pakistan 0.08% (2020: 0.08%)Lucky Cement Ltd. 5,148 28,255 0.02%Engro Corp., Ltd. 8,707 16,326 0.01%MCB Bank Ltd. 14,550 14,864 0.01%Hub Power Co., Ltd. 28,009 14,235 0.01%

106
Vanguard ESG Emerging Markets All Cap Equity Index Fund
.Number of
SharesFair Value
US Dollars ($)% of Total
Net AssetsHabib Bank Ltd. 18,232 14,125 0.01%Fauji Fertilizer Co., Ltd. 17,413 11,715 0.01%Engro Fertilizers Ltd. 18,543 8,254 0.01%Millat Tractors Ltd. 1,145 7,814 0.00%Bank Alfalah Ltd. 29,627 5,987 0.00%United Bank Ltd. 6,933 5,389 0.00%Nishat Mills Ltd. 6,000 3,560 0.00%Searle Co., Ltd. 2,059 3,180 0.00%DG Khan Cement Co., Ltd. 4,193 3,139 0.00%Fauji Cement Co., Ltd. 11,000 1,602 0.00%National Bank of Pakistan 6,500 1,536 0.00%Kot Addu Power Co., Ltd. 5,000 1,412 0.00%SUI Northern Gas Pipeline 4,000 1,237 0.00%SUI Southern Gas Co., Ltd. 13,000 1,101 0.00%test test 143,731 0.08%Philippines 0.68% (2020: 0.76%)Ayala Land, Inc. 202,500 149,547 0.08%Ayala Corp. 8,510 139,465 0.08%BDO Unibank, Inc. 50,860 117,942 0.06%International Container Terminal Services, Inc. 29,020 97,318 0.05%
JG Summit Holdings, Inc. 75,440 96,048 0.05%Bank of the Philippine Islands 46,890 85,202 0.05%
Universal Robina Corp. 22,760 67,373 0.04%PLDT, Inc. 2,380 63,041 0.03%Jollibee Foods Corp. 10,980 48,045 0.03%Metropolitan Bank & Trust Co. 47,830 47,717 0.03%
Manila Electric Co. 7,190 40,829 0.02%GT Capital Holdings, Inc. 2,730 33,947 0.02%Globe Telecom, Inc. 715 26,951 0.01%Security Bank Corp. 11,040 26,687 0.01%Metro Pacific Investments Corp. 333,000 26,536 0.01%
Megaworld Corp. 303,000 20,049 0.01%Puregold Price Club, Inc. 23,700 19,663 0.01%Aboitiz Power Corp. 37,800 18,933 0.01%Robinsons Land Corp. 49,800 17,629 0.01%Robinsons Retail Holdings, Inc. 15,790 17,370 0.01%
Wilcon Depot, Inc. 34,000 14,035 0.01%First Gen Corp. 20,200 12,414 0.01%Manila Water Co., Inc. 31,100 11,659 0.01%Century Pacific Food, Inc. 21,300 10,211 0.01%AC Energy Corp. 58,900 9,955 0.01%D&L Industries, Inc. 50,400 8,435 0.01%Nickel Asia Corp. 73,000 8,240 0.00%Vista Land & Lifescapes, Inc. 101,000 7,862 0.00%
Filinvest Land, Inc. 272,000 6,129 0.00%CEMEX Holdings Philippines, Inc. 216,000 5,620 0.00%
Cebu Air, Inc. 3,700 4,108 0.00%test test 1,258,960 0.68%Qatar 0.81% (2020: 0.93%)Qatar National Bank QPSC 114,045 562,238 0.30%Industries Qatar QSC 40,537 147,519 0.08%Qatar Islamic Bank SAQ 29,905 142,010 0.08%Masraf Al Rayan QSC 94,305 115,492 0.06%Commercial Bank PSQC 52,234 75,604 0.04%Qatar Gas Transport Co., Ltd. 71,125 58,603 0.03%
Mesaieed Petrochemical Holding Co. 112,405 58,101 0.03%
Qatar Electricity & Water Co. QSC 11,507 52,652 0.03%
Qatar International Islamic Bank QSC 20,165 51,562 0.03%
Ooredoo QPSC 22,174 44,427 0.02%Barwa Real Estate Co. 50,891 41,652 0.02%Doha Bank QPSC 36,506 28,314 0.02%
.Number of
SharesFair Value
US Dollars ($)% of Total
Net AssetsQatar Aluminum Manufacturing Co. 65,141 27,373 0.01%
Qatar Insurance Co. SAQ 39,375 26,820 0.01%Vodafone Qatar QSC 43,421 19,260 0.01%United Development Co. QSC 46,199 18,398 0.01%
Ezdan Holding Group QSC 39,131 17,776 0.01%Al Meera Consumer Goods Co. QSC 2,601 13,780 0.01%
Medicare Group 3,784 8,990 0.01%test test 1,510,571 0.81%Romania 0.04% (2020: 0.04%)Banca Transilvania SA 116,095 76,184 0.04%test test 76,184 0.04%Russia 1.15% (2020: 1.13%)Sberbank of Russia PJSC 263,050 1,100,720 0.59%Polyus PJSC 719 139,413 0.08%Magnit PJSC 1,795 130,533 0.07%Mobile TeleSystems PJSC 22,990 107,832 0.06%Novolipetsk Steel PJSC 29,840 93,849 0.05%VTB Bank PJSC 130,210,000 86,268 0.05%Moscow Exchange MICEX-RTS PJSC 36,300 84,815 0.05%
Inter RAO UES PJSC 919,000 58,936 0.03%PhosAgro PJSC 869 56,777 0.03%RusHydro PJSC 3,101,000 36,905 0.02%Rostelecom PJSC 26,150 36,537 0.02%Sistema PJSFC 80,100 34,758 0.02%Detsky Mir PJSC 14,260 29,514 0.02%Credit Bank of Moscow PJSC 314,400 27,884 0.01%
Aeroflot PJSC 25,320 23,700 0.01%Federal Grid Co. Unified Energy System PJSC 6,120,000 18,388 0.01%
ROSSETI PJSC 633,000 11,738 0.01%Unipro PJSC 298,000 11,246 0.01%LSR Group PJSC Class A 938 9,951 0.01%M.Video PJSC 1,053 8,879 0.00%Mosenergo PJSC 228,000 7,323 0.00%OGK-2 PJSC 492,000 5,286 0.00%Rosseti Lenenergo PJSC - Preference Shares 2,210 4,648 0.00%
ENEL RUSSIA PJSC 379,000 4,148 0.00%TGC-1 PJSC 6,100,000 1,029 0.00%test test 2,131,077 1.15%Saudi Arabia 3.10% (2020: 2.51%)Al Rajhi Bank 31,515 932,745 0.50%Saudi National Bank 56,412 866,396 0.47%Saudi Telecom Co. 15,380 539,678 0.29%Riyad Bank 37,816 267,205 0.14%Saudi British Bank 23,002 193,196 0.10%Saudi Arabian Mining Co. 10,376 174,852 0.09%SABIC Agri-Nutrients Co. 5,139 163,608 0.09%Banque Saudi Fransi 15,180 155,427 0.08%Alinma Bank 25,278 141,811 0.08%Saudi Electricity Co. 20,102 129,389 0.07%Yanbu National Petrochemical Co. 5,941 115,005 0.06%
Almarai Co. JSC 6,443 108,918 0.06%Dr Sulaiman Al Habib Medical Services Group Co. 2,351 102,430 0.06%
Arab National Bank 16,906 102,327 0.06%Bank AlBilad 9,248 90,497 0.05%Saudi Kayan Petrochemical Co. 18,504 89,106 0.05%
Etihad Etisalat Co. 9,587 84,740 0.05%Jarir Marketing Co. 1,477 83,176 0.04%Savola Group 6,646 76,465 0.04%Sahara International Petrochemical Co. 9,275 75,800 0.04%
Mouwasat Medical Services Co. 1,136 54,583 0.03%

107
Vanguard ESG Emerging Markets All Cap Equity Index Fund
.Number of
SharesFair Value
US Dollars ($)% of Total
Net AssetsSaudi Industrial Investment Group 5,748 53,642 0.03%
Advanced Petrochemical Co. 2,763 53,265 0.03%
Bank Al-Jazira 10,589 52,234 0.03%Bupa Arabia for Cooperative Insurance Co. 1,504 49,807 0.03%
Mobile Telecommunications Co. Saudi Arabia 12,090 46,872 0.03%
National Industrialization Co. 8,781 45,235 0.02%Southern Province Cement Co. 1,749 40,759 0.02%
Saudi Research & Media Group 861 40,635 0.02%
Abdullah Al Othaim Markets Co. 1,199 39,643 0.02%
Emaar Economic City 11,309 38,597 0.02%National Petrochemical Co. 3,265 38,305 0.02%Dar Al Arkan Real Estate Development Co. 13,216 37,212 0.02%
Co. for Cooperative Insurance 1,668 36,826 0.02%
Saudi Cement Co. 1,966 33,340 0.02%United Electronics Co. 818 29,009 0.02%Arabian Centres Co., Ltd. 3,839 26,819 0.01%Qassim Cement Co. 1,124 25,774 0.01%Saudi Airlines Catering Co. 1,143 23,985 0.01%Saudi Pharmaceutical Industries & Medical Appliances Corp. 1,525 23,462 0.01%
Yamama Cement Co. 2,467 22,562 0.01%Saudi Ground Services Co. 2,323 22,422 0.01%Yanbu Cement Co. 1,858 22,046 0.01%Seera Group Holding 3,743 21,657 0.01%Saudia Dairy & Foodstuff Co. 393 18,904 0.01%
Dallah Healthcare Co. 850 17,995 0.01%Al Hammadi Co. for Development & Investment 1,673 17,665 0.01%
Eastern Province Cement Co. 1,252 16,308 0.01%
National Agriculture Development Co. 1,507 16,173 0.01%
Saudi Ceramic Co. 1,058 16,165 0.01%Middle East Healthcare Co. 1,499 15,648 0.01%City Cement Co. 1,915 15,395 0.01%Arabian Cement Co. 1,234 14,938 0.01%Arriyadh Development Co. 2,176 14,203 0.01%Najran Cement Co. 2,162 13,928 0.01%Astra Industrial Group 1,019 13,409 0.01%Saudi Real Estate Co. 1,854 13,199 0.01%Jadwa Saudi Fund REIT 3,133 13,149 0.01%Saudi Public Transport Co. 1,710 13,040 0.01%Leejam Sports Co. JSC 610 12,654 0.01%Fawaz Abdulaziz Al Hokair & Co. 1,857 12,453 0.01%
United International Transportation Co. 996 11,977 0.01%
National Gas & Industrialization Co. 1,041 11,908 0.01%
Northern Region Cement Co. 2,147 10,762 0.01%
National Medical Care Co. 592 10,734 0.01%Herfy Food Services Co. 571 9,714 0.01%Dur Hospitality Co. 1,004 9,396 0.00%Aseer Trading Tourism & Manufacturing Co. 1,284 9,227 0.00%
Zamil Industrial Investment Co. 825 8,579 0.00%
Bawan Co. 675 7,289 0.00%Tabuk Cement Co. 1,107 7,155 0.00%Al Jouf Cement Co. 1,816 6,992 0.00%Hail Cement Co. 1,261 6,382 0.00%
.Number of
SharesFair Value
US Dollars ($)% of Total
Net AssetsMethanol Chemicals Co. 926 6,197 0.00%Mediterranean & Gulf Insurance & Reinsurance Co. 621 4,462 0.00%
Abdul Mohsen Al-Hokair Tourism & Development Co. 362 2,272 0.00%
test test 5,749,734 3.10%South Africa 4.10% (2020: 4.07%)Naspers Ltd. Class N 10,532 2,211,464 1.19%FirstRand Ltd. 126,229 473,754 0.26%Impala Platinum Holdings Ltd. 20,416 336,708 0.18%
Standard Bank Group Ltd. 33,058 295,441 0.16%Capitec Bank Holdings Ltd. 2,129 251,459 0.14%Gold Fields Ltd. 22,567 202,931 0.11%Sanlam Ltd. 45,075 193,732 0.10%Bid Corp., Ltd. 8,624 186,996 0.10%Anglo American Platinum Ltd. 1,520 175,583 0.10%
Absa Group Ltd. 18,214 173,125 0.09%Vodacom Group Ltd. 15,574 140,451 0.08%Shoprite Holdings Ltd. 12,595 137,110 0.07%Northam Platinum Ltd. 8,876 134,849 0.07%Bidvest Group Ltd. 8,710 116,180 0.06%Aspen Pharmacare Holdings Ltd. 9,955 113,007 0.06%
Nedbank Group Ltd. 9,315 111,470 0.06%Clicks Group Ltd. 6,445 110,897 0.06%Old Mutual Ltd. 117,233 110,839 0.06%Remgro Ltd. 13,340 107,066 0.06%Mr Price Group Ltd. 6,431 94,816 0.05%Discovery Ltd. 10,316 91,227 0.05%Foschini Group Ltd. 8,064 89,819 0.05%MultiChoice Group 10,928 89,804 0.05%Growthpoint Properties Ltd. REIT 84,974 88,671 0.05%
Woolworths Holdings Ltd. 22,033 83,186 0.05%NEPI Rockcastle plc 10,839 76,836 0.04%Tiger Brands Ltd. 4,350 63,671 0.03%Kumba Iron Ore Ltd. 1,391 62,405 0.03%SPAR Group Ltd. 4,888 61,923 0.03%Life Healthcare Group Holdings Ltd. 36,080 57,410 0.03%
Harmony Gold Mining Co., Ltd. 14,057 51,941 0.03%
African Rainbow Minerals Ltd. 2,799 50,055 0.03%
Truworths International Ltd. 11,122 44,928 0.02%AVI Ltd. 9,010 44,833 0.02%Rand Merchant Investment Holdings Ltd. 20,315 44,589 0.02%
Pepkor Holdings Ltd. 31,566 44,568 0.02%Redefine Properties Ltd. REIT 145,885 43,728 0.02%
Sappi Ltd. 14,830 42,977 0.02%Netcare Ltd. 39,699 39,591 0.02%Barloworld Ltd. 5,296 39,516 0.02%Transaction Capital Ltd. 14,558 38,560 0.02%Momentum Metropolitan Holdings 28,141 38,431 0.02%
Pick n Pay Stores Ltd. 9,731 35,949 0.02%Royal Bafokeng Platinum Ltd. 3,997 28,572 0.02%
Resilient Ltd. REIT 7,815 28,543 0.02%Fortress Ltd. REIT Class A 28,270 26,887 0.02%Investec Ltd. 6,789 25,922 0.01%Motus Holdings Ltd. 3,865 25,265 0.01%Coronation Fund Managers Ltd. 7,341 24,935 0.01%
Telkom SA SOC Ltd. 7,002 22,739 0.01%PSG Group Ltd. 3,760 20,958 0.01%Dis-Chem Pharmacies Ltd. 9,256 20,841 0.01%

108
Vanguard ESG Emerging Markets All Cap Equity Index Fund
.Number of
SharesFair Value
US Dollars ($)% of Total
Net AssetsAeci Ltd. 2,805 19,313 0.01%Equites Property Fund Ltd. REIT 14,512 19,188 0.01%
Vukile Property Fund Ltd. REIT 23,321 18,799 0.01%
Super Group Ltd. 8,639 18,792 0.01%Santam Ltd. 1,005 18,271 0.01%KAP Industrial Holdings Ltd. 61,017 17,649 0.01%Omnia Holdings Ltd. 4,388 16,979 0.01%MAS Real Estate, Inc. 13,210 16,819 0.01%JSE Ltd. 2,170 16,155 0.01%Imperial Logistics Ltd. 4,560 15,144 0.01%Hyprop Investments Ltd. REIT 7,709 14,307 0.01%
Advtech Ltd. 13,813 13,785 0.01%Irongate Group 12,385 13,444 0.01%Massmart Holdings Ltd. 2,661 11,741 0.01%Investec Property Fund Ltd. REIT 15,064 11,141 0.01%
Liberty Holdings Ltd. 2,476 10,709 0.01%Raubex Group Ltd. 4,545 10,389 0.01%Astral Foods Ltd. 872 9,658 0.01%Ninety One Ltd. 3,141 9,404 0.01%Attacq Ltd. REIT 18,775 9,020 0.01%DRDGOLD Ltd. 8,592 8,984 0.01%Cashbuild Ltd. 453 8,788 0.01%EPP NV 10,621 8,442 0.01%S.A. Corporate Real Estate Ltd. REIT 53,729 7,940 0.00%
Wilson Bayly Holmes-Ovcon Ltd. 999 7,906 0.00%
DataTec Ltd. 3,654 7,053 0.00%Adcock Ingram Holdings Ltd. 2,194 6,807 0.00%
Famous Brands Ltd. 1,605 6,154 0.00%Hudaco Industries Ltd. 600 5,371 0.00%Fortress Ltd. REIT Class B 23,090 4,512 0.00%Zeder Investments Ltd. 22,332 4,489 0.00%Emira Property Fund Ltd. REIT 6,206 4,281 0.00%
Curro Holdings Ltd. 4,382 3,600 0.00%Alexander Forbes Group Holdings Ltd. 11,775 3,422 0.00%
Long4Life Ltd. 10,374 3,073 0.00%Blue Label Telecoms Ltd. 8,663 2,548 0.00%Allied Electronics Corp., Ltd. Class A 3,674 2,177 0.00%
test test 7,613,412 4.10%Taiwan 19.84% (2020: 17.93%)Taiwan Semiconductor Manufacturing Co., Ltd. 619,000 13,218,663 7.12%
MediaTek, Inc. 38,000 1,312,014 0.71%Hon Hai Precision Industry Co., Ltd. 307,000 1,234,060 0.67%
Delta Electronics, Inc. 56,000 608,991 0.33%United Microelectronics Corp. 300,000 571,736 0.31%
Formosa Plastics Corp. 125,000 462,091 0.25%China Steel Corp. 319,000 453,384 0.24%Evergreen Marine Corp. Taiwan Ltd. 64,000 452,508 0.24%
Nan Ya Plastics Corp. 145,000 432,983 0.23%Cathay Financial Holding Co., Ltd. 212,000 410,114 0.22%
Chunghwa Telecom Co., Ltd. 97,000 396,878 0.21%
ASE Technology Holding Co., Ltd. 88,000 353,737 0.19%
Mega Financial Holding Co., Ltd. 278,000 327,763 0.18%
Uni-President Enterprises Corp. 123,000 323,144 0.17%
Largan Precision Co., Ltd. 2,811 312,754 0.17%
.Number of
SharesFair Value
US Dollars ($)% of Total
Net AssetsE.Sun Financial Holding Co., Ltd. 304,992 287,888 0.16%
Yuanta Financial Holding Co., Ltd. 297,560 286,747 0.15%
Novatek Microelectronics Corp. 15,000 268,641 0.14%
Formosa Chemicals & Fibre Corp. 88,000 267,514 0.14%
Yang Ming Marine Transport Corp. 39,000 255,451 0.14%
Taiwan Cement Corp. 133,850 245,001 0.13%Asustek Computer, Inc. 18,000 240,000 0.13%Chailease Holding Co., Ltd. 32,120 233,443 0.13%Silergy Corp. 1,650 224,441 0.12%Yageo Corp. 11,000 219,112 0.12%Realtek Semiconductor Corp. 12,000 217,497 0.12%
Quanta Computer, Inc. 68,000 213,549 0.12%First Financial Holding Co., Ltd. 258,960 210,979 0.11%
Wan Hai Lines Ltd. 18,000 207,375 0.11%Taiwan Cooperative Financial Holding Co., Ltd. 243,960 186,062 0.10%
AU Optronics Corp. 228,000 185,346 0.10%Hotai Motor Co., Ltd. 7,750 170,785 0.09%China Development Financial Holding Corp. 359,000 169,434 0.09%
Accton Technology Corp. 14,000 166,065 0.09%Globalwafers Co., Ltd. 5,000 164,917 0.09%Innolux Corp. 218,000 162,351 0.09%Hua Nan Financial Holdings Co., Ltd. 244,680 162,022 0.09%
Airtac International Group 4,000 154,329 0.08%Taiwan Mobile Co., Ltd. 42,000 153,755 0.08%Unimicron Technology Corp. 33,000 152,786 0.08%Taishin Financial Holding Co., Ltd. 266,809 146,033 0.08%
Shanghai Commercial & Savings Bank Ltd. 84,000 136,420 0.07%
Win Semiconductors Corp. 10,000 134,590 0.07%SinoPac Financial Holdings Co., Ltd. 269,000 132,750 0.07%
President Chain Store Corp. 14,000 132,149 0.07%Pegatron Corp. 53,000 130,871 0.07%Catcher Technology Co., Ltd. 19,000 124,109 0.07%Eclat Textile Co., Ltd. 5,000 117,721 0.06%Lite-On Technology Corp. ADR 55,000 113,701 0.06%
Asia Cement Corp. 60,000 109,179 0.06%Walsin Technology Corp. 13,000 106,146 0.06%Shin Kong Financial Holding Co., Ltd. 307,000 105,005 0.06%
Micro-Star International Co., Ltd. 18,000 101,750 0.05%
Hiwin Technologies Corp. 7,091 100,527 0.05%Feng TAY Enterprise Co., Ltd. 11,400 100,038 0.05%
Vanguard International Semiconductor Corp. 23,000 97,407 0.05%
Far EasTone Telecommunications Co., Ltd. 42,000 97,378 0.05%
Pou Chen Corp. 69,000 97,324 0.05%Chang Hwa Commercial Bank Ltd. 167,880 97,309 0.05%
Sino-American Silicon Products, Inc. 14,000 96,976 0.05%
eMemory Technology, Inc. 2,000 95,828 0.05%Winbond Electronics Corp. 76,000 95,060 0.05%Giant Manufacturing Co., Ltd. 8,000 91,449 0.05%
Walsin Lihwa Corp. 82,000 86,231 0.05%Compal Electronics, Inc. 106,000 85,028 0.05%

109
Vanguard ESG Emerging Markets All Cap Equity Index Fund
.Number of
SharesFair Value
US Dollars ($)% of Total
Net AssetsCheng Shin Rubber Industry Co., Ltd. 48,000 80,538 0.04%
Wistron Corp. 72,000 80,108 0.04%Acer, Inc. 74,000 77,818 0.04%Macronix International Co., Ltd. 47,000 77,089 0.04%
Parade Technologies Ltd. 1,500 74,563 0.04%Inventec Corp. 78,000 73,486 0.04%TA Chen Stainless Pipe 34,003 72,613 0.04%Voltronic Power Technology Corp. 1,500 72,409 0.04%
Wiwynn Corp. 2,000 71,566 0.04%Nan Ya Printed Circuit Board Corp. 5,000 69,897 0.04%
WPG Holdings Ltd. 38,000 69,692 0.04%Powertech Technology, Inc. 18,000 69,448 0.04%Phison Electronics Corp. 4,000 68,910 0.04%Chroma ATE, Inc. 10,000 68,730 0.04%momo.com, Inc. 1,000 67,654 0.04%Merida Industry Co., Ltd. 6,000 67,402 0.04%Oneness Biotech Co., Ltd. 8,000 66,613 0.04%Foxconn Technology Co., Ltd. 28,000 66,024 0.04%
ASMedia Technology, Inc. 1,342 64,782 0.03%ASPEED Technology, Inc. 895 64,565 0.03%Synnex Technology International Corp. 35,000 63,939 0.03%
Tripod Technology Corp. 13,000 62,988 0.03%Elite Material Co., Ltd. 8,000 62,593 0.03%E Ink Holdings, Inc. 23,000 61,581 0.03%ENNOSTAR, Inc. 21,550 60,715 0.03%Zhen Ding Technology Holding Ltd. 16,000 60,296 0.03%
Nanya Technology Corp. 21,000 60,070 0.03%Nien Made Enterprise Co., Ltd. 4,000 59,363 0.03%
Taiwan High Speed Rail Corp. 54,000 57,949 0.03%
Ruentex Development Co., Ltd. 28,500 57,895 0.03%
Teco Electric & Machinery Co., Ltd. 47,000 56,004 0.03%
YFY, Inc. 34,000 55,767 0.03%Taiwan Glass Industry Corp. 39,000 52,350 0.03%Simplo Technology Co., Ltd. 4,000 51,539 0.03%China Life Insurance Co., Ltd. 53,660 50,747 0.03%
Makalot Industrial Co., Ltd. 5,075 49,908 0.03%Sinbon Electronics Co., Ltd. 5,000 49,170 0.03%Elan Microelectronics Corp. 7,000 48,865 0.03%HannStar Display Corp. 61,000 48,384 0.03%Chung Hung Steel Corp. 22,000 48,323 0.03%Radiant Opto-Electronics Corp. 11,000 47,968 0.03%
Wisdom Marine Lines Co., Ltd. 12,023 47,682 0.03%
China Airlines Ltd. 68,000 46,493 0.03%Nantex Industry Co., Ltd. 9,000 46,353 0.03%Gigabyte Technology Co., Ltd. 12,000 46,299 0.03%
AP Memory Technology Corp. 2,000 45,509 0.02%
Compeq Manufacturing Co., Ltd. 30,000 45,222 0.02%
International Games System Co., Ltd. 1,500 45,222 0.02%
Tung Ho Steel Enterprise Corp. 24,000 45,222 0.02%
Fitipower Integrated Technology, Inc. 4,000 44,145 0.02%
Eva Airways Corp. 61,000 44,115 0.02%Lien Hwa Industrial Holdings Corp. 24,480 43,930 0.02%
Alchip Technologies Ltd. 2,000 43,858 0.02%
.Number of
SharesFair Value
US Dollars ($)% of Total
Net AssetsChina Petrochemical Development Corp. 87,000 43,559 0.02%
Cheng Loong Corp. 25,000 43,517 0.02%King Yuan Electronics Co., Ltd. 27,000 43,510 0.02%
IBF Financial Holdings Co., Ltd. 73,153 43,321 0.02%
Chicony Electronics Co., Ltd. 15,000 43,284 0.02%
Lotes Co., Ltd. 2,000 41,920 0.02%Highwealth Construction Corp. 26,300 41,202 0.02%
ITEQ Corp. 8,000 40,915 0.02%Genius Electronic Optical Co., Ltd. 2,000 40,485 0.02%
Taiwan Business Bank 118,500 40,191 0.02%Qisda Corp. ADR 36,000 39,795 0.02%Poya International Co., Ltd. 2,000 38,977 0.02%Chipbond Technology Corp. 15,000 38,762 0.02%FLEXium Interconnect, Inc. 8,000 38,762 0.02%FocalTech Systems Co., Ltd. 4,700 38,123 0.02%Great Wall Enterprise Co., Ltd. 17,000 36,669 0.02%
Taiwan Fertilizer Co., Ltd. 17,000 35,937 0.02%Yieh Phui Enterprise Co., Ltd. 30,000 35,801 0.02%
U-Ming Marine Transport Corp. 11,000 35,176 0.02%
Elite Semiconductor Microelectronics Technology, Inc. 6,000 35,101 0.02%
Eternal Materials Co., Ltd. 24,000 34,886 0.02%RichWave Technology Corp. 2,000 34,778 0.02%Ruentex Industries Ltd. 11,000 34,703 0.02%Kinsus Interconnect Technology Corp. 7,000 33,917 0.02%
Sitronix Technology Corp. 3,000 33,701 0.02%King's Town Bank Co., Ltd. 23,000 32,895 0.02%TXC Corp. 7,000 31,655 0.02%United Integrated Services Co., Ltd. 4,000 30,507 0.02%
Taiwan Surface Mounting Technology Corp. 7,000 30,399 0.02%
Tainan Spinning Co., Ltd. 28,000 29,696 0.02%Global Unichip Corp. 2,000 29,646 0.02%Tong Hsing Electronic Industries Ltd. 3,755 28,638 0.02%
Capital Securities Corp. 47,000 28,592 0.02%Shinkong Synthetic Fibers Corp. 35,000 28,578 0.02%
Taichung Commercial Bank Co., Ltd. 67,922 28,278 0.02%
King Slide Works Co., Ltd. 2,000 28,174 0.02%Formosa Taffeta Co., Ltd. 24,000 28,081 0.02%USI Corp. 21,000 27,962 0.02%Bizlink Holding, Inc. 3,000 27,887 0.02%Pan Jit International, Inc. 9,000 27,844 0.02%TCI Co., Ltd. 3,000 27,672 0.02%Wafer Works Corp. 12,000 26,315 0.01%HTC Corp. 18,000 25,389 0.01%Sensortek Technology Corp. 1,000 25,123 0.01%Taiwan Union Technology Corp. 6,000 25,087 0.01%
Goldsun Building Materials Co., Ltd. 27,279 24,819 0.01%
Xintec, Inc. 4,000 24,262 0.01%ChipMOS Technologies, Inc. 14,000 23,917 0.01%Grand Pacific Petrochemical 22,000 23,648 0.01%Taiwan Secom Co., Ltd. 7,000 23,641 0.01%United Renewable Energy Co., Ltd. 50,000 23,508 0.01%
Hota Industrial Manufacturing Co., Ltd. 6,073 23,431 0.01%

110
Vanguard ESG Emerging Markets All Cap Equity Index Fund
.Number of
SharesFair Value
US Dollars ($)% of Total
Net AssetsNan Kang Rubber Tire Co., Ltd. 17,000 23,429 0.01%
Longchen Paper & Packaging Co., Ltd. 22,157 23,141 0.01%
Greatek Electronics, Inc. 8,000 22,625 0.01%Fusheng Precision Co., Ltd. 3,000 22,557 0.01%UPC Technology Corp. 23,000 22,453 0.01%Kenda Rubber Industrial Co., Ltd. 15,400 22,385 0.01%
Advanced Wireless Semiconductor Co. 4,000 22,324 0.01%
International CSRC Investment Holdings Co. 23,000 22,164 0.01%
General Interface Solution Holding Ltd. 5,000 22,162 0.01%
Microbio Co., Ltd. 10,000 22,073 0.01%Mitac Holdings Corp. 22,240 22,030 0.01%Coretronic Corp. 10,000 22,001 0.01%Taiwan Paiho Ltd. 6,000 21,965 0.01%TSRC Corp. 17,000 21,934 0.01%Jentech Precision Industrial Co., Ltd. 2,000 21,678 0.01%
Pegavision Corp. 1,000 21,678 0.01%Gold Circuit Electronics Ltd. 9,000 21,610 0.01%Standard Foods Corp. 11,000 21,358 0.01%Huaku Development Co., Ltd. 7,000 21,355 0.01%
Far Eastern Department Stores Ltd. 26,000 21,229 0.01%
President Securities Corp. 22,040 21,160 0.01%Pixart Imaging, Inc. 3,000 21,157 0.01%Yulon Finance Corp. 4,100 20,969 0.01%Yulon Motor Co., Ltd. 13,543 20,706 0.01%Far Eastern International Bank 53,220 20,247 0.01%
Center Laboratories, Inc. 8,047 20,159 0.01%Sigurd Microelectronics Corp. 10,000 20,099 0.01%
Hsin Kuang Steel Co., Ltd. 7,000 20,048 0.01%A-DATA Technology Co., Ltd. 5,000 20,009 0.01%Episil Holdings, Inc. 7,000 19,672 0.01%Evergreen International Storage & Transport Corp. 11,000 19,582 0.01%
Ardentec Corp. 12,000 19,467 0.01%Gudeng Precision Industrial Co., Ltd. 2,000 19,381 0.01%
Taiwan Hon Chuan Enterprise Co., Ltd. 7,000 19,320 0.01%
China Motor Corp. 7,000 19,295 0.01%WT Microelectronics Co., Ltd. 10,000 19,273 0.01%
Century Iron & Steel Industrial Co., Ltd. 4,000 19,237 0.01%
Visual Photonics Epitaxy Co., Ltd. 4,000 19,237 0.01%
Wistron NeWeb Corp. 7,000 19,094 0.01%LandMark Optoelectronics Corp. 2,000 19,022 0.01%
Merry Electronics Co., Ltd. 5,000 18,932 0.01%Everlight Electronics Co., Ltd. 10,000 18,914 0.01%
Run Long Construction Co., Ltd. 9,200 18,821 0.01%
Grape King Bio Ltd. 3,000 18,573 0.01%Transcend Information, Inc. 7,000 18,566 0.01%Sanyang Motor Co., Ltd. 17,000 18,426 0.01%Tung Thih Electronic Co., Ltd. 2,000 18,376 0.01%
Solar Applied Materials Technology Corp. 11,000 18,338 0.01%
Via Technologies, Inc. 9,000 18,283 0.01%Chung-Hsin Electric & Machinery Manufacturing Corp. 10,000 18,232 0.01%
.Number of
SharesFair Value
US Dollars ($)% of Total
Net AssetsAdvanced Ceramic X Corp. 1,000 18,125 0.01%Chilisin Electronics Corp. 5,000 18,125 0.01%Andes Technology Corp. 1,000 18,089 0.01%SDI Corp. 4,000 18,017 0.01%Topco Scientific Co., Ltd. 4,000 17,945 0.01%Getac Technology Corp. 9,000 17,766 0.01%Clevo Co. 16,000 17,400 0.01%Asia Vital Components Co., Ltd. 6,000 17,378 0.01%
Charoen Pokphand Enterprise 6,000 17,357 0.01%
Sporton International, Inc. 2,000 17,227 0.01%Foxsemicon Integrated Technology, Inc. 2,000 17,120 0.01%
Chong Hong Construction Co., Ltd. 6,000 17,055 0.01%
Global Mixed Mode Technology, Inc. 2,000 16,869 0.01%
KMC Kuei Meng International, Inc. 2,000 16,761 0.01%
Cheng Uei Precision Industry Co., Ltd. 11,000 16,680 0.01%
Oriental Union Chemical Corp. 21,000 16,581 0.01%
Asia Optical Co., Inc. 5,000 16,510 0.01%China Steel Chemical Corp. 4,000 16,438 0.01%Faraday Technology Corp. 6,000 16,388 0.01%Primax Electronics Ltd. 8,000 16,366 0.01%TaiDoc Technology Corp. 2,000 16,366 0.01%Pharmaessentia Corp. 5,072 15,801 0.01%Ennoconn Corp. 2,000 15,720 0.01%Pan-International Industrial Corp. 11,000 15,713 0.01%
TTY Biopharm Co., Ltd. 5,000 15,648 0.01%Holy Stone Enterprise Co., Ltd. 3,000 15,612 0.01%
Tong Yang Industry Co., Ltd. 12,000 15,548 0.01%YC INOX Co., Ltd. 10,055 15,518 0.01%Adimmune Corp. 8,000 15,390 0.01%Arcadyan Technology Corp. 4,000 15,289 0.01%Sunny Friend Environmental Technology Co., Ltd. 2,000 15,074 0.01%
Kinpo Electronics 32,000 14,873 0.01%Cub Elecparts, Inc. 2,000 14,823 0.01%Sercomm Corp. 6,000 14,816 0.01%Chlitina Holding Ltd. 2,000 14,787 0.01%Co.-Tech Development Corp. 5,000 14,625 0.01%
Thinking Electronic Industrial Co., Ltd. 2,000 14,284 0.01%
Taiwan Cogeneration Corp. 10,000 13,890 0.01%Supreme Electronics Co., Ltd. 9,528 13,764 0.01%
Innodisk Corp. 2,000 13,674 0.01%Prince Housing & Development Corp. 32,000 13,667 0.01%
Formosa Sumco Technology Corp. 2,000 13,567 0.01%
Sincere Navigation Corp. 7,000 13,541 0.01%AURAS Technology Co., Ltd. 2,000 13,495 0.01%Taiwan TEA Corp. 17,000 13,423 0.01%Farglory Land Development Co., Ltd. 7,000 13,391 0.01%
RDC Semiconductor Co., Ltd. 1,000 13,351 0.01%
Kaimei Electronic Corp. 3,000 13,244 0.01%AmTRAN Technology Co., Ltd. 21,000 13,114 0.01%
ITE Technology, Inc. 3,000 13,082 0.01%Chicony Power Technology Co., Ltd. 5,000 12,992 0.01%
Shin Zu Shing Co., Ltd. 3,041 12,770 0.01%Jih Sun Financial Holdings Co., Ltd. 27,000 12,549 0.01%
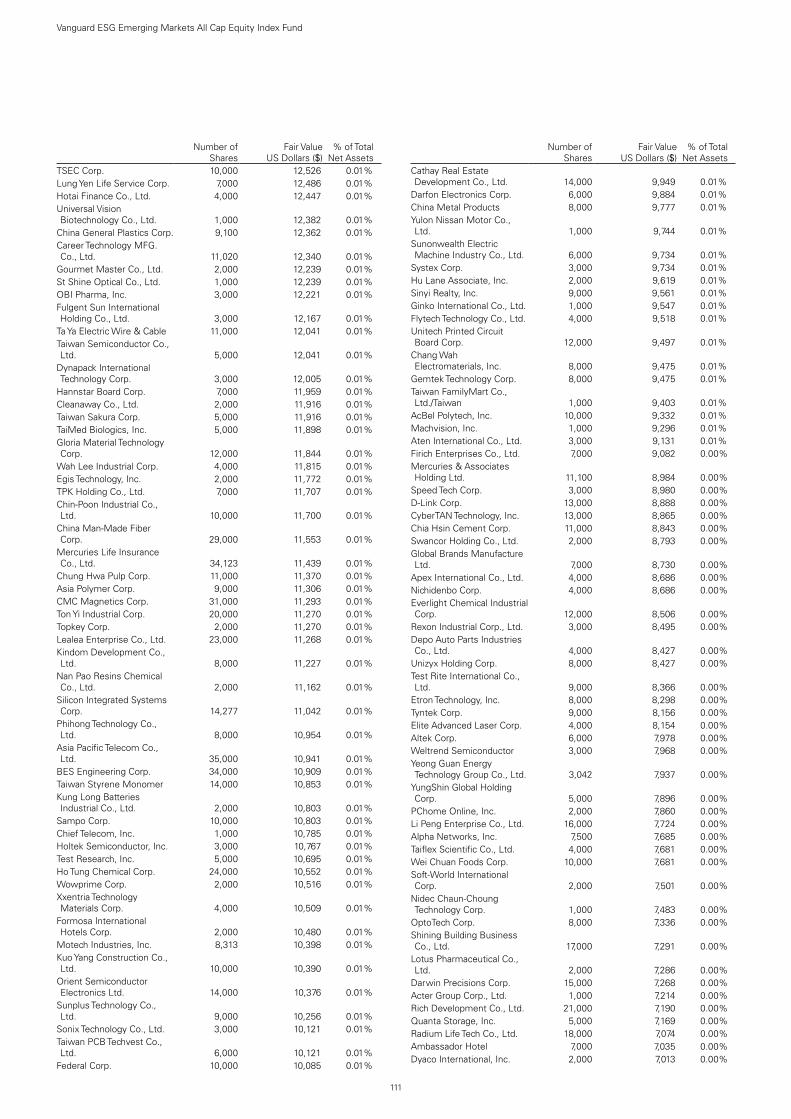
111
Vanguard ESG Emerging Markets All Cap Equity Index Fund
.Number of
SharesFair Value
US Dollars ($)% of Total
Net AssetsTSEC Corp. 10,000 12,526 0.01%Lung Yen Life Service Corp. 7,000 12,486 0.01%Hotai Finance Co., Ltd. 4,000 12,447 0.01%Universal Vision Biotechnology Co., Ltd. 1,000 12,382 0.01%
China General Plastics Corp. 9,100 12,362 0.01%Career Technology MFG. Co., Ltd. 11,020 12,340 0.01%
Gourmet Master Co., Ltd. 2,000 12,239 0.01%St Shine Optical Co., Ltd. 1,000 12,239 0.01%OBI Pharma, Inc. 3,000 12,221 0.01%Fulgent Sun International Holding Co., Ltd. 3,000 12,167 0.01%
Ta Ya Electric Wire & Cable 11,000 12,041 0.01%Taiwan Semiconductor Co., Ltd. 5,000 12,041 0.01%
Dynapack International Technology Corp. 3,000 12,005 0.01%
Hannstar Board Corp. 7,000 11,959 0.01%Cleanaway Co., Ltd. 2,000 11,916 0.01%Taiwan Sakura Corp. 5,000 11,916 0.01%TaiMed Biologics, Inc. 5,000 11,898 0.01%Gloria Material Technology Corp. 12,000 11,844 0.01%
Wah Lee Industrial Corp. 4,000 11,815 0.01%Egis Technology, Inc. 2,000 11,772 0.01%TPK Holding Co., Ltd. 7,000 11,707 0.01%Chin-Poon Industrial Co., Ltd. 10,000 11,700 0.01%
China Man-Made Fiber Corp. 29,000 11,553 0.01%
Mercuries Life Insurance Co., Ltd. 34,123 11,439 0.01%
Chung Hwa Pulp Corp. 11,000 11,370 0.01%Asia Polymer Corp. 9,000 11,306 0.01%CMC Magnetics Corp. 31,000 11,293 0.01%Ton Yi Industrial Corp. 20,000 11,270 0.01%Topkey Corp. 2,000 11,270 0.01%Lealea Enterprise Co., Ltd. 23,000 11,268 0.01%Kindom Development Co., Ltd. 8,000 11,227 0.01%
Nan Pao Resins Chemical Co., Ltd. 2,000 11,162 0.01%
Silicon Integrated Systems Corp. 14,277 11,042 0.01%
Phihong Technology Co., Ltd. 8,000 10,954 0.01%
Asia Pacific Telecom Co., Ltd. 35,000 10,941 0.01%
BES Engineering Corp. 34,000 10,909 0.01%Taiwan Styrene Monomer 14,000 10,853 0.01%Kung Long Batteries Industrial Co., Ltd. 2,000 10,803 0.01%
Sampo Corp. 10,000 10,803 0.01%Chief Telecom, Inc. 1,000 10,785 0.01%Holtek Semiconductor, Inc. 3,000 10,767 0.01%Test Research, Inc. 5,000 10,695 0.01%Ho Tung Chemical Corp. 24,000 10,552 0.01%Wowprime Corp. 2,000 10,516 0.01%Xxentria Technology Materials Corp. 4,000 10,509 0.01%
Formosa International Hotels Corp. 2,000 10,480 0.01%
Motech Industries, Inc. 8,313 10,398 0.01%Kuo Yang Construction Co., Ltd. 10,000 10,390 0.01%
Orient Semiconductor Electronics Ltd. 14,000 10,376 0.01%
Sunplus Technology Co., Ltd. 9,000 10,256 0.01%
Sonix Technology Co., Ltd. 3,000 10,121 0.01%Taiwan PCB Techvest Co., Ltd. 6,000 10,121 0.01%
Federal Corp. 10,000 10,085 0.01%
.Number of
SharesFair Value
US Dollars ($)% of Total
Net AssetsCathay Real Estate Development Co., Ltd. 14,000 9,949 0.01%
Darfon Electronics Corp. 6,000 9,884 0.01%China Metal Products 8,000 9,777 0.01%Yulon Nissan Motor Co., Ltd. 1,000 9,744 0.01%
Sunonwealth Electric Machine Industry Co., Ltd. 6,000 9,734 0.01%
Systex Corp. 3,000 9,734 0.01%Hu Lane Associate, Inc. 2,000 9,619 0.01%Sinyi Realty, Inc. 9,000 9,561 0.01%Ginko International Co., Ltd. 1,000 9,547 0.01%Flytech Technology Co., Ltd. 4,000 9,518 0.01%Unitech Printed Circuit Board Corp. 12,000 9,497 0.01%
Chang Wah Electromaterials, Inc. 8,000 9,475 0.01%
Gemtek Technology Corp. 8,000 9,475 0.01%Taiwan FamilyMart Co., Ltd./Taiwan 1,000 9,403 0.01%
AcBel Polytech, Inc. 10,000 9,332 0.01%Machvision, Inc. 1,000 9,296 0.01%Aten International Co., Ltd. 3,000 9,131 0.01%Firich Enterprises Co., Ltd. 7,000 9,082 0.00%Mercuries & Associates Holding Ltd. 11,100 8,984 0.00%
Speed Tech Corp. 3,000 8,980 0.00%D-Link Corp. 13,000 8,888 0.00%CyberTAN Technology, Inc. 13,000 8,865 0.00%Chia Hsin Cement Corp. 11,000 8,843 0.00%Swancor Holding Co., Ltd. 2,000 8,793 0.00%Global Brands Manufacture Ltd. 7,000 8,730 0.00%
Apex International Co., Ltd. 4,000 8,686 0.00%Nichidenbo Corp. 4,000 8,686 0.00%Everlight Chemical Industrial Corp. 12,000 8,506 0.00%
Rexon Industrial Corp., Ltd. 3,000 8,495 0.00%Depo Auto Parts Industries Co., Ltd. 4,000 8,427 0.00%
Unizyx Holding Corp. 8,000 8,427 0.00%Test Rite International Co., Ltd. 9,000 8,366 0.00%
Etron Technology, Inc. 8,000 8,298 0.00%Tyntek Corp. 9,000 8,156 0.00%Elite Advanced Laser Corp. 4,000 8,154 0.00%Altek Corp. 6,000 7,978 0.00%Weltrend Semiconductor 3,000 7,968 0.00%Yeong Guan Energy Technology Group Co., Ltd. 3,042 7,937 0.00%
YungShin Global Holding Corp. 5,000 7,896 0.00%
PChome Online, Inc. 2,000 7,860 0.00%Li Peng Enterprise Co., Ltd. 16,000 7,724 0.00%Alpha Networks, Inc. 7,500 7,685 0.00%Taiflex Scientific Co., Ltd. 4,000 7,681 0.00%Wei Chuan Foods Corp. 10,000 7,681 0.00%Soft-World International Corp. 2,000 7,501 0.00%
Nidec Chaun-Choung Technology Corp. 1,000 7,483 0.00%
OptoTech Corp. 8,000 7,336 0.00%Shining Building Business Co., Ltd. 17,000 7,291 0.00%
Lotus Pharmaceutical Co., Ltd. 2,000 7,286 0.00%
Darwin Precisions Corp. 15,000 7,268 0.00%Acter Group Corp., Ltd. 1,000 7,214 0.00%Rich Development Co., Ltd. 21,000 7,190 0.00%Quanta Storage, Inc. 5,000 7,169 0.00%Radium Life Tech Co., Ltd. 18,000 7,074 0.00%Ambassador Hotel 7,000 7,035 0.00%Dyaco International, Inc. 2,000 7,013 0.00%
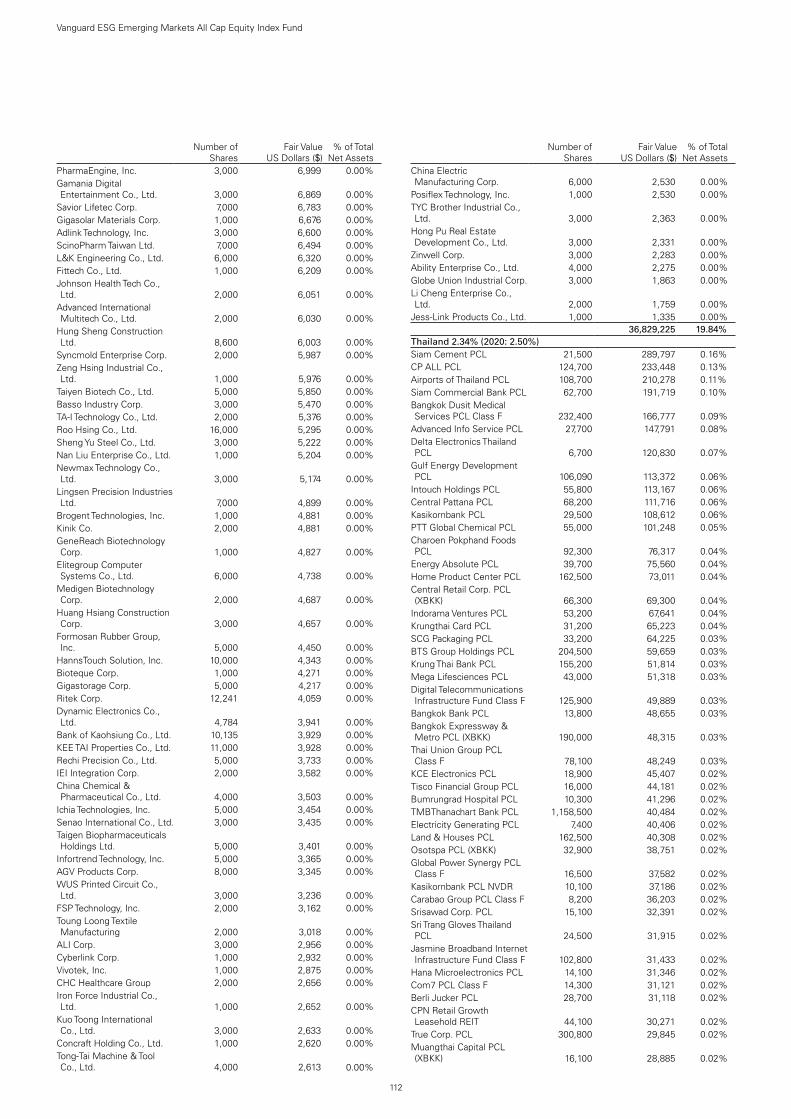
112
Vanguard ESG Emerging Markets All Cap Equity Index Fund
.Number of
SharesFair Value
US Dollars ($)% of Total
Net AssetsPharmaEngine, Inc. 3,000 6,999 0.00%Gamania Digital Entertainment Co., Ltd. 3,000 6,869 0.00%
Savior Lifetec Corp. 7,000 6,783 0.00%Gigasolar Materials Corp. 1,000 6,676 0.00%Adlink Technology, Inc. 3,000 6,600 0.00%ScinoPharm Taiwan Ltd. 7,000 6,494 0.00%L&K Engineering Co., Ltd. 6,000 6,320 0.00%Fittech Co., Ltd. 1,000 6,209 0.00%Johnson Health Tech Co., Ltd. 2,000 6,051 0.00%
Advanced International Multitech Co., Ltd. 2,000 6,030 0.00%
Hung Sheng Construction Ltd. 8,600 6,003 0.00%
Syncmold Enterprise Corp. 2,000 5,987 0.00%Zeng Hsing Industrial Co., Ltd. 1,000 5,976 0.00%
Taiyen Biotech Co., Ltd. 5,000 5,850 0.00%Basso Industry Corp. 3,000 5,470 0.00%TA-I Technology Co., Ltd. 2,000 5,376 0.00%Roo Hsing Co., Ltd. 16,000 5,295 0.00%Sheng Yu Steel Co., Ltd. 3,000 5,222 0.00%Nan Liu Enterprise Co., Ltd. 1,000 5,204 0.00%Newmax Technology Co., Ltd. 3,000 5,174 0.00%
Lingsen Precision Industries Ltd. 7,000 4,899 0.00%
Brogent Technologies, Inc. 1,000 4,881 0.00%Kinik Co. 2,000 4,881 0.00%GeneReach Biotechnology Corp. 1,000 4,827 0.00%
Elitegroup Computer Systems Co., Ltd. 6,000 4,738 0.00%
Medigen Biotechnology Corp. 2,000 4,687 0.00%
Huang Hsiang Construction Corp. 3,000 4,657 0.00%
Formosan Rubber Group, Inc. 5,000 4,450 0.00%
HannsTouch Solution, Inc. 10,000 4,343 0.00%Bioteque Corp. 1,000 4,271 0.00%Gigastorage Corp. 5,000 4,217 0.00%Ritek Corp. 12,241 4,059 0.00%Dynamic Electronics Co., Ltd. 4,784 3,941 0.00%
Bank of Kaohsiung Co., Ltd. 10,135 3,929 0.00%KEE TAI Properties Co., Ltd. 11,000 3,928 0.00%Rechi Precision Co., Ltd. 5,000 3,733 0.00%IEI Integration Corp. 2,000 3,582 0.00%China Chemical & Pharmaceutical Co., Ltd. 4,000 3,503 0.00%
Ichia Technologies, Inc. 5,000 3,454 0.00%Senao International Co., Ltd. 3,000 3,435 0.00%Taigen Biopharmaceuticals Holdings Ltd. 5,000 3,401 0.00%
Infortrend Technology, Inc. 5,000 3,365 0.00%AGV Products Corp. 8,000 3,345 0.00%WUS Printed Circuit Co., Ltd. 3,000 3,236 0.00%
FSP Technology, Inc. 2,000 3,162 0.00%Toung Loong Textile Manufacturing 2,000 3,018 0.00%
ALI Corp. 3,000 2,956 0.00%Cyberlink Corp. 1,000 2,932 0.00%Vivotek, Inc. 1,000 2,875 0.00%CHC Healthcare Group 2,000 2,656 0.00%Iron Force Industrial Co., Ltd. 1,000 2,652 0.00%
Kuo Toong International Co., Ltd. 3,000 2,633 0.00%
Concraft Holding Co., Ltd. 1,000 2,620 0.00%Tong-Tai Machine & Tool Co., Ltd. 4,000 2,613 0.00%
.Number of
SharesFair Value
US Dollars ($)% of Total
Net AssetsChina Electric Manufacturing Corp. 6,000 2,530 0.00%
Posiflex Technology, Inc. 1,000 2,530 0.00%TYC Brother Industrial Co., Ltd. 3,000 2,363 0.00%
Hong Pu Real Estate Development Co., Ltd. 3,000 2,331 0.00%
Zinwell Corp. 3,000 2,283 0.00%Ability Enterprise Co., Ltd. 4,000 2,275 0.00%Globe Union Industrial Corp. 3,000 1,863 0.00%Li Cheng Enterprise Co., Ltd. 2,000 1,759 0.00%
Jess-Link Products Co., Ltd. 1,000 1,335 0.00%test test 36,829,225 19.84%Thailand 2.34% (2020: 2.50%)Siam Cement PCL 21,500 289,797 0.16%CP ALL PCL 124,700 233,448 0.13%Airports of Thailand PCL 108,700 210,278 0.11%Siam Commercial Bank PCL 62,700 191,719 0.10%Bangkok Dusit Medical Services PCL Class F 232,400 166,777 0.09%
Advanced Info Service PCL 27,700 147,791 0.08%Delta Electronics Thailand PCL 6,700 120,830 0.07%
Gulf Energy Development PCL 106,090 113,372 0.06%
Intouch Holdings PCL 55,800 113,167 0.06%Central Pattana PCL 68,200 111,716 0.06%Kasikornbank PCL 29,500 108,612 0.06%PTT Global Chemical PCL 55,000 101,248 0.05%Charoen Pokphand Foods PCL 92,300 76,317 0.04%
Energy Absolute PCL 39,700 75,560 0.04%Home Product Center PCL 162,500 73,011 0.04%Central Retail Corp. PCL (XBKK) 66,300 69,300 0.04%
Indorama Ventures PCL 53,200 67,641 0.04%Krungthai Card PCL 31,200 65,223 0.04%SCG Packaging PCL 33,200 64,225 0.03%BTS Group Holdings PCL 204,500 59,659 0.03%Krung Thai Bank PCL 155,200 51,814 0.03%Mega Lifesciences PCL 43,000 51,318 0.03%Digital Telecommunications Infrastructure Fund Class F 125,900 49,889 0.03%
Bangkok Bank PCL 13,800 48,655 0.03%Bangkok Expressway & Metro PCL (XBKK) 190,000 48,315 0.03%
Thai Union Group PCL Class F 78,100 48,249 0.03%
KCE Electronics PCL 18,900 45,407 0.02%Tisco Financial Group PCL 16,000 44,181 0.02%Bumrungrad Hospital PCL 10,300 41,296 0.02%TMBThanachart Bank PCL 1,158,500 40,484 0.02%Electricity Generating PCL 7,400 40,406 0.02%Land & Houses PCL 162,500 40,308 0.02%Osotspa PCL (XBKK) 32,900 38,751 0.02%Global Power Synergy PCL Class F 16,500 37,582 0.02%
Kasikornbank PCL NVDR 10,100 37,186 0.02%Carabao Group PCL Class F 8,200 36,203 0.02%Srisawad Corp. PCL 15,100 32,391 0.02%Sri Trang Gloves Thailand PCL 24,500 31,915 0.02%
Jasmine Broadband Internet Infrastructure Fund Class F 102,800 31,433 0.02%
Hana Microelectronics PCL 14,100 31,346 0.02%Com7 PCL Class F 14,300 31,121 0.02%Berli Jucker PCL 28,700 31,118 0.02%CPN Retail Growth Leasehold REIT 44,100 30,271 0.02%
True Corp. PCL 300,800 29,845 0.02%Muangthai Capital PCL (XBKK) 16,100 28,885 0.02%
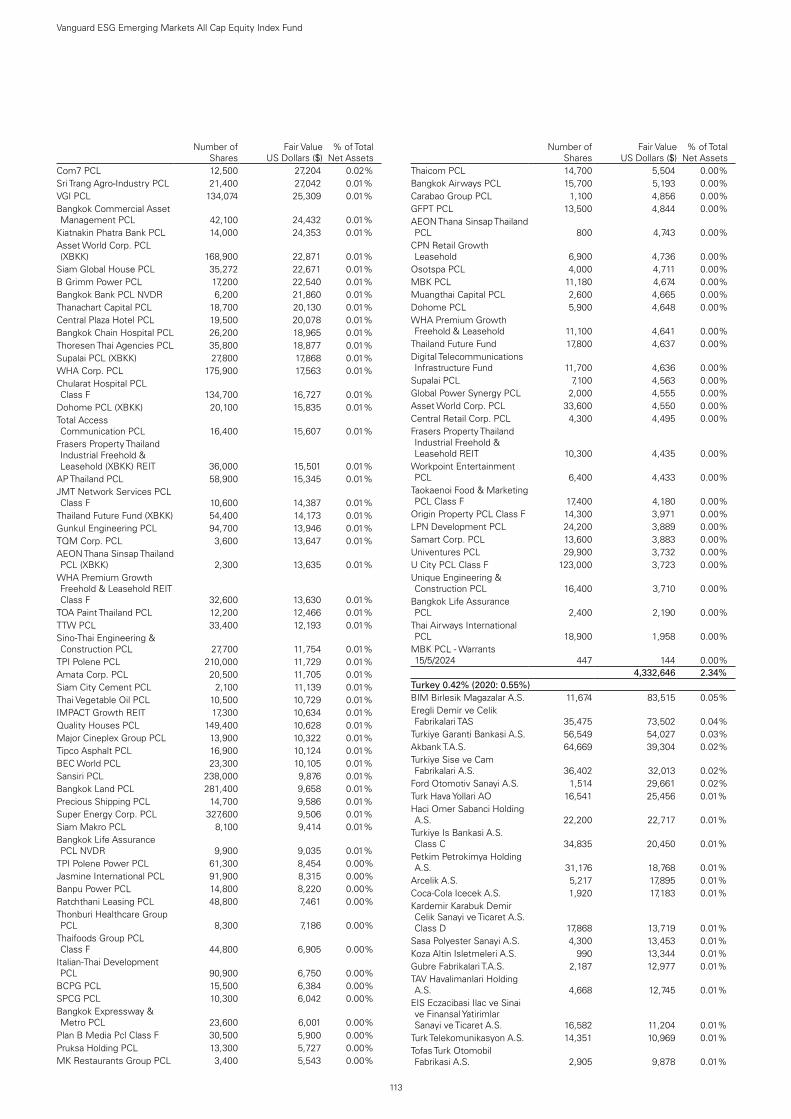
113
Vanguard ESG Emerging Markets All Cap Equity Index Fund
.Number of
SharesFair Value
US Dollars ($)% of Total
Net AssetsCom7 PCL 12,500 27,204 0.02%Sri Trang Agro-Industry PCL 21,400 27,042 0.01%VGI PCL 134,074 25,309 0.01%Bangkok Commercial Asset Management PCL 42,100 24,432 0.01%
Kiatnakin Phatra Bank PCL 14,000 24,353 0.01%Asset World Corp. PCL (XBKK) 168,900 22,871 0.01%
Siam Global House PCL 35,272 22,671 0.01%B Grimm Power PCL 17,200 22,540 0.01%Bangkok Bank PCL NVDR 6,200 21,860 0.01%Thanachart Capital PCL 18,700 20,130 0.01%Central Plaza Hotel PCL 19,500 20,078 0.01%Bangkok Chain Hospital PCL 26,200 18,965 0.01%Thoresen Thai Agencies PCL 35,800 18,877 0.01%Supalai PCL (XBKK) 27,800 17,868 0.01%WHA Corp. PCL 175,900 17,563 0.01%Chularat Hospital PCL Class F 134,700 16,727 0.01%
Dohome PCL (XBKK) 20,100 15,835 0.01%Total Access Communication PCL 16,400 15,607 0.01%
Frasers Property Thailand Industrial Freehold & Leasehold (XBKK) REIT 36,000 15,501 0.01%
AP Thailand PCL 58,900 15,345 0.01%JMT Network Services PCL Class F 10,600 14,387 0.01%
Thailand Future Fund (XBKK) 54,400 14,173 0.01%Gunkul Engineering PCL 94,700 13,946 0.01%TQM Corp. PCL 3,600 13,647 0.01%AEON Thana Sinsap Thailand PCL (XBKK) 2,300 13,635 0.01%
WHA Premium Growth Freehold & Leasehold REIT Class F 32,600 13,630 0.01%
TOA Paint Thailand PCL 12,200 12,466 0.01%TTW PCL 33,400 12,193 0.01%Sino-Thai Engineering & Construction PCL 27,700 11,754 0.01%
TPI Polene PCL 210,000 11,729 0.01%Amata Corp. PCL 20,500 11,705 0.01%Siam City Cement PCL 2,100 11,139 0.01%Thai Vegetable Oil PCL 10,500 10,729 0.01%IMPACT Growth REIT 17,300 10,634 0.01%Quality Houses PCL 149,400 10,628 0.01%Major Cineplex Group PCL 13,900 10,322 0.01%Tipco Asphalt PCL 16,900 10,124 0.01%BEC World PCL 23,300 10,105 0.01%Sansiri PCL 238,000 9,876 0.01%Bangkok Land PCL 281,400 9,658 0.01%Precious Shipping PCL 14,700 9,586 0.01%Super Energy Corp. PCL 327,600 9,506 0.01%Siam Makro PCL 8,100 9,414 0.01%Bangkok Life Assurance PCL NVDR 9,900 9,035 0.01%
TPI Polene Power PCL 61,300 8,454 0.00%Jasmine International PCL 91,900 8,315 0.00%Banpu Power PCL 14,800 8,220 0.00%Ratchthani Leasing PCL 48,800 7,461 0.00%Thonburi Healthcare Group PCL 8,300 7,186 0.00%
Thaifoods Group PCL Class F 44,800 6,905 0.00%
Italian-Thai Development PCL 90,900 6,750 0.00%
BCPG PCL 15,500 6,384 0.00%SPCG PCL 10,300 6,042 0.00%Bangkok Expressway & Metro PCL 23,600 6,001 0.00%
Plan B Media Pcl Class F 30,500 5,900 0.00%Pruksa Holding PCL 13,300 5,727 0.00%MK Restaurants Group PCL 3,400 5,543 0.00%
.Number of
SharesFair Value
US Dollars ($)% of Total
Net AssetsThaicom PCL 14,700 5,504 0.00%Bangkok Airways PCL 15,700 5,193 0.00%Carabao Group PCL 1,100 4,856 0.00%GFPT PCL 13,500 4,844 0.00%AEON Thana Sinsap Thailand PCL 800 4,743 0.00%
CPN Retail Growth Leasehold 6,900 4,736 0.00%
Osotspa PCL 4,000 4,711 0.00%MBK PCL 11,180 4,674 0.00%Muangthai Capital PCL 2,600 4,665 0.00%Dohome PCL 5,900 4,648 0.00%WHA Premium Growth Freehold & Leasehold 11,100 4,641 0.00%
Thailand Future Fund 17,800 4,637 0.00%Digital Telecommunications Infrastructure Fund 11,700 4,636 0.00%
Supalai PCL 7,100 4,563 0.00%Global Power Synergy PCL 2,000 4,555 0.00%Asset World Corp. PCL 33,600 4,550 0.00%Central Retail Corp. PCL 4,300 4,495 0.00%Frasers Property Thailand Industrial Freehold & Leasehold REIT 10,300 4,435 0.00%
Workpoint Entertainment PCL 6,400 4,433 0.00%
Taokaenoi Food & Marketing PCL Class F 17,400 4,180 0.00%
Origin Property PCL Class F 14,300 3,971 0.00%LPN Development PCL 24,200 3,889 0.00%Samart Corp. PCL 13,600 3,883 0.00%Univentures PCL 29,900 3,732 0.00%U City PCL Class F 123,000 3,723 0.00%Unique Engineering & Construction PCL 16,400 3,710 0.00%
Bangkok Life Assurance PCL 2,400 2,190 0.00%
Thai Airways International PCL 18,900 1,958 0.00%
MBK PCL - Warrants 15/5/2024 447 144 0.00%
test test 4,332,646 2.34%Turkey 0.42% (2020: 0.55%)BIM Birlesik Magazalar A.S. 11,674 83,515 0.05%Eregli Demir ve Celik Fabrikalari TAS 35,475 73,502 0.04%
Turkiye Garanti Bankasi A.S. 56,549 54,027 0.03%Akbank T.A.S. 64,669 39,304 0.02%Turkiye Sise ve Cam Fabrikalari A.S. 36,402 32,013 0.02%
Ford Otomotiv Sanayi A.S. 1,514 29,661 0.02%Turk Hava Yollari AO 16,541 25,456 0.01%Haci Omer Sabanci Holding A.S. 22,200 22,717 0.01%
Turkiye Is Bankasi A.S. Class C 34,835 20,450 0.01%
Petkim Petrokimya Holding A.S. 31,176 18,768 0.01%
Arcelik A.S. 5,217 17,895 0.01%Coca-Cola Icecek A.S. 1,920 17,183 0.01%Kardemir Karabuk Demir Celik Sanayi ve Ticaret A.S. Class D 17,868 13,719 0.01%
Sasa Polyester Sanayi A.S. 4,300 13,453 0.01%Koza Altin Isletmeleri A.S. 990 13,344 0.01%Gubre Fabrikalari T.A.S. 2,187 12,977 0.01%TAV Havalimanlari Holding A.S. 4,668 12,745 0.01%
EIS Eczacibasi Ilac ve Sinai ve Finansal Yatirimlar Sanayi ve Ticaret A.S. 16,582 11,204 0.01%
Turk Telekomunikasyon A.S. 14,351 10,969 0.01%Tofas Turk Otomobil Fabrikasi A.S. 2,905 9,878 0.01%

114
Vanguard ESG Emerging Markets All Cap Equity Index Fund
.Number of
SharesFair Value
US Dollars ($)% of Total
Net AssetsUlker Biskuvi Sanayi A.S. 4,024 9,607 0.01%Emlak Konut Gayrimenkul Yatirim Ortakligi A.S. REIT 44,358 9,548 0.01%
Aksa Enerji Uretim A.S. Class B 6,945 9,241 0.01%
Koza Anadolu Metal Madencilik Isletmeleri A.S. 5,553 9,038 0.01%
Migros Ticaret A.S. 2,406 9,001 0.01%Pegasus Hava Tasimaciligi A.S. 1,069 8,866 0.01%
Enerjisa Enerji A.S. 7,380 8,792 0.01%Dogan Sirketler Grubu Holding A.S. 26,716 8,734 0.01%
Bera Holding A.S. 6,192 8,560 0.01%Hektas Ticaret TAS 9,735 8,483 0.01%Sok Marketler Ticaret A.S. 6,202 8,381 0.00%Tekfen Holding A.S. 4,880 8,269 0.00%Yapi ve Kredi Bankasi A.S. 32,319 8,036 0.00%Oyak Cimento Fabrikalari A.S. 9,503 7,405 0.00%
Turkiye Halk Bankasi A.S. 12,388 7,201 0.00%Is Yatirim Menkul Degerler A.S. 4,254 6,948 0.00%
Sarkuysan Elektrolitik Bakir Sanayi ve Ticaret A.S. 4,882 6,867 0.00%
Turk Traktor ve Ziraat Makineleri A.S. 331 6,447 0.00%
AG Anadolu Grubu Holding A.S. 2,541 6,347 0.00%
Iskenderun Demir ve Celik A.S. 4,657 6,036 0.00%
Vestel Elektronik Sanayi ve Ticaret A.S. 1,717 5,989 0.00%
Nuh Cimento Sanayi A.S. 1,234 5,719 0.00%Aksa Akrilik Kimya Sanayii A.S. 3,155 5,440 0.00%
MLP Saglik Hizmetleri A.S. Class B 2,094 5,341 0.00%
Alarko Holding A.S. 5,304 5,147 0.00%Turkiye Vakiflar Bankasi TAO Class D 12,663 5,102 0.00%
Kardemir Karabuk Demir Celik Sanayi ve Ticaret A.S. Class A 7,493 5,089 0.00%
Logo Yazilim Sanayi Ve Ticaret A.S. 1,260 4,818 0.00%
EGE Endustri VE Ticaret A.S. 32 4,454 0.00%Mavi Giyim Sanayi Ve Ticaret A.S. Class B 664 4,307 0.00%
Is Finansal Kiralama A.S. 11,712 3,977 0.00%Yatas Yatak ve Yorgan Sanayi ve Ticaret A.S. 2,273 3,401 0.00%
Cimsa Cimento Sanayi VE Ticaret A.S. 1,367 3,320 0.00%
Turkiye Sinai Kalkinma Bankasi A.S. 18,202 2,682 0.00%
.Number of
SharesFair Value
US Dollars ($)% of Total
Net AssetsAygaz A.S. 1,419 2,174 0.00%Kartonsan Karton Sanayi ve Ticaret A.S. 257 1,528 0.00%
Kordsa Teknik Tekstil A.S. 657 1,505 0.00%Aksigorta A.S. 1,632 1,473 0.00%Akcansa Cimento A.S. 538 931 0.00%Albaraka Turk Katilim Bankasi A.S. 5,056 867 0.00%
Dogus Otomotiv Servis ve Ticaret A.S. 285 832 0.00%
Torunlar Gayrimenkul Yatirim Ortakligi A.S. REIT 2,431 798 0.00%
Brisa Bridgestone Sabanci Sanayi ve Ticaret A.S. 324 753 0.00%
Zorlu Enerji Elektrik Uretim A.S. 3,413 719 0.00%
Is Gayrimenkul Yatirim Ortakligi A.S. REIT 3,185 689 0.00%
Tat Gida Sanayi A.S. 727 680 0.00%Konya Cimento Sanayii A.S. 7 650 0.00%Sekerbank Turk A.S. 5,288 645 0.00%Polisan Holding A.S. 1,893 580 0.00%test test 774,197 0.42%United Arab Emirates 0.87% (2020: 0.77%)First Abu Dhabi Bank PJSC 112,750 512,619 0.28%Emirates Telecommunications Group Co. PJSC 44,849 268,619 0.15%
Emirates NBD Bank PJSC 65,529 236,380 0.13%Abu Dhabi Commercial Bank PJSC 72,418 135,446 0.07%
Aldar Properties PJSC 101,647 105,711 0.06%Emaar Properties PJSC 88,793 100,562 0.05%Dubai Islamic Bank PJSC 48,402 63,514 0.03%Abu Dhabi Islamic Bank PJSC 39,337 58,687 0.03%
Emaar Malls PJSC 48,558 26,968 0.02%Dubai Investments PJSC 50,227 23,246 0.01%Emaar Development PJSC 20,140 20,287 0.01%Air Arabia PJSC 54,854 19,862 0.01%Dubai Financial Market PJSC 48,949 15,458 0.01%
GFH FINANCIAL GROUP BSC 70,986 14,610 0.01%
DAMAC Properties Dubai Co. PJSC 20,638 7,192 0.00%
Aramex PJSC 4,782 5,077 0.00%Union Properties PJSC 50,494 3,643 0.00%RAK Properties PJSC 14,687 2,539 0.00%Deyaar Development PJSC 16,488 1,342 0.00%Arabtec Holding PJSC 3,637 525 0.00%test test 1,622,287 0.87%United States 0.03% (2020: 0.00%)Canadian Solar, Inc. 1,210 54,256 0.03%StoneCo Ltd. Class A 30 2,012 0.00%test test 56,268 0.03%Total Equities 184,512,878 99.42%
Principal CouponMaturity
DateFair Value
US Dollars ($)% of Total
Net AssetsBonds 0.00% (2020: 0.00%)India 0.00% (2020: 0.00%)Britannia Industries Ltd. INR53,447 5.50% 3/6/2024 714 0.00%Total Bonds 714 0.00%Financial Assets at Fair Value Through Profit or Loss 184,513,592 99.42%
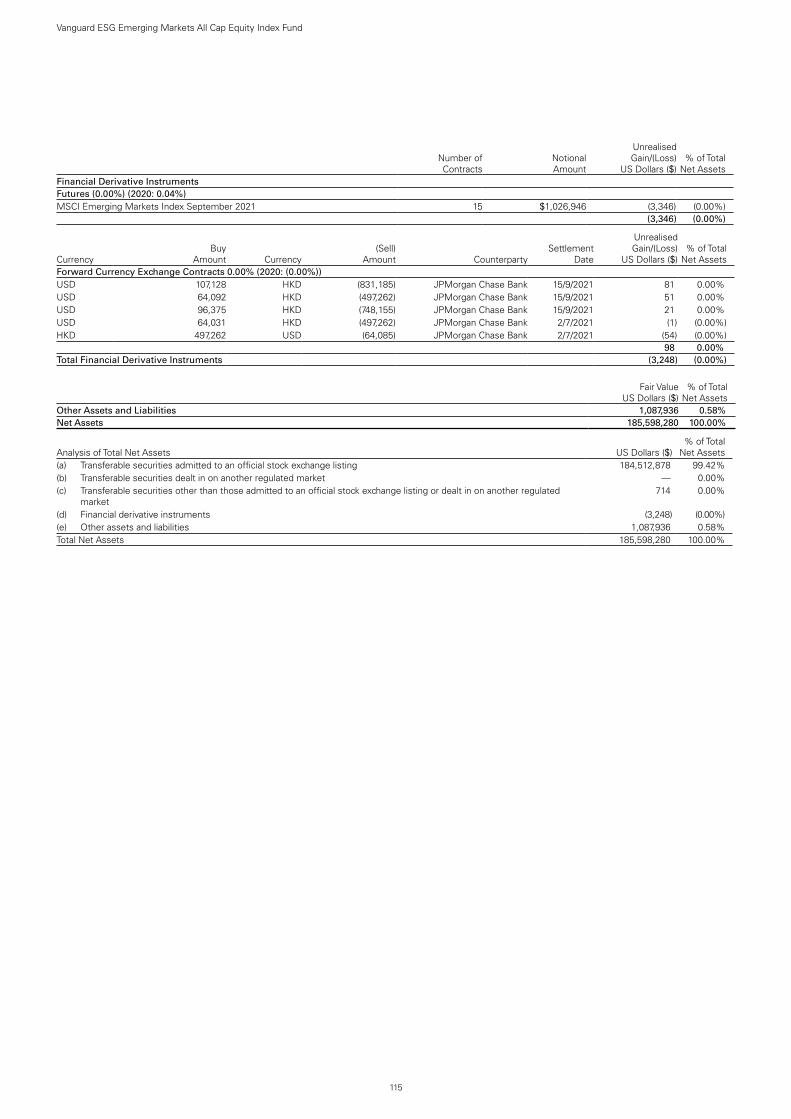
115
Vanguard ESG Emerging Markets All Cap Equity Index Fund
testNumber of Contracts
Notional Amount
Unrealised Gain/(Loss)
US Dollars ($)% of Total
Net AssetsFinancial Derivative InstrumentsFutures (0.00%) (2020: 0.04%)MSCI Emerging Markets Index September 2021 15 $1,026,946 (3,346 ) (0.00 %)test test test (3,346 ) (0.00 %)
CurrencyBuy
Amount Currency(Sell)
Amount CounterpartySettlement
Date
Unrealised Gain/(Loss)
US Dollars ($)% of Total
Net AssetsForward Currency Exchange Contracts 0.00% (2020: (0.00%))USD 107,128 HKD (831,185) JPMorgan Chase Bank 15/9/2021 81 0.00 %USD 64,092 HKD (497,262) JPMorgan Chase Bank 15/9/2021 51 0.00 %USD 96,375 HKD (748,155) JPMorgan Chase Bank 15/9/2021 21 0.00 %USD 64,031 HKD (497,262) JPMorgan Chase Bank 2/7/2021 (1 ) (0.00 %)HKD 497,262 USD (64,085) JPMorgan Chase Bank 2/7/2021 (54 ) (0.00 %)test 98 0.00 %Total Financial Derivative Instruments (3,248 ) (0.00 %)
Fair Value US Dollars ($)
% of Total Net Assets
Other Assets and Liabilities 1,087,936 0.58%Net Assets 185,598,280 100.00%
Analysis of Total Net Assets US Dollars ($)% of Total
Net Assets(a) Transferable securities admitted to an official stock exchange listing 184,512,878 99.42%(b) Transferable securities dealt in on another regulated market — 0.00%(c) Transferable securities other than those admitted to an official stock exchange listing or dealt in on another regulated
market 714 0.00%
(d) Financial derivative instruments (3,248) (0.00%)(e) Other assets and liabilities 1,087,936 0.58%Total Net Assets 185,598,280 100.00%

The accompanying notes form an integral part of the financial statements.
116
Vanguard ESG Emerging Markets All Cap Equity Index Fund
Statement of Assets and Liabilities
US Dollars ($)
As at 30 June 2021
US Dollars ($)
As at 31 December 2020
Current AssetsFinancial Assets at Fair Value Through Profit or Loss 184,513,592 42,907,747 Financial Derivative Instruments 153 17,894 Cash 2,695,981 766,130 Unrealised Appreciation on Spot Currency Contracts 2,841 — Receivables: Interest and Dividends 390,367 25,188 Capital Shares Issued 9,469,777 418,440 Investments Sold 16,224 — Futures Margin Cash 32,008 65,563
Total Current Assets 197,120,943 44,200,962
Current LiabilitiesFinancial Derivative Instruments 3,401 1 Bank Overdraft 1,125 25 Unrealised Depreciation on Spot Currency Contracts — 901 Payables and Other Liabilities: Investments Purchased 10,681,031 — Income Distribution Payable 383,731 15,609 Capital Shares Redeemed 148,384 29,037 Management Fees Payable 29,302 7,844 Deferred Capital Gains Tax 275,689 102,115
Total Current Liabilities 11,522,663 155,532
Net Assets Attributable to Holders of Redeemable Participating Shares (“Net Assets”) 185,598,280 44,045,430

117
Vanguard ESG Emerging Markets All Cap Equity Index Fund
The accompanying notes form an integral part of the financial statements.
Net Asset Value Per Share
.As at
30 June 2021As at
31 December 2020EUR Acc1
US ($) Equivalent 53,982,084 10,529,292Net Assets 45,519,929 8,605,527Number of Shares Outstanding 346,931 72,959Net Asset Value Per Share2 131.21 117.95
Institutional Plus EUR Acc3
US ($) Equivalent 79,877 —Net Assets 67,356 —Number of Shares Outstanding 662 —Net Asset Value Per Share2 101.75 —
GBP Acc1
US ($) Equivalent 68,090,001 16,203,540Net Assets 49,288,793 11,853,792Number of Shares Outstanding 390,728 100,230Net Asset Value Per Share2 126.15 118.27
GBP Dist1
US ($) Equivalent 10,995,665 6,918,046Net Assets 7,959,510 5,060,936Number of Shares Outstanding 64,336 43,297Net Asset Value Per Share2 123.72 116.89
Institutional Plus GBP Dist1
US ($) Equivalent 52,294,103 4,238,122Net Assets 37,854,504 3,100,422Number of Shares Outstanding 305,998 26,524Net Asset Value Per Share2 123.71 116.89
USD Acc1
Net Assets 156,550 6,156,430Number of Shares Outstanding 1,143 48,437Net Asset Value Per Share2 136.96 127.10
1 The share class was launched on 9 June 2020.2 The net asset value per share shown may diverge from the net asset value per share used for dealing purposes because of any adjustments for swing pricing and trade date accounting.3 The share class was launched on 3 March 2021.

118
Vanguard ESG Emerging Markets All Cap Equity Index Fund
The accompanying notes form an integral part of the financial statements.
Statement of Operations
US Dollars ($)
Six Months Ended 30 June 2021
US Dollars ($) Period Ended
30 June 20201
Investment Income/(Loss) Interest Income 278 2 Dividend Income 1,189,920 41,970 Securities Lending Income 1,190 — Net Gain/(Loss) on Financial Instruments 4,903,308 (91,516)
Total Investment Income/(Loss) 6,094,696 (49,544)
Expenses Management Fees 114,952 1,502 Transaction Fees and Commissions 144,624 11,448 Other Expenses 1,531 —
Total Expenses 261,107 12,950
Finance Costs Interest Expense 2,721 220 Distribution Paid 416,960 1,144 Income Equalisation (203,628) (238)
Total Finance Costs 216,053 1,126
Net Investment Income/(Loss) 5,617,536 (63,620)
Foreign Withholding Tax (287,977) (4,171)
Net Increase/(Decrease) in Net Assets 5,329,559 (67,791)
Statement of Changes in Net Assets
US Dollars ($)
US Dollars ($)
Six Months Ended Period Ended30 June 2021 30 June 20201
Increase/(Decrease) in Net Assets
Net Increase/(Decrease) in Net Assets From Operations 5,329,559 (67,791)
Capital Transactions Subscriptions 168,161,176 11,199,039 Redemptions (31,938,426) (4,278) Reinvestments 541 —
Total Capital Transactions2 136,223,291 11,194,761
Total Increase/(Decrease) for the Period 141,552,850 11,126,970
Net AssetsBeginning of Period 44,045,430 —
End of Period 185,598,280 11,126,970
1 The Fund was launched on 9 June 2020.2 Capital Transactions include income equalisation adjustments as shown in the Statement of Operations.
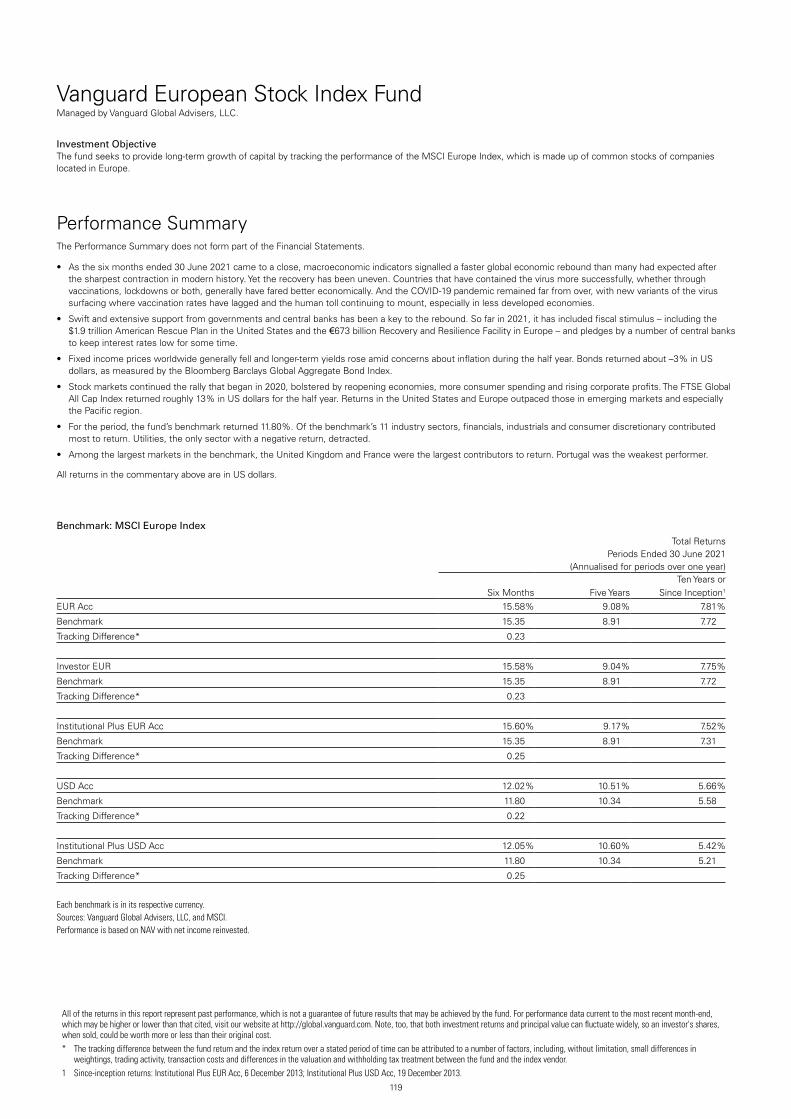
Vanguard European Stock Index FundManaged by Vanguard Global Advisers, LLC.
119
Investment ObjectiveThe fund seeks to provide long-term growth of capital by tracking the performance of the MSCI Europe Index, which is made up of common stocks of companies located in Europe.
Performance SummaryThe Performance Summary does not form part of the Financial Statements.
• As the six months ended 30 June 2021 came to a close, macroeconomic indicators signalled a faster global economic rebound than many had expected after the sharpest contraction in modern history. Yet the recovery has been uneven. Countries that have contained the virus more successfully, whether through vaccinations, lockdowns or both, generally have fared better economically. And the COVID-19 pandemic remained far from over, with new variants of the virus surfacing where vaccination rates have lagged and the human toll continuing to mount, especially in less developed economies.
• Swift and extensive support from governments and central banks has been a key to the rebound. So far in 2021, it has included fiscal stimulus – including the $1.9 trillion American Rescue Plan in the United States and the €673 billion Recovery and Resilience Facility in Europe – and pledges by a number of central banks to keep interest rates low for some time.
• Fixed income prices worldwide generally fell and longer-term yields rose amid concerns about inflation during the half year. Bonds returned about –3% in US dollars, as measured by the Bloomberg Barclays Global Aggregate Bond Index.
• Stock markets continued the rally that began in 2020, bolstered by reopening economies, more consumer spending and rising corporate profits. The FTSE Global All Cap Index returned roughly 13% in US dollars for the half year. Returns in the United States and Europe outpaced those in emerging markets and especially the Pacific region.
• For the period, the fund’s benchmark returned 11.80%. Of the benchmark’s 11 industry sectors, financials, industrials and consumer discretionary contributed most to return. Utilities, the only sector with a negative return, detracted.
• Among the largest markets in the benchmark, the United Kingdom and France were the largest contributors to return. Portugal was the weakest performer.
All returns in the commentary above are in US dollars.
Benchmark: MSCI Europe Index
Total ReturnsPeriods Ended 30 June 2021
(Annualised for periods over one year)
Six Months Five YearsTen Years or
Since Inception1
EUR Acc 15.58 % 9.08 % 7.81 %
Benchmark 15.35 8.91 7.72
Tracking Difference* 0.23
Investor EUR 15.58 % 9.04 % 7.75 %
Benchmark 15.35 8.91 7.72
Tracking Difference* 0.23
Institutional Plus EUR Acc 15.60 % 9.17 % 7.52 %
Benchmark 15.35 8.91 7.31
Tracking Difference* 0.25
USD Acc 12.02 % 10.51 % 5.66 %
Benchmark 11.80 10.34 5.58
Tracking Difference* 0.22
Institutional Plus USD Acc 12.05 % 10.60 % 5.42 %
Benchmark 11.80 10.34 5.21
Tracking Difference* 0.25
Each benchmark is in its respective currency.Sources: Vanguard Global Advisers, LLC, and MSCI.Performance is based on NAV with net income reinvested.
All of the returns in this report represent past performance, which is not a guarantee of future results that may be achieved by the fund. For performance data current to the most recent month-end, which may be higher or lower than that cited, visit our website at http://global.vanguard.com. Note, too, that both investment returns and principal value can fluctuate widely, so an investor's shares, when sold, could be worth more or less than their original cost.* The tracking difference between the fund return and the index return over a stated period of time can be attributed to a number of factors, including, without limitation, small differences in
weightings, trading activity, transaction costs and differences in the valuation and withholding tax treatment between the fund and the index vendor.1 Since-inception returns: Institutional Plus EUR Acc, 6 December 2013; Institutional Plus USD Acc, 19 December 2013.

Significant Portfolio ChangesFor the Six Months Ended 30 June 2021
120
Vanguard European Stock Index Fund
The Central Bank of Ireland requires a schedule of material changes in the composition of the portfolio during the period. These are defined as aggregate purchases of a security exceeding 1% of the total value of purchases for the period and aggregate disposals greater than 1% of the total value of sales. At a minimum, the largest 20 purchases and 20 sales must be shown; all purchases and sales must be shown if there are fewer than 20. A full listing of the portfolio changes for the period is available, upon request, at no extra cost from the Administrator.
SharesCost
US Dollars ($)
Purchases
ASM International NV 24,060 6,532,056Nestle SA 51,047 6,065,318Roche Holding AG (XSWX) 16,561 5,583,342ASML Holding NV 7,800 4,875,020Roche Holding AG 11,689 4,173,365Sinch AB 23,459 4,068,378LVMH Moet Hennessy Louis Vuitton
SE 4,993 3,607,566Novartis AG 38,648 3,506,123Embracer Group AB Class B 118,011 3,396,645Partners Group Holding AG 2,236 3,308,432EDP Renovaveis SA 135,864 3,240,015Just Eat Takeaway.com NV 31,552 2,983,981Unilever plc 48,544 2,835,324Volvo AB Class A 103,010 2,805,622SAP SE 19,372 2,635,562AstraZeneca plc 23,940 2,575,578Kinnevik AB Class B 117,617 2,484,014Novo Nordisk A/S Class B 31,633 2,400,269Adyen NV 1,027 2,369,564Cellnex Telecom SA 39,123 2,337,356
SharesProceeds
US Dollars ($)
Sales
Nestle SA 163,598 18,078,022ASML Holding NV 27,051 15,915,587Roche Holding AG 38,900 12,649,678Novartis AG 125,457 10,796,198LVMH Moet Hennessy Louis Vuitton
SE 15,752 10,535,208Unilever plc 150,757 8,339,482SAP SE 59,727 7,524,542AstraZeneca plc 74,652 7,337,029TotalEnergies SE 152,959 7,236,256British American Tobacco plc 185,776 7,044,376HSBC Holdings plc 1,163,748 7,002,179Siemens AG 43,354 6,999,358Novo Nordisk A/S Class B 97,842 6,812,365Iberdrola SA 501,259 6,553,008Allianz SE 25,558 6,465,996Sanofi 63,784 6,123,808Diageo plc 135,090 5,631,155L’Oreal SA 14,019 5,356,869Rio Tinto plc 64,196 5,268,512Royal Dutch Shell plc Class A 242,482 4,953,802

Financial StatementsStatement of Investments30 June 2021
121
Vanguard European Stock Index Fund
.Number of
SharesFair Value
US Dollars ($)% of Total
Net AssetsEquities 99.41% (2020: 99.30%)Austria 0.30% (2020: 0.28%)Erste Group Bank AG 129,529 4,752,645 0.09%OMV AG 69,553 3,956,705 0.08%Verbund AG 32,034 2,949,855 0.06%Voestalpine AG 54,624 2,224,497 0.04%Raiffeisen Bank International AG 69,971 1,584,892 0.03%test test 15,468,594 0.30%Belgium 1.46% (2020: 1.56%)Anheuser-Busch InBev SA 357,822 25,804,183 0.50%KBC Group NV 116,685 8,897,624 0.17%Argenx SE 21,526 6,512,112 0.13%UCB SA 59,839 6,256,104 0.12%Groupe Bruxelles Lambert SA 53,299 5,962,975 0.11%Umicore SA 92,923 5,675,165 0.11%Ageas SA 81,549 4,525,979 0.09%Solvay SA 34,378 4,370,423 0.08%Sofina SA 7,263 3,133,479 0.06%Elia Group SA 14,701 1,551,619 0.03%Etablissements Franz Colruyt NV 25,553 1,429,104 0.03%
Proximus SADP 70,666 1,365,148 0.03%test test 75,483,915 1.46%Denmark 3.99% (2020: 4.02%)Novo Nordisk A/S Class B 808,204 67,718,204 1.31%DSV PANALPINA A/S 97,144 22,657,199 0.44%Vestas Wind Systems A/S 474,302 18,516,578 0.36%Genmab A/S 30,794 12,601,351 0.25%Orsted A/S 88,878 12,473,011 0.24%Coloplast A/S Class B 56,022 9,193,235 0.18%Carlsberg A/S Class B 47,966 8,942,159 0.17%AP Moller-Maersk A/S Class B 2,842 8,169,467 0.16%Novozymes A/S Class B 98,404 7,418,101 0.14%Pandora A/S 46,581 6,262,255 0.12%Danske Bank A/S 326,652 5,748,467 0.11%GN Store Nord A/S 60,539 5,288,733 0.10%Chr Hansen Holding A/S 49,049 4,427,320 0.09%AP Moller-Maersk A/S Class A 1,527 4,242,106 0.08%Tryg A/S 168,918 4,147,152 0.08%Ambu A/S Class B 77,274 2,971,153 0.06%Demant A/S 51,369 2,891,813 0.06%ROCKWOOL International A/S Class B 4,047 1,970,400 0.04%
test test 205,638,704 3.99%Finland 1.63% (2020: 1.67%)Nokia OYJ 2,532,062 13,559,018 0.26%Kone OYJ Class B 159,581 13,020,201 0.25%Neste OYJ 198,708 12,168,853 0.24%Sampo OYJ Class A 234,350 10,772,011 0.21%UPM-Kymmene OYJ 249,653 9,444,425 0.19%Fortum OYJ 210,127 5,796,150 0.11%Stora Enso OYJ Class R 276,000 5,035,640 0.10%Kesko OYJ Class B 126,662 4,678,994 0.09%Elisa OYJ 65,750 3,923,598 0.08%Wartsila OYJ Abp 217,803 3,232,532 0.06%Orion OYJ Class B 49,627 2,133,409 0.04%test test 83,764,831 1.63%France 17.73% (2020: 17.63%)LVMH Moet Hennessy Louis Vuitton SE 130,305 102,189,828 1.98%
Sanofi 531,667 55,711,324 1.08%TotalEnergies SE 1,172,865 53,069,812 1.03%L’Oreal SA (Prime De Fidelite) 92,182 41,081,942 0.80%Schneider Electric SE 252,919 39,795,593 0.77%Airbus SE 276,173 35,515,570 0.69%BNP Paribas SA 528,054 33,108,211 0.64%
.Number of
SharesFair Value
US Dollars ($)% of Total
Net AssetsKering SA 35,199 30,764,218 0.60%Air Liquide SA (Prime De Fidelite) 173,315 30,349,188 0.59%
Vinci SA 249,896 26,668,686 0.52%EssilorLuxottica SA 133,858 24,706,636 0.48%AXA SA 907,643 23,018,254 0.45%Safran SA 160,495 22,253,503 0.43%Pernod Ricard SA 98,269 21,815,765 0.42%Hermes International 14,852 21,637,554 0.42%Danone SA 306,143 21,554,574 0.42%Cie de Saint-Gobain 237,452 15,639,749 0.30%Dassault Systemes SE 62,110 15,062,703 0.29%Capgemini SE 75,482 14,501,285 0.28%Legrand SA 125,540 13,288,840 0.26%Cie Generale des Etablissements Michelin SCA 79,643 12,703,341 0.25%
STMicroelectronics NV 320,674 11,638,693 0.23%L’Oreal SA 26,069 11,617,942 0.22%Societe Generale SA 380,800 11,226,545 0.22%Teleperformance 27,655 11,226,093 0.22%Vivendi SE 334,080 11,223,934 0.22%Orange SA 935,180 10,663,323 0.21%Worldline SA 111,587 10,446,211 0.20%ArcelorMittal SA 337,467 10,345,225 0.20%Engie SA (Prime De Fidelite) 665,935 9,124,567 0.18%Air Liquide SA 48,798 8,545,017 0.17%Veolia Environnement SA 254,657 7,691,882 0.15%Credit Agricole SA 547,579 7,671,704 0.15%Eurofins Scientific SE 62,010 7,089,030 0.14%Publicis Groupe SA 103,633 6,629,138 0.13%Alstom SA 130,596 6,596,075 0.13%Edenred 114,681 6,534,810 0.13%Sartorius Stedim Biotech 13,074 6,184,728 0.12%Carrefour SA 289,473 5,693,399 0.11%Thales SA 50,349 5,137,352 0.10%Unibail-Rodamco-Westfield (XAMS) REIT 57,076 4,940,432 0.10%
Bureau Veritas SA 135,598 4,290,295 0.08%Eiffage SA 39,550 4,024,221 0.08%Bouygues SA 105,982 3,920,086 0.08%Suez SA 164,129 3,902,544 0.07%Arkema SA 28,671 3,597,299 0.07%Renault SA 88,817 3,590,108 0.07%Gecina SA REIT 21,784 3,337,707 0.06%Valeo SA 108,952 3,277,961 0.06%Getlink SE 207,884 3,241,865 0.06%Orpea SA 24,585 3,126,911 0.06%Ubisoft Entertainment SA 43,608 3,053,238 0.06%Sodexo SA 32,159 3,001,410 0.06%Accor SA 80,182 2,994,316 0.06%Electricite de France SA (Prime De Fidelite) 213,453 2,916,103 0.06%
Atos SE 46,811 2,847,825 0.05%La Francaise des Jeux SAEM 44,801 2,634,161 0.05%Amundi SA 28,749 2,534,847 0.05%Klepierre SA REIT 96,909 2,497,307 0.05%SCOR SE 75,151 2,390,241 0.05%Bollore SA 426,437 2,285,817 0.04%BioMerieux 19,514 2,267,882 0.04%Faurecia SE (XPAR) 45,635 2,238,884 0.04%Remy Cointreau SA 10,665 2,201,951 0.04%Covivio REIT 23,690 2,026,137 0.04%Ipsen SA 18,091 1,881,955 0.04%Aeroports de Paris 13,748 1,790,967 0.03%Wendel SE 12,627 1,698,092 0.03%SEB SA (Prime De Fidelite) 8,916 1,611,399 0.03%
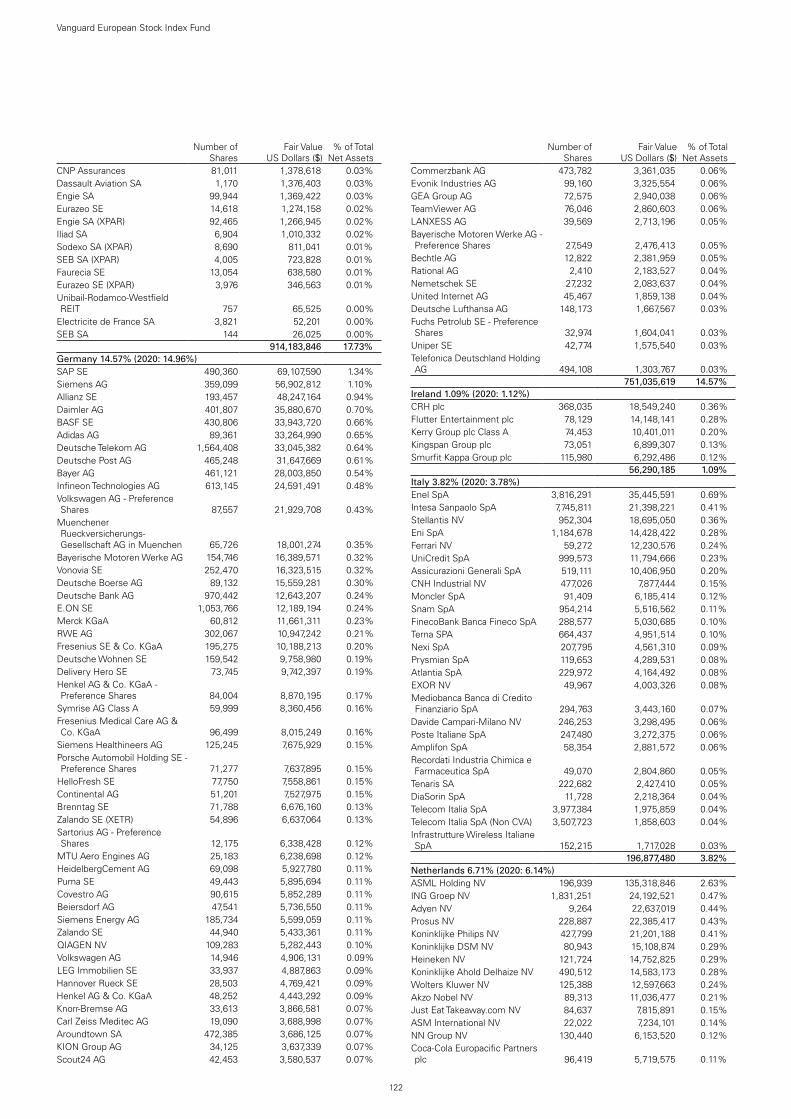
122
Vanguard European Stock Index Fund
.Number of
SharesFair Value
US Dollars ($)% of Total
Net AssetsCNP Assurances 81,011 1,378,618 0.03%Dassault Aviation SA 1,170 1,376,403 0.03%Engie SA 99,944 1,369,422 0.03%Eurazeo SE 14,618 1,274,158 0.02%Engie SA (XPAR) 92,465 1,266,945 0.02%Iliad SA 6,904 1,010,332 0.02%Sodexo SA (XPAR) 8,690 811,041 0.01%SEB SA (XPAR) 4,005 723,828 0.01%Faurecia SE 13,054 638,580 0.01%Eurazeo SE (XPAR) 3,976 346,563 0.01%Unibail-Rodamco-Westfield REIT 757 65,525 0.00%
Electricite de France SA 3,821 52,201 0.00%SEB SA 144 26,025 0.00%test test 914,183,846 17.73%Germany 14.57% (2020: 14.96%)SAP SE 490,360 69,107,590 1.34%Siemens AG 359,099 56,902,812 1.10%Allianz SE 193,457 48,247,164 0.94%Daimler AG 401,807 35,880,670 0.70%BASF SE 430,806 33,943,720 0.66%Adidas AG 89,361 33,264,990 0.65%Deutsche Telekom AG 1,564,408 33,045,382 0.64%Deutsche Post AG 465,248 31,647,669 0.61%Bayer AG 461,121 28,003,850 0.54%Infineon Technologies AG 613,145 24,591,491 0.48%Volkswagen AG - Preference Shares 87,557 21,929,708 0.43%
Muenchener Rueckversicherungs-Gesellschaft AG in Muenchen 65,726 18,001,274 0.35%
Bayerische Motoren Werke AG 154,746 16,389,571 0.32%Vonovia SE 252,470 16,323,515 0.32%Deutsche Boerse AG 89,132 15,559,281 0.30%Deutsche Bank AG 970,442 12,643,207 0.24%E.ON SE 1,053,766 12,189,194 0.24%Merck KGaA 60,812 11,661,311 0.23%RWE AG 302,067 10,947,242 0.21%Fresenius SE & Co. KGaA 195,275 10,188,213 0.20%Deutsche Wohnen SE 159,542 9,758,980 0.19%Delivery Hero SE 73,745 9,742,397 0.19%Henkel AG & Co. KGaA - Preference Shares 84,004 8,870,195 0.17%
Symrise AG Class A 59,999 8,360,456 0.16%Fresenius Medical Care AG & Co. KGaA 96,499 8,015,249 0.16%
Siemens Healthineers AG 125,245 7,675,929 0.15%Porsche Automobil Holding SE - Preference Shares 71,277 7,637,895 0.15%
HelloFresh SE 77,750 7,558,861 0.15%Continental AG 51,201 7,527,975 0.15%Brenntag SE 71,788 6,676,160 0.13%Zalando SE (XETR) 54,896 6,637,064 0.13%Sartorius AG - Preference Shares 12,175 6,338,428 0.12%
MTU Aero Engines AG 25,183 6,238,698 0.12%HeidelbergCement AG 69,098 5,927,780 0.11%Puma SE 49,443 5,895,694 0.11%Covestro AG 90,615 5,852,289 0.11%Beiersdorf AG 47,541 5,736,550 0.11%Siemens Energy AG 185,734 5,599,059 0.11%Zalando SE 44,940 5,433,361 0.11%QIAGEN NV 109,283 5,282,443 0.10%Volkswagen AG 14,946 4,906,131 0.09%LEG Immobilien SE 33,937 4,887,863 0.09%Hannover Rueck SE 28,503 4,769,421 0.09%Henkel AG & Co. KGaA 48,252 4,443,292 0.09%Knorr-Bremse AG 33,613 3,866,581 0.07%Carl Zeiss Meditec AG 19,090 3,688,998 0.07%Aroundtown SA 472,385 3,686,125 0.07%KION Group AG 34,125 3,637,339 0.07%Scout24 AG 42,453 3,580,537 0.07%
.Number of
SharesFair Value
US Dollars ($)% of Total
Net AssetsCommerzbank AG 473,782 3,361,035 0.06%Evonik Industries AG 99,160 3,325,554 0.06%GEA Group AG 72,575 2,940,038 0.06%TeamViewer AG 76,046 2,860,603 0.06%LANXESS AG 39,569 2,713,196 0.05%Bayerische Motoren Werke AG - Preference Shares 27,549 2,476,413 0.05%
Bechtle AG 12,822 2,381,959 0.05%Rational AG 2,410 2,183,527 0.04%Nemetschek SE 27,232 2,083,637 0.04%United Internet AG 45,467 1,859,138 0.04%Deutsche Lufthansa AG 148,173 1,667,567 0.03%Fuchs Petrolub SE - Preference Shares 32,974 1,604,041 0.03%
Uniper SE 42,774 1,575,540 0.03%Telefonica Deutschland Holding AG 494,108 1,303,767 0.03%
test test 751,035,619 14.57%Ireland 1.09% (2020: 1.12%)CRH plc 368,035 18,549,240 0.36%Flutter Entertainment plc 78,129 14,148,141 0.28%Kerry Group plc Class A 74,453 10,401,011 0.20%Kingspan Group plc 73,051 6,899,307 0.13%Smurfit Kappa Group plc 115,980 6,292,486 0.12%test test 56,290,185 1.09%Italy 3.82% (2020: 3.78%)Enel SpA 3,816,291 35,445,591 0.69%Intesa Sanpaolo SpA 7,745,811 21,398,221 0.41%Stellantis NV 952,304 18,695,050 0.36%Eni SpA 1,184,678 14,428,422 0.28%Ferrari NV 59,272 12,230,576 0.24%UniCredit SpA 999,573 11,794,666 0.23%Assicurazioni Generali SpA 519,111 10,406,950 0.20%CNH Industrial NV 477,026 7,877,444 0.15%Moncler SpA 91,409 6,185,414 0.12%Snam SpA 954,214 5,516,562 0.11%FinecoBank Banca Fineco SpA 288,577 5,030,685 0.10%Terna SPA 664,437 4,951,514 0.10%Nexi SpA 207,795 4,561,310 0.09%Prysmian SpA 119,653 4,289,531 0.08%Atlantia SpA 229,972 4,164,492 0.08%EXOR NV 49,967 4,003,326 0.08%Mediobanca Banca di Credito Finanziario SpA 294,763 3,443,160 0.07%
Davide Campari-Milano NV 246,253 3,298,495 0.06%Poste Italiane SpA 247,480 3,272,375 0.06%Amplifon SpA 58,354 2,881,572 0.06%Recordati Industria Chimica e Farmaceutica SpA 49,070 2,804,860 0.05%
Tenaris SA 222,682 2,427,410 0.05%DiaSorin SpA 11,728 2,218,364 0.04%Telecom Italia SpA 3,977,384 1,975,859 0.04%Telecom Italia SpA (Non CVA) 3,507,723 1,858,603 0.04%Infrastrutture Wireless Italiane SpA 152,215 1,717,028 0.03%
test test 196,877,480 3.82%Netherlands 6.71% (2020: 6.14%)ASML Holding NV 196,939 135,318,846 2.63%ING Groep NV 1,831,251 24,192,521 0.47%Adyen NV 9,264 22,637,019 0.44%Prosus NV 228,887 22,385,417 0.43%Koninklijke Philips NV 427,799 21,201,188 0.41%Koninklijke DSM NV 80,943 15,108,874 0.29%Heineken NV 121,724 14,752,825 0.29%Koninklijke Ahold Delhaize NV 490,512 14,583,173 0.28%Wolters Kluwer NV 125,388 12,597,663 0.24%Akzo Nobel NV 89,313 11,036,477 0.21%Just Eat Takeaway.com NV 84,637 7,815,891 0.15%ASM International NV 22,022 7,234,101 0.14%NN Group NV 130,440 6,153,520 0.12%Coca-Cola Europacific Partners plc 96,419 5,719,575 0.11%

123
Vanguard European Stock Index Fund
.Number of
SharesFair Value
US Dollars ($)% of Total
Net AssetsHeineken Holding NV 54,371 5,477,454 0.11%Koninklijke KPN NV 1,567,960 4,897,775 0.10%Randstad NV 56,625 4,331,277 0.08%Aegon NV 826,912 3,431,242 0.07%ABN AMRO Bank NV GDR 198,687 2,401,469 0.05%InPost SA 91,745 1,841,555 0.04%Koninklijke Vopak NV 32,737 1,486,914 0.03%JDE Peet's NV 34,622 1,256,382 0.02%test test 345,861,158 6.71%Norway 0.97% (2020: 0.94%)Equinor A.S.A 455,834 9,650,425 0.19%DNB A.S.A 433,951 9,460,466 0.18%Telenor A.S.A 331,761 5,594,120 0.11%Mowi A.S.A 204,461 5,203,477 0.10%Yara International A.S.A 82,317 4,335,293 0.08%Norsk Hydro A.S.A 639,843 4,085,085 0.08%Orkla A.S.A 357,052 3,638,900 0.07%Adevinta A.S.A Class B 126,099 2,417,879 0.05%Gjensidige Forsikring A.S.A 94,434 2,082,877 0.04%Schibsted A.S.A Class B 44,251 1,844,049 0.04%Schibsted A.S.A Class A 35,184 1,699,260 0.03%test test 50,011,831 0.97%Portugal 0.29% (2020: 0.27%)EDP - Energias de Portugal SA 1,294,747 6,863,419 0.14%EDP Renovaveis SA 135,864 3,148,306 0.06%Galp Energia SGPS SA 236,363 2,565,332 0.05%Jeronimo Martins SGPS SA 119,368 2,177,170 0.04%Banco Espirito Santo SA 1,505,981 18 0.00%test test 14,754,245 0.29%Spain 3.78% (2020: 3.89%)Iberdrola SA 2,710,138 33,039,433 0.64%Banco Santander SA 8,142,335 31,087,476 0.60%Banco Bilbao Vizcaya Argentaria SA 3,130,826 19,410,762 0.38%
Industria de Diseno Textil SA 511,749 18,030,498 0.35%Cellnex Telecom SA 239,252 15,241,919 0.30%Amadeus IT Group SA 211,593 14,885,057 0.29%Telefonica SA 2,453,309 11,465,863 0.22%Repsol SA 700,577 8,768,414 0.17%Ferrovial SA 223,711 6,566,147 0.13%CaixaBank SA 2,068,940 6,364,524 0.12%Aena SME SA 35,246 5,780,695 0.11%Grifols SA 141,313 3,827,598 0.08%Red Electrica Corp. SA 204,694 3,800,198 0.07%Siemens Gamesa Renewable Energy SA 113,361 3,785,684 0.07%
Naturgy Energy Group SA 138,834 3,569,465 0.07%Endesa SA 146,546 3,555,721 0.07%ACS Actividades de Construccion y Servicios SA 109,543 2,934,600 0.06%
Enagas SA 117,970 2,725,964 0.05%ACS Actividades de Construccion y Servicios SA - Rights Issue 7/7/2021 109,543 153,290 0.00%
test test 194,993,308 3.78%Sweden 5.76% (2020: 5.34%)Investor AB Class B 857,089 19,768,223 0.38%Atlas Copco AB Class A 316,349 19,383,065 0.38%Telefonaktiebolaget LM Ericsson Class B 1,370,814 17,240,665 0.33%
Nordea Bank Abp 1,522,673 16,960,627 0.33%Volvo AB Class B 662,075 15,939,997 0.31%Assa Abloy AB Class B 470,630 14,186,890 0.28%Hexagon AB Class B 926,046 13,730,189 0.27%Sandvik AB 530,315 13,555,288 0.26%Evolution AB 79,779 12,615,906 0.24%Skandinaviska Enskilda Banken AB Class A 760,378 9,829,083 0.19%
Atlas Copco AB Class B 182,036 9,578,434 0.19%Essity AB Class B 286,178 9,496,713 0.18%H & M Hennes & Mauritz AB Class B 344,707 8,182,214 0.16%
.Number of
SharesFair Value
US Dollars ($)% of Total
Net AssetsSwedbank AB Class A 422,236 7,861,983 0.15%Svenska Handelsbanken AB Class A 689,334 7,783,083 0.15%
Epiroc AB Class A 310,129 7,071,339 0.14%Nibe Industrier AB Class B 670,163 7,054,141 0.14%Swedish Match AB 767,102 6,546,085 0.13%Telia Co. AB 1,250,074 5,551,564 0.11%Alfa Laval AB 146,116 5,164,884 0.10%Boliden AB 127,109 4,889,865 0.10%Svenska Cellulosa AB SCA Class B 287,248 4,710,691 0.09%
SKF AB Class B 181,048 4,612,917 0.09%Kinnevik AB Class B 111,899 4,482,685 0.09%Skanska AB Class B 157,566 4,182,280 0.08%EQT AB 112,247 4,076,626 0.08%Sinch AB 234,590 3,949,996 0.08%Epiroc AB Class B 183,885 3,611,196 0.07%Lundin Energy AB 94,076 3,330,883 0.06%Tele2 AB Class B 236,736 3,227,658 0.06%Embracer Group AB Class B 118,011 3,194,465 0.06%Fastighets AB Balder Class B 49,865 3,131,085 0.06%Electrolux AB 103,563 2,873,605 0.06%Industrivarden AB Class C 75,204 2,754,149 0.05%Husqvarna AB Class B 197,697 2,628,362 0.05%Volvo AB Class A 103,010 2,555,933 0.05%Securitas AB Class B 148,042 2,338,649 0.05%Investment AB Latour Class B 69,524 2,282,741 0.04%L E Lundbergforetagen AB Class B 34,499 2,227,551 0.04%
ICA Gruppen AB 47,215 2,198,948 0.04%Industrivarden AB Class A 50,084 1,948,978 0.04%test test 296,709,636 5.76%Switzerland 15.12% (2020: 15.35%)Nestle SA 1,352,268 168,559,873 3.27%Roche Holding AG 329,920 124,404,842 2.41%Novartis AG 1,041,886 95,041,735 1.84%Cie Financiere Richemont SA 245,062 29,679,982 0.58%Zurich Insurance Group AG 70,545 28,329,425 0.55%ABB Ltd. 814,348 27,654,442 0.54%UBS Group AG 1,721,429 26,370,352 0.51%Lonza Group AG 34,966 24,807,381 0.48%Sika AG 66,472 21,753,427 0.42%Givaudan SA 4,330 20,156,856 0.39%Alcon, Inc. 234,681 16,446,839 0.32%Partners Group Holding AG 10,654 16,153,601 0.31%Holcim Ltd. 245,751 14,755,429 0.29%Geberit AG 17,349 13,025,592 0.25%Swiss Re AG 141,481 12,777,448 0.25%Credit Suisse Group AG 1,150,228 12,060,377 0.23%Logitech International SA 81,301 9,859,731 0.19%Sonova Holding AG 25,887 9,745,958 0.19%Kuehne + Nagel International AG 25,504 8,735,399 0.17%
SGS SA 2,827 8,728,575 0.17%Straumann Holding AG 4,809 7,673,798 0.15%Swiss Life Holding AG 14,981 7,286,696 0.14%Swisscom AG 12,260 7,005,714 0.14%Julius Baer Group Ltd. 105,903 6,917,751 0.13%Roche Holding AG (XSWX) 14,872 6,046,300 0.12%Schindler Holding AG 19,209 5,881,048 0.11%Chocoladefabriken Lindt & Spruengli AG (XSWX) 51 5,346,352 0.10%
Temenos AG 31,440 5,054,345 0.10%Adecco Group AG 73,146 4,974,260 0.10%Chocoladefabriken Lindt & Spruengli AG 483 4,809,883 0.09%
Swatch Group AG 13,748 4,720,739 0.09%Barry Callebaut AG 1,679 3,905,285 0.08%Swiss Prime Site AG 34,922 3,468,210 0.07%Baloise Holding AG 21,861 3,412,714 0.07%EMS-Chemie Holding AG 3,313 3,257,983 0.06%Vifor Pharma AG 23,192 3,004,535 0.06%

124
Vanguard European Stock Index Fund
.Number of
SharesFair Value
US Dollars ($)% of Total
Net AssetsSchindler Holding AG (XSWX) 9,508 2,781,374 0.05%Clariant AG 100,432 1,999,187 0.04%Swatch Group AG REG 24,523 1,619,656 0.03%Banque Cantonale Vaudoise 14,236 1,279,831 0.03%test test 779,492,925 15.12%United Kingdom 22.19% (2020: 22.35%)AstraZeneca plc 616,158 73,908,953 1.43%Unilever plc 1,234,013 72,118,484 1.40%HSBC Holdings plc 9,561,899 55,122,346 1.07%Diageo plc 1,098,324 52,513,048 1.02%GlaxoSmithKline plc 2,360,838 46,292,021 0.90%Rio Tinto plc 526,787 43,292,650 0.84%BP plc 9,553,013 41,570,580 0.81%British American Tobacco plc 1,023,077 39,573,231 0.77%Royal Dutch Shell plc Class A 1,919,622 38,367,135 0.74%Royal Dutch Shell plc Class B 1,745,946 33,742,999 0.65%Reckitt Benckiser Group plc 334,502 29,560,395 0.57%BHP Group plc 991,220 29,166,534 0.57%Anglo American plc 607,776 24,117,858 0.47%RELX plc 907,001 24,044,619 0.47%Prudential plc 1,224,851 23,240,586 0.45%Lloyds Banking Group plc 33,262,200 21,454,085 0.42%National Grid plc 1,663,755 21,163,614 0.41%Vodafone Group plc 12,592,604 21,108,370 0.41%Glencore plc 4,690,602 20,051,840 0.39%Barclays plc 8,150,371 19,266,965 0.37%Compass Group plc 837,841 17,616,167 0.34%London Stock Exchange Group plc 152,438 16,783,662 0.33%
Experian plc 430,743 16,578,090 0.32%Ashtead Group plc 210,731 15,615,373 0.30%Ferguson plc 105,663 14,669,799 0.28%Tesco plc 3,631,586 11,185,077 0.22%BT Group plc 4,167,227 11,168,222 0.22%BAE Systems plc 1,511,113 10,896,891 0.21%Aviva plc 1,849,473 10,370,560 0.20%SSE plc 487,211 10,099,229 0.20%Legal & General Group plc 2,799,770 9,963,304 0.19%Imperial Brands plc 442,454 9,516,821 0.18%Smith & Nephew plc 408,722 8,822,328 0.17%Segro plc REIT 555,283 8,395,862 0.16%Standard Chartered plc 1,252,768 7,978,233 0.15%WPP plc 570,937 7,683,719 0.15%3i Group plc 459,620 7,447,870 0.14%Croda International plc 66,056 6,723,525 0.13%Next plc 61,837 6,710,966 0.13%Halma plc 179,642 6,680,640 0.13%Entain plc 276,816 6,674,922 0.13%
.Number of
SharesFair Value
US Dollars ($)% of Total
Net AssetsSpirax-Sarco Engineering plc 34,849 6,554,554 0.13%Natwest Group plc 2,299,704 6,455,514 0.13%Ocado Group plc 225,875 6,250,061 0.12%Persimmon plc 151,156 6,176,731 0.12%Mondi plc 230,221 6,045,917 0.12%Rentokil Initial plc 861,010 5,887,739 0.11%Intertek Group plc 74,991 5,728,876 0.11%InterContinental Hotels Group plc 85,806 5,701,615 0.11%
Burberry Group plc 191,418 5,463,214 0.11%Rolls-Royce Holdings plc 3,885,381 5,309,491 0.10%Bunzl plc 159,638 5,268,507 0.10%St James's Place plc 255,904 5,221,469 0.10%Associated British Foods plc 165,260 5,059,093 0.10%Kingfisher plc 1,002,984 5,050,411 0.10%Melrose Industries plc 2,305,323 4,939,452 0.10%Informa plc 696,306 4,824,950 0.09%Sage Group plc 506,881 4,790,979 0.09%Barratt Developments plc 482,514 4,633,987 0.09%United Utilities Group plc 324,143 4,363,240 0.08%Smiths Group plc 187,910 4,127,453 0.08%Pearson plc 357,591 4,100,151 0.08%Whitbread plc 93,831 4,046,825 0.08%Auto Trader Group plc 457,432 4,002,578 0.08%Admiral Group plc 90,820 3,944,566 0.08%M&G plc 1,237,510 3,913,179 0.08%Johnson Matthey plc 91,982 3,904,816 0.08%Severn Trent plc 112,749 3,895,485 0.08%WM Morrison Supermarkets plc 1,142,473 3,893,590 0.08%
Standard Life Aberdeen plc 1,021,757 3,825,182 0.07%DCC plc 45,490 3,718,999 0.07%Taylor Wimpey plc 1,690,378 3,711,757 0.07%Hargreaves Lansdown plc 166,834 3,662,213 0.07%Berkeley Group Holdings plc 57,367 3,641,521 0.07%Antofagasta plc 183,187 3,632,729 0.07%Coca-Cola HBC AG 94,727 3,420,696 0.07%Land Securities Group plc REIT 333,483 3,111,501 0.06%JD Sports Fashion plc 243,991 3,097,594 0.06%J Sainsbury plc 773,472 2,904,218 0.06%Schroders plc 58,547 2,841,306 0.06%British Land Co. plc REIT 414,538 2,834,112 0.05%Phoenix Group Holdings plc 300,542 2,808,303 0.05%AVEVA Group plc 54,133 2,772,918 0.05%Hikma Pharmaceuticals plc 81,425 2,751,372 0.05%Direct Line Insurance Group plc 646,137 2,543,927 0.05%Evraz plc 239,625 1,959,697 0.04%test test 1,144,050,061 22.19%Total Equities 5,124,616,338 99.41%Financial Assets at Fair Value Through Profit or Loss 5,124,616,338 99.41%
testNumber of Contracts
Notional Amount
Unrealised Gain/(Loss)
US Dollars ($)% of Total
Net AssetsFinancial Derivative InstrumentsFutures (0.01%) (2020: 0.01%)Swiss Market Index IX September 2021 34 CHF4,073,526 (20,583 ) (0.00 %)FTSE 100 Index September 2021 61 £4,292,877 (48,037 ) (0.00 %)Euro Stoxx 600 Index September 2021 270 €6,140,253 (58,172 ) (0.00 %)Euro Stoxx 50 Index September 2021 240 €9,869,089 (161,150 ) (0.01 %)test test test (287,942 ) (0.01 %)
CurrencyBuy
Amount Currency(Sell)
Amount CounterpartySettlement
Date
Unrealised Gain/(Loss)
US Dollars ($)% of Total
Net AssetsForward Currency Exchange Contracts (0.00%) (2020: 0.00%)USD 7,756,545 CHF (6,950,151) UBS AG 15/9/2021 222,203 0.00 %USD 5,289,742 GBP (3,748,533) JPMorgan Chase Bank 15/9/2021 110,451 0.00 %EUR 6,959,437 CHF (7,578,240) Citibank NA 15/9/2021 51,025 0.00 %EUR 2,954,463 CHF (3,217,050) BNP Paribas 15/9/2021 21,782 0.00 %GBP 11,880,486 EUR (13,809,477) BNP Paribas 15/9/2021 12,532 0.00 %GBP 639,000 EUR (739,414) Morgan Stanley 15/9/2021 4,639 0.00 %

125
Vanguard European Stock Index Fund
CurrencyBuy
Amount Currency(Sell)
Amount CounterpartySettlement
Date
Unrealised Gain/(Loss)
US Dollars ($)% of Total
Net AssetsGBP 980,490 EUR (1,137,766) BNP Paribas 15/9/2021 3,318 0.00 %EUR 655,906 GBP (561,840) JPMorgan Chase Bank 15/9/2021 2,783 0.00 %CHF 216,280 EUR (195,380) JPMorgan Chase Bank 2/7/2021 2,280 0.00 %EUR 113,132 NOK (1,142,238) JPMorgan Chase Bank 15/9/2021 1,597 0.00 %EUR 198,516 CHF (216,280) BNP Paribas 2/7/2021 1,439 0.00 %EUR 89,347 SEK (899,506) Goldman Sachs International 15/9/2021 871 0.00 %GBP 269,100 EUR (312,854) JPMorgan Chase Bank 2/7/2021 735 0.00 %EUR 546,421 CHF (598,350) JPMorgan Chase Bank 15/9/2021 382 0.00 %GBP 423,840 EUR (492,755) JPMorgan Chase Bank 15/9/2021 331 0.00 %GBP 269,100 EUR (312,836) JPMorgan Chase Bank 15/9/2021 232 0.00 %GBP 283,060 EUR (329,085) Goldman Sachs International 15/9/2021 221 0.00 %GBP 281,900 EUR (327,748) Citibank NA 15/9/2021 205 0.00 %CHF 240,440 EUR (219,442) Citibank NA 15/9/2021 2 0.00 %EUR 1,263,170 DKK (9,394,134) HSBC Bank 15/9/2021 (4 ) (0.00 %)GBP 70,200 EUR (81,669) BNP Paribas 15/9/2021 (10 ) (0.00 %)CHF 959,440 EUR (875,710) BNP Paribas 15/9/2021 (62 ) (0.00 %)CHF 594,200 EUR (542,395) BNP Paribas 15/9/2021 (98 ) (0.00 %)EUR 313,272 GBP (269,100) JPMorgan Chase Bank 2/7/2021 (239 ) (0.00 %)CHF 119,290 EUR (109,104) JPMorgan Chase Bank 15/9/2021 (275 ) (0.00 %)CHF 239,540 EUR (218,864) Citibank NA 15/9/2021 (287 ) (0.00 %)CHF 478,760 EUR (437,317) Citibank NA 15/9/2021 (432 ) (0.00 %)CHF 239,680 EUR (219,169) Citibank NA 15/9/2021 (497 ) (0.00 %)GBP 208,035 EUR (242,459) JPMorgan Chase Bank 15/9/2021 (548 ) (0.00 %)CHF 216,280 EUR (198,607) BNP Paribas 15/9/2021 (1,442 ) (0.00 %)GBP 1,612,070 EUR (1,876,936) JPMorgan Chase Bank 15/9/2021 (2,005 ) (0.00 %)CHF 354,750 EUR (325,617) JPMorgan Chase Bank 15/9/2021 (2,191 ) (0.00 %)GBP 489,300 EUR (571,417) Citibank NA 15/9/2021 (2,656 ) (0.00 %)CHF 582,550 EUR (533,965) Morgan Stanley 15/9/2021 (2,714 ) (0.00 %)CHF 1,197,100 EUR (1,095,887) JPMorgan Chase Bank 15/9/2021 (3,946 ) (0.00 %)GBP 1,351,755 EUR (1,576,679) JPMorgan Chase Bank 15/9/2021 (5,041 ) (0.00 %)EUR 4,450,760 GBP (3,830,760) JPMorgan Chase Bank 15/9/2021 (6,400 ) (0.00 %)CHF 1,415,280 EUR (1,301,087) JPMorgan Chase Bank 15/9/2021 (11,159 ) (0.00 %)EUR 10,020,630 GBP (8,640,040) Citibank NA 15/9/2021 (35,555 ) (0.00 %)CHF 15,248,847 EUR (14,002,848) BNP Paribas 15/9/2021 (101,661 ) (0.00 %)EUR 4,699,345 USD (5,718,485) Standard Chartered Bank 15/9/2021 (136,719 ) (0.00 %)EUR 6,051,898 USD (7,364,909) Standard Chartered Bank 15/9/2021 (176,614 ) (0.00 %)test (53,527 ) (0.00 %)Total Financial Derivative Instruments (341,469 ) (0.01 %)
Fair Value US Dollars ($)
% of Total Net Assets
Other Assets and Liabilities 30,947,686 0.60 %Net Assets 5,155,222,555 100.00 %
Analysis of Total Net Assets US Dollars ($)% of Total
Net Assets(a) Transferable securities admitted to an official stock exchange listing 5,115,102,816 99.22 %(b) Transferable securities dealt in on another regulated market — 0.00 %(c) Transferable securities other than those admitted to an official stock exchange listing or dealt in on another regulated
market 9,513,522 0.19 %
(d) Financial derivative instruments (341,469 ) (0.01 %)(e) Other assets and liabilities 30,947,686 0.60 %Total Net Assets 5,155,222,555 100.00 %

The accompanying notes form an integral part of the financial statements.
126
Vanguard European Stock Index Fund
Statement of Assets and Liabilities
US Dollars ($)
As at 30 June 2021
US Dollars ($)
As at 31 December 2020
Current AssetsFinancial Assets at Fair Value Through Profit or Loss 5,124,616,338 5,019,753,390 Financial Derivative Instruments 437,028 2,217,955 Cash 6,163,087 18,174,393 Unrealised Appreciation on Spot Currency Contracts — 162 Receivables: Interest and Dividends 14,159,101 12,955,416 Capital Shares Issued 13,167,546 5,123,058 Investments Sold 2,106,519 — Futures Margin Cash 1,956,203 3,389,564 Cash Collateral 320,000 300,000
Total Current Assets 5,162,925,822 5,061,913,938
Current LiabilitiesFinancial Derivative Instruments 778,497 1,736,594 Bank Overdraft 15,697 10,273 Payables and Other Liabilities: Investments Purchased 4 — Capital Shares Redeemed 6,448,067 4,641,731 Management Fees Payable 461,002 461,595
Total Current Liabilities 7,703,267 6,850,193
Net Assets Attributable to Holders of Redeemable Participating Shares (“Net Assets”) 5,155,222,555 5,055,063,745

127
Vanguard European Stock Index Fund
The accompanying notes form an integral part of the financial statements.
Net Asset Value Per Share
.As at
30 June 2021As at
31 December 2020As at
31 December 2019EUR AccUS ($) Equivalent 2,952,095,643 3,072,686,008 3,159,479,620Net Assets 2,489,329,340 2,511,287,691 2,814,681,198Number of Shares Outstanding 97,614,682 113,806,148 123,590,869Net Asset Value Per Share1 25.50 22.07 22.77
Investor EUR US ($) Equivalent 353,298,445 329,389,480 148,484,669Net Assets 297,915,885 269,208,030 132,280,330Number of Shares Outstanding 11,909,635 12,437,393 5,921,401Net Asset Value Per Share1 25.01 21.65 22.34
Institutional Plus EUR AccUS ($) Equivalent 1,469,637,189 951,271,870 801,092,980Net Assets 1,239,258,959 777,468,746 713,668,585Number of Shares Outstanding 7,159,317 5,191,765 4,619,450Net Asset Value Per Share1 173.10 149.75 154.49
USD AccNet Assets 167,196,787 322,606,723 580,619,391Number of Shares Outstanding 5,530,853 11,953,643 22,721,775Net Asset Value Per Share1 30.23 26.99 25.55
Institutional Plus USD AccNet Assets 212,994,491 379,109,664 74,932,114Number of Shares Outstanding 1,431,588 2,854,719 596,161Net Asset Value Per Share1 148.78 132.80 125.69
1 The net asset value per share shown may diverge from the net asset value per share used for dealing purposes because of any adjustments for swing pricing and trade date accounting.

128
Vanguard European Stock Index Fund
The accompanying notes form an integral part of the financial statements.
Statement of Operations
US Dollars ($)
Six Months Ended 30 June 2021
US Dollars ($)
Six Months Ended 30 June 2020
Investment Income/(Loss) Interest Income 28 5,578 Dividend Income 105,426,220 73,339,890 Securities Lending Income 622,975 612,518 Net Gain/(Loss) on Financial Instruments 473,409,346 (632,487,319)
Total Investment Income/(Loss) 579,458,569 (558,529,333)
Expenses Management Fees 2,723,803 2,259,681 Transaction Fees and Commissions 566,528 650,699
Total Expenses 3,290,331 2,910,380
Finance Costs Interest Expense 86,175 89,111
Total Finance Costs 86,175 89,111
Net Investment Income/(Loss) 576,082,063 (561,528,824)
Foreign Withholding Tax (9,492,269) (9,216,531)
Net Increase/(Decrease) in Net Assets 566,589,794 (570,745,355)
Statement of Changes in Net Assets
US Dollars ($)
US Dollars ($)
Six Months Ended Six Months Ended30 June 2021 30 June 2020
Increase/(Decrease) in Net Assets
Net Increase/(Decrease) in Net Assets From Operations 566,589,794 (570,745,355)
Capital Transactions Subscriptions 1,124,847,753 1,014,855,181 Redemptions (1,591,278,737) (1,111,152,531)
Total Capital Transactions (466,430,984) (96,297,350)
Total Increase/(Decrease) for the Period 100,158,810 (667,042,705)
Net AssetsBeginning of Period 5,055,063,745 4,799,898,916
End of Period 5,155,222,555 4,132,856,211

Vanguard Eurozone Stock Index FundManaged by Vanguard Global Advisers, LLC.
129
Investment ObjectiveThe fund seeks to provide long-term growth of capital by tracking the performance of the MSCI EMU Index, a market-capitalisation-weighted index of common stocks designed to capture 85% of the underlying euro zone countries' market capitalisation.
Performance SummaryThe Performance Summary does not form part of the Financial Statements.
• As the six months ended 30 June 2021 came to a close, macroeconomic indicators signalled a faster global economic rebound than many had expected after the sharpest contraction in modern history. Yet the recovery has been uneven. Countries that have contained the virus more successfully, whether through vaccinations, lockdowns or both, generally have fared better economically. And the COVID-19 pandemic remained far from over, with new variants of the virus surfacing where vaccination rates have lagged and the human toll continuing to mount, especially in less developed economies.
• Swift and extensive support from governments and central banks has been a key to the rebound. So far in 2021, it has included fiscal stimulus – including the $1.9 trillion American Rescue Plan in the United States and the €673 billion Recovery and Resilience Facility in Europe – and pledges by a number of central banks to keep interest rates low for some time.
• Fixed income prices worldwide generally fell and longer-term yields rose amid concerns about inflation, resulting in negative returns for the six months.
• Stock markets continued the rally that began in 2020, bolstered by reopening economies, more consumer spending and rising corporate profits. Returns in the United States and Europe outpaced those in emerging markets and the Pacific region.
• For the period, the fund’s benchmark returned 15.27%. The benchmark got strong contributions from most sectors, notably consumer discretionary, financials, information technology and industrials. Utilities, the only sector with a negative return, detracted from performance.
• Among markets, France was the most notable contributor to return, followed by Germany and the Netherlands. Portugal was the only market to detract from performance.
All returns in the commentary above are in euros.
Benchmark: MSCI EMU Index
Total ReturnsPeriods Ended 30 June 2021
(Annualised for periods over one year)
Six Months Five YearsTen Years or
Since Inception1
EUR Acc 15.63 % 10.49 % 7.64 %
Benchmark 15.27 10.10 7.29
Tracking Difference* 0.36
Investor EUR 15.63 % 10.46 % 7.58 %
Benchmark 15.27 10.10 7.29
Tracking Difference* 0.36
Institutional Plus EUR Acc 15.65 % 10.58 % 7.76 %
Benchmark 15.27 10.10 7.31
Tracking Difference* 0.38
USD Acc 12.07 % 11.94 % 5.37 %
Benchmark 11.73 11.55 4.98
Tracking Difference* 0.34
Institutional Plus USD Acc 12.09 % 12.03 % 5.45 %
Benchmark 11.73 11.55 4.98
Tracking Difference* 0.36
Each benchmark is in its respective currency.Sources: Vanguard Global Advisers, LLC, and MSCI.Performance is based on NAV with net income reinvested.
All of the returns in this report represent past performance, which is not a guarantee of future results that may be achieved by the fund. For performance data current to the most recent month-end, which may be higher or lower than that cited, visit our website at http://global.vanguard.com. Note, too, that both investment returns and principal value can fluctuate widely, so an investor's shares, when sold, could be worth more or less than their original cost.* The tracking difference between the fund return and the index return over a stated period of time can be attributed to a number of factors, including, without limitation, small differences in
weightings, trading activity, transaction costs and differences in the valuation and withholding tax treatment between the fund and the index vendor.1 Since-inception returns: Institutional Plus EUR Acc, 2 September 2014; USD Acc and Institutional Plus USD Acc, 27 February 2014.

Significant Portfolio ChangesFor the Six Months Ended 30 June 2021
130
Vanguard Eurozone Stock Index Fund
The Central Bank of Ireland requires a schedule of material changes in the composition of the portfolio during the period. These are defined as aggregate purchases of a security exceeding 1% of the total value of purchases for the period and aggregate disposals greater than 1% of the total value of sales. At a minimum, the largest 20 purchases and 20 sales must be shown; all purchases and sales must be shown if there are fewer than 20. A full listing of the portfolio changes for the period is available, upon request, at no extra cost from the Administrator.
SharesCost
Euro (€)
Purchases
ASM International NV 19,325 4,322,417EDP Renovaveis SA 108,421 2,120,715Just Eat Takeaway.com NV 23,357 1,808,187Cellnex Telecom SA 27,388 1,354,000Adyen NV 684 1,290,092Delivery Hero SE 11,175 1,288,959Safran SA 9,968 1,190,663InPost SA 75,444 1,145,994ASML Holding NV 2,470 1,139,535Danone SA 16,629 956,094CaixaBank SA 348,913 906,090Kinnevik AB 49,769 862,580LVMH Moet Hennessy Louis Vuitton
SE 1,622 814,082STMicroelectronics NV 20,918 641,663SAP SE 5,994 632,487Vinci SA 7,180 627,813Deutsche Bank AG 50,830 580,712Siemens AG 4,438 569,662HelloFresh SE 7,589 553,492Sanofi 6,455 526,083TotalEnergies SE 14,804 523,321Zalando SE (XETR) 5,784 519,872Sampo OYJ Class A 13,420 515,103
SharesProceeds
Euro (€)
Sales
ASML Holding NV 42,224 20,497,444LVMH Moet Hennessy Louis Vuitton
SE 26,123 14,887,705SAP SE 98,187 10,651,880Siemens AG 71,963 9,525,346TotalEnergies SE 244,918 9,366,432Sanofi 106,375 8,713,927Allianz SE 40,905 8,387,779L’Oreal SA (XPAR) 23,567 7,735,581Iberdrola SA 696,598 7,734,970Schneider Electric SE 50,777 6,453,782Enel SpA 762,657 6,297,168Air Liquide SA (XPAR) 44,431 6,103,075BASF SE 86,185 5,780,486Daimler AG 80,406 5,472,292Airbus SE 55,340 5,397,129BNP Paribas SA 105,911 5,119,811Adidas AG 17,910 5,035,224Deutsche Telekom AG 311,133 4,998,637Bayer AG 92,248 4,787,053Banco Santander SA 1,630,741 4,702,624Kering SA 7,405 4,601,353

Financial StatementsStatement of Investments30 June 2021
131
Vanguard Eurozone Stock Index Fund
.Number of
SharesFair Value
EUR (€)% of Total
Net AssetsEquities 99.89% (2020: 98.98%)Austria 0.58% (2020: 0.53%)Erste Group Bank AG 98,716 3,054,273 0.18%OMV AG 51,882 2,488,779 0.15%Verbund AG 24,369 1,892,253 0.11%Voestalpine AG 41,555 1,426,999 0.08%Raiffeisen Bank International AG 52,528 1,003,285 0.06%
test test 9,865,589 0.58%Belgium 2.85% (2020: 3.01%)Anheuser-Busch InBev SA 270,761 16,464,976 0.98%KBC Group NV 88,812 5,710,612 0.34%Argenx SE 16,238 4,142,314 0.25%UCB SA 44,739 3,944,190 0.23%Groupe Bruxelles Lambert SA 40,068 3,780,015 0.22%
Umicore SA 69,670 3,588,005 0.21%Ageas SA 61,860 2,895,048 0.17%Solvay SA 26,148 2,803,066 0.17%Sofina SA 5,519 2,007,812 0.12%Elia Group SA 10,901 970,189 0.06%Etablissements Franz Colruyt NV 19,082 899,907 0.05%
Proximus SADP 53,508 871,645 0.05%test test 48,077,779 2.85%Finland 3.17% (2020: 3.22%)Nokia OYJ 1,915,142 8,647,824 0.51%Kone OYJ Class B 120,676 8,302,509 0.49%Neste OYJ 150,289 7,760,924 0.46%Sampo OYJ Class A 177,018 6,861,218 0.41%UPM-Kymmene OYJ 189,350 6,040,265 0.36%Fortum OYJ 157,196 3,656,379 0.22%Stora Enso OYJ Class R 208,082 3,201,342 0.19%Kesko OYJ Class B 97,758 3,045,162 0.18%Elisa OYJ 50,139 2,522,994 0.15%Wartsila OYJ Abp 169,292 2,118,689 0.12%Orion OYJ Class B 38,002 1,377,572 0.08%test test 53,534,878 3.17%France 34.51% (2020: 34.02%)LVMH Moet Hennessy Louis Vuitton SE 98,626 65,221,374 3.86%
Sanofi 402,526 35,567,197 2.10%TotalEnergies SE 887,413 33,859,243 2.00%Schneider Electric SE 191,301 25,381,817 1.50%L’Oreal SA (Prime De Fidelite) 66,031 24,814,450 1.47%
Airbus SE 208,909 22,654,092 1.34%BNP Paribas SA 399,467 21,119,820 1.25%Kering SA 26,648 19,639,576 1.16%Air Liquide SA (Prime De Fidelite) 127,236 18,787,668 1.11%
Vinci SA 189,065 17,013,959 1.01%EssilorLuxottica SA 101,368 15,776,915 0.93%AXA SA 687,025 14,692,030 0.87%Safran SA 121,409 14,195,140 0.84%Pernod Ricard SA 74,413 13,930,114 0.82%Hermes International 11,253 13,824,310 0.82%Danone SA 231,703 13,756,207 0.81%Cie de Saint-Gobain 179,702 9,980,649 0.59%Dassault Systemes SE 46,917 9,594,526 0.57%Capgemini SE 56,940 9,224,280 0.55%Legrand SA 94,922 8,472,738 0.50%Cie Generale des Etablissements Michelin SCA 60,095 8,082,777 0.48%
STMicroelectronics NV 242,595 7,424,620 0.44%
.Number of
SharesFair Value
EUR (€)% of Total
Net AssetsVivendi SE 252,738 7,160,068 0.42%Societe Generale SA 287,657 7,151,153 0.42%Teleperformance 20,851 7,137,297 0.42%Orange SA 708,368 6,810,958 0.40%Worldline SA 84,353 6,658,826 0.39%ArcelorMittal SA 254,407 6,576,421 0.39%Engie SA (Prime De Fidelite) 477,056 5,511,905 0.33%Credit Agricole SA 413,846 4,889,177 0.29%Veolia Environnement SA 191,113 4,867,648 0.29%Eurofins Scientific SE 47,320 4,561,648 0.27%Publicis Groupe SA 79,007 4,261,638 0.25%Alstom SA 98,587 4,198,820 0.25%Edenred 87,371 4,198,177 0.25%L’Oreal SA 10,852 4,078,182 0.24%L’Oreal SA (XPAR) 10,732 4,033,086 0.24%Sartorius Stedim Biotech 9,782 3,902,040 0.23%Carrefour SA 216,965 3,598,365 0.21%Thales SA 37,755 3,248,440 0.19%Unibail-Rodamco-Westfield REIT 43,613 3,183,313 0.19%
Air Liquide SA (XPAR) 19,447 2,871,544 0.17%Bureau Veritas SA 105,182 2,806,256 0.17%Eiffage SA 29,813 2,557,955 0.15%Bouygues SA 81,785 2,550,874 0.15%Air Liquide SA - EUR 16,846 2,487,480 0.15%Suez SA 123,783 2,481,849 0.15%Renault SA 68,714 2,342,117 0.14%Arkema SA 21,966 2,324,003 0.14%Gecina SA REIT 16,431 2,122,885 0.13%Valeo SA 82,025 2,080,974 0.12%Getlink SE 157,407 2,069,902 0.12%Orpea SA 18,501 1,984,232 0.12%Ubisoft Entertainment SA 33,126 1,955,759 0.12%Accor SA 60,751 1,913,049 0.11%Atos SE 35,418 1,816,943 0.11%Electricite de France SA (Prime De Fidelite) 152,901 1,761,419 0.10%
La Francaise des Jeux SAEM 34,189 1,695,091 0.10%
Amundi SA 21,734 1,615,923 0.10%Klepierre SA REIT 73,833 1,604,391 0.10%SCOR SE 56,736 1,521,659 0.09%BioMerieux 14,824 1,452,752 0.09%Bollore SA 316,411 1,430,178 0.09%Remy Cointreau SA 8,135 1,416,303 0.08%Sodexo SA (Prime De Fidelite 2022) 17,491 1,376,542 0.08%
Covivio REIT 18,607 1,341,937 0.08%Faurecia SE (XPAR) 32,220 1,332,941 0.08%Ipsen SA 13,468 1,181,413 0.07%Aeroports de Paris 10,616 1,166,168 0.07%Wendel SE 9,532 1,080,929 0.06%SEB SA (Prime De Fidelite) 6,342 966,521 0.06%Engie SA 78,884 911,426 0.05%Engie SA (XPAR) 76,977 889,392 0.05%Eurazeo SE 12,028 884,058 0.05%Dassault Aviation SA 874 867,008 0.05%CNP Assurances 59,810 858,273 0.05%Sodexo SA - EUR 10,370 816,119 0.05%L’Oreal SA - EUR 1,902 714,772 0.04%Air Liquide SA 4,722 697,250 0.04%Iliad SA 5,280 651,552 0.04%Faurecia SE 10,800 445,500 0.03%SEB SA (XPAR) 2,146 327,050 0.02%Sodexo SA (XPAR) 3,083 242,632 0.01%SEB SA - EUR 1,258 191,719 0.01%
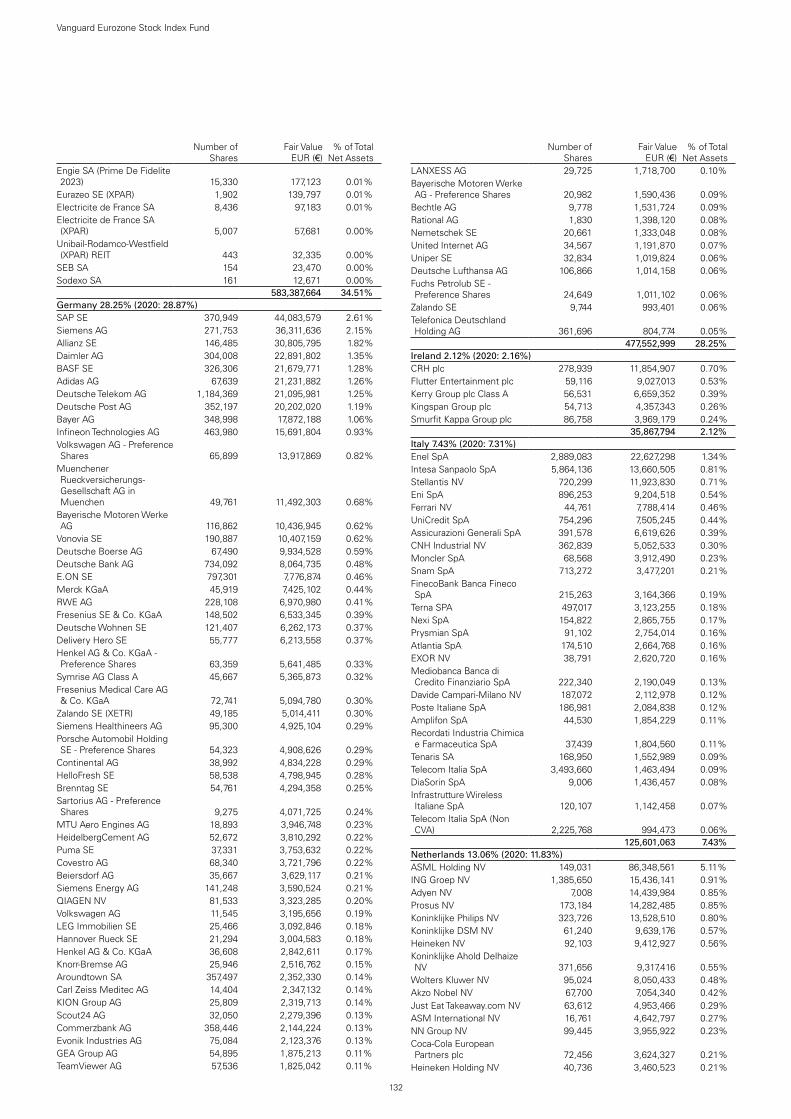
132
Vanguard Eurozone Stock Index Fund
.Number of
SharesFair Value
EUR (€)% of Total
Net AssetsEngie SA (Prime De Fidelite 2023) 15,330 177,123 0.01%
Eurazeo SE (XPAR) 1,902 139,797 0.01%Electricite de France SA 8,436 97,183 0.01%Electricite de France SA (XPAR) 5,007 57,681 0.00%
Unibail-Rodamco-Westfield (XPAR) REIT 443 32,335 0.00%
SEB SA 154 23,470 0.00%Sodexo SA 161 12,671 0.00%test test 583,387,664 34.51%Germany 28.25% (2020: 28.87%)SAP SE 370,949 44,083,579 2.61%Siemens AG 271,753 36,311,636 2.15%Allianz SE 146,485 30,805,795 1.82%Daimler AG 304,008 22,891,802 1.35%BASF SE 326,306 21,679,771 1.28%Adidas AG 67,639 21,231,882 1.26%Deutsche Telekom AG 1,184,369 21,095,981 1.25%Deutsche Post AG 352,197 20,202,020 1.19%Bayer AG 348,998 17,872,188 1.06%Infineon Technologies AG 463,980 15,691,804 0.93%Volkswagen AG - Preference Shares 65,899 13,917,869 0.82%
Muenchener Rueckversicherungs-Gesellschaft AG in Muenchen 49,761 11,492,303 0.68%
Bayerische Motoren Werke AG 116,862 10,436,945 0.62%
Vonovia SE 190,887 10,407,159 0.62%Deutsche Boerse AG 67,490 9,934,528 0.59%Deutsche Bank AG 734,092 8,064,735 0.48%E.ON SE 797,301 7,776,874 0.46%Merck KGaA 45,919 7,425,102 0.44%RWE AG 228,108 6,970,980 0.41%Fresenius SE & Co. KGaA 148,502 6,533,345 0.39%Deutsche Wohnen SE 121,407 6,262,173 0.37%Delivery Hero SE 55,777 6,213,558 0.37%Henkel AG & Co. KGaA - Preference Shares 63,359 5,641,485 0.33%
Symrise AG Class A 45,667 5,365,873 0.32%Fresenius Medical Care AG & Co. KGaA 72,741 5,094,780 0.30%
Zalando SE (XETR) 49,185 5,014,411 0.30%Siemens Healthineers AG 95,300 4,925,104 0.29%Porsche Automobil Holding SE - Preference Shares 54,323 4,908,626 0.29%
Continental AG 38,992 4,834,228 0.29%HelloFresh SE 58,538 4,798,945 0.28%Brenntag SE 54,761 4,294,358 0.25%Sartorius AG - Preference Shares 9,275 4,071,725 0.24%
MTU Aero Engines AG 18,893 3,946,748 0.23%HeidelbergCement AG 52,672 3,810,292 0.22%Puma SE 37,331 3,753,632 0.22%Covestro AG 68,340 3,721,796 0.22%Beiersdorf AG 35,667 3,629,117 0.21%Siemens Energy AG 141,248 3,590,524 0.21%QIAGEN NV 81,533 3,323,285 0.20%Volkswagen AG 11,545 3,195,656 0.19%LEG Immobilien SE 25,466 3,092,846 0.18%Hannover Rueck SE 21,294 3,004,583 0.18%Henkel AG & Co. KGaA 36,608 2,842,611 0.17%Knorr-Bremse AG 25,946 2,516,762 0.15%Aroundtown SA 357,497 2,352,330 0.14%Carl Zeiss Meditec AG 14,404 2,347,132 0.14%KION Group AG 25,809 2,319,713 0.14%Scout24 AG 32,050 2,279,396 0.13%Commerzbank AG 358,446 2,144,224 0.13%Evonik Industries AG 75,084 2,123,376 0.13%GEA Group AG 54,895 1,875,213 0.11%TeamViewer AG 57,536 1,825,042 0.11%
.Number of
SharesFair Value
EUR (€)% of Total
Net AssetsLANXESS AG 29,725 1,718,700 0.10%Bayerische Motoren Werke AG - Preference Shares 20,982 1,590,436 0.09%
Bechtle AG 9,778 1,531,724 0.09%Rational AG 1,830 1,398,120 0.08%Nemetschek SE 20,661 1,333,048 0.08%United Internet AG 34,567 1,191,870 0.07%Uniper SE 32,834 1,019,824 0.06%Deutsche Lufthansa AG 106,866 1,014,158 0.06%Fuchs Petrolub SE - Preference Shares 24,649 1,011,102 0.06%
Zalando SE 9,744 993,401 0.06%Telefonica Deutschland Holding AG 361,696 804,774 0.05%
test test 477,552,999 28.25%Ireland 2.12% (2020: 2.16%)CRH plc 278,939 11,854,907 0.70%Flutter Entertainment plc 59,116 9,027,013 0.53%Kerry Group plc Class A 56,531 6,659,352 0.39%Kingspan Group plc 54,713 4,357,343 0.26%Smurfit Kappa Group plc 86,758 3,969,179 0.24%test test 35,867,794 2.12%Italy 7.43% (2020: 7.31%)Enel SpA 2,889,083 22,627,298 1.34%Intesa Sanpaolo SpA 5,864,136 13,660,505 0.81%Stellantis NV 720,299 11,923,830 0.71%Eni SpA 896,253 9,204,518 0.54%Ferrari NV 44,761 7,788,414 0.46%UniCredit SpA 754,296 7,505,245 0.44%Assicurazioni Generali SpA 391,578 6,619,626 0.39%CNH Industrial NV 362,839 5,052,533 0.30%Moncler SpA 68,568 3,912,490 0.23%Snam SpA 713,272 3,477,201 0.21%FinecoBank Banca Fineco SpA 215,263 3,164,366 0.19%
Terna SPA 497,017 3,123,255 0.18%Nexi SpA 154,822 2,865,755 0.17%Prysmian SpA 91,102 2,754,014 0.16%Atlantia SpA 174,510 2,664,768 0.16%EXOR NV 38,791 2,620,720 0.16%Mediobanca Banca di Credito Finanziario SpA 222,340 2,190,049 0.13%
Davide Campari-Milano NV 187,072 2,112,978 0.12%Poste Italiane SpA 186,981 2,084,838 0.12%Amplifon SpA 44,530 1,854,229 0.11%Recordati Industria Chimica e Farmaceutica SpA 37,439 1,804,560 0.11%
Tenaris SA 168,950 1,552,989 0.09%Telecom Italia SpA 3,493,660 1,463,494 0.09%DiaSorin SpA 9,006 1,436,457 0.08%Infrastrutture Wireless Italiane SpA 120,107 1,142,458 0.07%
Telecom Italia SpA (Non CVA) 2,225,768 994,473 0.06%
test test 125,601,063 7.43%Netherlands 13.06% (2020: 11.83%)ASML Holding NV 149,031 86,348,561 5.11%ING Groep NV 1,385,650 15,436,141 0.91%Adyen NV 7,008 14,439,984 0.85%Prosus NV 173,184 14,282,485 0.85%Koninklijke Philips NV 323,726 13,528,510 0.80%Koninklijke DSM NV 61,240 9,639,176 0.57%Heineken NV 92,103 9,412,927 0.56%Koninklijke Ahold Delhaize NV 371,656 9,317,416 0.55%
Wolters Kluwer NV 95,024 8,050,433 0.48%Akzo Nobel NV 67,700 7,054,340 0.42%Just Eat Takeaway.com NV 63,612 4,953,466 0.29%ASM International NV 16,761 4,642,797 0.27%NN Group NV 99,445 3,955,922 0.23%Coca-Cola European Partners plc 72,456 3,624,327 0.21%
Heineken Holding NV 40,736 3,460,523 0.21%
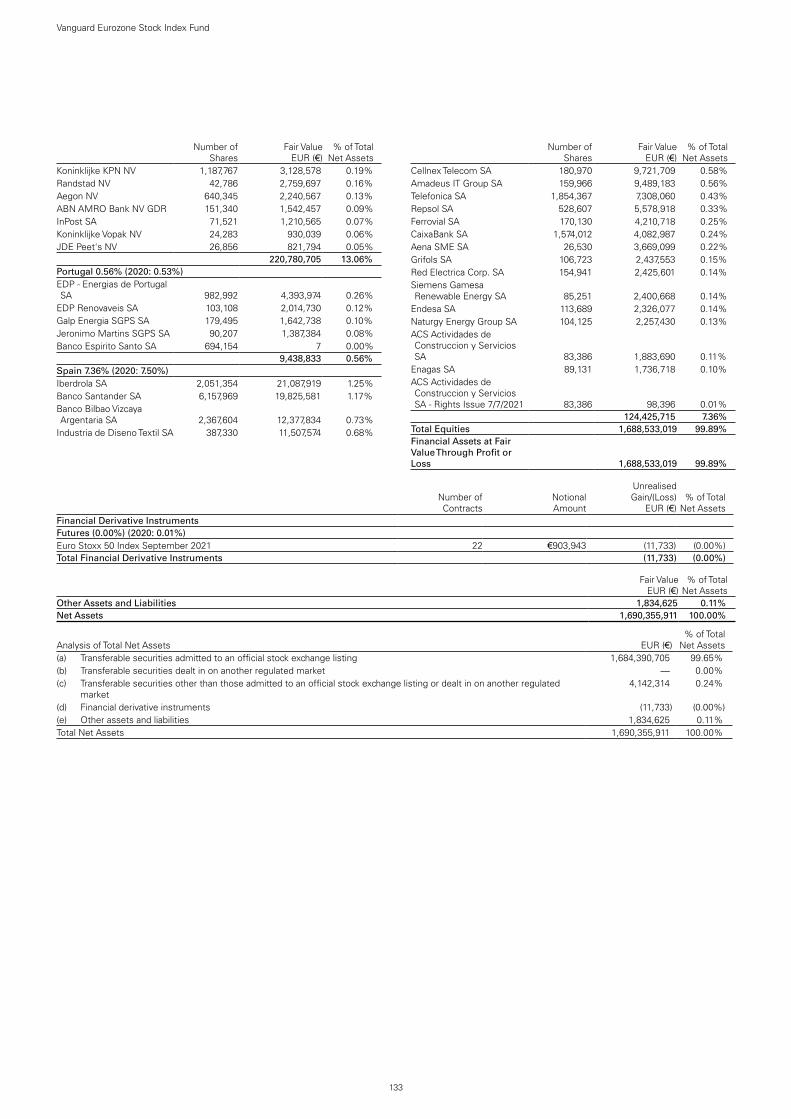
133
Vanguard Eurozone Stock Index Fund
.Number of
SharesFair Value
EUR (€)% of Total
Net AssetsKoninklijke KPN NV 1,187,767 3,128,578 0.19%Randstad NV 42,786 2,759,697 0.16%Aegon NV 640,345 2,240,567 0.13%ABN AMRO Bank NV GDR 151,340 1,542,457 0.09%InPost SA 71,521 1,210,565 0.07%Koninklijke Vopak NV 24,283 930,039 0.06%JDE Peet's NV 26,856 821,794 0.05%test test 220,780,705 13.06%Portugal 0.56% (2020: 0.53%)EDP - Energias de Portugal SA 982,992 4,393,974 0.26%
EDP Renovaveis SA 103,108 2,014,730 0.12%Galp Energia SGPS SA 179,495 1,642,738 0.10%Jeronimo Martins SGPS SA 90,207 1,387,384 0.08%Banco Espirito Santo SA 694,154 7 0.00%test test 9,438,833 0.56%Spain 7.36% (2020: 7.50%)Iberdrola SA 2,051,354 21,087,919 1.25%Banco Santander SA 6,157,969 19,825,581 1.17%Banco Bilbao Vizcaya Argentaria SA 2,367,604 12,377,834 0.73%
Industria de Diseno Textil SA 387,330 11,507,574 0.68%
.Number of
SharesFair Value
EUR (€)% of Total
Net AssetsCellnex Telecom SA 180,970 9,721,709 0.58%Amadeus IT Group SA 159,966 9,489,183 0.56%Telefonica SA 1,854,367 7,308,060 0.43%Repsol SA 528,607 5,578,918 0.33%Ferrovial SA 170,130 4,210,718 0.25%CaixaBank SA 1,574,012 4,082,987 0.24%Aena SME SA 26,530 3,669,099 0.22%Grifols SA 106,723 2,437,553 0.15%Red Electrica Corp. SA 154,941 2,425,601 0.14%Siemens Gamesa Renewable Energy SA 85,251 2,400,668 0.14%
Endesa SA 113,689 2,326,077 0.14%Naturgy Energy Group SA 104,125 2,257,430 0.13%ACS Actividades de Construccion y Servicios SA 83,386 1,883,690 0.11%
Enagas SA 89,131 1,736,718 0.10%ACS Actividades de Construccion y Servicios SA - Rights Issue 7/7/2021 83,386 98,396 0.01%
test test 124,425,715 7.36%Total Equities 1,688,533,019 99.89%Financial Assets at Fair Value Through Profit or Loss 1,688,533,019 99.89%
testNumber of Contracts
Notional Amount
Unrealised Gain/(Loss)
EUR (€)% of Total
Net AssetsFinancial Derivative InstrumentsFutures (0.00%) (2020: 0.01%)Euro Stoxx 50 Index September 2021 22 €903,943 (11,733 ) (0.00 %)Total Financial Derivative Instruments (11,733 ) (0.00 %)
Fair Value EUR (€)
% of Total Net Assets
Other Assets and Liabilities 1,834,625 0.11 %Net Assets 1,690,355,911 100.00 %
Analysis of Total Net Assets EUR (€)% of Total
Net Assets(a) Transferable securities admitted to an official stock exchange listing 1,684,390,705 99.65 %(b) Transferable securities dealt in on another regulated market — 0.00 %(c) Transferable securities other than those admitted to an official stock exchange listing or dealt in on another regulated
market 4,142,314 0.24 %
(d) Financial derivative instruments (11,733 ) (0.00 %)(e) Other assets and liabilities 1,834,625 0.11 %Total Net Assets 1,690,355,911 100.00 %
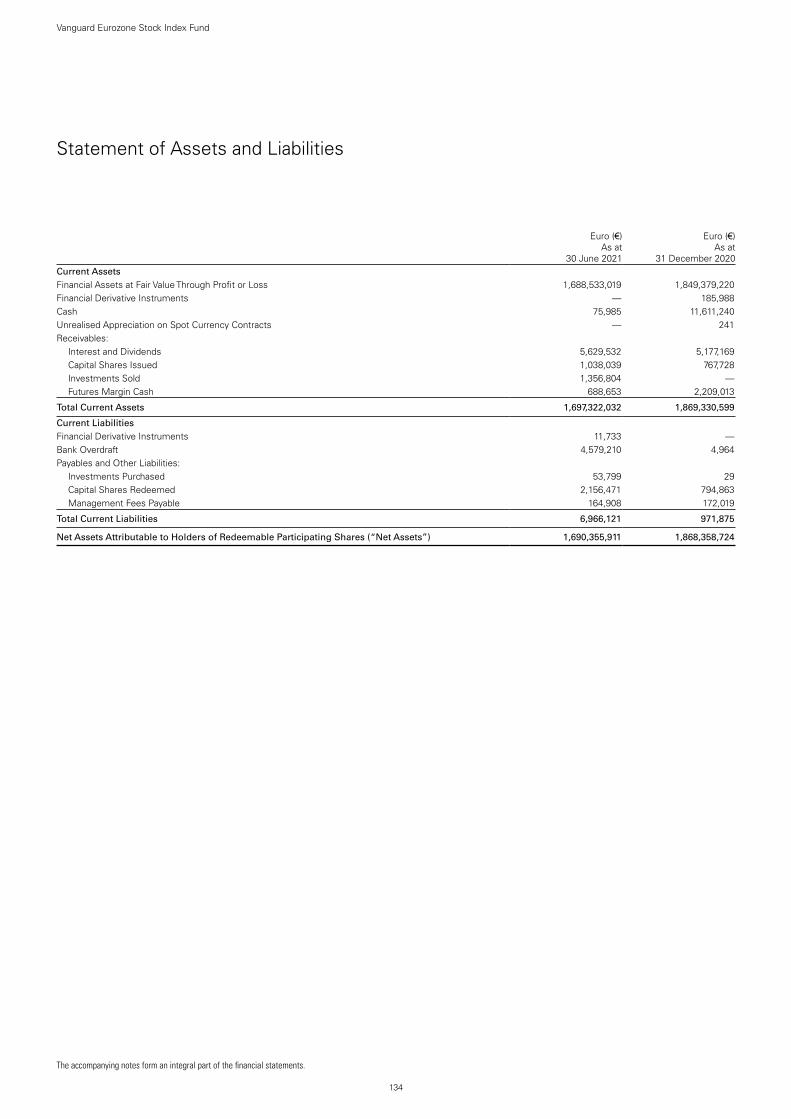
The accompanying notes form an integral part of the financial statements.
134
Vanguard Eurozone Stock Index Fund
Statement of Assets and Liabilities
Euro (€)
As at 30 June 2021
Euro (€)
As at 31 December 2020
Current AssetsFinancial Assets at Fair Value Through Profit or Loss 1,688,533,019 1,849,379,220 Financial Derivative Instruments — 185,988 Cash 75,985 11,611,240 Unrealised Appreciation on Spot Currency Contracts — 241 Receivables: Interest and Dividends 5,629,532 5,177,169 Capital Shares Issued 1,038,039 767,728 Investments Sold 1,356,804 — Futures Margin Cash 688,653 2,209,013
Total Current Assets 1,697,322,032 1,869,330,599
Current LiabilitiesFinancial Derivative Instruments 11,733 — Bank Overdraft 4,579,210 4,964 Payables and Other Liabilities: Investments Purchased 53,799 29 Capital Shares Redeemed 2,156,471 794,863 Management Fees Payable 164,908 172,019
Total Current Liabilities 6,966,121 971,875
Net Assets Attributable to Holders of Redeemable Participating Shares (“Net Assets”) 1,690,355,911 1,868,358,724

135
Vanguard Eurozone Stock Index Fund
The accompanying notes form an integral part of the financial statements.
Net Asset Value Per Share
. As at 30 June 2021
As at 31 December 2020
As at 31 December 2019
EUR AccNet Assets 1,295,327,275 1,306,383,548 1,305,756,896Number of Shares Outstanding 5,149,462 6,003,698 5,955,718Net Asset Value Per Share1 251.55 217.60 219.24
Investor EUR Net Assets 68,728,035 72,818,651 104,836,563Number of Shares Outstanding 315,462 386,387 552,098Net Asset Value Per Share1 217.86 188.46 189.89
Institutional Plus EUR AccNet Assets 291,228,608 482,580,036 438,852,785Number of Shares Outstanding 1,748,709 3,350,463 3,025,183Net Asset Value Per Share1 166.54 144.03 145.07
USD AccEUR (€) Equivalent 30,970,997 3,411,151 834,195Net Assets 36,728,505 4,173,714 936,384Number of Shares Outstanding 123,109 15,675 3,804Net Asset Value Per Share1 298.34 266.27 246.16
Institutional Plus USD AccEUR (€) Equivalent 4,100,996 3,165,338 1,810,734Net Assets 4,863,371 3,872,949 2,032,549Number of Shares Outstanding 32,942 29,399 16,698Net Asset Value Per Share1 147.63 131.74 121.72
1 The net asset value per share shown may diverge from the net asset value per share used for dealing purposes because of any adjustments for swing pricing and trade date accounting.
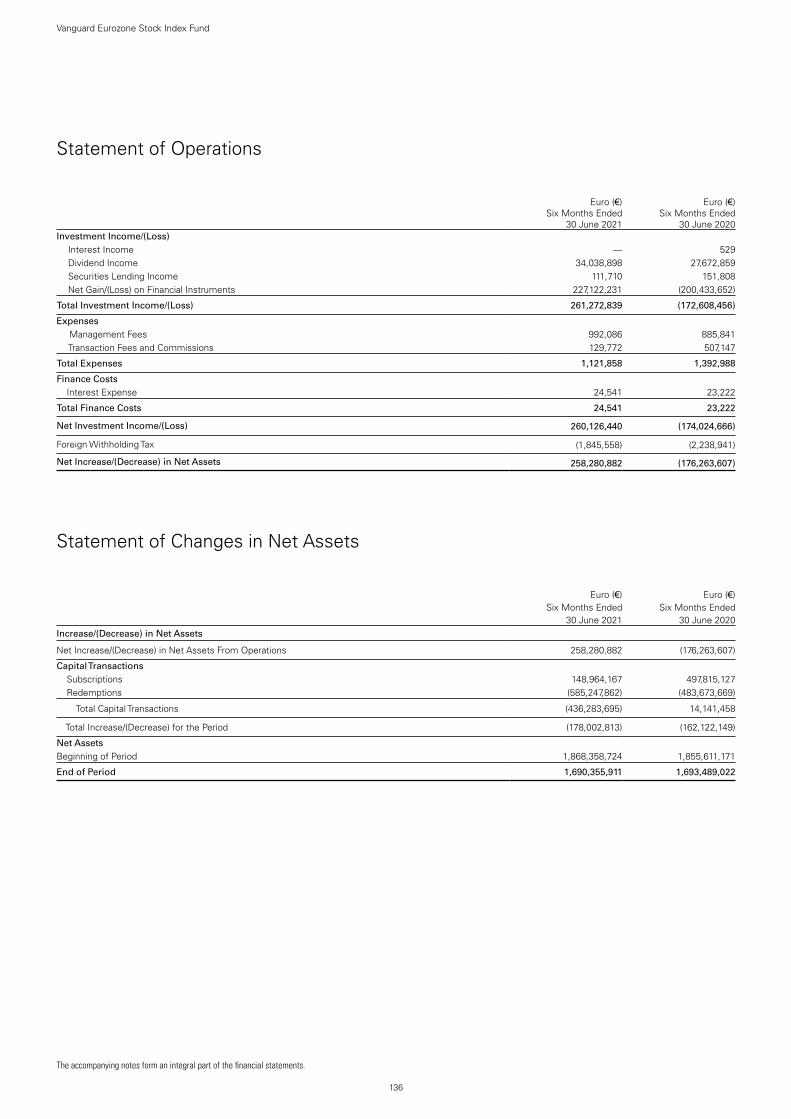
136
Vanguard Eurozone Stock Index Fund
The accompanying notes form an integral part of the financial statements.
Statement of Operations
Euro (€)
Six Months Ended 30 June 2021
Euro (€)
Six Months Ended 30 June 2020
Investment Income/(Loss) Interest Income — 529 Dividend Income 34,038,898 27,672,859 Securities Lending Income 111,710 151,808 Net Gain/(Loss) on Financial Instruments 227,122,231 (200,433,652)
Total Investment Income/(Loss) 261,272,839 (172,608,456)
Expenses Management Fees 992,086 885,841 Transaction Fees and Commissions 129,772 507,147
Total Expenses 1,121,858 1,392,988
Finance Costs Interest Expense 24,541 23,222
Total Finance Costs 24,541 23,222
Net Investment Income/(Loss) 260,126,440 (174,024,666)
Foreign Withholding Tax (1,845,558) (2,238,941)
Net Increase/(Decrease) in Net Assets 258,280,882 (176,263,607)
Statement of Changes in Net Assets
Euro (€)
Euro (€)
Six Months Ended Six Months Ended30 June 2021 30 June 2020
Increase/(Decrease) in Net Assets
Net Increase/(Decrease) in Net Assets From Operations 258,280,882 (176,263,607)
Capital Transactions Subscriptions 148,964,167 497,815,127 Redemptions (585,247,862) (483,673,669)
Total Capital Transactions (436,283,695) 14,141,458
Total Increase/(Decrease) for the Period (178,002,813) (162,122,149)
Net AssetsBeginning of Period 1,868,358,724 1,855,611,171
End of Period 1,690,355,911 1,693,489,022

Significant Portfolio ChangesFor the Period Ended 30 June 2021
137
Vanguard Global Enhanced Equity FundVanguard Global Enhanced Equity Fund was fully redeemed during the period.
The Central Bank of Ireland requires a schedule of material changes in the composition of the portfolio during the period. These are defined as aggregate purchases of a security exceeding 1% of the total value of purchases for the period and aggregate disposals greater than 1% of the total value of sales. At a minimum, the largest 20 purchases and 20 sales must be shown; all purchases and sales must be shown if there are fewer than 20. A full listing of the portfolio changes for the period is available, upon request, at no extra cost from the Administrator.
SharesProceeds
US Dollars ($)
Sales
Apple, Inc. 2,733 352,683Microsoft Corp. 1,208 258,839Alphabet, Inc. Class C 109 190,620Amazon.com, Inc. 51 159,289Facebook, Inc. Class A 496 123,614JPMorgan Chase & Co. 776 108,691Tesla, Inc. 117 97,764Nestle SA 779 88,158Intel Corp. 1,521 86,596Bank of America Corp. 2,539 85,544Home Depot, Inc. 313 84,128Roche Holding AG 226 78,621Verizon Communications, Inc. 1,319 75,471Merck & Co., Inc. 896 74,276Novartis AG 790 74,002QUALCOMM, Inc. 453 72,225Royal Dutch Shell plc Class A 3,512 71,423Citigroup, Inc. 1,003 68,391Texas Instruments, Inc. 398 68,194Eli Lilly & Co. 345 64,361

The accompanying notes form an integral part of the financial statements.
138
Vanguard Global Enhanced Equity Fund
Statement of Assets and Liabilities
US Dollars ($)
As at 30 June 2021*
US Dollars ($)
As at 31 December 2020
Current AssetsFinancial Assets at Fair Value Through Profit or Loss — 7,167,261 Financial Derivative Instruments — 6,125 Cash — 61,886 Unrealised Appreciation on Spot Currency Contracts — 1,597 Receivables: Interest and Dividends — 130,516 Investments Sold — 3,680,881 Futures Margin Cash — 20,330
Total Current Assets — 11,068,596
Current LiabilitiesBank Overdraft — 25 Payables and Other Liabilities: Capital Shares Redeemed — 3,685,065 Management Fees Payable — 7,665
Total Current Liabilities — 3,692,755
Net Assets Attributable to Holders of Redeemable Participating Shares (“Net Assets”) — 7,375,841
Net Asset Value Per Share
.As at
30 June 2021As at
31 December 2020As at
31 December 2019Institutional USD Net Assets — 7,375,841 239,739,615Number of Shares Outstanding — 36,944 1,237,271Net Asset Value Per Share1 — 199.65 193.76
* The Fund liquidated on 14 January 2021.1 The net asset value per share shown may diverge from the net asset value per share used for dealing purposes because of any adjustments for swing pricing and trade date accounting.

139
Vanguard Global Enhanced Equity Fund
The accompanying notes form an integral part of the financial statements.
Statement of Operations
US Dollars ($)
Six Months Ended 30 June 2021*
US Dollars ($)
Six Months Ended 30 June 2020
Investment Income/(Loss) Interest Income — 2,306 Dividend Income 2,017 3,236,167 Securities Lending Income — 27,605 Net Gain/(Loss) on Financial Instruments 250,934 (36,830,099)
Total Investment Income/(Loss) 252,951 (33,564,021)
Expenses Management Fees 1,322 486,515 Transaction Fees and Commissions 855 39,590 Other Expenses 28 —
Total Expenses 2,205 526,105
Finance Costs Interest Expense 3 281
Total Finance Costs 3 281
Net Investment Income/(Loss) 250,743 (34,090,407)
Foreign Withholding Tax (4,968) (629,855)
Net Increase/(Decrease) in Net Assets 245,775 (34,720,262)
Statement of Changes in Net Assets
US Dollars ($)
US Dollars ($)
Six Months Ended Six Months Ended30 June 2021* 30 June 2020
Increase/(Decrease) in Net Assets
Net Increase/(Decrease) in Net Assets From Operations 245,775 (34,720,262)
Capital Transactions Subscriptions — 4,491,275 Redemptions (7,621,616) (73,510,509)
Total Capital Transactions (7,621,616) (69,019,234)
Total Increase/(Decrease) for the Period (7,375,841) (103,739,496)
Net AssetsBeginning of Period 7,375,841 239,739,615
End of Period — 136,000,119
* The Fund liquidated on 14 January 2021.

Vanguard Global Small-Cap Index FundManaged by Vanguard Global Advisers, LLC.
140
Investment ObjectiveThe fund seeks to provide long-term growth of capital by tracking the performance of the MSCI World Small Cap Index, a market-capitalisation-weighted index of small-cap companies in developed countries.
Performance SummaryThe Performance Summary does not form part of the Financial Statements.
• As the six months ended 30 June 2021 came to a close, macroeconomic indicators signalled a faster global economic rebound than many had expected after the sharpest contraction in modern history. Yet the recovery has been uneven. Countries that have contained the virus more successfully, whether through vaccinations, lockdowns or both, generally have fared better economically. And the COVID-19 pandemic remained far from over, with new variants of the virus surfacing where vaccination rates have lagged and the human toll continuing to mount, especially in less developed economies.
• Swift and extensive support from governments and central banks has been a key to the rebound. So far in 2021, it has included fiscal stimulus – including the $1.9 trillion American Rescue Plan in the United States and the €673 billion Recovery and Resilience Facility in Europe – and pledges by a number of central banks to keep interest rates low for some time.
• Fixed income prices worldwide generally fell and longer-term yields rose amid concerns about inflation during the half year. Bonds returned about –3% in US dollars, as measured by the Bloomberg Barclays Global Aggregate Bond Index.
• Stock markets continued the rally that began in 2020, bolstered by reopening economies, more consumer spending and rising corporate profits. The FTSE Global All Cap Index returned roughly 13% in US dollars for the half year. Returns in the United States and Europe outpaced those in emerging markets and especially the Pacific region.
• In this environment, the fund’s benchmark index returned 14.87%.
• Results were positive in all of the index’s 11 sectors. Industrials, consumer discretionary and financials, the three largest sectors, contributed most to returns.
• By region, US stocks, which account for more than half the index, contributed most to results.
Benchmark returns in the commentary above are in US dollars.
Benchmark: MSCI World Small Cap Index
Total ReturnsPeriods Ended 30 June 2021
(Annualised for periods over one year)
Six Months Five YearsTen Years or
Since Inception1
EUR Acc 18.49 % 12.67 % 13.48 %
Benchmark 18.52 12.89 13.72
Tracking Difference* -0.03
EUR Dist 18.49 % — 12.51 %
Benchmark 18.52 — 12.73
Tracking Difference* -0.03
Investor EUR 18.49 % 12.66 % 11.65 %
Benchmark 18.52 12.89 11.89
Tracking Difference* -0.03
Institutional Plus EUR Acc 18.52 % 12.75 % 12.32 %
Benchmark 18.52 12.89 12.47
Tracking Difference* —
GBP Acc 13.64 % 13.41 % 11.99 %
Benchmark 13.67 13.62 12.22
Tracking Difference* -0.03
GBP Dist 13.64 % 13.41 % 11.99 %
Benchmark 13.67 13.62 12.22
Tracking Difference* -0.03
Institutional Plus GBP Acc 13.67 % 13.49 % 12.93 %
Benchmark 13.67 13.62 13.06
Tracking Difference* —
Institutional Plus GBP Dist 13.67 % 13.49 % 12.93 %
Benchmark 13.67 13.62 13.06
Tracking Difference* —
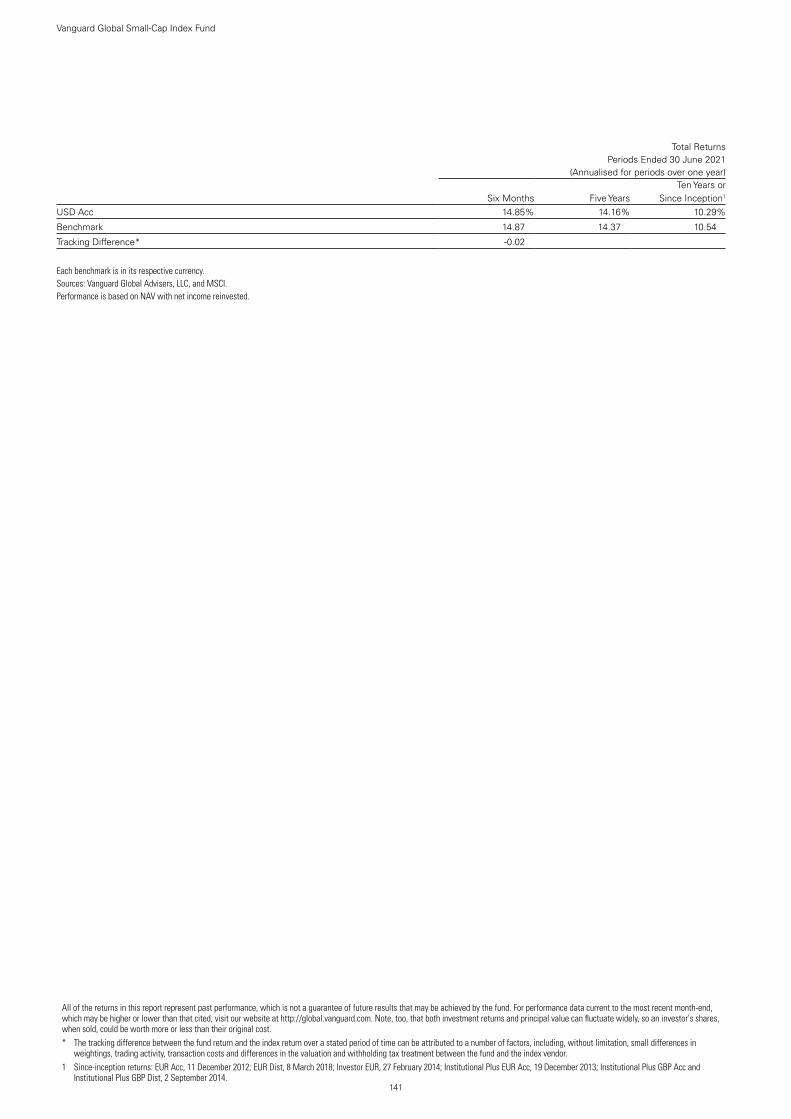
141
Vanguard Global Small-Cap Index Fund
Total ReturnsPeriods Ended 30 June 2021
(Annualised for periods over one year)
Six Months Five YearsTen Years or
Since Inception1
USD Acc 14.85 % 14.16 % 10.29 %
Benchmark 14.87 14.37 10.54
Tracking Difference* -0.02
Each benchmark is in its respective currency.Sources: Vanguard Global Advisers, LLC, and MSCI.Performance is based on NAV with net income reinvested.
All of the returns in this report represent past performance, which is not a guarantee of future results that may be achieved by the fund. For performance data current to the most recent month-end, which may be higher or lower than that cited, visit our website at http://global.vanguard.com. Note, too, that both investment returns and principal value can fluctuate widely, so an investor's shares, when sold, could be worth more or less than their original cost.* The tracking difference between the fund return and the index return over a stated period of time can be attributed to a number of factors, including, without limitation, small differences in
weightings, trading activity, transaction costs and differences in the valuation and withholding tax treatment between the fund and the index vendor.1 Since-inception returns: EUR Acc, 11 December 2012; EUR Dist, 8 March 2018; Investor EUR, 27 February 2014; Institutional Plus EUR Acc, 19 December 2013; Institutional Plus GBP Acc and
Institutional Plus GBP Dist, 2 September 2014.

Significant Portfolio ChangesFor the Six Months Ended 30 June 2021
142
Vanguard Global Small-Cap Index Fund
The Central Bank of Ireland requires a schedule of material changes in the composition of the portfolio during the period. These are defined as aggregate purchases of a security exceeding 1% of the total value of purchases for the period and aggregate disposals greater than 1% of the total value of sales. At a minimum, the largest 20 purchases and 20 sales must be shown; all purchases and sales must be shown if there are fewer than 20. A full listing of the portfolio changes for the period is available, upon request, at no extra cost from the Administrator.
SharesCost
US Dollars ($)
Purchases
Organon & Co. 105,695 3,884,600AMC Entertainment Holdings, Inc.
Class A 138,553 3,386,570OGE Energy Corp. 83,692 2,895,070Axalta Coating Systems Ltd. 87,855 2,822,456Cabot Oil & Gas Corp. 166,104 2,724,546Perrigo Co. plc 64,267 2,613,560Vimeo, Inc. 55,652 2,516,711Sarepta Therapeutics, Inc. 32,045 2,477,173Ionis Pharmaceuticals, Inc. 53,438 1,971,626Beyond Meat, Inc. 13,710 1,951,204Bridgebio Pharma, Inc. 29,086 1,797,367ASM Pacific Technology Ltd. 129,800 1,725,221SSR Mining, Inc. 88,505 1,654,683Syneos Health, Inc. Class A 19,189 1,596,577Chesapeake Energy Corp. 29,843 1,580,187Eastern Bankshares, Inc. 68,524 1,558,236Sagax AB Class B 54,263 1,548,160Bill.com Holdings, Inc. 10,352 1,534,256Amada Co., Ltd. 142,400 1,505,840Tokyu Fudosan Holdings Corp. 256,600 1,505,275
SharesProceeds
US Dollars ($)
Sales
Plug Power, Inc. 196,319 9,497,913Caesars Entertainment, Inc. 87,759 9,346,422Charles River Laboratories
International, Inc. 23,107 7,665,420L Brands, Inc. 109,916 7,585,221Bio-Techne Corp. 18,086 7,410,951ASM International NV 19,713 5,350,220PRA Health Sciences, Inc. 30,529 5,050,694Devon Energy Corp. 258,507 4,729,999Boston Beer Co., Inc. Class A 4,409 4,626,032Novavax, Inc. 29,523 4,538,394Inphi Corp. 23,784 4,099,068Eaton Vance Corp. 49,154 3,592,131FLIR Systems, Inc. 61,056 3,505,599Futu Holdings Ltd. ADR 23,276 3,274,287TCF Financial Corp. 71,488 3,249,953Embracer Group AB 109,409 3,144,211Sinch AB 17,923 3,112,446Grubhub, Inc. 43,670 2,699,814Domino's Pizza Enterprises Ltd. 27,926 2,301,254Parsley Energy, Inc. Class A 132,555 2,244,156
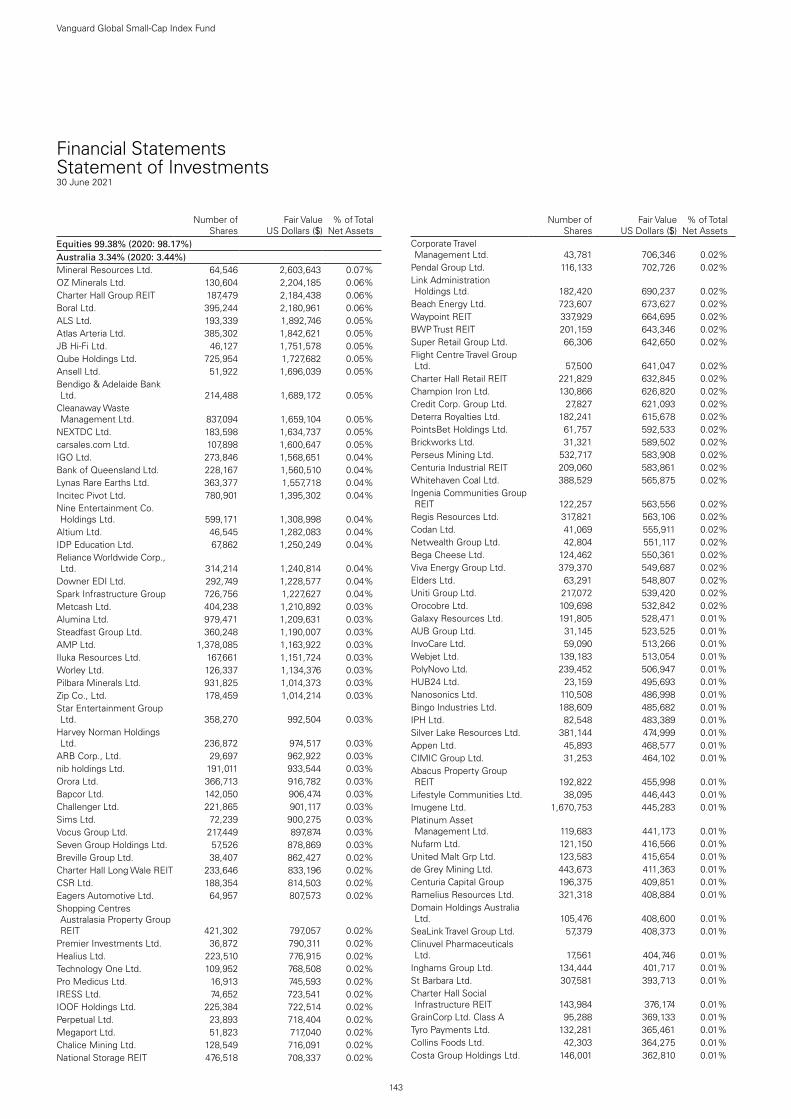
Financial StatementsStatement of Investments30 June 2021
143
Vanguard Global Small-Cap Index Fund
.Number of
SharesFair Value
US Dollars ($)% of Total
Net AssetsEquities 99.38% (2020: 98.17%)Australia 3.34% (2020: 3.44%)Mineral Resources Ltd. 64,546 2,603,643 0.07%OZ Minerals Ltd. 130,604 2,204,185 0.06%Charter Hall Group REIT 187,479 2,184,438 0.06%Boral Ltd. 395,244 2,180,961 0.06%ALS Ltd. 193,339 1,892,746 0.05%Atlas Arteria Ltd. 385,302 1,842,621 0.05%JB Hi-Fi Ltd. 46,127 1,751,578 0.05%Qube Holdings Ltd. 725,954 1,727,682 0.05%Ansell Ltd. 51,922 1,696,039 0.05%Bendigo & Adelaide Bank Ltd. 214,488 1,689,172 0.05%
Cleanaway Waste Management Ltd. 837,094 1,659,104 0.05%
NEXTDC Ltd. 183,598 1,634,737 0.05%carsales.com Ltd. 107,898 1,600,647 0.05%IGO Ltd. 273,846 1,568,651 0.04%Bank of Queensland Ltd. 228,167 1,560,510 0.04%Lynas Rare Earths Ltd. 363,377 1,557,718 0.04%Incitec Pivot Ltd. 780,901 1,395,302 0.04%Nine Entertainment Co. Holdings Ltd. 599,171 1,308,998 0.04%
Altium Ltd. 46,545 1,282,083 0.04%IDP Education Ltd. 67,862 1,250,249 0.04%Reliance Worldwide Corp., Ltd. 314,214 1,240,814 0.04%
Downer EDI Ltd. 292,749 1,228,577 0.04%Spark Infrastructure Group 726,756 1,227,627 0.04%Metcash Ltd. 404,238 1,210,892 0.03%Alumina Ltd. 979,471 1,209,631 0.03%Steadfast Group Ltd. 360,248 1,190,007 0.03%AMP Ltd. 1,378,085 1,163,922 0.03%Iluka Resources Ltd. 167,661 1,151,724 0.03%Worley Ltd. 126,337 1,134,376 0.03%Pilbara Minerals Ltd. 931,825 1,014,373 0.03%Zip Co., Ltd. 178,459 1,014,214 0.03%Star Entertainment Group Ltd. 358,270 992,504 0.03%
Harvey Norman Holdings Ltd. 236,872 974,517 0.03%
ARB Corp., Ltd. 29,697 962,922 0.03%nib holdings Ltd. 191,011 933,544 0.03%Orora Ltd. 366,713 916,782 0.03%Bapcor Ltd. 142,050 906,474 0.03%Challenger Ltd. 221,865 901,117 0.03%Sims Ltd. 72,239 900,275 0.03%Vocus Group Ltd. 217,449 897,874 0.03%Seven Group Holdings Ltd. 57,526 878,869 0.03%Breville Group Ltd. 38,407 862,427 0.02%Charter Hall Long Wale REIT 233,646 833,196 0.02%CSR Ltd. 188,354 814,503 0.02%Eagers Automotive Ltd. 64,957 807,573 0.02%Shopping Centres Australasia Property Group REIT 421,302 797,057 0.02%
Premier Investments Ltd. 36,872 790,311 0.02%Healius Ltd. 223,510 776,915 0.02%Technology One Ltd. 109,952 768,508 0.02%Pro Medicus Ltd. 16,913 745,593 0.02%IRESS Ltd. 74,652 723,541 0.02%IOOF Holdings Ltd. 225,384 722,514 0.02%Perpetual Ltd. 23,893 718,404 0.02%Megaport Ltd. 51,823 717,040 0.02%Chalice Mining Ltd. 128,549 716,091 0.02%National Storage REIT 476,518 708,337 0.02%
.Number of
SharesFair Value
US Dollars ($)% of Total
Net AssetsCorporate Travel Management Ltd. 43,781 706,346 0.02%
Pendal Group Ltd. 116,133 702,726 0.02%Link Administration Holdings Ltd. 182,420 690,237 0.02%
Beach Energy Ltd. 723,607 673,627 0.02%Waypoint REIT 337,929 664,695 0.02%BWP Trust REIT 201,159 643,346 0.02%Super Retail Group Ltd. 66,306 642,650 0.02%Flight Centre Travel Group Ltd. 57,500 641,047 0.02%
Charter Hall Retail REIT 221,829 632,845 0.02%Champion Iron Ltd. 130,866 626,820 0.02%Credit Corp. Group Ltd. 27,827 621,093 0.02%Deterra Royalties Ltd. 182,241 615,678 0.02%PointsBet Holdings Ltd. 61,757 592,533 0.02%Brickworks Ltd. 31,321 589,502 0.02%Perseus Mining Ltd. 532,717 583,908 0.02%Centuria Industrial REIT 209,060 583,861 0.02%Whitehaven Coal Ltd. 388,529 565,875 0.02%Ingenia Communities Group REIT 122,257 563,556 0.02%
Regis Resources Ltd. 317,821 563,106 0.02%Codan Ltd. 41,069 555,911 0.02%Netwealth Group Ltd. 42,804 551,117 0.02%Bega Cheese Ltd. 124,462 550,361 0.02%Viva Energy Group Ltd. 379,370 549,687 0.02%Elders Ltd. 63,291 548,807 0.02%Uniti Group Ltd. 217,072 539,420 0.02%Orocobre Ltd. 109,698 532,842 0.02%Galaxy Resources Ltd. 191,805 528,471 0.01%AUB Group Ltd. 31,145 523,525 0.01%InvoCare Ltd. 59,090 513,266 0.01%Webjet Ltd. 139,183 513,054 0.01%PolyNovo Ltd. 239,452 506,947 0.01%HUB24 Ltd. 23,159 495,693 0.01%Nanosonics Ltd. 110,508 486,998 0.01%Bingo Industries Ltd. 188,609 485,682 0.01%IPH Ltd. 82,548 483,389 0.01%Silver Lake Resources Ltd. 381,144 474,999 0.01%Appen Ltd. 45,893 468,577 0.01%CIMIC Group Ltd. 31,253 464,102 0.01%Abacus Property Group REIT 192,822 455,998 0.01%
Lifestyle Communities Ltd. 38,095 446,443 0.01%Imugene Ltd. 1,670,753 445,283 0.01%Platinum Asset Management Ltd. 119,683 441,173 0.01%
Nufarm Ltd. 121,150 416,566 0.01%United Malt Grp Ltd. 123,583 415,654 0.01%de Grey Mining Ltd. 443,673 411,363 0.01%Centuria Capital Group 196,375 409,851 0.01%Ramelius Resources Ltd. 321,318 408,884 0.01%Domain Holdings Australia Ltd. 105,476 408,600 0.01%
SeaLink Travel Group Ltd. 57,379 408,373 0.01%Clinuvel Pharmaceuticals Ltd. 17,561 404,746 0.01%
Inghams Group Ltd. 134,444 401,717 0.01%St Barbara Ltd. 307,581 393,713 0.01%Charter Hall Social Infrastructure REIT 143,984 376,174 0.01%
GrainCorp Ltd. Class A 95,288 369,133 0.01%Tyro Payments Ltd. 132,281 365,461 0.01%Collins Foods Ltd. 42,303 364,275 0.01%Costa Group Holdings Ltd. 146,001 362,810 0.01%

144
Vanguard Global Small-Cap Index Fund
.Number of
SharesFair Value
US Dollars ($)% of Total
Net AssetsEVENT Hospitality & Entertainment Ltd. 37,712 357,867 0.01%
Arena REIT 132,239 357,402 0.01%Growthpoint Properties Australia Ltd. REIT 116,894 357,176 0.01%
Sandfire Resources Ltd. 69,218 354,924 0.01%Blackmores Ltd. 6,370 351,354 0.01%Paladin Energy Ltd. 908,512 351,264 0.01%Cromwell Property Group REIT 526,739 346,018 0.01%
GUD Holdings Ltd. 38,233 344,154 0.01%Kogan.com Ltd. 39,349 342,088 0.01%Adbri Ltd. 131,056 341,414 0.01%Telix Pharmaceuticals Ltd. 72,098 329,637 0.01%EML Payments Ltd. 125,728 328,478 0.01%Aventus Group REIT 137,683 325,601 0.01%Nickel Mines Ltd. 435,494 323,678 0.01%Hansen Technologies Ltd. 68,800 320,756 0.01%Pinnacle Investment Management Group Ltd. 35,483 318,867 0.01%
City Chic Collective Ltd. 77,083 317,707 0.01%Gold Road Resources Ltd. 326,882 309,212 0.01%oOh!media Ltd. 234,401 307,959 0.01%Accent Group Ltd. 146,760 307,402 0.01%SmartGroup Corp., Ltd. 54,568 302,336 0.01%Genworth Mortgage Insurance Australia Ltd. 180,979 298,914 0.01%
McMillan Shakespeare Ltd. 29,875 290,451 0.01%Mesoblast Ltd. 193,532 287,682 0.01%Jumbo Interactive Ltd. 21,515 287,028 0.01%Monadelphous Group Ltd. 36,496 286,323 0.01%Centuria Office REIT 155,899 273,876 0.01%Bravura Solutions Ltd. 103,761 273,424 0.01%New Hope Corp., Ltd. 210,291 273,125 0.01%Omni Bridgeway Ltd. 96,771 272,441 0.01%nearmap Ltd. 194,857 272,097 0.01%Rural Funds Group REIT 133,665 265,925 0.01%Integral Diagnostics Ltd. 67,773 264,579 0.01%Temple & Webster Group Ltd. 32,399 262,451 0.01%
G8 Education Ltd. 334,719 252,547 0.01%West African Resources Ltd. 335,860 250,886 0.01%
Data#3 Ltd. 57,819 243,517 0.01%Select Harvests Ltd. 46,687 236,589 0.01%Nick Scali Ltd. 26,734 235,227 0.01%Austal Ltd. 148,940 229,224 0.01%Tassal Group Ltd. 85,261 229,155 0.01%Western Areas Ltd. 122,536 219,865 0.01%Lovisa Holdings Ltd. 18,674 213,797 0.01%Redbubble Ltd. 78,230 212,020 0.01%Westgold Resources Ltd. 149,088 210,424 0.01%Australian Ethical Investment Ltd. 33,156 210,087 0.01%
Dicker Data Ltd. 25,051 208,006 0.01%Bellevue Gold Ltd. 286,848 204,584 0.01%BWX Ltd. 49,912 203,845 0.01%Johns Lyng Group Ltd. 51,210 196,074 0.01%BrainChip Holdings Ltd. 527,590 194,083 0.01%GWA Group Ltd. 92,854 193,097 0.01%Betmakers Technology Group Ltd. 232,232 186,553 0.01%
Resolute Mining Ltd. 490,351 185,906 0.01%Irongate Group 167,940 182,817 0.01%NRW Holdings Ltd. 164,568 181,000 0.01%GDI Property Group REIT 215,007 180,786 0.01%Pact Group Holdings Ltd. 64,637 179,547 0.00%Coronado Global Resources, Inc. Class CDI 278,981 175,934 0.00%
Southern Cross Media Group Ltd. 111,062 174,264 0.00%
Electro Optic Systems Holdings Ltd. 51,082 165,288 0.00%
.Number of
SharesFair Value
US Dollars ($)% of Total
Net AssetsSigma Healthcare Ltd. 352,102 157,283 0.00%Australian Pharmaceutical Industries Ltd. 175,972 147,304 0.00%
Mayne Pharma Group Ltd. 611,635 146,939 0.00%Cedar Woods Properties Ltd. 28,696 144,557 0.00%
Alkane Resources Ltd. 165,896 143,228 0.00%Mount Gibson Iron Ltd. 192,804 136,786 0.00%Emeco Holdings Ltd. 163,729 129,680 0.00%Maas Group Holdings Ltd. 30,394 127,782 0.00%Nuix Ltd. 75,636 125,492 0.00%Australian Agricultural Co., Ltd. 120,207 123,636 0.00%
HT&E Ltd. 95,439 122,881 0.00%Objective Corp., Ltd. 9,144 119,929 0.00%Perenti Global Ltd. 237,798 119,613 0.00%Home Consortium Ltd. REIT 28,311 115,624 0.00%Cooper Energy Ltd. 578,739 112,967 0.00%Jupiter Mines Ltd. 456,061 99,292 0.00%MA Financial Group Ltd. 23,057 97,975 0.00%SG Fleet Group Ltd. 42,139 94,908 0.00%Costa Group Holdings Ltd. (XASX) 23,065 57,316 0.00%
Integrated Research Ltd. 38,448 56,142 0.00%AET and D Holdings No.1 Ltd. Unlisted Shares 24,489 — 0.00%
test test 116,064,691 3.34%Austria 0.34% (2020: 0.35%)Wienerberger AG 46,615 1,796,624 0.05%ANDRITZ AG 28,026 1,574,723 0.05%BAWAG Group AG 28,156 1,498,552 0.04%CA Immobilien Anlagen AG 25,534 1,064,369 0.03%Oesterreichische Post AG 14,054 747,499 0.02%IMMOFINANZ AG 32,119 721,804 0.02%Lenzing AG 5,223 639,216 0.02%Telekom Austria AG Class A 68,452 584,476 0.02%UNIQA Insurance Group AG 52,469 456,717 0.01%S IMMO AG 18,119 434,044 0.01%Vienna Insurance Group AG Wiener Versicherung Gruppe 15,557 427,095 0.01%
AT&S Austria Technologie & Systemtechnik AG 9,624 416,578 0.01%
EVN AG 14,474 341,235 0.01%DO & CO AG 2,918 263,341 0.01%Palfinger AG 5,298 222,100 0.01%Schoeller-Bleckmann Oilfield Equipment AG 3,478 146,216 0.01%
Semperit AG Holding 3,365 135,280 0.01%Agrana Beteiligungs AG 5,419 130,777 0.00%Zumtobel Group AG 10,964 110,519 0.00%Porr AG 5,529 104,909 0.00%FACC AG 7,536 83,918 0.00%test test 11,899,992 0.34%Belgium 0.59% (2020: 0.57%)Warehouses de Pauw CVA REIT 54,567 2,083,694 0.06%
Aedifica SA REIT 13,356 1,762,867 0.05%Ackermans & van Haaren NV 9,419 1,590,607 0.05%
Cofinimmo SA REIT 10,409 1,584,974 0.05%Galapagos NV 18,507 1,283,487 0.04%D'ieteren Group 8,719 1,054,666 0.03%Melexis NV 8,298 861,544 0.02%Barco NV 28,542 781,211 0.02%Telenet Group Holding NV 19,194 722,471 0.02%Euronav NV 74,029 688,281 0.02%Bekaert SA 14,900 664,035 0.02%KBC Ancora 14,274 609,053 0.02%VGP NV 2,975 587,068 0.02%Fagron 24,704 551,653 0.02%Gimv NV 8,365 535,683 0.02%

145
Vanguard Global Small-Cap Index Fund
.Number of
SharesFair Value
US Dollars ($)% of Total
Net AssetsXior Student Housing NV REIT 8,852 533,277 0.01%
Montea NV REIT 4,275 502,916 0.01%bpost SA 42,019 502,788 0.01%Retail Estates NV REIT 4,313 350,363 0.01%Befimmo SA REIT 8,475 336,692 0.01%Tessenderlo Group SA 7,485 316,002 0.01%Cie d'Entreprises CFE 3,003 313,391 0.01%AGFA-Gevaert NV 65,345 303,384 0.01%Ontex Group NV 24,220 301,586 0.01%Kinepolis Group NV 5,494 296,578 0.01%Recticel SA 15,344 258,390 0.01%Mithra Pharmaceuticals SA 8,279 233,179 0.01%Intervest Offices & Warehouses NV REIT 7,180 194,562 0.01%
Econocom Group SA 47,120 178,815 0.00%Ion Beam Applications 8,476 167,461 0.00%Orange Belgium SA 6,435 144,384 0.00%Immobel SA 1,653 142,905 0.00%Van de Velde NV 1,969 58,376 0.00%test test 20,496,343 0.59%Canada 3.49% (2020: 3.39%)Tourmaline Oil Corp. 113,110 3,236,281 0.09%TFI International, Inc. 34,014 3,108,588 0.09%Descartes Systems Group, Inc. 34,186 2,366,766 0.07%
ARC Resources Ltd. 275,029 2,343,177 0.07%Element Fleet Management Corp. 177,021 2,067,127 0.06%
Stantec, Inc. 43,455 1,940,964 0.06%SNC-Lavalin Group, Inc. 70,923 1,847,102 0.05%Finning International, Inc. 65,280 1,710,681 0.05%Boyd Group Services, Inc. 8,857 1,613,472 0.05%Premium Brands Holdings Corp. 15,616 1,588,083 0.05%
Endeavour Mining plc 70,364 1,512,630 0.04%CI Financial Corp. 78,542 1,442,971 0.04%Capital Power Corp. 43,239 1,429,893 0.04%Kinaxis, Inc. 10,777 1,419,208 0.04%Colliers International Group, Inc. 12,481 1,399,186 0.04%
SSR Mining, Inc. 88,505 1,383,717 0.04%BRP, Inc. 16,414 1,285,761 0.04%First Majestic Silver Corp. 80,294 1,269,609 0.04%Alamos Gold, Inc. Class A 157,480 1,204,341 0.03%Gibson Energy, Inc. 60,686 1,163,928 0.03%Linamar Corp. 18,382 1,154,163 0.03%Brookfield Infrastructure Corp. Class A 15,090 1,138,544 0.03%
Whitecap Resources, Inc. 225,774 1,123,127 0.03%Boralex, Inc. Class A 35,254 1,074,730 0.03%Aritzia, Inc. 35,674 1,068,232 0.03%Primo Water Corp. 62,409 1,045,274 0.03%Canadian Western Bank 36,178 1,016,712 0.03%Crescent Point Energy Corp. 221,174 1,002,008 0.03%Canada Goose Holdings, Inc. 22,775 996,487 0.03%
TransAlta Corp. 99,760 994,941 0.03%Tricon Residential, Inc. 81,040 933,239 0.03%Innergex Renewable Energy, Inc. 52,019 905,281 0.03%
Stella-Jones, Inc. 24,959 899,556 0.03%Parex Resources, Inc. 53,658 896,972 0.03%Allied Properties REIT 24,463 889,977 0.03%PrairieSky Royalty Ltd. 72,614 880,187 0.03%Labrador Iron Ore Royalty Corp. 22,999 872,376 0.03%
Dye & Durham Ltd. 22,070 848,901 0.02%MEG Energy Corp. 115,012 833,124 0.02%ATS Automation Tooling Systems, Inc. 28,933 831,330 0.02%
Bombardier, Inc. Class B 874,674 826,430 0.02%Osisko Gold Royalties Ltd. 60,164 825,476 0.02%
.Number of
SharesFair Value
US Dollars ($)% of Total
Net AssetsMethanex Corp. 24,788 822,530 0.02%Great Canadian Gaming Corp. 22,584 811,769 0.02%
Enghouse Systems Ltd. 17,563 782,768 0.02%LifeWorks, Inc. 28,990 782,400 0.02%Superior Plus Corp. 63,438 782,281 0.02%Granite REIT 11,652 776,110 0.02%Enerplus Corp. 107,060 770,334 0.02%H&R REIT 59,092 763,524 0.02%Aurora Cannabis, Inc. 83,691 758,984 0.02%Novagold Resources, Inc. 92,743 744,460 0.02%Equinox Gold Corp. 106,653 741,567 0.02%MAG Silver Corp. 34,896 730,440 0.02%Choice Properties REIT 63,076 727,898 0.02%Altus Group Ltd. 15,655 726,302 0.02%SmartCentres REIT 29,984 711,161 0.02%Pretium Resources, Inc. 73,934 708,114 0.02%Interfor Corp. 28,157 705,801 0.02%Russel Metals, Inc. 25,804 705,791 0.02%Maple Leaf Foods, Inc. 33,700 700,235 0.02%TransAlta Renewables, Inc. 41,396 696,341 0.02%Cronos Group, Inc. 79,162 682,751 0.02%Eldorado Gold Corp. 67,523 671,249 0.02%Turquoise Hill Resources Ltd. 39,222 662,305 0.02%
Centerra Gold, Inc. 86,265 655,539 0.02%Cogeco Communications, Inc. 6,688 654,650 0.02%
Sandstorm Gold Ltd. 82,449 651,842 0.02%First Capital REIT 45,785 650,744 0.02%K92 Mining, Inc. 87,618 633,980 0.02%ECN Capital Corp. 83,279 625,450 0.02%Canfor Corp. 27,023 618,891 0.02%Home Capital Group, Inc. Class B 20,594 618,668 0.02%
NFI Group, Inc. 26,943 612,924 0.02%Richelieu Hardware Ltd. 18,874 611,504 0.02%Converge Technology Solutions Corp. 72,812 600,936 0.02%
Hudbay Minerals, Inc. 88,673 590,771 0.02%goeasy Ltd. 4,580 586,712 0.02%NexGen Energy Ltd. 142,007 584,863 0.02%Intertape Polymer Group, Inc. 25,098 582,505 0.02%
Laurentian Bank of Canada 16,399 578,593 0.02%ERO Copper Corp. 27,394 575,400 0.02%Transcontinental, Inc. Class A 30,596 575,204 0.02%
Vermilion Energy, Inc. 65,085 570,801 0.02%OceanaGold Corp. 299,038 567,503 0.02%Lithium Americas Corp. 36,721 546,233 0.02%Trisura Group Ltd. 4,012 537,147 0.02%Capstone Mining Corp. 123,193 535,232 0.02%IAMGOLD Corp. 181,282 534,345 0.02%North West Co., Inc. 18,708 531,644 0.02%Aurinia Pharmaceuticals, Inc. 40,206 521,772 0.01%
Dream Industrial REIT 41,458 511,571 0.01%New Gold, Inc. 279,686 503,674 0.01%Real Matters, Inc. 34,772 502,078 0.01%Cargojet, Inc. 3,356 498,752 0.01%Birchcliff Energy Ltd. 117,143 491,919 0.01%Wesdome Gold Mines Ltd. 51,716 491,141 0.01%Peyto Exploration & Development Corp. 72,447 488,518 0.01%
Spin Master Corp. 12,412 483,329 0.01%Equitable Group, Inc. 4,399 472,583 0.01%Jamieson Wellness, Inc. 17,185 469,073 0.01%Badger Infrastructure Solutions Ltd. 15,344 466,156 0.01%
Canaccord Genuity Group, Inc. 42,042 461,060 0.01%

146
Vanguard Global Small-Cap Index Fund
.Number of
SharesFair Value
US Dollars ($)% of Total
Net AssetsSilverCrest Metals, Inc. 51,542 452,028 0.01%Fortuna Silver Mines, Inc. 80,653 450,062 0.01%Mind Medicine MindMed, Inc. 129,668 447,355 0.01%
Cascades, Inc. 35,979 443,382 0.01%Summit Industrial Income REIT 30,895 443,353 0.01%
Dundee Precious Metals, Inc. 71,643 434,498 0.01%
Corus Entertainment, Inc. Class B 83,305 427,861 0.01%
Stelco Holdings, Inc. 14,487 425,847 0.01%Sprott, Inc. 10,545 415,481 0.01%Winpak Ltd. 13,296 415,211 0.01%Seabridge Gold, Inc. 23,438 411,107 0.01%Paramount Resources Ltd. Class A 29,539 409,343 0.01%
Mullen Group Ltd. 37,521 404,814 0.01%InterRent REIT 29,607 403,112 0.01%Silvercorp Metals, Inc. 72,995 400,845 0.01%Endeavour Silver Corp. 64,952 398,115 0.01%AutoCanada, Inc. 9,861 397,689 0.01%Well Health Technologies Corp. 55,378 392,650 0.01%
Topaz Energy Corp. 27,417 383,037 0.01%Killam Apartment REIT 23,021 376,836 0.01%Sienna Senior Living, Inc. 28,246 375,001 0.01%MTY Food Group, Inc. 8,506 374,847 0.01%Torex Gold Resources, Inc. 32,343 372,978 0.01%Aecon Group, Inc. 25,583 371,876 0.01%Denison Mines Corp. 304,690 371,543 0.01%Docebo, Inc. 6,232 369,199 0.01%NorthWest Healthcare Properties REIT 35,398 363,899 0.01%
Sleep Country Canada Holdings, Inc. 15,127 362,447 0.01%
Martinrea International, Inc. 33,916 357,976 0.01%HEXO Corp. 59,236 344,423 0.01%Energy Fuels, Inc. 56,590 342,291 0.01%SunOpta, Inc. 27,581 337,886 0.01%Celestica, Inc. 42,993 337,472 0.01%Freehold Royalties Ltd. 42,413 334,632 0.01%Westport Fuel Systems, Inc. 62,343 331,274 0.01%Park Lawn Corp. 12,240 329,550 0.01%Cominar REIT 36,160 319,170 0.01%Sierra Wireless, Inc. 16,694 316,813 0.01%Village Farms International, Inc. 28,542 306,326 0.01%
Boardwalk REIT 9,092 300,154 0.01%Absolute Software Corp. 20,490 296,686 0.01%Cineplex, Inc. 24,654 296,652 0.01%WPT Industrial REIT 16,340 296,244 0.01%Advantage Energy Ltd. 72,438 296,000 0.01%First National Financial Corp. 7,289 289,665 0.01%Organigram Holdings, Inc. 97,255 278,814 0.01%Osisko Mining, Inc. 109,145 272,356 0.01%Trillium Therapeutics, Inc. 27,954 271,120 0.01%CT REIT 20,427 270,205 0.01%Enerflex Ltd. 39,613 268,395 0.01%Fiera Capital Corp. 30,324 266,434 0.01%Savaria Corp. 16,235 262,739 0.01%Uranium Participation Corp. 57,554 254,236 0.01%Argonaut Gold, Inc. 105,438 252,888 0.01%Timbercreek Financial Corp. 32,620 251,308 0.01%Westshore Terminals Investment Corp. 18,054 249,021 0.01%
Victoria Gold Corp. 16,467 245,349 0.01%AG Growth International, Inc. 7,707 239,743 0.01%
Extendicare, Inc. 34,584 237,672 0.01%Lundin Gold, Inc. 28,234 237,354 0.01%Exchange Income Corp. 7,317 235,529 0.01%
.Number of
SharesFair Value
US Dollars ($)% of Total
Net AssetsOrla Mining Ltd. 54,216 224,167 0.01%GDI Integrated Facility Services, Inc. 5,252 217,706 0.01%
Enthusiast Gaming Holdings, Inc. 34,770 206,660 0.01%
Pason Systems, Inc. 28,523 205,694 0.01%Artis REIT 22,403 202,808 0.01%Rogers Sugar, Inc. 43,392 202,540 0.01%Solaris Resources, Inc. 20,670 201,141 0.01%Crombie REIT 13,972 200,164 0.01%Roxgold, Inc. 126,019 192,341 0.01%DREAM Unlimited Corp. Class A 8,943 191,239 0.01%
Morguard Corp. 1,673 190,700 0.01%Altius Minerals Corp. 13,580 186,762 0.01%Canacol Energy Ltd. 68,218 186,755 0.01%Lassonde Industries, Inc. Class A 1,320 184,414 0.01%
Largo Resources Ltd. 11,763 183,337 0.01%Charlottes Web Holdings, Inc. 49,696 177,787 0.01%
Knight Therapeutics, Inc. 40,798 172,971 0.00%Sabina Gold & Silver Corp. 122,173 172,658 0.00%PyroGenesis Canada, Inc. 32,722 171,234 0.00%New Pacific Metals Corp. 33,194 159,764 0.00%Minto Apartment REIT 7,931 153,330 0.00%Cogeco, Inc. 1,957 151,939 0.00%HLS Therapeutics, Inc. 10,681 146,030 0.00%Computer Modelling Group Ltd. 34,795 143,586 0.00%
Evertz Technologies Ltd. 12,140 141,076 0.00%Dream Office REIT 7,583 140,601 0.00%AirBoss of America Corp. 4,759 136,433 0.00%Score Media & Gaming, Inc. Class A 6,589 132,280 0.00%
Andlauer Healthcare Group, Inc. 4,363 129,238 0.00%
Chorus Aviation, Inc. 30,942 118,691 0.00%Recipe Unlimited Corp. 6,780 116,349 0.00%Morguard North American Residential REIT 8,503 115,360 0.00%
Maverix Metals, Inc. 21,319 115,350 0.00%Calibre Mining Corp. 85,535 113,973 0.00%Wallbridge Mining Co., Ltd. 187,222 80,132 0.00%Slate Grocery REIT 7,603 78,897 0.00%Endeavour Mining Corp. 3,007 64,642 0.00%Corby Spirit & Wine Ltd. Class A 4,113 59,853 0.00%
Great Basin Gold Ltd. 61,601 1 0.00%Poseidon Concepts Corp. 9,800 1 0.00%test test 121,338,771 3.49%Denmark 0.65% (2020: 0.63%)Royal Unibrew A/S 19,879 2,532,369 0.07%SimCorp A/S 16,356 2,053,320 0.06%Netcompany Group A/S 16,137 1,833,589 0.05%ISS A/S 63,060 1,480,322 0.04%ALK-Abello A/S 2,614 1,247,273 0.04%Ringkjoebing Landbobank A/S 11,574 1,173,910 0.03%
Jyske Bank A/S 21,459 1,038,292 0.03%Topdanmark A/S 18,786 977,865 0.03%Bavarian Nordic A/S 23,303 961,768 0.03%H Lundbeck A/S 27,852 886,122 0.03%Chemometec A/S 6,262 842,350 0.02%Dfds A/S 14,838 837,197 0.02%NKT A/S 16,992 779,883 0.02%Sydbank A.S. 25,159 774,765 0.02%FLSmidth & Co. A/S 17,324 720,250 0.02%Schouw & Co. A/S 5,316 583,268 0.02%Scandinavian Tobacco Group A/S 27,407 559,456 0.02%
Zealand Pharma A/S 14,920 440,661 0.01%Spar Nord Bank A/S 35,381 398,354 0.01%

147
Vanguard Global Small-Cap Index Fund
.Number of
SharesFair Value
US Dollars ($)% of Total
Net AssetsDrilling Co. of 1972 A/S 8,660 361,837 0.01%D/S Norden A/S 10,624 338,007 0.01%Per Aarsleff Holding A/S 7,327 329,511 0.01%Nilfisk Holding A/S 8,781 307,378 0.01%Matas A/S 15,863 287,381 0.01%Alm Brand A/S 27,336 197,918 0.01%cBrain A/S 3,513 175,915 0.01%NTG Nordic Transport Group A/S 2,634 158,362 0.01%
TORM plc Class A 11,218 99,289 0.00%Brodrene Hartmann A/S 1,148 95,201 0.00%NNIT A/S 4,031 79,327 0.00%test test 22,551,140 0.65%Finland 0.66% (2020: 0.63%)Metso Outotec OYJ 250,881 2,914,504 0.08%Valmet OYJ 52,721 2,299,553 0.07%Nokian Renkaat OYJ 53,508 2,160,647 0.06%Huhtamaki OYJ 39,125 1,853,614 0.05%TietoEVRY OYJ 36,222 1,144,339 0.03%Kojamo OYJ 49,009 1,119,968 0.03%Konecranes OYJ Class A 23,782 1,001,773 0.03%QT Group OYJ 7,059 826,244 0.02%Cargotec OYJ Class B 15,401 796,312 0.02%Outokumpu OYJ 131,397 787,221 0.02%Revenio Group OYJ 9,937 753,016 0.02%Kemira OYJ 45,599 718,127 0.02%Metsa Board OYJ 68,793 707,721 0.02%Uponor OYJ 22,548 653,518 0.02%Neles OYJ 38,294 552,220 0.02%Tokmanni Group Corp. 19,938 551,389 0.02%Sanoma OYJ 28,269 468,669 0.01%Musti Group OYJ 12,479 462,020 0.01%YIT OYJ 58,384 357,612 0.01%Caverion OYJ 42,363 346,393 0.01%Harvia OYJ 5,600 338,693 0.01%Aktia Bank OYJ 21,953 280,647 0.01%BasWare OYJ 5,229 246,493 0.01%Kamux Corp. 12,287 238,821 0.01%Citycon OYJ 27,623 235,367 0.01%Finnair OYJ 270,054 222,771 0.01%F-Secure OYJ 39,363 187,889 0.01%Talenom OYJ 10,787 182,674 0.01%Remedy Entertainment OYJ 3,137 175,778 0.01%Admicom OYJ 1,359 138,601 0.00%Rovio Entertainment OYJ 14,291 116,516 0.00%Oriola OYJ Class B 42,433 92,692 0.00%test test 22,931,802 0.66%France 1.23% (2020: 1.23%)Euronext NV 32,466 3,530,581 0.10%Rexel SA 97,850 2,046,951 0.06%SOITEC 8,749 1,928,794 0.06%Rubis SCA 38,396 1,707,063 0.05%Alten SA 11,706 1,552,024 0.04%Elis SA 75,636 1,425,281 0.04%SPIE SA 52,869 1,216,329 0.04%Sopra Steria Group SACA 6,276 1,207,207 0.04%SES SA Class A 153,238 1,170,672 0.03%Korian SA 29,234 1,079,580 0.03%APERAM SA 20,111 1,030,543 0.03%ICADE REIT 11,705 1,010,534 0.03%Nexans SA 9,701 884,114 0.03%Verallia SA 22,673 840,516 0.02%Eutelsat Communications SA 68,620 801,884 0.02%
Nexity SA 16,020 801,341 0.02%Trigano SA 3,669 757,956 0.02%Gaztransport Et Technigaz SA 8,964 723,931 0.02%
IPSOS 16,960 715,012 0.02%Neoen SA 15,908 714,617 0.02%JCDecaux SA 25,703 712,650 0.02%Cie Plastic Omnium SA 22,812 712,569 0.02%
.Number of
SharesFair Value
US Dollars ($)% of Total
Net AssetsSociete BIC SA 9,591 666,514 0.02%Imerys SA 14,129 660,170 0.02%ALD SA 42,788 641,383 0.02%Technip Energies NV 45,515 623,965 0.02%Virbac SA 1,739 595,999 0.02%Coface SA 45,630 553,031 0.02%Air France-KLM 114,153 550,972 0.02%Casino Guichard Perrachon SA 15,206 482,377 0.01%
Interparfums SA 6,459 419,753 0.01%Quadient SA 13,854 416,323 0.01%Fnac Darty SA 6,460 415,605 0.01%Vicat SA 8,183 395,447 0.01%Derichebourg SA 38,530 389,302 0.01%Elior Group SA 49,868 372,572 0.01%Valneva SE 26,143 345,373 0.01%Tarkett SA 14,324 339,737 0.01%Lagardere SCA 12,904 318,911 0.01%ID Logistics Group 1,132 316,816 0.01%Maisons du Monde SA 12,491 309,593 0.01%Technicolor SA 79,813 309,506 0.01%Altarea SCA REIT 1,397 293,568 0.01%Albioma SA (Prime De Fidelite) 7,165 293,316 0.01%
Mercialys SA REIT 24,176 292,724 0.01%PEUGEOT INVEST 2,154 289,672 0.01%Beneteau SA 16,813 265,980 0.01%Mersen SA 6,714 261,556 0.01%Kaufman & Broad SA 5,499 261,503 0.01%CGG SA 293,567 261,315 0.01%Voltalia SA 9,712 259,143 0.01%Carmila SA REIT 17,703 242,691 0.01%Eramet SA 3,705 241,876 0.01%Metropole Television SA 11,451 240,905 0.01%Cellectis SA 14,588 231,819 0.01%Solutions 30 SE 33,046 228,473 0.01%X-Fab Silicon Foundries SE 23,489 222,845 0.01%McPhy Energy SA 8,510 215,565 0.01%Chargeurs SA 6,845 189,949 0.01%Vilmorin & Cie SA 2,717 180,437 0.01%Lisi SA 5,514 180,151 0.01%Aubay 3,186 168,133 0.01%Television Francaise 1 16,105 162,818 0.00%Pharmagest Interactive 1,460 160,848 0.00%Manitou BF SA 4,928 157,791 0.00%AB Science SA 13,500 156,414 0.00%Bonduelle SCA 6,125 153,626 0.00%Akka Technologies 4,962 138,402 0.00%LNA Sante SA 2,127 133,688 0.00%Boiron SA 2,409 110,417 0.00%SMCP SA 15,121 109,654 0.00%AKWEL 3,695 107,795 0.00%Albioma SA 2,613 106,969 0.00%ABC arbitrage 12,685 106,806 0.00%Guerbet 2,824 99,800 0.00%LISI 2,364 77,236 0.00%Devoteam SA 557 72,660 0.00%Groupe Guillin 2,595 72,011 0.00%Cie des Alpes 4,255 68,323 0.00%Albioma SA - EUR 1,325 54,242 0.00%Nacon SA 6,968 46,027 0.00%test test 42,610,646 1.23%Germany 1.92% (2020: 2.03%)Evotec SE 53,312 2,417,004 0.07%Dialog Semiconductor plc 29,498 2,293,399 0.07%TAG Immobilien AG 60,131 1,908,238 0.05%thyssenkrupp AG 162,419 1,693,066 0.05%Rheinmetall AG 16,955 1,674,908 0.05%CTS Eventim AG & Co. KGaA 23,331 1,458,116 0.04%
Gerresheimer AG 12,909 1,427,544 0.04%HUGO BOSS AG 24,093 1,310,878 0.04%

148
Vanguard Global Small-Cap Index Fund
.Number of
SharesFair Value
US Dollars ($)% of Total
Net AssetsProSiebenSat.1 Media SE 65,658 1,306,166 0.04%Befesa SA 16,540 1,271,038 0.04%alstria office AG REIT 66,771 1,234,474 0.04%Freenet AG 51,675 1,220,725 0.03%Aixtron SE 44,732 1,212,139 0.03%Aurubis AG 12,596 1,167,523 0.03%Grand City Properties SA 42,460 1,147,048 0.03%Varta AG 7,291 1,124,032 0.03%K+S AG 79,160 1,077,695 0.03%Siltronic AG 6,173 1,028,539 0.03%MorphoSys AG 13,195 1,023,689 0.03%Shop Apotheke Europe NV 5,352 1,005,355 0.03%Fraport AG Frankfurt Airport Services Worldwide 14,528 989,964 0.03%
Cancom SE 16,190 979,186 0.03%Wacker Chemie AG 6,212 958,054 0.03%Software AG 20,541 924,202 0.03%Jungheinrich AG - Preference Shares 18,897 923,738 0.03%
Stroeer SE & Co. KGaA 11,235 900,008 0.03%CompuGroup Medical SE & Co. KgaA 10,857 850,415 0.02%
zooplus AG 2,611 845,932 0.02%Stabilus SA 10,322 839,111 0.02%Sixt SE 6,182 832,828 0.02%ADLER Group SA 30,705 807,642 0.02%Duerr AG 20,304 772,439 0.02%Nordex SE 31,791 772,115 0.02%Encavis AG 38,781 733,087 0.02%Hypoport SE 1,395 721,288 0.02%Eckert & Ziegler Strahlen- und Medizintechnik AG 6,033 689,339 0.02%
METRO AG 53,203 658,695 0.02%Hochtief AG 8,532 655,248 0.02%Norma Group SE 12,280 628,824 0.02%Jenoptik AG 21,411 585,523 0.02%Instone Real Estate Group AG 18,819 566,863 0.02%
Deutsche Pfandbriefbank AG 57,278 566,367 0.02%
1&1 AG 17,900 547,672 0.02%Dermapharm Holding SE 6,748 538,165 0.02%Krones AG 6,004 536,503 0.02%GRENKE AG 12,051 528,777 0.02%Aareal Bank AG 22,732 524,870 0.01%Deutsche EuroShop AG 20,600 488,591 0.01%VERBIO Vereinigte BioEnergie AG 9,459 479,209 0.01%
Suedzucker AG 29,377 470,315 0.01%S&T AG 20,297 464,555 0.01%Salzgitter AG 15,407 457,875 0.01%Global Fashion Group SA 30,037 454,879 0.01%Sixt SE - Preference Shares 5,472 441,269 0.01%flatexDEGIRO AG 3,272 440,410 0.01%Amadeus Fire AG 2,405 439,792 0.01%Deutz AG 53,175 430,071 0.01%STRATEC SE 3,060 427,479 0.01%Kloeckner & Co. SE 30,745 420,754 0.01%PATRIZIA AG 15,919 415,324 0.01%Hornbach Holding AG & Co. KGaA 3,586 408,678 0.01%
Nagarro SE 3,316 407,008 0.01%KWS Saat SE & Co. KGaA 4,750 390,932 0.01%AURELIUS Equity Opportunities SE & Co. KGaA 12,150 373,473 0.01%
Wacker Neuson SE 12,799 367,923 0.01%New Work SE 1,164 365,803 0.01%Bilfinger SE 12,051 360,712 0.01%Cewe Stiftung & Co. KGAA 2,277 352,658 0.01%Ceconomy AG 69,250 338,021 0.01%DIC Asset AG 19,286 333,234 0.01%
.Number of
SharesFair Value
US Dollars ($)% of Total
Net AssetsJOST Werke AG 5,443 324,679 0.01%LPKF Laser & Electronics AG 10,456 304,538 0.01%
Hensoldt AG 16,301 293,837 0.01%Steico SE 2,230 292,488 0.01%Pfeiffer Vacuum Technology AG 1,528 290,291 0.01%
Washtec AG 4,541 281,644 0.01%Zeal Network SE 5,556 276,073 0.01%SMA Solar Technology AG 4,798 275,280 0.01%SGL Carbon SE 27,840 267,095 0.01%Wuestenrot & Wuerttembergische AG 11,230 257,297 0.01%
Hamburger Hafen und Logistik AG 10,214 256,791 0.01%
Westwing Group AG 4,666 255,311 0.01%SAF-Holland SE 17,726 246,579 0.01%ElringKlinger AG 13,606 242,192 0.01%STO SE & Co. KGaA - Preference Shares 1,103 240,681 0.01%
ADVA Optical Networking SE 17,322 239,932 0.01%
Indus Holding AG 6,057 239,912 0.01%Secunet Security Networks AG 523 232,585 0.01%
Draegerwerk AG & Co. KGaA 2,483 230,856 0.01%
BayWa AG 5,268 227,402 0.01%Takkt AG 13,465 223,873 0.01%MLP SE 25,843 213,611 0.01%Deutsche Beteiligungs AG 5,280 213,519 0.01%Hamborner AG REIT 19,785 210,675 0.01%Vossloh AG 4,044 204,060 0.01%Home24 SE 10,235 191,169 0.01%Northern Data AG 1,974 191,023 0.01%Draegerwerk AG & Co. KGaA - Preference Shares 1,998 189,080 0.01%
Adesso SE 1,111 185,772 0.01%Borussia Dortmund GmbH & Co. KGaA 24,824 182,962 0.01%
Koenig & Bauer AG 5,408 180,536 0.00%Bertrandt AG 2,632 176,041 0.00%Basler AG 1,411 174,693 0.00%Elmos Semiconductor SE 3,988 172,622 0.00%Hornbach Baumarkt AG 3,668 161,163 0.00%MBB SE 1,025 159,723 0.00%CropEnergies AG 12,156 155,979 0.00%Media & Games Invest SE 25,171 149,192 0.00%Medios AG 3,606 143,686 0.00%Corestate Capital Holding SA 10,574 137,937 0.00%
Datagroup SE 1,769 136,361 0.00%PNE AG 11,010 97,012 0.00%Exasol AG 4,577 95,150 0.00%OHB SE 1,925 84,352 0.00%test test 66,713,050 1.92%Greece 0.00% (2020: 0.00%)Cyprus Popular Bank PCL 390,444 5 0.00%test test 5 0.00%Hong Kong 0.82% (2020: 0.70%)SITC International Holdings Co., Ltd. 538,025 2,248,165 0.06%
Man Wah Holdings Ltd. 730,400 1,755,025 0.05%ASM Pacific Technology Ltd. 124,400 1,685,183 0.05%Vitasoy International Holdings Ltd. 294,000 1,092,205 0.03%
Hysan Development Co., Ltd. 245,000 976,422 0.03%
PCCW Ltd. 1,710,000 896,193 0.03%Hang Lung Group Ltd. 327,000 833,727 0.02%Kerry Properties Ltd. 245,500 809,287 0.02%Yue Yuen Industrial Holdings Ltd. 316,000 780,453 0.02%

149
Vanguard Global Small-Cap Index Fund
.Number of
SharesFair Value
US Dollars ($)% of Total
Net AssetsPacific Basin Shipping Ltd. 1,895,000 763,773 0.02%Kerry Logistics Network Ltd. 249,500 756,611 0.02%
VTech Holdings Ltd. 68,277 718,742 0.02%NWS Holdings Ltd. 659,000 700,933 0.02%Fortune REIT 616,000 659,956 0.02%MGM China Holdings Ltd. 379,600 574,837 0.02%Atlas Corp. 36,626 521,921 0.02%Melco International Development Ltd. 281,000 515,985 0.01%
Vobile Group Ltd. 112,000 506,216 0.01%Luk Fook Holdings International Ltd. 143,681 495,844 0.01%
Champion REIT 870,394 489,788 0.01%Shangri-La Asia Ltd. 462,000 452,133 0.01%IGG, Inc. 337,000 445,234 0.01%Health & Happiness H&H International Holdings Ltd. 96,500 404,473 0.01%
HKBN Ltd. 318,500 385,521 0.01%First Pacific Co., Ltd. 1,042,000 355,570 0.01%Johnson Electric Holdings Ltd. 136,625 352,741 0.01%
United Laboratories International Holdings Ltd. 399,836 327,969 0.01%
SUNeVision Holdings Ltd. 316,500 324,005 0.01%Hong Kong Television Network Ltd. 233,000 292,531 0.01%
Stella International Holdings Ltd. 186,000 287,412 0.01%
Realord Group Holdings Ltd. 196,000 287,216 0.01%Cafe de Coral Holdings Ltd. 136,000 279,501 0.01%Haitong International Securities Group Ltd. 949,573 261,670 0.01%
Sunlight REIT 441,099 255,031 0.01%Chow Sang Sang Holdings International Ltd. 137,998 238,827 0.01%
CITIC Telecom International Holdings Ltd. 717,778 237,539 0.01%
Value Partners Group Ltd. 370,628 236,718 0.01%Pacific Textiles Holdings Ltd. 380,844 229,021 0.01%Dah Sing Financial Holdings Ltd. 63,741 217,919 0.01%
VSTECS Holdings Ltd. 266,600 215,248 0.01%MECOM Power & Construction Ltd. 415,000 208,412 0.01%
C-Mer Eye Care Holdings Ltd. 160,000 205,618 0.01%
Shun Tak Holdings Ltd. 632,500 203,616 0.01%Prosperity REIT 530,920 203,047 0.01%Far East Consortium International Ltd. 513,127 193,599 0.01%
Zensun Enterprises Ltd. 2,300,000 192,510 0.01%Dah Sing Banking Group Ltd. 173,403 191,359 0.01%
Guotai Junan International Holdings Ltd. 1,195,800 190,938 0.01%
EC Healthcare 105,000 189,020 0.01%Comba Telecom Systems Holdings Ltd. 706,000 184,549 0.01%
Texhong Textile Group Ltd. 113,000 182,759 0.01%K Wah International Holdings Ltd. 364,000 176,707 0.01%
Perfect Medical Health Management Ltd. 144,000 173,931 0.01%
Hongkong & Shanghai Hotels Ltd. 160,500 168,853 0.00%
Fosun Tourism Group 98,600 157,438 0.00%Sa Sa International Holdings Ltd. 501,826 143,456 0.00%
Crystal International Group Ltd. 276,000 141,805 0.00%
CK Life Sciences Int'l Holdings, Inc. 1,212,000 138,900 0.00%
Vesync Co., Ltd. 93,000 138,676 0.00%
.Number of
SharesFair Value
US Dollars ($)% of Total
Net AssetsLifestyle International Holdings Ltd. 168,500 129,317 0.00%
Television Broadcasts Ltd. 123,700 117,872 0.00%CMBC Capital Holdings Ltd. 8,980,000 114,478 0.00%Hutchison Telecommunications Hong Kong Holdings Ltd. 579,191 114,110 0.00%
Citychamp Watch & Jewellery Group Ltd. 574,000 112,348 0.00%
Nissin Foods Co., Ltd. 144,000 110,144 0.00%Chinese Estates Holdings Ltd. 203,000 94,627 0.00%
Cowell e Holdings, Inc. 144,000 94,382 0.00%Apollo Future Mobility Group Ltd. 1,696,000 91,725 0.00%
Huobi Technology Holdings Ltd. 45,500 81,909 0.00%
SmarTone Telecommunications Holdings Ltd. 123,500 73,154 0.00%
BOCOM International Holdings Co., Ltd. 281,000 67,664 0.00%
Macau Legend Development Ltd. 405,000 53,716 0.00%
Sun Hung Kai & Co., Ltd. 92,500 49,669 0.00%VPower Group International Holdings Ltd. 176,000 39,661 0.00%
Suncity Group Holdings Ltd. 670,000 33,647 0.00%Convoy Global Holdings Ltd. - Rights Issue 31/12/2049 1,446,000 31,095 0.00%
Hsin Chong Group Holdings Ltd. 398,300 17,951 0.00%
Brightoil Petroleum Holdings Ltd. 571,226 14,711 0.00%
test test 28,694,918 0.82%Ireland 0.20% (2020: 0.18%)Bank of Ireland Group plc 392,951 2,104,925 0.06%Glanbia plc 82,809 1,344,402 0.04%AIB Group plc 317,406 817,943 0.02%Total Produce plc 133,944 419,349 0.01%Hibernia plc REIT 278,823 410,014 0.01%Cairn Homes plc 308,505 390,002 0.01%Uniphar plc 93,466 377,969 0.01%Glenveagh Properties plc 316,678 360,526 0.01%Dalata Hotel Group plc 74,935 340,799 0.01%Irish Residential Properties plc REIT 181,921 328,356 0.01%
Origin Enterprises plc 53,325 208,369 0.01%test test 7,102,654 0.20%Israel 1.03% (2020: 0.89%)Fiverr International Ltd. 10,853 2,631,744 0.08%Kornit Digital Ltd. 17,551 2,182,116 0.06%Tower Semiconductor Ltd. 42,607 1,258,139 0.04%Nova Measuring Instruments Ltd. 11,451 1,176,201 0.03%
Inmode Ltd. 9,904 937,711 0.03%Bezeq The Israeli Telecommunication Corp., Ltd. 813,236 885,987 0.03%
Shufersal Ltd. 109,777 873,904 0.03%Alony Hetz Properties & Investments Ltd. 61,536 857,368 0.02%
Nano Dimension Ltd. ADR 100,031 824,255 0.02%Enlight Renewable Energy Ltd. 358,579 769,759 0.02%
First International Bank Of Israel Ltd. 23,269 745,522 0.02%
Mivne Real Estate KD Ltd. 249,730 724,244 0.02%Shikun & Binui Ltd. 101,029 653,580 0.02%Strauss Group Ltd. 22,146 620,170 0.02%Phoenix Holdings Ltd. 62,999 589,099 0.02%Cognyte Software Ltd. 23,990 587,755 0.02%Gav-Yam Lands Corp., Ltd. 58,959 564,711 0.02%Melisron Ltd. 7,982 546,259 0.02%

150
Vanguard Global Small-Cap Index Fund
.Number of
SharesFair Value
US Dollars ($)% of Total
Net AssetsBig Shopping Centers Ltd. 4,222 540,302 0.02%Radware Ltd. 16,900 520,182 0.02%Clal Insurance Enterprises Holdings Ltd. 26,197 520,161 0.01%
Amot Investments Ltd. 78,147 512,746 0.01%Israel Corp., Ltd. 1,624 492,209 0.01%Paz Oil Co., Ltd. 3,997 490,901 0.01%Airport City Ltd. 28,408 476,532 0.01%Shapir Engineering & Industry Ltd. 61,458 468,691 0.01%
Camtek Ltd. 11,817 448,237 0.01%Electra Ltd. 785 445,440 0.01%Danel Adir Yeoshua Ltd. 2,124 445,202 0.01%Harel Insurance Investments & Financial Services Ltd. 43,922 435,378 0.01%
Nano-X Imaging Ltd. 13,263 425,079 0.01%Maytronics Ltd. 17,693 368,738 0.01%Kenon Holdings Ltd. 10,671 368,090 0.01%Matrix IT Ltd. 13,476 364,433 0.01%Fox Wizel Ltd. 3,126 358,216 0.01%Formula Systems 1985 Ltd. 3,968 356,188 0.01%AudioCodes Ltd. 10,535 354,023 0.01%Reit 1 Ltd. REIT 64,727 342,059 0.01%Ashtrom Group Ltd. 15,054 341,874 0.01%Hilan Ltd. 6,670 321,781 0.01%OPC Energy Ltd. 32,334 315,749 0.01%Sapiens International Corp. NV 11,657 312,666 0.01%
Mega Or Holdings Ltd. 9,694 312,374 0.01%Energix-Renewable Energies Ltd. 78,980 303,219 0.01%
Isracard Ltd. 73,784 302,518 0.01%Delek Automotive Systems Ltd. 22,427 294,576 0.01%
FIBI Holdings Ltd. 7,427 277,843 0.01%Compugen Ltd. 33,193 274,838 0.01%Elco Ltd. 4,556 271,249 0.01%Partner Communications Co., Ltd. 58,017 265,648 0.01%
Taro Pharmaceutical Industries Ltd. 3,408 245,240 0.01%
Summit Real Estate Holdings Ltd. 16,234 244,768 0.01%
One Software Technologies Ltd. 15,840 237,515 0.01%
Migdal Insurance & Financial Holdings Ltd. 171,631 236,496 0.01%
Delek Group Ltd. 3,483 233,554 0.01%Menora Mivtachim Holdings Ltd. 11,443 226,507 0.01%
Electra Consumer Products 1970 Ltd. 3,768 216,586 0.01%
Fattal Holdings 1998 Ltd. 2,271 215,984 0.01%Gazit-Globe Ltd. 29,751 214,653 0.01%Rami Levy Chain Stores Hashikma Marketing 2006 Ltd. 3,216 211,604 0.01%
AFI Properties Ltd. 4,667 202,091 0.01%Oil Refineries Ltd. 759,929 195,900 0.01%Cellcom Israel Ltd. 42,911 186,604 0.01%Equital Ltd. 6,735 182,714 0.01%YH Dimri Construction & Development Ltd. 3,013 179,569 0.01%
Tadiran Group Ltd. 1,474 175,061 0.01%Caesarstone Ltd. 11,753 173,474 0.01%Israel Canada T.R Ltd. 42,070 171,069 0.00%Blue Square Real Estate Ltd. 2,072 158,905 0.00%
Ituran Location & Control Ltd. 5,715 155,677 0.00%
Magic Software Enterprises Ltd. 9,561 154,308 0.00%
NEOGAMES SA 2,489 152,999 0.00%
.Number of
SharesFair Value
US Dollars ($)% of Total
Net AssetsGilat Satellite Networks Ltd. 14,122 142,758 0.00%Arad Investment & Industrial Development Ltd. 1,259 140,872 0.00%
UroGen Pharma Ltd. 9,048 138,163 0.00%Isras Investment Co., Ltd. 575 132,558 0.00%Altshuler Shaham Provident Funds & Pension Ltd. 21,762 130,899 0.00%
IDI Insurance Co., Ltd. 3,818 127,716 0.00%Delta Galil Industries Ltd. 3,064 126,942 0.00%Azorim-Investment Development & Construction Co., Ltd. 30,320 121,894 0.00%
Doral Group Renewable Energy Resources Ltd. 24,671 116,522 0.00%
Brack Capital Properties NV 1,044 111,433 0.00%Electreon Wireless Ltd. 1,812 109,382 0.00%Malam - Team Ltd. 2,693 92,397 0.00%Property & Building Corp., Ltd. 753 91,742 0.00%
M Yochananof & Sons Ltd. 1,210 81,323 0.00%Prashkovsky Investments & Construction Ltd. 2,429 69,996 0.00%
Naphtha Israel Petroleum Corp., Ltd. 8,926 41,582 0.00%
test test 35,903,123 1.03%Italy 1.06% (2020: 1.08%)Banco BPM SpA 553,845 1,781,911 0.05%Interpump Group SpA 28,636 1,695,934 0.05%Reply SpA 8,437 1,386,754 0.04%Hera SpA 328,736 1,358,230 0.04%Leonardo SpA 163,290 1,319,114 0.04%A2A SpA 626,199 1,280,259 0.04%Italgas SpA 192,257 1,256,723 0.04%de' Longhi SpA 26,966 1,174,908 0.03%Azimut Holding SpA 44,862 1,089,574 0.03%Buzzi Unicem SpA 40,311 1,069,394 0.03%Banca Generali SpA 24,226 1,033,691 0.03%BPER Banca 418,692 911,375 0.03%Banca Mediolanum SpA 92,083 895,887 0.03%Unipol Gruppo SpA 159,263 867,291 0.02%Pirelli & C SpA 146,291 849,390 0.02%Cerved Group SpA 72,458 842,094 0.02%Brunello Cucinelli SpA 14,326 837,907 0.02%Brembo SpA 63,009 798,035 0.02%Iren SpA 277,475 791,713 0.02%Banca Popolare di Sondrio SCPA 178,718 775,283 0.02%
ERG SpA 22,820 676,556 0.02%Technogym SpA 50,893 649,409 0.02%BFF Bank SpA 62,124 622,536 0.02%Autogrill SpA 77,345 566,851 0.02%Sesa SpA 3,282 548,789 0.02%Saipem SpA 224,840 544,208 0.02%Gruppo MutuiOnline SpA 10,940 521,545 0.02%Anima Holding SpA 104,109 517,433 0.01%Enav SpA 110,083 496,080 0.01%Mediaset SpA 128,783 464,891 0.01%GVS SpA 27,837 455,894 0.01%Salvatore Ferragamo SpA 18,863 403,660 0.01%ACEA SpA 17,423 402,701 0.01%Tamburi Investment Partners SpA 40,308 395,316 0.01%
Societa Cattolica Di Assicurazione SpA 46,959 390,099 0.01%
Carel Industries SpA 15,522 372,753 0.01%MARR SpA 14,776 352,209 0.01%Tinexta SpA 8,893 346,126 0.01%Falck Renewables SpA 52,429 345,696 0.01%Illimity Bank SpA 22,228 309,996 0.01%doValue SpA 27,316 300,617 0.01%Webuild SpA 100,407 266,485 0.01%Tod's SpA 3,910 265,693 0.01%

151
Vanguard Global Small-Cap Index Fund
.Number of
SharesFair Value
US Dollars ($)% of Total
Net AssetsRAI Way SpA 43,715 263,355 0.01%Piaggio & C SpA 66,546 261,688 0.01%Maire Tecnimont SpA 66,559 243,427 0.01%CIR SpA-Compagnie Industriali 372,748 223,673 0.01%
Esprinet SpA 12,144 213,431 0.01%Biesse SpA 6,380 213,211 0.01%Juventus Football Club SpA 247,175 211,636 0.01%Danieli & C Officine Meccaniche SpA 12,111 208,830 0.01%
El.En. SpA 4,031 207,946 0.01%Fincantieri SpA 224,972 202,764 0.01%Danieli & C Officine Meccaniche SpA (MTAA) 7,473 197,185 0.01%
Zignago Vetro SpA 9,785 194,948 0.01%Saras SpA 231,888 193,872 0.01%Cementir Holding NV 18,225 185,872 0.01%Italmobiliare SpA 4,669 168,601 0.00%Ascopiave SpA 38,488 162,032 0.00%Sanlorenzo SpA/Ameglia 5,548 152,641 0.00%Banca IFIS SpA 9,404 149,439 0.00%Credito Emiliano SpA 23,697 141,916 0.00%Banca Monte dei Paschi di Siena SpA 100,773 137,911 0.00%
La Doria SpA 5,770 130,284 0.00%Arnoldo Mondadori Editore SpA 66,892 127,558 0.00%
Datalogic SpA 4,333 102,462 0.00%Fila SpA 7,337 93,451 0.00%Immobiliare Grande Distribuzione SIIQ SpA REIT 18,641 89,752 0.00%
Salcef SpA 3,711 61,392 0.00%Banca Carige SpA - Warrants 28/2/2022 3,242,382 2,961 0.00%
Bio On SpA 2,300 — 0.00%test test 36,773,248 1.06%Japan 10.27% (2020: 10.87%)Taiyo Yuden Co., Ltd. 45,250 2,238,242 0.06%Mitsui OSK Lines Ltd. 44,900 2,160,249 0.06%Food & Life Cos Ltd. 44,700 1,931,133 0.06%Ebara Corp. 38,900 1,917,137 0.06%BayCurrent Consulting, Inc. 5,300 1,905,307 0.06%Advance Residence Investment Corp. REIT 527 1,756,825 0.05%
Asics Corp. 59,600 1,510,003 0.04%Showa Denko KK 50,700 1,507,433 0.04%Sojitz Corp. 495,300 1,494,959 0.04%SCREEN Holdings Co., Ltd. 15,100 1,493,810 0.04%Tokyu Fudosan Holdings Corp. 240,100 1,445,056 0.04%
Amada Co., Ltd. 142,400 1,440,807 0.04%Matsumotokiyoshi Holdings Co., Ltd. 32,500 1,436,278 0.04%
Open House Co., Ltd. 30,300 1,425,047 0.04%NOF Corp. 27,311 1,424,729 0.04%Marui Group Co., Ltd. 74,600 1,403,413 0.04%Haseko Corp. 101,700 1,394,607 0.04%Industrial & Infrastructure Fund Investment Corp. REIT Class A 726 1,386,065 0.04%
Sekisui House, Inc. REIT 1,624 1,346,139 0.04%Nagoya Railroad Co., Ltd. 71,300 1,327,199 0.04%Nikon Corp. 121,600 1,298,279 0.04%Skylark Holdings Co., Ltd. 90,704 1,260,981 0.04%IHI Corp. 52,800 1,253,994 0.04%Kyushu Electric Power Co., Inc. 161,800 1,246,410 0.04%
Nifco, Inc. 32,290 1,220,439 0.04%Japan Prime Realty Investment Corp. REIT 311 1,218,894 0.04%
Sumitomo Heavy Industries Ltd. 44,000 1,213,082 0.04%
.Number of
SharesFair Value
US Dollars ($)% of Total
Net AssetsKyushu Railway Co. 53,700 1,212,471 0.04%Kawasaki Heavy Industries Ltd. 56,400 1,206,865 0.04%
Kenedix Office Investment Corp. REIT Class A 171 1,206,352 0.04%
Activia Properties, Inc. REIT 251 1,189,531 0.03%Fukuoka Financial Group, Inc. 67,800 1,184,469 0.03%
COMSYS Holdings Corp. 42,750 1,184,397 0.03%Nichirei Corp. 44,650 1,174,280 0.03%Kuraray Co., Ltd. 120,800 1,161,308 0.03%Keihan Holdings Co., Ltd. 37,300 1,129,183 0.03%Alfresa Holdings Corp. 75,400 1,127,026 0.03%NET One Systems Co., Ltd. 34,000 1,122,714 0.03%LaSalle Logiport REIT 658 1,112,179 0.03%Iwatani Corp. 18,483 1,109,080 0.03%Freee KK 11,900 1,094,684 0.03%Japan Airport Terminal Co., Ltd. 24,200 1,088,008 0.03%
Mitsui Fudosan Logistics Park, Inc. REIT 203 1,082,764 0.03%
Keikyu Corp. 88,300 1,080,380 0.03%Teijin Ltd. 70,700 1,078,431 0.03%Nippon Accommodations Fund, Inc. REIT Class A 186 1,074,205 0.03%
Tokyo Tatemono Co., Ltd. 75,200 1,073,221 0.03%Air Water, Inc. 69,600 1,071,059 0.03%Japan Hotel Investment Corp. REIT Class A 1,779 1,067,496 0.03%
Seibu Holdings, Inc. 90,700 1,063,982 0.03%Chugoku Electric Power Co., Inc. 116,200 1,061,598 0.03%
Denka Co., Ltd. 31,800 1,058,663 0.03%Rohto Pharmaceutical Co., Ltd. 39,267 1,056,059 0.03%
Benefit One, Inc. 33,300 1,048,594 0.03%Aozora Bank Ltd. 46,800 1,047,824 0.03%Fancl Corp. 32,240 1,045,716 0.03%Shinko Electric Industries Co., Ltd. 28,400 1,040,148 0.03%
Kyowa Exeo Corp. 41,899 1,032,469 0.03%Bank of Kyoto Ltd. 22,300 1,012,632 0.03%Yokohama Rubber Co., Ltd. 47,200 1,011,702 0.03%Relo Group, Inc. 44,200 1,011,515 0.03%Anritsu Corp. 54,100 1,009,470 0.03%Sankyu, Inc. 23,192 1,006,122 0.03%Tokai Carbon Co., Ltd. 72,734 1,003,951 0.03%Taiheiyo Cement Corp. 45,700 1,003,432 0.03%Sugi Holdings Co., Ltd. 13,745 1,003,104 0.03%Konica Minolta, Inc. 175,900 973,084 0.03%Japan Logistics Fund, Inc. REIT 323 971,997 0.03%
Money Forward, Inc. 15,200 970,970 0.03%TechnoPro Holdings, Inc. 40,500 958,951 0.03%Ulvac, Inc. 18,650 946,027 0.03%Sumitomo Rubber Industries Ltd. 67,600 933,695 0.03%
Sumitomo Forestry Co., Ltd. 50,850 932,334 0.03%Zenkoku Hosho Co., Ltd. 21,650 931,424 0.03%Invincible Investment Corp. REIT 2,414 930,887 0.03%
Kewpie Corp. 41,350 928,782 0.03%Mitsubishi Materials Corp. 46,300 923,998 0.03%JCR Pharmaceuticals Co., Ltd. 27,300 919,921 0.03%
Sundrug Co., Ltd. 28,700 912,794 0.03%Nankai Electric Railway Co., Ltd. 42,600 910,801 0.03%
Mori Hills Investment Corp. REIT Class A 606 909,628 0.03%
NGK Spark Plug Co., Ltd. 61,300 909,089 0.03%Sega Sammy Holdings, Inc. 69,000 906,406 0.03%Nihon Kohden Corp. 31,569 901,646 0.03%

152
Vanguard Global Small-Cap Index Fund
.Number of
SharesFair Value
US Dollars ($)% of Total
Net AssetsToyo Tire Corp. 42,595 901,100 0.03%Jeol Ltd. 15,349 898,896 0.03%Frontier Real Estate Investment Corp. REIT 192 897,811 0.03%
Isetan Mitsukoshi Holdings Ltd. 128,500 896,108 0.03%
Sanwa Holdings Corp. 72,850 895,282 0.03%Kamigumi Co., Ltd. 44,100 895,191 0.03%Electric Power Development Co., Ltd. 61,600 879,683 0.03%
SMS Co., Ltd. 29,300 877,759 0.03%Daiwa Office Investment Corp. REIT Class A 125 870,574 0.03%
Horiba Ltd. 13,321 864,143 0.03%Alps Alpine Co., Ltd. 81,600 862,391 0.03%Daicel Corp. 104,500 860,555 0.03%J Front Retailing Co., Ltd. 96,600 857,293 0.03%Zensho Holdings Co., Ltd. 33,298 855,926 0.02%DMG Mori Co., Ltd. 47,550 854,263 0.02%Outsourcing, Inc. 46,800 851,331 0.02%Shimamura Co., Ltd. 8,800 845,193 0.02%Tokyo Ohka Kogyo Co., Ltd. 13,370 844,434 0.02%Menicon Co., Ltd. 11,900 836,292 0.02%JTEKT Corp. 81,200 833,290 0.02%Kenedix Residential Next Investment Corp. REIT 385 832,854 0.02%
Park24 Co., Ltd. 45,800 832,727 0.02%Hulic Reit, Inc. REIT 491 827,697 0.02%Mebuki Financial Group, Inc. 387,800 817,598 0.02%Nihon Unisys Ltd. 27,078 814,853 0.02%Toyo Seikan Group Holdings Ltd. 59,400 811,873 0.02%
Ube Industries Ltd. 39,750 805,458 0.02%Comforia Residential, Inc. REIT 254 800,973 0.02%
Mitsubishi Motors Corp. 283,900 798,061 0.02%Dowa Holdings Co., Ltd. 20,200 796,243 0.02%Kinden Corp. 48,500 792,675 0.02%Nippon Electric Glass Co., Ltd. 33,600 790,125 0.02%
Calbee, Inc. 34,200 789,444 0.02%Kaneka Corp. 19,500 786,219 0.02%JGC Holdings Corp. 84,300 786,111 0.02%Suzuken Co., Ltd. 26,800 785,963 0.02%Daiwa Securities Living Investments Corp. REIT Class A 718 781,461 0.02%
Kagome Co., Ltd. 29,532 779,875 0.02%Justsystems Corp. 13,200 777,800 0.02%GMO internet, Inc. 28,339 773,648 0.02%House Foods Group, Inc. 25,250 772,356 0.02%AEON Investment Corp. REIT 521 772,182 0.02%
DeNA Co., Ltd. 36,300 772,180 0.02%Coca-Cola Bottlers Japan Holdings, Inc. 49,200 769,540 0.02%
Tsumura & Co. 24,350 766,765 0.02%Invesco Office J-Reit, Inc. REIT 3,734 763,352 0.02%
Credit Saison Co., Ltd. 62,400 761,236 0.02%Zeon Corp. 54,900 760,260 0.02%SHIFT, Inc. 4,900 759,789 0.02%JAFCO Group Co., ltd. 12,200 759,546 0.02%As One Corp. 5,800 758,249 0.02%Aica Kogyo Co., Ltd. 21,393 752,677 0.02%Nippon Gas Co., Ltd. 44,150 751,015 0.02%Kadokawa Corp. 18,475 750,719 0.02%Morinaga Milk Industry Co., Ltd. 14,303 746,143 0.02%
Kobe Steel Ltd. 116,000 745,184 0.02%DIC Corp. 29,450 744,277 0.02%Ship Healthcare Holdings, Inc. 31,800 742,926 0.02%
.Number of
SharesFair Value
US Dollars ($)% of Total
Net AssetsSawai Group Holdings Co., Ltd. 16,595 740,114 0.02%
Penta-Ocean Construction Co., Ltd. 105,747 736,485 0.02%
Japan Excellent, Inc. REIT 514 735,410 0.02%Ushio, Inc. 39,850 728,854 0.02%Rakus Co., Ltd. 26,400 721,903 0.02%GS Yuasa Corp. 28,200 720,308 0.02%NIPPON Investment Corp. REIT 174 715,659 0.02%
NTT UD Investment Corp. REIT 484 715,600 0.02%
Takara Holdings, Inc. 57,150 713,152 0.02%Kawasaki Kisen Kaisha Ltd. 19,800 712,686 0.02%Furukawa Electric Co., Ltd. 28,250 704,277 0.02%Tokyo Seimitsu Co., Ltd. 15,500 702,451 0.02%K's Holdings Corp. 60,996 701,792 0.02%Mani, Inc. 30,185 692,414 0.02%SHO-BOND Holdings Co., Ltd. 16,536 689,062 0.02%
Mitsubishi Estate Logistics Investment Corp. REIT 155 686,391 0.02%
Ezaki Glico Co., Ltd. 18,400 686,332 0.02%Mirait Holdings Corp. 38,543 684,460 0.02%Internet Initiative Japan, Inc. 21,900 680,737 0.02%Shinsei Bank Ltd. 51,700 678,682 0.02%Infomart Corp. 82,600 677,976 0.02%Yamazaki Baking Co., Ltd. 47,900 675,839 0.02%Nipro Corp. 57,100 675,487 0.02%Fujitsu General Ltd. 25,224 669,746 0.02%Mabuchi Motor Co., Ltd. 17,500 662,222 0.02%FP Corp. 17,808 661,843 0.02%Seria Co., Ltd. 17,600 649,356 0.02%Mitsubishi Logistics Corp. 21,900 649,167 0.02%Nippo Corp. 22,676 646,631 0.02%Topcon Corp. 43,276 646,469 0.02%Nakanishi, Inc. 29,500 645,869 0.02%Japan Steel Works Ltd. 25,100 645,422 0.02%Tokyu, Inc. REIT 349 644,293 0.02%Toda Corp. 93,400 643,761 0.02%Benesse Holdings, Inc. 25,800 642,269 0.02%Ain Holdings, Inc. 10,255 640,302 0.02%Fuji Corp. 27,727 635,031 0.02%Seino Holdings Co., Ltd. 49,450 634,443 0.02%Toyoda Gosei Co., Ltd. 25,700 633,296 0.02%Takashimaya Co., Ltd. 57,900 630,176 0.02%Daiseki Co., Ltd. 13,990 628,976 0.02%NHK Spring Co., Ltd. 76,400 627,775 0.02%Aeon Mall Co., Ltd. 40,600 625,882 0.02%Sumitomo Bakelite Co., Ltd. 14,100 623,759 0.02%Rengo Co., Ltd. 74,781 623,231 0.02%Hirogin Holdings, Inc. 118,000 621,948 0.02%Digital Garage, Inc. 13,700 616,556 0.02%PALTAC Corp. 11,875 616,272 0.02%Mitsui Mining & Smelting Co., Ltd. 22,200 616,056 0.02%
OSG Corp. 35,250 611,690 0.02%Sotetsu Holdings, Inc. 30,800 607,453 0.02%Asahi Holdings, Inc. 29,622 604,770 0.02%Nichias Corp. 23,660 595,817 0.02%Nishi-Nippon Railroad Co., Ltd. 24,500 594,234 0.02%
Milbon Co., Ltd. 10,500 594,108 0.02%cocokara fine, Inc. 7,936 593,466 0.02%Katitas Co., Ltd. 21,000 590,323 0.02%Mori Trust Sogo, Inc. REIT 412 583,162 0.02%Amano Corp. 22,950 579,178 0.02%Fujitec Co., Ltd. 25,863 574,164 0.02%Daiwabo Holdings Co., Ltd. 33,255 571,378 0.02%Kenedix Retail Corp. REIT 210 568,565 0.02%ADEKA Corp. 30,188 567,096 0.02%Meitec Corp. 10,450 565,857 0.02%

153
Vanguard Global Small-Cap Index Fund
.Number of
SharesFair Value
US Dollars ($)% of Total
Net AssetsMaruichi Steel Tube Ltd. 24,000 564,159 0.02%Daiichikosho Co., Ltd. 14,678 564,030 0.02%Toyota Boshoku Corp. 27,250 563,954 0.02%Nippon Suisan Kaisha Ltd. 118,212 563,421 0.02%Resorttrust, Inc. 34,394 562,129 0.02%Sapporo Holdings Ltd. 26,900 560,346 0.02%Systena Corp. 29,200 560,112 0.02%Heiwa Real Estate, Inc. REIT 355 559,735 0.02%
Kyudenko Corp. 17,399 558,856 0.02%Sansan, Inc. 6,300 556,266 0.02%Daido Steel Co., Ltd. 11,200 553,996 0.02%Goldwin, Inc. 9,400 553,041 0.02%Nishimatsu Construction Co., Ltd. 17,700 551,779 0.02%
TS Tech Co., Ltd. 35,496 548,479 0.02%Hitachi Transport System Ltd. 13,193 547,381 0.02%
H.U. Group Holdings, Inc. 21,200 547,047 0.02%Yamato Kogyo Co., Ltd. 16,450 544,677 0.02%Japan Elevator Service Holdings Co., Ltd. 23,300 542,036 0.02%
Seven Bank Ltd. 254,100 540,297 0.02%Yoshinoya Holdings Co., Ltd. 28,200 539,405 0.02%Nikkon Holdings Co., Ltd. 24,729 538,740 0.02%Cosmo Energy Holdings Co., Ltd. 23,400 536,984 0.02%
Kaken Pharmaceutical Co., Ltd. 12,500 536,084 0.02%
Nippon Shokubai Co., Ltd. 11,100 534,048 0.02%Nippon Kayaku Co., Ltd. 55,700 526,939 0.02%Tokuyama Corp. 25,600 521,734 0.02%Sosei Group Corp. 31,500 519,087 0.02%Kyushu Financial Group, Inc. 146,800 518,476 0.02%Fuji Soft, Inc. 10,300 516,902 0.02%Nisshinbo Holdings, Inc. 59,431 513,509 0.02%Kotobuki Spirits Co., Ltd. 7,900 511,055 0.02%Hoshino Resorts, Inc. REIT 84 510,857 0.02%BASE, Inc. 33,500 509,789 0.02%Morinaga & Co., Ltd. 15,930 509,519 0.02%Hazama Ando Corp. 68,950 508,164 0.01%Heiwa Real Estate Co., Ltd. 13,400 505,865 0.01%OBIC Business Consultants Co., Ltd. 8,700 503,235 0.01%
Mitsui High-Tec, Inc. 8,700 500,883 0.01%JMDC, Inc. 10,000 499,144 0.01%OKUMA Corp. 10,200 499,018 0.01%Dexerials Corp. 23,600 498,409 0.01%Hachijuni Bank Ltd. 154,300 497,697 0.01%Kokuyo Co., Ltd. 31,750 496,317 0.01%Mixi, Inc. 18,700 493,657 0.01%RENOVA, Inc. 12,500 492,725 0.01%Sankyo Co., Ltd. 19,200 490,769 0.01%Takara Bio, Inc. 18,350 490,204 0.01%AEON Financial Service Co., Ltd. 41,400 488,266 0.01%
Maeda Corp. 55,944 485,396 0.01%Kusuri no Aoki Holdings Co., Ltd. 6,650 485,314 0.01%
Chugoku Bank Ltd. 63,400 482,112 0.01%Yamaguchi Financial Group, Inc. 84,200 480,969 0.01%
Nagase & Co., Ltd. 32,176 480,654 0.01%NSD Co., Ltd. 28,718 480,229 0.01%Raksul, Inc. 9,800 479,449 0.01%Sanken Electric Co., Ltd. 9,600 478,313 0.01%Izumi Co., Ltd. 12,650 476,412 0.01%Trusco Nakayama Corp. 18,642 475,666 0.01%Aiful Corp. 137,350 473,962 0.01%Gunma Bank Ltd. 150,100 473,331 0.01%Fukuoka Corp. REIT 277 466,700 0.01%Ariake Japan Co., Ltd. 7,500 465,582 0.01%
.Number of
SharesFair Value
US Dollars ($)% of Total
Net AssetsToshiba TEC Corp. 11,300 465,276 0.01%DCM Holdings Co., Ltd. 48,667 463,913 0.01%Fujikura Ltd. 99,600 463,047 0.01%en Japan, Inc. 13,000 462,654 0.01%Macnica Fuji Electronics Holdings, Inc. 19,186 461,716 0.01%
Toei Co., Ltd. 2,466 461,250 0.01%NS Solutions Corp. 14,300 461,249 0.01%Nippon Paper Industries Co., Ltd. 41,150 461,218 0.01%
Iyo Bank Ltd. 93,600 460,452 0.01%Daio Paper Corp. 27,689 458,781 0.01%Ichigo Office Investment Corp. REIT 512 455,767 0.01%
Shochiku Co., Ltd. 3,903 450,468 0.01%Colowide Co., Ltd. 25,176 449,353 0.01%Dip Corp. 14,500 448,757 0.01%Yaoko Co., Ltd. 7,800 447,662 0.01%NEC Networks & System Integration Corp. 28,247 446,648 0.01%
NOK Corp. 35,900 445,718 0.01%NTN Corp. 170,200 444,707 0.01%Global One Corp. REIT 391 441,060 0.01%Senko Group Holdings Co., Ltd. 45,096 440,437 0.01%
Toei Animation Co., Ltd. 3,700 439,040 0.01%Fuji Oil Holdings, Inc. 18,431 438,897 0.01%Fuyo General Lease Co., Ltd. 6,891 435,848 0.01%
CKD Corp. 20,623 434,794 0.01%Hitachi Zosen Corp. 66,545 429,883 0.01%Fuji Kyuko Co., Ltd. 8,950 428,994 0.01%IR Japan Holdings Ltd. 3,400 428,561 0.01%Glory Ltd. 20,600 427,442 0.01%Canon Marketing Japan, Inc. 18,350 427,048 0.01%JINS Holdings, Inc. 5,550 425,538 0.01%AnGes, Inc. 52,700 424,487 0.01%Fukuyama Transporting Co., Ltd. 11,400 423,687 0.01%
Musashi Seimitsu Industry Co., Ltd. 18,870 420,618 0.01%
Tadano Ltd. 40,245 420,616 0.01%Monex Group, Inc. 62,400 420,535 0.01%Nippon Light Metal Holdings Co., Ltd. 24,595 414,386 0.01%
Kyoritsu Maintenance Co., Ltd. 12,484 407,173 0.01%
Toyobo Co., Ltd. 33,750 405,341 0.01%Citizen Watch Co., Ltd. 109,200 403,388 0.01%Heiwa Corp. 22,650 401,411 0.01%Itoham Yonekyu Holdings, Inc. 62,155 400,404 0.01%
Makino Milling Machine Co., Ltd. 9,891 399,240 0.01%
Sumitomo Osaka Cement Co., Ltd. 14,650 398,622 0.01%
Pilot Corp. 11,700 396,360 0.01%Inaba Denki Sangyo Co., Ltd. 16,952 394,971 0.01%
Hanwa Co., Ltd. 13,639 394,461 0.01%Mizuho Leasing Co., Ltd. 11,687 394,340 0.01%Sakata Seed Corp. 11,971 393,676 0.01%Medley, Inc. 9,100 393,549 0.01%Shikoku Electric Power Co., Inc. 57,700 393,019 0.01%
Iriso Electronics Co., Ltd. 8,100 391,170 0.01%Megmilk Snow Brand Co., Ltd. 20,183 384,421 0.01%
GungHo Online Entertainment, Inc. 19,260 383,673 0.01%
Matsui Securities Co., Ltd. 52,500 383,143 0.01%Information Services International-Dentsu Ltd. 9,278 382,856 0.01%

154
Vanguard Global Small-Cap Index Fund
.Number of
SharesFair Value
US Dollars ($)% of Total
Net AssetsBic Camera, Inc. 37,850 381,603 0.01%Kureha Corp. 6,582 381,316 0.01%euglena Co., Ltd. 46,267 381,008 0.01%Wacom Co., Ltd. 59,550 378,794 0.01%Shoei Co., Ltd. 10,000 377,962 0.01%Fuji Seal International, Inc. 17,954 376,744 0.01%Autobacs Seven Co., Ltd. 28,240 376,058 0.01%Lintec Corp. 17,200 373,475 0.01%Hokuhoku Financial Group, Inc. 51,000 372,655 0.01%
Kanematsu Corp. 27,970 372,211 0.01%Maruwa Co., Ltd. 3,678 370,816 0.01%Takeuchi Manufacturing Co., Ltd. 14,800 368,967 0.01%
Toagosei Co., Ltd. 36,252 368,759 0.01%HIS Co., Ltd. 16,901 366,526 0.01%Duskin Co., Ltd. 15,986 364,975 0.01%Wacoal Holdings Corp. 16,100 364,821 0.01%Hankyu Hanshin, Inc. REIT Class A 251 363,870 0.01%
Taiyo Holdings Co., Ltd. 7,682 363,371 0.01%Change, Inc. 13,500 363,073 0.01%Arcs Co., Ltd. 16,665 362,759 0.01%Tokai Rika Co., Ltd. 22,600 362,651 0.01%SOSiLA Logistics, Inc. REIT 255 362,087 0.01%Ferrotec Holdings Corp. 11,700 359,992 0.01%Kumagai Gumi Co., Ltd. 14,150 356,969 0.01%Kura Sushi, Inc. 8,500 356,113 0.01%Sanrio Co., Ltd. 20,100 356,037 0.01%Takuma Co., Ltd. 23,300 352,471 0.01%Maruha Nichiro Corp. 16,477 350,502 0.01%CRE Logistics, Inc. REIT 207 349,694 0.01%Nihon Parkerizing Co., Ltd. 34,973 349,446 0.01%Ichigo, Inc. 109,400 346,957 0.01%Seiren Co., Ltd. 17,521 346,347 0.01%Earth Corp. 5,948 345,658 0.01%Toho Holdings Co., Ltd. 21,439 345,180 0.01%Rorze Corp. 3,900 343,653 0.01%Descente Ltd. 12,314 343,381 0.01%KOMEDA Holdings Co., Ltd. 18,400 343,166 0.01%Funai Soken Holdings, Inc. 15,770 342,140 0.01%Starts Corp., Inc. 13,350 341,959 0.01%Oisix ra daichi, Inc. 9,300 341,869 0.01%Hokuriku Electric Power Co. 62,300 340,155 0.01%Kiyo Bank Ltd. 25,914 335,511 0.01%Japan Aviation Electronics Industry Ltd. 18,917 334,571 0.01%
Kohnan Shoji Co., Ltd. 9,694 333,643 0.01%TKC Corp. 11,000 333,499 0.01%Noevir Holdings Co., Ltd. 6,550 332,841 0.01%GNI Group Ltd. 17,600 332,686 0.01%Star Asia Investment Corp. REIT 592 331,763 0.01%
Kintetsu World Express, Inc. 15,726 331,268 0.01%WealthNavi, Inc. 9,100 330,827 0.01%DTS Corp. 13,760 327,914 0.01%Sumitomo Warehouse Co., Ltd. 22,470 323,314 0.01%
Kandenko Co., Ltd. 41,300 322,616 0.01%EDION Corp. 32,950 322,108 0.01%Atom Corp. 46,100 321,483 0.01%UT Group Co., Ltd. 11,000 321,110 0.01%Create SD Holdings Co., Ltd. 10,798 321,051 0.01%
Japan Material Co., Ltd. 26,200 318,913 0.01%Elecom Co., Ltd. 17,000 318,894 0.01%Okumura Corp. 12,100 318,444 0.01%Daishi Hokuetsu Financial Group, Inc. 14,614 317,719 0.01%
Ai Holdings Corp. 16,050 316,691 0.01%Nojima Corp. 12,800 316,684 0.01%
.Number of
SharesFair Value
US Dollars ($)% of Total
Net AssetsItochu Advance Logistics Investment Corp. REIT 221 315,401 0.01%
UACJ Corp. 12,500 313,429 0.01%Fujimi, Inc. 6,854 312,472 0.01%Oki Electric Industry Co., Ltd. 34,050 312,307 0.01%
Daihen Corp. 7,488 312,028 0.01%Tokyo Steel Manufacturing Co., Ltd. 31,150 310,967 0.01%
Komeri Co., Ltd. 13,150 310,178 0.01%Okamura Corp. 22,858 309,538 0.01%TOKAI Holdings Corp. 37,924 309,228 0.01%MCJ Co., Ltd. 27,600 308,103 0.01%Nextage Co., Ltd. 18,100 306,912 0.01%Tokai Tokyo Financial Holdings, Inc. 86,314 306,403 0.01%
Japan Lifeline Co., Ltd. 25,100 305,524 0.01%Hogy Medical Co., Ltd. 9,924 305,347 0.01%BML, Inc. 8,942 305,344 0.01%Nishi-Nippon Financial Holdings, Inc. 53,600 305,209 0.01%
Orient Corp. 230,500 303,208 0.01%Aeon Delight Co., Ltd. 9,636 302,563 0.01%Giken Ltd. 7,350 299,987 0.01%Kato Sangyo Co., Ltd. 9,821 299,523 0.01%Taikisha Ltd. 10,026 299,452 0.01%West Holdings Corp. 8,450 298,822 0.01%Tocalo Co., Ltd. 23,576 298,019 0.01%T Hasegawa Co., Ltd. 13,400 297,000 0.01%Monogatari Corp. 4,400 296,135 0.01%Toridoll Holdings Corp. 17,400 295,356 0.01%Tsubakimoto Chain Co. 10,334 295,151 0.01%San-A Co., Ltd. 7,756 294,894 0.01%M&A Capital Partners Co., Ltd. 6,000 292,999 0.01%
Tokyotokeiba Co., Ltd. 7,169 292,922 0.01%Paramount Bed Holdings Co., Ltd. 16,396 292,348 0.01%
H2O Retailing Corp. 36,007 292,299 0.01%Nippn Corp. 20,612 291,380 0.01%Nissin Electric Co., Ltd. 22,958 290,207 0.01%Nitto Boseki Co., Ltd. 9,386 290,062 0.01%KH Neochem Co., Ltd. 12,400 288,354 0.01%Raito Kogyo Co., Ltd. 17,700 288,010 0.01%Hokkaido Electric Power Co., Inc. 63,400 287,325 0.01%
Mirai Corp. REIT 614 287,112 0.01%Kanamoto Co., Ltd. 12,400 285,784 0.01%eGuarantee, Inc. 13,500 285,715 0.01%Valor Holdings Co., Ltd. 13,991 285,392 0.01%Create Restaurants Holdings, Inc. 34,700 285,128 0.01%
Fuso Chemical Co., Ltd. 7,700 284,440 0.01%Saizeriya Co., Ltd. 11,839 284,268 0.01%Mandom Corp. 15,238 284,194 0.01%Takasago Thermal Engineering Co., Ltd. 16,963 283,048 0.01%
Joyful Honda Co., Ltd. 23,200 283,024 0.01%Transcosmos, Inc. 10,225 282,825 0.01%Toyo Ink SC Holdings Co., Ltd. 15,846 280,971 0.01%
Nisshin Oillio Group Ltd. 10,106 279,533 0.01%Round One Corp. 22,530 279,113 0.01%Infocom Corp. 10,100 278,913 0.01%BeNext-Yumeshin Group Co. 24,199 277,987 0.01%
Meidensha Corp. 13,927 277,185 0.01%Prima Meat Packers Ltd. 10,221 276,729 0.01%Kumiai Chemical Industry Co., Ltd. 35,958 275,379 0.01%
Chudenko Corp. 13,394 275,265 0.01%Sato Holdings Corp. 11,213 275,198 0.01%Shiga Bank Ltd. 15,700 274,704 0.01%
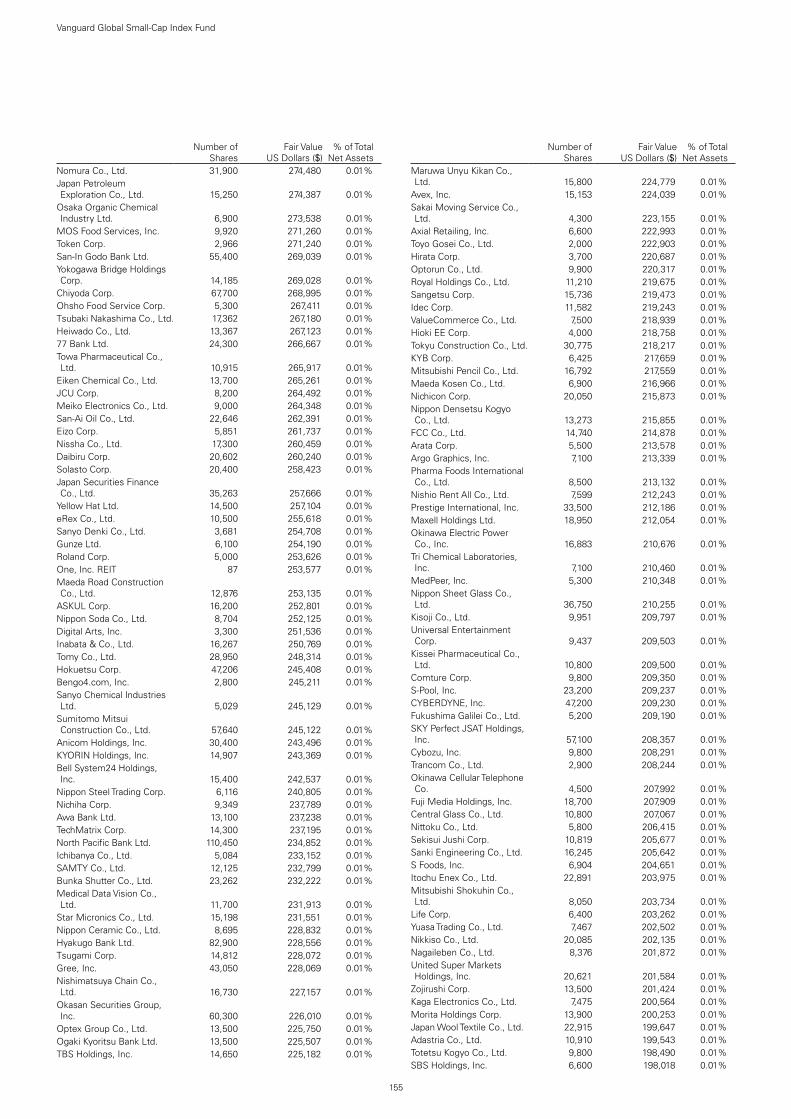
155
Vanguard Global Small-Cap Index Fund
.Number of
SharesFair Value
US Dollars ($)% of Total
Net AssetsNomura Co., Ltd. 31,900 274,480 0.01%Japan Petroleum Exploration Co., Ltd. 15,250 274,387 0.01%
Osaka Organic Chemical Industry Ltd. 6,900 273,538 0.01%
MOS Food Services, Inc. 9,920 271,260 0.01%Token Corp. 2,966 271,240 0.01%San-In Godo Bank Ltd. 55,400 269,039 0.01%Yokogawa Bridge Holdings Corp. 14,185 269,028 0.01%
Chiyoda Corp. 67,700 268,995 0.01%Ohsho Food Service Corp. 5,300 267,411 0.01%Tsubaki Nakashima Co., Ltd. 17,362 267,180 0.01%Heiwado Co., Ltd. 13,367 267,123 0.01%77 Bank Ltd. 24,300 266,667 0.01%Towa Pharmaceutical Co., Ltd. 10,915 265,917 0.01%
Eiken Chemical Co., Ltd. 13,700 265,261 0.01%JCU Corp. 8,200 264,492 0.01%Meiko Electronics Co., Ltd. 9,000 264,348 0.01%San-Ai Oil Co., Ltd. 22,646 262,391 0.01%Eizo Corp. 5,851 261,737 0.01%Nissha Co., Ltd. 17,300 260,459 0.01%Daibiru Corp. 20,602 260,240 0.01%Solasto Corp. 20,400 258,423 0.01%Japan Securities Finance Co., Ltd. 35,263 257,666 0.01%
Yellow Hat Ltd. 14,500 257,104 0.01%eRex Co., Ltd. 10,500 255,618 0.01%Sanyo Denki Co., Ltd. 3,681 254,708 0.01%Gunze Ltd. 6,100 254,190 0.01%Roland Corp. 5,000 253,626 0.01%One, Inc. REIT 87 253,577 0.01%Maeda Road Construction Co., Ltd. 12,876 253,135 0.01%
ASKUL Corp. 16,200 252,801 0.01%Nippon Soda Co., Ltd. 8,704 252,125 0.01%Digital Arts, Inc. 3,300 251,536 0.01%Inabata & Co., Ltd. 16,267 250,769 0.01%Tomy Co., Ltd. 28,950 248,314 0.01%Hokuetsu Corp. 47,206 245,408 0.01%Bengo4.com, Inc. 2,800 245,211 0.01%Sanyo Chemical Industries Ltd. 5,029 245,129 0.01%
Sumitomo Mitsui Construction Co., Ltd. 57,640 245,122 0.01%
Anicom Holdings, Inc. 30,400 243,496 0.01%KYORIN Holdings, Inc. 14,907 243,369 0.01%Bell System24 Holdings, Inc. 15,400 242,537 0.01%
Nippon Steel Trading Corp. 6,116 240,805 0.01%Nichiha Corp. 9,349 237,789 0.01%Awa Bank Ltd. 13,100 237,238 0.01%TechMatrix Corp. 14,300 237,195 0.01%North Pacific Bank Ltd. 110,450 234,852 0.01%Ichibanya Co., Ltd. 5,084 233,152 0.01%SAMTY Co., Ltd. 12,125 232,799 0.01%Bunka Shutter Co., Ltd. 23,262 232,222 0.01%Medical Data Vision Co., Ltd. 11,700 231,913 0.01%
Star Micronics Co., Ltd. 15,198 231,551 0.01%Nippon Ceramic Co., Ltd. 8,695 228,832 0.01%Hyakugo Bank Ltd. 82,900 228,556 0.01%Tsugami Corp. 14,812 228,072 0.01%Gree, Inc. 43,050 228,069 0.01%Nishimatsuya Chain Co., Ltd. 16,730 227,157 0.01%
Okasan Securities Group, Inc. 60,300 226,010 0.01%
Optex Group Co., Ltd. 13,500 225,750 0.01%Ogaki Kyoritsu Bank Ltd. 13,500 225,507 0.01%TBS Holdings, Inc. 14,650 225,182 0.01%
.Number of
SharesFair Value
US Dollars ($)% of Total
Net AssetsMaruwa Unyu Kikan Co., Ltd. 15,800 224,779 0.01%
Avex, Inc. 15,153 224,039 0.01%Sakai Moving Service Co., Ltd. 4,300 223,155 0.01%
Axial Retailing, Inc. 6,600 222,993 0.01%Toyo Gosei Co., Ltd. 2,000 222,903 0.01%Hirata Corp. 3,700 220,687 0.01%Optorun Co., Ltd. 9,900 220,317 0.01%Royal Holdings Co., Ltd. 11,210 219,675 0.01%Sangetsu Corp. 15,736 219,473 0.01%Idec Corp. 11,582 219,243 0.01%ValueCommerce Co., Ltd. 7,500 218,939 0.01%Hioki EE Corp. 4,000 218,758 0.01%Tokyu Construction Co., Ltd. 30,775 218,217 0.01%KYB Corp. 6,425 217,659 0.01%Mitsubishi Pencil Co., Ltd. 16,792 217,559 0.01%Maeda Kosen Co., Ltd. 6,900 216,966 0.01%Nichicon Corp. 20,050 215,873 0.01%Nippon Densetsu Kogyo Co., Ltd. 13,273 215,855 0.01%
FCC Co., Ltd. 14,740 214,878 0.01%Arata Corp. 5,500 213,578 0.01%Argo Graphics, Inc. 7,100 213,339 0.01%Pharma Foods International Co., Ltd. 8,500 213,132 0.01%
Nishio Rent All Co., Ltd. 7,599 212,243 0.01%Prestige International, Inc. 33,500 212,186 0.01%Maxell Holdings Ltd. 18,950 212,054 0.01%Okinawa Electric Power Co., Inc. 16,883 210,676 0.01%
Tri Chemical Laboratories, Inc. 7,100 210,460 0.01%
MedPeer, Inc. 5,300 210,348 0.01%Nippon Sheet Glass Co., Ltd. 36,750 210,255 0.01%
Kisoji Co., Ltd. 9,951 209,797 0.01%Universal Entertainment Corp. 9,437 209,503 0.01%
Kissei Pharmaceutical Co., Ltd. 10,800 209,500 0.01%
Comture Corp. 9,800 209,350 0.01%S-Pool, Inc. 23,200 209,237 0.01%CYBERDYNE, Inc. 47,200 209,230 0.01%Fukushima Galilei Co., Ltd. 5,200 209,190 0.01%SKY Perfect JSAT Holdings, Inc. 57,100 208,357 0.01%
Cybozu, Inc. 9,800 208,291 0.01%Trancom Co., Ltd. 2,900 208,244 0.01%Okinawa Cellular Telephone Co. 4,500 207,992 0.01%
Fuji Media Holdings, Inc. 18,700 207,909 0.01%Central Glass Co., Ltd. 10,800 207,067 0.01%Nittoku Co., Ltd. 5,800 206,415 0.01%Sekisui Jushi Corp. 10,819 205,677 0.01%Sanki Engineering Co., Ltd. 16,245 205,642 0.01%S Foods, Inc. 6,904 204,651 0.01%Itochu Enex Co., Ltd. 22,891 203,975 0.01%Mitsubishi Shokuhin Co., Ltd. 8,050 203,734 0.01%
Life Corp. 6,400 203,262 0.01%Yuasa Trading Co., Ltd. 7,467 202,502 0.01%Nikkiso Co., Ltd. 20,085 202,135 0.01%Nagaileben Co., Ltd. 8,376 201,872 0.01%United Super Markets Holdings, Inc. 20,621 201,584 0.01%
Zojirushi Corp. 13,500 201,424 0.01%Kaga Electronics Co., Ltd. 7,475 200,564 0.01%Morita Holdings Corp. 13,900 200,253 0.01%Japan Wool Textile Co., Ltd. 22,915 199,647 0.01%Adastria Co., Ltd. 10,910 199,543 0.01%Totetsu Kogyo Co., Ltd. 9,800 198,490 0.01%SBS Holdings, Inc. 6,600 198,018 0.01%

156
Vanguard Global Small-Cap Index Fund
.Number of
SharesFair Value
US Dollars ($)% of Total
Net AssetsJuroku Bank Ltd. 11,150 196,499 0.01%Koa Corp. 12,575 196,346 0.01%LITALICO, Inc. 3,800 196,180 0.01%Nitta Corp. 8,384 196,173 0.01%Belc Co., Ltd. 4,050 195,585 0.01%Shizuoka Gas Co., Ltd. 21,797 195,405 0.01%Jaccs Co., Ltd. 8,314 194,760 0.01%Nissan Shatai Co., Ltd. 30,137 194,686 0.01%Kameda Seika Co., Ltd. 4,850 193,581 0.01%Hosiden Corp. 21,563 193,307 0.01%Seiko Holdings Corp. 9,647 192,697 0.01%Toppan Forms Co., Ltd. 19,550 190,586 0.01%Micronics Japan Co., Ltd. 13,700 190,089 0.01%Nachi-Fujikoshi Corp. 5,383 189,634 0.01%Pacific Industrial Co., Ltd. 17,550 189,272 0.01%Nitto Kogyo Corp. 11,513 189,100 0.01%Nippon Road Co., Ltd. 2,715 188,599 0.01%Saibu Gas Holdings Co., Ltd. 8,600 188,597 0.01%
DyDo Group Holdings, Inc. 4,188 188,288 0.01%Topre Corp. 13,124 188,128 0.01%Nanto Bank Ltd. 11,350 187,854 0.01%Tamura Corp. 25,000 187,630 0.01%FULLCAST Holdings Co., Ltd. 9,000 187,476 0.01%
Nippon Seiki Co., Ltd. 17,554 187,418 0.01%Joshin Denki Co., Ltd. 7,732 187,396 0.01%Yodogawa Steel Works Ltd. 9,281 187,226 0.01%Pasona Group, Inc. 9,600 186,828 0.01%Financial Products Group Co., Ltd. 27,850 186,185 0.01%
Insource Co., Ltd. 8,600 185,885 0.01%Zuken, Inc. 6,600 184,936 0.01%EPS Holdings, Inc. 11,400 184,676 0.01%Nohmi Bosai Ltd. 9,739 183,917 0.01%Takara Standard Co., Ltd. 13,422 183,813 0.01%Ringer Hut Co., Ltd. 8,554 183,504 0.01%Starts Proceed Investment Corp. REIT Class A 84 183,152 0.01%
Broadleaf Co., Ltd. 39,200 182,597 0.01%METAWATER Co., Ltd. 9,600 182,416 0.01%Hamakyorex Co., Ltd. 6,300 181,070 0.01%Megachips Corp. 6,308 181,016 0.01%Hiday Hidaka Corp. 11,101 180,232 0.01%Sakata INX Corp. 19,750 179,901 0.01%Ricoh Leasing Co., Ltd. 5,786 179,591 0.01%Doutor Nichires Holdings Co., Ltd. 11,575 178,751 0.01%
Mori Trust Hotel Reit, Inc. REIT 141 178,743 0.01%
Toyo Construction Co., Ltd. 34,941 178,499 0.01%V Technology Co., Ltd. 3,700 178,016 0.01%JTOWER, Inc. 3,500 177,539 0.01%Fujimori Kogyo Co., Ltd. 4,850 177,412 0.01%Aida Engineering Ltd. 19,903 177,350 0.01%Mochida Pharmaceutical Co., Ltd. 5,400 177,097 0.01%
KFC Holdings Japan Ltd. 6,900 175,686 0.01%Kyokuto Kaihatsu Kogyo Co., Ltd. 12,350 175,475 0.01%
Aruhi Corp. 13,595 175,404 0.01%ZERIA Pharmaceutical Co., Ltd. 9,229 174,203 0.01%
Maruzen Showa Unyu Co., Ltd. 5,778 173,876 0.01%
Belluna Co., Ltd. 19,713 173,526 0.01%Tokai Corp. 7,900 173,104 0.01%Noritsu Koki Co., Ltd. 8,000 171,259 0.01%Sun Corp. 5,100 171,164 0.01%Mitsui-Soko Holdings Co., Ltd. 7,519 171,123 0.01%
RS Technologies Co., Ltd. 2,900 170,880 0.01%
.Number of
SharesFair Value
US Dollars ($)% of Total
Net AssetsKonishi Co., Ltd. 11,700 170,140 0.01%YA-MAN Ltd. 12,600 169,604 0.01%Future Corp. 9,350 169,495 0.01%Shinmaywa Industries Ltd. 19,486 168,367 0.01%Uzabase, Inc. 7,000 168,330 0.01%Relia, Inc. 13,732 167,892 0.01%Arcland Sakamoto Co., Ltd. 12,228 167,131 0.01%Kitz Corp. 24,483 166,544 0.01%United Arrows Ltd. 8,581 166,301 0.01%Nippon Carbon Co., Ltd. 4,400 166,105 0.01%ARTERIA Networks Corp. 10,200 165,972 0.01%Max Co., Ltd. 10,092 165,669 0.01%Shima Seiki Manufacturing Ltd. 9,650 165,108 0.01%
Grace Technology, Inc. 11,400 165,058 0.01%Shibaura Machine Co., Ltd. 7,450 164,653 0.01%Kappa Create Co., Ltd. 12,573 164,597 0.01%Digital Holdings, Inc. 8,100 164,131 0.01%SanBio Co., Ltd. 12,900 163,647 0.01%Modec, Inc. 8,816 163,468 0.01%Japan Pulp & Paper Co., Ltd. 5,139 163,444 0.01%
Obara Group, Inc. 4,726 162,231 0.01%V-Cube, Inc. 7,300 162,127 0.01%Yamazen Corp. 17,863 160,942 0.00%JIG-SAW, Inc. 1,900 160,573 0.00%Ryobi Ltd. 11,483 160,466 0.00%Snow Peak, Inc. 5,300 160,447 0.00%giftee, Inc. 5,000 159,474 0.00%Demae-Can Co., Ltd. 11,400 158,998 0.00%COLOPL, Inc. 21,300 158,709 0.00%Mitsuboshi Belting Ltd. 10,039 158,287 0.00%Okamoto Industries, Inc. 4,288 158,014 0.00%Nichi-iko Pharmaceutical Co., Ltd. 19,703 157,993 0.00%
Hokuto Corp. 9,060 156,646 0.00%Noritake Co., Ltd. 4,101 155,926 0.00%Tamron Co., Ltd. 7,107 155,920 0.00%Premier Anti-Aging Co., Ltd. 1,200 155,906 0.00%Zenrin Co., Ltd. 15,140 155,370 0.00%Tachi-S Co., Ltd. 11,575 154,973 0.00%Alpen Co., Ltd. 5,817 154,767 0.00%Keihanshin Building Co., Ltd. 12,600 154,619 0.00%
Hokkoku Bank Ltd. 7,750 154,525 0.00%Aomori Bank Ltd. 8,300 153,526 0.00%Takara Leben Real Estate Investment Corp. REIT 137 153,429 0.00%
Enigmo, Inc. 12,000 153,419 0.00%Exedy Corp. 10,440 153,228 0.00%Riken Keiki Co., Ltd. 6,400 153,095 0.00%Sodick Co., Ltd. 16,600 152,704 0.00%Suruga Bank Ltd. 50,900 152,255 0.00%YAMABIKO Corp. 13,800 151,068 0.00%Tokushu Tokai Paper Co., Ltd. 3,900 150,743 0.00%
Elan Corp. 13,000 150,041 0.00%IDOM, Inc. 25,450 149,962 0.00%Plaid, Inc. 6,000 149,635 0.00%Mimasu Semiconductor Industry Co., Ltd. 6,055 149,534 0.00%
Ryosan Co., Ltd. 8,219 149,510 0.00%TV Asahi Holdings Corp. 9,400 149,143 0.00%TOMONY Holdings, Inc. 56,278 148,567 0.00%Fujibo Holdings, Inc. 4,250 148,189 0.00%Riso Kagaku Corp. 9,247 147,965 0.00%Computer Engineering & Consulting Ltd. 10,300 147,090 0.00%
Furukawa Co., Ltd. 13,015 146,579 0.00%G-7 Holdings, Inc. 4,800 146,175 0.00%Curves Holdings Co., Ltd. 17,600 145,411 0.00%Sinko Industries Ltd. 8,600 145,283 0.00%
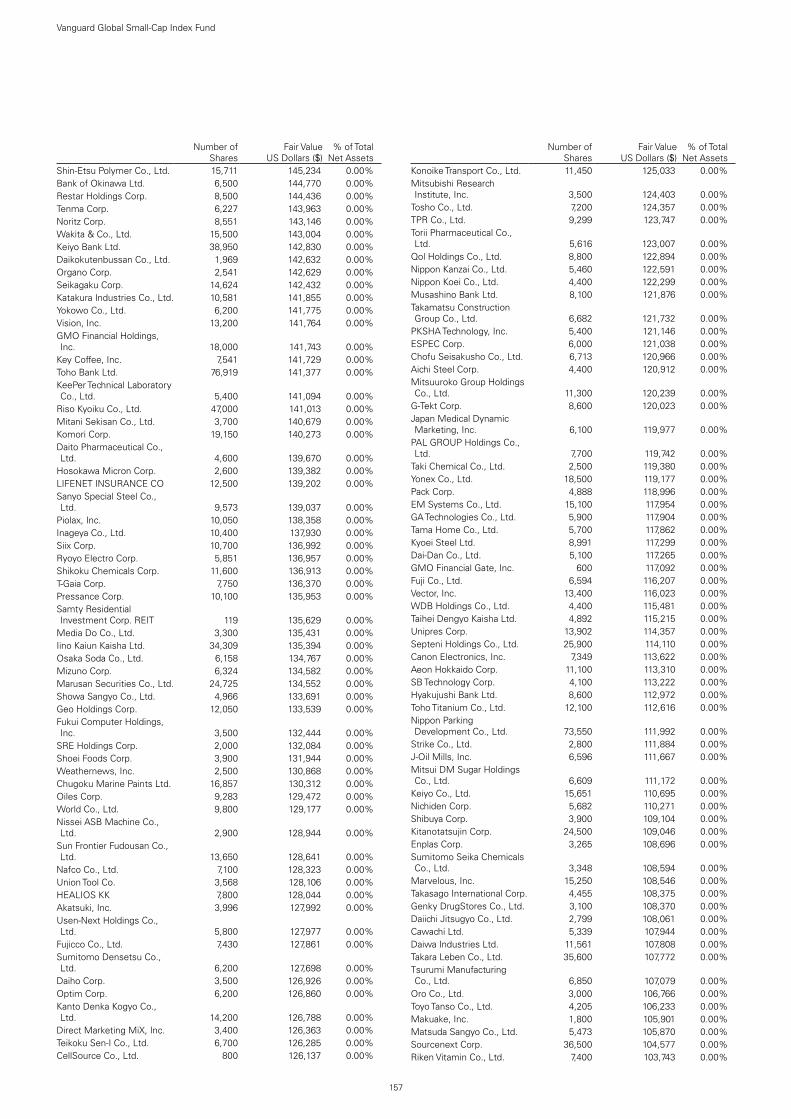
157
Vanguard Global Small-Cap Index Fund
.Number of
SharesFair Value
US Dollars ($)% of Total
Net AssetsShin-Etsu Polymer Co., Ltd. 15,711 145,234 0.00%Bank of Okinawa Ltd. 6,500 144,770 0.00%Restar Holdings Corp. 8,500 144,436 0.00%Tenma Corp. 6,227 143,963 0.00%Noritz Corp. 8,551 143,146 0.00%Wakita & Co., Ltd. 15,500 143,004 0.00%Keiyo Bank Ltd. 38,950 142,830 0.00%Daikokutenbussan Co., Ltd. 1,969 142,632 0.00%Organo Corp. 2,541 142,629 0.00%Seikagaku Corp. 14,624 142,432 0.00%Katakura Industries Co., Ltd. 10,581 141,855 0.00%Yokowo Co., Ltd. 6,200 141,775 0.00%Vision, Inc. 13,200 141,764 0.00%GMO Financial Holdings, Inc. 18,000 141,743 0.00%
Key Coffee, Inc. 7,541 141,729 0.00%Toho Bank Ltd. 76,919 141,377 0.00%KeePer Technical Laboratory Co., Ltd. 5,400 141,094 0.00%
Riso Kyoiku Co., Ltd. 47,000 141,013 0.00%Mitani Sekisan Co., Ltd. 3,700 140,679 0.00%Komori Corp. 19,150 140,273 0.00%Daito Pharmaceutical Co., Ltd. 4,600 139,670 0.00%
Hosokawa Micron Corp. 2,600 139,382 0.00%LIFENET INSURANCE CO 12,500 139,202 0.00%Sanyo Special Steel Co., Ltd. 9,573 139,037 0.00%
Piolax, Inc. 10,050 138,358 0.00%Inageya Co., Ltd. 10,400 137,930 0.00%Siix Corp. 10,700 136,992 0.00%Ryoyo Electro Corp. 5,851 136,957 0.00%Shikoku Chemicals Corp. 11,600 136,913 0.00%T-Gaia Corp. 7,750 136,370 0.00%Pressance Corp. 10,100 135,953 0.00%Samty Residential Investment Corp. REIT 119 135,629 0.00%
Media Do Co., Ltd. 3,300 135,431 0.00%Iino Kaiun Kaisha Ltd. 34,309 135,394 0.00%Osaka Soda Co., Ltd. 6,158 134,767 0.00%Mizuno Corp. 6,324 134,582 0.00%Marusan Securities Co., Ltd. 24,725 134,552 0.00%Showa Sangyo Co., Ltd. 4,966 133,691 0.00%Geo Holdings Corp. 12,050 133,539 0.00%Fukui Computer Holdings, Inc. 3,500 132,444 0.00%
SRE Holdings Corp. 2,000 132,084 0.00%Shoei Foods Corp. 3,900 131,944 0.00%Weathernews, Inc. 2,500 130,868 0.00%Chugoku Marine Paints Ltd. 16,857 130,312 0.00%Oiles Corp. 9,283 129,472 0.00%World Co., Ltd. 9,800 129,177 0.00%Nissei ASB Machine Co., Ltd. 2,900 128,944 0.00%
Sun Frontier Fudousan Co., Ltd. 13,650 128,641 0.00%
Nafco Co., Ltd. 7,100 128,323 0.00%Union Tool Co. 3,568 128,106 0.00%HEALIOS KK 7,800 128,044 0.00%Akatsuki, Inc. 3,996 127,992 0.00%Usen-Next Holdings Co., Ltd. 5,800 127,977 0.00%
Fujicco Co., Ltd. 7,430 127,861 0.00%Sumitomo Densetsu Co., Ltd. 6,200 127,698 0.00%
Daiho Corp. 3,500 126,926 0.00%Optim Corp. 6,200 126,860 0.00%Kanto Denka Kogyo Co., Ltd. 14,200 126,788 0.00%
Direct Marketing MiX, Inc. 3,400 126,363 0.00%Teikoku Sen-I Co., Ltd. 6,700 126,285 0.00%CellSource Co., Ltd. 800 126,137 0.00%
.Number of
SharesFair Value
US Dollars ($)% of Total
Net AssetsKonoike Transport Co., Ltd. 11,450 125,033 0.00%Mitsubishi Research Institute, Inc. 3,500 124,403 0.00%
Tosho Co., Ltd. 7,200 124,357 0.00%TPR Co., Ltd. 9,299 123,747 0.00%Torii Pharmaceutical Co., Ltd. 5,616 123,007 0.00%
Qol Holdings Co., Ltd. 8,800 122,894 0.00%Nippon Kanzai Co., Ltd. 5,460 122,591 0.00%Nippon Koei Co., Ltd. 4,400 122,299 0.00%Musashino Bank Ltd. 8,100 121,876 0.00%Takamatsu Construction Group Co., Ltd. 6,682 121,732 0.00%
PKSHA Technology, Inc. 5,400 121,146 0.00%ESPEC Corp. 6,000 121,038 0.00%Chofu Seisakusho Co., Ltd. 6,713 120,966 0.00%Aichi Steel Corp. 4,400 120,912 0.00%Mitsuuroko Group Holdings Co., Ltd. 11,300 120,239 0.00%
G-Tekt Corp. 8,600 120,023 0.00%Japan Medical Dynamic Marketing, Inc. 6,100 119,977 0.00%
PAL GROUP Holdings Co., Ltd. 7,700 119,742 0.00%
Taki Chemical Co., Ltd. 2,500 119,380 0.00%Yonex Co., Ltd. 18,500 119,177 0.00%Pack Corp. 4,888 118,996 0.00%EM Systems Co., Ltd. 15,100 117,954 0.00%GA Technologies Co., Ltd. 5,900 117,904 0.00%Tama Home Co., Ltd. 5,700 117,862 0.00%Kyoei Steel Ltd. 8,991 117,299 0.00%Dai-Dan Co., Ltd. 5,100 117,265 0.00%GMO Financial Gate, Inc. 600 117,092 0.00%Fuji Co., Ltd. 6,594 116,207 0.00%Vector, Inc. 13,400 116,023 0.00%WDB Holdings Co., Ltd. 4,400 115,481 0.00%Taihei Dengyo Kaisha Ltd. 4,892 115,215 0.00%Unipres Corp. 13,902 114,357 0.00%Septeni Holdings Co., Ltd. 25,900 114,110 0.00%Canon Electronics, Inc. 7,349 113,622 0.00%Aeon Hokkaido Corp. 11,100 113,310 0.00%SB Technology Corp. 4,100 113,222 0.00%Hyakujushi Bank Ltd. 8,600 112,972 0.00%Toho Titanium Co., Ltd. 12,100 112,616 0.00%Nippon Parking Development Co., Ltd. 73,550 111,992 0.00%
Strike Co., Ltd. 2,800 111,884 0.00%J-Oil Mills, Inc. 6,596 111,667 0.00%Mitsui DM Sugar Holdings Co., Ltd. 6,609 111,172 0.00%
Keiyo Co., Ltd. 15,651 110,695 0.00%Nichiden Corp. 5,682 110,271 0.00%Shibuya Corp. 3,900 109,104 0.00%Kitanotatsujin Corp. 24,500 109,046 0.00%Enplas Corp. 3,265 108,696 0.00%Sumitomo Seika Chemicals Co., Ltd. 3,348 108,594 0.00%
Marvelous, Inc. 15,250 108,546 0.00%Takasago International Corp. 4,455 108,375 0.00%Genky DrugStores Co., Ltd. 3,100 108,370 0.00%Daiichi Jitsugyo Co., Ltd. 2,799 108,061 0.00%Cawachi Ltd. 5,339 107,944 0.00%Daiwa Industries Ltd. 11,561 107,808 0.00%Takara Leben Co., Ltd. 35,600 107,772 0.00%Tsurumi Manufacturing Co., Ltd. 6,850 107,079 0.00%
Oro Co., Ltd. 3,000 106,766 0.00%Toyo Tanso Co., Ltd. 4,205 106,233 0.00%Makuake, Inc. 1,800 105,901 0.00%Matsuda Sangyo Co., Ltd. 5,473 105,870 0.00%Sourcenext Corp. 36,500 104,577 0.00%Riken Vitamin Co., Ltd. 7,400 103,743 0.00%

158
Vanguard Global Small-Cap Index Fund
.Number of
SharesFair Value
US Dollars ($)% of Total
Net AssetsMatsuyafoods Holdings Co., Ltd. 3,258 103,473 0.00%
Central Security Patrols Co., Ltd. 3,700 103,176 0.00%
Nittetsu Mining Co., Ltd. 1,990 103,095 0.00%Yamashin-Filter Corp. 16,200 103,047 0.00%Proto Corp. 8,700 102,998 0.00%Arcland Service Holdings Co., Ltd. 5,200 102,885 0.00%
Tosei Corp. 10,600 102,476 0.00%Futaba Industrial Co., Ltd. 21,712 102,310 0.00%Yukiguni Maitake Co., Ltd. 6,700 101,958 0.00%CI Takiron Corp. 19,017 100,062 0.00%Nippon Signal Co., Ltd. 12,107 99,919 0.00%Tsukishima Kikai Co., Ltd. 9,571 99,685 0.00%Marudai Food Co., Ltd. 6,493 99,159 0.00%Denyo Co., Ltd. 5,600 98,286 0.00%Plenus Co., Ltd. 5,350 98,092 0.00%Nichireki Co., Ltd. 8,300 97,739 0.00%Anest Iwata Corp. 10,700 97,562 0.00%Hibiya Engineering Ltd. 5,900 96,535 0.00%Koshidaka Holdings Co., Ltd. 17,600 95,937 0.00%
Ichikoh Industries Ltd. 14,700 95,890 0.00%Mitsubishi Logisnext Co., Ltd. 10,400 95,295 0.00%
Miroku Jyoho Service Co., Ltd. 6,600 94,846 0.00%
Retail Partners Co., Ltd. 8,900 94,060 0.00%TKP Corp. 5,000 93,837 0.00%Toenec Corp. 2,862 92,959 0.00%Itochu-Shokuhin Co., Ltd. 1,944 92,655 0.00%Eagle Industry Co., Ltd. 9,148 92,560 0.00%LIFULL Co., Ltd. 28,900 92,176 0.00%Starzen Co., Ltd. 4,800 90,949 0.00%Aichi Corp. 12,338 90,709 0.00%Yurtec Corp. 13,956 90,659 0.00%Matsuya Co., Ltd. 10,719 90,395 0.00%Bank of Nagoya Ltd. 4,050 90,312 0.00%Xebio Holdings Co., Ltd. 10,332 90,018 0.00%Sumitomo Riko Co., Ltd. 13,700 89,120 0.00%Doshisha Co., Ltd. 5,700 88,795 0.00%Onward Holdings Co., Ltd. 29,300 88,700 0.00%Uchida Yoko Co., Ltd. 2,000 88,657 0.00%LEC, Inc. 8,700 88,576 0.00%Melco Holdings, Inc. 1,845 88,103 0.00%Yokohama Reito Co., Ltd. 11,065 87,930 0.00%Gakken Holdings Co., Ltd. 7,200 87,575 0.00%RPA Holdings, Inc. 12,800 87,532 0.00%Japan Investment Adviser Co., Ltd. 6,500 87,494 0.00%
JM Holdings Co., Ltd. 4,400 87,374 0.00%Link And Motivation, Inc. 12,400 87,366 0.00%ST Corp. 5,600 87,287 0.00%JDC Corp. 16,900 86,792 0.00%Dainichiseika Color & Chemicals Manufacturing Co., Ltd. 4,197 86,670 0.00%
Sinfonia Technology Co., Ltd. 7,700 86,650 0.00%
Nagatanien Holdings Co., Ltd. 4,500 86,602 0.00%
Goldcrest Co., Ltd. 5,757 86,207 0.00%Sanshin Electronics Co., Ltd. 4,400 85,669 0.00%
ES-Con Japan Ltd. 12,400 85,467 0.00%YAKUODO Holdings Co., Ltd. 4,000 85,413 0.00%
Kamakura Shinsho Ltd. 9,400 85,200 0.00%GMO GlobalSign Holdings KK 2,000 84,782 0.00%
Yondoshi Holdings, Inc. 4,950 84,514 0.00%Software Service, Inc. 900 84,332 0.00%
.Number of
SharesFair Value
US Dollars ($)% of Total
Net AssetsSenshu Ikeda Holdings, Inc. 58,730 84,134 0.00%Rock Field Co., Ltd. 6,300 83,781 0.00%JAC Recruitment Co., Ltd. 5,200 83,442 0.00%Daikyonishikawa Corp. 13,400 83,305 0.00%Nihon Nohyaku Co., Ltd. 18,299 83,095 0.00%Amuse, Inc. 3,900 82,575 0.00%Tatsuta Electric Wire & Cable Co., Ltd. 16,600 82,409 0.00%
Halows Co., Ltd. 3,300 81,645 0.00%TOC Co., Ltd. 13,212 81,184 0.00%CONEXIO Corp. 6,000 81,088 0.00%VT Holdings Co., Ltd. 19,500 80,994 0.00%Maxvalu Tokai Co., Ltd. 3,600 80,440 0.00%Toa Corp. 3,603 79,922 0.00%AOKI Holdings, Inc. 13,316 79,903 0.00%Kintetsu Department Store Co., Ltd. 2,900 79,823 0.00%
Taiko Pharmaceutical Co., Ltd. 8,700 79,796 0.00%
Tonami Holdings Co., Ltd. 1,900 79,602 0.00%Okuwa Co., Ltd. 8,089 79,221 0.00%Meisei Industrial Co., Ltd. 12,000 79,142 0.00%Hennge KK 2,300 78,849 0.00%Leopalace21 Corp. 61,850 77,459 0.00%ZIGExN Co., Ltd. 20,500 77,205 0.00%Elematec Corp. 6,500 76,660 0.00%World Holdings Co., Ltd. 2,800 76,565 0.00%Advan Co., Ltd. 8,900 74,975 0.00%Shinnihon Corp. 9,900 74,926 0.00%Mie Kotsu Group Holdings, Inc. 17,800 74,895 0.00%
Kamei Corp. 7,400 74,873 0.00%Open Door, Inc. 3,700 74,307 0.00%Shin Nippon Air Technologies Co., Ltd. 4,000 72,835 0.00%
Wowow, Inc. 3,350 72,650 0.00%Chubu Shiryo Co., Ltd. 7,100 72,030 0.00%Raiznext Corp. 6,883 71,565 0.00%Japan Display, Inc. 207,200 70,940 0.00%Alpha Systems, Inc. 2,200 70,763 0.00%J-Stream, Inc. 2,100 69,723 0.00%PR Times, Inc. 2,100 68,966 0.00%Fujiya Co., Ltd. 3,552 68,422 0.00%Sparx Group Co., Ltd. 28,300 65,274 0.00%Daiken Corp. 3,470 65,217 0.00%JSP Corp. 4,400 63,231 0.00%Ebase Co., Ltd. 8,200 62,872 0.00%Nihon Chouzai Co., Ltd. 4,400 61,962 0.00%Kojima Co., Ltd. 9,000 61,546 0.00%Bushiroad, Inc. 2,400 60,438 0.00%Nitto Kohki Co., Ltd. 3,592 58,286 0.00%Fujio Food Group, Inc. 5,000 56,176 0.00%Altech Corp. 3,180 55,583 0.00%NS United Kaiun Kaisha Ltd. 2,483 54,184 0.00%Modalis Therapeutics Corp. 3,100 48,459 0.00%Fukuda Corp. 1,100 47,770 0.00%Osaka Steel Co., Ltd. 4,692 47,136 0.00%Edulab, Inc. 900 45,004 0.00%Shinnihonseiyaku Co., Ltd. 2,200 44,163 0.00%Kanematsu Electronics Ltd. 1,200 38,814 0.00%AI inside, Inc. 300 36,247 0.00%MTI Ltd. 5,500 33,499 0.00%test test 357,124,912 10.27%Netherlands 0.89% (2020: 1.01%)IMCD NV 22,695 3,609,167 0.10%Signify NV 51,952 3,286,271 0.09%AerCap Holdings NV 52,314 2,679,000 0.08%BE Semiconductor Industries NV 27,035 2,293,630 0.07%
ASR Nederland NV 56,976 2,202,036 0.06%Aalberts NV 40,152 2,157,969 0.06%Corbion NV 23,869 1,364,361 0.04%

159
Vanguard Global Small-Cap Index Fund
.Number of
SharesFair Value
US Dollars ($)% of Total
Net AssetsArcadis NV 28,905 1,183,292 0.03%PostNL NV 187,291 1,015,480 0.03%Boskalis Westminster 31,629 1,014,989 0.03%SBM Offshore NV 63,629 966,989 0.03%OCI NV 38,332 932,796 0.03%Basic-Fit NV 20,484 875,969 0.03%TKH Group NV 15,718 792,945 0.02%Alfen Beheer BV 8,329 777,842 0.02%Intertrust NV 34,818 626,792 0.02%Accell Group NV 10,147 545,110 0.02%Flow Traders 12,321 530,104 0.02%AMG Advanced Metallurgical Group NV 12,648 431,979 0.01%
Eurocommercial Properties NV 17,268 429,631 0.01%
Fugro NV 43,066 412,815 0.01%Sligro Food Group NV 10,688 313,704 0.01%NSI NV REIT 7,761 299,583 0.01%Van Lanschot Kempen NV ADR 11,700 297,619 0.01%
Pharming Group NV 253,252 288,018 0.01%Koninklijke BAM Groep NV 97,870 271,822 0.01%Wereldhave NV REIT 15,601 265,863 0.01%TomTom NV 28,165 235,977 0.01%CM.com NV 4,077 159,310 0.01%Vastned Retail NV REIT 5,265 154,221 0.00%B&S Group Sarl 11,930 122,520 0.00%Fastned BV 1,694 108,481 0.00%ForFarmers NV 13,711 80,974 0.00%SIF Holding NV 4,483 78,364 0.00%Brunel International NV 5,417 70,150 0.00%SRH NV 17,962 — 0.00%test test 30,875,773 0.89%New Zealand 0.34% (2020: 0.40%)Contact Energy Ltd. 314,688 1,820,674 0.05%Fletcher Building Ltd. 315,638 1,658,551 0.05%Infratil Ltd. 287,620 1,547,503 0.05%Chorus Ltd. 188,605 843,441 0.02%Summerset Group Holdings Ltd. 89,739 840,876 0.02%
SKYCITY Entertainment Group Ltd. 317,117 777,765 0.02%
Goodman Property Trust REIT 413,930 666,683 0.02%
Precinct Properties New Zealand Ltd. 533,363 596,300 0.02%
Genesis Energy Ltd. 211,409 502,255 0.02%Pushpay Holdings Ltd. 397,443 499,884 0.02%Kiwi Property Group Ltd. 566,017 460,763 0.01%Argosy Property Ltd. 351,380 383,022 0.01%Z Energy Ltd. 189,949 363,672 0.01%Air New Zealand Ltd. 245,508 265,900 0.01%Oceania Healthcare Ltd. 247,066 257,230 0.01%Restaurant Brands New Zealand Ltd. 10,730 107,590 0.00%
Synlait Milk Ltd. 39,731 101,054 0.00%test test 11,693,163 0.34%Norway 0.90% (2020: 0.86%)TOMRA Systems A.S.A 44,672 2,465,858 0.07%Nordic Semiconductor A.S.A 69,888 1,772,133 0.05%Storebrand A.S.A 189,658 1,719,114 0.05%Bakkafrost P/F 20,030 1,654,968 0.05%Salmar A.S.A 22,899 1,520,001 0.04%NEL A.S.A 529,617 1,235,847 0.04%Scatec A.S.A 45,303 1,200,330 0.03%Entra A.S.A 48,123 1,100,568 0.03%Leroy Seafood Group A.S.A 122,732 1,076,536 0.03%SpareBank 1 SR-Bank A.S.A 75,246 994,221 0.03%Subsea 7 SA 93,719 900,248 0.03%Borregaard A.S.A 40,015 874,218 0.02%Kongsberg Gruppen A.S.A 33,396 860,009 0.02%SpareBank 1 SMN 55,103 763,292 0.02%
.Number of
SharesFair Value
US Dollars ($)% of Total
Net AssetsAker A.S.A Class A 10,119 746,707 0.02%Kahoot! A.S.A 98,864 677,843 0.02%Atea A.S.A 32,877 639,568 0.02%TGS A.S.A 49,688 633,717 0.02%Veidekke A.S.A 46,118 617,393 0.02%Golden Ocean Group Ltd. 55,806 616,738 0.02%Norwegian Finans Holding A.S.A 49,386 556,405 0.02%
Austevoll Seafood A.S.A 38,517 478,038 0.01%Vaccibody A.S. 51,328 450,340 0.01%Europris A.S.A 70,448 442,081 0.01%Sbanken A.S.A 32,742 407,886 0.01%Frontline Ltd. 44,207 399,266 0.01%Elkem A.S.A 106,685 388,297 0.01%SpareBank 1 Nord Norge 38,899 385,591 0.01%Meltwater Holding BV 51,801 276,276 0.01%Fjordkraft Holding A.S.A 45,269 269,083 0.01%REC Silicon A.S.A 118,731 259,257 0.01%Pexip Holding A.S.A 28,751 256,932 0.01%Crayon Group Holding A.S.A 17,316 253,345 0.01%Atlantic Sapphire A.S.A 23,843 251,863 0.01%Grieg Seafood A.S.A 23,807 245,396 0.01%Bonheur A.S.A 8,667 245,249 0.01%LINK Mobility Group Holding A.S.A 64,873 237,020 0.01%
Aker Carbon Capture A.S.A 100,532 231,259 0.01%Sparebank 1 Oestlandet 16,407 226,890 0.01%DNO A.S.A 193,794 226,106 0.01%Protector Forsikring A.S.A 23,270 223,636 0.01%Quantafuel A.S.A 46,527 207,515 0.01%BW LPG Ltd. 31,688 204,743 0.01%Hexagon Composites A.S.A 46,611 202,039 0.01%FLEX LNG Ltd. 13,796 199,600 0.01%Aker Solutions A.S.A 96,439 179,537 0.01%Aker Horizons Holding A.S.A 45,526 150,991 0.00%BW Offshore Ltd. 41,857 149,719 0.00%Stolt-Nielsen Ltd. 9,957 145,562 0.00%XXL A.S.A 55,009 116,664 0.00%Wallenius Wilhelmsen A.S.A Class B 33,175 115,580 0.00%
Selvaag Bolig A.S.A 16,670 115,263 0.00%Volue A.S.A 19,596 113,178 0.00%Norway Royal Salmon A.S.A 5,096 102,095 0.00%Hafnia Ltd. 48,846 100,244 0.00%Hexagon Purus A.S.A 22,158 99,728 0.00%BW Energy Ltd. 29,653 90,284 0.00%Aker BioMarine A.S.A 9,585 82,314 0.00%Ocean Yield A.S.A 21,203 73,328 0.00%test test 31,227,909 0.90%Portugal 0.07% (2020: 0.09%)Banco Comercial Portugues SA Class R 3,468,514 555,297 0.02%
REN - Redes Energeticas Nacionais SGPS SA 175,409 486,761 0.01%
Sonae SGPS SA 333,167 316,082 0.01%Navigator Co., SA 88,051 300,938 0.01%NOS SGPS SA 80,258 281,346 0.01%CTT-Correios de Portugal SA 37,283 213,111 0.01%Corticeira Amorim SGPS SA 16,250 204,271 0.00%Altri SGPS SA 27,701 172,137 0.00%test test 2,529,943 0.07%Singapore 0.68% (2020: 0.70%)Mapletree Industrial Trust REIT 744,072 1,566,526 0.04%
Frasers Logistics & Commercial Trust REIT 1,070,050 1,146,312 0.03%
Yangzijiang Shipbuilding Holdings Ltd. 950,900 997,448 0.03%
Keppel DC REIT 517,079 957,839 0.03%ComfortDelGro Corp., Ltd. 763,500 931,513 0.03%Suntec REIT 841,800 914,319 0.03%NetLink NBN Trust 1,228,100 867,947 0.02%

160
Vanguard Global Small-Cap Index Fund
.Number of
SharesFair Value
US Dollars ($)% of Total
Net AssetsSingapore Press Holdings Ltd. 679,900 864,923 0.02%
Frasers Centrepoint Trust REIT 435,043 786,456 0.02%
SATS Ltd. 262,600 767,756 0.02%Mapletree North Asia Commercial Trust REIT 881,300 681,857 0.02%
Keppel REIT 737,650 647,543 0.02%Sembcorp Industries Ltd. 403,700 642,700 0.02%Ascott Residence Trust 803,069 597,433 0.02%Parkway Life REIT 170,745 583,038 0.02%Keppel Infrastructure Trust 1,365,229 563,683 0.02%Hutchison Port Holdings Trust 2,117,000 476,325 0.01%
Golden Agri-Resources Ltd. 2,740,000 468,829 0.01%Manulife US REIT 591,495 467,281 0.01%Haw Par Corp., Ltd. 44,300 451,503 0.01%CapitaLand China Trust REIT 425,750 433,922 0.01%Nanofilm Technologies International Ltd. 104,400 426,392 0.01%
Ascendas India Trust 381,600 394,602 0.01%Raffles Medical Group Ltd. 422,105 370,543 0.01%iFAST Corp., Ltd. 55,200 334,682 0.01%Singapore Post Ltd. 617,150 328,271 0.01%AEM Holdings Ltd. 109,000 310,571 0.01%Cromwell European REIT 102,880 303,793 0.01%Olam International Ltd. 253,600 301,860 0.01%Sheng Siong Group Ltd. 246,800 290,094 0.01%CDL Hospitality Trusts 315,858 289,023 0.01%Sembcorp Marine Ltd. 3,199,372 285,616 0.01%ARA LOGOS Logistics Trust REIT 456,873 283,804 0.01%
ESR REIT 910,590 277,743 0.01%OUE Commercial REIT 856,361 258,017 0.01%SPH REIT 388,550 251,479 0.01%First Resources Ltd. 251,600 250,814 0.01%Starhill Global REIT 569,781 237,373 0.01%Yanlord Land Group Ltd. 248,550 225,585 0.01%StarHub Ltd. 241,700 219,368 0.01%AIMS APAC REIT 195,200 213,468 0.01%SIA Engineering Co., Ltd. 125,600 200,893 0.01%Lendlease Global Commercial REIT 327,100 199,540 0.01%
Keppel Pacific Oak US REIT 244,600 192,011 0.01%Riverstone Holdings Ltd. 202,700 185,479 0.01%Prime US REIT 201,600 174,384 0.00%Sasseur REIT 198,800 139,760 0.00%Frasers Hospitality Trust 353,300 135,359 0.00%COSCO Shipping International Singapore Co., Ltd. 577,600 126,761 0.00%
Far East Hospitality Trust 292,200 126,079 0.00%OUE Ltd. 124,200 122,888 0.00%Japfa Ltd. 187,300 114,955 0.00%Medtecs International Corp., Ltd. 168,400 107,114 0.00%
Best World International Ltd. 87,100 84,106 0.00%
China Aviation Oil Singapore Corp., Ltd. 95,100 72,871 0.00%
Oxley Holdings Ltd. 274,100 47,920 0.00%Silverlake Axis Ltd. 269,180 47,059 0.00%Eagle Hospitality Trust 181,300 24,838 0.00%Olam International Ltd. - Rights Issue 19/7/2021 38,040 9,905 0.00%
Ezion Holdings Ltd. - Warrants 16/4/2023 198,094 1 0.00%
test test 23,780,174 0.68%Spain 0.71% (2020: 0.76%)Banco de Sabadell SA 2,270,900 1,546,355 0.04%Acciona SA 10,005 1,510,405 0.04%Merlin Properties Socimi SA REIT 141,544 1,466,399 0.04%
.Number of
SharesFair Value
US Dollars ($)% of Total
Net AssetsFluidra SA 35,558 1,410,527 0.04%Bankinter SA 273,089 1,372,827 0.04%Inmobiliaria Colonial Socimi SA REIT 111,355 1,124,456 0.03%
Viscofan SA 15,705 1,095,124 0.03%Mapfre SA 449,109 949,357 0.03%Acerinox SA 67,797 818,879 0.02%Grupo Catalana Occidente SA 17,151 662,046 0.02%
Ebro Foods SA 29,126 612,058 0.02%CIE Automotive SA 19,784 585,608 0.02%Applus Services SA 59,423 580,671 0.02%Linea Directa Aseguradora SA Compania de Seguros y Reaseguros 270,204 566,208 0.02%
Compania de Distribucion Integral Logista Holdings SA 27,246 560,273 0.02%
Solaria Energia y Medio Ambiente SA 30,881 558,116 0.02%
Zardoya Otis SA 80,700 556,029 0.02%Pharma Mar SA 6,083 547,241 0.02%Laboratorios Farmaceuticos Rovi SA 7,810 540,894 0.02%
Almirall SA 30,244 527,594 0.01%Faes Farma SA 128,607 513,366 0.01%Indra Sistemas SA 51,035 465,720 0.01%Mediaset Espana Comunicacion SA 68,077 427,075 0.01%
Euskaltel SA 32,337 421,066 0.01%Sacyr SA 150,667 382,724 0.01%Gestamp Automocion SA 68,951 365,180 0.01%Melia Hotels International SA 48,187 356,585 0.01%
Corp. Financiera Alba SA 5,801 316,453 0.01%Construcciones y Auxiliar de Ferrocarriles SA 6,918 291,654 0.01%
Ence Energia y Celulosa SA 66,645 270,772 0.01%Prosegur Compania de Seguridad SA 79,037 258,695 0.01%
Unicaja Banco SA 243,195 249,470 0.01%Liberbank SA 679,049 249,316 0.01%Neinor Homes SA 16,615 223,834 0.01%eDreams ODIGEO SA 26,399 212,572 0.01%Global Dominion Access SA 39,683 205,652 0.01%Prosegur Cash SA 190,604 193,714 0.01%Solarpack Corp. Tecnologica SA 6,065 188,083 0.01%
Atresmedia Corp. de Medios de Comunicacion SA 41,715 182,643 0.01%
Tecnicas Reunidas SA 13,376 169,254 0.00%Grenergy Renovables SA 4,509 160,951 0.00%Talgo SA 26,973 152,579 0.00%Metrovacesa SA 18,888 149,179 0.00%Lar Espana Real Estate Socimi SA REIT 23,692 137,813 0.00%
Soltec Power Holdings SA 14,362 128,250 0.00%Audax Renovables SA 44,448 103,155 0.00%Miquel y Costas & Miquel SA 3,523 68,351 0.00%
Promotora de Informaciones SA Class A 72,201 65,930 0.00%
Distribuidora Internacional de Alimentacion SA 617,824 49,749 0.00%
Grupo Empresarial San Jose SA 7,653 47,466 0.00%
Abengoa SA - Warrants 31/3/2025 143,586 1,022 0.00%
Let's GOWEX SA 3,759 — 0.00%test test 24,599,340 0.71%Sweden 2.71% (2020: 2.87%)Getinge AB Class B 92,485 3,490,837 0.10%Indutrade AB 112,247 2,874,376 0.08%

161
Vanguard Global Small-Cap Index Fund
.Number of
SharesFair Value
US Dollars ($)% of Total
Net AssetsCastellum AB 96,950 2,469,053 0.07%Trelleborg AB Class B 99,586 2,313,773 0.07%Lifco AB Class B 94,193 2,202,791 0.06%Elekta AB Class B 148,359 2,151,098 0.06%Dometic Group AB 119,668 2,039,442 0.06%Thule Group AB 41,297 1,832,063 0.05%Fabege AB 108,982 1,749,645 0.05%AddTech AB Class B 104,369 1,732,944 0.05%Beijer Ref AB Class B 96,787 1,725,884 0.05%Holmen AB Class B 37,647 1,700,512 0.05%Millicom International Cellular SA ADR 40,925 1,621,275 0.05%
AAK AB 71,584 1,605,422 0.05%Avanza Bank Holding AB 50,001 1,560,457 0.04%Sagax AB Class B 51,971 1,544,761 0.04%BillerudKorsnas AB 75,513 1,499,726 0.04%Swedish Orphan Biovitrum AB 80,677 1,472,103 0.04%
Kindred Group plc 92,916 1,457,491 0.04%Samhallsbyggnadsbolaget i Norden AB 342,592 1,436,522 0.04%
Sweco AB Class B 77,333 1,407,921 0.04%Nordic Entertainment Group AB Class B 30,587 1,348,351 0.04%
Hexpol AB 104,822 1,295,544 0.04%Wihlborgs Fastigheter AB 57,533 1,249,262 0.04%Stillfront Group AB 127,112 1,222,495 0.04%Bravida Holding AB 83,829 1,213,500 0.03%AFRY AB 36,584 1,204,616 0.03%Axfood AB 39,276 1,087,052 0.03%Wallenstam AB Class B 64,746 1,025,077 0.03%SSAB AB Class B 232,670 1,018,321 0.03%Bure Equity AB 23,178 1,002,230 0.03%Nyfosa AB 73,806 998,504 0.03%Vitrolife AB 23,997 997,800 0.03%Loomis AB Class B 29,556 925,164 0.03%Intrum AB 28,033 918,137 0.03%Peab AB Class B 72,747 899,114 0.03%Fortnox AB 18,062 888,723 0.03%MIPS AB 10,283 884,957 0.03%Mycronic AB 28,859 871,289 0.02%Arjo AB Class B 81,052 835,905 0.02%JM AB 23,007 796,030 0.02%Hufvudstaden AB Class A 46,702 794,553 0.02%BHG Group AB 40,881 791,123 0.02%Nolato AB Class B 80,083 788,455 0.02%Kungsleden AB 64,942 786,702 0.02%Saab AB Class B 29,268 777,204 0.02%Nordnet AB publ 45,252 764,328 0.02%Lindab International AB 32,540 759,837 0.02%Instalco AB 16,686 692,636 0.02%Electrolux Professional AB Class B 92,922 658,983 0.02%
Pandox AB Class B 38,501 641,072 0.02%Corem Property Group AB Class B 280,400 635,414 0.02%
Biotage AB 25,232 597,745 0.02%Bilia AB Class A 27,871 590,847 0.02%Catena AB 10,697 573,115 0.02%Modern Times Group MTG AB Class B 42,147 571,182 0.02%
Granges AB 39,633 551,015 0.02%NCC AB Class B 31,750 542,399 0.02%Troax Group AB 16,591 542,224 0.02%Ratos AB Class B 89,311 541,997 0.02%CELLINK AB Class B 10,654 528,455 0.02%Sdiptech AB Class B 10,302 525,812 0.01%Kambi Group plc 10,505 522,784 0.01%SSAB AB Class A 103,797 508,295 0.01%PowerCell Sweden AB 19,217 507,606 0.01%Fingerprint Cards AB Class B 120,241 459,191 0.01%
.Number of
SharesFair Value
US Dollars ($)% of Total
Net AssetsMunters Group AB 50,443 451,219 0.01%Atrium Ljungberg AB Class B 19,033 433,754 0.01%
HMS Networks AB 9,986 422,693 0.01%Boozt AB 19,186 421,762 0.01%Nobia AB 49,242 420,323 0.01%Sagax AB Class D 107,202 416,792 0.01%Storytel AB Class B 15,743 408,663 0.01%Cint Group AB 35,383 398,010 0.01%Xvivo Perfusion AB 9,457 387,031 0.01%SAS AB 1,512,240 371,334 0.01%Platzer Fastigheter Holding AB Class B 24,405 370,406 0.01%
Dios Fastigheter AB 35,694 369,997 0.01%Bonava AB Class B 32,803 361,126 0.01%Betsson AB Class B 43,641 356,184 0.01%INVISIO AB 16,047 353,883 0.01%Beijer Alma AB 17,714 352,948 0.01%Paradox Interactive AB 16,768 352,922 0.01%Camurus AB 13,603 340,387 0.01%Inwido AB 19,632 339,743 0.01%SwedenCare AB 24,984 335,958 0.01%BioGaia AB Class B 6,009 334,452 0.01%AcadeMedia AB 34,883 329,572 0.01%Adapteo OYJ 17,075 327,438 0.01%Nobina AB 35,991 326,994 0.01%Coor Service Management Holding AB 40,632 322,124 0.01%
Dustin Group AB 23,565 311,366 0.01%Cibus Nordic Real Estate AB 13,019 311,160 0.01%Oncopeptides AB 27,822 303,688 0.01%Mekonomen AB 17,853 295,179 0.01%Bufab AB 10,495 290,841 0.01%Cellavision AB 6,660 287,048 0.01%Tobii AB 36,322 281,372 0.01%SkiStar AB 16,669 277,942 0.01%Hansa Biopharma AB 15,773 276,650 0.01%Resurs Holding AB 52,700 260,537 0.01%Alimak Group AB 15,770 257,420 0.01%Better Collective A/S 10,819 256,808 0.01%KNOW IT AB 7,744 253,994 0.01%Cloetta AB Class B 84,909 253,571 0.01%Fagerhult AB 30,922 248,037 0.01%Scandic Hotels Group AB 61,991 242,320 0.01%Svolder AB Class B 8,389 236,991 0.01%Desenio Group AB 21,637 225,171 0.01%Creades AB Class A 17,800 222,288 0.01%BioArctic AB Class B 13,653 219,989 0.01%Ambea AB 27,993 208,504 0.01%Duni AB 15,885 205,803 0.01%Sedana Medical AB 24,120 201,372 0.01%Attendo AB 42,750 195,751 0.01%Investment AB Oresund 11,174 194,157 0.01%New Wave Group AB Class B 15,086 191,570 0.01%
Clas Ohlson AB Class B 18,400 189,870 0.01%Samhallsbyggnadsbolaget i Norden AB (FNSE) Class D 52,066 177,406 0.00%
K-fast Holding AB Class B 23,644 172,793 0.00%Hexatronic Group AB 11,053 165,689 0.00%Re:NewCell AB 7,970 165,511 0.00%Karo Pharma AB 25,367 162,545 0.00%BoneSupport Holding AB 17,979 158,091 0.00%Calliditas Therapeutics AB Class B 10,756 157,212 0.00%
Bactiguard Holding AB Class B 7,358 151,425 0.00%
GARO AB 10,370 143,082 0.00%Enad Global 7 AB 16,897 140,674 0.00%LeoVegas AB 31,085 138,121 0.00%Lime Technologies AB 3,389 129,027 0.00%Scandi Standard AB 17,826 119,435 0.00%

162
Vanguard Global Small-Cap Index Fund
.Number of
SharesFair Value
US Dollars ($)% of Total
Net AssetsCollector AB 24,308 103,688 0.00%Implantica AG Class A 8,104 103,478 0.00%Betsson AB - Rights Issue 31/12/2049 43,641 18,779 0.00%
test test 94,435,211 2.71%Switzerland 1.86% (2020: 2.00%)VAT Group AG 10,916 3,632,565 0.10%SIG Combibloc Group AG 129,675 3,526,835 0.10%Georg Fischer AG 1,695 2,517,699 0.07%Tecan Group AG 4,841 2,400,730 0.07%PSP Swiss Property AG 18,241 2,318,729 0.07%ams AG 110,224 2,213,185 0.06%Belimo Holding AG 3,981 1,821,781 0.05%Siegfried Holding AG 1,614 1,514,735 0.04%Helvetia Holding AG 13,675 1,472,021 0.04%Bucher Industries AG 2,805 1,468,123 0.04%Galenica AG 20,468 1,445,946 0.04%Zur Rose Group AG 3,604 1,382,180 0.04%Flughafen Zurich AG 8,236 1,363,237 0.04%Cembra Money Bank AG 12,097 1,357,125 0.04%Dufry AG 22,644 1,342,447 0.04%Bachem Holding AG Class B 2,112 1,252,097 0.04%Idorsia Ltd. 43,182 1,188,457 0.03%Allreal Holding AG 5,707 1,124,915 0.03%DKSH Holding AG 14,131 1,082,355 0.03%Sulzer AG 7,457 1,031,000 0.03%Daetwyler Holding AG 2,998 1,013,550 0.03%Interroll Holding AG 245 972,738 0.03%SFS Group AG 6,689 963,170 0.03%Mobimo Holding AG 2,758 907,050 0.03%BKW AG 8,695 905,857 0.03%Stadler Rail AG 20,553 904,523 0.03%Softwareone Holding AG 37,559 887,828 0.03%Vontobel Holding AG 11,025 859,958 0.02%Emmi AG 829 851,107 0.02%dormakaba Holding AG ADR 1,182 806,243 0.02%Forbo Holding AG 421 797,958 0.02%Bystronic AG 587 793,801 0.02%Inficon Holding AG 667 772,099 0.02%OC Oerlikon Corp. AG 67,699 751,438 0.02%Comet Holding AG 2,706 745,039 0.02%ALSO Holding AG 2,490 717,894 0.02%Valiant Holding AG 6,793 673,899 0.02%Schweiter Technologies AG 430 630,800 0.02%Bossard Holding AG 2,059 629,272 0.02%Landis+Gyr Group AG 8,852 618,639 0.02%Kardex Holding AG 2,658 615,364 0.02%Swissquote Group Holding SA 3,882 587,119 0.02%
Aryzta AG 416,022 567,988 0.02%St Galler Kantonalbank AG 1,215 540,234 0.02%Meyer Burger Technology AG 862,482 531,383 0.02%
Huber + Suhner AG 5,835 493,010 0.01%Burckhardt Compression Holding AG 1,194 483,749 0.01%
VZ Holding AG 5,667 480,654 0.01%Arbonia AG 21,913 419,129 0.01%LEM Holding SA 185 388,273 0.01%Komax Holding AG 1,503 379,835 0.01%Zehnder Group AG 3,790 361,636 0.01%Medacta Group SA 2,695 353,949 0.01%Valora Holding AG 1,632 343,579 0.01%Vetropack Holding AG 5,580 336,846 0.01%Liechtensteinische Landesbank AG 5,229 298,687 0.01%
EFG International AG 35,991 295,528 0.01%Bobst Group SA 3,556 284,680 0.01%Sensirion Holding AG 3,497 280,713 0.01%Rieter Holding AG 1,394 272,662 0.01%Bell Food Group AG 876 268,671 0.01%Intershop Holding AG 404 265,735 0.01%
.Number of
SharesFair Value
US Dollars ($)% of Total
Net AssetsGurit Holding AG 119 260,053 0.01%Basilea Pharmaceutica AG 5,293 258,824 0.01%COSMO Pharmaceuticals NV 2,597 239,654 0.01%
u-blox Holding AG 3,237 238,131 0.01%Orior AG 2,615 236,506 0.01%Ypsomed Holding AG 1,484 231,506 0.01%Autoneum Holding AG 1,233 230,366 0.01%Leonteq AG 3,635 217,467 0.01%Mobilezone Holding AG 17,071 200,933 0.01%Ascom Holding AG 11,856 195,986 0.01%Metall Zug AG 83 186,769 0.01%V-ZUG Holding AG 1,143 176,084 0.01%Molecular Partners AG 8,628 175,855 0.00%Swiss Steel Holding AG 360,402 175,454 0.00%Peach Property Group AG 2,920 173,744 0.00%Medartis Holding AG 1,809 166,936 0.00%Relief Therapeutics Holding AG 732,992 158,596 0.00%
Coltene Holding AG 1,144 155,198 0.00%Implenia AG 5,421 141,221 0.00%GAM Holding AG 62,898 136,772 0.00%Burkhalter Holding AG 1,756 127,281 0.00%APG SGA SA 490 120,333 0.00%TX Group AG 1,242 115,419 0.00%test test 64,827,537 1.86%United Kingdom 6.42% (2020: 6.71%)Intermediate Capital Group plc 114,543 3,360,920 0.10%
DS Smith plc 555,606 3,207,558 0.09%Rightmove plc 355,263 3,187,113 0.09%B&M European Value Retail SA 352,622 2,792,227 0.08%
Electrocomponents plc 193,080 2,744,655 0.08%Pennon Group plc 171,576 2,691,404 0.08%Weir Group plc 104,846 2,680,979 0.08%Howden Joinery Group plc 235,065 2,651,750 0.08%Dechra Pharmaceuticals plc 43,756 2,641,522 0.08%Royal Mail plc 323,806 2,582,836 0.07%IMI plc 107,149 2,545,961 0.07%ITV plc 1,467,157 2,544,652 0.07%Bellway plc 49,948 2,235,621 0.06%Travis Perkins plc 93,420 2,179,740 0.06%Spectris plc 48,076 2,150,504 0.06%ConvaTec Group plc 642,995 2,137,167 0.06%Games Workshop Group plc 13,430 2,115,027 0.06%UNITE Group plc REIT 138,654 2,057,178 0.06%Diploma plc 50,006 2,006,106 0.06%Future plc 46,310 2,003,695 0.06%Meggitt plc 308,164 1,963,389 0.06%ASOS plc 28,233 1,934,523 0.06%Tate & Lyle plc 188,178 1,919,533 0.05%Avast plc 272,651 1,844,850 0.05%Tritax Big Box plc REIT 676,707 1,835,085 0.05%Genus plc 26,763 1,833,799 0.05%Derwent London plc REIT 39,454 1,809,524 0.05%boohoo Group plc 408,968 1,753,663 0.05%IG Group Holdings plc 147,543 1,726,383 0.05%Abcam plc 87,196 1,663,510 0.05%Rotork plc 352,432 1,657,296 0.05%Centrica plc 2,327,300 1,654,464 0.05%Inchcape plc 155,494 1,650,793 0.05%Marks & Spencer Group plc 807,734 1,634,154 0.05%Hiscox Ltd. 140,198 1,610,614 0.05%HomeServe plc 120,104 1,585,343 0.05%TUI AG 310,537 1,585,123 0.05%Fevertree Drinks plc 42,424 1,507,949 0.04%UDG Healthcare plc 100,912 1,490,238 0.04%Hays plc 676,506 1,482,211 0.04%Quilter plc 720,013 1,479,560 0.04%Man Group plc 589,250 1,464,828 0.04%Vistry Group plc 89,884 1,460,863 0.04%

163
Vanguard Global Small-Cap Index Fund
.Number of
SharesFair Value
US Dollars ($)% of Total
Net AssetsCarnival plc 62,801 1,440,851 0.04%Greggs plc 39,840 1,428,209 0.04%Virgin Money UK plc 520,631 1,428,023 0.04%Britvic plc 107,295 1,388,846 0.04%Grafton Group plc 87,179 1,381,371 0.04%Countryside Properties plc 201,433 1,315,102 0.04%Close Brothers Group plc 60,747 1,271,372 0.04%Pets at Home Group plc 196,510 1,237,897 0.04%IWG plc 296,711 1,232,134 0.04%Victrex plc 34,822 1,224,749 0.03%Big Yellow Group plc REIT 67,355 1,216,132 0.03%Aggreko plc 101,926 1,213,745 0.03%OSB Group plc 185,143 1,186,753 0.03%Balfour Beatty plc 276,573 1,171,432 0.03%WH Smith plc 52,649 1,169,894 0.03%Softcat plc 47,631 1,168,605 0.03%Cranswick plc 21,025 1,153,086 0.03%QinetiQ Group plc 237,388 1,126,801 0.03%SSP Group plc 304,850 1,121,904 0.03%Dr. Martens plc 182,230 1,120,250 0.03%Beazley plc 243,272 1,117,090 0.03%Investec plc 278,675 1,109,885 0.03%Londonmetric Property plc REIT 344,991 1,102,824 0.03%
Primary Health Properties plc REIT 517,238 1,099,675 0.03%
John Laing Group plc 196,833 1,087,116 0.03%Safestore Holdings plc REIT 82,740 1,082,432 0.03%Assura plc REIT 1,046,535 1,070,567 0.03%JET2 plc 64,781 1,059,134 0.03%Grainger plc 268,624 1,057,608 0.03%Pagegroup plc 136,437 1,053,608 0.03%Computacenter plc 29,360 1,043,187 0.03%ITM Power plc 162,259 1,020,791 0.03%Micro Focus International plc 132,667 1,002,502 0.03%
Redrow plc 116,745 986,695 0.03%Renishaw plc 14,469 984,619 0.03%Ashmore Group plc 184,604 981,832 0.03%Network International Holdings plc 194,319 981,692 0.03%
S4 Capital plc 113,036 980,644 0.03%Keywords Studios plc 28,229 971,024 0.03%Dunelm Group plc 48,995 960,438 0.03%Drax Group plc 161,845 948,430 0.03%CVS Group plc 28,212 941,209 0.03%easyJet plc 75,683 935,534 0.03%Great Portland Estates plc REIT 95,220 933,288 0.03%
Bodycote plc 79,610 930,957 0.03%Domino's Pizza Group plc 170,090 913,097 0.03%Serco Group plc 486,782 912,535 0.03%Synthomer plc 133,435 906,185 0.03%Gamma Communications plc 32,807 901,892 0.03%
Savills plc 56,554 898,455 0.03%GB Group plc 78,169 891,429 0.03%RWS Holdings plc 113,941 886,970 0.03%Ultra Electronics Holdings plc 27,756 878,067 0.02%
Ascential plc 152,290 875,185 0.02%Breedon Group plc 586,353 873,199 0.02%Spirent Communications plc 255,747 870,535 0.02%National Express Group plc 229,992 847,048 0.02%TP ICAP Group plc 305,525 824,720 0.02%888 Holdings plc 154,856 821,047 0.02%IntegraFin Holdings plc 114,885 817,346 0.02%Genuit Group plc 96,222 813,506 0.02%Lancashire Holdings Ltd. 95,746 810,143 0.02%John Wood Group plc 266,680 809,386 0.02%Moneysupermarket.com Group plc 226,999 804,666 0.02%
.Number of
SharesFair Value
US Dollars ($)% of Total
Net AssetsTrainline plc 196,778 798,119 0.02%Dixons Carphone plc 443,003 796,806 0.02%Burford Capital Ltd. 75,237 773,285 0.02%Paragon Banking Group plc 107,697 758,024 0.02%Gamesys Group plc 29,521 752,016 0.02%Marshalls plc 77,999 739,177 0.02%Frasers Group plc 87,559 728,774 0.02%AJ Bell plc 120,059 719,481 0.02%Sanne Group plc 62,334 716,446 0.02%Mediclinic International plc 170,443 699,783 0.02%Hill & Smith Holdings plc 33,716 695,860 0.02%Kainos Group plc 34,023 693,266 0.02%Playtech plc 116,076 681,822 0.02%Ferrexpo plc 114,379 675,962 0.02%Aston Martin Lagonda Global Holdings plc 25,996 674,251 0.02%
Capital & Counties Properties plc REIT 302,525 674,110 0.02%
Vesuvius plc 92,035 671,308 0.02%Jupiter Fund Management plc 171,549 668,302 0.02%
Plus500 Ltd. 36,148 666,654 0.02%IP Group plc 413,211 664,446 0.02%Euromoney Institutional Investor plc 46,994 660,884 0.02%
Centamin plc 472,138 660,062 0.02%Liontrust Asset Management plc 25,061 650,866 0.02%
Indivior plc 304,311 649,924 0.02%St Modwen Properties plc 83,134 639,689 0.02%Shaftesbury plc REIT 80,006 629,436 0.02%Hammerson plc REIT 1,222,250 628,620 0.02%Rhi Magnesita NV 11,222 627,857 0.02%Crest Nicholson Holdings plc 107,071 620,348 0.02%
Draper Esprit plc 49,211 614,562 0.02%Rathbone Brothers plc 24,141 604,294 0.02%Workspace Group plc REIT 52,139 600,709 0.02%Learning Technologies Group plc 229,051 595,191 0.02%
J D Wetherspoon plc 36,306 590,825 0.02%Morgan Advanced Materials plc 120,988 590,000 0.02%
Sirius Real Estate Ltd. 382,731 584,768 0.02%Secure Income plc REIT 110,562 580,396 0.02%Biffa plc 128,957 578,980 0.02%Brewin Dolphin Holdings plc 117,496 564,044 0.02%Restaurant Group plc 316,207 560,009 0.02%Just Group plc 435,076 559,865 0.02%Bytes Technology Group plc 87,459 559,398 0.02%Coats Group plc 591,408 556,377 0.02%Ceres Power Holdings plc 37,041 540,870 0.02%Mitie Group plc 571,071 536,456 0.02%Firstgroup plc 472,086 534,122 0.02%C&C Group plc 154,676 519,235 0.01%Ibstock plc 174,259 513,718 0.01%Elementis plc 241,762 503,311 0.01%Essentra plc 116,428 496,994 0.01%Halfords Group plc 83,023 494,552 0.01%NCC Group plc 120,862 490,877 0.01%Redde Northgate plc 88,173 486,008 0.01%Harbour Energy plc 93,234 485,569 0.01%Vectura Group plc 257,015 484,293 0.01%Diversified Energy Co. plc 332,788 483,636 0.01%Energean plc 48,203 475,453 0.01%Avon Rubber plc 12,837 463,913 0.01%Smart Metering Systems plc 38,158 458,079 0.01%
Reach plc 119,471 453,869 0.01%Oxford Biomedica plc 25,090 450,588 0.01%Chemring Group plc 112,939 448,556 0.01%Morgan Sindall Group plc 15,028 447,387 0.01%
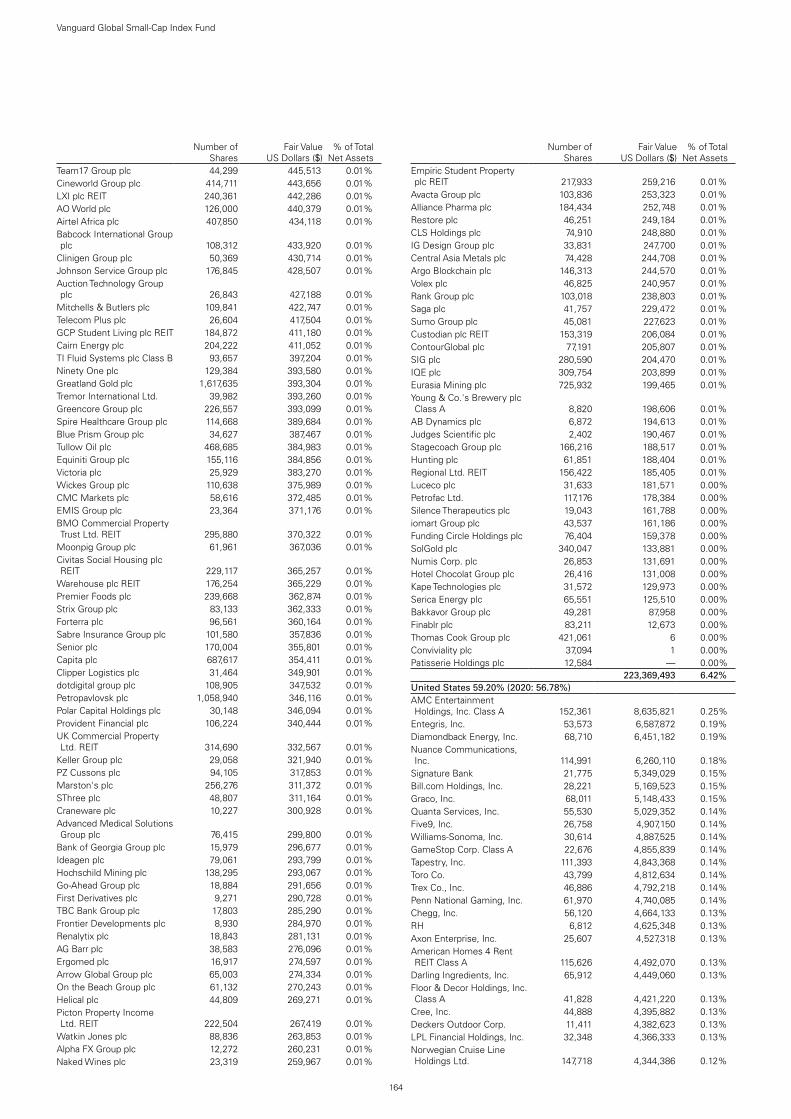
164
Vanguard Global Small-Cap Index Fund
.Number of
SharesFair Value
US Dollars ($)% of Total
Net AssetsTeam17 Group plc 44,299 445,513 0.01%Cineworld Group plc 414,711 443,656 0.01%LXI plc REIT 240,361 442,286 0.01%AO World plc 126,000 440,379 0.01%Airtel Africa plc 407,850 434,118 0.01%Babcock International Group plc 108,312 433,920 0.01%
Clinigen Group plc 50,369 430,714 0.01%Johnson Service Group plc 176,845 428,507 0.01%Auction Technology Group plc 26,843 427,188 0.01%
Mitchells & Butlers plc 109,841 422,747 0.01%Telecom Plus plc 26,604 417,504 0.01%GCP Student Living plc REIT 184,872 411,180 0.01%Cairn Energy plc 204,222 411,052 0.01%TI Fluid Systems plc Class B 93,657 397,204 0.01%Ninety One plc 129,384 393,580 0.01%Greatland Gold plc 1,617,635 393,304 0.01%Tremor International Ltd. 39,982 393,260 0.01%Greencore Group plc 226,557 393,099 0.01%Spire Healthcare Group plc 114,668 389,684 0.01%Blue Prism Group plc 34,627 387,467 0.01%Tullow Oil plc 468,685 384,983 0.01%Equiniti Group plc 155,116 384,856 0.01%Victoria plc 25,929 383,270 0.01%Wickes Group plc 110,638 375,989 0.01%CMC Markets plc 58,616 372,485 0.01%EMIS Group plc 23,364 371,176 0.01%BMO Commercial Property Trust Ltd. REIT 295,880 370,322 0.01%
Moonpig Group plc 61,961 367,036 0.01%Civitas Social Housing plc REIT 229,117 365,257 0.01%
Warehouse plc REIT 176,254 365,229 0.01%Premier Foods plc 239,668 362,874 0.01%Strix Group plc 83,133 362,333 0.01%Forterra plc 96,561 360,164 0.01%Sabre Insurance Group plc 101,580 357,836 0.01%Senior plc 170,004 355,801 0.01%Capita plc 687,617 354,411 0.01%Clipper Logistics plc 31,464 349,901 0.01%dotdigital group plc 108,905 347,532 0.01%Petropavlovsk plc 1,058,940 346,116 0.01%Polar Capital Holdings plc 30,148 346,094 0.01%Provident Financial plc 106,224 340,444 0.01%UK Commercial Property Ltd. REIT 314,690 332,567 0.01%
Keller Group plc 29,058 321,940 0.01%PZ Cussons plc 94,105 317,853 0.01%Marston's plc 256,276 311,372 0.01%SThree plc 48,807 311,164 0.01%Craneware plc 10,227 300,928 0.01%Advanced Medical Solutions Group plc 76,415 299,800 0.01%
Bank of Georgia Group plc 15,979 296,677 0.01%Ideagen plc 79,061 293,799 0.01%Hochschild Mining plc 138,295 293,067 0.01%Go-Ahead Group plc 18,884 291,656 0.01%First Derivatives plc 9,271 290,728 0.01%TBC Bank Group plc 17,803 285,290 0.01%Frontier Developments plc 8,930 284,970 0.01%Renalytix plc 18,843 281,131 0.01%AG Barr plc 38,583 276,096 0.01%Ergomed plc 16,917 274,597 0.01%Arrow Global Group plc 65,003 274,334 0.01%On the Beach Group plc 61,132 270,243 0.01%Helical plc 44,809 269,271 0.01%Picton Property Income Ltd. REIT 222,504 267,419 0.01%
Watkin Jones plc 88,836 263,853 0.01%Alpha FX Group plc 12,272 260,231 0.01%Naked Wines plc 23,319 259,967 0.01%
.Number of
SharesFair Value
US Dollars ($)% of Total
Net AssetsEmpiric Student Property plc REIT 217,933 259,216 0.01%
Avacta Group plc 103,836 253,323 0.01%Alliance Pharma plc 184,434 252,748 0.01%Restore plc 46,251 249,184 0.01%CLS Holdings plc 74,910 248,880 0.01%IG Design Group plc 33,831 247,700 0.01%Central Asia Metals plc 74,428 244,708 0.01%Argo Blockchain plc 146,313 244,570 0.01%Volex plc 46,825 240,957 0.01%Rank Group plc 103,018 238,803 0.01%Saga plc 41,757 229,472 0.01%Sumo Group plc 45,081 227,623 0.01%Custodian plc REIT 153,319 206,084 0.01%ContourGlobal plc 77,191 205,807 0.01%SIG plc 280,590 204,470 0.01%IQE plc 309,754 203,899 0.01%Eurasia Mining plc 725,932 199,465 0.01%Young & Co.'s Brewery plc Class A 8,820 198,606 0.01%
AB Dynamics plc 6,872 194,613 0.01%Judges Scientific plc 2,402 190,467 0.01%Stagecoach Group plc 166,216 188,517 0.01%Hunting plc 61,851 188,404 0.01%Regional Ltd. REIT 156,422 185,405 0.01%Luceco plc 31,633 181,571 0.00%Petrofac Ltd. 117,176 178,384 0.00%Silence Therapeutics plc 19,043 161,788 0.00%iomart Group plc 43,537 161,186 0.00%Funding Circle Holdings plc 76,404 159,378 0.00%SolGold plc 340,047 133,881 0.00%Numis Corp. plc 26,853 131,691 0.00%Hotel Chocolat Group plc 26,416 131,008 0.00%Kape Technologies plc 31,572 129,973 0.00%Serica Energy plc 65,551 125,510 0.00%Bakkavor Group plc 49,281 87,958 0.00%Finablr plc 83,211 12,673 0.00%Thomas Cook Group plc 421,061 6 0.00%Conviviality plc 37,094 1 0.00%Patisserie Holdings plc 12,584 — 0.00%test test 223,369,493 6.42%United States 59.20% (2020: 56.78%)AMC Entertainment Holdings, Inc. Class A 152,361 8,635,821 0.25%
Entegris, Inc. 53,573 6,587,872 0.19%Diamondback Energy, Inc. 68,710 6,451,182 0.19%Nuance Communications, Inc. 114,991 6,260,110 0.18%
Signature Bank 21,775 5,349,029 0.15%Bill.com Holdings, Inc. 28,221 5,169,523 0.15%Graco, Inc. 68,011 5,148,433 0.15%Quanta Services, Inc. 55,530 5,029,352 0.14%Five9, Inc. 26,758 4,907,150 0.14%Williams-Sonoma, Inc. 30,614 4,887,525 0.14%GameStop Corp. Class A 22,676 4,855,839 0.14%Tapestry, Inc. 111,393 4,843,368 0.14%Toro Co. 43,799 4,812,634 0.14%Trex Co., Inc. 46,886 4,792,218 0.14%Penn National Gaming, Inc. 61,970 4,740,085 0.14%Chegg, Inc. 56,120 4,664,133 0.13%RH 6,812 4,625,348 0.13%Axon Enterprise, Inc. 25,607 4,527,318 0.13%American Homes 4 Rent REIT Class A 115,626 4,492,070 0.13%
Darling Ingredients, Inc. 65,912 4,449,060 0.13%Floor & Decor Holdings, Inc. Class A 41,828 4,421,220 0.13%
Cree, Inc. 44,888 4,395,882 0.13%Deckers Outdoor Corp. 11,411 4,382,623 0.13%LPL Financial Holdings, Inc. 32,348 4,366,333 0.13%Norwegian Cruise Line Holdings Ltd. 147,718 4,344,386 0.12%

165
Vanguard Global Small-Cap Index Fund
.Number of
SharesFair Value
US Dollars ($)% of Total
Net AssetsMarathon Oil Corp. 318,161 4,333,353 0.12%Five Below, Inc. 22,249 4,300,064 0.12%Guardant Health, Inc. 34,564 4,292,503 0.12%Repligen Corp. 21,105 4,212,980 0.12%Gaming and Leisure Properties, Inc. REIT 89,756 4,158,395 0.12%
Cleveland-Cliffs, Inc. 192,541 4,151,184 0.12%Carlisle Cos, Inc. 21,637 4,140,889 0.12%Hubbell, Inc. Class B 22,032 4,116,459 0.12%East West Bancorp, Inc. 57,408 4,115,580 0.12%Jones Lang LaSalle, Inc. 20,741 4,054,036 0.12%Universal Display Corp. 18,225 4,051,964 0.12%Lithia Motors, Inc. Class A 11,782 4,048,766 0.12%Proofpoint, Inc. 23,254 4,040,615 0.12%Comerica, Inc. 56,512 4,031,566 0.12%Texas Pacific Land Corp. 2,509 4,013,748 0.12%DXC Technology Co. 102,966 4,009,496 0.12%Intellia Therapeutics, Inc. 24,573 3,978,614 0.11%MKS Instruments, Inc. 22,337 3,974,869 0.11%Zynga, Inc. Class A 372,283 3,957,368 0.11%CRISPR Therapeutics AG 24,307 3,935,060 0.11%Middleby Corp. 22,499 3,898,177 0.11%First Horizon Corp. 225,480 3,896,294 0.11%Penumbra, Inc. 13,995 3,835,470 0.11%Watsco, Inc. 13,326 3,819,765 0.11%Reliance Steel & Aluminum Co. 25,168 3,797,851 0.11%
Manhattan Associates, Inc. 26,032 3,770,475 0.11%Aspen Technology, Inc. 27,162 3,735,861 0.11%Western Alliance Bancorp 40,225 3,734,891 0.11%Syneos Health, Inc. Class A 41,131 3,680,813 0.11%Service Corp. International 68,615 3,677,078 0.11%Targa Resources Corp. 82,691 3,675,615 0.11%Americold Realty Trust REIT 96,950 3,669,557 0.11%AptarGroup, Inc. 26,011 3,663,389 0.11%Lamar Advertising Co. REIT Class A 35,028 3,657,624 0.11%
Kimco Realty Corp. REIT 175,088 3,650,585 0.10%CubeSmart REIT 78,013 3,613,562 0.10%Bright Horizons Family Solutions, Inc. 24,512 3,605,960 0.10%
Flex Ltd. 201,785 3,605,898 0.10%Elastic NV 24,718 3,602,896 0.10%Beyond Meat, Inc. 22,796 3,590,142 0.10%AECOM 56,557 3,581,189 0.10%Ciena Corp. 62,889 3,577,755 0.10%Natera, Inc. 31,235 3,546,110 0.10%Berry Global Group, Inc. 54,313 3,542,294 0.10%Capri Holdings Ltd. 61,749 3,531,425 0.10%Zions Bancorp NA 66,577 3,519,260 0.10%Kohl's Corp. 63,736 3,512,491 0.10%First Solar, Inc. 38,661 3,499,207 0.10%CyrusOne, Inc. REIT 48,661 3,480,235 0.10%WEX, Inc. 17,879 3,466,738 0.10%Oshkosh Corp. 27,650 3,446,296 0.10%Nielsen Holdings plc 137,388 3,389,362 0.10%Jabil, Inc. 58,167 3,380,666 0.10%Smartsheet, Inc. Class A 46,641 3,373,077 0.10%Builders FirstSource, Inc. 78,963 3,368,562 0.10%AGCO Corp. 25,700 3,350,766 0.10%National Retail Properties, Inc. REIT 71,155 3,335,746 0.10%
Bruker Corp. 43,664 3,317,591 0.10%STORE Capital Corp. REIT 95,904 3,309,647 0.10%Life Storage, Inc. REIT 30,726 3,298,436 0.09%Federal Realty Investment Trust REIT 28,055 3,287,204 0.09%
APA Corp. 151,859 3,284,710 0.09%Ovintiv, Inc. 104,085 3,275,555 0.09%Polaris, Inc. 23,884 3,271,153 0.09%US Foods Holding Corp. 84,995 3,260,408 0.09%Amedisys, Inc. 13,280 3,252,670 0.09%
.Number of
SharesFair Value
US Dollars ($)% of Total
Net AssetsScotts Miracle-Gro Co. 16,892 3,241,913 0.09%United Therapeutics Corp. 18,036 3,235,839 0.09%Gentex Corp. 97,051 3,211,418 0.09%Arrowhead Pharmaceuticals, Inc. 38,325 3,174,076 0.09%
Donaldson Co., Inc. 49,920 3,171,418 0.09%Encompass Health Corp. 40,365 3,149,681 0.09%Brunswick Corp. 31,466 3,134,643 0.09%YETI Holdings, Inc. 33,911 3,113,708 0.09%Commerce Bancshares, Inc. 41,739 3,112,060 0.09%II-VI, Inc. 42,807 3,107,360 0.09%Crocs, Inc. 26,649 3,105,141 0.09%Organon & Co. 102,316 3,096,082 0.09%PVH Corp. 28,708 3,088,694 0.09%ITT, Inc. 33,710 3,087,499 0.09%Chemed Corp. 6,481 3,075,234 0.09%Hill-Rom Holdings, Inc. 27,008 3,067,839 0.09%Gap, Inc. 91,136 3,066,726 0.09%Lattice Semiconductor Corp. 54,484 3,060,911 0.09%Rexford Industrial Realty, Inc. REIT 53,653 3,055,538 0.09%
Tempur Sealy International, Inc. 77,685 3,044,475 0.09%
SiteOne Landscape Supply, Inc. 17,898 3,029,415 0.09%
Royal Gold, Inc. 26,531 3,027,187 0.09%Cimarex Energy Co. 41,699 3,021,093 0.09%Starwood Property Trust, Inc. REIT 115,201 3,014,810 0.09%
Woodward, Inc. 24,258 2,980,823 0.09%Nutanix, Inc. Class A 77,575 2,964,917 0.09%IAA, Inc. 54,323 2,962,776 0.09%Kilroy Realty Corp. REIT 42,502 2,959,839 0.08%People's United Financial, Inc. 172,279 2,952,862 0.08%
Jefferies Financial Group, Inc. 85,924 2,938,601 0.08%
Casey's General Stores, Inc. 14,954 2,910,647 0.08%Lincoln Electric Holdings, Inc. 21,958 2,892,088 0.08%
Old Republic International Corp. 115,968 2,888,763 0.08%
Ares Management Corp. Class A 45,296 2,880,373 0.08%
Concentrix Corp. 17,910 2,879,928 0.08%Brooks Automation, Inc. 30,010 2,859,353 0.08%Apartment Income Corp. REIT 60,250 2,857,657 0.08%
Freshpet, Inc. 17,524 2,855,711 0.08%Harley-Davidson, Inc. 62,299 2,854,540 0.08%Paylocity Holding Corp. 14,901 2,843,111 0.08%Scientific Games Corp. 36,546 2,830,122 0.08%Mattel, Inc. 140,710 2,828,271 0.08%Cabot Oil & Gas Corp. 161,746 2,824,085 0.08%Euronet Worldwide, Inc. 20,860 2,823,401 0.08%Envista Holdings Corp. 65,081 2,812,150 0.08%Churchill Downs, Inc. 14,130 2,801,414 0.08%Leggett & Platt, Inc. 53,709 2,782,663 0.08%SLM Corp. 132,866 2,782,214 0.08%First American Financial Corp. 44,502 2,774,700 0.08%
Alcoa Corp. 75,301 2,774,089 0.08%Vertiv Holdings Co. Class A 101,477 2,770,322 0.08%Anaplan, Inc. 51,645 2,752,678 0.08%Brixmor Property Group, Inc. REIT 120,229 2,752,042 0.08%
Silicon Laboratories, Inc. 17,949 2,750,684 0.08%EMCOR Group, Inc. 22,316 2,749,108 0.08%OGE Energy Corp. 81,684 2,748,667 0.08%First Industrial Realty Trust, Inc. REIT 52,411 2,737,427 0.08%
Skechers USA, Inc. Class A 54,896 2,735,468 0.08%Acuity Brands, Inc. 14,624 2,735,127 0.08%

166
Vanguard Global Small-Cap Index Fund
.Number of
SharesFair Value
US Dollars ($)% of Total
Net AssetsWyndham Hotels & Resorts, Inc. 37,760 2,729,670 0.08%
Pinnacle Financial Partners, Inc. 30,807 2,719,950 0.08%
Prosperity Bancshares, Inc. 37,642 2,702,696 0.08%Stifel Financial Corp. 41,601 2,698,241 0.08%Post Holdings, Inc. 24,814 2,691,575 0.08%HealthEquity, Inc. 33,393 2,687,469 0.08%First Financial Bankshares, Inc. 54,452 2,675,227 0.08%
Dick's Sporting Goods, Inc. 26,684 2,673,470 0.08%Tetra Tech, Inc. 21,901 2,672,798 0.08%Olin Corp. 57,560 2,662,726 0.08%Affiliated Managers Group, Inc. 17,248 2,659,814 0.08%
Sonoco Products Co. 39,692 2,655,395 0.08%Toll Brothers, Inc. 45,916 2,654,404 0.08%Stericycle, Inc. 37,081 2,653,146 0.08%Acceleron Pharma, Inc. 21,108 2,648,843 0.08%Omnicell, Inc. 17,472 2,646,134 0.08%BJ's Wholesale Club Holdings, Inc. 55,594 2,645,163 0.08%
ManpowerGroup, Inc. 22,242 2,644,796 0.08%EastGroup Properties, Inc. REIT 16,075 2,643,534 0.08%
Synovus Financial Corp. 60,183 2,640,830 0.08%Digital Turbine, Inc. 34,725 2,640,142 0.08%Fox Factory Holding Corp. 16,941 2,637,036 0.08%TopBuild Corp. 13,329 2,636,210 0.08%Hanesbrands, Inc. 141,105 2,634,430 0.08%Upwork, Inc. 45,155 2,632,085 0.08%Fate Therapeutics, Inc. 30,242 2,624,703 0.08%Cullen/Frost Bankers, Inc. 23,396 2,620,352 0.08%Performance Food Group Co. 54,014 2,619,139 0.08%
Coherent, Inc. 9,895 2,615,644 0.08%American Campus Communities, Inc. REIT 55,940 2,613,517 0.08%
Axalta Coating Systems Ltd. 85,622 2,610,615 0.07%CACI International, Inc. Class A 10,225 2,608,602 0.07%
New York Times Co. Class A 59,793 2,603,985 0.07%Louisiana-Pacific Corp. 43,008 2,592,952 0.07%Nexstar Media Group, Inc. Class A 17,526 2,591,745 0.07%
Popular, Inc. 34,368 2,579,318 0.07%Texas Roadhouse, Inc. Class A 26,760 2,574,312 0.07%
Dolby Laboratories, Inc. Class A 26,072 2,562,617 0.07%
MDU Resources Group, Inc. 81,698 2,560,415 0.07%Terminix Global Holdings, Inc. 53,456 2,550,386 0.07%
United States Steel Corp. 106,202 2,548,848 0.07%MasTec, Inc. 24,011 2,547,567 0.07%Pacific Biosciences of California, Inc. 72,668 2,541,200 0.07%
Thor Industries, Inc. 22,359 2,526,567 0.07%Marriott Vacations Worldwide Corp. 15,793 2,515,825 0.07%
Littelfuse, Inc. 9,871 2,515,032 0.07%Lumentum Holdings, Inc. 30,658 2,514,876 0.07%Advanced Drainage Systems, Inc. 21,471 2,502,874 0.07%
Tandem Diabetes Care, Inc. 25,624 2,495,778 0.07%MSA Safety, Inc. 14,965 2,477,905 0.07%Perrigo Co. plc 53,972 2,474,616 0.07%Planet Fitness, Inc. Class A 32,868 2,473,317 0.07%Vimeo, Inc. 50,338 2,466,562 0.07%CDK Global, Inc. 49,512 2,460,251 0.07%Morningstar, Inc. 9,565 2,459,257 0.07%EQT Corp. 110,474 2,459,151 0.07%Ingredion, Inc. 27,171 2,458,976 0.07%
.Number of
SharesFair Value
US Dollars ($)% of Total
Net AssetsUltragenyx Pharmaceutical, Inc. 25,784 2,458,504 0.07%
Denali Therapeutics, Inc. 31,331 2,457,604 0.07%Varonis Systems, Inc. Class B 42,580 2,453,460 0.07%
Janus Henderson Group plc 62,879 2,440,334 0.07%Tenet Healthcare Corp. 36,397 2,438,235 0.07%Primerica, Inc. 15,918 2,437,683 0.07%Landstar System, Inc. 15,405 2,434,298 0.07%LHC Group, Inc. 12,147 2,432,558 0.07%STAG Industrial, Inc. REIT 64,687 2,421,234 0.07%Rexnord Corp. 48,377 2,420,785 0.07%J2 Global, Inc. 17,528 2,410,976 0.07%American Eagle Outfitters, Inc. 64,099 2,405,635 0.07%
Evercore, Inc. Class A 17,042 2,399,002 0.07%Douglas Emmett, Inc. REIT 71,170 2,392,735 0.07%Macy's, Inc. 126,079 2,390,458 0.07%Valvoline, Inc. 73,591 2,388,764 0.07%Globus Medical, Inc. Class A 30,809 2,388,622 0.07%
NCR Corp. 52,182 2,380,021 0.07%Shockwave Medical, Inc. 12,511 2,373,712 0.07%Healthcare Trust of America, Inc. REIT Class A 88,863 2,372,642 0.07%
Redfin Corp. 37,351 2,368,427 0.07%Halozyme Therapeutics, Inc. 52,109 2,366,270 0.07%NextEra Energy Partners LP 30,883 2,358,226 0.07%South State Corp. 28,811 2,355,587 0.07%Virgin Galactic Holdings, Inc. 51,189 2,354,694 0.07%Sarepta Therapeutics, Inc. 30,272 2,353,345 0.07%Fastly, Inc. Class A 39,458 2,351,697 0.07%Blackline, Inc. 21,133 2,351,469 0.07%Twist Bioscience Corp. 17,579 2,342,402 0.07%STAAR Surgical Co. 15,326 2,337,215 0.07%Unum Group 82,220 2,335,048 0.07%Foot Locker, Inc. 37,872 2,334,051 0.07%Chemours Co. 66,783 2,324,048 0.07%CoreSite Realty Corp. REIT 17,193 2,314,178 0.07%NOV, Inc. 150,578 2,306,855 0.07%SL Green Realty Corp. REIT 28,820 2,305,600 0.07%Ralph Lauren Corp. Class A 19,534 2,301,301 0.07%Exelixis, Inc. 126,174 2,298,890 0.07%Mirati Therapeutics, Inc. 14,199 2,293,564 0.07%Eagle Materials, Inc. 16,037 2,279,018 0.07%Helen of Troy Ltd. 9,865 2,250,404 0.06%Invitae Corp. 66,650 2,248,105 0.06%Spirit Realty Capital, Inc. REIT 46,917 2,244,509 0.06%
BWX Technologies, Inc. 38,514 2,238,434 0.06%Valley National Bancorp 166,059 2,230,172 0.06%Saia, Inc. 10,635 2,227,926 0.06%Vontier Corp. 68,284 2,224,693 0.06%Huntsman Corp. 83,885 2,224,630 0.06%Q2 Holdings, Inc. 21,682 2,224,140 0.06%MGM Growth Properties LLC REIT Class A 60,518 2,216,169 0.06%
Timken Co. 27,484 2,214,936 0.06%National Instruments Corp. 52,372 2,214,288 0.06%Cousins Properties, Inc. REIT 59,960 2,205,329 0.06%
Colfax Corp. 48,020 2,199,796 0.06%Synaptics, Inc. 14,110 2,195,234 0.06%Regal Beloit Corp. 16,379 2,186,760 0.06%Maximus, Inc. 24,841 2,185,263 0.06%Teradata Corp. 43,714 2,184,389 0.06%KBR, Inc. 56,942 2,172,337 0.06%Acadia Healthcare Co., Inc. 34,579 2,169,832 0.06%Pegasystems, Inc. 15,572 2,167,467 0.06%Synnex Corp. 17,687 2,153,569 0.06%Nevro Corp. 12,988 2,153,281 0.06%

167
Vanguard Global Small-Cap Index Fund
.Number of
SharesFair Value
US Dollars ($)% of Total
Net AssetsInteractive Brokers Group, Inc. Class A 32,545 2,139,183 0.06%
Biohaven Pharmaceutical Holding Co., Ltd. 21,891 2,125,178 0.06%
Glacier Bancorp, Inc. 38,573 2,124,601 0.06%Chart Industries, Inc. 14,509 2,122,957 0.06%Flowserve Corp. 52,608 2,121,155 0.06%Change Healthcare, Inc. 91,888 2,117,100 0.06%nVent Electric plc 67,572 2,110,949 0.06%Herbalife Nutrition Ltd. 39,960 2,107,091 0.06%Hexcel Corp. 33,633 2,098,699 0.06%Inspire Medical Systems, Inc. 10,859 2,098,610 0.06%
Element Solutions, Inc. 89,429 2,090,850 0.06%Alteryx, Inc. Class A 24,291 2,089,512 0.06%Boyd Gaming Corp. 33,807 2,078,792 0.06%Bank OZK 49,106 2,070,309 0.06%ASGN, Inc. 21,357 2,070,134 0.06%Science Applications International Corp. 23,576 2,068,322 0.06%
Travel + Leisure Co. 34,776 2,067,433 0.06%MicroStrategy, Inc. Class A 3,110 2,066,595 0.06%Armstrong World Industries, Inc. 19,207 2,060,143 0.06%
Spirit AeroSystems Holdings, Inc. Class A 43,509 2,053,190 0.06%
Medpace Holdings, Inc. 11,610 2,050,674 0.06%Qurate Retail, Inc. 156,528 2,048,952 0.06%AutoNation, Inc. 21,597 2,047,612 0.06%CIT Group, Inc. 39,626 2,044,305 0.06%New York Community Bancorp, Inc. 185,330 2,042,337 0.06%
NeoGenomics, Inc. 45,112 2,037,709 0.06%Essent Group Ltd. 45,189 2,031,246 0.06%Ionis Pharmaceuticals, Inc. 50,825 2,027,409 0.06%QTS Realty Trust, Inc. REIT Class A 26,225 2,027,193 0.06%
Hanover Insurance Group, Inc. 14,884 2,018,866 0.06%
Valmont Industries, Inc. 8,533 2,014,215 0.06%Ashland Global Holdings, Inc. 22,932 2,006,550 0.06%
3D Systems Corp. 50,121 2,003,336 0.06%Cirrus Logic, Inc. 23,530 2,002,874 0.06%RBC Bearings, Inc. 10,041 2,002,376 0.06%Neogen Corp. 43,343 1,995,512 0.06%Power Integrations, Inc. 24,300 1,994,058 0.06%Pure Storage, Inc. Class A 101,741 1,987,002 0.06%Blueprint Medicines Corp. 22,584 1,986,489 0.06%Alliance Data Systems Corp. 19,040 1,983,778 0.06%Quidel Corp. 15,474 1,982,529 0.06%IDACORP, Inc. 20,274 1,976,715 0.06%Flowers Foods, Inc. 81,601 1,974,744 0.06%Selective Insurance Group, Inc. 24,327 1,974,136 0.06%
HollyFrontier Corp. 59,968 1,972,947 0.06%Graphic Packaging Holding Co. 108,739 1,972,525 0.06%
ChampionX Corp. 76,878 1,971,921 0.06%Rayonier, Inc. REIT 54,869 1,971,443 0.06%Curtiss-Wright Corp. 16,583 1,969,397 0.06%Goodyear Tire & Rubber Co. 114,783 1,968,528 0.06%ZoomInfo Technologies, Inc. Class A 37,701 1,966,861 0.06%
Integra LifeSciences Holdings Corp. 28,781 1,964,015 0.06%
Ollie's Bargain Outlet Holdings, Inc. 23,339 1,963,510 0.06%
New Residential Investment Corp. REIT 185,020 1,959,362 0.06%
Clean Harbors, Inc. 21,001 1,956,033 0.06%Iridium Communications, Inc. 48,785 1,950,912 0.06%
.Number of
SharesFair Value
US Dollars ($)% of Total
Net AssetsSimpson Manufacturing Co., Inc. 17,658 1,950,150 0.06%
Kemper Corp. 26,384 1,949,778 0.06%Park Hotels & Resorts, Inc. REIT 94,576 1,949,211 0.06%
FireEye, Inc. 96,302 1,947,226 0.06%Sterling Bancorp 78,521 1,946,536 0.06%Appian Corp. Class A 14,013 1,930,291 0.06%Wingstop, Inc. 12,244 1,930,022 0.06%OneMain Holdings, Inc. Class A 32,134 1,925,148 0.06%
Everbridge, Inc. 14,135 1,923,491 0.06%Novanta, Inc. 14,241 1,919,117 0.06%United Bankshares, Inc. 52,357 1,911,031 0.05%WillScot Mobile Mini Holdings Corp. 68,427 1,907,060 0.05%
PacWest Bancorp 46,223 1,902,539 0.05%CareDx, Inc. 20,770 1,900,870 0.05%Sailpoint Technologies Holdings, Inc. 37,039 1,891,582 0.05%
Rapid7, Inc. 19,966 1,889,383 0.05%FTI Consulting, Inc. 13,822 1,888,223 0.05%Innovative Industrial Properties, Inc. REIT Class A 9,867 1,884,794 0.05%
Highwoods Properties, Inc. REIT 41,523 1,875,594 0.05%
First Citizens BancShares, Inc. Class A 2,250 1,873,665 0.05%
WESCO International, Inc. 18,192 1,870,501 0.05%John Bean Technologies Corp. 13,088 1,866,611 0.05%
Webster Financial Corp. 34,981 1,865,887 0.05%AMN Healthcare Services, Inc. 19,086 1,850,960 0.05%
National Fuel Gas Co. 35,423 1,850,852 0.05%PDC Energy, Inc. 40,415 1,850,603 0.05%Exponent, Inc. 20,701 1,846,736 0.05%TG Therapeutics, Inc. 47,586 1,845,861 0.05%Hawaiian Electric Industries, Inc. 43,658 1,845,860 0.05%
Select Medical Holdings Corp. 43,659 1,845,029 0.05%
MGIC Investment Corp. 135,580 1,843,888 0.05%Agree Realty Corp. REIT 25,943 1,828,722 0.05%Blackstone Mortgage Trust, Inc. REIT Class A 57,311 1,827,648 0.05%
Ensign Group, Inc. 21,073 1,826,397 0.05%UFP Industries, Inc. 24,496 1,821,033 0.05%Terreno Realty Corp. REIT 28,198 1,819,335 0.05%Avient Corp. 36,873 1,812,677 0.05%Hannon Armstrong Sustainable Infrastructure Capital, Inc. REIT 32,270 1,811,960 0.05%
Wendy's Co. 77,336 1,811,209 0.05%Air Lease Corp. Class A 43,293 1,807,050 0.05%Semtech Corp. 26,229 1,804,555 0.05%Carter's, Inc. 17,303 1,785,151 0.05%Crane Co. 19,300 1,782,741 0.05%Radian Group, Inc. 79,339 1,765,293 0.05%Allison Transmission Holdings, Inc. 44,173 1,755,435 0.05%
Tilray, Inc. 96,650 1,746,771 0.05%Advanced Energy Industries, Inc. 15,463 1,742,835 0.05%
Healthcare Realty Trust, Inc. REIT 57,677 1,741,845 0.05%
Wintrust Financial Corp. 23,026 1,741,456 0.05%H&R Block, Inc. 74,026 1,738,130 0.05%Premier, Inc. Class A 49,762 1,731,220 0.05%Adient plc 38,234 1,728,177 0.05%RLI Corp. 16,510 1,726,781 0.05%Under Armour, Inc. Class A 81,526 1,724,275 0.05%

168
Vanguard Global Small-Cap Index Fund
.Number of
SharesFair Value
US Dollars ($)% of Total
Net AssetsCommScope Holding Co., Inc. 80,907 1,724,128 0.05%
Matador Resources Co. 47,825 1,722,178 0.05%Workiva, Inc. Class A 15,460 1,721,162 0.05%frontdoor, Inc. 34,503 1,718,939 0.05%Choice Hotels International, Inc. 14,419 1,713,842 0.05%
MSC Industrial Direct Co., Inc. Class A 19,069 1,711,061 0.05%
Sonos, Inc. 48,355 1,703,547 0.05%Houlihan Lokey, Inc. Class A 20,815 1,702,459 0.05%Credit Acceptance Corp. 3,749 1,702,458 0.05%Signet Jewelers Ltd. 21,025 1,698,610 0.05%Altra Industrial Motion Corp. 26,081 1,695,787 0.05%CMC Materials, Inc. 11,221 1,691,454 0.05%UMB Financial Corp. 18,127 1,686,899 0.05%EnerSys 17,257 1,686,527 0.05%Umpqua Holdings Corp. 91,201 1,682,658 0.05%Balchem Corp. 12,816 1,682,228 0.05%Hudson Pacific Properties, Inc. REIT 60,438 1,681,385 0.05%
Portland General Electric Co. 36,483 1,681,137 0.05%
Grand Canyon Education, Inc. 18,615 1,674,792 0.05%
ICU Medical, Inc. 8,130 1,673,154 0.05%Community Bank System, Inc. 22,113 1,672,848 0.05%
Univar Solutions, Inc. 68,469 1,669,274 0.05%National Vision Holdings, Inc. 32,643 1,669,037 0.05%
Ryman Hospitality Properties, Inc. REIT 21,068 1,663,529 0.05%
LivaNova plc 19,719 1,658,565 0.05%Envestnet, Inc. 21,856 1,657,996 0.05%Range Resources Corp. 98,613 1,652,754 0.05%Lemonade, Inc. 15,086 1,650,559 0.05%Bridgebio Pharma, Inc. 27,066 1,649,943 0.05%Avis Budget Group, Inc. 21,164 1,648,464 0.05%Resideo Technologies, Inc. 54,896 1,646,880 0.05%FNB Corp. 133,550 1,646,671 0.05%Avnet, Inc. 41,065 1,645,885 0.05%Antero Resources Corp. 109,482 1,645,514 0.05%Itron, Inc. 16,457 1,645,371 0.05%Viavi Solutions, Inc. 92,627 1,635,793 0.05%Box, Inc. Class A 64,016 1,635,609 0.05%Black Hills Corp. 24,888 1,633,399 0.05%Watts Water Technologies, Inc. Class A 11,190 1,632,733 0.05%
AZEK Co., Inc. Class A 38,429 1,631,695 0.05%Evoqua Water Technologies Corp. 48,249 1,629,851 0.05%
Cardlytics, Inc. 12,787 1,623,054 0.05%LivePerson, Inc. 25,618 1,620,082 0.05%Ryder System, Inc. 21,790 1,619,651 0.05%Cerence, Inc. 15,156 1,617,297 0.05%Summit Materials, Inc. Class A 46,304 1,613,694 0.05%
BankUnited, Inc. 37,776 1,612,657 0.05%Alarm.com Holdings, Inc. 19,004 1,609,639 0.05%Alkermes plc 65,631 1,609,272 0.05%CONMED Corp. 11,685 1,605,870 0.05%Hecla Mining Co. 215,587 1,603,967 0.05%Overstock.com, Inc. 17,381 1,602,528 0.05%Asana, Inc. Class A 25,813 1,601,180 0.05%Xerox Holdings Corp. 68,031 1,598,048 0.05%ONE Gas, Inc. 21,540 1,596,545 0.05%Howard Hughes Corp. 16,361 1,594,543 0.05%ACI Worldwide, Inc. 42,875 1,592,377 0.05%Beam Therapeutics, Inc. 12,359 1,590,727 0.05%EPR Properties REIT 30,187 1,590,251 0.05%Trupanion, Inc. 13,762 1,584,006 0.05%Shake Shack, Inc. Class A 14,782 1,581,970 0.05%
.Number of
SharesFair Value
US Dollars ($)% of Total
Net AssetsKorn Ferry 21,802 1,581,735 0.05%Weingarten Realty Investors REIT 49,186 1,577,395 0.05%
Nordstrom, Inc. 43,094 1,575,948 0.05%TEGNA, Inc. 83,973 1,575,333 0.05%TripAdvisor, Inc. 39,061 1,574,158 0.05%Home BancShares, Inc. 63,763 1,573,671 0.05%Arena Pharmaceuticals, Inc. 23,050 1,572,010 0.05%Glaukos Corp. 18,459 1,565,877 0.04%Bloom Energy Corp. Class A 58,131 1,561,980 0.04%Open Lending Corp. Class A 36,241 1,561,625 0.04%Physicians Realty Trust REIT 84,360 1,558,129 0.04%PNM Resources, Inc. 31,796 1,550,691 0.04%Denbury, Inc. 20,193 1,550,419 0.04%Apellis Pharmaceuticals, Inc. 24,528 1,550,170 0.04%
Chesapeake Energy Corp. 29,843 1,549,449 0.04%Magnite, Inc. 45,604 1,543,239 0.04%New Jersey Resources Corp. 38,964 1,541,805 0.04%
JBG SMITH Properties REIT 48,929 1,541,753 0.04%Southwestern Energy Co. 271,889 1,541,611 0.04%Brighthouse Financial, Inc. 33,823 1,540,299 0.04%Bed Bath & Beyond, Inc. 46,228 1,538,930 0.04%DigitalBridge Group, Inc. REIT 194,773 1,538,707 0.04%
W R Grace & Co. 22,258 1,538,473 0.04%Kulicke & Soffa Industries, Inc. 25,042 1,532,570 0.04%
Sabra Health Care, Inc. REIT 83,948 1,527,854 0.04%Tilray, Inc. Class 2 84,503 1,527,814 0.04%TechnipFMC plc 168,616 1,525,975 0.04%Sabre Corp. 121,827 1,520,401 0.04%Editas Medicine, Inc. Class A 26,833 1,519,821 0.04%
Southwest Gas Holdings, Inc. 22,925 1,517,406 0.04%
Rogers Corp. 7,531 1,512,225 0.04%Maravai LifeSciences Holdings, Inc. Class A 36,219 1,511,419 0.04%
Assured Guaranty Ltd. 31,821 1,510,861 0.04%Axis Capital Holdings Ltd. 30,777 1,508,381 0.04%Arconic Corp. 42,236 1,504,446 0.04%First Hawaiian, Inc. 53,040 1,503,154 0.04%Lancaster Colony Corp. 7,763 1,502,218 0.04%Mercury Systems, Inc. 22,657 1,501,706 0.04%Brink's Co. 19,527 1,500,455 0.04%Sanderson Farms, Inc. 7,972 1,498,497 0.04%Steven Madden Ltd. 34,176 1,495,542 0.04%Cloudera, Inc. 94,237 1,494,599 0.04%Stitch Fix, Inc. Class A 24,786 1,494,596 0.04%New Relic, Inc. 22,226 1,488,475 0.04%Commercial Metals Co. 48,416 1,487,340 0.04%Spire, Inc. 20,527 1,483,486 0.04%LGI Homes, Inc. 9,145 1,480,941 0.04%Silgan Holdings, Inc. 35,679 1,480,679 0.04%ALLETE, Inc. 21,073 1,474,689 0.04%Stamps.com, Inc. 7,358 1,473,734 0.04%Reata Pharmaceuticals, Inc. Class A 10,386 1,469,931 0.04%
Pacific Premier Bancorp, Inc. 34,427 1,455,918 0.04%
Sensient Technologies Corp. 16,813 1,455,333 0.04%SPS Commerce, Inc. 14,535 1,451,320 0.04%Hancock Whitney Corp. 32,623 1,449,766 0.04%Hilton Grand Vacations, Inc. 35,013 1,449,188 0.04%Luminar Technologies, Inc. Class A 65,899 1,446,483 0.04%
Murphy Oil Corp. 61,985 1,443,011 0.04%Diodes, Inc. 18,064 1,440,965 0.04%Onto Innovation, Inc. 19,715 1,439,984 0.04%White Mountains Insurance Group Ltd. 1,253 1,438,482 0.04%
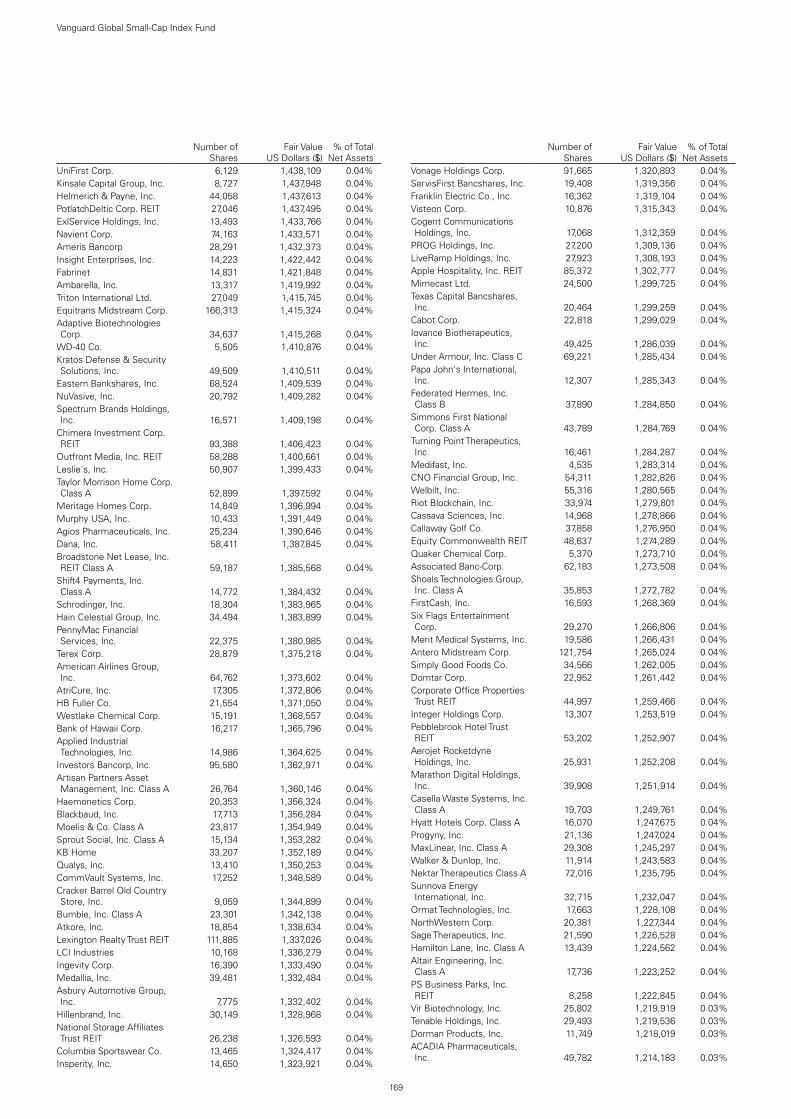
169
Vanguard Global Small-Cap Index Fund
.Number of
SharesFair Value
US Dollars ($)% of Total
Net AssetsUniFirst Corp. 6,129 1,438,109 0.04%Kinsale Capital Group, Inc. 8,727 1,437,948 0.04%Helmerich & Payne, Inc. 44,058 1,437,613 0.04%PotlatchDeltic Corp. REIT 27,046 1,437,495 0.04%ExlService Holdings, Inc. 13,493 1,433,766 0.04%Navient Corp. 74,163 1,433,571 0.04%Ameris Bancorp 28,291 1,432,373 0.04%Insight Enterprises, Inc. 14,223 1,422,442 0.04%Fabrinet 14,831 1,421,848 0.04%Ambarella, Inc. 13,317 1,419,992 0.04%Triton International Ltd. 27,049 1,415,745 0.04%Equitrans Midstream Corp. 166,313 1,415,324 0.04%Adaptive Biotechnologies Corp. 34,637 1,415,268 0.04%
WD-40 Co. 5,505 1,410,876 0.04%Kratos Defense & Security Solutions, Inc. 49,509 1,410,511 0.04%
Eastern Bankshares, Inc. 68,524 1,409,539 0.04%NuVasive, Inc. 20,792 1,409,282 0.04%Spectrum Brands Holdings, Inc. 16,571 1,409,198 0.04%
Chimera Investment Corp. REIT 93,388 1,406,423 0.04%
Outfront Media, Inc. REIT 58,288 1,400,661 0.04%Leslie's, Inc. 50,907 1,399,433 0.04%Taylor Morrison Home Corp. Class A 52,899 1,397,592 0.04%
Meritage Homes Corp. 14,849 1,396,994 0.04%Murphy USA, Inc. 10,433 1,391,449 0.04%Agios Pharmaceuticals, Inc. 25,234 1,390,646 0.04%Dana, Inc. 58,411 1,387,845 0.04%Broadstone Net Lease, Inc. REIT Class A 59,187 1,385,568 0.04%
Shift4 Payments, Inc. Class A 14,772 1,384,432 0.04%
Schrodinger, Inc. 18,304 1,383,965 0.04%Hain Celestial Group, Inc. 34,494 1,383,899 0.04%PennyMac Financial Services, Inc. 22,375 1,380,985 0.04%
Terex Corp. 28,879 1,375,218 0.04%American Airlines Group, Inc. 64,762 1,373,602 0.04%
AtriCure, Inc. 17,305 1,372,806 0.04%HB Fuller Co. 21,554 1,371,050 0.04%Westlake Chemical Corp. 15,191 1,368,557 0.04%Bank of Hawaii Corp. 16,217 1,365,796 0.04%Applied Industrial Technologies, Inc. 14,986 1,364,625 0.04%
Investors Bancorp, Inc. 95,580 1,362,971 0.04%Artisan Partners Asset Management, Inc. Class A 26,764 1,360,146 0.04%
Haemonetics Corp. 20,353 1,356,324 0.04%Blackbaud, Inc. 17,713 1,356,284 0.04%Moelis & Co. Class A 23,817 1,354,949 0.04%Sprout Social, Inc. Class A 15,134 1,353,282 0.04%KB Home 33,207 1,352,189 0.04%Qualys, Inc. 13,410 1,350,253 0.04%CommVault Systems, Inc. 17,252 1,348,589 0.04%Cracker Barrel Old Country Store, Inc. 9,059 1,344,899 0.04%
Bumble, Inc. Class A 23,301 1,342,138 0.04%Atkore, Inc. 18,854 1,338,634 0.04%Lexington Realty Trust REIT 111,885 1,337,026 0.04%LCI Industries 10,168 1,336,279 0.04%Ingevity Corp. 16,390 1,333,490 0.04%Medallia, Inc. 39,481 1,332,484 0.04%Asbury Automotive Group, Inc. 7,775 1,332,402 0.04%
Hillenbrand, Inc. 30,149 1,328,968 0.04%National Storage Affiliates Trust REIT 26,238 1,326,593 0.04%
Columbia Sportswear Co. 13,465 1,324,417 0.04%Insperity, Inc. 14,650 1,323,921 0.04%
.Number of
SharesFair Value
US Dollars ($)% of Total
Net AssetsVonage Holdings Corp. 91,665 1,320,893 0.04%ServisFirst Bancshares, Inc. 19,408 1,319,356 0.04%Franklin Electric Co., Inc. 16,362 1,319,104 0.04%Visteon Corp. 10,876 1,315,343 0.04%Cogent Communications Holdings, Inc. 17,068 1,312,359 0.04%
PROG Holdings, Inc. 27,200 1,309,136 0.04%LiveRamp Holdings, Inc. 27,923 1,308,193 0.04%Apple Hospitality, Inc. REIT 85,372 1,302,777 0.04%Mimecast Ltd. 24,500 1,299,725 0.04%Texas Capital Bancshares, Inc. 20,464 1,299,259 0.04%
Cabot Corp. 22,818 1,299,029 0.04%Iovance Biotherapeutics, Inc. 49,425 1,286,039 0.04%
Under Armour, Inc. Class C 69,221 1,285,434 0.04%Papa John's International, Inc. 12,307 1,285,343 0.04%
Federated Hermes, Inc. Class B 37,890 1,284,850 0.04%
Simmons First National Corp. Class A 43,789 1,284,769 0.04%
Turning Point Therapeutics, Inc. 16,461 1,284,287 0.04%
Medifast, Inc. 4,535 1,283,314 0.04%CNO Financial Group, Inc. 54,311 1,282,826 0.04%Welbilt, Inc. 55,316 1,280,565 0.04%Riot Blockchain, Inc. 33,974 1,279,801 0.04%Cassava Sciences, Inc. 14,968 1,278,866 0.04%Callaway Golf Co. 37,858 1,276,950 0.04%Equity Commonwealth REIT 48,637 1,274,289 0.04%Quaker Chemical Corp. 5,370 1,273,710 0.04%Associated Banc-Corp. 62,183 1,273,508 0.04%Shoals Technologies Group, Inc. Class A 35,853 1,272,782 0.04%
FirstCash, Inc. 16,593 1,268,369 0.04%Six Flags Entertainment Corp. 29,270 1,266,806 0.04%
Merit Medical Systems, Inc. 19,586 1,266,431 0.04%Antero Midstream Corp. 121,754 1,265,024 0.04%Simply Good Foods Co. 34,566 1,262,005 0.04%Domtar Corp. 22,952 1,261,442 0.04%Corporate Office Properties Trust REIT 44,997 1,259,466 0.04%
Integer Holdings Corp. 13,307 1,253,519 0.04%Pebblebrook Hotel Trust REIT 53,202 1,252,907 0.04%
Aerojet Rocketdyne Holdings, Inc. 25,931 1,252,208 0.04%
Marathon Digital Holdings, Inc. 39,908 1,251,914 0.04%
Casella Waste Systems, Inc. Class A 19,703 1,249,761 0.04%
Hyatt Hotels Corp. Class A 16,070 1,247,675 0.04%Progyny, Inc. 21,136 1,247,024 0.04%MaxLinear, Inc. Class A 29,308 1,245,297 0.04%Walker & Dunlop, Inc. 11,914 1,243,583 0.04%Nektar Therapeutics Class A 72,016 1,235,795 0.04%Sunnova Energy International, Inc. 32,715 1,232,047 0.04%
Ormat Technologies, Inc. 17,663 1,228,108 0.04%NorthWestern Corp. 20,381 1,227,344 0.04%Sage Therapeutics, Inc. 21,590 1,226,528 0.04%Hamilton Lane, Inc. Class A 13,439 1,224,562 0.04%Altair Engineering, Inc. Class A 17,736 1,223,252 0.04%
PS Business Parks, Inc. REIT 8,258 1,222,845 0.04%
Vir Biotechnology, Inc. 25,802 1,219,919 0.03%Tenable Holdings, Inc. 29,493 1,219,536 0.03%Dorman Products, Inc. 11,749 1,218,019 0.03%ACADIA Pharmaceuticals, Inc. 49,782 1,214,183 0.03%

170
Vanguard Global Small-Cap Index Fund
.Number of
SharesFair Value
US Dollars ($)% of Total
Net AssetsEmergent BioSolutions, Inc. 19,271 1,213,880 0.03%CNX Resources Corp. 88,576 1,209,948 0.03%iHeartMedia, Inc. Class A 44,734 1,204,687 0.03%Cathay General Bancorp 30,447 1,198,394 0.03%Essential Properties Realty Trust, Inc. REIT 44,307 1,198,061 0.03%
ABM Industries, Inc. 26,925 1,194,124 0.03%Owens & Minor, Inc. 28,198 1,193,621 0.03%GATX Corp. 13,485 1,193,018 0.03%BancorpSouth Bank 42,078 1,192,070 0.03%2U, Inc. 28,595 1,191,554 0.03%Grocery Outlet Holding Corp. 34,247 1,187,001 0.03%
Beacon Roofing Supply, Inc. 22,291 1,186,996 0.03%Maxar Technologies, Inc. 29,734 1,186,981 0.03%Verint Systems, Inc. 26,321 1,186,287 0.03%API Group Corp. 56,771 1,185,946 0.03%Yelp, Inc. Class A 29,668 1,185,533 0.03%Urban Outfitters, Inc. 28,742 1,184,745 0.03%Avista Corp. 27,700 1,181,959 0.03%Sprouts Farmers Market, Inc. 47,447 1,179,058 0.03%
Allscripts Healthcare Solutions, Inc. 63,529 1,175,922 0.03%
Old National Bancorp 66,335 1,168,159 0.03%Installed Building Products, Inc. 9,534 1,166,580 0.03%
Insmed, Inc. 40,912 1,164,356 0.03%Nu Skin Enterprises, Inc. Class A 20,534 1,163,251 0.03%
National Health Investors, Inc. REIT 17,300 1,159,965 0.03%
American States Water Co. 14,569 1,159,110 0.03%TriNet Group, Inc. 15,958 1,156,636 0.03%Enstar Group Ltd. 4,840 1,156,373 0.03%MACOM Technology Solutions Holdings, Inc. 18,018 1,154,593 0.03%
BioCryst Pharmaceuticals, Inc. 72,863 1,151,964 0.03%
Abercrombie & Fitch Co. Class A 24,809 1,151,882 0.03%
Brinker International, Inc. 18,603 1,150,596 0.03%Comfort Systems USA, Inc. 14,585 1,149,152 0.03%Kennametal, Inc. 31,918 1,146,495 0.03%Badger Meter, Inc. 11,684 1,146,434 0.03%Vroom, Inc. 27,375 1,145,918 0.03%Vishay Intertechnology, Inc. 50,797 1,145,472 0.03%MDC Holdings, Inc. 22,572 1,142,143 0.03%Kodiak Sciences, Inc. 12,270 1,141,110 0.03%Arcosa, Inc. 19,394 1,139,204 0.03%Skyline Champion Corp. 21,360 1,138,488 0.03%Coty, Inc. Class A 121,853 1,138,107 0.03%Bandwidth, Inc. Class A 8,245 1,137,150 0.03%Albany International Corp. Class A 12,738 1,136,994 0.03%
8x8, Inc. 40,781 1,132,081 0.03%United Community Banks, Inc. 35,358 1,131,810 0.03%
Livent Corp. 58,435 1,131,302 0.03%Intra-Cellular Therapies, Inc. 27,656 1,128,918 0.03%Macquarie Infrastructure Corp. 29,491 1,128,621 0.03%
PagerDuty, Inc. 26,474 1,127,263 0.03%FuelCell Energy, Inc. 126,594 1,126,687 0.03%NanoString Technologies, Inc. 17,388 1,126,569 0.03%
Veracyte, Inc. 28,149 1,125,397 0.03%Sleep Number Corp. 10,232 1,125,008 0.03%FormFactor, Inc. 30,841 1,124,463 0.03%Herman Miller, Inc. 23,852 1,124,383 0.03%PTC Therapeutics, Inc. 26,573 1,123,241 0.03%Continental Resources, Inc. 29,533 1,123,140 0.03%Phreesia, Inc. 18,301 1,121,851 0.03%
.Number of
SharesFair Value
US Dollars ($)% of Total
Net AssetsCornerstone OnDemand, Inc. 21,686 1,118,564 0.03%
John Wiley & Sons, Inc. Class A 18,586 1,118,505 0.03%
Rambus, Inc. 47,134 1,117,547 0.03%Viasat, Inc. 22,412 1,117,014 0.03%NewMarket Corp. 3,469 1,116,949 0.03%Atlantic Union Bankshares Corp. 30,821 1,116,337 0.03%
Calix, Inc. 23,472 1,114,920 0.03%American Equity Investment Life Holding Co. 34,469 1,114,038 0.03%
Cannae Holdings, Inc. 32,785 1,111,739 0.03%Columbia Banking System, Inc. 28,776 1,109,603 0.03%
Covetrus, Inc. 41,041 1,108,107 0.03%Werner Enterprises, Inc. 24,881 1,107,702 0.03%Arvinas, Inc. 14,384 1,107,568 0.03%Nikola Corp. 61,265 1,106,446 0.03%Kontoor Brands, Inc. 19,597 1,105,467 0.03%Fisker, Inc. 57,208 1,102,970 0.03%SPX FLOW, Inc. 16,897 1,102,360 0.03%Renewable Energy Group, Inc. 17,680 1,102,171 0.03%
Red Rock Resorts, Inc. Class A 25,897 1,100,623 0.03%
Wolverine World Wide, Inc. 32,701 1,100,062 0.03%California Water Service Group 19,781 1,098,637 0.03%
Rent-A-Center, Inc. 20,687 1,097,859 0.03%1Life Healthcare, Inc. 33,105 1,094,451 0.03%SPX Corp. 17,905 1,093,637 0.03%BOK Financial Corp. 12,588 1,090,121 0.03%Transocean Ltd. 240,864 1,088,705 0.03%Allakos, Inc. 12,718 1,085,736 0.03%Macerich Co. REIT 59,373 1,083,557 0.03%SM Energy Co. 43,962 1,082,784 0.03%Amkor Technology, Inc. 45,696 1,081,624 0.03%Independent Bank Group, Inc. 14,602 1,080,256 0.03%
Silvergate Capital Corp. Class A 9,523 1,079,146 0.03%
Brady Corp. Class A 19,230 1,077,649 0.03%World Wrestling Entertainment, Inc. Class A 18,553 1,074,033 0.03%
Callon Petroleum Co. 18,607 1,073,438 0.03%Inovalon Holdings, Inc. Class A 31,406 1,070,316 0.03%
MGE Energy, Inc. 14,371 1,069,777 0.03%Sunstone Hotel Investors, Inc. REIT 86,049 1,068,729 0.03%
MicroVision, Inc. 63,763 1,068,030 0.03%ODP Corp. 22,222 1,066,878 0.03%Group 1 Automotive, Inc. 6,902 1,065,876 0.03%Minerals Technologies, Inc. 13,534 1,064,720 0.03%Pacira BioSciences, Inc. 17,500 1,061,900 0.03%Graham Holdings Co. Class B 1,675 1,061,782 0.03%
Plexus Corp. 11,613 1,061,544 0.03%EVERTEC, Inc. 24,276 1,059,647 0.03%CVB Financial Corp. 51,427 1,058,882 0.03%Rocket Cos, Inc. Class A 54,715 1,058,735 0.03%R1 RCM, Inc. 47,556 1,057,645 0.03%Amyris, Inc. 64,565 1,056,929 0.03%Energizer Holdings, Inc. 24,578 1,056,362 0.03%SeaWorld Entertainment, Inc. 21,152 1,056,331 0.03%
Focus Financial Partners, Inc. Class A 21,738 1,054,293 0.03%
Cadence BanCorp Class A 50,430 1,052,978 0.03%Sorrento Therapeutics, Inc. 108,621 1,052,537 0.03%Patterson Cos, Inc. 34,547 1,049,883 0.03%J & J Snack Foods Corp. 6,019 1,049,774 0.03%

171
Vanguard Global Small-Cap Index Fund
.Number of
SharesFair Value
US Dollars ($)% of Total
Net AssetsVista Outdoor, Inc. 22,653 1,048,381 0.03%RLJ Lodging Trust REIT 68,362 1,041,153 0.03%Prestige Consumer Healthcare, Inc. 19,959 1,039,864 0.03%
Allegheny Technologies, Inc. 49,872 1,039,831 0.03%iRobot Corp. 11,134 1,039,804 0.03%O-I Glass, Inc. 63,672 1,039,764 0.03%Stepan Co. 8,626 1,037,449 0.03%First BanCorp 86,951 1,036,456 0.03%Dicerna Pharmaceuticals, Inc. 27,737 1,035,145 0.03%
Momentive Global, Inc. 49,101 1,034,558 0.03%Madison Square Garden Sports Corp. 5,968 1,029,898 0.03%
Tri Pointe Homes, Inc. 47,925 1,027,033 0.03%South Jersey Industries, Inc. 39,607 1,027,010 0.03%Virtu Financial, Inc. Class A 37,159 1,026,703 0.03%Axos Financial, Inc. 22,129 1,026,564 0.03%Perficient, Inc. 12,715 1,022,540 0.03%Veoneer, Inc. 44,249 1,019,939 0.03%Corcept Therapeutics, Inc. 46,358 1,019,876 0.03%Masonite International Corp. 9,117 1,019,189 0.03%Jack in the Box, Inc. 9,134 1,017,893 0.03%Fulton Financial Corp. 64,361 1,015,617 0.03%Boot Barn Holdings, Inc. 12,083 1,015,576 0.03%Fluor Corp. 57,354 1,015,166 0.03%Federal Signal Corp. 25,120 1,010,578 0.03%Tronox Holdings plc Class A 45,094 1,010,106 0.03%Penske Automotive Group, Inc. 13,366 1,008,999 0.03%
Washington Federal, Inc. 31,741 1,008,729 0.03%Proto Labs, Inc. 10,965 1,006,587 0.03%SunPower Corp. Class A 34,412 1,005,519 0.03%TreeHouse Foods, Inc. 22,580 1,005,262 0.03%eXp World Holdings, Inc. 25,825 1,001,235 0.03%Kennedy-Wilson Holdings, Inc. 50,310 999,660 0.03%
AAON, Inc. 15,971 999,625 0.03%WesBanco, Inc. 28,030 998,709 0.03%BigCommerce Holdings, Inc. 15,351 996,587 0.03%
Helios Technologies, Inc. 12,747 994,903 0.03%Sanmina Corp. 25,532 994,727 0.03%Independent Bank Corp. 13,085 987,917 0.03%Gibraltar Industries, Inc. 12,902 984,552 0.03%Xperi Holding Corp. 44,229 983,653 0.03%Brandywine Realty Trust REIT 71,626 981,992 0.03%
Forward Air Corp. 10,940 981,865 0.03%Cheesecake Factory, Inc. 18,099 980,604 0.03%Barnes Group, Inc. 19,099 978,824 0.03%Uniti Group, Inc. REIT 92,293 977,383 0.03%Goosehead Insurance, Inc. Class A 7,675 977,027 0.03%
Sally Beauty Holdings, Inc. 44,268 976,995 0.03%Moog, Inc. Class A 11,612 976,105 0.03%Herc Holdings, Inc. 8,646 968,957 0.03%Retail Properties of America, Inc. REIT Class A 84,454 966,998 0.03%
ESCO Technologies, Inc. 10,280 964,367 0.03%LendingTree, Inc. 4,546 963,206 0.03%At Home Group, Inc. 26,132 962,703 0.03%Celsius Holdings, Inc. 12,605 959,114 0.03%Upstart Holdings, Inc. 7,667 957,608 0.03%KAR Auction Services, Inc. 54,445 955,510 0.03%Avaya Holdings Corp. 35,447 953,524 0.03%Cushman & Wakefield plc 54,071 944,620 0.03%Edgewell Personal Care Co. 21,517 944,596 0.03%Liberty Latin America Ltd. Class C 66,853 942,627 0.03%
Hilltop Holdings, Inc. 25,871 941,704 0.03%Dycom Industries, Inc. 12,627 941,090 0.03%
.Number of
SharesFair Value
US Dollars ($)% of Total
Net AssetsBig Lots, Inc. 14,231 939,388 0.03%Belden, Inc. 18,564 938,781 0.03%MEDNAX, Inc. 31,135 938,720 0.03%Urban Edge Properties REIT 49,063 937,103 0.03%Vicor Corp. 8,858 936,645 0.03%Shutterstock, Inc. 9,496 932,222 0.03%Healthcare Services Group, Inc. 29,473 930,463 0.03%
ManTech International Corp. Class A 10,745 929,872 0.03%
Gentherm Inc. 13,078 929,192 0.03%Mueller Industries, Inc. 21,453 929,129 0.03%InterDigital, Inc. 12,711 928,284 0.03%Mr Cooper Group, Inc. 27,993 925,449 0.03%Hub Group, Inc. Class A 14,018 924,908 0.03%Towne Bank 30,395 924,616 0.03%Magnolia Oil & Gas Corp. Class A 58,939 921,217 0.03%
Revolve Group, Inc. Class A 13,370 921,193 0.03%Green Dot Corp. Class A 19,640 920,134 0.03%First Financial Bancorp 38,907 919,372 0.03%FibroGen, Inc. 34,511 919,028 0.03%Piper Sandler Cos 7,083 917,673 0.03%Ultra Clean Holdings, Inc. 17,049 915,872 0.03%Myriad Genetics, Inc. 29,937 915,473 0.03%Winnebago Industries, Inc. 13,446 913,790 0.03%AeroVironment, Inc. 9,118 913,168 0.03%SITE Centers Corp. REIT 60,522 911,461 0.03%Ligand Pharmaceuticals, Inc. 6,933 909,540 0.03%
PriceSmart, Inc. 9,987 908,917 0.03%Shenandoah Telecommunications Co. 18,735 908,835 0.03%
Piedmont Office Realty Trust, Inc. REIT Class A 49,146 907,727 0.03%
Mueller Water Products, Inc. Class A 62,614 902,894 0.03%
CryoPort, Inc. 14,271 900,500 0.03%Appfolio, Inc. Class A 6,372 899,726 0.03%WSFS Financial Corp. 19,268 897,696 0.03%Trinity Industries, Inc. 33,341 896,539 0.03%International Bancshares Corp. 20,865 895,943 0.03%
Verra Mobility Corp. Class A 58,183 894,273 0.03%Bluebird Bio, Inc. 27,861 890,995 0.03%GrowGeneration Corp. 18,472 888,503 0.03%Cinemark Holdings, Inc. 40,478 888,492 0.03%MP Materials Corp. 24,101 888,363 0.03%First Merchants Corp. 21,310 887,988 0.03%Surgery Partners, Inc. 13,317 887,179 0.03%Arbor Realty Trust, Inc. REIT 49,715 885,921 0.03%Innospec, Inc. 9,766 884,897 0.03%Apollo Commercial Real Estate Finance, Inc. REIT 55,407 883,742 0.03%
B&G Foods, Inc. 26,913 882,746 0.03%Realogy Holdings Corp. 48,418 882,176 0.03%Virtus Investment Partners, Inc. 3,161 878,031 0.03%
Bloomin' Brands, Inc. 32,344 877,816 0.03%Hostess Brands, Inc. Class A 54,087 875,669 0.03%
Boise Cascade Co. 15,000 875,250 0.03%Retail Opportunity Investments Corp. REIT 49,556 875,159 0.03%
NetScout Systems, Inc. 30,594 873,153 0.02%ModivCare, Inc. 5,134 873,139 0.02%CareTrust, Inc. REIT 37,577 872,914 0.02%Chesapeake Utilities Corp. 7,244 871,671 0.02%Flagstar Bancorp, Inc. 20,613 871,312 0.02%Domo, Inc. Class B 10,760 869,731 0.02%Karuna Therapeutics, Inc. 7,616 868,148 0.02%Renasant Corp. 21,686 867,440 0.02%
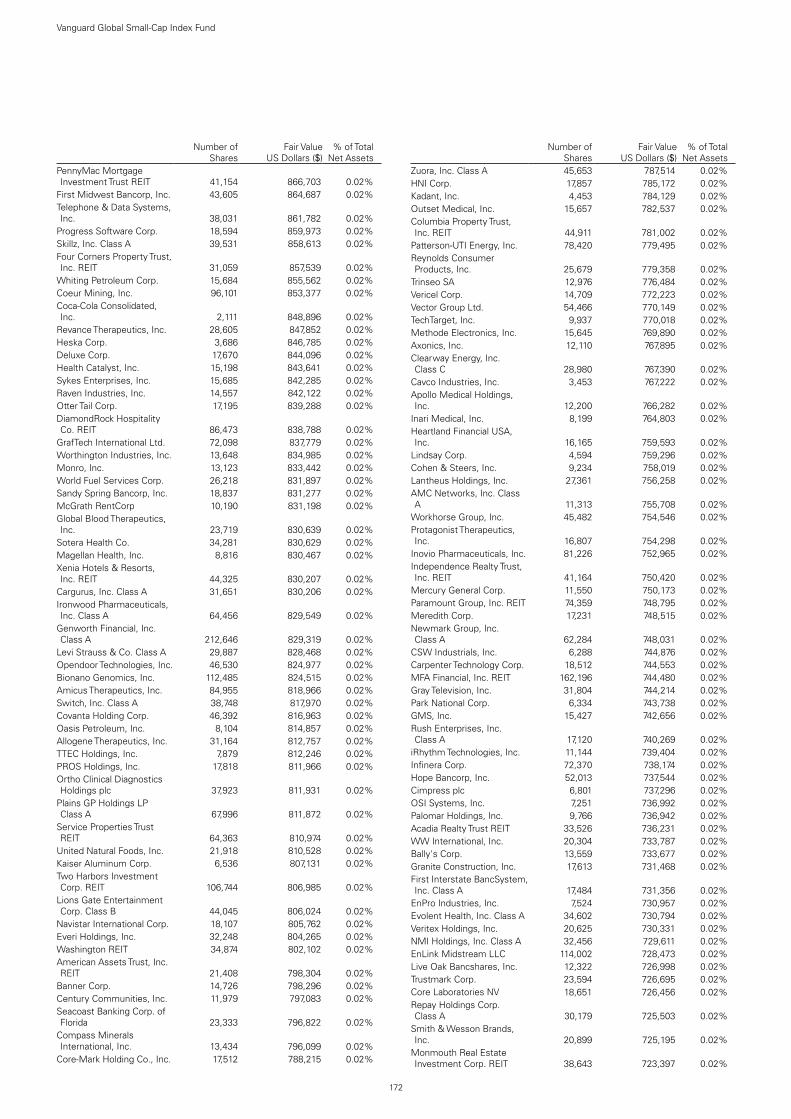
172
Vanguard Global Small-Cap Index Fund
.Number of
SharesFair Value
US Dollars ($)% of Total
Net AssetsPennyMac Mortgage Investment Trust REIT 41,154 866,703 0.02%
First Midwest Bancorp, Inc. 43,605 864,687 0.02%Telephone & Data Systems, Inc. 38,031 861,782 0.02%
Progress Software Corp. 18,594 859,973 0.02%Skillz, Inc. Class A 39,531 858,613 0.02%Four Corners Property Trust, Inc. REIT 31,059 857,539 0.02%
Whiting Petroleum Corp. 15,684 855,562 0.02%Coeur Mining, Inc. 96,101 853,377 0.02%Coca-Cola Consolidated, Inc. 2,111 848,896 0.02%
Revance Therapeutics, Inc. 28,605 847,852 0.02%Heska Corp. 3,686 846,785 0.02%Deluxe Corp. 17,670 844,096 0.02%Health Catalyst, Inc. 15,198 843,641 0.02%Sykes Enterprises, Inc. 15,685 842,285 0.02%Raven Industries, Inc. 14,557 842,122 0.02%Otter Tail Corp. 17,195 839,288 0.02%DiamondRock Hospitality Co. REIT 86,473 838,788 0.02%
GrafTech International Ltd. 72,098 837,779 0.02%Worthington Industries, Inc. 13,648 834,985 0.02%Monro, Inc. 13,123 833,442 0.02%World Fuel Services Corp. 26,218 831,897 0.02%Sandy Spring Bancorp, Inc. 18,837 831,277 0.02%McGrath RentCorp 10,190 831,198 0.02%Global Blood Therapeutics, Inc. 23,719 830,639 0.02%
Sotera Health Co. 34,281 830,629 0.02%Magellan Health, Inc. 8,816 830,467 0.02%Xenia Hotels & Resorts, Inc. REIT 44,325 830,207 0.02%
Cargurus, Inc. Class A 31,651 830,206 0.02%Ironwood Pharmaceuticals, Inc. Class A 64,456 829,549 0.02%
Genworth Financial, Inc. Class A 212,646 829,319 0.02%
Levi Strauss & Co. Class A 29,887 828,468 0.02%Opendoor Technologies, Inc. 46,530 824,977 0.02%Bionano Genomics, Inc. 112,485 824,515 0.02%Amicus Therapeutics, Inc. 84,955 818,966 0.02%Switch, Inc. Class A 38,748 817,970 0.02%Covanta Holding Corp. 46,392 816,963 0.02%Oasis Petroleum, Inc. 8,104 814,857 0.02%Allogene Therapeutics, Inc. 31,164 812,757 0.02%TTEC Holdings, Inc. 7,879 812,246 0.02%PROS Holdings, Inc. 17,818 811,966 0.02%Ortho Clinical Diagnostics Holdings plc 37,923 811,931 0.02%
Plains GP Holdings LP Class A 67,996 811,872 0.02%
Service Properties Trust REIT 64,363 810,974 0.02%
United Natural Foods, Inc. 21,918 810,528 0.02%Kaiser Aluminum Corp. 6,536 807,131 0.02%Two Harbors Investment Corp. REIT 106,744 806,985 0.02%
Lions Gate Entertainment Corp. Class B 44,045 806,024 0.02%
Navistar International Corp. 18,107 805,762 0.02%Everi Holdings, Inc. 32,248 804,265 0.02%Washington REIT 34,874 802,102 0.02%American Assets Trust, Inc. REIT 21,408 798,304 0.02%
Banner Corp. 14,726 798,296 0.02%Century Communities, Inc. 11,979 797,083 0.02%Seacoast Banking Corp. of Florida 23,333 796,822 0.02%
Compass Minerals International, Inc. 13,434 796,099 0.02%
Core-Mark Holding Co., Inc. 17,512 788,215 0.02%
.Number of
SharesFair Value
US Dollars ($)% of Total
Net AssetsZuora, Inc. Class A 45,653 787,514 0.02%HNI Corp. 17,857 785,172 0.02%Kadant, Inc. 4,453 784,129 0.02%Outset Medical, Inc. 15,657 782,537 0.02%Columbia Property Trust, Inc. REIT 44,911 781,002 0.02%
Patterson-UTI Energy, Inc. 78,420 779,495 0.02%Reynolds Consumer Products, Inc. 25,679 779,358 0.02%
Trinseo SA 12,976 776,484 0.02%Vericel Corp. 14,709 772,223 0.02%Vector Group Ltd. 54,466 770,149 0.02%TechTarget, Inc. 9,937 770,018 0.02%Methode Electronics, Inc. 15,645 769,890 0.02%Axonics, Inc. 12,110 767,895 0.02%Clearway Energy, Inc. Class C 28,980 767,390 0.02%
Cavco Industries, Inc. 3,453 767,222 0.02%Apollo Medical Holdings, Inc. 12,200 766,282 0.02%
Inari Medical, Inc. 8,199 764,803 0.02%Heartland Financial USA, Inc. 16,165 759,593 0.02%
Lindsay Corp. 4,594 759,296 0.02%Cohen & Steers, Inc. 9,234 758,019 0.02%Lantheus Holdings, Inc. 27,361 756,258 0.02%AMC Networks, Inc. Class A 11,313 755,708 0.02%
Workhorse Group, Inc. 45,482 754,546 0.02%Protagonist Therapeutics, Inc. 16,807 754,298 0.02%
Inovio Pharmaceuticals, Inc. 81,226 752,965 0.02%Independence Realty Trust, Inc. REIT 41,164 750,420 0.02%
Mercury General Corp. 11,550 750,173 0.02%Paramount Group, Inc. REIT 74,359 748,795 0.02%Meredith Corp. 17,231 748,515 0.02%Newmark Group, Inc. Class A 62,284 748,031 0.02%
CSW Industrials, Inc. 6,288 744,876 0.02%Carpenter Technology Corp. 18,512 744,553 0.02%MFA Financial, Inc. REIT 162,196 744,480 0.02%Gray Television, Inc. 31,804 744,214 0.02%Park National Corp. 6,334 743,738 0.02%GMS, Inc. 15,427 742,656 0.02%Rush Enterprises, Inc. Class A 17,120 740,269 0.02%
iRhythm Technologies, Inc. 11,144 739,404 0.02%Infinera Corp. 72,370 738,174 0.02%Hope Bancorp, Inc. 52,013 737,544 0.02%Cimpress plc 6,801 737,296 0.02%OSI Systems, Inc. 7,251 736,992 0.02%Palomar Holdings, Inc. 9,766 736,942 0.02%Acadia Realty Trust REIT 33,526 736,231 0.02%WW International, Inc. 20,304 733,787 0.02%Bally's Corp. 13,559 733,677 0.02%Granite Construction, Inc. 17,613 731,468 0.02%First Interstate BancSystem, Inc. Class A 17,484 731,356 0.02%
EnPro Industries, Inc. 7,524 730,957 0.02%Evolent Health, Inc. Class A 34,602 730,794 0.02%Veritex Holdings, Inc. 20,625 730,331 0.02%NMI Holdings, Inc. Class A 32,456 729,611 0.02%EnLink Midstream LLC 114,002 728,473 0.02%Live Oak Bancshares, Inc. 12,322 726,998 0.02%Trustmark Corp. 23,594 726,695 0.02%Core Laboratories NV 18,651 726,456 0.02%Repay Holdings Corp. Class A 30,179 725,503 0.02%
Smith & Wesson Brands, Inc. 20,899 725,195 0.02%
Monmouth Real Estate Investment Corp. REIT 38,643 723,397 0.02%

173
Vanguard Global Small-Cap Index Fund
.Number of
SharesFair Value
US Dollars ($)% of Total
Net AssetsEagle Bancorp, Inc. 12,881 722,366 0.02%Kite Realty Group Trust REIT 32,789 721,686 0.02%TPI Composites, Inc. 14,902 721,555 0.02%Argo Group International Holdings Ltd. 13,913 721,111 0.02%
Acushnet Holdings Corp. 14,555 719,017 0.02%Array Technologies, Inc. 46,045 718,302 0.02%M/I Homes, Inc. 12,229 717,475 0.02%PRA Group, Inc. 18,650 717,466 0.02%JELD-WEN Holding, Inc. 27,235 715,191 0.02%OPKO Health, Inc. 176,280 713,934 0.02%Option Care Health, Inc. 32,637 713,771 0.02%Danimer Scientific, Inc. 28,482 713,474 0.02%Triumph Bancorp, Inc. 9,590 712,058 0.02%New York Mortgage Trust, Inc. REIT 159,017 710,806 0.02%
Strategic Education, Inc. 9,276 705,533 0.02%Accolade, Inc. 12,969 704,346 0.02%ICF International, Inc. 8,011 703,846 0.02%Xencor, Inc. 20,387 703,148 0.02%Knowles Corp. 35,589 702,527 0.02%Cactus, Inc. Class A 19,033 698,892 0.02%Oxford Industries, Inc. 7,049 696,723 0.02%Duck Creek Technologies, Inc. 15,998 696,073 0.02%
SJW Group 10,969 694,338 0.02%Luminex Corp. 18,865 694,232 0.02%Global Net Lease, Inc. REIT 37,272 689,532 0.02%ADT, Inc. 63,821 688,629 0.02%JFrog Ltd. 15,107 687,671 0.02%Meritor, Inc. 29,350 687,377 0.02%Supernus Pharmaceuticals, Inc. 22,305 686,771 0.02%
nCino, Inc. 11,461 686,743 0.02%Community Health Systems, Inc. 44,477 686,725 0.02%
Provident Financial Services, Inc. 29,947 685,487 0.02%
Greif, Inc. Class A 11,315 685,123 0.02%Bottomline Technologies DE, Inc. 18,472 684,942 0.02%
Alaska Air Group, Inc. 11,331 683,373 0.02%Central Garden & Pet Co. Class A 14,148 683,348 0.02%
Patrick Industries, Inc. 9,358 683,134 0.02%Great Western Bancorp, Inc. 20,749 680,360 0.02%Avanos Medical, Inc. 18,643 678,046 0.02%Adtalem Global Education, Inc. 18,996 677,017 0.02%
SpringWorks Therapeutics, Inc. 8,199 675,680 0.02%
PJT Partners, Inc. Class A 9,442 673,970 0.02%LendingClub Corp. 37,096 672,550 0.02%Tanger Factory Outlet Centers, Inc. REIT 35,667 672,323 0.02%
Empire State Realty Trust, Inc. REIT Class A 56,017 672,204 0.02%
Northwest Natural Holding Co. 12,746 669,420 0.02%
Plantronics, Inc. 16,030 668,932 0.02%NBT Bancorp, Inc. 18,577 668,215 0.02%Establishment Labs Holdings, Inc. 7,633 666,666 0.02%
Camping World Holdings, Inc. Class A 16,257 666,374 0.02%
Unisys Corp. 26,319 666,134 0.02%Industrial Logistics Properties Trust REIT 25,398 663,904 0.02%
Encore Wire Corp. 8,759 663,845 0.02%La-Z-Boy, Inc. 17,855 661,349 0.02%BGC Partners, Inc. Class A 116,570 660,952 0.02%Easterly Government Properties, Inc. REIT 31,345 660,753 0.02%
.Number of
SharesFair Value
US Dollars ($)% of Total
Net AssetsMeta Financial Group, Inc. 13,039 660,165 0.02%Westamerica BanCorp 11,325 657,190 0.02%Lakeland Financial Corp. 10,646 656,219 0.02%Capitol Federal Financial, Inc. 55,572 654,638 0.02%
Rocket Pharmaceuticals, Inc. 14,780 654,606 0.02%
Alamo Group, Inc. 4,283 653,928 0.02%Axsome Therapeutics, Inc. 9,684 653,283 0.02%Sturm Ruger & Co., Inc. 7,251 652,445 0.02%Horace Mann Educators Corp. 17,389 650,696 0.02%
Quanterix Corp. 11,085 650,246 0.02%Silk Road Medical, Inc. 13,551 648,551 0.02%Materion Corp. 8,600 648,010 0.02%Ameresco, Inc. Class A 10,275 644,448 0.02%MYR Group, Inc. 7,048 640,804 0.02%Cardiovascular Systems, Inc. 15,011 640,219 0.02%
Allegro MicroSystems, Inc. 23,000 637,100 0.02%fuboTV, Inc. 19,825 636,581 0.02%Oceaneering International, Inc. 40,884 636,564 0.02%
Purple Innovation, Inc. Class A 24,102 636,534 0.02%
Northwest Bancshares, Inc. 46,646 636,251 0.02%Ichor Holdings Ltd. 11,821 635,970 0.02%Malibu Boats, Inc. Class A 8,669 635,698 0.02%AdaptHealth Corp. Class A 23,164 634,925 0.02%CBIZ, Inc. 19,300 632,461 0.02%Clean Energy Fuels Corp. 62,234 631,675 0.02%Seres Therapeutics, Inc. 26,415 629,998 0.02%Avid Bioservices, Inc. 24,471 627,681 0.02%Green Plains, Inc. 18,651 627,047 0.02%Pitney Bowes, Inc. 71,338 625,634 0.02%Blink Charging Co. 15,188 625,290 0.02%Dave & Buster's Entertainment, Inc. 15,382 624,509 0.02%
Hibbett, Inc. 6,944 622,391 0.02%ArcBest Corp. 10,689 621,993 0.02%LTC Properties, Inc. REIT 16,199 621,880 0.02%Primoris Services Corp. 21,107 621,179 0.02%Harsco Corp. 30,363 620,012 0.02%Laureate Education, Inc. Class A 42,724 619,925 0.02%
Clover Health Investments Corp. 46,510 619,513 0.02%
PAR Technology Corp. 8,856 619,389 0.02%G-III Apparel Group Ltd. 18,766 616,651 0.02%C3.ai, Inc. Class A 9,852 616,046 0.02%SiTime Corp. 4,866 615,987 0.02%Ferro Corp. 28,539 615,586 0.02%US Physical Therapy, Inc. 5,308 615,038 0.02%Buckle, Inc. 12,335 613,666 0.02%Middlesex Water Co. 7,478 611,177 0.02%Sinclair Broadcast Group, Inc. Class A 18,356 609,786 0.02%
Anavex Life Sciences Corp. 26,660 609,448 0.02%Cohu, Inc. 16,564 609,390 0.02%Ocugen, Inc. 75,872 609,252 0.02%Academy Sports & Outdoors, Inc. 14,697 606,104 0.02%
RealReal, Inc. 30,506 602,799 0.02%Yext, Inc. 42,052 600,923 0.02%Enerpac Tool Group Corp. Class A 22,522 599,536 0.02%
REVOLUTION Medicines, Inc. 18,849 598,267 0.02%
Greenbrier Cos, Inc. 13,728 598,266 0.02%Office Properties Income Trust REIT 20,358 596,693 0.02%
Brookdale Senior Living, Inc. 75,528 596,671 0.02%

174
Vanguard Global Small-Cap Index Fund
.Number of
SharesFair Value
US Dollars ($)% of Total
Net AssetsSt Joe Co. 13,359 595,945 0.02%CSG Systems International, Inc. 12,608 594,845 0.02%
Porch Group, Inc. 30,676 593,274 0.02%PBF Energy, Inc. Class A 38,669 591,636 0.02%Berkshire Hills Bancorp, Inc. 21,539 590,384 0.02%Deciphera Pharmaceuticals, Inc. 16,095 589,238 0.02%
PGT Innovations, Inc. 25,314 588,044 0.02%Dine Brands Global, Inc. 6,585 587,711 0.02%Stewart Information Services Corp. 10,363 587,478 0.02%
XPEL, Inc. 6,992 586,419 0.02%Enterprise Financial Services Corp. 12,614 585,163 0.02%
iStar, Inc. REIT 28,142 583,384 0.02%Sangamo Therapeutics, Inc. 48,671 582,592 0.02%Tennant Co. 7,291 582,186 0.02%Gevo, Inc. 79,897 580,851 0.02%GoPro, Inc. Class A 49,612 577,980 0.02%James River Group Holdings Ltd. 15,400 577,808 0.02%
RadNet, Inc. 17,130 577,110 0.02%Madison Square Garden Entertainment Corp. 6,862 576,202 0.02%
Butterfly Network, Inc. 39,790 576,159 0.02%Encore Capital Group, Inc. 12,121 574,414 0.02%Lions Gate Entertainment Corp. Class A 27,734 574,094 0.02%
Delek US Holdings, Inc. 26,452 571,892 0.02%Heron Therapeutics, Inc. 36,834 571,664 0.02%Super Micro Computer, Inc. 16,107 566,644 0.02%Kosmos Energy Ltd. 163,692 566,374 0.02%Castle Biosciences, Inc. 7,720 566,108 0.02%Houghton Mifflin Harcourt Co. 51,090 564,034 0.02%
Addus HomeCare Corp. 6,450 562,698 0.02%AZZ, Inc. 10,863 562,486 0.02%Astec Industries, Inc. 8,934 562,306 0.02%Senseonics Holdings, Inc. 146,357 562,011 0.02%Cal-Maine Foods, Inc. 15,492 560,965 0.02%Redwood Trust, Inc. REIT 46,468 560,869 0.02%eHealth, Inc. 9,585 559,764 0.02%First Commonwealth Financial Corp. 39,777 559,662 0.02%
JetBlue Airways Corp. 33,298 558,740 0.02%AAR Corp. 14,337 555,559 0.02%Extreme Networks, Inc. 49,702 554,674 0.02%Celldex Therapeutics, Inc. 16,544 553,231 0.02%Prothena Corp. plc 10,752 552,760 0.02%TriMas Corp. 18,211 552,340 0.02%Alexander & Baldwin, Inc. REIT 30,133 552,037 0.02%
FARO Technologies, Inc. 7,095 551,778 0.02%Mesa Laboratories, Inc. 2,034 551,560 0.02%American Woodmark Corp. 6,741 550,672 0.02%Vocera Communications, Inc. 13,778 549,053 0.02%
Stride, Inc. 17,072 548,523 0.02%Zymeworks, Inc. 15,750 546,368 0.02%Liberty Oilfield Services, Inc. Class A 38,579 546,279 0.02%
Broadmark Realty Capital, Inc. REIT 51,551 545,925 0.02%
TriCo Bancshares 12,786 544,428 0.02%Brightsphere Investment Group, Inc. 23,145 542,287 0.02%
SolarWinds Corp. 32,089 541,983 0.02%Axcelis Technologies, Inc. 13,388 541,143 0.02%ImmunoGen, Inc. 82,090 540,973 0.02%Fulgent Genetics, Inc. 5,862 540,652 0.02%Schnitzer Steel Industries, Inc. Class A 10,976 538,373 0.02%
.Number of
SharesFair Value
US Dollars ($)% of Total
Net AssetsUSANA Health Sciences, Inc. 5,222 534,889 0.02%
Children's Place, Inc. 5,745 534,630 0.02%Universal Corp. 9,371 533,866 0.02%Utz Brands, Inc. 24,467 533,136 0.02%Conduent, Inc. 71,021 532,657 0.02%Avid Technology, Inc. 13,574 531,422 0.02%StepStone Group, Inc. Class A 15,412 530,173 0.02%
Stock Yards Bancorp, Inc. 10,415 530,019 0.02%ACM Research, Inc. Class A 5,166 528,069 0.02%nLight, Inc. 14,527 527,040 0.02%Steelcase, Inc. Class A 34,840 526,432 0.02%Evo Payments, Inc. Class A 18,975 526,366 0.02%FB Financial Corp. 14,097 526,100 0.02%TTM Technologies, Inc. 36,722 525,125 0.01%Codexis, Inc. 23,123 523,967 0.01%Safehold, Inc. REIT 6,669 523,517 0.01%Certara, Inc. 18,478 523,482 0.01%Inogen, Inc. 8,024 522,924 0.01%Globalstar, Inc. 293,093 521,706 0.01%Enova International, Inc. 15,246 521,566 0.01%Employers Holdings, Inc. 12,168 520,790 0.01%Driven Brands Holdings, Inc. 16,787 519,054 0.01%MannKind Corp. 95,020 517,859 0.01%CoreCivic, Inc. 49,447 517,710 0.01%Boston Private Financial Holdings, Inc. 35,005 516,324 0.01%
NV5 Global, Inc. 5,456 515,647 0.01%Veeco Instruments, Inc. 21,443 515,490 0.01%Multiplan Corp. 54,094 514,975 0.01%Schweitzer-Mauduit International, Inc. 12,734 514,199 0.01%
Lordstown Motors Corp. Class A 46,195 510,917 0.01%
ProAssurance Corp. 22,447 510,669 0.01%Desktop Metal, Inc. Class A 44,328 509,772 0.01%Translate Bio, Inc. 18,500 509,490 0.01%Petco Health & Wellness Co., Inc. Class A 22,705 508,819 0.01%
Kforce, Inc. 8,084 508,726 0.01%elf Beauty, Inc. 18,665 506,568 0.01%Tellurian, Inc. 108,917 506,464 0.01%California Resources Corp. 16,760 505,146 0.01%First Busey Corp. 20,483 505,111 0.01%Relay Therapeutics, Inc. 13,794 504,722 0.01%Nelnet, Inc. Class A 6,696 503,740 0.01%Tompkins Financial Corp. 6,460 501,038 0.01%Montrose Environmental Group, Inc. 9,306 499,360 0.01%
American Axle & Manufacturing Holdings, Inc. 48,239 499,274 0.01%
Columbus McKinnon Corp. 10,338 498,705 0.01%Vanda Pharmaceuticals, Inc. 23,172 498,430 0.01%Kura Oncology, Inc. 23,872 497,731 0.01%Customers Bancorp, Inc. 12,763 497,629 0.01%Southside Bancshares, Inc. 12,993 496,722 0.01%BellRing Brands, Inc. Class A 15,800 495,172 0.01%
Shyft Group, Inc. 13,231 494,972 0.01%Kaman Corp. 9,815 494,676 0.01%CorVel Corp. 3,681 494,358 0.01%American National Group, Inc. 3,326 494,077 0.01%
Centennial Resource Development, Inc. Class A 72,867 494,038 0.01%
OceanFirst Financial Corp. 23,705 494,012 0.01%Mack-Cali Realty Corp. REIT 28,790 493,749 0.01%REGENXBIO, Inc. 12,652 491,530 0.01%City Holding Co. 6,499 488,985 0.01%Atara Biotherapeutics, Inc. 31,439 488,876 0.01%Agilysys, Inc. 8,594 488,741 0.01%

175
Vanguard Global Small-Cap Index Fund
.Number of
SharesFair Value
US Dollars ($)% of Total
Net AssetsMacroGenics, Inc. 18,091 485,924 0.01%NETGEAR, Inc. 12,679 485,859 0.01%Bancorp, Inc. 21,089 485,258 0.01%Standex International Corp. 5,109 484,895 0.01%First Bancorp/Southern Pines NC 11,852 484,865 0.01%
US Concrete, Inc. 6,551 483,464 0.01%S&T Bancorp, Inc. 15,395 481,864 0.01%Safety Insurance Group, Inc. 6,150 481,422 0.01%Viper Energy Partners LP 25,546 481,031 0.01%Jamf Holding Corp. 14,276 479,245 0.01%OFG Bancorp 21,635 478,566 0.01%Arcus Biosciences, Inc. 17,406 477,969 0.01%National Bank Holdings Corp. Class A 12,658 477,713 0.01%
Getty Realty Corp. REIT 15,331 477,561 0.01%Tupperware Brands Corp. 20,106 477,518 0.01%NexPoint Residential Trust, Inc. REIT 8,660 476,127 0.01%
Joint Corp. 5,663 475,239 0.01%Matthews International Corp. Class A 13,213 475,139 0.01%
Orion Engineered Carbons SA 25,015 475,035 0.01%
BioLife Solutions, Inc. 10,649 473,987 0.01%Knoll, Inc. 18,221 473,564 0.01%Griffon Corp. 18,452 472,925 0.01%H&E Equipment Services, Inc. 14,162 471,170 0.01%
Model N, Inc. 13,725 470,356 0.01%National Beverage Corp. 9,957 470,269 0.01%Endo International plc 100,340 469,591 0.01%Ladder Capital Corp. REIT Class A 40,512 467,508 0.01%
Schneider National, Inc. Class B 21,458 467,141 0.01%
Inter Parfums, Inc. 6,483 466,776 0.01%BJ's Restaurants, Inc. 9,488 466,240 0.01%BancFirst Corp. 7,468 466,227 0.01%CEVA, Inc. 9,854 466,094 0.01%Alector, Inc. 22,330 465,134 0.01%McAfee Corp. Class A 16,538 463,395 0.01%Invesco Mortgage Capital, Inc. REIT 118,297 461,358 0.01%
Dillard's, Inc. Class A 2,541 459,616 0.01%TFS Financial Corp. 22,594 458,658 0.01%Selectquote, Inc. 23,751 457,444 0.01%Seaboard Corp. 118 456,510 0.01%Apogee Enterprises, Inc. 11,160 454,547 0.01%Tabula Rasa HealthCare, Inc. 9,077 453,850 0.01%Pilgrim's Pride Corp. 20,443 453,426 0.01%CryoLife, Inc. 15,903 451,645 0.01%B. Riley Financial, Inc. 5,970 450,735 0.01%Cytokinetics, Inc. 22,735 449,926 0.01%Denny's Corp. 27,232 449,056 0.01%Chefs' Warehouse, Inc. 14,107 449,026 0.01%Designer Brands, Inc. Class A 27,098 448,472 0.01%
Brookline Bancorp, Inc. 29,985 448,276 0.01%uniQure NV 14,540 447,832 0.01%Community Healthcare Trust, Inc. REIT 9,431 447,595 0.01%
WideOpenWest, Inc. 21,601 447,357 0.01%Pennant Group, Inc. 10,923 446,751 0.01%Groupon, Inc. Class A 10,343 446,404 0.01%CTS Corp. 12,011 446,329 0.01%Nuvation Bio, Inc. 47,918 446,117 0.01%Aaron's Co., Inc. 13,944 446,069 0.01%Freedom Holding Corp. 6,826 444,714 0.01%US Ecology, Inc. 11,832 443,937 0.01%Premier Financial Corp. 15,530 441,207 0.01%AngioDynamics, Inc. 16,241 440,618 0.01%
.Number of
SharesFair Value
US Dollars ($)% of Total
Net AssetsePlus, Inc. 5,077 440,125 0.01%Calavo Growers, Inc. 6,935 439,818 0.01%Ping Identity Holding Corp. 19,187 439,382 0.01%Lovesac Co. 5,502 439,005 0.01%Hyliion Holdings Corp. 37,614 438,203 0.01%IMAX Corp. 20,335 437,202 0.01%NOW, Inc. 46,043 436,948 0.01%Marten Transport Ltd. 26,482 436,688 0.01%Bonanza Creek Energy, Inc. 9,254 435,586 0.01%Benchmark Electronics, Inc. 15,298 435,381 0.01%QAD, Inc. Class A 5,000 435,100 0.01%BRP Group, Inc. Class A 16,317 434,848 0.01%Triumph Group, Inc. 20,947 434,650 0.01%DMC Global, Inc. 7,714 433,604 0.01%Fresh Del Monte Produce, Inc. 13,186 433,556 0.01%
LeMaitre Vascular, Inc. 7,101 433,303 0.01%Eventbrite, Inc. Class A 22,783 432,877 0.01%Ideanomics, Inc. 152,394 432,799 0.01%Gates Industrial Corp. plc 23,917 432,180 0.01%Sonic Automotive, Inc. Class A 9,654 431,920 0.01%
Dime Community Bancshares, Inc. 12,828 431,277 0.01%
AMERISAFE, Inc. 7,221 431,021 0.01%Scholastic Corp. 11,363 430,544 0.01%Cerus Corp. 72,758 430,000 0.01%MarineMax, Inc. 8,819 429,838 0.01%EW Scripps Co. Class A 21,062 429,454 0.01%Tenneco, Inc. Class A 22,217 429,232 0.01%Dynavax Technologies Corp. 43,505 428,524 0.01%Archrock, Inc. 47,920 426,967 0.01%Tactile Systems Technology, Inc. 8,207 426,764 0.01%
Centerspace REIT 5,405 426,454 0.01%Upland Software, Inc. 10,354 426,274 0.01%Varex Imaging Corp. 15,890 426,170 0.01%RPT Realty REIT 32,812 425,900 0.01%Canoo, Inc. 42,835 425,780 0.01%EchoStar Corp. Class A 17,430 423,375 0.01%ADTRAN, Inc. 20,490 423,118 0.01%Viad Corp. 8,483 422,878 0.01%Generation Bio Co. 15,640 420,716 0.01%Meridian Bancorp, Inc. 20,528 420,003 0.01%Huron Consulting Group, Inc. 8,515 418,512 0.01%
StoneX Group, Inc. 6,885 417,713 0.01%Guess?, Inc. 15,794 416,962 0.01%Zentalis Pharmaceuticals, Inc. 7,827 416,396 0.01%
Parsons Corp. 10,544 415,012 0.01%TrueBlue, Inc. 14,695 413,076 0.01%Caleres, Inc. 15,105 412,215 0.01%Andersons, Inc. 13,491 411,880 0.01%Apartment Investment & Management Co. REIT Class A 61,374 411,820 0.01%
Diversified Healthcare Trust REIT 98,372 411,195 0.01%
Signify Health, Inc. Class A 13,486 410,379 0.01%Zumiez, Inc. 8,328 407,989 0.01%Diebold Nixdorf, Inc. 31,735 407,477 0.01%Alphatec Holdings, Inc. 26,533 406,486 0.01%Donnelley Financial Solutions, Inc. 12,316 406,428 0.01%
Preferred Bank 6,421 406,257 0.01%Hanger, Inc. 16,062 406,047 0.01%Genesco, Inc. 6,341 403,795 0.01%Kearny Financial Corp. 33,744 403,241 0.01%Velodyne Lidar, Inc. 37,869 402,926 0.01%Cowen, Inc. Class A 9,763 400,771 0.01%

176
Vanguard Global Small-Cap Index Fund
.Number of
SharesFair Value
US Dollars ($)% of Total
Net AssetsMagnaChip Semiconductor Corp. 16,742 399,464 0.01%
MGP Ingredients, Inc. 5,902 399,211 0.01%QuinStreet, Inc. 21,459 398,708 0.01%Impinj, Inc. 7,705 397,501 0.01%Ready Capital Corp. REIT 24,994 396,655 0.01%Cornerstone Building Brands, Inc. 21,717 394,815 0.01%
Brigham Minerals, Inc. Class A 18,479 393,418 0.01%
Weis Markets, Inc. 7,572 391,170 0.01%Morphic Holding, Inc. 6,782 389,219 0.01%Atrion Corp. 625 388,081 0.01%America's Car-Mart, Inc. 2,732 387,179 0.01%Simulations Plus, Inc. 7,041 386,621 0.01%Zogenix, Inc. 22,346 386,139 0.01%CAI International, Inc. 6,893 386,008 0.01%ConnectOne Bancorp, Inc. 14,698 384,647 0.01%Douglas Dynamics, Inc. 9,433 383,829 0.01%Liberty Media Corp.-Liberty Braves Class C 13,807 383,420 0.01%
Kraton Corp. 11,854 382,766 0.01%Ebix, Inc. 11,288 382,663 0.01%Columbia Financial, Inc. 22,195 382,198 0.01%GCP Applied Technologies, Inc. 16,402 381,511 0.01%
Dril-Quip, Inc. 11,257 380,824 0.01%Tivity Health, Inc. 14,454 380,285 0.01%Clearway Energy, Inc. Class A 15,077 380,242 0.01%
German American Bancorp, Inc. 10,216 380,035 0.01%
Manitowoc Co., Inc. 15,508 379,946 0.01%GEO Group, Inc. REIT 53,347 379,831 0.01%Krystal Biotech, Inc. 5,579 379,372 0.01%Northern Oil & Gas, Inc. 18,180 377,599 0.01%Cars.com, Inc. 26,349 377,581 0.01%UMH Properties, Inc. REIT 17,287 377,202 0.01%Origin Bancorp, Inc. 8,877 376,917 0.01%Arch Resources, Inc. 6,574 374,587 0.01%Veritiv Corp. 6,096 374,416 0.01%Great Lakes Dredge & Dock Corp. 25,548 373,256 0.01%
Natus Medical, Inc. 14,326 372,189 0.01%SMART Global Holdings, Inc. 7,796 371,713 0.01%
Corsair Gaming, Inc. 11,157 371,417 0.01%Heritage Financial Corp. 14,824 370,896 0.01%Extraction Oil & Gas, Inc. 6,737 369,929 0.01%American Finance Trust, Inc. REIT 43,616 369,864 0.01%
OptimizeRx Corp. 5,970 369,543 0.01%National HealthCare Corp. 5,285 369,422 0.01%Kirby Corp. 6,071 368,145 0.01%Global Medical, Inc. REIT 24,868 367,052 0.01%SiriusPoint Ltd. 36,446 367,011 0.01%Lakeland Bancorp, Inc. 20,892 365,192 0.01%Madrigal Pharmaceuticals, Inc. 3,742 364,508 0.01%
HomeStreet, Inc. 8,947 364,501 0.01%Cortexyme, Inc. 6,841 362,573 0.01%Interface, Inc. Class A 23,694 362,518 0.01%AdvanSix, Inc. 12,136 362,381 0.01%Harmonic, Inc. 42,520 362,270 0.01%NextGen Healthcare, Inc. 21,832 362,193 0.01%MiMedx Group, Inc. 28,949 362,152 0.01%Summit Hotel Properties, Inc. REIT 38,811 362,107 0.01%
Angi, Inc. Class A 26,743 361,565 0.01%Photronics, Inc. 27,319 360,884 0.01%NETSTREIT Corp. REIT 15,642 360,705 0.01%Monarch Casino & Resort, Inc. 5,450 360,627 0.01%
.Number of
SharesFair Value
US Dollars ($)% of Total
Net AssetsPerdoceo Education Corp. 29,377 360,456 0.01%Agenus, Inc. 65,302 358,508 0.01%Heidrick & Struggles International, Inc. 8,024 357,469 0.01%
SmileDirectClub, Inc. Class A 41,153 357,208 0.01%
Wabash National Corp. 22,310 356,960 0.01%Standard Motor Products, Inc. 8,217 356,207 0.01%
Ocular Therapeutix, Inc. 25,092 355,805 0.01%Mitek Systems, Inc. 18,413 354,634 0.01%Innoviva, Inc. 26,424 354,346 0.01%Washington Trust Bancorp, Inc. 6,897 354,161 0.01%
Coherus Biosciences, Inc. 25,537 353,177 0.01%Universal Health Realty Income Trust REIT 5,738 353,174 0.01%
Warrior Met Coal, Inc. 20,525 353,030 0.01%Quotient Technology, Inc. 32,647 352,914 0.01%Gladstone Commercial Corp. REIT 15,626 352,523 0.01%
Bryn Mawr Bank Corp. 8,328 351,358 0.01%ACCO Brands Corp. 40,691 351,163 0.01%Y-mAbs Therapeutics, Inc. 10,377 350,743 0.01%Ranpak Holdings Corp. Class A 13,949 349,143 0.01%
Playa Hotels & Resorts NV 46,984 349,091 0.01%Pulmonx Corp. 7,877 347,533 0.01%Allegiant Travel Co. 1,791 347,454 0.01%E2open Parent Holdings, Inc. 30,399 347,157 0.01%
First Foundation, Inc. 15,391 346,451 0.01%US Silica Holdings, Inc. 29,947 346,187 0.01%AppHarvest, Inc. 21,540 344,640 0.01%OrthoPediatrics Corp. 5,440 343,699 0.01%Marcus & Millichap, Inc. 8,838 343,533 0.01%Axogen, Inc. 15,882 343,210 0.01%Blucora, Inc. 19,759 342,028 0.01%ORBCOMM, Inc. 30,413 341,842 0.01%Franchise Group, Inc. 9,692 341,837 0.01%Rubius Therapeutics, Inc. 13,981 341,276 0.01%Enanta Pharmaceuticals, Inc. 7,746 340,901 0.01%
Spirit Airlines, Inc. 11,185 340,471 0.01%PetIQ, Inc. Class A 8,815 340,259 0.01%Neenah, Inc. 6,776 339,952 0.01%Rite Aid Corp. 20,846 339,790 0.01%Construction Partners, Inc. Class A 10,807 339,340 0.01%
ViewRay, Inc. 51,301 338,587 0.01%Federal Agricultural Mortgage Corp. Class C 3,414 337,645 0.01%
Radius Global Infrastructure, Inc. Class A 23,284 337,618 0.01%
Modine Manufacturing Co. 20,346 337,540 0.01%Meridian Bioscience, Inc. 15,188 336,870 0.01%Constellation Pharmaceuticals, Inc. 9,948 336,242 0.01%
Echo Global Logistics, Inc. 10,918 335,619 0.01%Banc of California, Inc. 19,096 334,944 0.01%Omeros Corp. 22,535 334,419 0.01%Vaxart, Inc. 44,630 334,279 0.01%Kelly Services, Inc. Class A 13,876 332,608 0.01%OraSure Technologies, Inc. 32,685 331,426 0.01%Mersana Therapeutics, Inc. 24,396 331,298 0.01%1-800-Flowers.com, Inc. Class A 10,369 330,460 0.01%
Quanex Building Products Corp. 13,300 330,372 0.01%
Heartland Express, Inc. 19,182 328,588 0.01%Myovant Sciences Ltd. 14,406 328,025 0.01%Golden Entertainment, Inc. 7,301 327,085 0.01%TransMedics Group, Inc. 9,854 326,956 0.01%

177
Vanguard Global Small-Cap Index Fund
.Number of
SharesFair Value
US Dollars ($)% of Total
Net AssetsClear Channel Outdoor Holdings, Inc. Class A 123,204 325,259 0.01%
Granite Point Mortgage Trust, Inc. REIT 21,987 324,308 0.01%
Unitil Corp. 6,101 323,170 0.01%Vivint Smart Home, Inc. 24,415 322,278 0.01%Rackspace Technology, Inc. 16,417 321,937 0.01%Cerevel Therapeutics Holdings, Inc. 12,529 320,993 0.01%
Hims & Hers Health, Inc. 29,420 320,384 0.01%Univest Financial Corp. 12,137 320,053 0.01%ARMOUR Residential, Inc. REIT 27,918 318,824 0.01%
Ruth's Hospitality Group, Inc. 13,843 318,804 0.01%
Stoneridge, Inc. 10,760 317,420 0.01%Green Brick Partners, Inc. 13,902 316,131 0.01%UWM Holdings Corp. 37,274 314,965 0.01%MRC Global, Inc. 33,465 314,571 0.01%Travere Therapeutics, Inc. 21,553 314,458 0.01%Sportsman's Warehouse Holdings, Inc. 17,695 314,440 0.01%
Tucows, Inc. Class A 3,897 313,007 0.01%Gorman-Rupp Co. 9,087 312,956 0.01%Energy Recovery, Inc. 13,726 312,678 0.01%BrightSpire Capital, Inc. REIT 33,223 312,296 0.01%
Collegium Pharmaceutical, Inc. 13,175 311,457 0.01%
Paya Holdings, Inc. 28,244 311,249 0.01%HealthStream, Inc. 11,134 311,084 0.01%Citi Trends, Inc. 3,560 309,720 0.01%Tattooed Chef, Inc. 14,396 308,794 0.01%HarborOne Bancorp, Inc. 21,521 308,611 0.01%NexTier Oilfield Solutions, Inc. 64,807 308,481 0.01%
OneSpan, Inc. 12,074 308,370 0.01%Sterling Construction Co., Inc. 12,732 307,223 0.01%
Johnson Outdoors, Inc. Class A 2,536 306,856 0.01%
Amphastar Pharmaceuticals, Inc. 15,220 306,835 0.01%
Personalis, Inc. 12,035 304,486 0.01%1st Source Corp. 6,543 303,988 0.01%Argan, Inc. 6,358 303,849 0.01%First Bancshares, Inc. 8,116 303,782 0.01%SI-BONE, Inc. 9,633 303,151 0.01%BTRS Holdings, Inc. 23,993 302,792 0.01%Nabors Industries Ltd. 2,648 302,508 0.01%Orthofix Medical, Inc. 7,541 302,470 0.01%Piedmont Lithium, Inc. 3,869 302,401 0.01%Zomedica Corp. 362,151 301,563 0.01%Surmodics, Inc. 5,548 300,979 0.01%Vuzix Corp. 16,324 299,545 0.01%WisdomTree Investments, Inc. 48,280 299,336 0.01%
QCR Holdings, Inc. 6,190 297,677 0.01%Allegiance Bancshares, Inc. 7,730 297,141 0.01%Ingles Markets, Inc. Class A 5,096 296,944 0.01%A10 Networks, Inc. 26,370 296,926 0.01%Camden National Corp. 6,212 296,685 0.01%ScanSource, Inc. 10,502 295,421 0.01%Theravance Biopharma, Inc. 20,333 295,235 0.01%SP Plus Corp. 9,607 293,878 0.01%Matson, Inc. 4,588 293,632 0.01%Central Pacific Financial Corp. 11,259 293,410 0.01%
Ambac Financial Group, Inc. 18,732 293,343 0.01%Aerie Pharmaceuticals, Inc. 18,294 292,887 0.01%Chuy's Holdings, Inc. 7,852 292,566 0.01%Digi International, Inc. 14,483 291,253 0.01%CarParts.com, Inc. 14,299 291,128 0.01%
.Number of
SharesFair Value
US Dollars ($)% of Total
Net AssetsRomeo Power, Inc. 35,639 290,101 0.01%Gannett Co., Inc. 52,774 289,729 0.01%Rigel Pharmaceuticals, Inc. 66,404 288,193 0.01%Armada Hoffler Properties, Inc. REIT 21,683 288,167 0.01%
DermTech, Inc. 6,928 287,997 0.01%Replimune Group, Inc. 7,481 287,420 0.01%Horizon Bancorp, Inc. 16,481 287,264 0.01%IGM Biosciences, Inc. 3,437 285,958 0.01%Seritage Growth Properties REIT 15,481 284,850 0.01%
Inseego Corp. 28,169 284,225 0.01%John B Sanfilippo & Son, Inc. 3,206 283,955 0.01%
Northfield Bancorp, Inc. 17,260 283,064 0.01%Allovir, Inc. 14,303 282,341 0.01%Chase Corp. 2,744 281,562 0.01%Hydrofarm Holdings Group, Inc. 4,763 281,541 0.01%
Rhythm Pharmaceuticals, Inc. 14,375 281,463 0.01%
Hawkins, Inc. 8,592 281,388 0.01%TPG RE Finance Trust, Inc. REIT 20,850 280,433 0.01%
Arcutis Biotherapeutics, Inc. 10,236 279,340 0.01%BrightView Holdings, Inc. 17,292 278,747 0.01%Carriage Services, Inc. Class A 7,531 278,421 0.01%
Century Aluminum Co. 21,562 277,934 0.01%SpartanNash Co. 14,385 277,774 0.01%Advantage Solutions, Inc. 25,714 277,454 0.01%Antares Pharma, Inc. 63,631 277,431 0.01%Central Garden & Pet Co. 5,235 277,089 0.01%Arcturus Therapeutics Holdings, Inc. 8,165 276,304 0.01%
MetroMile, Inc. 30,164 276,001 0.01%Koppers Holdings, Inc. 8,503 275,072 0.01%ChemoCentryx, Inc. 20,464 274,013 0.01%KKR Real Estate Finance Trust, Inc. REIT 12,641 273,425 0.01%
Helix Energy Solutions Group, Inc. 47,792 272,892 0.01%
CrossFirst Bankshares, Inc. 19,715 271,081 0.01%Radius Health, Inc. 14,858 271,010 0.01%American Software, Inc. Class A 12,327 270,701 0.01%
Peapack-Gladstone Financial Corp. 8,711 270,651 0.01%
Ethan Allen Interiors, Inc. 9,741 268,852 0.01%Haverty Furniture Cos, Inc. 6,287 268,832 0.01%SunCoke Energy, Inc. 37,630 268,678 0.01%Forterra, Inc. 11,420 268,484 0.01%Pactiv Evergreen, Inc. 17,757 267,598 0.01%Ribbon Communications, Inc. 35,118 267,248 0.01%
Heritage Commerce Corp. 23,938 266,430 0.01%Luxfer Holdings plc ADR 11,952 265,932 0.01%Nicolet Bankshares, Inc. 3,773 265,393 0.01%Lands' End, Inc. 6,455 264,978 0.01%National Research Corp. 5,766 264,659 0.01%ProPetro Holding Corp. 28,840 264,174 0.01%Community Trust Bancorp, Inc. 6,528 263,601 0.01%
Great Southern Bancorp, Inc. 4,881 263,086 0.01%
American Well Corp. Class A 20,745 260,972 0.01%
Universal Electronics, Inc. 5,360 259,960 0.01%MediaAlpha, Inc. Class A 6,150 258,915 0.01%Saul Centers, Inc. REIT 5,684 258,338 0.01%Tutor Perini Corp. 18,648 258,275 0.01%Clovis Oncology, Inc. 44,516 258,193 0.01%Turning Point Brands, Inc. 5,638 258,051 0.01%

178
Vanguard Global Small-Cap Index Fund
.Number of
SharesFair Value
US Dollars ($)% of Total
Net AssetsMyers Industries, Inc. 12,284 257,964 0.01%Insteel Industries, Inc. 8,019 257,811 0.01%Dynex Capital, Inc. REIT 13,813 257,751 0.01%Anterix, Inc. 4,284 256,997 0.01%PetMed Express, Inc. 8,066 256,902 0.01%ChannelAdvisor Corp. 10,466 256,522 0.01%Arrow Financial Corp. 7,131 256,359 0.01%ImmunityBio, Inc. 17,918 255,869 0.01%Shoe Carnival, Inc. 3,567 255,362 0.01%Aclaris Therapeutics, Inc. 14,529 255,129 0.01%Mercer International, Inc. 19,958 254,465 0.01%G1 Therapeutics, Inc. 11,598 254,460 0.01%I3 Verticals, Inc. Class A 8,336 251,914 0.01%Cantaloupe, Inc. 21,194 251,361 0.01%Chatham Lodging Trust REIT 19,479 250,695 0.01%First Mid Bancshares, Inc. 6,185 250,554 0.01%Ennis, Inc. 11,617 249,998 0.01%Epizyme, Inc. 30,080 249,965 0.01%Akebia Therapeutics, Inc. 65,901 249,765 0.01%REX Holdings, Inc. Class A 7,492 249,708 0.01%Urstadt Biddle Properties, Inc. REIT Class A 12,881 249,634 0.01%
Cincinnati Bell, Inc. 16,173 249,388 0.01%Alpha & Omega Semiconductor Ltd. 8,178 248,529 0.01%
McEwen Mining, Inc. 180,055 248,476 0.01%PQ Group Holdings, Inc. 16,136 247,849 0.01%Genco Shipping & Trading Ltd. 13,066 246,686 0.01%
Spectrum Pharmaceuticals, Inc. 65,776 246,660 0.01%
City Office, Inc. REIT 19,777 245,828 0.01%Lumber Liquidators Holdings, Inc. 11,640 245,604 0.01%
HCI Group, Inc. 2,458 244,399 0.01%Flushing Financial Corp. 11,378 243,831 0.01%Accel Entertainment, Inc. Class A 20,526 243,644 0.01%
Essa Pharma, Inc. 8,510 243,131 0.01%Glatfelter Corp. 17,325 242,030 0.01%Alexander's, Inc. REIT 901 241,423 0.01%Anika Therapeutics, Inc. 5,573 241,255 0.01%CIRCOR International, Inc. 7,394 241,044 0.01%PDF Solutions, Inc. 13,238 240,667 0.01%Tootsie Roll Industries, Inc. 7,086 240,286 0.01%DXP Enterprises, Inc. 7,188 239,360 0.01%Phibro Animal Health Corp. Class A 8,284 239,242 0.01%
York Water Co. 5,271 238,776 0.01%PC Connection, Inc. 5,157 238,614 0.01%PAE, Inc. 26,782 238,360 0.01%NGM Biopharmaceuticals, Inc. 12,079 238,198 0.01%
Midland States Bancorp, Inc. 9,062 238,059 0.01%
Albireo Pharma, Inc. 6,763 237,922 0.01%Sutro Biopharma, Inc. 12,727 236,595 0.01%RMR Group, Inc. Class A 6,123 236,593 0.01%Syndax Pharmaceuticals, Inc. 13,778 236,568 0.01%
United Fire Group, Inc. 8,498 235,650 0.01%Byline Bancorp, Inc. 10,342 234,039 0.01%Comtech Telecommunications Corp. 9,667 233,555 0.01%
World Acceptance Corp. 1,455 233,149 0.01%TrustCo Bank Corp. NY 6,774 232,890 0.01%Chimerix, Inc. 29,043 232,344 0.01%Rush Street Interactive, Inc. 18,915 231,898 0.01%Boston Omaha Corp. Class A 7,310 231,800 0.01%
MSG Networks, Inc. Class A 15,849 231,078 0.01%
XL Fleet Corp. 27,726 230,958 0.01%
.Number of
SharesFair Value
US Dollars ($)% of Total
Net AssetsIntercept Pharmaceuticals, Inc. 11,558 230,813 0.01%
Precigen, Inc. 35,109 228,911 0.01%Ares Commercial Real Estate Corp. REIT 15,582 228,900 0.01%
ZIOPHARM Oncology, Inc. 86,659 228,780 0.01%Scholar Rock Holding Corp. 7,881 227,761 0.01%Keros Therapeutics, Inc. 5,357 227,512 0.01%Cadiz, Inc. 16,710 227,256 0.01%National Presto Industries, Inc. 2,233 226,984 0.01%
Thermon Group Holdings, Inc. 13,269 226,104 0.01%
CatchMark Timber Trust, Inc. REIT Class A 19,294 225,740 0.01%
Telos Corp. 6,637 225,724 0.01%Forrester Research, Inc. 4,925 225,565 0.01%Winmark Corp. 1,174 225,502 0.01%Humanigen, Inc. 12,952 225,106 0.01%Atlas Air Worldwide Holdings, Inc. 3,301 224,831 0.01%
CVR Energy, Inc. 12,503 224,554 0.01%Franklin Street Properties Corp. REIT 42,683 224,513 0.01%
Triple-S Management Corp. Class B 10,060 224,036 0.01%
Consolidated Communications Holdings, Inc. 25,486 224,022 0.01%
Global Industrial Co. 6,079 223,160 0.01%Ducommun, Inc. 4,085 222,878 0.01%Curis, Inc. 27,535 222,207 0.01%Precision BioSciences, Inc. 17,716 221,804 0.01%VBI Vaccines, Inc. 66,036 221,221 0.01%Eagle Pharmaceuticals, Inc. 5,165 221,062 0.01%Peoples Bancorp, Inc. 7,457 220,876 0.01%Nurix Therapeutics, Inc. 8,285 219,801 0.01%First of Long Island Corp. 10,353 219,794 0.01%TrueCar, Inc. 38,729 218,819 0.01%MBIA, Inc. 19,845 218,295 0.01%National Western Life Group, Inc. Class A 970 217,658 0.01%
Kymera Therapeutics, Inc. 4,466 216,601 0.01%Veritone, Inc. 10,988 216,573 0.01%Vectrus, Inc. 4,538 215,963 0.01%CBTX, Inc. 7,903 215,831 0.01%Comstock Resources, Inc. 32,287 215,354 0.01%Diamond Hill Investment Group, Inc. 1,287 215,328 0.01%
Cara Therapeutics, Inc. 15,062 214,935 0.01%Hyster-Yale Materials Handling, Inc. 2,945 214,926 0.01%
Altabancorp 4,933 213,648 0.01%Amneal Pharmaceuticals, Inc. 41,646 213,228 0.01%
Organogenesis Holdings, Inc. Class A 12,826 213,168 0.01%
Vertex, Inc. Class A 9,704 212,906 0.01%Cass Information Systems, Inc. 5,191 211,533 0.01%
Hovnanian Enterprises, Inc. Class A 1,990 211,517 0.01%
Napco Security Technologies, Inc. 5,815 211,492 0.01%
Entercom Communications Corp. Class A 48,919 210,841 0.01%
PLBY Group, Inc. 5,394 209,773 0.01%Kimball Electronics, Inc. 9,622 209,182 0.01%Bank First Corp. 2,996 209,031 0.01%RAPT Therapeutics, Inc. 6,555 208,383 0.01%Par Pacific Holdings, Inc. 12,376 208,164 0.01%Nautilus, Inc. 12,255 206,497 0.01%Vaxcyte, Inc. 9,171 206,439 0.01%

179
Vanguard Global Small-Cap Index Fund
.Number of
SharesFair Value
US Dollars ($)% of Total
Net AssetsXenon Pharmaceuticals, Inc. 11,063 205,993 0.01%Waterstone Financial, Inc. 10,445 205,349 0.01%Lindblad Expeditions Holdings, Inc. 12,737 203,919 0.01%
Ardelyx, Inc. 26,885 203,788 0.01%REX American Resources Corp. 2,258 203,626 0.01%
Kadmon Holdings, Inc. 52,580 203,485 0.01%Veru, Inc. 25,210 203,445 0.01%American Public Education, Inc. 7,175 203,339 0.01%
Clearwater Paper Corp. 7,014 203,196 0.01%American Vanguard Corp. 11,600 203,116 0.01%Merus NV 9,627 202,841 0.01%Karyopharm Therapeutics, Inc. 19,644 202,726 0.01%
Catalyst Pharmaceuticals, Inc. 35,233 202,590 0.01%
TriState Capital Holdings, Inc. 9,917 202,208 0.01%
Intersect ENT, Inc. 11,818 201,970 0.01%Mercantile Bank Corp. 6,683 201,827 0.01%ShotSpotter, Inc. 4,135 201,664 0.01%Kimball International, Inc. Class B 15,307 201,287 0.01%
Ellington Financial, Inc. REIT 10,493 200,941 0.01%ATN International, Inc. 4,387 199,565 0.01%United States Cellular Corp. 5,487 199,233 0.01%Capstead Mortgage Corp. REIT 32,322 198,457 0.01%
Victory Capital Holdings, Inc. Class A 6,134 198,067 0.01%
Heritage-Crystal Clean, Inc. 6,661 197,698 0.01%Frank's International NV 65,170 197,465 0.01%Movado Group, Inc. 6,245 196,530 0.01%IES Holdings, Inc. 3,823 196,349 0.01%One Liberty Properties, Inc. REIT 6,912 196,232 0.01%
Brightcove, Inc. 13,648 195,849 0.01%Bar Harbor Bankshares 6,813 194,988 0.01%Stoke Therapeutics, Inc. 5,781 194,588 0.01%GAN Ltd. 11,816 194,255 0.01%Viking Therapeutics, Inc. 32,272 193,309 0.01%Dyne Therapeutics, Inc. 9,186 193,273 0.01%GoHealth, Inc. Class A 17,183 192,621 0.01%Harmony Biosciences Holdings, Inc. 6,786 191,569 0.01%
Republic Bancorp, Inc. Class A 4,150 191,440 0.01%
TherapeuticsMD, Inc. 159,075 189,299 0.01%Applied Molecular Transport, Inc. 4,127 188,769 0.01%
Contango Oil & Gas Co. 43,675 188,676 0.01%OneSpaWorld Holdings Ltd. 19,365 187,647 0.01%Independent Bank Corp. (XNGS) 8,642 187,618 0.01%
Akero Therapeutics, Inc. 7,548 187,266 0.01%Barrett Business Services, Inc. 2,577 187,116 0.01%
SkyWest, Inc. 4,343 187,053 0.01%Phathom Pharmaceuticals, Inc. 5,519 186,818 0.01%
Dorian LPG Ltd. 13,219 186,652 0.01%Amerant Bancorp, Inc. Class A 8,704 186,092 0.01%
Willdan Group, Inc. 4,943 186,055 0.01%Eargo, Inc. 4,597 183,466 0.01%NeoPhotonics Corp. 17,890 182,657 0.01%International Seaways, Inc. 9,497 182,152 0.01%Liberty Latin America Ltd. Class A 13,015 180,388 0.01%
Gossamer Bio, Inc. 22,190 180,183 0.01%
.Number of
SharesFair Value
US Dollars ($)% of Total
Net AssetsInternational Money Express, Inc. 12,066 179,180 0.01%
Fluidigm Corp. 29,079 179,127 0.01%Duluth Holdings, Inc. Class B 8,612 177,838 0.00%
Five Point Holdings LLC Class A 21,983 177,623 0.00%
Gogo, Inc. 15,535 176,788 0.00%MidWestOne Financial Group, Inc. 6,133 176,446 0.00%
Watford Holdings Ltd. 5,037 176,245 0.00%Bank of Marin Bancorp 5,524 176,216 0.00%Cambium Networks Corp. 3,624 175,220 0.00%First Community Bankshares, Inc. 5,825 173,876 0.00%
REV Group, Inc. 11,034 173,123 0.00%MeiraGTx Holdings plc 11,098 172,019 0.00%Omega Flex, Inc. 1,168 171,357 0.00%Loral Space & Communications, Inc. 4,409 171,290 0.00%
TCR2 Therapeutics, Inc. 10,435 171,238 0.00%Marcus Corp. 8,052 170,783 0.00%Funko, Inc. Class A 8,021 170,687 0.00%AssetMark Financial Holdings, Inc. 6,806 170,558 0.00%
Flexion Therapeutics, Inc. 20,685 170,238 0.00%Forestar Group, Inc. 8,118 169,747 0.00%Container Store Group, Inc. 12,991 169,403 0.00%Resources Connection, Inc. 11,763 168,917 0.00%EverQuote, Inc. Class A 5,165 168,792 0.00%Shattuck Labs, Inc. 5,821 168,751 0.00%Bioxcel Therapeutics, Inc. 5,799 168,519 0.00%Vishay Precision Group, Inc. 4,929 167,783 0.00%Applied Therapeutics, Inc. 8,064 167,570 0.00%Crinetics Pharmaceuticals, Inc. 8,870 167,199 0.00%
Geron Corp. 118,277 166,771 0.00%Select Energy Services, Inc. Class A 27,378 165,363 0.00%
Forma Therapeutics Holdings, Inc. 6,602 164,324 0.00%
ALX Oncology Holdings, Inc. 2,990 163,493 0.00%
Computer Programs & Systems, Inc. 4,913 163,259 0.00%
C4 Therapeutics, Inc. 4,288 162,258 0.00%Kronos Worldwide, Inc. 11,307 161,916 0.00%Grid Dynamics Holdings, Inc. 10,762 161,753 0.00%
Talos Energy, Inc. 10,274 160,685 0.00%Relmada Therapeutics, Inc. 5,011 160,402 0.00%Esperion Therapeutics, Inc. 7,578 160,275 0.00%AnaptysBio, Inc. 6,174 160,092 0.00%Kronos Bio, Inc. 6,666 159,651 0.00%Immunovant, Inc. 15,081 159,406 0.00%Praxis Precision Medicines, Inc. 8,637 157,884 0.00%
Universal Insurance Holdings, Inc. 11,308 156,955 0.00%
CuriosityStream, Inc. 11,472 156,478 0.00%First Financial Corp. 3,800 155,116 0.00%Benefitfocus, Inc. 10,983 154,860 0.00%RPC, Inc. 31,241 154,643 0.00%PMV Pharmaceuticals, Inc. 4,477 152,934 0.00%FRP Holdings, Inc. 2,745 152,842 0.00%CytomX Therapeutics, Inc. 24,130 152,743 0.00%Alto Ingredients, Inc. 24,794 151,491 0.00%CEL-SCI Corp. 17,433 151,318 0.00%Hackett Group, Inc. 8,389 151,170 0.00%DSP Group, Inc. 10,188 150,782 0.00%Seer, Inc. Class A 4,470 146,527 0.00%CarLotz, Inc. 26,779 146,213 0.00%El Pollo Loco Holdings, Inc. 7,961 145,607 0.00%

180
Vanguard Global Small-Cap Index Fund
.Number of
SharesFair Value
US Dollars ($)% of Total
Net AssetsORIC Pharmaceuticals, Inc. 8,109 143,448 0.00%Taysha Gene Therapies, Inc. 6,720 142,464 0.00%Poshmark, Inc. Class A 2,981 142,313 0.00%Eastman Kodak Co. 17,076 142,072 0.00%Atea Pharmaceuticals, Inc. 6,563 140,973 0.00%Limelight Networks, Inc. 44,483 140,121 0.00%United States Lime & Minerals, Inc. 1,003 139,507 0.00%
Black Diamond Therapeutics, Inc. 11,235 136,955 0.00%
Blue Bird Corp. 5,492 136,531 0.00%Tredegar Corp. 9,883 136,089 0.00%BioAtla, Inc. 3,211 136,082 0.00%Hawaiian Holdings, Inc. 5,523 134,596 0.00%Tejon Ranch Co. 8,752 133,118 0.00%Cullinan Oncology, Inc. 5,141 132,381 0.00%ANI Pharmaceuticals, Inc. 3,761 131,823 0.00%Provention Bio, Inc. 15,603 131,533 0.00%Neoleukin Therapeutics, Inc. 14,177 130,854 0.00%Puma Biotechnology, Inc. 14,241 130,732 0.00%ON24, Inc. 3,673 130,318 0.00%Casa Systems, Inc. 14,677 130,185 0.00%XBiotech, Inc. 7,767 128,622 0.00%Rush Enterprises, Inc. Class B 3,368 128,456 0.00%
Landec Corp. 11,356 127,755 0.00%Avrobio, Inc. 14,361 127,669 0.00%Silverback Therapeutics, Inc. 4,109 126,927 0.00%Vital Farms, Inc. 6,310 125,948 0.00%Avidity Biosciences, Inc. 5,097 125,947 0.00%Quotient Ltd. 34,326 124,947 0.00%Pliant Therapeutics, Inc. 4,280 124,634 0.00%Air Transport Services Group, Inc. 5,362 124,559 0.00%
Star Group LP 11,115 124,488 0.00%Merchants Bancorp 3,168 124,312 0.00%Rekor Systems, Inc. 12,185 123,800 0.00%Nkarta, Inc. 3,903 123,686 0.00%Aligos Therapeutics, Inc. 6,062 123,574 0.00%Durect Corp. 75,750 123,472 0.00%Kiniksa Pharmaceuticals Ltd. Class A 8,800 122,584 0.00%
Vapotherm, Inc. 5,126 121,179 0.00%State Auto Financial Corp. 7,078 121,175 0.00%Independence Holding Co. 2,611 120,942 0.00%Annexon, Inc. 5,332 120,023 0.00%Passage Bio, Inc. 9,016 119,372 0.00%Molecular Templates, Inc. 15,087 117,980 0.00%Repare Therapeutics, Inc. 3,687 114,961 0.00%Amalgamated Financial Corp. 7,296 114,036 0.00%
BioDelivery Sciences International, Inc. 31,837 113,976 0.00%
Capital City Bank Group, Inc. 4,361 112,470 0.00%
Aspira Women's Health, Inc. 19,755 111,023 0.00%Mission Produce, Inc. 5,346 110,716 0.00%Prelude Therapeutics, Inc. 3,690 105,645 0.00%Homology Medicines, Inc. 14,430 104,906 0.00%PubMatic, Inc. Class A 2,685 104,903 0.00%908 Devices, Inc. 2,698 104,548 0.00%Zynex, Inc. 6,702 104,082 0.00%Inhibrx, Inc. 3,773 103,833 0.00%Hemisphere Media Group, Inc. Class A 8,769 103,474 0.00%
IVERIC bio, Inc. 16,348 103,156 0.00%Arko Corp. 11,213 103,047 0.00%eGain Corp. 8,943 102,666 0.00%Lexicon Pharmaceuticals, Inc. 22,287 102,297 0.00%
Frequency Therapeutics, Inc. 10,193 101,522 0.00%
.Number of
SharesFair Value
US Dollars ($)% of Total
Net AssetsAthersys, Inc. 69,845 100,577 0.00%Liberty Media Corp.-Liberty Braves Class A 3,544 100,012 0.00%
Cue Biopharma, Inc. 8,528 99,351 0.00%VirnetX Holding Corp. 23,227 99,179 0.00%Kinnate Biopharma, Inc. 4,188 97,497 0.00%Apria, Inc. 3,463 96,964 0.00%Accelerate Diagnostics, Inc. 11,918 96,059 0.00%Akouos, Inc. 7,550 94,752 0.00%Athenex, Inc. 20,465 94,548 0.00%Century Bancorp, Inc. Class A 817 93,138 0.00%
FutureFuel Corp. 9,501 91,210 0.00%Heritage Insurance Holdings, Inc. 10,528 90,330 0.00%
4D Molecular Therapeutics, Inc. 3,636 87,555 0.00%
Bristow Group, Inc. 3,391 86,844 0.00%Ontrak, Inc. 2,587 84,026 0.00%Atreca, Inc. Class A 9,825 83,709 0.00%Rimini Street, Inc. 13,367 82,341 0.00%Adverum Biotechnologies, Inc. 23,155 81,042 0.00%
SIGA Technologies, Inc. 12,690 79,693 0.00%Village Super Market, Inc. Class A 3,387 79,628 0.00%
Arko Corp. (XTAE) 8,644 78,681 0.00%Aterian, Inc. 5,266 77,042 0.00%Bolt Biotherapeutics, Inc. 4,918 76,032 0.00%Luther Burbank Corp. 5,485 65,052 0.00%Kala Pharmaceuticals, Inc. 12,077 64,008 0.00%Greif, Inc. Class B 1,082 63,838 0.00%Crawford & Co. Class A 7,007 63,553 0.00%Donegal Group, Inc. Class A 4,274 62,272 0.00%BM Technologies, Inc. 1,964 24,432 0.00%Alder Biopharmaceuticals, Inc. 23,851 20,989 0.00%
Nabors Industries Ltd. - Warrants 11/6/2026 1,059 10,590 0.00%
Escrow Spirit Mta Reitacals 14,166 3,791 0.00%Geron Corp. - Warrants 31/12/2025 25,946 1,427 0.00%
Media General, Inc. CVR 15,608 606 0.00%NewStar Financial, Inc. 4,182 383 0.00%Contra Progenics Pharmacals, Inc. 26,029 — 0.00%
ESC Diamond Resorts 6,567 — 0.00%test test 2,059,237,387 59.20%Total Equities 3,456,781,225 99.38%Financial Assets at Fair Value Through Profit or Loss 3,456,781,225 99.38%

181
Vanguard Global Small-Cap Index Fund
testNumber of Contracts
Notional Amount
Unrealised Gain/(Loss)
US Dollars ($)% of Total
Net AssetsFinancial Derivative InstrumentsFutures (0.00%) (2020: 0.01%)SPI 200 Index September 2021 13 AU($)2,345,008 1,852 0.00%Topix Index September 2021 11 ¥214,641,988 (8,217) (0.00%)FTSE 100 Index September 2021 16 £1,123,722 (9,452) (0.00%)Euro Stoxx 50 Index September 2021 32 €1,306,407 (10,254) (0.00%)Russell 2000 E-mini September 2021 136 $15,764,269 (71,229) (0.00%)test test test (97,300) (0.00%)
CurrencyBuy
Amount Currency(Sell)
Amount CounterpartySettlement
Date
Unrealised Gain/(Loss)
US Dollars ($)% of Total
Net AssetsForward Currency Exchange Contracts 0.00% (2020: 0.02%)USD 3,428,799 AUD (4,388,750) State Street Bank & Trust Co. 2/7/2021 133,944 0.00 %USD 5,460,600 EUR (4,494,096) Standard Chartered Bank 2/7/2021 131,050 0.00 %USD 3,953,803 AUD (5,107,461) Standard Chartered Bank 2/7/2021 119,376 0.00 %USD 3,221,330 AUD (4,171,200) Goldman Sachs International 2/7/2021 89,801 0.00 %USD 4,057,698 GBP (2,875,635) State Street Bank & Trust Co. 2/7/2021 85,152 0.00 %USD 3,248,884 EUR (2,664,350) JPMorgan Chase Bank 15/9/2021 84,235 0.00 %USD 3,984,697 EUR (3,293,440) JPMorgan Chase Bank 2/7/2021 79,004 0.00 %USD 2,831,278 JPY (305,840,000) JPMorgan Chase Bank 2/7/2021 75,714 0.00 %USD 4,321,574 JPY (471,840,000) Citibank NA 2/7/2021 70,380 0.00 %USD 3,781,378 JPY (411,915,000) Goldman Sachs International 2/7/2021 70,098 0.00 %USD 3,103,750 EUR (2,555,053) BNP Paribas 15/9/2021 68,921 0.00 %USD 2,253,879 AUD (2,910,000) JPMorgan Chase Bank 15/9/2021 68,491 0.00 %USD 2,510,516 GBP (1,775,000) JPMorgan Chase Bank 15/9/2021 58,025 0.00 %USD 3,162,270 AUD (4,139,400) BNP Paribas 2/7/2021 54,614 0.00 %USD 2,387,494 AUD (3,107,175) Citibank NA 15/9/2021 54,029 0.00 %USD 4,739,713 EUR (3,954,150) Goldman Sachs International 2/7/2021 50,484 0.00 %USD 2,587,660 GBP (1,836,640) Citibank NA 15/9/2021 50,003 0.00 %USD 1,505,726 AUD (1,942,875) Morgan Stanley 2/7/2021 47,112 0.00 %USD 1,890,827 EUR (1,564,290) Morgan Stanley 2/7/2021 35,735 0.00 %USD 2,850,773 JPY (312,240,000) JPMorgan Chase Bank 15/9/2021 35,694 0.00 %USD 4,450,873 JPY (490,500,000) JPMorgan Chase Bank 2/7/2021 31,556 0.00 %USD 2,171,764 JPY (238,066,383) Standard Chartered Bank 2/7/2021 26,829 0.00 %USD 3,025,770 JPY (332,860,000) Citibank NA 15/9/2021 24,786 0.00 %USD 1,201,597 GBP (852,300) Morgan Stanley 2/7/2021 24,187 0.00 %USD 1,748,467 AUD (2,300,000) JPMorgan Chase Bank 2/7/2021 21,741 0.00 %USD 4,484,430 EUR (3,763,200) Toronto-Dominion Bank 2/7/2021 21,649 0.00 %USD 1,396,484 JPY (152,680,000) Morgan Stanley 2/7/2021 20,865 0.00 %USD 1,046,396 JPY (114,090,000) Citibank NA 2/7/2021 18,465 0.00 %USD 965,709 EUR (800,000) Citibank NA 2/7/2021 16,988 0.00 %USD 465,956 AUD (600,000) Citibank NA 2/7/2021 15,506 0.00 %USD 541,395 EUR (444,180) JPMorgan Chase Bank 2/7/2021 14,642 0.00 %USD 546,677 AUD (709,000) JPMorgan Chase Bank 2/7/2021 14,395 0.00 %USD 406,847 AUD (524,775) Toronto-Dominion Bank 2/7/2021 12,872 0.00 %USD 718,608 JPY (78,400,000) State Street Bank & Trust Co. 2/7/2021 12,238 0.00 %USD 1,822,769 GBP (1,311,760) State Street Bank & Trust Co. 2/7/2021 10,638 0.00 %USD 393,571 AUD (510,450) State Street Bank & Trust Co. 2/7/2021 10,350 0.00 %USD 1,815,838 EUR (1,520,145) BNP Paribas 15/9/2021 10,247 0.00 %USD 356,527 JPY (38,540,000) JPMorgan Chase Bank 2/7/2021 9,289 0.00 %USD 1,091,721 AUD (1,441,400) Morgan Stanley 15/9/2021 9,240 0.00 %USD 574,894 EUR (477,240) JPMorgan Chase Bank 2/7/2021 8,935 0.00 %EUR 1,431,525 USD (1,689,459) State Street Bank & Trust Co. 2/7/2021 8,187 0.00 %USD 246,101 EUR (200,850) Morgan Stanley 2/7/2021 7,913 0.00 %USD 1,370,442 GBP (986,650) Morgan Stanley 15/9/2021 7,202 0.00 %EUR 851,840 USD (1,003,673) BNP Paribas 2/7/2021 6,525 0.00 %EUR 1,471,080 USD (1,739,020) JPMorgan Chase Bank 2/7/2021 5,535 0.00 %USD 1,594,390 JPY (176,265,000) Morgan Stanley 15/9/2021 5,228 0.00 %USD 135,462 AUD (174,350) JPMorgan Chase Bank 2/7/2021 4,568 0.00 %USD 191,196 EUR (157,440) JPMorgan Chase Bank 2/7/2021 4,488 0.00 %USD 136,617 AUD (176,150) Morgan Stanley 2/7/2021 4,372 0.00 %USD 764,697 GBP (550,480) Citibank NA 2/7/2021 4,236 0.00 %USD 147,823 EUR (121,080) BNP Paribas 2/7/2021 4,234 0.00 %USD 747,335 EUR (625,639) Citibank NA 15/9/2021 4,217 0.00 %USD 181,912 JPY (19,740,000) JPMorgan Chase Bank 2/7/2021 4,058 0.00 %USD 148,265 EUR (122,100) Citibank NA 2/7/2021 3,466 0.00 %USD 175,541 JPY (19,115,000) Barclays Bank plc 2/7/2021 3,319 0.00 %USD 539,644 EUR (452,280) State Street Bank & Trust Co. 2/7/2021 3,285 0.00 %USD 292,968 GBP (209,700) JPMorgan Chase Bank 15/9/2021 3,228 0.00 %

182
Vanguard Global Small-Cap Index Fund
CurrencyBuy
Amount Currency(Sell)
Amount CounterpartySettlement
Date
Unrealised Gain/(Loss)
US Dollars ($)% of Total
Net AssetsGBP 562,092 USD (773,395) Morgan Stanley 2/7/2021 3,108 0.00 %USD 138,365 AUD (180,325) Citibank NA 2/7/2021 2,986 0.00 %USD 129,194 AUD (168,125) JPMorgan Chase Bank 2/7/2021 2,974 0.00 %USD 391,956 EUR (327,520) JPMorgan Chase Bank 15/9/2021 2,935 0.00 %USD 275,283 AUD (362,650) JPMorgan Chase Bank 15/9/2021 2,935 0.00 %USD 99,720 GBP (70,265) BNP Paribas 2/7/2021 2,652 0.00 %USD 464,525 GBP (334,400) State Street Bank & Trust Co. 2/7/2021 2,568 0.00 %EUR 415,030 USD (489,724) Goldman Sachs International 2/7/2021 2,461 0.00 %GBP 266,000 USD (365,109) Goldman Sachs International 2/7/2021 2,357 0.00 %USD 99,058 GBP (70,085) Morgan Stanley 2/7/2021 2,239 0.00 %USD 99,888 GBP (70,780) Citibank NA 2/7/2021 2,109 0.00 %USD 98,393 GBP (69,835) JPMorgan Chase Bank 2/7/2021 1,919 0.00 %GBP 200,220 USD (274,818) BNP Paribas 2/7/2021 1,776 0.00 %GBP 205,290 USD (281,938) Citibank NA 2/7/2021 1,660 0.00 %USD 194,111 GBP (139,320) JPMorgan Chase Bank 2/7/2021 1,647 0.00 %GBP 669,200 USD (922,860) Citibank NA 2/7/2021 1,607 0.00 %GBP 732,820 USD (1,011,001) JPMorgan Chase Bank 2/7/2021 1,353 0.00 %USD 176,163 JPY (19,405,000) Citibank NA 2/7/2021 1,328 0.00 %USD 314,999 EUR (264,740) JPMorgan Chase Bank 2/7/2021 1,043 0.00 %USD 352,773 JPY (39,060,000) JPMorgan Chase Bank 15/9/2021 618 0.00 %USD 97,600 GBP (70,230) Citibank NA 15/9/2021 564 0.00 %USD 98,225 EUR (82,230) Citibank NA 15/9/2021 554 0.00 %AUD 181,675 USD (135,995) Goldman Sachs International 15/9/2021 442 0.00 %GBP 205,455 USD (283,454) Citibank NA 2/7/2021 371 0.00 %GBP 71,145 USD (98,237) Goldman Sachs International 15/9/2021 63 0.00 %EUR 529,880 USD (629,329) Citibank NA 15/9/2021 50 0.00 %JPY 58,395,000 USD (526,439) Citibank NA 15/9/2021 36 0.00 %EUR 415,030 USD (492,167) BNP Paribas 2/7/2021 18 0.00 %EUR 82,740 USD (98,263) Goldman Sachs International 15/9/2021 14 0.00 %GBP 350,175 USD (483,827) Citibank NA 15/9/2021 5 0.00 %AUD 541,500 USD (406,665) Citibank NA 15/9/2021 (3 ) (0.00 %)EUR 1,284,690 USD (1,523,645) Barclays Bank plc 2/7/2021 (130 ) (0.00 %)USD 184,010 GBP (133,370) JPMorgan Chase Bank 2/7/2021 (234 ) (0.00 %)GBP 275,780 USD (381,224) Citibank NA 2/7/2021 (248 ) (0.00 %)AUD 540,375 USD (406,203) BNP Paribas 15/9/2021 (385 ) (0.00 %)GBP 471,205 USD (651,453) BNP Paribas 2/7/2021 (507 ) (0.00 %)GBP 133,450 USD (185,075) State Street Bank & Trust Co. 2/7/2021 (720 ) (0.00 %)GBP 424,050 USD (586,690) BNP Paribas 15/9/2021 (786 ) (0.00 %)GBP 277,260 USD (383,947) JPMorgan Chase Bank 2/7/2021 (926 ) (0.00 %)EUR 150,880 USD (179,881) Goldman Sachs International 2/7/2021 (952 ) (0.00 %)GBP 133,990 USD (186,229) Goldman Sachs International 2/7/2021 (1,129 ) (0.00 %)JPY 19,625,000 USD (178,148) BNP Paribas 15/9/2021 (1,214 ) (0.00 %)GBP 69,515 USD (97,253) Citibank NA 2/7/2021 (1,222 ) (0.00 %)EUR 151,360 USD (180,789) State Street Bank & Trust Co. 2/7/2021 (1,291 ) (0.00 %)GBP 133,200 USD (185,308) BNP Paribas 2/7/2021 (1,299 ) (0.00 %)EUR 151,600 USD (181,183) Citibank NA 2/7/2021 (1,401 ) (0.00 %)GBP 138,000 USD (192,067) Citibank NA 2/7/2021 (1,426 ) (0.00 %)EUR 152,400 USD (182,240) Goldman Sachs International 2/7/2021 (1,509 ) (0.00 %)EUR 150,320 USD (179,875) BNP Paribas 2/7/2021 (1,610 ) (0.00 %)GBP 617,760 USD (855,103) JPMorgan Chase Bank 2/7/2021 (1,699 ) (0.00 %)EUR 79,120 USD (95,662) JPMorgan Chase Bank 2/7/2021 (1,834 ) (0.00 %)EUR 451,935 USD (538,845) BNP Paribas 15/9/2021 (2,048 ) (0.00 %)GBP 335,425 USD (465,450) JPMorgan Chase Bank 2/7/2021 (2,078 ) (0.00 %)GBP 70,815 USD (100,037) Morgan Stanley 15/9/2021 (2,193 ) (0.00 %)JPY 19,645,000 USD (179,382) JPMorgan Chase Bank 15/9/2021 (2,267 ) (0.00 %)JPY 58,740,000 USD (531,902) BNP Paribas 15/9/2021 (2,317 ) (0.00 %)EUR 469,080 USD (558,658) Citibank NA 2/7/2021 (2,376 ) (0.00 %)JPY 136,010,000 USD (1,228,637) Citibank NA 15/9/2021 (2,405 ) (0.00 %)GBP 70,050 USD (99,188) UBS AG 2/7/2021 (2,417 ) (0.00 %)GBP 70,245 USD (99,830) Citibank NA 2/7/2021 (2,790 ) (0.00 %)JPY 18,810,000 USD (172,339) JPMorgan Chase Bank 2/7/2021 (2,864 ) (0.00 %)GBP 602,280 USD (835,064) Barclays Bank plc 2/7/2021 (3,044 ) (0.00 %)JPY 28,106,383 USD (256,282) State Street Bank & Trust Co. 2/7/2021 (3,049 ) (0.00 %)USD 438,353 GBP (319,597) JPMorgan Chase Bank 2/7/2021 (3,154 ) (0.00 %)JPY 19,360,000 USD (177,605) State Street Bank & Trust Co. 2/7/2021 (3,175 ) (0.00 %)GBP 346,700 USD (482,231) BNP Paribas 2/7/2021 (3,283 ) (0.00 %)JPY 18,760,000 USD (172,338) Citibank NA 2/7/2021 (3,314 ) (0.00 %)AUD 506,175 USD (383,337) Goldman Sachs International 2/7/2021 (3,326 ) (0.00 %)JPY 19,065,000 USD (175,133) BNP Paribas 2/7/2021 (3,361 ) (0.00 %)JPY 19,450,000 USD (178,606) Goldman Sachs International 2/7/2021 (3,365 ) (0.00 %)

183
Vanguard Global Small-Cap Index Fund
CurrencyBuy
Amount Currency(Sell)
Amount CounterpartySettlement
Date
Unrealised Gain/(Loss)
US Dollars ($)% of Total
Net AssetsJPY 19,035,000 USD (174,875) JPMorgan Chase Bank 2/7/2021 (3,374 ) (0.00 %)AUD 546,750 USD (414,002) JPMorgan Chase Bank 15/9/2021 (3,397 ) (0.00 %)JPY 39,450,000 USD (359,074) JPMorgan Chase Bank 15/9/2021 (3,402 ) (0.00 %)JPY 19,620,000 USD (180,222) Citibank NA 2/7/2021 (3,450 ) (0.00 %)JPY 19,075,000 USD (175,466) Barclays Bank plc 2/7/2021 (3,604 ) (0.00 %)JPY 18,840,000 USD (173,393) State Street Bank & Trust Co. 2/7/2021 (3,648 ) (0.00 %)JPY 59,130,000 USD (536,831) JPMorgan Chase Bank 15/9/2021 (3,730 ) (0.00 %)JPY 19,525,000 USD (179,708) Citibank NA 2/7/2021 (3,791 ) (0.00 %)AUD 168,550 USD (130,347) State Street Bank & Trust Co. 2/7/2021 (3,809 ) (0.00 %)AUD 335,850 USD (256,093) Citibank NA 2/7/2021 (3,954 ) (0.00 %)EUR 588,750 USD (702,222) Goldman Sachs International 2/7/2021 (4,023 ) (0.00 %)EUR 530,880 USD (633,636) JPMorgan Chase Bank 2/7/2021 (4,065 ) (0.00 %)AUD 182,600 USD (141,212) Morgan Stanley 15/9/2021 (4,080 ) (0.00 %)GBP 141,640 USD (199,791) BNP Paribas 15/9/2021 (4,089 ) (0.00 %)AUD 168,775 USD (130,830) Goldman Sachs International 2/7/2021 (4,122 ) (0.00 %)JPY 19,185,000 USD (176,990) Citibank NA 2/7/2021 (4,136 ) (0.00 %)AUD 167,300 USD (129,804) BNP Paribas 2/7/2021 (4,204 ) (0.00 %)GBP 140,910 USD (199,013) Goldman Sachs International 2/7/2021 (4,353 ) (0.00 %)AUD 174,825 USD (135,615) Citibank NA 2/7/2021 (4,365 ) (0.00 %)JPY 38,400,000 USD (350,405) Citibank NA 2/7/2021 (4,428 ) (0.00 %)AUD 175,050 USD (135,901) JPMorgan Chase Bank 2/7/2021 (4,482 ) (0.00 %)EUR 536,770 USD (642,102) JPMorgan Chase Bank 15/9/2021 (4,540 ) (0.00 %)AUD 173,200 USD (134,586) JPMorgan Chase Bank 2/7/2021 (4,556 ) (0.00 %)EUR 352,530 USD (422,634) Citibank NA 2/7/2021 (4,568 ) (0.00 %)AUD 175,100 USD (136,035) JPMorgan Chase Bank 2/7/2021 (4,579 ) (0.00 %)JPY 39,040,000 USD (356,507) Citibank NA 2/7/2021 (4,764 ) (0.00 %)JPY 117,240,000 USD (1,061,092) Bank of America 2/7/2021 (4,781 ) (0.00 %)GBP 354,700 USD (494,905) JPMorgan Chase Bank 15/9/2021 (4,821 ) (0.00 %)AUD 169,025 USD (131,792) Citibank NA 2/7/2021 (4,897 ) (0.00 %)EUR 275,940 USD (332,176) State Street Bank & Trust Co. 2/7/2021 (4,939 ) (0.00 %)JPY 19,635,000 USD (181,879) Citibank NA 2/7/2021 (4,971 ) (0.00 %)USD 2,171,624 GBP (1,575,615) Goldman Sachs International 2/7/2021 (5,009 ) (0.00 %)AUD 175,475 USD (136,783) Citibank NA 2/7/2021 (5,045 ) (0.00 %)USD 1,111,136 GBP (808,207) Goldman Sachs International 2/7/2021 (5,362 ) (0.00 %)EUR 163,960 USD (200,165) Morgan Stanley 15/9/2021 (5,417 ) (0.00 %)AUD 178,700 USD (140,000) Citibank NA 2/7/2021 (5,840 ) (0.00 %)AUD 523,050 USD (398,816) Goldman Sachs International 2/7/2021 (6,136 ) (0.00 %)EUR 317,840 USD (383,075) JPMorgan Chase Bank 2/7/2021 (6,149 ) (0.00 %)JPY 38,440,000 USD (352,651) Goldman Sachs International 2/7/2021 (6,314 ) (0.00 %)GBP 208,110 USD (293,863) JPMorgan Chase Bank 2/7/2021 (6,369 ) (0.00 %)AUD 521,925 USD (398,280) Citibank NA 2/7/2021 (6,445 ) (0.00 %)AUD 364,550 USD (281,099) BNP Paribas 15/9/2021 (7,325 ) (0.00 %)EUR 353,790 USD (426,899) JPMorgan Chase Bank 2/7/2021 (7,339 ) (0.00 %)EUR 200,300 USD (244,944) Citibank NA 2/7/2021 (7,409 ) (0.00 %)EUR 288,540 USD (350,288) BNP Paribas 15/9/2021 (7,567 ) (0.00 %)JPY 57,855,000 USD (528,954) JPMorgan Chase Bank 2/7/2021 (7,691 ) (0.00 %)JPY 38,000,000 USD (350,253) Goldman Sachs International 2/7/2021 (7,880 ) (0.00 %)JPY 58,800,000 USD (537,888) Goldman Sachs International 2/7/2021 (8,111 ) (0.00 %)AUD 333,800 USD (258,745) Goldman Sachs International 2/7/2021 (8,145 ) (0.00 %)JPY 39,080,000 USD (360,377) Citibank NA 2/7/2021 (8,273 ) (0.00 %)JPY 37,980,000 USD (350,492) JPMorgan Chase Bank 2/7/2021 (8,299 ) (0.00 %)AUD 355,800 USD (275,449) Citibank NA 2/7/2021 (8,332 ) (0.00 %)GBP 841,500 USD (1,171,056) Citibank NA 15/9/2021 (8,368 ) (0.00 %)AUD 351,550 USD (272,448) Barclays Bank plc 2/7/2021 (8,522 ) (0.00 %)EUR 357,030 USD (431,929) Citibank NA 2/7/2021 (8,527 ) (0.00 %)AUD 357,350 USD (277,002) Citibank NA 2/7/2021 (8,722 ) (0.00 %)AUD 334,000 USD (259,546) State Street Bank & Trust Co. 2/7/2021 (8,795 ) (0.00 %)AUD 350,100 USD (271,928) JPMorgan Chase Bank 2/7/2021 (9,090 ) (0.00 %)AUD 351,700 USD (273,309) Citibank NA 2/7/2021 (9,270 ) (0.00 %)AUD 351,000 USD (272,928) Citibank NA 2/7/2021 (9,414 ) (0.00 %)EUR 1,518,270 USD (1,809,974) Citibank NA 2/7/2021 (9,457 ) (0.00 %)AUD 1,014,900 USD (771,929) BNP Paribas 2/7/2021 (9,993 ) (0.00 %)JPY 56,670,000 USD (520,796) JPMorgan Chase Bank 2/7/2021 (10,210 ) (0.00 %)EUR 280,350 USD (342,728) JPMorgan Chase Bank 2/7/2021 (10,261 ) (0.00 %)EUR 283,010 USD (346,003) Goldman Sachs International 2/7/2021 (10,381 ) (0.00 %)EUR 1,139,040 USD (1,363,440) Citibank NA 15/9/2021 (10,516 ) (0.00 %)EUR 437,360 USD (529,439) JPMorgan Chase Bank 2/7/2021 (10,773 ) (0.00 %)JPY 58,740,000 USD (540,211) Citibank NA 2/7/2021 (10,974 ) (0.00 %)JPY 58,755,000 USD (540,501) BNP Paribas 2/7/2021 (11,129 ) (0.00 %)AUD 529,575 USD (409,193) JPMorgan Chase Bank 2/7/2021 (11,615 ) (0.00 %)

184
Vanguard Global Small-Cap Index Fund
CurrencyBuy
Amount Currency(Sell)
Amount CounterpartySettlement
Date
Unrealised Gain/(Loss)
US Dollars ($)% of Total
Net AssetsAUD 1,255,975 USD (954,988) Citibank NA 15/9/2021 (11,760 ) (0.00 %)JPY 76,520,000 USD (701,824) Goldman Sachs International 2/7/2021 (12,392 ) (0.00 %)GBP 351,175 USD (497,686) JPMorgan Chase Bank 2/7/2021 (12,555 ) (0.00 %)EUR 903,440 USD (1,083,963) Citibank NA 2/7/2021 (12,573 ) (0.00 %)AUD 537,450 USD (417,208) JPMorgan Chase Bank 2/7/2021 (13,717 ) (0.00 %)EUR 472,800 USD (574,713) JPMorgan Chase Bank 2/7/2021 (14,020 ) (0.00 %)GBP 421,590 USD (596,896) JPMorgan Chase Bank 2/7/2021 (14,490 ) (0.00 %)JPY 77,360,000 USD (711,753) JPMorgan Chase Bank 2/7/2021 (14,753 ) (0.00 %)JPY 79,540,000 USD (731,429) JPMorgan Chase Bank 2/7/2021 (14,787 ) (0.00 %)AUD 671,200 USD (520,078) JPMorgan Chase Bank 2/7/2021 (16,174 ) (0.00 %)GBP 491,015 USD (694,612) Citibank NA 2/7/2021 (16,300 ) (0.00 %)AUD 1,561,711 USD (1,188,836) Goldman Sachs International 2/7/2021 (16,381 ) (0.00 %)JPY 158,560,000 USD (1,445,972) Barclays Bank plc 2/7/2021 (17,375 ) (0.00 %)JPY 95,475,000 USD (879,491) Citibank NA 2/7/2021 (19,278 ) (0.00 %)AUD 879,500 USD (680,658) Citibank NA 2/7/2021 (20,373 ) (0.00 %)AUD 1,688,500 USD (1,288,241) State Street Bank & Trust Co. 2/7/2021 (20,599 ) (0.00 %)JPY 159,518,598 USD (1,458,872) Citibank NA 15/9/2021 (20,692 ) (0.00 %)EUR 528,580 USD (647,607) JPMorgan Chase Bank 2/7/2021 (20,764 ) (0.00 %)JPY 175,950,000 USD (1,606,276) Citibank NA 2/7/2021 (20,998 ) (0.00 %)AUD 1,360,600 USD (1,042,593) Barclays Bank plc 2/7/2021 (21,123 ) (0.00 %)AUD 1,543,500 USD (1,180,376) Citibank NA 2/7/2021 (21,593 ) (0.00 %)USD 2,585,242 EUR (2,200,000) JPMorgan Chase Bank 2/7/2021 (23,739 ) (0.00 %)JPY 194,250,000 USD (1,774,772) JPMorgan Chase Bank 2/7/2021 (24,614 ) (0.00 %)AUD 1,059,150 USD (820,536) Citibank NA 2/7/2021 (25,379 ) (0.00 %)JPY 238,066,383 USD (2,172,960) Standard Chartered Bank 15/9/2021 (26,612 ) (0.00 %)JPY 115,260,000 USD (1,067,016) State Street Bank & Trust Co. 2/7/2021 (28,544 ) (0.00 %)USD 5,260,609 GBP (3,828,710) Barclays Bank plc 2/7/2021 (28,563 ) (0.00 %)AUD 882,375 USD (694,270) JPMorgan Chase Bank 2/7/2021 (31,827 ) (0.00 %)AUD 1,419,975 USD (1,100,668) State Street Bank & Trust Co. 15/9/2021 (34,277 ) (0.00 %)AUD 1,580,625 USD (1,221,624) State Street Bank & Trust Co. 2/7/2021 (34,969 ) (0.00 %)EUR 4,711,200 USD (5,627,627) State Street Bank & Trust Co. 2/7/2021 (40,612 ) (0.00 %)AUD 5,385,475 USD (4,108,105) State Street Bank & Trust Co. 2/7/2021 (64,959 ) (0.00 %)JPY 489,750,000 USD (4,487,701) BNP Paribas 2/7/2021 (75,141 ) (0.00 %)GBP 2,875,635 USD (4,057,838) State Street Bank & Trust Co. 15/9/2021 (84,617 ) (0.00 %)EUR 3,023,061 USD (3,685,912) JPMorgan Chase Bank 2/7/2021 (100,863 ) (0.00 %)AUD 5,107,461 USD (3,954,853) Standard Chartered Bank 15/9/2021 (119,188 ) (0.00 %)EUR 4,494,096 USD (5,468,454) Standard Chartered Bank 15/9/2021 (130,478 ) (0.00 %)GBP 4,881,621 USD (6,916,228) JPMorgan Chase Bank 2/7/2021 (172,511 ) (0.00 %)test 2,396 0.00 %Total Financial Derivative Instruments (94,904 ) (0.00 %)
Fair Value US Dollars ($)
% of Total Net Assets
Other Assets and Liabilities 21,564,243 0.62 %Net Assets 3,478,250,564 100.00 %
Analysis of Total Net Assets US Dollars ($)% of Total
Net Assets(a) Transferable securities admitted to an official stock exchange listing 3,398,659,945 97.71 %(b) Transferable securities dealt in on another regulated market 58,060,877 1.67 %(c) Transferable securities other than those admitted to an official stock exchange listing or dealt in on another regulated
market 60,403 0.00 %
(d) Financial derivative instruments (94,904 ) (0.00 %)(e) Other assets and liabilities 21,564,243 0.62 %Total Net Assets 3,478,250,564 100.00 %

The accompanying notes form an integral part of the financial statements.
185
Vanguard Global Small-Cap Index Fund
Statement of Assets and Liabilities
US Dollars ($)
As at 30 June 2021
US Dollars ($)
As at 31 December 2020
Current AssetsFinancial Assets at Fair Value Through Profit or Loss 3,456,781,225 3,042,217,822 Financial Derivative Instruments 1,927,585 2,020,964 Cash 6,551,427 41,639,963 Unrealised Appreciation on Spot Currency Contracts 6,320 32,589 Receivables: Interest and Dividends 4,009,779 3,762,300 Capital Shares Issued 12,486,667 12,173,059 Investments Sold 4,322,315 406,970 Futures Margin Cash 1,062,507 3,516,900 Cash Collateral 100,000 — Other Receivables 7,083 7,083
Total Current Assets 3,487,254,908 3,105,777,650
Current LiabilitiesFinancial Derivative Instruments 2,022,489 1,067,076 Bank Overdraft 1,159 1,945 Payables and Other Liabilities: Investments Purchased 326,602 328,761 Income Distribution Payable 2,152,217 1,989,060 Capital Shares Redeemed 3,691,821 2,607,369 Management Fees Payable 810,056 700,721
Total Current Liabilities 9,004,344 6,694,932
Net Assets Attributable to Holders of Redeemable Participating Shares (“Net Assets”) 3,478,250,564 3,099,082,718
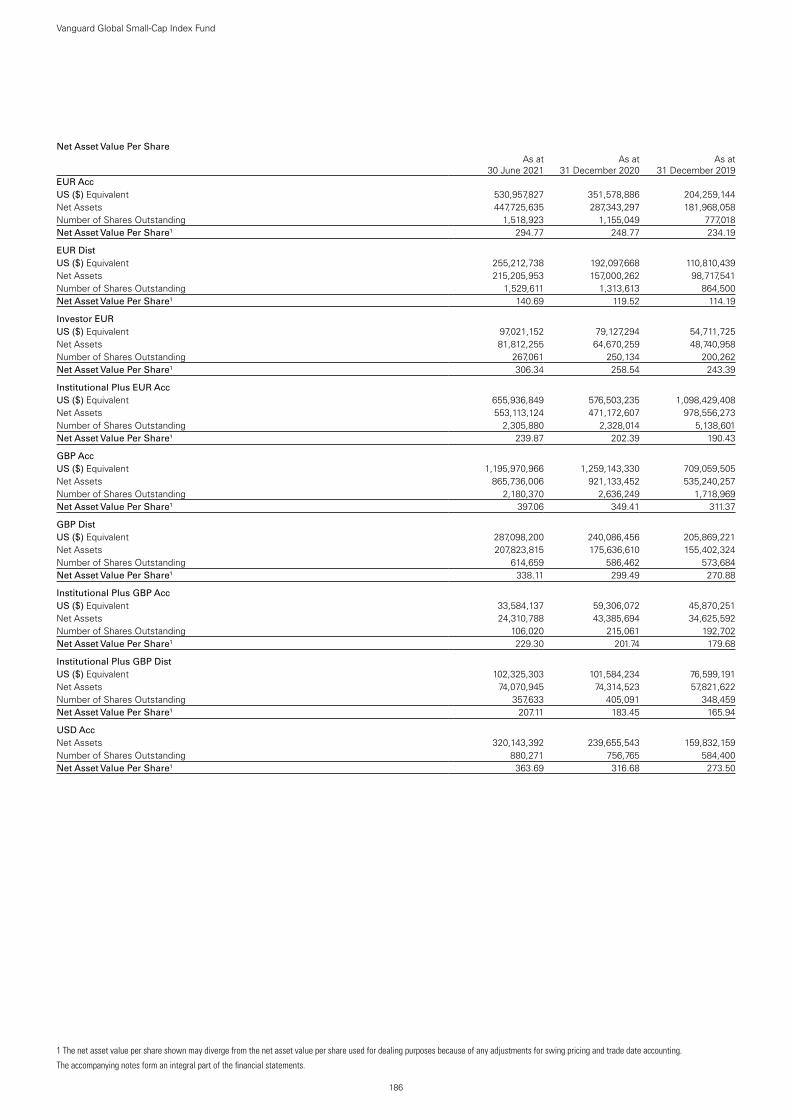
186
Vanguard Global Small-Cap Index Fund
The accompanying notes form an integral part of the financial statements.
Net Asset Value Per Share
.As at
30 June 2021As at
31 December 2020As at
31 December 2019EUR AccUS ($) Equivalent 530,957,827 351,578,886 204,259,144Net Assets 447,725,635 287,343,297 181,968,058Number of Shares Outstanding 1,518,923 1,155,049 777,018Net Asset Value Per Share1 294.77 248.77 234.19
EUR DistUS ($) Equivalent 255,212,738 192,097,668 110,810,439Net Assets 215,205,953 157,000,262 98,717,541Number of Shares Outstanding 1,529,611 1,313,613 864,500Net Asset Value Per Share1 140.69 119.52 114.19
Investor EUR US ($) Equivalent 97,021,152 79,127,294 54,711,725Net Assets 81,812,255 64,670,259 48,740,958Number of Shares Outstanding 267,061 250,134 200,262Net Asset Value Per Share1 306.34 258.54 243.39
Institutional Plus EUR AccUS ($) Equivalent 655,936,849 576,503,235 1,098,429,408Net Assets 553,113,124 471,172,607 978,556,273Number of Shares Outstanding 2,305,880 2,328,014 5,138,601Net Asset Value Per Share1 239.87 202.39 190.43
GBP AccUS ($) Equivalent 1,195,970,966 1,259,143,330 709,059,505Net Assets 865,736,006 921,133,452 535,240,257Number of Shares Outstanding 2,180,370 2,636,249 1,718,969Net Asset Value Per Share1 397.06 349.41 311.37
GBP DistUS ($) Equivalent 287,098,200 240,086,456 205,869,221Net Assets 207,823,815 175,636,610 155,402,324Number of Shares Outstanding 614,659 586,462 573,684Net Asset Value Per Share1 338.11 299.49 270.88
Institutional Plus GBP AccUS ($) Equivalent 33,584,137 59,306,072 45,870,251Net Assets 24,310,788 43,385,694 34,625,592Number of Shares Outstanding 106,020 215,061 192,702Net Asset Value Per Share1 229.30 201.74 179.68
Institutional Plus GBP DistUS ($) Equivalent 102,325,303 101,584,234 76,599,191Net Assets 74,070,945 74,314,523 57,821,622Number of Shares Outstanding 357,633 405,091 348,459Net Asset Value Per Share1 207.11 183.45 165.94
USD AccNet Assets 320,143,392 239,655,543 159,832,159Number of Shares Outstanding 880,271 756,765 584,400Net Asset Value Per Share1 363.69 316.68 273.50
1 The net asset value per share shown may diverge from the net asset value per share used for dealing purposes because of any adjustments for swing pricing and trade date accounting.
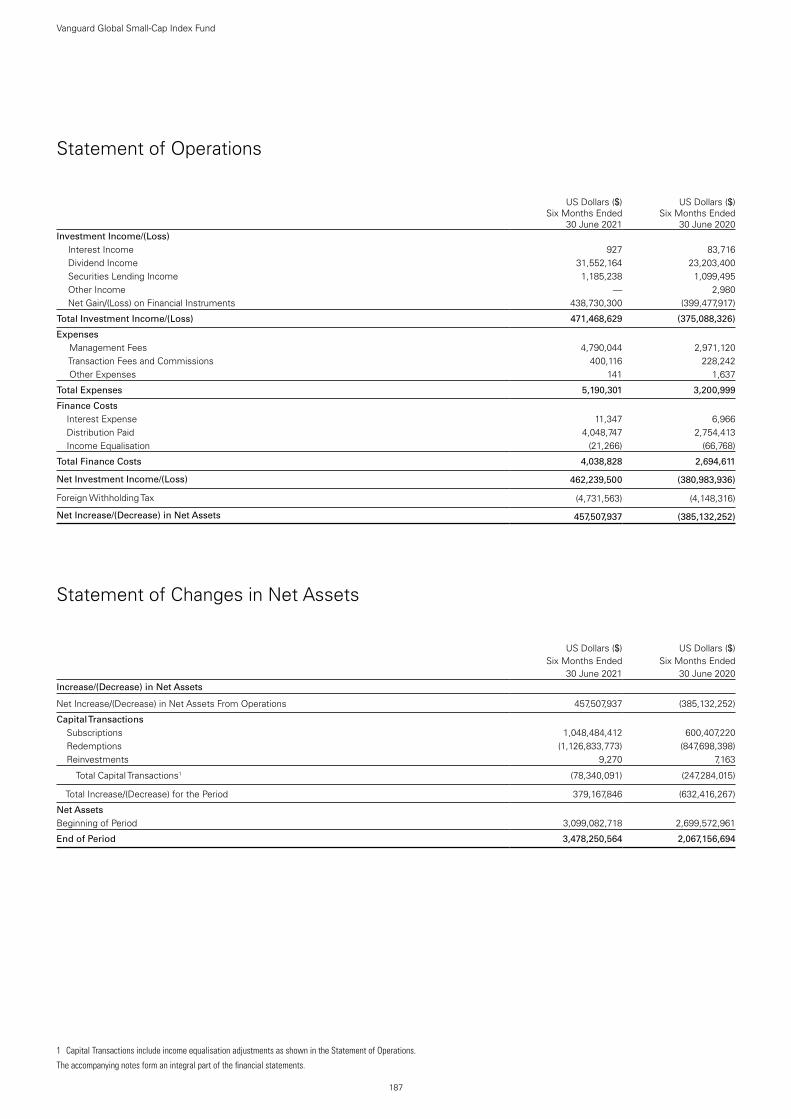
187
Vanguard Global Small-Cap Index Fund
The accompanying notes form an integral part of the financial statements.
Statement of Operations
US Dollars ($)
Six Months Ended 30 June 2021
US Dollars ($)
Six Months Ended 30 June 2020
Investment Income/(Loss) Interest Income 927 83,716 Dividend Income 31,552,164 23,203,400 Securities Lending Income 1,185,238 1,099,495 Other Income — 2,980 Net Gain/(Loss) on Financial Instruments 438,730,300 (399,477,917)
Total Investment Income/(Loss) 471,468,629 (375,088,326)
Expenses Management Fees 4,790,044 2,971,120 Transaction Fees and Commissions 400,116 228,242 Other Expenses 141 1,637
Total Expenses 5,190,301 3,200,999
Finance Costs Interest Expense 11,347 6,966 Distribution Paid 4,048,747 2,754,413 Income Equalisation (21,266) (66,768)
Total Finance Costs 4,038,828 2,694,611
Net Investment Income/(Loss) 462,239,500 (380,983,936)
Foreign Withholding Tax (4,731,563) (4,148,316)
Net Increase/(Decrease) in Net Assets 457,507,937 (385,132,252)
Statement of Changes in Net Assets
US Dollars ($)
US Dollars ($)
Six Months Ended Six Months Ended30 June 2021 30 June 2020
Increase/(Decrease) in Net Assets
Net Increase/(Decrease) in Net Assets From Operations 457,507,937 (385,132,252)
Capital Transactions Subscriptions 1,048,484,412 600,407,220 Redemptions (1,126,833,773) (847,698,398) Reinvestments 9,270 7,163
Total Capital Transactions1 (78,340,091) (247,284,015)
Total Increase/(Decrease) for the Period 379,167,846 (632,416,267)
Net AssetsBeginning of Period 3,099,082,718 2,699,572,961
End of Period 3,478,250,564 2,067,156,694
1 Capital Transactions include income equalisation adjustments as shown in the Statement of Operations.
Vanguard Global Stock Index FundManaged by Vanguard Global Advisers, LLC.
188
Investment ObjectiveThe fund seeks to provide long-term growth of capital by tracking the performance of the MSCI World Index, a market-capitalisation-weighted index of common stocks of companies in developed countries.
Performance SummaryThe Performance Summary does not form part of the Financial Statements.
• As the six months ended 30 June 2021 came to a close, macroeconomic indicators signalled a faster global economic rebound than many had expected after the sharpest contraction in modern history. Yet the recovery has been uneven. Countries that have contained the virus more successfully, whether through vaccinations, lockdowns or both, generally have fared better economically. And the COVID-19 pandemic remained far from over, with new variants of the virus surfacing where vaccination rates have lagged and the human toll continuing to mount, especially in less developed economies.
• Swift and extensive support from governments and central banks has been a key to the rebound. So far in 2021, it has included fiscal stimulus – including the $1.9 trillion American Rescue Plan in the United States and the €673 billion Recovery and Resilience Facility in Europe – and pledges by a number of central banks to keep interest rates low for some time.
• Fixed income prices worldwide generally fell and longer-term yields rose amid concerns about inflation during the half year. Bonds returned about –3% in US dollars, as measured by the Bloomberg Barclays Global Aggregate Bond Index.
• Stock markets continued the rally that began in 2020, bolstered by reopening economies, more consumer spending and rising corporate profits. The FTSE Global All Cap Index returned roughly 13% in US dollars for the half year. Returns in the United States and Europe outpaced those in emerging markets and especially the Pacific region.
• In this environment, the fund’s benchmark index returned 13.05%.
• Results were positive in all of the index’s 11 sectors except utilities. Information technology and financials, the two largest sectors, contributed most to returns.
• By region, US stocks, which accounted for more than half the index, contributed most to results.
Benchmark returns in the commentary above are in US dollars.
Benchmark: MSCI World Index
Total ReturnsPeriods Ended 30 June 2021
(Annualised for periods over one year)
Six Months Five YearsTen Years or
Since Inception1
EUR Acc 16.61 % 13.20 % 12.71 %
Benchmark 16.64 13.34 12.90
Tracking Difference* -0.03
Investor EUR 16.61 % 13.17 % 12.65 %
Benchmark 16.64 13.34 12.90
Tracking Difference* -0.03
Institutional Plus EUR Acc 16.65 % 13.30 % 12.76 %
Benchmark 16.64 13.34 12.80
Tracking Difference* 0.01
EUR Hedged Acc 13.78 % 12.77 % 10.29 %
Benchmark 13.86 12.89 10.49
Tracking Difference* -0.08
Institutional Plus GBP Acc 11.87 % — 12.19 %
Benchmark 11.86 — N/A
Tracking Difference* 0.01
USD Acc 13.02 % 14.69 % 10.47 %
Benchmark 13.05 14.83 10.65
Tracking Difference* -0.03
USD Dist 13.02 % — 13.07 %
Benchmark 13.05 — 13.18
Tracking Difference* -0.03
Investor USD 13.02 % 14.65 % 10.41 %
Benchmark 13.05 14.83 10.65
Tracking Difference* -0.03

189
Vanguard Global Stock Index Fund
Total ReturnsPeriods Ended 30 June 2021
(Annualised for periods over one year)
Six Months Five YearsTen Years or
Since Inception1
Institutional Plus USD Acc 13.06 % 14.79 % 10.64 %
Benchmark 13.05 14.83 10.68
Tracking Difference* 0.01
Institutional Plus USD Dist 13.06 % — 48.10 %
Benchmark 13.05 — 48.14
Tracking Difference* 0.01
Each benchmark is in its respective currency.Sources: Vanguard Global Advisers, LLC, and MSCI.Performance is based on NAV with net income reinvested.
All of the returns in this report represent past performance, which is not a guarantee of future results that may be achieved by the fund. For performance data current to the most recent month-end, which may be higher or lower than that cited, visit our website at http://global.vanguard.com. Note, too, that both investment returns and principal value can fluctuate widely, so an investor's shares, when sold, could be worth more or less than their original cost.* The tracking difference between the fund return and the index return over a stated period of time can be attributed to a number of factors, including, without limitation, small differences in
weightings, trading activity, transaction costs and differences in the valuation and withholding tax treatment between the fund and the index vendor.1 Since-inception returns: Institutional Plus EUR Acc, 6 December 2013; Institutional Plus GBP Acc, 14 December 2017; USD Dist, 8 March 2018; Institutional Plus USD Acc, 19 December 2013;
Institutional Plus USD Dist, 26 March 2020.
Significant Portfolio ChangesFor the Six Months Ended 30 June 2021
190
Vanguard Global Stock Index Fund
The Central Bank of Ireland requires a schedule of material changes in the composition of the portfolio during the period. These are defined as aggregate purchases of a security exceeding 1% of the total value of purchases for the period and aggregate disposals greater than 1% of the total value of sales. At a minimum, the largest 20 purchases and 20 sales must be shown; all purchases and sales must be shown if there are fewer than 20. A full listing of the portfolio changes for the period is available, upon request, at no extra cost from the Administrator.
SharesCost
US Dollars ($)
Purchases
Apple, Inc. 547,410 68,879,352Microsoft Corp. 231,334 54,257,689Amazon.com, Inc. 13,765 43,264,593Facebook, Inc. Class A 77,699 21,766,440Alphabet, Inc. Class C 10,263 21,642,448Tesla, Inc. 28,741 19,839,546Alphabet, Inc. Class A 9,045 18,891,247JPMorgan Chase & Co. 96,936 14,714,713Johnson & Johnson 84,668 13,790,033NVIDIA Corp. 20,434 11,494,622Visa, Inc. Class A 53,071 11,408,117Berkshire Hathaway, Inc. Class B 42,521 11,054,461UnitedHealth Group, Inc. 29,793 10,833,172Walt Disney Co. 58,431 10,767,888Walmart, Inc. 74,745 10,509,560Procter & Gamble Co. 78,334 10,267,744Mastercard, Inc. Class A 28,725 10,080,431Nestle SA 87,023 9,960,347Home Depot, Inc. 33,632 9,719,709Bank of America Corp. 253,790 9,497,618
SharesProceeds
US Dollars ($)
Sales
Apple, Inc. 332,961 41,738,391Microsoft Corp. 115,792 28,500,652Amazon.com, Inc. 6,086 19,529,356Alphabet, Inc. Class C 6,772 15,204,111Facebook, Inc. Class A 37,215 11,563,449Alphabet, Inc. Class A 3,659 8,479,613SoftBank Group Corp. 95,700 7,221,784JPMorgan Chase & Co. 44,506 7,169,336Johnson & Johnson 40,771 6,784,333Tesla, Inc. 11,114 6,747,929Berkshire Hathaway, Inc. Class B 25,037 6,701,265Intel Corp. 107,612 6,333,053NVIDIA Corp. 9,623 5,744,232Procter & Gamble Co. 41,010 5,488,496UnitedHealth Group, Inc. 13,934 5,479,763Mastercard, Inc. Class A 14,923 5,421,340Bank of America Corp. 128,646 5,272,890ASML Holding NV 7,753 4,982,239Visa, Inc. Class A 21,767 4,948,578Nestle SA 39,822 4,792,186

Financial StatementsStatement of Investments30 June 2021
191
Vanguard Global Stock Index Fund
.Number of
SharesFair Value
US Dollars ($)% of Total
Net AssetsEquities 100.05% (2020: 97.69%)Australia 2.13% (2020: 2.15%)Commonwealth Bank of Australia 407,167 30,528,323 0.23%
BHP Group Ltd. 678,294 24,733,262 0.19%CSL Ltd. 105,027 22,486,951 0.17%Westpac Banking Corp. 840,318 16,282,722 0.12%National Australia Bank Ltd. 767,915 15,116,149 0.11%Australia & New Zealand Banking Group Ltd. 649,883 13,734,375 0.10%
Wesfarmers Ltd. 258,908 11,487,573 0.09%Macquarie Group Ltd. 77,928 9,151,850 0.07%Woolworths Group Ltd. 295,820 8,468,172 0.06%Rio Tinto Ltd. 83,790 7,966,332 0.06%Transurban Group 632,775 6,760,044 0.05%Fortescue Metals Group Ltd. 383,390 6,717,953 0.05%
Goodman Group REIT 373,550 5,936,971 0.04%Aristocrat Leisure Ltd. 135,308 4,377,189 0.03%Afterpay Ltd. 49,129 4,358,534 0.03%Coles Group Ltd. 308,722 3,961,001 0.03%Woodside Petroleum Ltd. 221,619 3,695,310 0.03%Newcrest Mining Ltd. 190,236 3,610,481 0.03%James Hardie Industries plc 103,261 3,509,475 0.03%Sonic Healthcare Ltd. 110,623 3,189,128 0.02%Xero Ltd. 28,988 2,983,672 0.02%Brambles Ltd. 335,882 2,884,749 0.02%Cochlear Ltd. 14,343 2,709,984 0.02%ASX Ltd. 45,932 2,679,709 0.02%QBE Insurance Group Ltd. 323,179 2,617,941 0.02%Telstra Corp., Ltd. 925,796 2,613,355 0.02%Suncorp Group Ltd. 311,231 2,595,926 0.02%Amcor plc 228,001 2,589,829 0.02%Scentre Group REIT 1,238,419 2,547,496 0.02%Santos Ltd. 456,228 2,428,418 0.02%South32 Ltd. 1,071,424 2,356,809 0.02%Insurance Australia Group Ltd. 607,524 2,353,469 0.02%
Tabcorp Holdings Ltd. 544,802 2,118,672 0.02%BlueScope Steel Ltd. 123,660 2,038,717 0.02%Dexus REIT 249,109 1,995,488 0.02%Ramsay Health Care Ltd. 40,517 1,914,822 0.01%APA Group 285,998 1,910,946 0.01%Mirvac Group REIT 870,689 1,908,716 0.01%Seek Ltd. 75,849 1,887,112 0.01%Stockland REIT 534,822 1,871,072 0.01%Northern Star Resources Ltd. 241,773 1,775,178 0.01%
Computershare Ltd. 136,304 1,729,381 0.01%REA Group Ltd. 12,845 1,630,021 0.01%GPT Group REIT 431,856 1,588,658 0.01%Medibank Pvt Ltd. 630,825 1,496,550 0.01%Oil Search Ltd. 501,767 1,435,233 0.01%Treasury Wine Estates Ltd. 163,127 1,430,421 0.01%Endeavour Group Ltd. 295,820 1,396,926 0.01%Origin Energy Ltd. 406,204 1,375,359 0.01%Magellan Financial Group Ltd. 33,181 1,341,687 0.01%
Evolution Mining Ltd. 381,098 1,287,492 0.01%Sydney Airport 295,699 1,285,357 0.01%Domino's Pizza Enterprises Ltd. 13,473 1,218,941 0.01%
Reece Ltd. 66,142 1,172,381 0.01%Lendlease Corp., Ltd. 131,852 1,134,401 0.01%Aurizon Holdings Ltd. 404,785 1,130,479 0.01%Vicinity Centres REIT 889,423 1,031,649 0.01%
.Number of
SharesFair Value
US Dollars ($)% of Total
Net AssetsAmpol Ltd. 46,788 990,907 0.01%Orica Ltd. 88,928 886,609 0.01%Crown Resorts Ltd. 98,209 878,129 0.01%AGL Energy Ltd. 140,850 867,094 0.01%Qantas Airways Ltd. 232,855 814,642 0.01%WiseTech Global Ltd. 29,790 714,109 0.01%Washington H Soul Pattinson & Co., Ltd. 25,351 641,958 0.01%
AusNet Services Ltd. 411,197 540,236 0.00%BGP Holdings Beneficial 1,010,126 3,792 0.00%test test 282,876,287 2.13%Austria 0.05% (2020: 0.05%)Erste Group Bank AG 59,939 2,199,267 0.01%OMV AG 32,748 1,862,956 0.01%Verbund AG 14,947 1,376,396 0.01%Voestalpine AG 25,641 1,044,199 0.01%Raiffeisen Bank International AG 38,639 875,200 0.01%
test test 7,358,018 0.05%Belgium 0.28% (2020: 0.30%)Anheuser-Busch InBev SA 174,396 12,576,494 0.09%KBC Group NV 58,115 4,431,465 0.03%Argenx SE 10,814 3,271,485 0.02%UCB SA 30,543 3,193,238 0.02%Groupe Bruxelles Lambert SA 27,399 3,065,340 0.02%
Umicore SA 48,324 2,951,333 0.02%Ageas SA 42,153 2,339,496 0.02%Solvay SA 16,794 2,134,996 0.02%Sofina SA 3,506 1,512,595 0.01%Elia Group SA 7,190 758,869 0.01%Etablissements Franz Colruyt NV 13,262 741,704 0.01%
Proximus SADP 35,621 688,138 0.01%test test 37,665,153 0.28%Canada 3.39% (2020: 3.09%)Shopify, Inc. Class A 25,974 38,025,911 0.29%Royal Bank of Canada 327,652 33,230,893 0.25%Toronto-Dominion Bank 416,234 29,199,909 0.22%Enbridge, Inc. 459,638 18,421,896 0.14%Bank of Nova Scotia 276,208 17,982,629 0.14%Canadian National Railway Co. 163,341 17,252,176 0.13%
Bank of Montreal 147,935 15,179,376 0.11%Brookfield Asset Management, Inc. Class A 293,778 15,003,247 0.11%
Canadian Imperial Bank of Commerce 103,844 11,833,503 0.09%
Canadian Pacific Railway Ltd. 153,043 11,780,715 0.09%
TC Energy Corp. 218,192 10,808,283 0.08%Canadian Natural Resources Ltd. 277,160 10,072,034 0.08%
Manulife Financial Corp. 439,759 8,665,202 0.07%Suncor Energy, Inc. 359,511 8,619,786 0.06%Barrick Gold Corp. 403,884 8,362,744 0.06%Nutrien Ltd. 129,359 7,846,366 0.06%Alimentation Couche-Tard, Inc. Class B 195,715 7,199,239 0.05%
Constellation Software, Inc. 4,580 6,943,824 0.05%Waste Connections, Inc. 56,724 6,783,593 0.05%Sun Life Financial, Inc. 129,722 6,696,140 0.05%Franco-Nevada Corp. 43,990 6,390,504 0.05%Magna International, Inc. 66,734 6,185,142 0.05%National Bank of Canada 78,217 5,859,801 0.04%Intact Financial Corp. 37,100 5,045,636 0.04%Fortis, Inc. 107,392 4,758,620 0.04%

192
Vanguard Global Stock Index Fund
.Number of
SharesFair Value
US Dollars ($)% of Total
Net AssetsCGI, Inc. Class A 51,127 4,640,365 0.03%Wheaton Precious Metals Corp. 103,442 4,564,379 0.03%
Rogers Communications, Inc. Class B 83,259 4,430,888 0.03%
Power Corp. of Canada 134,140 4,244,210 0.03%Pembina Pipeline Corp. 128,259 4,079,885 0.03%Thomson Reuters Corp. 40,997 4,076,525 0.03%Restaurant Brands International, Inc. 61,265 3,951,575 0.03%
Agnico Eagle Mines Ltd. 58,666 3,551,323 0.03%WSP Global, Inc. 27,821 3,250,988 0.02%First Quantum Minerals Ltd. 140,734 3,247,008 0.02%Open Text Corp. 61,018 3,101,900 0.02%Cenovus Energy, Inc. 321,733 3,081,445 0.02%Dollarama, Inc. 65,408 2,997,052 0.02%Shaw Communications, Inc. Class B 102,912 2,984,390 0.02%
Metro, Inc. 59,450 2,853,197 0.02%Emera, Inc. 61,077 2,773,940 0.02%Teck Resources Ltd. Class B 112,760 2,599,772 0.02%Fairfax Financial Holdings Ltd. 5,906 2,592,669 0.02%
Loblaw Cos Ltd. 41,393 2,550,167 0.02%Telus Corp., Ltd. 108,312 2,431,619 0.02%Kirkland Lake Gold Ltd. 59,018 2,276,742 0.02%CAE, Inc. 69,503 2,142,958 0.02%Bausch Health Cos, Inc. 72,258 2,122,867 0.02%Canadian Tire Corp., Ltd. Class A 12,695 2,011,024 0.02%
Algonquin Power & Utilities Corp. 131,035 1,954,467 0.01%
Kinross Gold Corp. 306,093 1,942,898 0.01%Imperial Oil Ltd. 60,414 1,843,205 0.01%Great-West Lifeco, Inc. 61,626 1,832,407 0.01%Lightspeed POS, Inc. 21,675 1,816,023 0.01%Toromont Industries Ltd. 20,541 1,791,511 0.01%CCL Industries, Inc. Class B 32,120 1,770,841 0.01%Cameco Corp. 90,690 1,740,123 0.01%Northland Power, Inc. 48,721 1,663,903 0.01%Saputo, Inc. 55,080 1,644,438 0.01%Gildan Activewear, Inc. Class A 43,652 1,612,406 0.01%
Hydro One Ltd. 66,151 1,600,488 0.01%George Weston Ltd. 16,740 1,597,215 0.01%Inter Pipeline Ltd. 95,140 1,548,147 0.01%BlackBerry Ltd. 119,600 1,463,248 0.01%Lundin Mining Corp. 161,841 1,461,183 0.01%Keyera Corp. 53,738 1,445,540 0.01%FirstService Corp. 8,317 1,427,988 0.01%Ritchie Bros Auctioneers, Inc. 24,042 1,426,832 0.01%
Onex Corp. 18,748 1,362,761 0.01%Pan American Silver Corp. 47,579 1,360,168 0.01%West Fraser Timber Co., Ltd. 18,686 1,342,863 0.01%
Brookfield Renewable Corp. Class A 31,809 1,337,812 0.01%
iA Financial Corp., Inc. 24,476 1,333,994 0.01%TMX Group Ltd. 12,546 1,326,636 0.01%AltaGas Ltd. 62,035 1,303,522 0.01%GFL Environmental, Inc. 40,451 1,294,249 0.01%Canopy Growth Corp. 51,069 1,236,412 0.01%Empire Co., Ltd. 38,629 1,219,732 0.01%Nuvei Corp. 13,256 1,093,620 0.01%Parkland Corp. 31,790 1,028,432 0.01%Ivanhoe Mines Ltd. Class A 138,131 998,363 0.01%B2Gold Corp. 237,712 998,225 0.01%Canadian Apartment Properties REIT 20,544 964,239 0.01%
Yamana Gold, Inc. 226,912 956,538 0.01%Quebecor, Inc. Class B 35,483 947,321 0.01%Ballard Power Systems, Inc. 50,004 907,769 0.01%
.Number of
SharesFair Value
US Dollars ($)% of Total
Net AssetsCanadian Utilities Ltd. Class A 29,749 826,428 0.01%
Air Canada 38,415 791,070 0.01%IGM Financial, Inc. 22,135 782,224 0.01%BCE, Inc. 15,338 757,177 0.01%RioCan REIT 39,508 704,463 0.01%Atco Ltd. Class I 18,581 659,631 0.01%test test 451,820,569 3.39%Denmark 0.76% (2020: 0.76%)Novo Nordisk A/S Class B 398,747 33,410,415 0.25%DSV PANALPINA A/S 47,275 11,026,096 0.08%Vestas Wind Systems A/S 233,139 9,101,662 0.07%Genmab A/S 15,002 6,139,036 0.05%Orsted A/S 42,594 5,977,581 0.04%Coloplast A/S Class B 27,430 4,501,275 0.03%Carlsberg A/S Class B 23,840 4,444,420 0.03%AP Moller-Maersk A/S Class B 1,397 4,015,744 0.03%
Novozymes A/S Class B 50,339 3,794,762 0.03%Pandora A/S 22,130 2,975,112 0.02%Danske Bank A/S 167,299 2,944,151 0.02%GN Store Nord A/S 31,654 2,765,318 0.02%AP Moller-Maersk A/S Class A 811 2,253,011 0.02%
Tryg A/S 88,727 2,178,361 0.02%Chr Hansen Holding A/S 23,430 2,114,867 0.02%Ambu A/S Class B 36,325 1,396,681 0.01%Demant A/S 23,812 1,340,494 0.01%ROCKWOOL International A/S Class B 1,632 794,587 0.01%
test test 101,173,573 0.76%Finland 0.31% (2020: 0.32%)Nokia OYJ 1,217,766 6,521,054 0.05%Kone OYJ Class B 78,074 6,370,051 0.05%Neste OYJ 94,774 5,803,948 0.04%Sampo OYJ Class A 116,179 5,340,224 0.04%UPM-Kymmene OYJ 124,711 4,717,843 0.04%Fortum OYJ 107,482 2,964,787 0.02%Stora Enso OYJ Class R 144,582 2,637,909 0.02%Kesko OYJ Class B 58,729 2,169,495 0.02%Elisa OYJ 32,628 1,947,059 0.01%Wartsila OYJ Abp 98,881 1,467,546 0.01%Orion OYJ Class B 23,500 1,010,239 0.01%test test 40,950,155 0.31%France 3.36% (2020: 3.33%)LVMH Moet Hennessy Louis Vuitton SE 63,889 50,104,032 0.38%
Sanofi 260,968 27,345,825 0.21%TotalEnergies SE 565,197 25,574,042 0.19%L’Oreal SA (Prime De Fidelite) 48,585 21,652,450 0.16%
Schneider Electric SE 123,471 19,427,571 0.15%Airbus SE 135,239 17,391,600 0.13%BNP Paribas SA 258,058 16,179,858 0.12%Air Liquide SA (Prime De Fidelite) 88,072 15,422,287 0.12%
Kering SA 17,149 14,988,368 0.11%Vinci SA 123,913 13,223,889 0.10%EssilorLuxottica SA 66,437 12,262,508 0.09%AXA SA 441,015 11,184,348 0.08%Safran SA 77,897 10,800,842 0.08%Danone SA 151,233 10,647,844 0.08%Pernod Ricard SA 47,727 10,595,417 0.08%Hermes International 7,213 10,508,462 0.08%Cie de Saint-Gobain 118,987 7,837,065 0.06%Dassault Systemes SE 30,554 7,409,851 0.06%Capgemini SE 36,631 7,037,394 0.05%Legrand SA 62,858 6,653,735 0.05%Cie Generale des Etablissements Michelin SCA 39,075 6,232,601 0.05%
STMicroelectronics NV 155,376 5,639,289 0.04%
193
Vanguard Global Stock Index Fund
.Number of
SharesFair Value
US Dollars ($)% of Total
Net AssetsTeleperformance 13,776 5,592,141 0.04%Societe Generale SA 188,076 5,544,758 0.04%Vivendi SE 162,991 5,475,935 0.04%Orange SA 460,362 5,249,245 0.04%ArcelorMittal SA 170,938 5,240,192 0.04%Worldline SA 54,685 5,119,333 0.04%Engie SA (Prime De Fidelite) 337,387 4,622,839 0.03%L’Oreal SA 9,187 4,094,290 0.03%Veolia Environnement SA 126,481 3,820,343 0.03%Credit Agricole SA 267,202 3,743,560 0.03%Eurofins Scientific SE 32,219 3,683,301 0.03%Air Liquide SA 20,702 3,625,127 0.03%Publicis Groupe SA 53,601 3,428,719 0.03%Edenred 59,526 3,391,940 0.03%Alstom SA 64,490 3,257,227 0.02%Sartorius Stedim Biotech 6,086 2,879,016 0.02%Carrefour SA 135,246 2,660,039 0.02%Unibail-Rodamco-Westfield REIT 29,908 2,588,802 0.02%
Bureau Veritas SA 67,240 2,127,461 0.02%Thales SA 20,737 2,115,896 0.02%Suez SA 85,605 2,035,455 0.01%Eiffage SA 18,973 1,930,507 0.01%Arkema SA 15,075 1,891,433 0.01%Bouygues SA 50,607 1,871,863 0.01%Renault SA 42,978 1,737,231 0.01%Valeo SA 57,322 1,724,606 0.01%Ubisoft Entertainment SA 23,583 1,651,176 0.01%Gecina SA REIT 10,406 1,594,389 0.01%Orpea SA 11,881 1,511,118 0.01%Electricite de France SA (Prime De Fidelite) 109,564 1,496,816 0.01%
La Francaise des Jeux SAEM 23,835 1,401,425 0.01%
Accor SA 36,810 1,374,632 0.01%Getlink SE 84,435 1,316,729 0.01%Atos SE 21,635 1,316,201 0.01%Amundi SA 14,044 1,238,283 0.01%Remy Cointreau SA 5,776 1,192,543 0.01%Engie SA 84,601 1,159,193 0.01%SCOR SE 36,085 1,147,714 0.01%Sodexo SA 12,295 1,147,496 0.01%Klepierre SA REIT 44,028 1,134,584 0.01%Bollore SA 210,028 1,125,806 0.01%BioMerieux 9,390 1,091,289 0.01%Covivio REIT 11,710 1,001,522 0.01%Faurecia SE (XPAR) 17,302 848,848 0.01%SEB SA (Prime De Fidelite) 4,656 841,484 0.01%Aeroports de Paris 5,900 768,600 0.01%Ipsen SA 7,382 767,928 0.01%CNP Assurances 44,533 757,848 0.01%Dassault Aviation SA 641 754,081 0.01%Wendel SE 5,131 690,022 0.00%Eurazeo SE 6,996 609,797 0.00%Iliad SA 3,017 441,508 0.00%Sodexo SA - EU 4,433 413,733 0.00%Faurecia SE 8,274 404,751 0.00%Sodexo SA (XPAR) 2,932 273,645 0.00%Eurazeo SE (XPAR) 2,447 213,289 0.00%SEB SA 1,146 207,118 0.00%test test 447,464,105 3.36%Germany 2.77% (2020: 2.84%)SAP SE 239,878 33,806,571 0.25%Siemens AG 176,936 28,037,271 0.21%Allianz SE 94,683 23,613,445 0.18%Daimler AG 196,167 17,517,374 0.13%BASF SE 209,773 16,528,265 0.12%Adidas AG 43,637 16,244,048 0.12%Deutsche Telekom AG 759,212 16,037,025 0.12%Deutsche Post AG 226,514 15,408,212 0.12%Bayer AG 225,228 13,678,083 0.10%Infineon Technologies AG 298,062 11,954,414 0.09%
.Number of
SharesFair Value
US Dollars ($)% of Total
Net AssetsVolkswagen AG - Preference Shares 44,474 11,139,051 0.08%
Muenchener Rueckversicherungs-Gesellschaft AG in Muenchen 31,773 8,702,104 0.07%
Bayerische Motoren Werke AG 77,557 8,214,273 0.06%
Vonovia SE 122,855 7,943,223 0.06%Deutsche Boerse AG 43,255 7,550,787 0.06%Deutsche Bank AG 481,788 6,276,877 0.05%Zalando SE 50,119 6,059,516 0.05%E.ON SE 507,551 5,870,979 0.04%Merck KGaA 29,695 5,694,314 0.04%RWE AG 150,329 5,448,089 0.04%Fresenius SE & Co. KGaA 99,511 5,191,854 0.04%Deutsche Wohnen SE 78,940 4,828,659 0.04%Delivery Hero SE 35,191 4,649,057 0.04%Symrise AG Class A 30,318 4,224,609 0.03%Henkel AG & Co. KGaA - Preference Shares 38,657 4,081,891 0.03%
Fresenius Medical Care AG & Co. KGaA 47,130 3,914,638 0.03%
Porsche Automobil Holding SE - Preference Shares 36,489 3,910,085 0.03%
Siemens Healthineers AG 62,972 3,859,385 0.03%Continental AG 25,397 3,734,067 0.03%HelloFresh SE 37,676 3,662,864 0.03%Brenntag SE 34,259 3,186,028 0.02%HeidelbergCement AG 36,130 3,099,521 0.02%MTU Aero Engines AG 12,493 3,094,947 0.02%Sartorius AG - Preference Shares 5,867 3,054,419 0.02%
Puma SE 25,563 3,048,190 0.02%Beiersdorf AG 23,861 2,879,195 0.02%Siemens Energy AG 95,381 2,875,315 0.02%Covestro AG 43,417 2,804,048 0.02%QIAGEN NV 56,616 2,736,664 0.02%LEG Immobilien SE 17,643 2,541,078 0.02%Henkel AG & Co. KGaA 25,336 2,333,069 0.02%Volkswagen AG 6,951 2,281,715 0.02%Hannover Rueck SE 13,299 2,225,328 0.02%Aroundtown SA 253,235 1,976,049 0.02%Knorr-Bremse AG 16,365 1,882,504 0.01%Carl Zeiss Meditec AG 9,121 1,762,564 0.01%Scout24 AG 20,528 1,731,356 0.01%KION Group AG 16,018 1,707,338 0.01%Evonik Industries AG 45,637 1,530,540 0.01%Commerzbank AG 212,912 1,510,409 0.01%GEA Group AG 34,701 1,405,749 0.01%TeamViewer AG 35,947 1,352,209 0.01%LANXESS AG 18,243 1,250,900 0.01%Bayerische Motoren Werke AG - Preference Shares 13,483 1,212,003 0.01%
Bechtle AG 5,935 1,102,552 0.01%Nemetschek SE 13,436 1,028,046 0.01%Rational AG 1,092 989,382 0.01%United Internet AG 23,553 963,078 0.01%Uniper SE 22,097 813,922 0.01%Fuchs Petrolub SE - Preference Shares 16,133 784,800 0.01%
Deutsche Lufthansa AG 60,911 685,504 0.01%Telefonica Deutschland Holding AG 205,671 542,689 0.00%
test test 368,172,141 2.77%Hong Kong 0.96% (2020: 0.98%)AIA Group Ltd. 2,777,277 34,510,998 0.26%Hong Kong Exchanges & Clearing Ltd. 277,738 16,551,588 0.12%
Techtronic Industries Co., Ltd. 317,602 5,545,669 0.04%
CK Hutchison Holdings Ltd. 624,569 4,865,716 0.04%Link REIT 480,672 4,657,644 0.03%

194
Vanguard Global Stock Index Fund
.Number of
SharesFair Value
US Dollars ($)% of Total
Net AssetsSun Hung Kai Properties Ltd. 294,133 4,382,159 0.03%
Galaxy Entertainment Group Ltd. 511,050 4,089,927 0.03%
Hong Kong & China Gas Co., Ltd. 2,624,229 4,075,304 0.03%
CLP Holdings Ltd. 377,660 3,734,850 0.03%Hang Seng Bank Ltd. 181,690 3,628,723 0.03%CK Asset Holdings Ltd. 512,624 3,538,138 0.03%Jardine Matheson Holdings Ltd. 51,866 3,315,275 0.02%
BOC Hong Kong Holdings Ltd. 884,823 3,002,258 0.02%
Sands China Ltd. 549,618 2,314,300 0.02%Wharf Real Estate Investment Co., Ltd. 375,046 2,180,486 0.02%
Futu Holdings Ltd. ADR 11,337 2,030,343 0.02%Power Assets Holdings Ltd. 326,949 2,006,106 0.02%MTR Corp., Ltd. 354,928 1,976,685 0.01%WH Group Ltd. 2,126,761 1,911,548 0.01%New World Development Co., Ltd. 348,347 1,809,950 0.01%
Xinyi Glass Holdings Ltd. 388,000 1,581,308 0.01%Henderson Land Development Co., Ltd. 313,447 1,485,330 0.01%
ESR Cayman Ltd. 438,324 1,478,794 0.01%HKT Trust & HKT Ltd. 935,481 1,274,476 0.01%Hongkong Land Holdings Ltd. 263,237 1,253,008 0.01%
Budweiser Brewing Co. APAC Ltd. 389,600 1,229,125 0.01%
Sino Land Co., Ltd. 727,285 1,146,297 0.01%Chow Tai Fook Jewellery Group Ltd. 467,000 1,066,796 0.01%
Hang Lung Properties Ltd. 433,993 1,053,987 0.01%CK Infrastructure Holdings Ltd. 169,829 1,012,521 0.01%
Swire Pacific Ltd. Class A 132,507 898,355 0.01%Melco Resorts & Entertainment Ltd. ADR 50,381 834,813 0.01%
Swire Properties Ltd. 277,599 827,523 0.01%HK Electric Investments & HK Electric Investments Ltd. 671,296 680,299 0.01%
Wynn Macau Ltd. 377,127 593,430 0.00%Bank of East Asia Ltd. 312,780 580,785 0.00%SJM Holdings Ltd. 491,228 536,401 0.00%test test 127,660,915 0.96%Ireland 0.21% (2020: 0.21%)CRH plc 178,253 8,984,085 0.07%Flutter Entertainment plc 38,575 6,985,428 0.05%Kerry Group plc Class A 36,561 5,107,536 0.04%Kingspan Group plc 37,244 3,517,512 0.03%Smurfit Kappa Group plc 54,202 2,940,726 0.02%test test 27,535,287 0.21%Israel 0.17% (2020: 0.18%)Wix.com Ltd. 13,099 3,802,378 0.03%Nice Ltd. 14,553 3,555,961 0.03%Check Point Software Technologies Ltd. 24,730 2,871,895 0.02%
Bank Leumi Le-Israel BM 326,732 2,482,702 0.02%Teva Pharmaceutical Industries Ltd. ADR 245,857 2,433,984 0.02%
Bank Hapoalim BM 272,792 2,190,038 0.01%Israel Discount Bank Ltd. Class A 258,683 1,232,088 0.01%
ICL Group Ltd. 164,912 1,118,983 0.01%CyberArk Software Ltd. 8,456 1,101,563 0.01%Mizrahi Tefahot Bank Ltd. 35,263 1,086,514 0.01%Elbit Systems Ltd. 5,968 772,900 0.00%Azrieli Group Ltd. 9,094 640,501 0.00%test test 23,289,507 0.17%
.Number of
SharesFair Value
US Dollars ($)% of Total
Net AssetsItaly 0.73% (2020: 0.72%)Enel SpA 1,867,200 17,342,495 0.13%Intesa Sanpaolo SpA 3,683,551 10,176,009 0.08%Stellantis NV 465,323 9,134,937 0.07%Eni SpA 592,788 7,219,679 0.05%Ferrari NV 29,162 6,017,479 0.05%UniCredit SpA 490,828 5,791,625 0.04%Assicurazioni Generali SpA 255,557 5,123,315 0.04%CNH Industrial NV 245,984 4,062,095 0.03%Moncler SpA 46,450 3,143,153 0.02%Snam SpA 431,897 2,496,910 0.02%Terna SPA 328,574 2,448,598 0.02%Nexi SpA 106,610 2,340,197 0.02%FinecoBank Banca Fineco SpA 131,865 2,298,767 0.02%
Prysmian SpA 62,525 2,241,506 0.02%Atlantia SpA 118,731 2,150,063 0.02%EXOR NV 24,647 1,974,703 0.01%Davide Campari-Milano NV 133,984 1,794,681 0.01%Poste Italiane SpA 122,736 1,622,912 0.01%Mediobanca Banca di Credito Finanziario SpA 136,025 1,588,924 0.01%
Recordati Industria Chimica e Farmaceutica SpA 26,929 1,539,272 0.01%
Amplifon SpA 27,861 1,375,801 0.01%Telecom Italia SpA (Non CVA) 2,382,201 1,262,233 0.01%
Tenaris SA 108,157 1,178,997 0.01%DiaSorin SpA 5,951 1,125,638 0.01%Infrastrutture Wireless Italiane SpA 73,147 825,119 0.01%
Telecom Italia SpA 1,014,114 503,785 0.00%test test 96,778,893 0.73%Japan 6.79% (2020: 7.62%)Toyota Motor Corp. 485,954 42,513,860 0.32%Sony Group Corp. 288,635 28,124,944 0.21%Keyence Corp. 44,892 22,678,570 0.17%SoftBank Group Corp. 289,972 20,312,932 0.15%Recruit Holdings Co., Ltd. 310,327 15,294,069 0.11%Mitsubishi UFJ Financial Group, Inc. 2,808,654 15,185,812 0.11%
Nintendo Co., Ltd. 25,698 14,961,751 0.11%Tokyo Electron Ltd. 34,237 14,831,201 0.11%Shin-Etsu Chemical Co., Ltd. 80,733 13,514,904 0.10%
Hitachi Ltd. 220,737 12,650,762 0.09%Takeda Pharmaceutical Co., Ltd. 359,832 12,057,079 0.09%
Nidec Corp. 102,762 11,920,540 0.09%Honda Motor Co., Ltd. 372,329 11,908,892 0.09%KDDI Corp. 367,051 11,458,976 0.09%Hoya Corp. 85,599 11,360,242 0.09%FANUC Corp. 44,590 10,764,835 0.08%Daikin Industries Ltd. 57,044 10,633,754 0.08%Sumitomo Mitsui Financial Group, Inc. 294,715 10,169,911 0.08%
Murata Manufacturing Co., Ltd. 131,285 10,032,970 0.08%
Fast Retailing Co., Ltd. 13,299 10,020,681 0.08%SoftBank Corp. 675,818 8,850,360 0.07%Fujitsu Ltd. 44,710 8,378,845 0.06%Daiichi Sankyo Co., Ltd. 387,728 8,364,850 0.06%Seven & i Holdings Co., Ltd. 171,909 8,204,361 0.06%Mizuho Financial Group, Inc. 566,466 8,102,214 0.06%ITOCHU Corp. 279,912 8,070,262 0.06%Mitsui & Co., Ltd. 355,102 8,000,113 0.06%Nippon Telegraph & Telephone Corp. 302,854 7,898,107 0.06%
Mitsubishi Corp. 287,205 7,835,451 0.06%SMC Corp. 12,972 7,672,870 0.06%Astellas Pharma, Inc. 418,906 7,301,321 0.05%M3, Inc. 99,852 7,298,849 0.05%Denso Corp. 101,276 6,915,675 0.05%

195
Vanguard Global Stock Index Fund
.Number of
SharesFair Value
US Dollars ($)% of Total
Net AssetsKao Corp. 109,010 6,713,067 0.05%Oriental Land Co., Ltd. 47,047 6,710,100 0.05%Shiseido Co., Ltd. 90,641 6,672,922 0.05%Tokio Marine Holdings, Inc. 143,817 6,618,770 0.05%FUJIFILM Holdings Corp. 81,450 6,046,189 0.05%Mitsubishi Electric Corp. 416,101 6,045,255 0.05%Chugai Pharmaceutical Co., Ltd. 151,830 6,021,765 0.04%
Panasonic Corp. 519,753 6,019,844 0.04%Bridgestone Corp. 132,114 6,017,085 0.04%Terumo Corp. 145,202 5,889,714 0.04%Olympus Corp. 268,360 5,338,669 0.04%Canon, Inc. 232,109 5,255,338 0.04%Eisai Co., Ltd. 53,307 5,247,130 0.04%Japan Tobacco, Inc. 276,851 5,234,452 0.04%Komatsu Ltd. 209,309 5,205,852 0.04%Central Japan Railway Co. 33,517 5,088,399 0.04%East Japan Railway Co. 70,989 5,070,095 0.04%Asahi Group Holdings Ltd. 105,406 4,929,836 0.04%Mitsui Fudosan Co., Ltd. 211,002 4,891,505 0.04%Kubota Corp. 239,650 4,851,730 0.04%ORIX Corp. 280,423 4,736,039 0.04%Sysmex Corp. 39,125 4,653,122 0.03%Kyocera Corp. 74,763 4,626,293 0.03%Mitsubishi Estate Co., Ltd. 276,314 4,472,458 0.03%Dai-ichi Life Holdings, Inc. 235,985 4,324,655 0.03%Advantest Corp. 47,600 4,292,963 0.03%Shimano, Inc. 17,702 4,202,610 0.03%Daiwa House Industry Co., Ltd. 135,677 4,076,789 0.03%
Toshiba Corp. 93,766 4,059,335 0.03%Aeon Co., Ltd. 150,744 4,054,157 0.03%Unicharm Corp. 94,015 3,786,351 0.03%Kirin Holdings Co., Ltd. 192,837 3,763,266 0.03%Otsuka Holdings Co., Ltd. 90,463 3,754,960 0.03%Nomura Holdings, Inc. 731,670 3,743,060 0.03%Secom Co., Ltd. 48,922 3,721,933 0.03%Suzuki Motor Corp. 87,703 3,714,675 0.03%TDK Corp. 29,953 3,640,562 0.03%Sumitomo Corp. 269,191 3,608,940 0.03%Omron Corp. 43,594 3,460,340 0.03%Nitori Holdings Co., Ltd. 19,266 3,412,646 0.03%Nippon Steel Corp. 199,275 3,363,742 0.02%Lasertec Corp. 17,000 3,306,875 0.02%Asahi Kasei Corp. 296,085 3,255,895 0.02%Bandai Namco Holdings, Inc. 46,605 3,236,610 0.02%
Z Holdings Corp. 635,479 3,187,987 0.02%Obic Co., Ltd. 16,903 3,153,988 0.02%Marubeni Corp. 360,980 3,142,110 0.02%Shionogi & Co., Ltd. 60,134 3,137,544 0.02%Renesas Electronics Corp. 288,391 3,120,620 0.02%MS&AD Insurance Group Holdings, Inc. 107,125 3,096,288 0.02%
Japan Post Holdings Co., Ltd. 371,755 3,049,001 0.02%
Sekisui House Ltd. 146,399 3,005,407 0.02%Subaru Corp. 150,882 2,979,168 0.02%Yaskawa Electric Corp. 58,385 2,856,388 0.02%NEC Corp. 54,363 2,801,661 0.02%Toyota Industries Corp. 32,202 2,788,190 0.02%Nitto Denko Corp. 37,257 2,782,778 0.02%Ajinomoto Co., Inc. 105,374 2,738,072 0.02%ENEOS Holdings, Inc. 651,568 2,729,201 0.02%Nomura Research Institute Ltd. 81,313 2,692,362 0.02%
Nexon Co., Ltd. 119,232 2,659,865 0.02%Sompo Holdings, Inc. 71,226 2,634,958 0.02%Japan Exchange Group, Inc. 114,779 2,554,321 0.02%Nissan Motor Co., Ltd. 504,969 2,508,239 0.02%Sumitomo Electric Industries Ltd. 168,308 2,485,420 0.02%
.Number of
SharesFair Value
US Dollars ($)% of Total
Net AssetsSumitomo Realty & Development Co., Ltd. 69,277 2,477,968 0.02%
Sumitomo Mitsui Trust Holdings, Inc. 76,530 2,432,632 0.02%
Mitsubishi Chemical Holdings Corp. 284,448 2,392,398 0.02%
Rakuten Group, Inc. 210,406 2,377,233 0.02%Makita Corp. 49,680 2,340,989 0.02%Sumitomo Metal Mining Co., Ltd. 59,346 2,312,564 0.02%
Kyowa Kirin Co., Ltd. 64,684 2,296,198 0.02%Shimadzu Corp. 58,290 2,255,659 0.02%NTT Data Corp. 144,235 2,252,088 0.02%Toyota Tsusho Corp. 47,500 2,246,824 0.02%Nippon Paint Holdings Co., Ltd. 165,250 2,245,220 0.02%
MINEBEA MITSUMI, Inc. 81,491 2,157,871 0.02%MISUMI Group, Inc. 63,600 2,154,573 0.02%Kikkoman Corp. 32,240 2,129,194 0.02%Toray Industries, Inc. 317,204 2,112,312 0.02%West Japan Railway Co. 36,917 2,106,787 0.02%Nippon Building Fund, Inc. REIT 336 2,097,919 0.02%
Mitsubishi Heavy Industries Ltd. 71,100 2,094,116 0.02%
Daifuku Co., Ltd. 22,500 2,045,455 0.02%Disco Corp. 6,500 1,988,242 0.01%AGC, Inc. 47,288 1,985,423 0.01%Ono Pharmaceutical Co., Ltd. 87,310 1,950,099 0.01%
Yamato Holdings Co., Ltd. 68,107 1,939,077 0.01%Hamamatsu Photonics KK 31,919 1,926,816 0.01%Japan Metropolitan Fund Invest REIT 1,765 1,914,641 0.01%
CyberAgent, Inc. 88,800 1,908,172 0.01%Daiwa Securities Group, Inc. 346,989 1,907,361 0.01%Pan Pacific International Holdings Corp. 91,772 1,906,714 0.01%
Japan Real Estate Investment Corp. REIT 306 1,883,035 0.01%
SG Holdings Co., Ltd. 71,200 1,868,687 0.01%TOTO Ltd. 35,540 1,841,202 0.01%Resona Holdings, Inc. 477,376 1,837,418 0.01%Yakult Honsha Co., Ltd. 32,422 1,837,412 0.01%Inpex Corp. 239,315 1,787,478 0.01%Rohm Co., Ltd. 19,194 1,776,037 0.01%Chubu Electric Power Co., Inc. 144,749 1,771,053 0.01%
Nihon M&A Center, Inc. 67,400 1,749,522 0.01%Sumitomo Chemical Co., Ltd. 326,340 1,731,816 0.01%
Nippon Yusen KK 34,106 1,730,037 0.01%Dentsu Group, Inc. 48,185 1,725,699 0.01%Ricoh Co., Ltd. 152,510 1,713,487 0.01%Trend Micro, Inc. 32,401 1,699,016 0.01%Odakyu Electric Railway Co., Ltd. 66,304 1,676,268 0.01%
Sekisui Chemical Co., Ltd. 97,898 1,675,000 0.01%MEIJI Holdings Co., Ltd. 27,787 1,664,867 0.01%Yamaha Motor Co., Ltd. 60,436 1,644,443 0.01%Yamaha Corp. 30,148 1,637,917 0.01%Hankyu Hanshin Holdings, Inc. 53,007 1,635,724 0.01%
Isuzu Motors Ltd. 121,488 1,605,756 0.01%Mitsui Chemicals, Inc. 46,438 1,604,557 0.01%Tokyo Gas Co., Ltd. 84,063 1,588,252 0.01%Koito Manufacturing Co., Ltd. 25,263 1,572,820 0.01%
Daito Trust Construction Co., Ltd. 14,338 1,569,571 0.01%
Tokyu Corp. 114,038 1,552,495 0.01%T&D Holdings, Inc. 118,239 1,529,788 0.01%

196
Vanguard Global Stock Index Fund
.Number of
SharesFair Value
US Dollars ($)% of Total
Net AssetsNomura Real Estate Master Fund, Inc. REIT 952 1,527,626 0.01%
Lixil Corp. 58,701 1,519,488 0.01%Kansai Electric Power Co., Inc. 157,705 1,505,437 0.01%
Nippon Express Co., Ltd. 19,570 1,491,686 0.01%GLP J-Reit REIT 858 1,481,150 0.01%SUMCO Corp. 60,200 1,478,016 0.01%Kintetsu Group Holdings Co., Ltd. 41,737 1,466,567 0.01%
Nippon Prologis, Inc. REIT 460 1,465,087 0.01%Osaka Gas Co., Ltd. 77,112 1,437,469 0.01%SBI Holdings, Inc. 60,560 1,433,928 0.01%Mercari, Inc. 26,200 1,392,738 0.01%Daiwa House Investment Corp. REIT Class A 470 1,386,837 0.01%
Taisei Corp. 42,264 1,386,079 0.01%Aisin Corp. 32,338 1,383,958 0.01%Fuji Electric Co., Ltd. 29,508 1,379,823 0.01%JSR Corp. 44,743 1,354,505 0.01%MonotaRO Co., Ltd. 55,800 1,322,227 0.01%GMO Payment Gateway, Inc. 10,100 1,316,758 0.01%
Nissan Chemical Corp. 26,800 1,313,560 0.01%TIS, Inc. 51,300 1,311,272 0.01%Asahi Intecc Co., Ltd. 54,600 1,306,583 0.01%Keio Corp. 22,184 1,305,176 0.01%Konami Holdings Corp. 21,164 1,271,861 0.01%Kajima Corp. 99,860 1,265,907 0.01%JFE Holdings, Inc. 106,231 1,245,216 0.01%Ibiden Co., Ltd. 23,000 1,241,283 0.01%Otsuka Corp. 23,462 1,232,394 0.01%Kose Corp. 7,713 1,214,733 0.01%Brother Industries Ltd. 60,167 1,201,822 0.01%Ryohin Keikaku Co., Ltd. 56,480 1,185,678 0.01%Seiko Epson Corp. 67,060 1,180,604 0.01%Kobayashi Pharmaceutical Co., Ltd. 13,800 1,179,944 0.01%
NGK Insulators Ltd. 69,348 1,164,652 0.01%Kansai Paint Co., Ltd. 45,480 1,160,049 0.01%Obayashi Corp. 144,439 1,149,109 0.01%Suntory Beverage & Food Ltd. 30,445 1,146,591 0.01%
Santen Pharmaceutical Co., Ltd. 82,278 1,134,204 0.01%
Tobu Railway Co., Ltd. 43,795 1,133,248 0.01%Capcom Co., Ltd. 38,600 1,130,282 0.01%Dai Nippon Printing Co., Ltd. 53,016 1,122,034 0.01%Keisei Electric Railway Co., Ltd. 34,873 1,113,837 0.01%
Orix JREIT, Inc. REIT 576 1,109,549 0.01%Azbil Corp. 26,600 1,103,640 0.01%Kurita Water Industries Ltd. 22,970 1,103,073 0.01%TOPPAN, Inc. 68,343 1,099,128 0.01%Mazda Motor Corp. 116,716 1,097,860 0.01%Hirose Electric Co., Ltd. 7,479 1,094,997 0.01%PeptiDream, Inc. 21,900 1,075,367 0.01%Tokyo Electric Power Co. Holdings, Inc. 358,631 1,066,296 0.01%
Oji Holdings Corp. 183,747 1,056,227 0.01%Hitachi Metals Ltd. 53,692 1,027,496 0.01%Concordia Financial Group Ltd. 279,875 1,026,301 0.01%
Square Enix Holdings Co., Ltd. 20,200 1,002,811 0.01%
USS Co., Ltd. 57,129 997,531 0.01%Nabtesco Corp. 26,038 985,310 0.01%Tosoh Corp. 56,500 975,349 0.01%Hoshizaki Corp. 11,419 971,217 0.01%Stanley Electric Co., Ltd. 33,513 970,757 0.01%United Urban Investment Corp. REIT 662 958,495 0.01%
.Number of
SharesFair Value
US Dollars ($)% of Total
Net AssetsMcDonald's Holdings Co. Japan Ltd. 21,633 955,056 0.01%
Tsuruha Holdings, Inc. 8,200 953,798 0.01%Nissin Foods Holdings Co., Ltd. 13,216 952,590 0.01%
Japan Post Insurance Co., Ltd. 50,889 941,761 0.01%
Toho Co., Ltd. 22,407 924,624 0.01%Kobe Bussan Co., Ltd. 29,200 920,804 0.01%Iida Group Holdings Co., Ltd. 35,620 917,859 0.01%
Idemitsu Kosan Co., Ltd. 37,614 909,256 0.01%Medipal Holdings Corp. 46,767 894,131 0.01%Kakaku.com, Inc. 29,395 888,551 0.01%Miura Co., Ltd. 20,400 884,999 0.01%Sumitomo Dainippon Pharma Co., Ltd. 41,998 880,902 0.01%
Chiba Bank Ltd. 146,129 880,803 0.01%ZOZO, Inc. 25,400 863,907 0.01%NH Foods Ltd. 21,970 855,126 0.01%Toho Gas Co., Ltd. 17,372 851,461 0.01%Hakuhodo DY Holdings, Inc. 54,644 848,781 0.01%ANA Holdings, Inc. 36,000 847,211 0.01%Persol Holdings Co., Ltd. 42,800 846,437 0.01%Shimizu Corp. 109,452 840,194 0.01%Lion Corp. 48,700 825,781 0.01%THK Co., Ltd. 26,902 803,497 0.01%Nippon Shinyaku Co., Ltd. 10,100 801,703 0.01%Hulic Co., Ltd. 70,325 792,020 0.01%Sharp Corp. 47,800 789,417 0.01%Casio Computer Co., Ltd. 46,744 782,085 0.01%Mitsubishi Gas Chemical Co., Inc. 36,840 782,008 0.01%
Rinnai Corp. 8,196 780,536 0.01%Toyo Suisan Kaisha Ltd. 20,243 779,699 0.01%Yamada Holdings Co., Ltd. 167,430 773,868 0.01%Hikari Tsushin, Inc. 4,384 770,627 0.01%Yokogawa Electric Corp. 50,196 750,747 0.01%Sohgo Security Services Co., Ltd. 16,284 742,383 0.01%
Itochu Techno-Solutions Corp. 23,900 740,751 0.01%
Pigeon Corp. 25,600 721,939 0.01%Japan Airlines Co., Ltd. 33,270 719,716 0.01%Japan Post Bank Co., Ltd. 85,022 714,709 0.01%SCSK Corp. 11,900 709,776 0.01%Ito En Ltd. 11,900 706,559 0.01%Welcia Holdings Co., Ltd. 21,500 703,171 0.01%NSK Ltd. 81,974 693,518 0.00%Mitsubishi HC Capital, Inc. 126,603 678,699 0.00%Cosmos Pharmaceutical Corp. 4,600 675,556 0.00%
Tohoku Electric Power Co., Inc. 85,628 671,199 0.00%
Nisshin Seifun Group, Inc. 45,640 668,213 0.00%Shizuoka Bank Ltd. 85,321 660,336 0.00%Oracle Corp. Japan 8,565 655,937 0.00%Nomura Real Estate Holdings, Inc. 25,834 655,917 0.00%
Nippon Sanso Holdings Corp. 31,872 653,866 0.00%
Hitachi Construction Machinery Co., Ltd. 21,310 651,838 0.00%
Harmonic Drive Systems, Inc. 11,400 628,597 0.00%
Koei Tecmo Holdings Co., Ltd. 12,610 615,787 0.00%
Pola Orbis Holdings, Inc. 22,900 605,357 0.00%Lawson, Inc. 13,055 604,583 0.00%Hisamitsu Pharmaceutical Co., Inc. 11,968 589,828 0.00%
Hino Motors Ltd. 66,898 588,876 0.00%Tokyo Century Corp. 9,500 510,992 0.00%

197
Vanguard Global Stock Index Fund
.Number of
SharesFair Value
US Dollars ($)% of Total
Net AssetsAcom Co., Ltd. 103,843 452,834 0.00%ABC-Mart, Inc. 7,840 449,958 0.00%Taisho Pharmaceutical Holdings Co., Ltd. 8,374 448,917 0.00%
test test 903,764,299 6.79%Netherlands 1.27% (2020: 1.16%)ASML Holding NV 96,445 66,268,368 0.50%ING Groep NV 889,535 11,751,581 0.09%Adyen NV 4,487 10,964,195 0.08%Prosus NV 111,651 10,919,599 0.08%Koninklijke Philips NV 208,166 10,316,449 0.08%Koninklijke DSM NV 39,065 7,291,899 0.05%Heineken NV 58,750 7,120,440 0.05%Koninklijke Ahold Delhaize NV 238,867 7,101,638 0.05%
Wolters Kluwer NV 60,291 6,057,403 0.05%Akzo Nobel NV 44,656 5,518,177 0.04%Just Eat Takeaway.com NV 41,995 3,878,072 0.03%ASM International NV 11,241 3,692,604 0.03%NN Group NV 64,671 3,050,861 0.02%Coca-Cola European Partners plc 48,488 2,876,308 0.02%
Heineken Holding NV 24,160 2,433,932 0.02%Koninklijke KPN NV 776,072 2,424,185 0.02%Randstad NV 26,925 2,059,508 0.02%Aegon NV 398,965 1,655,491 0.01%ABN AMRO Bank NV GDR 96,416 1,165,351 0.01%InPost SA 46,849 940,379 0.01%Koninklijke Vopak NV 15,438 701,193 0.01%JDE Peet's NV 16,427 596,112 0.00%test test 168,783,745 1.27%New Zealand 0.07% (2020: 0.09%)Fisher & Paykel Healthcare Corp., Ltd. 141,114 3,068,538 0.02%
Auckland International Airport Ltd. 319,605 1,623,565 0.01%
Spark New Zealand Ltd. 423,513 1,420,462 0.01%Meridian Energy Ltd. 292,265 1,088,493 0.01%Ryman Healthcare Ltd. 92,375 847,502 0.01%a2 Milk Co., Ltd. 169,366 762,139 0.01%Mercury NZ Ltd. 145,084 676,188 0.00%test test 9,486,887 0.07%Norway 0.19% (2020: 0.18%)Equinor A.S.A 230,552 4,880,998 0.04%DNB A.S.A 219,169 4,778,053 0.04%Mowi A.S.A 107,065 2,724,775 0.02%Telenor A.S.A 154,001 2,596,749 0.02%Yara International A.S.A 42,438 2,235,032 0.02%Norsk Hydro A.S.A 297,223 1,897,624 0.01%Orkla A.S.A 176,865 1,802,522 0.01%Schibsted A.S.A Class A 27,025 1,305,210 0.01%Adevinta A.S.A Class B 66,062 1,266,703 0.01%Gjensidige Forsikring A.S.A 46,852 1,033,388 0.01%Schibsted A.S.A Class B 8,151 339,672 0.00%test test 24,860,726 0.19%Portugal 0.06% (2020: 0.05%)EDP - Energias de Portugal SA 672,898 3,567,014 0.03%
EDP Renovaveis SA 65,351 1,514,345 0.01%Galp Energia SGPS SA 115,164 1,249,916 0.01%Jeronimo Martins SGPS SA 58,115 1,059,968 0.01%Banco Espirito Santo SA 676,875 8 0.00%test test 7,391,251 0.06%Singapore 0.31% (2020: 0.31%)DBS Group Holdings Ltd. 408,864 9,067,279 0.07%Oversea-Chinese Banking Corp., Ltd. 750,467 6,671,686 0.05%
United Overseas Bank Ltd. 276,429 5,309,773 0.04%Singapore Telecommunications Ltd. 1,989,052 3,388,580 0.02%
Ascendas REIT 810,953 1,779,729 0.01%CapitaLand Integrated Commercial Trust REIT 1,118,172 1,738,565 0.01%
.Number of
SharesFair Value
US Dollars ($)% of Total
Net AssetsWilmar International Ltd. 482,375 1,614,855 0.01%CapitaLand Ltd. 571,179 1,576,457 0.01%Singapore Exchange Ltd. 183,182 1,523,564 0.01%Keppel Corp., Ltd. 327,346 1,332,080 0.01%Singapore Airlines Ltd. 343,627 1,239,839 0.01%Venture Corp., Ltd. 64,100 916,055 0.01%Mapletree Logistics Trust REIT 594,256 906,282 0.01%
Singapore Technologies Engineering Ltd. 309,272 890,405 0.01%
Sea Ltd. ADR 3,121 857,027 0.01%Mapletree Commercial Trust REIT 528,700 849,570 0.01%
Genting Singapore Ltd. 1,365,646 848,322 0.01%City Developments Ltd. 119,061 645,703 0.00%UOL Group Ltd. 84,213 457,339 0.00%test test 41,613,110 0.31%Spain 0.72% (2020: 0.73%)Iberdrola SA 1,328,146 16,191,497 0.12%Banco Santander SA 3,953,052 15,092,772 0.11%Banco Bilbao Vizcaya Argentaria SA 1,562,408 9,686,750 0.07%
Industria de Diseno Textil SA 247,019 8,703,242 0.07%Cellnex Telecom SA 117,584 7,490,871 0.06%Amadeus IT Group SA 103,048 7,249,178 0.06%Telefonica SA 1,223,823 5,719,698 0.04%Repsol SA 357,240 4,471,212 0.03%CaixaBank SA 1,026,245 3,156,960 0.03%Ferrovial SA 107,539 3,156,380 0.02%Aena SME SA 17,839 2,925,774 0.02%Red Electrica Corp. SA 99,447 1,846,260 0.02%Grifols SA 67,869 1,838,297 0.02%Endesa SA 71,405 1,732,536 0.01%Siemens Gamesa Renewable Energy SA 51,648 1,724,782 0.01%
Naturgy Energy Group SA 65,279 1,678,343 0.01%Enagas SA 59,137 1,366,494 0.01%ACS Actividades de Construccion y Servicios SA 48,753 1,306,068 0.01%
ACS Actividades de Construccion y Servicios SA - Rights Issue 7/7/2021 48,753 68,223 0.00%
test test 95,405,337 0.72%Sweden 1.09% (2020: 1.01%)Atlas Copco AB Class A 176,723 10,828,020 0.08%Investor AB Class B 427,219 9,853,540 0.07%Nordea Bank Abp 761,407 8,481,099 0.06%Telefonaktiebolaget LM Ericsson Class B 663,040 8,339,024 0.06%
Volvo AB Class B 324,872 7,821,559 0.06%Assa Abloy AB Class B 227,071 6,844,934 0.05%Hexagon AB Class B 455,791 6,757,868 0.05%Sandvik AB 257,122 6,572,250 0.05%Evolution AB 39,488 6,244,461 0.05%Skandinaviska Enskilda Banken AB Class A 384,995 4,976,666 0.04%
Essity AB Class B 143,712 4,769,031 0.04%H&M Hennes & Mauritz AB Class B 166,276 3,946,847 0.03%
Swedbank AB Class A 211,339 3,935,107 0.03%Svenska Handelsbanken AB Class A 343,792 3,881,662 0.03%
Nibe Industrier AB Class B 335,336 3,529,749 0.03%Epiroc AB Class A 152,310 3,472,864 0.03%Swedish Match AB 392,625 3,350,476 0.02%Atlas Copco AB Class B 61,125 3,216,297 0.02%Telia Co. AB 628,309 2,790,313 0.02%Alfa Laval AB 69,798 2,467,208 0.02%Boliden AB 60,532 2,328,657 0.02%Svenska Cellulosa AB SCA Class B 134,965 2,213,343 0.02%
SKF AB Class B 85,342 2,174,427 0.02%

198
Vanguard Global Stock Index Fund
.Number of
SharesFair Value
US Dollars ($)% of Total
Net AssetsIndustrivarden AB Class A 54,930 2,137,557 0.02%Skanska AB Class B 77,173 2,048,406 0.02%Sinch AB 120,980 2,037,046 0.01%Kinnevik AB Class B 50,647 2,028,924 0.01%EQT AB 55,836 2,027,872 0.01%Epiroc AB Class B 93,141 1,829,134 0.01%Lundin Energy AB 50,354 1,782,849 0.01%Embracer Group AB Class B 57,290 1,550,795 0.01%Tele2 AB Class B 111,937 1,526,149 0.01%Husqvarna AB Class B 106,664 1,418,087 0.01%Fastighets AB Balder Class B 22,018 1,382,537 0.01%
Electrolux AB 48,255 1,338,951 0.01%L E Lundbergforetagen AB Class B 20,000 1,291,371 0.01%
Volvo AB Class A 49,767 1,234,842 0.01%Investment AB Latour Class B 32,825 1,077,771 0.01%
ICA Gruppen AB 22,913 1,067,129 0.01%Securitas AB Class B 62,656 989,789 0.01%test test 145,564,611 1.09%Switzerland 2.87% (2020: 2.91%)Nestle SA 662,361 82,563,136 0.62%Roche Holding AG 162,932 61,437,712 0.46%Novartis AG 509,030 46,434,153 0.35%Cie Financiere Richemont SA 119,270 14,445,044 0.11%
Zurich Insurance Group AG 34,079 13,685,427 0.10%ABB Ltd. 398,815 13,543,358 0.10%UBS Group AG 836,312 12,811,357 0.10%Lonza Group AG 16,910 11,997,163 0.09%Sika AG 32,263 10,558,292 0.08%Givaudan SA 2,090 9,729,291 0.07%Alcon, Inc. 117,459 8,231,724 0.06%Partners Group Holding AG 5,217 7,910,018 0.06%Holcim Ltd. 118,138 7,093,264 0.05%Geberit AG 8,764 6,579,992 0.05%Swiss Re AG 69,598 6,285,542 0.05%Credit Suisse Group AG 572,070 5,998,272 0.05%Logitech International SA 40,779 4,945,449 0.04%Sonova Holding AG 12,862 4,842,296 0.04%SGS SA 1,419 4,381,269 0.03%Kuehne + Nagel International AG 12,648 4,332,079 0.03%
Straumann Holding AG 2,472 3,944,610 0.03%Swiss Life Holding AG 7,525 3,660,129 0.03%Swisscom AG 6,210 3,548,571 0.03%Julius Baer Group Ltd. 49,496 3,233,157 0.02%Schindler Holding AG 9,802 3,000,991 0.02%Chocoladefabriken Lindt & Spruengli AG (XSWX) 27 2,830,421 0.02%
Adecco Group AG 37,085 2,521,949 0.02%Swatch Group AG 7,117 2,443,810 0.02%Temenos AG 14,899 2,395,187 0.02%Chocoladefabriken Lindt & Spruengli AG 232 2,310,337 0.02%
Roche Holding AG BR 5,619 2,284,438 0.02%Barry Callebaut AG 880 2,046,844 0.02%EMS-Chemie Holding AG 1,830 1,799,611 0.01%Swiss Prime Site AG 17,434 1,731,423 0.01%Baloise Holding AG 10,083 1,574,054 0.01%Vifor Pharma AG 10,409 1,348,491 0.01%Schindler Holding AG (XSWX) 4,429 1,295,615 0.01%
Clariant AG 44,900 893,774 0.01%Swatch Group AG (XVTX) 8,336 550,563 0.00%Banque Cantonale Vaudoise 6,080 546,598 0.00%test test 381,765,411 2.87%United Kingdom 4.21% (2020: 4.23%)AstraZeneca plc 303,468 36,401,381 0.27%Unilever plc 606,862 35,466,375 0.27%HSBC Holdings plc 4,697,238 27,078,594 0.20%
.Number of
SharesFair Value
US Dollars ($)% of Total
Net AssetsDiageo plc 536,621 25,656,914 0.19%GlaxoSmithKline plc 1,155,188 22,651,274 0.17%Rio Tinto plc 258,850 21,272,929 0.16%BP plc 4,646,926 20,221,412 0.15%British American Tobacco plc 497,278 19,235,011 0.14%
Royal Dutch Shell plc Class A 957,855 19,144,474 0.14%
Royal Dutch Shell plc Class B 834,309 16,124,260 0.12%
Reckitt Benckiser Group plc 162,892 14,394,987 0.11%BHP Group plc 484,276 14,249,765 0.11%Anglo American plc 296,636 11,771,154 0.09%RELX plc 440,325 11,673,027 0.09%Prudential plc 596,944 11,326,544 0.09%Lloyds Banking Group plc 16,125,419 10,400,879 0.08%National Grid plc 816,344 10,384,215 0.08%Vodafone Group plc 6,117,631 10,254,687 0.08%Glencore plc 2,272,171 9,713,297 0.07%Barclays plc 3,941,592 9,317,676 0.07%Compass Group plc 417,632 8,780,992 0.07%Experian plc 216,241 8,322,510 0.06%London Stock Exchange Group plc 73,887 8,135,074 0.06%
Ashtead Group plc 104,750 7,762,077 0.06%Ferguson plc 51,411 7,137,683 0.05%Tesco plc 1,815,206 5,590,730 0.04%BAE Systems plc 750,647 5,413,042 0.04%BT Group plc 2,019,681 5,412,771 0.04%Aviva plc 906,823 5,084,833 0.04%SSE plc 241,091 4,997,493 0.04%Legal & General Group plc 1,363,109 4,850,780 0.04%Imperial Brands plc 220,642 4,745,828 0.04%Smith & Nephew plc 205,092 4,426,943 0.03%Standard Chartered plc 636,083 4,050,885 0.03%Segro plc REIT 263,499 3,984,097 0.03%WPP plc 291,296 3,920,286 0.03%3i Group plc 231,867 3,757,267 0.03%Croda International plc 34,085 3,469,350 0.03%Entain plc 140,399 3,385,470 0.03%Next plc 31,073 3,372,250 0.03%Halma plc 89,852 3,341,473 0.03%Natwest Group plc 1,172,285 3,290,729 0.03%Ocado Group plc 112,386 3,109,770 0.02%Spirax-Sarco Engineering plc 16,489 3,101,324 0.02%Persimmon plc 75,697 3,093,228 0.02%Rentokil Initial plc 435,980 2,981,309 0.02%Mondi plc 113,223 2,973,390 0.02%Intertek Group plc 37,662 2,877,158 0.02%InterContinental Hotels Group plc 42,113 2,798,314 0.02%
Rolls-Royce Holdings plc 1,994,264 2,725,222 0.02%Associated British Foods plc 84,277 2,579,966 0.02%Melrose Industries plc 1,182,863 2,534,436 0.02%Burberry Group plc 86,409 2,466,178 0.02%St James's Place plc 119,659 2,441,524 0.02%Bunzl plc 73,192 2,415,544 0.02%Informa plc 339,642 2,353,499 0.02%Kingfisher plc 455,866 2,295,461 0.02%United Utilities Group plc 170,345 2,292,988 0.02%Sage Group plc 241,830 2,285,748 0.02%Barratt Developments plc 218,503 2,098,468 0.02%WM Morrison Supermarkets plc 613,916 2,092,248 0.02%
Johnson Matthey plc 47,851 2,031,369 0.02%Standard Life Aberdeen plc 536,040 2,006,789 0.02%Whitbread plc 45,343 1,955,592 0.01%Smiths Group plc 88,903 1,952,759 0.01%Admiral Group plc 43,607 1,893,974 0.01%M&G plc 592,733 1,874,304 0.01%Severn Trent plc 53,659 1,853,922 0.01%Auto Trader Group plc 210,834 1,844,819 0.01%

199
Vanguard Global Stock Index Fund
.Number of
SharesFair Value
US Dollars ($)% of Total
Net AssetsPearson plc 160,145 1,836,228 0.01%Taylor Wimpey plc 822,942 1,807,028 0.01%Coca-Cola HBC AG 49,388 1,783,455 0.01%Antofagasta plc 89,324 1,771,359 0.01%Berkeley Group Holdings plc 27,025 1,715,483 0.01%Hargreaves Lansdown plc 75,465 1,656,550 0.01%DCC plc 20,083 1,641,870 0.01%J Sainsbury plc 411,522 1,545,175 0.01%JD Sports Fashion plc 121,698 1,545,020 0.01%Land Securities Group plc REIT 160,731 1,499,671 0.01%
Phoenix Group Holdings plc 156,104 1,458,656 0.01%Schroders plc 28,393 1,377,922 0.01%British Land Co. plc REIT 198,835 1,359,394 0.01%Hikma Pharmaceuticals plc 38,577 1,303,527 0.01%AVEVA Group plc 25,083 1,284,856 0.01%Direct Line Insurance Group plc 303,424 1,194,620 0.01%
Evraz plc 117,083 957,526 0.01%test test 560,639,061 4.21%United States 67.35% (2020: 64.47%)Apple, Inc. 3,862,167 528,962,392 3.98%Microsoft Corp. 1,648,667 446,623,890 3.36%Amazon.com, Inc. 98,482 338,793,837 2.55%Facebook, Inc. Class A 553,317 192,393,854 1.45%Alphabet, Inc. Class A 69,747 170,307,527 1.28%Alphabet, Inc. Class C 67,278 168,620,197 1.27%Tesla, Inc. 176,678 120,088,037 0.90%NVIDIA Corp. 142,343 113,888,634 0.86%JPMorgan Chase & Co. 702,595 109,281,626 0.82%Johnson & Johnson 605,259 99,710,368 0.75%Visa, Inc. Class A 390,728 91,360,021 0.69%Berkshire Hathaway, Inc. Class B 316,849 88,058,674 0.66%
UnitedHealth Group, Inc. 218,632 87,548,998 0.66%Home Depot, Inc. 248,409 79,215,146 0.60%Procter & Gamble Co. 568,285 76,678,695 0.58%PayPal Holdings, Inc. 256,023 74,625,584 0.56%Mastercard, Inc. Class A 204,254 74,571,093 0.56%Bank of America Corp. 1,788,761 73,750,616 0.55%Walt Disney Co. 417,899 73,454,107 0.55%Adobe, Inc. 110,033 64,439,726 0.48%Exxon Mobil Corp. 969,775 61,173,407 0.46%Comcast Corp. Class A 1,052,080 59,989,602 0.45%Netflix, Inc. 101,956 53,854,179 0.40%Verizon Communications, Inc. 953,597 53,430,040 0.40%
Intel Corp. 934,307 52,451,995 0.39%Salesforce.com, Inc. 211,058 51,555,138 0.39%Cisco Systems, Inc. 971,770 51,503,810 0.39%Coca-Cola Co. 943,294 51,041,638 0.38%Walmart, Inc. 358,602 50,570,054 0.38%Pfizer, Inc. 1,283,457 50,260,176 0.38%Abbott Laboratories 407,404 47,230,346 0.36%AT&T, Inc. 1,639,944 47,197,588 0.35%PepsiCo, Inc. 317,026 46,973,742 0.35%Chevron Corp. 442,469 46,344,203 0.35%AbbVie, Inc. 405,596 45,686,333 0.34%Thermo Fisher Scientific, Inc. 90,469 45,638,896 0.34%
Merck & Co., Inc. 582,080 45,268,362 0.34%NIKE, Inc. Class B 291,387 45,016,378 0.34%Broadcom, Inc. 93,880 44,765,739 0.34%Wells Fargo & Co. 949,773 43,015,219 0.32%Eli Lilly & Co. 187,214 42,969,357 0.32%Accenture plc Class A 145,645 42,934,690 0.32%Texas Instruments, Inc. 211,533 40,677,796 0.31%Costco Wholesale Corp. 101,785 40,273,271 0.30%Danaher Corp. 147,115 39,479,781 0.30%McDonald's Corp. 170,837 39,461,639 0.30%Medtronic plc 309,342 38,398,622 0.29%QUALCOMM, Inc. 260,781 37,273,428 0.28%
.Number of
SharesFair Value
US Dollars ($)% of Total
Net AssetsPhilip Morris International, Inc. 359,561 35,636,091 0.27%
Linde plc 121,060 34,998,446 0.26%Honeywell International, Inc. 159,529 34,992,686 0.26%United Parcel Service, Inc. Class B 165,141 34,344,374 0.26%
Bristol-Myers Squibb Co. 513,864 34,336,392 0.26%Oracle Corp. 440,000 34,249,600 0.26%Citigroup, Inc. 477,137 33,757,443 0.25%Union Pacific Corp. 153,309 33,717,248 0.25%NextEra Energy, Inc. 450,055 32,980,030 0.25%Lowe's Cos, Inc. 167,466 32,483,380 0.24%Amgen, Inc. 132,391 32,270,306 0.24%Intuit, Inc. 62,807 30,786,107 0.23%Boeing Co. 127,942 30,649,786 0.23%BlackRock, Inc. Class A 34,934 30,566,202 0.23%Starbucks Corp. 271,569 30,364,130 0.23%International Business Machines Corp. 206,688 30,298,394 0.23%
Goldman Sachs Group, Inc. 79,191 30,055,360 0.23%Applied Materials, Inc. 210,331 29,951,134 0.23%Raytheon Technologies Corp. 350,266 29,881,192 0.22%
Morgan Stanley 323,375 29,650,254 0.22%American Tower Corp. REIT 102,447 27,675,033 0.21%Target Corp. 114,462 27,670,044 0.21%Caterpillar, Inc. 124,945 27,191,780 0.20%General Electric Co. 2,006,502 27,007,517 0.20%3M Co. 133,604 26,537,763 0.20%Advanced Micro Devices, Inc. 280,286 26,327,264 0.20%
American Express Co. 157,902 26,090,147 0.20%CVS Health Corp. 302,723 25,259,207 0.19%Intuitive Surgical, Inc. 27,191 25,005,931 0.19%ServiceNow, Inc. 45,214 24,847,354 0.19%Deere & Co. 68,950 24,319,354 0.18%Charles Schwab Corp. 333,708 24,297,279 0.18%S&P Global, Inc. 55,416 22,745,497 0.17%Charter Communications, Inc. Class A 31,259 22,551,806 0.17%
Micron Technology, Inc. 258,427 21,961,126 0.17%Square, Inc. Class A 90,034 21,950,289 0.17%Lockheed Martin Corp. 57,685 21,825,120 0.16%Anthem, Inc. 56,370 21,522,066 0.16%Lam Research Corp. 33,051 21,506,286 0.16%T-Mobile US, Inc. 143,221 20,742,697 0.16%Booking Holdings, Inc. 9,446 20,668,698 0.16%Zoetis, Inc. Class A 109,461 20,399,152 0.15%Altria Group, Inc. 427,201 20,368,944 0.15%Prologis, Inc. REIT 169,596 20,271,810 0.15%Mondelez International, Inc. Class A 323,677 20,210,392 0.15%
Fidelity National Information Services, Inc. 142,643 20,208,234 0.15%
Stryker Corp. 77,740 20,191,410 0.15%Gilead Sciences, Inc. 289,664 19,946,263 0.15%Automatic Data Processing, Inc. 98,127 19,489,985 0.15%
Crown Castle International Corp. REIT 99,152 19,344,555 0.15%
Cigna Corp. 80,766 19,147,196 0.14%ConocoPhillips 308,578 18,792,400 0.14%US Bancorp 328,167 18,695,674 0.14%TJX Cos, Inc. 276,244 18,624,370 0.14%PNC Financial Services Group, Inc. 97,425 18,584,793 0.14%
Zoom Video Communications, Inc. Class A 47,053 18,210,923 0.14%
General Motors Co. 299,359 17,713,072 0.13%CME Group, Inc. Class A 82,248 17,492,505 0.13%Duke Energy Corp. 176,175 17,391,996 0.13%FedEx Corp. 57,999 17,302,842 0.13%

200
Vanguard Global Stock Index Fund
.Number of
SharesFair Value
US Dollars ($)% of Total
Net AssetsTruist Financial Corp. 308,927 17,145,449 0.13%Moderna, Inc. 72,830 17,113,593 0.13%Activision Blizzard, Inc. 178,327 17,019,529 0.13%CSX Corp. 523,980 16,809,278 0.13%Estee Lauder Cos, Inc. Class A 52,771 16,785,400 0.13%
Equinix, Inc. REIT 20,499 16,452,497 0.12%Chubb Ltd. 103,304 16,419,138 0.12%Marsh & McLennan Cos, Inc. 116,230 16,351,236 0.12%
Capital One Financial Corp. 105,594 16,334,336 0.12%Illinois Tool Works, Inc. 72,679 16,248,117 0.12%Becton Dickinson & Co. 66,525 16,178,215 0.12%MercadoLibre, Inc. 10,312 16,063,930 0.12%Sherwin-Williams Co. 58,851 16,033,955 0.12%Illumina, Inc. 33,481 15,843,544 0.12%Norfolk Southern Corp. 58,023 15,399,884 0.12%Intercontinental Exchange, Inc. 128,225 15,220,308 0.11%
Blackstone Group, Inc. Class A 156,597 15,211,833 0.11%
Colgate-Palmolive Co. 185,569 15,096,038 0.11%Edwards Lifesciences Corp. 143,016 14,812,167 0.11%Autodesk, Inc. 50,637 14,780,940 0.11%Snap, Inc. Class A 216,273 14,736,842 0.11%Fiserv, Inc. 137,509 14,698,337 0.11%Southern Co. 241,481 14,612,015 0.11%Air Products & Chemicals, Inc. 50,582 14,551,430 0.11%
Analog Devices, Inc. 84,410 14,532,026 0.11%Twilio, Inc. Class A 36,635 14,440,052 0.11%Moody's Corp. 38,271 13,868,262 0.10%Uber Technologies, Inc. 276,081 13,837,180 0.10%Boston Scientific Corp. 323,514 13,833,459 0.10%Dominion Energy, Inc. 186,743 13,738,683 0.10%Eaton Corp. plc 91,363 13,538,169 0.10%Waste Management, Inc. 96,541 13,526,360 0.10%Regeneron Pharmaceuticals, Inc. 23,965 13,385,411 0.10%
Ford Motor Co. 894,926 13,298,600 0.10%Emerson Electric Co. 137,502 13,233,192 0.10%Progressive Corp. 133,914 13,151,694 0.10%NXP Semiconductors NV 63,675 13,099,221 0.10%Northrop Grumman Corp. 36,014 13,088,568 0.10%Humana, Inc. 29,322 12,981,436 0.10%HCA Healthcare, Inc. 62,063 12,830,905 0.10%Global Payments, Inc. 67,245 12,611,127 0.09%Twitter, Inc. 182,587 12,563,811 0.09%IDEXX Laboratories, Inc. 19,814 12,513,532 0.09%Freeport-McMoRan, Inc. 335,670 12,456,714 0.09%Aon plc Class A 51,453 12,284,918 0.09%Dollar General Corp. 56,652 12,258,926 0.09%Biogen, Inc. 35,091 12,150,961 0.09%Ecolab, Inc. 58,801 12,111,242 0.09%DocuSign, Inc. Class A 42,907 11,995,510 0.09%Vertex Pharmaceuticals, Inc. 59,452 11,987,307 0.09%Newmont Corp. 183,791 11,648,674 0.09%Roku, Inc. Class A 25,325 11,630,506 0.09%KLA Corp. 35,306 11,446,558 0.09%Johnson Controls International plc 164,891 11,316,469 0.09%
Roper Technologies, Inc. 23,805 11,193,111 0.08%EOG Resources, Inc. 133,407 11,131,480 0.08%eBay, Inc. 156,983 11,021,776 0.08%Public Storage REIT 35,844 10,777,932 0.08%Dow, Inc. 169,735 10,740,831 0.08%Marvell Technology, Inc. 182,525 10,646,683 0.08%IQVIA Holdings, Inc. 43,691 10,587,203 0.08%Schlumberger NV 327,121 10,471,143 0.08%Align Technology, Inc. 17,123 10,462,153 0.08%MetLife, Inc. 174,048 10,416,773 0.08%General Dynamics Corp. 55,060 10,365,596 0.08%
.Number of
SharesFair Value
US Dollars ($)% of Total
Net AssetsKimberly-Clark Corp. 77,007 10,301,996 0.08%L3Harris Technologies, Inc. 47,635 10,296,305 0.08%Crowdstrike Holdings, Inc. Class A 40,877 10,272,799 0.08%
Lululemon Athletica, Inc. 28,142 10,270,986 0.08%Agilent Technologies, Inc. 69,181 10,225,644 0.08%T Rowe Price Group, Inc. 51,566 10,208,521 0.08%TE Connectivity Ltd. 75,393 10,193,888 0.08%MSCI, Inc. Class A 18,899 10,074,679 0.08%Ross Stores, Inc. 81,074 10,053,176 0.08%Trane Technologies plc 54,510 10,037,471 0.08%Centene Corp. 136,185 9,931,972 0.07%Chipotle Mexican Grill, Inc. Class A 6,396 9,915,975 0.07%
Bank of New York Mellon Corp. 193,458 9,910,853 0.07%
Veeva Systems, Inc. Class A 31,628 9,834,727 0.07%Exelon Corp. 221,534 9,816,172 0.07%Workday, Inc. Class A 41,093 9,810,543 0.07%Pinterest, Inc. Class A 123,920 9,783,484 0.07%Simon Property Group, Inc. REIT 74,923 9,775,953 0.07%
DuPont de Nemours, Inc. 125,952 9,749,944 0.07%Aptiv plc 61,493 9,674,694 0.07%IHS Markit Ltd. 85,696 9,654,511 0.07%American International Group, Inc. 201,961 9,613,344 0.07%
Synopsys, Inc. 34,852 9,611,833 0.07%Sempra Energy 72,404 9,592,082 0.07%Digital Realty Trust, Inc. REIT 63,524 9,557,821 0.07%
Dexcom, Inc. 22,333 9,536,191 0.07%Prudential Financial, Inc. 92,899 9,519,361 0.07%American Electric Power Co., Inc. 112,518 9,517,898 0.07%
Electronic Arts, Inc. 65,474 9,417,125 0.07%PPG Industries, Inc. 55,466 9,416,463 0.07%Match Group, Inc. 58,029 9,357,176 0.07%O'Reilly Automotive, Inc. 16,491 9,337,369 0.07%Constellation Brands, Inc. Class A 39,899 9,331,977 0.07%
Amphenol Corp. Class A 135,555 9,273,318 0.07%Marathon Petroleum Corp. 153,257 9,259,788 0.07%Allstate Corp. 70,843 9,240,761 0.07%Baxter International, Inc. 114,383 9,207,831 0.07%Alexion Pharmaceuticals, Inc. 50,032 9,191,379 0.07%
Microchip Technology, Inc. 61,285 9,176,816 0.07%Carrier Global Corp. 187,377 9,106,522 0.07%Sysco Corp. 115,845 9,006,949 0.07%Parker-Hannifin Corp. 29,312 9,002,008 0.07%Walgreens Boots Alliance, Inc. 167,370 8,805,336 0.07%
Cadence Design Systems, Inc. 63,353 8,667,957 0.07%
Marriott International, Inc. Class A 62,859 8,581,511 0.06%
Travelers Cos, Inc. 57,198 8,563,113 0.06%HP, Inc. 283,383 8,555,333 0.06%International Flavors & Fragrances, Inc. 57,016 8,518,190 0.06%
General Mills, Inc. 138,650 8,447,944 0.06%Cognizant Technology Solutions Corp. Class A 121,575 8,420,284 0.06%
Phillips 66 97,814 8,394,397 0.06%Xilinx, Inc. 57,789 8,358,601 0.06%Motorola Solutions, Inc. 38,503 8,349,376 0.06%Palo Alto Networks, Inc. 22,461 8,334,154 0.06%Kinder Morgan, Inc. 456,287 8,318,112 0.06%Cintas Corp. 21,725 8,298,950 0.06%Xcel Energy, Inc. 125,651 8,277,888 0.06%Discover Financial Services 69,798 8,256,405 0.06%Monster Beverage Corp. 89,677 8,191,994 0.06%
201
Vanguard Global Stock Index Fund
.Number of
SharesFair Value
US Dollars ($)% of Total
Net AssetsResMed, Inc. 33,045 8,146,253 0.06%Cummins, Inc. 33,410 8,145,692 0.06%Aflac, Inc. 151,682 8,139,256 0.06%SBA Communications Corp. REIT Class A 25,238 8,043,351 0.06%
Paychex, Inc. 73,779 7,916,487 0.06%AutoZone, Inc. 5,267 7,859,523 0.06%TransDigm Group, Inc. 12,140 7,858,101 0.06%Zimmer Biomet Holdings, Inc. 48,842 7,854,770 0.06%
Yum! Brands, Inc. 68,229 7,848,382 0.06%Welltower, Inc. REIT 94,098 7,819,544 0.06%Otis Worldwide Corp. 94,935 7,762,835 0.06%Archer-Daniels-Midland Co. 126,193 7,647,296 0.06%Trade Desk, Inc. Class A 98,820 7,644,715 0.06%Mettler-Toledo International, Inc. 5,514 7,638,765 0.06%
Hilton Worldwide Holdings, Inc. 63,207 7,624,028 0.06%
Williams Cos, Inc. 286,751 7,613,239 0.06%Pioneer Natural Resources Co. 46,778 7,602,361 0.06%
Fortinet, Inc. 31,893 7,596,594 0.06%Rockwell Automation, Inc. 26,489 7,576,384 0.06%Corteva, Inc. 169,340 7,510,229 0.06%Stanley Black & Decker, Inc. 36,311 7,443,392 0.06%Valero Energy Corp. 94,549 7,382,386 0.06%CoStar Group, Inc. 89,040 7,374,293 0.06%First Republic Bank 39,316 7,358,776 0.06%KKR & Co., Inc. 122,233 7,241,083 0.05%Skyworks Solutions, Inc. 37,675 7,224,181 0.05%Peloton Interactive, Inc. Class A 58,062 7,200,849 0.05%
McKesson Corp. 37,157 7,105,905 0.05%Corning, Inc. 173,261 7,086,375 0.05%DR Horton, Inc. 78,149 7,062,325 0.05%PACCAR, Inc. 78,644 7,018,977 0.05%AMETEK, Inc. 52,453 7,002,475 0.05%Fastenal Co. 132,822 6,906,744 0.05%Public Service Enterprise Group, Inc. 114,740 6,854,568 0.05%
ANSYS, Inc. 19,617 6,808,276 0.05%Ameriprise Financial, Inc. 27,150 6,757,092 0.05%Willis Towers Watson plc 29,276 6,734,066 0.05%Occidental Petroleum Corp. 215,043 6,724,395 0.05%Okta, Inc. Class A 27,237 6,664,349 0.05%Liberty Broadband Corp. Class C 38,374 6,664,029 0.05%
Keysight Technologies, Inc. 42,959 6,633,299 0.05%Copart, Inc. 50,313 6,632,763 0.05%EPAM Systems, Inc. 12,965 6,624,596 0.05%Equifax, Inc. 27,640 6,620,056 0.05%Synchrony Financial 135,892 6,593,480 0.05%State Street Corp. 79,819 6,567,507 0.05%Nucor Corp. 68,391 6,560,749 0.05%CBRE Group, Inc. Class A 76,291 6,540,427 0.05%AvalonBay Communities, Inc. REIT 31,322 6,536,588 0.05%
SVB Financial Group 11,736 6,530,262 0.05%Zebra Technologies Corp. Class A 12,297 6,511,139 0.05%
Maxim Integrated Products, Inc. 61,617 6,491,967 0.05%
WEC Energy Group, Inc. 71,867 6,392,570 0.05%American Water Works Co., Inc. 41,315 6,367,881 0.05%
Kroger Co. 165,567 6,342,872 0.05%Kraft Heinz Co. 155,538 6,342,840 0.05%VF Corp. 77,131 6,327,827 0.05%LyondellBasell Industries NV Class A 61,477 6,324,139 0.05%
Fifth Third Bancorp 164,672 6,295,411 0.05%Arthur J Gallagher & Co. 44,537 6,238,743 0.05%
.Number of
SharesFair Value
US Dollars ($)% of Total
Net AssetsLaboratory Corp. of America Holdings 22,564 6,224,279 0.05%
Verisk Analytics, Inc. Class A 35,545 6,210,422 0.05%
Eversource Energy 77,383 6,209,212 0.05%Lennar Corp. Class A 62,248 6,184,339 0.05%Equity Residential REIT 80,272 6,180,944 0.05%West Pharmaceutical Services, Inc. 17,203 6,177,597 0.05%
Best Buy Co., Inc. 52,840 6,075,543 0.05%Generac Holdings, Inc. 14,529 6,031,714 0.05%Ball Corp. 74,332 6,022,379 0.05%Dell Technologies, Inc. Class C 60,303 6,010,400 0.05%
Kansas City Southern 20,975 5,943,686 0.04%Etsy, Inc. 28,821 5,932,515 0.04%Realty Income Corp. REIT 88,099 5,879,727 0.04%HubSpot, Inc. 10,021 5,839,437 0.04%ViacomCBS, Inc. Class B 129,128 5,836,586 0.04%Old Dominion Freight Line, Inc. 22,954 5,825,725 0.04%
CDW Corp. 33,105 5,781,788 0.04%Weyerhaeuser Co. REIT 167,860 5,777,741 0.04%DTE Energy Co. 44,454 5,761,238 0.04%Keurig Dr Pepper, Inc. 163,294 5,754,481 0.04%Hershey Co. 32,960 5,740,973 0.04%Hess Corp. 65,502 5,719,635 0.04%ONEOK, Inc. 102,433 5,699,372 0.04%Republic Services, Inc. Class A 51,211 5,633,722 0.04%
Alexandria Real Estate Equities, Inc. REIT 30,665 5,579,190 0.04%
Splunk, Inc. 38,457 5,560,113 0.04%Cerner Corp. 70,820 5,535,291 0.04%Consolidated Edison, Inc. 76,980 5,521,006 0.04%VeriSign, Inc. 24,162 5,501,446 0.04%Dollar Tree, Inc. 54,670 5,439,665 0.04%Brown-Forman Corp. Class B 72,360 5,422,658 0.04%
Vulcan Materials Co. 31,138 5,420,192 0.04%International Paper Co. 87,859 5,386,635 0.04%Cloudflare, Inc. Class A 50,873 5,384,398 0.04%Northern Trust Corp. 45,725 5,286,725 0.04%United Rentals, Inc. 16,554 5,280,892 0.04%Fortive Corp. 75,604 5,272,623 0.04%Clorox Co. 29,288 5,269,204 0.04%Wayfair, Inc. Class A 16,657 5,258,781 0.04%Hartford Financial Services Group, Inc. 84,614 5,243,530 0.04%
RingCentral, Inc. Class A 17,896 5,200,220 0.04%Expedia Group, Inc. 31,683 5,186,824 0.04%Qorvo, Inc. 26,365 5,158,312 0.04%Dover Corp. 34,162 5,144,797 0.04%Xylem, Inc. 42,853 5,140,646 0.04%Teradyne, Inc. 38,360 5,138,706 0.04%Martin Marietta Materials, Inc. 14,589 5,132,556 0.04%
Tyson Foods, Inc. Class A 69,542 5,129,418 0.04%Tractor Supply Co. 27,485 5,113,859 0.04%Gartner, Inc. 21,023 5,091,771 0.04%McCormick & Co., Inc. 57,540 5,081,933 0.04%Enphase Energy, Inc. 27,640 5,075,533 0.04%Edison International 87,764 5,074,514 0.04%Extra Space Storage, Inc. REIT 30,862 5,055,813 0.04%
Teladoc Health, Inc. 30,395 5,054,385 0.04%Expeditors International of Washington, Inc. 39,910 5,052,606 0.04%
TransUnion 45,532 4,999,869 0.04%Carnival Corp. 189,059 4,983,595 0.04%Ventas, Inc. REIT 87,069 4,971,640 0.04%Invitation Homes, Inc. REIT 133,189 4,966,618 0.04%Garmin Ltd. 34,267 4,956,379 0.04%

202
Vanguard Global Stock Index Fund
.Number of
SharesFair Value
US Dollars ($)% of Total
Net AssetsCaesars Entertainment, Inc. 47,611 4,939,641 0.04%Huntington Bancshares, Inc. 345,403 4,928,901 0.04%Seagen, Inc. 31,185 4,923,488 0.04%Exact Sciences Corp. 39,598 4,922,427 0.04%Waters Corp. 14,236 4,920,104 0.04%Arista Networks, Inc. 13,556 4,911,474 0.04%CarMax, Inc. 38,008 4,908,733 0.04%Western Digital Corp. 68,338 4,863,615 0.04%Carvana Co. Class A 16,103 4,860,207 0.04%Church & Dwight Co., Inc. 56,983 4,856,091 0.04%Slack Technologies, Inc. Class A 109,164 4,835,965 0.04%
PPL Corp. 171,648 4,800,995 0.04%FirstEnergy Corp. 128,275 4,773,113 0.04%Halliburton Co. 206,119 4,765,471 0.04%KeyCorp 230,438 4,758,545 0.04%Nasdaq, Inc. 27,053 4,755,917 0.04%Burlington Stores, Inc. 14,674 4,724,881 0.04%Cheniere Energy, Inc. 54,464 4,724,207 0.04%MongoDB, Inc. Class A 13,022 4,707,713 0.04%Entergy Corp. 47,195 4,705,341 0.04%Take-Two Interactive Software, Inc. 26,530 4,696,341 0.04%
STERIS plc 22,713 4,685,692 0.04%Alnylam Pharmaceuticals, Inc. 27,493 4,660,613 0.04%
Royal Caribbean Cruises Ltd. 54,555 4,652,450 0.04%
Novocure Ltd. 20,860 4,627,165 0.04%Essex Property Trust, Inc. REIT 15,404 4,621,354 0.03%
Teledyne Technologies, Inc. 10,916 4,571,948 0.03%Ameren Corp. 57,104 4,570,604 0.03%Mid-America Apartment Communities, Inc. REIT 27,131 4,569,403 0.03%
Citizens Financial Group, Inc. 99,324 4,555,992 0.03%
Trimble, Inc. 55,661 4,554,740 0.03%FleetCor Technologies, Inc. 17,738 4,541,992 0.03%Horizon Therapeutics plc 48,361 4,528,524 0.03%Regions Financial Corp. 223,998 4,520,280 0.03%Darden Restaurants, Inc. 30,877 4,507,733 0.03%Akamai Technologies, Inc. 38,616 4,502,626 0.03%WW Grainger, Inc. 10,162 4,450,956 0.03%Zillow Group, Inc. Class C 36,321 4,439,153 0.03%Avantor, Inc. 124,972 4,437,756 0.03%Albemarle Corp. 26,334 4,436,226 0.03%Broadridge Financial Solutions, Inc. 27,421 4,429,314 0.03%
Teleflex, Inc. 11,018 4,426,922 0.03%Cooper Cos, Inc. 11,156 4,420,788 0.03%Hewlett Packard Enterprise Co. 302,065 4,404,108 0.03%
Pool Corp. 9,592 4,399,467 0.03%Ingersoll Rand, Inc. 90,114 4,398,464 0.03%Ulta Beauty, Inc. 12,668 4,380,214 0.03%Coupa Software, Inc. 16,562 4,341,066 0.03%M&T Bank Corp. 29,682 4,313,091 0.03%Tyler Technologies, Inc. 9,504 4,299,324 0.03%Seagate Technology Holdings plc 48,784 4,289,577 0.03%
Sun Communities, Inc. REIT 24,875 4,263,575 0.03%Conagra Brands, Inc. 116,463 4,236,924 0.03%Devon Energy Corp. 144,586 4,220,465 0.03%Paycom Software, Inc. 11,585 4,210,800 0.03%Insulet Corp. 15,246 4,185,179 0.03%AmerisourceBergen Corp. Class A 36,531 4,182,434 0.03%
Charles River Laboratories International, Inc. 11,298 4,179,356 0.03%
Healthpeak Properties, Inc. REIT 125,199 4,167,875 0.03%
PerkinElmer, Inc. 26,930 4,158,261 0.03%
.Number of
SharesFair Value
US Dollars ($)% of Total
Net AssetsLas Vegas Sands Corp. 78,904 4,157,452 0.03%Ally Financial, Inc. 83,199 4,146,638 0.03%MarketAxess Holdings, Inc. 8,919 4,134,759 0.03%Catalent, Inc. 38,216 4,131,914 0.03%Datadog, Inc. Class A 39,657 4,127,501 0.03%Jacobs Engineering Group, Inc. 30,928 4,126,414 0.03%
Omnicom Group, Inc. 51,368 4,108,926 0.03%Domino's Pizza, Inc. 8,774 4,092,983 0.03%Avery Dennison Corp. 19,450 4,089,168 0.03%NVR, Inc. 822 4,088,053 0.03%Boston Properties, Inc. REIT 35,402 4,056,715 0.03%Genuine Parts Co. 32,056 4,054,122 0.03%NetApp, Inc. 49,521 4,051,808 0.03%Duke Realty Corp. REIT 85,567 4,051,597 0.03%CMS Energy Corp. 68,445 4,043,731 0.03%Plug Power, Inc. 117,718 4,024,778 0.03%Baker Hughes Co. Class A 175,650 4,017,115 0.03%AES Corp. 153,849 4,010,843 0.03%Zscaler, Inc. 18,540 4,005,752 0.03%Viatris, Inc. 280,208 4,004,172 0.03%IDEX Corp. 18,113 3,985,766 0.03%Cardinal Health, Inc. 69,693 3,978,773 0.03%Hologic, Inc. 59,429 3,965,103 0.03%Kellogg Co. 61,562 3,960,283 0.03%Bio-Techne Corp. 8,769 3,948,330 0.03%Cincinnati Financial Corp. 33,781 3,939,540 0.03%VICI Properties, Inc. REIT 126,965 3,938,454 0.03%Celanese Corp. Class A 25,896 3,925,834 0.03%Markel Corp. 3,294 3,909,023 0.03%Zendesk, Inc. 27,052 3,904,686 0.03%SS&C Technologies Holdings, Inc. 54,156 3,902,481 0.03%
Quest Diagnostics, Inc. 29,511 3,894,567 0.03%Monolithic Power Systems, Inc. 10,368 3,871,930 0.03%
L Brands, Inc. 53,620 3,863,857 0.03%Principal Financial Group, Inc. 60,646 3,832,221 0.03%
MGM Resorts International 89,518 3,817,943 0.03%Eastman Chemical Co. 32,528 3,797,644 0.03%Textron, Inc. 54,724 3,763,369 0.03%Incyte Corp. 44,674 3,758,424 0.03%Arch Capital Group Ltd. 96,378 3,752,959 0.03%Raymond James Financial, Inc. 28,883 3,751,902 0.03%
ON Semiconductor Corp. 97,840 3,745,315 0.03%NortonLifeLock, Inc. 137,456 3,741,552 0.03%PTC, Inc. 26,363 3,724,037 0.03%BioMarin Pharmaceutical, Inc. 43,844 3,658,343 0.03%
Elanco Animal Health, Inc. 102,492 3,555,447 0.03%PG&E Corp. 347,398 3,533,038 0.03%GoDaddy, Inc. Class A 40,201 3,495,879 0.03%Lyft, Inc. Class A 57,327 3,467,137 0.03%UDR, Inc. REIT 70,372 3,446,821 0.03%HEICO Corp. Class A 27,743 3,445,126 0.03%Fair Isaac Corp. 6,833 3,434,812 0.03%ABIOMED, Inc. 10,975 3,425,407 0.03%FMC Corp. 31,343 3,391,313 0.03%Masco Corp. 57,472 3,385,676 0.03%Cognex Corp. 40,119 3,372,002 0.03%Novavax, Inc. 15,873 3,369,997 0.03%10X Genomics, Inc. Class A 17,170 3,362,229 0.03%SolarEdge Technologies, Inc. 12,089 3,341,037 0.03%Bio-Rad Laboratories, Inc. Class A 5,135 3,308,429 0.03%
Citrix Systems, Inc. 28,134 3,299,274 0.03%Westrock Co. 61,634 3,280,161 0.02%Molina Healthcare, Inc. 12,916 3,268,523 0.02%Crown Holdings, Inc. 31,913 3,261,828 0.02%DENTSPLY SIRONA, Inc. 51,429 3,253,399 0.02%
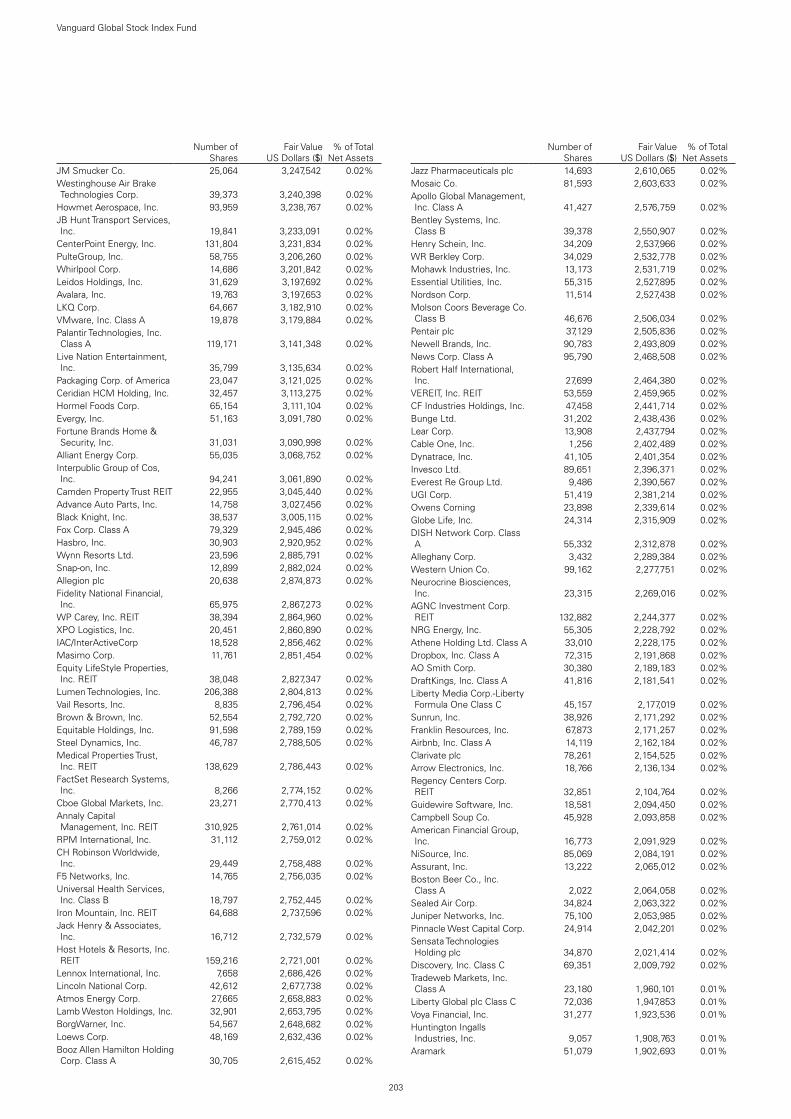
203
Vanguard Global Stock Index Fund
.Number of
SharesFair Value
US Dollars ($)% of Total
Net AssetsJM Smucker Co. 25,064 3,247,542 0.02%Westinghouse Air Brake Technologies Corp. 39,373 3,240,398 0.02%
Howmet Aerospace, Inc. 93,959 3,238,767 0.02%JB Hunt Transport Services, Inc. 19,841 3,233,091 0.02%
CenterPoint Energy, Inc. 131,804 3,231,834 0.02%PulteGroup, Inc. 58,755 3,206,260 0.02%Whirlpool Corp. 14,686 3,201,842 0.02%Leidos Holdings, Inc. 31,629 3,197,692 0.02%Avalara, Inc. 19,763 3,197,653 0.02%LKQ Corp. 64,667 3,182,910 0.02%VMware, Inc. Class A 19,878 3,179,884 0.02%Palantir Technologies, Inc. Class A 119,171 3,141,348 0.02%
Live Nation Entertainment, Inc. 35,799 3,135,634 0.02%
Packaging Corp. of America 23,047 3,121,025 0.02%Ceridian HCM Holding, Inc. 32,457 3,113,275 0.02%Hormel Foods Corp. 65,154 3,111,104 0.02%Evergy, Inc. 51,163 3,091,780 0.02%Fortune Brands Home & Security, Inc. 31,031 3,090,998 0.02%
Alliant Energy Corp. 55,035 3,068,752 0.02%Interpublic Group of Cos, Inc. 94,241 3,061,890 0.02%
Camden Property Trust REIT 22,955 3,045,440 0.02%Advance Auto Parts, Inc. 14,758 3,027,456 0.02%Black Knight, Inc. 38,537 3,005,115 0.02%Fox Corp. Class A 79,329 2,945,486 0.02%Hasbro, Inc. 30,903 2,920,952 0.02%Wynn Resorts Ltd. 23,596 2,885,791 0.02%Snap-on, Inc. 12,899 2,882,024 0.02%Allegion plc 20,638 2,874,873 0.02%Fidelity National Financial, Inc. 65,975 2,867,273 0.02%
WP Carey, Inc. REIT 38,394 2,864,960 0.02%XPO Logistics, Inc. 20,451 2,860,890 0.02%IAC/InterActiveCorp 18,528 2,856,462 0.02%Masimo Corp. 11,761 2,851,454 0.02%Equity LifeStyle Properties, Inc. REIT 38,048 2,827,347 0.02%
Lumen Technologies, Inc. 206,388 2,804,813 0.02%Vail Resorts, Inc. 8,835 2,796,454 0.02%Brown & Brown, Inc. 52,554 2,792,720 0.02%Equitable Holdings, Inc. 91,598 2,789,159 0.02%Steel Dynamics, Inc. 46,787 2,788,505 0.02%Medical Properties Trust, Inc. REIT 138,629 2,786,443 0.02%
FactSet Research Systems, Inc. 8,266 2,774,152 0.02%
Cboe Global Markets, Inc. 23,271 2,770,413 0.02%Annaly Capital Management, Inc. REIT 310,925 2,761,014 0.02%
RPM International, Inc. 31,112 2,759,012 0.02%CH Robinson Worldwide, Inc. 29,449 2,758,488 0.02%
F5 Networks, Inc. 14,765 2,756,035 0.02%Universal Health Services, Inc. Class B 18,797 2,752,445 0.02%
Iron Mountain, Inc. REIT 64,688 2,737,596 0.02%Jack Henry & Associates, Inc. 16,712 2,732,579 0.02%
Host Hotels & Resorts, Inc. REIT 159,216 2,721,001 0.02%
Lennox International, Inc. 7,658 2,686,426 0.02%Lincoln National Corp. 42,612 2,677,738 0.02%Atmos Energy Corp. 27,665 2,658,883 0.02%Lamb Weston Holdings, Inc. 32,901 2,653,795 0.02%BorgWarner, Inc. 54,567 2,648,682 0.02%Loews Corp. 48,169 2,632,436 0.02%Booz Allen Hamilton Holding Corp. Class A 30,705 2,615,452 0.02%
.Number of
SharesFair Value
US Dollars ($)% of Total
Net AssetsJazz Pharmaceuticals plc 14,693 2,610,065 0.02%Mosaic Co. 81,593 2,603,633 0.02%Apollo Global Management, Inc. Class A 41,427 2,576,759 0.02%
Bentley Systems, Inc. Class B 39,378 2,550,907 0.02%
Henry Schein, Inc. 34,209 2,537,966 0.02%WR Berkley Corp. 34,029 2,532,778 0.02%Mohawk Industries, Inc. 13,173 2,531,719 0.02%Essential Utilities, Inc. 55,315 2,527,895 0.02%Nordson Corp. 11,514 2,527,438 0.02%Molson Coors Beverage Co. Class B 46,676 2,506,034 0.02%
Pentair plc 37,129 2,505,836 0.02%Newell Brands, Inc. 90,783 2,493,809 0.02%News Corp. Class A 95,790 2,468,508 0.02%Robert Half International, Inc. 27,699 2,464,380 0.02%
VEREIT, Inc. REIT 53,559 2,459,965 0.02%CF Industries Holdings, Inc. 47,458 2,441,714 0.02%Bunge Ltd. 31,202 2,438,436 0.02%Lear Corp. 13,908 2,437,794 0.02%Cable One, Inc. 1,256 2,402,489 0.02%Dynatrace, Inc. 41,105 2,401,354 0.02%Invesco Ltd. 89,651 2,396,371 0.02%Everest Re Group Ltd. 9,486 2,390,567 0.02%UGI Corp. 51,419 2,381,214 0.02%Owens Corning 23,898 2,339,614 0.02%Globe Life, Inc. 24,314 2,315,909 0.02%DISH Network Corp. Class A 55,332 2,312,878 0.02%
Alleghany Corp. 3,432 2,289,384 0.02%Western Union Co. 99,162 2,277,751 0.02%Neurocrine Biosciences, Inc. 23,315 2,269,016 0.02%
AGNC Investment Corp. REIT 132,882 2,244,377 0.02%
NRG Energy, Inc. 55,305 2,228,792 0.02%Athene Holding Ltd. Class A 33,010 2,228,175 0.02%Dropbox, Inc. Class A 72,315 2,191,868 0.02%AO Smith Corp. 30,380 2,189,183 0.02%DraftKings, Inc. Class A 41,816 2,181,541 0.02%Liberty Media Corp.-Liberty Formula One Class C 45,157 2,177,019 0.02%
Sunrun, Inc. 38,926 2,171,292 0.02%Franklin Resources, Inc. 67,873 2,171,257 0.02%Airbnb, Inc. Class A 14,119 2,162,184 0.02%Clarivate plc 78,261 2,154,525 0.02%Arrow Electronics, Inc. 18,766 2,136,134 0.02%Regency Centers Corp. REIT 32,851 2,104,764 0.02%
Guidewire Software, Inc. 18,581 2,094,450 0.02%Campbell Soup Co. 45,928 2,093,858 0.02%American Financial Group, Inc. 16,773 2,091,929 0.02%
NiSource, Inc. 85,069 2,084,191 0.02%Assurant, Inc. 13,222 2,065,012 0.02%Boston Beer Co., Inc. Class A 2,022 2,064,058 0.02%
Sealed Air Corp. 34,824 2,063,322 0.02%Juniper Networks, Inc. 75,100 2,053,985 0.02%Pinnacle West Capital Corp. 24,914 2,042,201 0.02%Sensata Technologies Holding plc 34,870 2,021,414 0.02%
Discovery, Inc. Class C 69,351 2,009,792 0.02%Tradeweb Markets, Inc. Class A 23,180 1,960,101 0.01%
Liberty Global plc Class C 72,036 1,947,853 0.01%Voya Financial, Inc. 31,277 1,923,536 0.01%Huntington Ingalls Industries, Inc. 9,057 1,908,763 0.01%
Aramark 51,079 1,902,693 0.01%

204
Vanguard Global Stock Index Fund
.Number of
SharesFair Value
US Dollars ($)% of Total
Net AssetsLiberty Media Corp.-Liberty SiriusXM Class C 40,097 1,860,100 0.01%
Carlyle Group, Inc. 39,660 1,843,397 0.01%Omega Healthcare Investors, Inc. REIT 50,682 1,839,250 0.01%
Autoliv, Inc. 18,644 1,822,637 0.01%Vistra Corp. 97,552 1,809,590 0.01%DaVita, Inc. 14,913 1,795,973 0.01%IPG Photonics Corp. 8,402 1,770,890 0.01%Reinsurance Group of America, Inc. 15,378 1,753,092 0.01%
Vornado Realty Trust REIT 37,340 1,742,658 0.01%Altice USA, Inc. Class A 49,840 1,701,538 0.01%Southwest Airlines Co. 31,986 1,698,137 0.01%RenaissanceRe Holdings Ltd. 11,385 1,694,316 0.01%
SEI Investments Co. 27,239 1,688,001 0.01%Rollins, Inc. 49,018 1,676,416 0.01%Knight-Swift Transportation Holdings, Inc. Class A 36,525 1,660,427 0.01%
Delta Air Lines, Inc. 37,611 1,627,052 0.01%Sirius XM Holdings, Inc. 239,370 1,565,480 0.01%
.Number of
SharesFair Value
US Dollars ($)% of Total
Net AssetsRoyalty Pharma plc Class A 38,082 1,560,981 0.01%Zillow Group, Inc. Class A 12,373 1,516,064 0.01%Liberty Global plc Class A 54,705 1,485,788 0.01%Amcor plc 125,572 1,439,055 0.01%Snowflake, Inc. Class A 5,706 1,379,711 0.01%Unity Software, Inc. 12,467 1,369,251 0.01%AMERCO 2,314 1,363,872 0.01%Chewy, Inc. Class A 16,805 1,339,527 0.01%Oak Street Health, Inc. 21,848 1,279,637 0.01%PPD, Inc. 26,808 1,235,581 0.01%Discovery, Inc. Class A 40,147 1,231,710 0.01%Erie Indemnity Co. Class A 5,802 1,121,817 0.01%Fox Corp. Class B 30,417 1,070,678 0.01%Liberty Media Corp.-Liberty SiriusXM Class A 16,106 750,217 0.01%
Liberty Broadband Corp. Class A 3,091 519,813 0.00%
Organon & Co. 1,361 41,184 0.00%HEICO Corp. 1 139 0.00%test test 8,962,786,817 67.35%Total Equities 13,314,805,858 100.05%Financial Assets at Fair Value Through Profit or Loss 13,314,805,858 100.05%
testNumber of Contracts
Notional Amount
Unrealised Gain/(Loss)
US Dollars ($)% of Total
Net AssetsFinancial Derivative InstrumentsFutures (0.00%) (2020: 0.04%)S&P 500 E-mini September 2021 (36) $(7,718,400) (900 ) (0.00 %)Topix Index September 2021 7 ¥136,731,818 (6,503 ) (0.00 %)test test test (7,403 ) (0.00 %)
CurrencyBuy
Amount Currency(Sell)
Amount CounterpartySettlement
Date
Unrealised Gain/(Loss)
US Dollars ($)% of Total
Net AssetsForward Currency Exchange Contracts (0.00%) (2020: 0.01%)USD 10,908,988 EUR (8,935,820) Morgan Stanley 15/9/2021 295,241 0.00 %USD 8,834,766 JPY (967,540,314) JPMorgan Chase Bank 15/9/2021 111,662 0.00 %USD 14,626,066 EUR (12,244,680) Citibank NA 15/9/2021 82,137 0.00 %USD 3,410,151 GBP (2,414,000) Morgan Stanley 15/9/2021 74,764 0.00 %USD 11,469,418 EUR (9,619,360) Morgan Stanley 15/9/2021 43,779 0.00 %USD 6,724,310 GBP (4,838,625) Citibank NA 15/9/2021 38,854 0.00 %USD 7,801,651 JPY (861,520,000) UBS AG 15/9/2021 34,400 0.00 %USD 1,751,345 GBP (1,258,200) BNP Paribas 15/9/2021 12,909 0.00 %USD 3,757,211 EUR (3,152,380) Citibank NA 15/9/2021 12,892 0.00 %USD 425,885 AUD (550,000) Morgan Stanley 15/9/2021 12,839 0.00 %USD 8,774,249 JPY (972,000,000) Citibank NA 15/9/2021 10,938 0.00 %USD 540,975 CAD (657,386) Toronto-Dominion Bank 15/9/2021 10,109 0.00 %USD 1,668,612 EUR (1,396,890) Morgan Stanley 15/9/2021 9,420 0.00 %USD 6,007,815 GBP (4,342,170) HSBC Bank 15/9/2021 8,304 0.00 %USD 269,395 CHF (241,387) UBS AG 15/9/2021 7,717 0.00 %USD 2,404,007 JPY (266,000,000) Citibank NA 15/9/2021 5,817 0.00 %USD 981,665 GBP (706,750) Morgan Stanley 15/9/2021 5,159 0.00 %USD 200,304 GBP (141,620) JPMorgan Chase Bank 15/9/2021 4,630 0.00 %USD 1,240,081 JPY (137,095,000) Morgan Stanley 15/9/2021 4,066 0.00 %GBP 1,698,360 USD (2,345,102) Goldman Sachs International 15/9/2021 1,496 0.00 %EUR 4,430,870 USD (5,262,141) Goldman Sachs International 15/9/2021 737 0.00 %USD 1,228,362 JPY (136,255,000) UBS AG 15/9/2021 (79 ) (0.00 %)JPY 116,580,000 USD (1,053,117) Citibank NA 15/9/2021 (2,061 ) (0.00 %)JPY 39,160,000 USD (355,970) BNP Paribas 15/9/2021 (2,913 ) (0.00 %)JPY 38,970,000 USD (354,573) JPMorgan Chase Bank 15/9/2021 (3,230 ) (0.00 %)GBP 141,640 USD (199,558) Citibank NA 15/9/2021 (3,856 ) (0.00 %)GBP 141,280 USD (199,505) JPMorgan Chase Bank 15/9/2021 (4,301 ) (0.00 %)GBP 634,275 USD (882,675) Citibank NA 15/9/2021 (6,307 ) (0.00 %)EUR 411,100 USD (499,323) JPMorgan Chase Bank 15/9/2021 (11,029 ) (0.00 %)EUR 412,200 USD (500,735) Citibank NA 15/9/2021 (11,134 ) (0.00 %)JPY 138,075,000 USD (1,256,758) JPMorgan Chase Bank 15/9/2021 (11,908 ) (0.00 %)EUR 1,520,145 USD (1,819,626) Citibank NA 15/9/2021 (14,035 ) (0.00 %)JPY 236,520,000 USD (2,147,326) JPMorgan Chase Bank 15/9/2021 (14,920 ) (0.00 %)GBP 1,209,465 USD (1,687,540) JPMorgan Chase Bank 15/9/2021 (16,440 ) (0.00 %)GBP 638,460 USD (900,561) JPMorgan Chase Bank 15/9/2021 (18,411 ) (0.00 %)

205
Vanguard Global Stock Index Fund
CurrencyBuy
Amount Currency(Sell)
Amount CounterpartySettlement
Date
Unrealised Gain/(Loss)
US Dollars ($)% of Total
Net AssetsGBP 2,080,350 USD (2,893,016) BNP Paribas 15/9/2021 (18,628 ) (0.00 %)JPY 353,250,000 USD (3,206,665) BNP Paribas 15/9/2021 (21,850 ) (0.00 %)EUR 2,937,270 USD (3,513,659) JPMorgan Chase Bank 15/9/2021 (24,842 ) (0.00 %)EUR 5,280,600 USD (6,300,368) JPMorgan Chase Bank 15/9/2021 (28,201 ) (0.00 %)JPY 427,020,000 USD (3,878,143) JPMorgan Chase Bank 15/9/2021 (28,236 ) (0.00 %)EUR 1,692,890 USD (2,055,138) JPMorgan Chase Bank 15/9/2021 (44,365 ) (0.00 %)JPY 662,178,753 USD (6,044,810) Bank of America 15/9/2021 (74,770 ) (0.00 %)GBP 3,992,153 USD (5,633,209) State Street Bank & Trust Co. 15/9/2021 (117,312 ) (0.00 %)EUR 12,077,099 USD (14,696,243) Standard Chartered Bank 15/9/2021 (351,361 ) (0.00 %)test (42,319 ) (0.00 %)Hedge Share Class Level Forward Currency Exchange Contracts (0.23%) (2020: 0.20%)JPY 282,687,956 EUR (2,109,406) Citibank NA 2/7/2021 45,422 0.00 %EUR 878,861,991 USD (1,042,923,553) Morgan Stanley 3/8/2021 24,396 0.00 %EUR 914,456 NZD (1,537,508) Morgan Stanley 2/7/2021 10,120 0.00 %EUR 2,348,446 NOK (23,916,553) Morgan Stanley 2/7/2021 5,709 0.00 %EUR 716,950 AUD (1,126,941) Citibank NA 2/7/2021 4,180 0.00 %EUR 2,373,378 CHF (2,598,835) Citibank NA 2/7/2021 3,064 0.00 %HKD 3,137,457 EUR (338,192) Citibank NA 6/7/2021 2,915 0.00 %EUR 43,755,735 CAD (64,296,515) Toronto-Dominion Bank 3/8/2021 2,509 0.00 %EUR 13,573,223 SEK (137,642,646) Morgan Stanley 2/7/2021 1,985 0.00 %EUR 55,670,860 GBP (47,817,216) Morgan Stanley 3/8/2021 1,730 0.00 %EUR 11,824,368 HKD (108,953,047) Morgan Stanley 3/8/2021 1,269 0.00 %EUR 89,123,405 JPY (11,735,308,248) Morgan Stanley 3/8/2021 1,158 0.00 %GBP 565,816 EUR (658,219) Citibank NA 2/7/2021 1,064 0.00 %EUR 119,344 NOK (1,208,831) Citibank NA 2/7/2021 1,054 0.00 %EUR 1,403,677 CAD (2,060,344) Citibank NA 2/7/2021 772 0.00 %EUR 328,926 SEK (3,329,429) Citibank NA 2/7/2021 764 0.00 %EUR 27,363,857 AUD (43,247,043) Morgan Stanley 4/8/2021 379 0.00 %EUR 47,147 NZD (79,560) Citibank NA 2/7/2021 319 0.00 %EUR 14,405,185 SEK (146,149,613) Morgan Stanley 3/8/2021 183 0.00 %SGD 35,252 EUR (21,980) Citibank NA 2/7/2021 159 0.00 %CHF 41,402,480 EUR (37,769,438) Morgan Stanley 2/7/2021 114 0.00 %EUR 510,568 SEK (5,177,539) Citibank NA 2/7/2021 75 0.00 %ILS 30,438 EUR (7,832) Citibank NA 2/7/2021 53 0.00 %EUR 3,981,012 SGD (6,350,812) Morgan Stanley 3/8/2021 50 0.00 %DKK 1,064,969 EUR (143,187) Citibank NA 2/7/2021 32 0.00 %EUR 2,458,689 NOK (25,103,295) Morgan Stanley 3/8/2021 28 0.00 %CHF 871,809 EUR (795,445) Morgan Stanley 3/8/2021 23 0.00 %EUR 914,468 NZD (1,553,128) Morgan Stanley 3/8/2021 17 0.00 %EUR 25,428,241 USD (30,155,351)Brown Brothers Harriman & Co. 2/7/2021 15 0.00 %EUR 467,152 CHF (512,082) Citibank NA 2/7/2021 4 0.00 %DKK 828,739 EUR (111,438) Morgan Stanley 3/8/2021 2 0.00 %NZD 36,054 EUR (21,228) Morgan Stanley 3/8/2021 — 0.00 %NOK 865,651 EUR (84,784) Morgan Stanley 3/8/2021 — 0.00 %ILS 4,948,124 EUR (1,280,486) Morgan Stanley 2/7/2021 (1 ) (0.00 %)ILS 115,307 EUR (29,828) Morgan Stanley 3/8/2021 (1 ) (0.00 %)NOK 25,103,295 EUR (2,459,924) Morgan Stanley 2/7/2021 (1 ) (0.00 %)NZD 1,553,128 EUR (915,126) Morgan Stanley 2/7/2021 (1 ) (0.00 %)SGD 6,350,812 EUR (3,983,981) Morgan Stanley 2/7/2021 (2 ) (0.00 %)NOK 22,089 EUR (2,169) Citibank NA 2/7/2021 (5 ) (0.00 %)AUD 855,054 EUR (541,019) Morgan Stanley 4/8/2021 (5 ) (0.00 %)DKK 73,054,237 EUR (9,824,076) Morgan Stanley 2/7/2021 (6 ) (0.00 %)SGD 211,063 EUR (132,311) Morgan Stanley 3/8/2021 (8 ) (0.00 %)EUR 1,279,968 ILS (4,948,124) Morgan Stanley 3/8/2021 (11 ) (0.00 %)SEK 3,307,691 EUR (326,028) Morgan Stanley 3/8/2021 (12 ) (0.00 %)AUD 43,247,043 EUR (27,378,131) Morgan Stanley 2/7/2021 (16 ) (0.00 %)SEK 146,149,613 EUR (14,410,349) Morgan Stanley 2/7/2021 (16 ) (0.00 %)CAD 64,296,515 EUR (43,783,803) Toronto-Dominion Bank 2/7/2021 (25 ) (0.00 %)CAD 1,647,783 EUR (1,121,351) Morgan Stanley 3/8/2021 (46 ) (0.00 %)GBP 1,252,866 EUR (1,458,641) Morgan Stanley 3/8/2021 (46 ) (0.00 %)HKD 3,323,238 EUR (360,670) Morgan Stanley 3/8/2021 (49 ) (0.00 %)EUR 3,599 SGD (5,806) Citibank NA 2/7/2021 (50 ) (0.00 %)EUR 507,902 DKK (3,777,208) Citibank NA 2/7/2021 (52 ) (0.00 %)JPY 11,735,308,248 EUR (89,158,465) Morgan Stanley 2/7/2021 (53 ) (0.00 %)JPY 263,701,514 EUR (2,002,699) Morgan Stanley 3/8/2021 (57 ) (0.00 %)EUR 9,823,443 DKK (73,054,237) Morgan Stanley 3/8/2021 (88 ) (0.00 %)EUR 34,931,482 CHF (38,291,563) Morgan Stanley 2/7/2021 (128 ) (0.00 %)EUR 267,384 AUD (422,673) JPMorgan Chase Bank 2/7/2021 (231 ) (0.00 %)USD 18,003,823 EUR (15,171,502) Morgan Stanley 3/8/2021 (241 ) (0.00 %)EUR 37,776,582 CHF (41,402,480) Morgan Stanley 3/8/2021 (332 ) (0.00 %)
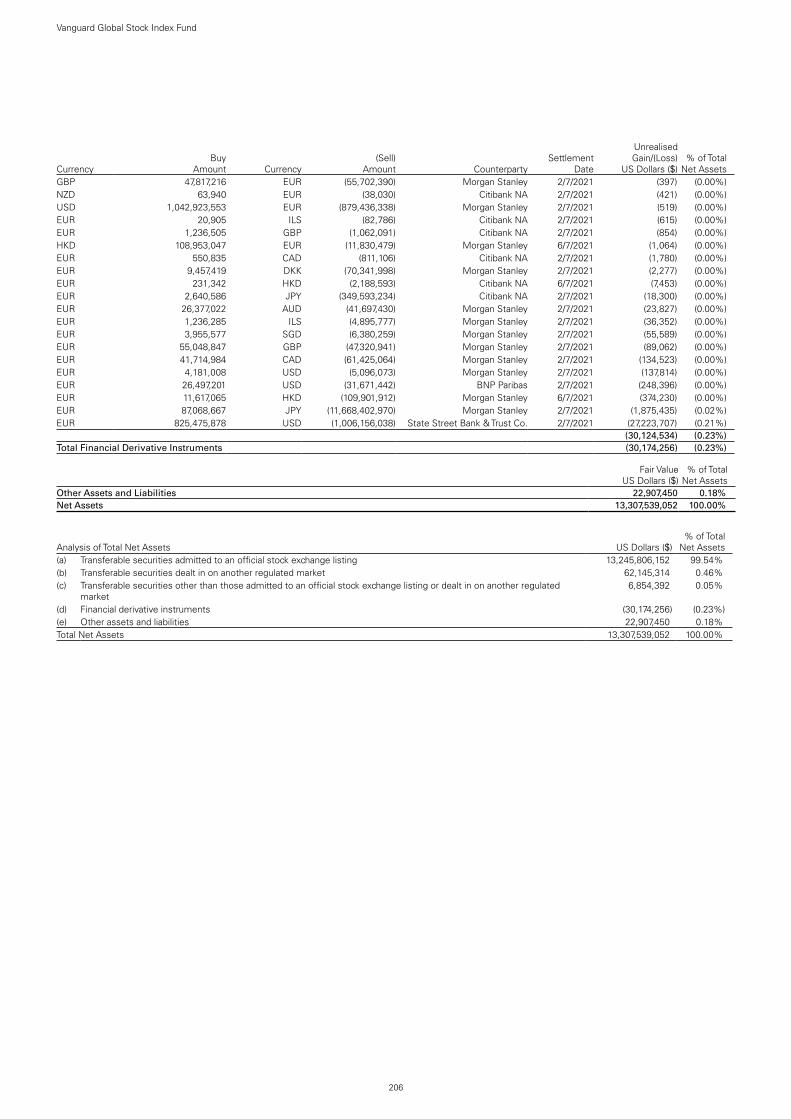
206
Vanguard Global Stock Index Fund
CurrencyBuy
Amount Currency(Sell)
Amount CounterpartySettlement
Date
Unrealised Gain/(Loss)
US Dollars ($)% of Total
Net AssetsGBP 47,817,216 EUR (55,702,390) Morgan Stanley 2/7/2021 (397 ) (0.00 %)NZD 63,940 EUR (38,030) Citibank NA 2/7/2021 (421 ) (0.00 %)USD 1,042,923,553 EUR (879,436,338) Morgan Stanley 2/7/2021 (519 ) (0.00 %)EUR 20,905 ILS (82,786) Citibank NA 2/7/2021 (615 ) (0.00 %)EUR 1,236,505 GBP (1,062,091) Citibank NA 2/7/2021 (854 ) (0.00 %)HKD 108,953,047 EUR (11,830,479) Morgan Stanley 6/7/2021 (1,064 ) (0.00 %)EUR 550,835 CAD (811,106) Citibank NA 2/7/2021 (1,780 ) (0.00 %)EUR 9,457,419 DKK (70,341,998) Morgan Stanley 2/7/2021 (2,277 ) (0.00 %)EUR 231,342 HKD (2,188,593) Citibank NA 6/7/2021 (7,453 ) (0.00 %)EUR 2,640,586 JPY (349,593,234) Citibank NA 2/7/2021 (18,300 ) (0.00 %)EUR 26,377,022 AUD (41,697,430) Morgan Stanley 2/7/2021 (23,827 ) (0.00 %)EUR 1,236,285 ILS (4,895,777) Morgan Stanley 2/7/2021 (36,352 ) (0.00 %)EUR 3,955,577 SGD (6,380,259) Morgan Stanley 2/7/2021 (55,589 ) (0.00 %)EUR 55,048,847 GBP (47,320,941) Morgan Stanley 2/7/2021 (89,062 ) (0.00 %)EUR 41,714,984 CAD (61,425,064) Morgan Stanley 2/7/2021 (134,523 ) (0.00 %)EUR 4,181,008 USD (5,096,073) Morgan Stanley 2/7/2021 (137,814 ) (0.00 %)EUR 26,497,201 USD (31,671,442) BNP Paribas 2/7/2021 (248,396 ) (0.00 %)EUR 11,617,065 HKD (109,901,912) Morgan Stanley 6/7/2021 (374,230 ) (0.00 %)EUR 87,068,667 JPY (11,668,402,970) Morgan Stanley 2/7/2021 (1,875,435 ) (0.02 %)EUR 825,475,878 USD (1,006,156,038) State Street Bank & Trust Co. 2/7/2021 (27,223,707 ) (0.21 %)test (30,124,534 ) (0.23 %)Total Financial Derivative Instruments (30,174,256 ) (0.23 %)
Fair Value US Dollars ($)
% of Total Net Assets
Other Assets and Liabilities 22,907,450 0.18 %Net Assets 13,307,539,052 100.00 %
Analysis of Total Net Assets US Dollars ($)% of Total
Net Assets(a) Transferable securities admitted to an official stock exchange listing 13,245,806,152 99.54 %(b) Transferable securities dealt in on another regulated market 62,145,314 0.46 %(c) Transferable securities other than those admitted to an official stock exchange listing or dealt in on another regulated
market 6,854,392 0.05 %
(d) Financial derivative instruments (30,174,256 ) (0.23 %)(e) Other assets and liabilities 22,907,450 0.18 %Total Net Assets 13,307,539,052 100.00 %

The accompanying notes form an integral part of the financial statements.
207
Vanguard Global Stock Index Fund
Statement of Assets and Liabilities
US Dollars ($)
As at 30 June 2021
US Dollars ($)
As at 31 December 2020
Current AssetsFinancial Assets at Fair Value Through Profit or Loss 13,314,805,858 10,954,461,512 Financial Derivative Instruments 897,434 33,400,509 Cash 60,727,783 194,618,354 Unrealised Appreciation on Spot Currency Contracts — 14,364 Receivables: Interest and Dividends 13,813,071 11,812,976 Capital Shares Issued 26,343,382 12,966,685 Investments Sold 1,054,105 1,809,767 Futures Margin Cash 719,406 13,029,330 Cash Collateral 26,190,000 2,610,000
Total Current Assets 13,444,551,039 11,224,723,497
Current LiabilitiesFinancial Derivative Instruments 31,071,690 5,667,531 Bank Overdraft 4,838 4,566 Unrealised Depreciation on Spot Currency Contracts 112,395 — Payables and Other Liabilities: Investments Purchased 13,534 — Income Distribution Payable 439,880 209,117 Capital Shares Redeemed 103,450,202 3,490,622 Management Fees Payable 1,919,448 1,630,718
Total Current Liabilities 137,011,987 11,002,554
Net Assets Attributable to Holders of Redeemable Participating Shares (“Net Assets”) 13,307,539,052 11,213,720,943
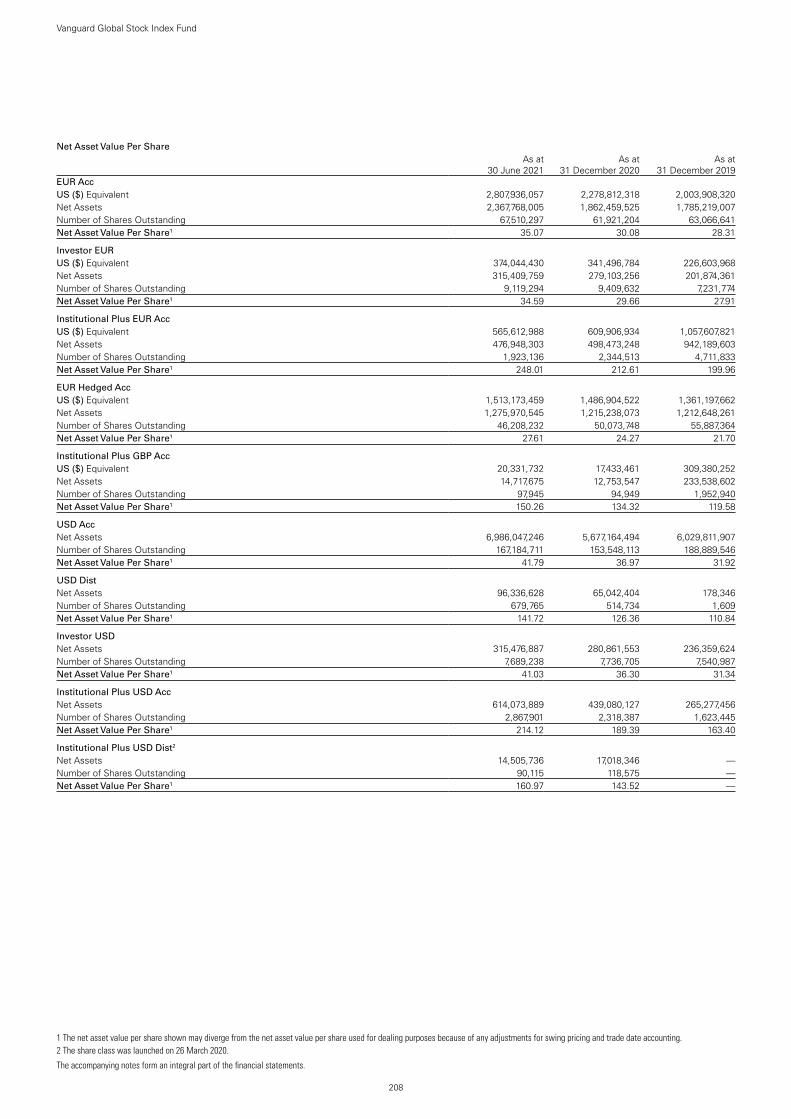
208
Vanguard Global Stock Index Fund
The accompanying notes form an integral part of the financial statements.
Net Asset Value Per Share
.As at
30 June 2021As at
31 December 2020As at
31 December 2019EUR AccUS ($) Equivalent 2,807,936,057 2,278,812,318 2,003,908,320Net Assets 2,367,768,005 1,862,459,525 1,785,219,007Number of Shares Outstanding 67,510,297 61,921,204 63,066,641Net Asset Value Per Share1 35.07 30.08 28.31
Investor EUR US ($) Equivalent 374,044,430 341,496,784 226,603,968Net Assets 315,409,759 279,103,256 201,874,361Number of Shares Outstanding 9,119,294 9,409,632 7,231,774Net Asset Value Per Share1 34.59 29.66 27.91
Institutional Plus EUR AccUS ($) Equivalent 565,612,988 609,906,934 1,057,607,821Net Assets 476,948,303 498,473,248 942,189,603Number of Shares Outstanding 1,923,136 2,344,513 4,711,833Net Asset Value Per Share1 248.01 212.61 199.96
EUR Hedged AccUS ($) Equivalent 1,513,173,459 1,486,904,522 1,361,197,662Net Assets 1,275,970,545 1,215,238,073 1,212,648,261Number of Shares Outstanding 46,208,232 50,073,748 55,887,364Net Asset Value Per Share1 27.61 24.27 21.70
Institutional Plus GBP AccUS ($) Equivalent 20,331,732 17,433,461 309,380,252Net Assets 14,717,675 12,753,547 233,538,602Number of Shares Outstanding 97,945 94,949 1,952,940Net Asset Value Per Share1 150.26 134.32 119.58
USD AccNet Assets 6,986,047,246 5,677,164,494 6,029,811,907Number of Shares Outstanding 167,184,711 153,548,113 188,889,546Net Asset Value Per Share1 41.79 36.97 31.92
USD DistNet Assets 96,336,628 65,042,404 178,346Number of Shares Outstanding 679,765 514,734 1,609Net Asset Value Per Share1 141.72 126.36 110.84
Investor USD Net Assets 315,476,887 280,861,553 236,359,624Number of Shares Outstanding 7,689,238 7,736,705 7,540,987Net Asset Value Per Share1 41.03 36.30 31.34
Institutional Plus USD AccNet Assets 614,073,889 439,080,127 265,277,456Number of Shares Outstanding 2,867,901 2,318,387 1,623,445Net Asset Value Per Share1 214.12 189.39 163.40
Institutional Plus USD Dist2
Net Assets 14,505,736 17,018,346 —Number of Shares Outstanding 90,115 118,575 —Net Asset Value Per Share1 160.97 143.52 —
1 The net asset value per share shown may diverge from the net asset value per share used for dealing purposes because of any adjustments for swing pricing and trade date accounting.2 The share class was launched on 26 March 2020.

209
Vanguard Global Stock Index Fund
The accompanying notes form an integral part of the financial statements.
Statement of Operations
US Dollars ($)
Six Months Ended 30 June 2021
US Dollars ($)
Six Months Ended 30 June 2020
Investment Income/(Loss) Interest Income 23,388 121,740 Dividend Income 134,305,748 120,875,712 Securities Lending Income 719,542 1,096,998 Net Gain/(Loss) on Financial Instruments 1,400,376,458 (650,731,328)
Total Investment Income/(Loss) 1,535,425,136 (528,636,878)
Expenses Management Fees 10,780,495 8,336,595 Transaction Fees and Commissions 935,632 556,197 Other Expenses — 106
Total Expenses 11,716,127 8,892,898
Finance Costs Interest Expense 27,548 27,102 Distribution Paid 778,295 434,600 Income Equalisation (77,076) (53,208)
Total Finance Costs 728,767 408,494
Net Investment Income/(Loss) 1,522,980,242 (537,938,270)
Foreign Withholding Tax (23,548,631) (24,902,051)
Net Increase/(Decrease) in Net Assets 1,499,431,611 (562,840,321)
Statement of Changes in Net Assets
US Dollars ($)
US Dollars ($)
Six Months Ended Six Months Ended30 June 2021 30 June 2020
Increase/(Decrease) in Net Assets
Net Increase/(Decrease) in Net Assets From Operations 1,499,431,611 (562,840,321)
Capital Transactions Subscriptions 8,495,683,655 1,909,235,992 Redemptions (7,901,297,200) (2,932,342,595) Reinvestments 43 43
Total Capital Transactions1 594,386,498 (1,023,106,560)
Total Increase/(Decrease) for the Period 2,093,818,109 (1,585,946,881)
Net AssetsBeginning of Period 11,213,720,943 11,490,325,356
End of Period 13,307,539,052 9,904,378,475
1 Capital Transactions include income equalisation adjustments as shown in the Statement of Operations.

Vanguard Japan Stock Index FundManaged by Vanguard Global Advisers, LLC.
210
Investment ObjectiveThe fund seeks to track the performance of the MSCI Japan Index, which emphasises stocks of companies located in Japan.
Performance SummaryThe Performance Summary does not form part of the Financial Statements.
• As the six months ended 30 June 2021 came to a close, macroeconomic indicators signalled a faster global economic rebound than many had expected after the sharpest contraction in modern history. Yet the recovery has been uneven. Countries that have contained the virus more successfully, whether through vaccinations, lockdowns or both, generally have fared better economically. And the COVID-19 pandemic remained far from over, with new variants of the virus surfacing where vaccination rates have lagged and the human toll continuing to mount, especially in less developed economies.
• Swift and extensive support from governments and central banks has been a key to the rebound. So far in 2021, it has included fiscal stimulus – including the $1.9 trillion American Rescue Plan in the United States and the €673 billion Recovery and Resilience Facility in Europe – and pledges by a number of central banks to keep interest rates low for some time.
• Fixed income prices worldwide generally fell and longer-term yields rose amid concerns about inflation, resulting in negative returns for the six months.
• Stock markets continued the rally that began in 2020, bolstered by reopening economies, more consumer spending and rising corporate profits. Returns in the United States and Europe outpaced those in emerging markets and especially the Pacific region.
• The Japanese economy shrank in the first quarter of 2021 after ending 2020 with two strong quarters of growth. Demand remained dampened amid low vaccination rates and emergency restrictions on shopping and restaurants, even as the nation prepared to host the Olympics.
• In this environment, the fund’s benchmark index returned 4.50%.
• Results were positive in seven of the index’s 11 sectors. Industrials and consumer discretionary, the two largest sectors, contributed most to returns. Health care stocks were the biggest detractor.
Benchmark returns in the commentary above are in euros.
Benchmark: MSCI Japan Index
Total ReturnsPeriods Ended 30 June 2021
(Annualised for periods over one year)
Six Months Five YearsTen Years or
Since Inception1
EUR Acc 4.41 % 8.56 % 9.08 %
Benchmark 4.50 8.76 9.33
Tracking Difference* -0.09
Investor EUR 4.41 % 8.51 % 9.02 %
Benchmark 4.50 8.76 9.33
Tracking Difference* -0.09
Institutional Plus EUR Acc 4.43 % 8.60 % 8.84 %
Benchmark 4.50 8.76 9.00
Tracking Difference* -0.07
GBP Acc 0.13 % 9.27 % 8.56 %
Benchmark 0.22 9.47 8.78
Tracking Difference* -0.09
GBP Dist 0.13 % 9.27 % 8.56 %
Benchmark 0.22 9.47 8.78
Tracking Difference* -0.09
Institutional Plus GBP Acc 0.15 % 9.30 % 10.03 %
Benchmark 0.22 9.47 10.19
Tracking Difference* -0.07
Institutional Plus GBP Dist 0.15 % 9.31 % 10.03 %
Benchmark 0.22 9.47 10.19
Tracking Difference* -0.07
JPY Acc 8.78 % 11.74 % 5.74 %
Benchmark 8.88 11.94 5.92
Tracking Difference* -0.10

211
Vanguard Japan Stock Index Fund
Total ReturnsPeriods Ended 30 June 2021
(Annualised for periods over one year)
Six Months Five YearsTen Years or
Since Inception1
Investor JPY 8.78 % 11.68 % 10.30 %
Benchmark 8.88 11.94 10.62
Tracking Difference* -0.10
Institutional Plus JPY Acc 8.81 % 11.77 % 8.38 %
Benchmark 8.88 11.94 8.55
Tracking Difference* -0.07
USD Acc 1.19 % 9.99 % 6.91 %
Benchmark 1.28 10.19 7.15
Tracking Difference* -0.09
Investor USD 1.19 % 9.94 % 6.85 %
Benchmark 1.28 10.19 7.15
Tracking Difference* -0.09
Institutional Plus USD Acc 1.21 % — 8.32 %
Benchmark 1.28 — 8.47
Tracking Difference* -0.07
Each benchmark is in its respective currency.Sources: Vanguard Global Advisers, LLC, and MSCI.Performance is based on NAV with net income reinvested.
All of the returns in this report represent past performance, which is not a guarantee of future results that may be achieved by the fund. For performance data current to the most recent month-end, which may be higher or lower than that cited, visit our website at http://global.vanguard.com. Note, too, that both investment returns and principal value can fluctuate widely, so an investor's shares, when sold, could be worth more or less than their original cost.* The tracking difference between the fund return and the index return over a stated period of time can be attributed to a number of factors, including, without limitation, small differences in
weightings, trading activity, transaction costs and differences in the valuation and withholding tax treatment between the fund and the index vendor.1 Since-inception returns: Institutional Plus EUR Acc, 6 December 2013; Institutional Plus GBP Acc and Institutional Plus GBP Dist, 2 September 2014; JPY Acc, 10 March 2015; Institutional Plus JPY
Acc, 27 February 2014; Institutional Plus USD Acc, 8 September 2016.

Significant Portfolio ChangesFor the Six Months Ended 30 June 2021
212
Vanguard Japan Stock Index Fund
The Central Bank of Ireland requires a schedule of material changes in the composition of the portfolio during the period. These are defined as aggregate purchases of a security exceeding 1% of the total value of purchases for the period and aggregate disposals greater than 1% of the total value of sales. At a minimum, the largest 20 purchases and 20 sales must be shown; all purchases and sales must be shown if there are fewer than 20. A full listing of the portfolio changes for the period is available, upon request, at no extra cost from the Administrator.
SharesCost
Euro (€)
Purchases
Toyota Motor Corp. 307,600 20,190,006Keyence Corp. 40,900 16,478,569Sony Group Corp. 182,600 15,421,133SoftBank Group Corp. 174,400 12,560,796Nintendo Co., Ltd. 16,200 8,061,665Mitsubishi UFJ Financial Group, Inc. 1,779,700 8,010,709Recruit Holdings Co., Ltd. 197,600 7,906,439Tokyo Electron Ltd. 21,700 7,747,333Shin-Etsu Chemical Co., Ltd. 51,300 7,294,651Nidec Corp. 64,900 6,503,619Takeda Pharmaceutical Co., Ltd. 228,000 6,494,113KDDI Corp. 233,400 6,177,164Renesas Electronics Corp. 676,444 6,075,083Daikin Industries Ltd. 36,000 6,018,297Honda Motor Co., Ltd. 236,700 5,920,136Fast Retailing Co., Ltd. 8,500 5,882,561Hitachi Ltd. 140,300 5,688,780Sumitomo Mitsui Financial Group,
Inc. 190,900 5,660,734FANUC Corp. 27,900 5,633,956Murata Manufacturing Co., Ltd. 83,200 5,582,248Daiichi Sankyo Co., Ltd. 246,400 5,422,501Hoya Corp. 50,800 5,222,529
SharesProceeds
Euro (€)
Sales
SoftBank Group Corp. 319,100 19,286,084ITOCHU Corp. 145,400 3,522,825Tokyu Fudosan Holdings Corp. 701,490 3,339,389Nagoya Railroad Co., Ltd. 213,380 3,321,772Marui Group Co., Ltd. 215,485 3,255,075Amada Co., Ltd. 370,523 3,206,708Kyushu Railway Co. 169,303 3,120,721Kuraray Co., Ltd. 359,329 3,045,913Air Water, Inc. 211,424 2,896,971Fukuoka Financial Group, Inc. 192,160 2,893,189Keihan Holdings Co., Ltd. 110,526 2,850,333Kyushu Electric Power Co., Inc. 425,700 2,809,434Bank of Kyoto Ltd. 65,429 2,682,602Alfresa Holdings Corp. 210,514 2,662,409Teijin Ltd. 199,643 2,653,905Chugoku Electric Power Co., Inc. 324,617 2,587,006Keikyu Corp. 247,344 2,574,712Taiheiyo Cement Corp. 127,673 2,454,799Japan Airport Terminal Co., Ltd. 67,322 2,425,039Shinsei Bank Ltd. 178,195 2,277,882Sundrug Co., Ltd. 80,070 2,270,105Seibu Holdings, Inc. 241,548 2,223,721NGK Spark Plug Co., Ltd. 171,393 2,154,017Sega Sammy Holdings, Inc. 194,153 2,077,640Coca-Cola Bottlers Japan Holdings,
Inc. 143,543 2,008,041Suzuken Co., Ltd. 77,142 1,991,927Shimamura Co., Ltd. 25,455 1,991,026Calbee, Inc. 96,405 1,841,669Yamazaki Baking Co., Ltd. 134,213 1,659,522Toyoda Gosei Co., Ltd. 73,196 1,514,226Aeon Mall Co., Ltd. 115,701 1,502,757Mitsubishi Corp. 47,900 1,041,881

Financial StatementsStatement of Investments30 June 2021
213
Vanguard Japan Stock Index Fund
.Number of
SharesFair Value
EUR (€)% of Total
Net AssetsEquities 98.48% (2020: 98.32%)Communication Services 8.66% (2020: 9.46%)SoftBank Group Corp. 1,487,022 87,838,693 2.20%Nintendo Co., Ltd. 132,731 65,163,949 1.63%KDDI Corp. 1,912,485 50,346,508 1.26%SoftBank Corp. 3,405,676 37,608,537 0.94%Nippon Telegraph & Telephone
Corp. 1,526,306 33,564,736 0.84%Z Holdings Corp. 3,144,903 13,303,765 0.34%Nexon Co., Ltd. 578,702 10,886,134 0.27%CyberAgent, Inc. 479,500 8,688,505 0.22%Dentsu Group, Inc. 256,065 7,733,132 0.20%Konami Holdings Corp. 110,487 5,598,931 0.14%Capcom Co., Ltd. 208,700 5,153,163 0.13%Toho Co., Ltd. 132,979 4,627,182 0.12%Square Enix Holdings Co., Ltd. 101,900 4,265,735 0.11%Kakaku.com, Inc. 160,903 4,101,330 0.10%Hakuhodo DY Holdings, Inc. 279,533 3,661,326 0.09%Koei Tecmo Holdings Co., Ltd. 70,930 2,920,770 0.07%. . 345,462,396 8.66%Consumer Discretionary 18.79% (2020: 18.05%)Toyota Motor Corp. 2,515,254 185,553,500 4.65%Sony Group Corp. 1,495,466 122,877,153 3.08%Honda Motor Co., Ltd. 1,933,347 52,144,227 1.31%Fast Retailing Co., Ltd. 69,194 43,964,143 1.10%Denso Corp. 513,866 29,588,971 0.74%Oriental Land Co., Ltd. 237,092 28,514,508 0.71%Bridgestone Corp. 677,059 26,002,539 0.65%Panasonic Corp. 2,618,326 25,571,952 0.64%Shimano, Inc. 87,949 17,606,766 0.44%Suzuki Motor Corp. 436,697 15,596,909 0.39%Nitori Holdings Co., Ltd. 94,898 14,174,529 0.36%Bandai Namco Holdings, Inc. 236,862 13,870,917 0.35%Toyota Industries Corp. 173,883 12,695,464 0.32%Sekisui House Ltd. 729,866 12,634,563 0.32%Subaru Corp. 729,692 12,149,241 0.30%Nissan Motor Co., Ltd. 2,752,888 11,530,406 0.29%Sumitomo Electric Industries
Ltd. 894,072 11,133,187 0.28%Rakuten Group, Inc. 1,026,737 9,781,936 0.25%Pan Pacific International
Holdings Corp. 488,540 8,559,088 0.21%Yamaha Motor Co., Ltd. 331,909 7,615,423 0.19%Isuzu Motors Ltd. 653,764 7,286,504 0.18%Yamaha Corp. 158,882 7,278,805 0.18%Sekisui Chemical Co., Ltd. 451,297 6,511,117 0.16%Koito Manufacturing Co., Ltd. 123,933 6,506,285 0.16%Aisin Corp. 174,591 6,300,624 0.16%Mercari, Inc. 121,300 5,437,270 0.14%Mazda Motor Corp. 674,811 5,352,427 0.13%Ryohin Keikaku Co., Ltd. 299,880 5,308,496 0.13%ZOZO, Inc. 148,388 4,255,825 0.11%USS Co., Ltd. 262,686 3,867,753 0.10%Iida Group Holdings Co., Ltd. 176,320 3,831,208 0.10%Stanley Electric Co., Ltd. 152,409 3,722,714 0.09%Hikari Tsushin, Inc. 24,988 3,703,879 0.09%Sharp Corp. 255,451 3,557,445 0.09%McDonald's Holdings Co.
Japan Ltd. 95,300 3,547,783 0.09%Rinnai Corp. 42,308 3,397,548 0.09%Casio Computer Co., Ltd. 232,553 3,280,967 0.08%Yamada Holdings Co., Ltd. 809,913 3,156,631 0.08%ABC-Mart, Inc. 38,293 1,853,220 0.05%. . 749,721,923 18.79%Consumer Staples 7.13% (2020: 7.51%)Seven & i Holdings Co., Ltd. 893,504 35,957,919 0.90%
.Number of
SharesFair Value
EUR (€)% of Total
Net AssetsKao Corp. 571,518 29,678,128 0.74%Shiseido Co., Ltd. 474,260 29,441,490 0.74%Japan Tobacco, Inc. 1,422,475 22,678,884 0.57%Asahi Group Holdings Ltd. 540,900 21,332,221 0.54%Aeon Co., Ltd. 775,274 17,581,974 0.44%Unicharm Corp. 478,506 16,250,360 0.41%Kirin Holdings Co., Ltd. 974,925 16,043,449 0.40%Ajinomoto Co., Inc. 553,028 12,117,428 0.30%Kikkoman Corp. 172,345 9,597,779 0.24%MEIJI Holdings Co., Ltd. 144,682 7,309,779 0.18%Yakult Honsha Co., Ltd. 151,940 7,260,906 0.18%Suntory Beverage & Food Ltd. 164,953 5,238,471 0.13%Kose Corp. 39,412 5,234,051 0.13%Tsuruha Holdings, Inc. 46,941 4,604,120 0.12%Nissin Foods Holdings Co.,
Ltd. 75,300 4,576,706 0.12%Kobayashi Pharmaceutical
Co., Ltd. 63,300 4,563,920 0.11%Kobe Bussan Co., Ltd. 163,700 4,352,961 0.11%Lion Corp. 267,772 3,828,713 0.10%Toyo Suisan Kaisha Ltd. 103,736 3,369,254 0.09%NH Foods Ltd. 98,706 3,239,630 0.08%Ito En Ltd. 64,300 3,219,322 0.08%Pigeon Corp. 135,000 3,210,304 0.08%Welcia Holdings Co., Ltd. 113,500 3,130,189 0.08%Cosmos Pharmaceutical Corp. 23,400 2,897,821 0.07%Nisshin Seifun Group, Inc. 234,622 2,896,611 0.07%Pola Orbis Holdings, Inc. 109,907 2,449,929 0.06%Lawson, Inc. 58,974 2,302,989 0.06%. . 284,365,308 7.13%Energy 0.64% (2020: 0.51%)ENEOS Holdings, Inc. 3,638,780 12,852,376 0.32%Inpex Corp. 1,213,631 7,643,799 0.19%Idemitsu Kosan Co., Ltd. 247,425 5,043,503 0.13%. . 25,539,678 0.64%Financials 8.61% (2020: 8.13%)Mitsubishi UFJ Financial
Group, Inc. 14,494,937 66,085,782 1.66%Sumitomo Mitsui Financial
Group, Inc. 1,547,763 45,037,192 1.13%Mizuho Financial Group, Inc. 2,859,748 34,491,301 0.86%Tokio Marine Holdings, Inc. 749,231 29,076,002 0.73%ORIX Corp. 1,447,996 20,621,530 0.52%Dai-ichi Life Holdings, Inc. 1,208,108 18,669,160 0.47%Nomura Holdings, Inc. 3,642,663 15,713,845 0.39%Japan Post Holdings Co., Ltd. 1,867,611 12,916,327 0.32%MS&AD Insurance Group
Holdings, Inc. 527,458 12,855,540 0.32%Sompo Holdings, Inc. 375,939 11,727,472 0.29%Japan Exchange Group, Inc. 604,302 11,340,157 0.28%Sumitomo Mitsui Trust
Holdings, Inc. 400,236 10,727,852 0.27%Resona Holdings, Inc. 2,529,873 8,211,037 0.21%Daiwa Securities Group, Inc. 1,711,048 7,931,061 0.20%T&D Holdings, Inc. 637,469 6,954,751 0.17%SBI Holdings, Inc. 288,698 5,764,176 0.14%Japan Post Insurance Co., Ltd. 267,777 4,178,706 0.11%Concordia Financial Group Ltd. 1,296,800 4,009,918 0.10%Mitsubishi HC Capital, Inc. 790,976 3,575,595 0.09%Shizuoka Bank Ltd. 533,482 3,481,617 0.09%Japan Post Bank Co., Ltd. 484,696 3,435,731 0.09%Chiba Bank Ltd. 622,036 3,161,620 0.08%Tokyo Century Corp. 42,900 1,945,807 0.05%Acom Co., Ltd. 464,434 1,707,802 0.04%. . 343,619,981 8.61%

214
Vanguard Japan Stock Index Fund
.Number of
SharesFair Value
EUR (€)% of Total
Net AssetsHealth Care 10.05% (2020: 11.09%)Takeda Pharmaceutical Co.,
Ltd. 1,869,171 52,813,298 1.32%Hoya Corp. 442,136 49,479,659 1.24%Daiichi Sankyo Co., Ltd. 2,017,948 36,710,719 0.92%Astellas Pharma, Inc. 2,207,167 32,439,339 0.81%M3, Inc. 523,120 32,244,146 0.81%Chugai Pharmaceutical Co.,
Ltd. 796,373 26,633,892 0.67%Terumo Corp. 765,478 26,182,208 0.66%Eisai Co., Ltd. 281,165 23,337,309 0.58%Olympus Corp. 1,381,736 23,178,868 0.58%Sysmex Corp. 198,653 19,922,192 0.50%Otsuka Holdings Co., Ltd. 462,719 16,195,845 0.41%Shionogi & Co., Ltd. 313,920 13,811,493 0.35%Kyowa Kirin Co., Ltd. 319,980 9,578,271 0.24%Ono Pharmaceutical Co., Ltd. 438,472 8,258,220 0.21%Asahi Intecc Co., Ltd. 247,300 4,990,226 0.12%Santen Pharmaceutical Co.,
Ltd. 427,905 4,974,012 0.12%PeptiDream, Inc. 114,000 4,720,298 0.12%Nippon Shinyaku Co., Ltd. 58,800 3,935,694 0.10%Sumitomo Dainippon Pharma
Co., Ltd. 214,540 3,794,542 0.10%Medipal Holdings Corp. 219,157 3,533,205 0.09%Hisamitsu Pharmaceutical
Co., Inc. 60,875 2,529,848 0.06%Taisho Pharmaceutical
Holdings Co., Ltd. 39,760 1,797,345 0.04%. . 401,060,629 10.05%Industrials 21.43% (2020: 20.22%)Recruit Holdings Co., Ltd. 1,608,836 66,860,124 1.68%Hitachi Ltd. 1,147,634 55,462,172 1.39%Nidec Corp. 530,418 51,884,014 1.30%Daikin Industries Ltd. 295,421 46,437,617 1.16%FANUC Corp. 227,529 46,318,938 1.16%Mitsui & Co., Ltd. 1,832,209 34,807,269 0.87%Mitsubishi Corp. 1,497,476 34,449,571 0.86%ITOCHU Corp. 1,409,590 34,269,744 0.86%SMC Corp. 67,883 33,858,197 0.85%Mitsubishi Electric Corp. 2,164,629 26,518,641 0.66%Central Japan Railway Co. 170,975 21,887,723 0.55%Komatsu Ltd. 1,038,217 21,774,288 0.55%East Japan Railway Co. 358,432 21,586,573 0.54%Kubota Corp. 1,218,200 20,796,476 0.52%Toshiba Corp. 485,904 17,738,298 0.44%Secom Co., Ltd. 248,984 15,973,046 0.40%Sumitomo Corp. 1,334,240 15,083,598 0.38%Marubeni Corp. 1,853,387 13,603,676 0.34%Yaskawa Electric Corp. 284,540 11,738,463 0.29%Makita Corp. 265,585 10,552,936 0.26%Toyota Tsusho Corp. 251,712 10,039,944 0.25%MISUMI Group, Inc. 336,793 9,620,972 0.24%MINEBEA MITSUMI, Inc. 430,174 9,605,319 0.24%Mitsubishi Heavy Industries
Ltd. 379,957 9,436,641 0.24%West Japan Railway Co. 192,744 9,275,279 0.23%Daifuku Co., Ltd. 120,100 9,206,663 0.23%SG Holdings Co., Ltd. 379,600 8,401,073 0.21%Yamato Holdings Co., Ltd. 345,426 8,292,972 0.21%Nippon Yusen KK 191,363 8,185,297 0.21%AGC, Inc. 229,113 8,111,548 0.20%Nihon M&A Center, Inc. 358,900 7,855,698 0.20%Odakyu Electric Railway Co.,
Ltd. 349,382 7,448,285 0.19%TOTO Ltd. 167,888 7,334,248 0.18%Hankyu Hanshin Holdings, Inc. 271,141 7,055,436 0.18%Lixil Corp. 315,623 6,889,256 0.17%Tokyu Corp. 592,246 6,798,838 0.17%Taisei Corp. 226,332 6,259,151 0.16%Keio Corp. 121,889 6,047,081 0.15%
.Number of
SharesFair Value
EUR (€)% of Total
Net AssetsKintetsu Group Holdings Co.,
Ltd. 203,309 6,024,060 0.15%MonotaRO Co., Ltd. 297,200 5,938,443 0.15%Fuji Electric Co., Ltd. 150,458 5,932,677 0.15%Nippon Express Co., Ltd. 90,909 5,843,127 0.15%Kajima Corp. 532,312 5,690,212 0.14%Obayashi Corp. 769,926 5,165,088 0.13%Tobu Railway Co., Ltd. 224,080 4,889,400 0.12%Dai Nippon Printing Co., Ltd. 269,321 4,806,415 0.12%Kurita Water Industries Ltd. 117,312 4,750,482 0.12%Hoshizaki Corp. 64,493 4,625,436 0.12%NGK Insulators Ltd. 306,370 4,338,706 0.11%Nabtesco Corp. 133,512 4,260,275 0.11%Shimizu Corp. 656,060 4,246,697 0.11%TOPPAN, Inc. 311,720 4,227,377 0.11%Keisei Electric Railway Co.,
Ltd. 154,834 4,170,140 0.10%Miura Co., Ltd. 104,400 3,819,134 0.10%ANA Holdings, Inc. 190,612 3,782,609 0.10%THK Co., Ltd. 143,984 3,626,318 0.09%Persol Holdings Co., Ltd. 212,700 3,547,073 0.09%Sohgo Security Services Co.,
Ltd. 85,661 3,293,076 0.08%NSK Ltd. 461,207 3,290,255 0.08%Hitachi Construction
Machinery Co., Ltd. 126,021 3,250,504 0.08%Japan Airlines Co., Ltd. 172,841 3,152,877 0.08%Hino Motors Ltd. 346,568 2,572,475 0.06%Harmonic Drive Systems, Inc. 50,400 2,343,419 0.06%. . 855,051,340 21.43%Information Technology 13.72% (2020: 13.73%)Keyence Corp. 230,766 98,303,833 2.46%Tokyo Electron Ltd. 177,136 64,705,227 1.62%Murata Manufacturing Co.,
Ltd. 681,262 43,901,616 1.10%Fujitsu Ltd. 233,159 36,845,427 0.92%FUJIFILM Holdings Corp. 427,015 26,729,184 0.67%Canon, Inc. 1,186,147 22,646,395 0.57%Kyocera Corp. 380,576 19,858,194 0.50%Advantest Corp. 236,700 18,001,157 0.45%TDK Corp. 153,696 15,752,250 0.39%Omron Corp. 220,021 14,726,791 0.37%Lasertec Corp. 89,400 14,664,195 0.37%Renesas Electronics Corp. 1,485,378 13,553,394 0.34%Obic Co., Ltd. 82,647 13,003,949 0.33%NEC Corp. 291,217 12,655,544 0.32%Nomura Research Institute
Ltd. 417,749 11,663,821 0.29%NTT Data Corp. 747,798 9,845,798 0.25%Shimadzu Corp. 280,695 9,159,377 0.23%Disco Corp. 34,179 8,815,911 0.22%Hamamatsu Photonics KK 166,251 8,462,665 0.21%Rohm Co., Ltd. 103,785 8,097,913 0.20%Ricoh Co., Ltd. 794,744 7,529,424 0.19%Trend Micro, Inc. 158,335 7,001,127 0.18%SUMCO Corp. 328,000 6,790,604 0.17%Otsuka Corp. 135,040 5,981,348 0.15%TIS, Inc. 265,100 5,713,959 0.14%Ibiden Co., Ltd. 125,200 5,697,695 0.14%GMO Payment Gateway, Inc. 49,000 5,386,823 0.14%Azbil Corp. 146,400 5,121,991 0.13%Seiko Epson Corp. 331,877 4,926,855 0.12%Hirose Electric Co., Ltd. 38,528 4,756,614 0.12%Brother Industries Ltd. 279,977 4,715,808 0.12%Yokogawa Electric Corp. 273,792 3,453,003 0.09%SCSK Corp. 62,600 3,148,476 0.08%Itochu Techno-Solutions Corp. 112,000 2,927,147 0.07%Oracle Corp. Japan 45,077 2,910,999 0.07%. . 547,454,514 13.72%Materials 4.88% (2020: 5.11%)Shin-Etsu Chemical Co., Ltd. 419,989 59,285,938 1.49%Nippon Steel Corp. 1,013,995 14,433,032 0.36%

215
Vanguard Japan Stock Index Fund
.Number of
SharesFair Value
EUR (€)% of Total
Net AssetsAsahi Kasei Corp. 1,487,087 13,789,301 0.35%Nitto Denko Corp. 178,789 11,260,648 0.28%Mitsubishi Chemical Holdings
Corp. 1,517,475 10,762,271 0.27%Nippon Paint Holdings Co.,
Ltd. 843,330 9,661,999 0.24%Sumitomo Metal Mining Co.,
Ltd. 293,003 9,627,782 0.24%Toray Industries, Inc. 1,643,344 9,227,834 0.23%Sumitomo Chemical Co., Ltd. 1,765,100 7,898,647 0.20%Mitsui Chemicals, Inc. 218,191 6,357,264 0.16%JSR Corp. 241,124 6,155,280 0.15%Nissan Chemical Corp. 146,135 6,039,781 0.15%JFE Holdings, Inc. 582,624 5,758,823 0.15%Oji Holdings Corp. 963,481 4,670,162 0.12%Kansai Paint Co., Ltd. 210,434 4,526,097 0.11%Tosoh Corp. 309,072 4,499,075 0.11%Hitachi Metals Ltd. 255,445 4,122,114 0.10%Mitsubishi Gas Chemical Co.,
Inc. 188,697 3,377,601 0.09%Nippon Sanso Holdings Corp. 182,054 3,149,425 0.08%. . 194,603,074 4.88%Real Estate 3.56% (2020: 3.29%)Mitsui Fudosan Co., Ltd. 1,086,966 21,248,282 0.53%Mitsubishi Estate Co., Ltd. 1,401,649 19,130,863 0.48%Daiwa House Industry Co.,
Ltd. 671,250 17,007,803 0.43%Sumitomo Realty &
Development Co., Ltd. 366,712 11,060,728 0.28%Nippon Building Fund, Inc.
REIT 1,763 9,282,258 0.23%
.Number of
SharesFair Value
EUR (€)% of Total
Net AssetsJapan Real Estate Investment
Corp. REIT 1,477 7,664,243 0.19%Japan Metropolitan Fund
Invest REIT 8,277 7,571,249 0.19%GLP J-Reit REIT 4,932 7,179,375 0.18%Daito Trust Construction Co.,
Ltd. 77,560 7,159,491 0.18%Nomura Real Estate Master
Fund, Inc. REIT 5,026 6,800,713 0.17%Nippon Prologis, Inc. REIT 2,446 6,569,222 0.16%Daiwa House Investment
Corp. REIT Class REIT A 2,340 5,822,309 0.15%Orix JREIT, Inc. REIT 3,112 5,054,932 0.13%United Urban Investment
Corp. REIT 3,526 4,304,932 0.11%Hulic Co., Ltd. 323,759 3,074,680 0.08%Nomura Real Estate Holdings,
Inc. 139,179 2,979,770 0.07%. . 141,910,850 3.56%Utilities 1.01% (2020: 1.22%)Chubu Electric Power Co., Inc. 763,840 7,880,799 0.20%Tokyo Gas Co., Ltd. 445,743 7,101,515 0.18%Osaka Gas Co., Ltd. 444,470 6,986,683 0.18%Kansai Electric Power Co., Inc. 835,033 6,721,600 0.17%Tokyo Electric Power Co.
Holdings, Inc. 1,813,266 4,546,148 0.11%Toho Gas Co., Ltd. 88,099 3,641,145 0.09%Tohoku Electric Power Co., Inc. 499,875 3,304,066 0.08%. . 40,181,956 1.01%Total Equities 3,928,971,649 98.48%Financial Assets at Fair Value Through Profit or Loss
3,928,971,649 98.48%
testNumber of Contracts
Notional Amount
Unrealised Gain/(Loss)
EUR (€)% of Total
Net AssetsFinancial Derivative InstrumentsFutures (0.01%) (2020: 0.03%)Topix Index September 2021 407 ¥7,957,949,048 (379,410 ) (0.01 %)test test test (379,410 ) (0.01 %)
CurrencyBuy
Amount Currency(Sell)
Amount CounterpartySettlement
Date
Unrealised Gain/(Loss)
EUR (€)% of Total
Net AssetsForward Currency Exchange Contracts (0.02%) (2020: 0.01%)USD 57,473,801 JPY (6,204,660,000) Citibank NA 2/7/2021 1,324,671 0.03 %USD 43,596,605 JPY (4,739,570,000) JPMorgan Chase Bank 2/7/2021 753,798 0.02 %USD 18,494,490 JPY (2,005,581,357) Citibank NA 2/7/2021 358,008 0.01 %USD 53,405,978 JPY (5,882,967,546) JPMorgan Chase Bank 2/7/2021 338,558 0.01 %USD 29,497,818 JPY (3,233,518,364) Standard Chartered Bank 2/7/2021 307,275 0.00 %USD 10,517,547 JPY (1,136,930,000) JPMorgan Chase Bank 2/7/2021 231,058 0.00 %USD 18,038,308 JPY (1,975,900,000) Citibank NA 2/7/2021 198,839 0.00 %USD 17,534,764 JPY (1,932,385,342) JPMorgan Chase Bank 2/7/2021 104,831 0.00 %USD 7,173,341 JPY (785,765,000) UBS AG 2/7/2021 79,045 0.00 %USD 5,200,000 JPY (570,013,912) Bank of America 2/7/2021 54,200 0.00 %USD 2,104,778 JPY (227,360,000) State Street Bank & Trust Co. 2/7/2021 47,479 0.00 %USD 4,129,397 JPY (453,675,000) BNP Paribas 15/9/2021 32,982 0.00 %USD 5,481,468 JPY (605,740,000) Goldman Sachs International 2/7/2021 20,119 0.00 %USD 6,377,559 JPY (705,060,000) Morgan Stanley 15/9/2021 17,606 0.00 %USD 1,260,060 JPY (138,110,000) Goldman Sachs International 2/7/2021 13,250 0.00 %USD 1,047,788 JPY (114,780,000) Bank of America 15/9/2021 10,911 0.00 %USD 1,781,480 JPY (196,250,000) BNP Paribas 15/9/2021 10,220 0.00 %USD 1,038,068 JPY (114,914,073) Citibank NA 15/9/2021 1,711 0.00 %USD 67,444 GBP (47,795) State Street Bank & Trust Co. 15/9/2021 1,184 0.00 %JPY 175,185,000 USD (1,579,318) Citibank NA 15/9/2021 90 0.00 %USD 65,763 GBP (47,795) State Street Bank & Trust Co. 2/7/2021 (222 ) (0.00 %)GBP 47,795 USD (67,442) State Street Bank & Trust Co. 2/7/2021 (1,193 ) (0.00 %)JPY 120,000,000 USD (1,083,788) JPMorgan Chase Bank 15/9/2021 (1,597 ) (0.00 %)JPY 38,330,000 USD (349,392) BNP Paribas 2/7/2021 (3,412 ) (0.00 %)JPY 560,000,000 USD (5,055,123) Citibank NA 15/9/2021 (5,305 ) (0.00 %)JPY 66,157,609 USD (603,245) State Street Bank & Trust Co. 2/7/2021 (6,051 ) (0.00 %)JPY 117,090,000 USD (1,069,040) JPMorgan Chase Bank 15/9/2021 (11,269 ) (0.00 %)JPY 138,740,000 USD (1,265,226) Barclays Bank plc 2/7/2021 (12,820 ) (0.00 %)JPY 215,380,000 USD (1,957,851) Citibank NA 15/9/2021 (13,503 ) (0.00 %)

216
Vanguard Japan Stock Index Fund
CurrencyBuy
Amount Currency(Sell)
Amount CounterpartySettlement
Date
Unrealised Gain/(Loss)
EUR (€)% of Total
Net AssetsJPY 214,335,000 USD (1,950,154) JPMorgan Chase Bank 15/9/2021 (14,955 ) (0.00 %)JPY 1,040,000,000 USD (9,399,126) Citibank NA 15/9/2021 (19,148 ) (0.00 %)JPY 394,200,000 USD (3,578,876) JPMorgan Chase Bank 15/9/2021 (20,936 ) (0.00 %)JPY 882,308,905 USD (7,980,849) Morgan Stanley 15/9/2021 (22,033 ) (0.00 %)JPY 553,840,000 USD (5,016,594) JPMorgan Chase Bank 2/7/2021 (22,426 ) (0.00 %)JPY 200,785,000 USD (1,836,479) JPMorgan Chase Bank 2/7/2021 (23,140 ) (0.00 %)JPY 465,840,000 USD (4,230,701) JPMorgan Chase Bank 15/9/2021 (25,933 ) (0.00 %)JPY 373,210,000 USD (3,402,587) JPMorgan Chase Bank 15/9/2021 (31,839 ) (0.00 %)JPY 293,625,000 USD (2,685,384) Barclays Bank plc 15/9/2021 (32,105 ) (0.00 %)JPY 312,320,000 USD (2,852,056) Citibank NA 2/7/2021 (32,135 ) (0.00 %)JPY 294,000,000 USD (2,689,463) JPMorgan Chase Bank 2/7/2021 (34,215 ) (0.00 %)JPY 254,995,000 USD (2,340,853) Goldman Sachs International 2/7/2021 (36,592 ) (0.00 %)JPY 169,560,000 USD (1,577,882) Goldman Sachs International 2/7/2021 (42,311 ) (0.00 %)JPY 344,340,000 USD (3,158,208) Goldman Sachs International 2/7/2021 (47,024 ) (0.00 %)JPY 420,000,000 USD (3,839,958) JPMorgan Chase Bank 2/7/2021 (47,081 ) (0.00 %)JPY 392,000,000 USD (3,593,041) State Street Bank & Trust Co. 2/7/2021 (51,599 ) (0.00 %)JPY 570,282,024 USD (5,200,000) State Street Bank & Trust Co. 2/7/2021 (52,164 ) (0.00 %)JPY 569,701,184 USD (5,200,000) Bank of America 15/9/2021 (53,643 ) (0.00 %)JPY 388,300,000 USD (3,562,291) Goldman Sachs International 2/7/2021 (53,779 ) (0.00 %)JPY 322,830,000 USD (2,979,181) JPMorgan Chase Bank 2/7/2021 (59,483 ) (0.00 %)JPY 919,555,000 USD (8,356,757) UBS AG 2/7/2021 (60,487 ) (0.00 %)JPY 445,280,000 USD (4,084,917) State Street Bank & Trust Co. 2/7/2021 (61,576 ) (0.00 %)JPY 376,865,000 USD (3,471,187) Goldman Sachs International 2/7/2021 (63,834 ) (0.00 %)JPY 395,640,000 USD (3,641,263) State Street Bank & Trust Co. 2/7/2021 (64,607 ) (0.00 %)JPY 616,420,000 USD (5,634,851) JPMorgan Chase Bank 2/7/2021 (68,317 ) (0.00 %)JPY 513,405,000 USD (4,708,725) JPMorgan Chase Bank 2/7/2021 (70,021 ) (0.00 %)JPY 494,910,000 USD (4,546,887) UBS AG 2/7/2021 (74,068 ) (0.00 %)JPY 587,700,000 USD (5,385,320) UBS AG 2/7/2021 (76,101 ) (0.00 %)JPY 364,150,000 USD (3,373,802) JPMorgan Chase Bank 2/7/2021 (78,317 ) (0.00 %)JPY 639,540,000 USD (5,859,550) Barclays Bank plc 2/7/2021 (82,140 ) (0.00 %)JPY 668,440,000 USD (6,122,230) Citibank NA 2/7/2021 (84,075 ) (0.00 %)JPY 758,550,000 USD (6,966,117) Morgan Stanley 2/7/2021 (111,070 ) (0.00 %)JPY 1,048,950,000 USD (9,583,767) JPMorgan Chase Bank 2/7/2021 (112,080 ) (0.01 %)JPY 744,040,000 USD (6,842,710) JPMorgan Chase Bank 2/7/2021 (117,247 ) (0.00 %)JPY 580,630,000 USD (5,371,009) BNP Paribas 2/7/2021 (117,747 ) (0.00 %)JPY 671,475,000 USD (6,194,773) JPMorgan Chase Bank 2/7/2021 (122,189 ) (0.00 %)JPY 955,750,000 USD (8,777,069) Barclays Bank plc 2/7/2021 (139,922 ) (0.01 %)JPY 953,250,000 USD (8,756,666) BNP Paribas 2/7/2021 (141,711 ) (0.00 %)JPY 829,080,000 USD (7,640,312) JPMorgan Chase Bank 2/7/2021 (143,730 ) (0.00 %)JPY 1,020,240,000 USD (9,371,563) Citibank NA 2/7/2021 (151,264 ) (0.00 %)JPY 1,613,600,000 USD (14,724,330) Citibank NA 2/7/2021 (156,913 ) (0.01 %)JPY 1,049,125,000 USD (9,650,525) Citibank NA 2/7/2021 (167,044 ) (0.01 %)JPY 1,007,000,000 USD (9,280,769) State Street Bank & Trust Co. 2/7/2021 (175,292 ) (0.00 %)JPY 1,350,720,000 USD (12,408,350) Citibank NA 2/7/2021 (201,202 ) (0.01 %)JPY 1,017,380,000 USD (9,415,530) State Street Bank & Trust Co. 2/7/2021 (210,067 ) (0.00 %)JPY 1,032,210,000 USD (9,559,028) Bank of America 2/7/2021 (218,401 ) (0.00 %)JPY 1,584,885,000 USD (14,599,048) State Street Bank & Trust Co. 2/7/2021 (269,431 ) (0.01 %)JPY 3,233,518,364 USD (29,514,059) Standard Chartered Bank 15/9/2021 (304,314 ) (0.01 %)JPY 2,733,500,000 USD (25,158,141) Goldman Sachs International 2/7/2021 (446,746 ) (0.02 %)test (961,991 ) (0.02 %)Total Financial Derivative Instruments (1,341,401 ) (0.03 %)zwa
Fair Value EUR (€)
% of Total Net Assets
Other Assets and Liabilities 61,834,159 1.55 %Net Assets 3,989,464,407 100.00 %
Analysis of Total Net Assets EUR (€)% of Total
Net Assets(a) Transferable securities admitted to an official stock exchange listing 3,928,971,649 98.48 %(b) Transferable securities dealt in on another regulated market — 0.00 %(c) Transferable securities other than those admitted to an official stock exchange listing or dealt in on another regulated
market — 0.00 %
(d) Financial derivative instruments (1,341,401 ) (0.03 %)(e) Other assets and liabilities 61,834,159 1.55 %Total Net Assets 3,989,464,407 100.00 %

The accompanying notes form an integral part of the financial statements.
217
Vanguard Japan Stock Index Fund
Statement of Assets and Liabilities
Euro (€)
As at 30 June 2021
Euro (€)
As at 31 December 2020
Current AssetsFinancial Assets at Fair Value Through Profit or Loss 3,928,971,649 3,409,671,266 Financial Derivative Instruments 3,905,835 2,935,065 Cash 56,547,022 41,439,435 Receivables: Interest and Dividends 4,567,410 3,991,980 Capital Shares Issued 4,022,083 7,036,906 Investments Sold — 5,775,719 Futures Margin Cash 2,688,900 1,991,548 Cash Collateral 1,635,889 —
Total Current Assets 4,002,338,788 3,472,841,919
Current LiabilitiesFinancial Derivative Instruments 5,247,236 1,499,019 Bank Overdraft 6,072,119 5,196 Unrealised Depreciation on Spot Currency Contracts 18,864 12,202 Payables and Other Liabilities: Investments Purchased 62,768 — Income Distribution Payable — 2,232,450 Capital Shares Redeemed 980,761 547,384 Management Fees Payable 492,633 440,879
Total Current Liabilities 12,874,381 4,737,130
Net Assets Attributable to Holders of Redeemable Participating Shares (“Net Assets”) 3,989,464,407 3,468,104,789
Net Asset Value Per Share
.As at
30 June 2021As at
31 December 2020As at
31 December 2019EUR AccNet Assets 308,062,896 273,071,100 236,608,665Number of Shares Outstanding 1,314,813 1,216,830 1,105,841Net Asset Value Per Share1 234.30 224.41 213.96
Investor EUR Net Assets 136,085,898 137,381,041 79,481,745Number of Shares Outstanding 583,186 614,682 372,991Net Asset Value Per Share1 233.35 223.50 213.09
Institutional Plus EUR AccNet Assets 486,048,714 413,172,625 211,912,033Number of Shares Outstanding 2,561,786 2,274,103 1,223,815Net Asset Value Per Share1 189.73 181.69 173.16
GBP AccEUR (€) Equivalent 1,863,914,920 1,584,762,221 1,292,883,110Net Assets 1,600,070,078 1,418,512,692 1,095,498,296Number of Shares Outstanding 5,995,449 5,322,175 4,553,992Net Asset Value Per Share1 266.88 266.53 240.56
GBP DistEUR (€) Equivalent 48,677,468 43,036,502 42,958,474Net Assets 41,786,972 38,521,756 36,399,992Number of Shares Outstanding 188,506 174,006 179,131Net Asset Value Per Share1 221.67 221.38 203.20
Institutional Plus GBP AccEUR (€) Equivalent 25,778,936 19,351,560 9,882,803Net Assets 22,129,821 17,321,484 8,373,993Number of Shares Outstanding 115,281 90,370 48,425Net Asset Value Per Share1 191.96 191.67 172.93

218
Vanguard Japan Stock Index Fund
The accompanying notes form an integral part of the financial statements.
Net Asset Value Per Share (continued)
.As at
30 June 2021As at
31 December 2020As at
31 December 2019Institutional Plus GBP DistEUR (€) Equivalent 290,257,965 86,520,999 80,334,097Net Assets 249,170,753 77,444,511 68,069,469Number of Shares Outstanding 1,447,353 450,534 431,435Net Asset Value Per Share1 172.16 171.89 157.77
JPY AccEUR (€) Equivalent 144,763,413 144,897,526 127,057,553Net Assets 19,054,200,934 18,304,241,119 15,499,457,260Number of Shares Outstanding 1,340,356 1,400,721 1,288,247Net Asset Value Per Share1 14,215.78 13,067.73 12,031.43
Investor JPY EUR (€) Equivalent 12,492,461 11,912,457 14,317,022Net Assets 1,644,295,731 1,504,846,158 1,746,500,427Number of Shares Outstanding 53,866 53,628 67,601Net Asset Value Per Share1 30,525.67 28,060.83 25,835.42
Institutional Plus JPY AccEUR (€) Equivalent 76,650,877 78,853,528 72,149,229Net Assets 10,089,021,679 9,961,205,201 8,801,317,709Number of Shares Outstanding 558,845 600,359 576,373Net Asset Value Per Share1 18,053.35 16,592.08 15,270.18
USD AccEUR (€) Equivalent 554,313,140 631,581,885 673,966,547Net Assets 657,359,953 772,772,015 756,527,449Number of Shares Outstanding 2,365,288 2,813,766 3,149,231Net Asset Value Per Share1 277.92 274.64 240.23
Investor USDEUR (€) Equivalent 33,726,278 36,032,418 35,114,936Net Assets 39,995,993 44,087,465 39,416,516Number of Shares Outstanding 145,923 162,771 166,374Net Asset Value Per Share1 274.09 270.86 236.92
Institutional Plus USD AccEUR (€) Equivalent 8,691,441 7,530,927 5,881,574Net Assets 10,307,180 9,214,466 6,602,067Number of Shares Outstanding 70,193 63,514 52,047Net Asset Value Per Share1 146.84 145.08 126.85
1 The net asset value per share shown may diverge from the net asset value per share used for dealing purposes because of any adjustments for swing pricing and trade date accounting.

219
Vanguard Japan Stock Index Fund
The accompanying notes form an integral part of the financial statements.
Statement of Operations
Euro (€)
Six Months Ended 30 June 2021
Euro (€)
Six Months Ended 30 June 2020
Investment Income/(Loss) Interest Income 926 66,781 Dividend Income 41,762,221 36,782,588 Securities Lending Income 191,170 508,131 Net Gain/(Loss) on Financial Instruments 122,321,629 (247,582,106)
Total Investment Income/(Loss) 164,275,946 (210,224,606)
Expenses Management Fees 2,837,660 2,155,285 Transaction Fees and Commissions 126,378 93,162
Total Expenses 2,964,038 2,248,447
Finance Costs Interest Expense 20,606 59,841
Total Finance Costs 20,606 59,841
Net Investment Income/(Loss) 161,291,302 (212,532,894)
Foreign Withholding Tax (6,199,752) (5,514,535)
Net Increase/(Decrease) in Net Assets 155,091,550 (218,047,429)
Statement of Changes in Net Assets
Euro (€)
Euro (€)
Six Months Ended Six Months Ended30 June 2021 30 June 2020
Increase/(Decrease) in Net Assets
Net Increase/(Decrease) in Net Assets From Operations 155,091,550 (218,047,429)
Capital Transactions Subscriptions 1,433,222,396 547,764,654 Redemptions (1,066,964,743) (369,388,672) Reinvestments 10,415 20,586
Total Capital Transactions 366,268,068 178,396,568
Total Increase/(Decrease) for the Period 521,359,618 (39,650,861)
Net AssetsBeginning of Period 3,468,104,789 2,882,547,788
End of Period 3,989,464,407 2,842,896,927

Vanguard Pacific ex-Japan Stock Index FundManaged by Vanguard Global Advisers, LLC.
220
Investment ObjectiveThe fund seeks to provide long-term growth of capital by tracking the performance of the MSCI Pacific ex-Japan Index, which is made up of common stocks of companies located in the Pacific region.
Performance SummaryThe Performance Summary does not form part of the Financial Statements.
• As the six months ended 30 June 2021 came to a close, macroeconomic indicators signalled a faster global economic rebound than many had expected after the sharpest contraction in modern history. Yet the recovery has been uneven. Countries that have contained the virus more successfully, whether through vaccinations, lockdowns or both, generally have fared better economically. And the COVID-19 pandemic remained far from over, with new variants of the virus surfacing where vaccination rates have lagged and the human toll continuing to mount, especially in less developed economies.
• Swift and extensive support from governments and central banks has been a key to the rebound. So far in 2021, it has included fiscal stimulus – including the $1.9 trillion American Rescue Plan in the United States and the €673 billion Recovery and Resilience Facility in Europe – and pledges by a number of central banks to keep interest rates low for some time.
• Fixed income prices worldwide generally fell and longer-term yields rose amid concerns about inflation, resulting in negative returns for the six months.
• Stock markets continued the rally that began in 2020, bolstered by reopening economies, more consumer spending and rising corporate profits. Returns in the United States and Europe outpaced those in emerging markets and especially the Pacific region.
• In this environment, the fund’s benchmark index returned 13.07%.
• Results were positive in all of the index’s 11 sectors. Financials, the largest sector, contributed most to returns. Information technology, energy and utilities stocks were weakest.
• Australian stocks, which account for more than half the index, had double-digit returns, as did Hong Kong and Singapore. New Zealand detracted.
Benchmark returns in the commentary above are in euros.
Benchmark: MSCI Pacific ex-Japan Index
Total ReturnsPeriods Ended 30 June 2021
(Annualised for periods over one year)
Six Months Five YearsTen Years or
Since Inception1
AUD Acc 12.57 % — 8.72 %
Benchmark 12.65 — 8.90
Tracking Difference* -0.08
EUR Acc 13.00 % 8.84 % 7.79 %
Benchmark 13.07 9.00 7.99
Tracking Difference* -0.07
Institutional Plus EUR Acc 13.03 % 8.88 % 7.83 %
Benchmark 13.07 9.00 7.99
Tracking Difference* -0.04
GBP Acc 8.38 % 9.55 % 6.93 %
Benchmark 8.45 9.71 7.14
Tracking Difference* -0.07
GBP Dist 8.38 % 9.55 % 6.93 %
Benchmark 8.45 9.71 7.14
Tracking Difference* -0.07
Institutional Plus GBP Acc 8.40 % 9.59 % 7.36 %
Benchmark 8.45 9.71 7.53
Tracking Difference* -0.05
Institutional Plus GBP Dist 8.40 % 9.59 % 7.36 %
Benchmark 8.45 9.71 7.53
Tracking Difference* -0.05
USD Acc 9.53 % 10.27 % 5.31 %
Benchmark 9.60 10.43 5.54
Tracking Difference* -0.07

221
Vanguard Pacific ex-Japan Stock Index Fund
Total ReturnsPeriods Ended 30 June 2021
(Annualised for periods over one year)
Six Months Five YearsTen Years or
Since Inception1
Institutional Plus USD Acc 9.55 % 10.31 % 5.80 %
Benchmark 9.60 10.43 5.96
Tracking Difference* -0.05
Each benchmark is in its respective currency.Sources: Vanguard Global Advisers, LLC, and MSCI.Performance is based on NAV with net income reinvested.
All of the returns in this report represent past performance, which is not a guarantee of future results that may be achieved by the fund. For performance data current to the most recent month-end, which may be higher or lower than that cited, visit our website at http://global.vanguard.com. Note, too, that both investment returns and principal value can fluctuate widely, so an investor's shares, when sold, could be worth more or less than their original cost.* The tracking difference between the fund return and the index return over a stated period of time can be attributed to a number of factors, including, without limitation, small differences in
weightings, trading activity, transaction costs and differences in the valuation and withholding tax treatment between the fund and the index vendor.1 Since-inception returns: AUD Acc, 15 August 2017; EUR Acc and Institutional Plus EUR Acc, 27 February 2014; Institutional Plus GBP Acc and Institutional Plus GBP Dist, 2 September 2014;
Institutional Plus USD Acc, 6 December 2013.

Significant Portfolio ChangesFor the Six Months Ended 30 June 2021
222
Vanguard Pacific ex-Japan Stock Index Fund
The Central Bank of Ireland requires a schedule of material changes in the composition of the portfolio during the period. These are defined as aggregate purchases of a security exceeding 1% of the total value of purchases for the period and aggregate disposals greater than 1% of the total value of sales. At a minimum, the largest 20 purchases and 20 sales must be shown; all purchases and sales must be shown if there are fewer than 20. A full listing of the portfolio changes for the period is available, upon request, at no extra cost from the Administrator.
SharesCost
Euro (€)
Purchases
AIA Group Ltd. 2,222,800 23,824,669Commonwealth Bank of Australia 327,386 18,716,181BHP Group Ltd. 544,005 16,498,959CSL Ltd. 83,708 14,612,160Futu Holdings Ltd. ADR 102,881 11,909,007Westpac Banking Corp. 738,926 11,435,534Hong Kong Exchanges & Clearing
Ltd. 221,400 11,407,494National Australia Bank Ltd. 609,184 9,999,069Australia & New Zealand Banking
Group Ltd. 525,341 9,055,783Domino's Pizza Enterprises Ltd. 124,467 8,422,278Reece Ltd. 597,411 7,818,346Wesfarmers Ltd. 209,866 7,267,617Northern Star Resources Ltd. 907,207 7,107,077Chow Tai Fook Jewellery Group Ltd. 4,116,000 6,245,946Woolworths Group Ltd. 233,912 6,128,933Macquarie Group Ltd. 63,818 6,083,241Sea Ltd. ADR 28,404 6,066,360DBS Group Holdings Ltd. 330,000 5,739,507Rio Tinto Ltd. 69,733 5,400,904Fortescue Metals Group Ltd. 313,882 4,575,307Oversea-Chinese Banking Corp., Ltd. 635,000 4,509,621Transurban Group 509,798 4,419,356Goodman Group REIT 310,959 3,650,299Xero Ltd. 42,521 3,592,058
SharesProceeds
Euro (€)
Sales
AIA Group Ltd. 1,512,400 15,786,595Commonwealth Bank of Australia 216,614 12,162,678BHP Group Ltd. 372,686 11,473,252CSL Ltd. 56,027 9,362,076Hong Kong Exchanges & Clearing
Ltd. 151,300 7,547,816ASM Pacific Technology Ltd. 656,256 7,132,291National Australia Bank Ltd. 403,394 6,744,211Westpac Banking Corp. 412,045 6,494,495Australia & New Zealand Banking
Group Ltd. 341,005 6,162,990AMP Ltd. 7,342,255 5,437,837CK Asset Holdings Ltd. 979,000 5,100,566Wesfarmers Ltd. 143,805 4,709,915PCCW Ltd. 9,225,808 4,168,157Macquarie Group Ltd. 43,130 4,136,982Woolworths Group Ltd. 155,614 4,002,894Suntec REIT 4,302,000 3,808,298Rio Tinto Ltd. 48,080 3,684,409DBS Group Holdings Ltd. 208,300 3,674,420Fortescue Metals Group Ltd. 215,449 3,036,279Transurban Group 346,765 2,882,170CIMIC Group Ltd. 210,606 2,797,596TPG Telecom Ltd. 798,652 2,730,996Oversea-Chinese Banking Corp., Ltd. 338,600 2,493,195Goodman Group REIT 207,585 2,328,803United Overseas Bank Ltd. 142,100 2,273,223Techtronic Industries Co., Ltd. 169,000 2,261,428

Financial StatementsStatement of Investments30 June 2021
223
Vanguard Pacific ex-Japan Stock Index Fund
.Number of
SharesFair Value
EUR (€)% of Total
Net AssetsEquities 98.95% (2020: 99.41%)Australia 60.58% (2020: 60.20%)Commonwealth Bank of Australia 3,646,301 230,533,909 6.61%
BHP Group Ltd. 6,054,664 186,168,156 5.34%CSL Ltd. 935,184 168,841,269 4.84%Westpac Banking Corp. 7,540,072 123,200,010 3.53%National Australia Bank Ltd. 6,776,632 112,484,799 3.22%Australia & New Zealand Banking Group Ltd. 5,848,475 104,224,131 2.99%
Wesfarmers Ltd. 2,330,372 87,188,656 2.50%Macquarie Group Ltd. 706,478 69,962,599 2.01%Woolworths Group Ltd. 2,600,751 62,778,774 1.80%Rio Tinto Ltd. 762,969 61,168,107 1.75%Fortescue Metals Group Ltd. 3,480,514 51,427,035 1.47%
Transurban Group 5,627,222 50,692,790 1.45%Goodman Group REIT 3,417,339 45,799,018 1.31%Afterpay Ltd. 445,990 33,364,115 0.96%Aristocrat Leisure Ltd. 1,181,113 32,219,233 0.92%Coles Group Ltd. 2,741,768 29,663,338 0.85%Woodside Petroleum Ltd. 1,977,796 27,808,483 0.80%Newcrest Mining Ltd. 1,678,265 26,858,692 0.77%James Hardie Industries plc 912,862 26,161,514 0.75%Xero Ltd. 271,391 23,554,839 0.68%Sonic Healthcare Ltd. 933,063 22,682,423 0.65%Brambles Ltd. 3,021,921 21,885,495 0.63%Cochlear Ltd. 135,119 21,527,575 0.62%QBE Insurance Group Ltd. 3,031,730 20,709,004 0.59%Telstra Corp., Ltd. 8,555,797 20,365,523 0.58%ASX Ltd. 397,944 19,576,999 0.56%Suncorp Group Ltd. 2,631,909 18,511,098 0.53%Scentre Group REIT 10,666,899 18,502,738 0.53%South32 Ltd. 9,825,987 18,225,987 0.52%Santos Ltd. 3,853,591 17,296,535 0.50%Insurance Australia Group Ltd. 5,066,518 16,550,325 0.47%
Dexus REIT 2,232,076 15,077,198 0.43%Ramsay Health Care Ltd. 376,377 14,999,130 0.43%Mirvac Group REIT 8,092,544 14,959,434 0.43%Tabcorp Holdings Ltd. 4,556,435 14,941,775 0.43%Stockland REIT 4,905,887 14,472,738 0.42%Seek Ltd. 689,269 14,460,673 0.41%BlueScope Steel Ltd. 1,035,378 14,393,901 0.41%Northern Star Resources Ltd. 2,271,642 14,064,555 0.40%
APA Group 2,425,698 13,667,025 0.39%GPT Group REIT 4,003,480 12,418,839 0.36%Computershare Ltd. 1,114,063 11,919,107 0.34%REA Group Ltd. 108,608 11,621,786 0.33%Medibank Pvt Ltd. 5,660,453 11,323,626 0.32%Treasury Wine Estates Ltd. 1,482,782 10,963,959 0.31%Endeavour Group Ltd. 2,600,751 10,356,110 0.30%Origin Energy Ltd. 3,620,330 10,336,463 0.30%Lendlease Corp., Ltd. 1,414,622 10,262,951 0.29%Evolution Mining Ltd. 3,511,666 10,003,983 0.29%Sydney Airport 2,717,162 9,959,587 0.29%Oil Search Ltd. 4,057,414 9,786,368 0.28%Magellan Financial Group Ltd. 283,321 9,660,339 0.28%
Domino's Pizza Enterprises Ltd. 124,467 9,495,647 0.27%
Aurizon Holdings Ltd. 3,811,597 8,976,296 0.26%Reece Ltd. 597,411 8,929,280 0.26%Ampol Ltd. 489,812 8,747,415 0.25%Vicinity Centres REIT 7,973,045 7,798,300 0.22%
.Number of
SharesFair Value
EUR (€)% of Total
Net AssetsOrica Ltd. 838,183 7,046,674 0.20%AGL Energy Ltd. 1,274,507 6,616,119 0.19%WiseTech Global Ltd. 300,498 6,074,181 0.17%Crown Resorts Ltd. 765,382 5,770,816 0.17%Qantas Airways Ltd. 1,900,430 5,606,412 0.16%Washington H Soul Pattinson & Co., Ltd. 220,576 4,710,010 0.14%
AusNet Services Ltd. 3,897,564 4,317,959 0.12%BGP Holdings Beneficial 3,231,283 10,228 0.00%test test 2,113,682,053 60.58%Hong Kong 27.40% (2020: 27.73%)AIA Group Ltd. 24,858,532 260,474,806 7.47%Hong Kong Exchanges & Clearing Ltd. 2,475,470 124,398,158 3.57%
Techtronic Industries Co., Ltd. 2,825,000 41,594,995 1.19%
CK Hutchison Holdings Ltd. 5,547,664 36,444,203 1.04%Link REIT 4,278,420 34,958,505 1.00%Sun Hung Kai Properties Ltd. 2,679,563 33,663,577 0.96%
Hong Kong & China Gas Co., Ltd. 23,009,910 30,131,806 0.86%
Galaxy Entertainment Group Ltd. 4,464,495 30,128,423 0.86%
CLP Holdings Ltd. 3,375,170 28,146,202 0.81%Hang Seng Bank Ltd. 1,571,526 26,466,487 0.76%CK Asset Holdings Ltd. 4,125,673 24,011,679 0.69%Jardine Matheson Holdings Ltd. 443,800 23,920,816 0.69%
BOC Hong Kong Holdings Ltd. 7,604,216 21,756,949 0.62%
Sands China Ltd. 4,986,824 17,706,582 0.51%Wharf Real Estate Investment Co., Ltd. 3,431,403 16,822,573 0.48%
Futu Holdings Ltd. ADR 102,881 15,485,503 0.44%WH Group Ltd. 19,697,000 14,928,578 0.43%MTR Corp., Ltd. 3,175,459 14,912,675 0.43%Power Assets Holdings Ltd. 2,851,026 14,751,189 0.42%New World Development Co., Ltd. 3,129,588 13,711,774 0.39%
Xinyi Glass Holdings Ltd. 3,736,000 12,839,364 0.37%Henderson Land Development Co., Ltd. 2,982,789 11,918,821 0.34%
ESR Cayman Ltd. 4,086,288 11,625,006 0.33%Hongkong Land Holdings Ltd. 2,397,200 9,621,951 0.28%
Budweiser Brewing Co. APAC Ltd. 3,538,000 9,412,107 0.27%
Sino Land Co., Ltd. 6,773,030 9,001,758 0.26%HKT Trust & HKT Ltd. 7,796,389 8,956,578 0.26%Hang Lung Properties Ltd. 4,164,832 8,529,079 0.24%Chow Tai Fook Jewellery Group Ltd. 4,116,000 7,928,516 0.23%
CK Infrastructure Holdings Ltd. 1,361,580 6,845,215 0.20%
Melco Resorts & Entertainment Ltd. ADR 440,960 6,233,826 0.18%
Swire Properties Ltd. 2,403,279 6,041,129 0.17%Swire Pacific Ltd. Class A 1,022,654 5,846,420 0.17%HK Electric Investments & HK Electric Investments Ltd. 5,481,500 4,684,218 0.13%
Wynn Macau Ltd. 3,232,412 4,289,047 0.12%Bank of East Asia Ltd. 2,716,520 4,253,448 0.12%SJM Holdings Ltd. 4,058,720 3,737,213 0.11%test test 956,179,176 27.40%

224
Vanguard Pacific ex-Japan Stock Index Fund
.Number of
SharesFair Value
EUR (€)% of Total
Net AssetsNew Zealand 2.00% (2020: 2.57%)Fisher & Paykel Healthcare Corp., Ltd. 1,184,528 21,719,939 0.62%
Auckland International Airport Ltd. 2,571,609 11,015,724 0.31%
Spark New Zealand Ltd. 3,803,979 10,758,532 0.31%Meridian Energy Ltd. 2,639,024 8,287,895 0.24%Ryman Healthcare Ltd. 874,200 6,763,153 0.19%a2 Milk Co., Ltd. 1,526,244 5,791,400 0.17%Mercury NZ Ltd. 1,399,571 5,500,402 0.16%test test 69,837,045 2.00%Singapore 8.97% (2020: 8.91%)DBS Group Holdings Ltd. 3,705,570 69,295,499 1.99%Oversea-Chinese Banking Corp., Ltd. 6,898,451 51,713,927 1.48%
United Overseas Bank Ltd. 2,422,185 39,233,006 1.12%Singapore Telecommunications Ltd. 16,968,735 24,376,592 0.70%
CapitaLand Ltd. 5,420,943 12,616,439 0.36%Ascendas REIT 6,607,864 12,228,442 0.35%
.Number of
SharesFair Value
EUR (€)% of Total
Net AssetsCapitaLand Integrated Commercial Trust REIT 9,310,245 12,206,620 0.35%
Singapore Exchange Ltd. 1,651,082 11,579,731 0.33%Wilmar International Ltd. 3,947,085 11,142,356 0.32%Keppel Corp., Ltd. 2,992,035 10,266,964 0.29%Singapore Airlines Ltd. 2,760,228 8,397,978 0.24%Mapletree Logistics Trust REIT 6,158,821 7,920,261 0.23%
Singapore Technologies Engineering Ltd. 3,218,455 7,813,515 0.22%
Venture Corp., Ltd. 565,900 6,819,540 0.20%Sea Ltd. ADR 28,404 6,658,976 0.19%Genting Singapore Ltd. 12,411,997 6,501,539 0.19%Mapletree Commercial Trust REIT 4,430,000 6,002,684 0.17%
UOL Group Ltd. 959,845 4,395,538 0.13%City Developments Ltd. 846,266 3,870,102 0.11%test test 313,039,709 8.97%Total Equities 3,452,737,983 98.95%Financial Assets at Fair Value Through Profit or Loss 3,452,737,983 98.95%
testNumber of Contracts
Notional Amount
Unrealised Gain/(Loss)
EUR (€)% of Total
Net AssetsFinancial Derivative InstrumentsFutures (0.02%) (2020: 0.00%)SPI 200 Index September 2021 169 AU($)30,457,865 37,547 0.00 %MSCI Pacific Ex-Japan September 2021 259 $21,068,277 (527,369 ) (0.02 %)test test test (489,822 ) (0.02 %)
CurrencyBuy
Amount Currency(Sell)
Amount CounterpartySettlement
Date
Unrealised Gain/(Loss)
EUR (€)% of Total
Net AssetsForward Currency Exchange Contracts (0.00%) (2020: 0.02%)USD 23,570,315 AUD (30,336,900) JPMorgan Chase Bank 2/7/2021 670,277 0.02 %USD 20,929,239 AUD (27,000,000) Citibank NA 2/7/2021 555,683 0.01 %USD 20,009,937 AUD (25,817,591) Toronto-Dominion Bank 2/7/2021 529,029 0.01 %USD 17,560,438 AUD (22,691,100) BNP Paribas 2/7/2021 442,778 0.01 %USD 12,857,599 AUD (16,494,650) Citibank NA 2/7/2021 399,897 0.01 %USD 22,917,616 AUD (30,058,575) BNP Paribas 2/7/2021 296,092 0.01 %USD 10,118,858 AUD (13,025,850) JPMorgan Chase Bank 2/7/2021 286,448 0.01 %USD 7,907,339 AUD (10,225,600) Morgan Stanley 15/9/2021 191,947 0.00 %USD 8,696,401 AUD (11,383,350) Citibank NA 2/7/2021 126,781 0.00 %USD 4,737,130 AUD (6,119,350) Standard Chartered Bank 2/7/2021 120,606 0.00 %USD 2,967,052 AUD (3,822,525) Goldman Sachs International 2/7/2021 82,039 0.00 %USD 1,779,508 SGD (2,357,881) Citibank NA 15/9/2021 21,658 0.00 %USD 549,579 AUD (709,000) JPMorgan Chase Bank 2/7/2021 14,585 0.00 %USD 11,617,845 HKD (90,136,323) BNP Paribas 15/9/2021 7,842 0.00 %USD 2,677,250 HKD (20,772,699) Citibank NA 2/7/2021 2,001 0.00 %USD 4,226,742 HKD (32,806,970) Barclays Bank plc 2/7/2021 1,875 0.00 %HKD 8,000,000 USD (1,029,413) BNP Paribas 2/7/2021 623 0.00 %USD 4,316,049 HKD (33,513,162) Citibank NA 2/7/2021 503 0.00 %HKD 13,554,510 USD (1,745,687) BNP Paribas 15/9/2021 (18 ) (0.00 %)AUD 2,000,000 USD (1,502,006) BNP Paribas 15/9/2021 (18 ) (0.00 %)USD 130,683 HKD (1,015,119) UBS AG 2/7/2021 (28 ) (0.00 %)SGD 1,180,097 USD (877,935) Citibank NA 15/9/2021 (155 ) (0.00 %)USD 1,291,108 HKD (10,028,373) JPMorgan Chase Bank 2/7/2021 (197 ) (0.00 %)AUD 2,812,080 USD (2,114,684) Citibank NA 15/9/2021 (2,385 ) (0.00 %)USD 1,750,424 SGD (2,357,881) Citibank NA 2/7/2021 (3,112 ) (0.00 %)AUD 6,484,500 USD (4,874,314) JPMorgan Chase Bank 15/9/2021 (3,792 ) (0.00 %)HKD 68,089,576 USD (8,775,810) JPMorgan Chase Bank 15/9/2021 (5,597 ) (0.00 %)AUD 4,185,425 USD (3,150,888) JPMorgan Chase Bank 15/9/2021 (6,454 ) (0.00 %)HKD 90,136,323 USD (11,616,512) BNP Paribas 2/7/2021 (8,227 ) (0.00 %)AUD 721,300 USD (554,233) Citibank NA 15/9/2021 (10,560 ) (0.00 %)AUD 531,750 USD (412,184) JPMorgan Chase Bank 2/7/2021 (10,939 ) (0.00 %)AUD 709,000 USD (546,677) JPMorgan Chase Bank 2/7/2021 (12,138 ) (0.00 %)AUD 1,372,000 USD (1,049,223) Citibank NA 2/7/2021 (16,185 ) (0.00 %)AUD 889,500 USD (688,622) Citibank NA 2/7/2021 (17,565 ) (0.00 %)AUD 3,603,500 USD (2,729,302) Morgan Stanley 15/9/2021 (19,449 ) (0.00 %)AUD 714,800 USD (559,998) Citibank NA 2/7/2021 (19,700 ) (0.00 %)SGD 2,357,881 USD (1,779,834) Citibank NA 2/7/2021 (21,688 ) (0.00 %)
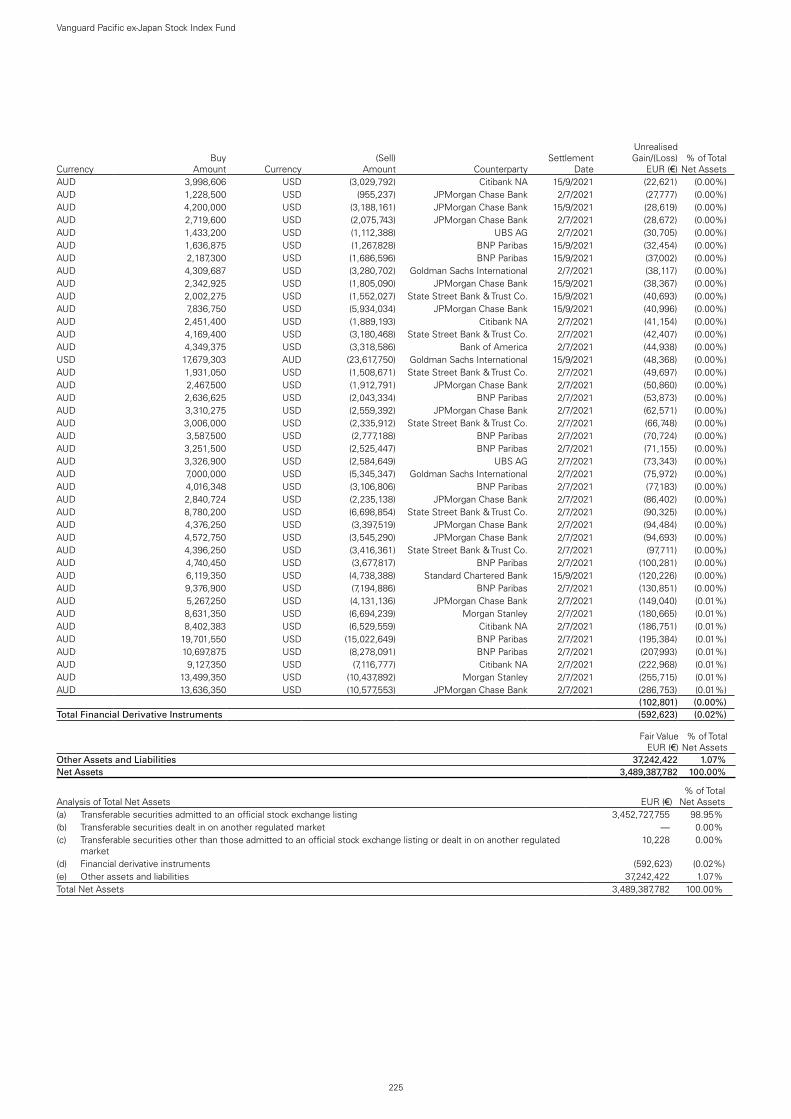
225
Vanguard Pacific ex-Japan Stock Index Fund
CurrencyBuy
Amount Currency(Sell)
Amount CounterpartySettlement
Date
Unrealised Gain/(Loss)
EUR (€)% of Total
Net AssetsAUD 3,998,606 USD (3,029,792) Citibank NA 15/9/2021 (22,621 ) (0.00 %)AUD 1,228,500 USD (955,237) JPMorgan Chase Bank 2/7/2021 (27,777 ) (0.00 %)AUD 4,200,000 USD (3,188,161) JPMorgan Chase Bank 15/9/2021 (28,619 ) (0.00 %)AUD 2,719,600 USD (2,075,743) JPMorgan Chase Bank 2/7/2021 (28,672 ) (0.00 %)AUD 1,433,200 USD (1,112,388) UBS AG 2/7/2021 (30,705 ) (0.00 %)AUD 1,636,875 USD (1,267,828) BNP Paribas 15/9/2021 (32,454 ) (0.00 %)AUD 2,187,300 USD (1,686,596) BNP Paribas 15/9/2021 (37,002 ) (0.00 %)AUD 4,309,687 USD (3,280,702) Goldman Sachs International 2/7/2021 (38,117 ) (0.00 %)AUD 2,342,925 USD (1,805,090) JPMorgan Chase Bank 15/9/2021 (38,367 ) (0.00 %)AUD 2,002,275 USD (1,552,027) State Street Bank & Trust Co. 15/9/2021 (40,693 ) (0.00 %)AUD 7,836,750 USD (5,934,034) JPMorgan Chase Bank 15/9/2021 (40,996 ) (0.00 %)AUD 2,451,400 USD (1,889,193) Citibank NA 2/7/2021 (41,154 ) (0.00 %)AUD 4,169,400 USD (3,180,468) State Street Bank & Trust Co. 2/7/2021 (42,407 ) (0.00 %)AUD 4,349,375 USD (3,318,586) Bank of America 2/7/2021 (44,938 ) (0.00 %)USD 17,679,303 AUD (23,617,750) Goldman Sachs International 15/9/2021 (48,368 ) (0.00 %)AUD 1,931,050 USD (1,508,671) State Street Bank & Trust Co. 2/7/2021 (49,697 ) (0.00 %)AUD 2,467,500 USD (1,912,791) JPMorgan Chase Bank 2/7/2021 (50,860 ) (0.00 %)AUD 2,636,625 USD (2,043,334) BNP Paribas 2/7/2021 (53,873 ) (0.00 %)AUD 3,310,275 USD (2,559,392) JPMorgan Chase Bank 2/7/2021 (62,571 ) (0.00 %)AUD 3,006,000 USD (2,335,912) State Street Bank & Trust Co. 2/7/2021 (66,748 ) (0.00 %)AUD 3,587,500 USD (2,777,188) BNP Paribas 2/7/2021 (70,724 ) (0.00 %)AUD 3,251,500 USD (2,525,447) BNP Paribas 2/7/2021 (71,155 ) (0.00 %)AUD 3,326,900 USD (2,584,649) UBS AG 2/7/2021 (73,343 ) (0.00 %)AUD 7,000,000 USD (5,345,347) Goldman Sachs International 2/7/2021 (75,972 ) (0.00 %)AUD 4,016,348 USD (3,106,806) BNP Paribas 2/7/2021 (77,183 ) (0.00 %)AUD 2,840,724 USD (2,235,138) JPMorgan Chase Bank 2/7/2021 (86,402 ) (0.00 %)AUD 8,780,200 USD (6,698,854) State Street Bank & Trust Co. 2/7/2021 (90,325 ) (0.00 %)AUD 4,376,250 USD (3,397,519) JPMorgan Chase Bank 2/7/2021 (94,484 ) (0.00 %)AUD 4,572,750 USD (3,545,290) JPMorgan Chase Bank 2/7/2021 (94,693 ) (0.00 %)AUD 4,396,250 USD (3,416,361) State Street Bank & Trust Co. 2/7/2021 (97,711 ) (0.00 %)AUD 4,740,450 USD (3,677,817) BNP Paribas 2/7/2021 (100,281 ) (0.00 %)AUD 6,119,350 USD (4,738,388) Standard Chartered Bank 15/9/2021 (120,226 ) (0.00 %)AUD 9,376,900 USD (7,194,886) BNP Paribas 2/7/2021 (130,851 ) (0.00 %)AUD 5,267,250 USD (4,131,136) JPMorgan Chase Bank 2/7/2021 (149,040 ) (0.01 %)AUD 8,631,350 USD (6,694,239) Morgan Stanley 2/7/2021 (180,665 ) (0.01 %)AUD 8,402,383 USD (6,529,559) Citibank NA 2/7/2021 (186,751 ) (0.01 %)AUD 19,701,550 USD (15,022,649) BNP Paribas 2/7/2021 (195,384 ) (0.01 %)AUD 10,697,875 USD (8,278,091) BNP Paribas 2/7/2021 (207,993 ) (0.01 %)AUD 9,127,350 USD (7,116,777) Citibank NA 2/7/2021 (222,968 ) (0.01 %)AUD 13,499,350 USD (10,437,892) Morgan Stanley 2/7/2021 (255,715 ) (0.01 %)AUD 13,636,350 USD (10,577,553) JPMorgan Chase Bank 2/7/2021 (286,753 ) (0.01 %)test (102,801 ) (0.00 %)Total Financial Derivative Instruments (592,623 ) (0.02 %)
Fair Value EUR (€)
% of Total Net Assets
Other Assets and Liabilities 37,242,422 1.07 %Net Assets 3,489,387,782 100.00 %
Analysis of Total Net Assets EUR (€)% of Total
Net Assets(a) Transferable securities admitted to an official stock exchange listing 3,452,727,755 98.95 %(b) Transferable securities dealt in on another regulated market — 0.00 %(c) Transferable securities other than those admitted to an official stock exchange listing or dealt in on another regulated
market 10,228 0.00 %
(d) Financial derivative instruments (592,623 ) (0.02 %)(e) Other assets and liabilities 37,242,422 1.07 %Total Net Assets 3,489,387,782 100.00 %
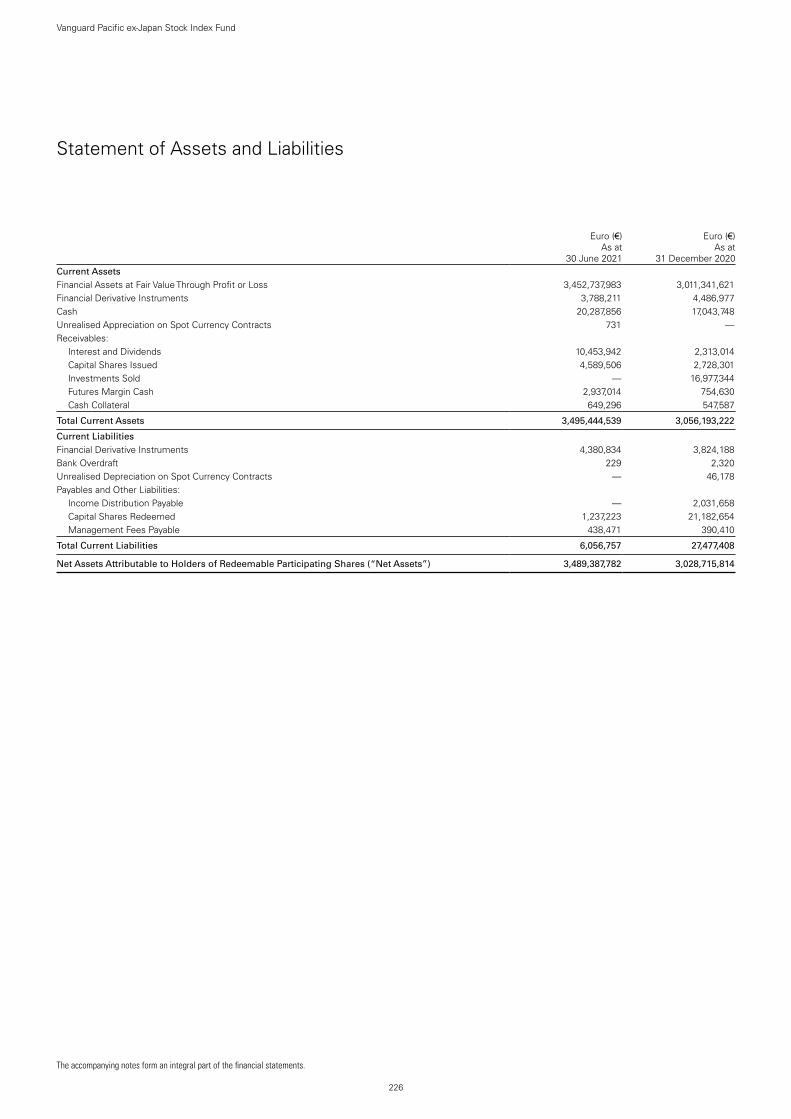
The accompanying notes form an integral part of the financial statements.
226
Vanguard Pacific ex-Japan Stock Index Fund
Statement of Assets and Liabilities
Euro (€)
As at 30 June 2021
Euro (€)
As at 31 December 2020
Current AssetsFinancial Assets at Fair Value Through Profit or Loss 3,452,737,983 3,011,341,621 Financial Derivative Instruments 3,788,211 4,486,977 Cash 20,287,856 17,043,748 Unrealised Appreciation on Spot Currency Contracts 731 — Receivables: Interest and Dividends 10,453,942 2,313,014 Capital Shares Issued 4,589,506 2,728,301 Investments Sold — 16,977,344 Futures Margin Cash 2,937,014 754,630 Cash Collateral 649,296 547,587
Total Current Assets 3,495,444,539 3,056,193,222
Current LiabilitiesFinancial Derivative Instruments 4,380,834 3,824,188 Bank Overdraft 229 2,320 Unrealised Depreciation on Spot Currency Contracts — 46,178 Payables and Other Liabilities: Income Distribution Payable — 2,031,658 Capital Shares Redeemed 1,237,223 21,182,654 Management Fees Payable 438,471 390,410
Total Current Liabilities 6,056,757 27,477,408
Net Assets Attributable to Holders of Redeemable Participating Shares (“Net Assets”) 3,489,387,782 3,028,715,814

227
Vanguard Pacific ex-Japan Stock Index Fund
The accompanying notes form an integral part of the financial statements.
Net Asset Value Per Share
.As at
30 June 2021As at
31 December 2020As at
31 December 2019AUD AccEUR (€) Equivalent 318,845,543 253,727,426 4,719,161Net Assets 503,654,946 402,317,386 7,535,754Number of Shares Outstanding 3,643,440 3,276,238 59,543Net Asset Value Per Share1 138.24 122.80 126.56
EUR AccNet Assets 520,389,327 479,504,155 678,435,235Number of Shares Outstanding 1,959,551 2,040,316 2,820,800Net Asset Value Per Share1 265.57 235.01 240.51
Institutional Plus EUR AccNet Assets 167,410,922 150,635,182 323,924,374Number of Shares Outstanding 963,060 979,397 2,058,775Net Asset Value Per Share1 173.83 153.80 157.34
GBP AccEUR (€) Equivalent 1,181,328,443 960,342,569 899,851,736Net Assets 1,014,106,531 859,597,802 762,471,128Number of Shares Outstanding 3,001,146 2,756,890 2,524,196Net Asset Value Per Share1 337.91 311.80 302.06
GBP DistEUR (€) Equivalent 65,267,333 53,108,293 52,672,786Net Assets 56,028,473 47,536,966 44,631,218Number of Shares Outstanding 257,406 236,680 223,235Net Asset Value Per Share1 217.67 200.85 199.93
Institutional Plus GBP AccEUR (€) Equivalent 123,047,514 106,641,249 44,578,402Net Assets 105,629,631 95,454,046 37,772,605Number of Shares Outstanding 650,466 637,147 260,358Net Asset Value Per Share1 162.39 149.81 145.08
Institutional Plus GBP DistEUR (€) Equivalent 28,636,564 20,600,279 36,058,891Net Assets 24,582,940 18,439,206 30,553,770Number of Shares Outstanding 191,844 155,978 259,653Net Asset Value Per Share1 128.14 118.22 117.67
USD AccEUR (€) Equivalent 829,808,871 814,476,448 906,914,321Net Assets 984,070,340 996,552,658 1,018,011,325Number of Shares Outstanding 3,125,047 3,466,042 3,771,207Net Asset Value Per Share1 314.90 287.52 269.94
Institutional Plus USD AccEUR (€) Equivalent 254,653,265 189,680,213 390,592,485Net Assets 301,993,307 232,083,225 438,440,064Number of Shares Outstanding 1,970,842 1,659,157 3,339,812Net Asset Value Per Share1 153.23 139.88 131.28
1 The net asset value per share shown may diverge from the net asset value per share used for dealing purposes because of any adjustments for swing pricing and trade date accounting.

228
Vanguard Pacific ex-Japan Stock Index Fund
The accompanying notes form an integral part of the financial statements.
Statement of Operations
Euro (€)
Six Months Ended 30 June 2021
Euro (€)
Six Months Ended 30 June 2020
Investment Income/(Loss) Interest Income 359 58,561 Dividend Income 67,153,221 49,544,493 Securities Lending Income 18,083 137,604 Net Gain/(Loss) on Financial Instruments 330,630,257 (459,861,923)
Total Investment Income/(Loss) 397,801,920 (410,121,265)
Expenses Management Fees 2,525,519 2,142,287 Transaction Fees and Commissions 358,832 463,821 Other Expenses — 810
Total Expenses 2,884,351 2,606,918
Finance Costs Interest Expense 6,592 20,985
Total Finance Costs 6,592 20,985
Net Investment Income/(Loss) 394,910,977 (412,749,168)
Foreign Withholding Tax (1,028,114) (367,795)
Net Increase/(Decrease) in Net Assets 393,882,863 (413,116,963)
Statement of Changes in Net Assets
Euro (€)
Euro (€)
Six Months Ended Six Months Ended30 June 2021 30 June 2020
Increase/(Decrease) in Net Assets
Net Increase/(Decrease) in Net Assets From Operations 393,882,863 (413,116,963)
Capital Transactions Subscriptions 1,335,772,614 443,985,412 Redemptions (1,268,987,897) (638,352,583) Reinvestments 4,388 7,220
Total Capital Transactions 66,789,105 (194,359,951)
Total Increase/(Decrease) for the Period 460,671,968 (607,476,914)
Net AssetsBeginning of Period 3,028,715,814 3,344,847,436
End of Period 3,489,387,782 2,737,370,522

Vanguard SRI European Stock FundManaged by Vanguard Global Advisers, LLC.
229
Investment ObjectiveThe fund aims to provide long-term growth of capital by seeking to achieve the performance of the FTSE Developed Europe Index, a market-capitalisation-weighted index of common stocks of large and mid-sized companies in developed countries in Europe.
Performance SummaryThe Performance Summary does not form part of the Financial Statements.
• As the six months ended 30 June 2021 came to a close, macroeconomic indicators signalled a faster global economic rebound than many had expected after the sharpest contraction in modern history. Yet the recovery has been uneven. Countries that have contained the virus more successfully, whether through vaccinations, lockdowns or both, generally have fared better economically. And the COVID-19 pandemic remained far from over, with new variants of the virus surfacing where vaccination rates have lagged and the human toll continuing to mount, especially in less developed economies.
• Swift and extensive support from governments and central banks has been a key to the rebound. So far in 2021, it has included fiscal stimulus – including the $1.9 trillion American Rescue Plan in the United States and the €673 billion Recovery and Resilience Facility in Europe – and pledges by a number of central banks to keep interest rates low for some time.
• Fixed income prices worldwide generally fell and longer-term yields rose amid concerns about inflation, resulting in negative returns for the six months.
• Stock markets continued the rally that began in 2020, bolstered by reopening economies, more consumer spending and rising corporate profits. Returns in the United States and Europe outpaced those in emerging markets and the Pacific region.
• For the period, the fund’s benchmark returned 15.30%. Financials, industrials and consumer discretionary contributed most to the index return. Utilities, the only sector with a negative return, was the only detractor.
• Among the largest markets in the benchmark, the United Kingdom and France made the strongest contributions to return, followed by Germany and Switzerland.
All returns in the commentary above are in British pounds.

230
Vanguard SRI European Stock Fund
Benchmark: FTSE Developed Europe Index
Total ReturnsPeriods Ended 30 June 2021
(Annualised for periods over one year)
Six Months Five YearsTen Years or
Since Inception1
EUR Acc 15.71 % 9.19 % 7.78 %
Benchmark 15.30 9.05 7.78
Tracking Difference* 0.41
Institutional Plus EUR Acc 15.73 % 9.28 % 7.63 %
Benchmark 15.30 9.05 7.45
Tracking Difference* 0.43
GBP Acc 10.97 % 9.90 % 9.26 %
Benchmark 10.58 9.76 9.26
Tracking Difference* 0.39
GBP Dist 10.97 % 9.90 % 9.26 %
Benchmark 10.58 9.76 9.26
Tracking Difference* 0.39
Institutional Plus GBP Acc 11.00 % 9.99 % 8.05 %
Benchmark 10.58 9.76 7.90
Tracking Difference* 0.42
USD Acc 12.15 % 10.63 % 5.18 %
Benchmark 11.75 10.48 5.12
Tracking Difference* 0.40
Each benchmark is in its respective currency.Sources: Vanguard Global Advisers, LLC, and FTSE.Performance is based on NAV with net income reinvested.
All of the returns in this report represent past performance, which is not a guarantee of future results that may be achieved by the fund. For performance data current to the most recent month-end, which may be higher or lower than that cited, visit our website at http://global.vanguard.com. Note, too, that both investment returns and principal value can fluctuate widely, so an investor's shares, when sold, could be worth more or less than their original cost.* The tracking difference between the fund return and the index return over a stated period of time can be attributed to a number of factors, including, without limitation, small differences in
weightings, trading activity, transaction costs and differences in the valuation and withholding tax treatment between the fund and the index vendor.1 Since-inception returns: Institutional Plus EUR Acc, 6 December 2013; GBP Acc and GBP Dist, 25 October 2011; Institutional Plus GBP Acc and USD Acc, 2 September 2014.
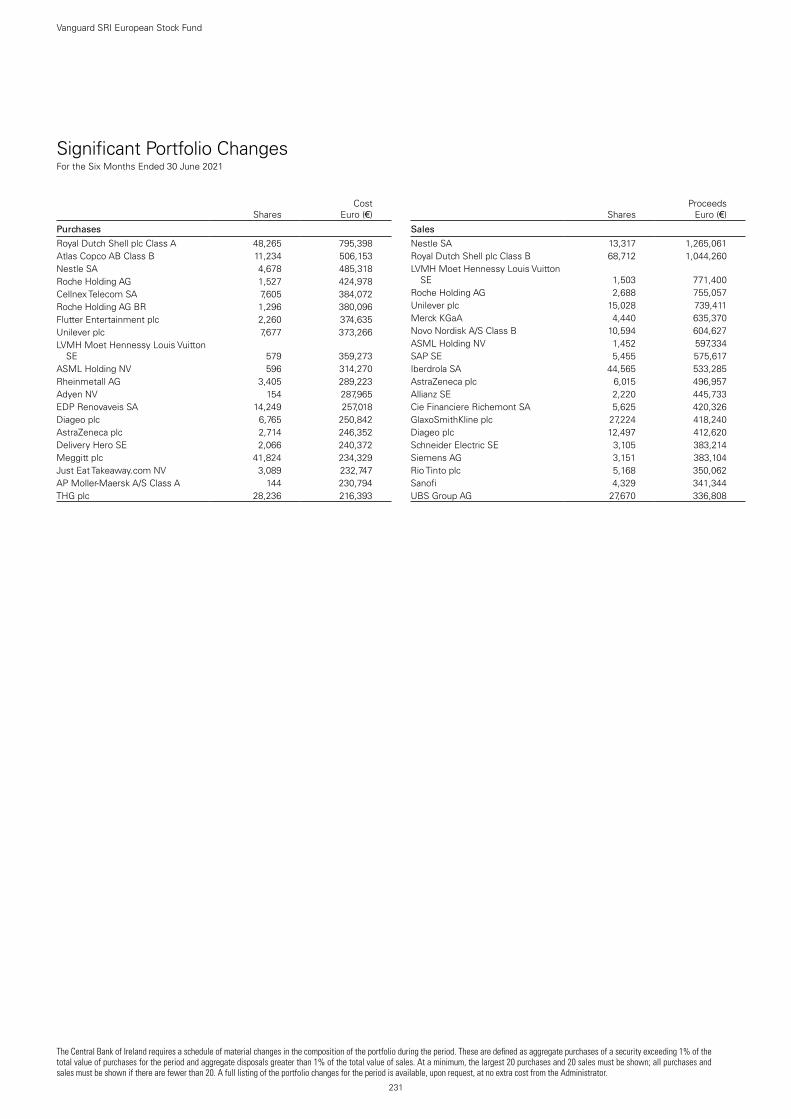
Significant Portfolio ChangesFor the Six Months Ended 30 June 2021
231
Vanguard SRI European Stock Fund
The Central Bank of Ireland requires a schedule of material changes in the composition of the portfolio during the period. These are defined as aggregate purchases of a security exceeding 1% of the total value of purchases for the period and aggregate disposals greater than 1% of the total value of sales. At a minimum, the largest 20 purchases and 20 sales must be shown; all purchases and sales must be shown if there are fewer than 20. A full listing of the portfolio changes for the period is available, upon request, at no extra cost from the Administrator.
SharesCost
Euro (€)
Purchases
Royal Dutch Shell plc Class A 48,265 795,398Atlas Copco AB Class B 11,234 506,153Nestle SA 4,678 485,318Roche Holding AG 1,527 424,978Cellnex Telecom SA 7,605 384,072Roche Holding AG BR 1,296 380,096Flutter Entertainment plc 2,260 374,635Unilever plc 7,677 373,266LVMH Moet Hennessy Louis Vuitton
SE 579 359,273ASML Holding NV 596 314,270Rheinmetall AG 3,405 289,223Adyen NV 154 287,965EDP Renovaveis SA 14,249 257,018Diageo plc 6,765 250,842AstraZeneca plc 2,714 246,352Delivery Hero SE 2,066 240,372Meggitt plc 41,824 234,329Just Eat Takeaway.com NV 3,089 232,747AP Moller-Maersk A/S Class A 144 230,794THG plc 28,236 216,393
SharesProceeds
Euro (€)
Sales
Nestle SA 13,317 1,265,061Royal Dutch Shell plc Class B 68,712 1,044,260LVMH Moet Hennessy Louis Vuitton
SE 1,503 771,400Roche Holding AG 2,688 755,057Unilever plc 15,028 739,411Merck KGaA 4,440 635,370Novo Nordisk A/S Class B 10,594 604,627ASML Holding NV 1,452 597,334SAP SE 5,455 575,617Iberdrola SA 44,565 533,285AstraZeneca plc 6,015 496,957Allianz SE 2,220 445,733Cie Financiere Richemont SA 5,625 420,326GlaxoSmithKline plc 27,224 418,240Diageo plc 12,497 412,620Schneider Electric SE 3,105 383,214Siemens AG 3,151 383,104Rio Tinto plc 5,168 350,062Sanofi 4,329 341,344UBS Group AG 27,670 336,808

Financial StatementsStatement of Investments30 June 2021
232
Vanguard SRI European Stock Fund
.Number of
SharesFair Value
EUR (€)% of Total
Net AssetsEquities 97.34% (2020: 99.06%)Austria 0.36% (2020: 0.33%)Voestalpine AG 11,012 378,152 0.10%Erste Group Bank AG 11,950 369,733 0.10%OMV AG 4,814 230,928 0.06%Raiffeisen Bank International AG 8,451 161,414 0.04%
Verbund AG 1,849 143,575 0.04%ANDRITZ AG 1,404 66,521 0.02%test test 1,350,323 0.36%Belgium 1.51% (2020: 1.59%)Anheuser-Busch InBev SA 34,979 2,127,073 0.57%KBC Group NV 11,430 734,949 0.20%UCB SA 6,644 585,735 0.16%Groupe Bruxelles Lambert SA 4,966 468,492 0.12%
Argenx SE (XBRU) 1,618 412,752 0.11%Umicore SA 7,264 374,096 0.10%Ageas SA 4,494 210,319 0.06%Solvay SA 1,760 188,672 0.05%Sofina SA 486 176,807 0.05%Argenx SE 445 113,520 0.03%Proximus SADP 4,921 80,163 0.02%Ackermans & van Haaren NV 448 63,795 0.02%
Elia Group SA 455 40,495 0.01%Telenet Group Holding NV 700 22,218 0.01%Warehouses de Pauw CVA REIT 686 22,089 0.00%
test test 5,621,175 1.51%Denmark 3.61% (2020: 3.79%)Novo Nordisk A/S Class B 65,623 4,636,523 1.25%DSV PANALPINA A/S 7,190 1,414,071 0.38%Vestas Wind Systems A/S 37,695 1,240,913 0.33%Orsted A/S 7,410 876,894 0.24%Genmab A/S 2,312 797,794 0.21%Coloplast A/S Class B 5,311 734,917 0.20%Carlsberg A/S Class B 3,586 563,730 0.15%Novozymes A/S Class B 8,509 540,892 0.15%AP Moller-Maersk A/S Class B 220 533,266 0.14%
Pandora A/S 3,097 351,087 0.09%AP Moller-Maersk A/S Class A 149 349,044 0.09%
Chr Hansen Holding A/S 4,359 331,780 0.09%GN Store Nord A/S 3,943 290,466 0.08%Ambu A/S Class B 6,629 214,927 0.06%Tryg A/S 7,856 162,640 0.04%Demant A/S 3,156 149,816 0.04%H Lundbeck A/S 4,987 133,792 0.04%ROCKWOOL International A/S Class B 219 89,912 0.02%
SimCorp A/S 328 34,722 0.01%test test 13,447,186 3.61%Finland 2.15% (2020: 2.27%)Nordea Bank Abp 157,143 1,476,830 0.40%Kone OYJ Class B 16,348 1,124,742 0.30%Nokia OYJ 221,236 998,991 0.27%Sampo OYJ Class A 21,016 814,580 0.22%Neste OYJ 15,046 776,975 0.21%UPM-Kymmene OYJ 21,103 673,186 0.18%Stora Enso OYJ Class R 19,204 295,454 0.08%Fortum OYJ 12,481 290,308 0.08%Wartsila OYJ Abp 22,456 281,037 0.07%Elisa OYJ 5,388 271,124 0.07%Orion OYJ Class B 6,913 250,596 0.07%
.Number of
SharesFair Value
EUR (€)% of Total
Net AssetsKesko OYJ Class B 7,768 241,973 0.06%Metso Outotec OYJ 17,550 171,920 0.05%Kojamo OYJ 8,357 161,039 0.04%Huhtamaki OYJ 2,549 101,833 0.03%Nokian Renkaat OYJ 2,355 80,188 0.02%test test 8,010,776 2.15%France 15.93% (2020: 16.33%)LVMH Moet Hennessy Louis Vuitton SE 9,751 6,448,336 1.73%
Sanofi 46,914 4,145,321 1.11%TotalEnergies SE 95,628 3,648,686 0.98%Schneider Electric SE 19,510 2,588,587 0.69%BNP Paribas SA 43,688 2,309,785 0.62%Kering SA 2,886 2,126,982 0.57%L’Oreal SA 5,122 1,924,848 0.52%EssilorLuxottica SA 11,676 1,817,253 0.49%Vinci SA 19,482 1,753,185 0.47%L’Oreal SA (Prime De Fidelite) 4,598 1,727,928 0.46%
AXA SA 75,573 1,616,129 0.43%Hermes International 1,301 1,598,278 0.43%Pernod Ricard SA 8,089 1,514,261 0.41%Danone SA 25,143 1,492,740 0.40%Air Liquide SA 9,177 1,355,076 0.36%Air Liquide SA (Prime De Fidelite) 9,176 1,354,928 0.36%
Cie de Saint-Gobain 17,677 981,781 0.26%Dassault Systemes SE 4,781 977,714 0.26%Societe Generale SA 37,602 934,786 0.25%Cie Generale des Etablissements Michelin SCA 6,906 928,857 0.25%
Capgemini SE 5,587 905,094 0.24%Vivendi SE 30,274 857,662 0.23%Legrand SA 9,305 830,564 0.22%Orange SA 77,899 748,999 0.20%Teleperformance 2,135 730,810 0.20%STMicroelectronics NV 23,775 727,634 0.20%Worldline SA 8,852 698,777 0.19%Credit Agricole SA 56,471 667,148 0.18%Eurofins Scientific SE 5,543 534,345 0.14%Publicis Groupe SA 8,952 482,871 0.13%Alstom SA 10,998 468,405 0.13%Veolia Environnement SA 18,233 464,395 0.12%Sartorius Stedim Biotech 1,148 457,937 0.12%Edenred 9,032 433,988 0.12%Renault SA 12,077 411,645 0.11%Engie SA 33,648 388,769 0.10%Gecina SA REIT 2,565 331,398 0.09%Carrefour SA 19,722 327,089 0.09%Bouygues SA 9,844 307,034 0.08%Eiffage SA 3,332 285,886 0.08%Arkema SA 2,544 269,155 0.07%Valeo SA 10,466 265,522 0.07%Euronext NV 2,895 265,472 0.07%Bureau Veritas SA 9,503 253,540 0.07%Getlink SE 19,014 250,034 0.07%Bollore SA 51,841 234,321 0.06%Orpea SA 2,136 229,086 0.06%Suez SA 11,373 228,029 0.06%Ubisoft Entertainment SA 3,682 217,385 0.06%Ipsen SA 2,468 216,493 0.06%Accor SA 6,868 216,273 0.06%Atos SE 3,987 204,533 0.06%Covivio REIT 2,790 201,215 0.05%SCOR SE 7,170 192,299 0.05%
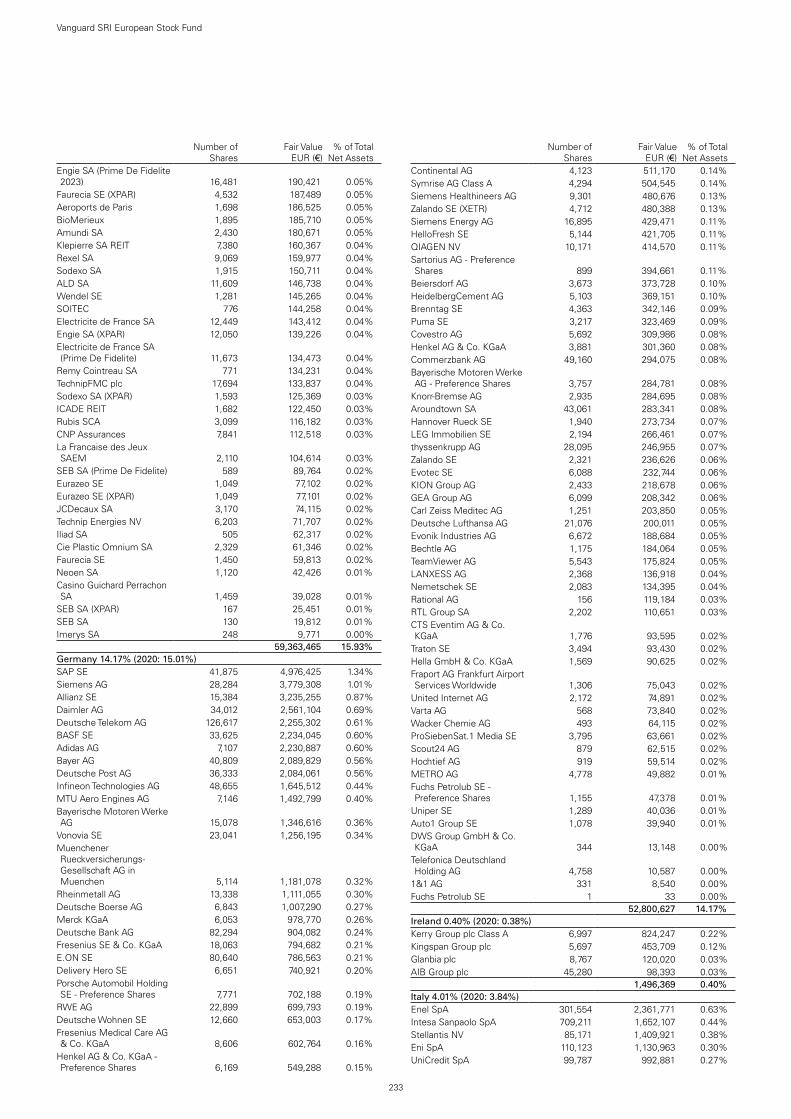
233
Vanguard SRI European Stock Fund
.Number of
SharesFair Value
EUR (€)% of Total
Net AssetsEngie SA (Prime De Fidelite 2023) 16,481 190,421 0.05%
Faurecia SE (XPAR) 4,532 187,489 0.05%Aeroports de Paris 1,698 186,525 0.05%BioMerieux 1,895 185,710 0.05%Amundi SA 2,430 180,671 0.05%Klepierre SA REIT 7,380 160,367 0.04%Rexel SA 9,069 159,977 0.04%Sodexo SA 1,915 150,711 0.04%ALD SA 11,609 146,738 0.04%Wendel SE 1,281 145,265 0.04%SOITEC 776 144,258 0.04%Electricite de France SA 12,449 143,412 0.04%Engie SA (XPAR) 12,050 139,226 0.04%Electricite de France SA (Prime De Fidelite) 11,673 134,473 0.04%
Remy Cointreau SA 771 134,231 0.04%TechnipFMC plc 17,694 133,837 0.04%Sodexo SA (XPAR) 1,593 125,369 0.03%ICADE REIT 1,682 122,450 0.03%Rubis SCA 3,099 116,182 0.03%CNP Assurances 7,841 112,518 0.03%La Francaise des Jeux SAEM 2,110 104,614 0.03%
SEB SA (Prime De Fidelite) 589 89,764 0.02%Eurazeo SE 1,049 77,102 0.02%Eurazeo SE (XPAR) 1,049 77,101 0.02%JCDecaux SA 3,170 74,115 0.02%Technip Energies NV 6,203 71,707 0.02%Iliad SA 505 62,317 0.02%Cie Plastic Omnium SA 2,329 61,346 0.02%Faurecia SE 1,450 59,813 0.02%Neoen SA 1,120 42,426 0.01%Casino Guichard Perrachon SA 1,459 39,028 0.01%
SEB SA (XPAR) 167 25,451 0.01%SEB SA 130 19,812 0.01%Imerys SA 248 9,771 0.00%test test 59,363,465 15.93%Germany 14.17% (2020: 15.01%)SAP SE 41,875 4,976,425 1.34%Siemens AG 28,284 3,779,308 1.01%Allianz SE 15,384 3,235,255 0.87%Daimler AG 34,012 2,561,104 0.69%Deutsche Telekom AG 126,617 2,255,302 0.61%BASF SE 33,625 2,234,045 0.60%Adidas AG 7,107 2,230,887 0.60%Bayer AG 40,809 2,089,829 0.56%Deutsche Post AG 36,333 2,084,061 0.56%Infineon Technologies AG 48,655 1,645,512 0.44%MTU Aero Engines AG 7,146 1,492,799 0.40%Bayerische Motoren Werke AG 15,078 1,346,616 0.36%
Vonovia SE 23,041 1,256,195 0.34%Muenchener Rueckversicherungs-Gesellschaft AG in Muenchen 5,114 1,181,078 0.32%
Rheinmetall AG 13,338 1,111,055 0.30%Deutsche Boerse AG 6,843 1,007,290 0.27%Merck KGaA 6,053 978,770 0.26%Deutsche Bank AG 82,294 904,082 0.24%Fresenius SE & Co. KGaA 18,063 794,682 0.21%E.ON SE 80,640 786,563 0.21%Delivery Hero SE 6,651 740,921 0.20%Porsche Automobil Holding SE - Preference Shares 7,771 702,188 0.19%
RWE AG 22,899 699,793 0.19%Deutsche Wohnen SE 12,660 653,003 0.17%Fresenius Medical Care AG & Co. KGaA 8,606 602,764 0.16%
Henkel AG & Co. KGaA - Preference Shares 6,169 549,288 0.15%
.Number of
SharesFair Value
EUR (€)% of Total
Net AssetsContinental AG 4,123 511,170 0.14%Symrise AG Class A 4,294 504,545 0.14%Siemens Healthineers AG 9,301 480,676 0.13%Zalando SE (XETR) 4,712 480,388 0.13%Siemens Energy AG 16,895 429,471 0.11%HelloFresh SE 5,144 421,705 0.11%QIAGEN NV 10,171 414,570 0.11%Sartorius AG - Preference Shares 899 394,661 0.11%
Beiersdorf AG 3,673 373,728 0.10%HeidelbergCement AG 5,103 369,151 0.10%Brenntag SE 4,363 342,146 0.09%Puma SE 3,217 323,469 0.09%Covestro AG 5,692 309,986 0.08%Henkel AG & Co. KGaA 3,881 301,360 0.08%Commerzbank AG 49,160 294,075 0.08%Bayerische Motoren Werke AG - Preference Shares 3,757 284,781 0.08%
Knorr-Bremse AG 2,935 284,695 0.08%Aroundtown SA 43,061 283,341 0.08%Hannover Rueck SE 1,940 273,734 0.07%LEG Immobilien SE 2,194 266,461 0.07%thyssenkrupp AG 28,095 246,955 0.07%Zalando SE 2,321 236,626 0.06%Evotec SE 6,088 232,744 0.06%KION Group AG 2,433 218,678 0.06%GEA Group AG 6,099 208,342 0.06%Carl Zeiss Meditec AG 1,251 203,850 0.05%Deutsche Lufthansa AG 21,076 200,011 0.05%Evonik Industries AG 6,672 188,684 0.05%Bechtle AG 1,175 184,064 0.05%TeamViewer AG 5,543 175,824 0.05%LANXESS AG 2,368 136,918 0.04%Nemetschek SE 2,083 134,395 0.04%Rational AG 156 119,184 0.03%RTL Group SA 2,202 110,651 0.03%CTS Eventim AG & Co. KGaA 1,776 93,595 0.02%
Traton SE 3,494 93,430 0.02%Hella GmbH & Co. KGaA 1,569 90,625 0.02%Fraport AG Frankfurt Airport Services Worldwide 1,306 75,043 0.02%
United Internet AG 2,172 74,891 0.02%Varta AG 568 73,840 0.02%Wacker Chemie AG 493 64,115 0.02%ProSiebenSat.1 Media SE 3,795 63,661 0.02%Scout24 AG 879 62,515 0.02%Hochtief AG 919 59,514 0.02%METRO AG 4,778 49,882 0.01%Fuchs Petrolub SE - Preference Shares 1,155 47,378 0.01%
Uniper SE 1,289 40,036 0.01%Auto1 Group SE 1,078 39,940 0.01%DWS Group GmbH & Co. KGaA 344 13,148 0.00%
Telefonica Deutschland Holding AG 4,758 10,587 0.00%
1&1 AG 331 8,540 0.00%Fuchs Petrolub SE 1 33 0.00%test test 52,800,627 14.17%Ireland 0.40% (2020: 0.38%)Kerry Group plc Class A 6,997 824,247 0.22%Kingspan Group plc 5,697 453,709 0.12%Glanbia plc 8,767 120,020 0.03%AIB Group plc 45,280 98,393 0.03%test test 1,496,369 0.40%Italy 4.01% (2020: 3.84%)Enel SpA 301,554 2,361,771 0.63%Intesa Sanpaolo SpA 709,211 1,652,107 0.44%Stellantis NV 85,171 1,409,921 0.38%Eni SpA 110,123 1,130,963 0.30%UniCredit SpA 99,787 992,881 0.27%

234
Vanguard SRI European Stock Fund
.Number of
SharesFair Value
EUR (€)% of Total
Net AssetsFerrari NV 5,625 978,750 0.26%Assicurazioni Generali SpA 56,437 954,067 0.26%CNH Industrial NV 38,676 538,563 0.14%Snam SpA 100,138 488,173 0.13%Moncler SpA 7,598 433,542 0.12%FinecoBank Banca Fineco SpA 27,208 399,958 0.11%
Recordati Industria Chimica e Farmaceutica SpA 7,575 365,115 0.10%
Terna SPA 52,644 330,815 0.09%EXOR NV 4,361 294,629 0.08%Nexi SpA 15,885 294,031 0.08%Davide Campari-Milano NV 25,750 290,846 0.08%Prysmian SpA 8,221 248,521 0.07%Amplifon SpA 5,404 225,023 0.06%Mediobanca Banca di Credito Finanziario SpA 22,303 219,685 0.06%
Telecom Italia SpA 504,792 211,457 0.06%Poste Italiane SpA 16,457 183,496 0.05%DiaSorin SpA 944 150,568 0.04%Infrastrutture Wireless Italiane SpA 15,674 149,091 0.04%
Tenaris SA 14,130 129,883 0.03%Telecom Italia SpA (Non CVA) 262,073 117,094 0.03%
Pirelli & C SpA 22,665 110,968 0.03%Hera SpA 25,545 88,999 0.02%A2A SpA 32,304 55,692 0.02%Banca Mediolanum SpA 5,434 44,580 0.01%UnipolSai Assicurazioni SpA 16,878 41,317 0.01%Italgas SpA 5,984 32,984 0.01%Buzzi Unicem SpA 613 13,713 0.00%test test 14,939,203 4.01%Netherlands 6.69% (2020: 6.45%)ASML Holding NV 15,102 8,750,099 2.35%Adyen NV 1,085 2,235,643 0.60%ING Groep NV 154,631 1,722,589 0.46%Prosus NV 18,052 1,488,748 0.40%Koninklijke Philips NV 33,726 1,409,410 0.38%Koninklijke DSM NV 6,697 1,054,108 0.28%Koninklijke Ahold Delhaize NV 39,758 996,733 0.27%
Heineken NV 9,697 991,033 0.27%ArcelorMittal SA 35,757 924,319 0.25%Wolters Kluwer NV 10,544 893,288 0.24%Akzo Nobel NV 7,187 748,885 0.20%NN Group NV 12,878 512,287 0.14%ASM International NV 1,560 432,120 0.12%Heineken Holding NV 4,476 380,236 0.10%Koninklijke KPN NV 115,747 304,878 0.08%Unibail-Rodamco-Westfield REIT 3,967 289,551 0.08%
ABN AMRO Bank NV GDR 23,555 240,073 0.06%Aegon NV 65,317 228,544 0.06%IMCD NV 1,610 215,901 0.06%Randstad NV 2,986 192,597 0.05%Signify NV 3,536 188,610 0.05%Galapagos NV 2,298 134,387 0.04%JDE Peet's NV 4,197 128,428 0.03%InPost SA 7,010 118,651 0.03%Unibail-Rodamco-Westfield (XPAR) REIT 1,575 114,959 0.03%
Aalberts NV 2,029 91,954 0.03%ASR Nederland NV 2,389 77,858 0.02%Koninklijke Vopak NV 1,209 46,305 0.01%test test 24,912,194 6.69%Norway 1.13% (2020: 1.09%)DNB A.S.A 45,904 843,868 0.23%Equinor A.S.A 41,030 732,476 0.20%Norsk Hydro A.S.A 81,651 439,583 0.12%Mowi A.S.A 17,967 385,576 0.10%Telenor A.S.A 23,480 333,854 0.09%
.Number of
SharesFair Value
EUR (€)% of Total
Net AssetsYara International A.S.A 6,095 270,679 0.07%Orkla A.S.A 30,858 265,191 0.07%TOMRA Systems A.S.A 4,226 196,704 0.05%Scatec A.S.A 5,290 118,190 0.03%Salmar A.S.A 1,935 108,308 0.03%Schibsted A.S.A Class A 2,498 101,732 0.03%Adevinta A.S.A Class B 5,897 95,347 0.02%Schibsted A.S.A Class B 2,386 83,844 0.02%Aker BP A.S.A 2,749 73,918 0.02%Gjensidige Forsikring A.S.A 3,482 64,761 0.02%Leroy Seafood Group A.S.A 8,451 62,507 0.02%Aker A.S.A Class A 354 22,028 0.01%test test 4,198,566 1.13%Poland 0.55% (2020: 0.51%)Powszechna Kasa Oszczednosci Bank Polski SA 39,390 330,059 0.09%
KGHM Polska Miedz SA 6,748 280,474 0.08%Polski Koncern Naftowy ORLEN SA 13,830 235,201 0.06%
Bank Polska Kasa Opieki SA 11,123 229,126 0.06%Allegro.eu SA 11,953 173,733 0.05%Powszechny Zaklad Ubezpieczen SA 19,983 162,441 0.04%
Santander Bank Polska SA 2,851 160,651 0.04%CD Projekt SA 2,794 114,502 0.03%LPP SA 40 114,027 0.03%Polskie Gornictwo Naftowe i Gazownictwo SA 64,741 95,676 0.03%
Dino Polska SA 1,226 76,009 0.02%Cyfrowy Polsat SA 8,874 58,849 0.02%test test 2,030,748 0.55%Portugal 0.26% (2020: 0.32%)EDP - Energias de Portugal SA 96,157 429,822 0.11%
EDP Renovaveis SA 11,117 217,226 0.06%Galp Energia SGPS SA 23,476 214,853 0.06%Jeronimo Martins SGPS SA 8,016 123,286 0.03%Banco Espirito Santo SA 430,102 4 0.00%test test 985,191 0.26%Spain 3.92% (2020: 4.10%)Iberdrola SA 219,273 2,254,127 0.61%Banco Santander SA 684,422 2,203,497 0.59%Banco Bilbao Vizcaya Argentaria SA 266,588 1,393,722 0.38%
Cellnex Telecom SA 23,956 1,286,916 0.35%Industria de Diseno Textil SA 39,064 1,160,591 0.31%Amadeus IT Group SA 16,521 980,026 0.26%Telefonica SA 194,582 766,848 0.21%Repsol SA 55,609 586,897 0.16%CaixaBank SA 220,938 573,113 0.15%Ferrovial SA 21,300 527,175 0.14%Aena SME SA 3,153 436,060 0.12%Grifols SA 14,923 340,841 0.09%ACS Actividades de Construccion y Servicios SA 11,833 267,308 0.07%
Siemens Gamesa Renewable Energy SA 9,278 261,269 0.07%
Endesa SA 11,556 236,436 0.06%Naturgy Energy Group SA 10,853 235,293 0.06%Red Electrica Corp. SA 14,944 233,948 0.06%Enagas SA 8,784 171,156 0.05%Merlin Properties Socimi SA REIT 18,527 161,852 0.04%
Inmobiliaria Colonial Socimi SA REIT 15,657 133,319 0.04%
Bankinter SA 27,777 117,747 0.03%Mapfre SA 44,343 79,041 0.02%Acciona SA 487 61,995 0.02%Linea Directa Aseguradora SA Compania de Seguros y Reaseguros 27,777 49,082 0.01%

235
Vanguard SRI European Stock Fund
.Number of
SharesFair Value
EUR (€)% of Total
Net AssetsZardoya Otis SA 8,146 47,328 0.01%Grifols SA - Preference Shares Class B 2,245 33,226 0.01%
ACS Actividades de Construccion y Servicios SA - Rights Issue 7/7/2021 11,833 13,963 0.00%
test test 14,612,776 3.92%Sweden 5.64% (2020: 5.26%)Investor AB Class B 100,728 1,959,042 0.53%Atlas Copco AB Class A 26,849 1,387,190 0.37%Telefonaktiebolaget LM Ericsson Class B 118,075 1,252,234 0.34%
Volvo AB Class B 60,959 1,237,573 0.33%Sandvik AB 40,369 870,111 0.23%Assa Abloy AB Class B 34,100 866,790 0.23%Hexagon AB Class B 65,091 813,798 0.22%Saab AB Class B 36,206 810,726 0.22%Evolution AB 5,738 765,143 0.21%Atlas Copco AB Class B 17,009 754,689 0.20%Skandinaviska Enskilda Banken AB Class A 67,696 737,902 0.20%
Essity AB Class B 25,611 716,664 0.19%Svenska Handelsbanken AB Class A 66,748 635,495 0.17%
H & M Hennes & Mauritz AB Class B 29,351 587,483 0.16%
Boliden AB 16,390 531,681 0.14%Epiroc AB Class A 22,927 440,817 0.12%Telia Co. AB 97,203 364,008 0.10%Nibe Industrier AB Class B 39,458 350,228 0.09%SKF AB Class B 16,195 347,948 0.09%Alfa Laval AB 11,469 341,854 0.09%Kinnevik AB Class B 10,015 338,310 0.09%Industrivarden AB Class A 10,162 333,456 0.09%Skanska AB Class B 13,348 298,757 0.08%Sinch AB 20,442 290,244 0.08%Svenska Cellulosa AB SCA Class B 20,489 283,335 0.08%
EQT AB 8,944 273,911 0.07%Castellum AB 10,655 228,817 0.06%Electrolux AB 9,742 227,941 0.06%Fastighets AB Balder Class B 3,946 208,934 0.06%
Tele2 AB Class B 16,862 193,858 0.05%Epiroc AB Class B 11,667 193,204 0.05%Trelleborg AB Class B 9,540 186,906 0.05%Investor AB Class A 9,360 180,288 0.05%Husqvarna AB Class B 14,642 164,149 0.04%L E Lundbergforetagen AB Class B 2,891 157,406 0.04%
Getinge AB Class B 4,775 151,979 0.04%Lundin Energy AB 4,818 143,847 0.04%Elekta AB Class B 11,301 138,170 0.04%Swedish Orphan Biovitrum AB 8,673 133,447 0.04%
Sweco AB Class B 8,070 123,891 0.03%Indutrade AB 5,333 115,158 0.03%Industrivarden AB Class C 3,291 101,631 0.03%Volvo AB Class A 4,651 97,312 0.03%Svenska Handelsbanken AB Class B 9,289 93,788 0.03%
Lifco AB Class B 4,265 84,106 0.02%Securitas AB Class B 6,060 80,724 0.02%Investment AB Latour Class B 2,905 80,430 0.02%
ICA Gruppen AB 1,950 76,581 0.02%Sagax AB Class B 2,763 69,252 0.02%Telefonaktiebolaget LM Ericsson Class A 6,423 68,144 0.02%
Skandinaviska Enskilda Banken AB Class C 5,987 64,463 0.02%
Kinnevik AB Class A 1,161 44,370 0.01%test test 20,998,185 5.64%
.Number of
SharesFair Value
EUR (€)% of Total
Net AssetsSwitzerland 14.21% (2020: 14.65%)Nestle SA 111,972 11,769,358 3.16%Roche Holding AG 28,415 9,035,001 2.42%Cie Financiere Richemont SA 21,092 2,154,058 0.58%
ABB Ltd. 72,745 2,083,099 0.56%Zurich Insurance Group AG 6,054 2,050,057 0.55%UBS Group AG 145,371 1,877,831 0.50%Lonza Group AG 2,998 1,793,571 0.48%Sika AG 5,485 1,513,622 0.41%Givaudan SA 377 1,479,886 0.40%Holcim Ltd. 23,900 1,210,058 0.32%Alcon, Inc. 19,760 1,167,732 0.31%Partners Group Holding AG 897 1,146,835 0.31%Swiss Re AG 12,660 964,121 0.26%Geberit AG 1,385 876,849 0.24%Credit Suisse Group AG 98,998 875,297 0.23%Roche Holding AG BR 2,119 726,446 0.20%SGS SA 270 702,964 0.19%Sonova Holding AG 2,184 693,342 0.19%Kuehne + Nagel International AG 2,325 671,505 0.18%
Swisscom AG 1,381 665,438 0.18%Swiss Life Holding AG 1,551 636,141 0.17%Logitech International SA 5,676 580,448 0.16%Straumann Holding AG 413 555,722 0.15%Schindler Holding AG 2,086 538,538 0.14%Barry Callebaut AG 266 521,718 0.14%Julius Baer Group Ltd. 8,885 489,402 0.13%Chocoladefabriken Lindt & Spruengli AG 54 453,454 0.12%
Adecco Group AG 6,592 378,013 0.10%Swatch Group AG 1,303 377,283 0.10%Vifor Pharma AG 3,324 363,122 0.10%Chocoladefabriken Lindt & Spruengli AG (XSWX) 4 353,589 0.09%
VAT Group AG 1,252 351,323 0.09%Georg Fischer AG 254 318,141 0.09%EMS-Chemie Holding AG 381 315,940 0.08%Temenos AG 2,303 312,197 0.08%Swiss Prime Site AG 3,717 311,280 0.08%Schindler Holding AG (XSWX) 1,221 301,188 0.08%
SIG Combibloc Group AG 12,729 291,927 0.08%Baloise Holding AG 2,040 268,542 0.07%Swatch Group AG REG 4,481 249,561 0.07%Banque Cantonale Vaudoise 2,825 214,158 0.06%Tecan Group AG 495 206,998 0.06%PSP Swiss Property AG 1,752 187,796 0.05%Flughafen Zurich AG 1,126 157,161 0.04%Sulzer AG 1,312 152,961 0.04%OC Oerlikon Corp. AG 16,319 152,741 0.04%ams AG 8,307 140,649 0.04%Clariant AG 8,008 134,418 0.04%Helvetia Holding AG 1,309 118,817 0.03%DKSH Holding AG 1,079 69,690 0.02%test test 52,959,988 14.21%United Kingdom 22.80% (2020: 23.14%)AstraZeneca plc 53,070 5,367,919 1.44%Unilever plc 102,923 5,072,140 1.36%Diageo plc 95,443 3,847,980 1.03%GlaxoSmithKline plc 217,311 3,593,135 0.96%Rio Tinto plc 48,355 3,350,985 0.90%BP plc 785,724 2,883,153 0.77%Royal Dutch Shell plc Class A 164,744 2,776,548 0.75%
Royal Dutch Shell plc Class B 150,216 2,448,054 0.66%
Reckitt Benckiser Group plc 27,481 2,047,840 0.55%Anglo American plc 56,062 1,875,926 0.50%RELX plc 81,795 1,828,474 0.49%National Grid plc 165,371 1,773,829 0.48%

236
Vanguard SRI European Stock Fund
.Number of
SharesFair Value
EUR (€)% of Total
Net AssetsPrudential plc 105,027 1,680,416 0.45%Vodafone Group plc 1,115,503 1,576,746 0.42%Lloyds Banking Group plc 2,782,228 1,513,226 0.41%Barclays plc 729,875 1,454,911 0.39%London Stock Exchange Group plc 14,739 1,368,401 0.37%
CRH plc 30,899 1,316,305 0.35%Compass Group plc 72,248 1,280,936 0.34%Experian plc 38,288 1,242,599 0.33%Ashtead Group plc 18,797 1,174,531 0.32%Ferguson plc 9,395 1,099,892 0.30%Flutter Entertainment plc 6,919 1,059,476 0.28%Meggitt plc 174,244 936,126 0.25%Tesco plc 326,766 848,655 0.23%Aviva plc 173,041 818,192 0.22%SSE plc 45,956 803,277 0.22%BT Group plc 355,139 802,578 0.22%Smith & Nephew plc 42,151 767,211 0.21%Legal & General Group plc 229,821 689,640 0.18%Segro plc REIT 53,875 686,895 0.18%Standard Chartered plc 125,022 671,389 0.18%Spirax-Sarco Engineering plc 3,758 596,021 0.16%Halma plc 18,901 592,716 0.16%3i Group plc 43,014 587,753 0.16%Natwest Group plc 243,872 577,262 0.15%WPP plc 50,135 568,953 0.15%Just Eat Takeaway.com NV 6,880 536,329 0.14%Intertek Group plc 8,226 529,908 0.14%Croda International plc 5,985 513,690 0.14%Rentokil Initial plc 88,678 511,338 0.14%Associated British Foods plc 19,661 507,531 0.14%Bunzl plc 18,144 504,936 0.14%Mondi plc 22,247 492,652 0.13%Smurfit Kappa Group plc 10,466 478,894 0.13%Ocado Group plc 20,050 467,824 0.13%Burberry Group plc 19,282 464,055 0.12%Entain plc 22,622 459,979 0.12%Persimmon plc 13,078 450,637 0.12%Admiral Group plc 11,955 437,844 0.12%United Utilities Group plc 38,346 435,256 0.12%Antofagasta plc 25,663 429,139 0.12%InterContinental Hotels Group plc 7,547 422,870 0.11%
Evraz plc 58,318 402,172 0.11%Smiths Group plc 21,696 401,850 0.11%Melrose Industries plc 222,221 401,498 0.11%Polymetal International plc 22,139 400,900 0.11%Next plc 4,262 390,034 0.10%Standard Life Aberdeen plc 121,904 384,835 0.10%Sage Group plc 47,704 380,211 0.10%Severn Trent plc 12,851 374,402 0.10%St James's Place plc 21,304 366,546 0.10%Hikma Pharmaceuticals plc 12,848 366,083 0.10%Informa plc 61,462 359,130 0.10%Coca-Cola HBC AG 11,748 357,731 0.10%Barratt Developments plc 43,216 349,978 0.09%
.Number of
SharesFair Value
EUR (€)% of Total
Net AssetsWM Morrison Supermarkets plc 118,650 340,976 0.09%
Pennon Group plc 25,608 338,727 0.09%DCC plc 4,839 333,594 0.09%Whitbread plc 8,831 321,166 0.09%Tate & Lyle plc 37,227 320,211 0.09%M&G plc 118,897 317,032 0.08%Taylor Wimpey plc 170,928 316,491 0.08%Phoenix Group Holdings plc 39,484 311,108 0.08%AVEVA Group plc 7,196 310,826 0.08%Kingfisher plc 73,168 310,675 0.08%Berkeley Group Holdings plc 5,730 306,709 0.08%Land Securities Group plc REIT 38,461 302,600 0.08%
Hargreaves Lansdown plc 16,149 298,921 0.08%Johnson Matthey plc 8,296 296,974 0.08%Intermediate Capital Group plc 11,958 295,869 0.08%
DS Smith plc 60,506 294,549 0.08%Pearson plc 30,058 290,620 0.08%Schroders plc 6,960 284,823 0.08%IMI plc 14,074 281,990 0.08%Weir Group plc 12,559 270,800 0.07%Fresnillo plc 29,730 267,223 0.07%British Land Co. plc REIT 43,757 252,262 0.07%Bellway plc 6,138 231,664 0.06%ConvaTec Group plc 80,845 226,587 0.06%ITV plc 154,647 226,175 0.06%Howden Joinery Group plc 23,139 220,111 0.06%International Consolidated Airlines Group SA 104,140 211,350 0.06%
J Sainsbury plc 65,925 208,731 0.06%Derwent London plc REIT 5,270 203,815 0.05%THG plc 28,236 200,641 0.05%B&M European Value Retail SA 28,024 187,121 0.05%
Direct Line Insurance Group plc 55,490 184,224 0.05%
Rightmove plc 24,269 183,591 0.05%easyJet plc 16,866 175,802 0.05%Hiscox Ltd. 17,884 173,247 0.05%Travis Perkins plc 8,746 172,078 0.05%JD Sports Fashion plc 15,744 168,546 0.05%HomeServe plc 14,382 160,080 0.04%Avast plc 27,500 156,906 0.04%Quilter plc 82,986 143,797 0.04%Ashmore Group plc 30,335 136,048 0.04%Auto Trader Group plc 16,789 123,877 0.03%Renishaw plc 2,122 121,766 0.03%Centrica plc 197,481 118,381 0.03%TUI AG 26,778 115,260 0.03%Dr. Martens plc 11,455 59,380 0.02%Wickes Group plc 6,427 18,417 0.00%NMC Health plc 4,513 — 0.00%test test 84,950,083 22.80%Total Equities 362,676,855 97.34%Financial Assets at Fair Value Through Profit or Loss 362,676,855 97.34%
testNumber of Contracts
Notional Amount
Unrealised Gain/(Loss)
EUR (€)% of Total
Net AssetsFinancial Derivative InstrumentsFutures (0.03%) (2020: 0.01%)Swiss Market Index IX September 2021 17 CHF2,025,127 1,937 0.00 %FTSE 100 Index September 2021 35 £2,471,899 (33,461 ) (0.01 %)Euro Stoxx 50 Index September 2021 127 €5,224,555 (74,070 ) (0.02 %)test test test (105,594 ) (0.03 %)

237
Vanguard SRI European Stock Fund
CurrencyBuy
Amount Currency(Sell)
Amount CounterpartySettlement
Date
Unrealised Gain/(Loss)
EUR (€)% of Total
Net AssetsForward Currency Exchange Contracts (0.00%) (2020: 0.01%)EUR 876,675 CHF (958,720) Citibank NA 15/9/2021 1,673 0.00 %GBP 213,000 EUR (246,471) Morgan Stanley 15/9/2021 1,302 0.00 %GBP 833,066 EUR (968,328) BNP Paribas 15/9/2021 740 0.00 %GBP 212,430 EUR (246,404) BNP Paribas 15/9/2021 706 0.00 %GBP 70,815 EUR (82,076) Citibank NA 15/9/2021 300 0.00 %GBP 70,035 EUR (81,267) JPMorgan Chase Bank 15/9/2021 202 0.00 %EUR 109,432 CHF (119,770) Citibank NA 15/9/2021 121 0.00 %GBP 70,940 EUR (82,421) JPMorgan Chase Bank 15/9/2021 100 0.00 %EUR 81,937 GBP (70,475) Citibank NA 15/9/2021 (43 ) (0.00 %)CHF 119,670 EUR (109,299) BNP Paribas 15/9/2021 (79 ) (0.00 %)GBP 911,625 EUR (1,060,548) Citibank NA 15/9/2021 (96 ) (0.00 %)CHF 831,880 EUR (759,362) Citibank NA 15/9/2021 (125 ) (0.00 %)GBP 69,345 EUR (80,820) JPMorgan Chase Bank 15/9/2021 (154 ) (0.00 %)GBP 71,145 EUR (82,983) JPMorgan Chase Bank 15/9/2021 (223 ) (0.00 %)GBP 70,230 EUR (81,988) BNP Paribas 15/9/2021 (293 ) (0.00 %)CHF 116,510 EUR (106,793) Morgan Stanley 15/9/2021 (457 ) (0.00 %)GBP 911,170 EUR (1,060,877) JPMorgan Chase Bank 15/9/2021 (954 ) (0.00 %)EUR 1,727,695 GBP (1,486,065) Goldman Sachs International 15/9/2021 (977 ) (0.00 %)CHF 235,600 EUR (216,169) BNP Paribas 15/9/2021 (1,142 ) (0.00 %)CHF 677,618 EUR (621,867) BNP Paribas 15/9/2021 (3,420 ) (0.00 %)CHF 825,580 EUR (758,968) JPMorgan Chase Bank 15/9/2021 (5,480 ) (0.00 %)test (8,299 ) (0.00 %)Total Financial Derivative Instruments (113,893 ) (0.03 %)
Fair Value EUR (€)
% of Total Net Assets
Other Assets and Liabilities 10,036,236 2.69 %Net Assets 372,599,198 100.00 %
Analysis of Total Net Assets EUR (€)% of Total
Net Assets(a) Transferable securities admitted to an official stock exchange listing 362,057,170 97.17 %(b) Transferable securities dealt in on another regulated market 355,455 0.10 %(c) Transferable securities other than those admitted to an official stock exchange listing or dealt in on another regulated
market 264,230 0.07 %
(d) Financial derivative instruments (113,893 ) (0.03 %)(e) Other assets and liabilities 10,036,236 2.69 %Total Net Assets 372,599,198 100.00 %

The accompanying notes form an integral part of the financial statements.
238
Vanguard SRI European Stock Fund
Statement of Assets and Liabilities
Euro (€)
As at 30 June 2021
Euro (€)
As at 31 December 2020
Current AssetsFinancial Assets at Fair Value Through Profit or Loss 362,676,855 337,730,508 Financial Derivative Instruments 7,081 132,891 Cash 7,482,875 3,050,373 Receivables: Interest and Dividends 1,227,276 1,306,426 Capital Shares Issued 261,885 724,497 Investments Sold 213,452 — Futures Margin Cash 1,216,815 513,362
Total Current Assets 373,086,239 343,458,057
Current LiabilitiesFinancial Derivative Instruments 120,974 58,548 Bank Overdraft 3,780 1,025 Unrealised Depreciation on Spot Currency Contracts 586 7,128 Payables and Other Liabilities: Investments Purchased 1,581 — Income Distribution Payable 184,141 30,079 Capital Shares Redeemed 134,357 2,375,280 Management Fees Payable 41,622 39,184
Total Current Liabilities 487,041 2,511,244
Net Assets Attributable to Holders of Redeemable Participating Shares (“Net Assets”) 372,599,198 340,946,813

239
Vanguard SRI European Stock Fund
The accompanying notes form an integral part of the financial statements.
Net Asset Value Per Share
.As at
30 June 2021As at
31 December 2020As at
31 December 2019EUR AccNet Assets 270,894,955 270,076,160 264,531,886Number of Shares Outstanding 1,115,038 1,286,188 1,237,728Net Asset Value Per Share1 242.95 209.98 213.72
Institutional Plus EUR AccNet Assets 24,981,432 22,882,423 32,682,552Number of Shares Outstanding 143,280 151,875 213,208Net Asset Value Per Share1 174.35 150.67 153.29
GBP AccEUR (€) Equivalent 60,441,926 38,519,783 26,300,222Net Assets 51,886,122 34,478,864 22,284,960Number of Shares Outstanding 220,085 162,280 108,855Net Asset Value Per Share1 235.75 212.47 204.72
GBP DistEUR (€) Equivalent 15,584,530 8,898,985 8,267,770Net Assets 13,378,476 7,965,437 7,005,527Number of Shares Outstanding 75,294 48,869 43,543Net Asset Value Per Share1 177.68 163.00 160.89
Institutional Plus GBP AccEUR (€) Equivalent 9,882 8,539 8,687Net Assets 8,483 7,643 7,361Number of Shares Outstanding 50 50 50Net Asset Value Per Share1 169.66 152.86 147.22
USD AccEUR (€) Equivalent 686,473 560,923 337,478Net Assets 814,088 686,317 378,819Number of Shares Outstanding 5,767 5,452 3,223Net Asset Value Per Share1 141.16 125.88 117.54
1 The net asset value per share shown may diverge from the net asset value per share used for dealing purposes because of any adjustments for swing pricing and trade date accounting.

240
Vanguard SRI European Stock Fund
The accompanying notes form an integral part of the financial statements.
Statement of Operations
Euro (€)
Six Months Ended 30 June 2021
Euro (€)
Six Months Ended 30 June 2020
Investment Income/(Loss) Interest Income 6 449 Dividend Income 6,965,808 5,368,661 Securities Lending Income 43,871 36,737 Net Gain/(Loss) on Financial Instruments 42,626,546 (45,898,694)
Total Investment Income/(Loss) 49,636,231 (40,492,847)
Expenses Management Fees 227,966 226,247 Transaction Fees and Commissions 65,133 44,470
Total Expenses 293,099 270,717
Finance Costs Interest Expense 18,329 8,467 Distribution Paid 246,438 115,666 Income Equalisation (46,735) (1,809)
Total Finance Costs 218,032 122,324
Net Investment Income/(Loss) 49,125,100 (40,885,888)
Foreign Withholding Tax (581,333) (646,840)
Net Increase/(Decrease) in Net Assets 48,543,767 (41,532,728)
Statement of Changes in Net Assets
Euro (€)
Euro (€)
Six Months Ended Six Months Ended30 June 2021 30 June 2020
Increase/(Decrease) in Net Assets
Net Increase/(Decrease) in Net Assets From Operations 48,543,767 (41,532,728)
Capital Transactions Subscriptions 45,958,954 44,759,579 Redemptions (62,850,336) (34,690,150)
Total Capital Transactions1 (16,891,382) 10,069,429
Total Increase/(Decrease) for the Period 31,652,385 (31,463,299)
Net AssetsBeginning of Period 340,946,813 337,472,890
End of Period 372,599,198 306,009,591
1 Capital Transactions include income equalisation adjustments as shown in the Statement of Operations.

Vanguard U.S. 500 Stock Index FundManaged by Vanguard Global Advisers, LLC.
241
Investment ObjectiveThe fund seeks to track the performance of the S&P 500 Index, a widely recognised benchmark of US stock market performance that is dominated by the stocks of large US companies.
Performance SummaryThe Performance Summary does not form part of the Financial Statements.
• As the six months ended 30 June 2021 came to a close, macroeconomic indicators signalled a faster global economic rebound than many had expected after the sharpest contraction in modern history. Yet the recovery has been uneven. Countries that have contained the virus more successfully, whether through vaccinations, lockdowns or both, generally have fared better economically. And the COVID-19 pandemic remained far from over, with new variants of the virus surfacing where vaccination rates have lagged and the human toll continuing to mount, especially in less developed economies.
• Swift and extensive support from governments and central banks has been a key to the rebound. So far in 2021, it has included fiscal stimulus – including the $1.9 trillion American Rescue Plan in the United States and the €673 billion Recovery and Resilience Facility in Europe – and pledges by a number of central banks to keep interest rates low for some time.
• Fixed income prices worldwide generally fell and longer-term yields rose amid concerns about inflation during the half year. Bonds returned about –3% in US dollars, as measured by the Bloomberg Barclays Global Aggregate Bond Index.
• Stock markets continued the rally that began in 2020, bolstered by reopening economies, more consumer spending and rising corporate profits. The FTSE Global All Cap Index returned roughly 13% in US dollars for the half year. Returns in the United States and Europe outpaced those in emerging markets and especially the Pacific region.
• In the US, the Federal Reserve expressed optimism about the economy and signalled that it might tighten its monetary policy sooner than expected. For now, it kept its target for short-term interest rates at 0%–0.25%. The yield of the bellwether US 10-year Treasury note finished the period at 1.47%, up from 0.91% six months earlier.
• The fund’s benchmark index returned 15.00%, as all 11 of its industry sectors posted positive results.
• Information technology, financials and communication services were the biggest contributors to return. Utilities and consumer staples contributed the least.
All returns are in US dollars.

242
Vanguard U.S. 500 Stock Index Fund
Benchmark: S&P 500 Index
Total ReturnsPeriods Ended 30 June 2021
(Annualised for periods over one year)
Six Months Five YearsTen Years or
Since Inception1
EUR Acc 18.63 % 15.36 % 16.30 %
Benchmark2 18.65 15.45 16.46
Tracking Difference* -0.02
Investor EUR 18.63 % 15.24 % 16.19 %
Benchmark2 18.65 15.45 16.46
Tracking Difference* -0.02
Institutional Plus EUR Acc 18.65 % 15.40 % 15.85 %
Benchmark2 18.65 15.45 15.89
Tracking Difference* —
EUR Hedged Acc 14.63 % 14.34 % 12.34 %
Benchmark2 14.58 14.31 12.43
Tracking Difference* 0.05
USD Acc 14.98 % 16.87 % 13.99 %
Benchmark2 15.00 16.97 14.14
Tracking Difference* -0.02
Investor USD 14.98 % 16.76 % 13.88 %
Benchmark2 15.00 16.97 14.14
Tracking Difference* -0.02
Institutional Plus USD Acc 15.00 % 16.92 % 13.70 %
Benchmark2 15.00 16.97 13.74
Tracking Difference* —
Each benchmark is in its respective currency.Sources: Vanguard Global Advisers, LLC, and Standard and Poor’s.Performance is based on NAV with net income reinvested.
All of the returns in this report represent past performance, which is not a guarantee of future results that may be achieved by the fund. For performance data current to the most recent month-end, which may be higher or lower than that cited, visit our website at http://global.vanguard.com. Note, too, that both investment returns and principal value can fluctuate widely, so an investor's shares, when sold, could be worth more or less than their original cost.* The tracking difference between the fund return and the index return over a stated period of time can be attributed to a number of factors, including, without limitation, small differences in
weightings, trading activity, transaction costs and differences in the valuation and withholding tax treatment between the fund and the index vendor.1 Since-inception returns: Institutional Plus EUR Acc, 6 December 2013; Institutional Plus USD Acc, 19 December 2013. 2 Index returns are adjusted for 30% withholding tax on dividends paid by US securities.

Significant Portfolio ChangesFor the Six Months Ended 30 June 2021
243
Vanguard U.S. 500 Stock Index Fund
The Central Bank of Ireland requires a schedule of material changes in the composition of the portfolio during the period. These are defined as aggregate purchases of a security exceeding 1% of the total value of purchases for the period and aggregate disposals greater than 1% of the total value of sales. At a minimum, the largest 20 purchases and 20 sales must be shown; all purchases and sales must be shown if there are fewer than 20. A full listing of the portfolio changes for the period is available, upon request, at no extra cost from the Administrator.
SharesCost
US Dollars ($)
Purchases
NXP Semiconductors NV 74,500 15,046,967Apple, Inc. 84,800 10,980,289Microsoft Corp. 41,100 10,119,754Amazon.com, Inc. 2,800 9,172,456Enphase Energy, Inc. 39,400 7,894,535Generac Holdings, Inc. 16,900 5,168,097Trimble, Inc. 72,100 5,163,188Tesla, Inc. 7,400 5,072,104Caesars Entertainment, Inc. 56,200 5,027,314Penn National Gaming, Inc. 40,000 4,669,744Monolithic Power Systems, Inc. 12,100 4,647,228Charles River Laboratories
International, Inc. 13,300 4,277,776PTC, Inc. 28,300 3,957,646Facebook, Inc. Class A 12,800 3,668,604Alphabet, Inc. Class C 1,600 3,527,502Alphabet, Inc. Class A 1,500 3,244,862Berkshire Hathaway, Inc. Class B 10,500 2,741,069Johnson & Johnson 16,400 2,683,705NVIDIA Corp. 4,300 2,667,528JPMorgan Chase & Co. 16,400 2,475,410
SharesProceeds
US Dollars ($)
Sales
Apple, Inc. 609,100 77,253,253Microsoft Corp. 260,300 61,058,701Amazon.com, Inc. 14,100 44,859,544Alphabet, Inc. Class C 11,300 23,642,168Facebook, Inc. Class A 82,200 22,817,093Alphabet, Inc. Class A 9,800 19,883,364Berkshire Hathaway, Inc. Class B 78,400 19,636,058Tesla, Inc. 25,500 18,496,507JPMorgan Chase & Co. 107,300 15,841,149Johnson & Johnson 89,900 14,553,247Visa, Inc. Class A 57,600 12,396,348Procter & Gamble Co. 91,100 11,974,902UnitedHealth Group, Inc. 33,100 11,699,087NVIDIA Corp. 20,600 11,524,525Walt Disney Co. 60,300 11,216,977Home Depot, Inc. 39,400 11,056,825Mastercard, Inc. Class A 30,700 10,885,422PayPal Holdings, Inc. 39,700 10,126,647Bank of America Corp. 274,000 9,889,014Intel Corp. 152,400 8,991,190

Financial StatementsStatement of Investments30 June 2021
244
Vanguard U.S. 500 Stock Index Fund
.Number of
SharesFair Value
US Dollars ($)% of Total
Net AssetsEquities 99.11% (2020: 99.35%)Communication Services 11.04% (2020: 10.70%)Facebook, Inc. Class A 623,112 216,662,274 2.27%Alphabet, Inc. Class A 78,326 191,255,644 2.01%Alphabet, Inc. Class C 73,935 185,304,769 1.94%Walt Disney Co. 472,526 83,055,895 0.87%Comcast Corp. Class A 1,192,438 67,992,815 0.71%Netflix, Inc. 115,273 60,888,351 0.64%Verizon Communications, Inc. 1,076,727 60,329,014 0.63%AT&T, Inc. 1,856,905 53,441,726 0.56%Charter Communications, Inc.
Class A 35,844 25,859,654 0.27%T-Mobile US, Inc. 152,374 22,068,326 0.23%Activision Blizzard, Inc. 202,141 19,292,337 0.20%Twitter, Inc. 207,597 14,284,750 0.15%Electronic Arts, Inc. 74,359 10,695,055 0.11%ViacomCBS, Inc. Class B 157,484 7,118,277 0.08%Take-Two Interactive Software,
Inc. 30,022 5,314,494 0.06%Omnicom Group, Inc. 55,931 4,473,921 0.05%Lumen Technologies, Inc. 258,356 3,511,058 0.04%Interpublic Group of Cos, Inc. 102,370 3,326,001 0.04%Live Nation Entertainment, Inc. 37,600 3,293,384 0.03%Fox Corp. Class A 83,546 3,102,063 0.03%DISH Network Corp. Class A 64,396 2,691,753 0.03%News Corp. Class A 103,047 2,655,521 0.03%Discovery, Inc. Class C 77,804 2,254,760 0.02%Fox Corp. Class B 40,637 1,430,422 0.02%Discovery, Inc. Class A 44,686 1,370,966 0.01%News Corp. Class B 29,082 708,147 0.01%. . 1,052,381,377 11.04%Consumer Discretionary 12.17% (2020: 12.64%)Amazon.com, Inc. 111,526 383,667,284 4.02%Tesla, Inc. 200,396 136,209,161 1.43%Home Depot, Inc. 276,561 88,192,537 0.92%NIKE, Inc. Class B 331,647 51,236,145 0.54%McDonald's Corp. 194,039 44,821,069 0.47%Lowe's Cos, Inc. 183,806 35,652,850 0.37%Starbucks Corp. 306,414 34,260,149 0.36%Target Corp. 128,665 31,103,477 0.33%Booking Holdings, Inc. 10,710 23,434,444 0.25%TJX Cos, Inc. 313,681 21,148,373 0.22%General Motors Co. 332,050 19,647,399 0.21%Ford Motor Co. 1,019,695 15,152,668 0.16%Dollar General Corp. 61,421 13,290,890 0.14%eBay, Inc. 168,259 11,813,464 0.12%Ross Stores, Inc. 92,710 11,496,040 0.12%Chipotle Mexican Grill, Inc.
Class A 7,367 11,421,355 0.12%Aptiv plc 70,323 11,063,918 0.12%O'Reilly Automotive, Inc. 18,172 10,289,168 0.11%Marriott International, Inc.
Class A 69,492 9,487,048 0.10%Yum! Brands, Inc. 77,548 8,920,346 0.09%Hilton Worldwide Holdings,
Inc. 72,463 8,740,487 0.09%AutoZone, Inc. 5,591 8,343,002 0.09%DR Horton, Inc. 85,506 7,727,177 0.08%Lennar Corp. Class A 71,609 7,114,354 0.07%VF Corp. 84,059 6,896,200 0.07%Etsy, Inc. 33,100 6,813,304 0.07%Best Buy Co., Inc. 58,106 6,681,028 0.07%Expedia Group, Inc. 36,886 6,038,607 0.06%Dollar Tree, Inc. 60,531 6,022,835 0.06%Garmin Ltd. 39,013 5,642,840 0.06%Caesars Entertainment, Inc. 54,100 5,612,875 0.06%
.Number of
SharesFair Value
US Dollars ($)% of Total
Net AssetsTractor Supply Co. 29,998 5,581,428 0.06%Carnival Corp. 208,201 5,488,178 0.06%CarMax, Inc. 42,396 5,475,443 0.06%Darden Restaurants, Inc. 34,078 4,975,047 0.05%Ulta Beauty, Inc. 14,284 4,938,979 0.05%Royal Caribbean Cruises Ltd. 56,939 4,855,758 0.05%Pool Corp. 10,400 4,770,064 0.05%Genuine Parts Co. 37,475 4,739,463 0.05%Domino's Pizza, Inc. 10,100 4,711,549 0.05%Las Vegas Sands Corp. 85,616 4,511,107 0.05%MGM Resorts International 105,644 4,505,717 0.05%NVR, Inc. 891 4,431,210 0.05%L Brands, Inc. 60,619 4,368,205 0.05%PulteGroup, Inc. 68,251 3,724,457 0.04%LKQ Corp. 72,375 3,562,298 0.04%Whirlpool Corp. 16,220 3,536,284 0.04%Advance Auto Parts, Inc. 17,025 3,492,508 0.04%Wynn Resorts Ltd. 27,484 3,361,293 0.03%Tapestry, Inc. 72,614 3,157,257 0.03%Hasbro, Inc. 33,367 3,153,849 0.03%BorgWarner, Inc. 62,423 3,030,012 0.03%Mohawk Industries, Inc. 15,314 2,943,198 0.03%Penn National Gaming, Inc. 38,400 2,937,216 0.03%Norwegian Cruise Line
Holdings Ltd. 96,394 2,834,948 0.03%Newell Brands, Inc. 98,696 2,711,179 0.03%PVH Corp. 18,298 1,968,682 0.02%Gap, Inc. 54,512 1,834,329 0.02%Leggett & Platt, Inc. 34,235 1,773,715 0.02%Hanesbrands, Inc. 89,731 1,675,278 0.02%Ralph Lauren Corp. Class A 12,343 1,454,129 0.01%Under Armour, Inc. Class A 46,671 987,092 0.01%Under Armour, Inc. Class C 53,126 986,550 0.01%. . 1,160,416,916 12.17%Consumer Staples 5.81% (2020: 6.47%)Procter & Gamble Co. 636,599 85,896,303 0.90%Coca-Cola Co. 1,009,278 54,612,033 0.57%PepsiCo, Inc. 359,348 53,244,593 0.56%Walmart, Inc. 357,086 50,356,268 0.53%Costco Wholesale Corp. 114,985 45,496,115 0.48%Philip Morris International, Inc. 405,447 40,183,852 0.42%Altria Group, Inc. 481,466 22,956,299 0.24%Mondelez International, Inc.
Class A 365,519 22,823,006 0.24%Estee Lauder Cos, Inc. Class A 60,291 19,177,361 0.20%Colgate-Palmolive Co. 220,116 17,906,437 0.19%Kimberly-Clark Corp. 87,711 11,733,978 0.12%Sysco Corp. 133,084 10,347,281 0.11%Constellation Brands, Inc.
Class A 43,876 10,262,158 0.11%Walgreens Boots Alliance, Inc. 186,420 9,807,556 0.10%General Mills, Inc. 158,739 9,671,967 0.10%Monster Beverage Corp. 96,252 8,792,620 0.09%Archer-Daniels-Midland Co. 145,081 8,791,909 0.09%Kroger Co. 196,332 7,521,479 0.08%Kraft Heinz Co. 168,889 6,887,294 0.07%Hershey Co. 37,980 6,615,356 0.07%Clorox Co. 32,470 5,841,678 0.06%McCormick & Co., Inc. 64,546 5,700,703 0.06%Tyson Foods, Inc. Class A 76,803 5,664,989 0.06%Church & Dwight Co., Inc. 63,771 5,434,565 0.06%Conagra Brands, Inc. 124,793 4,539,969 0.05%Kellogg Co. 65,501 4,213,679 0.04%JM Smucker Co. 28,320 3,669,422 0.04%Brown-Forman Corp. Class B 47,227 3,539,191 0.04%Hormel Foods Corp. 73,501 3,509,673 0.04%

245
Vanguard U.S. 500 Stock Index Fund
.Number of
SharesFair Value
US Dollars ($)% of Total
Net AssetsLamb Weston Holdings, Inc. 38,149 3,077,098 0.03%Molson Coors Beverage Co.
Class B 49,027 2,632,260 0.03%Campbell Soup Co. 52,887 2,411,118 0.03%. . 553,318,210 5.81%Energy 2.83% (2020: 2.27%)Exxon Mobil Corp. 1,100,882 69,443,637 0.73%Chevron Corp. 502,620 52,644,419 0.55%ConocoPhillips 350,860 21,367,374 0.22%EOG Resources, Inc. 151,751 12,662,103 0.13%Schlumberger NV 363,379 11,631,762 0.12%Marathon Petroleum Corp. 165,698 10,011,473 0.10%Pioneer Natural Resources Co. 60,292 9,798,656 0.10%Phillips 66 113,812 9,767,346 0.10%Kinder Morgan, Inc. 505,628 9,217,598 0.10%Williams Cos, Inc. 315,713 8,382,180 0.09%Valero Energy Corp. 106,239 8,295,141 0.09%Occidental Petroleum Corp. 218,381 6,828,774 0.07%ONEOK, Inc. 116,158 6,463,031 0.07%Hess Corp. 71,375 6,232,465 0.07%Halliburton Co. 231,614 5,354,916 0.06%Devon Energy Corp. 154,941 4,522,728 0.05%Diamondback Energy, Inc. 47,332 4,444,001 0.05%Baker Hughes Co. Class A 188,922 4,320,646 0.04%Marathon Oil Corp. 205,366 2,797,085 0.03%APA Corp. 98,207 2,124,217 0.02%Cabot Oil & Gas Corp. 103,574 1,808,402 0.02%NOV, Inc. 102,852 1,575,693 0.02%. . 269,693,647 2.83%Financials 11.18% (2020: 10.37%)Berkshire Hathaway, Inc.
Class B 465,878 129,476,814 1.36%JPMorgan Chase & Co. 787,264 122,451,043 1.28%Bank of America Corp. 1,961,215 80,860,894 0.85%Wells Fargo & Co. 1,075,054 48,689,196 0.51%Citigroup, Inc. 537,604 38,035,483 0.40%Morgan Stanley 387,176 35,500,167 0.37%Goldman Sachs Group, Inc. 88,516 33,594,477 0.35%BlackRock, Inc. Class A 36,850 32,242,644 0.34%Charles Schwab Corp. 390,158 28,407,404 0.30%American Express Co. 169,181 27,953,777 0.29%S&P Global, Inc. 62,638 25,709,767 0.27%PNC Financial Services Group,
Inc. 110,526 21,083,940 0.22%US Bancorp 352,640 20,089,901 0.21%CME Group, Inc. Class A 93,378 19,859,633 0.21%Truist Financial Corp. 349,851 19,416,731 0.20%Marsh & McLennan Cos, Inc. 132,315 18,614,074 0.20%Chubb Ltd. 116,988 18,594,073 0.20%Capital One Financial Corp. 117,458 18,169,578 0.19%Intercontinental Exchange, Inc. 146,371 17,374,238 0.18%Moody's Corp. 41,878 15,175,331 0.16%Progressive Corp. 152,179 14,945,500 0.16%Aon plc Class A 58,669 14,007,810 0.15%T Rowe Price Group, Inc. 59,053 11,690,722 0.12%MetLife, Inc. 193,305 11,569,304 0.12%MSCI, Inc. Class A 21,463 11,441,496 0.12%Bank of New York Mellon Corp. 209,855 10,750,872 0.11%American International Group,
Inc. 223,128 10,620,893 0.11%Prudential Financial, Inc. 102,650 10,518,546 0.11%Allstate Corp. 77,725 10,138,449 0.11%Travelers Cos, Inc. 65,435 9,796,274 0.10%Discover Financial Services 79,314 9,382,053 0.10%Aflac, Inc. 164,084 8,804,747 0.09%First Republic Bank 45,721 8,557,600 0.09%SVB Financial Group 14,109 7,850,671 0.08%Willis Towers Watson plc 33,473 7,699,459 0.08%Berkshire Hathaway, Inc.
Class A 18 7,534,818 0.08%Ameriprise Financial, Inc. 30,134 7,499,750 0.08%Arthur J Gallagher & Co. 53,382 7,477,751 0.08%
.Number of
SharesFair Value
US Dollars ($)% of Total
Net AssetsState Street Corp. 90,190 7,420,833 0.08%Fifth Third Bancorp 182,487 6,976,478 0.07%Synchrony Financial 140,858 6,834,430 0.07%Northern Trust Corp. 53,979 6,241,052 0.07%Hartford Financial Services
Group, Inc. 92,506 5,732,597 0.06%Huntington Bancshares, Inc. 382,641 5,460,287 0.06%Nasdaq, Inc. 29,748 5,229,698 0.06%KeyCorp 252,569 5,215,550 0.05%Citizens Financial Group, Inc. 110,559 5,071,341 0.05%Regions Financial Corp. 250,551 5,056,119 0.05%M&T Bank Corp. 33,527 4,871,808 0.05%MarketAxess Holdings, Inc. 9,900 4,589,541 0.05%Cincinnati Financial Corp. 38,827 4,528,005 0.05%Principal Financial Group, Inc. 65,766 4,155,754 0.04%Raymond James Financial, Inc. 31,748 4,124,065 0.04%Cboe Global Markets, Inc. 27,920 3,323,876 0.04%Loews Corp. 58,533 3,198,828 0.03%Lincoln National Corp. 46,474 2,920,426 0.03%WR Berkley Corp. 36,713 2,732,549 0.03%Everest Re Group Ltd. 10,423 2,626,700 0.03%Invesco Ltd. 97,957 2,618,391 0.03%Comerica, Inc. 36,313 2,590,569 0.03%Assurant, Inc. 15,688 2,450,152 0.03%Globe Life, Inc. 24,511 2,334,673 0.02%Franklin Resources, Inc. 70,902 2,268,155 0.02%Zions Bancorp NA 42,685 2,256,329 0.02%People's United Financial, Inc. 110,537 1,894,604 0.02%Unum Group 53,997 1,533,515 0.02%. . 1,065,842,205 11.18%Health Care 12.87% (2020: 13.37%)Johnson & Johnson 684,852 112,822,519 1.18%UnitedHealth Group, Inc. 245,393 98,265,173 1.03%Pfizer, Inc. 1,455,710 57,005,604 0.60%Abbott Laboratories 462,083 53,569,282 0.56%AbbVie, Inc. 459,316 51,737,354 0.54%Thermo Fisher Scientific, Inc. 102,269 51,591,642 0.54%Merck & Co., Inc. 658,435 51,206,490 0.54%Eli Lilly & Co. 207,003 47,511,329 0.50%Danaher Corp. 165,083 44,301,674 0.46%Medtronic plc 349,977 43,442,645 0.46%Bristol-Myers Squibb Co. 581,003 38,822,620 0.41%Amgen, Inc. 149,427 36,422,831 0.38%CVS Health Corp. 342,363 28,566,769 0.30%Intuitive Surgical, Inc. 30,771 28,298,242 0.30%Anthem, Inc. 63,708 24,323,714 0.25%Zoetis, Inc. Class A 123,507 23,016,765 0.24%Gilead Sciences, Inc. 326,132 22,457,450 0.24%Stryker Corp. 85,261 22,144,840 0.23%Cigna Corp. 89,209 21,148,778 0.22%Becton Dickinson & Co. 75,611 18,387,839 0.19%Illumina, Inc. 38,001 17,982,453 0.19%Edwards Lifesciences Corp. 161,725 16,749,858 0.18%Boston Scientific Corp. 369,574 15,802,984 0.17%Regeneron Pharmaceuticals,
Inc. 27,221 15,204,017 0.16%Humana, Inc. 33,567 14,860,782 0.16%HCA Healthcare, Inc. 68,346 14,129,852 0.15%IDEXX Laboratories, Inc. 22,168 14,000,200 0.15%Vertex Pharmaceuticals, Inc. 67,309 13,571,514 0.14%Biogen, Inc. 39,107 13,541,581 0.14%IQVIA Holdings, Inc. 49,937 12,100,734 0.13%Agilent Technologies, Inc. 78,947 11,669,156 0.12%Align Technology, Inc. 18,768 11,467,248 0.12%Centene Corp. 151,450 11,045,249 0.12%Dexcom, Inc. 25,200 10,760,400 0.11%Alexion Pharmaceuticals, Inc. 57,406 10,546,056 0.11%Baxter International, Inc. 130,808 10,530,044 0.11%ResMed, Inc. 37,851 9,331,029 0.10%Zimmer Biomet Holdings, Inc. 54,273 8,728,184 0.09%Mettler-Toledo International,
Inc. 6,021 8,341,132 0.09%

246
Vanguard U.S. 500 Stock Index Fund
.Number of
SharesFair Value
US Dollars ($)% of Total
Net AssetsMcKesson Corp. 41,126 7,864,936 0.08%Laboratory Corp. of America
Holdings 25,282 6,974,040 0.07%West Pharmaceutical Services,
Inc. 19,200 6,894,720 0.07%Cerner Corp. 78,659 6,147,987 0.06%Waters Corp. 16,066 5,552,570 0.06%STERIS plc 25,400 5,240,020 0.05%Cooper Cos, Inc. 12,846 5,090,484 0.05%Teleflex, Inc. 12,159 4,885,365 0.05%Catalent, Inc. 44,500 4,811,340 0.05%Charles River Laboratories
International, Inc. 13,000 4,808,960 0.05%PerkinElmer, Inc. 29,054 4,486,228 0.05%Viatris, Inc. 313,269 4,476,614 0.05%Quest Diagnostics, Inc. 33,874 4,470,352 0.05%Hologic, Inc. 66,366 4,427,940 0.05%AmerisourceBergen Corp.
Class A 38,661 4,426,298 0.05%Cardinal Health, Inc. 75,648 4,318,744 0.04%Incyte Corp. 48,725 4,099,234 0.04%ABIOMED, Inc. 11,686 3,647,318 0.04%Bio-Rad Laboratories, Inc.
Class A 5,600 3,608,024 0.04%DENTSPLY SIRONA, Inc. 56,549 3,577,290 0.04%Universal Health Services, Inc.
Class B 20,303 2,972,968 0.03%Henry Schein, Inc. 36,922 2,739,243 0.03%DaVita, Inc. 18,133 2,183,757 0.02%Organon & Co. 66,183 2,002,698 0.02%Perrigo Co. plc 35,151 1,611,673 0.02%. . 1,226,724,836 12.87%Industrials 8.47% (2020: 8.34%)Honeywell International, Inc. 180,702 39,636,984 0.42%United Parcel Service, Inc.
Class B 188,097 39,118,533 0.41%Union Pacific Corp. 172,776 37,998,626 0.40%Boeing Co. 142,992 34,255,164 0.36%Raytheon Technologies Corp. 394,032 33,614,870 0.35%Caterpillar, Inc. 142,501 31,012,493 0.33%General Electric Co. 2,283,157 30,731,293 0.32%3M Co. 150,801 29,953,603 0.31%Deere & Co. 81,162 28,626,649 0.30%Lockheed Martin Corp. 63,583 24,056,628 0.25%CSX Corp. 590,776 18,952,094 0.20%FedEx Corp. 63,474 18,936,198 0.20%Norfolk Southern Corp. 65,085 17,274,210 0.18%Illinois Tool Works, Inc. 74,681 16,695,684 0.18%Eaton Corp. plc 103,627 15,355,449 0.16%Emerson Electric Co. 155,939 15,007,569 0.16%Waste Management, Inc. 101,110 14,166,522 0.15%Northrop Grumman Corp. 38,941 14,152,328 0.15%Roper Technologies, Inc. 27,374 12,871,255 0.13%Johnson Controls International
plc 186,718 12,814,456 0.13%L3Harris Technologies, Inc. 53,286 11,517,769 0.12%Trane Technologies plc 62,188 11,451,298 0.12%General Dynamics Corp. 59,538 11,208,624 0.12%IHS Markit Ltd. 97,445 10,978,154 0.12%Carrier Global Corp. 212,469 10,325,993 0.11%Parker-Hannifin Corp. 33,574 10,310,911 0.11%Cummins, Inc. 38,040 9,274,532 0.10%TransDigm Group, Inc. 14,242 9,218,704 0.10%Cintas Corp. 22,939 8,762,698 0.09%Rockwell Automation, Inc. 30,165 8,627,793 0.09%Stanley Black & Decker, Inc. 42,075 8,624,954 0.09%Otis Worldwide Corp. 104,684 8,560,011 0.09%Southwest Airlines Co. 153,438 8,146,023 0.09%PACCAR, Inc. 90,390 8,067,308 0.08%AMETEK, Inc. 60,107 8,024,285 0.08%Fastenal Co. 148,942 7,744,984 0.08%Equifax, Inc. 31,584 7,564,684 0.08%
.Number of
SharesFair Value
US Dollars ($)% of Total
Net AssetsVerisk Analytics, Inc. Class A 42,077 7,351,693 0.08%Delta Air Lines, Inc. 165,839 7,174,195 0.08%Copart, Inc. 54,215 7,147,163 0.07%Generac Holdings, Inc. 16,400 6,808,460 0.07%Kansas City Southern 23,698 6,715,302 0.07%Old Dominion Freight Line, Inc. 24,700 6,268,860 0.07%Fortive Corp. 87,990 6,136,423 0.06%United Rentals, Inc. 18,897 6,028,332 0.06%Republic Services, Inc. Class A 54,618 6,008,526 0.06%Dover Corp. 37,413 5,634,398 0.06%Xylem, Inc. 46,862 5,621,566 0.06%Expeditors International of
Washington, Inc. 44,115 5,584,959 0.06%Teledyne Technologies, Inc. 12,100 5,067,843 0.05%WW Grainger, Inc. 11,414 4,999,332 0.05%Ingersoll Rand, Inc. 96,945 4,731,885 0.05%Jacobs Engineering Group, Inc. 33,699 4,496,121 0.05%United Airlines Holdings, Inc. 84,472 4,417,041 0.05%IDEX Corp. 19,700 4,334,985 0.05%Textron, Inc. 58,507 4,023,526 0.04%Masco Corp. 65,449 3,855,601 0.04%Westinghouse Air Brake
Technologies Corp. 46,508 3,827,608 0.04%Fortune Brands Home &
Security, Inc. 36,105 3,596,419 0.04%American Airlines Group, Inc. 167,876 3,560,650 0.04%JB Hunt Transport Services,
Inc. 21,816 3,554,917 0.04%Leidos Holdings, Inc. 34,800 3,518,280 0.04%Howmet Aerospace, Inc. 102,062 3,518,077 0.04%Quanta Services, Inc. 36,192 3,277,909 0.03%Allegion plc 23,296 3,245,133 0.03%CH Robinson Worldwide, Inc. 34,401 3,222,342 0.03%Snap-on, Inc. 14,164 3,164,663 0.03%Pentair plc 43,216 2,916,648 0.03%Robert Half International, Inc. 29,578 2,631,555 0.03%AO Smith Corp. 35,121 2,530,819 0.03%Nielsen Holdings plc 93,168 2,298,455 0.02%Huntington Ingalls Industries,
Inc. 10,511 2,215,193 0.02%Rollins, Inc. 57,451 1,964,824 0.02%Alaska Air Group, Inc. 32,266 1,945,962 0.02%. . 807,034,998 8.47%Information Technology 27.18% (2020: 27.43%)Apple, Inc. 4,079,716 558,757,903 5.86%Microsoft Corp. 1,958,787 530,635,398 5.57%NVIDIA Corp. 162,007 129,621,801 1.36%Visa, Inc. Class A 439,957 102,870,746 1.08%PayPal Holdings, Inc. 305,508 89,049,472 0.93%Mastercard, Inc. Class A 227,490 83,054,324 0.87%Adobe, Inc. 124,290 72,789,196 0.76%Intel Corp. 1,050,107 58,953,007 0.62%Salesforce.com, Inc. 240,872 58,837,803 0.62%Cisco Systems, Inc. 1,096,105 58,093,565 0.61%Broadcom, Inc. 106,236 50,657,574 0.53%Accenture plc Class A 165,335 48,739,105 0.51%Texas Instruments, Inc. 240,189 46,188,345 0.48%QUALCOMM, Inc. 293,406 41,936,520 0.44%Oracle Corp. 472,484 36,778,155 0.39%Intuit, Inc. 71,046 34,824,618 0.37%International Business
Machines Corp. 232,414 34,069,568 0.36%Applied Materials, Inc. 238,637 33,981,909 0.36%Advanced Micro Devices, Inc. 316,043 29,685,919 0.31%ServiceNow, Inc. 51,400 28,246,870 0.30%Micron Technology, Inc. 291,622 24,782,038 0.26%Lam Research Corp. 37,142 24,168,299 0.25%Fidelity National Information
Services, Inc. 161,230 22,841,454 0.24%Automatic Data Processing,
Inc. 110,635 21,974,324 0.23%Autodesk, Inc. 57,274 16,718,281 0.18%

247
Vanguard U.S. 500 Stock Index Fund
.Number of
SharesFair Value
US Dollars ($)% of Total
Net AssetsFiserv, Inc. 154,890 16,556,192 0.17%Analog Devices, Inc. 95,944 16,517,719 0.17%NXP Semiconductors NV 71,700 14,750,124 0.15%Global Payments, Inc. 76,784 14,400,071 0.15%KLA Corp. 39,892 12,933,385 0.14%TE Connectivity Ltd. 85,900 11,614,539 0.12%Synopsys, Inc. 39,610 10,924,042 0.11%Microchip Technology, Inc. 71,189 10,659,841 0.11%Amphenol Corp. Class A 155,528 10,639,670 0.11%Cadence Design Systems, Inc. 72,432 9,910,146 0.10%Motorola Solutions, Inc. 44,123 9,568,073 0.10%Cognizant Technology
Solutions Corp. Class A 136,948 9,485,018 0.10%HP, Inc. 311,866 9,415,235 0.10%Xilinx, Inc. 64,037 9,262,312 0.10%Paychex, Inc. 83,449 8,954,078 0.09%Fortinet, Inc. 35,238 8,393,339 0.09%Corning, Inc. 201,529 8,242,536 0.09%Skyworks Solutions, Inc. 42,912 8,228,376 0.09%ANSYS, Inc. 22,687 7,873,750 0.08%Keysight Technologies, Inc. 48,044 7,418,474 0.08%Zebra Technologies Corp.
Class A 13,900 7,359,911 0.08%Maxim Integrated Products,
Inc. 69,811 7,355,287 0.08%Enphase Energy, Inc. 35,200 6,463,776 0.07%CDW Corp. 36,485 6,372,105 0.07%VeriSign, Inc. 25,699 5,851,405 0.06%Teradyne, Inc. 43,100 5,773,676 0.06%Qorvo, Inc. 29,331 5,738,610 0.06%Western Digital Corp. 79,931 5,688,689 0.06%FleetCor Technologies, Inc. 21,756 5,570,841 0.06%Gartner, Inc. 22,375 5,419,225 0.06%Trimble, Inc. 65,200 5,335,316 0.06%Arista Networks, Inc. 14,310 5,184,656 0.05%Hewlett Packard Enterprise Co. 339,259 4,946,396 0.05%Akamai Technologies, Inc. 42,328 4,935,445 0.05%Broadridge Financial Solutions,
Inc. 30,084 4,859,468 0.05%Tyler Technologies, Inc. 10,600 4,795,122 0.05%NetApp, Inc. 57,596 4,712,505 0.05%Paycom Software, Inc. 12,800 4,652,416 0.05%Seagate Technology Holdings
plc 51,661 4,542,552 0.05%Monolithic Power Systems,
Inc. 11,200 4,182,640 0.04%NortonLifeLock, Inc. 150,540 4,097,699 0.04%PTC, Inc. 27,300 3,856,398 0.04%Citrix Systems, Inc. 32,303 3,788,173 0.04%Jack Henry & Associates, Inc. 19,413 3,174,220 0.03%F5 Networks, Inc. 15,388 2,872,324 0.03%DXC Technology Co. 66,300 2,581,722 0.03%Western Union Co. 107,093 2,459,926 0.03%Juniper Networks, Inc. 85,352 2,334,377 0.02%IPG Photonics Corp. 9,291 1,958,264 0.02%. . 2,590,866,258 27.18%Materials 2.58% (2020: 2.61%)Linde plc 135,288 39,111,761 0.41%Sherwin-Williams Co. 62,242 16,957,833 0.18%Air Products & Chemicals, Inc. 57,562 16,559,436 0.17%Freeport-McMoRan, Inc. 381,176 14,145,441 0.15%Ecolab, Inc. 64,652 13,316,373 0.14%Newmont Corp. 208,181 13,194,512 0.14%Dow, Inc. 194,369 12,299,670 0.13%DuPont de Nemours, Inc. 138,368 10,711,067 0.11%PPG Industries, Inc. 61,596 10,457,153 0.11%International Flavors &
Fragrances, Inc. 64,706 9,667,076 0.10%Corteva, Inc. 191,651 8,499,722 0.09%Nucor Corp. 77,854 7,468,534 0.08%Ball Corp. 85,373 6,916,921 0.07%
.Number of
SharesFair Value
US Dollars ($)% of Total
Net AssetsLyondellBasell Industries NV
Class A 67,166 6,909,366 0.07%International Paper Co. 101,756 6,238,660 0.07%Vulcan Materials Co. 34,415 5,990,619 0.06%Martin Marietta Materials, Inc. 16,258 5,719,727 0.06%Albemarle Corp. 30,327 5,108,886 0.05%Amcor plc 399,900 4,582,854 0.05%Avery Dennison Corp. 21,629 4,547,281 0.05%Celanese Corp. Class A 29,271 4,437,484 0.05%Eastman Chemical Co. 35,520 4,146,960 0.04%Westrock Co. 68,995 3,671,914 0.04%FMC Corp. 33,506 3,625,349 0.04%Packaging Corp. of America 24,628 3,335,124 0.04%Mosaic Co. 90,052 2,873,559 0.03%CF Industries Holdings, Inc. 55,849 2,873,431 0.03%Sealed Air Corp. 39,967 2,368,045 0.02%. . 245,734,758 2.58%Real Estate 2.55% (2020: 2.41%)American Tower Corp. REIT 118,261 31,947,027 0.34%Prologis, Inc. REIT 192,386 22,995,899 0.24%Crown Castle International
Corp. REIT 112,364 21,922,216 0.23%Equinix, Inc. REIT 23,284 18,687,738 0.20%Public Storage REIT 39,532 11,886,877 0.12%Simon Property Group, Inc.
REIT 85,433 11,147,298 0.12%Digital Realty Trust, Inc. REIT 73,242 11,019,991 0.12%SBA Communications Corp.
REIT Class A 28,459 9,069,883 0.10%Welltower, Inc. REIT 108,868 9,046,931 0.09%AvalonBay Communities, Inc.
REIT 36,373 7,590,681 0.08%CBRE Group, Inc. Class A 87,152 7,471,541 0.08%Equity Residential REIT 89,466 6,888,882 0.07%Weyerhaeuser Co. REIT 194,580 6,697,444 0.07%Alexandria Real Estate
Equities, Inc. REIT 35,792 6,511,997 0.07%Realty Income Corp. REIT 97,224 6,488,730 0.07%Extra Space Storage, Inc. REIT 34,710 5,686,192 0.06%Ventas, Inc. REIT 97,651 5,575,872 0.06%Essex Property Trust, Inc. REIT 16,867 5,060,269 0.05%Mid-America Apartment
Communities, Inc. REIT 29,622 4,988,937 0.05%Healthpeak Properties, Inc.
REIT 140,093 4,663,696 0.05%Duke Realty Corp. REIT 97,290 4,606,682 0.05%Boston Properties, Inc. REIT 37,136 4,255,414 0.04%UDR, Inc. REIT 76,773 3,760,342 0.04%Iron Mountain, Inc. REIT 75,248 3,184,495 0.03%Host Hotels & Resorts, Inc.
REIT 184,493 3,152,985 0.03%Regency Centers Corp. REIT 41,106 2,633,661 0.03%Kimco Realty Corp. REIT 112,369 2,342,894 0.02%Federal Realty Investment
Trust REIT 18,246 2,137,884 0.02%Vornado Realty Trust REIT 41,363 1,930,411 0.02%. . 243,352,869 2.55%Utilities 2.43% (2020: 2.74%)NextEra Energy, Inc. 510,036 37,375,438 0.39%Duke Energy Corp. 199,958 19,739,854 0.21%Southern Co. 275,257 16,655,801 0.17%Dominion Energy, Inc. 209,632 15,422,626 0.16%Exelon Corp. 254,123 11,260,190 0.12%American Electric Power Co.,
Inc. 129,886 10,987,057 0.11%Sempra Energy 81,896 10,849,582 0.11%Xcel Energy, Inc. 139,760 9,207,389 0.10%Public Service Enterprise
Group, Inc. 131,024 7,827,374 0.08%American Water Works Co.,
Inc. 47,332 7,295,281 0.08%WEC Energy Group, Inc. 81,767 7,273,174 0.08%Eversource Energy 89,528 7,183,727 0.07%
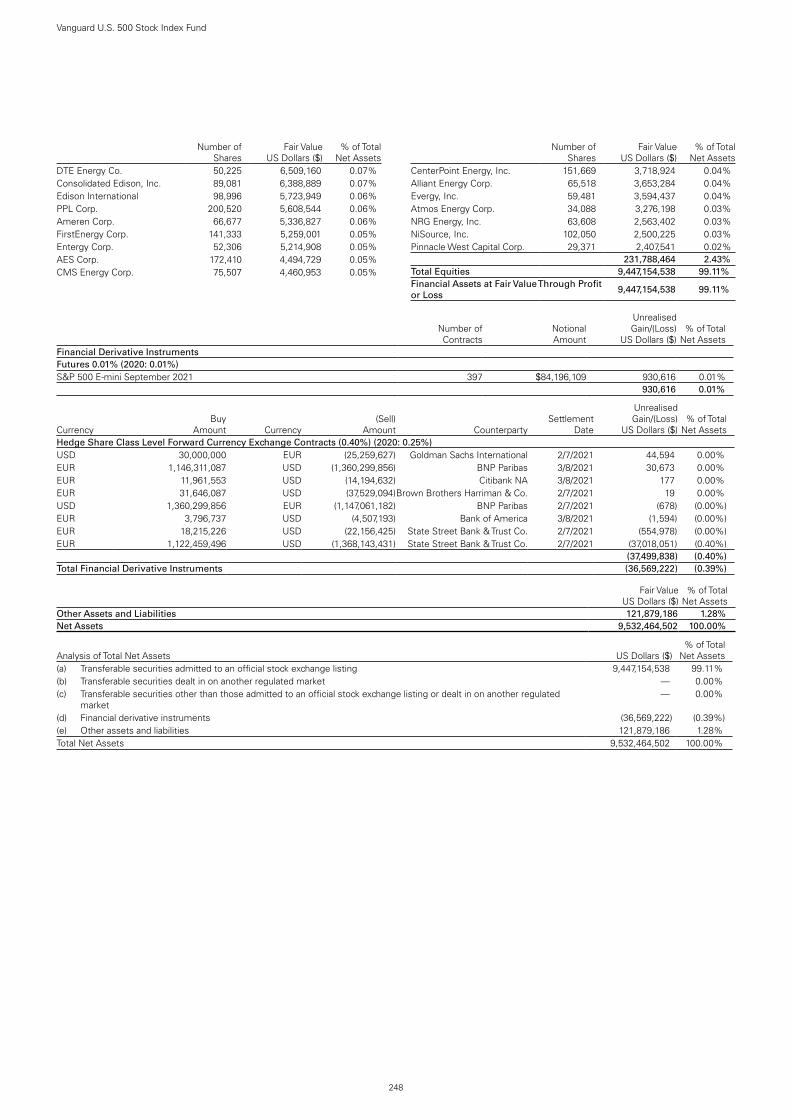
248
Vanguard U.S. 500 Stock Index Fund
.Number of
SharesFair Value
US Dollars ($)% of Total
Net AssetsDTE Energy Co. 50,225 6,509,160 0.07%Consolidated Edison, Inc. 89,081 6,388,889 0.07%Edison International 98,996 5,723,949 0.06%PPL Corp. 200,520 5,608,544 0.06%Ameren Corp. 66,677 5,336,827 0.06%FirstEnergy Corp. 141,333 5,259,001 0.05%Entergy Corp. 52,306 5,214,908 0.05%AES Corp. 172,410 4,494,729 0.05%CMS Energy Corp. 75,507 4,460,953 0.05%
.Number of
SharesFair Value
US Dollars ($)% of Total
Net AssetsCenterPoint Energy, Inc. 151,669 3,718,924 0.04%Alliant Energy Corp. 65,518 3,653,284 0.04%Evergy, Inc. 59,481 3,594,437 0.04%Atmos Energy Corp. 34,088 3,276,198 0.03%NRG Energy, Inc. 63,608 2,563,402 0.03%NiSource, Inc. 102,050 2,500,225 0.03%Pinnacle West Capital Corp. 29,371 2,407,541 0.02%. . 231,788,464 2.43%Total Equities 9,447,154,538 99.11%Financial Assets at Fair Value Through Profit or Loss
9,447,154,538 99.11%
testNumber of Contracts
Notional Amount
Unrealised Gain/(Loss)
US Dollars ($)% of Total
Net AssetsFinancial Derivative InstrumentsFutures 0.01% (2020: 0.01%)S&P 500 E-mini September 2021 397 $84,196,109 930,616 0.01 %test test test 930,616 0.01 %
CurrencyBuy
Amount Currency(Sell)
Amount CounterpartySettlement
Date
Unrealised Gain/(Loss)
US Dollars ($)% of Total
Net AssetsHedge Share Class Level Forward Currency Exchange Contracts (0.40%) (2020: 0.25%)USD 30,000,000 EUR (25,259,627) Goldman Sachs International 2/7/2021 44,594 0.00 %EUR 1,146,311,087 USD (1,360,299,856) BNP Paribas 3/8/2021 30,673 0.00 %EUR 11,961,553 USD (14,194,632) Citibank NA 3/8/2021 177 0.00 %EUR 31,646,087 USD (37,529,094)Brown Brothers Harriman & Co. 2/7/2021 19 0.00 %USD 1,360,299,856 EUR (1,147,061,182) BNP Paribas 2/7/2021 (678 ) (0.00 %)EUR 3,796,737 USD (4,507,193) Bank of America 3/8/2021 (1,594 ) (0.00 %)EUR 18,215,226 USD (22,156,425) State Street Bank & Trust Co. 2/7/2021 (554,978 ) (0.00 %)EUR 1,122,459,496 USD (1,368,143,431) State Street Bank & Trust Co. 2/7/2021 (37,018,051 ) (0.40 %)test (37,499,838 ) (0.40 %)Total Financial Derivative Instruments (36,569,222 ) (0.39 %)
Fair Value US Dollars ($)
% of Total Net Assets
Other Assets and Liabilities 121,879,186 1.28 %Net Assets 9,532,464,502 100.00 %
Analysis of Total Net Assets US Dollars ($)% of Total
Net Assets(a) Transferable securities admitted to an official stock exchange listing 9,447,154,538 99.11 %(b) Transferable securities dealt in on another regulated market — 0.00 %(c) Transferable securities other than those admitted to an official stock exchange listing or dealt in on another regulated
market — 0.00 %
(d) Financial derivative instruments (36,569,222 ) (0.39 %)(e) Other assets and liabilities 121,879,186 1.28 %Total Net Assets 9,532,464,502 100.00 %

The accompanying notes form an integral part of the financial statements.
249
Vanguard U.S. 500 Stock Index Fund
Statement of Assets and Liabilities
US Dollars ($)
As at 30 June 2021
US Dollars ($)
As at 31 December 2020
Current AssetsFinancial Assets at Fair Value Through Profit or Loss 9,447,154,538 9,122,277,586 Financial Derivative Instruments 1,006,079 23,977,292 Cash 33,609,949 60,513,293 Unrealised Appreciation on Spot Currency Contracts 59,096 20,467 Receivables: Interest and Dividends 4,145,340 5,020,251 Capital Shares Issued 24,684,213 9,357,952 Investments Sold 48,048,518 — Futures Margin Cash 3,573,409 630,631 Cash Collateral 32,400,000 —
Total Current Assets 9,594,681,142 9,221,797,472
Current LiabilitiesFinancial Derivative Instruments 37,575,301 — Bank Overdraft 110 817 Payables and Other Liabilities: Investments Purchased 2,567 26,378,032 Capital Shares Redeemed 23,934,992 14,299,068 Management Fees Payable 703,670 700,400
Total Current Liabilities 62,216,640 41,378,317
Net Assets Attributable to Holders of Redeemable Participating Shares (“Net Assets”) 9,532,464,502 9,180,419,155
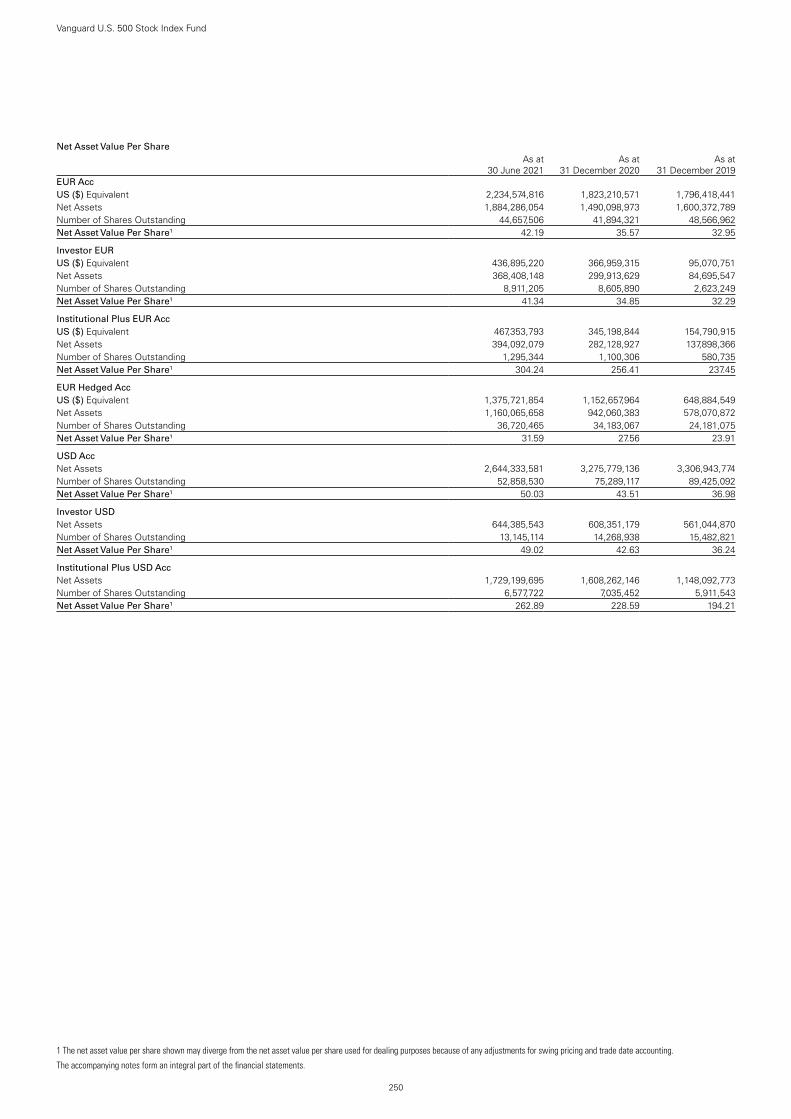
250
Vanguard U.S. 500 Stock Index Fund
The accompanying notes form an integral part of the financial statements.
Net Asset Value Per Share
.As at
30 June 2021As at
31 December 2020As at
31 December 2019EUR AccUS ($) Equivalent 2,234,574,816 1,823,210,571 1,796,418,441Net Assets 1,884,286,054 1,490,098,973 1,600,372,789Number of Shares Outstanding 44,657,506 41,894,321 48,566,962Net Asset Value Per Share1 42.19 35.57 32.95
Investor EUR US ($) Equivalent 436,895,220 366,959,315 95,070,751Net Assets 368,408,148 299,913,629 84,695,547Number of Shares Outstanding 8,911,205 8,605,890 2,623,249Net Asset Value Per Share1 41.34 34.85 32.29
Institutional Plus EUR AccUS ($) Equivalent 467,353,793 345,198,844 154,790,915Net Assets 394,092,079 282,128,927 137,898,366Number of Shares Outstanding 1,295,344 1,100,306 580,735Net Asset Value Per Share1 304.24 256.41 237.45
EUR Hedged AccUS ($) Equivalent 1,375,721,854 1,152,657,964 648,884,549Net Assets 1,160,065,658 942,060,383 578,070,872Number of Shares Outstanding 36,720,465 34,183,067 24,181,075Net Asset Value Per Share1 31.59 27.56 23.91
USD AccNet Assets 2,644,333,581 3,275,779,136 3,306,943,774Number of Shares Outstanding 52,858,530 75,289,117 89,425,092Net Asset Value Per Share1 50.03 43.51 36.98
Investor USDNet Assets 644,385,543 608,351,179 561,044,870Number of Shares Outstanding 13,145,114 14,268,938 15,482,821Net Asset Value Per Share1 49.02 42.63 36.24
Institutional Plus USD AccNet Assets 1,729,199,695 1,608,262,146 1,148,092,773Number of Shares Outstanding 6,577,722 7,035,452 5,911,543Net Asset Value Per Share1 262.89 228.59 194.21
1 The net asset value per share shown may diverge from the net asset value per share used for dealing purposes because of any adjustments for swing pricing and trade date accounting.
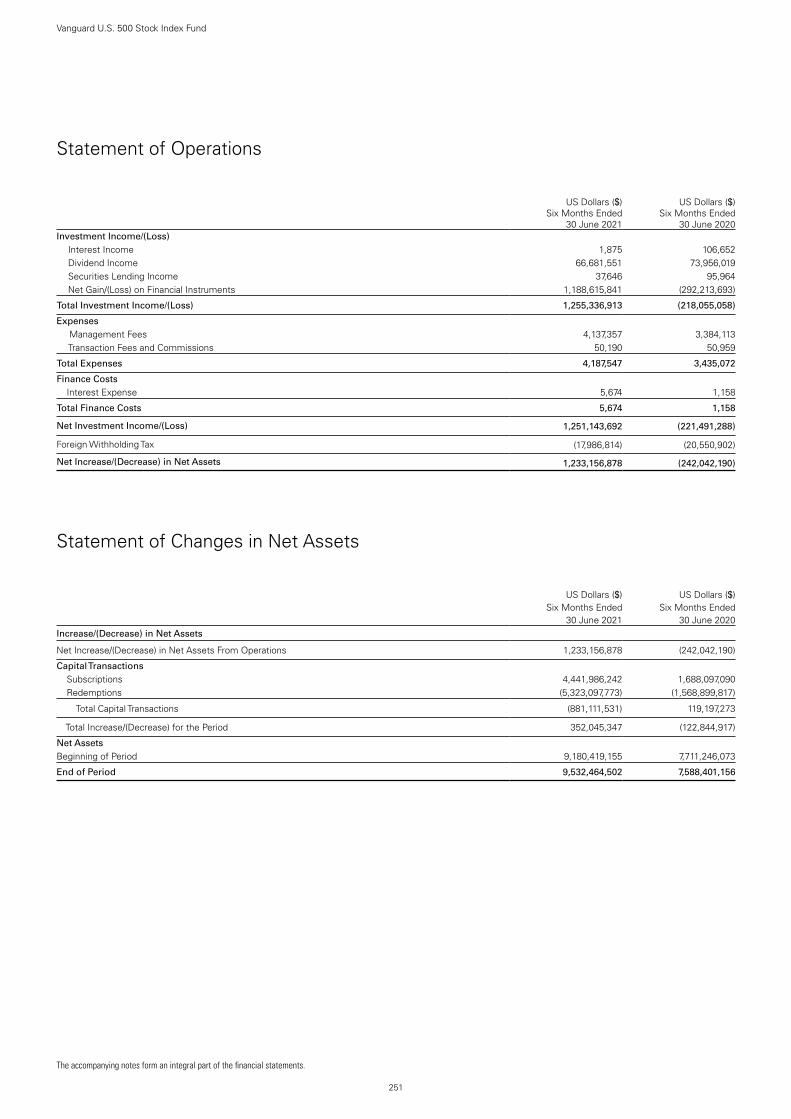
251
Vanguard U.S. 500 Stock Index Fund
The accompanying notes form an integral part of the financial statements.
Statement of Operations
US Dollars ($)
Six Months Ended 30 June 2021
US Dollars ($)
Six Months Ended 30 June 2020
Investment Income/(Loss) Interest Income 1,875 106,652 Dividend Income 66,681,551 73,956,019 Securities Lending Income 37,646 95,964 Net Gain/(Loss) on Financial Instruments 1,188,615,841 (292,213,693)
Total Investment Income/(Loss) 1,255,336,913 (218,055,058)
Expenses Management Fees 4,137,357 3,384,113 Transaction Fees and Commissions 50,190 50,959
Total Expenses 4,187,547 3,435,072
Finance Costs Interest Expense 5,674 1,158
Total Finance Costs 5,674 1,158
Net Investment Income/(Loss) 1,251,143,692 (221,491,288)
Foreign Withholding Tax (17,986,814) (20,550,902)
Net Increase/(Decrease) in Net Assets 1,233,156,878 (242,042,190)
Statement of Changes in Net Assets
US Dollars ($)
US Dollars ($)
Six Months Ended Six Months Ended30 June 2021 30 June 2020
Increase/(Decrease) in Net Assets
Net Increase/(Decrease) in Net Assets From Operations 1,233,156,878 (242,042,190)
Capital Transactions Subscriptions 4,441,986,242 1,688,097,090 Redemptions (5,323,097,773) (1,568,899,817)
Total Capital Transactions (881,111,531) 119,197,273
Total Increase/(Decrease) for the Period 352,045,347 (122,844,917)
Net AssetsBeginning of Period 9,180,419,155 7,711,246,073
End of Period 9,532,464,502 7,588,401,156

Vanguard U.S. Opportunities FundSub-managed by PRIMECAP Management Company.
252
Investment ObjectiveThe fund seeks to provide long-term growth of capital by investing in stocks with above-average earnings growth potential that is not reflected in their current market prices.
Performance SummaryThe Performance Summary does not form part of the Financial Statements. The fund is actively managed and seeks to invest as described in the prospectus. The following performance information shows how the fund's returns compare with those of the Russell 3000 Index, a market index that has investment characteristics similar to those of the fund.
• As the six months ended 30 June 2021 came to a close, macroeconomic indicators signalled a faster global economic rebound than many had expected after the sharpest contraction in modern history. Yet the recovery has been uneven. Countries that have contained the virus more successfully, whether through vaccinations, lockdowns or both, generally have fared better economically. And the COVID-19 pandemic remained far from over, with new variants of the virus surfacing where vaccination rates have lagged and the human toll continuing to mount, especially in less developed economies.
• Swift and extensive support from governments and central banks has been a key to the rebound. So far in 2021, it has included fiscal stimulus – including the $1.9 trillion American Rescue Plan in the United States and the €673 billion Recovery and Resilience Facility in Europe – and pledges by a number of central banks to keep interest rates low for some time.
• Fixed income prices worldwide generally fell and longer-term yields rose amid concerns about inflation during the half year. Bonds returned about –3% in US dollars, as measured by the Bloomberg Barclays Global Aggregate Bond Index.
• Stock markets continued the rally that began in 2020, bolstered by reopening economies, more consumer spending and rising corporate profits. The FTSE Global All Cap Index returned roughly 13% in US dollars for the half year. Returns in the United States and Europe outpaced those in emerging markets and especially the Pacific region.
• In the US, the Federal Reserve expressed optimism about the economy and signalled that it might tighten its monetary policy sooner than expected. For now, it kept its target for short-term interest rates at 0%–0.25%. The yield of the bellwether US 10-year Treasury note finished the period at 1.47%, up from 0.91% six months earlier.
• In this environment, the fund’s benchmark returned 14.88% as all 11 of the index’s sectors recorded positive results.
• The fund trailed its benchmark. Relative performance was hurt in particular by security selection in health care. Financials and consumer staples provided the biggest boosts to performance.
Benchmark returns in the commentary above are in US dollars.
Benchmark: Russell 3000 Index
Total ReturnsPeriods Ended 30 June 2021
(Annualised for periods over one year)
Six Months Five YearsTen Years or
Since InceptionInvestor EUR 16.75 % 18.05 % 19.01 %
Benchmark 18.53 15.74 16.37
Investor GBP Income 11.97 % 18.82 % 18.41 %
Benchmark 13.67 16.49 15.78
Institutional USD 13.22 % 19.72 % 16.76 %
Benchmark 14.88 17.26 14.05
Investor USD 13.16 % 19.60 % 16.64 %
Benchmark 14.88 17.26 14.05
Each benchmark is in its respective currency.Sources: Vanguard Global Advisers, LLC, and FTSE.Performance is based on NAV with net income reinvested.
All of the returns in this report represent past performance, which is not a guarantee of future results that may be achieved by the fund. For performance data current to the most recent month-end, which may be higher or lower than that cited, visit our website at http://global.vanguard.com. Note, too, that both investment returns and principal value can fluctuate widely, so an investor's shares, when sold, could be worth more or less than their original cost.

Significant Portfolio ChangesFor the Six Months Ended 30 June 2021
253
Vanguard U.S. Opportunities Fund
The Central Bank of Ireland requires a schedule of material changes in the composition of the portfolio during the period. These are defined as aggregate purchases of a security exceeding 1% of the total value of purchases for the period and aggregate disposals greater than 1% of the total value of sales. At a minimum, the largest 20 purchases and 20 sales must be shown; all purchases and sales must be shown if there are fewer than 20. A full listing of the portfolio changes for the period is available, upon request, at no extra cost from the Administrator.
SharesCost
US Dollars ($)
Purchases
Xometry, Inc. Class A 219,200 9,644,800Splunk, Inc. 51,800 7,051,550Alibaba Group Holding Ltd. ADR 29,000 6,743,493Maxar Technologies, Inc. 142,260 5,218,617Pulmonx Corp. 96,805 4,392,401Biogen, Inc. 14,830 4,005,250FibroGen, Inc. 119,860 3,962,723MarketAxess Holdings, Inc. 8,300 3,911,064CME Group, Inc. Class A 20,000 3,637,520XPeng, Inc. ADR 95,118 3,020,800Olink Holding AB ADR 145,200 2,904,000WEX, Inc. 12,170 2,629,626Brinker International, Inc. 30,300 1,870,415Dollar Tree, Inc. 17,000 1,790,107Sun Country Airlines Holdings, Inc. 67,500 1,769,053GAN Ltd. 85,500 1,544,516Las Vegas Sands Corp. 25,700 1,523,234Plantronics, Inc. 35,000 1,298,538Rhythm Pharmaceuticals, Inc. 38,300 1,150,244Ivanhoe Mines Ltd. Class A 158,800 907,374JELD-WEN Holding, Inc. 28,900 843,223
SharesProceeds
US Dollars ($)
Sales
BlackBerry Ltd. 939,350 17,262,294NetApp, Inc. 128,590 9,848,861Southwest Airlines Co. 126,060 7,400,161L Brands, Inc. 116,400 6,938,697Pinterest, Inc. Class A 91,900 6,269,137ABIOMED, Inc. 18,770 6,082,940NN, Inc. 715,138 5,641,167Tesla, Inc. 6,600 5,511,539Discover Financial Services 48,694 5,362,289Eli Lilly & Co. 26,920 5,276,214Hilton Worldwide Holdings, Inc. 36,000 4,511,263Micron Technology, Inc. 51,300 4,435,039Delta Air Lines, Inc. 89,130 3,997,038Flex Ltd. 217,510 3,931,523Charles Schwab Corp. 53,850 3,851,706KLA Corp. 12,060 3,791,697JPMorgan Chase & Co. 24,290 3,645,093Olink Holding AB ADR 115,500 3,530,002AstraZeneca plc ADR 58,600 3,024,575WillScot Mobile Mini Holdings Corp. 110,000 3,004,834Crowdstrike Holdings, Inc. Class A 12,700 2,812,531Telefonaktiebolaget LM Ericsson
ADR 207,200 2,811,855Raytheon Technologies Corp. 35,000 2,690,690Nuance Communications, Inc. 51,000 2,500,617Seagen, Inc. 16,300 2,462,699Alphabet, Inc. Class C 1,050 2,303,429Insulet Corp. 8,060 2,299,630NVIDIA Corp. 4,220 2,292,694

Financial StatementsStatement of Investments30 June 2021
254
Vanguard U.S. Opportunities Fund
.Number of
SharesFair Value
US Dollars ($)% of Total
Net AssetsEquities 98.01% (2020: 97.68%)Communication Services 5.24% (2020: 5.30%)Alphabet, Inc. Class A 10,050 24,539,989 1.32%Pinterest, Inc. Class A 249,350 19,686,183 1.06%Alphabet, Inc. Class C 6,575 16,479,054 0.88%Baidu, Inc. ADR 57,355 11,694,685 0.63%Facebook, Inc. Class A 17,300 6,015,383 0.32%Activision Blizzard, Inc. 50,100 4,781,544 0.26%comScore, Inc. 743,425 3,717,125 0.20%IMAX Corp. 147,900 3,179,850 0.17%Skillz, Inc. Class A 85,800 1,863,576 0.10%T-Mobile US, Inc. 11,300 1,636,579 0.09%Walt Disney Co. 7,800 1,371,006 0.07%Altice USA, Inc. Class A 23,700 809,118 0.04%Take-Two Interactive Software,
Inc. 3,100 548,762 0.03%Snap, Inc. Class A 7,800 531,492 0.03%Live Nation Entertainment, Inc. 3,400 297,806 0.02%Madison Square Garden
Entertainment Corp. 3,023 253,841 0.01%Madison Square Garden
Sports Corp. 823 142,025 0.01%. . 97,548,018 5.24%Consumer Discretionary 12.31% (2020: 12.14%)Tesla, Inc. 83,370 56,666,589 3.04%Alibaba Group Holding Ltd.
ADR 107,800 24,446,884 1.31%Entain plc 745,849 17,984,813 0.97%XPeng, Inc. ADR 340,038 15,104,488 0.81%CarMax, Inc. 79,400 10,254,510 0.55%Marriott International, Inc.
Class A 64,600 8,819,192 0.47%Amazon.com, Inc. 2,400 8,256,384 0.44%Royal Caribbean Cruises Ltd. 93,720 7,992,442 0.43%Carnival Corp. 278,100 7,330,716 0.39%Restaurant Brands
International, Inc. 111,800 7,204,392 0.39%Ross Stores, Inc. 42,100 5,220,400 0.28%L Brands, Inc. 68,846 4,961,043 0.27%Hilton Worldwide Holdings,
Inc. 39,666 4,784,513 0.26%GAN Ltd. 281,100 4,621,284 0.25%McDonald's Corp. 20,000 4,619,800 0.25%Capri Holdings Ltd. 80,000 4,575,200 0.25%Newell Brands, Inc. 150,000 4,120,500 0.22%TJX Cos, Inc. 60,400 4,072,168 0.22%Darden Restaurants, Inc. 23,300 3,401,567 0.18%iRobot Corp. 32,900 3,072,531 0.16%At Home Group, Inc. 81,100 2,987,724 0.16%Sony Group Corp. ADR 29,750 2,892,295 0.15%Norwegian Cruise Line
Holdings Ltd. 93,740 2,756,893 0.15%Dollar Tree, Inc. 27,000 2,686,500 0.14%Burlington Stores, Inc. 6,900 2,221,731 0.12%Brinker International, Inc. 30,300 1,874,055 0.10%Whirlpool Corp. 8,550 1,864,071 0.10%Las Vegas Sands Corp. 30,600 1,612,314 0.09%Tuesday Morning Corp. 280,000 1,260,000 0.07%Five Below, Inc. 5,300 1,024,331 0.05%MGM Resorts International 15,650 667,472 0.04%. . 229,356,802 12.31%Consumer Staples 0.45% (2020: 0.43%)Tyson Foods, Inc. Class A 30,000 2,212,800 0.12%BJ's Wholesale Club Holdings,
Inc. 37,000 1,760,460 0.09%Sanderson Farms, Inc. 6,500 1,221,805 0.07%Calavo Growers, Inc. 17,600 1,116,192 0.06%
.Number of
SharesFair Value
US Dollars ($)% of Total
Net AssetsBeyond Meat, Inc. 6,600 1,039,434 0.06%Mission Produce, Inc. 46,700 967,157 0.05%. . 8,317,848 0.45%Energy 1.18% (2020: 0.88%)Pioneer Natural Resources Co. 32,800 5,330,656 0.29%Hess Corp. 60,600 5,291,592 0.28%Transocean Ltd. 961,600 4,346,432 0.23%EOG Resources, Inc. 23,800 1,985,872 0.11%Cabot Oil & Gas Corp. 85,400 1,491,084 0.08%Cameco Corp. 60,200 1,154,636 0.06%Valero Energy Corp. 14,600 1,139,968 0.06%New Fortress Energy, Inc.
Class A 17,900 678,052 0.04%TechnipFMC plc 51,800 468,790 0.02%Technip Energies NV 10,360 142,025 0.01%. . 22,029,107 1.18%Financials 11.99% (2020: 10.31%)Charles Schwab Corp. 591,030 43,032,894 2.31%Morgan Stanley 314,593 28,845,032 1.55%Raymond James Financial, Inc. 187,270 24,326,373 1.31%Wells Fargo & Co. 417,700 18,917,633 1.02%Bank of America Corp. 452,398 18,652,370 1.00%Tradeweb Markets, Inc. Class
A 182,300 15,415,288 0.83%Northern Trust Corp. 125,636 14,526,034 0.78%Everarc Holdings Ltd. 1,088,658 13,608,225 0.73%MarketAxess Holdings, Inc. 16,000 7,417,440 0.40%Discover Financial Services 55,400 6,553,266 0.35%CME Group, Inc. Class A 27,900 5,933,772 0.32%Marsh & McLennan Cos, Inc. 40,000 5,627,200 0.30%LPL Financial Holdings, Inc. 35,000 4,724,300 0.25%Goldman Sachs Group, Inc. 11,000 4,174,830 0.22%US Bancorp 70,150 3,996,445 0.21%NMI Holdings, Inc. Class A 146,200 3,286,576 0.18%American Express Co. 18,800 3,106,324 0.17%JPMorgan Chase & Co. 5,700 886,578 0.05%Everarc Holdings Ltd. -
Warrants 1/12/2022 1,085,900 244,328 0.01%. . 223,274,908 11.99%Health Care 28.39% (2020: 29.55%)Eli Lilly & Co. 268,368 61,595,823 3.31%ABIOMED, Inc. 128,619 40,143,276 2.16%Biogen, Inc. 93,171 32,262,322 1.73%BeiGene Ltd. ADR 76,719 26,329,194 1.41%BioMarin Pharmaceutical, Inc. 312,935 26,111,296 1.40%Seagen, Inc. 145,300 22,939,964 1.23%Amgen, Inc. 76,267 18,590,081 1.00%Zentalis Pharmaceuticals, Inc. 348,880 18,560,416 1.00%Nektar Therapeutics Class A 1,056,286 18,125,868 0.97%Pulmonx Corp. 398,030 17,561,084 0.94%Xencor, Inc. 478,195 16,492,946 0.89%Insulet Corp. 56,775 15,585,305 0.84%Shockwave Medical, Inc. 78,400 14,874,832 0.80%AstraZeneca plc ADR 247,500 14,825,250 0.80%Elanco Animal Health, Inc. 386,431 13,405,291 0.72%Zimmer Biomet Holdings, Inc. 77,900 12,527,878 0.67%Thermo Fisher Scientific, Inc. 23,330 11,769,285 0.63%FibroGen, Inc. 392,941 10,464,019 0.56%LivaNova plc 118,400 9,958,624 0.53%Roche Holding AG 23,521 8,869,200 0.48%Bristol-Myers Squibb Co. 123,600 8,258,952 0.44%Glaukos Corp. 92,300 7,829,809 0.42%Penumbra, Inc. 27,450 7,522,947 0.40%Illumina, Inc. 14,670 6,941,991 0.37%Fluidigm Corp. 1,117,421 6,883,313 0.37%Calithera Biosciences, Inc. 3,267,000 6,828,030 0.37%

255
Vanguard U.S. Opportunities Fund
.Number of
SharesFair Value
US Dollars ($)% of Total
Net AssetsEpizyme, Inc. 763,327 6,343,247 0.34%Exact Sciences Corp. 45,200 5,618,812 0.30%Boston Scientific Corp. 119,600 5,114,096 0.27%CVS Health Corp. 60,210 5,023,922 0.27%Arena Pharmaceuticals, Inc. 69,900 4,767,180 0.26%Abbott Laboratories 41,100 4,764,723 0.26%Rhythm Pharmaceuticals, Inc. 223,311 4,372,429 0.23%Charles River Laboratories
International, Inc. 11,040 4,083,917 0.22%Turning Point Therapeutics, Inc. 49,400 3,854,188 0.21%PerkinElmer, Inc. 19,100 2,949,231 0.16%Novartis AG ADR 24,030 2,192,497 0.12%WaVe Life Sciences Ltd. 310,186 2,065,839 0.11%Alkermes plc 83,600 2,049,872 0.11%IQVIA Holdings, Inc. 8,314 2,014,648 0.11%NuVasive, Inc. 28,900 1,958,842 0.10%Siemens Healthineers AG 29,496 1,807,731 0.10%Agilent Technologies, Inc. 11,380 1,682,078 0.09%Prestige Consumer
Healthcare, Inc. 31,400 1,635,940 0.09%QIAGEN NV 27,210 1,315,258 0.07%Olink Holding AB ADR 29,700 1,022,274 0.05%Seer, Inc. Class A 27,700 908,006 0.05%Alcon, Inc. 12,880 904,949 0.05%Accuray, Inc. 200,000 904,000 0.05%UnitedHealth Group, Inc. 1,981 793,272 0.04%Omnicell, Inc. 5,207 788,600 0.04%OraSure Technologies, Inc. 64,500 654,030 0.03%Adaptive Biotechnologies
Corp. 14,200 580,212 0.03%Allogene Therapeutics, Inc. 19,700 513,776 0.03%Omthera Pharmaceutical 1,665,100 437,205 0.02%Health Catalyst, Inc. 7,438 412,883 0.02%Mereo Biopharma Group plc
ADR 104,000 329,680 0.02%10X Genomics, Inc. Class A 1,650 323,103 0.02%Guardant Health, Inc. 2,389 296,690 0.02%Waters Corp. 857 296,188 0.02%Repligen Corp. 1,450 289,449 0.02%Bridgebio Pharma, Inc. 3,200 195,072 0.01%Contra Pfenex, Inc. 180,300 135,225 0.01%Sio Gene Therapies, Inc. 10,000 27,300 0.00%. . 528,683,360 28.39%Industrials 16.16% (2020: 15.13%)Jacobs Engineering Group, Inc. 200,300 26,724,026 1.44%AECOM 392,130 24,829,671 1.33%Southwest Airlines Co. 441,782 23,454,206 1.26%Xometry, Inc. Class A 219,200 19,155,888 1.03%FedEx Corp. 61,600 18,377,128 0.99%Curtiss-Wright Corp. 150,230 17,841,315 0.96%Maxar Technologies, Inc. 346,740 13,841,861 0.74%Delta Air Lines, Inc. 309,200 13,375,992 0.72%Siemens AG 76,730 12,158,632 0.65%JetBlue Airways Corp. 689,350 11,567,293 0.62%Carrier Global Corp. 225,000 10,935,000 0.59%General Dynamics Corp. 57,000 10,730,820 0.58%Textron, Inc. 154,880 10,651,098 0.57%Colfax Corp. 221,200 10,133,172 0.55%American Airlines Group, Inc. 387,500 8,218,875 0.44%United Airlines Holdings, Inc. 153,810 8,042,725 0.43%TransDigm Group, Inc. 12,309 7,967,493 0.43%Matson, Inc. 92,492 5,919,488 0.32%Old Dominion Freight Line, Inc. 22,750 5,773,950 0.31%Masonite International Corp. 38,700 4,326,273 0.23%Uber Technologies, Inc. 82,100 4,114,852 0.22%Gibraltar Industries, Inc. 51,800 3,952,858 0.21%AMETEK, Inc. 20,000 2,670,000 0.14%Meggitt plc 387,342 2,467,852 0.13%Otis Worldwide Corp. 30,000 2,453,100 0.13%Kirby Corp. 37,400 2,267,936 0.12%Axon Enterprise, Inc. 12,000 2,121,600 0.11%CSX Corp. 66,000 2,117,280 0.11%
.Number of
SharesFair Value
US Dollars ($)% of Total
Net AssetsLyft, Inc. Class A 29,950 1,811,376 0.10%Sun Country Airlines Holdings,
Inc. 48,300 1,787,583 0.10%WillScot Mobile Mini Holdings
Corp. 59,000 1,644,330 0.09%Raytheon Technologies Corp. 15,000 1,279,650 0.07%L3Harris Technologies, Inc. 5,900 1,275,285 0.07%Spirit Airlines, Inc. 37,300 1,135,412 0.06%Armstrong World Industries,
Inc. 10,000 1,072,600 0.06%Rockwell Automation, Inc. 3,480 995,349 0.05%NN, Inc. 106,000 779,100 0.04%JELD-WEN Holding, Inc. 28,900 758,914 0.04%Air Canada 30,100 619,842 0.03%Controladora Vuela Cia de
Aviacion SAB de CV ADR 31,000 595,510 0.03%IDEX Corp. 2,500 550,125 0.03%Frontier Group Holdings, Inc. 29,300 499,272 0.03%Allegiant Travel Co. 50 9,700 0.00%. . 301,004,432 16.16%Information Technology 21.67% (2020: 23.25%)Flex Ltd. 1,587,685 28,371,931 1.52%Micron Technology, Inc. 274,500 23,327,010 1.25%KLA Corp. 57,350 18,593,443 1.00%Telefonaktiebolaget LM
Ericsson ADR 1,387,400 17,453,492 0.94%Autodesk, Inc. 55,000 16,054,500 0.86%Adobe, Inc. 26,600 15,578,024 0.84%Nutanix, Inc. Class A 393,760 15,049,507 0.81%Trimble, Inc. 175,770 14,383,259 0.77%Universal Display Corp. 64,670 14,378,081 0.77%Altair Engineering, Inc. Class A 201,600 13,904,352 0.75%Splunk, Inc. 91,400 13,214,612 0.71%Intel Corp. 227,610 12,778,025 0.69%NetApp, Inc. 151,260 12,376,093 0.66%BlackBerry Ltd. 1,001,080 12,233,198 0.66%Visa, Inc. Class A 45,700 10,685,574 0.57%Oracle Corp. 135,000 10,508,400 0.56%MaxLinear, Inc. Class A 245,500 10,431,295 0.56%QUALCOMM, Inc. 70,874 10,130,021 0.54%Apple, Inc. 70,000 9,587,200 0.52%908 Devices, Inc. 205,277 7,954,484 0.43%Plantronics, Inc. 162,000 6,760,260 0.36%Axcelis Technologies, Inc. 156,980 6,345,132 0.34%Arlo Technologies, Inc. 918,400 6,217,568 0.33%Cree, Inc. 58,900 5,768,077 0.31%Texas Instruments, Inc. 29,504 5,673,619 0.31%Crowdstrike Holdings, Inc.
Class A 22,316 5,608,234 0.30%Jabil, Inc. 94,700 5,503,964 0.30%FormFactor, Inc. 139,200 5,075,232 0.27%Corning, Inc. 119,600 4,891,640 0.26%Hewlett Packard Enterprise Co. 321,723 4,690,721 0.25%OSI Systems, Inc. 42,500 4,319,700 0.23%Mastercard, Inc. Class A 11,600 4,235,044 0.23%HP, Inc. 138,140 4,170,447 0.22%Analog Devices, Inc. 23,410 4,030,266 0.22%nLight, Inc. 103,921 3,770,254 0.20%Stratasys Ltd. 127,400 3,294,564 0.18%Nuance Communications, Inc. 55,000 2,994,200 0.16%Applied Materials, Inc. 18,500 2,634,400 0.14%MongoDB, Inc. Class A 6,900 2,494,488 0.13%WEX, Inc. 12,170 2,359,763 0.13%Ciena Corp. 40,000 2,275,600 0.12%Intuit, Inc. 4,500 2,205,765 0.12%ServiceSource International,
Inc. 1,548,133 2,182,868 0.12%Ambarella, Inc. 20,000 2,132,600 0.11%Teradyne, Inc. 15,740 2,108,530 0.11%Keysight Technologies, Inc. 13,580 2,096,888 0.11%NVIDIA Corp. 2,620 2,096,262 0.11%RingCentral, Inc. Class A 5,150 1,496,487 0.08%

256
Vanguard U.S. Opportunities Fund
.Number of
SharesFair Value
US Dollars ($)% of Total
Net AssetsVonage Holdings Corp. 95,800 1,380,478 0.07%MACOM Technology Solutions
Holdings, Inc. 20,600 1,320,048 0.07%Cerence, Inc. 11,600 1,237,836 0.07%PROS Holdings, Inc. 26,460 1,205,782 0.07%Palo Alto Networks, Inc. 2,940 1,090,887 0.06%Materialise NV ADR 19,000 457,710 0.03%Unity Software, Inc. 4,160 456,893 0.02%Rapid7, Inc. 3,800 359,594 0.02%Zoom Video Communications,
Inc. Class A 800 309,624 0.02%CyberArk Software Ltd. 2,300 299,621 0.02%Microsoft Corp. 1,100 297,990 0.02%Okta, Inc. Class A 1,100 269,148 0.01%Jamf Holding Corp. 5,500 184,635 0.01%DocuSign, Inc. Class A 575 160,753 0.01%Keywords Studios plc 3,600 123,833 0.01%
.Number of
SharesFair Value
US Dollars ($)% of Total
Net AssetsnCino, Inc. 1,144 68,548 0.00%. . 403,648,454 21.67%Materials 0.61% (2020: 0.55%)Albemarle Corp. 26,740 4,504,621 0.24%DuPont de Nemours, Inc. 20,660 1,599,291 0.09%Dow, Inc. 23,380 1,479,486 0.08%Ingevity Corp. 14,500 1,179,720 0.06%Ivanhoe Mines Ltd. Class A 158,800 1,147,751 0.06%Corteva, Inc. 23,100 1,024,485 0.06%Marrone Bio Innovations, Inc. 207,000 343,620 0.02%. . 11,278,974 0.61%Real Estate 0.01% (2020: 0.14%)Healthpeak Properties, Inc.
REIT 4,600 153,134 0.01%Safehold, Inc. REIT 800 62,800 0.00%. . 215,934 0.01%Total Equities 1,825,357,837 98.01%Financial Assets at Fair Value Through Profit or Loss
1,825,357,837 98.01%
Fair Value US Dollars ($)
% of Total Net Assets
Other Assets and Liabilities 37,121,307 1.99 %Net Assets 1,862,479,144 100.00 %
Analysis of Total Net Assets US Dollars ($)% of Total
Net Assets(a) Transferable securities admitted to an official stock exchange listing 1,823,637,656 97.92%(b) Transferable securities dealt in on another regulated market 1,147,751 0.06%(c) Transferable securities other than those admitted to an official stock exchange listing or dealt in on another regulated
market 572,430 0.03%
(d) Financial derivative instruments — 0.00%(e) Other assets and liabilities 37,121,307 1.99%Total Net Assets 1,862,479,144 100.00%

The accompanying notes form an integral part of the financial statements.
257
Vanguard U.S. Opportunities Fund
Statement of Assets and Liabilities
US Dollars ($)
As at 30 June 2021
US Dollars ($)
As at 31 December 2020
Current AssetsFinancial Assets at Fair Value Through Profit or Loss 1,825,357,837 1,718,222,343 Cash 44,236,268 45,152,248 Unrealised Appreciation on Spot Currency Contracts 46 5 Receivables: Interest and Dividends 478,866 449,985 Capital Shares Issued 756,466 1,255,477 Investments Sold 8,157,355 898,083
Total Current Assets 1,878,986,838 1,765,978,141
Current LiabilitiesBank Overdraft 844 929 Payables and Other Liabilities: Investments Purchased 14,007,190 907,870 Capital Shares Redeemed 1,175,655 4,690,410 Management Fees Payable 1,324,005 1,281,929
Total Current Liabilities 16,507,694 6,881,138
Net Assets Attributable to Holders of Redeemable Participating Shares (“Net Assets”) 1,862,479,144 1,759,097,003
Net Asset Value Per Share
.As at
30 June 2021As at
31 December 2020As at
31 December 2019Investor EUR US ($) Equivalent 61,282,905 46,536,957 112,560,609Net Assets 51,676,284 38,034,374 100,276,713Number of Shares Outstanding 37,896 32,732 96,905Net Asset Value Per Share1 1,363.63 1,161.99 1,034.79
Investor GBP Income US ($) Equivalent 35,163,991 36,146,419 95,228,787Net Assets 25,454,408 26,443,118 71,884,348Number of Shares Outstanding 21,757 25,438 82,032Net Asset Value Per Share1 1,169.94 1,039.51 876.30
Institutional USD Net Assets 1,384,424,911 1,288,235,179 1,564,398,401Number of Shares Outstanding 1,011,710 1,071,291 1,593,987Net Asset Value Per Share1 1,368.40 1,202.51 981.44
Investor USD Net Assets 381,607,337 388,178,448 464,424,961Number of Shares Outstanding 235,956 272,997 399,791Net Asset Value Per Share1 1,617.28 1,421.91 1,161.67
1 The net asset value per share shown may diverge from the net asset value per share used for dealing purposes because of any adjustments for swing pricing and trade date accounting.

258
Vanguard U.S. Opportunities Fund
The accompanying notes form an integral part of the financial statements.
Statement of Operations
US Dollars ($)
Six Months Ended 30 June 2021
US Dollars ($)
Six Months Ended 30 June 2020
Investment Income/(Loss) Interest Income 1,495 174,218 Dividend Income 6,177,415 9,911,995 Securities Lending Income 134,260 162,322 Net Gain/(Loss) on Financial Instruments 241,319,494 (165,174,928)
Total Investment Income/(Loss) 247,632,664 (154,926,393)
Expenses Management Fees 8,097,867 8,081,862 Transaction Fees and Commissions 212,642 568,547 Other Expenses 52,152 8,000
Total Expenses 8,362,661 8,658,409
Finance Costs Interest Expense 5,227 5,809
Total Finance Costs 5,227 5,809
Net Investment Income/(Loss) 239,264,776 (163,590,611)
Foreign Withholding Tax (1,507,728) (2,720,852)
Net Increase/(Decrease) in Net Assets 237,757,048 (166,311,463)
Statement of Changes in Net Assets
US Dollars ($)
US Dollars ($)
Six Months Ended Six Months Ended30 June 2021 30 June 2020
Increase/(Decrease) in Net Assets
Net Increase/(Decrease) in Net Assets From Operations 237,757,048 (166,311,463)
Capital Transactions Subscriptions 132,293,516 198,287,762 Redemptions (266,668,423) (526,289,666)
Total Capital Transactions (134,374,907) (328,001,904)
Total Increase/(Decrease) for the Period 103,382,141 (494,313,367)
Net AssetsBeginning of Period 1,759,097,003 2,236,612,758
End of Period 1,862,479,144 1,742,299,391

Vanguard 20+ Year Euro Treasury Index FundManaged by Vanguard Global Advisers, LLC.
259
Investment ObjectiveThe fund seeks to provide returns consistent with the performance of the Bloomberg Barclays Euro Treasury 20+ Year Bond Index, a market-weighted index designed to reflect the total universe of euro-denominated euro zone treasury securities with maturities of at least 20 years and a minimum credit rating of AA–.
Performance SummaryThe Performance Summary does not form part of the Financial Statements.
• As the six months ended 30 June 2021 came to a close, macroeconomic indicators signalled a faster global economic rebound than many had expected after the sharpest contraction in modern history. Yet the recovery has been uneven. Countries that have contained the virus more successfully, whether through vaccinations, lockdowns or both, generally have fared better economically. And the COVID-19 pandemic remained far from over, with new variants of the virus surfacing where vaccination rates have lagged and the human toll continuing to mount, especially in less developed economies.
• Swift and extensive support from governments and central banks has been a key to the rebound. So far in 2021, it has included fiscal stimulus – including the $1.9 trillion American Rescue Plan in the United States and the €673 billion Recovery and Resilience Facility in Europe – and pledges by a number of central banks to keep interest rates low for some time.
• Stock markets worldwide continued the rally that began in 2020, bolstered by reopening economies, more consumer spending and rising corporate profits. They posted strong gains for the six months ended 30 June.
• Fixed income securities struggled amid concerns that an upturn in inflation might persist or even accelerate given the stronger-than-expected rebound in global growth, extraordinary monetary and fiscal stimulus and a jump in demand for goods and services as economies reopened and supply gradually picked up. With longer-term yields rising and prices falling, returns were negative for the half year.
• In this environment, the fund’s benchmark index returned –10.52% for the six months.
• By country, the Netherlands and Germany held up best but still posted negative performances; Austria, France and Belgium were among the laggards.
• By maturity, bonds maturing in more than 30 years significantly underperformed those maturing in 20 to 30 years. From a credit-quality perspective, AA-rated Treasury bonds fared worse than those rated AAA.
Benchmark returns in the commentary above are in euros.
Benchmark: Bloomberg Barclays Euro Treasury 20+ Year Bond Index
Total ReturnsPeriods Ended 30 June 2021
(Annualised for periods over one year)
Six Months Five YearsTen Years or
Since Inception1
EUR Acc -10.55 % 1.81 % 7.66 %
Benchmark -10.52 1.99 7.90
Tracking Difference* -0.03
Institutional Plus EUR Acc -10.52 % 1.90 % 2.66 %
Benchmark -10.52 1.99 2.78
Tracking Difference* —
Sources: Vanguard Global Advisers, LLC, and Bloomberg.Performance is based on NAV with net income reinvested.
All of the returns in this report represent past performance, which is not a guarantee of future results that may be achieved by the fund. For performance data current to the most recent month-end, which may be higher or lower than that cited, visit our website at http://global.vanguard.com. Note, too, that both investment returns and principal value can fluctuate widely, so an investor's shares, when sold, could be worth more or less than their original cost.* The tracking difference between the fund return and the index return over a stated period of time can be attributed to a number of factors, including, without limitation, small differences in
weightings, trading activity, transaction costs and differences in the valuation and withholding tax treatment between the fund and the index vendor.1 Since-inception returns: Institutional Plus EUR Acc, 10 March 2015.

Significant Portfolio ChangesFor the Six Months Ended 30 June 2021
260
Vanguard 20+ Year Euro Treasury Index Fund
The Central Bank of Ireland requires a schedule of material changes in the composition of the portfolio during the period. These are defined as aggregate purchases of a security exceeding 1% of the total value of purchases for the period and aggregate disposals greater than 1% of the total value of sales. At a minimum, the largest 20 purchases and 20 sales must be shown; all purchases and sales must be shown if there are fewer than 20. A full listing of the portfolio changes for the period is available, upon request, at no extra cost from the Administrator.
1
Principal Euro (€)
Cost Euro (€)
Purchases
Bundesrepublik Deutschland Bundesanleihe 0.00% 15/8/2050 33,366,000 30,208,742
French Republic Government Bond OAT 0.75% 25/5/2052 19,910,000 19,537,428
Bundesrepublik Deutschland Bundesanleihe 2.50% 4/7/2044 9,750,000 15,013,828
French Republic Government Bond OAT 3.25% 25/5/2045 8,950,000 14,132,091
Bundesrepublik Deutschland Bundesanleihe 1.25% 15/8/2048 11,140,000 14,027,963
French Republic Government Bond OAT 4.00% 25/4/2060 5,620,000 11,200,946
Bundesrepublik Deutschland Bundesanleihe 2.50% 15/8/2046 6,950,000 10,825,926
French Republic Government Bond OAT 0.50% 25/5/2072 11,770,000 10,478,640
French Republic Government Bond OAT 4.00% 25/4/2055 5,080,000 9,658,831
French Republic Government Bond OAT 2.00% 25/5/2048 7,340,000 9,597,584
Netherlands Government Bond 2.75% 15/1/2047 5,750,000 9,233,364
French Republic Government Bond OAT 0.50% 25/6/2044 9,200,000 8,974,746
French Republic Government Bond OAT 4.50% 25/4/2041 4,450,000 7,940,500
Netherlands Government Bond 3.75% 15/1/2042 4,200,000 7,200,601
Kingdom of Belgium Government Bond 0.65% 22/6/2071 7,955,000 7,109,708
French Republic Government Bond OAT 1.50% 25/5/2050 5,650,000 6,552,369
Kingdom of Belgium Government Bond 3.75% 22/6/2045 3,618,000 6,044,937
Bundesrepublik Deutschland Bundesanleihe 3.25% 4/7/2042 3,520,000 5,845,770
Finland Government Bond 0.13% 15/4/2052 5,100,000 4,596,952
Republic of Austria Government Bond 0.70% 20/4/2071 4,650,000 4,490,832
Kingdom of Belgium Government Bond 1.60% 22/6/2047 3,510,716 4,173,631
Netherlands Government Bond 0.00% 15/1/2052 3,930,000 3,677,855
Republic of Austria Government Bond 3.15% 20/6/2044 2,200,000 3,499,418
Republic of Austria Government Bond 0.85% 30/6/2120 3,320,000 3,162,634
Republic of Austria Government Bond 0.75% 20/3/2051 2,820,000 2,942,536
Kingdom of Belgium Government Bond 1.70% 22/6/2050 2,350,000 2,825,002
Principal Euro (€)
Proceeds Euro (€)
Sales
French Republic Government Bond OAT 4.50% 25/4/2041 42,797,943 74,453,121
Kingdom of Belgium Government Bond 4.25% 28/3/2041 18,551,295 31,777,429
Bundesrepublik Deutschland Bundesanleihe 2.50% 4/7/2044 9,300,000 14,444,392
French Republic Government Bond OAT 3.25% 25/5/2045 8,530,000 13,592,982
Bundesrepublik Deutschland Bundesanleihe 0.00% 15/8/2050 12,696,000 11,337,436
Bundesrepublik Deutschland Bundesanleihe 1.25% 15/8/2048 8,100,000 10,108,344
French Republic Government Bond OAT 4.00% 25/4/2060 4,083,561 8,200,182
French Republic Government Bond OAT 1.50% 25/5/2050 5,900,000 6,871,554
French Republic Government Bond OAT 0.75% 25/5/2052 5,450,000 5,147,542
Netherlands Government Bond 2.75% 15/1/2047 3,200,000 5,131,275
Bundesrepublik Deutschland Bundesanleihe 3.25% 4/7/2042 2,780,000 4,697,349
Netherlands Government Bond 3.75% 15/1/2042 2,610,000 4,491,017
Kingdom of Belgium Government Bond 1.60% 22/6/2047 3,500,000 4,181,235
Bundesrepublik Deutschland Bundesanleihe 2.50% 15/8/2046 2,000,000 3,069,340
French Republic Government Bond OAT 1.75% 25/5/2066 2,154,000 3,019,413
Kingdom of Belgium Government Bond 2.15% 22/6/2066 1,915,000 2,979,446
French Republic Government Bond OAT 2.00% 25/5/2048 2,000,000 2,545,600
Kingdom of Belgium Government Bond 3.75% 22/6/2045 1,400,000 2,521,470
Republic of Austria Government Bond 3.15% 20/6/2044 1,420,000 2,285,725
Kingdom of Belgium Government Bond 2.25% 22/6/2057 1,500,000 2,063,595

261
Vanguard 20+ Year Euro Treasury Index Fund
Financial StatementsStatement of Investments30 June 2021
Principal EUR (€) Coupon
Maturity Date
Fair Value EUR (€)
% of Total Net Assets
Bonds 99.38% (2020: 99.06%)Austria 8.33% (2020: 7.74%)Republic of Austria Government Bond 8,343,000 3.15% 20/6/2044 13,243,638 1.85%Republic of Austria Government Bond 9,197,000 1.50% 20/2/2047 11,276,775 1.57%Republic of Austria Government Bond 6,169,000 2.10% 20/9/2117 10,191,109 1.42%Republic of Austria Government Bond 4,220,000 3.80% 26/1/2062 8,779,522 1.22%Republic of Austria Government Bond 5,670,000 0.75% 20/3/2051 5,854,329 0.82%Republic of Austria Government Bond 4,850,000 0.85% 30/6/2120 4,432,701 0.62%Republic of Austria Government Bond 3,150,000 0.70% 20/4/2071 3,002,333 0.42%Republic of Austria Government Bond 2,229,000 1.50% 2/11/2086 2,913,384 0.41%test - - - 59,693,791 8.33%Belgium 10.01% (2020: 12.96%)Kingdom of Belgium Government Bond 12,402,828 3.75% 22/6/2045 20,618,390 2.88%Kingdom of Belgium Government Bond 12,140,716 1.60% 22/6/2047 14,339,763 2.00%Kingdom of Belgium Government Bond 10,270,000 1.70% 22/6/2050 12,419,198 1.73%Kingdom of Belgium Government Bond 6,740,000 2.15% 22/6/2066 9,431,642 1.32%Kingdom of Belgium Government Bond 6,542,560 2.25% 22/6/2057 9,116,599 1.27%Kingdom of Belgium Government Bond 6,955,000 0.65% 22/6/2071 5,785,503 0.81%test - - - 71,711,095 10.01%Finland 2.24% (2020: 1.68%)Finland Government Bond 5,047,000 2.63% 4/7/2042 7,336,364 1.03%Finland Government Bond 3,949,000 1.38% 15/4/2047 4,821,887 0.67%Finland Government Bond 4,400,000 0.13% 15/4/2052 3,856,220 0.54%test - - - 16,014,471 2.24%France 38.58% (2020: 42.32%)French Republic Government Bond OAT 29,164,691 3.25% 25/5/2045 45,451,169 6.34%French Republic Government Bond OAT 33,509,000 2.00% 25/5/2048 43,153,067 6.02%French Republic Government Bond OAT 22,212,762 4.00% 25/4/2055 42,086,128 5.88%French Republic Government Bond OAT 34,609,000 1.50% 25/5/2050 40,226,820 5.62%French Republic Government Bond OAT 19,774,323 4.00% 25/4/2060 39,119,036 5.46%French Republic Government Bond OAT 34,439,000 0.75% 25/5/2052 32,922,144 4.60%French Republic Government Bond OAT 13,018,000 1.75% 25/5/2066 16,392,315 2.29%French Republic Government Bond OAT 9,200,000 0.50% 25/6/2044 8,789,727 1.23%French Republic Government Bond OAT 10,620,000 0.50% 25/5/2072 8,194,265 1.14%test - - - 276,334,671 38.58%Germany 30.03% (2020: 25.49%)Bundesrepublik Deutschland Bundesanleihe 36,555,890 2.50% 15/8/2046 57,175,446 7.98%Bundesrepublik Deutschland Bundesanleihe 31,428,075 2.50% 4/7/2044 48,208,912 6.73%Bundesrepublik Deutschland Bundesanleihe 30,532,000 1.25% 15/8/2048 38,516,187 5.38%Bundesrepublik Deutschland Bundesanleihe 21,560,322 3.25% 4/7/2042 35,719,647 4.98%Bundesrepublik Deutschland Bundesanleihe 38,555,000 0.00% 15/8/2050 35,536,330 4.96%test - - - 215,156,522 30.03%Netherlands 10.19% (2020: 8.87%)Netherlands Government Bond 20,172,287 2.75% 15/1/2047 32,561,822 4.55%Netherlands Government Bond 18,669,646 3.75% 15/1/2042 32,042,662 4.47%Netherlands Government Bond 9,380,000 0.00% 15/1/2052 8,396,305 1.17%test - - - 73,000,789 10.19%Total Bonds 711,911,339 99.38%Financial Assets at Fair Value Through Profit or Loss 711,911,339 99.38%
Fair Value EUR (€)
% of Total Net Assets
Other Assets and Liabilities 4,459,926 0.62 %Net Assets 716,371,265 100.00 %
Analysis of Total Net Assets EUR (€)% of Total
Net Assets(a) Transferable securities admitted to an official stock exchange listing 577,918,642 80.67%(b) Transferable securities dealt in on another regulated market 133,992,697 18.71%(c) Transferable securities other than those admitted to an official stock exchange listing or dealt in on another regulated
market — 0.00%
(d) Financial derivative instruments — 0.00%(e) Other assets and liabilities 4,459,926 0.62%Total Net Assets 716,371,265 100.00%
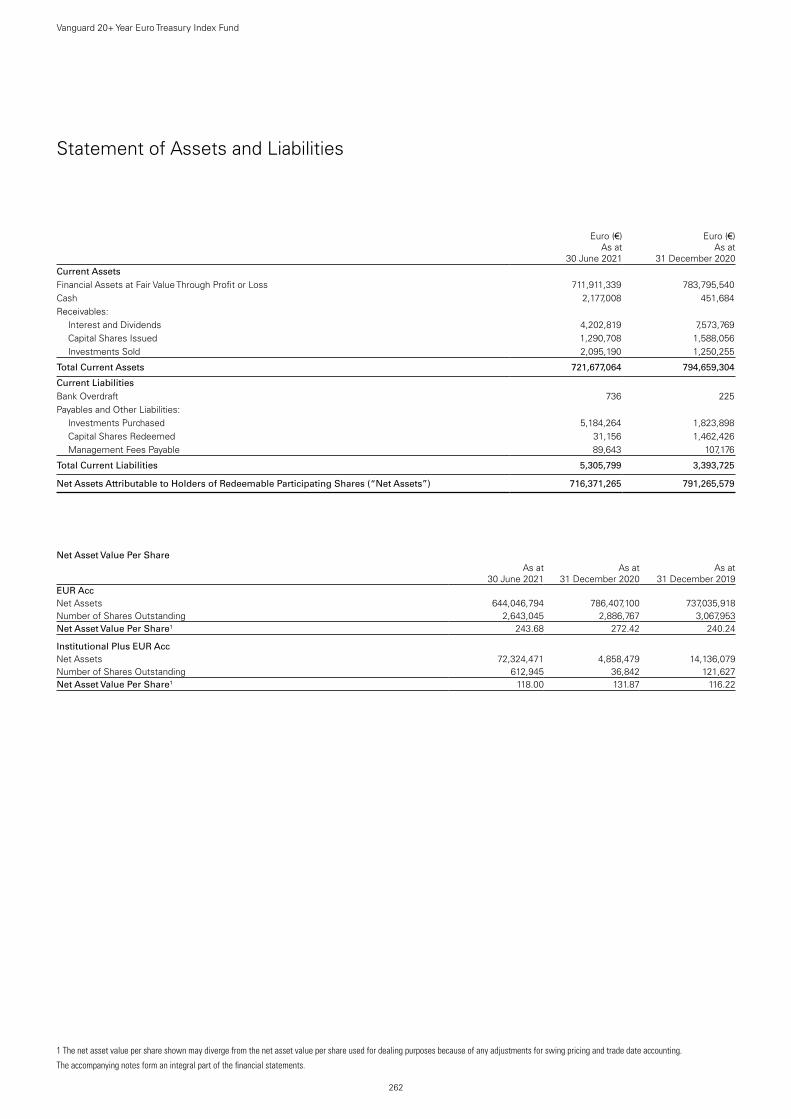
The accompanying notes form an integral part of the financial statements.
262
Vanguard 20+ Year Euro Treasury Index Fund
Statement of Assets and Liabilities
Euro (€)
As at 30 June 2021
Euro (€)
As at 31 December 2020
Current AssetsFinancial Assets at Fair Value Through Profit or Loss 711,911,339 783,795,540 Cash 2,177,008 451,684 Receivables: Interest and Dividends 4,202,819 7,573,769 Capital Shares Issued 1,290,708 1,588,056 Investments Sold 2,095,190 1,250,255
Total Current Assets 721,677,064 794,659,304
Current LiabilitiesBank Overdraft 736 225 Payables and Other Liabilities: Investments Purchased 5,184,264 1,823,898 Capital Shares Redeemed 31,156 1,462,426 Management Fees Payable 89,643 107,176
Total Current Liabilities 5,305,799 3,393,725
Net Assets Attributable to Holders of Redeemable Participating Shares (“Net Assets”) 716,371,265 791,265,579
Net Asset Value Per Share
.As at
30 June 2021As at
31 December 2020As at
31 December 2019EUR AccNet Assets 644,046,794 786,407,100 737,035,918Number of Shares Outstanding 2,643,045 2,886,767 3,067,953Net Asset Value Per Share1 243.68 272.42 240.24
Institutional Plus EUR AccNet Assets 72,324,471 4,858,479 14,136,079Number of Shares Outstanding 612,945 36,842 121,627Net Asset Value Per Share1 118.00 131.87 116.22
1 The net asset value per share shown may diverge from the net asset value per share used for dealing purposes because of any adjustments for swing pricing and trade date accounting.

263
Vanguard 20+ Year Euro Treasury Index Fund
The accompanying notes form an integral part of the financial statements.
Statement of Operations
Euro (€)
Six Months Ended 30 June 2021
Euro (€)
Six Months Ended 30 June 2020
Investment Income/(Loss) Interest Income 3,063,738 3,875,735 Net Gain/(Loss) on Financial Instruments (86,925,705) 53,144,833
Total Investment Income/(Loss) (83,861,967) 57,020,568
Expenses Management Fees 576,679 620,097 Transaction Fees and Commissions — 9
Total Expenses 576,679 620,106
Finance Costs Interest Expense 4,853 2,398
Total Finance Costs 4,853 2,398
Net Investment Income/(Loss) (84,443,499) 56,398,064
Net Increase/(Decrease) in Net Assets (84,443,499) 56,398,064
Statement of Changes in Net Assets
Euro (€)
Euro (€)
Six Months Ended Six Months Ended30 June 2021 30 June 2020
Increase/(Decrease) in Net Assets
Net Increase/(Decrease) in Net Assets From Operations (84,443,499) 56,398,064
Capital Transactions Subscriptions 103,956,926 116,570,537 Redemptions (94,407,741) (134,397,494)
Total Capital Transactions 9,549,185 (17,826,957)
Total Increase/(Decrease) for the Period (74,894,314) 38,571,107
Net AssetsBeginning of Period 791,265,579 751,171,997
End of Period 716,371,265 789,743,104

Vanguard Emerging Markets Bond FundManaged by Vanguard Global Advisers, LLC.
264
Investment ObjectiveThe Fund seeks to provide total return while generating a moderate level of income by investing primarily in bonds of issuers in emerging-market countries.
Performance SummaryThe Performance Summary does not form part of the Financial Statements.
• As the six months ended 30 June 2021 came to a close, macroeconomic indicators signalled a faster global economic rebound than many had expected after the sharpest contraction in modern history. Yet the recovery has been uneven. Countries that have contained the virus more successfully, whether through vaccinations, lockdowns or both, generally have fared better economically. And the COVID-19 pandemic remained far from over, with new variants of the virus surfacing where vaccination rates have lagged and the human toll continuing to mount, especially in less developed economies.
• Swift and extensive support from governments and central banks has been a key to the rebound. So far in 2021, it has included fiscal stimulus – including the $1.9 trillion American Rescue Plan in the United States and the €673 billion Recovery and Resilience Facility in Europe – and pledges by a number of central banks to keep interest rates low for some time.
• Stock markets worldwide continued the rally that began in 2020, bolstered by reopening economies, more consumer spending and rising corporate profits. They posted strong gains for the six months ended 30 June.
• Fixed income securities struggled amid concerns that an upturn in inflation might persist or even accelerate given the stronger-than-expected rebound in global growth, extraordinary monetary and fiscal stimulus and a jump in demand for goods and services as economies reopened and supply gradually picked up. With longer-term yields rising and prices falling, returns were negative for the half year.
• In this environment, the fund’s benchmark index returned –0.66% for the six months.
• Security selection drove the fund’s performance relative to its benchmark. The biggest impact was seen in bonds tied to Costa Rica, Mexico and Ecuador. Sector allocation held back performance somewhat; an underweight allocation to China and overweights to El Salvador and the Ivory Coast were the main detractors.
Benchmark returns in the commentary above are in US dollars.
Benchmark: J.P. Morgan EMBI Global Diversified Index
Total ReturnsPeriods Ended 30 June 2021
(Annualised for periods over one year)
Six MonthsTen Years or
Since Inception1
Institutional Plus CHF Hedged Acc — 1.72 %
Benchmark — 1.77
Investor EUR Hedged Acc -0.35 % 10.61 %
Benchmark -1.14 2.81
Institutional Plus EUR Hedged Acc — 1.81 %
Benchmark — 1.82
Investor GBP Hedged Acc 0.07 % 11.35 %
Benchmark -0.71 3.35
Investor USD Acc 0.16 % 12.40 %
Benchmark -0.66 4.40
Institutional Plus USD Acc 0.23 % 12.57 %
Benchmark -0.66 4.40
Each benchmark is in its respective currency.Sources: Vanguard Global Advisers, LLC, and J.P. Morgan.Performance is based on NAV with net income reinvested.
All of the returns in this report represent past performance, which is not a guarantee of future results that may be achieved by the fund. For performance data current to the most recent month-end, which may be higher or lower than that cited, visit our website at http://global.vanguard.com. Note, too, that both investment returns and principal value can fluctuate widely, so an investor's shares, when sold, could be worth more or less than their original cost.1 Since-inception returns: Institutional Plus CHF Hedged Acc, 27 April 2021; Investor EUR Hedged Acc, 3 December 2019; Institutional Plus EUR Hedged Acc, 27 April 2021; Investor GBP Hedged Acc,
Investor USD Acc and Institutional Plus USD Acc, 3 December 2019.

Significant Portfolio ChangesFor the Six Months Ended 30 June 2021
265
Vanguard Emerging Markets Bond Fund
The Central Bank of Ireland requires a schedule of material changes in the composition of the portfolio during the period. These are defined as aggregate purchases of a security exceeding 1% of the total value of purchases for the period and aggregate disposals greater than 1% of the total value of sales. At a minimum, the largest 20 purchases and 20 sales must be shown; all purchases and sales must be shown if there are fewer than 20. A full listing of the portfolio changes for the period is available, upon request, at no extra cost from the Administrator.
PrincipalCost
US Dollars ($)
Purchases
US Treasury Bond 1.63% 15/11/2050 $9,140,000 8,621,757US Treasury Note 0.13% 30/4/2023 $8,200,000 8,196,156Mexican Bonos 8.00% 7/12/2023 MXN150,000,000 7,969,238US Treasury Bond 1.88% 15/2/2051 $8,340,000 7,631,819Development Bank of Kazakhstan
JSC 2.95% 6/5/2031 $7,000,000 6,969,970Mexico Government International
Bond 4.50% 22/4/2029 $5,793,000 6,720,976Turkey Government International
Bond 4.38% 8/7/2027 €5,500,000 6,480,380Serbia International Bond 3.13%
15/5/2027 €4,774,000 6,382,544Republic of South Africa
Government International Bond 5.88% 16/9/2025 $5,635,000 6,264,280
Philippine Government International Bond 3.20% 6/7/2046 $6,098,000 6,046,106
Ecuador Government International Bond 0.50% 31/7/2030 $8,432,890 6,010,490
Turkey Government International Bond 5.88% 26/6/2031 $6,000,000 5,965,800
Petroleos del Peru SA 5.63% 19/6/2047 $5,500,000 5,839,415
Empresa Nacional del Petroleo 3.75% 5/8/2026 $5,050,000 5,406,410
Dominican Republic International Bond 5.88% 30/1/2060 $5,141,000 5,168,192
Colombia Government International Bond 3.88% 15/2/2061 $5,567,000 5,165,395
SA Global Sukuk Ltd. 2.69% 17/6/2031 $5,131,000 5,131,000
Republic of Uzbekistan Bond 4.75% 20/2/2024 $4,700,000 5,041,175
Ukraine Government International Bond 6.88% 21/5/2029 $5,030,000 5,033,900
PanamaGovernment International Bond 3.36% 30/6/2031 $5,008,000 5,008,000
Mexican Bonos 7.75% 23/11/2034 MXN93,500,000 4,984,659Guatemala Government Bond 4.38%
5/6/2027 $4,280,000 4,689,710Philippine Government International
Bond 1.75% 28/4/2041 €3,910,000 4,651,580Mexico Government International
Bond 3.25% 16/4/2030 $4,388,000 4,487,275US Treasury Bond 2.38% 15/5/2051 $4,200,000 4,370,281
PrincipalProceeds
US Dollars ($)
Sales
US Treasury Bond 1.63% 15/11/2050 $12,190,000 10,814,398US Treasury Note 0.13% 30/4/2023 $8,200,000 8,190,506US Treasury Bond 1.88% 15/2/2051 $8,340,000 7,797,977Brazilian Government International
Bond 3.88% 12/6/2030 $6,234,000 6,154,769Turkey Government International
Bond 5.88% 26/6/2031 $6,000,000 5,770,738Morocco Government International
Bond 4.00% 15/12/2050 $5,625,000 5,403,188Mexican Bonos 7.75% 23/11/2034 MXN93,500,000 5,074,735Republic of Azerbaijan International
Bond 3.50% 1/9/2032 $4,653,000 4,791,138Mexico Government International
Bond 3.25% 16/4/2030 $4,388,000 4,523,032US Treasury Bond 2.38% 15/5/2051 $4,200,000 4,389,523Mexico Government International
Bond 2.66% 24/5/2031 $4,267,000 4,295,623Qatar Government International
Bond 3.40% 16/4/2025 $3,917,000 4,274,426US Treasury Note 0.63% 15/8/2030 $4,450,000 4,221,227Colombia Government International
Bond 4.50% 15/3/2029 $3,800,000 4,165,880Dominican Republic International
Bond 5.88% 30/1/2060 $3,752,000 3,754,377Romanian Government International
Bond 2.00% 14/4/2033 €3,120,000 3,694,323Peruvian Government International
Bond 2.78% 23/1/2031 $3,600,000 3,626,485Brazilian Government International
Bond 4.75% 14/1/2050 $3,587,000 3,602,865Croatia Government International
Bond 1.75% 4/3/2041 €2,900,000 3,586,672GC Treasury Center Co., Ltd. 4.30%
18/3/2051 $2,859,000 3,136,296Mexico Government International
Bond 3.75% 11/1/2028 $2,775,000 3,062,906Petrobras Global Finance BV 5.50%
10/6/2051 $3,035,000 3,051,836Petrobras Global Finance BV 6.85%
5/6/2115 $2,700,000 3,044,470Costa Rica Government International
Bond 6.13% 19/2/2031 $2,960,000 3,030,021Office Chérifien des Phosphates
3.75% 23/6/2031 $3,000,000 3,019,113Ecopetrol SA 5.38% 26/6/2026 $2,545,000 2,868,113

266
Vanguard Emerging Markets Bond Fund
Financial StatementsStatement of Investments30 June 2021
Principal CouponMaturity
DateFair Value
US Dollars ($)% of Total
Net AssetsBonds 92.13% (2020: 88.63%)Angola 0.32% (2020: 0.46%)Angolan Government International Bond $1,185,000 9.13% 26/11/2049 1,212,625 0.32%test - - - 1,212,625 0.32%Argentina 1.10% (2020: 0.73%)Argentine Republic Government International Bond $7,389,000 0.13% 9/7/2035 2,338,619 0.61%Argentine Republic Government International Bond $5,041,539 0.13% 9/7/2030 1,807,392 0.47%Argentine Republic Government International Bond $205,919 1.00% 9/7/2029 77,940 0.02%test - - - 4,223,951 1.10%Armenia 0.29% (2020: 0.25%)Republic of Armenia International Bond $1,170,000 3.60% 2/2/2031 1,102,213 0.29%test - - - 1,102,213 0.29%Azerbaijan 1.68% (2020: 3.01%)Republic of Azerbaijan International Bond $2,500,000 5.13% 1/9/2029 2,805,469 0.73%Southern Gas Corridor CJSC $2,185,000 6.88% 24/3/2026 2,609,567 0.68%State Oil Co. of the Azerbaijan Republic $450,000 6.95% 18/3/2030 565,819 0.15%Republic of Azerbaijan International Bond $447,000 3.50% 1/9/2032 463,287 0.12%test - - - 6,444,142 1.68%Bahrain 0.06% (2020: 0.73%)Bahrain Government International Bond $250,000 6.00% 19/9/2044 237,000 0.06%test - - - 237,000 0.06%Belarus 0.46% (2020: 0.18%)Republic of Belarus International Bond $1,340,000 6.38% 24/2/2031 1,157,090 0.30%Republic of Belarus International Bond $400,000 7.63% 29/6/2027 388,325 0.10%Republic of Belarus International Bond $240,000 6.20% 28/2/2030 207,495 0.06%test - - - 1,752,910 0.46%Bermuda 0.30% (2020: 0.00%)Bermuda Government International Bond $702,000 2.38% 20/8/2030 700,815 0.18%Bermuda Government International Bond $380,000 4.75% 15/2/2029 443,365 0.12%test - - - 1,144,180 0.30%Brazil 2.03% (2020: 4.39%)Brazilian Government International Bond $3,774,000 4.63% 13/1/2028 4,080,166 1.07%Brazilian Government International Bond $2,200,000 3.88% 12/6/2030 2,221,725 0.58%Embraer SA $815,000 5.15% 15/6/2022 836,190 0.22%Embraer Netherlands Finance BV $600,000 5.05% 15/6/2025 633,390 0.16%test - - - 7,771,471 2.03%Cameroon 0.06% (2020: 0.09%)Republic of Cameroon International Bond $200,000 9.50% 19/11/2025 234,038 0.06%test - - - 234,038 0.06%Chile 4.00% (2020: 1.11%)Empresa Nacional del Petroleo $5,050,000 3.75% 5/8/2026 5,279,775 1.38%Chile Government International Bond $3,370,000 3.10% 7/5/2041 3,388,535 0.89%Empresa Nacional del Petroleo $2,505,000 5.25% 6/11/2029 2,786,124 0.73%VTR Comunicaciones SpA $1,491,000 4.38% 15/4/2029 1,488,987 0.39%Empresa Nacional del Petroleo $1,270,000 4.50% 14/9/2047 1,241,806 0.32%Empresa Nacional del Petroleo $780,000 4.38% 30/10/2024 840,596 0.22%Inversiones CMPC SA $250,000 4.75% 15/9/2024 271,453 0.07%test - - - 15,297,276 4.00%Colombia 2.19% (2020: 3.96%)Colombia Government International Bond $5,567,000 3.88% 15/2/2061 4,971,331 1.30%Colombia Government International Bond $3,535,000 4.13% 22/2/2042 3,432,485 0.89%test - - - 8,403,816 2.19%Costa Rica 0.95% (2020: 1.92%)Costa Rica Government International Bond $1,785,000 7.16% 12/3/2045 1,858,966 0.48%Costa Rica Government International Bond $1,000,000 4.38% 30/4/2025 1,024,562 0.27%Costa Rica Government International Bond $740,000 4.25% 26/1/2023 750,314 0.20%test - - - 3,633,842 0.95%Croatia 0.57% (2020: 0.00%)Croatia Government International Bond $2,000,000 5.50% 4/4/2023 2,167,875 0.57%test - - - 2,167,875 0.57%Czech Republic 0.25% (2020: 0.00%)EP Infrastructure A.S. €812,000 1.82% 2/3/2031 976,336 0.25%test - - - 976,336 0.25%Dominican Republic 2.66% (2020: 2.07%)Dominican Republic International Bond $4,889,000 5.88% 30/1/2060 4,871,583 1.27%Dominican Republic International Bond $2,532,000 5.50% 27/1/2025 2,784,883 0.73%

267
Vanguard Emerging Markets Bond Fund
Principal CouponMaturity
DateFair Value
US Dollars ($)% of Total
Net AssetsDominican Republic International Bond $1,685,000 4.50% 30/1/2030 1,719,543 0.45%Dominican Republic International Bond $802,000 5.30% 21/1/2041 799,644 0.21%test - - - 10,175,653 2.66%Ecuador 2.71% (2020: 1.99%)Ecuador Government International Bond $9,472,855 0.50% 31/7/2030 8,122,973 2.12%Ecuador Government International Bond $4,069,969 0.00% 31/7/2030 2,247,386 0.59%test - - - 10,370,359 2.71%Egypt 0.67% (2020: 0.39%)Egypt Government International Bond $2,765,000 7.50% 16/2/2061 2,577,498 0.67%test - - - 2,577,498 0.67%El Salvador 1.38% (2020: 0.69%)El Salvador Government International Bond $3,839,000 7.12% 20/1/2050 3,272,748 0.85%El Salvador Government International Bond $1,121,000 5.88% 30/1/2025 1,034,122 0.27%El Salvador Government International Bond $545,000 8.63% 28/2/2029 532,737 0.14%El Salvador Government International Bond $450,000 9.50% 15/7/2052 441,000 0.12%test - - - 5,280,607 1.38%Gabon 0.86% (2020: 0.34%)Gabon Government International Bond $2,070,000 6.38% 12/12/2024 2,199,763 0.58%Gabon Government International Bond $1,000,000 6.95% 16/6/2025 1,084,250 0.28%test - - - 3,284,013 0.86%Georgia 0.75% (2020: 0.00%)Georgia Government International Bond $2,820,000 2.75% 22/4/2026 2,861,419 0.75%test - - - 2,861,419 0.75%Guatemala 1.28% (2020: 0.77%)Guatemala Government Bond $2,500,000 4.38% 5/6/2027 2,721,563 0.71%Guatemala Government Bond $2,000,000 4.50% 3/5/2026 2,192,875 0.57%test - - - 4,914,438 1.28%Honduras 0.47% (2020: 0.24%)Honduras Government International Bond $867,000 5.63% 24/6/2030 906,449 0.24%Honduras Government International Bond $515,000 7.50% 15/3/2024 551,790 0.14%Honduras Government International Bond $300,000 6.25% 19/1/2027 326,775 0.09%test - - - 1,785,014 0.47%Hungary 0.33% (2020: 1.18%)Hungary Government International Bond €1,000,000 1.63% 28/4/2032 1,263,206 0.33%test - - - 1,263,206 0.33%India 0.42% (2020: 0.46%)Export-Import Bank of India $1,294,000 3.88% 1/2/2028 1,399,396 0.36%Export-Import Bank of India $200,000 3.88% 12/3/2024 212,892 0.06%test - - - 1,612,288 0.42%Indonesia 3.22% (2020: 2.86%)Indonesia Government International Bond $3,250,000 3.85% 18/7/2027 3,614,203 0.95%Indonesia Government International Bond $1,657,000 4.35% 11/1/2048 1,879,452 0.49%Perusahaan Perseroan Persero PT Perusahaan Listrik Negara $1,175,000 4.13% 15/5/2027 1,272,819 0.33%Perusahaan Penerbit SBSN Indonesia III $1,100,000 4.33% 28/5/2025 1,228,081 0.32%Indonesia Government International Bond €1,000,000 0.90% 14/2/2027 1,197,240 0.31%Indonesia Government International Bond $875,000 4.75% 8/1/2026 997,117 0.26%Perusahaan Perseroan Persero PT Perusahaan Listrik Negara $683,000 5.25% 24/10/2042 772,559 0.20%Indonesia Asahan Aluminium Persero PT $600,000 5.80% 15/5/2050 709,425 0.19%Indonesia Government International Bond $320,000 4.13% 15/1/2025 353,460 0.09%Perusahaan Perseroan Persero PT Perusahaan Listrik Negara $245,000 5.45% 21/5/2028 285,701 0.08%test - - - 12,310,057 3.22%Iraq 0.14% (2020: 0.00%)Iraq International Bond $567,875 5.80% 15/1/2028 548,638 0.14%test - - - 548,638 0.14%Israel 0.32% (2020: 0.90%)State of Israel $1,086,000 3.80% 13/5/2060 1,237,904 0.32%test - - - 1,237,904 0.32%Ivory Coast 1.65% (2020: 1.22%)Ivory Coast Government International Bond €2,351,000 6.63% 22/3/2048 2,927,976 0.76%Ivory Coast Government International Bond €1,474,000 4.88% 30/1/2032 1,743,428 0.46%Ivory Coast Government International Bond €1,000,000 5.88% 17/10/2031 1,275,436 0.33%Ivory Coast Government International Bond €285,000 6.88% 17/10/2040 368,463 0.10%test - - - 6,315,303 1.65%Jamaica 0.31% (2020: 1.14%)Jamaica Government International Bond $1,000,000 6.75% 28/4/2028 1,169,875 0.31%test - - - 1,169,875 0.31%Jordan 0.24% (2020: 0.95%)Jordan Government International Bond $860,000 7.38% 10/10/2047 900,474 0.24%test - - - 900,474 0.24%Kazakhstan 3.69% (2020: 2.24%)Development Bank of Kazakhstan JSC $7,000,000 2.95% 6/5/2031 6,958,000 1.82%KazMunayGas National Co. JSC $2,250,000 6.38% 24/10/2048 2,982,375 0.78%

268
Vanguard Emerging Markets Bond Fund
Principal CouponMaturity
DateFair Value
US Dollars ($)% of Total
Net AssetsDevelopment Bank of Kazakhstan JSC KZT550,000,000 10.95% 6/5/2026 1,286,915 0.34%Kazakhstan Temir Zholy Finance BV $762,000 6.95% 10/7/2042 1,045,035 0.27%KazMunayGas National Co. JSC $800,000 5.75% 19/4/2047 994,000 0.26%KazTransGas JSC $547,000 4.38% 26/9/2027 605,989 0.16%Development Bank of Kazakhstan JSC $230,000 4.13% 10/12/2022 239,603 0.06%test - - - 14,111,917 3.69%Kenya 0.90% (2020: 1.21%)Kenya Government International Bond $1,556,000 6.88% 24/6/2024 1,709,460 0.45%Kenya Government International Bond $875,000 8.00% 22/5/2032 982,625 0.26%Kenya Government International Bond $675,000 8.25% 28/2/2048 742,416 0.19%test - - - 3,434,501 0.90%Lebanese Republic 0.14% (2020: 0.24%)Lebanon Government International Bond $2,085,000 6.65% 22/4/2024 265,837 0.07%Lebanon Government International Bond $1,200,000 6.25% 27/5/2022 153,000 0.04%Lebanon Government International Bond $355,000 8.25% 17/5/2034 44,375 0.01%Lebanon Government International Bond $190,000 7.00% 20/3/2028 23,192 0.01%Lebanon Government International Bond $100,000 6.10% 4/10/2022 12,750 0.01%Lebanon Government International Bond $100,000 6.65% 26/2/2030 12,500 0.00%Lebanon Government International Bond $70,000 8.25% 12/4/2021 8,925 0.00%Lebanon Government International Bond $55,000 8.20% 17/5/2033 6,875 0.00%Lebanon Government International Bond $55,000 7.15% 20/11/2031 6,875 0.00%test - - - 534,329 0.14%Macedonia 0.19% (2020: 0.00%)North Macedonia Government International Bond €635,000 1.63% 10/3/2028 740,574 0.19%test - - - 740,574 0.19%Malaysia 0.99% (2020: 0.57%)Petronas Capital Ltd. $1,746,000 3.50% 21/4/2030 1,911,241 0.50%Petronas Energy Canada Ltd. $1,875,000 2.11% 23/3/2028 1,896,188 0.49%test - - - 3,807,429 0.99%Mexico 9.62% (2020: 8.35%)Mexico Government International Bond $8,203,000 4.50% 22/4/2029 9,276,055 2.42%Mexican Bonos MXN150,000,000 8.00% 7/12/2023 7,903,336 2.07%Petroleos Mexicanos $5,545,000 6.84% 23/1/2030 5,707,191 1.49%Comision Federal de Electricidad $2,900,000 3.35% 9/2/2031 2,873,719 0.75%Mexican Bonos MXN50,000,000 8.50% 18/11/2038 2,765,501 0.72%Mexico Government International Bond $2,365,000 3.77% 24/5/2061 2,199,893 0.58%Comision Federal de Electricidad $2,112,000 4.68% 9/2/2051 2,033,196 0.53%Petroleos Mexicanos $1,400,000 6.35% 12/2/2048 1,186,080 0.31%Petroleos Mexicanos $734,000 4.63% 21/9/2023 763,498 0.20%Petroleos Mexicanos $715,000 6.75% 21/9/2047 627,413 0.16%Mexico Government International Bond $590,000 3.75% 19/4/2071 538,670 0.14%Petroleos Mexicanos $410,000 6.50% 23/1/2029 424,350 0.11%Mexico Government International Bond $300,000 5.75% 12/10/2110 357,712 0.09%Petroleos Mexicanos $223,000 6.38% 23/1/2045 191,780 0.05%test - - - 36,848,394 9.62%Mongolia 0.13% (2020: 0.22%)Mongolia Government International Bond $480,000 5.13% 7/4/2026 510,000 0.13%test - - - 510,000 0.13%Morocco 2.28% (2020: 4.69%)OCP SA $3,735,000 5.13% 23/6/2051 3,791,025 0.99%Morocco Government International Bond €2,640,000 2.00% 30/9/2030 3,094,576 0.81%Morocco Government International Bond $2,000,000 4.00% 15/12/2050 1,852,500 0.48%test - - - 8,738,101 2.28%Oman 0.71% (2020: 0.47%)Oman Government International Bond $2,679,000 7.00% 25/1/2051 2,714,999 0.71%test - - - 2,714,999 0.71%Pakistan 1.01% (2020: 0.00%)Pakistan Government International Bond $3,660,000 8.88% 8/4/2051 3,875,025 1.01%test - - - 3,875,025 1.01%Panama 4.64% (2020: 3.60%)Panama Government International Bond $5,008,000 3.36% 30/6/2031 4,997,045 1.30%Panama Government International Bond $2,500,000 6.70% 26/1/2036 3,398,125 0.89%Panama Government International Bond $2,210,000 8.88% 30/9/2027 3,046,761 0.80%Panama Government International Bond $2,048,000 3.87% 23/7/2060 2,088,064 0.55%Panama Government International Bond $1,400,000 4.50% 16/4/2050 1,586,200 0.41%Panama Government International Bond $1,300,000 4.50% 1/4/2056 1,473,713 0.38%Panama Government International Bond $625,000 4.50% 15/5/2047 709,492 0.19%Panama Government International Bond $380,000 7.13% 29/1/2026 471,390 0.12%test - - - 17,770,790 4.64%Paraguay 1.92% (2020: 0.51%)Paraguay Government International Bond $3,575,000 5.00% 15/4/2026 4,056,061 1.06%

269
Vanguard Emerging Markets Bond Fund
Principal CouponMaturity
DateFair Value
US Dollars ($)% of Total
Net AssetsParaguay Government International Bond $3,137,000 4.63% 25/1/2023 3,309,143 0.86%test - - - 7,365,204 1.92%Peru 3.56% (2020: 2.65%)Petroleos del Peru SA $6,112,000 5.63% 19/6/2047 6,432,880 1.68%Fondo MIVIVIENDA SA $2,727,000 3.50% 31/1/2023 2,801,992 0.73%Peruvian Government International Bond $1,730,000 7.35% 21/7/2025 2,119,034 0.55%Corp. Financiera de Desarrollo SA $1,400,000 2.40% 28/9/2027 1,371,825 0.36%Peruvian Government International Bond $509,000 2.39% 23/1/2026 525,002 0.14%Corp. Financiera de Desarrollo SA $347,000 4.75% 15/7/2025 379,596 0.10%test - - - 13,630,329 3.56%Philippines 2.26% (2020: 0.00%)Philippine Government International Bond €3,910,000 1.75% 28/4/2041 4,592,818 1.20%Philippine Government International Bond $4,068,000 3.20% 6/7/2046 4,071,814 1.06%test - - - 8,664,632 2.26%Qatar 0.18% (2020: 2.00%)Qatar Government International Bond $417,000 3.40% 16/4/2025 453,957 0.12%Qatar Government International Bond $200,000 4.63% 2/6/2046 248,725 0.06%test - - - 702,682 0.18%Romania 1.62% (2020: 3.55%)Romanian Government International Bond €3,100,000 2.50% 8/2/2030 3,948,105 1.03%Romanian Government International Bond €1,000,000 2.75% 14/4/2041 1,174,041 0.31%Romanian Government International Bond €700,000 2.63% 2/12/2040 821,829 0.21%Romanian Government International Bond €200,000 3.62% 26/5/2030 273,943 0.07%test - - - 6,217,918 1.62%Russia 3.06% (2020: 3.10%)Russian Foreign Bond-Eurobond €3,400,000 2.65% 27/5/2036 4,087,249 1.07%Russian Federal Bond-OFZ py273,515,000 7.05% 19/1/2028 3,764,017 0.98%Gazprom PJSC Via Gaz Capital SA $1,977,000 5.15% 11/2/2026 2,219,578 0.58%Russian Foreign Bond-Eurobond $800,000 5.10% 28/3/2035 951,400 0.25%Russian Federal Bond-OFZ py48,010,000 7.65% 10/4/2030 683,002 0.18%test - - - 11,705,246 3.06%Saudi Arabia 2.39% (2020: 1.96%)SA Global Sukuk Ltd. $3,846,000 2.69% 17/6/2031 3,881,576 1.01%Saudi Government International Bond $2,670,000 4.00% 17/4/2025 2,945,844 0.77%Saudi Arabian Oil Co. $1,285,000 3.50% 16/4/2029 1,390,049 0.36%Saudi Arabian Oil Co. $900,000 2.88% 16/4/2024 947,250 0.25%test - - - 9,164,719 2.39%Serbia 2.29% (2020: 1.31%)Serbia International Bond €6,659,000 3.13% 15/5/2027 8,775,439 2.29%test - - - 8,775,439 2.29%South Africa 3.40% (2020: 3.74%)Republic of South Africa Government International Bond $5,635,000 5.88% 16/9/2025 6,363,324 1.66%Republic of South Africa Government International Bond $2,578,000 5.75% 30/9/2049 2,639,711 0.69%Republic of South Africa Government International Bond $2,763,000 5.00% 12/10/2046 2,622,778 0.69%Republic of South Africa Government International Bond $1,250,000 6.25% 8/3/2041 1,374,843 0.36%test - - - 13,000,656 3.40%Supranational 0.64% (2020: 1.02%)Banque Ouest Africaine de Developpement $1,520,000 4.70% 22/10/2031 1,645,605 0.43%African Export-Import Bank $750,000 3.99% 21/9/2029 789,375 0.21%test - - - 2,434,980 0.64%Thailand 0.25% (2020: 0.00%)GC Treasury Center Co., Ltd. $870,000 4.30% 18/3/2051 951,911 0.25%test - - - 951,911 0.25%Trinidad & Tobago 0.22% (2020: 1.10%)Trinidad & Tobago Government International Bond $800,000 4.38% 16/1/2024 842,400 0.22%test - - - 842,400 0.22%Tunisia 0.52% (2020: 0.00%)Banque Centrale de Tunisie International Bond €1,805,000 6.38% 15/7/2026 1,974,389 0.52%test - - - 1,974,389 0.52%Turkey 5.31% (2020: 0.16%)Turkey Government International Bond €5,500,000 4.38% 8/7/2027 6,480,380 1.69%Turkey Government International Bond $4,000,000 4.25% 14/4/2026 3,837,000 1.00%Turkey Government International Bond $3,500,000 7.38% 5/2/2025 3,782,844 0.99%Hazine Mustesarligi Varlik Kiralama A.S. $3,000,000 5.13% 22/6/2026 2,996,062 0.78%Turkey Government International Bond $1,000,000 4.25% 13/3/2025 981,125 0.26%Turkey Government International Bond $1,000,000 5.25% 13/3/2030 948,000 0.25%Turkey Government International Bond $893,000 4.88% 16/4/2043 710,661 0.19%Turkey Government International Bond $550,000 7.25% 23/12/2023 593,416 0.15%test - - - 20,329,488 5.31%Ukraine 4.19% (2020: 4.32%)Ukraine Government International Bond $5,030,000 6.88% 21/5/2029 5,231,200 1.37%Ukraine Government International Bond €2,000,000 4.38% 27/1/2030 2,211,703 0.58%
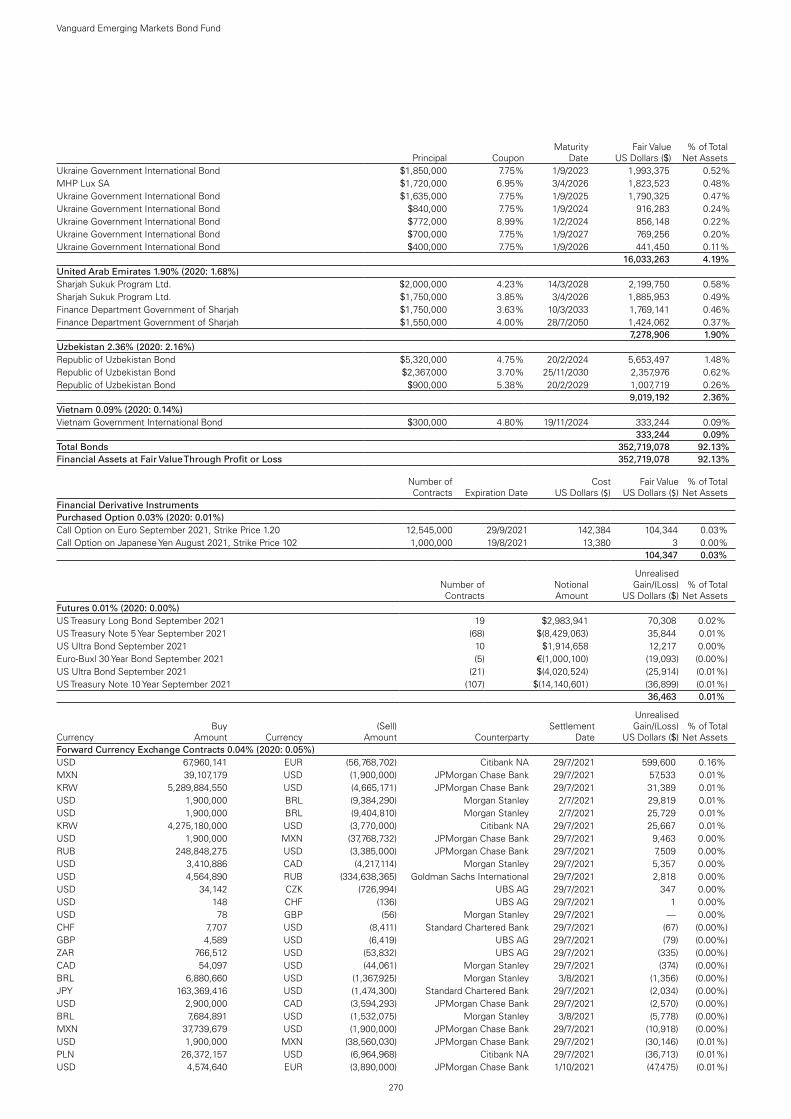
270
Vanguard Emerging Markets Bond Fund
Principal CouponMaturity
DateFair Value
US Dollars ($)% of Total
Net AssetsUkraine Government International Bond $1,850,000 7.75% 1/9/2023 1,993,375 0.52%MHP Lux SA $1,720,000 6.95% 3/4/2026 1,823,523 0.48%Ukraine Government International Bond $1,635,000 7.75% 1/9/2025 1,790,325 0.47%Ukraine Government International Bond $840,000 7.75% 1/9/2024 916,283 0.24%Ukraine Government International Bond $772,000 8.99% 1/2/2024 856,148 0.22%Ukraine Government International Bond $700,000 7.75% 1/9/2027 769,256 0.20%Ukraine Government International Bond $400,000 7.75% 1/9/2026 441,450 0.11%test - - - 16,033,263 4.19%United Arab Emirates 1.90% (2020: 1.68%)Sharjah Sukuk Program Ltd. $2,000,000 4.23% 14/3/2028 2,199,750 0.58%Sharjah Sukuk Program Ltd. $1,750,000 3.85% 3/4/2026 1,885,953 0.49%Finance Department Government of Sharjah $1,750,000 3.63% 10/3/2033 1,769,141 0.46%Finance Department Government of Sharjah $1,550,000 4.00% 28/7/2050 1,424,062 0.37%test - - - 7,278,906 1.90%Uzbekistan 2.36% (2020: 2.16%)Republic of Uzbekistan Bond $5,320,000 4.75% 20/2/2024 5,653,497 1.48%Republic of Uzbekistan Bond $2,367,000 3.70% 25/11/2030 2,357,976 0.62%Republic of Uzbekistan Bond $900,000 5.38% 20/2/2029 1,007,719 0.26%test - - - 9,019,192 2.36%Vietnam 0.09% (2020: 0.14%)Vietnam Government International Bond $300,000 4.80% 19/11/2024 333,244 0.09%test - - - 333,244 0.09%Total Bonds 352,719,078 92.13%Financial Assets at Fair Value Through Profit or Loss 352,719,078 92.13%
Number of Contracts Expiration Date
Cost US Dollars ($)
Fair Value US Dollars ($)
% of Total Net Assets
Financial Derivative InstrumentsPurchased Option 0.03% (2020: 0.01%)Call Option on Euro September 2021, Strike Price 1.20 12,545,000 29/9/2021 142,384 104,344 0.03 %Call Option on Japanese Yen August 2021, Strike Price 102 1,000,000 19/8/2021 13,380 3 0.00 %
104,347 0.03 %
testNumber of Contracts
Notional Amount
Unrealised Gain/(Loss)
US Dollars ($)% of Total
Net AssetsFutures 0.01% (2020: 0.00%)US Treasury Long Bond September 2021 19 $2,983,941 70,308 0.02 %US Treasury Note 5 Year September 2021 (68) $(8,429,063) 35,844 0.01 %US Ultra Bond September 2021 10 $1,914,658 12,217 0.00 %Euro-Buxl 30 Year Bond September 2021 (5) €(1,000,100) (19,093 ) (0.00 %)US Ultra Bond September 2021 (21) $(4,020,524) (25,914 ) (0.01 %)US Treasury Note 10 Year September 2021 (107) $(14,140,601) (36,899 ) (0.01 %)test test test 36,463 0.01 %
CurrencyBuy
Amount Currency(Sell)
Amount CounterpartySettlement
Date
Unrealised Gain/(Loss)
US Dollars ($)% of Total
Net AssetsForward Currency Exchange Contracts 0.04% (2020: 0.05%)USD 67,960,141 EUR (56,768,702) Citibank NA 29/7/2021 599,600 0.16 %MXN 39,107,179 USD (1,900,000) JPMorgan Chase Bank 29/7/2021 57,533 0.01 %KRW 5,289,884,550 USD (4,665,171) JPMorgan Chase Bank 29/7/2021 31,389 0.01 %USD 1,900,000 BRL (9,384,290) Morgan Stanley 2/7/2021 29,819 0.01 %USD 1,900,000 BRL (9,404,810) Morgan Stanley 2/7/2021 25,729 0.01 %KRW 4,275,180,000 USD (3,770,000) Citibank NA 29/7/2021 25,667 0.01 %USD 1,900,000 MXN (37,768,732) JPMorgan Chase Bank 29/7/2021 9,463 0.00 %RUB 248,848,275 USD (3,385,000) JPMorgan Chase Bank 29/7/2021 7,509 0.00 %USD 3,410,886 CAD (4,217,114) Morgan Stanley 29/7/2021 5,357 0.00 %USD 4,564,890 RUB (334,638,365) Goldman Sachs International 29/7/2021 2,818 0.00 %USD 34,142 CZK (726,994) UBS AG 29/7/2021 347 0.00 %USD 148 CHF (136) UBS AG 29/7/2021 1 0.00 %USD 78 GBP (56) Morgan Stanley 29/7/2021 — 0.00 %CHF 7,707 USD (8,411) Standard Chartered Bank 29/7/2021 (67 ) (0.00 %)GBP 4,589 USD (6,419) UBS AG 29/7/2021 (79 ) (0.00 %)ZAR 766,512 USD (53,832) UBS AG 29/7/2021 (335 ) (0.00 %)CAD 54,097 USD (44,061) Morgan Stanley 29/7/2021 (374 ) (0.00 %)BRL 6,880,660 USD (1,367,925) Morgan Stanley 3/8/2021 (1,356 ) (0.00 %)JPY 163,369,416 USD (1,474,300) Standard Chartered Bank 29/7/2021 (2,034 ) (0.00 %)USD 2,900,000 CAD (3,594,293) JPMorgan Chase Bank 29/7/2021 (2,570 ) (0.00 %)BRL 7,684,891 USD (1,532,075) Morgan Stanley 3/8/2021 (5,778 ) (0.00 %)MXN 37,739,679 USD (1,900,000) JPMorgan Chase Bank 29/7/2021 (10,918 ) (0.00 %)USD 1,900,000 MXN (38,560,030) JPMorgan Chase Bank 29/7/2021 (30,146 ) (0.01 %)PLN 26,372,157 USD (6,964,968) Citibank NA 29/7/2021 (36,713 ) (0.01 %)USD 4,574,640 EUR (3,890,000) JPMorgan Chase Bank 1/10/2021 (47,475 ) (0.01 %)

271
Vanguard Emerging Markets Bond Fund
CurrencyBuy
Amount Currency(Sell)
Amount CounterpartySettlement
Date
Unrealised Gain/(Loss)
US Dollars ($)% of Total
Net AssetsUSD 5,015,185 CLP (3,692,630,851) Citibank NA 29/7/2021 (52,378 ) (0.02 %)HUF 2,151,497,008 USD (7,348,453) BNP Paribas 29/7/2021 (81,930 ) (0.02 %)USD 2,701,397 MXN (55,615,802) Goldman Sachs International 29/7/2021 (82,485 ) (0.02 %)USD 16,271,462 MXN (330,955,620) BNP Paribas 29/7/2021 (294,722 ) (0.08 %)test 145,872 0.04 %Hedge Share Class Level Forward Currency Exchange Contracts (0.86%) (2020: 0.27%)USD 543,044 EUR (445,460) UBS AG 2/7/2021 14,773 0.00 %USD 333,191 EUR (275,033) Barclays Bank plc 2/7/2021 7,029 0.00 %CHF 53,542,409 USD (57,971,426) UBS AG 3/8/2021 3,390 0.00 %USD 87,483 EUR (72,134) Barclays Bank plc 2/7/2021 1,940 0.00 %EUR 33,899,074 USD (40,227,658) UBS AG 3/8/2021 466 0.00 %USD 30,869 EUR (25,843) UBS AG 2/7/2021 221 0.00 %USD 4,369 GBP (3,140) UBS AG 2/7/2021 31 0.00 %GBP 33,199 USD (45,837) Barclays Bank plc 2/7/2021 26 0.00 %USD 3,582 EUR (3,007) Barclays Bank plc 2/7/2021 16 0.00 %EUR 132,438 USD (157,163) UBS AG 3/8/2021 1 0.00 %USD 57,924,389 CHF (53,542,409) UBS AG 2/7/2021 — 0.00 %EUR 36,604 USD (43,438) UBS AG 3/8/2021 — 0.00 %GBP 2,383 USD (3,292) UBS AG 3/8/2021 — 0.00 %CHF 123,778 USD (134,025) UBS AG 3/8/2021 (1 ) (0.00 %)CHF 225,668 USD (244,351) UBS AG 3/8/2021 (1 ) (0.00 %)GBP 94,961 USD (131,198) UBS AG 3/8/2021 (2 ) (0.00 %)USD 29,056,382 GBP (21,033,249) UBS AG 2/7/2021 (3 ) (0.00 %)EUR 236 USD (287) Barclays Bank plc 2/7/2021 (7 ) (0.00 %)EUR 103,679 USD (122,969) Barclays Bank plc 2/7/2021 (16 ) (0.00 %)USD 40,200,912 EUR (33,899,074) UBS AG 2/7/2021 (20 ) (0.00 %)GBP 851 USD (1,206) Barclays Bank plc 2/7/2021 (30 ) (0.00 %)EUR 4,885 USD (5,827) Barclays Bank plc 2/7/2021 (34 ) (0.00 %)GBP 38,252 USD (52,916) UBS AG 2/7/2021 (73 ) (0.00 %)GBP 9,866 USD (13,709) Barclays Bank plc 2/7/2021 (80 ) (0.00 %)GBP 17,896 USD (24,863) UBS AG 2/7/2021 (141 ) (0.00 %)EUR 4,493 USD (5,478) Barclays Bank plc 2/7/2021 (150 ) (0.00 %)CHF 23,593 USD (25,676) Barclays Bank plc 2/7/2021 (152 ) (0.00 %)EUR 35,183 USD (41,886) UBS AG 2/7/2021 (163 ) (0.00 %)CHF 78,946 USD (85,587) Barclays Bank plc 2/7/2021 (180 ) (0.00 %)GBP 6,286 USD (8,871) Barclays Bank plc 2/7/2021 (187 ) (0.00 %)GBP 5,507 USD (7,802) Barclays Bank plc 2/7/2021 (195 ) (0.00 %)EUR 8,175 USD (9,917) Barclays Bank plc 2/7/2021 (222 ) (0.00 %)CHF 26,764 USD (29,196) Barclays Bank plc 2/7/2021 (241 ) (0.00 %)EUR 7,453 USD (9,087) Barclays Bank plc 2/7/2021 (249 ) (0.00 %)CHF 55,392 USD (60,185) UBS AG 2/7/2021 (260 ) (0.00 %)EUR 8,784 USD (10,689) Barclays Bank plc 2/7/2021 (273 ) (0.00 %)GBP 22,797 USD (31,846) Barclays Bank plc 2/7/2021 (353 ) (0.00 %)GBP 21,033,249 USD (29,059,411) UBS AG 3/8/2021 (416 ) (0.00 %)GBP 14,413 USD (20,328) Barclays Bank plc 2/7/2021 (417 ) (0.00 %)CHF 100,737 USD (109,411) UBS AG 2/7/2021 (429 ) (0.00 %)EUR 12,367 USD (15,104) Barclays Bank plc 2/7/2021 (438 ) (0.00 %)GBP 53,716 USD (74,689) Barclays Bank plc 2/7/2021 (483 ) (0.00 %)GBP 47,664 USD (66,337) UBS AG 2/7/2021 (492 ) (0.00 %)GBP 14,252 USD (20,189) Barclays Bank plc 2/7/2021 (500 ) (0.00 %)EUR 21,609 USD (26,195) Barclays Bank plc 2/7/2021 (569 ) (0.00 %)EUR 63,760 USD (76,193) Barclays Bank plc 2/7/2021 (579 ) (0.00 %)CHF 100,576 USD (109,536) Barclays Bank plc 2/7/2021 (728 ) (0.00 %)GBP 27,494 USD (38,835) Barclays Bank plc 2/7/2021 (854 ) (0.00 %)CHF 85,004 USD (92,908) UBS AG 2/7/2021 (948 ) (0.00 %)CHF 168,753 USD (183,585) UBS AG 2/7/2021 (1,021 ) (0.00 %)CHF 106,959 USD (116,753) UBS AG 2/7/2021 (1,040 ) (0.00 %)CHF 44,982 USD (49,767) Barclays Bank plc 2/7/2021 (1,104 ) (0.00 %)GBP 29,560 USD (42,022) Barclays Bank plc 2/7/2021 (1,186 ) (0.00 %)GBP 37,711 USD (53,471) UBS AG 2/7/2021 (1,375 ) (0.00 %)GBP 47,781 USD (67,460) Barclays Bank plc 2/7/2021 (1,453 ) (0.00 %)EUR 46,264 USD (56,606) Barclays Bank plc 2/7/2021 (1,741 ) (0.00 %)GBP 56,395 USD (79,664) UBS AG 2/7/2021 (1,757 ) (0.00 %)GBP 50,530 USD (71,613) Barclays Bank plc 2/7/2021 (1,808 ) (0.00 %)EUR 57,624 USD (70,238) UBS AG 2/7/2021 (1,902 ) (0.00 %)GBP 82,877 USD (116,760) Barclays Bank plc 2/7/2021 (2,269 ) (0.00 %)CHF 65,573 USD (73,223) Barclays Bank plc 2/7/2021 (2,284 ) (0.00 %)CHF 84,053 USD (93,536) Barclays Bank plc 2/7/2021 (2,604 ) (0.00 %)CHF 87,006 USD (96,880) Barclays Bank plc 2/7/2021 (2,754 ) (0.00 %)GBP 82,704 USD (117,031) Barclays Bank plc 2/7/2021 (2,779 ) (0.00 %)

272
Vanguard Emerging Markets Bond Fund
CurrencyBuy
Amount Currency(Sell)
Amount CounterpartySettlement
Date
Unrealised Gain/(Loss)
US Dollars ($)% of Total
Net AssetsGBP 206,519 USD (288,128) UBS AG 2/7/2021 (2,833 ) (0.00 %)CHF 92,735 USD (103,192) Barclays Bank plc 2/7/2021 (2,867 ) (0.00 %)CHF 109,872 USD (122,419) Barclays Bank plc 2/7/2021 (3,555 ) (0.00 %)CHF 120,560 USD (134,626) Barclays Bank plc 2/7/2021 (4,199 ) (0.00 %)CHF 136,102 USD (151,503) Barclays Bank plc 2/7/2021 (4,262 ) (0.00 %)CHF 161,995 USD (180,324) Barclays Bank plc 2/7/2021 (5,071 ) (0.00 %)CHF 164,917 USD (183,672) Barclays Bank plc 2/7/2021 (5,258 ) (0.00 %)CHF 188,147 USD (209,312) Barclays Bank plc 2/7/2021 (5,766 ) (0.00 %)CHF 192,728 USD (214,307) UBS AG 2/7/2021 (5,806 ) (0.00 %)CHF 167,628 USD (187,223) UBS AG 2/7/2021 (5,876 ) (0.00 %)EUR 160,693 USD (196,878) Barclays Bank plc 2/7/2021 (6,312 ) (0.00 %)GBP 216,811 USD (306,648) Barclays Bank plc 2/7/2021 (7,135 ) (0.00 %)GBP 195,464 USD (277,401) UBS AG 2/7/2021 (7,378 ) (0.00 %)EUR 1,997,282 USD (2,376,961) UBS AG 2/7/2021 (8,383 ) (0.00 %)EUR 260,738 USD (318,161) Barclays Bank plc 2/7/2021 (8,951 ) (0.00 %)CHF 294,363 USD (327,578) UBS AG 2/7/2021 (9,124 ) (0.00 %)CHF 293,703 USD (328,284) Barclays Bank plc 2/7/2021 (10,544 ) (0.00 %)EUR 2,019,980 USD (2,409,333) UBS AG 2/7/2021 (13,838 ) (0.01 %)EUR 591,871 USD (718,718) Barclays Bank plc 2/7/2021 (16,818 ) (0.01 %)EUR 2,088,278 USD (2,495,785) UBS AG 2/7/2021 (19,294 ) (0.01 %)GBP 19,737,844 USD (27,986,684) UBS AG 2/7/2021 (719,836 ) (0.19 %)EUR 27,227,197 USD (33,186,032) UBS AG 2/7/2021 (897,283 ) (0.24 %)CHF 50,591,321 USD (56,255,771) UBS AG 2/7/2021 (1,523,991 ) (0.40 %)test (3,303,450 ) (0.86 %)
CurrencyNotional Amount
Expiration Date Counterparty/Broker Referenced Obligation
Premium paid/received
Fair Value US Dollars ($)
% of Total Net Assets
Credit Default Swap Contracts 0.03% (2020: (0.11%))USD 10,000,000 20/6/2026 Morgan Stanley Buying default protection on Brazilian Government
International Bond, 4.25% 7/1/2025 1.00% 306,606 0.08 %
USD 7,000,000 20/6/2026 Morgan Stanley Selling default protection on Chile Government International Bond, 3.24% 6/2/2028 1.00%
142,718 0.04 %
USD 2,860,000 20/6/2026 Morgan Stanley Buying default protection on Colombia Government International Bond, 10.375% 28/1/2033 1.00%
49,238 0.01 %
USD 1,500,000 20/6/2025 Bank of America Selling default protection on Panama Government International Bond, 8.875% 30/9/2027 1.00%
29,747 0.01 %
USD 1,000,000 20/6/2025 HSBC Bank Selling default protection on Panama Government International Bond, 8.875% 30/9/2027 1.00%
19,827 0.01 %
USD 1,350,000 20/6/2026 JPMorgan Chase Bank Selling default protection on Peruvian Government International Bond, 8.75% 21/11/2033 1.00%
11,581 0.00 %
USD 1,350,000 20/6/2026 Bank of America Selling default protection on Peruvian Government International Bond, 8.75% 21/11/2033 1.00%
11,581 0.00 %
USD 660,000 20/6/2026 JPMorgan Chase Bank Selling default protection on Peruvian Government International Bond, 8.75% 21/11/2033 1.00%
5,667 0.00 %
USD 300,000 20/6/2026 Barclays Bank plc Selling default protection on Peruvian Government International Bond, 8.75% 21/11/2033 1.00%
2,574 0.00 %
USD 250,000 20/6/2026 Citibank NA Selling default protection on Russian Foreign Bond - Eurobond, 7.5% 31/3/2030 1.00%
2,056 0.00 %
USD 1,520,000 20/6/2026 Morgan Stanley1 Buying default protection on CDX.NA.HY.36.V1 5.00% (154,736 ) (0.04 %)USD 10,000,000 20/6/2026 Citibank NA Selling default protection on Brazilian Government
International Bond, 4.25% 7/1/2025 1.00% (306,606 ) (0.08 %)
120,253 0.03 %
Number of Contracts Expiration Date
Premium US Dollars ($)
Fair Value US Dollars ($)
% of Total Net Assets
Swaptions 0.00% (2020: 0.00%)Put Swaption on Credit Default Index Swap North America High Yield 5-Year, Strike Price 106 2,275,000 18/8/2021 22,068 3,973 0.00 %Put Swaption on Credit Default Index Swap North America High Yield 5-Year, Strike Price 106 1,520,000 18/8/2021 11,856 2,654 0.00 %Put Swaption on Credit Default Index Swap North America High Yield 5-Year, Strike Price 106 7,540,000 21/7/2021 50,518 1,819 0.00 %
8,446 0.00 %Total Financial Derivative Instruments (2,888,069 ) (0.75 %)
Fair Value US Dollars ($)
% of Total Net Assets
Other Assets and Liabilities 33,008,206 8.62 %Net Assets 382,839,215 100.00 %
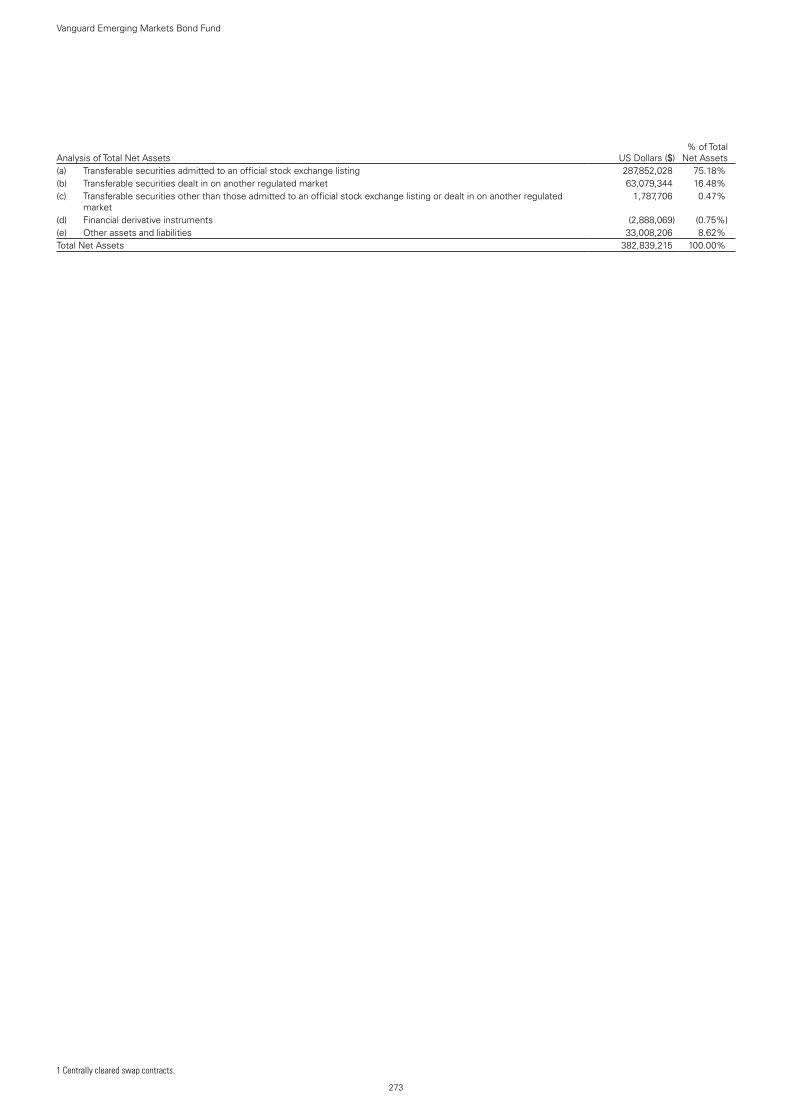
273
Vanguard Emerging Markets Bond Fund
Analysis of Total Net Assets US Dollars ($)% of Total
Net Assets(a) Transferable securities admitted to an official stock exchange listing 287,852,028 75.18 %(b) Transferable securities dealt in on another regulated market 63,079,344 16.48 %(c) Transferable securities other than those admitted to an official stock exchange listing or dealt in on another regulated
market 1,787,706 0.47 %
(d) Financial derivative instruments (2,888,069 ) (0.75 %)(e) Other assets and liabilities 33,008,206 8.62 %Total Net Assets 382,839,215 100.00 %
1 Centrally cleared swap contracts.
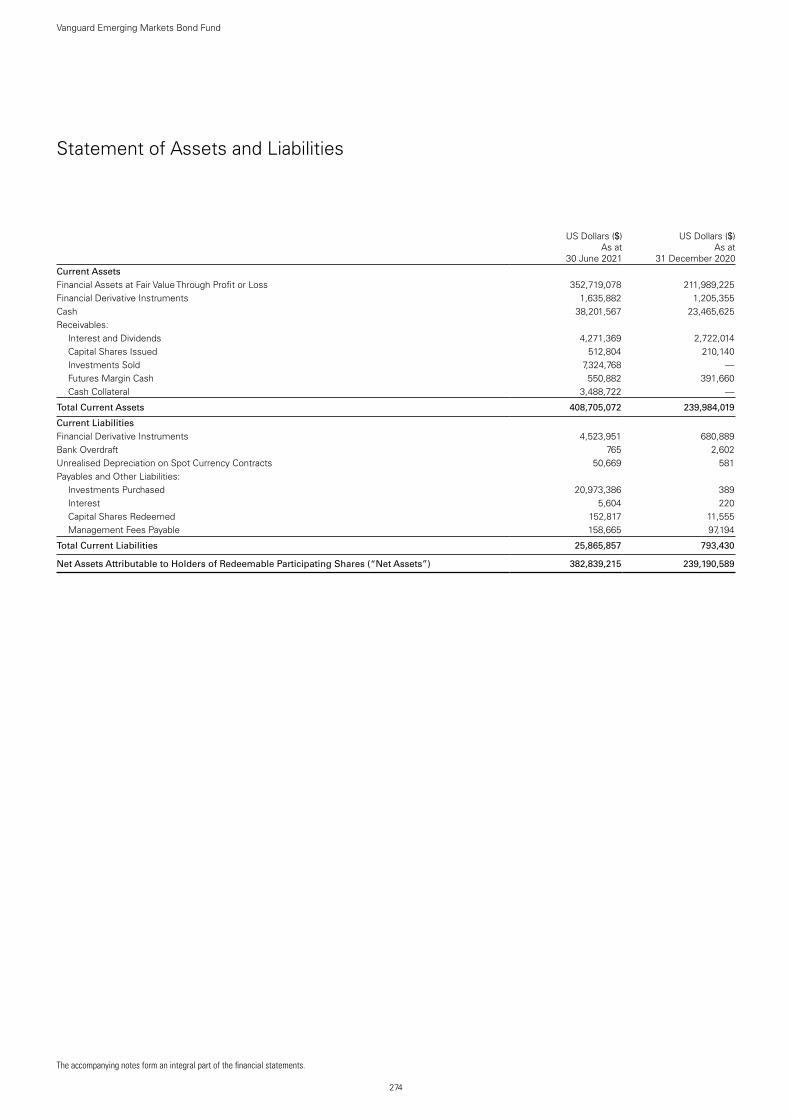
The accompanying notes form an integral part of the financial statements.
274
Vanguard Emerging Markets Bond Fund
Statement of Assets and Liabilities
US Dollars ($)
As at 30 June 2021
US Dollars ($)
As at 31 December 2020
Current AssetsFinancial Assets at Fair Value Through Profit or Loss 352,719,078 211,989,225 Financial Derivative Instruments 1,635,882 1,205,355 Cash 38,201,567 23,465,625 Receivables: Interest and Dividends 4,271,369 2,722,014 Capital Shares Issued 512,804 210,140 Investments Sold 7,324,768 — Futures Margin Cash 550,882 391,660 Cash Collateral 3,488,722 —
Total Current Assets 408,705,072 239,984,019
Current LiabilitiesFinancial Derivative Instruments 4,523,951 680,889 Bank Overdraft 765 2,602 Unrealised Depreciation on Spot Currency Contracts 50,669 581 Payables and Other Liabilities: Investments Purchased 20,973,386 389 Interest 5,604 220 Capital Shares Redeemed 152,817 11,555 Management Fees Payable 158,665 97,194
Total Current Liabilities 25,865,857 793,430
Net Assets Attributable to Holders of Redeemable Participating Shares (“Net Assets”) 382,839,215 239,190,589

275
Vanguard Emerging Markets Bond Fund
The accompanying notes form an integral part of the financial statements.
Net Asset Value Per Share
.As at
30 June 2021As at
31 December 2020As at
31 December 2019Institutional Plus CHF Hedged Acc1
US ($) Equivalent 58,116,418 — —Net Assets 53,719,911 — —Number of Shares Outstanding 528,188 — —Net Asset Value Per Share2 101.71 — —
Investor EUR Hedged Acc3
US ($) Equivalent 35,346,580 13,996,230 1,039,082Net Assets 29,805,701 11,439,034 925,686Number of Shares Outstanding 253,510 96,977 9,018Net Asset Value Per Share2 117.57 117.96 102.65
Institutional Plus EUR Hedged Acc1
US ($) Equivalent 4,981,299 — —Net Assets 4,200,438 — —Number of Shares Outstanding 41,264 — —Net Asset Value Per Share2 101.79 — —
Investor GBP Hedged Acc3
US ($) Equivalent 29,123,964 19,675,171 1,050,980Net Assets 21,082,171 14,393,483 793,342Number of Shares Outstanding 177,438 121,262 7,723Net Asset Value Per Share2 118.81 118.70 102.72
Investor USD Acc3
Net Assets 108,770,068 43,966,911 1,025,270Number of Shares Outstanding 902,036 365,291 9,965Net Asset Value Per Share2 120.58 120.36 102.89
Institutional Plus USD Acc3
Net Assets 146,500,886 161,552,277 12,304,657Number of Shares Outstanding 1,212,078 1,340,061 119,581Net Asset Value Per Share2 120.87 120.56 102.90
1 The share class was launched on 27 April 2021.2 The net asset value per share shown may diverge from the net asset value per share used for dealing purposes because of any adjustments for swing pricing and trade date accounting.3 The share class was launched on 3 December 2019.

276
Vanguard Emerging Markets Bond Fund
The accompanying notes form an integral part of the financial statements.
Statement of Operations
US Dollars ($)
Six Months Ended 30 June 2021
US Dollars ($)
Six Months Ended 30 June 2020
Investment Income/(Loss) Interest Income 5,946,735 922,551 Other Income 51,022 630 Net Gain/(Loss) on Financial Instruments (4,805,496) 4,536,560
Total Investment Income/(Loss) 1,192,261 5,459,741
Expenses Management Fees 772,983 86,862 Transaction Fees and Commissions 1,588 309
Total Expenses 774,571 87,171
Finance Costs Interest Expense 51,890 11,138
Total Finance Costs 51,890 11,138
Net Investment Income/(Loss) 365,800 5,361,432
Foreign Withholding Tax (12,823) (14,043)
Net Increase/(Decrease) in Net Assets 352,977 5,347,389
Statement of Changes in Net Assets
US Dollars ($)
US Dollars ($)
Six Months Ended Six Months Ended30 June 2021 30 June 2020
Increase/(Decrease) in Net Assets
Net Increase/(Decrease) in Net Assets From Operations 352,977 5,347,389
Capital Transactions Subscriptions 223,634,126 115,097,375 Redemptions (80,338,477) (6,654,222)
Total Capital Transactions 143,295,649 108,443,153
Total Increase/(Decrease) for the Period 143,648,626 113,790,542
Net AssetsBeginning of Period 239,190,589 15,419,989
End of Period 382,839,215 129,210,531

Vanguard Euro Government Bond Index FundManaged by Vanguard Global Advisers, LLC.
277
Investment ObjectiveThe fund seeks to provide returns consistent with the performance of the Bloomberg Barclays Euro Government Float Adjusted Bond Index, a market-weighted index designed to reflect the total universe of euro-denominated euro zone treasury and government-related securities with maturities greater than 1 year.
Performance SummaryThe Performance Summary does not form part of the Financial Statements.
• As the six months ended 30 June 2021 came to a close, macroeconomic indicators signalled a faster global economic rebound than many had expected after the sharpest contraction in modern history. Yet the recovery has been uneven. Countries that have contained the virus more successfully, whether through vaccinations, lockdowns or both, generally have fared better economically. And the COVID-19 pandemic remained far from over, with new variants of the virus surfacing where vaccination rates have lagged and the human toll continuing to mount, especially in less developed economies.
• Swift and extensive support from governments and central banks has been a key to the rebound. So far in 2021, it has included fiscal stimulus – including the $1.9 trillion American Rescue Plan in the United States and the €673 billion Recovery and Resilience Facility in Europe – and pledges by a number of central banks to keep interest rates low for some time.
• Stock markets worldwide continued the rally that began in 2020, bolstered by reopening economies, more consumer spending and rising corporate profits. They posted strong gains for the six months ended 30 June.
• Fixed income securities struggled amid concerns that an upturn in inflation might persist or even accelerate given the stronger-than-expected rebound in global growth, extraordinary monetary and fiscal stimulus and a jump in demand for goods and services as economies reopened and supply gradually picked up. With longer-term yields rising and prices falling, returns were negative for the half year.
• The fund’s benchmark returned –2.86% for the six months.
• Among the larger constituents in the index, Austria and Belgium performed worse than the index as a whole, posting declines of more than 4%. Italy and Portugal performed the best but still finished in negative territory.
• By maturity, longer-dated bonds significantly underperformed, but returns were negative across the maturity spectrum. From a credit-quality perspective, results were mixed, but bonds rated BBB held up the best.
Benchmark returns in the commentary above are in euros.
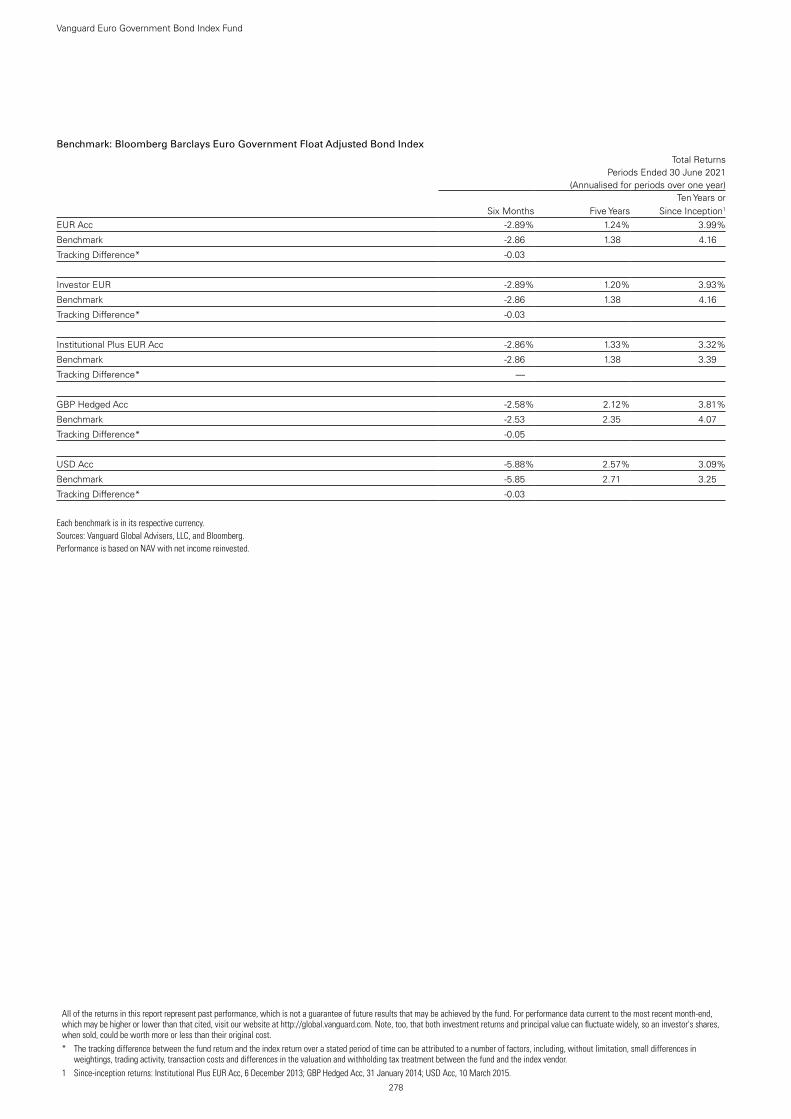
278
Vanguard Euro Government Bond Index Fund
Benchmark: Bloomberg Barclays Euro Government Float Adjusted Bond Index
Total ReturnsPeriods Ended 30 June 2021
(Annualised for periods over one year)
Six Months Five YearsTen Years or
Since Inception1
EUR Acc -2.89 % 1.24 % 3.99 %
Benchmark -2.86 1.38 4.16
Tracking Difference* -0.03
Investor EUR -2.89 % 1.20 % 3.93 %
Benchmark -2.86 1.38 4.16
Tracking Difference* -0.03
Institutional Plus EUR Acc -2.86 % 1.33 % 3.32 %
Benchmark -2.86 1.38 3.39
Tracking Difference* —
GBP Hedged Acc -2.58 % 2.12 % 3.81 %
Benchmark -2.53 2.35 4.07
Tracking Difference* -0.05
USD Acc -5.88 % 2.57 % 3.09 %
Benchmark -5.85 2.71 3.25
Tracking Difference* -0.03
Each benchmark is in its respective currency.Sources: Vanguard Global Advisers, LLC, and Bloomberg.Performance is based on NAV with net income reinvested.
All of the returns in this report represent past performance, which is not a guarantee of future results that may be achieved by the fund. For performance data current to the most recent month-end, which may be higher or lower than that cited, visit our website at http://global.vanguard.com. Note, too, that both investment returns and principal value can fluctuate widely, so an investor's shares, when sold, could be worth more or less than their original cost.* The tracking difference between the fund return and the index return over a stated period of time can be attributed to a number of factors, including, without limitation, small differences in
weightings, trading activity, transaction costs and differences in the valuation and withholding tax treatment between the fund and the index vendor.1 Since-inception returns: Institutional Plus EUR Acc, 6 December 2013; GBP Hedged Acc, 31 January 2014; USD Acc, 10 March 2015.
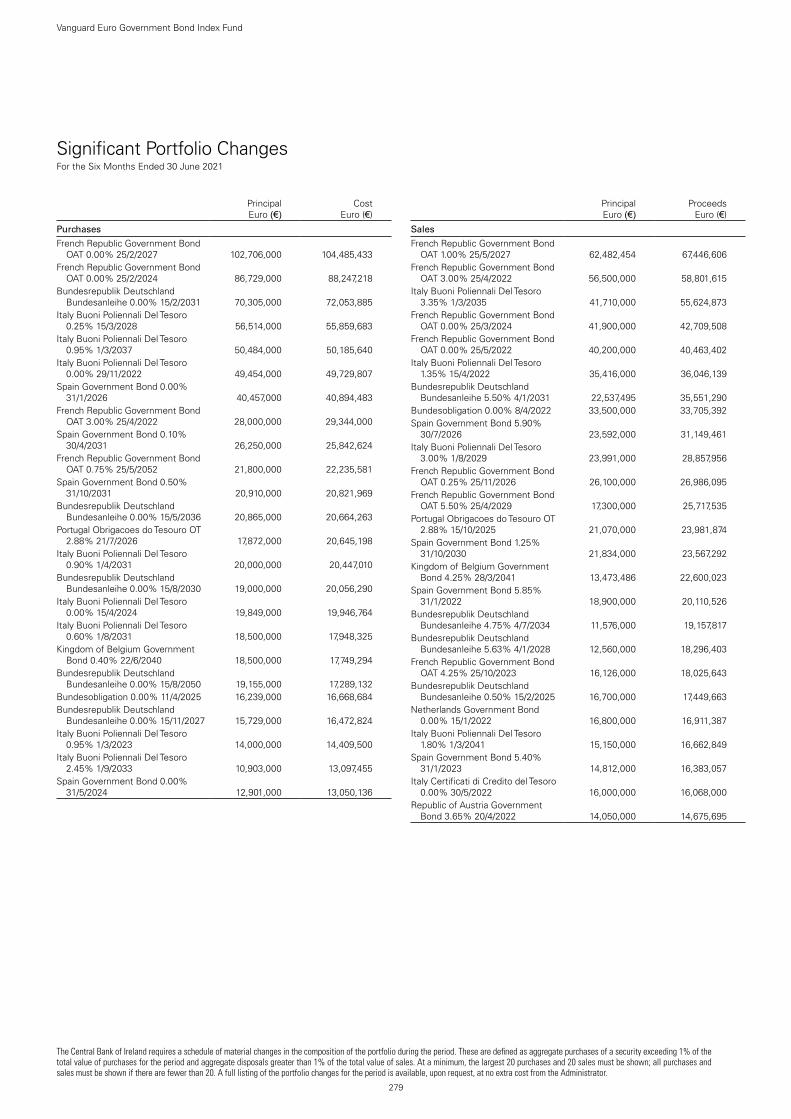
Significant Portfolio ChangesFor the Six Months Ended 30 June 2021
279
Vanguard Euro Government Bond Index Fund
The Central Bank of Ireland requires a schedule of material changes in the composition of the portfolio during the period. These are defined as aggregate purchases of a security exceeding 1% of the total value of purchases for the period and aggregate disposals greater than 1% of the total value of sales. At a minimum, the largest 20 purchases and 20 sales must be shown; all purchases and sales must be shown if there are fewer than 20. A full listing of the portfolio changes for the period is available, upon request, at no extra cost from the Administrator.
Principal Euro (€)
Cost Euro (€)
Purchases
French Republic Government Bond OAT 0.00% 25/2/2027 102,706,000 104,485,433
French Republic Government Bond OAT 0.00% 25/2/2024 86,729,000 88,247,218
Bundesrepublik Deutschland Bundesanleihe 0.00% 15/2/2031 70,305,000 72,053,885
Italy Buoni Poliennali Del Tesoro 0.25% 15/3/2028 56,514,000 55,859,683
Italy Buoni Poliennali Del Tesoro 0.95% 1/3/2037 50,484,000 50,185,640
Italy Buoni Poliennali Del Tesoro 0.00% 29/11/2022 49,454,000 49,729,807
Spain Government Bond 0.00% 31/1/2026 40,457,000 40,894,483
French Republic Government Bond OAT 3.00% 25/4/2022 28,000,000 29,344,000
Spain Government Bond 0.10% 30/4/2031 26,250,000 25,842,624
French Republic Government Bond OAT 0.75% 25/5/2052 21,800,000 22,235,581
Spain Government Bond 0.50% 31/10/2031 20,910,000 20,821,969
Bundesrepublik Deutschland Bundesanleihe 0.00% 15/5/2036 20,865,000 20,664,263
Portugal Obrigacoes do Tesouro OT 2.88% 21/7/2026 17,872,000 20,645,198
Italy Buoni Poliennali Del Tesoro 0.90% 1/4/2031 20,000,000 20,447,010
Bundesrepublik Deutschland Bundesanleihe 0.00% 15/8/2030 19,000,000 20,056,290
Italy Buoni Poliennali Del Tesoro 0.00% 15/4/2024 19,849,000 19,946,764
Italy Buoni Poliennali Del Tesoro 0.60% 1/8/2031 18,500,000 17,948,325
Kingdom of Belgium Government Bond 0.40% 22/6/2040 18,500,000 17,749,294
Bundesrepublik Deutschland Bundesanleihe 0.00% 15/8/2050 19,155,000 17,289,132
Bundesobligation 0.00% 11/4/2025 16,239,000 16,668,684Bundesrepublik Deutschland
Bundesanleihe 0.00% 15/11/2027 15,729,000 16,472,824Italy Buoni Poliennali Del Tesoro
0.95% 1/3/2023 14,000,000 14,409,500Italy Buoni Poliennali Del Tesoro
2.45% 1/9/2033 10,903,000 13,097,455Spain Government Bond 0.00%
31/5/2024 12,901,000 13,050,136
Principal Euro (€)
Proceeds Euro (€)
Sales
French Republic Government Bond OAT 1.00% 25/5/2027 62,482,454 67,446,606
French Republic Government Bond OAT 3.00% 25/4/2022 56,500,000 58,801,615
Italy Buoni Poliennali Del Tesoro 3.35% 1/3/2035 41,710,000 55,624,873
French Republic Government Bond OAT 0.00% 25/3/2024 41,900,000 42,709,508
French Republic Government Bond OAT 0.00% 25/5/2022 40,200,000 40,463,402
Italy Buoni Poliennali Del Tesoro 1.35% 15/4/2022 35,416,000 36,046,139
Bundesrepublik Deutschland Bundesanleihe 5.50% 4/1/2031 22,537,495 35,551,290
Bundesobligation 0.00% 8/4/2022 33,500,000 33,705,392Spain Government Bond 5.90%
30/7/2026 23,592,000 31,149,461Italy Buoni Poliennali Del Tesoro
3.00% 1/8/2029 23,991,000 28,857,956French Republic Government Bond
OAT 0.25% 25/11/2026 26,100,000 26,986,095French Republic Government Bond
OAT 5.50% 25/4/2029 17,300,000 25,717,535Portugal Obrigacoes do Tesouro OT
2.88% 15/10/2025 21,070,000 23,981,874Spain Government Bond 1.25%
31/10/2030 21,834,000 23,567,292Kingdom of Belgium Government
Bond 4.25% 28/3/2041 13,473,486 22,600,023Spain Government Bond 5.85%
31/1/2022 18,900,000 20,110,526Bundesrepublik Deutschland
Bundesanleihe 4.75% 4/7/2034 11,576,000 19,157,817Bundesrepublik Deutschland
Bundesanleihe 5.63% 4/1/2028 12,560,000 18,296,403French Republic Government Bond
OAT 4.25% 25/10/2023 16,126,000 18,025,643Bundesrepublik Deutschland
Bundesanleihe 0.50% 15/2/2025 16,700,000 17,449,663Netherlands Government Bond
0.00% 15/1/2022 16,800,000 16,911,387Italy Buoni Poliennali Del Tesoro
1.80% 1/3/2041 15,150,000 16,662,849Spain Government Bond 5.40%
31/1/2023 14,812,000 16,383,057Italy Certificati di Credito del Tesoro
0.00% 30/5/2022 16,000,000 16,068,000Republic of Austria Government
Bond 3.65% 20/4/2022 14,050,000 14,675,695

280
Vanguard Euro Government Bond Index Fund
Financial StatementsStatement of Investments30 June 2021
Principal EUR (€) Coupon
Maturity Date
Fair Value EUR (€)
% of Total Net Assets
Bonds 98.68% (2020: 99.06%)Austria 3.36% (2020: 3.30%)Republic of Austria Government Bond 10,719,000 4.15% 15/3/2037 17,144,396 0.31%Republic of Austria Government Bond 14,000,000 0.75% 20/2/2028 14,980,307 0.27%Republic of Austria Government Bond 9,450,000 4.85% 15/3/2026 11,862,471 0.21%Republic of Austria Government Bond 10,877,000 1.20% 20/10/2025 11,697,235 0.21%Republic of Austria Government Bond 10,000,000 0.00% 20/4/2025 10,203,417 0.18%Republic of Austria Government Bond 9,600,000 0.00% 15/7/2024 9,773,449 0.18%Republic of Austria Government Bond 9,460,000 0.00% 20/4/2023 9,570,113 0.17%Republic of Austria Government Bond 8,700,000 0.50% 20/4/2027 9,152,296 0.16%Republic of Austria Government Bond 8,000,000 0.00% 20/2/2030 8,062,924 0.15%Republic of Austria Government Bond 6,694,000 0.50% 20/2/2029 7,050,737 0.13%Republic of Austria Government Bond 5,718,000 1.50% 20/2/2047 7,011,047 0.13%Republic of Austria Government Bond 2,882,000 3.80% 26/1/2062 5,995,872 0.11%Republic of Austria Government Bond 5,150,000 3.40% 22/11/2022 5,441,860 0.10%Republic of Austria Government Bond 3,300,000 3.15% 20/6/2044 5,238,404 0.09%Republic of Austria Government Bond 4,800,000 0.75% 20/10/2026 5,101,405 0.09%Republic of Austria Government Bond 4,847,000 0.00% 20/2/2031 4,848,178 0.09%Republic of Austria Government Bond 4,800,000 0.00% 20/9/2022 4,839,444 0.09%Republic of Austria Government Bond 3,750,000 2.40% 23/5/2034 4,822,738 0.09%Republic of Austria Government Bond 4,666,000 0.00% 15/7/2023 4,726,721 0.09%Republic of Austria Government Bond 2,616,000 2.10% 20/9/2117 4,321,598 0.08%Republic of Austria Government Bond 4,089,000 0.85% 30/6/2120 3,737,179 0.07%Autobahnen- und Schnell- strassen-Finanzierungs AG 2,100,000 0.63% 15/9/2022 2,129,782 0.04%Republic of Austria Government Bond 1,950,000 0.70% 20/4/2071 1,858,587 0.03%Autobahnen- und Schnell- strassen-Finanzierungs AG 1,500,000 0.25% 18/10/2024 1,532,844 0.03%Republic of Austria Government Bond 1,259,000 0.75% 20/3/2051 1,299,930 0.02%OeBB-Infrastruktur AG 950,000 3.38% 18/5/2032 1,269,849 0.02%OeBB-Infrastruktur AG 1,000,000 2.25% 28/5/2029 1,175,527 0.02%Republic of Austria Government Bond 873,000 1.50% 2/11/2086 1,141,043 0.02%Autobahnen- und Schnell- strassen-Finanzierungs AG 950,000 3.38% 22/9/2025 1,100,445 0.02%OeBB-Infrastruktur AG 900,000 3.88% 30/6/2025 1,053,085 0.02%Verbund AG 1,000,000 0.90% 1/4/2041 1,005,472 0.02%OeBB-Infrastruktur AG 920,000 1.00% 18/11/2024 963,640 0.02%Verbund AG 900,000 1.50% 20/11/2024 954,262 0.02%Oesterreichische Kontrollbank AG 800,000 0.00% 8/10/2026 810,125 0.01%Autobahnen- und Schnell- strassen-Finanzierungs AG 800,000 0.10% 16/7/2035 772,621 0.01%Autobahnen- und Schnell- strassen-Finanzierungs AG 700,000 0.10% 9/7/2029 708,479 0.01%Autobahnen- und Schnell- strassen-Finanzierungs AG 500,000 2.75% 20/6/2033 647,583 0.01%OeBB-Infrastruktur AG 400,000 3.00% 24/10/2033 529,506 0.01%Autobahnen- und Schnell- strassen-Finanzierungs AG 500,000 0.00% 16/7/2027 506,331 0.01%OeBB-Infrastruktur AG 450,000 2.25% 4/7/2023 474,877 0.01%Autobahnen- und Schnell- strassen-Finanzierungs AG 300,000 2.75% 11/6/2032 383,107 0.01%EVN AG 200,000 4.25% 13/4/2022 207,231 0.00%test - - - 186,106,117 3.36%Belgium 5.10% (2020: 5.16%)Kingdom of Belgium Government Bond 13,351,109 5.00% 28/3/2035 21,879,635 0.39%Kingdom of Belgium Government Bond 19,375,000 0.90% 22/6/2029 21,002,177 0.38%Kingdom of Belgium Government Bond 18,883,000 1.00% 22/6/2026 20,269,194 0.37%Kingdom of Belgium Government Bond 18,150,000 0.50% 22/10/2024 18,825,630 0.34%Kingdom of Belgium Government Bond 18,500,000 0.40% 22/6/2040 17,805,662 0.32%Kingdom of Belgium Government Bond 16,450,000 4.25% 28/9/2022 17,464,674 0.32%Kingdom of Belgium Government Bond 14,200,000 2.60% 22/6/2024 15,577,756 0.28%Kingdom of Belgium Government Bond 13,309,000 0.00% 22/10/2027 13,582,117 0.24%Kingdom of Belgium Government Bond 7,030,000 3.75% 22/6/2045 11,686,632 0.21%Kingdom of Belgium Government Bond 7,220,000 3.00% 22/6/2034 9,751,880 0.18%Kingdom of Belgium Government Bond 6,940,000 1.60% 22/6/2047 8,197,042 0.15%Kingdom of Belgium Government Bond 7,400,000 0.80% 22/6/2025 7,801,090 0.14%Kingdom of Belgium Government Bond 6,700,000 1.25% 22/4/2033 7,555,246 0.14%Kingdom of Belgium Government Bond 9,000,000 0.65% 22/6/2071 7,486,632 0.13%Kingdom of Belgium Government Bond 7,260,000 0.10% 22/6/2030 7,358,175 0.13%Kingdom of Belgium Government Bond 5,000,000 4.00% 28/3/2032 7,108,187 0.13%Kingdom of Belgium Government Bond 5,500,000 1.90% 22/6/2038 6,761,221 0.12%Kingdom of Belgium Government Bond 5,900,000 1.00% 22/6/2031 6,472,992 0.12%Kingdom of Belgium Government Bond 6,200,000 0.20% 22/10/2023 6,323,334 0.11%

281
Vanguard Euro Government Bond Index Fund
Principal EUR (€) Coupon
Maturity Date
Fair Value EUR (€)
% of Total Net Assets
Kingdom of Belgium Government Bond 5,813,000 0.80% 22/6/2027 6,219,840 0.11%Kingdom of Belgium Government Bond 4,000,000 2.25% 22/6/2057 5,573,720 0.10%Kingdom of Belgium Government Bond 5,000,000 0.00% 22/10/2031 4,947,307 0.09%Kingdom of Belgium Government Bond 4,100,000 1.45% 22/6/2037 4,731,927 0.09%Ministeries Van de Vlaamse Gemeenschap 4,500,000 0.01% 23/6/2027 4,542,401 0.08%Kingdom of Belgium Government Bond 3,296,000 1.70% 22/6/2050 3,985,752 0.07%Kingdom of Belgium Government Bond 2,595,000 0.80% 22/6/2028 2,789,331 0.05%Region Wallonne Belgium 2,000,000 0.38% 22/10/2031 1,995,060 0.04%Ministeries Van de Vlaamse Gemeenschap 2,000,000 0.13% 15/10/2035 1,901,711 0.03%FLUVIUS System Operator CVBA 1,300,000 2.88% 7/5/2029 1,564,456 0.03%Ministeries Van de Vlaamse Gemeenschap 1,500,000 0.38% 15/4/2030 1,532,063 0.03%FLUVIUS System Operator CVBA 1,200,000 0.25% 14/6/2028 1,199,278 0.02%Ministeries Van de Vlaamse Gemeenschap 1,200,000 1.00% 23/1/2051 1,195,591 0.02%Ministeries Van de Vlaamse Gemeenschap 1,200,000 0.88% 21/3/2046 1,185,795 0.02%Region Wallonne Belgium 1,000,000 0.50% 8/4/2030 1,024,319 0.02%Region Wallonne Belgium 1,000,000 0.05% 22/6/2025 1,012,263 0.02%Region Wallonne Belgium 1,000,000 0.50% 22/6/2037 963,617 0.02%Region Wallonne Belgium 800,000 1.05% 22/6/2040 817,809 0.01%Proximus SADP 600,000 1.88% 1/10/2025 647,450 0.01%FLUVIUS System Operator CVBA 600,000 2.75% 30/11/2022 624,906 0.01%Region Wallonne Belgium 700,000 0.65% 16/1/2051 606,900 0.01%Proximus SADP 500,000 2.38% 4/4/2024 535,851 0.01%FLUVIUS System Operator CVBA 300,000 2.88% 9/10/2023 320,911 0.01%test - - - 282,827,534 5.10%Cyprus 0.14% (2020: 0.12%)Cyprus Government International Bond 1,900,000 0.63% 21/1/2030 1,944,739 0.03%Cyprus Government International Bond 1,895,000 1.25% 21/1/2040 1,933,489 0.03%Cyprus Government International Bond 1,080,000 0.00% 9/2/2026 1,085,927 0.02%Cyprus Government International Bond 824,000 2.75% 26/2/2034 1,027,218 0.02%Cyprus Government International Bond 840,000 0.63% 3/12/2024 864,426 0.02%Cyprus Government International Bond 500,000 2.25% 16/4/2050 603,986 0.01%Cyprus Government International Bond 325,000 2.75% 3/5/2049 437,159 0.01%test - - - 7,896,944 0.14%Finland 1.48% (2020: 1.54%)Finland Government Bond 5,200,000 2.75% 4/7/2028 6,335,858 0.11%Finland Government Bond 5,700,000 0.88% 15/9/2025 6,047,551 0.11%Finland Government Bond 5,198,000 1.13% 15/4/2034 5,837,178 0.11%Finland Government Bond 5,214,000 0.75% 15/4/2031 5,616,119 0.10%Finland Government Bond 4,338,000 0.50% 15/9/2029 4,580,779 0.08%Finland Government Bond 4,260,000 0.50% 15/4/2026 4,466,455 0.08%Finland Government Bond 4,150,000 1.50% 15/4/2023 4,311,400 0.08%Finland Government Bond 3,500,000 4.00% 4/7/2025 4,152,445 0.07%Finland Government Bond 3,800,000 2.00% 15/4/2024 4,085,563 0.07%Finland Government Bond 2,750,000 2.63% 4/7/2042 3,997,424 0.07%Finland Government Bond 3,600,000 0.13% 15/4/2036 3,520,815 0.06%Finland Government Bond 2,500,000 1.38% 15/4/2047 3,052,600 0.06%Finland Government Bond 2,250,000 0.13% 15/9/2031 2,272,737 0.04%Finnvera OYJ 2,000,000 1.25% 14/7/2033 2,232,890 0.04%Kuntarahoitus OYJ 2,000,000 0.13% 7/3/2024 2,033,287 0.04%Finnvera OYJ 1,900,000 0.50% 13/4/2026 1,973,256 0.04%Finland Government Bond 2,000,000 0.25% 15/9/2040 1,945,977 0.04%Finland Government Bond 2,000,000 0.13% 15/4/2052 1,752,827 0.03%Kuntarahoitus OYJ 1,500,000 0.63% 26/11/2026 1,574,664 0.03%Kuntarahoitus OYJ 1,400,000 0.00% 22/4/2025 1,422,165 0.03%Kuntarahoitus OYJ 1,200,000 0.00% 2/3/2031 1,193,556 0.02%Finland Government Bond 1,100,000 1.63% 15/9/2022 1,130,398 0.02%Kuntarahoitus OYJ 1,000,000 0.75% 7/9/2027 1,059,839 0.02%Finnvera OYJ 1,000,000 0.38% 9/4/2029 1,033,321 0.02%Fortum OYJ 1,000,000 0.88% 27/2/2023 1,017,199 0.02%Fortum OYJ 790,000 2.25% 6/9/2022 813,328 0.01%Finnvera OYJ 800,000 0.63% 22/9/2022 811,673 0.01%Kuntarahoitus OYJ 800,000 0.00% 14/10/2030 799,924 0.01%Fortum OYJ 700,000 1.63% 27/2/2026 745,240 0.01%Kuntarahoitus OYJ 600,000 0.00% 15/11/2024 608,934 0.01%Kuntarahoitus OYJ 600,000 0.05% 10/9/2035 577,224 0.01%Fortum OYJ 400,000 2.13% 27/2/2029 447,154 0.01%Kuntarahoitus OYJ 400,000 0.05% 6/9/2029 404,090 0.01%Fingrid OYJ 250,000 3.50% 3/4/2024 274,941 0.01%test - - - 82,128,811 1.48%France 24.21% (2020: 24.75%)French Republic Government Bond OAT 102,706,000 0.00% 25/2/2027 104,571,065 1.89%

282
Vanguard Euro Government Bond Index Fund
Principal EUR (€) Coupon
Maturity Date
Fair Value EUR (€)
% of Total Net Assets
French Republic Government Bond OAT 86,729,000 0.00% 25/2/2024 88,132,479 1.59%French Republic Government Bond OAT 50,495,000 0.75% 25/11/2028 53,992,185 0.97%French Republic Government Bond OAT 50,400,000 0.75% 25/5/2028 53,823,387 0.97%French Republic Government Bond OAT 25,560,000 4.50% 25/4/2041 44,325,963 0.80%French Republic Government Bond OAT 37,100,000 2.25% 25/5/2024 40,208,222 0.73%French Republic Government Bond OAT 39,469,000 0.00% 25/11/2029 39,692,709 0.72%French Republic Government Bond OAT 31,700,000 2.50% 25/5/2030 38,908,555 0.70%French Republic Government Bond OAT 34,000,000 1.50% 25/5/2031 38,836,147 0.70%French Republic Government Bond OAT 31,484,152 1.25% 25/5/2034 35,274,979 0.64%French Republic Government Bond OAT 32,000,000 1.75% 25/11/2024 34,551,267 0.62%French Republic Government Bond OAT 20,980,000 4.75% 25/4/2035 33,650,567 0.61%French Republic Government Bond OAT 26,700,000 3.50% 25/4/2026 31,847,833 0.57%French Republic Government Bond OAT 29,700,000 1.00% 25/11/2025 31,655,386 0.57%French Republic Government Bond OAT 26,300,000 1.25% 25/5/2036 29,462,412 0.53%French Republic Government Bond OAT 17,859,000 4.00% 25/10/2038 28,343,615 0.51%French Republic Government Bond OAT 22,051,000 6.00% 25/10/2025 28,338,975 0.51%French Republic Government Bond OAT 21,359,000 2.00% 25/5/2048 27,506,233 0.50%French Republic Government Bond OAT 16,750,000 3.25% 25/5/2045 26,103,725 0.47%French Republic Government Bond OAT 26,000,000 0.00% 25/11/2030 25,927,569 0.47%French Republic Government Bond OAT 25,200,000 0.00% 25/3/2023 25,482,042 0.46%French Republic Government Bond OAT 26,300,000 0.75% 25/5/2052 25,141,624 0.45%French Republic Government Bond OAT 14,986,000 5.75% 25/10/2032 24,480,708 0.44%French Republic Government Bond OAT 23,044,000 1.75% 25/5/2023 24,098,829 0.43%French Republic Government Bond OAT 18,549,000 1.50% 25/5/2050 21,559,920 0.39%French Republic Government Bond OAT 20,400,000 0.50% 25/5/2025 21,220,087 0.38%French Republic Government Bond OAT 10,260,000 4.00% 25/4/2060 20,297,095 0.37%French Republic Government Bond OAT 10,662,000 4.00% 25/4/2055 20,201,103 0.36%French Republic Government Bond OAT 11,600,000 1.75% 25/6/2039 14,081,357 0.25%French Republic Government Bond OAT 13,000,000 0.50% 25/5/2026 13,604,317 0.25%French Republic Government Bond OAT 10,000,000 2.25% 25/10/2022 10,385,782 0.19%French Republic Government Bond OAT 8,500,000 0.00% 25/3/2025 8,668,884 0.16%French Republic Government Bond OAT 7,000,000 2.75% 25/10/2027 8,368,364 0.15%French Republic Government Bond OAT 10,630,000 0.50% 25/5/2072 8,201,981 0.15%UNEDIC A.S.SEO 7,600,000 0.13% 25/11/2024 7,731,346 0.14%French Republic Government Bond OAT 6,431,000 8.50% 25/4/2023 7,507,062 0.14%French Republic Government Bond OAT 6,965,000 0.00% 25/2/2023 7,039,201 0.13%French Republic Government Bond OAT 6,633,000 0.50% 25/5/2040 6,500,155 0.12%French Republic Government Bond OAT 4,027,000 5.50% 25/4/2029 5,824,624 0.10%Caisse d'Amortissement de la Dette Sociale 4,700,000 4.00% 15/12/2025 5,622,437 0.10%Caisse d'Amortissement de la Dette Sociale 5,000,000 0.00% 25/11/2026 5,067,507 0.09%French Republic Government Bond OAT 4,800,000 0.00% 25/2/2026 4,899,072 0.09%Caisse d'Amortissement de la Dette Sociale 4,600,000 1.38% 25/11/2024 4,886,920 0.09%Caisse d'Amortissement de la Dette Sociale 4,800,000 0.13% 25/10/2023 4,870,135 0.09%UNEDIC A.S.SEO 4,000,000 0.00% 25/11/2028 4,017,723 0.07%Agence Francaise de Developpement EPIC 3,800,000 1.38% 17/9/2024 4,016,509 0.07%Bpifrance SACA 3,700,000 1.00% 25/5/2027 3,954,651 0.07%Caisse d'Amortissement de la Dette Sociale 3,500,000 4.13% 25/4/2023 3,795,849 0.07%Bpifrance SACA 3,400,000 0.13% 25/11/2023 3,449,768 0.06%French Republic Government Bond OAT 3,400,000 0.00% 25/11/2031 3,355,600 0.06%SNCF Reseau 3,100,000 1.13% 19/5/2027 3,317,874 0.06%UNEDIC A.S.SEO 3,000,000 0.50% 20/3/2029 3,124,191 0.06%Caisse d'Amortissement de la Dette Sociale 3,000,000 0.50% 25/5/2023 3,057,125 0.05%Agence Francaise de Developpement EPIC 2,700,000 0.25% 21/7/2026 2,765,791 0.05%SNCF Reseau 1,750,000 5.00% 10/10/2033 2,689,446 0.05%Electricite de France SA 2,500,000 2.75% 10/3/2023 2,628,089 0.05%UNEDIC A.S.SEO 2,400,000 1.25% 21/10/2027 2,616,059 0.05%Caisse d'Amortissement de la Dette Sociale 2,500,000 2.50% 25/10/2022 2,599,898 0.05%Agence Francaise de Developpement EPIC 2,400,000 0.25% 29/6/2029 2,436,299 0.04%Electricite de France SA 2,100,000 4.63% 11/9/2024 2,417,343 0.04%Coentreprise de Transport d'Electricite SA 2,100,000 2.13% 29/7/2032 2,404,202 0.04%Societe Du Grand Paris EPIC 2,200,000 1.13% 22/10/2028 2,384,821 0.04%SNCF Reseau 1,900,000 2.25% 20/12/2047 2,381,009 0.04%SNCF Reseau 2,000,000 1.88% 30/3/2034 2,331,209 0.04%Societe Nationale SNCF SA 2,000,000 4.13% 19/2/2025 2,316,850 0.04%Societe Du Grand Paris EPIC 2,700,000 0.70% 15/10/2060 2,304,253 0.04%Societe Du Grand Paris EPIC 2,100,000 1.13% 25/5/2034 2,267,963 0.04%SNCF Reseau 1,800,000 3.13% 25/10/2028 2,203,676 0.04%Agence Francaise de Developpement EPIC 2,200,000 0.01% 25/11/2028 2,202,717 0.04%Bpifrance SACA 2,000,000 2.50% 25/5/2024 2,171,641 0.04%Agence Francaise de Developpement EPIC 2,100,000 0.50% 25/5/2030 2,168,893 0.04%UNEDIC A.S.SEO 2,000,000 0.88% 25/5/2028 2,135,586 0.04%

283
Vanguard Euro Government Bond Index Fund
Principal EUR (€) Coupon
Maturity Date
Fair Value EUR (€)
% of Total Net Assets
Dexia Credit Local SA 2,000,000 1.00% 18/10/2027 2,134,423 0.04%SFIL SA 2,000,000 0.75% 6/2/2026 2,089,759 0.04%Societe Nationale SNCF SA 1,850,000 4.63% 2/2/2024 2,089,120 0.04%RTE Reseau de Transport d'Electricite SADIR 1,900,000 1.50% 27/9/2030 2,079,894 0.04%Caisse d'Amortissement de la Dette Sociale 2,100,000 0.00% 25/5/2031 2,065,425 0.04%Societe Du Grand Paris EPIC 2,100,000 0.00% 25/11/2030 2,053,951 0.04%UNEDIC A.S.SEO 2,000,000 0.25% 25/11/2029 2,036,639 0.04%UNEDIC A.S.SEO 2,000,000 0.10% 25/11/2026 2,036,611 0.04%Bpifrance SACA 2,000,000 0.25% 14/2/2023 2,024,524 0.04%La Banque Postale SA^ 2,000,000 0.50% 17/6/2026 2,024,185 0.04%Societe Du Grand Paris EPIC 2,200,000 1.00% 18/2/2070 2,002,662 0.04%Agence Francaise de Developpement EPIC 2,000,000 0.50% 31/5/2035 2,001,483 0.04%UNEDIC A.S.SEO 2,000,000 0.50% 25/5/2036 1,997,055 0.04%Bpifrance SACA 1,900,000 0.05% 26/9/2029 1,895,854 0.03%SNCF Reseau 1,500,000 4.25% 7/10/2026 1,849,052 0.03%Dexia Credit Local SA 1,700,000 0.00% 29/5/2024 1,718,672 0.03%Caisse d'Amortissement de la Dette Sociale 1,700,000 0.00% 25/2/2028 1,714,555 0.03%Caisse Centrale du Credit Immobilier de France SA 1,700,000 0.00% 22/1/2023 1,710,827 0.03%SNCF Reseau 1,500,000 4.50% 30/1/2024 1,689,672 0.03%Electricite de France SA 1,400,000 4.00% 12/11/2025 1,646,617 0.03%Dexia Credit Local SA 1,600,000 0.75% 25/1/2023 1,631,249 0.03%Dexia Credit Local SA 1,500,000 1.25% 27/10/2025 1,595,282 0.03%UNEDIC A.S.SEO 1,400,000 1.50% 20/4/2032 1,591,570 0.03%Societe Nationale SNCF SA 1,800,000 0.88% 28/2/2051 1,586,909 0.03%Electricite de France SA^ 1,400,000 5.38% Perpetual 1,571,500 0.03%Bpifrance SACA 1,500,000 0.63% 25/5/2026 1,567,771 0.03%UNEDIC A.S.SEO 1,500,000 0.63% 3/3/2026 1,564,667 0.03%Dexia Credit Local SA 1,500,000 0.63% 17/1/2026 1,556,802 0.03%Aeroports de Paris 1,500,000 1.13% 18/6/2034 1,553,312 0.03%Bpifrance SACA 1,500,000 0.25% 4/6/2031 1,506,567 0.03%Caisse d'Amortissement de la Dette Sociale 1,500,000 0.00% 25/11/2030 1,481,367 0.03%Regie Autonome des Transports Parisiens 1,400,000 2.88% 9/9/2022 1,455,260 0.03%Electricite de France SA 1,300,000 2.00% 9/12/2049 1,400,060 0.02%UNEDIC A.S.SEO 1,300,000 0.88% 25/10/2022 1,324,297 0.02%La Poste SA 1,200,000 1.13% 4/6/2025 1,256,813 0.02%Electricite de France SA 1,100,000 1.88% 13/10/2036 1,225,543 0.02%Caisse d'Amortissement de la Dette Sociale 1,200,000 0.00% 25/2/2026 1,217,734 0.02%Bpifrance SACA 1,200,000 0.00% 25/5/2028 1,205,867 0.02%UNEDIC A.S.SEO 1,200,000 0.00% 19/11/2030 1,185,178 0.02%Societe Du Grand Paris EPIC 1,200,000 0.88% 10/5/2046 1,183,056 0.02%Regie Autonome des Transports Parisiens 1,100,000 0.88% 25/5/2027 1,159,868 0.02%RTE Reseau de Transport d'Electricite SADIR 1,100,000 1.00% 19/10/2026 1,151,842 0.02%SNCF Reseau 1,100,000 0.75% 25/5/2036 1,119,460 0.02%Agence Francaise de Developpement EPIC 1,000,000 1.38% 5/7/2032 1,113,480 0.02%UNEDIC A.S.SEO 1,000,000 2.38% 25/5/2024 1,082,870 0.02%La Banque Postale SA 1,000,000 1.38% 24/4/2029 1,065,779 0.02%UNEDIC A.S.SEO 1,100,000 0.10% 25/5/2034 1,060,711 0.02%SNCF Reseau 1,000,000 0.88% 22/1/2029 1,058,207 0.02%RTE Reseau de Transport d'Electricite SADIR 1,000,000 1.63% 8/10/2024 1,054,736 0.02%La Poste SA 1,000,000 1.00% 17/9/2034 1,033,514 0.02%Dexia Credit Local SA 1,000,000 0.50% 17/1/2025 1,027,933 0.02%Agence France Locale 1,000,000 0.50% 20/6/2024 1,024,182 0.02%Caisse Centrale du Credit Immobilier de France SA 1,000,000 0.13% 26/10/2022 1,007,559 0.02%Agence France Locale 1,000,000 0.00% 20/9/2027 1,002,154 0.02%UNEDIC A.S.SEO 1,000,000 0.00% 5/3/2030 996,317 0.02%Agence Francaise de Developpement EPIC 900,000 2.25% 27/5/2025 990,965 0.02%La Banque Postale SA^ 1,000,000 0.75% 2/8/2032 983,067 0.02%Agence France Locale 1,000,000 0.00% 20/3/2031 974,826 0.02%SNCF Reseau 800,000 1.50% 29/5/2037 895,361 0.02%La Poste SA 900,000 0.63% 18/1/2036 858,851 0.02%RTE Reseau de Transport d'Electricite SADIR 800,000 1.63% 27/11/2025 856,066 0.02%Aeroports de Paris 800,000 1.00% 5/1/2029 839,104 0.01%Societe Du Grand Paris EPIC 700,000 1.70% 25/5/2050 815,970 0.01%Electricite de France SA 600,000 4.63% 26/4/2030 815,257 0.01%Bpifrance SACA 800,000 0.13% 25/3/2025 815,137 0.01%La Poste SA 800,000 0.38% 17/9/2027 811,897 0.01%Agence Francaise de Developpement EPIC 800,000 0.50% 25/10/2022 810,412 0.01%Caisse Centrale du Credit Immobilier de France SA 800,000 0.05% 25/3/2025 808,699 0.01%Region of Ile de France 800,000 0.10% 2/7/2030 794,257 0.01%Action Logement Services 800,000 0.50% 30/10/2034 790,621 0.01%RTE Reseau de Transport d'Electricite SADIR 800,000 0.00% 9/9/2027 790,584 0.01%
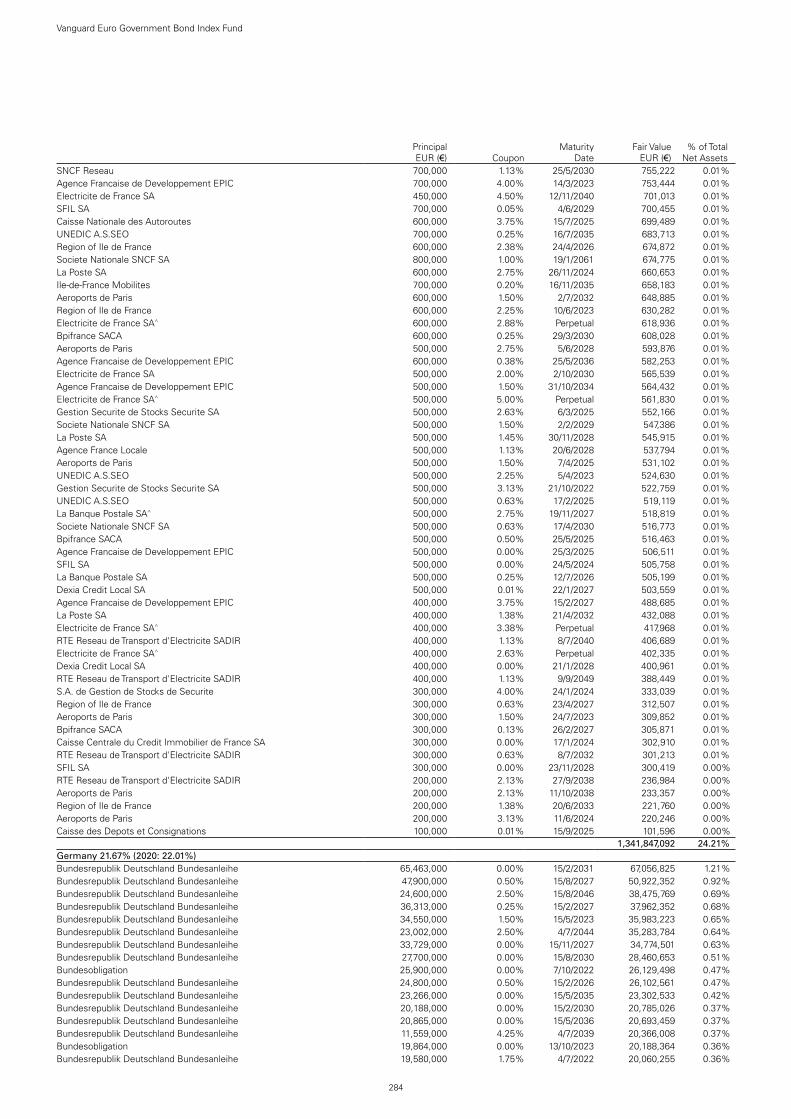
284
Vanguard Euro Government Bond Index Fund
Principal EUR (€) Coupon
Maturity Date
Fair Value EUR (€)
% of Total Net Assets
SNCF Reseau 700,000 1.13% 25/5/2030 755,222 0.01%Agence Francaise de Developpement EPIC 700,000 4.00% 14/3/2023 753,444 0.01%Electricite de France SA 450,000 4.50% 12/11/2040 701,013 0.01%SFIL SA 700,000 0.05% 4/6/2029 700,455 0.01%Caisse Nationale des Autoroutes 600,000 3.75% 15/7/2025 699,489 0.01%UNEDIC A.S.SEO 700,000 0.25% 16/7/2035 683,713 0.01%Region of Ile de France 600,000 2.38% 24/4/2026 674,872 0.01%Societe Nationale SNCF SA 800,000 1.00% 19/1/2061 674,775 0.01%La Poste SA 600,000 2.75% 26/11/2024 660,653 0.01%Ile-de-France Mobilites 700,000 0.20% 16/11/2035 658,183 0.01%Aeroports de Paris 600,000 1.50% 2/7/2032 648,885 0.01%Region of Ile de France 600,000 2.25% 10/6/2023 630,282 0.01%Electricite de France SA^ 600,000 2.88% Perpetual 618,936 0.01%Bpifrance SACA 600,000 0.25% 29/3/2030 608,028 0.01%Aeroports de Paris 500,000 2.75% 5/6/2028 593,876 0.01%Agence Francaise de Developpement EPIC 600,000 0.38% 25/5/2036 582,253 0.01%Electricite de France SA 500,000 2.00% 2/10/2030 565,539 0.01%Agence Francaise de Developpement EPIC 500,000 1.50% 31/10/2034 564,432 0.01%Electricite de France SA^ 500,000 5.00% Perpetual 561,830 0.01%Gestion Securite de Stocks Securite SA 500,000 2.63% 6/3/2025 552,166 0.01%Societe Nationale SNCF SA 500,000 1.50% 2/2/2029 547,386 0.01%La Poste SA 500,000 1.45% 30/11/2028 545,915 0.01%Agence France Locale 500,000 1.13% 20/6/2028 537,794 0.01%Aeroports de Paris 500,000 1.50% 7/4/2025 531,102 0.01%UNEDIC A.S.SEO 500,000 2.25% 5/4/2023 524,630 0.01%Gestion Securite de Stocks Securite SA 500,000 3.13% 21/10/2022 522,759 0.01%UNEDIC A.S.SEO 500,000 0.63% 17/2/2025 519,119 0.01%La Banque Postale SA^ 500,000 2.75% 19/11/2027 518,819 0.01%Societe Nationale SNCF SA 500,000 0.63% 17/4/2030 516,773 0.01%Bpifrance SACA 500,000 0.50% 25/5/2025 516,463 0.01%Agence Francaise de Developpement EPIC 500,000 0.00% 25/3/2025 506,511 0.01%SFIL SA 500,000 0.00% 24/5/2024 505,758 0.01%La Banque Postale SA 500,000 0.25% 12/7/2026 505,199 0.01%Dexia Credit Local SA 500,000 0.01% 22/1/2027 503,559 0.01%Agence Francaise de Developpement EPIC 400,000 3.75% 15/2/2027 488,685 0.01%La Poste SA 400,000 1.38% 21/4/2032 432,088 0.01%Electricite de France SA^ 400,000 3.38% Perpetual 417,968 0.01%RTE Reseau de Transport d'Electricite SADIR 400,000 1.13% 8/7/2040 406,689 0.01%Electricite de France SA^ 400,000 2.63% Perpetual 402,335 0.01%Dexia Credit Local SA 400,000 0.00% 21/1/2028 400,961 0.01%RTE Reseau de Transport d'Electricite SADIR 400,000 1.13% 9/9/2049 388,449 0.01%S.A. de Gestion de Stocks de Securite 300,000 4.00% 24/1/2024 333,039 0.01%Region of Ile de France 300,000 0.63% 23/4/2027 312,507 0.01%Aeroports de Paris 300,000 1.50% 24/7/2023 309,852 0.01%Bpifrance SACA 300,000 0.13% 26/2/2027 305,871 0.01%Caisse Centrale du Credit Immobilier de France SA 300,000 0.00% 17/1/2024 302,910 0.01%RTE Reseau de Transport d'Electricite SADIR 300,000 0.63% 8/7/2032 301,213 0.01%SFIL SA 300,000 0.00% 23/11/2028 300,419 0.00%RTE Reseau de Transport d'Electricite SADIR 200,000 2.13% 27/9/2038 236,984 0.00%Aeroports de Paris 200,000 2.13% 11/10/2038 233,357 0.00%Region of Ile de France 200,000 1.38% 20/6/2033 221,760 0.00%Aeroports de Paris 200,000 3.13% 11/6/2024 220,246 0.00%Caisse des Depots et Consignations 100,000 0.01% 15/9/2025 101,596 0.00%test - - - 1,341,847,092 24.21%Germany 21.67% (2020: 22.01%)Bundesrepublik Deutschland Bundesanleihe 65,463,000 0.00% 15/2/2031 67,056,825 1.21%Bundesrepublik Deutschland Bundesanleihe 47,900,000 0.50% 15/8/2027 50,922,352 0.92%Bundesrepublik Deutschland Bundesanleihe 24,600,000 2.50% 15/8/2046 38,475,769 0.69%Bundesrepublik Deutschland Bundesanleihe 36,313,000 0.25% 15/2/2027 37,962,352 0.68%Bundesrepublik Deutschland Bundesanleihe 34,550,000 1.50% 15/5/2023 35,983,223 0.65%Bundesrepublik Deutschland Bundesanleihe 23,002,000 2.50% 4/7/2044 35,283,784 0.64%Bundesrepublik Deutschland Bundesanleihe 33,729,000 0.00% 15/11/2027 34,774,501 0.63%Bundesrepublik Deutschland Bundesanleihe 27,700,000 0.00% 15/8/2030 28,460,653 0.51%Bundesobligation 25,900,000 0.00% 7/10/2022 26,129,498 0.47%Bundesrepublik Deutschland Bundesanleihe 24,800,000 0.50% 15/2/2026 26,102,561 0.47%Bundesrepublik Deutschland Bundesanleihe 23,266,000 0.00% 15/5/2035 23,302,533 0.42%Bundesrepublik Deutschland Bundesanleihe 20,188,000 0.00% 15/2/2030 20,785,026 0.37%Bundesrepublik Deutschland Bundesanleihe 20,865,000 0.00% 15/5/2036 20,693,459 0.37%Bundesrepublik Deutschland Bundesanleihe 11,559,000 4.25% 4/7/2039 20,366,008 0.37%Bundesobligation 19,864,000 0.00% 13/10/2023 20,188,364 0.36%Bundesrepublik Deutschland Bundesanleihe 19,580,000 1.75% 4/7/2022 20,060,255 0.36%

285
Vanguard Euro Government Bond Index Fund
Principal EUR (€) Coupon
Maturity Date
Fair Value EUR (€)
% of Total Net Assets
Bundesrepublik Deutschland Bundesanleihe 18,165,000 0.00% 15/8/2029 18,710,634 0.34%Bundesrepublik Deutschland Bundesanleihe 20,092,400 0.00% 15/8/2050 18,515,815 0.33%Bundesrepublik Deutschland Bundesanleihe 14,264,000 1.25% 15/8/2048 17,994,068 0.32%Bundesrepublik Deutschland Bundesanleihe 16,420,000 0.25% 15/2/2029 17,259,124 0.31%Bundesrepublik Deutschland Bundesanleihe 16,100,000 1.00% 15/8/2025 17,208,016 0.31%Bundesobligation 16,239,000 0.00% 11/4/2025 16,641,881 0.30%Bundesrepublik Deutschland Bundesanleihe 9,666,000 4.00% 4/1/2037 15,745,049 0.28%Bundesrepublik Deutschland Bundesanleihe 8,169,102 4.75% 4/7/2040 15,471,079 0.28%Bundesrepublik Deutschland Bundesanleihe 13,150,000 1.50% 4/9/2022 13,492,993 0.24%Bundesrepublik Deutschland Bundesanleihe 7,650,000 3.25% 4/7/2042 12,673,990 0.23%Bundesrepublik Deutschland Bundesanleihe 11,200,000 1.75% 15/2/2024 11,928,180 0.21%Bundesrepublik Deutschland Bundesanleihe 11,500,000 0.00% 15/8/2026 11,845,345 0.21%Bundesrepublik Deutschland Bundesanleihe 11,133,000 0.25% 15/8/2028 11,698,252 0.21%Bundesrepublik Deutschland Bundesanleihe 11,100,000 1.00% 15/8/2024 11,694,752 0.21%Bundesobligation 10,200,000 0.00% 14/4/2023 10,326,782 0.19%Bundesobligation 10,000,000 0.00% 10/10/2025 10,279,273 0.19%Kreditanstalt fuer Wiederaufbau 9,800,000 0.00% 15/12/2027 9,956,399 0.18%Bundesrepublik Deutschland Bundesanleihe 9,260,000 1.50% 15/5/2024 9,850,363 0.18%Kreditanstalt fuer Wiederaufbau 9,600,000 0.13% 24/2/2023 9,717,607 0.17%Bundesobligation 9,400,000 0.00% 18/10/2024 9,609,757 0.17%Bundesrepublik Deutschland Bundesanleihe 9,150,000 1.50% 15/2/2023 9,477,601 0.17%Bundesrepublik Deutschland Bundesanleihe 8,500,000 2.00% 15/8/2023 8,992,115 0.16%Bundesobligation 8,600,000 0.00% 5/4/2024 8,762,918 0.16%Kreditanstalt fuer Wiederaufbau 7,870,000 0.00% 15/9/2028 7,976,430 0.14%Kreditanstalt fuer Wiederaufbau 7,200,000 0.00% 2/4/2024 7,310,841 0.13%Kreditanstalt fuer Wiederaufbau 6,400,000 0.13% 15/1/2024 6,513,087 0.12%Kreditanstalt fuer Wiederaufbau 6,200,000 0.38% 9/3/2026 6,431,968 0.12%Kreditanstalt fuer Wiederaufbau 5,700,000 0.00% 15/9/2023 5,773,706 0.10%Gemeinsame Deutsche Bundeslaender 5,160,000 0.25% 18/3/2024 5,263,815 0.09%Kreditanstalt fuer Wiederaufbau 4,800,000 0.50% 15/9/2027 5,029,255 0.09%Kreditanstalt fuer Wiederaufbau 4,700,000 0.75% 15/1/2029 5,024,865 0.09%NRW Bank 4,800,000 0.50% 11/5/2026 4,981,805 0.09%State of North Rhine-Westphalia Germany 4,100,000 1.65% 22/2/2038 4,874,998 0.09%NRW Bank 4,800,000 0.13% 7/7/2023 4,860,737 0.09%State of North Rhine-Westphalia Germany 3,500,000 2.38% 13/5/2033 4,382,619 0.08%Kreditanstalt fuer Wiederaufbau 4,300,000 0.38% 15/3/2023 4,372,304 0.08%Kreditanstalt fuer Wiederaufbau 4,300,000 0.00% 4/7/2024 4,368,624 0.08%State of Rhineland-Palatinate 4,000,000 0.50% 21/1/2025 4,132,588 0.07%Kreditanstalt fuer Wiederaufbau 3,975,000 0.63% 15/1/2025 4,131,868 0.07%Bundesobligation 4,000,000 0.00% 10/4/2026 4,114,294 0.07%State of North Rhine-Westphalia Germany 2,600,000 2.15% 21/3/2119 4,083,324 0.07%Kreditanstalt fuer Wiederaufbau 3,800,000 0.63% 4/7/2022 3,848,071 0.07%State of North Rhine-Westphalia Germany 3,500,000 1.00% 16/10/2046 3,830,514 0.07%Kreditanstalt fuer Wiederaufbau 3,712,000 0.13% 7/11/2023 3,773,834 0.07%Landwirtschaftliche Rentenbank 3,500,000 0.25% 29/8/2025 3,597,668 0.06%Landwirtschaftliche Rentenbank 3,500,000 0.38% 22/1/2024 3,580,983 0.06%NRW Bank 3,400,000 0.25% 16/5/2024 3,468,445 0.06%Kreditanstalt fuer Wiederaufbau 3,440,000 0.00% 10/1/2031 3,447,185 0.06%Land Berlin 3,200,000 0.63% 5/2/2029 3,380,490 0.06%State of Lower Saxony 3,200,000 0.38% 9/1/2026 3,305,628 0.06%State of North Rhine-Westphalia Germany 3,000,000 0.90% 15/11/2028 3,228,105 0.06%Kreditanstalt fuer Wiederaufbau 3,000,000 0.50% 28/9/2026 3,137,425 0.06%NRW Bank 3,000,000 0.50% 26/5/2025 3,101,762 0.06%Land Berlin 3,000,000 0.50% 10/2/2025 3,100,090 0.06%State of Lower Saxony 3,000,000 0.40% 27/10/2025 3,099,857 0.06%Kreditanstalt fuer Wiederaufbau 3,000,000 0.25% 15/9/2025 3,087,113 0.06%Free & Hanseatic City of Hamburg 3,000,000 0.25% 20/1/2025 3,072,763 0.05%State of Bremen 3,000,000 0.38% 22/2/2024 3,067,584 0.05%Kreditanstalt fuer Wiederaufbau 3,000,000 0.13% 4/10/2024 3,062,179 0.05%Landwirtschaftliche Rentenbank 3,020,000 0.00% 19/7/2028 3,059,626 0.05%State of Schleswig-Holstein Germany 3,000,000 0.05% 4/11/2024 3,049,249 0.05%State of Hesse 3,000,000 0.13% 25/1/2024 3,048,484 0.05%Kreditanstalt fuer Wiederaufbau 3,000,000 0.38% 20/5/2036 3,030,540 0.05%State of Rhineland-Palatinate 3,000,000 0.01% 16/1/2023 3,026,359 0.05%State of North Rhine-Westphalia Germany 3,000,000 0.00% 5/12/2022 3,023,668 0.05%State of Hesse 3,000,000 0.00% 8/11/2030 2,991,145 0.05%Landwirtschaftliche Rentenbank 2,800,000 0.63% 18/5/2027 2,951,221 0.05%Bundesrepublik Deutschland Bundesanleihe 2,700,000 0.50% 15/2/2028 2,878,405 0.05%Gemeinsame Deutsche Bundeslaender 2,500,000 0.75% 25/9/2028 2,662,186 0.05%State of Saxony-Anhalt 2,500,000 0.50% 25/6/2027 2,610,318 0.05%Kreditanstalt fuer Wiederaufbau 2,560,000 0.00% 15/6/2026 2,608,992 0.05%

286
Vanguard Euro Government Bond Index Fund
Principal EUR (€) Coupon
Maturity Date
Fair Value EUR (€)
% of Total Net Assets
State of North Rhine-Westphalia Germany 2,750,000 0.00% 12/10/2035 2,605,816 0.05%State of Hesse 2,500,000 0.38% 6/7/2026 2,587,211 0.05%Bundesrepublik Deutschland Bundesanleihe 2,500,000 0.00% 15/11/2028 2,575,241 0.05%Kreditanstalt fuer Wiederaufbau 2,500,000 0.00% 30/9/2026 2,546,419 0.05%Gemeinsame Deutsche Bundeslaender 2,500,000 0.13% 14/4/2023 2,529,617 0.05%State of Lower Saxony 2,500,000 0.01% 10/1/2031 2,490,004 0.04%Kreditanstalt fuer Wiederaufbau 2,480,000 0.00% 17/9/2030 2,487,180 0.04%Kreditanstalt fuer Wiederaufbau 2,000,000 1.13% 9/5/2033 2,231,525 0.04%State of North Rhine-Westphalia Germany 2,500,000 0.20% 27/1/2051 2,220,983 0.04%State of North Rhine-Westphalia Germany 2,000,000 0.95% 13/3/2028 2,151,847 0.04%Land Berlin 2,000,000 0.75% 3/4/2034 2,114,210 0.04%NRW Bank 2,000,000 0.63% 4/1/2028 2,101,837 0.04%State of Rhineland-Palatinate 2,000,000 0.75% 19/1/2026 2,100,614 0.04%Deutsche Bahn Finance GmbH 2,000,000 0.63% 26/9/2028 2,091,567 0.04%State of North Rhine-Westphalia Germany 2,000,000 0.75% 16/8/2041 2,081,470 0.04%State of North Rhine-Westphalia Germany 2,000,000 0.50% 16/4/2026 2,080,962 0.04%Landwirtschaftliche Rentenbank 2,000,000 0.38% 14/2/2028 2,079,703 0.04%Landeskreditbank Baden-Wuerttemberg Foerderbank 2,000,000 0.38% 13/4/2026 2,064,639 0.04%Land Berlin 2,000,000 0.75% 8/9/2023 2,056,217 0.04%NRW Bank 2,000,000 0.25% 28/9/2026 2,054,838 0.04%State of Lower Saxony 2,000,000 0.13% 7/3/2025 2,039,965 0.04%State of Lower Saxony 2,000,000 0.25% 6/2/2024 2,038,943 0.04%State of North Rhine-Westphalia Germany 2,000,000 0.00% 5/5/2025 2,031,860 0.04%State of Hesse 2,000,000 0.38% 10/3/2023 2,031,123 0.04%Kreditanstalt fuer Wiederaufbau 2,000,000 0.13% 7/6/2023 2,027,989 0.04%Land Baden-Wuerttemberg 2,000,000 0.01% 2/9/2030 1,998,698 0.04%Landwirtschaftliche Rentenbank 2,000,000 0.00% 30/6/2031 1,996,080 0.04%Landwirtschaftliche Rentenbank 1,960,000 0.00% 22/9/2027 1,993,515 0.04%Kreditanstalt fuer Wiederaufbau 1,940,000 0.00% 31/3/2027 1,973,276 0.04%Land Berlin 1,700,000 1.30% 13/6/2033 1,911,471 0.03%Landesbank Baden-Wuerttemberg 1,900,000 0.38% 21/2/2031 1,867,553 0.03%State of North Rhine-Westphalia Germany 1,500,000 1.55% 16/6/2048 1,855,723 0.03%State of North Rhine-Westphalia Germany 1,800,000 0.20% 16/2/2024 1,832,727 0.03%Kreditanstalt fuer Wiederaufbau 1,700,000 0.63% 22/2/2027 1,790,165 0.03%State of Brandenburg 1,540,000 1.45% 26/11/2038 1,788,975 0.03%State of Rhineland-Palatinate 1,700,000 0.10% 18/8/2026 1,735,605 0.03%Free State of Bavaria 1,800,000 0.01% 18/1/2035 1,729,561 0.03%Land Baden-Wuerttemberg 1,600,000 2.00% 13/11/2023 1,695,788 0.03%State of North Rhine-Westphalia Germany 1,500,000 1.38% 15/1/2120 1,686,633 0.03%State of Hesse 1,550,000 1.75% 20/1/2023 1,605,916 0.03%State of North Rhine-Westphalia Germany 1,100,000 1.95% 26/9/2078 1,574,598 0.03%State of Lower Saxony 1,500,000 1.00% 18/8/2022 1,526,632 0.03%Land Baden-Wuerttemberg 1,500,000 1.00% 18/7/2022 1,524,596 0.03%State of Lower Saxony 1,500,000 0.00% 11/2/2027 1,522,244 0.03%State of Lower Saxony 1,500,000 0.38% 19/1/2023 1,521,827 0.03%State of North Rhine-Westphalia Germany 1,500,000 0.13% 16/3/2023 1,516,844 0.03%State of Schleswig-Holstein Germany 1,480,000 0.01% 16/7/2025 1,503,702 0.03%State of Schleswig-Holstein Germany 1,500,000 0.01% 22/5/2030 1,502,056 0.03%State of Lower Saxony 1,500,000 0.01% 13/8/2030 1,498,907 0.03%State of Bremen 1,500,000 0.55% 4/2/2050 1,480,992 0.03%EWE AG 1,520,000 0.38% 22/10/2032 1,480,672 0.03%State of Hesse 1,400,000 1.38% 10/6/2024 1,477,031 0.03%Kreditanstalt fuer Wiederaufbau 1,500,000 0.05% 29/9/2034 1,465,182 0.03%Land Berlin 1,350,000 1.63% 3/6/2024 1,433,561 0.03%State of Hesse 1,400,000 0.00% 22/9/2027 1,418,985 0.03%Deutsche Bahn Finance GmbH^ 1,400,000 0.95% Perpetual 1,401,071 0.02%State of North Rhine-Westphalia Germany 1,500,000 0.95% 10/1/2121 1,381,113 0.02%Kreditanstalt fuer Wiederaufbau 1,300,000 0.63% 7/1/2028 1,374,028 0.02%Deutsche Bahn Finance GmbH 1,350,000 0.38% 23/6/2029 1,372,270 0.02%Kreditanstalt fuer Wiederaufbau 1,300,000 0.38% 23/4/2030 1,350,712 0.02%State of North Rhine-Westphalia Germany 1,000,000 1.75% 26/10/2057 1,328,413 0.02%Gemeinsame Deutsche Bundeslaender 1,250,000 0.00% 25/9/2029 1,255,907 0.02%Land Baden-Wuerttemberg 1,200,000 0.63% 27/1/2026 1,253,801 0.02%State of Hesse 1,175,000 0.88% 10/12/2024 1,228,583 0.02%Kreditanstalt fuer Wiederaufbau 1,130,000 0.88% 4/7/2039 1,223,773 0.02%State of Saxony-Anhalt 1,125,000 0.75% 29/1/2029 1,198,389 0.02%State of North Rhine-Westphalia Germany 1,000,000 1.50% 12/6/2040 1,178,786 0.02%Deutsche Bahn Finance GmbH 1,100,000 1.00% 17/12/2027 1,169,428 0.02%Free & Hanseatic City of Hamburg 1,000,000 1.45% 5/11/2038 1,161,850 0.02%Kreditanstalt fuer Wiederaufbau 1,000,000 1.25% 4/7/2036 1,134,756 0.02%Land Thueringen 1,000,000 1.25% 5/12/2033 1,120,664 0.02%

287
Vanguard Euro Government Bond Index Fund
Principal EUR (€) Coupon
Maturity Date
Fair Value EUR (€)
% of Total Net Assets
Wirtschafts- und Infrastrukturbank Hessen 1,000,000 1.25% 6/9/2033 1,115,041 0.02%Wirtschafts- und Infrastrukturbank Hessen 1,050,000 1.75% 15/4/2024 1,114,265 0.02%Land Berlin 1,200,000 0.10% 18/1/2041 1,106,350 0.02%EnBW International Finance BV 1,100,000 0.13% 1/3/2028 1,099,634 0.02%State of Lower Saxony 1,000,000 0.88% 25/10/2028 1,073,721 0.02%State of Lower Saxony 1,016,000 0.38% 14/5/2029 1,053,040 0.02%Gemeinsame Deutsche Bundeslaender 1,000,000 1.13% 30/9/2024 1,051,623 0.02%Land Baden-Wuerttemberg 1,050,000 0.01% 7/3/2031 1,047,790 0.02%Bayerische Landesbodenkreditanstalt 1,000,000 0.63% 23/11/2026 1,046,523 0.02%Land Berlin 1,000,000 0.63% 20/3/2026 1,045,600 0.02%Land Thueringen 1,000,000 0.88% 25/11/2024 1,044,809 0.02%Bayerische Landesbodenkreditanstalt 1,000,000 0.75% 28/5/2025 1,042,994 0.02%Land Baden-Wuerttemberg 1,000,000 0.63% 16/1/2025 1,037,813 0.02%Bayerische Landesbodenkreditanstalt 1,000,000 1.88% 25/1/2023 1,037,215 0.02%Land Berlin 1,000,000 0.63% 25/8/2036 1,030,881 0.02%Land Thueringen 1,000,000 0.20% 26/10/2026 1,026,005 0.02%EnBW International Finance BV 1,000,000 0.63% 17/4/2025 1,025,514 0.02%Land Berlin 1,000,000 0.25% 22/4/2025 1,025,039 0.02%State of Lower Saxony 1,000,000 0.13% 8/4/2027 1,021,947 0.02%State of North Rhine-Westphalia Germany 1,000,000 0.60% 4/6/2041 1,016,388 0.02%State of Lower Saxony 1,000,000 0.00% 10/7/2026 1,015,932 0.02%Landesbank Baden-Wuerttemberg 1,000,000 0.38% 24/5/2024 1,015,384 0.02%Free State of Bavaria 1,000,000 0.01% 7/5/2027 1,014,792 0.02%State of Hesse 1,000,000 0.00% 25/4/2025 1,014,496 0.02%State of Bremen 1,000,000 0.50% 7/10/2022 1,013,240 0.02%Land Berlin 1,000,000 0.01% 21/11/2023 1,012,178 0.02%Kreditanstalt fuer Wiederaufbau 1,000,000 0.00% 15/6/2029 1,009,983 0.02%NRW Bank 1,000,000 0.00% 14/5/2029 1,003,200 0.02%Land Berlin 1,000,000 0.01% 2/7/2030 999,775 0.02%NRW Bank 1,000,000 0.00% 3/2/2031 993,843 0.02%NRW Bank 1,000,000 0.50% 17/6/2041 992,780 0.02%EnBW International Finance BV 1,000,000 0.50% 1/3/2033 988,352 0.02%Gemeinsame Deutsche Bundeslaender 950,000 1.75% 31/1/2023 984,881 0.02%Land Baden-Wuerttemberg 1,000,000 0.01% 9/7/2032 982,839 0.02%Free & Hanseatic City of Hamburg 950,000 1.88% 26/9/2022 978,695 0.02%State of Brandenburg 915,000 1.63% 28/5/2024 971,129 0.02%Land Berlin 1,000,000 0.13% 4/6/2035 967,986 0.02%Free State of Saxony 1,000,000 0.01% 17/12/2035 949,422 0.02%Free & Hanseatic City of Hamburg 1,000,000 0.01% 5/11/2035 948,544 0.02%Land Berlin 1,000,000 0.35% 9/9/2050 934,385 0.02%Kreditanstalt fuer Wiederaufbau 900,000 0.00% 18/2/2025 915,505 0.02%Landwirtschaftliche Rentenbank 1,000,000 0.01% 26/11/2040 914,619 0.02%Deutsche Bahn Finance GmbH 1,000,000 0.63% 8/12/2050 899,163 0.02%Landesbank Baden-Wuerttemberg 900,000 0.38% 7/5/2029 898,909 0.02%Deutsche Bahn Finance GmbH 800,000 1.63% 16/8/2033 896,329 0.02%State of Saxony-Anhalt 850,000 1.63% 25/4/2023 883,395 0.02%State of North Rhine-Westphalia Germany 900,000 0.38% 2/9/2050 846,091 0.01%State of North Rhine-Westphalia Germany 750,000 2.00% 15/10/2025 826,856 0.01%Investitionsbank Berlin 800,000 0.01% 30/7/2024 810,587 0.01%State of North Rhine-Westphalia Germany 800,000 0.20% 17/4/2023 810,584 0.01%Land Berlin 800,000 0.10% 18/1/2030 809,109 0.01%EnBW Energie Baden-Wuerttemberg AG^ 800,000 1.63% 5/8/2079 805,059 0.01%EnBW Energie Baden-Wuerttemberg AG^ 800,000 1.13% 5/11/2079 804,538 0.01%State of Hesse 700,000 1.30% 10/10/2033 789,089 0.01%State of North Rhine-Westphalia Germany 700,000 1.25% 12/5/2036 784,900 0.01%Niedersachsen Invest GmbH 800,000 0.25% 16/7/2035 781,834 0.01%Deutsche Bahn Finance GmbH 800,000 0.63% 15/4/2036 780,437 0.01%State of Schleswig-Holstein Germany 800,000 0.20% 15/8/2039 760,073 0.01%State of North Rhine-Westphalia Germany 700,000 1.25% 14/3/2025 743,420 0.01%Land Berlin 700,000 1.88% 12/6/2023 733,013 0.01%State of Lower Saxony 750,000 0.05% 9/3/2035 720,711 0.01%Free & Hanseatic City of Hamburg 795,000 0.20% 3/9/2049 711,389 0.01%State of North Rhine-Westphalia Germany 700,000 0.38% 16/2/2023 710,425 0.01%EnBW International Finance BV 600,000 1.88% 31/10/2033 691,120 0.01%State of North Rhine-Westphalia Germany 670,000 0.13% 4/6/2031 675,727 0.01%State of North Rhine-Westphalia Germany 640,000 0.00% 26/11/2029 642,552 0.01%Land Thueringen 710,000 0.13% 13/1/2051 622,676 0.01%State of Bremen 655,000 0.40% 20/8/2049 621,142 0.01%EnBW International Finance BV 625,000 0.25% 19/10/2030 617,473 0.01%State of Saarland 670,000 0.05% 5/11/2040 613,101 0.01%State of Hesse 600,000 0.38% 4/7/2022 605,756 0.01%

288
Vanguard Euro Government Bond Index Fund
Principal EUR (€) Coupon
Maturity Date
Fair Value EUR (€)
% of Total Net Assets
State of Bremen 500,000 1.50% 12/11/2038 583,860 0.01%Land Berlin 500,000 1.38% 27/8/2038 574,453 0.01%State of Lower Saxony 500,000 1.13% 12/9/2033 552,555 0.01%Deutsche Bahn Finance GmbH 500,000 1.38% 16/4/2040 538,674 0.01%Kreditanstalt fuer Wiederaufbau 500,000 0.75% 28/6/2028 533,614 0.01%State of North Rhine-Westphalia Germany 500,000 1.88% 15/3/2024 532,137 0.01%NRW Bank 500,000 0.88% 10/11/2025 526,609 0.01%State of North Rhine-Westphalia Germany 500,000 1.00% 16/1/2025 525,325 0.01%State of Brandenburg 500,000 0.75% 8/8/2036 525,151 0.01%Land Thueringen 500,000 0.50% 12/5/2025 517,474 0.01%State of Hesse 500,000 0.50% 17/2/2025 516,897 0.01%State of Rhineland-Palatinate 500,000 1.75% 5/9/2022 513,687 0.01%State of Lower Saxony 500,000 0.01% 15/4/2024 506,959 0.01%State of North Rhine-Westphalia Germany 500,000 0.50% 25/11/2039 500,490 0.01%Free & Hanseatic City of Hamburg 500,000 0.01% 3/6/2030 499,994 0.01%State of Lower Saxony 450,000 2.13% 16/1/2024 480,262 0.01%Deutsche Bahn Finance GmbH 450,000 2.50% 12/9/2023 477,713 0.01%State of Brandenburg 500,000 0.30% 4/10/2049 461,783 0.01%State of North Rhine-Westphalia Germany 400,000 1.63% 24/10/2030 459,700 0.01%NRW Bank 450,000 0.00% 18/2/2030 449,873 0.01%State of Brandenburg 500,000 0.13% 26/1/2046 447,152 0.01%Deutsche Bahn Finance GmbH 440,000 1.13% 29/5/2051 441,539 0.01%State of Bremen 400,000 1.88% 18/3/2024 425,575 0.01%State of Lower Saxony 400,000 2.13% 11/10/2023 424,223 0.01%State of North Rhine-Westphalia Germany 400,000 0.80% 30/7/2049 422,084 0.01%State of Bremen 400,000 0.50% 3/3/2025 413,393 0.01%Free & Hanseatic City of Hamburg 400,000 0.38% 1/4/2025 411,751 0.01%EnBW Energie Baden-Wuerttemberg AG^ 400,000 1.88% 29/6/2080 410,178 0.01%Niedersachsen Invest GmbH 400,000 0.00% 16/7/2025 405,234 0.01%Deutsche Bahn Finance GmbH 400,000 0.75% 16/7/2035 402,778 0.01%Free & Hanseatic City of Hamburg 350,000 1.88% 27/2/2024 372,139 0.01%Deutsche Bahn Finance GmbH 350,000 3.38% 4/11/2022 367,410 0.01%Deutsche Bahn Finance GmbH 300,000 2.75% 19/3/2029 361,499 0.01%EnBW International Finance BV 300,000 4.88% 16/1/2025 354,046 0.01%Deutsche Bahn Finance GmbH 300,000 1.63% 6/11/2030 339,737 0.01%Deutsche Bahn Finance GmbH 300,000 2.00% 20/2/2023 311,456 0.01%FMS Wertmanagement 300,000 0.38% 29/4/2030 309,387 0.01%EnBW International Finance BV 150,000 6.13% 7/7/2039 276,712 0.00%Landwirtschaftliche Rentenbank 200,000 0.63% 20/2/2030 211,870 0.00%Deutsche Bahn Finance GmbH^ 200,000 1.60% Perpetual 202,000 0.00%Deutsche Bahn Finance GmbH 190,000 0.00% 14/2/2024 191,368 0.00%Deutsche Bahn Finance GmbH 180,000 0.88% 23/6/2039 179,451 0.00%test - - - 1,201,158,814 21.67%Ireland 1.85% (2020: 1.82%)Ireland Government Bond 12,488,426 0.55% 22/4/2041 12,276,456 0.22%Ireland Government Bond 9,650,000 5.40% 13/3/2025 11,770,795 0.21%Ireland Government Bond 9,630,000 1.00% 15/5/2026 10,291,289 0.19%Ireland Government Bond 6,640,000 2.40% 15/5/2030 8,059,356 0.14%Ireland Government Bond 7,450,000 0.00% 18/10/2022 7,508,510 0.14%Ireland Government Bond 6,800,000 1.10% 15/5/2029 7,429,421 0.13%Ireland Government Bond 6,350,000 3.40% 18/3/2024 7,036,429 0.13%Ireland Government Bond 5,303,000 1.50% 15/5/2050 6,170,720 0.11%Ireland Government Bond 6,000,000 0.00% 18/10/2031 5,903,012 0.11%Ireland Government Bond 4,300,000 1.35% 18/3/2031 4,836,823 0.09%Ireland Government Bond 4,219,000 0.20% 15/5/2027 4,339,446 0.08%Ireland Government Bond 4,000,000 3.90% 20/3/2023 4,310,542 0.08%Ireland Government Bond 3,250,000 1.30% 15/5/2033 3,654,470 0.07%Ireland Government Bond 1,133,331 2.00% 18/2/2045 1,454,150 0.03%Ireland Government Bond 1,158,075 1.70% 15/5/2037 1,377,230 0.02%Ireland Government Bond 1,263,000 0.90% 15/5/2028 1,357,180 0.02%ESB Finance DAC 1,200,000 1.13% 11/6/2030 1,269,568 0.02%Ireland Government Bond 1,000,000 0.20% 18/10/2030 1,012,585 0.02%ESB Finance DAC 600,000 3.49% 12/1/2024 654,173 0.01%ESB Finance DAC 500,000 2.13% 8/6/2027 557,096 0.01%GAS Networks Ireland 550,000 0.13% 4/12/2024 553,918 0.01%GAS Networks Ireland 500,000 1.38% 5/12/2026 533,986 0.01%test - - - 102,357,155 1.85%Italy 20.09% (2020: 19.36%)Italy Buoni Poliennali Del Tesoro 108,023,000 1.85% 1/7/2025 116,137,567 2.09%Italy Buoni Poliennali Del Tesoro 72,706,000 3.00% 1/8/2029 86,683,604 1.56%Italy Buoni Poliennali Del Tesoro 56,514,000 0.25% 15/3/2028 55,939,795 1.01%
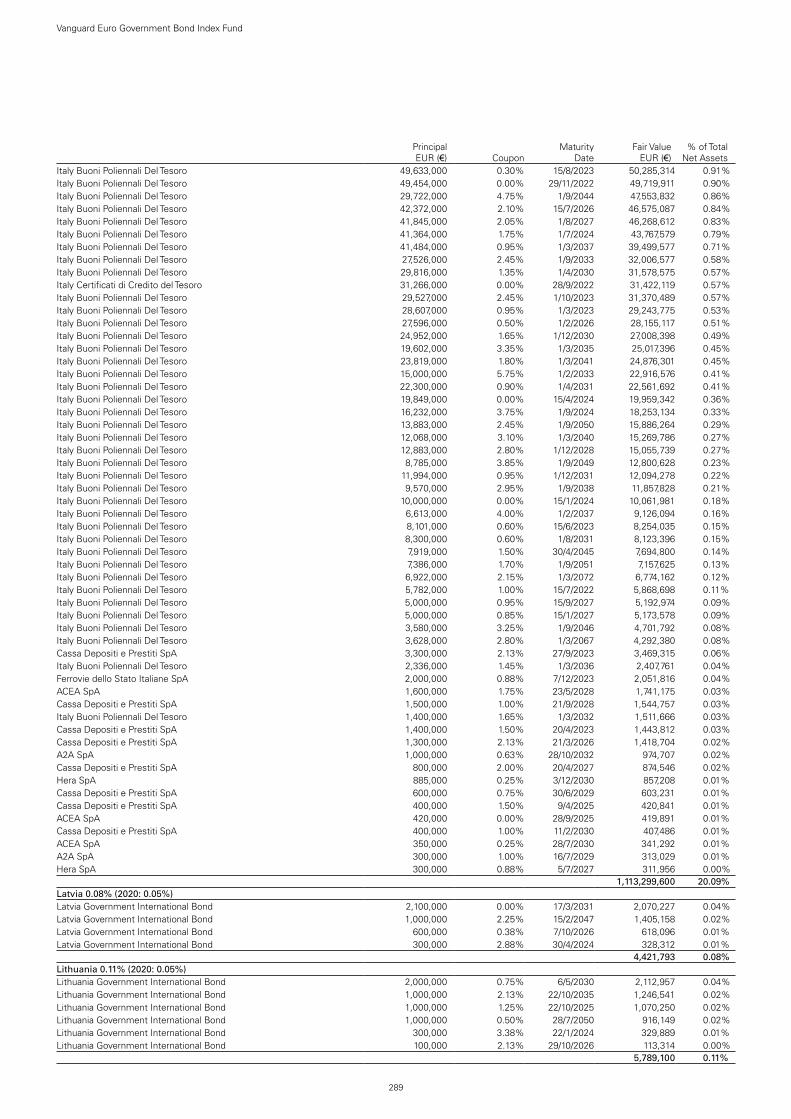
289
Vanguard Euro Government Bond Index Fund
Principal EUR (€) Coupon
Maturity Date
Fair Value EUR (€)
% of Total Net Assets
Italy Buoni Poliennali Del Tesoro 49,633,000 0.30% 15/8/2023 50,285,314 0.91%Italy Buoni Poliennali Del Tesoro 49,454,000 0.00% 29/11/2022 49,719,911 0.90%Italy Buoni Poliennali Del Tesoro 29,722,000 4.75% 1/9/2044 47,553,832 0.86%Italy Buoni Poliennali Del Tesoro 42,372,000 2.10% 15/7/2026 46,575,087 0.84%Italy Buoni Poliennali Del Tesoro 41,845,000 2.05% 1/8/2027 46,268,612 0.83%Italy Buoni Poliennali Del Tesoro 41,364,000 1.75% 1/7/2024 43,767,579 0.79%Italy Buoni Poliennali Del Tesoro 41,484,000 0.95% 1/3/2037 39,499,577 0.71%Italy Buoni Poliennali Del Tesoro 27,526,000 2.45% 1/9/2033 32,006,577 0.58%Italy Buoni Poliennali Del Tesoro 29,816,000 1.35% 1/4/2030 31,578,575 0.57%Italy Certificati di Credito del Tesoro 31,266,000 0.00% 28/9/2022 31,422,119 0.57%Italy Buoni Poliennali Del Tesoro 29,527,000 2.45% 1/10/2023 31,370,489 0.57%Italy Buoni Poliennali Del Tesoro 28,607,000 0.95% 1/3/2023 29,243,775 0.53%Italy Buoni Poliennali Del Tesoro 27,596,000 0.50% 1/2/2026 28,155,117 0.51%Italy Buoni Poliennali Del Tesoro 24,952,000 1.65% 1/12/2030 27,008,398 0.49%Italy Buoni Poliennali Del Tesoro 19,602,000 3.35% 1/3/2035 25,017,396 0.45%Italy Buoni Poliennali Del Tesoro 23,819,000 1.80% 1/3/2041 24,876,301 0.45%Italy Buoni Poliennali Del Tesoro 15,000,000 5.75% 1/2/2033 22,916,576 0.41%Italy Buoni Poliennali Del Tesoro 22,300,000 0.90% 1/4/2031 22,561,692 0.41%Italy Buoni Poliennali Del Tesoro 19,849,000 0.00% 15/4/2024 19,959,342 0.36%Italy Buoni Poliennali Del Tesoro 16,232,000 3.75% 1/9/2024 18,253,134 0.33%Italy Buoni Poliennali Del Tesoro 13,883,000 2.45% 1/9/2050 15,886,264 0.29%Italy Buoni Poliennali Del Tesoro 12,068,000 3.10% 1/3/2040 15,269,786 0.27%Italy Buoni Poliennali Del Tesoro 12,883,000 2.80% 1/12/2028 15,055,739 0.27%Italy Buoni Poliennali Del Tesoro 8,785,000 3.85% 1/9/2049 12,800,628 0.23%Italy Buoni Poliennali Del Tesoro 11,994,000 0.95% 1/12/2031 12,094,278 0.22%Italy Buoni Poliennali Del Tesoro 9,570,000 2.95% 1/9/2038 11,857,828 0.21%Italy Buoni Poliennali Del Tesoro 10,000,000 0.00% 15/1/2024 10,061,981 0.18%Italy Buoni Poliennali Del Tesoro 6,613,000 4.00% 1/2/2037 9,126,094 0.16%Italy Buoni Poliennali Del Tesoro 8,101,000 0.60% 15/6/2023 8,254,035 0.15%Italy Buoni Poliennali Del Tesoro 8,300,000 0.60% 1/8/2031 8,123,396 0.15%Italy Buoni Poliennali Del Tesoro 7,919,000 1.50% 30/4/2045 7,694,800 0.14%Italy Buoni Poliennali Del Tesoro 7,386,000 1.70% 1/9/2051 7,157,625 0.13%Italy Buoni Poliennali Del Tesoro 6,922,000 2.15% 1/3/2072 6,774,162 0.12%Italy Buoni Poliennali Del Tesoro 5,782,000 1.00% 15/7/2022 5,868,698 0.11%Italy Buoni Poliennali Del Tesoro 5,000,000 0.95% 15/9/2027 5,192,974 0.09%Italy Buoni Poliennali Del Tesoro 5,000,000 0.85% 15/1/2027 5,173,578 0.09%Italy Buoni Poliennali Del Tesoro 3,580,000 3.25% 1/9/2046 4,701,792 0.08%Italy Buoni Poliennali Del Tesoro 3,628,000 2.80% 1/3/2067 4,292,380 0.08%Cassa Depositi e Prestiti SpA 3,300,000 2.13% 27/9/2023 3,469,315 0.06%Italy Buoni Poliennali Del Tesoro 2,336,000 1.45% 1/3/2036 2,407,761 0.04%Ferrovie dello Stato Italiane SpA 2,000,000 0.88% 7/12/2023 2,051,816 0.04%ACEA SpA 1,600,000 1.75% 23/5/2028 1,741,175 0.03%Cassa Depositi e Prestiti SpA 1,500,000 1.00% 21/9/2028 1,544,757 0.03%Italy Buoni Poliennali Del Tesoro 1,400,000 1.65% 1/3/2032 1,511,666 0.03%Cassa Depositi e Prestiti SpA 1,400,000 1.50% 20/4/2023 1,443,812 0.03%Cassa Depositi e Prestiti SpA 1,300,000 2.13% 21/3/2026 1,418,704 0.02%A2A SpA 1,000,000 0.63% 28/10/2032 974,707 0.02%Cassa Depositi e Prestiti SpA 800,000 2.00% 20/4/2027 874,546 0.02%Hera SpA 885,000 0.25% 3/12/2030 857,208 0.01%Cassa Depositi e Prestiti SpA 600,000 0.75% 30/6/2029 603,231 0.01%Cassa Depositi e Prestiti SpA 400,000 1.50% 9/4/2025 420,841 0.01%ACEA SpA 420,000 0.00% 28/9/2025 419,891 0.01%Cassa Depositi e Prestiti SpA 400,000 1.00% 11/2/2030 407,486 0.01%ACEA SpA 350,000 0.25% 28/7/2030 341,292 0.01%A2A SpA 300,000 1.00% 16/7/2029 313,029 0.01%Hera SpA 300,000 0.88% 5/7/2027 311,956 0.00%test - - - 1,113,299,600 20.09%Latvia 0.08% (2020: 0.05%)Latvia Government International Bond 2,100,000 0.00% 17/3/2031 2,070,227 0.04%Latvia Government International Bond 1,000,000 2.25% 15/2/2047 1,405,158 0.02%Latvia Government International Bond 600,000 0.38% 7/10/2026 618,096 0.01%Latvia Government International Bond 300,000 2.88% 30/4/2024 328,312 0.01%test - - - 4,421,793 0.08%Lithuania 0.11% (2020: 0.05%)Lithuania Government International Bond 2,000,000 0.75% 6/5/2030 2,112,957 0.04%Lithuania Government International Bond 1,000,000 2.13% 22/10/2035 1,246,541 0.02%Lithuania Government International Bond 1,000,000 1.25% 22/10/2025 1,070,250 0.02%Lithuania Government International Bond 1,000,000 0.50% 28/7/2050 916,149 0.02%Lithuania Government International Bond 300,000 3.38% 22/1/2024 329,889 0.01%Lithuania Government International Bond 100,000 2.13% 29/10/2026 113,314 0.00%test - - - 5,789,100 0.11%

290
Vanguard Euro Government Bond Index Fund
Principal EUR (€) Coupon
Maturity Date
Fair Value EUR (€)
% of Total Net Assets
Luxembourg 0.06% (2020: 0.07%)Luxembourg Government Bond 2,000,000 0.63% 1/2/2027 2,106,262 0.04%Luxembourg Government Bond 1,250,000 2.13% 10/7/2023 1,319,299 0.02%test - - - 3,425,561 0.06%Netherlands 5.13% (2020: 5.16%)Netherlands Government Bond 23,450,000 1.75% 15/7/2023 24,632,819 0.44%Netherlands Government Bond 17,900,000 0.50% 15/7/2026 18,831,291 0.34%Netherlands Government Bond 11,045,000 2.75% 15/1/2047 17,828,683 0.32%Netherlands Government Bond 10,367,596 4.00% 15/1/2037 16,632,471 0.30%Netherlands Government Bond 8,490,000 3.75% 15/1/2042 14,571,364 0.26%Netherlands Government Bond 12,910,010 0.25% 15/7/2029 13,443,585 0.24%Netherlands Government Bond 9,950,000 2.50% 15/1/2033 12,896,465 0.23%Netherlands Government Bond 12,000,000 0.00% 15/1/2027 12,305,256 0.22%Netherlands Government Bond 8,498,834 5.50% 15/1/2028 11,818,665 0.21%Netherlands Government Bond 10,920,000 0.75% 15/7/2028 11,774,970 0.21%Netherlands Government Bond 11,500,000 0.00% 15/1/2024 11,704,642 0.21%Netherlands Government Bond 10,200,000 0.25% 15/7/2025 10,550,214 0.19%Netherlands Government Bond 7,100,000 2.00% 15/7/2024 7,682,340 0.14%Netherlands Government Bond 6,697,232 0.50% 15/1/2040 7,065,290 0.13%Netherlands Government Bond 6,600,000 3.75% 15/1/2023 7,057,617 0.13%Netherlands Government Bond 6,000,000 0.00% 15/7/2030 6,096,701 0.11%Netherlands Government Bond 6,000,000 0.00% 15/1/2052 5,370,771 0.10%BNG Bank NV 5,300,000 0.50% 26/8/2022 5,363,532 0.10%Netherlands Government Bond 5,300,000 0.00% 15/1/2038 5,131,579 0.09%Nederlandse Waterschapsbank NV 3,200,000 0.50% 27/10/2022 3,244,367 0.06%Nederlandse Waterschapsbank NV 3,000,000 0.63% 18/1/2027 3,146,408 0.06%Nederlandse Waterschapsbank NV 2,600,000 0.13% 17/1/2024 2,642,241 0.05%Nederlandse Waterschapsbank NV 2,500,000 0.50% 29/4/2030 2,609,263 0.05%BNG Bank NV 2,400,000 0.25% 7/5/2025 2,460,726 0.04%BNG Bank NV 2,000,000 1.50% 15/7/2039 2,354,211 0.04%Nederlandse Waterschapsbank NV 2,200,000 0.75% 4/10/2041 2,276,789 0.04%Netherlands Government Bond 2,000,000 0.75% 15/7/2027 2,145,084 0.04%BNG Bank NV 2,000,000 0.50% 16/4/2025 2,068,957 0.04%BNG Bank NV 2,000,000 0.25% 7/6/2024 2,041,733 0.04%BNG Bank NV 1,500,000 1.00% 12/1/2026 1,591,401 0.03%BNG Bank NV 1,500,000 0.50% 26/11/2025 1,556,867 0.03%Nederlandse Waterschapsbank NV 1,500,000 0.50% 19/1/2023 1,524,134 0.03%Royal Schiphol Group NV 1,493,000 0.00% 22/4/2025 1,495,031 0.03%BNG Bank NV 1,500,000 0.13% 19/4/2033 1,481,239 0.03%BNG Bank NV 1,500,000 0.13% 9/7/2035 1,449,777 0.03%Nederlandse Waterschapsbank NV 1,500,000 0.00% 2/10/2034 1,443,602 0.03%Netherlands Government Bond 1,350,000 2.25% 15/7/2022 1,391,438 0.02%Nederlandse Gasunie NV 1,300,000 0.38% 3/10/2031 1,296,197 0.02%TenneT Holding BV 1,000,000 2.00% 5/6/2034 1,172,118 0.02%BNG Bank NV 1,000,000 1.50% 29/3/2038 1,168,470 0.02%BNG Bank NV 1,000,000 1.38% 21/10/2030 1,123,175 0.02%BNG Bank NV 1,000,000 0.88% 17/10/2035 1,070,506 0.02%BNG Bank NV 1,000,000 0.13% 11/4/2026 1,021,041 0.02%BNG Bank NV 1,000,000 0.00% 20/1/2031 993,391 0.02%BNG Bank NV 1,000,000 0.01% 5/10/2032 983,638 0.02%Stedin Holding NV 900,000 1.38% 19/9/2028 971,138 0.02%Nederlandse Waterschapsbank NV 1,000,000 0.13% 3/9/2035 967,673 0.02%TenneT Holding BV 800,000 1.50% 3/6/2039 870,735 0.02%BNG Bank NV 750,000 3.88% 26/5/2023 813,117 0.01%TenneT Holding BV 800,000 0.13% 9/12/2027 800,537 0.01%Nederlandse Waterschapsbank NV 600,000 3.00% 11/9/2031 777,138 0.01%BNG Bank NV 750,000 2.25% 30/8/2022 774,425 0.01%TenneT Holding BV 750,000 1.13% 9/6/2041 761,922 0.01%TenneT Holding BV 700,000 0.88% 3/6/2030 730,001 0.01%TenneT Holding BV 600,000 1.00% 13/6/2026 629,360 0.01%Nederlandse Waterschapsbank NV 600,000 0.05% 28/1/2030 603,493 0.01%Nederlandse Waterschapsbank NV 500,000 1.50% 27/4/2038 584,310 0.01%Nederlandse Waterschapsbank NV 500,000 1.25% 27/5/2036 558,125 0.01%TenneT Holding BV 500,000 1.25% 24/10/2033 541,599 0.01%BNG Bank NV 500,000 1.13% 4/9/2024 525,283 0.01%Nederlandse Gasunie NV 500,000 1.00% 11/5/2026 524,345 0.01%Stedin Holding NV 500,000 0.50% 14/11/2029 506,161 0.01%Nederlandse Waterschapsbank NV 400,000 3.25% 9/3/2027 479,891 0.01%TenneT Holding BV 450,000 0.50% 9/6/2031 451,325 0.01%TenneT Holding BV 400,000 4.63% 21/2/2023 433,060 0.01%Stedin Holding NV 400,000 0.88% 24/10/2025 415,324 0.01%

291
Vanguard Euro Government Bond Index Fund
Principal EUR (€) Coupon
Maturity Date
Fair Value EUR (€)
% of Total Net Assets
Alliander NV 400,000 2.25% 14/11/2022 414,232 0.01%Enexis Holding NV 400,000 0.63% 17/6/2032 406,005 0.01%Royal Schiphol Group NV 400,000 0.38% 8/9/2027 405,137 0.01%Royal Schiphol Group NV 373,000 0.88% 8/9/2032 380,938 0.01%BNG Bank NV 345,000 2.25% 17/7/2023 364,558 0.01%Royal Schiphol Group NV 364,000 0.75% 22/4/2033 362,637 0.01%TenneT Holding BV 385,000 0.50% 30/11/2040 349,523 0.01%Enexis Holding NV 300,000 0.88% 28/4/2026 313,428 0.00%Alliander NV^ 300,000 1.63% Perpetual 312,899 0.00%TenneT Holding BV 310,000 0.13% 30/11/2032 294,807 0.00%Royal Schiphol Group NV 200,000 1.50% 5/11/2030 219,269 0.00%BNG Bank NV 200,000 0.63% 19/6/2027 210,173 0.00%Alliander NV 200,000 0.38% 10/6/2030 202,087 0.00%test - - - 284,464,714 5.13%Portugal 1.82% (2020: 1.99%)Portugal Obrigacoes do Tesouro OT 17,872,000 2.88% 21/7/2026 20,786,673 0.38%Portugal Obrigacoes do Tesouro OT 14,151,000 0.70% 15/10/2027 14,889,700 0.27%Portugal Obrigacoes do Tesouro OT 9,600,000 5.65% 15/2/2024 11,182,072 0.20%Portugal Obrigacoes do Tesouro OT 7,794,000 4.95% 25/10/2023 8,806,157 0.16%Portugal Obrigacoes do Tesouro OT 6,000,000 2.25% 18/4/2034 7,241,383 0.13%Portugal Obrigacoes do Tesouro OT 7,000,000 0.48% 18/10/2030 7,136,223 0.13%Portugal Obrigacoes do Tesouro OT 4,500,000 3.88% 15/2/2030 5,931,382 0.11%Portugal Obrigacoes do Tesouro OT 3,330,000 4.10% 15/2/2045 5,391,449 0.10%Portugal Obrigacoes do Tesouro OT 3,913,000 1.95% 15/6/2029 4,496,696 0.08%Portugal Obrigacoes do Tesouro OT 3,791,000 0.90% 12/10/2035 3,892,998 0.07%Portugal Obrigacoes do Tesouro OT 2,400,000 4.10% 15/4/2037 3,598,829 0.06%Portugal Obrigacoes do Tesouro OT 3,808,000 1.00% 12/4/2052 3,475,273 0.06%Portugal Obrigacoes do Tesouro OT 2,000,000 0.30% 17/10/2031 1,981,115 0.04%Portugal Obrigacoes do Tesouro OT 1,349,000 4.13% 14/4/2027 1,690,122 0.03%test - - - 100,500,072 1.82%Slovakia 0.68% (2020: 0.63%)Slovakia Government Bond 4,800,000 0.63% 22/5/2026 5,050,576 0.09%Slovakia Government Bond 4,200,000 3.00% 28/2/2023 4,461,820 0.08%Slovakia Government Bond 3,494,000 1.00% 14/5/2032 3,812,062 0.07%Slovakia Government Bond 3,600,000 0.00% 13/11/2023 3,647,500 0.07%Slovakia Government Bond 3,000,000 1.00% 12/6/2028 3,261,799 0.06%Slovakia Government Bond 2,600,000 1.88% 9/3/2037 3,152,791 0.06%Slovakia Government Bond 2,250,000 2.00% 17/10/2047 2,834,583 0.05%Slovakia Government Bond 2,195,000 0.75% 9/4/2030 2,346,722 0.04%Slovakia Government Bond 2,250,000 0.25% 14/5/2025 2,309,597 0.04%Slovakia Government Bond 1,340,000 1.63% 21/1/2031 1,555,164 0.03%Slovakia Government Bond 1,220,000 0.38% 21/4/2036 1,207,290 0.02%Eustream A.S. 1,000,000 1.63% 25/6/2027 1,056,804 0.02%SPP Infrastructure Financing BV 850,000 2.63% 12/2/2025 925,567 0.02%Slovakia Government Bond 700,000 1.38% 21/1/2027 767,998 0.01%SPP-Distribucia A.S. 700,000 1.00% 9/6/2031 705,795 0.01%Slovakia Government Bond 500,000 3.63% 16/1/2029 644,719 0.01%test - - - 37,740,787 0.68%Slovenia 0.39% (2020: 0.48%)Slovenia Government Bond 4,800,000 1.00% 6/3/2028 5,194,265 0.09%Slovenia Government Bond 2,800,000 1.75% 3/11/2040 3,359,156 0.06%Slovenia Government Bond 1,500,000 3.13% 7/8/2045 2,272,446 0.04%Slovenia Government Bond 2,140,000 0.28% 14/1/2030 2,190,811 0.04%Slovenia Government Bond 1,850,000 4.63% 9/9/2024 2,165,068 0.04%Slovenia Government Bond 1,900,000 0.20% 31/3/2023 1,931,605 0.03%Slovenia Government Bond 1,500,000 1.19% 14/3/2029 1,647,863 0.03%Slovenia Government Bond 900,000 2.13% 28/7/2025 998,899 0.02%Slovenia Government Bond 600,000 1.50% 25/3/2035 684,732 0.01%Slovenia Government Bond 600,000 0.69% 3/3/2081 514,132 0.01%Slovenia Government Bond 470,000 0.49% 20/10/2050 425,605 0.01%Slovenia Government Bond 340,000 0.00% 12/2/2031 336,800 0.01%test - - - 21,721,382 0.39%Spain 12.51% (2020: 12.57%)Spain Government Bond 52,572,000 0.00% 30/4/2023 53,064,023 0.96%Spain Government Bond 40,457,000 0.00% 31/1/2026 40,915,646 0.74%Spain Government Bond 35,301,000 1.50% 30/4/2027 38,649,453 0.70%Spain Government Bond 30,978,000 1.40% 30/4/2028 33,856,322 0.61%Spain Government Bond 31,147,000 1.25% 31/10/2030 33,734,469 0.61%Spain Government Bond 21,395,000 2.35% 30/7/2033 25,725,736 0.46%Spain Government Bond 15,189,000 4.90% 30/7/2040 25,467,150 0.46%Spain Government Bond 14,987,000 4.70% 30/7/2041 24,779,735 0.45%

292
Vanguard Euro Government Bond Index Fund
Principal EUR (€) Coupon
Maturity Date
Fair Value EUR (€)
% of Total Net Assets
Spain Government Bond 22,400,000 0.80% 30/7/2027 23,572,709 0.42%Spain Government Bond 21,462,000 0.25% 30/7/2024 21,912,720 0.39%Spain Government Bond 19,982,000 1.40% 30/7/2028 21,874,627 0.39%Spain Government Bond 21,500,000 0.00% 31/1/2025 21,788,084 0.39%Spain Government Bond 20,910,000 0.50% 31/10/2031 20,950,900 0.38%Spain Government Bond 18,660,000 1.45% 30/4/2029 20,539,648 0.37%Spain Government Bond 12,594,000 4.20% 31/1/2037 18,818,327 0.34%Spain Government Bond 18,332,000 0.35% 30/7/2023 18,655,034 0.34%Spain Government Bond 19,150,000 0.10% 30/4/2031 18,571,758 0.33%Spain Government Bond 10,074,000 5.15% 31/10/2044 18,209,279 0.33%Spain Government Bond 15,050,000 4.65% 30/7/2025 18,151,361 0.33%Spain Government Bond 11,543,000 2.90% 31/10/2046 15,596,798 0.28%Spain Government Bond 13,761,000 2.75% 31/10/2024 15,228,545 0.27%Spain Government Bond 13,080,000 1.95% 30/4/2026 14,472,834 0.26%Spain Government Bond 12,750,000 4.40% 31/10/2023 14,218,330 0.26%Spain Government Bond 12,901,000 0.00% 31/5/2024 13,055,893 0.23%Spain Government Bond 12,000,000 0.00% 31/1/2028 11,978,516 0.22%Spain Government Bond 8,814,000 2.70% 31/10/2048 11,573,368 0.21%Spain Government Bond 7,973,785 6.00% 31/1/2029 11,536,994 0.21%Spain Government Bond 8,300,000 1.60% 30/4/2025 8,931,865 0.16%Spain Government Bond 8,606,000 1.45% 31/10/2071 7,587,587 0.14%Spain Government Bond 8,356,000 1.00% 31/10/2050 7,557,056 0.14%Spain Government Bond 7,601,000 0.85% 30/7/2037 7,489,547 0.13%Spain Government Bond 4,673,000 3.45% 30/7/2066 7,201,324 0.13%Spain Government Bond 4,000,000 1.20% 31/10/2040 4,061,706 0.07%Spain Government Bond 3,700,000 1.45% 31/10/2027 4,048,933 0.07%Spain Government Bond 3,000,000 3.80% 30/4/2024 3,362,885 0.06%Spain Government Bond 2,900,000 1.85% 30/7/2035 3,314,875 0.06%Spain Government Bond 2,611,000 0.50% 30/4/2030 2,659,928 0.05%Spain Government Bond 1,585,000 5.75% 30/7/2032 2,484,678 0.04%Fondo de Titulizacion Del Deficit Del Sistema Electrico FTA 2,000,000 0.85% 17/12/2023 2,060,020 0.04%Autonomous Community of Madrid Spain 1,900,000 1.83% 30/4/2025 2,048,858 0.04%Autonomous Community of Andalusia Spain 2,000,000 0.50% 30/4/2031 1,982,250 0.04%Fondo de Titulizacion Del Deficit Del Sistema Electrico FTA 1,900,000 0.50% 17/3/2023 1,929,910 0.03%Basque Government 1,900,000 0.45% 30/4/2032 1,876,736 0.03%Adif-Alta Velocidad 1,500,000 1.88% 28/1/2025 1,614,624 0.03%Spain Government Bond 1,500,000 0.60% 31/10/2029 1,547,032 0.03%Basque Government 1,500,000 0.25% 30/4/2031 1,474,643 0.03%Instituto de Credito Oficial 1,250,000 0.00% 30/4/2027 1,255,370 0.02%Autonomous Community of Madrid Spain 1,000,000 4.30% 15/9/2026 1,226,806 0.02%Spain Government Bond 995,000 1.95% 30/7/2030 1,141,643 0.02%Autonomous Community of Madrid Spain 1,000,000 4.13% 21/5/2024 1,127,449 0.02%Adif-Alta Velocidad 1,000,000 0.95% 30/4/2027 1,052,585 0.02%Adif-Alta Velocidad 1,000,000 0.55% 30/4/2030 1,010,800 0.02%Instituto de Credito Oficial 1,000,000 0.00% 30/4/2026 1,009,805 0.02%Autonomous Community of Madrid Spain 1,000,000 0.42% 30/4/2030 1,003,683 0.02%Junta de Castilla y Leon 1,000,000 0.43% 30/4/2030 997,430 0.02%Autonomous Community of Madrid Spain 800,000 1.77% 30/4/2028 886,645 0.02%Instituto de Credito Oficial 600,000 0.25% 30/4/2024 611,055 0.01%Autonomous Community of Madrid Spain 600,000 0.42% 30/4/2031 594,460 0.01%Adif-Alta Velocidad 500,000 1.88% 22/9/2022 513,928 0.01%Fondo de Titulizacion Del Deficit Del Sistema Electrico FTA 400,000 0.01% 17/9/2025 404,524 0.01%Autonomous Community of Madrid Spain 350,000 2.88% 17/7/2023 373,062 0.01%test - - - 693,341,961 12.51%Total Bonds 5,469,027,437 98.68%Financial Assets at Fair Value Through Profit or Loss 5,469,027,437 98.68%
CurrencyBuy
Amount Currency(Sell)
Amount CounterpartySettlement
Date
Unrealised Gain/(Loss)
EUR (€)% of Total
Net AssetsFinancial Derivative InstrumentsHedge Share Class Level Forward Currency Exchange Contracts 0.04% (2020: 0.07%)GBP 704,983,493 EUR (818,737,202) Toronto-Dominion Bank 2/7/2021 2,494,993 0.04 %EUR 738,395,299 GBP (633,676,078) Morgan Stanley 2/7/2021 228,801 0.00 %EUR 967,681 GBP (827,490) BNP Paribas 2/7/2021 3,741 0.00 %EUR 81,543,170 GBP (70,000,000) Morgan Stanley 2/7/2021 475 0.00 %GBP 69,169 EUR (80,348) BNP Paribas 2/7/2021 226 0.00 %GBP 39,558 EUR (45,882) Citibank NA 2/7/2021 199 0.00 %GBP 45,840 EUR (53,204) Morgan Stanley 2/7/2021 194 0.00 %GBP 60,942 EUR (70,828) BNP Paribas 2/7/2021 163 0.00 %GBP 16,671 EUR (19,284) BNP Paribas 2/7/2021 136 0.00 %GBP 17,903 EUR (20,745) Morgan Stanley 2/7/2021 110 0.00 %

293
Vanguard Euro Government Bond Index Fund
CurrencyBuy
Amount Currency(Sell)
Amount CounterpartySettlement
Date
Unrealised Gain/(Loss)
EUR (€)% of Total
Net AssetsGBP 87,786 EUR (102,202) JPMorgan Chase Bank 2/7/2021 60 0.00 %GBP 18,696 EUR (21,724) JPMorgan Chase Bank 2/7/2021 55 0.00 %GBP 86,482 EUR (100,698) Morgan Stanley 2/7/2021 44 0.00 %GBP 9,866 EUR (11,464) BNP Paribas 2/7/2021 28 0.00 %GBP 16,950 EUR (19,721) BNP Paribas 2/7/2021 24 0.00 %GBP 49,044 EUR (57,108) BNP Paribas 2/7/2021 24 0.00 %GBP 30,493 EUR (35,500) Goldman Sachs International 2/7/2021 21 0.00 %GBP 46,692 EUR (54,384) BNP Paribas 2/7/2021 7 0.00 %GBP 1,054 EUR (1,224) BNP Paribas 2/7/2021 4 0.00 %GBP 27,583 EUR (32,113) Morgan Stanley 3/8/2021 (1 ) (0.00 %)GBP 52,136 EUR (60,735) BNP Paribas 2/7/2021 (2 ) (0.00 %)GBP 6,021 EUR (7,020) JPMorgan Chase Bank 2/7/2021 (6 ) (0.00 %)GBP 1,454,752 EUR (1,693,685) Morgan Stanley 3/8/2021 (45 ) (0.00 %)GBP 16,367 EUR (19,117) BNP Paribas 2/7/2021 (51 ) (0.00 %)GBP 35,490 EUR (41,420) BNP Paribas 2/7/2021 (78 ) (0.00 %)GBP 47,782 EUR (55,859) BNP Paribas 2/7/2021 (198 ) (0.00 %)EUR 90,406 GBP (77,801) BNP Paribas 2/7/2021 (225 ) (0.00 %)EUR 307,599 GBP (264,712) BNP Paribas 2/7/2021 (763 ) (0.00 %)EUR 1,038,080 GBP (892,354) Morgan Stanley 2/7/2021 (1,419 ) (0.00 %)GBP 70,000,000 EUR (81,497,012) Morgan Stanley 3/8/2021 (2,163 ) (0.00 %)GBP 633,676,078 EUR (737,977,372) Morgan Stanley 3/8/2021 (244,002 ) (0.00 %)Total Financial Derivative Instruments 2,480,352 0.04 %
Fair Value EUR (€)
% of Total Net Assets
Other Assets and Liabilities 70,644,829 1.28 %Net Assets 5,542,152,618 100.00 %
Analysis of Total Net Assets EUR (€)% of Total
Net Assets(a) Transferable securities admitted to an official stock exchange listing 4,043,863,540 72.97%(b) Transferable securities dealt in on another regulated market 1,425,163,897 25.71%(c) Transferable securities other than those admitted to an official stock exchange listing or dealt in on another regulated
market — 0.00%
(d) Financial derivative instruments 2,480,352 0.04%(e) Other assets and liabilities 70,644,829 1.28%Total Net Assets 5,542,152,618 100.00%
^ Floating Rate Note (FRN). The effective interest rate is at 30 June 2021.

The accompanying notes form an integral part of the financial statements.
294
Vanguard Euro Government Bond Index Fund
Statement of Assets and Liabilities
Euro (€)
As at 30 June 2021
Euro (€)
As at 31 December 2020
Current AssetsFinancial Assets at Fair Value Through Profit or Loss 5,469,027,437 5,864,234,452 Financial Derivative Instruments 2,729,305 7,867,926 Cash 61,263,839 9,349,955 Unrealised Appreciation on Spot Currency Contracts — 9,633 Receivables: Interest and Dividends 29,127,402 44,375,642 Capital Shares Issued 4,198,407 16,873,005 Investments Sold 16,001,759 14,113,363 Cash Collateral — 5
Total Current Assets 5,582,348,149 5,956,823,981
Current LiabilitiesFinancial Derivative Instruments 248,953 3,806,529 Bank Overdraft 31,421 4,512 Unrealised Depreciation on Spot Currency Contracts 154 — Payables and Other Liabilities: Investments Purchased 37,923,303 22,491,862 Capital Shares Redeemed 1,541,640 10,034,082 Management Fees Payable 450,060 494,696
Total Current Liabilities 40,195,531 36,831,681
Net Assets Attributable to Holders of Redeemable Participating Shares (“Net Assets”) 5,542,152,618 5,919,992,300
Net Asset Value Per Share
.As at
30 June 2021As at
31 December 2020As at
31 December 2019EUR AccNet Assets 2,650,519,523 2,791,150,732 3,705,466,814Number of Shares Outstanding 10,975,569 11,223,599 15,593,947Net Asset Value Per Share1 241.49 248.69 237.62
Investor EUR Net Assets 141,307,242 183,952,406 60,140,469Number of Shares Outstanding 620,736 784,694 268,489Net Asset Value Per Share1 227.64 234.43 224.00
Institutional Plus EUR AccNet Assets 1,909,379,393 2,134,672,552 2,317,701,507Number of Shares Outstanding 14,908,945 16,190,788 18,408,525Net Asset Value Per Share1 128.07 131.84 125.90
GBP Hedged AccEUR (€) Equivalent 823,412,445 792,634,444 595,276,937Net Assets 706,855,019 709,483,103 504,395,846Number of Shares Outstanding 5,356,664 5,237,988 3,923,546Net Asset Value Per Share1 131.96 135.45 128.56
USD AccEUR (€) Equivalent 17,534,015 17,582,166 6,854,583Net Assets 20,793,588 21,512,659 7,694,269Number of Shares Outstanding 171,603 167,097 68,178Net Asset Value Per Share1 121.17 128.74 112.86
1 The net asset value per share shown may diverge from the net asset value per share used for dealing purposes because of any adjustments for swing pricing and trade date accounting.

295
Vanguard Euro Government Bond Index Fund
The accompanying notes form an integral part of the financial statements.
Statement of Operations
Euro (€)
Six Months Ended 30 June 2021
Euro (€)
Six Months Ended 30 June 2020
Investment Income/(Loss) Interest Income 19,844,392 30,679,776 Net Gain/(Loss) on Financial Instruments (152,160,161) 47,065,987
Total Investment Income/(Loss) (132,315,769) 77,745,763
Expenses Management Fees 2,794,284 3,188,832
Total Expenses 2,794,284 3,188,832
Finance Costs Interest Expense 119,915 53,048
Total Finance Costs 119,915 53,048
Net Investment Income/(Loss) (135,229,968) 74,503,883
Net Increase/(Decrease) in Net Assets (135,229,968) 74,503,883
Statement of Changes in Net Assets
Euro (€)
Euro (€)
Six Months Ended Six Months Ended30 June 2021 30 June 2020
Increase/(Decrease) in Net Assets
Net Increase/(Decrease) in Net Assets From Operations (135,229,968) 74,503,883
Capital Transactions Subscriptions 732,274,545 1,188,784,907 Redemptions (974,884,259) (1,964,659,641)
Total Capital Transactions (242,609,714) (775,874,734)
Total Increase/(Decrease) for the Period (377,839,682) (701,370,851)
Net AssetsBeginning of Period 5,919,992,300 6,699,498,213
End of Period 5,542,152,618 5,998,127,362

Vanguard Euro Investment Grade Bond Index FundManaged by Vanguard Global Advisers, LLC.
296
Investment ObjectiveThe fund seeks to provide returns consistent with the performance of the Bloomberg Barclays EUR Non-Government Float Adjusted Bond Index, a market-weighted index of euro-denominated, investment-grade fixed income securities, excluding euro zone treasury and government-related securities, with maturities greater than 1 year.
Performance SummaryThe Performance Summary does not form part of the Financial Statements.
• As the six months ended 30 June 2021 came to a close, macroeconomic indicators signalled a faster global economic rebound than many had expected after the sharpest contraction in modern history. Yet the recovery has been uneven. Countries that have contained the virus more successfully, whether through vaccinations, lockdowns or both, generally have fared better economically. And the COVID-19 pandemic remained far from over, with new variants of the virus surfacing where vaccination rates have lagged and the human toll continuing to mount, especially in less developed economies.
• Swift and extensive support from governments and central banks has been a key to the rebound. So far in 2021, it has included fiscal stimulus – including the $1.9 trillion American Rescue Plan in the United States and the €673 billion Recovery and Resilience Facility in Europe – and pledges by a number of central banks to keep interest rates low for some time.
• Stock markets worldwide continued the rally that began in 2020, bolstered by reopening economies, more consumer spending and rising corporate profits. They posted strong gains for the six months ended 30 June.
• Fixed income securities struggled amid concerns that an upturn in inflation might persist or even accelerate given the stronger-than-expected rebound in global growth, extraordinary monetary and fiscal stimulus and a jump in demand for goods and services as economies reopened and supply gradually picked up. With longer-term yields rising and prices falling, returns were negative for the half year.
• In this environment, the fund’s benchmark index returned –1.11% for the six months.
• Corporate bonds, which accounted for well over half the index, performed a little better than the index as a whole. Noncorporate bonds underperformed, while securitised debt was roughly in line with the performance of the index.
• Among the larger constituents in the index, France and Denmark held up relatively well but still finished in negative territory. Supranational bonds were a laggard.
• By maturity, longer-dated bonds significantly underperformed. From a credit-quality perspective, bonds on the bottom rung of the investment-grade credit ladder held up best.
Benchmark returns in the commentary above are in euros.
Benchmark: Bloomberg Barclays EUR Non-Government Float Adjusted Bond Index8
Total ReturnsPeriods Ended 30 June 2021
(Annualised for periods over one year)
Six Months Five YearsTen Years or
Since Inception1
EUR Acc -1.15 % 1.43 % 3.41 %
Benchmark -1.11 1.57 3.53
Tracking Difference* -0.04
Investor EUR -1.15 % 1.40 % 3.35 %
Benchmark -1.11 1.57 3.53
Tracking Difference* -0.04
Institutional Plus EUR Acc -1.13 % 1.52 % 2.56 %
Benchmark -1.11 1.57 2.59
Tracking Difference* -0.02
GBP Hedged Acc -0.83 % 2.29 % 3.10 %
Benchmark -0.78 2.52 3.31
Tracking Difference* -0.05
Each benchmark is in its respective currency.Sources: Vanguard Global Advisers, LLC, and Bloomberg.Performance is based on NAV with net income reinvested.
All of the returns in this report represent past performance, which is not a guarantee of future results that may be achieved by the fund. For performance data current to the most recent month-end, which may be higher or lower than that cited, visit our website at http://global.vanguard.com. Note, too, that both investment returns and principal value can fluctuate widely, so an investor's shares, when sold, could be worth more or less than their original cost.* The tracking difference between the fund return and the index return over a stated period of time can be attributed to a number of factors, including, without limitation, small differences in
weightings, trading activity, transaction costs and differences in the valuation and withholding tax treatment between the fund and the index vendor..1 Since-inception returns: Institutional Plus EUR Acc, 6 December 2013; GBP Hedged Acc, 31 January 2014.

Significant Portfolio ChangesFor the Six Months Ended 30 June 2021
297
Vanguard Euro Investment Grade Bond Index Fund
The Central Bank of Ireland requires a schedule of material changes in the composition of the portfolio during the period. These are defined as aggregate purchases of a security exceeding 1% of the total value of purchases for the period and aggregate disposals greater than 1% of the total value of sales. At a minimum, the largest 20 purchases and 20 sales must be shown; all purchases and sales must be shown if there are fewer than 20. A full listing of the portfolio changes for the period is available, upon request, at no extra cost from the Administrator.
Principal Euro (€)
Cost Euro (€)
Purchases
European Union 0.00% 4/7/2031 12,390,000 12,329,090European Union 0.00% 2/6/2028 7,940,000 8,172,736European Union 0.20% 4/6/2036 7,400,000 7,327,000European Union 0.00% 4/3/2026 5,530,000 5,663,507European Investment Bank 0.00%
14/1/2031 4,800,000 4,977,154BPCE SA 0.01% 29/1/2029 4,600,000 4,709,544European Financial Stability Facility
0.00% 20/1/2031 3,640,000 3,758,429European Union 0.75% 4/1/2047 3,345,000 3,412,235European Union 0.45% 2/5/2046 3,380,000 3,366,847European Union 0.30% 4/11/2050 3,120,000 3,260,587Honeywell International, Inc. 2.25%
22/2/2028 2,533,000 2,944,508European Investment Bank 0.20%
17/3/2036 2,700,000 2,691,441Iberdrola International BV 1.45%
9/2/2170 2,600,000 2,638,400Goldman Sachs Group, Inc. 0.25%
26/1/2028 2,500,000 2,472,655Autoroutes du Sud de la France SA
1.38% 27/6/2028 2,200,000 2,397,054easyJet FinCo BV 1.88% 3/3/2028 2,364,000 2,340,175European Union 0.25% 22/4/2036 2,310,000 2,264,456General Motors Financial Co., Inc.
0.20% 2/9/2022 2,212,000 2,219,056BPCE SA 0.13% 3/12/2030 2,200,000 2,194,412SpareBank 1 Boligkreditt A.S. 1.00%
30/1/2029 2,000,000 2,193,500
Principal Euro (€)
Proceeds Euro (€)
Sales
DNB Boligkreditt A.S. 2.75% 21/3/2022 3,900,000 4,025,463
ING Groep NV 1.00% 20/9/2023 3,800,000 3,914,180European Financial Stability Facility
0.00% 17/11/2022 3,300,000 3,336,767European Stability Mechanism
0.00% 18/10/2022 3,300,000 3,333,165European Stability Mechanism
0.00% 16/12/2024 2,880,000 2,931,888Nordea Kiinnitysluottopankki OYJ
0.25% 28/2/2023 2,800,000 2,838,164Upjohn Finance BV 0.82% 23/6/2022 2,600,000 2,627,557European Stability Mechanism
0.01% 4/3/2030 2,500,000 2,522,265Enel Finance International NV 5.00%
14/9/2022 2,200,000 2,362,338Societe Generale SA 0.75%
25/1/2027 2,200,000 2,261,930Westpac Banking Corp. 0.63%
14/1/2022 2,200,000 2,225,410DVB Bank SE 1.00% 25/4/2022 2,100,000 2,128,371Caisse de Refinancement de
l'Habitat SA 4.00% 17/6/2022 2,000,000 2,125,080Takeda Pharmaceutical Co., Ltd.
1.13% 21/11/2022 2,000,000 2,047,980JPMorgan Chase & Co. 0.63%
25/1/2024 2,000,000 2,040,920UBS AG 0.75% 21/4/2023 2,000,000 2,040,280European Union 2.75% 4/4/2022 1,950,000 2,021,234Honeywell International, Inc. 2.25%
22/2/2028 1,743,000 2,016,667Banco Santander SA 1.38% 9/2/2022 1,900,000 1,932,148Caisse Francaise de Financement
Local 0.50% 13/4/2022 1,900,000 1,919,000

298
Vanguard Euro Investment Grade Bond Index Fund
Financial StatementsStatement of Investments30 June 2021
,
Principal EUR (€) Coupon
Maturity Date
Fair Value EUR (€)
% of Total Net Assets
Bonds 98.98% (2020: 98.64%)Andorra 0.02% (2020: 0.00%)Andorra International Bond 500,000 1.25% 6/5/2031 509,651 0.02%test - - - 509,651 0.02%Australia 1.99% (2020: 1.83%)Commonwealth Bank of Australia 2,400,000 0.88% 19/2/2029 2,553,116 0.09%National Australia Bank Ltd. 2,000,000 0.01% 6/1/2029 1,996,768 0.07%National Australia Bank Ltd. 1,700,000 1.38% 30/8/2028 1,846,215 0.07%Commonwealth Bank of Australia^ 1,700,000 1.94% 3/10/2029 1,780,394 0.07%Westpac Banking Corp. 1,600,000 0.38% 2/4/2026 1,643,971 0.06%National Australia Bank Ltd. 1,500,000 0.75% 30/1/2026 1,567,174 0.06%Toyota Finance Australia Ltd. 1,311,000 2.28% 21/10/2027 1,488,143 0.05%Westpac Banking Corp. 1,300,000 0.50% 4/12/2023 1,329,059 0.05%Glencore Finance Europe Ltd. 1,200,000 1.75% 17/3/2025 1,260,421 0.05%Westpac Banking Corp. 1,000,000 1.45% 17/7/2028 1,088,749 0.04%National Australia Bank Ltd. 1,000,000 0.88% 19/2/2027 1,057,410 0.04%Australia & New Zealand Banking Group Ltd. 1,000,000 0.75% 29/9/2026 1,039,240 0.04%Australia & New Zealand Banking Group Ltd. 1,000,000 0.45% 22/11/2023 1,019,912 0.04%APT Pipelines Ltd. 1,000,000 1.25% 15/3/2033 993,633 0.04%APT Pipelines Ltd. 1,000,000 0.75% 15/3/2029 992,019 0.04%Westpac Banking Corp. 900,000 0.50% 16/1/2025 925,841 0.03%Westpac Banking Corp. 900,000 0.63% 22/11/2024 925,464 0.03%Australia & New Zealand Banking Group Ltd.^ 900,000 1.13% 21/11/2029 919,456 0.03%Commonwealth Bank of Australia 900,000 0.38% 24/4/2023 913,468 0.03%National Australia Bank Ltd. 900,000 0.25% 20/5/2024 912,633 0.03%Macquarie Group Ltd. 850,000 0.35% 3/3/2028 837,952 0.03%BHP Billiton Finance Ltd. 700,000 3.25% 24/9/2027 831,962 0.03%Australia & New Zealand Banking Group Ltd. 800,000 0.25% 29/11/2022 808,125 0.03%Scentre Group Trust 1/Scentre Group Trust 2 700,000 1.75% 11/4/2028 758,495 0.03%APT Pipelines Ltd. 700,000 2.00% 15/7/2030 757,557 0.03%Glencore Finance Europe Ltd. 700,000 1.50% 15/10/2026 733,943 0.03%Telstra Corp., Ltd. 700,000 3.50% 21/9/2022 732,617 0.03%Australia & New Zealand Banking Group Ltd. 700,000 3.63% 18/7/2022 730,184 0.03%AusNet Services Holdings Pty Ltd.^ 710,000 1.63% 11/3/2081 721,538 0.03%National Australia Bank Ltd. 700,000 0.63% 30/8/2023 714,728 0.03%Telstra Corp., Ltd. 670,000 2.50% 15/9/2023 710,096 0.03%Toyota Finance Australia Ltd. 700,000 0.25% 9/4/2024 708,127 0.03%BHP Billiton Finance Ltd. 600,000 1.50% 29/4/2030 656,648 0.02%BHP Billiton Finance Ltd. 500,000 3.13% 29/4/2033 635,331 0.02%National Australia Bank Ltd. 600,000 1.88% 13/1/2023 621,415 0.02%Westpac Banking Corp.^ 600,000 0.77% 13/5/2031 599,204 0.02%APT Pipelines Ltd. 500,000 2.00% 22/3/2027 547,848 0.02%Glencore Capital Finance DAC 550,000 0.75% 1/3/2029 540,468 0.02%Transurban Finance Co. Pty Ltd. 500,000 2.00% 28/8/2025 537,744 0.02%Scentre Group Trust 1 500,000 2.25% 16/7/2024 532,163 0.02%Telstra Corp., Ltd. 500,000 1.13% 14/4/2026 525,526 0.02%Telstra Corp., Ltd. 500,000 1.00% 23/4/2030 522,578 0.02%Amcor UK Finance plc 500,000 1.13% 23/6/2027 521,209 0.02%Vicinity Centres Trust 500,000 1.13% 7/11/2029 515,315 0.02%Scentre Group Trust 1/Scentre Group Trust 2 500,000 1.38% 22/3/2023 511,675 0.02%National Australia Bank Ltd. 500,000 0.88% 16/11/2022 509,155 0.02%Glencore Capital Finance DAC 500,000 1.13% 10/3/2028 508,656 0.02%Bank of Queensland Ltd. 500,000 0.50% 10/7/2022 504,685 0.02%Bank of Queensland Ltd. 490,000 0.13% 4/6/2024 495,908 0.02%Transurban Finance Co. Pty Ltd. 400,000 3.00% 8/4/2030 472,456 0.02%Commonwealth Bank of Australia 400,000 1.63% 10/2/2031 455,452 0.02%National Australia Bank Ltd. 400,000 2.25% 6/6/2025 440,095 0.02%Sydney Airport Finance Co. Pty Ltd. 400,000 2.75% 23/4/2024 430,962 0.02%Telstra Corp., Ltd. 400,000 1.38% 26/3/2029 430,817 0.02%Sydney Airport Finance Co. Pty Ltd. 400,000 1.75% 26/4/2028 428,630 0.02%Aurizon Network Pty Ltd. 400,000 2.00% 18/9/2024 425,887 0.02%Stockland Trust 400,000 1.63% 27/4/2026 424,837 0.02%Transurban Finance Co. Pty Ltd. 400,000 1.88% 16/9/2024 422,784 0.01%Ausgrid Finance Pty Ltd. 400,000 1.25% 30/7/2025 416,845 0.01%Macquarie Group Ltd. 400,000 0.63% 3/2/2027 405,609 0.01%

299
Vanguard Euro Investment Grade Bond Index Fund
Principal EUR (€) Coupon
Maturity Date
Fair Value EUR (€)
% of Total Net Assets
AusNet Services Holdings Pty Ltd. 400,000 0.63% 25/8/2030 402,803 0.01%Origin Energy Finance Ltd. 400,000 1.00% 17/9/2029 395,831 0.01%Australia & New Zealand Banking Group Ltd.^ 350,000 0.67% 5/5/2031 348,742 0.01%BHP Billiton Finance Ltd. 300,000 3.00% 29/5/2024 327,758 0.01%AusNet Services Holdings Pty Ltd. 300,000 1.50% 26/2/2027 323,241 0.01%Brambles Finance plc 300,000 1.50% 4/10/2027 321,885 0.01%Scentre Group Trust 1/Scentre Group Trust 2 300,000 1.45% 28/3/2029 319,499 0.01%Transurban Finance Co. Pty Ltd. 300,000 1.45% 16/5/2029 316,270 0.01%Amcor Pty Ltd. 300,000 2.75% 22/3/2023 314,818 0.01%Commonwealth Bank of Australia 300,000 0.50% 27/7/2026 310,885 0.01%Wesfarmers Ltd. 300,000 2.75% 2/8/2022 310,089 0.01%Aurizon Network Pty Ltd. 200,000 3.13% 1/6/2026 227,165 0.01%Scentre Group Trust 2 206,000 3.25% 11/9/2023 221,539 0.01%Transurban Finance Co. Pty Ltd. 200,000 1.75% 29/3/2028 215,423 0.01%test - - - 53,694,260 1.99%Austria 1.45% (2020: 1.48%)Raiffeisenlandesbank Niederoesterreich-Wien AG 1,520,000 2.13% 12/9/2022 1,568,058 0.06%Erste Group Bank AG 1,500,000 0.25% 27/1/2031 1,478,130 0.05%Erste Group Bank AG 1,400,000 0.63% 19/1/2023 1,424,118 0.05%BAWAG PSK Bank fuer Arbeit und Wirtschaft und Oesterreichische
Postsparkasse AG 1,400,000 0.01% 2/10/2029 1,401,958 0.05%JAB Holdings BV 1,000,000 1.25% 22/5/2024 1,035,777 0.04%Raiffeisen-Landesbank Steiermark AG 900,000 1.38% 11/5/2033 1,018,149 0.04%Erste Group Bank AG 1,000,000 0.01% 11/9/2029 1,002,284 0.04%OMV AG 900,000 1.00% 14/12/2026 944,182 0.03%Raiffeisen Bank International AG 900,000 1.00% 4/12/2023 925,227 0.03%HYPO NOE Landesbank fuer Niederoesterreich und Wien AG 900,000 0.01% 1/10/2026 911,132 0.03%Raiffeisenlandesbank Niederoesterreich-Wien AG 900,000 0.38% 15/1/2035 904,879 0.03%OMV AG 900,000 0.00% 3/7/2025 901,682 0.03%Mondi Finance Europe GmbH 800,000 2.38% 1/4/2028 899,591 0.03%JAB Holdings BV 800,000 1.75% 25/6/2026 854,441 0.03%Erste Group Bank AG 800,000 0.63% 17/4/2026 834,888 0.03%Raiffeisen Bank International AG 800,000 0.13% 3/12/2029 806,788 0.03%JAB Holdings BV 700,000 2.50% 25/6/2029 789,231 0.03%OMV AG 700,000 2.00% 9/4/2028 782,564 0.03%JAB Holdings BV 700,000 2.25% 19/12/2039 735,522 0.03%OMV AG 600,000 3.50% 27/9/2027 724,757 0.03%HYPO NOE Landesbank fuer Niederoesterreich und Wien AG 700,000 0.01% 18/6/2027 706,206 0.03%Volksbank Wien AG 700,000 0.13% 19/11/2029 705,736 0.03%OMV AG 700,000 0.00% 16/6/2023 703,041 0.03%Raiffeisenlandesbank Niederoesterreich-Wien AG 600,000 0.88% 30/1/2029 641,968 0.02%UniCredit Bank Austria AG 600,000 0.63% 16/1/2026 624,955 0.02%BAWAG PSK Bank fuer Arbeit und Wirtschaft und Oesterreichische
Postsparkasse AG 600,000 0.01% 21/1/2028 605,652 0.02%OMV AG^ 500,000 6.25% Perpetual 603,721 0.02%JAB Holdings BV 500,000 2.50% 17/4/2027 555,931 0.02%Telekom Finanzmanagement GmbH 500,000 1.50% 7/12/2026 537,507 0.02%OMV AG^ 500,000 2.50% Perpetual 523,181 0.02%OMV AG 500,000 1.50% 9/4/2024 522,649 0.02%BAWAG Group AG^ 500,000 2.38% 26/3/2029 522,233 0.02%Hypo Vorarlberg Bank AG 500,000 0.75% 11/2/2025 519,997 0.02%UniCredit Bank Austria AG 500,000 0.25% 21/6/2030 508,946 0.02%Raiffeisen Bank International AG 500,000 0.38% 25/9/2026 508,051 0.02%HYPO NOE Landesbank fuer Niederoesterreich und Wien AG 500,000 0.38% 4/4/2023 507,408 0.02%Raiffeisen Bank International AG 500,000 0.25% 22/1/2025 505,040 0.02%Erste Group Bank AG 500,000 0.10% 15/1/2030 503,472 0.02%Vienna Insurance Group AG Wiener Versicherung Gruppe 500,000 1.00% 26/3/2036 501,905 0.02%UNIQA Insurance Group AG^ 400,000 6.00% 27/7/2046 497,106 0.02%BAWAG PSK Bank fuer Arbeit und Wirtschaft und Oesterreichische
Postsparkasse AG 500,000 0.38% 3/9/2027 494,320 0.02%OMV AG 450,000 1.00% 3/7/2034 455,324 0.02%UniCredit Bank Austria AG 400,000 2.38% 22/1/2024 428,882 0.02%UNIQA Insurance Group AG 400,000 1.38% 9/7/2030 427,440 0.02%Hypo Vorarlberg Bank AG 400,000 0.25% 21/5/2027 409,366 0.02%Raiffeisen-Landesbank Steiermark AG 400,000 0.63% 20/1/2023 406,800 0.02%CA Immobilien Anlagen AG 400,000 0.88% 5/2/2027 401,960 0.01%Raiffeisen-Landesbank Steiermark AG 300,000 2.38% 14/6/2028 351,398 0.01%Vienna Insurance Group AG Wiener Versicherung Gruppe^ 300,000 3.75% 2/3/2046 339,284 0.01%Vienna Insurance Group AG Wiener Versicherung Gruppe^ 300,000 5.50% 9/10/2043 336,582 0.01%OMV AG^ 300,000 2.88% Perpetual 316,779 0.01%Erste Group Bank AG 300,000 0.88% 13/5/2027 312,958 0.01%OMV AG^ 300,000 2.88% Perpetual 312,488 0.01%

300
Vanguard Euro Investment Grade Bond Index Fund
Principal EUR (€) Coupon
Maturity Date
Fair Value EUR (€)
% of Total Net Assets
Erste Group Bank AG 300,000 0.88% 22/5/2026 312,376 0.01%UniCredit Bank Austria AG 300,000 0.75% 25/2/2025 312,192 0.01%OMV AG 300,000 0.75% 16/6/2030 308,075 0.01%Raiffeisenlandesbank Oberoesterreich AG 300,000 0.50% 22/1/2035 306,678 0.01%Erste Group Bank AG 300,000 0.05% 16/9/2025 301,328 0.01%JAB Holdings BV 200,000 3.38% 17/4/2035 245,995 0.01%OMV AG 200,000 2.38% 9/4/2032 235,756 0.01%Telekom Finanzmanagement GmbH 200,000 3.50% 4/7/2023 214,833 0.01%Borealis AG 200,000 1.75% 10/12/2025 214,011 0.01%JAB Holdings BV 200,000 1.63% 30/4/2025 210,845 0.01%JAB Holdings BV 200,000 1.00% 20/12/2027 204,769 0.01%test - - - 39,108,502 1.45%Belgium 1.75% (2020: 1.66%)Anheuser-Busch InBev SA 2,500,000 1.15% 22/1/2027 2,640,889 0.10%Anheuser-Busch InBev SA 1,850,000 2.75% 17/3/2036 2,240,504 0.08%Belfius Bank SA 2,100,000 0.75% 10/2/2025 2,184,245 0.08%Elia Transmission Belgium SA 1,900,000 1.38% 14/1/2026 2,012,740 0.07%Anheuser-Busch InBev SA 1,700,000 1.13% 1/7/2027 1,796,828 0.07%Anheuser-Busch InBev SA 1,100,000 3.70% 2/4/2040 1,493,847 0.06%Belfius Bank SA 1,400,000 0.75% 12/9/2022 1,417,999 0.05%Anheuser-Busch InBev SA 1,200,000 2.13% 2/12/2027 1,343,112 0.05%Anheuser-Busch InBev SA 1,100,000 2.88% 2/4/2032 1,337,048 0.05%Belfius Bank SA 1,300,000 0.38% 13/2/2026 1,310,104 0.05%KBC Group NV 1,100,000 1.13% 25/1/2024 1,136,698 0.04%Argenta Spaarbank NV 1,100,000 1.00% 29/1/2027 1,123,924 0.04%ING Belgium SA 1,100,000 0.01% 20/2/2030 1,099,082 0.04%Belfius Bank SA 1,100,000 0.13% 8/2/2028 1,090,417 0.04%ING Belgium SA 1,000,000 0.63% 30/5/2025 1,038,462 0.04%KBC Group NV 1,000,000 0.75% 18/10/2023 1,023,146 0.04%KBC Group NV^ 1,000,000 0.13% 14/1/2029 977,828 0.04%Belfius Bank SA 900,000 0.38% 24/10/2023 916,906 0.03%Belfius Bank SA 900,000 0.13% 28/1/2030 907,096 0.03%Anheuser-Busch InBev SA 800,000 2.00% 17/3/2028 893,461 0.03%Anheuser-Busch InBev SA 800,000 2.00% 23/1/2035 892,981 0.03%Argenta Spaarbank NV 900,000 0.01% 11/2/2031 892,808 0.03%Euroclear Bank SA 850,000 0.13% 7/7/2025 855,797 0.03%Anheuser-Busch InBev SA 750,000 2.70% 31/3/2026 846,230 0.03%Argenta Spaarbank NV 800,000 1.00% 13/10/2026 818,657 0.03%KBC Group NV 800,000 0.63% 10/4/2025 817,931 0.03%KBC Bank NV 800,000 0.00% 3/12/2025 811,362 0.03%BNP Paribas Fortis SA 800,000 0.00% 24/10/2023 808,057 0.03%Euroclear Investments SA 700,000 1.13% 7/12/2026 741,937 0.03%ING Belgium SA 700,000 0.75% 28/9/2026 736,918 0.03%BNP Paribas Fortis SA 700,000 0.63% 4/10/2025 727,588 0.03%Solvay SA 700,000 1.63% 2/12/2022 715,850 0.03%AG Insurance SA^ 600,000 3.50% 30/6/2047 682,384 0.03%Groupe Bruxelles Lambert SA 700,000 0.13% 28/1/2031 678,657 0.02%Ageas SA^ 600,000 3.25% 2/7/2049 678,241 0.02%Elia Transmission Belgium SA 600,000 0.88% 28/4/2030 618,727 0.02%KBC Group NV^ 600,000 0.50% 3/12/2029 600,250 0.02%Anheuser-Busch InBev SA 500,000 1.65% 28/3/2031 547,788 0.02%Elia Group SA^ 500,000 2.75% Perpetual 526,316 0.02%BNP Paribas Fortis SA 500,000 0.50% 23/9/2024 514,354 0.02%Euroclear Bank SA 500,000 0.50% 10/7/2023 507,647 0.02%Solvay SA 500,000 0.50% 6/9/2029 506,179 0.02%KBC Bank NV 500,000 0.38% 1/9/2022 505,246 0.02%Euroclear Investments SA^ 400,000 2.63% 11/4/2048 439,567 0.02%KBC Bank NV 400,000 2.00% 31/1/2023 415,977 0.02%KBC Group NV 400,000 0.75% 24/1/2030 409,555 0.02%Ethias SA 300,000 5.00% 14/1/2026 351,920 0.01%Belfius Bank SA 300,000 3.13% 11/5/2026 338,705 0.01%Lonza Finance International NV 300,000 1.63% 21/4/2027 323,544 0.01%Brussels Airport Co. NV 300,000 1.00% 3/5/2024 306,231 0.01%Euroclear Bank SA 250,000 0.25% 7/9/2022 251,861 0.01%Solvay SA 200,000 2.75% 2/12/2027 232,444 0.01%ASR Nederland NV^ 150,000 5.00% Perpetual 170,447 0.01%Anheuser-Busch InBev SA 100,000 1.50% 18/4/2030 108,643 0.00%test - - - 47,365,135 1.75%Bulgaria 0.21% (2020: 0.24%)Bulgaria Government International Bond 1,300,000 2.63% 26/3/2027 1,487,480 0.05%Bulgaria Government International Bond 1,000,000 0.38% 23/9/2030 982,975 0.04%
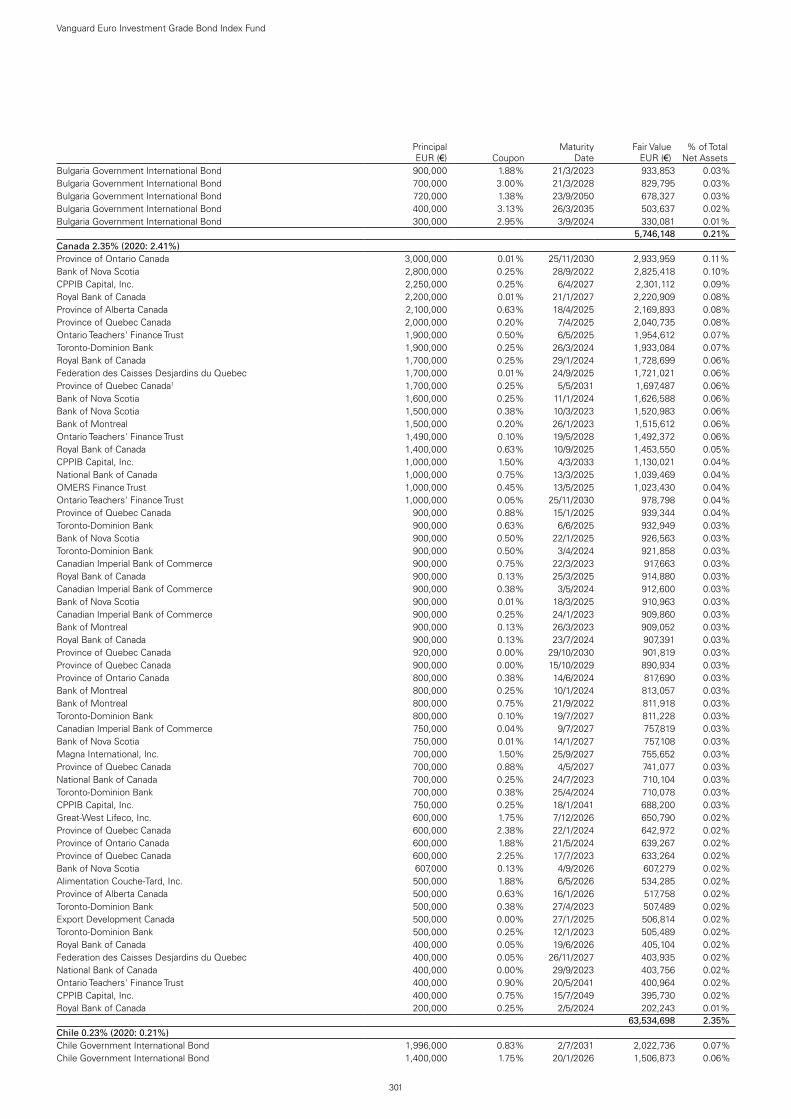
301
Vanguard Euro Investment Grade Bond Index Fund
Principal EUR (€) Coupon
Maturity Date
Fair Value EUR (€)
% of Total Net Assets
Bulgaria Government International Bond 900,000 1.88% 21/3/2023 933,853 0.03%Bulgaria Government International Bond 700,000 3.00% 21/3/2028 829,795 0.03%Bulgaria Government International Bond 720,000 1.38% 23/9/2050 678,327 0.03%Bulgaria Government International Bond 400,000 3.13% 26/3/2035 503,637 0.02%Bulgaria Government International Bond 300,000 2.95% 3/9/2024 330,081 0.01%test - - - 5,746,148 0.21%Canada 2.35% (2020: 2.41%)Province of Ontario Canada 3,000,000 0.01% 25/11/2030 2,933,959 0.11%Bank of Nova Scotia 2,800,000 0.25% 28/9/2022 2,825,418 0.10%CPPIB Capital, Inc. 2,250,000 0.25% 6/4/2027 2,301,112 0.09%Royal Bank of Canada 2,200,000 0.01% 21/1/2027 2,220,909 0.08%Province of Alberta Canada 2,100,000 0.63% 18/4/2025 2,169,893 0.08%Province of Quebec Canada 2,000,000 0.20% 7/4/2025 2,040,735 0.08%Ontario Teachers' Finance Trust 1,900,000 0.50% 6/5/2025 1,954,612 0.07%Toronto-Dominion Bank 1,900,000 0.25% 26/3/2024 1,933,084 0.07%Royal Bank of Canada 1,700,000 0.25% 29/1/2024 1,728,699 0.06%Federation des Caisses Desjardins du Quebec 1,700,000 0.01% 24/9/2025 1,721,021 0.06%Province of Quebec Canada1 1,700,000 0.25% 5/5/2031 1,697,487 0.06%Bank of Nova Scotia 1,600,000 0.25% 11/1/2024 1,626,588 0.06%Bank of Nova Scotia 1,500,000 0.38% 10/3/2023 1,520,983 0.06%Bank of Montreal 1,500,000 0.20% 26/1/2023 1,515,612 0.06%Ontario Teachers' Finance Trust 1,490,000 0.10% 19/5/2028 1,492,372 0.06%Royal Bank of Canada 1,400,000 0.63% 10/9/2025 1,453,550 0.05%CPPIB Capital, Inc. 1,000,000 1.50% 4/3/2033 1,130,021 0.04%National Bank of Canada 1,000,000 0.75% 13/3/2025 1,039,469 0.04%OMERS Finance Trust 1,000,000 0.45% 13/5/2025 1,023,430 0.04%Ontario Teachers' Finance Trust 1,000,000 0.05% 25/11/2030 978,798 0.04%Province of Quebec Canada 900,000 0.88% 15/1/2025 939,344 0.04%Toronto-Dominion Bank 900,000 0.63% 6/6/2025 932,949 0.03%Bank of Nova Scotia 900,000 0.50% 22/1/2025 926,563 0.03%Toronto-Dominion Bank 900,000 0.50% 3/4/2024 921,858 0.03%Canadian Imperial Bank of Commerce 900,000 0.75% 22/3/2023 917,663 0.03%Royal Bank of Canada 900,000 0.13% 25/3/2025 914,880 0.03%Canadian Imperial Bank of Commerce 900,000 0.38% 3/5/2024 912,600 0.03%Bank of Nova Scotia 900,000 0.01% 18/3/2025 910,963 0.03%Canadian Imperial Bank of Commerce 900,000 0.25% 24/1/2023 909,860 0.03%Bank of Montreal 900,000 0.13% 26/3/2023 909,052 0.03%Royal Bank of Canada 900,000 0.13% 23/7/2024 907,391 0.03%Province of Quebec Canada 920,000 0.00% 29/10/2030 901,819 0.03%Province of Quebec Canada 900,000 0.00% 15/10/2029 890,934 0.03%Province of Ontario Canada 800,000 0.38% 14/6/2024 817,690 0.03%Bank of Montreal 800,000 0.25% 10/1/2024 813,057 0.03%Bank of Montreal 800,000 0.75% 21/9/2022 811,918 0.03%Toronto-Dominion Bank 800,000 0.10% 19/7/2027 811,228 0.03%Canadian Imperial Bank of Commerce 750,000 0.04% 9/7/2027 757,819 0.03%Bank of Nova Scotia 750,000 0.01% 14/1/2027 757,108 0.03%Magna International, Inc. 700,000 1.50% 25/9/2027 755,652 0.03%Province of Quebec Canada 700,000 0.88% 4/5/2027 741,077 0.03%National Bank of Canada 700,000 0.25% 24/7/2023 710,104 0.03%Toronto-Dominion Bank 700,000 0.38% 25/4/2024 710,078 0.03%CPPIB Capital, Inc. 750,000 0.25% 18/1/2041 688,200 0.03%Great-West Lifeco, Inc. 600,000 1.75% 7/12/2026 650,790 0.02%Province of Quebec Canada 600,000 2.38% 22/1/2024 642,972 0.02%Province of Ontario Canada 600,000 1.88% 21/5/2024 639,267 0.02%Province of Quebec Canada 600,000 2.25% 17/7/2023 633,264 0.02%Bank of Nova Scotia 607,000 0.13% 4/9/2026 607,279 0.02%Alimentation Couche-Tard, Inc. 500,000 1.88% 6/5/2026 534,285 0.02%Province of Alberta Canada 500,000 0.63% 16/1/2026 517,758 0.02%Toronto-Dominion Bank 500,000 0.38% 27/4/2023 507,489 0.02%Export Development Canada 500,000 0.00% 27/1/2025 506,814 0.02%Toronto-Dominion Bank 500,000 0.25% 12/1/2023 505,489 0.02%Royal Bank of Canada 400,000 0.05% 19/6/2026 405,104 0.02%Federation des Caisses Desjardins du Quebec 400,000 0.05% 26/11/2027 403,935 0.02%National Bank of Canada 400,000 0.00% 29/9/2023 403,756 0.02%Ontario Teachers' Finance Trust 400,000 0.90% 20/5/2041 400,964 0.02%CPPIB Capital, Inc. 400,000 0.75% 15/7/2049 395,730 0.02%Royal Bank of Canada 200,000 0.25% 2/5/2024 202,243 0.01%test - - - 63,534,698 2.35%Chile 0.23% (2020: 0.21%)Chile Government International Bond 1,996,000 0.83% 2/7/2031 2,022,736 0.07%Chile Government International Bond 1,400,000 1.75% 20/1/2026 1,506,873 0.06%

302
Vanguard Euro Investment Grade Bond Index Fund
Principal EUR (€) Coupon
Maturity Date
Fair Value EUR (€)
% of Total Net Assets
Chile Government International Bond 800,000 1.25% 29/1/2040 784,159 0.03%Chile Government International Bond 782,000 1.25% 22/1/2051 698,824 0.03%Chile Government International Bond 500,000 1.44% 1/2/2029 534,364 0.02%Corp. Nacional del Cobre de Chile 400,000 2.25% 9/7/2024 424,992 0.01%Chile Government International Bond 260,000 1.63% 30/1/2025 274,870 0.01%test - - - 6,246,818 0.23%China 0.56% (2020: 0.69%)China Government International Bond 2,850,000 0.13% 12/11/2026 2,858,460 0.11%China Government International Bond 2,100,000 0.50% 12/11/2031 2,091,203 0.08%China Development Bank 1,800,000 0.63% 12/12/2022 1,817,122 0.07%Export-Import Bank of China 1,100,000 0.75% 28/5/2023 1,116,693 0.04%State Grid Overseas Investment 2016 Ltd. 900,000 2.13% 2/5/2030 982,116 0.04%Bank of China Luxembourg SA 900,000 0.13% 16/1/2023 903,830 0.03%China Government International Bond 850,000 1.00% 12/11/2039 832,986 0.03%Lunar Funding V for Swisscom AG 700,000 1.13% 12/10/2026 739,906 0.03%State Grid Overseas Investment 2016 Ltd. 640,000 1.30% 5/8/2032 664,922 0.02%Prosus NV 600,000 2.03% 3/8/2032 617,037 0.02%China Government International Bond 600,000 0.63% 25/11/2035 584,186 0.02%State Grid Overseas Investment 2016 Ltd. 530,000 0.80% 5/8/2026 540,941 0.02%China Development Bank 400,000 0.88% 24/1/2024 408,244 0.02%State Grid Overseas Investment 2016 Ltd. 300,000 1.75% 19/5/2025 317,003 0.01%Swisscom Finance BV 300,000 0.38% 14/11/2028 304,121 0.01%State Grid Europe Development 2014 plc 200,000 2.45% 26/1/2027 218,996 0.01%test - - - 14,997,766 0.56%Colombia 0.03% (2020: 0.03%)Colombia Government International Bond 800,000 3.88% 22/3/2026 892,908 0.03%test - - - 892,908 0.03%Croatia 0.32% (2020: 0.30%)Croatia Government International Bond 2,200,000 3.00% 11/3/2025 2,442,972 0.09%Croatia Government International Bond 2,200,000 1.50% 17/6/2031 2,292,714 0.08%Croatia Government International Bond 2,000,000 1.13% 19/6/2029 2,056,434 0.08%Croatia Government International Bond 840,000 1.75% 4/3/2041 850,664 0.03%Croatia Government International Bond 500,000 2.70% 15/6/2028 573,515 0.02%Croatia Government International Bond 480,000 1.13% 4/3/2033 477,067 0.02%test - - - 8,693,366 0.32%Czech Republic 0.22% (2020: 0.25%)CPI Property Group SA 900,000 1.63% 23/4/2027 925,893 0.03%EP Infrastructure A.S. 825,000 1.82% 2/3/2031 837,506 0.03%EP Infrastructure A.S. 750,000 1.70% 30/7/2026 780,667 0.03%CEZ A.S. 700,000 0.88% 2/12/2026 717,322 0.03%CEZ A.S. 500,000 4.88% 16/4/2025 591,760 0.02%CEZ A.S. 400,000 3.00% 5/6/2028 463,903 0.02%EP Infrastructure A.S. 400,000 1.66% 26/4/2024 413,564 0.02%CPI Property Group SA 300,000 2.75% 12/5/2026 326,658 0.01%Ceske Drahy A.S. 300,000 1.50% 23/5/2026 314,028 0.01%CPI Property Group SA 300,000 1.50% 27/1/2031 292,588 0.01%EP Infrastructure A.S. 200,000 2.05% 9/10/2028 210,369 0.01%test - - - 5,874,258 0.22%Denmark 1.17% (2020: 1.04%)AP Moller-Maersk A/S 2,500,000 1.75% 16/3/2026 2,685,741 0.10%Kommunekredit 1,400,000 0.25% 29/3/2023 1,419,080 0.05%Danske Bank A/S^ 1,325,000 0.50% 27/8/2025 1,338,717 0.05%Jyske Realkredit A/S 1,300,000 0.38% 1/4/2025 1,333,990 0.05%Orsted A/S 1,200,000 2.63% 19/9/2022 1,243,373 0.05%Danske Bank A/S^ 1,200,000 1.38% 12/2/2030 1,223,150 0.05%Nykredit Realkredit A/S 1,000,000 0.25% 13/1/2026 1,000,613 0.04%Orsted A/S 900,000 1.50% 26/11/2029 983,233 0.04%Carlsberg Breweries A/S 900,000 2.50% 28/5/2024 963,342 0.04%Kommunekredit 900,000 0.63% 11/5/2026 940,298 0.03%Jyske Realkredit A/S 900,000 0.50% 1/10/2026 933,430 0.03%Kommunekredit 900,000 0.50% 24/1/2025 929,049 0.03%Nykredit Realkredit A/S 900,000 0.75% 20/1/2027 917,532 0.03%Kommunekredit 1,000,000 0.13% 26/9/2040 912,089 0.03%Danske Mortgage Bank plc 900,000 0.01% 14/1/2028 909,576 0.03%Nykredit Realkredit A/S 700,000 0.63% 17/1/2025 714,424 0.03%Danske Bank A/S 700,000 0.75% 2/6/2023 713,111 0.03%Carlsberg Breweries A/S 700,000 0.38% 30/6/2027 707,912 0.03%Danske Bank A/S 700,000 0.25% 28/11/2022 705,706 0.03%Nykredit Realkredit A/S^ 600,000 2.75% 17/11/2027 621,995 0.02%ISS Finance BV 600,000 1.25% 7/7/2025 620,636 0.02%Danske Bank A/S 600,000 0.88% 22/5/2023 610,788 0.02%
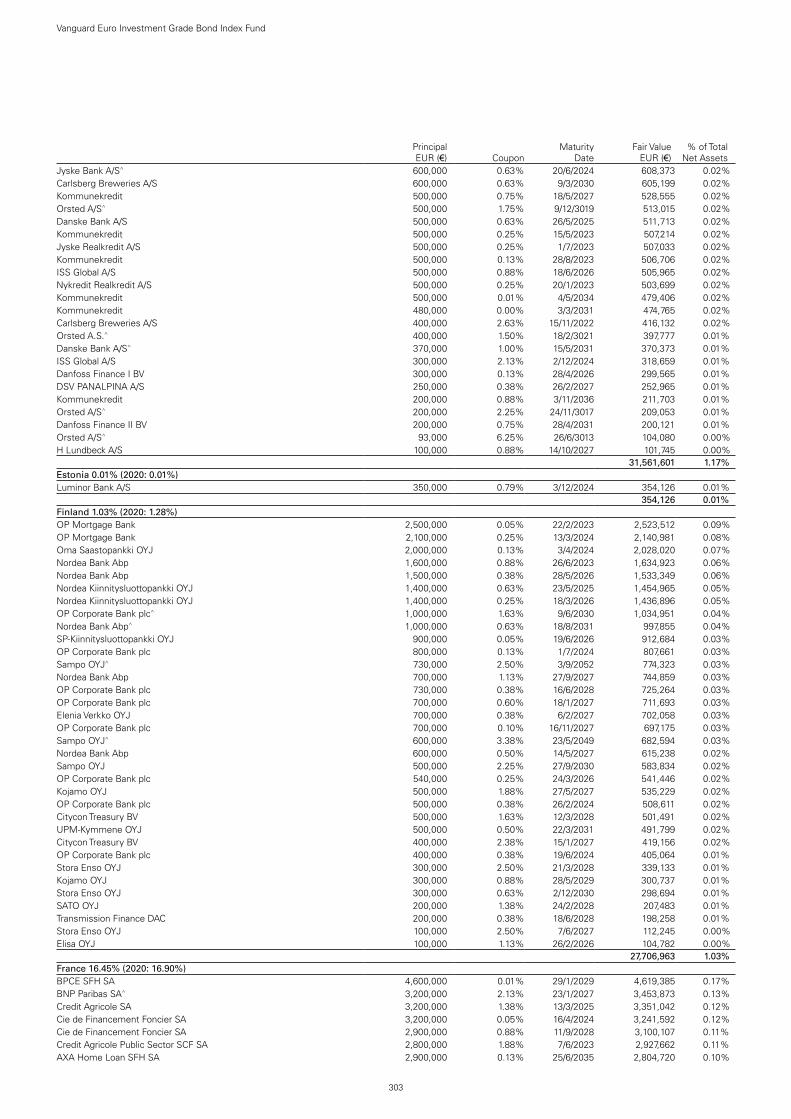
303
Vanguard Euro Investment Grade Bond Index Fund
Principal EUR (€) Coupon
Maturity Date
Fair Value EUR (€)
% of Total Net Assets
Jyske Bank A/S^ 600,000 0.63% 20/6/2024 608,373 0.02%Carlsberg Breweries A/S 600,000 0.63% 9/3/2030 605,199 0.02%Kommunekredit 500,000 0.75% 18/5/2027 528,555 0.02%Orsted A/S^ 500,000 1.75% 9/12/3019 513,015 0.02%Danske Bank A/S 500,000 0.63% 26/5/2025 511,713 0.02%Kommunekredit 500,000 0.25% 15/5/2023 507,214 0.02%Jyske Realkredit A/S 500,000 0.25% 1/7/2023 507,033 0.02%Kommunekredit 500,000 0.13% 28/8/2023 506,706 0.02%ISS Global A/S 500,000 0.88% 18/6/2026 505,965 0.02%Nykredit Realkredit A/S 500,000 0.25% 20/1/2023 503,699 0.02%Kommunekredit 500,000 0.01% 4/5/2034 479,406 0.02%Kommunekredit 480,000 0.00% 3/3/2031 474,765 0.02%Carlsberg Breweries A/S 400,000 2.63% 15/11/2022 416,132 0.02%Orsted A.S.^ 400,000 1.50% 18/2/3021 397,777 0.01%Danske Bank A/S^ 370,000 1.00% 15/5/2031 370,373 0.01%ISS Global A/S 300,000 2.13% 2/12/2024 318,659 0.01%Danfoss Finance I BV 300,000 0.13% 28/4/2026 299,565 0.01%DSV PANALPINA A/S 250,000 0.38% 26/2/2027 252,965 0.01%Kommunekredit 200,000 0.88% 3/11/2036 211,703 0.01%Orsted A/S^ 200,000 2.25% 24/11/3017 209,053 0.01%Danfoss Finance II BV 200,000 0.75% 28/4/2031 200,121 0.01%Orsted A/S^ 93,000 6.25% 26/6/3013 104,080 0.00%H Lundbeck A/S 100,000 0.88% 14/10/2027 101,745 0.00%test - - - 31,561,601 1.17%Estonia 0.01% (2020: 0.01%)Luminor Bank A/S 350,000 0.79% 3/12/2024 354,126 0.01%test - - - 354,126 0.01%Finland 1.03% (2020: 1.28%)OP Mortgage Bank 2,500,000 0.05% 22/2/2023 2,523,512 0.09%OP Mortgage Bank 2,100,000 0.25% 13/3/2024 2,140,981 0.08%Oma Saastopankki OYJ 2,000,000 0.13% 3/4/2024 2,028,020 0.07%Nordea Bank Abp 1,600,000 0.88% 26/6/2023 1,634,923 0.06%Nordea Bank Abp 1,500,000 0.38% 28/5/2026 1,533,349 0.06%Nordea Kiinnitysluottopankki OYJ 1,400,000 0.63% 23/5/2025 1,454,965 0.05%Nordea Kiinnitysluottopankki OYJ 1,400,000 0.25% 18/3/2026 1,436,896 0.05%OP Corporate Bank plc^ 1,000,000 1.63% 9/6/2030 1,034,951 0.04%Nordea Bank Abp^ 1,000,000 0.63% 18/8/2031 997,855 0.04%SP-Kiinnitysluottopankki OYJ 900,000 0.05% 19/6/2026 912,684 0.03%OP Corporate Bank plc 800,000 0.13% 1/7/2024 807,661 0.03%Sampo OYJ^ 730,000 2.50% 3/9/2052 774,323 0.03%Nordea Bank Abp 700,000 1.13% 27/9/2027 744,859 0.03%OP Corporate Bank plc 730,000 0.38% 16/6/2028 725,264 0.03%OP Corporate Bank plc 700,000 0.60% 18/1/2027 711,693 0.03%Elenia Verkko OYJ 700,000 0.38% 6/2/2027 702,058 0.03%OP Corporate Bank plc 700,000 0.10% 16/11/2027 697,175 0.03%Sampo OYJ^ 600,000 3.38% 23/5/2049 682,594 0.03%Nordea Bank Abp 600,000 0.50% 14/5/2027 615,238 0.02%Sampo OYJ 500,000 2.25% 27/9/2030 583,834 0.02%OP Corporate Bank plc 540,000 0.25% 24/3/2026 541,446 0.02%Kojamo OYJ 500,000 1.88% 27/5/2027 535,229 0.02%OP Corporate Bank plc 500,000 0.38% 26/2/2024 508,611 0.02%Citycon Treasury BV 500,000 1.63% 12/3/2028 501,491 0.02%UPM-Kymmene OYJ 500,000 0.50% 22/3/2031 491,799 0.02%Citycon Treasury BV 400,000 2.38% 15/1/2027 419,156 0.02%OP Corporate Bank plc 400,000 0.38% 19/6/2024 405,064 0.01%Stora Enso OYJ 300,000 2.50% 21/3/2028 339,133 0.01%Kojamo OYJ 300,000 0.88% 28/5/2029 300,737 0.01%Stora Enso OYJ 300,000 0.63% 2/12/2030 298,694 0.01%SATO OYJ 200,000 1.38% 24/2/2028 207,483 0.01%Transmission Finance DAC 200,000 0.38% 18/6/2028 198,258 0.01%Stora Enso OYJ 100,000 2.50% 7/6/2027 112,245 0.00%Elisa OYJ 100,000 1.13% 26/2/2026 104,782 0.00%test - - - 27,706,963 1.03%France 16.45% (2020: 16.90%)BPCE SFH SA 4,600,000 0.01% 29/1/2029 4,619,385 0.17%BNP Paribas SA^ 3,200,000 2.13% 23/1/2027 3,453,873 0.13%Credit Agricole SA 3,200,000 1.38% 13/3/2025 3,351,042 0.12%Cie de Financement Foncier SA 3,200,000 0.05% 16/4/2024 3,241,592 0.12%Cie de Financement Foncier SA 2,900,000 0.88% 11/9/2028 3,100,107 0.11%Credit Agricole Public Sector SCF SA 2,800,000 1.88% 7/6/2023 2,927,662 0.11%AXA Home Loan SFH SA 2,900,000 0.13% 25/6/2035 2,804,720 0.10%

304
Vanguard Euro Investment Grade Bond Index Fund
Principal EUR (€) Coupon
Maturity Date
Fair Value EUR (€)
% of Total Net Assets
Banque Federative du Credit Mutuel SA 2,700,000 0.75% 15/6/2023 2,757,644 0.10%Engie SA^ 2,700,000 1.38% Perpetual 2,747,858 0.10%BNP Paribas SA^ 2,500,000 0.50% 19/2/2028 2,503,359 0.09%Veolia Environnement SA 2,400,000 0.89% 14/1/2024 2,456,859 0.09%Autoroutes du Sud de la France SA 2,200,000 1.38% 27/6/2028 2,385,126 0.09%Caisse Francaise de Financement Local 2,300,000 0.63% 26/1/2023 2,340,237 0.09%BPCE SFH SA 2,300,000 0.01% 8/11/2026 2,328,956 0.09%Caisse Francaise de Financement Local 2,200,000 0.50% 16/1/2025 2,267,222 0.08%AXA SA^ 2,000,000 3.94% Perpetual 2,215,994 0.08%BPCE SFH SA 2,200,000 0.13% 3/12/2030 2,208,804 0.08%BPCE SA 2,100,000 1.00% 15/7/2024 2,175,563 0.08%TotalEnergies Capital International SA 2,000,000 1.49% 8/4/2027 2,158,844 0.08%TotalEnergies SE^ 2,100,000 1.75% Perpetual 2,151,625 0.08%Orange SA 2,000,000 1.25% 7/7/2027 2,134,312 0.08%Banque Federative du Credit Mutuel SA 2,000,000 1.63% 15/11/2027 2,113,632 0.08%Caisse de Refinancement de l'Habitat SA 1,900,000 4.30% 24/2/2023 2,051,502 0.08%Caisse de Refinancement de l'Habitat SA 2,000,000 0.01% 27/11/2026 2,025,598 0.07%AXA SA^ 1,759,000 3.25% 28/5/2049 2,013,754 0.07%Caisse Francaise de Financement Local 2,000,000 0.01% 18/3/2031 1,981,823 0.07%Caisse Francaise de Financement Local 1,900,000 0.50% 19/2/2027 1,975,497 0.07%Societe Generale SA^ 2,000,000 0.50% 12/6/2029 1,957,098 0.07%Engie SA 1,900,000 0.88% 27/3/2024 1,952,549 0.07%Credit Agricole Home Loan SFH SA 1,900,000 0.63% 28/11/2022 1,930,272 0.07%Caisse Francaise de Financement Local 1,900,000 0.01% 7/5/2025 1,925,478 0.07%Credit Mutuel Home Loan SFH SA 1,900,000 0.38% 12/9/2022 1,920,144 0.07%Cie de Financement Foncier SA 1,900,000 0.20% 16/9/2022 1,916,130 0.07%Credit Agricole Home Loan SFH SA 1,900,000 0.01% 3/11/2031 1,873,743 0.07%Engie SA 1,700,000 1.75% 27/3/2028 1,869,082 0.07%Societe Generale SFH SA 1,800,000 0.50% 28/1/2026 1,865,018 0.07%Credit Agricole Home Loan SFH SA 1,800,000 0.38% 24/3/2023 1,826,941 0.07%BPCE SFH SA 1,800,000 0.01% 23/3/2028 1,814,630 0.07%Dassault Systemes SE 1,800,000 0.13% 16/9/2026 1,812,554 0.07%Societe Generale SFH SA 1,700,000 0.75% 29/1/2027 1,791,949 0.07%Sanofi 1,700,000 1.00% 21/3/2026 1,788,517 0.07%Societe Generale SFH SA 1,800,000 0.01% 5/2/2031 1,786,770 0.07%LVMH Moet Hennessy Louis Vuitton SE 1,700,000 0.75% 7/4/2025 1,758,406 0.06%Societe Generale SA 1,700,000 1.13% 23/1/2025 1,758,405 0.06%Credit Mutuel Home Loan SFH SA 1,700,000 0.25% 30/4/2024 1,732,230 0.06%Cie de Financement Foncier SA 1,700,000 0.25% 11/4/2023 1,722,084 0.06%Cie de Financement Foncier SA 1,450,000 4.00% 24/10/2025 1,721,947 0.06%Orange SA 1,600,000 1.13% 15/7/2024 1,659,606 0.06%Credit Agricole Home Loan SFH SA 1,400,000 4.00% 16/7/2025 1,647,195 0.06%Credit Agricole Home Loan SFH SA 1,400,000 1.50% 28/9/2038 1,645,653 0.06%BNP Paribas SA 1,550,000 2.88% 24/10/2022 1,617,855 0.06%CNP Assurances^ 1,400,000 4.25% 5/6/2045 1,594,900 0.06%BNP Paribas SA^ 1,600,000 0.50% 19/1/2030 1,574,731 0.06%Credit Agricole SA^ 1,500,000 1.63% 5/6/2030 1,558,439 0.06%Credit Agricole SA 1,400,000 2.63% 17/3/2027 1,553,997 0.06%Danone SA^ 1,500,000 1.75% Perpetual 1,537,366 0.06%BPCE SA 1,500,000 0.25% 15/1/2026 1,513,968 0.06%BNP Paribas SA^ 1,500,000 1.13% 15/1/2032 1,512,691 0.06%TotalEnergies Capital International SA 1,300,000 1.99% 8/4/2032 1,502,649 0.06%Caisse de Refinancement de l'Habitat SA 1,500,000 0.01% 8/10/2029 1,501,422 0.06%Credit Mutuel Arkea SA 1,400,000 1.63% 15/4/2026 1,487,562 0.05%Banque Federative du Credit Mutuel SA 1,500,000 0.63% 21/2/2031 1,483,805 0.05%Caisse de Refinancement de l'Habitat SA 1,400,000 3.30% 23/9/2022 1,465,992 0.05%Credit Mutuel Home Loan SFH SA 1,400,000 0.63% 2/2/2026 1,458,971 0.05%TotalEnergies Capital International SA 1,300,000 2.50% 25/3/2026 1,458,398 0.05%Banque Federative du Credit Mutuel SA 1,400,000 0.75% 17/7/2025 1,443,509 0.05%Caisse Francaise de Financement Local 1,400,000 0.38% 11/5/2024 1,431,367 0.05%BPCE SFH SA 1,400,000 0.38% 21/2/2024 1,429,911 0.05%Orange SA 781,000 8.13% 28/1/2033 1,429,254 0.05%Caisse Francaise de Financement Local 1,500,000 0.01% 19/10/2035 1,425,450 0.05%Cie de Financement Foncier SA 1,400,000 0.63% 10/2/2023 1,425,172 0.05%Credit Mutuel Home Loan SFH SA 1,400,000 0.13% 9/4/2025 1,425,013 0.05%HSBC Continental Europe SA 1,400,000 0.60% 20/3/2023 1,423,359 0.05%BPCE SFH SA 1,400,000 0.50% 11/10/2022 1,417,959 0.05%Holding d'Infrastructures de Transport SASU 1,400,000 0.63% 27/3/2023 1,414,974 0.05%Cie de Financement Foncier SA 1,400,000 0.01% 10/11/2027 1,413,789 0.05%Credit Agricole SA 1,300,000 1.88% 20/12/2026 1,410,950 0.05%Credit Mutuel Home Loan SFH SA 1,300,000 1.00% 30/4/2028 1,398,930 0.05%

305
Vanguard Euro Investment Grade Bond Index Fund
Principal EUR (€) Coupon
Maturity Date
Fair Value EUR (€)
% of Total Net Assets
Arkea Home Loans SFH SA 1,400,000 0.01% 4/10/2030 1,391,204 0.05%Orange SA 1,200,000 1.88% 12/9/2030 1,359,304 0.05%Credit Agricole Assurances SA^ 1,100,000 4.75% 27/9/2048 1,343,300 0.05%Cie de Financement Foncier SA 1,300,000 0.38% 9/4/2027 1,342,592 0.05%BPCE SA 1,300,000 0.63% 26/9/2024 1,325,416 0.05%Credit Agricole Home Loan SFH SA 1,300,000 0.13% 16/12/2024 1,322,949 0.05%Societe Generale SA 1,300,000 0.50% 13/1/2023 1,314,460 0.05%Caisse de Refinancement de l'Habitat SA 1,300,000 0.01% 7/2/2028 1,311,376 0.05%Cie de Financement Foncier SA 700,000 3.88% 25/4/2055 1,300,804 0.05%Capgemini SE 1,100,000 2.38% 15/4/2032 1,294,581 0.05%Banque Federative du Credit Mutuel SA 1,200,000 1.88% 18/6/2029 1,291,276 0.05%Unibail-Rodamco-Westfield SE 1,200,000 1.13% 15/9/2025 1,248,698 0.05%TotalEnergies SE^ 1,200,000 2.71% Perpetual 1,248,664 0.05%Credit Agricole Home Loan SFH SA 1,200,000 0.50% 19/2/2026 1,244,053 0.05%Orange SA 1,100,000 2.00% 15/1/2029 1,242,819 0.05%Unibail-Rodamco-Westfield SE 1,200,000 0.88% 21/2/2025 1,242,690 0.05%Credit Agricole Assurances SA^ 1,100,000 4.25% Perpetual 1,222,258 0.04%Carrefour SA 1,200,000 1.75% 15/7/2022 1,219,819 0.04%AXA Bank Europe SCF 1,200,000 0.01% 22/1/2027 1,213,218 0.04%LVMH Moet Hennessy Louis Vuitton SE 1,200,000 0.13% 11/2/2028 1,211,039 0.04%TotalEnergies SE^ 1,200,000 2.13% Perpetual 1,180,860 0.04%Eutelsat SA 1,100,000 2.00% 2/10/2025 1,177,467 0.04%Caisse Francaise de Financement Local 1,200,000 0.38% 13/2/2040 1,173,919 0.04%Engie SA 1,000,000 2.13% 30/3/2032 1,157,168 0.04%Caisse Nationale de Reassurance Mutuelle Agricole Groupama^ 1,000,000 6.38% Perpetual 1,153,500 0.04%ICADE 1,100,000 1.13% 17/11/2025 1,151,178 0.04%Suez SA 1,100,000 1.25% 14/5/2035 1,148,991 0.04%Sanofi 1,100,000 1.00% 1/4/2025 1,148,512 0.04%Credit Agricole Assurances SA^ 1,000,000 4.50% Perpetual 1,140,130 0.04%Cie de Saint-Gobain 1,000,000 2.38% 4/10/2027 1,134,517 0.04%Caisse Nationale de Reassurance Mutuelle Agricole Groupama 900,000 6.00% 23/1/2027 1,131,964 0.04%Credit Agricole SA 1,100,000 0.75% 5/12/2023 1,128,411 0.04%EssilorLuxottica SA 1,100,000 0.38% 27/11/2027 1,121,784 0.04%Cie Financiere et Industrielle des Autoroutes SA 1,100,000 0.38% 7/2/2025 1,121,142 0.04%Arkea Home Loans SFH SA 1,100,000 0.13% 12/7/2029 1,113,566 0.04%RCI Banque SA 1,100,000 0.75% 26/9/2022 1,110,750 0.04%Banque Federative du Credit Mutuel SA 1,100,000 0.13% 5/2/2024 1,109,378 0.04%TotalEnergies SE^ 1,000,000 3.37% Perpetual 1,108,936 0.04%EssilorLuxottica SA 1,100,000 0.00% 27/5/2023 1,106,633 0.04%BPCE SA^ 1,100,000 0.50% 15/9/2027 1,104,355 0.04%Credit Mutuel Arkea SA 1,100,000 0.38% 3/10/2028 1,102,913 0.04%TotalEnergies Capital International SA 1,000,000 1.38% 4/10/2029 1,088,663 0.04%Airbus SE 1,000,000 1.63% 9/6/2030 1,087,791 0.04%Credit Mutuel Home Loan SFH SA 1,000,000 4.13% 16/1/2023 1,071,680 0.04%Airbus SE 1,000,000 1.38% 9/6/2026 1,062,464 0.04%BNP Paribas SA 1,000,000 1.13% 28/8/2024 1,036,888 0.04%Societe Generale SA 1,000,000 1.25% 15/2/2024 1,034,359 0.04%Sodexo SA 1,000,000 0.75% 27/4/2025 1,029,189 0.04%CNP Assurances 1,000,000 1.88% 20/10/2022 1,024,949 0.04%Societe Generale SA 1,000,000 0.75% 26/5/2023 1,020,346 0.04%Cie Generale des Etablissements Michelin SCA 900,000 1.75% 3/9/2030 1,019,351 0.04%BNP Paribas SA 1,000,000 0.75% 11/11/2022 1,016,212 0.04%BNP Paribas SA^ 1,000,000 0.50% 4/6/2026 1,015,363 0.04%Credit Agricole SA 1,000,000 0.88% 14/1/2032 1,014,691 0.04%Sanofi 1,000,000 0.50% 21/3/2023 1,013,315 0.04%HSBC Continental Europe SA 1,000,000 0.25% 17/5/2024 1,013,277 0.04%BNP Paribas SA^ 1,000,000 0.50% 15/7/2025 1,013,147 0.04%Capgemini SE 900,000 2.00% 15/4/2029 1,012,073 0.04%LVMH Moet Hennessy Louis Vuitton SE 1,000,000 0.00% 11/2/2026 1,007,373 0.04%BPCE SA 1,000,000 0.50% 24/2/2027 1,007,226 0.04%RCI Banque SA 1,000,000 0.25% 8/3/2023 1,005,508 0.04%Cie de Financement Foncier SA 900,000 1.25% 15/11/2032 1,004,620 0.04%Caisse Francaise de Financement Local 900,000 1.25% 11/5/2032 1,004,011 0.04%Banque Federative du Credit Mutuel SA 1,000,000 0.63% 3/11/2028 1,002,572 0.04%Societe Generale SFH SA 1,000,000 0.01% 11/2/2030 999,328 0.04%Banque Federative du Credit Mutuel SA 1,000,000 0.25% 29/6/2028 997,948 0.04%APRR SA 900,000 1.50% 25/1/2030 997,745 0.04%Banque Federative du Credit Mutuel SA 1,000,000 0.01% 11/5/2026 996,574 0.04%HSBC Continental Europe SA 1,000,000 0.10% 3/9/2027 994,365 0.04%BPCE SA 1,000,000 0.01% 14/1/2027 991,223 0.04%BPCE SFH SA 1,000,000 0.01% 18/3/2031 989,531 0.04%

306
Vanguard Euro Investment Grade Bond Index Fund
Principal EUR (€) Coupon
Maturity Date
Fair Value EUR (€)
% of Total Net Assets
Societe Generale SA 1,000,000 0.13% 18/2/2028 988,446 0.04%Credit Agricole SA 900,000 1.75% 5/3/2029 978,191 0.04%Unibail-Rodamco-Westfield SE 900,000 1.88% 15/1/2031 975,372 0.04%BPCE SA 1,000,000 0.25% 14/1/2031 971,146 0.04%Banque Federative du Credit Mutuel SA 900,000 1.63% 19/1/2026 966,024 0.04%Societe Generale SA 900,000 1.75% 22/3/2029 964,300 0.04%Bouygues SA 900,000 1.13% 24/7/2028 960,211 0.04%Credit Mutuel Home Loan SFH SA 900,000 2.50% 11/9/2023 958,922 0.04%Orange SA^ 800,000 5.00% Perpetual 955,102 0.04%Orange SA^ 850,000 5.25% Perpetual 954,177 0.04%Danone SA 900,000 2.60% 28/6/2023 953,713 0.03%Schneider Electric SE 900,000 1.00% 9/4/2027 951,207 0.03%BPCE SA 900,000 1.38% 23/3/2026 947,922 0.03%BPCE SFH SA 900,000 0.75% 27/11/2026 947,531 0.03%Capgemini SE 900,000 2.50% 1/7/2023 942,984 0.03%BPCE SA^ 900,000 2.75% 30/11/2027 934,325 0.03%Caisse Francaise de Financement Local 900,000 0.50% 19/1/2026 932,440 0.03%EssilorLuxottica SA 900,000 0.75% 27/11/2031 931,621 0.03%LVMH Moet Hennessy Louis Vuitton SE 900,000 0.75% 26/5/2024 924,838 0.03%Banque Federative du Credit Mutuel SA 850,000 3.00% 21/5/2024 922,869 0.03%Credit Agricole Home Loan SFH SA 900,000 0.63% 11/9/2023 921,486 0.03%EssilorLuxottica SA 900,000 0.38% 5/1/2026 920,204 0.03%BPCE SFH SA 900,000 0.50% 23/1/2035 918,901 0.03%Credit Agricole Home Loan SFH SA 900,000 0.25% 23/2/2024 916,383 0.03%Legrand SA 900,000 0.50% 9/10/2023 913,950 0.03%LVMH Moet Hennessy Louis Vuitton SE 900,000 0.38% 11/2/2031 912,552 0.03%Societe Generale SFH SA 900,000 0.50% 21/9/2022 911,194 0.03%BNP Paribas SA 850,000 2.88% 26/9/2023 910,720 0.03%TotalEnergies Capital International SA 900,000 0.25% 12/7/2023 910,572 0.03%EssilorLuxottica SA 900,000 0.13% 27/5/2025 910,108 0.03%Engie SA 900,000 0.38% 28/2/2023 908,621 0.03%Credit Mutuel Home Loan SFH SA 900,000 0.13% 28/1/2030 907,749 0.03%Schneider Electric SE 900,000 0.25% 11/3/2029 905,916 0.03%Credit Agricole Public Sector SCF SA 900,000 0.01% 13/9/2028 904,583 0.03%Societe Generale SA^ 900,000 1.13% 30/6/2031 899,768 0.03%Caisse Francaise de Financement Local 900,000 0.01% 24/6/2030 897,001 0.03%BNP Paribas SA 800,000 2.88% 1/10/2026 896,291 0.03%SCOR SE^ 800,000 3.00% 8/6/2046 891,311 0.03%Banque Federative du Credit Mutuel SA 900,000 0.25% 19/7/2028 881,928 0.03%Credit Agricole Home Loan SFH SA 800,000 0.88% 6/5/2034 858,780 0.03%Klepierre SA 800,000 1.38% 16/2/2027 849,558 0.03%Suez SA 800,000 1.25% 2/4/2027 848,708 0.03%Autoroutes du Sud de la France SA 800,000 1.13% 20/4/2026 846,101 0.03%HSBC SFH France SA 800,000 2.00% 16/10/2023 844,831 0.03%Credit Agricole SA 800,000 1.00% 3/7/2029 843,409 0.03%Cie Financiere et Industrielle des Autoroutes SA 800,000 1.00% 19/5/2031 843,137 0.03%Pernod Ricard SA 800,000 1.13% 7/4/2025 835,113 0.03%Credit Agricole SA^ 800,000 1.00% 22/4/2026 825,461 0.03%Sanofi 800,000 0.50% 13/1/2027 823,983 0.03%Cie de Financement Foncier SA 800,000 0.50% 4/9/2024 822,611 0.03%Cie de Saint-Gobain 800,000 0.63% 15/3/2024 817,531 0.03%Klepierre SA 800,000 1.00% 17/4/2023 815,225 0.03%Veolia Environnement SA 500,000 6.13% 25/11/2033 813,294 0.03%Unibail-Rodamco-Westfield SE 700,000 2.63% 9/4/2030 811,266 0.03%PSA Banque France SA 800,000 0.63% 10/10/2022 809,106 0.03%Alstom SA 800,000 0.25% 14/10/2026 803,630 0.03%Credit Agricole SA 700,000 3.13% 5/2/2026 802,734 0.03%La Banque Postale Home Loan SFH SA 800,000 0.01% 22/10/2029 800,883 0.03%Orange SA 800,000 0.50% 4/9/2032 794,424 0.03%BNP Paribas SA 800,000 0.13% 4/9/2026 794,262 0.03%TotalEnergies SE^ 750,000 2.63% Perpetual 792,802 0.03%Unibail-Rodamco-Westfield SE 800,000 0.88% 29/3/2032 780,510 0.03%Engie Alliance GIE 700,000 5.75% 24/6/2023 779,598 0.03%ELO SACA 700,000 2.88% 29/1/2026 779,428 0.03%Klepierre SA 700,000 2.00% 12/5/2029 778,154 0.03%Gecina SA 700,000 1.63% 29/5/2034 776,600 0.03%Caisse de Refinancement de l'Habitat SA 700,000 3.60% 8/3/2024 776,288 0.03%TotalEnergies Capital International SA 700,000 1.62% 18/5/2040 772,240 0.03%TotalEnergies Capital International SA 700,000 1.49% 4/9/2030 770,840 0.03%Caisse de Refinancement de l'Habitat SA 700,000 3.90% 20/10/2023 770,728 0.03%Engie SA^ 700,000 3.88% Perpetual 769,849 0.03%
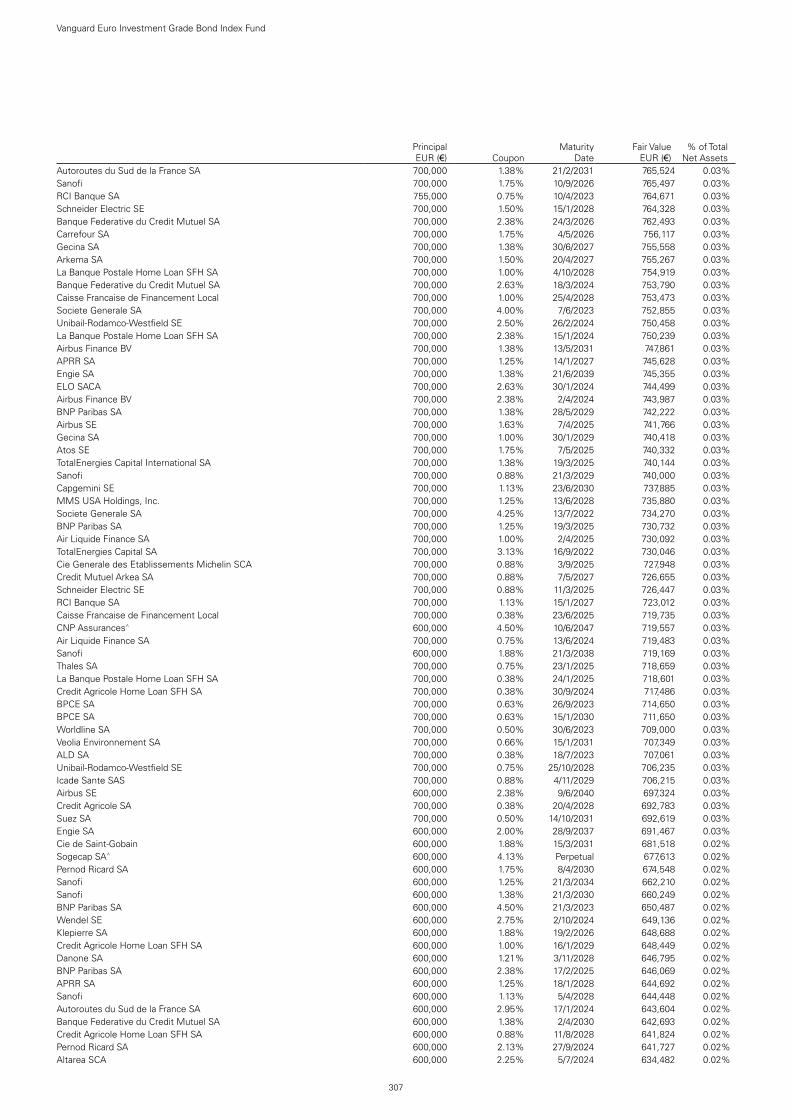
307
Vanguard Euro Investment Grade Bond Index Fund
Principal EUR (€) Coupon
Maturity Date
Fair Value EUR (€)
% of Total Net Assets
Autoroutes du Sud de la France SA 700,000 1.38% 21/2/2031 765,524 0.03%Sanofi 700,000 1.75% 10/9/2026 765,497 0.03%RCI Banque SA 755,000 0.75% 10/4/2023 764,671 0.03%Schneider Electric SE 700,000 1.50% 15/1/2028 764,328 0.03%Banque Federative du Credit Mutuel SA 700,000 2.38% 24/3/2026 762,493 0.03%Carrefour SA 700,000 1.75% 4/5/2026 756,117 0.03%Gecina SA 700,000 1.38% 30/6/2027 755,558 0.03%Arkema SA 700,000 1.50% 20/4/2027 755,267 0.03%La Banque Postale Home Loan SFH SA 700,000 1.00% 4/10/2028 754,919 0.03%Banque Federative du Credit Mutuel SA 700,000 2.63% 18/3/2024 753,790 0.03%Caisse Francaise de Financement Local 700,000 1.00% 25/4/2028 753,473 0.03%Societe Generale SA 700,000 4.00% 7/6/2023 752,855 0.03%Unibail-Rodamco-Westfield SE 700,000 2.50% 26/2/2024 750,458 0.03%La Banque Postale Home Loan SFH SA 700,000 2.38% 15/1/2024 750,239 0.03%Airbus Finance BV 700,000 1.38% 13/5/2031 747,861 0.03%APRR SA 700,000 1.25% 14/1/2027 745,628 0.03%Engie SA 700,000 1.38% 21/6/2039 745,355 0.03%ELO SACA 700,000 2.63% 30/1/2024 744,499 0.03%Airbus Finance BV 700,000 2.38% 2/4/2024 743,987 0.03%BNP Paribas SA 700,000 1.38% 28/5/2029 742,222 0.03%Airbus SE 700,000 1.63% 7/4/2025 741,766 0.03%Gecina SA 700,000 1.00% 30/1/2029 740,418 0.03%Atos SE 700,000 1.75% 7/5/2025 740,332 0.03%TotalEnergies Capital International SA 700,000 1.38% 19/3/2025 740,144 0.03%Sanofi 700,000 0.88% 21/3/2029 740,000 0.03%Capgemini SE 700,000 1.13% 23/6/2030 737,885 0.03%MMS USA Holdings, Inc. 700,000 1.25% 13/6/2028 735,880 0.03%Societe Generale SA 700,000 4.25% 13/7/2022 734,270 0.03%BNP Paribas SA 700,000 1.25% 19/3/2025 730,732 0.03%Air Liquide Finance SA 700,000 1.00% 2/4/2025 730,092 0.03%TotalEnergies Capital SA 700,000 3.13% 16/9/2022 730,046 0.03%Cie Generale des Etablissements Michelin SCA 700,000 0.88% 3/9/2025 727,948 0.03%Credit Mutuel Arkea SA 700,000 0.88% 7/5/2027 726,655 0.03%Schneider Electric SE 700,000 0.88% 11/3/2025 726,447 0.03%RCI Banque SA 700,000 1.13% 15/1/2027 723,012 0.03%Caisse Francaise de Financement Local 700,000 0.38% 23/6/2025 719,735 0.03%CNP Assurances^ 600,000 4.50% 10/6/2047 719,557 0.03%Air Liquide Finance SA 700,000 0.75% 13/6/2024 719,483 0.03%Sanofi 600,000 1.88% 21/3/2038 719,169 0.03%Thales SA 700,000 0.75% 23/1/2025 718,659 0.03%La Banque Postale Home Loan SFH SA 700,000 0.38% 24/1/2025 718,601 0.03%Credit Agricole Home Loan SFH SA 700,000 0.38% 30/9/2024 717,486 0.03%BPCE SA 700,000 0.63% 26/9/2023 714,650 0.03%BPCE SA 700,000 0.63% 15/1/2030 711,650 0.03%Worldline SA 700,000 0.50% 30/6/2023 709,000 0.03%Veolia Environnement SA 700,000 0.66% 15/1/2031 707,349 0.03%ALD SA 700,000 0.38% 18/7/2023 707,061 0.03%Unibail-Rodamco-Westfield SE 700,000 0.75% 25/10/2028 706,235 0.03%Icade Sante SAS 700,000 0.88% 4/11/2029 706,215 0.03%Airbus SE 600,000 2.38% 9/6/2040 697,324 0.03%Credit Agricole SA 700,000 0.38% 20/4/2028 692,783 0.03%Suez SA 700,000 0.50% 14/10/2031 692,619 0.03%Engie SA 600,000 2.00% 28/9/2037 691,467 0.03%Cie de Saint-Gobain 600,000 1.88% 15/3/2031 681,518 0.02%Sogecap SA^ 600,000 4.13% Perpetual 677,613 0.02%Pernod Ricard SA 600,000 1.75% 8/4/2030 674,548 0.02%Sanofi 600,000 1.25% 21/3/2034 662,210 0.02%Sanofi 600,000 1.38% 21/3/2030 660,249 0.02%BNP Paribas SA 600,000 4.50% 21/3/2023 650,487 0.02%Wendel SE 600,000 2.75% 2/10/2024 649,136 0.02%Klepierre SA 600,000 1.88% 19/2/2026 648,688 0.02%Credit Agricole Home Loan SFH SA 600,000 1.00% 16/1/2029 648,449 0.02%Danone SA 600,000 1.21% 3/11/2028 646,795 0.02%BNP Paribas SA 600,000 2.38% 17/2/2025 646,069 0.02%APRR SA 600,000 1.25% 18/1/2028 644,692 0.02%Sanofi 600,000 1.13% 5/4/2028 644,448 0.02%Autoroutes du Sud de la France SA 600,000 2.95% 17/1/2024 643,604 0.02%Banque Federative du Credit Mutuel SA 600,000 1.38% 2/4/2030 642,693 0.02%Credit Agricole Home Loan SFH SA 600,000 0.88% 11/8/2028 641,824 0.02%Pernod Ricard SA 600,000 2.13% 27/9/2024 641,727 0.02%Altarea SCA 600,000 2.25% 5/7/2024 634,482 0.02%

308
Vanguard Euro Investment Grade Bond Index Fund
Principal EUR (€) Coupon
Maturity Date
Fair Value EUR (€)
% of Total Net Assets
APRR SA 600,000 1.13% 9/1/2026 632,446 0.02%Sodexo SA 600,000 1.00% 27/4/2029 629,914 0.02%La Mondiale SAM 600,000 2.13% 23/6/2031 629,495 0.02%Credit Agricole Assurances SA 600,000 2.00% 17/7/2030 628,377 0.02%Societe Generale SA 600,000 1.38% 13/1/2028 627,446 0.02%Danone SA 600,000 1.25% 30/5/2024 625,332 0.02%Cie de Saint-Gobain 600,000 1.00% 17/3/2025 625,012 0.02%TotalEnergies Capital International SA 600,000 0.70% 31/5/2028 622,084 0.02%BPCE SA 600,000 1.00% 1/4/2025 620,346 0.02%Banque Federative du Credit Mutuel SA 600,000 0.75% 8/6/2026 619,901 0.02%Danone SA 600,000 0.71% 3/11/2024 617,776 0.02%Danone SA 600,000 0.57% 17/3/2027 617,601 0.02%Unibail-Rodamco-Westfield SE 600,000 1.38% 4/12/2031 617,131 0.02%EssilorLuxottica SA 600,000 0.50% 5/6/2028 616,381 0.02%Orange SA^ 600,000 1.75% Perpetual 616,103 0.02%Pernod Ricard SA 600,000 0.50% 24/10/2027 615,468 0.02%BPCE SA 600,000 0.88% 31/1/2024 614,928 0.02%Caisse Francaise de Financement Local 500,000 3.00% 2/10/2028 612,316 0.02%Danone SA 600,000 0.40% 10/6/2029 608,860 0.02%Veolia Environnement SA 600,000 0.80% 15/1/2032 605,230 0.02%Schneider Electric SE 600,000 0.00% 12/6/2023 604,015 0.02%Credit Mutuel Arkea SA 500,000 3.38% 11/3/2031 602,736 0.02%Societe Generale SA 600,000 0.88% 24/9/2029 602,005 0.02%TotalEnergies SE^ 600,000 1.63% Perpetual 600,112 0.02%Caisse Nationale de Reassurance Mutuelle Agricole Groupama 600,000 0.75% 7/7/2028 597,030 0.02%ELO SACA 500,000 3.25% 23/7/2027 580,125 0.02%Airbus SE 500,000 2.38% 7/4/2032 578,439 0.02%Carrefour SA 500,000 2.63% 15/12/2027 574,163 0.02%Caisse Francaise de Financement Local 500,000 1.45% 16/1/2034 573,174 0.02%AXA Bank Europe SCF 600,000 0.25% 9/6/2040 572,222 0.02%AXA Bank Europe SCF 500,000 1.38% 18/4/2033 565,731 0.02%Caisse Francaise de Financement Local 500,000 1.25% 22/1/2035 561,714 0.02%Orange SA 500,000 1.63% 7/4/2032 556,662 0.02%Sanofi 500,000 1.50% 1/4/2030 554,640 0.02%Suez SA 500,000 1.63% 17/9/2030 551,453 0.02%Vinci SA 500,000 1.63% 18/1/2029 550,052 0.02%Unibail-Rodamco-Westfield SE 500,000 2.25% 14/5/2038 549,234 0.02%Air Liquide Finance SA 500,000 1.38% 2/4/2030 549,226 0.02%Unibail-Rodamco-Westfield SE 500,000 2.00% 29/6/2032 545,432 0.02%MMS USA Holdings, Inc. 500,000 1.75% 13/6/2031 542,184 0.02%Kering SA 500,000 1.50% 5/4/2027 541,173 0.02%Imerys SA 500,000 1.88% 31/3/2028 540,343 0.02%BPCE SA 500,000 2.88% 16/1/2024 540,339 0.02%Credit Mutuel Home Loan SFH SA 500,000 1.00% 30/1/2029 539,963 0.02%Gecina SA 500,000 1.38% 26/1/2028 539,716 0.02%Unibail-Rodamco-Westfield SE 500,000 2.13% 9/4/2025 538,192 0.02%Pernod Ricard SA 500,000 1.50% 18/5/2026 536,251 0.02%Cie de Financement Foncier SA 500,000 2.00% 7/5/2024 534,598 0.02%Edenred 500,000 1.38% 18/6/2029 534,452 0.02%Autoroutes du Sud de la France SA 500,000 1.25% 18/1/2027 533,592 0.02%Teleperformance 500,000 1.88% 2/7/2025 532,676 0.02%Air Liquide Finance SA 500,000 1.88% 5/6/2024 531,685 0.02%RCI Banque SA 500,000 1.63% 26/5/2026 528,733 0.02%Arkema SA 500,000 1.50% 20/1/2025 528,028 0.02%Air Liquide Finance SA 500,000 1.25% 3/6/2025 526,954 0.02%Suez SA^ 500,000 2.88% Perpetual 526,583 0.02%Orange SA^ 500,000 2.38% Perpetual 525,234 0.02%La Banque Postale Home Loan SFH SA 500,000 0.63% 23/6/2027 524,452 0.02%Edenred 500,000 1.38% 10/3/2025 524,269 0.02%Orange SA 500,000 2.50% 1/3/2023 523,957 0.02%Carrefour SA 500,000 1.00% 17/5/2027 523,389 0.02%Thales SA 500,000 1.00% 15/5/2028 522,870 0.02%Orange SA 500,000 1.00% 12/9/2025 522,176 0.02%BNP Paribas SA 500,000 1.63% 2/7/2031 521,804 0.02%Danone SA 500,000 1.13% 14/1/2025 521,358 0.02%Sodexo SA 500,000 1.13% 22/5/2025 521,264 0.02%Unibail-Rodamco-Westfield SE 500,000 1.00% 14/3/2025 520,398 0.02%Airbus Finance BV 500,000 0.88% 13/5/2026 519,394 0.02%Covivio 500,000 1.13% 17/9/2031 518,184 0.02%Schneider Electric SE 500,000 1.50% 8/9/2023 517,497 0.02%BNP Paribas SA^ 500,000 1.13% 17/4/2029 517,326 0.02%

309
Vanguard Euro Investment Grade Bond Index Fund
Principal EUR (€) Coupon
Maturity Date
Fair Value EUR (€)
% of Total Net Assets
BNP Paribas SA^ 500,000 2.63% 14/10/2027 516,417 0.02%TDF Infrastructure SASU 500,000 2.88% 19/10/2022 515,264 0.02%Vivendi SE 500,000 1.13% 24/11/2023 514,147 0.02%Credit Mutuel Arkea SA 500,000 0.88% 5/10/2023 512,797 0.02%BPCE SA 500,000 0.63% 28/4/2025 512,462 0.02%Sanofi 500,000 0.63% 5/4/2024 512,060 0.02%Cie Generale des Etablissements Michelin SCA 400,000 2.50% 3/9/2038 511,793 0.02%Engie SA^ 500,000 1.63% Perpetual 511,033 0.02%Arkea Home Loans SFH SA 500,000 0.38% 4/3/2024 510,555 0.02%JCDecaux SA 500,000 1.00% 1/6/2023 509,502 0.02%Engie SA 500,000 0.38% 21/6/2027 507,559 0.02%La Mondiale SAM 500,000 0.75% 20/4/2026 506,213 0.02%Unibail-Rodamco-Westfield SE 500,000 0.63% 4/5/2027 506,137 0.02%Societe Generale SA 500,000 0.75% 25/1/2027 505,783 0.02%LVMH Moet Hennessy Louis Vuitton SE 500,000 0.00% 11/2/2024 503,730 0.02%Societe Generale SA 500,000 0.13% 24/2/2026 501,938 0.02%Thales SA 500,000 0.25% 29/1/2027 501,807 0.02%Klepierre SA 500,000 0.63% 1/7/2030 500,475 0.02%Orange SA 500,000 0.00% 4/9/2026 499,427 0.02%Orange SA 500,000 0.75% 29/6/2034 499,319 0.02%BNP Paribas SA^ 500,000 0.50% 1/9/2028 498,801 0.02%Engie SA 500,000 0.00% 4/3/2027 496,934 0.02%BNP Paribas SA^ 500,000 0.25% 13/4/2027 496,739 0.02%La Banque Postale Home Loan SFH SA 500,000 0.25% 12/2/2035 493,868 0.02%Tikehau Capital SCA 500,000 1.63% 31/3/2029 493,136 0.02%Unibail-Rodamco-Westfield SE 500,000 1.75% 1/7/2049 476,370 0.02%Orange SA 450,000 3.38% 16/9/2022 470,675 0.02%MMB SCF SACA 450,000 0.75% 31/10/2025 469,484 0.02%Legrand SA 400,000 1.88% 6/7/2032 464,215 0.02%APRR SA 400,000 1.50% 17/1/2033 448,015 0.02%BPCE SA 400,000 2.88% 22/4/2026 446,957 0.02%Cie de Saint-Gobain 400,000 1.88% 21/9/2028 446,032 0.02%Holding d'Infrastructures de Transport SASU 400,000 2.50% 4/5/2027 445,893 0.02%Legrand SA 400,000 1.88% 16/12/2027 444,162 0.02%CNP Assurances^ 400,000 4.00% Perpetual 443,678 0.02%TotalEnergies Capital International SA 400,000 1.54% 31/5/2039 438,365 0.02%BPCE SA 400,000 4.63% 18/7/2023 438,356 0.02%TDF Infrastructure SASU 400,000 2.50% 7/4/2026 434,164 0.02%Engie SA^ 400,000 3.25% Perpetual 433,385 0.02%Edenred 400,000 1.88% 6/3/2026 433,321 0.02%Bouygues SA 400,000 1.38% 7/6/2027 432,623 0.02%Orange SA 400,000 1.38% 20/3/2028 431,466 0.02%EssilorLuxottica SA 400,000 2.63% 10/2/2024 430,493 0.02%Cie de Saint-Gobain 400,000 1.38% 14/6/2027 430,182 0.02%Suez SA 400,000 1.75% 10/9/2025 428,931 0.02%SANEF SA 400,000 1.88% 16/3/2026 428,865 0.02%Sanofi 400,000 1.50% 22/9/2025 427,484 0.02%Suez SA 400,000 2.75% 9/10/2023 426,704 0.02%Societe Fonciere Lyonnaise SA 400,000 1.50% 5/6/2027 426,280 0.02%Cie Financiere et Industrielle des Autoroutes SA 400,000 1.13% 13/10/2027 426,210 0.02%Holding d'Infrastructures de Transport SASU 400,000 1.63% 27/11/2027 425,786 0.02%RCI Banque SA 400,000 1.75% 10/4/2026 424,347 0.02%Sanofi 400,000 2.50% 14/11/2023 424,221 0.02%JCDecaux SA 400,000 2.00% 24/10/2024 423,510 0.02%Air Liquide SA 400,000 2.38% 6/9/2023 423,345 0.02%Autoroutes du Sud de la France SA 400,000 2.88% 18/1/2023 419,846 0.02%Autoroutes du Sud de la France SA 400,000 1.00% 13/5/2026 419,780 0.02%Orange SA 400,000 0.88% 3/2/2027 417,669 0.02%Credit Mutuel Arkea SA^ 400,000 1.25% 11/6/2029 416,834 0.02%Orange SA 400,000 1.00% 12/5/2025 416,232 0.02%Unibail-Rodamco-Westfield SE 400,000 1.00% 27/2/2027 416,077 0.02%APRR SA 400,000 1.50% 15/1/2024 415,855 0.02%Arkema SA 400,000 0.75% 3/12/2029 415,614 0.02%Engie SA 400,000 0.88% 19/9/2025 414,858 0.02%Air Liquide Finance SA 400,000 0.63% 20/6/2030 413,896 0.02%GELF Bond Issuer I SA 400,000 1.13% 18/7/2029 412,262 0.01%Schneider Electric SE 400,000 0.25% 9/9/2024 405,779 0.01%Engie SA 400,000 0.38% 11/6/2027 405,570 0.01%BPCE SA 400,000 0.13% 4/12/2024 404,000 0.01%Danone SA 400,000 0.42% 3/11/2022 403,604 0.01%Credit Agricole Home Loan SFH SA 400,000 0.05% 29/8/2022 402,588 0.01%

310
Vanguard Euro Investment Grade Bond Index Fund
Principal EUR (€) Coupon
Maturity Date
Fair Value EUR (€)
% of Total Net Assets
TotalEnergies SE^ 400,000 2.00% Perpetual 402,520 0.01%Engie SA^ 400,000 1.50% Perpetual 401,114 0.01%Safran SA 400,000 0.13% 16/3/2026 400,706 0.01%BPCE SA 400,000 0.75% 3/3/2031 399,055 0.01%Mutuelle Assurance Des Commercants et Industriels de France et Des
Cadres et Sal 400,000 0.63% 21/6/2027 397,761 0.01%Teleperformance 400,000 0.25% 26/11/2027 394,733 0.01%Orange SA^ 400,000 1.38% Perpetual 394,213 0.01%Credit Mutuel Arkea SA 300,000 3.50% 9/2/2029 358,287 0.01%SCOR SE^ 300,000 3.63% 27/5/2048 352,592 0.01%Engie SA 180,000 5.95% 16/3/2111 349,827 0.01%Engie SA 300,000 1.88% 19/9/2033 339,665 0.01%TotalEnergies Capital International SA 300,000 2.88% 19/11/2025 339,199 0.01%BNP Paribas Cardif SA^ 300,000 4.03% Perpetual 339,030 0.01%AXA SA^ 300,000 3.88% Perpetual 338,434 0.01%Unibail-Rodamco-Westfield SE 316,000 1.38% 9/3/2026 335,244 0.01%Banque Federative du Credit Mutuel SA 300,000 2.50% 25/5/2028 335,194 0.01%Cie Generale des Etablissements Michelin SCA 300,000 1.75% 28/5/2027 331,845 0.01%BNP Paribas SA 300,000 2.75% 27/1/2026 331,713 0.01%Capgemini SE 300,000 1.75% 18/4/2028 329,627 0.01%Covivio 300,000 1.88% 20/5/2026 326,345 0.01%Terega SA 300,000 2.20% 5/8/2025 325,496 0.01%Covivio 300,000 1.63% 23/6/2030 323,159 0.01%Klepierre SA 300,000 1.63% 13/12/2032 322,918 0.01%ICADE 300,000 1.63% 28/2/2028 322,152 0.01%Banque Federative du Credit Mutuel SA 300,000 1.88% 4/11/2026 321,089 0.01%CNP Assurances^ 300,000 2.50% 30/6/2051 320,896 0.01%APRR SA 300,000 1.25% 6/1/2027 320,628 0.01%Indigo Group SAS 300,000 2.13% 16/4/2025 319,688 0.01%Unibail-Rodamco-Westfield SE 300,000 1.50% 22/2/2028 319,422 0.01%Carmila SA 300,000 2.13% 7/3/2028 316,134 0.01%Icade Sante SAS 300,000 1.38% 17/9/2030 315,033 0.01%Engie SA 300,000 1.00% 13/3/2026 313,551 0.01%Eutelsat SA 300,000 1.50% 13/10/2028 313,290 0.01%Credit Mutuel Arkea SA^ 300,000 1.88% 25/10/2029 313,261 0.01%Vivendi SE 300,000 1.13% 11/12/2028 313,148 0.01%Danone SA 300,000 1.00% 26/3/2025 311,750 0.01%Capgemini SE 300,000 1.00% 18/10/2024 310,199 0.01%Legrand SA 300,000 0.63% 24/6/2028 310,168 0.01%BNP Paribas Cardif SA 300,000 1.00% 29/11/2024 307,487 0.01%Capgemini SE 300,000 0.63% 23/6/2025 307,414 0.01%Orange SA 300,000 0.75% 11/9/2023 306,285 0.01%ALD SA 300,000 1.25% 11/10/2022 305,910 0.01%PSA Banque France SA 300,000 0.63% 21/6/2024 305,166 0.01%Safran SA 300,000 0.75% 17/3/2031 304,779 0.01%Orange SA 300,000 1.38% 4/9/2049 302,590 0.01%Worldline SA 300,000 0.25% 18/9/2024 302,395 0.01%Suez SA^ 300,000 1.63% Perpetual 301,595 0.01%Engie SA 300,000 0.50% 24/10/2030 301,544 0.01%APRR SA 300,000 0.13% 18/1/2029 299,208 0.01%Imerys SA 300,000 1.00% 15/7/2031 298,147 0.01%ICADE 300,000 0.63% 18/1/2031 292,469 0.01%Alstom SA 300,000 0.00% 11/1/2029 291,698 0.01%Cie Generale des Etablissements Michelin SCA 300,000 0.63% 2/11/2040 285,882 0.01%La Mondiale SAM^ 200,000 5.05% Perpetual 232,675 0.01%Sodexo SA 200,000 2.50% 24/6/2026 224,700 0.01%JCDecaux SA 200,000 2.63% 24/4/2028 222,799 0.01%Orange SA 200,000 1.38% 16/1/2030 217,677 0.01%Orange SA 200,000 3.13% 9/1/2024 217,115 0.01%Societe Generale SA 200,000 2.63% 27/2/2025 216,791 0.01%ELO SACA 200,000 2.38% 25/4/2025 215,890 0.01%Carmila SA 200,000 2.38% 16/9/2024 214,536 0.01%Unibail-Rodamco-Westfield SE 200,000 2.00% 28/4/2036 214,530 0.01%GELF Bond Issuer I SA 200,000 1.63% 20/10/2026 213,076 0.01%Kering SA 200,000 1.25% 10/5/2026 212,360 0.01%Klepierre SA 200,000 1.75% 6/11/2024 211,937 0.01%Imerys SA 200,000 1.50% 15/1/2027 211,306 0.01%Holding d'Infrastructures de Transport SASU 200,000 1.63% 18/9/2029 210,812 0.01%Cie de Saint-Gobain 200,000 1.13% 23/3/2026 210,698 0.01%Wendel SE 200,000 1.38% 26/4/2026 210,459 0.01%Pernod Ricard SA 200,000 0.88% 24/10/2031 210,216 0.01%

311
Vanguard Euro Investment Grade Bond Index Fund
Principal EUR (€) Coupon
Maturity Date
Fair Value EUR (€)
% of Total Net Assets
Legrand SA 200,000 1.00% 6/3/2026 209,323 0.01%TotalEnergies Capital International SA 200,000 2.13% 15/3/2023 208,633 0.01%Engie SA 200,000 1.25% 24/10/2041 206,557 0.01%TotalEnergies Capital International SA 200,000 0.63% 4/10/2024 205,495 0.01%SANEF SA 200,000 0.95% 19/10/2028 204,746 0.01%Carrefour SA 200,000 0.88% 12/6/2023 203,700 0.01%RCI Banque SA 200,000 1.00% 17/5/2023 203,433 0.01%Societe Generale SA^ 200,000 1.38% 23/2/2028 203,154 0.01%EssilorLuxottica SA 200,000 0.25% 5/1/2024 202,695 0.01%Dassault Systemes SE 200,000 0.38% 16/9/2029 202,253 0.01%Mutuelle Assurance Des Commercants et Industriels de France et Des
Cadres et Sal^ 200,000 2.13% 21/6/2052 201,754 0.01%Arkema SA^ 200,000 1.50% Perpetual 201,510 0.01%Terega SA 200,000 0.88% 17/9/2030 201,453 0.01%Arkema SA 200,000 0.13% 14/10/2026 201,413 0.01%LVMH Moet Hennessy Louis Vuitton SE 200,000 0.13% 28/2/2023 201,358 0.01%APRR SA 200,000 0.00% 20/1/2023 201,160 0.01%Carrefour Banque SA 200,000 0.11% 14/6/2025 200,366 0.01%SCOR SE^ 200,000 1.38% 17/9/2051 200,234 0.01%Altarea SCA 200,000 1.75% 16/1/2030 199,864 0.01%Vinci SA 200,000 0.00% 27/11/2028 197,477 0.01%Orange SA 200,000 0.13% 16/9/2029 197,417 0.01%Cie Generale des Etablissements Michelin SCA 200,000 0.00% 2/11/2028 196,893 0.01%Cie Generale des Etablissements Michelin SCA 200,000 0.25% 2/11/2032 194,772 0.01%Suez SA 150,000 4.13% 24/6/2022 156,768 0.01%PSA Tresorerie GIE 100,000 6.00% 19/9/2033 150,488 0.01%Gecina SA 100,000 2.00% 30/6/2032 115,420 0.00%TotalEnergies Capital Canada Ltd. 100,000 2.13% 18/9/2029 114,853 0.00%Engie SA 100,000 2.38% 19/5/2026 111,640 0.00%Banque Federative du Credit Mutuel SA 100,000 3.00% 11/9/2025 111,189 0.00%Airbus SE 100,000 2.00% 7/4/2028 110,627 0.00%Bouygues SA 100,000 3.63% 16/1/2023 106,274 0.00%BNP Paribas SA 100,000 1.50% 17/11/2025 105,902 0.00%Cie de Saint-Gobain 100,000 1.75% 3/4/2023 103,269 0.00%Carrefour SA 100,000 0.75% 26/4/2024 102,319 0.00%Sodexo SA 100,000 0.50% 17/1/2024 101,642 0.00%Sanofi 100,000 0.00% 13/9/2022 100,425 0.00%Terega SASU 100,000 0.63% 27/2/2028 99,601 0.00%test - - - 444,206,590 16.45%Germany 12.05% (2020: 12.14%)Allianz SE^ 2,600,000 5.63% 17/10/2042 2,787,254 0.10%Commerzbank AG 2,500,000 0.50% 4/12/2026 2,537,339 0.09%Daimler International Finance BV 2,310,000 1.38% 26/6/2026 2,467,462 0.09%Landesbank Hessen-Thueringen Girozentrale 2,300,000 0.01% 22/1/2025 2,332,890 0.09%Berlin Hyp AG 2,300,000 0.01% 17/2/2027 2,331,402 0.09%Commerzbank AG 2,300,000 0.01% 11/3/2030 2,299,840 0.09%Volkswagen International Finance NV^ 2,000,000 3.88% Perpetual 2,210,110 0.08%Eurogrid GmbH 1,900,000 1.88% 10/6/2025 2,034,754 0.08%DZ HYP AG 2,000,000 0.01% 12/9/2025 2,030,021 0.08%UniCredit Bank AG 2,000,000 0.13% 26/10/2023 2,026,914 0.07%E.ON SE 2,000,000 0.38% 20/4/2023 2,021,608 0.07%DZ HYP AG 2,000,000 0.01% 27/10/2028 2,015,172 0.07%Berlin Hyp AG 2,000,000 0.01% 27/1/2031 1,991,068 0.07%Commerzbank AG 1,900,000 0.13% 9/1/2024 1,927,409 0.07%UniCredit Bank AG 1,900,000 0.01% 10/9/2024 1,924,914 0.07%DZ HYP AG 1,900,000 0.01% 29/1/2024 1,922,686 0.07%Santander Consumer Bank AG 1,900,000 0.25% 15/10/2024 1,914,674 0.07%Muenchener Hypothekenbank eG 1,740,000 1.00% 18/4/2039 1,905,238 0.07%Daimler AG 1,700,000 2.63% 7/4/2025 1,871,963 0.07%Deutsche Bank AG 1,700,000 2.63% 12/2/2026 1,863,858 0.07%Volkswagen International Finance NV^ 1,700,000 3.50% Perpetual 1,836,767 0.07%Deutsche Pfandbriefbank AG 1,800,000 0.25% 29/1/2024 1,831,546 0.07%Allianz SE^ 1,600,000 3.38% Perpetual 1,744,451 0.06%Landesbank Baden-Wuerttemberg 1,700,000 0.13% 27/6/2023 1,721,265 0.06%UniCredit Bank AG 1,700,000 0.01% 10/3/2031 1,688,485 0.06%SAP SE 1,500,000 1.63% 10/3/2031 1,678,716 0.06%Deutsche Telekom International Finance BV 1,600,000 4.25% 13/7/2022 1,676,407 0.06%E.ON International Finance BV 1,600,000 1.00% 13/4/2025 1,656,440 0.06%Deutsche Bank AG 1,590,000 1.13% 30/8/2023 1,633,211 0.06%Daimler International Finance BV 1,600,000 0.25% 6/11/2023 1,614,032 0.06%Deutsche Telekom International Finance BV 1,400,000 2.00% 1/12/2029 1,591,414 0.06%

312
Vanguard Euro Investment Grade Bond Index Fund
Principal EUR (€) Coupon
Maturity Date
Fair Value EUR (€)
% of Total Net Assets
Volkswagen Bank GmbH 1,500,000 1.25% 10/6/2024 1,554,916 0.06%Deutsche Bank AG^ 1,500,000 1.38% 3/9/2026 1,554,203 0.06%HeidelbergCement AG 1,454,000 1.50% 7/2/2025 1,527,658 0.06%Aareal Bank AG 1,500,000 0.01% 3/8/2026 1,521,464 0.06%Aareal Bank AG 1,500,000 0.01% 1/2/2028 1,516,091 0.06%Berlin Hyp AG 1,500,000 0.01% 7/7/2028 1,514,131 0.06%SAP SE 1,400,000 1.25% 10/3/2028 1,507,121 0.06%Deutsche Bank AG 1,549,380 0.00% 15/10/2026 1,455,875 0.05%DZ HYP AG 1,400,000 0.50% 13/11/2025 1,451,412 0.05%Landesbank Hessen-Thueringen Girozentrale 1,400,000 0.50% 25/9/2025 1,449,723 0.05%Volkswagen International Finance NV^ 1,300,000 3.88% Perpetual 1,443,341 0.05%Daimler International Finance BV 1,400,000 0.63% 6/5/2027 1,437,732 0.05%Vonovia Finance BV 1,400,000 0.63% 9/7/2026 1,431,203 0.05%Deutsche Hypothekenbank AG 1,400,000 0.25% 10/12/2024 1,431,185 0.05%BMW Finance NV 1,300,000 1.50% 6/2/2029 1,426,646 0.05%Muenchener Hypothekenbank eG 1,400,000 0.01% 5/9/2023 1,414,917 0.05%Daimler AG 1,400,000 0.00% 8/2/2024 1,406,109 0.05%Vier Gas Transport GmbH 1,300,000 3.13% 10/7/2023 1,389,053 0.05%Volkswagen Bank GmbH 1,300,000 1.88% 31/1/2024 1,363,251 0.05%BMW Finance NV 1,340,000 0.13% 13/7/2022 1,347,449 0.05%Bayer AG 1,300,000 1.38% 6/7/2032 1,332,975 0.05%Deutsche Post AG 1,200,000 1.63% 5/12/2028 1,329,994 0.05%Deutsche Telekom AG 1,300,000 0.50% 5/7/2027 1,329,852 0.05%Deutsche Telekom International Finance BV 1,300,000 0.63% 3/4/2023 1,320,525 0.05%Siemens Financieringsmaatschappij NV 1,300,000 0.13% 5/9/2029 1,297,873 0.05%Landesbank Hessen-Thueringen Girozentrale 1,200,000 1.88% 26/6/2023 1,256,628 0.05%Volkswagen International Finance NV^ 1,100,000 4.63% Perpetual 1,253,691 0.05%BMW Finance NV 1,200,000 0.75% 13/7/2026 1,247,669 0.05%Daimler AG 1,200,000 1.13% 8/8/2034 1,238,153 0.05%Volkswagen International Finance NV 1,000,000 3.25% 18/11/2030 1,228,752 0.05%Aroundtown SA 1,200,000 0.63% 9/7/2025 1,218,584 0.05%Commerzbank AG 1,200,000 0.05% 1/8/2022 1,207,471 0.04%E.ON SE 1,200,000 0.00% 28/8/2024 1,204,317 0.04%Volkswagen Leasing GmbH 1,200,000 0.25% 12/1/2026 1,203,741 0.04%UniCredit Bank AG 1,100,000 0.63% 20/11/2025 1,145,940 0.04%Commerzbank AG 1,100,000 0.63% 28/8/2024 1,123,592 0.04%Fresenius SE & Co. KGaA 1,100,000 0.75% 15/1/2028 1,122,053 0.04%Commerzbank AG 1,050,000 0.88% 18/4/2028 1,121,999 0.04%Siemens Financieringsmaatschappij NV 1,100,000 0.38% 6/9/2023 1,117,280 0.04%Volkswagen International Finance NV 800,000 4.13% 16/11/2038 1,116,476 0.04%Deutsche Bank AG^ 1,100,000 1.38% 17/2/2032 1,115,587 0.04%Bayer Capital Corp. BV 1,000,000 2.13% 15/12/2029 1,113,900 0.04%Deutsche Pfandbriefbank AG 1,100,000 0.05% 5/9/2022 1,107,111 0.04%Daimler AG 1,060,000 0.75% 8/2/2030 1,084,141 0.04%UniCredit Bank AG 1,070,000 0.25% 15/1/2032 1,082,713 0.04%Infineon Technologies AG 1,000,000 1.63% 24/6/2029 1,076,977 0.04%Volkswagen Financial Services AG 900,000 3.38% 6/4/2028 1,071,546 0.04%Bayer Capital Corp. BV 1,000,000 1.50% 26/6/2026 1,057,022 0.04%Deutsche Bank AG^ 1,000,000 1.75% 19/11/2030 1,056,485 0.04%Aroundtown SA 1,000,000 1.50% 28/5/2026 1,051,811 0.04%Fresenius Medical Care AG & Co. KGaA 1,000,000 1.25% 29/11/2029 1,049,585 0.04%Daimler AG 900,000 2.38% 22/5/2030 1,047,017 0.04%Volkswagen Leasing GmbH 1,000,000 1.13% 4/4/2024 1,031,144 0.04%Daimler AG 1,000,000 0.75% 10/9/2030 1,028,988 0.04%Merck Financial Services GmbH 1,000,000 0.50% 16/7/2028 1,022,197 0.04%Landesbank Baden-Wuerttemberg 1,000,000 0.01% 17/6/2026 1,014,514 0.04%Bayer AG 1,000,000 0.38% 6/7/2024 1,011,125 0.04%DZ HYP AG 1,000,000 0.01% 23/6/2028 1,008,929 0.04%BASF SE 1,000,000 0.10% 5/6/2023 1,006,966 0.04%Vonovia SE 1,000,000 0.38% 16/6/2027 1,001,130 0.04%Bayer AG 1,000,000 0.05% 12/1/2025 997,981 0.04%Volkswagen Financial Services AG 900,000 3.00% 6/4/2025 997,506 0.04%Daimler AG 900,000 2.00% 22/8/2026 989,431 0.04%Deutsche Bank AG 950,000 0.50% 22/1/2026 984,308 0.04%Bayer AG 1,000,000 0.38% 12/1/2029 980,572 0.04%HeidelbergCement Finance Luxembourg SA 900,000 1.75% 24/4/2028 977,344 0.04%Allianz SE^ 900,000 2.24% 7/7/2045 962,861 0.04%Fresenius SE & Co. KGaA 900,000 1.88% 15/2/2025 959,621 0.04%HeidelbergCement AG 900,000 2.25% 3/6/2024 956,508 0.04%Norddeutsche Landesbank-Girozentrale 900,000 0.75% 18/1/2028 951,656 0.04%Muenchener Hypothekenbank eG 900,000 0.63% 10/11/2027 946,264 0.03%
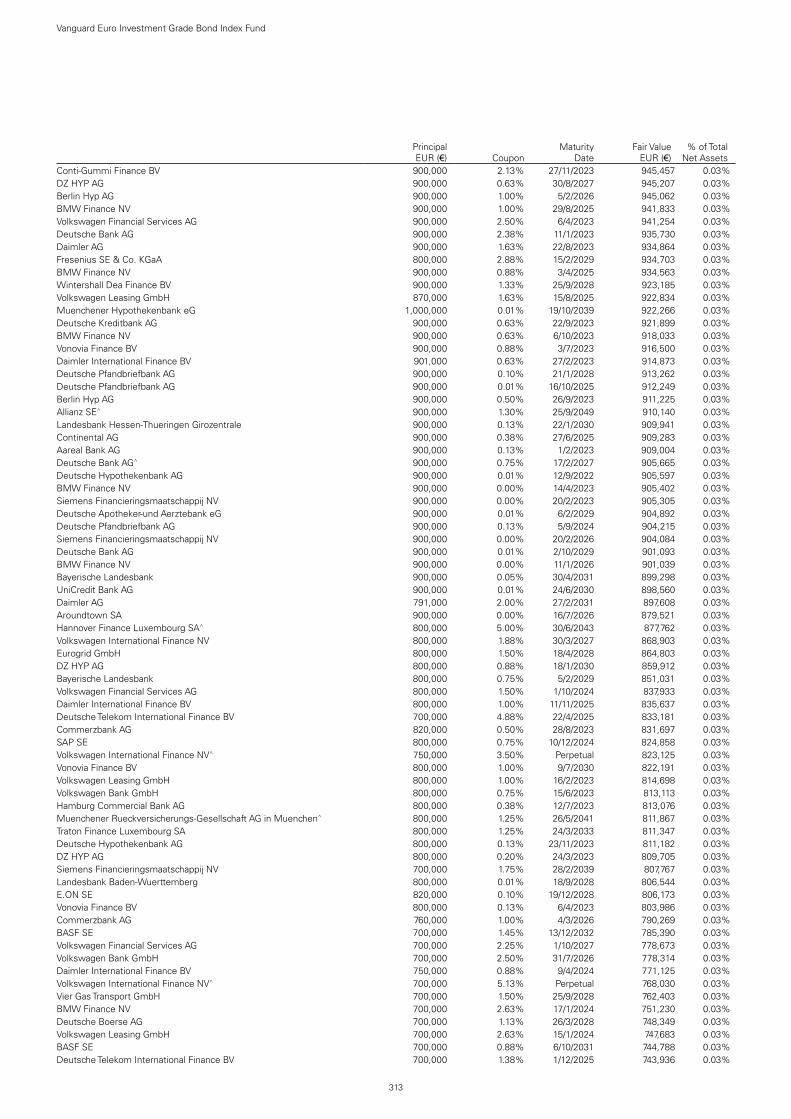
313
Vanguard Euro Investment Grade Bond Index Fund
Principal EUR (€) Coupon
Maturity Date
Fair Value EUR (€)
% of Total Net Assets
Conti-Gummi Finance BV 900,000 2.13% 27/11/2023 945,457 0.03%DZ HYP AG 900,000 0.63% 30/8/2027 945,207 0.03%Berlin Hyp AG 900,000 1.00% 5/2/2026 945,062 0.03%BMW Finance NV 900,000 1.00% 29/8/2025 941,833 0.03%Volkswagen Financial Services AG 900,000 2.50% 6/4/2023 941,254 0.03%Deutsche Bank AG 900,000 2.38% 11/1/2023 935,730 0.03%Daimler AG 900,000 1.63% 22/8/2023 934,864 0.03%Fresenius SE & Co. KGaA 800,000 2.88% 15/2/2029 934,703 0.03%BMW Finance NV 900,000 0.88% 3/4/2025 934,563 0.03%Wintershall Dea Finance BV 900,000 1.33% 25/9/2028 923,185 0.03%Volkswagen Leasing GmbH 870,000 1.63% 15/8/2025 922,834 0.03%Muenchener Hypothekenbank eG 1,000,000 0.01% 19/10/2039 922,266 0.03%Deutsche Kreditbank AG 900,000 0.63% 22/9/2023 921,899 0.03%BMW Finance NV 900,000 0.63% 6/10/2023 918,033 0.03%Vonovia Finance BV 900,000 0.88% 3/7/2023 916,500 0.03%Daimler International Finance BV 901,000 0.63% 27/2/2023 914,873 0.03%Deutsche Pfandbriefbank AG 900,000 0.10% 21/1/2028 913,262 0.03%Deutsche Pfandbriefbank AG 900,000 0.01% 16/10/2025 912,249 0.03%Berlin Hyp AG 900,000 0.50% 26/9/2023 911,225 0.03%Allianz SE^ 900,000 1.30% 25/9/2049 910,140 0.03%Landesbank Hessen-Thueringen Girozentrale 900,000 0.13% 22/1/2030 909,941 0.03%Continental AG 900,000 0.38% 27/6/2025 909,283 0.03%Aareal Bank AG 900,000 0.13% 1/2/2023 909,004 0.03%Deutsche Bank AG^ 900,000 0.75% 17/2/2027 905,665 0.03%Deutsche Hypothekenbank AG 900,000 0.01% 12/9/2022 905,597 0.03%BMW Finance NV 900,000 0.00% 14/4/2023 905,402 0.03%Siemens Financieringsmaatschappij NV 900,000 0.00% 20/2/2023 905,305 0.03%Deutsche Apotheker-und Aerztebank eG 900,000 0.01% 6/2/2029 904,892 0.03%Deutsche Pfandbriefbank AG 900,000 0.13% 5/9/2024 904,215 0.03%Siemens Financieringsmaatschappij NV 900,000 0.00% 20/2/2026 904,084 0.03%Deutsche Bank AG 900,000 0.01% 2/10/2029 901,093 0.03%BMW Finance NV 900,000 0.00% 11/1/2026 901,039 0.03%Bayerische Landesbank 900,000 0.05% 30/4/2031 899,298 0.03%UniCredit Bank AG 900,000 0.01% 24/6/2030 898,560 0.03%Daimler AG 791,000 2.00% 27/2/2031 897,608 0.03%Aroundtown SA 900,000 0.00% 16/7/2026 879,521 0.03%Hannover Finance Luxembourg SA^ 800,000 5.00% 30/6/2043 877,762 0.03%Volkswagen International Finance NV 800,000 1.88% 30/3/2027 868,903 0.03%Eurogrid GmbH 800,000 1.50% 18/4/2028 864,803 0.03%DZ HYP AG 800,000 0.88% 18/1/2030 859,912 0.03%Bayerische Landesbank 800,000 0.75% 5/2/2029 851,031 0.03%Volkswagen Financial Services AG 800,000 1.50% 1/10/2024 837,933 0.03%Daimler International Finance BV 800,000 1.00% 11/11/2025 835,637 0.03%Deutsche Telekom International Finance BV 700,000 4.88% 22/4/2025 833,181 0.03%Commerzbank AG 820,000 0.50% 28/8/2023 831,697 0.03%SAP SE 800,000 0.75% 10/12/2024 824,858 0.03%Volkswagen International Finance NV^ 750,000 3.50% Perpetual 823,125 0.03%Vonovia Finance BV 800,000 1.00% 9/7/2030 822,191 0.03%Volkswagen Leasing GmbH 800,000 1.00% 16/2/2023 814,698 0.03%Volkswagen Bank GmbH 800,000 0.75% 15/6/2023 813,113 0.03%Hamburg Commercial Bank AG 800,000 0.38% 12/7/2023 813,076 0.03%Muenchener Rueckversicherungs-Gesellschaft AG in Muenchen^ 800,000 1.25% 26/5/2041 811,867 0.03%Traton Finance Luxembourg SA 800,000 1.25% 24/3/2033 811,347 0.03%Deutsche Hypothekenbank AG 800,000 0.13% 23/11/2023 811,182 0.03%DZ HYP AG 800,000 0.20% 24/3/2023 809,705 0.03%Siemens Financieringsmaatschappij NV 700,000 1.75% 28/2/2039 807,767 0.03%Landesbank Baden-Wuerttemberg 800,000 0.01% 18/9/2028 806,544 0.03%E.ON SE 820,000 0.10% 19/12/2028 806,173 0.03%Vonovia Finance BV 800,000 0.13% 6/4/2023 803,986 0.03%Commerzbank AG 760,000 1.00% 4/3/2026 790,269 0.03%BASF SE 700,000 1.45% 13/12/2032 785,390 0.03%Volkswagen Financial Services AG 700,000 2.25% 1/10/2027 778,673 0.03%Volkswagen Bank GmbH 700,000 2.50% 31/7/2026 778,314 0.03%Daimler International Finance BV 750,000 0.88% 9/4/2024 771,125 0.03%Volkswagen International Finance NV^ 700,000 5.13% Perpetual 768,030 0.03%Vier Gas Transport GmbH 700,000 1.50% 25/9/2028 762,403 0.03%BMW Finance NV 700,000 2.63% 17/1/2024 751,230 0.03%Deutsche Boerse AG 700,000 1.13% 26/3/2028 748,349 0.03%Volkswagen Leasing GmbH 700,000 2.63% 15/1/2024 747,683 0.03%BASF SE 700,000 0.88% 6/10/2031 744,788 0.03%Deutsche Telekom International Finance BV 700,000 1.38% 1/12/2025 743,936 0.03%

314
Vanguard Euro Investment Grade Bond Index Fund
Principal EUR (€) Coupon
Maturity Date
Fair Value EUR (€)
% of Total Net Assets
Grand City Properties SA 700,000 1.38% 3/8/2026 739,967 0.03%Siemens Financieringsmaatschappij NV 726,000 0.30% 28/2/2024 737,089 0.03%Bayerische Landesbank 700,000 0.88% 10/9/2025 735,984 0.03%Infineon Technologies AG 700,000 1.13% 24/6/2026 731,641 0.03%Aroundtown SA 700,000 1.45% 9/7/2028 730,467 0.03%BASF SE 700,000 0.88% 22/5/2025 730,128 0.03%Eurogrid GmbH 700,000 1.63% 3/11/2023 727,243 0.03%Wurth Finance International BV 700,000 0.75% 22/11/2027 726,685 0.03%HeidelbergCement AG 700,000 2.25% 30/3/2023 725,746 0.03%Daimler International Finance BV 700,000 2.38% 12/9/2022 723,519 0.03%LEG Immobilien SE 700,000 0.88% 28/11/2027 722,803 0.03%LEG Immobilien SE 700,000 1.25% 23/1/2024 721,302 0.03%DZ HYP AG 700,000 0.38% 6/6/2025 720,147 0.03%Landesbank Baden-Wuerttemberg 700,000 0.38% 27/2/2025 719,416 0.03%Bayer AG 700,000 1.13% 6/1/2030 719,219 0.03%Siemens Financieringsmaatschappij NV 600,000 2.88% 10/3/2028 714,253 0.03%Wintershall Dea Finance BV 700,000 0.84% 25/9/2025 713,428 0.03%BMW Finance NV 700,000 0.38% 14/1/2027 713,184 0.03%Muenchener Hypothekenbank eG 700,000 0.25% 13/12/2023 712,285 0.03%SAP SE 700,000 0.38% 18/5/2029 711,544 0.03%Deutsche Bank AG 700,000 0.25% 15/5/2023 709,436 0.03%Santander Consumer Bank AG 700,000 0.75% 17/10/2022 709,123 0.03%Siemens Financieringsmaatschappij NV 700,000 0.50% 20/2/2032 708,955 0.03%Deutsche Hypothekenbank AG 700,000 0.01% 18/2/2027 707,951 0.03%DZ HYP AG 700,000 0.50% 29/7/2022 707,818 0.03%alstria office-AG 700,000 0.50% 26/9/2025 706,020 0.03%E.ON International Finance BV 650,000 1.50% 31/7/2029 705,834 0.03%DZ HYP AG 700,000 0.13% 30/9/2022 705,703 0.03%HOCHTIEF AG 700,000 0.50% 3/9/2027 703,526 0.03%Siemens Financieringsmaatschappij NV 699,000 0.00% 5/9/2024 703,256 0.03%Hannover Rueck SE^ 700,000 1.13% 9/10/2039 702,987 0.03%E.ON SE 700,000 0.63% 7/11/2031 701,508 0.03%LEG Immobilien SE 700,000 0.75% 30/6/2031 699,407 0.03%Vier Gas Transport GmbH 700,000 0.13% 10/9/2029 685,338 0.03%Bayerische Landesbank 650,000 2.00% 11/7/2022 666,911 0.02%Deutsche Bank AG 650,000 0.25% 8/3/2024 661,835 0.02%Allianz SE^ 600,000 4.75% Perpetual 660,885 0.02%ING-DiBa AG 600,000 1.00% 23/5/2039 658,121 0.02%Bertelsmann SE & Co. KGaA 600,000 1.50% 15/5/2030 651,683 0.02%Deutsche Wohnen SE 600,000 1.50% 30/4/2030 647,506 0.02%Allianz SE^ 600,000 2.12% 8/7/2050 643,267 0.02%Volkswagen Leasing GmbH 600,000 1.50% 19/6/2026 636,570 0.02%Grand City Properties SA 600,000 1.50% 22/2/2027 636,408 0.02%Deutsche Hypothekenbank AG 600,000 0.75% 5/3/2029 636,397 0.02%BASF SE 600,000 0.88% 15/11/2027 631,293 0.02%Volkswagen Leasing GmbH 600,000 1.38% 20/1/2025 627,530 0.02%Vonovia Finance BV 600,000 1.25% 6/12/2024 626,850 0.02%Fresenius Finance Ireland plc 600,000 1.50% 30/1/2024 622,307 0.02%Wintershall Dea Finance BV 600,000 1.82% 25/9/2031 622,176 0.02%Volkswagen Leasing GmbH 600,000 2.38% 6/9/2022 618,452 0.02%DVB Bank SE 600,000 1.25% 16/6/2023 618,194 0.02%Commerzbank AG 600,000 1.25% 23/10/2023 617,873 0.02%Commerzbank AG 550,000 1.25% 9/1/2034 616,987 0.02%E.ON International Finance BV 400,000 5.75% 14/2/2033 616,700 0.02%Siemens Financieringsmaatschappij NV 600,000 0.38% 5/6/2026 613,405 0.02%Deutsche Post AG 600,000 0.38% 20/5/2026 612,148 0.02%Bayer Capital Corp. BV 600,000 0.63% 15/12/2022 606,769 0.02%SAP SE 600,000 0.13% 18/5/2026 606,158 0.02%Wintershall Dea Finance BV 600,000 0.45% 25/9/2023 605,655 0.02%Fresenius Medical Care AG & Co. KGaA 600,000 0.25% 29/11/2023 604,858 0.02%E.ON SE 600,000 0.25% 24/10/2026 604,768 0.02%Siemens Financieringsmaatschappij NV 600,000 0.25% 20/2/2029 603,547 0.02%Landesbank Hessen-Thueringen Girozentrale 600,000 0.00% 18/7/2022 603,356 0.02%Vantage Towers AG 600,000 0.38% 31/3/2027 598,883 0.02%Deutsche Telekom AG 550,000 1.38% 5/7/2034 586,553 0.02%Muenchener Rueckversicherungs-Gesellschaft AG in Muenchen^ 500,000 3.25% 26/5/2049 581,414 0.02%Bayer AG 600,000 0.63% 12/7/2031 580,473 0.02%DZ HYP AG 535,000 0.88% 17/4/2034 575,634 0.02%BMW Finance NV 550,000 2.38% 24/1/2023 573,892 0.02%Deutsche Boerse AG 550,000 2.38% 5/10/2022 569,370 0.02%Talanx AG 500,000 2.50% 23/7/2026 565,802 0.02%

315
Vanguard Euro Investment Grade Bond Index Fund
Principal EUR (€) Coupon
Maturity Date
Fair Value EUR (€)
% of Total Net Assets
ING-DiBa AG 500,000 1.25% 9/10/2033 561,865 0.02%BASF SE 500,000 1.50% 22/5/2030 557,367 0.02%Bertelsmann SE & Co. KGaA 500,000 2.00% 1/4/2028 556,587 0.02%Allianz Finance II BV 500,000 1.50% 15/1/2030 555,252 0.02%Continental AG 500,000 2.50% 27/8/2026 554,923 0.02%Allianz Finance II BV 500,000 1.38% 21/4/2031 554,213 0.02%Volkswagen Financial Services AG 500,000 2.25% 16/10/2026 553,476 0.02%Siemens Financieringsmaatschappij NV 500,000 1.38% 6/9/2030 551,067 0.02%Merck KGaA^ 500,000 2.88% 25/6/2079 545,031 0.02%UniCredit Bank AG 505,000 0.85% 22/5/2034 541,444 0.02%Fresenius SE & Co. KGaA 500,000 1.63% 8/10/2027 537,993 0.02%E.ON International Finance BV 500,000 1.63% 30/5/2026 536,792 0.02%Talanx AG^ 500,000 2.25% 5/12/2047 536,783 0.02%Vonovia Finance BV 500,000 1.50% 14/1/2028 535,528 0.02%Deutsche Kreditbank AG 500,000 0.88% 2/10/2028 535,201 0.02%Volkswagen International Finance NV^ 500,000 3.38% Perpetual 534,013 0.02%Deutsche Apotheker-und Aerztebank eG 500,000 0.75% 5/7/2028 530,295 0.02%Fresenius Medical Care AG & Co. KGaA 500,000 1.50% 11/7/2025 528,675 0.02%Deutsche Bank AG^ 500,000 1.38% 10/6/2026 525,107 0.02%Bayerische Landesbank 500,000 0.63% 19/7/2027 525,091 0.02%BMW Finance NV 500,000 0.88% 14/1/2032 524,197 0.02%Daimler AG 500,000 1.13% 6/11/2031 524,036 0.02%Vonovia Finance BV 500,000 1.63% 7/10/2039 522,710 0.02%Berlin Hyp AG 500,000 1.25% 22/1/2025 522,446 0.02%LANXESS AG 500,000 1.13% 16/5/2025 522,363 0.02%Vonovia Finance BV 500,000 1.63% 7/4/2024 521,441 0.02%Knorr-Bremse AG 500,000 1.13% 13/6/2025 521,179 0.02%Deutsche Kreditbank AG 500,000 0.50% 19/3/2027 520,571 0.02%BMW Finance NV 500,000 1.00% 14/11/2024 519,646 0.02%Deutsche Bank AG 500,000 0.63% 21/8/2025 519,639 0.02%Muenchener Hypothekenbank eG 500,000 0.50% 22/4/2026 519,035 0.02%Volkswagen International Finance NV 500,000 0.88% 22/9/2028 517,318 0.02%Muenchener Hypothekenbank eG 500,000 0.50% 14/3/2025 516,421 0.02%Deutsche Apotheker-und Aerztebank eG 500,000 0.50% 14/2/2025 515,880 0.02%Merck KGaA^ 500,000 1.63% 9/9/2080 514,983 0.02%Deutsche Telekom International Finance BV 500,000 0.88% 30/1/2024 513,867 0.02%Aroundtown SA 500,000 1.00% 7/1/2025 513,373 0.02%Norddeutsche Landesbank-Girozentrale 500,000 0.25% 28/10/2026 512,521 0.02%Norddeutsche Landesbank-Girozentrale 500,000 0.38% 9/10/2024 512,348 0.02%E.ON SE 500,000 0.75% 18/12/2030 512,094 0.02%Grand City Properties SA^ 500,000 2.50% Perpetual 511,849 0.02%Bayerische Landesbank 500,000 0.25% 14/1/2025 511,545 0.02%Deutsche Bank AG^ 500,000 1.00% 19/11/2025 510,400 0.02%BMW Finance NV 500,000 1.25% 5/9/2022 509,770 0.02%Volkswagen Financial Services AG 500,000 0.88% 12/4/2023 508,620 0.02%BASF SE 500,000 0.25% 5/6/2027 508,326 0.02%Merck Financial Services GmbH 500,000 1.38% 1/9/2022 507,971 0.02%Commerzbank AG 500,000 0.05% 11/7/2024 507,039 0.02%Evonik Finance BV 500,000 0.38% 7/9/2024 506,961 0.02%Deutsche Telekom International Finance BV 500,000 0.63% 1/12/2022 506,939 0.02%E.ON SE 500,000 0.38% 29/9/2027 506,160 0.02%Deutsche Apotheker-und Aerztebank eG 500,000 0.15% 7/3/2023 505,466 0.02%Traton Finance Luxembourg SA 500,000 0.75% 24/3/2029 505,263 0.02%Hamburger Sparkasse AG 500,000 0.01% 11/2/2028 504,196 0.02%Deutsche Wohnen SE 500,000 1.30% 7/4/2041 503,518 0.02%HeidelbergCement Finance Luxembourg SA 500,000 0.50% 9/8/2022 503,378 0.02%BMW Finance NV 500,000 0.00% 24/3/2023 502,766 0.02%Merck Financial Services GmbH 500,000 0.01% 15/12/2023 502,719 0.02%E.ON SE 500,000 0.00% 18/12/2023 502,709 0.02%Hannover Rueck SE^ 500,000 1.38% 30/6/2042 502,482 0.02%Daimler AG 500,000 0.75% 11/3/2033 502,305 0.02%Deutsche Telekom AG 482,000 0.88% 25/3/2026 502,275 0.02%Commerzbank AG 500,000 0.38% 1/9/2027 502,133 0.02%Mercedes-Benz Finance Co., Ltd. 500,000 0.00% 21/8/2022 501,694 0.02%Traton Finance Luxembourg SA 500,000 0.13% 24/3/2025 501,147 0.02%Santander Consumer Bank AG 500,000 0.05% 14/2/2030 500,889 0.02%Aroundtown SA^ 500,000 2.13% Perpetual 500,725 0.02%Fresenius Finance Ireland plc 500,000 0.50% 1/10/2028 500,368 0.02%Fresenius Finance Ireland plc 500,000 0.00% 1/10/2025 498,838 0.02%Fresenius Finance Ireland plc 500,000 0.88% 1/10/2031 498,212 0.02%Robert Bosch Investment Nederland BV 400,000 2.63% 24/5/2028 471,039 0.02%

316
Vanguard Euro Investment Grade Bond Index Fund
Principal EUR (€) Coupon
Maturity Date
Fair Value EUR (€)
% of Total Net Assets
Deutsche Telekom International Finance BV 270,000 7.50% 24/1/2033 467,696 0.02%Deutsche Telekom AG 400,000 2.25% 29/3/2039 466,326 0.02%Vonovia Finance BV 500,000 1.00% 28/1/2041 465,910 0.02%Vonovia Finance BV 400,000 2.25% 7/4/2030 453,662 0.02%Deutsche Telekom AG 400,000 1.75% 25/3/2031 448,430 0.02%Hannover Rueck SE^ 400,000 3.38% Perpetual 445,959 0.02%Siemens Financieringsmaatschappij NV 399,000 1.25% 28/2/2031 435,756 0.02%Aroundtown SA 400,000 2.00% 2/11/2026 430,215 0.02%Deutsche Telekom International Finance BV 400,000 1.38% 30/1/2027 428,466 0.02%Deutsche Post AG 400,000 2.75% 9/10/2023 428,014 0.02%Vonovia Finance BV 400,000 1.50% 22/3/2026 426,261 0.02%Fresenius Medical Care AG & Co. KGaA 400,000 1.50% 29/5/2030 425,507 0.02%Robert Bosch GmbH 400,000 1.75% 8/7/2024 424,100 0.02%Deutsche Post AG 400,000 1.25% 1/4/2026 424,034 0.02%O2 Telefonica Deutschland Finanzierungs GmbH 400,000 1.75% 5/7/2025 423,872 0.02%Deutsche Bank AG 400,000 1.75% 17/1/2028 423,194 0.02%Aroundtown SA 400,000 1.63% 31/1/2028 422,146 0.02%Covestro AG 400,000 1.75% 25/9/2024 422,062 0.02%Deutsche Bank AG 400,000 1.63% 20/1/2027 420,451 0.02%Commerzbank AG 400,000 0.88% 8/9/2025 420,253 0.02%HeidelbergCement Finance Luxembourg SA 400,000 1.13% 1/12/2027 419,817 0.02%Hannover Rueck SE^ 400,000 1.75% 8/10/2040 419,530 0.02%Merck Financial Services GmbH 400,000 0.88% 5/7/2031 418,705 0.02%Deutsche Post AG 400,000 0.75% 20/5/2029 417,554 0.02%DZ HYP AG 400,000 0.50% 1/4/2027 416,686 0.02%Brenntag Finance BV 400,000 1.13% 27/9/2025 416,451 0.02%E.ON SE 400,000 1.00% 7/10/2025 416,330 0.02%Evonik Industries AG 400,000 0.75% 7/9/2028 415,355 0.02%Commerzbank AG 400,000 0.50% 9/6/2026 415,341 0.02%Deutsche Telekom AG 400,000 1.75% 9/12/2049 414,322 0.02%Merck KGaA^ 400,000 1.63% 25/6/2079 412,767 0.02%Deutsche Boerse AG^ 400,000 1.25% 16/6/2047 410,064 0.02%Infineon Technologies AG 400,000 0.75% 24/6/2023 406,831 0.01%Vonovia Finance BV 400,000 0.63% 7/10/2027 406,591 0.01%Volkswagen Bank GmbH 400,000 1.25% 1/8/2022 406,466 0.01%Aareal Bank AG 400,000 0.13% 1/2/2024 405,999 0.01%Hella GmbH & Co. KGaA 400,000 0.50% 26/1/2027 404,948 0.01%Vonovia Finance BV 400,000 1.13% 14/9/2034 404,254 0.01%E.ON SE 400,000 0.00% 29/9/2022 401,614 0.01%Volkswagen Leasing GmbH 400,000 0.38% 20/7/2026 401,302 0.01%Vonovia SE 400,000 0.63% 14/12/2029 400,467 0.01%Vantage Towers AG 400,000 0.00% 31/3/2025 398,643 0.01%adidas AG 400,000 0.00% 5/10/2028 397,097 0.01%Grand City Properties SA 400,000 0.13% 11/1/2028 388,807 0.01%BMW Finance NV 400,000 0.20% 11/1/2033 385,180 0.01%Commerzbank AG 341,000 1.50% 28/8/2028 367,768 0.01%Commerzbank AG 350,000 1.50% 21/9/2022 357,566 0.01%Fresenius SE & Co. KGaA 300,000 4.00% 1/2/2024 331,060 0.01%Aroundtown SA 300,000 1.88% 19/1/2026 321,620 0.01%Roadster Finance DAC 300,000 2.38% 8/12/2027 320,357 0.01%Deutsche Post AG 300,000 1.00% 20/5/2032 320,134 0.01%Siemens Financieringsmaatschappij NV 300,000 1.00% 6/9/2027 318,238 0.01%Vonovia Finance BV 300,000 1.50% 31/3/2025 316,875 0.01%Talanx AG 300,000 3.13% 13/2/2023 316,336 0.01%Deutsche Telekom International Finance BV 300,000 1.13% 22/5/2026 316,125 0.01%Volkswagen International Finance NV 300,000 1.25% 23/9/2032 313,919 0.01%Aroundtown SA^ 300,000 2.88% Perpetual 307,461 0.01%Vonovia Finance BV 300,000 2.13% 9/7/2022 307,363 0.01%Evonik Industries AG 300,000 0.63% 18/9/2025 307,288 0.01%Bayer AG 300,000 0.75% 6/1/2027 305,685 0.01%Allianz Finance II BV 300,000 0.50% 14/1/2031 305,133 0.01%Deutsche Pfandbriefbank AG 300,000 0.75% 7/2/2023 304,584 0.01%Aroundtown SA 300,000 0.38% 23/9/2022 301,741 0.01%Eurogrid GmbH 300,000 0.74% 21/4/2033 301,105 0.01%Vonovia SE 300,000 0.00% 16/9/2024 300,793 0.01%Clearstream Banking AG 300,000 0.00% 1/12/2025 300,421 0.01%Volkswagen Leasing GmbH 300,000 0.63% 19/7/2029 299,804 0.01%Siemens Financieringsmaatschappij NV 300,000 0.50% 5/9/2034 298,414 0.01%Volkswagen International Finance NV 300,000 1.50% 21/1/2041 295,394 0.01%Grand City Properties SA^ 300,000 1.50% Perpetual 293,302 0.01%Aroundtown SA^ 300,000 1.63% Perpetual 288,645 0.01%
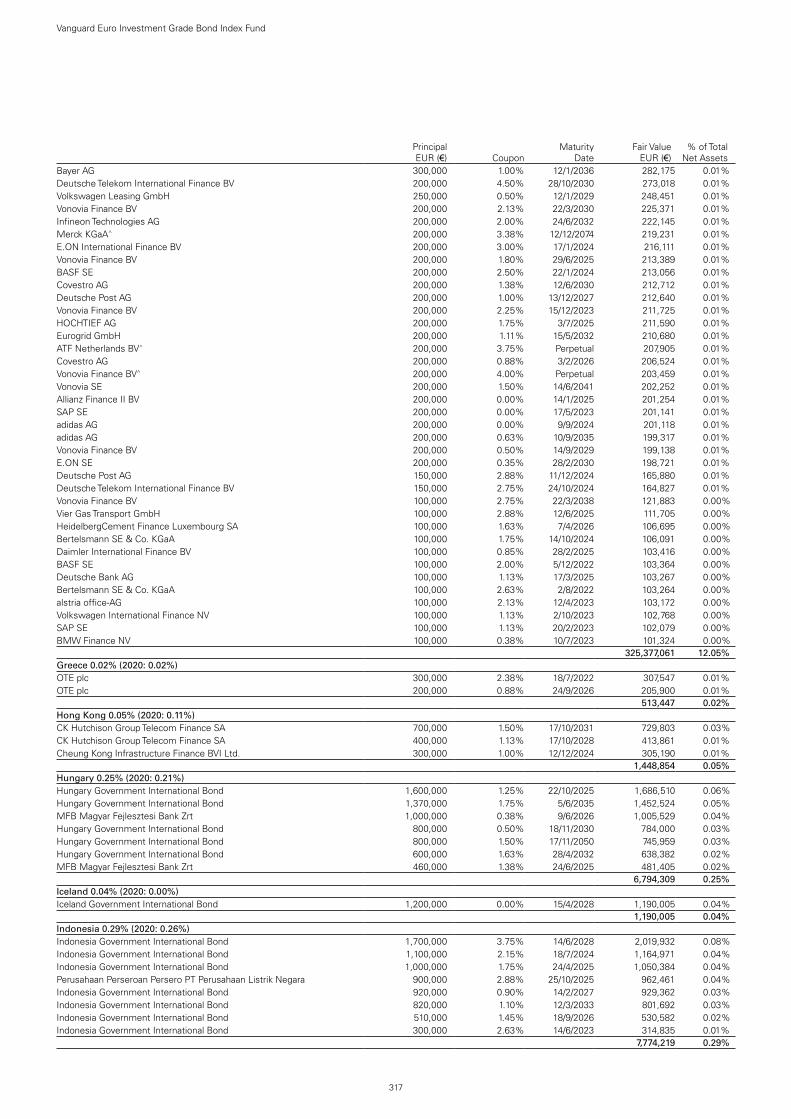
317
Vanguard Euro Investment Grade Bond Index Fund
Principal EUR (€) Coupon
Maturity Date
Fair Value EUR (€)
% of Total Net Assets
Bayer AG 300,000 1.00% 12/1/2036 282,175 0.01%Deutsche Telekom International Finance BV 200,000 4.50% 28/10/2030 273,018 0.01%Volkswagen Leasing GmbH 250,000 0.50% 12/1/2029 248,451 0.01%Vonovia Finance BV 200,000 2.13% 22/3/2030 225,371 0.01%Infineon Technologies AG 200,000 2.00% 24/6/2032 222,145 0.01%Merck KGaA^ 200,000 3.38% 12/12/2074 219,231 0.01%E.ON International Finance BV 200,000 3.00% 17/1/2024 216,111 0.01%Vonovia Finance BV 200,000 1.80% 29/6/2025 213,389 0.01%BASF SE 200,000 2.50% 22/1/2024 213,056 0.01%Covestro AG 200,000 1.38% 12/6/2030 212,712 0.01%Deutsche Post AG 200,000 1.00% 13/12/2027 212,640 0.01%Vonovia Finance BV 200,000 2.25% 15/12/2023 211,725 0.01%HOCHTIEF AG 200,000 1.75% 3/7/2025 211,590 0.01%Eurogrid GmbH 200,000 1.11% 15/5/2032 210,680 0.01%ATF Netherlands BV^ 200,000 3.75% Perpetual 207,905 0.01%Covestro AG 200,000 0.88% 3/2/2026 206,524 0.01%Vonovia Finance BV^ 200,000 4.00% Perpetual 203,459 0.01%Vonovia SE 200,000 1.50% 14/6/2041 202,252 0.01%Allianz Finance II BV 200,000 0.00% 14/1/2025 201,254 0.01%SAP SE 200,000 0.00% 17/5/2023 201,141 0.01%adidas AG 200,000 0.00% 9/9/2024 201,118 0.01%adidas AG 200,000 0.63% 10/9/2035 199,317 0.01%Vonovia Finance BV 200,000 0.50% 14/9/2029 199,138 0.01%E.ON SE 200,000 0.35% 28/2/2030 198,721 0.01%Deutsche Post AG 150,000 2.88% 11/12/2024 165,880 0.01%Deutsche Telekom International Finance BV 150,000 2.75% 24/10/2024 164,827 0.01%Vonovia Finance BV 100,000 2.75% 22/3/2038 121,883 0.00%Vier Gas Transport GmbH 100,000 2.88% 12/6/2025 111,705 0.00%HeidelbergCement Finance Luxembourg SA 100,000 1.63% 7/4/2026 106,695 0.00%Bertelsmann SE & Co. KGaA 100,000 1.75% 14/10/2024 106,091 0.00%Daimler International Finance BV 100,000 0.85% 28/2/2025 103,416 0.00%BASF SE 100,000 2.00% 5/12/2022 103,364 0.00%Deutsche Bank AG 100,000 1.13% 17/3/2025 103,267 0.00%Bertelsmann SE & Co. KGaA 100,000 2.63% 2/8/2022 103,264 0.00%alstria office-AG 100,000 2.13% 12/4/2023 103,172 0.00%Volkswagen International Finance NV 100,000 1.13% 2/10/2023 102,768 0.00%SAP SE 100,000 1.13% 20/2/2023 102,079 0.00%BMW Finance NV 100,000 0.38% 10/7/2023 101,324 0.00%test - - - 325,377,061 12.05%Greece 0.02% (2020: 0.02%)OTE plc 300,000 2.38% 18/7/2022 307,547 0.01%OTE plc 200,000 0.88% 24/9/2026 205,900 0.01%test - - - 513,447 0.02%Hong Kong 0.05% (2020: 0.11%)CK Hutchison Group Telecom Finance SA 700,000 1.50% 17/10/2031 729,803 0.03%CK Hutchison Group Telecom Finance SA 400,000 1.13% 17/10/2028 413,861 0.01%Cheung Kong Infrastructure Finance BVI Ltd. 300,000 1.00% 12/12/2024 305,190 0.01%test - - - 1,448,854 0.05%Hungary 0.25% (2020: 0.21%)Hungary Government International Bond 1,600,000 1.25% 22/10/2025 1,686,510 0.06%Hungary Government International Bond 1,370,000 1.75% 5/6/2035 1,452,524 0.05%MFB Magyar Fejlesztesi Bank Zrt 1,000,000 0.38% 9/6/2026 1,005,529 0.04%Hungary Government International Bond 800,000 0.50% 18/11/2030 784,000 0.03%Hungary Government International Bond 800,000 1.50% 17/11/2050 745,959 0.03%Hungary Government International Bond 600,000 1.63% 28/4/2032 638,382 0.02%MFB Magyar Fejlesztesi Bank Zrt 460,000 1.38% 24/6/2025 481,405 0.02%test - - - 6,794,309 0.25%Iceland 0.04% (2020: 0.00%)Iceland Government International Bond 1,200,000 0.00% 15/4/2028 1,190,005 0.04%test - - - 1,190,005 0.04%Indonesia 0.29% (2020: 0.26%)Indonesia Government International Bond 1,700,000 3.75% 14/6/2028 2,019,932 0.08%Indonesia Government International Bond 1,100,000 2.15% 18/7/2024 1,164,971 0.04%Indonesia Government International Bond 1,000,000 1.75% 24/4/2025 1,050,384 0.04%Perusahaan Perseroan Persero PT Perusahaan Listrik Negara 900,000 2.88% 25/10/2025 962,461 0.04%Indonesia Government International Bond 920,000 0.90% 14/2/2027 929,362 0.03%Indonesia Government International Bond 820,000 1.10% 12/3/2033 801,692 0.03%Indonesia Government International Bond 510,000 1.45% 18/9/2026 530,582 0.02%Indonesia Government International Bond 300,000 2.63% 14/6/2023 314,835 0.01%test - - - 7,774,219 0.29%
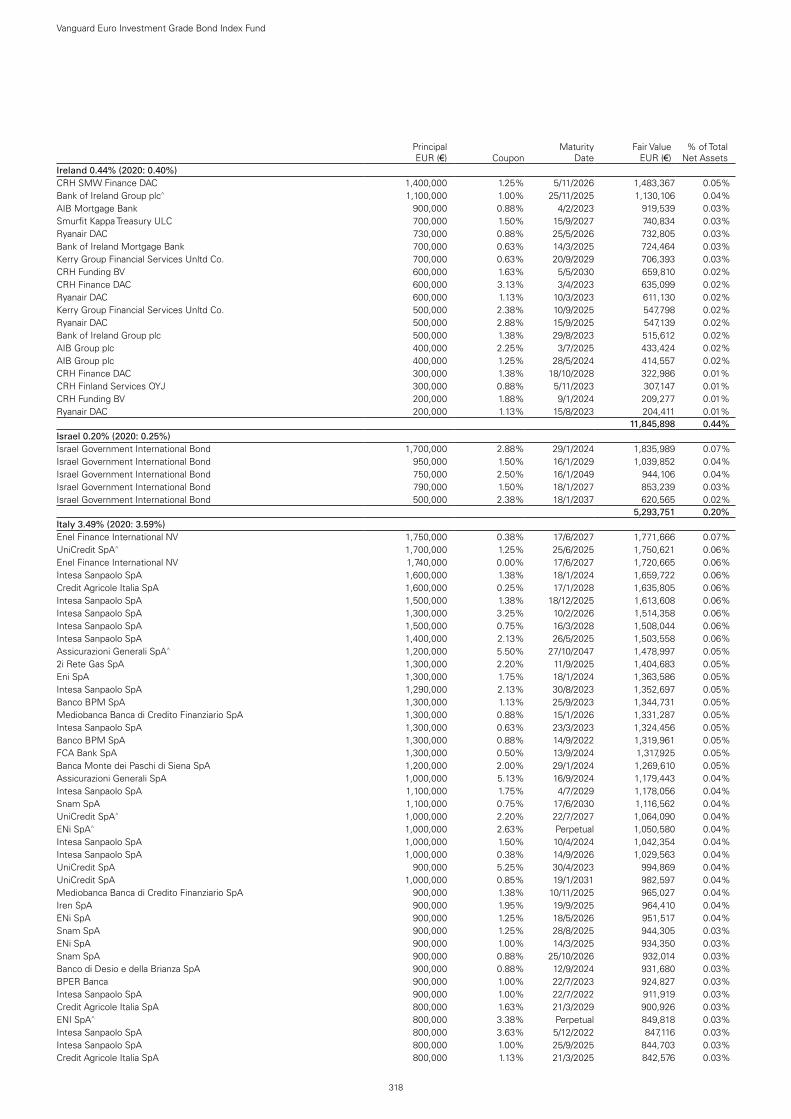
318
Vanguard Euro Investment Grade Bond Index Fund
Principal EUR (€) Coupon
Maturity Date
Fair Value EUR (€)
% of Total Net Assets
Ireland 0.44% (2020: 0.40%)CRH SMW Finance DAC 1,400,000 1.25% 5/11/2026 1,483,367 0.05%Bank of Ireland Group plc^ 1,100,000 1.00% 25/11/2025 1,130,106 0.04%AIB Mortgage Bank 900,000 0.88% 4/2/2023 919,539 0.03%Smurfit Kappa Treasury ULC 700,000 1.50% 15/9/2027 740,834 0.03%Ryanair DAC 730,000 0.88% 25/5/2026 732,805 0.03%Bank of Ireland Mortgage Bank 700,000 0.63% 14/3/2025 724,464 0.03%Kerry Group Financial Services Unltd Co. 700,000 0.63% 20/9/2029 706,393 0.03%CRH Funding BV 600,000 1.63% 5/5/2030 659,810 0.02%CRH Finance DAC 600,000 3.13% 3/4/2023 635,099 0.02%Ryanair DAC 600,000 1.13% 10/3/2023 611,130 0.02%Kerry Group Financial Services Unltd Co. 500,000 2.38% 10/9/2025 547,798 0.02%Ryanair DAC 500,000 2.88% 15/9/2025 547,139 0.02%Bank of Ireland Group plc 500,000 1.38% 29/8/2023 515,612 0.02%AIB Group plc 400,000 2.25% 3/7/2025 433,424 0.02%AIB Group plc 400,000 1.25% 28/5/2024 414,557 0.02%CRH Finance DAC 300,000 1.38% 18/10/2028 322,986 0.01%CRH Finland Services OYJ 300,000 0.88% 5/11/2023 307,147 0.01%CRH Funding BV 200,000 1.88% 9/1/2024 209,277 0.01%Ryanair DAC 200,000 1.13% 15/8/2023 204,411 0.01%test - - - 11,845,898 0.44%Israel 0.20% (2020: 0.25%)Israel Government International Bond 1,700,000 2.88% 29/1/2024 1,835,989 0.07%Israel Government International Bond 950,000 1.50% 16/1/2029 1,039,852 0.04%Israel Government International Bond 750,000 2.50% 16/1/2049 944,106 0.04%Israel Government International Bond 790,000 1.50% 18/1/2027 853,239 0.03%Israel Government International Bond 500,000 2.38% 18/1/2037 620,565 0.02%test - - - 5,293,751 0.20%Italy 3.49% (2020: 3.59%)Enel Finance International NV 1,750,000 0.38% 17/6/2027 1,771,666 0.07%UniCredit SpA^ 1,700,000 1.25% 25/6/2025 1,750,621 0.06%Enel Finance International NV 1,740,000 0.00% 17/6/2027 1,720,665 0.06%Intesa Sanpaolo SpA 1,600,000 1.38% 18/1/2024 1,659,722 0.06%Credit Agricole Italia SpA 1,600,000 0.25% 17/1/2028 1,635,805 0.06%Intesa Sanpaolo SpA 1,500,000 1.38% 18/12/2025 1,613,608 0.06%Intesa Sanpaolo SpA 1,300,000 3.25% 10/2/2026 1,514,358 0.06%Intesa Sanpaolo SpA 1,500,000 0.75% 16/3/2028 1,508,044 0.06%Intesa Sanpaolo SpA 1,400,000 2.13% 26/5/2025 1,503,558 0.06%Assicurazioni Generali SpA^ 1,200,000 5.50% 27/10/2047 1,478,997 0.05%2i Rete Gas SpA 1,300,000 2.20% 11/9/2025 1,404,683 0.05%Eni SpA 1,300,000 1.75% 18/1/2024 1,363,586 0.05%Intesa Sanpaolo SpA 1,290,000 2.13% 30/8/2023 1,352,697 0.05%Banco BPM SpA 1,300,000 1.13% 25/9/2023 1,344,731 0.05%Mediobanca Banca di Credito Finanziario SpA 1,300,000 0.88% 15/1/2026 1,331,287 0.05%Intesa Sanpaolo SpA 1,300,000 0.63% 23/3/2023 1,324,456 0.05%Banco BPM SpA 1,300,000 0.88% 14/9/2022 1,319,961 0.05%FCA Bank SpA 1,300,000 0.50% 13/9/2024 1,317,925 0.05%Banca Monte dei Paschi di Siena SpA 1,200,000 2.00% 29/1/2024 1,269,610 0.05%Assicurazioni Generali SpA 1,000,000 5.13% 16/9/2024 1,179,443 0.04%Intesa Sanpaolo SpA 1,100,000 1.75% 4/7/2029 1,178,056 0.04%Snam SpA 1,100,000 0.75% 17/6/2030 1,116,562 0.04%UniCredit SpA^ 1,000,000 2.20% 22/7/2027 1,064,090 0.04%ENi SpA^ 1,000,000 2.63% Perpetual 1,050,580 0.04%Intesa Sanpaolo SpA 1,000,000 1.50% 10/4/2024 1,042,354 0.04%Intesa Sanpaolo SpA 1,000,000 0.38% 14/9/2026 1,029,563 0.04%UniCredit SpA 900,000 5.25% 30/4/2023 994,869 0.04%UniCredit SpA 1,000,000 0.85% 19/1/2031 982,597 0.04%Mediobanca Banca di Credito Finanziario SpA 900,000 1.38% 10/11/2025 965,027 0.04%Iren SpA 900,000 1.95% 19/9/2025 964,410 0.04%ENi SpA 900,000 1.25% 18/5/2026 951,517 0.04%Snam SpA 900,000 1.25% 28/8/2025 944,305 0.03%ENi SpA 900,000 1.00% 14/3/2025 934,350 0.03%Snam SpA 900,000 0.88% 25/10/2026 932,014 0.03%Banco di Desio e della Brianza SpA 900,000 0.88% 12/9/2024 931,680 0.03%BPER Banca 900,000 1.00% 22/7/2023 924,827 0.03%Intesa Sanpaolo SpA 900,000 1.00% 22/7/2022 911,919 0.03%Credit Agricole Italia SpA 800,000 1.63% 21/3/2029 900,926 0.03%ENI SpA^ 800,000 3.38% Perpetual 849,818 0.03%Intesa Sanpaolo SpA 800,000 3.63% 5/12/2022 847,116 0.03%Intesa Sanpaolo SpA 800,000 1.00% 25/9/2025 844,703 0.03%Credit Agricole Italia SpA 800,000 1.13% 21/3/2025 842,576 0.03%

319
Vanguard Euro Investment Grade Bond Index Fund
Principal EUR (€) Coupon
Maturity Date
Fair Value EUR (€)
% of Total Net Assets
Mediobanca Banca di Credito Finanziario SpA 800,000 1.13% 12/8/2024 837,726 0.03%Enel Finance International NV 800,000 1.00% 16/9/2024 828,770 0.03%Intesa Sanpaolo SpA 800,000 1.00% 4/7/2024 823,844 0.03%UniCredit SpA 800,000 0.38% 31/10/2026 819,035 0.03%ENI SpA 700,000 3.75% 12/9/2025 810,746 0.03%Enel Finance International NV 800,000 0.00% 17/6/2024 804,919 0.03%UniCredit SpA^ 770,000 1.25% 16/6/2026 796,547 0.03%ENI SpA 700,000 2.00% 18/5/2031 789,310 0.03%Banca Monte dei Paschi di Siena SpA 700,000 2.13% 26/11/2025 767,083 0.03%Eni SpA 700,000 1.63% 17/5/2028 765,285 0.03%Enel SpA^ 700,000 3.50% 24/5/2080 765,043 0.03%Intesa Sanpaolo SpA 700,000 1.13% 4/10/2027 752,540 0.03%ENI SpA 700,000 1.50% 17/1/2027 751,590 0.03%Assicurazioni Generali SpA^ 600,000 5.00% 8/6/2048 727,329 0.03%UniCredit SpA 700,000 0.75% 30/4/2025 725,479 0.03%Intesa Sanpaolo SpA 700,000 1.00% 27/1/2023 715,915 0.03%UniCredit SpA^ 700,000 1.20% 20/1/2026 714,584 0.03%UniCredit SpA 700,000 1.00% 18/1/2023 711,821 0.03%ENI SpA 700,000 0.63% 23/1/2030 705,301 0.03%FCA Bank SpA 700,000 0.25% 28/2/2023 703,979 0.03%Enel SpA 600,000 5.25% 20/5/2024 694,516 0.03%Covivio 600,000 2.38% 20/2/2028 666,713 0.02%Intesa Sanpaolo SpA 600,000 1.25% 15/1/2030 657,750 0.02%UniCredit SpA 600,000 3.00% 31/1/2024 653,147 0.02%Enel SpA^ 600,000 2.25% Perpetual 627,792 0.02%Enel Finance International NV 600,000 1.13% 17/10/2034 626,433 0.02%UniCredit SpA 600,000 1.80% 20/1/2030 622,910 0.02%UniCredit SpA 600,000 2.00% 4/3/2023 621,300 0.02%ENI SpA 600,000 1.00% 11/10/2034 614,189 0.02%Banca Popolare di Sondrio SCPA 600,000 0.75% 4/4/2023 608,715 0.02%Intesa Sanpaolo SpA 600,000 0.75% 17/10/2022 607,688 0.02%Mediobanca Banca di Credito Finanziario SpA 600,000 0.63% 27/9/2022 606,478 0.02%FCA Bank SpA 600,000 0.63% 24/11/2022 606,125 0.02%Mediobanca Banca di Credito Finanziario SpA 600,000 0.75% 15/7/2027 604,294 0.02%Enel Finance International NV 600,000 0.88% 17/6/2036 595,726 0.02%UniCredit SpA 550,000 0.50% 9/4/2025 555,934 0.02%Banca Monte dei Paschi di Siena SpA 520,000 0.88% 8/10/2026 541,076 0.02%Credit Agricole Italia SpA 500,000 1.00% 17/1/2045 539,220 0.02%ENI SpA 500,000 1.50% 2/2/2026 533,980 0.02%Enel Finance International NV 500,000 1.13% 16/9/2026 526,045 0.02%Banco BPM SpA 500,000 1.00% 23/1/2025 522,677 0.02%Terna SPA 500,000 1.00% 10/4/2026 522,569 0.02%2i Rete Gas SpA 530,000 0.58% 29/1/2031 519,665 0.02%Credito Emiliano SpA 500,000 1.13% 17/1/2024 518,201 0.02%Intesa Sanpaolo SpA 500,000 1.00% 19/11/2026 515,444 0.02%Intesa Sanpaolo SpA 500,000 0.50% 15/7/2024 513,521 0.02%Credit Agricole Italia SpA 500,000 0.88% 16/6/2023 512,341 0.02%Terna SPA 500,000 0.13% 25/7/2025 502,707 0.02%Snam SpA 500,000 0.00% 12/5/2024 501,834 0.02%Terna SPA 500,000 0.38% 23/6/2029 499,897 0.02%Italgas SpA 500,000 0.00% 16/2/2028 486,770 0.02%Italgas SpA 500,000 0.50% 16/2/2033 478,159 0.02%Assicurazioni Generali SpA 400,000 3.88% 29/1/2029 472,254 0.02%Enel SpA^ 400,000 3.38% Perpetual 442,954 0.02%Mediobanca Banca di Credito Finanziario SpA 400,000 1.25% 24/11/2029 440,940 0.02%Snam SpA 400,000 1.38% 25/10/2027 425,942 0.02%UniCredit SpA^ 410,000 0.80% 5/7/2029 410,866 0.02%Italgas SpA 400,000 0.88% 24/4/2030 408,130 0.01%Terna SPA 350,000 4.90% 28/10/2024 408,024 0.01%Credit Agricole Italia SpA 400,000 0.25% 30/9/2024 407,342 0.01%Enel SpA 300,000 5.63% 21/6/2027 396,987 0.01%Terna SPA 400,000 0.38% 25/9/2030 392,236 0.01%Assicurazioni Generali SpA 300,000 4.13% 4/5/2026 351,648 0.01%Intesa Sanpaolo SpA 300,000 1.75% 20/3/2028 320,536 0.01%Terna SPA 300,000 1.38% 26/7/2027 320,172 0.01%Eni SpA 300,000 1.13% 19/9/2028 317,116 0.01%Buzzi Unicem SpA 300,000 2.13% 28/4/2023 310,870 0.01%ASTM SpA 300,000 1.63% 8/2/2028 308,929 0.01%Iren SpA 300,000 0.88% 14/10/2029 306,043 0.01%Snam SpA 300,000 1.00% 12/9/2034 302,815 0.01%ENI SpA^ 300,000 2.00% Perpetual 299,945 0.01%

320
Vanguard Euro Investment Grade Bond Index Fund
Principal EUR (€) Coupon
Maturity Date
Fair Value EUR (€)
% of Total Net Assets
Terna SPA 300,000 0.75% 24/7/2032 299,945 0.01%Snam SpA 300,000 0.00% 15/8/2025 299,698 0.01%Intesa Sanpaolo SpA 260,000 0.75% 4/12/2024 266,644 0.01%Assicurazioni Generali SpA 220,000 2.43% 14/7/2031 236,873 0.01%2i Rete Gas SpA 200,000 1.61% 31/10/2027 214,016 0.01%Assicurazioni Generali SpA 200,000 2.12% 1/10/2030 211,795 0.01%Enel SpA^ 200,000 2.50% Perpetual 209,528 0.01%Iren SpA 200,000 0.88% 4/11/2024 205,841 0.01%Italgas SpA 200,000 1.00% 11/12/2031 203,928 0.01%FCA Bank SpA 200,000 0.13% 16/11/2023 200,631 0.01%FCA Bank SpA 200,000 0.00% 16/4/2024 199,967 0.01%Enel SpA 200,000 1.38% 8/9/2169 197,527 0.01%Enel SpA^ 200,000 1.88% Perpetual 196,861 0.01%FCA Bank SpA 150,000 0.50% 18/9/2023 151,618 0.01%ERG SpA 100,000 1.88% 11/4/2025 106,171 0.00%test - - - 94,334,736 3.49%Japan 1.12% (2020: 1.10%)Development Bank of Japan, Inc. 2,300,000 0.88% 10/10/2025 2,399,546 0.09%Sumitomo Mitsui Banking Corp. 1,900,000 0.55% 6/11/2023 1,937,598 0.07%Takeda Pharmaceutical Co., Ltd. 1,300,000 3.00% 21/11/2030 1,558,294 0.06%Mitsubishi UFJ Financial Group, Inc. 1,300,000 0.98% 9/10/2023 1,334,925 0.05%Mizuho Financial Group, Inc. 1,000,000 0.52% 10/6/2024 1,017,956 0.04%Takeda Pharmaceutical Co., Ltd. 996,000 1.13% 21/11/2022 1,014,698 0.04%Sumitomo Mitsui Trust Bank Ltd. 1,000,000 0.01% 15/10/2027 995,549 0.04%Sumitomo Mitsui Financial Group, Inc. 900,000 0.82% 23/7/2023 919,263 0.03%Sumitomo Mitsui Financial Group, Inc. 900,000 0.47% 30/5/2024 915,251 0.03%Sumitomo Mitsui Banking Corp. 900,000 0.27% 18/6/2026 915,204 0.03%Mitsubishi UFJ Financial Group, Inc. 900,000 0.68% 26/1/2023 913,419 0.03%Mizuho Financial Group, Inc. 900,000 0.12% 6/9/2024 905,414 0.03%Takeda Pharmaceutical Co., Ltd. 800,000 2.25% 21/11/2026 884,116 0.03%Takeda Pharmaceutical Co., Ltd. 800,000 1.00% 9/7/2029 826,407 0.03%Sumitomo Mitsui Financial Group, Inc. 740,000 0.93% 11/10/2024 764,924 0.03%Nissan Motor Co., Ltd. 669,000 3.20% 17/9/2028 757,390 0.03%Takeda Pharmaceutical Co., Ltd. 700,000 1.38% 9/7/2032 729,444 0.03%Mizuho Financial Group, Inc. 700,000 0.80% 15/4/2030 712,253 0.03%Sumitomo Mitsui Financial Group, Inc. 700,000 0.63% 23/10/2029 704,463 0.03%Takeda Pharmaceutical Co., Ltd. 600,000 2.00% 9/7/2040 645,826 0.02%Sumitomo Mitsui Financial Group, Inc. 600,000 1.55% 15/6/2026 640,992 0.02%JT International Financial Services BV^ 600,000 2.38% 7/4/2081 630,858 0.02%Mizuho Financial Group, Inc. 600,000 1.02% 11/10/2023 616,467 0.02%Toyota Motor Finance Netherlands BV 600,000 0.63% 26/9/2023 611,860 0.02%Asahi Group Holdings Ltd. 488,000 1.15% 19/9/2025 511,245 0.02%Sumitomo Mitsui Banking Corp. 500,000 0.41% 7/11/2029 509,338 0.02%Toyota Finance Australia Ltd. 500,000 0.50% 6/4/2023 507,055 0.02%Mizuho Financial Group, Inc. 500,000 0.18% 13/4/2026 500,264 0.02%Mizuho Financial Group, Inc. 500,000 0.40% 6/9/2029 493,541 0.02%JT International Financial Services BV^ 400,000 2.88% 7/10/2083 436,066 0.02%American Honda Finance Corp. 400,000 1.38% 10/11/2022 409,544 0.02%American Honda Finance Corp. 400,000 0.75% 17/1/2024 408,930 0.02%NTT Finance Corp. 400,000 0.34% 3/3/2030 398,745 0.01%Development Bank of Japan, Inc. 300,000 4.75% 26/11/2027 390,293 0.01%JT International Financial Services BV 300,000 1.13% 28/9/2025 312,424 0.01%Mitsubishi UFJ Financial Group, Inc. 300,000 0.34% 19/7/2024 304,109 0.01%Asahi Group Holdings Ltd. 300,000 0.34% 19/4/2027 301,300 0.01%Asahi Group Holdings Ltd. 244,000 0.16% 23/10/2024 245,634 0.01%Mitsubishi UFJ Financial Group, Inc. 200,000 0.98% 9/6/2024 206,570 0.01%JT International Financial Services BV 200,000 1.00% 26/11/2029 205,874 0.01%Nidec Corp. 200,000 0.05% 30/3/2026 199,984 0.01%Nissan Motor Co., Ltd. 171,000 2.65% 17/3/2026 186,406 0.01%Asahi Group Holdings Ltd. 160,000 0.54% 23/10/2028 161,267 0.01%Nissan Motor Co., Ltd. 100,000 1.94% 15/9/2023 104,164 0.00%NTT Finance Corp. 100,000 0.01% 3/3/2025 100,288 0.00%test - - - 30,245,158 1.12%Kazakhstan 0.06% (2020: 0.06%)Kazakhstan Government International Bond 1,000,000 0.60% 30/9/2026 999,242 0.03%Kazakhstan Government International Bond 300,000 2.38% 9/11/2028 335,547 0.01%Kazakhstan Government International Bond 200,000 1.55% 9/11/2023 206,812 0.01%Kazakhstan Government International Bond 200,000 1.50% 30/9/2034 201,322 0.01%test - - - 1,742,923 0.06%Luxembourg 0.47% (2020: 0.44%)Blackstone Property Partners Europe Holdings Sarl 900,000 1.40% 6/7/2022 909,648 0.03%

321
Vanguard Euro Investment Grade Bond Index Fund
Principal EUR (€) Coupon
Maturity Date
Fair Value EUR (€)
% of Total Net Assets
Logicor Financing Sarl 800,000 1.50% 14/11/2022 814,536 0.03%NORD/LB Luxembourg SA Covered Bond Bank 800,000 0.38% 7/3/2024 813,741 0.03%Blackstone Property Partners Europe Holdings Sarl 800,000 1.00% 4/5/2028 796,323 0.03%Blackstone Property Partners Europe Holdings Sarl 600,000 2.20% 24/7/2025 640,847 0.02%Blackstone Property Partners Europe Holdings Sarl 600,000 2.00% 15/2/2024 625,225 0.02%SES SA 600,000 0.88% 4/11/2027 614,317 0.02%Logicor Financing Sarl 600,000 0.75% 15/7/2024 610,021 0.02%NORD/LB Luxembourg SA Covered Bond Bank 600,000 0.38% 15/6/2023 608,024 0.02%Logicor Financing Sarl 500,000 2.25% 13/5/2025 535,843 0.02%Prologis International Funding II SA 500,000 0.88% 9/7/2029 514,625 0.02%Bevco Lux Sarl 510,000 1.00% 16/1/2030 505,450 0.02%Logicor Financing Sarl 450,000 1.50% 13/7/2026 472,971 0.02%Logicor Financing Sarl 400,000 3.25% 13/11/2028 465,114 0.02%SELP Finance Sarl 400,000 1.25% 25/10/2023 410,468 0.02%Eurofins Scientific SE 400,000 0.88% 19/5/2031 397,003 0.02%Prologis International Funding II SA 400,000 0.75% 23/3/2033 391,970 0.02%Logicor Financing Sarl 400,000 0.88% 14/1/2031 386,869 0.01%Logicor Financing Sarl 300,000 1.63% 15/7/2027 316,124 0.01%NORD/LB Luxembourg SA Covered Bond Bank 300,000 0.05% 28/1/2025 302,319 0.01%NORD/LB Luxembourg SA Covered Bond Bank 300,000 0.01% 10/6/2027 299,919 0.01%Prologis International Funding II SA 275,000 1.88% 17/4/2025 294,656 0.01%Prologis International Funding II SA 225,000 1.63% 17/6/2032 243,357 0.01%Prologis International Funding II SA 200,000 2.38% 14/11/2030 231,283 0.01%Czech Gas Networks Investments Sarl 200,000 1.00% 16/7/2027 207,079 0.01%Blackstone Property Partners Europe Holdings Sarl 200,000 1.25% 26/4/2027 204,396 0.01%test - - - 12,612,128 0.47%Mexico 0.48% (2020: 0.59%)Mexico Government International Bond 1,120,000 2.88% 8/4/2039 1,165,600 0.04%Mexico Government International Bond 1,213,000 1.45% 25/10/2033 1,158,415 0.04%Mexico Government International Bond 1,080,000 1.13% 17/1/2030 1,060,840 0.04%Mexico Government International Bond 1,000,000 1.63% 6/3/2024 1,042,056 0.04%Mexico Government International Bond 850,000 3.38% 23/2/2031 987,532 0.04%Mexico Government International Bond 780,000 1.63% 8/4/2026 822,970 0.03%Mexico Government International Bond 730,000 1.38% 15/1/2025 761,437 0.03%Mexico Government International Bond 700,000 4.00% 15/3/2115 754,157 0.03%Mexico Government International Bond 600,000 3.63% 9/4/2029 702,325 0.03%Mexico Government International Bond 765,000 2.13% 25/10/2051 645,493 0.02%Mexico Government International Bond 600,000 3.00% 6/3/2045 631,080 0.02%Mexico Government International Bond 600,000 1.75% 17/4/2028 629,970 0.02%Mexico Government International Bond 560,000 1.35% 18/9/2027 580,285 0.02%America Movil SAB de CV 500,000 3.26% 22/7/2023 534,538 0.02%America Movil SAB de CV 500,000 1.50% 10/3/2024 520,470 0.02%America Movil SAB de CV 400,000 2.13% 10/3/2028 443,933 0.02%America Movil SAB de CV^ 300,000 6.38% 6/9/2073 338,486 0.01%America Movil SAB de CV 200,000 0.75% 26/6/2027 204,138 0.01%test - - - 12,983,725 0.48%Netherlands 4.12% (2020: 4.34%)ABN AMRO Bank NV 2,900,000 1.25% 10/1/2033 3,242,543 0.12%Cooperatieve Rabobank UA 2,500,000 0.88% 8/2/2028 2,665,634 0.10%ABN AMRO Bank NV 2,300,000 0.88% 15/1/2024 2,366,698 0.09%Cooperatieve Rabobank UA 1,900,000 1.38% 3/2/2027 2,047,795 0.08%ING Groep NV^ 2,000,000 0.25% 1/2/2030 1,943,461 0.07%Cooperatieve Rabobank UA 1,900,000 0.25% 31/5/2024 1,937,437 0.07%ABN AMRO Bank NV 1,600,000 1.13% 12/1/2032 1,763,014 0.06%Cooperatieve Rabobank UA 1,500,000 0.50% 6/12/2022 1,520,594 0.06%ING Groep NV^ 1,400,000 2.50% 15/2/2029 1,480,180 0.05%Cooperatieve Rabobank UA 1,400,000 0.75% 21/6/2039 1,464,160 0.05%ABN AMRO Bank NV 1,400,000 1.00% 16/4/2025 1,461,541 0.05%Cooperatieve Rabobank UA 1,300,000 1.25% 31/5/2032 1,448,850 0.05%Cooperatieve Rabobank UA 1,200,000 4.13% 14/7/2025 1,409,290 0.05%ABN AMRO Bank NV 1,400,000 0.38% 14/1/2035 1,408,772 0.05%Cooperatieve Rabobank UA 1,300,000 3.88% 25/7/2023 1,406,545 0.05%ING Bank NV 1,300,000 0.75% 18/2/2029 1,381,894 0.05%Cooperatieve Rabobank UA^ 1,300,000 0.88% 5/5/2028 1,347,466 0.05%ABN AMRO Bank NV 1,200,000 1.00% 13/4/2031 1,306,187 0.05%ABN AMRO Bank NV 1,100,000 1.50% 30/9/2030 1,247,102 0.05%Shell International Finance BV 1,200,000 0.50% 11/5/2024 1,225,078 0.04%ABN AMRO Bank NV 1,100,000 1.25% 28/5/2025 1,149,493 0.04%ING Groep NV^ 1,100,000 1.63% 26/9/2029 1,140,787 0.04%Aegon Bank NV 1,100,000 0.38% 21/11/2024 1,125,734 0.04%Enel Finance International NV 1,100,000 0.50% 17/6/2030 1,099,833 0.04%

322
Vanguard Euro Investment Grade Bond Index Fund
Principal EUR (€) Coupon
Maturity Date
Fair Value EUR (€)
% of Total Net Assets
de Volksbank NV 1,000,000 1.00% 8/3/2028 1,076,129 0.04%NN Group NV^ 900,000 4.63% 13/1/2048 1,072,125 0.04%Koninklijke Philips NV 1,000,000 1.38% 30/3/2025 1,051,095 0.04%ABN AMRO Bank NV 900,000 1.45% 12/4/2038 1,047,144 0.04%ABN AMRO Bank NV 1,000,000 0.50% 17/7/2023 1,016,648 0.04%ABN AMRO Bank NV 1,000,000 0.60% 15/1/2027 1,015,323 0.04%ING Groep NV^ 1,000,000 0.10% 3/9/2025 1,001,889 0.04%EXOR NV 900,000 1.75% 18/1/2028 968,537 0.04%Achmea BV 900,000 1.50% 26/5/2027 962,092 0.04%ABN AMRO Bank NV 900,000 2.50% 5/9/2023 958,757 0.04%Heineken NV 900,000 1.63% 30/3/2025 957,744 0.04%Shell International Finance BV 900,000 1.25% 11/11/2032 954,678 0.03%de Volksbank NV 900,000 0.75% 18/5/2027 950,147 0.03%Cooperatieve Rabobank UA 900,000 0.63% 26/4/2026 939,404 0.03%Nationale-Nederlanden Levensverzekering Maatschappij NV^ 850,000 9.00% 29/8/2042 938,269 0.03%Shell International Finance BV 900,000 1.13% 7/4/2024 934,106 0.03%Nationale-Nederlanden Bank NV 900,000 0.63% 11/9/2025 933,720 0.03%Cooperatieve Rabobank UA 900,000 0.75% 29/8/2023 919,235 0.03%Cooperatieve Rabobank UA 900,000 0.00% 21/6/2027 910,277 0.03%NIBC Bank NV 900,000 0.13% 21/4/2031 895,085 0.03%ING Groep NV^ 900,000 0.25% 18/2/2029 882,121 0.03%NIBC Bank NV 800,000 1.00% 11/9/2028 857,511 0.03%ING Groep NV 800,000 1.13% 14/2/2025 832,271 0.03%NIBC Bank NV 800,000 0.88% 8/7/2025 823,535 0.03%ASML Holding NV 750,000 1.63% 28/5/2027 816,737 0.03%NN Group NV^ 700,000 4.50% Perpetual 800,688 0.03%ABN AMRO Bank NV 700,000 1.38% 12/1/2037 800,634 0.03%Shell International Finance BV 800,000 0.13% 8/11/2027 799,931 0.03%Nationale-Nederlanden Bank NV 800,000 0.01% 8/7/2030 796,716 0.03%Shell International Finance BV 800,000 0.50% 8/11/2031 793,884 0.03%Shell International Finance BV 700,000 1.88% 7/4/2032 791,037 0.03%ABN AMRO Bank NV 700,000 1.13% 23/4/2039 779,157 0.03%EXOR NV 700,000 2.25% 29/4/2030 776,980 0.03%Heineken NV 700,000 1.50% 3/10/2029 763,800 0.03%Shell International Finance BV 700,000 1.88% 15/9/2025 759,176 0.03%NN Group NV 700,000 1.63% 1/6/2027 758,205 0.03%ABN AMRO Bank NV 700,000 7.13% 6/7/2022 750,721 0.03%Van Lanschot Kempen Wealth Management NV 700,000 0.88% 15/2/2027 738,728 0.03%ING Bank NV 700,000 1.88% 22/5/2023 731,468 0.03%ABN AMRO Bank NV^ 700,000 2.88% 18/1/2028 729,894 0.03%Koninklijke DSM NV 700,000 0.75% 28/9/2026 726,120 0.03%Koninklijke Philips NV 700,000 0.50% 22/5/2026 717,109 0.03%NIBC Bank NV 700,000 1.13% 19/4/2023 715,764 0.03%LeasePlan Corp. NV 700,000 1.00% 2/5/2023 715,536 0.03%Koninklijke KPN NV 700,000 0.63% 9/4/2025 713,871 0.03%Nationale-Nederlanden Bank NV 700,000 0.38% 26/2/2025 710,744 0.03%ING Groep NV^ 700,000 1.00% 13/11/2030 709,366 0.03%Koninklijke Ahold Delhaize NV 700,000 0.25% 26/6/2025 707,320 0.03%LeasePlan Corp. NV 700,000 0.13% 13/9/2023 704,069 0.03%de Volksbank NV 700,000 0.38% 3/3/2028 692,564 0.03%Shell International Finance BV 600,000 1.63% 20/1/2027 652,303 0.02%ASML Holding NV 600,000 3.38% 19/9/2023 649,697 0.02%Heineken NV 600,000 1.38% 29/1/2027 642,226 0.02%Cooperatieve Rabobank UA 600,000 1.13% 7/5/2031 640,546 0.02%ING Groep NV^ 600,000 2.13% 26/5/2031 638,001 0.02%Cooperatieve Rabobank UA 600,000 4.13% 14/9/2022 630,594 0.02%Akzo Nobel NV 600,000 2.63% 27/7/2022 619,504 0.02%Shell International Finance BV 600,000 0.38% 15/2/2025 611,877 0.02%Cooperatieve Rabobank UA 550,000 1.25% 23/3/2026 585,614 0.02%Heineken NV 500,000 2.25% 30/3/2030 578,580 0.02%Shell International Finance BV 600,000 0.88% 8/11/2039 567,772 0.02%Signify NV 500,000 2.38% 11/5/2027 554,246 0.02%Vesteda Finance BV 500,000 2.00% 10/7/2026 543,776 0.02%Shell International Finance BV 500,000 1.50% 7/4/2028 543,689 0.02%Nationale-Nederlanden Bank NV 500,000 1.00% 25/9/2028 537,723 0.02%Wolters Kluwer NV 500,000 2.50% 13/5/2024 534,942 0.02%Shell International Finance BV 500,000 1.25% 12/5/2028 534,887 0.02%ABN AMRO Bank NV 517,000 0.50% 15/4/2026 530,764 0.02%Heineken NV 500,000 1.25% 7/5/2033 525,344 0.02%JAB Holdings BV 500,000 1.75% 25/5/2023 519,352 0.02%NIBC Bank NV 500,000 0.50% 19/3/2027 517,865 0.02%

323
Vanguard Euro Investment Grade Bond Index Fund
Principal EUR (€) Coupon
Maturity Date
Fair Value EUR (€)
% of Total Net Assets
Shell International Finance BV 500,000 0.75% 15/8/2028 516,439 0.02%PostNL NV 500,000 0.63% 23/9/2026 511,274 0.02%Koninklijke DSM NV 500,000 0.63% 23/6/2032 506,638 0.02%Euronext NV 500,000 1.50% 17/5/2041 505,650 0.02%de Volksbank NV 500,000 0.01% 16/9/2024 503,064 0.02%ABN AMRO Bank NV 500,000 1.00% 2/6/2033 501,949 0.02%Cooperatieve Rabobank UA 500,000 0.63% 25/2/2033 498,065 0.02%JDE Peet's NV 500,000 0.50% 16/1/2029 496,741 0.02%Nationale-Nederlanden Bank NV 500,000 0.38% 4/3/2041 487,698 0.02%ASR Nederland NV^ 400,000 3.38% 2/5/2049 447,974 0.02%Heineken NV 400,000 1.75% 17/3/2031 446,903 0.02%NN Group NV^ 400,000 4.63% 8/4/2044 445,925 0.02%NN Group NV^ 400,000 4.38% Perpetual 440,869 0.02%ING Groep NV 400,000 2.13% 10/1/2026 436,290 0.02%Koninklijke Ahold Delhaize NV 400,000 1.75% 2/4/2027 435,366 0.02%Koninklijke Philips NV 400,000 1.38% 2/5/2028 430,990 0.02%Heineken NV 400,000 1.75% 7/5/2040 427,985 0.02%Akzo Nobel NV 400,000 1.75% 7/11/2024 426,556 0.02%Heineken NV 400,000 1.25% 17/3/2027 424,886 0.02%ING Groep NV^ 400,000 2.00% 22/3/2030 421,488 0.02%Heineken NV 400,000 1.50% 7/12/2024 421,045 0.02%ASML Holding NV 400,000 0.63% 7/5/2029 412,391 0.01%NN Group NV 400,000 0.88% 13/1/2023 405,984 0.01%Van Lanschot Kempen Wealth Management NV 400,000 0.38% 31/3/2023 405,564 0.01%Koninklijke KPN NV 400,000 0.88% 14/12/2032 398,965 0.01%NIBC Bank NV 400,000 0.01% 15/10/2029 397,442 0.01%CTP NV 400,000 1.25% 21/6/2029 395,377 0.01%Achmea BV^ 300,000 6.00% 4/4/2043 329,948 0.01%Euronext NV 325,000 0.13% 17/5/2026 325,794 0.01%Koninklijke DSM NV 300,000 2.38% 3/4/2024 319,833 0.01%Koninklijke Ahold Delhaize NV 300,000 1.13% 19/3/2026 314,795 0.01%Achmea Bank NV 300,000 0.01% 16/6/2025 303,396 0.01%ASML Holding NV 300,000 0.63% 7/7/2022 302,291 0.01%Wolters Kluwer NV 300,000 0.25% 30/3/2028 299,568 0.01%ASML Holding NV 300,000 0.25% 25/2/2030 298,677 0.01%Koninklijke Ahold Delhaize NV 300,000 0.38% 18/3/2030 297,863 0.01%Euronext NV 280,000 1.13% 12/6/2029 293,504 0.01%ELM BV for Helvetia Schweizerische Versicherungsgesellschaft AG^ 233,000 3.38% 29/9/2047 261,684 0.01%LeasePlan Corp. NV 200,000 3.50% 9/4/2025 225,277 0.01%Akzo Nobel NV 200,000 1.63% 14/4/2030 219,514 0.01%ASML Holding NV 200,000 1.38% 7/7/2026 213,778 0.01%Heineken NV 200,000 1.00% 4/5/2026 209,540 0.01%NIBC Bank NV 200,000 2.00% 9/4/2024 208,825 0.01%Koninklijke DSM NV 200,000 1.00% 9/4/2025 208,332 0.01%Koninklijke KPN NV 200,000 1.13% 11/9/2028 206,443 0.01%Wolters Kluwer NV 200,000 0.75% 3/7/2030 204,335 0.01%JDE Peet's NV 200,000 1.13% 16/6/2033 200,579 0.01%de Volksbank NV 200,000 0.25% 22/6/2026 198,961 0.01%ASR Nederland NV^ 100,000 5.13% 29/9/2045 118,074 0.00%Wolters Kluwer NV 100,000 1.50% 22/3/2027 107,529 0.00%Akzo Nobel NV 100,000 1.13% 8/4/2026 105,867 0.00%LeasePlan Corp. NV 100,000 1.38% 7/3/2024 103,932 0.00%LeasePlan Corp. NV 100,000 0.75% 3/10/2022 101,228 0.00%test - - - 111,276,536 4.12%New Zealand 0.41% (2020: 0.39%)BNZ International Funding Ltd. 2,600,000 0.50% 3/7/2024 2,665,507 0.10%ASB Finance Ltd. 1,500,000 0.25% 21/5/2031 1,503,492 0.06%ASB Finance Ltd. 1,100,000 0.63% 18/10/2024 1,133,175 0.04%ANZ New Zealand Int'l Ltd. 900,000 0.38% 17/9/2029 908,057 0.04%ANZ New Zealand Int'l Ltd. 800,000 0.50% 17/1/2024 817,147 0.03%Westpac Securities NZ Ltd. 600,000 0.30% 25/6/2024 608,832 0.02%ASB Finance Ltd. 500,000 0.75% 9/10/2025 520,705 0.02%BNZ International Funding Ltd. 500,000 0.63% 3/7/2025 517,596 0.02%Auckland Council 500,000 0.63% 13/11/2024 515,453 0.02%ANZ New Zealand Int'l Ltd. 500,000 0.13% 22/9/2023 505,733 0.02%BNZ International Funding Ltd. 350,000 0.50% 13/5/2023 355,355 0.01%Chorus Ltd. 300,000 0.88% 5/12/2026 308,204 0.01%Auckland Council 300,000 0.13% 26/9/2029 298,225 0.01%Fonterra Co.-operative Group Ltd. 280,000 0.75% 8/11/2024 287,515 0.01%test - - - 10,944,996 0.41%

324
Vanguard Euro Investment Grade Bond Index Fund
Principal EUR (€) Coupon
Maturity Date
Fair Value EUR (€)
% of Total Net Assets
Norway 1.87% (2020: 1.78%)SpareBank 1 Boligkreditt A.S. 2,000,000 1.00% 30/1/2029 2,157,107 0.08%SpareBank 1 Boligkreditt A.S. 2,000,000 0.13% 12/5/2031 1,997,161 0.07%DNB Boligkreditt A.S. 1,900,000 0.25% 23/1/2023 1,921,871 0.07%Equinor A.S.A 1,800,000 0.75% 22/5/2026 1,867,184 0.07%Santander Consumer Bank A.S. 1,800,000 0.75% 1/3/2023 1,829,502 0.07%DNB Bank A.S.A 1,500,000 0.05% 14/11/2023 1,512,295 0.06%DNB Boligkreditt A.S. 1,400,000 0.38% 14/11/2023 1,426,952 0.05%SpareBank 1 Boligkreditt A.S. 1,400,000 0.13% 14/5/2026 1,426,184 0.05%DNB Bank A.S..A^ 1,400,000 1.13% 20/3/2028 1,426,105 0.05%DNB Boligkreditt A.S. 1,200,000 0.63% 14/1/2026 1,249,220 0.05%DNB Boligkreditt A.S. 1,200,000 0.01% 12/5/2028 1,208,118 0.04%Telenor A.S.A 1,100,000 1.13% 31/5/2029 1,169,709 0.04%Sparebanken Vest Boligkreditt A.S. 1,100,000 0.13% 15/3/2023 1,111,388 0.04%Eika Boligkreditt A.S. 1,000,000 2.13% 30/1/2023 1,041,516 0.04%DNB Boligkreditt A.S. 1,000,000 0.25% 7/9/2026 1,024,711 0.04%Sparebanken Vest Boligkreditt A.S. 1,000,000 0.01% 24/11/2025 1,012,521 0.04%Telenor A.S.A 1,000,000 0.25% 14/2/2028 1,001,507 0.04%DNB Bank A.S..A^ 1,000,000 0.25% 23/2/2029 986,593 0.04%SR-Boligkreditt A.S. 900,000 0.75% 17/10/2025 940,328 0.03%Statkraft A.S. 900,000 1.13% 20/3/2025 937,412 0.03%Sparebanken Soer Boligkreditt A.S. 900,000 0.50% 6/2/2026 930,667 0.03%Eika Boligkreditt A.S. 900,000 0.50% 28/8/2025 929,744 0.03%Eika Boligkreditt A.S. 900,000 0.38% 16/2/2024 918,986 0.03%SR-Boligkreditt A.S. 900,000 0.75% 18/1/2023 917,253 0.03%SR-Boligkreditt A.S. 900,000 0.01% 26/6/2027 907,859 0.03%SpareBank 1 Boligkreditt A.S. 900,000 0.13% 5/11/2029 906,984 0.03%Santander Consumer Bank A.S. 900,000 0.13% 14/4/2026 895,414 0.03%Equinor A.S.A 800,000 0.75% 9/11/2026 828,741 0.03%Statnett SF 800,000 0.88% 8/3/2025 826,197 0.03%Equinor A.S.A 700,000 1.63% 9/11/2036 773,168 0.03%Kommunalbanken A.S. 700,000 0.88% 24/5/2027 741,677 0.03%SpareBank 1 Boligkreditt A.S. 700,000 0.38% 26/6/2024 716,271 0.03%Sparebank 1 Oestlandet 700,000 0.88% 13/3/2023 714,131 0.03%Equinor A.S.A 660,000 1.38% 22/5/2032 713,734 0.03%SpareBank 1 Boligkreditt A.S. 700,000 0.38% 19/6/2023 711,635 0.03%Eika Boligkreditt A.S. 700,000 0.38% 20/4/2023 710,820 0.03%SpareBank 1 Boligkreditt A.S. 700,000 0.75% 5/9/2022 710,445 0.03%Kommunalbanken A.S. 700,000 0.05% 24/10/2029 699,400 0.03%Sparebanken Soer Boligkreditt A.S. 600,000 0.38% 20/2/2023 608,305 0.02%Santander Consumer Bank A.S. 600,000 0.13% 25/2/2025 600,900 0.02%Telenor A.S.A 500,000 2.50% 22/5/2025 550,392 0.02%Equinor A.S.A 500,000 1.63% 17/2/2035 549,712 0.02%Norsk Hydro A.S.A 500,000 2.00% 11/4/2029 547,473 0.02%Statnett SF 500,000 1.25% 26/4/2030 538,941 0.02%SpareBank 1 Boligkreditt A.S. 500,000 0.25% 30/8/2026 512,643 0.02%SpareBank 1 SR-Bank A.S.A 500,000 0.63% 25/3/2024 510,290 0.02%Telenor A.S.A 500,000 0.88% 14/2/2035 507,539 0.02%SpareBank 1 Boligkreditt A.S. 450,000 0.38% 9/3/2023 456,568 0.02%Telenor A.S.A 400,000 2.63% 6/12/2024 438,731 0.02%Statkraft A.S. 400,000 1.50% 26/3/2030 438,666 0.02%Kommunalbanken A.S. 400,000 0.63% 20/4/2026 416,922 0.02%Norsk Hydro A.S.A 400,000 1.13% 11/4/2025 413,394 0.02%DNB Boligkreditt A.S. 400,000 1.88% 21/11/2022 413,222 0.01%Equinor A.S.A 346,000 2.88% 10/9/2025 391,032 0.01%Statkraft A.S. 300,000 1.50% 21/9/2023 310,205 0.01%Telenor A.S.A 200,000 1.75% 31/5/2034 226,230 0.01%Santander Consumer Bank A.S. 200,000 0.13% 11/9/2024 200,927 0.01%Avinor A.S. 100,000 1.00% 29/4/2025 103,948 0.00%test - - - 50,536,550 1.87%Peru 0.09% (2020: 0.07%)Peruvian Government International Bond 1,200,000 2.75% 30/1/2026 1,329,244 0.05%Peruvian Government International Bond 500,000 3.75% 1/3/2030 600,667 0.02%Peruvian Government International Bond 510,000 1.25% 11/3/2033 496,121 0.02%test - - - 2,426,032 0.09%Philippines 0.09% (2020: 0.03%)Philippine Government International Bond 900,000 0.70% 3/2/2029 894,904 0.03%Philippine Government International Bond 888,000 0.25% 28/4/2025 891,386 0.03%Philippine Government International Bond 500,000 1.75% 28/4/2041 495,119 0.02%Philippine Government International Bond 120,000 1.20% 28/4/2033 119,985 0.01%test - - - 2,401,394 0.09%

325
Vanguard Euro Investment Grade Bond Index Fund
Principal EUR (€) Coupon
Maturity Date
Fair Value EUR (€)
% of Total Net Assets
Poland 0.55% (2020: 0.67%)Republic of Poland Government International Bond 1,750,000 5.25% 20/1/2025 2,094,638 0.08%Republic of Poland Government International Bond 1,250,000 2.38% 18/1/2036 1,518,604 0.06%Republic of Poland Government International Bond 1,500,000 0.00% 10/2/2025 1,512,681 0.06%Republic of Poland Government International Bond 1,204,000 0.00% 7/7/2023 1,213,119 0.04%Bank Gospodarstwa Krajowego 900,000 1.63% 30/4/2028 984,263 0.04%Republic of Poland Government International Bond 900,000 3.00% 15/1/2024 977,643 0.04%Republic of Poland Government International Bond 900,000 1.13% 7/8/2026 958,574 0.04%Republic of Poland Government International Bond 765,000 3.38% 9/7/2024 850,527 0.03%Republic of Poland Government International Bond 800,000 0.88% 10/5/2027 845,076 0.03%Republic of Poland Government International Bond 700,000 1.50% 19/1/2026 753,886 0.03%Republic of Poland Government International Bond 520,000 2.00% 8/3/2049 640,715 0.02%Atrium Finance Issuer BV 500,000 2.63% 5/9/2027 540,149 0.02%ORLEN Capital AB 500,000 2.50% 7/6/2023 522,646 0.02%Republic of Poland Government International Bond 350,000 3.75% 19/1/2023 372,956 0.01%Republic of Poland Government International Bond 265,000 2.00% 25/10/2046 326,911 0.01%Bank Gospodarstwa Krajowego 200,000 2.00% 1/6/2030 228,003 0.01%Bank Gospodarstwa Krajowego 200,000 1.75% 6/5/2026 216,661 0.01%Republic of Poland Government International Bond 100,000 1.38% 22/10/2027 109,062 0.00%Republic of Poland Government International Bond 100,000 1.00% 7/3/2029 107,516 0.00%test - - - 14,773,630 0.55%Portugal 0.29% (2020: 0.40%)EDP Finance BV 1,300,000 1.13% 12/2/2024 1,343,301 0.05%EDP Finance BV 800,000 1.88% 13/10/2025 863,255 0.03%Banco Santander Totta SA 700,000 0.88% 25/4/2024 724,134 0.03%Banco Santander Totta SA 600,000 1.25% 26/9/2027 652,787 0.02%EDP Finance BV 600,000 2.00% 22/4/2025 645,589 0.02%Ren Finance BV 500,000 1.75% 18/1/2028 542,988 0.02%EDP-Energias de Portugal SA 500,000 1.63% 15/4/2027 537,604 0.02%Brisa Concessao Rodoviaria SA 500,000 1.88% 30/4/2025 536,430 0.02%EDP Finance BV 500,000 2.38% 23/3/2023 522,815 0.02%EDP Finance BV 500,000 0.38% 16/9/2026 505,107 0.02%Caixa Economica Montepio Geral Caixa Economica Bancaria SA 400,000 0.13% 14/11/2024 403,756 0.02%Galp Gas Natural Distribuicao SA 300,000 1.38% 19/9/2023 308,818 0.01%Brisa Concessao Rodoviaria SA 200,000 2.00% 22/3/2023 207,455 0.01%test - - - 7,794,039 0.29%Romania 0.93% (2020: 0.79%)Romanian Government International Bond 1,600,000 3.63% 24/4/2024 1,763,739 0.07%Romanian Government International Bond 1,530,000 2.75% 26/2/2026 1,694,666 0.06%Romanian Government International Bond 1,500,000 2.88% 11/3/2029 1,661,906 0.06%Romanian Government International Bond 1,410,000 3.62% 26/5/2030 1,632,342 0.06%Romanian Government International Bond 1,420,000 2.75% 29/10/2025 1,572,650 0.06%Romanian Government International Bond 1,250,000 3.88% 29/10/2035 1,468,617 0.05%Romanian Government International Bond 1,250,000 3.38% 28/1/2050 1,334,551 0.05%Romanian Government International Bond 1,300,000 2.75% 14/4/2041 1,293,906 0.05%Romanian Government International Bond 1,200,000 2.00% 8/12/2026 1,291,999 0.05%Romanian Government International Bond 1,245,000 2.12% 16/7/2031 1,285,502 0.05%Romanian Government International Bond 990,000 4.63% 3/4/2049 1,255,452 0.05%Romanian Government International Bond 1,000,000 2.88% 26/5/2028 1,116,732 0.04%Romanian Government International Bond 900,000 4.13% 11/3/2039 1,066,500 0.04%Romanian Government International Bond 950,000 2.38% 19/4/2027 1,038,994 0.04%Romanian Government International Bond 845,000 2.00% 28/1/2032 854,766 0.03%Globalworth Real Estate Investments Ltd. 700,000 2.95% 29/7/2026 758,651 0.03%Romanian Government International Bond 740,000 2.00% 14/4/2033 734,660 0.03%NE Property BV 700,000 1.88% 9/10/2026 719,226 0.03%Romanian Government International Bond 600,000 2.88% 28/10/2024 655,500 0.02%Romanian Government International Bond 650,000 2.63% 2/12/2040 645,501 0.02%Romanian Government International Bond 640,000 1.38% 2/12/2029 638,612 0.02%Romanian Government International Bond 350,000 3.50% 3/4/2034 399,000 0.01%NE Property BV 300,000 3.38% 14/7/2027 333,182 0.01%test - - - 25,216,654 0.93%Russia 0.31% (2020: 0.27%)Russian Foreign Bond-Eurobond 1,800,000 2.88% 4/12/2025 1,967,078 0.07%Gazprom PJSC Via Gaz Capital SA 1,000,000 2.95% 24/1/2024 1,053,117 0.04%Gazprom PJSC Via Gaz Capital SA 1,000,000 2.50% 21/3/2026 1,047,700 0.04%Russian Railways Via RZD Capital plc 900,000 4.60% 6/3/2023 964,168 0.04%Gazprom PJSC Via Gaz Capital SA 800,000 3.13% 17/11/2023 844,273 0.03%Russian Foreign Bond-Eurobond 800,000 1.85% 20/11/2032 781,224 0.03%Russian Foreign Bond-Eurobond 600,000 2.65% 27/5/2036 608,596 0.02%Gazprom PJSC via Gaz Finance plc 500,000 2.95% 15/4/2025 531,967 0.02%

326
Vanguard Euro Investment Grade Bond Index Fund
Principal EUR (€) Coupon
Maturity Date
Fair Value EUR (€)
% of Total Net Assets
Russian Railways Via RZD Capital plc 500,000 2.20% 23/5/2027 526,657 0.02%test - - - 8,324,780 0.31%Saudi Arabia 0.12% (2020: 0.07%)Saudi Government International Bond 1,410,000 0.00% 3/3/2024 1,407,565 0.05%Saudi Government International Bond 1,250,000 2.00% 9/7/2039 1,291,092 0.05%Saudi Government International Bond 600,000 0.63% 3/3/2030 590,288 0.02%test - - - 3,288,945 0.12%Singapore 0.30% (2020: 0.26%)United Overseas Bank Ltd. 2,900,000 0.25% 11/9/2023 2,941,349 0.11%Oversea-Chinese Banking Corp., Ltd. 900,000 0.63% 18/4/2025 930,048 0.04%DBS Bank Ltd. 900,000 0.38% 21/11/2024 919,595 0.03%Ascendas 800,000 0.75% 23/6/2028 799,397 0.03%DBS Bank Ltd. 700,000 0.38% 23/1/2024 712,965 0.03%DBS Group Holdings Ltd.^ 600,000 1.50% 11/4/2028 616,156 0.02%Temasek Financial I Ltd. 500,000 1.25% 20/11/2049 544,618 0.02%Oversea-Chinese Banking Corp., Ltd. 500,000 0.38% 1/3/2023 506,130 0.02%test - - - 7,970,258 0.30%Slovakia 0.08% (2020: 0.03%)Vseobecna Uverova Banka A.S. 1,500,000 0.01% 24/3/2026 1,513,345 0.05%Granvia A.S. 557,886 4.78% 30/9/2039 710,570 0.03%test - - - 2,223,915 0.08%South Africa 0.05% (2020: 0.05%)Anglo American Capital plc 700,000 1.63% 18/9/2025 743,079 0.03%Anglo American Capital plc 300,000 1.63% 11/3/2026 318,054 0.01%Anglo American Capital plc 300,000 3.25% 3/4/2023 317,379 0.01%test - - - 1,378,512 0.05%South Korea 0.39% (2020: 0.36%)Kookmin Bank 2,100,000 0.05% 15/7/2025 2,120,048 0.08%Korea Housing Finance Corp. 2,000,000 0.01% 5/2/2025 2,015,202 0.07%Korea Housing Finance Corp. 1,000,000 0.01% 7/7/2025 1,007,059 0.04%Korea Housing Finance Corp. 920,000 0.75% 30/10/2023 941,836 0.04%Korea Development Bank 900,000 0.63% 17/7/2023 916,147 0.03%Export-Import Bank of Korea 900,000 0.38% 26/3/2024 915,179 0.03%Export-Import Bank of Korea 800,000 0.63% 11/7/2023 813,857 0.03%LG Chem Ltd. 600,000 0.50% 15/4/2023 605,545 0.02%Korea International Bond 470,000 0.00% 16/9/2025 472,547 0.02%Korea International Bond 400,000 2.13% 10/6/2024 427,603 0.02%Korea Development Bank 310,000 0.00% 10/7/2024 311,392 0.01%test - - - 10,546,415 0.39%Spain 5.11% (2020: 5.54%)Programa Cedulas TDA Fondo de Titulizacion de Activos 2,100,000 4.25% 10/4/2031 2,924,764 0.11%Banco Santander SA 2,500,000 1.13% 27/11/2024 2,625,131 0.10%Iberdrola International BV^ 2,600,000 1.45% Perpetual 2,623,985 0.10%CaixaBank SA 2,300,000 1.00% 17/1/2028 2,458,494 0.09%Banco Santander SA 2,400,000 0.01% 27/2/2025 2,428,518 0.09%CaixaBank SA 2,300,000 1.00% 25/9/2025 2,418,696 0.09%Banco de Sabadell SA 2,300,000 1.63% 7/3/2024 2,393,914 0.09%Programa Cedulas TDA Fondo de Titulizacion de Activos 1,800,000 4.25% 28/3/2027 2,248,367 0.08%AYT Cedulas Cajas Global FTA 1,700,000 4.75% 25/5/2027 2,164,816 0.08%Telefonica Emisiones SA 2,000,000 1.07% 5/2/2024 2,058,842 0.08%Banco Bilbao Vizcaya Argentaria SA 2,000,000 0.63% 18/3/2023 2,036,486 0.08%Telefonica Emisiones SA 1,900,000 1.46% 13/4/2026 2,028,745 0.07%Santander Consumer Finance SA 1,900,000 1.13% 9/10/2023 1,957,318 0.07%CaixaBank SA 1,600,000 3.88% 17/2/2025 1,844,250 0.07%CaixaBank SA 1,150,000 4.13% 24/3/2036 1,757,564 0.06%Banco Bilbao Vizcaya Argentaria SA 1,500,000 4.00% 25/2/2025 1,739,444 0.06%Bankinter SA 1,600,000 1.00% 5/2/2025 1,672,015 0.06%Banco Santander SA 1,600,000 1.38% 14/12/2022 1,639,036 0.06%Iberdrola International BV 1,600,000 0.38% 15/9/2025 1,631,345 0.06%Santander Consumer Finance SA 1,500,000 0.50% 14/11/2026 1,521,515 0.06%Banco de Sabadell SA 1,500,000 0.13% 20/10/2023 1,517,609 0.06%Banco Bilbao Vizcaya Argentaria SA 1,500,000 0.50% 14/1/2027 1,509,272 0.06%Banco Santander SA 1,500,000 0.50% 4/2/2027 1,505,914 0.06%Banco Santander SA 1,400,000 1.00% 7/4/2025 1,468,401 0.05%Red Electrica Financiaciones SAU 1,400,000 0.38% 24/7/2028 1,423,250 0.05%Banco de Sabadell SA 1,400,000 0.13% 10/2/2028 1,416,239 0.05%Telefonica Emisiones SA 1,300,000 1.45% 22/1/2027 1,387,272 0.05%Banco Santander SA 1,200,000 1.50% 25/1/2026 1,295,890 0.05%Banco Santander SA 1,200,000 1.38% 5/1/2026 1,258,004 0.05%CaixaBank SA 1,200,000 1.38% 19/6/2026 1,254,111 0.05%Banco Santander SA 1,200,000 1.63% 22/10/2030 1,236,953 0.05%

327
Vanguard Euro Investment Grade Bond Index Fund
Principal EUR (€) Coupon
Maturity Date
Fair Value EUR (€)
% of Total Net Assets
Banco Bilbao Vizcaya Argentaria SA 1,200,000 0.75% 4/6/2025 1,236,219 0.05%CaixaBank SA 1,200,000 1.00% 8/2/2023 1,227,448 0.05%CaixaBank SA 1,100,000 1.25% 11/1/2027 1,184,663 0.04%Inmobiliaria Colonial Socimi SA 1,100,000 1.63% 28/11/2025 1,166,900 0.04%AyT Cedulas Cajas X Fondo de Titulizacion de Activos 1,000,000 3.75% 30/6/2025 1,156,093 0.04%CaixaBank SA 1,100,000 1.13% 17/5/2024 1,137,347 0.04%Telefonica Emisiones SA 1,000,000 1.81% 21/5/2032 1,102,022 0.04%Banco Santander SA 900,000 2.00% 27/11/2034 1,095,049 0.04%Cedulas TDA 6 Fondo de Titulizacion de Activos 900,000 3.88% 23/5/2025 1,044,333 0.04%Banco Bilbao Vizcaya Argentaria SA 900,000 3.50% 10/2/2027 1,039,965 0.04%Iberdrola Finanzas SA 1,000,000 1.00% 7/3/2025 1,039,831 0.04%CaixaBank SA 1,000,000 0.63% 27/3/2025 1,034,019 0.04%Telefonica Emisiones SA 900,000 2.32% 17/10/2028 1,027,074 0.04%CaixaBank SA 1,000,000 0.75% 9/7/2026 1,024,380 0.04%Telefonica Emisiones SA 900,000 1.79% 12/3/2029 994,039 0.04%Banco Santander SA 1,000,000 0.10% 27/2/2032 991,415 0.04%Naturgy Finance BV 900,000 1.25% 15/1/2026 948,043 0.03%Enagas Financiaciones SA 900,000 1.25% 6/2/2025 944,455 0.03%Iberdrola International BV^ 900,000 1.87% Perpetual 928,250 0.03%Criteria Caixa SA 900,000 1.50% 10/5/2023 926,236 0.03%CaixaBank SA 900,000 1.00% 14/3/2023 921,761 0.03%Cajamar Caja Rural SCC 900,000 0.88% 18/6/2023 921,095 0.03%Santander Consumer Finance SA 900,000 0.88% 30/5/2023 919,419 0.03%Caja Rural de Navarra SCC 900,000 0.63% 1/12/2023 918,782 0.03%Banco de Sabadell SA 900,000 0.88% 22/7/2025 918,151 0.03%CaixaBank SA 900,000 1.13% 5/8/2022 915,418 0.03%CaixaBank SA 900,000 0.75% 18/4/2023 914,667 0.03%Banco Bilbao Vizcaya Argentaria SA 900,000 0.38% 2/10/2024 911,894 0.03%Telefonica Emisiones SA 900,000 0.66% 3/2/2030 911,858 0.03%Bankinter SA 900,000 0.63% 6/10/2027 906,667 0.03%Abertis Infraestructuras SA 800,000 2.38% 27/9/2027 882,215 0.03%Naturgy Finance BV 800,000 0.75% 28/11/2029 821,581 0.03%Abertis Infraestructuras SA 700,000 3.00% 27/3/2031 818,018 0.03%Deutsche Bank SA Espanola 800,000 0.50% 11/3/2024 817,561 0.03%CaixaBank SA 800,000 1.13% 12/1/2023 816,004 0.03%Mapfre SA^ 700,000 4.38% 31/3/2047 811,266 0.03%CaixaBank SA^ 800,000 0.50% 9/2/2029 788,179 0.03%Abertis Infraestructuras SA 700,000 2.25% 29/3/2029 767,463 0.03%Merlin Properties Socimi SA 700,000 2.38% 13/7/2027 763,862 0.03%Repsol International Finance BV 700,000 2.00% 15/12/2025 758,804 0.03%Banco Santander SA 700,000 2.13% 8/2/2028 757,763 0.03%AYT Cedulas Cajas Global FTA 700,000 3.75% 14/12/2022 741,992 0.03%Ferrovial Emisiones SA 700,000 1.38% 14/5/2026 740,279 0.03%Telefonica Emisiones SA 700,000 1.20% 21/8/2027 740,131 0.03%Iberdrola Finanzas SA 700,000 0.88% 16/6/2025 725,572 0.03%Iberdrola International BV^ 700,000 2.25% Perpetual 723,754 0.03%Naturgy Finance BV 700,000 0.88% 15/5/2025 723,557 0.03%Banco Bilbao Vizcaya Argentaria SA 700,000 1.13% 28/2/2024 722,358 0.03%CaixaBank SA 700,000 0.63% 1/10/2024 711,198 0.03%Banco Santander SA 700,000 0.30% 4/10/2026 705,391 0.03%Banco Santander SA^ 700,000 0.50% 24/3/2027 703,127 0.03%Merlin Properties Socimi SA 700,000 1.38% 1/6/2030 694,741 0.03%Merlin Properties Socimi SA 700,000 1.88% 4/12/2034 693,092 0.03%Banco Santander SA 600,000 3.13% 19/1/2027 681,073 0.03%Banco Santander SA 600,000 3.25% 4/4/2026 676,077 0.02%AYT Cedulas Cajas Global FTA 600,000 4.25% 25/10/2023 663,675 0.02%ACS Servicios Comunicaciones y Energia SA 600,000 1.88% 20/4/2026 634,758 0.02%CaixaBank SA^ 600,000 2.25% 17/4/2030 628,744 0.02%Abertis Infraestructuras SA 600,000 1.38% 20/5/2026 628,142 0.02%CaixaBank SA^ 600,000 2.75% 14/7/2028 626,597 0.02%Iberdrola International BV^ 600,000 1.88% Perpetual 615,491 0.02%CaixaBank SA 500,000 4.00% 3/2/2025 577,940 0.02%Inmobiliaria Colonial Socimi SA 500,000 2.50% 28/11/2029 561,786 0.02%Enagas Financiaciones SA 500,000 1.38% 5/5/2028 543,286 0.02%Mapfre SA 500,000 1.63% 19/5/2026 541,592 0.02%Amadeus IT Group SA 500,000 1.88% 24/9/2028 534,568 0.02%Iberdrola International BV 500,000 1.88% 8/10/2024 533,725 0.02%Red Electrica Financiaciones SAU 500,000 1.25% 13/3/2027 532,395 0.02%Iberdrola Finanzas SA 500,000 1.25% 28/10/2026 532,088 0.02%CaixaBank SA 500,000 2.38% 1/2/2024 530,618 0.02%Redexis Gas Finance BV 500,000 1.88% 28/5/2025 530,111 0.02%

328
Vanguard Euro Investment Grade Bond Index Fund
Principal EUR (€) Coupon
Maturity Date
Fair Value EUR (€)
% of Total Net Assets
PITCH1 500,000 5.13% 20/7/2022 528,922 0.02%Abanca Corp. Bancaria SA 500,000 0.75% 28/5/2029 527,828 0.02%Prosegur Cash SA 500,000 1.38% 4/2/2026 527,307 0.02%CaixaBank SA 500,000 1.75% 24/10/2023 520,840 0.02%Abertis Infraestructuras SA 500,000 1.00% 27/2/2027 513,478 0.02%Enagas Financiaciones SA 500,000 1.00% 25/3/2023 510,909 0.02%Abertis Infraestructuras SA 500,000 1.13% 26/3/2028 510,835 0.02%CaixaBank SA^ 500,000 0.75% 10/7/2026 510,775 0.02%Criteria Caixa SA 500,000 0.88% 28/10/2027 507,143 0.02%Banco Bilbao Vizcaya Argentaria SA 500,000 0.75% 11/9/2022 506,616 0.02%Santander Consumer Finance SA 500,000 0.38% 27/6/2024 506,160 0.02%CaixaBank SA 500,000 0.38% 3/2/2025 505,193 0.02%Banco de Sabadell SA^ 500,000 0.63% 7/11/2025 504,108 0.02%CaixaBank SA^ 500,000 1.25% 18/6/2031 503,393 0.02%CaixaBank SA^ 500,000 0.75% 26/5/2028 502,990 0.02%Banco Bilbao Vizcaya Argentaria SA^ 500,000 1.00% 16/1/2030 502,851 0.02%Repsol International Finance BV 500,000 0.25% 2/8/2027 501,849 0.02%Inmobiliaria Colonial Socimi SA 500,000 0.75% 22/6/2029 495,410 0.02%Repsol International Finance BV 400,000 2.63% 15/4/2030 472,308 0.02%Telefonica Emisiones SA 400,000 1.96% 1/7/2039 441,216 0.02%Redexis Gas Finance BV 400,000 1.88% 27/4/2027 429,531 0.02%Kutxabank SA 400,000 1.25% 22/9/2025 424,989 0.02%FCC Servicios Medio Ambiente Holding SAU 400,000 1.66% 4/12/2026 422,342 0.02%Naturgy Finance BV 400,000 1.25% 19/4/2026 421,298 0.02%Deutsche Bank SA Espanola 400,000 0.88% 16/1/2025 415,539 0.02%Abertis Infraestructuras SA 400,000 1.25% 7/2/2028 412,337 0.02%Santander Consumer Finance SA 400,000 0.38% 17/1/2025 404,803 0.01%Banco Santander SA 400,000 0.20% 11/2/2028 396,749 0.01%Repsol International Finance BV 300,000 2.25% 10/12/2026 335,644 0.01%Banco Santander SA 300,000 2.50% 18/3/2025 324,639 0.01%Naturgy Finance BV 300,000 1.50% 29/1/2028 323,412 0.01%Ferrovial Emisiones SA 300,000 2.50% 15/7/2024 322,930 0.01%Telefonica Emisiones SA 300,000 3.99% 23/1/2023 320,343 0.01%Amadeus IT Group SA 300,000 1.50% 18/9/2026 319,383 0.01%Telefonica Emisiones SA 300,000 1.50% 11/9/2025 318,224 0.01%Banco Bilbao Vizcaya Argentaria SA^ 300,000 2.58% 22/2/2029 316,218 0.01%Ferrovial Emisiones SA 300,000 1.38% 31/3/2025 314,838 0.01%Red Electrica Financiaciones SAU 300,000 1.00% 21/4/2026 314,791 0.01%Red Electrica Financiaciones SAU 300,000 1.13% 24/4/2025 314,358 0.01%Red Electrica Financiaciones SAU 300,000 2.13% 1/7/2023 314,052 0.01%Iberdrola International BV 300,000 1.75% 17/9/2023 313,493 0.01%Red Electrica Corp. SA 300,000 0.88% 14/4/2025 310,657 0.01%CaixaBank SA 300,000 1.13% 12/11/2026 309,762 0.01%Santander Consumer Finance SA 300,000 1.00% 27/2/2024 308,716 0.01%Banco de Sabadell SA^ 300,000 1.13% 11/3/2027 308,375 0.01%FCC Servicios Medio Ambiente Holding SAU 300,000 0.82% 4/12/2023 305,030 0.01%Iberdrola International BV^ 300,000 1.83% Perpetual 301,500 0.01%Bankinter SA^ 300,000 1.25% 23/12/2032 300,695 0.01%NorteGas Energia Distribucion SA 300,000 0.91% 22/1/2031 296,176 0.01%Telefonica Emisiones SA 200,000 2.93% 17/10/2029 240,674 0.01%Mapfre SA^ 200,000 4.13% 7/9/2048 232,035 0.01%FCC Aqualia SA 200,000 2.63% 8/6/2027 221,037 0.01%Abertis Infraestructuras SA 200,000 2.50% 27/2/2025 218,243 0.01%Telefonica Emisiones SA 200,000 1.86% 13/7/2040 216,420 0.01%Abertis Infraestructuras SA 200,000 1.63% 15/7/2029 210,227 0.01%Naturgy Finance BV 200,000 1.38% 21/1/2025 210,103 0.01%Abertis Infraestructuras SA 200,000 0.63% 15/7/2025 203,720 0.01%NorteGas Energia Distribucion SA 100,000 2.07% 28/9/2027 108,044 0.00%Telefonica Emisiones SA 100,000 1.53% 17/1/2025 105,856 0.00%Banco Santander SA 100,000 1.13% 17/1/2025 103,447 0.00%Ferrovial Emisiones SA 100,000 0.54% 12/11/2028 100,573 0.00%test - - - 138,045,561 5.11%Supranational 16.34% (2020: 14.86%)European Union 12,390,000 0.00% 4/7/2031 12,363,078 0.46%European Investment Bank 11,240,000 0.00% 25/3/2025 11,434,429 0.42%European Union 8,119,000 0.50% 4/4/2025 8,417,649 0.31%European Financial Stability Facility 8,000,000 0.00% 15/10/2025 8,136,454 0.30%European Union 7,940,000 0.00% 2/6/2028 8,061,151 0.30%European Financial Stability Facility 7,000,000 0.00% 24/4/2023 7,074,449 0.26%European Investment Bank 6,100,000 0.63% 22/1/2029 6,457,849 0.24%European Investment Bank 6,300,000 0.00% 17/6/2027 6,407,647 0.24%

329
Vanguard Euro Investment Grade Bond Index Fund
Principal EUR (€) Coupon
Maturity Date
Fair Value EUR (€)
% of Total Net Assets
European Union 6,400,000 0.20% 4/6/2036 6,244,283 0.23%European Investment Bank 6,000,000 0.05% 24/5/2024 6,103,042 0.23%European Investment Bank 4,800,000 4.50% 15/10/2025 5,829,559 0.22%European Investment Bank 5,500,000 1.63% 15/3/2023 5,709,708 0.21%European Investment Bank 5,600,000 0.00% 16/10/2023 5,672,681 0.21%European Union 5,530,000 0.00% 4/3/2026 5,638,405 0.21%European Union 6,050,000 0.30% 4/11/2050 5,497,881 0.20%European Financial Stability Facility 5,140,000 0.50% 20/1/2023 5,228,917 0.19%European Investment Bank 5,130,000 0.05% 16/1/2030 5,183,813 0.19%European Investment Bank 3,800,000 4.00% 15/4/2030 5,176,376 0.19%European Union 5,225,000 0.00% 4/7/2035 4,991,925 0.19%European Stability Mechanism 4,643,000 0.75% 5/9/2028 4,950,259 0.18%European Union 4,900,000 0.00% 4/10/2030 4,913,458 0.18%European Union 5,215,000 0.10% 4/10/2040 4,826,999 0.18%European Financial Stability Facility 4,500,000 0.88% 26/7/2027 4,805,036 0.18%European Stability Mechanism 4,470,000 0.00% 10/2/2023 4,511,539 0.17%European Financial Stability Facility 4,400,000 0.20% 17/1/2024 4,479,162 0.17%European Financial Stability Facility 3,950,000 1.20% 17/2/2045 4,456,133 0.17%European Stability Mechanism 4,375,000 0.13% 22/4/2024 4,453,061 0.17%European Financial Stability Facility 3,825,000 1.25% 24/5/2033 4,311,441 0.16%European Investment Bank 4,300,000 0.05% 13/10/2034 4,180,427 0.15%European Investment Bank 4,000,000 0.88% 13/9/2024 4,179,335 0.15%European Financial Stability Facility 3,550,000 1.45% 5/9/2040 4,151,876 0.15%European Stability Mechanism 3,110,000 1.80% 2/11/2046 4,018,939 0.15%European Financial Stability Facility 2,750,000 3.38% 3/4/2037 4,017,309 0.15%European Financial Stability Facility 3,800,000 0.63% 16/10/2026 3,988,351 0.15%European Stability Mechanism 3,800,000 0.50% 2/3/2026 3,954,228 0.15%European Financial Stability Facility 3,750,000 1.88% 23/5/2023 3,925,910 0.15%European Investment Bank 2,900,000 3.00% 14/10/2033 3,885,821 0.14%European Union 3,200,000 3.00% 4/9/2026 3,760,690 0.14%European Investment Bank 3,600,000 0.00% 23/5/2023 3,640,411 0.13%European Financial Stability Facility 3,640,000 0.00% 20/1/2031 3,634,876 0.13%European Financial Stability Facility 3,335,000 0.95% 14/2/2028 3,592,410 0.13%European Investment Bank 3,500,000 0.00% 15/3/2024 3,552,442 0.13%European Financial Stability Facility 2,750,000 1.80% 10/7/2048 3,546,831 0.13%European Investment Bank 3,300,000 0.88% 14/1/2028 3,544,502 0.13%European Investment Bank 3,400,000 0.38% 14/4/2026 3,525,305 0.13%European Union 3,345,000 0.75% 4/1/2047 3,440,801 0.13%European Financial Stability Facility 3,300,000 0.40% 17/2/2025 3,398,464 0.13%International Bank for Reconstruction & Development 3,300,000 0.01% 24/4/2028 3,337,867 0.12%European Financial Stability Facility 2,970,000 0.88% 10/4/2035 3,195,570 0.12%European Financial Stability Facility 2,295,000 3.00% 4/9/2034 3,119,575 0.12%European Financial Stability Facility 2,650,000 1.38% 31/5/2047 3,105,390 0.12%European Investment Bank 3,100,000 0.00% 14/1/2031 3,097,165 0.11%European Financial Stability Facility 2,500,000 1.70% 13/2/2043 3,069,804 0.11%European Investment Bank 3,000,000 0.13% 15/4/2025 3,067,098 0.11%European Union 3,180,000 0.45% 2/5/2046 3,067,009 0.11%European Financial Stability Facility 2,200,000 1.75% 17/7/2053 2,872,664 0.11%International Bank for Reconstruction & Development 2,800,000 0.00% 15/1/2027 2,841,784 0.11%European Financial Stability Facility 2,800,000 0.13% 17/10/2023 2,841,285 0.11%European Union 2,650,000 0.75% 4/4/2031 2,839,691 0.11%European Financial Stability Facility 2,800,000 0.00% 19/4/2024 2,838,165 0.11%European Investment Bank 2,500,000 2.75% 15/9/2025 2,837,938 0.11%European Financial Stability Facility 2,700,000 0.40% 31/5/2026 2,800,981 0.10%European Investment Bank 2,700,000 2.25% 14/10/2022 2,800,720 0.10%European Investment Bank 2,700,000 0.38% 16/7/2025 2,789,798 0.10%European Union 2,450,000 1.25% 4/4/2033 2,752,835 0.10%European Stability Mechanism 2,550,000 0.75% 15/3/2027 2,701,393 0.10%European Financial Stability Facility 2,500,000 1.75% 27/6/2024 2,669,465 0.10%European Investment Bank 2,700,000 0.20% 17/3/2036 2,644,117 0.10%European Investment Bank 2,400,000 1.00% 14/4/2032 2,640,830 0.10%European Stability Mechanism 2,600,000 0.10% 31/7/2023 2,634,454 0.10%European Financial Stability Facility 1,850,000 2.35% 29/7/2044 2,561,069 0.10%European Stability Mechanism 1,980,000 1.75% 20/10/2045 2,520,441 0.09%European Stability Mechanism 1,800,000 1.85% 1/12/2055 2,477,104 0.09%European Financial Stability Facility 2,430,000 0.70% 20/1/2050 2,466,837 0.09%European Investment Bank 2,000,000 1.50% 16/10/2048 2,456,622 0.09%European Investment Bank 2,200,000 1.00% 14/3/2031 2,414,929 0.09%European Investment Bank 1,650,000 2.75% 15/3/2040 2,327,900 0.09%European Union 2,310,000 0.25% 22/4/2036 2,266,115 0.08%European Investment Bank 2,000,000 1.13% 15/9/2036 2,225,458 0.08%

330
Vanguard Euro Investment Grade Bond Index Fund
Principal EUR (€) Coupon
Maturity Date
Fair Value EUR (€)
% of Total Net Assets
European Union 1,650,000 3.38% 4/4/2032 2,222,443 0.08%European Investment Bank 1,750,000 1.75% 15/9/2045 2,207,473 0.08%European Stability Mechanism 2,150,000 0.00% 14/3/2025 2,183,989 0.08%European Union 1,850,000 2.50% 4/11/2027 2,176,863 0.08%European Financial Stability Facility 2,100,000 0.40% 26/1/2026 2,173,249 0.08%European Investment Bank 2,000,000 0.50% 15/1/2027 2,092,975 0.08%European Investment Bank 2,000,000 0.05% 15/12/2023 2,030,718 0.08%International Bank for Reconstruction & Development 1,900,000 0.50% 16/4/2030 1,980,373 0.07%European Union 1,759,000 1.38% 4/10/2029 1,976,248 0.07%European Investment Bank 1,900,000 0.20% 15/7/2024 1,942,371 0.07%African Development Bank 1,900,000 0.13% 7/10/2026 1,937,634 0.07%European Investment Bank 1,900,000 0.00% 15/5/2028 1,930,221 0.07%European Investment Bank 1,850,000 0.10% 15/10/2026 1,895,148 0.07%European Stability Mechanism 1,720,000 0.88% 18/7/2042 1,837,932 0.07%Council Of Europe Development Bank 1,800,000 0.00% 9/4/2027 1,832,439 0.07%European Union 1,800,000 0.70% 6/7/2051 1,821,429 0.07%European Investment Bank 1,700,000 2.13% 15/1/2024 1,817,108 0.07%International Bank for Reconstruction & Development 1,800,000 0.00% 21/2/2030 1,800,624 0.07%European Stability Mechanism 1,600,000 1.13% 3/5/2032 1,776,963 0.07%European Financial Stability Facility 1,200,000 2.00% 28/2/2056 1,685,047 0.06%European Financial Stability Facility 1,600,000 0.00% 20/7/2026 1,627,364 0.06%European Financial Stability Facility 1,600,000 0.00% 17/11/2022 1,613,319 0.06%European Stability Mechanism 1,400,000 1.20% 23/5/2033 1,568,580 0.06%European Union 1,050,000 3.38% 4/4/2038 1,549,314 0.06%European Stability Mechanism 1,300,000 1.63% 17/11/2036 1,545,346 0.06%European Investment Bank 1,250,000 3.50% 15/4/2027 1,531,581 0.06%European Stability Mechanism 1,400,000 1.00% 23/9/2025 1,483,069 0.06%European Union 1,250,000 1.50% 4/10/2035 1,452,776 0.05%European Bank for Reconstruction & Development 1,400,000 0.00% 10/1/2024 1,417,563 0.05%European Financial Stability Facility 1,397,000 0.00% 13/10/2027 1,415,802 0.05%European Stability Mechanism 1,350,000 0.50% 5/3/2029 1,414,657 0.05%European Stability Mechanism 1,300,000 2.13% 20/11/2023 1,382,792 0.05%European Financial Stability Facility 1,310,000 0.50% 11/7/2025 1,357,210 0.05%European Union 1,300,000 0.63% 4/11/2023 1,336,625 0.05%European Investment Bank 1,200,000 1.13% 15/11/2032 1,336,433 0.05%European Union 1,300,000 0.00% 6/7/2026 1,325,246 0.05%European Investment Bank 1,200,000 1.25% 13/11/2026 1,305,218 0.05%Corp. Andina de Fomento 1,200,000 1.63% 3/6/2025 1,268,091 0.05%European Investment Bank 950,000 2.63% 15/3/2035 1,247,114 0.05%European Union 1,200,000 0.00% 4/7/2029 1,212,661 0.05%Corp. Andina de Fomento 1,100,000 1.13% 13/2/2025 1,138,612 0.04%European Union 700,000 3.75% 4/4/2042 1,136,981 0.04%Council of Europe Development Bank 1,050,000 1.75% 24/4/2024 1,117,357 0.04%International Bank for Reconstruction & Development 1,325,000 0.20% 21/1/2061 1,110,369 0.04%European Union 900,000 2.88% 4/4/2028 1,089,736 0.04%Corp. Andina de Fomento 1,070,000 0.25% 4/2/2026 1,069,419 0.04%European Stability Mechanism 1,050,000 0.00% 15/12/2026 1,067,295 0.04%European Investment Bank 1,025,000 0.50% 13/11/2037 1,051,753 0.04%Nordic Investment Bank 1,020,000 0.00% 6/4/2023 1,030,424 0.04%European Investment Bank 1,000,000 0.00% 9/9/2030 1,001,521 0.04%European Stability Mechanism 1,000,000 0.01% 15/10/2031 994,441 0.04%European Investment Bank 800,000 1.50% 15/11/2047 978,355 0.04%European Financial Stability Facility 900,000 0.75% 3/5/2027 953,348 0.04%International Bank for Reconstruction & Development 900,000 0.63% 22/11/2027 948,268 0.04%European Financial Stability Facility 1,120,000 0.05% 18/1/2052 938,143 0.03%EUROFIMA 970,000 0.15% 10/10/2034 935,353 0.03%Council Of Europe Development Bank 900,000 0.38% 8/6/2026 933,217 0.03%European Investment Bank 900,000 0.00% 13/3/2026 916,943 0.03%African Development Bank 900,000 0.25% 24/1/2024 916,523 0.03%Nordic Investment Bank 900,000 0.00% 30/4/2027 914,995 0.03%European Investment Bank 850,000 0.88% 13/9/2047 909,349 0.03%Asian Development Bank 900,000 0.00% 24/10/2029 900,998 0.03%European Investment Bank 850,000 3.00% 28/9/2022 888,583 0.03%European Union 800,000 1.13% 4/4/2036 886,924 0.03%European Investment Bank 950,000 0.01% 15/5/2041 867,987 0.03%European Stability Mechanism 850,000 0.01% 4/3/2030 853,662 0.03%Council Of Europe Development Bank 800,000 0.63% 30/1/2029 847,567 0.03%European Investment Bank 860,000 0.25% 15/6/2040 826,350 0.03%African Development Bank 728,000 0.50% 21/3/2029 756,582 0.03%Council Of Europe Development Bank 700,000 0.13% 25/5/2023 709,126 0.03%Asian Development Bank 600,000 1.40% 6/2/2037 690,865 0.03%

331
Vanguard Euro Investment Grade Bond Index Fund
Principal EUR (€) Coupon
Maturity Date
Fair Value EUR (€)
% of Total Net Assets
European Investment Bank 600,000 1.00% 14/11/2042 666,009 0.02%International Development Association 650,000 0.00% 19/10/2026 657,471 0.02%European Investment Bank 400,000 3.63% 14/3/2042 647,792 0.02%European Investment Bank 500,000 2.75% 13/9/2030 628,093 0.02%EUROFIMA 600,000 0.00% 28/7/2026 607,101 0.02%European Financial Stability Facility 600,000 0.00% 17/7/2023 606,577 0.02%International Bank for Reconstruction & Development 700,000 0.13% 3/1/2051 605,065 0.02%European Union 550,000 0.00% 4/11/2025 560,654 0.02%International Bank for Reconstruction & Development 500,000 1.20% 8/8/2034 559,547 0.02%EUROFIMA 550,000 0.25% 9/2/2024 559,135 0.02%European Investment Bank 500,000 1.13% 13/4/2033 555,051 0.02%European Investment Bank 560,000 0.01% 15/11/2035 536,263 0.02%Council of Europe Development Bank 500,000 0.75% 9/6/2025 523,517 0.02%International Bank for Reconstruction & Development 500,000 0.50% 21/6/2035 512,261 0.02%Corp. Andina de Fomento 500,000 0.63% 30/1/2024 508,140 0.02%Council Of Europe Development Bank 500,000 0.05% 21/1/2030 505,675 0.02%EUROFIMA 500,000 0.10% 20/5/2030 499,000 0.02%European Investment Bank 550,000 0.05% 27/1/2051 466,665 0.02%African Development Bank 400,000 0.25% 21/11/2024 408,951 0.02%International Bank for Reconstruction & Development 400,000 0.10% 17/9/2035 387,114 0.01%European Investment Bank 350,000 0.13% 20/6/2029 356,946 0.01%European Financial Stability Facility 300,000 2.13% 19/2/2024 320,971 0.01%European Financial Stability Facility 300,000 2.25% 5/9/2022 310,306 0.01%EUROFIMA 300,000 0.25% 25/4/2023 303,913 0.01%Asian Development Bank 225,000 0.03% 31/1/2030 225,261 0.01%Nordic Investment Bank 200,000 0.00% 25/9/2026 203,439 0.01%test - - - 441,371,356 16.34%Sweden 1.86% (2020: 1.85%)Skandinaviska Enskilda Banken AB^ 1,956,000 1.38% 31/10/2028 2,009,988 0.07%Stadshypotek AB 1,700,000 0.38% 22/2/2023 1,724,387 0.06%Svenska Handelsbanken AB^ 1,600,000 1.63% 5/3/2029 1,661,899 0.06%Skandinaviska Enskilda Banken AB 1,500,000 0.75% 15/11/2027 1,586,710 0.06%Swedbank Hypotek AB 1,400,000 0.45% 23/8/2023 1,427,977 0.05%Sveriges Sakerstallda Obligationer AB 1,200,000 0.25% 19/4/2023 1,215,659 0.04%Heimstaden Bostad AB 1,000,000 2.13% 5/9/2023 1,044,500 0.04%Sveriges Sakerstallda Obligationer AB 1,000,000 0.63% 30/10/2025 1,040,150 0.04%Sveriges Sakerstallda Obligationer AB 1,000,000 0.50% 29/1/2025 1,031,081 0.04%Stadshypotek AB 1,000,000 0.38% 21/2/2024 1,021,552 0.04%Lansforsakringar Bank AB 1,000,000 0.05% 15/4/2026 996,151 0.04%Swedbank AB 1,000,000 0.20% 12/1/2028 983,362 0.04%Swedbank AB 900,000 0.75% 5/5/2025 928,618 0.03%Swedbank AB^ 900,000 1.50% 18/9/2028 924,590 0.03%Lansforsakringar Bank AB 900,000 0.88% 25/9/2023 922,253 0.03%Swedbank AB^ 900,000 1.00% 22/11/2027 910,834 0.03%Castellum AB 900,000 0.75% 4/9/2026 904,971 0.03%Lansforsakringar Hypotek AB 800,000 0.63% 27/3/2025 827,910 0.03%Samhallsbyggnadsbolaget i Norden AB 800,000 1.00% 12/8/2027 808,255 0.03%Akelius Residential Property Financing BV 800,000 0.75% 22/2/2030 786,548 0.03%Lansforsakringar Hypotek AB 750,000 0.25% 12/4/2023 759,624 0.03%Telia Co. AB 650,000 3.88% 1/10/2025 757,803 0.03%Fastighets AB Balder 700,000 1.88% 14/3/2025 735,683 0.03%Swedbank Hypotek AB 720,000 0.05% 28/5/2025 730,428 0.03%Sweden Government International Bond 700,000 0.13% 24/4/2023 708,670 0.03%Telia Co. AB 600,000 3.00% 7/9/2027 704,425 0.03%Telia Co. AB 600,000 2.13% 20/2/2034 690,819 0.03%Svenska Handelsbanken AB 660,000 1.00% 15/4/2025 689,587 0.03%Akelius Residential Property AB 600,000 1.75% 7/2/2025 632,641 0.02%Telia Co. AB^ 600,000 3.00% 4/4/2078 627,327 0.02%Essity AB 600,000 1.13% 27/3/2024 618,708 0.02%Svenska Handelsbanken AB 600,000 0.05% 3/9/2026 598,348 0.02%Molnlycke Holding AB 550,000 1.88% 28/2/2025 584,725 0.02%Sveriges Sakerstallda Obligationer AB 500,000 1.25% 19/4/2033 557,323 0.02%EQT AB 530,000 0.88% 14/5/2031 525,819 0.02%Swedbank AB^ 520,000 0.30% 20/5/2027 520,233 0.02%Tele2 AB 500,000 1.13% 15/5/2024 515,222 0.02%Securitas AB 500,000 1.13% 20/2/2024 514,222 0.02%Akelius Residential Property Financing BV 500,000 1.13% 11/1/2029 512,564 0.02%Sagax AB 500,000 1.13% 30/1/2027 510,437 0.02%Skandinaviska Enskilda Banken AB 500,000 0.63% 12/11/2029 507,979 0.02%Skandinaviska Enskilda Banken AB 500,000 0.38% 11/2/2027 503,820 0.02%Svenska Handelsbanken AB 500,000 0.50% 18/2/2030 499,944 0.02%

332
Vanguard Euro Investment Grade Bond Index Fund
Principal EUR (€) Coupon
Maturity Date
Fair Value EUR (€)
% of Total Net Assets
SBB Treasury OYJ 500,000 1.13% 26/11/2029 498,010 0.02%Balder Finland OYJ 500,000 1.00% 20/1/2029 492,314 0.02%Molnlycke Holding AB 500,000 0.63% 15/1/2031 485,368 0.02%Essity AB 500,000 0.25% 8/2/2031 484,753 0.02%Investor AB 400,000 1.50% 20/6/2039 440,600 0.02%Essity AB 400,000 1.63% 30/3/2027 431,622 0.02%Securitas AB 400,000 1.25% 6/3/2025 416,142 0.02%Lansforsakringar Hypotek AB 400,000 0.63% 29/1/2026 415,778 0.02%Swedbank Hypotek AB 400,000 0.50% 5/2/2026 414,255 0.02%Region Stockholm 400,000 0.75% 26/2/2025 414,005 0.02%Heimstaden Bostad AB 400,000 1.13% 21/1/2026 411,079 0.02%Samhallsbyggnadsbolaget i Norden AB 400,000 1.13% 4/9/2026 410,097 0.02%Vattenfall AB 400,000 0.50% 24/6/2026 408,616 0.02%Svenska Handelsbanken AB^ 400,000 1.25% 2/3/2028 407,945 0.02%Telia Co. AB^ 400,000 1.38% 11/5/2081 404,653 0.01%Vattenfall AB 400,000 0.05% 15/10/2025 401,244 0.01%Balder Finland OYJ 400,000 1.38% 24/5/2030 399,315 0.01%Sagax Euro Mtn NL BV 400,000 1.00% 17/5/2029 398,474 0.01%SBB Treasury OYJ 400,000 0.75% 14/12/2028 391,910 0.01%Vattenfall AB 390,000 0.13% 12/2/2029 384,027 0.01%Akelius Residential Property AB 357,000 1.13% 14/3/2024 366,830 0.01%Telia Co. AB 300,000 3.63% 14/2/2024 329,915 0.01%Telia Co. AB 300,000 1.63% 23/2/2035 327,129 0.01%Investor AB 300,000 4.50% 12/5/2023 327,074 0.01%Atlas Copco AB 300,000 2.50% 28/2/2023 313,859 0.01%Akelius Residential Property Financing BV 300,000 1.00% 17/1/2028 306,510 0.01%Swedbank AB 300,000 0.40% 29/8/2023 304,737 0.01%Alfa Laval Treasury International AB 300,000 1.38% 12/9/2022 304,545 0.01%Autoliv, Inc. 300,000 0.75% 26/6/2023 304,380 0.01%Svenska Handelsbanken AB 300,000 0.13% 18/6/2024 303,378 0.01%Essity AB 300,000 0.50% 3/2/2030 300,463 0.01%Vattenfall AB 200,000 5.38% 29/4/2024 231,255 0.01%Molnlycke Holding AB 200,000 1.75% 28/2/2024 209,393 0.01%Securitas AB 200,000 0.25% 22/2/2028 196,570 0.01%H&M Finance BV 200,000 0.25% 25/8/2029 195,919 0.01%Region Stockholm 150,000 2.13% 12/9/2022 154,587 0.01%Investor AB 100,000 1.50% 12/9/2030 110,274 0.00%Essity AB 100,000 1.13% 5/3/2025 104,002 0.00%Skandinaviska Enskilda Banken AB 100,000 0.50% 13/3/2023 101,546 0.00%Fastighets AB Balder 100,000 1.25% 28/1/2028 101,080 0.00%test - - - 50,167,399 1.86%Switzerland 2.04% (2020: 2.02%)Credit Suisse Group AG^ 3,000,000 3.25% 2/4/2026 3,307,305 0.12%UBS Group AG 2,095,000 1.50% 30/11/2024 2,174,655 0.08%UBS Group AG^ 1,900,000 1.25% 17/4/2025 1,966,073 0.07%UBS AG 1,900,000 0.75% 21/4/2023 1,935,194 0.07%Nestle Finance International Ltd. 1,500,000 0.00% 12/11/2024 1,511,803 0.06%Credit Suisse Group AG^ 1,500,000 0.65% 14/1/2028 1,500,656 0.06%UBS AG 1,400,000 0.63% 23/1/2023 1,419,801 0.05%ELM BV for Swiss Reinsurance Co., Ltd.^ 1,300,000 2.60% Perpetual 1,397,764 0.05%Credit Suisse Group AG^ 1,300,000 1.00% 24/6/2027 1,326,332 0.05%Holcim Finance Luxembourg SA 1,200,000 2.38% 9/4/2025 1,302,183 0.05%Argentum Netherlands BV for Zurich Insurance Co., Ltd.^ 1,000,000 3.50% 1/10/2046 1,140,027 0.04%Novartis Finance SA 1,000,000 1.13% 30/9/2027 1,065,212 0.04%Richemont International Holding SA 900,000 2.00% 26/3/2038 1,040,212 0.04%Roche Finance Europe BV 1,000,000 0.88% 25/2/2025 1,038,968 0.04%Novartis Finance SA 1,000,000 0.00% 23/9/2028 987,624 0.04%Richemont International Holding SA 900,000 1.13% 26/5/2032 958,283 0.04%Nestle Finance International Ltd. 900,000 1.13% 1/4/2026 951,846 0.04%Nestle Finance International Ltd. 800,000 1.75% 2/11/2037 932,862 0.03%Swiss Re Finance Luxembourg SA^ 800,000 2.53% 30/4/2050 883,275 0.03%Coca-Cola HBC Finance BV 800,000 1.88% 11/11/2024 853,983 0.03%Givaudan Finance Europe BV 800,000 1.00% 22/4/2027 841,842 0.03%ELM BV for Swiss Life Insurance & Pension Group^ 700,000 4.50% Perpetual 821,652 0.03%Credit Suisse Group AG^ 800,000 1.25% 17/7/2025 821,439 0.03%UBS Group AG^ 800,000 0.25% 29/1/2026 803,137 0.03%Credit Suisse AG 800,000 0.25% 5/1/2026 802,781 0.03%Nestle Finance International Ltd. 800,000 0.00% 14/6/2026 802,368 0.03%UBS Group AG 800,000 0.25% 24/2/2028 792,760 0.03%Credit Suisse Group AG 800,000 0.63% 18/1/2033 752,504 0.03%Roche Finance Europe BV 738,000 0.50% 27/2/2023 747,978 0.03%

333
Vanguard Euro Investment Grade Bond Index Fund
Principal EUR (€) Coupon
Maturity Date
Fair Value EUR (€)
% of Total Net Assets
Credit Suisse AG 700,000 1.00% 7/6/2023 716,295 0.03%Nestle Finance International Ltd. 700,000 0.75% 16/5/2023 712,867 0.03%Holcim Finance Luxembourg SA 700,000 0.50% 29/11/2026 711,755 0.03%UBS Group AG^ 700,000 0.25% 5/11/2028 692,669 0.03%Novartis Finance SA 600,000 1.70% 14/8/2038 690,615 0.03%Nestle Finance International Ltd. 600,000 1.50% 1/4/2030 664,665 0.02%Richemont International Holding SA 600,000 1.00% 26/3/2026 628,511 0.02%Nestle Finance International Ltd. 600,000 1.75% 12/9/2022 615,768 0.02%Novartis Finance SA 600,000 0.50% 14/8/2023 609,698 0.02%Nestle Finance International Ltd. 600,000 0.38% 12/5/2032 598,116 0.02%UBS AG 600,000 0.50% 31/3/2031 597,162 0.02%Argentum Netherlands BV for Givaudan SA 500,000 2.00% 17/9/2030 571,265 0.02%Holcim Finance Luxembourg SA 500,000 1.75% 29/8/2029 547,289 0.02%Richemont International Holding SA 500,000 1.63% 26/5/2040 546,587 0.02%Aquarius & Investments PLC for Zurich Insurance Co., Ltd.^ 500,000 4.25% 2/10/2043 546,557 0.02%Firmenich Productions Participations SAS 500,000 1.38% 30/10/2026 533,394 0.02%Cloverie PLC for Zurich Insurance Co., Ltd. 500,000 1.75% 16/9/2024 531,990 0.02%ABB Finance BV 500,000 0.75% 16/5/2024 512,029 0.02%Holcim Finance Luxembourg SA 500,000 0.50% 23/4/2031 489,020 0.02%Tyco Electronics Group SA 500,000 0.00% 16/2/2029 484,258 0.02%Holcim Finance Luxembourg SA 500,000 0.63% 19/1/2033 480,298 0.02%Argentum Netherlands BV for Zurich Insurance Co., Ltd.^ 400,000 2.75% 19/2/2049 448,419 0.02%Givaudan Finance Europe BV 400,000 1.63% 22/4/2032 444,738 0.02%Coca-Cola HBC Finance BV 400,000 1.63% 14/5/2031 439,941 0.02%Zurich Finance Ireland Designated Activity Co. 400,000 1.63% 17/6/2039 438,918 0.02%Nestle Finance International Ltd. 435,000 0.88% 14/6/2041 433,059 0.02%Richemont International Holding SA 400,000 0.75% 26/5/2028 416,141 0.02%ABB Finance BV 400,000 0.63% 3/5/2023 405,853 0.01%Nestle Finance International Ltd. 400,000 0.00% 3/12/2025 402,382 0.01%UBS AG 400,000 0.01% 31/3/2026 399,466 0.01%Argentum Netherlands BV for Swiss Life AG^ 300,000 4.38% Perpetual 339,005 0.01%Firmenich Productions Participations SAS 300,000 1.75% 30/4/2030 330,586 0.01%Novartis Finance SA 300,000 1.38% 14/8/2030 328,801 0.01%Sika Capital BV 300,000 1.50% 29/4/2031 328,797 0.01%Barry Callebaut Services NV 300,000 2.38% 24/5/2024 317,862 0.01%Tyco Electronics Group SA 300,000 0.00% 14/2/2025 300,829 0.01%Holcim Finance Luxembourg SA 200,000 2.25% 26/5/2028 224,510 0.01%Swiss Re Finance UK plc^ 200,000 2.71% 4/6/2052 220,228 0.01%Novartis Finance SA 200,000 1.63% 9/11/2026 218,660 0.01%Novartis Finance SA 200,000 0.13% 20/9/2023 202,092 0.01%Helvetia Europe SA^ 180,000 2.75% 30/9/2041 194,521 0.01%Nestle Finance International Ltd. 200,000 0.38% 3/12/2040 184,357 0.01%Holcim Finance Luxembourg SA 113,000 1.38% 26/5/2023 116,010 0.00%Richemont International Holding SA 100,000 1.50% 26/3/2030 110,025 0.00%Nestle Finance International Ltd. 100,000 1.25% 2/11/2029 108,423 0.00%Adecco International Financial Services BV 100,000 1.00% 2/12/2024 103,866 0.00%Novartis Finance SA 100,000 0.63% 20/9/2028 103,758 0.00%Glencore Finance Europe Ltd. 100,000 1.88% 13/9/2023 103,648 0.00%test - - - 55,026,222 2.04%United Arab Emirates 0.11% (2020: 0.08%)Emirates Telecommunications Group Co. PJSC 700,000 2.75% 18/6/2026 790,397 0.03%Emirates Telecommunications Group Co. PJSC 600,000 0.88% 17/5/2033 592,013 0.02%MDGH - GMTN BV 500,000 3.63% 30/5/2023 536,431 0.02%DP World plc 500,000 2.38% 25/9/2026 535,145 0.02%MDGH GMTN RSC Ltd. 500,000 1.00% 10/3/2034 498,786 0.02%Emirates Telecommunications Group Co. PJSC 110,000 0.38% 17/5/2028 110,574 0.00%test - - - 3,063,346 0.11%United Kingdom 5.74% (2020: 5.84%)easyJet FinCo BV 2,164,000 1.88% 3/3/2028 2,170,844 0.08%WPP Finance SA 1,800,000 2.38% 19/5/2027 2,019,339 0.07%Barclays plc^ 1,800,000 3.38% 2/4/2025 1,961,147 0.07%Lloyds Banking Group plc^ 1,900,000 0.50% 12/11/2025 1,927,910 0.07%BP Capital Markets plc^ 1,800,000 3.25% Perpetual 1,923,431 0.07%Natwest Group plc^ 1,800,000 1.75% 2/3/2026 1,897,021 0.07%HSBC Holdings plc 1,700,000 3.00% 30/6/2025 1,881,278 0.07%BP Capital Markets plc^ 1,700,000 3.63% Perpetual 1,851,002 0.07%Standard Chartered plc^ 1,700,000 0.75% 3/10/2023 1,718,854 0.06%HSBC Holdings plc^ 1,700,000 0.77% 13/11/2031 1,699,134 0.06%Nationwide Building Society^ 1,600,000 2.00% 25/7/2029 1,683,531 0.06%National Westminster Bank plc 1,600,000 0.50% 15/5/2024 1,638,792 0.06%Vodafone Group plc 1,500,000 0.90% 24/11/2026 1,562,010 0.06%

334
Vanguard Euro Investment Grade Bond Index Fund
Principal EUR (€) Coupon
Maturity Date
Fair Value EUR (€)
% of Total Net Assets
Santander UK Group Holdings plc^ 1,500,000 0.39% 28/2/2025 1,513,772 0.06%BP Capital Markets plc 1,400,000 0.83% 8/11/2027 1,443,427 0.05%BP Capital Markets plc 1,200,000 2.52% 7/4/2028 1,371,192 0.05%Santander UK plc 1,350,000 0.05% 12/1/2027 1,363,105 0.05%SSE plc 1,300,000 0.88% 6/9/2025 1,344,552 0.05%Cadent Finance plc 1,300,000 0.75% 11/3/2032 1,291,176 0.05%BAT Netherlands Finance BV 1,100,000 3.13% 7/4/2028 1,252,311 0.05%Santander UK plc 1,200,000 0.38% 20/9/2023 1,220,604 0.05%Lloyds Bank plc 1,200,000 0.13% 18/6/2026 1,218,873 0.05%Vodafone Group plc 1,100,000 2.20% 25/8/2026 1,216,491 0.05%Vodafone Group plc 1,100,000 1.63% 24/11/2030 1,200,744 0.04%HSBC Holdings plc 1,167,000 0.88% 6/9/2024 1,200,619 0.04%Diageo Finance plc 1,000,000 2.50% 27/3/2032 1,198,705 0.04%Santander UK Group Holdings plc 1,161,000 1.13% 8/9/2023 1,192,268 0.04%Experian Finance plc 1,100,000 1.38% 25/6/2026 1,162,760 0.04%HSBC Holdings plc^ 1,100,000 1.50% 4/12/2024 1,142,545 0.04%Compass Group Finance Netherlands BV 1,100,000 0.63% 3/7/2024 1,123,284 0.04%Motability Operations Group plc 1,100,000 0.38% 3/1/2026 1,118,837 0.04%National Grid Electricity Transmission plc 1,100,000 0.19% 20/1/2025 1,107,846 0.04%Lloyds Banking Group plc^ 1,090,000 0.63% 15/1/2024 1,102,801 0.04%WPP Finance 2013 1,000,000 3.00% 20/11/2023 1,075,980 0.04%Virgin Money UK plc^ 1,000,000 2.88% 24/6/2025 1,074,449 0.04%Nationwide Building Society^ 1,000,000 1.50% 8/3/2026 1,051,608 0.04%Aptiv plc 978,000 1.50% 10/3/2025 1,023,959 0.04%Natwest Group plc^ 1,000,000 0.75% 15/11/2025 1,020,375 0.04%Unilever Finance Netherlands BV 900,000 1.75% 25/3/2030 1,013,917 0.04%GlaxoSmithKline Capital plc 900,000 1.75% 21/5/2030 1,005,304 0.04%Aviva plc^ 900,000 3.38% 4/12/2045 1,004,757 0.04%Yorkshire Building Society 1,000,000 0.01% 13/10/2027 1,004,598 0.04%Coca-Cola Europacific Partners plc 900,000 1.75% 27/3/2026 968,787 0.04%Lloyds Bank Corporate Markets plc 950,000 0.25% 4/10/2022 957,405 0.04%Linde Finance BV 900,000 1.88% 22/5/2024 956,284 0.04%BP Capital Markets plc 900,000 1.88% 7/4/2024 950,854 0.04%Reckitt Benckiser Treasury Services Nederland BV 923,000 0.75% 19/5/2030 949,247 0.04%Lloyds Bank plc 900,000 1.25% 13/1/2025 944,683 0.03%Motability Operations Group plc 900,000 0.88% 14/3/2025 932,720 0.03%Lloyds Banking Group plc^ 900,000 1.75% 7/9/2028 931,919 0.03%CK Hutchison Finance 16 Ltd. 900,000 1.25% 6/4/2023 921,020 0.03%Unilever Finance Netherlands BV 900,000 0.50% 12/8/2023 916,001 0.03%Heathrow Funding Ltd. 855,000 1.88% 14/3/2034 893,415 0.03%London Stock Exchange Group plc 800,000 1.75% 6/12/2027 877,775 0.03%BP Capital Markets plc 850,000 0.83% 19/9/2024 875,248 0.03%Nationwide Building Society 800,000 1.13% 31/5/2028 866,077 0.03%Imperial Brands Finance plc 800,000 2.13% 12/2/2027 856,973 0.03%GlaxoSmithKline Capital plc 800,000 1.00% 12/9/2026 841,154 0.03%BP Capital Markets plc 700,000 2.82% 7/4/2032 840,995 0.03%Tesco Corporate Treasury Services plc 800,000 0.88% 29/5/2026 822,676 0.03%CK Hutchison Group Telecom Finance SA 800,000 0.75% 17/4/2026 819,436 0.03%RELX Finance BV 800,000 0.50% 10/3/2028 810,217 0.03%Nationwide Building Society 800,000 0.25% 22/7/2025 808,053 0.03%BAT International Finance plc 750,000 2.25% 16/1/2030 807,562 0.03%Barclays plc^ 800,000 1.11% 12/5/2032 807,089 0.03%Sky Ltd. 700,000 2.50% 15/9/2026 787,409 0.03%Yorkshire Building Society 769,000 0.88% 20/3/2023 786,246 0.03%Yorkshire Building Society 750,000 0.63% 21/9/2025 768,034 0.03%Unilever Finance Netherlands BV 700,000 1.38% 31/7/2029 766,398 0.03%Heathrow Funding Ltd. 733,000 1.50% 12/10/2025 764,575 0.03%Lloyds Bank plc 700,000 4.88% 13/1/2023 757,307 0.03%CNH Industrial Finance Europe SA 700,000 1.88% 19/1/2026 749,308 0.03%British Telecommunications plc 700,000 1.50% 23/6/2027 742,579 0.03%Unilever Finance Netherlands BV 700,000 1.25% 25/3/2025 737,297 0.03%Vodafone Group plc 700,000 1.13% 20/11/2025 733,411 0.03%Annington Funding plc 700,000 1.65% 12/7/2024 731,867 0.03%Rentokil Initial plc 700,000 0.88% 30/5/2026 723,089 0.03%BP Capital Markets plc 700,000 0.90% 3/7/2024 722,507 0.03%Standard Chartered plc^ 700,000 0.90% 2/7/2027 721,358 0.03%British Telecommunications plc 700,000 1.00% 21/11/2024 720,809 0.03%Barclays plc^ 700,000 2.00% 7/2/2028 717,697 0.03%BAT Capital Corp. 700,000 1.13% 16/11/2023 716,081 0.03%Cadent Finance plc 700,000 0.63% 22/9/2024 714,894 0.03%Nationwide Building Society 700,000 0.63% 19/4/2023 712,678 0.03%

335
Vanguard Euro Investment Grade Bond Index Fund
Principal EUR (€) Coupon
Maturity Date
Fair Value EUR (€)
% of Total Net Assets
Vodafone Group plc 700,000 0.50% 30/1/2024 712,457 0.03%Coventry Building Society 700,000 0.13% 20/6/2026 709,212 0.03%Unilever Finance Netherlands BV 700,000 0.38% 14/2/2023 708,492 0.03%Barclays plc^ 700,000 0.63% 14/11/2023 708,144 0.03%CK Hutchison Group Telecom Finance SA 700,000 0.38% 17/10/2023 706,149 0.03%GlaxoSmithKline Capital plc 700,000 0.13% 12/5/2023 705,969 0.03%RELX Finance BV 700,000 0.00% 18/3/2024 702,793 0.03%BP Capital Markets plc 700,000 1.10% 15/11/2034 702,428 0.03%BP Capital Markets plc 600,000 2.97% 27/2/2026 680,196 0.03%WPP Finance SA 600,000 2.25% 22/9/2026 666,675 0.02%CK Hutchison Finance 16 Ltd. 600,000 2.00% 6/4/2028 665,858 0.02%BP Capital Markets plc 600,000 2.21% 25/9/2026 664,119 0.02%BAT International Finance plc 600,000 2.75% 25/3/2025 653,267 0.02%Vodafone Group plc 600,000 1.88% 11/9/2025 645,165 0.02%GlaxoSmithKline Capital plc 550,000 4.00% 16/6/2025 639,829 0.02%Linde Finance BV 600,000 1.00% 20/4/2028 638,072 0.02%WPP Finance 2016 600,000 1.38% 20/3/2025 629,725 0.02%Barclays plc 600,000 1.88% 8/12/2023 629,283 0.02%Nationwide Building Society 600,000 1.25% 3/3/2025 628,794 0.02%Santander UK plc 620,000 0.10% 12/5/2024 627,972 0.02%Natwest Group plc 600,000 2.50% 22/3/2023 626,978 0.02%CK Hutchison Europe Finance 18 Ltd. 600,000 1.25% 13/4/2025 626,376 0.02%DS Smith plc 600,000 1.38% 26/7/2024 621,951 0.02%Tesco Corporate Treasury Services plc 600,000 1.38% 24/10/2023 618,617 0.02%Vodafone Group plc 500,000 2.88% 20/11/2037 614,405 0.02%Imperial Brands Finance plc 600,000 1.13% 14/8/2023 612,362 0.02%Barclays plc^ 600,000 0.75% 9/6/2025 610,410 0.02%Babcock International Group plc 600,000 1.75% 6/10/2022 610,201 0.02%Lseg Netherlands BV 600,000 0.00% 6/4/2025 600,187 0.02%RELX Finance BV 550,000 1.50% 13/5/2027 591,074 0.02%Nationwide Building Society 500,000 2.25% 25/6/2029 588,999 0.02%Phoenix Group Holdings plc 500,000 4.38% 24/1/2029 587,490 0.02%Vodafone Group plc 500,000 2.50% 24/5/2039 583,661 0.02%BAT International Finance plc 562,000 2.38% 19/1/2023 582,813 0.02%BG Energy Capital plc 500,000 2.25% 21/11/2029 571,691 0.02%Lloyds Banking Group plc^ 500,000 3.50% 1/4/2026 562,625 0.02%Diageo Finance plc 500,000 2.38% 20/5/2026 556,660 0.02%Imperial Brands Finance Netherlands BV 550,000 1.75% 18/3/2033 555,522 0.02%Unilever plc 500,000 1.50% 11/6/2039 553,451 0.02%Unilever Finance Netherlands BV 500,000 1.38% 4/9/2030 552,567 0.02%Diageo Finance plc 500,000 1.88% 27/3/2027 549,964 0.02%Sky Ltd. 500,000 2.25% 17/11/2025 549,110 0.02%National Grid plc 550,000 0.55% 18/9/2029 549,046 0.02%Global Switch Holdings Ltd. 500,000 2.25% 31/5/2027 547,389 0.02%SSE plc 500,000 1.75% 16/4/2030 546,972 0.02%WPP Finance Deutschland GmbH 500,000 1.63% 23/3/2030 545,428 0.02%Coca-Cola Europacific Partners plc 500,000 2.38% 7/5/2025 543,797 0.02%Smiths Group plc 500,000 2.00% 23/2/2027 542,271 0.02%National Grid plc 550,000 0.16% 20/1/2028 541,024 0.02%BP Capital Markets plc 500,000 1.95% 3/3/2025 536,778 0.02%Coca-Cola Europacific Partners plc 500,000 1.50% 8/11/2027 536,617 0.02%BAT Netherlands Finance BV 500,000 2.38% 7/10/2024 534,407 0.02%Unilever Finance Netherlands BV 500,000 1.13% 12/2/2027 532,075 0.02%CNH Industrial Finance Europe SA 500,000 1.75% 12/9/2025 530,907 0.02%Royal Mail plc 500,000 1.25% 8/10/2026 524,336 0.02%BP Capital Markets plc 500,000 1.23% 8/5/2031 521,194 0.02%Diageo Finance plc 500,000 1.00% 22/4/2025 520,477 0.02%Mondi Finance plc 500,000 1.50% 15/4/2024 519,350 0.02%Coca-Cola Europacific Partners plc 500,000 1.13% 26/5/2024 517,005 0.02%British Telecommunications plc 480,000 1.75% 10/3/2026 514,126 0.02%SELP Finance Sarl 487,000 1.50% 20/11/2025 511,978 0.02%AstraZeneca plc 500,000 0.75% 12/5/2024 511,710 0.02%Nationwide Building Society 500,000 0.75% 26/10/2022 508,059 0.02%Yorkshire Building Society 500,000 0.38% 11/4/2023 506,851 0.02%Linde Finance BV 500,000 0.55% 19/5/2032 506,681 0.02%Canary Wharf Group Investment Holdings plc 500,000 1.75% 7/4/2026 503,452 0.02%Barclays plc^ 500,000 1.13% 22/3/2031 502,742 0.02%GlaxoSmithKline Capital plc 500,000 0.00% 23/9/2023 502,742 0.02%Clydesdale Bank plc 500,000 0.01% 22/9/2026 502,560 0.02%Coca-Cola Europacific Partners plc 500,000 0.70% 12/9/2031 499,023 0.02%Channel Link Enterprises Finance plc^ 500,000 1.76% 30/6/2050 498,567 0.02%

336
Vanguard Euro Investment Grade Bond Index Fund
Principal EUR (€) Coupon
Maturity Date
Fair Value EUR (€)
% of Total Net Assets
Yorkshire Building Society 470,000 0.13% 8/5/2024 476,167 0.02%Global Switch Finance BV 447,000 1.38% 7/10/2030 456,592 0.02%CK Hutchison Europe Finance 18 Ltd. 400,000 2.00% 13/4/2030 449,954 0.02%Vodafone Group plc 400,000 1.88% 20/11/2029 445,892 0.02%Lloyds Bank Corporate Markets plc 400,000 2.38% 9/4/2026 442,787 0.02%Diageo Finance plc 400,000 1.50% 22/10/2027 433,743 0.02%AstraZeneca plc 400,000 1.25% 12/5/2028 425,299 0.02%Coca-Cola Europacific Partners plc 400,000 2.63% 6/11/2023 423,564 0.02%Sky Ltd. 400,000 1.88% 24/11/2023 420,040 0.02%BP Capital Markets plc 400,000 1.08% 26/6/2025 416,522 0.02%Unilever Finance Netherlands BV 400,000 1.00% 3/6/2023 410,260 0.02%British Telecommunications plc 400,000 1.13% 10/3/2023 409,083 0.02%DS Smith plc 400,000 2.25% 16/9/2022 409,027 0.02%DS Smith plc 400,000 0.88% 12/9/2026 408,784 0.02%RELX Finance BV 400,000 0.88% 10/3/2032 407,675 0.02%BAT International Finance plc 400,000 0.88% 13/10/2023 406,776 0.02%Diageo Finance plc 398,000 0.50% 19/6/2024 405,383 0.01%Lloyds Bank plc 400,000 0.13% 23/9/2029 402,047 0.01%HSBC Holdings plc^ 400,000 0.31% 13/11/2026 401,480 0.01%AstraZeneca plc 400,000 0.38% 3/6/2029 400,371 0.01%CCEP Finance Ireland DAC 400,000 0.88% 6/5/2033 399,545 0.01%London Stock Exchange Group plc 350,000 1.75% 19/9/2029 388,620 0.01%Fidelity International Ltd. 321,000 2.50% 4/11/2026 353,656 0.01%HSBC Holdings plc 300,000 3.13% 7/6/2028 351,838 0.01%Wellcome Trust Ltd. 325,000 1.13% 21/1/2027 345,453 0.01%Rio Tinto Finance plc 300,000 2.88% 11/12/2024 331,887 0.01%British Telecommunications plc 300,000 2.13% 26/9/2028 330,729 0.01%Standard Chartered plc 300,000 3.13% 19/11/2024 330,247 0.01%Unilever Finance Netherlands BV 300,000 1.13% 29/4/2028 321,235 0.01%CNH Industrial Finance Europe SA 300,000 1.75% 25/3/2027 320,846 0.01%Brambles Finance Ltd. 300,000 2.38% 12/6/2024 320,147 0.01%SSE plc 300,000 1.38% 4/9/2027 320,064 0.01%Informa plc 300,000 2.13% 6/10/2025 319,655 0.01%Heathrow Funding Ltd. 300,000 1.88% 12/7/2032 317,945 0.01%Diageo Finance plc 300,000 1.75% 23/9/2024 317,355 0.01%RELX Capital, Inc. 300,000 1.30% 12/5/2025 314,672 0.01%NatWest Markets plc 300,000 1.00% 28/5/2024 309,578 0.01%British Telecommunications plc 300,000 1.13% 12/9/2029 309,111 0.01%RELX Finance BV 300,000 1.00% 22/3/2024 308,641 0.01%BAT International Finance plc 300,000 1.25% 13/3/2027 308,443 0.01%CK Hutchison Finance 16 II Ltd. 300,000 0.88% 3/10/2024 308,174 0.01%Unilever Finance Netherlands BV 300,000 0.50% 29/4/2024 306,683 0.01%Babcock International Group plc 300,000 1.38% 13/9/2027 305,064 0.01%Reckitt Benckiser Treasury Services Nederland BV 300,000 0.38% 19/5/2026 305,036 0.01%CNH Industrial Finance Europe SA 300,000 0.00% 1/4/2024 299,855 0.01%CCEP Finance Ireland DAC 300,000 0.50% 6/9/2029 299,811 0.01%Motability Operations Group plc 300,000 0.13% 20/7/2028 297,687 0.01%Cadent Finance plc 260,000 0.63% 19/3/2030 260,890 0.01%Tesco Corporate Treasury Services plc 250,000 0.38% 27/7/2029 244,149 0.01%BAT International Finance plc 250,000 2.00% 13/3/2045 241,349 0.01%Unilever Finance Netherlands BV 200,000 1.63% 12/2/2033 226,551 0.01%Coca-Cola Europacific Partners plc 200,000 1.88% 18/3/2030 222,290 0.01%Vodafone Group plc 200,000 1.60% 29/7/2031 217,392 0.01%Vodafone Group plc 200,000 1.50% 24/7/2027 215,592 0.01%InterContinental Hotels Group plc 200,000 2.13% 15/5/2027 215,394 0.01%Mondi Finance plc 200,000 1.63% 27/4/2026 213,418 0.01%Unilever Finance Netherlands BV 200,000 1.00% 14/2/2027 211,463 0.01%GlaxoSmithKline Capital plc 200,000 1.38% 2/12/2024 210,791 0.01%Pearson Funding plc 200,000 1.38% 6/5/2025 207,904 0.01%Informa plc 200,000 1.25% 22/4/2028 203,650 0.01%National Grid Electricity Transmission plc 200,000 0.82% 7/7/2032 202,063 0.01%Tritax EuroBox plc 200,000 0.95% 2/6/2026 199,820 0.01%Aviva plc^ 100,000 3.88% 3/7/2044 110,370 0.00%BP Capital Markets plc 100,000 1.57% 16/2/2027 107,461 0.00%Barclays plc^ 100,000 1.38% 24/1/2026 104,154 0.00%Lloyds Banking Group plc 100,000 1.00% 9/11/2023 102,680 0.00%Lseg Netherlands BV 100,000 0.75% 6/4/2033 100,083 0.00%test - - - 154,944,450 5.74%United States 11.43% (2020: 11.44%)Goldman Sachs Group, Inc. 3,700,000 1.25% 1/5/2025 3,826,005 0.14%JPMorgan Chase & Co.^ 3,200,000 1.09% 11/3/2027 3,331,787 0.12%

337
Vanguard Euro Investment Grade Bond Index Fund
Principal EUR (€) Coupon
Maturity Date
Fair Value EUR (€)
% of Total Net Assets
Bank of America Corp.^ 3,200,000 0.65% 26/10/2031 3,168,681 0.12%JPMorgan Chase & Co.^ 2,650,000 1.00% 25/7/2031 2,723,438 0.10%Goldman Sachs Group, Inc. 2,400,000 3.38% 27/3/2025 2,691,351 0.10%Goldman Sachs Group, Inc. 2,500,000 0.25% 26/1/2028 2,456,129 0.09%Citigroup, Inc.^ 2,300,000 0.50% 8/10/2027 2,318,596 0.09%General Electric Co. 2,200,000 0.88% 17/5/2025 2,260,420 0.08%JPMorgan Chase & Co.^ 2,200,000 0.39% 24/2/2028 2,207,824 0.08%International Business Machines Corp.1 2,100,000 0.38% 31/1/2023 2,123,417 0.08%PepsiCo, Inc. 1,982,000 0.50% 6/5/2028 2,034,600 0.08%Digital Dutch Finco BV 2,025,000 0.13% 15/10/2022 2,032,882 0.08%Wells Fargo & Co. 1,900,000 1.00% 2/2/2027 1,962,735 0.07%Citigroup, Inc. 1,800,000 1.75% 28/1/2025 1,911,863 0.07%AT&T, Inc. 1,800,000 2.40% 15/3/2024 1,910,513 0.07%Verizon Communications, Inc. 1,800,000 0.88% 8/4/2027 1,862,220 0.07%Apple, Inc. 1,700,000 1.38% 24/5/2029 1,857,841 0.07%Citigroup, Inc. 1,800,000 0.75% 26/10/2023 1,834,796 0.07%Fidelity National Information Services, Inc. 1,800,000 0.13% 3/12/2022 1,808,800 0.07%Bank of America Corp.^ 1,600,000 1.66% 25/4/2028 1,722,043 0.06%Wells Fargo & Co. 1,600,000 1.38% 26/10/2026 1,690,981 0.06%Morgan Stanley^ 1,700,000 0.50% 7/2/2031 1,669,838 0.06%Morgan Stanley 1,500,000 1.75% 30/1/2025 1,595,182 0.06%Verizon Communications, Inc. 1,500,000 1.25% 8/4/2030 1,580,946 0.06%Wells Fargo & Co. 1,450,000 2.00% 27/4/2026 1,572,279 0.06%AbbVie, Inc. 1,500,000 1.38% 17/5/2024 1,557,310 0.06%Honeywell International, Inc. 1,370,000 2.25% 22/2/2028 1,551,694 0.06%Exxon Mobil Corp. 1,500,000 0.14% 26/6/2024 1,512,234 0.06%AT&T, Inc. 1,400,000 1.95% 15/9/2023 1,458,751 0.05%Stellantis NV 1,300,000 2.75% 15/5/2026 1,442,016 0.05%Bank of America Corp.^ 1,400,000 0.81% 9/5/2026 1,439,750 0.05%Upjohn Finance BV 1,400,000 1.02% 23/6/2024 1,439,447 0.05%Goldman Sachs Group, Inc. 1,400,000 1.38% 15/5/2024 1,437,021 0.05%Medtronic Global Holdings SCA 1,400,000 0.38% 7/3/2023 1,416,312 0.05%Bank of America Corp. 1,300,000 2.38% 19/6/2024 1,395,284 0.05%Morgan Stanley^ 1,300,000 1.34% 23/10/2026 1,366,118 0.05%Apple, Inc. 1,300,000 0.88% 24/5/2025 1,350,958 0.05%Goldman Sachs Group, Inc.^ 1,350,000 0.01% 30/4/2024 1,350,789 0.05%AT&T, Inc. 1,100,000 3.15% 4/9/2036 1,338,246 0.05%Digital Euro Finco LLC 1,200,000 2.50% 16/1/2026 1,318,671 0.05%International Business Machines Corp. 1,300,000 0.30% 11/2/2028 1,304,186 0.05%Medtronic Global Holdings SCA 1,300,000 0.00% 15/10/2025 1,302,728 0.05%Fidelity National Information Services, Inc. 1,225,000 1.50% 21/5/2027 1,300,423 0.05%Procter & Gamble Co. 1,200,000 1.20% 30/10/2028 1,294,683 0.05%JPMorgan Chase & Co.^ 1,200,000 1.64% 18/5/2028 1,290,685 0.05%Goldman Sachs Group, Inc. 1,240,000 0.88% 21/1/2030 1,263,553 0.05%Verizon Communications, Inc. 1,100,000 3.25% 17/2/2026 1,260,888 0.05%Stellantis NV 1,000,000 4.50% 7/7/2028 1,247,461 0.05%Verizon Communications, Inc. 1,200,000 1.30% 18/5/2033 1,238,011 0.05%Procter & Gamble Co. 950,000 4.88% 11/5/2027 1,223,727 0.05%Goldman Sachs Group, Inc. 1,137,000 1.63% 27/7/2026 1,213,736 0.04%Bank of America Corp.^ 1,000,000 3.65% 31/3/2029 1,208,341 0.04%DH Europe Finance II Sarl 1,200,000 0.20% 18/3/2026 1,206,415 0.04%Prologis Euro Finance LLC 1,200,000 0.25% 10/9/2027 1,201,433 0.04%Morgan Stanley 1,162,000 1.00% 2/12/2022 1,183,354 0.04%GE Capital European Funding Unlimited Co. 700,000 6.03% 1/3/2038 1,150,202 0.04%Microsoft Corp. 930,000 3.13% 6/12/2028 1,136,824 0.04%Mondelez International Holdings Netherlands BV 1,100,000 0.88% 1/10/2031 1,120,731 0.04%Wells Fargo & Co. 1,100,000 0.50% 26/4/2024 1,117,385 0.04%Verizon Communications, Inc. 900,000 2.88% 15/1/2038 1,110,271 0.04%Comcast Corp. 1,100,000 0.75% 20/2/2032 1,104,065 0.04%Apple, Inc. 1,008,000 1.63% 10/11/2026 1,097,093 0.04%International Business Machines Corp. 1,100,000 0.65% 11/2/2032 1,097,036 0.04%Verizon Communications, Inc. 1,100,000 0.38% 22/3/2029 1,090,848 0.04%Exxon Mobil Corp. 1,064,000 0.52% 26/6/2028 1,078,767 0.04%Upjohn Finance BV 1,000,000 1.91% 23/6/2032 1,064,368 0.04%Stellantis NV 1,000,000 2.00% 20/3/2025 1,063,166 0.04%Wells Fargo & Co. 1,000,000 1.50% 24/5/2027 1,060,670 0.04%Procter & Gamble Co. 1,030,000 2.00% 16/8/2022 1,058,569 0.04%Berkshire Hathaway, Inc. 1,000,000 1.13% 16/3/2027 1,054,010 0.04%Morgan Stanley 1,000,000 1.88% 30/3/2023 1,037,283 0.04%Morgan Stanley 974,000 1.38% 27/10/2026 1,034,329 0.04%Walmart, Inc. 750,000 4.88% 21/9/2029 1,030,117 0.04%

338
Vanguard Euro Investment Grade Bond Index Fund
Principal EUR (€) Coupon
Maturity Date
Fair Value EUR (€)
% of Total Net Assets
3M Co. 1,000,000 0.95% 15/5/2023 1,024,664 0.04%Celanese US Holdings LLC 1,000,000 1.13% 26/9/2023 1,023,532 0.04%Digital Dutch Finco BV 1,000,000 1.25% 1/2/2031 1,022,063 0.04%Schlumberger Finance BV 900,000 2.00% 6/5/2032 1,019,432 0.04%Eaton Capital Unlimited Co. 1,000,000 0.58% 8/3/2030 1,000,956 0.04%Coca-Cola Co. 900,000 1.63% 9/3/2035 996,350 0.04%Danaher Corp. 900,000 2.10% 30/9/2026 990,638 0.04%Coca-Cola Co. 1,000,000 0.13% 15/3/2029 987,607 0.04%AT&T, Inc. 955,000 1.30% 5/9/2023 982,073 0.04%Fidelity National Information Services, Inc. 965,000 0.75% 21/5/2023 980,636 0.04%JPMorgan Chase & Co. 1,000,000 0.60% 17/2/2033 976,867 0.04%Citigroup, Inc. 925,000 1.25% 10/4/2029 974,871 0.04%Wells Fargo & Co.^ 900,000 1.74% 4/5/2030 970,442 0.04%Wells Fargo & Co. 900,000 2.13% 4/6/2024 957,888 0.04%Schlumberger Finance BV 900,000 1.38% 28/10/2026 957,616 0.04%Danaher Corp. 900,000 1.70% 30/3/2024 943,940 0.03%Citigroup, Inc.^ 900,000 1.25% 6/7/2026 939,684 0.03%Goldman Sachs Group, Inc. 900,000 2.00% 27/7/2023 939,393 0.03%PartnerRe Ireland Finance DAC 891,000 1.25% 15/9/2026 936,565 0.03%Nestle Holdings, Inc. 900,000 0.88% 18/7/2025 936,044 0.03%Berkshire Hathaway, Inc. 900,000 1.30% 15/3/2024 932,822 0.03%Molson Coors Beverage Co. 900,000 1.25% 15/7/2024 928,885 0.03%Johnson & Johnson 900,000 0.65% 20/5/2024 923,069 0.03%Stellantis NV 800,000 3.88% 5/1/2026 919,113 0.03%Thermo Fisher Scientific, Inc. 900,000 0.88% 1/10/2031 916,842 0.03%National Grid North America, Inc. 900,000 0.75% 8/8/2023 916,399 0.03%General Motors Financial Co., Inc. 900,000 0.85% 26/2/2026 916,357 0.03%DH Europe Finance II Sarl 900,000 1.35% 18/9/2039 916,294 0.03%Morgan Stanley^ 900,000 0.64% 26/7/2024 914,330 0.03%AT&T, Inc. 800,000 2.35% 5/9/2029 906,230 0.03%AT&T, Inc. 800,000 2.45% 15/3/2035 901,162 0.03%DH Europe Finance II Sarl 900,000 0.75% 18/9/2031 901,146 0.03%Wells Fargo & Co. 870,000 2.63% 16/8/2022 899,383 0.03%Thermo Fisher Scientific, Inc. 848,000 1.40% 23/1/2026 897,597 0.03%Philip Morris International, Inc. 900,000 0.80% 1/8/2031 895,507 0.03%Morgan Stanley 850,000 1.75% 11/3/2024 892,827 0.03%Toyota Motor Credit Corp. 880,000 0.75% 21/7/2022 890,905 0.03%Exxon Mobil Corp. 900,000 1.41% 26/6/2039 887,528 0.03%AT&T, Inc. 800,000 2.05% 19/5/2032 886,429 0.03%DH Europe Finance Sarl 800,000 2.50% 8/7/2025 875,156 0.03%AT&T, Inc. 700,000 3.38% 15/3/2034 872,226 0.03%Discovery Communications LLC 800,000 1.90% 19/3/2027 857,003 0.03%Verizon Communications, Inc. 800,000 1.38% 2/11/2028 853,581 0.03%Medtronic Global Holdings SCA 800,000 1.13% 7/3/2027 844,612 0.03%General Electric Co. 800,000 1.50% 17/5/2029 844,443 0.03%Verizon Communications, Inc. 850,000 0.75% 22/3/2032 840,238 0.03%PepsiCo, Inc. 800,000 0.88% 18/7/2028 840,038 0.03%Fiserv, Inc. 800,000 1.13% 1/7/2027 835,520 0.03%International Business Machines Corp. 800,000 0.88% 31/1/2025 827,966 0.03%PepsiCo, Inc. 772,000 1.13% 18/3/2031 827,480 0.03%Booking Holdings, Inc. 758,000 1.80% 3/3/2027 821,686 0.03%Medtronic Global Holdings SCA 700,000 2.25% 7/3/2039 820,808 0.03%Eli Lilly & Co. 800,000 0.63% 1/11/2031 815,098 0.03%American Tower Corp. 800,000 1.25% 21/5/2033 812,292 0.03%Berkshire Hathaway, Inc. 800,000 0.75% 16/3/2023 812,143 0.03%General Motors Financial Co., Inc. 808,000 0.20% 2/9/2022 811,268 0.03%Ecolab, Inc. 790,000 1.00% 15/1/2024 810,723 0.03%Apple, Inc. 800,000 0.00% 15/11/2025 805,638 0.03%Simon International Finance SCA 800,000 1.13% 19/3/2033 803,856 0.03%Johnson & Johnson 700,000 1.65% 20/5/2035 801,014 0.03%Stellantis NV 800,000 0.75% 18/1/2029 797,152 0.03%General Electric Co. 700,000 2.13% 17/5/2037 761,201 0.03%Philip Morris International, Inc. 700,000 2.88% 30/5/2024 759,851 0.03%Toyota Motor Credit Corp. 750,000 0.25% 16/7/2026 759,692 0.03%American International Group, Inc. 700,000 1.88% 21/6/2027 756,372 0.03%Altria Group, Inc. 700,000 2.20% 15/6/2027 755,796 0.03%Bank of America Corp.^ 700,000 1.78% 4/5/2027 753,329 0.03%Morgan Stanley^ 750,000 0.41% 29/10/2027 752,648 0.03%Equitable Financial Life Global Funding 750,000 0.60% 16/6/2028 752,415 0.03%FedEx Corp. 700,000 1.63% 11/1/2027 751,654 0.03%AT&T, Inc. 700,000 1.60% 19/5/2028 750,834 0.03%
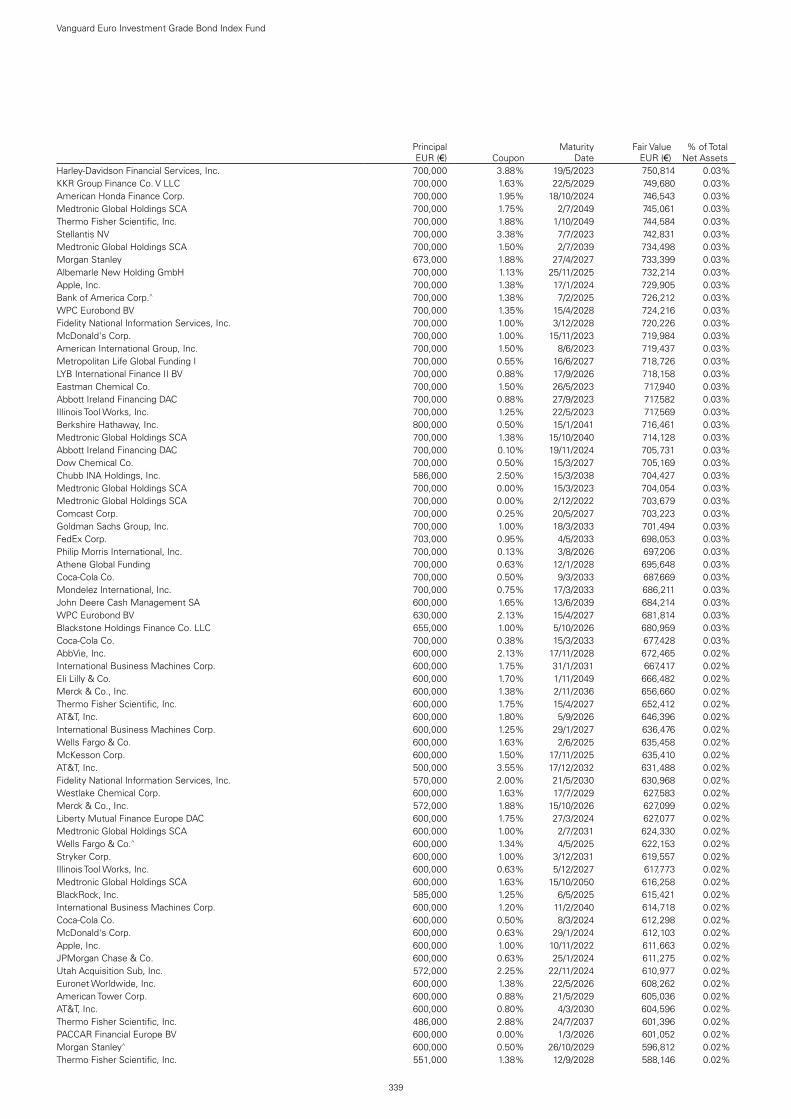
339
Vanguard Euro Investment Grade Bond Index Fund
Principal EUR (€) Coupon
Maturity Date
Fair Value EUR (€)
% of Total Net Assets
Harley-Davidson Financial Services, Inc. 700,000 3.88% 19/5/2023 750,814 0.03%KKR Group Finance Co. V LLC 700,000 1.63% 22/5/2029 749,680 0.03%American Honda Finance Corp. 700,000 1.95% 18/10/2024 746,543 0.03%Medtronic Global Holdings SCA 700,000 1.75% 2/7/2049 745,061 0.03%Thermo Fisher Scientific, Inc. 700,000 1.88% 1/10/2049 744,584 0.03%Stellantis NV 700,000 3.38% 7/7/2023 742,831 0.03%Medtronic Global Holdings SCA 700,000 1.50% 2/7/2039 734,498 0.03%Morgan Stanley 673,000 1.88% 27/4/2027 733,399 0.03%Albemarle New Holding GmbH 700,000 1.13% 25/11/2025 732,214 0.03%Apple, Inc. 700,000 1.38% 17/1/2024 729,905 0.03%Bank of America Corp.^ 700,000 1.38% 7/2/2025 726,212 0.03%WPC Eurobond BV 700,000 1.35% 15/4/2028 724,216 0.03%Fidelity National Information Services, Inc. 700,000 1.00% 3/12/2028 720,226 0.03%McDonald's Corp. 700,000 1.00% 15/11/2023 719,984 0.03%American International Group, Inc. 700,000 1.50% 8/6/2023 719,437 0.03%Metropolitan Life Global Funding I 700,000 0.55% 16/6/2027 718,726 0.03%LYB International Finance II BV 700,000 0.88% 17/9/2026 718,158 0.03%Eastman Chemical Co. 700,000 1.50% 26/5/2023 717,940 0.03%Abbott Ireland Financing DAC 700,000 0.88% 27/9/2023 717,582 0.03%Illinois Tool Works, Inc. 700,000 1.25% 22/5/2023 717,569 0.03%Berkshire Hathaway, Inc. 800,000 0.50% 15/1/2041 716,461 0.03%Medtronic Global Holdings SCA 700,000 1.38% 15/10/2040 714,128 0.03%Abbott Ireland Financing DAC 700,000 0.10% 19/11/2024 705,731 0.03%Dow Chemical Co. 700,000 0.50% 15/3/2027 705,169 0.03%Chubb INA Holdings, Inc. 586,000 2.50% 15/3/2038 704,427 0.03%Medtronic Global Holdings SCA 700,000 0.00% 15/3/2023 704,054 0.03%Medtronic Global Holdings SCA 700,000 0.00% 2/12/2022 703,679 0.03%Comcast Corp. 700,000 0.25% 20/5/2027 703,223 0.03%Goldman Sachs Group, Inc. 700,000 1.00% 18/3/2033 701,494 0.03%FedEx Corp. 703,000 0.95% 4/5/2033 698,053 0.03%Philip Morris International, Inc. 700,000 0.13% 3/8/2026 697,206 0.03%Athene Global Funding 700,000 0.63% 12/1/2028 695,648 0.03%Coca-Cola Co. 700,000 0.50% 9/3/2033 687,669 0.03%Mondelez International, Inc. 700,000 0.75% 17/3/2033 686,211 0.03%John Deere Cash Management SA 600,000 1.65% 13/6/2039 684,214 0.03%WPC Eurobond BV 630,000 2.13% 15/4/2027 681,814 0.03%Blackstone Holdings Finance Co. LLC 655,000 1.00% 5/10/2026 680,959 0.03%Coca-Cola Co. 700,000 0.38% 15/3/2033 677,428 0.03%AbbVie, Inc. 600,000 2.13% 17/11/2028 672,465 0.02%International Business Machines Corp. 600,000 1.75% 31/1/2031 667,417 0.02%Eli Lilly & Co. 600,000 1.70% 1/11/2049 666,482 0.02%Merck & Co., Inc. 600,000 1.38% 2/11/2036 656,660 0.02%Thermo Fisher Scientific, Inc. 600,000 1.75% 15/4/2027 652,412 0.02%AT&T, Inc. 600,000 1.80% 5/9/2026 646,396 0.02%International Business Machines Corp. 600,000 1.25% 29/1/2027 636,476 0.02%Wells Fargo & Co. 600,000 1.63% 2/6/2025 635,458 0.02%McKesson Corp. 600,000 1.50% 17/11/2025 635,410 0.02%AT&T, Inc. 500,000 3.55% 17/12/2032 631,488 0.02%Fidelity National Information Services, Inc. 570,000 2.00% 21/5/2030 630,968 0.02%Westlake Chemical Corp. 600,000 1.63% 17/7/2029 627,583 0.02%Merck & Co., Inc. 572,000 1.88% 15/10/2026 627,099 0.02%Liberty Mutual Finance Europe DAC 600,000 1.75% 27/3/2024 627,077 0.02%Medtronic Global Holdings SCA 600,000 1.00% 2/7/2031 624,330 0.02%Wells Fargo & Co.^ 600,000 1.34% 4/5/2025 622,153 0.02%Stryker Corp. 600,000 1.00% 3/12/2031 619,557 0.02%Illinois Tool Works, Inc. 600,000 0.63% 5/12/2027 617,773 0.02%Medtronic Global Holdings SCA 600,000 1.63% 15/10/2050 616,258 0.02%BlackRock, Inc. 585,000 1.25% 6/5/2025 615,421 0.02%International Business Machines Corp. 600,000 1.20% 11/2/2040 614,718 0.02%Coca-Cola Co. 600,000 0.50% 8/3/2024 612,298 0.02%McDonald's Corp. 600,000 0.63% 29/1/2024 612,103 0.02%Apple, Inc. 600,000 1.00% 10/11/2022 611,663 0.02%JPMorgan Chase & Co. 600,000 0.63% 25/1/2024 611,275 0.02%Utah Acquisition Sub, Inc. 572,000 2.25% 22/11/2024 610,977 0.02%Euronet Worldwide, Inc. 600,000 1.38% 22/5/2026 608,262 0.02%American Tower Corp. 600,000 0.88% 21/5/2029 605,036 0.02%AT&T, Inc. 600,000 0.80% 4/3/2030 604,596 0.02%Thermo Fisher Scientific, Inc. 486,000 2.88% 24/7/2037 601,396 0.02%PACCAR Financial Europe BV 600,000 0.00% 1/3/2026 601,052 0.02%Morgan Stanley^ 600,000 0.50% 26/10/2029 596,812 0.02%Thermo Fisher Scientific, Inc. 551,000 1.38% 12/9/2028 588,146 0.02%

340
Vanguard Euro Investment Grade Bond Index Fund
Principal EUR (€) Coupon
Maturity Date
Fair Value EUR (€)
% of Total Net Assets
Apple, Inc. 524,000 2.00% 17/9/2027 588,090 0.02%McDonald's Corp. 500,000 2.63% 11/6/2029 588,000 0.02%Philip Morris International, Inc. 600,000 1.45% 1/8/2039 582,763 0.02%Danaher Corp. 500,000 2.50% 30/3/2030 580,791 0.02%Eli Lilly & Co. 500,000 2.13% 3/6/2030 579,259 0.02%Illinois Tool Works, Inc. 500,000 2.13% 22/5/2030 578,253 0.02%Altria Group, Inc. 500,000 3.13% 15/6/2031 575,746 0.02%Southern Power Co. 522,000 1.85% 20/6/2026 565,867 0.02%AbbVie, Inc. 500,000 2.13% 1/6/2029 560,657 0.02%Raytheon Technologies Corp. 500,000 2.15% 18/5/2030 559,248 0.02%Thermo Fisher Scientific, Inc. 500,000 1.95% 24/7/2029 556,349 0.02%John Deere Cash Management SA 500,000 1.85% 2/4/2028 556,144 0.02%3M Co. 500,000 1.50% 2/6/2031 555,085 0.02%Prologis Euro Finance LLC 500,000 1.88% 5/1/2029 553,458 0.02%Philip Morris International, Inc. 500,000 2.75% 19/3/2025 550,787 0.02%Blackstone Holdings Finance Co. LLC 500,000 2.00% 19/5/2025 538,679 0.02%Chubb INA Holdings, Inc. 500,000 1.55% 15/3/2028 538,286 0.02%Coca-Cola Co. 500,000 1.25% 8/3/2031 536,694 0.02%Baxter International, Inc. 500,000 1.30% 15/5/2029 536,122 0.02%Thermo Fisher Scientific, Inc. 500,000 2.00% 15/4/2025 536,073 0.02%Citigroup, Inc. 500,000 2.38% 22/5/2024 535,770 0.02%Thermo Fisher Scientific, Inc. 520,000 0.75% 12/9/2024 533,329 0.02%Chubb INA Holdings, Inc. 500,000 1.40% 15/6/2031 533,094 0.02%Coca-Cola Co. 500,000 1.13% 9/3/2027 529,746 0.02%DXC Technology Co. 500,000 1.75% 15/1/2026 528,346 0.02%General Motors Financial Co., Inc. 500,000 1.69% 26/3/2025 526,916 0.02%Altria Group, Inc. 500,000 1.70% 15/6/2025 525,725 0.02%FedEx Corp. 500,000 1.30% 5/8/2031 525,054 0.02%DH Europe Finance II Sarl 500,000 1.80% 18/9/2049 524,225 0.02%Becton Dickinson Euro Finance Sarl 500,000 1.21% 4/6/2026 523,295 0.02%Kellogg Co. 500,000 1.25% 10/3/2025 522,725 0.02%International Flavors & Fragrances, Inc. 500,000 1.75% 14/3/2024 522,207 0.02%Schlumberger Finance France SAS 500,000 1.00% 18/2/2026 521,871 0.02%International Business Machines Corp. 500,000 1.13% 6/9/2024 520,166 0.02%PPG Industries, Inc. 500,000 0.88% 3/11/2025 518,484 0.02%General Motors Financial Co., Inc. 490,000 2.20% 1/4/2024 517,714 0.02%AbbVie, Inc. 500,000 1.25% 1/6/2024 517,274 0.02%Kellogg Co. 500,000 1.00% 17/5/2024 515,635 0.02%Stellantis NV 500,000 1.13% 18/9/2029 513,973 0.02%AbbVie, Inc. 500,000 0.75% 18/11/2027 513,722 0.02%AT&T, Inc. 500,000 1.80% 14/9/2039 512,317 0.02%Verizon Communications, Inc. 500,000 1.50% 19/9/2039 511,821 0.02%Harley-Davidson Financial Services, Inc. 500,000 0.90% 19/11/2024 511,113 0.02%Dover Corp. 500,000 0.75% 4/11/2027 510,608 0.02%Simon International Finance SCA 500,000 1.38% 18/11/2022 509,048 0.02%Honeywell International, Inc. 501,000 0.75% 10/3/2032 508,292 0.02%Apple, Inc. 500,000 0.50% 15/11/2031 507,241 0.02%Medtronic Global Holdings SCA 500,000 0.25% 2/7/2025 506,381 0.02%Comcast Corp. 500,000 1.25% 20/2/2040 505,583 0.02%Microsoft Corp. 400,000 2.63% 2/5/2033 504,362 0.02%Prologis Euro Finance LLC 500,000 0.38% 6/2/2028 504,037 0.02%BorgWarner, Inc. 500,000 1.00% 19/5/2031 503,643 0.02%Mondelez International Holdings Netherlands BV 500,000 0.00% 22/9/2026 495,767 0.02%Walgreens Boots Alliance, Inc. 455,000 2.13% 20/11/2026 495,594 0.02%Stellantis NV 500,000 1.25% 20/6/2033 493,942 0.02%Schlumberger Finance BV 500,000 0.50% 15/10/2031 492,398 0.02%Amgen, Inc. 450,000 2.00% 25/2/2026 490,568 0.02%Philip Morris International, Inc. 400,000 3.13% 3/6/2033 486,514 0.02%Metropolitan Life Global Funding I 474,000 0.38% 9/4/2024 481,162 0.02%Verizon Communications, Inc. 400,000 2.63% 1/12/2031 474,800 0.02%General Electric Co. 350,000 4.13% 19/9/2035 473,102 0.02%Stryker Corp. 400,000 2.63% 30/11/2030 472,405 0.02%John Deere Cash Management SA 400,000 2.20% 2/4/2032 471,981 0.02%Prologis LP 400,000 3.00% 2/6/2026 456,216 0.02%Bristol-Myers Squibb Co. 400,000 1.75% 15/5/2035 454,984 0.02%PVH Corp. 400,000 3.13% 15/12/2027 454,372 0.02%Medtronic Global Holdings SCA 400,000 1.63% 7/3/2031 440,940 0.02%Goldman Sachs Group, Inc. 400,000 2.00% 22/3/2028 439,516 0.02%WPC Eurobond BV 400,000 2.25% 9/4/2026 434,160 0.02%Johnson & Johnson 400,000 1.15% 20/11/2028 432,192 0.02%Citigroup, Inc. 400,000 1.63% 21/3/2028 431,752 0.02%
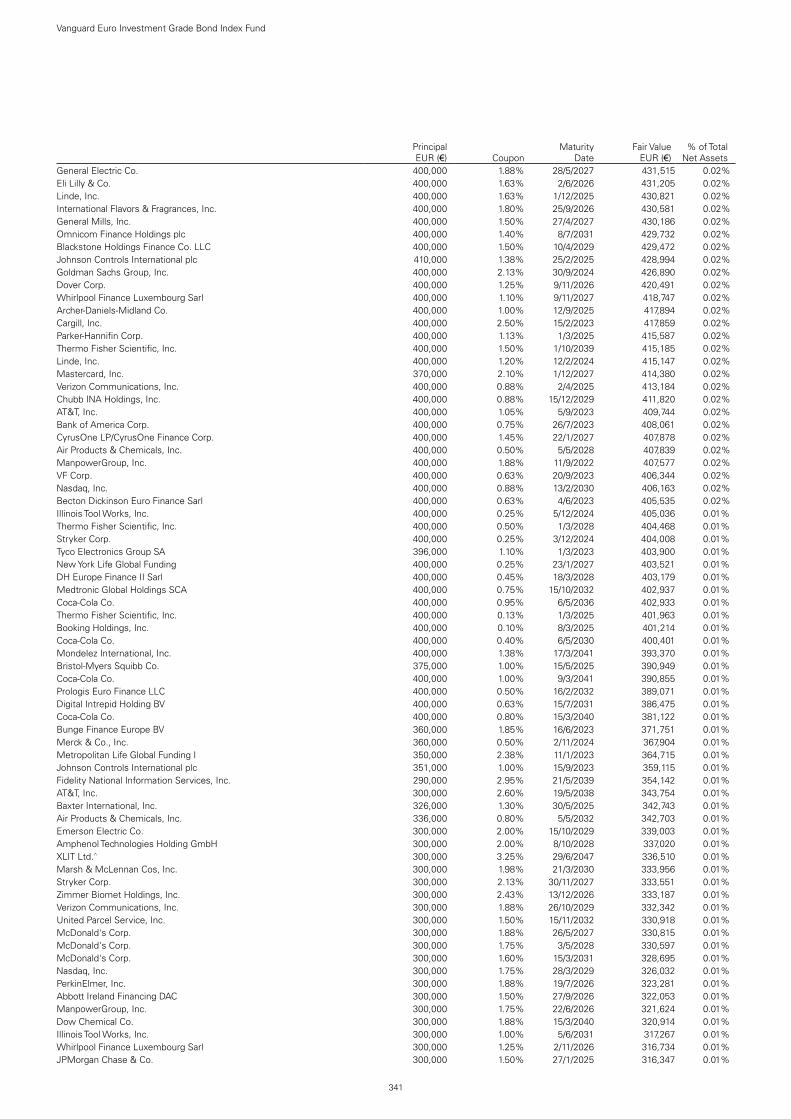
341
Vanguard Euro Investment Grade Bond Index Fund
Principal EUR (€) Coupon
Maturity Date
Fair Value EUR (€)
% of Total Net Assets
General Electric Co. 400,000 1.88% 28/5/2027 431,515 0.02%Eli Lilly & Co. 400,000 1.63% 2/6/2026 431,205 0.02%Linde, Inc. 400,000 1.63% 1/12/2025 430,821 0.02%International Flavors & Fragrances, Inc. 400,000 1.80% 25/9/2026 430,581 0.02%General Mills, Inc. 400,000 1.50% 27/4/2027 430,186 0.02%Omnicom Finance Holdings plc 400,000 1.40% 8/7/2031 429,732 0.02%Blackstone Holdings Finance Co. LLC 400,000 1.50% 10/4/2029 429,472 0.02%Johnson Controls International plc 410,000 1.38% 25/2/2025 428,994 0.02%Goldman Sachs Group, Inc. 400,000 2.13% 30/9/2024 426,890 0.02%Dover Corp. 400,000 1.25% 9/11/2026 420,491 0.02%Whirlpool Finance Luxembourg Sarl 400,000 1.10% 9/11/2027 418,747 0.02%Archer-Daniels-Midland Co. 400,000 1.00% 12/9/2025 417,894 0.02%Cargill, Inc. 400,000 2.50% 15/2/2023 417,859 0.02%Parker-Hannifin Corp. 400,000 1.13% 1/3/2025 415,587 0.02%Thermo Fisher Scientific, Inc. 400,000 1.50% 1/10/2039 415,185 0.02%Linde, Inc. 400,000 1.20% 12/2/2024 415,147 0.02%Mastercard, Inc. 370,000 2.10% 1/12/2027 414,380 0.02%Verizon Communications, Inc. 400,000 0.88% 2/4/2025 413,184 0.02%Chubb INA Holdings, Inc. 400,000 0.88% 15/12/2029 411,820 0.02%AT&T, Inc. 400,000 1.05% 5/9/2023 409,744 0.02%Bank of America Corp. 400,000 0.75% 26/7/2023 408,061 0.02%CyrusOne LP/CyrusOne Finance Corp. 400,000 1.45% 22/1/2027 407,878 0.02%Air Products & Chemicals, Inc. 400,000 0.50% 5/5/2028 407,839 0.02%ManpowerGroup, Inc. 400,000 1.88% 11/9/2022 407,577 0.02%VF Corp. 400,000 0.63% 20/9/2023 406,344 0.02%Nasdaq, Inc. 400,000 0.88% 13/2/2030 406,163 0.02%Becton Dickinson Euro Finance Sarl 400,000 0.63% 4/6/2023 405,535 0.02%Illinois Tool Works, Inc. 400,000 0.25% 5/12/2024 405,036 0.01%Thermo Fisher Scientific, Inc. 400,000 0.50% 1/3/2028 404,468 0.01%Stryker Corp. 400,000 0.25% 3/12/2024 404,008 0.01%Tyco Electronics Group SA 396,000 1.10% 1/3/2023 403,900 0.01%New York Life Global Funding 400,000 0.25% 23/1/2027 403,521 0.01%DH Europe Finance II Sarl 400,000 0.45% 18/3/2028 403,179 0.01%Medtronic Global Holdings SCA 400,000 0.75% 15/10/2032 402,937 0.01%Coca-Cola Co. 400,000 0.95% 6/5/2036 402,933 0.01%Thermo Fisher Scientific, Inc. 400,000 0.13% 1/3/2025 401,963 0.01%Booking Holdings, Inc. 400,000 0.10% 8/3/2025 401,214 0.01%Coca-Cola Co. 400,000 0.40% 6/5/2030 400,401 0.01%Mondelez International, Inc. 400,000 1.38% 17/3/2041 393,370 0.01%Bristol-Myers Squibb Co. 375,000 1.00% 15/5/2025 390,949 0.01%Coca-Cola Co. 400,000 1.00% 9/3/2041 390,855 0.01%Prologis Euro Finance LLC 400,000 0.50% 16/2/2032 389,071 0.01%Digital Intrepid Holding BV 400,000 0.63% 15/7/2031 386,475 0.01%Coca-Cola Co. 400,000 0.80% 15/3/2040 381,122 0.01%Bunge Finance Europe BV 360,000 1.85% 16/6/2023 371,751 0.01%Merck & Co., Inc. 360,000 0.50% 2/11/2024 367,904 0.01%Metropolitan Life Global Funding I 350,000 2.38% 11/1/2023 364,715 0.01%Johnson Controls International plc 351,000 1.00% 15/9/2023 359,115 0.01%Fidelity National Information Services, Inc. 290,000 2.95% 21/5/2039 354,142 0.01%AT&T, Inc. 300,000 2.60% 19/5/2038 343,754 0.01%Baxter International, Inc. 326,000 1.30% 30/5/2025 342,743 0.01%Air Products & Chemicals, Inc. 336,000 0.80% 5/5/2032 342,703 0.01%Emerson Electric Co. 300,000 2.00% 15/10/2029 339,003 0.01%Amphenol Technologies Holding GmbH 300,000 2.00% 8/10/2028 337,020 0.01%XLIT Ltd.^ 300,000 3.25% 29/6/2047 336,510 0.01%Marsh & McLennan Cos, Inc. 300,000 1.98% 21/3/2030 333,956 0.01%Stryker Corp. 300,000 2.13% 30/11/2027 333,551 0.01%Zimmer Biomet Holdings, Inc. 300,000 2.43% 13/12/2026 333,187 0.01%Verizon Communications, Inc. 300,000 1.88% 26/10/2029 332,342 0.01%United Parcel Service, Inc. 300,000 1.50% 15/11/2032 330,918 0.01%McDonald's Corp. 300,000 1.88% 26/5/2027 330,815 0.01%McDonald's Corp. 300,000 1.75% 3/5/2028 330,597 0.01%McDonald's Corp. 300,000 1.60% 15/3/2031 328,695 0.01%Nasdaq, Inc. 300,000 1.75% 28/3/2029 326,032 0.01%PerkinElmer, Inc. 300,000 1.88% 19/7/2026 323,281 0.01%Abbott Ireland Financing DAC 300,000 1.50% 27/9/2026 322,053 0.01%ManpowerGroup, Inc. 300,000 1.75% 22/6/2026 321,624 0.01%Dow Chemical Co. 300,000 1.88% 15/3/2040 320,914 0.01%Illinois Tool Works, Inc. 300,000 1.00% 5/6/2031 317,267 0.01%Whirlpool Finance Luxembourg Sarl 300,000 1.25% 2/11/2026 316,734 0.01%JPMorgan Chase & Co. 300,000 1.50% 27/1/2025 316,347 0.01%
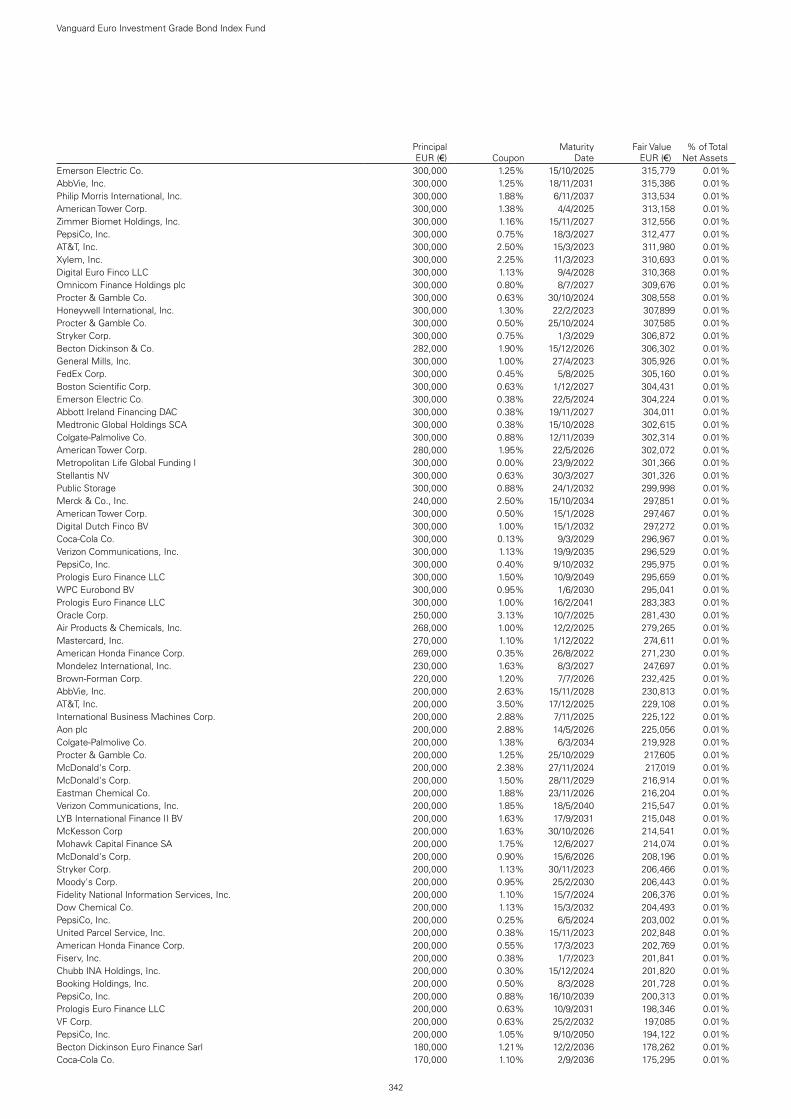
342
Vanguard Euro Investment Grade Bond Index Fund
Principal EUR (€) Coupon
Maturity Date
Fair Value EUR (€)
% of Total Net Assets
Emerson Electric Co. 300,000 1.25% 15/10/2025 315,779 0.01%AbbVie, Inc. 300,000 1.25% 18/11/2031 315,386 0.01%Philip Morris International, Inc. 300,000 1.88% 6/11/2037 313,534 0.01%American Tower Corp. 300,000 1.38% 4/4/2025 313,158 0.01%Zimmer Biomet Holdings, Inc. 300,000 1.16% 15/11/2027 312,556 0.01%PepsiCo, Inc. 300,000 0.75% 18/3/2027 312,477 0.01%AT&T, Inc. 300,000 2.50% 15/3/2023 311,980 0.01%Xylem, Inc. 300,000 2.25% 11/3/2023 310,693 0.01%Digital Euro Finco LLC 300,000 1.13% 9/4/2028 310,368 0.01%Omnicom Finance Holdings plc 300,000 0.80% 8/7/2027 309,676 0.01%Procter & Gamble Co. 300,000 0.63% 30/10/2024 308,558 0.01%Honeywell International, Inc. 300,000 1.30% 22/2/2023 307,899 0.01%Procter & Gamble Co. 300,000 0.50% 25/10/2024 307,585 0.01%Stryker Corp. 300,000 0.75% 1/3/2029 306,872 0.01%Becton Dickinson & Co. 282,000 1.90% 15/12/2026 306,302 0.01%General Mills, Inc. 300,000 1.00% 27/4/2023 305,926 0.01%FedEx Corp. 300,000 0.45% 5/8/2025 305,160 0.01%Boston Scientific Corp. 300,000 0.63% 1/12/2027 304,431 0.01%Emerson Electric Co. 300,000 0.38% 22/5/2024 304,224 0.01%Abbott Ireland Financing DAC 300,000 0.38% 19/11/2027 304,011 0.01%Medtronic Global Holdings SCA 300,000 0.38% 15/10/2028 302,615 0.01%Colgate-Palmolive Co. 300,000 0.88% 12/11/2039 302,314 0.01%American Tower Corp. 280,000 1.95% 22/5/2026 302,072 0.01%Metropolitan Life Global Funding I 300,000 0.00% 23/9/2022 301,366 0.01%Stellantis NV 300,000 0.63% 30/3/2027 301,326 0.01%Public Storage 300,000 0.88% 24/1/2032 299,998 0.01%Merck & Co., Inc. 240,000 2.50% 15/10/2034 297,851 0.01%American Tower Corp. 300,000 0.50% 15/1/2028 297,467 0.01%Digital Dutch Finco BV 300,000 1.00% 15/1/2032 297,272 0.01%Coca-Cola Co. 300,000 0.13% 9/3/2029 296,967 0.01%Verizon Communications, Inc. 300,000 1.13% 19/9/2035 296,529 0.01%PepsiCo, Inc. 300,000 0.40% 9/10/2032 295,975 0.01%Prologis Euro Finance LLC 300,000 1.50% 10/9/2049 295,659 0.01%WPC Eurobond BV 300,000 0.95% 1/6/2030 295,041 0.01%Prologis Euro Finance LLC 300,000 1.00% 16/2/2041 283,383 0.01%Oracle Corp. 250,000 3.13% 10/7/2025 281,430 0.01%Air Products & Chemicals, Inc. 268,000 1.00% 12/2/2025 279,265 0.01%Mastercard, Inc. 270,000 1.10% 1/12/2022 274,611 0.01%American Honda Finance Corp. 269,000 0.35% 26/8/2022 271,230 0.01%Mondelez International, Inc. 230,000 1.63% 8/3/2027 247,697 0.01%Brown-Forman Corp. 220,000 1.20% 7/7/2026 232,425 0.01%AbbVie, Inc. 200,000 2.63% 15/11/2028 230,813 0.01%AT&T, Inc. 200,000 3.50% 17/12/2025 229,108 0.01%International Business Machines Corp. 200,000 2.88% 7/11/2025 225,122 0.01%Aon plc 200,000 2.88% 14/5/2026 225,056 0.01%Colgate-Palmolive Co. 200,000 1.38% 6/3/2034 219,928 0.01%Procter & Gamble Co. 200,000 1.25% 25/10/2029 217,605 0.01%McDonald's Corp. 200,000 2.38% 27/11/2024 217,019 0.01%McDonald's Corp. 200,000 1.50% 28/11/2029 216,914 0.01%Eastman Chemical Co. 200,000 1.88% 23/11/2026 216,204 0.01%Verizon Communications, Inc. 200,000 1.85% 18/5/2040 215,547 0.01%LYB International Finance II BV 200,000 1.63% 17/9/2031 215,048 0.01%McKesson Corp 200,000 1.63% 30/10/2026 214,541 0.01%Mohawk Capital Finance SA 200,000 1.75% 12/6/2027 214,074 0.01%McDonald's Corp. 200,000 0.90% 15/6/2026 208,196 0.01%Stryker Corp. 200,000 1.13% 30/11/2023 206,466 0.01%Moody's Corp. 200,000 0.95% 25/2/2030 206,443 0.01%Fidelity National Information Services, Inc. 200,000 1.10% 15/7/2024 206,376 0.01%Dow Chemical Co. 200,000 1.13% 15/3/2032 204,493 0.01%PepsiCo, Inc. 200,000 0.25% 6/5/2024 203,002 0.01%United Parcel Service, Inc. 200,000 0.38% 15/11/2023 202,848 0.01%American Honda Finance Corp. 200,000 0.55% 17/3/2023 202,769 0.01%Fiserv, Inc. 200,000 0.38% 1/7/2023 201,841 0.01%Chubb INA Holdings, Inc. 200,000 0.30% 15/12/2024 201,820 0.01%Booking Holdings, Inc. 200,000 0.50% 8/3/2028 201,728 0.01%PepsiCo, Inc. 200,000 0.88% 16/10/2039 200,313 0.01%Prologis Euro Finance LLC 200,000 0.63% 10/9/2031 198,346 0.01%VF Corp. 200,000 0.63% 25/2/2032 197,085 0.01%PepsiCo, Inc. 200,000 1.05% 9/10/2050 194,122 0.01%Becton Dickinson Euro Finance Sarl 180,000 1.21% 12/2/2036 178,262 0.01%Coca-Cola Co. 170,000 1.10% 2/9/2036 175,295 0.01%

343
Vanguard Euro Investment Grade Bond Index Fund
Principal EUR (€) Coupon
Maturity Date
Fair Value EUR (€)
% of Total Net Assets
Johnson Controls International plc/Tyco Fire & Security Finance SCA 170,000 1.00% 15/9/2032 173,334 0.01%Eaton Capital Unlimited Co. 159,000 0.75% 20/9/2024 163,157 0.01%Johnson Controls International plc/Tyco Fire & Security Finance SCA 160,000 0.38% 15/9/2027 160,371 0.01%Illinois Tool Works, Inc. 100,000 3.00% 19/5/2034 129,255 0.00%Procter & Gamble Co. 100,000 1.88% 30/10/2038 118,870 0.00%Mondelez International, Inc. 100,000 2.38% 6/3/2035 115,156 0.00%JPMorgan Chase & Co. 100,000 3.00% 19/2/2026 113,750 0.00%Philip Morris International, Inc. 100,000 2.88% 3/3/2026 112,920 0.00%United Parcel Service, Inc. 100,000 1.00% 15/11/2028 105,681 0.00%Fiat Chrysler Finance Europe SENC 100,000 4.75% 15/7/2022 105,121 0.00%Verizon Communications, Inc. 100,000 1.63% 1/3/2024 104,644 0.00%John Deere Cash Management SA 100,000 1.38% 2/4/2024 104,467 0.00%AbbVie, Inc. 100,000 1.50% 15/11/2023 103,783 0.00%Procter & Gamble Co. 100,000 1.13% 2/11/2023 103,453 0.00%Amphenol Technologies Holding GmbH 100,000 0.75% 4/5/2026 103,173 0.00%Booking Holdings, Inc. 100,000 2.15% 25/11/2022 102,799 0.00%Toyota Motor Credit Corp. 100,000 0.63% 21/11/2024 102,620 0.00%Colgate-Palmolive Co. 100,000 0.50% 6/3/2026 102,542 0.00%American Tower Corp. 100,000 1.00% 15/1/2032 100,302 0.00%Prologis Euro Finance LLC 100,000 1.00% 6/2/2035 99,532 0.00%VF Corp. 100,000 0.25% 25/2/2028 99,296 0.00%test - - - 308,821,326 11.43%Total Bonds 2,673,191,320 98.98%Financial Assets at Fair Value Through Profit or Loss 2,673,191,320 98.98%
testNumber of Contracts
Notional Amount
Unrealised Gain/(Loss)
EUR(€)% of Total
Net AssetsFinancial Derivative InstrumentsFutures 0.00% (2020: (0.00%))Euro-Bund September 2021 68 €11,719,030 18,450 0.00 %Euro-Schatz September 2021 (122) €(13,681,690) 610 0.00 %Euro-Bobl September 2021 (50) €(6,707,830) 330 0.00 %Euro-Buxl 30 Year Bond September 2021 (8) €(1,616,267) (9,653 ) (0.00 %)test test test 9,737 0.00 %
CurrencyBuy
Amount Currency(Sell)
Amount CounterpartySettlement
Date
Unrealised Gain/(Loss)
EUR (€)% of Total
Net AssetsHedge Share Class Level Forward Currency Exchange Contracts 0.04% (2020: 0.07%)GBP 424,338,622 EUR (493,324,074) Toronto-Dominion Bank 2/7/2021 986,136 0.04 %EUR 445,571,352 GBP (382,380,423) Morgan Stanley 2/7/2021 138,066 0.01 %GBP 198,182 EUR (230,289) BNP Paribas 2/7/2021 572 0.00 %EUR 48,925,902 GBP (42,000,000) Morgan Stanley 2/7/2021 285 0.00 %GBP 71,399 EUR (82,962) JPMorgan Chase Bank 2/7/2021 210 0.00 %GBP 6,305 EUR (7,293) BNP Paribas 2/7/2021 51 0.00 %GBP 35,984 EUR (41,867) BNP Paribas 2/7/2021 50 0.00 %GBP 16,103 EUR (18,712) BNP Paribas 2/7/2021 46 0.00 %GBP 8,779 EUR (10,198) BNP Paribas 2/7/2021 29 0.00 %GBP 9,493 EUR (11,033) BNP Paribas 2/7/2021 25 0.00 %GBP 3,521 EUR (4,084) Citibank NA 2/7/2021 18 0.00 %GBP 2,010 EUR (2,334) BNP Paribas 2/7/2021 7 0.00 %GBP 9,615 EUR (11,196) Morgan Stanley 2/7/2021 5 0.00 %GBP 4,527 EUR (5,274) BNP Paribas 2/7/2021 — 0.00 %EUR 68 GBP (58) BNP Paribas 2/7/2021 — 0.00 %GBP 39 EUR (45) JPMorgan Chase Bank 2/7/2021 — 0.00 %GBP 3,872 EUR (4,508) Morgan Stanley 3/8/2021 — 0.00 %EUR 4,890 GBP (4,198) BNP Paribas 2/7/2021 (1 ) (0.00 %)EUR 357 GBP (308) Morgan Stanley 2/7/2021 (1 ) (0.00 %)GBP 3,720 EUR (4,345) BNP Paribas 2/7/2021 (12 ) (0.00 %)EUR 21,856 GBP (18,773) Goldman Sachs International 2/7/2021 (13 ) (0.00 %)GBP 6,826 EUR (7,967) BNP Paribas 2/7/2021 (15 ) (0.00 %)GBP 23,903 EUR (27,869) JPMorgan Chase Bank 2/7/2021 (24 ) (0.00 %)GBP 932,401 EUR (1,085,542) Morgan Stanley 3/8/2021 (29 ) (0.00 %)GBP 6,703 EUR (7,839) BNP Paribas 2/7/2021 (30 ) (0.00 %)GBP 17,870 EUR (20,891) BNP Paribas 2/7/2021 (74 ) (0.00 %)EUR 18,046 GBP (15,573) Morgan Stanley 2/7/2021 (95 ) (0.00 %)EUR 96,417 GBP (82,882) Morgan Stanley 2/7/2021 (132 ) (0.00 %)EUR 303,734 GBP (261,386) BNP Paribas 2/7/2021 (753 ) (0.00 %)GBP 42,000,000 EUR (48,898,207) Morgan Stanley 3/8/2021 (1,298 ) (0.00 %)

344
Vanguard Euro Investment Grade Bond Index Fund
CurrencyBuy
Amount Currency(Sell)
Amount CounterpartySettlement
Date
Unrealised Gain/(Loss)
EUR (€)% of Total
Net AssetsGBP 382,380,423 EUR (445,319,161) Morgan Stanley 3/8/2021 (147,239 ) (0.01 %)test 975,784 0.04 %Total Financial Derivative Instruments 985,521 0.04 %
Fair Value EUR (€)
% of Total Net Assets
Other Assets and Liabilities 26,679,318 0.98 %Net Assets 2,700,856,159 100.00 %
Analysis of Total Net Assets EUR (€)% of Total
Net Assets(a) Transferable securities admitted to an official stock exchange listing 2,440,438,502 90.36%(b) Transferable securities dealt in on another regulated market 214,199,370 7.93%(c) Transferable securities other than those admitted to an official stock exchange listing or dealt in on another regulated
market 18,553,448 0.69%
(d) Financial derivative instruments 985,521 0.04%(e) Other assets and liabilities 26,679,318 0.98%Total Net Assets 2,700,856,159 100.00%
^ Floating Rate Note (FRN). The effective interest rate is at 30 June 2021.1 Denotes securities pledged in full or part thereof as collateral for derivatives.

The accompanying notes form an integral part of the financial statements.
345
Vanguard Euro Investment Grade Bond Index Fund
Statement of Assets and Liabilities
Euro (€)
As at 30 June 2021
Euro (€)
As at 31 December 2020
Current AssetsFinancial Assets at Fair Value Through Profit or Loss 2,673,191,320 2,740,763,470 Financial Derivative Instruments 1,144,890 3,749,173 Cash 18,891,300 14,107,877 Receivables: Interest and Dividends 13,384,609 18,645,565 Capital Shares Issued 8,711,856 5,114,044 Investments Sold 4,907,472 15,977 Futures Margin Cash — 28,030
Total Current Assets 2,720,231,447 2,782,424,136
Current LiabilitiesFinancial Derivative Instruments 159,369 1,812,554 Bank Overdraft 8,328 8,336 Unrealised Depreciation on Spot Currency Contracts 209 15,338 Payables and Other Liabilities: Investments Purchased 17,719,794 427 Capital Shares Redeemed 1,181,464 1,674,883 Futures Margin Cash Due to Broker 49,709 — Management Fees Payable 256,415 271,750
Total Current Liabilities 19,375,288 3,783,288
Net Assets Attributable to Holders of Redeemable Participating Shares (“Net Assets”) 2,700,856,159 2,778,640,848
Net Asset Value Per Share
.As at
30 June 2021As at
31 December 2020As at
31 December 2019EUR AccNet Assets 1,844,268,642 1,719,532,972 1,559,392,128Number of Shares Outstanding 8,060,471 7,428,839 6,918,363Net Asset Value Per Share1 228.80 231.47 225.40
Investor EURNet Assets 101,589,478 128,961,122 59,329,586Number of Shares Outstanding 475,087 596,153 281,649Net Asset Value Per Share1 213.83 216.32 210.65
Institutional Plus EUR AccNet Assets 259,199,777 461,137,888 452,633,868Number of Shares Outstanding 2,140,859 3,765,689 3,797,269Net Asset Value Per Share1 121.07 122.46 119.20
GBP Hedged AccEUR (€) Equivalent 495,798,262 469,008,866 352,601,059Net Assets 425,615,974 419,807,477 298,769,360Number of Shares Outstanding 3,394,135 3,320,021 2,439,608Net Asset Value Per Share1 125.40 126.45 122.47
1 The net asset value per share shown may diverge from the net asset value per share used for dealing purposes because of any adjustments for swing pricing and trade date accounting.

346
Vanguard Euro Investment Grade Bond Index Fund
The accompanying notes form an integral part of the financial statements.
Statement of Operations
Euro (€)
Six Months Ended 30 June 2021
Euro (€)
Six Months Ended 30 June 2020
Investment Income/(Loss) Interest Income 12,497,728 14,494,643 Other Income 660 2,650 Net Gain/(Loss) on Financial Instruments (22,351,503) (38,049,575)
Total Investment Income/(Loss) (9,853,115) (23,552,282)
Expenses Management Fees 1,573,430 1,485,513 Transaction Fees and Commissions 4,096 3,193
Total Expenses 1,577,526 1,488,706
Finance Costs Interest Expense 64,989 125,251
Total Finance Costs 64,989 125,251
Net Investment Income/(Loss) (11,495,630) (25,166,239)
Foreign Withholding Tax (7,985) (16,347)
Net Increase/(Decrease) in Net Assets (11,503,615) (25,182,586)
Statement of Changes in Net Assets
Euro (€)
Euro (€)
Six Months Ended Six Months Ended30 June 2021 30 June 2020
Increase/(Decrease) in Net Assets
Net Increase/(Decrease) in Net Assets From Operations (11,503,615) (25,182,586)
Capital Transactions Subscriptions 455,991,513 1,140,952,184 Redemptions (522,272,587) (531,936,251)
Total Capital Transactions (66,281,074) 609,015,933
Total Increase/(Decrease) for the Period (77,784,689) 583,833,347
Net AssetsBeginning of Period 2,778,640,848 2,423,956,641
End of Period 2,700,856,159 3,007,789,988

Vanguard Eurozone Inflation-Linked Bond Index FundManaged by Vanguard Global Advisers, LLC.
347
Investment ObjectiveThe fund seeks to provide returns consistent with the performance of the Bloomberg Barclays Global Inflation-Linked: Eurozone – Euro CPI Index, a market-weighted index of euro-denominated inflation-linked government securities within the euro zone, designed to serve as a hedge against inflation in the euro zone region, with maturities greater than 1 year.
Performance SummaryThe Performance Summary does not form part of the Financial Statements.
• As the six months ended 30 June 2021 came to a close, macroeconomic indicators signalled a faster global economic rebound than many had expected after the sharpest contraction in modern history. Yet the recovery has been uneven. Countries that have contained the virus more successfully, whether through vaccinations, lockdowns or both, generally have fared better economically. And the COVID-19 pandemic remained far from over, with new variants of the virus surfacing where vaccination rates have lagged and the human toll continuing to mount, especially in less developed economies.
• Swift and extensive support from governments and central banks has been a key to the rebound. So far in 2021, it has included fiscal stimulus – including the $1.9 trillion American Rescue Plan in the United States and the €673 billion Recovery and Resilience Facility in Europe – and pledges by a number of central banks to keep interest rates low for some time.
• Stock markets worldwide continued the rally that began in 2020, bolstered by reopening economies, more consumer spending and rising corporate profits. They posted strong gains for the six months ended 30 June.
• Fixed income securities struggled amid concerns that an upturn in inflation might persist or even accelerate given the stronger-than-expected rebound in global growth, extraordinary monetary and fiscal stimulus and a jump in demand for goods and services as economies reopened and supply gradually picked up. With longer-term yields rising and prices falling, returns were negative for the half year.
• With consumer prices climbing in the euro area, the fund’s benchmark index returned 1.58% for the six months.
• By country, Italy and Spain returned more than 2%, while France was the laggard.
• By maturity, results were mixed, but shorter-dated bonds generally produced the highest returns. From a credit-quality perspective, bonds on the bottom rung of the investment-grade ladder returned the most.
Benchmark returns in the commentary above are in euros.
Benchmark: Bloomberg Barclays Global Inflation-Linked: Eurozone – Euro CPI Index
Total ReturnsPeriods Ended 30 June 2021
(Annualised for periods over one year)
Six Months Five YearsTen Years or
Since Inception1
EUR Acc 1.54 % 2.44 % 3.78 %
Benchmark 1.58 2.60 3.96
Tracking Difference* -0.04
Investor EUR 1.54 % 2.41 % 3.72 %
Benchmark 1.58 2.60 3.96
Tracking Difference* -0.04
Institutional Plus EUR Acc 1.57 % 2.53 % 3.39 %
Benchmark 1.58 2.60 3.48
Tracking Difference* -0.01
Each benchmark is in its respective currency.Sources: Vanguard Global Advisers, LLC, and Bloomberg.Performance is based on NAV with net income reinvested.
All of the returns in this report represent past performance, which is not a guarantee of future results that may be achieved by the fund. For performance data current to the most recent month-end, which may be higher or lower than that cited, visit our website at http://global.vanguard.com. Note, too, that both investment returns and principal value can fluctuate widely, so an investor's shares, when sold, could be worth more or less than their original cost..* The tracking difference between the fund return and the index return over a stated period of time can be attributed to a number of factors, including, without limitation, small differences in
weightings, trading activity, transaction costs and differences in the valuation and withholding tax treatment between the fund and the index vendor.1 Since-inception returns: Institutional Plus EUR Acc, 27 February 2014.
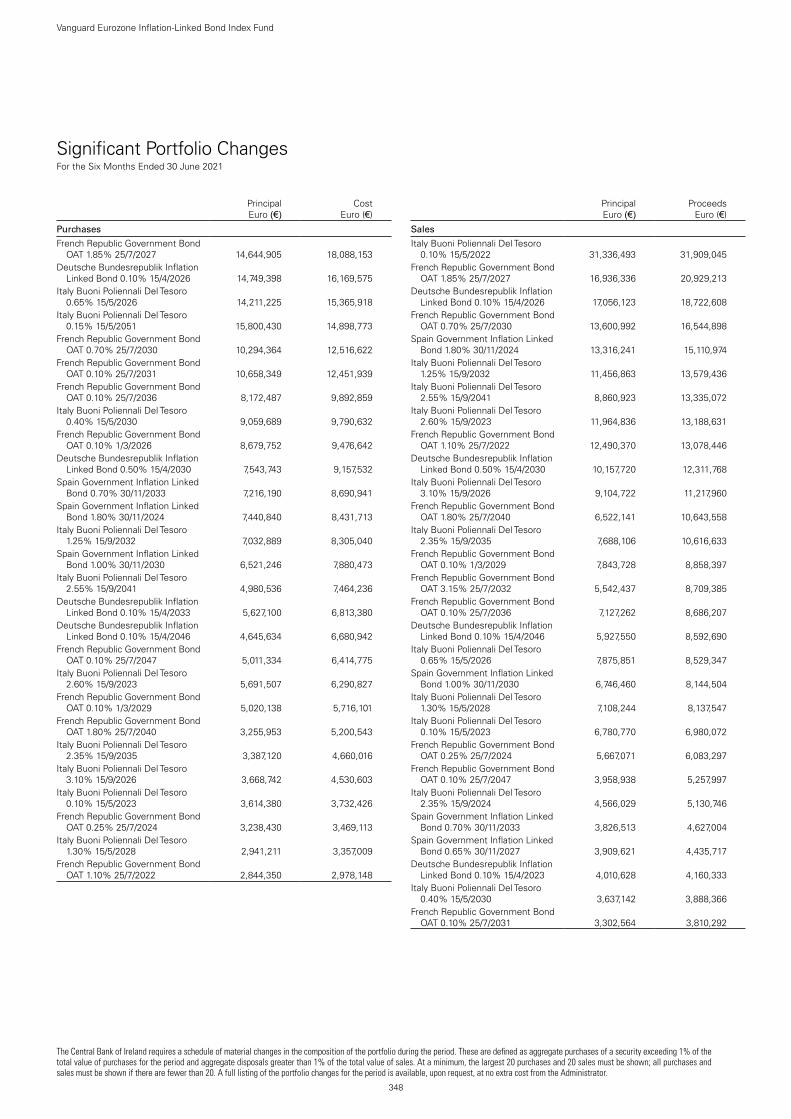
Significant Portfolio ChangesFor the Six Months Ended 30 June 2021
348
Vanguard Eurozone Inflation-Linked Bond Index Fund
The Central Bank of Ireland requires a schedule of material changes in the composition of the portfolio during the period. These are defined as aggregate purchases of a security exceeding 1% of the total value of purchases for the period and aggregate disposals greater than 1% of the total value of sales. At a minimum, the largest 20 purchases and 20 sales must be shown; all purchases and sales must be shown if there are fewer than 20. A full listing of the portfolio changes for the period is available, upon request, at no extra cost from the Administrator.
Principal Euro (€)
Cost Euro (€)
Purchases
French Republic Government Bond OAT 1.85% 25/7/2027 14,644,905 18,088,153
Deutsche Bundesrepublik Inflation Linked Bond 0.10% 15/4/2026 14,749,398 16,169,575
Italy Buoni Poliennali Del Tesoro 0.65% 15/5/2026 14,211,225 15,365,918
Italy Buoni Poliennali Del Tesoro 0.15% 15/5/2051 15,800,430 14,898,773
French Republic Government Bond OAT 0.70% 25/7/2030 10,294,364 12,516,622
French Republic Government Bond OAT 0.10% 25/7/2031 10,658,349 12,451,939
French Republic Government Bond OAT 0.10% 25/7/2036 8,172,487 9,892,859
Italy Buoni Poliennali Del Tesoro 0.40% 15/5/2030 9,059,689 9,790,632
French Republic Government Bond OAT 0.10% 1/3/2026 8,679,752 9,476,642
Deutsche Bundesrepublik Inflation Linked Bond 0.50% 15/4/2030 7,543,743 9,157,532
Spain Government Inflation Linked Bond 0.70% 30/11/2033 7,216,190 8,690,941
Spain Government Inflation Linked Bond 1.80% 30/11/2024 7,440,840 8,431,713
Italy Buoni Poliennali Del Tesoro 1.25% 15/9/2032 7,032,889 8,305,040
Spain Government Inflation Linked Bond 1.00% 30/11/2030 6,521,246 7,880,473
Italy Buoni Poliennali Del Tesoro 2.55% 15/9/2041 4,980,536 7,464,236
Deutsche Bundesrepublik Inflation Linked Bond 0.10% 15/4/2033 5,627,100 6,813,380
Deutsche Bundesrepublik Inflation Linked Bond 0.10% 15/4/2046 4,645,634 6,680,942
French Republic Government Bond OAT 0.10% 25/7/2047 5,011,334 6,414,775
Italy Buoni Poliennali Del Tesoro 2.60% 15/9/2023 5,691,507 6,290,827
French Republic Government Bond OAT 0.10% 1/3/2029 5,020,138 5,716,101
French Republic Government Bond OAT 1.80% 25/7/2040 3,255,953 5,200,543
Italy Buoni Poliennali Del Tesoro 2.35% 15/9/2035 3,387,120 4,660,016
Italy Buoni Poliennali Del Tesoro 3.10% 15/9/2026 3,668,742 4,530,603
Italy Buoni Poliennali Del Tesoro 0.10% 15/5/2023 3,614,380 3,732,426
French Republic Government Bond OAT 0.25% 25/7/2024 3,238,430 3,469,113
Italy Buoni Poliennali Del Tesoro 1.30% 15/5/2028 2,941,211 3,357,009
French Republic Government Bond OAT 1.10% 25/7/2022 2,844,350 2,978,148
Principal Euro (€)
Proceeds Euro (€)
Sales
Italy Buoni Poliennali Del Tesoro 0.10% 15/5/2022 31,336,493 31,909,045
French Republic Government Bond OAT 1.85% 25/7/2027 16,936,336 20,929,213
Deutsche Bundesrepublik Inflation Linked Bond 0.10% 15/4/2026 17,056,123 18,722,608
French Republic Government Bond OAT 0.70% 25/7/2030 13,600,992 16,544,898
Spain Government Inflation Linked Bond 1.80% 30/11/2024 13,316,241 15,110,974
Italy Buoni Poliennali Del Tesoro 1.25% 15/9/2032 11,456,863 13,579,436
Italy Buoni Poliennali Del Tesoro 2.55% 15/9/2041 8,860,923 13,335,072
Italy Buoni Poliennali Del Tesoro 2.60% 15/9/2023 11,964,836 13,188,631
French Republic Government Bond OAT 1.10% 25/7/2022 12,490,370 13,078,446
Deutsche Bundesrepublik Inflation Linked Bond 0.50% 15/4/2030 10,157,720 12,311,768
Italy Buoni Poliennali Del Tesoro 3.10% 15/9/2026 9,104,722 11,217,960
French Republic Government Bond OAT 1.80% 25/7/2040 6,522,141 10,643,558
Italy Buoni Poliennali Del Tesoro 2.35% 15/9/2035 7,688,106 10,616,633
French Republic Government Bond OAT 0.10% 1/3/2029 7,843,728 8,858,397
French Republic Government Bond OAT 3.15% 25/7/2032 5,542,437 8,709,385
French Republic Government Bond OAT 0.10% 25/7/2036 7,127,262 8,686,207
Deutsche Bundesrepublik Inflation Linked Bond 0.10% 15/4/2046 5,927,550 8,592,690
Italy Buoni Poliennali Del Tesoro 0.65% 15/5/2026 7,875,851 8,529,347
Spain Government Inflation Linked Bond 1.00% 30/11/2030 6,746,460 8,144,504
Italy Buoni Poliennali Del Tesoro 1.30% 15/5/2028 7,108,244 8,137,547
Italy Buoni Poliennali Del Tesoro 0.10% 15/5/2023 6,780,770 6,980,072
French Republic Government Bond OAT 0.25% 25/7/2024 5,667,071 6,083,297
French Republic Government Bond OAT 0.10% 25/7/2047 3,958,938 5,257,997
Italy Buoni Poliennali Del Tesoro 2.35% 15/9/2024 4,566,029 5,130,746
Spain Government Inflation Linked Bond 0.70% 30/11/2033 3,826,513 4,627,004
Spain Government Inflation Linked Bond 0.65% 30/11/2027 3,909,621 4,435,717
Deutsche Bundesrepublik Inflation Linked Bond 0.10% 15/4/2023 4,010,628 4,160,333
Italy Buoni Poliennali Del Tesoro 0.40% 15/5/2030 3,637,142 3,888,366
French Republic Government Bond OAT 0.10% 25/7/2031 3,302,564 3,810,292

349
Vanguard Eurozone Inflation-Linked Bond Index Fund
Financial StatementsStatement of Investments30 June 2021
Principal EUR (€) Coupon
Maturity Date
Fair Value EUR (€)
% of Total Net Assets
Bonds 99.31% (2020: 99.48%)France 36.90% (2020: 36.60%)French Republic Government Bond OAT 63,408,977 1.85% 25/7/2027 77,815,570 6.10%French Republic Government Bond OAT 36,289,554 1.80% 25/7/2040 57,650,985 4.52%French Republic Government Bond OAT 51,178,945 0.25% 25/7/2024 54,693,599 4.28%French Republic Government Bond OAT 52,277,968 1.10% 25/7/2022 54,179,370 4.24%French Republic Government Bond OAT 34,131,300 3.15% 25/7/2032 52,468,509 4.11%French Republic Government Bond OAT 42,358,955 0.70% 25/7/2030 51,193,718 4.01%French Republic Government Bond OAT 31,212,492 0.10% 25/7/2047 39,533,715 3.10%French Republic Government Bond OAT 21,786,975 0.10% 25/7/2036 26,026,766 2.04%French Republic Government Bond OAT 22,942,964 0.10% 1/3/2029 25,917,223 2.03%French Republic Government Bond OAT 20,983,847 0.10% 1/3/2026 22,829,617 1.79%French Republic Government Bond OAT 7,521,434 0.10% 25/7/2031 8,689,376 0.68%test - - - 470,998,448 36.90%Germany 16.27% (2020: 15.70%)Deutsche Bundesrepublik Inflation Linked Bond 53,704,314 0.50% 15/4/2030 64,822,035 5.08%Deutsche Bundesrepublik Inflation Linked Bond 46,126,347 0.10% 15/4/2026 50,477,690 3.96%Deutsche Bundesrepublik Inflation Linked Bond 44,505,642 0.10% 15/4/2023 45,739,607 3.58%Deutsche Bundesrepublik Inflation Linked Bond 27,871,174 0.10% 15/4/2046 39,749,079 3.11%Deutsche Bundesrepublik Inflation Linked Bond 5,718,720 0.10% 15/4/2033 6,928,530 0.54%test - - - 207,716,941 16.27%Italy 33.32% (2020: 34.71%)Italy Buoni Poliennali Del Tesoro 52,007,286 2.60% 15/9/2023 56,783,899 4.45%Italy Buoni Poliennali Del Tesoro 41,292,276 2.35% 15/9/2035 55,927,934 4.38%Italy Buoni Poliennali Del Tesoro 34,688,532 2.55% 15/9/2041 51,522,460 4.04%Italy Buoni Poliennali Del Tesoro 41,341,905 1.30% 15/5/2028 47,102,051 3.69%Italy Buoni Poliennali Del Tesoro 37,970,542 1.25% 15/9/2032 44,906,752 3.52%Italy Buoni Poliennali Del Tesoro 32,923,867 3.10% 15/9/2026 40,278,694 3.15%Italy Buoni Poliennali Del Tesoro 34,549,894 2.35% 15/9/2024 38,710,145 3.03%Italy Buoni Poliennali Del Tesoro 31,196,384 0.40% 15/5/2030 33,701,837 2.64%Italy Buoni Poliennali Del Tesoro 25,917,684 0.10% 15/5/2023 26,576,367 2.08%Italy Buoni Poliennali Del Tesoro 15,119,710 0.65% 15/5/2026 16,311,266 1.28%Italy Buoni Poliennali Del Tesoro 14,600,872 0.15% 15/5/2051 13,587,142 1.06%test - - - 425,408,547 33.32%Spain 12.82% (2020: 12.47%)Spain Government Inflation Linked Bond 36,008,560 1.00% 30/11/2030 43,187,021 3.38%Spain Government Inflation Linked Bond 32,763,586 1.80% 30/11/2024 36,829,980 2.89%Spain Government Inflation Linked Bond 31,848,852 0.65% 30/11/2027 36,110,176 2.83%Spain Government Inflation Linked Bond 27,326,755 0.70% 30/11/2033 32,479,543 2.54%Spain Government Inflation Linked Bond 14,345,187 0.15% 30/11/2023 15,022,692 1.18%test - - - 163,629,412 12.82%Total Bonds 1,267,753,348 99.31%Financial Assets at Fair Value Through Profit or Loss 1,267,753,348 99.31%
Fair Value EUR (€)
% of Total Net Assets
Other Assets and Liabilities 8,802,572 0.69 %Net Assets 1,276,555,920 100.00 %
Analysis of Total Net Assets EUR (€)% of Total
Net Assets(a) Transferable securities admitted to an official stock exchange listing 488,295,809 38.25%(b) Transferable securities dealt in on another regulated market 779,457,539 61.06%(c) Transferable securities other than those admitted to an official stock exchange listing or dealt in on another regulated
market — 0.00%
(d) Financial derivative instruments — 0.00%(e) Other assets and liabilities 8,802,572 0.69%Total Net Assets 1,276,555,920 100.00%

The accompanying notes form an integral part of the financial statements.
350
Vanguard Eurozone Inflation-Linked Bond Index Fund
Statement of Assets and Liabilities
Euro (€)
As at 30 June 2021
Euro (€)
As at 31 December 2020
Current AssetsFinancial Assets at Fair Value Through Profit or Loss 1,267,753,348 1,331,499,742 Cash 2,165,641 2,746,796 Receivables: Interest and Dividends 6,320,178 4,252,980 Capital Shares Issued 3,687,185 3,609,425 Investments Sold 3,554,603 409,542
Total Current Assets 1,283,480,955 1,342,518,485
Current LiabilitiesBank Overdraft 1,295 836 Payables and Other Liabilities: Investments Purchased 4,108,989 — Capital Shares Redeemed 2,721,302 3,996,204 Management Fees Payable 93,449 93,391
Total Current Liabilities 6,925,035 4,090,431
Net Assets Attributable to Holders of Redeemable Participating Shares (“Net Assets”) 1,276,555,920 1,338,428,054
Net Asset Value Per Share
.As at
30 June 2021As at
31 December 2020As at
31 December 2019EUR AccNet Assets 624,465,044 490,547,455 528,271,744Number of Shares Outstanding 4,605,855 3,673,876 4,103,169Net Asset Value Per Share1 135.58 133.52 128.75
Investor EURNet Assets 38,774,281 30,805,525 26,181,549Number of Shares Outstanding 248,463 200,442 176,675Net Asset Value Per Share1 156.06 153.69 148.19
Institutional Plus EUR AccNet Assets 613,316,595 817,075,074 1,766,039,442Number of Shares Outstanding 4,801,410 6,497,056 14,572,511Net Asset Value Per Share1 127.74 125.76 121.19
1 The net asset value per share shown may diverge from the net asset value per share used for dealing purposes because of any adjustments for swing pricing and trade date accounting.

351
Vanguard Eurozone Inflation-Linked Bond Index Fund
The accompanying notes form an integral part of the financial statements.
Statement of Operations
Euro (€)
Six Months Ended 30 June 2021
Euro (€)
Six Months Ended 30 June 2020
Investment Income/(Loss) Interest Income 17,954,410 — Net Gain/(Loss) on Financial Instruments 2,259,098 (36,943,320)
Total Investment Income/(Loss) 20,213,508 (36,943,320)
Expenses Management Fees 561,357 837,498 Negative Yield on Financial Assets — 2,571,175
Total Expenses 561,357 3,408,673
Finance Costs Interest Expense 7,495 29,244
Total Finance Costs 7,495 29,244
Net Investment Income/(Loss) 19,644,656 (40,381,237)
Net Increase/(Decrease) in Net Assets 19,644,656 (40,381,237)
Statement of Changes in Net Assets
Euro (€)
Euro (€)
Six Months Ended Six Months Ended30 June 2021 30 June 2020
Increase/(Decrease) in Net Assets
Net Increase/(Decrease) in Net Assets From Operations 19,644,656 (40,381,237)
Capital Transactions Subscriptions 426,986,342 397,973,754 Redemptions (508,503,132) (372,489,092)
Total Capital Transactions (81,516,790) 25,484,662
Total Increase/(Decrease) for the Period (61,872,134) (14,896,575)
Net AssetsBeginning of Period 1,338,428,054 2,320,492,735
End of Period 1,276,555,920 2,305,596,160

Vanguard Global Bond Index FundManaged by Vanguard Global Advisers, LLC, and sub-managed by Vanguard Investments Australia Ltd.
352
Investment ObjectiveThe fund seeks to provide returns consistent with the performance of the Bloomberg Barclays Global Aggregate Float Adjusted and Scaled Index, a market-weighted index of global government, government-related agency, corporate and securitised fixed income investments with maturities greater than 1 year.
Performance SummaryThe Performance Summary does not form part of the Financial Statements.
• As the six months ended 30 June 2021 came to a close, macroeconomic indicators signalled a faster global economic rebound than many had expected after the sharpest contraction in modern history. Yet the recovery has been uneven. Countries that have contained the virus more successfully, whether through vaccinations, lockdowns or both, generally have fared better economically. And the COVID-19 pandemic remained far from over, with new variants of the virus surfacing where vaccination rates have lagged and the human toll continuing to mount, especially in less developed economies.
• Swift and extensive support from governments and central banks has been a key to the rebound. So far in 2021, it has included fiscal stimulus – including the $1.9 trillion American Rescue Plan in the United States and the €673 billion Recovery and Resilience Facility in Europe – and pledges by a number of central banks to keep interest rates low for some time.
• Stock markets worldwide continued the rally that began in 2020, bolstered by reopening economies, more consumer spending and rising corporate profits. They posted strong gains for the six months ended 30 June 2021.
• Fixed income securities struggled amid concerns that an upturn in inflation might persist or even accelerate given the stronger-than-expected rebound in global growth, extraordinary monetary and fiscal stimulus and a jump in demand for goods and services as economies reopened and supply gradually picked up. With longer-term yields rising and prices falling, returns were negative for the half year.
• In this environment, the fund’s benchmark returned –1.76% for the six months.
• Among the larger constituents, the United Kingdom, Belgium and Canada underperformed, while Japan, China and Italy held up the best.
• By sector, Treasuries, which make up about half the fund, returned –2.4%. On the other hand, corporate bonds outpaced the index as a whole, with financials and industrials doing better than utilities. Noncorporate bonds and securitised debt also held up better than the index.
• By maturity, bonds maturing in 20 years or more significantly underperformed. From a credit-quality perspective, bonds rated AA fared the worst.
Benchmark returns in the commentary above are in US dollars.
Benchmark: Bloomberg Barclays Global Aggregate Float Adjusted and Scaled Index Hedged
Total ReturnsPeriods Ended 30 June 2021
(Annualised for periods over one year)
Six Months Five YearsTen Years or
Since Inception1
CHF Hedged Acc -2.39 % 0.46 % 2.12 %
Benchmark -2.32 0.59 2.28
Tracking Difference* -0.07
CHF Hedged Dist — — -1.94 %
Benchmark — — -1.61
Tracking Difference* -0.33
Institutional Plus CHF Hedged Acc -2.37 % 0.51 % 1.28 %
Benchmark -2.32 0.59 1.36
Tracking Difference* -0.05
EUR Hedged Acc -2.26 % 0.93 % 2.16 %
Benchmark -2.17 1.04 2.25
Tracking Difference* -0.09
EUR Hedged Dist — — -1.81 %
Benchmark — — -1.47
Tracking Difference* -0.34
Institutional Plus EUR Hedged Acc -2.23 % 0.98 % 2.21 %
Benchmark -2.17 1.04 2.25
Tracking Difference* -0.06
GBP Hedged Acc -1.91 % 1.89 % 3.41 %
Benchmark -1.80 2.03 3.56
Tracking Difference* -0.11
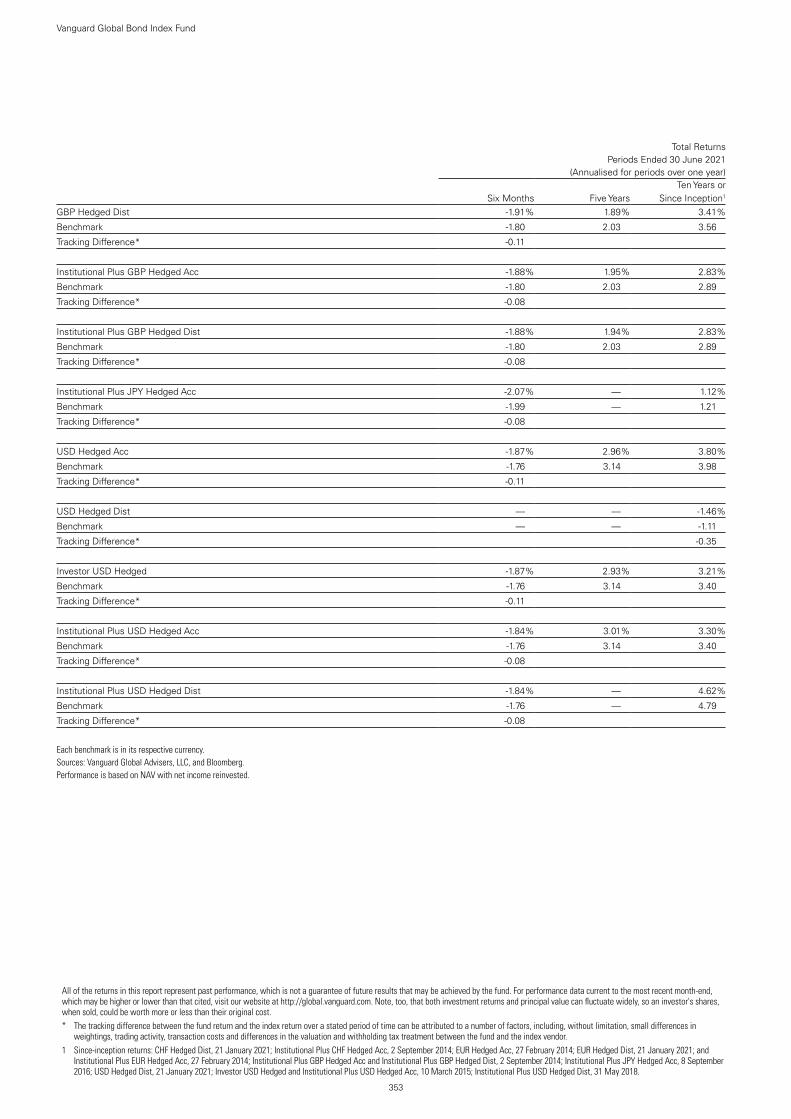
353
Vanguard Global Bond Index Fund
Total ReturnsPeriods Ended 30 June 2021
(Annualised for periods over one year)
Six Months Five YearsTen Years or
Since Inception1
GBP Hedged Dist -1.91 % 1.89 % 3.41 %
Benchmark -1.80 2.03 3.56
Tracking Difference* -0.11
Institutional Plus GBP Hedged Acc -1.88 % 1.95 % 2.83 %
Benchmark -1.80 2.03 2.89
Tracking Difference* -0.08
Institutional Plus GBP Hedged Dist -1.88 % 1.94 % 2.83 %
Benchmark -1.80 2.03 2.89
Tracking Difference* -0.08
Institutional Plus JPY Hedged Acc -2.07 % — 1.12 %
Benchmark -1.99 — 1.21
Tracking Difference* -0.08
USD Hedged Acc -1.87 % 2.96 % 3.80 %
Benchmark -1.76 3.14 3.98
Tracking Difference* -0.11
USD Hedged Dist — — -1.46 %
Benchmark — — -1.11
Tracking Difference* -0.35
Investor USD Hedged -1.87 % 2.93 % 3.21 %
Benchmark -1.76 3.14 3.40
Tracking Difference* -0.11
Institutional Plus USD Hedged Acc -1.84 % 3.01 % 3.30 %
Benchmark -1.76 3.14 3.40
Tracking Difference* -0.08
Institutional Plus USD Hedged Dist -1.84 % — 4.62 %
Benchmark -1.76 — 4.79
Tracking Difference* -0.08
Each benchmark is in its respective currency.Sources: Vanguard Global Advisers, LLC, and Bloomberg.Performance is based on NAV with net income reinvested.
All of the returns in this report represent past performance, which is not a guarantee of future results that may be achieved by the fund. For performance data current to the most recent month-end, which may be higher or lower than that cited, visit our website at http://global.vanguard.com. Note, too, that both investment returns and principal value can fluctuate widely, so an investor's shares, when sold, could be worth more or less than their original cost. * The tracking difference between the fund return and the index return over a stated period of time can be attributed to a number of factors, including, without limitation, small differences in
weightings, trading activity, transaction costs and differences in the valuation and withholding tax treatment between the fund and the index vendor.1 Since-inception returns: CHF Hedged Dist, 21 January 2021; Institutional Plus CHF Hedged Acc, 2 September 2014; EUR Hedged Acc, 27 February 2014; EUR Hedged Dist, 21 January 2021; and
Institutional Plus EUR Hedged Acc, 27 February 2014; Institutional Plus GBP Hedged Acc and Institutional Plus GBP Hedged Dist, 2 September 2014; Institutional Plus JPY Hedged Acc, 8 September 2016; USD Hedged Dist, 21 January 2021; Investor USD Hedged and Institutional Plus USD Hedged Acc, 10 March 2015; Institutional Plus USD Hedged Dist, 31 May 2018.
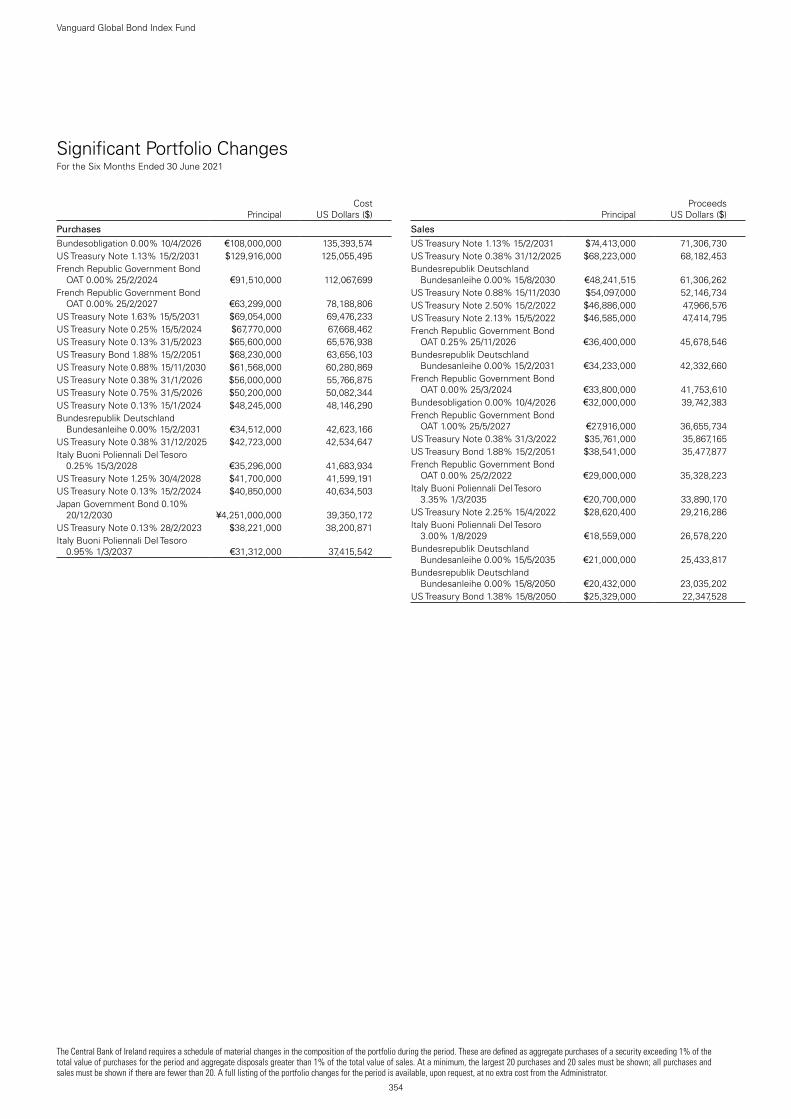
Significant Portfolio ChangesFor the Six Months Ended 30 June 2021
354
Vanguard Global Bond Index Fund
The Central Bank of Ireland requires a schedule of material changes in the composition of the portfolio during the period. These are defined as aggregate purchases of a security exceeding 1% of the total value of purchases for the period and aggregate disposals greater than 1% of the total value of sales. At a minimum, the largest 20 purchases and 20 sales must be shown; all purchases and sales must be shown if there are fewer than 20. A full listing of the portfolio changes for the period is available, upon request, at no extra cost from the Administrator.
PrincipalCost
US Dollars ($)
Purchases
Bundesobligation 0.00% 10/4/2026 €108,000,000 135,393,574US Treasury Note 1.13% 15/2/2031 $129,916,000 125,055,495French Republic Government Bond
OAT 0.00% 25/2/2024 €91,510,000 112,067,699French Republic Government Bond
OAT 0.00% 25/2/2027 €63,299,000 78,188,806US Treasury Note 1.63% 15/5/2031 $69,054,000 69,476,233US Treasury Note 0.25% 15/5/2024 $67,770,000 67,668,462US Treasury Note 0.13% 31/5/2023 $65,600,000 65,576,938US Treasury Bond 1.88% 15/2/2051 $68,230,000 63,656,103US Treasury Note 0.88% 15/11/2030 $61,568,000 60,280,869US Treasury Note 0.38% 31/1/2026 $56,000,000 55,766,875US Treasury Note 0.75% 31/5/2026 $50,200,000 50,082,344US Treasury Note 0.13% 15/1/2024 $48,245,000 48,146,290Bundesrepublik Deutschland
Bundesanleihe 0.00% 15/2/2031 €34,512,000 42,623,166US Treasury Note 0.38% 31/12/2025 $42,723,000 42,534,647Italy Buoni Poliennali Del Tesoro
0.25% 15/3/2028 €35,296,000 41,683,934US Treasury Note 1.25% 30/4/2028 $41,700,000 41,599,191US Treasury Note 0.13% 15/2/2024 $40,850,000 40,634,503Japan Government Bond 0.10%
20/12/2030 ¥4,251,000,000 39,350,172US Treasury Note 0.13% 28/2/2023 $38,221,000 38,200,871Italy Buoni Poliennali Del Tesoro
0.95% 1/3/2037 €31,312,000 37,415,542
PrincipalProceeds
US Dollars ($)
Sales
US Treasury Note 1.13% 15/2/2031 $74,413,000 71,306,730US Treasury Note 0.38% 31/12/2025 $68,223,000 68,182,453Bundesrepublik Deutschland
Bundesanleihe 0.00% 15/8/2030 €48,241,515 61,306,262US Treasury Note 0.88% 15/11/2030 $54,097,000 52,146,734US Treasury Note 2.50% 15/2/2022 $46,886,000 47,966,576US Treasury Note 2.13% 15/5/2022 $46,585,000 47,414,795French Republic Government Bond
OAT 0.25% 25/11/2026 €36,400,000 45,678,546Bundesrepublik Deutschland
Bundesanleihe 0.00% 15/2/2031 €34,233,000 42,332,660French Republic Government Bond
OAT 0.00% 25/3/2024 €33,800,000 41,753,610Bundesobligation 0.00% 10/4/2026 €32,000,000 39,742,383French Republic Government Bond
OAT 1.00% 25/5/2027 €27,916,000 36,655,734US Treasury Note 0.38% 31/3/2022 $35,761,000 35,867,165US Treasury Bond 1.88% 15/2/2051 $38,541,000 35,477,877French Republic Government Bond
OAT 0.00% 25/2/2022 €29,000,000 35,328,223Italy Buoni Poliennali Del Tesoro
3.35% 1/3/2035 €20,700,000 33,890,170US Treasury Note 2.25% 15/4/2022 $28,620,400 29,216,286Italy Buoni Poliennali Del Tesoro
3.00% 1/8/2029 €18,559,000 26,578,220Bundesrepublik Deutschland
Bundesanleihe 0.00% 15/5/2035 €21,000,000 25,433,817Bundesrepublik Deutschland
Bundesanleihe 0.00% 15/8/2050 €20,432,000 23,035,202US Treasury Bond 1.38% 15/8/2050 $25,329,000 22,347,528

355
Vanguard Global Bond Index Fund
Financial StatementsStatement of Investments30 June 2021
Principal CouponMaturity
DateFair Value
US Dollars ($)% of Total
Net AssetsBonds 98.91% (2020: 97.66%)Australia 1.99% (2020: 1.89%)Australia Government Bond AU($)30,100,000 2.25% 21/5/2028 24,291,563 0.11%Australia Government Bond AU($)22,900,000 0.25% 21/11/2025 16,879,460 0.08%Australia Government Bond AU($)21,400,000 0.25% 21/11/2024 15,970,170 0.07%Australia Government Bond AU($)15,100,000 3.25% 21/4/2029 13,033,030 0.06%Australia Government Bond AU($)15,300,000 2.75% 21/11/2028 12,761,091 0.06%Australia Government Bond AU($)15,105,000 2.75% 21/11/2029 12,629,175 0.06%Australia Government Bond AU($)10,500,000 4.25% 21/4/2026 9,187,540 0.04%Australia Government Bond AU($)10,000,000 4.75% 21/4/2027 9,131,010 0.04%Treasury Corp. of Victoria AU($)11,500,000 1.50% 20/11/2030 8,448,335 0.04%National Australia Bank Ltd. €7,000,000 0.01% 6/1/2029 8,287,885 0.04%Australia Government Bond AU($)11,000,000 1.25% 21/5/2032 7,986,275 0.04%New South Wales Treasury Corp. AU($)9,000,000 3.00% 20/5/2027 7,459,010 0.03%Australia Government Bond AU($)9,330,000 1.50% 21/6/2031 7,004,972 0.03%Australia Government Bond AU($)8,500,000 2.50% 21/5/2030 6,977,067 0.03%Australia Government Bond AU($)9,200,000 0.50% 21/9/2026 6,784,652 0.03%Australia Government Bond AU($)7,160,000 3.00% 21/3/2047 6,136,401 0.03%Australia Government Bond AU($)7,800,000 1.00% 21/12/2030 5,616,145 0.03%Australia Government Bond AU($)6,800,000 2.75% 21/5/2041 5,596,597 0.03%Australia Government Bond AU($)7,700,000 1.00% 21/11/2031 5,480,336 0.03%Australia Government Bond AU($)5,700,000 3.75% 21/4/2037 5,345,948 0.03%Australia Government Bond AU($)5,150,000 4.50% 21/4/2033 5,068,867 0.02%Australia Government Bond AU($)6,500,000 1.75% 21/11/2032 4,946,674 0.02%Ausgrid Finance Pty Ltd. AU($)6,100,000 3.75% 30/10/2024 4,928,611 0.02%Queensland Treasury Corp. AU($)5,450,000 3.25% 21/8/2029 4,631,874 0.02%Queensland Treasury Corp. AU($)5,800,000 6.00% 21/7/2022 4,627,115 0.02%Western Australian Treasury Corp. AU($)5,350,000 3.25% 20/7/2028 4,535,070 0.02%New South Wales Treasury Corp. AU($)5,200,000 5.00% 20/8/2024 4,449,436 0.02%Australia Government Bond AU($)5,250,000 5.75% 15/7/2022 4,176,279 0.02%Australia & New Zealand Banking Group Ltd. £2,907,000 1.81% 16/9/2031 4,025,239 0.02%Australia Government Bond AU($)4,800,000 3.25% 21/4/2025 3,971,254 0.02%Australia Government Bond AU($)4,648,000 2.75% 21/6/2035 3,896,971 0.02%New South Wales Treasury Corp. AU($)5,000,000 2.00% 20/3/2031 3,822,395 0.02%NBN Co., Ltd. AU($)5,000,000 1.00% 3/12/2025 3,679,636 0.02%Queensland Treasury Corp. AU($)4,500,000 4.25% 21/7/2023 3,660,405 0.02%Australia Government Bond AU($)4,000,000 3.25% 21/6/2039 3,540,896 0.02%Australia Government Bond AU($)4,000,000 2.75% 21/11/2027 3,321,887 0.02%Australia Government Bond AU($)5,000,000 1.75% 21/6/2051 3,304,629 0.02%Treasury Corp. of Victoria AU($)4,000,000 2.50% 22/10/2029 3,219,833 0.02%Western Australian Treasury Corp. AU($)4,000,000 2.75% 20/10/2022 3,109,281 0.02%Aurizon Network Pty Ltd. AU($)4,000,000 2.90% 2/9/2030 2,983,156 0.01%Queensland Treasury Corp. AU($)3,500,000 3.25% 21/7/2028 2,964,976 0.01%Optus Finance Pty Ltd. AU($)3,700,000 2.50% 1/7/2030 2,827,497 0.01%New South Wales Treasury Corp. AU($)3,300,000 3.00% 20/2/2030 2,750,646 0.01%New South Wales Treasury Corp. AU($)3,200,000 3.00% 20/3/2028 2,659,432 0.01%Macquarie Bank Ltd. $2,500,000 2.30% 22/1/2025 2,609,035 0.01%Toyota Finance Australia Ltd. €2,000,000 2.00% 21/10/2024 2,540,231 0.01%Treasury Corp. of Victoria AU($)2,700,000 5.50% 17/11/2026 2,499,778 0.01%National Housing Finance & Investment Corp. AU($)3,360,000 1.52% 27/5/2030 2,499,161 0.01%Australia Government Bond AU($)3,000,000 5.50% 21/4/2023 2,472,699 0.01%Queensland Treasury Corp. AU($)2,800,000 4.75% 21/7/2025 2,437,555 0.01%Commonwealth Bank of Australia €2,000,000 0.38% 24/4/2023 2,407,293 0.01%Queensland Treasury Corp. AU($)3,200,000 2.25% 16/4/2040 2,303,636 0.01%BHP Billiton Finance USA Ltd. $1,695,000 5.00% 30/9/2043 2,302,863 0.01%Woolworths Group Ltd. AU($)3,000,000 1.85% 20/5/2025 2,302,678 0.01%Glencore Funding LLC $2,050,000 3.88% 27/10/2027 2,258,348 0.01%Queensland Treasury Corp. AU($)2,750,000 2.75% 20/8/2027 2,254,878 0.01%AGI Finance Pty Ltd. AU($)3,000,000 2.12% 24/6/2027 2,253,858 0.01%New South Wales Treasury Corp. AU($)2,700,000 3.00% 20/4/2029 2,249,971 0.01%Western Australian Treasury Corp. AU($)2,400,000 3.00% 21/10/2026 1,986,498 0.01%Westpac Banking Corp. $1,875,000 2.00% 16/1/2025 1,953,367 0.01%Western Australian Treasury Corp. AU($)2,500,000 1.75% 22/10/2031 1,867,615 0.01%Treasury Corp. of Victoria AU($)2,000,000 4.25% 20/12/2032 1,860,796 0.01%Australia & New Zealand Banking Group Ltd. €1,500,000 0.25% 29/11/2022 1,796,916 0.01%

356
Vanguard Global Bond Index Fund
Principal CouponMaturity
DateFair Value
US Dollars ($)% of Total
Net AssetsNorthern Territory Treasury Corp. AU($)2,200,000 2.75% 21/4/2027 1,795,056 0.01%Queensland Treasury Corp. AU($)2,000,000 3.50% 21/8/2030 1,738,373 0.01%Queensland Treasury Corp. AU($)2,300,000 1.75% 21/8/2031 1,718,275 0.01%Australia & New Zealand Banking Group Ltd. €1,401,000 0.63% 21/2/2023 1,689,867 0.01%National Australia Bank Ltd. €1,300,000 1.38% 30/8/2028 1,674,268 0.01%Treasury Corp. of Victoria AU($)2,000,000 6.00% 17/10/2022 1,617,295 0.01%Treasury Corp. of Victoria AU($)1,900,000 3.00% 20/10/2028 1,582,593 0.01%New South Wales Treasury Corp. AU($)1,800,000 3.50% 20/11/2037 1,577,002 0.01%Australia Government Bond AU($)2,000,000 2.00% 21/12/2021 1,515,645 0.01%NSW Electricity Networks Finance Pty Ltd. AU($)2,000,000 2.73% 23/4/2029 1,508,618 0.01%Victoria Power Networks Finance Pty Ltd. AU($)2,000,000 1.60% 21/4/2026 1,507,839 0.01%National Australia Bank Ltd. AU($)1,950,000 1.65% 21/1/2025 1,501,440 0.01%National Australia Bank Ltd. €1,200,000 0.75% 30/1/2026 1,486,810 0.01%Queensland Treasury Corp. AU($)1,700,000 5.75% 22/7/2024 1,480,987 0.01%Westpac Banking Corp. $1,425,000 2.00% 13/1/2023 1,461,568 0.01%New South Wales Treasury Corp. AU($)1,800,000 4.00% 20/4/2023 1,445,950 0.01%Toyota Finance Australia Ltd. €1,200,000 0.25% 9/4/2024 1,439,601 0.01%Australia & New Zealand Banking Group Ltd. AU($)1,800,000 1.65% 16/1/2025 1,385,661 0.01%Westpac Banking Corp. $1,200,000 2.85% 13/5/2026 1,294,773 0.01%Scentre Group Trust 1/Scentre Group Trust 2 $1,175,000 3.75% 23/3/2027 1,289,442 0.01%Glencore Finance Europe Ltd. €1,000,000 1.50% 15/10/2026 1,243,404 0.01%Commonwealth Bank of Australia^ €1,000,000 1.94% 3/10/2029 1,241,982 0.01%Westpac Banking Corp. €1,000,000 0.50% 16/1/2025 1,219,950 0.01%Westpac Banking Corp. €1,000,000 0.50% 4/12/2023 1,212,409 0.01%National Australia Bank Ltd. €1,000,000 0.25% 20/5/2024 1,202,546 0.01%Commonwealth Bank of Australia $1,200,000 2.69% 11/3/2031 1,197,590 0.01%Ausgrid Finance Pty Ltd. AU($)1,600,000 1.81% 5/2/2027 1,182,241 0.01%National Australia Bank Ltd. $1,250,000 2.65% 14/1/2041 1,168,962 0.01%Lonsdale Finance Pty Ltd. AU($)1,500,000 2.45% 20/11/2026 1,159,284 0.01%National Australia Bank Ltd. $1,150,000 2.33% 21/8/2030 1,116,294 0.01%Scentre Group Trust 1/Scentre Group Trust 2 €900,000 1.38% 22/3/2023 1,092,230 0.01%Australia & New Zealand Banking Group Ltd. $1,050,000 2.63% 9/11/2022 1,082,640 0.01%Macquarie Group Ltd. €900,000 0.35% 3/3/2028 1,052,181 0.01%BHP Billiton Finance Ltd. £550,000 4.30% 25/9/2042 1,034,196 0.01%Transurban Finance Co. Pty Ltd. €800,000 1.45% 16/5/2029 1,000,172 0.01%South Australian Government Financing Authority AU($)1,200,000 3.00% 24/5/2028 997,288 0.01%Westpac Banking Corp. €800,000 0.38% 5/3/2023 960,941 0.01%Australia & New Zealand Banking Group Ltd. $850,000 4.50% 19/3/2024 930,017 0.01%Westpac Banking Corp. $800,000 3.35% 8/3/2027 884,775 0.01%Treasury Corp. of Victoria AU($)1,000,000 5.50% 17/12/2024 876,980 0.01%Bank of Queensland Ltd. €730,000 0.13% 4/6/2024 876,146 0.01%Westpac Banking Corp.^ $781,000 4.32% 23/11/2031 868,350 0.01%Goodman US Finance Three LLC $800,000 3.70% 15/3/2028 866,577 0.01%Transurban Finance Co. Pty Ltd. $775,000 4.13% 2/2/2026 863,291 0.01%National Housing Finance & Investment Corp. AU($)1,200,000 1.41% 29/6/2032 862,071 0.01%New South Wales Treasury Corp. AU($)1,000,000 4.00% 20/5/2026 859,181 0.01%Commonwealth Bank of Australia $800,000 2.63% 6/9/2026 857,952 0.00%Australia & New Zealand Banking Group Ltd.^ €725,000 0.67% 5/5/2031 856,686 0.00%Network Finance Co. Pty Ltd. AU($)1,100,000 2.58% 3/10/2028 835,186 0.00%National Australia Bank Ltd. $800,000 1.88% 13/12/2022 818,182 0.00%Glencore Capital Finance DAC €700,000 0.75% 1/3/2029 815,742 0.00%Downer Group Finance Pty Ltd. AU($)1,000,000 3.70% 29/4/2026 803,350 0.00%Commonwealth Bank of Australia $650,000 4.32% 10/1/2048 765,738 0.00%Aurizon Finance Pty Ltd. AU($)1,000,000 3.00% 9/3/2028 757,527 0.00%Macquarie Group Ltd.^ $700,000 3.19% 28/11/2023 725,184 0.00%Coles Group Treasury Pty Ltd. AU($)1,000,000 2.10% 27/8/2030 722,347 0.00%Commonwealth Bank of Australia €600,000 0.50% 11/7/2022 718,746 0.00%Commonwealth Bank of Australia $600,000 3.90% 12/7/2047 715,722 0.00%Westpac Banking Corp.^ €600,000 0.77% 13/5/2031 710,596 0.00%NSW Electricity Networks Finance Pty Ltd. AU($)950,000 2.54% 23/9/2030 689,297 0.00%Argentum Netherlands BV for Swiss Re Ltd.^ $600,000 5.63% 15/8/2052 687,665 0.00%South Australian Government Financing Authority AU($)900,000 1.50% 22/9/2022 687,632 0.00%Woodside Finance Ltd. $605,000 3.70% 15/9/2026 653,742 0.00%BHP Billiton Finance USA Ltd. $600,000 3.85% 30/9/2023 644,963 0.00%Macquarie Group Ltd.^ $650,000 1.34% 12/1/2027 643,984 0.00%Woodside Finance Ltd. $600,000 3.65% 5/3/2025 640,118 0.00%Telstra Corp., Ltd. €500,000 1.00% 23/4/2030 619,725 0.00%Australia & New Zealand Banking Group Ltd. $550,000 4.40% 19/5/2026 619,164 0.00%National Australia Bank Ltd. €500,000 0.88% 16/11/2022 603,806 0.00%Glencore Capital Finance DAC €500,000 1.13% 10/3/2028 603,215 0.00%APT Pipelines Ltd. £400,000 3.13% 18/7/2031 599,851 0.00%

357
Vanguard Global Bond Index Fund
Principal CouponMaturity
DateFair Value
US Dollars ($)% of Total
Net AssetsAustralia & New Zealand Banking Group Ltd.^ $575,000 2.95% 22/7/2030 598,001 0.00%Macquarie Bank Ltd.^ $600,000 3.05% 3/3/2036 597,372 0.00%Westpac Banking Corp.^ $575,000 2.89% 4/2/2030 596,485 0.00%APT Pipelines Ltd. €500,000 1.25% 15/3/2033 589,175 0.00%APT Pipelines Ltd. €500,000 0.75% 15/3/2029 588,218 0.00%Scentre Group Trust 2^ $550,000 5.13% 24/9/2080 586,696 0.00%Macquarie Bank Ltd. $525,000 3.90% 15/1/2026 585,308 0.00%Wesfarmers Ltd. AU($)750,000 1.94% 23/6/2028 565,553 0.00%Telstra Corp., Ltd. $525,000 3.13% 7/4/2025 562,276 0.00%National Housing Finance & Investment Corp. AU($)700,000 2.38% 28/3/2029 560,788 0.00%APT Pipelines Ltd. £400,000 2.50% 15/3/2036 557,153 0.00%Rio Tinto Finance USA plc $450,000 4.13% 21/8/2042 548,419 0.00%National Australia Bank Ltd. AU($)700,000 3.00% 10/2/2023 547,723 0.00%Sydney Airport Finance Co. Pty Ltd. $500,000 3.63% 28/4/2026 543,047 0.00%Scentre Group Trust 2^ $500,000 4.75% 24/9/2080 533,529 0.00%Optus Finance Pty Ltd. AU($)700,000 1.60% 1/7/2025 533,408 0.00%Transurban Finance Co. Pty Ltd. €400,000 1.75% 29/3/2028 510,941 0.00%Telstra Corp., Ltd. €400,000 1.38% 26/3/2029 510,906 0.00%Transurban Finance Co. Pty Ltd. $500,000 2.45% 16/3/2031 502,197 0.00%South Australian Government Financing Authority AU($)600,000 3.00% 20/7/2026 494,616 0.00%Westpac Banking Corp.^ $500,000 2.67% 15/11/2035 492,287 0.00%Westpac Banking Corp. $500,000 2.96% 16/11/2040 490,895 0.00%Woodside Finance Ltd. $450,000 3.70% 15/3/2028 483,474 0.00%Macquarie Group Ltd. €400,000 0.63% 3/2/2027 481,011 0.00%AusNet Services Holdings Pty Ltd. AU($)550,000 4.40% 16/8/2027 476,740 0.00%AusNet Services Holdings Pty Ltd.^ €390,000 1.63% 11/3/2081 470,017 0.00%Scentre Group Trust 1 £300,000 3.88% 16/7/2026 463,594 0.00%Transurban Queensland Finance Pty Ltd. AU($)600,000 3.25% 5/8/2031 460,441 0.00%Westpac Banking Corp. $425,000 2.65% 16/1/2030 455,419 0.00%Glencore Funding LLC $400,000 4.00% 27/3/2027 443,160 0.00%Commonwealth Bank of Australia $400,000 3.74% 12/9/2039 437,258 0.00%Northern Territory Treasury Corp. AU($)500,000 3.50% 21/4/2028 425,959 0.00%Commonwealth Bank of Australia^ $400,000 3.61% 12/9/2034 424,361 0.00%BHP Billiton Finance USA Ltd. $350,000 4.13% 24/2/2042 422,386 0.00%Westpac Banking Corp. AU($)500,000 5.25% 21/11/2023 417,357 0.00%Queensland Treasury Corp. AU($)500,000 3.25% 21/7/2026 417,310 0.00%South Australian Government Financing Authority AU($)500,000 4.25% 20/11/2023 411,665 0.00%Amcor Finance USA, Inc. $375,000 3.63% 28/4/2026 411,486 0.00%GAIF Bond Issuer Pty Ltd. $375,000 3.40% 30/9/2026 408,255 0.00%Commonwealth Bank of Australia €300,000 1.63% 10/2/2031 405,091 0.00%Northern Territory Treasury Corp. AU($)500,000 2.75% 21/10/2024 400,973 0.00%Commonwealth Bank of Australia AU($)500,000 3.25% 25/4/2023 394,628 0.00%Scentre Group Trust 1/Scentre Group Trust 2 €300,000 1.45% 28/3/2029 378,894 0.00%Westpac Banking Corp. $350,000 3.30% 26/2/2024 375,210 0.00%Amcor UK Finance plc €300,000 1.13% 23/6/2027 370,861 0.00%AGI Finance Pty Ltd. AU($)500,000 1.82% 23/11/2028 359,136 0.00%AusNet Services Holdings Pty Ltd. €300,000 0.63% 25/8/2030 358,263 0.00%Macquarie Group Ltd.^ $300,000 5.03% 15/1/2030 356,484 0.00%Westpac Banking Corp. $325,000 2.35% 19/2/2025 341,617 0.00%Wesfarmers Ltd. AU($)450,000 2.55% 23/6/2031 340,721 0.00%QBE Insurance Group Ltd.^ $300,000 7.50% 24/11/2043 337,947 0.00%QBE Insurance Group Ltd.^ $300,000 5.88% 17/6/2046 333,107 0.00%National Australia Bank Ltd. $300,000 3.38% 14/1/2026 330,329 0.00%National Australia Bank Ltd. CHF300,000 0.25% 19/1/2023 328,260 0.00%Rio Tinto Finance USA plc $250,000 4.75% 22/3/2042 327,178 0.00%Scentre Group Trust 2 €250,000 3.25% 11/9/2023 318,839 0.00%Macquarie Group Ltd.^ $275,000 4.65% 27/3/2029 317,042 0.00%Westpac Banking Corp. $300,000 2.75% 11/1/2023 311,108 0.00%National Australia Bank Ltd.^ CA($)345,000 3.52% 12/6/2030 292,488 0.00%Macquarie Group Ltd.^ $265,000 3.76% 28/11/2028 290,922 0.00%Westpac Banking Corp. £200,000 2.63% 14/12/2022 285,323 0.00%Macquarie Group Ltd.^ $265,000 4.15% 27/3/2024 280,567 0.00%Australia & New Zealand Banking Group Ltd. $250,000 3.70% 16/11/2025 278,787 0.00%National Australia Bank Ltd. $250,000 3.63% 20/6/2023 265,934 0.00%AusNet Services Holdings Pty Ltd. €200,000 1.50% 26/2/2027 255,554 0.00%Sydney Airport Finance Co. Pty Ltd. €200,000 2.75% 23/4/2024 255,539 0.00%Glencore Funding LLC $250,000 1.63% 27/4/2026 250,756 0.00%Tasmanian Public Finance Corp. AU($)300,000 3.25% 19/2/2026 248,072 0.00%Ausgrid Finance Pty Ltd. €200,000 1.25% 30/7/2025 247,168 0.00%Australia & New Zealand Banking Group Ltd. AU($)300,000 3.35% 9/5/2023 237,450 0.00%Origin Energy Finance Ltd. €200,000 1.00% 17/9/2029 234,708 0.00%

358
Vanguard Global Bond Index Fund
Principal CouponMaturity
DateFair Value
US Dollars ($)% of Total
Net AssetsAPT Pipelines Ltd. $200,000 4.25% 15/7/2027 226,089 0.00%Macquarie Bank Ltd. $200,000 4.88% 10/6/2025 223,590 0.00%Macquarie Bank Ltd. $200,000 3.62% 3/6/2030 211,464 0.00%Sydney Airport Finance Co. Pty Ltd. $200,000 3.90% 22/3/2023 210,607 0.00%Glencore Funding LLC $200,000 3.88% 27/4/2051 209,894 0.00%Toyota Finance Australia Ltd. €150,000 2.28% 21/10/2027 201,921 0.00%APT Pipelines Ltd. €150,000 2.00% 15/7/2030 192,511 0.00%Glencore Funding LLC $175,000 2.85% 27/4/2031 177,845 0.00%Rio Tinto Finance USA Ltd. $125,000 5.20% 2/11/2040 171,336 0.00%Ausgrid Finance Pty Ltd. $150,000 4.35% 1/8/2028 169,109 0.00%Macquarie Bank Ltd. $150,000 4.00% 29/7/2025 166,410 0.00%Suncorp-Metway Ltd. $150,000 3.30% 15/4/2024 160,290 0.00%Westpac Banking Corp. $150,000 3.65% 15/5/2023 159,164 0.00%Ausgrid Finance Pty Ltd. $150,000 3.85% 1/5/2023 156,655 0.00%National Australia Bank Ltd. £100,000 3.00% 4/9/2026 153,690 0.00%Vicinity Centres Trust £100,000 3.38% 7/4/2026 150,608 0.00%Glencore Finance Europe Ltd. £100,000 3.13% 26/3/2026 147,489 0.00%APT Pipelines Ltd. €100,000 2.00% 22/3/2027 129,939 0.00%Commonwealth Bank of Australia $125,000 2.50% 18/9/2022 128,279 0.00%Transurban Finance Co. Pty Ltd. €100,000 2.00% 28/8/2025 127,542 0.00%Aurizon Network Pty Ltd. €100,000 2.00% 18/9/2024 126,265 0.00%Telstra Corp., Ltd. €100,000 2.50% 15/9/2023 125,687 0.00%Transurban Finance Co. Pty Ltd. €100,000 1.88% 16/9/2024 125,345 0.00%Telstra Corp., Ltd. €100,000 3.50% 21/9/2022 124,116 0.00%Australia & New Zealand Banking Group Ltd. €100,000 3.63% 18/7/2022 123,704 0.00%APT Pipelines Ltd. $110,000 4.20% 23/3/2025 120,621 0.00%Westpac Banking Corp. $100,000 4.42% 24/7/2039 118,167 0.00%Goodman US Finance Four LLC $100,000 4.50% 15/10/2037 114,902 0.00%Commonwealth Bank of Australia $100,000 3.15% 19/9/2027 109,520 0.00%Transurban Finance Co. Pty Ltd. $100,000 3.38% 22/3/2027 108,451 0.00%DBNGP Finance Co. Pty Ltd. AU($)100,000 4.23% 28/5/2025 82,658 0.00%United Energy Distribution Pty Ltd. AU($)100,000 3.85% 23/10/2024 81,826 0.00%Scentre Group Trust 1/Scentre Group Trust 2 $75,000 3.25% 28/10/2025 80,429 0.00%Westpac Banking Corp.^ $40,000 4.11% 24/7/2034 43,904 0.00%test - - - 439,198,647 1.99%Austria 0.74% (2020: 0.72%)Republic of Austria Government Bond €23,000,000 0.50% 20/4/2027 28,693,710 0.13%Republic of Austria Government Bond €10,000,000 0.00% 15/7/2024 12,073,264 0.06%Republic of Austria Government Bond €9,020,000 0.00% 20/2/2031 10,699,417 0.05%Republic of Austria Government Bond €7,600,000 0.75% 20/10/2026 9,578,780 0.04%Republic of Austria Government Bond €7,800,000 3.50% 15/9/2021 9,327,923 0.04%Republic of Austria Government Bond €4,550,000 4.15% 15/3/2037 8,630,330 0.04%Republic of Austria Government Bond €5,050,000 2.40% 23/5/2034 7,701,970 0.04%Republic of Austria Government Bond €4,400,000 1.50% 20/2/2047 6,397,930 0.03%Republic of Austria Government Bond €4,248,000 0.00% 20/2/2030 5,077,327 0.02%Republic of Austria Government Bond €3,883,000 0.00% 20/4/2023 4,658,450 0.02%Republic of Austria Government Bond €3,162,000 0.50% 20/2/2029 3,949,651 0.02%Republic of Austria Government Bond €1,400,000 3.80% 26/1/2062 3,454,097 0.02%Republic of Austria Government Bond €1,600,000 3.15% 20/6/2044 3,011,987 0.01%Oesterreichische Kontrollbank AG £2,100,000 1.13% 15/12/2022 2,939,012 0.01%Verbund AG €2,400,000 0.90% 1/4/2041 2,861,733 0.01%Republic of Austria Government Bond €1,174,000 2.10% 20/9/2117 2,299,973 0.01%Republic of Austria Government Bond €1,912,000 0.00% 15/7/2023 2,296,948 0.01%Republic of Austria Government Bond €2,019,000 0.85% 30/6/2120 2,188,322 0.01%Oesterreichische Kontrollbank AG £1,500,000 0.50% 15/12/2025 2,066,774 0.01%Republic of Austria Government Bond €1,500,000 1.20% 20/10/2025 1,912,993 0.01%BAWAG PSK Bank fuer Arbeit und Wirtschaft und Oesterreichische
Postsparkasse AG €1,500,000 0.38% 3/9/2027 1,758,640 0.01%Republic of Austria Government Bond €1,102,000 1.50% 2/11/2086 1,708,116 0.01%Republic of Austria Government Bond €1,200,000 0.75% 20/3/2051 1,469,344 0.01%Republic of Austria Government Bond €1,157,000 0.00% 20/4/2025 1,399,997 0.01%HYPO NOE Landesbank fuer Niederoesterreich und Wien AG €1,100,000 0.01% 18/6/2027 1,316,054 0.01%BAWAG PSK Bank fuer Arbeit und Wirtschaft und Oesterreichische
Postsparkasse AG €1,000,000 0.01% 21/1/2028 1,197,072 0.01%Erste Group Bank AG €1,000,000 0.10% 15/1/2030 1,194,136 0.01%UniCredit Bank Austria AG €900,000 0.63% 20/3/2029 1,123,087 0.01%OMV AG €930,000 0.00% 3/7/2025 1,104,948 0.01%OMV AG €910,000 1.00% 3/7/2034 1,091,937 0.01%Autobahnen- und Schnell- strassen-Finanzierungs AG €950,000 0.10% 16/7/2035 1,088,048 0.01%Oesterreichische Kontrollbank AG €800,000 0.00% 8/10/2026 960,728 0.01%Oesterreichische Kontrollbank AG $895,000 3.13% 7/11/2023 951,447 0.01%

359
Vanguard Global Bond Index Fund
Principal CouponMaturity
DateFair Value
US Dollars ($)% of Total
Net AssetsAutobahnen- und Schnell- strassen-Finanzierungs AG €700,000 0.00% 16/7/2027 840,641 0.01%Raiffeisenlandesbank Niederoesterreich-Wien AG €700,000 0.38% 15/1/2035 834,630 0.01%BAWAG PSK Bank fuer Arbeit und Wirtschaft und Oesterreichische
Postsparkasse AG €700,000 0.01% 2/10/2029 831,291 0.00%Oesterreichische Kontrollbank AG CHF600,000 2.88% 25/2/2030 818,623 0.00%Oesterreichische Kontrollbank AG $800,000 0.38% 17/9/2025 785,432 0.00%OeBB-Infrastruktur AG €500,000 2.25% 28/5/2029 697,028 0.00%Oesterreichische Kontrollbank AG $700,000 0.50% 2/2/2026 688,064 0.00%JAB Holdings BV €500,000 2.50% 25/6/2029 668,535 0.00%Borealis AG €500,000 1.75% 10/12/2025 634,490 0.00%Erste Group Bank AG €500,000 0.75% 5/2/2025 616,950 0.00%JAB Holdings BV €500,000 1.25% 22/5/2024 614,164 0.00%UNIQA Insurance Group AG €400,000 1.38% 9/7/2030 506,901 0.00%JAB Holdings BV €400,000 1.75% 25/6/2026 506,641 0.00%OMV AG^ €400,000 2.50% Perpetual 496,352 0.00%Raiffeisenlandesbank Niederoesterreich-Wien AG €400,000 0.38% 13/9/2024 486,070 0.00%Hypo Vorarlberg Bank AG €400,000 0.25% 21/5/2027 485,467 0.00%Erste Group Bank AG €400,000 0.63% 19/1/2023 482,532 0.00%CA Immobilien Anlagen AG €400,000 0.88% 5/2/2027 476,685 0.00%Oesterreichische Kontrollbank AG $400,000 1.50% 12/2/2025 411,480 0.00%Autobahnen- und Schnell- strassen-Finanzierungs AG €260,000 2.75% 11/6/2032 393,750 0.00%Republic of Austria Government Bond €300,000 3.40% 22/11/2022 375,932 0.00%UniCredit Bank Austria AG €300,000 0.75% 25/2/2025 370,228 0.00%OMV AG €300,000 0.75% 16/6/2030 365,346 0.00%Autobahnen- und Schnell- strassen-Finanzierungs AG €300,000 0.10% 9/7/2029 360,080 0.00%Suzano Austria GmbH $320,000 3.13% 15/1/2032 316,669 0.00%OMV AG^ €200,000 6.25% Perpetual 286,381 0.00%OMV AG^ €200,000 2.88% Perpetual 247,053 0.00%Hypo Vorarlberg Bank AG €200,000 0.75% 11/2/2025 246,666 0.00%JAB Holdings BV $250,000 2.20% 23/11/2030 243,555 0.00%JAB Holdings BV €200,000 1.00% 20/12/2027 242,836 0.00%Raiffeisen-Landesbank Steiermark AG €200,000 0.63% 20/1/2023 241,212 0.00%Autobahnen- und Schnell- strassen-Finanzierungs AG €200,000 0.63% 15/9/2022 240,544 0.00%OeBB-Infrastruktur AG €180,000 1.00% 18/11/2024 223,587 0.00%Oesterreichische Kontrollbank AG $200,000 1.63% 17/9/2022 203,375 0.00%OeBB-Infrastruktur AG €100,000 3.00% 24/10/2033 156,985 0.00%Republic of Austria Government Bond €122,000 1.65% 21/10/2024 155,597 0.00%Autobahnen- und Schnell- strassen-Finanzierungs AG €100,000 2.75% 20/6/2033 153,594 0.00%Verbund AG €100,000 1.50% 20/11/2024 125,740 0.00%Erste Group Bank AG €100,000 0.75% 17/1/2028 125,589 0.00%JAB Holdings BV €100,000 1.63% 30/4/2025 125,020 0.00%Oesterreichische Kontrollbank AG CHF100,000 2.63% 22/11/2024 119,811 0.00%Republic of Austria Government International Bond CA($)100,000 5.38% 1/12/2034 106,637 0.00%Oesterreichische Kontrollbank AG $100,000 2.88% 13/3/2023 104,380 0.00%OeBB-Infrastruktur AG €50,000 3.38% 18/5/2032 79,259 0.00%Autobahnen- und Schnell- strassen-Finanzierungs AG €50,000 3.38% 22/9/2025 68,685 0.00%OeBB-Infrastruktur AG €50,000 2.25% 4/7/2023 62,573 0.00%Telekom Finanzmanagement GmbH €21,000 3.13% 3/12/2021 25,275 0.00%test - - - 163,832,480 0.74%Belgium 1.36% (2020: 1.30%)Kingdom of Belgium Government Bond €34,300,000 2.25% 22/6/2023 43,041,681 0.20%Kingdom of Belgium Government Bond €31,800,000 0.10% 22/6/2030 38,221,584 0.17%Kingdom of Belgium Government Bond €19,500,000 0.80% 22/6/2025 24,378,458 0.11%Kingdom of Belgium Government Bond €10,550,000 0.80% 22/6/2027 13,386,881 0.06%Kingdom of Belgium Government Bond €6,440,000 3.75% 22/6/2045 12,696,031 0.06%Kingdom of Belgium Government Bond €10,000,000 0.50% 22/10/2024 12,300,449 0.06%Kingdom of Belgium Government Bond €7,000,000 1.90% 22/6/2038 10,204,895 0.05%Kingdom of Belgium Government Bond €6,300,000 1.45% 22/6/2037 8,622,690 0.04%Kingdom of Belgium Government Bond €5,000,000 2.25% 22/6/2057 8,262,343 0.04%Kingdom of Belgium Government Bond €5,719,000 1.70% 22/6/2050 8,201,462 0.04%Kingdom of Belgium Government Bond €5,000,000 1.25% 22/4/2033 6,686,393 0.03%Kingdom of Belgium Government Bond €3,125,000 5.00% 28/3/2035 6,073,245 0.03%Kingdom of Belgium Government Bond €4,255,000 0.40% 22/6/2040 4,856,619 0.02%Anheuser-Busch Cos LLC/Anheuser-Busch InBev Worldwide, Inc. $3,835,000 4.90% 1/2/2046 4,850,933 0.02%Kingdom of Belgium Government Bond €4,839,000 0.65% 22/6/2071 4,773,618 0.02%Kingdom of Belgium Government Bond €2,800,000 3.00% 22/6/2034 4,484,946 0.02%Kingdom of Belgium Government Bond €2,753,000 1.00% 22/6/2026 3,504,449 0.02%Kingdom of Belgium Government Bond €2,900,000 4.25% 28/9/2021 3,479,970 0.02%Anheuser-Busch InBev SA €1,800,000 2.75% 17/3/2036 2,585,202 0.01%Anheuser-Busch Cos LLC/Anheuser-Busch InBev Worldwide, Inc. $2,050,000 4.70% 1/2/2036 2,514,270 0.01%Region Wallonne Belgium €2,100,000 0.50% 22/6/2037 2,399,783 0.01%
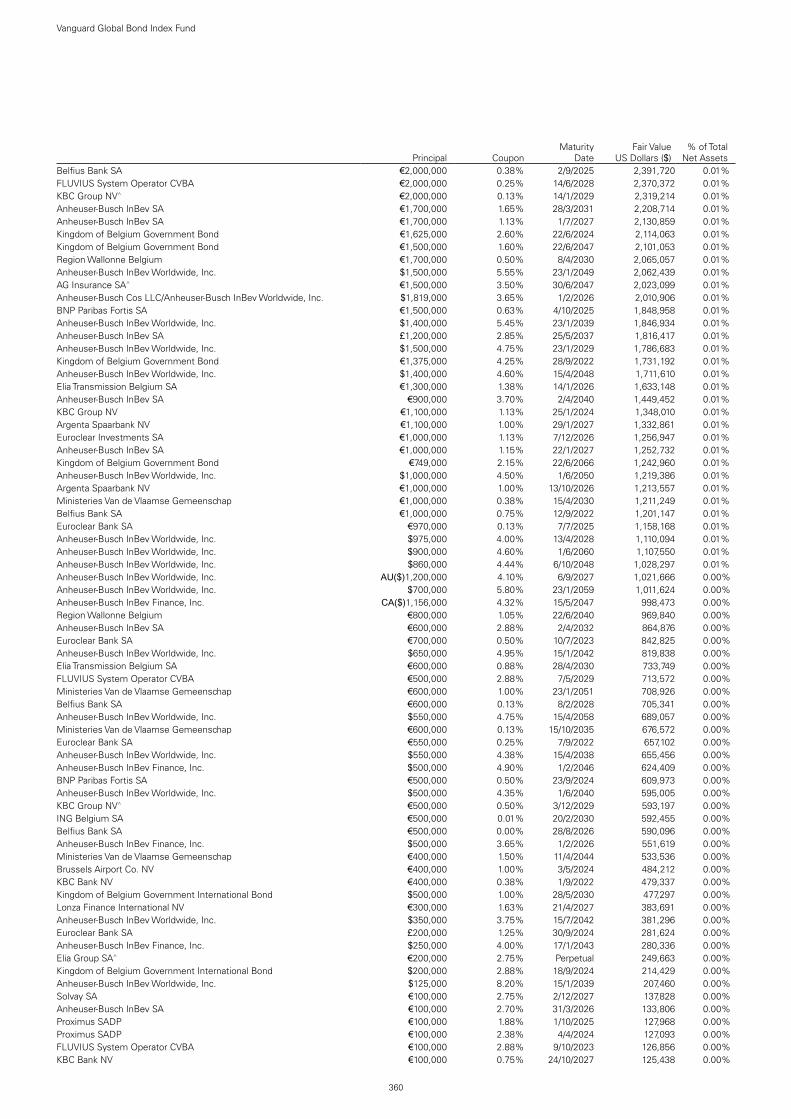
360
Vanguard Global Bond Index Fund
Principal CouponMaturity
DateFair Value
US Dollars ($)% of Total
Net AssetsBelfius Bank SA €2,000,000 0.38% 2/9/2025 2,391,720 0.01%FLUVIUS System Operator CVBA €2,000,000 0.25% 14/6/2028 2,370,372 0.01%KBC Group NV^ €2,000,000 0.13% 14/1/2029 2,319,214 0.01%Anheuser-Busch InBev SA €1,700,000 1.65% 28/3/2031 2,208,714 0.01%Anheuser-Busch InBev SA €1,700,000 1.13% 1/7/2027 2,130,859 0.01%Kingdom of Belgium Government Bond €1,625,000 2.60% 22/6/2024 2,114,063 0.01%Kingdom of Belgium Government Bond €1,500,000 1.60% 22/6/2047 2,101,053 0.01%Region Wallonne Belgium €1,700,000 0.50% 8/4/2030 2,065,057 0.01%Anheuser-Busch InBev Worldwide, Inc. $1,500,000 5.55% 23/1/2049 2,062,439 0.01%AG Insurance SA^ €1,500,000 3.50% 30/6/2047 2,023,099 0.01%Anheuser-Busch Cos LLC/Anheuser-Busch InBev Worldwide, Inc. $1,819,000 3.65% 1/2/2026 2,010,906 0.01%BNP Paribas Fortis SA €1,500,000 0.63% 4/10/2025 1,848,958 0.01%Anheuser-Busch InBev Worldwide, Inc. $1,400,000 5.45% 23/1/2039 1,846,934 0.01%Anheuser-Busch InBev SA £1,200,000 2.85% 25/5/2037 1,816,417 0.01%Anheuser-Busch InBev Worldwide, Inc. $1,500,000 4.75% 23/1/2029 1,786,683 0.01%Kingdom of Belgium Government Bond €1,375,000 4.25% 28/9/2022 1,731,192 0.01%Anheuser-Busch InBev Worldwide, Inc. $1,400,000 4.60% 15/4/2048 1,711,610 0.01%Elia Transmission Belgium SA €1,300,000 1.38% 14/1/2026 1,633,148 0.01%Anheuser-Busch InBev SA €900,000 3.70% 2/4/2040 1,449,452 0.01%KBC Group NV €1,100,000 1.13% 25/1/2024 1,348,010 0.01%Argenta Spaarbank NV €1,100,000 1.00% 29/1/2027 1,332,861 0.01%Euroclear Investments SA €1,000,000 1.13% 7/12/2026 1,256,947 0.01%Anheuser-Busch InBev SA €1,000,000 1.15% 22/1/2027 1,252,732 0.01%Kingdom of Belgium Government Bond €749,000 2.15% 22/6/2066 1,242,960 0.01%Anheuser-Busch InBev Worldwide, Inc. $1,000,000 4.50% 1/6/2050 1,219,386 0.01%Argenta Spaarbank NV €1,000,000 1.00% 13/10/2026 1,213,557 0.01%Ministeries Van de Vlaamse Gemeenschap €1,000,000 0.38% 15/4/2030 1,211,249 0.01%Belfius Bank SA €1,000,000 0.75% 12/9/2022 1,201,147 0.01%Euroclear Bank SA €970,000 0.13% 7/7/2025 1,158,168 0.01%Anheuser-Busch InBev Worldwide, Inc. $975,000 4.00% 13/4/2028 1,110,094 0.01%Anheuser-Busch InBev Worldwide, Inc. $900,000 4.60% 1/6/2060 1,107,550 0.01%Anheuser-Busch InBev Worldwide, Inc. $860,000 4.44% 6/10/2048 1,028,297 0.01%Anheuser-Busch InBev Worldwide, Inc. AU($)1,200,000 4.10% 6/9/2027 1,021,666 0.00%Anheuser-Busch InBev Worldwide, Inc. $700,000 5.80% 23/1/2059 1,011,624 0.00%Anheuser-Busch InBev Finance, Inc. CA($)1,156,000 4.32% 15/5/2047 998,473 0.00%Region Wallonne Belgium €800,000 1.05% 22/6/2040 969,840 0.00%Anheuser-Busch InBev SA €600,000 2.88% 2/4/2032 864,876 0.00%Euroclear Bank SA €700,000 0.50% 10/7/2023 842,825 0.00%Anheuser-Busch InBev Worldwide, Inc. $650,000 4.95% 15/1/2042 819,838 0.00%Elia Transmission Belgium SA €600,000 0.88% 28/4/2030 733,749 0.00%FLUVIUS System Operator CVBA €500,000 2.88% 7/5/2029 713,572 0.00%Ministeries Van de Vlaamse Gemeenschap €600,000 1.00% 23/1/2051 708,926 0.00%Belfius Bank SA €600,000 0.13% 8/2/2028 705,341 0.00%Anheuser-Busch InBev Worldwide, Inc. $550,000 4.75% 15/4/2058 689,057 0.00%Ministeries Van de Vlaamse Gemeenschap €600,000 0.13% 15/10/2035 676,572 0.00%Euroclear Bank SA €550,000 0.25% 7/9/2022 657,102 0.00%Anheuser-Busch InBev Worldwide, Inc. $550,000 4.38% 15/4/2038 655,456 0.00%Anheuser-Busch InBev Finance, Inc. $500,000 4.90% 1/2/2046 624,409 0.00%BNP Paribas Fortis SA €500,000 0.50% 23/9/2024 609,973 0.00%Anheuser-Busch InBev Worldwide, Inc. $500,000 4.35% 1/6/2040 595,005 0.00%KBC Group NV^ €500,000 0.50% 3/12/2029 593,197 0.00%ING Belgium SA €500,000 0.01% 20/2/2030 592,455 0.00%Belfius Bank SA €500,000 0.00% 28/8/2026 590,096 0.00%Anheuser-Busch InBev Finance, Inc. $500,000 3.65% 1/2/2026 551,619 0.00%Ministeries Van de Vlaamse Gemeenschap €400,000 1.50% 11/4/2044 533,536 0.00%Brussels Airport Co. NV €400,000 1.00% 3/5/2024 484,212 0.00%KBC Bank NV €400,000 0.38% 1/9/2022 479,337 0.00%Kingdom of Belgium Government International Bond $500,000 1.00% 28/5/2030 477,297 0.00%Lonza Finance International NV €300,000 1.63% 21/4/2027 383,691 0.00%Anheuser-Busch InBev Worldwide, Inc. $350,000 3.75% 15/7/2042 381,296 0.00%Euroclear Bank SA £200,000 1.25% 30/9/2024 281,624 0.00%Anheuser-Busch InBev Finance, Inc. $250,000 4.00% 17/1/2043 280,336 0.00%Elia Group SA^ €200,000 2.75% Perpetual 249,663 0.00%Kingdom of Belgium Government International Bond $200,000 2.88% 18/9/2024 214,429 0.00%Anheuser-Busch InBev Worldwide, Inc. $125,000 8.20% 15/1/2039 207,460 0.00%Solvay SA €100,000 2.75% 2/12/2027 137,828 0.00%Anheuser-Busch InBev SA €100,000 2.70% 31/3/2026 133,806 0.00%Proximus SADP €100,000 1.88% 1/10/2025 127,968 0.00%Proximus SADP €100,000 2.38% 4/4/2024 127,093 0.00%FLUVIUS System Operator CVBA €100,000 2.88% 9/10/2023 126,856 0.00%KBC Bank NV €100,000 0.75% 24/10/2027 125,438 0.00%

361
Vanguard Global Bond Index Fund
Principal CouponMaturity
DateFair Value
US Dollars ($)% of Total
Net AssetsBelfius Bank SA €100,000 0.75% 10/2/2025 123,347 0.00%test - - - 299,931,638 1.36%Bermuda 0.02% (2020: 0.01%)Bermuda Government International Bond $1,800,000 3.72% 25/1/2027 1,968,876 0.01%Bermuda Government International Bond $800,000 4.85% 6/2/2024 881,511 0.01%Triton Container International Ltd. $200,000 3.15% 15/6/2031 201,277 0.00%Triton Container International Ltd. $200,000 1.15% 7/6/2024 199,503 0.00%test - - - 3,251,167 0.02%Brazil 0.04% (2020: 0.04%)Suzano Austria GmbH $900,000 7.00% 16/3/2047 1,215,801 0.01%Vale Overseas Ltd. $612,000 6.88% 21/11/2036 838,702 0.01%Vale Overseas Ltd. $575,000 6.88% 10/11/2039 802,505 0.01%GUSAP III LP $600,000 4.25% 21/1/2030 649,074 0.01%Vale Overseas Ltd. $600,000 3.75% 8/7/2030 638,127 0.00%Vale Overseas Ltd. $425,000 8.25% 17/1/2034 619,008 0.00%Suzano Austria GmbH $500,000 6.00% 15/1/2029 595,200 0.00%Fibria Overseas Finance Ltd. $450,000 5.25% 12/5/2024 503,552 0.00%Votorantim Cimentos International SA $200,000 7.25% 5/4/2041 271,077 0.00%Vale Canada Ltd. $200,000 7.20% 15/9/2032 262,012 0.00%Raizen Fuels Finance SA $200,000 5.30% 20/1/2027 226,593 0.00%Suzano Austria GmbH $200,000 5.00% 15/1/2030 226,480 0.00%Gerdau Trade, Inc. $200,000 4.88% 24/10/2027 224,596 0.00%Vale Overseas Ltd. $150,000 6.25% 10/8/2026 180,272 0.00%GTL Trade Finance, Inc./Gerdau Holdings, Inc. $158,000 5.89% 29/4/2024 177,525 0.00%Fibria Overseas Finance Ltd. $150,000 4.00% 14/1/2025 162,029 0.00%Vale SA $100,000 5.63% 11/9/2042 125,102 0.00%test - - - 7,717,655 0.04%Bulgaria 0.02% (2020: 0.03%)Bulgaria Government International Bond €2,600,000 0.38% 23/9/2030 3,030,846 0.02%Bulgaria Government International Bond €400,000 3.13% 26/3/2035 597,264 0.00%Bulgaria Government International Bond €530,000 1.38% 23/9/2050 592,148 0.00%Bulgaria Government International Bond €400,000 1.88% 21/3/2023 492,203 0.00%Bulgaria Government International Bond €100,000 3.00% 21/3/2028 140,579 0.00%Bulgaria Government International Bond €100,000 2.95% 3/9/2024 130,481 0.00%test - - - 4,983,521 0.02%Canada 3.70% (2020: 3.71%)Canadian Government Bond CA($)18,681,000 1.25% 1/3/2025 15,343,531 0.07%Canadian Government Bond CA($)13,300,000 0.25% 1/5/2023 10,701,461 0.05%Canadian Government Bond CA($)12,531,000 2.00% 1/12/2051 10,488,874 0.05%Canadian Government Bond CA($)12,411,000 0.25% 1/8/2022 10,019,326 0.05%Canadian Government Bond CA($)11,245,000 0.25% 1/11/2022 9,068,882 0.04%Canadian Government Bond CA($)10,470,000 0.25% 1/2/2023 8,436,767 0.04%Canadian Government Bond CA($)10,252,000 1.25% 1/6/2030 8,218,988 0.04%Canadian Government Bond CA($)6,836,000 5.75% 1/6/2033 8,042,553 0.04%Province of Ontario Canada CA($)7,050,000 4.65% 2/6/2041 7,621,636 0.04%Canadian Government Bond CA($)7,973,000 2.50% 1/6/2024 6,783,300 0.03%Toronto-Dominion Bank $6,600,000 2.50% 18/1/2022 6,680,393 0.03%Canadian Government Bond CA($)5,375,000 5.00% 1/6/2037 6,400,653 0.03%Canadian Government Bond CA($)7,555,000 0.50% 1/9/2025 6,005,810 0.03%Canadian Government Bond CA($)7,143,000 1.00% 1/9/2022 5,814,827 0.03%Canadian Government Bond CA($)6,829,000 1.75% 1/3/2023 5,638,008 0.03%Province of Ontario Canada CA($)5,960,000 3.45% 2/6/2045 5,562,004 0.03%Province of Quebec Canada CA($)5,840,000 3.10% 1/12/2051 5,220,544 0.03%Province of Ontario Canada CA($)5,670,000 2.90% 2/12/2046 4,837,217 0.02%Province of Ontario Canada CA($)5,765,000 2.65% 2/12/2050 4,671,415 0.02%Canada Housing Trust No 1 CA($)5,545,000 2.40% 15/12/2022 4,608,579 0.02%Province of Ontario Canada CA($)5,420,000 2.80% 2/6/2048 4,539,181 0.02%Canadian Government Bond CA($)5,359,000 2.25% 1/3/2024 4,516,495 0.02%Canada Housing Trust No 1 CA($)5,185,000 2.90% 15/6/2024 4,447,715 0.02%Province of Quebec Canada CA($)4,605,000 3.50% 1/12/2048 4,398,972 0.02%Province of Ontario Canada CA($)5,130,000 2.60% 2/6/2025 4,381,301 0.02%Province of Quebec Canada CA($)4,165,000 4.25% 1/12/2043 4,378,164 0.02%Province of Ontario Canada CA($)5,050,000 2.90% 2/6/2049 4,304,977 0.02%Canadian Government Bond CA($)5,765,000 0.50% 1/12/2030 4,292,058 0.02%Canadian Government Bond CA($)5,078,000 1.50% 1/9/2024 4,204,256 0.02%Province of Ontario Canada CA($)5,145,000 2.05% 2/6/2030 4,200,988 0.02%Province of Ontario Canada CA($)3,950,000 4.60% 2/6/2039 4,188,118 0.02%Province of Quebec Canada $3,900,000 2.50% 20/4/2026 4,176,678 0.02%Province of Ontario Canada CA($)4,920,000 2.85% 2/6/2023 4,147,080 0.02%Canadian Government Bond CA($)3,741,000 3.50% 1/12/2045 4,038,135 0.02%Canadian Government Bond CA($)4,908,000 1.00% 1/6/2027 3,944,235 0.02%

362
Vanguard Global Bond Index Fund
Principal CouponMaturity
DateFair Value
US Dollars ($)% of Total
Net AssetsCanadian Government Bond CA($)4,025,000 2.75% 1/12/2048 3,900,700 0.02%Canada Housing Trust No 1 CA($)4,680,000 1.80% 15/12/2024 3,897,354 0.02%Province of Quebec Canada CA($)4,375,000 3.75% 1/9/2024 3,852,727 0.02%Province of Ontario Canada CA($)4,340,000 3.50% 2/6/2024 3,773,666 0.02%Canadian Government Bond CA($)4,390,000 2.25% 1/6/2025 3,744,002 0.02%Province of Ontario Canada CA($)3,300,000 5.60% 2/6/2035 3,714,971 0.02%Province of Ontario Canada CA($)4,190,000 2.90% 2/6/2028 3,665,213 0.02%Province of Quebec Canada CA($)3,790,000 3.50% 1/12/2045 3,598,242 0.02%Province of Quebec Canada CA($)4,430,000 1.90% 1/9/2030 3,582,489 0.02%Canada Housing Trust No 1 CA($)4,220,000 2.35% 15/9/2023 3,540,650 0.02%Province of Ontario Canada CA($)3,760,000 3.50% 2/6/2043 3,530,423 0.02%Bank of Nova Scotia €2,900,000 0.38% 10/3/2023 3,487,218 0.02%Canada Housing Trust No 1 CA($)4,150,000 1.75% 15/6/2030 3,363,539 0.02%Province of Ontario Canada CA($)3,815,000 2.70% 2/6/2029 3,289,810 0.02%Canada Housing Trust No 1 CA($)3,860,000 2.55% 15/12/2023 3,262,920 0.02%Province of Quebec Canada CA($)2,815,000 5.00% 1/12/2041 3,203,757 0.02%Canada Housing Trust No 1 CA($)3,665,000 2.65% 15/3/2028 3,186,395 0.02%Province of Ontario Canada CA($)3,700,000 2.60% 2/6/2027 3,175,607 0.02%Province of Ontario Canada CA($)4,590,000 1.90% 2/12/2051 3,138,983 0.02%Province of Ontario Canada $2,940,000 3.05% 29/1/2024 3,131,288 0.02%Hydro-Quebec CA($)2,605,000 5.00% 15/2/2050 3,114,594 0.02%Province of Ontario Canada CA($)3,635,000 2.40% 2/6/2026 3,088,488 0.02%Ontario Teachers' Finance Trust €2,590,000 0.10% 19/5/2028 3,076,371 0.02%Province of Alberta Canada CA($)3,525,000 3.10% 1/6/2050 3,058,044 0.02%Province of Quebec Canada $3,000,000 1.90% 21/4/2031 3,055,735 0.02%Canadian Government Bond CA($)2,664,000 4.00% 1/6/2041 2,979,089 0.02%Province of Quebec Canada CA($)3,475,000 2.30% 1/9/2029 2,923,215 0.01%Province of Quebec Canada CA($)3,350,000 2.75% 1/9/2027 2,909,252 0.01%Province of Ontario Canada €2,500,000 0.01% 25/11/2030 2,899,485 0.01%Hydro-Quebec CA($)2,705,000 4.00% 15/2/2055 2,851,901 0.01%Province of British Columbia Canada CA($)3,335,000 2.20% 18/6/2030 2,770,508 0.01%Canada Housing Trust No 1 CA($)3,400,000 1.25% 15/6/2026 2,748,602 0.01%Province of Alberta Canada CA($)3,345,000 2.05% 1/6/2030 2,721,946 0.01%Province of Alberta Canada €2,200,000 0.63% 18/4/2025 2,695,812 0.01%Province of Quebec Canada CA($)3,120,000 2.75% 1/9/2025 2,688,301 0.01%Canada Housing Trust No 1 CA($)3,205,000 2.35% 15/6/2023 2,680,562 0.01%Province of Ontario Canada CA($)3,200,000 1.75% 8/9/2025 2,647,733 0.01%Canada Housing Trust No 1 CA($)3,125,000 1.95% 15/12/2025 2,613,390 0.01%Province of Quebec Canada CA($)2,980,000 2.75% 1/9/2028 2,592,409 0.01%Ontario Teachers' Cadillac Fairview Properties Trust $2,255,000 4.13% 1/2/2029 2,571,483 0.01%Canada Housing Trust No 1 CA($)2,855,000 2.55% 15/3/2025 2,439,618 0.01%Province of Ontario Canada CA($)3,190,000 1.35% 2/12/2030 2,437,340 0.01%Province of Ontario Canada €2,000,000 0.38% 14/6/2024 2,424,246 0.01%CPPIB Capital, Inc. £1,750,000 0.38% 25/7/2023 2,422,374 0.01%National Bank of Canada €2,000,000 0.25% 24/7/2023 2,406,036 0.01%Export Development Canada €2,000,000 0.00% 27/1/2025 2,404,121 0.01%Canada Government International Bond $2,400,000 0.75% 19/5/2026 2,385,329 0.01%Province of British Columbia Canada CA($)2,680,000 2.95% 18/6/2050 2,334,750 0.01%Canadian Government Bond CA($)2,800,000 2.00% 1/9/2023 2,333,617 0.01%Province of Alberta Canada CA($)2,675,000 2.55% 1/6/2027 2,287,871 0.01%Province of Ontario Canada CA($)2,155,000 4.70% 2/6/2037 2,278,514 0.01%Bank of Montreal €1,900,000 0.13% 26/3/2023 2,275,873 0.01%Canada Housing Trust No 1 CA($)2,605,000 2.65% 15/12/2028 2,267,095 0.01%Province of Quebec Canada CA($)1,990,000 6.25% 1/6/2032 2,257,387 0.01%Province of Quebec Canada CA($)2,675,000 3.50% 1/12/2022 2,254,018 0.01%Ontario Teachers' Finance Trust €1,800,000 0.50% 6/5/2025 2,195,975 0.01%Canada Housing Trust No 1 CA($)2,885,000 1.10% 15/3/2031 2,191,293 0.01%Province of Alberta Canada CA($)2,533,000 3.05% 1/12/2048 2,183,139 0.01%Province of Quebec Canada €1,800,000 0.25% 5/5/2031 2,131,464 0.01%Hydro-Quebec CA($)1,835,000 5.00% 15/2/2045 2,127,210 0.01%Province of Quebec Canada CA($)2,440,000 2.50% 1/9/2026 2,087,386 0.01%Province of Ontario Canada CA($)2,450,000 2.60% 8/9/2023 2,063,671 0.01%Nutrien Ltd. $1,800,000 4.13% 15/3/2035 2,057,951 0.01%Royal Bank of Canada $1,950,000 2.25% 1/11/2024 2,043,568 0.01%Province of Ontario Canada CA($)2,500,000 2.15% 2/6/2031 2,038,361 0.01%Province of Ontario Canada £1,490,000 0.25% 15/12/2026 1,999,939 0.01%Canada Housing Trust No 1 CA($)2,480,000 0.95% 15/6/2025 1,997,634 0.01%Air Canada 2017-1 Class AA Pass Through Trust $1,962,000 3.30% 15/1/2030 1,982,023 0.01%Province of Alberta Canada CA($)2,250,000 2.90% 1/12/2028 1,964,187 0.01%Canadian Government Bond CA($)2,510,000 0.25% 1/3/2026 1,959,824 0.01%Province of British Columbia Canada $1,795,000 2.25% 2/6/2026 1,901,293 0.01%

363
Vanguard Global Bond Index Fund
Principal CouponMaturity
DateFair Value
US Dollars ($)% of Total
Net AssetsProvince of Quebec Canada CA($)2,185,000 3.00% 1/9/2023 1,856,421 0.01%Bank of Nova Scotia €1,550,000 0.01% 14/1/2027 1,855,565 0.01%Province of New Brunswick Canada CA($)2,155,000 2.35% 14/8/2027 1,822,964 0.01%Hydro-Quebec CA($)1,475,000 6.00% 15/2/2040 1,820,359 0.01%Royal Bank of Canada $1,800,000 1.15% 10/6/2025 1,809,934 0.01%Canadian Imperial Bank of Commerce $1,700,000 3.10% 2/4/2024 1,807,311 0.01%Province of Alberta Canada $1,700,000 2.05% 17/8/2026 1,778,047 0.01%Canadian Natural Resources Ltd. $1,700,000 2.95% 15/7/2030 1,763,346 0.01%Canada Housing Trust No 1 CA($)2,090,000 2.10% 15/9/2029 1,749,650 0.01%Toronto-Dominion Bank $1,700,000 1.90% 1/12/2022 1,738,257 0.01%Province of Quebec Canada €1,400,000 0.88% 15/1/2025 1,732,840 0.01%PSP Capital, Inc. CA($)2,100,000 2.05% 15/1/2030 1,730,051 0.01%Province of British Columbia Canada CA($)1,590,000 4.30% 18/6/2042 1,674,896 0.01%Canada Housing Trust No 1 CA($)2,000,000 1.90% 15/9/2026 1,666,331 0.01%Canada Housing Trust No 1 CA($)1,910,000 2.35% 15/6/2027 1,628,975 0.01%Province of Ontario Canada AU($)2,000,000 3.10% 26/8/2025 1,624,788 0.01%Province of Alberta Canada CA($)1,770,000 3.30% 1/12/2046 1,589,750 0.01%Canada Housing Trust No 1 CA($)1,845,000 3.15% 15/9/2023 1,573,975 0.01%Federation des Caisses Desjardins du Quebec €1,300,000 0.01% 24/9/2025 1,560,733 0.01%Royal Bank of Canada $1,500,000 1.60% 17/4/2023 1,532,791 0.01%Province of British Columbia Canada CA($)1,795,000 2.80% 18/6/2048 1,523,208 0.01%CDP Financial, Inc. $1,505,000 0.88% 10/6/2025 1,508,151 0.01%Bank of Nova Scotia $1,500,000 0.70% 15/4/2024 1,501,448 0.01%Province of Ontario Canada $1,370,000 3.40% 17/10/2023 1,462,178 0.01%Province of Quebec Canada CA($)1,250,000 5.75% 1/12/2036 1,461,167 0.01%Province of British Columbia Canada CA($)1,700,000 2.55% 18/6/2027 1,460,388 0.01%Province of British Columbia Canada CA($)1,605,000 3.20% 18/6/2044 1,458,713 0.01%Canada Housing Trust No 1 CA($)1,785,000 1.90% 15/3/2031 1,458,316 0.01%Province of Ontario Canada CA($)1,855,000 1.05% 8/9/2027 1,456,588 0.01%Hydro-Quebec CA($)2,060,000 2.10% 15/2/2060 1,444,879 0.01%Province of Quebec Canada CA($)1,345,000 6.00% 1/10/2029 1,435,245 0.01%CPPIB Capital, Inc. $1,485,000 1.25% 28/1/2031 1,429,414 0.01%Canadian Government Bond CA($)1,725,000 1.50% 1/6/2023 1,420,982 0.01%Province of Quebec Canada £1,000,000 1.50% 15/12/2023 1,420,574 0.01%Toronto-Dominion Bank^ CA($)1,670,000 3.59% 14/9/2028 1,419,327 0.01%Hydro-Quebec CA($)1,175,000 6.50% 15/2/2035 1,419,152 0.01%Province of Quebec Canada £1,000,000 0.75% 13/12/2024 1,393,361 0.01%Cenovus Energy, Inc. $1,025,000 6.75% 15/11/2039 1,390,009 0.01%Canadian Government Bond CA($)1,500,000 8.00% 1/6/2023 1,384,974 0.01%Canadian Government Bond CA($)1,700,000 1.50% 1/6/2031 1,380,369 0.01%Intact Financial Corp. CA($)1,590,000 2.85% 7/6/2027 1,350,499 0.01%Canada Housing Trust No 1 CA($)1,725,000 1.40% 15/3/2031 1,347,454 0.01%Province of Ontario Canada CA($)1,200,000 6.20% 2/6/2031 1,336,143 0.01%Province of Ontario Canada CA($)1,190,000 5.85% 8/3/2033 1,323,158 0.01%Canadian Government Bond CA($)1,305,000 2.75% 1/12/2064 1,319,070 0.01%Bell Telephone Co. of Canada or Bell Canada CA($)1,590,000 2.20% 29/5/2028 1,282,881 0.01%CPPIB Capital, Inc. $1,200,000 3.13% 25/9/2023 1,272,853 0.01%Province of Ontario Canada CA($)1,530,000 1.85% 1/2/2027 1,265,284 0.01%Fortis, Inc. CA($)1,500,000 2.85% 12/12/2023 1,260,503 0.01%Province of Ontario Canada CA($)1,465,000 2.65% 5/2/2025 1,252,791 0.01%Royal Bank of Canada €1,000,000 0.63% 10/9/2025 1,231,261 0.01%Province of Manitoba Canada CA($)1,150,000 4.65% 5/3/2040 1,229,115 0.01%Bank of Nova Scotia €1,000,000 0.50% 22/1/2025 1,220,901 0.01%Province of Ontario Canada CA($)1,440,000 2.30% 8/9/2024 1,214,451 0.01%OMERS Finance Trust €1,000,000 0.45% 13/5/2025 1,213,686 0.01%Province of British Columbia Canada CA($)1,400,000 2.85% 18/6/2025 1,209,757 0.01%Canadian Imperial Bank of Commerce €1,000,000 0.75% 22/3/2023 1,209,173 0.01%Toronto-Dominion Bank €1,000,000 0.10% 19/7/2027 1,202,545 0.01%Royal Bank of Canada €1,000,000 0.25% 28/6/2023 1,202,455 0.01%Bank of Nova Scotia $1,125,000 2.70% 3/8/2026 1,201,539 0.01%Bank of Nova Scotia €1,000,000 0.25% 28/9/2022 1,196,665 0.01%Province of Quebec Canada €1,025,000 0.00% 29/10/2030 1,191,526 0.01%Bank of Montreal $1,150,000 1.85% 1/5/2025 1,188,291 0.01%Province of Manitoba Canada CA($)1,380,000 2.60% 2/6/2027 1,184,069 0.01%AltaGas Ltd. CA($)1,330,000 3.98% 4/10/2027 1,175,156 0.01%Toronto-Dominion Bank €980,000 0.00% 9/2/2024 1,174,040 0.01%Province of Quebec Canada €1,000,000 0.00% 15/10/2029 1,173,954 0.01%Suncor Energy, Inc. $815,000 6.80% 15/5/2038 1,171,128 0.01%Bank of Nova Scotia^ CA($)1,390,000 2.84% 3/7/2029 1,167,998 0.01%Barrick Gold Corp. $885,000 5.25% 1/4/2042 1,165,281 0.01%Ontario Teachers' Finance Trust €1,000,000 0.05% 25/11/2030 1,160,757 0.01%
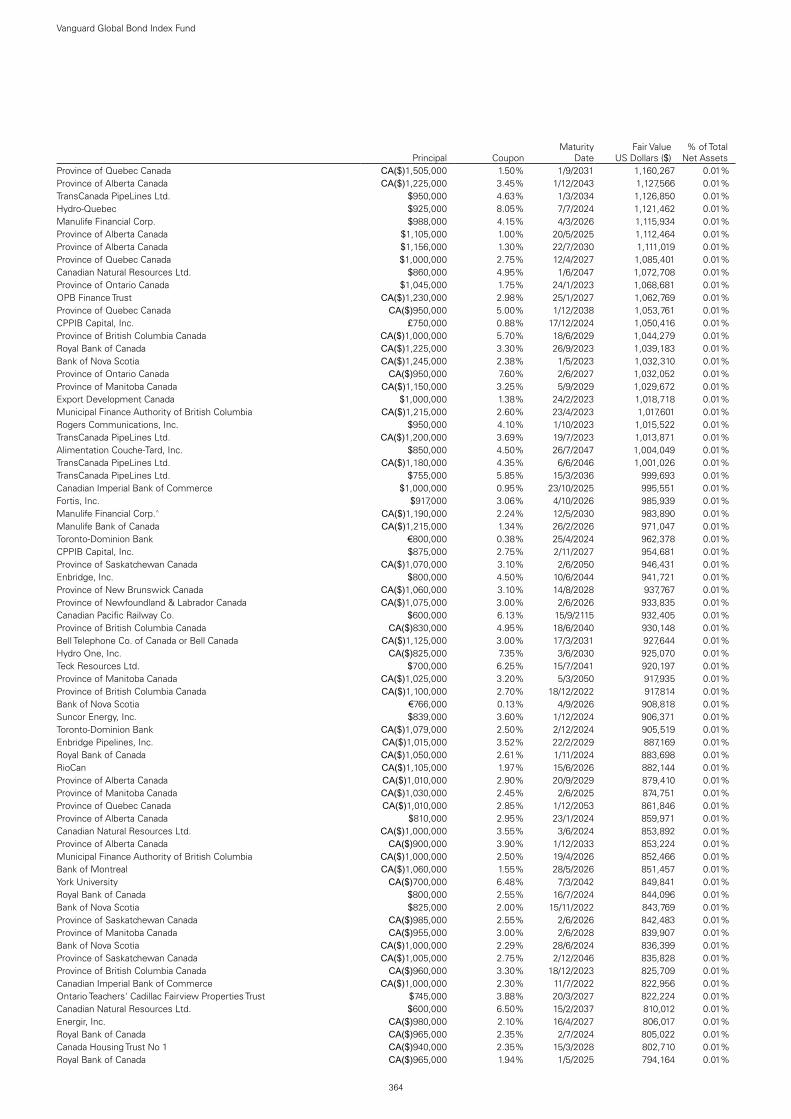
364
Vanguard Global Bond Index Fund
Principal CouponMaturity
DateFair Value
US Dollars ($)% of Total
Net AssetsProvince of Quebec Canada CA($)1,505,000 1.50% 1/9/2031 1,160,267 0.01%Province of Alberta Canada CA($)1,225,000 3.45% 1/12/2043 1,127,566 0.01%TransCanada PipeLines Ltd. $950,000 4.63% 1/3/2034 1,126,850 0.01%Hydro-Quebec $925,000 8.05% 7/7/2024 1,121,462 0.01%Manulife Financial Corp. $988,000 4.15% 4/3/2026 1,115,934 0.01%Province of Alberta Canada $1,105,000 1.00% 20/5/2025 1,112,464 0.01%Province of Alberta Canada $1,156,000 1.30% 22/7/2030 1,111,019 0.01%Province of Quebec Canada $1,000,000 2.75% 12/4/2027 1,085,401 0.01%Canadian Natural Resources Ltd. $860,000 4.95% 1/6/2047 1,072,708 0.01%Province of Ontario Canada $1,045,000 1.75% 24/1/2023 1,068,681 0.01%OPB Finance Trust CA($)1,230,000 2.98% 25/1/2027 1,062,769 0.01%Province of Quebec Canada CA($)950,000 5.00% 1/12/2038 1,053,761 0.01%CPPIB Capital, Inc. £750,000 0.88% 17/12/2024 1,050,416 0.01%Province of British Columbia Canada CA($)1,000,000 5.70% 18/6/2029 1,044,279 0.01%Royal Bank of Canada CA($)1,225,000 3.30% 26/9/2023 1,039,183 0.01%Bank of Nova Scotia CA($)1,245,000 2.38% 1/5/2023 1,032,310 0.01%Province of Ontario Canada CA($)950,000 7.60% 2/6/2027 1,032,052 0.01%Province of Manitoba Canada CA($)1,150,000 3.25% 5/9/2029 1,029,672 0.01%Export Development Canada $1,000,000 1.38% 24/2/2023 1,018,718 0.01%Municipal Finance Authority of British Columbia CA($)1,215,000 2.60% 23/4/2023 1,017,601 0.01%Rogers Communications, Inc. $950,000 4.10% 1/10/2023 1,015,522 0.01%TransCanada PipeLines Ltd. CA($)1,200,000 3.69% 19/7/2023 1,013,871 0.01%Alimentation Couche-Tard, Inc. $850,000 4.50% 26/7/2047 1,004,049 0.01%TransCanada PipeLines Ltd. CA($)1,180,000 4.35% 6/6/2046 1,001,026 0.01%TransCanada PipeLines Ltd. $755,000 5.85% 15/3/2036 999,693 0.01%Canadian Imperial Bank of Commerce $1,000,000 0.95% 23/10/2025 995,551 0.01%Fortis, Inc. $917,000 3.06% 4/10/2026 985,939 0.01%Manulife Financial Corp.^ CA($)1,190,000 2.24% 12/5/2030 983,890 0.01%Manulife Bank of Canada CA($)1,215,000 1.34% 26/2/2026 971,047 0.01%Toronto-Dominion Bank €800,000 0.38% 25/4/2024 962,378 0.01%CPPIB Capital, Inc. $875,000 2.75% 2/11/2027 954,681 0.01%Province of Saskatchewan Canada CA($)1,070,000 3.10% 2/6/2050 946,431 0.01%Enbridge, Inc. $800,000 4.50% 10/6/2044 941,721 0.01%Province of New Brunswick Canada CA($)1,060,000 3.10% 14/8/2028 937,767 0.01%Province of Newfoundland & Labrador Canada CA($)1,075,000 3.00% 2/6/2026 933,835 0.01%Canadian Pacific Railway Co. $600,000 6.13% 15/9/2115 932,405 0.01%Province of British Columbia Canada CA($)830,000 4.95% 18/6/2040 930,148 0.01%Bell Telephone Co. of Canada or Bell Canada CA($)1,125,000 3.00% 17/3/2031 927,644 0.01%Hydro One, Inc. CA($)825,000 7.35% 3/6/2030 925,070 0.01%Teck Resources Ltd. $700,000 6.25% 15/7/2041 920,197 0.01%Province of Manitoba Canada CA($)1,025,000 3.20% 5/3/2050 917,935 0.01%Province of British Columbia Canada CA($)1,100,000 2.70% 18/12/2022 917,814 0.01%Bank of Nova Scotia €766,000 0.13% 4/9/2026 908,818 0.01%Suncor Energy, Inc. $839,000 3.60% 1/12/2024 906,371 0.01%Toronto-Dominion Bank CA($)1,079,000 2.50% 2/12/2024 905,519 0.01%Enbridge Pipelines, Inc. CA($)1,015,000 3.52% 22/2/2029 887,169 0.01%Royal Bank of Canada CA($)1,050,000 2.61% 1/11/2024 883,698 0.01%RioCan CA($)1,105,000 1.97% 15/6/2026 882,144 0.01%Province of Alberta Canada CA($)1,010,000 2.90% 20/9/2029 879,410 0.01%Province of Manitoba Canada CA($)1,030,000 2.45% 2/6/2025 874,751 0.01%Province of Quebec Canada CA($)1,010,000 2.85% 1/12/2053 861,846 0.01%Province of Alberta Canada $810,000 2.95% 23/1/2024 859,971 0.01%Canadian Natural Resources Ltd. CA($)1,000,000 3.55% 3/6/2024 853,892 0.01%Province of Alberta Canada CA($)900,000 3.90% 1/12/2033 853,224 0.01%Municipal Finance Authority of British Columbia CA($)1,000,000 2.50% 19/4/2026 852,466 0.01%Bank of Montreal CA($)1,060,000 1.55% 28/5/2026 851,457 0.01%York University CA($)700,000 6.48% 7/3/2042 849,841 0.01%Royal Bank of Canada $800,000 2.55% 16/7/2024 844,096 0.01%Bank of Nova Scotia $825,000 2.00% 15/11/2022 843,769 0.01%Province of Saskatchewan Canada CA($)985,000 2.55% 2/6/2026 842,483 0.01%Province of Manitoba Canada CA($)955,000 3.00% 2/6/2028 839,907 0.01%Bank of Nova Scotia CA($)1,000,000 2.29% 28/6/2024 836,399 0.01%Province of Saskatchewan Canada CA($)1,005,000 2.75% 2/12/2046 835,828 0.01%Province of British Columbia Canada CA($)960,000 3.30% 18/12/2023 825,709 0.01%Canadian Imperial Bank of Commerce CA($)1,000,000 2.30% 11/7/2022 822,956 0.01%Ontario Teachers' Cadillac Fairview Properties Trust $745,000 3.88% 20/3/2027 822,224 0.01%Canadian Natural Resources Ltd. $600,000 6.50% 15/2/2037 810,012 0.01%Energir, Inc. CA($)980,000 2.10% 16/4/2027 806,017 0.01%Royal Bank of Canada CA($)965,000 2.35% 2/7/2024 805,022 0.01%Canada Housing Trust No 1 CA($)940,000 2.35% 15/3/2028 802,710 0.01%Royal Bank of Canada CA($)965,000 1.94% 1/5/2025 794,164 0.01%

365
Vanguard Global Bond Index Fund
Principal CouponMaturity
DateFair Value
US Dollars ($)% of Total
Net AssetsToronto-Dominion Bank CA($)960,000 1.94% 13/3/2025 791,061 0.01%407 International, Inc. CA($)905,000 3.14% 6/3/2030 788,821 0.01%Canadian Government Bond CA($)700,000 8.00% 1/6/2027 788,203 0.01%Province of Alberta Canada CA($)915,000 3.10% 1/6/2024 787,057 0.01%Granite Holdings LP CA($)990,000 2.38% 18/12/2030 775,968 0.01%Bank of Montreal^ $700,000 3.80% 15/12/2032 771,704 0.01%TransCanada PipeLines Ltd. $610,000 4.88% 15/5/2048 771,429 0.01%Bank of Montreal CA($)870,000 3.19% 1/3/2028 766,034 0.01%HSBC Bank Canada $750,000 0.95% 14/5/2023 757,718 0.01%Province of Ontario Canada CA($)700,000 6.50% 8/3/2029 756,830 0.01%Canadian Natural Resources Ltd. $695,000 3.90% 1/2/2025 756,675 0.01%Ontario Electricity Financial Corp. CA($)703,000 8.25% 22/6/2026 753,708 0.01%Province of Ontario Canada CA($)850,000 9.50% 13/7/2022 750,484 0.01%Toronto-Dominion Bank $750,000 0.45% 11/9/2023 750,481 0.01%Ontario Teachers' Finance Trust $750,000 0.38% 29/9/2023 748,651 0.01%Bank of Nova Scotia^ CA($)870,000 3.89% 18/1/2029 747,940 0.01%Canadian Imperial Bank of Commerce CA($)905,000 2.00% 17/4/2025 746,130 0.01%Cenovus Energy, Inc. $600,000 5.40% 15/6/2047 744,995 0.01%Fairfax Financial Holdings Ltd. $650,000 4.63% 29/4/2030 743,617 0.01%Canadian Government Bond CA($)700,000 9.00% 1/6/2025 743,384 0.01%Province of Saskatchewan Canada CA($)810,000 3.30% 2/6/2048 742,143 0.01%University of Toronto CA($)750,000 4.25% 7/12/2051 739,210 0.01%Province of Nova Scotia Canada CA($)910,000 2.00% 1/9/2030 738,749 0.01%Bank of Montreal CA($)870,000 2.70% 11/9/2024 737,183 0.01%Province of Manitoba Canada CA($)845,000 2.75% 2/6/2029 730,831 0.01%Province of Manitoba Canada CA($)865,000 2.55% 2/6/2023 725,099 0.01%Canadian National Railway Co. $800,000 2.45% 1/5/2050 723,975 0.01%Canada Government International Bond $705,000 2.00% 15/11/2022 721,936 0.01%Ontario Teachers' Finance Trust $700,000 1.63% 12/9/2024 720,690 0.01%Canadian National Railway Co. CA($)820,000 3.95% 22/9/2045 718,144 0.00%Province of Alberta Canada CA($)785,000 3.50% 1/6/2031 715,704 0.00%Enbridge, Inc. CA($)850,000 3.19% 5/12/2022 708,496 0.00%Province of Alberta Canada CA($)910,000 1.65% 1/6/2031 706,331 0.00%Province of Quebec Canada $686,000 1.50% 11/2/2025 705,031 0.00%Province of Ontario Canada CA($)750,000 8.10% 8/9/2023 703,607 0.00%OMERS Finance Trust $700,000 1.10% 26/3/2026 702,401 0.00%Toronto-Dominion Bank^ CA($)825,000 3.11% 22/4/2030 701,833 0.00%Canadian Natural Resources Ltd. $500,000 6.75% 1/2/2039 701,777 0.00%Province of Newfoundland & Labrador Canada CA($)925,000 2.65% 17/10/2050 697,901 0.00%Province of Alberta Canada CA($)825,000 2.20% 1/6/2026 694,469 0.00%Brookfield Finance, Inc. $600,000 4.35% 15/4/2030 693,310 0.00%Toronto-Dominion Bank CA($)820,000 2.85% 8/3/2024 692,637 0.00%Province of New Brunswick Canada CA($)800,000 3.05% 14/8/2050 690,815 0.00%Province of Saskatchewan Canada CA($)780,000 3.05% 2/12/2028 688,642 0.00%Province of Saskatchewan Canada CA($)685,000 3.90% 2/6/2045 683,744 0.00%Greater Toronto Airports Authority CA($)875,000 2.75% 17/10/2039 682,367 0.00%Pembina Pipeline Corp. CA($)805,000 3.31% 1/2/2030 676,368 0.00%Great-West Lifeco, Inc. CA($)893,000 2.98% 8/7/2050 676,350 0.00%CI Financial Corp. CA($)785,000 3.76% 26/5/2025 675,866 0.00%Province of Manitoba Canada CA($)800,000 2.85% 5/9/2046 673,438 0.00%Toronto-Dominion Bank CA($)815,000 1.91% 18/7/2023 672,802 0.00%Royal Bank of Canada CA($)800,000 2.95% 1/5/2023 671,820 0.00%Province of Quebec Canada $575,000 7.13% 9/2/2024 670,309 0.00%Province of British Columbia Canada CA($)790,000 2.30% 18/6/2026 670,185 0.00%Bank of Nova Scotia CA($)765,000 3.10% 2/2/2028 669,608 0.00%Bank of Montreal CA($)795,000 2.89% 20/6/2023 668,229 0.00%Hydro-Quebec CA($)600,000 6.00% 15/8/2031 660,454 0.00%Royal Bank of Canada^ CA($)805,000 2.09% 30/6/2030 659,981 0.00%Bank of Montreal $650,000 2.50% 11/1/2022 657,559 0.00%Brookfield Renewable Partners ULC CA($)755,000 3.38% 15/1/2030 656,623 0.00%TransCanada PipeLines Ltd. $475,000 6.20% 15/10/2037 652,495 0.00%Province of Newfoundland & Labrador Canada CA($)755,000 2.85% 2/6/2028 652,243 0.00%Federation des Caisses Desjardins du Quebec CA($)790,000 2.39% 25/8/2022 651,652 0.00%Suncor Energy, Inc. CA($)800,000 3.95% 4/3/2051 647,569 0.00%Emera US Finance LP $540,000 4.75% 15/6/2046 644,524 0.00%Rogers Communications, Inc. CA($)750,000 4.00% 13/3/2024 644,299 0.00%Enbridge, Inc. CA($)755,000 3.20% 8/6/2027 643,276 0.00%H&R CA($)785,000 2.91% 2/6/2026 641,507 0.00%Hydro-Quebec CA($)725,000 9.63% 15/7/2022 641,075 0.00%South Coast British Columbia Transportation Authority CA($)820,000 1.60% 3/7/2030 640,924 0.00%Canadian Imperial Bank of Commerce CA($)735,000 3.30% 26/5/2025 640,181 0.00%

366
Vanguard Global Bond Index Fund
Principal CouponMaturity
DateFair Value
US Dollars ($)% of Total
Net AssetsBell Telephone Co. of Canada or Bell Canada CA($)720,000 3.80% 21/8/2028 637,634 0.00%Federation des Caisses Desjardins du Quebec^ CA($)790,000 1.99% 28/5/2031 636,593 0.00%Bank of Nova Scotia CA($)765,000 2.16% 3/2/2025 634,686 0.00%Royal Bank of Canada^ CA($)752,000 2.88% 23/12/2029 633,976 0.00%City of Montreal Canada CA($)725,000 3.00% 1/9/2027 633,068 0.00%Province of Manitoba Canada CA($)680,000 3.40% 5/9/2048 630,564 0.00%Choice Properties LP CA($)760,000 3.60% 20/9/2022 629,989 0.00%Brookfield Infrastructure Finance ULC CA($)735,000 3.41% 9/10/2029 625,408 0.00%Export Development Canada $600,000 2.75% 15/3/2023 625,241 0.00%CU, Inc. CA($)600,000 4.59% 24/10/2061 625,175 0.00%Canadian Pacific Railway Co. $587,000 2.90% 1/2/2025 623,257 0.00%407 International, Inc. CA($)600,000 4.68% 7/10/2053 622,154 0.00%Export Development Canada $600,000 2.50% 24/1/2023 620,987 0.00%National Bank of Canada $605,000 2.10% 1/2/2023 620,737 0.00%Toronto-Dominion Bank CA($)765,000 1.89% 8/3/2028 616,800 0.00%OMERS Realty Corp. CA($)700,000 3.24% 4/10/2027 610,798 0.00%AltaLink LP CA($)600,000 4.87% 15/11/2040 610,553 0.00%Province of Newfoundland & Labrador Canada CA($)710,000 3.30% 17/10/2046 610,152 0.00%TransCanada PipeLines Ltd. CA($)695,000 3.80% 5/4/2027 609,948 0.00%CPPIB Capital, Inc. €500,000 0.25% 6/4/2027 606,420 0.00%Rogers Communications, Inc. $515,000 4.35% 1/5/2049 606,176 0.00%Bank of Nova Scotia $600,000 1.30% 11/6/2025 605,739 0.00%Toronto-Dominion Bank $600,000 0.75% 12/6/2023 604,319 0.00%Province of Saskatchewan Canada CA($)700,000 2.65% 2/6/2027 602,793 0.00%Federation des Caisses Desjardins du Quebec €500,000 0.38% 30/5/2023 602,239 0.00%Bank of Montreal €500,000 0.75% 21/9/2022 601,783 0.00%Province of British Columbia Canada CA($)510,000 4.90% 18/6/2048 601,612 0.00%TransCanada PipeLines Ltd. $500,000 4.75% 15/5/2038 601,268 0.00%Canadian Imperial Bank of Commerce $600,000 1.15% 8/7/2026 599,502 0.00%Royal Bank of Canada €500,000 0.13% 23/7/2024 597,819 0.00%Hydro One, Inc. CA($)700,000 2.77% 24/2/2026 596,207 0.00%TELUS Corp. CA($)710,000 3.35% 15/3/2023 592,896 0.00%CDP Financial, Inc. $550,000 3.15% 24/7/2024 592,273 0.00%PSP Capital, Inc. CA($)680,000 3.00% 5/11/2025 591,586 0.00%Choice Properties CA($)685,000 3.53% 11/6/2029 589,905 0.00%Brookfield Asset Management, Inc. $538,000 4.00% 15/1/2025 589,129 0.00%CPPIB Capital, Inc. €500,000 0.75% 15/7/2049 586,621 0.00%Province of Alberta Canada CA($)700,000 2.55% 15/12/2022 583,117 0.00%Canadian Imperial Bank of Commerce CA($)700,000 2.43% 9/6/2023 581,624 0.00%Bank of Montreal CA($)695,000 2.37% 3/2/2025 580,490 0.00%Enbridge, Inc. CA($)700,000 4.24% 27/8/2042 579,727 0.00%National Bank of Canada CA($)680,000 2.98% 4/3/2024 575,680 0.00%Province of Nova Scotia Canada CA($)500,000 6.60% 1/12/2031 573,736 0.00%Province of Alberta Canada CA($)675,000 2.65% 1/9/2023 569,042 0.00%Bruce Power LP CA($)630,000 4.00% 21/6/2030 564,180 0.00%Rogers Communications, Inc. CA($)665,000 3.25% 1/5/2029 561,586 0.00%Province of New Brunswick Canada CA($)600,000 3.55% 3/6/2043 561,286 0.00%Loblaw Cos Ltd. CA($)605,000 4.49% 11/12/2028 561,126 0.00%Province of Manitoba Canada $548,000 2.10% 6/9/2022 559,759 0.00%Bank of Montreal $550,000 2.10% 15/6/2022 559,278 0.00%Export Development Canada $550,000 1.75% 18/7/2022 559,000 0.00%Enbridge Gas, Inc. CA($)650,000 2.81% 1/6/2026 553,413 0.00%Toronto-Dominion Bank^ $500,000 3.63% 15/9/2031 553,253 0.00%Canadian Imperial Bank of Commerce^ CA($)655,000 2.95% 19/6/2029 551,493 0.00%Canadian Imperial Bank of Commerce^ CA($)650,000 3.45% 4/4/2028 546,515 0.00%Bank of Montreal CA($)655,000 2.28% 29/7/2024 545,419 0.00%TELUS Corp. CA($)645,000 3.15% 19/2/2030 544,242 0.00%CPPIB Capital, Inc. €500,000 0.25% 18/1/2041 544,091 0.00%Great-West Lifeco, Inc. CA($)620,000 3.34% 28/2/2028 542,990 0.00%TELUS Corp. CA($)600,000 4.70% 6/3/2048 542,867 0.00%Shaw Communications, Inc. CA($)500,000 6.75% 9/11/2039 542,739 0.00%Aeroports de Montreal CA($)500,000 5.67% 16/10/2037 542,112 0.00%Province of Nova Scotia Canada CA($)515,000 4.40% 1/6/2042 541,841 0.00%Toronto-Dominion Bank^ CA($)635,000 3.06% 26/1/2032 540,716 0.00%Royal Bank of Canada CA($)650,000 2.36% 5/12/2022 537,891 0.00%Bank of Montreal^ CA($)650,000 2.08% 17/6/2030 532,724 0.00%Bell Telephone Co. of Canada or Bell Canada CA($)600,000 4.45% 27/2/2047 530,347 0.00%HSBC Bank Canada CA($)655,000 1.78% 20/5/2026 529,847 0.00%Enbridge, Inc. CA($)635,000 2.99% 3/10/2029 528,717 0.00%Province of British Columbia Canada CA($)600,000 2.95% 18/12/2028 528,507 0.00%Canadian Imperial Bank of Commerce CA($)620,000 3.29% 15/1/2024 528,096 0.00%

367
Vanguard Global Bond Index Fund
Principal CouponMaturity
DateFair Value
US Dollars ($)% of Total
Net AssetsOMERS Finance Trust $500,000 2.50% 2/5/2024 526,332 0.00%Province of Manitoba Canada CA($)500,000 4.40% 5/3/2042 524,759 0.00%Export Development Canada €430,000 0.25% 7/3/2026 522,218 0.00%Antares Holdings LP $500,000 3.95% 15/7/2026 520,260 0.00%Municipal Finance Authority of British Columbia CA($)620,000 2.15% 3/6/2024 519,777 0.00%Province of Alberta Canada $500,000 1.88% 13/11/2024 519,590 0.00%OMERS Realty Corp. CA($)600,000 3.33% 5/6/2025 519,586 0.00%Alimentation Couche-Tard, Inc. CA($)600,000 3.60% 2/6/2025 519,093 0.00%Province of Manitoba Canada CA($)510,000 4.05% 5/9/2045 518,758 0.00%Province of Saskatchewan Canada CA($)500,000 5.75% 5/3/2029 518,638 0.00%Nutrien Ltd. $480,000 3.38% 15/3/2025 517,628 0.00%CT CA($)600,000 3.53% 9/6/2025 515,874 0.00%Province of Newfoundland & Labrador Canada CA($)560,000 3.70% 17/10/2048 514,607 0.00%Sun Life Financial, Inc.^ CA($)500,000 5.40% 29/5/2042 514,429 0.00%Province of Saskatchewan Canada CA($)620,000 2.20% 2/6/2030 512,518 0.00%SmartCentres CA($)600,000 3.44% 28/8/2026 512,499 0.00%TransCanada PipeLines Ltd. $500,000 2.50% 1/8/2022 511,625 0.00%TransCanada PipeLines Ltd. $370,000 6.10% 1/6/2040 508,827 0.00%Suncor Energy, Inc. $360,000 6.50% 15/6/2038 508,099 0.00%Canada Government International Bond $490,000 1.63% 22/1/2025 506,828 0.00%Canadian Imperial Bank of Commerce CA($)600,000 2.97% 11/7/2023 505,463 0.00%City of Toronto Canada CA($)585,000 2.65% 9/11/2029 500,465 0.00%Bank of Montreal $500,000 0.45% 8/12/2023 500,183 0.00%Toronto-Dominion Bank $500,000 0.55% 4/3/2024 499,615 0.00%Royal Bank of Canada $500,000 1.20% 27/4/2026 499,460 0.00%National Bank of Canada CA($)595,000 2.55% 12/7/2024 499,051 0.00%Province of Nova Scotia Canada CA($)560,000 3.15% 1/12/2051 498,988 0.00%Bank of Montreal CA($)600,000 2.27% 11/7/2022 493,638 0.00%Canadian Natural Resources Ltd. $475,000 2.95% 15/1/2023 492,145 0.00%Bank of Nova Scotia $471,000 2.20% 3/2/2025 491,741 0.00%Bank of Montreal^ $500,000 0.95% 22/1/2027 491,230 0.00%Financement-Quebec CA($)455,000 5.25% 1/6/2034 487,961 0.00%Province of New Brunswick Canada CA($)470,000 4.65% 26/9/2035 484,488 0.00%Federation des Caisses Desjardins du Quebec €400,000 0.05% 26/11/2027 479,026 0.00%Ontario Teachers' Finance Trust $500,000 1.25% 27/9/2030 478,196 0.00%Enbridge Gas, Inc. CA($)580,000 2.37% 9/8/2029 478,070 0.00%Fairfax Financial Holdings Ltd. CA($)530,000 4.70% 16/12/2026 475,044 0.00%North West Redwater Partnership/NWR Financing Co., Ltd. CA($)500,000 4.75% 1/6/2037 472,991 0.00%Regional Municipality of Peel Ontario CA($)425,000 5.10% 29/6/2040 469,345 0.00%Suncor Energy, Inc. $350,000 5.95% 1/12/2034 462,811 0.00%Canadian National Railway Co. CA($)545,000 2.80% 22/9/2025 462,772 0.00%Royal Bank of Canada CA($)500,000 4.93% 16/7/2025 461,861 0.00%Greater Toronto Airports Authority CA($)545,000 2.73% 3/4/2029 461,762 0.00%TransCanada PipeLines Ltd. CA($)530,000 4.55% 15/11/2041 461,114 0.00%Province of Newfoundland & Labrador Canada CA($)535,000 2.85% 2/6/2029 461,092 0.00%Muskrat Falls/Labrador Transmission Assets Funding Trust CA($)450,000 3.86% 1/12/2048 460,681 0.00%Ontario Teachers' Finance Trust $450,000 2.13% 19/9/2022 460,083 0.00%Toronto-Dominion Bank^ CA($)500,000 4.86% 4/3/2031 457,933 0.00%Bell Telephone Co. of Canada or Bell Canada CA($)500,000 4.75% 29/9/2044 457,870 0.00%City of Toronto Canada CA($)540,000 2.40% 7/6/2027 457,690 0.00%TELUS Corp. CA($)500,000 4.85% 5/4/2044 457,601 0.00%City of Montreal Canada CA($)500,000 3.50% 1/12/2038 455,444 0.00%Suncor Energy, Inc. CA($)535,000 3.00% 14/9/2026 455,117 0.00%Toyota Credit Canada, Inc. CA($)545,000 2.31% 23/10/2024 454,653 0.00%Toyota Credit Canada, Inc. CA($)540,000 3.04% 12/7/2023 454,286 0.00%South Coast British Columbia Transportation Authority CA($)525,000 3.15% 16/11/2048 451,225 0.00%Province of Ontario Canada CA($)545,000 1.95% 27/1/2023 450,496 0.00%Intact Financial Corp. CA($)580,000 1.93% 16/12/2030 449,462 0.00%Rio Tinto Alcan, Inc. $325,000 5.75% 1/6/2035 449,404 0.00%Canadian Imperial Bank of Commerce^ CA($)555,000 1.96% 21/4/2031 448,225 0.00%Choice Properties CA($)500,000 4.18% 8/3/2028 447,208 0.00%Pembina Pipeline Corp. CA($)505,000 4.02% 27/3/2028 446,469 0.00%Province of Newfoundland & Labrador Canada CA($)565,000 1.75% 2/6/2030 444,264 0.00%Nova Scotia Power, Inc. CA($)545,000 3.31% 25/4/2050 440,259 0.00%Province of Nova Scotia Canada CA($)450,000 3.50% 2/6/2062 439,362 0.00%SmartCentres CA($)520,000 3.53% 20/12/2029 438,969 0.00%FortisBC Energy, Inc. CA($)395,000 6.00% 2/10/2037 438,940 0.00%Brookfield Renewable Partners ULC CA($)500,000 3.63% 15/1/2027 438,577 0.00%Canadian Imperial Bank of Commerce CA($)525,000 2.35% 28/8/2024 437,973 0.00%Province of British Columbia Canada CA($)520,000 2.75% 18/6/2052 436,513 0.00%City of Toronto Canada CA($)500,000 3.90% 29/9/2023 432,550 0.00%
368
Vanguard Global Bond Index Fund
Principal CouponMaturity
DateFair Value
US Dollars ($)% of Total
Net AssetsProvince of Manitoba Canada CA($)500,000 3.30% 2/6/2024 432,432 0.00%NAV Canada CA($)490,000 3.53% 23/2/2046 432,043 0.00%SSL Finance, Inc. CA($)487,975 4.10% 31/10/2045 431,209 0.00%Canadian National Railway Co. $404,000 2.95% 21/11/2024 430,759 0.00%Nutrien Ltd. $300,000 6.13% 15/1/2041 429,301 0.00%Suncor Energy, Inc. CA($)500,000 4.34% 13/9/2046 429,215 0.00%Cenovus Energy, Inc. $375,000 5.38% 15/7/2025 429,019 0.00%Pembina Pipeline Corp. CA($)500,000 3.54% 3/2/2025 428,582 0.00%Bank of Montreal CA($)500,000 2.70% 9/12/2026 428,048 0.00%Honda Canada Finance, Inc. CA($)510,000 2.50% 4/6/2024 426,751 0.00%Cenovus Energy, Inc. CA($)500,000 3.60% 10/3/2027 426,746 0.00%Province of Alberta Canada CA($)505,000 2.95% 1/6/2052 426,521 0.00%Bank of Nova Scotia CA($)500,000 2.62% 2/12/2026 426,436 0.00%Enbridge Gas, Inc. CA($)500,000 3.51% 29/11/2047 426,371 0.00%Toronto Hydro Corp. CA($)450,000 4.08% 16/9/2044 425,441 0.00%First Capital CA($)500,000 3.60% 6/5/2026 424,219 0.00%Canadian Imperial Bank of Commerce^ CA($)520,000 2.01% 21/7/2030 424,036 0.00%Province of Alberta Canada CA($)500,000 2.35% 1/6/2025 423,127 0.00%Export Development Canada $400,000 2.63% 21/2/2024 422,627 0.00%Toronto-Dominion Bank CA($)500,000 3.01% 30/5/2023 420,831 0.00%Labrador-Island Link Funding Trust CA($)400,000 3.85% 1/12/2053 418,074 0.00%Emera, Inc. CA($)500,000 2.90% 16/6/2023 417,740 0.00%National Bank of Canada^ CA($)500,000 3.18% 1/2/2028 417,057 0.00%Bell Telephone Co. of Canada or Bell Canada CA($)501,000 2.90% 10/9/2029 416,736 0.00%Province of Quebec Canada $400,000 2.63% 13/2/2023 415,028 0.00%Thomson Reuters Corp. $300,000 5.85% 15/4/2040 414,463 0.00%TransCanada PipeLines Ltd. CA($)500,000 4.18% 3/7/2048 413,909 0.00%Honda Canada Finance, Inc. CA($)500,000 2.27% 15/7/2022 410,795 0.00%Thomson Reuters Corp. CA($)490,000 2.24% 14/5/2025 405,901 0.00%Central 1 Credit Union CA($)485,000 2.58% 6/12/2023 405,257 0.00%Toronto-Dominion Bank^ CA($)475,000 3.22% 25/7/2029 403,911 0.00%Toronto-Dominion Bank $400,000 1.15% 12/6/2025 402,974 0.00%Province of Saskatchewan Canada CA($)370,000 4.75% 1/6/2040 402,030 0.00%Shaw Communications, Inc. CA($)465,000 4.35% 31/1/2024 401,568 0.00%Barrick PD Australia Finance Pty Ltd. $290,000 5.95% 15/10/2039 401,355 0.00%Province of Manitoba Canada CA($)450,000 3.15% 5/9/2052 401,311 0.00%Bell Telephone Co. of Canada or Bell Canada CA($)500,000 2.50% 14/5/2030 399,715 0.00%Province of Saskatchewan Canada CA($)395,000 3.75% 5/3/2054 396,633 0.00%Cenovus Energy, Inc. $350,000 4.40% 15/4/2029 396,478 0.00%EPCOR Utilities, Inc. CA($)335,000 6.65% 15/4/2038 395,068 0.00%City of Montreal Canada CA($)500,000 1.75% 1/9/2030 393,882 0.00%Alberta Powerline LP CA($)437,201 4.07% 1/3/2054 393,224 0.00%Cenovus Energy, Inc. $350,000 4.25% 15/4/2027 391,365 0.00%Royal Office Finance LP CA($)391,794 5.21% 12/11/2032 391,134 0.00%Bell Telephone Co. of Canada or Bell Canada CA($)460,000 2.90% 12/8/2026 388,969 0.00%Hydro One, Inc. CA($)480,000 2.16% 28/2/2030 388,559 0.00%City of Montreal Canada CA($)450,000 2.75% 1/9/2026 386,823 0.00%Enbridge Gas, Inc. CA($)440,000 3.65% 1/4/2050 385,565 0.00%Penske Truck Leasing Canada, Inc. CA($)465,000 2.85% 7/12/2022 385,334 0.00%Bank of Nova Scotia CA($)490,000 1.40% 1/11/2027 384,043 0.00%Thomson Reuters Corp. $350,000 3.35% 15/5/2026 381,060 0.00%Ontario Power Generation, Inc. CA($)435,000 3.32% 4/10/2027 380,845 0.00%TransCanada PipeLines Ltd. $300,000 5.60% 31/3/2034 380,375 0.00%Brookfield Asset Management, Inc. CA($)430,000 5.04% 8/3/2024 378,658 0.00%OPB Finance Trust CA($)450,000 2.90% 24/5/2023 378,312 0.00%Royal Bank of Canada CA($)455,000 2.33% 28/1/2027 377,720 0.00%Royal Bank of Canada^ CA($)450,000 2.74% 25/7/2029 377,234 0.00%Province of New Brunswick Canada CA($)350,000 4.80% 26/9/2039 376,687 0.00%Lower Mattagami Energy LP CA($)360,000 4.94% 21/9/2043 376,199 0.00%Regional Municipality of York CA($)435,000 2.65% 18/4/2029 372,718 0.00%Province of Ontario Canada $350,000 2.30% 15/6/2026 370,989 0.00%Nutrien Ltd. $350,000 2.95% 13/5/2030 369,451 0.00%Bell Telephone Co. of Canada or Bell Canada CA($)485,000 3.50% 30/9/2050 367,073 0.00%Canadian Pacific Railway Co. $265,000 5.95% 15/5/2037 366,685 0.00%PSP Capital Inc CA($)425,000 3.29% 4/4/2024 366,678 0.00%ENMAX Corp. CA($)420,000 3.88% 18/10/2029 366,067 0.00%Brookfield Finance, Inc. $300,000 4.70% 20/9/2047 365,798 0.00%CI Financial Corp. $350,000 4.10% 15/6/2051 364,640 0.00%CDP Financial, Inc. $360,000 1.00% 17/4/2023 364,328 0.00%North West Redwater Partnership/NWR Financing Co., Ltd. CA($)425,000 4.05% 22/7/2044 363,851 0.00%Rogers Communications, Inc. CA($)350,000 6.11% 25/8/2040 360,836 0.00%
369
Vanguard Global Bond Index Fund
Principal CouponMaturity
DateFair Value
US Dollars ($)% of Total
Net AssetsCU, Inc. CA($)390,000 4.09% 2/9/2044 360,551 0.00%Province of Quebec Canada $250,000 7.50% 15/9/2029 359,667 0.00%Province of Manitoba Canada CA($)420,000 2.55% 2/6/2026 359,178 0.00%First Capital CA($)430,000 3.45% 1/3/2028 358,601 0.00%Magna International, Inc. $350,000 2.45% 15/6/2030 358,446 0.00%IGM Financial, Inc. CA($)400,000 4.12% 9/12/2047 357,659 0.00%TELUS Corp. CA($)425,000 2.75% 8/7/2026 357,133 0.00%Cenovus Energy, Inc. CA($)422,000 3.50% 7/2/2028 356,978 0.00%TransCanada PipeLines Ltd. CA($)420,000 4.34% 15/10/2049 356,908 0.00%CPPIB Capital, Inc. CA($)435,000 1.95% 30/9/2029 356,725 0.00%TELUS Corp. CA($)430,000 4.10% 5/4/2051 355,610 0.00%AltaLink LP CA($)340,000 4.92% 17/9/2043 355,570 0.00%Fairfax Financial Holdings Ltd. CA($)425,000 3.95% 3/3/2031 355,350 0.00%Enbridge Pipelines, Inc. CA($)400,000 4.55% 29/9/2045 354,493 0.00%City of Montreal Canada CA($)400,000 3.15% 1/9/2028 353,186 0.00%Enbridge Gas, Inc. CA($)415,000 2.90% 1/4/2030 352,881 0.00%Royal Bank of Canada CA($)420,000 2.33% 5/12/2023 350,717 0.00%Municipal Finance Authority of British Columbia CA($)425,000 2.30% 15/4/2031 350,682 0.00%Magna International, Inc. $325,000 3.63% 15/6/2024 350,611 0.00%Westcoast Energy, Inc. CA($)400,000 3.77% 8/12/2025 350,054 0.00%TELUS Corp. CA($)400,000 3.75% 17/1/2025 346,798 0.00%Toronto-Dominion Bank $350,000 0.75% 11/9/2025 346,662 0.00%Enbridge Gas, Inc. CA($)400,000 3.59% 22/11/2047 345,667 0.00%Province of Saskatchewan Canada CA($)400,000 3.20% 3/6/2024 345,050 0.00%Metro, Inc. CA($)390,000 4.27% 4/12/2047 344,969 0.00%Barrick North America Finance LLC $250,000 5.70% 30/5/2041 344,001 0.00%Province of New Brunswick Canada CA($)335,000 5.65% 27/12/2028 343,883 0.00%Enbridge, Inc. $320,000 3.13% 15/11/2029 342,712 0.00%Hydro One, Inc. CA($)300,000 6.93% 1/6/2032 339,432 0.00%Province of British Columbia Canada CA($)300,000 6.35% 18/6/2031 339,081 0.00%Province of New Brunswick Canada CA($)310,000 4.80% 3/6/2041 337,773 0.00%CPPIB Capital, Inc. CA($)380,000 3.00% 15/6/2028 336,415 0.00%Royal Bank of Canada^ CA($)430,000 1.67% 28/1/2033 336,052 0.00%Allied Properties CA($)400,000 3.39% 15/8/2029 335,904 0.00%Enbridge, Inc. $250,000 5.50% 1/12/2046 335,257 0.00%Great-West Lifeco, Inc. CA($)300,000 6.00% 16/11/2039 333,689 0.00%City of Ottawa Ontario CA($)440,000 2.50% 11/5/2051 333,377 0.00%CU, Inc. CA($)375,000 3.81% 10/9/2042 331,877 0.00%Province of Newfoundland & Labrador Canada CA($)300,000 5.70% 17/10/2035 331,334 0.00%FortisAlberta, Inc. CA($)300,000 6.22% 31/10/2034 327,510 0.00%Canadian Imperial Bank of Commerce $325,000 0.45% 22/6/2023 324,959 0.00%Bank of Montreal^ CA($)385,000 2.88% 17/9/2029 324,120 0.00%City of Toronto Canada CA($)395,000 2.90% 29/4/2051 323,739 0.00%Regional Municipality of York CA($)380,000 2.50% 2/6/2026 323,526 0.00%Canadian Imperial Bank of Commerce $325,000 1.25% 22/6/2026 323,373 0.00%Province of Quebec Canada $300,000 2.88% 16/10/2024 321,670 0.00%Greater Toronto Airports Authority CA($)300,000 5.30% 25/2/2041 321,469 0.00%Bank of Montreal $300,000 3.30% 5/2/2024 321,280 0.00%407 International, Inc. CA($)365,000 3.67% 8/3/2049 319,883 0.00%Province of Prince Edward Island Canada CA($)405,000 2.65% 1/12/2051 318,940 0.00%Province of New Brunswick Canada CA($)365,000 3.10% 14/8/2048 318,248 0.00%Province of Nova Scotia Canada CA($)300,000 4.90% 1/6/2035 316,914 0.00%Canadian Government Bond CA($)293,000 5.75% 1/6/2029 316,664 0.00%Bank of Montreal $300,000 2.50% 28/6/2024 316,642 0.00%Province of Quebec Canada $300,000 2.50% 9/4/2024 316,219 0.00%Suncor Energy, Inc. $285,000 4.00% 15/11/2047 314,966 0.00%Ontario Electricity Financial Corp. CA($)300,000 9.00% 26/5/2025 313,805 0.00%Hydro One, Inc. CA($)420,000 2.71% 28/2/2050 312,160 0.00%Teranet Holdings LP CA($)325,000 5.75% 17/12/2040 311,955 0.00%Federation des Caisses Desjardins du Quebec^ CA($)370,000 2.86% 26/5/2030 311,133 0.00%H&R CA($)370,000 3.37% 30/1/2024 309,963 0.00%407 International, Inc. CA($)410,000 2.84% 7/3/2050 309,442 0.00%Federation des Caisses Desjardins du Quebec CA($)370,000 2.42% 4/10/2024 309,284 0.00%Brookfield Renewable Partners ULC CA($)355,000 3.75% 2/6/2025 308,703 0.00%Canadian Natural Resources Ltd. $300,000 2.05% 15/7/2025 308,547 0.00%TELUS Corp. CA($)350,000 3.75% 10/3/2026 306,473 0.00%Municipal Finance Authority of British Columbia CA($)345,000 3.05% 23/10/2028 304,307 0.00%Canadian Tire Corp., Ltd. CA($)300,000 6.57% 24/2/2034 303,187 0.00%Pembina Pipeline Corp. CA($)350,000 4.75% 26/3/2048 303,117 0.00%Canadian Natural Resources Ltd. $225,000 6.25% 15/3/2038 300,831 0.00%AltaGas Ltd. CA($)380,000 2.08% 30/5/2028 300,159 0.00%

370
Vanguard Global Bond Index Fund
Principal CouponMaturity
DateFair Value
US Dollars ($)% of Total
Net AssetsHydro One, Inc. CA($)340,000 3.63% 25/6/2049 299,219 0.00%Brookfield Finance, Inc. $250,000 4.85% 29/3/2029 294,488 0.00%Province of Quebec Canada $300,000 1.35% 28/5/2030 293,437 0.00%Manulife Finance Delaware LP^ CA($)300,000 5.06% 15/12/2041 293,318 0.00%OMERS Finance Trust CA($)345,000 2.60% 14/5/2029 292,878 0.00%City of Winnipeg Canada CA($)282,000 4.30% 15/11/2051 292,343 0.00%CU, Inc. CA($)300,000 4.54% 24/10/2041 291,539 0.00%City of Montreal Canada CA($)300,000 4.10% 1/12/2034 290,271 0.00%Ontario Power Generation, Inc. CA($)305,000 4.25% 18/1/2049 288,262 0.00%Air Canada 2015-1 Class A Pass Through Trust $282,387 3.60% 15/3/2027 286,187 0.00%Bank of Nova Scotia CA($)340,000 2.49% 23/9/2024 285,022 0.00%Labrador-Island Link Funding Trust CA($)300,000 3.76% 1/6/2033 284,947 0.00%Regional Municipality of York CA($)300,000 4.00% 31/5/2032 283,868 0.00%City of Montreal Canada CA($)340,000 2.30% 1/9/2029 282,870 0.00%Royal Bank of Canada £200,000 1.38% 9/12/2024 281,862 0.00%Province of Nova Scotia Canada CA($)300,000 3.45% 1/6/2045 279,099 0.00%Shaw Communications, Inc. CA($)345,000 2.90% 9/12/2030 278,581 0.00%Aeroports de Montreal CA($)350,000 3.03% 21/4/2050 277,185 0.00%Muskrat Falls/Labrador Transmission Assets Funding Trust CA($)300,000 3.63% 1/6/2029 276,652 0.00%ARC Resources Ltd. CA($)335,000 3.47% 10/3/2031 276,423 0.00%AltaLink LP CA($)300,000 3.99% 30/6/2042 275,630 0.00%Manulife Bank of Canada CA($)330,000 2.84% 12/1/2023 274,927 0.00%TELUS Corp. CA($)340,000 3.95% 16/2/2050 274,282 0.00%Nutrien Ltd. $200,000 5.88% 1/12/2036 271,902 0.00%Bruce Power LP CA($)300,000 4.13% 21/6/2033 270,740 0.00%Bell Telephone Co. of Canada or Bell Canada CA($)310,000 3.60% 29/9/2027 270,515 0.00%City of Toronto Canada CA($)335,000 2.80% 22/11/2049 270,084 0.00%Northwestern Hydro Acquisition Co. III LP CA($)313,000 3.94% 31/12/2038 269,713 0.00%Bruce Power LP CA($)300,000 4.01% 21/6/2029 269,324 0.00%Cenovus Energy, Inc. $225,000 5.25% 15/6/2037 269,262 0.00%Canadian Pacific Railway Co. CA($)310,000 3.15% 13/3/2029 268,025 0.00%Suncor Energy, Inc. $250,000 3.10% 15/5/2025 267,661 0.00%Canadian Imperial Bank of Commerce $250,000 3.50% 13/9/2023 266,969 0.00%Bruce Power LP CA($)315,000 3.00% 21/6/2024 266,371 0.00%Nouvelle Autoroute 30 Financement, Inc. CA($)299,727 4.11% 31/3/2042 266,265 0.00%Nutrien Ltd. $250,000 3.00% 1/4/2025 266,204 0.00%Toronto-Dominion Bank $250,000 2.65% 12/6/2024 264,669 0.00%City of Toronto Canada CA($)350,000 2.15% 25/8/2040 262,086 0.00%Pembina Pipeline Corp. CA($)300,000 4.81% 25/3/2044 260,299 0.00%British Columbia Ferry Services, Inc. CA($)253,000 4.70% 23/10/2043 259,106 0.00%Federation des Caisses Desjardins du Quebec $250,000 2.05% 10/2/2025 258,096 0.00%AIMCo Realty Investors LP CA($)295,000 3.37% 1/6/2027 257,351 0.00%CI Financial Corp. $250,000 3.20% 17/12/2030 256,665 0.00%55 Ontario School Board Trust CA($)235,000 5.90% 2/6/2033 256,641 0.00%Royal Bank of Canada $250,000 1.95% 17/1/2023 256,199 0.00%Nutrien Ltd. $250,000 1.90% 13/5/2023 256,107 0.00%Canadian Imperial Bank of Commerce $250,000 2.35% 27/7/2022 255,585 0.00%Ontario Power Generation, Inc. CA($)295,000 3.22% 8/4/2030 255,368 0.00%Federation des Caisses Desjardins du Quebec $250,000 1.95% 26/9/2022 255,179 0.00%407 International, Inc. CA($)250,000 5.75% 14/2/2036 255,102 0.00%Canada Housing Trust No 1 CA($)300,000 2.25% 15/12/2025 254,028 0.00%OMERS Realty Corp. CA($)300,000 3.36% 5/6/2023 253,713 0.00%RioCan CA($)300,000 3.29% 12/2/2024 253,176 0.00%Canadian Imperial Bank of Commerce $250,000 0.95% 23/6/2023 252,291 0.00%National Bank of Canada^ $250,000 0.90% 15/8/2023 251,305 0.00%Toronto-Dominion Bank CA($)291,000 3.23% 24/7/2024 250,102 0.00%Toronto-Dominion Bank $250,000 0.25% 6/1/2023 249,775 0.00%Canadian Western Bank CA($)300,000 2.92% 15/12/2022 249,545 0.00%Greater Toronto Airports Authority CA($)200,200 6.98% 15/10/2032 249,406 0.00%Royal Bank of Canada $250,000 0.43% 19/1/2024 249,243 0.00%National Bank of Canada^ $250,000 0.55% 15/11/2024 248,904 0.00%Hydro One, Inc. CA($)250,000 4.59% 9/10/2043 248,699 0.00%Canadian Imperial Bank of Commerce CA($)300,000 2.47% 5/12/2022 248,615 0.00%Allied Properties CA($)295,000 3.11% 8/4/2027 247,915 0.00%Saputo, Inc. CA($)305,000 2.24% 16/6/2027 247,905 0.00%Bank of Montreal^ $230,000 4.34% 5/10/2028 246,786 0.00%Toronto-Dominion Bank $250,000 0.75% 6/1/2026 246,610 0.00%Canadian Western Bank CA($)295,000 2.60% 6/9/2024 246,522 0.00%North West Redwater Partnership/NWR Financing Co., Ltd. CA($)270,000 4.25% 1/6/2029 245,715 0.00%Plenary Properties LTAP LP CA($)226,702 6.29% 31/1/2044 245,354 0.00%Crombie CA($)275,000 4.80% 31/1/2025 244,049 0.00%

371
Vanguard Global Bond Index Fund
Principal CouponMaturity
DateFair Value
US Dollars ($)% of Total
Net AssetsBell Telephone Co. of Canada or Bell Canada $200,000 4.30% 29/7/2049 242,606 0.00%Fair Hydro Trust CA($)275,000 3.36% 15/5/2033 241,925 0.00%Fairfax Financial Holdings Ltd. $210,000 4.85% 17/4/2028 241,565 0.00%Province of Manitoba Canada CA($)250,000 3.45% 5/3/2063 241,162 0.00%Nova Scotia Power, Inc. CA($)230,000 5.67% 14/11/2035 239,496 0.00%Province of Manitoba Canada CA($)340,000 2.05% 5/9/2052 239,247 0.00%Province of Newfoundland & Labrador Canada CA($)230,000 4.65% 17/10/2040 236,736 0.00%Province of Ontario Canada CA($)250,000 7.50% 7/2/2024 236,378 0.00%CU, Inc. CA($)255,000 3.95% 23/11/2048 234,172 0.00%Province of New Brunswick Canada CA($)240,000 3.80% 14/8/2045 233,457 0.00%Pembina Pipeline Corp. CA($)270,000 4.67% 28/5/2050 231,995 0.00%Province of Saskatchewan Canada CA($)250,000 3.40% 3/2/2042 231,231 0.00%Nutrien Ltd. $175,000 5.00% 1/4/2049 230,698 0.00%Bank of Nova Scotia $225,000 1.95% 1/2/2023 230,626 0.00%Scotiabank Capital Trust^ CA($)217,000 5.65% 31/12/2056 230,373 0.00%Enbridge, Inc. $225,000 2.90% 15/7/2022 230,308 0.00%Canadian Pacific Railway Co. CA($)200,000 6.45% 17/11/2039 230,129 0.00%TransCanada PipeLines Ltd. $200,000 4.25% 15/5/2028 230,006 0.00%TransCanada PipeLines Ltd. $185,000 5.00% 16/10/2043 229,883 0.00%Province of Quebec Canada $200,000 7.50% 15/7/2023 227,909 0.00%City of Toronto Canada CA($)250,000 3.50% 2/6/2036 227,685 0.00%Loblaw Cos Ltd. CA($)285,000 2.28% 7/5/2030 226,301 0.00%Dollarama, Inc. CA($)265,000 3.55% 6/11/2023 225,373 0.00%Brookfield Finance, Inc. $200,000 3.90% 25/1/2028 223,493 0.00%FortisBC Energy, Inc. CA($)200,000 6.05% 15/2/2038 223,278 0.00%Pembina Pipeline Corp. CA($)265,000 4.54% 3/4/2049 222,924 0.00%Province of Nova Scotia Canada CA($)200,000 5.80% 1/6/2033 222,236 0.00%Enbridge Pipelines, Inc. CA($)260,000 4.20% 12/5/2051 220,417 0.00%Canadian Natural Resources Ltd. $200,000 3.85% 1/6/2027 220,287 0.00%Alimentation Couche-Tard, Inc. $200,000 3.55% 26/7/2027 220,081 0.00%Rogers Communications, Inc. $175,000 5.00% 15/3/2044 218,894 0.00%Province of New Brunswick Canada CA($)250,000 3.65% 3/6/2024 218,171 0.00%Province of Nova Scotia Canada CA($)200,000 4.70% 1/6/2041 216,783 0.00%FortisAlberta, Inc. CA($)300,000 2.63% 8/6/2051 216,639 0.00%Suncor Energy, Inc. $200,000 3.75% 4/3/2051 216,238 0.00%Brookfield Finance, Inc. $200,000 4.00% 1/4/2024 216,228 0.00%TransCanada PipeLines Ltd. CA($)255,000 4.33% 16/9/2047 215,898 0.00%407 International, Inc. CA($)250,000 3.60% 21/5/2047 215,872 0.00%Thomson Reuters Corp. $200,000 4.30% 23/11/2023 215,621 0.00%Rogers Communications, Inc. $185,000 4.50% 15/3/2043 215,506 0.00%Alectra, Inc. CA($)200,000 5.30% 29/4/2041 215,494 0.00%Canadian National Railway Co. $200,000 2.75% 1/3/2026 214,676 0.00%Bank of Nova Scotia $200,000 3.40% 11/2/2024 214,179 0.00%Province of Ontario Canada $200,000 2.50% 27/4/2026 213,913 0.00%Choice Properties CA($)260,000 2.98% 4/3/2030 213,783 0.00%Canadian Western Bank CA($)270,000 1.82% 16/12/2027 213,029 0.00%TELUS Corp. $175,000 4.30% 15/6/2049 211,198 0.00%Canada Post Corp. CA($)200,000 4.36% 16/7/2040 211,124 0.00%Manulife Financial Corp. $150,000 5.38% 4/3/2046 210,558 0.00%Alimentation Couche-Tard, Inc. $195,000 3.80% 25/1/2050 209,824 0.00%Hydro One, Inc. CA($)200,000 5.36% 20/5/2036 209,084 0.00%TELUS Corp. $195,000 2.80% 16/2/2027 208,267 0.00%Saputo, Inc. CA($)245,000 2.88% 19/11/2024 207,112 0.00%Province of New Brunswick Canada CA($)200,000 4.55% 26/3/2037 206,262 0.00%Brookfield Finance, Inc. $200,000 2.72% 15/4/2031 206,255 0.00%Brookfield Finance LLC $200,000 3.45% 15/4/2050 206,150 0.00%Brookfield Infrastructure Finance ULC CA($)260,000 2.86% 1/9/2032 206,061 0.00%Metro, Inc. CA($)200,000 5.97% 15/10/2035 205,796 0.00%Province of New Brunswick Canada $180,000 3.63% 24/2/2028 205,561 0.00%Brookfield Asset Management, Inc. CA($)200,000 5.95% 14/6/2035 204,568 0.00%Province of Alberta Canada $200,000 2.20% 26/7/2022 204,154 0.00%OPB Finance Trust CA($)215,000 3.89% 4/7/2042 203,451 0.00%Labrador-Island Link Funding Trust CA($)200,000 3.86% 1/12/2045 202,108 0.00%Province of Manitoba Canada CA($)200,000 4.10% 5/3/2041 201,238 0.00%Province of British Columbia Canada CA($)180,000 5.40% 18/6/2035 200,871 0.00%Enbridge, Inc. $180,000 4.00% 15/11/2049 199,973 0.00%Nutrien Ltd. $150,000 5.25% 15/1/2045 199,674 0.00%Enbridge, Inc. $180,000 3.70% 15/7/2027 198,906 0.00%Suncor Energy, Inc. $150,000 5.95% 15/5/2035 197,290 0.00%Reliance LP CA($)225,000 3.75% 15/3/2026 194,766 0.00%Canadian Pacific Railway Co. $150,000 4.80% 1/8/2045 193,754 0.00%

372
Vanguard Global Bond Index Fund
Principal CouponMaturity
DateFair Value
US Dollars ($)% of Total
Net AssetsCanadian Natural Resources Ltd. CA($)225,000 3.42% 1/12/2026 193,512 0.00%First Nations Finance Authority CA($)220,000 3.05% 1/6/2028 193,366 0.00%City of Montreal Canada CA($)200,000 4.25% 1/12/2032 193,270 0.00%Manulife Financial Corp.^ $175,000 4.06% 24/2/2032 193,066 0.00%Allied Properties CA($)235,000 3.12% 21/2/2030 191,906 0.00%Province of Manitoba Canada CA($)235,000 2.05% 2/6/2030 191,731 0.00%bcIMC Realty Corp. CA($)224,000 2.84% 3/6/2025 190,412 0.00%Pembina Pipeline Corp. CA($)225,000 2.99% 22/1/2024 188,772 0.00%North West Redwater Partnership/NWR Financing Co., Ltd. CA($)210,000 4.35% 10/1/2039 188,265 0.00%Hydro One, Inc. CA($)200,000 4.17% 6/6/2044 188,241 0.00%Enbridge Gas, Inc. CA($)200,000 4.20% 2/6/2044 187,414 0.00%Alimentation Couche-Tard, Inc. $180,000 2.95% 25/1/2030 187,326 0.00%City of Montreal Canada CA($)150,000 6.00% 1/6/2043 186,916 0.00%CU, Inc. CA($)210,000 3.76% 19/11/2046 186,393 0.00%Suncor Energy, Inc. $150,000 5.35% 15/7/2033 184,893 0.00%Cenovus Energy, Inc. $175,000 3.80% 15/9/2023 184,557 0.00%Fairfax Financial Holdings Ltd. $175,000 3.38% 3/3/2031 182,707 0.00%Maritime Link Financing Trust CA($)193,846 3.50% 1/12/2052 179,524 0.00%Hydro-Quebec CA($)150,000 6.50% 16/1/2035 179,297 0.00%Cenovus Energy, Inc. $175,000 3.00% 15/8/2022 178,607 0.00%North West Redwater Partnership/NWR Financing Co., Ltd. CA($)200,000 4.15% 1/6/2033 178,439 0.00%Municipal Finance Authority of British Columbia CA($)210,000 2.80% 3/12/2023 178,219 0.00%Hydro One, Inc. CA($)200,000 3.72% 18/11/2047 178,058 0.00%TMX Group Ltd. CA($)208,000 3.00% 11/12/2024 177,031 0.00%North West Redwater Partnership/NWR Financing Co., Ltd. CA($)210,000 2.80% 1/6/2027 176,211 0.00%Rogers Communications, Inc. CA($)160,000 6.56% 22/3/2041 173,382 0.00%Loblaw Cos Ltd. CA($)200,000 4.86% 12/9/2023 173,306 0.00%AIMCo Realty Investors LP CA($)205,000 2.71% 1/6/2029 171,811 0.00%AltaLink LP CA($)200,000 3.67% 6/11/2023 171,792 0.00%Province of Saskatchewan Canada CA($)205,000 2.80% 2/12/2052 171,481 0.00%Rio Tinto Alcan, Inc. $120,000 7.25% 15/3/2031 170,608 0.00%CU, Inc. CA($)220,000 2.96% 7/9/2049 170,494 0.00%TCHC Issuer Trust CA($)165,000 4.88% 11/5/2037 170,464 0.00%Manulife Financial Corp.^ CA($)200,000 3.05% 20/8/2029 169,468 0.00%HSBC Bank Canada CA($)200,000 3.25% 15/9/2023 169,235 0.00%Magna International, Inc. CA($)200,000 3.10% 15/12/2022 166,521 0.00%Capital City Link General Partnership CA($)184,335 4.39% 31/3/2046 165,815 0.00%Laurentian Bank of Canada CA($)200,000 3.00% 12/9/2022 165,788 0.00%RioCan CA($)200,000 2.58% 12/2/2025 165,781 0.00%Ontario Power Generation, Inc. CA($)220,000 2.95% 21/2/2051 165,298 0.00%City of Toronto Canada CA($)165,000 4.15% 10/3/2044 164,913 0.00%Canadian Natural Resources Ltd. CA($)200,000 2.50% 17/1/2028 163,451 0.00%Enbridge, Inc. $155,000 2.50% 15/1/2025 162,588 0.00%First Capital CA($)190,000 3.75% 12/7/2027 161,951 0.00%Nova Scotia Power, Inc. CA($)150,000 5.61% 15/6/2040 160,659 0.00%Province of British Columbia Canada CA($)150,000 4.70% 18/6/2037 159,978 0.00%TransCanada PipeLines Ltd. $150,000 3.75% 16/10/2023 159,638 0.00%Algonquin Power Co. CA($)171,000 4.60% 29/1/2029 159,457 0.00%Hydro One, Inc. CA($)175,000 3.79% 31/7/2062 158,534 0.00%Newfoundland & Labrador Hydro CA($)175,000 3.60% 1/12/2045 157,793 0.00%Province of Manitoba Canada CA($)150,000 4.60% 5/3/2038 157,214 0.00%Suncor Energy, Inc. $150,000 2.80% 15/5/2023 155,906 0.00%Rogers Communications, Inc. $150,000 3.00% 15/3/2023 155,341 0.00%Province of Newfoundland & Labrador Canada CA($)150,000 6.15% 17/4/2028 154,449 0.00%Northwestern Hydro Acquisition Co. II LP CA($)173,000 3.88% 31/12/2036 153,148 0.00%Crosslinx Transit Solutions GP CA($)172,000 4.65% 30/9/2046 152,240 0.00%Rogers Communications, Inc. $100,000 7.50% 15/8/2038 151,999 0.00%Sun Life Financial, Inc.^ CA($)180,000 3.05% 19/9/2028 151,327 0.00%Enbridge Pipelines, Inc. CA($)175,000 4.33% 22/2/2049 151,077 0.00%FortisBC Energy, Inc. CA($)210,000 2.54% 13/7/2050 151,046 0.00%Hydro-Quebec $100,000 8.50% 1/12/2029 149,584 0.00%City of Toronto Canada CA($)170,000 3.25% 24/6/2046 148,460 0.00%Shaw Communications, Inc. CA($)175,000 4.25% 9/12/2049 144,554 0.00%Morguard Corp. CA($)175,000 4.72% 25/1/2024 144,385 0.00%City of Montreal Canada CA($)165,000 3.15% 1/12/2036 144,193 0.00%Cameco Corp. CA($)166,000 4.19% 24/6/2024 143,209 0.00%Ontario Power Generation, Inc. CA($)165,000 3.65% 13/9/2050 141,564 0.00%407 International, Inc. CA($)160,000 3.72% 11/5/2048 141,369 0.00%Hospital Infrastructure Partners NOH Partnership CA($)141,939 5.44% 31/1/2045 140,659 0.00%Nova Scotia Power, Inc. CA($)165,000 3.57% 5/4/2049 139,720 0.00%SmartCentres CA($)165,000 3.65% 11/12/2030 139,234 0.00%

373
Vanguard Global Bond Index Fund
Principal CouponMaturity
DateFair Value
US Dollars ($)% of Total
Net AssetsGreater Toronto Airports Authority CA($)150,150 3.26% 1/6/2037 138,837 0.00%Rogers Communications, Inc. CA($)125,000 6.68% 4/11/2039 135,922 0.00%Canadian Natural Resources Ltd. $100,000 7.20% 15/1/2032 135,849 0.00%BCI QuadReal Realty CA($)175,000 1.75% 24/7/2030 135,752 0.00%CI Financial Corp. CA($)160,000 3.22% 22/7/2024 134,922 0.00%Gibson Energy, Inc. CA($)155,000 3.60% 17/9/2029 132,796 0.00%Capital Power Corp. CA($)152,000 4.28% 18/9/2024 132,719 0.00%Thomson Reuters Corp. $100,000 5.50% 15/8/2035 132,070 0.00%Fairfax Financial Holdings Ltd. CA($)150,000 4.25% 6/12/2027 131,553 0.00%Province of Saskatchewan Canada CA($)150,000 2.95% 2/6/2058 130,387 0.00%Inter Pipeline Ltd. CA($)152,000 3.48% 16/12/2026 130,275 0.00%Pembina Pipeline Corp. CA($)150,000 3.62% 3/4/2029 129,448 0.00%Hospital for Sick Children CA($)150,000 3.42% 7/12/2057 129,052 0.00%Bridging North America GP CA($)150,000 4.34% 31/8/2053 128,965 0.00%City of Toronto Canada CA($)150,000 2.95% 28/4/2035 128,724 0.00%Bell Telephone Co. of Canada or Bell Canada CA($)150,000 3.35% 12/3/2025 128,662 0.00%Brookfield Renewable Partners ULC CA($)140,000 4.25% 15/1/2029 128,577 0.00%CIBC Capital Trust^ CA($)150,000 10.25% 30/6/2108 128,480 0.00%Province of British Columbia Canada $125,000 2.00% 23/10/2022 127,895 0.00%Brookfield Renewable Partners ULC CA($)140,000 4.29% 5/11/2049 127,652 0.00%SEC LP & Arci Ltd. CA($)145,915 5.19% 29/8/2033 126,884 0.00%Province of Ontario Canada €100,000 1.88% 21/5/2024 126,351 0.00%Metro, Inc. CA($)145,000 3.39% 6/12/2027 126,253 0.00%EPCOR Utilities, Inc. CA($)165,000 2.90% 19/5/2050 126,070 0.00%Alectra, Inc. CA($)150,000 2.49% 17/5/2027 126,036 0.00%Province of Alberta Canada CA($)120,000 4.50% 1/12/2040 125,384 0.00%Ivanhoe Cambridge II, Inc. CA($)149,000 2.91% 27/6/2023 124,788 0.00%Original Wempi, Inc. CA($)150,000 4.31% 13/2/2024 124,666 0.00%Export Development Canada CA($)150,000 1.65% 31/7/2024 124,268 0.00%Hydro One, Inc. CA($)140,000 3.64% 5/4/2050 123,586 0.00%Province of Newfoundland & Labrador Canada CA($)115,000 5.60% 17/10/2033 123,457 0.00%North West Redwater Partnership/NWR Financing Co., Ltd. CA($)150,000 3.70% 23/2/2043 121,944 0.00%Co.-operators Financial Services Ltd. CA($)150,000 3.33% 13/5/2030 121,888 0.00%RioCan CA($)150,000 2.36% 10/3/2027 120,925 0.00%NAV Canada CA($)150,000 2.92% 29/9/2051 119,566 0.00%Great-West Lifeco Finance Delaware LP $100,000 4.15% 3/6/2047 118,995 0.00%Westcoast Energy, Inc. CA($)129,000 4.79% 28/10/2041 118,780 0.00%City of Ottawa Ontario CA($)135,000 3.25% 10/11/2047 118,667 0.00%Keyera Corp. CA($)135,000 3.93% 21/6/2028 117,980 0.00%TELUS Corp. CA($)135,000 3.30% 2/5/2029 115,773 0.00%Cameco Corp. CA($)140,000 2.95% 21/10/2027 115,594 0.00%TransCanada PipeLines Ltd. $100,000 4.10% 15/4/2030 114,795 0.00%Kinross Gold Corp. $100,000 4.50% 15/7/2027 114,286 0.00%Shaw Communications, Inc. CA($)135,000 3.30% 10/12/2029 113,797 0.00%Province of New Brunswick Canada $110,000 2.50% 12/12/2022 113,107 0.00%Cordelio Amalco GP I CA($)128,568 4.09% 30/6/2034 112,755 0.00%Enbridge Pipelines, Inc. CA($)135,000 4.13% 9/8/2046 112,692 0.00%Nutrien Ltd. $100,000 4.00% 15/12/2026 112,679 0.00%Newfoundland & Labrador Hydro CA($)100,000 6.65% 27/8/2031 112,199 0.00%Magna International, Inc. $100,000 4.15% 1/10/2025 111,856 0.00%City of Toronto Canada CA($)100,000 5.20% 1/6/2040 111,587 0.00%TriSummit Utilities, Inc. CA($)130,000 3.15% 6/4/2026 111,373 0.00%Canadian National Railway Co. $100,000 3.65% 3/2/2048 110,968 0.00%CU, Inc. CA($)110,000 4.72% 9/9/2043 110,118 0.00%Clover LP CA($)125,655 4.22% 30/6/2034 109,964 0.00%Ontario Infrastructure & Lands Corp. CA($)107,000 4.70% 1/6/2037 109,671 0.00%Hydro One, Inc. CA($)120,000 3.91% 23/2/2046 109,510 0.00%Province of New Brunswick Canada CA($)100,000 5.50% 27/1/2034 109,206 0.00%Hydro One, Inc. CA($)100,000 5.49% 16/7/2040 108,717 0.00%Canadian National Railway Co. $75,000 6.38% 15/11/2037 108,128 0.00%Enbridge, Inc. $100,000 3.50% 10/6/2024 107,429 0.00%Cenovus Energy, Inc. $100,000 4.00% 15/4/2024 107,090 0.00%Export Development Canada CA($)130,000 1.80% 1/9/2022 106,769 0.00%Province of Alberta Canada $100,000 3.35% 1/11/2023 106,689 0.00%City of Toronto Canada CA($)100,000 4.70% 10/6/2041 106,016 0.00%Canadian National Railway Co. $100,000 3.20% 2/8/2046 103,631 0.00%Capital Power Corp. CA($)130,000 3.15% 1/10/2032 103,129 0.00%Nutrien Ltd. $100,000 3.15% 1/10/2022 102,664 0.00%Canadian Government Bond CA($)120,000 2.00% 1/6/2028 102,339 0.00%CU, Inc. CA($)100,000 4.56% 7/11/2053 102,113 0.00%Gibson Energy, Inc. CA($)121,000 2.85% 14/7/2027 100,390 0.00%

374
Vanguard Global Bond Index Fund
Principal CouponMaturity
DateFair Value
US Dollars ($)% of Total
Net AssetsCity of Toronto Canada CA($)105,000 3.80% 13/12/2042 100,201 0.00%Province of Saskatchewan Canada $91,000 8.50% 15/7/2022 98,277 0.00%Royal Bank of Canada $90,000 3.70% 5/10/2023 96,522 0.00%Original Wempi, Inc. CA($)116,303 4.06% 13/2/2024 96,078 0.00%Province of New Brunswick Canada CA($)100,000 3.55% 3/6/2055 95,680 0.00%Regional Municipality of York CA($)100,000 4.05% 1/5/2034 95,623 0.00%Teck Resources Ltd. $75,000 6.00% 15/8/2040 95,542 0.00%TELUS Corp. CA($)110,000 4.40% 29/1/2046 94,974 0.00%407 International, Inc. CA($)100,000 3.98% 11/9/2052 92,506 0.00%Intact Financial Corp. CA($)120,000 2.95% 16/12/2050 89,693 0.00%EPCOR Utilities, Inc. CA($)110,000 3.11% 8/7/2049 87,559 0.00%City of Toronto Canada CA($)100,000 3.20% 1/8/2048 87,074 0.00%CU, Inc. CA($)100,000 3.55% 22/11/2047 85,921 0.00%Hydro One, Inc. CA($)100,000 2.97% 26/6/2025 85,742 0.00%Bank of Nova Scotia $75,000 4.50% 16/12/2025 85,077 0.00%Cogeco Communications, Inc. CA($)100,000 4.18% 26/5/2023 84,691 0.00%Hydro One, Inc. CA($)90,000 4.00% 22/12/2051 84,368 0.00%Capital Power Corp. CA($)93,000 4.42% 8/2/2030 83,766 0.00%Sun Life Financial, Inc.^ CA($)100,000 2.75% 23/11/2027 82,800 0.00%Air Canada 2013-1 Class A Pass Through Trust $80,287 4.13% 15/5/2025 82,470 0.00%TransEd Partners GP CA($)99,120 3.95% 30/9/2050 82,403 0.00%Loblaw Cos Ltd. CA($)80,000 5.90% 18/1/2036 81,351 0.00%InPower BC General Partnership CA($)91,187 4.47% 31/3/2033 80,993 0.00%TriSummit Utilities, Inc. CA($)87,000 4.26% 5/12/2028 79,723 0.00%CCL Industries, Inc. CA($)90,000 3.86% 13/4/2028 78,957 0.00%H&R CA($)95,000 3.42% 23/1/2023 78,949 0.00%First Nations Finance Authority CA($)100,000 1.71% 16/6/2030 78,926 0.00%Power Financial Corp. CA($)72,000 6.90% 11/3/2033 78,759 0.00%City of Ottawa Ontario CA($)75,000 4.20% 30/7/2053 78,227 0.00%Bruce Power LP CA($)80,000 4.75% 21/6/2049 77,871 0.00%Federated Co.-Operatives Ltd. CA($)89,000 3.92% 17/6/2025 75,940 0.00%Canadian National Railway Co. CA($)100,000 3.05% 8/2/2050 74,708 0.00%EPCOR Utilities, Inc. CA($)75,000 4.55% 28/2/2042 73,116 0.00%British Columbia Ferry Services, Inc. CA($)70,000 5.02% 20/3/2037 71,846 0.00%Laurentian Bank of Canada CA($)85,000 3.45% 27/6/2023 71,801 0.00%City of Vancouver CA($)75,000 3.70% 18/10/2052 71,584 0.00%Empire Life Insurance Co.^ CA($)85,000 3.66% 15/3/2028 71,559 0.00%407 International, Inc. CA($)80,000 3.83% 11/5/2046 71,378 0.00%Enbridge Gas, Inc. CA($)80,000 3.80% 1/6/2046 71,240 0.00%FortisBC Energy, Inc. CA($)75,000 3.85% 7/12/2048 68,700 0.00%Cenovus Energy, Inc. $50,000 6.80% 15/9/2037 65,738 0.00%Bell Telephone Co. of Canada or Bell Canada CA($)75,000 4.35% 18/12/2045 65,233 0.00%Enbridge, Inc. CA($)75,000 4.57% 11/3/2044 65,036 0.00%TMX Group Ltd. CA($)75,000 4.46% 3/10/2023 64,868 0.00%New Brunswick F-M Project Co., Inc. CA($)64,363 6.47% 30/11/2027 60,624 0.00%EPCOR Utilities, Inc. CA($)65,000 3.95% 26/11/2048 59,740 0.00%Enbridge Gas, Inc. CA($)70,000 3.01% 9/8/2049 54,650 0.00%Clover LP CA($)61,418 4.22% 31/3/2034 53,717 0.00%Province of Ontario Canada $50,000 3.20% 16/5/2024 53,716 0.00%CCL Industries, Inc. $50,000 3.25% 1/10/2026 53,657 0.00%Rogers Communications, Inc. $50,000 2.90% 15/11/2026 53,499 0.00%Atco Ltd.^ CA($)58,000 5.50% 1/11/2078 51,755 0.00%City of Greater Sudbury Canada CA($)70,000 2.42% 12/3/2050 50,893 0.00%Enbridge, Inc. CA($)55,000 4.87% 21/11/2044 49,704 0.00%Genworth MI Canada, Inc. CA($)57,000 4.24% 1/4/2024 49,157 0.00%Pembina Pipeline Corp. CA($)50,000 4.75% 30/4/2043 42,992 0.00%Canadian Natural Resources Ltd. CA($)45,000 4.85% 30/5/2047 41,080 0.00%Brookfield Asset Management, Inc. CA($)45,000 3.80% 16/3/2027 39,658 0.00%IGM Financial, Inc. CA($)40,000 4.56% 25/1/2047 38,084 0.00%North West Redwater Partnership/NWR Financing Co., Ltd. CA($)425 4.05% 22/7/2044 35,684 0.00%Canadian Imperial Bank of Commerce $30,000 2.25% 28/1/2025 31,362 0.00%Kingston Solar LP CA($)36,314 3.57% 31/7/2035 30,733 0.00%Rogers Communications, Inc. $25,000 3.70% 15/11/2049 26,620 0.00%North West Redwater Partnership/NWR Financing Co., Ltd. CA($)270 4.25% 1/6/2029 24,398 0.00%North West Redwater Partnership/NWR Financing Co., Ltd. CA($)210 4.35% 10/1/2039 18,671 0.00%EPCOR Utilities, Inc. CA($)9,000 6.80% 28/6/2029 9,639 0.00%Ontario School Boards Financing Corp. CA($)3,977 5.48% 26/11/2029 3,779 0.00%Alliance Pipeline LP CA($)1,547 6.77% 31/12/2025 1,443 0.00%test - - - 814,539,017 3.70%Chile 0.12% (2020: 0.12%)Chile Government International Bond €1,758,000 0.83% 2/7/2031 2,112,738 0.01%

375
Vanguard Global Bond Index Fund
Principal CouponMaturity
DateFair Value
US Dollars ($)% of Total
Net AssetsChile Government International Bond $1,400,000 3.50% 25/1/2050 1,470,517 0.01%Chile Government International Bond $1,200,000 3.13% 21/1/2026 1,299,986 0.01%Chile Government International Bond $1,100,000 3.24% 6/2/2028 1,197,556 0.01%Chile Government International Bond €1,107,000 1.25% 22/1/2051 1,173,159 0.01%Corp. Nacional del Cobre de Chile $1,000,000 3.70% 30/1/2050 1,059,492 0.01%Chile Government International Bond $1,000,000 2.45% 31/1/2031 1,018,783 0.01%Chile Government International Bond $1,000,000 3.10% 7/5/2041 1,003,753 0.01%Chile Government International Bond €800,000 1.63% 30/1/2025 1,002,979 0.01%Empresa Nacional del Petroleo $1,000,000 4.50% 14/9/2047 986,113 0.01%Corp. Nacional del Cobre de Chile $800,000 3.63% 1/8/2027 872,110 0.01%Corp. Nacional del Cobre de Chile $700,000 4.50% 16/9/2025 790,161 0.01%Chile Government International Bond $800,000 3.10% 22/1/2061 765,809 0.00%Corp. Nacional del Cobre de Chile $650,000 4.38% 5/2/2049 762,204 0.00%Banco Santander Chile $700,000 2.70% 10/1/2025 730,731 0.00%Empresa de Transporte de Pasajeros Metro SA $600,000 4.70% 7/5/2050 676,776 0.00%Banco del Estado de Chile $600,000 2.70% 9/1/2025 625,951 0.00%Engie Energia Chile SA $600,000 3.40% 28/1/2030 615,675 0.00%Cencosud SA $500,000 5.15% 12/2/2025 552,568 0.00%Inversiones CMPC SA $500,000 4.75% 15/9/2024 543,928 0.00%Celulosa Arauco y Constitucion SA $450,000 5.50% 2/11/2047 538,502 0.00%Empresa de los Ferrocarriles del Estado $600,000 3.07% 18/8/2050 518,736 0.00%Cencosud SA $400,000 4.38% 17/7/2027 438,352 0.00%Celulosa Arauco y Constitucion SA $400,000 4.20% 29/1/2030 432,789 0.00%Inversiones CMPC SA $400,000 3.85% 13/1/2030 426,276 0.00%Corp. Nacional del Cobre de Chile $400,000 3.00% 30/9/2029 416,063 0.00%Transelec SA $375,000 3.88% 12/1/2029 406,738 0.00%Corp. Nacional del Cobre de Chile $400,000 3.15% 15/1/2051 386,401 0.00%Engie Energia Chile SA $350,000 4.50% 29/1/2025 382,207 0.00%Corp. Nacional del Cobre de Chile $250,000 5.63% 18/10/2043 333,097 0.00%Cencosud SA $300,000 4.38% 17/7/2027 328,764 0.00%Colbun SA $250,000 4.50% 10/7/2024 271,037 0.00%Corp. Nacional del Cobre de Chile $200,000 4.88% 4/11/2044 246,239 0.00%Empresa de Transporte de Pasajeros Metro SA $200,000 5.00% 25/1/2047 231,545 0.00%Celulosa Arauco y Constitucion SA $200,000 5.15% 29/1/2050 229,255 0.00%Celeo Redes Operacion Chile SA $193,257 5.20% 22/6/2047 225,393 0.00%Sociedad Quimica y Minera de Chile SA $200,000 4.25% 7/5/2029 225,023 0.00%Inversiones CMPC SA $200,000 4.38% 4/4/2027 222,018 0.00%Chile Government International Bond $200,000 3.86% 21/6/2047 220,736 0.00%Sociedad Quimica y Minera de Chile SA $200,000 4.25% 22/1/2050 216,935 0.00%Celulosa Arauco y Constitucion SA $200,000 4.50% 1/8/2024 215,627 0.00%Celulosa Arauco y Constitucion SA $200,000 3.88% 2/11/2027 215,370 0.00%Falabella SA $200,000 3.75% 30/10/2027 214,090 0.00%Empresa Nacional de Telecomunicaciones SA $175,000 4.75% 1/8/2026 193,701 0.00%Enel Americas SA $175,000 4.00% 25/10/2026 190,651 0.00%Enel Chile SA $150,000 4.88% 12/6/2028 173,242 0.00%Colbun SA $100,000 3.95% 11/10/2027 109,481 0.00%GNL Quintero SA $100,000 4.63% 31/7/2029 108,913 0.00%Enel Generacion Chile SA $100,000 4.25% 15/4/2024 107,019 0.00%test - - - 27,485,189 0.12%China 1.12% (2020: 1.22%)Agricultural Development Bank of China CNY100,000,000 3.06% 5/8/2023 15,523,598 0.07%China Government Bond CNY70,200,000 3.25% 6/6/2026 11,022,617 0.05%China Development Bank CNY55,000,000 3.68% 26/2/2026 8,658,757 0.04%China Development Bank CNY52,500,000 3.03% 18/1/2022 8,153,980 0.04%China Government International Bond $7,200,000 0.40% 21/10/2023 7,193,623 0.03%China Development Bank CNY40,000,000 3.43% 14/1/2027 6,212,663 0.03%China Development Bank CNY35,500,000 3.50% 13/8/2026 5,547,652 0.03%China Development Bank CNY30,000,000 3.70% 20/10/2030 4,707,634 0.02%China Government Bond CNY30,000,000 3.22% 6/12/2025 4,705,845 0.02%China Development Bank CNY30,000,000 3.34% 14/7/2025 4,665,815 0.02%Agricultural Development Bank of China CNY29,000,000 4.00% 12/11/2025 4,618,546 0.02%China Government Bond CNY23,200,000 4.08% 22/10/2048 3,854,737 0.02%China Development Bank CNY23,400,000 3.30% 1/2/2024 3,649,348 0.02%Export-Import Bank of China $3,100,000 3.63% 31/7/2024 3,375,507 0.02%Export-Import Bank of China CNY21,300,000 3.28% 11/2/2024 3,318,472 0.02%BOC Aviation Ltd. $3,200,000 2.38% 15/9/2021 3,204,680 0.02%State Grid Overseas Investment 2016 Ltd. $3,000,000 3.75% 2/5/2023 3,158,459 0.02%China Government Bond CNY20,000,000 3.19% 11/4/2024 3,132,446 0.02%China Government Bond CNY20,000,000 3.13% 21/11/2029 3,092,620 0.02%China Government Bond CNY20,000,000 3.02% 27/5/2031 3,078,365 0.02%Tencent Holdings Ltd. $3,000,000 2.39% 3/6/2030 2,989,337 0.01%

376
Vanguard Global Bond Index Fund
Principal CouponMaturity
DateFair Value
US Dollars ($)% of Total
Net AssetsTencent Holdings Ltd. $3,029,000 3.24% 3/6/2050 2,953,244 0.01%Bank of China Ltd. $2,600,000 5.00% 13/11/2024 2,902,219 0.01%China Government Bond CNY18,500,000 3.39% 16/3/2050 2,711,970 0.01%China Government International Bond $2,500,000 1.95% 3/12/2024 2,610,752 0.01%Sinopec Group Overseas Development 2013 Ltd. $2,250,000 4.38% 17/10/2023 2,427,815 0.01%Bank of China Luxembourg SA €2,000,000 0.13% 16/1/2023 2,381,893 0.01%State Grid Overseas Investment 2016 Ltd. $2,000,000 4.25% 2/5/2028 2,299,942 0.01%Agricultural Development Bank of China CNY14,600,000 3.75% 25/1/2029 2,295,412 0.01%Sinopec Group Overseas Development 2018 Ltd. $2,000,000 4.25% 12/9/2028 2,286,248 0.01%China Cinda Finance 2017 I Ltd. $2,000,000 4.75% 21/2/2029 2,159,334 0.01%Sinopec Group Overseas Development 2016 Ltd. $2,000,000 2.75% 29/9/2026 2,123,372 0.01%Lunar Funding V for Swisscom AG €1,600,000 1.13% 12/10/2026 2,005,610 0.01%Sinopec Group Overseas Development 2018 Ltd. $1,900,000 2.70% 13/5/2030 1,966,171 0.01%Sinopec Group Overseas Development 2018 Ltd. $1,400,000 4.60% 12/9/2048 1,735,541 0.01%Industrial & Commercial Bank of China Ltd. $1,500,000 4.88% 21/9/2025 1,680,733 0.01%China Development Bank $1,450,000 4.00% 24/1/2037 1,632,709 0.01%China Development Bank CNY10,000,000 3.90% 3/8/2040 1,587,271 0.01%China Railway Resources Huitung Ltd. $1,481,000 3.85% 5/2/2023 1,538,580 0.01%ICBCIL Finance Co., Ltd. $1,500,000 3.13% 15/11/2022 1,537,733 0.01%Weichai International Hong Kong Energy Group Co., Ltd.^ $1,500,000 3.75% Perpetual 1,529,220 0.01%China Huaneng Group Hong Kong Treasury Management Holding Ltd. $1,400,000 2.60% 10/12/2024 1,462,400 0.01%Industrial & Commercial Bank of China Ltd. £1,050,000 1.50% 31/7/2022 1,461,235 0.01%Export-Import Bank of China €1,200,000 0.75% 28/5/2023 1,444,676 0.01%China Mengniu Dairy Co., Ltd. $1,400,000 1.88% 17/6/2025 1,407,415 0.01%Avi Funding Co., Ltd. $1,200,000 3.80% 16/9/2025 1,316,948 0.01%Tencent Holdings Ltd. $1,200,000 3.28% 11/4/2024 1,278,447 0.01%China Development Bank €1,000,000 0.88% 24/1/2024 1,210,342 0.01%Sinopec Group Overseas Development 2017 Ltd. $1,150,000 3.00% 12/4/2022 1,170,388 0.01%Industrial & Commercial Bank of China Ltd. $1,050,000 3.54% 8/11/2027 1,162,742 0.01%China Cinda Finance 2017 I Ltd. $1,100,000 4.40% 9/3/2027 1,155,002 0.01%Tencent Holdings Ltd. $1,050,000 3.60% 19/1/2028 1,147,799 0.01%Minmetals Bounteous Finance BVI Ltd.^ $1,100,000 3.38% Perpetual 1,128,478 0.01%Country Garden Holdings Co., Ltd. $1,000,000 7.25% 8/4/2026 1,109,512 0.01%China Government International Bond €950,000 1.00% 12/11/2039 1,104,055 0.01%Sinopec Group Overseas Development 2014 Ltd. $1,000,000 4.38% 10/4/2024 1,093,233 0.01%BOC Aviation Ltd. $1,000,000 3.88% 27/4/2026 1,082,131 0.01%Longfor Group Holdings Ltd. $1,000,000 3.95% 16/9/2029 1,078,945 0.01%Sinopec Group Overseas Development 2015 Ltd. $1,000,000 3.25% 28/4/2025 1,069,413 0.01%State Grid Overseas Investment 2016 Ltd. $900,000 4.00% 4/5/2047 1,064,279 0.01%Zhongyuan Sincere Investment Co., Ltd. $1,000,000 4.25% 28/6/2024 1,041,276 0.01%China Government International Bond $1,000,000 2.75% 3/12/2039 1,039,349 0.01%CMB International Leasing Management Ltd. $1,000,000 3.00% 3/7/2024 1,036,620 0.01%Sinopec Group Overseas Development 2018 Ltd. $1,000,000 3.44% 12/11/2049 1,031,230 0.01%China Huaneng Group Hong Kong Treasury Management Holding Ltd.^ $1,000,000 3.08% Perpetual 1,022,547 0.01%Sino-Ocean Land Treasure IV Ltd. $1,000,000 4.75% 14/1/2030 1,014,252 0.01%Hanhui International Ltd. $1,000,000 4.37% 22/8/2022 1,004,968 0.01%Coastal Emerald Ltd.^ $1,000,000 4.30% Perpetual 1,000,794 0.01%Huarong Finance II Co., Ltd. $1,350,000 5.50% 16/1/2025 998,887 0.01%Country Garden Holdings Co., Ltd. $1,000,000 3.88% 22/10/2030 984,311 0.01%Alibaba Group Holding Ltd. $1,000,000 3.25% 9/2/2061 968,266 0.01%China Development Bank $850,000 3.38% 24/1/2027 935,562 0.01%China Development Bank CNY5,800,000 4.01% 9/1/2037 929,829 0.01%China Southern Power Grid International Finance BVI 2018 Co., Ltd. $863,000 3.88% 18/9/2023 916,897 0.01%China Construction Bank Corp.^ $890,000 2.45% 24/6/2030 909,181 0.01%China Cinda Finance 2015 I Ltd. $850,000 4.25% 23/4/2025 889,647 0.01%Joy Treasure Assets Holdings, Inc. $900,000 3.50% 24/9/2029 883,907 0.01%CITIC Ltd. $800,000 3.88% 28/2/2027 870,707 0.00%CITIC Ltd. $800,000 3.70% 14/6/2026 863,808 0.00%Bank of China Hong Kong Ltd.^ $800,000 5.90% Perpetual 861,524 0.00%Tencent Holdings Ltd. $750,000 3.98% 11/4/2029 839,252 0.00%Alibaba Group Holding Ltd. $725,000 4.20% 6/12/2047 836,582 0.00%China Government International Bond €700,000 0.13% 12/11/2026 832,594 0.00%China Government International Bond €700,000 0.50% 12/11/2031 826,652 0.00%China Merchants Finance Co., Ltd. $700,000 4.75% 3/8/2025 776,946 0.00%CNPC Global Capital Ltd. $800,000 2.00% 23/6/2030 775,003 0.00%Huarong Finance 2019 Co., Ltd. $1,000,000 2.50% 24/2/2023 769,967 0.00%Minmetals Bounteous Finance BVI Ltd. $700,000 4.20% 27/7/2026 769,290 0.00%Alibaba Group Holding Ltd. $700,000 3.40% 6/12/2027 764,730 0.00%Tencent Holdings Ltd. $700,000 3.80% 11/2/2025 760,910 0.00%Alibaba Group Holding Ltd. $750,000 3.15% 9/2/2051 737,903 0.00%CNPC General Capital Ltd. $700,000 3.40% 16/4/2023 731,153 0.00%

377
Vanguard Global Bond Index Fund
Principal CouponMaturity
DateFair Value
US Dollars ($)% of Total
Net AssetsTencent Holdings Ltd. $750,000 3.29% 3/6/2060 728,411 0.00%Export-Import Bank of China $700,000 2.75% 28/11/2022 720,600 0.00%China Government International Bond $700,000 2.13% 2/11/2022 715,955 0.00%Chongqing Nan'an Urban Construction & Development Group Co., Ltd. $700,000 4.66% 4/6/2024 713,921 0.00%Alibaba Group Holding Ltd. $600,000 4.00% 6/12/2037 672,988 0.00%China Southern Power Grid International Finance BVI Co., Ltd. $650,000 2.75% 8/5/2022 660,092 0.00%Prosus NV $600,000 3.68% 21/1/2030 641,286 0.00%Alibaba Group Holding Ltd. $650,000 2.13% 9/2/2031 639,052 0.00%China Government International Bond $650,000 0.55% 21/10/2025 638,564 0.00%Sunny Express Enterprises Corp. $600,000 3.13% 23/4/2030 624,310 0.00%Prosus NV $650,000 3.83% 8/2/2051 603,230 0.00%Meituan $600,000 3.05% 28/10/2030 591,460 0.00%Vanke Real Estate Hong Kong Co., Ltd. $550,000 3.98% 9/11/2027 590,685 0.00%China Government International Bond $600,000 1.20% 21/10/2030 579,005 0.00%Tencent Holdings Ltd. $525,000 3.93% 19/1/2038 572,060 0.00%State Grid Overseas Investment 2016 Ltd. $500,000 3.50% 4/5/2027 550,292 0.00%Sinopec Group Overseas Development 2017 Ltd. $500,000 3.63% 12/4/2027 549,630 0.00%Vanke Real Estate Hong Kong Co., Ltd. $500,000 5.35% 11/3/2024 549,336 0.00%Sino-Ocean Land Treasure Finance I Ltd. $500,000 6.00% 30/7/2024 547,620 0.00%Bank of China Ltd. $500,000 3.50% 20/4/2027 546,432 0.00%China Development Bank $500,000 3.00% 1/6/2026 538,261 0.00%Charming Light Investments Ltd. $500,000 5.00% 3/9/2024 537,920 0.00%Vanke Real Estate Hong Kong Co., Ltd. $500,000 4.20% 7/6/2024 536,828 0.00%China Construction Bank Corp.^ $500,000 4.25% 27/2/2029 536,352 0.00%Foxconn Far East Ltd. $500,000 3.00% 23/9/2026 533,038 0.00%BOC Aviation Ltd. $500,000 3.50% 18/9/2027 532,732 0.00%Vertex Capital Investment Ltd. $500,000 4.75% 3/4/2024 529,479 0.00%Azure Orbit IV International Finance Ltd. $500,000 3.75% 25/1/2023 518,152 0.00%China Cinda Finance 2017 I Ltd. $500,000 4.10% 9/3/2024 518,074 0.00%Geely Automobile Holdings Ltd.^ $500,000 4.00% Perpetual 517,208 0.00%Baidu, Inc. $500,000 2.88% 6/7/2022 510,667 0.00%Foxconn Far East Ltd. $500,000 2.50% 28/10/2030 502,468 0.00%Sinopec Group Overseas Development 2018 Ltd. $500,000 2.30% 8/1/2031 496,181 0.00%BOC Aviation Ltd. $500,000 2.63% 17/9/2030 495,638 0.00%Amipeace Ltd. $500,000 2.25% 22/10/2030 490,161 0.00%Sunshine Life Insurance Corp., Ltd. $470,000 4.50% 20/4/2026 481,579 0.00%Baidu, Inc. $400,000 4.88% 14/11/2028 473,206 0.00%Shimao Group Holdings Ltd. $500,000 3.45% 11/1/2031 465,835 0.00%Tencent Holdings Ltd. $450,000 2.99% 19/1/2023 464,561 0.00%Chalco Hong Kong Investment Co., Ltd.^ $450,000 4.25% Perpetual 452,379 0.00%Export-Import Bank of China $400,000 3.25% 28/11/2027 442,532 0.00%China Government International Bond $400,000 2.63% 2/11/2027 431,806 0.00%China Railway Xunjie Co., Ltd. $400,000 3.25% 28/7/2026 425,783 0.00%Alibaba Group Holding Ltd. $400,000 2.80% 6/6/2023 415,429 0.00%Country Garden Holdings Co., Ltd. $400,000 5.13% 17/1/2025 415,052 0.00%Voyage Bonds Ltd. $400,000 3.38% 28/9/2022 408,250 0.00%Sinopec Group Overseas Development 2017 Ltd. $400,000 2.50% 13/9/2022 408,245 0.00%Contemporary Ruiding Development Ltd. $400,000 2.63% 17/9/2030 400,622 0.00%ENN Energy Holdings Ltd. $400,000 2.63% 17/9/2030 399,103 0.00%Country Garden Holdings Co., Ltd. $400,000 3.30% 12/1/2031 376,354 0.00%Shimao Group Holdings Ltd. $350,000 5.60% 15/7/2026 368,395 0.00%Prosus NV $375,000 4.03% 3/8/2050 360,958 0.00%Huarong Finance II Co., Ltd. $500,000 4.63% 3/6/2026 351,930 0.00%Huarong Finance 2017 Co., Ltd. $500,000 4.25% 7/11/2027 350,518 0.00%China Government Bond CNY2,100,000 3.73% 25/5/2070 322,873 0.00%Bocom Leasing Management Hong Kong Co., Ltd. $300,000 4.38% 22/1/2024 322,103 0.00%China Great Wall International Holdings III Ltd. $300,000 3.88% 31/8/2027 305,873 0.00%State Grid Overseas Investment 2016 Ltd. $300,000 2.75% 4/5/2022 305,054 0.00%Baidu, Inc. $275,000 3.63% 6/7/2027 303,534 0.00%Alibaba Group Holding Ltd. $275,000 3.60% 28/11/2024 298,887 0.00%China Cinda 2020 I Management Ltd. $300,000 2.50% 18/3/2025 294,940 0.00%Sino-Ocean Land Treasure Finance II Ltd. $250,000 5.95% 4/2/2027 277,246 0.00%Sinopec Group Overseas Development 2017 Ltd. $250,000 3.25% 13/9/2027 270,772 0.00%State Grid Overseas Investment 2016 Ltd. €220,000 0.80% 5/8/2026 266,284 0.00%Weibo Corp. $250,000 3.50% 5/7/2024 263,568 0.00%State Grid Overseas Investment 2014 Ltd. $200,000 4.85% 7/5/2044 261,954 0.00%China Government International Bond $200,000 4.00% 19/10/2048 257,587 0.00%Industrial & Commercial Bank of China Ltd. $250,000 2.96% 8/11/2022 257,224 0.00%Central Plaza Development Ltd. $250,000 4.65% 19/1/2026 242,874 0.00%Alibaba Group Holding Ltd. $200,000 4.40% 6/12/2057 240,419 0.00%Hongkong Xiangyu Investment Co., Ltd. $250,000 4.50% 30/1/2023 236,716 0.00%

378
Vanguard Global Bond Index Fund
Principal CouponMaturity
DateFair Value
US Dollars ($)% of Total
Net AssetsAlibaba Group Holding Ltd. $200,000 4.50% 28/11/2034 233,413 0.00%Prosus NV $200,000 5.50% 21/7/2025 228,573 0.00%Baidu, Inc. $200,000 4.38% 29/3/2028 227,451 0.00%Sinopec Group Overseas Development 2017 Ltd. $200,000 4.00% 13/9/2047 225,435 0.00%China Resources Land Ltd. $206,000 4.13% 26/2/2029 225,115 0.00%China Great Wall International Holdings V Ltd. $250,000 2.38% 18/8/2030 224,321 0.00%Baidu, Inc. $200,000 4.13% 30/6/2025 220,887 0.00%JD.com, Inc. $200,000 3.88% 29/4/2026 220,320 0.00%State Grid Overseas Investment 2014 Ltd. $200,000 4.13% 7/5/2024 217,913 0.00%Country Garden Holdings Co., Ltd. $200,000 5.63% 14/1/2030 217,177 0.00%Baidu, Inc. $200,000 3.43% 7/4/2030 216,942 0.00%Export-Import Bank of China $200,000 2.88% 26/4/2026 214,247 0.00%JD.com, Inc. $200,000 4.13% 14/1/2050 213,976 0.00%JD.com, Inc. $200,000 3.38% 14/1/2030 213,618 0.00%Charming Light Investments Ltd. $200,000 4.38% 21/12/2027 212,639 0.00%Baidu, Inc. $200,000 3.88% 29/9/2023 212,614 0.00%Baidu, Inc. $200,000 3.08% 7/4/2025 211,798 0.00%Country Garden Holdings Co., Ltd. $200,000 8.00% 27/1/2024 210,534 0.00%China Huadian Overseas Development Management Co., Ltd.^ $200,000 4.00% Perpetual 209,157 0.00%State Grid Overseas Investment 2013 Ltd. $200,000 3.13% 22/5/2023 208,664 0.00%Leading Affluence Ltd. $200,000 4.50% 24/1/2023 208,152 0.00%Sinopec Capital 2013 Ltd. $200,000 3.13% 24/4/2023 207,736 0.00%COSCO Finance 2011 Ltd. $200,000 4.00% 3/12/2022 207,578 0.00%Baidu, Inc. $200,000 3.50% 28/11/2022 207,555 0.00%Amber Circle Funding Ltd. $200,000 3.25% 4/12/2022 207,147 0.00%Sunrise Cayman Ltd. $200,000 5.25% 11/3/2024 206,676 0.00%China Minmetals Corp.^ $200,000 3.75% Perpetual 204,305 0.00%Elect Global Investments Ltd.^ $200,000 4.10% Perpetual 204,226 0.00%Baidu, Inc. $200,000 1.72% 9/4/2026 202,251 0.00%Kunming Rail Transit Group Co., Ltd. $200,000 3.50% 12/12/2022 200,348 0.00%China Government International Bond $200,000 2.25% 21/10/2050 188,274 0.00%Sinopec Group Overseas Development 2012 Ltd. $150,000 4.88% 17/5/2042 185,991 0.00%Huarong Finance II Co., Ltd. $250,000 5.00% 19/11/2025 179,968 0.00%Huarong Finance 2017 Co., Ltd. $250,000 4.95% 7/11/2047 167,574 0.00%test - - - 247,793,562 1.12%Colombia 0.18% (2020: 0.21%)Colombian TES COP17,000,000,000 5.75% 3/11/2027 4,358,705 0.02%Colombian TES COP11,300,000,000 6.00% 28/4/2028 2,914,324 0.01%Colombian TES COP9,500,000,000 10.00% 24/7/2024 2,904,088 0.01%Colombian TES COP10,000,000,000 7.50% 26/8/2026 2,840,247 0.01%Colombia Government International Bond $2,300,000 5.00% 15/6/2045 2,443,865 0.01%Colombia Government International Bond $2,075,000 3.88% 25/4/2027 2,201,928 0.01%Colombian TES COP8,000,000,000 7.00% 30/6/2032 2,097,683 0.01%Colombian TES COP7,500,000,000 6.25% 26/11/2025 2,043,363 0.01%Colombian TES COP7,000,000,000 7.75% 18/9/2030 1,960,256 0.01%Colombian TES COP7,100,000,000 7.25% 18/10/2034 1,855,461 0.01%Colombia Government International Bond $1,700,000 4.50% 15/3/2029 1,854,263 0.01%Ecopetrol SA $1,475,000 4.13% 16/1/2025 1,552,550 0.01%Colombia Government International Bond $1,300,000 5.63% 26/2/2044 1,470,753 0.01%Ecopetrol SA $900,000 6.88% 29/4/2030 1,086,052 0.01%Ecopetrol SA $825,000 5.38% 26/6/2026 909,657 0.01%Ecopetrol SA $850,000 5.88% 28/5/2045 909,296 0.01%Colombia Government International Bond $900,000 4.13% 15/5/2051 852,767 0.01%Empresas Publicas de Medellin ESP $800,000 4.25% 18/7/2029 797,450 0.00%Colombia Government International Bond $500,000 10.38% 28/1/2033 747,975 0.00%Colombia Government International Bond $700,000 4.00% 26/2/2024 741,509 0.00%Colombia Government International Bond $800,000 3.88% 15/2/2061 715,403 0.00%Colombia Government International Bond $500,000 3.00% 30/1/2030 489,933 0.00%Colombia Government International Bond $500,000 4.13% 22/2/2042 485,581 0.00%Colombia Government International Bond $300,000 6.13% 18/1/2041 355,013 0.00%Colombia Government International Bond $300,000 5.20% 15/5/2049 327,971 0.00%Colombia Government International Bond $290,000 4.50% 28/1/2026 316,663 0.00%Bancolombia SA $300,000 3.00% 29/1/2025 307,591 0.00%Colombian TES COP1,000,000,000 7.25% 26/10/2050 245,089 0.00%Colombia Government International Bond $200,000 3.25% 22/4/2032 195,696 0.00%SURA Asset Management SA $150,000 4.88% 17/4/2024 161,870 0.00%Colombia Government International Bond $100,000 8.13% 21/5/2024 118,370 0.00%Ecopetrol SA $50,000 7.38% 18/9/2043 61,640 0.00%test - - - 40,323,012 0.18%Croatia 0.04% (2020: 0.03%)Croatia Government International Bond €1,800,000 1.13% 19/6/2029 2,194,853 0.01%

379
Vanguard Global Bond Index Fund
Principal CouponMaturity
DateFair Value
US Dollars ($)% of Total
Net AssetsCroatia Government International Bond €1,380,000 1.13% 4/3/2033 1,626,541 0.01%Croatia Government International Bond $1,250,000 5.50% 4/4/2023 1,357,308 0.01%Croatia Government International Bond €950,000 1.50% 17/6/2031 1,174,083 0.01%Croatia Government International Bond €950,000 1.75% 4/3/2041 1,140,907 0.00%Croatia Government International Bond $500,000 6.00% 26/1/2024 566,884 0.00%test - - - 8,060,576 0.04%Cyprus 0.02% (2020: 0.01%)Cyprus Government International Bond €1,520,000 0.00% 9/2/2026 1,812,461 0.01%Cyprus Government International Bond €750,000 2.25% 16/4/2050 1,074,400 0.01%Cyprus Government International Bond €500,000 0.63% 21/1/2030 606,912 0.00%Cyprus Government International Bond €250,000 2.75% 26/2/2034 369,592 0.00%Cyprus Government International Bond €245,000 1.25% 21/1/2040 296,447 0.00%test - - - 4,159,812 0.02%Czech Republic 0.16% (2020: 0.16%)Czech Republic Government Bond Kč168,150,000 1.20% 13/3/2031 7,385,726 0.03%Czech Republic Government Bond Kč116,840,000 0.25% 10/2/2027 5,008,947 0.02%Czech Republic Government Bond Kč98,000,000 2.40% 17/9/2025 4,698,061 0.02%Czech Republic Government Bond Kč82,000,000 0.95% 15/5/2030 3,546,973 0.02%Czech Republic Government Bond Kč50,000,000 2.00% 13/10/2033 2,361,678 0.01%Czech Republic Government Bond Kč42,090,000 0.45% 25/10/2023 1,920,669 0.01%EP Infrastructure A.S. €1,260,000 1.82% 2/3/2031 1,516,885 0.01%Czech Republic Government Bond Kč25,000,000 4.20% 4/12/2036 1,513,913 0.01%Czech Republic Government Bond Kč30,000,000 1.00% 26/6/2026 1,349,292 0.01%CPI Property Group SA €1,000,000 1.63% 23/4/2027 1,220,018 0.01%CEZ A.S. €1,000,000 0.88% 2/12/2026 1,215,245 0.01%EP Infrastructure A.S. €700,000 1.66% 26/4/2024 858,280 0.00%CEZ A.S. €500,000 3.00% 5/6/2028 687,677 0.00%Czech Republic Government Bond Kč10,000,000 2.75% 23/7/2029 498,123 0.00%EP Infrastructure A.S. €400,000 1.70% 30/7/2026 493,756 0.00%CPI Property Group SA €400,000 1.50% 27/1/2031 462,640 0.00%Czech Republic Government Bond Kč8,000,000 5.70% 25/5/2024 418,364 0.00%CEZ A.S. €200,000 4.88% 16/4/2025 280,707 0.00%Czech Republic Government Bond Kč5,000,000 2.50% 25/8/2028 243,348 0.00%CPI Property Group SA £100,000 2.75% 22/1/2028 141,282 0.00%test - - - 35,821,584 0.16%Denmark 0.40% (2020: 0.45%)Denmark Government Bond DKK(kr)45,850,000 4.50% 15/11/2039 12,861,486 0.06%Denmark Government Bond DKK(kr)66,800,000 0.50% 15/11/2029 11,192,381 0.05%Nykredit Realkredit A/S DKK(kr)50,200,000 1.00% 1/1/2022 8,061,768 0.04%Denmark Government Bond DKK(kr)31,000,000 1.75% 15/11/2025 5,419,854 0.03%AP Moller-Maersk A/S €3,300,000 1.75% 16/3/2026 4,204,226 0.02%Denmark Government Bond DKK(kr)23,000,000 0.50% 15/11/2027 3,844,958 0.02%Danske Bank A/S €2,300,000 1.38% 24/5/2022 2,768,651 0.01%Orsted A/S £1,600,000 2.50% 16/5/2033 2,399,353 0.01%AP Moller-Maersk A/S £1,500,000 4.00% 4/4/2025 2,298,210 0.01%Orsted A/S €1,500,000 1.50% 26/11/2029 1,943,359 0.01%Danske Bank A/S^ €1,600,000 1.38% 12/2/2030 1,934,045 0.01%Kommunekredit €1,400,000 0.13% 28/8/2023 1,682,529 0.01%Orsted A/S^ £1,200,000 2.50% 18/2/3021 1,646,135 0.01%Nykredit Realkredit A/S DKK(kr)10,000,000 1.00% 1/7/2021 1,594,756 0.01%Kommunekredit €1,320,000 0.00% 3/3/2031 1,548,317 0.01%Nykredit Realkredit A/S €1,200,000 0.75% 20/1/2027 1,450,802 0.01%Danske Bank A/S €1,100,000 0.88% 22/5/2023 1,327,944 0.01%Denmark Government International Bond $1,325,000 0.13% 27/10/2022 1,324,068 0.01%Danske Bank A/S^ €1,075,000 0.50% 27/8/2025 1,288,040 0.01%Kommunekredit €1,000,000 0.50% 24/1/2025 1,224,177 0.01%Sydbank A/S €1,000,000 1.38% 18/9/2023 1,222,505 0.01%ISS Global A/S €1,000,000 0.88% 18/6/2026 1,200,047 0.01%Danske Mortgage Bank plc €1,000,000 0.01% 14/1/2028 1,198,517 0.01%Denmark Government Bond DKK(kr)7,000,000 1.50% 15/11/2023 1,170,972 0.01%Denmark Government Bond DKK(kr)5,000,000 7.00% 10/11/2024 1,000,501 0.00%Nordea Kredit Realkreditaktieselskab DKK(kr)6,000,000 1.00% 1/10/2021 959,797 0.00%Carlsberg Breweries A/S €800,000 0.38% 30/6/2027 959,443 0.00%Carlsberg Breweries A/S €700,000 2.50% 28/5/2024 888,554 0.00%Orsted A/S^ €700,000 2.25% 24/11/3017 867,706 0.00%Danske Bank A/S €550,000 0.63% 26/5/2025 667,525 0.00%Danske Bank A/S^ €500,000 2.50% 21/6/2029 624,831 0.00%Jyske Realkredit A/S €500,000 0.50% 1/10/2026 614,975 0.00%Danfoss Finance I BV €500,000 0.13% 28/4/2026 592,091 0.00%Kommunekredit €400,000 0.88% 3/11/2036 502,118 0.00%Orsted A/S^ €400,000 1.75% 9/12/3019 486,707 0.00%

380
Vanguard Global Bond Index Fund
Principal CouponMaturity
DateFair Value
US Dollars ($)% of Total
Net AssetsNykredit Realkredit A/S €400,000 0.25% 20/1/2023 477,869 0.00%Danfoss Finance II BV €400,000 0.75% 28/4/2031 474,646 0.00%Danske Bank A/S $400,000 4.38% 12/6/2028 449,007 0.00%Danske Bank A/S^ €375,000 1.00% 15/5/2031 445,161 0.00%Danske Bank A/S $400,000 3.88% 12/9/2023 425,853 0.00%Denmark Government Bond DKK(kr)2,400,000 3.00% 15/11/2021 387,755 0.00%Kommunekredit €300,000 0.25% 29/3/2023 360,619 0.00%AP Moller-Maersk A/S $250,000 3.88% 28/9/2025 274,631 0.00%Jyske Realkredit A/S €200,000 0.25% 1/7/2023 240,516 0.00%Danske Bank A/S^ $225,000 3.24% 20/12/2025 239,475 0.00%Danske Bank A/S $200,000 5.38% 12/1/2024 221,843 0.00%AP Moller-Maersk A/S $175,000 4.50% 20/6/2029 202,437 0.00%Orsted A/S £100,000 4.88% 12/1/2032 180,611 0.00%Nykredit Realkredit A/S^ €100,000 2.75% 17/11/2027 122,937 0.00%ISS Global A/S €100,000 1.50% 31/8/2027 122,855 0.00%H Lundbeck A/S €100,000 0.88% 14/10/2027 120,659 0.00%Carlsberg Breweries A/S €100,000 0.63% 9/3/2030 119,618 0.00%Nykredit Realkredit A/S DKK(kr)367,098 2.00% 1/10/2047 60,752 0.00%Nykredit Realkredit A/S DKK(kr)143,598 3.00% 1/10/2031 23,993 0.00%Nordea Kredit Realkreditaktieselskab DKK(kr)32,193 3.50% 1/10/2044 5,779 0.00%test - - - 87,928,364 0.40%Finland 0.57% (2020: 0.54%)Finland Government Bond €21,600,000 0.13% 15/9/2031 25,874,294 0.12%Finland Government Bond €11,300,000 0.75% 15/4/2031 14,434,170 0.07%Finland Government Bond €6,000,000 0.00% 15/9/2030 7,162,774 0.03%Finland Government Bond €4,599,000 0.50% 15/9/2029 5,759,187 0.03%OP Mortgage Bank €4,000,000 0.01% 19/11/2030 4,727,463 0.02%Finland Government Bond €3,200,000 0.88% 15/9/2025 4,026,268 0.02%OP Corporate Bank plc €2,935,000 0.38% 16/6/2028 3,458,037 0.02%Finland Government Bond €2,250,000 0.00% 15/9/2023 2,707,098 0.01%OP Corporate Bank plc €2,000,000 0.38% 11/10/2022 2,395,106 0.01%OP Corporate Bank plc €2,000,000 0.13% 1/7/2024 2,394,513 0.01%Kuntarahoitus OYJ €1,850,000 0.63% 26/11/2026 2,303,119 0.01%Finland Government Bond €1,800,000 2.00% 15/4/2024 2,295,033 0.01%Kuntarahoitus OYJ €1,900,000 0.00% 2/3/2031 2,241,110 0.01%OP Corporate Bank plc^ €1,600,000 1.63% 9/6/2030 1,963,757 0.01%Aktia Bank OYJ €1,500,000 0.38% 5/3/2026 1,836,539 0.01%Nordea Kiinnitysluottopankki OYJ €1,500,000 0.25% 18/3/2026 1,825,731 0.01%OP Corporate Bank plc €1,500,000 0.60% 18/1/2027 1,808,563 0.01%Nordea Bank Abp^ €1,500,000 0.63% 18/8/2031 1,775,035 0.01%Nordea Bank Abp^ $1,500,000 4.63% 13/9/2033 1,689,237 0.01%OP Mortgage Bank €1,400,000 0.63% 4/9/2022 1,683,004 0.01%Sampo OYJ^ €1,240,000 2.50% 3/9/2052 1,559,800 0.01%OP Corporate Bank plc €1,200,000 0.10% 16/11/2027 1,417,337 0.01%Kuntarahoitus OYJ €1,100,000 0.13% 7/3/2024 1,326,201 0.01%Kuntarahoitus OYJ €1,040,000 0.00% 14/10/2030 1,233,219 0.01%Finnvera OYJ €1,000,000 0.50% 13/4/2026 1,231,624 0.01%Nordea Bank Abp €1,000,000 0.50% 14/5/2027 1,216,018 0.01%Nordea Bank Abp €1,000,000 0.38% 28/5/2026 1,212,265 0.01%Danske Mortgage Bank plc €1,000,000 0.38% 21/11/2023 1,209,594 0.01%Finland Government Bond €1,000,000 0.25% 15/9/2040 1,153,867 0.01%Finland Government Bond €800,000 4.00% 4/7/2025 1,125,574 0.01%Finland Government Bond €575,000 2.63% 4/7/2042 991,205 0.01%Finland Government Bond €800,000 1.63% 15/9/2022 974,937 0.01%Nordea Kiinnitysluottopankki OYJ €800,000 0.25% 28/2/2023 960,774 0.01%Elenia Verkko OYJ €800,000 0.38% 6/2/2027 951,509 0.00%Kuntarahoitus OYJ €700,000 0.05% 10/9/2035 798,619 0.00%Finnvera OYJ €650,000 0.38% 9/4/2029 796,520 0.00%Kojamo OYJ €600,000 1.88% 27/5/2027 761,674 0.00%Finland Government International Bond $800,000 0.88% 20/5/2030 760,656 0.00%Nordea Bank Abp €600,000 0.88% 26/6/2023 727,070 0.00%Finland Government Bond €500,000 2.75% 4/7/2028 722,471 0.00%Kojamo OYJ €600,000 0.88% 28/5/2029 713,287 0.00%Sampo OYJ^ €500,000 3.38% 23/5/2049 674,573 0.00%Nordea Bank Abp $600,000 3.75% 30/8/2023 640,251 0.00%OP Corporate Bank plc €500,000 0.38% 26/2/2024 603,162 0.00%Kuntarahoitus OYJ $600,000 0.38% 1/9/2023 600,015 0.00%Kuntarahoitus OYJ €500,000 0.05% 6/9/2029 599,013 0.00%Transmission Finance DAC €500,000 0.38% 18/6/2028 587,785 0.00%Finnvera OYJ $500,000 2.38% 4/6/2025 530,639 0.00%Finnvera OYJ $500,000 1.63% 23/10/2024 516,085 0.00%

381
Vanguard Global Bond Index Fund
Principal CouponMaturity
DateFair Value
US Dollars ($)% of Total
Net AssetsFortum OYJ €400,000 2.25% 6/9/2022 488,367 0.00%OP Corporate Bank plc €400,000 0.38% 19/6/2024 480,365 0.00%Kuntarahoitus OYJ $425,000 2.88% 7/3/2023 443,486 0.00%Nordea Bank Abp $400,000 1.00% 9/6/2023 404,645 0.00%Stora Enso OYJ €300,000 2.50% 7/6/2027 399,334 0.00%Fortum OYJ €300,000 2.13% 27/2/2029 397,710 0.00%Fortum OYJ €300,000 1.63% 27/2/2026 378,763 0.00%Citycon Treasury BV €300,000 2.50% 1/10/2024 375,806 0.00%Fortum OYJ €300,000 0.88% 27/2/2023 361,889 0.00%Kuntarahoitus OYJ €300,000 0.00% 15/11/2024 361,067 0.00%Finnvera OYJ €300,000 0.63% 22/9/2022 360,961 0.00%Nordea Bank Abp $350,000 0.75% 28/8/2025 346,037 0.00%Kuntarahoitus OYJ $300,000 1.38% 12/9/2022 304,114 0.00%Kuntarahoitus OYJ $300,000 0.63% 20/3/2026 296,233 0.00%Nordea Bank Abp $265,000 0.63% 24/5/2024 264,971 0.00%OP Corporate Bank plc €200,000 0.63% 12/11/2029 238,360 0.00%Kuntarahoitus OYJ $200,000 2.50% 15/11/2023 209,788 0.00%Finland Government Bond €150,000 1.50% 15/4/2023 184,803 0.00%Elisa OYJ €100,000 1.13% 26/2/2026 124,261 0.00%test - - - 125,376,742 0.57%France 6.47% (2020: 6.70%)French Republic Government Bond OAT €91,510,000 0.00% 25/2/2024 110,277,845 0.50%French Republic Government Bond OAT €64,038,000 0.75% 25/11/2028 81,202,304 0.37%French Republic Government Bond OAT €63,299,000 0.00% 25/2/2027 76,429,432 0.35%French Republic Government Bond OAT €30,542,914 1.25% 25/5/2034 40,581,986 0.18%French Republic Government Bond OAT €32,330,000 0.50% 25/5/2040 37,572,273 0.17%French Republic Government Bond OAT €30,000,000 0.00% 25/2/2026 36,311,309 0.17%French Republic Government Bond OAT €28,080,000 0.00% 25/11/2029 33,488,816 0.15%French Republic Government Bond OAT €26,000,000 0.50% 25/5/2026 32,266,720 0.15%French Republic Government Bond OAT €24,697,000 2.25% 25/5/2024 31,741,923 0.14%French Republic Government Bond OAT €25,000,000 0.50% 25/5/2025 30,839,340 0.14%French Republic Government Bond OAT €19,700,000 1.75% 25/6/2039 28,359,646 0.13%French Republic Government Bond OAT €23,176,000 0.75% 25/5/2052 26,273,874 0.12%French Republic Government Bond OAT €20,600,000 0.00% 25/11/2030 24,361,484 0.11%French Republic Government Bond OAT €12,280,000 3.25% 25/5/2045 22,695,205 0.10%French Republic Government Bond OAT €16,131,000 1.75% 25/5/2023 20,005,409 0.09%BPCE SFH SA €15,600,000 0.13% 3/12/2030 18,574,076 0.09%French Republic Government Bond OAT €14,500,000 1.00% 25/11/2025 18,327,669 0.08%French Republic Government Bond OAT €13,300,000 1.50% 25/5/2031 18,015,940 0.08%French Republic Government Bond OAT €15,000,000 0.00% 25/3/2023 17,987,592 0.08%French Republic Government Bond OAT €10,214,000 2.00% 25/5/2048 15,598,905 0.07%French Republic Government Bond OAT €6,280,000 4.00% 25/4/2060 14,733,103 0.07%French Republic Government Bond OAT €6,600,000 4.50% 25/4/2041 13,573,421 0.06%French Republic Government Bond OAT €7,100,000 4.75% 25/4/2035 13,504,961 0.06%French Republic Government Bond OAT €10,900,000 2.25% 25/10/2022 13,424,983 0.06%French Republic Government Bond OAT €5,950,000 4.00% 25/4/2055 13,369,077 0.06%French Republic Government Bond OAT €9,700,000 1.75% 25/11/2024 12,420,349 0.06%French Republic Government Bond OAT €10,000,000 0.00% 25/3/2025 12,094,622 0.06%French Republic Government Bond OAT €5,650,000 5.75% 25/10/2032 10,945,479 0.05%French Republic Government Bond OAT €8,500,000 0.00% 25/11/2031 9,948,516 0.05%French Republic Government Bond OAT €10,194,000 0.50% 25/5/2072 9,327,777 0.04%French Republic Government Bond OAT €7,000,000 1.25% 25/5/2036 9,299,480 0.04%Dexia Credit Local SA €7,500,000 0.25% 1/6/2023 9,018,016 0.04%French Republic Government Bond OAT €6,800,000 0.75% 25/5/2028 8,611,870 0.04%Agence Francaise de Developpement EPIC €5,900,000 0.01% 25/11/2028 7,005,452 0.03%French Republic Government Bond OAT €4,700,000 2.50% 25/5/2030 6,841,192 0.03%UNEDIC A.S.SEO €5,000,000 0.13% 25/11/2024 6,031,975 0.03%Agence Francaise de Developpement EPIC €5,000,000 0.13% 15/11/2023 6,009,387 0.03%Bpifrance SACA £4,000,000 0.75% 22/7/2022 5,554,082 0.03%Caisse Francaise de Financement Local €4,200,000 0.01% 27/4/2029 5,004,175 0.02%Caisse d'Amortissement de la Dette Sociale €3,900,000 1.38% 25/11/2024 4,913,490 0.02%UNEDIC A.S.SEO €4,100,000 0.50% 25/5/2036 4,855,031 0.02%French Republic Government Bond OAT €2,500,000 4.00% 25/10/2038 4,705,288 0.02%Caisse Francaise de Financement Local €4,000,000 0.01% 18/3/2031 4,700,487 0.02%Banque Federative du Credit Mutuel SA €3,500,000 0.75% 15/6/2023 4,239,265 0.02%SNCF Reseau €3,500,000 0.75% 25/5/2036 4,224,078 0.02%Electricite de France SA £2,000,000 5.50% 17/10/2041 4,113,416 0.02%SNCF Reseau €3,000,000 0.88% 22/1/2029 3,764,783 0.02%Caisse Francaise de Financement Local €3,000,000 0.63% 13/4/2026 3,710,146 0.02%Caisse d'Amortissement de la Dette Sociale €3,000,000 0.13% 25/10/2023 3,609,683 0.02%Caisse d'Amortissement de la Dette Sociale €3,000,000 0.13% 25/11/2022 3,589,472 0.02%

382
Vanguard Global Bond Index Fund
Principal CouponMaturity
DateFair Value
US Dollars ($)% of Total
Net AssetsSFIL SA €2,900,000 0.05% 4/6/2029 3,441,347 0.02%Agence Francaise de Developpement EPIC €2,800,000 0.25% 21/7/2026 3,401,432 0.02%French Republic Government Bond OAT €2,307,342 1.50% 25/5/2050 3,180,436 0.02%Credit Mutuel Home Loan SFH SA €2,500,000 0.13% 9/4/2025 3,017,720 0.01%Cie de Financement Foncier SA €2,500,000 0.33% 12/9/2023 3,015,802 0.01%Caisse d'Amortissement de la Dette Sociale €2,400,000 0.00% 25/11/2026 2,884,587 0.01%French Republic Government Bond OAT €2,401,000 0.00% 25/2/2023 2,877,680 0.01%Arkea Home Loans SFH SA €2,400,000 0.01% 4/10/2030 2,828,278 0.01%Agence Francaise de Developpement EPIC €2,400,000 0.38% 25/5/2036 2,761,976 0.01%BNP Paribas SA €2,172,000 1.50% 17/11/2025 2,727,789 0.01%Cie de Financement Foncier SA €1,900,000 4.00% 24/10/2025 2,675,798 0.01%Orange SA €2,100,000 1.25% 7/7/2027 2,657,635 0.01%Caisse Francaise de Financement Local €2,200,000 0.63% 26/1/2023 2,654,623 0.01%Aeroports de Paris €2,100,000 1.00% 5/1/2029 2,612,121 0.01%Autoroutes du Sud de la France SA €2,000,000 1.38% 27/6/2028 2,571,382 0.01%Banque Federative du Credit Mutuel SA €2,000,000 1.88% 18/6/2029 2,552,207 0.01%La Banque Postale Home Loan SFH SA €2,000,000 0.88% 7/2/2028 2,531,972 0.01%Credit Mutuel Home Loan SFH SA €2,000,000 2.50% 11/9/2023 2,527,078 0.01%Capgemini SE €2,000,000 1.13% 23/6/2030 2,500,165 0.01%Societe Du Grand Paris EPIC €2,100,000 0.88% 10/5/2046 2,455,225 0.01%Societe Generale SFH SA €2,000,000 0.50% 30/1/2025 2,445,836 0.01%Caisse Francaise de Financement Local €2,000,000 0.50% 16/1/2025 2,444,272 0.01%Credit Agricole Home Loan SFH SA €2,000,000 0.38% 30/9/2024 2,431,046 0.01%Banque Federative du Credit Mutuel SA £1,700,000 1.75% 19/12/2024 2,422,245 0.01%Bpifrance SACA €2,000,000 0.13% 25/11/2023 2,406,518 0.01%Electricite de France SA £1,200,000 6.13% 2/6/2034 2,406,262 0.01%BNP Paribas SA^ €2,000,000 0.50% 15/7/2025 2,402,982 0.01%Bpifrance SACA €2,000,000 0.25% 14/2/2023 2,400,883 0.01%Banque Federative du Credit Mutuel SA €2,000,000 0.25% 29/6/2028 2,366,934 0.01%Caisse Francaise de Financement Local €2,000,000 0.01% 24/6/2030 2,363,896 0.01%Banque Federative du Credit Mutuel SA €2,000,000 0.63% 21/2/2031 2,346,193 0.01%Bpifrance SACA €1,900,000 0.00% 25/5/2028 2,264,226 0.01%Caisse Francaise de Financement Local €2,000,000 0.01% 19/10/2035 2,253,921 0.01%Orange SA £1,400,000 3.25% 15/1/2032 2,200,641 0.01%BNP Paribas SA^ $2,075,000 3.05% 13/1/2031 2,186,083 0.01%BPCE SFH SA €1,800,000 0.01% 8/11/2026 2,161,494 0.01%Caisse d'Amortissement de la Dette Sociale $2,200,000 0.38% 23/9/2025 2,158,971 0.01%AXA SA^ €1,565,000 3.25% 28/5/2049 2,124,726 0.01%WEA Finance LLC/Westfield UK & Europe Finance plc $1,984,000 3.75% 17/9/2024 2,123,234 0.01%BNP Paribas SA £1,600,000 1.25% 13/7/2031 2,071,435 0.01%Cie Financiere et Industrielle des Autoroutes SA €1,700,000 0.38% 7/2/2025 2,054,779 0.01%Credit Agricole SA^ €1,600,000 1.00% 22/4/2026 1,957,829 0.01%Banque Federative du Credit Mutuel SA €1,600,000 0.13% 5/2/2024 1,913,616 0.01%TotalEnergies Capital International SA $1,750,000 3.70% 15/1/2024 1,886,563 0.01%TotalEnergies Capital International SA €1,500,000 0.95% 18/5/2031 1,872,883 0.01%Credit Mutuel Arkea SA €1,300,000 3.38% 11/3/2031 1,858,438 0.01%BPCE SA €1,500,000 1.00% 1/4/2025 1,839,171 0.01%UNEDIC A.S.SEO €1,600,000 0.10% 25/5/2034 1,829,669 0.01%Dexia Credit Local SA €1,500,000 0.63% 3/2/2024 1,827,047 0.01%Electricite de France SA €995,000 5.63% 21/2/2033 1,824,088 0.01%BPCE SFH SA €1,500,000 0.01% 10/11/2027 1,796,632 0.01%Worldline SA €1,500,000 0.25% 18/9/2024 1,793,049 0.01%Agence France Locale €1,500,000 0.00% 20/9/2027 1,782,682 0.01%Societe Generale SA^ €1,500,000 1.13% 30/6/2031 1,778,391 0.01%Orange SA €1,500,000 0.75% 29/6/2034 1,776,429 0.01%BNP Paribas SA €1,500,000 0.13% 4/9/2026 1,766,091 0.01%Sanofi €1,400,000 1.00% 21/3/2026 1,746,708 0.01%Societe Generale SA^ €1,500,000 0.50% 12/6/2029 1,740,692 0.01%Caisse d'Amortissement de la Dette Sociale $1,750,000 0.63% 18/2/2026 1,727,314 0.01%Societe Du Grand Paris EPIC €1,600,000 1.00% 18/2/2070 1,727,242 0.01%BNP Paribas SA $1,600,000 3.80% 10/1/2024 1,716,864 0.01%Aeroports de Paris €1,300,000 2.13% 2/10/2026 1,705,978 0.01%TotalEnergies SE^ €1,400,000 1.75% Perpetual 1,701,075 0.01%Caisse Centrale du Credit Immobilier de France SA €1,400,000 0.13% 26/10/2022 1,672,810 0.01%Caisse d'Amortissement de la Dette Sociale €1,300,000 4.13% 25/4/2023 1,671,985 0.01%Caisse d'Amortissement de la Dette Sociale $1,700,000 1.00% 21/10/2030 1,610,968 0.01%Credit Mutuel Arkea SA €1,300,000 1.25% 31/5/2024 1,595,920 0.01%SNCF Reseau €1,200,000 1.50% 29/5/2037 1,592,713 0.01%BPCE SA €1,300,000 0.63% 26/9/2024 1,571,811 0.01%Engie SA €1,200,000 1.75% 27/3/2028 1,564,619 0.01%BPCE SA $1,500,000 2.38% 14/1/2025 1,561,690 0.01%

383
Vanguard Global Bond Index Fund
Principal CouponMaturity
DateFair Value
US Dollars ($)% of Total
Net AssetsLVMH Moet Hennessy Louis Vuitton SE €1,300,000 0.13% 11/2/2028 1,555,852 0.01%Air Liquide Finance SA $1,500,000 2.25% 27/9/2023 1,555,681 0.01%Caisse de Refinancement de l'Habitat SA €1,300,000 0.01% 7/2/2028 1,555,161 0.01%BPCE SA $1,500,000 2.75% 11/1/2023 1,554,377 0.01%BNP Paribas SA^ €1,200,000 2.13% 23/1/2027 1,535,981 0.01%Banque Federative du Credit Mutuel SA €1,300,000 0.25% 19/7/2028 1,510,712 0.01%Bpifrance SACA €1,200,000 0.63% 25/5/2026 1,487,376 0.01%Credit Mutuel Home Loan SFH SA €1,200,000 0.63% 2/2/2026 1,483,023 0.01%Caisse d'Amortissement de la Dette Sociale €1,200,000 2.50% 25/10/2022 1,479,945 0.01%Electricite de France SA €900,000 4.63% 26/4/2030 1,450,221 0.01%Banque Federative du Credit Mutuel SA €1,200,000 0.63% 3/11/2028 1,426,740 0.01%French Republic Government Bond OAT €825,000 5.50% 25/4/2029 1,415,104 0.01%AXA SA^ £800,000 5.63% 16/1/2054 1,407,194 0.01%Dexia Credit Local SA £1,000,000 1.13% 15/6/2022 1,393,507 0.01%Caisse Francaise de Financement Local €1,200,000 0.38% 13/2/2040 1,392,151 0.01%LVMH Moet Hennessy Louis Vuitton SE £1,000,000 1.13% 11/2/2027 1,390,613 0.01%LVMH Moet Hennessy Louis Vuitton SE £1,000,000 1.00% 14/6/2022 1,388,134 0.01%SNCF Reseau €1,000,000 1.88% 30/3/2034 1,382,290 0.01%Agence Francaise de Developpement EPIC €1,100,000 1.38% 17/9/2024 1,378,815 0.01%Caisse d'Amortissement de la Dette Sociale $1,400,000 1.38% 20/1/2031 1,367,057 0.01%Orange SA €1,000,000 2.00% 15/1/2029 1,339,872 0.01%Ile-de-France Mobilites €1,200,000 0.20% 16/11/2035 1,338,067 0.01%Credit Agricole Home Loan SFH SA €1,000,000 1.38% 3/2/2032 1,337,456 0.01%Credit Agricole Assurances SA^ €1,000,000 4.25% Perpetual 1,317,705 0.01%BPCE SA^ €1,100,000 0.50% 15/9/2027 1,309,655 0.01%Sanofi €1,000,000 1.25% 21/3/2034 1,308,859 0.01%Caisse de Refinancement de l'Habitat SA €1,000,000 3.90% 20/10/2023 1,305,723 0.01%Airbus SE €1,000,000 1.63% 9/6/2030 1,290,011 0.01%Bpifrance SACA €1,000,000 2.50% 25/5/2024 1,287,675 0.01%Caisse d'Amortissement de la Dette Sociale €1,100,000 0.00% 25/5/2031 1,283,012 0.01%Credit Mutuel Home Loan SFH SA €1,000,000 1.00% 30/1/2029 1,280,683 0.01%Credit Agricole Home Loan SFH SA €1,000,000 0.88% 11/8/2028 1,268,565 0.01%BNP Paribas SA^ $1,300,000 2.59% 12/8/2035 1,268,025 0.01%Airbus SE €1,000,000 1.38% 9/6/2026 1,259,976 0.01%Sanofi €1,000,000 0.88% 21/3/2029 1,253,665 0.01%Credit Agricole SA €1,000,000 1.00% 3/7/2029 1,250,249 0.01%Orange SA €1,000,000 1.00% 12/9/2025 1,238,498 0.01%Sanofi €1,000,000 1.00% 1/4/2025 1,238,200 0.01%MMB SCF SACA €1,000,000 0.75% 31/10/2025 1,237,247 0.01%Unibail-Rodamco-Westfield SE €1,000,000 1.13% 15/9/2025 1,234,026 0.01%TotalEnergies Capital International SA €1,000,000 0.70% 31/5/2028 1,229,549 0.01%Banque Federative du Credit Mutuel SA $1,200,000 2.13% 21/11/2022 1,229,096 0.01%Societe Generale SFH SA €1,000,000 0.50% 28/1/2026 1,228,736 0.01%EssilorLuxottica SA €1,000,000 0.75% 27/11/2031 1,227,565 0.01%Credit Agricole Public Sector SCF SA €1,000,000 0.50% 10/10/2025 1,226,958 0.01%Bpifrance SACA €1,000,000 0.50% 25/5/2025 1,224,947 0.01%Agence Francaise de Developpement EPIC €1,000,000 0.50% 25/5/2030 1,224,805 0.01%BNP Paribas SA €1,000,000 1.13% 22/11/2023 1,223,193 0.01%La Poste SA €1,000,000 0.63% 21/10/2026 1,220,318 0.01%Cie de Financement Foncier SA €1,000,000 0.38% 11/12/2024 1,216,454 0.01%Credit Mutuel Arkea SA €1,000,000 0.88% 5/10/2023 1,216,252 0.01%BPCE SA €1,000,000 0.88% 31/1/2024 1,215,406 0.01%Cie de Financement Foncier SA €1,000,000 0.23% 14/9/2026 1,214,343 0.01%Arkea Home Loans SFH SA €1,000,000 0.38% 4/3/2024 1,210,934 0.01%Bpifrance SACA €1,000,000 0.13% 25/3/2025 1,208,338 0.01%Credit Agricole Home Loan SFH SA €1,000,000 0.25% 23/2/2024 1,207,487 0.01%Societe Generale SFH SA €1,000,000 0.25% 11/9/2023 1,204,450 0.01%LVMH Moet Hennessy Louis Vuitton SE €1,000,000 0.38% 11/2/2031 1,202,439 0.01%Societe Generale SA $1,150,000 2.63% 22/1/2025 1,201,808 0.01%AXA Home Loan SFH SA €1,000,000 0.05% 5/7/2027 1,200,987 0.01%Societe Generale SA €1,000,000 0.50% 13/1/2023 1,199,091 0.01%Electricite de France SA $1,000,000 4.50% 4/12/2069 1,198,522 0.01%La Banque Postale SA €1,000,000 0.25% 12/7/2026 1,198,231 0.01%Unibail-Rodamco-Westfield SE €1,000,000 0.75% 25/10/2028 1,196,463 0.01%Dexia Credit Local SA €1,000,000 0.01% 22/1/2027 1,194,340 0.01%Caisse d'Amortissement de la Dette Sociale $1,200,000 0.38% 27/5/2024 1,194,099 0.01%Credit Agricole Home Loan SFH SA €1,000,000 0.05% 29/8/2022 1,193,573 0.01%Credit Agricole Public Sector SCF SA €1,000,000 0.01% 13/9/2028 1,191,939 0.01%Alstom SA €1,000,000 0.25% 14/10/2026 1,191,281 0.01%UNEDIC A.S.SEO €1,000,000 0.00% 25/11/2028 1,191,154 0.01%Credit Mutuel Arkea SA €1,000,000 0.38% 3/10/2028 1,189,040 0.01%

384
Vanguard Global Bond Index Fund
Principal CouponMaturity
DateFair Value
US Dollars ($)% of Total
Net AssetsBNP Paribas SA^ €1,000,000 0.50% 19/2/2028 1,187,494 0.01%Klepierre SA €1,000,000 0.63% 1/7/2030 1,187,027 0.01%Agence Francaise de Developpement EPIC €1,000,000 0.50% 31/5/2035 1,186,779 0.01%TotalEnergies SE^ €1,000,000 1.63% Perpetual 1,186,121 0.01%Legrand France SA $936,000 8.50% 15/2/2025 1,182,949 0.01%APRR SA €1,000,000 0.13% 18/1/2029 1,182,768 0.01%HSBC Continental Europe SA €1,000,000 0.10% 3/9/2027 1,179,218 0.01%UNEDIC A.S.SEO €1,000,000 0.00% 19/11/2030 1,171,252 0.01%TotalEnergies Capital International SA €900,000 1.54% 31/5/2039 1,169,678 0.01%Aeroports de Paris €900,000 1.50% 2/7/2032 1,154,270 0.01%ELO SACA €900,000 2.38% 25/4/2025 1,152,107 0.01%Electricite de France SA^ $1,093,000 5.25% Perpetual 1,145,361 0.01%Credit Agricole SA^ $1,100,000 1.91% 16/6/2026 1,121,108 0.01%Societe Du Grand Paris EPIC €1,100,000 0.70% 15/10/2060 1,113,287 0.01%Societe Du Grand Paris EPIC €800,000 1.70% 25/5/2050 1,105,896 0.01%Orange SA $700,000 9.00% 1/3/2031 1,102,734 0.01%Airbus SE €800,000 2.38% 9/6/2040 1,102,609 0.01%BNP Paribas SA $1,025,000 3.38% 9/1/2025 1,101,080 0.01%Societe Nationale SNCF SA €1,100,000 1.00% 19/1/2061 1,100,297 0.01%BPCE SA €900,000 0.63% 28/4/2025 1,093,912 0.01%MMS USA Holdings, Inc. €900,000 0.63% 13/6/2025 1,087,315 0.01%Dexia Credit Local SA €900,000 0.00% 29/5/2024 1,079,033 0.01%Electricite de France SA €800,000 2.00% 2/10/2030 1,073,076 0.01%Caisse Nationale de Reassurance Mutuelle Agricole Groupama €900,000 0.75% 7/7/2028 1,062,027 0.01%Air Liquide Finance SA $1,000,000 2.50% 27/9/2026 1,061,497 0.01%Dexia Credit Local SA $1,000,000 3.25% 26/9/2023 1,060,663 0.01%La Banque Postale Home Loan SFH SA €900,000 0.25% 12/2/2035 1,054,221 0.01%Orange SA €900,000 0.13% 16/9/2029 1,053,527 0.01%UNEDIC A.S.SEO €900,000 0.25% 16/7/2035 1,042,477 0.01%Schneider Electric SE €800,000 1.50% 15/1/2028 1,035,904 0.01%TotalEnergies Capital International SA $975,000 3.39% 29/6/2060 1,029,518 0.01%Dexia Credit Local SA $1,000,000 1.13% 9/4/2026 1,006,978 0.01%SNCF Reseau £500,000 5.25% 31/1/2035 1,004,879 0.01%Societe Generale SA $900,000 4.75% 24/11/2025 1,003,418 0.01%Credit Agricole Assurances SA €800,000 2.00% 17/7/2030 993,590 0.01%Electricite de France SA^ €800,000 3.38% Perpetual 991,338 0.01%Credit Mutuel Arkea SA €800,000 0.88% 7/5/2027 984,846 0.01%Societe Generale SA $945,000 3.00% 22/1/2030 982,435 0.01%Credit Agricole SA $890,000 4.38% 17/3/2025 980,269 0.01%Banque Federative du Credit Mutuel SA €800,000 0.75% 8/6/2026 980,187 0.01%Electricite de France SA^ €800,000 2.88% Perpetual 978,662 0.01%Banque Federative du Credit Mutuel SA €800,000 0.75% 17/7/2025 978,204 0.01%TotalEnergies Capital International SA €800,000 0.63% 4/10/2024 974,784 0.01%Orange SA^ €800,000 1.75% Perpetual 971,375 0.01%Veolia Environnement SA €800,000 0.89% 14/1/2024 971,196 0.01%Caisse de Refinancement de l'Habitat SA €800,000 0.13% 30/4/2027 966,468 0.01%UNEDIC A.S.SEO €800,000 0.25% 25/11/2029 966,100 0.01%Engie SA^ €800,000 1.38% Perpetual 965,536 0.01%Bpifrance SACA €800,000 0.25% 29/3/2030 961,413 0.01%Banque Federative du Credit Mutuel SA €800,000 0.50% 16/11/2022 961,054 0.01%Cie de Financement Foncier SA €800,000 0.25% 11/4/2023 961,044 0.01%Societe Generale SA €800,000 0.75% 25/1/2027 959,693 0.01%LVMH Moet Hennessy Louis Vuitton SE €800,000 0.00% 11/2/2024 955,798 0.01%Dexia Credit Local SA €800,000 0.00% 21/1/2028 950,998 0.01%AXA SA^ €700,000 3.38% 6/7/2047 950,446 0.01%Bpifrance SACA €800,000 0.05% 26/9/2029 946,650 0.01%Engie SA €800,000 0.00% 4/3/2027 942,903 0.01%Orange SA €800,000 0.50% 4/9/2032 942,107 0.01%Region of Ile de France €800,000 0.10% 2/7/2030 941,910 0.01%ELO SACA €700,000 2.88% 29/1/2026 924,324 0.01%BPCE SA $850,000 3.50% 23/10/2027 923,532 0.01%RTE Reseau de Transport d'Electricite SADIR €800,000 1.13% 9/9/2049 921,323 0.01%APRR SA €700,000 1.50% 25/1/2030 920,287 0.01%Suez SA €700,000 1.63% 17/9/2030 915,555 0.01%TotalEnergies Capital International SA $900,000 3.13% 29/5/2050 913,368 0.01%Vinci SA €700,000 1.63% 18/1/2029 913,229 0.01%Autoroutes du Sud de la France SA €700,000 1.38% 21/2/2031 907,835 0.01%Unibail-Rodamco-Westfield SE €700,000 2.00% 29/6/2032 905,560 0.00%Arkema SA €700,000 1.50% 20/4/2027 895,671 0.00%Engie SA €700,000 1.38% 21/6/2039 883,916 0.00%Electricite de France SA $675,000 5.00% 21/9/2048 879,366 0.00%

385
Vanguard Global Bond Index Fund
Principal CouponMaturity
DateFair Value
US Dollars ($)% of Total
Net AssetsRegie Autonome des Transports Parisiens €700,000 0.88% 25/5/2027 875,310 0.00%Electricite de France SA €700,000 2.75% 10/3/2023 872,662 0.00%UNEDIC A.S.SEO €700,000 0.50% 20/3/2029 864,495 0.00%TotalEnergies Capital International SA $800,000 2.83% 10/1/2030 858,843 0.00%Danone SA €700,000 0.71% 3/11/2024 854,724 0.00%BPCE SA AU($)1,000,000 4.50% 26/4/2028 850,502 0.00%Aeroports de Paris €600,000 2.75% 5/6/2028 845,133 0.00%Agence Francaise de Developpement EPIC €700,000 0.25% 29/6/2029 842,685 0.00%Worldline SA €700,000 0.50% 30/6/2023 840,803 0.00%Unibail-Rodamco-Westfield SE €700,000 0.63% 4/5/2027 840,319 0.00%Caisse Centrale du Credit Immobilier de France SA €700,000 0.05% 25/3/2025 839,157 0.00%Societe Nationale SNCF SA €800,000 0.88% 28/2/2051 836,407 0.00%BPCE SA €700,000 0.75% 3/3/2031 828,169 0.00%French Republic Government Bond OAT €553,000 1.75% 25/5/2066 825,789 0.00%ELO SACA €600,000 3.25% 23/7/2027 825,565 0.00%Credit Agricole SA €700,000 0.38% 20/4/2028 821,571 0.00%Banque Federative du Credit Mutuel SA $800,000 2.70% 20/7/2022 819,711 0.00%Carrefour SA €600,000 2.63% 15/12/2027 817,080 0.00%TotalEnergies SE^ €700,000 2.13% Perpetual 816,889 0.00%Societe Du Grand Paris EPIC €700,000 0.00% 25/11/2030 811,927 0.00%Cie de Saint-Gobain €600,000 2.38% 4/10/2027 807,254 0.00%BNP Paribas SA $700,000 4.40% 14/8/2028 806,893 0.00%Pernod Ricard SA €600,000 1.75% 8/4/2030 799,947 0.00%Credit Agricole SA $750,000 3.75% 24/4/2023 793,999 0.00%Engie SA £350,000 5.00% 1/10/2060 791,049 0.00%BNP Paribas SA €620,000 2.38% 20/5/2024 790,215 0.00%Pernod Ricard SA $750,000 4.25% 15/7/2022 778,470 0.00%UNEDIC A.S.SEO €600,000 1.25% 21/10/2027 775,596 0.00%Banque Federative du Credit Mutuel SA €600,000 1.75% 15/3/2029 774,270 0.00%Societe Du Grand Paris EPIC €600,000 1.13% 25/5/2034 768,451 0.00%TotalEnergies Capital International SA €600,000 1.49% 8/4/2027 768,052 0.00%Eutelsat SA €600,000 2.00% 2/10/2025 761,650 0.00%Caisse d'Amortissement de la Dette Sociale $705,000 3.38% 20/3/2024 759,805 0.00%La Banque Postale SA €600,000 1.38% 24/4/2029 758,344 0.00%Agence Francaise de Developpement EPIC €600,000 0.88% 25/5/2031 756,607 0.00%Credit Agricole SA €600,000 1.25% 14/4/2026 754,013 0.00%Holding d'Infrastructures de Transport SASU €600,000 1.63% 18/9/2029 750,004 0.00%Carrefour SA €600,000 1.00% 17/5/2027 744,825 0.00%Orange SA €600,000 0.88% 3/2/2027 742,971 0.00%Electricite de France SA £300,000 6.00% 23/1/2114 732,908 0.00%Unibail-Rodamco-Westfield SE €600,000 1.38% 4/12/2031 731,855 0.00%EssilorLuxottica SA €600,000 0.50% 5/6/2028 730,966 0.00%BPCE SA €600,000 0.63% 26/9/2023 726,431 0.00%RTE Reseau de Transport d'Electricite SADIR €600,000 1.13% 8/7/2040 723,438 0.00%BPCE SA €600,000 0.63% 15/1/2030 723,382 0.00%BNP Paribas SA^ €600,000 0.50% 4/6/2026 722,472 0.00%Danone SA €600,000 0.40% 10/6/2029 722,047 0.00%SFIL SA €600,000 0.00% 24/5/2024 719,734 0.00%Engie SA €600,000 0.38% 28/2/2023 718,356 0.00%Terega SA €600,000 0.88% 17/9/2030 716,710 0.00%Dassault Systemes SE €600,000 0.13% 16/9/2026 716,503 0.00%Schneider Electric SE €600,000 0.00% 12/6/2023 716,301 0.00%Electricite de France SA^ €600,000 2.63% Perpetual 715,693 0.00%RTE Reseau de Transport d'Electricite SADIR €600,000 0.63% 8/7/2032 714,416 0.00%BNP Paribas SA^ €600,000 0.50% 1/9/2028 709,834 0.00%Westfield America Management Ltd. £500,000 2.13% 30/3/2025 707,272 0.00%Westfield America Management Ltd. £500,000 2.63% 30/3/2029 704,912 0.00%RTE Reseau de Transport d'Electricite SADIR €500,000 2.13% 27/9/2038 702,597 0.00%Capgemini SE €500,000 2.38% 15/4/2032 697,838 0.00%Credit Agricole Home Loan SFH SA €500,000 1.50% 28/9/2038 696,993 0.00%Orange SA $500,000 5.50% 6/2/2044 696,030 0.00%ICADE €600,000 0.63% 18/1/2031 693,678 0.00%Electricite de France SA $625,000 3.63% 13/10/2025 686,511 0.00%Pernod Ricard SA $500,000 5.50% 15/1/2042 679,580 0.00%La Poste SA €600,000 0.63% 18/1/2036 679,008 0.00%Caisse Nationale de Reassurance Mutuelle Agricole Groupama €500,000 3.38% 24/9/2028 672,553 0.00%Dexia Credit Local SA $650,000 1.63% 16/10/2024 668,861 0.00%SNCF Reseau €500,000 2.63% 29/12/2025 668,635 0.00%Electricite de France SA^ €500,000 5.00% Perpetual 666,274 0.00%RCI Banque SA €554,000 0.75% 10/4/2023 665,404 0.00%SCOR SE^ €500,000 3.00% 8/6/2046 660,628 0.00%

386
Vanguard Global Bond Index Fund
Principal CouponMaturity
DateFair Value
US Dollars ($)% of Total
Net AssetsAirbus SE $580,000 3.95% 10/4/2047 659,388 0.00%Electricite de France SA $460,000 6.00% 22/1/2114 653,437 0.00%RTE Reseau de Transport d'Electricite SADIR €500,000 1.50% 27/9/2030 649,091 0.00%MMS USA Holdings, Inc. €500,000 1.75% 13/6/2031 642,975 0.00%Societe Du Grand Paris EPIC €500,000 1.13% 22/10/2028 642,763 0.00%SNCF Reseau €500,000 1.13% 25/5/2030 639,727 0.00%Electricite de France SA €500,000 2.00% 9/12/2049 638,589 0.00%Klepierre SA €500,000 1.63% 13/12/2032 638,247 0.00%Sanofi €500,000 1.13% 5/4/2028 636,875 0.00%Airbus Finance BV €500,000 1.38% 13/5/2031 633,492 0.00%Electricite de France SA $500,000 4.88% 22/1/2044 629,965 0.00%BNP Paribas SA $600,000 3.50% 1/3/2023 629,415 0.00%Danone SA $600,000 2.59% 2/11/2023 625,417 0.00%RTE Reseau de Transport d'Electricite SADIR €500,000 1.63% 8/10/2024 625,406 0.00%Banque Federative du Credit Mutuel SA €500,000 1.25% 3/6/2030 621,350 0.00%Banque Federative du Credit Mutuel SA €500,000 1.25% 14/1/2025 621,179 0.00%Credit Mutuel Arkea SA^ €500,000 1.88% 25/10/2029 619,161 0.00%BNP Paribas SA €500,000 1.63% 2/7/2031 618,807 0.00%BNP Paribas Home Loan SFH SA €500,000 0.88% 14/11/2024 618,273 0.00%Sodexo SA €500,000 1.13% 22/5/2025 618,168 0.00%Cie de Financement Foncier SA €500,000 0.75% 21/1/2025 616,548 0.00%Danone SA €500,000 1.00% 26/3/2025 616,173 0.00%Electricite de France SA $500,000 4.88% 21/9/2038 615,913 0.00%Orange SA €500,000 1.13% 15/7/2024 615,040 0.00%Engie SA €500,000 0.88% 19/9/2025 614,975 0.00%Covivio €500,000 1.13% 17/9/2031 614,514 0.00%BNP Paribas SA $650,000 2.82% 26/1/2041 613,934 0.00%Societe Generale SA €500,000 1.25% 15/2/2024 613,323 0.00%Societe Generale SA €500,000 1.13% 23/1/2025 613,321 0.00%Societe Generale SA €500,000 1.25% 12/6/2030 611,496 0.00%Cie de Financement Foncier SA €500,000 0.50% 4/9/2024 609,709 0.00%Capgemini SE €500,000 0.63% 23/6/2025 607,604 0.00%BNP Paribas SA €500,000 1.13% 15/1/2023 606,545 0.00%Cie de Saint-Gobain €500,000 0.63% 15/3/2024 605,944 0.00%BPCE SFH SA €500,000 0.38% 21/2/2024 605,618 0.00%Dexia Credit Local SA €500,000 0.75% 25/1/2023 604,531 0.00%Cie de Financement Foncier SA €500,000 0.63% 10/2/2023 603,611 0.00%Safran SA €500,000 0.75% 17/3/2031 602,396 0.00%Societe Generale SFH SA €500,000 0.50% 20/1/2023 602,181 0.00%La Poste SA €500,000 0.38% 17/9/2027 601,768 0.00%AXA Bank Europe SCF €500,000 0.38% 23/3/2023 601,574 0.00%Engie SA €500,000 0.38% 11/6/2027 601,207 0.00%HSBC Continental Europe SA €500,000 0.25% 17/5/2024 600,822 0.00%Caisse d'Amortissement de la Dette Sociale $600,000 0.38% 19/5/2023 600,743 0.00%La Mondiale SAM €500,000 0.75% 20/4/2026 600,318 0.00%AXA Bank Europe SCF €500,000 0.01% 22/1/2027 599,481 0.00%RCI Banque SA €500,000 0.75% 26/9/2022 598,745 0.00%Thales SA €500,000 0.25% 29/1/2027 595,093 0.00%Engie SA^ €500,000 1.50% Perpetual 594,602 0.00%Teleperformance €500,000 0.25% 26/11/2027 585,142 0.00%Orange SA^ €500,000 1.38% Perpetual 584,371 0.00%Alstom SA €500,000 0.00% 11/1/2029 576,541 0.00%Credit Agricole SA $600,000 2.81% 11/1/2041 568,369 0.00%Unibail-Rodamco-Westfield SE €500,000 1.75% 1/7/2049 564,927 0.00%Credit Agricole SA^ $500,000 4.00% 10/1/2033 543,588 0.00%Societe Generale SA $500,000 4.25% 14/4/2025 543,213 0.00%Pernod Ricard SA $500,000 3.25% 8/6/2026 542,270 0.00%RCI Banque SA £385,000 1.88% 8/11/2022 538,760 0.00%Credit Agricole SA $500,000 3.25% 4/10/2024 535,868 0.00%Cie de Saint-Gobain €400,000 1.88% 21/9/2028 528,949 0.00%Banque Federative du Credit Mutuel SA €400,000 2.63% 31/3/2027 527,398 0.00%Credit Agricole SA $500,000 3.25% 14/1/2030 527,065 0.00%TotalEnergies SE^ €400,000 3.37% Perpetual 526,035 0.00%BNP Paribas SA^ $500,000 2.22% 9/6/2026 515,526 0.00%Engie SA^ €400,000 3.25% Perpetual 513,951 0.00%Edenred €400,000 1.88% 6/3/2026 513,875 0.00%BPCE SA £300,000 5.25% 16/4/2029 512,007 0.00%Covivio €400,000 1.63% 23/6/2030 510,980 0.00%Sodexo, Inc. $500,000 2.72% 16/4/2031 510,320 0.00%TotalEnergies Capital International SA $500,000 2.99% 29/6/2041 508,632 0.00%Societe Fonciere Lyonnaise SA €400,000 1.50% 5/6/2027 505,525 0.00%

387
Vanguard Global Bond Index Fund
Principal CouponMaturity
DateFair Value
US Dollars ($)% of Total
Net AssetsTotalEnergies Capital International SA €400,000 1.38% 19/3/2025 501,564 0.00%TotalEnergies SE^ €400,000 2.63% Perpetual 501,431 0.00%MMS USA Holdings, Inc. €400,000 1.25% 13/6/2028 498,674 0.00%BNP Paribas SA $450,000 4.38% 28/9/2025 498,441 0.00%La Poste SA €400,000 1.13% 4/6/2025 496,818 0.00%UNEDIC A.S.SEO €400,000 0.63% 3/3/2026 494,810 0.00%Credit Mutuel Arkea SA^ €400,000 1.25% 11/6/2029 494,323 0.00%TotalEnergies SE^ €400,000 2.71% Perpetual 493,597 0.00%SNCF Reseau £200,000 4.83% 25/3/2060 491,359 0.00%LVMH Moet Hennessy Louis Vuitton SE €400,000 0.75% 26/5/2024 487,451 0.00%Danone SA^ €400,000 1.75% Perpetual 486,177 0.00%Electricite de France SA $400,000 4.75% 13/10/2035 485,040 0.00%AXA SA €376,000 1.13% 15/5/2028 484,057 0.00%EssilorLuxottica SA €400,000 0.25% 5/1/2024 480,751 0.00%Agence Francaise de Developpement EPIC €400,000 0.00% 25/3/2025 480,537 0.00%BPCE SFH SA €400,000 0.50% 11/10/2022 480,445 0.00%Dassault Systemes SE €400,000 0.38% 16/9/2029 479,703 0.00%BPCE SA €400,000 0.13% 4/12/2024 479,104 0.00%Credit Agricole SA £300,000 7.38% 18/12/2023 479,036 0.00%Icade Sante SAS €400,000 0.88% 4/11/2029 478,572 0.00%APRR SA €400,000 0.00% 20/1/2023 477,111 0.00%Suez SA^ €400,000 1.63% Perpetual 476,883 0.00%Engie SA €400,000 0.50% 24/10/2030 476,802 0.00%Safran SA €400,000 0.13% 16/3/2026 475,198 0.00%SFIL SA €400,000 0.00% 23/11/2028 475,022 0.00%Electricite de France SA^ £300,000 5.88% Perpetual 470,606 0.00%Vinci SA €400,000 0.00% 27/11/2028 468,375 0.00%SNCF Reseau €350,000 4.50% 30/1/2024 467,549 0.00%Cie Generale des Etablissements Michelin SCA €400,000 0.63% 2/11/2040 452,036 0.00%BNP Paribas SA $400,000 4.38% 12/5/2026 445,018 0.00%BNP Paribas SA^ $400,000 4.38% 1/3/2033 442,351 0.00%Electricite de France SA $325,000 5.25% 13/10/2055 435,900 0.00%Sodexo SA £300,000 1.75% 26/6/2028 422,566 0.00%Banque Federative du Credit Mutuel SA £300,000 1.25% 5/12/2025 418,655 0.00%Credit Agricole Home Loan SFH SA €300,000 4.00% 16/7/2025 418,588 0.00%BNP Paribas SA^ £300,000 2.00% 24/5/2031 417,854 0.00%TotalEnergies Capital International SA £300,000 1.41% 3/9/2031 406,549 0.00%Sodexo, Inc. $400,000 1.63% 16/4/2026 402,831 0.00%APRR SA €300,000 1.63% 13/1/2032 401,906 0.00%Orange SA^ €300,000 5.25% Perpetual 399,374 0.00%TotalEnergies Capital International SA €300,000 2.50% 25/3/2026 399,119 0.00%APRR SA €300,000 1.50% 17/1/2033 398,476 0.00%BNP Paribas SA $350,000 4.63% 13/3/2027 395,310 0.00%TotalEnergies Capital International SA €300,000 1.62% 18/5/2040 392,486 0.00%Eutelsat SA €300,000 2.25% 13/7/2027 389,625 0.00%TDF Infrastructure SASU €300,000 2.50% 7/4/2026 386,156 0.00%Banque Federative du Credit Mutuel SA €300,000 2.63% 18/3/2024 383,109 0.00%Kering SA €300,000 1.25% 10/5/2026 377,756 0.00%Atos SE €300,000 1.75% 7/5/2025 376,269 0.00%La Mondiale SAM €300,000 2.13% 23/6/2031 373,259 0.00%Capgemini SE €300,000 2.50% 1/7/2023 372,761 0.00%TotalEnergies Capital International SA €300,000 2.13% 15/3/2023 371,127 0.00%Air Liquide Finance SA €300,000 1.00% 2/4/2025 371,064 0.00%Region of Ile de France €300,000 0.63% 23/4/2027 370,602 0.00%Cie de Saint-Gobain €300,000 1.00% 17/3/2025 370,601 0.00%GELF Bond Issuer I SA €300,000 1.13% 18/7/2029 366,676 0.00%Bpifrance SACA €300,000 0.13% 26/2/2027 362,732 0.00%Sodexo SA €300,000 0.50% 17/1/2024 361,612 0.00%BPCE SFH SA €300,000 0.38% 10/2/2023 360,715 0.00%Orange SA €300,000 1.38% 4/9/2049 358,842 0.00%Arkema SA^ €300,000 1.50% Perpetual 358,456 0.00%PSA Tresorerie GIE €200,000 6.00% 19/9/2033 356,927 0.00%Carrefour Banque SA €300,000 0.11% 14/6/2025 356,422 0.00%Terega SASU €300,000 0.63% 27/2/2028 354,352 0.00%Cie Generale des Etablissements Michelin SCA €300,000 0.25% 2/11/2032 346,471 0.00%Vinci SA $300,000 3.75% 10/4/2029 338,579 0.00%TotalEnergies Capital International SA $300,000 3.46% 19/2/2029 334,490 0.00%BNP Paribas SA^ $300,000 7.20% Perpetual 320,334 0.00%Sanofi $300,000 3.38% 19/6/2023 316,953 0.00%Banque Federative du Credit Mutuel SA $300,000 0.65% 27/2/2024 299,344 0.00%Orange SA^ £200,000 5.75% Perpetual 297,735 0.00%

388
Vanguard Global Bond Index Fund
Principal CouponMaturity
DateFair Value
US Dollars ($)% of Total
Net AssetsTotalEnergies Capital International SA $280,000 2.43% 10/1/2025 294,465 0.00%Banque Federative du Credit Mutuel SA $275,000 3.75% 20/7/2023 293,064 0.00%BPCE SA $250,000 4.63% 12/9/2028 291,884 0.00%TotalEnergies Capital International SA £200,000 1.75% 7/7/2025 286,505 0.00%Sanofi $250,000 3.63% 19/6/2028 285,368 0.00%Electricite de France SA $190,000 6.95% 26/1/2039 285,298 0.00%AXA SA^ $200,000 6.38% Perpetual 278,018 0.00%French Republic Government Bond OAT €200,000 8.50% 25/4/2023 276,866 0.00%Aeroports de Paris €200,000 2.13% 11/10/2038 276,738 0.00%BPCE SA $250,000 3.38% 2/12/2026 275,581 0.00%BPCE SA $250,000 3.25% 11/1/2028 272,429 0.00%Orange SA $200,000 5.38% 13/1/2042 269,957 0.00%TotalEnergies Capital International SA $250,000 3.46% 12/7/2049 269,374 0.00%Electricite de France SA^ €200,000 5.38% Perpetual 266,235 0.00%Gecina SA €200,000 1.63% 29/5/2034 263,134 0.00%BPCE SA $250,000 2.70% 1/10/2029 261,154 0.00%Engie SA^ €200,000 3.88% Perpetual 260,847 0.00%Region of Ile de France €200,000 1.38% 14/3/2029 260,690 0.00%Capgemini SE €200,000 1.75% 18/4/2028 260,603 0.00%Societe Nationale SNCF SA €200,000 1.50% 2/2/2029 259,658 0.00%Air Liquide Finance SA €200,000 1.25% 13/6/2028 257,944 0.00%Terega SA €200,000 2.20% 5/8/2025 257,337 0.00%Electricite de France SA $200,000 4.95% 13/10/2045 256,787 0.00%Kering SA €200,000 1.50% 5/4/2027 256,711 0.00%Wendel SE €200,000 2.75% 2/10/2024 256,603 0.00%Dexia Credit Local SA $250,000 2.38% 20/9/2022 256,209 0.00%Societe Generale SA $200,000 5.63% 24/11/2045 256,167 0.00%Societe Generale SCF SA €200,000 4.25% 3/2/2023 255,218 0.00%RTE Reseau de Transport d'Electricite SADIR €200,000 1.63% 27/11/2025 253,802 0.00%Imerys SA €200,000 2.00% 10/12/2024 252,007 0.00%RCI Banque SA €200,000 1.63% 26/5/2026 250,810 0.00%Credit Mutuel Home Loan SFH SA €200,000 0.88% 7/4/2026 250,287 0.00%Suez SA^ €200,000 2.88% Perpetual 249,790 0.00%Orange SA^ €200,000 2.38% Perpetual 249,150 0.00%Caisse de Refinancement de l'Habitat SA €200,000 3.30% 23/9/2022 248,360 0.00%Indigo Group SAS €200,000 1.63% 19/4/2028 247,415 0.00%APRR SA €200,000 1.50% 15/1/2024 246,581 0.00%BPCE SA^ €200,000 2.75% 30/11/2027 246,226 0.00%Capgemini SE €200,000 1.00% 18/10/2024 245,243 0.00%Electricite de France SA^ €200,000 3.00% Perpetual 245,163 0.00%BNP Paribas Home Loan SFH SA €200,000 0.38% 7/5/2025 243,783 0.00%La Banque Postale Home Loan SFH SA €200,000 0.38% 24/1/2025 243,482 0.00%Vivendi SE €200,000 0.88% 18/9/2024 243,441 0.00%UNEDIC A.S.SEO €200,000 0.88% 25/10/2022 241,613 0.00%PSA Banque France SA €200,000 0.63% 21/6/2024 241,264 0.00%Credit Agricole Home Loan SFH SA €200,000 0.38% 24/3/2023 240,730 0.00%Arkea Home Loans SFH SA €200,000 0.63% 30/9/2022 240,526 0.00%Agence Francaise de Developpement EPIC €200,000 0.50% 25/10/2022 240,267 0.00%Holding d'Infrastructures de Transport SASU €200,000 0.63% 27/3/2023 239,717 0.00%Credit Mutuel Home Loan SFH SA €200,000 0.38% 12/9/2022 239,695 0.00%Arkema SA €200,000 0.13% 14/10/2026 238,856 0.00%LVMH Moet Hennessy Louis Vuitton SE €200,000 0.13% 28/2/2023 238,790 0.00%Altarea SCA €200,000 1.75% 16/1/2030 237,018 0.00%Imerys SA €200,000 1.00% 15/7/2031 235,715 0.00%TotalEnergies Capital Canada Ltd. $225,000 2.75% 15/7/2023 235,665 0.00%Cie Generale des Etablissements Michelin SCA €200,000 0.00% 2/11/2028 233,496 0.00%Unibail-Rodamco-Westfield SE €200,000 0.88% 29/3/2032 231,402 0.00%AXA SA^ $200,000 5.13% 17/1/2047 227,740 0.00%BPCE SA $200,000 5.15% 21/7/2024 223,030 0.00%BPCE SA $200,000 5.70% 22/10/2023 221,646 0.00%BPCE SA $200,000 4.50% 15/3/2025 220,650 0.00%Societe Generale SA $200,000 5.00% 17/1/2024 217,696 0.00%WEA Finance LLC/Westfield UK & Europe Finance plc $200,000 4.75% 17/9/2044 216,048 0.00%Electricite de France SA^ $200,000 5.63% Perpetual 215,731 0.00%La Mondiale SAM^ $200,000 4.80% 18/1/2048 214,724 0.00%Electricite de France SA £100,000 5.13% 22/9/2050 213,862 0.00%Banque Federative du Credit Mutuel SA $200,000 2.38% 21/11/2024 209,298 0.00%Air Liquide Finance SA $200,000 2.25% 10/9/2029 206,423 0.00%Engie SA $200,000 2.88% 10/10/2022 205,916 0.00%Societe Nationale SNCF SA €150,000 4.63% 2/2/2024 200,877 0.00%AXA SA^ €150,000 5.13% 4/7/2043 195,665 0.00%

389
Vanguard Global Bond Index Fund
Principal CouponMaturity
DateFair Value
US Dollars ($)% of Total
Net AssetsEngie SA £100,000 7.00% 30/10/2028 191,335 0.00%TotalEnergies Capital SA $150,000 3.88% 11/10/2028 171,960 0.00%AXA SA^ £100,000 5.45% Perpetual 159,831 0.00%WEA Finance LLC $145,000 2.88% 15/1/2027 149,643 0.00%SNCF Reseau €100,000 4.25% 7/10/2026 146,186 0.00%Caisse d'Amortissement de la Dette Sociale €100,000 4.00% 15/12/2025 141,865 0.00%Orange SA^ €100,000 5.00% Perpetual 141,582 0.00%RTE Reseau de Transport d'Electricite SADIR €100,000 2.75% 20/6/2029 141,221 0.00%Electricite de France SA €100,000 4.00% 12/11/2025 139,480 0.00%RTE Reseau de Transport d'Electricite SADIR €100,000 2.00% 18/4/2036 137,311 0.00%WEA Finance LLC $125,000 4.13% 20/9/2028 135,916 0.00%TotalEnergies Capital International SA €100,000 2.88% 19/11/2025 134,085 0.00%Region of Ile de France €100,000 2.38% 24/4/2026 133,388 0.00%WEA Finance LLC $125,000 4.63% 20/9/2048 133,253 0.00%Agence Francaise de Developpement EPIC €100,000 2.25% 28/5/2026 133,152 0.00%Wendel SE €100,000 2.50% 9/2/2027 131,856 0.00%Legrand SA €100,000 1.88% 16/12/2027 131,683 0.00%Caisse de Refinancement de l'Habitat SA €100,000 3.60% 8/3/2024 131,514 0.00%Agence Francaise de Developpement EPIC €100,000 2.25% 27/5/2025 130,576 0.00%Caisse de Refinancement de l'Habitat SA €100,000 2.40% 17/1/2025 130,291 0.00%Sanofi €100,000 1.75% 10/9/2026 129,686 0.00%Schneider Electric SE $125,000 2.95% 27/9/2022 128,825 0.00%UNEDIC A.S.SEO €100,000 2.38% 25/5/2024 128,418 0.00%Gecina SA €100,000 1.38% 26/1/2028 128,010 0.00%Banque Federative du Credit Mutuel SA €100,000 3.00% 28/11/2023 127,984 0.00%Holding d'Infrastructures de Transport SASU €100,000 2.25% 24/3/2025 127,739 0.00%BNP Paribas SA €100,000 2.38% 17/2/2025 127,696 0.00%Engie SA €100,000 1.38% 22/6/2028 127,587 0.00%Carmila SA €100,000 2.38% 16/9/2024 127,209 0.00%Autoroutes du Sud de la France SA €100,000 2.95% 17/1/2024 127,208 0.00%Pernod Ricard SA €100,000 1.50% 18/5/2026 127,188 0.00%Sanofi €100,000 1.50% 22/9/2025 126,738 0.00%Suez SA €100,000 2.75% 9/10/2023 126,507 0.00%Indigo Group SAS €100,000 2.13% 16/4/2025 126,373 0.00%BPCE SFH SA €100,000 1.75% 27/6/2024 126,274 0.00%Sanofi €100,000 2.50% 14/11/2023 125,771 0.00%Klepierre SA €100,000 1.75% 6/11/2024 125,668 0.00%HSBC SFH France SA €100,000 2.00% 16/10/2023 125,236 0.00%Air Liquide Finance SA €100,000 1.25% 3/6/2025 124,983 0.00%Dexia Credit Local SA €100,000 1.25% 26/11/2024 124,973 0.00%Cie de Saint-Gobain €100,000 1.13% 23/3/2026 124,933 0.00%Pernod Ricard SA €100,000 0.88% 24/10/2031 124,648 0.00%Autoroutes du Sud de la France SA €100,000 1.00% 13/5/2026 124,454 0.00%Edenred €100,000 1.38% 10/3/2025 124,346 0.00%RTE Reseau de Transport d'Electricite SADIR €100,000 1.00% 19/10/2026 124,179 0.00%ICADE €100,000 1.13% 17/11/2025 124,107 0.00%Danone SA €100,000 1.13% 14/1/2025 123,656 0.00%Danone SA €100,000 1.25% 30/5/2024 123,597 0.00%Regie Autonome des Transports Parisiens €100,000 2.88% 9/9/2022 123,271 0.00%Aeroports de Paris €100,000 1.50% 24/7/2023 122,485 0.00%BNP Paribas SA^ €100,000 2.63% 14/10/2027 122,484 0.00%Danone SA €100,000 0.57% 17/3/2027 122,069 0.00%Air Liquide Finance SA €100,000 0.75% 13/6/2024 121,891 0.00%SANEF SA €100,000 0.95% 19/10/2028 121,404 0.00%Carrefour SA €100,000 1.75% 15/7/2022 120,549 0.00%Credit Agricole Home Loan SFH SA €100,000 0.63% 28/11/2022 120,479 0.00%Pernod Ricard SA €100,000 0.00% 24/10/2023 119,206 0.00%Action Logement Services €100,000 0.50% 30/10/2034 117,200 0.00%BPCE SA^ $100,000 1.65% 6/10/2026 100,410 0.00%Electricite de France SA €50,000 4.50% 12/11/2040 92,370 0.00%Electricite de France SA €50,000 4.63% 11/9/2024 68,255 0.00%BNP Paribas SA €50,000 2.88% 26/9/2023 63,531 0.00%Autoroutes du Sud de la France SA €50,000 5.63% 4/7/2022 62,865 0.00%BNP Paribas SA €50,000 2.88% 24/10/2022 61,891 0.00%test - - - 1,426,703,045 6.47%Germany 5.95% (2020: 5.82%)Bundesrepublik Deutschland Bundesanleihe €87,200,000 0.00% 15/11/2027 106,615,904 0.48%Bundesobligation €76,000,000 0.00% 10/4/2026 92,703,689 0.42%Bundesrepublik Deutschland Bundesanleihe €38,000,000 0.50% 15/2/2026 47,431,089 0.22%Bundesobligation €35,821,000 0.00% 13/10/2023 43,173,791 0.20%Bundesrepublik Deutschland Bundesanleihe €25,000,000 0.50% 15/2/2028 31,606,482 0.14%

390
Vanguard Global Bond Index Fund
Principal CouponMaturity
DateFair Value
US Dollars ($)% of Total
Net AssetsBundesrepublik Deutschland Bundesanleihe €16,200,000 2.50% 15/8/2046 30,047,980 0.14%Bundesrepublik Deutschland Bundesanleihe €14,550,000 2.50% 4/7/2044 26,467,969 0.12%Bundesrepublik Deutschland Bundesanleihe €21,883,000 0.00% 15/5/2036 25,737,693 0.12%Bundesrepublik Deutschland Bundesanleihe €21,119,000 0.00% 15/5/2035 25,084,348 0.11%Bundesobligation €20,000,000 0.00% 14/4/2023 24,012,805 0.11%Bundesrepublik Deutschland Bundesanleihe €17,758,485 0.00% 15/8/2030 21,706,236 0.10%Bundesschatzanweisungen €18,000,000 0.00% 10/3/2023 21,589,227 0.10%Bundesobligation €16,000,000 0.00% 5/4/2024 19,333,849 0.09%Bundesrepublik Deutschland Bundesanleihe €15,400,000 2.25% 4/9/2021 18,356,135 0.08%Bundesrepublik Deutschland Bundesanleihe €14,100,000 1.00% 15/8/2024 17,617,132 0.08%Bundesrepublik Deutschland Bundesanleihe €12,700,000 3.25% 4/7/2021 15,060,930 0.07%Bundesobligation €10,000,000 0.00% 18/10/2024 12,123,629 0.06%Bundesobligation €10,000,000 0.00% 8/10/2021 11,880,367 0.05%Bundesrepublik Deutschland Bundesanleihe €10,216,000 0.00% 15/8/2050 11,217,387 0.05%Bundesobligation €8,465,000 0.00% 11/4/2025 10,287,697 0.05%Bundesrepublik Deutschland Bundesanleihe €8,000,000 0.00% 15/11/2028 9,772,729 0.04%Bundesrepublik Deutschland Bundesanleihe €4,800,000 4.00% 4/1/2037 9,272,280 0.04%KFW €7,000,000 0.00% 15/12/2027 8,433,781 0.04%Bundesrepublik Deutschland Bundesanleihe €5,400,000 1.25% 15/8/2048 8,078,484 0.04%Bundesrepublik Deutschland Bundesanleihe €6,397,000 0.25% 15/2/2029 7,973,886 0.04%Bundesrepublik Deutschland Bundesanleihe €6,000,000 1.00% 15/8/2025 7,605,088 0.04%KFW €6,000,000 0.13% 24/2/2023 7,202,568 0.03%Bundesobligation €5,724,434 0.00% 7/10/2022 6,848,760 0.03%KFW €5,000,000 0.50% 15/9/2027 6,212,701 0.03%Aareal Bank AG €5,000,000 0.01% 3/8/2026 6,014,349 0.03%KFW $5,501,000 2.50% 20/11/2024 5,849,376 0.03%KFW €4,700,000 0.00% 4/7/2024 5,662,681 0.03%Bundesrepublik Deutschland Bundesanleihe €2,393,856 4.75% 4/7/2040 5,376,410 0.03%Bundesrepublik Deutschland Bundesanleihe €4,331,000 0.25% 15/2/2027 5,369,418 0.03%Land Baden-Wuerttemberg €4,550,000 0.01% 9/7/2032 5,303,249 0.02%KFW €4,000,000 0.63% 7/1/2028 5,013,723 0.02%Landwirtschaftliche Rentenbank €4,000,000 0.50% 28/2/2029 4,979,504 0.02%Bundesrepublik Deutschland Bundesanleihe €2,350,000 4.25% 4/7/2039 4,910,227 0.02%KFW €4,000,000 0.00% 2/4/2024 4,816,626 0.02%KFW €4,000,000 0.00% 30/6/2023 4,800,288 0.02%State of Rhineland-Palatinate €4,000,000 0.01% 16/1/2023 4,785,279 0.02%Deutsche Bahn Finance GmbH AU($)5,720,000 3.50% 27/9/2024 4,635,256 0.02%KFW $4,000,000 0.38% 18/7/2025 3,945,738 0.02%KFW $3,850,000 1.75% 22/8/2022 3,919,509 0.02%State of North Rhine-Westphalia Germany €3,000,000 0.50% 16/4/2026 3,701,719 0.02%State of Lower Saxony €3,125,000 0.01% 10/1/2031 3,691,120 0.02%Landeskreditbank Baden-Wuerttemberg Foerderbank €3,000,000 0.38% 13/4/2026 3,672,682 0.02%Landwirtschaftliche Rentenbank $3,504,000 2.00% 13/1/2025 3,665,591 0.02%Landwirtschaftliche Rentenbank €3,020,000 0.00% 19/7/2028 3,628,411 0.02%KFW €3,000,000 0.00% 15/6/2026 3,625,785 0.02%Landesbank Baden-Wuerttemberg €3,000,000 0.38% 24/5/2024 3,612,432 0.02%NRW Bank €3,000,000 0.13% 7/7/2023 3,602,718 0.02%KFW €3,000,000 0.38% 20/5/2036 3,593,917 0.02%State of North Rhine-Westphalia Germany €3,000,000 0.00% 5/12/2022 3,585,768 0.02%Landeskreditbank Baden-Wuerttemberg Foerderbank AU($)4,204,000 4.25% 7/8/2025 3,574,911 0.02%Bundesrepublik Deutschland Bundesanleihe €2,800,000 1.75% 15/2/2024 3,536,407 0.02%FMS Wertmanagement £2,400,000 1.13% 7/9/2023 3,378,126 0.02%KFW $3,000,000 2.88% 3/4/2028 3,323,264 0.02%Landwirtschaftliche Rentenbank €2,500,000 0.38% 22/1/2024 3,033,349 0.01%Volkswagen Leasing GmbH €2,500,000 0.50% 12/1/2029 2,946,377 0.01%State of North Rhine-Westphalia Germany €2,100,000 1.50% 12/6/2040 2,935,636 0.01%State of North Rhine-Westphalia Germany €1,545,000 2.15% 21/3/2119 2,877,511 0.01%Bundesrepublik Deutschland Bundesanleihe €2,350,000 1.75% 4/7/2022 2,855,221 0.01%State of Lower Saxony €2,365,000 0.00% 11/2/2027 2,846,244 0.01%State of North Rhine-Westphalia Germany €2,350,000 0.60% 4/6/2041 2,832,536 0.01%Landwirtschaftliche Rentenbank £2,000,000 1.13% 15/12/2023 2,821,172 0.01%State of North Rhine-Westphalia Germany €2,200,000 0.95% 13/3/2028 2,807,063 0.01%Siemens Financieringsmaatschappij NV €2,300,000 0.38% 5/6/2026 2,788,509 0.01%EnBW International Finance BV €2,300,000 0.13% 1/3/2028 2,726,662 0.01%BMW US Capital LLC $2,650,000 0.80% 1/4/2024 2,663,997 0.01%E.ON International Finance BV £1,500,000 4.75% 31/1/2034 2,646,220 0.01%State of North Rhine-Westphalia Germany €2,500,000 0.20% 27/1/2051 2,633,863 0.01%Volkswagen Financial Services AG €2,000,000 3.00% 6/4/2025 2,628,761 0.01%Gemeinsame Deutsche Bundeslaender €2,100,000 0.50% 5/2/2025 2,573,863 0.01%Deutsche Bahn Finance GmbH €2,200,000 0.63% 15/4/2036 2,545,182 0.01%Landwirtschaftliche Rentenbank €2,000,000 0.63% 18/5/2027 2,499,895 0.01%

391
Vanguard Global Bond Index Fund
Principal CouponMaturity
DateFair Value
US Dollars ($)% of Total
Net AssetsNRW Bank €2,000,000 0.63% 4/1/2028 2,492,569 0.01%HeidelbergCement Finance Luxembourg SA €2,000,000 1.13% 1/12/2027 2,489,305 0.01%KFW $2,500,000 0.63% 22/1/2026 2,476,405 0.01%Deutsche Post AG €2,000,000 0.75% 20/5/2029 2,475,884 0.01%Landwirtschaftliche Rentenbank €2,000,000 0.50% 6/3/2025 2,454,790 0.01%Land Berlin €2,000,000 0.63% 25/8/2036 2,445,043 0.01%Gemeinsame Deutsche Bundeslaender €2,000,000 0.38% 17/4/2025 2,442,695 0.01%KFW €2,000,000 0.25% 15/9/2025 2,440,672 0.01%Deutsche Pfandbriefbank AG €2,000,000 0.50% 22/5/2024 2,433,738 0.01%EnBW International Finance BV €2,000,000 0.63% 17/4/2025 2,432,314 0.01%Norddeutsche Landesbank-Girozentrale €2,000,000 0.38% 9/10/2024 2,430,372 0.01%Free & Hanseatic City of Hamburg €2,000,000 0.25% 20/1/2025 2,429,327 0.01%Gemeinsame Deutsche Bundeslaender €2,000,000 0.25% 18/3/2024 2,419,519 0.01%BMW Finance NV €2,000,000 0.63% 6/10/2023 2,419,323 0.01%Commerzbank AG €2,000,000 0.13% 15/12/2026 2,418,691 0.01%State of North Rhine-Westphalia Germany €2,000,000 0.00% 5/5/2025 2,409,582 0.01%Land Berlin €2,000,000 0.00% 11/12/2024 2,407,398 0.01%State of Hesse €2,000,000 0.00% 22/9/2027 2,403,964 0.01%KFW €1,950,000 0.63% 15/1/2025 2,403,765 0.01%Gemeinsame Deutsche Bundeslaender €2,000,000 0.13% 14/4/2023 2,399,899 0.01%DZ HYP AG €2,000,000 0.01% 23/6/2028 2,392,977 0.01%Aareal Bank AG €2,000,000 0.01% 4/7/2022 2,384,538 0.01%E.ON SE €2,040,000 0.10% 19/12/2028 2,378,444 0.01%State of Schleswig-Holstein Germany €1,970,000 0.01% 16/7/2025 2,373,637 0.01%NRW Bank €1,938,000 0.38% 16/5/2029 2,370,357 0.01%Land Baden-Wuerttemberg €2,000,000 0.01% 7/3/2031 2,366,808 0.01%Landwirtschaftliche Rentenbank €1,960,000 0.00% 22/9/2027 2,364,109 0.01%KFW €1,910,000 0.00% 18/2/2025 2,304,090 0.01%Land Baden-Wuerttemberg €1,900,000 0.01% 2/9/2030 2,251,743 0.01%EnBW International Finance BV €1,900,000 0.50% 1/3/2033 2,226,965 0.01%Daimler International Finance BV €1,755,000 1.38% 26/6/2026 2,223,124 0.01%State of North Rhine-Westphalia Germany €1,300,000 1.95% 26/9/2078 2,206,827 0.01%State of North Rhine-Westphalia Germany €2,000,000 0.95% 10/1/2121 2,183,817 0.01%State of North Rhine-Westphalia Germany €1,800,000 0.20% 9/4/2030 2,176,409 0.01%KFW £1,600,000 0.13% 30/12/2026 2,150,770 0.01%KFW £1,500,000 1.38% 15/12/2025 2,149,035 0.01%Volkswagen Financial Services AG €1,500,000 3.38% 6/4/2028 2,117,911 0.01%KFW €1,750,000 0.00% 30/9/2026 2,113,859 0.01%Bundesrepublik Deutschland Bundesanleihe €1,051,216 3.25% 4/7/2042 2,065,342 0.01%Deutsche Bank AG $1,956,000 3.30% 16/11/2022 2,024,094 0.01%FMS Wertmanagement $1,980,000 2.00% 1/8/2022 2,017,232 0.01%KFW $2,000,000 0.25% 8/3/2024 1,989,783 0.01%Volkswagen Group of America Finance LLC $2,000,000 1.25% 24/11/2025 1,989,071 0.01%BMW Finance NV €1,580,000 1.00% 14/11/2024 1,947,344 0.01%KFW €1,600,000 0.00% 31/3/2027 1,929,986 0.01%Bundesrepublik Deutschland Bundesanleihe €1,600,000 2.00% 4/1/2022 1,923,569 0.01%KFW €1,610,000 0.00% 10/1/2031 1,913,287 0.01%Deutsche Kreditbank AG €1,500,000 0.88% 2/10/2028 1,904,083 0.01%Landesbank Baden-Wuerttemberg €1,600,000 0.38% 7/5/2029 1,895,139 0.01%State of Lower Saxony €1,500,000 0.40% 27/10/2025 1,838,060 0.01%Bundesrepublik Deutschland Bundesanleihe €1,500,000 1.50% 4/9/2022 1,825,248 0.01%BMW Finance NV €1,480,000 0.75% 13/7/2026 1,824,853 0.01%BMW Finance NV €1,520,000 0.13% 13/7/2022 1,812,588 0.01%Vonovia Finance BV €1,500,000 0.88% 3/7/2023 1,811,463 0.01%State of Schleswig-Holstein Germany €1,500,000 0.05% 4/11/2024 1,808,052 0.01%Deutsche Hypothekenbank AG €1,500,000 0.13% 23/11/2023 1,803,713 0.01%Land Berlin €1,500,000 0.01% 21/11/2023 1,800,513 0.01%Vonovia SE €1,500,000 1.50% 14/6/2041 1,798,883 0.01%Aareal Bank AG €1,500,000 0.13% 1/2/2023 1,796,646 0.01%Landesbank Baden-Wuerttemberg €1,490,000 0.01% 16/7/2027 1,788,767 0.01%Deutsche Telekom International Finance BV $1,193,000 8.75% 15/6/2030 1,786,754 0.01%Vonovia SE €1,500,000 0.63% 14/12/2029 1,780,929 0.01%Landwirtschaftliche Rentenbank €1,600,000 0.01% 26/11/2040 1,735,435 0.01%Volkswagen Financial Services AG €1,280,000 2.25% 16/10/2026 1,680,301 0.01%Allianz SE^ €1,400,000 1.30% 25/9/2049 1,678,966 0.01%KFW €1,400,000 0.00% 15/6/2029 1,676,835 0.01%Siemens Financieringsmaatschappij NV $1,310,000 4.40% 27/5/2045 1,676,829 0.01%Deutsche Bank AG €1,400,000 0.01% 2/10/2029 1,662,276 0.01%KFW $1,600,000 2.13% 17/1/2023 1,646,688 0.01%KFW €1,350,000 0.00% 15/9/2028 1,622,616 0.01%State of North Rhine-Westphalia Germany €1,300,000 0.75% 16/8/2041 1,604,470 0.01%

392
Vanguard Global Bond Index Fund
Principal CouponMaturity
DateFair Value
US Dollars ($)% of Total
Net AssetsDaimler AG €1,300,000 0.75% 8/2/2030 1,576,781 0.01%State of North Rhine-Westphalia Germany €1,000,000 1.75% 26/10/2057 1,575,365 0.01%Investitionsbank Berlin €1,300,000 0.01% 30/7/2024 1,562,072 0.01%Land Thueringen €1,500,000 0.13% 13/1/2051 1,560,065 0.01%Landesbank Baden-Wuerttemberg €1,300,000 0.50% 4/8/2022 1,559,191 0.01%Eurogrid GmbH €1,300,000 0.74% 21/4/2033 1,547,347 0.01%Deutsche Telekom International Finance BV $1,268,000 4.75% 21/6/2038 1,541,668 0.01%Deutsche Bahn Finance GmbH €1,250,000 1.13% 29/5/2051 1,487,559 0.01%Bayer US Finance II LLC $1,175,000 4.88% 25/6/2048 1,471,048 0.01%State of North Rhine-Westphalia Germany €1,210,000 0.13% 4/6/2031 1,447,205 0.01%SAP SE €1,200,000 0.38% 18/5/2029 1,446,548 0.01%Landwirtschaftliche Rentenbank £1,010,000 1.38% 8/9/2025 1,444,818 0.01%KFW €1,200,000 0.00% 15/12/2022 1,436,122 0.01%Daimler International Finance BV £1,000,000 1.63% 11/11/2024 1,416,065 0.01%Volkswagen International Finance NV^ €1,100,000 3.50% Perpetual 1,409,438 0.01%FMS Wertmanagement £1,000,000 1.13% 20/3/2023 1,402,977 0.01%KFW £1,000,000 0.88% 15/9/2026 1,402,654 0.01%Deutsche Bahn Finance GmbH €1,100,000 1.00% 17/12/2027 1,386,825 0.01%KFW $1,350,000 2.00% 4/10/2022 1,380,696 0.01%Landeskreditbank Baden-Wuerttemberg Foerderbank £1,000,000 0.38% 9/12/2024 1,377,171 0.01%Bundesrepublik Deutschland Bundesanleihe €1,100,000 1.50% 15/5/2023 1,358,604 0.01%Volkswagen Bank GmbH €1,100,000 1.25% 10/6/2024 1,352,249 0.01%Vonovia Finance BV €1,100,000 1.00% 9/7/2030 1,340,674 0.01%Bayer AG €1,100,000 1.13% 6/1/2030 1,340,307 0.01%State of Hesse €1,000,000 1.30% 10/10/2033 1,336,829 0.01%State of Saarland €1,230,000 0.05% 5/11/2040 1,334,783 0.01%Land Berlin €1,000,000 1.30% 13/6/2033 1,333,419 0.01%Deutsche Bank AG^ €1,100,000 1.00% 19/11/2025 1,331,624 0.01%Deutsche Telekom International Finance BV £900,000 2.50% 10/10/2025 1,329,731 0.01%Volkswagen International Finance NV €800,000 4.13% 16/11/2038 1,324,029 0.01%Santander Consumer Bank AG €1,100,000 0.75% 17/10/2022 1,321,492 0.01%Bayer Capital Corp. BV €1,100,000 0.63% 15/12/2022 1,319,206 0.01%Volkswagen International Finance NV^ €1,000,000 3.88% Perpetual 1,310,485 0.01%Deutsche Telekom International Finance BV $1,050,000 4.88% 6/3/2042 1,306,148 0.01%Aroundtown SA^ £890,000 4.75% Perpetual 1,298,063 0.01%E.ON International Finance BV €1,000,000 1.50% 31/7/2029 1,287,767 0.01%State of North Rhine-Westphalia Germany €1,140,000 0.00% 12/10/2035 1,281,044 0.01%Deutsche Bahn Finance GmbH €1,000,000 1.13% 18/12/2028 1,277,522 0.01%Bayer US Finance II LLC $1,275,000 2.75% 15/7/2021 1,276,061 0.01%UniCredit Bank AG €1,000,000 0.88% 11/1/2029 1,270,520 0.01%Deutsche Hypothekenbank AG €1,000,000 0.75% 5/3/2029 1,257,839 0.01%Commerzbank AG €1,000,000 2.00% 27/11/2023 1,256,230 0.01%Gemeinsame Deutsche Bundeslaender €1,050,000 0.00% 25/9/2029 1,251,079 0.01%Daimler Finance North America LLC $1,250,000 0.75% 1/3/2024 1,249,529 0.01%Aroundtown SA €1,000,000 1.50% 28/5/2026 1,247,342 0.01%Muenchener Hypothekenbank eG €1,000,000 0.63% 10/11/2027 1,246,861 0.01%Deutsche Bank AG €1,000,000 1.63% 20/1/2027 1,246,533 0.01%Daimler AG €1,000,000 1.13% 6/11/2031 1,242,908 0.01%Bayerische Landesbodenkreditanstalt €1,000,000 0.63% 23/11/2026 1,241,072 0.01%Daimler International Finance BV €1,000,000 1.00% 11/11/2025 1,238,728 0.01%BASF SE €1,000,000 0.88% 22/5/2025 1,236,940 0.01%Daimler AG €1,000,000 1.63% 22/8/2023 1,231,838 0.01%UniCredit Bank AG €1,000,000 0.50% 4/5/2026 1,231,460 0.01%KFW €1,000,000 0.38% 9/3/2026 1,230,270 0.01%Landesbank Hessen-Thueringen Girozentrale €1,000,000 0.50% 25/9/2025 1,228,019 0.01%Daimler AG €1,000,000 1.13% 8/8/2034 1,223,604 0.01%E.ON SE €1,000,000 0.88% 20/8/2031 1,222,488 0.01%Land Berlin €1,000,000 0.75% 8/9/2023 1,219,234 0.01%Landwirtschaftliche Rentenbank €1,000,000 0.25% 29/8/2025 1,218,993 0.01%Aroundtown SA €1,000,000 1.00% 7/1/2025 1,217,617 0.01%Wintershall Dea Finance BV €1,000,000 1.33% 25/9/2028 1,216,450 0.01%State of Lower Saxony €1,000,000 0.13% 8/4/2027 1,211,927 0.01%Fresenius SE & Co. KGaA €1,000,000 0.75% 15/1/2028 1,209,675 0.01%State of Lower Saxony €1,000,000 0.25% 6/2/2024 1,208,991 0.01%State of Hesse €1,000,000 0.13% 20/6/2024 1,206,942 0.01%KFW €1,000,000 0.38% 15/3/2023 1,205,841 0.01%Deutsche Bahn Finance GmbH €1,000,000 0.38% 23/6/2029 1,205,463 0.01%ING-DiBa AG €1,000,000 0.25% 9/10/2023 1,205,287 0.01%State of Lower Saxony €1,000,000 0.00% 10/7/2026 1,204,794 0.01%Siemens Financieringsmaatschappij NV €1,000,000 0.38% 6/9/2023 1,204,529 0.01%Siemens Financieringsmaatschappij NV €1,000,000 0.50% 20/2/2032 1,201,071 0.01%
393
Vanguard Global Bond Index Fund
Principal CouponMaturity
DateFair Value
US Dollars ($)% of Total
Net AssetsLand Berlin €1,000,000 0.10% 18/1/2030 1,199,403 0.01%Daimler International Finance BV €1,000,000 0.25% 6/11/2023 1,196,301 0.01%alstria office-AG €1,000,000 0.50% 26/9/2025 1,196,099 0.01%Deutsche Pfandbriefbank AG €1,000,000 0.05% 5/9/2022 1,193,567 0.01%Deutsche Bank AG^ €1,000,000 0.75% 17/2/2027 1,193,365 0.01%Commerzbank AG €1,000,000 0.05% 1/8/2022 1,193,283 0.01%Siemens Financieringsmaatschappij NV €1,000,000 0.00% 20/2/2023 1,192,891 0.01%BMW Finance NV €1,000,000 0.00% 24/3/2023 1,192,461 0.01%Hochtief AG €1,000,000 0.50% 3/9/2027 1,191,874 0.01%Hannover Rueck SE^ €1,000,000 1.13% 9/10/2039 1,190,961 0.01%Commerzbank AG €1,000,000 0.38% 1/9/2027 1,190,958 0.01%Deutsche Hypothekenbank AG €1,000,000 0.25% 18/11/2021 1,189,406 0.01%KFW €1,000,000 0.00% 17/9/2030 1,189,333 0.01%Landwirtschaftliche Rentenbank $1,200,000 0.50% 27/5/2025 1,189,239 0.01%State of Lower Saxony €1,000,000 0.01% 13/8/2030 1,185,036 0.01%LEG Immobilien SE €1,000,000 0.75% 30/6/2031 1,184,895 0.01%Vantage Towers AG €1,000,000 0.38% 31/3/2027 1,183,693 0.01%E.ON International Finance BV £600,000 6.38% 7/6/2032 1,173,672 0.01%Landesbank Baden-Wuerttemberg €1,000,000 0.38% 21/2/2031 1,165,648 0.01%Vier Gas Transport GmbH €1,000,000 0.13% 10/9/2029 1,161,060 0.01%Bertelsmann SE & Co. KGaA €900,000 1.50% 15/5/2030 1,159,246 0.01%Talanx AG^ €900,000 2.25% 5/12/2047 1,145,827 0.01%Deutsche Telekom International Finance BV €900,000 1.38% 30/1/2027 1,143,265 0.01%Free State of Bavaria €1,000,000 0.01% 18/1/2035 1,139,493 0.01%UniCredit Bank AG €950,000 0.01% 19/11/2027 1,139,138 0.01%EnBW International Finance BV €970,000 0.25% 19/10/2030 1,136,470 0.01%KFW $1,100,000 2.38% 29/12/2022 1,135,401 0.01%Allianz Finance II BV €900,000 0.88% 6/12/2027 1,124,991 0.01%Deutsche Bank AG $1,014,000 4.10% 13/1/2026 1,111,783 0.01%Fresenius SE & Co. KGaA €800,000 2.88% 15/2/2029 1,108,464 0.01%State of Brandenburg €1,000,000 0.30% 4/10/2049 1,095,256 0.01%Muenchener Hypothekenbank eG €1,000,000 0.01% 19/10/2039 1,093,716 0.01%Vonovia Finance BV €900,000 0.63% 9/7/2026 1,091,098 0.01%Deutsche Bank AG €900,000 0.25% 15/5/2023 1,081,698 0.01%SAP SE €900,000 0.13% 18/5/2026 1,078,263 0.01%KFW €800,000 1.25% 4/7/2036 1,076,566 0.01%Commerzbank AG €900,000 0.25% 26/1/2022 1,072,057 0.01%Volkswagen Leasing GmbH €900,000 0.25% 12/1/2026 1,070,637 0.01%Free & Hanseatic City of Hamburg €900,000 0.01% 3/6/2030 1,067,296 0.01%State of Hesse €900,000 0.00% 8/11/2030 1,064,160 0.01%Vantage Towers AG €900,000 0.00% 31/3/2025 1,063,689 0.01%DZ HYP AG €880,000 0.38% 10/11/2034 1,052,117 0.01%VW Credit Canada, Inc. CA($)1,295,000 1.50% 23/9/2025 1,040,485 0.01%Daimler Finance North America LLC $1,000,000 2.63% 10/3/2030 1,038,757 0.01%E.ON International Finance BV £550,000 6.25% 3/6/2030 1,029,256 0.01%KFW $1,000,000 1.38% 5/8/2024 1,025,666 0.01%State of Brandenburg €850,000 0.38% 29/1/2035 1,014,354 0.01%KFW €800,000 0.75% 28/6/2028 1,012,501 0.01%Grand City Properties SA €800,000 1.50% 22/2/2027 1,006,288 0.01%KFW $1,000,000 0.25% 25/4/2023 999,949 0.01%Fresenius Medical Care AG & Co. KGaA €800,000 1.25% 29/11/2029 995,762 0.01%Volkswagen Bank GmbH €800,000 1.88% 31/1/2024 994,880 0.01%Aroundtown SA £667,000 3.00% 16/10/2029 982,326 0.01%Deutsche Telekom AG €800,000 0.50% 5/7/2027 970,506 0.01%BASF SE €800,000 0.25% 5/6/2027 964,518 0.01%Aroundtown SA €800,000 0.63% 9/7/2025 963,413 0.01%State of Bremen €800,000 0.50% 7/10/2022 961,281 0.01%Niedersachsen Invest GmbH €800,000 0.00% 16/7/2025 961,134 0.01%KFW €800,000 0.00% 15/9/2023 960,988 0.01%State of Hesse €800,000 0.38% 4/7/2022 957,822 0.01%Landwirtschaftliche Rentenbank $900,000 3.13% 14/11/2023 957,694 0.00%Daimler Finance North America LLC $900,000 2.70% 14/6/2024 947,410 0.00%State of North Rhine-Westphalia Germany €700,000 1.25% 12/5/2036 930,813 0.00%Volkswagen Bank GmbH €700,000 2.50% 31/7/2026 923,003 0.00%Merck KGaA^ €700,000 2.88% 25/6/2079 904,894 0.00%State of Lower Saxony €750,000 0.01% 15/4/2024 901,803 0.00%KFW €700,000 0.88% 4/7/2039 899,019 0.00%Berlin Hyp AG €750,000 0.01% 2/9/2030 887,761 0.00%Bayer US Finance II LLC $775,000 5.50% 15/8/2025 884,937 0.00%Vonovia Finance BV €700,000 1.50% 22/3/2026 884,631 0.00%BMW International Investment BV £630,000 1.25% 11/7/2022 878,088 0.00%
394
Vanguard Global Bond Index Fund
Principal CouponMaturity
DateFair Value
US Dollars ($)% of Total
Net AssetsDeutsche Bahn Finance GmbH £590,000 1.88% 13/2/2026 856,413 0.00%EnBW Energie Baden-Wuerttemberg AG^ €700,000 1.88% 29/6/2080 851,253 0.00%Siemens Financieringsmaatschappij NV $850,000 0.40% 11/3/2023 850,667 0.00%Vonovia Finance BV €700,000 1.13% 14/9/2034 838,958 0.00%KFW AU($)1,000,000 4.00% 27/2/2025 838,820 0.00%E.ON SE €700,000 0.25% 24/10/2026 836,727 0.00%Santander Consumer Bank AG €700,000 0.25% 15/10/2024 836,541 0.00%Siemens Financieringsmaatschappij NV £600,000 1.00% 20/2/2025 836,392 0.00%BMW US Capital LLC $800,000 2.55% 1/4/2031 836,084 0.00%Merck Financial Services GmbH €700,000 0.01% 15/12/2023 834,644 0.00%Daimler Canada Finance, Inc. CA($)1,030,000 1.65% 22/9/2025 832,641 0.00%Deutsche Telekom AG €600,000 2.25% 29/3/2039 829,524 0.00%Fresenius Finance Ireland plc €700,000 0.00% 1/10/2025 828,200 0.00%Volkswagen International Finance NV^ €600,000 4.63% Perpetual 823,562 0.00%Land Berlin €740,000 0.35% 9/9/2050 819,984 0.00%Niedersachsen Invest GmbH €700,000 0.25% 16/7/2035 811,280 0.00%Grand City Properties SA €700,000 0.13% 11/1/2028 806,901 0.00%Land Berlin €700,000 0.13% 4/6/2035 803,554 0.00%Siemens Financieringsmaatschappij NV $750,000 3.13% 16/3/2024 800,305 0.00%Bertelsmann SE & Co. KGaA €600,000 2.00% 1/4/2028 792,068 0.00%KFW €652,000 0.13% 7/11/2023 786,087 0.00%EWE AG €680,000 0.38% 22/10/2032 785,547 0.00%KFW AU($)1,000,000 2.80% 7/3/2023 783,197 0.00%Deutsche Bank AG^ $750,000 2.13% 24/11/2026 761,566 0.00%Landwirtschaftliche Rentenbank $800,000 0.88% 3/9/2030 756,588 0.00%Siemens Financieringsmaatschappij NV €626,000 0.30% 28/2/2024 753,712 0.00%Aroundtown SA £500,000 3.25% 18/7/2027 750,771 0.00%BASF SE €600,000 0.88% 15/11/2027 748,650 0.00%Volkswagen Financial Services AG €600,000 1.50% 1/10/2024 745,279 0.00%State of Lower Saxony €650,000 0.05% 9/3/2035 740,733 0.00%State of North Rhine-Westphalia Germany €500,000 1.65% 16/5/2047 739,616 0.00%Volkswagen International Finance NV €600,000 0.88% 22/9/2028 736,185 0.00%SAP SE €600,000 0.75% 10/12/2024 733,649 0.00%Volkswagen International Finance NV^ €600,000 2.70% Perpetual 732,652 0.00%BMW Finance NV €600,000 0.38% 14/1/2027 724,941 0.00%Hamburg Commercial Bank AG €600,000 0.38% 12/7/2023 723,170 0.00%Commerzbank AG €600,000 0.50% 28/8/2023 721,690 0.00%Traton Finance Luxembourg SA €600,000 1.25% 24/3/2033 721,632 0.00%E.ON International Finance BV €600,000 0.75% 30/11/2022 720,128 0.00%Volkswagen Financial Services NV £500,000 2.75% 10/7/2023 718,325 0.00%Deutsche Bahn Finance GmbH €500,000 2.75% 19/3/2029 714,503 0.00%Vonovia SE €600,000 0.00% 16/9/2024 713,420 0.00%Traton Finance Luxembourg SA €600,000 0.00% 14/6/2024 712,100 0.00%Bayer AG €600,000 0.05% 12/1/2025 710,103 0.00%Deutsche Telekom International Finance BV $675,000 2.49% 19/9/2023 701,814 0.00%Siemens Financieringsmaatschappij NV £500,000 0.88% 5/6/2023 695,985 0.00%BMW Finance NV £500,000 0.88% 16/8/2022 694,500 0.00%Deutsche Bahn Finance GmbH €650,000 0.63% 8/12/2050 693,106 0.00%State of Bremen €500,000 1.50% 12/11/2038 692,400 0.00%Deutsche Telekom AG $650,000 3.63% 21/1/2050 688,947 0.00%Land Berlin €500,000 1.38% 27/8/2038 681,243 0.00%Deutsche Bahn Finance GmbH £500,000 0.38% 3/12/2026 675,502 0.00%Siemens Financieringsmaatschappij NV $640,000 2.35% 15/10/2026 672,245 0.00%Free & Hanseatic City of Hamburg €485,000 1.45% 5/11/2038 668,251 0.00%SAP SE €500,000 1.63% 10/3/2031 663,596 0.00%Deutsche Post AG €500,000 1.63% 5/12/2028 657,183 0.00%HeidelbergCement Finance Luxembourg SA €550,000 0.50% 9/8/2022 656,652 0.00%Siemens Financieringsmaatschappij NV $600,000 3.25% 27/5/2025 650,969 0.00%State of North Rhine-Westphalia Germany €500,000 1.00% 16/10/2046 648,944 0.00%KFW CA($)700,000 5.05% 4/2/2025 645,903 0.00%Deutsche Bank AG^ $600,000 3.55% 18/9/2031 638,496 0.00%SAP SE €500,000 1.25% 10/3/2028 638,320 0.00%Aroundtown SA €500,000 2.00% 2/11/2026 637,739 0.00%E.ON International Finance BV €500,000 1.63% 30/5/2026 636,581 0.00%Allianz SE^ €500,000 5.63% 17/10/2042 635,655 0.00%Deutsche Telekom AG €500,000 1.38% 5/7/2034 632,358 0.00%Covestro AG €500,000 1.38% 12/6/2030 630,637 0.00%KFW £300,000 4.88% 15/3/2037 629,233 0.00%Grand City Properties SA €500,000 1.38% 3/8/2026 626,805 0.00%Aroundtown SA €500,000 1.63% 31/1/2028 625,779 0.00%Eurogrid GmbH €500,000 1.11% 15/5/2032 624,613 0.00%

395
Vanguard Global Bond Index Fund
Principal CouponMaturity
DateFair Value
US Dollars ($)% of Total
Net AssetsState of Hesse €500,000 0.75% 4/8/2036 623,557 0.00%State of Rhineland-Palatinate €500,000 0.75% 19/1/2026 622,779 0.00%Volkswagen International Finance NV €500,000 1.25% 23/9/2032 620,461 0.00%Deutsche Bahn Finance GmbH €500,000 0.63% 26/9/2028 620,097 0.00%Land Berlin €500,000 0.63% 20/3/2026 619,988 0.00%Allianz Finance II BV €500,000 0.88% 15/1/2026 619,650 0.00%Deutsche Telekom International Finance BV €300,000 7.50% 24/1/2033 616,268 0.00%Deutsche Bank AG €500,000 0.63% 21/8/2025 616,239 0.00%State of Lower Saxony €500,000 0.63% 20/1/2025 615,260 0.00%State of Rhineland-Palatinate €500,000 0.50% 21/1/2025 612,605 0.00%Volkswagen International Finance NV £400,000 3.38% 16/11/2026 612,537 0.00%Volkswagen Leasing GmbH €500,000 1.13% 4/4/2024 611,417 0.00%Deutsche Telekom AG €494,000 0.88% 25/3/2026 610,478 0.00%DZ HYP AG €500,000 0.38% 6/6/2025 610,015 0.00%Bayer AG €500,000 1.38% 6/7/2032 607,990 0.00%Land Berlin €500,000 0.25% 22/4/2025 607,797 0.00%E.ON SE €500,000 0.75% 18/12/2030 607,293 0.00%Allianz Finance II BV €500,000 0.50% 14/1/2031 603,095 0.00%Land Baden-Wuerttemberg €500,000 1.00% 18/7/2022 602,673 0.00%Volkswagen Bank GmbH €500,000 1.25% 1/8/2022 602,534 0.00%Deutsche Telekom International Finance BV €500,000 0.63% 3/4/2023 602,312 0.00%Free State of Bavaria €500,000 0.15% 3/4/2030 601,414 0.00%State of North Rhine-Westphalia Germany €500,000 0.20% 17/4/2023 600,795 0.00%Siemens Financieringsmaatschappij NV $600,000 1.20% 11/3/2026 600,148 0.00%State of North Rhine-Westphalia Germany €500,000 0.13% 16/3/2023 599,608 0.00%Bayer AG €500,000 0.38% 6/7/2024 599,546 0.00%E.ON SE €500,000 0.38% 20/4/2023 599,356 0.00%Merck Financial Services GmbH €500,000 0.13% 16/7/2025 598,566 0.00%Wintershall Dea Finance BV €500,000 0.45% 25/9/2023 598,538 0.00%EnBW Energie Baden-Wuerttemberg AG^ €500,000 1.63% 5/8/2079 596,699 0.00%EnBW Energie Baden-Wuerttemberg AG^ €500,000 1.13% 5/11/2079 596,314 0.00%E.ON SE €500,000 0.00% 18/12/2023 596,163 0.00%Daimler AG €500,000 0.75% 11/3/2033 595,684 0.00%E.ON SE €500,000 0.00% 29/9/2022 595,343 0.00%State of North Rhine-Westphalia Germany €500,000 0.00% 26/11/2029 595,314 0.00%EEW Energy from Waste GmbH €500,000 0.36% 30/6/2026 594,348 0.00%Traton Finance Luxembourg SA €500,000 0.13% 24/3/2025 594,311 0.00%Siemens Financieringsmaatschappij NV €500,000 0.13% 5/9/2029 591,980 0.00%Landwirtschaftliche Rentenbank AU($)700,000 3.25% 12/4/2028 587,463 0.00%Aroundtown SA^ €500,000 1.63% Perpetual 570,507 0.00%HeidelbergCement AG €455,000 1.50% 7/2/2025 566,919 0.00%Bayer AG €500,000 1.00% 12/1/2036 557,719 0.00%Bayer US Finance II LLC $500,000 4.25% 15/12/2025 557,444 0.00%Deutsche Telekom International Finance BV $475,000 4.38% 21/6/2028 552,123 0.00%Muenchener Rueckversicherungs-Gesellschaft AG in Muenchen^ €400,000 3.25% 26/5/2049 551,599 0.00%EnBW International Finance BV €400,000 1.88% 31/10/2033 546,400 0.00%BASF SE €400,000 1.45% 13/12/2032 532,225 0.00%KFW €400,000 1.13% 9/5/2033 529,273 0.00%Daimler International Finance BV €438,000 0.63% 27/2/2023 527,422 0.00%Infineon Technologies AG €400,000 2.00% 24/6/2032 526,882 0.00%Deutsche Bank AG $500,000 3.95% 27/2/2023 524,870 0.00%BMW Finance NV €400,000 1.50% 6/2/2029 520,572 0.00%Bayer US Finance II LLC $500,000 2.85% 15/4/2025 517,824 0.00%Vier Gas Transport GmbH €400,000 1.50% 25/9/2028 516,648 0.00%Volkswagen International Finance NV €400,000 1.88% 30/3/2027 515,216 0.00%Daimler Finance North America LLC $500,000 2.55% 15/8/2022 511,780 0.00%Fresenius Medical Care AG & Co. KGaA €400,000 1.50% 29/5/2030 504,609 0.00%Fresenius Medical Care AG & Co. KGaA €400,000 1.50% 11/7/2025 501,564 0.00%Daimler Finance North America LLC $500,000 2.00% 6/7/2021 500,000 0.00%Landwirtschaftliche Rentenbank $500,000 0.88% 30/3/2026 499,750 0.00%Gemeinsame Deutsche Bundeslaender €400,000 1.13% 30/9/2024 498,848 0.00%Sparkasse KoelnBonn €400,000 1.13% 14/10/2024 498,008 0.00%DZ HYP AG €390,000 0.88% 17/4/2034 497,628 0.00%Hannover Rueck SE^ €400,000 1.75% 8/10/2040 497,520 0.00%Siemens Financieringsmaatschappij NV $450,000 3.40% 16/3/2027 497,503 0.00%Land Baden-Wuerttemberg €400,000 0.63% 27/1/2026 495,627 0.00%E.ON SE €400,000 1.00% 7/10/2025 493,725 0.00%Merck KGaA^ €400,000 1.63% 25/6/2079 489,501 0.00%FMS Wertmanagement €400,000 0.38% 29/4/2030 489,203 0.00%Merck KGaA^ €400,000 1.63% 9/9/2080 488,575 0.00%Fresenius Medical Care US Finance III, Inc. $500,000 2.38% 16/2/2031 488,463 0.00%

396
Vanguard Global Bond Index Fund
Principal CouponMaturity
DateFair Value
US Dollars ($)% of Total
Net AssetsDeutsche Bank AG €400,000 0.25% 8/3/2024 482,997 0.00%Deutsche Pfandbriefbank AG €400,000 0.75% 7/2/2023 481,609 0.00%Deutsche Pfandbriefbank AG €400,000 0.50% 19/1/2023 481,602 0.00%Muenchener Rueckversicherungs-Gesellschaft AG in Muenchen^ €400,000 1.25% 26/5/2041 481,397 0.00%Deutsche Bank AG^ €400,000 1.38% 17/2/2032 481,082 0.00%BMW US Capital LLC $450,000 2.80% 11/4/2026 480,310 0.00%Deutsche Bahn Finance GmbH €400,000 0.75% 16/7/2035 477,655 0.00%Volkswagen Leasing GmbH €400,000 0.38% 20/7/2026 475,904 0.00%Clearstream Banking AG €400,000 0.00% 1/12/2025 475,026 0.00%Volkswagen Leasing GmbH €400,000 0.00% 12/7/2023 474,961 0.00%Volkswagen Leasing GmbH €400,000 0.63% 19/7/2029 474,051 0.00%adidas AG €400,000 0.63% 10/9/2035 472,741 0.00%Fresenius Finance Ireland plc €400,000 0.88% 1/10/2031 472,664 0.00%adidas AG €400,000 0.00% 5/10/2028 470,917 0.00%Daimler Finance North America LLC $450,000 3.35% 22/2/2023 470,459 0.00%UniCredit Bank AG €365,000 0.85% 22/5/2034 464,091 0.00%Grand City Properties SA^ €400,000 1.50% Perpetual 463,770 0.00%Aroundtown SA €400,000 0.00% 16/7/2026 463,566 0.00%Daimler Finance North America LLC $450,000 2.45% 2/3/2031 460,692 0.00%Volkswagen Group of America Finance LLC $400,000 3.75% 13/5/2030 448,475 0.00%Wirtschafts- und Infrastrukturbank Hessen €350,000 1.75% 15/4/2024 440,469 0.00%Volkswagen International Finance NV €300,000 3.25% 18/11/2030 437,153 0.00%Fresenius Medical Care US Finance III, Inc. $400,000 3.75% 15/6/2029 435,745 0.00%Daimler Finance North America LLC $400,000 3.10% 15/8/2029 430,670 0.00%Free & Hanseatic City of Hamburg €400,000 0.20% 3/9/2049 424,471 0.00%Volkswagen Financial Services NV £300,000 1.63% 10/2/2024 422,672 0.00%BASF SE £300,000 1.38% 21/6/2022 418,565 0.00%KFW $540,000 0.00% 18/4/2036 407,832 0.00%NRW Bank $400,000 0.63% 19/5/2025 397,748 0.00%Eurogrid GmbH €300,000 1.50% 18/4/2028 384,589 0.00%Vonovia Finance BV €300,000 1.80% 29/6/2025 379,587 0.00%Fresenius SE & Co. KGaA €300,000 1.88% 15/2/2025 379,338 0.00%Volkswagen Group of America Finance LLC $350,000 4.25% 13/11/2023 378,173 0.00%HeidelbergCement AG €300,000 2.25% 3/6/2024 378,108 0.00%Volkswagen Group of America Finance LLC $350,000 3.35% 13/5/2025 377,457 0.00%Deutsche Kreditbank AG €300,000 1.63% 18/6/2024 377,403 0.00%Siemens Financieringsmaatschappij NV $300,000 4.20% 16/3/2047 376,906 0.00%Landesbank Hessen-Thueringen Girozentrale €300,000 1.88% 26/6/2023 372,559 0.00%Volkswagen Leasing GmbH €300,000 1.38% 20/1/2025 372,094 0.00%LANXESS AG €300,000 1.13% 16/5/2025 371,682 0.00%State of Hesse €300,000 0.50% 17/2/2025 367,793 0.00%Covestro AG €300,000 0.88% 3/2/2026 367,374 0.00%LEG Immobilien SE €300,000 1.25% 23/1/2024 366,597 0.00%Deutsche Hypothekenbank AG €300,000 0.25% 10/12/2024 363,695 0.00%Volkswagen Leasing GmbH €300,000 1.00% 16/2/2023 362,307 0.00%Infineon Technologies AG €300,000 0.75% 24/6/2023 361,845 0.00%Deutsche Hypothekenbank AG €300,000 0.25% 22/2/2023 360,098 0.00%VW Credit Canada, Inc. CA($)425,000 2.85% 26/9/2024 358,707 0.00%SAP SE €300,000 0.00% 17/5/2023 357,800 0.00%Vonovia Finance BV €300,000 0.13% 6/4/2023 357,543 0.00%Siemens Financieringsmaatschappij NV €299,000 0.00% 5/9/2024 356,743 0.00%E.ON SE €300,000 0.63% 7/11/2031 356,537 0.00%Deutsche Bahn Finance GmbH^ €300,000 0.95% Perpetual 356,042 0.00%Siemens Financieringsmaatschappij NV €300,000 0.50% 5/9/2034 353,889 0.00%Deutsche Telekom International Finance BV €250,000 4.88% 22/4/2025 352,882 0.00%Landwirtschaftliche Rentenbank $325,000 2.50% 15/11/2027 351,283 0.00%Bundesrepublik Deutschland Bundesanleihe €279,000 0.00% 15/2/2031 338,922 0.00%Deutsche Telekom International Finance BV $300,000 3.60% 19/1/2027 330,038 0.00%State of Bremen €280,000 0.40% 20/8/2049 314,888 0.00%Volkswagen Group of America Finance LLC $300,000 3.13% 12/5/2023 313,393 0.00%Deutsche Bahn Finance GmbH €232,000 1.63% 16/8/2033 308,257 0.00%Fresenius Medical Care US Finance III, Inc. $300,000 3.00% 1/12/2031 306,600 0.00%Fresenius Medical Care US Finance III, Inc. $300,000 1.88% 1/12/2026 300,363 0.00%Deutsche Telekom International Finance BV £200,000 2.25% 13/4/2029 290,477 0.00%Deutsche Bank AG €258,230 0.00% 15/10/2026 287,754 0.00%Daimler International Finance BV £200,000 2.00% 4/9/2023 284,069 0.00%Deutsche Telekom International Finance BV £200,000 1.25% 6/10/2023 280,765 0.00%Bayer US Finance II LLC $225,000 4.40% 15/7/2044 259,542 0.00%Bayer US Finance II LLC $200,000 5.88% 15/4/2038 257,887 0.00%KFW $250,000 1.75% 14/9/2029 257,576 0.00%Gemeinsame Deutsche Bundeslaender €200,000 1.75% 14/5/2024 252,425 0.00%

397
Vanguard Global Bond Index Fund
Principal CouponMaturity
DateFair Value
US Dollars ($)% of Total
Net AssetsLand Baden-Wuerttemberg €200,000 2.00% 13/11/2023 251,379 0.00%O2 Telefonica Deutschland Finanzierungs GmbH €200,000 1.75% 5/7/2025 251,335 0.00%Covestro AG €200,000 1.75% 25/9/2024 250,262 0.00%Siemens Financieringsmaatschappij NV $250,000 0.65% 11/3/2024 250,238 0.00%Deutsche Bank AG^ €200,000 1.38% 10/6/2026 249,090 0.00%Land Berlin €200,000 1.88% 12/6/2023 248,366 0.00%Bayerische Landesbodenkreditanstalt €200,000 0.75% 28/5/2025 247,377 0.00%Brenntag Finance BV €200,000 1.13% 27/9/2025 246,934 0.00%Eurogrid GmbH €200,000 1.63% 3/11/2023 246,411 0.00%Deutsche Telekom AG €200,000 1.75% 9/12/2049 245,672 0.00%LEG Immobilien SE €200,000 0.88% 28/11/2027 244,906 0.00%Volkswagen Financial Services AG €200,000 0.88% 12/4/2023 241,269 0.00%Vonovia Finance BV €200,000 0.63% 7/10/2027 241,088 0.00%Berlin Hyp AG €200,000 0.25% 22/2/2023 240,128 0.00%Landwirtschaftliche Rentenbank €200,000 0.25% 24/11/2022 239,958 0.00%Deutsche Apotheker-und Aerztebank eG €200,000 0.15% 7/3/2023 239,773 0.00%DZ HYP AG €200,000 0.13% 30/9/2022 239,112 0.00%Allianz Finance II BV €200,000 0.00% 14/1/2025 238,667 0.00%Aroundtown SA €200,000 0.38% 23/9/2022 238,556 0.00%adidas AG €200,000 0.00% 9/9/2024 238,505 0.00%Henkel AG & Co. KGaA £158,000 0.88% 13/9/2022 219,392 0.00%Volkswagen Group of America Finance LLC $200,000 3.20% 26/9/2026 216,374 0.00%Daimler Finance North America LLC $200,000 3.25% 1/8/2024 213,783 0.00%Volkswagen Group of America Finance LLC $200,000 2.85% 26/9/2024 211,327 0.00%Bayer US Finance II LLC $175,000 4.70% 15/7/2064 209,748 0.00%Deutsche Telekom International Finance BV £100,000 8.88% 27/11/2028 209,473 0.00%Landwirtschaftliche Rentenbank $200,000 1.75% 27/7/2026 207,913 0.00%Volkswagen Group of America Finance LLC $200,000 2.70% 26/9/2022 205,489 0.00%KFW £100,000 6.00% 7/12/2028 190,149 0.00%BMW US Capital LLC $175,000 3.45% 12/4/2023 183,831 0.00%KFW $175,000 2.00% 2/5/2025 183,586 0.00%BMW US Capital LLC $150,000 3.75% 12/4/2028 169,295 0.00%Daimler Finance North America LLC $150,000 3.45% 6/1/2027 164,599 0.00%Siemens Financieringsmaatschappij NV $150,000 3.30% 15/9/2046 163,366 0.00%Landwirtschaftliche Rentenbank $150,000 2.38% 10/6/2025 159,480 0.00%Siemens Financieringsmaatschappij NV $125,000 6.13% 17/8/2026 154,569 0.00%Deutsche Bahn Finance GmbH £100,000 3.13% 24/7/2026 154,247 0.00%Siemens Financieringsmaatschappij NV £100,000 2.75% 10/9/2025 149,289 0.00%State of North Rhine-Westphalia Germany €110,000 1.38% 15/1/2120 146,680 0.00%BMW US Capital LLC $125,000 3.30% 6/4/2027 136,683 0.00%State of North Rhine-Westphalia Germany €100,000 1.63% 24/10/2030 136,290 0.00%Volkswagen International Finance NV^ €100,000 4.63% Perpetual 134,949 0.00%Talanx AG €100,000 2.50% 23/7/2026 134,197 0.00%Bayer US Finance II LLC $125,000 3.95% 15/4/2045 133,578 0.00%Daimler Finance North America LLC $125,000 3.70% 4/5/2023 131,970 0.00%Allianz SE^ €100,000 4.75% Perpetual 130,624 0.00%Volkswagen International Finance NV^ €100,000 3.50% Perpetual 130,153 0.00%Merck KGaA^ €100,000 3.38% 12/12/2074 129,993 0.00%Siemens Financieringsmaatschappij NV $125,000 2.00% 15/9/2023 129,105 0.00%Deutsche Wohnen SE €100,000 1.50% 30/4/2030 127,979 0.00%Eurogrid GmbH €100,000 1.88% 10/6/2025 127,001 0.00%Volkswagen Leasing GmbH €100,000 2.63% 15/1/2024 126,668 0.00%Roadster Finance DAC €100,000 2.38% 8/12/2027 126,637 0.00%State of Bremen €100,000 1.88% 18/3/2024 126,172 0.00%Bertelsmann SE & Co. KGaA €100,000 1.75% 14/10/2024 125,813 0.00%Robert Bosch GmbH €100,000 1.75% 8/7/2024 125,735 0.00%Deutsche Post AG €100,000 1.25% 1/4/2026 125,716 0.00%Landwirtschaftliche Rentenbank €100,000 0.63% 20/2/2030 125,628 0.00%State of North Rhine-Westphalia Germany €100,000 1.00% 16/1/2025 124,597 0.00%BMW US Capital LLC $120,000 2.25% 15/9/2023 124,272 0.00%Deutsche Wohnen SE €100,000 1.00% 30/4/2025 122,914 0.00%Deutsche Boerse AG €100,000 2.38% 5/10/2022 122,767 0.00%DZ HYP AG €100,000 0.38% 31/3/2026 122,436 0.00%DZ HYP AG €100,000 0.63% 5/6/2024 122,284 0.00%Free & Hanseatic City of Hamburg €100,000 0.38% 1/4/2025 122,074 0.00%Deutsche Telekom AG £78,000 3.13% 6/2/2034 121,808 0.00%State of Lower Saxony €100,000 1.00% 18/8/2022 120,695 0.00%Deutsche Telekom International Finance BV €100,000 0.63% 1/12/2022 120,236 0.00%State of Hesse €100,000 1.13% 10/12/2021 119,479 0.00%Bayer US Finance II LLC $100,000 4.20% 15/7/2034 112,093 0.00%E.ON International Finance BV £50,000 6.75% 27/1/2039 111,787 0.00%

398
Vanguard Global Bond Index Fund
Principal CouponMaturity
DateFair Value
US Dollars ($)% of Total
Net AssetsEnBW International Finance BV €50,000 6.13% 7/7/2039 109,384 0.00%KFW £50,000 5.75% 7/6/2032 102,550 0.00%E.ON International Finance BV €80,000 3.00% 17/1/2024 102,515 0.00%Bayer US Finance II LLC $100,000 2.20% 15/7/2022 101,048 0.00%E.ON International Finance BV $50,000 6.65% 30/4/2038 72,946 0.00%Siemens Financieringsmaatschappij NV €50,000 2.88% 10/3/2028 70,586 0.00%Deutsche Post AG €50,000 2.88% 11/12/2024 65,572 0.00%Aroundtown SA CA($)75,000 4.63% 18/9/2025 65,541 0.00%State of North Rhine-Westphalia Germany €50,000 2.00% 15/10/2025 65,371 0.00%State of Lower Saxony €50,000 2.13% 16/1/2024 63,282 0.00%State of North Rhine-Westphalia Germany €50,000 1.88% 15/3/2024 63,106 0.00%Free & Hanseatic City of Hamburg €50,000 1.88% 27/2/2024 63,046 0.00%Land Berlin €50,000 1.63% 3/6/2024 62,965 0.00%Bayerische Landesbank €50,000 1.75% 8/4/2024 62,925 0.00%Deutsche Telekom International Finance BV €50,000 4.25% 13/7/2022 62,127 0.00%BMW Finance NV €50,000 2.38% 24/1/2023 61,871 0.00%State of Saxony-Anhalt €50,000 1.63% 25/4/2023 61,625 0.00%Gemeinsame Deutsche Bundeslaender €50,000 1.75% 31/1/2023 61,472 0.00%State of Hesse €50,000 1.75% 20/1/2023 61,434 0.00%Free & Hanseatic City of Hamburg €50,000 1.88% 26/9/2022 61,086 0.00%Bayerische Landesbank €50,000 2.00% 11/7/2022 60,838 0.00%Vonovia Finance BV €50,000 2.13% 9/7/2022 60,750 0.00%State of Hesse €50,000 3.00% 23/8/2021 59,601 0.00%Daimler Finance North America LLC $50,000 3.30% 19/5/2025 53,976 0.00%Bundesrepublik Deutschland Bundesanleihe €10,000 2.00% 15/8/2023 12,546 0.00%test - - - 1,311,765,285 5.95%Guernsey 0.00% (2020: 0.00%)States of Guernsey Bond £100,000 3.38% 12/12/2046 182,211 0.00%test - - - 182,211 0.00%Hong Kong 0.05% (2020: 0.06%)Hong Kong Government Bond Programme HKD13,000,000 1.25% 29/6/2027 1,706,552 0.01%CK Hutchison Group Telecom Finance SA €1,000,000 1.13% 17/10/2028 1,226,995 0.01%AIA Group Ltd. $1,000,000 3.20% 11/3/2025 1,063,765 0.01%AIA Group Ltd. $1,000,000 3.20% 16/9/2040 1,031,345 0.01%Hong Kong Government Bond Programme HKD5,000,000 2.02% 7/3/2034 685,517 0.01%AIA Group Ltd. $500,000 4.50% 16/3/2046 631,005 0.00%Hong Kong Government Bond Programme HKD4,000,000 1.97% 17/1/2029 548,268 0.00%HPHT Finance 17 Ltd. $500,000 2.75% 11/9/2022 509,604 0.00%Hongkong Electric Finance Ltd. $500,000 2.25% 9/6/2030 501,248 0.00%AIA Group Ltd. $425,000 3.60% 9/4/2029 471,358 0.00%Li & Fung Ltd. $450,000 4.50% 18/8/2025 465,589 0.00%Hutchison Whampoa Finance UK plc £200,000 5.63% 24/11/2026 340,389 0.00%Hutchison Whampoa International 14 Ltd. $300,000 3.63% 31/10/2024 326,482 0.00%Link Finance Cayman 2009 Ltd. $300,000 3.60% 3/9/2024 319,922 0.00%CK Hutchison International 16 Ltd. $300,000 2.75% 3/10/2026 319,644 0.00%AIA Group Ltd. $200,000 3.38% 7/4/2030 219,369 0.00%CK Hutchison International 17 II Ltd. $200,000 3.25% 29/9/2027 217,975 0.00%Nan Fung Treasury Ltd. $200,000 3.88% 3/10/2027 211,944 0.00%AIA Group Ltd. $200,000 3.13% 13/3/2023 207,817 0.00%Castle Peak Power Finance Co., Ltd. $200,000 2.20% 22/6/2030 200,282 0.00%CLP Power Hong Kong Financing Ltd. $200,000 2.13% 30/6/2030 198,749 0.00%test - - - 11,403,819 0.05%Hungary 0.16% (2020: 0.15%)Hungary Government Bond HUF1,157,000,000 1.00% 26/11/2025 3,751,788 0.02%Hungary Government Bond HUF1,033,230,000 3.00% 27/10/2027 3,647,540 0.02%Hungary Government Bond HUF1,000,000,000 3.00% 21/8/2030 3,525,058 0.02%Hungary Government Bond HUF1,000,000,000 1.50% 22/4/2026 3,293,057 0.01%Hungary Government International Bond $2,150,000 5.38% 21/2/2023 2,324,488 0.01%Hungary Government Bond HUF582,570,000 5.50% 24/6/2025 2,237,520 0.01%MFB Magyar Fejlesztesi Bank Zrt €1,790,000 1.38% 24/6/2025 2,221,541 0.01%Hungary Government Bond HUF600,000,000 2.25% 20/4/2033 1,903,407 0.01%Hungary Government International Bond €1,500,000 1.50% 17/11/2050 1,658,687 0.01%Hungary Government International Bond €1,300,000 0.50% 18/11/2030 1,510,837 0.01%Hungary Government International Bond $1,200,000 5.75% 22/11/2023 1,347,901 0.01%Hungary Government Bond HUF396,000,000 3.00% 27/10/2038 1,301,829 0.01%Hungary Government International Bond €1,000,000 1.25% 22/10/2025 1,250,020 0.01%Hungary Government International Bond €1,000,000 1.13% 28/4/2026 1,249,047 0.00%Hungary Government International Bond $620,000 7.63% 29/3/2041 1,017,234 0.00%Hungary Government Bond HUF168,000,000 6.75% 22/10/2028 733,349 0.00%Hungary Government Bond HUF200,000,000 7.00% 24/6/2022 715,657 0.00%Hungary Government International Bond $500,000 5.38% 25/3/2024 564,070 0.00%

399
Vanguard Global Bond Index Fund
Principal CouponMaturity
DateFair Value
US Dollars ($)% of Total
Net AssetsHungary Government Bond HUF100,000,000 1.75% 26/10/2022 341,497 0.00%Hungary Government Bond HUF90,000,000 6.00% 24/11/2023 336,330 0.00%test - - - 34,930,857 0.16%India 0.08% (2020: 0.07%)Export-Import Bank of India $6,685,000 3.88% 1/2/2028 7,235,361 0.03%State Bank of India $3,000,000 4.50% 28/9/2023 3,213,436 0.02%Power Finance Corp., Ltd. $1,250,000 3.95% 23/4/2030 1,284,100 0.01%Adani Ports & Special Economic Zone Ltd. $1,000,000 3.38% 24/7/2024 1,040,636 0.01%ICICI Bank Ltd. $950,000 3.80% 14/12/2027 1,021,560 0.01%Reliance Industries Ltd. $550,000 4.88% 10/2/2045 683,067 0.00%NTPC Ltd. $500,000 4.38% 26/11/2024 542,399 0.00%UPL Corp., Ltd. $500,000 4.50% 8/3/2028 536,861 0.00%ICICI Bank Ltd. $450,000 4.00% 18/3/2026 486,729 0.00%Bharti Airtel International Netherlands BV $350,000 5.35% 20/5/2024 385,248 0.00%Reliance Industries Ltd. $350,000 3.67% 30/11/2027 382,008 0.00%State Bank of India $300,000 4.88% 17/4/2024 328,525 0.00%Adani Ports & Special Economic Zone Ltd. $300,000 4.38% 3/7/2029 313,333 0.00%Adani Ports & Special Economic Zone Ltd. $300,000 3.10% 2/2/2031 285,954 0.00%Export-Import Bank of India $200,000 3.38% 5/8/2026 213,418 0.00%Adani Electricity Mumbai Ltd. $200,000 3.95% 12/2/2030 200,497 0.00%Indian Railway Finance Corp., Ltd. $200,000 2.80% 10/2/2031 194,307 0.00%Adani Transmission Ltd. $100,000 4.00% 3/8/2026 104,930 0.00%test - - - 18,452,369 0.08%Indonesia 0.66% (2020: 0.64%)Indonesia Treasury Bond IDR160,000,000,000 6.50% 15/6/2025 11,579,608 0.05%Indonesia Treasury Bond IDR120,000,000,000 7.00% 15/9/2030 8,555,682 0.04%Indonesia Treasury Bond IDR95,000,000,000 8.25% 15/5/2029 7,307,841 0.03%Indonesia Treasury Bond IDR90,700,000,000 8.38% 15/4/2039 6,913,301 0.03%Indonesia Treasury Bond IDR99,160,000,000 6.13% 15/5/2028 6,830,426 0.03%Indonesia Treasury Bond IDR77,473,000,000 8.38% 15/3/2034 5,910,854 0.03%Indonesia Treasury Bond IDR79,454,000,000 6.63% 15/5/2033 5,465,205 0.03%Indonesia Treasury Bond IDR69,647,000,000 8.38% 15/3/2024 5,250,489 0.02%Indonesia Treasury Bond IDR65,869,000,000 7.00% 15/5/2027 4,821,604 0.02%Indonesia Treasury Bond IDR63,000,000,000 8.13% 15/5/2024 4,739,540 0.02%Indonesia Treasury Bond IDR60,000,000,000 5.50% 15/4/2026 4,159,187 0.02%Indonesia Treasury Bond IDR50,000,000,000 8.38% 15/9/2026 3,877,715 0.02%Indonesia Treasury Bond IDR50,000,000,000 8.25% 15/5/2036 3,787,589 0.02%Indonesia Treasury Bond IDR45,000,000,000 7.50% 15/5/2038 3,177,418 0.02%Indonesia Government International Bond $2,500,000 3.40% 18/9/2029 2,704,521 0.01%Indonesia Treasury Bond IDR35,000,000,000 7.50% 15/8/2032 2,538,391 0.01%Indonesia Treasury Bond IDR33,000,000,000 7.38% 15/5/2048 2,307,861 0.01%Indonesia Treasury Bond IDR26,937,000,000 8.75% 15/5/2031 2,140,870 0.01%Indonesia Treasury Bond IDR30,000,000,000 7.50% 15/6/2035 2,138,583 0.01%Indonesia Government International Bond $1,700,000 5.13% 15/1/2045 2,107,902 0.01%Perusahaan Perseroan Persero PT Perusahaan Listrik Negara $1,925,000 4.13% 15/5/2027 2,091,920 0.01%Indonesia Treasury Bond IDR30,000,000,000 6.50% 15/2/2031 2,059,010 0.01%Pertamina Persero PT $2,000,000 3.10% 21/1/2030 2,053,662 0.01%Perusahaan Perseroan Persero PT Perusahaan Listrik Negara $1,550,000 6.15% 21/5/2048 1,954,989 0.01%Indonesia Treasury Bond IDR25,000,000,000 5.63% 15/5/2023 1,763,668 0.01%Indonesia Government International Bond $1,400,000 4.75% 8/1/2026 1,598,814 0.01%Perusahaan Penerbit SBSN Indonesia III $1,250,000 4.33% 28/5/2025 1,396,125 0.01%Indonesia Government International Bond $1,175,000 5.88% 15/1/2024 1,325,762 0.01%Indonesia Treasury Bond IDR17,658,000,000 7.50% 15/4/2040 1,246,701 0.01%Indonesia Government International Bond $800,000 6.75% 15/1/2044 1,182,287 0.01%Indonesia Government International Bond $1,000,000 4.45% 15/4/2070 1,181,367 0.01%Perusahaan Penerbit SBSN Indonesia III $1,000,000 4.40% 1/3/2028 1,141,459 0.01%Indonesia Asahan Aluminium Persero PT $1,000,000 4.75% 15/5/2025 1,101,952 0.01%Indonesia Government International Bond $834,000 5.35% 11/2/2049 1,083,394 0.01%Minejesa Capital BV $1,000,000 4.63% 10/8/2030 1,059,671 0.01%Indonesia Government International Bond $1,000,000 3.50% 14/2/2050 1,036,883 0.01%Indonesia Government International Bond $900,000 4.13% 15/1/2025 994,437 0.01%Indonesia Government International Bond $850,000 4.20% 15/10/2050 967,576 0.01%Indonesia Government International Bond $700,000 6.63% 17/2/2037 965,870 0.01%Indonesia Government International Bond $700,000 5.95% 8/1/2046 963,812 0.01%Indonesia Government International Bond $800,000 4.75% 18/7/2047 952,919 0.01%Indonesia Government International Bond $750,000 4.75% 11/2/2029 881,456 0.01%Perusahaan Penerbit SBSN Indonesia III $800,000 3.75% 1/3/2023 842,210 0.00%Pertamina Persero PT $700,000 5.63% 20/5/2043 825,306 0.00%Indonesia Government International Bond $700,000 4.35% 11/1/2048 794,516 0.00%Indonesia Government International Bond €660,000 0.90% 14/2/2027 790,659 0.00%Perusahaan Perseroan Persero PT Perusahaan Listrik Negara $600,000 6.25% 25/1/2049 761,870 0.00%

400
Vanguard Global Bond Index Fund
Principal CouponMaturity
DateFair Value
US Dollars ($)% of Total
Net AssetsPerusahaan Perseroan Persero PT Perusahaan Listrik Negara $750,000 3.00% 30/6/2030 752,110 0.00%Indonesia Government International Bond $700,000 3.70% 30/10/2049 733,939 0.00%Perusahaan Penerbit SBSN Indonesia III $700,000 3.80% 23/6/2050 731,877 0.00%Indonesia Government International Bond €570,000 1.45% 18/9/2026 703,243 0.00%Indonesia Government International Bond $425,000 7.75% 17/1/2038 642,977 0.00%Indonesia Government International Bond $500,000 5.25% 17/1/2042 623,313 0.00%Pertamina Persero PT $600,000 4.18% 21/1/2050 617,729 0.00%Perusahaan Penerbit SBSN Indonesia III $600,000 2.80% 23/6/2030 614,745 0.00%Indonesia Asahan Aluminium Persero PT $500,000 6.53% 15/11/2028 614,326 0.00%Indonesia Asahan Aluminium Persero PT $500,000 5.45% 15/5/2030 582,382 0.00%Indonesia Government International Bond $500,000 3.85% 18/7/2027 556,940 0.00%Indonesia Government International Bond $500,000 4.45% 11/2/2024 547,470 0.00%Perusahaan Perseroan Persero PT Perusahaan Listrik Negara $500,000 4.88% 17/7/2049 544,492 0.00%Perusahaan Perseroan Persero PT Perusahaan Listrik Negara $500,000 3.88% 17/7/2029 530,671 0.00%Indonesia Government International Bond $500,000 1.85% 12/3/2031 489,411 0.00%Indonesia Government International Bond €390,000 1.10% 12/3/2033 452,175 0.00%Perusahaan Penerbit SBSN Indonesia III $400,000 4.35% 10/9/2024 441,547 0.00%Pelabuhan Indonesia II PT $400,000 4.25% 5/5/2025 437,132 0.00%Pertamina Persero PT $400,000 4.15% 25/2/2060 401,636 0.00%Indonesia Government International Bond €300,000 1.75% 24/4/2025 373,695 0.00%Indonesia Treasury Bond IDR5,000,000,000 6.88% 15/8/2051 343,193 0.00%Perusahaan Penerbit SBSN Indonesia III $300,000 4.55% 29/3/2026 340,673 0.00%Indonesia Government International Bond $300,000 4.35% 8/1/2027 339,542 0.00%Pertamina Persero PT $233,000 6.50% 27/5/2041 301,610 0.00%Pertamina Persero PT $260,000 4.30% 20/5/2023 276,317 0.00%Pertamina Persero PT $200,000 6.00% 3/5/2042 245,170 0.00%Pelabuhan Indonesia II PT $200,000 5.38% 5/5/2045 239,640 0.00%Perusahaan Perseroan Persero PT Perusahaan Listrik Negara $200,000 5.45% 21/5/2028 233,637 0.00%Perusahaan Perseroan Persero PT Perusahaan Listrik Negara $200,000 5.25% 24/10/2042 226,277 0.00%Indonesia Government International Bond $200,000 4.10% 24/4/2028 226,262 0.00%Pelabuhan Indonesia III Persero PT $200,000 4.88% 1/10/2024 221,061 0.00%Indonesia Government International Bond $200,000 3.50% 11/1/2028 218,358 0.00%Bank Mandiri Persero Tbk PT $200,000 3.75% 11/4/2024 213,007 0.00%LLPL Capital Pte Ltd. $182,400 6.88% 4/2/2039 212,370 0.00%Indonesia Government International Bond $125,000 8.50% 12/10/2035 200,054 0.00%test - - - 144,561,863 0.66%Ireland 0.49% (2020: 0.43%)Ireland Government Bond €15,000,000 1.10% 15/5/2029 19,435,038 0.09%Ireland Government Bond €12,506,703 0.55% 22/4/2041 14,579,956 0.07%Ireland Government Bond €11,500,000 0.00% 18/10/2022 13,744,958 0.06%Ireland Government Bond €8,000,000 0.20% 15/5/2027 9,758,045 0.05%Ireland Government Bond €3,402,000 1.50% 15/5/2050 4,694,579 0.02%Ireland Government Bond €3,579,000 0.40% 15/5/2035 4,263,780 0.02%Ireland Government Bond €3,000,000 1.35% 18/3/2031 4,001,853 0.02%Ryanair DAC €2,348,000 0.88% 25/5/2026 2,795,192 0.01%Ireland Government Bond €2,000,000 1.30% 15/5/2033 2,666,976 0.01%SMBC Aviation Capital Finance DAC $2,025,000 2.65% 15/7/2021 2,026,624 0.01%ESB Finance DAC £1,300,000 1.88% 21/7/2035 1,807,951 0.01%AIB Group plc $1,300,000 4.75% 12/10/2023 1,411,220 0.01%ESB Finance DAC €1,000,000 1.13% 11/6/2030 1,254,650 0.01%Kerry Group Financial Services Unltd Co. €1,000,000 0.63% 20/9/2029 1,196,731 0.01%Bank of Ireland Group plc $1,100,000 4.50% 25/11/2023 1,190,254 0.01%Avolon Holdings Funding Ltd. $1,060,000 5.13% 1/10/2023 1,145,989 0.01%Avolon Holdings Funding Ltd. $1,000,000 2.13% 21/2/2026 991,271 0.01%Bank of Ireland Group plc^ €800,000 1.00% 25/11/2025 974,685 0.01%Ireland Government Bond €720,000 1.00% 15/5/2026 912,481 0.01%AerCap Ireland Capital DAC/AerCap Global Aviation Trust $850,000 3.88% 23/1/2028 910,472 0.01%AerCap Ireland Capital DAC/AerCap Global Aviation Trust $850,000 3.65% 21/7/2027 908,625 0.01%CRH America Finance, Inc. $800,000 3.95% 4/4/2028 903,912 0.01%Park Aerospace Holdings Ltd. $800,000 5.50% 15/2/2024 879,820 0.01%NIE Finance plc £600,000 2.50% 27/10/2025 877,940 0.00%Bank of Ireland Mortgage Bank €700,000 0.63% 14/3/2025 859,142 0.00%ESB Finance DAC €600,000 2.13% 5/11/2033 832,304 0.00%Park Aerospace Holdings Ltd. $738,000 5.25% 15/8/2022 772,620 0.00%AerCap Ireland Capital DAC/AerCap Global Aviation Trust $677,000 4.45% 3/4/2026 743,676 0.00%CRH America Finance, Inc. $650,000 3.40% 9/5/2027 713,423 0.00%Ireland Government Bond €485,611 1.70% 15/5/2037 684,867 0.00%Avolon Holdings Funding Ltd. $625,000 4.38% 1/5/2026 679,144 0.00%GAS Networks Ireland €500,000 0.13% 4/12/2024 597,174 0.00%CRH Finance Switzerland AG CHF500,000 1.38% 30/9/2022 552,363 0.00%AerCap Ireland Capital DAC/AerCap Global Aviation Trust $500,000 2.88% 14/8/2024 522,883 0.00%

401
Vanguard Global Bond Index Fund
Principal CouponMaturity
DateFair Value
US Dollars ($)% of Total
Net AssetsRyanair DAC €400,000 2.88% 15/9/2025 519,081 0.00%AerCap Ireland Capital DAC/AerCap Global Aviation Trust $500,000 1.75% 30/1/2026 494,253 0.00%AIB Group plc €400,000 1.25% 28/5/2024 491,624 0.00%CRH America Finance, Inc. $373,000 4.40% 9/5/2047 447,499 0.00%SMBC Aviation Capital Finance DAC $400,000 3.00% 15/7/2022 409,034 0.00%Ireland Government Bond €266,908 2.00% 18/2/2045 406,127 0.00%ESB Finance DAC €300,000 2.13% 8/6/2027 396,396 0.00%Park Aerospace Holdings Ltd. $350,000 4.50% 15/3/2023 367,964 0.00%Avolon Holdings Funding Ltd. $335,000 2.88% 15/2/2025 345,120 0.00%AerCap Ireland Capital DAC/AerCap Global Aviation Trust $275,000 4.88% 16/1/2024 299,489 0.00%CRH Finance DAC €200,000 1.38% 18/10/2028 255,353 0.00%GAS Networks Ireland €200,000 1.38% 5/12/2026 253,302 0.00%AerCap Ireland Capital DAC/AerCap Global Aviation Trust $225,000 4.63% 15/10/2027 251,377 0.00%AIB Mortgage Bank €200,000 0.88% 4/2/2023 242,329 0.00%Avolon Holdings Funding Ltd. $200,000 3.95% 1/7/2024 213,235 0.00%SMBC Aviation Capital Finance DAC $200,000 4.13% 15/7/2023 212,738 0.00%AerCap Ireland Capital DAC/AerCap Global Aviation Trust $200,000 3.30% 23/1/2023 207,263 0.00%Kerry Group Financial Services Unltd Co. $200,000 3.20% 9/4/2023 207,215 0.00%CRH America Finance, Inc. $150,000 4.50% 4/4/2048 183,374 0.00%AerCap Ireland Capital DAC/AerCap Global Aviation Trust $150,000 6.50% 15/7/2025 175,879 0.00%AerCap Ireland Capital DAC/AerCap Global Aviation Trust $150,000 4.50% 15/9/2023 160,891 0.00%AerCap Ireland Capital DAC/AerCap Global Aviation Trust $150,000 4.63% 1/7/2022 156,016 0.00%Avolon Holdings Funding Ltd. $150,000 3.25% 15/2/2027 154,782 0.00%AerCap Ireland Capital DAC/AerCap Global Aviation Trust $125,000 4.45% 1/10/2025 137,612 0.00%ESB Finance DAC €100,000 3.49% 12/1/2024 129,297 0.00%test - - - 107,407,848 0.49%Israel 0.23% (2020: 0.24%)Israel Government Bond-Fixed ILS27,000,000 0.50% 30/4/2025 8,348,995 0.04%Israel Government Bond-Fixed ILS23,100,000 1.00% 31/3/2030 7,041,654 0.03%Israel Government Bond-Fixed ILS11,040,000 3.75% 31/3/2047 4,393,639 0.02%Israel Government Bond-Fixed ILS12,000,000 2.00% 31/3/2027 3,992,757 0.02%Israel Government Bond-Fixed ILS10,500,000 1.75% 31/8/2025 3,454,672 0.02%Israel Government Bond-Fixed ILS10,000,000 1.50% 30/11/2023 3,193,801 0.02%State of Israel $2,200,000 3.80% 13/5/2060 2,507,546 0.01%Israel Government Bond-Fixed ILS7,200,000 2.25% 28/9/2028 2,462,606 0.01%Israel Government International Bond €1,710,000 1.50% 18/1/2027 2,190,220 0.01%Israel Government Bond-Fixed ILS5,000,000 4.25% 31/3/2023 1,662,268 0.01%Israel Government International Bond $1,193,000 2.88% 16/3/2026 1,286,657 0.01%State of Israel $1,200,000 3.38% 15/1/2050 1,284,854 0.01%State of Israel $1,100,000 2.50% 15/1/2030 1,153,839 0.01%Israel Government International Bond €500,000 2.50% 16/1/2049 746,410 0.01%Israel Government Bond-Fixed ILS2,470,000 1.50% 31/5/2037 720,192 0.00%Israel Electric Corp., Ltd. $600,000 4.25% 14/8/2028 672,480 0.00%Israel Government Bond-Fixed ILS1,300,000 5.50% 31/1/2042 642,121 0.00%Israel Government International Bond $500,000 4.50% 3/4/2120 632,277 0.00%Israel Government International Bond $500,000 4.50% 30/1/2043 623,321 0.00%Israel Government Bond-Fixed ILS1,500,000 6.25% 30/10/2026 618,552 0.00%Israel Electric Corp., Ltd. $500,000 5.00% 12/11/2024 559,005 0.00%Israel Government International Bond $400,000 3.88% 3/7/2050 463,111 0.00%Israel Government International Bond $400,000 3.15% 30/6/2023 421,651 0.00%ICL Group Ltd. $275,000 6.38% 31/5/2038 354,013 0.00%Israel Government International Bond $200,000 4.13% 17/1/2048 241,185 0.00%Israel Government International Bond €150,000 2.88% 29/1/2024 192,115 0.00%Delek & Avner Tamar Bond Ltd. $75,000 5.41% 30/12/2025 75,473 0.00%test - - - 49,935,414 0.23%Italy 4.30% (2020: 4.14%)Italy Buoni Poliennali Del Tesoro €79,921,000 1.85% 1/7/2025 101,897,954 0.46%Italy Buoni Poliennali Del Tesoro €30,990,000 3.00% 1/8/2029 43,816,365 0.20%Italy Buoni Poliennali Del Tesoro €35,296,000 0.25% 15/3/2028 41,432,236 0.19%Italy Buoni Poliennali Del Tesoro €30,000,000 0.90% 1/4/2031 35,994,498 0.16%Italy Buoni Poliennali Del Tesoro €30,000,000 0.00% 29/11/2022 35,768,295 0.16%Italy Buoni Poliennali Del Tesoro €31,312,000 0.95% 1/3/2037 35,356,616 0.16%Italy Buoni Poliennali Del Tesoro €23,948,000 2.10% 15/7/2026 31,217,062 0.14%Italy Buoni Poliennali Del Tesoro €23,281,000 3.75% 1/9/2024 31,046,676 0.14%Italy Certificati di Credito del Tesoro €25,873,000 0.00% 28/9/2022 30,835,997 0.14%Italy Buoni Poliennali Del Tesoro €25,000,000 0.00% 15/1/2024 29,831,259 0.14%Italy Buoni Poliennali Del Tesoro €21,012,000 1.80% 1/3/2041 26,024,221 0.12%Italy Buoni Poliennali Del Tesoro €18,432,000 2.05% 1/8/2027 24,169,264 0.11%Italy Buoni Poliennali Del Tesoro €17,500,000 1.65% 1/12/2030 22,463,611 0.10%Italy Buoni Poliennali Del Tesoro €16,563,000 1.75% 1/7/2024 20,783,422 0.10%Italy Buoni Poliennali Del Tesoro €16,818,000 0.30% 15/8/2023 20,206,591 0.09%

402
Vanguard Global Bond Index Fund
Principal CouponMaturity
DateFair Value
US Dollars ($)% of Total
Net AssetsItaly Buoni Poliennali Del Tesoro €16,000,000 1.35% 1/4/2030 20,096,073 0.09%Italy Buoni Poliennali Del Tesoro €15,477,000 2.45% 1/10/2023 19,500,099 0.09%Italy Buoni Poliennali Del Tesoro €15,500,000 0.95% 15/9/2027 19,090,880 0.09%Italy Buoni Poliennali Del Tesoro €15,200,000 1.00% 15/7/2022 18,295,965 0.08%Italy Buoni Poliennali Del Tesoro €12,350,000 3.50% 1/3/2030 18,185,464 0.08%Italy Buoni Poliennali Del Tesoro €11,530,000 2.95% 1/9/2038 16,942,230 0.08%Italy Buoni Poliennali Del Tesoro €12,099,000 2.45% 1/9/2050 16,418,595 0.08%Italy Buoni Poliennali Del Tesoro €11,381,000 2.20% 1/6/2027 15,029,249 0.07%Italy Buoni Poliennali Del Tesoro €12,791,000 1.50% 30/4/2045 14,739,392 0.07%Italy Buoni Poliennali Del Tesoro €7,530,000 4.75% 1/9/2044 14,287,312 0.07%Italy Buoni Poliennali Del Tesoro €8,983,000 3.35% 1/3/2035 13,596,001 0.06%Italy Certificati di Credito del Tesoro €11,292,000 0.00% 29/11/2021 13,420,095 0.06%Italy Buoni Poliennali Del Tesoro €8,167,000 2.45% 1/9/2033 11,261,772 0.05%Italy Buoni Poliennali Del Tesoro €9,125,000 2.15% 15/12/2021 10,956,665 0.05%Italy Buoni Poliennali Del Tesoro €7,181,000 3.10% 1/3/2040 10,775,332 0.05%Italy Buoni Poliennali Del Tesoro €8,616,000 0.50% 1/2/2026 10,424,733 0.05%Italy Buoni Poliennali Del Tesoro €7,500,000 0.35% 1/2/2025 9,039,490 0.04%Italy Buoni Poliennali Del Tesoro €4,859,000 3.85% 1/9/2049 8,396,233 0.04%Italy Buoni Poliennali Del Tesoro €7,035,000 2.15% 1/3/2072 8,164,624 0.04%Republic of Italy Government International Bond $5,000,000 3.88% 6/5/2051 5,382,578 0.03%Italy Buoni Poliennali Del Tesoro €3,912,000 1.70% 1/9/2051 4,495,796 0.02%Italy Buoni Poliennali Del Tesoro €2,700,000 3.45% 1/3/2048 4,358,612 0.02%Italy Buoni Poliennali Del Tesoro €3,162,000 0.95% 1/12/2031 3,781,167 0.02%Enel Finance International NV €2,600,000 0.88% 17/6/2036 3,061,375 0.01%Italy Buoni Poliennali Del Tesoro €1,832,000 4.00% 1/2/2037 2,998,196 0.01%Enel Finance International NV €2,400,000 0.38% 17/6/2027 2,881,396 0.01%UniCredit SpA^ €2,250,000 2.20% 22/7/2027 2,839,286 0.01%Intesa Sanpaolo SpA $2,650,000 3.25% 23/9/2024 2,818,525 0.01%Italy Buoni Poliennali Del Tesoro €1,550,000 5.75% 1/2/2033 2,808,266 0.01%Enel Finance International NV €2,240,000 0.00% 17/6/2027 2,626,897 0.01%Italy Buoni Poliennali Del Tesoro €2,200,000 0.60% 1/8/2031 2,553,467 0.01%Eni SpA €2,000,000 1.25% 18/5/2026 2,507,565 0.01%Republic of Italy Government International Bond $2,487,000 1.25% 17/2/2026 2,453,964 0.01%Italy Buoni Poliennali Del Tesoro €1,725,000 2.80% 1/3/2067 2,420,294 0.01%Terna SPA €2,000,000 0.38% 23/6/2029 2,371,313 0.01%UniCredit SpA €2,000,000 0.85% 19/1/2031 2,330,523 0.01%Cassa Depositi e Prestiti SpA €1,800,000 2.13% 27/9/2023 2,244,142 0.01%Italy Buoni Poliennali Del Tesoro €1,400,000 3.25% 1/9/2046 2,180,502 0.01%Terna SPA €1,700,000 1.38% 26/7/2027 2,151,587 0.01%Enel Finance International NV £1,490,000 1.00% 20/10/2027 2,022,515 0.01%UniCredit SpA^ €1,500,000 1.25% 25/6/2025 1,831,819 0.01%Italy Buoni Poliennali Del Tesoro €1,381,000 2.00% 1/2/2028 1,811,083 0.01%Enel Finance International NV $1,625,000 3.50% 6/4/2028 1,781,613 0.01%Snam SpA €1,300,000 0.75% 17/6/2030 1,564,882 0.01%Intesa Sanpaolo SpA £1,100,000 2.50% 15/1/2030 1,563,495 0.01%Cassa Depositi e Prestiti SpA €1,200,000 2.00% 20/4/2027 1,555,687 0.01%Enel SpA^ €1,300,000 1.88% Perpetual 1,517,473 0.01%UniCredit SpA^ €1,255,000 0.80% 5/7/2029 1,491,447 0.01%Italy Buoni Poliennali Del Tesoro €1,227,000 0.60% 15/6/2023 1,482,587 0.01%Enel Finance International NV $1,300,000 3.63% 25/5/2027 1,429,367 0.01%2i Rete Gas SpA €1,100,000 2.20% 11/9/2025 1,409,535 0.01%Enel Finance International NV $1,000,000 6.00% 7/10/2039 1,393,384 0.01%Enel Finance International NV $1,150,000 4.88% 14/6/2029 1,373,637 0.01%Intesa Sanpaolo SpA $1,150,000 4.70% 23/9/2049 1,352,011 0.01%Terna SPA €1,100,000 0.75% 24/7/2032 1,304,253 0.01%Republic of Italy Government International Bond $1,123,000 6.88% 27/9/2023 1,271,498 0.01%Intesa Sanpaolo SpA €1,000,000 1.75% 4/7/2029 1,270,052 0.01%UniCredit SpA^ €1,030,000 1.25% 16/6/2026 1,263,590 0.01%Intesa Sanpaolo SpA €1,000,000 1.00% 25/9/2025 1,252,167 0.01%Intesa Sanpaolo SpA €1,050,000 0.75% 16/3/2028 1,251,873 0.01%Intesa Sanpaolo SpA €1,000,000 2.13% 30/8/2023 1,243,537 0.01%Mediobanca Banca di Credito Finanziario SpA €1,000,000 1.13% 12/8/2024 1,241,824 0.01%Banco di Desio e della Brianza SpA €1,000,000 0.88% 12/9/2024 1,227,643 0.01%Banco BPM SpA €1,000,000 1.13% 25/9/2023 1,226,705 0.01%Intesa Sanpaolo SpA €1,000,000 0.50% 15/7/2024 1,217,970 0.01%Mediobanca Banca di Credito Finanziario SpA €1,000,000 0.88% 15/1/2026 1,214,441 0.01%Credit Agricole Italia SpA €1,000,000 0.25% 17/1/2028 1,212,438 0.01%Eni SpA €1,000,000 0.63% 23/1/2030 1,194,880 0.01%Cassa Depositi e Prestiti SpA €1,000,000 0.75% 30/6/2029 1,192,286 0.01%Intesa Sanpaolo SpA $1,000,000 4.00% 23/9/2029 1,098,058 0.01%Intesa Sanpaolo SpA €850,000 2.13% 26/5/2025 1,082,578 0.01%

403
Vanguard Global Bond Index Fund
Principal CouponMaturity
DateFair Value
US Dollars ($)% of Total
Net AssetsEnel SpA €920,000 1.38% 8/9/2169 1,077,536 0.01%Republic of Italy Government International Bond £600,000 6.00% 4/8/2028 1,069,868 0.01%Cassa Depositi e Prestiti SpA €800,000 2.13% 21/3/2026 1,035,348 0.01%Assicurazioni Generali SpA €790,000 2.43% 14/7/2031 1,008,713 0.01%Snam SpA €800,000 1.25% 28/8/2025 995,424 0.01%Ferrovie dello Stato Italiane SpA €800,000 0.88% 7/12/2023 973,300 0.01%UniCredit SpA €750,000 0.38% 31/10/2026 910,588 0.01%Republic of Italy Government International Bond $800,000 4.00% 17/10/2049 879,782 0.01%Banca Monte dei Paschi di Siena SpA €700,000 0.88% 8/10/2026 863,776 0.00%UniCredit SpA^ €700,000 1.20% 20/1/2026 847,426 0.00%UniCredit SpA €700,000 0.50% 9/4/2025 839,087 0.00%Snam SpA €700,000 0.00% 15/8/2025 829,293 0.00%Republic of Italy Government International Bond $650,000 5.38% 15/6/2033 818,635 0.00%Enel SpA £400,000 5.75% 22/6/2037 801,165 0.00%FCA Bank SpA €650,000 0.50% 18/9/2023 779,148 0.00%ACEA SpA €600,000 1.75% 23/5/2028 774,322 0.00%Eni SpA $600,000 5.70% 1/10/2040 769,613 0.00%Enel SpA^ €600,000 2.25% Perpetual 744,499 0.00%Iren SpA €600,000 0.88% 4/11/2024 732,320 0.00%Enel Finance International NV £350,000 5.75% 14/9/2040 730,469 0.00%Terna SPA €600,000 1.00% 23/7/2023 730,406 0.00%Italgas SpA €600,000 1.00% 11/12/2031 725,515 0.00%FCA Bank SpA €600,000 0.63% 24/11/2022 718,804 0.00%FCA Bank SpA €600,000 0.25% 28/2/2023 715,584 0.00%Republic of Italy Government International Bond $700,000 0.88% 6/5/2024 697,799 0.00%Republic of Italy Government International Bond $650,000 2.88% 17/10/2029 676,709 0.00%Enel Finance International NV $550,000 4.75% 25/5/2047 676,702 0.00%Mediobanca Banca di Credito Finanziario SpA €500,000 1.25% 24/11/2029 653,638 0.00%Enel SpA^ €500,000 3.50% 24/5/2080 648,046 0.00%Credit Agricole Italia SpA €500,000 1.00% 17/1/2045 639,460 0.00%Mediobanca Banca di Credito Finanziario SpA €500,000 1.38% 10/11/2025 635,792 0.00%Intesa Sanpaolo SpA €500,000 1.00% 19/11/2026 611,265 0.00%Enel Finance International NV £385,000 5.63% 14/8/2024 611,130 0.00%Italgas SpA €500,000 0.88% 24/4/2030 605,002 0.00%Intesa Sanpaolo SpA €500,000 0.63% 23/3/2023 604,105 0.00%FCA Bank SpA €500,000 0.50% 13/9/2024 601,126 0.00%Terna SPA €500,000 0.38% 25/9/2030 581,440 0.00%Intesa Sanpaolo SpA €470,000 1.00% 4/7/2024 573,985 0.00%UniCredit SpA $500,000 4.63% 12/4/2027 560,850 0.00%UniCredit SpA^ $550,000 3.13% 3/6/2032 552,808 0.00%Intesa Sanpaolo SpA $500,000 3.38% 12/1/2023 520,167 0.00%Eni SpA €400,000 1.63% 17/5/2028 518,601 0.00%Iren SpA €400,000 1.95% 19/9/2025 508,309 0.00%ERG SpA €400,000 1.88% 11/4/2025 503,632 0.00%Assicurazioni Generali SpA €400,000 2.12% 1/10/2030 502,336 0.00%Banca Popolare di Sondrio SCPA €400,000 0.75% 4/4/2023 481,250 0.00%Snam SpA €400,000 1.00% 12/9/2034 478,811 0.00%ENI SpA^ €400,000 2.00% Perpetual 474,274 0.00%Covivio €300,000 2.38% 20/2/2028 395,327 0.00%Banca Monte dei Paschi di Siena SpA €300,000 2.13% 26/11/2025 389,864 0.00%Credit Agricole Italia SpA €300,000 1.00% 25/3/2027 379,227 0.00%Enel Finance International NV $350,000 4.25% 14/9/2023 376,907 0.00%Enel Finance International NV €300,000 1.13% 16/9/2026 374,302 0.00%Enel SpA^ €300,000 2.50% Perpetual 372,718 0.00%Terna SPA €300,000 1.00% 10/4/2026 371,829 0.00%UniCredit SpA €300,000 0.75% 30/4/2025 368,719 0.00%ASTM SpA €300,000 1.63% 8/2/2028 366,359 0.00%Enel Finance International NV $300,000 2.65% 10/9/2024 315,180 0.00%Enel Finance International NV $300,000 2.75% 6/4/2023 311,134 0.00%Assicurazioni Generali SpA^ €200,000 5.50% 27/10/2047 292,324 0.00%Intesa Sanpaolo SpA €240,000 0.75% 4/12/2024 291,889 0.00%Assicurazioni Generali SpA €200,000 3.88% 29/1/2029 280,023 0.00%Enel SpA^ €200,000 3.38% Perpetual 262,649 0.00%Intesa Sanpaolo SpA €200,000 1.38% 18/12/2025 255,144 0.00%Eni SpA^ €200,000 3.38% Perpetual 251,950 0.00%Intesa Sanpaolo SpA €200,000 3.63% 5/12/2022 251,149 0.00%Eni SpA^ €200,000 2.63% Perpetual 249,176 0.00%A2A SpA €200,000 1.00% 16/7/2029 247,480 0.00%Hera SpA €200,000 0.88% 5/7/2027 246,633 0.00%FCA Bank SpA €200,000 0.13% 16/11/2023 237,929 0.00%FCA Bank SpA €200,000 0.00% 16/4/2024 237,140 0.00%
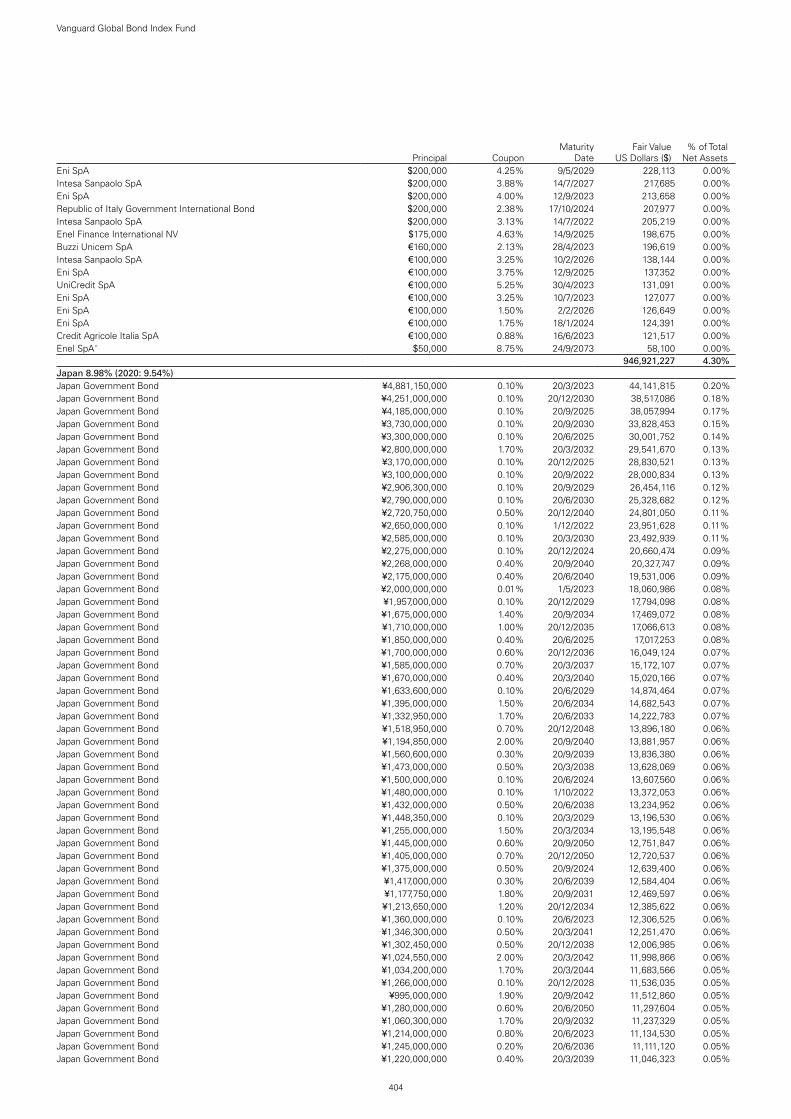
404
Vanguard Global Bond Index Fund
Principal CouponMaturity
DateFair Value
US Dollars ($)% of Total
Net AssetsEni SpA $200,000 4.25% 9/5/2029 228,113 0.00%Intesa Sanpaolo SpA $200,000 3.88% 14/7/2027 217,685 0.00%Eni SpA $200,000 4.00% 12/9/2023 213,658 0.00%Republic of Italy Government International Bond $200,000 2.38% 17/10/2024 207,977 0.00%Intesa Sanpaolo SpA $200,000 3.13% 14/7/2022 205,219 0.00%Enel Finance International NV $175,000 4.63% 14/9/2025 198,675 0.00%Buzzi Unicem SpA €160,000 2.13% 28/4/2023 196,619 0.00%Intesa Sanpaolo SpA €100,000 3.25% 10/2/2026 138,144 0.00%Eni SpA €100,000 3.75% 12/9/2025 137,352 0.00%UniCredit SpA €100,000 5.25% 30/4/2023 131,091 0.00%Eni SpA €100,000 3.25% 10/7/2023 127,077 0.00%Eni SpA €100,000 1.50% 2/2/2026 126,649 0.00%Eni SpA €100,000 1.75% 18/1/2024 124,391 0.00%Credit Agricole Italia SpA €100,000 0.88% 16/6/2023 121,517 0.00%Enel SpA^ $50,000 8.75% 24/9/2073 58,100 0.00%test - - - 946,921,227 4.30%Japan 8.98% (2020: 9.54%)Japan Government Bond ¥4,881,150,000 0.10% 20/3/2023 44,141,815 0.20%Japan Government Bond ¥4,251,000,000 0.10% 20/12/2030 38,517,086 0.18%Japan Government Bond ¥4,185,000,000 0.10% 20/9/2025 38,057,994 0.17%Japan Government Bond ¥3,730,000,000 0.10% 20/9/2030 33,828,453 0.15%Japan Government Bond ¥3,300,000,000 0.10% 20/6/2025 30,001,752 0.14%Japan Government Bond ¥2,800,000,000 1.70% 20/3/2032 29,541,670 0.13%Japan Government Bond ¥3,170,000,000 0.10% 20/12/2025 28,830,521 0.13%Japan Government Bond ¥3,100,000,000 0.10% 20/9/2022 28,000,834 0.13%Japan Government Bond ¥2,906,300,000 0.10% 20/9/2029 26,454,116 0.12%Japan Government Bond ¥2,790,000,000 0.10% 20/6/2030 25,328,682 0.12%Japan Government Bond ¥2,720,750,000 0.50% 20/12/2040 24,801,050 0.11%Japan Government Bond ¥2,650,000,000 0.10% 1/12/2022 23,951,628 0.11%Japan Government Bond ¥2,585,000,000 0.10% 20/3/2030 23,492,939 0.11%Japan Government Bond ¥2,275,000,000 0.10% 20/12/2024 20,660,474 0.09%Japan Government Bond ¥2,268,000,000 0.40% 20/9/2040 20,327,747 0.09%Japan Government Bond ¥2,175,000,000 0.40% 20/6/2040 19,531,006 0.09%Japan Government Bond ¥2,000,000,000 0.01% 1/5/2023 18,060,986 0.08%Japan Government Bond ¥1,957,000,000 0.10% 20/12/2029 17,794,098 0.08%Japan Government Bond ¥1,675,000,000 1.40% 20/9/2034 17,469,072 0.08%Japan Government Bond ¥1,710,000,000 1.00% 20/12/2035 17,066,613 0.08%Japan Government Bond ¥1,850,000,000 0.40% 20/6/2025 17,017,253 0.08%Japan Government Bond ¥1,700,000,000 0.60% 20/12/2036 16,049,124 0.07%Japan Government Bond ¥1,585,000,000 0.70% 20/3/2037 15,172,107 0.07%Japan Government Bond ¥1,670,000,000 0.40% 20/3/2040 15,020,166 0.07%Japan Government Bond ¥1,633,600,000 0.10% 20/6/2029 14,874,464 0.07%Japan Government Bond ¥1,395,000,000 1.50% 20/6/2034 14,682,543 0.07%Japan Government Bond ¥1,332,950,000 1.70% 20/6/2033 14,222,783 0.07%Japan Government Bond ¥1,518,950,000 0.70% 20/12/2048 13,896,180 0.06%Japan Government Bond ¥1,194,850,000 2.00% 20/9/2040 13,881,957 0.06%Japan Government Bond ¥1,560,600,000 0.30% 20/9/2039 13,836,380 0.06%Japan Government Bond ¥1,473,000,000 0.50% 20/3/2038 13,628,069 0.06%Japan Government Bond ¥1,500,000,000 0.10% 20/6/2024 13,607,560 0.06%Japan Government Bond ¥1,480,000,000 0.10% 1/10/2022 13,372,053 0.06%Japan Government Bond ¥1,432,000,000 0.50% 20/6/2038 13,234,952 0.06%Japan Government Bond ¥1,448,350,000 0.10% 20/3/2029 13,196,530 0.06%Japan Government Bond ¥1,255,000,000 1.50% 20/3/2034 13,195,548 0.06%Japan Government Bond ¥1,445,000,000 0.60% 20/9/2050 12,751,847 0.06%Japan Government Bond ¥1,405,000,000 0.70% 20/12/2050 12,720,537 0.06%Japan Government Bond ¥1,375,000,000 0.50% 20/9/2024 12,639,400 0.06%Japan Government Bond ¥1,417,000,000 0.30% 20/6/2039 12,584,404 0.06%Japan Government Bond ¥1,177,750,000 1.80% 20/9/2031 12,469,597 0.06%Japan Government Bond ¥1,213,650,000 1.20% 20/12/2034 12,385,622 0.06%Japan Government Bond ¥1,360,000,000 0.10% 20/6/2023 12,306,525 0.06%Japan Government Bond ¥1,346,300,000 0.50% 20/3/2041 12,251,470 0.06%Japan Government Bond ¥1,302,450,000 0.50% 20/12/2038 12,006,985 0.06%Japan Government Bond ¥1,024,550,000 2.00% 20/3/2042 11,998,866 0.06%Japan Government Bond ¥1,034,200,000 1.70% 20/3/2044 11,683,566 0.05%Japan Government Bond ¥1,266,000,000 0.10% 20/12/2028 11,536,035 0.05%Japan Government Bond ¥995,000,000 1.90% 20/9/2042 11,512,860 0.05%Japan Government Bond ¥1,280,000,000 0.60% 20/6/2050 11,297,604 0.05%Japan Government Bond ¥1,060,300,000 1.70% 20/9/2032 11,237,329 0.05%Japan Government Bond ¥1,214,000,000 0.80% 20/6/2023 11,134,530 0.05%Japan Government Bond ¥1,245,000,000 0.20% 20/6/2036 11,111,120 0.05%Japan Government Bond ¥1,220,000,000 0.40% 20/3/2039 11,046,323 0.05%

405
Vanguard Global Bond Index Fund
Principal CouponMaturity
DateFair Value
US Dollars ($)% of Total
Net AssetsJapan Government Bond ¥1,220,000,000 0.10% 20/3/2031 11,040,020 0.05%Japan Government Bond ¥1,162,100,000 0.10% 20/6/2028 10,594,926 0.05%Japan Government Bond ¥1,120,000,000 0.60% 20/9/2037 10,550,080 0.05%Japan Government Bond ¥1,150,000,000 0.01% 1/4/2023 10,383,960 0.05%Japan Government Bond ¥876,100,000 2.00% 20/9/2041 10,229,156 0.05%Japan Government Bond ¥1,070,000,000 0.90% 20/3/2057 10,133,016 0.05%Japan Government Bond ¥1,100,000,000 0.10% 1/11/2022 9,940,355 0.05%Japan Government Bond ¥970,000,000 1.20% 20/9/2035 9,918,419 0.05%Japan Government Bond ¥1,165,000,000 0.40% 20/3/2050 9,759,624 0.05%Japan Government Bond ¥1,035,000,000 0.50% 20/9/2036 9,645,805 0.04%Japan Government Bond ¥1,044,500,000 0.70% 20/6/2048 9,591,781 0.04%Japan Government Bond ¥1,055,000,000 0.70% 20/3/2051 9,533,092 0.04%Japan Government Bond ¥1,153,000,000 0.50% 20/3/2060 9,523,904 0.04%Japan Government Bond ¥1,070,000,000 0.30% 20/12/2039 9,457,828 0.04%Japan Government Bond ¥980,000,000 0.60% 20/6/2037 9,233,873 0.04%Japan Government Bond ¥1,000,000,000 0.60% 20/12/2023 9,171,128 0.04%Japan Government Bond ¥1,010,000,000 0.10% 20/3/2024 9,157,078 0.04%Japan Government Bond ¥1,000,000,000 0.30% 20/12/2024 9,143,473 0.04%Japan Government Bond ¥1,100,450,000 0.50% 20/3/2059 9,115,347 0.04%Japan Government Bond ¥990,000,000 0.40% 20/3/2036 9,105,596 0.04%Japan Government Bond ¥1,000,000,000 0.01% 20/3/2026 9,054,669 0.04%Japan Government Bond ¥1,000,000,000 0.10% 1/3/2023 9,042,237 0.04%Japan Government Bond ¥990,000,000 0.10% 20/3/2025 8,994,889 0.04%Japan Government Bond ¥861,000,000 1.50% 20/3/2033 8,985,024 0.04%Japan Government Bond ¥966,000,000 0.80% 20/3/2058 8,874,107 0.04%Japan Government Bond ¥950,000,000 0.80% 20/9/2023 8,734,846 0.04%Japan Government Bond ¥1,022,500,000 0.40% 20/12/2049 8,578,216 0.04%Japan Government Bond ¥896,000,000 0.80% 20/9/2047 8,456,823 0.04%Japan Government Bond ¥825,000,000 1.20% 20/3/2035 8,421,489 0.04%Japan Government Bond ¥780,000,000 1.70% 20/9/2033 8,342,709 0.04%Japan Government Bond ¥946,400,000 0.50% 20/3/2049 8,218,446 0.04%Japan Government Bond ¥905,400,000 0.10% 20/9/2024 8,216,132 0.04%Japan Government Bond ¥925,000,000 0.50% 20/9/2046 8,178,289 0.04%Japan Government Bond ¥663,700,000 2.20% 20/3/2041 7,969,018 0.04%Japan Government Bond ¥807,400,000 0.70% 20/9/2038 7,693,421 0.04%Japan Government Bond ¥690,600,000 1.70% 20/12/2032 7,335,248 0.03%Japan Government Bond ¥625,000,000 1.80% 20/3/2043 7,143,034 0.03%Japan Expressway Holding & Debt Repayment Agency ¥680,000,000 2.42% 20/6/2028 7,113,058 0.03%Japan Government Bond ¥677,650,000 1.30% 20/6/2035 7,013,592 0.03%Japan Government Bond ¥737,300,000 0.60% 20/12/2037 6,939,924 0.03%Major Joint Local Government Bond ¥750,000,000 0.20% 25/4/2031 6,808,274 0.03%Japan Government Bond ¥786,150,000 0.40% 20/9/2049 6,611,578 0.03%Japan Government Bond ¥700,000,000 0.60% 20/6/2024 6,444,098 0.03%Japan Government Bond ¥587,200,000 1.50% 20/3/2045 6,419,907 0.03%Japan Government Bond ¥590,000,000 1.40% 20/3/2055 6,381,602 0.03%Japan Government Bond ¥550,000,000 1.80% 20/9/2043 6,295,837 0.03%Japan Government Bond ¥588,200,000 1.80% 20/12/2031 6,244,305 0.03%Japan Government Bond ¥681,700,000 0.10% 20/9/2028 6,214,476 0.03%Japan Government Bond ¥545,000,000 1.70% 20/9/2044 6,162,105 0.03%Japan Expressway Holding & Debt Repayment Agency ¥600,000,000 2.34% 20/10/2027 6,158,099 0.03%Japan Government Bond ¥650,000,000 0.80% 20/12/2047 6,127,275 0.03%Japan Government Bond ¥715,000,000 0.40% 20/6/2049 6,028,667 0.03%Japan Government Bond ¥650,000,000 0.10% 20/12/2026 5,918,266 0.03%Japan Government Bond ¥620,000,000 0.80% 20/3/2046 5,889,762 0.03%Japan Government Bond ¥650,000,000 0.60% 20/12/2046 5,875,942 0.03%Japan Government Bond ¥505,600,000 1.90% 20/6/2043 5,871,484 0.03%Japan Government Bond ¥641,000,000 0.10% 20/3/2028 5,843,494 0.03%Major Joint Local Government Bond ¥640,000,000 0.06% 23/10/2026 5,777,094 0.03%Japan Government Bond ¥700,000,000 0.40% 20/3/2056 5,675,628 0.03%Japan Government Bond ¥600,000,000 0.80% 20/6/2047 5,671,459 0.03%Japan Government Bond ¥600,000,000 0.80% 20/3/2048 5,648,897 0.03%Japan Government Bond ¥455,500,000 2.50% 20/3/2038 5,551,575 0.03%Japan Government Bond ¥455,150,000 1.90% 20/3/2053 5,482,772 0.03%Japan Government Bond ¥600,000,000 0.10% 20/6/2027 5,467,622 0.03%Japan Government Bond ¥519,500,000 1.70% 20/12/2031 5,466,105 0.03%Japan Government Bond ¥596,650,000 0.10% 20/3/2026 5,426,671 0.03%Deposit Insurance Corp. of Japan ¥600,000,000 0.10% 14/10/2022 5,413,510 0.03%Japan Government Bond ¥500,000,000 1.60% 20/12/2033 5,302,280 0.02%Japan Government Bond ¥413,000,000 2.50% 20/9/2037 5,009,977 0.02%Japan Government Bond ¥512,900,000 0.90% 20/9/2048 4,928,922 0.02%Japan Government Bond ¥532,650,000 0.80% 20/12/2022 4,863,123 0.02%

406
Vanguard Global Bond Index Fund
Principal CouponMaturity
DateFair Value
US Dollars ($)% of Total
Net AssetsJapan Government Bond ¥471,650,000 2.10% 20/12/2027 4,852,113 0.02%Japan Government Bond ¥450,000,000 1.40% 20/12/2045 4,830,290 0.02%Japan Government Bond ¥520,600,000 0.80% 20/9/2022 4,742,504 0.02%Major Joint Local Government Bond ¥520,000,000 0.21% 23/6/2028 4,736,164 0.02%Japan Government Bond ¥553,000,000 0.30% 20/6/2046 4,665,028 0.02%Japan Government Bond ¥411,000,000 1.70% 20/12/2043 4,638,734 0.02%Japan Government Bond ¥438,550,000 1.60% 20/6/2032 4,594,619 0.02%Sumitomo Mitsui Financial Group, Inc. ¥500,000,000 0.85% 12/9/2024 4,571,808 0.02%Japan Government Bond ¥464,000,000 2.00% 20/9/2025 4,555,899 0.02%Deposit Insurance Corp. of Japan ¥500,000,000 0.10% 6/8/2024 4,520,998 0.02%Japan Government Bond ¥500,000,000 0.10% 1/2/2023 4,520,583 0.02%Japan Finance Corp. ¥500,000,000 0.00% 31/7/2024 4,508,327 0.02%Japan Government Bond ¥420,000,000 1.90% 20/6/2031 4,473,266 0.02%Japan Government Bond ¥400,000,000 1.60% 20/6/2045 4,452,377 0.02%Japan Government Bond ¥479,000,000 0.10% 20/12/2027 4,366,280 0.02%Japan Government Bond ¥400,000,000 2.20% 20/3/2031 4,353,251 0.02%Japan Government Bond ¥355,050,000 2.00% 20/3/2052 4,341,800 0.02%Japan Government Bond ¥470,000,000 0.60% 20/3/2024 4,318,441 0.02%Japan Government Bond ¥416,900,000 1.90% 20/12/2028 4,306,912 0.02%Japan Government Bond ¥440,000,000 0.80% 20/3/2047 4,159,569 0.02%Japan Government Bond ¥386,500,000 1.90% 20/3/2031 4,105,329 0.02%Japan Government Bond ¥440,000,000 0.10% 20/9/2027 4,010,262 0.02%Japan Government Bond ¥345,500,000 1.70% 20/6/2044 3,902,129 0.02%Japan Government Bond ¥400,000,000 2.00% 20/12/2024 3,870,093 0.02%Japan Government Bond ¥368,650,000 2.10% 20/9/2028 3,842,160 0.02%Japan Government Bond ¥357,000,000 2.10% 20/12/2030 3,841,752 0.02%Japan Government Bond ¥320,000,000 2.40% 20/3/2037 3,820,508 0.02%Japan Government Bond ¥364,000,000 1.90% 20/3/2029 3,773,603 0.02%Major Joint Local Government Bond ¥400,000,000 0.13% 25/10/2030 3,610,454 0.02%Japan Government Bond ¥380,000,000 0.10% 20/9/2023 3,440,508 0.02%Japan Government Bond ¥377,050,000 0.60% 20/3/2023 3,438,699 0.02%Japan Government Bond ¥370,000,000 0.10% 20/3/2027 3,370,087 0.02%Japan Government Bond ¥278,000,000 2.30% 20/3/2040 3,358,903 0.02%Japan Government Bond ¥314,000,000 2.40% 20/3/2028 3,300,577 0.02%Japan Government Bond ¥261,000,000 2.20% 20/3/2050 3,295,018 0.02%Japan Government Bond ¥300,000,000 1.50% 20/12/2044 3,275,623 0.02%Development Bank of Japan, Inc. ¥356,000,000 1.70% 20/9/2022 3,272,198 0.02%Japan Government Bond ¥258,450,000 2.20% 20/3/2051 3,271,278 0.02%Japan Government Bond ¥300,000,000 1.70% 20/9/2031 3,149,209 0.02%Japan Government Bond ¥295,300,000 2.10% 20/9/2029 3,125,361 0.01%Major Joint Local Government Bond ¥330,000,000 0.20% 25/5/2028 3,004,622 0.01%Japan Government Bond ¥260,000,000 2.40% 20/3/2034 2,995,887 0.01%Japan Government Bond ¥284,000,000 2.10% 20/6/2029 2,994,762 0.01%Japan Government Bond ¥325,000,000 0.30% 20/12/2025 2,982,339 0.01%Major Joint Local Government Bond ¥320,000,000 0.22% 25/10/2027 2,915,605 0.01%Japan Government Bond ¥275,000,000 1.80% 20/6/2031 2,905,250 0.01%Japan Government Bond ¥244,150,000 2.50% 20/9/2035 2,898,886 0.01%Nissan Motor Co., Ltd. $2,550,000 4.81% 17/9/2030 2,875,417 0.01%Japan Government Bond ¥268,000,000 2.00% 20/6/2030 2,844,570 0.01%Japan Government Bond ¥320,000,000 0.70% 20/3/2061 2,829,506 0.01%Japan Government Bond ¥262,000,000 2.20% 20/12/2029 2,803,012 0.01%Japan Government Bond ¥270,000,000 1.60% 20/6/2030 2,778,356 0.01%Tokyo Metropolitan Government ¥300,000,000 0.44% 19/3/2025 2,746,285 0.01%Mizuho Financial Group, Inc. ¥300,000,000 0.65% 26/1/2027 2,719,975 0.01%East Nippon Expressway Co., Ltd. ¥300,000,000 0.14% 31/7/2029 2,696,351 0.01%Japan Government Bond ¥295,000,000 0.10% 20/6/2026 2,684,423 0.01%Japan Government Bond ¥230,000,000 1.70% 20/3/2054 2,664,760 0.01%Japan Government Bond ¥248,750,000 2.30% 20/6/2028 2,612,617 0.01%Japan Government Bond ¥255,750,000 2.10% 20/12/2026 2,581,796 0.01%Japan Expressway Holding & Debt Repayment Agency ¥300,000,000 0.42% 28/12/2049 2,510,721 0.01%Japan Government Bond ¥211,150,000 2.20% 20/9/2039 2,505,610 0.01%Japan Government Bond ¥200,150,000 2.40% 20/9/2038 2,419,756 0.01%Japan Government Bond ¥250,000,000 0.40% 20/9/2025 2,302,368 0.01%Major Joint Local Government Bond ¥250,000,000 0.45% 25/2/2025 2,288,643 0.01%Major Joint Local Government Bond ¥250,000,000 0.46% 25/12/2024 2,287,682 0.01%Japan Bank for International Cooperation $2,200,000 2.00% 17/10/2029 2,277,236 0.01%Nissan Motor Co., Ltd. €1,673,000 3.20% 17/9/2028 2,246,143 0.01%Japan Government Bond ¥209,850,000 2.10% 20/12/2029 2,228,589 0.01%Japan Expressway Holding & Debt Repayment Agency ¥240,000,000 0.32% 30/1/2026 2,194,049 0.01%Japan Government Bond ¥180,000,000 2.30% 20/3/2039 2,156,782 0.01%Sumitomo Mitsui Financial Group, Inc. $2,000,000 3.04% 16/7/2029 2,144,033 0.01%

407
Vanguard Global Bond Index Fund
Principal CouponMaturity
DateFair Value
US Dollars ($)% of Total
Net AssetsJapan Government Bond ¥203,000,000 2.10% 20/3/2029 2,132,323 0.01%Japan Government Bond ¥200,800,000 1.90% 20/9/2030 2,120,728 0.01%Mizuho Bank Ltd. $2,000,000 3.50% 21/3/2023 2,104,380 0.01%Nissan Motor Co., Ltd. €1,620,000 2.65% 17/3/2026 2,094,237 0.01%Japan Government Bond ¥196,050,000 1.70% 20/6/2032 2,073,514 0.01%Japan Government Bond ¥163,850,000 2.20% 20/3/2049 2,063,165 0.01%Japan Bank for International Cooperation $2,000,000 1.75% 23/1/2023 2,044,339 0.01%Japan Government Bond ¥190,000,000 1.80% 20/3/2032 2,022,871 0.01%Japan Expressway Holding & Debt Repayment Agency ¥200,000,000 1.08% 27/4/2035 2,001,416 0.01%Japan Government Bond ¥219,400,000 0.70% 20/12/2022 2,000,156 0.01%Japan Government Bond ¥186,300,000 2.10% 20/3/2030 1,985,174 0.01%Japan Government Bond ¥180,000,000 2.00% 20/12/2030 1,921,863 0.01%Kyushu Electric Power Co., Inc. ¥200,000,000 1.02% 24/5/2024 1,850,365 0.01%Tokyo Metropolitan Government ¥180,000,000 1.29% 20/6/2035 1,846,942 0.01%Japan Finance Organization for Municipalities ¥200,000,000 0.32% 19/1/2026 1,836,714 0.01%Japan Finance Organization for Municipalities ¥200,000,000 0.92% 28/7/2023 1,835,788 0.01%Major Joint Local Government Bond ¥200,000,000 0.55% 25/9/2024 1,833,842 0.01%Japan Expressway Holding & Debt Repayment Agency ¥200,000,000 0.50% 29/11/2024 1,833,779 0.01%Tokyo Metropolitan Government ¥200,000,000 0.76% 20/9/2023 1,832,314 0.01%Japan Government Bond ¥170,000,000 1.40% 20/9/2045 1,824,525 0.01%Major Joint Local Government Bond ¥200,000,000 0.25% 25/2/2027 1,824,022 0.01%NTT Finance Corp. ¥200,000,000 0.38% 20/9/2030 1,821,263 0.01%Major Joint Local Government Bond ¥200,000,000 0.80% 25/10/2022 1,820,965 0.01%Major Joint Local Government Bond ¥200,000,000 0.18% 25/4/2028 1,818,251 0.01%Japan Expressway Holding & Debt Repayment Agency ¥200,000,000 0.14% 30/4/2027 1,815,744 0.01%East Nippon Expressway Co., Ltd. ¥200,000,000 0.22% 31/1/2030 1,807,748 0.01%West Nippon Expressway Co., Ltd. ¥200,000,000 0.09% 20/9/2022 1,803,370 0.01%Nissan Motor Co., Ltd. $1,600,000 4.35% 17/9/2027 1,760,465 0.01%Mitsubishi UFJ Financial Group, Inc. $1,550,000 3.20% 18/7/2029 1,676,969 0.01%Development Bank of Japan, Inc. $1,600,000 1.88% 28/8/2029 1,639,524 0.01%Japan Expressway Holding & Debt Repayment Agency ¥200,000,000 0.30% 30/9/2049 1,612,616 0.01%Japan Government Bond ¥150,000,000 1.80% 20/12/2032 1,609,405 0.01%Nippon Life Insurance Co.^ $1,550,000 3.40% 23/1/2050 1,604,357 0.01%Japan Government Bond ¥150,000,000 2.20% 20/6/2029 1,592,285 0.01%Mitsubishi UFJ Financial Group, Inc. €1,300,000 0.98% 9/10/2023 1,583,087 0.01%Japan Government Bond ¥150,000,000 1.50% 20/6/2032 1,557,081 0.01%Japan Finance Organization for Municipalities ¥170,000,000 0.31% 28/7/2023 1,541,884 0.01%Mizuho Financial Group, Inc. $1,400,000 3.48% 12/4/2026 1,532,594 0.01%Japan Government Bond ¥144,000,000 1.60% 20/3/2033 1,518,414 0.01%Mitsubishi UFJ Financial Group, Inc.^ $1,500,000 0.85% 15/9/2024 1,507,203 0.01%Japan Government Bond ¥137,000,000 2.10% 20/12/2028 1,433,895 0.01%Mitsubishi UFJ Financial Group, Inc. $1,300,000 2.80% 18/7/2024 1,376,182 0.01%Mizuho Financial Group, Inc. €1,100,000 1.02% 11/10/2023 1,340,293 0.01%Japan Government Bond ¥123,000,000 2.20% 20/3/2030 1,320,359 0.01%Takeda Pharmaceutical Co., Ltd. $1,325,000 2.05% 31/3/2030 1,313,547 0.01%Takeda Pharmaceutical Co., Ltd. $1,300,000 3.18% 9/7/2050 1,311,738 0.01%NTT Finance Corp. €1,100,000 0.34% 3/3/2030 1,300,396 0.01%Japan Government Bond ¥123,450,000 1.60% 20/3/2032 1,290,481 0.01%Japan Government Bond ¥120,000,000 2.00% 20/3/2031 1,284,574 0.01%Japan Government Bond ¥137,900,000 1.40% 20/12/2022 1,270,040 0.01%Sumitomo Life Insurance Co.^ $1,150,000 4.00% 14/9/2077 1,243,915 0.01%Nomura Holdings, Inc. $1,175,000 2.65% 16/1/2025 1,234,080 0.01%Japan Government Bond ¥118,000,000 1.80% 20/6/2030 1,233,178 0.01%Nomura Holdings, Inc. $1,175,000 3.10% 16/1/2030 1,233,082 0.01%JT International Financial Services BV €1,000,000 1.00% 26/11/2029 1,220,727 0.01%Sumitomo Mitsui Banking Corp. €1,000,000 0.55% 6/11/2023 1,209,367 0.01%Sumitomo Mitsui Banking Corp. €1,000,000 0.41% 7/11/2029 1,208,049 0.01%Mizuho Financial Group, Inc. €1,000,000 0.80% 15/4/2030 1,206,659 0.01%Mitsubishi UFJ Financial Group, Inc. €1,000,000 0.34% 19/7/2024 1,202,141 0.01%Development Bank of Japan, Inc. €1,000,000 0.01% 15/10/2024 1,196,722 0.01%Mizuho Financial Group, Inc. €1,000,000 0.12% 6/9/2024 1,193,034 0.01%Japan Government Bond ¥113,850,000 2.20% 20/3/2028 1,183,337 0.01%Japan Government Bond ¥101,000,000 2.40% 20/12/2034 1,175,018 0.01%Sumitomo Mitsui Financial Group, Inc. $1,110,000 2.35% 15/1/2025 1,160,036 0.01%Japan Finance Organization for Municipalities $1,100,000 2.38% 13/2/2025 1,158,111 0.01%Japan Government Bond ¥125,000,000 1.90% 20/9/2022 1,153,951 0.01%Mitsubishi UFJ Financial Group, Inc. $1,125,000 2.62% 18/7/2022 1,151,972 0.01%Sumitomo Mitsui Financial Group, Inc. $1,000,000 3.94% 19/7/2028 1,136,154 0.01%Sumitomo Mitsui Financial Group, Inc. $1,100,000 2.44% 19/10/2021 1,107,356 0.01%Sumitomo Mitsui Trust Bank Ltd. $1,100,000 0.85% 25/3/2024 1,102,386 0.01%Japan Government Bond ¥109,000,000 2.00% 20/3/2027 1,099,853 0.01%

408
Vanguard Global Bond Index Fund
Principal CouponMaturity
DateFair Value
US Dollars ($)% of Total
Net AssetsJapan Bank for International Cooperation $1,000,000 2.75% 16/11/2027 1,086,016 0.01%Mitsubishi UFJ Financial Group, Inc. $1,000,000 3.76% 26/7/2023 1,067,675 0.01%Sumitomo Mitsui Financial Group, Inc. $1,010,000 2.75% 15/1/2030 1,062,050 0.01%Japan Government Bond ¥89,650,000 2.30% 20/12/2036 1,055,561 0.01%Japan Government Bond ¥100,000,000 1.80% 20/9/2030 1,048,086 0.01%Japan Expressway Holding & Debt Repayment Agency ¥100,000,000 1.43% 31/7/2034 1,038,825 0.01%Sumitomo Mitsui Financial Group, Inc. $1,000,000 2.78% 12/7/2022 1,025,389 0.01%Mitsubishi UFJ Financial Group, Inc. $1,000,000 2.67% 25/7/2022 1,025,015 0.01%Japan Bank for International Cooperation $1,000,000 0.38% 15/9/2023 998,000 0.01%NTT Finance Corp. $1,000,000 1.16% 3/4/2026 997,083 0.01%Sumitomo Mitsui Financial Group, Inc. $1,000,000 0.51% 12/1/2024 996,329 0.01%Development Bank of Japan, Inc. ¥100,000,000 2.30% 19/3/2026 995,950 0.01%Mitsubishi UFJ Financial Group, Inc. $950,000 2.53% 13/9/2023 991,630 0.01%Japan Government Bond ¥107,700,000 1.00% 20/3/2023 988,893 0.01%Japan Bank for International Cooperation $1,000,000 0.63% 15/7/2025 988,685 0.01%Toyota Motor Finance Netherlands BV £700,000 1.38% 23/5/2023 984,426 0.01%Takeda Pharmaceutical Co., Ltd. €800,000 1.00% 9/7/2029 980,037 0.01%NTT Finance Corp. €800,000 0.01% 3/3/2025 951,453 0.01%Japan Government Bond ¥100,000,000 1.90% 20/3/2024 950,601 0.01%Japan Expressway Holding & Debt Repayment Agency ¥100,000,000 0.63% 30/9/2038 936,998 0.01%Japan Expressway Holding & Debt Repayment Agency ¥102,000,000 0.38% 26/12/2025 934,744 0.01%Daiichi Sankyo Co., Ltd. ¥100,000,000 0.81% 25/7/2036 921,065 0.00%Japan Government Bond ¥100,000,000 0.50% 20/12/2024 920,624 0.00%Major Joint Local Government Bond ¥100,000,000 0.50% 25/8/2025 919,436 0.00%Tokyo Metropolitan Government ¥100,000,000 0.48% 19/9/2025 918,842 0.00%Japan Government Bond ¥100,000,000 0.40% 20/3/2025 918,813 0.00%Major Joint Local Government Bond ¥100,000,000 0.69% 25/4/2024 918,371 0.00%Japan Expressway Holding & Debt Repayment Agency ¥100,000,000 0.80% 29/9/2023 917,835 0.00%Takeda Pharmaceutical Co., Ltd. €700,000 2.25% 21/11/2026 917,414 0.00%Major Joint Local Government Bond ¥100,000,000 0.81% 25/9/2023 917,235 0.00%Japan Expressway Holding & Debt Repayment Agency ¥100,000,000 0.66% 29/2/2024 917,219 0.00%Major Joint Local Government Bond ¥100,000,000 0.71% 25/12/2023 916,752 0.00%Tokyo Metropolitan Government ¥100,000,000 0.64% 19/3/2024 916,431 0.00%Major Joint Local Government Bond ¥100,000,000 0.51% 25/11/2024 916,217 0.00%Major Joint Local Government Bond ¥100,000,000 0.66% 24/11/2023 915,143 0.00%Japan Expressway Holding & Debt Repayment Agency ¥100,000,000 0.41% 28/2/2025 915,111 0.00%Panasonic Corp. ¥100,000,000 0.47% 18/9/2026 915,109 0.00%Fast Retailing Co., Ltd. ¥100,000,000 0.41% 6/6/2028 914,677 0.00%MUFG Bank Ltd. ¥100,000,000 1.39% 31/5/2022 910,902 0.00%Japan Finance Organization for Municipalities ¥100,000,000 0.54% 21/4/2023 910,007 0.00%Japan Finance Organization for Municipalities ¥100,000,000 0.90% 15/2/2022 906,232 0.00%Panasonic Corp. ¥100,000,000 0.30% 20/9/2023 905,397 0.00%NTT Finance Corp. ¥100,000,000 0.18% 19/12/2025 902,532 0.00%Japan Government Bond ¥69,100,000 2.40% 20/3/2048 896,167 0.00%Takeda Pharmaceutical Co., Ltd. €700,000 2.00% 9/7/2040 893,532 0.00%Asahi Group Holdings Ltd. €712,000 1.15% 19/9/2025 884,580 0.00%Toyota Motor Corp. $875,000 3.18% 20/7/2021 876,302 0.00%Japan Bank for International Cooperation $800,000 2.88% 21/7/2027 872,889 0.00%Takeda Pharmaceutical Co., Ltd. $850,000 3.38% 9/7/2060 871,720 0.00%Japan Government Bond ¥75,650,000 2.90% 20/11/2030 864,620 0.00%Sumitomo Mitsui Financial Group, Inc. $800,000 2.45% 27/9/2024 839,475 0.00%Japan Bank for International Cooperation $800,000 2.13% 10/2/2025 837,318 0.00%Nissan Motor Co., Ltd. $800,000 3.04% 15/9/2023 834,408 0.00%Kyushu Electric Power Co., Inc. ¥90,000,000 1.06% 23/2/2024 831,764 0.00%Kansai Electric Power Co., Inc. ¥90,000,000 0.49% 23/7/2027 825,764 0.00%Japan Bank for International Cooperation $800,000 0.63% 22/5/2023 804,010 0.00%Japan Bank for International Cooperation $750,000 3.38% 31/10/2023 799,959 0.00%Mitsubishi UFJ Financial Group, Inc. $700,000 3.96% 2/3/2028 795,399 0.00%Mizuho Financial Group, Inc. $750,000 2.60% 11/9/2022 769,846 0.00%Sumitomo Mitsui Financial Group, Inc. $750,000 1.47% 8/7/2025 758,629 0.00%Dai-ichi Life Insurance Co., Ltd.^ $700,000 4.00% Perpetual 758,388 0.00%Sumitomo Mitsui Financial Group, Inc. $700,000 3.94% 16/10/2023 755,106 0.00%JT International Financial Services BV £500,000 2.75% 28/9/2033 748,983 0.00%Japan Government Bond ¥78,900,000 1.80% 20/12/2023 744,630 0.00%ORIX Corp. $725,000 2.90% 18/7/2022 743,689 0.00%Development Bank of Japan, Inc. $750,000 0.50% 27/8/2025 736,314 0.00%Mizuho Financial Group, Inc. €600,000 0.96% 16/10/2024 735,304 0.00%Takeda Pharmaceutical Co., Ltd. €600,000 1.13% 21/11/2022 724,898 0.00%Takeda Pharmaceutical Co., Ltd. $600,000 5.00% 26/11/2028 722,669 0.00%Japan Government Bond ¥74,000,000 2.40% 20/6/2024 716,827 0.00%Sumitomo Mitsui Financial Group, Inc. €560,000 0.93% 11/10/2024 686,472 0.00%

409
Vanguard Global Bond Index Fund
Principal CouponMaturity
DateFair Value
US Dollars ($)% of Total
Net AssetsNippon Life Insurance Co.^ $700,000 2.75% 21/1/2051 686,227 0.00%Japan Bank for International Cooperation $600,000 3.50% 31/10/2028 685,086 0.00%Japan Bank for International Cooperation $660,000 2.38% 16/11/2022 678,652 0.00%Japan Government Bond ¥68,000,000 2.10% 20/9/2025 670,188 0.00%Central Japan Railway Co. $550,000 4.25% 24/11/2045 663,261 0.00%Mizuho Financial Group, Inc.^ $600,000 3.15% 16/7/2030 646,423 0.00%Japan Expressway Holding & Debt Repayment Agency ¥70,000,000 0.45% 31/3/2025 641,783 0.00%Nissan Motor Co., Ltd. $600,000 3.52% 17/9/2025 640,367 0.00%JT International Financial Services BV^ €500,000 2.38% 7/4/2081 623,445 0.00%Japan Government Bond ¥58,100,000 2.30% 20/6/2027 598,487 0.00%Development Bank of Japan, Inc. $600,000 0.50% 4/3/2024 598,482 0.00%Mitsubishi UFJ Financial Group, Inc. $550,000 3.41% 7/3/2024 589,146 0.00%Mizuho Financial Group, Inc. $550,000 2.84% 13/9/2026 588,916 0.00%Mizuho Financial Group, Inc.^ $500,000 4.25% 11/9/2029 576,128 0.00%Mizuho Financial Group, Inc. $500,000 4.02% 5/3/2028 570,280 0.00%Japan Government Bond ¥58,000,000 2.10% 20/6/2025 568,785 0.00%Nissan Motor Co., Ltd. €459,000 1.94% 15/9/2023 566,993 0.00%East Japan Railway Co. £300,000 4.50% 25/1/2036 558,268 0.00%Nippon Life Insurance Co.^ $500,000 4.70% 20/1/2046 556,140 0.00%Sumitomo Mitsui Financial Group, Inc. $500,000 3.36% 12/7/2027 546,642 0.00%Mizuho Financial Group Cayman 3 Ltd. $500,000 4.60% 27/3/2024 544,863 0.00%Nippon Life Insurance Co.^ $500,000 4.00% 19/9/2047 542,539 0.00%Sumitomo Mitsui Financial Group, Inc. $500,000 3.01% 19/10/2026 539,635 0.00%Japan Bank for International Cooperation $500,000 3.00% 29/5/2024 534,352 0.00%Sumitomo Mitsui Financial Group, Inc. $500,000 3.75% 19/7/2023 533,410 0.00%Japan Expressway Holding & Debt Repayment Agency ¥50,000,000 2.37% 20/9/2028 524,050 0.00%Sumitomo Mitsui Financial Group, Inc. $500,000 3.10% 17/1/2023 521,047 0.00%JT International Financial Services BV^ €400,000 2.88% 7/10/2083 517,131 0.00%Japan Expressway Holding & Debt Repayment Agency ¥56,000,000 0.75% 31/1/2024 514,508 0.00%Japan Government Bond ¥49,000,000 2.20% 20/9/2028 514,016 0.00%Meiji Yasuda Life Insurance Co.^ $450,000 5.20% 20/10/2045 508,172 0.00%Japan Government Bond ¥50,000,000 2.30% 20/9/2026 506,992 0.00%Japan Bank for International Cooperation $450,000 3.25% 20/7/2028 504,901 0.00%Mitsubishi UFJ Financial Group, Inc. $500,000 2.05% 17/7/2030 498,821 0.00%American Honda Finance Corp. €400,000 0.75% 17/1/2024 484,950 0.00%Japan Bank for International Cooperation $500,000 1.25% 21/1/2031 482,037 0.00%Asahi Group Holdings Ltd. €400,000 0.34% 19/4/2027 476,415 0.00%Development Bank of Japan, Inc. £340,000 1.13% 28/4/2023 476,156 0.00%Mizuho Financial Group, Inc.^ $450,000 2.84% 16/7/2025 474,951 0.00%Japan International Cooperation Agency $500,000 1.00% 22/7/2030 473,523 0.00%Mizuho Financial Group, Inc.^ $450,000 2.72% 16/7/2023 460,710 0.00%Japan Finance Organization for Municipalities ¥50,000,000 0.69% 28/6/2024 459,601 0.00%Marubeni Corp. $425,000 3.56% 26/4/2024 453,538 0.00%West Nippon Expressway Co., Ltd. ¥50,000,000 0.17% 22/5/2026 452,694 0.00%Japan Government Bond ¥44,000,000 2.10% 20/9/2027 450,526 0.00%Mitsubishi UFJ Financial Group, Inc. $400,000 3.74% 7/3/2029 450,291 0.00%NTT Finance Corp. $450,000 0.58% 1/3/2024 449,175 0.00%Japan Government Bond ¥38,650,000 2.30% 20/3/2035 446,219 0.00%Japan Bank for International Cooperation $400,000 2.88% 1/6/2027 436,179 0.00%NTT Finance Corp. $425,000 2.07% 3/4/2031 430,901 0.00%Asahi Group Holdings Ltd. €359,000 0.16% 23/10/2024 428,589 0.00%Mitsubishi HC Capital, Inc. $400,000 3.96% 19/9/2023 426,379 0.00%Mitsubishi UFJ Financial Group, Inc. $350,000 4.29% 26/7/2038 425,255 0.00%NTT Finance Corp. $425,000 0.37% 3/3/2023 424,886 0.00%Toyota Motor Corp. $400,000 3.42% 20/7/2023 424,627 0.00%NTT Finance Corp. $425,000 1.59% 3/4/2028 423,653 0.00%Development Bank of Japan, Inc. $400,000 1.75% 28/8/2024 413,116 0.00%Toyota Motor Corp. $400,000 2.16% 2/7/2022 407,685 0.00%Japan Bank for International Cooperation $400,000 1.63% 17/10/2022 406,843 0.00%ORIX Corp. $400,000 2.25% 9/3/2031 403,266 0.00%Development Bank of Japan, Inc. $400,000 1.25% 28/1/2031 385,449 0.00%Japan Government Bond ¥38,800,000 1.90% 20/3/2025 375,964 0.00%Japan Government Bond ¥36,000,000 2.10% 20/6/2028 373,652 0.00%Panasonic Corp. $355,000 2.68% 19/7/2024 373,190 0.00%Toyota Motor Corp. $325,000 3.67% 20/7/2028 368,656 0.00%Mitsubishi UFJ Financial Group, Inc. $325,000 3.29% 25/7/2027 357,789 0.00%Japan Government Bond ¥30,450,000 2.50% 20/6/2034 355,656 0.00%Sumitomo Mitsui Financial Group, Inc. $300,000 4.31% 16/10/2028 348,047 0.00%Mitsubishi UFJ Financial Group, Inc. $300,000 3.75% 18/7/2039 341,589 0.00%Mitsubishi UFJ Financial Group, Inc. $320,000 3.46% 2/3/2023 336,156 0.00%Mitsubishi UFJ Financial Group, Inc. $300,000 3.85% 1/3/2026 335,300 0.00%

410
Vanguard Global Bond Index Fund
Principal CouponMaturity
DateFair Value
US Dollars ($)% of Total
Net AssetsORIX Corp. $300,000 3.70% 18/7/2027 335,028 0.00%Mitsubishi UFJ Financial Group, Inc. $325,000 1.41% 17/7/2025 328,497 0.00%Japan Government Bond ¥32,000,000 2.10% 20/3/2027 324,546 0.00%Mitsubishi UFJ Financial Group, Inc. $300,000 2.76% 13/9/2026 319,165 0.00%Sumitomo Mitsui Financial Group, Inc. $300,000 2.63% 14/7/2026 318,644 0.00%Panasonic Corp. $310,000 2.54% 19/7/2022 316,040 0.00%Japan Bank for International Cooperation $300,000 1.75% 17/10/2024 310,055 0.00%Toyota Motor Corp. $300,000 1.34% 25/3/2026 303,498 0.00%Toyota Motor Corp. $300,000 0.68% 25/3/2024 300,449 0.00%Sumitomo Mitsui Financial Group, Inc. $300,000 1.71% 12/1/2031 291,572 0.00%Mitsubishi UFJ Financial Group, Inc. $250,000 4.05% 11/9/2028 287,393 0.00%Development Bank of Japan, Inc. $250,000 3.25% 6/9/2028 280,449 0.00%Panasonic Corp. $260,000 3.11% 19/7/2029 278,901 0.00%Sumitomo Mitsui Financial Group, Inc. $250,000 3.54% 17/1/2028 276,696 0.00%Dai-ichi Life Insurance Co., Ltd.^ $250,000 5.10% Perpetual 276,241 0.00%Sumitomo Mitsui Banking Corp. $250,000 3.65% 23/7/2025 274,965 0.00%Mitsubishi UFJ Financial Group, Inc. $250,000 3.78% 2/3/2025 274,475 0.00%Japan Government Bond ¥25,150,000 2.20% 20/5/2031 274,345 0.00%Major Joint Local Government Bond ¥30,000,000 0.21% 25/3/2027 273,106 0.00%Sumitomo Mitsui Banking Corp. $250,000 3.40% 11/7/2024 269,317 0.00%Mizuho Financial Group, Inc.^ $250,000 3.92% 11/9/2024 267,737 0.00%Development Bank of Japan, Inc. $250,000 2.88% 19/9/2024 266,911 0.00%MUFG Bank Ltd. $200,000 4.70% 10/3/2044 261,245 0.00%Sumitomo Mitsui Banking Corp. $250,000 3.00% 18/1/2023 260,020 0.00%Takeda Pharmaceutical Co., Ltd. $250,000 3.03% 9/7/2040 252,643 0.00%Japan Government Bond ¥26,900,000 1.80% 20/6/2023 251,508 0.00%Japan Government Bond ¥24,000,000 2.20% 20/9/2027 247,143 0.00%Mitsubishi UFJ Financial Group, Inc. €200,000 0.98% 9/6/2024 244,971 0.00%Sumitomo Mitsui Financial Group, Inc. $225,000 3.20% 17/9/2029 239,581 0.00%Asahi Group Holdings Ltd. €200,000 0.54% 23/10/2028 239,058 0.00%Japan Government Bond ¥20,000,000 2.50% 20/3/2036 238,691 0.00%Nidec Corp. €200,000 0.05% 30/3/2026 237,161 0.00%Mitsubishi UFJ Financial Group, Inc. $200,000 3.68% 22/2/2027 223,413 0.00%Mitsui Fudosan Co., Ltd. $200,000 3.95% 24/1/2029 223,105 0.00%Sumitomo Mitsui Financial Group, Inc. $200,000 3.78% 9/3/2026 222,605 0.00%MUFG Bank Ltd. $200,000 4.10% 9/9/2023 215,765 0.00%SMBC Aviation Capital Finance DAC $200,000 3.55% 15/4/2024 212,733 0.00%Japan Bank for International Cooperation $200,000 2.50% 28/5/2025 212,445 0.00%Mitsubishi HC Capital, Inc. $200,000 3.56% 28/2/2024 212,345 0.00%Development Bank of Japan, Inc. $200,000 3.13% 6/9/2023 211,395 0.00%Japan Bank for International Cooperation $200,000 2.50% 23/5/2024 210,832 0.00%Nippon Life Insurance Co.^ $200,000 5.00% 18/10/2042 209,124 0.00%Osaka Prefecture ¥20,000,000 1.45% 26/9/2034 208,013 0.00%Mizuho Financial Group Cayman 2 Ltd. $200,000 4.20% 18/7/2022 207,414 0.00%Japan Government Bond ¥21,000,000 2.00% 20/12/2025 207,099 0.00%Mitsui Fudosan Co., Ltd. $200,000 2.95% 23/1/2023 206,741 0.00%Sumitomo Mitsui Financial Group, Inc. $200,000 2.78% 18/10/2022 206,120 0.00%Japan Bank for International Cooperation $200,000 2.50% 1/6/2022 204,112 0.00%Japan International Cooperation Agency $200,000 1.75% 28/4/2031 201,222 0.00%Japan Bank for International Cooperation $200,000 0.50% 15/4/2024 199,555 0.00%Sumitomo Mitsui Financial Group, Inc. $200,000 0.95% 12/1/2026 197,540 0.00%Tokyo Metropolitan Government ¥20,000,000 0.44% 19/12/2025 183,716 0.00%Japan Government Bond ¥18,000,000 2.10% 20/6/2027 183,452 0.00%Mitsubishi UFJ Financial Group, Inc. $150,000 4.15% 7/3/2039 179,600 0.00%Tokyo Metropolitan Government ¥19,500,000 0.08% 18/9/2026 176,228 0.00%Major Joint Local Government Bond ¥18,900,000 0.51% 25/9/2025 173,908 0.00%Toyota Motor Corp. $155,000 2.36% 2/7/2024 163,023 0.00%Japan Bank for International Cooperation $150,000 3.25% 20/7/2023 158,507 0.00%Mizuho Financial Group, Inc.^ $150,000 2.87% 13/9/2030 157,523 0.00%Mizuho Financial Group, Inc.^ $150,000 2.56% 13/9/2025 156,992 0.00%Japan Government Bond ¥16,000,000 2.10% 20/12/2024 155,302 0.00%Japan Bank for International Cooperation $150,000 3.13% 20/7/2021 150,220 0.00%Japan Finance Organization for Municipalities ¥16,300,000 0.67% 17/3/2023 148,573 0.00%Japan Government Bond ¥14,000,000 2.10% 20/3/2026 139,267 0.00%Japan Government Bond ¥11,000,000 2.50% 20/9/2036 132,101 0.00%Japan Government Bond ¥12,000,000 2.30% 20/3/2026 120,389 0.00%Toyota Finance Australia Ltd. €100,000 0.50% 6/4/2023 120,263 0.00%Japan Government Bond ¥10,000,000 2.30% 20/12/2035 116,414 0.00%Japan Government Bond ¥10,000,000 2.30% 20/6/2035 115,867 0.00%Japan Government Bond ¥12,000,000 2.20% 20/6/2024 115,601 0.00%Japan Government Bond ¥12,000,000 1.90% 20/9/2023 112,961 0.00%
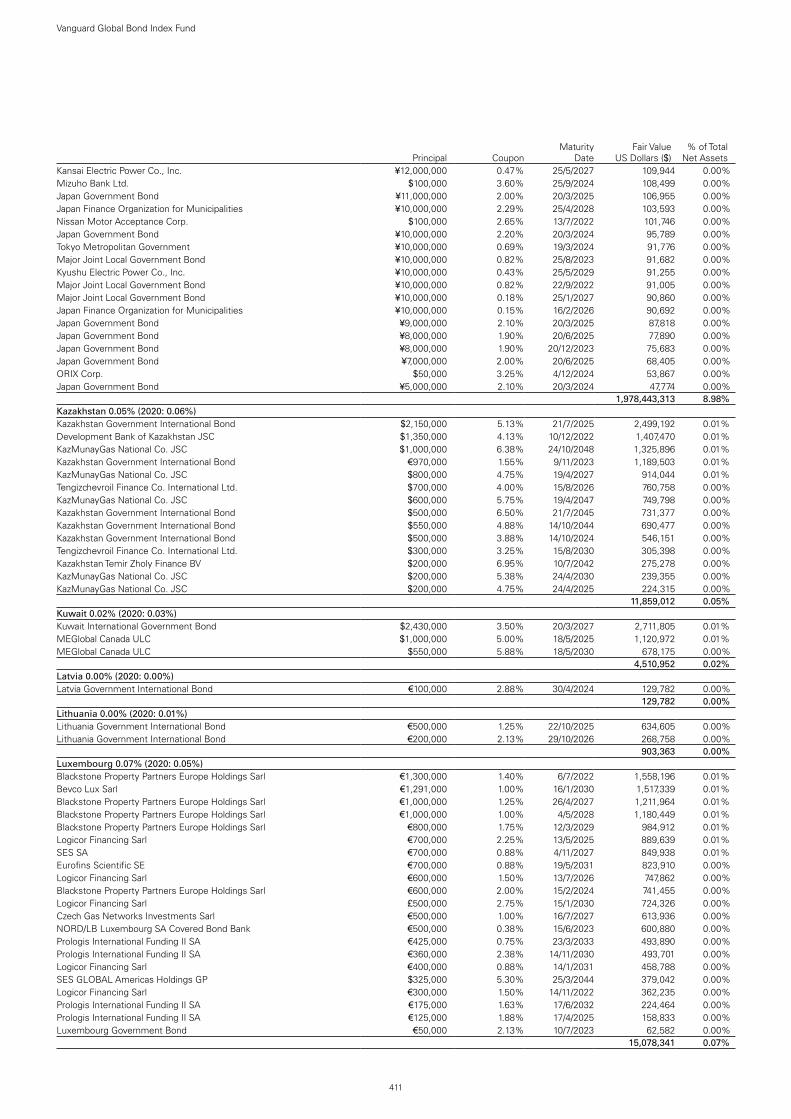
411
Vanguard Global Bond Index Fund
Principal CouponMaturity
DateFair Value
US Dollars ($)% of Total
Net AssetsKansai Electric Power Co., Inc. ¥12,000,000 0.47% 25/5/2027 109,944 0.00%Mizuho Bank Ltd. $100,000 3.60% 25/9/2024 108,499 0.00%Japan Government Bond ¥11,000,000 2.00% 20/3/2025 106,955 0.00%Japan Finance Organization for Municipalities ¥10,000,000 2.29% 25/4/2028 103,593 0.00%Nissan Motor Acceptance Corp. $100,000 2.65% 13/7/2022 101,746 0.00%Japan Government Bond ¥10,000,000 2.20% 20/3/2024 95,789 0.00%Tokyo Metropolitan Government ¥10,000,000 0.69% 19/3/2024 91,776 0.00%Major Joint Local Government Bond ¥10,000,000 0.82% 25/8/2023 91,682 0.00%Kyushu Electric Power Co., Inc. ¥10,000,000 0.43% 25/5/2029 91,255 0.00%Major Joint Local Government Bond ¥10,000,000 0.82% 22/9/2022 91,005 0.00%Major Joint Local Government Bond ¥10,000,000 0.18% 25/1/2027 90,860 0.00%Japan Finance Organization for Municipalities ¥10,000,000 0.15% 16/2/2026 90,692 0.00%Japan Government Bond ¥9,000,000 2.10% 20/3/2025 87,818 0.00%Japan Government Bond ¥8,000,000 1.90% 20/6/2025 77,890 0.00%Japan Government Bond ¥8,000,000 1.90% 20/12/2023 75,683 0.00%Japan Government Bond ¥7,000,000 2.00% 20/6/2025 68,405 0.00%ORIX Corp. $50,000 3.25% 4/12/2024 53,867 0.00%Japan Government Bond ¥5,000,000 2.10% 20/3/2024 47,774 0.00%test - - - 1,978,443,313 8.98%Kazakhstan 0.05% (2020: 0.06%)Kazakhstan Government International Bond $2,150,000 5.13% 21/7/2025 2,499,192 0.01%Development Bank of Kazakhstan JSC $1,350,000 4.13% 10/12/2022 1,407,470 0.01%KazMunayGas National Co. JSC $1,000,000 6.38% 24/10/2048 1,325,896 0.01%Kazakhstan Government International Bond €970,000 1.55% 9/11/2023 1,189,503 0.01%KazMunayGas National Co. JSC $800,000 4.75% 19/4/2027 914,044 0.01%Tengizchevroil Finance Co. International Ltd. $700,000 4.00% 15/8/2026 760,758 0.00%KazMunayGas National Co. JSC $600,000 5.75% 19/4/2047 749,798 0.00%Kazakhstan Government International Bond $500,000 6.50% 21/7/2045 731,377 0.00%Kazakhstan Government International Bond $550,000 4.88% 14/10/2044 690,477 0.00%Kazakhstan Government International Bond $500,000 3.88% 14/10/2024 546,151 0.00%Tengizchevroil Finance Co. International Ltd. $300,000 3.25% 15/8/2030 305,398 0.00%Kazakhstan Temir Zholy Finance BV $200,000 6.95% 10/7/2042 275,278 0.00%KazMunayGas National Co. JSC $200,000 5.38% 24/4/2030 239,355 0.00%KazMunayGas National Co. JSC $200,000 4.75% 24/4/2025 224,315 0.00%test - - - 11,859,012 0.05%Kuwait 0.02% (2020: 0.03%)Kuwait International Government Bond $2,430,000 3.50% 20/3/2027 2,711,805 0.01%MEGlobal Canada ULC $1,000,000 5.00% 18/5/2025 1,120,972 0.01%MEGlobal Canada ULC $550,000 5.88% 18/5/2030 678,175 0.00%test - - - 4,510,952 0.02%Latvia 0.00% (2020: 0.00%)Latvia Government International Bond €100,000 2.88% 30/4/2024 129,782 0.00%test - - - 129,782 0.00%Lithuania 0.00% (2020: 0.01%)Lithuania Government International Bond €500,000 1.25% 22/10/2025 634,605 0.00%Lithuania Government International Bond €200,000 2.13% 29/10/2026 268,758 0.00%test - - - 903,363 0.00%Luxembourg 0.07% (2020: 0.05%)Blackstone Property Partners Europe Holdings Sarl €1,300,000 1.40% 6/7/2022 1,558,196 0.01%Bevco Lux Sarl €1,291,000 1.00% 16/1/2030 1,517,339 0.01%Blackstone Property Partners Europe Holdings Sarl €1,000,000 1.25% 26/4/2027 1,211,964 0.01%Blackstone Property Partners Europe Holdings Sarl €1,000,000 1.00% 4/5/2028 1,180,449 0.01%Blackstone Property Partners Europe Holdings Sarl €800,000 1.75% 12/3/2029 984,912 0.01%Logicor Financing Sarl €700,000 2.25% 13/5/2025 889,639 0.01%SES SA €700,000 0.88% 4/11/2027 849,938 0.01%Eurofins Scientific SE €700,000 0.88% 19/5/2031 823,910 0.00%Logicor Financing Sarl €600,000 1.50% 13/7/2026 747,862 0.00%Blackstone Property Partners Europe Holdings Sarl €600,000 2.00% 15/2/2024 741,455 0.00%Logicor Financing Sarl £500,000 2.75% 15/1/2030 724,326 0.00%Czech Gas Networks Investments Sarl €500,000 1.00% 16/7/2027 613,936 0.00%NORD/LB Luxembourg SA Covered Bond Bank €500,000 0.38% 15/6/2023 600,880 0.00%Prologis International Funding II SA €425,000 0.75% 23/3/2033 493,890 0.00%Prologis International Funding II SA €360,000 2.38% 14/11/2030 493,701 0.00%Logicor Financing Sarl €400,000 0.88% 14/1/2031 458,788 0.00%SES GLOBAL Americas Holdings GP $325,000 5.30% 25/3/2044 379,042 0.00%Logicor Financing Sarl €300,000 1.50% 14/11/2022 362,235 0.00%Prologis International Funding II SA €175,000 1.63% 17/6/2032 224,464 0.00%Prologis International Funding II SA €125,000 1.88% 17/4/2025 158,833 0.00%Luxembourg Government Bond €50,000 2.13% 10/7/2023 62,582 0.00%test - - - 15,078,341 0.07%

412
Vanguard Global Bond Index Fund
Principal CouponMaturity
DateFair Value
US Dollars ($)% of Total
Net AssetsMacau 0.01% (2020: 0.01%)Sands China Ltd. $800,000 5.40% 8/8/2028 929,704 0.01%Sands China Ltd. $700,000 4.38% 18/6/2030 759,529 0.00%Sands China Ltd. $575,000 5.13% 8/8/2025 643,722 0.00%Sands China Ltd. $400,000 4.60% 8/8/2023 424,759 0.00%test - - - 2,757,714 0.01%Malaysia 0.41% (2020: 0.38%)Malaysia Government Bond RM37,500,000 3.91% 15/7/2026 9,537,729 0.04%Malaysia Government Bond RM37,000,000 3.88% 14/3/2025 9,345,264 0.04%Malaysia Government Bond RM27,500,000 3.89% 15/8/2029 6,954,718 0.03%Malaysia Government Bond RM26,800,000 3.76% 20/4/2023 6,661,731 0.03%Malaysia Government Bond RM14,568,000 4.89% 8/6/2038 3,808,536 0.02%Malaysia Government Bond RM14,000,000 3.90% 16/11/2027 3,559,012 0.02%Malaysia Government Bond RM14,500,000 3.84% 15/4/2033 3,510,842 0.02%Malaysia Government Bond RM13,500,000 4.23% 30/6/2031 3,488,625 0.02%Malaysia Government Bond RM15,300,000 3.76% 22/5/2040 3,476,374 0.02%Malaysia Government Bond RM11,116,000 4.64% 7/11/2033 2,892,165 0.01%Malaysia Government Bond RM11,000,000 3.83% 5/7/2034 2,640,498 0.01%Malaysia Government Bond RM10,000,000 4.76% 7/4/2037 2,594,277 0.01%Malaysia Government Bond RM10,000,000 3.80% 17/8/2023 2,498,664 0.01%Malaysia Government Bond RM10,000,000 3.48% 15/3/2023 2,470,789 0.01%Petronas Capital Ltd. $2,150,000 3.50% 21/4/2030 2,351,647 0.01%Malaysia Government Bond RM10,000,000 2.63% 15/4/2031 2,277,980 0.01%Malaysia Government Bond RM8,640,000 4.92% 6/7/2048 2,232,194 0.01%Malaysia Government Bond RM8,500,000 3.96% 15/9/2025 2,161,841 0.01%Malaysia Government Bond RM7,500,000 3.90% 30/11/2026 1,922,607 0.01%Petronas Capital Ltd. $1,500,000 4.55% 21/4/2050 1,847,893 0.01%Malaysia Government Bond RM5,500,000 3.42% 15/8/2022 1,348,635 0.01%Malaysia Government Bond RM5,000,000 3.73% 15/6/2028 1,258,854 0.01%Malaysia Government Bond RM4,500,000 4.18% 15/7/2024 1,142,134 0.01%Malaysia Government Bond RM4,500,000 4.07% 15/6/2050 1,043,574 0.01%Malaysia Government Bond RM4,000,000 4.74% 15/3/2046 1,011,800 0.01%Petronas Capital Ltd. $1,000,000 2.48% 28/1/2032 1,005,316 0.01%Malaysia Sovereign Sukuk Bhd $700,000 4.24% 22/4/2045 893,869 0.00%Petronas Capital Ltd. $800,000 3.50% 18/3/2025 866,377 0.00%Malaysia Government Bond RM3,000,000 4.50% 15/4/2030 790,016 0.00%Petronas Capital Ltd. $600,000 4.50% 18/3/2045 734,140 0.00%Petronas Capital Ltd. $500,000 4.80% 21/4/2060 661,169 0.00%TNB Global Ventures Capital Bhd $600,000 3.24% 19/10/2026 641,445 0.00%Gohl Capital Ltd. $500,000 4.25% 24/1/2027 525,787 0.00%Malaysia Wakala Sukuk Bhd $500,000 2.07% 28/4/2031 504,964 0.00%Malaysia Sovereign Sukuk Bhd $450,000 3.04% 22/4/2025 482,075 0.00%Malaysia Government Bond RM1,604,000 4.94% 30/9/2043 417,927 0.00%Malayan Banking Bhd^ $400,000 3.91% 29/10/2026 403,468 0.00%Genm Capital Labuan Ltd. $400,000 3.88% 19/4/2031 399,994 0.00%Malaysia Government Bond RM1,000,000 5.25% 15/9/2028 274,353 0.00%Malaysia Sukuk Global Bhd $250,000 3.18% 27/4/2026 272,689 0.00%Petroliam Nasional Bhd $150,000 7.63% 15/10/2026 195,842 0.00%SSG Resources Ltd. $100,000 4.25% 4/10/2022 103,322 0.00%test - - - 91,211,136 0.41%Mexico 0.55% (2020: 0.56%)Mexican Bonos MXN150,000,000 5.75% 5/3/2026 7,339,870 0.03%Mexican Bonos MXN107,500,000 7.75% 29/5/2031 5,692,230 0.03%Mexican Bonos MXN107,500,000 7.50% 3/6/2027 5,632,600 0.03%Mexican Bonos MXN97,500,000 8.00% 5/9/2024 5,157,557 0.02%Mexican Bonos MXN90,000,000 8.50% 31/5/2029 4,975,001 0.02%Mexican Bonos MXN87,200,000 8.50% 18/11/2038 4,818,745 0.02%Mexican Bonos MXN90,000,000 8.00% 7/11/2047 4,752,116 0.02%Mexican Bonos MXN82,500,000 7.75% 13/11/2042 4,248,851 0.02%Mexican Bonos MXN73,500,000 10.00% 5/12/2024 4,126,754 0.02%Mexican Bonos MXN75,000,000 8.00% 7/12/2023 3,950,249 0.02%Mexican Bonos MXN52,500,000 10.00% 20/11/2036 3,308,896 0.02%Mexico Government International Bond $2,800,000 3.25% 16/4/2030 2,894,150 0.01%Mexico Government International Bond $2,700,000 4.28% 14/8/2041 2,837,502 0.01%Mexico Government International Bond $2,250,000 4.75% 8/3/2044 2,487,434 0.01%Mexico Government International Bond $1,900,000 4.15% 28/3/2027 2,149,178 0.01%Mexico Government International Bond $1,850,000 4.50% 22/4/2029 2,093,426 0.01%Mexico Government International Bond €1,610,000 1.45% 25/10/2033 1,823,381 0.01%Mexico Government International Bond $1,500,000 5.55% 21/1/2045 1,813,384 0.01%Mexico Government International Bond €1,743,000 2.13% 25/10/2051 1,744,115 0.01%Mexican Bonos MXN29,000,000 7.75% 23/11/2034 1,535,473 0.01%

413
Vanguard Global Bond Index Fund
Principal CouponMaturity
DateFair Value
US Dollars ($)% of Total
Net AssetsMexican Bonos MXN30,000,000 6.75% 9/3/2023 1,535,452 0.01%Mexico Government International Bond $1,300,000 5.00% 27/4/2051 1,479,791 0.01%Fomento Economico Mexicano SAB de CV $1,350,000 3.50% 16/1/2050 1,421,073 0.01%Mexico Government International Bond $1,100,000 5.75% 12/10/2110 1,312,572 0.01%Mexico Government International Bond $1,200,000 3.75% 11/1/2028 1,310,352 0.01%Banco Nacional de Comercio Exterior SNC $1,150,000 4.38% 14/10/2025 1,271,582 0.01%America Movil SAB de CV $875,000 6.13% 30/3/2040 1,240,371 0.01%Southern Copper Corp. $875,000 5.88% 23/4/2045 1,223,044 0.01%Mexico Government International Bond $1,000,000 4.75% 27/4/2032 1,144,924 0.01%Mexico Government International Bond €895,000 2.88% 8/4/2039 1,104,594 0.01%Mexico Government International Bond $1,000,000 4.60% 10/2/2048 1,074,664 0.01%Mexico Government International Bond $976,000 3.60% 30/1/2025 1,071,349 0.01%Mexico City Airport Trust $1,000,000 5.50% 31/7/2047 1,009,501 0.01%Mexico Government International Bond $775,000 6.05% 11/1/2040 972,796 0.01%Grupo Televisa SAB $800,000 5.00% 13/5/2045 953,737 0.01%Mexico Government International Bond $900,000 4.35% 15/1/2047 940,473 0.01%Mexico Government International Bond $1,000,000 3.77% 24/5/2061 931,815 0.01%Mexico Government International Bond €790,000 1.13% 17/1/2030 920,240 0.01%Mexico Government International Bond $1,000,000 3.75% 19/4/2071 915,741 0.01%America Movil SAB de CV $700,000 4.38% 22/4/2049 864,809 0.01%Grupo Bimbo SAB de CV $725,000 4.70% 10/11/2047 850,464 0.01%BBVA Bancomer SA $750,000 4.38% 10/4/2024 814,925 0.00%Mexico City Airport Trust $748,000 4.25% 31/10/2026 811,068 0.00%Mexico Government International Bond $740,000 4.60% 23/1/2046 796,432 0.00%Comision Federal de Electricidad $800,000 3.35% 9/2/2031 793,754 0.00%Comision Federal de Electricidad $800,000 4.68% 9/2/2051 772,592 0.00%Grupo Bimbo SAB de CV $700,000 3.88% 27/6/2024 756,597 0.00%Mexico Government International Bond €600,000 3.00% 6/3/2045 748,398 0.00%Industrias Penoles SAB de CV $600,000 5.65% 12/9/2049 719,834 0.00%Comision Federal de Electricidad $600,000 4.75% 23/2/2027 672,018 0.00%Mexico Government International Bond $600,000 3.90% 27/4/2025 665,186 0.00%Trust Fibra Uno $600,000 4.87% 15/1/2030 659,846 0.00%Alfa SAB de CV $600,000 5.25% 25/3/2024 654,009 0.00%Industrias Penoles SAB de CV $600,000 4.75% 6/8/2050 648,562 0.00%Southern Copper Corp. $500,000 5.25% 8/11/2042 639,056 0.00%Grupo Televisa SAB $500,000 5.25% 24/5/2049 628,150 0.00%Coca-Cola Femsa SAB de CV $600,000 2.75% 22/1/2030 627,203 0.00%Alpek SAB de CV $600,000 3.25% 25/2/2031 606,849 0.00%America Movil SAB de CV €500,000 0.75% 26/6/2027 605,217 0.00%America Movil SAB de CV $500,000 2.88% 7/5/2030 527,029 0.00%Southern Copper Corp. $350,000 7.50% 27/7/2035 507,865 0.00%America Movil SAB de CV $350,000 6.38% 1/3/2035 501,249 0.00%Mexico Government International Bond $500,000 2.66% 24/5/2031 488,901 0.00%Coca-Cola Femsa SAB de CV $500,000 1.85% 1/9/2032 482,280 0.00%Trust Fibra Uno $400,000 6.39% 15/1/2050 467,071 0.00%America Movil SAB de CV £250,000 4.38% 7/8/2041 446,557 0.00%Mexico Government International Bond $400,000 4.50% 31/1/2050 425,641 0.00%America Movil SAB de CV $400,000 3.13% 16/7/2022 410,880 0.00%Infraestructura Energetica Nova SAB de CV $400,000 4.75% 15/1/2051 405,981 0.00%BBVA Bancomer SA $350,000 4.38% 10/4/2024 380,298 0.00%Orbia Advance Corp. SAB de CV $300,000 5.88% 17/9/2044 362,797 0.00%Orbia Advance Corp. SAB de CV $300,000 5.50% 15/1/2048 352,121 0.00%Infraestructura Energetica Nova SAB de CV $325,000 3.75% 14/1/2028 350,817 0.00%Trust Fibra Uno $300,000 5.25% 30/1/2026 337,641 0.00%Infraestructura Energetica Nova SAB de CV $325,000 4.88% 14/1/2048 333,250 0.00%America Movil SAB de CV $300,000 3.63% 22/4/2029 331,195 0.00%America Movil SAB de CV $275,000 4.38% 16/7/2042 331,193 0.00%Grupo Bimbo SAB de CV $300,000 4.00% 6/9/2049 321,282 0.00%Mexico Government International Bond £200,000 5.63% 19/3/2114 301,938 0.00%Orbia Advance Corp. SAB de CV $200,000 6.75% 19/9/2042 261,568 0.00%America Movil SAB de CV €200,000 1.50% 10/3/2024 246,890 0.00%Comision Federal de Electricidad $200,000 6.13% 16/6/2045 239,708 0.00%Grupo Televisa SAB $200,000 4.63% 30/1/2026 222,281 0.00%Comision Federal de Electricidad $200,000 5.75% 14/2/2042 221,167 0.00%Banco Inbursa SA Institucion De Banca Multiple Grupo Financiero Inbursa $200,000 4.13% 6/6/2024 214,118 0.00%America Movil SAB de CV $150,000 6.13% 15/11/2037 208,041 0.00%Coca-Cola Femsa SAB de CV $150,000 5.25% 26/11/2043 201,503 0.00%Fermaca Enterprises S de RL de CV $166,715 6.38% 30/3/2038 189,269 0.00%America Movil SAB de CV £100,000 4.95% 22/7/2033 181,029 0.00%Grupo Televisa SAB $150,000 6.63% 18/3/2025 177,916 0.00%Becle SAB de CV $150,000 3.75% 13/5/2025 163,154 0.00%

414
Vanguard Global Bond Index Fund
Principal CouponMaturity
DateFair Value
US Dollars ($)% of Total
Net AssetsSouthern Copper Corp. $100,000 3.88% 23/4/2025 108,980 0.00%Mexico Government International Bond $75,000 7.50% 8/4/2033 105,519 0.00%America Movil SAB de CV £50,000 5.75% 28/6/2030 91,161 0.00%Grupo Televisa SAB $50,000 8.50% 11/3/2032 74,028 0.00%Grupo Televisa SAB $50,000 6.63% 15/1/2040 69,038 0.00%Mexico Government International Bond $50,000 6.75% 27/9/2034 66,497 0.00%test - - - 120,657,805 0.55%Netherlands 1.67% (2020: 1.65%)Netherlands Government Bond €18,500,000 0.25% 15/7/2025 22,692,425 0.10%Netherlands Government Bond €9,870,000 3.75% 15/1/2042 20,088,972 0.09%Netherlands Government Bond €15,000,000 0.00% 15/1/2027 18,241,003 0.08%Netherlands Government Bond €13,500,000 0.75% 15/7/2027 17,171,022 0.08%Netherlands Government Bond €10,550,000 2.50% 15/1/2033 16,216,164 0.07%Netherlands Government Bond €11,400,000 0.00% 15/7/2030 13,737,148 0.06%Netherlands Government Bond €7,625,000 0.50% 15/1/2040 9,539,433 0.04%Netherlands Government Bond €6,450,000 1.75% 15/7/2023 8,034,873 0.04%Netherlands Government Bond €5,000,000 0.50% 15/7/2026 6,237,997 0.03%Netherlands Government Bond €4,900,000 3.25% 15/7/2021 5,818,852 0.03%Netherlands Government Bond €4,500,000 0.00% 15/1/2024 5,431,514 0.03%Netherlands Government Bond €2,600,000 2.75% 15/1/2047 4,977,084 0.02%Netherlands Government Bond €4,000,000 0.00% 15/7/2031 4,788,036 0.02%Netherlands Government Bond €3,450,000 2.25% 15/7/2022 4,216,939 0.02%BNG Bank NV AU($)5,000,000 4.75% 6/3/2023 4,034,756 0.02%Netherlands Government Bond €2,225,000 5.50% 15/1/2028 3,669,333 0.02%BNG Bank NV €3,100,000 0.13% 19/4/2033 3,630,310 0.02%BNG Bank NV €2,800,000 0.50% 26/8/2022 3,360,324 0.02%BNG Bank NV £2,450,000 0.38% 15/12/2025 3,358,531 0.02%Netherlands Government Bond €2,600,000 2.00% 15/7/2024 3,336,235 0.02%ING Groep NV €2,700,000 1.13% 14/2/2025 3,331,092 0.02%Nederlandse Waterschapsbank NV €2,700,000 0.75% 4/10/2041 3,313,691 0.02%Netherlands Government Bond €2,600,000 0.25% 15/7/2029 3,210,775 0.02%BNG Bank NV €2,700,000 0.13% 9/7/2035 3,094,723 0.02%Nederlandse Waterschapsbank NV €2,500,000 0.00% 14/4/2023 2,992,512 0.01%TenneT Holding BV €2,500,000 0.13% 9/12/2027 2,966,742 0.01%Netherlands Government Bond €1,450,000 4.00% 15/1/2037 2,758,638 0.01%ABN AMRO Bank NV €2,100,000 2.50% 5/9/2023 2,652,976 0.01%Cooperatieve Rabobank UA €2,100,000 4.13% 14/9/2022 2,617,377 0.01%Cooperatieve Rabobank UA €2,000,000 0.88% 1/2/2029 2,539,365 0.01%Heineken NV €2,000,000 1.63% 30/3/2025 2,523,974 0.01%ING Bank NV €2,000,000 0.75% 18/2/2029 2,521,212 0.01%BNG Bank NV €2,000,000 0.50% 16/4/2025 2,453,576 0.01%NIBC Bank NV €2,000,000 0.88% 8/7/2025 2,441,576 0.01%Nationale-Nederlanden Bank NV €2,000,000 0.25% 27/2/2024 2,411,675 0.01%ING Groep NV^ €2,000,000 0.10% 3/9/2025 2,376,280 0.01%Cooperatieve Rabobank UA £1,700,000 1.25% 14/1/2025 2,371,405 0.01%Nationale-Nederlanden Bank NV €2,000,000 0.38% 4/3/2041 2,313,446 0.01%TenneT Holding BV €1,800,000 1.38% 5/6/2028 2,303,634 0.01%Shell International Finance BV $2,000,000 2.25% 6/1/2023 2,058,566 0.01%NIBC Bank NV €1,600,000 0.13% 21/4/2031 1,887,077 0.01%JDE Peet's NV €1,500,000 0.00% 16/1/2026 1,768,426 0.01%BNG Bank NV €1,500,000 0.00% 20/1/2031 1,767,093 0.01%BNG Bank NV €1,500,000 0.01% 5/10/2032 1,749,744 0.01%Shell International Finance BV $1,425,000 4.38% 11/5/2045 1,747,505 0.01%NXP BV/NXP Funding LLC $1,585,000 4.88% 1/3/2024 1,744,984 0.01%Nederlandse Waterschapsbank NV €1,400,000 0.50% 27/10/2022 1,683,279 0.01%Shell International Finance BV $1,400,000 4.13% 11/5/2035 1,662,769 0.01%Cooperatieve Rabobank UA £1,000,000 5.25% 14/9/2027 1,662,763 0.01%ING Groep NV^ €1,300,000 1.63% 26/9/2029 1,598,834 0.01%Shell International Finance BV $1,350,000 4.00% 10/5/2046 1,579,014 0.01%ABN AMRO Bank NV €1,300,000 0.38% 14/1/2035 1,551,330 0.01%Enel Finance International NV €1,300,000 0.50% 17/6/2030 1,541,436 0.01%de Volksbank NV €1,300,000 0.38% 3/3/2028 1,525,293 0.01%Aegon Bank NV €1,200,000 0.38% 21/11/2024 1,456,373 0.01%BNG Bank NV €1,000,000 1.50% 15/7/2039 1,395,929 0.01%TenneT Holding BV €1,100,000 0.50% 9/6/2031 1,308,332 0.01%Cooperatieve Rabobank UA $1,190,000 3.38% 21/5/2025 1,299,998 0.01%Shell International Finance BV €1,000,000 1.63% 20/1/2027 1,289,277 0.01%Cooperatieve Rabobank UA^ $1,300,000 1.00% 24/9/2026 1,286,176 0.01%TenneT Holding BV €1,050,000 1.13% 9/6/2041 1,264,988 0.01%Heineken NV €1,000,000 1.25% 7/5/2033 1,246,010 0.01%BNG Bank NV €1,000,000 0.50% 26/11/2025 1,230,859 0.01%

415
Vanguard Global Bond Index Fund
Principal CouponMaturity
DateFair Value
US Dollars ($)% of Total
Net AssetsNationale-Nederlanden Bank NV €1,000,000 0.38% 26/2/2025 1,204,102 0.01%Stedin Holding NV €1,000,000 0.50% 14/11/2029 1,200,512 0.01%Nederlandse Gasunie NV €1,000,000 0.38% 3/10/2031 1,182,431 0.01%Cooperatieve Rabobank UA $800,000 5.75% 1/12/2043 1,130,598 0.01%TenneT Holding BV €900,000 0.88% 3/6/2030 1,113,053 0.01%Cooperatieve Rabobank UA^ €900,000 0.88% 5/5/2028 1,106,280 0.01%Cooperatieve Rabobank UA $800,000 5.25% 24/5/2041 1,103,765 0.01%Cooperatieve Rabobank UA $1,000,000 3.75% 21/7/2026 1,099,499 0.01%NIBC Bank NV €900,000 1.13% 19/4/2023 1,091,345 0.01%Cooperatieve Rabobank UA $1,000,000 3.88% 26/9/2023 1,073,752 0.01%Cooperatieve Rabobank UA^ $1,000,000 4.00% 10/4/2029 1,068,854 0.01%Shell International Finance BV £800,000 1.00% 10/12/2030 1,047,954 0.01%ING Groep NV^ $1,000,000 2.73% 1/4/2032 1,030,012 0.01%Cooperatieve Rabobank UA €800,000 1.38% 3/2/2027 1,022,518 0.01%Nationale-Nederlanden Bank NV €900,000 0.05% 24/9/2035 1,021,990 0.01%Cooperatieve Rabobank UA €800,000 1.13% 7/5/2031 1,012,832 0.01%Cooperatieve Rabobank UA^ $1,000,000 1.34% 24/6/2026 1,003,607 0.01%Shell International Finance BV $715,000 5.50% 25/3/2040 995,442 0.01%NIBC Bank NV €800,000 0.50% 19/3/2027 982,617 0.01%ASML Holding NV €800,000 0.63% 7/5/2029 978,108 0.01%Cooperatieve Rabobank UA €800,000 0.63% 27/2/2024 968,788 0.01%ABN AMRO Bank NV €800,000 0.60% 15/1/2027 963,258 0.01%Royal Schiphol Group NV €800,000 0.38% 8/9/2027 960,904 0.01%Euronext NV €800,000 1.50% 17/5/2041 959,441 0.01%Shell International Finance BV $920,000 3.13% 7/11/2049 952,247 0.01%JDE Peet's NV €800,000 0.50% 16/1/2029 942,537 0.01%ABN AMRO Bank NV €700,000 1.13% 23/4/2039 924,003 0.01%NXP BV/NXP Funding LLC/NXP USA, Inc. $800,000 4.30% 18/6/2029 918,092 0.01%Shell International Finance BV €700,000 1.88% 15/9/2025 900,307 0.01%Shell International Finance BV €800,000 0.88% 8/11/2039 897,761 0.01%Koninklijke Philips NV €700,000 1.38% 2/5/2028 894,443 0.01%NIBC Bank NV €700,000 1.00% 11/9/2028 889,807 0.01%Koninklijke KPN NV £500,000 5.75% 17/9/2029 859,803 0.01%Nederlandse Waterschapsbank NV €750,000 0.00% 2/10/2034 855,984 0.01%BNG Bank NV $800,000 2.38% 16/3/2026 854,032 0.01%NN Group NV^ €600,000 4.63% 13/1/2048 847,622 0.01%BNG Bank NV $800,000 2.63% 27/2/2024 845,356 0.01%Nederlandse Waterschapsbank NV AU($)1,000,000 3.30% 2/5/2029 839,969 0.00%ASML Holding NV €650,000 1.63% 28/5/2027 839,425 0.00%TenneT Holding BV €600,000 2.00% 5/6/2034 834,009 0.00%Nederlandse Waterschapsbank NV $800,000 1.75% 15/1/2025 830,139 0.00%NXP BV/NXP Funding LLC $800,000 3.88% 1/9/2022 829,867 0.00%TenneT Holding BV €770,000 0.50% 30/11/2040 828,999 0.00%ABN AMRO Bank NV €600,000 1.45% 12/4/2038 827,872 0.00%de Volksbank NV €700,000 0.25% 22/6/2026 825,816 0.00%ABN AMRO Bank NV^ $825,000 1.54% 16/6/2027 820,354 0.00%Cooperatieve Rabobank UA $750,000 4.63% 1/12/2023 819,711 0.00%Shell International Finance BV $785,000 2.38% 7/11/2029 815,842 0.00%ABN AMRO Bank NV €600,000 1.38% 10/1/2034 808,508 0.00%Shell International Finance BV €600,000 1.88% 7/4/2032 804,078 0.00%Euronext NV €665,000 0.13% 17/5/2026 790,549 0.00%Royal Schiphol Group NV €660,000 0.00% 22/4/2025 783,759 0.00%Cooperatieve Rabobank UA $750,000 2.75% 10/1/2023 777,244 0.00%ING Groep NV €600,000 2.13% 10/1/2026 776,094 0.00%TenneT Holding BV €660,000 0.13% 30/11/2032 744,333 0.00%Shell International Finance BV $725,000 2.38% 21/8/2022 742,132 0.00%de Volksbank NV €600,000 0.01% 16/9/2024 715,900 0.00%Nederlandse Waterschapsbank NV €600,000 0.05% 28/1/2030 715,683 0.00%LeasePlan Corp. NV €600,000 0.13% 13/9/2023 715,676 0.00%JDE Peet's NV €600,000 1.13% 16/6/2033 713,599 0.00%Shell International Finance BV $650,000 3.40% 12/8/2023 690,567 0.00%Cooperatieve Rabobank UA $500,000 5.25% 4/8/2045 670,329 0.00%Nationale-Nederlanden Levensverzekering Maatschappij NV^ €500,000 9.00% 29/8/2042 654,525 0.00%ABN AMRO Bank NV $575,000 4.75% 28/7/2025 645,642 0.00%ABN AMRO Bank NV €500,000 1.00% 13/4/2031 645,420 0.00%TenneT Holding BV €500,000 1.25% 24/10/2033 642,282 0.00%EXOR NV €500,000 1.75% 18/1/2028 638,105 0.00%BNG Bank NV $600,000 3.00% 20/9/2023 634,658 0.00%Akzo Nobel NV €500,000 1.75% 7/11/2024 632,315 0.00%ABN AMRO Bank NV^ $600,000 4.40% 27/3/2028 631,634 0.00%EXOR NV €535,000 0.88% 19/1/2031 628,840 0.00%

416
Vanguard Global Bond Index Fund
Principal CouponMaturity
DateFair Value
US Dollars ($)% of Total
Net AssetsVan Lanschot Kempen Wealth Management NV €500,000 0.88% 15/2/2027 625,755 0.00%Aegon Bank NV €500,000 0.75% 27/6/2027 623,311 0.00%Nederlandse Gasunie NV €500,000 1.00% 11/5/2026 621,820 0.00%BNG Bank NV $600,000 1.50% 16/10/2024 617,228 0.00%Shell International Finance BV €500,000 1.13% 7/4/2024 615,420 0.00%ING Groep NV €500,000 1.00% 20/9/2023 609,349 0.00%Koninklijke Philips NV €500,000 0.50% 22/5/2026 607,443 0.00%Nederlandse Waterschapsbank NV €500,000 0.50% 19/1/2023 602,490 0.00%ING Groep NV^ €500,000 1.00% 13/11/2030 600,883 0.00%Koninklijke DSM NV €500,000 0.63% 23/6/2032 600,821 0.00%ING Groep NV £400,000 3.00% 18/2/2026 598,117 0.00%Aegon NV £300,000 6.13% 15/12/2031 593,705 0.00%Shell International Finance BV £500,000 1.75% 10/9/2052 591,732 0.00%Koninklijke KPN NV €500,000 0.88% 14/12/2032 591,415 0.00%ASML Holding NV €500,000 0.25% 25/2/2030 590,335 0.00%Koninklijke Ahold Delhaize NV €500,000 0.38% 18/3/2030 588,726 0.00%CTP NV €500,000 1.25% 21/6/2029 586,096 0.00%ABN AMRO Bank NV €466,000 0.50% 15/4/2026 567,341 0.00%ING Groep NV $500,000 4.10% 2/10/2023 538,888 0.00%Shell International Finance BV $500,000 2.50% 12/9/2026 532,420 0.00%Heineken NV €400,000 1.50% 3/10/2029 517,594 0.00%NN Group NV €400,000 1.63% 1/6/2027 513,803 0.00%Stedin Holding NV €400,000 1.38% 19/9/2028 511,854 0.00%Vesteda Finance BV €400,000 1.50% 24/5/2027 507,056 0.00%Shell International Finance BV $500,000 0.38% 15/9/2023 500,030 0.00%Shell International Finance BV $400,000 4.55% 12/8/2043 499,282 0.00%Koninklijke Ahold Delhaize NV €400,000 1.13% 19/3/2026 497,754 0.00%TenneT Holding BV €400,000 1.00% 13/6/2026 497,572 0.00%ABN AMRO Bank NV^ €400,000 2.88% 18/1/2028 494,618 0.00%Koninklijke DSM NV €400,000 0.75% 28/9/2026 492,060 0.00%ELM BV for Helvetia Schweizerische Versicherungsgesellschaft AG^ €367,000 3.38% 29/9/2047 488,805 0.00%Euronext NV €390,000 1.13% 12/6/2029 484,806 0.00%Koninklijke KPN NV €400,000 0.63% 9/4/2025 483,760 0.00%Enexis Holding NV €400,000 0.63% 17/6/2032 481,481 0.00%Achmea Bank NV €400,000 0.01% 16/6/2025 479,730 0.00%Nederlandse Waterschapsbank NV $500,000 1.00% 28/5/2030 477,547 0.00%BNG Bank NV $500,000 1.00% 3/6/2030 477,416 0.00%Shell International Finance BV €400,000 0.13% 8/11/2027 474,319 0.00%Wolters Kluwer NV €400,000 0.25% 30/3/2028 473,678 0.00%NIBC Bank NV €400,000 0.01% 15/10/2029 471,327 0.00%Shell International Finance BV €400,000 0.50% 8/11/2031 470,734 0.00%Shell International Finance BV $435,000 3.25% 6/4/2050 463,074 0.00%ING Groep NV $400,000 4.05% 9/4/2029 456,782 0.00%Cooperatieve Rabobank UA $400,000 4.38% 4/8/2025 445,968 0.00%Netherlands Government Bond €350,000 3.75% 15/1/2023 443,844 0.00%Shell International Finance BV $400,000 2.88% 10/5/2026 432,356 0.00%Shell International Finance BV $400,000 2.38% 6/4/2025 420,949 0.00%ASR Nederland NV^ €300,000 3.38% 2/5/2049 398,439 0.00%Royal Schiphol Group NV €327,000 0.88% 8/9/2032 396,042 0.00%Heineken NV €300,000 1.38% 29/1/2027 380,808 0.00%Heineken NV €300,000 1.75% 7/5/2040 380,661 0.00%BNG Bank NV €300,000 1.00% 12/1/2026 377,448 0.00%BNG Bank NV €300,000 2.25% 17/7/2023 375,939 0.00%NIBC Bank NV €300,000 2.00% 9/4/2024 371,468 0.00%Stedin Holding NV €300,000 0.88% 24/10/2025 369,399 0.00%Shell International Finance BV €300,000 0.75% 15/8/2028 367,467 0.00%BNG Bank NV €300,000 0.25% 7/5/2025 364,772 0.00%Shell International Finance BV $350,000 2.00% 7/11/2024 364,220 0.00%Van Lanschot Kempen Wealth Management NV €300,000 0.38% 31/3/2023 360,718 0.00%Koninklijke Ahold Delhaize NV €300,000 0.25% 26/6/2025 359,490 0.00%Heineken NV $325,000 3.50% 29/1/2028 359,121 0.00%BNG Bank NV €300,000 0.38% 14/1/2022 357,490 0.00%Nederlandse Waterschapsbank NV $350,000 0.13% 15/2/2023 349,178 0.00%Heineken NV $275,000 4.35% 29/3/2047 344,289 0.00%Cooperatieve Rabobank UA £200,000 4.63% 23/5/2029 328,980 0.00%Royal Schiphol Group NV €275,000 0.75% 22/4/2033 324,901 0.00%ING Groep NV $300,000 3.55% 9/4/2024 322,992 0.00%Shell International Finance BV $300,000 2.75% 6/4/2030 319,836 0.00%BNG Bank NV $300,000 1.50% 6/9/2022 304,619 0.00%UPP Bond 1 Issuer plc £175,819 4.90% 28/2/2040 294,732 0.00%Shell International Finance BV $270,000 3.25% 11/5/2025 293,170 0.00%

417
Vanguard Global Bond Index Fund
Principal CouponMaturity
DateFair Value
US Dollars ($)% of Total
Net AssetsABN AMRO Bank NV £200,000 1.38% 16/1/2025 281,284 0.00%JAB Holdings BV $250,000 3.75% 28/5/2051 267,076 0.00%Cooperatieve Rabobank UA $250,000 3.95% 9/11/2022 261,682 0.00%Royal Schiphol Group NV €200,000 1.50% 5/11/2030 260,031 0.00%ING Bank NV $250,000 2.63% 5/12/2022 258,240 0.00%ABN AMRO Bank NV €200,000 2.38% 23/1/2024 254,451 0.00%Viterra Finance BV $250,000 3.20% 21/4/2031 251,606 0.00%Viterra Finance BV $250,000 2.00% 21/4/2026 250,333 0.00%Cooperatieve Rabobank UA $250,000 0.38% 12/1/2024 249,022 0.00%Alliander NV^ €200,000 1.63% Perpetual 247,378 0.00%BNG Bank NV $250,000 0.50% 24/11/2025 246,234 0.00%PostNL NV €200,000 1.00% 21/11/2024 244,538 0.00%Alliander NV €200,000 0.38% 10/6/2030 239,655 0.00%Aegon NV^ $200,000 5.50% 11/4/2048 227,010 0.00%ING Groep NV $200,000 3.95% 29/3/2027 224,571 0.00%NXP BV/NXP Funding LLC $200,000 4.63% 1/6/2023 214,922 0.00%Nederlandse Waterschapsbank NV $200,000 0.50% 2/12/2025 196,908 0.00%NXP BV/NXP Funding LLC $150,000 5.55% 1/12/2028 183,914 0.00%Koninklijke KPN NV £100,000 5.00% 18/11/2026 159,775 0.00%NXP BV/NXP Funding LLC $125,000 5.35% 1/3/2026 145,797 0.00%Nederlandse Waterschapsbank NV €100,000 3.25% 9/3/2027 142,276 0.00%Netherlands Government Bond €100,000 7.50% 15/1/2023 133,722 0.00%Heineken NV €100,000 2.88% 4/8/2025 132,832 0.00%TenneT Holding BV €100,000 4.63% 21/2/2023 128,391 0.00%de Volksbank NV €100,000 1.00% 8/3/2028 127,618 0.00%ABN AMRO Bank NV €100,000 7.13% 6/7/2022 127,183 0.00%Wolters Kluwer NV €100,000 2.50% 13/5/2024 126,878 0.00%Heineken NV €100,000 1.50% 7/12/2024 124,829 0.00%Cooperatieve Rabobank UA €100,000 2.38% 22/5/2023 124,814 0.00%Enexis Holding NV €100,000 0.88% 28/4/2026 123,898 0.00%LeasePlan Corp. NV €100,000 1.38% 7/3/2024 123,253 0.00%Alliander NV €100,000 2.25% 14/11/2022 122,810 0.00%Koninklijke Ahold Delhaize NV $66,000 5.70% 1/10/2040 90,428 0.00%BNG Bank NV €50,000 3.88% 26/5/2023 64,285 0.00%BNG Bank NV €50,000 2.25% 30/8/2022 61,226 0.00%test - - - 369,045,749 1.67%New Zealand 0.25% (2020: 0.24%)ASB Finance Ltd. €8,000,000 0.25% 21/5/2031 9,509,286 0.04%New Zealand Government Bond NZ($)7,200,000 3.00% 20/4/2029 5,569,272 0.02%New Zealand Government Bond NZ($)8,000,000 0.50% 15/5/2024 5,551,031 0.02%New Zealand Government Bond NZ($)6,400,000 0.25% 15/5/2028 4,115,868 0.02%New Zealand Government Bond NZ($)5,450,000 2.75% 15/4/2037 4,037,550 0.02%BNZ International Funding Ltd. €3,100,000 0.50% 3/7/2024 3,768,914 0.02%New Zealand Local Government Funding Agency Bond NZ($)5,000,000 1.50% 20/4/2029 3,379,908 0.02%New Zealand Government Bond NZ($)4,500,000 2.75% 15/4/2025 3,356,069 0.01%New Zealand Government Bond NZ($)3,850,000 1.50% 15/5/2031 2,623,134 0.01%New Zealand Government Bond NZ($)2,500,000 3.50% 14/4/2033 2,027,878 0.01%New Zealand Government Bond NZ($)2,300,000 4.50% 15/4/2027 1,898,931 0.01%Westpac Securities NZ Ltd. CHF1,500,000 0.38% 5/2/2024 1,654,853 0.01%Auckland Council €1,000,000 1.00% 19/1/2027 1,260,384 0.01%Westpac Securities NZ Ltd. €1,000,000 0.30% 25/6/2024 1,203,356 0.01%New Zealand Government Bond NZ($)1,970,000 1.75% 15/5/2041 1,195,582 0.01%Auckland Council €1,000,000 0.13% 26/9/2029 1,178,886 0.01%BNZ International Funding Ltd. €625,000 0.50% 13/5/2023 752,528 0.00%Chorus Ltd. €500,000 0.88% 5/12/2026 609,165 0.00%BNZ International Funding Ltd. $500,000 3.38% 1/3/2023 524,592 0.00%BNZ International Funding Ltd. $500,000 2.65% 3/11/2022 515,277 0.00%ANZ New Zealand Int'l Ltd. $250,000 2.55% 13/2/2030 261,042 0.00%Bank of New Zealand $250,000 2.00% 21/2/2025 258,548 0.00%ANZ New Zealand Int'l Ltd. $200,000 3.45% 17/7/2027 221,480 0.00%Housing New Zealand Ltd. NZ($)100,000 2.25% 5/10/2026 72,175 0.00%test - - - 55,545,709 0.25%Norway 0.47% (2020: 0.44%)Norway Government Bond NOK(kr)119,705,000 1.25% 17/9/2031 13,749,977 0.06%SpareBank 1 Boligkreditt A.S. €5,500,000 1.00% 30/1/2029 7,034,811 0.03%Norway Government Bond NOK(kr)50,000,000 1.38% 19/8/2030 5,829,249 0.03%Sparebanken Vest Boligkreditt A.S. €4,000,000 0.01% 24/11/2025 4,802,993 0.02%Norway Government Bond NOK(kr)37,000,000 2.00% 26/4/2028 4,513,025 0.02%Norway Government Bond NOK(kr)31,229,000 1.75% 6/9/2029 3,755,149 0.02%Kommunalbanken A.S. €2,750,000 0.05% 24/10/2029 3,258,431 0.02%Santander Consumer Bank A.S. €2,500,000 0.75% 1/3/2023 3,013,342 0.01%

418
Vanguard Global Bond Index Fund
Principal CouponMaturity
DateFair Value
US Dollars ($)% of Total
Net AssetsSparebanken Vest Boligkreditt A.S. €2,300,000 0.13% 15/3/2023 2,755,808 0.01%DNB Bank A.S.A €2,300,000 0.05% 14/11/2023 2,749,927 0.01%Eika Boligkreditt A.S. €1,900,000 0.50% 28/8/2025 2,327,677 0.01%Norway Government Bond NOK(kr)18,000,000 3.00% 14/3/2024 2,210,513 0.01%Equinor A.S.A $1,855,000 2.65% 15/1/2024 1,950,295 0.01%Equinor A.S.A $1,400,000 7.25% 23/9/2027 1,858,423 0.01%SpareBank 1 Boligkreditt A.S. €1,500,000 0.13% 14/5/2026 1,812,120 0.01%SR-Boligkreditt A.S. €1,500,000 0.01% 26/6/2027 1,794,383 0.01%DNB Bank A.S.A^ €1,500,000 0.25% 23/2/2029 1,755,001 0.01%Equinor A.S.A €1,000,000 1.63% 9/11/2036 1,309,856 0.01%Statnett SF €1,000,000 1.25% 26/4/2030 1,278,261 0.01%SR-Boligkreditt A.S. €1,000,000 0.75% 17/10/2025 1,239,039 0.01%Equinor A.S.A $1,100,000 3.63% 10/9/2028 1,236,514 0.01%Kommunalbanken A.S. €1,000,000 0.63% 20/4/2026 1,236,070 0.01%Telenor A.S.A €1,000,000 0.75% 31/5/2026 1,226,078 0.01%Statnett SF €1,000,000 0.88% 8/3/2025 1,224,734 0.01%SpareBank 1 Boligkreditt A.S. €1,000,000 0.13% 5/11/2029 1,195,102 0.01%Telenor A.S.A €1,000,000 0.25% 14/2/2028 1,187,687 0.01%Norway Government Bond NOK(kr)10,000,000 1.50% 19/2/2026 1,183,051 0.01%Equinor A.S.A $825,000 5.10% 17/8/2040 1,097,488 0.01%Kommunalbanken A.S. $1,000,000 2.00% 19/6/2024 1,042,780 0.01%Equinor A.S.A $900,000 3.25% 10/11/2024 973,666 0.01%SpareBank 1 SMN €800,000 0.75% 3/7/2023 968,001 0.01%Eika Boligkreditt A.S. €800,000 0.38% 20/4/2023 963,385 0.01%Sparebanken Vest Boligkreditt A.S. €800,000 0.01% 28/6/2027 957,944 0.01%Norway Government Bond NOK(kr)8,000,000 2.00% 24/5/2023 953,242 0.01%DNB Bank A.S.A^ $950,000 1.13% 16/9/2026 942,563 0.00%Kommunalbanken A.S. $850,000 2.50% 11/1/2023 878,940 0.00%Kommunalbanken A.S. AU($)1,000,000 4.25% 16/7/2025 850,450 0.00%Sparebanken Soer Boligkreditt A.S. €700,000 0.38% 20/2/2023 841,621 0.00%Santander Consumer Bank A.S. €700,000 0.13% 25/2/2025 831,376 0.00%Kommunalbanken A.S. $800,000 0.25% 8/12/2023 796,722 0.00%Norway Government Bond NOK(kr)6,000,000 1.75% 17/2/2027 718,860 0.00%Kommunalbanken A.S. $630,000 2.75% 5/2/2024 666,823 0.00%Telenor A.S.A €500,000 1.13% 31/5/2029 630,526 0.00%Equinor A.S.A $596,000 1.75% 22/1/2026 613,603 0.00%Kommunalbanken A.S. $600,000 0.50% 13/1/2026 589,848 0.00%Aker BP A.S.A $550,000 3.00% 15/1/2025 577,971 0.00%Equinor A.S.A $500,000 3.70% 6/4/2050 574,856 0.00%Telenor A.S.A €450,000 0.88% 14/2/2035 541,702 0.00%SR-Boligkreditt A.S. €450,000 0.01% 8/10/2026 539,653 0.00%Yara International A.S.A $500,000 3.15% 4/6/2030 536,239 0.00%Aker BP A.S.A $500,000 2.88% 15/1/2026 527,437 0.00%Sparebank 1 Oestlandet €400,000 0.88% 13/3/2023 483,936 0.00%Kommunalbanken A.S. $500,000 1.13% 14/6/2030 481,778 0.00%Yara International A.S.A $400,000 4.75% 1/6/2028 470,916 0.00%Aker BP A.S.A $400,000 3.75% 15/1/2030 430,855 0.00%Equinor A.S.A £200,000 6.88% 11/3/2031 408,005 0.00%Equinor A.S.A $348,000 3.95% 15/5/2043 406,604 0.00%Kommunalbanken A.S. $400,000 0.25% 4/11/2022 400,176 0.00%Santander Consumer Bank A.S. €300,000 0.13% 11/9/2024 357,419 0.00%Equinor A.S.A $300,000 3.13% 6/4/2030 326,756 0.00%DNB Boligkreditt A.S. $300,000 2.50% 28/3/2022 305,012 0.00%Kommunalbanken A.S. $300,000 0.50% 21/10/2024 298,836 0.00%Equinor A.S.A €200,000 2.88% 10/9/2025 268,049 0.00%SpareBank 1 Boligkreditt A.S. €200,000 0.38% 9/3/2023 240,642 0.00%Kommunalbanken A.S. $200,000 2.13% 11/2/2025 210,207 0.00%Equinor A.S.A £100,000 4.25% 10/4/2041 186,516 0.00%Equinor A.S.A $135,000 2.45% 17/1/2023 139,323 0.00%Telenor A.S.A €100,000 2.50% 22/5/2025 130,542 0.00%Statkraft A.S. €100,000 1.50% 26/3/2030 130,053 0.00%Statkraft A.S. €100,000 2.50% 28/11/2022 123,198 0.00%Statkraft A.S. €100,000 1.50% 21/9/2023 122,624 0.00%DNB Boligkreditt A.S. €100,000 1.88% 21/11/2022 122,510 0.00%SpareBank 1 Boligkreditt A.S. €100,000 0.75% 5/9/2022 120,360 0.00%Equinor A.S.A $100,000 3.70% 1/3/2024 108,101 0.00%Equinor A.S.A $50,000 4.80% 8/11/2043 65,136 0.00%test - - - 102,440,766 0.47%Panama 0.06% (2020: 0.06%)Panama Government International Bond $3,228,000 3.75% 16/3/2025 3,513,395 0.02%Panama Government International Bond $2,500,000 3.87% 23/7/2060 2,553,721 0.01%

419
Vanguard Global Bond Index Fund
Principal CouponMaturity
DateFair Value
US Dollars ($)% of Total
Net AssetsPanama Government International Bond $1,400,000 4.50% 1/4/2056 1,588,110 0.01%Panama Government International Bond $1,000,000 4.30% 29/4/2053 1,108,615 0.01%Panama Government International Bond $500,000 9.38% 1/4/2029 740,432 0.01%Panama Government International Bond $650,000 4.00% 22/9/2024 708,532 0.00%Panama Government International Bond $400,000 3.16% 23/1/2030 419,096 0.00%AES Panama Generation Holdings SRL $400,000 4.38% 31/5/2030 418,771 0.00%Panama Government International Bond $300,000 6.70% 26/1/2036 407,862 0.00%Panama Government International Bond $245,000 8.88% 30/9/2027 338,843 0.00%Panama Government International Bond $200,000 4.50% 16/4/2050 227,615 0.00%Empresa de Transmision Electrica SA $200,000 5.13% 2/5/2049 221,688 0.00%Panama Government International Bond $110,000 3.88% 17/3/2028 120,953 0.00%test - - - 12,367,633 0.06%Peru 0.13% (2020: 0.13%)Peruvian Government International Bond $2,900,000 2.78% 23/1/2031 2,951,326 0.01%Peru Government Bond PEN6,000,000 5.94% 12/2/2029 1,713,029 0.01%Peru Government Bond PEN5,300,000 6.35% 12/8/2028 1,548,004 0.01%Peruvian Government International Bond $1,100,000 5.63% 18/11/2050 1,516,136 0.01%Peru Government Bond PEN4,500,000 8.20% 12/8/2026 1,475,556 0.01%Peru Government Bond PEN5,000,000 6.95% 12/8/2031 1,471,532 0.01%Peru Government Bond PEN5,125,000 6.15% 12/8/2032 1,364,363 0.01%Peru Government Bond PEN4,900,000 6.90% 12/8/2037 1,346,842 0.01%Kallpa Generacion SA $1,300,000 4.13% 16/8/2027 1,339,105 0.01%Peruvian Government International Bond $1,500,000 3.23% 28/7/2121 1,320,396 0.01%Peruvian Government International Bond €1,110,000 1.25% 11/3/2033 1,280,527 0.01%Petroleos del Peru SA $1,000,000 5.63% 19/6/2047 1,061,619 0.01%Peru Government Bond PEN4,200,000 5.40% 12/8/2034 1,037,188 0.01%Peru Government Bond PEN3,500,000 5.35% 12/8/2040 808,974 0.00%Corp. Financiera de Desarrollo SA $800,000 2.40% 28/9/2027 784,929 0.00%Peru Government Bond PEN2,500,000 5.70% 12/8/2024 729,941 0.00%Corp. Financiera de Desarrollo SA $600,000 4.75% 15/7/2025 659,828 0.00%Peruvian Government International Bond $363,000 8.75% 21/11/2033 569,264 0.00%Peruvian Government International Bond $500,000 3.30% 11/3/2041 505,567 0.00%Banco de Credito del Peru $475,000 4.25% 1/4/2023 497,628 0.00%Peru Government Bond PEN1,500,000 6.85% 12/2/2042 410,495 0.00%Banco de Credito del Peru^ $400,000 3.25% 30/9/2031 397,997 0.00%Peruvian Government International Bond €300,000 2.75% 30/1/2026 394,088 0.00%Peruvian Government International Bond $300,000 3.55% 10/3/2051 311,694 0.00%Peruvian Government International Bond €200,000 3.75% 1/3/2030 284,932 0.00%Peruvian Government International Bond $250,000 4.13% 25/8/2027 279,859 0.00%Banco BBVA Peru SA^ $200,000 5.25% 22/9/2029 210,301 0.00%Petroleos del Peru SA $200,000 4.75% 19/6/2032 209,877 0.00%Peruvian Government International Bond $200,000 2.39% 23/1/2026 206,431 0.00%Banco de Credito del Peru $200,000 2.70% 11/1/2025 206,212 0.00%Peru Government Bond PEN800,000 6.71% 12/2/2055 206,103 0.00%Peruvian Government International Bond $200,000 2.84% 20/6/2030 206,028 0.00%Peruvian Government International Bond $100,000 6.55% 14/3/2037 137,564 0.00%Lima Metro Line 2 Finance Ltd. $115,507 5.88% 5/7/2034 134,808 0.00%Peru Government Bond PEN400,000 5.20% 12/9/2023 114,202 0.00%Consorcio Transmantaro SA $100,000 4.38% 7/5/2023 104,502 0.00%test - - - 27,796,847 0.13%Philippines 0.09% (2020: 0.08%)Philippine Government International Bond $1,825,000 7.75% 14/1/2031 2,696,534 0.01%Philippine Government International Bond $1,300,000 3.70% 1/3/2041 1,403,164 0.01%Philippine Government International Bond $950,000 9.50% 21/10/2024 1,222,576 0.01%Philippine Government International Bond $970,000 5.50% 30/3/2026 1,173,580 0.01%Philippine Government International Bond $1,000,000 4.20% 21/1/2024 1,094,551 0.01%Bank of the Philippine Islands $1,000,000 4.25% 4/9/2023 1,073,705 0.01%Philippine Government International Bond €880,000 0.88% 17/5/2027 1,062,355 0.01%Philippine Government International Bond €850,000 1.20% 28/4/2033 1,007,892 0.01%Philippine Government International Bond $700,000 6.38% 23/10/2034 987,004 0.01%Philippine Government International Bond $700,000 6.38% 15/1/2032 962,755 0.00%Philippine Government International Bond $600,000 9.50% 2/2/2030 949,709 0.00%Philippine Government International Bond $750,000 5.00% 13/1/2037 944,509 0.00%Philippine Government International Bond $950,000 2.95% 5/5/2045 917,902 0.00%Philippine Government International Bond €600,000 0.70% 3/2/2029 707,511 0.00%Philippine Government International Bond €555,000 0.25% 28/4/2025 660,684 0.00%Philippine Government International Bond $500,000 3.95% 20/1/2040 555,433 0.00%Philippine Government International Bond $500,000 3.70% 2/2/2042 539,640 0.00%BDO Unibank, Inc. $500,000 2.95% 6/3/2023 517,573 0.00%Philippine Government International Bond $500,000 3.20% 6/7/2046 501,532 0.00%Power Sector Assets & Liabilities Management Corp. $400,000 7.39% 2/12/2024 486,326 0.00%

420
Vanguard Global Bond Index Fund
Principal CouponMaturity
DateFair Value
US Dollars ($)% of Total
Net AssetsPhilippine Government International Bond $400,000 3.00% 1/2/2028 431,648 0.00%Philippine Government International Bond $200,000 1.95% 6/1/2032 197,245 0.00%Philippine Government International Bond $100,000 10.63% 16/3/2025 135,959 0.00%test - - - 20,229,787 0.09%Poland 0.24% (2020: 0.30%)Republic of Poland Government Bond zł27,750,000 2.75% 25/10/2029 7,980,341 0.04%Republic of Poland Government Bond zł18,500,000 2.50% 25/7/2027 5,174,120 0.02%Republic of Poland Government Bond zł14,000,000 3.25% 25/7/2025 4,006,695 0.02%Republic of Poland Government International Bond €3,008,000 0.00% 7/7/2023 3,594,206 0.02%Republic of Poland Government Bond zł13,000,000 2.25% 25/10/2024 3,583,356 0.02%Republic of Poland Government Bond zł12,920,000 0.25% 25/10/2026 3,212,926 0.02%Republic of Poland Government Bond zł11,000,000 2.75% 25/4/2028 3,133,240 0.01%Republic of Poland Government International Bond €2,300,000 0.00% 10/2/2025 2,750,629 0.01%Republic of Poland Government International Bond €2,100,000 1.00% 7/3/2029 2,677,565 0.01%Republic of Poland Government International Bond €2,000,000 1.13% 7/8/2026 2,526,162 0.01%Republic of Poland Government Bond zł8,000,000 2.50% 25/7/2026 2,229,478 0.01%Republic of Poland Government Bond zł7,600,000 1.25% 25/10/2030 1,932,601 0.01%Republic of Poland Government Bond zł4,700,000 4.00% 25/4/2047 1,669,340 0.01%Republic of Poland Government Bond zł5,500,000 4.00% 25/10/2023 1,564,148 0.01%Republic of Poland Government International Bond €1,000,000 2.38% 18/1/2036 1,440,730 0.01%Republic of Poland Government Bond zł5,000,000 2.50% 25/1/2023 1,359,832 0.01%Republic of Poland Government Bond zł3,500,000 5.75% 23/9/2022 982,874 0.00%Republic of Poland Government Bond zł3,500,000 2.50% 25/4/2024 968,163 0.00%Republic of Poland Government International Bond €500,000 4.50% 18/1/2022 608,889 0.00%Republic of Poland Government International Bond $400,000 3.25% 6/4/2026 441,124 0.00%Republic of Poland Government International Bond €300,000 2.00% 8/3/2049 438,360 0.00%Republic of Poland Government International Bond €300,000 3.00% 15/1/2024 386,462 0.00%ORLEN Capital AB €300,000 2.50% 7/6/2023 371,884 0.00%Republic of Poland Government International Bond €100,000 3.38% 9/7/2024 131,848 0.00%Republic of Poland Government International Bond €100,000 0.88% 10/5/2027 125,272 0.00%Republic of Poland Government International Bond $100,000 3.00% 17/3/2023 104,489 0.00%Republic of Poland Government International Bond €50,000 3.75% 19/1/2023 63,184 0.00%test - - - 53,457,918 0.24%Portugal 0.36% (2020: 0.40%)Portugal Obrigacoes do Tesouro OT €9,470,000 1.95% 15/6/2029 12,905,704 0.06%Portugal Obrigacoes do Tesouro OT €7,000,000 5.65% 15/2/2024 9,669,347 0.04%Portugal Obrigacoes do Tesouro OT €7,791,000 0.90% 12/10/2035 9,487,934 0.04%Portugal Obrigacoes do Tesouro OT €6,000,000 2.25% 18/4/2034 8,587,556 0.04%Portugal Obrigacoes do Tesouro OT €6,310,000 0.70% 15/10/2027 7,873,652 0.04%Portugal Obrigacoes do Tesouro OT €3,400,000 4.10% 15/2/2045 6,528,122 0.03%Portugal Obrigacoes do Tesouro OT €2,765,000 2.88% 21/7/2026 3,813,775 0.02%EDP Finance BV €1,500,000 2.00% 22/4/2025 1,914,009 0.01%Banco Santander Totta SA €1,500,000 0.88% 25/4/2024 1,840,180 0.01%EDP Finance BV $1,650,000 3.63% 15/7/2024 1,772,289 0.01%Portugal Government International Bond $1,435,000 5.13% 15/10/2024 1,630,523 0.01%Portugal Obrigacoes do Tesouro OT €1,499,000 1.00% 12/4/2052 1,622,339 0.01%EDP Finance BV £800,000 8.63% 4/1/2024 1,317,551 0.01%EDP Finance BV €1,000,000 1.63% 26/1/2026 1,268,380 0.01%EDP Finance BV €800,000 1.88% 13/10/2025 1,023,734 0.01%EDP Finance BV $1,000,000 1.71% 24/1/2028 988,212 0.01%Portugal Obrigacoes do Tesouro OT €613,000 4.13% 14/4/2027 910,783 0.00%Caixa Economica Montepio Geral Caixa Economica Bancaria SA €700,000 0.88% 17/10/2022 842,368 0.00%Portugal Obrigacoes do Tesouro OT €520,000 4.95% 25/10/2023 696,751 0.00%Banco Santander Totta SA €500,000 1.25% 26/9/2027 645,117 0.00%EDP-Energias de Portugal SA €400,000 1.63% 15/4/2027 510,036 0.00%EDP Finance BV €400,000 2.38% 23/3/2023 496,005 0.00%EDP Finance BV €333,000 1.88% 29/9/2023 413,336 0.00%EDP Finance BV €300,000 0.38% 16/9/2026 359,403 0.00%Ren Finance BV €250,000 1.75% 18/1/2028 321,965 0.00%Brisa Concessao Rodoviaria SA €200,000 2.38% 10/5/2027 266,081 0.00%Brisa Concessao Rodoviaria SA €200,000 2.00% 22/3/2023 246,021 0.00%Brisa Concessao Rodoviaria SA €100,000 1.88% 30/4/2025 127,230 0.00%Galp Gas Natural Distribuicao SA €100,000 1.38% 19/9/2023 122,076 0.00%test - - - 78,200,479 0.36%Qatar 0.12% (2020: 0.13%)Qatar Government International Bond $3,500,000 4.82% 14/3/2049 4,503,175 0.02%Qatar Government International Bond $2,650,000 4.00% 14/3/2029 3,050,172 0.02%Qatar Government International Bond $1,700,000 5.10% 23/4/2048 2,257,486 0.01%Qatar Government International Bond $1,600,000 4.40% 16/4/2050 1,947,974 0.01%Ras Laffan Liquefied Natural Gas Co., Ltd. 3 $1,605,037 5.84% 30/9/2027 1,840,378 0.01%Qatar Government International Bond $1,225,000 3.75% 16/4/2030 1,386,476 0.01%

421
Vanguard Global Bond Index Fund
Principal CouponMaturity
DateFair Value
US Dollars ($)% of Total
Net AssetsQatar Government International Bond $1,300,000 3.88% 23/4/2023 1,381,206 0.01%Qatar Government International Bond $950,000 5.75% 20/1/2042 1,321,672 0.01%Qatar Government International Bond $900,000 6.40% 20/1/2040 1,317,923 0.01%Qatar Government International Bond $1,075,000 3.25% 2/6/2026 1,176,414 0.01%SoQ Sukuk A QSC $800,000 3.24% 18/1/2023 835,219 0.00%Nakilat, Inc. $681,905 6.07% 31/12/2033 835,126 0.00%Qatar Government International Bond $600,000 3.40% 16/4/2025 653,433 0.00%Qatar Government International Bond $600,000 3.38% 14/3/2024 643,513 0.00%Ras Laffan Liquefied Natural Gas Co., Ltd. 3 $500,000 6.33% 30/9/2027 576,598 0.00%Ooredoo International Finance Ltd. $500,000 3.75% 22/6/2026 552,066 0.00%Qatar Government International Bond $200,000 9.75% 15/6/2030 318,783 0.00%Qatar Government International Bond $250,000 4.63% 2/6/2046 310,386 0.00%Ooredoo International Finance Ltd. $200,000 3.88% 31/1/2028 225,362 0.00%ABQ Finance Ltd. $200,000 1.88% 8/9/2025 200,009 0.00%test - - - 25,333,371 0.12%Romania 0.08% (2020: 0.09%)Romanian Government International Bond €1,220,000 2.63% 2/12/2040 1,436,785 0.01%Romanian Government International Bond €1,000,000 4.13% 11/3/2039 1,405,291 0.01%Romanian Government International Bond €1,000,000 3.88% 29/10/2035 1,393,306 0.01%Romanian Government International Bond $1,090,000 5.13% 15/6/2048 1,333,336 0.01%Romanian Government International Bond €1,000,000 2.00% 8/12/2026 1,276,818 0.01%Romanian Government International Bond €1,000,000 2.75% 14/4/2041 1,180,341 0.01%Romanian Government International Bond €750,000 2.88% 26/5/2028 993,250 0.01%Romanian Government International Bond €800,000 2.00% 14/4/2033 941,874 0.01%Romanian Government International Bond €585,000 2.75% 29/10/2025 768,330 0.00%Romanian Government International Bond €470,000 4.63% 3/4/2049 706,823 0.00%Romanian Government International Bond €500,000 2.38% 19/4/2027 648,496 0.00%Romanian Government International Bond €470,000 3.62% 26/5/2030 645,265 0.00%Romanian Government International Bond €500,000 2.50% 8/2/2030 637,035 0.00%NE Property BV €500,000 1.88% 9/10/2026 609,236 0.00%Romanian Government International Bond €445,000 2.12% 16/7/2031 544,893 0.00%Romanian Government International Bond €440,000 2.00% 28/1/2032 527,826 0.00%Romanian Government International Bond $500,000 3.00% 14/2/2031 517,706 0.00%Romanian Government International Bond €400,000 3.38% 28/1/2050 506,446 0.00%Romanian Government International Bond $370,000 6.13% 22/1/2044 505,754 0.00%Romanian Government International Bond €400,000 1.38% 2/12/2029 473,331 0.00%Romanian Government International Bond $400,000 4.38% 22/8/2023 431,738 0.00%Romanian Government International Bond $150,000 6.75% 7/2/2022 155,816 0.00%Romanian Government International Bond $100,000 4.00% 14/2/2051 104,981 0.00%test - - - 17,744,677 0.08%Russia 0.40% (2020: 0.41%)Russian Federal Bond-OFZ py600,000,000 6.50% 28/2/2024 8,170,144 0.04%Russian Federal Bond-OFZ py450,000,000 6.00% 6/10/2027 5,873,620 0.03%Russian Federal Bond-OFZ py365,000,000 7.60% 20/7/2022 5,066,698 0.02%Russian Federal Bond-OFZ py300,000,000 5.90% 12/3/2031 3,771,466 0.02%Russian Foreign Bond-Eurobond $2,800,000 5.25% 23/6/2047 3,515,600 0.02%Russian Foreign Bond-Eurobond €2,700,000 2.88% 4/12/2025 3,499,137 0.02%Russian Federal Bond-OFZ py245,000,000 7.65% 10/4/2030 3,487,980 0.02%Russian Foreign Bond-Eurobond $3,200,000 4.88% 16/9/2023 3,478,873 0.02%Russian Federal Bond-OFZ py249,000,000 7.40% 17/7/2024 3,461,508 0.02%Russian Foreign Bond-Eurobond $3,000,000 4.25% 23/6/2027 3,348,269 0.01%Russian Federal Bond-OFZ py205,000,000 7.70% 23/3/2033 2,942,112 0.01%Russian Federal Bond-OFZ py200,000,000 7.40% 7/12/2022 2,775,512 0.01%Russian Federal Bond-OFZ py200,000,000 7.25% 10/5/2034 2,768,188 0.01%Russian Foreign Bond-Eurobond $2,200,000 4.38% 21/3/2029 2,476,077 0.01%Russian Foreign Bond-Eurobond $2,000,000 5.10% 28/3/2035 2,375,837 0.01%Russian Foreign Bond-Eurobond $2,000,000 4.75% 27/5/2026 2,271,776 0.01%Russian Federal Bond-OFZ py150,000,000 7.95% 7/10/2026 2,146,184 0.01%Russian Federal Bond-OFZ py150,000,000 7.00% 25/1/2023 2,066,194 0.01%Russian Federal Bond-OFZ py135,000,000 7.05% 19/1/2028 1,860,172 0.01%Russian Federal Bond-OFZ py110,000,000 7.00% 16/8/2023 1,512,812 0.01%Gazprom PJSC Via Gaz Capital SA £1,000,000 4.25% 6/4/2024 1,469,528 0.01%Gazprom OAO Via Gaz Capital SA $950,000 8.63% 28/4/2034 1,418,035 0.01%Russian Federal Bond-OFZ py95,000,000 8.15% 3/2/2027 1,374,718 0.01%Russian Federal Bond-OFZ py100,000,000 6.90% 23/5/2029 1,363,671 0.01%Russian Foreign Bond-Eurobond $1,000,000 5.63% 4/4/2042 1,282,393 0.01%Gazprom PJSC via Gaz Finance plc €1,000,000 2.95% 15/4/2025 1,261,719 0.01%Gazprom PJSC Via Gaz Capital SA €1,000,000 3.13% 17/11/2023 1,251,530 0.01%Russian Federal Bond-OFZ py100,000,000 6.10% 18/7/2035 1,249,319 0.01%Russian Railways Via RZD Capital plc €1,000,000 2.20% 23/5/2027 1,249,125 0.00%Gazprom PJSC Via Gaz Capital SA $1,000,000 4.95% 6/2/2028 1,117,601 0.00%

422
Vanguard Global Bond Index Fund
Principal CouponMaturity
DateFair Value
US Dollars ($)% of Total
Net AssetsLukoil International Finance BV $1,000,000 4.56% 24/4/2023 1,060,138 0.00%Gazprom PJSC Via Gaz Capital SA $750,000 7.29% 16/8/2037 1,045,354 0.00%MMC Norilsk Nickel OJSC Via MMC Finance DAC $800,000 6.63% 14/10/2022 854,499 0.00%Novolipetsk Steel Via Steel Funding DAC $600,000 4.70% 30/5/2026 666,254 0.00%Gazprom Neft OAO Via GPN Capital SA $600,000 6.00% 27/11/2023 661,158 0.00%Russian Foreign Bond-Eurobond $600,000 4.50% 4/4/2022 617,324 0.00%Lukoil Securities BV $500,000 3.88% 6/5/2030 530,129 0.00%MMC Norilsk Nickel OJSC Via MMC Finance DAC $500,000 2.55% 11/9/2025 506,136 0.00%Lukoil International Finance BV $400,000 4.75% 2/11/2026 450,604 0.00%Russian Foreign Bond-Eurobond $250,000 12.75% 24/6/2028 417,855 0.00%Sibur Securities DAC $400,000 2.95% 8/7/2025 409,307 0.00%ALROSA Finance SA $300,000 3.10% 25/6/2027 307,852 0.00%Russian Foreign Bond-Eurobond $202,500 7.50% 31/3/2030 232,879 0.00%Severstal OAO Via Steel Capital SA $200,000 5.90% 17/10/2022 212,240 0.00%test - - - 87,877,527 0.40%Saudi Arabia 0.25% (2020: 0.22%)Saudi Government International Bond €4,280,000 0.00% 3/3/2024 5,066,889 0.02%Saudi Government International Bond $3,450,000 3.63% 4/3/2028 3,812,185 0.02%Saudi Arabian Oil Co. $3,000,000 3.50% 16/4/2029 3,247,600 0.02%Saudi Government International Bond $2,550,000 4.63% 4/10/2047 3,042,361 0.01%Saudi Government International Bond $2,100,000 5.25% 16/1/2050 2,753,899 0.01%Saudi Government International Bond $2,750,000 2.25% 2/2/2033 2,671,216 0.01%Saudi Government International Bond $2,250,000 4.38% 16/4/2029 2,603,085 0.01%Saudi Government International Bond €2,000,000 0.63% 3/3/2030 2,333,407 0.01%Saudi Government International Bond $1,800,000 4.50% 26/10/2046 2,107,120 0.01%Saudi Government International Bond $2,000,000 2.88% 4/3/2023 2,075,098 0.01%Saudi Government International Bond $1,600,000 5.00% 17/4/2049 2,017,575 0.01%KSA Sukuk Ltd. $1,500,000 4.30% 19/1/2029 1,727,480 0.01%Saudi Government International Bond $1,450,000 4.50% 17/4/2030 1,706,267 0.01%Saudi Government International Bond $1,400,000 4.50% 22/4/2060 1,692,680 0.01%Saudi Government International Bond $1,450,000 2.90% 22/10/2025 1,551,785 0.01%KSA Sukuk Ltd. $1,300,000 2.89% 20/4/2022 1,324,280 0.01%Saudi Electricity Global Sukuk Co. 4 $1,000,000 4.72% 27/9/2028 1,177,201 0.01%Saudi Arabian Oil Co. $1,000,000 4.25% 16/4/2039 1,120,755 0.01%Saudi Government International Bond $1,000,000 4.00% 17/4/2025 1,104,385 0.01%Saudi Electricity Global Sukuk Co. 3 $1,020,000 4.00% 8/4/2024 1,104,226 0.01%SABIC Capital II BV $1,000,000 4.00% 10/10/2023 1,073,113 0.01%Saudi Government International Bond $1,000,000 2.75% 3/2/2032 1,026,684 0.01%Saudi Government International Bond $1,000,000 3.45% 2/2/2061 997,057 0.00%Saudi Arabian Oil Co. $1,000,000 3.25% 24/11/2050 971,993 0.00%Saudi Arabian Oil Co. $1,000,000 3.50% 24/11/2070 970,599 0.00%Saudi Arabian Oil Co. $750,000 4.38% 16/4/2049 862,780 0.00%Saudi Electricity Global Sukuk Co. 4 $600,000 4.22% 27/1/2024 650,196 0.00%Saudi Government International Bond €520,000 2.00% 9/7/2039 636,940 0.00%SA Global Sukuk Ltd. $600,000 2.69% 17/6/2031 606,981 0.00%SA Global Sukuk Ltd. $600,000 0.95% 17/6/2024 599,724 0.00%Saudi Government International Bond $500,000 3.25% 22/10/2030 538,160 0.00%Saudi Electricity Global Sukuk Co. 3 $380,000 5.50% 8/4/2044 483,475 0.00%Samba Funding Ltd. $400,000 2.75% 2/10/2024 417,998 0.00%Acwa Power Management & Investments One Ltd. $299,679 5.95% 15/12/2039 357,703 0.00%Saudi Telecom Co. $300,000 3.89% 13/5/2029 331,518 0.00%KSA Sukuk Ltd. $300,000 3.63% 20/4/2027 330,560 0.00%Saudi Government International Bond $300,000 3.75% 21/1/2055 317,056 0.00%SA Global Sukuk Ltd. $250,000 1.60% 17/6/2026 249,336 0.00%Saudi Arabian Oil Co. $200,000 2.88% 16/4/2024 210,522 0.00%test - - - 55,871,889 0.25%Singapore 0.29% (2020: 0.28%)Singapore Government Bond SG($)7,500,000 1.75% 1/2/2023 5,696,638 0.03%Singapore Government Bond SG($)6,000,000 2.00% 1/2/2024 4,630,931 0.02%Singapore Government Bond SG($)5,000,000 2.88% 1/7/2029 4,141,870 0.02%Singapore Government Bond SG($)4,300,000 2.88% 1/9/2030 3,569,360 0.02%Singapore Government Bond SG($)3,600,000 2.75% 1/4/2042 3,059,045 0.02%Singapore Government Bond SG($)3,650,000 2.25% 1/8/2036 2,852,034 0.01%Singapore Government Bond SG($)3,200,000 3.50% 1/3/2027 2,692,792 0.01%Singapore Government Bond SG($)3,000,000 3.38% 1/9/2033 2,624,048 0.01%Singapore Government Bond SG($)3,500,000 0.50% 1/11/2025 2,573,836 0.01%Oversea-Chinese Banking Corp., Ltd. €2,000,000 0.63% 18/4/2025 2,450,986 0.01%Temasek Financial I Ltd. $2,500,000 2.25% 6/4/2051 2,408,697 0.01%Housing & Development Board SG($)3,000,000 3.10% 24/7/2024 2,380,281 0.01%Singapore Government Bond SG($)2,750,000 2.38% 1/7/2039 2,198,241 0.01%Singapore Government Bond SG($)2,500,000 2.75% 1/3/2046 2,163,576 0.01%
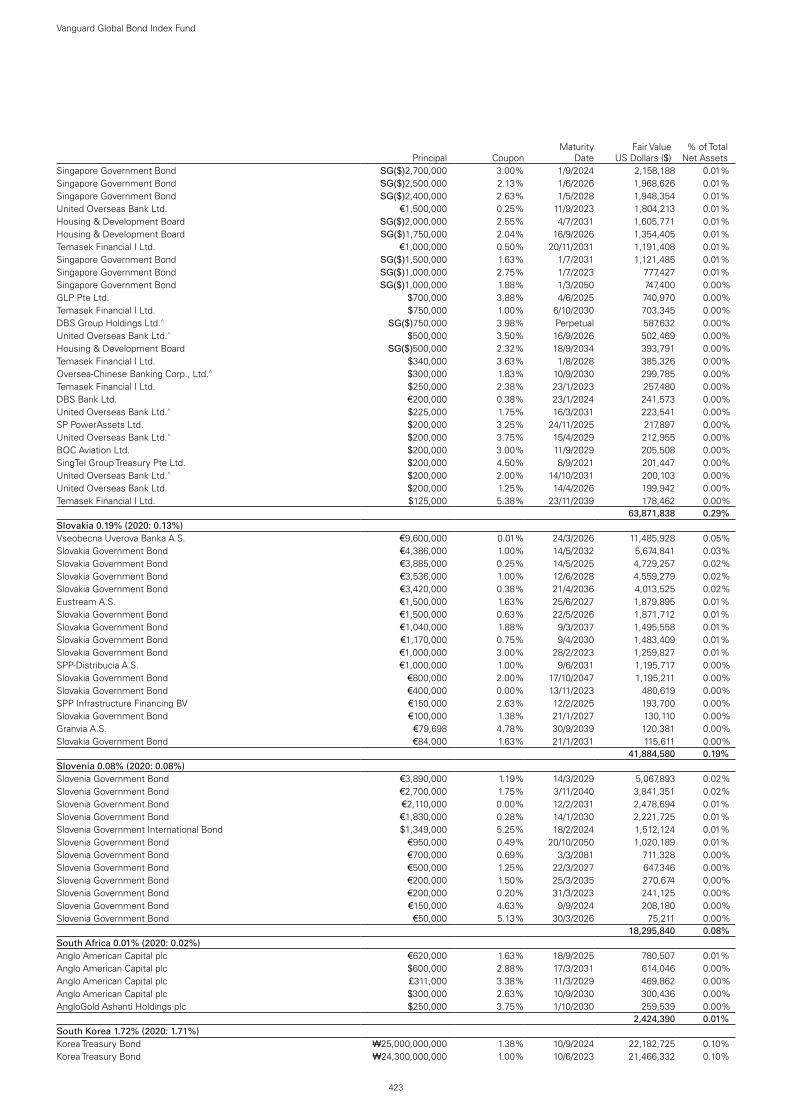
423
Vanguard Global Bond Index Fund
Principal CouponMaturity
DateFair Value
US Dollars ($)% of Total
Net AssetsSingapore Government Bond SG($)2,700,000 3.00% 1/9/2024 2,158,188 0.01%Singapore Government Bond SG($)2,500,000 2.13% 1/6/2026 1,968,626 0.01%Singapore Government Bond SG($)2,400,000 2.63% 1/5/2028 1,948,354 0.01%United Overseas Bank Ltd. €1,500,000 0.25% 11/9/2023 1,804,213 0.01%Housing & Development Board SG($)2,000,000 2.55% 4/7/2031 1,605,771 0.01%Housing & Development Board SG($)1,750,000 2.04% 16/9/2026 1,354,405 0.01%Temasek Financial I Ltd. €1,000,000 0.50% 20/11/2031 1,191,408 0.01%Singapore Government Bond SG($)1,500,000 1.63% 1/7/2031 1,121,485 0.01%Singapore Government Bond SG($)1,000,000 2.75% 1/7/2023 777,427 0.01%Singapore Government Bond SG($)1,000,000 1.88% 1/3/2050 747,400 0.00%GLP Pte Ltd. $700,000 3.88% 4/6/2025 740,970 0.00%Temasek Financial I Ltd. $750,000 1.00% 6/10/2030 703,345 0.00%DBS Group Holdings Ltd.^ SG($)750,000 3.98% Perpetual 587,632 0.00%United Overseas Bank Ltd.^ $500,000 3.50% 16/9/2026 502,469 0.00%Housing & Development Board SG($)500,000 2.32% 18/9/2034 393,791 0.00%Temasek Financial I Ltd. $340,000 3.63% 1/8/2028 385,326 0.00%Oversea-Chinese Banking Corp., Ltd.^ $300,000 1.83% 10/9/2030 299,785 0.00%Temasek Financial I Ltd. $250,000 2.38% 23/1/2023 257,480 0.00%DBS Bank Ltd. €200,000 0.38% 23/1/2024 241,573 0.00%United Overseas Bank Ltd.^ $225,000 1.75% 16/3/2031 223,541 0.00%SP PowerAssets Ltd. $200,000 3.25% 24/11/2025 217,897 0.00%United Overseas Bank Ltd.^ $200,000 3.75% 15/4/2029 212,955 0.00%BOC Aviation Ltd. $200,000 3.00% 11/9/2029 205,508 0.00%SingTel Group Treasury Pte Ltd. $200,000 4.50% 8/9/2021 201,447 0.00%United Overseas Bank Ltd.^ $200,000 2.00% 14/10/2031 200,103 0.00%United Overseas Bank Ltd. $200,000 1.25% 14/4/2026 199,942 0.00%Temasek Financial I Ltd. $125,000 5.38% 23/11/2039 178,462 0.00%test - - - 63,871,838 0.29%Slovakia 0.19% (2020: 0.13%)Vseobecna Uverova Banka A.S. €9,600,000 0.01% 24/3/2026 11,485,928 0.05%Slovakia Government Bond €4,386,000 1.00% 14/5/2032 5,674,841 0.03%Slovakia Government Bond €3,885,000 0.25% 14/5/2025 4,729,257 0.02%Slovakia Government Bond €3,536,000 1.00% 12/6/2028 4,559,279 0.02%Slovakia Government Bond €3,420,000 0.38% 21/4/2036 4,013,525 0.02%Eustream A.S. €1,500,000 1.63% 25/6/2027 1,879,895 0.01%Slovakia Government Bond €1,500,000 0.63% 22/5/2026 1,871,712 0.01%Slovakia Government Bond €1,040,000 1.88% 9/3/2037 1,495,558 0.01%Slovakia Government Bond €1,170,000 0.75% 9/4/2030 1,483,409 0.01%Slovakia Government Bond €1,000,000 3.00% 28/2/2023 1,259,827 0.01%SPP-Distribucia A.S. €1,000,000 1.00% 9/6/2031 1,195,717 0.00%Slovakia Government Bond €800,000 2.00% 17/10/2047 1,195,211 0.00%Slovakia Government Bond €400,000 0.00% 13/11/2023 480,619 0.00%SPP Infrastructure Financing BV €150,000 2.63% 12/2/2025 193,700 0.00%Slovakia Government Bond €100,000 1.38% 21/1/2027 130,110 0.00%Granvia A.S. €79,698 4.78% 30/9/2039 120,381 0.00%Slovakia Government Bond €84,000 1.63% 21/1/2031 115,611 0.00%test - - - 41,884,580 0.19%Slovenia 0.08% (2020: 0.08%)Slovenia Government Bond €3,890,000 1.19% 14/3/2029 5,067,893 0.02%Slovenia Government Bond €2,700,000 1.75% 3/11/2040 3,841,351 0.02%Slovenia Government Bond €2,110,000 0.00% 12/2/2031 2,478,694 0.01%Slovenia Government Bond €1,830,000 0.28% 14/1/2030 2,221,725 0.01%Slovenia Government International Bond $1,349,000 5.25% 18/2/2024 1,512,124 0.01%Slovenia Government Bond €950,000 0.49% 20/10/2050 1,020,189 0.01%Slovenia Government Bond €700,000 0.69% 3/3/2081 711,328 0.00%Slovenia Government Bond €500,000 1.25% 22/3/2027 647,346 0.00%Slovenia Government Bond €200,000 1.50% 25/3/2035 270,674 0.00%Slovenia Government Bond €200,000 0.20% 31/3/2023 241,125 0.00%Slovenia Government Bond €150,000 4.63% 9/9/2024 208,180 0.00%Slovenia Government Bond €50,000 5.13% 30/3/2026 75,211 0.00%test - - - 18,295,840 0.08%South Africa 0.01% (2020: 0.02%)Anglo American Capital plc €620,000 1.63% 18/9/2025 780,507 0.01%Anglo American Capital plc $600,000 2.88% 17/3/2031 614,046 0.00%Anglo American Capital plc £311,000 3.38% 11/3/2029 469,862 0.00%Anglo American Capital plc $300,000 2.63% 10/9/2030 300,436 0.00%AngloGold Ashanti Holdings plc $250,000 3.75% 1/10/2030 259,539 0.00%test - - - 2,424,390 0.01%South Korea 1.72% (2020: 1.71%)Korea Treasury Bond ₩25,000,000,000 1.38% 10/9/2024 22,182,725 0.10%Korea Treasury Bond ₩24,300,000,000 1.00% 10/6/2023 21,466,332 0.10%

424
Vanguard Global Bond Index Fund
Principal CouponMaturity
DateFair Value
US Dollars ($)% of Total
Net AssetsKorea Treasury Bond ₩21,800,000,000 1.25% 10/12/2022 19,397,407 0.09%Korea Treasury Bond ₩19,290,000,000 1.50% 10/3/2050 14,668,308 0.07%Korea Treasury Bond ₩16,000,000,000 2.00% 10/12/2021 14,306,778 0.07%Korea Treasury Bond ₩13,000,000,000 1.63% 10/6/2022 11,625,698 0.05%Korea Treasury Bond ₩11,580,000,000 2.00% 10/3/2049 9,921,547 0.05%Korea National Housing Bond I ₩10,000,000,000 1.75% 30/4/2022 9,612,016 0.04%Korea Treasury Bond ₩10,600,000,000 1.13% 10/9/2025 9,235,523 0.04%Korea Treasury Bond ₩10,000,000,000 2.00% 10/9/2022 9,038,050 0.04%Korea Treasury Bond ₩10,000,000,000 1.88% 10/3/2024 9,030,068 0.04%Korea Treasury Bond ₩10,000,000,000 1.50% 10/3/2025 8,887,385 0.04%Korea Treasury Bond ₩8,605,000,000 2.63% 10/3/2048 8,358,436 0.04%Korea Treasury Bond ₩9,500,000,000 1.50% 10/12/2026 8,285,079 0.04%Korea Treasury Bond ₩8,225,000,000 2.38% 10/12/2027 7,508,680 0.03%Korea Treasury Bond ₩8,000,000,000 2.25% 10/9/2023 7,285,540 0.03%Korea Treasury Bond ₩9,300,000,000 1.13% 10/9/2039 6,965,885 0.03%Korea Treasury Bond ₩7,850,000,000 1.88% 10/6/2029 6,847,370 0.03%Korea Treasury Bond ₩8,000,000,000 1.50% 10/12/2030 6,747,592 0.03%Korea Treasury Bond ₩7,300,000,000 2.38% 10/9/2038 6,684,319 0.03%Korea Treasury Bond ₩7,200,000,000 2.25% 10/9/2037 6,482,601 0.03%Korea Treasury Bond ₩7,000,000,000 2.13% 10/3/2047 6,162,294 0.03%Korea Treasury Bond ₩7,250,000,000 1.38% 10/6/2030 6,076,917 0.03%Korea Treasury Bond ₩6,400,330,000 2.63% 10/6/2028 5,934,227 0.03%Korea Treasury Bond ₩6,000,000,000 2.75% 10/12/2044 5,866,705 0.03%Korea Treasury Bond ₩7,000,000,000 1.50% 10/9/2036 5,708,220 0.03%Korea Treasury Bond ₩6,300,000,000 1.38% 10/12/2029 5,315,149 0.02%Korea Treasury Bond ₩5,500,000,000 2.25% 10/6/2025 5,002,026 0.02%Korea Treasury Bond ₩5,300,000,000 2.63% 10/9/2035 4,987,962 0.02%Kookmin Bank €4,100,000 0.05% 15/7/2025 4,908,609 0.02%Korea Treasury Bond ₩5,400,000,000 2.00% 10/3/2046 4,632,611 0.02%Korea Treasury Bond ₩5,000,000,000 2.25% 10/12/2025 4,544,970 0.02%Korea Treasury Bond ₩5,000,000,000 0.88% 10/12/2023 4,388,345 0.02%Korea Treasury Bond ₩5,000,000,000 1.25% 10/3/2026 4,358,164 0.02%Korea Treasury Bond ₩4,500,000,000 2.13% 10/6/2027 4,048,155 0.02%Korea Treasury Bond ₩4,300,000,000 3.00% 10/9/2024 4,024,770 0.02%Korea Treasury Bond ₩4,800,000,000 1.88% 10/3/2051 3,985,881 0.02%Korea Treasury Bond ₩4,500,000,000 1.50% 10/9/2040 3,576,009 0.02%Korea Treasury Bond ₩3,900,000,000 2.38% 10/12/2028 3,564,236 0.02%Korea Treasury Bond ₩3,000,000,000 5.50% 10/12/2029 3,381,327 0.02%Korea Treasury Bond ₩3,100,000,000 3.00% 10/12/2042 3,129,688 0.02%Korea Treasury Bond ₩2,850,000,000 3.75% 10/12/2033 2,963,895 0.01%Korea Housing Finance Corp. €2,000,000 0.01% 5/2/2025 2,389,828 0.01%Korea Housing Finance Corp. €2,000,000 0.01% 7/7/2025 2,388,544 0.01%Korea International Bond €1,960,000 0.00% 16/9/2025 2,336,960 0.01%Korea Treasury Bond ₩2,578,000,000 2.00% 10/9/2068 2,169,218 0.01%Korea Treasury Bond ₩1,800,000,000 4.00% 10/12/2031 1,880,074 0.01%Export-Import Bank of Korea €1,500,000 0.38% 26/3/2024 1,808,850 0.01%Korea Treasury Bond ₩2,000,000,000 1.88% 10/6/2026 1,785,821 0.01%Korea Treasury Bond ₩1,800,000,000 3.00% 10/3/2023 1,659,187 0.01%Korea Gas Corp. $1,500,000 2.25% 18/7/2026 1,572,996 0.01%Korea Treasury Bond ₩2,100,000,000 1.63% 10/9/2070 1,552,770 0.01%NongHyup Bank $1,400,000 1.88% 12/9/2021 1,403,457 0.01%Korea Treasury Bond ₩1,200,000,000 5.50% 10/3/2028 1,320,517 0.01%Korea International Bond $1,100,000 2.75% 19/1/2027 1,189,120 0.01%Export-Import Bank of Korea $1,200,000 1.25% 21/9/2030 1,143,831 0.01%Shinhan Bank Co., Ltd. $1,000,000 4.50% 26/3/2028 1,140,237 0.01%Korea Treasury Bond ₩1,000,000,000 4.75% 10/12/2030 1,089,861 0.01%POSCO $1,000,000 2.75% 15/7/2024 1,050,981 0.01%KT Corp. $1,000,000 2.50% 18/7/2026 1,048,978 0.01%Kookmin Bank $1,000,000 1.75% 4/5/2025 1,020,085 0.01%Korea Development Bank $1,000,000 1.63% 19/1/2031 982,982 0.01%Hyundai Capital America $950,000 2.38% 10/2/2023 974,155 0.01%Korea International Bond $750,000 4.13% 10/6/2044 957,184 0.01%Korea Treasury Bond ₩1,000,000,000 3.38% 10/9/2023 935,342 0.01%Korea Treasury Bond ₩1,000,000,000 3.75% 10/6/2022 913,138 0.01%Korea National Oil Corp. $850,000 1.25% 7/4/2026 845,371 0.00%Export-Import Bank of Korea $750,000 4.00% 14/1/2024 815,035 0.00%Korea Development Bank €630,000 0.00% 10/7/2024 750,473 0.00%Export-Import Bank of Korea $700,000 2.88% 21/1/2025 745,621 0.00%Korea National Oil Corp. $700,000 2.38% 7/4/2031 708,031 0.00%Korea International Bond $550,000 3.88% 20/9/2048 695,278 0.00%Hyundai Capital America $600,000 0.80% 8/1/2024 598,075 0.00%
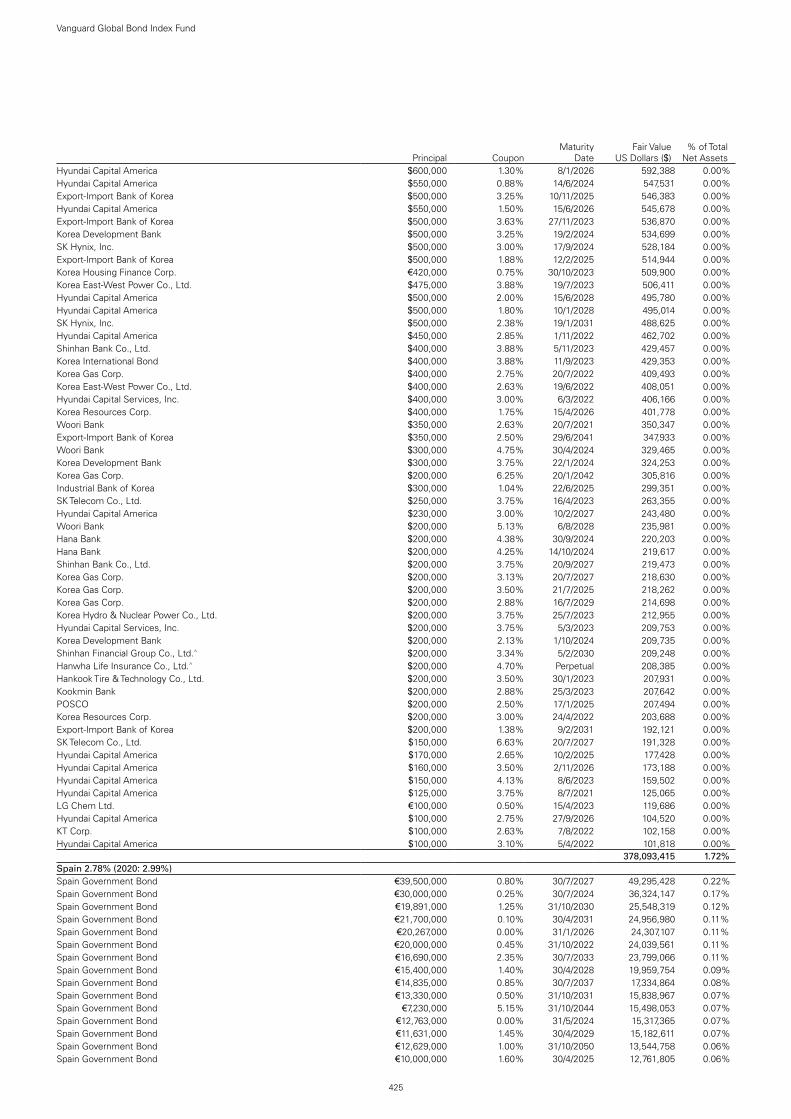
425
Vanguard Global Bond Index Fund
Principal CouponMaturity
DateFair Value
US Dollars ($)% of Total
Net AssetsHyundai Capital America $600,000 1.30% 8/1/2026 592,388 0.00%Hyundai Capital America $550,000 0.88% 14/6/2024 547,531 0.00%Export-Import Bank of Korea $500,000 3.25% 10/11/2025 546,383 0.00%Hyundai Capital America $550,000 1.50% 15/6/2026 545,678 0.00%Export-Import Bank of Korea $500,000 3.63% 27/11/2023 536,870 0.00%Korea Development Bank $500,000 3.25% 19/2/2024 534,699 0.00%SK Hynix, Inc. $500,000 3.00% 17/9/2024 528,184 0.00%Export-Import Bank of Korea $500,000 1.88% 12/2/2025 514,944 0.00%Korea Housing Finance Corp. €420,000 0.75% 30/10/2023 509,900 0.00%Korea East-West Power Co., Ltd. $475,000 3.88% 19/7/2023 506,411 0.00%Hyundai Capital America $500,000 2.00% 15/6/2028 495,780 0.00%Hyundai Capital America $500,000 1.80% 10/1/2028 495,014 0.00%SK Hynix, Inc. $500,000 2.38% 19/1/2031 488,625 0.00%Hyundai Capital America $450,000 2.85% 1/11/2022 462,702 0.00%Shinhan Bank Co., Ltd. $400,000 3.88% 5/11/2023 429,457 0.00%Korea International Bond $400,000 3.88% 11/9/2023 429,353 0.00%Korea Gas Corp. $400,000 2.75% 20/7/2022 409,493 0.00%Korea East-West Power Co., Ltd. $400,000 2.63% 19/6/2022 408,051 0.00%Hyundai Capital Services, Inc. $400,000 3.00% 6/3/2022 406,166 0.00%Korea Resources Corp. $400,000 1.75% 15/4/2026 401,778 0.00%Woori Bank $350,000 2.63% 20/7/2021 350,347 0.00%Export-Import Bank of Korea $350,000 2.50% 29/6/2041 347,933 0.00%Woori Bank $300,000 4.75% 30/4/2024 329,465 0.00%Korea Development Bank $300,000 3.75% 22/1/2024 324,253 0.00%Korea Gas Corp. $200,000 6.25% 20/1/2042 305,816 0.00%Industrial Bank of Korea $300,000 1.04% 22/6/2025 299,351 0.00%SK Telecom Co., Ltd. $250,000 3.75% 16/4/2023 263,355 0.00%Hyundai Capital America $230,000 3.00% 10/2/2027 243,480 0.00%Woori Bank $200,000 5.13% 6/8/2028 235,981 0.00%Hana Bank $200,000 4.38% 30/9/2024 220,203 0.00%Hana Bank $200,000 4.25% 14/10/2024 219,617 0.00%Shinhan Bank Co., Ltd. $200,000 3.75% 20/9/2027 219,473 0.00%Korea Gas Corp. $200,000 3.13% 20/7/2027 218,630 0.00%Korea Gas Corp. $200,000 3.50% 21/7/2025 218,262 0.00%Korea Gas Corp. $200,000 2.88% 16/7/2029 214,698 0.00%Korea Hydro & Nuclear Power Co., Ltd. $200,000 3.75% 25/7/2023 212,955 0.00%Hyundai Capital Services, Inc. $200,000 3.75% 5/3/2023 209,753 0.00%Korea Development Bank $200,000 2.13% 1/10/2024 209,735 0.00%Shinhan Financial Group Co., Ltd.^ $200,000 3.34% 5/2/2030 209,248 0.00%Hanwha Life Insurance Co., Ltd.^ $200,000 4.70% Perpetual 208,385 0.00%Hankook Tire & Technology Co., Ltd. $200,000 3.50% 30/1/2023 207,931 0.00%Kookmin Bank $200,000 2.88% 25/3/2023 207,642 0.00%POSCO $200,000 2.50% 17/1/2025 207,494 0.00%Korea Resources Corp. $200,000 3.00% 24/4/2022 203,688 0.00%Export-Import Bank of Korea $200,000 1.38% 9/2/2031 192,121 0.00%SK Telecom Co., Ltd. $150,000 6.63% 20/7/2027 191,328 0.00%Hyundai Capital America $170,000 2.65% 10/2/2025 177,428 0.00%Hyundai Capital America $160,000 3.50% 2/11/2026 173,188 0.00%Hyundai Capital America $150,000 4.13% 8/6/2023 159,502 0.00%Hyundai Capital America $125,000 3.75% 8/7/2021 125,065 0.00%LG Chem Ltd. €100,000 0.50% 15/4/2023 119,686 0.00%Hyundai Capital America $100,000 2.75% 27/9/2026 104,520 0.00%KT Corp. $100,000 2.63% 7/8/2022 102,158 0.00%Hyundai Capital America $100,000 3.10% 5/4/2022 101,818 0.00%test - - - 378,093,415 1.72%Spain 2.78% (2020: 2.99%)Spain Government Bond €39,500,000 0.80% 30/7/2027 49,295,428 0.22%Spain Government Bond €30,000,000 0.25% 30/7/2024 36,324,147 0.17%Spain Government Bond €19,891,000 1.25% 31/10/2030 25,548,319 0.12%Spain Government Bond €21,700,000 0.10% 30/4/2031 24,956,980 0.11%Spain Government Bond €20,267,000 0.00% 31/1/2026 24,307,107 0.11%Spain Government Bond €20,000,000 0.45% 31/10/2022 24,039,561 0.11%Spain Government Bond €16,690,000 2.35% 30/7/2033 23,799,066 0.11%Spain Government Bond €15,400,000 1.40% 30/4/2028 19,959,754 0.09%Spain Government Bond €14,835,000 0.85% 30/7/2037 17,334,864 0.08%Spain Government Bond €13,330,000 0.50% 31/10/2031 15,838,967 0.07%Spain Government Bond €7,230,000 5.15% 31/10/2044 15,498,053 0.07%Spain Government Bond €12,763,000 0.00% 31/5/2024 15,317,365 0.07%Spain Government Bond €11,631,000 1.45% 30/4/2029 15,182,611 0.07%Spain Government Bond €12,629,000 1.00% 31/10/2050 13,544,758 0.06%Spain Government Bond €10,000,000 1.60% 30/4/2025 12,761,805 0.06%

426
Vanguard Global Bond Index Fund
Principal CouponMaturity
DateFair Value
US Dollars ($)% of Total
Net AssetsSpain Government Bond €6,357,000 4.90% 30/7/2040 12,640,127 0.06%Spain Government Bond €9,581,000 0.50% 30/4/2030 11,575,025 0.05%Spain Government Bond €8,409,000 1.95% 30/4/2026 11,034,134 0.05%Spain Government Bond €6,565,000 2.90% 31/10/2046 10,519,608 0.05%Spain Government Bond €8,500,000 1.20% 31/10/2040 10,235,652 0.05%Spain Government Bond €7,000,000 3.80% 30/4/2024 9,305,439 0.04%Spain Government Bond €7,506,000 0.00% 30/4/2023 8,984,673 0.04%Spain Government Bond €4,400,000 4.70% 30/7/2041 8,627,455 0.04%Spain Government Bond €6,350,000 4.40% 31/10/2023 8,397,697 0.04%Spain Government Bond €5,971,000 1.40% 30/7/2028 7,751,698 0.04%Spain Government Bond €5,996,000 0.00% 31/1/2028 7,097,926 0.03%Spain Government Bond €5,050,000 5.40% 31/1/2023 6,553,849 0.03%Spain Government Bond €4,500,000 1.50% 30/4/2027 5,842,745 0.03%CaixaBank SA €4,700,000 1.00% 14/3/2023 5,708,497 0.03%Spain Government Bond €3,550,000 4.80% 31/1/2024 4,787,312 0.02%Spain Government Bond €4,375,000 1.45% 31/10/2071 4,574,340 0.02%Spain Government Bond €2,399,000 3.45% 30/7/2066 4,384,246 0.02%Spain Government Bond €2,933,000 2.75% 31/10/2024 3,849,183 0.02%Fondo De Titulizacion Del Deficit Del Sistema Electrico FTA €3,100,000 0.50% 17/3/2023 3,734,163 0.02%Banco Santander SA ¥400,000,000 0.46% 5/12/2024 3,616,607 0.02%Spain Government Bond €2,500,000 4.65% 30/7/2025 3,575,698 0.02%Telefonica Emisiones SA €2,800,000 1.20% 21/8/2027 3,510,886 0.02%Programa Cedulas TDA Fondo de Titulizacion de Activos €2,100,000 4.25% 10/4/2031 3,468,478 0.02%Spain Government Bond €1,900,000 4.20% 31/1/2037 3,366,813 0.02%Basque Government €2,500,000 0.45% 30/4/2032 2,928,450 0.01%Autonomous Community of Andalusia Spain €2,400,000 0.50% 30/4/2031 2,820,900 0.01%Telefonica Emisiones SA €2,200,000 1.07% 5/2/2024 2,685,738 0.01%Spain Government Bond €2,201,000 0.35% 30/7/2023 2,656,160 0.01%Bankinter SA €2,000,000 1.25% 7/2/2028 2,568,135 0.01%Basque Government €2,000,000 0.85% 30/4/2030 2,478,881 0.01%Spain Government Bond €1,500,000 5.15% 31/10/2028 2,438,558 0.01%Santander Consumer Finance SA €2,000,000 0.38% 17/1/2025 2,400,279 0.01%Instituto de Credito Oficial €2,000,000 0.00% 30/4/2027 2,381,990 0.01%Spain Government Bond €1,521,000 2.70% 31/10/2048 2,368,449 0.01%Telefonica Emisiones SA $1,900,000 4.10% 8/3/2027 2,138,798 0.01%Autonomous Community of Madrid Spain €1,650,000 0.42% 30/4/2031 1,938,668 0.01%CaixaBank SA €1,600,000 0.63% 1/10/2024 1,927,794 0.01%Santander Consumer Finance SA €1,600,000 0.50% 14/11/2026 1,924,656 0.01%Banco de Sabadell SA €1,600,000 0.13% 10/2/2028 1,919,448 0.01%Spain Government Bond €1,367,000 1.85% 30/7/2035 1,853,044 0.01%Fondo De Titulizacion Del Deficit Del Sistema Electrico FTA €1,500,000 0.85% 17/12/2023 1,832,233 0.01%Cajamar Caja Rural SCC €1,500,000 0.88% 18/6/2023 1,820,544 0.01%CaixaBank SA €1,500,000 1.13% 5/8/2022 1,809,324 0.01%Banco Bilbao Vizcaya Argentaria SA €1,500,000 0.50% 14/1/2027 1,789,845 0.01%Banco Santander SA €1,500,000 0.50% 4/2/2027 1,785,864 0.01%Autonomous Community of Madrid Spain €1,500,000 0.42% 30/4/2030 1,785,401 0.01%Banco Santander SA €1,400,000 0.88% 9/5/2031 1,783,097 0.01%Telefonica Emisiones SA £1,000,000 5.45% 8/10/2029 1,757,650 0.01%Autonomous Community of Madrid Spain €1,300,000 1.77% 30/4/2028 1,708,643 0.01%CaixaBank SA €1,300,000 1.13% 17/5/2024 1,594,013 0.01%Banco Santander SA €1,200,000 0.25% 10/7/2029 1,454,081 0.01%Telefonica Emisiones SA €1,200,000 0.66% 3/2/2030 1,441,830 0.01%Telefonica Emisiones SA €1,100,000 1.46% 13/4/2026 1,392,883 0.01%Merlin Properties Socimi SA €1,000,000 2.38% 13/7/2027 1,294,091 0.01%Telefonica Emisiones SA $1,025,000 5.21% 8/3/2047 1,283,215 0.01%CaixaBank SA €1,000,000 1.00% 17/1/2028 1,267,621 0.01%Adif-Alta Velocidad €1,000,000 0.95% 30/4/2027 1,248,260 0.01%CaixaBank SA^ €1,000,000 2.75% 14/7/2028 1,238,470 0.01%Banco Santander SA €1,000,000 1.63% 22/10/2030 1,222,419 0.01%Deutsche Bank SA Espanola €1,000,000 0.50% 11/3/2024 1,211,932 0.01%Banco Santander SA €1,000,000 0.75% 9/9/2022 1,202,429 0.01%Autonomous Community of Madrid Spain €900,000 2.15% 30/4/2027 1,199,316 0.01%Instituto de Credito Oficial €1,000,000 0.00% 30/4/2026 1,197,527 0.01%Merlin Properties Socimi SA €1,000,000 1.38% 1/6/2030 1,176,991 0.01%Banco de Sabadell SA €900,000 1.63% 7/3/2024 1,110,891 0.01%Fondo De Titulizacion Del Deficit Del Sistema Electrico FTA €900,000 0.01% 17/9/2025 1,079,381 0.01%Iberdrola International BV^ €900,000 1.83% Perpetual 1,072,647 0.01%Bankinter SA^ €900,000 1.25% 23/12/2032 1,069,784 0.01%Banco Santander SA €900,000 0.20% 11/2/2028 1,058,636 0.01%Banco Santander SA €900,000 0.10% 27/2/2032 1,058,147 0.01%Banco Santander SA $1,000,000 2.96% 25/3/2031 1,030,812 0.01%
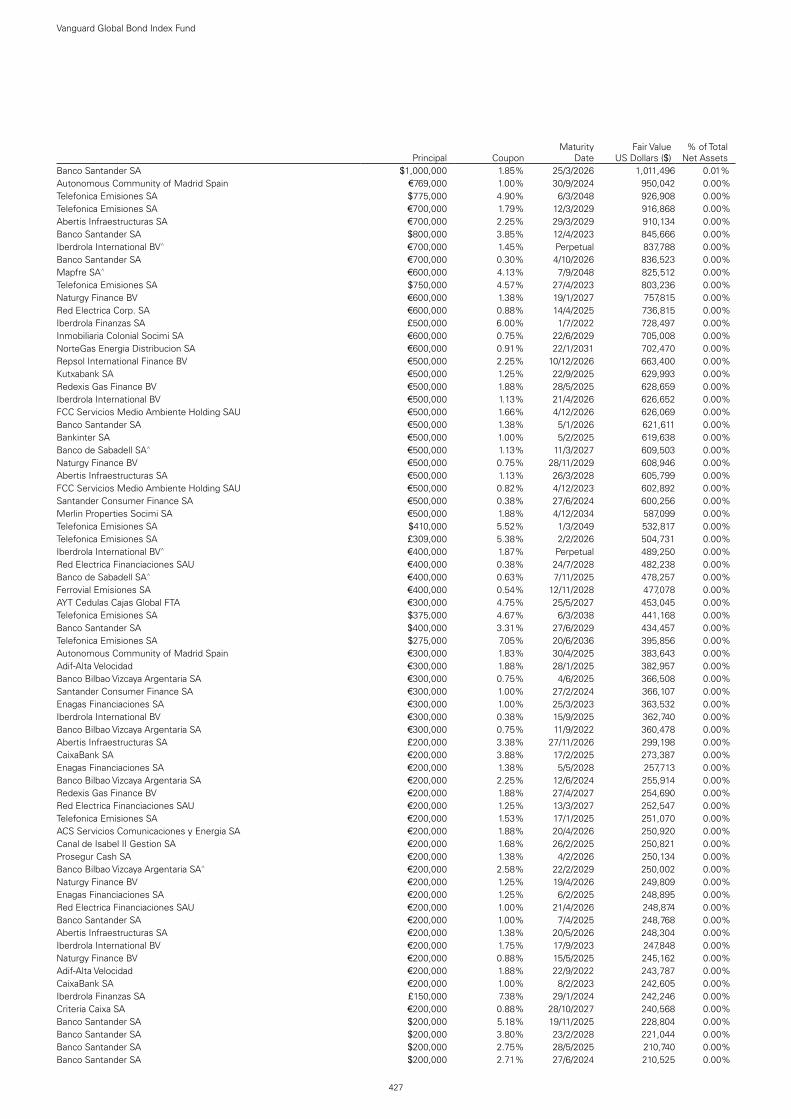
427
Vanguard Global Bond Index Fund
Principal CouponMaturity
DateFair Value
US Dollars ($)% of Total
Net AssetsBanco Santander SA $1,000,000 1.85% 25/3/2026 1,011,496 0.01%Autonomous Community of Madrid Spain €769,000 1.00% 30/9/2024 950,042 0.00%Telefonica Emisiones SA $775,000 4.90% 6/3/2048 926,908 0.00%Telefonica Emisiones SA €700,000 1.79% 12/3/2029 916,868 0.00%Abertis Infraestructuras SA €700,000 2.25% 29/3/2029 910,134 0.00%Banco Santander SA $800,000 3.85% 12/4/2023 845,666 0.00%Iberdrola International BV^ €700,000 1.45% Perpetual 837,788 0.00%Banco Santander SA €700,000 0.30% 4/10/2026 836,523 0.00%Mapfre SA^ €600,000 4.13% 7/9/2048 825,512 0.00%Telefonica Emisiones SA $750,000 4.57% 27/4/2023 803,236 0.00%Naturgy Finance BV €600,000 1.38% 19/1/2027 757,815 0.00%Red Electrica Corp. SA €600,000 0.88% 14/4/2025 736,815 0.00%Iberdrola Finanzas SA £500,000 6.00% 1/7/2022 728,497 0.00%Inmobiliaria Colonial Socimi SA €600,000 0.75% 22/6/2029 705,008 0.00%NorteGas Energia Distribucion SA €600,000 0.91% 22/1/2031 702,470 0.00%Repsol International Finance BV €500,000 2.25% 10/12/2026 663,400 0.00%Kutxabank SA €500,000 1.25% 22/9/2025 629,993 0.00%Redexis Gas Finance BV €500,000 1.88% 28/5/2025 628,659 0.00%Iberdrola International BV €500,000 1.13% 21/4/2026 626,652 0.00%FCC Servicios Medio Ambiente Holding SAU €500,000 1.66% 4/12/2026 626,069 0.00%Banco Santander SA €500,000 1.38% 5/1/2026 621,611 0.00%Bankinter SA €500,000 1.00% 5/2/2025 619,638 0.00%Banco de Sabadell SA^ €500,000 1.13% 11/3/2027 609,503 0.00%Naturgy Finance BV €500,000 0.75% 28/11/2029 608,946 0.00%Abertis Infraestructuras SA €500,000 1.13% 26/3/2028 605,799 0.00%FCC Servicios Medio Ambiente Holding SAU €500,000 0.82% 4/12/2023 602,892 0.00%Santander Consumer Finance SA €500,000 0.38% 27/6/2024 600,256 0.00%Merlin Properties Socimi SA €500,000 1.88% 4/12/2034 587,099 0.00%Telefonica Emisiones SA $410,000 5.52% 1/3/2049 532,817 0.00%Telefonica Emisiones SA £309,000 5.38% 2/2/2026 504,731 0.00%Iberdrola International BV^ €400,000 1.87% Perpetual 489,250 0.00%Red Electrica Financiaciones SAU €400,000 0.38% 24/7/2028 482,238 0.00%Banco de Sabadell SA^ €400,000 0.63% 7/11/2025 478,257 0.00%Ferrovial Emisiones SA €400,000 0.54% 12/11/2028 477,078 0.00%AYT Cedulas Cajas Global FTA €300,000 4.75% 25/5/2027 453,045 0.00%Telefonica Emisiones SA $375,000 4.67% 6/3/2038 441,168 0.00%Banco Santander SA $400,000 3.31% 27/6/2029 434,457 0.00%Telefonica Emisiones SA $275,000 7.05% 20/6/2036 395,856 0.00%Autonomous Community of Madrid Spain €300,000 1.83% 30/4/2025 383,643 0.00%Adif-Alta Velocidad €300,000 1.88% 28/1/2025 382,957 0.00%Banco Bilbao Vizcaya Argentaria SA €300,000 0.75% 4/6/2025 366,508 0.00%Santander Consumer Finance SA €300,000 1.00% 27/2/2024 366,107 0.00%Enagas Financiaciones SA €300,000 1.00% 25/3/2023 363,532 0.00%Iberdrola International BV €300,000 0.38% 15/9/2025 362,740 0.00%Banco Bilbao Vizcaya Argentaria SA €300,000 0.75% 11/9/2022 360,478 0.00%Abertis Infraestructuras SA £200,000 3.38% 27/11/2026 299,198 0.00%CaixaBank SA €200,000 3.88% 17/2/2025 273,387 0.00%Enagas Financiaciones SA €200,000 1.38% 5/5/2028 257,713 0.00%Banco Bilbao Vizcaya Argentaria SA €200,000 2.25% 12/6/2024 255,914 0.00%Redexis Gas Finance BV €200,000 1.88% 27/4/2027 254,690 0.00%Red Electrica Financiaciones SAU €200,000 1.25% 13/3/2027 252,547 0.00%Telefonica Emisiones SA €200,000 1.53% 17/1/2025 251,070 0.00%ACS Servicios Comunicaciones y Energia SA €200,000 1.88% 20/4/2026 250,920 0.00%Canal de Isabel II Gestion SA €200,000 1.68% 26/2/2025 250,821 0.00%Prosegur Cash SA €200,000 1.38% 4/2/2026 250,134 0.00%Banco Bilbao Vizcaya Argentaria SA^ €200,000 2.58% 22/2/2029 250,002 0.00%Naturgy Finance BV €200,000 1.25% 19/4/2026 249,809 0.00%Enagas Financiaciones SA €200,000 1.25% 6/2/2025 248,895 0.00%Red Electrica Financiaciones SAU €200,000 1.00% 21/4/2026 248,874 0.00%Banco Santander SA €200,000 1.00% 7/4/2025 248,768 0.00%Abertis Infraestructuras SA €200,000 1.38% 20/5/2026 248,304 0.00%Iberdrola International BV €200,000 1.75% 17/9/2023 247,848 0.00%Naturgy Finance BV €200,000 0.88% 15/5/2025 245,162 0.00%Adif-Alta Velocidad €200,000 1.88% 22/9/2022 243,787 0.00%CaixaBank SA €200,000 1.00% 8/2/2023 242,605 0.00%Iberdrola Finanzas SA £150,000 7.38% 29/1/2024 242,246 0.00%Criteria Caixa SA €200,000 0.88% 28/10/2027 240,568 0.00%Banco Santander SA $200,000 5.18% 19/11/2025 228,804 0.00%Banco Santander SA $200,000 3.80% 23/2/2028 221,044 0.00%Banco Santander SA $200,000 2.75% 28/5/2025 210,740 0.00%Banco Santander SA $200,000 2.71% 27/6/2024 210,525 0.00%
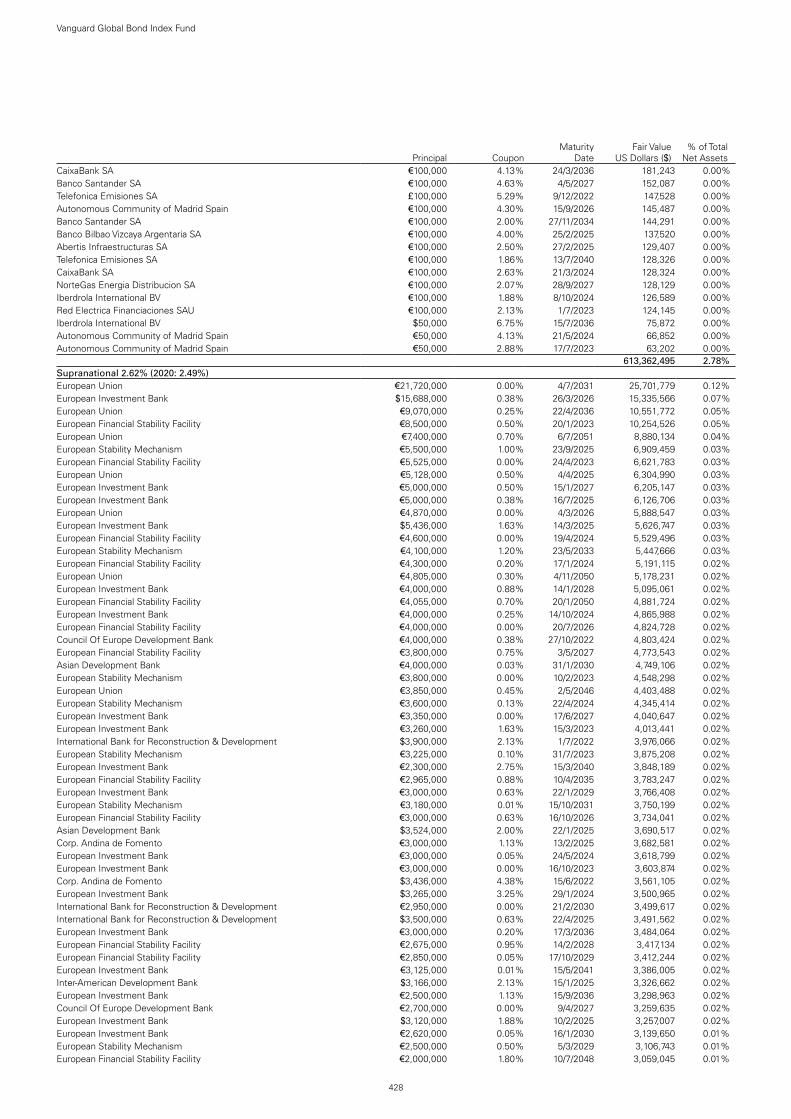
428
Vanguard Global Bond Index Fund
Principal CouponMaturity
DateFair Value
US Dollars ($)% of Total
Net AssetsCaixaBank SA €100,000 4.13% 24/3/2036 181,243 0.00%Banco Santander SA €100,000 4.63% 4/5/2027 152,087 0.00%Telefonica Emisiones SA £100,000 5.29% 9/12/2022 147,528 0.00%Autonomous Community of Madrid Spain €100,000 4.30% 15/9/2026 145,487 0.00%Banco Santander SA €100,000 2.00% 27/11/2034 144,291 0.00%Banco Bilbao Vizcaya Argentaria SA €100,000 4.00% 25/2/2025 137,520 0.00%Abertis Infraestructuras SA €100,000 2.50% 27/2/2025 129,407 0.00%Telefonica Emisiones SA €100,000 1.86% 13/7/2040 128,326 0.00%CaixaBank SA €100,000 2.63% 21/3/2024 128,324 0.00%NorteGas Energia Distribucion SA €100,000 2.07% 28/9/2027 128,129 0.00%Iberdrola International BV €100,000 1.88% 8/10/2024 126,589 0.00%Red Electrica Financiaciones SAU €100,000 2.13% 1/7/2023 124,145 0.00%Iberdrola International BV $50,000 6.75% 15/7/2036 75,872 0.00%Autonomous Community of Madrid Spain €50,000 4.13% 21/5/2024 66,852 0.00%Autonomous Community of Madrid Spain €50,000 2.88% 17/7/2023 63,202 0.00%test - - - 613,362,495 2.78%Supranational 2.62% (2020: 2.49%)European Union €21,720,000 0.00% 4/7/2031 25,701,779 0.12%European Investment Bank $15,688,000 0.38% 26/3/2026 15,335,566 0.07%European Union €9,070,000 0.25% 22/4/2036 10,551,772 0.05%European Financial Stability Facility €8,500,000 0.50% 20/1/2023 10,254,526 0.05%European Union €7,400,000 0.70% 6/7/2051 8,880,134 0.04%European Stability Mechanism €5,500,000 1.00% 23/9/2025 6,909,459 0.03%European Financial Stability Facility €5,525,000 0.00% 24/4/2023 6,621,783 0.03%European Union €5,128,000 0.50% 4/4/2025 6,304,990 0.03%European Investment Bank €5,000,000 0.50% 15/1/2027 6,205,147 0.03%European Investment Bank €5,000,000 0.38% 16/7/2025 6,126,706 0.03%European Union €4,870,000 0.00% 4/3/2026 5,888,547 0.03%European Investment Bank $5,436,000 1.63% 14/3/2025 5,626,747 0.03%European Financial Stability Facility €4,600,000 0.00% 19/4/2024 5,529,496 0.03%European Stability Mechanism €4,100,000 1.20% 23/5/2033 5,447,666 0.03%European Financial Stability Facility €4,300,000 0.20% 17/1/2024 5,191,115 0.02%European Union €4,805,000 0.30% 4/11/2050 5,178,231 0.02%European Investment Bank €4,000,000 0.88% 14/1/2028 5,095,061 0.02%European Financial Stability Facility €4,055,000 0.70% 20/1/2050 4,881,724 0.02%European Investment Bank €4,000,000 0.25% 14/10/2024 4,865,988 0.02%European Financial Stability Facility €4,000,000 0.00% 20/7/2026 4,824,728 0.02%Council Of Europe Development Bank €4,000,000 0.38% 27/10/2022 4,803,424 0.02%European Financial Stability Facility €3,800,000 0.75% 3/5/2027 4,773,543 0.02%Asian Development Bank €4,000,000 0.03% 31/1/2030 4,749,106 0.02%European Stability Mechanism €3,800,000 0.00% 10/2/2023 4,548,298 0.02%European Union €3,850,000 0.45% 2/5/2046 4,403,488 0.02%European Stability Mechanism €3,600,000 0.13% 22/4/2024 4,345,414 0.02%European Investment Bank €3,350,000 0.00% 17/6/2027 4,040,647 0.02%European Investment Bank €3,260,000 1.63% 15/3/2023 4,013,441 0.02%International Bank for Reconstruction & Development $3,900,000 2.13% 1/7/2022 3,976,066 0.02%European Stability Mechanism €3,225,000 0.10% 31/7/2023 3,875,208 0.02%European Investment Bank €2,300,000 2.75% 15/3/2040 3,848,189 0.02%European Financial Stability Facility €2,965,000 0.88% 10/4/2035 3,783,247 0.02%European Investment Bank €3,000,000 0.63% 22/1/2029 3,766,408 0.02%European Stability Mechanism €3,180,000 0.01% 15/10/2031 3,750,199 0.02%European Financial Stability Facility €3,000,000 0.63% 16/10/2026 3,734,041 0.02%Asian Development Bank $3,524,000 2.00% 22/1/2025 3,690,517 0.02%Corp. Andina de Fomento €3,000,000 1.13% 13/2/2025 3,682,581 0.02%European Investment Bank €3,000,000 0.05% 24/5/2024 3,618,799 0.02%European Investment Bank €3,000,000 0.00% 16/10/2023 3,603,874 0.02%Corp. Andina de Fomento $3,436,000 4.38% 15/6/2022 3,561,105 0.02%European Investment Bank $3,265,000 3.25% 29/1/2024 3,500,965 0.02%International Bank for Reconstruction & Development €2,950,000 0.00% 21/2/2030 3,499,617 0.02%International Bank for Reconstruction & Development $3,500,000 0.63% 22/4/2025 3,491,562 0.02%European Investment Bank €3,000,000 0.20% 17/3/2036 3,484,064 0.02%European Financial Stability Facility €2,675,000 0.95% 14/2/2028 3,417,134 0.02%European Financial Stability Facility €2,850,000 0.05% 17/10/2029 3,412,244 0.02%European Investment Bank €3,125,000 0.01% 15/5/2041 3,386,005 0.02%Inter-American Development Bank $3,166,000 2.13% 15/1/2025 3,326,662 0.02%European Investment Bank €2,500,000 1.13% 15/9/2036 3,298,963 0.02%Council Of Europe Development Bank €2,700,000 0.00% 9/4/2027 3,259,635 0.02%European Investment Bank $3,120,000 1.88% 10/2/2025 3,257,007 0.02%European Investment Bank €2,620,000 0.05% 16/1/2030 3,139,650 0.01%European Stability Mechanism €2,500,000 0.50% 5/3/2029 3,106,743 0.01%European Financial Stability Facility €2,000,000 1.80% 10/7/2048 3,059,045 0.01%
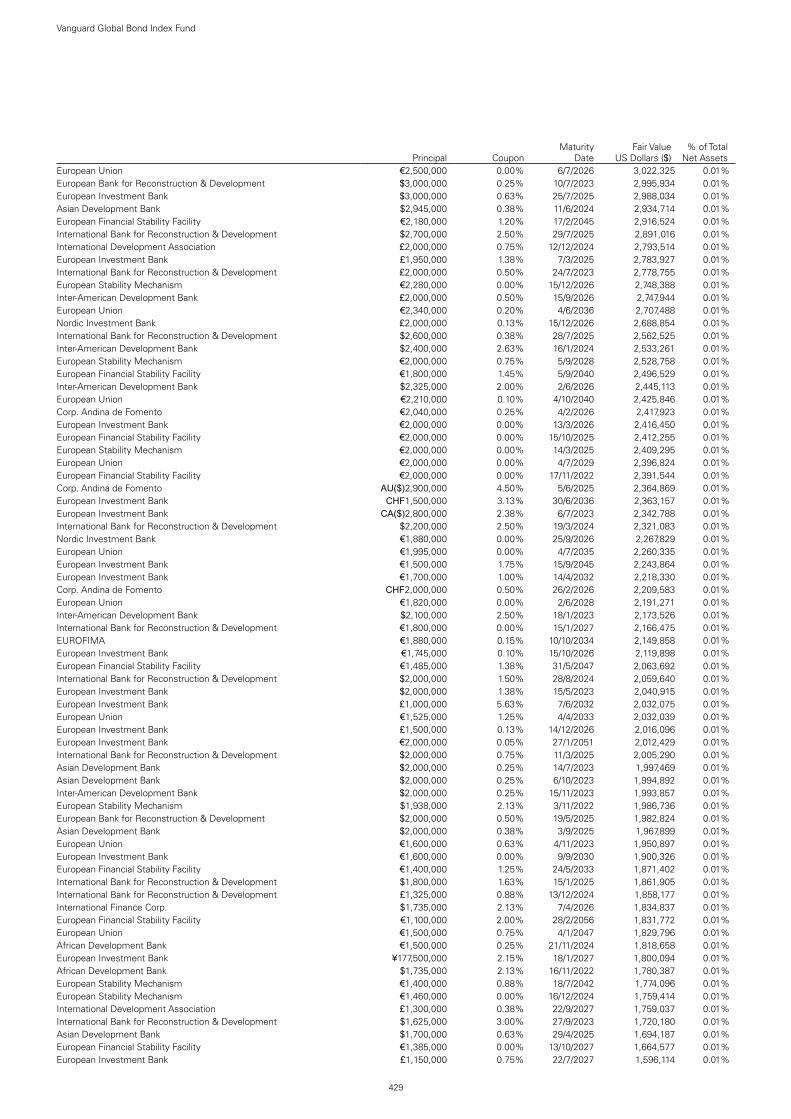
429
Vanguard Global Bond Index Fund
Principal CouponMaturity
DateFair Value
US Dollars ($)% of Total
Net AssetsEuropean Union €2,500,000 0.00% 6/7/2026 3,022,325 0.01%European Bank for Reconstruction & Development $3,000,000 0.25% 10/7/2023 2,995,934 0.01%European Investment Bank $3,000,000 0.63% 25/7/2025 2,988,034 0.01%Asian Development Bank $2,945,000 0.38% 11/6/2024 2,934,714 0.01%European Financial Stability Facility €2,180,000 1.20% 17/2/2045 2,916,524 0.01%International Bank for Reconstruction & Development $2,700,000 2.50% 29/7/2025 2,891,016 0.01%International Development Association £2,000,000 0.75% 12/12/2024 2,793,514 0.01%European Investment Bank £1,950,000 1.38% 7/3/2025 2,783,927 0.01%International Bank for Reconstruction & Development £2,000,000 0.50% 24/7/2023 2,778,755 0.01%European Stability Mechanism €2,280,000 0.00% 15/12/2026 2,748,388 0.01%Inter-American Development Bank £2,000,000 0.50% 15/9/2026 2,747,944 0.01%European Union €2,340,000 0.20% 4/6/2036 2,707,488 0.01%Nordic Investment Bank £2,000,000 0.13% 15/12/2026 2,688,854 0.01%International Bank for Reconstruction & Development $2,600,000 0.38% 28/7/2025 2,562,525 0.01%Inter-American Development Bank $2,400,000 2.63% 16/1/2024 2,533,261 0.01%European Stability Mechanism €2,000,000 0.75% 5/9/2028 2,528,758 0.01%European Financial Stability Facility €1,800,000 1.45% 5/9/2040 2,496,529 0.01%Inter-American Development Bank $2,325,000 2.00% 2/6/2026 2,445,113 0.01%European Union €2,210,000 0.10% 4/10/2040 2,425,846 0.01%Corp. Andina de Fomento €2,040,000 0.25% 4/2/2026 2,417,923 0.01%European Investment Bank €2,000,000 0.00% 13/3/2026 2,416,450 0.01%European Financial Stability Facility €2,000,000 0.00% 15/10/2025 2,412,255 0.01%European Stability Mechanism €2,000,000 0.00% 14/3/2025 2,409,295 0.01%European Union €2,000,000 0.00% 4/7/2029 2,396,824 0.01%European Financial Stability Facility €2,000,000 0.00% 17/11/2022 2,391,544 0.01%Corp. Andina de Fomento AU($)2,900,000 4.50% 5/6/2025 2,364,869 0.01%European Investment Bank CHF1,500,000 3.13% 30/6/2036 2,363,157 0.01%European Investment Bank CA($)2,800,000 2.38% 6/7/2023 2,342,788 0.01%International Bank for Reconstruction & Development $2,200,000 2.50% 19/3/2024 2,321,083 0.01%Nordic Investment Bank €1,880,000 0.00% 25/9/2026 2,267,829 0.01%European Union €1,995,000 0.00% 4/7/2035 2,260,335 0.01%European Investment Bank €1,500,000 1.75% 15/9/2045 2,243,864 0.01%European Investment Bank €1,700,000 1.00% 14/4/2032 2,218,330 0.01%Corp. Andina de Fomento CHF2,000,000 0.50% 26/2/2026 2,209,583 0.01%European Union €1,820,000 0.00% 2/6/2028 2,191,271 0.01%Inter-American Development Bank $2,100,000 2.50% 18/1/2023 2,173,526 0.01%International Bank for Reconstruction & Development €1,800,000 0.00% 15/1/2027 2,166,475 0.01%EUROFIMA €1,880,000 0.15% 10/10/2034 2,149,858 0.01%European Investment Bank €1,745,000 0.10% 15/10/2026 2,119,898 0.01%European Financial Stability Facility €1,485,000 1.38% 31/5/2047 2,063,692 0.01%International Bank for Reconstruction & Development $2,000,000 1.50% 28/8/2024 2,059,640 0.01%European Investment Bank $2,000,000 1.38% 15/5/2023 2,040,915 0.01%European Investment Bank £1,000,000 5.63% 7/6/2032 2,032,075 0.01%European Union €1,525,000 1.25% 4/4/2033 2,032,039 0.01%European Investment Bank £1,500,000 0.13% 14/12/2026 2,016,096 0.01%European Investment Bank €2,000,000 0.05% 27/1/2051 2,012,429 0.01%International Bank for Reconstruction & Development $2,000,000 0.75% 11/3/2025 2,005,290 0.01%Asian Development Bank $2,000,000 0.25% 14/7/2023 1,997,469 0.01%Asian Development Bank $2,000,000 0.25% 6/10/2023 1,994,892 0.01%Inter-American Development Bank $2,000,000 0.25% 15/11/2023 1,993,857 0.01%European Stability Mechanism $1,938,000 2.13% 3/11/2022 1,986,736 0.01%European Bank for Reconstruction & Development $2,000,000 0.50% 19/5/2025 1,982,824 0.01%Asian Development Bank $2,000,000 0.38% 3/9/2025 1,967,899 0.01%European Union €1,600,000 0.63% 4/11/2023 1,950,897 0.01%European Investment Bank €1,600,000 0.00% 9/9/2030 1,900,326 0.01%European Financial Stability Facility €1,400,000 1.25% 24/5/2033 1,871,402 0.01%International Bank for Reconstruction & Development $1,800,000 1.63% 15/1/2025 1,861,905 0.01%International Bank for Reconstruction & Development £1,325,000 0.88% 13/12/2024 1,858,177 0.01%International Finance Corp. $1,735,000 2.13% 7/4/2026 1,834,837 0.01%European Financial Stability Facility €1,100,000 2.00% 28/2/2056 1,831,772 0.01%European Union €1,500,000 0.75% 4/1/2047 1,829,796 0.01%African Development Bank €1,500,000 0.25% 21/11/2024 1,818,658 0.01%European Investment Bank ¥177,500,000 2.15% 18/1/2027 1,800,094 0.01%African Development Bank $1,735,000 2.13% 16/11/2022 1,780,387 0.01%European Stability Mechanism €1,400,000 0.88% 18/7/2042 1,774,096 0.01%European Stability Mechanism €1,460,000 0.00% 16/12/2024 1,759,414 0.01%International Development Association £1,300,000 0.38% 22/9/2027 1,759,037 0.01%International Bank for Reconstruction & Development $1,625,000 3.00% 27/9/2023 1,720,180 0.01%Asian Development Bank $1,700,000 0.63% 29/4/2025 1,694,187 0.01%European Financial Stability Facility €1,385,000 0.00% 13/10/2027 1,664,577 0.01%European Investment Bank £1,150,000 0.75% 22/7/2027 1,596,114 0.01%

430
Vanguard Global Bond Index Fund
Principal CouponMaturity
DateFair Value
US Dollars ($)% of Total
Net AssetsEuropean Investment Bank $1,500,000 2.88% 15/8/2023 1,580,542 0.01%Inter-American Development Bank $1,525,000 3.00% 26/9/2022 1,577,786 0.01%African Development Bank $1,465,000 3.00% 20/9/2023 1,549,893 0.01%European Financial Stability Facility €1,000,000 1.75% 17/7/2053 1,548,496 0.01%European Investment Bank €1,300,000 0.00% 14/1/2031 1,540,260 0.01%Asian Development Bank $1,410,000 2.50% 2/11/2027 1,524,178 0.01%European Financial Stability Facility €1,200,000 1.75% 27/6/2024 1,519,545 0.01%International Bank for Reconstruction & Development $1,500,000 1.38% 20/4/2028 1,513,123 0.01%Inter-American Development Bank $1,500,000 0.63% 15/7/2025 1,493,717 0.01%European Financial Stability Facility €1,200,000 2.25% 5/9/2022 1,471,967 0.01%International Bank for Reconstruction & Development $1,500,000 1.25% 10/2/2031 1,465,557 0.01%Inter-American Development Bank $1,360,000 2.38% 7/7/2027 1,458,153 0.01%European Investment Bank €1,000,000 1.50% 16/10/2048 1,456,654 0.01%Nordic Investment Bank €1,200,000 0.13% 10/6/2024 1,449,691 0.01%Asian Development Bank NZ($)2,000,000 3.00% 17/1/2023 1,447,460 0.01%International Bank for Reconstruction & Development €1,200,000 0.01% 24/4/2028 1,439,410 0.01%International Bank for Reconstruction & Development $1,300,000 3.13% 20/11/2025 1,430,559 0.01%European Investment Bank £1,000,000 1.00% 21/9/2026 1,411,368 0.01%Nordic Investment Bank £1,000,000 1.13% 15/12/2023 1,410,380 0.01%Inter-American Development Bank $1,353,000 1.75% 14/3/2025 1,405,676 0.01%International Bank for Reconstruction & Development £1,000,000 1.00% 21/12/2029 1,395,801 0.01%International Bank for Reconstruction & Development $1,300,000 2.50% 25/11/2024 1,382,840 0.01%Asian Development Bank $1,400,000 0.50% 4/2/2026 1,377,567 0.01%International Finance Corp. £964,000 1.38% 7/3/2025 1,376,569 0.01%European Stability Mechanism €1,000,000 1.13% 3/5/2032 1,317,063 0.01%European Investment Bank €1,000,000 1.00% 14/11/2042 1,316,367 0.01%International Bank for Reconstruction & Development €964,000 1.20% 8/8/2034 1,279,356 0.01%European Financial Stability Facility €1,080,000 0.00% 20/1/2031 1,278,969 0.01%Inter-American Development Bank $1,200,000 2.25% 18/6/2029 1,276,837 0.01%European Financial Stability Facility €760,000 3.88% 30/3/2032 1,271,226 0.01%European Investment Bank €1,000,000 2.13% 15/1/2024 1,267,593 0.01%European Financial Stability Facility €1,000,000 0.88% 26/7/2027 1,266,287 0.01%Nordic Investment Bank £900,000 1.13% 15/12/2022 1,260,115 0.01%International Bank for Reconstruction & Development €1,000,000 0.63% 12/1/2033 1,244,641 0.01%European Investment Bank SEK(kr)10,000,000 1.38% 12/5/2028 1,229,657 0.01%European Investment Bank €1,000,000 0.38% 14/4/2026 1,229,606 0.01%Asian Development Bank $1,200,000 1.88% 19/7/2022 1,221,447 0.01%Nordic Investment Bank €1,000,000 0.38% 19/9/2022 1,199,676 0.01%Inter-American Development Bank AU($)1,500,000 3.75% 25/7/2022 1,169,695 0.01%European Investment Bank AU($)1,500,000 1.70% 15/11/2024 1,165,663 0.01%European Investment Bank $1,100,000 2.63% 15/3/2024 1,164,331 0.01%European Investment Bank $1,100,000 2.25% 24/6/2024 1,156,695 0.01%Asian Development Bank $1,100,000 2.75% 17/3/2023 1,146,608 0.01%Asian Development Bank NZ($)1,500,000 3.50% 30/5/2024 1,121,366 0.01%Asian Development Bank $1,100,000 1.75% 13/9/2022 1,120,411 0.01%Banque Ouest Africaine de Developpement $1,000,000 4.70% 22/10/2031 1,083,731 0.01%Inter-American Development Bank $950,000 3.13% 18/9/2028 1,068,672 0.01%European Investment Bank $1,000,000 3.13% 14/12/2023 1,066,640 0.01%European Investment Bank €800,000 1.13% 15/11/2032 1,056,584 0.01%Asian Development Bank $975,000 2.63% 30/1/2024 1,029,904 0.01%Asian Development Bank $1,000,000 1.50% 18/10/2024 1,029,733 0.01%EUROFIMA €845,000 0.25% 9/2/2024 1,018,729 0.01%Inter-American Development Bank $950,000 3.00% 21/2/2024 1,013,498 0.01%Inter-American Development Bank $1,000,000 0.50% 24/5/2023 1,004,279 0.01%International Bank for Reconstruction & Development $970,000 1.75% 23/10/2029 997,764 0.00%International Bank for Reconstruction & Development $1,000,000 0.13% 20/4/2023 997,586 0.00%International Finance Corp. $1,000,000 0.38% 16/7/2025 985,824 0.00%Asian Infrastructure Investment Bank $1,000,000 0.50% 27/1/2026 983,292 0.00%Nordic Investment Bank $1,000,000 0.38% 11/9/2025 982,798 0.00%European Investment Bank $1,000,000 1.25% 14/2/2031 978,302 0.00%International Bank for Reconstruction & Development $1,000,000 0.75% 24/11/2027 974,133 0.00%European Investment Bank $960,000 1.38% 6/9/2022 973,517 0.00%Inter-American Development Bank $1,000,000 0.63% 16/9/2027 968,646 0.00%European Investment Bank €840,000 0.01% 15/11/2035 953,931 0.00%International Bank for Reconstruction & Development $1,000,000 0.88% 14/5/2030 953,551 0.00%International Bank for Reconstruction & Development $1,000,000 0.75% 26/8/2030 938,704 0.00%International Bank for Reconstruction & Development $900,000 1.88% 19/6/2023 927,948 0.00%IDB Trust Services Ltd. $900,000 2.39% 12/4/2022 912,715 0.00%Asian Infrastructure Investment Bank $850,000 2.25% 16/5/2024 891,708 0.00%European Union €730,000 0.00% 4/11/2025 882,476 0.00%Africa Finance Corp. $800,000 4.38% 17/4/2026 871,928 0.00%

431
Vanguard Global Bond Index Fund
Principal CouponMaturity
DateFair Value
US Dollars ($)% of Total
Net AssetsEuropean Investment Bank AU($)1,000,000 5.00% 22/8/2022 792,604 0.00%European Investment Bank $740,000 2.50% 15/3/2023 768,059 0.00%Corp. Andina de Fomento €600,000 1.63% 3/6/2025 751,915 0.00%International Bank for Reconstruction & Development $750,000 0.88% 15/7/2026 748,298 0.00%European Stability Mechanism €628,931 0.00% 17/1/2022 748,073 0.00%European Investment Bank €600,000 0.50% 13/11/2037 730,112 0.00%Inter-American Development Bank £500,000 1.38% 15/12/2024 712,940 0.00%European Investment Bank €590,000 0.00% 25/3/2025 711,784 0.00%Asian Development Bank £500,000 1.13% 15/12/2025 708,567 0.00%European Investment Bank €450,000 2.63% 15/3/2035 700,557 0.00%International Bank for Reconstruction & Development $700,000 0.25% 24/11/2023 697,882 0.00%International Bank for Reconstruction & Development €700,000 0.20% 21/1/2061 695,661 0.00%Council Of Europe Development Bank €550,000 1.75% 24/4/2024 694,086 0.00%European Investment Bank $500,000 4.88% 15/2/2036 689,572 0.00%Inter-American Development Bank $700,000 1.13% 13/1/2031 676,461 0.00%European Investment Bank £350,000 3.88% 8/6/2037 666,693 0.00%European Union €500,000 1.13% 4/4/2036 657,377 0.00%European Investment Bank €500,000 1.00% 14/3/2031 650,878 0.00%International Bank for Reconstruction & Development CA($)770,000 1.80% 26/7/2024 639,779 0.00%European Investment Bank €400,000 3.00% 14/10/2033 635,613 0.00%European Financial Stability Facility €500,000 2.13% 19/2/2024 634,400 0.00%International Finance Corp. $600,000 2.88% 31/7/2023 631,632 0.00%European Stability Mechanism €500,000 0.50% 2/3/2026 617,016 0.00%European Stability Mechanism $600,000 1.38% 11/9/2024 614,714 0.00%Asian Development Bank €515,000 0.00% 24/10/2029 611,415 0.00%Nordic Investment Bank $600,000 1.38% 17/10/2022 608,899 0.00%European Financial Stability Facility €610,000 0.05% 18/1/2052 605,939 0.00%International Development Association $600,000 0.88% 28/4/2026 598,475 0.00%European Investment Bank €400,000 2.75% 13/9/2030 595,884 0.00%European Bank for Reconstruction & Development $550,000 2.75% 7/3/2023 572,850 0.00%European Investment Bank £400,000 2.50% 31/10/2022 569,702 0.00%Asian Development Bank $480,000 3.13% 26/9/2028 540,217 0.00%Arab Petroleum Investments Corp. $500,000 4.13% 18/9/2023 536,699 0.00%International Bank for Reconstruction & Development €500,000 0.25% 10/1/2050 532,625 0.00%European Investment Bank $500,000 2.50% 15/10/2024 531,391 0.00%Council Of Europe Development Bank $500,000 2.50% 27/2/2024 526,931 0.00%Asian Development Bank $500,000 1.88% 24/1/2030 518,099 0.00%International Development Association $495,000 2.75% 24/4/2023 516,936 0.00%International Finance Corp. $500,000 1.38% 16/10/2024 512,645 0.00%Asian Development Bank $500,000 1.63% 24/1/2023 510,848 0.00%European Investment Bank £200,000 4.63% 12/10/2054 510,777 0.00%Nordic Investment Bank $500,000 0.38% 19/5/2023 500,740 0.00%Asian Development Bank $500,000 1.50% 4/3/2031 500,738 0.00%Asian Infrastructure Investment Bank $500,000 0.50% 28/5/2025 495,039 0.00%European Bank for Reconstruction & Development $500,000 0.50% 28/1/2026 492,034 0.00%African Development Bank €400,000 0.13% 7/10/2026 483,756 0.00%Nordic Investment Bank €400,000 0.00% 6/4/2023 479,208 0.00%International Bank for Reconstruction & Development CA($)610,000 0.88% 28/9/2027 475,358 0.00%International Finance Corp. $500,000 0.75% 27/8/2030 469,270 0.00%International Bank for Reconstruction & Development CA($)555,000 1.90% 16/1/2025 462,689 0.00%Council Of Europe Development Bank $450,000 0.25% 20/10/2023 448,776 0.00%International Bank for Reconstruction & Development $400,000 7.63% 19/1/2023 445,556 0.00%International Bank for Reconstruction & Development CA($)555,000 0.75% 2/7/2025 442,670 0.00%European Bank for Reconstruction & Development $420,000 1.63% 27/9/2024 433,832 0.00%Inter-American Development Bank AU($)500,000 4.75% 27/8/2024 424,425 0.00%African Export-Import Bank $400,000 3.99% 21/9/2029 420,473 0.00%European Stability Mechanism €350,000 0.01% 4/3/2030 416,853 0.00%Corp. Andina de Fomento $400,000 2.75% 6/1/2023 412,562 0.00%International Bank for Reconstruction & Development AU($)500,000 3.00% 19/10/2026 411,689 0.00%Asian Development Bank $400,000 1.75% 19/9/2029 411,216 0.00%Council Of Europe Development Bank $400,000 1.38% 27/2/2025 409,947 0.00%International Finance Corp. $400,000 2.00% 24/10/2022 409,376 0.00%International Bank for Reconstruction & Development AU($)500,000 2.20% 27/2/2024 392,901 0.00%European Investment Bank £200,000 6.00% 7/12/2028 379,811 0.00%European Financial Stability Facility €300,000 0.40% 17/2/2025 366,385 0.00%European Investment Bank €250,000 3.50% 15/4/2027 363,260 0.00%EUROFIMA €300,000 0.25% 25/4/2023 360,411 0.00%Asian Development Bank $360,000 1.25% 9/6/2028 359,702 0.00%Nordic Investment Bank $350,000 0.50% 21/1/2026 344,572 0.00%European Investment Bank $350,000 0.75% 23/9/2030 328,491 0.00%European Stability Mechanism €200,000 1.85% 1/12/2055 326,400 0.00%

432
Vanguard Global Bond Index Fund
Principal CouponMaturity
DateFair Value
US Dollars ($)% of Total
Net AssetsEuropean Investment Bank $300,000 2.13% 13/4/2026 317,523 0.00%Asian Development Bank $300,000 2.00% 24/4/2026 315,473 0.00%Nordic Investment Bank $300,000 2.25% 21/5/2024 314,946 0.00%Council Of Europe Development Bank $300,000 2.63% 13/2/2023 311,204 0.00%Inter-American Development Bank CA($)375,000 1.70% 10/10/2024 310,468 0.00%European Financial Stability Facility €250,000 1.88% 23/5/2023 310,382 0.00%European Investment Bank €250,000 3.00% 28/9/2022 309,933 0.00%European Investment Bank $300,000 2.00% 15/12/2022 307,754 0.00%IDB Trust Services Ltd. $300,000 2.26% 26/9/2022 306,164 0.00%European Stability Mechanism $300,000 0.38% 10/9/2025 294,846 0.00%International Development Association $300,000 0.38% 23/9/2025 294,652 0.00%International Development Association $300,000 1.00% 3/12/2030 286,681 0.00%Council Of Europe Development Bank $285,000 0.38% 10/6/2024 283,877 0.00%International Finance Corp. £200,000 1.25% 15/12/2023 282,989 0.00%European Investment Bank €200,000 2.75% 15/9/2025 269,241 0.00%European Investment Bank $250,000 2.38% 24/5/2027 268,213 0.00%European Investment Bank $270,000 0.63% 21/10/2027 261,378 0.00%European Financial Stability Facility €150,000 3.38% 3/4/2037 259,861 0.00%European Investment Bank AU($)300,000 4.75% 7/8/2024 254,164 0.00%Asian Development Bank $225,000 2.75% 19/1/2028 246,931 0.00%European Financial Stability Facility €150,000 3.00% 4/9/2034 241,798 0.00%Inter-American Development Bank CA($)255,000 4.40% 26/1/2026 235,372 0.00%Banque Ouest Africaine de Developpement $200,000 5.00% 27/7/2027 222,526 0.00%Asian Development Bank $200,000 2.63% 12/1/2027 217,023 0.00%African Export-Import Bank $200,000 4.13% 20/6/2024 213,546 0.00%Africa Finance Corp. $200,000 3.88% 13/4/2024 212,161 0.00%Nordic Investment Bank $200,000 2.88% 19/7/2023 210,270 0.00%European Union €150,000 2.50% 4/11/2027 209,314 0.00%Inter-American Development Bank CA($)265,000 0.88% 27/8/2027 206,505 0.00%European Bank for Reconstruction & Development $200,000 1.50% 13/2/2025 205,923 0.00%Council Of Europe Development Bank $200,000 1.75% 26/9/2022 203,792 0.00%Asian Development Bank $200,000 1.88% 10/8/2022 203,760 0.00%Council Of Europe Development Bank $200,000 0.25% 10/6/2023 199,824 0.00%Asian Development Bank CA($)208,000 4.65% 16/2/2027 197,426 0.00%European Investment Bank €100,000 3.63% 14/3/2042 192,054 0.00%European Union €100,000 3.38% 4/4/2038 174,984 0.00%European Investment Bank CA($)200,000 2.38% 18/1/2023 166,276 0.00%International Finance Corp. CA($)200,000 1.38% 13/9/2024 164,113 0.00%Inter-American Development Bank $150,000 3.00% 4/10/2023 158,858 0.00%Inter-American Development Bank $150,000 2.00% 23/7/2026 157,722 0.00%Inter-American Development Bank CA($)175,000 0.75% 15/10/2025 139,077 0.00%Council Of Europe Development Bank €100,000 0.75% 9/6/2025 124,168 0.00%Asian Development Bank $110,000 2.38% 10/8/2027 118,082 0.00%EUROFIMA CA($)100,000 4.55% 30/3/2027 92,871 0.00%International Finance Corp. CA($)100,000 2.38% 19/7/2023 83,737 0.00%European Investment Bank $75,000 1.63% 9/10/2029 76,588 0.00%International Bank for Reconstruction & Development CA($)90,000 1.95% 20/9/2029 73,831 0.00%Inter-American Development Bank $50,000 3.88% 28/10/2041 63,756 0.00%Asian Development Bank $40,000 2.13% 19/3/2025 42,102 0.00%test - - - 576,681,049 2.62%Sweden 0.76% (2020: 0.76%)Stadshypotek AB SEK(kr)100,000,000 0.50% 1/6/2026 11,729,827 0.05%Sveriges Sakerstallda Obligationer AB SEK(kr)90,000,000 0.50% 11/6/2025 10,609,307 0.05%Sweden Government Bond SEK(kr)57,500,000 0.75% 12/11/2029 7,005,274 0.03%Sweden Government Bond SEK(kr)55,000,000 1.50% 13/11/2023 6,697,887 0.03%Stadshypotek AB SEK(kr)50,000,000 1.50% 1/6/2023 6,015,184 0.03%Nordea Hypotek AB SEK(kr)50,000,000 1.00% 17/9/2025 6,013,060 0.03%Skandinaviska Enskilda Banken AB SEK(kr)50,000,000 1.00% 18/12/2024 6,008,528 0.03%Swedbank Hypotek AB SEK(kr)40,000,000 1.00% 18/9/2024 4,802,989 0.02%Lansforsakringar Hypotek AB SEK(kr)35,000,000 1.25% 20/9/2023 4,203,263 0.02%Danske Hypotek AB SEK(kr)32,000,000 1.00% 20/12/2023 3,828,226 0.02%Sweden Government Bond SEK(kr)29,280,000 1.38% 23/6/2071 3,602,035 0.02%Sweden Government Bond SEK(kr)26,000,000 1.00% 12/11/2026 3,205,153 0.02%Skandinaviska Enskilda Banken AB €2,600,000 0.63% 30/1/2023 3,138,069 0.02%Stadshypotek AB SEK(kr)26,000,000 1.00% 3/9/2025 3,126,529 0.02%Kommuninvest I Sverige AB SEK(kr)25,000,000 0.75% 22/2/2023 2,960,893 0.01%Sveriges Sakerstallda Obligationer AB €2,000,000 0.63% 30/10/2025 2,467,027 0.01%Lansforsakringar Hypotek AB €2,000,000 0.63% 29/1/2026 2,465,357 0.01%Nordea Hypotek AB SEK(kr)20,000,000 1.25% 20/9/2023 2,401,658 0.01%Nordea Hypotek AB SEK(kr)20,000,000 1.00% 18/9/2024 2,401,401 0.01%Kommuninvest I Sverige AB SEK(kr)20,000,000 1.00% 13/11/2023 2,391,235 0.01%

433
Vanguard Global Bond Index Fund
Principal CouponMaturity
DateFair Value
US Dollars ($)% of Total
Net AssetsSvensk Exportkredit AB $2,400,000 0.63% 14/5/2025 2,385,024 0.01%Sweden Government Bond SEK(kr)22,000,000 0.50% 24/11/2045 2,364,682 0.01%Skandinaviska Enskilda Banken AB SEK(kr)19,000,000 1.50% 15/12/2021 2,237,850 0.01%Kommuninvest I Sverige AB SEK(kr)18,000,000 1.00% 12/11/2026 2,166,887 0.01%Sweden Government Bond SEK(kr)12,000,000 3.50% 30/3/2039 2,060,033 0.01%Swedbank Hypotek AB €1,500,000 0.45% 23/8/2023 1,814,397 0.01%Svensk Exportkredit AB $1,750,000 0.25% 29/9/2023 1,743,347 0.01%Svensk Exportkredit AB £1,150,000 0.13% 15/12/2025 1,557,990 0.01%Stadshypotek AB SEK(kr)12,000,000 1.50% 3/12/2024 1,465,638 0.01%Swedbank AB £1,000,000 1.63% 28/12/2022 1,406,724 0.01%Skandinaviska Enskilda Banken AB $1,350,000 2.20% 12/12/2022 1,386,003 0.01%Stadshypotek AB SEK(kr)10,000,000 2.00% 1/9/2028 1,272,513 0.01%Stadshypotek AB €1,000,000 0.38% 13/3/2026 1,222,826 0.01%Swedbank AB^ €1,000,000 1.00% 22/11/2027 1,200,175 0.01%Svenska Handelsbanken AB €1,000,000 0.13% 18/6/2024 1,199,251 0.01%Skandinaviska Enskilda Banken AB €1,000,000 0.05% 1/7/2024 1,196,183 0.01%Swedbank Hypotek AB €980,000 0.05% 28/5/2025 1,179,014 0.01%Stadshypotek AB SEK(kr)10,000,000 1.50% 15/12/2021 1,177,959 0.01%Vattenfall AB €990,000 0.13% 12/2/2029 1,156,059 0.01%Svenska Handelsbanken AB £800,000 1.63% 15/12/2023 1,136,024 0.01%Sweden Government Bond SEK(kr)8,000,000 2.50% 12/5/2025 1,031,969 0.01%Skandinaviska Enskilda Banken AB^ €833,000 1.38% 31/10/2028 1,015,121 0.01%Swedbank AB $1,000,000 0.60% 25/9/2023 1,001,523 0.01%Fastighets AB Balder €800,000 1.88% 14/3/2025 997,081 0.01%Fastighets AB Balder €800,000 1.13% 29/1/2027 965,922 0.01%Danske Hypotek AB SEK(kr)8,000,000 1.00% 21/12/2022 949,962 0.01%SBB Treasury OYJ €800,000 1.13% 26/11/2029 944,944 0.01%Svensk Exportkredit AB $900,000 1.63% 14/11/2022 916,892 0.01%Kommuninvest I Sverige AB $900,000 0.38% 19/6/2024 895,649 0.01%Samhallsbyggnadsbolaget i Norden AB €700,000 1.13% 4/9/2026 851,084 0.01%Svenska Handelsbanken AB €700,000 1.13% 14/12/2022 849,386 0.01%Sweden Government Bond SEK(kr)7,000,000 3.50% 1/6/2022 847,288 0.00%Skandinaviska Enskilda Banken AB €700,000 0.38% 11/2/2027 836,472 0.00%Balder Finland OYJ €700,000 1.38% 24/5/2030 828,709 0.00%Svenska Handelsbanken AB €700,000 0.05% 3/9/2026 827,844 0.00%Balder Finland OYJ €700,000 1.00% 20/1/2029 817,370 0.00%Akelius Residential Property Financing BV €700,000 0.75% 22/2/2030 816,171 0.00%Essity AB €700,000 0.25% 8/2/2031 804,816 0.00%Svensk Exportkredit AB $765,000 2.00% 30/8/2022 780,680 0.00%Swedbank AB^ €650,000 0.30% 20/5/2027 771,181 0.00%Kommuninvest I Sverige AB $750,000 1.63% 24/10/2022 763,804 0.00%Svenska Handelsbanken AB $700,000 3.90% 20/11/2023 758,503 0.00%Svenska Handelsbanken AB^ €600,000 1.63% 5/3/2029 739,067 0.00%Samhallsbyggnadsbolaget i Norden AB €600,000 1.00% 12/8/2027 718,882 0.00%Kommuninvest I Sverige AB $700,000 0.13% 20/7/2022 699,542 0.00%Sveriges Sakerstallda Obligationer AB €500,000 1.25% 19/4/2033 660,929 0.00%Svenska Handelsbanken AB $650,000 0.63% 30/6/2023 652,946 0.00%Akelius Residential Property AB €528,000 1.13% 14/3/2024 643,397 0.00%Samhallsbyggnadsbolaget i Norden AB €500,000 1.75% 14/1/2025 621,360 0.00%Swedbank AB €500,000 0.75% 5/5/2025 611,805 0.00%Tele2 AB €500,000 1.13% 15/5/2024 611,001 0.00%Securitas AB €500,000 1.13% 20/2/2024 609,815 0.00%Akelius Residential Property Financing BV €500,000 1.13% 11/1/2029 607,849 0.00%Kommuninvest I Sverige AB $600,000 0.50% 29/11/2024 597,065 0.00%Sagax Euro Mtn NL BV €500,000 1.00% 17/5/2029 590,688 0.00%SBB Treasury OYJ €500,000 0.75% 14/12/2028 580,958 0.00%Sweden Government Bond SEK(kr)4,000,000 2.25% 1/6/2032 560,314 0.00%Telia Co. AB €400,000 2.13% 20/2/2034 546,162 0.00%Tele2 AB €400,000 2.13% 15/5/2028 523,176 0.00%Svenska Handelsbanken AB^ $500,000 1.42% 11/6/2027 498,501 0.00%Svenska Handelsbanken AB $500,000 0.55% 11/6/2024 497,851 0.00%Svensk Exportkredit AB $500,000 0.38% 30/7/2024 496,542 0.00%Vattenfall AB €400,000 0.50% 24/6/2026 484,577 0.00%Svenska Handelsbanken AB €390,000 1.00% 15/4/2025 483,234 0.00%Swedbank AB €400,000 0.40% 29/8/2023 481,850 0.00%Vattenfall AB €400,000 0.05% 15/10/2025 475,835 0.00%Essity AB €400,000 0.50% 3/2/2030 475,093 0.00%Atlas Copco AB €370,000 0.63% 30/8/2026 452,855 0.00%Swedbank AB $400,000 1.30% 2/6/2023 406,160 0.00%Kommuninvest I Sverige AB $400,000 0.38% 16/2/2024 399,037 0.00%Telia Co. AB €300,000 1.63% 23/2/2035 387,943 0.00%

434
Vanguard Global Bond Index Fund
Principal CouponMaturity
DateFair Value
US Dollars ($)% of Total
Net AssetsSecuritas AB €300,000 1.25% 6/3/2025 370,127 0.00%Heimstaden Bostad AB €300,000 1.13% 21/1/2026 365,624 0.00%Akelius Residential Property Financing BV €300,000 1.00% 17/1/2028 363,490 0.00%Autoliv, Inc. €300,000 0.75% 26/6/2023 360,965 0.00%Stadshypotek AB €300,000 0.38% 22/2/2023 360,874 0.00%Molnlycke Holding AB €250,000 1.88% 28/2/2025 315,193 0.00%Kommuninvest I Sverige AB $300,000 0.25% 15/9/2023 299,336 0.00%Akelius Residential Property AB £200,000 2.38% 15/8/2025 288,995 0.00%Kommuninvest I Sverige AB $250,000 0.25% 1/12/2022 250,039 0.00%Sweden Government International Bond $250,000 0.13% 14/10/2022 249,806 0.00%Telia Co. AB^ €200,000 3.00% 4/4/2078 247,982 0.00%Alfa Laval Treasury International AB €200,000 1.38% 12/9/2022 240,773 0.00%Vattenfall AB £100,000 6.88% 15/4/2039 239,612 0.00%Castellum AB €200,000 0.75% 4/9/2026 238,490 0.00%Securitas AB €200,000 0.25% 22/2/2028 233,112 0.00%H&M Finance BV €200,000 0.25% 25/8/2029 232,340 0.00%Svensk Exportkredit AB $200,000 2.88% 14/3/2023 208,717 0.00%Swedbank AB $200,000 0.85% 18/3/2024 200,692 0.00%Kommuninvest I Sverige AB $200,000 0.25% 9/8/2023 199,510 0.00%Telia Co. AB €100,000 3.63% 14/2/2024 130,415 0.00%Telia Co. AB^ €100,000 1.38% 11/5/2081 119,970 0.00%Sweden Government International Bond $100,000 2.38% 15/2/2023 103,428 0.00%test - - - 167,407,776 0.76%Switzerland 0.83% (2020: 0.87%)Swiss Confederation Government Bond CHF14,300,000 1.25% 28/5/2026 16,865,596 0.08%Swiss Confederation Government Bond CHF4,000,000 1.25% 11/6/2024 4,582,374 0.02%Pfandbriefbank schweizerischer Hypothekarinstitute AG CHF3,900,000 0.75% 28/11/2034 4,548,354 0.02%Pfandbriefzentrale der schweizerischen Kantonalbanken AG CHF4,000,000 0.13% 12/3/2024 4,403,979 0.02%Pfandbriefzentrale der schweizerischen Kantonalbanken AG CHF4,000,000 0.00% 25/7/2023 4,380,711 0.02%Swiss Confederation Government Bond CHF2,425,000 4.00% 8/4/2028 3,428,655 0.02%Pfandbriefbank schweizerischer Hypothekarinstitute AG CHF2,980,000 0.38% 12/5/2027 3,344,144 0.02%Credit Suisse Group AG $2,931,000 4.55% 17/4/2026 3,316,970 0.02%Swiss Confederation Government Bond CHF2,850,000 0.00% 26/6/2034 3,116,653 0.01%Swiss Confederation Government Bond CHF2,500,000 0.50% 28/6/2045 3,015,657 0.01%Pfandbriefzentrale der schweizerischen Kantonalbanken AG CHF2,500,000 0.70% 4/3/2039 2,928,923 0.01%Zuercher Kantonalbank CHF2,500,000 0.13% 13/5/2026 2,759,455 0.01%Pfandbriefbank schweizerischer Hypothekarinstitute AG CHF2,000,000 1.88% 15/9/2031 2,568,786 0.01%Swiss Confederation Government Bond CHF1,615,000 2.50% 8/3/2036 2,399,821 0.01%Swiss Confederation Government Bond CHF2,000,000 0.50% 27/6/2032 2,325,269 0.01%Pfandbriefzentrale der schweizerischen Kantonalbanken AG CHF2,000,000 0.63% 1/11/2030 2,290,283 0.01%Pfandbriefbank schweizerischer Hypothekarinstitute AG CHF2,000,000 0.50% 15/6/2029 2,264,412 0.01%UBS Group AG $2,000,000 4.25% 23/3/2028 2,262,375 0.01%Credit Suisse Group AG $2,175,000 3.57% 9/1/2023 2,209,241 0.01%Pfandbriefbank schweizerischer Hypothekarinstitute AG CHF2,000,000 0.13% 6/9/2028 2,205,054 0.01%Glencore Finance Canada Ltd. $2,100,000 4.25% 25/10/2022 2,197,906 0.01%Pfandbriefbank schweizerischer Hypothekarinstitute AG CHF2,000,000 0.25% 14/10/2036 2,179,956 0.01%Credit Suisse Group AG $1,800,000 4.28% 9/1/2028 2,002,936 0.01%Swiss Confederation Government Bond CHF1,700,000 0.00% 22/6/2029 1,890,637 0.01%Pfandbriefbank schweizerischer Hypothekarinstitute AG CHF1,600,000 0.50% 17/6/2041 1,820,744 0.01%Swiss Confederation Government Bond CHF1,200,000 1.50% 30/4/2042 1,695,121 0.01%Pfandbriefbank schweizerischer Hypothekarinstitute AG CHF1,500,000 0.50% 5/10/2035 1,693,127 0.01%Roche Finance Europe BV €1,400,000 0.50% 27/2/2023 1,682,706 0.01%Credit Suisse Group AG $1,550,000 3.75% 26/3/2025 1,681,142 0.01%Pfandbriefbank schweizerischer Hypothekarinstitute AG CHF1,400,000 1.00% 21/5/2024 1,581,640 0.01%Swiss Confederation Government Bond CHF700,000 4.00% 6/1/2049 1,575,256 0.01%Pfandbriefbank schweizerischer Hypothekarinstitute AG CHF1,300,000 1.13% 16/11/2023 1,463,544 0.01%Swiss Confederation Government Bond CHF700,000 2.00% 25/6/2064 1,396,373 0.01%Credit Suisse Group AG^ $1,250,000 3.87% 12/1/2029 1,375,601 0.01%Swiss Re Finance Luxembourg SA^ $1,200,000 5.00% 2/4/2049 1,369,500 0.01%Argentum Netherlands BV for Zurich Insurance Co., Ltd.^ €1,000,000 3.50% 1/10/2046 1,351,958 0.01%Canton of Vaud CHF1,000,000 2.00% 24/10/2033 1,348,285 0.01%Credit Suisse Group AG $1,060,000 4.88% 15/5/2045 1,337,621 0.01%Credit Suisse Schweiz AG CHF1,200,000 0.00% 31/7/2025 1,312,818 0.01%Zurich Finance Ireland Designated Activity Co. €1,000,000 1.63% 17/6/2039 1,301,281 0.01%UBS Group AG $1,250,000 3.49% 23/5/2023 1,283,560 0.01%Canton of Basel-Landschaft CHF1,000,000 1.38% 29/9/2034 1,266,472 0.01%Novartis Finance SA €1,000,000 0.50% 14/8/2023 1,205,068 0.01%Credit Suisse AG €1,000,000 0.25% 5/1/2026 1,190,023 0.01%Nestle Finance International Ltd. €1,000,000 0.00% 14/6/2026 1,189,411 0.01%Pfandbriefzentrale der schweizerischen Kantonalbanken AG CHF1,000,000 1.38% 19/3/2027 1,184,353 0.01%UBS AG €1,000,000 0.50% 31/3/2031 1,180,291 0.01%

435
Vanguard Global Bond Index Fund
Principal CouponMaturity
DateFair Value
US Dollars ($)% of Total
Net AssetsUBS Group AG^ €1,000,000 0.25% 5/11/2028 1,173,479 0.01%Pfandbriefbank schweizerischer Hypothekarinstitute AG CHF1,000,000 1.50% 15/12/2025 1,173,411 0.01%Swiss Confederation Government Bond CHF1,000,000 0.50% 27/5/2030 1,158,997 0.01%Pfandbriefbank schweizerischer Hypothekarinstitute AG CHF1,000,000 0.63% 23/1/2037 1,152,344 0.01%Pfandbriefzentrale der schweizerischen Kantonalbanken AG CHF1,000,000 0.63% 16/7/2029 1,143,112 0.01%Credit Suisse Group AG €1,000,000 0.63% 18/1/2033 1,115,493 0.01%Pfandbriefzentrale der schweizerischen Kantonalbanken AG CHF1,000,000 1.00% 13/2/2023 1,110,423 0.01%Credit Suisse Group AG CHF1,000,000 1.00% 14/4/2023 1,101,532 0.01%Nestle Finance International Ltd. €900,000 0.38% 12/5/2032 1,063,958 0.01%Holcim Finance Luxembourg SA €900,000 0.63% 19/1/2033 1,025,254 0.01%Nestle Finance International Ltd. €865,000 0.88% 14/6/2041 1,021,226 0.01%Credit Suisse Group AG^ $900,000 4.19% 1/4/2031 1,011,419 0.01%Novartis Finance SA €800,000 1.13% 30/9/2027 1,010,588 0.01%Pfandbriefbank schweizerischer Hypothekarinstitute AG CHF800,000 1.50% 2/8/2033 1,010,567 0.01%Credit Suisse AG $1,000,000 1.00% 5/5/2023 1,010,190 0.01%Credit Suisse AG $1,000,000 0.50% 2/2/2024 996,381 0.01%Holcim Finance Luxembourg SA €800,000 0.50% 29/11/2026 964,652 0.01%Swiss Confederation Government Bond CHF750,000 0.50% 30/5/2058 955,872 0.01%Argentum Netherlands BV for Swiss Life AG^ €700,000 4.38% Perpetual 938,062 0.01%Argentum Netherlands BV for Zurich Insurance Co., Ltd.^ €700,000 2.75% 19/2/2049 930,615 0.01%Swiss Confederation Government Bond CHF700,000 3.25% 27/6/2027 929,074 0.01%UBS Group AG^ $900,000 2.86% 15/8/2023 923,254 0.01%Glencore Finance Canada Ltd. $715,000 5.55% 25/10/2042 919,367 0.00%Pfandbriefbank schweizerischer Hypothekarinstitute AG CHF750,000 1.25% 29/9/2023 845,023 0.00%UBS Group AG $750,000 4.13% 15/4/2026 840,615 0.00%Roche Holdings, Inc. $775,000 3.00% 10/11/2025 837,849 0.00%Roche Holdings, Inc. $770,000 3.35% 30/9/2024 830,166 0.00%UBS Group AG^ $800,000 1.01% 30/7/2024 805,601 0.00%Tyco Electronics Group SA €700,000 0.00% 16/2/2029 803,994 0.00%Zurich Finance Australia Ltd. AU($)1,000,000 3.48% 31/5/2023 789,789 0.00%Swiss Re Finance UK plc^ €600,000 2.71% 4/6/2052 783,506 0.00%Basellandschaftliche Kantonalbank CHF700,000 0.38% 13/5/2030 781,170 0.00%Novartis Finance SA €600,000 1.38% 14/8/2030 779,850 0.00%Pfandbriefbank schweizerischer Hypothekarinstitute AG CHF700,000 0.38% 8/7/2039 776,487 0.00%Richemont International Holding SA €600,000 1.00% 26/3/2026 745,351 0.00%Canton of Zurich CHF600,000 1.25% 3/12/2032 742,831 0.00%Pfandbriefbank schweizerischer Hypothekarinstitute AG CHF600,000 1.00% 25/1/2036 725,644 0.00%Tyco Electronics Group SA €600,000 0.00% 14/2/2025 713,507 0.00%Credit Suisse Group AG^ £500,000 2.13% 12/9/2025 708,881 0.00%Pfandbriefzentrale der schweizerischen Kantonalbanken AG CHF600,000 0.50% 30/3/2034 677,954 0.00%Coca-Cola HBC Finance BV €500,000 1.63% 14/5/2031 652,158 0.00%Richemont International Holding SA €500,000 1.63% 26/5/2040 648,198 0.00%Richemont International Holding SA €450,000 2.00% 26/3/2038 616,794 0.00%Credit Suisse Group AG^ €500,000 1.25% 17/7/2025 608,840 0.00%Novartis Capital Corp. $550,000 3.10% 17/5/2027 601,703 0.00%UBS AG $600,000 1.25% 1/6/2026 598,705 0.00%Nestle Finance International Ltd. €500,000 0.00% 12/11/2024 597,616 0.00%Swiss Confederation Government Bond CHF500,000 1.50% 24/7/2025 588,604 0.00%Novartis Capital Corp. $500,000 3.70% 21/9/2042 583,142 0.00%Pfandbriefzentrale der schweizerischen Kantonalbanken AG CHF500,000 1.63% 31/10/2024 579,165 0.00%Pfandbriefbank schweizerischer Hypothekarinstitute AG CHF475,000 0.75% 18/10/2038 560,390 0.00%Nestle Holdings, Inc. $500,000 3.50% 24/9/2025 550,994 0.00%Glencore Funding LLC $500,000 4.63% 29/4/2024 548,964 0.00%Swiss Confederation Government Bond CHF350,000 3.50% 8/4/2033 542,055 0.00%Tyco Electronics Group SA $500,000 3.13% 15/8/2027 539,383 0.00%Holcim Finance Luxembourg SA €400,000 2.25% 26/5/2028 532,492 0.00%Alcon Finance Corp. $500,000 3.00% 23/9/2029 526,873 0.00%Canton of Geneva Switzerland CHF420,000 1.50% 5/3/2032 524,615 0.00%Roche Holdings, Inc. $425,000 4.00% 28/11/2044 524,049 0.00%Swiss Confederation Government Bond CHF400,000 1.25% 27/6/2037 521,333 0.00%Novartis Capital Corp. $500,000 2.20% 14/8/2030 517,079 0.00%Credit Suisse Group AG^ $500,000 2.19% 5/6/2026 511,858 0.00%Richemont International Holding SA €400,000 0.75% 26/5/2028 493,501 0.00%Glencore Finance Europe Ltd. €400,000 1.88% 13/9/2023 491,663 0.00%UBS Group AG^ $500,000 2.10% 11/2/2032 489,260 0.00%Novartis Capital Corp. $475,000 2.40% 21/9/2022 487,188 0.00%UBS AG €400,000 0.75% 21/4/2023 483,147 0.00%Nestle Finance International Ltd. €400,000 0.75% 16/5/2023 483,079 0.00%Nestle Finance International Ltd. €400,000 0.00% 3/12/2025 477,185 0.00%Novartis Capital Corp. $450,000 2.00% 14/2/2027 467,930 0.00%Holcim Finance Luxembourg SA €400,000 0.50% 23/4/2031 463,943 0.00%

436
Vanguard Global Bond Index Fund
Principal CouponMaturity
DateFair Value
US Dollars ($)% of Total
Net AssetsSika Capital BV €350,000 1.50% 29/4/2031 454,907 0.00%Roche Holdings, Inc. $425,000 2.63% 15/5/2026 453,832 0.00%LafargeHolcim Sterling Finance Netherlands BV £300,000 3.00% 12/5/2032 450,027 0.00%Nestle Finance International Ltd. €400,000 0.38% 3/12/2040 437,257 0.00%Credit Suisse Group Funding Guernsey Ltd. $400,000 3.80% 15/9/2022 415,938 0.00%Swiss Confederation Government Bond CHF300,000 2.25% 22/6/2031 406,640 0.00%Swiss Confederation Government Bond CHF320,000 0.50% 24/5/2055 401,296 0.00%UBS AG $400,000 0.38% 1/6/2023 399,440 0.00%UBS Group AG^ $400,000 1.36% 30/1/2027 397,371 0.00%Credit Suisse Group AG^ €300,000 3.25% 2/4/2026 392,213 0.00%Firmenich Productions Participations SAS €300,000 1.75% 30/4/2030 392,042 0.00%Cloverie plc for Zurich Insurance Co., Ltd. €300,000 1.50% 15/12/2028 388,061 0.00%LafargeHolcim Finance US LLC $350,000 3.50% 22/9/2026 381,849 0.00%Credit Suisse AG $350,000 3.63% 9/9/2024 380,096 0.00%Credit Suisse Group AG^ €300,000 1.00% 24/6/2027 362,976 0.00%Novartis Capital Corp. $345,000 1.75% 14/2/2025 356,090 0.00%Novartis Capital Corp. $345,000 2.75% 14/8/2050 347,934 0.00%Cloverie plc for Zurich Insurance Co., Ltd.^ $300,000 5.63% 24/6/2046 347,702 0.00%Novartis Capital Corp. $275,000 4.00% 20/11/2045 335,810 0.00%Pfandbriefbank schweizerischer Hypothekarinstitute AG CHF300,000 1.38% 30/11/2021 327,376 0.00%Roche Holdings, Inc. $300,000 0.45% 5/3/2024 299,206 0.00%Roche Holdings, Inc. $300,000 0.99% 5/3/2026 298,992 0.00%Helvetia Europe SA^ €220,000 2.75% 30/9/2041 281,945 0.00%Credit Suisse Group AG $250,000 3.80% 9/6/2023 264,759 0.00%Nestle Finance International Ltd. €200,000 1.50% 1/4/2030 262,742 0.00%Glencore Funding LLC $225,000 4.88% 12/3/2029 262,126 0.00%Tyco Electronics Group SA $235,000 3.70% 15/2/2026 257,692 0.00%Alcon Finance Corp. $250,000 2.60% 27/5/2030 255,501 0.00%Cloverie plc for Swiss Reinsurance Co., Ltd.^ €200,000 6.63% 1/9/2042 255,384 0.00%ELM BV for Swiss Reinsurance Co., Ltd.^ €200,000 2.60% Perpetual 255,017 0.00%Coca-Cola HBC Finance BV €200,000 1.88% 11/11/2024 253,185 0.00%Barry Callebaut Services NV €200,000 2.38% 24/5/2024 251,301 0.00%LafargeHolcim Finance US LLC $200,000 4.75% 22/9/2046 247,640 0.00%Glencore Funding LLC $200,000 4.00% 16/4/2025 218,403 0.00%Novartis Capital Corp. $200,000 3.40% 6/5/2024 215,729 0.00%Alcon Finance Corp. $200,000 2.75% 23/9/2026 211,723 0.00%Roche Holdings, Inc. $200,000 2.38% 28/1/2027 210,717 0.00%Credit Suisse Group AG^ $150,000 3.00% 14/12/2023 154,872 0.00%Novartis Finance SA €100,000 1.70% 14/8/2038 136,500 0.00%Novartis Capital Corp. $125,000 3.00% 20/11/2025 135,610 0.00%Aquarius & Investments plc for Zurich Insurance Co., Ltd.^ €100,000 4.25% 2/10/2043 129,632 0.00%Nestle Finance International Ltd. €100,000 1.25% 2/11/2029 128,579 0.00%Nestle Finance International Ltd. €100,000 1.75% 12/9/2022 121,707 0.00%Adecco International Financial Services BV €100,000 1.50% 22/11/2022 120,875 0.00%UBS Group AG $100,000 4.13% 24/9/2025 111,495 0.00%Glencore Funding LLC $100,000 4.13% 30/5/2023 106,360 0.00%Glencore Funding LLC $100,000 3.00% 27/10/2022 102,904 0.00%Zurich Finance UK plc^ £50,000 6.63% Perpetual 73,931 0.00%test - - - 183,266,820 0.83%Taiwan 0.01% (2020: 0.00%)TSMC Global Ltd. $2,000,000 1.38% 28/9/2030 1,884,288 0.01%Competition Team Technologies Ltd. $425,000 3.75% 12/3/2024 455,234 0.00%test - - - 2,339,522 0.01%Thailand 0.34% (2020: 0.39%)Thailand Government Bond ฿192,450,000 3.30% 17/6/2038 6,767,970 0.03%Thailand Government Bond ฿200,000,000 0.95% 17/6/2025 6,308,389 0.03%Thailand Government Bond ฿180,000,000 2.40% 17/12/2023 5,872,135 0.03%Thailand Government Bond ฿120,000,000 3.65% 20/6/2031 4,387,535 0.02%Thailand Government Bond ฿140,000,000 1.60% 17/12/2029 4,380,595 0.02%Thailand Government Bond ฿123,000,000 1.45% 17/12/2024 3,945,069 0.02%Thailand Government Bond ฿110,000,000 2.88% 17/12/2028 3,799,096 0.02%Thailand Government Bond ฿95,000,000 3.40% 17/6/2036 3,377,931 0.02%Thailand Government Bond ฿94,000,000 3.60% 17/6/2067 3,361,657 0.02%Thailand Government Bond ฿90,500,000 2.88% 17/6/2046 2,925,848 0.01%Thailand Government Bond ฿110,000,000 1.88% 17/6/2049 2,873,270 0.01%Thailand Government Bond ฿80,000,000 3.85% 12/12/2025 2,833,297 0.01%Thailand Government Bond ฿70,000,000 4.88% 22/6/2029 2,715,717 0.01%Thailand Government Bond ฿65,000,000 3.78% 25/6/2032 2,406,598 0.01%Thailand Government Bond ฿70,000,000 3.63% 16/6/2023 2,315,961 0.01%Thailand Government Bond ฿55,000,000 3.58% 17/12/2027 1,974,893 0.01%Thailand Government Bond ฿50,285,000 4.00% 17/6/2066 1,965,354 0.01%

437
Vanguard Global Bond Index Fund
Principal CouponMaturity
DateFair Value
US Dollars ($)% of Total
Net AssetsSiam Commercial Bank PCL $1,800,000 3.90% 11/2/2024 1,932,642 0.01%Thailand Government Bond ฿50,000,000 1.59% 17/12/2035 1,445,423 0.01%Thailand Government Bond ฿34,400,000 4.68% 29/6/2044 1,438,349 0.01%PTTEP Canada International Finance Ltd. $800,000 6.35% 12/6/2042 1,118,624 0.01%Thailand Government Bond ฿30,000,000 2.00% 17/6/2042 868,742 0.01%Thailand Government Bond ฿20,000,000 5.67% 13/3/2028 803,068 0.00%Thailand Government Bond ฿19,000,000 4.26% 12/12/2037 721,267 0.00%Thailand Government Bond ฿20,000,000 2.00% 17/12/2031 636,976 0.00%Thaioil Treasury Center Co., Ltd. $500,000 5.38% 20/11/2048 594,953 0.00%GC Treasury Center Co., Ltd. $500,000 4.30% 18/3/2051 550,244 0.00%Thailand Government Bond ฿12,000,000 4.85% 17/6/2061 545,078 0.00%Bangkok Bank PCL $500,000 3.88% 27/9/2022 519,386 0.00%GC Treasury Center Co., Ltd. $500,000 2.98% 18/3/2031 511,293 0.00%PTT Treasury Center Co., Ltd. $400,000 4.50% 25/10/2042 452,204 0.00%Thailand Government Bond ฿10,000,000 3.80% 14/6/2041 380,536 0.00%Thailand Government Bond ฿10,000,000 1.60% 17/6/2035 291,062 0.00%Thaioil Treasury Center Co., Ltd. $200,000 4.63% 20/11/2028 228,276 0.00%test - - - 75,249,438 0.34%United Arab Emirates 0.24% (2020: 0.24%)Abu Dhabi Government International Bond $3,500,000 3.13% 16/4/2030 3,800,742 0.02%Emirates NBD Bank PJSC AU($)5,000,000 3.05% 26/2/2030 3,757,579 0.02%Abu Dhabi Government International Bond $3,400,000 3.13% 3/5/2026 3,713,938 0.02%Abu Dhabi Government International Bond $2,700,000 3.88% 16/4/2050 3,112,306 0.01%Fab Sukuk Co., Ltd. $2,200,000 3.88% 22/1/2024 2,366,135 0.01%Emirates NBD Bank PJSC $2,000,000 2.63% 18/2/2025 2,095,486 0.01%Abu Dhabi Crude Oil Pipeline LLC $1,700,000 3.65% 2/11/2029 1,890,991 0.01%DP World plc $1,600,000 4.70% 30/9/2049 1,771,486 0.01%MDGH-GMTN BV $1,500,000 3.70% 7/11/2049 1,640,014 0.01%Abu Dhabi Government International Bond $1,500,000 2.50% 16/4/2025 1,593,697 0.01%Fab Sukuk Co., Ltd. $1,500,000 3.63% 5/3/2023 1,575,328 0.01%DAE Funding LLC $1,500,000 5.00% 1/8/2024 1,537,905 0.01%Abu Dhabi Government International Bond $1,500,000 3.13% 30/9/2049 1,529,422 0.01%DP World plc £900,000 4.25% 25/9/2030 1,408,068 0.01%Abu Dhabi Government International Bond $1,300,000 2.13% 30/9/2024 1,360,699 0.01%Sharjah Sukuk Program Ltd. $1,200,000 3.85% 3/4/2026 1,291,144 0.01%DP World Crescent Ltd. $1,100,000 3.75% 30/1/2030 1,183,450 0.01%Galaxy Pipeline Assets Bidco Ltd. $1,200,000 2.63% 31/3/2036 1,178,231 0.01%Abu Dhabi National Energy Co. PJSC $1,000,000 4.00% 3/10/2049 1,144,451 0.01%Abu Dhabi National Energy Co. PJSC $1,000,000 4.38% 23/4/2025 1,122,769 0.01%DIB Sukuk Ltd. $1,000,000 3.63% 6/2/2023 1,042,327 0.01%Abu Dhabi Government International Bond $800,000 4.13% 11/10/2047 953,010 0.00%Emirates Telecommunications Group Co. PJSC €800,000 0.88% 17/5/2033 936,090 0.00%Finance Department Government of Sharjah $1,000,000 4.00% 28/7/2050 916,842 0.00%Abu Dhabi Government International Bond $800,000 3.13% 11/10/2027 878,934 0.00%Aldar Sukuk No 2 Ltd. $800,000 3.88% 22/10/2029 864,727 0.00%MAF Sukuk Ltd. $750,000 4.64% 14/5/2029 844,949 0.00%Sharjah Sukuk Program Ltd. $800,000 2.94% 10/6/2027 826,565 0.00%Abu Dhabi Government International Bond $700,000 2.50% 30/9/2029 730,779 0.00%First Abu Dhabi Bank PJSC £520,000 1.38% 19/2/2023 725,096 0.00%Abu Dhabi National Energy Co. PJSC $600,000 4.88% 23/4/2030 724,023 0.00%DP World plc $400,000 6.85% 2/7/2037 541,941 0.00%Emirates Telecommunications Group Co. PJSC $500,000 3.50% 18/6/2024 539,963 0.00%RAK Capital $500,000 3.09% 31/3/2025 530,622 0.00%DAE Funding LLC $500,000 1.55% 1/8/2024 498,840 0.00%Galaxy Pipeline Assets Bidco Ltd. $500,000 3.25% 30/9/2040 497,222 0.00%DP World plc $300,000 5.63% 25/9/2048 374,650 0.00%BOS Funding Ltd. $350,000 4.00% 18/9/2024 361,624 0.00%Abu Dhabi Crude Oil Pipeline LLC $250,000 4.60% 2/11/2047 294,660 0.00%DP World Crescent Ltd. $200,000 4.85% 26/9/2028 230,088 0.00%Abu Dhabi National Energy Co. PJSC $200,000 4.38% 22/6/2026 229,347 0.00%Emirates Telecommunications Group Co. PJSC €190,000 0.38% 17/5/2028 226,498 0.00%ADCB Finance Cayman Ltd. $200,000 4.50% 6/3/2023 211,759 0.00%Sharjah Sukuk Program Ltd. $200,000 3.23% 23/10/2029 206,608 0.00%Emirates Telecommunications Group Co. PJSC €100,000 2.75% 18/6/2026 133,905 0.00%test - - - 53,394,910 0.24%United Kingdom 4.28% (2020: 4.51%)United Kingdom Gilt £22,994,000 1.25% 22/10/2041 31,968,670 0.15%United Kingdom Gilt £16,881,448 1.75% 7/9/2037 25,495,630 0.12%United Kingdom Gilt £18,650,000 0.38% 22/10/2030 24,888,499 0.11%United Kingdom Gilt £18,800,000 0.25% 31/7/2031 24,502,359 0.11%United Kingdom Gilt £17,900,000 0.13% 31/1/2028 24,083,455 0.11%

438
Vanguard Global Bond Index Fund
Principal CouponMaturity
DateFair Value
US Dollars ($)% of Total
Net AssetsUnited Kingdom Gilt £17,141,000 0.13% 31/1/2024 23,647,928 0.11%United Kingdom Gilt £17,000,000 0.13% 30/1/2026 23,261,593 0.11%United Kingdom Gilt £15,380,000 0.63% 7/6/2025 21,566,053 0.10%United Kingdom Gilt £16,073,000 0.63% 31/7/2035 20,912,529 0.10%United Kingdom Gilt £9,750,000 4.25% 7/12/2040 20,686,691 0.10%United Kingdom Gilt £13,250,000 1.50% 22/7/2047 19,363,392 0.09%United Kingdom Gilt £13,329,000 0.75% 22/7/2023 18,673,139 0.09%United Kingdom Gilt £11,664,000 1.63% 22/10/2054 17,876,882 0.08%United Kingdom Gilt £9,500,000 1.75% 22/7/2057 15,260,344 0.07%United Kingdom Gilt £5,847,000 4.25% 7/12/2046 13,386,293 0.06%United Kingdom Gilt £12,254,000 0.50% 22/10/2061 13,372,742 0.06%United Kingdom Gilt £5,525,000 3.75% 22/7/2052 12,610,129 0.06%United Kingdom Gilt £10,489,952 0.63% 22/10/2050 12,313,564 0.06%United Kingdom Gilt £9,405,000 0.88% 31/1/2046 11,950,089 0.06%United Kingdom Gilt £5,950,000 4.25% 7/3/2036 11,816,590 0.05%United Kingdom Gilt £7,500,000 1.25% 22/7/2027 10,858,638 0.05%United Kingdom Gilt £5,297,000 4.75% 7/12/2030 10,002,004 0.05%United Kingdom Gilt £6,929,000 1.25% 31/7/2051 9,577,936 0.04%United Kingdom Gilt £5,680,000 1.63% 22/10/2071 9,520,939 0.04%United Kingdom Gilt £3,800,000 4.50% 7/12/2042 8,524,898 0.04%United Kingdom Gilt £3,785,000 3.25% 22/1/2044 7,316,774 0.03%United Kingdom Gilt £2,768,000 4.25% 7/12/2055 7,104,261 0.03%Reckitt Benckiser Treasury Services plc $5,875,000 3.00% 26/6/2027 6,353,829 0.03%United Kingdom Gilt £3,125,480 4.50% 7/9/2034 6,202,551 0.03%HSBC Holdings plc^ $6,013,000 2.10% 4/6/2026 6,184,838 0.03%easyJet FinCo BV €5,104,000 1.88% 3/3/2028 6,071,976 0.03%Barclays plc $5,022,000 3.65% 16/3/2025 5,445,991 0.03%United Kingdom Gilt £2,109,000 3.50% 22/7/2068 5,439,037 0.03%Nationwide Building Society $5,100,000 1.00% 28/8/2025 5,074,683 0.02%Heathrow Funding Ltd. €4,066,000 1.50% 12/10/2025 5,029,580 0.02%Lloyds Banking Group plc $4,185,000 4.58% 10/12/2025 4,702,650 0.02%HSBC Holdings plc^ $4,450,000 2.63% 7/11/2025 4,670,809 0.02%Juturna European Loan Conduit No 16 plc £2,403,990 5.06% 10/8/2033 4,090,481 0.02%United Kingdom Gilt £1,850,000 4.25% 7/9/2039 3,859,653 0.02%Vodafone Group plc $3,275,000 4.38% 30/5/2028 3,809,682 0.02%United Kingdom Gilt £1,850,000 2.50% 22/7/2065 3,755,373 0.02%Natwest Group plc^ €3,000,000 1.75% 2/3/2026 3,749,461 0.02%United Kingdom Gilt £1,700,000 4.75% 7/12/2038 3,704,023 0.02%HSBC Holdings plc $3,183,000 4.30% 8/3/2026 3,593,174 0.02%United Kingdom Gilt £1,770,000 4.25% 7/6/2032 3,313,448 0.02%Transport for London £2,200,000 2.13% 24/4/2025 3,181,966 0.02%HSBC Holdings plc €2,400,000 3.00% 30/6/2025 3,149,658 0.02%Vodafone Group plc €2,550,000 0.90% 24/11/2026 3,149,059 0.02%Lloyds Banking Group plc $2,700,000 4.55% 16/8/2028 3,146,197 0.02%Santander UK Group Holdings plc^ £2,000,000 2.92% 8/5/2026 2,929,324 0.01%HSBC Holdings plc $2,250,000 5.25% 14/3/2044 2,917,905 0.01%Skipton Building Society^ £2,000,000 2.00% 2/10/2026 2,821,694 0.01%Lloyds Banking Group plc^ ¥300,000,000 0.82% 30/5/2025 2,729,809 0.01%Vodafone Group plc €2,000,000 2.20% 25/8/2026 2,622,976 0.01%Santander UK plc £1,330,000 5.25% 16/2/2029 2,408,838 0.01%United Kingdom Gilt £1,000,000 4.25% 7/12/2049 2,385,013 0.01%HSBC Holdings plc^ £1,600,000 3.00% 22/7/2028 2,384,043 0.01%Vodafone Group plc $2,040,000 4.25% 17/9/2050 2,374,667 0.01%Notting Hill Genesis £1,400,000 3.25% 12/10/2048 2,323,434 0.01%Tesco Property Finance 2 plc £1,208,671 6.05% 13/10/2039 2,221,698 0.01%AA Bond Co., Ltd. £1,500,000 4.88% 31/7/2024 2,207,012 0.01%HSBC Holdings plc $1,600,000 6.50% 2/5/2036 2,204,137 0.01%BP Capital Markets plc €1,500,000 2.82% 7/4/2032 2,137,148 0.01%BAT Capital Corp. £1,500,000 2.13% 15/8/2025 2,127,452 0.01%Vodafone Group plc €1,700,000 1.13% 20/11/2025 2,112,254 0.01%United Kingdom Gilt £1,500,000 0.50% 22/7/2022 2,082,591 0.01%Lloyds Banking Group plc $1,900,000 4.05% 16/8/2023 2,036,481 0.01%BP Capital Markets plc €1,500,000 2.52% 7/4/2028 2,032,621 0.01%BP Capital Markets plc $1,819,000 3.54% 4/11/2024 1,980,561 0.01%United Kingdom Gilt £754,262 4.00% 22/1/2060 1,959,222 0.01%HSBC Holdings plc^ £1,400,000 1.75% 24/7/2027 1,955,509 0.01%Southern Gas Networks plc £1,300,000 2.50% 3/2/2025 1,897,209 0.01%Cadent Finance plc €1,500,000 0.63% 22/9/2024 1,816,698 0.01%Leeds Building Society^ £1,300,000 1.50% 16/3/2027 1,795,454 0.01%Yorkshire Building Society^ £1,200,000 3.38% 13/9/2028 1,787,590 0.01%GlaxoSmithKline Capital plc £1,300,000 1.63% 12/5/2035 1,741,647 0.01%

439
Vanguard Global Bond Index Fund
Principal CouponMaturity
DateFair Value
US Dollars ($)% of Total
Net AssetsWPP Finance Deutschland GmbH €1,300,000 1.63% 23/3/2030 1,681,739 0.01%AstraZeneca plc $1,718,000 0.70% 8/4/2026 1,673,826 0.01%Places for People Homes Ltd. £1,056,000 3.63% 22/11/2028 1,670,518 0.01%Clydesdale Bank plc €1,400,000 0.01% 22/9/2026 1,668,762 0.01%Karbon Homes Ltd. £940,000 3.38% 15/11/2047 1,664,064 0.01%Scottish Widows Ltd. £1,100,000 5.50% 16/6/2023 1,649,769 0.01%Nationwide Building Society^ €1,300,000 2.00% 25/7/2029 1,622,156 0.01%AstraZeneca plc $1,480,000 3.38% 16/11/2025 1,620,736 0.01%Santander UK Group Holdings plc £1,050,000 3.63% 14/1/2026 1,594,150 0.01%HSBC Holdings plc^ £1,110,000 2.26% 13/11/2026 1,592,178 0.01%GlaxoSmithKline Capital plc €1,200,000 1.75% 21/5/2030 1,589,587 0.01%Anglian Water Services Financing plc £1,000,000 4.50% 22/2/2026 1,587,195 0.01%Nationwide Building Society $1,400,000 4.00% 14/9/2026 1,545,431 0.01%Barclays plc £1,000,000 3.00% 8/5/2026 1,483,872 0.01%Prs Finance plc £1,000,000 2.00% 23/1/2029 1,478,024 0.01%BAE Systems Finance, Inc. $1,135,000 7.50% 1/7/2027 1,474,238 0.01%HSBC Holdings plc $1,300,000 4.38% 23/11/2026 1,466,993 0.01%Network Rail Infrastructure Finance plc £1,000,000 3.00% 7/9/2023 1,464,580 0.01%Lloyds Banking Group plc^ £1,030,000 1.99% 15/12/2031 1,431,133 0.01%Unilever plc £1,000,000 1.50% 22/7/2026 1,430,879 0.01%GlaxoSmithKline Capital plc £900,000 3.38% 20/12/2027 1,415,021 0.01%Channel Link Enterprises Finance plc^ £1,000,000 3.04% 30/6/2050 1,399,839 0.01%Lloyds Banking Group plc^ €1,150,000 0.63% 15/1/2024 1,379,801 0.01%Virgin Money UK plc^ £900,000 4.00% 3/9/2027 1,378,273 0.01%GlaxoSmithKline Capital plc £1,000,000 1.25% 12/10/2028 1,377,137 0.01%Unilever Finance Netherlands BV €1,100,000 1.25% 25/3/2025 1,373,996 0.01%Wessex Water Services Finance plc £1,000,000 1.50% 17/9/2029 1,368,068 0.01%Eastern Power Networks plc £1,000,000 1.88% 1/6/2035 1,365,147 0.01%Nationwide Building Society^ $1,300,000 3.77% 8/3/2024 1,365,145 0.01%Virgin Money UK plc^ £900,000 4.00% 25/9/2026 1,361,478 0.01%Sky Ltd. $1,225,000 3.75% 16/9/2024 1,338,783 0.01%CK Hutchison International 21 Ltd. $1,300,000 3.13% 15/4/2041 1,333,233 0.01%Diageo Finance plc £1,000,000 1.25% 28/3/2033 1,330,793 0.01%Unilever plc €1,000,000 1.50% 11/6/2039 1,312,675 0.01%National Grid plc €1,120,000 0.16% 20/1/2028 1,306,533 0.01%GlaxoSmithKline Capital plc $1,175,000 3.38% 1/6/2029 1,306,088 0.01%Standard Chartered plc^ $1,235,000 2.82% 30/1/2026 1,296,166 0.01%Yorkshire Building Society €1,069,000 0.88% 20/3/2023 1,296,158 0.01%Vodafone Group plc €1,000,000 1.60% 29/7/2031 1,289,025 0.01%Connect Plus M25 Issuer plc £841,167 2.61% 31/3/2039 1,288,451 0.01%BP Capital Markets plc €1,000,000 0.83% 8/11/2027 1,222,686 0.01%Santander UK plc €1,000,000 0.50% 10/1/2025 1,218,454 0.01%Barclays plc^ €1,000,000 2.00% 7/2/2028 1,215,882 0.01%DS Smith plc €1,000,000 0.88% 12/9/2026 1,211,944 0.01%Standard Chartered plc^ $1,200,000 1.21% 23/3/2025 1,205,933 0.01%Linde Finance BV €1,000,000 0.55% 19/5/2032 1,201,745 0.01%Standard Chartered plc^ €1,000,000 0.75% 3/10/2023 1,199,052 0.01%Nationwide Building Society €1,000,000 0.25% 22/7/2025 1,197,838 0.01%Santander UK Group Holdings plc^ €1,000,000 0.39% 28/2/2025 1,196,788 0.01%Barclays plc^ €1,000,000 1.11% 12/5/2032 1,196,408 0.01%GlaxoSmithKline Capital plc €1,000,000 0.00% 23/9/2023 1,192,403 0.01%Rothesay Life plc £800,000 3.38% 12/7/2026 1,190,554 0.01%Channel Link Enterprises Finance plc^ €1,000,000 1.76% 30/6/2050 1,182,502 0.01%United Kingdom Gilt £760,000 1.75% 22/1/2049 1,175,905 0.01%Natwest Group plc^ $1,000,000 4.89% 18/5/2029 1,171,329 0.01%Peabody Capital No 2 plc £700,000 3.25% 14/9/2048 1,169,182 0.01%BP Capital Markets plc $1,025,000 3.72% 28/11/2028 1,155,616 0.01%BG Energy Capital plc €850,000 2.25% 21/11/2029 1,152,546 0.01%BAT Capital Corp. $1,000,000 4.91% 2/4/2030 1,149,262 0.01%Wellcome Trust Ltd. £665,000 2.52% 7/2/2118 1,145,630 0.01%Guinness Partnership Ltd. £600,000 4.00% 24/10/2044 1,140,735 0.01%BP Capital Markets plc^ €900,000 3.25% Perpetual 1,140,498 0.01%Coventry Building Society £800,000 1.88% 24/10/2023 1,134,883 0.01%Reynolds American, Inc. $925,000 5.85% 15/8/2045 1,134,265 0.01%BAT Capital Corp. $1,050,000 3.56% 15/8/2027 1,123,560 0.01%Yorkshire Building Society €930,000 0.13% 8/5/2024 1,117,359 0.01%HSBC Holdings plc^ $1,000,000 4.04% 13/3/2028 1,109,164 0.01%Southern Water Services Finance Ltd. £650,000 6.64% 31/3/2026 1,106,044 0.01%Segro plc £700,000 2.88% 11/10/2037 1,095,682 0.01%Nationwide Building Society^ $1,000,000 4.13% 18/10/2032 1,090,556 0.01%Pension Insurance Corp. plc £600,000 8.00% 23/11/2026 1,082,991 0.01%

440
Vanguard Global Bond Index Fund
Principal CouponMaturity
DateFair Value
US Dollars ($)% of Total
Net AssetsAstraZeneca plc $725,000 6.45% 15/9/2037 1,080,677 0.01%Pearson Funding plc £700,000 3.75% 4/6/2030 1,078,843 0.01%CK Hutchison Group Telecom Finance SA €900,000 0.38% 17/10/2023 1,076,685 0.01%Sage Group plc £794,000 1.63% 25/2/2031 1,073,197 0.01%United Utilities Water Finance plc £800,000 1.88% 3/6/2042 1,073,102 0.01%HSBC Holdings plc^ $1,000,000 3.95% 18/5/2024 1,061,946 0.01%BP Capital Markets plc $970,000 3.51% 17/3/2025 1,061,646 0.01%United Kingdom Gilt £550,000 6.00% 7/12/2028 1,059,310 0.01%HSBC Holdings plc $875,000 4.95% 31/3/2030 1,055,999 0.01%BAT Capital Corp. $1,000,000 2.79% 6/9/2024 1,051,469 0.01%Standard Chartered plc $950,000 4.05% 12/4/2026 1,050,174 0.01%National Grid Gas plc £850,000 1.63% 14/1/2043 1,035,482 0.01%UK Municipal Bonds Agency Finance Co. Designated Activity Co. £800,000 1.63% 26/8/2060 1,030,061 0.01%Reckitt Benckiser Treasury Services plc $975,000 2.75% 26/6/2024 1,029,725 0.01%BAT Capital Corp. $975,000 4.54% 15/8/2047 1,028,093 0.01%Barclays plc AU($)1,250,000 4.00% 26/6/2029 1,022,822 0.01%Tesco Personal Finance Group plc £700,000 3.50% 25/7/2025 1,016,955 0.01%BAT Netherlands Finance BV €800,000 2.38% 7/10/2024 1,014,006 0.01%HSBC Holdings plc^ $1,000,000 1.65% 18/4/2026 1,013,369 0.01%Heathrow Funding Ltd. £700,000 2.75% 13/10/2029 1,006,451 0.01%National Grid plc €850,000 0.55% 18/9/2029 1,006,267 0.01%BAT Capital Corp. $870,000 5.28% 2/4/2050 1,005,906 0.01%Santander UK Group Holdings plc^ $1,000,000 1.09% 15/3/2025 1,003,828 0.01%Standard Chartered plc^ $1,000,000 3.27% 18/2/2036 1,002,808 0.01%Clarion Funding plc £600,000 3.13% 19/4/2048 999,643 0.01%HSBC Holdings plc^ $925,000 3.80% 11/3/2025 994,629 0.01%BAT Capital Corp. $875,000 4.70% 2/4/2027 988,564 0.01%Coca-Cola Europacific Partners plc €800,000 1.13% 26/5/2024 980,987 0.01%Legal & General Group plc^ £600,000 5.13% 14/11/2048 979,788 0.01%Babcock International Group plc £700,000 1.88% 5/10/2026 965,693 0.01%Nationwide Building Society^ $900,000 4.36% 1/8/2024 965,125 0.01%Gatwick Funding Ltd. £693,000 2.50% 15/4/2030 959,976 0.01%Vodafone Group plc £600,000 3.38% 8/8/2049 955,213 0.01%Heathrow Funding Ltd. £605,000 7.13% 14/2/2024 954,864 0.01%WHG Treasury plc £500,000 4.25% 6/10/2045 948,825 0.01%National Grid Gas plc £750,000 1.13% 14/1/2033 947,486 0.01%Standard Chartered plc £500,000 4.38% 18/1/2038 947,263 0.01%Phoenix Group Holdings plc £560,000 5.63% 28/4/2031 944,786 0.01%CPUK Finance Ltd. £600,000 3.69% 28/8/2028 920,372 0.01%Affordable Housing Finance plc £525,000 2.89% 11/8/2043 919,757 0.01%Virgin Money UK plc^ £625,000 3.38% 24/4/2026 917,666 0.01%Nationwide Building Society £600,000 3.00% 6/5/2026 912,662 0.01%Yorkshire Building Society €750,000 0.63% 21/9/2025 910,811 0.01%BP Capital Markets plc^ €700,000 3.63% Perpetual 903,866 0.01%Santander UK Group Holdings plc^ $900,000 1.53% 21/8/2026 901,671 0.01%Society of Lloyd's^ £562,000 4.88% 7/2/2047 895,312 0.01%Bank of England Euro Note $900,000 0.25% 8/3/2024 895,042 0.01%BAT International Finance plc €700,000 2.25% 16/1/2030 893,842 0.01%BAT Capital Corp. $825,000 4.76% 6/9/2049 892,827 0.01%BAT International Finance plc $889,000 1.67% 25/3/2026 890,103 0.01%Vodafone Group plc $700,000 5.00% 30/5/2038 881,725 0.01%Legal & General Group plc^ £500,000 5.50% 27/6/2064 879,793 0.01%Santander UK Group Holdings plc^ $800,000 3.82% 3/11/2028 879,148 0.01%Standard Chartered plc $800,000 4.30% 19/2/2027 876,565 0.01%AstraZeneca plc $1,000,000 2.13% 6/8/2050 872,761 0.01%WPP Finance 2016 €700,000 1.38% 20/3/2025 871,255 0.01%Cadent Finance plc £600,000 2.75% 22/9/2046 864,622 0.01%Diageo Finance plc €700,000 1.00% 22/4/2025 864,127 0.01%Blend Funding plc £500,000 3.46% 21/9/2047 856,255 0.01%BUPA Finance plc £600,000 2.00% 5/4/2024 855,907 0.01%Standard Chartered plc $665,000 5.70% 26/3/2044 850,973 0.01%Santander UK plc €710,000 0.05% 12/1/2027 850,163 0.01%HSBC Holdings plc $800,000 3.60% 25/5/2023 846,989 0.01%Motability Operations Group plc €700,000 0.38% 3/1/2026 844,346 0.01%Babcock International Group plc €700,000 1.38% 13/9/2027 844,142 0.01%Lloyds Banking Group plc AU($)1,000,000 4.25% 22/11/2027 843,798 0.01%Wm Morrison Supermarkets plc £600,000 2.50% 1/10/2031 843,763 0.01%United Kingdom Gilt £600,000 0.88% 22/10/2029 843,250 0.01%Skipton Building Society €700,000 0.01% 22/9/2024 838,727 0.01%Canary Wharf Group Investment Holdings plc €700,000 1.75% 7/4/2026 835,861 0.01%Natwest Group plc^ $700,000 5.08% 27/1/2030 829,968 0.01%
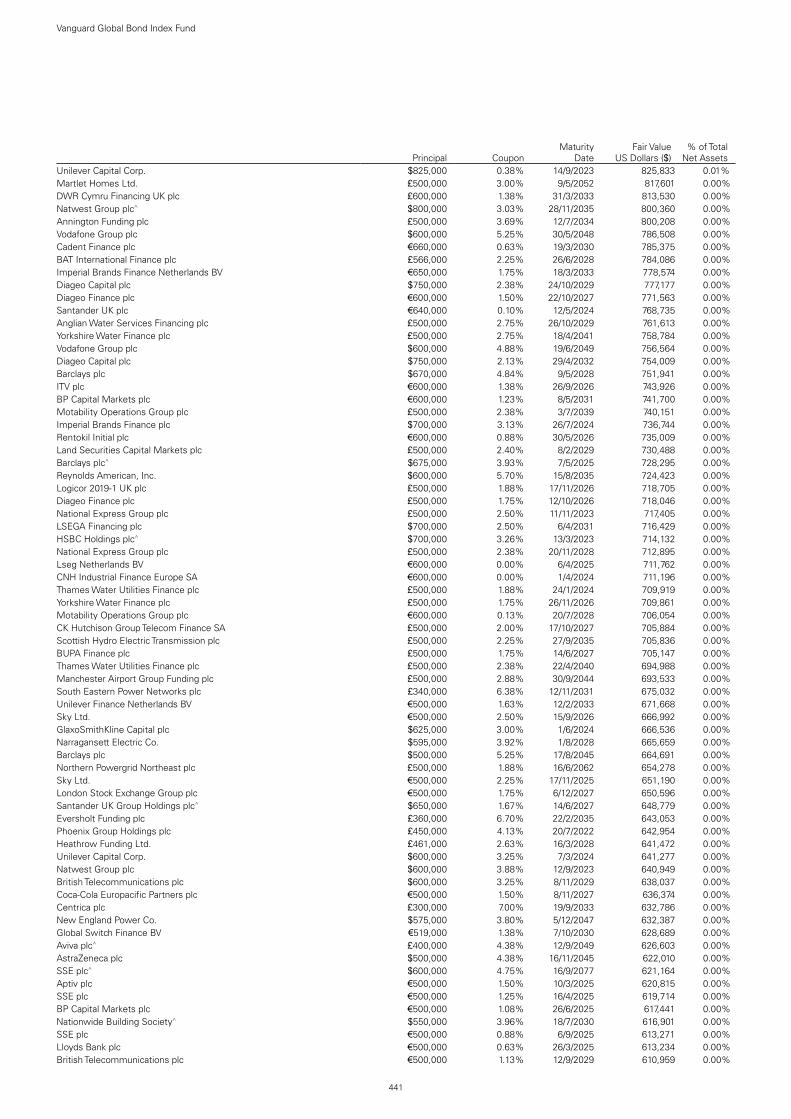
441
Vanguard Global Bond Index Fund
Principal CouponMaturity
DateFair Value
US Dollars ($)% of Total
Net AssetsUnilever Capital Corp. $825,000 0.38% 14/9/2023 825,833 0.01%Martlet Homes Ltd. £500,000 3.00% 9/5/2052 817,601 0.00%DWR Cymru Financing UK plc £600,000 1.38% 31/3/2033 813,530 0.00%Natwest Group plc^ $800,000 3.03% 28/11/2035 800,360 0.00%Annington Funding plc £500,000 3.69% 12/7/2034 800,208 0.00%Vodafone Group plc $600,000 5.25% 30/5/2048 786,508 0.00%Cadent Finance plc €660,000 0.63% 19/3/2030 785,375 0.00%BAT International Finance plc £566,000 2.25% 26/6/2028 784,086 0.00%Imperial Brands Finance Netherlands BV €650,000 1.75% 18/3/2033 778,574 0.00%Diageo Capital plc $750,000 2.38% 24/10/2029 777,177 0.00%Diageo Finance plc €600,000 1.50% 22/10/2027 771,563 0.00%Santander UK plc €640,000 0.10% 12/5/2024 768,735 0.00%Anglian Water Services Financing plc £500,000 2.75% 26/10/2029 761,613 0.00%Yorkshire Water Finance plc £500,000 2.75% 18/4/2041 758,784 0.00%Vodafone Group plc $600,000 4.88% 19/6/2049 756,564 0.00%Diageo Capital plc $750,000 2.13% 29/4/2032 754,009 0.00%Barclays plc $670,000 4.84% 9/5/2028 751,941 0.00%ITV plc €600,000 1.38% 26/9/2026 743,926 0.00%BP Capital Markets plc €600,000 1.23% 8/5/2031 741,700 0.00%Motability Operations Group plc £500,000 2.38% 3/7/2039 740,151 0.00%Imperial Brands Finance plc $700,000 3.13% 26/7/2024 736,744 0.00%Rentokil Initial plc €600,000 0.88% 30/5/2026 735,009 0.00%Land Securities Capital Markets plc £500,000 2.40% 8/2/2029 730,488 0.00%Barclays plc^ $675,000 3.93% 7/5/2025 728,295 0.00%Reynolds American, Inc. $600,000 5.70% 15/8/2035 724,423 0.00%Logicor 2019-1 UK plc £500,000 1.88% 17/11/2026 718,705 0.00%Diageo Finance plc £500,000 1.75% 12/10/2026 718,046 0.00%National Express Group plc £500,000 2.50% 11/11/2023 717,405 0.00%LSEGA Financing plc $700,000 2.50% 6/4/2031 716,429 0.00%HSBC Holdings plc^ $700,000 3.26% 13/3/2023 714,132 0.00%National Express Group plc £500,000 2.38% 20/11/2028 712,895 0.00%Lseg Netherlands BV €600,000 0.00% 6/4/2025 711,762 0.00%CNH Industrial Finance Europe SA €600,000 0.00% 1/4/2024 711,196 0.00%Thames Water Utilities Finance plc £500,000 1.88% 24/1/2024 709,919 0.00%Yorkshire Water Finance plc £500,000 1.75% 26/11/2026 709,861 0.00%Motability Operations Group plc €600,000 0.13% 20/7/2028 706,054 0.00%CK Hutchison Group Telecom Finance SA £500,000 2.00% 17/10/2027 705,884 0.00%Scottish Hydro Electric Transmission plc £500,000 2.25% 27/9/2035 705,836 0.00%BUPA Finance plc £500,000 1.75% 14/6/2027 705,147 0.00%Thames Water Utilities Finance plc £500,000 2.38% 22/4/2040 694,988 0.00%Manchester Airport Group Funding plc £500,000 2.88% 30/9/2044 693,533 0.00%South Eastern Power Networks plc £340,000 6.38% 12/11/2031 675,032 0.00%Unilever Finance Netherlands BV €500,000 1.63% 12/2/2033 671,668 0.00%Sky Ltd. €500,000 2.50% 15/9/2026 666,992 0.00%GlaxoSmithKline Capital plc $625,000 3.00% 1/6/2024 666,536 0.00%Narragansett Electric Co. $595,000 3.92% 1/8/2028 665,659 0.00%Barclays plc $500,000 5.25% 17/8/2045 664,691 0.00%Northern Powergrid Northeast plc £500,000 1.88% 16/6/2062 654,278 0.00%Sky Ltd. €500,000 2.25% 17/11/2025 651,190 0.00%London Stock Exchange Group plc €500,000 1.75% 6/12/2027 650,596 0.00%Santander UK Group Holdings plc^ $650,000 1.67% 14/6/2027 648,779 0.00%Eversholt Funding plc £360,000 6.70% 22/2/2035 643,053 0.00%Phoenix Group Holdings plc £450,000 4.13% 20/7/2022 642,954 0.00%Heathrow Funding Ltd. £461,000 2.63% 16/3/2028 641,472 0.00%Unilever Capital Corp. $600,000 3.25% 7/3/2024 641,277 0.00%Natwest Group plc $600,000 3.88% 12/9/2023 640,949 0.00%British Telecommunications plc $600,000 3.25% 8/11/2029 638,037 0.00%Coca-Cola Europacific Partners plc €500,000 1.50% 8/11/2027 636,374 0.00%Centrica plc £300,000 7.00% 19/9/2033 632,786 0.00%New England Power Co. $575,000 3.80% 5/12/2047 632,387 0.00%Global Switch Finance BV €519,000 1.38% 7/10/2030 628,689 0.00%Aviva plc^ £400,000 4.38% 12/9/2049 626,603 0.00%AstraZeneca plc $500,000 4.38% 16/11/2045 622,010 0.00%SSE plc^ $600,000 4.75% 16/9/2077 621,164 0.00%Aptiv plc €500,000 1.50% 10/3/2025 620,815 0.00%SSE plc €500,000 1.25% 16/4/2025 619,714 0.00%BP Capital Markets plc €500,000 1.08% 26/6/2025 617,441 0.00%Nationwide Building Society^ $550,000 3.96% 18/7/2030 616,901 0.00%SSE plc €500,000 0.88% 6/9/2025 613,271 0.00%Lloyds Bank plc €500,000 0.63% 26/3/2025 613,234 0.00%British Telecommunications plc €500,000 1.13% 12/9/2029 610,959 0.00%

442
Vanguard Global Bond Index Fund
Principal CouponMaturity
DateFair Value
US Dollars ($)% of Total
Net AssetsInforma plc €500,000 1.50% 5/7/2023 610,521 0.00%Reckitt Benckiser Treasury Services Nederland BV €500,000 0.75% 19/5/2030 609,812 0.00%CK Hutchison Finance 16 II Ltd. €500,000 0.88% 3/10/2024 609,106 0.00%Leeds Building Society €500,000 0.50% 3/7/2024 607,346 0.00%Lloyds Banking Group plc $550,000 3.75% 11/1/2027 606,983 0.00%Imperial Brands Finance plc €500,000 1.13% 14/8/2023 605,167 0.00%Natwest Group plc^ €500,000 0.75% 15/11/2025 605,031 0.00%Barclays plc^ €500,000 0.75% 9/6/2025 603,238 0.00%Reckitt Benckiser Treasury Services Nederland BV €500,000 0.38% 19/5/2026 602,904 0.00%Swan Housing Capital plc £400,000 3.63% 5/3/2048 602,728 0.00%Yorkshire Building Society €500,000 0.38% 11/4/2023 601,075 0.00%Clarion Funding plc £400,000 2.63% 18/1/2029 600,941 0.00%RELX Finance BV €500,000 0.50% 10/3/2028 600,523 0.00%BUPA Finance plc £371,000 5.00% 8/12/2026 598,379 0.00%Wessex Water Services Finance plc £476,000 1.25% 12/1/2036 595,087 0.00%Virgin Money UK plc^ £381,000 5.13% 11/12/2030 587,414 0.00%Barclays plc^ $505,000 5.09% 20/6/2030 586,970 0.00%Together Housing Finance plc £300,000 4.50% 17/12/2042 586,486 0.00%Lloyds Banking Group plc $500,000 4.34% 9/1/2048 586,055 0.00%Western Power Distribution plc £400,000 3.63% 6/11/2023 585,007 0.00%Lloyds Banking Group plc^ $575,000 2.86% 17/3/2023 584,690 0.00%DS Smith plc £400,000 2.88% 26/7/2029 583,838 0.00%United Utilities Water Finance plc £400,000 2.00% 14/2/2025 575,880 0.00%Prudential plc £300,000 6.13% 19/12/2031 571,249 0.00%CK Hutchison International 17 II Ltd. $550,000 2.75% 29/3/2023 570,354 0.00%Heathrow Funding Ltd. £300,000 6.45% 10/12/2031 568,716 0.00%Chancellor Masters & Scholars of The University of Cambridge £300,000 2.35% 27/6/2078 566,081 0.00%Southern Electric Power Distribution plc £300,000 5.50% 7/6/2032 565,747 0.00%AstraZeneca plc $550,000 3.00% 28/5/2051 565,440 0.00%BAT Capital Corp. $550,000 2.76% 15/8/2022 562,949 0.00%Hyde Housing Association Ltd. £450,000 1.75% 18/8/2055 562,123 0.00%Reckitt Benckiser Treasury Services plc £400,000 1.75% 19/5/2032 560,949 0.00%WPP Finance SA £354,000 3.75% 19/5/2032 559,071 0.00%Student Finance plc £400,000 2.67% 30/9/2024 558,934 0.00%South Eastern Power Networks plc £300,000 5.63% 30/9/2030 555,928 0.00%Clarion Funding plc £400,000 1.88% 22/1/2035 553,636 0.00%BAT International Finance plc £300,000 6.00% 24/11/2034 541,413 0.00%Vodafone Group plc $500,000 3.75% 16/1/2024 541,377 0.00%BP Capital Markets plc $500,000 3.81% 10/2/2024 540,950 0.00%Barclays plc^ $500,000 4.34% 16/5/2024 533,047 0.00%SELP Finance Sarl €427,000 1.50% 20/11/2025 532,351 0.00%BAT Capital Corp. $500,000 3.22% 15/8/2024 531,132 0.00%Unilever Capital Corp. $500,000 2.60% 5/5/2024 527,359 0.00%University of Oxford £300,000 2.54% 8/12/2117 520,331 0.00%Santander UK Group Holdings plc^ $500,000 2.90% 15/3/2032 515,699 0.00%HSBC Holdings plc^ $500,000 2.80% 24/5/2032 513,248 0.00%Motability Operations Group plc £400,000 1.50% 20/1/2041 513,179 0.00%BAT Capital Corp. $475,000 4.39% 15/8/2037 512,481 0.00%Lloyds Bank plc $500,000 2.13% 24/7/2022 509,919 0.00%Nationwide Building Society^ $450,000 4.30% 8/3/2029 508,991 0.00%Santander UK Group Holdings plc $500,000 3.57% 10/1/2023 507,984 0.00%CNH Industrial Finance Europe SA €400,000 1.88% 19/1/2026 507,774 0.00%Natwest Group plc^ $475,000 3.75% 1/11/2029 505,350 0.00%Barclays plc $450,000 4.38% 12/1/2026 504,192 0.00%CNH Industrial Finance Europe SA €400,000 1.75% 12/9/2025 503,682 0.00%Barclays plc^ $500,000 2.67% 10/3/2032 503,387 0.00%Barclays plc^ $500,000 1.01% 10/12/2024 501,866 0.00%HSBC Holdings plc^ $500,000 2.01% 22/9/2028 501,669 0.00%LSEGA Financing plc $500,000 1.38% 6/4/2026 500,859 0.00%HSBC Holdings plc^ $500,000 2.36% 18/8/2031 500,283 0.00%Natwest Group plc $450,000 5.13% 28/5/2024 499,688 0.00%Standard Chartered plc^ $500,000 0.99% 12/1/2025 498,827 0.00%Nationwide Building Society $500,000 0.55% 22/1/2024 497,886 0.00%London & Quadrant Housing Trust £300,000 3.13% 28/2/2053 497,802 0.00%Gatwick Funding Ltd. £300,000 6.13% 2/3/2026 496,830 0.00%Mondi Finance plc €400,000 1.50% 15/4/2024 492,718 0.00%Global Switch Holdings Ltd. €400,000 1.50% 31/1/2024 489,945 0.00%Smith & Nephew plc $500,000 2.03% 14/10/2030 489,917 0.00%BAE Systems plc $500,000 3.00% 15/9/2050 488,985 0.00%Tesco Corporate Treasury Services plc €400,000 0.88% 29/5/2026 487,806 0.00%BAT Capital Corp. €400,000 1.13% 16/11/2023 485,257 0.00%

443
Vanguard Global Bond Index Fund
Principal CouponMaturity
DateFair Value
US Dollars ($)% of Total
Net AssetsBritish Telecommunications plc €400,000 1.13% 10/3/2023 485,132 0.00%BAE Systems plc $500,000 1.90% 15/2/2031 482,986 0.00%Just Group plc^ £300,000 7.00% 15/4/2031 481,695 0.00%British Telecommunications plc €400,000 0.50% 12/9/2025 480,907 0.00%HSBC Bank plc £250,000 4.75% 24/3/2046 480,291 0.00%Yorkshire Water Finance plc £300,000 3.63% 1/8/2029 477,745 0.00%HSBC Holdings plc^ €400,000 0.31% 13/11/2026 476,115 0.00%AstraZeneca plc €400,000 0.38% 3/6/2029 474,800 0.00%HSBC Holdings plc^ €400,000 0.77% 13/11/2031 474,118 0.00%CCEP Finance Ireland DAC €400,000 0.50% 6/9/2029 474,061 0.00%CCEP Finance Ireland DAC €400,000 0.88% 6/5/2033 473,821 0.00%RL Finance Bonds NO 4 plc^ £300,000 4.88% 7/10/2049 473,034 0.00%Accent Capital plc £300,000 2.63% 18/7/2049 466,984 0.00%Tesco Corporate Treasury Services plc €400,000 0.38% 27/7/2029 463,258 0.00%London Stock Exchange Group plc €349,000 1.75% 19/9/2029 459,547 0.00%Barclays plc $400,000 5.20% 12/5/2026 457,862 0.00%UNITE USAF II plc £300,000 3.92% 30/6/2025 453,504 0.00%Annington Funding plc £300,000 3.18% 12/7/2029 451,903 0.00%Network Rail Infrastructure Finance plc £250,000 4.38% 9/12/2030 451,092 0.00%HSBC Holdings plc^ $400,000 3.97% 22/5/2030 447,495 0.00%Natwest Group plc^ £300,000 3.13% 28/3/2027 445,728 0.00%Next Group plc £300,000 3.00% 26/8/2025 444,064 0.00%Tesco Corporate Treasury Services plc £300,000 2.75% 27/4/2030 442,649 0.00%Imperial Brands Finance plc $400,000 4.25% 21/7/2025 440,364 0.00%BP Capital Markets plc £300,000 2.27% 3/7/2026 439,002 0.00%BAT International Finance plc $400,000 3.95% 15/6/2025 436,647 0.00%Natwest Group plc^ $400,000 4.27% 22/3/2025 434,039 0.00%Hutchison Whampoa International 03/33 Ltd. $285,000 7.45% 24/11/2033 431,292 0.00%BP Capital Markets plc $400,000 3.99% 26/9/2023 431,182 0.00%London & Quadrant Housing Trust £200,000 5.49% 15/6/2042 430,622 0.00%Natwest Group plc^ $400,000 4.52% 25/6/2024 429,416 0.00%Imperial Brands Finance plc $400,000 3.50% 26/7/2026 429,180 0.00%Gatwick Funding Ltd. £300,000 3.13% 28/9/2039 425,826 0.00%Heathrow Funding Ltd. CA($)500,000 3.25% 21/5/2025 425,224 0.00%HSBC Holdings plc CA($)500,000 3.20% 5/12/2023 423,136 0.00%Western Power Distribution South West plc £200,000 5.75% 23/3/2040 422,053 0.00%THFC Funding No 3 plc £200,000 5.20% 11/10/2043 420,761 0.00%Westfield Stratford City Finance NO 2 plc £300,000 1.64% 4/8/2026 418,892 0.00%National Grid Electricity Transmission plc £300,000 1.38% 16/9/2026 418,441 0.00%HSBC Holdings plc $300,000 6.50% 15/9/2037 417,867 0.00%HSBC Holdings plc^ $375,000 4.29% 12/9/2026 417,356 0.00%British Airways 2019-1 Class AA Pass Through Trust $405,264 3.30% 15/12/2032 414,917 0.00%HSBC Holdings plc $375,000 4.25% 18/8/2025 414,856 0.00%Lloyds Banking Group plc^ $400,000 2.91% 7/11/2023 412,484 0.00%Orbit Capital plc £300,000 2.00% 24/11/2038 409,090 0.00%National Grid Electricity Transmission plc £300,000 2.00% 16/9/2038 408,797 0.00%CK Hutchison International 21 Ltd. $400,000 2.50% 15/4/2031 407,933 0.00%SSE plc £200,000 8.38% 20/11/2028 404,699 0.00%LSEGA Financing plc $400,000 2.00% 6/4/2028 404,458 0.00%National Grid Electricity Transmission plc £300,000 2.00% 17/4/2040 404,166 0.00%ENW Finance plc £300,000 1.42% 30/7/2030 403,971 0.00%CK Hutchison International 21 Ltd. $400,000 1.50% 15/4/2026 402,286 0.00%Heathrow Funding Ltd. £200,000 5.88% 13/5/2041 401,814 0.00%BAT International Finance plc €350,000 2.00% 13/3/2045 400,702 0.00%CK Hutchison Europe Finance 18 Ltd. €300,000 2.00% 13/4/2030 400,201 0.00%HSBC Holdings plc £200,000 6.00% 29/3/2040 397,663 0.00%BAT Capital Corp. $375,000 3.46% 6/9/2029 396,475 0.00%Barclays plc^ $375,000 3.81% 10/3/2042 395,740 0.00%Affordable Housing Finance plc £200,000 3.80% 20/5/2042 392,568 0.00%Thames Water Utilities Finance plc £200,000 4.63% 4/6/2046 389,197 0.00%BP Capital Markets plc €300,000 1.95% 3/3/2025 381,939 0.00%CNH Industrial Finance Europe SA €300,000 1.75% 25/3/2027 380,491 0.00%Brambles Finance Ltd. €300,000 2.38% 12/6/2024 379,662 0.00%Vodafone Group plc $325,000 4.38% 19/2/2043 379,255 0.00%Experian Finance plc €300,000 1.38% 25/6/2026 376,068 0.00%Sky Ltd. €300,000 1.88% 24/11/2023 373,594 0.00%Royal Mail plc €300,000 1.25% 8/10/2026 373,086 0.00%Vodafone Group plc £250,000 3.00% 12/8/2056 371,148 0.00%Tritax Big Box plc £250,000 2.63% 14/12/2026 370,331 0.00%Motability Operations Group plc €300,000 0.88% 14/3/2025 368,704 0.00%SSE plc £250,000 5.88% 22/9/2022 368,015 0.00%
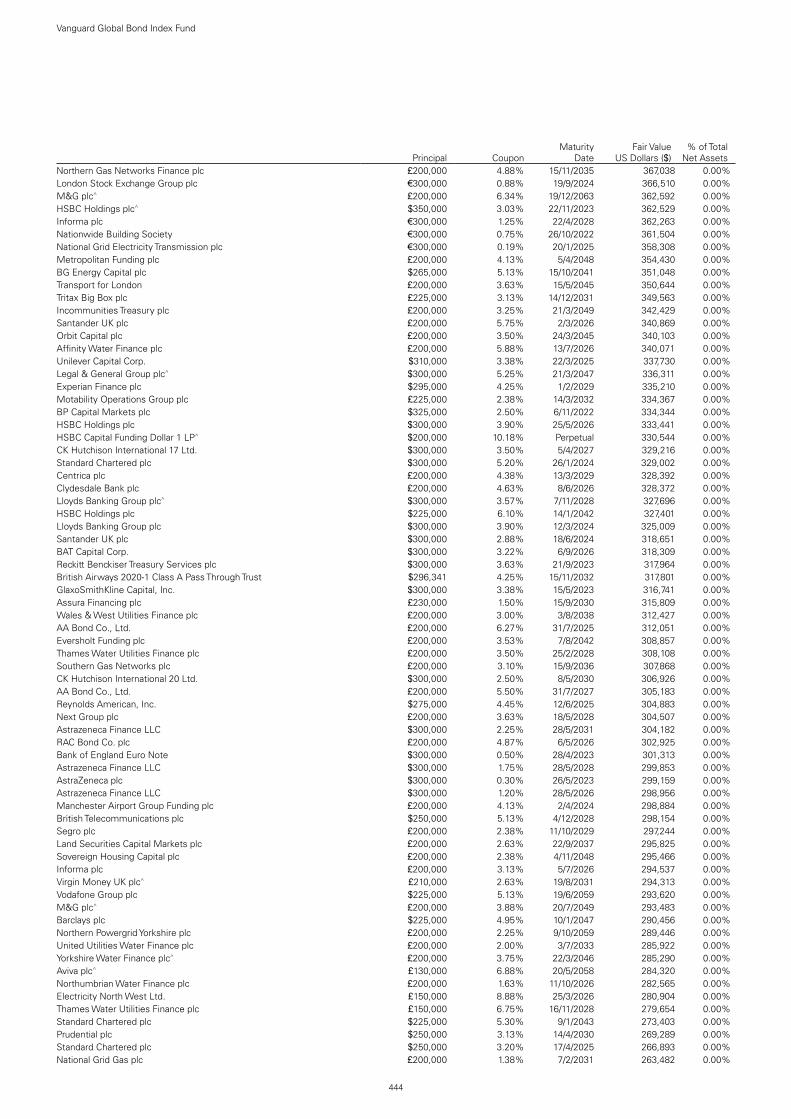
444
Vanguard Global Bond Index Fund
Principal CouponMaturity
DateFair Value
US Dollars ($)% of Total
Net AssetsNorthern Gas Networks Finance plc £200,000 4.88% 15/11/2035 367,038 0.00%London Stock Exchange Group plc €300,000 0.88% 19/9/2024 366,510 0.00%M&G plc^ £200,000 6.34% 19/12/2063 362,592 0.00%HSBC Holdings plc^ $350,000 3.03% 22/11/2023 362,529 0.00%Informa plc €300,000 1.25% 22/4/2028 362,263 0.00%Nationwide Building Society €300,000 0.75% 26/10/2022 361,504 0.00%National Grid Electricity Transmission plc €300,000 0.19% 20/1/2025 358,308 0.00%Metropolitan Funding plc £200,000 4.13% 5/4/2048 354,430 0.00%BG Energy Capital plc $265,000 5.13% 15/10/2041 351,048 0.00%Transport for London £200,000 3.63% 15/5/2045 350,644 0.00%Tritax Big Box plc £225,000 3.13% 14/12/2031 349,563 0.00%Incommunities Treasury plc £200,000 3.25% 21/3/2049 342,429 0.00%Santander UK plc £200,000 5.75% 2/3/2026 340,869 0.00%Orbit Capital plc £200,000 3.50% 24/3/2045 340,103 0.00%Affinity Water Finance plc £200,000 5.88% 13/7/2026 340,071 0.00%Unilever Capital Corp. $310,000 3.38% 22/3/2025 337,730 0.00%Legal & General Group plc^ $300,000 5.25% 21/3/2047 336,311 0.00%Experian Finance plc $295,000 4.25% 1/2/2029 335,210 0.00%Motability Operations Group plc £225,000 2.38% 14/3/2032 334,367 0.00%BP Capital Markets plc $325,000 2.50% 6/11/2022 334,344 0.00%HSBC Holdings plc $300,000 3.90% 25/5/2026 333,441 0.00%HSBC Capital Funding Dollar 1 LP^ $200,000 10.18% Perpetual 330,544 0.00%CK Hutchison International 17 Ltd. $300,000 3.50% 5/4/2027 329,216 0.00%Standard Chartered plc $300,000 5.20% 26/1/2024 329,002 0.00%Centrica plc £200,000 4.38% 13/3/2029 328,392 0.00%Clydesdale Bank plc £200,000 4.63% 8/6/2026 328,372 0.00%Lloyds Banking Group plc^ $300,000 3.57% 7/11/2028 327,696 0.00%HSBC Holdings plc $225,000 6.10% 14/1/2042 327,401 0.00%Lloyds Banking Group plc $300,000 3.90% 12/3/2024 325,009 0.00%Santander UK plc $300,000 2.88% 18/6/2024 318,651 0.00%BAT Capital Corp. $300,000 3.22% 6/9/2026 318,309 0.00%Reckitt Benckiser Treasury Services plc $300,000 3.63% 21/9/2023 317,964 0.00%British Airways 2020-1 Class A Pass Through Trust $296,341 4.25% 15/11/2032 317,801 0.00%GlaxoSmithKline Capital, Inc. $300,000 3.38% 15/5/2023 316,741 0.00%Assura Financing plc £230,000 1.50% 15/9/2030 315,809 0.00%Wales & West Utilities Finance plc £200,000 3.00% 3/8/2038 312,427 0.00%AA Bond Co., Ltd. £200,000 6.27% 31/7/2025 312,051 0.00%Eversholt Funding plc £200,000 3.53% 7/8/2042 308,857 0.00%Thames Water Utilities Finance plc £200,000 3.50% 25/2/2028 308,108 0.00%Southern Gas Networks plc £200,000 3.10% 15/9/2036 307,868 0.00%CK Hutchison International 20 Ltd. $300,000 2.50% 8/5/2030 306,926 0.00%AA Bond Co., Ltd. £200,000 5.50% 31/7/2027 305,183 0.00%Reynolds American, Inc. $275,000 4.45% 12/6/2025 304,883 0.00%Next Group plc £200,000 3.63% 18/5/2028 304,507 0.00%Astrazeneca Finance LLC $300,000 2.25% 28/5/2031 304,182 0.00%RAC Bond Co. plc £200,000 4.87% 6/5/2026 302,925 0.00%Bank of England Euro Note $300,000 0.50% 28/4/2023 301,313 0.00%Astrazeneca Finance LLC $300,000 1.75% 28/5/2028 299,853 0.00%AstraZeneca plc $300,000 0.30% 26/5/2023 299,159 0.00%Astrazeneca Finance LLC $300,000 1.20% 28/5/2026 298,956 0.00%Manchester Airport Group Funding plc £200,000 4.13% 2/4/2024 298,884 0.00%British Telecommunications plc $250,000 5.13% 4/12/2028 298,154 0.00%Segro plc £200,000 2.38% 11/10/2029 297,244 0.00%Land Securities Capital Markets plc £200,000 2.63% 22/9/2037 295,825 0.00%Sovereign Housing Capital plc £200,000 2.38% 4/11/2048 295,466 0.00%Informa plc £200,000 3.13% 5/7/2026 294,537 0.00%Virgin Money UK plc^ £210,000 2.63% 19/8/2031 294,313 0.00%Vodafone Group plc $225,000 5.13% 19/6/2059 293,620 0.00%M&G plc^ £200,000 3.88% 20/7/2049 293,483 0.00%Barclays plc $225,000 4.95% 10/1/2047 290,456 0.00%Northern Powergrid Yorkshire plc £200,000 2.25% 9/10/2059 289,446 0.00%United Utilities Water Finance plc £200,000 2.00% 3/7/2033 285,922 0.00%Yorkshire Water Finance plc^ £200,000 3.75% 22/3/2046 285,290 0.00%Aviva plc^ £130,000 6.88% 20/5/2058 284,320 0.00%Northumbrian Water Finance plc £200,000 1.63% 11/10/2026 282,565 0.00%Electricity North West Ltd. £150,000 8.88% 25/3/2026 280,904 0.00%Thames Water Utilities Finance plc £150,000 6.75% 16/11/2028 279,654 0.00%Standard Chartered plc $225,000 5.30% 9/1/2043 273,403 0.00%Prudential plc $250,000 3.13% 14/4/2030 269,289 0.00%Standard Chartered plc $250,000 3.20% 17/4/2025 266,893 0.00%National Grid Gas plc £200,000 1.38% 7/2/2031 263,482 0.00%

445
Vanguard Global Bond Index Fund
Principal CouponMaturity
DateFair Value
US Dollars ($)% of Total
Net AssetsCK Hutchison Finance 16 Ltd. €200,000 2.00% 6/4/2028 263,214 0.00%Wales & West Utilities Finance plc £200,000 1.88% 28/5/2041 262,286 0.00%Ashtead Capital, Inc. $250,000 4.38% 15/8/2027 262,082 0.00%Diageo Capital plc $250,000 2.13% 24/10/2024 261,164 0.00%Gatwick Funding Ltd. £200,000 2.63% 7/10/2046 258,283 0.00%Smiths Group plc €200,000 2.00% 23/2/2027 257,232 0.00%Urenco Finance NV €200,000 2.38% 2/12/2024 254,802 0.00%Diageo Capital plc $250,000 1.38% 29/9/2025 254,111 0.00%Mead Johnson Nutrition Co. $225,000 4.13% 15/11/2025 253,044 0.00%Barclays plc^ $250,000 2.65% 24/6/2031 253,030 0.00%AstraZeneca plc $200,000 4.38% 17/8/2048 252,244 0.00%SP Manweb plc £150,000 4.88% 20/9/2027 251,068 0.00%GlaxoSmithKline Capital, Inc. $200,000 4.20% 18/3/2043 248,892 0.00%RELX Capital, Inc. €200,000 1.30% 12/5/2025 248,779 0.00%NatWest Markets plc €200,000 1.00% 28/5/2024 244,752 0.00%Standard Chartered plc^ €200,000 0.90% 2/7/2027 244,417 0.00%Unilever Finance Netherlands BV €200,000 1.00% 3/6/2023 243,264 0.00%RELX Finance BV €200,000 0.88% 10/3/2032 241,731 0.00%BG Energy Capital plc €200,000 1.25% 21/11/2022 241,480 0.00%Vodafone Group plc €200,000 0.50% 30/1/2024 241,401 0.00%easyJet plc €200,000 1.13% 18/10/2023 241,380 0.00%Lloyds Bank plc €200,000 0.13% 23/9/2029 238,394 0.00%RELX Finance BV €200,000 0.00% 18/3/2024 238,126 0.00%M&G plc^ $200,000 6.50% 20/10/2048 237,625 0.00%Tritax EuroBox plc €200,000 0.95% 2/6/2026 236,966 0.00%AstraZeneca plc $250,000 1.38% 6/8/2030 236,885 0.00%Diageo Investment Corp. $150,000 7.45% 15/4/2035 236,843 0.00%Diageo Capital plc $200,000 3.88% 29/4/2043 235,909 0.00%New England Power Co. $250,000 2.81% 6/10/2050 233,350 0.00%National Westminster Bank plc £150,000 5.13% 13/1/2024 231,760 0.00%Greene King Finance plc £152,839 4.06% 15/3/2035 231,272 0.00%Standard Chartered plc^ $200,000 4.31% 21/5/2030 229,929 0.00%Unilever Capital Corp. $200,000 3.50% 22/3/2028 224,815 0.00%Barclays plc $200,000 4.34% 10/1/2028 223,528 0.00%THFC Funding No 2 plc £100,000 6.35% 8/7/2039 223,186 0.00%Beazley Insurance DAC $200,000 5.50% 10/9/2029 222,587 0.00%Standard Chartered plc^ $200,000 4.87% 15/3/2033 222,056 0.00%Nationwide Building Society $200,000 3.90% 21/7/2025 221,592 0.00%Lloyds Banking Group plc $200,000 4.50% 4/11/2024 221,068 0.00%Reynolds American, Inc. $175,000 6.15% 15/9/2043 220,916 0.00%Heathrow Funding Ltd. €178,000 1.88% 14/3/2034 220,574 0.00%BP Capital Markets plc $200,000 3.28% 19/9/2027 218,979 0.00%British Telecommunications plc $200,000 4.50% 4/12/2023 217,634 0.00%Imperial Brands Finance plc $200,000 3.88% 26/7/2029 216,915 0.00%Peabody Capital No 2 plc £100,000 4.63% 12/12/2053 215,785 0.00%Circle Anglia Social Housing plc £100,000 5.20% 2/3/2044 214,853 0.00%Standard Chartered plc^ $200,000 3.79% 21/5/2025 214,812 0.00%CK Hutchison International 19 II Ltd. $200,000 3.38% 6/9/2049 214,003 0.00%AstraZeneca plc $200,000 3.50% 17/8/2023 212,435 0.00%Transport for London £100,000 4.00% 7/4/2064 210,483 0.00%CK Hutchison International 19 II Ltd. $200,000 2.75% 6/9/2029 209,090 0.00%GlaxoSmithKline Capital, Inc. $200,000 2.80% 18/3/2023 208,272 0.00%HSBC Holdings plc^ $200,000 2.85% 4/6/2031 207,545 0.00%Experian Finance plc $200,000 2.75% 8/3/2030 207,132 0.00%LCR Finance plc £100,000 4.50% 7/12/2038 205,917 0.00%Northumbrian Water Finance plc £100,000 5.13% 23/1/2042 205,917 0.00%Unilever Capital Corp. $200,000 2.13% 6/9/2029 205,836 0.00%Notting Hill Genesis £100,000 4.38% 20/2/2054 205,672 0.00%Imperial Brands Finance plc $200,000 3.75% 21/7/2022 205,268 0.00%Santander UK plc $200,000 2.10% 13/1/2023 205,200 0.00%British Telecommunications plc £100,000 6.38% 23/6/2037 204,713 0.00%London Power Networks plc £137,000 2.63% 1/3/2029 204,362 0.00%Santander UK plc $200,000 1.63% 12/2/2023 204,039 0.00%BPHA Finance plc £100,000 4.82% 11/4/2044 202,496 0.00%Vodafone Group plc $150,000 6.25% 30/11/2032 202,470 0.00%GlaxoSmithKline Capital, Inc. $150,000 5.38% 15/4/2034 202,209 0.00%Severn Trent Utilities Finance plc £100,000 4.88% 24/1/2042 200,660 0.00%Diageo Capital plc $200,000 2.00% 29/4/2030 200,358 0.00%Heathrow Funding Ltd. $200,000 4.88% 15/7/2021 200,298 0.00%Niagara Mohawk Power Corp. $175,000 4.12% 28/11/2042 199,194 0.00%GlaxoSmithKline Capital plc £100,000 4.25% 18/12/2045 196,804 0.00%

446
Vanguard Global Bond Index Fund
Principal CouponMaturity
DateFair Value
US Dollars ($)% of Total
Net AssetsMyriad Capital plc £100,000 4.75% 20/12/2043 195,238 0.00%HSBC Bank Capital Funding Sterling 1 LP^ £100,000 5.84% Perpetual 195,007 0.00%Legal & General Finance plc £100,000 5.88% 11/12/2031 194,985 0.00%EMH Treasury plc £100,000 4.50% 29/1/2044 194,345 0.00%GlaxoSmithKline Capital plc £100,000 5.25% 19/12/2033 194,136 0.00%Compass Group Finance Netherlands BV €150,000 1.50% 5/9/2028 194,027 0.00%Unilever Capital Corp. $200,000 1.38% 14/9/2030 193,364 0.00%Western Power Distribution West Midlands plc £100,000 5.75% 16/4/2032 190,188 0.00%Unilever Capital Corp. $175,000 3.10% 30/7/2025 190,179 0.00%Lloyds Bank plc £100,000 6.00% 8/2/2029 188,495 0.00%Northern Powergrid Yorkshire plc £100,000 5.13% 4/5/2035 187,427 0.00%Yorkshire Housing Finance plc £100,000 4.13% 31/10/2044 183,381 0.00%London & Quadrant Housing Trust £100,000 3.75% 27/10/2049 182,428 0.00%Diageo Finance plc €148,000 0.50% 19/6/2024 178,769 0.00%Centrica plc £100,000 4.25% 12/9/2044 178,235 0.00%BP Capital Markets plc CA($)200,000 3.47% 15/5/2025 173,540 0.00%Lloyds Banking Group plc CA($)200,000 3.50% 3/2/2025 172,002 0.00%Transport for London £100,000 4.00% 12/9/2033 171,624 0.00%RELX Capital, Inc. $150,000 4.00% 18/3/2029 170,377 0.00%Heathrow Funding Ltd. CA($)200,000 3.40% 8/3/2028 170,270 0.00%Motability Operations Group plc £100,000 3.63% 10/3/2036 170,169 0.00%Citizen Treasury plc £100,000 3.25% 20/10/2048 169,854 0.00%Lloyds Bank plc £100,000 4.88% 30/3/2027 169,785 0.00%HSBC Holdings plc £100,000 5.75% 20/12/2027 169,268 0.00%BAE Systems Holdings, Inc. $135,000 4.75% 7/10/2044 169,148 0.00%Nationwide Building Society £100,000 5.63% 28/1/2026 169,061 0.00%Kennedy Wilson Europe Real Estate Ltd. £118,877 3.95% 30/6/2022 167,230 0.00%CNH Industrial NV $150,000 3.85% 15/11/2027 166,329 0.00%M&G plc^ £100,000 5.56% 20/7/2055 166,104 0.00%Gatwick Funding Ltd. £100,000 4.63% 27/3/2034 165,756 0.00%Anglian Water Services Financing plc £100,000 4.50% 5/10/2027 165,069 0.00%Crh Finance UK plc £100,000 4.13% 2/12/2029 165,059 0.00%Aviva plc^ £100,000 5.13% 4/6/2050 165,007 0.00%Sky Ltd. £100,000 4.00% 26/11/2029 164,885 0.00%Lloyds Bank plc £100,000 7.50% 15/4/2024 163,921 0.00%Southern Housing Group Ltd. £100,000 3.50% 19/10/2047 163,913 0.00%AstraZeneca plc $150,000 3.13% 12/6/2027 163,394 0.00%Lloyds Bank plc £100,000 5.13% 7/3/2025 161,175 0.00%RSA Insurance Group Ltd.^ £100,000 5.13% 10/10/2045 157,778 0.00%RELX Capital, Inc. $150,000 3.50% 16/3/2023 157,363 0.00%Aspire Defence Finance plc £85,715 4.67% 31/3/2040 155,625 0.00%Morhomes plc £100,000 3.40% 19/2/2038 154,953 0.00%RL Finance Bonds No. 2 plc^ £100,000 6.13% 30/11/2043 153,459 0.00%Wm Morrison Supermarkets plc £100,000 4.75% 4/7/2029 153,123 0.00%BAT International Finance plc £100,000 4.00% 4/9/2026 152,992 0.00%Severn Trent Utilities Finance plc £100,000 2.75% 5/12/2031 152,584 0.00%Cadent Finance plc £100,000 3.13% 21/3/2040 152,375 0.00%Scotland Gas Networks plc £100,000 3.25% 8/3/2027 152,254 0.00%Linde Finance BV £100,000 5.88% 24/4/2023 151,769 0.00%DWR Cymru Financing UK plc £100,000 2.50% 31/3/2036 151,373 0.00%InterContinental Hotels Group plc £100,000 3.75% 14/8/2025 150,057 0.00%National Grid Electricity Transmission plc £100,000 2.75% 6/2/2035 149,898 0.00%BUPA Finance plc £100,000 5.00% 25/4/2023 148,206 0.00%Western Power Distribution East Midlands plc £100,000 5.25% 17/1/2023 147,969 0.00%Bazalgette Finance plc £100,000 2.38% 29/11/2027 147,733 0.00%Compass Group plc £100,000 2.00% 3/7/2029 145,395 0.00%Compass Group plc £100,000 2.00% 5/9/2025 144,585 0.00%HSBC Holdings plc $100,000 6.80% 1/6/2038 143,896 0.00%Cadent Finance plc £100,000 2.63% 22/9/2038 143,197 0.00%Diageo Capital plc $100,000 5.88% 30/9/2036 142,596 0.00%SSE plc^ £100,000 3.63% 16/9/2077 141,527 0.00%Nationwide Building Society €100,000 2.25% 25/6/2029 139,699 0.00%BAE Systems Holdings, Inc. $125,000 3.85% 15/12/2025 137,922 0.00%Unilever Capital Corp. $100,000 5.90% 15/11/2032 137,903 0.00%Natwest Group plc $120,000 6.00% 19/12/2023 134,544 0.00%Diageo Finance plc €100,000 2.38% 20/5/2026 132,029 0.00%Coca-Cola Europacific Partners plc €100,000 1.88% 18/3/2030 131,807 0.00%Rio Tinto Finance plc €100,000 2.88% 11/12/2024 131,195 0.00%Aviva plc^ €100,000 3.88% 3/7/2044 130,888 0.00%British Telecommunications plc €100,000 2.13% 26/9/2028 130,737 0.00%Standard Chartered plc €100,000 3.13% 19/11/2024 130,547 0.00%

447
Vanguard Global Bond Index Fund
Principal CouponMaturity
DateFair Value
US Dollars ($)% of Total
Net AssetsMead Johnson Nutrition Co. $100,000 4.60% 1/6/2044 130,120 0.00%WPP Finance 2010 $125,000 3.63% 7/9/2022 129,522 0.00%LCR Finance plc £50,000 5.10% 7/3/2051 129,274 0.00%BAT International Finance plc €100,000 2.75% 25/3/2025 129,118 0.00%Lloyds Bank plc €100,000 4.88% 13/1/2023 128,299 0.00%WPP Finance 2013 €100,000 3.00% 20/11/2023 127,600 0.00%British Telecommunications plc €100,000 1.50% 23/6/2027 125,804 0.00%Diageo Finance plc €100,000 1.75% 23/9/2024 125,450 0.00%Wods Transmission plc £79,470 3.45% 24/8/2034 123,760 0.00%Arqiva Financing plc £76,669 4.88% 31/12/2032 123,515 0.00%Greater Gabbard OFTO plc £76,897 4.14% 29/11/2032 123,228 0.00%BAT Capital Corp. $125,000 3.73% 25/9/2040 122,402 0.00%Heathrow Funding Ltd. €100,000 1.50% 11/2/2030 122,149 0.00%CK Hutchison Finance 16 Ltd. €100,000 1.25% 6/4/2023 121,360 0.00%Unilever Finance Netherlands BV €100,000 0.50% 29/4/2024 121,232 0.00%Babcock International Group plc €100,000 1.75% 6/10/2022 120,606 0.00%AstraZeneca plc $100,000 4.00% 18/9/2042 119,312 0.00%Lseg Netherlands BV €100,000 0.75% 6/4/2033 118,688 0.00%Gwynt y Mor OFTO plc £78,360 2.78% 17/2/2034 114,100 0.00%Vodafone Group plc $100,000 4.13% 30/5/2025 111,628 0.00%nVent Finance Sarl $100,000 4.55% 15/4/2028 109,990 0.00%WPP Finance 2010 $100,000 3.75% 19/9/2024 108,894 0.00%Eastern Power Networks plc £50,000 6.25% 12/11/2036 108,293 0.00%GlaxoSmithKline Capital plc £50,000 5.25% 10/4/2042 106,736 0.00%Centrica plc $100,000 4.00% 16/10/2023 105,153 0.00%nVent Finance Sarl $100,000 3.95% 15/4/2023 104,482 0.00%Unilever Capital Corp. $100,000 2.00% 28/7/2026 104,252 0.00%NatWest Markets plc $100,000 3.63% 29/9/2022 103,999 0.00%Diageo Capital plc $100,000 2.63% 29/4/2023 103,621 0.00%Network Rail Infrastructure Finance plc £50,000 4.75% 29/11/2035 100,485 0.00%Sky Ltd. £50,000 6.00% 21/5/2027 87,751 0.00%LCR Finance plc £50,000 4.50% 7/12/2028 87,033 0.00%Southern Gas Networks plc £50,000 4.88% 21/3/2029 86,007 0.00%Broadgate Financing plc £50,000 5.00% 5/10/2031 79,320 0.00%Network Rail Infrastructure Finance plc £50,000 4.75% 22/1/2024 76,845 0.00%Mead Johnson Nutrition Co. $50,000 5.90% 1/11/2039 71,628 0.00%GlaxoSmithKline Capital plc €50,000 4.00% 16/6/2025 68,979 0.00%Santander UK plc $50,000 4.00% 13/3/2024 54,477 0.00%test - - - 942,711,519 4.28%United States 41.65% (2020: 39.68%)US Treasury Note1 $89,450,000 0.13% 30/11/2022 89,408,070 0.41%US Treasury Note1 $65,422,000 0.13% 30/9/2022 65,414,333 0.30%US Treasury Note1 $58,619,100 1.13% 28/2/2025 59,690,730 0.27%Federal National Mortgage Association $56,304,000 2.50% 1/7/2051 58,223,966 0.27%US Treasury Note1 $57,800,000 0.13% 15/5/2023 57,691,625 0.26%US Treasury Note1 $56,558,000 0.25% 30/6/2025 55,554,980 0.25%US Treasury Note1 $54,633,000 1.38% 15/10/2022 55,503,713 0.25%US Treasury Note1 $55,539,000 0.25% 15/5/2024 55,243,949 0.25%US Treasury Note1 $55,503,000 1.13% 15/2/2031 53,898,616 0.25%US Treasury Note1 $52,525,000 0.13% 31/5/2023 52,414,205 0.24%US Treasury Note1 $48,907,400 1.13% 28/2/2027 49,255,101 0.23%US Treasury Note $48,003,000 1.63% 15/5/2031 48,753,047 0.22%Federal National Mortgage Association $48,245,000 2.00% 1/7/2050 48,734,687 0.22%US Treasury Note $45,905,000 2.50% 31/1/2024 48,429,775 0.22%US Treasury Note1 $44,993,000 0.38% 30/11/2025 44,184,532 0.20%US Treasury Note1 $46,154,000 0.88% 15/11/2030 43,896,781 0.20%US Treasury Note1 $40,736,000 1.63% 31/10/2026 42,190,403 0.19%US Treasury Note1 $44,335,700 0.63% 15/8/2030 41,315,330 0.19%US Treasury Note $37,717,000 0.75% 31/5/2026 37,507,789 0.17%US Treasury Note $38,630,000 0.63% 30/11/2027 37,395,651 0.17%US Treasury Note $36,875,000 0.50% 31/3/2025 36,693,506 0.17%US Treasury Note $36,573,000 0.13% 15/12/2023 36,381,563 0.17%US Treasury Note $35,360,500 1.50% 15/2/2030 35,714,105 0.16%US Treasury Note $37,994,000 0.63% 15/5/2030 35,518,453 0.16%US Treasury Note1 $33,725,000 2.38% 29/2/2024 35,503,467 0.16%US Treasury Note $35,005,000 0.13% 15/10/2023 34,854,588 0.16%US Treasury Note $35,353,000 0.38% 31/1/2026 34,648,702 0.16%US Treasury Note $35,970,000 0.50% 31/10/2027 34,587,403 0.16%US Treasury Note $35,390,000 0.63% 31/12/2027 34,212,177 0.16%US Treasury Note $34,069,000 1.25% 30/4/2028 34,186,112 0.16%US Treasury Note $32,405,000 1.63% 15/12/2022 33,094,872 0.15%

448
Vanguard Global Bond Index Fund
Principal CouponMaturity
DateFair Value
US Dollars ($)% of Total
Net AssetsUS Treasury Note $30,025,000 2.88% 30/11/2025 32,757,744 0.15%US Treasury Note $31,775,000 0.50% 30/4/2027 30,816,785 0.14%US Treasury Note $30,346,000 0.13% 28/2/2023 30,311,624 0.14%US Treasury Note $30,818,000 0.63% 31/3/2027 30,151,079 0.14%US Treasury Note1 $29,213,000 1.50% 30/11/2024 30,144,164 0.14%US Treasury Note1 $30,017,500 1.13% 29/2/2028 29,933,076 0.14%US Treasury Note1 $28,856,500 1.63% 15/8/2029 29,514,789 0.14%US Treasury Note $28,400,000 1.63% 30/11/2026 29,405,094 0.13%US Treasury Note $28,505,000 0.13% 15/1/2024 28,335,752 0.13%US Treasury Bond $29,689,000 1.88% 15/2/2051 28,329,800 0.13%US Treasury Note1 $27,498,000 1.50% 15/1/2023 28,057,627 0.13%US Treasury Note1 $26,786,000 1.50% 31/1/2027 27,533,078 0.13%US Treasury Note $27,610,000 0.13% 15/2/2024 27,433,123 0.13%US Treasury Bond $32,255,000 1.38% 15/8/2050 27,184,917 0.12%US Treasury Note $24,500,000 2.63% 15/2/2029 26,865,781 0.12%Government National Mortgage Association $26,266,000 2.00% 1/7/2051 26,746,142 0.12%US Treasury Bond $29,735,300 1.38% 15/11/2040 26,710,662 0.12%US Treasury Note $23,880,000 2.88% 15/5/2028 26,529,188 0.12%US Treasury Bond $26,766,000 1.88% 15/2/2041 26,209,769 0.12%US Treasury Bond $29,181,000 1.63% 15/11/2050 26,199,067 0.12%US Treasury Note1 $24,487,000 1.63% 15/11/2022 24,982,479 0.11%US Treasury Note $23,955,300 2.00% 31/10/2022 24,544,825 0.11%US Treasury Note $24,373,000 0.38% 15/4/2024 24,344,438 0.11%US Treasury Note $24,500,000 0.38% 31/12/2025 24,032,969 0.11%US Treasury Note $23,049,000 1.75% 31/12/2024 23,987,166 0.11%US Treasury Note $21,200,000 3.13% 15/11/2028 23,982,500 0.11%US Treasury Note $24,254,000 0.25% 31/5/2025 23,850,398 0.11%US Treasury Note $23,687,500 0.13% 30/6/2023 23,630,132 0.11%US Treasury Bond $19,694,000 3.13% 15/8/2044 23,623,568 0.11%US Treasury Note $23,360,000 0.13% 31/3/2023 23,326,238 0.11%US Treasury Note $23,560,500 0.38% 30/4/2025 23,306,488 0.11%US Treasury Note $23,737,000 0.25% 31/8/2025 23,262,260 0.11%US Treasury Bond $17,977,500 3.63% 15/8/2043 23,134,795 0.11%US Treasury Note $23,426,000 0.75% 31/1/2028 22,807,407 0.11%US Treasury Note $23,207,000 0.50% 31/8/2027 22,378,438 0.10%US Treasury Note $21,332,000 2.63% 28/2/2023 22,194,446 0.10%US Treasury Note $21,298,000 2.00% 30/11/2022 21,852,081 0.10%US Treasury Bond $21,000,000 8.00% 15/11/2021 21,599,648 0.10%US Treasury Bond $17,933,000 3.00% 15/2/2049 21,460,757 0.10%US Treasury Note $21,245,000 1.25% 31/5/2028 21,301,432 0.10%US Treasury Bond $17,820,000 3.00% 15/5/2045 21,008,109 0.10%US Treasury Note $20,690,000 0.13% 15/7/2023 20,636,659 0.10%US Treasury Note $20,831,000 0.50% 28/2/2026 20,516,908 0.09%US Treasury Bond $20,703,100 2.00% 15/2/2050 20,334,326 0.09%US Treasury Note $20,195,000 0.13% 15/8/2023 20,135,046 0.09%US Treasury Bond $16,898,000 3.00% 15/2/2048 20,132,383 0.09%US Treasury Bond $17,000,000 3.00% 15/11/2044 20,004,219 0.09%US Treasury Bond1 $17,745,000 2.75% 15/11/2042 19,971,443 0.09%US Treasury Note $18,124,000 2.75% 15/2/2028 19,970,383 0.09%US Treasury Bond $16,592,700 3.00% 15/8/2048 19,802,350 0.09%US Treasury Note $18,591,000 2.75% 15/2/2024 19,745,675 0.09%US Treasury Note $19,013,000 1.63% 30/9/2026 19,696,280 0.09%US Treasury Bond1 $23,510,100 1.25% 15/5/2050 19,193,793 0.09%US Treasury Bond $14,823,000 3.63% 15/2/2044 19,147,147 0.09%US Treasury Note1 $17,618,000 2.75% 30/6/2025 19,053,592 0.09%US Treasury Note $17,674,000 2.75% 28/2/2025 19,045,116 0.09%US Treasury Note $19,009,000 0.13% 30/4/2023 18,975,586 0.09%US Treasury Note $18,232,600 1.50% 30/9/2024 18,813,764 0.09%Federal National Mortgage Association $18,584,173 2.00% 1/12/2050 18,787,372 0.09%US Treasury Note1 $16,709,900 2.88% 15/8/2028 18,581,931 0.09%US Treasury Note1 $17,874,000 1.75% 15/11/2029 18,452,112 0.09%US Treasury Bond $16,942,000 2.50% 15/2/2045 18,321,185 0.08%US Treasury Note $18,295,000 0.13% 15/9/2023 18,229,252 0.08%US Treasury Bond $17,541,000 2.25% 15/8/2049 18,165,898 0.08%US Treasury Bond1 $13,225,900 4.50% 15/2/2036 18,144,282 0.08%US Treasury Note $18,115,000 0.50% 31/5/2027 17,537,584 0.08%US Treasury Note $16,420,000 2.50% 31/1/2025 17,534,764 0.08%US Treasury Bond $15,100,000 2.88% 15/8/2045 17,452,297 0.08%US Treasury Bond1 $16,382,000 2.38% 15/11/2049 17,439,151 0.08%US Treasury Bond $14,520,000 3.13% 15/2/2043 17,337,788 0.08%US Treasury Note $17,343,000 0.13% 31/1/2023 17,327,418 0.08%

449
Vanguard Global Bond Index Fund
Principal CouponMaturity
DateFair Value
US Dollars ($)% of Total
Net AssetsUS Treasury Note1 $17,770,000 0.50% 30/6/2027 17,191,087 0.08%US Treasury Bond $13,740,000 3.38% 15/5/2044 17,123,475 0.08%US Treasury Note1 $15,775,000 2.38% 15/5/2029 17,024,676 0.08%Federal Home Loan Mortgage Corp. $16,528,321 2.00% 1/12/2050 16,706,859 0.08%US Treasury Note1 $15,604,000 2.75% 31/8/2023 16,435,401 0.08%US Treasury Note $16,476,000 0.75% 31/3/2026 16,403,918 0.08%US Treasury Note $15,331,000 2.13% 30/9/2024 16,126,296 0.07%Federal National Mortgage Association $15,888,959 2.00% 1/1/2051 16,060,516 0.07%US Treasury Note1 $15,525,000 2.00% 15/2/2023 15,979,228 0.07%US Treasury Note $14,634,000 2.63% 31/3/2025 15,718,974 0.07%US Treasury Note $14,560,000 2.25% 15/11/2024 15,392,650 0.07%US Treasury Note $15,835,000 0.38% 31/7/2027 15,179,332 0.07%US Treasury Note $14,650,000 1.50% 15/8/2026 15,086,066 0.07%Federal National Mortgage Association $14,519,000 2.00% 1/7/2036 14,973,735 0.07%US Treasury Bond $13,000,000 2.88% 15/5/2043 14,939,844 0.07%Federal National Mortgage Association $15,224,000 1.50% 1/7/2051 14,928,639 0.07%US Treasury Note $14,779,000 0.13% 30/4/2022 14,783,041 0.07%US Treasury Bond1 $13,100,000 2.75% 15/8/2042 14,751,828 0.07%US Treasury Note1 $14,444,000 1.25% 31/7/2023 14,740,779 0.07%Federal National Mortgage Association $13,824,985 3.00% 1/11/2046 14,545,275 0.07%US Treasury Note1 $13,915,000 1.75% 31/12/2026 14,500,952 0.07%Federal Home Loan Mortgage Corp. $14,335,164 2.00% 1/5/2051 14,489,886 0.07%US Treasury Note $13,305,000 2.63% 31/12/2025 14,382,913 0.07%US Treasury Note $13,985,000 1.75% 15/5/2023 14,380,513 0.07%US Treasury Note1 $14,254,000 0.25% 15/4/2023 14,262,909 0.07%US Treasury Note $14,233,000 0.13% 31/7/2022 14,235,780 0.07%US Treasury Note $14,190,000 0.25% 15/6/2023 14,192,771 0.07%Federal National Mortgage Association $13,772,587 2.00% 1/2/2051 13,924,361 0.06%US Treasury Note $13,780,200 0.50% 15/3/2023 13,850,716 0.06%US Treasury Bond $10,800,000 3.38% 15/11/2048 13,783,500 0.06%US Treasury Bond $12,900,000 2.38% 15/5/2051 13,772,766 0.06%US Treasury Bond $11,601,000 3.00% 15/11/2045 13,710,932 0.06%US Treasury Bond $12,000,000 2.75% 15/11/2047 13,653,750 0.06%US Treasury Note $13,697,000 0.75% 30/4/2026 13,628,515 0.06%US Treasury Note $13,000,000 2.00% 30/4/2024 13,578,906 0.06%Government National Mortgage Association $13,128,000 2.50% 1/7/2051 13,578,816 0.06%Federal National Mortgage Association $13,264,904 2.00% 1/6/2051 13,408,125 0.06%US Treasury Note $12,780,000 2.75% 31/5/2023 13,394,039 0.06%US Treasury Note1 $12,942,000 1.50% 31/10/2024 13,355,537 0.06%US Treasury Note $12,262,300 2.88% 31/7/2025 13,331,419 0.06%US Treasury Note $12,630,000 2.25% 31/1/2024 13,242,752 0.06%US Treasury Bond $12,200,000 2.50% 15/2/2046 13,212,219 0.06%US Treasury Bond $12,775,000 2.25% 15/8/2046 13,204,160 0.06%US Treasury Bond $12,185,000 2.50% 15/5/2046 13,195,974 0.06%Federal National Mortgage Association $12,914,754 2.00% 1/9/2050 13,068,532 0.06%US Treasury Note $12,332,000 2.00% 31/5/2024 12,888,867 0.06%US Treasury Bond $11,000,000 2.88% 15/5/2049 12,876,875 0.06%US Treasury Note $12,150,000 2.25% 31/10/2024 12,838,184 0.06%US Treasury Note $12,547,000 1.50% 15/9/2022 12,754,810 0.06%Federal National Mortgage Association $12,465,475 2.00% 1/11/2050 12,600,237 0.06%US Treasury Note1 $12,150,000 1.63% 15/5/2026 12,594,234 0.06%US Treasury Note1 $12,271,000 1.50% 15/8/2022 12,461,776 0.06%Federal National Mortgage Association $12,272,041 2.00% 1/5/2051 12,408,089 0.06%US Treasury Note $12,065,000 1.25% 31/8/2024 12,349,659 0.06%US Treasury Note $12,250,000 0.25% 15/11/2023 12,230,859 0.06%Federal Home Loan Mortgage Corp. $12,097,298 2.00% 1/2/2051 12,227,892 0.06%US Treasury Bond $14,179,000 1.13% 15/8/2040 12,198,371 0.06%US Treasury Note $11,860,000 1.25% 31/3/2028 11,908,181 0.06%US Treasury Note $11,300,000 2.00% 15/2/2025 11,864,117 0.06%US Treasury Note $10,900,000 2.88% 31/5/2025 11,833,313 0.06%US Treasury Note $11,515,000 1.75% 30/9/2022 11,747,099 0.05%US Treasury Note1 $10,947,000 2.38% 30/4/2026 11,737,237 0.05%US Treasury Note $11,708,000 0.25% 31/10/2025 11,447,314 0.05%US Treasury Note $11,628,000 0.25% 31/7/2025 11,407,250 0.05%US Treasury Note $10,775,000 2.50% 15/8/2023 11,283,445 0.05%US Treasury Note $10,883,000 1.38% 31/1/2025 11,183,133 0.05%Federal National Mortgage Association $11,010,667 2.00% 1/10/2050 11,133,999 0.05%US Treasury Note $10,556,000 2.63% 30/6/2023 11,056,173 0.05%US Treasury Bond $9,400,000 2.88% 15/11/2046 10,904,000 0.05%US Treasury Note1 $10,650,000 1.38% 30/6/2023 10,890,457 0.05%US Treasury Note $10,050,000 2.25% 15/8/2027 10,748,004 0.05%

450
Vanguard Global Bond Index Fund
Principal CouponMaturity
DateFair Value
US Dollars ($)% of Total
Net AssetsUS Treasury Note $10,164,000 2.13% 31/3/2024 10,642,026 0.05%US Treasury Note $10,000,000 2.38% 15/8/2024 10,587,500 0.05%Federal National Mortgage Association $10,223,675 2.50% 1/6/2051 10,579,995 0.05%US Treasury Note $10,027,000 2.13% 30/11/2024 10,561,251 0.05%US Treasury Bond $12,225,000 1.13% 15/5/2040 10,555,523 0.05%Federal National Mortgage Association $10,182,553 2.50% 1/6/2050 10,531,938 0.05%Federal National Mortgage Association $10,354,433 2.00% 1/4/2051 10,466,229 0.05%Federal National Mortgage Association $10,320,000 1.50% 1/7/2036 10,440,641 0.05%US Treasury Note $9,762,800 2.88% 31/10/2023 10,343,229 0.05%Government National Mortgage Association $9,971,116 2.50% 20/12/2050 10,316,469 0.05%Federal Home Loan Mortgage Corp. $10,188,649 2.00% 1/11/2050 10,298,639 0.05%Federal Home Loan Mortgage Corp. $9,621,558 2.00% 1/2/2036 9,961,434 0.05%Federal Home Loan Mortgage Corp. $9,824,627 2.00% 1/3/2051 9,932,548 0.05%US Treasury Bond $9,520,000 2.25% 15/5/2041 9,906,750 0.05%US Treasury Note1 $9,320,000 2.13% 29/2/2024 9,751,050 0.05%US Treasury Bond $6,850,000 4.75% 15/2/2037 9,718,438 0.05%Government National Mortgage Association $9,312,837 2.50% 20/8/2050 9,635,391 0.05%US Treasury Note $8,874,000 2.63% 31/12/2023 9,375,936 0.04%US Treasury Note $8,910,000 2.00% 30/6/2024 9,319,303 0.04%Federal National Mortgage Association $8,875,000 3.00% 1/7/2051 9,251,655 0.04%Government National Mortgage Association $9,037,453 2.00% 20/3/2051 9,211,359 0.04%US Treasury Note $8,362,600 3.00% 31/10/2025 9,160,967 0.04%Federal National Mortgage Association $8,689,757 2.50% 1/5/2050 8,987,921 0.04%US Treasury Note1 $8,720,500 2.13% 31/12/2022 8,974,961 0.04%US Treasury Bond $6,825,000 3.75% 15/8/2041 8,859,703 0.04%Government National Mortgage Association $8,591,030 2.00% 20/4/2051 8,756,345 0.04%Government National Mortgage Association $8,509,623 2.00% 20/1/2051 8,673,124 0.04%Federal Home Loan Banks $8,500,000 0.13% 2/6/2023 8,479,257 0.04%Federal Home Loan Mortgage Corp. $8,177,346 2.50% 1/7/2051 8,462,845 0.04%US Treasury Bond1 $7,200,000 3.00% 15/5/2042 8,422,875 0.04%US Treasury Note $8,239,000 1.50% 28/2/2023 8,417,297 0.04%US Treasury Bond $6,400,000 3.75% 15/11/2043 8,397,000 0.04%US Treasury Bond1 $7,031,000 3.13% 15/2/2042 8,383,369 0.04%Federal National Mortgage Association $8,075,000 2.50% 1/7/2051 8,355,790 0.04%Federal Home Loan Mortgage Corp. $7,834,854 2.50% 1/2/2051 8,173,166 0.04%US Treasury Note $7,725,000 1.88% 31/10/2022 7,902,434 0.04%Federal Home Loan Mortgage Corp. $7,780,603 2.00% 1/4/2051 7,874,544 0.04%Federal Home Loan Mortgage Corp. $7,583,319 2.50% 1/7/2050 7,858,500 0.04%US Treasury Note $7,227,000 2.75% 31/8/2025 7,826,615 0.04%US Treasury Note $7,500,000 1.63% 15/2/2026 7,774,219 0.04%US Treasury Note $7,280,000 2.25% 31/3/2026 7,758,888 0.04%Federal National Mortgage Association $7,365,310 3.00% 1/1/2047 7,755,807 0.04%US Treasury Note $7,376,000 2.25% 30/4/2024 7,755,749 0.04%Federal National Mortgage Association $7,619,533 2.00% 1/3/2051 7,701,800 0.04%US Treasury Note $7,500,000 1.75% 31/1/2023 7,685,449 0.04%Federal Home Loan Mortgage Corp. $7,230,153 3.50% 1/7/2049 7,635,936 0.04%US Treasury Note $7,990,000 0.38% 30/9/2027 7,634,820 0.04%Federal National Mortgage Association $7,307,539 2.50% 1/1/2051 7,581,002 0.04%Federal National Mortgage Association $7,195,697 2.50% 1/12/2050 7,449,088 0.04%Federal National Mortgage Association $7,126,452 2.50% 1/7/2050 7,370,976 0.04%US Treasury Bond $5,280,000 4.50% 15/5/2038 7,365,600 0.03%Federal Home Loan Mortgage Corp. $7,235,534 2.00% 1/1/2051 7,313,969 0.03%Federal National Mortgage Association $6,995,332 3.00% 1/9/2049 7,294,063 0.03%Federal Home Loan Mortgage Corp. $7,125,000 2.00% 1/7/2051 7,201,901 0.03%US Treasury Note $7,000,000 1.63% 31/5/2023 7,185,117 0.03%Federal Home Loan Mortgage Corp. $7,103,151 2.00% 1/6/2051 7,179,817 0.03%Federal National Mortgage Association $7,071,213 2.00% 1/8/2050 7,152,917 0.03%Federal National Mortgage Association $7,000,000 2.00% 1/7/2051 7,075,579 0.03%Federal Home Loan Mortgage Corp. $7,143,157 1.50% 1/11/2050 7,010,546 0.03%US Treasury Note $6,800,000 1.50% 31/3/2023 6,953,531 0.03%US Treasury Note $6,615,000 2.75% 30/4/2023 6,920,169 0.03%Government National Mortgage Association $6,675,159 2.50% 20/4/2051 6,912,188 0.03%Federal National Mortgage Association $6,424,418 3.50% 1/7/2047 6,871,727 0.03%US Treasury Note $6,825,000 1.25% 30/6/2028 6,836,730 0.03%Federal National Mortgage Association $7,000,000 0.75% 8/10/2027 6,836,055 0.03%Federal Home Loan Mortgage Corp. $6,422,170 2.50% 1/10/2050 6,674,431 0.03%Federal National Mortgage Association $6,250,000 4.00% 1/7/2051 6,655,187 0.03%Federal National Mortgage Association $6,215,194 3.50% 1/1/2048 6,570,368 0.03%Federal Home Loan Mortgage Corp. $6,107,027 4.00% 1/7/2049 6,556,091 0.03%Government National Mortgage Association $6,274,636 3.00% 20/8/2050 6,555,142 0.03%US Treasury Note $6,185,000 2.13% 31/7/2024 6,497,149 0.03%

451
Vanguard Global Bond Index Fund
Principal CouponMaturity
DateFair Value
US Dollars ($)% of Total
Net AssetsFederal National Mortgage Association $6,273,532 2.50% 1/8/2050 6,488,790 0.03%Federal National Mortgage Association $6,135,939 3.00% 1/12/2049 6,404,456 0.03%Federal National Mortgage Association $5,957,152 4.00% 1/3/2050 6,398,823 0.03%US Treasury Bond1 $4,425,000 4.63% 15/2/2040 6,345,727 0.03%Federal Home Loan Mortgage Corp. $6,259,359 2.00% 1/10/2050 6,326,931 0.03%US Treasury Note $6,084,000 1.75% 30/6/2024 6,319,280 0.03%JPMorgan Chase & Co.^ $5,669,000 3.96% 29/1/2027 6,312,247 0.03%US Treasury Bond1 $4,500,000 4.38% 15/5/2040 6,283,125 0.03%Federal National Mortgage Association $6,098,562 2.00% 1/7/2050 6,164,410 0.03%Federal National Mortgage Association $5,725,313 3.50% 1/4/2048 6,042,221 0.03%Government National Mortgage Association $5,711,348 4.00% 20/5/2049 6,038,912 0.03%Bank of America Corp.^ $5,900,000 1.49% 19/5/2024 6,004,272 0.03%Government National Mortgage Association $5,698,621 3.00% 20/9/2049 5,956,008 0.03%US Treasury Bond $4,979,000 3.13% 15/11/2041 5,930,456 0.03%Bank of America Corp.^ $4,950,000 4.08% 20/3/2051 5,907,892 0.03%US Treasury Note $5,401,000 2.88% 30/4/2025 5,857,553 0.03%Federal National Mortgage Association $5,446,047 4.00% 1/3/2049 5,819,088 0.03%Federal National Mortgage Association $5,600,065 2.50% 1/2/2051 5,805,396 0.03%GE Capital International Funding Co. Unlimited Co. $4,808,000 4.42% 15/11/2035 5,774,734 0.03%Government National Mortgage Association $5,416,227 4.50% 20/4/2049 5,774,010 0.03%US Treasury Note $5,650,000 1.88% 30/9/2022 5,772,711 0.03%Federal National Mortgage Association $5,462,624 3.00% 1/9/2050 5,710,710 0.03%Federal Home Loan Mortgage Corp. $5,467,603 3.00% 1/10/2049 5,703,660 0.03%US Treasury Bond $3,865,000 4.75% 15/2/2041 5,664,037 0.03%Federal National Mortgage Association $5,427,239 2.50% 1/9/2050 5,613,459 0.03%Government National Mortgage Association $5,500,000 2.00% 20/6/2051 5,605,835 0.03%Federal Home Loan Mortgage Corp. $5,360,661 2.50% 1/11/2050 5,547,553 0.03%Freddie Mac Multifamily Structured Pass Through Certificates $5,300,000 2.07% 25/1/2030 5,534,738 0.03%US Treasury Note $5,275,000 1.88% 30/6/2026 5,531,744 0.03%US Treasury Bond $4,650,000 3.00% 15/2/2047 5,521,875 0.03%US Treasury Note $5,205,000 2.50% 15/5/2024 5,514,047 0.03%Goldman Sachs Group, Inc. £4,000,000 1.00% 16/12/2025 5,511,167 0.03%US Treasury Bond $5,000,000 7.63% 15/11/2022 5,505,859 0.03%Federal National Mortgage Association $5,581,216 1.50% 1/1/2051 5,477,607 0.03%Federal National Mortgage Association $5,177,011 3.50% 1/6/2049 5,473,008 0.03%US Treasury Note $5,416,000 0.25% 15/3/2024 5,394,844 0.03%Federal National Mortgage Association $5,138,000 1.75% 2/7/2024 5,334,766 0.03%Morgan Stanley Bank of America Merrill Lynch Trust 2016 $4,700,000 3.72% 15/12/2049 5,228,208 0.03%Capital One Bank USA NA^ $5,000,000 2.28% 28/1/2026 5,184,145 0.03%Federal Home Loan Mortgage Corp. $4,926,705 3.00% 1/12/2046 5,183,721 0.03%Federal Home Loan Mortgage Corp. $5,000,000 1.50% 12/2/2025 5,158,434 0.02%US Treasury Bond $3,700,000 4.38% 15/2/2038 5,088,078 0.02%Government National Mortgage Association $4,991,741 2.00% 20/11/2050 5,087,651 0.02%Federal National Mortgage Association $4,786,251 3.00% 1/7/2034 5,041,328 0.02%Bank of America Corp.^ $5,000,000 2.09% 14/6/2029 5,040,840 0.02%Bank of America Corp.^ $5,000,000 0.81% 24/10/2024 5,016,783 0.02%Government National Mortgage Association $4,722,002 3.50% 20/9/2047 4,998,628 0.02%Federal National Mortgage Association $5,073,045 1.50% 1/12/2050 4,978,869 0.02%Government National Mortgage Association $4,703,079 3.00% 20/8/2046 4,953,683 0.02%Morgan Stanley^ $5,000,000 0.99% 10/12/2026 4,925,905 0.02%Federal Home Loan Mortgage Corp. $5,000,000 0.38% 23/9/2025 4,924,516 0.02%Federal Home Loan Mortgage Corp. $4,652,700 2.50% 1/8/2050 4,842,768 0.02%State of California $3,075,000 7.50% 1/4/2034 4,836,421 0.02%Federal Home Loan Mortgage Corp. $4,674,266 2.50% 1/6/2050 4,834,676 0.02%Federal National Mortgage Association $4,425,644 4.50% 1/2/2048 4,805,673 0.02%JPMorgan Chase & Co.^ $4,550,000 2.96% 13/5/2031 4,782,006 0.02%US Treasury Bond $4,200,000 2.75% 15/8/2047 4,774,875 0.02%Citigroup Commercial Mortgage Trust 2018 $4,200,000 4.01% 10/3/2051 4,762,109 0.02%Federal National Mortgage Association $4,425,883 4.00% 1/6/2047 4,751,837 0.02%Government National Mortgage Association $4,542,240 3.00% 20/11/2049 4,744,702 0.02%US Treasury Note1 $4,534,000 1.63% 30/4/2023 4,649,652 0.02%US Treasury Note $4,375,000 2.13% 31/5/2026 4,640,234 0.02%Federal National Mortgage Association $4,467,954 2.50% 1/10/2050 4,624,604 0.02%Federal National Mortgage Association $4,384,683 3.00% 1/5/2050 4,570,963 0.02%Federal National Mortgage Association $4,372,568 2.50% 1/4/2051 4,524,876 0.02%Federal Home Loan Mortgage Corp. $4,470,026 2.00% 1/7/2050 4,518,282 0.02%JPMorgan Chase & Co. $4,185,000 3.13% 23/1/2025 4,490,954 0.02%Morgan Stanley^ $4,275,000 2.70% 22/1/2031 4,478,064 0.02%Federal National Mortgage Association $4,228,222 3.00% 1/12/2032 4,471,607 0.02%Equitable Financial Life Global Funding €3,750,000 0.60% 16/6/2028 4,461,448 0.02%Federal Home Loan Mortgage Corp. $4,142,417 3.00% 1/11/2049 4,359,775 0.02%

452
Vanguard Global Bond Index Fund
Principal CouponMaturity
DateFair Value
US Dollars ($)% of Total
Net AssetsGovernment National Mortgage Association $4,175,000 3.00% 1/7/2051 4,355,026 0.02%Federal Home Loan Mortgage Corp. $4,398,923 1.50% 1/5/2051 4,316,149 0.02%US Treasury Note $4,186,000 1.63% 31/10/2023 4,313,215 0.02%JPMorgan Chase & Co.^ $4,100,000 2.74% 15/10/2030 4,298,942 0.02%Government National Mortgage Association $4,141,327 2.50% 20/5/2051 4,288,382 0.02%Federal Home Loan Mortgage Corp. $3,993,008 3.50% 1/8/2043 4,287,349 0.02%Federal Home Loan Mortgage Corp. $3,956,661 3.50% 1/10/2045 4,283,619 0.02%Federal Home Loan Mortgage Corp. $3,981,987 4.00% 1/9/2049 4,271,602 0.02%Wells Fargo & Co.^ $3,100,000 5.01% 4/4/2051 4,246,756 0.02%Government National Mortgage Association $4,047,991 3.00% 20/12/2049 4,228,423 0.02%Government National Mortgage Association $3,948,206 3.50% 20/7/2046 4,201,955 0.02%Wells Fargo & Co.^ $3,550,000 4.48% 4/4/2031 4,197,585 0.02%US Treasury Note $3,997,000 2.25% 31/12/2023 4,185,921 0.02%Government National Mortgage Association $3,967,750 3.00% 20/12/2046 4,179,172 0.02%US Treasury Note $3,970,000 2.75% 31/7/2023 4,175,323 0.02%Federal National Mortgage Association $3,954,763 3.00% 1/2/2049 4,159,532 0.02%FedEx Corp. €3,530,000 0.95% 4/5/2033 4,156,768 0.02%Wells Fargo & Co. $3,857,000 3.00% 22/4/2026 4,148,227 0.02%JPMorgan Chase & Co.^ $3,500,000 4.49% 24/3/2031 4,148,154 0.02%Government National Mortgage Association $3,943,089 3.00% 20/4/2051 4,137,694 0.02%US Treasury Note $3,900,000 2.13% 15/5/2025 4,117,547 0.02%Federal Home Loan Mortgage Corp. $3,813,122 4.00% 1/9/2048 4,059,692 0.02%US Treasury Bond $2,937,000 4.25% 15/11/2040 4,048,012 0.02%Government National Mortgage Association $3,850,000 3.50% 1/7/2051 4,041,460 0.02%Federal Home Loan Mortgage Corp. $3,721,412 4.50% 1/1/2049 4,038,527 0.02%Government National Mortgage Association $3,869,454 3.00% 20/4/2050 4,038,290 0.02%Federal Home Loan Mortgage Corp. $3,925,515 2.00% 1/11/2040 4,004,828 0.02%Government National Mortgage Association $3,868,529 2.50% 20/9/2050 4,002,517 0.02%Morgan Stanley^ $4,000,000 0.86% 21/10/2025 3,999,653 0.02%Federal Home Loan Mortgage Corp. $4,064,438 1.50% 1/3/2051 3,987,958 0.02%Federal National Mortgage Association $3,830,000 2.38% 19/1/2023 3,955,722 0.02%Federal Home Loan Mortgage Corp. $3,799,018 2.50% 1/1/2051 3,930,209 0.02%Federal National Mortgage Association $3,715,831 3.00% 1/4/2046 3,918,744 0.02%Federal National Mortgage Association $3,738,706 3.00% 1/3/2050 3,912,210 0.02%Federal Home Loan Mortgage Corp. $3,700,600 3.00% 1/1/2047 3,893,813 0.02%US Treasury Note $3,970,000 0.25% 30/9/2025 3,886,258 0.02%JPMorgan Chase & Co.^ $3,750,000 3.11% 22/4/2041 3,885,894 0.02%State of California $2,400,000 7.35% 1/11/2039 3,838,368 0.02%Federal Home Loan Mortgage Corp. $3,649,704 3.00% 1/2/2050 3,821,166 0.02%Goldman Sachs Group, Inc.^ €3,200,000 0.01% 30/4/2024 3,797,097 0.02%Comcast Corp. $3,450,000 3.15% 15/2/2028 3,783,168 0.02%Federal Home Loan Mortgage Corp. $3,656,773 2.00% 1/1/2036 3,779,289 0.02%Southwest Airlines Co. $3,200,000 5.13% 15/6/2027 3,768,214 0.02%Government National Mortgage Association $3,635,418 2.50% 20/6/2051 3,764,508 0.02%Federal Home Loan Mortgage Corp. $3,635,851 2.00% 1/8/2035 3,762,336 0.02%US Treasury Bond $3,000,000 3.50% 15/2/2039 3,748,125 0.02%Federal Home Loan Mortgage Corp. $3,412,934 4.00% 1/6/2048 3,729,748 0.02%Verizon Communications, Inc. $3,109,000 4.27% 15/1/2036 3,708,207 0.02%Federal National Mortgage Association $3,532,985 2.50% 1/11/2031 3,699,795 0.02%Federal Home Loan Mortgage Corp. $3,497,473 3.00% 1/5/2050 3,687,029 0.02%Federal National Mortgage Association $3,555,377 2.00% 1/6/2036 3,669,316 0.02%JPMorgan Chase & Co. $3,355,000 3.30% 1/4/2026 3,669,010 0.02%Government National Mortgage Association $3,506,662 3.50% 15/9/2049 3,668,874 0.02%Federal National Mortgage Association $3,548,920 2.00% 1/5/2036 3,662,653 0.02%US Treasury Note $3,654,000 0.13% 31/12/2022 3,651,431 0.02%US Treasury Note1 $3,504,000 1.75% 31/7/2024 3,641,970 0.02%Federal National Mortgage Association $3,455,251 3.00% 1/8/2035 3,640,351 0.02%Federal Home Loan Mortgage Corp. $3,482,383 2.50% 1/12/2049 3,600,546 0.02%Federal Home Loan Mortgage Corp. $3,417,742 3.00% 1/9/2046 3,595,690 0.02%Federal Home Loan Banks $3,500,000 1.38% 17/2/2023 3,565,838 0.02%Boeing Co. $3,358,000 3.10% 1/5/2026 3,555,063 0.02%Transcontinental Gas Pipe Line Co. LLC $2,798,000 7.85% 1/2/2026 3,554,753 0.02%Bank of America Corp.^ €3,000,000 0.65% 26/10/2031 3,522,881 0.02%Goldman Sachs Group, Inc. $3,183,000 3.75% 25/2/2026 3,521,318 0.02%Ally Financial, Inc. $2,450,000 8.00% 1/11/2031 3,512,241 0.02%Morgan Stanley €2,898,000 1.00% 2/12/2022 3,499,894 0.02%Federal Home Loan Mortgage Corp. $3,202,844 5.00% 1/10/2049 3,499,537 0.02%US Treasury Bond $2,400,000 5.00% 15/5/2037 3,495,750 0.02%Morgan Stanley^ €2,800,000 1.34% 23/10/2026 3,489,401 0.02%Aflac, Inc. $2,650,000 4.75% 15/1/2049 3,487,994 0.02%Federal National Mortgage Association $3,334,624 3.00% 1/6/2050 3,475,536 0.02%
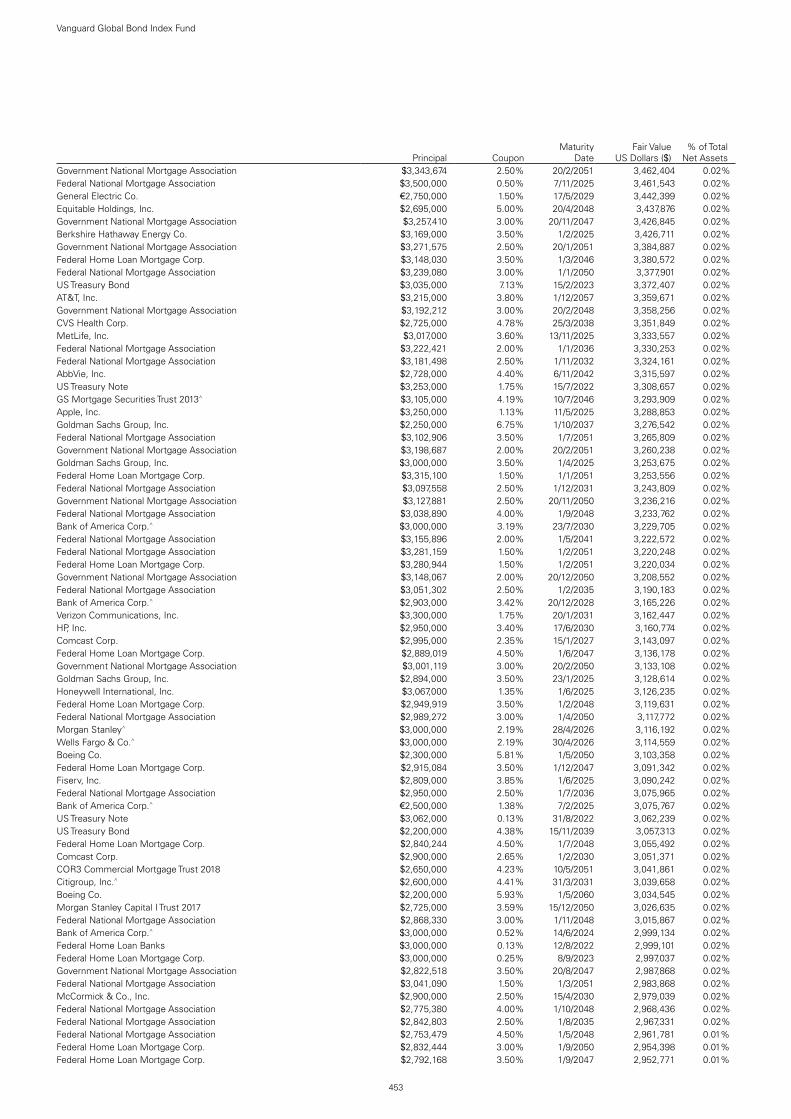
453
Vanguard Global Bond Index Fund
Principal CouponMaturity
DateFair Value
US Dollars ($)% of Total
Net AssetsGovernment National Mortgage Association $3,343,674 2.50% 20/2/2051 3,462,404 0.02%Federal National Mortgage Association $3,500,000 0.50% 7/11/2025 3,461,543 0.02%General Electric Co. €2,750,000 1.50% 17/5/2029 3,442,399 0.02%Equitable Holdings, Inc. $2,695,000 5.00% 20/4/2048 3,437,876 0.02%Government National Mortgage Association $3,257,410 3.00% 20/11/2047 3,426,845 0.02%Berkshire Hathaway Energy Co. $3,169,000 3.50% 1/2/2025 3,426,711 0.02%Government National Mortgage Association $3,271,575 2.50% 20/1/2051 3,384,887 0.02%Federal Home Loan Mortgage Corp. $3,148,030 3.50% 1/3/2046 3,380,572 0.02%Federal National Mortgage Association $3,239,080 3.00% 1/1/2050 3,377,901 0.02%US Treasury Bond $3,035,000 7.13% 15/2/2023 3,372,407 0.02%AT&T, Inc. $3,215,000 3.80% 1/12/2057 3,359,671 0.02%Government National Mortgage Association $3,192,212 3.00% 20/2/2048 3,358,256 0.02%CVS Health Corp. $2,725,000 4.78% 25/3/2038 3,351,849 0.02%MetLife, Inc. $3,017,000 3.60% 13/11/2025 3,333,557 0.02%Federal National Mortgage Association $3,222,421 2.00% 1/1/2036 3,330,253 0.02%Federal National Mortgage Association $3,181,498 2.50% 1/11/2032 3,324,161 0.02%AbbVie, Inc. $2,728,000 4.40% 6/11/2042 3,315,597 0.02%US Treasury Note $3,253,000 1.75% 15/7/2022 3,308,657 0.02%GS Mortgage Securities Trust 2013^ $3,105,000 4.19% 10/7/2046 3,293,909 0.02%Apple, Inc. $3,250,000 1.13% 11/5/2025 3,288,853 0.02%Goldman Sachs Group, Inc. $2,250,000 6.75% 1/10/2037 3,276,542 0.02%Federal National Mortgage Association $3,102,906 3.50% 1/7/2051 3,265,809 0.02%Government National Mortgage Association $3,198,687 2.00% 20/2/2051 3,260,238 0.02%Goldman Sachs Group, Inc. $3,000,000 3.50% 1/4/2025 3,253,675 0.02%Federal Home Loan Mortgage Corp. $3,315,100 1.50% 1/1/2051 3,253,556 0.02%Federal National Mortgage Association $3,097,558 2.50% 1/12/2031 3,243,809 0.02%Government National Mortgage Association $3,127,881 2.50% 20/11/2050 3,236,216 0.02%Federal National Mortgage Association $3,038,890 4.00% 1/9/2048 3,233,762 0.02%Bank of America Corp.^ $3,000,000 3.19% 23/7/2030 3,229,705 0.02%Federal National Mortgage Association $3,155,896 2.00% 1/5/2041 3,222,572 0.02%Federal National Mortgage Association $3,281,159 1.50% 1/2/2051 3,220,248 0.02%Federal Home Loan Mortgage Corp. $3,280,944 1.50% 1/2/2051 3,220,034 0.02%Government National Mortgage Association $3,148,067 2.00% 20/12/2050 3,208,552 0.02%Federal National Mortgage Association $3,051,302 2.50% 1/2/2035 3,190,183 0.02%Bank of America Corp.^ $2,903,000 3.42% 20/12/2028 3,165,226 0.02%Verizon Communications, Inc. $3,300,000 1.75% 20/1/2031 3,162,447 0.02%HP, Inc. $2,950,000 3.40% 17/6/2030 3,160,774 0.02%Comcast Corp. $2,995,000 2.35% 15/1/2027 3,143,097 0.02%Federal Home Loan Mortgage Corp. $2,889,019 4.50% 1/6/2047 3,136,178 0.02%Government National Mortgage Association $3,001,119 3.00% 20/2/2050 3,133,108 0.02%Goldman Sachs Group, Inc. $2,894,000 3.50% 23/1/2025 3,128,614 0.02%Honeywell International, Inc. $3,067,000 1.35% 1/6/2025 3,126,235 0.02%Federal Home Loan Mortgage Corp. $2,949,919 3.50% 1/2/2048 3,119,631 0.02%Federal National Mortgage Association $2,989,272 3.00% 1/4/2050 3,117,772 0.02%Morgan Stanley^ $3,000,000 2.19% 28/4/2026 3,116,192 0.02%Wells Fargo & Co.^ $3,000,000 2.19% 30/4/2026 3,114,559 0.02%Boeing Co. $2,300,000 5.81% 1/5/2050 3,103,358 0.02%Federal Home Loan Mortgage Corp. $2,915,084 3.50% 1/12/2047 3,091,342 0.02%Fiserv, Inc. $2,809,000 3.85% 1/6/2025 3,090,242 0.02%Federal National Mortgage Association $2,950,000 2.50% 1/7/2036 3,075,965 0.02%Bank of America Corp.^ €2,500,000 1.38% 7/2/2025 3,075,767 0.02%US Treasury Note $3,062,000 0.13% 31/8/2022 3,062,239 0.02%US Treasury Bond $2,200,000 4.38% 15/11/2039 3,057,313 0.02%Federal Home Loan Mortgage Corp. $2,840,244 4.50% 1/7/2048 3,055,492 0.02%Comcast Corp. $2,900,000 2.65% 1/2/2030 3,051,371 0.02%COR3 Commercial Mortgage Trust 2018 $2,650,000 4.23% 10/5/2051 3,041,861 0.02%Citigroup, Inc.^ $2,600,000 4.41% 31/3/2031 3,039,658 0.02%Boeing Co. $2,200,000 5.93% 1/5/2060 3,034,545 0.02%Morgan Stanley Capital I Trust 2017 $2,725,000 3.59% 15/12/2050 3,026,635 0.02%Federal National Mortgage Association $2,868,330 3.00% 1/11/2048 3,015,867 0.02%Bank of America Corp.^ $3,000,000 0.52% 14/6/2024 2,999,134 0.02%Federal Home Loan Banks $3,000,000 0.13% 12/8/2022 2,999,101 0.02%Federal Home Loan Mortgage Corp. $3,000,000 0.25% 8/9/2023 2,997,037 0.02%Government National Mortgage Association $2,822,518 3.50% 20/8/2047 2,987,868 0.02%Federal National Mortgage Association $3,041,090 1.50% 1/3/2051 2,983,868 0.02%McCormick & Co., Inc. $2,900,000 2.50% 15/4/2030 2,979,039 0.02%Federal National Mortgage Association $2,775,380 4.00% 1/10/2048 2,968,436 0.02%Federal National Mortgage Association $2,842,803 2.50% 1/8/2035 2,967,331 0.02%Federal National Mortgage Association $2,753,479 4.50% 1/5/2048 2,961,781 0.01%Federal Home Loan Mortgage Corp. $2,832,444 3.00% 1/9/2050 2,954,398 0.01%Federal Home Loan Mortgage Corp. $2,792,168 3.50% 1/9/2047 2,952,771 0.01%

454
Vanguard Global Bond Index Fund
Principal CouponMaturity
DateFair Value
US Dollars ($)% of Total
Net AssetsGovernment National Mortgage Association $2,802,035 3.00% 20/9/2046 2,951,342 0.01%Fidelity National Information Services, Inc. €2,325,000 1.50% 21/5/2027 2,926,979 0.01%Federal National Mortgage Association $2,633,181 4.50% 1/2/2047 2,924,555 0.01%Federal Home Loan Mortgage Corp. $2,833,112 2.00% 1/6/2036 2,923,887 0.01%Federal National Mortgage Association $2,745,708 4.00% 1/8/2048 2,922,313 0.01%Citigroup, Inc. ¥300,000,000 2.40% 31/10/2025 2,883,997 0.01%Federal National Mortgage Association $2,684,863 3.50% 1/6/2034 2,877,993 0.01%AbbVie, Inc. $2,650,000 3.20% 21/11/2029 2,876,174 0.01%Chubb INA Holdings, Inc. €2,252,000 1.55% 15/3/2028 2,875,146 0.01%CVS Health Corp. $2,500,000 4.30% 25/3/2028 2,872,009 0.01%AbbVie, Inc. $2,200,000 4.88% 14/11/2048 2,852,664 0.01%Federal National Mortgage Association $2,721,086 3.00% 1/10/2049 2,846,542 0.01%Federal National Mortgage Association $3,000,000 0.88% 5/8/2030 2,842,995 0.01%Microsoft Corp. $2,648,000 2.88% 6/2/2024 2,802,001 0.01%Citigroup, Inc. $2,450,000 4.45% 29/9/2027 2,798,139 0.01%T-Mobile USA, Inc. $2,500,000 3.88% 15/4/2030 2,790,481 0.01%Federal National Mortgage Association $2,600,826 4.00% 1/8/2047 2,782,249 0.01%Discover Financial Services $2,457,000 4.50% 30/1/2026 2,780,948 0.01%Federal Home Loan Mortgage Corp. $2,824,632 1.50% 1/6/2051 2,771,481 0.01%Citigroup, Inc. $2,500,000 3.70% 12/1/2026 2,762,936 0.01%Nestle Holdings, Inc. £2,000,000 1.38% 23/6/2033 2,760,159 0.01%Government National Mortgage Association $2,598,332 4.00% 20/8/2048 2,759,612 0.01%Verizon Communications, Inc. €2,350,000 0.75% 22/3/2032 2,754,860 0.01%Wells Fargo & Co. CHF2,500,000 0.50% 2/11/2023 2,750,115 0.01%Government National Mortgage Association $2,587,299 3.50% 20/3/2047 2,738,869 0.01%Federal National Mortgage Association $2,586,000 2.50% 5/2/2024 2,725,732 0.01%Federal National Mortgage Association $2,560,594 3.50% 1/3/2048 2,721,523 0.01%US Treasury Bond $2,000,000 5.38% 15/2/2031 2,716,875 0.01%Boston Scientific Corp. $2,445,000 3.75% 1/3/2026 2,714,499 0.01%AT&T, Inc. $2,703,000 3.55% 15/9/2055 2,708,464 0.01%Federal National Mortgage Association $2,558,576 3.50% 1/12/2047 2,704,788 0.01%Government National Mortgage Association $2,548,831 3.50% 20/10/2049 2,698,487 0.01%Federal National Mortgage Association $2,580,261 3.00% 1/7/2050 2,690,390 0.01%Berkshire Hathaway, Inc. ¥300,000,000 0.17% 13/9/2024 2,687,957 0.01%Federal National Mortgage Association $2,590,000 1.63% 7/1/2025 2,681,887 0.01%Verizon Communications, Inc. $2,304,000 4.33% 21/9/2028 2,677,931 0.01%US Treasury Note $2,693,000 0.25% 15/6/2024 2,676,800 0.01%Bank of America Corp.^ $2,750,000 2.68% 19/6/2041 2,675,762 0.01%CVS Health Corp. $2,541,000 3.70% 9/3/2023 2,675,111 0.01%Federal National Mortgage Association $2,584,057 2.50% 1/1/2050 2,671,619 0.01%AbbVie, Inc. $2,460,000 3.20% 14/5/2026 2,666,375 0.01%Comcast Corp. $2,150,000 4.60% 15/10/2038 2,664,999 0.01%Federal National Mortgage Association $2,552,401 3.00% 1/7/2049 2,664,246 0.01%Federal Home Loan Mortgage Corp. $2,501,748 4.00% 1/10/2048 2,663,150 0.01%Cintas Corp. No 2 $2,375,000 3.70% 1/4/2027 2,658,488 0.01%Federal National Mortgage Association $2,506,264 3.50% 1/6/2050 2,643,481 0.01%Federal Home Loan Mortgage Corp. $2,461,686 3.00% 1/1/2046 2,638,582 0.01%WRKCo, Inc. $2,300,000 4.65% 15/3/2026 2,638,046 0.01%Microsoft Corp. $2,181,000 3.70% 8/8/2046 2,633,545 0.01%Federal National Mortgage Association $2,503,818 3.00% 1/6/2051 2,627,944 0.01%Federal Home Loan Mortgage Corp. $2,588,549 1.50% 1/1/2036 2,621,237 0.01%Apple, Inc. $2,200,000 3.85% 4/5/2043 2,618,485 0.01%Visa, Inc. $2,375,000 3.15% 14/12/2025 2,598,475 0.01%Colonial Enterprises, Inc. $2,400,000 3.25% 15/5/2030 2,598,413 0.01%Cigna Corp. $2,318,000 4.13% 15/11/2025 2,598,212 0.01%US Treasury Bond $1,975,000 3.88% 15/8/2040 2,594,656 0.01%Federal National Mortgage Association $2,462,761 3.00% 1/5/2034 2,594,004 0.01%Federal Home Loan Mortgage Corp. $2,554,803 1.50% 1/12/2035 2,587,064 0.01%BANK 2018 $2,300,000 3.97% 15/9/2060 2,586,019 0.01%Federal National Mortgage Association $2,551,718 1.50% 1/3/2036 2,583,440 0.01%Verizon Communications, Inc. £1,600,000 3.38% 27/10/2036 2,566,359 0.01%AT&T, Inc. $2,355,000 3.40% 15/5/2025 2,566,081 0.01%Wells Fargo & Co.^ $2,450,000 2.41% 30/10/2025 2,563,336 0.01%Citigroup, Inc. $2,237,000 4.60% 9/3/2026 2,548,112 0.01%NVIDIA Corp. $2,250,000 3.50% 1/4/2050 2,544,487 0.01%Microsoft Corp. $2,200,000 3.45% 8/8/2036 2,542,514 0.01%Johnson & Johnson $2,175,000 3.63% 3/3/2037 2,535,667 0.01%VMware, Inc. $2,140,000 4.70% 15/5/2030 2,533,316 0.01%Boeing Co. $2,500,000 2.20% 4/2/2026 2,523,626 0.01%Dell International LLC/EMC Corp. $2,100,000 6.02% 15/6/2026 2,518,637 0.01%AbbVie, Inc. $2,075,000 4.55% 15/3/2035 2,514,817 0.01%

455
Vanguard Global Bond Index Fund
Principal CouponMaturity
DateFair Value
US Dollars ($)% of Total
Net AssetsGovernment National Mortgage Association $2,428,262 2.50% 20/10/2050 2,512,366 0.01%Federal National Mortgage Association $2,344,039 3.50% 1/11/2045 2,500,539 0.01%Federal Home Loan Mortgage Corp. $2,500,000 0.25% 26/6/2023 2,499,507 0.01%JPMCC Commercial Mortgage Securities Trust 2017 $2,275,000 3.45% 15/9/2050 2,497,857 0.01%Federal Home Loan Mortgage Corp. $2,416,699 2.00% 1/5/2036 2,494,132 0.01%Exxon Mobil Corp. $2,320,000 2.99% 19/3/2025 2,489,270 0.01%Federal National Mortgage Association $2,382,035 2.50% 1/7/2035 2,487,058 0.01%Federal National Mortgage Association $2,257,470 5.00% 1/2/2049 2,469,519 0.01%Federal National Mortgage Association $2,339,867 3.50% 1/9/2050 2,464,718 0.01%Federal Home Loan Mortgage Corp. $2,309,922 3.00% 1/3/2043 2,464,107 0.01%Federal National Mortgage Association $2,309,256 4.00% 1/6/2048 2,457,339 0.01%Chubb Corp. $1,700,000 6.00% 11/5/2037 2,456,884 0.01%Federal Home Loan Mortgage Corp. $2,270,789 3.50% 1/8/2046 2,456,416 0.01%AbbVie, Inc. €2,000,000 1.25% 1/6/2024 2,453,742 0.01%Federal Home Loan Mortgage Corp. $2,319,880 3.50% 1/7/2047 2,453,318 0.01%Federal National Mortgage Association $2,493,103 1.50% 1/10/2050 2,446,821 0.01%Federal National Mortgage Association $2,405,086 1.50% 1/12/2035 2,435,458 0.01%Federal Home Loan Mortgage Corp. $2,283,352 3.50% 1/8/2049 2,434,490 0.01%Government National Mortgage Association $2,316,718 3.00% 20/5/2051 2,432,917 0.01%Federal National Mortgage Association $2,477,528 1.50% 1/11/2050 2,431,535 0.01%Dell International LLC/EMC Corp. $2,015,000 5.30% 1/10/2029 2,430,251 0.01%Federal National Mortgage Association $2,298,317 3.50% 1/3/2050 2,424,349 0.01%Federal Home Loan Mortgage Corp. $2,336,562 2.50% 1/10/2049 2,415,845 0.01%JPMorgan Chase & Co.^ $2,290,000 3.56% 23/4/2024 2,414,821 0.01%Verizon Communications, Inc. $2,275,000 3.40% 22/3/2041 2,409,749 0.01%Federal Home Loan Mortgage Corp. $2,292,124 3.00% 1/6/2051 2,405,709 0.01%Pacific Gas & Electric Co. $2,700,000 3.50% 1/8/2050 2,403,071 0.01%International Business Machines Corp. €2,000,000 0.38% 31/1/2023 2,398,247 0.01%General Motors Financial Co., Inc. $2,275,000 3.70% 9/5/2023 2,389,125 0.01%Bank of America Corp. $2,175,000 4.20% 26/8/2024 2,387,277 0.01%Government National Mortgage Association $2,282,261 3.00% 20/8/2049 2,386,697 0.01%Federal National Mortgage Association $2,277,739 3.00% 1/10/2050 2,383,738 0.01%JPMorgan Chase & Co.^ €2,000,000 0.39% 24/2/2028 2,380,235 0.01%Bank of America Corp. $2,275,000 3.30% 11/1/2023 2,374,163 0.01%Federal National Mortgage Association $2,239,760 3.50% 1/7/2048 2,372,804 0.01%Federal National Mortgage Association $2,338,367 1.50% 1/6/2036 2,367,439 0.01%Federal National Mortgage Association $2,308,422 2.00% 1/6/2041 2,357,244 0.01%Federal Home Loan Mortgage Corp. $2,264,384 2.00% 1/10/2035 2,344,446 0.01%Federal Home Loan Mortgage Corp. $2,232,717 2.50% 1/12/2031 2,338,891 0.01%Federal National Mortgage Association $2,229,574 3.00% 1/8/2050 2,328,191 0.01%Freddie Mac Multifamily Structured Pass Through Certificates $2,175,000 3.14% 25/10/2024 2,327,131 0.01%Federal National Mortgage Association $2,200,652 3.50% 1/11/2047 2,326,411 0.01%Federal National Mortgage Association $2,199,698 3.50% 1/9/2047 2,325,402 0.01%Raytheon Technologies Corp. $2,091,000 3.95% 16/8/2025 2,325,209 0.01%Government National Mortgage Association $2,182,776 4.00% 20/9/2048 2,317,417 0.01%Shire Acquisitions Investments Ireland DAC $2,125,000 3.20% 23/9/2026 2,306,586 0.01%US Treasury Note $2,208,800 1.88% 31/8/2024 2,304,227 0.01%BP Capital Markets America, Inc. $2,105,000 3.41% 11/2/2026 2,302,933 0.01%Federal Home Loan Mortgage Corp. $2,174,289 3.50% 1/1/2048 2,299,352 0.01%Federal Home Loan Mortgage Corp. $2,183,181 3.00% 1/2/2047 2,297,168 0.01%Morgan Stanley^ $2,300,000 0.79% 30/5/2025 2,290,926 0.01%AT&T, Inc. £1,250,000 5.20% 18/11/2033 2,281,061 0.01%Energy Transfer LP $1,960,000 5.00% 15/5/2050 2,264,261 0.01%Federal National Mortgage Association $2,107,869 3.50% 1/5/2047 2,253,886 0.01%AT&T, Inc. £1,500,000 2.90% 4/12/2026 2,242,842 0.01%Tennessee Valley Authority $1,573,000 5.25% 15/9/2039 2,242,063 0.01%CenterPoint Energy, Inc. $2,125,000 2.95% 1/3/2030 2,240,667 0.01%National Rural Utilities Cooperative Finance Corp. $2,115,000 2.95% 7/2/2024 2,232,641 0.01%Federal National Mortgage Association $2,111,513 3.50% 1/5/2049 2,232,178 0.01%Federal National Mortgage Association $2,196,282 1.50% 1/5/2036 2,223,587 0.01%Federal National Mortgage Association $2,150,893 2.00% 1/2/2036 2,219,716 0.01%Virginia Electric & Power Co. $2,050,000 2.95% 15/11/2026 2,214,742 0.01%American Express Credit Corp. $2,000,000 3.30% 3/5/2027 2,212,938 0.01%Duke Energy Florida LLC $1,800,000 4.20% 15/7/2048 2,206,976 0.01%Federal National Mortgage Association $2,092,229 3.50% 1/12/2049 2,201,759 0.01%Philip Morris International, Inc. $2,032,000 3.25% 10/11/2024 2,199,178 0.01%Federal National Mortgage Association $2,086,124 3.00% 1/7/2046 2,194,139 0.01%Morgan Stanley Bank of America Merrill Lynch Trust 2015 $2,000,000 3.73% 15/5/2048 2,188,634 0.01%JPMorgan Chase & Co.^ $1,900,000 3.88% 24/7/2038 2,187,932 0.01%Altria Group, Inc. $2,025,000 4.50% 2/5/2043 2,186,236 0.01%Mastercard, Inc. $2,000,000 2.95% 1/6/2029 2,185,917 0.01%
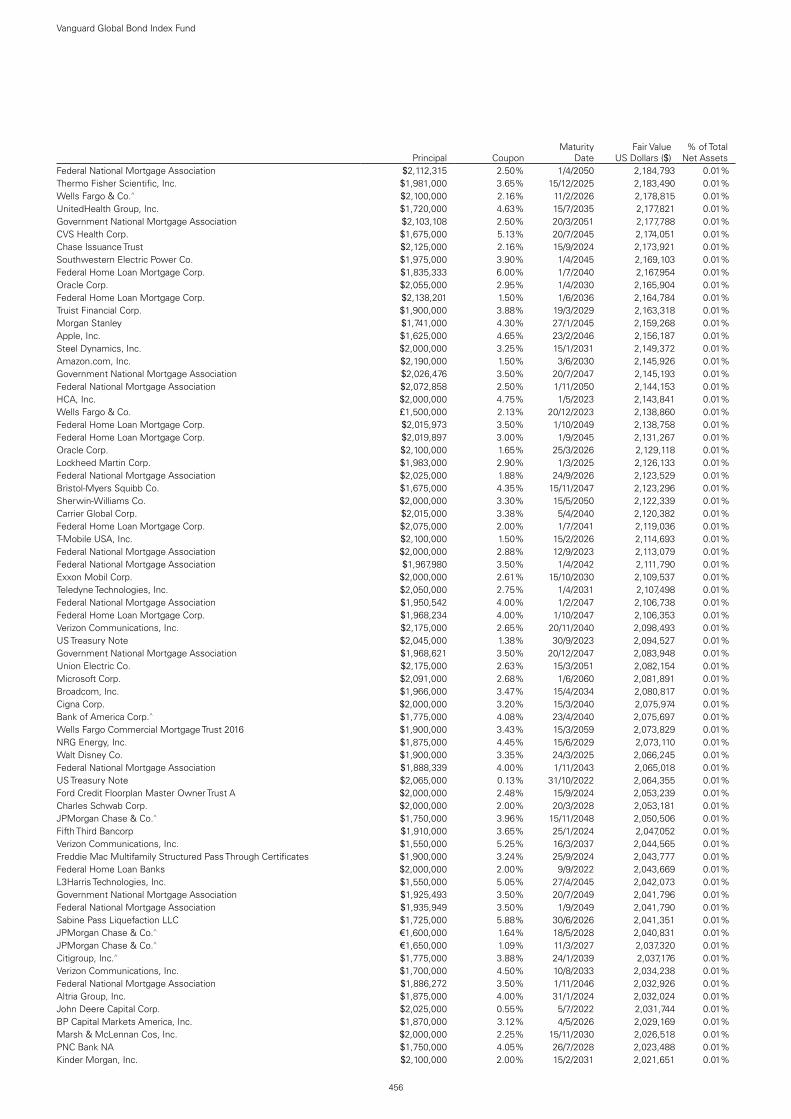
456
Vanguard Global Bond Index Fund
Principal CouponMaturity
DateFair Value
US Dollars ($)% of Total
Net AssetsFederal National Mortgage Association $2,112,315 2.50% 1/4/2050 2,184,793 0.01%Thermo Fisher Scientific, Inc. $1,981,000 3.65% 15/12/2025 2,183,490 0.01%Wells Fargo & Co.^ $2,100,000 2.16% 11/2/2026 2,178,815 0.01%UnitedHealth Group, Inc. $1,720,000 4.63% 15/7/2035 2,177,821 0.01%Government National Mortgage Association $2,103,108 2.50% 20/3/2051 2,177,788 0.01%CVS Health Corp. $1,675,000 5.13% 20/7/2045 2,174,051 0.01%Chase Issuance Trust $2,125,000 2.16% 15/9/2024 2,173,921 0.01%Southwestern Electric Power Co. $1,975,000 3.90% 1/4/2045 2,169,103 0.01%Federal Home Loan Mortgage Corp. $1,835,333 6.00% 1/7/2040 2,167,954 0.01%Oracle Corp. $2,055,000 2.95% 1/4/2030 2,165,904 0.01%Federal Home Loan Mortgage Corp. $2,138,201 1.50% 1/6/2036 2,164,784 0.01%Truist Financial Corp. $1,900,000 3.88% 19/3/2029 2,163,318 0.01%Morgan Stanley $1,741,000 4.30% 27/1/2045 2,159,268 0.01%Apple, Inc. $1,625,000 4.65% 23/2/2046 2,156,187 0.01%Steel Dynamics, Inc. $2,000,000 3.25% 15/1/2031 2,149,372 0.01%Amazon.com, Inc. $2,190,000 1.50% 3/6/2030 2,145,926 0.01%Government National Mortgage Association $2,026,476 3.50% 20/7/2047 2,145,193 0.01%Federal National Mortgage Association $2,072,858 2.50% 1/11/2050 2,144,153 0.01%HCA, Inc. $2,000,000 4.75% 1/5/2023 2,143,841 0.01%Wells Fargo & Co. £1,500,000 2.13% 20/12/2023 2,138,860 0.01%Federal Home Loan Mortgage Corp. $2,015,973 3.50% 1/10/2049 2,138,758 0.01%Federal Home Loan Mortgage Corp. $2,019,897 3.00% 1/9/2045 2,131,267 0.01%Oracle Corp. $2,100,000 1.65% 25/3/2026 2,129,118 0.01%Lockheed Martin Corp. $1,983,000 2.90% 1/3/2025 2,126,133 0.01%Federal National Mortgage Association $2,025,000 1.88% 24/9/2026 2,123,529 0.01%Bristol-Myers Squibb Co. $1,675,000 4.35% 15/11/2047 2,123,296 0.01%Sherwin-Williams Co. $2,000,000 3.30% 15/5/2050 2,122,339 0.01%Carrier Global Corp. $2,015,000 3.38% 5/4/2040 2,120,382 0.01%Federal Home Loan Mortgage Corp. $2,075,000 2.00% 1/7/2041 2,119,036 0.01%T-Mobile USA, Inc. $2,100,000 1.50% 15/2/2026 2,114,693 0.01%Federal National Mortgage Association $2,000,000 2.88% 12/9/2023 2,113,079 0.01%Federal National Mortgage Association $1,967,980 3.50% 1/4/2042 2,111,790 0.01%Exxon Mobil Corp. $2,000,000 2.61% 15/10/2030 2,109,537 0.01%Teledyne Technologies, Inc. $2,050,000 2.75% 1/4/2031 2,107,498 0.01%Federal National Mortgage Association $1,950,542 4.00% 1/2/2047 2,106,738 0.01%Federal Home Loan Mortgage Corp. $1,968,234 4.00% 1/10/2047 2,106,353 0.01%Verizon Communications, Inc. $2,175,000 2.65% 20/11/2040 2,098,493 0.01%US Treasury Note $2,045,000 1.38% 30/9/2023 2,094,527 0.01%Government National Mortgage Association $1,968,621 3.50% 20/12/2047 2,083,948 0.01%Union Electric Co. $2,175,000 2.63% 15/3/2051 2,082,154 0.01%Microsoft Corp. $2,091,000 2.68% 1/6/2060 2,081,891 0.01%Broadcom, Inc. $1,966,000 3.47% 15/4/2034 2,080,817 0.01%Cigna Corp. $2,000,000 3.20% 15/3/2040 2,075,974 0.01%Bank of America Corp.^ $1,775,000 4.08% 23/4/2040 2,075,697 0.01%Wells Fargo Commercial Mortgage Trust 2016 $1,900,000 3.43% 15/3/2059 2,073,829 0.01%NRG Energy, Inc. $1,875,000 4.45% 15/6/2029 2,073,110 0.01%Walt Disney Co. $1,900,000 3.35% 24/3/2025 2,066,245 0.01%Federal National Mortgage Association $1,888,339 4.00% 1/11/2043 2,065,018 0.01%US Treasury Note $2,065,000 0.13% 31/10/2022 2,064,355 0.01%Ford Credit Floorplan Master Owner Trust A $2,000,000 2.48% 15/9/2024 2,053,239 0.01%Charles Schwab Corp. $2,000,000 2.00% 20/3/2028 2,053,181 0.01%JPMorgan Chase & Co.^ $1,750,000 3.96% 15/11/2048 2,050,506 0.01%Fifth Third Bancorp $1,910,000 3.65% 25/1/2024 2,047,052 0.01%Verizon Communications, Inc. $1,550,000 5.25% 16/3/2037 2,044,565 0.01%Freddie Mac Multifamily Structured Pass Through Certificates $1,900,000 3.24% 25/9/2024 2,043,777 0.01%Federal Home Loan Banks $2,000,000 2.00% 9/9/2022 2,043,669 0.01%L3Harris Technologies, Inc. $1,550,000 5.05% 27/4/2045 2,042,073 0.01%Government National Mortgage Association $1,925,493 3.50% 20/7/2049 2,041,796 0.01%Federal National Mortgage Association $1,935,949 3.50% 1/9/2049 2,041,790 0.01%Sabine Pass Liquefaction LLC $1,725,000 5.88% 30/6/2026 2,041,351 0.01%JPMorgan Chase & Co.^ €1,600,000 1.64% 18/5/2028 2,040,831 0.01%JPMorgan Chase & Co.^ €1,650,000 1.09% 11/3/2027 2,037,320 0.01%Citigroup, Inc.^ $1,775,000 3.88% 24/1/2039 2,037,176 0.01%Verizon Communications, Inc. $1,700,000 4.50% 10/8/2033 2,034,238 0.01%Federal National Mortgage Association $1,886,272 3.50% 1/11/2046 2,032,926 0.01%Altria Group, Inc. $1,875,000 4.00% 31/1/2024 2,032,024 0.01%John Deere Capital Corp. $2,025,000 0.55% 5/7/2022 2,031,744 0.01%BP Capital Markets America, Inc. $1,870,000 3.12% 4/5/2026 2,029,169 0.01%Marsh & McLennan Cos, Inc. $2,000,000 2.25% 15/11/2030 2,026,518 0.01%PNC Bank NA $1,750,000 4.05% 26/7/2028 2,023,488 0.01%Kinder Morgan, Inc. $2,100,000 2.00% 15/2/2031 2,021,651 0.01%

457
Vanguard Global Bond Index Fund
Principal CouponMaturity
DateFair Value
US Dollars ($)% of Total
Net AssetsFederal Home Loan Mortgage Corp. $1,915,845 3.00% 1/8/2034 2,017,869 0.01%Raytheon Technologies Corp. $1,750,000 4.13% 16/11/2028 2,015,607 0.01%JPMorgan Chase & Co.^ $2,000,000 2.07% 1/6/2029 2,015,420 0.01%CSAIL 2018-CX12 Commercial Mortgage Trust^ $1,750,000 4.22% 15/8/2051 2,014,793 0.01%Exxon Mobil Corp. $1,850,000 3.45% 15/4/2051 2,013,107 0.01%Northrop Grumman Corp. $1,700,000 4.40% 1/5/2030 2,010,571 0.01%Federal National Mortgage Association $1,940,000 1.63% 15/10/2024 2,008,484 0.01%Philip Morris International, Inc. $1,838,000 3.38% 11/8/2025 2,005,035 0.01%Federal Home Loan Mortgage Corp. $2,000,000 0.38% 5/5/2023 2,004,988 0.01%JPMorgan Chase & Co.^ $2,000,000 0.97% 23/6/2025 2,002,350 0.01%Walt Disney Co. $1,500,000 4.70% 23/3/2050 2,002,119 0.01%Metropolitan Life Global Funding I £1,500,000 0.63% 8/12/2027 1,997,252 0.01%Federal Farm Credit Banks Funding Corp. $2,000,000 0.13% 13/4/2023 1,995,807 0.01%JPMorgan Chase & Co.^ $2,000,000 0.82% 1/6/2025 1,995,673 0.01%AutoZone, Inc. $1,750,000 4.00% 15/4/2030 1,990,765 0.01%Altria Group, Inc. $1,675,000 5.38% 31/1/2044 1,990,328 0.01%Otis Worldwide Corp. $1,885,000 3.36% 15/2/2050 1,985,192 0.01%AT&T, Inc. $2,000,000 1.65% 1/2/2028 1,985,117 0.01%Dell International LLC/EMC Corp. $1,830,000 5.45% 15/6/2023 1,985,087 0.01%Federal National Mortgage Association $1,853,340 4.00% 1/4/2049 1,981,185 0.01%Energy Transfer LP $1,821,000 4.05% 15/3/2025 1,976,566 0.01%Verizon Communications, Inc. $2,000,000 0.85% 20/11/2025 1,975,576 0.01%Federal National Mortgage Association $1,838,506 3.50% 1/8/2042 1,972,854 0.01%UnitedHealth Group, Inc. $1,875,000 2.38% 15/8/2024 1,972,650 0.01%Federal National Mortgage Association $1,947,981 1.50% 1/2/2036 1,972,574 0.01%Federal Home Loan Mortgage Corp. $2,000,000 0.38% 21/7/2025 1,971,560 0.01%Federal National Mortgage Association $2,000,000 0.38% 25/8/2025 1,971,335 0.01%University of California $1,400,000 4.77% 15/5/2115 1,968,260 0.01%Leland Stanford Junior University $1,625,000 3.65% 1/5/2048 1,964,363 0.01%Bank of America Corp.^ $1,890,000 3.00% 20/12/2023 1,958,961 0.01%Federal National Mortgage Association $1,897,773 2.00% 1/12/2035 1,958,148 0.01%Anthem, Inc. $1,750,000 3.65% 1/12/2027 1,957,915 0.01%CCRE6 Commercial Mortgage Trust 2013 $1,890,000 3.10% 10/3/2046 1,955,414 0.01%Dell International LLC/EMC Corp. $1,195,000 8.35% 15/7/2046 1,955,076 0.01%Federal National Mortgage Association $1,929,725 1.50% 1/1/2036 1,954,093 0.01%AT&T, Inc. $1,510,000 5.15% 15/2/2050 1,953,590 0.01%Broadcom, Inc. $1,900,000 3.50% 15/2/2041 1,949,816 0.01%Federal Home Loan Mortgage Corp. $1,846,821 3.00% 1/8/2050 1,948,558 0.01%Federal Home Loan Mortgage Corp. $1,909,144 2.00% 1/10/2040 1,947,717 0.01%General Electric Co. $1,404,000 6.75% 15/3/2032 1,947,109 0.01%Freddie Mac Multifamily Structured Pass Through Certificates $1,675,000 3.77% 25/12/2028 1,940,679 0.01%Verizon Communications, Inc. $1,571,000 4.52% 15/9/2048 1,939,264 0.01%Freddie Mac Multifamily Structured Pass Through Certificates $1,925,000 1.56% 25/4/2030 1,935,207 0.01%Allied World Assurance Co. Holdings Ltd. $1,765,000 4.35% 29/10/2025 1,935,074 0.01%JPMorgan Chase & Co. €1,600,000 0.63% 25/1/2024 1,933,097 0.01%Dell International LLC/EMC Corp. $1,500,000 6.20% 15/7/2030 1,928,583 0.01%JPMorgan Chase & Co.^ $1,750,000 3.51% 23/1/2029 1,928,067 0.01%Dollar General Corp. $1,750,000 3.50% 3/4/2030 1,924,675 0.01%Morgan Stanley^ €1,650,000 0.50% 7/2/2031 1,922,018 0.01%Merck & Co., Inc. $1,803,000 2.75% 10/2/2025 1,921,048 0.01%Athene Holding Ltd. $1,800,000 3.50% 15/1/2031 1,920,986 0.01%Government National Mortgage Association $1,831,104 3.00% 20/6/2050 1,912,472 0.01%General Motors Financial Co., Inc. $1,800,000 4.15% 19/6/2023 1,912,061 0.01%Government National Mortgage Association $1,792,450 3.00% 20/4/2043 1,907,828 0.01%Morgan Stanley^ $1,800,000 3.22% 22/4/2042 1,904,628 0.01%AutoZone, Inc. $2,000,000 1.65% 15/1/2031 1,903,347 0.01%Burlington Northern Santa Fe LLC $1,725,000 3.25% 15/6/2027 1,900,307 0.01%Freddie Mac Multifamily Structured Pass Through Certificates^ $1,650,000 3.78% 25/11/2051 1,899,429 0.01%T-Mobile USA, Inc. $1,595,000 4.50% 15/4/2050 1,897,415 0.01%CVS Health Corp. $1,950,000 2.70% 21/8/2040 1,890,886 0.01%Applied Materials, Inc. $1,690,000 3.90% 1/10/2025 1,886,460 0.01%Booking Holdings, Inc. $1,700,000 3.60% 1/6/2026 1,884,601 0.01%Federal National Mortgage Association $1,740,659 4.50% 1/12/2048 1,879,402 0.01%Verizon Communications, Inc. $1,750,000 3.55% 22/3/2051 1,869,976 0.01%Santander Holdings USA, Inc. $1,750,000 3.24% 5/10/2026 1,869,745 0.01%GE Capital Funding LLC $1,600,000 4.40% 15/5/2030 1,864,969 0.01%Microsoft Corp. $1,740,000 2.70% 12/2/2025 1,863,331 0.01%UnitedHealth Group, Inc. $1,665,000 3.50% 15/8/2039 1,858,680 0.01%Shire Acquisitions Investments Ireland DAC $1,775,000 2.88% 23/9/2023 1,857,575 0.01%Port Authority of New York & New Jersey $1,325,000 5.65% 1/11/2040 1,856,908 0.01%Government National Mortgage Association $1,736,478 4.00% 20/12/2047 1,853,450 0.01%

458
Vanguard Global Bond Index Fund
Principal CouponMaturity
DateFair Value
US Dollars ($)% of Total
Net AssetsAmazon.com, Inc. $1,850,000 1.00% 12/5/2026 1,850,651 0.01%Federal Home Loan Mortgage Corp. $1,785,188 2.50% 1/5/2051 1,847,341 0.01%QUALCOMM, Inc. $1,885,000 1.30% 20/5/2028 1,844,969 0.01%Bank of America Corp. $1,700,000 3.25% 21/10/2027 1,844,055 0.01%CVS Health Corp. $1,550,000 4.25% 1/4/2050 1,842,354 0.01%Digital Euro Finco LLC €1,500,000 1.13% 9/4/2028 1,840,326 0.01%Goldman Sachs Group, Inc. £1,200,000 3.13% 25/7/2029 1,840,311 0.01%Federal National Mortgage Association $1,728,057 4.00% 1/7/2048 1,838,871 0.01%Weyerhaeuser Co. $1,275,000 7.38% 15/3/2032 1,837,839 0.01%Bank of New York Mellon Corp. $1,800,000 1.95% 23/8/2022 1,834,701 0.01%Becton Dickinson & Co. $1,650,000 3.70% 6/6/2027 1,834,084 0.01%Federal National Mortgage Association $1,717,160 4.00% 1/5/2049 1,827,349 0.01%CVS Health Corp. $1,400,000 5.05% 25/3/2048 1,820,648 0.01%Morgan Stanley^ $1,550,000 3.97% 22/7/2038 1,818,530 0.01%Government National Mortgage Association $1,719,821 3.50% 20/2/2050 1,816,454 0.01%General Electric Co. $1,500,000 4.35% 1/5/2050 1,815,812 0.01%General Electric Co. $1,550,000 4.25% 1/5/2040 1,813,468 0.01%JPMorgan Chase & Co.^ $1,700,000 3.80% 23/7/2024 1,809,959 0.01%Federal National Mortgage Association $1,715,571 3.50% 1/5/2051 1,808,242 0.01%Wells Fargo Commercial Mortgage Trust 2015 $1,676,798 3.41% 15/9/2058 1,806,744 0.01%Berkshire Hathaway, Inc. ¥200,000,000 0.44% 13/9/2029 1,801,106 0.01%JPMorgan Chase & Co. £1,300,000 0.99% 28/4/2026 1,796,878 0.01%Federal Home Loan Mortgage Corp. $1,800,000 0.25% 4/12/2023 1,796,514 0.01%American Tower Corp. €1,500,000 0.88% 21/5/2029 1,793,782 0.01%Federal Home Loan Mortgage Corp. $1,757,378 2.00% 1/9/2040 1,792,885 0.01%Government National Mortgage Association $1,712,556 3.00% 20/5/2050 1,787,739 0.01%Federal Home Loan Mortgage Corp. $1,650,647 4.00% 1/1/2046 1,786,385 0.01%Cisco Systems, Inc. $1,650,000 3.63% 4/3/2024 1,785,561 0.01%Government National Mortgage Association $1,691,569 3.50% 20/2/2049 1,785,549 0.01%Nestle Holdings, Inc. $1,500,000 3.90% 24/9/2038 1,784,448 0.01%Federal National Mortgage Association $1,707,246 3.00% 1/2/2050 1,780,531 0.01%Oracle Corp. $1,685,000 2.65% 15/7/2026 1,778,402 0.01%Lowe's Cos, Inc. $1,675,000 2.50% 15/4/2026 1,777,795 0.01%Boeing Co. $1,500,000 5.15% 1/5/2030 1,777,582 0.01%Bank of America Corp.^ $1,725,000 2.69% 22/4/2032 1,776,892 0.01%JPMBB Commercial Mortgage Securities Trust 2014 $1,650,000 4.08% 15/2/2047 1,774,185 0.01%Cigna Corp. $1,400,000 4.80% 15/7/2046 1,772,215 0.01%Dow Chemical Co. $1,485,000 4.38% 15/11/2042 1,769,922 0.01%JPMorgan Chase & Co.^ €1,450,000 1.00% 25/7/2031 1,767,208 0.01%Upjohn Finance BV €1,400,000 1.91% 23/6/2032 1,767,127 0.01%Benchmark 2018-B8 Mortgage Trust $1,525,000 4.23% 15/1/2052 1,766,019 0.01%Microsoft Corp. $1,585,000 3.30% 6/2/2027 1,764,019 0.01%Federal National Mortgage Association $1,591,754 4.50% 1/5/2041 1,763,829 0.01%Federal Home Loan Mortgage Corp. $1,200,000 6.75% 15/3/2031 1,763,618 0.01%Federal National Mortgage Association $1,670,575 3.50% 1/4/2050 1,758,293 0.01%T-Mobile USA, Inc. $1,500,000 4.38% 15/4/2040 1,758,186 0.01%Lowe's Cos, Inc. $1,800,000 1.30% 15/4/2028 1,755,757 0.01%Enstar Group Ltd. $1,525,000 4.95% 1/6/2029 1,750,986 0.01%Federal Home Loan Mortgage Corp. $1,678,020 3.00% 1/12/2049 1,749,117 0.01%JPMorgan Chase & Co.^ $1,575,000 3.78% 1/2/2028 1,747,884 0.01%Government National Mortgage Association $1,637,823 3.50% 20/5/2046 1,743,085 0.01%Federal National Mortgage Association $1,720,791 1.50% 1/11/2035 1,742,521 0.01%Government National Mortgage Association $1,644,918 3.50% 20/10/2047 1,741,281 0.01%PepsiCo, Inc. $1,550,000 3.45% 6/10/2046 1,739,849 0.01%CVS Health Corp. $1,500,000 4.13% 1/4/2040 1,738,867 0.01%Citigroup, Inc.^ €1,400,000 1.25% 6/7/2026 1,733,467 0.01%Federal National Mortgage Association $1,646,856 2.50% 1/9/2034 1,725,727 0.01%Federal Home Loan Mortgage Corp. $1,615,969 4.00% 1/3/2049 1,720,028 0.01%High Street Funding Trust I $1,525,000 4.11% 15/2/2028 1,719,829 0.01%Federal National Mortgage Association $1,600,000 2.44% 25/10/2029 1,719,461 0.01%AT&T, Inc. $1,733,000 2.55% 1/12/2033 1,717,618 0.01%Federal National Mortgage Association $1,642,872 2.50% 1/9/2035 1,715,142 0.01%Federal National Mortgage Association $1,675,000 2.00% 5/10/2022 1,713,684 0.01%AbbVie, Inc. $1,475,000 4.05% 21/11/2039 1,712,254 0.01%PepsiCo, Inc. $1,500,000 3.50% 19/3/2040 1,711,298 0.01%Government National Mortgage Association $1,623,614 3.00% 20/6/2046 1,710,128 0.01%Athene Global Funding €1,450,000 0.63% 12/1/2028 1,708,865 0.01%Federal National Mortgage Association^ $1,725,000 1.51% 25/2/2031 1,706,504 0.01%Bank of America Corp. $1,075,000 7.75% 14/5/2038 1,703,050 0.01%UnitedHealth Group, Inc. $1,650,000 3.13% 15/5/2060 1,700,632 0.01%Federal Home Loan Mortgage Corp. $1,637,393 2.00% 1/11/2034 1,689,142 0.01%

459
Vanguard Global Bond Index Fund
Principal CouponMaturity
DateFair Value
US Dollars ($)% of Total
Net AssetsMPLX LP $1,305,000 5.50% 15/2/2049 1,688,537 0.01%AbbVie, Inc. $1,600,000 2.60% 21/11/2024 1,687,750 0.01%Government National Mortgage Association $1,601,688 3.00% 20/1/2047 1,687,034 0.01%Sammons Financial Group, Inc. $1,500,000 4.45% 12/5/2027 1,683,351 0.01%Home Depot, Inc. $1,175,000 5.88% 16/12/2036 1,679,166 0.01%Microsoft Corp. $1,577,000 2.92% 17/3/2052 1,672,791 0.01%Athene Global Funding £1,200,000 1.75% 24/11/2027 1,670,508 0.01%Microsoft Corp. $1,562,000 3.04% 17/3/2062 1,670,150 0.01%NextEra Energy Capital Holdings, Inc. $1,650,000 2.25% 1/6/2030 1,665,328 0.01%SITE Centers Corp. $1,500,000 4.70% 1/6/2027 1,664,595 0.01%Linde, Inc. €1,300,000 1.63% 1/12/2025 1,660,460 0.01%PepsiCo, Inc. $1,540,000 2.75% 19/3/2030 1,659,693 0.01%Federal Home Loan Mortgage Corp. $1,570,932 3.50% 1/6/2048 1,658,798 0.01%Walmart, Inc. $1,515,000 3.05% 8/7/2026 1,658,485 0.01%Alexandria Real Estate Equities, Inc. $1,700,000 2.00% 18/5/2032 1,657,148 0.01%Comcast Corp. $1,500,000 3.40% 1/4/2030 1,656,708 0.01%Southwest Airlines Co. $1,450,000 5.25% 4/5/2025 1,656,329 0.01%Fiserv, Inc. $1,503,000 3.50% 1/7/2029 1,654,539 0.01%CCRE25 Commercial Mortgage Trust 2015 $1,541,425 3.51% 10/8/2048 1,654,278 0.01%Comcast Corp. $1,275,000 4.70% 15/10/2048 1,653,005 0.01%Federal National Mortgage Association $1,533,548 4.00% 1/4/2047 1,652,670 0.01%Honeywell International, Inc. €1,230,000 2.25% 22/2/2028 1,652,110 0.01%Mileage Plus Holdings LLC/Mileage Plus Intellectual Property Assets Ltd. $1,500,000 6.50% 20/6/2027 1,651,509 0.01%AbbVie, Inc. $1,510,000 3.80% 15/3/2025 1,651,400 0.01%Verizon Communications, Inc. AU($)2,000,000 4.05% 17/2/2025 1,649,157 0.01%Spectra Energy Partners LP $1,500,000 4.75% 15/3/2024 1,646,895 0.01%Verizon Communications, Inc. €1,400,000 0.38% 22/3/2029 1,646,446 0.01%Federal National Mortgage Association $1,591,274 2.00% 1/10/2035 1,642,631 0.01%Wells Fargo & Co. $1,200,000 5.61% 15/1/2044 1,641,300 0.01%AbbVie, Inc. $1,500,000 3.60% 14/5/2025 1,637,511 0.01%Enable Midstream Partners LP $1,500,000 5.00% 15/5/2044 1,632,603 0.01%Truist Bank $1,489,000 3.30% 15/5/2026 1,632,568 0.01%Alphabet, Inc. $1,650,000 0.45% 15/8/2025 1,632,419 0.01%Federal National Mortgage Association $1,527,641 3.50% 1/7/2033 1,632,264 0.01%Aon Corp. $1,550,000 2.80% 15/5/2030 1,630,665 0.01%Freddie Mac Multifamily Structured Pass Through Certificates $1,400,000 3.93% 25/6/2028 1,627,972 0.01%Microsoft Corp. $1,575,000 2.00% 8/8/2023 1,626,570 0.01%MetLife, Inc. $1,500,000 4.37% 15/9/2023 1,625,527 0.01%Comcast Corp. $1,500,000 3.45% 1/2/2050 1,624,847 0.01%MidAmerican Energy Co. $1,175,000 5.80% 15/10/2036 1,622,586 0.01%McDonald's Corp. $1,491,000 3.30% 1/7/2025 1,618,927 0.01%Bank of America Corp.^ $1,502,000 3.37% 23/1/2026 1,618,874 0.01%Kinder Morgan Energy Partners LP $1,498,000 4.15% 1/2/2024 1,615,076 0.01%Caterpillar, Inc. $1,500,000 3.40% 15/5/2024 1,610,994 0.01%HP, Inc. $1,550,000 2.20% 17/6/2025 1,609,086 0.01%AT&T, Inc. $1,525,000 3.85% 1/6/2060 1,608,641 0.01%Visa, Inc. $1,250,000 4.30% 14/12/2045 1,607,325 0.01%PECO Energy Co. $1,501,000 3.15% 15/10/2025 1,606,268 0.01%Freddie Mac Multifamily Structured Pass Through Certificates $1,500,000 2.43% 25/8/2029 1,606,029 0.01%Federal National Mortgage Association $1,503,975 3.50% 1/9/2045 1,604,388 0.01%Wells Fargo & Co.^ €1,300,000 1.34% 4/5/2025 1,598,591 0.01%Freddie Mac Multifamily Structured Pass Through Certificates $1,550,000 1.91% 25/5/2031 1,598,111 0.01%Government National Mortgage Association $1,498,337 3.50% 20/9/2045 1,597,768 0.01%Microsoft Corp. $1,625,000 2.53% 1/6/2050 1,596,840 0.01%Government National Mortgage Association $1,529,048 3.00% 20/1/2050 1,596,749 0.01%Bank of America Corp. $1,455,000 4.00% 22/1/2025 1,595,985 0.01%Federal National Mortgage Association $1,503,924 3.00% 1/9/2042 1,594,895 0.01%Expedia Group, Inc. $1,500,000 3.60% 15/12/2023 1,593,721 0.01%Nestle Holdings, Inc. $1,500,000 3.35% 24/9/2023 1,593,530 0.01%AbbVie, Inc. $1,550,000 2.30% 21/11/2022 1,591,008 0.01%Verizon Communications, Inc. $1,231,000 4.86% 21/8/2046 1,590,181 0.01%Intercontinental Exchange, Inc. $1,675,000 1.85% 15/9/2032 1,589,933 0.01%Federal National Mortgage Association $1,500,000 2.47% 25/4/2026 1,587,195 0.01%Anthem, Inc. $1,471,000 3.35% 1/12/2024 1,586,837 0.01%Amazon.com, Inc. $1,680,000 2.50% 3/6/2050 1,586,774 0.01%ViacomCBS, Inc. $1,475,000 3.50% 15/1/2025 1,586,087 0.01%Federal National Mortgage Association $1,532,427 2.50% 1/5/2051 1,585,806 0.01%General Motors Co. $1,450,000 4.88% 2/10/2023 1,578,342 0.01%Schlumberger Investment SA $1,500,000 2.65% 26/6/2030 1,577,745 0.01%Cox Communications, Inc. $1,450,000 3.35% 15/9/2026 1,576,808 0.01%PepsiCo, Inc. $1,500,000 2.25% 19/3/2025 1,576,720 0.01%

460
Vanguard Global Bond Index Fund
Principal CouponMaturity
DateFair Value
US Dollars ($)% of Total
Net AssetsFederal National Mortgage Association $1,466,740 4.00% 1/9/2047 1,569,055 0.01%Federal Home Loan Mortgage Corp. $1,549,114 2.00% 1/8/2050 1,566,993 0.01%Sempra Energy $1,425,000 3.40% 1/2/2028 1,565,780 0.01%Nasdaq, Inc. €1,300,000 0.88% 13/2/2030 1,565,422 0.01%Viatris, Inc. $1,475,000 4.00% 22/6/2050 1,563,004 0.01%DuPont de Nemours, Inc. $1,125,000 5.42% 15/11/2048 1,562,323 0.01%MPLX LP $1,380,000 4.25% 1/12/2027 1,561,617 0.01%Juniper Networks, Inc. $1,400,000 3.75% 15/8/2029 1,558,399 0.01%Southwest Airlines Co. $1,450,000 4.75% 4/5/2023 1,556,259 0.01%Verizon Communications, Inc. $1,325,000 4.13% 15/8/2046 1,556,169 0.01%AT&T, Inc. $1,551,000 3.50% 15/9/2053 1,555,535 0.01%Federal National Mortgage Association $1,453,389 4.00% 1/4/2048 1,554,772 0.01%American International Group, Inc. $1,375,000 3.88% 15/1/2035 1,554,172 0.01%Federal National Mortgage Association $1,467,890 3.50% 1/5/2050 1,553,668 0.01%Walmart, Inc. $1,140,000 5.25% 1/9/2035 1,552,615 0.01%Federal Home Loan Mortgage Corp. $1,473,146 3.00% 1/9/2037 1,551,088 0.01%Federal Home Loan Mortgage Corp. $1,429,448 3.50% 1/5/2050 1,548,968 0.01%Federal Home Loan Mortgage Corp. $1,409,260 4.00% 1/8/2044 1,547,442 0.01%Federal Home Loan Mortgage Corp. $1,482,436 3.00% 1/1/2050 1,545,247 0.01%Bank of America Corp.^ $1,500,000 2.59% 29/4/2031 1,544,115 0.01%Phillips 66 $1,230,000 4.88% 15/11/2044 1,540,109 0.01%Freddie Mac Multifamily Structured Pass Through Certificates $1,450,000 2.67% 25/12/2024 1,539,372 0.01%Pfizer, Inc. $1,200,000 4.40% 15/5/2044 1,539,079 0.01%Federal National Mortgage Association $1,390,000 2.94% 25/4/2029 1,538,724 0.01%Boeing Co. $1,500,000 1.95% 1/2/2024 1,537,220 0.01%Metropolitan Life Global Funding I $1,500,000 1.95% 13/1/2023 1,536,047 0.01%Lockheed Martin Corp. $1,389,000 3.55% 15/1/2026 1,535,486 0.01%Wells Fargo & Co.^ €1,200,000 1.74% 4/5/2030 1,534,463 0.01%Goldman Sachs Group, Inc.^ $1,500,000 2.62% 22/4/2032 1,534,051 0.01%Oracle Corp. $1,490,000 3.60% 1/4/2050 1,530,909 0.01%Federal National Mortgage Association^ $1,394,000 3.06% 25/5/2027 1,529,243 0.01%AbbVie, Inc. $1,224,000 4.70% 14/5/2045 1,527,133 0.01%Government National Mortgage Association $1,449,740 3.00% 20/3/2046 1,526,989 0.01%Government National Mortgage Association $1,462,296 3.00% 20/3/2050 1,525,708 0.01%Linde, Inc. $1,500,000 2.20% 15/8/2022 1,524,765 0.01%AT&T, Inc. $1,314,000 4.30% 15/2/2030 1,519,248 0.01%Federal National Mortgage Association $1,418,096 4.00% 1/12/2047 1,517,017 0.01%McDonald's Corp. $1,500,000 2.13% 1/3/2030 1,516,349 0.01%Mastercard, Inc. $1,500,000 1.90% 15/3/2031 1,515,370 0.01%Brandywine Operating Partnership LP $1,390,000 3.95% 15/11/2027 1,510,883 0.01%Wells Fargo Bank NA $1,100,000 5.85% 1/2/2037 1,510,041 0.01%ViacomCBS, Inc. $1,250,000 4.95% 15/1/2031 1,508,954 0.01%Government National Mortgage Association $1,414,823 3.50% 20/7/2045 1,508,712 0.01%Boeing Co. $1,500,000 1.17% 4/2/2023 1,505,601 0.01%Federal Home Loan Mortgage Corp. $1,424,179 3.00% 1/9/2036 1,503,302 0.01%Morgan Stanley $1,325,000 4.35% 8/9/2026 1,501,590 0.01%Pacific Gas & Electric Co. $1,600,000 2.50% 1/2/2031 1,501,214 0.01%JPMorgan Chase & Co.^ $1,500,000 0.65% 16/9/2024 1,500,796 0.01%Federal National Mortgage Association $1,500,000 0.25% 22/5/2023 1,500,595 0.01%Capital One Financial Corp. $1,475,000 3.05% 9/3/2022 1,499,397 0.01%International Business Machines Corp. $1,500,000 1.95% 15/5/2030 1,498,604 0.01%United Parcel Service, Inc. $1,100,000 5.20% 1/4/2040 1,498,085 0.01%Federal National Mortgage Association $1,500,000 0.25% 27/11/2023 1,497,742 0.01%Federal Home Loan Banks $1,500,000 0.13% 17/3/2023 1,497,485 0.01%Viatris, Inc. $1,400,000 3.85% 22/6/2040 1,494,283 0.01%Intel Corp. $1,309,000 3.73% 8/12/2047 1,493,685 0.01%Federal Home Loan Mortgage Corp. $1,353,503 4.50% 1/10/2048 1,492,877 0.01%Bank of America Corp.^ $1,350,000 3.71% 24/4/2028 1,492,795 0.01%Coca-Cola Co. €1,300,000 0.38% 15/3/2033 1,491,959 0.01%Diamondback Energy, Inc. $1,390,000 3.50% 1/12/2029 1,489,855 0.01%MPLX LP $1,473,000 1.75% 1/3/2026 1,489,754 0.01%Gilead Sciences, Inc. $1,350,000 3.65% 1/3/2026 1,488,941 0.01%Penske Truck Leasing Co. LP/PTL Finance Corp. $1,500,000 1.20% 15/11/2025 1,488,141 0.01%Wells Fargo & Co. $1,325,000 4.10% 3/6/2026 1,488,066 0.01%General Electric Co. $1,092,000 5.88% 14/1/2038 1,487,201 0.01%Federal Home Loan Mortgage Corp. $1,422,659 3.00% 1/4/2050 1,483,611 0.01%Stellantis NV €1,000,000 4.50% 7/7/2028 1,479,363 0.01%Federal National Mortgage Association $1,389,087 3.00% 1/12/2047 1,478,836 0.01%Federal National Mortgage Association $1,387,312 3.00% 1/11/2042 1,477,244 0.01%Northrop Grumman Corp. $1,050,000 5.25% 1/5/2050 1,476,484 0.01%Government National Mortgage Association $1,383,619 3.00% 20/1/2043 1,475,935 0.01%

461
Vanguard Global Bond Index Fund
Principal CouponMaturity
DateFair Value
US Dollars ($)% of Total
Net AssetsComcast Corp. $1,225,000 4.40% 15/8/2035 1,475,345 0.01%Sysco Corp. $1,000,000 6.60% 1/4/2040 1,474,727 0.01%Apple, Inc. $1,500,000 2.65% 8/2/2051 1,471,490 0.01%Federal Home Loan Mortgage Corp. $1,408,292 2.50% 1/8/2035 1,470,314 0.01%ONEOK, Inc. $1,242,000 5.85% 15/1/2026 1,470,013 0.01%Cargill, Inc. $1,400,000 3.25% 1/3/2023 1,467,115 0.01%JPMDB Commercial Mortgage Securities Trust 2018 $1,275,000 4.21% 15/6/2051 1,465,190 0.01%Dollar General Corp. $1,250,000 4.13% 3/4/2050 1,465,064 0.01%Broadcom Corp./Broadcom Cayman Finance Ltd. $1,325,000 3.88% 15/1/2027 1,464,416 0.01%US Treasury Bond $1,300,000 6.25% 15/8/2023 1,463,414 0.01%Federal National Mortgage Association^ $1,275,000 3.70% 25/8/2028 1,462,025 0.01%Constellation Brands, Inc. $1,325,000 3.75% 1/5/2050 1,460,974 0.01%Federal Home Loan Mortgage Corp. $1,302,878 5.00% 1/3/2049 1,457,877 0.01%Government National Mortgage Association $1,337,635 3.50% 15/8/2043 1,457,843 0.01%Goldman Sachs Group, Inc. $1,300,000 4.25% 21/10/2025 1,454,463 0.01%Wells Fargo & Co. $1,350,000 4.13% 15/8/2023 1,450,982 0.01%Equinix, Inc. $1,350,000 3.20% 18/11/2029 1,450,635 0.01%Freddie Mac Multifamily Structured Pass Through Certificates $1,300,000 3.41% 25/12/2026 1,448,979 0.01%Commonwealth Edison Co. $1,420,000 2.20% 1/3/2030 1,447,420 0.01%JPMorgan Chase & Co.^ $1,350,000 3.33% 22/4/2052 1,440,754 0.01%Oracle Corp. $1,360,000 3.85% 1/4/2060 1,439,989 0.01%Bank of America Corp.^ $1,350,000 3.86% 23/7/2024 1,438,739 0.01%DXC Technology Co. £1,000,000 2.75% 15/1/2025 1,437,548 0.01%GE Capital International Funding Co. Unlimited Co. $1,316,000 3.37% 15/11/2025 1,435,747 0.01%Conagra Brands, Inc. $1,263,000 4.60% 1/11/2025 1,435,547 0.01%Amgen, Inc. $1,111,000 4.66% 15/6/2051 1,434,838 0.01%Federal Home Loan Mortgage Corp. $1,339,344 3.50% 1/12/2044 1,433,925 0.01%Carrier Global Corp. $1,350,000 3.58% 5/4/2050 1,432,979 0.01%Federal National Mortgage Association $1,332,068 4.50% 1/11/2048 1,432,474 0.01%Government National Mortgage Association $1,341,855 3.50% 20/1/2046 1,431,605 0.01%Walmart, Inc. £700,000 5.63% 27/3/2034 1,431,172 0.01%Exxon Mobil Corp. $1,400,000 1.57% 15/4/2023 1,430,295 0.01%Ventas Canada Finance Ltd. CA($)1,710,000 2.80% 12/4/2024 1,430,195 0.01%American Express Co. $1,400,000 2.50% 1/8/2022 1,429,943 0.01%Morgan Stanley^ €1,200,000 0.41% 29/10/2027 1,428,105 0.01%Bank of America Corp.^ $1,350,000 3.31% 22/4/2042 1,427,811 0.01%Federal National Mortgage Association $1,326,455 4.50% 1/4/2048 1,427,462 0.01%Verizon Communications, Inc. $1,125,000 4.81% 15/3/2039 1,426,484 0.01%Federal Home Loan Mortgage Corp. $1,394,914 2.00% 1/6/2041 1,424,517 0.01%Federal National Mortgage Association $1,353,318 3.00% 1/10/2026 1,422,788 0.01%Government National Mortgage Association $1,336,960 4.50% 20/1/2050 1,420,922 0.01%Bristol-Myers Squibb Co. $1,125,000 4.25% 26/10/2049 1,420,915 0.01%DuPont de Nemours, Inc. $1,075,000 5.32% 15/11/2038 1,420,776 0.01%Federal Home Loan Mortgage Corp. $1,320,333 3.50% 1/4/2050 1,420,221 0.01%Government National Mortgage Association $1,340,192 3.50% 20/8/2049 1,420,012 0.01%Broadcom, Inc. $1,220,000 4.75% 15/4/2029 1,419,189 0.01%Comcast Corp. $1,299,000 3.38% 15/8/2025 1,417,893 0.01%Marsh & McLennan Cos, Inc. $1,100,000 4.75% 15/3/2039 1,411,801 0.01%State of Illinois $1,200,000 5.10% 1/6/2033 1,411,692 0.01%T-Mobile USA, Inc. $1,300,000 3.50% 15/4/2025 1,409,807 0.01%Morgan Stanley^ $1,400,000 1.59% 4/5/2027 1,409,647 0.01%Alabama Power Co. $1,475,000 1.45% 15/9/2030 1,409,196 0.01%Citigroup, Inc. $1,075,000 4.65% 23/7/2048 1,408,077 0.01%Government National Mortgage Association $1,329,976 3.50% 20/11/2047 1,407,889 0.01%JPMorgan Chase & Co.^ $1,400,000 1.58% 22/4/2027 1,407,516 0.01%US Treasury Bond $1,123,000 6.88% 15/8/2025 1,402,960 0.01%ConocoPhillips $1,050,000 5.90% 15/10/2032 1,402,747 0.01%Amazon.com, Inc. $1,150,000 4.05% 22/8/2047 1,402,087 0.01%CVS Health Corp. $1,250,000 3.75% 1/4/2030 1,401,320 0.01%Cigna Corp. $1,125,000 4.80% 15/8/2038 1,401,204 0.01%American Express Co. $1,280,000 3.63% 5/12/2024 1,400,850 0.01%John Deere Cash Management SA €1,000,000 2.20% 2/4/2032 1,399,306 0.01%Athene Holding Ltd. $1,250,000 4.13% 12/1/2028 1,396,996 0.01%Federal Home Loan Mortgage Corp. $1,320,803 3.00% 1/11/2030 1,395,660 0.01%Wells Fargo Commercial Mortgage Trust 2018 $1,200,000 4.30% 15/1/2052 1,394,784 0.01%Verizon Communications, Inc. $1,300,000 3.70% 22/3/2061 1,394,290 0.01%Morgan Stanley $1,255,000 3.63% 20/1/2027 1,392,815 0.01%Citigroup, Inc.^ $1,300,000 3.11% 8/4/2026 1,390,788 0.01%CD 2016-CD2 Mortgage Trust^ $1,265,000 3.53% 10/11/2049 1,390,332 0.01%Freddie Mac Multifamily Structured Pass Through Certificates^ $1,200,000 3.85% 25/5/2028 1,387,784 0.01%JPMorgan Chase & Co.^ $1,350,000 2.58% 22/4/2032 1,386,976 0.01%

462
Vanguard Global Bond Index Fund
Principal CouponMaturity
DateFair Value
US Dollars ($)% of Total
Net AssetsComcast Corp. $1,000,000 4.95% 15/10/2058 1,383,547 0.01%Cisco Systems, Inc. $975,000 5.50% 15/1/2040 1,379,464 0.01%Federal National Mortgage Association $1,297,093 3.00% 1/5/2043 1,377,012 0.01%ConocoPhillips $1,225,000 3.75% 1/10/2027 1,375,954 0.01%Intel Corp. $1,305,000 2.45% 15/11/2029 1,374,522 0.01%Charter Communications Operating LLC/Charter Communications
Operating Capital $1,190,000 4.80% 1/3/2050 1,371,006 0.01%Federal Home Loan Mortgage Corp. $1,312,343 2.50% 1/4/2027 1,369,515 0.01%Visa, Inc. $1,325,000 1.90% 15/4/2027 1,369,031 0.01%Valero Energy Corp. $1,200,000 4.35% 1/6/2028 1,367,308 0.01%Amazon.com, Inc. $1,300,000 3.10% 12/5/2051 1,366,562 0.01%Kinder Morgan, Inc. $1,125,000 5.05% 15/2/2046 1,364,961 0.01%Federal National Mortgage Association $1,304,382 2.50% 1/11/2035 1,363,491 0.01%General Motors Financial Co., Inc. $1,250,000 4.00% 15/1/2025 1,361,899 0.01%Verizon Communications, Inc. $1,280,000 2.63% 15/8/2026 1,359,881 0.01%Chevron Corp. $1,300,000 2.98% 11/5/2040 1,359,398 0.01%Federal Home Loan Mortgage Corp. $1,281,291 3.00% 1/1/2043 1,359,358 0.01%Federal Home Loan Mortgage Corp. $1,285,553 3.50% 1/11/2047 1,359,310 0.01%ERAC USA Finance LLC $995,000 5.63% 15/3/2042 1,357,127 0.01%Comcast Corp. $1,500,000 2.45% 15/8/2052 1,354,193 0.01%Kinder Morgan Energy Partners LP $1,075,000 5.50% 1/3/2044 1,352,110 0.01%MetLife, Inc. $900,000 9.25% 8/4/2038 1,351,765 0.01%Federal National Mortgage Association $1,282,481 3.00% 1/9/2037 1,349,649 0.01%Verizon Communications, Inc. €1,100,000 0.88% 8/4/2027 1,349,582 0.01%Mylan, Inc. $1,175,000 4.55% 15/4/2028 1,348,475 0.01%Freddie Mac Multifamily Structured Pass Through Certificates $1,250,000 2.86% 25/5/2026 1,347,678 0.01%Federal Home Loan Mortgage Corp. $1,290,338 2.50% 1/9/2035 1,347,087 0.01%Federal National Mortgage Association $1,305,478 2.00% 1/8/2035 1,346,889 0.01%Federal National Mortgage Association $1,215,495 4.50% 1/4/2041 1,346,820 0.01%Federal National Mortgage Association $1,279,952 3.00% 1/12/2046 1,346,225 0.01%Schlumberger Finance BV €1,000,000 2.00% 6/5/2032 1,343,272 0.01%Visa, Inc. $1,300,000 2.80% 14/12/2022 1,342,460 0.01%Government National Mortgage Association $1,273,368 3.00% 20/10/2046 1,341,220 0.01%Federal Home Loan Banks $1,180,000 3.25% 16/11/2028 1,340,822 0.01%Apple, Inc. $1,230,000 2.90% 12/9/2027 1,340,820 0.01%Federal National Mortgage Association $1,252,372 4.00% 1/7/2047 1,339,733 0.01%Becton Dickinson & Co. $1,250,000 3.36% 6/6/2024 1,339,161 0.01%Conagra Brands, Inc. $1,050,000 5.30% 1/11/2038 1,335,483 0.01%Federal National Mortgage Association $1,248,205 4.00% 1/1/2048 1,335,275 0.01%Federal Home Loan Mortgage Corp. $1,217,829 4.50% 1/8/2048 1,335,178 0.01%GS Mortgage Securities Trust 2017 $1,213,000 3.43% 10/8/2050 1,334,668 0.01%Wells Fargo & Co.^ $1,300,000 3.07% 30/4/2041 1,333,069 0.01%Goldman Sachs Group, Inc. $900,000 6.25% 1/2/2041 1,332,963 0.01%BP Capital Markets America, Inc. $1,235,000 3.02% 16/1/2027 1,332,209 0.01%Federal Home Loan Mortgage Corp. $1,251,322 4.00% 1/5/2049 1,331,900 0.01%Oracle Corp. $1,250,000 2.95% 15/11/2024 1,331,762 0.01%Gilead Sciences, Inc. $1,050,000 4.75% 1/3/2046 1,331,405 0.01%Charter Communications Operating LLC/Charter Communications
Operating Capital $1,286,000 4.46% 23/7/2022 1,331,175 0.01%VMware, Inc. $1,160,000 4.65% 15/5/2027 1,330,990 0.01%Marriott International, Inc. $1,250,000 3.50% 15/10/2032 1,328,983 0.01%General Motors Financial Co., Inc. $1,150,000 5.25% 1/3/2026 1,328,590 0.01%Government National Mortgage Association $1,247,992 3.50% 20/3/2046 1,328,200 0.01%Intel Corp. $1,000,000 4.75% 25/3/2050 1,327,742 0.01%Federal Home Loan Mortgage Corp. $1,283,325 2.50% 1/12/2050 1,327,543 0.01%Federal Home Loan Mortgage Corp. $1,274,295 3.00% 1/5/2049 1,327,450 0.01%Citigroup, Inc. $1,225,000 3.20% 21/10/2026 1,327,250 0.01%Federal Home Loan Mortgage Corp. $1,300,938 2.00% 1/2/2041 1,327,223 0.01%Federal Home Loan Mortgage Corp. $1,213,570 5.00% 1/5/2049 1,326,076 0.01%DTE Electric Co. $1,225,000 3.25% 1/4/2051 1,325,334 0.01%Federal National Mortgage Association $1,249,485 3.00% 1/2/2047 1,324,440 0.01%Gilead Sciences, Inc. $1,045,000 4.80% 1/4/2044 1,323,090 0.01%Securian Financial Group, Inc. $1,090,000 4.80% 15/4/2048 1,318,657 0.01%Broadcom, Inc. $1,211,000 3.46% 15/9/2026 1,318,022 0.01%Federal Home Loan Mortgage Corp. $1,289,959 2.00% 1/5/2041 1,317,334 0.01%Simon Property Group LP $1,300,000 3.25% 13/9/2049 1,316,292 0.01%Abbott Laboratories $1,225,000 2.95% 15/3/2025 1,316,075 0.01%Oracle Corp. $1,200,000 3.80% 15/11/2037 1,315,666 0.01%Global Payments, Inc. $1,230,000 3.20% 15/8/2029 1,313,845 0.01%Government National Mortgage Association $1,208,906 4.00% 20/4/2046 1,313,240 0.01%Federal Home Loan Mortgage Corp. $1,250,000 3.00% 1/7/2051 1,312,915 0.01%

463
Vanguard Global Bond Index Fund
Principal CouponMaturity
DateFair Value
US Dollars ($)% of Total
Net AssetsOracle Corp. $1,200,000 3.95% 25/3/2051 1,311,245 0.01%Federal National Mortgage Association $1,227,876 3.50% 1/8/2045 1,310,694 0.01%Costco Wholesale Corp. $1,325,000 1.75% 20/4/2032 1,305,481 0.01%Southern Co. $1,125,000 4.25% 1/7/2036 1,304,946 0.01%Federal Home Loan Mortgage Corp. $1,246,769 2.50% 1/12/2030 1,304,719 0.01%Hewlett Packard Enterprise Co. $1,250,000 4.40% 15/10/2022 1,304,603 0.01%LYB International Finance III LLC $1,200,000 3.38% 1/5/2030 1,303,743 0.01%Boeing Co. $1,300,000 1.43% 4/2/2024 1,303,341 0.01%Digital Euro Finco LLC €1,000,000 2.50% 16/1/2026 1,303,176 0.01%Otis Worldwide Corp. $1,260,000 3.11% 15/2/2040 1,302,753 0.01%Amazon.com, Inc. $1,300,000 0.80% 3/6/2025 1,302,530 0.01%Exxon Mobil Corp. $1,200,000 3.04% 1/3/2026 1,302,514 0.01%Altria Group, Inc. $1,150,000 4.40% 14/2/2026 1,300,897 0.01%Government National Mortgage Association $1,276,284 2.00% 20/9/2050 1,300,806 0.01%Goldman Sachs Group, Inc.^ $1,175,000 3.69% 5/6/2028 1,297,681 0.01%GS Mortgage Securities Trust 2015 $1,180,000 3.76% 10/7/2048 1,295,247 0.01%Enterprise Products Operating LLC $1,200,000 3.13% 31/7/2029 1,294,741 0.01%Federal Home Loan Mortgage Corp. $1,268,659 2.00% 1/12/2040 1,294,292 0.01%CSAIL 2015-C4 Commercial Mortgage Trust $1,175,000 3.81% 15/11/2048 1,292,049 0.01%Boeing Co. $1,000,000 5.71% 1/5/2040 1,290,257 0.01%Government National Mortgage Association $1,220,059 4.00% 20/6/2049 1,290,033 0.01%Federal Home Loan Mortgage Corp. $1,289,542 1.50% 1/3/2041 1,289,521 0.01%Bristol-Myers Squibb Co. $1,150,000 3.40% 26/7/2029 1,288,227 0.01%Pfizer, Inc. $1,190,000 2.75% 3/6/2026 1,287,555 0.01%Government National Mortgage Association $1,209,555 3.50% 20/6/2046 1,287,293 0.01%Government National Mortgage Association $1,200,634 4.50% 20/7/2048 1,285,755 0.01%AT&T, Inc. $1,163,000 3.95% 15/1/2025 1,284,270 0.01%Federal Home Loan Mortgage Corp. $1,225,181 2.50% 1/8/2031 1,283,301 0.01%Federal Home Loan Mortgage Corp. $1,254,545 2.00% 1/3/2041 1,281,169 0.01%Berkshire Hathaway, Inc. $1,000,000 4.50% 11/2/2043 1,280,170 0.01%Jefferies Group LLC/Jefferies Group Capital Finance, Inc. $1,100,000 4.85% 15/1/2027 1,279,499 0.01%Federal Home Loan Mortgage Corp. $1,233,098 2.50% 1/4/2051 1,276,029 0.01%Medtronic, Inc. $1,024,000 4.38% 15/3/2035 1,274,457 0.01%ConocoPhillips $970,000 4.88% 1/10/2047 1,274,017 0.01%Federal National Mortgage Association $1,200,000 2.13% 24/4/2026 1,271,796 0.01%Discovery Communications LLC €1,000,000 1.90% 19/3/2027 1,270,399 0.01%Federal Home Loan Mortgage Corp. $1,195,978 3.00% 1/7/2035 1,269,639 0.01%Federal National Mortgage Association $1,189,683 3.50% 1/2/2046 1,269,112 0.01%US Treasury Bond $900,000 6.25% 15/5/2030 1,268,859 0.01%Sempra Energy $1,225,000 2.90% 1/2/2023 1,268,456 0.01%AbbVie, Inc. $1,050,000 4.50% 14/5/2035 1,268,345 0.01%International Business Machines Corp. $1,025,000 4.25% 15/5/2049 1,267,818 0.01%Amgen, Inc. $1,045,000 4.40% 1/5/2045 1,267,224 0.01%Goldman Sachs Group, Inc.^ $1,080,000 4.02% 31/10/2038 1,266,321 0.01%Intel Corp. $1,000,000 4.60% 25/3/2040 1,265,529 0.01%Verizon Communications, Inc. €1,000,000 1.38% 2/11/2028 1,265,327 0.01%Berkshire Hathaway Energy Co. $1,150,000 3.25% 15/4/2028 1,263,765 0.01%JPMorgan Chase & Co. $1,200,000 3.38% 1/5/2023 1,263,245 0.01%Verizon Communications, Inc. $1,250,000 1.45% 20/3/2026 1,261,549 0.01%JPMBB Commercial Mortgage Securities Trust 2015 $1,157,000 3.80% 15/8/2048 1,261,149 0.01%Energy Transfer LP $1,200,000 4.25% 15/3/2023 1,259,404 0.01%AbbVie, Inc. $1,050,000 4.25% 21/11/2049 1,258,937 0.01%Federal National Mortgage Association $1,149,860 4.00% 1/2/2041 1,257,456 0.01%Federal Home Loan Mortgage Corp. $1,182,733 3.50% 1/5/2046 1,257,392 0.01%Merck & Co., Inc. $1,200,000 2.80% 18/5/2023 1,255,247 0.01%Wells Fargo & Co. €1,000,000 1.38% 26/10/2026 1,253,334 0.01%US Bank NA $1,200,000 2.05% 21/1/2025 1,252,484 0.01%Ecolab, Inc. $1,325,000 1.30% 30/1/2031 1,252,462 0.01%Anthem, Inc. $1,200,000 3.30% 15/1/2023 1,252,031 0.01%Morgan Stanley $1,150,000 3.88% 29/4/2024 1,250,253 0.01%Government National Mortgage Association $1,142,524 4.00% 20/10/2043 1,248,694 0.01%Citigroup, Inc.^ €1,000,000 1.50% 24/7/2026 1,248,479 0.01%Comcast Corp. £900,000 1.50% 20/2/2029 1,248,113 0.01%Federal National Mortgage Association $1,200,832 2.50% 1/7/2049 1,247,818 0.01%Federal Home Loan Mortgage Corp. $1,139,717 4.00% 1/1/2047 1,246,231 0.01%Microsoft Corp. $1,075,000 3.50% 12/2/2035 1,246,124 0.01%Government National Mortgage Association $1,166,257 4.00% 20/11/2047 1,244,818 0.01%Federal National Mortgage Association $1,157,659 3.50% 1/7/2043 1,242,230 0.01%HCA, Inc. $950,000 5.50% 15/6/2047 1,237,140 0.01%Target Corp. $995,000 4.00% 1/7/2042 1,236,562 0.01%Government National Mortgage Association $1,158,286 3.00% 20/12/2042 1,235,567 0.01%
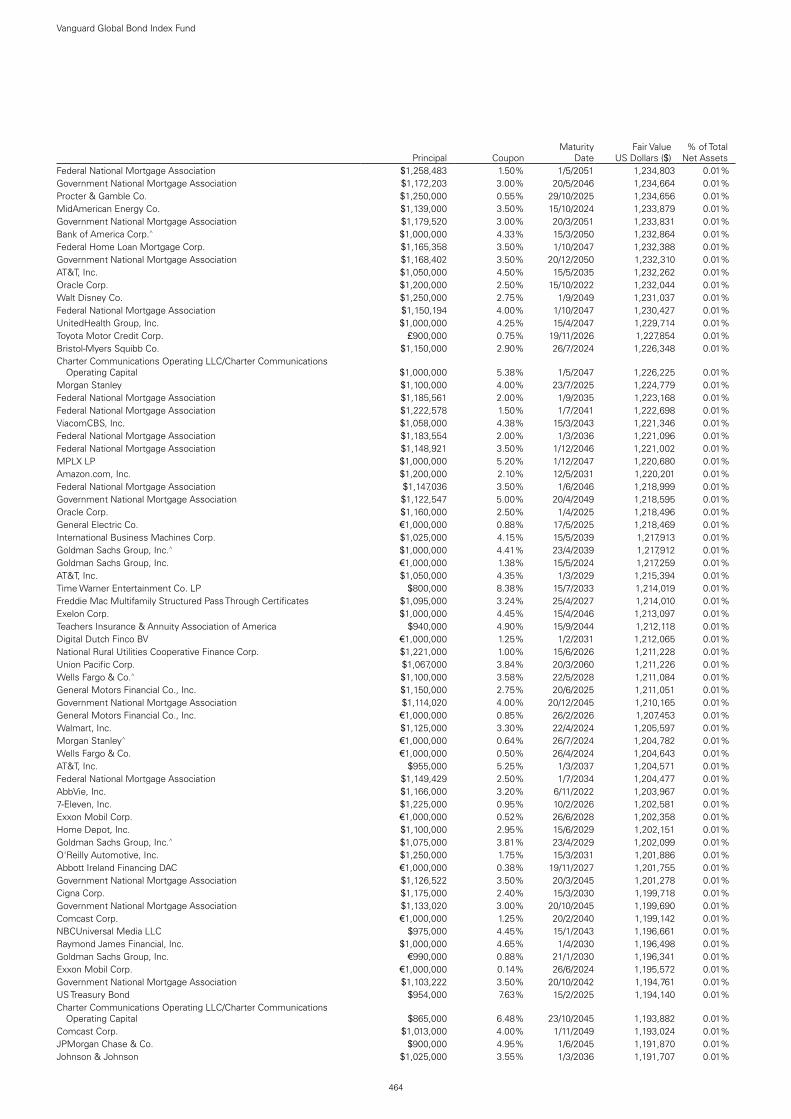
464
Vanguard Global Bond Index Fund
Principal CouponMaturity
DateFair Value
US Dollars ($)% of Total
Net AssetsFederal National Mortgage Association $1,258,483 1.50% 1/5/2051 1,234,803 0.01%Government National Mortgage Association $1,172,203 3.00% 20/5/2046 1,234,664 0.01%Procter & Gamble Co. $1,250,000 0.55% 29/10/2025 1,234,656 0.01%MidAmerican Energy Co. $1,139,000 3.50% 15/10/2024 1,233,879 0.01%Government National Mortgage Association $1,179,520 3.00% 20/3/2051 1,233,831 0.01%Bank of America Corp.^ $1,000,000 4.33% 15/3/2050 1,232,864 0.01%Federal Home Loan Mortgage Corp. $1,165,358 3.50% 1/10/2047 1,232,388 0.01%Government National Mortgage Association $1,168,402 3.50% 20/12/2050 1,232,310 0.01%AT&T, Inc. $1,050,000 4.50% 15/5/2035 1,232,262 0.01%Oracle Corp. $1,200,000 2.50% 15/10/2022 1,232,044 0.01%Walt Disney Co. $1,250,000 2.75% 1/9/2049 1,231,037 0.01%Federal National Mortgage Association $1,150,194 4.00% 1/10/2047 1,230,427 0.01%UnitedHealth Group, Inc. $1,000,000 4.25% 15/4/2047 1,229,714 0.01%Toyota Motor Credit Corp. £900,000 0.75% 19/11/2026 1,227,854 0.01%Bristol-Myers Squibb Co. $1,150,000 2.90% 26/7/2024 1,226,348 0.01%Charter Communications Operating LLC/Charter Communications
Operating Capital $1,000,000 5.38% 1/5/2047 1,226,225 0.01%Morgan Stanley $1,100,000 4.00% 23/7/2025 1,224,779 0.01%Federal National Mortgage Association $1,185,561 2.00% 1/9/2035 1,223,168 0.01%Federal National Mortgage Association $1,222,578 1.50% 1/7/2041 1,222,698 0.01%ViacomCBS, Inc. $1,058,000 4.38% 15/3/2043 1,221,346 0.01%Federal National Mortgage Association $1,183,554 2.00% 1/3/2036 1,221,096 0.01%Federal National Mortgage Association $1,148,921 3.50% 1/12/2046 1,221,002 0.01%MPLX LP $1,000,000 5.20% 1/12/2047 1,220,680 0.01%Amazon.com, Inc. $1,200,000 2.10% 12/5/2031 1,220,201 0.01%Federal National Mortgage Association $1,147,036 3.50% 1/6/2046 1,218,999 0.01%Government National Mortgage Association $1,122,547 5.00% 20/4/2049 1,218,595 0.01%Oracle Corp. $1,160,000 2.50% 1/4/2025 1,218,496 0.01%General Electric Co. €1,000,000 0.88% 17/5/2025 1,218,469 0.01%International Business Machines Corp. $1,025,000 4.15% 15/5/2039 1,217,913 0.01%Goldman Sachs Group, Inc.^ $1,000,000 4.41% 23/4/2039 1,217,912 0.01%Goldman Sachs Group, Inc. €1,000,000 1.38% 15/5/2024 1,217,259 0.01%AT&T, Inc. $1,050,000 4.35% 1/3/2029 1,215,394 0.01%Time Warner Entertainment Co. LP $800,000 8.38% 15/7/2033 1,214,019 0.01%Freddie Mac Multifamily Structured Pass Through Certificates $1,095,000 3.24% 25/4/2027 1,214,010 0.01%Exelon Corp. $1,000,000 4.45% 15/4/2046 1,213,097 0.01%Teachers Insurance & Annuity Association of America $940,000 4.90% 15/9/2044 1,212,118 0.01%Digital Dutch Finco BV €1,000,000 1.25% 1/2/2031 1,212,065 0.01%National Rural Utilities Cooperative Finance Corp. $1,221,000 1.00% 15/6/2026 1,211,228 0.01%Union Pacific Corp. $1,067,000 3.84% 20/3/2060 1,211,226 0.01%Wells Fargo & Co.^ $1,100,000 3.58% 22/5/2028 1,211,084 0.01%General Motors Financial Co., Inc. $1,150,000 2.75% 20/6/2025 1,211,051 0.01%Government National Mortgage Association $1,114,020 4.00% 20/12/2045 1,210,165 0.01%General Motors Financial Co., Inc. €1,000,000 0.85% 26/2/2026 1,207,453 0.01%Walmart, Inc. $1,125,000 3.30% 22/4/2024 1,205,597 0.01%Morgan Stanley^ €1,000,000 0.64% 26/7/2024 1,204,782 0.01%Wells Fargo & Co. €1,000,000 0.50% 26/4/2024 1,204,643 0.01%AT&T, Inc. $955,000 5.25% 1/3/2037 1,204,571 0.01%Federal National Mortgage Association $1,149,429 2.50% 1/7/2034 1,204,477 0.01%AbbVie, Inc. $1,166,000 3.20% 6/11/2022 1,203,967 0.01%7-Eleven, Inc. $1,225,000 0.95% 10/2/2026 1,202,581 0.01%Exxon Mobil Corp. €1,000,000 0.52% 26/6/2028 1,202,358 0.01%Home Depot, Inc. $1,100,000 2.95% 15/6/2029 1,202,151 0.01%Goldman Sachs Group, Inc.^ $1,075,000 3.81% 23/4/2029 1,202,099 0.01%O'Reilly Automotive, Inc. $1,250,000 1.75% 15/3/2031 1,201,886 0.01%Abbott Ireland Financing DAC €1,000,000 0.38% 19/11/2027 1,201,755 0.01%Government National Mortgage Association $1,126,522 3.50% 20/3/2045 1,201,278 0.01%Cigna Corp. $1,175,000 2.40% 15/3/2030 1,199,718 0.01%Government National Mortgage Association $1,133,020 3.00% 20/10/2045 1,199,690 0.01%Comcast Corp. €1,000,000 1.25% 20/2/2040 1,199,142 0.01%NBCUniversal Media LLC $975,000 4.45% 15/1/2043 1,196,661 0.01%Raymond James Financial, Inc. $1,000,000 4.65% 1/4/2030 1,196,498 0.01%Goldman Sachs Group, Inc. €990,000 0.88% 21/1/2030 1,196,341 0.01%Exxon Mobil Corp. €1,000,000 0.14% 26/6/2024 1,195,572 0.01%Government National Mortgage Association $1,103,222 3.50% 20/10/2042 1,194,761 0.01%US Treasury Bond $954,000 7.63% 15/2/2025 1,194,140 0.01%Charter Communications Operating LLC/Charter Communications
Operating Capital $865,000 6.48% 23/10/2045 1,193,882 0.01%Comcast Corp. $1,013,000 4.00% 1/11/2049 1,193,024 0.01%JPMorgan Chase & Co. $900,000 4.95% 1/6/2045 1,191,870 0.01%Johnson & Johnson $1,025,000 3.55% 1/3/2036 1,191,707 0.01%

465
Vanguard Global Bond Index Fund
Principal CouponMaturity
DateFair Value
US Dollars ($)% of Total
Net AssetsSimon International Finance SCA €1,000,000 1.13% 19/3/2033 1,191,616 0.01%Federal National Mortgage Association $1,153,229 2.00% 1/7/2035 1,189,810 0.01%Eaton Capital Unlimited Co. €1,000,000 0.13% 8/3/2026 1,186,605 0.01%Eversource Energy $1,105,000 3.80% 1/12/2023 1,186,279 0.01%Bank of America Corp.^ $1,025,000 3.95% 23/1/2049 1,185,915 0.01%Trustees of Princeton University $1,200,000 2.52% 1/7/2050 1,185,078 0.01%AT&T, Inc. $1,169,000 3.65% 15/9/2059 1,184,343 0.01%PNC Bank NA^ $1,175,000 2.03% 9/12/2022 1,183,374 0.01%PPL Capital Funding, Inc. $1,100,000 3.10% 15/5/2026 1,182,973 0.01%Federal National Mortgage Association $1,100,018 4.50% 1/6/2048 1,182,933 0.01%Wells Fargo Commercial Mortgage Trust 2015 $1,096,242 3.79% 15/9/2048 1,182,879 0.01%Federal Home Loan Mortgage Corp. $1,143,137 2.50% 1/11/2049 1,181,925 0.01%Stellantis NV €1,000,000 0.75% 18/1/2029 1,181,678 0.01%Pfizer, Inc. $1,050,000 3.45% 15/3/2029 1,181,232 0.01%Morgan Stanley^ €1,000,000 0.50% 26/10/2029 1,179,598 0.01%Truist Bank $1,100,000 3.20% 1/4/2024 1,176,878 0.01%Texas Instruments, Inc. $980,000 3.88% 15/3/2039 1,176,563 0.01%Abbott Laboratories $1,200,000 1.15% 30/1/2028 1,176,218 0.01%Walt Disney Co. $1,000,000 3.80% 13/5/2060 1,175,469 0.01%ConocoPhillips Co. $975,000 4.30% 15/11/2044 1,175,000 0.01%Verizon Communications, Inc. $1,150,000 2.10% 22/3/2028 1,174,354 0.01%Wells Fargo & Co. €1,000,000 0.63% 14/8/2030 1,172,840 0.01%Citigroup, Inc.^ $1,070,000 3.52% 27/10/2028 1,171,758 0.01%Altria Group, Inc. $950,000 5.80% 14/2/2039 1,171,240 0.01%Federal National Mortgage Association $1,121,520 2.50% 1/7/2028 1,170,858 0.01%Discovery Communications LLC $1,000,000 4.65% 15/5/2050 1,170,420 0.01%Goldman Sachs Group, Inc.^ $1,025,000 4.22% 1/5/2029 1,170,212 0.01%Federal Home Loan Mortgage Corp. $1,071,303 4.00% 1/12/2045 1,169,639 0.01%Oracle Corp. $844,000 6.13% 8/7/2039 1,168,809 0.01%Federal National Mortgage Association $1,086,037 4.00% 1/3/2047 1,168,656 0.01%Citigroup, Inc.^ $1,050,000 3.89% 10/1/2028 1,168,357 0.01%Hewlett Packard Enterprise Co. $864,000 6.35% 15/10/2045 1,166,692 0.01%Federal Home Loan Mortgage Corp. $1,090,108 4.00% 1/8/2047 1,166,490 0.01%Government National Mortgage Association $1,101,546 3.50% 20/1/2048 1,166,078 0.01%Halliburton Co. $990,000 4.85% 15/11/2035 1,165,975 0.01%Federal National Mortgage Association $1,001,972 5.50% 1/6/2038 1,163,296 0.01%General Motors Co. $850,000 6.60% 1/4/2036 1,162,894 0.01%Oracle Corp. $1,070,000 4.00% 15/7/2046 1,162,665 0.01%Berkshire Hathaway Energy Co. $825,000 6.13% 1/4/2036 1,162,522 0.01%Home Depot, Inc. $1,050,000 3.35% 15/4/2050 1,161,950 0.01%Hershey Co. $1,103,000 2.45% 15/11/2029 1,161,337 0.01%Federal National Mortgage Association $1,113,779 3.00% 1/11/2049 1,160,911 0.01%Berkshire Hathaway Finance Corp. $800,000 5.75% 15/1/2040 1,160,499 0.01%JPMorgan Chase & Co. €1,000,000 0.60% 17/2/2033 1,158,467 0.01%Freddie Mac Multifamily Structured Pass Through Certificates $1,150,000 1.34% 25/9/2027 1,157,495 0.01%NIKE, Inc. $1,025,000 3.38% 27/3/2050 1,157,041 0.01%Federal National Mortgage Association $1,107,487 2.50% 1/10/2035 1,156,997 0.01%Berry Global, Inc. $1,155,000 1.57% 15/1/2026 1,156,489 0.01%Government National Mortgage Association $1,068,861 3.50% 20/4/2043 1,154,052 0.01%Prologis Euro Finance LLC €1,000,000 0.50% 16/2/2032 1,153,499 0.01%ERAC USA Finance LLC $945,000 4.50% 15/2/2045 1,153,127 0.01%Verizon Communications, Inc. $870,000 5.01% 15/4/2049 1,151,163 0.01%Lowe's Cos, Inc. $1,200,000 1.70% 15/10/2030 1,151,125 0.01%Federal National Mortgage Association $1,075,396 3.50% 1/11/2031 1,149,576 0.01%Comerica, Inc. $1,000,000 4.00% 1/2/2029 1,149,295 0.01%Federal National Mortgage Association $1,086,868 3.50% 1/2/2048 1,148,978 0.01%HCA, Inc. $900,000 5.25% 15/6/2049 1,148,741 0.01%Xcel Energy, Inc. $1,100,000 2.60% 1/12/2029 1,147,236 0.01%Federal National Mortgage Association $1,095,846 2.50% 1/10/2031 1,147,154 0.01%Federal National Mortgage Association $1,100,165 3.00% 1/9/2040 1,146,964 0.01%Benchmark 2018-B7 Mortgage Trust^ $975,000 4.51% 15/5/2053 1,146,033 0.01%McKesson Corp €900,000 1.63% 30/10/2026 1,144,909 0.01%Government National Mortgage Association $1,053,079 5.00% 20/5/2049 1,143,183 0.01%Walt Disney Co. $1,000,000 3.80% 22/3/2030 1,142,721 0.01%Federal National Mortgage Association $1,076,295 3.00% 1/7/2033 1,140,953 0.01%Teachers Insurance & Annuity Association of America $955,000 4.27% 15/5/2047 1,140,902 0.01%Equitable Holdings, Inc. $995,000 4.35% 20/4/2028 1,140,741 0.01%Wells Fargo & Co.^ $1,100,000 2.39% 2/6/2028 1,140,613 0.01%Constellation Brands, Inc. $1,025,000 3.70% 6/12/2026 1,140,168 0.01%Medtronic Global Holdings SCA €910,000 1.13% 7/3/2027 1,139,349 0.01%Broadcom, Inc. $1,000,000 4.30% 15/11/2032 1,138,616 0.01%

466
Vanguard Global Bond Index Fund
Principal CouponMaturity
DateFair Value
US Dollars ($)% of Total
Net AssetsFederal National Mortgage Association $975,000 3.61% 25/2/2031 1,137,229 0.01%Medtronic Global Holdings SCA €900,000 1.75% 2/7/2049 1,136,015 0.01%Chubb Corp. $750,000 6.50% 15/5/2038 1,135,420 0.01%ONEOK, Inc. $1,020,000 4.45% 1/9/2049 1,132,798 0.01%Eli Lilly & Co. $1,250,000 2.25% 15/5/2050 1,132,655 0.01%GLP Capital LP/GLP Financing II, Inc. $950,000 5.75% 1/6/2028 1,130,783 0.01%Caterpillar, Inc. $950,000 3.80% 15/8/2042 1,129,938 0.01%Franklin Resources, Inc. $1,175,000 1.60% 30/10/2030 1,129,070 0.01%GS Mortgage Securities Trust 2017 $1,025,000 3.43% 10/5/2050 1,127,964 0.01%Federal Home Loan Banks $1,000,000 3.25% 9/6/2028 1,126,751 0.01%Mississippi Power Co. $1,000,000 3.95% 30/3/2028 1,126,680 0.01%Illinois Tool Works, Inc. $1,050,000 2.65% 15/11/2026 1,126,180 0.01%Apple, Inc. $1,025,000 3.25% 23/2/2026 1,125,569 0.01%Goldman Sachs Group, Inc. $1,000,000 3.80% 15/3/2030 1,125,112 0.01%Federal National Mortgage Association $1,060,614 3.00% 1/9/2048 1,124,956 0.01%Broadcom, Inc. $1,000,000 4.15% 15/11/2030 1,122,171 0.01%Comcast Corp. $1,050,000 3.40% 15/7/2046 1,121,873 0.01%Apple, Inc. $1,050,000 2.45% 4/8/2026 1,116,887 0.01%Government National Mortgage Association $1,054,476 3.50% 20/3/2048 1,116,250 0.01%US Bank NA $1,044,000 2.80% 27/1/2025 1,115,528 0.01%Walt Disney Co. $1,000,000 3.50% 13/5/2040 1,114,197 0.01%Wells Fargo Commercial Mortgage Trust 2017 $1,011,000 3.45% 15/7/2050 1,113,891 0.01%Weyerhaeuser Co. $975,000 4.00% 15/11/2029 1,112,829 0.01%Federal National Mortgage Association $1,036,264 3.50% 1/2/2041 1,112,224 0.01%DTE Energy Co. $1,000,000 3.80% 15/3/2027 1,112,144 0.01%Visa, Inc. $1,075,000 2.70% 15/4/2040 1,111,945 0.01%Caterpillar Financial Services Corp. $1,050,000 3.45% 15/5/2023 1,110,950 0.01%Government National Mortgage Association $1,026,551 3.50% 20/12/2041 1,110,294 0.01%Eaton Corp. $1,075,000 2.75% 2/11/2022 1,109,837 0.01%Morgan Stanley Bank of America Merrill Lynch Trust 2017 $1,000,000 3.60% 15/5/2050 1,106,009 0.01%Freddie Mac Multifamily Structured Pass Through Certificates $1,000,000 3.22% 25/3/2027 1,105,919 0.01%Wells Fargo Commercial Mortgage Trust 2015 $1,000,000 3.81% 15/12/2048 1,104,578 0.01%Federal National Mortgage Association $1,048,976 3.50% 1/1/2050 1,103,891 0.01%Federal Home Loan Mortgage Corp. $1,057,569 3.00% 1/10/2050 1,103,557 0.01%Bunge Ltd. Finance Corp. $1,000,000 3.75% 25/9/2027 1,102,669 0.01%Bank of America Corp.^ $1,100,000 1.32% 19/6/2026 1,102,635 0.01%Morgan Stanley Capital I Trust 2017 $1,000,000 3.53% 15/6/2050 1,102,570 0.01%Molson Coors Beverage Co. €900,000 1.25% 15/7/2024 1,101,565 0.01%US Treasury Note $1,079,000 1.88% 31/8/2022 1,101,001 0.01%Federal National Mortgage Association $1,046,178 3.00% 1/6/2037 1,100,970 0.01%Federal Home Loan Mortgage Corp. $1,100,000 0.25% 24/8/2023 1,099,553 0.01%President & Fellows of Harvard College $800,000 4.88% 15/10/2040 1,098,345 0.01%Amazon.com, Inc. $1,100,000 0.45% 12/5/2024 1,097,863 0.01%Federal Home Loan Mortgage Corp. $1,047,523 3.00% 1/1/2048 1,097,670 0.01%UBS Commercial Mortgage Trust 2017 $1,000,000 3.46% 15/6/2050 1,096,701 0.01%Government National Mortgage Association $1,015,141 4.50% 20/4/2048 1,094,876 0.01%Abbott Ireland Financing DAC €900,000 0.88% 27/9/2023 1,094,117 0.01%Tennessee Valley Authority $1,000,000 2.88% 1/2/2027 1,093,945 0.01%PepsiCo, Inc. $1,050,000 2.75% 1/3/2023 1,092,438 0.01%Government National Mortgage Association $1,043,292 3.00% 20/7/2049 1,091,652 0.01%Intel Corp. $1,000,000 3.40% 25/3/2025 1,091,648 0.01%Northrop Grumman Corp. $1,000,000 3.25% 15/1/2028 1,091,374 0.01%Gilead Sciences, Inc. $1,015,000 3.70% 1/4/2024 1,090,717 0.01%ERAC USA Finance LLC $1,000,000 3.85% 15/11/2024 1,090,686 0.01%JPMorgan Chase & Co. $1,000,000 3.88% 10/9/2024 1,090,183 0.01%Exelon Corp. $1,000,000 3.40% 15/4/2026 1,089,203 0.01%CSAIL 2017-C8 Commercial Mortgage Trust $1,000,000 3.39% 15/6/2050 1,088,946 0.01%Tyson Foods, Inc. $825,000 5.10% 28/9/2048 1,088,408 0.01%Amazon.com, Inc. $850,000 4.25% 22/8/2057 1,087,590 0.01%Cheniere Corpus Christi Holdings LLC $995,000 3.70% 15/11/2029 1,086,698 0.01%Duke Energy Florida LLC $1,035,000 2.50% 1/12/2029 1,086,166 0.01%GS Mortgage Securities Trust 2014 $1,000,000 3.93% 10/9/2047 1,085,924 0.01%Government National Mortgage Association $1,027,657 3.50% 20/3/2050 1,085,399 0.01%Federal National Mortgage Association $1,063,654 2.00% 1/2/2041 1,085,010 0.01%Charter Communications Operating LLC/Charter Communications
Operating Capital $850,000 5.75% 1/4/2048 1,084,724 0.01%Prudential Financial, Inc. $850,000 4.60% 15/5/2044 1,084,009 0.01%Raytheon Technologies Corp. $895,000 4.45% 16/11/2038 1,083,236 0.01%Federal National Mortgage Association $977,367 4.50% 1/11/2042 1,083,180 0.01%Procter & Gamble Co. $1,000,000 2.80% 25/3/2027 1,082,787 0.01%Discover Financial Services $992,000 3.75% 4/3/2025 1,082,525 0.01%

467
Vanguard Global Bond Index Fund
Principal CouponMaturity
DateFair Value
US Dollars ($)% of Total
Net AssetsApple, Inc. $1,000,000 3.45% 6/5/2024 1,082,461 0.01%Becton Dickinson Euro Finance Sarl €900,000 0.63% 4/6/2023 1,082,079 0.01%Principal Financial Group, Inc. $1,000,000 3.10% 15/11/2026 1,082,078 0.01%Federal Home Loan Mortgage Corp. $1,016,083 3.50% 1/6/2046 1,080,198 0.01%Morgan Stanley^ $725,000 5.60% 24/3/2051 1,079,783 0.01%Verizon Communications, Inc. $1,150,000 3.00% 20/11/2060 1,079,667 0.01%Spectra Energy Partners LP $1,000,000 3.50% 15/3/2025 1,079,242 0.01%Royalty Pharma plc $1,100,000 2.20% 2/9/2030 1,079,015 0.01%Government National Mortgage Association $996,054 3.50% 20/5/2042 1,078,701 0.01%Federal National Mortgage Association $1,003,085 4.50% 1/8/2048 1,078,693 0.01%Freddie Mac Multifamily Structured Pass Through Certificates $1,000,000 2.54% 25/10/2029 1,077,899 0.01%JPMorgan Chase & Co. $1,000,000 2.95% 1/10/2026 1,077,462 0.01%Amazon.com, Inc. $975,000 3.15% 22/8/2027 1,077,180 0.01%CSX Corp. $1,000,000 3.40% 1/8/2024 1,076,434 0.01%Government National Mortgage Association $1,009,035 3.50% 20/10/2045 1,075,996 0.01%Plains All American Pipeline LP/PAA Finance Corp. $1,020,000 3.55% 15/12/2029 1,075,769 0.01%Starbucks Corp. $1,000,000 3.50% 15/11/2050 1,074,900 0.01%Air Lease Corp. $1,000,000 3.38% 1/7/2025 1,073,519 0.01%Freddie Mac Multifamily Structured Pass Through Certificates^ $1,000,000 3.16% 25/5/2025 1,071,888 0.01%Federal National Mortgage Association $1,050,000 2.00% 1/7/2041 1,071,840 0.01%Goldman Sachs Group, Inc. $1,000,000 3.63% 20/2/2024 1,071,833 0.01%Wells Fargo Commercial Mortgage Trust 2014 $1,000,000 3.82% 15/8/2050 1,071,796 0.01%Baxter International, Inc. $1,100,000 1.73% 1/4/2031 1,070,776 0.01%Pacific Gas & Electric Co. $1,000,000 4.55% 1/7/2030 1,069,738 0.01%General Motors Co. $775,000 6.25% 2/10/2043 1,069,732 0.01%Progress Energy, Inc. $775,000 6.00% 1/12/2039 1,069,080 0.01%Federal National Mortgage Association $1,000,000 2.47% 25/8/2029 1,068,874 0.01%Coca-Cola Co. €900,000 0.40% 6/5/2030 1,068,381 0.01%Federal National Mortgage Association $1,003,881 3.00% 1/12/2042 1,067,902 0.01%AbbVie, Inc. $900,000 4.30% 14/5/2036 1,067,683 0.01%Berkshire Hathaway Finance Corp. $850,000 4.40% 15/5/2042 1,067,665 0.01%Keurig Dr Pepper, Inc. $875,000 4.50% 15/11/2045 1,067,406 0.01%Federal National Mortgage Association $1,022,000 3.00% 1/12/2050 1,067,032 0.01%Prologis LP $1,250,000 2.13% 15/10/2050 1,066,638 0.01%Citigroup, Inc.^ $1,000,000 3.35% 24/4/2025 1,066,584 0.01%Bunge Finance Europe BV €870,000 1.85% 16/6/2023 1,065,411 0.01%Apple, Inc. $1,085,000 2.65% 11/5/2050 1,063,421 0.01%AT&T, Inc. $875,000 4.75% 15/5/2046 1,063,022 0.01%Oracle Corp. $1,000,000 3.65% 25/3/2041 1,062,145 0.01%JPMorgan Chase & Co.^ $1,000,000 3.22% 1/3/2025 1,062,139 0.01%Apple, Inc. $1,000,000 3.00% 9/2/2024 1,061,034 0.01%Albemarle Corp. $968,000 4.15% 1/12/2024 1,060,004 0.01%AbbVie, Inc. $875,000 4.45% 14/5/2046 1,059,851 0.01%CSX Corp. $1,000,000 3.35% 15/9/2049 1,059,406 0.01%Marathon Petroleum Corp. $950,000 3.80% 1/4/2028 1,058,191 0.01%Government National Mortgage Association $991,773 3.50% 20/4/2045 1,057,588 0.01%Federal National Mortgage Association $1,002,989 3.00% 1/2/2034 1,057,218 0.01%Sabra Health Care LP $1,000,000 3.90% 15/10/2029 1,056,382 0.01%Oncor Electric Delivery Co. LLC $1,000,000 3.10% 15/9/2049 1,056,344 0.01%Crown Castle International Corp. $950,000 3.80% 15/2/2028 1,055,599 0.01%Federal National Mortgage Association $1,008,343 2.50% 1/5/2036 1,055,374 0.01%Freddie Mac Multifamily Structured Pass Through Certificates $1,000,000 3.00% 25/1/2024 1,055,046 0.01%ONEOK Partners LP $975,000 5.00% 15/9/2023 1,053,489 0.01%Philip Morris International, Inc. $900,000 4.25% 10/11/2044 1,051,119 0.01%Tennessee Valley Authority $1,050,000 0.75% 15/5/2025 1,051,024 0.01%Verizon Communications, Inc. $1,100,000 2.88% 20/11/2050 1,050,473 0.01%Constellation Brands, Inc. $1,000,000 2.88% 1/5/2030 1,050,247 0.01%Freddie Mac Multifamily Structured Pass Through Certificates^ $900,000 3.92% 25/9/2028 1,050,053 0.01%Fifth Third Bank NA $946,000 3.85% 15/3/2026 1,050,046 0.01%Oracle Corp. $995,000 3.60% 1/4/2040 1,049,625 0.01%Apple, Inc. $950,000 3.20% 11/5/2027 1,049,400 0.01%Union Pacific Corp. $974,000 3.25% 15/1/2025 1,049,323 0.01%Federal National Mortgage Association $993,151 3.00% 1/1/2037 1,047,986 0.01%Fox Corp. $775,000 5.58% 25/1/2049 1,046,557 0.01%Lennar Corp. $1,000,000 4.75% 15/11/2022 1,046,170 0.01%Walmart, Inc. $985,000 2.95% 24/9/2049 1,045,820 0.01%Federal Home Loan Mortgage Corp. $997,360 3.00% 1/2/2048 1,045,521 0.01%AT&T, Inc. $1,000,000 3.65% 1/6/2051 1,045,093 0.01%Boeing Co. $1,023,000 2.25% 15/6/2026 1,044,445 0.01%Voya Financial, Inc. $760,000 5.70% 15/7/2043 1,044,429 0.01%Federal National Mortgage Association $987,927 3.00% 1/12/2030 1,043,530 0.01%

468
Vanguard Global Bond Index Fund
Principal CouponMaturity
DateFair Value
US Dollars ($)% of Total
Net AssetsPfizer, Inc. $875,000 3.90% 15/3/2039 1,042,858 0.01%Oracle Corp. $1,000,000 2.88% 25/3/2031 1,041,284 0.01%Duke Energy Carolinas LLC $1,000,000 2.45% 15/8/2029 1,040,196 0.01%Southern California Edison Co. $800,000 6.00% 15/1/2034 1,039,718 0.01%AT&T, Inc. $1,000,000 2.75% 1/6/2031 1,039,590 0.01%New York Life Global Funding $990,000 2.35% 14/7/2026 1,039,180 0.01%AT&T, Inc. $885,000 4.55% 9/3/2049 1,038,683 0.01%Omnicom Group, Inc./Omnicom Capital, Inc. $940,000 3.60% 15/4/2026 1,037,638 0.01%Quanta Services, Inc. $1,000,000 2.90% 1/10/2030 1,037,309 0.01%Comerica, Inc. $975,000 3.70% 31/7/2023 1,036,951 0.01%Bristol-Myers Squibb Co. $1,000,000 2.75% 15/2/2023 1,036,465 0.01%Steel Dynamics, Inc. $950,000 3.45% 15/4/2030 1,035,106 0.01%AT&T, Inc. $841,000 4.90% 15/8/2037 1,034,944 0.01%Charter Communications Operating LLC/Charter Communications
Operating Capital $950,000 4.50% 1/2/2024 1,034,760 0.01%Welltower, Inc. $1,000,000 2.80% 1/6/2031 1,033,317 0.01%Government National Mortgage Association $953,996 3.50% 20/7/2042 1,033,154 0.01%Federal National Mortgage Association $989,436 2.50% 1/12/2027 1,032,246 0.01%Carrier Global Corp. $1,000,000 2.70% 15/2/2031 1,031,990 0.01%Halliburton Co. $845,000 5.00% 15/11/2045 1,031,732 0.01%Benchmark 2018-B4 Mortgage Trust^ $900,000 4.12% 15/7/2051 1,031,203 0.01%Abbott Laboratories $800,000 4.75% 30/11/2036 1,030,297 0.01%Pacific Gas & Electric Co. $1,000,000 4.95% 1/7/2050 1,030,057 0.01%Dominion Energy, Inc. $1,000,000 2.45% 15/1/2023 1,029,636 0.01%Bank of America Corp. $750,000 6.11% 29/1/2037 1,029,266 0.01%CVS Health Corp. $1,000,000 3.50% 20/7/2022 1,027,962 0.01%Brixmor Operating Partnership LP $946,000 3.85% 1/2/2025 1,027,710 0.01%Citigroup, Inc.^ $1,000,000 2.57% 3/6/2031 1,027,687 0.01%Federal National Mortgage Association $972,094 3.50% 1/10/2047 1,027,646 0.01%Progressive Corp. $850,000 3.95% 26/3/2050 1,027,365 0.01%Johnson & Johnson $1,100,000 2.25% 1/9/2050 1,026,829 0.01%Oklahoma Gas & Electric Co. $900,000 3.85% 15/8/2047 1,026,530 0.01%UBS-Barclays Commercial Mortgage Trust 2012 $1,000,000 2.85% 10/12/2045 1,025,634 0.01%American International Group, Inc. €800,000 1.88% 21/6/2027 1,025,121 0.01%Enterprise Products Operating LLC $970,000 2.80% 31/1/2030 1,024,877 0.01%Duke Energy Progress LLC $850,000 4.20% 15/8/2045 1,024,639 0.01%CenterPoint Energy Resources Corp. $975,000 3.55% 1/4/2023 1,024,091 0.01%Discovery Communications LLC $955,000 3.80% 13/3/2024 1,023,908 0.01%Coca-Cola Co. $1,000,000 2.25% 5/1/2032 1,023,874 0.01%Verizon Communications, Inc. $1,000,000 2.55% 21/3/2031 1,023,146 0.01%John Deere Financial, Inc. CA($)1,305,000 1.34% 8/9/2027 1,022,416 0.01%AT&T, Inc. €800,000 1.80% 5/9/2026 1,022,082 0.01%IHS Markit Ltd. $975,000 5.00% 1/11/2022 1,020,907 0.01%Freddie Mac Multifamily Structured Pass Through Certificates $1,000,000 1.55% 25/1/2027 1,020,774 0.01%NVIDIA Corp. $900,000 3.50% 1/4/2040 1,020,028 0.01%Tennessee Valley Authority $700,000 7.13% 1/5/2030 1,019,874 0.01%BANK 2018 $900,000 3.95% 15/8/2061 1,019,600 0.01%Federal National Mortgage Association $933,165 4.00% 1/9/2043 1,019,578 0.01%Enterprise Products Operating LLC^ $990,000 5.38% 15/2/2078 1,019,568 0.01%Federal National Mortgage Association $962,240 3.00% 1/9/2032 1,019,404 0.01%Government National Mortgage Association $957,300 4.00% 20/5/2048 1,018,203 0.01%Government National Mortgage Association $961,275 3.50% 20/5/2047 1,017,589 0.01%FedEx Corp. $750,000 5.25% 15/5/2050 1,017,440 0.01%Hewlett Packard Enterprise Co. $1,000,000 1.45% 1/4/2024 1,016,840 0.01%Federal Home Loan Mortgage Corp. $928,654 4.00% 1/9/2040 1,015,987 0.01%Xilinx, Inc. $1,000,000 2.38% 1/6/2030 1,015,836 0.01%Oracle Corp. $910,000 4.13% 15/5/2045 1,013,271 0.01%UnitedHealth Group, Inc. $1,000,000 2.75% 15/5/2040 1,011,954 0.01%Federal Home Loan Mortgage Corp. $950,861 3.00% 1/11/2042 1,011,877 0.01%Hewlett Packard Enterprise Co. $1,000,000 1.75% 1/4/2026 1,011,617 0.01%T-Mobile USA, Inc. $1,000,000 2.55% 15/2/2031 1,011,398 0.01%International Business Machines Corp. $1,000,000 2.85% 15/5/2040 1,011,072 0.01%Hasbro, Inc. $950,000 3.00% 19/11/2024 1,010,472 0.01%Berkshire Hathaway Finance Corp. $1,000,000 1.85% 12/3/2030 1,010,122 0.01%Bank of America Corp.^ $1,000,000 1.73% 22/7/2027 1,008,261 0.01%Discovery Communications LLC £700,000 2.50% 20/9/2024 1,007,966 0.01%Charter Communications Operating LLC/Charter Communications
Operating Capital $1,025,000 3.85% 1/4/2061 1,007,579 0.01%Freddie Mac Multifamily Structured Pass Through Certificates $1,000,000 1.94% 25/2/2035 1,006,696 0.01%Fidelity National Information Services, Inc. £700,000 2.25% 3/12/2029 1,005,889 0.01%Williams Cos, Inc. $920,000 3.90% 15/1/2025 1,005,857 0.01%

469
Vanguard Global Bond Index Fund
Principal CouponMaturity
DateFair Value
US Dollars ($)% of Total
Net AssetsCharter Communications Operating LLC/Charter Communications
Operating Capital $750,000 6.38% 23/10/2035 1,005,073 0.01%Bank of America Corp.^ $1,000,000 0.98% 22/4/2025 1,003,139 0.01%Royalty Pharma plc $1,000,000 0.75% 2/9/2023 1,002,988 0.01%Athene Global Funding $1,000,000 0.95% 8/1/2024 1,002,885 0.01%Home Depot, Inc. $925,000 2.80% 14/9/2027 1,002,549 0.01%Citigroup, Inc.^ $1,000,000 0.98% 1/5/2025 1,002,490 0.01%KKR Group Finance Co. III LLC $770,000 5.13% 1/6/2044 1,002,448 0.01%Federal Home Loan Mortgage Corp. $1,000,000 0.38% 20/4/2023 1,002,422 0.01%DTE Energy Co. $940,000 2.85% 1/10/2026 1,002,074 0.01%Toyota Motor Credit Corp. $1,000,000 0.50% 14/8/2023 1,001,963 0.01%CNH Industrial Capital LLC $925,000 4.20% 15/1/2024 1,001,400 0.01%General Dynamics Corp. $950,000 3.38% 15/5/2023 1,001,368 0.01%Federal National Mortgage Association $949,945 3.00% 1/7/2032 1,001,306 0.01%Morgan Stanley^ $1,000,000 0.56% 10/11/2023 1,001,102 0.01%Goldman Sachs Group, Inc.^ $1,000,000 0.63% 17/11/2023 1,000,543 0.01%McDonald's Corp. $900,000 3.70% 30/1/2026 1,000,482 0.01%Goldman Sachs Group, Inc. $1,000,000 0.48% 27/1/2023 1,000,031 0.01%Federal National Mortgage Association $1,000,000 0.25% 10/7/2023 999,861 0.01%Protective Life Global Funding $975,000 2.62% 22/8/2022 999,795 0.01%Newmont Corp. $1,000,000 2.25% 1/10/2030 999,343 0.01%Federal National Mortgage Association $1,000,000 0.63% 22/4/2025 998,866 0.01%Federal Home Loan Mortgage Corp. $1,000,000 0.25% 6/11/2023 998,809 0.01%Federal Farm Credit Banks Funding Corp. $1,000,000 0.13% 10/5/2023 998,729 0.01%Northwestern Mutual Global Funding $1,000,000 0.60% 25/3/2024 998,634 0.01%DTE Energy Co. $1,000,000 1.05% 1/6/2025 998,375 0.01%State of California $625,000 7.30% 1/10/2039 997,756 0.01%Government National Mortgage Association $948,313 3.00% 20/7/2047 997,640 0.01%Federal Home Loan Mortgage Corp. $1,000,000 0.13% 16/10/2023 996,518 0.01%Federal National Mortgage Association^ $929,860 2.67% 25/12/2026 995,929 0.01%Federal Farm Credit Banks Funding Corp. $1,000,000 0.25% 26/2/2024 995,309 0.01%Nestle Holdings, Inc. $1,000,000 0.38% 15/1/2024 994,917 0.01%Federal Home Loan Banks $1,000,000 0.50% 14/4/2025 994,086 0.01%Becton Dickinson Euro Finance Sarl €800,000 1.21% 4/6/2026 992,922 0.01%Federal National Mortgage Association $1,000,000 0.50% 17/6/2025 992,442 0.01%AbbVie, Inc. $960,000 2.90% 6/11/2022 991,858 0.01%Archer-Daniels-Midland Co. €800,000 1.00% 12/9/2025 991,161 0.01%Federal Home Loan Mortgage Corp. $951,596 2.50% 1/6/2041 990,886 0.01%Enterprise Products Operating LLC $1,000,000 3.20% 15/2/2052 990,813 0.01%UnitedHealth Group, Inc. $800,000 4.25% 15/6/2048 990,188 0.01%International Business Machines Corp. $900,000 3.30% 15/5/2026 989,748 0.01%Apple, Inc. $1,000,000 0.70% 8/2/2026 989,012 0.01%New York Life Global Funding $1,000,000 0.85% 15/1/2026 988,272 0.01%Energy Transfer LP $840,000 5.50% 1/6/2027 986,797 0.01%Nestle Holdings, Inc. €800,000 0.88% 18/7/2025 986,716 0.01%Toyota Motor Credit Corp. $1,000,000 1.15% 13/8/2027 984,608 0.01%Indiana Michigan Power Co. $875,000 3.85% 15/5/2028 984,261 0.01%Broadcom, Inc. $1,000,000 2.45% 15/2/2031 984,113 0.01%Federal Home Loan Mortgage Corp. $846,294 6.00% 1/4/2039 983,959 0.01%Willis North America, Inc. $750,000 5.05% 15/9/2048 983,116 0.01%Pacific Life Global Funding II $1,000,000 1.45% 20/1/2028 983,065 0.01%AT&T, Inc. $1,000,000 2.25% 1/2/2032 982,887 0.01%Equinix, Inc. $1,000,000 1.55% 15/3/2028 982,163 0.01%CVS Health Corp. $1,000,000 1.30% 21/8/2027 981,694 0.01%Truist Bank $873,000 4.05% 3/11/2025 981,131 0.01%AT&T, Inc. $1,000,000 3.10% 1/2/2043 980,326 0.01%Marathon Oil Corp. $900,000 3.85% 1/6/2025 980,315 0.01%Mars, Inc. $1,000,000 0.88% 16/7/2026 980,052 0.01%Time Warner Cable LLC $700,000 6.75% 15/6/2039 979,998 0.01%Pfizer, Inc. $925,000 3.20% 15/9/2023 979,207 0.01%Verizon Communications, Inc. €800,000 1.30% 18/5/2033 978,772 0.01%Chubb INA Holdings, Inc. $950,000 2.88% 3/11/2022 978,327 0.01%Apple, Inc. $1,000,000 2.80% 8/2/2061 978,159 0.01%Omnicom Group, Inc./Omnicom Capital, Inc. $900,000 3.65% 1/11/2024 977,073 0.01%Federal Home Loan Banks $925,000 2.50% 13/2/2024 976,543 0.01%Santander Holdings USA, Inc. $880,000 4.50% 17/7/2025 976,439 0.01%State of California $575,000 7.55% 1/4/2039 975,752 0.01%Walmart, Inc. $915,000 2.85% 8/7/2024 975,293 0.01%CNA Financial Corp. $900,000 3.95% 15/5/2024 975,203 0.01%Chevron USA, Inc. $1,000,000 1.02% 12/8/2027 974,255 0.01%American Tower Corp. $1,000,000 1.50% 31/1/2028 974,038 0.01%
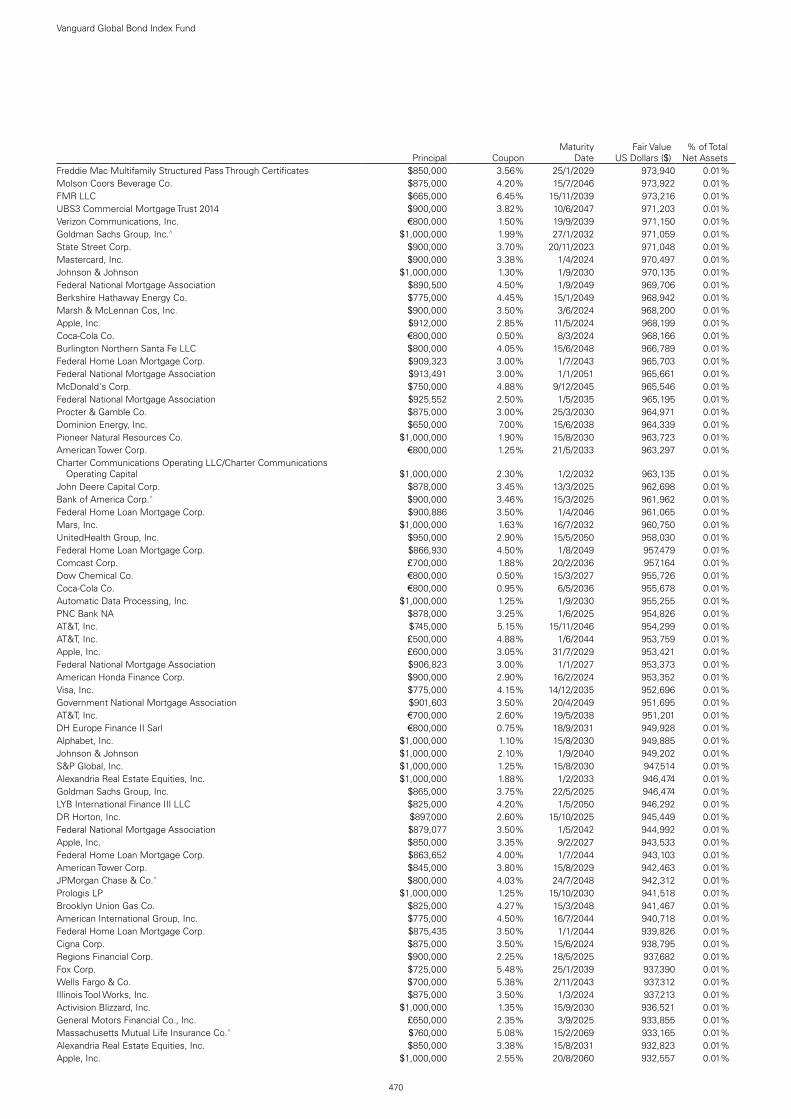
470
Vanguard Global Bond Index Fund
Principal CouponMaturity
DateFair Value
US Dollars ($)% of Total
Net AssetsFreddie Mac Multifamily Structured Pass Through Certificates $850,000 3.56% 25/1/2029 973,940 0.01%Molson Coors Beverage Co. $875,000 4.20% 15/7/2046 973,922 0.01%FMR LLC $665,000 6.45% 15/11/2039 973,216 0.01%UBS3 Commercial Mortgage Trust 2014 $900,000 3.82% 10/6/2047 971,203 0.01%Verizon Communications, Inc. €800,000 1.50% 19/9/2039 971,150 0.01%Goldman Sachs Group, Inc.^ $1,000,000 1.99% 27/1/2032 971,059 0.01%State Street Corp. $900,000 3.70% 20/11/2023 971,048 0.01%Mastercard, Inc. $900,000 3.38% 1/4/2024 970,497 0.01%Johnson & Johnson $1,000,000 1.30% 1/9/2030 970,135 0.01%Federal National Mortgage Association $890,500 4.50% 1/9/2049 969,706 0.01%Berkshire Hathaway Energy Co. $775,000 4.45% 15/1/2049 968,942 0.01%Marsh & McLennan Cos, Inc. $900,000 3.50% 3/6/2024 968,200 0.01%Apple, Inc. $912,000 2.85% 11/5/2024 968,199 0.01%Coca-Cola Co. €800,000 0.50% 8/3/2024 968,166 0.01%Burlington Northern Santa Fe LLC $800,000 4.05% 15/6/2048 966,789 0.01%Federal Home Loan Mortgage Corp. $909,323 3.00% 1/7/2043 965,703 0.01%Federal National Mortgage Association $913,491 3.00% 1/1/2051 965,661 0.01%McDonald's Corp. $750,000 4.88% 9/12/2045 965,546 0.01%Federal National Mortgage Association $925,552 2.50% 1/5/2035 965,195 0.01%Procter & Gamble Co. $875,000 3.00% 25/3/2030 964,971 0.01%Dominion Energy, Inc. $650,000 7.00% 15/6/2038 964,339 0.01%Pioneer Natural Resources Co. $1,000,000 1.90% 15/8/2030 963,723 0.01%American Tower Corp. €800,000 1.25% 21/5/2033 963,297 0.01%Charter Communications Operating LLC/Charter Communications
Operating Capital $1,000,000 2.30% 1/2/2032 963,135 0.01%John Deere Capital Corp. $878,000 3.45% 13/3/2025 962,698 0.01%Bank of America Corp.^ $900,000 3.46% 15/3/2025 961,962 0.01%Federal Home Loan Mortgage Corp. $900,886 3.50% 1/4/2046 961,065 0.01%Mars, Inc. $1,000,000 1.63% 16/7/2032 960,750 0.01%UnitedHealth Group, Inc. $950,000 2.90% 15/5/2050 958,030 0.01%Federal Home Loan Mortgage Corp. $866,930 4.50% 1/8/2049 957,479 0.01%Comcast Corp. £700,000 1.88% 20/2/2036 957,164 0.01%Dow Chemical Co. €800,000 0.50% 15/3/2027 955,726 0.01%Coca-Cola Co. €800,000 0.95% 6/5/2036 955,678 0.01%Automatic Data Processing, Inc. $1,000,000 1.25% 1/9/2030 955,255 0.01%PNC Bank NA $878,000 3.25% 1/6/2025 954,826 0.01%AT&T, Inc. $745,000 5.15% 15/11/2046 954,299 0.01%AT&T, Inc. £500,000 4.88% 1/6/2044 953,759 0.01%Apple, Inc. £600,000 3.05% 31/7/2029 953,421 0.01%Federal National Mortgage Association $906,823 3.00% 1/1/2027 953,373 0.01%American Honda Finance Corp. $900,000 2.90% 16/2/2024 953,352 0.01%Visa, Inc. $775,000 4.15% 14/12/2035 952,696 0.01%Government National Mortgage Association $901,603 3.50% 20/4/2049 951,695 0.01%AT&T, Inc. €700,000 2.60% 19/5/2038 951,201 0.01%DH Europe Finance II Sarl €800,000 0.75% 18/9/2031 949,928 0.01%Alphabet, Inc. $1,000,000 1.10% 15/8/2030 949,885 0.01%Johnson & Johnson $1,000,000 2.10% 1/9/2040 949,202 0.01%S&P Global, Inc. $1,000,000 1.25% 15/8/2030 947,514 0.01%Alexandria Real Estate Equities, Inc. $1,000,000 1.88% 1/2/2033 946,474 0.01%Goldman Sachs Group, Inc. $865,000 3.75% 22/5/2025 946,474 0.01%LYB International Finance III LLC $825,000 4.20% 1/5/2050 946,292 0.01%DR Horton, Inc. $897,000 2.60% 15/10/2025 945,449 0.01%Federal National Mortgage Association $879,077 3.50% 1/5/2042 944,992 0.01%Apple, Inc. $850,000 3.35% 9/2/2027 943,533 0.01%Federal Home Loan Mortgage Corp. $863,652 4.00% 1/7/2044 943,103 0.01%American Tower Corp. $845,000 3.80% 15/8/2029 942,463 0.01%JPMorgan Chase & Co.^ $800,000 4.03% 24/7/2048 942,312 0.01%Prologis LP $1,000,000 1.25% 15/10/2030 941,518 0.01%Brooklyn Union Gas Co. $825,000 4.27% 15/3/2048 941,467 0.01%American International Group, Inc. $775,000 4.50% 16/7/2044 940,718 0.01%Federal Home Loan Mortgage Corp. $875,435 3.50% 1/1/2044 939,826 0.01%Cigna Corp. $875,000 3.50% 15/6/2024 938,795 0.01%Regions Financial Corp. $900,000 2.25% 18/5/2025 937,682 0.01%Fox Corp. $725,000 5.48% 25/1/2039 937,390 0.01%Wells Fargo & Co. $700,000 5.38% 2/11/2043 937,312 0.01%Illinois Tool Works, Inc. $875,000 3.50% 1/3/2024 937,213 0.01%Activision Blizzard, Inc. $1,000,000 1.35% 15/9/2030 936,521 0.01%General Motors Financial Co., Inc. £650,000 2.35% 3/9/2025 933,855 0.01%Massachusetts Mutual Life Insurance Co.^ $760,000 5.08% 15/2/2069 933,165 0.01%Alexandria Real Estate Equities, Inc. $850,000 3.38% 15/8/2031 932,823 0.01%Apple, Inc. $1,000,000 2.55% 20/8/2060 932,557 0.01%

471
Vanguard Global Bond Index Fund
Principal CouponMaturity
DateFair Value
US Dollars ($)% of Total
Net AssetsNew York Life Global Funding $920,000 1.10% 5/5/2023 931,874 0.01%Berkshire Hathaway Finance Corp. $750,000 4.25% 15/1/2049 931,442 0.01%BP Capital Markets America, Inc. $1,000,000 2.77% 10/11/2050 930,597 0.01%QUALCOMM, Inc. $700,000 4.80% 20/5/2045 930,261 0.01%Johnson & Johnson $850,000 2.90% 15/1/2028 929,798 0.01%Visa, Inc. $1,050,000 2.00% 15/8/2050 928,077 0.01%Government National Mortgage Association $853,545 4.00% 20/10/2045 927,209 0.01%Federal Home Loan Mortgage Corp. $863,422 3.50% 1/9/2043 926,860 0.01%Gilead Sciences, Inc. $800,000 4.00% 1/9/2036 926,799 0.01%KeyBank NA $848,000 3.30% 1/6/2025 926,714 0.01%Amazon.com, Inc. $875,000 3.25% 12/5/2061 926,299 0.01%Government National Mortgage Association $857,889 3.50% 20/5/2043 926,265 0.01%Lockheed Martin Corp. $700,000 4.70% 15/5/2046 926,257 0.01%Federal National Mortgage Association $908,145 2.00% 1/12/2040 926,217 0.01%Caterpillar, Inc. $840,000 3.25% 19/9/2049 926,174 0.01%State of Texas $640,000 5.52% 1/4/2039 925,824 0.01%Home Depot, Inc. $850,000 3.00% 1/4/2026 925,348 0.01%Federal Home Loan Mortgage Corp. $845,416 4.00% 1/2/2041 924,944 0.01%Wells Fargo & Co. $750,000 4.65% 4/11/2044 924,183 0.01%Freddie Mac Multifamily Structured Pass Through Certificates $850,000 2.65% 25/11/2029 923,986 0.01%Federal Home Loan Mortgage Corp. $880,776 2.50% 1/1/2032 922,660 0.01%Eli Lilly & Co. €700,000 1.70% 1/11/2049 922,111 0.01%Southern California Edison Co. $875,000 4.00% 1/4/2047 921,378 0.01%Government National Mortgage Association $870,346 3.50% 20/6/2047 921,333 0.01%Citigroup Commercial Mortgage Trust 2016 $850,000 3.31% 10/4/2049 921,312 0.01%HP, Inc. $700,000 6.00% 15/9/2041 920,628 0.01%DuPont de Nemours, Inc. $850,000 4.21% 15/11/2023 920,223 0.01%Federal National Mortgage Association $864,415 4.00% 1/7/2049 919,878 0.01%Burlington Northern Santa Fe LLC $700,000 4.95% 15/9/2041 919,661 0.01%American Municipal Power, Inc. $620,000 5.94% 15/2/2047 919,479 0.01%Honeywell International, Inc. $875,000 2.30% 15/8/2024 918,924 0.01%Rochester Gas & Electric Corp. $850,000 3.10% 1/6/2027 918,877 0.01%Federal National Mortgage Association $866,648 3.00% 1/11/2032 917,678 0.01%United Parcel Service, Inc. $725,000 4.25% 15/3/2049 916,215 0.01%Exxon Mobil Corp. $775,000 4.11% 1/3/2046 916,049 0.01%Evergy, Inc. $865,000 2.90% 15/9/2029 915,638 0.01%Federal Home Loan Mortgage Corp. $835,404 4.50% 1/4/2049 915,478 0.01%Discovery Communications LLC $725,000 5.30% 15/5/2049 914,253 0.01%Charter Communications Operating LLC/Charter Communications
Operating Capital $850,000 4.40% 1/12/2061 914,219 0.01%Florida Power & Light Co. $750,000 4.13% 1/2/2042 913,991 0.01%Federal Home Loan Mortgage Corp. $875,987 3.00% 1/6/2050 913,016 0.01%Air Lease Corp. $900,000 3.00% 1/2/2030 911,823 0.01%Discovery Communications LLC $835,000 3.63% 15/5/2030 911,585 0.01%7-Eleven, Inc. $975,000 2.80% 10/2/2051 909,921 0.01%General Dynamics Corp. $800,000 3.75% 15/5/2028 909,744 0.01%Government National Mortgage Association $849,992 4.50% 20/8/2048 909,740 0.01%Procter & Gamble Co. $850,000 2.45% 3/11/2026 909,623 0.01%McDonald's Corp. €700,000 1.60% 15/3/2031 909,532 0.01%Oracle Corp. $875,000 2.40% 15/9/2023 907,697 0.01%Texas Health Resources $1,000,000 2.33% 15/11/2050 907,327 0.01%Humana, Inc. $835,000 3.85% 1/10/2024 906,612 0.01%Danaher Corp. $725,000 4.38% 15/9/2045 906,332 0.01%PacifiCorp $850,000 3.30% 15/3/2051 905,477 0.01%Massachusetts Mutual Life Insurance Co. $853,000 3.73% 15/10/2070 904,644 0.01%NIKE, Inc. $850,000 2.38% 1/11/2026 904,165 0.01%Crown Castle International Corp. $800,000 4.45% 15/2/2026 903,140 0.01%Federal National Mortgage Association $849,220 3.00% 1/8/2043 902,527 0.01%General Motors Co. $625,000 6.75% 1/4/2046 902,460 0.01%Federal National Mortgage Association $855,214 3.00% 1/2/2048 901,916 0.01%General Motors Co. $660,000 5.95% 1/4/2049 898,574 0.01%Government National Mortgage Association $841,293 4.00% 20/5/2047 897,964 0.01%Federal Home Loan Mortgage Corp. $853,646 3.00% 1/8/2046 897,816 0.01%Goldman Sachs Group, Inc.^ CA($)1,050,000 3.31% 31/10/2025 897,628 0.01%Eastman Chemical Co. €700,000 1.88% 23/11/2026 897,388 0.01%Government National Mortgage Association $841,427 3.50% 20/5/2045 897,265 0.01%Altria Group, Inc. €700,000 2.20% 15/6/2027 896,298 0.01%Aflac, Inc. $795,000 3.60% 1/4/2030 896,210 0.01%Federal National Mortgage Association $825,297 4.00% 1/9/2044 895,951 0.01%Amgen, Inc. $850,000 3.38% 21/2/2050 895,723 0.01%Union Pacific Corp. $850,000 3.25% 5/2/2050 895,390 0.01%

472
Vanguard Global Bond Index Fund
Principal CouponMaturity
DateFair Value
US Dollars ($)% of Total
Net AssetsViacomCBS, Inc. $700,000 5.25% 1/4/2044 895,030 0.01%CVS Health Corp. $810,000 3.88% 20/7/2025 894,352 0.01%Bank of America Corp.^ $850,000 3.55% 5/3/2024 892,958 0.01%Nuveen LLC $775,000 4.00% 1/11/2028 892,890 0.01%LYB International Finance II BV €700,000 1.63% 17/9/2031 892,587 0.01%Government National Mortgage Association $821,670 4.00% 20/9/2045 892,583 0.01%Government National Mortgage Association $836,750 4.50% 20/5/2049 892,024 0.01%Federal Home Loan Mortgage Corp. $835,792 3.50% 1/12/2045 891,964 0.01%Air Lease Corp. $875,000 2.63% 1/7/2022 891,430 0.01%Morgan Stanley Capital I Trust 2016 $825,000 3.33% 15/3/2049 891,371 0.01%Bay Area Toll Authority $550,000 6.26% 1/4/2049 890,720 0.01%Federal National Mortgage Association $846,056 3.00% 1/10/2046 890,285 0.01%Government National Mortgage Association $834,062 4.00% 20/9/2047 890,246 0.01%Goldman Sachs Group, Inc.^ $850,000 3.21% 22/4/2042 889,437 0.01%FedEx Corp. $800,000 3.40% 15/2/2028 888,793 0.01%Comcast Corp. $775,000 3.90% 1/3/2038 888,734 0.01%Government National Mortgage Association $836,657 3.50% 20/6/2049 888,603 0.01%Digital Euro Finco LLC €700,000 2.63% 15/4/2024 888,202 0.01%Federal National Mortgage Association $840,274 3.00% 1/12/2036 886,669 0.01%Alphabet, Inc. $1,000,000 2.25% 15/8/2060 885,777 0.01%US Treasury Note $834,000 2.88% 30/11/2023 885,083 0.01%Alphabet, Inc. $1,000,000 2.05% 15/8/2050 885,073 0.01%Union Pacific Corp. $825,000 3.65% 15/2/2024 884,513 0.01%Government National Mortgage Association $834,848 4.00% 20/7/2049 882,646 0.01%Federal National Mortgage Association $845,340 2.50% 1/4/2028 882,528 0.01%Goldman Sachs Group, Inc.^ $825,000 3.27% 29/9/2025 882,404 0.01%Corning, Inc. ¥100,000,000 0.99% 10/8/2027 882,279 0.01%United Airlines 2016-1 Class AA Pass Through Trust $835,701 3.10% 7/7/2028 881,597 0.01%Utah Acquisition Sub, Inc. $800,000 3.95% 15/6/2026 881,326 0.01%Freddie Mac Multifamily Structured Pass Through Certificates $900,000 1.72% 25/7/2035 881,296 0.01%Federal Home Loan Mortgage Corp. $835,657 3.00% 1/1/2033 881,103 0.01%Government National Mortgage Association $821,661 3.50% 20/10/2044 880,889 0.01%Becton Dickinson & Co. $808,000 3.73% 15/12/2024 880,082 0.01%Lowe's Cos, Inc. $800,000 3.70% 15/4/2046 878,806 0.01%Federal Home Loan Mortgage Corp. $803,059 5.00% 1/3/2050 877,508 0.01%Wells Fargo & Co. £600,000 2.50% 2/5/2029 877,289 0.01%Home Depot, Inc. $800,000 3.30% 15/4/2040 877,087 0.01%Wells Fargo Commercial Mortgage Trust 2018 $750,000 4.44% 15/9/2061 876,975 0.01%Aon Corp. $750,000 4.50% 15/12/2028 876,938 0.01%AT&T, Inc. $780,000 4.13% 17/2/2026 876,593 0.01%Citigroup, Inc. $680,000 4.65% 30/7/2045 876,293 0.01%Verizon Communications, Inc. €700,000 1.25% 8/4/2030 874,927 0.01%Citigroup, Inc. $775,000 4.13% 25/7/2028 873,952 0.01%Goldman Sachs Group, Inc.^ $875,000 0.66% 10/9/2024 873,441 0.01%Discover Financial Services $800,000 3.95% 6/11/2024 873,362 0.01%Citigroup, Inc. $865,000 2.90% 8/12/2021 873,107 0.01%Realty Income Corp. $800,000 3.25% 15/1/2031 873,023 0.01%Goldman Sachs Group, Inc.^ $875,000 1.54% 10/9/2027 872,314 0.01%Oracle Corp. $800,000 4.00% 15/11/2047 872,135 0.01%ViacomCBS, Inc. $820,000 2.90% 15/1/2027 871,940 0.01%Raytheon Technologies Corp. $700,000 4.50% 1/6/2042 871,281 0.01%Federal National Mortgage Association $834,778 2.50% 1/6/2035 870,533 0.01%John Deere Capital Corp. $900,000 1.45% 15/1/2031 870,133 0.01%Valero Energy Corp. $635,000 6.63% 15/6/2037 869,812 0.01%Government National Mortgage Association $789,983 4.00% 20/2/2041 868,649 0.01%AT&T, Inc. $760,000 4.35% 15/6/2045 868,327 0.01%Freddie Mac Multifamily Structured Pass Through Certificates $850,000 1.60% 25/12/2027 867,242 0.01%Discover Bank $771,000 4.25% 13/3/2026 866,061 0.01%DuPont de Nemours, Inc. $725,000 4.73% 15/11/2028 864,057 0.01%Broadcom, Inc. $770,000 4.25% 15/4/2026 863,476 0.01%Parker-Hannifin Corp. €700,000 1.13% 1/3/2025 862,478 0.01%Consolidated Edison Co. of New York, Inc. $650,000 5.50% 1/12/2039 862,282 0.01%Charter Communications Operating LLC/Charter Communications
Operating Capital $700,000 5.38% 1/4/2038 862,160 0.01%State Street Corp.^ $800,000 3.78% 3/12/2024 862,036 0.01%University of Pittsburgh-of the Commonwealth System of Higher
Education $825,000 3.56% 15/9/2119 861,960 0.01%Bank of America Corp.^ $750,000 4.27% 23/7/2029 861,930 0.01%Charter Communications Operating LLC/Charter Communications
Operating Capital $780,000 3.75% 15/2/2028 860,944 0.01%Global Payments, Inc. $817,000 2.65% 15/2/2025 860,628 0.01%
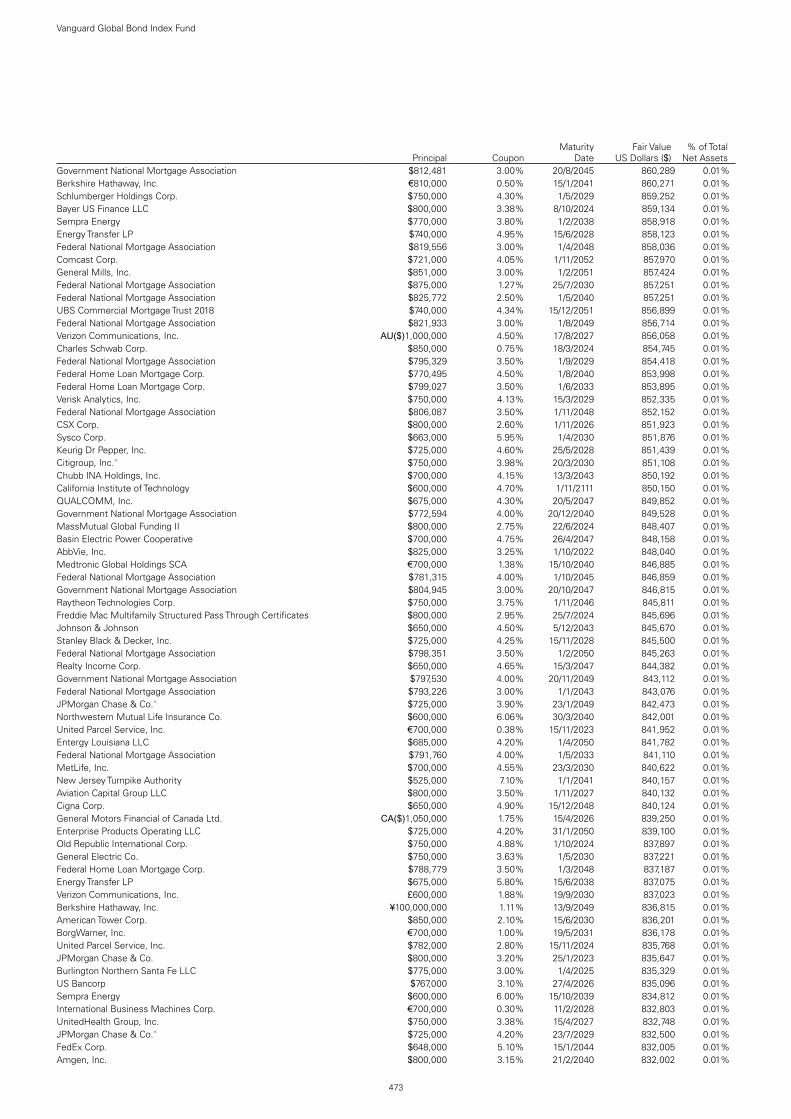
473
Vanguard Global Bond Index Fund
Principal CouponMaturity
DateFair Value
US Dollars ($)% of Total
Net AssetsGovernment National Mortgage Association $812,481 3.00% 20/8/2045 860,289 0.01%Berkshire Hathaway, Inc. €810,000 0.50% 15/1/2041 860,271 0.01%Schlumberger Holdings Corp. $750,000 4.30% 1/5/2029 859,252 0.01%Bayer US Finance LLC $800,000 3.38% 8/10/2024 859,134 0.01%Sempra Energy $770,000 3.80% 1/2/2038 858,918 0.01%Energy Transfer LP $740,000 4.95% 15/6/2028 858,123 0.01%Federal National Mortgage Association $819,556 3.00% 1/4/2048 858,036 0.01%Comcast Corp. $721,000 4.05% 1/11/2052 857,970 0.01%General Mills, Inc. $851,000 3.00% 1/2/2051 857,424 0.01%Federal National Mortgage Association $875,000 1.27% 25/7/2030 857,251 0.01%Federal National Mortgage Association $825,772 2.50% 1/5/2040 857,251 0.01%UBS Commercial Mortgage Trust 2018 $740,000 4.34% 15/12/2051 856,899 0.01%Federal National Mortgage Association $821,933 3.00% 1/8/2049 856,714 0.01%Verizon Communications, Inc. AU($)1,000,000 4.50% 17/8/2027 856,058 0.01%Charles Schwab Corp. $850,000 0.75% 18/3/2024 854,745 0.01%Federal National Mortgage Association $795,329 3.50% 1/9/2029 854,418 0.01%Federal Home Loan Mortgage Corp. $770,495 4.50% 1/8/2040 853,998 0.01%Federal Home Loan Mortgage Corp. $799,027 3.50% 1/6/2033 853,895 0.01%Verisk Analytics, Inc. $750,000 4.13% 15/3/2029 852,335 0.01%Federal National Mortgage Association $806,087 3.50% 1/11/2048 852,152 0.01%CSX Corp. $800,000 2.60% 1/11/2026 851,923 0.01%Sysco Corp. $663,000 5.95% 1/4/2030 851,876 0.01%Keurig Dr Pepper, Inc. $725,000 4.60% 25/5/2028 851,439 0.01%Citigroup, Inc.^ $750,000 3.98% 20/3/2030 851,108 0.01%Chubb INA Holdings, Inc. $700,000 4.15% 13/3/2043 850,192 0.01%California Institute of Technology $600,000 4.70% 1/11/2111 850,150 0.01%QUALCOMM, Inc. $675,000 4.30% 20/5/2047 849,852 0.01%Government National Mortgage Association $772,594 4.00% 20/12/2040 849,528 0.01%MassMutual Global Funding II $800,000 2.75% 22/6/2024 848,407 0.01%Basin Electric Power Cooperative $700,000 4.75% 26/4/2047 848,158 0.01%AbbVie, Inc. $825,000 3.25% 1/10/2022 848,040 0.01%Medtronic Global Holdings SCA €700,000 1.38% 15/10/2040 846,885 0.01%Federal National Mortgage Association $781,315 4.00% 1/10/2045 846,859 0.01%Government National Mortgage Association $804,945 3.00% 20/10/2047 846,815 0.01%Raytheon Technologies Corp. $750,000 3.75% 1/11/2046 845,811 0.01%Freddie Mac Multifamily Structured Pass Through Certificates $800,000 2.95% 25/7/2024 845,696 0.01%Johnson & Johnson $650,000 4.50% 5/12/2043 845,670 0.01%Stanley Black & Decker, Inc. $725,000 4.25% 15/11/2028 845,500 0.01%Federal National Mortgage Association $798,351 3.50% 1/2/2050 845,263 0.01%Realty Income Corp. $650,000 4.65% 15/3/2047 844,382 0.01%Government National Mortgage Association $797,530 4.00% 20/11/2049 843,112 0.01%Federal National Mortgage Association $793,226 3.00% 1/1/2043 843,076 0.01%JPMorgan Chase & Co.^ $725,000 3.90% 23/1/2049 842,473 0.01%Northwestern Mutual Life Insurance Co. $600,000 6.06% 30/3/2040 842,001 0.01%United Parcel Service, Inc. €700,000 0.38% 15/11/2023 841,952 0.01%Entergy Louisiana LLC $685,000 4.20% 1/4/2050 841,782 0.01%Federal National Mortgage Association $791,760 4.00% 1/5/2033 841,110 0.01%MetLife, Inc. $700,000 4.55% 23/3/2030 840,622 0.01%New Jersey Turnpike Authority $525,000 7.10% 1/1/2041 840,157 0.01%Aviation Capital Group LLC $800,000 3.50% 1/11/2027 840,132 0.01%Cigna Corp. $650,000 4.90% 15/12/2048 840,124 0.01%General Motors Financial of Canada Ltd. CA($)1,050,000 1.75% 15/4/2026 839,250 0.01%Enterprise Products Operating LLC $725,000 4.20% 31/1/2050 839,100 0.01%Old Republic International Corp. $750,000 4.88% 1/10/2024 837,897 0.01%General Electric Co. $750,000 3.63% 1/5/2030 837,221 0.01%Federal Home Loan Mortgage Corp. $788,779 3.50% 1/3/2048 837,187 0.01%Energy Transfer LP $675,000 5.80% 15/6/2038 837,075 0.01%Verizon Communications, Inc. £600,000 1.88% 19/9/2030 837,023 0.01%Berkshire Hathaway, Inc. ¥100,000,000 1.11% 13/9/2049 836,815 0.01%American Tower Corp. $850,000 2.10% 15/6/2030 836,201 0.01%BorgWarner, Inc. €700,000 1.00% 19/5/2031 836,178 0.01%United Parcel Service, Inc. $782,000 2.80% 15/11/2024 835,768 0.01%JPMorgan Chase & Co. $800,000 3.20% 25/1/2023 835,647 0.01%Burlington Northern Santa Fe LLC $775,000 3.00% 1/4/2025 835,329 0.01%US Bancorp $767,000 3.10% 27/4/2026 835,096 0.01%Sempra Energy $600,000 6.00% 15/10/2039 834,812 0.01%International Business Machines Corp. €700,000 0.30% 11/2/2028 832,803 0.01%UnitedHealth Group, Inc. $750,000 3.38% 15/4/2027 832,748 0.01%JPMorgan Chase & Co.^ $725,000 4.20% 23/7/2029 832,500 0.01%FedEx Corp. $648,000 5.10% 15/1/2044 832,005 0.01%Amgen, Inc. $800,000 3.15% 21/2/2040 832,002 0.01%

474
Vanguard Global Bond Index Fund
Principal CouponMaturity
DateFair Value
US Dollars ($)% of Total
Net AssetsWalmart, Inc. $785,000 2.38% 24/9/2029 831,694 0.01%Exxon Mobil Corp. $815,000 1.90% 16/8/2022 830,173 0.01%LYB International Finance III LLC $800,000 3.38% 1/10/2040 829,232 0.01%Lowe's Cos, Inc. $700,000 4.50% 15/4/2030 828,287 0.01%Duke Energy Indiana LLC $735,000 3.75% 15/5/2046 828,034 0.01%Federal National Mortgage Association $774,066 3.50% 1/7/2046 827,694 0.01%Keurig Dr Pepper, Inc. $625,000 5.09% 25/5/2048 826,970 0.01%Nestle Holdings, Inc. £600,000 0.63% 18/12/2025 826,841 0.01%Federal National Mortgage Association $826,232 1.50% 1/6/2041 826,219 0.01%Amazon.com, Inc. $800,000 2.40% 22/2/2023 826,201 0.01%Time Warner Cable LLC $640,000 5.88% 15/11/2040 825,937 0.01%Freddie Mac Multifamily Structured Pass Through Certificates $780,000 2.25% 25/2/2052 825,788 0.01%Bank of America Corp. $750,000 3.50% 19/4/2026 825,544 0.01%Comcast Corp. $707,000 3.97% 1/11/2047 824,791 0.01%Southwestern Electric Power Co. $750,000 3.85% 1/2/2048 824,675 0.01%Liberty Mutual Group, Inc. $750,000 3.95% 15/5/2060 823,755 0.01%Becton Dickinson & Co. €683,000 1.00% 15/12/2022 823,193 0.01%Mondelez International Holdings Netherlands BV €700,000 0.00% 22/9/2026 823,102 0.01%American International Group, Inc. $750,000 3.40% 30/6/2030 822,660 0.01%Plains All American Pipeline LP/PAA Finance Corp. $735,000 4.65% 15/10/2025 822,411 0.01%Thermo Fisher Scientific, Inc. $783,000 2.60% 1/10/2029 822,376 0.01%Burlington Northern Santa Fe LLC $700,000 3.90% 1/8/2046 821,956 0.01%International Flavors & Fragrances, Inc. $800,000 3.27% 15/11/2040 821,200 0.01%Charter Communications Operating LLC/Charter Communications
Operating Capital $825,000 3.70% 1/4/2051 821,007 0.01%7-Eleven, Inc. $850,000 1.30% 10/2/2028 820,280 0.01%Freddie Mac Multifamily Structured Pass Through Certificates^ $700,000 4.06% 25/10/2028 820,028 0.01%Altria Group, Inc. €600,000 3.13% 15/6/2031 819,332 0.01%Citigroup, Inc. $625,000 5.88% 22/2/2033 819,029 0.01%Bank of America Corp. $725,000 4.25% 22/10/2026 818,522 0.01%Huntington National Bank $800,000 2.50% 7/8/2022 817,973 0.01%Bank of America Corp.^ $800,000 2.50% 13/2/2031 817,950 0.01%American Honda Finance Corp. £600,000 0.75% 25/11/2026 817,348 0.01%Federal Home Loan Mortgage Corp. $766,517 4.00% 1/8/2048 817,210 0.01%Federal Home Loan Mortgage Corp. $749,173 5.50% 1/9/2048 815,803 0.01%Amazon.com, Inc. $685,000 3.88% 22/8/2037 815,427 0.01%Prudential Financial, Inc. $650,000 4.35% 25/2/2050 814,668 0.01%Amazon.com, Inc. $600,000 4.95% 5/12/2044 814,535 0.01%Federal National Mortgage Association $780,722 2.50% 1/8/2027 814,501 0.01%Expedia Group, Inc. $800,000 2.95% 15/3/2031 813,921 0.01%Las Vegas Sands Corp. $775,000 3.20% 8/8/2024 813,313 0.01%Goldman Sachs Group, Inc. $775,000 3.63% 22/1/2023 813,205 0.01%Marriott International, Inc. $800,000 2.85% 15/4/2031 812,977 0.01%Government National Mortgage Association $767,686 3.00% 20/7/2045 812,859 0.01%New York Life Global Funding CA($)1,000,000 2.00% 17/4/2028 811,429 0.01%Federal National Mortgage Association $755,715 3.50% 1/3/2041 811,111 0.01%Block Financial LLC $750,000 3.88% 15/8/2030 810,984 0.01%Prudential Financial, Inc.^ $775,000 3.70% 1/10/2050 810,244 0.01%Appalachian Power Co. $675,000 4.45% 1/6/2045 809,972 0.01%Chevron Corp. $790,000 2.36% 5/12/2022 809,108 0.01%AT&T, Inc. $800,000 1.70% 25/3/2026 808,595 0.01%Government National Mortgage Association $759,525 3.00% 20/7/2043 808,415 0.01%UnitedHealth Group, Inc. $800,000 1.25% 15/1/2026 806,863 0.01%State Board of Administration Finance Corp. $800,000 1.26% 1/7/2025 806,736 0.01%Ares Capital Corp. $750,000 4.20% 10/6/2024 806,132 0.01%Federal Home Loan Mortgage Corp. $779,211 2.00% 1/3/2036 806,125 0.01%Federal National Mortgage Association $768,452 2.50% 1/6/2036 804,771 0.01%Federal Home Loan Mortgage Corp. $760,606 3.00% 1/11/2036 803,049 0.01%Pfizer, Inc. $490,000 7.20% 15/3/2039 802,570 0.01%Realty Income Corp. $727,000 3.88% 15/4/2025 802,535 0.01%Verisk Analytics, Inc. $750,000 3.63% 15/5/2050 802,359 0.01%Northrop Grumman Corp. $675,000 4.03% 15/10/2047 801,775 0.01%Constellation Brands, Inc. $697,000 4.75% 1/12/2025 801,424 0.01%Citigroup, Inc.^ $775,000 2.67% 29/1/2031 801,198 0.01%Federal Home Loan Mortgage Corp. $800,000 0.13% 25/7/2022 800,196 0.01%Goldman Sachs Group, Inc. $600,000 5.15% 22/5/2045 800,185 0.01%Berkshire Hathaway Finance Corp. £500,000 2.63% 19/6/2059 799,617 0.01%Michigan State Building Authority $800,000 2.71% 15/10/2040 798,352 0.01%Prudential Financial, Inc. $700,000 3.70% 13/3/2051 798,052 0.01%Puget Energy, Inc. $740,000 3.65% 15/5/2025 797,502 0.01%Apple, Inc. $625,000 4.38% 13/5/2045 796,714 0.01%

475
Vanguard Global Bond Index Fund
Principal CouponMaturity
DateFair Value
US Dollars ($)% of Total
Net AssetsApple, Inc. $670,000 3.85% 4/8/2046 795,812 0.01%MetLife, Inc. $612,000 4.72% 15/12/2044 795,341 0.01%BANK 2017 $725,000 3.78% 15/5/2050 794,775 0.01%CC Holdings GS V LLC/Crown Castle GS III Corp. $750,000 3.85% 15/4/2023 794,452 0.01%Federal National Mortgage Association $716,170 5.00% 1/10/2049 794,263 0.01%United Airlines 2020-1 Class A Pass Through Trust $713,738 5.88% 15/10/2027 793,925 0.01%Entergy Louisiana LLC $650,000 4.20% 1/9/2048 793,154 0.01%Enterprise Products Operating LLC $625,000 5.10% 15/2/2045 793,057 0.01%Schlumberger Investment SA $780,000 2.40% 1/8/2022 792,555 0.01%QUALCOMM, Inc. $765,000 2.60% 30/1/2023 792,168 0.01%Virginia Electric & Power Co. $625,000 4.65% 15/8/2043 791,628 0.01%American International Group, Inc. $750,000 2.50% 30/6/2025 791,214 0.01%T-Mobile USA, Inc. $800,000 3.00% 15/2/2041 791,115 0.01%Mastercard, Inc. $650,000 3.95% 26/2/2048 791,038 0.01%Ascension Health $750,000 2.53% 15/11/2029 791,022 0.01%Energy Transfer LP $625,000 6.00% 15/6/2048 790,324 0.01%Capital One Financial Corp. $700,000 3.80% 31/1/2028 790,044 0.01%Oracle Corp. $745,000 2.80% 1/4/2027 789,933 0.01%Government National Mortgage Association $746,439 3.00% 15/12/2045 789,616 0.01%Verizon Communications, Inc. $611,000 4.67% 15/3/2055 789,441 0.01%Exelon Corp. $625,000 4.70% 15/4/2050 789,170 0.01%Federal Home Loan Banks $800,000 0.38% 4/9/2025 788,094 0.01%Bank of New York Mellon Corp. $732,000 3.00% 24/2/2025 786,979 0.01%Federal Home Loan Mortgage Corp. $725,553 3.50% 1/1/2045 786,716 0.01%Union Pacific Corp. $710,000 3.80% 6/4/2071 786,460 0.01%Constellation Brands, Inc. $700,000 4.75% 15/11/2024 786,211 0.01%Bristol-Myers Squibb Co. $650,000 4.13% 15/6/2039 785,855 0.01%Government National Mortgage Association $736,127 3.00% 20/9/2042 785,242 0.01%LC6 Commercial Mortgage Trust 2013 $762,254 2.94% 10/1/2046 785,143 0.01%Textron, Inc. $725,000 4.30% 1/3/2024 784,969 0.01%New York State Dormitory Authority $755,000 3.14% 1/7/2043 784,573 0.01%Johnson Controls International plc/Tyco Fire & Security Finance SCA €660,000 0.38% 15/9/2027 784,508 0.01%Goldman Sachs Group, Inc. $600,000 4.75% 21/10/2045 783,508 0.01%Owl Rock Capital Corp. $750,000 3.40% 15/7/2026 782,141 0.01%Chicago Transit Authority Sales & Transfer Tax Receipts Revenue $555,000 6.90% 1/12/2040 780,949 0.01%JPMorgan Chase & Co.^ $750,000 3.16% 22/4/2042 780,931 0.01%Delta Air Lines, Inc./SkyMiles IP Ltd. $725,000 4.50% 20/10/2025 780,520 0.01%Apple, Inc. $750,000 2.20% 11/9/2029 780,266 0.01%Cigna Corp. $750,000 3.40% 15/3/2050 780,159 0.01%Air Lease Corp. CA($)940,000 2.63% 5/12/2024 778,409 0.01%Virginia Electric & Power Co. $715,000 3.15% 15/1/2026 778,364 0.01%PECO Energy Co. $750,000 3.00% 15/9/2049 778,327 0.01%International Paper Co. $625,000 4.35% 15/8/2048 778,085 0.01%Lowe's Cos, Inc. $675,000 4.05% 3/5/2047 777,744 0.01%Mylan, Inc. $750,000 3.13% 15/1/2023 777,442 0.01%Federal Home Loan Mortgage Corp. $723,613 3.50% 1/7/2042 776,840 0.01%Starbucks Corp. $675,000 4.00% 15/11/2028 776,811 0.01%American Tower Corp. $725,000 3.13% 15/1/2027 776,714 0.01%Charter Communications Operating LLC/Charter Communications
Operating Capital $650,000 5.13% 1/7/2049 776,429 0.01%Mosaic Co. $750,000 3.25% 15/11/2022 776,362 0.01%Illinois Tool Works, Inc. $650,000 3.90% 1/9/2042 776,100 0.01%ERP Operating LP $725,000 2.85% 1/11/2026 775,519 0.01%Verizon Communications, Inc. $650,000 4.40% 1/11/2034 775,072 0.01%Transcontinental Gas Pipe Line Co. LLC $600,000 5.40% 15/8/2041 774,970 0.01%Apple, Inc. $600,000 4.45% 6/5/2044 773,339 0.01%AT&T, Inc. $600,000 5.35% 1/9/2040 772,790 0.01%Walt Disney Co. $700,000 3.38% 15/11/2026 772,023 0.01%L3Harris Technologies, Inc. $665,000 4.40% 15/6/2028 771,882 0.01%Consumers Energy Co. $850,000 2.50% 1/5/2060 770,872 0.01%Sierra Pacific Power Co. $725,000 2.60% 1/5/2026 770,541 0.01%Philip Morris International, Inc. $750,000 2.50% 2/11/2022 770,387 0.01%Oracle Corp. $750,000 2.30% 25/3/2028 770,122 0.01%NVIDIA Corp. $650,000 3.70% 1/4/2060 770,066 0.01%Federal Home Loan Mortgage Corp. $719,416 4.00% 1/11/2048 768,994 0.01%TD Ameritrade Holding Corp. $700,000 3.30% 1/4/2027 768,408 0.01%Federal Home Loan Mortgage Corp. $717,246 4.00% 1/5/2050 767,720 0.01%Chevron USA, Inc. $700,000 3.90% 15/11/2024 767,539 0.01%John Deere Capital Corp. $750,000 2.15% 8/9/2022 766,716 0.01%Federal National Mortgage Association $726,594 3.00% 1/10/2036 766,712 0.01%Anthem, Inc. $712,000 3.50% 15/8/2024 766,594 0.01%
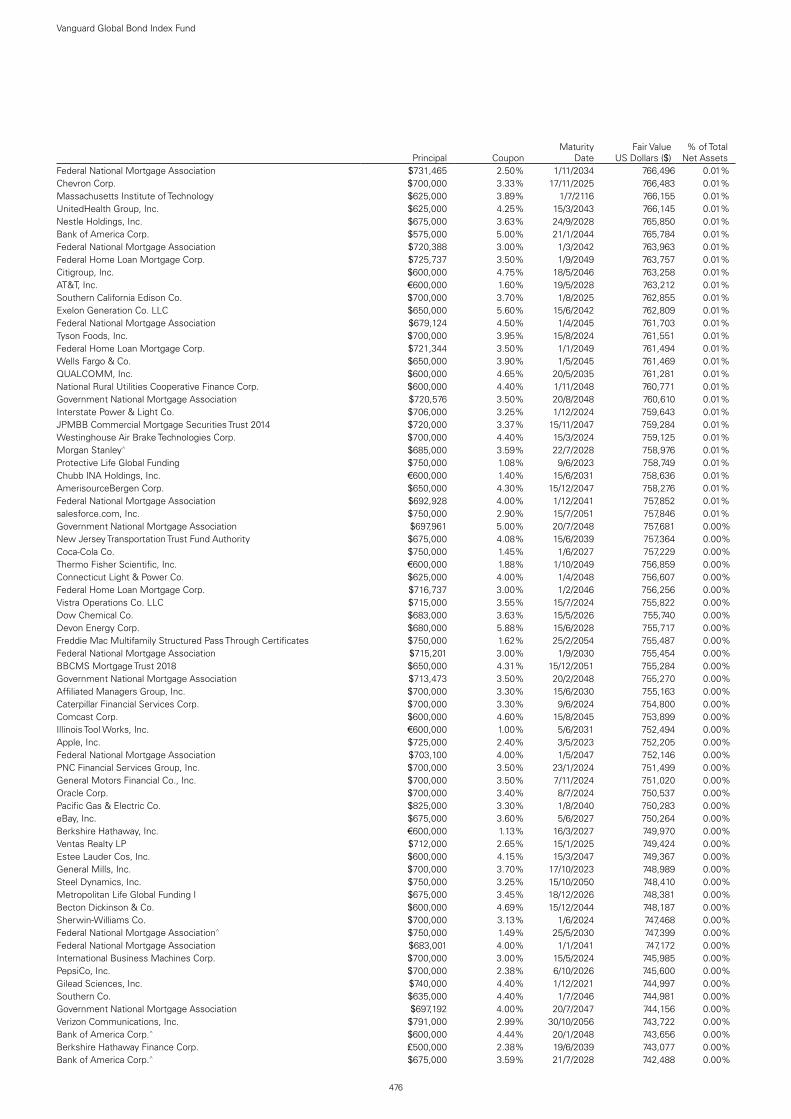
476
Vanguard Global Bond Index Fund
Principal CouponMaturity
DateFair Value
US Dollars ($)% of Total
Net AssetsFederal National Mortgage Association $731,465 2.50% 1/11/2034 766,496 0.01%Chevron Corp. $700,000 3.33% 17/11/2025 766,483 0.01%Massachusetts Institute of Technology $625,000 3.89% 1/7/2116 766,155 0.01%UnitedHealth Group, Inc. $625,000 4.25% 15/3/2043 766,145 0.01%Nestle Holdings, Inc. $675,000 3.63% 24/9/2028 765,850 0.01%Bank of America Corp. $575,000 5.00% 21/1/2044 765,784 0.01%Federal National Mortgage Association $720,388 3.00% 1/3/2042 763,963 0.01%Federal Home Loan Mortgage Corp. $725,737 3.50% 1/9/2049 763,757 0.01%Citigroup, Inc. $600,000 4.75% 18/5/2046 763,258 0.01%AT&T, Inc. €600,000 1.60% 19/5/2028 763,212 0.01%Southern California Edison Co. $700,000 3.70% 1/8/2025 762,855 0.01%Exelon Generation Co. LLC $650,000 5.60% 15/6/2042 762,809 0.01%Federal National Mortgage Association $679,124 4.50% 1/4/2045 761,703 0.01%Tyson Foods, Inc. $700,000 3.95% 15/8/2024 761,551 0.01%Federal Home Loan Mortgage Corp. $721,344 3.50% 1/1/2049 761,494 0.01%Wells Fargo & Co. $650,000 3.90% 1/5/2045 761,469 0.01%QUALCOMM, Inc. $600,000 4.65% 20/5/2035 761,281 0.01%National Rural Utilities Cooperative Finance Corp. $600,000 4.40% 1/11/2048 760,771 0.01%Government National Mortgage Association $720,576 3.50% 20/8/2048 760,610 0.01%Interstate Power & Light Co. $706,000 3.25% 1/12/2024 759,643 0.01%JPMBB Commercial Mortgage Securities Trust 2014 $720,000 3.37% 15/11/2047 759,284 0.01%Westinghouse Air Brake Technologies Corp. $700,000 4.40% 15/3/2024 759,125 0.01%Morgan Stanley^ $685,000 3.59% 22/7/2028 758,976 0.01%Protective Life Global Funding $750,000 1.08% 9/6/2023 758,749 0.01%Chubb INA Holdings, Inc. €600,000 1.40% 15/6/2031 758,636 0.01%AmerisourceBergen Corp. $650,000 4.30% 15/12/2047 758,276 0.01%Federal National Mortgage Association $692,928 4.00% 1/12/2041 757,852 0.01%salesforce.com, Inc. $750,000 2.90% 15/7/2051 757,846 0.01%Government National Mortgage Association $697,961 5.00% 20/7/2048 757,681 0.00%New Jersey Transportation Trust Fund Authority $675,000 4.08% 15/6/2039 757,364 0.00%Coca-Cola Co. $750,000 1.45% 1/6/2027 757,229 0.00%Thermo Fisher Scientific, Inc. €600,000 1.88% 1/10/2049 756,859 0.00%Connecticut Light & Power Co. $625,000 4.00% 1/4/2048 756,607 0.00%Federal Home Loan Mortgage Corp. $716,737 3.00% 1/2/2046 756,256 0.00%Vistra Operations Co. LLC $715,000 3.55% 15/7/2024 755,822 0.00%Dow Chemical Co. $683,000 3.63% 15/5/2026 755,740 0.00%Devon Energy Corp. $680,000 5.88% 15/6/2028 755,717 0.00%Freddie Mac Multifamily Structured Pass Through Certificates $750,000 1.62% 25/2/2054 755,487 0.00%Federal National Mortgage Association $715,201 3.00% 1/9/2030 755,454 0.00%BBCMS Mortgage Trust 2018 $650,000 4.31% 15/12/2051 755,284 0.00%Government National Mortgage Association $713,473 3.50% 20/2/2048 755,270 0.00%Affiliated Managers Group, Inc. $700,000 3.30% 15/6/2030 755,163 0.00%Caterpillar Financial Services Corp. $700,000 3.30% 9/6/2024 754,800 0.00%Comcast Corp. $600,000 4.60% 15/8/2045 753,899 0.00%Illinois Tool Works, Inc. €600,000 1.00% 5/6/2031 752,494 0.00%Apple, Inc. $725,000 2.40% 3/5/2023 752,205 0.00%Federal National Mortgage Association $703,100 4.00% 1/5/2047 752,146 0.00%PNC Financial Services Group, Inc. $700,000 3.50% 23/1/2024 751,499 0.00%General Motors Financial Co., Inc. $700,000 3.50% 7/11/2024 751,020 0.00%Oracle Corp. $700,000 3.40% 8/7/2024 750,537 0.00%Pacific Gas & Electric Co. $825,000 3.30% 1/8/2040 750,283 0.00%eBay, Inc. $675,000 3.60% 5/6/2027 750,264 0.00%Berkshire Hathaway, Inc. €600,000 1.13% 16/3/2027 749,970 0.00%Ventas Realty LP $712,000 2.65% 15/1/2025 749,424 0.00%Estee Lauder Cos, Inc. $600,000 4.15% 15/3/2047 749,367 0.00%General Mills, Inc. $700,000 3.70% 17/10/2023 748,989 0.00%Steel Dynamics, Inc. $750,000 3.25% 15/10/2050 748,410 0.00%Metropolitan Life Global Funding I $675,000 3.45% 18/12/2026 748,381 0.00%Becton Dickinson & Co. $600,000 4.69% 15/12/2044 748,187 0.00%Sherwin-Williams Co. $700,000 3.13% 1/6/2024 747,468 0.00%Federal National Mortgage Association^ $750,000 1.49% 25/5/2030 747,399 0.00%Federal National Mortgage Association $683,001 4.00% 1/1/2041 747,172 0.00%International Business Machines Corp. $700,000 3.00% 15/5/2024 745,985 0.00%PepsiCo, Inc. $700,000 2.38% 6/10/2026 745,600 0.00%Gilead Sciences, Inc. $740,000 4.40% 1/12/2021 744,997 0.00%Southern Co. $635,000 4.40% 1/7/2046 744,981 0.00%Government National Mortgage Association $697,192 4.00% 20/7/2047 744,156 0.00%Verizon Communications, Inc. $791,000 2.99% 30/10/2056 743,722 0.00%Bank of America Corp.^ $600,000 4.44% 20/1/2048 743,656 0.00%Berkshire Hathaway Finance Corp. £500,000 2.38% 19/6/2039 743,077 0.00%Bank of America Corp.^ $675,000 3.59% 21/7/2028 742,488 0.00%

477
Vanguard Global Bond Index Fund
Principal CouponMaturity
DateFair Value
US Dollars ($)% of Total
Net AssetsKroger Co. $650,000 3.95% 15/1/2050 742,110 0.00%Verisk Analytics, Inc. $550,000 5.50% 15/6/2045 741,945 0.00%CVS Health Corp. $690,000 3.38% 12/8/2024 741,794 0.00%Freddie Mac Multifamily Structured Pass Through Certificates $750,000 1.37% 25/6/2030 741,036 0.00%S&P Global, Inc. $686,000 2.95% 22/1/2027 740,903 0.00%Toyota Motor Credit Corp. $675,000 3.05% 11/1/2028 740,780 0.00%Commonwealth Edison Co. $700,000 3.20% 15/11/2049 740,457 0.00%PepsiCo, Inc. $750,000 1.63% 1/5/2030 740,145 0.00%Apple, Inc. €556,000 2.00% 17/9/2027 740,006 0.00%Citigroup, Inc. $680,000 3.30% 27/4/2025 739,437 0.00%Dominion Energy South Carolina, Inc. $510,000 5.10% 1/6/2065 739,239 0.00%JPMorgan Chase & Co. $711,000 2.70% 18/5/2023 739,044 0.00%Athene Holding Ltd. $585,000 6.15% 3/4/2030 738,854 0.00%Federal Home Loan Mortgage Corp. $704,654 3.00% 1/6/2048 738,335 0.00%Berkshire Hathaway, Inc. $675,000 3.13% 15/3/2026 737,921 0.00%Goldman Sachs Group, Inc. $565,000 4.80% 8/7/2044 737,468 0.00%Walmart, Inc. $581,000 4.30% 22/4/2044 737,360 0.00%PNC Financial Services Group, Inc. $700,000 2.55% 22/1/2030 737,017 0.00%Berkshire Hathaway Energy Co. $600,000 4.25% 15/10/2050 736,289 0.00%Enterprise Products Operating LLC $600,000 4.85% 15/3/2044 736,158 0.00%Government National Mortgage Association $658,447 4.50% 20/8/2040 735,870 0.00%Federal Home Loan Mortgage Corp. $687,352 4.00% 1/6/2047 735,513 0.00%AT&T, Inc. $625,000 4.65% 1/6/2044 735,433 0.00%Federal Home Loan Mortgage Corp. $700,000 2.75% 19/6/2023 734,234 0.00%Spectra Energy Partners LP $675,000 3.38% 15/10/2026 733,847 0.00%3M Co. $700,000 2.38% 26/8/2029 733,660 0.00%UnitedHealth Group, Inc. $600,000 4.20% 15/1/2047 733,309 0.00%Chubb INA Holdings, Inc. €600,000 0.88% 15/12/2029 732,566 0.00%Home Depot, Inc. $550,000 4.88% 15/2/2044 732,516 0.00%Florida Power & Light Co. $500,000 5.96% 1/4/2039 731,386 0.00%American International Group, Inc. $600,000 4.38% 15/1/2055 729,142 0.00%AT&T, Inc. €600,000 1.80% 14/9/2039 729,068 0.00%International Business Machines Corp. €600,000 1.20% 11/2/2040 728,994 0.00%Government National Mortgage Association $673,095 3.50% 20/6/2042 728,945 0.00%Merck & Co., Inc. $650,000 3.40% 7/3/2029 728,481 0.00%Lam Research Corp. $662,000 3.80% 15/3/2025 728,443 0.00%Columbia Property Trust Operating Partnership LP $690,000 3.65% 15/8/2026 728,212 0.00%PPG Industries, Inc. $700,000 2.55% 15/6/2030 727,058 0.00%General Dynamics Corp. $680,000 2.63% 15/11/2027 726,598 0.00%FedEx Corp. $600,000 4.55% 1/4/2046 726,356 0.00%7-Eleven, Inc. $725,000 0.63% 10/2/2023 725,420 0.00%Apple, Inc. €600,000 1.00% 10/11/2022 725,371 0.00%Lazard Group LLC $665,000 3.63% 1/3/2027 724,810 0.00%International Business Machines Corp. $700,000 2.88% 9/11/2022 724,303 0.00%Puget Sound Energy, Inc. $590,000 4.30% 20/5/2045 724,075 0.00%Federal Home Loan Mortgage Corp. $663,769 4.00% 1/2/2045 723,957 0.00%Mid-America Apartments LP $670,000 3.75% 15/6/2024 723,933 0.00%7-Eleven, Inc. $725,000 0.80% 10/2/2024 723,344 0.00%Microsoft Corp. $700,000 2.38% 1/5/2023 723,191 0.00%Intercontinental Exchange, Inc. $750,000 3.00% 15/9/2060 722,933 0.00%Benchmark 2018-B5 Mortgage Trust $625,000 4.21% 15/7/2051 722,802 0.00%Government National Mortgage Association $677,188 3.50% 20/12/2045 722,126 0.00%Federal Home Loan Mortgage Corp. $666,908 4.00% 1/8/2045 721,750 0.00%Humana, Inc. $700,000 3.15% 1/12/2022 721,724 0.00%AT&T, Inc. €500,000 3.15% 4/9/2036 721,375 0.00%Euronet Worldwide, Inc. €600,000 1.38% 22/5/2026 721,337 0.00%Old Republic International Corp. $645,000 3.88% 26/8/2026 721,291 0.00%Federal Home Loan Mortgage Corp. $688,401 2.50% 1/2/2032 721,137 0.00%Utah Acquisition Sub, Inc. €569,000 2.25% 22/11/2024 720,757 0.00%Intel Corp. $600,000 4.10% 11/5/2047 719,817 0.00%Morgan Stanley $624,000 5.00% 24/11/2025 719,721 0.00%University of Chicago $750,000 2.55% 1/4/2050 719,231 0.00%Oracle Corp. $675,000 2.95% 15/5/2025 718,846 0.00%Medtronic Global Holdings SCA €600,000 0.38% 15/10/2028 717,743 0.00%Hewlett Packard Enterprise Co. $630,000 4.90% 15/10/2025 717,387 0.00%Transcontinental Gas Pipe Line Co. LLC $600,000 4.45% 1/8/2042 716,640 0.00%Federal Home Loan Mortgage Corp. $679,169 3.00% 1/10/2045 716,616 0.00%DXC Technology Co. $625,000 4.75% 15/4/2027 716,504 0.00%Government National Mortgage Association $676,169 3.00% 20/12/2044 716,323 0.00%Florida Power & Light Co. $670,000 3.25% 1/6/2024 715,712 0.00%Southern Power Co. €556,000 1.85% 20/6/2026 714,770 0.00%
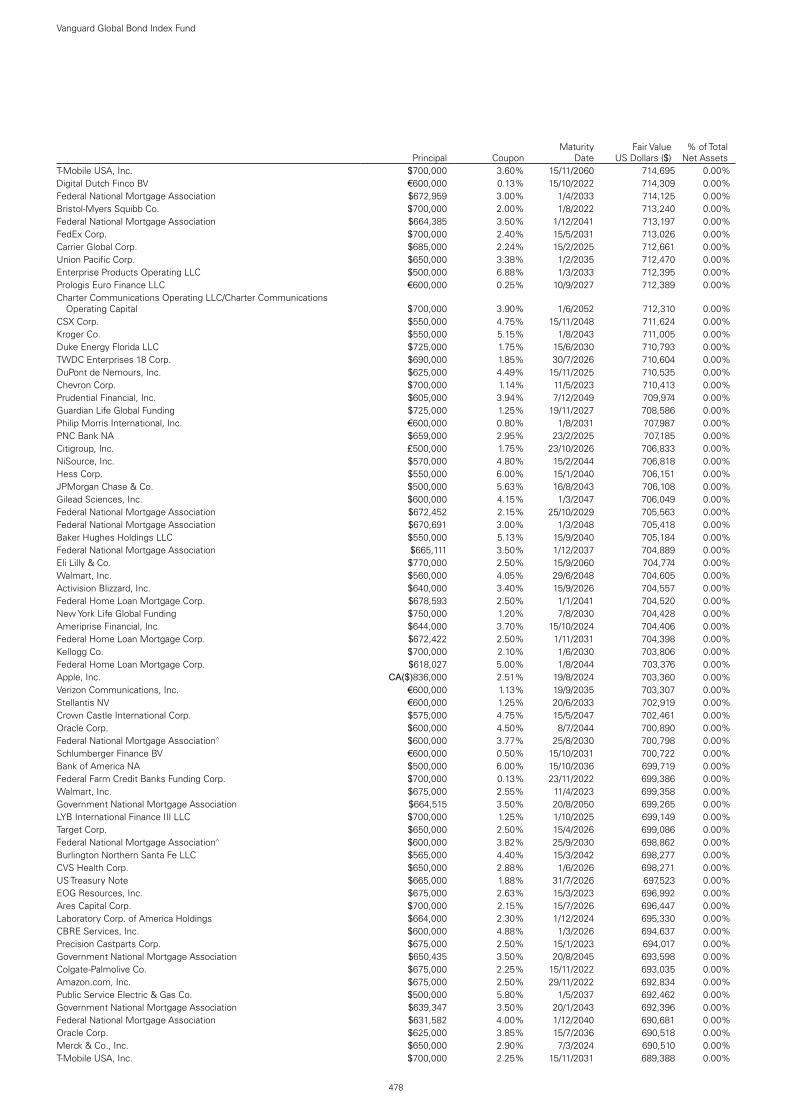
478
Vanguard Global Bond Index Fund
Principal CouponMaturity
DateFair Value
US Dollars ($)% of Total
Net AssetsT-Mobile USA, Inc. $700,000 3.60% 15/11/2060 714,695 0.00%Digital Dutch Finco BV €600,000 0.13% 15/10/2022 714,309 0.00%Federal National Mortgage Association $672,959 3.00% 1/4/2033 714,125 0.00%Bristol-Myers Squibb Co. $700,000 2.00% 1/8/2022 713,240 0.00%Federal National Mortgage Association $664,385 3.50% 1/12/2041 713,197 0.00%FedEx Corp. $700,000 2.40% 15/5/2031 713,026 0.00%Carrier Global Corp. $685,000 2.24% 15/2/2025 712,661 0.00%Union Pacific Corp. $650,000 3.38% 1/2/2035 712,470 0.00%Enterprise Products Operating LLC $500,000 6.88% 1/3/2033 712,395 0.00%Prologis Euro Finance LLC €600,000 0.25% 10/9/2027 712,389 0.00%Charter Communications Operating LLC/Charter Communications
Operating Capital $700,000 3.90% 1/6/2052 712,310 0.00%CSX Corp. $550,000 4.75% 15/11/2048 711,624 0.00%Kroger Co. $550,000 5.15% 1/8/2043 711,005 0.00%Duke Energy Florida LLC $725,000 1.75% 15/6/2030 710,793 0.00%TWDC Enterprises 18 Corp. $690,000 1.85% 30/7/2026 710,604 0.00%DuPont de Nemours, Inc. $625,000 4.49% 15/11/2025 710,535 0.00%Chevron Corp. $700,000 1.14% 11/5/2023 710,413 0.00%Prudential Financial, Inc. $605,000 3.94% 7/12/2049 709,974 0.00%Guardian Life Global Funding $725,000 1.25% 19/11/2027 708,586 0.00%Philip Morris International, Inc. €600,000 0.80% 1/8/2031 707,987 0.00%PNC Bank NA $659,000 2.95% 23/2/2025 707,185 0.00%Citigroup, Inc. £500,000 1.75% 23/10/2026 706,833 0.00%NiSource, Inc. $570,000 4.80% 15/2/2044 706,818 0.00%Hess Corp. $550,000 6.00% 15/1/2040 706,151 0.00%JPMorgan Chase & Co. $500,000 5.63% 16/8/2043 706,108 0.00%Gilead Sciences, Inc. $600,000 4.15% 1/3/2047 706,049 0.00%Federal National Mortgage Association $672,452 2.15% 25/10/2029 705,563 0.00%Federal National Mortgage Association $670,691 3.00% 1/3/2048 705,418 0.00%Baker Hughes Holdings LLC $550,000 5.13% 15/9/2040 705,184 0.00%Federal National Mortgage Association $665,111 3.50% 1/12/2037 704,889 0.00%Eli Lilly & Co. $770,000 2.50% 15/9/2060 704,774 0.00%Walmart, Inc. $560,000 4.05% 29/6/2048 704,605 0.00%Activision Blizzard, Inc. $640,000 3.40% 15/9/2026 704,557 0.00%Federal Home Loan Mortgage Corp. $678,593 2.50% 1/1/2041 704,520 0.00%New York Life Global Funding $750,000 1.20% 7/8/2030 704,428 0.00%Ameriprise Financial, Inc. $644,000 3.70% 15/10/2024 704,406 0.00%Federal Home Loan Mortgage Corp. $672,422 2.50% 1/11/2031 704,398 0.00%Kellogg Co. $700,000 2.10% 1/6/2030 703,806 0.00%Federal Home Loan Mortgage Corp. $618,027 5.00% 1/8/2044 703,376 0.00%Apple, Inc. CA($)836,000 2.51% 19/8/2024 703,360 0.00%Verizon Communications, Inc. €600,000 1.13% 19/9/2035 703,307 0.00%Stellantis NV €600,000 1.25% 20/6/2033 702,919 0.00%Crown Castle International Corp. $575,000 4.75% 15/5/2047 702,461 0.00%Oracle Corp. $600,000 4.50% 8/7/2044 700,890 0.00%Federal National Mortgage Association^ $600,000 3.77% 25/8/2030 700,798 0.00%Schlumberger Finance BV €600,000 0.50% 15/10/2031 700,722 0.00%Bank of America NA $500,000 6.00% 15/10/2036 699,719 0.00%Federal Farm Credit Banks Funding Corp. $700,000 0.13% 23/11/2022 699,386 0.00%Walmart, Inc. $675,000 2.55% 11/4/2023 699,358 0.00%Government National Mortgage Association $664,515 3.50% 20/8/2050 699,265 0.00%LYB International Finance III LLC $700,000 1.25% 1/10/2025 699,149 0.00%Target Corp. $650,000 2.50% 15/4/2026 699,086 0.00%Federal National Mortgage Association^ $600,000 3.82% 25/9/2030 698,862 0.00%Burlington Northern Santa Fe LLC $565,000 4.40% 15/3/2042 698,277 0.00%CVS Health Corp. $650,000 2.88% 1/6/2026 698,271 0.00%US Treasury Note $665,000 1.88% 31/7/2026 697,523 0.00%EOG Resources, Inc. $675,000 2.63% 15/3/2023 696,992 0.00%Ares Capital Corp. $700,000 2.15% 15/7/2026 696,447 0.00%Laboratory Corp. of America Holdings $664,000 2.30% 1/12/2024 695,330 0.00%CBRE Services, Inc. $600,000 4.88% 1/3/2026 694,637 0.00%Precision Castparts Corp. $675,000 2.50% 15/1/2023 694,017 0.00%Government National Mortgage Association $650,435 3.50% 20/8/2045 693,598 0.00%Colgate-Palmolive Co. $675,000 2.25% 15/11/2022 693,035 0.00%Amazon.com, Inc. $675,000 2.50% 29/11/2022 692,834 0.00%Public Service Electric & Gas Co. $500,000 5.80% 1/5/2037 692,462 0.00%Government National Mortgage Association $639,347 3.50% 20/1/2043 692,396 0.00%Federal National Mortgage Association $631,582 4.00% 1/12/2040 690,681 0.00%Oracle Corp. $625,000 3.85% 15/7/2036 690,518 0.00%Merck & Co., Inc. $650,000 2.90% 7/3/2024 690,510 0.00%T-Mobile USA, Inc. $700,000 2.25% 15/11/2031 689,388 0.00%

479
Vanguard Global Bond Index Fund
Principal CouponMaturity
DateFair Value
US Dollars ($)% of Total
Net AssetsCommonwealth Edison Co. $575,000 4.00% 1/3/2048 689,248 0.00%Wells Fargo Commercial Mortgage Trust 2018 $600,000 4.18% 15/6/2051 688,958 0.00%Government National Mortgage Association $638,024 3.50% 20/7/2043 688,877 0.00%Camden Property Trust $650,000 2.80% 15/5/2030 688,772 0.00%Federal Home Loan Mortgage Corp. $652,143 3.00% 1/2/2037 688,540 0.00%Invesco Finance plc $525,000 5.38% 30/11/2043 688,410 0.00%Dell International LLC/EMC Corp. $450,000 8.10% 15/7/2036 688,268 0.00%JPMCC Commercial Mortgage Securities Trust 2017 $625,000 3.49% 15/7/2050 687,597 0.00%Federal National Mortgage Association $628,589 4.00% 1/7/2042 687,348 0.00%Sherwin-Williams Co. $618,000 3.95% 15/1/2026 686,341 0.00%AT&T, Inc. $700,000 3.50% 1/2/2061 686,153 0.00%American Tower Corp. $641,000 3.38% 15/5/2024 685,827 0.00%TTX Co. $600,000 3.90% 1/2/2045 685,556 0.00%Becton Dickinson & Co. $550,000 4.67% 6/6/2047 685,394 0.00%Campbell Soup Co. $600,000 4.15% 15/3/2028 683,954 0.00%Exelon Corp. $600,000 4.05% 15/4/2030 683,120 0.00%Walmart, Inc. $600,000 3.70% 26/6/2028 683,030 0.00%Bank of America Corp.^ $700,000 1.92% 24/10/2031 682,277 0.00%Eversource Energy $585,000 4.25% 1/4/2029 682,089 0.00%Federal National Mortgage Association $646,646 3.00% 1/1/2046 681,957 0.00%Government National Mortgage Association $629,381 3.50% 20/8/2042 681,604 0.00%Energy Transfer LP $525,000 6.50% 1/2/2042 681,519 0.00%Mid-America Apartments LP $600,000 3.95% 15/3/2029 681,359 0.00%Federal Home Loan Banks $660,000 1.50% 15/8/2024 680,851 0.00%Morgan Stanley^ $700,000 1.93% 28/4/2032 680,802 0.00%Oracle Corp. $525,000 5.38% 15/7/2040 680,424 0.00%Burlington Northern Santa Fe LLC $550,000 4.38% 1/9/2042 680,323 0.00%Duke Energy Carolinas LLC $600,000 3.75% 1/6/2045 679,735 0.00%JPMorgan Chase & Co.^ $600,000 4.01% 23/4/2029 679,602 0.00%Estee Lauder Cos, Inc. $650,000 2.38% 1/12/2029 679,044 0.00%Ventas Realty LP $570,000 4.75% 15/11/2030 678,686 0.00%Coca-Cola Co. €600,000 0.80% 15/3/2040 677,959 0.00%Wells Fargo & Co.^ $640,000 2.88% 30/10/2030 677,894 0.00%Wells Fargo & Co. CA($)800,000 3.18% 8/2/2024 677,742 0.00%Fox Corp. $625,000 4.03% 25/1/2024 677,096 0.00%Bristol-Myers Squibb Co. $700,000 1.45% 13/11/2030 676,718 0.00%International Business Machines Corp. $665,000 1.88% 1/8/2022 676,100 0.00%PartnerRe Ireland Finance DAC €542,000 1.25% 15/9/2026 675,628 0.00%Apple, Inc. $670,000 0.75% 11/5/2023 675,554 0.00%FedEx Corp. 2020-1 Class AA Pass Through Trust $681,285 1.88% 20/2/2034 674,661 0.00%General Motors Financial Co., Inc. $650,000 3.25% 5/1/2023 674,537 0.00%ERP Operating LP $650,000 2.50% 15/2/2030 673,378 0.00%CSX Corp. $575,000 4.10% 15/3/2044 672,962 0.00%DTE Electric Co. $655,000 2.25% 1/3/2030 672,802 0.00%Federal Home Loan Mortgage Corp. $640,929 2.50% 1/2/2035 671,689 0.00%Citigroup, Inc. $500,000 5.30% 6/5/2044 670,856 0.00%Boston Scientific Corp. $650,000 1.90% 1/6/2025 670,691 0.00%Government National Mortgage Association $609,311 4.00% 20/11/2040 669,986 0.00%Walt Disney Co. $500,000 4.95% 15/10/2045 669,918 0.00%AT&T, Inc. $600,000 3.80% 15/2/2027 669,277 0.00%JPMorgan Chase & Co.^ $550,000 4.26% 22/2/2048 668,935 0.00%Wells Fargo & Co. $625,000 3.00% 19/2/2025 668,924 0.00%Federal Home Loan Mortgage Corp. $635,335 3.00% 1/3/2047 668,507 0.00%Healthpeak Properties, Inc. $630,000 3.00% 15/1/2030 668,254 0.00%Eastman Chemical Co. $550,000 4.65% 15/10/2044 668,227 0.00%AT&T, Inc. €500,000 2.45% 15/3/2035 667,930 0.00%Government National Mortgage Association $613,969 5.00% 20/3/2049 666,502 0.00%WFRBS Commercial Mortgage Trust 2012 $650,000 2.88% 15/12/2045 666,301 0.00%Metropolitan Transportation Authority $500,000 5.18% 15/11/2049 666,170 0.00%Southern California Edison Co. $500,000 6.05% 15/3/2039 666,041 0.00%UnitedHealth Group, Inc. $600,000 3.45% 15/1/2027 665,959 0.00%Alexandria Real Estate Equities, Inc. $593,000 4.30% 15/1/2026 665,860 0.00%Government National Mortgage Association $586,088 5.00% 20/7/2040 665,805 0.00%Chevron Corp. $650,000 1.55% 11/5/2025 665,604 0.00%Morgan Stanley $625,000 4.10% 22/5/2023 665,078 0.00%Federal National Mortgage Association $554,893 6.50% 1/10/2037 665,023 0.00%Kinder Morgan, Inc. $597,000 4.30% 1/6/2025 664,937 0.00%United Parcel Service, Inc. $600,000 3.05% 15/11/2027 664,638 0.00%AbbVie, Inc. €500,000 2.13% 17/11/2028 664,563 0.00%Wells Fargo & Co. $550,000 4.40% 14/6/2046 664,192 0.00%Oglethorpe Power Corp. $525,000 5.38% 1/11/2040 664,172 0.00%
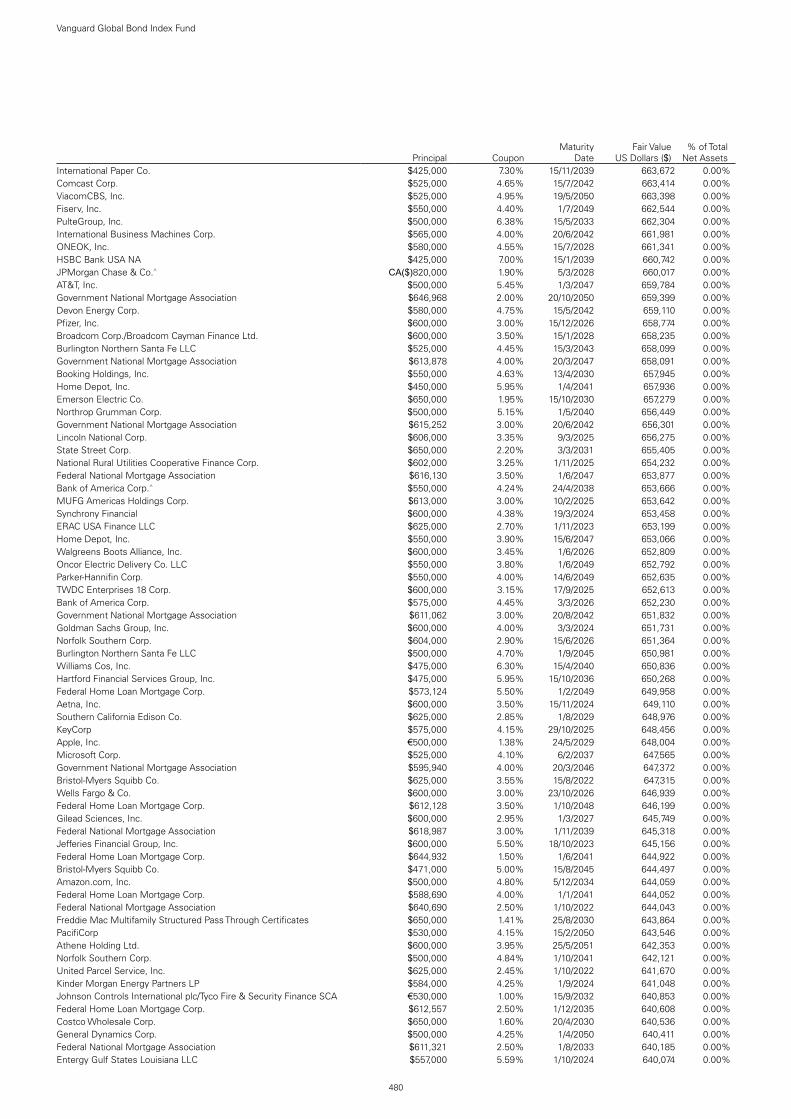
480
Vanguard Global Bond Index Fund
Principal CouponMaturity
DateFair Value
US Dollars ($)% of Total
Net AssetsInternational Paper Co. $425,000 7.30% 15/11/2039 663,672 0.00%Comcast Corp. $525,000 4.65% 15/7/2042 663,414 0.00%ViacomCBS, Inc. $525,000 4.95% 19/5/2050 663,398 0.00%Fiserv, Inc. $550,000 4.40% 1/7/2049 662,544 0.00%PulteGroup, Inc. $500,000 6.38% 15/5/2033 662,304 0.00%International Business Machines Corp. $565,000 4.00% 20/6/2042 661,981 0.00%ONEOK, Inc. $580,000 4.55% 15/7/2028 661,341 0.00%HSBC Bank USA NA $425,000 7.00% 15/1/2039 660,742 0.00%JPMorgan Chase & Co.^ CA($)820,000 1.90% 5/3/2028 660,017 0.00%AT&T, Inc. $500,000 5.45% 1/3/2047 659,784 0.00%Government National Mortgage Association $646,968 2.00% 20/10/2050 659,399 0.00%Devon Energy Corp. $580,000 4.75% 15/5/2042 659,110 0.00%Pfizer, Inc. $600,000 3.00% 15/12/2026 658,774 0.00%Broadcom Corp./Broadcom Cayman Finance Ltd. $600,000 3.50% 15/1/2028 658,235 0.00%Burlington Northern Santa Fe LLC $525,000 4.45% 15/3/2043 658,099 0.00%Government National Mortgage Association $613,878 4.00% 20/3/2047 658,091 0.00%Booking Holdings, Inc. $550,000 4.63% 13/4/2030 657,945 0.00%Home Depot, Inc. $450,000 5.95% 1/4/2041 657,936 0.00%Emerson Electric Co. $650,000 1.95% 15/10/2030 657,279 0.00%Northrop Grumman Corp. $500,000 5.15% 1/5/2040 656,449 0.00%Government National Mortgage Association $615,252 3.00% 20/6/2042 656,301 0.00%Lincoln National Corp. $606,000 3.35% 9/3/2025 656,275 0.00%State Street Corp. $650,000 2.20% 3/3/2031 655,405 0.00%National Rural Utilities Cooperative Finance Corp. $602,000 3.25% 1/11/2025 654,232 0.00%Federal National Mortgage Association $616,130 3.50% 1/6/2047 653,877 0.00%Bank of America Corp.^ $550,000 4.24% 24/4/2038 653,666 0.00%MUFG Americas Holdings Corp. $613,000 3.00% 10/2/2025 653,642 0.00%Synchrony Financial $600,000 4.38% 19/3/2024 653,458 0.00%ERAC USA Finance LLC $625,000 2.70% 1/11/2023 653,199 0.00%Home Depot, Inc. $550,000 3.90% 15/6/2047 653,066 0.00%Walgreens Boots Alliance, Inc. $600,000 3.45% 1/6/2026 652,809 0.00%Oncor Electric Delivery Co. LLC $550,000 3.80% 1/6/2049 652,792 0.00%Parker-Hannifin Corp. $550,000 4.00% 14/6/2049 652,635 0.00%TWDC Enterprises 18 Corp. $600,000 3.15% 17/9/2025 652,613 0.00%Bank of America Corp. $575,000 4.45% 3/3/2026 652,230 0.00%Government National Mortgage Association $611,062 3.00% 20/8/2042 651,832 0.00%Goldman Sachs Group, Inc. $600,000 4.00% 3/3/2024 651,731 0.00%Norfolk Southern Corp. $604,000 2.90% 15/6/2026 651,364 0.00%Burlington Northern Santa Fe LLC $500,000 4.70% 1/9/2045 650,981 0.00%Williams Cos, Inc. $475,000 6.30% 15/4/2040 650,836 0.00%Hartford Financial Services Group, Inc. $475,000 5.95% 15/10/2036 650,268 0.00%Federal Home Loan Mortgage Corp. $573,124 5.50% 1/2/2049 649,958 0.00%Aetna, Inc. $600,000 3.50% 15/11/2024 649,110 0.00%Southern California Edison Co. $625,000 2.85% 1/8/2029 648,976 0.00%KeyCorp $575,000 4.15% 29/10/2025 648,456 0.00%Apple, Inc. €500,000 1.38% 24/5/2029 648,004 0.00%Microsoft Corp. $525,000 4.10% 6/2/2037 647,565 0.00%Government National Mortgage Association $595,940 4.00% 20/3/2046 647,372 0.00%Bristol-Myers Squibb Co. $625,000 3.55% 15/8/2022 647,315 0.00%Wells Fargo & Co. $600,000 3.00% 23/10/2026 646,939 0.00%Federal Home Loan Mortgage Corp. $612,128 3.50% 1/10/2048 646,199 0.00%Gilead Sciences, Inc. $600,000 2.95% 1/3/2027 645,749 0.00%Federal National Mortgage Association $618,987 3.00% 1/11/2039 645,318 0.00%Jefferies Financial Group, Inc. $600,000 5.50% 18/10/2023 645,156 0.00%Federal Home Loan Mortgage Corp. $644,932 1.50% 1/6/2041 644,922 0.00%Bristol-Myers Squibb Co. $471,000 5.00% 15/8/2045 644,497 0.00%Amazon.com, Inc. $500,000 4.80% 5/12/2034 644,059 0.00%Federal Home Loan Mortgage Corp. $588,690 4.00% 1/1/2041 644,052 0.00%Federal National Mortgage Association $640,690 2.50% 1/10/2022 644,043 0.00%Freddie Mac Multifamily Structured Pass Through Certificates $650,000 1.41% 25/8/2030 643,864 0.00%PacifiCorp $530,000 4.15% 15/2/2050 643,546 0.00%Athene Holding Ltd. $600,000 3.95% 25/5/2051 642,353 0.00%Norfolk Southern Corp. $500,000 4.84% 1/10/2041 642,121 0.00%United Parcel Service, Inc. $625,000 2.45% 1/10/2022 641,670 0.00%Kinder Morgan Energy Partners LP $584,000 4.25% 1/9/2024 641,048 0.00%Johnson Controls International plc/Tyco Fire & Security Finance SCA €530,000 1.00% 15/9/2032 640,853 0.00%Federal Home Loan Mortgage Corp. $612,557 2.50% 1/12/2035 640,608 0.00%Costco Wholesale Corp. $650,000 1.60% 20/4/2030 640,536 0.00%General Dynamics Corp. $500,000 4.25% 1/4/2050 640,411 0.00%Federal National Mortgage Association $611,321 2.50% 1/8/2033 640,185 0.00%Entergy Gulf States Louisiana LLC $557,000 5.59% 1/10/2024 640,074 0.00%

481
Vanguard Global Bond Index Fund
Principal CouponMaturity
DateFair Value
US Dollars ($)% of Total
Net AssetsWells Fargo & Co. $500,000 4.90% 17/11/2045 639,997 0.00%AT&T, Inc. $525,000 4.90% 15/6/2042 639,473 0.00%Neuberger Berman Group LLC/Neuberger Berman Finance Corp. $550,000 4.88% 15/4/2045 639,116 0.00%AutoNation, Inc. $575,000 4.50% 1/10/2025 638,979 0.00%JPMorgan Chase & Co.^ $650,000 1.04% 4/2/2027 638,892 0.00%Ohio State University $440,000 4.80% 1/6/2111 638,880 0.00%Marriott International, Inc. $600,000 3.13% 15/6/2026 638,608 0.00%TWDC Enterprises 18 Corp. CA($)755,000 2.76% 7/10/2024 638,422 0.00%Florida Power & Light Co. $525,000 3.95% 1/3/2048 637,969 0.00%US Treasury Bond $497,400 5.25% 15/11/2028 637,916 0.00%Federal National Mortgage Association^ $591,140 2.89% 25/2/2027 637,781 0.00%State Street Corp. $575,000 3.55% 18/8/2025 637,303 0.00%Louisville Gas & Electric Co. $586,000 3.30% 1/10/2025 636,657 0.00%General Motors Co. $500,000 5.40% 1/4/2048 636,631 0.00%Baxter International, Inc. €500,000 1.30% 15/5/2029 635,787 0.00%Federal National Mortgage Association $600,000 2.49% 25/5/2026 635,768 0.00%Ryder System, Inc. $600,000 3.75% 9/6/2023 635,322 0.00%Citigroup, Inc.^ $575,000 3.67% 24/7/2028 635,069 0.00%Federal Home Loan Mortgage Corp. $593,077 3.50% 1/10/2035 634,864 0.00%Dell International LLC/EMC Corp. $550,000 4.90% 1/10/2026 634,678 0.00%Sprint Spectrum Co. LLC/Sprint Spectrum Co. II LLC/Sprint Spectrum Co.
III LLC $550,000 5.15% 20/3/2028 633,957 0.00%Campbell Soup Co. $575,000 3.95% 15/3/2025 633,838 0.00%Morgan Stanley CA($)750,000 3.00% 7/2/2024 633,569 0.00%Goldman Sachs Group, Inc. €500,000 2.13% 30/9/2024 632,812 0.00%Williams Cos, Inc. $500,000 5.40% 4/3/2044 632,791 0.00%Fiserv, Inc. $600,000 2.75% 1/7/2024 632,687 0.00%Citigroup, Inc. $600,000 3.50% 15/5/2023 632,426 0.00%American Honda Finance Corp. €500,000 1.95% 18/10/2024 632,375 0.00%John Deere Capital Corp. $600,000 2.25% 14/9/2026 631,925 0.00%CSX Corp. $500,000 4.75% 30/5/2042 631,569 0.00%Cox Communications, Inc. $575,000 3.50% 15/8/2027 631,438 0.00%Federal National Mortgage Association $581,751 4.50% 1/4/2047 631,222 0.00%Walt Disney Co. $625,000 2.00% 1/9/2029 631,126 0.00%BANK 2018^ $540,000 4.41% 15/11/2061 631,123 0.00%Federal Home Loan Mortgage Corp. $604,327 2.50% 1/9/2028 631,060 0.00%Fidelity National Information Services, Inc. £406,000 3.36% 21/5/2031 630,982 0.00%Mars, Inc. $525,000 3.95% 1/4/2049 630,971 0.00%AEP Transmission Co. LLC $605,000 3.15% 15/9/2049 630,818 0.00%Federal National Mortgage Association $585,852 3.50% 1/1/2043 630,272 0.00%Amazon.com, Inc. $625,000 3.30% 5/12/2021 629,985 0.00%Federal National Mortgage Association $623,186 2.00% 1/12/2045 629,915 0.00%Jefferies Group LLC/Jefferies Group Capital Finance Inc $560,000 4.15% 23/1/2030 629,462 0.00%Verizon Communications, Inc. CA($)779,000 2.50% 16/5/2030 628,257 0.00%Coca-Cola Co. $500,000 4.20% 25/3/2050 628,217 0.00%Verizon Communications, Inc. $625,000 0.75% 22/3/2024 627,722 0.00%Moody's Corp. $600,000 3.25% 20/5/2050 627,616 0.00%American Honda Finance Corp. $600,000 2.15% 10/9/2024 627,140 0.00%Broadcom, Inc. $600,000 3.75% 15/2/2051 627,014 0.00%Walmart, Inc. $420,000 6.20% 15/4/2038 626,892 0.00%Morgan Stanley $500,000 4.38% 22/1/2047 626,697 0.00%DXC Technology Co. €500,000 1.75% 15/1/2026 626,565 0.00%Sherwin-Williams Co. $500,000 4.50% 1/6/2047 626,394 0.00%Verizon Communications, Inc. $576,000 3.38% 15/2/2025 625,803 0.00%Lam Research Corp. $600,000 3.13% 15/6/2060 625,643 0.00%Corning, Inc. $500,000 4.75% 15/3/2042 625,532 0.00%Federal Home Loan Mortgage Corp. $625,412 1.50% 1/1/2041 625,380 0.00%Citigroup, Inc. €500,000 1.25% 10/4/2029 624,919 0.00%Williams Cos, Inc. $600,000 3.70% 15/1/2023 624,603 0.00%JPMorgan Chase & Co.^ $600,000 2.30% 15/10/2025 624,406 0.00%Union Pacific Corp. $650,000 2.97% 16/9/2062 624,170 0.00%Government National Mortgage Association $603,306 2.50% 20/10/2049 623,940 0.00%Energy Transfer LP $490,000 6.13% 15/12/2045 623,767 0.00%Alabama Power Co. $550,000 3.70% 1/12/2047 623,637 0.00%Enterprise Products Operating LLC $500,000 4.95% 15/10/2054 623,604 0.00%PECO Energy Co. $625,000 2.80% 15/6/2050 623,082 0.00%Energy Transfer LP $490,000 6.05% 1/6/2041 622,778 0.00%Federal Home Loan Mortgage Corp. $596,034 2.50% 1/5/2028 622,375 0.00%Federal Home Loan Mortgage Corp. $579,061 3.50% 1/12/2029 622,280 0.00%Anthem, Inc. $510,000 4.38% 1/12/2047 622,169 0.00%Federal Home Loan Mortgage Corp. $614,572 2.00% 1/9/2050 622,077 0.00%
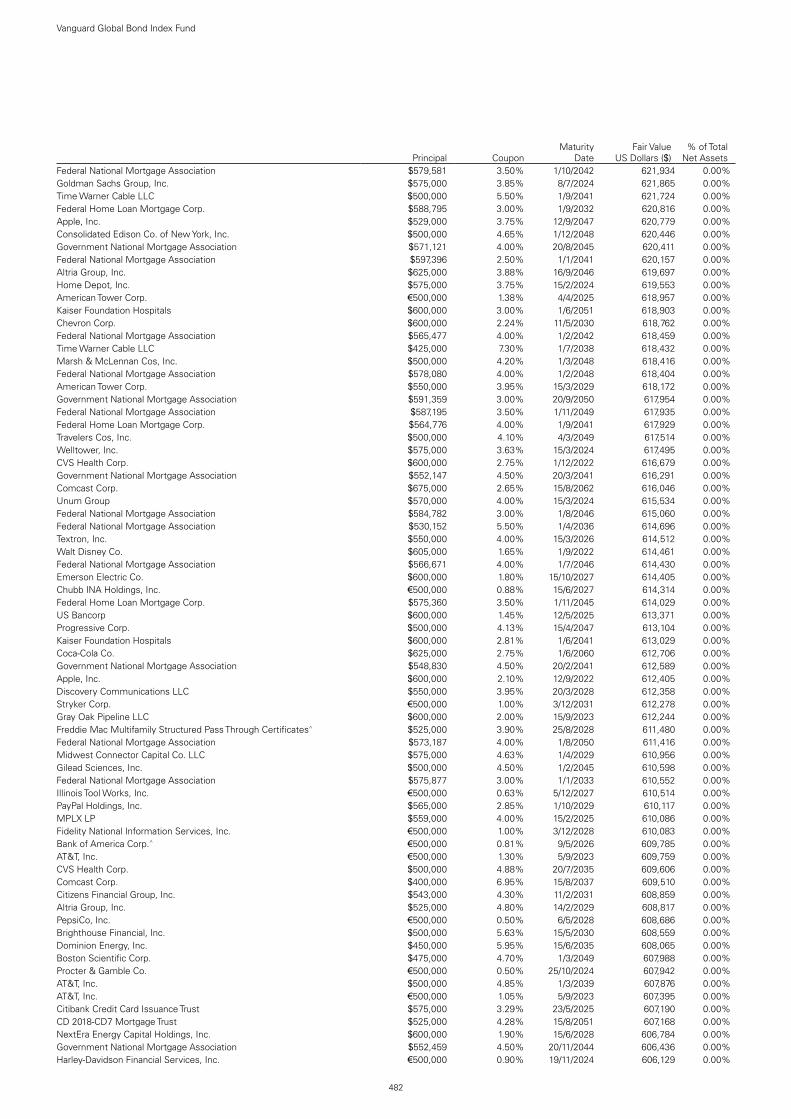
482
Vanguard Global Bond Index Fund
Principal CouponMaturity
DateFair Value
US Dollars ($)% of Total
Net AssetsFederal National Mortgage Association $579,581 3.50% 1/10/2042 621,934 0.00%Goldman Sachs Group, Inc. $575,000 3.85% 8/7/2024 621,865 0.00%Time Warner Cable LLC $500,000 5.50% 1/9/2041 621,724 0.00%Federal Home Loan Mortgage Corp. $588,795 3.00% 1/9/2032 620,816 0.00%Apple, Inc. $529,000 3.75% 12/9/2047 620,779 0.00%Consolidated Edison Co. of New York, Inc. $500,000 4.65% 1/12/2048 620,446 0.00%Government National Mortgage Association $571,121 4.00% 20/8/2045 620,411 0.00%Federal National Mortgage Association $597,396 2.50% 1/1/2041 620,157 0.00%Altria Group, Inc. $625,000 3.88% 16/9/2046 619,697 0.00%Home Depot, Inc. $575,000 3.75% 15/2/2024 619,553 0.00%American Tower Corp. €500,000 1.38% 4/4/2025 618,957 0.00%Kaiser Foundation Hospitals $600,000 3.00% 1/6/2051 618,903 0.00%Chevron Corp. $600,000 2.24% 11/5/2030 618,762 0.00%Federal National Mortgage Association $565,477 4.00% 1/2/2042 618,459 0.00%Time Warner Cable LLC $425,000 7.30% 1/7/2038 618,432 0.00%Marsh & McLennan Cos, Inc. $500,000 4.20% 1/3/2048 618,416 0.00%Federal National Mortgage Association $578,080 4.00% 1/2/2048 618,404 0.00%American Tower Corp. $550,000 3.95% 15/3/2029 618,172 0.00%Government National Mortgage Association $591,359 3.00% 20/9/2050 617,954 0.00%Federal National Mortgage Association $587,195 3.50% 1/11/2049 617,935 0.00%Federal Home Loan Mortgage Corp. $564,776 4.00% 1/9/2041 617,929 0.00%Travelers Cos, Inc. $500,000 4.10% 4/3/2049 617,514 0.00%Welltower, Inc. $575,000 3.63% 15/3/2024 617,495 0.00%CVS Health Corp. $600,000 2.75% 1/12/2022 616,679 0.00%Government National Mortgage Association $552,147 4.50% 20/3/2041 616,291 0.00%Comcast Corp. $675,000 2.65% 15/8/2062 616,046 0.00%Unum Group $570,000 4.00% 15/3/2024 615,534 0.00%Federal National Mortgage Association $584,782 3.00% 1/8/2046 615,060 0.00%Federal National Mortgage Association $530,152 5.50% 1/4/2036 614,696 0.00%Textron, Inc. $550,000 4.00% 15/3/2026 614,512 0.00%Walt Disney Co. $605,000 1.65% 1/9/2022 614,461 0.00%Federal National Mortgage Association $566,671 4.00% 1/7/2046 614,430 0.00%Emerson Electric Co. $600,000 1.80% 15/10/2027 614,405 0.00%Chubb INA Holdings, Inc. €500,000 0.88% 15/6/2027 614,314 0.00%Federal Home Loan Mortgage Corp. $575,360 3.50% 1/11/2045 614,029 0.00%US Bancorp $600,000 1.45% 12/5/2025 613,371 0.00%Progressive Corp. $500,000 4.13% 15/4/2047 613,104 0.00%Kaiser Foundation Hospitals $600,000 2.81% 1/6/2041 613,029 0.00%Coca-Cola Co. $625,000 2.75% 1/6/2060 612,706 0.00%Government National Mortgage Association $548,830 4.50% 20/2/2041 612,589 0.00%Apple, Inc. $600,000 2.10% 12/9/2022 612,405 0.00%Discovery Communications LLC $550,000 3.95% 20/3/2028 612,358 0.00%Stryker Corp. €500,000 1.00% 3/12/2031 612,278 0.00%Gray Oak Pipeline LLC $600,000 2.00% 15/9/2023 612,244 0.00%Freddie Mac Multifamily Structured Pass Through Certificates^ $525,000 3.90% 25/8/2028 611,480 0.00%Federal National Mortgage Association $573,187 4.00% 1/8/2050 611,416 0.00%Midwest Connector Capital Co. LLC $575,000 4.63% 1/4/2029 610,956 0.00%Gilead Sciences, Inc. $500,000 4.50% 1/2/2045 610,598 0.00%Federal National Mortgage Association $575,877 3.00% 1/1/2033 610,552 0.00%Illinois Tool Works, Inc. €500,000 0.63% 5/12/2027 610,514 0.00%PayPal Holdings, Inc. $565,000 2.85% 1/10/2029 610,117 0.00%MPLX LP $559,000 4.00% 15/2/2025 610,086 0.00%Fidelity National Information Services, Inc. €500,000 1.00% 3/12/2028 610,083 0.00%Bank of America Corp.^ €500,000 0.81% 9/5/2026 609,785 0.00%AT&T, Inc. €500,000 1.30% 5/9/2023 609,759 0.00%CVS Health Corp. $500,000 4.88% 20/7/2035 609,606 0.00%Comcast Corp. $400,000 6.95% 15/8/2037 609,510 0.00%Citizens Financial Group, Inc. $543,000 4.30% 11/2/2031 608,859 0.00%Altria Group, Inc. $525,000 4.80% 14/2/2029 608,817 0.00%PepsiCo, Inc. €500,000 0.50% 6/5/2028 608,686 0.00%Brighthouse Financial, Inc. $500,000 5.63% 15/5/2030 608,559 0.00%Dominion Energy, Inc. $450,000 5.95% 15/6/2035 608,065 0.00%Boston Scientific Corp. $475,000 4.70% 1/3/2049 607,988 0.00%Procter & Gamble Co. €500,000 0.50% 25/10/2024 607,942 0.00%AT&T, Inc. $500,000 4.85% 1/3/2039 607,876 0.00%AT&T, Inc. €500,000 1.05% 5/9/2023 607,395 0.00%Citibank Credit Card Issuance Trust $575,000 3.29% 23/5/2025 607,190 0.00%CD 2018-CD7 Mortgage Trust $525,000 4.28% 15/8/2051 607,168 0.00%NextEra Energy Capital Holdings, Inc. $600,000 1.90% 15/6/2028 606,784 0.00%Government National Mortgage Association $552,459 4.50% 20/11/2044 606,436 0.00%Harley-Davidson Financial Services, Inc. €500,000 0.90% 19/11/2024 606,129 0.00%

483
Vanguard Global Bond Index Fund
Principal CouponMaturity
DateFair Value
US Dollars ($)% of Total
Net AssetsFederal Home Loan Mortgage Corp. $566,494 3.50% 1/3/2045 605,962 0.00%AIG Global Funding $600,000 0.80% 7/7/2023 604,426 0.00%Citigroup, Inc. €500,000 0.75% 26/10/2023 604,412 0.00%Chevron USA, Inc. $545,000 3.25% 15/10/2029 604,149 0.00%Mondelez International Holdings Netherlands BV €500,000 0.88% 1/10/2031 604,125 0.00%Costco Wholesale Corp. $600,000 1.38% 20/6/2027 604,121 0.00%Public Storage $550,000 3.09% 15/9/2027 603,889 0.00%DH Europe Finance II Sarl €500,000 1.35% 18/9/2039 603,685 0.00%McDonald's Corp. $500,000 4.20% 1/4/2050 603,580 0.00%Wells Fargo & Co. CA($)730,000 2.49% 18/2/2027 603,265 0.00%Principal Life Global Funding II $600,000 1.25% 23/6/2025 603,179 0.00%Atmos Energy Corp. $500,000 4.13% 15/3/2049 602,396 0.00%Toyota Motor Credit Corp. €500,000 0.25% 16/7/2026 600,612 0.00%Yale-New Haven Health Services Corp. $650,000 2.50% 1/7/2050 600,052 0.00%Pacific Gas & Electric Co. $600,000 4.50% 1/7/2040 600,030 0.00%Federal Farm Credit Banks Funding Corp. $600,000 0.13% 3/2/2023 599,456 0.00%Bristol-Myers Squibb Co. $625,000 2.55% 13/11/2050 598,553 0.00%Federal National Mortgage Association^ $565,567 3.06% 25/6/2024 598,247 0.00%New York Life Global Funding €500,000 0.25% 23/1/2027 598,170 0.00%Prologis Euro Finance LLC €500,000 0.38% 6/2/2028 597,738 0.00%Kaiser Foundation Hospitals $550,000 3.27% 1/11/2049 597,457 0.00%Government National Mortgage Association $559,720 4.00% 20/8/2047 597,424 0.00%Amgen, Inc. $575,000 2.20% 21/2/2027 597,093 0.00%Eaton Corp. $500,000 4.15% 2/11/2042 596,716 0.00%Public Service Co. of Colorado $600,000 1.88% 15/6/2031 596,716 0.00%Medtronic Global Holdings SCA €500,000 0.00% 15/3/2023 596,384 0.00%Fortune Brands Home & Security, Inc. $541,000 4.00% 15/6/2025 596,242 0.00%DH Europe Finance II Sarl €500,000 0.20% 18/3/2026 596,120 0.00%Zoetis, Inc. $600,000 2.00% 15/5/2030 596,050 0.00%Exxon Mobil Corp. $565,000 2.28% 16/8/2026 595,993 0.00%Bank of America Corp.^ €500,000 0.58% 8/8/2029 595,989 0.00%Federal National Mortgage Association $559,784 4.00% 1/8/2049 595,701 0.00%Stellantis NV €500,000 0.63% 30/3/2027 595,570 0.00%AT&T, Inc. $522,000 4.10% 15/2/2028 595,293 0.00%Booking Holdings, Inc. €500,000 0.10% 8/3/2025 594,750 0.00%Marathon Petroleum Corp. $520,000 4.50% 1/4/2048 594,693 0.00%Anthem, Inc. $575,000 2.95% 1/12/2022 594,525 0.00%Government National Mortgage Association $558,501 3.00% 20/8/2043 594,451 0.00%Walt Disney Co. $575,000 1.75% 30/8/2024 594,106 0.00%PACCAR Financial Europe BV €500,000 0.00% 1/3/2026 593,989 0.00%Federal National Mortgage Association $550,000 2.52% 25/8/2029 593,792 0.00%Stellantis NV $550,000 5.25% 15/4/2023 593,038 0.00%Walmart, Inc. $485,000 4.00% 11/4/2043 592,047 0.00%University of California $500,000 4.60% 15/5/2031 592,005 0.00%Discovery Communications LLC $475,000 5.20% 20/9/2047 591,682 0.00%Federal National Mortgage Association $520,135 5.00% 1/7/2035 591,593 0.00%Travelers Cos, Inc. $450,000 4.60% 1/8/2043 591,430 0.00%Federal National Mortgage Association $556,782 3.00% 1/7/2043 591,088 0.00%Charter Communications Operating LLC/Charter Communications
Operating Capital $500,000 5.05% 30/3/2029 591,050 0.00%Carrier Global Corp. $570,000 2.72% 15/2/2030 590,950 0.00%Government National Mortgage Association $555,189 3.00% 20/10/2044 590,926 0.00%Tyson Foods, Inc. $475,000 4.88% 15/8/2034 590,644 0.00%UnitedHealth Group, Inc. $450,000 4.75% 15/7/2045 589,939 0.00%Southern Co. Gas Capital Corp. $500,000 4.40% 30/5/2047 588,968 0.00%Visa, Inc. $500,000 3.65% 15/9/2047 588,952 0.00%AT&T, Inc. $500,000 4.50% 9/3/2048 588,948 0.00%Aetna, Inc. $475,000 4.75% 15/3/2044 588,694 0.00%United Parcel Service, Inc. $500,000 3.75% 15/11/2047 588,600 0.00%CSX Corp. $475,000 4.25% 1/11/2066 587,778 0.00%Raytheon Technologies Corp. $500,000 4.05% 4/5/2047 587,665 0.00%Kimberly-Clark Corp. $600,000 1.05% 15/9/2027 587,000 0.00%CSX Corp. $400,000 6.22% 30/4/2040 586,761 0.00%Discover Bank $500,000 4.65% 13/9/2028 586,650 0.00%Citigroup COmmercial Mortgage Trust 2018 $500,000 4.41% 10/11/2051 586,232 0.00%Welltower, Inc. $550,000 3.10% 15/1/2030 586,143 0.00%Walgreens Boots Alliance, Inc. $490,000 4.80% 18/11/2044 586,059 0.00%Energy Transfer LP $500,000 5.95% 1/12/2025 585,896 0.00%ONEOK, Inc. $500,000 4.95% 13/7/2047 585,875 0.00%PulteGroup, Inc. $500,000 5.50% 1/3/2026 585,741 0.00%Prudential Financial, Inc.^ $500,000 5.70% 15/9/2048 585,487 0.00%

484
Vanguard Global Bond Index Fund
Principal CouponMaturity
DateFair Value
US Dollars ($)% of Total
Net AssetsFederal National Mortgage Association $501,889 5.50% 1/11/2039 585,336 0.00%Exxon Mobil Corp. €500,000 1.41% 26/6/2039 584,733 0.00%Motorola Solutions, Inc. $534,000 4.00% 1/9/2024 584,670 0.00%GE Capital European Funding Unlimited Co. €300,000 6.03% 1/3/2038 584,582 0.00%Boston Gas Co. $555,000 3.00% 1/8/2029 584,477 0.00%Capital One Financial Corp. $542,000 3.30% 30/10/2024 583,950 0.00%Digital Realty Trust LP $525,000 3.60% 1/7/2029 583,698 0.00%Federal National Mortgage Association $547,102 3.50% 1/10/2045 583,629 0.00%Delta Air Lines, Inc. $500,000 7.00% 1/5/2025 583,432 0.00%BorgWarner, Inc. $550,000 2.65% 1/7/2027 583,270 0.00%Coca-Cola Co. €500,000 0.50% 9/3/2033 582,505 0.00%BlackRock, Inc. $525,000 3.20% 15/3/2027 581,643 0.00%Intel Corp. $500,000 3.90% 25/3/2030 581,372 0.00%General Motors Financial Co., Inc. €488,000 0.20% 2/9/2022 581,060 0.00%Duke Energy Indiana LLC $550,000 3.25% 1/10/2049 580,728 0.00%Amcor Finance USA, Inc. $500,000 4.50% 15/5/2028 580,627 0.00%Apple, Inc. $585,000 1.65% 11/5/2030 579,884 0.00%Government National Mortgage Association $546,416 3.00% 15/11/2042 579,800 0.00%Federal National Mortgage Association $550,000 2.29% 25/6/2026 579,101 0.00%Raytheon Technologies Corp. $450,000 4.63% 16/11/2048 577,826 0.00%Union Pacific Corp. $525,000 3.75% 5/2/2070 577,484 0.00%Morgan Stanley^ $600,000 1.79% 13/2/2032 577,158 0.00%ViacomCBS, Inc. $500,000 4.20% 19/5/2032 576,868 0.00%Philip Morris International, Inc. €500,000 1.45% 1/8/2039 575,916 0.00%American Express Co. $550,000 3.40% 27/2/2023 575,816 0.00%ViacomCBS, Inc. $500,000 4.20% 1/6/2029 575,254 0.00%NextEra Energy Capital Holdings, Inc. $520,000 3.55% 1/5/2027 575,221 0.00%Government National Mortgage Association $531,059 3.50% 20/9/2042 575,123 0.00%Enterprise Products Operating LLC $500,000 4.25% 15/2/2048 575,121 0.00%American Tower Corp. $550,000 2.40% 15/3/2025 574,871 0.00%UnitedHealth Group, Inc. $500,000 3.85% 15/6/2028 574,433 0.00%CME Group, Inc. $400,000 5.30% 15/9/2043 574,404 0.00%TWDC Enterprises 18 Corp. $400,000 7.00% 1/3/2032 574,389 0.00%Southern Co. $550,000 2.95% 1/7/2023 574,335 0.00%Entergy Louisiana LLC $500,000 5.40% 1/11/2024 573,920 0.00%Norfolk Southern Corp. $500,000 3.94% 1/11/2047 573,911 0.00%Digital Intrepid Holding BV €500,000 0.63% 15/7/2031 572,901 0.00%Federal National Mortgage Association $535,180 4.00% 1/11/2047 572,513 0.00%Newmont Corp. $450,000 4.88% 15/3/2042 571,722 0.00%Port Authority of New York & New Jersey $435,000 4.46% 1/10/2062 571,433 0.00%Franciscan Missionaries of Our Lady Health System, Inc. $500,000 3.91% 1/7/2049 571,288 0.00%Metropolitan Life Global Funding I €474,000 0.38% 9/4/2024 570,610 0.00%Dollar Tree, Inc. $500,000 4.20% 15/5/2028 570,415 0.00%Dow Chemical Co. $500,000 4.55% 30/11/2025 570,262 0.00%MidAmerican Energy Co. $440,000 4.80% 15/9/2043 570,147 0.00%US Treasury Note $535,000 2.25% 15/11/2025 569,232 0.00%State Street Corp. $522,000 3.30% 16/12/2024 568,828 0.00%Consolidated Edison Co. of New York, Inc. $500,000 3.95% 1/4/2050 568,650 0.00%Johnson & Johnson $534,000 2.63% 15/1/2025 568,548 0.00%Nationwide Financial Services, Inc. $515,000 3.90% 30/11/2049 568,289 0.00%Halliburton Co. $415,000 6.70% 15/9/2038 568,246 0.00%Federal National Mortgage Association $499,557 5.00% 1/6/2035 568,152 0.00%PerkinElmer, Inc. $525,000 3.30% 15/9/2029 568,067 0.00%University of California $400,000 4.86% 15/5/2112 567,864 0.00%PepsiCo, Inc. $435,000 4.60% 17/7/2045 567,636 0.00%Welltower, Inc. $500,000 4.13% 15/3/2029 567,609 0.00%General Motors Financial Co., Inc. $550,000 3.55% 8/7/2022 567,446 0.00%Government National Mortgage Association $526,868 4.00% 15/8/2048 567,276 0.00%Freddie Mac Multifamily Structured Pass Through Certificates $515,000 2.80% 25/8/2034 567,109 0.00%Consumers Energy Co. $500,000 3.50% 1/8/2051 567,078 0.00%Goldman Sachs Group, Inc. $400,000 6.45% 1/5/2036 567,028 0.00%Union Pacific Corp. $506,000 3.60% 15/9/2037 566,481 0.00%Wells Fargo & Co. CA($)650,000 3.87% 21/5/2025 566,247 0.00%Federal Home Loan Mortgage Corp. $532,221 3.50% 1/10/2046 565,783 0.00%Virginia Electric & Power Co. $525,000 2.88% 15/7/2029 565,639 0.00%Freddie Mac Multifamily Structured Pass Through Certificates^ $500,000 3.29% 25/3/2029 564,929 0.00%Micron Technology, Inc. $500,000 4.19% 15/2/2027 564,591 0.00%Marathon Petroleum Corp. $500,000 4.70% 1/5/2025 563,895 0.00%Enable Midstream Partners LP $515,000 4.15% 15/9/2029 563,841 0.00%Goldman Sachs Group, Inc.^ $550,000 2.91% 24/7/2023 563,776 0.00%Coca-Cola Co. $500,000 3.45% 25/3/2030 563,642 0.00%

485
Vanguard Global Bond Index Fund
Principal CouponMaturity
DateFair Value
US Dollars ($)% of Total
Net AssetsGS Mortgage Securities Trust 2012 $562,746 3.48% 10/1/2045 563,557 0.00%Southwestern Public Service Co. $500,000 3.70% 15/8/2047 563,252 0.00%Integris Baptist Medical Center, Inc. $500,000 3.88% 15/8/2050 562,961 0.00%Keurig Dr Pepper, Inc. $528,000 4.06% 25/5/2023 562,786 0.00%Federal National Mortgage Association $524,219 3.50% 1/11/2042 562,526 0.00%UDR, Inc. $535,000 3.10% 1/11/2034 561,936 0.00%LC21 Commercial Mortgage Trust 2015 $515,000 3.71% 10/7/2048 561,892 0.00%FS KKR Capital Corp. $543,000 3.40% 15/1/2026 561,634 0.00%Aircastle Ltd. $500,000 5.25% 11/8/2025 561,592 0.00%Chevron Corp. $535,000 3.19% 24/6/2023 561,550 0.00%Discovery Communications LLC $500,000 4.13% 15/5/2029 561,496 0.00%Lennar Corp. $500,000 4.75% 30/5/2025 561,284 0.00%Eli Lilly & Co. $500,000 3.38% 15/3/2029 561,126 0.00%McDonald's Corp. $450,000 4.45% 1/9/2048 560,622 0.00%Government National Mortgage Association $502,228 4.50% 20/8/2041 560,573 0.00%Boeing Co. $500,000 4.88% 1/5/2025 560,399 0.00%Digital Realty Trust LP $500,000 3.70% 15/8/2027 560,317 0.00%Prologis Euro Finance LLC €500,000 1.00% 16/2/2041 560,107 0.00%Lincoln National Corp. $500,000 3.80% 1/3/2028 559,961 0.00%Federal Home Loan Mortgage Corp. $536,231 2.50% 1/2/2043 559,940 0.00%PNC Financial Services Group, Inc. $500,000 3.45% 23/4/2029 559,544 0.00%Nationwide Mutual Insurance Co. $500,000 4.35% 30/4/2050 559,503 0.00%Bank of America Corp.^ $525,000 3.09% 1/10/2025 559,161 0.00%Federal Home Loan Mortgage Corp. $526,165 3.00% 1/9/2042 558,223 0.00%Port Authority of New York & New Jersey $400,000 4.93% 1/10/2051 558,000 0.00%General Motors Co. $500,000 4.20% 1/10/2027 557,934 0.00%Federal National Mortgage Association $528,739 3.00% 1/9/2036 557,933 0.00%Duke Energy Progress LLC $500,000 3.60% 15/9/2047 557,670 0.00%QUALCOMM, Inc. $582,000 1.65% 20/5/2032 556,504 0.00%Delta Air Lines, Inc./SkyMiles IP Ltd. $500,000 4.75% 20/10/2028 556,435 0.00%Federal National Mortgage Association $493,745 5.00% 1/12/2043 556,222 0.00%Federal National Mortgage Association $513,425 4.00% 1/6/2038 555,924 0.00%Anthem, Inc. $500,000 3.70% 15/9/2049 555,890 0.00%Federal National Mortgage Association $535,291 2.50% 1/8/2040 555,691 0.00%Raytheon Technologies Corp. $400,000 5.70% 15/4/2040 555,384 0.00%Florida Gas Transmission Co. LLC $500,000 4.35% 15/7/2025 555,126 0.00%BANK 2017 $500,000 3.63% 15/5/2050 555,053 0.00%Bank of New York Mellon Corp. $500,000 3.30% 23/8/2029 554,272 0.00%Oracle Corp. $500,000 4.10% 25/3/2061 554,113 0.00%Federal Home Loan Mortgage Corp. $509,936 4.00% 1/5/2044 553,771 0.00%Textron, Inc. $500,000 3.65% 15/3/2027 553,607 0.00%Essex Portfolio LP $545,000 2.65% 15/3/2032 553,127 0.00%Federal National Mortgage Association $514,212 4.50% 1/8/2049 553,016 0.00%Pfizer, Inc. $450,000 4.00% 15/3/2049 552,762 0.00%T-Mobile USA, Inc. $500,000 3.75% 15/4/2027 552,547 0.00%Government National Mortgage Association $494,314 4.50% 20/5/2040 552,438 0.00%Government National Mortgage Association $517,430 4.00% 20/4/2047 552,285 0.00%BANK 2017 $499,000 3.52% 15/7/2060 552,238 0.00%QUALCOMM, Inc. $500,000 3.25% 20/5/2027 552,160 0.00%Time Warner Cable LLC £300,000 5.25% 15/7/2042 551,975 0.00%Protective Life Global Funding $550,000 1.90% 6/7/2028 551,940 0.00%NextEra Energy Capital Holdings, Inc. $550,000 0.65% 1/3/2023 551,905 0.00%BANK 2017 $499,000 3.74% 15/7/2060 551,222 0.00%Federal National Mortgage Association $497,102 5.00% 1/2/2050 551,147 0.00%Berkshire Hathaway Energy Co. $400,000 5.95% 15/5/2037 551,130 0.00%Vulcan Materials Co. $500,000 3.50% 1/6/2030 551,102 0.00%Federal National Mortgage Association $522,987 3.00% 1/6/2035 550,859 0.00%Blackstone Holdings Finance Co. LLC $530,000 2.50% 10/1/2030 550,804 0.00%Midwest Connector Capital Co. LLC $525,000 3.90% 1/4/2024 550,228 0.00%Estee Lauder Cos, Inc. $500,000 3.15% 15/3/2027 550,147 0.00%AbbVie, Inc. $445,000 4.63% 1/10/2042 550,090 0.00%CD 2017-CD4 Mortgage Trust^ $500,000 3.51% 10/5/2050 550,040 0.00%Progressive Corp. $500,000 3.20% 26/3/2030 549,990 0.00%Government National Mortgage Association $522,289 3.00% 20/3/2048 549,456 0.00%Kinder Morgan Energy Partners LP $400,000 6.50% 1/2/2037 549,127 0.00%Costco Wholesale Corp. $500,000 3.00% 18/5/2027 548,752 0.00%Tapestry, Inc. $504,000 4.25% 1/4/2025 548,167 0.00%CD 2017-CD4 Mortgage Trust $500,000 3.75% 10/5/2050 548,091 0.00%Spirit Realty LP $550,000 2.10% 15/3/2028 548,045 0.00%Government National Mortgage Association $513,897 3.50% 20/6/2045 547,999 0.00%Home Depot, Inc. $440,000 4.25% 1/4/2046 547,833 0.00%

486
Vanguard Global Bond Index Fund
Principal CouponMaturity
DateFair Value
US Dollars ($)% of Total
Net AssetsAmeren Corp. $500,000 3.50% 15/1/2031 547,680 0.00%Federal National Mortgage Association $539,026 2.00% 1/6/2050 547,599 0.00%Lennar Corp. $500,000 4.50% 30/4/2024 547,106 0.00%Bank of America Corp.^ $500,000 3.48% 13/3/2052 547,102 0.00%Marriott International, Inc. $475,000 4.63% 15/6/2030 546,942 0.00%CFCRE Commercial Mortgage Trust 2017 $500,000 3.57% 15/6/2050 546,651 0.00%American Express Co. $500,000 3.13% 20/5/2026 546,513 0.00%Johnson & Johnson $460,000 3.70% 1/3/2046 546,274 0.00%Union Pacific Corp. $525,000 2.89% 6/4/2036 546,129 0.00%Amgen, Inc. $500,000 3.20% 2/11/2027 545,562 0.00%Spirit Realty LP $550,000 2.70% 15/2/2032 545,387 0.00%Kinder Morgan Energy Partners LP $500,000 4.30% 1/5/2024 545,092 0.00%Kimberly-Clark Corp. $500,000 3.20% 30/7/2046 545,015 0.00%Texas Instruments, Inc. $500,000 2.90% 3/11/2027 544,574 0.00%Amgen, Inc. $433,000 4.56% 15/6/2048 544,408 0.00%Cimarex Energy Co. $500,000 4.38% 1/6/2024 544,227 0.00%Otis Worldwide Corp. $525,000 2.57% 15/2/2030 544,043 0.00%Federal Home Loan Mortgage Corp. $505,834 4.50% 1/2/2049 544,040 0.00%Raytheon Technologies Corp. $500,000 3.13% 4/5/2027 543,748 0.00%Goldman Sachs Group, Inc. $500,000 3.50% 16/11/2026 543,616 0.00%Niagara Mohawk Power Corp. $475,000 4.28% 15/12/2028 543,579 0.00%Bristol-Myers Squibb Co. $475,000 3.90% 20/2/2028 543,461 0.00%MPLX LP $475,000 4.50% 15/4/2038 543,027 0.00%Freddie Mac Multifamily Structured Pass Through Certificates^ $500,000 3.28% 25/6/2025 542,830 0.00%Target Corp. $500,000 3.50% 1/7/2024 542,514 0.00%Precision Castparts Corp. $500,000 3.25% 15/6/2025 542,346 0.00%Baker Hughes a GE Co. LLC/Baker Hughes Co.-Obligor, Inc. $525,000 2.77% 15/12/2022 542,260 0.00%Morgan Stanley Bank of America Merrill Lynch Trust 2014 $500,000 3.92% 15/10/2047 542,248 0.00%Federal National Mortgage Association $509,713 3.50% 1/8/2048 541,691 0.00%DTE Electric Co. $450,000 3.95% 1/3/2049 541,636 0.00%L3Harris Technologies, Inc. $500,000 3.95% 28/5/2024 541,526 0.00%Prudential Financial, Inc. $500,000 3.50% 15/5/2024 541,349 0.00%Wells Fargo & Co. $475,000 4.30% 22/7/2027 541,270 0.00%Cheniere Corpus Christi Holdings LLC $465,000 5.13% 30/6/2027 541,252 0.00%Honeywell International, Inc. $525,000 2.80% 1/6/2050 541,247 0.00%Verizon Communications, Inc. $500,000 3.50% 1/11/2024 541,048 0.00%Federal Home Loan Mortgage Corp. $503,602 3.50% 1/4/2043 540,644 0.00%Federal Home Loan Mortgage Corp. $510,807 3.00% 1/11/2032 540,592 0.00%Ameriprise Financial, Inc. $500,000 4.00% 15/10/2023 540,381 0.00%Federal Home Loan Mortgage Corp. $513,420 3.00% 1/6/2046 540,226 0.00%Union Electric Co. $500,000 2.95% 15/6/2027 540,220 0.00%Realty Income Corp. $500,000 3.00% 15/1/2027 540,096 0.00%Baptist Healthcare System Obligated Group $500,000 3.54% 15/8/2050 539,963 0.00%Pfizer, Inc. $435,000 4.13% 15/12/2046 539,825 0.00%CommonSpirit Health $470,000 4.19% 1/10/2049 539,772 0.00%PepsiCo, Inc. $525,000 2.88% 15/10/2049 539,461 0.00%Federal National Mortgage Association $501,759 3.50% 1/7/2042 539,401 0.00%Activision Blizzard, Inc. $600,000 2.50% 15/9/2050 539,324 0.00%Government National Mortgage Association $505,750 3.50% 20/11/2045 539,312 0.00%Lockheed Martin Corp. $375,000 6.15% 1/9/2036 539,280 0.00%Verizon Communications, Inc. $500,000 3.15% 22/3/2030 539,273 0.00%Federal National Mortgage Association $510,018 3.00% 1/4/2035 538,539 0.00%Aflac, Inc. $500,000 2.88% 15/10/2026 537,932 0.00%AbbVie, Inc. $500,000 2.95% 21/11/2026 537,518 0.00%FedEx Corp. $450,000 4.40% 15/1/2047 537,422 0.00%ViacomCBS, Inc. $475,000 4.75% 15/5/2025 537,413 0.00%Bank of America Corp. $500,000 4.10% 24/7/2023 537,290 0.00%AmerisourceBergen Corp. $500,000 3.25% 1/3/2025 536,932 0.00%Mosaic Co. $500,000 4.25% 15/11/2023 536,905 0.00%Citigroup Commercial Mortgage Trust 2013^ $500,000 4.37% 10/9/2046 536,757 0.00%Cameron LNG LLC $500,000 3.30% 15/1/2035 536,669 0.00%Government National Mortgage Association $493,247 4.00% 20/1/2045 536,479 0.00%Xylem, Inc. $450,000 4.38% 1/11/2046 536,340 0.00%Molson Coors Beverage Co. $500,000 3.00% 15/7/2026 536,245 0.00%Boston Gas Co. $500,000 3.15% 1/8/2027 536,007 0.00%Fidelity National Information Services, Inc. €370,000 2.95% 21/5/2039 535,832 0.00%Federal National Mortgage Association $500,515 3.50% 1/7/2045 535,425 0.00%Federal National Mortgage Association $498,455 3.50% 1/6/2044 535,075 0.00%Toyota Motor Credit Corp. $500,000 3.35% 8/1/2024 534,629 0.00%Federal National Mortgage Association $501,126 3.50% 1/12/2045 534,583 0.00%State Board of Administration Finance Corp. $525,000 1.71% 1/7/2027 534,350 0.00%

487
Vanguard Global Bond Index Fund
Principal CouponMaturity
DateFair Value
US Dollars ($)% of Total
Net AssetsWhirlpool Corp. $450,000 4.75% 26/2/2029 533,485 0.00%Pfizer, Inc. $500,000 2.63% 1/4/2030 533,194 0.00%Boeing Co. $500,000 4.51% 1/5/2023 532,926 0.00%Phillips 66 Partners LP $490,000 3.55% 1/10/2026 532,819 0.00%Southwestern Public Service Co. $425,000 4.40% 15/11/2048 532,801 0.00%Marsh & McLennan Cos, Inc. $490,000 3.50% 10/3/2025 532,720 0.00%Federal National Mortgage Association $525,000 1.38% 6/9/2022 532,617 0.00%JetBlue 2020-1 Class A Pass Through Trust $483,641 4.00% 15/11/2032 532,545 0.00%Nucor Corp. $500,000 4.00% 1/8/2023 532,469 0.00%Wells Fargo Bank NA $500,000 3.55% 14/8/2023 532,039 0.00%Federal Home Loan Mortgage Corp. $449,309 6.00% 1/11/2038 531,933 0.00%Archer-Daniels-Midland Co. $500,000 2.50% 11/8/2026 531,786 0.00%Federal Home Loan Mortgage Corp. $515,397 2.00% 1/12/2035 531,746 0.00%Hess Corp. $425,000 5.60% 15/2/2041 531,516 0.00%San Diego Gas & Electric Co. $500,000 3.32% 15/4/2050 531,499 0.00%NextEra Energy Capital Holdings, Inc. $500,000 2.75% 1/5/2025 531,273 0.00%Sutter Health $500,000 3.36% 15/8/2050 531,208 0.00%Government National Mortgage Association $467,431 5.00% 20/8/2040 531,009 0.00%Blackstone Secured Lending Fund $500,000 3.63% 15/1/2026 530,998 0.00%Federal Home Loan Mortgage Corp. $490,551 4.00% 1/9/2045 530,890 0.00%Abbott Laboratories $400,000 4.75% 15/4/2043 529,665 0.00%Starbucks Corp. $425,000 4.50% 15/11/2048 529,584 0.00%LYB International Finance III LLC $500,000 3.63% 1/4/2051 529,424 0.00%Government National Mortgage Association $488,605 3.50% 20/12/2042 529,147 0.00%Federal Home Loan Mortgage Corp. $477,102 4.50% 1/9/2040 528,807 0.00%Apple, Inc. $510,000 2.95% 11/9/2049 528,806 0.00%Federal Home Loan Mortgage Corp. $482,825 4.00% 1/12/2040 528,231 0.00%United Parcel Service, Inc. $475,000 3.40% 15/11/2046 527,933 0.00%NYU Langone Hospitals $500,000 3.38% 1/7/2055 527,723 0.00%Flowserve Corp. $500,000 3.50% 1/10/2030 527,664 0.00%Enterprise Products Operating LLC $484,000 3.75% 15/2/2025 527,650 0.00%Federal National Mortgage Association $503,383 2.50% 1/12/2034 527,491 0.00%Prudential Financial, Inc.^ $490,000 5.63% 15/6/2043 527,456 0.00%Energy Transfer LP $485,000 3.75% 15/5/2030 527,281 0.00%Sprint Spectrum Co. LLC/Sprint Spectrum Co. II LLC/Sprint Spectrum Co.
III LLC $492,188 4.74% 20/3/2025 527,252 0.00%Broadcom, Inc. $500,000 3.42% 15/4/2033 527,190 0.00%Energy Transfer LP $400,000 6.25% 15/4/2049 526,012 0.00%Cigna Corp. $488,000 3.25% 15/4/2025 525,958 0.00%KeyBank NA $500,000 3.38% 7/3/2023 525,020 0.00%Freddie Mac Multifamily Structured Pass Through Certificates^ $500,000 3.06% 25/11/2023 524,805 0.00%Host Hotels & Resorts LP $500,000 3.50% 15/9/2030 524,752 0.00%CVS Health Corp. $500,000 4.75% 1/12/2022 524,573 0.00%McDonald's Corp. $500,000 3.35% 1/4/2023 524,449 0.00%International Business Machines Corp. $475,000 3.45% 19/2/2026 524,364 0.00%Arthur J Gallagher & Co. $500,000 3.50% 20/5/2051 524,287 0.00%Procter & Gamble Co. $431,000 3.60% 25/3/2050 524,186 0.00%Mastercard, Inc. $500,000 2.95% 15/3/2051 524,177 0.00%Bayer US Finance II LLC $465,000 4.65% 15/11/2043 523,606 0.00%Apple, Inc. $500,000 2.05% 11/9/2026 523,091 0.00%Federal National Mortgage Association $491,486 4.00% 1/11/2048 523,003 0.00%Federal National Mortgage Association $452,182 5.50% 1/4/2034 522,426 0.00%Expedia Group, Inc. $500,000 3.25% 15/2/2030 522,355 0.00%Markel Corp. $475,000 3.50% 1/11/2027 522,146 0.00%Bristol-Myers Squibb Co. $400,000 4.55% 20/2/2048 522,092 0.00%Nordstrom, Inc. $500,000 4.25% 1/8/2031 522,064 0.00%Federal National Mortgage Association $482,609 4.00% 1/3/2046 521,920 0.00%Boeing Co. $500,000 2.75% 1/2/2026 521,879 0.00%Freddie Mac Multifamily Structured Pass Through Certificates $450,000 3.90% 25/4/2028 521,543 0.00%BANK 2018^ $450,000 4.23% 15/9/2060 521,413 0.00%Burlington Northern Santa Fe LLC $500,000 3.05% 15/2/2051 521,156 0.00%Duke University $500,000 2.83% 1/10/2055 521,116 0.00%Government National Mortgage Association $499,822 2.50% 20/12/2046 520,981 0.00%Energy Transfer LP $440,000 5.40% 1/10/2047 520,794 0.00%Raytheon Technologies Corp. $425,000 4.35% 15/4/2047 520,577 0.00%AT&T, Inc. $500,000 3.50% 1/6/2041 520,473 0.00%CommonSpirit Health $500,000 2.78% 1/10/2030 520,285 0.00%Discovery Communications LLC $500,000 2.95% 20/3/2023 520,191 0.00%eBay, Inc. $500,000 2.70% 11/3/2030 520,115 0.00%Home Depot, Inc. $400,000 4.50% 6/12/2048 519,944 0.00%Federal National Mortgage Association $483,404 4.50% 1/7/2049 519,884 0.00%

488
Vanguard Global Bond Index Fund
Principal CouponMaturity
DateFair Value
US Dollars ($)% of Total
Net AssetsKansas Development Finance Authority $400,000 4.93% 15/4/2045 519,884 0.00%Federal Home Loan Mortgage Corp. $485,397 4.00% 1/5/2047 519,459 0.00%Government National Mortgage Association $481,093 3.50% 20/3/2043 519,437 0.00%Capital One Financial Corp. $500,000 2.60% 11/5/2023 519,209 0.00%Coca-Cola Co. $500,000 3.00% 5/3/2051 518,888 0.00%Marathon Petroleum Corp. $440,000 5.13% 15/12/2026 517,991 0.00%Global Payments, Inc. $450,000 4.15% 15/8/2049 517,882 0.00%WW Grainger, Inc. $500,000 1.85% 15/2/2025 517,657 0.00%AT&T, Inc. $500,000 2.30% 1/6/2027 517,441 0.00%Government National Mortgage Association $485,218 3.50% 20/2/2046 517,418 0.00%Zoetis, Inc. $500,000 3.00% 15/5/2050 516,760 0.00%Mount Sinai Hospitals Group, Inc. $500,000 3.39% 1/7/2050 516,485 0.00%Air Lease Corp. $500,000 2.30% 1/2/2025 516,478 0.00%Federal National Mortgage Association $485,230 4.00% 1/3/2048 516,346 0.00%Government National Mortgage Association $481,556 3.50% 20/12/2044 516,268 0.00%Wells Fargo Commercial Mortgage Trust 2018 $450,000 4.15% 15/8/2051 516,250 0.00%Federal Home Loan Mortgage Corp. $465,382 4.50% 1/2/2041 515,955 0.00%Caterpillar Financial Services Corp. $500,000 2.55% 29/11/2022 515,918 0.00%Vornado Realty LP $500,000 3.40% 1/6/2031 515,571 0.00%Federal National Mortgage Association $482,060 3.00% 1/10/2042 515,504 0.00%Bank of America Corp.^ $500,000 2.02% 13/2/2026 515,501 0.00%Federal Home Loan Banks $350,000 5.50% 15/7/2036 515,421 0.00%UBS Commercial Mortgage Trust 2018^ $450,000 4.24% 15/6/2051 515,272 0.00%Fiserv, Inc. $500,000 3.50% 1/10/2022 515,174 0.00%Kimco Realty Corp. $500,000 2.70% 1/10/2030 515,037 0.00%NetApp, Inc. $500,000 1.88% 22/6/2025 514,426 0.00%Starbucks Corp. $500,000 2.00% 12/3/2027 514,186 0.00%Celanese US Holdings LLC €400,000 2.13% 1/3/2027 514,140 0.00%Walt Disney Co. $500,000 1.75% 13/1/2026 514,115 0.00%Motiva Enterprises LLC $400,000 6.85% 15/1/2040 513,976 0.00%Duke Energy Corp. $475,000 3.15% 15/8/2027 513,865 0.00%Omega Healthcare Investors, Inc. $500,000 3.38% 1/2/2031 513,738 0.00%Bunge Ltd. Finance Corp. $500,000 3.00% 25/9/2022 513,688 0.00%Bank of America Corp.^ $500,000 2.65% 11/3/2032 513,288 0.00%Plains All American Pipeline LP/PAA Finance Corp. $500,000 2.85% 31/1/2023 513,207 0.00%Pacific Gas & Electric Co. $500,000 3.30% 1/12/2027 513,014 0.00%Exxon Mobil Corp. $490,000 2.44% 16/8/2029 512,613 0.00%Georgia-Pacific LLC $500,000 1.75% 30/9/2025 512,533 0.00%PNC Financial Services Group, Inc.^ $500,000 2.31% 23/4/2032 511,807 0.00%Procter & Gamble Co. €400,000 1.20% 30/10/2028 511,788 0.00%Georgia-Pacific LLC $500,000 2.30% 30/4/2030 511,489 0.00%Mayo Clinic $475,000 3.20% 15/11/2061 511,422 0.00%Catholic Health Services of Long Island Obligated Group $500,000 3.37% 1/7/2050 511,147 0.00%Wells Fargo & Co.^ $500,000 1.65% 2/6/2024 510,766 0.00%Citigroup, Inc.^ $500,000 1.68% 15/5/2024 510,584 0.00%Visa, Inc. $500,000 2.15% 15/9/2022 510,468 0.00%Ecolab, Inc. $500,000 2.38% 10/8/2022 510,460 0.00%Enterprise Products Operating LLC $490,000 3.35% 15/3/2023 510,269 0.00%Norfolk Southern Corp. $450,000 3.80% 1/8/2028 509,688 0.00%Federal Home Loan Mortgage Corp. $509,501 1.50% 1/5/2041 509,493 0.00%Charter Communications Operating LLC/Charter Communications
Operating Capital $450,000 4.20% 15/3/2028 509,040 0.00%Federal National Mortgage Association $440,074 5.50% 1/5/2034 508,731 0.00%AT&T, Inc. CA($)575,000 4.00% 25/11/2025 508,722 0.00%Xcel Energy, Inc. $350,000 6.50% 1/7/2036 508,658 0.00%Zoetis, Inc. $395,000 4.70% 1/2/2043 508,515 0.00%Mondelez International, Inc. $500,000 1.50% 4/5/2025 508,447 0.00%CoStar Group, Inc. $500,000 2.80% 15/7/2030 508,318 0.00%CSAIL 2018-CX11 Commercial Mortgage Trust^ $450,000 4.03% 15/4/2051 508,317 0.00%salesforce.com, Inc. $500,000 3.05% 15/7/2061 508,108 0.00%KKR Group Finance Co. V LLC €400,000 1.63% 22/5/2029 508,026 0.00%State Board of Administration Finance Corp. $500,000 2.15% 1/7/2030 507,610 0.00%Dow Chemical Co. €400,000 1.88% 15/3/2040 507,429 0.00%Vornado Realty LP $500,000 2.15% 1/6/2026 507,196 0.00%Federal National Mortgage Association $475,480 3.00% 1/6/2033 507,130 0.00%VEREIT Operating Partnership LP $450,000 3.95% 15/8/2027 507,030 0.00%Electronic Arts, Inc. $440,000 4.80% 1/3/2026 506,897 0.00%Williams Cos, Inc. $500,000 2.60% 15/3/2031 506,868 0.00%Federal National Mortgage Association $350,000 6.63% 15/11/2030 506,371 0.00%Banner Health $500,000 2.91% 1/1/2051 506,210 0.00%NRG Energy, Inc. $500,000 2.00% 2/12/2025 506,171 0.00%
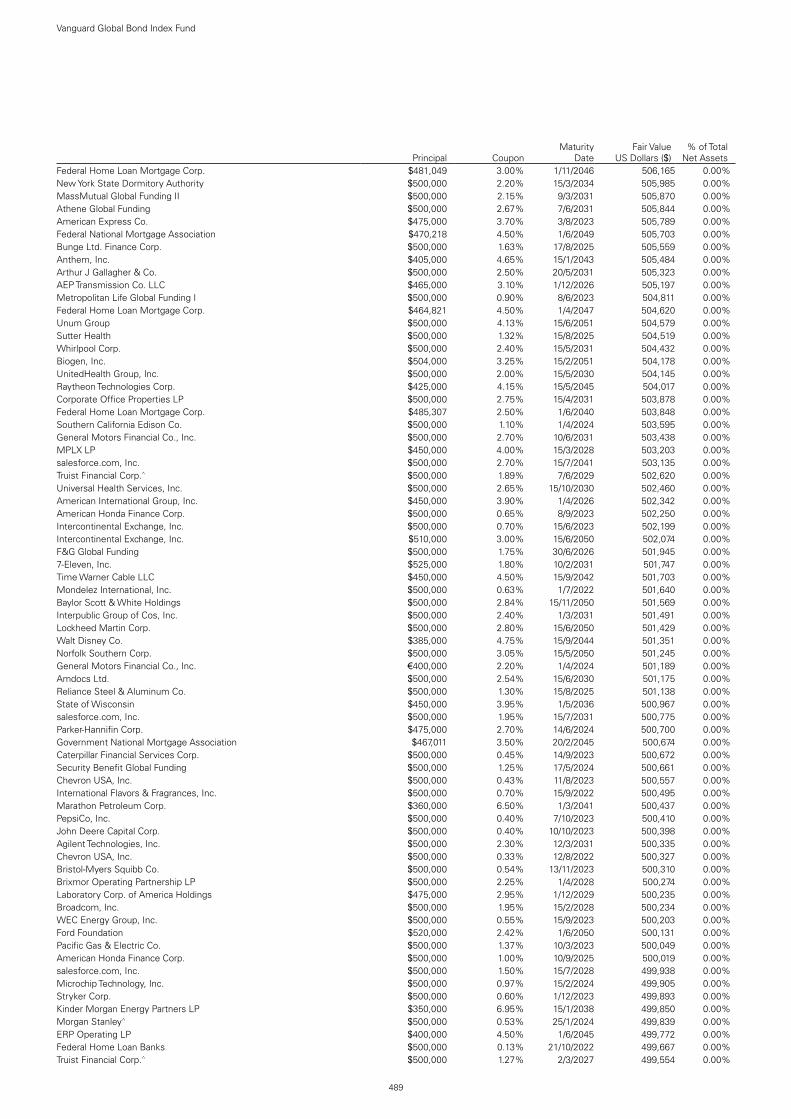
489
Vanguard Global Bond Index Fund
Principal CouponMaturity
DateFair Value
US Dollars ($)% of Total
Net AssetsFederal Home Loan Mortgage Corp. $481,049 3.00% 1/11/2046 506,165 0.00%New York State Dormitory Authority $500,000 2.20% 15/3/2034 505,985 0.00%MassMutual Global Funding II $500,000 2.15% 9/3/2031 505,870 0.00%Athene Global Funding $500,000 2.67% 7/6/2031 505,844 0.00%American Express Co. $475,000 3.70% 3/8/2023 505,789 0.00%Federal National Mortgage Association $470,218 4.50% 1/6/2049 505,703 0.00%Bunge Ltd. Finance Corp. $500,000 1.63% 17/8/2025 505,559 0.00%Anthem, Inc. $405,000 4.65% 15/1/2043 505,484 0.00%Arthur J Gallagher & Co. $500,000 2.50% 20/5/2031 505,323 0.00%AEP Transmission Co. LLC $465,000 3.10% 1/12/2026 505,197 0.00%Metropolitan Life Global Funding I $500,000 0.90% 8/6/2023 504,811 0.00%Federal Home Loan Mortgage Corp. $464,821 4.50% 1/4/2047 504,620 0.00%Unum Group $500,000 4.13% 15/6/2051 504,579 0.00%Sutter Health $500,000 1.32% 15/8/2025 504,519 0.00%Whirlpool Corp. $500,000 2.40% 15/5/2031 504,432 0.00%Biogen, Inc. $504,000 3.25% 15/2/2051 504,178 0.00%UnitedHealth Group, Inc. $500,000 2.00% 15/5/2030 504,145 0.00%Raytheon Technologies Corp. $425,000 4.15% 15/5/2045 504,017 0.00%Corporate Office Properties LP $500,000 2.75% 15/4/2031 503,878 0.00%Federal Home Loan Mortgage Corp. $485,307 2.50% 1/6/2040 503,848 0.00%Southern California Edison Co. $500,000 1.10% 1/4/2024 503,595 0.00%General Motors Financial Co., Inc. $500,000 2.70% 10/6/2031 503,438 0.00%MPLX LP $450,000 4.00% 15/3/2028 503,203 0.00%salesforce.com, Inc. $500,000 2.70% 15/7/2041 503,135 0.00%Truist Financial Corp.^ $500,000 1.89% 7/6/2029 502,620 0.00%Universal Health Services, Inc. $500,000 2.65% 15/10/2030 502,460 0.00%American International Group, Inc. $450,000 3.90% 1/4/2026 502,342 0.00%American Honda Finance Corp. $500,000 0.65% 8/9/2023 502,250 0.00%Intercontinental Exchange, Inc. $500,000 0.70% 15/6/2023 502,199 0.00%Intercontinental Exchange, Inc. $510,000 3.00% 15/6/2050 502,074 0.00%F&G Global Funding $500,000 1.75% 30/6/2026 501,945 0.00%7-Eleven, Inc. $525,000 1.80% 10/2/2031 501,747 0.00%Time Warner Cable LLC $450,000 4.50% 15/9/2042 501,703 0.00%Mondelez International, Inc. $500,000 0.63% 1/7/2022 501,640 0.00%Baylor Scott & White Holdings $500,000 2.84% 15/11/2050 501,569 0.00%Interpublic Group of Cos, Inc. $500,000 2.40% 1/3/2031 501,491 0.00%Lockheed Martin Corp. $500,000 2.80% 15/6/2050 501,429 0.00%Walt Disney Co. $385,000 4.75% 15/9/2044 501,351 0.00%Norfolk Southern Corp. $500,000 3.05% 15/5/2050 501,245 0.00%General Motors Financial Co., Inc. €400,000 2.20% 1/4/2024 501,189 0.00%Amdocs Ltd. $500,000 2.54% 15/6/2030 501,175 0.00%Reliance Steel & Aluminum Co. $500,000 1.30% 15/8/2025 501,138 0.00%State of Wisconsin $450,000 3.95% 1/5/2036 500,967 0.00%salesforce.com, Inc. $500,000 1.95% 15/7/2031 500,775 0.00%Parker-Hannifin Corp. $475,000 2.70% 14/6/2024 500,700 0.00%Government National Mortgage Association $467,011 3.50% 20/2/2045 500,674 0.00%Caterpillar Financial Services Corp. $500,000 0.45% 14/9/2023 500,672 0.00%Security Benefit Global Funding $500,000 1.25% 17/5/2024 500,661 0.00%Chevron USA, Inc. $500,000 0.43% 11/8/2023 500,557 0.00%International Flavors & Fragrances, Inc. $500,000 0.70% 15/9/2022 500,495 0.00%Marathon Petroleum Corp. $360,000 6.50% 1/3/2041 500,437 0.00%PepsiCo, Inc. $500,000 0.40% 7/10/2023 500,410 0.00%John Deere Capital Corp. $500,000 0.40% 10/10/2023 500,398 0.00%Agilent Technologies, Inc. $500,000 2.30% 12/3/2031 500,335 0.00%Chevron USA, Inc. $500,000 0.33% 12/8/2022 500,327 0.00%Bristol-Myers Squibb Co. $500,000 0.54% 13/11/2023 500,310 0.00%Brixmor Operating Partnership LP $500,000 2.25% 1/4/2028 500,274 0.00%Laboratory Corp. of America Holdings $475,000 2.95% 1/12/2029 500,235 0.00%Broadcom, Inc. $500,000 1.95% 15/2/2028 500,234 0.00%WEC Energy Group, Inc. $500,000 0.55% 15/9/2023 500,203 0.00%Ford Foundation $520,000 2.42% 1/6/2050 500,131 0.00%Pacific Gas & Electric Co. $500,000 1.37% 10/3/2023 500,049 0.00%American Honda Finance Corp. $500,000 1.00% 10/9/2025 500,019 0.00%salesforce.com, Inc. $500,000 1.50% 15/7/2028 499,938 0.00%Microchip Technology, Inc. $500,000 0.97% 15/2/2024 499,905 0.00%Stryker Corp. $500,000 0.60% 1/12/2023 499,893 0.00%Kinder Morgan Energy Partners LP $350,000 6.95% 15/1/2038 499,850 0.00%Morgan Stanley^ $500,000 0.53% 25/1/2024 499,839 0.00%ERP Operating LP $400,000 4.50% 1/6/2045 499,772 0.00%Federal Home Loan Banks $500,000 0.13% 21/10/2022 499,667 0.00%Truist Financial Corp.^ $500,000 1.27% 2/3/2027 499,554 0.00%
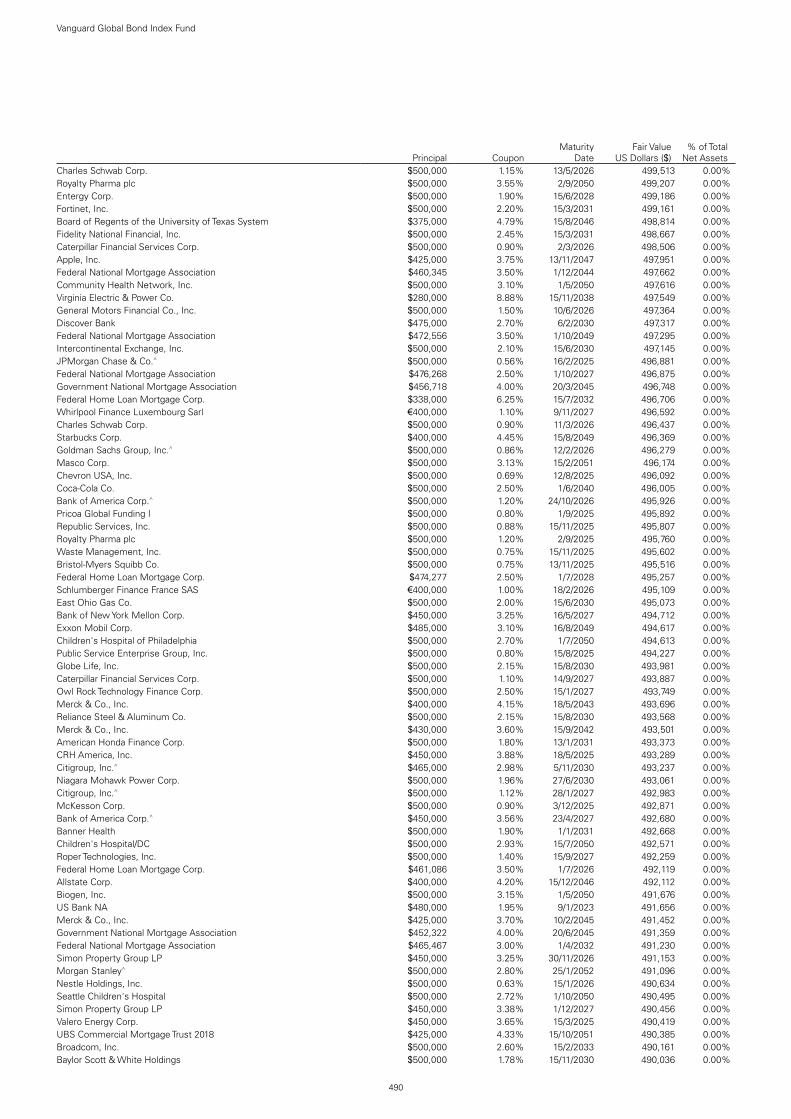
490
Vanguard Global Bond Index Fund
Principal CouponMaturity
DateFair Value
US Dollars ($)% of Total
Net AssetsCharles Schwab Corp. $500,000 1.15% 13/5/2026 499,513 0.00%Royalty Pharma plc $500,000 3.55% 2/9/2050 499,207 0.00%Entergy Corp. $500,000 1.90% 15/6/2028 499,186 0.00%Fortinet, Inc. $500,000 2.20% 15/3/2031 499,161 0.00%Board of Regents of the University of Texas System $375,000 4.79% 15/8/2046 498,814 0.00%Fidelity National Financial, Inc. $500,000 2.45% 15/3/2031 498,667 0.00%Caterpillar Financial Services Corp. $500,000 0.90% 2/3/2026 498,506 0.00%Apple, Inc. $425,000 3.75% 13/11/2047 497,951 0.00%Federal National Mortgage Association $460,345 3.50% 1/12/2044 497,662 0.00%Community Health Network, Inc. $500,000 3.10% 1/5/2050 497,616 0.00%Virginia Electric & Power Co. $280,000 8.88% 15/11/2038 497,549 0.00%General Motors Financial Co., Inc. $500,000 1.50% 10/6/2026 497,364 0.00%Discover Bank $475,000 2.70% 6/2/2030 497,317 0.00%Federal National Mortgage Association $472,556 3.50% 1/10/2049 497,295 0.00%Intercontinental Exchange, Inc. $500,000 2.10% 15/6/2030 497,145 0.00%JPMorgan Chase & Co.^ $500,000 0.56% 16/2/2025 496,881 0.00%Federal National Mortgage Association $476,268 2.50% 1/10/2027 496,875 0.00%Government National Mortgage Association $456,718 4.00% 20/3/2045 496,748 0.00%Federal Home Loan Mortgage Corp. $338,000 6.25% 15/7/2032 496,706 0.00%Whirlpool Finance Luxembourg Sarl €400,000 1.10% 9/11/2027 496,592 0.00%Charles Schwab Corp. $500,000 0.90% 11/3/2026 496,437 0.00%Starbucks Corp. $400,000 4.45% 15/8/2049 496,369 0.00%Goldman Sachs Group, Inc.^ $500,000 0.86% 12/2/2026 496,279 0.00%Masco Corp. $500,000 3.13% 15/2/2051 496,174 0.00%Chevron USA, Inc. $500,000 0.69% 12/8/2025 496,092 0.00%Coca-Cola Co. $500,000 2.50% 1/6/2040 496,005 0.00%Bank of America Corp.^ $500,000 1.20% 24/10/2026 495,926 0.00%Pricoa Global Funding I $500,000 0.80% 1/9/2025 495,892 0.00%Republic Services, Inc. $500,000 0.88% 15/11/2025 495,807 0.00%Royalty Pharma plc $500,000 1.20% 2/9/2025 495,760 0.00%Waste Management, Inc. $500,000 0.75% 15/11/2025 495,602 0.00%Bristol-Myers Squibb Co. $500,000 0.75% 13/11/2025 495,516 0.00%Federal Home Loan Mortgage Corp. $474,277 2.50% 1/7/2028 495,257 0.00%Schlumberger Finance France SAS €400,000 1.00% 18/2/2026 495,109 0.00%East Ohio Gas Co. $500,000 2.00% 15/6/2030 495,073 0.00%Bank of New York Mellon Corp. $450,000 3.25% 16/5/2027 494,712 0.00%Exxon Mobil Corp. $485,000 3.10% 16/8/2049 494,617 0.00%Children's Hospital of Philadelphia $500,000 2.70% 1/7/2050 494,613 0.00%Public Service Enterprise Group, Inc. $500,000 0.80% 15/8/2025 494,227 0.00%Globe Life, Inc. $500,000 2.15% 15/8/2030 493,981 0.00%Caterpillar Financial Services Corp. $500,000 1.10% 14/9/2027 493,887 0.00%Owl Rock Technology Finance Corp. $500,000 2.50% 15/1/2027 493,749 0.00%Merck & Co., Inc. $400,000 4.15% 18/5/2043 493,696 0.00%Reliance Steel & Aluminum Co. $500,000 2.15% 15/8/2030 493,568 0.00%Merck & Co., Inc. $430,000 3.60% 15/9/2042 493,501 0.00%American Honda Finance Corp. $500,000 1.80% 13/1/2031 493,373 0.00%CRH America, Inc. $450,000 3.88% 18/5/2025 493,289 0.00%Citigroup, Inc.^ $465,000 2.98% 5/11/2030 493,237 0.00%Niagara Mohawk Power Corp. $500,000 1.96% 27/6/2030 493,061 0.00%Citigroup, Inc.^ $500,000 1.12% 28/1/2027 492,983 0.00%McKesson Corp. $500,000 0.90% 3/12/2025 492,871 0.00%Bank of America Corp.^ $450,000 3.56% 23/4/2027 492,680 0.00%Banner Health $500,000 1.90% 1/1/2031 492,668 0.00%Children's Hospital/DC $500,000 2.93% 15/7/2050 492,571 0.00%Roper Technologies, Inc. $500,000 1.40% 15/9/2027 492,259 0.00%Federal Home Loan Mortgage Corp. $461,086 3.50% 1/7/2026 492,119 0.00%Allstate Corp. $400,000 4.20% 15/12/2046 492,112 0.00%Biogen, Inc. $500,000 3.15% 1/5/2050 491,676 0.00%US Bank NA $480,000 1.95% 9/1/2023 491,656 0.00%Merck & Co., Inc. $425,000 3.70% 10/2/2045 491,452 0.00%Government National Mortgage Association $452,322 4.00% 20/6/2045 491,359 0.00%Federal National Mortgage Association $465,467 3.00% 1/4/2032 491,230 0.00%Simon Property Group LP $450,000 3.25% 30/11/2026 491,153 0.00%Morgan Stanley^ $500,000 2.80% 25/1/2052 491,096 0.00%Nestle Holdings, Inc. $500,000 0.63% 15/1/2026 490,634 0.00%Seattle Children's Hospital $500,000 2.72% 1/10/2050 490,495 0.00%Simon Property Group LP $450,000 3.38% 1/12/2027 490,456 0.00%Valero Energy Corp. $450,000 3.65% 15/3/2025 490,419 0.00%UBS Commercial Mortgage Trust 2018 $425,000 4.33% 15/10/2051 490,385 0.00%Broadcom, Inc. $500,000 2.60% 15/2/2033 490,161 0.00%Baylor Scott & White Holdings $500,000 1.78% 15/11/2030 490,036 0.00%

491
Vanguard Global Bond Index Fund
Principal CouponMaturity
DateFair Value
US Dollars ($)% of Total
Net AssetsUBS Commercial Mortgage Trust 2018 $425,000 4.30% 15/8/2051 490,035 0.00%Anthem, Inc. $468,000 2.38% 15/1/2025 490,017 0.00%Northrop Grumman Corp. $375,000 5.05% 15/11/2040 489,947 0.00%Moody's Corp. €400,000 0.95% 25/2/2030 489,642 0.00%Federal Home Loan Mortgage Corp. $460,299 3.00% 1/10/2042 488,923 0.00%Federal National Mortgage Association $450,261 4.00% 1/11/2044 488,807 0.00%Walmart, Inc. $475,000 2.35% 15/12/2022 488,443 0.00%Federal National Mortgage Association $449,819 4.50% 1/1/2048 488,071 0.00%Oncor Electric Delivery Co. LLC $500,000 0.55% 1/10/2025 488,044 0.00%Conagra Brands, Inc. $500,000 1.38% 1/11/2027 487,955 0.00%Masco Corp. $500,000 2.00% 1/10/2030 487,826 0.00%Upjohn Finance BV €400,000 1.02% 23/6/2024 487,726 0.00%Crown Castle International Corp. $500,000 2.10% 1/4/2031 487,654 0.00%HSBC USA, Inc. $450,000 3.50% 23/6/2024 487,431 0.00%Adobe, Inc. $450,000 3.25% 1/2/2025 487,411 0.00%Medtronic Global Holdings SCA €400,000 1.63% 15/10/2050 487,214 0.00%Union Electric Co. $425,000 3.90% 15/9/2042 487,147 0.00%John Deere Capital Corp. $450,000 2.80% 8/9/2027 487,004 0.00%JPMorgan Chase & Co. $470,000 3.25% 23/9/2022 486,866 0.00%BANK 2017 $450,000 3.18% 15/9/2060 486,776 0.00%Trans-Allegheny Interstate Line Co. $450,000 3.85% 1/6/2025 486,709 0.00%Government National Mortgage Association $466,765 2.50% 20/11/2046 486,525 0.00%Johnson & Johnson €400,000 0.65% 20/5/2024 486,519 0.00%Apple, Inc. $455,000 2.75% 13/1/2025 486,461 0.00%Apple, Inc. $500,000 2.38% 8/2/2041 486,437 0.00%Rockefeller Foundation $500,000 2.49% 1/10/2050 486,381 0.00%Massachusetts Mutual Life Insurance Co. $375,000 4.90% 1/4/2077 486,292 0.00%Bank of America Corp. $446,000 4.00% 1/4/2024 486,273 0.00%Synchrony Financial $475,000 2.85% 25/7/2022 486,178 0.00%Municipal Electric Authority of Georgia $315,000 6.66% 1/4/2057 485,780 0.00%Discovery Communications LLC $425,000 4.90% 11/3/2026 485,571 0.00%JPMorgan Chase & Co. $370,000 4.85% 1/2/2044 485,129 0.00%Coca-Cola Co. $500,000 1.00% 15/3/2028 485,099 0.00%Government National Mortgage Association $455,761 3.50% 20/1/2047 485,053 0.00%Ameren Corp. $460,000 2.50% 15/9/2024 484,530 0.00%Federal National Mortgage Association $436,857 4.50% 1/8/2040 483,989 0.00%Air Products & Chemicals, Inc. €400,000 0.50% 5/5/2028 483,657 0.00%PepsiCo, Inc. $500,000 1.40% 25/2/2031 483,508 0.00%Federal Home Loan Mortgage Corp. $445,299 3.00% 1/9/2033 483,454 0.00%New Jersey Economic Development Authority $375,000 7.43% 15/2/2029 483,184 0.00%Sharp HealthCare $500,000 2.68% 1/8/2050 483,132 0.00%National Grid North America, Inc. €400,000 0.75% 8/8/2023 483,003 0.00%Simon International Finance SCA €400,000 1.38% 18/11/2022 482,944 0.00%Apollo Management Holdings LP $425,000 4.40% 27/5/2026 482,703 0.00%Cboe Global Markets, Inc. $500,000 1.63% 15/12/2030 482,399 0.00%Johnson Controls International plc/Tyco Fire & Security Finance SCA $500,000 1.75% 15/9/2030 481,885 0.00%Boston Scientific Corp. €400,000 0.63% 1/12/2027 481,367 0.00%Coca-Cola Co. $500,000 2.60% 1/6/2050 481,327 0.00%Bristol-Myers Squibb Co. $500,000 2.35% 13/11/2040 481,233 0.00%WP Carey, Inc. $500,000 2.25% 1/4/2033 481,101 0.00%Municipal Electric Authority of Georgia $316,000 6.64% 1/4/2057 481,088 0.00%Duke Realty LP $500,000 1.75% 1/2/2031 480,985 0.00%Roper Technologies, Inc. $500,000 1.75% 15/2/2031 480,636 0.00%Federal National Mortgage Association $450,503 3.50% 1/3/2046 480,581 0.00%US Bancorp $500,000 1.38% 22/7/2030 480,342 0.00%Illinois Tool Works, Inc. €400,000 0.25% 5/12/2024 480,332 0.00%Northwestern Mutual Life Insurance Co. $440,000 3.63% 30/9/2059 480,217 0.00%JPMorgan Chase & Co.^ $500,000 1.76% 19/11/2031 480,210 0.00%Stryker Corp. $375,000 4.63% 15/3/2046 480,183 0.00%Pacific LifeCorp $375,000 5.13% 30/1/2043 480,113 0.00%Viatris, Inc. $475,000 2.70% 22/6/2030 480,002 0.00%Consolidated Edison Co. of New York, Inc. $450,000 3.70% 15/11/2059 479,590 0.00%Federal National Mortgage Association $453,138 3.00% 1/1/2035 479,542 0.00%BP Capital Markets America, Inc. $500,000 2.94% 4/6/2051 479,509 0.00%Kroger Co. $500,000 1.70% 15/1/2031 479,491 0.00%Pricoa Global Funding I $450,000 3.45% 1/9/2023 479,245 0.00%Exxon Mobil Corp. $400,000 4.23% 19/3/2040 478,655 0.00%Government National Mortgage Association $449,673 3.00% 20/5/2043 478,618 0.00%Home Depot, Inc. $500,000 1.38% 15/3/2031 478,596 0.00%Newmont Corp. $350,000 5.45% 9/6/2044 478,181 0.00%International Paper Co. $375,000 4.80% 15/6/2044 478,135 0.00%

492
Vanguard Global Bond Index Fund
Principal CouponMaturity
DateFair Value
US Dollars ($)% of Total
Net AssetsAT&T, Inc. €400,000 0.80% 4/3/2030 477,994 0.00%Apple, Inc. €400,000 0.00% 15/11/2025 477,703 0.00%Nestle Holdings, Inc. $500,000 1.25% 15/9/2030 477,660 0.00%Coca-Cola Co. $500,000 1.38% 15/3/2031 477,597 0.00%Realty Income Corp. $500,000 1.80% 15/3/2033 477,414 0.00%Citizens Financial Group, Inc. $465,000 2.50% 6/2/2030 477,393 0.00%WRKCo, Inc. $450,000 3.00% 15/9/2024 477,253 0.00%Stryker Corp. $475,000 2.90% 15/6/2050 477,155 0.00%Home Depot, Inc. $450,000 3.13% 15/12/2049 476,963 0.00%NextEra Energy Capital Holdings, Inc.^ $425,000 4.80% 1/12/2077 476,752 0.00%Thermo Fisher Scientific, Inc. €400,000 0.13% 1/3/2025 476,688 0.00%Procter & Gamble Co. $500,000 1.20% 29/10/2030 476,485 0.00%Republic Services, Inc. $500,000 1.75% 15/2/2032 476,404 0.00%Chubb INA Holdings, Inc. $500,000 1.38% 15/9/2030 475,664 0.00%University of Southern California $310,000 5.25% 1/10/2111 475,543 0.00%Federal National Mortgage Association $429,111 4.50% 1/9/2042 475,407 0.00%PepsiCo, Inc. €400,000 0.88% 16/10/2039 475,102 0.00%Omega Healthcare Investors, Inc. $425,000 4.50% 1/4/2027 474,962 0.00%Regeneron Pharmaceuticals, Inc. $500,000 1.75% 15/9/2030 474,297 0.00%Federal National Mortgage Association $409,384 5.50% 1/2/2035 474,210 0.00%Federal National Mortgage Association $450,562 3.50% 1/7/2050 474,150 0.00%Freddie Mac Multifamily Structured Pass Through Certificates $475,000 1.50% 25/10/2030 473,749 0.00%Federal Home Loan Mortgage Corp. $448,966 3.00% 1/4/2047 473,716 0.00%Carmax Auto Owner Trust 2018 $467,171 3.36% 15/9/2023 473,612 0.00%NiSource, Inc. $500,000 1.70% 15/2/2031 473,541 0.00%Enbridge Energy Partners LP $300,000 7.38% 15/10/2045 473,483 0.00%Southwestern Public Service Co. $445,000 3.30% 15/6/2024 473,154 0.00%Duke Energy Florida LLC $320,000 6.40% 15/6/2038 472,347 0.00%Corning, Inc. $350,000 5.35% 15/11/2048 472,052 0.00%Federal National Mortgage Association $442,057 3.50% 1/1/2026 471,963 0.00%Federal National Mortgage Association $431,598 4.00% 1/5/2044 471,599 0.00%Coca-Cola Co. $500,000 2.50% 15/3/2051 470,855 0.00%Packaging Corp. of America $435,000 3.65% 15/9/2024 470,814 0.00%American Tower Corp. €400,000 0.50% 15/1/2028 470,355 0.00%Boeing Co. $450,000 3.95% 1/8/2059 470,215 0.00%Federal Home Loan Mortgage Corp. $450,965 3.00% 1/8/2049 470,072 0.00%Digital Dutch Finco BV €400,000 1.00% 15/1/2032 470,047 0.00%Anthem, Inc. $375,000 4.65% 15/8/2044 469,648 0.00%Government National Mortgage Association $445,824 3.00% 20/11/2046 469,579 0.00%Coca-Cola Co. €400,000 0.13% 9/3/2029 469,564 0.00%McDonald's Corp. $425,000 3.50% 1/3/2027 469,507 0.00%Toyota Motor Credit Corp. $455,000 1.80% 13/2/2025 469,351 0.00%Federal Home Loan Mortgage Corp. $449,185 2.50% 1/6/2028 469,022 0.00%Republic Services, Inc. $500,000 1.45% 15/2/2031 468,773 0.00%Chicago O'Hare International Airport $350,000 4.57% 1/1/2054 468,569 0.00%Freddie Mac Multifamily Structured Pass Through Certificates $450,000 2.02% 25/3/2031 468,325 0.00%American International Group, Inc. $425,000 3.75% 10/7/2025 468,047 0.00%Federal National Mortgage Association $431,141 4.50% 1/11/2047 467,805 0.00%Otis Worldwide Corp. $450,000 2.06% 5/4/2025 467,733 0.00%Citigroup, Inc. £200,000 6.80% 25/6/2038 467,161 0.00%Amgen, Inc. $440,000 2.60% 19/8/2026 467,115 0.00%Federal National Mortgage Association $442,136 3.00% 1/12/2035 466,936 0.00%Federal National Mortgage Association $427,829 4.00% 1/6/2044 466,842 0.00%Comcast Corp. $345,000 5.65% 15/6/2035 466,820 0.00%Berkshire Hathaway Finance Corp. $375,000 4.30% 15/5/2043 466,620 0.00%Brixmor Operating Partnership LP $416,000 4.13% 15/5/2029 466,475 0.00%Verizon Communications, Inc. £300,000 3.13% 2/11/2035 466,319 0.00%Kroger Co. $325,000 7.50% 1/4/2031 466,302 0.00%NextEra Energy Capital Holdings, Inc.^ $400,000 5.65% 1/5/2079 466,032 0.00%Kinder Morgan, Inc. $360,000 5.55% 1/6/2045 465,635 0.00%Ferguson Finance plc $400,000 4.50% 24/10/2028 465,400 0.00%New York & Presbyterian Hospital $500,000 2.61% 1/8/2060 465,058 0.00%Baker Hughes a GE Co. LLC/Baker Hughes Co.-Obligor, Inc. $425,000 3.34% 15/12/2027 464,861 0.00%Johnson & Johnson $425,000 2.95% 3/3/2027 464,600 0.00%Oracle Corp. $400,000 4.30% 8/7/2034 464,556 0.00%Federal National Mortgage Association $435,383 3.50% 1/1/2046 464,451 0.00%Intel Corp. $435,000 3.25% 15/11/2049 463,607 0.00%Huntington Ingalls Industries, Inc. $425,000 3.48% 1/12/2027 463,529 0.00%Home Depot, Inc. $500,000 2.38% 15/3/2051 462,533 0.00%Federal National Mortgage Association $416,784 4.50% 1/2/2045 462,475 0.00%Raytheon Technologies Corp. $450,000 2.50% 15/12/2022 461,805 0.00%

493
Vanguard Global Bond Index Fund
Principal CouponMaturity
DateFair Value
US Dollars ($)% of Total
Net AssetsFreddie Mac Multifamily Structured Pass Through Certificates $400,000 3.69% 25/1/2029 461,697 0.00%Sabine Pass Liquefaction LLC $400,000 4.50% 15/5/2030 461,516 0.00%MetLife, Inc. $350,000 4.88% 13/11/2043 461,410 0.00%Government National Mortgage Association $431,939 4.50% 20/12/2048 461,256 0.00%Banc of America Commercial Mortgage Trust 2017 $425,000 3.31% 15/2/2050 460,973 0.00%Anthem, Inc. $350,000 5.10% 15/1/2044 460,806 0.00%Merck & Co., Inc. €380,000 0.50% 2/11/2024 460,536 0.00%Government National Mortgage Association $429,471 3.50% 20/8/2044 460,428 0.00%Federal National Mortgage Association $425,520 4.00% 1/1/2046 460,181 0.00%US Treasury Note $440,000 2.13% 30/11/2023 458,975 0.00%Toyota Motor Credit Corp. $450,000 1.35% 25/8/2023 458,778 0.00%Virginia Electric & Power Co. $400,000 3.80% 15/9/2047 458,536 0.00%International Flavors & Fragrances, Inc. €370,000 1.75% 14/3/2024 458,271 0.00%Prudential Financial, Inc. $400,000 3.88% 27/3/2028 458,269 0.00%Adobe, Inc. $440,000 2.30% 1/2/2030 458,100 0.00%Government National Mortgage Association $426,901 4.00% 20/1/2047 457,647 0.00%Government National Mortgage Association $424,942 4.00% 15/6/2048 457,532 0.00%Midwest Connector Capital Co. LLC $450,000 3.63% 1/4/2022 457,334 0.00%Charles Schwab Corp. $425,000 3.55% 1/2/2024 457,295 0.00%Duke Energy Carolinas LLC $435,000 3.20% 15/8/2049 457,207 0.00%Aon plc $425,000 3.50% 14/6/2024 457,043 0.00%Federal National Mortgage Association $430,165 3.00% 1/4/2043 456,669 0.00%Apple, Inc. $440,000 1.80% 11/9/2024 456,665 0.00%Federal Home Loan Mortgage Corp. $421,537 3.50% 1/4/2042 456,564 0.00%American Honda Finance Corp. $450,000 3.38% 10/12/2021 456,299 0.00%Cigna Corp. $450,000 2.38% 15/3/2031 456,284 0.00%Dow Chemical Co. $325,000 5.55% 30/11/2048 456,231 0.00%Regeneron Pharmaceuticals, Inc. $500,000 2.80% 15/9/2050 455,798 0.00%Enterprise Products Operating LLC $325,000 6.13% 15/10/2039 455,644 0.00%Cleveland Electric Illuminating Co. $400,000 5.50% 15/8/2024 455,458 0.00%American International Group, Inc.^ $400,000 5.75% 1/4/2048 455,282 0.00%Government National Mortgage Association $427,858 4.00% 20/4/2048 455,244 0.00%Federal Home Loan Mortgage Corp. $423,112 4.50% 1/6/2048 455,161 0.00%Nucor Corp. $470,000 2.98% 15/12/2055 454,530 0.00%Federal National Mortgage Association $416,318 4.00% 1/11/2045 454,503 0.00%BP Capital Markets America, Inc. $450,000 3.06% 17/6/2041 454,449 0.00%Chevron USA, Inc. $500,000 2.34% 12/8/2050 453,200 0.00%Duke Energy Corp. $425,000 3.75% 1/9/2046 453,132 0.00%ACE Capital Trust II $300,000 9.70% 1/4/2030 452,721 0.00%Simon Property Group LP $440,000 2.45% 13/9/2029 452,681 0.00%Cigna Corp. $425,000 3.75% 15/7/2023 452,492 0.00%Comcast Corp. $400,000 3.75% 1/4/2040 452,240 0.00%Federal Home Loan Mortgage Corp. $429,984 3.00% 1/1/2027 452,172 0.00%New Jersey Turnpike Authority $275,000 7.41% 1/1/2040 452,160 0.00%Verizon Communications, Inc. $394,000 4.02% 3/12/2029 451,957 0.00%Federal Home Loan Mortgage Corp. $417,431 4.00% 1/2/2046 451,758 0.00%Arizona Public Service Co. $400,000 3.75% 15/5/2046 451,645 0.00%Federal National Mortgage Association $407,547 4.50% 1/6/2041 451,614 0.00%American Water Capital Corp. $400,000 3.75% 1/9/2047 451,549 0.00%Federal National Mortgage Association $429,458 3.00% 1/2/2027 451,503 0.00%Wells Fargo Bank NA £300,000 5.25% 1/8/2023 451,382 0.00%Nissan Motor Acceptance Corp. $425,000 3.88% 21/9/2023 451,055 0.00%Texas Transportation Commission State Highway Fund $365,000 5.18% 1/4/2030 451,027 0.00%Federal Home Loan Mortgage Corp. $415,289 4.00% 1/1/2045 450,988 0.00%Government National Mortgage Association $414,589 4.00% 20/8/2044 450,927 0.00%Wells Fargo Commercial Mortgage Trust 2012 $441,111 2.92% 15/10/2045 450,516 0.00%Walmart, Inc. $425,000 3.40% 26/6/2023 450,070 0.00%Carrier Global Corp. $430,000 2.49% 15/2/2027 449,982 0.00%Government National Mortgage Association $425,044 3.50% 20/5/2048 449,944 0.00%Consolidated Edison Co. of New York, Inc. $400,000 3.95% 1/3/2043 449,578 0.00%Federal Home Loan Mortgage Corp. $427,228 3.00% 1/5/2046 449,534 0.00%Regents of the University of California Medical Center Pooled Revenue $290,000 6.55% 15/5/2048 449,259 0.00%Kentucky Utilities Co. $425,000 3.30% 1/6/2050 448,991 0.00%MetLife, Inc. $350,000 6.40% 15/12/2036 448,601 0.00%Amgen, Inc. $435,000 2.45% 21/2/2030 448,440 0.00%Government National Mortgage Association $420,024 4.00% 20/6/2047 448,318 0.00%Commonwealth of Massachusetts $425,000 2.81% 1/9/2043 447,725 0.00%Comcast Corp. $420,000 3.25% 1/11/2039 446,926 0.00%Federal National Mortgage Association $412,895 3.50% 1/3/2045 446,816 0.00%Duke Energy Indiana LLC $325,000 6.12% 15/10/2035 446,699 0.00%Simon Property Group LP $410,000 3.38% 15/6/2027 446,625 0.00%

494
Vanguard Global Bond Index Fund
Principal CouponMaturity
DateFair Value
US Dollars ($)% of Total
Net AssetsFidelity National Information Services, Inc. $450,000 1.15% 1/3/2026 446,443 0.00%Government National Mortgage Association $437,323 2.00% 20/8/2050 445,726 0.00%Government National Mortgage Association $420,855 3.50% 20/9/2049 445,565 0.00%Government National Mortgage Association $399,117 4.50% 20/4/2041 445,484 0.00%JB Hunt Transport Services, Inc. $400,000 3.88% 1/3/2026 445,442 0.00%Tennessee Valley Authority $300,000 5.88% 1/4/2036 445,422 0.00%Federal National Mortgage Association $407,295 4.00% 1/3/2042 445,367 0.00%Southern Co. $410,000 3.25% 1/7/2026 444,788 0.00%Federal National Mortgage Association $406,720 4.00% 1/9/2040 444,778 0.00%Federal National Mortgage Association $376,245 6.00% 1/9/2037 444,590 0.00%Boardwalk Pipelines LP $375,000 5.95% 1/6/2026 444,421 0.00%Ecolab, Inc. $500,000 2.13% 15/8/2050 444,397 0.00%Broadcom, Inc. $395,000 4.11% 15/9/2028 444,072 0.00%Federal National Mortgage Association $403,800 4.00% 1/10/2044 444,049 0.00%Freddie Mac Multifamily Structured Pass Through Certificates^ $400,000 3.35% 25/11/2026 443,914 0.00%ONEOK Partners LP $325,000 6.85% 15/10/2037 443,802 0.00%Plains All American Pipeline LP/PAA Finance Corp. $395,000 4.50% 15/12/2026 443,770 0.00%Federal National Mortgage Association $424,379 2.50% 1/12/2035 443,674 0.00%Texas Instruments, Inc. $350,000 4.15% 15/5/2048 443,638 0.00%Government National Mortgage Association $418,490 3.00% 20/1/2046 443,115 0.00%Federal Home Loan Mortgage Corp. $421,281 3.00% 1/5/2027 443,068 0.00%Union Pacific Corp. $430,000 4.16% 15/7/2022 443,051 0.00%Consolidated Edison Co. of New York, Inc. $365,000 4.50% 15/5/2058 442,925 0.00%Federal National Mortgage Association $411,563 4.00% 1/7/2050 442,235 0.00%Discovery Communications LLC $418,000 4.00% 15/9/2055 442,076 0.00%Raytheon Technologies Corp. $400,000 3.50% 15/3/2027 441,394 0.00%Public Service Electric & Gas Co. $375,000 3.80% 1/3/2046 441,058 0.00%Berkshire Hathaway, Inc. $425,000 2.75% 15/3/2023 441,027 0.00%Chevron Phillips Chemical Co. LLC/Chevron Phillips Chemical Co. LP $400,000 3.40% 1/12/2026 440,982 0.00%George Washington University $350,000 4.30% 15/9/2044 440,962 0.00%KeyCorp $425,000 2.25% 6/4/2027 440,819 0.00%Air Lease Corp. $390,000 4.63% 1/10/2028 440,744 0.00%Parker-Hannifin Corp. $425,000 3.50% 15/9/2022 440,625 0.00%Federal Home Loan Mortgage Corp. $421,249 2.50% 1/8/2027 439,601 0.00%Procter & Gamble Co. $375,000 3.55% 25/3/2040 439,379 0.00%Federal Home Loan Mortgage Corp. $409,248 3.50% 1/7/2043 439,316 0.00%Federal Home Loan Mortgage Corp. $408,826 3.50% 1/1/2042 438,993 0.00%Honeywell International, Inc. $432,000 1.95% 1/6/2030 438,916 0.00%AT&T, Inc. $400,000 3.60% 15/7/2025 438,736 0.00%Carlyle Finance LLC $325,000 5.65% 15/9/2048 438,696 0.00%FedEx Corp. $400,000 3.25% 1/4/2026 437,976 0.00%Aon plc $350,000 4.60% 14/6/2044 437,432 0.00%Government National Mortgage Association $410,852 3.50% 20/4/2046 437,257 0.00%DR Horton, Inc. $400,000 5.75% 15/8/2023 437,212 0.00%Citigroup, Inc. $425,000 2.70% 27/10/2022 437,156 0.00%WRKCo, Inc. $400,000 3.75% 15/3/2025 436,902 0.00%Dominion Energy, Inc. $400,000 3.38% 1/4/2030 436,104 0.00%Kinder Morgan Energy Partners LP $340,000 5.80% 15/3/2035 436,001 0.00%Comcast Corp. $300,000 7.05% 15/3/2033 435,857 0.00%Waste Management, Inc. $450,000 1.15% 15/3/2028 435,785 0.00%International Business Machines Corp. $430,000 1.70% 15/5/2027 435,582 0.00%Anthem, Inc. $350,000 4.63% 15/5/2042 435,548 0.00%Federal National Mortgage Association $409,147 4.00% 1/12/2048 435,384 0.00%Virginia Electric & Power Co. $300,000 6.35% 30/11/2037 435,297 0.00%American Tower Corp. $400,000 3.38% 15/10/2026 435,278 0.00%Federal National Mortgage Association $407,704 3.50% 1/2/2032 435,272 0.00%Waste Management, Inc. $425,000 2.90% 15/9/2022 435,246 0.00%Federal National Mortgage Association $407,588 3.50% 1/4/2032 434,882 0.00%Federal Home Loan Mortgage Corp. $408,797 3.50% 1/12/2046 434,576 0.00%3M Co. $400,000 2.88% 15/10/2027 434,551 0.00%Consolidated Edison Co. of New York, Inc. $325,000 5.85% 15/3/2036 434,388 0.00%McDonald's Corp. $400,000 3.38% 26/5/2025 434,276 0.00%Prudential Financial, Inc.^ $400,000 4.50% 15/9/2047 434,222 0.00%Zimmer Biomet Holdings, Inc. $400,000 3.55% 1/4/2025 434,048 0.00%Connecticut Light & Power Co. $350,000 4.30% 15/4/2044 434,036 0.00%Federal Home Loan Mortgage Corp. $400,607 4.00% 1/7/2038 433,954 0.00%Federal Home Loan Mortgage Corp. $419,506 2.50% 1/4/2050 433,902 0.00%Metropolitan Transportation Authority $300,000 6.67% 15/11/2039 433,893 0.00%Deere & Co. $300,000 7.13% 3/3/2031 433,604 0.00%Federal Home Loan Mortgage Corp. $404,348 3.50% 1/7/2034 433,179 0.00%Morgan Stanley $400,000 3.13% 27/7/2026 433,036 0.00%

495
Vanguard Global Bond Index Fund
Principal CouponMaturity
DateFair Value
US Dollars ($)% of Total
Net AssetsFederal Home Loan Mortgage Corp. $405,454 3.50% 1/5/2032 432,800 0.00%UnitedHealth Group, Inc. $375,000 3.75% 15/10/2047 432,252 0.00%American Water Capital Corp. $400,000 2.95% 1/9/2027 432,033 0.00%PepsiCo, Inc. $400,000 2.85% 24/2/2026 432,015 0.00%Booking Holdings, Inc. €336,000 1.80% 3/3/2027 431,941 0.00%Los Angeles Community College District $250,000 6.75% 1/8/2049 431,805 0.00%Government National Mortgage Association $402,644 3.50% 20/11/2044 431,668 0.00%Ares Capital Corp. $415,000 3.50% 10/2/2023 430,767 0.00%Amgen, Inc. $400,000 3.63% 22/5/2024 430,673 0.00%New York & Presbyterian Hospital $365,000 3.95% 1/8/2119 430,555 0.00%Federal Home Loan Mortgage Corp. $407,447 3.00% 1/10/2030 430,539 0.00%Perrigo Finance Unlimited Co. $400,000 3.90% 15/12/2024 430,062 0.00%Marriott International, Inc. $400,000 3.75% 15/3/2025 429,936 0.00%S&P Global, Inc. $500,000 2.30% 15/8/2060 429,321 0.00%Federal National Mortgage Association $392,103 4.00% 1/7/2040 428,809 0.00%Cardinal Health, Inc. $404,000 3.08% 15/6/2024 428,654 0.00%ViacomCBS, Inc. $300,000 7.88% 30/7/2030 428,300 0.00%Gilead Sciences, Inc. $350,000 4.60% 1/9/2035 428,124 0.00%Procter & Gamble Co. £300,000 1.38% 3/5/2025 427,601 0.00%Ascension Health $400,000 3.11% 15/11/2039 427,571 0.00%Sonoco Products Co. $400,000 3.13% 1/5/2030 427,388 0.00%Boston Scientific Corp. $400,000 3.45% 1/3/2024 427,139 0.00%Truist Bank^ $400,000 3.69% 2/8/2024 426,710 0.00%Western Union Co. $403,000 2.85% 10/1/2025 426,660 0.00%Federal Home Loan Mortgage Corp. $396,386 3.50% 1/6/2045 426,556 0.00%Federal National Mortgage Association $408,977 3.00% 1/10/2039 426,374 0.00%Pfizer, Inc. $425,000 0.80% 28/5/2025 426,166 0.00%Edison International $400,000 3.55% 15/11/2024 426,065 0.00%General Motors Co. $350,000 5.15% 1/4/2038 426,044 0.00%Federal Home Loan Mortgage Corp. $399,174 3.50% 1/4/2045 426,002 0.00%AT&T, Inc. $425,000 0.90% 25/3/2024 425,913 0.00%Bristol-Myers Squibb Co. $400,000 3.25% 1/11/2023 425,791 0.00%United Parcel Service, Inc. $400,000 2.40% 15/11/2026 425,551 0.00%LyondellBasell Industries NV $350,000 4.63% 26/2/2055 425,390 0.00%Essex Portfolio LP $350,000 4.50% 15/3/2048 425,325 0.00%General Motors Financial Co., Inc. $400,000 4.25% 15/5/2023 425,141 0.00%Boston Scientific Corp. $411,000 2.65% 1/6/2030 424,893 0.00%Federal National Mortgage Association $391,361 4.50% 1/3/2048 424,641 0.00%Federal National Mortgage Association $394,709 3.50% 1/7/2029 424,465 0.00%Fidelity National Information Services, Inc. $425,000 2.25% 1/3/2031 424,340 0.00%Federal Home Loan Mortgage Corp. $402,066 3.00% 1/8/2029 424,195 0.00%Pfizer, Inc. $425,000 2.70% 28/5/2050 423,735 0.00%BP Capital Markets America, Inc. $400,000 3.22% 28/11/2023 423,669 0.00%Crown Castle International Corp. $425,000 3.25% 15/1/2051 423,338 0.00%Cargill, Inc. $400,000 3.13% 25/5/2051 422,975 0.00%Procter & Gamble Co. €300,000 1.88% 30/10/2038 422,903 0.00%Federal National Mortgage Association $378,923 5.00% 1/12/2048 422,891 0.00%Federal National Mortgage Association $400,332 3.50% 1/8/2049 422,789 0.00%Federal National Mortgage Association $396,252 3.00% 1/9/2033 422,628 0.00%Federal National Mortgage Association $404,847 2.50% 1/9/2027 422,364 0.00%Prudential Financial, Inc.^ $400,000 5.88% 15/9/2042 422,265 0.00%Government National Mortgage Association $383,665 4.00% 20/1/2041 421,870 0.00%Government National Mortgage Association $377,241 4.50% 20/7/2041 421,066 0.00%Johnson & Johnson $350,000 3.75% 3/3/2047 420,735 0.00%Santander Holdings USA, Inc. $375,000 4.40% 13/7/2027 420,714 0.00%eBay, Inc. $375,000 4.00% 15/7/2042 420,681 0.00%Sempra Energy $375,000 4.00% 1/2/2048 420,517 0.00%Raytheon Technologies Corp. $300,000 6.05% 1/6/2036 419,389 0.00%Federal National Mortgage Association $384,757 4.50% 1/1/2049 419,374 0.00%Tanger Properties LP $400,000 3.13% 1/9/2026 419,233 0.00%NIKE, Inc. $375,000 3.38% 1/11/2046 419,028 0.00%Steel Dynamics, Inc. $400,000 5.00% 15/12/2026 418,682 0.00%American Water Capital Corp. $400,000 3.25% 1/6/2051 418,540 0.00%NOV, Inc. $400,000 3.60% 1/12/2029 418,273 0.00%General Electric Co. $300,000 6.15% 7/8/2037 417,689 0.00%Bank of America Corp.^ CA($)495,000 2.93% 25/4/2025 417,530 0.00%Phillips 66 $350,000 4.65% 15/11/2034 417,365 0.00%Archer-Daniels-Midland Co. $305,000 5.38% 15/9/2035 417,304 0.00%Wisconsin Public Service Corp. $325,000 4.75% 1/11/2044 417,123 0.00%Thermo Fisher Scientific, Inc. $300,000 5.30% 1/2/2044 416,995 0.00%John Deere Capital Corp. $400,000 2.80% 6/3/2023 416,749 0.00%

496
Vanguard Global Bond Index Fund
Principal CouponMaturity
DateFair Value
US Dollars ($)% of Total
Net AssetsGovernment National Mortgage Association $382,533 4.00% 20/10/2044 416,061 0.00%Federal Home Loan Mortgage Corp. $391,659 3.00% 1/4/2043 415,943 0.00%Federal National Mortgage Association $385,477 3.50% 1/12/2042 415,917 0.00%Freddie Mac Multifamily Structured Pass Through Certificates $375,000 3.19% 25/7/2027 415,749 0.00%XLIT Ltd. $305,000 5.50% 31/3/2045 415,547 0.00%Federal Home Loan Mortgage Corp. $384,079 4.00% 1/1/2049 415,310 0.00%Discovery Communications LLC $300,000 6.35% 1/6/2040 414,922 0.00%Government National Mortgage Association $388,698 4.00% 20/1/2048 414,881 0.00%Federal Home Loan Mortgage Corp. $392,134 3.00% 1/2/2031 414,858 0.00%Federal National Mortgage Association $379,177 4.00% 1/3/2041 414,704 0.00%JP Morgan Chase Commercial Mortgage Securities Trust 2013 $400,000 2.96% 15/4/2046 414,619 0.00%American Transmission Systems, Inc. $325,000 5.00% 1/9/2044 414,300 0.00%XLIT Ltd. $369,000 4.45% 31/3/2025 413,819 0.00%Federal Home Loan Mortgage Corp. $386,643 3.50% 1/2/2033 413,771 0.00%Essential Utilities, Inc. $400,000 3.35% 15/4/2050 413,570 0.00%Eversource Energy $387,000 3.15% 15/1/2025 413,304 0.00%Resorts World Las Vegas LLC/RWLV Capital, Inc. $400,000 4.63% 16/4/2029 413,254 0.00%Owens Corning $350,000 4.40% 30/1/2048 413,086 0.00%Federal National Mortgage Association $386,809 3.50% 1/5/2032 412,711 0.00%ITC Holdings Corp. $315,000 5.30% 1/7/2043 412,672 0.00%RPM International, Inc. $375,000 4.25% 15/1/2048 412,549 0.00%Kentucky Utilities Co. $315,000 5.13% 1/11/2040 412,106 0.00%Comcast Corp. $375,000 3.30% 1/2/2027 411,721 0.00%Merck & Co., Inc. $425,000 2.35% 24/6/2040 411,505 0.00%Federal National Mortgage Association $391,326 3.00% 1/12/2026 411,414 0.00%Federal National Mortgage Association $361,582 5.00% 1/10/2041 411,401 0.00%Government National Mortgage Association $379,951 3.50% 20/10/2041 410,946 0.00%Virginia Electric & Power Co. $370,000 3.50% 15/3/2027 410,433 0.00%Toyota Auto Receivables 2018-C Owner Trust $400,000 3.13% 15/2/2024 409,856 0.00%Lear Corp. $325,000 5.25% 15/5/2049 409,772 0.00%Apple, Inc. $325,000 4.25% 9/2/2047 409,269 0.00%Federal Home Loan Mortgage Corp. $386,474 3.00% 1/3/2031 408,870 0.00%GLP Capital LP/GLP Financing II, Inc. $350,000 5.30% 15/1/2029 408,677 0.00%Federal National Mortgage Association $376,998 4.50% 1/1/2050 408,476 0.00%Federal National Mortgage Association $394,957 2.00% 1/11/2031 408,336 0.00%Government National Mortgage Association $374,387 3.50% 15/1/2042 407,980 0.00%VMware, Inc. $365,000 4.50% 15/5/2025 407,958 0.00%National Securities Clearing Corp. $400,000 1.50% 23/4/2025 407,852 0.00%Air Products & Chemicals, Inc. €337,000 0.80% 5/5/2032 407,621 0.00%Anthem, Inc. $325,000 4.55% 1/3/2048 407,356 0.00%Government National Mortgage Association $372,485 4.00% 20/1/2044 407,098 0.00%MPLX LP $350,000 4.70% 15/4/2048 406,946 0.00%Jersey Central Power & Light Co. $400,000 2.75% 1/3/2032 406,006 0.00%Home Depot, Inc. $320,000 4.40% 15/3/2045 405,778 0.00%Los Angeles Unified School District $300,000 5.75% 1/7/2034 405,522 0.00%Exxon Mobil Corp. $370,000 3.57% 6/3/2045 405,366 0.00%NOV, Inc. $410,000 3.95% 1/12/2042 404,696 0.00%3M Co. €333,000 0.95% 15/5/2023 404,644 0.00%Energy Transfer LP $350,000 4.90% 15/3/2035 404,158 0.00%Federal National Mortgage Association $376,407 3.50% 1/6/2043 403,904 0.00%Duquesne Light Holdings, Inc. $400,000 2.78% 7/1/2032 403,756 0.00%Philip Morris International, Inc. $375,000 3.60% 15/11/2023 403,654 0.00%Exxon Mobil Corp. $325,000 4.33% 19/3/2050 403,439 0.00%Norfolk Southern Corp. $330,000 4.45% 15/6/2045 403,421 0.00%Sixth Street Specialty Lending, Inc. $400,000 2.50% 1/8/2026 403,408 0.00%Federal Home Loan Mortgage Corp. $372,650 4.00% 1/10/2045 403,294 0.00%Boeing Co. $400,000 3.50% 1/3/2039 403,169 0.00%AT&T, Inc. CA($)450,000 4.85% 25/5/2047 402,980 0.00%Bank of America Corp. $400,000 2.50% 21/10/2022 402,664 0.00%Chevron USA, Inc. $300,000 5.05% 15/11/2044 402,601 0.00%East Ohio Gas Co. $400,000 1.30% 15/6/2025 402,362 0.00%Duke Energy Corp. $380,000 2.65% 1/9/2026 401,945 0.00%Diamondback Energy, Inc. $375,000 3.25% 1/12/2026 401,896 0.00%Interpublic Group of Cos, Inc. $300,000 5.40% 1/10/2048 401,804 0.00%Federal National Mortgage Association $374,227 4.00% 1/1/2050 401,657 0.00%New York City Transitional Finance Authority Future Tax Secured Revenue $300,000 5.51% 1/8/2037 401,499 0.00%Athene Global Funding $400,000 1.00% 16/4/2024 401,356 0.00%Federal National Mortgage Association^ $350,000 3.67% 25/9/2028 401,304 0.00%American Airlines 2016-3 Class AA Pass Through Trust $398,315 3.00% 15/10/2028 401,222 0.00%Biogen, Inc. $400,000 2.25% 1/5/2030 401,064 0.00%Federal National Mortgage Association $373,650 3.50% 1/1/2045 400,950 0.00%

497
Vanguard Global Bond Index Fund
Principal CouponMaturity
DateFair Value
US Dollars ($)% of Total
Net AssetsToyota Motor Credit Corp. $400,000 0.45% 22/7/2022 400,885 0.00%DTE Energy Co. $400,000 0.55% 1/11/2022 400,849 0.00%Cheniere Corpus Christi Holdings LLC $350,000 7.00% 30/6/2024 400,817 0.00%EOG Resources, Inc. $300,000 4.95% 15/4/2050 400,792 0.00%Caterpillar, Inc. $400,000 1.90% 12/3/2031 400,773 0.00%Brighthouse Financial Global Funding $400,000 1.00% 12/4/2024 400,736 0.00%Anthem, Inc. $350,000 4.10% 1/3/2028 400,518 0.00%Atmos Energy Corp. $400,000 0.63% 9/3/2023 400,107 0.00%Equinix, Inc. $380,000 2.63% 18/11/2024 400,042 0.00%Federal National Mortgage Association $368,390 4.50% 1/7/2047 399,717 0.00%Government National Mortgage Association $370,153 3.50% 20/9/2043 399,655 0.00%Johnson & Johnson $375,000 2.45% 1/3/2026 399,385 0.00%Federal Home Loan Mortgage Corp. $382,083 3.00% 1/12/2050 398,913 0.00%Federal National Mortgage Association $372,825 3.50% 1/10/2035 398,751 0.00%Trimble, Inc. $340,000 4.90% 15/6/2028 398,655 0.00%T-Mobile USA, Inc. $400,000 3.30% 15/2/2051 398,580 0.00%salesforce.com, Inc. $350,000 3.70% 11/4/2028 398,484 0.00%McDonald's Corp. $325,000 4.45% 1/3/2047 398,417 0.00%Alabama Power Co. $325,000 4.30% 2/1/2046 398,001 0.00%Federal National Mortgage Association $363,012 4.50% 1/4/2046 397,997 0.00%Federal National Mortgage Association $358,897 4.50% 1/8/2041 397,752 0.00%Westlake Chemical Corp. $339,000 4.38% 15/11/2047 397,417 0.00%Freddie Mac Multifamily Structured Pass Through Certificates $375,000 2.44% 25/2/2036 397,119 0.00%Boston Scientific Corp. $325,000 4.55% 1/3/2039 396,920 0.00%North Texas Tollway Authority $240,000 6.72% 1/1/2049 396,893 0.00%Federal Realty Investment Trust $335,000 4.50% 1/12/2044 396,754 0.00%Federal National Mortgage Association $368,422 3.50% 1/10/2044 396,491 0.00%Diamondback Energy, Inc. $375,000 2.88% 1/12/2024 396,403 0.00%Progressive Corp. $300,000 6.63% 1/3/2029 396,327 0.00%Johnson & Johnson $400,000 0.55% 1/9/2025 395,997 0.00%UBS Commercial Mortgage Trust 2018 $350,000 3.98% 15/2/2051 395,947 0.00%Fortinet, Inc. $400,000 1.00% 15/3/2026 395,941 0.00%John Deere Capital Corp. $400,000 0.70% 15/1/2026 395,935 0.00%Owens Corning $350,000 3.95% 15/8/2029 395,591 0.00%Moody's Corp. $300,000 4.88% 17/12/2048 394,747 0.00%Intel Corp. AU($)500,000 4.00% 1/12/2022 394,560 0.00%Government National Mortgage Association $362,427 4.00% 20/12/2044 394,193 0.00%Kroger Co. $300,000 5.40% 15/7/2040 394,147 0.00%Duke Energy Progress LLC $350,000 3.70% 1/9/2028 394,021 0.00%Aon Corp. $350,000 3.75% 2/5/2029 393,885 0.00%Alexandria Real Estate Equities, Inc. $400,000 3.00% 18/5/2051 392,567 0.00%Federal National Mortgage Association $373,644 3.00% 1/3/2035 392,369 0.00%Arrow Electronics, Inc. $350,000 3.88% 12/1/2028 392,045 0.00%Federal National Mortgage Association $368,393 4.00% 1/2/2050 392,030 0.00%Bristol-Myers Squibb Co. $300,000 4.63% 15/5/2044 391,729 0.00%Colgate-Palmolive Co. €300,000 1.38% 6/3/2034 391,220 0.00%Federal Home Loan Mortgage Corp. $376,451 2.50% 1/10/2046 391,195 0.00%Arch Capital Finance LLC $300,000 5.03% 15/12/2046 391,040 0.00%Citigroup, Inc. $350,000 4.40% 10/6/2025 390,996 0.00%Valero Energy Corp. $350,000 4.00% 1/4/2029 390,801 0.00%Apple, Inc. AU($)500,000 3.70% 28/8/2022 390,300 0.00%Federal National Mortgage Association $363,474 3.50% 1/12/2040 390,118 0.00%United Parcel Service, Inc. CA($)470,000 2.13% 21/5/2024 389,915 0.00%Marathon Oil Corp. $325,000 5.20% 1/6/2045 389,891 0.00%Nationwide Mutual Insurance Co. $225,000 9.38% 15/8/2039 389,771 0.00%Commonwealth Edison Co. $325,000 4.00% 1/3/2049 389,496 0.00%Merck & Co., Inc. €300,000 1.38% 2/11/2036 389,367 0.00%General Electric Co. £200,000 5.38% 18/12/2040 389,104 0.00%Government National Mortgage Association $349,955 4.50% 20/10/2043 388,930 0.00%Pacific Gas & Electric Co. $400,000 2.10% 1/8/2027 388,571 0.00%McDonald's Corp. $350,000 3.63% 1/5/2043 388,545 0.00%MetLife, Inc. $325,000 4.13% 13/8/2042 388,525 0.00%Sysco Corp. $250,000 6.60% 1/4/2050 388,508 0.00%Federal National Mortgage Association $360,865 4.50% 1/7/2048 388,066 0.00%Amgen, Inc. $300,000 4.95% 1/10/2041 387,987 0.00%Citizens Bank NA $350,000 3.75% 18/2/2026 387,956 0.00%Government National Mortgage Association $368,701 3.50% 20/7/2050 387,538 0.00%Cox Communications, Inc. $325,000 4.50% 30/6/2043 387,532 0.00%Medtronic, Inc. $353,000 3.50% 15/3/2025 387,466 0.00%Aon plc $300,000 4.75% 15/5/2045 386,718 0.00%Nasdaq, Inc. €300,000 1.75% 28/3/2029 386,641 0.00%

498
Vanguard Global Bond Index Fund
Principal CouponMaturity
DateFair Value
US Dollars ($)% of Total
Net AssetsAllstate Corp. $350,000 3.28% 15/12/2026 386,506 0.00%Federal National Mortgage Association $358,537 3.50% 1/6/2042 386,207 0.00%Capital One Financial Corp. $350,000 3.75% 28/7/2026 386,097 0.00%United Airlines 2020-1 Class B Pass Through Trust $363,938 4.88% 15/1/2026 385,965 0.00%Avery Dennison Corp. $375,000 2.65% 30/4/2030 385,964 0.00%Gilead Sciences, Inc. $375,000 3.25% 1/9/2022 385,732 0.00%Ventas Realty LP $370,000 3.13% 15/6/2023 385,662 0.00%Federal National Mortgage Association $357,822 4.50% 1/5/2049 384,825 0.00%CCRE25 Commercial Mortgage Trust 2015 $350,000 3.76% 10/8/2048 384,678 0.00%Bank of America Corp. $350,000 3.95% 21/4/2025 384,325 0.00%Quest Diagnostics, Inc. $350,000 3.45% 1/6/2026 384,249 0.00%Government National Mortgage Association $363,175 4.00% 20/5/2050 383,932 0.00%Morgan Stanley Bank of America Merrill Lynch Trust 2012 $375,876 2.86% 15/11/2045 383,535 0.00%Government National Mortgage Association $363,053 3.50% 20/10/2048 383,223 0.00%Dominion Energy, Inc. $375,000 2.75% 15/9/2022 382,930 0.00%Federal National Mortgage Association $366,924 2.50% 1/3/2027 382,799 0.00%Federal National Mortgage Association $350,016 5.00% 1/11/2048 382,429 0.00%Stryker Corp. $350,000 3.38% 1/11/2025 382,300 0.00%Fiserv, Inc. €300,000 1.63% 1/7/2030 382,052 0.00%AmerisourceBergen Corp. $350,000 3.45% 15/12/2027 381,928 0.00%Federal National Mortgage Association $356,923 4.00% 1/1/2049 381,821 0.00%Government National Mortgage Association $365,539 2.50% 20/2/2043 381,600 0.00%Tennessee Valley Authority $250,000 6.15% 15/1/2038 381,210 0.00%Federal National Mortgage Association $361,949 3.00% 1/3/2030 380,529 0.00%Freddie Mac Multifamily Structured Pass Through Certificates^ $350,000 3.59% 25/1/2025 380,108 0.00%Fidelity National Information Services, Inc. €315,000 0.75% 21/5/2023 379,611 0.00%Anthem, Inc. $375,000 1.50% 15/3/2026 379,573 0.00%Federal National Mortgage Association $365,274 2.50% 1/10/2040 379,198 0.00%Wells Fargo & Co. $300,000 4.75% 7/12/2046 379,166 0.00%Valero Energy Corp. $350,000 3.40% 15/9/2026 379,056 0.00%Federal National Mortgage Association $338,616 5.00% 1/1/2049 378,887 0.00%JPMorgan Chase & Co. $290,000 7.63% 15/10/2026 378,637 0.00%MetLife, Inc. $350,000 3.60% 10/4/2024 378,560 0.00%Zoetis, Inc. $350,000 3.00% 12/9/2027 377,923 0.00%Procter & Gamble Co. $350,000 2.70% 2/2/2026 377,860 0.00%JPMorgan Chase & Co.^ $350,000 4.02% 5/12/2024 377,756 0.00%Brooklyn Union Gas Co. $350,000 3.41% 10/3/2026 377,746 0.00%Federal Home Loan Mortgage Corp. $357,614 3.00% 1/7/2045 377,331 0.00%Dow Chemical Co. $350,000 3.60% 15/11/2050 377,322 0.00%Bank of New York Mellon Corp. $350,000 3.65% 4/2/2024 377,256 0.00%Oracle Corp. $325,000 4.38% 15/5/2055 376,983 0.00%Government National Mortgage Association $331,826 5.00% 20/9/2039 376,932 0.00%Wells Fargo & Co. €300,000 1.63% 2/6/2025 376,795 0.00%ViacomCBS, Inc. $275,000 5.85% 1/9/2043 376,674 0.00%Ryder System, Inc. $350,000 3.65% 18/3/2024 376,205 0.00%Federal Home Loan Mortgage Corp. $358,970 3.00% 1/3/2048 376,155 0.00%CenterPoint Energy Resources Corp. $275,000 5.85% 15/1/2041 376,108 0.00%Altria Group, Inc. $350,000 3.80% 14/2/2024 376,080 0.00%Federal National Mortgage Association $346,398 4.50% 1/5/2047 375,855 0.00%HollyFrontier Corp. $325,000 5.88% 1/4/2026 375,805 0.00%Roper Technologies, Inc. $375,000 0.45% 15/8/2022 375,222 0.00%State of Mississippi $290,000 5.25% 1/11/2034 375,159 0.00%CSX Corp. $300,000 4.50% 15/3/2049 375,030 0.00%Lockheed Martin Corp. $300,000 4.09% 15/9/2052 374,961 0.00%VEREIT Operating Partnership LP $350,000 3.10% 15/12/2029 374,827 0.00%PepsiCo, Inc. $350,000 2.63% 29/7/2029 374,765 0.00%Government National Mortgage Association $358,564 3.00% 20/10/2049 374,653 0.00%American Express Co. $350,000 3.40% 22/2/2024 374,577 0.00%Astrazeneca Finance LLC $375,000 0.70% 28/5/2024 374,573 0.00%Host Hotels & Resorts LP $355,000 3.75% 15/10/2023 374,116 0.00%Baxter International, Inc. €300,000 1.30% 30/5/2025 374,042 0.00%Government National Mortgage Association $348,665 4.50% 20/5/2048 374,017 0.00%FedEx Corp. €300,000 1.30% 5/8/2031 373,597 0.00%Government National Mortgage Association $350,223 3.00% 20/11/2042 373,589 0.00%Lowe's Cos, Inc. $350,000 3.88% 15/9/2023 373,577 0.00%Utah Acquisition Sub, Inc. $305,000 5.25% 15/6/2046 373,490 0.00%Government National Mortgage Association $343,198 4.00% 20/7/2044 373,278 0.00%New York Life Insurance Co. $300,000 4.45% 15/5/2069 373,275 0.00%Caterpillar Financial Services Corp. $375,000 0.80% 13/11/2025 372,808 0.00%Federal National Mortgage Association $324,760 5.50% 1/12/2032 372,806 0.00%Voya Financial, Inc. $350,000 3.13% 15/7/2024 372,777 0.00%

499
Vanguard Global Bond Index Fund
Principal CouponMaturity
DateFair Value
US Dollars ($)% of Total
Net AssetsPfizer, Inc. $350,000 2.95% 15/3/2024 372,326 0.00%Liberty Mutual Finance Europe DAC €300,000 1.75% 27/3/2024 371,825 0.00%Toyota Motor Credit Corp. $350,000 2.90% 17/4/2024 371,803 0.00%Federal National Mortgage Association^ $337,734 3.18% 25/6/2027 371,733 0.00%Discover Bank^ $350,000 4.68% 9/8/2028 371,692 0.00%MidAmerican Energy Co. $300,000 4.40% 15/10/2044 371,684 0.00%Cargill, Inc. €300,000 2.50% 15/2/2023 371,654 0.00%Arrow Electronics, Inc. $349,000 3.25% 8/9/2024 371,484 0.00%Oncor Electric Delivery Co. LLC $250,000 7.25% 15/1/2033 371,258 0.00%Omega Healthcare Investors, Inc. $325,000 5.25% 15/1/2026 370,872 0.00%Nationwide Financial Services, Inc. $300,000 6.75% 15/5/2037 370,866 0.00%General Motors Financial Co., Inc. $350,000 2.90% 26/2/2025 370,472 0.00%Federal Home Loan Mortgage Corp. $345,086 3.50% 1/8/2042 370,470 0.00%VF Corp. $350,000 2.95% 23/4/2030 370,412 0.00%McDonald's Corp. €300,000 0.90% 15/6/2026 370,349 0.00%Medtronic Global Holdings SCA €300,000 1.00% 2/7/2031 370,196 0.00%Synchrony Credit Card Master Note Trust $350,000 3.47% 15/5/2026 370,095 0.00%City of Houston TX $295,000 6.29% 1/3/2032 369,939 0.00%Linde, Inc. €300,000 1.20% 12/2/2024 369,242 0.00%Wells Fargo Bank NA $250,000 6.60% 15/1/2038 368,981 0.00%PPG Industries, Inc. €300,000 0.88% 3/11/2025 368,922 0.00%Wells Fargo Commercial Mortgage Trust 2018^ $325,000 4.01% 15/3/2051 368,835 0.00%Federal National Mortgage Association $364,219 1.50% 1/7/2035 368,818 0.00%Berkshire Hathaway, Inc. €300,000 1.30% 15/3/2024 368,744 0.00%Federal National Mortgage Association $331,674 4.50% 1/3/2047 368,567 0.00%Xylem, Inc. €300,000 2.25% 11/3/2023 368,451 0.00%City of San Antonio TX Electric & Gas Systems Revenue $250,000 5.81% 1/2/2041 368,235 0.00%Texas Eastern Transmission LP $330,000 4.15% 15/1/2048 368,157 0.00%Burlington Northern Santa Fe LLC $300,000 4.15% 15/12/2048 368,035 0.00%McDonald's Corp. $325,000 3.80% 1/4/2028 368,003 0.00%PacifiCorp $350,000 2.70% 15/9/2030 367,606 0.00%Stryker Corp. €300,000 1.13% 30/11/2023 367,271 0.00%UBS Commercial Mortgage Trust 2018^ $325,000 4.12% 15/3/2051 367,113 0.00%Amphenol Technologies Holding GmbH €300,000 0.75% 4/5/2026 367,059 0.00%Home Depot, Inc. $300,000 4.20% 1/4/2043 367,000 0.00%US Bancorp $335,000 3.15% 27/4/2027 366,920 0.00%Trane Technologies Luxembourg Finance SA $325,000 3.80% 21/3/2029 366,876 0.00%Federal National Mortgage Association $322,402 5.00% 1/2/2036 366,628 0.00%Tyson Foods, Inc. $300,000 4.55% 2/6/2047 366,625 0.00%Comcast Corp. $310,000 4.20% 15/8/2034 366,420 0.00%Freddie Mac Multifamily Structured Pass Through Certificates $310,000 3.54% 25/3/2034 366,206 0.00%Southern California Edison Co. $365,000 3.65% 1/2/2050 365,929 0.00%Government National Mortgage Association $329,215 4.50% 20/3/2044 365,880 0.00%Mastercard, Inc. $350,000 2.00% 3/3/2025 365,838 0.00%City of New York NY $250,000 6.27% 1/12/2037 365,675 0.00%Massachusetts Institute of Technology $250,000 4.68% 1/7/2114 365,611 0.00%Freddie Mac Multifamily Structured Pass Through Certificates $370,000 1.35% 25/5/2030 365,522 0.00%UnitedHealth Group, Inc. $240,000 6.63% 15/11/2037 365,323 0.00%Federal National Mortgage Association $340,663 3.50% 1/11/2033 365,137 0.00%Honeywell International, Inc. €300,000 1.30% 22/2/2023 365,137 0.00%Federal National Mortgage Association $341,565 3.50% 1/7/2028 365,127 0.00%Reliance Standard Life Global Funding II $350,000 2.50% 30/10/2024 364,912 0.00%Illinois Tool Works, Inc. €300,000 1.25% 22/5/2023 364,699 0.00%PepsiCo, Inc. $300,000 4.00% 5/3/2042 364,546 0.00%Capital One Financial Corp. $350,000 3.20% 30/1/2023 364,545 0.00%Global Payments, Inc. $350,000 2.90% 15/5/2030 364,423 0.00%Texas Private Activity Bond Surface Transportation Corp. $325,000 3.92% 31/12/2049 364,387 0.00%Keysight Technologies, Inc. $327,000 4.55% 30/10/2024 364,221 0.00%Federal Home Loan Mortgage Corp. $347,518 2.50% 1/8/2034 364,196 0.00%3M Co. $325,000 3.38% 1/3/2029 364,115 0.00%Travelers Cos, Inc. $300,000 4.00% 30/5/2047 364,033 0.00%General Motors Financial Co., Inc. $350,000 2.70% 20/8/2027 363,802 0.00%Halliburton Co. $350,000 2.92% 1/3/2030 363,789 0.00%Comcast Corp. $325,000 3.95% 15/10/2025 363,741 0.00%PepsiCo, Inc. $325,000 3.38% 29/7/2049 363,336 0.00%Comcast Corp. $250,000 6.45% 15/3/2037 363,293 0.00%Morgan Stanley $325,000 3.88% 27/1/2026 363,267 0.00%McDonald's Corp. €300,000 0.63% 29/1/2024 362,946 0.00%Teachers Insurance & Annuity Association of America $350,000 3.30% 15/5/2050 362,881 0.00%Federal National Mortgage Association $335,640 3.50% 1/1/2042 362,857 0.00%Intel Corp. $355,000 3.10% 15/2/2060 362,661 0.00%

500
Vanguard Global Bond Index Fund
Principal CouponMaturity
DateFair Value
US Dollars ($)% of Total
Net AssetsFederal National Mortgage Association $342,040 3.00% 1/8/2032 362,635 0.00%Federal National Mortgage Association $354,934 2.00% 1/4/2041 362,101 0.00%Hess Corp. $325,000 4.30% 1/4/2027 362,036 0.00%General Mills, Inc. €300,000 0.45% 15/1/2026 361,839 0.00%Altria Group, Inc. $375,000 4.00% 4/2/2061 361,438 0.00%Walt Disney Co. $350,000 3.00% 15/9/2022 361,115 0.00%Cameron LNG LLC $325,000 3.70% 15/1/2039 361,082 0.00%NIKE, Inc. $350,000 2.25% 1/5/2023 360,792 0.00%Exelon Corp. $275,000 5.10% 15/6/2045 360,281 0.00%Freddie Mac Multifamily Structured Pass Through Certificates $350,000 1.76% 25/3/2028 360,267 0.00%Energy Transfer LP $325,000 5.88% 15/1/2024 360,038 0.00%Federal National Mortgage Association $346,779 2.50% 1/4/2040 359,998 0.00%American Honda Finance Corp. $350,000 1.95% 10/5/2023 359,978 0.00%Medtronic Global Holdings SCA €300,000 0.38% 7/3/2023 359,915 0.00%Apple, Inc. $285,000 4.50% 23/2/2036 359,887 0.00%Federal Home Loan Mortgage Corp. $341,101 3.00% 1/7/2046 359,748 0.00%Thermo Fisher Scientific, Inc. €300,000 0.50% 1/3/2028 359,744 0.00%Equinix, Inc. $375,000 3.00% 15/7/2050 359,583 0.00%Bank of America Corp. $250,000 5.88% 7/2/2042 359,423 0.00%AmerisourceBergen Corp. $350,000 2.70% 15/3/2031 359,405 0.00%Chubb INA Holdings, Inc. €300,000 0.30% 15/12/2024 359,007 0.00%Federal National Mortgage Association $341,139 3.00% 1/6/2027 358,678 0.00%DH Europe Finance II Sarl €300,000 0.45% 18/3/2028 358,597 0.00%Goldman Sachs Group, Inc. $325,000 3.85% 26/1/2027 358,423 0.00%American Express Co. $340,000 2.50% 30/7/2024 358,328 0.00%Dow Chemical Co. $275,000 5.25% 15/11/2041 358,274 0.00%Owl Rock Capital Corp. $336,000 4.00% 30/3/2025 358,222 0.00%Laboratory Corp. of America Holdings $331,000 3.60% 1/2/2025 358,121 0.00%Federal National Mortgage Association $308,996 5.50% 1/10/2035 357,939 0.00%Federal Home Loan Mortgage Corp. $333,427 3.50% 1/1/2041 357,872 0.00%Southern Co. Gas Capital Corp. $300,000 4.40% 1/6/2043 357,726 0.00%Government National Mortgage Association $336,784 3.50% 20/5/2049 357,694 0.00%Fidelity National Information Services, Inc. €300,000 0.13% 3/12/2022 357,509 0.00%Bacardi Ltd. $275,000 5.30% 15/5/2048 357,420 0.00%Federal National Mortgage Association $322,441 4.50% 1/6/2039 357,413 0.00%Cardinal Health, Inc. $325,000 3.75% 15/9/2025 357,382 0.00%Federal National Mortgage Association $316,492 5.00% 1/11/2033 357,228 0.00%General Motors Financial Co., Inc. $350,000 1.70% 18/8/2023 357,076 0.00%Bristol-Myers Squibb Co. $325,000 3.20% 15/6/2026 356,788 0.00%Federal National Mortgage Association $350,000 1.78% 25/5/2030 356,584 0.00%Government National Mortgage Association $334,886 3.50% 20/9/2046 356,409 0.00%CSAIL 2016-C7 Commercial Mortgage Trust $325,000 3.50% 15/11/2049 356,382 0.00%PPL Electric Utilities Corp. $275,000 4.75% 15/7/2043 356,314 0.00%Trane Technologies Luxembourg Finance SA $325,000 3.50% 21/3/2026 355,812 0.00%Public Storage €300,000 0.88% 24/1/2032 355,768 0.00%Enterprise Products Operating LLC $320,000 3.95% 31/1/2060 355,751 0.00%DTE Electric Co. $300,000 4.00% 1/4/2043 355,518 0.00%Citigroup, Inc. $257,000 6.13% 25/8/2036 355,201 0.00%Thermo Fisher Scientific, Inc. €242,000 2.88% 24/7/2037 355,131 0.00%AvalonBay Communities, Inc. $325,000 3.45% 1/6/2025 354,976 0.00%Ares Capital Corp. $350,000 2.88% 15/6/2028 354,961 0.00%Federal National Mortgage Association $331,778 3.50% 1/10/2033 354,501 0.00%Los Angeles Department of Water & Power Power System Revenue $250,000 5.72% 1/7/2039 354,343 0.00%Duke Energy Carolinas LLC $250,000 6.00% 15/1/2038 354,280 0.00%Prologis Euro Finance LLC €300,000 1.00% 6/2/2035 354,104 0.00%MPLX LP $350,000 2.65% 15/8/2030 353,771 0.00%GS Mortgage Securities Trust 2017 $324,000 3.66% 10/8/2050 353,770 0.00%Comcast Corp. $325,000 3.15% 1/3/2026 353,651 0.00%American Honda Finance Corp. $350,000 0.88% 7/7/2023 353,107 0.00%Parker-Hannifin Corp. $300,000 4.20% 21/11/2034 352,973 0.00%Waste Connections, Inc. $341,000 2.60% 1/2/2030 352,693 0.00%Synchrony Card Issuance Trust $350,000 3.38% 15/9/2024 352,271 0.00%Dow Chemical Co. $200,000 9.40% 15/5/2039 352,174 0.00%Flex Ltd. $330,000 5.00% 15/2/2023 351,810 0.00%Kimberly-Clark Corp. $325,000 3.05% 15/8/2025 351,536 0.00%JM Smucker Co. $300,000 4.25% 15/3/2035 351,379 0.00%Kansas City Southern $275,000 4.95% 15/8/2045 351,346 0.00%JPMorgan Chase & Co.^ $350,000 0.70% 16/3/2024 351,118 0.00%PepsiCo, Inc. €300,000 0.40% 9/10/2032 350,997 0.00%Consolidated Edison Co. of New York, Inc. $250,000 6.30% 15/8/2037 350,863 0.00%Kimberly-Clark Corp. $340,000 2.88% 7/2/2050 350,797 0.00%

501
Vanguard Global Bond Index Fund
Principal CouponMaturity
DateFair Value
US Dollars ($)% of Total
Net AssetsAmazon.com, Inc. $350,000 0.40% 3/6/2023 350,752 0.00%Hormel Foods Corp. $350,000 0.65% 3/6/2024 350,673 0.00%Prologis Euro Finance LLC €300,000 1.50% 10/9/2049 350,622 0.00%Toyota Motor Credit Corp. $350,000 0.35% 14/10/2022 350,371 0.00%Honeywell International, Inc. $350,000 0.48% 19/8/2022 350,082 0.00%BlackRock, Inc. $350,000 1.90% 28/1/2031 350,052 0.00%International Business Machines Corp. $325,000 3.63% 12/2/2024 350,023 0.00%Teledyne Technologies, Inc. $350,000 0.65% 1/4/2023 349,883 0.00%Bristol-Myers Squibb Co. $325,000 3.25% 1/8/2042 349,735 0.00%Federal Home Loan Mortgage Corp. $326,227 3.50% 1/1/2050 349,627 0.00%Amgen, Inc. $325,000 3.13% 1/5/2025 349,589 0.00%Federal Home Loan Mortgage Corp. $315,730 4.50% 1/9/2046 349,195 0.00%Federal Home Loan Mortgage Corp. $333,920 2.50% 1/10/2035 348,810 0.00%Eli Lilly & Co. $275,000 4.15% 15/3/2059 348,762 0.00%UBS Commercial Mortgage Trust 2018 $300,000 4.45% 15/12/2051 348,561 0.00%Hasbro, Inc. $250,000 6.35% 15/3/2040 348,196 0.00%State of California $200,000 7.60% 1/11/2040 348,028 0.00%US Bancorp $325,000 3.38% 5/2/2024 347,791 0.00%Honeywell International, Inc. $250,000 5.38% 1/3/2041 347,787 0.00%Cummins, Inc. $350,000 0.75% 1/9/2025 347,758 0.00%Best Buy Co., Inc. $300,000 4.45% 1/10/2028 347,756 0.00%Energy Transfer LP $330,000 2.90% 15/5/2025 347,408 0.00%Toyota Motor Credit Corp. $350,000 0.80% 16/10/2025 347,339 0.00%Benchmark 2018-B6 Mortgage Trust $300,000 4.26% 10/10/2051 347,336 0.00%Merck & Co., Inc. $350,000 0.75% 24/2/2026 347,319 0.00%Consolidated Edison Co. of New York, Inc. $250,000 6.20% 15/6/2036 347,270 0.00%3M Co. $300,000 3.63% 15/10/2047 347,261 0.00%Massachusetts School Building Authority $325,000 3.40% 15/10/2040 346,990 0.00%Freddie Mac Multifamily Structured Pass Through Certificates $320,000 2.60% 25/9/2029 346,697 0.00%Lennar Corp. $300,000 4.75% 29/11/2027 346,663 0.00%Dow Chemical Co. $350,000 2.10% 15/11/2030 346,606 0.00%Agilent Technologies, Inc. $350,000 2.10% 4/6/2030 346,508 0.00%Virginia Electric & Power Co. $325,000 3.45% 15/2/2024 346,477 0.00%Federal National Mortgage Association^ $325,000 3.20% 25/11/2027 346,325 0.00%Citigroup, Inc.^ $325,000 4.04% 1/6/2024 346,302 0.00%Exxon Mobil Corp. $325,000 3.18% 15/3/2024 346,219 0.00%Quest Diagnostics, Inc. $300,000 4.20% 30/6/2029 346,042 0.00%Las Vegas Sands Corp. $332,000 2.90% 25/6/2025 345,999 0.00%Freddie Mac Multifamily Structured Pass Through Certificates^ $325,000 3.06% 25/8/2024 345,882 0.00%Trustees of the University of Pennsylvania $250,000 4.67% 1/9/2112 345,824 0.00%Government National Mortgage Association $322,565 3.50% 20/1/2045 345,817 0.00%Kinder Morgan Energy Partners LP $250,000 6.38% 1/3/2041 345,685 0.00%Trane Technologies Luxembourg Finance SA $275,000 4.50% 21/3/2049 345,521 0.00%Government National Mortgage Association $312,548 4.00% 15/7/2041 345,326 0.00%PepsiCo, Inc. €300,000 1.05% 9/10/2050 345,313 0.00%Federal Home Loan Mortgage Corp. $329,270 2.50% 1/12/2034 345,073 0.00%Federal Home Loan Mortgage Corp. $327,990 3.00% 1/12/2026 344,915 0.00%Crown Castle International Corp. $310,000 4.00% 15/11/2049 344,839 0.00%Novant Health, Inc. $325,000 3.32% 1/11/2061 344,698 0.00%UnitedHealth Group, Inc. $300,000 3.70% 15/8/2049 344,171 0.00%Cheniere Corpus Christi Holdings LLC $300,000 5.88% 31/3/2025 344,162 0.00%Lockheed Martin Corp. $294,000 3.80% 1/3/2045 342,827 0.00%Kinder Morgan, Inc. $300,000 4.30% 1/3/2028 342,661 0.00%American Financial Group, Inc. $279,000 5.25% 2/4/2030 342,532 0.00%Federal National Mortgage Association $319,395 3.50% 1/5/2035 342,370 0.00%Southwestern Electric Power Co. $300,000 4.10% 15/9/2028 342,203 0.00%Becton Dickinson & Co. $350,000 1.96% 11/2/2031 341,503 0.00%Boston Scientific Corp. $300,000 4.00% 1/3/2029 341,406 0.00%Fiserv, Inc. $315,000 3.20% 1/7/2026 341,248 0.00%Merck & Co., Inc. $350,000 1.45% 24/6/2030 340,975 0.00%Massachusetts Institute of Technology $200,000 5.60% 1/7/2111 340,525 0.00%Federal Home Loan Mortgage Corp. $322,255 3.00% 1/7/2030 340,475 0.00%Trustees of the University of Pennsylvania $350,000 2.40% 1/10/2050 339,841 0.00%American Equity Investment Life Holding Co. $300,000 5.00% 15/6/2027 339,462 0.00%Benchmark 2018-B2 Mortgage Trust^ $300,000 3.88% 15/2/2051 339,264 0.00%Oncor Electric Delivery Co. LLC $250,000 5.25% 30/9/2040 338,814 0.00%Federal National Mortgage Association $316,683 3.50% 1/6/2033 338,371 0.00%Federal National Mortgage Association $322,890 2.50% 1/2/2032 338,135 0.00%LYB International Finance III LLC $295,000 4.20% 15/10/2049 337,940 0.00%Los Angeles Unified School District $235,000 6.76% 1/7/2034 337,899 0.00%Goldman Sachs Group, Inc.^ CA($)425,000 2.01% 28/2/2029 337,850 0.00%

502
Vanguard Global Bond Index Fund
Principal CouponMaturity
DateFair Value
US Dollars ($)% of Total
Net AssetsPayPal Holdings, Inc. $315,000 2.65% 1/10/2026 337,845 0.00%Welltower, Inc. £200,000 4.50% 1/12/2034 337,769 0.00%Georgia Power Co. $285,000 4.30% 15/3/2042 337,616 0.00%Southern California Gas Co. $300,000 3.75% 15/9/2042 337,583 0.00%Stanley Black & Decker, Inc. $250,000 4.85% 15/11/2048 337,045 0.00%Crown Castle International Corp. $315,000 3.20% 1/9/2024 336,669 0.00%ONEOK Partners LP $250,000 6.65% 1/10/2036 336,606 0.00%Government National Mortgage Association $301,530 4.50% 20/9/2041 336,559 0.00%Federal National Mortgage Association $303,608 4.50% 1/12/2039 336,537 0.00%Pharmacia LLC $250,000 6.60% 1/12/2028 336,211 0.00%Dollar General Corp. $300,000 4.15% 1/11/2025 336,040 0.00%Duke Energy Corp. $325,000 3.50% 15/6/2051 336,021 0.00%Freddie Mac Multifamily Structured Pass Through Certificates^ $300,000 3.12% 25/10/2031 335,980 0.00%NBCUniversal Media LLC $225,000 6.40% 30/4/2040 335,828 0.00%Kirby Corp. $300,000 4.20% 1/3/2028 335,395 0.00%Life Storage LP $300,000 3.88% 15/12/2027 335,290 0.00%Abbott Laboratories $314,000 3.40% 30/11/2023 334,682 0.00%Freddie Mac Multifamily Structured Pass Through Certificates^ $300,000 3.43% 25/1/2027 334,560 0.00%CMS Energy Corp.^ $300,000 4.75% 1/6/2050 334,468 0.00%Brixmor Operating Partnership LP $300,000 4.13% 15/6/2026 334,461 0.00%State of California $285,000 4.60% 1/4/2038 334,410 0.00%Visa, Inc. $325,000 2.05% 15/4/2030 334,313 0.00%Conagra Brands, Inc. $250,000 5.40% 1/11/2048 334,156 0.00%Synchrony Financial $300,000 3.95% 1/12/2027 333,831 0.00%Southern Co. Gas Capital Corp. $300,000 3.95% 1/10/2046 333,751 0.00%Northwell Healthcare, Inc. $300,000 3.81% 1/11/2049 333,673 0.00%Amazon.com, Inc. $350,000 2.70% 3/6/2060 333,495 0.00%Federal National Mortgage Association $293,265 5.00% 1/3/2036 333,495 0.00%BANK 2017 $300,000 3.75% 15/9/2060 333,269 0.00%Federal National Mortgage Association $300,000 2.98% 25/8/2029 333,080 0.00%Metropolitan Transportation Authority $250,000 5.87% 15/11/2039 333,003 0.00%Marathon Oil Corp. $250,000 6.60% 1/10/2037 332,908 0.00%NextEra Energy Capital Holdings, Inc. $315,000 2.75% 1/11/2029 332,843 0.00%Duke Energy Carolinas LLC $300,000 3.45% 15/4/2051 332,698 0.00%Aetna, Inc. $225,000 6.75% 15/12/2037 332,335 0.00%American Water Capital Corp. $275,000 4.15% 1/6/2049 332,091 0.00%Huntington National Bank $325,000 1.80% 3/2/2023 331,827 0.00%Public Service Enterprise Group, Inc. $350,000 1.60% 15/8/2030 331,617 0.00%ONEOK, Inc. $300,000 4.00% 13/7/2027 331,519 0.00%San Diego Gas & Electric Co. $290,000 3.75% 1/6/2047 331,446 0.00%Federal Home Loan Mortgage Corp. $308,656 3.50% 1/10/2043 331,334 0.00%Maxim Integrated Products, Inc. $300,000 3.45% 15/6/2027 331,023 0.00%Enterprise Products Operating LLC $280,000 4.45% 15/2/2043 330,957 0.00%Sherwin-Williams Co. $300,000 3.45% 1/6/2027 330,587 0.00%VEREIT Operating Partnership LP $325,000 2.20% 15/6/2028 330,519 0.00%Waste Connections, Inc. $300,000 3.50% 1/5/2029 330,481 0.00%Government National Mortgage Association $290,892 5.00% 20/1/2040 330,433 0.00%SC Johnson & Son, Inc. $250,000 4.75% 15/10/2046 330,391 0.00%Consolidated Edison Co. of New York, Inc. $300,000 3.35% 1/4/2030 330,291 0.00%City of San Francisco CA Public Utilities Commission Water Revenue $200,000 6.95% 1/11/2050 330,096 0.00%Government National Mortgage Association $305,149 3.50% 20/11/2041 330,042 0.00%Markel Corp. $300,000 3.35% 17/9/2029 329,950 0.00%Mass General Brigham, Inc. $300,000 3.34% 1/7/2060 329,945 0.00%Wells Fargo & Co. $300,000 3.55% 29/9/2025 329,870 0.00%BANK 2017 $300,000 3.39% 15/6/2060 329,840 0.00%Federal Home Loan Mortgage Corp. $306,483 4.50% 1/9/2048 329,698 0.00%AT&T, Inc. $250,000 5.55% 15/8/2041 329,589 0.00%Office Properties Income Trust $325,000 2.65% 15/6/2026 329,548 0.00%Blackstone Secured Lending Fund $325,000 2.75% 16/9/2026 329,448 0.00%JPMorgan Chase & Co.^ $300,000 3.54% 1/5/2028 329,436 0.00%Amgen, Inc. £200,000 4.00% 13/9/2029 329,191 0.00%Parker-Hannifin Corp. $275,000 4.10% 1/3/2047 329,121 0.00%Citigroup Commercial Mortgage Trust 2016 $300,000 3.62% 10/2/2049 328,819 0.00%Duke Energy Corp. $300,000 3.40% 15/6/2029 328,689 0.00%Charles Schwab Corp. $300,000 3.20% 2/3/2027 328,389 0.00%DBJPM 17-C6 Mortgage Trust $300,000 3.33% 10/6/2050 328,371 0.00%CenterPoint Energy Houston Electric LLC $275,000 3.95% 1/3/2048 328,264 0.00%Evergy Kansas Central, Inc. $300,000 3.45% 15/4/2050 328,154 0.00%Amphenol Corp. $310,000 2.80% 15/2/2030 328,096 0.00%Synchrony Financial $300,000 4.25% 15/8/2024 327,876 0.00%Thermo Fisher Scientific, Inc. $300,000 3.20% 15/8/2027 327,555 0.00%

503
Vanguard Global Bond Index Fund
Principal CouponMaturity
DateFair Value
US Dollars ($)% of Total
Net AssetsFederal National Mortgage Association $308,659 3.00% 1/11/2033 327,437 0.00%Lowe's Cos, Inc. $300,000 3.10% 3/5/2027 327,384 0.00%Columbia Pipeline Group, Inc. $240,000 5.80% 1/6/2045 327,374 0.00%Discover Bank $300,000 3.45% 27/7/2026 327,356 0.00%Burlington Northern Santa Fe LLC $300,000 3.30% 15/9/2051 327,335 0.00%Charter Communications Operating LLC/Charter Communications
Operating Capital $325,000 3.50% 1/6/2041 327,203 0.00%Federal National Mortgage Association $310,023 3.00% 1/3/2037 327,140 0.00%Johnson Controls International plc $247,000 5.13% 14/9/2045 327,124 0.00%UnitedHealth Group, Inc. $300,000 3.10% 15/3/2026 327,109 0.00%Federal National Mortgage Association $306,577 3.50% 1/11/2050 326,660 0.00%Government National Mortgage Association $308,664 3.00% 15/8/2045 326,518 0.00%Pacific Gas & Electric Co. $325,000 3.00% 15/6/2028 326,453 0.00%Federal Home Loan Mortgage Corp. $311,320 2.50% 1/10/2031 326,124 0.00%PNC Financial Services Group, Inc. $300,000 3.90% 29/4/2024 325,997 0.00%Metropolitan Transportation Authority $200,000 7.34% 15/11/2039 325,930 0.00%Federal Home Loan Mortgage Corp. $305,397 3.50% 1/5/2045 325,922 0.00%Federal National Mortgage Association^ $300,000 2.96% 25/2/2027 325,778 0.00%Sysco Corp. $275,000 4.50% 1/4/2046 325,727 0.00%Metropolitan Life Global Funding I $300,000 3.00% 19/9/2027 325,318 0.00%Principal Financial Group, Inc. $300,000 3.40% 15/5/2025 325,278 0.00%Federal National Mortgage Association $300,700 4.00% 1/12/2045 325,194 0.00%Federal National Mortgage Association $304,761 3.50% 1/6/2032 325,169 0.00%Freddie Mac Multifamily Structured Pass Through Certificates $325,000 1.48% 25/4/2030 324,694 0.00%US Bancorp $300,000 3.00% 30/7/2029 324,600 0.00%Private Export Funding Corp. $325,000 1.40% 15/7/2028 324,550 0.00%Cigna Corp. $310,000 3.00% 15/7/2023 324,543 0.00%Public Service Co. of Colorado $300,000 3.20% 1/3/2050 324,403 0.00%Federal Home Loan Mortgage Corp. $311,082 2.50% 1/4/2041 323,926 0.00%Federal National Mortgage Association $311,321 2.50% 1/4/2048 323,503 0.00%Prudential Financial, Inc.^ $300,000 5.20% 15/3/2044 323,439 0.00%Wachovia Corp. $250,000 5.50% 1/8/2035 323,316 0.00%Government National Mortgage Association $305,245 3.50% 20/4/2047 323,127 0.00%Kroger Co. $300,000 4.00% 1/2/2024 323,005 0.00%Humana, Inc. $250,000 4.95% 1/10/2044 322,952 0.00%Wyeth LLC $225,000 5.95% 1/4/2037 322,850 0.00%Hormel Foods Corp. $325,000 1.80% 11/6/2030 322,650 0.00%Citadel LP $300,000 4.88% 15/1/2027 322,454 0.00%Broadridge Financial Solutions, Inc. $305,000 2.90% 1/12/2029 322,387 0.00%Metropolitan Life Global Funding I $300,000 3.60% 11/1/2024 322,338 0.00%AbbVie, Inc. $300,000 3.75% 14/11/2023 321,923 0.00%Federal National Mortgage Association $301,212 3.50% 1/10/2026 321,531 0.00%Freddie Mac Multifamily Structured Pass Through Certificates $300,000 2.67% 25/3/2026 321,496 0.00%Raytheon Technologies Corp. $225,000 6.13% 15/7/2038 321,134 0.00%UnitedHealth Group, Inc. $300,000 3.25% 15/5/2051 320,726 0.00%Florida Power & Light Co. $300,000 2.85% 1/4/2025 320,588 0.00%Government National Mortgage Association $300,478 4.50% 20/1/2049 320,509 0.00%Federal National Mortgage Association $281,691 5.00% 1/8/2040 320,365 0.00%Northwestern Mutual Life Insurance Co. $300,000 3.45% 30/3/2051 320,297 0.00%Federal National Mortgage Association $294,962 4.50% 1/6/2050 320,279 0.00%Philip Morris International, Inc. $300,000 2.75% 25/2/2026 320,150 0.00%Marathon Petroleum Corp. $300,000 4.50% 1/5/2023 320,050 0.00%Lincoln National Corp. $300,000 3.05% 15/1/2030 319,932 0.00%Microchip Technology, Inc. $300,000 4.33% 1/6/2023 319,882 0.00%Northrop Grumman Corp. $300,000 2.93% 15/1/2025 319,852 0.00%Coca-Cola Co. $325,000 1.65% 1/6/2030 319,506 0.00%Benchmark 2018-B8 Mortgage Trust^ $275,000 4.53% 15/1/2052 319,460 0.00%Altria Group, Inc. $300,000 4.45% 6/5/2050 319,227 0.00%Public Service Co. of New Hampshire $300,000 3.50% 1/11/2023 319,008 0.00%American Airlines 2016-2 Class AA Pass Through Trust $314,800 3.20% 15/6/2028 318,965 0.00%State of Connecticut $240,000 5.85% 15/3/2032 318,936 0.00%LYB International Finance III LLC $300,000 2.88% 1/5/2025 318,721 0.00%STERIS Irish FinCo UnLtd Co. $300,000 3.75% 15/3/2051 318,633 0.00%Federal Home Loan Mortgage Corp. $301,116 3.00% 1/10/2032 318,564 0.00%Kroger Co. $300,000 2.65% 15/10/2026 318,424 0.00%Air Lease Corp. $300,000 3.88% 3/7/2023 318,367 0.00%Energy Transfer LP $275,000 5.35% 15/5/2045 318,254 0.00%CCRE24 Commercial Mortgage Trust 2015 $291,000 3.70% 10/8/2048 318,216 0.00%American Water Capital Corp. $300,000 2.80% 1/5/2030 318,013 0.00%Federal National Mortgage Association^ $325,000 1.36% 25/10/2030 317,967 0.00%GLP Capital LP/GLP Financing II, Inc. $300,000 3.35% 1/9/2024 317,846 0.00%
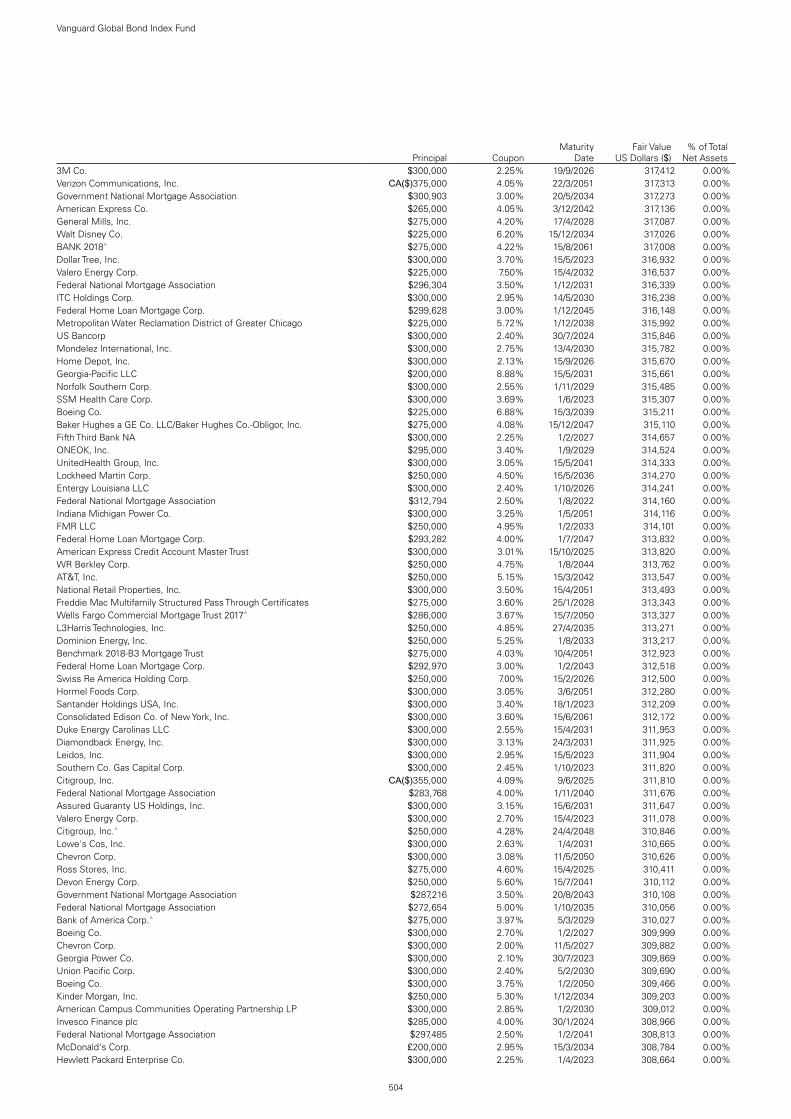
504
Vanguard Global Bond Index Fund
Principal CouponMaturity
DateFair Value
US Dollars ($)% of Total
Net Assets3M Co. $300,000 2.25% 19/9/2026 317,412 0.00%Verizon Communications, Inc. CA($)375,000 4.05% 22/3/2051 317,313 0.00%Government National Mortgage Association $300,903 3.00% 20/5/2034 317,273 0.00%American Express Co. $265,000 4.05% 3/12/2042 317,136 0.00%General Mills, Inc. $275,000 4.20% 17/4/2028 317,087 0.00%Walt Disney Co. $225,000 6.20% 15/12/2034 317,026 0.00%BANK 2018^ $275,000 4.22% 15/8/2061 317,008 0.00%Dollar Tree, Inc. $300,000 3.70% 15/5/2023 316,932 0.00%Valero Energy Corp. $225,000 7.50% 15/4/2032 316,537 0.00%Federal National Mortgage Association $296,304 3.50% 1/12/2031 316,339 0.00%ITC Holdings Corp. $300,000 2.95% 14/5/2030 316,238 0.00%Federal Home Loan Mortgage Corp. $299,628 3.00% 1/12/2045 316,148 0.00%Metropolitan Water Reclamation District of Greater Chicago $225,000 5.72% 1/12/2038 315,992 0.00%US Bancorp $300,000 2.40% 30/7/2024 315,846 0.00%Mondelez International, Inc. $300,000 2.75% 13/4/2030 315,782 0.00%Home Depot, Inc. $300,000 2.13% 15/9/2026 315,670 0.00%Georgia-Pacific LLC $200,000 8.88% 15/5/2031 315,661 0.00%Norfolk Southern Corp. $300,000 2.55% 1/11/2029 315,485 0.00%SSM Health Care Corp. $300,000 3.69% 1/6/2023 315,307 0.00%Boeing Co. $225,000 6.88% 15/3/2039 315,211 0.00%Baker Hughes a GE Co. LLC/Baker Hughes Co.-Obligor, Inc. $275,000 4.08% 15/12/2047 315,110 0.00%Fifth Third Bank NA $300,000 2.25% 1/2/2027 314,657 0.00%ONEOK, Inc. $295,000 3.40% 1/9/2029 314,524 0.00%UnitedHealth Group, Inc. $300,000 3.05% 15/5/2041 314,333 0.00%Lockheed Martin Corp. $250,000 4.50% 15/5/2036 314,270 0.00%Entergy Louisiana LLC $300,000 2.40% 1/10/2026 314,241 0.00%Federal National Mortgage Association $312,794 2.50% 1/8/2022 314,160 0.00%Indiana Michigan Power Co. $300,000 3.25% 1/5/2051 314,116 0.00%FMR LLC $250,000 4.95% 1/2/2033 314,101 0.00%Federal Home Loan Mortgage Corp. $293,282 4.00% 1/7/2047 313,832 0.00%American Express Credit Account Master Trust $300,000 3.01% 15/10/2025 313,820 0.00%WR Berkley Corp. $250,000 4.75% 1/8/2044 313,762 0.00%AT&T, Inc. $250,000 5.15% 15/3/2042 313,547 0.00%National Retail Properties, Inc. $300,000 3.50% 15/4/2051 313,493 0.00%Freddie Mac Multifamily Structured Pass Through Certificates $275,000 3.60% 25/1/2028 313,343 0.00%Wells Fargo Commercial Mortgage Trust 2017^ $286,000 3.67% 15/7/2050 313,327 0.00%L3Harris Technologies, Inc. $250,000 4.85% 27/4/2035 313,271 0.00%Dominion Energy, Inc. $250,000 5.25% 1/8/2033 313,217 0.00%Benchmark 2018-B3 Mortgage Trust $275,000 4.03% 10/4/2051 312,923 0.00%Federal Home Loan Mortgage Corp. $292,970 3.00% 1/2/2043 312,518 0.00%Swiss Re America Holding Corp. $250,000 7.00% 15/2/2026 312,500 0.00%Hormel Foods Corp. $300,000 3.05% 3/6/2051 312,280 0.00%Santander Holdings USA, Inc. $300,000 3.40% 18/1/2023 312,209 0.00%Consolidated Edison Co. of New York, Inc. $300,000 3.60% 15/6/2061 312,172 0.00%Duke Energy Carolinas LLC $300,000 2.55% 15/4/2031 311,953 0.00%Diamondback Energy, Inc. $300,000 3.13% 24/3/2031 311,925 0.00%Leidos, Inc. $300,000 2.95% 15/5/2023 311,904 0.00%Southern Co. Gas Capital Corp. $300,000 2.45% 1/10/2023 311,820 0.00%Citigroup, Inc. CA($)355,000 4.09% 9/6/2025 311,810 0.00%Federal National Mortgage Association $283,768 4.00% 1/11/2040 311,676 0.00%Assured Guaranty US Holdings, Inc. $300,000 3.15% 15/6/2031 311,647 0.00%Valero Energy Corp. $300,000 2.70% 15/4/2023 311,078 0.00%Citigroup, Inc.^ $250,000 4.28% 24/4/2048 310,846 0.00%Lowe's Cos, Inc. $300,000 2.63% 1/4/2031 310,665 0.00%Chevron Corp. $300,000 3.08% 11/5/2050 310,626 0.00%Ross Stores, Inc. $275,000 4.60% 15/4/2025 310,411 0.00%Devon Energy Corp. $250,000 5.60% 15/7/2041 310,112 0.00%Government National Mortgage Association $287,216 3.50% 20/8/2043 310,108 0.00%Federal National Mortgage Association $272,654 5.00% 1/10/2035 310,056 0.00%Bank of America Corp.^ $275,000 3.97% 5/3/2029 310,027 0.00%Boeing Co. $300,000 2.70% 1/2/2027 309,999 0.00%Chevron Corp. $300,000 2.00% 11/5/2027 309,882 0.00%Georgia Power Co. $300,000 2.10% 30/7/2023 309,869 0.00%Union Pacific Corp. $300,000 2.40% 5/2/2030 309,690 0.00%Boeing Co. $300,000 3.75% 1/2/2050 309,466 0.00%Kinder Morgan, Inc. $250,000 5.30% 1/12/2034 309,203 0.00%American Campus Communities Operating Partnership LP $300,000 2.85% 1/2/2030 309,012 0.00%Invesco Finance plc $285,000 4.00% 30/1/2024 308,966 0.00%Federal National Mortgage Association $297,485 2.50% 1/2/2041 308,813 0.00%McDonald's Corp. £200,000 2.95% 15/3/2034 308,784 0.00%Hewlett Packard Enterprise Co. $300,000 2.25% 1/4/2023 308,664 0.00%
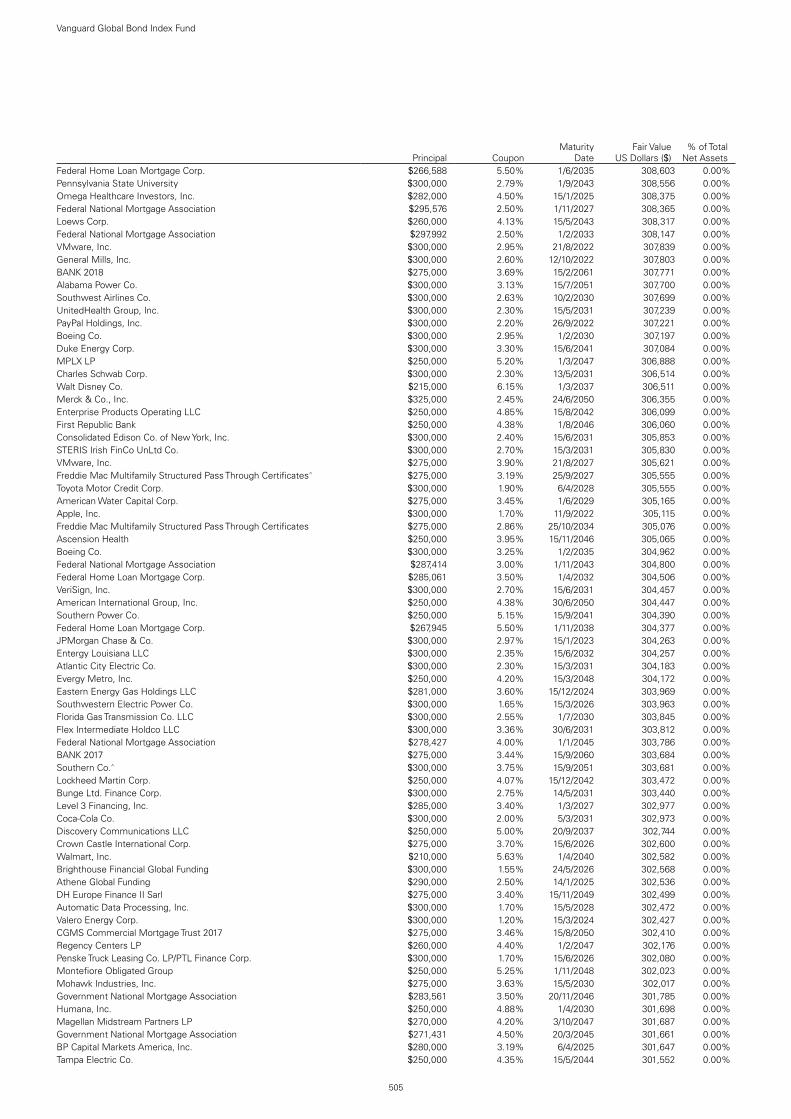
505
Vanguard Global Bond Index Fund
Principal CouponMaturity
DateFair Value
US Dollars ($)% of Total
Net AssetsFederal Home Loan Mortgage Corp. $266,588 5.50% 1/6/2035 308,603 0.00%Pennsylvania State University $300,000 2.79% 1/9/2043 308,556 0.00%Omega Healthcare Investors, Inc. $282,000 4.50% 15/1/2025 308,375 0.00%Federal National Mortgage Association $295,576 2.50% 1/11/2027 308,365 0.00%Loews Corp. $260,000 4.13% 15/5/2043 308,317 0.00%Federal National Mortgage Association $297,992 2.50% 1/2/2033 308,147 0.00%VMware, Inc. $300,000 2.95% 21/8/2022 307,839 0.00%General Mills, Inc. $300,000 2.60% 12/10/2022 307,803 0.00%BANK 2018 $275,000 3.69% 15/2/2061 307,771 0.00%Alabama Power Co. $300,000 3.13% 15/7/2051 307,700 0.00%Southwest Airlines Co. $300,000 2.63% 10/2/2030 307,699 0.00%UnitedHealth Group, Inc. $300,000 2.30% 15/5/2031 307,239 0.00%PayPal Holdings, Inc. $300,000 2.20% 26/9/2022 307,221 0.00%Boeing Co. $300,000 2.95% 1/2/2030 307,197 0.00%Duke Energy Corp. $300,000 3.30% 15/6/2041 307,084 0.00%MPLX LP $250,000 5.20% 1/3/2047 306,888 0.00%Charles Schwab Corp. $300,000 2.30% 13/5/2031 306,514 0.00%Walt Disney Co. $215,000 6.15% 1/3/2037 306,511 0.00%Merck & Co., Inc. $325,000 2.45% 24/6/2050 306,355 0.00%Enterprise Products Operating LLC $250,000 4.85% 15/8/2042 306,099 0.00%First Republic Bank $250,000 4.38% 1/8/2046 306,060 0.00%Consolidated Edison Co. of New York, Inc. $300,000 2.40% 15/6/2031 305,853 0.00%STERIS Irish FinCo UnLtd Co. $300,000 2.70% 15/3/2031 305,830 0.00%VMware, Inc. $275,000 3.90% 21/8/2027 305,621 0.00%Freddie Mac Multifamily Structured Pass Through Certificates^ $275,000 3.19% 25/9/2027 305,555 0.00%Toyota Motor Credit Corp. $300,000 1.90% 6/4/2028 305,555 0.00%American Water Capital Corp. $275,000 3.45% 1/6/2029 305,165 0.00%Apple, Inc. $300,000 1.70% 11/9/2022 305,115 0.00%Freddie Mac Multifamily Structured Pass Through Certificates $275,000 2.86% 25/10/2034 305,076 0.00%Ascension Health $250,000 3.95% 15/11/2046 305,065 0.00%Boeing Co. $300,000 3.25% 1/2/2035 304,962 0.00%Federal National Mortgage Association $287,414 3.00% 1/11/2043 304,800 0.00%Federal Home Loan Mortgage Corp. $285,061 3.50% 1/4/2032 304,506 0.00%VeriSign, Inc. $300,000 2.70% 15/6/2031 304,457 0.00%American International Group, Inc. $250,000 4.38% 30/6/2050 304,447 0.00%Southern Power Co. $250,000 5.15% 15/9/2041 304,390 0.00%Federal Home Loan Mortgage Corp. $267,945 5.50% 1/11/2038 304,377 0.00%JPMorgan Chase & Co. $300,000 2.97% 15/1/2023 304,263 0.00%Entergy Louisiana LLC $300,000 2.35% 15/6/2032 304,257 0.00%Atlantic City Electric Co. $300,000 2.30% 15/3/2031 304,183 0.00%Evergy Metro, Inc. $250,000 4.20% 15/3/2048 304,172 0.00%Eastern Energy Gas Holdings LLC $281,000 3.60% 15/12/2024 303,969 0.00%Southwestern Electric Power Co. $300,000 1.65% 15/3/2026 303,963 0.00%Florida Gas Transmission Co. LLC $300,000 2.55% 1/7/2030 303,845 0.00%Flex Intermediate Holdco LLC $300,000 3.36% 30/6/2031 303,812 0.00%Federal National Mortgage Association $278,427 4.00% 1/1/2045 303,786 0.00%BANK 2017 $275,000 3.44% 15/9/2060 303,684 0.00%Southern Co.^ $300,000 3.75% 15/9/2051 303,681 0.00%Lockheed Martin Corp. $250,000 4.07% 15/12/2042 303,472 0.00%Bunge Ltd. Finance Corp. $300,000 2.75% 14/5/2031 303,440 0.00%Level 3 Financing, Inc. $285,000 3.40% 1/3/2027 302,977 0.00%Coca-Cola Co. $300,000 2.00% 5/3/2031 302,973 0.00%Discovery Communications LLC $250,000 5.00% 20/9/2037 302,744 0.00%Crown Castle International Corp. $275,000 3.70% 15/6/2026 302,600 0.00%Walmart, Inc. $210,000 5.63% 1/4/2040 302,582 0.00%Brighthouse Financial Global Funding $300,000 1.55% 24/5/2026 302,568 0.00%Athene Global Funding $290,000 2.50% 14/1/2025 302,536 0.00%DH Europe Finance II Sarl $275,000 3.40% 15/11/2049 302,499 0.00%Automatic Data Processing, Inc. $300,000 1.70% 15/5/2028 302,472 0.00%Valero Energy Corp. $300,000 1.20% 15/3/2024 302,427 0.00%CGMS Commercial Mortgage Trust 2017 $275,000 3.46% 15/8/2050 302,410 0.00%Regency Centers LP $260,000 4.40% 1/2/2047 302,176 0.00%Penske Truck Leasing Co. LP/PTL Finance Corp. $300,000 1.70% 15/6/2026 302,080 0.00%Montefiore Obligated Group $250,000 5.25% 1/11/2048 302,023 0.00%Mohawk Industries, Inc. $275,000 3.63% 15/5/2030 302,017 0.00%Government National Mortgage Association $283,561 3.50% 20/11/2046 301,785 0.00%Humana, Inc. $250,000 4.88% 1/4/2030 301,698 0.00%Magellan Midstream Partners LP $270,000 4.20% 3/10/2047 301,687 0.00%Government National Mortgage Association $271,431 4.50% 20/3/2045 301,661 0.00%BP Capital Markets America, Inc. $280,000 3.19% 6/4/2025 301,647 0.00%Tampa Electric Co. $250,000 4.35% 15/5/2044 301,552 0.00%

506
Vanguard Global Bond Index Fund
Principal CouponMaturity
DateFair Value
US Dollars ($)% of Total
Net AssetsGolub Capital BDC, Inc. $300,000 2.50% 24/8/2026 301,542 0.00%Freddie Mac Multifamily Structured Pass Through Certificates $275,000 3.70% 25/5/2025 301,098 0.00%William Marsh Rice University $260,000 3.57% 15/5/2045 300,972 0.00%Cigna Corp. $300,000 1.25% 15/3/2026 300,903 0.00%Aflac, Inc. $300,000 1.13% 15/3/2026 300,634 0.00%Federal National Mortgage Association $285,819 3.00% 1/5/2048 300,618 0.00%TTX Co. $275,000 3.60% 15/1/2025 300,583 0.00%Northwestern Mutual Global Funding $300,000 1.70% 1/6/2028 300,423 0.00%Freddie Mac Multifamily Structured Pass Through Certificates $300,000 1.55% 25/11/2053 300,399 0.00%Federal National Mortgage Association $281,386 3.50% 1/2/2026 300,368 0.00%Toyota Motor Credit Corp. $300,000 0.40% 6/4/2023 300,185 0.00%HCA, Inc. $300,000 3.50% 15/7/2051 300,082 0.00%Cigna Corp. $300,000 0.61% 15/3/2024 300,028 0.00%John Deere Capital Corp. $300,000 0.25% 17/1/2023 299,860 0.00%KLA Corp. $260,000 4.10% 15/3/2029 299,768 0.00%Caterpillar Financial Services Corp. $300,000 0.25% 1/3/2023 299,742 0.00%Freddie Mac Multifamily Structured Pass Through Certificates $300,000 1.52% 25/11/2030 299,618 0.00%NIKE, Inc. $250,000 3.88% 1/11/2045 299,594 0.00%New York Life Global Funding $300,000 1.15% 9/6/2026 299,550 0.00%Guardian Life Global Funding $300,000 1.25% 13/5/2026 299,399 0.00%Federal National Mortgage Association $290,183 2.00% 1/11/2034 299,280 0.00%Plains All American Pipeline LP/PAA Finance Corp. $275,000 4.90% 15/2/2045 299,148 0.00%Freddie Mac Multifamily Structured Pass Through Certificates $250,000 3.75% 25/4/2033 299,063 0.00%Metropolitan Life Global Funding I $300,000 0.55% 7/6/2024 299,036 0.00%Devon Energy Corp. $210,000 7.95% 15/4/2032 299,034 0.00%Vontier Corp. $300,000 1.80% 1/4/2026 299,027 0.00%American Honda Finance Corp. $300,000 0.55% 12/7/2024 298,959 0.00%Amazon.com, Inc. $300,000 1.20% 3/6/2027 298,455 0.00%HP, Inc. $300,000 1.45% 17/6/2026 298,417 0.00%Federal National Mortgage Association $267,242 4.50% 1/9/2043 298,353 0.00%Penske Truck Leasing Co. LP/PTL Finance Corp. $275,000 3.40% 15/11/2026 298,157 0.00%Federal National Mortgage Association $276,573 4.00% 1/3/2035 298,081 0.00%San Diego County Water Authority $200,000 6.14% 1/5/2049 298,070 0.00%Public Service Co. of Colorado $255,000 3.80% 15/6/2047 297,869 0.00%Federal National Mortgage Association $268,660 4.50% 1/4/2039 297,798 0.00%Toyota Motor Credit Corp. $290,000 2.15% 13/2/2030 297,643 0.00%Freddie Mac Multifamily Structured Pass Through Certificates^ $275,000 3.60% 25/2/2025 297,599 0.00%Federal Home Loan Mortgage Corp. $281,876 3.50% 1/8/2048 297,565 0.00%Southern California Edison Co. $250,000 4.88% 1/3/2049 297,436 0.00%Berkshire Hathaway Energy Co. $225,000 5.15% 15/11/2043 297,262 0.00%General Motors Co. $240,000 5.20% 1/4/2045 297,191 0.00%AES Corp. $300,000 2.45% 15/1/2031 297,106 0.00%AES Corp. $300,000 1.38% 15/1/2026 297,012 0.00%HCA, Inc. $300,000 2.38% 15/7/2031 296,909 0.00%Conagra Brands, Inc. $200,000 8.25% 15/9/2030 296,905 0.00%Federal National Mortgage Association $271,710 5.00% 1/8/2048 296,872 0.00%Federal National Mortgage Association $271,423 4.00% 1/12/2039 296,832 0.00%Citigroup, Inc. $275,000 3.88% 25/10/2023 296,794 0.00%Hackensack Meridian Health, Inc. $300,000 2.88% 1/9/2050 296,539 0.00%University of California $300,000 1.61% 15/5/2030 296,229 0.00%Crown Castle International Corp. $300,000 2.25% 15/1/2031 296,027 0.00%Willis-Knighton Medical Center $300,000 3.07% 1/3/2051 295,995 0.00%Roper Technologies, Inc. $300,000 2.00% 30/6/2030 295,794 0.00%Truist Financial Corp. $275,000 3.75% 6/12/2023 295,757 0.00%American Homes 4 Rent LP $300,000 2.38% 15/7/2031 295,539 0.00%Federal Home Loan Mortgage Corp. $253,973 5.50% 1/1/2039 295,315 0.00%Government National Mortgage Association $270,895 3.50% 15/10/2043 295,239 0.00%Philip Morris International, Inc. $250,000 4.38% 15/11/2041 295,195 0.00%SC Johnson & Son, Inc. $250,000 4.00% 15/5/2043 294,994 0.00%DH Europe Finance II Sarl $275,000 3.25% 15/11/2039 294,974 0.00%Southern California Gas Co. $285,000 2.55% 1/2/2030 294,889 0.00%Flex Ltd. $255,000 4.88% 15/6/2029 294,546 0.00%Pioneer Natural Resources Co. $300,000 2.15% 15/1/2031 294,402 0.00%Duke Energy Carolinas LLC $250,000 4.00% 30/9/2042 294,383 0.00%Devon Energy Corp. $250,000 5.00% 15/6/2045 294,194 0.00%Federal National Mortgage Association $277,236 3.00% 1/2/2043 294,006 0.00%Virginia Electric & Power Co. $250,000 4.00% 15/11/2046 293,906 0.00%Hackensack Meridian Health, Inc. $300,000 2.68% 1/9/2041 293,476 0.00%WEC Energy Group, Inc. $300,000 1.38% 15/10/2027 293,242 0.00%Abbott Laboratories $200,000 6.00% 1/4/2039 292,969 0.00%State Street Corp.^ $250,000 4.14% 3/12/2029 292,925 0.00%

507
Vanguard Global Bond Index Fund
Principal CouponMaturity
DateFair Value
US Dollars ($)% of Total
Net AssetsWalt Disney Co. $200,000 6.40% 15/12/2035 292,901 0.00%Commonwealth Edison Co. $275,000 2.55% 15/6/2026 292,589 0.00%Ralph Lauren Corp. $275,000 2.95% 15/6/2030 292,582 0.00%State of California $250,000 4.50% 1/4/2033 292,565 0.00%Chevron USA, Inc. $200,000 6.00% 1/3/2041 292,528 0.00%Marvell Technology, Inc. $275,000 4.20% 22/6/2023 292,491 0.00%L3Harris Technologies, Inc. $275,000 3.85% 15/6/2023 292,406 0.00%Federal National Mortgage Association $271,861 4.50% 1/9/2048 292,353 0.00%QUALCOMM, Inc. $275,000 2.90% 20/5/2024 292,204 0.00%Government National Mortgage Association $266,515 4.00% 20/11/2041 292,164 0.00%Omega Healthcare Investors, Inc. $273,000 3.63% 1/10/2029 292,036 0.00%ConocoPhillips Co. $285,000 2.40% 15/12/2022 291,834 0.00%Phillips 66 Partners LP $255,000 4.68% 15/2/2045 291,823 0.00%PSEG Power LLC $275,000 3.85% 1/6/2023 291,787 0.00%Charles Schwab Corp. $300,000 1.65% 11/3/2031 291,429 0.00%Federal National Mortgage Association $200,000 7.13% 15/1/2030 291,385 0.00%Xilinx, Inc. $275,000 2.95% 1/6/2024 291,082 0.00%Raymond James Financial, Inc. $225,000 4.95% 15/7/2046 290,986 0.00%Virginia Electric & Power Co. $225,000 4.60% 1/12/2048 290,886 0.00%Evergy Kansas Central, Inc. $275,000 2.55% 1/7/2026 290,845 0.00%US Treasury Note $275,000 2.75% 15/11/2023 290,770 0.00%O'Reilly Automotive, Inc. $275,000 3.85% 15/6/2023 290,708 0.00%Digital Realty Trust LP $250,000 4.45% 15/7/2028 289,924 0.00%Fiserv, Inc. £200,000 2.25% 1/7/2025 289,921 0.00%Continental Airlines 2012-1 Class A Pass Through Trust $272,812 4.15% 11/4/2024 289,727 0.00%Wells Fargo Commercial Mortgage Trust 2015 $270,000 3.18% 15/4/2050 289,707 0.00%Federal National Mortgage Association $267,989 3.50% 1/8/2043 289,544 0.00%McDonald's Corp. $275,000 2.63% 1/9/2029 289,514 0.00%Genuine Parts Co. $300,000 1.88% 1/11/2030 289,410 0.00%Boeing Co. $225,000 5.88% 15/2/2040 289,136 0.00%National Rural Utilities Cooperative Finance Corp. $280,000 2.40% 15/3/2030 288,789 0.00%Berkshire Hathaway Energy Co. $300,000 1.65% 15/5/2031 288,704 0.00%Ameren Illinois Co. $300,000 1.55% 15/11/2030 288,703 0.00%McDonald's Corp. $200,000 6.30% 1/3/2038 288,307 0.00%Providence St Joseph Health Obligated Group $275,000 2.53% 1/10/2029 288,267 0.00%Government National Mortgage Association $266,145 3.50% 20/2/2043 288,228 0.00%Commonwealth Edison Co. $225,000 4.70% 15/1/2044 288,187 0.00%Caterpillar, Inc. $200,000 4.75% 15/5/2064 288,168 0.00%Dow Chemical Co. $225,000 4.80% 15/5/2049 288,148 0.00%Energy Transfer LP $250,000 5.15% 15/3/2045 288,131 0.00%Federal Home Loan Mortgage Corp. $276,019 2.50% 1/10/2027 288,071 0.00%Dell International LLC/EMC Corp. $265,000 4.00% 15/7/2024 288,065 0.00%Magellan Midstream Partners LP $250,000 5.00% 1/3/2026 287,854 0.00%Government National Mortgage Association $274,372 3.50% 15/4/2048 287,538 0.00%Southern California Edison Co. $250,000 4.65% 1/10/2043 287,483 0.00%Discover Card Execution Note Trust $275,000 3.03% 15/8/2025 287,265 0.00%Interstate Power & Light Co. $250,000 4.10% 26/9/2028 287,147 0.00%Target Corp. $275,000 2.35% 15/2/2030 287,103 0.00%Federal National Mortgage Association $272,530 3.00% 1/3/2027 286,542 0.00%Federal Home Loan Mortgage Corp. $266,601 3.50% 1/6/2042 286,212 0.00%Essential Utilities, Inc. $240,000 4.28% 1/5/2049 286,101 0.00%Entergy Arkansas LLC $300,000 2.65% 15/6/2051 286,020 0.00%Piedmont Operating Partnership LP $275,000 3.40% 1/6/2023 285,848 0.00%Essential Utilities, Inc. $275,000 2.70% 15/4/2030 285,700 0.00%Federal National Mortgage Association $241,824 6.00% 1/5/2038 285,687 0.00%Energy Transfer LP $275,000 3.60% 1/2/2023 285,324 0.00%Federal National Mortgage Association $260,899 4.50% 1/3/2049 285,322 0.00%Toyota Motor Credit Corp. $250,000 3.65% 8/1/2029 285,273 0.00%Alabama Power Co. $250,000 3.75% 1/3/2045 285,118 0.00%JPMorgan Chase & Co. $250,000 4.25% 1/10/2027 285,072 0.00%Colonial Pipeline Co. $260,000 3.75% 1/10/2025 285,064 0.00%Bank of America Corp. £150,000 7.00% 31/7/2028 285,049 0.00%Federal National Mortgage Association $271,684 2.53% 25/9/2024 284,579 0.00%Amgen, Inc. $275,000 1.90% 21/2/2025 284,454 0.00%Federal National Mortgage Association $262,352 4.00% 1/7/2037 284,276 0.00%Government National Mortgage Association $271,666 3.50% 15/6/2049 284,233 0.00%Federal National Mortgage Association^ $267,367 2.88% 25/5/2025 284,223 0.00%Kennametal, Inc. $250,000 4.63% 15/6/2028 283,928 0.00%GE Capital UK Funding Unlimited Co. £150,000 5.88% 18/1/2033 283,734 0.00%Charter Communications Operating LLC/Charter Communications
Operating Capital $250,000 4.91% 23/7/2025 283,469 0.00%

508
Vanguard Global Bond Index Fund
Principal CouponMaturity
DateFair Value
US Dollars ($)% of Total
Net AssetsFederal Home Loan Mortgage Corp. $271,059 2.50% 1/11/2035 283,308 0.00%PacifiCorp $200,000 6.00% 15/1/2039 283,144 0.00%Vistra Operations Co. LLC $265,000 3.70% 30/1/2027 283,111 0.00%CSX Corp. $250,000 3.80% 1/11/2046 282,873 0.00%Colgate-Palmolive Co. $225,000 4.00% 15/8/2045 282,859 0.00%Virginia Electric & Power Co. $250,000 3.80% 1/4/2028 282,683 0.00%Federal Home Loan Mortgage Corp. $267,326 3.00% 1/12/2030 282,477 0.00%Expedia Group, Inc. $250,000 4.63% 1/8/2027 282,474 0.00%American Express Credit Account Master Trust $275,000 2.35% 15/5/2025 282,456 0.00%American Tower Corp. $250,000 4.40% 15/2/2026 282,314 0.00%Protective Life Corp. $250,000 4.30% 30/9/2028 282,236 0.00%Ryder System, Inc. $250,000 4.63% 1/6/2025 282,033 0.00%Hershey Co. $270,000 2.05% 15/11/2024 281,912 0.00%Fidelity National Financial, Inc. $245,000 4.50% 15/8/2028 281,880 0.00%Bank of America Corp.^ $275,000 2.82% 21/7/2023 281,841 0.00%Dallas Area Rapid Transit $200,000 5.02% 1/12/2048 281,576 0.00%CNA Financial Corp. $250,000 3.90% 1/5/2029 281,150 0.00%Ventas Realty LP $250,000 4.00% 1/3/2028 281,085 0.00%Port Authority of New York & New Jersey $250,000 5.31% 1/8/2046 281,070 0.00%US Bancorp $250,000 3.95% 17/11/2025 281,050 0.00%Columbia Pipeline Group, Inc. $250,000 4.50% 1/6/2025 281,015 0.00%Federal Home Loan Mortgage Corp. $263,253 3.00% 1/4/2033 280,908 0.00%CenterPoint Energy Houston Electric LLC $225,000 4.25% 1/2/2049 280,881 0.00%Aetna, Inc. $250,000 3.88% 15/8/2047 280,828 0.00%JPMorgan Chase & Co. $200,000 5.60% 15/7/2041 280,220 0.00%Delta Air Lines 2019-1 Class AA Pass Through Trust $265,000 3.20% 25/4/2024 280,215 0.00%Mosaic Co. $250,000 4.05% 15/11/2027 280,186 0.00%Stryker Corp. €200,000 2.63% 30/11/2030 280,113 0.00%Goldman Sachs Capital I $200,000 6.35% 15/2/2034 280,005 0.00%Synchrony Financial $250,000 4.50% 23/7/2025 279,948 0.00%Mars, Inc. $300,000 2.45% 16/7/2050 279,843 0.00%Truist Bank $250,000 3.80% 30/10/2026 279,792 0.00%McDonald's Corp. $250,000 3.70% 15/2/2042 279,689 0.00%Martin Marietta Materials, Inc. $275,000 2.50% 15/3/2030 279,653 0.00%JPMorgan Chase & Co.^ $250,000 3.70% 6/5/2030 279,600 0.00%Autodesk, Inc. $250,000 4.38% 15/6/2025 279,503 0.00%Morgan Stanley $265,000 3.75% 25/2/2023 279,284 0.00%Government National Mortgage Association $265,098 3.00% 20/2/2047 279,224 0.00%Georgia Power Co. $275,000 3.25% 15/3/2051 279,086 0.00%General Motors Financial Co., Inc. $275,000 2.40% 10/4/2028 279,079 0.00%McDonald's Corp. $225,000 4.70% 9/12/2035 278,931 0.00%Commonwealth of Massachusetts $200,000 5.46% 1/12/2039 278,912 0.00%Level 3 Financing, Inc. $260,000 3.88% 15/11/2029 278,875 0.00%Allstate Corp. $200,000 5.95% 1/4/2036 278,796 0.00%Amgen, Inc. $275,000 2.30% 25/2/2031 278,498 0.00%Enterprise Products Operating LLC $225,000 4.90% 15/5/2046 278,424 0.00%Federal Home Loan Mortgage Corp. $261,901 3.00% 1/8/2043 278,139 0.00%Truist Financial Corp. $260,000 2.85% 26/10/2024 278,124 0.00%Medtronic Global Holdings SCA €200,000 2.25% 7/3/2039 278,113 0.00%Bacardi Ltd. $225,000 5.15% 15/5/2038 278,086 0.00%Hasbro, Inc. $250,000 3.90% 19/11/2029 278,038 0.00%Carlisle Cos, Inc. $250,000 3.75% 1/12/2027 277,961 0.00%Truist Financial Corp. $250,000 4.00% 1/5/2025 277,677 0.00%Federal Home Loan Mortgage Corp. $268,862 2.00% 1/1/2029 277,673 0.00%Huntington Bancshares Inc $250,000 4.00% 15/5/2025 277,499 0.00%Federal National Mortgage Association $262,772 3.00% 1/11/2045 277,121 0.00%McDonald's Corp. $250,000 3.63% 1/9/2049 276,978 0.00%Crown Castle International Corp. $275,000 1.35% 15/7/2025 276,901 0.00%Laboratory Corp. of America Holdings $250,000 3.60% 1/9/2027 276,681 0.00%Verisk Analytics, Inc. $250,000 4.00% 15/6/2025 276,615 0.00%Jersey Central Power & Light Co. $250,000 4.30% 15/1/2026 276,571 0.00%Nissan Motor Acceptance Corp. $275,000 2.00% 9/3/2026 276,545 0.00%Government National Mortgage Association $247,614 4.50% 20/10/2041 276,380 0.00%General Motors Financial Co., Inc. $250,000 4.30% 13/7/2025 276,377 0.00%Federal Home Loan Mortgage Corp. $249,274 4.50% 1/3/2041 276,363 0.00%Virginia Electric & Power Co. $300,000 2.45% 15/12/2050 276,321 0.00%Northern Natural Gas Co. $235,000 4.30% 15/1/2049 276,246 0.00%General Motors Financial Co., Inc. $250,000 4.00% 6/10/2026 276,154 0.00%JPMDB Commercial Mortgage Securities Trust 2017 $250,000 3.69% 15/3/2050 276,038 0.00%Pfizer, Inc. $275,000 2.55% 28/5/2040 275,830 0.00%Burlington Northern Santa Fe LLC $250,000 3.65% 1/9/2025 275,812 0.00%

509
Vanguard Global Bond Index Fund
Principal CouponMaturity
DateFair Value
US Dollars ($)% of Total
Net AssetsFreddie Mac Multifamily Structured Pass Through Certificates $275,000 1.52% 25/3/2030 275,757 0.00%Fidelity National Information Services, Inc. €210,000 2.00% 21/5/2030 275,676 0.00%Danaher Corp. €200,000 2.50% 30/3/2030 275,504 0.00%Honeywell International, Inc. $200,000 5.70% 15/3/2036 275,481 0.00%Williams Cos, Inc. $200,000 7.50% 15/1/2031 275,390 0.00%Bank of New York Mellon Corp.^ $250,000 3.44% 7/2/2028 275,365 0.00%General Motors Financial Co., Inc. $250,000 5.10% 17/1/2024 275,338 0.00%Wells Fargo Commercial Mortgage Trust 2017 $250,000 3.47% 15/11/2050 275,172 0.00%Hartford Financial Services Group, Inc. $250,000 3.60% 19/8/2049 274,876 0.00%ONE Gas, Inc. $225,000 4.66% 1/2/2044 274,825 0.00%Eli Lilly & Co. €200,000 2.13% 3/6/2030 274,777 0.00%Massachusetts Electric Co. $245,000 4.00% 15/8/2046 274,725 0.00%General Motors Co. $250,000 4.00% 1/4/2025 274,700 0.00%Raymond James Financial, Inc. $250,000 3.75% 1/4/2051 274,694 0.00%Martin Marietta Materials, Inc. $275,000 3.20% 15/7/2051 274,646 0.00%International Business Machines Corp. $250,000 3.30% 27/1/2027 274,544 0.00%Eastman Chemical Co. $267,000 3.60% 15/8/2022 274,365 0.00%Federal National Mortgage Association $270,921 1.50% 1/8/2035 274,342 0.00%QUALCOMM, Inc. $250,000 3.45% 20/5/2025 274,339 0.00%Cigna Corp. $250,000 3.40% 1/3/2027 274,327 0.00%Illinois Tool Works, Inc. €200,000 2.13% 22/5/2030 274,300 0.00%Government National Mortgage Association $248,239 4.00% 15/10/2041 274,272 0.00%JM Smucker Co. $250,000 3.38% 15/12/2027 274,199 0.00%PacifiCorp $200,000 5.75% 1/4/2037 274,079 0.00%General Dynamics Corp. $250,000 3.50% 15/5/2025 274,007 0.00%AbbVie, Inc. €200,000 2.63% 15/11/2028 273,721 0.00%PNC Financial Services Group, Inc. $250,000 3.15% 19/5/2027 273,566 0.00%Pfizer, Inc. $275,000 1.70% 28/5/2030 273,528 0.00%Mondelez International, Inc. €200,000 2.38% 6/3/2035 273,127 0.00%Duke Energy Florida LLC $250,000 3.20% 15/1/2027 273,084 0.00%Abbott Laboratories $200,000 4.90% 30/11/2046 272,941 0.00%Vulcan Materials Co. $225,000 4.50% 15/6/2047 272,865 0.00%CSAIL 2017-CX9 Commercial Mortgage Trust $250,000 3.45% 15/9/2050 272,824 0.00%Government National Mortgage Association $258,819 3.00% 20/7/2046 272,610 0.00%General Mills, Inc. $250,000 3.20% 10/2/2027 272,436 0.00%Adobe, Inc. $260,000 2.15% 1/2/2027 272,346 0.00%American International Group, Inc. $250,000 4.13% 15/2/2024 272,204 0.00%Georgia Power Co. $250,000 3.70% 30/1/2050 272,155 0.00%Intercontinental Exchange, Inc. $250,000 3.10% 15/9/2027 272,091 0.00%US Treasury Bond $199,000 4.25% 15/5/2039 272,039 0.00%Time Warner Cable LLC $200,000 6.55% 1/5/2037 271,936 0.00%American Financial Group, Inc. $250,000 3.50% 15/8/2026 271,935 0.00%Chevron USA, Inc. $200,000 5.25% 15/11/2043 271,926 0.00%Pfizer, Inc. $225,000 4.00% 15/12/2036 271,867 0.00%CVS Health Corp. $250,000 3.25% 15/8/2029 271,866 0.00%Wells Fargo Commercial Mortgage Trust 2017 $250,000 3.33% 15/12/2050 271,602 0.00%Duke Realty LP $250,000 3.75% 1/12/2024 271,596 0.00%Ingredion, Inc. $250,000 3.20% 1/10/2026 271,570 0.00%Government National Mortgage Association $256,308 3.00% 20/6/2045 271,390 0.00%Kimberly-Clark Corp. $250,000 2.75% 15/2/2026 271,308 0.00%Federal National Mortgage Association $250,284 3.50% 1/11/2044 271,237 0.00%CSX Corp. $200,000 5.50% 15/4/2041 271,090 0.00%Sysco Corp. $250,000 3.25% 15/7/2027 271,088 0.00%American Tower Corp. $250,000 3.70% 15/10/2049 270,941 0.00%CommonSpirit Health $250,000 3.35% 1/10/2029 270,924 0.00%Citigroup Commercial Mortgage Trust 2014 $250,000 3.64% 10/10/2047 270,796 0.00%AbbVie, Inc. €220,000 1.50% 15/11/2023 270,767 0.00%Federal National Mortgage Association $253,708 3.50% 1/3/2032 270,697 0.00%National Retail Properties, Inc. $250,000 3.50% 15/10/2027 270,676 0.00%PPL Capital Funding, Inc. $250,000 3.95% 15/3/2024 270,508 0.00%Xcel Energy, Inc. $250,000 3.50% 1/12/2049 270,250 0.00%Federal National Mortgage Association $237,465 5.50% 1/6/2049 270,151 0.00%Chubb INA Holdings, Inc. $250,000 3.15% 15/3/2025 270,143 0.00%Becton Dickinson Euro Finance Sarl €230,000 1.21% 12/2/2036 270,124 0.00%Federal National Mortgage Association $253,085 3.50% 1/4/2045 269,982 0.00%GATX Corp. $250,000 3.25% 15/9/2026 269,866 0.00%Bristol-Myers Squibb Co. €200,000 1.75% 15/5/2035 269,783 0.00%Government National Mortgage Association $246,289 4.00% 20/5/2042 269,705 0.00%Leggett & Platt, Inc. $250,000 3.80% 15/11/2024 269,689 0.00%Federal National Mortgage Association $250,064 4.00% 1/5/2046 269,646 0.00%CenterPoint Energy Houston Electric LLC $250,000 3.00% 1/2/2027 269,547 0.00%

510
Vanguard Global Bond Index Fund
Principal CouponMaturity
DateFair Value
US Dollars ($)% of Total
Net AssetsDXC Technology Co. $245,000 4.13% 15/4/2025 269,243 0.00%Discover Bank $250,000 4.20% 8/8/2023 269,242 0.00%Walt Disney Co. CA($)315,000 3.06% 30/3/2027 269,193 0.00%CCRE22 Commercial Mortgage Trust 2015^ $250,000 3.60% 10/3/2048 269,140 0.00%Farmers Exchange Capital III^ $215,000 5.45% 15/10/2054 269,123 0.00%Magellan Midstream Partners LP $250,000 3.25% 1/6/2030 269,114 0.00%Federal Home Loan Mortgage Corp. $247,871 4.50% 1/3/2048 269,089 0.00%Marathon Petroleum Corp. $250,000 3.63% 15/9/2024 268,989 0.00%Amgen, Inc. $283,000 2.77% 1/9/2053 268,976 0.00%Schlumberger Holdings Corp. $250,000 3.75% 1/5/2024 268,944 0.00%Republic Services, Inc. $250,000 3.20% 15/3/2025 268,870 0.00%Federal Home Loan Mortgage Corp. $265,512 1.50% 1/8/2035 268,865 0.00%Morgan Stanley Bank of America Merrill Lynch Trust 2014 $250,000 3.53% 15/12/2047 268,853 0.00%JPMBB Commercial Mortgage Securities Trust 2013 $250,000 4.20% 15/1/2047 268,843 0.00%Air Lease Corp. $250,000 3.63% 1/12/2027 268,788 0.00%Capital One Financial Corp. $250,000 3.20% 5/2/2025 268,680 0.00%Southwestern Public Service Co. $250,000 3.40% 15/8/2046 268,674 0.00%Verizon Communications, Inc. £200,000 1.13% 3/11/2028 268,654 0.00%Parker-Hannifin Corp. $250,000 3.30% 21/11/2024 268,613 0.00%Johnson & Johnson $250,000 3.38% 5/12/2023 268,514 0.00%Freddie Mac Multifamily Structured Pass Through Certificates $250,000 3.30% 25/7/2024 268,462 0.00%Atmos Energy Corp. $200,000 5.50% 15/6/2041 268,330 0.00%Hubbell, Inc. $250,000 3.15% 15/8/2027 268,256 0.00%Emerson Electric Co. €200,000 2.00% 15/10/2029 268,016 0.00%HP, Inc. $250,000 3.00% 17/6/2027 267,932 0.00%American Honda Finance Corp. $250,000 3.63% 10/10/2023 267,868 0.00%Timken Co. $250,000 3.88% 1/9/2024 267,811 0.00%Lowe's Cos, Inc. $250,000 3.13% 15/9/2024 267,780 0.00%Plains All American Pipeline LP/PAA Finance Corp. $250,000 3.80% 15/9/2030 267,732 0.00%Laboratory Corp. of America Holdings $250,000 3.25% 1/9/2024 267,620 0.00%Fiserv, Inc. $250,000 3.80% 1/10/2023 267,552 0.00%Southern California Edison Co. $250,000 4.13% 1/3/2048 267,416 0.00%PepsiCo, Inc. $250,000 2.75% 30/4/2025 267,366 0.00%NiSource, Inc. $195,000 5.65% 1/2/2045 267,135 0.00%Federal National Mortgage Association $247,386 3.50% 1/9/2044 267,047 0.00%Schlumberger Investment SA $250,000 3.65% 1/12/2023 266,906 0.00%Citigroup Commercial Mortgage Trust 2016 $250,000 3.35% 10/2/2049 266,866 0.00%Starbucks Corp. $250,000 3.85% 1/10/2023 266,850 0.00%SVB Financial Group $250,000 3.13% 5/6/2030 266,832 0.00%Federal National Mortgage Association $247,301 3.50% 1/4/2047 266,693 0.00%Methodist Hospital $275,000 2.71% 1/12/2050 266,539 0.00%Huntington National Bank $250,000 3.55% 6/10/2023 266,480 0.00%Microsoft Corp. $250,000 2.40% 8/8/2026 266,415 0.00%Westinghouse Air Brake Technologies Corp. $250,000 3.20% 15/6/2025 266,384 0.00%Federal Home Loan Mortgage Corp. $254,344 3.00% 1/3/2050 266,173 0.00%Consolidated Edison Co. of New York, Inc. $220,000 4.50% 1/12/2045 266,155 0.00%Government National Mortgage Association $252,674 3.00% 20/4/2046 266,137 0.00%Federal Home Loan Mortgage Corp. $248,427 3.50% 1/9/2035 265,930 0.00%Federal National Mortgage Association^ $250,000 2.56% 25/12/2026 265,918 0.00%Federal National Mortgage Association $242,630 4.50% 1/10/2046 265,411 0.00%Federal National Mortgage Association $239,418 4.50% 1/9/2039 265,385 0.00%Crown Castle International Corp. $250,000 3.10% 15/11/2029 265,334 0.00%Federal National Mortgage Association $242,645 4.00% 1/12/2042 265,323 0.00%Freddie Mac Multifamily Structured Pass Through Certificates $250,000 3.37% 25/7/2025 265,086 0.00%Benchmark 2018-B6 Mortgage Trust $250,000 4.20% 10/10/2051 265,075 0.00%Costco Wholesale Corp. $250,000 2.75% 18/5/2024 265,008 0.00%eBay, Inc. $250,000 3.65% 10/5/2051 264,936 0.00%Quest Diagnostics, Inc. $250,000 2.95% 30/6/2030 264,934 0.00%Atmos Energy Corp. $225,000 4.13% 15/10/2044 264,881 0.00%Federal Home Loan Mortgage Corp. $242,103 4.00% 1/7/2040 264,876 0.00%Linde, Inc. $250,000 2.65% 5/2/2025 264,854 0.00%Federal National Mortgage Association $253,885 3.00% 1/11/2050 264,844 0.00%Federal Home Loan Mortgage Corp. $247,284 3.50% 1/11/2044 264,747 0.00%Prudential Financial, Inc. $175,000 6.63% 21/6/2040 264,459 0.00%International Paper Co. $210,000 5.00% 15/9/2035 264,246 0.00%BANK 2018 $250,000 4.13% 15/9/2060 264,225 0.00%Government National Mortgage Association $247,594 3.00% 20/2/2043 264,113 0.00%American Honda Finance Corp. $250,000 2.35% 8/1/2027 264,090 0.00%National Securities Clearing Corp. $260,000 1.20% 23/4/2023 264,058 0.00%Allstate Corp.^ $200,000 6.50% 15/5/2057 264,028 0.00%CSX Corp. $290,000 2.50% 15/5/2051 263,932 0.00%

511
Vanguard Global Bond Index Fund
Principal CouponMaturity
DateFair Value
US Dollars ($)% of Total
Net AssetsSouthern California Edison Co. $245,000 4.05% 15/3/2042 263,920 0.00%Stryker Corp. €200,000 2.13% 30/11/2027 263,705 0.00%Verizon Communications, Inc. £200,000 1.88% 3/11/2038 263,482 0.00%Pricoa Global Funding I $250,000 2.40% 23/9/2024 263,374 0.00%Federal National Mortgage Association $240,945 5.00% 1/9/2048 263,258 0.00%Citizens Bank NA $250,000 3.70% 29/3/2023 263,132 0.00%Essex Portfolio LP $250,000 3.00% 15/1/2030 263,040 0.00%Federal Home Loan Mortgage Corp. $246,563 4.00% 1/5/2048 263,000 0.00%JPMBB Commercial Mortgage Securities Trust 2013 $250,000 3.66% 15/7/2045 262,785 0.00%Republic Services, Inc. $250,000 2.50% 15/8/2024 262,601 0.00%Williams Cos, Inc. $200,000 5.75% 24/6/2044 262,579 0.00%Healthpeak Properties, Inc. $250,000 2.88% 15/1/2031 262,559 0.00%Aon Corp. $200,000 8.21% 1/1/2027 262,321 0.00%Plains All American Pipeline LP/PAA Finance Corp. $200,000 6.65% 15/1/2037 262,195 0.00%Zions Bancorp NA $250,000 3.25% 29/10/2029 262,019 0.00%Evergy, Inc. $250,000 2.45% 15/9/2024 261,831 0.00%Ford Credit Floorplan Master Owner Trust A $250,000 3.17% 15/3/2025 261,826 0.00%Medtronic Global Holdings SCA €200,000 1.63% 7/3/2031 261,455 0.00%VEREIT Operating Partnership LP $250,000 2.85% 15/12/2032 261,455 0.00%Nucor Corp. $250,000 2.70% 1/6/2030 261,168 0.00%MUFG Union Bank NA $255,000 2.10% 9/12/2022 260,993 0.00%Citigroup Commercial Mortgage Trust 2016 $250,000 2.65% 10/7/2049 260,925 0.00%International Business Machines Corp. $200,000 4.70% 19/2/2046 260,875 0.00%Freddie Mac Multifamily Structured Pass Through Certificates^ $250,000 3.25% 25/4/2023 260,810 0.00%Government National Mortgage Association $245,029 3.00% 20/9/2043 260,801 0.00%Morgan Stanley $250,000 3.13% 23/1/2023 260,693 0.00%NiSource, Inc. $200,000 5.25% 15/2/2043 260,563 0.00%Truist Bank $250,000 2.75% 1/5/2023 260,561 0.00%Freddie Mac Multifamily Structured Pass Through Certificates^ $250,000 3.32% 25/2/2023 260,462 0.00%Kilroy Realty LP $250,000 3.80% 15/1/2023 260,076 0.00%Crown Castle International Corp. $200,000 5.20% 15/2/2049 259,873 0.00%Essex Portfolio LP $230,000 4.00% 1/3/2029 259,777 0.00%Stanley Black & Decker, Inc. $250,000 2.30% 15/3/2030 259,507 0.00%US Bank NA $250,000 2.85% 23/1/2023 259,436 0.00%Government National Mortgage Association $231,970 4.50% 20/9/2040 259,246 0.00%New York Life Global Funding $250,000 2.00% 22/1/2025 259,180 0.00%Federal Home Loan Mortgage Corp. $233,688 4.50% 1/5/2041 259,084 0.00%International Flavors & Fragrances, Inc. $200,000 5.00% 26/9/2048 259,042 0.00%JobsOhio Beverage System $250,000 2.83% 1/1/2038 258,920 0.00%Pfizer, Inc. £165,000 2.74% 15/6/2043 258,868 0.00%Black Hills Corp. $240,000 3.88% 15/10/2049 258,829 0.00%Wells Fargo Commercial Mortgage Trust 2018 $225,000 4.21% 15/5/2051 258,729 0.00%NVIDIA Corp. $235,000 3.20% 16/9/2026 258,625 0.00%Health Care Service Corp. A Mutual Legal Reserve Co. $250,000 3.20% 1/6/2050 258,597 0.00%UBS Commercial Mortgage Trust 2018 $225,000 4.31% 15/5/2051 258,593 0.00%Nucor Corp. $250,000 2.00% 1/6/2025 258,574 0.00%National Rural Utilities Cooperative Finance Corp. $250,000 2.70% 15/2/2023 258,501 0.00%GM Financial Consumer Automobile Receivables Trust 2018 $250,000 3.32% 17/6/2024 258,177 0.00%Charter Communications Operating LLC/Charter Communications
Operating Capital $175,000 6.83% 23/10/2055 258,053 0.00%Duke Energy Corp. $225,000 4.20% 15/6/2049 257,924 0.00%Merck & Co., Inc. $175,000 6.50% 1/12/2033 257,899 0.00%Thermo Fisher Scientific, Inc. €200,000 1.75% 15/4/2027 257,898 0.00%Abbott Laboratories $175,000 6.15% 30/11/2037 257,829 0.00%Markel Corp. $250,000 3.45% 7/5/2052 257,809 0.00%Crown Castle International Corp. $240,000 3.30% 1/7/2030 257,779 0.00%Oregon State University $250,000 3.42% 1/3/2060 257,740 0.00%Freddie Mac Multifamily Structured Pass Through Certificates $250,000 1.77% 25/5/2028 257,424 0.00%Federal Home Loan Mortgage Corp. $245,940 2.50% 1/10/2030 257,371 0.00%Exxon Mobil Corp. $250,000 3.00% 16/8/2039 257,082 0.00%Fidelity National Information Services, Inc. $250,000 3.10% 1/3/2041 256,842 0.00%Duke Realty LP $225,000 4.00% 15/9/2028 256,454 0.00%EI du Pont de Nemours & Co. $250,000 1.70% 15/7/2025 256,278 0.00%BP Capital Markets America, Inc. $225,000 3.94% 21/9/2028 256,272 0.00%AT&T, Inc. $225,000 4.30% 15/12/2042 256,270 0.00%Capital One Multi-Asset Execution Trust $250,000 2.29% 15/7/2025 256,185 0.00%Federal National Mortgage Association $231,890 4.00% 1/1/2044 256,069 0.00%Lazard Group LLC $225,000 4.38% 11/3/2029 255,995 0.00%Bank of New York Mellon Corp. $250,000 1.85% 27/1/2023 255,819 0.00%Anthem, Inc. $250,000 3.13% 15/5/2050 255,731 0.00%Alabama Power Co. $180,000 6.00% 1/3/2039 255,670 0.00%

512
Vanguard Global Bond Index Fund
Principal CouponMaturity
DateFair Value
US Dollars ($)% of Total
Net AssetsCommonwealth Financing Authority $225,000 3.81% 1/6/2041 255,667 0.00%Federal National Mortgage Association $240,217 4.00% 1/9/2049 255,630 0.00%Memorial Sloan-Kettering Cancer Center $250,000 2.96% 1/1/2050 255,628 0.00%Johnson & Johnson $175,000 5.85% 15/7/2038 255,394 0.00%MedStar Health, Inc. $230,000 3.63% 15/8/2049 255,327 0.00%International Flavors & Fragrances, Inc. €200,000 1.80% 25/9/2026 255,313 0.00%First Republic Bank^ $250,000 1.91% 12/2/2024 255,180 0.00%Motorola Solutions, Inc. $250,000 2.75% 24/5/2031 255,149 0.00%Public Storage $250,000 2.30% 1/5/2031 255,131 0.00%Puget Sound Energy, Inc. $185,000 5.76% 1/10/2039 255,119 0.00%Federal National Mortgage Association $234,887 4.00% 1/10/2033 255,105 0.00%Southern Co. Gas Capital Corp. $235,000 3.25% 15/6/2026 255,067 0.00%Viatris, Inc. $250,000 2.30% 22/6/2027 255,038 0.00%Federal National Mortgage Association $244,116 3.00% 1/6/2040 255,017 0.00%Government National Mortgage Association $236,438 4.50% 20/12/2047 255,010 0.00%Amcor Flexibles North America, Inc. $250,000 2.69% 25/5/2031 254,872 0.00%Burlington Northern Santa Fe LLC $225,000 3.55% 15/2/2050 254,849 0.00%Omnicom Finance Holdings plc €200,000 1.40% 8/7/2031 254,809 0.00%Abbott Ireland Financing DAC €200,000 1.50% 27/9/2026 254,615 0.00%PayPal Holdings, Inc. $250,000 1.35% 1/6/2023 254,522 0.00%CCRE24 Commercial Mortgage Trust 2015 $237,138 3.43% 10/8/2048 254,419 0.00%Thermo Fisher Scientific, Inc. €200,000 2.00% 15/4/2025 254,291 0.00%Government National Mortgage Association $233,349 3.50% 15/9/2041 254,287 0.00%DTE Electric Co. $250,000 1.90% 1/4/2028 254,262 0.00%Omnicom Group, Inc. $250,000 2.60% 1/8/2031 254,259 0.00%PepsiCo, Inc. €200,000 1.13% 18/3/2031 254,225 0.00%Government National Mortgage Association $240,079 3.00% 20/11/2045 254,206 0.00%United Parcel Service, Inc. €200,000 1.63% 15/11/2025 254,147 0.00%Health Care Service Corp. A Mutual Legal Reserve Co. $250,000 1.50% 1/6/2025 254,094 0.00%Blackstone Holdings Finance Co. LLC $215,000 4.00% 2/10/2047 254,084 0.00%Duke Energy Carolinas LLC $245,000 2.45% 1/2/2030 253,981 0.00%Mohawk Capital Finance SA €200,000 1.75% 12/6/2027 253,871 0.00%HCA, Inc. $225,000 4.13% 15/6/2029 253,727 0.00%Government National Mortgage Association $237,789 4.50% 20/2/2049 253,640 0.00%GLP Capital LP/GLP Financing II, Inc. $225,000 5.25% 1/6/2025 253,470 0.00%Business Development Corp. of America $250,000 3.25% 30/3/2026 253,374 0.00%New Jersey Transportation Trust Fund Authority $170,000 6.56% 15/12/2040 253,371 0.00%Viatris, Inc. $250,000 1.65% 22/6/2025 253,305 0.00%John Deere Capital Corp. $225,000 3.45% 7/3/2029 253,197 0.00%PayPal Holdings, Inc. $240,000 2.40% 1/10/2024 252,976 0.00%Western Union Co. $200,000 6.20% 17/11/2036 252,921 0.00%AIG Global Funding $250,000 2.70% 15/12/2021 252,865 0.00%Mars, Inc. $215,000 3.88% 1/4/2039 252,754 0.00%McDonald's Corp. CA($)295,000 3.13% 4/3/2025 252,663 0.00%MassMutual Global Funding II $250,000 0.85% 9/6/2023 252,523 0.00%Enterprise Products Operating LLC $235,000 3.70% 31/1/2051 252,512 0.00%National Rural Utilities Cooperative Finance Corp. $225,000 3.70% 15/3/2029 252,322 0.00%American Honda Finance Corp. €211,000 0.35% 26/8/2022 252,299 0.00%Oncor Electric Delivery Co. LLC $200,000 5.75% 15/3/2029 252,185 0.00%Anthem, Inc. $250,000 2.25% 15/5/2030 252,170 0.00%Stellantis NV €200,000 2.00% 20/3/2025 252,162 0.00%PepsiCo, Inc. $250,000 0.75% 1/5/2023 252,082 0.00%American Honda Finance Corp. $250,000 1.20% 8/7/2025 252,003 0.00%Freddie Mac Multifamily Structured Pass Through Certificates^ $240,000 3.31% 25/5/2023 252,002 0.00%Public Storage $250,000 1.85% 1/5/2028 251,942 0.00%Raytheon Technologies Corp. $200,000 4.70% 15/12/2041 251,804 0.00%Extra Space Storage LP $250,000 2.55% 1/6/2031 251,733 0.00%International Business Machines Corp. €200,000 1.25% 29/1/2027 251,599 0.00%General Motors Financial Co., Inc. $250,000 1.05% 8/3/2024 251,513 0.00%Consolidated Edison Co. of New York, Inc. $200,000 4.63% 1/12/2054 251,489 0.00%Ford Foundation $250,000 2.82% 1/6/2070 251,482 0.00%Yale University $250,000 0.87% 15/4/2025 251,481 0.00%Freddie Mac Multifamily Structured Pass Through Certificates^ $240,000 3.30% 25/4/2023 251,371 0.00%Coca-Cola Co. €200,000 1.13% 9/3/2027 251,290 0.00%Federal Home Loan Mortgage Corp. $237,470 3.00% 1/5/2031 251,232 0.00%Thermo Fisher Scientific, Inc. €200,000 1.40% 23/1/2026 251,052 0.00%Hubbell, Inc. $250,000 2.30% 15/3/2031 250,984 0.00%Health Care Service Corp. A Mutual Legal Reserve Co. $250,000 2.20% 1/6/2030 250,968 0.00%Bristol-Myers Squibb Co. $225,000 3.45% 15/11/2027 250,907 0.00%Alleghany Corp. $200,000 4.90% 15/9/2044 250,880 0.00%Nasdaq, Inc. $250,000 3.25% 28/4/2050 250,852 0.00%

513
Vanguard Global Bond Index Fund
Principal CouponMaturity
DateFair Value
US Dollars ($)% of Total
Net AssetsUniversity of California $250,000 0.88% 15/5/2025 250,665 0.00%WEC Energy Group, Inc. $250,000 0.80% 15/3/2024 250,647 0.00%AbbVie, Inc. $200,000 4.75% 15/3/2045 250,629 0.00%Prospect Capital Corp. $250,000 3.36% 15/11/2026 250,511 0.00%AmerisourceBergen Corp. $250,000 0.74% 15/3/2023 250,495 0.00%Mars, Inc. $200,000 4.20% 1/4/2059 250,492 0.00%Federal Home Loan Mortgage Corp. $225,558 4.50% 1/12/2040 250,486 0.00%Lam Research Corp. $185,000 4.88% 15/3/2049 250,381 0.00%Federal Home Loan Mortgage Corp. $234,573 3.50% 1/1/2046 250,338 0.00%Federal National Mortgage Association $235,559 3.50% 1/5/2046 250,337 0.00%Teledyne Technologies, Inc. $250,000 0.95% 1/4/2024 250,328 0.00%Oaktree Specialty Lending Corp. $250,000 2.70% 15/1/2027 250,326 0.00%Lowe's Cos, Inc. $200,000 4.55% 5/4/2049 250,130 0.00%JPMorgan Chase & Co. €200,000 1.50% 27/1/2025 250,104 0.00%Indiana Michigan Power Co. $200,000 4.55% 15/3/2046 250,076 0.00%Wells Fargo & Co. CA($)300,000 2.51% 27/10/2023 249,932 0.00%Fidelity National Information Services, Inc. $250,000 0.38% 1/3/2023 249,788 0.00%LYB International Finance III LLC $250,000 2.25% 1/10/2030 249,755 0.00%City of San Antonio TX Electric & Gas Systems Revenue $250,000 2.91% 1/2/2048 249,705 0.00%Principal Financial Group, Inc. $250,000 2.13% 15/6/2030 249,684 0.00%Emerson Electric Co. €200,000 1.25% 15/10/2025 249,655 0.00%Fidelity National Information Services, Inc. $250,000 0.60% 1/3/2024 249,602 0.00%AIG Global Funding $250,000 0.45% 8/12/2023 249,571 0.00%PacifiCorp $175,000 6.25% 15/10/2037 249,484 0.00%Altria Group, Inc. €200,000 1.70% 15/6/2025 249,383 0.00%Dover Corp. €200,000 1.25% 9/11/2026 249,330 0.00%FedEx Corp. $200,000 4.75% 15/11/2045 249,284 0.00%McDonald's Corp. $200,000 4.60% 26/5/2045 249,171 0.00%Kimco Realty Corp. $225,000 3.80% 1/4/2027 249,120 0.00%Kaiser Foundation Hospitals $200,000 4.15% 1/5/2047 249,114 0.00%Philip Morris International, Inc. $225,000 3.88% 21/8/2042 248,811 0.00%GXO Logistics, Inc. $250,000 1.65% 15/7/2026 248,732 0.00%Philip Morris International, Inc. $225,000 3.38% 15/8/2029 248,711 0.00%Fidelity National Information Services, Inc. $250,000 1.65% 1/3/2028 248,489 0.00%United Airlines 2016-2 Class AA Pass Through Trust $244,495 2.88% 7/10/2028 248,446 0.00%Roper Technologies, Inc. $250,000 1.00% 15/9/2025 248,437 0.00%California State University $250,000 2.90% 1/11/2051 248,432 0.00%Commonwealth Edison Co. $200,000 4.35% 15/11/2045 248,412 0.00%Kellogg Co. $200,000 4.50% 1/4/2046 248,262 0.00%PepsiCo, Inc. $200,000 4.25% 22/10/2044 248,248 0.00%George Washington University $200,000 4.13% 15/9/2048 248,201 0.00%Johnson Controls International plc €200,000 1.38% 25/2/2025 248,168 0.00%Federal Home Loan Mortgage Corp. $236,924 2.50% 1/11/2030 247,936 0.00%Global Payments, Inc. $250,000 1.20% 1/3/2026 247,900 0.00%Virginia Electric & Power Co. $200,000 4.45% 15/2/2044 247,776 0.00%New Jersey Transportation Trust Fund Authority $210,000 5.75% 15/12/2028 247,685 0.00%Blackstone Holdings Finance Co. LLC $200,000 4.45% 15/7/2045 247,551 0.00%Federal Home Loan Mortgage Corp. $223,210 4.50% 1/7/2040 247,401 0.00%Chubb INA Holdings, Inc. $225,000 3.35% 3/5/2026 247,334 0.00%Federal National Mortgage Association $231,733 3.50% 1/11/2025 247,322 0.00%Conagra Brands, Inc. $239,000 3.20% 25/1/2023 247,306 0.00%Stryker Corp. $250,000 1.95% 15/6/2030 247,280 0.00%Republic Services, Inc. $225,000 3.38% 15/11/2027 247,266 0.00%Sherwin-Williams Co. $230,000 2.95% 15/8/2029 247,054 0.00%PepsiCo, Inc. €200,000 0.75% 18/3/2027 247,045 0.00%Israel Government AID Bond $175,000 5.50% 18/9/2033 246,909 0.00%Federal Home Loan Mortgage Corp. $234,501 3.00% 1/4/2035 246,759 0.00%New York & Presbyterian Hospital $200,000 4.02% 1/8/2045 246,740 0.00%Government National Mortgage Association $220,653 4.50% 20/11/2039 246,557 0.00%UDR, Inc. $225,000 3.50% 1/7/2027 246,365 0.00%Energy Transfer LP $225,000 4.95% 15/1/2043 246,323 0.00%Government National Mortgage Association $230,535 3.50% 20/5/2032 246,261 0.00%Apollo Management Holdings LP $210,000 4.87% 15/2/2029 246,209 0.00%Kilroy Realty LP $250,000 2.50% 15/11/2032 246,101 0.00%Federal Home Loan Mortgage Corp. $236,654 2.50% 1/5/2050 246,028 0.00%AHS Hospital Corp. $250,000 2.78% 1/7/2051 246,002 0.00%Federal National Mortgage Association $222,070 4.50% 1/7/2050 245,983 0.00%Federal National Mortgage Association^ $250,000 1.44% 25/11/2030 245,874 0.00%Federal National Mortgage Association $226,928 4.00% 1/8/2031 245,845 0.00%Smithfield Foods, Inc. $225,000 4.25% 1/2/2027 245,682 0.00%Marathon Petroleum Corp. $225,000 4.75% 15/12/2023 245,479 0.00%
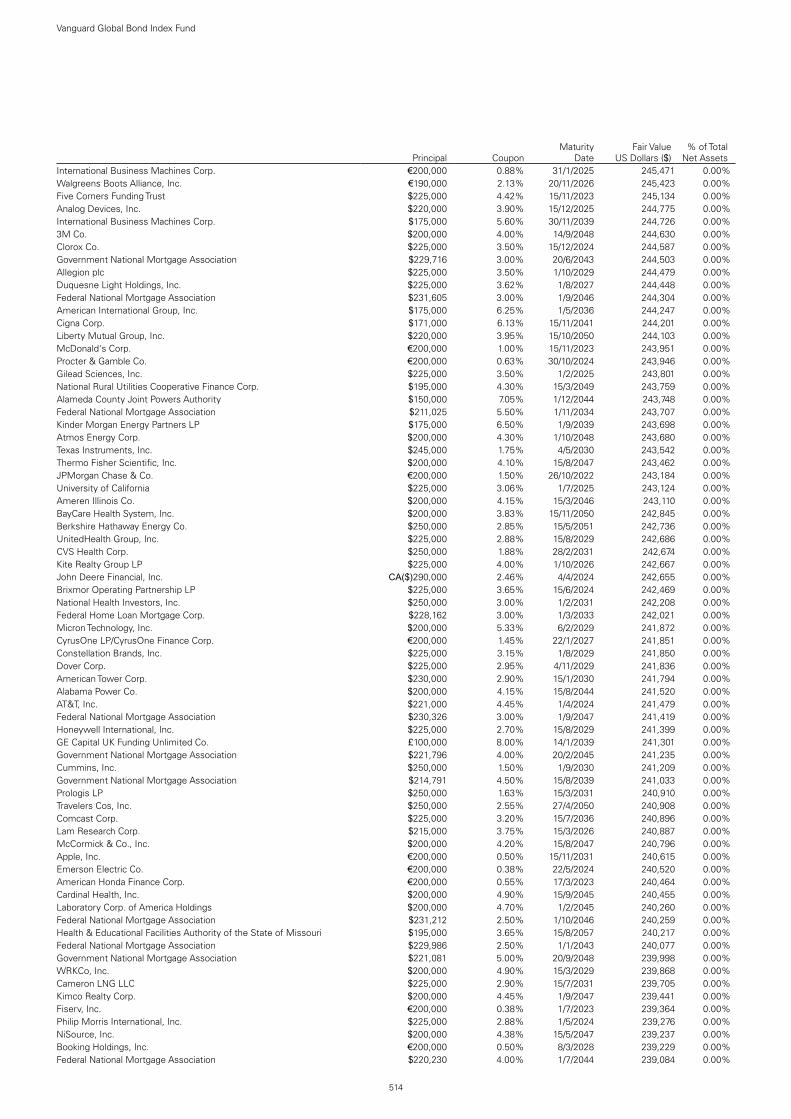
514
Vanguard Global Bond Index Fund
Principal CouponMaturity
DateFair Value
US Dollars ($)% of Total
Net AssetsInternational Business Machines Corp. €200,000 0.88% 31/1/2025 245,471 0.00%Walgreens Boots Alliance, Inc. €190,000 2.13% 20/11/2026 245,423 0.00%Five Corners Funding Trust $225,000 4.42% 15/11/2023 245,134 0.00%Analog Devices, Inc. $220,000 3.90% 15/12/2025 244,775 0.00%International Business Machines Corp. $175,000 5.60% 30/11/2039 244,726 0.00%3M Co. $200,000 4.00% 14/9/2048 244,630 0.00%Clorox Co. $225,000 3.50% 15/12/2024 244,587 0.00%Government National Mortgage Association $229,716 3.00% 20/6/2043 244,503 0.00%Allegion plc $225,000 3.50% 1/10/2029 244,479 0.00%Duquesne Light Holdings, Inc. $225,000 3.62% 1/8/2027 244,448 0.00%Federal National Mortgage Association $231,605 3.00% 1/9/2046 244,304 0.00%American International Group, Inc. $175,000 6.25% 1/5/2036 244,247 0.00%Cigna Corp. $171,000 6.13% 15/11/2041 244,201 0.00%Liberty Mutual Group, Inc. $220,000 3.95% 15/10/2050 244,103 0.00%McDonald's Corp. €200,000 1.00% 15/11/2023 243,951 0.00%Procter & Gamble Co. €200,000 0.63% 30/10/2024 243,946 0.00%Gilead Sciences, Inc. $225,000 3.50% 1/2/2025 243,801 0.00%National Rural Utilities Cooperative Finance Corp. $195,000 4.30% 15/3/2049 243,759 0.00%Alameda County Joint Powers Authority $150,000 7.05% 1/12/2044 243,748 0.00%Federal National Mortgage Association $211,025 5.50% 1/11/2034 243,707 0.00%Kinder Morgan Energy Partners LP $175,000 6.50% 1/9/2039 243,698 0.00%Atmos Energy Corp. $200,000 4.30% 1/10/2048 243,680 0.00%Texas Instruments, Inc. $245,000 1.75% 4/5/2030 243,542 0.00%Thermo Fisher Scientific, Inc. $200,000 4.10% 15/8/2047 243,462 0.00%JPMorgan Chase & Co. €200,000 1.50% 26/10/2022 243,184 0.00%University of California $225,000 3.06% 1/7/2025 243,124 0.00%Ameren Illinois Co. $200,000 4.15% 15/3/2046 243,110 0.00%BayCare Health System, Inc. $200,000 3.83% 15/11/2050 242,845 0.00%Berkshire Hathaway Energy Co. $250,000 2.85% 15/5/2051 242,736 0.00%UnitedHealth Group, Inc. $225,000 2.88% 15/8/2029 242,686 0.00%CVS Health Corp. $250,000 1.88% 28/2/2031 242,674 0.00%Kite Realty Group LP $225,000 4.00% 1/10/2026 242,667 0.00%John Deere Financial, Inc. CA($)290,000 2.46% 4/4/2024 242,655 0.00%Brixmor Operating Partnership LP $225,000 3.65% 15/6/2024 242,469 0.00%National Health Investors, Inc. $250,000 3.00% 1/2/2031 242,208 0.00%Federal Home Loan Mortgage Corp. $228,162 3.00% 1/3/2033 242,021 0.00%Micron Technology, Inc. $200,000 5.33% 6/2/2029 241,872 0.00%CyrusOne LP/CyrusOne Finance Corp. €200,000 1.45% 22/1/2027 241,851 0.00%Constellation Brands, Inc. $225,000 3.15% 1/8/2029 241,850 0.00%Dover Corp. $225,000 2.95% 4/11/2029 241,836 0.00%American Tower Corp. $230,000 2.90% 15/1/2030 241,794 0.00%Alabama Power Co. $200,000 4.15% 15/8/2044 241,520 0.00%AT&T, Inc. $221,000 4.45% 1/4/2024 241,479 0.00%Federal National Mortgage Association $230,326 3.00% 1/9/2047 241,419 0.00%Honeywell International, Inc. $225,000 2.70% 15/8/2029 241,399 0.00%GE Capital UK Funding Unlimited Co. £100,000 8.00% 14/1/2039 241,301 0.00%Government National Mortgage Association $221,796 4.00% 20/2/2045 241,235 0.00%Cummins, Inc. $250,000 1.50% 1/9/2030 241,209 0.00%Government National Mortgage Association $214,791 4.50% 15/8/2039 241,033 0.00%Prologis LP $250,000 1.63% 15/3/2031 240,910 0.00%Travelers Cos, Inc. $250,000 2.55% 27/4/2050 240,908 0.00%Comcast Corp. $225,000 3.20% 15/7/2036 240,896 0.00%Lam Research Corp. $215,000 3.75% 15/3/2026 240,887 0.00%McCormick & Co., Inc. $200,000 4.20% 15/8/2047 240,796 0.00%Apple, Inc. €200,000 0.50% 15/11/2031 240,615 0.00%Emerson Electric Co. €200,000 0.38% 22/5/2024 240,520 0.00%American Honda Finance Corp. €200,000 0.55% 17/3/2023 240,464 0.00%Cardinal Health, Inc. $200,000 4.90% 15/9/2045 240,455 0.00%Laboratory Corp. of America Holdings $200,000 4.70% 1/2/2045 240,260 0.00%Federal National Mortgage Association $231,212 2.50% 1/10/2046 240,259 0.00%Health & Educational Facilities Authority of the State of Missouri $195,000 3.65% 15/8/2057 240,217 0.00%Federal National Mortgage Association $229,986 2.50% 1/1/2043 240,077 0.00%Government National Mortgage Association $221,081 5.00% 20/9/2048 239,998 0.00%WRKCo, Inc. $200,000 4.90% 15/3/2029 239,868 0.00%Cameron LNG LLC $225,000 2.90% 15/7/2031 239,705 0.00%Kimco Realty Corp. $200,000 4.45% 1/9/2047 239,441 0.00%Fiserv, Inc. €200,000 0.38% 1/7/2023 239,364 0.00%Philip Morris International, Inc. $225,000 2.88% 1/5/2024 239,276 0.00%NiSource, Inc. $200,000 4.38% 15/5/2047 239,237 0.00%Booking Holdings, Inc. €200,000 0.50% 8/3/2028 239,229 0.00%Federal National Mortgage Association $220,230 4.00% 1/7/2044 239,084 0.00%

515
Vanguard Global Bond Index Fund
Principal CouponMaturity
DateFair Value
US Dollars ($)% of Total
Net AssetsState Street Corp.^ $225,000 3.03% 1/11/2034 239,074 0.00%Colgate-Palmolive Co. €200,000 0.88% 12/11/2039 239,010 0.00%Public Service Enterprise Group, Inc. $225,000 2.88% 15/6/2024 238,666 0.00%Kroger Co. $175,000 5.40% 15/1/2049 238,571 0.00%Tractor Supply Co. $250,000 1.75% 1/11/2030 238,556 0.00%General Electric Co. $206,000 4.13% 9/10/2042 238,108 0.00%Cummins, Inc. $250,000 2.60% 1/9/2050 238,079 0.00%CME Group, Inc. $222,000 3.00% 15/3/2025 237,981 0.00%GATX Corp. $250,000 1.90% 1/6/2031 237,942 0.00%Government National Mortgage Association $218,913 4.00% 20/7/2045 237,806 0.00%Huntington Bancshares, Inc. $225,000 2.63% 6/8/2024 237,629 0.00%Aptiv plc $175,000 5.40% 15/3/2049 237,557 0.00%Federal National Mortgage Association $225,000 2.21% 25/1/2030 237,302 0.00%Autodesk, Inc. $225,000 2.85% 15/1/2030 237,233 0.00%Roper Technologies, Inc. $235,000 2.80% 15/12/2021 237,182 0.00%DTE Electric Co. $225,000 2.63% 1/3/2031 237,123 0.00%United Airlines 2014-2 Class A Pass Through Trust $224,396 3.75% 3/9/2026 237,052 0.00%Atmos Energy Corp. $220,000 3.38% 15/9/2049 236,775 0.00%Zoetis, Inc. $200,000 3.95% 12/9/2047 236,751 0.00%Merck & Co., Inc. $200,000 3.90% 7/3/2039 236,734 0.00%Ally Financial, Inc. $210,000 5.13% 30/9/2024 236,714 0.00%Cox Communications, Inc. $225,000 3.60% 15/6/2051 236,710 0.00%State Street Corp.^ $225,000 2.35% 1/11/2025 236,655 0.00%Federal National Mortgage Association $213,335 4.50% 1/1/2040 236,473 0.00%Baker Hughes a GE Co. LLC/Baker Hughes Co.-Obligor, Inc. $200,000 4.49% 1/5/2030 236,268 0.00%Eastern Energy Gas Holdings LLC $200,000 4.80% 1/11/2043 236,250 0.00%salesforce.com, Inc. $225,000 3.25% 11/4/2023 236,048 0.00%Government National Mortgage Association $216,887 4.00% 20/9/2044 235,897 0.00%Fifth Third Bancorp $225,000 2.38% 28/1/2025 235,790 0.00%Mars, Inc. $215,000 3.20% 1/4/2030 235,678 0.00%Pennsylvania Turnpike Commission $165,000 5.51% 1/12/2045 235,666 0.00%KeyCorp $225,000 2.55% 1/10/2029 235,644 0.00%DH Europe Finance II Sarl $225,000 2.60% 15/11/2029 235,592 0.00%IHS Markit Ltd. $200,000 4.75% 1/8/2028 235,555 0.00%Discover Bank $225,000 2.45% 12/9/2024 235,403 0.00%PacifiCorp $200,000 4.10% 1/2/2042 235,381 0.00%Federal National Mortgage Association $225,492 2.50% 1/1/2028 235,249 0.00%Markel Corp. $200,000 4.30% 1/11/2047 235,248 0.00%Federal National Mortgage Association $222,739 3.50% 1/3/2038 235,090 0.00%Quest Diagnostics, Inc. $225,000 2.80% 30/6/2031 235,085 0.00%Fox Corp. $200,000 4.71% 25/1/2029 234,984 0.00%Freddie Mac Multifamily Structured Pass Through Certificates^ $225,000 3.06% 25/7/2023 234,960 0.00%DH Europe Finance II Sarl $225,000 2.20% 15/11/2024 234,942 0.00%Walmart, Inc. $200,000 3.63% 15/12/2047 234,608 0.00%Chevron USA, Inc. $175,000 4.95% 15/8/2047 234,453 0.00%Federal Home Loan Mortgage Corp. $215,885 4.00% 1/6/2044 234,443 0.00%3M Co. $225,000 2.00% 14/2/2025 234,404 0.00%Devon Energy Corp. $213,000 4.50% 15/1/2030 234,363 0.00%AbbVie, Inc. $225,000 2.85% 14/5/2023 234,253 0.00%Aetna, Inc. $225,000 2.80% 15/6/2023 234,189 0.00%Federal National Mortgage Association $200,339 6.00% 1/3/2034 234,136 0.00%DBGS 2018-C1 Mortgage Trust $200,000 4.47% 15/10/2051 234,054 0.00%Federal Home Loan Mortgage Corp. $224,578 2.50% 1/3/2037 234,022 0.00%Essex Portfolio LP $215,000 3.38% 15/4/2026 233,725 0.00%American Water Capital Corp. $200,000 4.00% 1/12/2046 233,724 0.00%Colonial Pipeline Co. $200,000 4.25% 15/4/2048 233,345 0.00%Tucson Electric Power Co. $200,000 4.00% 15/6/2050 233,213 0.00%Archer-Daniels-Midland Co. $175,000 4.50% 15/3/2049 233,169 0.00%BP Capital Markets America, Inc. $240,000 3.00% 24/2/2050 233,109 0.00%Simon Property Group LP $225,000 2.00% 13/9/2024 233,102 0.00%Simon Property Group LP $200,000 4.25% 30/11/2046 233,069 0.00%Federal National Mortgage Association $216,091 3.50% 1/6/2031 232,739 0.00%Kilroy Realty LP $200,000 4.75% 15/12/2028 232,257 0.00%Halliburton Co. $200,000 4.75% 1/8/2043 232,235 0.00%Steelcase, Inc. $200,000 5.13% 18/1/2029 232,152 0.00%PayPal Holdings, Inc. $224,000 2.30% 1/6/2030 232,119 0.00%Providence St Joseph Health Obligated Group $200,000 3.93% 1/10/2048 232,107 0.00%Johnson & Johnson $200,000 3.50% 15/1/2048 232,064 0.00%TC PipeLines LP $210,000 3.90% 25/5/2027 231,904 0.00%Consumers Energy Co. $215,000 3.25% 15/8/2046 231,764 0.00%Federal Home Loan Mortgage Corp. $219,568 3.00% 1/6/2029 231,653 0.00%

516
Vanguard Global Bond Index Fund
Principal CouponMaturity
DateFair Value
US Dollars ($)% of Total
Net AssetsFederal National Mortgage Association $219,460 3.50% 1/6/2048 231,608 0.00%Government National Mortgage Association $210,930 4.50% 20/5/2045 231,538 0.00%Niagara Mohawk Power Corp. $225,000 2.72% 28/11/2022 231,514 0.00%Entergy Mississippi LLC $200,000 3.85% 1/6/2049 231,507 0.00%Ecolab, Inc. €190,000 1.00% 15/1/2024 231,232 0.00%Government National Mortgage Association $211,795 5.00% 20/5/2048 231,113 0.00%Government National Mortgage Association $206,606 4.50% 20/1/2040 230,860 0.00%KeyCorp $200,000 4.10% 30/4/2028 230,851 0.00%Federal National Mortgage Association $217,683 3.50% 1/3/2037 230,702 0.00%Citigroup, Inc. $150,000 6.68% 13/9/2043 230,613 0.00%Government National Mortgage Association $205,890 4.50% 15/4/2040 230,612 0.00%Burlington Northern Santa Fe LLC $225,000 3.05% 1/9/2022 230,537 0.00%Linde, Inc. $200,000 3.55% 7/11/2042 230,414 0.00%New York City Water & Sewer System $155,000 5.75% 15/6/2041 230,270 0.00%American Electric Power Co., Inc. $200,000 4.30% 1/12/2028 230,268 0.00%DH Europe Finance II Sarl $225,000 2.05% 15/11/2022 230,204 0.00%Government National Mortgage Association $217,606 3.00% 15/3/2045 230,194 0.00%GLP Capital LP/GLP Financing II, Inc. $200,000 5.38% 15/4/2026 230,158 0.00%Federal National Mortgage Association $199,665 5.50% 1/11/2033 230,129 0.00%Government National Mortgage Association $204,466 4.50% 15/9/2047 229,839 0.00%American International Group, Inc. $200,000 4.20% 1/4/2028 229,794 0.00%Sherwin-Williams Co. $200,000 3.80% 15/8/2049 229,719 0.00%Pacific Life Insurance Co.^ $200,000 4.30% 24/10/2067 229,717 0.00%CSX Corp. $175,000 4.65% 1/3/2068 229,707 0.00%Apple, Inc. CHF200,000 0.75% 25/2/2030 229,227 0.00%Enable Midstream Partners LP $200,000 4.95% 15/5/2028 229,039 0.00%Office Properties Income Trust $215,000 4.25% 15/5/2024 228,993 0.00%eBay, Inc. $225,000 2.60% 10/5/2031 228,985 0.00%Government National Mortgage Association $210,044 3.50% 15/2/2042 228,920 0.00%Federal National Mortgage Association^ $206,000 3.15% 25/3/2028 228,731 0.00%Dominion Energy, Inc. $200,000 4.05% 15/9/2042 228,661 0.00%FedEx Corp. $200,000 4.10% 1/2/2045 228,588 0.00%Freddie Mac Multifamily Structured Pass Through Certificates^ $200,000 3.65% 25/2/2028 228,576 0.00%NiSource, Inc. $200,000 3.95% 30/3/2048 228,570 0.00%MetLife, Inc. $165,000 5.70% 15/6/2035 228,450 0.00%Ohio National Financial Services, Inc. $200,000 5.55% 24/1/2030 228,449 0.00%Cox Communications, Inc. $225,000 2.60% 15/6/2031 228,431 0.00%Duke Energy Corp. $225,000 2.55% 15/6/2031 228,146 0.00%New York City Water & Sewer System $150,000 5.95% 15/6/2042 228,029 0.00%Magellan Midstream Partners LP $210,000 3.95% 1/3/2050 227,710 0.00%AEP Transmission Co. LLC $200,000 3.65% 1/4/2050 227,550 0.00%Consumers Energy Co. $200,000 3.80% 15/11/2028 227,311 0.00%Federal Home Loan Mortgage Corp. $212,932 3.00% 1/12/2042 226,951 0.00%Leidos, Inc. $200,000 4.38% 15/5/2030 226,916 0.00%Federal Home Loan Mortgage Corp. $212,539 3.50% 1/11/2025 226,906 0.00%Federal National Mortgage Association $215,666 3.00% 1/12/2048 226,833 0.00%Johnson & Johnson $200,000 3.40% 15/1/2038 226,711 0.00%Berkshire Hathaway Energy Co. $200,000 3.70% 15/7/2030 226,668 0.00%Commonwealth Edison Co. $200,000 3.65% 15/6/2046 226,657 0.00%Crown Castle International Corp. $225,000 2.50% 15/7/2031 226,622 0.00%Corning, Inc. $200,000 3.90% 15/11/2049 226,511 0.00%Transcontinental Gas Pipe Line Co. LLC $200,000 4.00% 15/3/2028 226,484 0.00%JPMorgan Chase & Co. $200,000 4.13% 15/12/2026 226,343 0.00%S&P Global, Inc. $210,000 3.25% 1/12/2049 226,247 0.00%Stryker Corp. $225,000 1.15% 15/6/2025 226,247 0.00%Charles Schwab Corp. $205,000 3.25% 22/5/2029 226,201 0.00%Time Warner Entertainment Co. LP $200,000 8.38% 15/3/2023 225,988 0.00%Aptiv plc $200,000 4.25% 15/1/2026 225,984 0.00%Altria Group, Inc. $220,000 2.85% 9/8/2022 225,927 0.00%Public Service Co. of Colorado $200,000 3.60% 15/9/2042 225,926 0.00%Diamondback Energy, Inc. $200,000 4.40% 24/3/2051 225,916 0.00%National Fuel Gas Co. $200,000 4.75% 1/9/2028 225,746 0.00%Federal National Mortgage Association $198,334 5.00% 1/1/2039 225,589 0.00%eBay, Inc. $225,000 1.40% 10/5/2026 225,586 0.00%Federal Home Loan Mortgage Corp. $206,451 5.00% 1/8/2048 225,506 0.00%Federal Home Loan Mortgage Corp. $211,300 3.50% 1/9/2045 225,501 0.00%Government National Mortgage Association $210,171 3.50% 20/7/2044 225,320 0.00%Walmart, Inc. $170,000 4.88% 8/7/2040 224,897 0.00%Regency Centers LP $200,000 4.13% 15/3/2028 224,729 0.00%Principal Financial Group, Inc. $200,000 3.70% 15/5/2029 224,704 0.00%Guardian Life Insurance Co. of America $175,000 4.88% 19/6/2064 224,648 0.00%

517
Vanguard Global Bond Index Fund
Principal CouponMaturity
DateFair Value
US Dollars ($)% of Total
Net AssetsUnited Parcel Service, Inc. $200,000 3.40% 15/3/2029 224,643 0.00%Federal Home Loan Mortgage Corp. $206,806 4.00% 1/10/2044 224,584 0.00%Federal Home Loan Mortgage Corp. $217,220 2.00% 1/1/2032 224,564 0.00%Keurig Dr Pepper, Inc. $200,000 4.42% 25/5/2025 224,543 0.00%Halliburton Co. $200,000 4.50% 15/11/2041 224,516 0.00%Fifth Third Bank NA $200,000 3.95% 28/7/2025 224,184 0.00%Simon Property Group LP $225,000 1.75% 1/2/2028 224,167 0.00%Government National Mortgage Association $202,964 4.00% 15/1/2041 224,083 0.00%Western & Southern Life Insurance Co. $175,000 5.15% 15/1/2049 224,055 0.00%PepsiCo, Inc. $175,000 4.45% 14/4/2046 224,029 0.00%International Business Machines Corp. $200,000 3.50% 15/5/2029 223,904 0.00%Government National Mortgage Association $202,685 4.00% 15/4/2043 223,774 0.00%BlackRock, Inc. $200,000 3.25% 30/4/2029 223,671 0.00%Hyatt Hotels Corp. $200,000 4.85% 15/3/2026 223,590 0.00%Starbucks Corp. $200,000 3.50% 1/3/2028 223,582 0.00%Federal Home Loan Mortgage Corp. $213,503 2.50% 1/1/2036 223,392 0.00%Morgan Stanley^ $200,000 3.62% 1/4/2031 223,387 0.00%Federal Home Loan Mortgage Corp. $201,389 4.50% 1/11/2039 223,352 0.00%Dayton Power & Light Co. $200,000 3.95% 15/6/2049 223,251 0.00%Government National Mortgage Association $199,240 4.50% 15/3/2040 223,163 0.00%Healthcare Trust of America Holdings LP $200,000 3.75% 1/7/2027 223,099 0.00%Applied Materials, Inc. $175,000 4.35% 1/4/2047 222,978 0.00%Federal Home Loan Mortgage Corp. $191,641 5.50% 1/1/2040 222,904 0.00%Walmart, Inc. $170,000 4.75% 2/10/2043 222,885 0.00%Mid-America Apartments LP $200,000 3.60% 1/6/2027 222,802 0.00%Union Electric Co. $200,000 3.50% 15/3/2029 222,763 0.00%Apple, Inc. CHF200,000 0.38% 25/11/2024 222,493 0.00%Alcon Finance Corp. $200,000 3.80% 23/9/2049 222,346 0.00%Federal National Mortgage Association $207,591 3.50% 1/7/2034 222,318 0.00%Federal National Mortgage Association $150,000 7.25% 15/5/2030 222,286 0.00%PacifiCorp $200,000 3.50% 15/6/2029 222,184 0.00%JPMCC Commercial Mortgage Securities Trust 2017 $200,000 3.72% 15/3/2050 222,181 0.00%Wells Fargo Commercial Mortgage Trust 2017 $200,000 3.64% 15/3/2050 221,981 0.00%Federal National Mortgage Association $205,307 4.00% 1/10/2030 221,970 0.00%Crane Co. $200,000 4.20% 15/3/2048 221,832 0.00%Trinity Health Corp. $225,000 2.63% 1/12/2040 221,737 0.00%National Retail Properties, Inc. $200,000 4.00% 15/11/2025 221,679 0.00%Duke Energy Progress LLC $200,000 3.45% 15/3/2029 221,613 0.00%Kimberly-Clark Corp. $200,000 3.20% 25/4/2029 221,531 0.00%NRG Energy, Inc. $208,000 3.75% 15/6/2024 221,502 0.00%Duke Energy Florida LLC $150,000 6.35% 15/9/2037 221,478 0.00%Tyson Foods, Inc. $200,000 3.55% 2/6/2027 221,314 0.00%Morgan Stanley Bank of America Merrill Lynch Trust 2017 $200,000 3.85% 15/5/2050 221,222 0.00%JPMorgan Chase & Co. $200,000 3.90% 15/7/2025 221,176 0.00%Walt Disney Co. $200,000 3.70% 15/10/2025 220,980 0.00%Bay Area Toll Authority $125,000 6.91% 1/10/2050 220,924 0.00%Enbridge Energy Partners LP $150,000 7.50% 15/4/2038 220,820 0.00%Southern Co. $200,000 3.70% 30/4/2030 220,776 0.00%Cimarex Energy Co. $200,000 3.90% 15/5/2027 220,643 0.00%Crown Castle International Corp. $200,000 3.65% 1/9/2027 220,517 0.00%Federal National Mortgage Association $209,668 3.00% 1/4/2027 220,448 0.00%American Homes 4 Rent LP $225,000 3.38% 15/7/2051 220,415 0.00%Federal Home Loan Mortgage Corp. $205,870 3.50% 1/7/2044 220,408 0.00%Walgreens Boots Alliance, Inc. $200,000 4.10% 15/4/2050 220,407 0.00%Appalachian Power Co. $200,000 3.70% 1/5/2050 220,333 0.00%Ecolab, Inc. $200,000 3.25% 1/12/2027 220,226 0.00%CenterPoint Energy Houston Electric LLC $200,000 3.35% 1/4/2051 220,195 0.00%Federal Home Loan Mortgage Corp. $212,921 2.00% 1/12/2031 220,181 0.00%Federal National Mortgage Association $209,685 2.50% 1/5/2032 220,081 0.00%NiSource, Inc. $200,000 3.49% 15/5/2027 220,028 0.00%Wells Fargo Commercial Mortgage Trust 2017 $200,000 3.42% 15/9/2050 220,019 0.00%Citigroup Commercial Mortgage Trust 2017 $200,000 3.47% 12/10/2050 219,969 0.00%Highwoods Realty LP $200,000 3.88% 1/3/2027 219,767 0.00%JPMorgan Chase & Co. $200,000 3.63% 1/12/2027 219,717 0.00%Public Service Co. of Colorado $150,000 6.25% 1/9/2037 219,712 0.00%Cargill, Inc. $200,000 3.25% 23/5/2029 219,586 0.00%Tampa Electric Co. $200,000 3.45% 15/3/2051 219,514 0.00%Federal National Mortgage Association^ $200,000 3.06% 25/9/2027 219,415 0.00%PC1 Commercial Mortgage Trust 2015 $200,000 3.90% 10/7/2050 219,396 0.00%Federal National Mortgage Association $208,489 3.00% 1/4/2047 219,264 0.00%UBS Commercial Mortgage Trust 2017 $200,000 3.43% 15/8/2050 219,242 0.00%

518
Vanguard Global Bond Index Fund
Principal CouponMaturity
DateFair Value
US Dollars ($)% of Total
Net AssetsFreddie Mac Multifamily Structured Pass Through Certificates^ $200,000 3.12% 25/9/2026 219,225 0.00%Federal National Mortgage Association $196,032 4.50% 1/6/2047 219,190 0.00%Entergy Corp. $200,000 3.75% 15/6/2050 219,157 0.00%CNA Financial Corp. $200,000 3.45% 15/8/2027 219,135 0.00%Cantor Fitzgerald LP $200,000 4.88% 1/5/2024 219,119 0.00%Expedia Group, Inc. $200,000 4.50% 15/8/2024 219,059 0.00%Simon Property Group LP $200,000 3.50% 1/9/2025 219,034 0.00%Public Service Electric & Gas Co. $210,000 2.45% 15/1/2030 218,981 0.00%Xylem, Inc. $200,000 3.25% 1/11/2026 218,941 0.00%Wells Fargo & Co. $200,000 4.48% 16/1/2024 218,928 0.00%Federal National Mortgage Association $205,000 2.63% 6/9/2024 218,897 0.00%Waste Management, Inc. $200,000 3.15% 15/11/2027 218,865 0.00%Norfolk Southern Corp. $200,000 4.10% 15/5/2121 218,855 0.00%CCRE26 Commercial Mortgage Trust 2015 $200,000 3.63% 10/10/2048 218,760 0.00%WP Carey, Inc. $200,000 4.60% 1/4/2024 218,744 0.00%L3Harris Technologies, Inc. $225,000 1.80% 15/1/2031 218,693 0.00%Energy Transfer LP $200,000 3.90% 15/7/2026 218,508 0.00%Cardinal Health, Inc. $200,000 3.41% 15/6/2027 218,483 0.00%Bank of New York Mellon Corp. $200,000 3.00% 30/10/2028 218,352 0.00%UBS Commercial Mortgage Trust 2017 $200,000 3.72% 15/6/2050 218,351 0.00%Lazard Group LLC $200,000 3.75% 13/2/2025 218,295 0.00%Westlake Chemical Corp. $200,000 3.60% 15/8/2026 218,276 0.00%New York Life Global Funding $200,000 3.00% 10/1/2028 217,962 0.00%City of Hope $175,000 4.38% 15/8/2048 217,961 0.00%Walgreens Boots Alliance, Inc. $200,000 3.80% 18/11/2024 217,947 0.00%Expedia Group, Inc. $200,000 3.80% 15/2/2028 217,876 0.00%Amphenol Corp. $210,000 2.05% 1/3/2025 217,804 0.00%Cisco Systems, Inc. $200,000 2.95% 28/2/2026 217,641 0.00%Ventas Realty LP $200,000 3.25% 15/10/2026 217,611 0.00%Sherwin-Williams Co. $200,000 3.45% 1/8/2025 217,541 0.00%Blackstone Holdings Finance Co. LLC $200,000 3.15% 2/10/2027 217,448 0.00%Allstate Corp.^ $200,000 5.75% 15/8/2053 217,085 0.00%Federal National Mortgage Association $208,324 2.50% 1/12/2036 216,985 0.00%Marsh & McLennan Cos, Inc. $200,000 3.88% 15/3/2024 216,969 0.00%Aptiv Corp. $200,000 4.15% 15/3/2024 216,847 0.00%Cottage Health Obligated Group $200,000 3.30% 1/11/2049 216,792 0.00%Textron, Inc. $200,000 3.38% 1/3/2028 216,691 0.00%Dominion Energy, Inc. $200,000 3.30% 15/3/2025 216,619 0.00%Jabil, Inc. $200,000 3.60% 15/1/2030 216,535 0.00%Freddie Mac Multifamily Structured Pass Through Certificates $200,000 3.21% 25/3/2025 216,484 0.00%Florida Power & Light Co. $150,000 5.95% 1/2/2038 216,326 0.00%American Water Capital Corp. $200,000 3.45% 1/5/2050 216,270 0.00%Bank of New York Mellon Corp. $200,000 3.25% 11/9/2024 216,182 0.00%BlackRock, Inc. $200,000 3.50% 18/3/2024 216,167 0.00%John Deere Capital Corp. $200,000 3.35% 12/6/2024 216,149 0.00%Morgan Stanley Bank of America Merrill Lynch Trust 2016 $200,000 3.10% 15/11/2049 215,960 0.00%Hashemite Kingdom of Jordan Government AID Bond $200,000 3.00% 30/6/2025 215,851 0.00%Transcontinental Gas Pipe Line Co. LLC $200,000 3.25% 15/5/2030 215,634 0.00%Federal National Mortgage Association $203,411 3.50% 1/11/2037 215,576 0.00%Ally Financial, Inc. $200,000 3.88% 21/5/2024 215,571 0.00%Baker Hughes a GE Co. LLC/Baker Hughes Co.-Obligor, Inc. $200,000 3.14% 7/11/2029 215,539 0.00%Bunge Ltd. Finance Corp. $200,000 3.25% 15/8/2026 215,393 0.00%CFCRE Commercial Mortgage Trust 2016^ $200,000 3.22% 10/11/2049 215,221 0.00%Government National Mortgage Association $192,819 4.50% 20/5/2041 215,220 0.00%Dover Corp. $200,000 3.15% 15/11/2025 215,114 0.00%Willis North America, Inc. $200,000 3.60% 15/5/2024 215,083 0.00%Brighthouse Financial, Inc. $197,000 3.70% 22/6/2027 215,075 0.00%Alexandria Real Estate Equities, Inc. $190,000 3.95% 15/1/2028 214,980 0.00%PepsiCo, Inc. $200,000 3.60% 1/3/2024 214,942 0.00%Fox Corp. $195,000 3.50% 8/4/2030 214,911 0.00%Mylan, Inc. $175,000 5.20% 15/4/2048 214,888 0.00%Federal Home Loan Mortgage Corp. $199,216 4.50% 1/12/2048 214,880 0.00%Georgetown University $143,000 5.22% 1/10/2118 214,869 0.00%CenterPoint Energy, Inc. $200,000 3.70% 1/9/2049 214,771 0.00%CMS Energy Corp. $200,000 3.00% 15/5/2026 214,766 0.00%Appalachian Power Co. $175,000 4.50% 1/3/2049 214,514 0.00%American Express Co. $200,000 3.00% 30/10/2024 214,498 0.00%University of Southern California $200,000 3.03% 1/10/2039 214,406 0.00%Great Lakes Water Authority Sewage Disposal System Revenue $200,000 3.06% 1/7/2039 214,334 0.00%Government National Mortgage Association $202,292 3.00% 20/8/2044 214,305 0.00%Ecolab, Inc. $200,000 2.70% 1/11/2026 214,275 0.00%
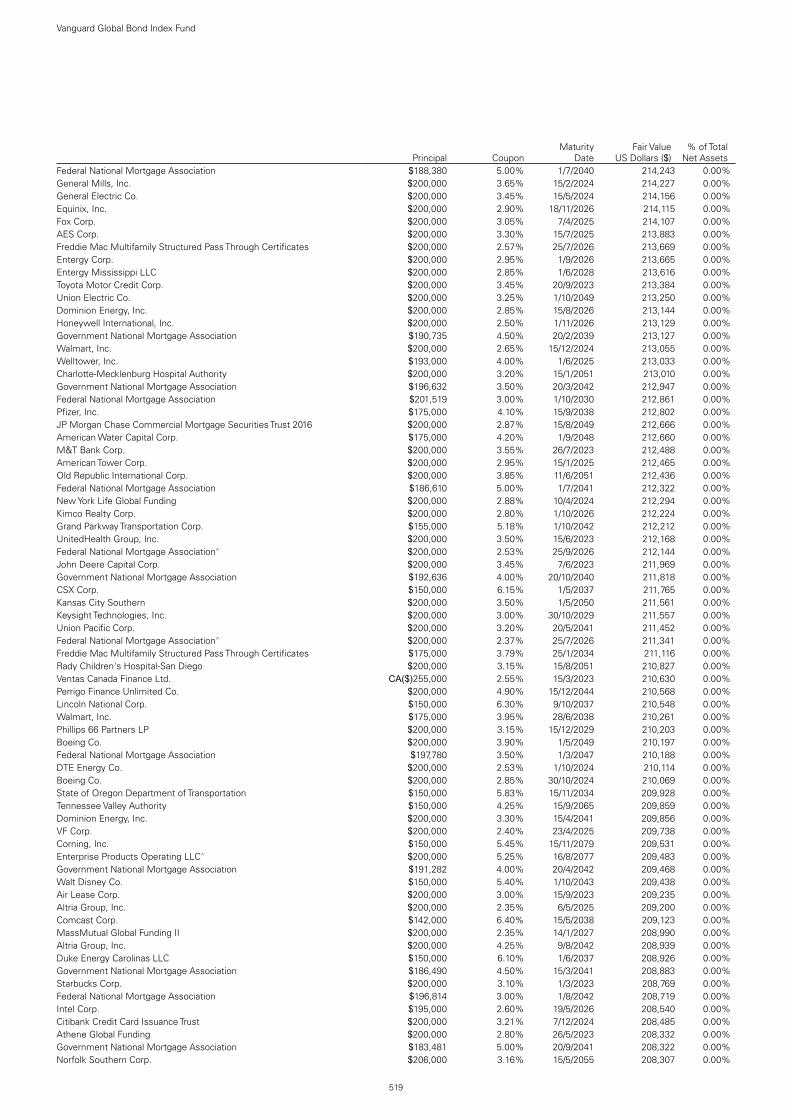
519
Vanguard Global Bond Index Fund
Principal CouponMaturity
DateFair Value
US Dollars ($)% of Total
Net AssetsFederal National Mortgage Association $188,380 5.00% 1/7/2040 214,243 0.00%General Mills, Inc. $200,000 3.65% 15/2/2024 214,227 0.00%General Electric Co. $200,000 3.45% 15/5/2024 214,156 0.00%Equinix, Inc. $200,000 2.90% 18/11/2026 214,115 0.00%Fox Corp. $200,000 3.05% 7/4/2025 214,107 0.00%AES Corp. $200,000 3.30% 15/7/2025 213,883 0.00%Freddie Mac Multifamily Structured Pass Through Certificates $200,000 2.57% 25/7/2026 213,669 0.00%Entergy Corp. $200,000 2.95% 1/9/2026 213,665 0.00%Entergy Mississippi LLC $200,000 2.85% 1/6/2028 213,616 0.00%Toyota Motor Credit Corp. $200,000 3.45% 20/9/2023 213,384 0.00%Union Electric Co. $200,000 3.25% 1/10/2049 213,250 0.00%Dominion Energy, Inc. $200,000 2.85% 15/8/2026 213,144 0.00%Honeywell International, Inc. $200,000 2.50% 1/11/2026 213,129 0.00%Government National Mortgage Association $190,735 4.50% 20/2/2039 213,127 0.00%Walmart, Inc. $200,000 2.65% 15/12/2024 213,055 0.00%Welltower, Inc. $193,000 4.00% 1/6/2025 213,033 0.00%Charlotte-Mecklenburg Hospital Authority $200,000 3.20% 15/1/2051 213,010 0.00%Government National Mortgage Association $196,632 3.50% 20/3/2042 212,947 0.00%Federal National Mortgage Association $201,519 3.00% 1/10/2030 212,861 0.00%Pfizer, Inc. $175,000 4.10% 15/9/2038 212,802 0.00%JP Morgan Chase Commercial Mortgage Securities Trust 2016 $200,000 2.87% 15/8/2049 212,666 0.00%American Water Capital Corp. $175,000 4.20% 1/9/2048 212,660 0.00%M&T Bank Corp. $200,000 3.55% 26/7/2023 212,488 0.00%American Tower Corp. $200,000 2.95% 15/1/2025 212,465 0.00%Old Republic International Corp. $200,000 3.85% 11/6/2051 212,436 0.00%Federal National Mortgage Association $186,610 5.00% 1/7/2041 212,322 0.00%New York Life Global Funding $200,000 2.88% 10/4/2024 212,294 0.00%Kimco Realty Corp. $200,000 2.80% 1/10/2026 212,224 0.00%Grand Parkway Transportation Corp. $155,000 5.18% 1/10/2042 212,212 0.00%UnitedHealth Group, Inc. $200,000 3.50% 15/6/2023 212,168 0.00%Federal National Mortgage Association^ $200,000 2.53% 25/9/2026 212,144 0.00%John Deere Capital Corp. $200,000 3.45% 7/6/2023 211,969 0.00%Government National Mortgage Association $192,636 4.00% 20/10/2040 211,818 0.00%CSX Corp. $150,000 6.15% 1/5/2037 211,765 0.00%Kansas City Southern $200,000 3.50% 1/5/2050 211,561 0.00%Keysight Technologies, Inc. $200,000 3.00% 30/10/2029 211,557 0.00%Union Pacific Corp. $200,000 3.20% 20/5/2041 211,452 0.00%Federal National Mortgage Association^ $200,000 2.37% 25/7/2026 211,341 0.00%Freddie Mac Multifamily Structured Pass Through Certificates $175,000 3.79% 25/1/2034 211,116 0.00%Rady Children's Hospital-San Diego $200,000 3.15% 15/8/2051 210,827 0.00%Ventas Canada Finance Ltd. CA($)255,000 2.55% 15/3/2023 210,630 0.00%Perrigo Finance Unlimited Co. $200,000 4.90% 15/12/2044 210,568 0.00%Lincoln National Corp. $150,000 6.30% 9/10/2037 210,548 0.00%Walmart, Inc. $175,000 3.95% 28/6/2038 210,261 0.00%Phillips 66 Partners LP $200,000 3.15% 15/12/2029 210,203 0.00%Boeing Co. $200,000 3.90% 1/5/2049 210,197 0.00%Federal National Mortgage Association $197,780 3.50% 1/3/2047 210,188 0.00%DTE Energy Co. $200,000 2.53% 1/10/2024 210,114 0.00%Boeing Co. $200,000 2.85% 30/10/2024 210,069 0.00%State of Oregon Department of Transportation $150,000 5.83% 15/11/2034 209,928 0.00%Tennessee Valley Authority $150,000 4.25% 15/9/2065 209,859 0.00%Dominion Energy, Inc. $200,000 3.30% 15/4/2041 209,856 0.00%VF Corp. $200,000 2.40% 23/4/2025 209,738 0.00%Corning, Inc. $150,000 5.45% 15/11/2079 209,531 0.00%Enterprise Products Operating LLC^ $200,000 5.25% 16/8/2077 209,483 0.00%Government National Mortgage Association $191,282 4.00% 20/4/2042 209,468 0.00%Walt Disney Co. $150,000 5.40% 1/10/2043 209,438 0.00%Air Lease Corp. $200,000 3.00% 15/9/2023 209,235 0.00%Altria Group, Inc. $200,000 2.35% 6/5/2025 209,200 0.00%Comcast Corp. $142,000 6.40% 15/5/2038 209,123 0.00%MassMutual Global Funding II $200,000 2.35% 14/1/2027 208,990 0.00%Altria Group, Inc. $200,000 4.25% 9/8/2042 208,939 0.00%Duke Energy Carolinas LLC $150,000 6.10% 1/6/2037 208,926 0.00%Government National Mortgage Association $186,490 4.50% 15/3/2041 208,883 0.00%Starbucks Corp. $200,000 3.10% 1/3/2023 208,769 0.00%Federal National Mortgage Association $196,814 3.00% 1/8/2042 208,719 0.00%Intel Corp. $195,000 2.60% 19/5/2026 208,540 0.00%Citibank Credit Card Issuance Trust $200,000 3.21% 7/12/2024 208,485 0.00%Athene Global Funding $200,000 2.80% 26/5/2023 208,332 0.00%Government National Mortgage Association $183,481 5.00% 20/9/2041 208,322 0.00%Norfolk Southern Corp. $206,000 3.16% 15/5/2055 208,307 0.00%

520
Vanguard Global Bond Index Fund
Principal CouponMaturity
DateFair Value
US Dollars ($)% of Total
Net AssetsToyota Motor Credit Corp. $200,000 2.25% 18/10/2023 208,154 0.00%Kaiser Foundation Hospitals $190,000 3.15% 1/5/2027 208,079 0.00%Gilead Sciences, Inc. $200,000 2.50% 1/9/2023 208,045 0.00%Entergy Corp. $200,000 2.80% 15/6/2030 207,990 0.00%Otis Worldwide Corp. $200,000 2.29% 5/4/2027 207,819 0.00%Federal Home Loan Mortgage Corp. $194,106 4.00% 1/6/2050 207,766 0.00%Anthem, Inc. $195,000 2.88% 15/9/2029 207,471 0.00%Public Service Electric & Gas Co. $200,000 3.00% 1/3/2051 207,387 0.00%Kohl's Corp. $200,000 3.38% 1/5/2031 207,183 0.00%Port Authority of New York & New Jersey $150,000 4.81% 15/10/2065 207,101 0.00%Government National Mortgage Association $195,985 3.50% 20/1/2050 206,997 0.00%Northwell Healthcare, Inc. $175,000 4.26% 1/11/2047 206,973 0.00%TJX Cos, Inc. $200,000 2.50% 15/5/2023 206,928 0.00%Federal National Mortgage Association $186,612 4.50% 1/2/2040 206,852 0.00%Intercontinental Exchange, Inc. $175,000 4.25% 21/9/2048 206,849 0.00%Energy Transfer LP $175,000 5.25% 15/4/2029 206,715 0.00%American Tower Corp. $200,000 2.70% 15/4/2031 206,619 0.00%GE Capital UK Funding Unlimited Co. £100,000 6.25% 5/5/2038 206,364 0.00%Federal National Mortgage Association $186,093 4.50% 1/8/2047 206,316 0.00%3M Co. $200,000 2.25% 15/3/2023 206,238 0.00%Waste Management, Inc. $200,000 2.95% 1/6/2041 206,197 0.00%Government National Mortgage Association $185,449 4.50% 20/6/2045 206,103 0.00%TJX Cos, Inc. $180,000 3.88% 15/4/2030 206,030 0.00%FedEx Corp. $200,000 3.25% 15/5/2041 205,927 0.00%University of Notre Dame du Lac $175,000 3.44% 15/2/2045 205,925 0.00%BlackRock, Inc. €165,000 1.25% 6/5/2025 205,849 0.00%SL Green Operating Partnership LP $200,000 3.25% 15/10/2022 205,835 0.00%Northern States Power Co. $200,000 2.25% 1/4/2031 205,742 0.00%Flex Intermediate Holdco LLC $200,000 4.32% 30/12/2039 205,701 0.00%Synovus Financial Corp. $200,000 3.13% 1/11/2022 205,681 0.00%International Business Machines Corp. $150,000 5.88% 29/11/2032 205,513 0.00%Duke Energy Carolinas LLC $175,000 3.95% 15/3/2048 205,373 0.00%Lincoln National Corp. $200,000 4.20% 15/3/2022 205,349 0.00%Flowserve Corp. $200,000 3.50% 15/9/2022 205,262 0.00%Entergy Louisiana LLC $175,000 4.00% 15/3/2033 205,042 0.00%CNH Industrial Capital LLC $200,000 1.95% 2/7/2023 205,040 0.00%Clorox Co. $200,000 3.05% 15/9/2022 205,029 0.00%Athene Global Funding $200,000 2.50% 24/3/2028 204,930 0.00%Skyworks Solutions, Inc. $200,000 3.00% 1/6/2031 204,910 0.00%Tampa Electric Co. $200,000 2.40% 15/3/2031 204,876 0.00%Bain Capital Specialty Finance, Inc. $200,000 2.95% 10/3/2026 204,847 0.00%Pennsylvania State University $200,000 2.84% 1/9/2050 204,820 0.00%Energy Transfer LP $190,000 4.25% 1/4/2024 204,755 0.00%PACCAR Financial Corp. $200,000 2.30% 10/8/2022 204,526 0.00%CenterPoint Energy, Inc. $200,000 2.50% 1/9/2022 204,461 0.00%Emory University $200,000 2.14% 1/9/2030 204,414 0.00%Union Pacific Corp. $200,000 2.38% 20/5/2031 204,338 0.00%AmFam Holdings, Inc. $200,000 2.81% 11/3/2031 204,336 0.00%Toyota Motor Credit Corp. $200,000 2.15% 8/9/2022 204,295 0.00%National Rural Utilities Cooperative Finance Corp. $200,000 2.30% 15/9/2022 204,271 0.00%Duke Energy Corp. $200,000 2.40% 15/8/2022 204,188 0.00%CenterPoint Energy, Inc. $200,000 2.65% 1/6/2031 204,079 0.00%Philip Morris International, Inc. $200,000 1.50% 1/5/2025 204,058 0.00%Assurant, Inc. $175,000 4.90% 27/3/2028 203,956 0.00%Public Service Co. of New Hampshire $200,000 2.20% 15/6/2031 203,910 0.00%Novant Health, Inc. $200,000 2.64% 1/11/2036 203,841 0.00%Honeywell International, Inc. $200,000 2.15% 8/8/2022 203,808 0.00%Plains All American Pipeline LP/PAA Finance Corp. $190,000 3.60% 1/11/2024 203,700 0.00%State of California $200,000 5.70% 1/11/2021 203,628 0.00%Laboratory Corp. of America Holdings $200,000 2.70% 1/6/2031 203,507 0.00%Edison International $200,000 2.40% 15/9/2022 203,488 0.00%Huntsman International LLC $200,000 2.95% 15/6/2031 203,426 0.00%Campbell Soup Co. $165,000 4.80% 15/3/2048 203,418 0.00%Valero Energy Corp. $200,000 2.15% 15/9/2027 203,369 0.00%Union Pacific Corp. $175,000 3.95% 15/8/2059 203,333 0.00%American Water Capital Corp. $200,000 2.30% 1/6/2031 203,331 0.00%Republic Services, Inc. $200,000 2.30% 1/3/2030 203,171 0.00%Walmart, Inc. £100,000 5.25% 28/9/2035 203,113 0.00%Apollo Management Holdings LP $200,000 2.65% 5/6/2030 203,068 0.00%Texas Transportation Commission $200,000 2.56% 1/4/2042 203,018 0.00%Los Angeles Community College District $200,000 2.11% 1/8/2032 202,988 0.00%

521
Vanguard Global Bond Index Fund
Principal CouponMaturity
DateFair Value
US Dollars ($)% of Total
Net AssetsIllumina, Inc. $200,000 2.55% 23/3/2031 202,930 0.00%Marriott International, Inc. $200,000 2.13% 3/10/2022 202,888 0.00%Skyworks Solutions, Inc. $200,000 1.80% 1/6/2026 202,826 0.00%Government National Mortgage Association $192,106 3.50% 20/12/2048 202,779 0.00%Johnson Controls International plc $183,000 3.90% 14/2/2026 202,777 0.00%CBRE Services, Inc. $200,000 2.50% 1/4/2031 202,692 0.00%Philip Morris International, Inc. $200,000 1.13% 1/5/2023 202,639 0.00%Piedmont Natural Gas Co., Inc. $200,000 2.50% 15/3/2031 202,623 0.00%Freddie Mac Multifamily Structured Pass Through Certificates $200,000 1.64% 25/1/2030 202,598 0.00%Federal Home Loan Mortgage Corp. $182,633 4.50% 1/5/2039 202,556 0.00%AmerisourceBergen Corp. $175,000 4.25% 1/3/2045 202,552 0.00%Equinix, Inc. $200,000 1.80% 15/7/2027 202,464 0.00%Air Products & Chemicals, Inc. $200,000 2.70% 15/5/2040 202,403 0.00%Baltimore Gas & Electric Co. $200,000 2.25% 15/6/2031 202,383 0.00%Discover Card Execution Note Trust $200,000 2.39% 15/7/2024 202,353 0.00%Lazard Group LLC $175,000 4.50% 19/9/2028 202,260 0.00%Highmark, Inc. $200,000 2.55% 10/5/2031 202,245 0.00%American Tower Corp. $200,000 1.60% 15/4/2026 202,152 0.00%Alabama Power Co. $185,000 3.45% 1/10/2049 202,148 0.00%Nissan Motor Acceptance Corp. $200,000 2.75% 9/3/2028 202,077 0.00%University of California $200,000 3.07% 15/5/2051 202,072 0.00%Puget Energy, Inc. $200,000 2.38% 15/6/2028 202,024 0.00%Ameren Illinois Co. $200,000 2.90% 15/6/2051 201,986 0.00%Freddie Mac Multifamily Structured Pass Through Certificates $199,219 2.37% 25/5/2022 201,955 0.00%Federal Home Loan Mortgage Corp. $187,867 3.50% 1/3/2042 201,951 0.00%National Fuel Gas Co. $200,000 2.95% 1/3/2031 201,737 0.00%Charles Schwab Corp. $175,000 4.00% 1/2/2029 201,727 0.00%PACCAR Financial Corp. $200,000 0.80% 8/6/2023 201,713 0.00%Federal National Mortgage Association $188,082 3.50% 1/9/2033 201,594 0.00%Fifth Third Bancorp $175,000 3.95% 14/3/2028 201,574 0.00%Dominion Energy, Inc. $200,000 1.45% 15/4/2026 201,483 0.00%Government National Mortgage Association $177,356 5.00% 20/10/2039 201,464 0.00%Federal National Mortgage Association $190,466 3.00% 1/3/2031 201,454 0.00%Los Angeles Community College District $200,000 1.81% 1/8/2030 201,312 0.00%Procter & Gamble Co. $169,000 3.50% 25/10/2047 201,192 0.00%Federal National Mortgage Association $180,558 4.50% 1/3/2034 201,188 0.00%Hormel Foods Corp. $200,000 1.70% 3/6/2028 201,096 0.00%Federal Home Loan Mortgage Corp. $188,119 3.50% 1/9/2033 201,037 0.00%FLIR Systems, Inc. $200,000 2.50% 1/8/2030 201,032 0.00%BP Capital Markets America, Inc. $200,000 3.38% 8/2/2061 200,986 0.00%Indiana University Health, Inc. Obligated Group $200,000 2.85% 1/11/2051 200,982 0.00%Equinix, Inc. $200,000 1.45% 15/5/2026 200,969 0.00%Mississippi Power Co. $200,000 3.10% 30/7/2051 200,928 0.00%Government National Mortgage Association $183,240 4.00% 20/3/2041 200,874 0.00%American University $175,000 3.67% 1/4/2049 200,722 0.00%Southern California Edison Co. $200,000 3.65% 1/6/2051 200,695 0.00%Wisconsin Electric Power Co. $200,000 1.70% 15/6/2028 200,666 0.00%Southern California Edison Co. $200,000 2.50% 1/6/2031 200,664 0.00%Global Payments, Inc. $175,000 4.80% 1/4/2026 200,658 0.00%Government National Mortgage Association $191,968 2.50% 20/10/2035 200,619 0.00%Owl Rock Capital Corp. $200,000 2.63% 15/1/2027 200,592 0.00%CyrusOne LP/CyrusOne Finance Corp. $190,000 2.90% 15/11/2024 200,587 0.00%Equinix, Inc. $200,000 1.25% 15/7/2025 200,575 0.00%Welltower, Inc. $175,000 4.25% 15/4/2028 200,536 0.00%Union Electric Co. $200,000 2.15% 15/3/2032 200,520 0.00%Federal Home Loan Mortgage Corp. $187,585 3.50% 1/10/2033 200,466 0.00%American Tower Corp. $200,000 1.30% 15/9/2025 200,438 0.00%Air Products & Chemicals, Inc. $200,000 2.80% 15/5/2050 200,407 0.00%CenterPoint Energy, Inc. $200,000 1.45% 1/6/2026 200,319 0.00%Illumina, Inc. $200,000 0.55% 23/3/2023 200,294 0.00%Equitable Financial Life Global Funding $200,000 0.50% 6/4/2023 200,265 0.00%ONE Gas, Inc. $200,000 1.10% 11/3/2024 200,247 0.00%Anthem, Inc. $200,000 0.45% 15/3/2023 200,217 0.00%Protective Life Global Funding $200,000 0.50% 12/4/2023 200,198 0.00%UnitedHealth Group, Inc. $200,000 1.15% 15/5/2026 200,135 0.00%ONE Gas, Inc. $200,000 0.85% 11/3/2023 200,105 0.00%Citizens Financial Group, Inc. $200,000 2.64% 30/9/2032 200,061 0.00%Diamondback Energy, Inc. $200,000 0.90% 24/3/2023 200,043 0.00%Laboratory Corp. of America Holdings $200,000 1.55% 1/6/2026 200,015 0.00%Tennessee Valley Authority $125,000 5.38% 1/4/2056 199,993 0.00%Western Union Co. $200,000 2.75% 15/3/2031 199,977 0.00%

522
Vanguard Global Bond Index Fund
Principal CouponMaturity
DateFair Value
US Dollars ($)% of Total
Net AssetsConsolidated Edison, Inc. $200,000 0.65% 1/12/2023 199,967 0.00%Burlington Northern Santa Fe LLC $150,000 4.90% 1/4/2044 199,928 0.00%Essential Properties LP $200,000 2.95% 15/7/2031 199,919 0.00%Federal Home Loan Mortgage Corp. $184,101 4.50% 1/8/2047 199,869 0.00%Federal Home Loan Mortgage Corp. $175,212 5.50% 1/6/2049 199,676 0.00%Valero Energy Corp. $160,000 4.90% 15/3/2045 199,671 0.00%Federal National Mortgage Association $180,220 4.50% 1/11/2040 199,663 0.00%Government National Mortgage Association $182,135 4.00% 20/10/2041 199,663 0.00%PPG Industries, Inc. $200,000 1.20% 15/3/2026 199,583 0.00%John Deere Capital Corp. $200,000 1.05% 17/6/2026 199,529 0.00%Government National Mortgage Association $175,617 5.00% 20/7/2039 199,489 0.00%Highmark, Inc. $200,000 1.45% 10/5/2026 199,482 0.00%Analog Devices, Inc. $180,000 3.50% 5/12/2026 199,462 0.00%Toyota Motor Credit Corp. $200,000 1.13% 18/6/2026 199,408 0.00%Agree LP $200,000 2.60% 15/6/2033 199,359 0.00%Israel Government AID Bond $175,000 5.50% 26/4/2024 199,315 0.00%Government National Mortgage Association $182,244 4.00% 20/11/2043 199,179 0.00%Banc of America Commercial Mortgage Trust 2017 $180,000 3.57% 15/2/2050 199,175 0.00%PACCAR Financial Corp. $200,000 0.35% 2/2/2024 199,143 0.00%Xcel Energy, Inc. $175,000 4.00% 15/6/2028 199,115 0.00%Mars, Inc. $175,000 3.60% 1/4/2034 199,080 0.00%Government National Mortgage Association $175,218 5.00% 20/11/2041 199,036 0.00%Cargill, Inc. $200,000 0.40% 2/2/2024 199,006 0.00%CNH Industrial Capital LLC $200,000 1.45% 15/7/2026 198,926 0.00%Western Union Co. $200,000 1.35% 15/3/2026 198,858 0.00%Citrix Systems, Inc. $175,000 4.50% 1/12/2027 198,687 0.00%Government National Mortgage Association $173,760 5.00% 15/3/2039 198,643 0.00%Pacific Gas & Electric Co. $200,000 4.45% 15/4/2042 198,616 0.00%Kilroy Realty LP $190,000 3.05% 15/2/2030 198,497 0.00%Government National Mortgage Association $182,704 4.00% 20/11/2045 198,472 0.00%Agree LP $200,000 2.00% 15/6/2028 198,379 0.00%Berry Global, Inc. $200,000 1.65% 15/1/2027 198,312 0.00%Piedmont Natural Gas Co., Inc. $180,000 3.50% 1/6/2029 198,205 0.00%Southern Co. $200,000 1.75% 15/3/2028 198,016 0.00%Federal Home Loan Mortgage Corp. $182,506 4.50% 1/8/2030 197,926 0.00%Federal National Mortgage Association $168,524 6.00% 1/8/2034 197,817 0.00%Omega Healthcare Investors, Inc. $175,000 4.75% 15/1/2028 197,754 0.00%Stanley Black & Decker, Inc. $150,000 5.20% 1/9/2040 197,693 0.00%Lear Corp. $175,000 4.25% 15/5/2029 197,625 0.00%Cargill, Inc. $200,000 0.75% 2/2/2026 197,607 0.00%Physicians Realty LP $175,000 4.30% 15/3/2027 197,493 0.00%Apple, Inc. €153,000 1.63% 10/11/2026 197,480 0.00%Yale University $200,000 1.48% 15/4/2030 197,480 0.00%Federal National Mortgage Association $174,926 5.00% 1/8/2033 197,440 0.00%Texas Transportation Commission $200,000 2.47% 1/10/2044 197,200 0.00%TWDC Enterprises 18 Corp. $165,000 4.13% 1/12/2041 197,168 0.00%Federal National Mortgage Association $170,140 6.00% 1/12/2032 197,071 0.00%Essex Portfolio LP $182,000 3.50% 1/4/2025 197,064 0.00%Intercontinental Exchange, Inc. $175,000 3.75% 21/9/2028 197,010 0.00%Essex Portfolio LP $200,000 1.70% 1/3/2028 196,740 0.00%Bristol-Myers Squibb Co. $200,000 1.13% 13/11/2027 196,726 0.00%Clorox Co. $200,000 1.80% 15/5/2030 196,700 0.00%Target Corp. $175,000 3.38% 15/4/2029 196,566 0.00%McCormick & Co., Inc. $200,000 0.90% 15/2/2026 196,548 0.00%County of Miami-Dade FL Aviation Revenue $175,000 4.28% 1/10/2041 196,296 0.00%Avnet, Inc. $185,000 4.88% 1/12/2022 195,628 0.00%Ventas Realty LP $175,000 3.85% 1/4/2027 195,627 0.00%American Tower Corp. $200,000 3.10% 15/6/2050 195,550 0.00%Bank of America Corp.^ $200,000 2.83% 24/10/2051 195,490 0.00%Cargill, Inc. $200,000 1.70% 2/2/2031 195,195 0.00%Devon Energy Corp. $175,000 5.25% 15/9/2024 195,030 0.00%UBS Commercial Mortgage Trust 2018 $175,000 3.72% 15/2/2051 195,012 0.00%Nestle Holdings, Inc. $200,000 1.00% 15/9/2027 194,948 0.00%Dover Corp. $150,000 5.38% 1/3/2041 194,673 0.00%Aon plc $175,000 3.88% 15/12/2025 194,558 0.00%Government National Mortgage Association $173,642 4.50% 20/10/2040 194,060 0.00%Yale University $200,000 2.40% 15/4/2050 194,049 0.00%Amgen, Inc. €150,000 2.00% 25/2/2026 193,922 0.00%Chubb INA Holdings, Inc. €136,000 2.50% 15/3/2038 193,877 0.00%Government National Mortgage Association $179,090 3.50% 20/1/2042 193,700 0.00%Northern States Power Co. $175,000 3.40% 15/8/2042 193,690 0.00%

523
Vanguard Global Bond Index Fund
Principal CouponMaturity
DateFair Value
US Dollars ($)% of Total
Net AssetsJohns Hopkins University $150,000 4.08% 1/7/2053 193,670 0.00%Federal Home Loan Mortgage Corp. $183,132 3.50% 1/5/2047 193,666 0.00%FedEx Corp. $150,000 4.95% 17/10/2048 193,571 0.00%General Motors Financial Co., Inc. $175,000 4.35% 9/4/2025 193,515 0.00%Abbott Laboratories $200,000 1.40% 30/6/2030 193,457 0.00%Eastern Energy Gas Holdings LLC $165,000 4.60% 15/12/2044 193,203 0.00%Advocate Health & Hospitals Corp. $175,000 3.39% 15/10/2049 193,128 0.00%Government National Mortgage Association $176,580 4.00% 15/7/2045 192,872 0.00%Mount Sinai Hospitals Group, Inc. $175,000 3.74% 1/7/2049 192,504 0.00%Federal National Mortgage Association^ $175,000 3.00% 25/1/2028 192,357 0.00%Packaging Corp. of America $175,000 3.40% 15/12/2027 192,352 0.00%Motorola Solutions, Inc. $165,000 4.60% 23/2/2028 192,271 0.00%Michigan Finance Authority $175,000 3.38% 1/12/2040 192,264 0.00%GATX Corp. $175,000 3.50% 15/3/2028 192,232 0.00%AvalonBay Communities, Inc. $175,000 3.35% 15/5/2027 192,214 0.00%Government National Mortgage Association $171,072 5.00% 15/10/2034 192,157 0.00%Federal National Mortgage Association $178,134 4.00% 1/1/2047 192,083 0.00%United Airlines 2019-2 Class AA Pass Through Trust $192,221 2.70% 1/5/2032 191,946 0.00%Pernod Ricard International Finance LLC $200,000 1.25% 1/4/2028 191,790 0.00%Consumers Energy Co. $150,000 4.35% 15/4/2049 191,707 0.00%CMS Energy Corp. $150,000 4.88% 1/3/2044 191,697 0.00%Manufacturers & Traders Trust Co. $179,000 2.90% 6/2/2025 191,476 0.00%SVB Financial Group $200,000 1.80% 2/2/2031 191,329 0.00%DTE Energy Co. $175,000 3.40% 15/6/2029 191,257 0.00%JetBlue 2019-1 Class AA Pass Through Trust $187,807 2.75% 15/5/2032 191,109 0.00%CSAIL 2015-C3 Commercial Mortgage Trust $175,000 3.72% 15/8/2048 191,046 0.00%Martin Marietta Materials, Inc. $175,000 4.25% 2/7/2024 190,985 0.00%JPMorgan Chase & Co. €150,000 1.50% 29/10/2026 190,984 0.00%American Campus Communities Operating Partnership LP $175,000 3.63% 15/11/2027 190,821 0.00%Cleveland Electric Illuminating Co. $150,000 5.95% 15/12/2036 190,768 0.00%Sales Tax Securitization Corp. $150,000 4.79% 1/1/2048 190,730 0.00%Dominion Energy, Inc.^ $175,000 5.75% 1/10/2054 190,708 0.00%ManpowerGroup, Inc. €150,000 1.75% 22/6/2026 190,707 0.00%Federal National Mortgage Association $178,531 3.50% 1/1/2032 190,603 0.00%American International Group, Inc. $150,000 4.75% 1/4/2048 190,548 0.00%Federal National Mortgage Association $176,196 5.50% 1/1/2049 190,520 0.00%Government National Mortgage Association $169,940 4.50% 15/7/2040 190,345 0.00%Federal National Mortgage Association $176,579 4.50% 1/5/2050 190,128 0.00%New York Life Insurance Co. $145,000 5.88% 15/5/2033 190,046 0.00%Conoco Funding Co. $130,000 7.25% 15/10/2031 189,973 0.00%AT&T, Inc. $175,000 4.05% 15/12/2023 189,784 0.00%Children's Hospital Corp. $150,000 4.12% 1/1/2047 189,770 0.00%General Motors Financial Co., Inc. $175,000 3.60% 21/6/2030 189,693 0.00%Cargill, Inc. $145,000 4.76% 23/11/2045 189,540 0.00%Government National Mortgage Association $172,843 4.00% 20/9/2041 189,477 0.00%Government National Mortgage Association $172,941 4.00% 20/6/2042 189,383 0.00%Waste Management, Inc. $200,000 1.50% 15/3/2031 189,283 0.00%Prologis LP $150,000 4.38% 15/9/2048 189,181 0.00%Government National Mortgage Association $176,450 4.00% 20/2/2047 189,158 0.00%Federal National Mortgage Association $174,842 4.00% 1/2/2046 189,084 0.00%Freddie Mac Multifamily Structured Pass Through Certificates $179,767 2.91% 25/4/2024 189,041 0.00%Devon Energy Corp. $135,000 7.88% 30/9/2031 189,017 0.00%Nasdaq, Inc. $200,000 1.65% 15/1/2031 188,857 0.00%Estee Lauder Cos, Inc. $150,000 4.38% 15/6/2045 188,766 0.00%Crane Co. $175,000 4.45% 15/12/2023 188,714 0.00%FMC Corp. $175,000 3.20% 1/10/2026 188,627 0.00%Dominion Energy, Inc. $150,000 4.60% 15/3/2049 188,615 0.00%Pfizer, Inc. $150,000 4.30% 15/6/2043 188,537 0.00%Johnson Controls International plc $150,000 4.50% 15/2/2047 188,160 0.00%Norfolk Southern Corp. $150,000 4.65% 15/1/2046 187,940 0.00%Spectra Energy Partners LP $160,000 4.50% 15/3/2045 187,932 0.00%Johnson & Johnson $150,000 4.38% 5/12/2033 187,776 0.00%Rockwell Automation, Inc. $150,000 4.20% 1/3/2049 187,769 0.00%Mylan, Inc. $175,000 4.20% 29/11/2023 187,734 0.00%Trane Technologies Global Holding Co., Ltd. $175,000 4.25% 15/6/2023 187,673 0.00%Federal Home Loan Mortgage Corp. $171,630 4.00% 1/10/2043 187,544 0.00%Kinder Morgan Energy Partners LP $150,000 5.40% 1/9/2044 187,475 0.00%Federal National Mortgage Association $175,619 3.50% 1/9/2026 187,466 0.00%Aircastle Ltd. $175,000 4.40% 25/9/2023 187,403 0.00%Boston Properties LP $175,000 3.20% 15/1/2025 187,343 0.00%HCA, Inc. $150,000 5.13% 15/6/2039 187,300 0.00%
524
Vanguard Global Bond Index Fund
Principal CouponMaturity
DateFair Value
US Dollars ($)% of Total
Net AssetsRoper Technologies, Inc. $175,000 2.95% 15/9/2029 187,153 0.00%Federal National Mortgage Association^ $175,000 2.92% 25/10/2025 187,144 0.00%Union Pacific Corp. $175,000 3.15% 1/3/2024 186,707 0.00%IHC Health Services, Inc. $150,000 4.13% 15/5/2048 186,639 0.00%Government National Mortgage Association $171,519 4.00% 20/5/2046 186,322 0.00%Athene Global Funding $175,000 2.95% 12/11/2026 186,183 0.00%Mars, Inc. $150,000 4.13% 1/4/2054 186,128 0.00%Whirlpool Corp. $150,000 4.60% 15/5/2050 186,084 0.00%Sabal Trail Transmission LLC $155,000 4.68% 1/5/2038 186,083 0.00%Federal Home Loan Mortgage Corp. $176,327 3.00% 1/8/2045 186,049 0.00%Equifax, Inc. $175,000 3.95% 15/6/2023 185,941 0.00%KLA Corp. $175,000 3.30% 1/3/2050 185,935 0.00%Mars, Inc. $175,000 2.70% 1/4/2025 185,899 0.00%San Diego Gas & Electric Co. $150,000 4.50% 15/8/2040 185,899 0.00%Intercontinental Exchange, Inc. $175,000 3.45% 21/9/2023 185,888 0.00%Children's Health System of Texas $200,000 2.51% 15/8/2050 185,776 0.00%Nasdaq, Inc. $200,000 2.50% 21/12/2040 185,754 0.00%Snap-on, Inc. $175,000 3.10% 1/5/2050 185,331 0.00%University of Virginia $200,000 2.26% 1/9/2050 185,314 0.00%Duke Energy Ohio, Inc. $150,000 4.30% 1/2/2049 185,186 0.00%Sabal Trail Transmission LLC $150,000 4.83% 1/5/2048 185,062 0.00%IDEX Corp. $175,000 3.00% 1/5/2030 184,998 0.00%United Airlines 2019-1 Class AA Pass Through Trust $168,516 4.15% 25/8/2031 184,816 0.00%Florida Power & Light Co. $150,000 3.99% 1/3/2049 184,434 0.00%Duke Energy Progress LLC $200,000 2.50% 15/8/2050 184,428 0.00%American Water Capital Corp. $150,000 4.30% 1/12/2042 184,051 0.00%Travelers Cos, Inc. $125,000 6.25% 15/6/2037 184,034 0.00%ONEOK, Inc. $150,000 5.20% 15/7/2048 183,987 0.00%Molson Coors Beverage Co. $150,000 5.00% 1/5/2042 183,984 0.00%Zimmer Biomet Holdings, Inc. $175,000 3.70% 19/3/2023 183,960 0.00%Crown Castle International Corp. $175,000 3.15% 15/7/2023 183,860 0.00%Arizona Public Service Co. $150,000 4.50% 1/4/2042 183,720 0.00%Connecticut Light & Power Co. $150,000 4.15% 1/6/2045 183,566 0.00%Federal Home Loan Mortgage Corp. $173,657 3.00% 1/1/2031 183,499 0.00%Roper Technologies, Inc. $175,000 2.35% 15/9/2024 183,332 0.00%Aviation Capital Group LLC $175,000 3.88% 1/5/2023 183,276 0.00%American Municipal Power, Inc. $100,000 8.08% 15/2/2050 183,237 0.00%Northern States Power Co. $125,000 6.20% 1/7/2037 183,235 0.00%Johnson Controls International plc €151,000 1.00% 15/9/2023 183,211 0.00%Ryder System, Inc. $175,000 2.50% 1/9/2024 183,181 0.00%Travelers Cos, Inc. $150,000 4.05% 7/3/2048 183,003 0.00%Penske Truck Leasing Co. LP/PTL Finance Corp. $175,000 4.88% 11/7/2022 182,526 0.00%AmerisourceBergen Corp. $175,000 2.80% 15/5/2030 182,518 0.00%Federal National Mortgage Association $170,331 4.00% 1/6/2050 182,352 0.00%Federal Home Loan Mortgage Corp. $163,368 4.50% 1/9/2038 182,185 0.00%FMC Corp. $150,000 4.50% 1/10/2049 182,076 0.00%Wyeth LLC $125,000 6.50% 1/2/2034 182,064 0.00%Precision Castparts Corp. $150,000 4.38% 15/6/2045 182,019 0.00%Federal National Mortgage Association $173,030 3.00% 1/5/2027 181,926 0.00%Trustees of Princeton University $125,000 5.70% 1/3/2039 181,895 0.00%Citigroup, Inc. $175,000 4.05% 30/7/2022 181,812 0.00%Evergy Kansas Central, Inc. $150,000 4.25% 1/12/2045 181,404 0.00%Grand Parkway Transportation Corp. $175,000 3.24% 1/10/2052 181,382 0.00%United Parcel Service, Inc. $175,000 2.50% 1/4/2023 181,289 0.00%Virginia Electric & Power Co. $175,000 2.75% 15/3/2023 181,038 0.00%Federal National Mortgage Association $155,588 5.50% 1/9/2041 181,002 0.00%Federal National Mortgage Association $177,320 2.00% 1/11/2040 180,867 0.00%Intel Corp. $170,000 2.88% 11/5/2024 180,742 0.00%Wells Fargo & Co. £100,000 4.63% 2/11/2035 180,550 0.00%Synchrony Credit Card Master Note Trust $175,000 2.62% 15/10/2025 180,302 0.00%Ohio Power Co. $150,000 4.15% 1/4/2048 180,231 0.00%General Dynamics Corp. $175,000 1.88% 15/8/2023 180,150 0.00%Schlumberger Finance Canada Ltd. $175,000 2.65% 20/11/2022 179,798 0.00%Discovery Communications LLC $150,000 4.88% 1/4/2043 179,722 0.00%Dominion Energy South Carolina, Inc. $140,000 4.60% 15/6/2043 179,716 0.00%Government National Mortgage Association $165,067 4.00% 20/11/2044 179,534 0.00%American Honda Finance Corp. $175,000 2.05% 10/1/2023 179,527 0.00%DTE Electric Co. $175,000 2.95% 1/3/2050 179,502 0.00%Philip Morris International, Inc. $175,000 2.50% 22/8/2022 179,502 0.00%ViacomCBS, Inc. $125,000 6.88% 30/4/2036 179,429 0.00%Leidos, Inc. $165,000 3.63% 15/5/2025 179,194 0.00%

525
Vanguard Global Bond Index Fund
Principal CouponMaturity
DateFair Value
US Dollars ($)% of Total
Net AssetsCharter Communications Operating LLC/Charter Communications
Operating Capital $175,000 2.80% 1/4/2031 179,025 0.00%MetLife, Inc. $125,000 6.38% 15/6/2034 178,866 0.00%Corning, Inc. $150,000 4.38% 15/11/2057 178,756 0.00%Philip Morris International, Inc. $125,000 6.38% 16/5/2038 178,593 0.00%Federal National Mortgage Association $163,894 4.00% 1/12/2035 178,410 0.00%Allstate Corp. $150,000 3.85% 10/8/2049 178,234 0.00%Florida Power & Light Co. $130,000 5.65% 1/2/2037 178,200 0.00%District of Columbia Water & Sewer Authority $125,000 4.81% 1/10/2114 177,953 0.00%MidAmerican Energy Co. $150,000 3.95% 1/8/2047 177,812 0.00%Federal Home Loan Mortgage Corp. $161,613 4.50% 1/5/2050 177,704 0.00%California State University $175,000 2.98% 1/11/2051 177,698 0.00%Equifax, Inc. $165,000 3.10% 15/5/2030 177,578 0.00%Brooklyn Union Gas Co. $150,000 4.49% 4/3/2049 177,180 0.00%Sempra Energy $165,000 4.05% 1/12/2023 176,994 0.00%Federal National Mortgage Association $161,787 4.00% 1/1/2042 176,946 0.00%Consumers Energy Co. $150,000 3.95% 15/5/2043 176,896 0.00%Adobe, Inc. $170,000 1.90% 1/2/2025 176,715 0.00%Federal Home Loan Mortgage Corp. $167,868 3.50% 1/2/2050 176,663 0.00%Federal National Mortgage Association $163,984 3.50% 1/9/2034 176,657 0.00%Federal National Mortgage Association $155,221 5.00% 1/7/2039 176,624 0.00%Xylem, Inc. $175,000 2.25% 30/1/2031 176,540 0.00%Freddie Mac Multifamily Structured Pass Through Certificates $160,000 3.12% 25/6/2027 176,461 0.00%Tennessee Gas Pipeline Co. LLC $170,000 2.90% 1/3/2030 176,409 0.00%Federal National Mortgage Association $159,369 4.50% 1/6/2044 176,376 0.00%Citibank Credit Card Issuance Trust $175,000 2.19% 20/11/2023 176,352 0.00%ERAC USA Finance LLC $125,000 6.70% 1/6/2034 175,698 0.00%Federal National Mortgage Association $162,128 4.00% 1/11/2031 175,643 0.00%Sysco Corp. $175,000 3.30% 15/2/2050 175,625 0.00%Wisconsin Power & Light Co. $155,000 3.65% 1/4/2050 175,567 0.00%Globe Life, Inc. $150,000 4.55% 15/9/2028 175,477 0.00%Oncor Electric Delivery Co. LLC $150,000 3.70% 15/5/2050 175,460 0.00%Government National Mortgage Association $152,918 5.00% 15/4/2039 175,184 0.00%Cox Communications, Inc. $164,000 3.15% 15/8/2024 175,058 0.00%Emerson Electric Co. $175,000 2.75% 15/10/2050 174,987 0.00%Massachusetts School Building Authority $125,000 5.72% 15/8/2039 174,950 0.00%Eastman Chemical Co. $150,000 4.50% 1/12/2028 174,945 0.00%PacifiCorp $125,000 6.10% 1/8/2036 174,889 0.00%Federal National Mortgage Association $160,059 5.00% 1/5/2049 174,845 0.00%Verizon Communications, Inc. $183,000 1.68% 30/10/2030 174,829 0.00%Eaton Corp. $150,000 4.00% 2/11/2032 174,739 0.00%Mastercard, Inc. $150,000 3.65% 1/6/2049 174,597 0.00%Connecticut Light & Power Co. $170,000 2.50% 15/1/2023 174,587 0.00%Lam Research Corp. $150,000 4.00% 15/3/2029 174,459 0.00%International Flavors & Fragrances, Inc. $148,000 4.38% 1/6/2047 174,345 0.00%Freddie Mac Multifamily Structured Pass Through Certificates $175,000 1.86% 25/10/2035 174,040 0.00%Equifax, Inc. $165,000 2.60% 15/12/2025 173,861 0.00%Adobe, Inc. $170,000 1.70% 1/2/2023 173,824 0.00%Freddie Mac Multifamily Structured Pass Through Certificates $150,000 3.85% 25/6/2028 173,755 0.00%Public Service Co. of Colorado $175,000 1.90% 15/1/2031 173,698 0.00%Kellogg Co. $150,000 4.30% 15/5/2028 173,619 0.00%Abbott Laboratories $125,000 5.30% 27/5/2040 173,416 0.00%Cleveland Electric Illuminating Co. $150,000 4.55% 15/11/2030 173,312 0.00%Markel Corp. $150,000 4.15% 17/9/2050 173,270 0.00%Oshkosh Corp. $150,000 4.60% 15/5/2028 173,210 0.00%Athene Global Funding $165,000 2.75% 25/6/2024 173,185 0.00%BANK 2018^ $150,000 4.26% 15/5/2061 173,139 0.00%Public Service Electric & Gas Co. $200,000 2.05% 1/8/2050 173,119 0.00%Sysco Corp. $170,000 2.40% 15/2/2030 173,047 0.00%Alexandria Real Estate Equities, Inc. $150,000 4.00% 1/2/2050 173,009 0.00%Government National Mortgage Association $159,088 4.00% 20/5/2045 172,818 0.00%Federal National Mortgage Association $161,631 3.50% 1/7/2035 172,701 0.00%Public Service Co. of Colorado $140,000 4.05% 15/9/2049 172,609 0.00%Constellation Brands, Inc. $150,000 4.10% 15/2/2048 172,302 0.00%General Electric Co. £100,000 5.25% 7/12/2028 172,250 0.00%Dollar General Corp. $150,000 4.13% 1/5/2028 171,887 0.00%Federal National Mortgage Association $161,692 3.50% 1/1/2047 171,836 0.00%FedEx Corp. $150,000 3.90% 1/2/2035 171,690 0.00%Federal National Mortgage Association $164,022 2.50% 1/1/2032 171,611 0.00%Eaton Capital Unlimited Co. €141,000 0.75% 20/9/2024 171,583 0.00%Brookfield Property Finance ULC CA($)203,000 4.30% 1/3/2024 171,538 0.00%

526
Vanguard Global Bond Index Fund
Principal CouponMaturity
DateFair Value
US Dollars ($)% of Total
Net AssetsBank of America Corp.^ CA($)200,000 3.41% 20/9/2025 171,512 0.00%Los Angeles Department of Water & Power Power System Revenue $100,000 6.60% 1/7/2050 171,499 0.00%New Jersey Transportation Trust Fund Authority $150,000 4.13% 15/6/2042 171,318 0.00%Commonwealth Financing Authority $150,000 3.86% 1/6/2038 171,274 0.00%Federal National Mortgage Association $156,638 4.00% 1/12/2043 171,200 0.00%Federal Home Loan Mortgage Corp. $161,769 3.50% 1/4/2047 171,074 0.00%Chevron USA, Inc. $150,000 3.85% 15/1/2028 171,005 0.00%Benchmark 2018-B4 Mortgage Trust^ $150,000 4.31% 15/7/2051 170,988 0.00%Edison International $150,000 5.75% 15/6/2027 170,879 0.00%Federal Home Loan Mortgage Corp. $162,267 3.00% 1/3/2027 170,659 0.00%National Retail Properties, Inc. $150,000 4.30% 15/10/2028 170,574 0.00%Government National Mortgage Association $157,020 4.00% 20/1/2046 170,572 0.00%Metropolitan Washington Airports Authority Dulles Toll Road Revenue $100,000 7.46% 1/10/2046 170,569 0.00%Cimarex Energy Co. $150,000 4.38% 15/3/2029 170,545 0.00%Amgen, Inc. £100,000 5.50% 7/12/2026 170,149 0.00%Packaging Corp. of America $145,000 4.05% 15/12/2049 170,094 0.00%VEREIT Operating Partnership LP $150,000 4.63% 1/11/2025 170,017 0.00%Magellan Midstream Partners LP $150,000 4.25% 15/9/2046 169,916 0.00%MidAmerican Energy Co. $150,000 3.65% 15/4/2029 169,867 0.00%Plains All American Pipeline LP/PAA Finance Corp. $160,000 4.70% 15/6/2044 169,617 0.00%American Airlines 2019-1 Class AA Pass Through Trust $165,525 3.15% 15/2/2032 169,545 0.00%Federal National Mortgage Association $157,419 3.50% 1/7/2044 169,465 0.00%Southern California Edison Co. $150,000 4.20% 1/3/2029 169,443 0.00%Federal National Mortgage Association $156,396 4.00% 1/12/2031 169,433 0.00%Avangrid, Inc. $150,000 3.80% 1/6/2029 169,401 0.00%Benchmark 2018-B2 Mortgage Trust^ $150,000 4.08% 15/2/2051 169,127 0.00%Avnet, Inc. $150,000 4.63% 15/4/2026 168,971 0.00%KLA Corp. $125,000 5.00% 15/3/2049 168,806 0.00%CenterPoint Energy Resources Corp. $150,000 4.00% 1/4/2028 168,787 0.00%CenterPoint Energy Houston Electric LLC $150,000 3.55% 1/8/2042 168,774 0.00%Phillips 66 $150,000 3.90% 15/3/2028 168,738 0.00%Federal National Mortgage Association $160,214 3.00% 1/11/2027 168,713 0.00%General Motors Financial Co., Inc. $150,000 4.35% 17/1/2027 168,694 0.00%Emerson Electric Co. $125,000 5.25% 15/11/2039 168,577 0.00%Freddie Mac Multifamily Structured Pass Through Certificates $150,000 3.35% 25/1/2028 168,480 0.00%Texas Eastern Transmission LP $165,000 2.80% 15/10/2022 168,413 0.00%Ingredion, Inc. $150,000 3.90% 1/6/2050 168,400 0.00%Stryker Corp. $150,000 3.65% 7/3/2028 168,354 0.00%Plains All American Pipeline LP/PAA Finance Corp. $150,000 5.15% 1/6/2042 168,246 0.00%Rockwell Automation, Inc. $150,000 3.50% 1/3/2029 168,158 0.00%Humana, Inc. $150,000 3.95% 15/3/2027 168,145 0.00%Reinsurance Group of America, Inc. $150,000 3.90% 15/5/2029 168,064 0.00%Government National Mortgage Association $152,143 4.00% 15/10/2040 167,974 0.00%KKR Group Finance Co. VI LLC $150,000 3.75% 1/7/2029 167,829 0.00%Federal National Mortgage Association $142,120 6.00% 1/5/2041 167,757 0.00%Duke Energy Ohio, Inc. $150,000 3.70% 15/6/2046 167,659 0.00%SSM Health Care Corp. $150,000 3.82% 1/6/2027 167,596 0.00%Federal Home Loan Mortgage Corp. $158,407 3.50% 1/8/2047 167,519 0.00%Government National Mortgage Association $155,280 4.50% 20/10/2047 167,476 0.00%Interstate Power & Light Co. $150,000 3.70% 15/9/2046 167,339 0.00%Cboe Global Markets, Inc. $150,000 3.65% 12/1/2027 167,193 0.00%Duke Energy Ohio, Inc. $150,000 3.65% 1/2/2029 167,132 0.00%Nasdaq, Inc. $150,000 3.85% 30/6/2026 167,081 0.00%UnitedHealth Group, Inc. $150,000 3.70% 15/12/2025 167,009 0.00%Federal National Mortgage Association $153,738 4.00% 1/12/2044 166,900 0.00%PartnerRe Finance B LLC $150,000 3.70% 2/7/2029 166,833 0.00%Oglethorpe Power Corp. $125,000 5.95% 1/11/2039 166,821 0.00%Constellation Brands, Inc. $125,000 5.25% 15/11/2048 166,805 0.00%BANK 2017 $150,000 3.54% 15/11/2054 166,619 0.00%Federal Home Loan Mortgage Corp. $141,095 6.00% 1/5/2037 166,509 0.00%UBS Commercial Mortgage Trust 2017 $150,000 3.68% 15/12/2050 166,423 0.00%Kilroy Realty LP $150,000 4.38% 1/10/2025 166,414 0.00%Federal National Mortgage Association $140,011 6.00% 1/11/2037 166,382 0.00%Constellation Brands, Inc. $150,000 3.60% 15/2/2028 166,333 0.00%Brooklyn Union Gas Co. $150,000 3.87% 4/3/2029 166,316 0.00%Federal National Mortgage Association^ $156,728 2.50% 25/10/2026 166,312 0.00%AXIS Specialty Finance plc $150,000 4.00% 6/12/2027 166,219 0.00%BANK 2017 $150,000 3.49% 15/11/2050 166,217 0.00%Federal Home Loan Mortgage Corp. $158,940 2.50% 1/11/2028 166,167 0.00%Wells Fargo Commercial Mortgage Trust 2017 $150,000 3.58% 15/10/2050 165,965 0.00%Federal Home Loan Mortgage Corp. $145,797 5.00% 1/4/2040 165,928 0.00%
527
Vanguard Global Bond Index Fund
Principal CouponMaturity
DateFair Value
US Dollars ($)% of Total
Net AssetsEnable Midstream Partners LP $150,000 4.40% 15/3/2027 165,841 0.00%John Deere Capital Corp. $150,000 3.40% 11/9/2025 165,625 0.00%UBS Commercial Mortgage Trust 2017 $150,000 3.56% 15/10/2050 165,570 0.00%Harley-Davidson, Inc. $150,000 4.63% 28/7/2045 165,489 0.00%Penske Truck Leasing Co. LP/PTL Finance Corp. $155,000 4.13% 1/8/2023 165,368 0.00%Welltower, Inc. £100,000 4.80% 20/11/2028 165,216 0.00%Truist Bank $150,000 3.63% 16/9/2025 165,093 0.00%Sysco Corp. $150,000 3.75% 1/10/2025 165,016 0.00%Stanley Black & Decker, Inc. $150,000 3.40% 1/3/2026 164,976 0.00%Entergy Arkansas LLC $150,000 3.50% 1/4/2026 164,888 0.00%UBS Commercial Mortgage Trust 2017 $150,000 3.49% 15/8/2050 164,804 0.00%Freddie Mac Multifamily Structured Pass Through Certificates $160,000 1.87% 25/3/2053 164,729 0.00%CSAIL 2017-CX10 Commercial Mortgage Trust^ $150,000 3.46% 15/11/2050 164,712 0.00%Moody's Corp. $150,000 4.88% 15/2/2024 164,687 0.00%CSX Corp. $150,000 3.25% 1/6/2027 164,496 0.00%ViacomCBS, Inc. $150,000 3.38% 15/2/2028 164,176 0.00%Bank of America Corp.^ CA($)190,000 3.52% 24/3/2026 164,157 0.00%Nasdaq, Inc. $150,000 4.25% 1/6/2024 164,072 0.00%Booking Holdings, Inc. $150,000 3.65% 15/3/2025 164,068 0.00%NiSource, Inc. $155,000 2.95% 1/9/2029 164,067 0.00%Martin Marietta Materials, Inc. $150,000 3.45% 1/6/2027 163,931 0.00%AvalonBay Communities, Inc. $150,000 3.30% 1/6/2029 163,842 0.00%Federal Home Loan Mortgage Corp. $152,992 4.00% 1/12/2047 163,712 0.00%LYB International Finance II BV $150,000 3.50% 2/3/2027 163,687 0.00%FMC Corp. $150,000 3.45% 1/10/2029 163,618 0.00%San Diego Gas & Electric Co. $135,000 4.15% 15/5/2048 163,537 0.00%Realty Income Corp. $150,000 3.25% 15/6/2029 163,426 0.00%SVB Financial Group $151,000 3.50% 29/1/2025 163,420 0.00%JM Smucker Co. $150,000 3.50% 15/3/2025 163,395 0.00%Camden Property Trust $150,000 3.15% 1/7/2029 163,379 0.00%UnitedHealth Group, Inc. $150,000 2.95% 15/10/2027 163,287 0.00%Bunge Ltd. Finance Corp. $150,000 4.35% 15/3/2024 163,284 0.00%Eaton Corp. $150,000 3.10% 15/9/2027 163,204 0.00%Oklahoma Gas & Electric Co. $150,000 3.25% 1/4/2030 163,166 0.00%Brighthouse Financial, Inc. $147,000 4.70% 22/6/2047 163,164 0.00%Federal Home Loan Mortgage Corp. $152,871 3.50% 1/8/2045 163,146 0.00%General Motors Co. $135,000 5.00% 1/4/2035 163,001 0.00%Fortive Corp. $150,000 3.15% 15/6/2026 162,969 0.00%Hershey Co. $150,000 3.20% 21/8/2025 162,948 0.00%Aircastle Ltd. $150,000 4.25% 15/6/2026 162,814 0.00%AvalonBay Communities, Inc. $150,000 3.20% 15/1/2028 162,751 0.00%Allegion US Holding Co., Inc. $150,000 3.55% 1/10/2027 162,750 0.00%Owens Corning $150,000 3.40% 15/8/2026 162,707 0.00%Sempra Energy $150,000 3.25% 15/6/2027 162,703 0.00%AbbVie, Inc. $150,000 3.85% 15/6/2024 162,640 0.00%Welltower, Inc. $150,000 4.50% 15/1/2024 162,558 0.00%Southern California Edison Co. $130,000 5.35% 15/7/2035 162,393 0.00%Duke Energy Carolinas LLC $150,000 2.95% 1/12/2026 162,385 0.00%Appalachian Power Co. $150,000 3.40% 1/6/2025 162,275 0.00%GS Mortgage Securities Trust 2015 $150,000 3.38% 10/5/2050 162,183 0.00%BANK 2017 $150,000 3.28% 15/11/2054 162,168 0.00%John Deere Capital Corp. $150,000 2.80% 18/7/2029 162,117 0.00%Thermo Fisher Scientific, Inc. $150,000 2.95% 19/9/2026 161,950 0.00%PacifiCorp $135,000 4.13% 15/1/2049 161,934 0.00%Piedmont Natural Gas Co., Inc. $150,000 3.64% 1/11/2046 161,870 0.00%Target Corp. $100,000 7.00% 15/1/2038 161,862 0.00%Federal Home Loan Mortgage Corp. $142,188 5.00% 1/3/2040 161,812 0.00%FS KKR Capital Corp. $150,000 4.63% 15/7/2024 161,764 0.00%Johnson & Johnson $125,000 4.50% 1/9/2040 161,735 0.00%ConocoPhillips Co. $150,000 3.35% 15/11/2024 161,729 0.00%Puget Sound Energy, Inc. $115,000 6.27% 15/3/2037 161,611 0.00%UnitedHealth Group, Inc. $150,000 3.50% 15/2/2024 161,553 0.00%American Water Capital Corp. $150,000 3.85% 1/3/2024 161,545 0.00%Federal National Mortgage Association $150,109 4.50% 1/3/2050 161,437 0.00%AutoZone, Inc. $150,000 3.25% 15/4/2025 161,421 0.00%ERP Operating LP $150,000 3.00% 1/7/2029 161,359 0.00%Lear Corp. $150,000 3.50% 30/5/2030 161,288 0.00%Federal National Mortgage Association $151,063 3.50% 1/3/2034 161,270 0.00%DC1 Commercial Mortgage Trust 2015 $150,000 3.35% 10/2/2048 161,172 0.00%Arizona Public Service Co. $150,000 3.15% 15/5/2025 161,164 0.00%HollyFrontier Corp. $150,000 4.50% 1/10/2030 161,058 0.00%

528
Vanguard Global Bond Index Fund
Principal CouponMaturity
DateFair Value
US Dollars ($)% of Total
Net AssetsIHS Markit Ltd. $150,000 3.63% 1/5/2024 161,035 0.00%Colgate-Palmolive Co. $150,000 3.25% 15/3/2024 161,024 0.00%Freddie Mac Multifamily Structured Pass Through Certificates $150,000 2.75% 25/1/2026 161,009 0.00%Lowe's Cos, Inc. $150,000 3.50% 1/4/2051 160,999 0.00%Delmarva Power & Light Co. $135,000 4.15% 15/5/2045 160,989 0.00%Metropolitan Life Global Funding I $150,000 2.95% 9/4/2030 160,901 0.00%CCRE11 Commercial Mortgage Trust 2013 $150,000 4.26% 10/8/2050 160,895 0.00%Penske Truck Leasing Co. LP/PTL Finance Corp. $150,000 3.45% 1/7/2024 160,892 0.00%Stryker Corp. $150,000 3.38% 15/5/2024 160,890 0.00%Federal National Mortgage Association $150,526 3.50% 1/3/2035 160,835 0.00%Fortune Brands Home & Security, Inc. $150,000 4.00% 21/9/2023 160,806 0.00%Federal National Mortgage Association $144,640 4.50% 1/1/2044 160,690 0.00%Celanese US Holdings LLC $150,000 3.50% 8/5/2024 160,565 0.00%Bristol-Myers Squibb Co. $125,000 4.50% 1/3/2044 160,525 0.00%Amcor Flexibles North America, Inc. $150,000 3.10% 15/9/2026 160,458 0.00%Berkshire Hathaway Energy Co. $150,000 3.75% 15/11/2023 160,350 0.00%Freddie Mac Multifamily Structured Pass Through Certificates $150,000 2.85% 25/1/2026 160,314 0.00%3M Co. $150,000 3.25% 14/2/2024 160,305 0.00%ViacomCBS, Inc. $144,000 3.70% 1/6/2028 160,261 0.00%Trinity Health Corp. $130,000 4.13% 1/12/2045 160,245 0.00%Kilroy Realty LP $150,000 3.45% 15/12/2024 160,242 0.00%Public Service Electric & Gas Co. $135,000 3.85% 1/5/2049 160,191 0.00%Boston Properties LP $150,000 2.75% 1/10/2026 160,169 0.00%New York State Thruway Authority $150,000 2.90% 1/1/2035 160,116 0.00%Welltower, Inc. $125,000 4.95% 1/9/2048 160,025 0.00%Southwest Airlines Co. $150,000 3.00% 15/11/2026 160,006 0.00%GS Mortgage Securities Trust 2016 $150,000 2.85% 10/10/2049 159,979 0.00%Regions Financial Corp. $150,000 3.80% 14/8/2023 159,958 0.00%Federal National Mortgage Association $154,886 2.00% 1/11/2027 159,931 0.00%Marriott International, Inc. $150,000 3.60% 15/4/2024 159,832 0.00%Bank of New York Mellon Corp. $150,000 3.45% 11/8/2023 159,747 0.00%Federal National Mortgage Association $141,521 5.00% 1/9/2033 159,736 0.00%Cummins, Inc. $150,000 3.65% 1/10/2023 159,687 0.00%Entergy Texas, Inc. $135,000 4.50% 30/3/2039 159,625 0.00%Bon Secours Mercy Health, Inc. $145,000 3.46% 1/6/2030 159,554 0.00%Las Vegas Sands Corp. $150,000 3.50% 18/8/2026 159,463 0.00%DTE Energy Co. $150,000 3.70% 1/8/2023 159,333 0.00%Southern California Edison Co. $125,000 5.63% 1/2/2036 159,317 0.00%Prologis LP $155,000 3.00% 15/4/2050 159,300 0.00%Protective Life Global Funding $150,000 3.10% 15/4/2024 159,273 0.00%Healthcare Trust of America Holdings LP $150,000 3.10% 15/2/2030 159,269 0.00%Washington Gas Light Co. $140,000 3.80% 15/9/2046 159,233 0.00%CD 2017-CD3 Mortgage Trust $144,000 3.63% 10/2/2050 159,164 0.00%ViacomCBS, Inc. $125,000 5.50% 15/5/2033 159,124 0.00%United Airlines 2015-1 Class AA Pass Through Trust $151,647 3.45% 1/12/2027 159,035 0.00%Assurant, Inc. $150,000 4.00% 15/3/2023 158,639 0.00%Government National Mortgage Association $141,458 4.50% 15/5/2040 158,519 0.00%Regional Transportation District Sales Tax Revenue $100,000 5.84% 1/11/2050 158,501 0.00%Consumers Energy Co. $150,000 3.38% 15/8/2023 158,366 0.00%Federal Home Loan Mortgage Corp. $144,891 5.00% 1/10/2048 158,313 0.00%Steel Dynamics, Inc. $150,000 2.80% 15/12/2024 158,312 0.00%Mass General Brigham, Inc. $150,000 3.19% 1/7/2049 158,308 0.00%Consolidated Edison Co. of New York, Inc. $125,000 5.30% 1/3/2035 158,294 0.00%Voya Financial, Inc. $125,000 4.80% 15/6/2046 158,247 0.00%Penske Truck Leasing Co. LP/PTL Finance Corp. $150,000 4.25% 17/1/2023 158,214 0.00%John Deere Capital Corp. $150,000 2.60% 7/3/2024 158,173 0.00%Westlake Chemical Corp. $125,000 5.00% 15/8/2046 158,126 0.00%Equifax, Inc. $150,000 2.60% 1/12/2024 158,101 0.00%Hartford Financial Services Group, Inc. $150,000 2.80% 19/8/2029 158,031 0.00%CommonSpirit Health $150,000 2.76% 1/10/2024 157,893 0.00%Verizon Communications, Inc. £108,000 2.50% 8/4/2031 157,798 0.00%Mondelez International, Inc. CA($)184,000 3.25% 7/3/2025 157,663 0.00%Government National Mortgage Association $138,781 5.00% 20/6/2040 157,657 0.00%American Honda Finance Corp. $150,000 2.40% 27/6/2024 157,652 0.00%Host Hotels & Resorts LP $150,000 3.38% 15/12/2029 157,540 0.00%Government National Mortgage Association $146,905 3.50% 20/4/2044 157,494 0.00%Government National Mortgage Association $144,301 5.00% 20/6/2048 157,463 0.00%Southwestern Public Service Co. $150,000 3.15% 1/5/2050 157,455 0.00%KeySpan Gas East Corp. $150,000 2.74% 15/8/2026 157,413 0.00%DR Horton, Inc. $150,000 2.50% 15/10/2024 157,307 0.00%Constellation Brands, Inc. $130,000 4.50% 9/5/2047 157,208 0.00%
529
Vanguard Global Bond Index Fund
Principal CouponMaturity
DateFair Value
US Dollars ($)% of Total
Net AssetsSmithfield Foods, Inc. $135,000 5.20% 1/4/2029 157,147 0.00%Federal National Mortgage Association $147,941 3.50% 1/6/2038 157,127 0.00%American Tower Corp. $150,000 3.00% 15/6/2023 157,116 0.00%National Rural Utilities Cooperative Finance Corp.^ $150,000 4.75% 30/4/2043 157,100 0.00%University of Southern California $150,000 2.95% 1/10/2051 156,971 0.00%Federal National Mortgage Association $135,618 5.50% 1/5/2036 156,875 0.00%General Dynamics Corp. $150,000 2.13% 15/8/2026 156,801 0.00%Estee Lauder Cos, Inc. $150,000 2.00% 1/12/2024 156,797 0.00%Metropolitan Life Global Funding I CA($)180,000 3.39% 9/4/2030 156,714 0.00%Southern California Edison Co. $125,000 5.50% 15/3/2040 156,528 0.00%Verisk Analytics, Inc. $150,000 4.13% 12/9/2022 156,387 0.00%Federal National Mortgage Association $142,900 4.00% 1/8/2039 156,278 0.00%Constellation Brands, Inc. $150,000 3.20% 15/2/2023 156,233 0.00%Texas Instruments, Inc. $150,000 2.25% 4/9/2029 156,176 0.00%Air Lease Corp. $150,000 3.25% 1/10/2029 156,059 0.00%Blackstone Holdings Finance Co. LLC $140,000 3.50% 10/9/2049 156,042 0.00%TD Ameritrade Holding Corp. $145,000 2.75% 1/10/2029 155,977 0.00%Burlington Northern Santa Fe LLC $150,000 3.00% 15/3/2023 155,897 0.00%Golden State Tobacco Securitization Corp. $150,000 3.12% 1/6/2038 155,838 0.00%Philip Morris International, Inc. $150,000 2.63% 6/3/2023 155,746 0.00%Booking Holdings, Inc. $150,000 2.75% 15/3/2023 155,731 0.00%Simon Property Group LP $150,000 2.75% 1/6/2023 155,724 0.00%Union Pacific Corp. $150,000 2.15% 5/2/2027 155,696 0.00%AEP Texas, Inc. $150,000 3.45% 15/1/2050 155,564 0.00%Markel Corp. $120,000 5.00% 20/5/2049 155,554 0.00%Florida Power & Light Co. $125,000 4.13% 1/6/2048 155,476 0.00%Toyota Motor Credit Corp. $150,000 2.70% 11/1/2023 155,421 0.00%HollyFrontier Corp. $150,000 2.63% 1/10/2023 155,222 0.00%Waste Management, Inc. $150,000 2.40% 15/5/2023 155,214 0.00%Camden Property Trust $135,000 4.10% 15/10/2028 155,185 0.00%Cleco Corporate Holdings LLC $130,000 4.97% 1/5/2046 155,120 0.00%Federal National Mortgage Association $144,364 4.50% 1/3/2029 155,095 0.00%Charles Schwab Corp. $150,000 2.65% 25/1/2023 155,082 0.00%South Carolina Public Service Authority $100,000 6.45% 1/1/2050 155,075 0.00%Duke Energy Carolinas LLC $150,000 2.50% 15/3/2023 154,943 0.00%Energy Transfer LP $140,000 4.20% 15/4/2027 154,911 0.00%NVR, Inc. $150,000 3.95% 15/9/2022 154,910 0.00%Federal Home Loan Mortgage Corp. $146,358 3.00% 1/8/2031 154,851 0.00%Brooklyn Union Gas Co. $130,000 4.50% 10/3/2046 154,847 0.00%Transatlantic Holdings, Inc. $100,000 8.00% 30/11/2039 154,746 0.00%Entergy Corp. $150,000 4.00% 15/7/2022 154,700 0.00%Omega Healthcare Investors, Inc. $145,000 4.38% 1/8/2023 154,640 0.00%Target Corp. $100,000 6.50% 15/10/2037 154,521 0.00%Georgia Power Co. $125,000 4.75% 1/9/2040 154,418 0.00%Public Service Enterprise Group, Inc. $150,000 2.65% 15/11/2022 154,304 0.00%General Motors Financial Co., Inc. $140,000 3.85% 5/1/2028 154,214 0.00%Federal Home Loan Mortgage Corp. $144,387 3.50% 1/2/2026 154,159 0.00%Chevron Phillips Chemical Co. LLC/Chevron Phillips Chemical Co. LP $138,000 3.70% 1/6/2028 153,975 0.00%Colgate-Palmolive Co. $150,000 1.95% 1/2/2023 153,966 0.00%CenterPoint Energy Houston Electric LLC $150,000 2.35% 1/4/2031 153,948 0.00%Federal Home Loan Mortgage Corp. $140,719 4.00% 1/5/2042 153,944 0.00%Air Lease Corp. $150,000 2.25% 15/1/2023 153,913 0.00%Hackensack Meridian Health, Inc. $125,000 4.21% 1/7/2048 153,698 0.00%DTE Energy Co. $150,000 2.25% 1/11/2022 153,551 0.00%Government National Mortgage Association $138,405 5.50% 20/1/2049 153,549 0.00%Lincoln National Corp. $100,000 7.00% 15/6/2040 153,543 0.00%Massachusetts School Building Authority $150,000 2.95% 15/5/2043 153,542 0.00%ViacomCBS, Inc. $125,000 4.85% 1/7/2042 153,367 0.00%3M Co. $150,000 1.75% 14/2/2023 153,363 0.00%City of Atlanta GA Water & Wastewater Revenue $150,000 2.26% 1/11/2035 153,336 0.00%Los Angeles County Metropolitan Transportation Authority $115,000 5.74% 1/6/2039 153,315 0.00%Duke Energy Corp. $125,000 4.80% 15/12/2045 153,227 0.00%Philip Morris International, Inc. $150,000 2.38% 17/8/2022 153,201 0.00%Federal National Mortgage Association $144,684 3.00% 1/6/2030 152,882 0.00%National Retail Properties, Inc. $150,000 2.50% 15/4/2030 152,733 0.00%Federal Home Loan Mortgage Corp. $130,998 5.50% 1/6/2041 152,578 0.00%Capital One Multi-Asset Execution Trust $150,000 2.43% 15/1/2025 152,363 0.00%Government National Mortgage Association $137,050 4.50% 20/2/2044 152,313 0.00%State of California $150,000 1.70% 1/2/2028 152,169 0.00%Indiana Michigan Power Co. $125,000 4.25% 15/8/2048 152,126 0.00%Transcontinental Gas Pipe Line Co. LLC $125,000 4.60% 15/3/2048 152,059 0.00%

530
Vanguard Global Bond Index Fund
Principal CouponMaturity
DateFair Value
US Dollars ($)% of Total
Net AssetsDallas Area Rapid Transit $100,000 6.00% 1/12/2044 152,046 0.00%Eastman Chemical Co. $150,000 3.50% 1/12/2021 151,968 0.00%Verizon Communications, Inc. £100,000 4.07% 18/6/2024 151,961 0.00%Federal National Mortgage Association $141,459 3.50% 1/10/2041 151,852 0.00%Florida Power & Light Co. $125,000 4.05% 1/6/2042 151,852 0.00%Xylem, Inc. $150,000 1.95% 30/1/2028 151,759 0.00%San Diego County Regional Transportation Commission $100,000 5.91% 1/4/2048 151,683 0.00%Chicago O'Hare International Airport $100,000 6.40% 1/1/2040 151,639 0.00%Federal National Mortgage Association^ $135,000 3.19% 25/2/2030 151,613 0.00%Trane Technologies Global Holding Co., Ltd. $125,000 4.30% 21/2/2048 151,579 0.00%Magellan Midstream Partners LP $125,000 4.85% 1/2/2049 151,443 0.00%Government National Mortgage Association $144,094 3.00% 20/2/2027 151,392 0.00%Federal Home Loan Mortgage Corp. $140,745 3.50% 1/11/2041 151,131 0.00%John Deere Capital Corp. $150,000 0.70% 5/7/2023 151,034 0.00%Federal National Mortgage Association $139,459 4.00% 1/8/2046 150,983 0.00%Caterpillar Financial Services Corp. $150,000 0.65% 7/7/2023 150,810 0.00%Duke Energy Ohio, Inc. $150,000 2.13% 1/6/2030 150,726 0.00%Port Authority of New York & New Jersey $150,000 3.18% 15/7/2060 150,707 0.00%American Water Capital Corp. $125,000 4.30% 1/9/2045 150,620 0.00%Intel Corp. $125,000 4.00% 15/12/2032 150,554 0.00%Federal Realty Investment Trust $140,000 3.20% 15/6/2029 150,443 0.00%Brown-Forman Corp. €120,000 1.20% 7/7/2026 150,345 0.00%West Virginia United Health System Obligated Group $150,000 3.13% 1/6/2050 150,283 0.00%Federal Home Loan Mortgage Corp. $134,837 4.50% 1/2/2046 150,281 0.00%Federal National Mortgage Association $135,574 4.50% 1/2/2041 150,230 0.00%Southern California Gas Co. $125,000 4.13% 1/6/2048 150,141 0.00%Port Authority of New York & New Jersey $140,000 3.29% 1/8/2069 150,065 0.00%JPMorgan Chase & Co. $100,000 8.75% 1/9/2030 150,045 0.00%Brown-Forman Corp. £100,000 2.60% 7/7/2028 149,881 0.00%Juniper Networks, Inc. $150,000 1.20% 10/12/2025 149,810 0.00%Walt Disney Co. $115,000 4.75% 15/11/2046 149,691 0.00%Government National Mortgage Association $138,699 4.50% 20/9/2047 149,593 0.00%Kroger Co. $125,000 4.45% 1/2/2047 149,400 0.00%PPL Electric Utilities Corp. $125,000 4.13% 15/6/2044 149,349 0.00%Simon Property Group LP $100,000 6.75% 1/2/2040 149,274 0.00%Sysco Corp. $125,000 4.45% 15/3/2048 149,268 0.00%Sutter Health $125,000 4.09% 15/8/2048 148,987 0.00%American International Group, Inc. £100,000 5.00% 26/4/2023 148,867 0.00%Comcast Corp. $125,000 4.25% 15/1/2033 148,831 0.00%Ameren Corp. $150,000 1.75% 15/3/2028 148,737 0.00%Arrow Electronics, Inc. $137,000 4.00% 1/4/2025 148,670 0.00%City of Tucson AZ $150,000 2.86% 1/7/2047 148,446 0.00%Government National Mortgage Association $132,790 4.50% 20/6/2040 148,404 0.00%Federal Home Loan Mortgage Corp. $135,654 4.00% 1/6/2042 148,394 0.00%Union Electric Co. $125,000 4.00% 1/4/2048 148,298 0.00%Ohio Power Co. $125,000 4.00% 1/6/2049 147,946 0.00%Lowe's Cos, Inc. $150,000 3.00% 15/10/2050 147,776 0.00%Kinder Morgan Energy Partners LP $100,000 7.50% 15/11/2040 147,652 0.00%Humana, Inc. $120,000 4.63% 1/12/2042 147,484 0.00%Stanford Health Care $125,000 3.80% 15/11/2048 147,236 0.00%Consolidated Edison Co. of New York, Inc. $100,000 6.75% 1/4/2038 147,225 0.00%Constellation Brands, Inc. $125,000 4.65% 15/11/2028 147,163 0.00%Eastern Energy Gas Holdings LLC $140,000 2.50% 15/11/2024 146,907 0.00%Norfolk Southern Corp. $125,000 4.10% 15/5/2049 146,871 0.00%Federal National Mortgage Association $137,592 3.50% 1/12/2025 146,848 0.00%Darden Restaurants, Inc. $125,000 4.55% 15/2/2048 146,833 0.00%Interpublic Group of Cos, Inc. $125,000 4.65% 1/10/2028 146,750 0.00%GATX Corp. $125,000 4.70% 1/4/2029 146,505 0.00%Duke Energy Florida LLC $135,000 3.40% 1/10/2046 146,500 0.00%Carlyle Holdings II Finance LLC $110,000 5.63% 30/3/2043 146,449 0.00%Federal Home Loan Mortgage Corp. $133,615 5.00% 1/4/2049 146,449 0.00%Federal National Mortgage Association $129,654 5.00% 1/3/2034 146,423 0.00%Johnson & Johnson $100,000 5.95% 15/8/2037 146,356 0.00%Government National Mortgage Association $134,800 4.50% 20/5/2047 146,266 0.00%Aetna, Inc. $100,000 6.63% 15/6/2036 145,699 0.00%Southern Power Co. $130,000 4.15% 1/12/2025 145,621 0.00%Morgan Stanley $100,000 7.25% 1/4/2032 145,512 0.00%Mass General Brigham, Inc. $125,000 3.77% 1/7/2048 145,417 0.00%CSX Corp. $125,000 4.25% 15/3/2029 145,313 0.00%Freddie Mac Multifamily Structured Pass Through Certificates $125,000 3.47% 25/3/2031 145,193 0.00%Keysight Technologies, Inc. $125,000 4.60% 6/4/2027 145,183 0.00%
531
Vanguard Global Bond Index Fund
Principal CouponMaturity
DateFair Value
US Dollars ($)% of Total
Net AssetsFederal National Mortgage Association $135,400 3.50% 1/2/2033 144,869 0.00%Federal National Mortgage Association $132,412 4.00% 1/3/2044 144,790 0.00%Energy Transfer LP $125,000 5.30% 1/4/2044 144,788 0.00%Jersey Central Power & Light Co. $133,000 4.70% 1/4/2024 144,777 0.00%Willis North America, Inc. $125,000 4.50% 15/9/2028 144,655 0.00%Kimberly-Clark Corp. $125,000 3.95% 1/11/2028 144,653 0.00%Commonwealth Edison Co. $125,000 3.75% 15/8/2047 144,626 0.00%IHS Markit Ltd. $125,000 4.25% 1/5/2029 144,520 0.00%Unum Group $135,000 4.50% 15/12/2049 144,491 0.00%Federal Home Loan Mortgage Corp. $136,453 3.00% 1/6/2035 144,370 0.00%Oncor Electric Delivery Co. LLC $125,000 3.75% 1/4/2045 144,255 0.00%Philip Morris International, Inc. €100,000 3.13% 3/6/2033 144,239 0.00%Federal Home Loan Mortgage Corp. $138,258 3.00% 1/11/2039 144,169 0.00%General Dynamics Corp. $125,000 3.60% 15/11/2042 143,976 0.00%Juniper Networks, Inc. $150,000 2.00% 10/12/2030 143,965 0.00%McDonald's Corp. $100,000 6.30% 15/10/2037 143,865 0.00%Essential Utilities, Inc. $130,000 3.57% 1/5/2029 143,804 0.00%Tennessee Valley Authority $100,000 4.88% 15/1/2048 143,732 0.00%L3Harris Technologies, Inc. $100,000 6.15% 15/12/2040 143,718 0.00%Vornado Realty LP $135,000 3.50% 15/1/2025 143,704 0.00%Republic Services, Inc. $100,000 6.20% 1/3/2040 143,653 0.00%Lowe's Cos, Inc. $125,000 4.25% 15/9/2044 143,453 0.00%Federal Home Loan Mortgage Corp. $130,973 4.00% 1/2/2042 143,298 0.00%Metropolitan Life Global Funding I £100,000 2.88% 11/1/2023 143,297 0.00%Charles Schwab Corp. $130,000 3.45% 13/2/2026 143,254 0.00%CenterPoint Energy, Inc. $125,000 4.25% 1/11/2028 143,199 0.00%Federal National Mortgage Association $132,063 4.00% 1/1/2032 143,072 0.00%Wyeth LLC $100,000 6.00% 15/2/2036 143,006 0.00%Ameren Illinois Co. $125,000 3.70% 1/12/2047 142,986 0.00%Federal National Mortgage Association $131,568 4.00% 1/6/2034 142,917 0.00%Republic Services, Inc. $140,000 3.05% 1/3/2050 142,916 0.00%General Motors Financial Co., Inc. £100,000 2.25% 6/9/2024 142,759 0.00%BANK 2018^ $125,000 4.05% 15/3/2061 142,662 0.00%AXIS Specialty Finance LLC^ $135,000 4.90% 15/1/2040 142,624 0.00%Southern Co. Gas Capital Corp. $150,000 1.75% 15/1/2031 142,580 0.00%Hartford Financial Services Group, Inc. $100,000 6.10% 1/10/2041 142,569 0.00%CME Group, Inc. $125,000 3.75% 15/6/2028 142,522 0.00%Nucor Corp. $125,000 3.95% 1/5/2028 142,473 0.00%Clorox Co. $125,000 3.90% 15/5/2028 142,388 0.00%Mid-America Apartments LP $150,000 1.70% 15/2/2031 142,371 0.00%Federal National Mortgage Association $134,766 3.00% 1/1/2031 142,224 0.00%Trustees of the University of Pennsylvania $125,000 3.61% 15/2/2119 142,104 0.00%Walmart, Inc. $105,000 5.00% 25/10/2040 142,027 0.00%Sabal Trail Transmission LLC $125,000 4.25% 1/5/2028 141,935 0.00%ONEOK Partners LP $110,000 6.13% 1/2/2041 141,815 0.00%American Municipal Power, Inc. $100,000 6.27% 15/2/2050 141,731 0.00%Public Service Electric & Gas Co. $125,000 3.65% 1/9/2042 141,629 0.00%Duke Energy Florida LLC $125,000 3.80% 15/7/2028 141,578 0.00%Northern Trust Corp. $125,000 3.65% 3/8/2028 141,488 0.00%Arch Capital Finance LLC $125,000 4.01% 15/12/2026 141,385 0.00%Boston Scientific Corp. $100,000 7.00% 15/11/2035 141,325 0.00%Government National Mortgage Association $134,491 3.00% 20/6/2035 141,269 0.00%Federal Home Loan Mortgage Corp. $131,847 3.50% 1/10/2034 141,247 0.00%WRKCo, Inc. $125,000 4.00% 15/3/2028 141,228 0.00%Constellation Brands, Inc. $125,000 4.40% 15/11/2025 141,168 0.00%CSX Corp. $125,000 3.80% 1/3/2028 140,922 0.00%AEP Texas, Inc. $125,000 3.95% 1/6/2028 140,874 0.00%Freddie Mac Multifamily Structured Pass Through Certificates $125,000 3.44% 25/12/2027 140,859 0.00%Duke Energy Carolinas LLC $125,000 3.70% 1/12/2047 140,844 0.00%Penske Truck Leasing Co. LP/PTL Finance Corp. $125,000 4.20% 1/4/2027 140,467 0.00%Commonwealth of Massachusetts Transportation Fund Revenue $100,000 5.73% 1/6/2040 140,381 0.00%Federal National Mortgage Association^ $125,000 3.28% 25/4/2029 140,287 0.00%Illinois State Toll Highway Authority $100,000 6.18% 1/1/2034 140,239 0.00%Apple, Inc. $125,000 3.45% 9/2/2045 140,194 0.00%Federal Home Loan Mortgage Corp. $122,788 5.00% 1/7/2041 139,745 0.00%AT&T, Inc. CA($)150,000 5.10% 25/11/2048 139,699 0.00%Dominion Energy South Carolina, Inc. $100,000 6.63% 1/2/2032 139,657 0.00%Morgan Stanley $125,000 3.95% 23/4/2027 139,635 0.00%Dallas Convention Center Hotel Development Corp. $100,000 7.09% 1/1/2042 139,632 0.00%CommonSpirit Health $125,000 3.82% 1/10/2049 139,550 0.00%Nevada Power Co. $135,000 3.13% 1/8/2050 139,516 0.00%
532
Vanguard Global Bond Index Fund
Principal CouponMaturity
DateFair Value
US Dollars ($)% of Total
Net AssetsBooking Holdings, Inc. $125,000 3.55% 15/3/2028 139,377 0.00%Benchmark 2018-B1 Mortgage Trust^ $125,000 3.67% 15/1/2051 139,338 0.00%Federal National Mortgage Association $130,481 3.50% 1/10/2025 139,258 0.00%Nevada Power Co. $135,000 2.40% 1/5/2030 139,182 0.00%Freddie Mac Multifamily Structured Pass Through Certificates $125,000 3.24% 25/8/2027 139,137 0.00%Virginia Electric & Power Co. $100,000 6.00% 15/5/2037 139,125 0.00%Bristol-Myers Squibb Co. $125,000 3.88% 15/8/2025 139,097 0.00%RWJ Barnabas Health, Inc. $125,000 3.48% 1/7/2049 139,090 0.00%Jabil, Inc. $125,000 3.95% 12/1/2028 138,992 0.00%Federal Home Loan Mortgage Corp. $128,395 4.00% 1/11/2045 138,954 0.00%Federal National Mortgage Association $125,365 4.50% 1/1/2042 138,938 0.00%BBCMS Mortgage Trust 2017 $125,000 3.67% 15/2/2050 138,787 0.00%GS Mortgage Securities Trust 2017 $125,000 3.67% 10/3/2050 138,777 0.00%Government National Mortgage Association $124,607 4.50% 20/4/2044 138,484 0.00%Federal National Mortgage Association^ $125,000 3.15% 25/3/2028 138,408 0.00%NextEra Energy Capital Holdings, Inc. $125,000 3.50% 1/4/2029 138,316 0.00%Dominion Energy, Inc. $125,000 3.90% 1/10/2025 138,231 0.00%Charles Schwab Corp. $125,000 3.85% 21/5/2025 138,225 0.00%Kroger Co. $125,000 3.88% 15/10/2046 138,006 0.00%Duke University Health System, Inc. $115,000 3.92% 1/6/2047 138,004 0.00%MetLife Capital Trust IV $100,000 7.88% 15/12/2037 137,896 0.00%State of Washington $100,000 5.14% 1/8/2040 137,869 0.00%Keurig Dr Pepper, Inc. $125,000 3.43% 15/6/2027 137,792 0.00%Autodesk, Inc. $125,000 3.50% 15/6/2027 137,722 0.00%Stryker Corp. $125,000 3.50% 15/3/2026 137,709 0.00%Federal National Mortgage Association^ $122,000 3.44% 25/6/2028 137,682 0.00%CR28 Commercial Mortgage Trust 2016 $125,000 3.76% 10/2/2049 137,675 0.00%Prudential Financial, Inc. $100,000 5.70% 14/12/2036 137,664 0.00%Kellogg Co. $125,000 3.40% 15/11/2027 137,621 0.00%Duke Realty LP $125,000 3.38% 15/12/2027 137,504 0.00%Marriott International, Inc $125,000 4.00% 15/4/2028 137,444 0.00%JPMorgan Chase & Co. $100,000 5.40% 6/1/2042 137,443 0.00%Citigroup Commercial Mortgage Trust 2015 $125,000 3.78% 10/9/2058 137,389 0.00%Baltimore Gas & Electric Co. $125,000 3.50% 15/8/2046 137,384 0.00%Toyota Motor Credit Corp. $125,000 3.20% 11/1/2027 137,376 0.00%Masco Corp. $125,000 3.50% 15/11/2027 137,368 0.00%Broadridge Financial Solutions, Inc. $125,000 3.40% 27/6/2026 137,278 0.00%Federal Home Loan Mortgage Corp. $126,482 4.00% 1/10/2031 137,104 0.00%Dominion Energy South Carolina, Inc. $100,000 5.45% 1/2/2041 137,044 0.00%AHS Hospital Corp. $100,000 5.02% 1/7/2045 136,984 0.00%Rutgers The State University of New Jersey $100,000 5.67% 1/5/2040 136,963 0.00%Eastern Energy Gas Holdings LLC $130,000 3.00% 15/11/2029 136,962 0.00%Kimberly-Clark Corp. $100,000 5.30% 1/3/2041 136,864 0.00%McDonald's Corp. $100,000 5.70% 1/2/2039 136,861 0.00%Government National Mortgage Association $129,479 3.00% 20/7/2030 136,739 0.00%Federal National Mortgage Association $126,253 4.00% 1/12/2038 136,703 0.00%Air Lease Corp. $125,000 4.25% 15/9/2024 136,450 0.00%Freddie Mac Multifamily Structured Pass Through Certificates^ $125,000 3.33% 25/8/2025 136,443 0.00%County of Cook IL $100,000 6.23% 15/11/2034 136,303 0.00%Flowers Foods, Inc. $125,000 3.50% 1/10/2026 136,241 0.00%City of New York NY $100,000 5.52% 1/10/2037 136,002 0.00%Vistra Operations Co. LLC $125,000 4.30% 15/7/2029 135,924 0.00%Norfolk Southern Corp. $125,000 3.15% 1/6/2027 135,910 0.00%Aspen Insurance Holdings Ltd. $125,000 4.65% 15/11/2023 135,853 0.00%UPMC $125,000 3.60% 3/4/2025 135,832 0.00%Florida Power & Light Co. $125,000 3.13% 1/12/2025 135,776 0.00%Michigan Finance Authority $125,000 3.08% 1/12/2034 135,746 0.00%Fifth Third Bancorp $125,000 4.30% 16/1/2024 135,566 0.00%Tyco Electronics Group SA €112,000 1.10% 1/3/2023 135,470 0.00%Federal Home Loan Mortgage Corp. $128,796 3.00% 1/10/2026 135,442 0.00%Georgia Power Co. $125,000 3.25% 30/3/2027 135,400 0.00%Pfizer, Inc. $125,000 3.40% 15/5/2024 135,335 0.00%ERP Operating LP $125,000 3.38% 1/6/2025 135,299 0.00%Whirlpool Corp. $112,500 4.50% 1/6/2046 135,164 0.00%BGC Partners, Inc. $125,000 5.38% 24/7/2023 135,090 0.00%Memorial Health Services $125,000 3.45% 1/11/2049 135,075 0.00%Federal National Mortgage Association $127,016 3.50% 1/4/2046 134,984 0.00%JPMBB Commercial Mortgage Securities Trust 2014 $125,000 3.49% 15/1/2048 134,946 0.00%Unum Group $120,000 4.00% 15/6/2029 134,884 0.00%Kaiser Foundation Hospitals $100,000 4.88% 1/4/2042 134,580 0.00%CCRE20 Commercial Mortgage Trust 2014 $125,000 3.59% 10/11/2047 134,535 0.00%

533
Vanguard Global Bond Index Fund
Principal CouponMaturity
DateFair Value
US Dollars ($)% of Total
Net AssetsBGC Partners, Inc. $127,000 3.75% 1/10/2024 134,460 0.00%Air Products & Chemicals, Inc. $125,000 3.35% 31/7/2024 134,451 0.00%JP Morgan Chase Commercial Mortgage Securities Trust 2014 $125,000 3.80% 15/7/2047 134,372 0.00%Black Hills Corp. $125,000 4.25% 30/11/2023 134,362 0.00%Freddie Mac Multifamily Structured Pass Through Certificates $125,000 2.65% 25/8/2026 134,245 0.00%Government National Mortgage Association $123,405 4.00% 20/6/2044 134,221 0.00%NiSource, Inc. $96,000 5.95% 15/6/2041 134,182 0.00%Federal Home Loan Mortgage Corp. $125,646 3.00% 1/8/2033 134,071 0.00%Tyson Foods, Inc. $125,000 3.90% 28/9/2023 133,930 0.00%International Paper Co. $100,000 5.15% 15/5/2046 133,888 0.00%Port Authority of New York & New Jersey $100,000 4.96% 1/8/2046 133,882 0.00%Avangrid, Inc. $125,000 3.15% 1/12/2024 133,870 0.00%DENTSPLY SIRONA, Inc. $125,000 3.25% 1/6/2030 133,777 0.00%Jefferies Group LLC $100,000 6.25% 15/1/2036 133,766 0.00%Freddie Mac Multifamily Structured Pass Through Certificates $125,000 3.39% 25/3/2024 133,702 0.00%PeaceHealth Obligated Group $100,000 4.79% 15/11/2048 133,526 0.00%Aon plc €100,000 2.88% 14/5/2026 133,447 0.00%UBS Commercial Mortgage Trust 2017 $125,000 3.30% 15/10/2050 133,422 0.00%Freddie Mac Multifamily Structured Pass Through Certificates $125,000 2.53% 25/5/2026 133,256 0.00%Air Lease Corp. $125,000 3.25% 1/3/2025 133,195 0.00%Federal Home Loan Mortgage Corp. $126,935 3.00% 1/12/2047 133,012 0.00%Caterpillar Financial Services Corp. $125,000 2.85% 17/5/2024 132,985 0.00%Freddie Mac Multifamily Structured Pass Through Certificates^ $125,000 3.53% 25/10/2023 132,951 0.00%Global Payments, Inc. $125,000 4.00% 1/6/2023 132,845 0.00%Hess Corp. $125,000 3.50% 15/7/2024 132,776 0.00%Salt River Project Agricultural Improvement & Power District $100,000 4.84% 1/1/2041 132,775 0.00%Bay Area Toll Authority $125,000 2.57% 1/4/2031 132,615 0.00%Government National Mortgage Association $112,552 6.00% 20/6/2036 132,572 0.00%General Mills, Inc. $125,000 2.88% 15/4/2030 132,543 0.00%Banner Health $125,000 3.18% 1/1/2050 132,541 0.00%Northwestern University $100,000 4.64% 1/12/2044 132,523 0.00%Evergy Metro, Inc. $100,000 5.30% 1/10/2041 132,417 0.00%Federal National Mortgage Association^ $124,711 2.57% 25/9/2026 132,362 0.00%Dallas/Fort Worth International Airport $125,000 3.14% 1/11/2045 132,266 0.00%Morgan Stanley $125,000 4.88% 1/11/2022 132,248 0.00%Trustees of Boston College $125,000 3.13% 1/7/2052 132,231 0.00%Cummins, Inc. $100,000 4.88% 1/10/2043 132,221 0.00%Government National Mortgage Association $121,311 3.50% 15/3/2042 132,212 0.00%Williams Cos, Inc. $120,000 4.55% 24/6/2024 132,187 0.00%Energy Transfer LP $100,000 6.63% 15/10/2036 132,151 0.00%Applied Materials, Inc. $100,000 5.10% 1/10/2035 132,112 0.00%Williams Cos, Inc. $100,000 5.80% 15/11/2043 132,061 0.00%Omnicom Group, Inc. $130,000 2.45% 30/4/2030 132,039 0.00%NSTAR Electric Co. $120,000 3.25% 15/5/2029 132,017 0.00%Cleveland Electric Illuminating Co. $125,000 3.50% 1/4/2028 131,577 0.00%Commonwealth of Massachusetts $125,000 2.90% 1/9/2049 131,576 0.00%Hershey Co. $125,000 3.38% 15/5/2023 131,534 0.00%Willis North America, Inc. $125,000 2.95% 15/9/2029 131,471 0.00%Marriott International, Inc. $115,000 4.65% 1/12/2028 131,405 0.00%PPL Capital Funding, Inc. $100,000 5.00% 15/3/2044 131,352 0.00%State of California $120,000 3.38% 1/4/2025 131,318 0.00%Hartford HealthCare Corp. $125,000 3.45% 1/7/2054 131,300 0.00%Coca-Cola Co. €100,000 1.63% 9/3/2035 131,286 0.00%Camden Property Trust $120,000 3.35% 1/11/2049 131,075 0.00%Ingredion, Inc. $125,000 2.90% 1/6/2030 131,018 0.00%Federal National Mortgage Association $118,201 4.50% 1/6/2040 130,953 0.00%Mosaic Co. $100,000 5.63% 15/11/2043 130,916 0.00%Ventas Realty LP $125,000 3.00% 15/1/2030 130,700 0.00%MPLX LP $125,000 3.38% 15/3/2023 130,660 0.00%Motorola Solutions, Inc. $100,000 5.50% 1/9/2044 130,610 0.00%Federal National Mortgage Association $122,837 3.50% 1/8/2037 130,464 0.00%Bank of America Corp. $100,000 4.88% 1/4/2044 130,450 0.00%Boeing Co. $125,000 2.80% 1/3/2024 130,447 0.00%National Fuel Gas Co. $125,000 3.75% 1/3/2023 130,400 0.00%Waste Management of Canada Corp. CA($)155,000 2.60% 23/9/2026 130,324 0.00%Primerica, Inc. $125,000 4.75% 15/7/2022 130,293 0.00%OhioHealth Corp. $125,000 3.04% 15/11/2050 130,175 0.00%Federal National Mortgage Association $121,260 3.50% 1/1/2044 130,119 0.00%Analog Devices, Inc. $125,000 2.88% 1/6/2023 130,095 0.00%Government National Mortgage Association $124,509 2.50% 20/2/2028 129,963 0.00%ERP Operating LP $125,000 3.00% 15/4/2023 129,950 0.00%

534
Vanguard Global Bond Index Fund
Principal CouponMaturity
DateFair Value
US Dollars ($)% of Total
Net AssetsAmerican International Group, Inc.^ $90,000 8.18% 15/5/2058 129,873 0.00%Loews Corp. $125,000 2.63% 15/5/2023 129,496 0.00%Sysco Canada, Inc. CA($)150,000 3.65% 25/4/2025 129,480 0.00%People's United Financial, Inc. $125,000 3.65% 6/12/2022 129,389 0.00%WW Grainger, Inc. $100,000 4.60% 15/6/2045 129,144 0.00%Brown-Forman Corp. $100,000 4.50% 15/7/2045 129,068 0.00%CME Group, Inc. $125,000 3.00% 15/9/2022 128,989 0.00%American Honda Finance Corp. $125,000 2.60% 16/11/2022 128,956 0.00%Advocate Health & Hospitals Corp. $125,000 3.01% 15/6/2050 128,893 0.00%Camden Property Trust $125,000 2.95% 15/12/2022 128,799 0.00%Federal Home Loan Mortgage Corp. $121,734 3.00% 1/9/2035 128,797 0.00%Federal Home Loan Mortgage Corp. $120,624 3.50% 1/10/2025 128,778 0.00%Northrop Grumman Corp. $100,000 4.75% 1/6/2043 128,769 0.00%Wells Fargo & Co. €100,000 2.00% 27/4/2026 128,591 0.00%Alexandria Real Estate Equities, Inc. $100,000 4.85% 15/4/2049 128,586 0.00%Federal National Mortgage Association $109,437 6.00% 1/4/2035 128,573 0.00%Markel Corp. $100,000 5.00% 5/4/2046 128,514 0.00%Government National Mortgage Association $113,101 5.00% 20/4/2038 128,500 0.00%Federal National Mortgage Association $122,698 2.50% 1/7/2030 128,375 0.00%Ohio Turnpike & Infrastructure Commission $125,000 3.22% 15/2/2048 128,356 0.00%McKesson Corp. $125,000 2.70% 15/12/2022 128,334 0.00%NYU Langone Hospitals $100,000 4.78% 1/7/2044 128,307 0.00%Molson Coors International LP CA($)150,000 3.44% 15/7/2026 128,278 0.00%Oncor Electric Delivery Co. LLC $88,000 5.35% 1/10/2052 128,178 0.00%Micron Technology, Inc. $110,000 4.66% 15/2/2030 128,066 0.00%Federal National Mortgage Association $119,001 4.50% 1/4/2049 127,981 0.00%Caterpillar Financial Services Corp. $125,000 1.45% 15/5/2025 127,979 0.00%Federal National Mortgage Association $116,990 4.00% 1/10/2041 127,951 0.00%Spirit Realty LP $120,000 3.20% 15/1/2027 127,894 0.00%Spirit Realty LP $120,000 3.40% 15/1/2030 127,885 0.00%Government National Mortgage Association $120,462 3.00% 15/7/2043 127,813 0.00%Verizon Communications, Inc. €100,000 1.85% 18/5/2040 127,808 0.00%PerkinElmer, Inc. €100,000 1.88% 19/7/2026 127,793 0.00%Blackstone Holdings Finance Co. LLC €100,000 2.00% 19/5/2025 127,764 0.00%Guardian Life Insurance Co. of America $100,000 4.85% 24/1/2077 127,671 0.00%Federal Home Loan Mortgage Corp. $120,621 3.00% 1/12/2035 127,620 0.00%Nissan Motor Acceptance Corp. $125,000 2.60% 28/9/2022 127,610 0.00%Federal Home Loan Mortgage Corp. $119,976 3.00% 1/9/2043 127,413 0.00%Zoetis, Inc. $100,000 4.45% 20/8/2048 127,407 0.00%Norfolk Southern Corp. $120,000 3.40% 1/11/2049 127,406 0.00%Keurig Dr Pepper, Inc. $100,000 4.99% 25/5/2038 127,349 0.00%Government National Mortgage Association $116,255 4.00% 20/3/2042 127,308 0.00%Coca-Cola Co. €100,000 1.25% 8/3/2031 127,293 0.00%Federal National Mortgage Association $121,441 2.50% 1/1/2035 127,257 0.00%Waste Connections, Inc. $125,000 3.05% 1/4/2050 127,222 0.00%Booking Holdings, Inc. €100,000 2.38% 23/9/2024 127,137 0.00%Massachusetts Institute of Technology $115,000 2.99% 1/7/2050 127,092 0.00%Federal Home Loan Mortgage Corp. $120,442 3.00% 1/5/2029 127,071 0.00%Consumers Energy Co. $120,000 3.10% 15/8/2050 127,069 0.00%PPL Electric Utilities Corp. $105,000 4.15% 1/10/2045 126,938 0.00%Federal Home Loan Mortgage Corp. $116,020 4.00% 1/10/2040 126,931 0.00%CSX Corp. $100,000 4.50% 1/8/2054 126,772 0.00%Advocate Health & Hospitals Corp. $125,000 2.21% 15/6/2030 126,686 0.00%Federal National Mortgage Association $110,006 5.50% 1/2/2033 126,684 0.00%Public Service Co. of Colorado $125,000 2.25% 15/9/2022 126,678 0.00%Caterpillar, Inc. $100,000 4.30% 15/5/2044 126,668 0.00%Federal Home Loan Mortgage Corp. $113,860 4.50% 1/9/2044 126,535 0.00%PPL Capital Funding, Inc. $100,000 4.70% 1/6/2043 126,413 0.00%Kroger Co. $100,000 5.00% 15/4/2042 126,298 0.00%Federal Home Loan Mortgage Corp. $120,972 2.50% 1/9/2027 126,242 0.00%Bank of America Corp.^ CA($)150,000 3.30% 24/4/2024 126,220 0.00%Ameren Corp. $115,000 3.65% 15/2/2026 126,117 0.00%US Treasury Note $124,000 1.63% 15/8/2022 126,112 0.00%Advocate Health & Hospitals Corp. $100,000 4.27% 15/8/2048 126,090 0.00%Federal Home Loan Mortgage Corp. $114,136 4.50% 1/4/2044 126,053 0.00%Pfizer, Inc. $100,000 4.20% 15/9/2048 125,976 0.00%Allstate Corp. $100,000 4.50% 15/6/2043 125,953 0.00%Virginia Electric & Power Co. $125,000 2.95% 15/1/2022 125,943 0.00%Mayo Clinic $100,000 4.13% 15/11/2052 125,839 0.00%Nationwide Financial Services, Inc. $100,000 5.30% 18/11/2044 125,838 0.00%Baltimore Gas & Electric Co. $120,000 3.20% 15/9/2049 125,717 0.00%

535
Vanguard Global Bond Index Fund
Principal CouponMaturity
DateFair Value
US Dollars ($)% of Total
Net AssetsAtmos Energy Corp. $120,000 2.63% 15/9/2029 125,639 0.00%Los Angeles Unified School District $100,000 5.76% 1/7/2029 125,560 0.00%New York State Electric & Gas Corp. $115,000 3.25% 1/12/2026 125,408 0.00%Avista Corp. $100,000 4.35% 1/6/2048 125,404 0.00%Hershey Co. $125,000 0.90% 1/6/2025 125,369 0.00%Whirlpool Finance Luxembourg Sarl €100,000 1.25% 2/11/2026 125,205 0.00%RPM International, Inc. $100,000 5.25% 1/6/2045 125,080 0.00%Federal Home Loan Mortgage Corp. $112,756 4.50% 1/10/2039 125,052 0.00%Southern California Gas Co. $100,000 4.30% 15/1/2049 124,888 0.00%Travelers Cos, Inc. $100,000 4.30% 25/8/2045 124,837 0.00%State of Illinois $100,000 6.63% 1/2/2035 124,836 0.00%John Deere Canada Funding, Inc. CA($)150,000 2.70% 17/1/2023 124,812 0.00%Sysco Corp. $100,000 4.85% 1/10/2045 124,770 0.00%Activision Blizzard, Inc. $100,000 4.50% 15/6/2047 124,768 0.00%Federal National Mortgage Association $113,896 5.00% 1/12/2049 124,691 0.00%Nissan Motor Acceptance Corp. $125,000 1.05% 8/3/2024 124,606 0.00%National Retail Properties, Inc. $100,000 4.80% 15/10/2048 124,333 0.00%Federal National Mortgage Association^ $118,735 2.64% 25/7/2024 124,221 0.00%Government National Mortgage Association $117,169 3.00% 20/3/2045 124,064 0.00%Wells Fargo & Co. €100,000 2.25% 2/5/2023 123,967 0.00%Comcast Corp. $100,000 4.50% 15/1/2043 123,941 0.00%Ventas Realty LP $100,000 4.88% 15/4/2049 123,901 0.00%Fiserv, Inc. €100,000 1.13% 1/7/2027 123,855 0.00%Southern California Edison Co. $100,000 6.65% 1/4/2029 123,848 0.00%Air Lease Corp. $115,000 3.63% 1/4/2027 123,803 0.00%Goldman Sachs Group, Inc. €100,000 2.00% 27/7/2023 123,781 0.00%WFRBS Commercial Mortgage Trust 2014 $116,937 3.41% 15/8/2047 123,749 0.00%JobsOhio Beverage System $100,000 4.53% 1/1/2035 123,667 0.00%Government National Mortgage Association $113,964 4.50% 20/3/2047 123,658 0.00%Bristol-Myers Squibb Co. €100,000 1.00% 15/5/2025 123,634 0.00%Metropolitan Life Global Funding I €100,000 2.38% 11/1/2023 123,576 0.00%Toledo Hospital $100,000 6.02% 15/11/2048 123,510 0.00%County of Miami-Dade FL Water & Sewer System Revenue $115,000 3.49% 1/10/2042 123,397 0.00%AT&T, Inc. €100,000 2.50% 15/3/2023 123,326 0.00%Cadence Design Systems, Inc. $112,000 4.38% 15/10/2024 123,182 0.00%Deere & Co. $100,000 3.90% 9/6/2042 122,961 0.00%Hershey Co. $125,000 2.65% 1/6/2050 122,911 0.00%Baltimore Gas & Electric Co. $100,000 4.25% 15/9/2048 122,900 0.00%Trustees of Boston University $100,000 4.06% 1/10/2048 122,842 0.00%Snap-on, Inc. $100,000 4.10% 1/3/2048 122,681 0.00%Kroger Co. $100,000 4.65% 15/1/2048 122,599 0.00%Wells Fargo & Co. €100,000 2.63% 16/8/2022 122,595 0.00%WW Grainger, Inc. $100,000 4.20% 15/5/2047 122,577 0.00%Government National Mortgage Association $111,441 4.00% 20/8/2040 122,538 0.00%Berkshire Hathaway Energy Co. $100,000 4.50% 1/2/2045 122,489 0.00%CCRE2 Commercial Mortgage Trust 2012 $120,000 3.15% 15/8/2045 122,455 0.00%University of Chicago $100,000 4.00% 1/10/2053 122,455 0.00%Omnicom Finance Holdings plc €100,000 0.80% 8/7/2027 122,415 0.00%Freddie Mac Multifamily Structured Pass Through Certificates^ $100,000 3.99% 25/8/2033 122,341 0.00%FS KKR Capital Corp. $115,000 4.13% 1/2/2025 122,332 0.00%Dow Chemical Co. $100,000 4.63% 1/10/2044 122,216 0.00%Brown-Forman Corp. $112,000 3.50% 15/4/2025 122,188 0.00%Procter & Gamble Co. €100,000 2.00% 16/8/2022 121,879 0.00%Goldman Sachs Group, Inc. $100,000 5.95% 15/1/2027 121,868 0.00%Kentucky Utilities Co. $100,000 4.38% 1/10/2045 121,865 0.00%Florida Power & Light Co. $100,000 4.05% 1/10/2044 121,716 0.00%Williams Cos, Inc. $100,000 4.85% 1/3/2048 121,715 0.00%Arizona Public Service Co. $100,000 4.25% 1/3/2049 121,622 0.00%Regency Centers LP $100,000 4.65% 15/3/2049 121,184 0.00%Burlington Northern Santa Fe LLC $100,000 4.15% 1/4/2045 121,153 0.00%Federal National Mortgage Association $111,759 4.50% 1/6/2031 121,148 0.00%Bank of America Corp.^ CA($)150,000 1.98% 15/9/2027 121,026 0.00%PECO Energy Co. $100,000 4.15% 1/10/2044 121,018 0.00%Connecticut Light & Power Co. $120,000 2.05% 1/7/2031 120,933 0.00%State of Oregon $100,000 5.89% 1/6/2027 120,920 0.00%ManpowerGroup, Inc. €100,000 1.88% 11/9/2022 120,836 0.00%Valmont Industries, Inc. $100,000 5.00% 1/10/2044 120,804 0.00%Keurig Dr Pepper, Inc. $100,000 4.42% 15/12/2046 120,769 0.00%S&P Global, Inc. $115,000 2.50% 1/12/2029 120,754 0.00%Mastercard, Inc. €100,000 1.10% 1/12/2022 120,615 0.00%VF Corp. €100,000 0.63% 20/9/2023 120,471 0.00%
536
Vanguard Global Bond Index Fund
Principal CouponMaturity
DateFair Value
US Dollars ($)% of Total
Net AssetsAltria Group, Inc. €100,000 1.00% 15/2/2023 120,440 0.00%Massachusetts Institute of Technology $100,000 3.96% 1/7/2038 120,326 0.00%PPG Industries, Inc. $115,000 2.40% 15/8/2024 120,322 0.00%Dignity Health $100,000 4.50% 1/11/2042 120,244 0.00%Potomac Electric Power Co. $100,000 4.15% 15/3/2043 120,210 0.00%Indiana University Health, Inc. Obligated Group $100,000 3.97% 1/11/2048 120,177 0.00%Board of Regents of the University of Texas System $125,000 2.44% 15/8/2049 120,171 0.00%Walmart, Inc. €100,000 1.90% 8/4/2022 120,058 0.00%Kohl's Corp. $100,000 5.55% 17/7/2045 119,916 0.00%Nationwide Mutual Insurance Co. $100,000 4.95% 22/4/2044 119,901 0.00%JM Smucker Co. $100,000 4.38% 15/3/2045 119,832 0.00%ONE Gas, Inc. $100,000 4.50% 1/11/2048 119,763 0.00%Aetna, Inc. $100,000 4.50% 15/5/2042 119,729 0.00%American Financial Group, Inc. $100,000 4.50% 15/6/2047 119,722 0.00%Government National Mortgage Association $109,520 4.00% 15/6/2046 119,624 0.00%Marathon Petroleum Corp. $100,000 5.00% 15/9/2054 119,569 0.00%Lincoln National Corp. $100,000 4.35% 1/3/2048 119,477 0.00%MPLX LP $115,000 3.50% 1/12/2022 119,474 0.00%Mastercard, Inc. $100,000 3.80% 21/11/2046 119,201 0.00%Evergy Kansas Central, Inc. $110,000 3.10% 1/4/2027 119,168 0.00%Alexandria Real Estate Equities, Inc. $100,000 4.70% 1/7/2030 119,160 0.00%NYU Langone Hospitals $100,000 4.37% 1/7/2047 119,019 0.00%Starbucks Corp. $100,000 4.30% 15/6/2045 118,954 0.00%PPL Electric Utilities Corp. $100,000 3.95% 1/6/2047 118,724 0.00%Southern California Gas Co. $100,000 3.95% 15/2/2050 118,565 0.00%Government National Mortgage Association $104,363 5.00% 20/2/2040 118,550 0.00%Archer-Daniels-Midland Co. $100,000 3.75% 15/9/2047 118,475 0.00%Cargill, Inc. $100,000 3.88% 23/5/2049 118,434 0.00%Johns Hopkins Health System Corp. $100,000 3.84% 15/5/2046 118,377 0.00%Zimmer Biomet Holdings, Inc. $100,000 4.45% 15/8/2045 118,374 0.00%Exelon Generation Co. LLC $100,000 5.75% 1/10/2041 118,176 0.00%Evergy Kansas Central, Inc. $100,000 4.10% 1/4/2043 118,070 0.00%Public Service Electric & Gas Co. $100,000 3.95% 1/5/2042 118,042 0.00%Government National Mortgage Association $107,467 4.00% 20/12/2041 117,810 0.00%VF Corp. €100,000 0.25% 25/2/2028 117,755 0.00%Evergy Kansas Central, Inc. $100,000 4.13% 1/3/2042 117,723 0.00%Freddie Mac Multifamily Structured Pass Through Certificates $100,000 3.72% 25/1/2031 117,686 0.00%Government National Mortgage Association $109,105 4.50% 20/11/2047 117,675 0.00%Prologis LP $100,000 4.38% 1/2/2029 117,637 0.00%Florida Power & Light Co. $100,000 3.70% 1/12/2047 117,605 0.00%Federal National Mortgage Association $109,577 3.50% 1/3/2042 117,585 0.00%Consumers Energy Co. $100,000 3.75% 15/2/2050 117,584 0.00%Citigroup Commercial Mortgage Trust 2012 $115,139 3.02% 10/9/2045 117,421 0.00%RWJ Barnabas Health, Inc. $100,000 3.95% 1/7/2046 117,357 0.00%Federal Home Loan Mortgage Corp. $108,863 4.50% 1/4/2050 117,231 0.00%Federal Home Loan Mortgage Corp. $106,841 4.50% 1/5/2028 117,046 0.00%University of Notre Dame du Lac $100,000 3.39% 15/2/2048 117,012 0.00%CommonSpirit Health $100,000 4.35% 1/11/2042 116,867 0.00%Martin Marietta Materials, Inc. $100,000 4.25% 15/12/2047 116,829 0.00%GATX Corp. $100,000 4.55% 7/11/2028 116,754 0.00%Mars, Inc. $100,000 3.95% 1/4/2044 116,712 0.00%Schlumberger Holdings Corp. $105,000 4.00% 21/12/2025 116,683 0.00%Freddie Mac Multifamily Structured Pass Through Certificates $100,000 3.46% 25/11/2032 116,681 0.00%Toledo Hospital $100,000 5.33% 15/11/2028 116,650 0.00%Black Hills Corp. $100,000 4.35% 1/5/2033 116,629 0.00%American Homes 4 Rent LP $100,000 4.90% 15/2/2029 116,542 0.00%Legg Mason, Inc. $100,000 4.75% 15/3/2026 116,466 0.00%Freddie Mac Multifamily Structured Pass Through Certificates $100,000 3.75% 25/11/2032 116,387 0.00%Cardinal Health, Inc. $100,000 4.60% 15/3/2043 116,367 0.00%MetLife, Inc. $90,000 4.60% 13/5/2046 116,165 0.00%Duke Realty LP $110,000 2.88% 15/11/2029 116,008 0.00%University of Michigan $115,000 2.44% 1/4/2040 116,003 0.00%E*TRADE Financial Corp. $100,000 4.50% 20/6/2028 115,997 0.00%BANK 2018^ $100,000 4.48% 15/9/2060 115,816 0.00%PPL Capital Funding, Inc. $100,000 4.13% 15/4/2030 115,812 0.00%BorgWarner, Inc. $100,000 4.38% 15/3/2045 115,805 0.00%Citrix Systems, Inc. $110,000 3.30% 1/3/2030 115,787 0.00%AEP Transmission Co. LLC $100,000 3.80% 15/6/2049 115,753 0.00%International Flavors & Fragrances, Inc. $100,000 4.45% 26/9/2028 115,728 0.00%CenterPoint Energy Resources Corp. $100,000 4.10% 1/9/2047 115,701 0.00%Allina Health System $100,000 3.89% 15/4/2049 115,668 0.00%

537
Vanguard Global Bond Index Fund
Principal CouponMaturity
DateFair Value
US Dollars ($)% of Total
Net AssetsDTE Electric Co. $100,000 3.75% 15/8/2047 115,558 0.00%Marvell Technology, Inc. $100,000 4.88% 22/6/2028 115,509 0.00%VEREIT Operating Partnership LP $100,000 4.88% 1/6/2026 115,424 0.00%American International Group, Inc. $100,000 4.25% 15/3/2029 115,419 0.00%Benchmark 2018-B6 Mortgage Trust $100,000 4.44% 10/10/2051 115,282 0.00%Government National Mortgage Association $107,503 4.00% 20/9/2046 115,246 0.00%Global Payments, Inc. $100,000 4.45% 1/6/2028 115,234 0.00%RPM International, Inc. $100,000 4.55% 1/3/2029 115,047 0.00%CHRISTUS Health $100,000 4.34% 1/7/2028 114,988 0.00%Micron Technology, Inc. $100,000 4.98% 6/2/2026 114,956 0.00%Federal National Mortgage Association $106,073 3.50% 1/6/2045 114,954 0.00%WW Grainger, Inc. $100,000 3.75% 15/5/2046 114,950 0.00%ERP Operating LP $100,000 4.15% 1/12/2028 114,910 0.00%CF Industries, Inc. $100,000 4.50% 1/12/2026 114,902 0.00%Brown & Brown, Inc. $100,000 4.50% 15/3/2029 114,848 0.00%Phillips 66 Partners LP $110,000 2.45% 15/12/2024 114,815 0.00%JPMorgan Chase & Co. $78,000 6.40% 15/5/2038 114,807 0.00%Kansas City Southern $100,000 4.30% 15/5/2043 114,796 0.00%Federal Home Loan Mortgage Corp. $104,882 4.00% 1/4/2044 114,607 0.00%WEC Energy Group, Inc. $105,000 3.55% 15/6/2025 114,470 0.00%AEP Transmission Co. LLC $100,000 3.75% 1/12/2047 114,464 0.00%Prologis LP $100,000 3.88% 15/9/2028 114,419 0.00%CubeSmart LP $100,000 4.38% 15/2/2029 114,396 0.00%Freddie Mac Multifamily Structured Pass Through Certificates $100,000 3.42% 25/4/2032 114,369 0.00%Philip Morris International, Inc. $100,000 4.13% 4/3/2043 114,280 0.00%AT&T, Inc. £50,000 7.00% 30/4/2040 114,278 0.00%Simon Property Group LP $105,000 3.30% 15/1/2026 114,270 0.00%Northwestern Mutual Life Insurance Co. $100,000 3.85% 30/9/2047 114,200 0.00%Expedia Group, Inc. $100,000 5.00% 15/2/2026 114,115 0.00%STORE Capital Corp. $100,000 4.63% 15/3/2029 114,022 0.00%Valero Energy Partners LP $100,000 4.50% 15/3/2028 113,936 0.00%Federal Home Loan Mortgage Corp. $107,918 3.50% 1/11/2048 113,925 0.00%Freddie Mac Multifamily Structured Pass Through Certificates $111,910 2.49% 25/4/2048 113,920 0.00%Government National Mortgage Association $100,233 5.00% 20/2/2043 113,881 0.00%Zoetis, Inc. $100,000 3.90% 20/8/2028 113,874 0.00%Huntsman International LLC $100,000 4.50% 1/5/2029 113,794 0.00%Board of Regents of the University of Texas System $100,000 3.35% 15/8/2047 113,730 0.00%Digital Realty Trust LP $100,000 4.75% 1/10/2025 113,697 0.00%Block Financial LLC $100,000 5.25% 1/10/2025 113,622 0.00%McKesson Corp. $100,000 3.95% 16/2/2028 113,477 0.00%GATX Corp. $106,000 3.25% 30/3/2025 113,461 0.00%Hanover Insurance Group, Inc. $100,000 4.50% 15/4/2026 113,393 0.00%Bank of America Corp.^ $100,000 3.97% 7/2/2030 113,388 0.00%Government National Mortgage Association $107,653 3.00% 20/12/2029 113,367 0.00%Realty Income Corp. $100,000 4.13% 15/10/2026 113,367 0.00%Walt Disney Co. $75,000 6.65% 15/11/2037 113,365 0.00%Government National Mortgage Association $108,700 2.50% 20/9/2031 113,323 0.00%Duke Energy Progress LLC $100,000 3.70% 15/10/2046 113,289 0.00%Precision Castparts Corp. $100,000 3.90% 15/1/2043 113,275 0.00%Marathon Oil Corp. $100,000 4.40% 15/7/2027 113,233 0.00%Ameren Illinois Co. $100,000 3.80% 15/5/2028 113,136 0.00%Willis North America, Inc. $100,000 3.88% 15/9/2049 113,124 0.00%WRKCo, Inc. $100,000 3.90% 1/6/2028 112,983 0.00%UBS Commercial Mortgage Trust 2018^ $100,000 4.22% 15/2/2051 112,914 0.00%MPLX LP $100,000 4.88% 1/6/2025 112,904 0.00%Cardinal Health, Inc. $100,000 4.37% 15/6/2047 112,836 0.00%Farmers Insurance Exchange^ $100,000 4.75% 1/11/2057 112,816 0.00%Pioneer Natural Resources Co. $100,000 4.45% 15/1/2026 112,780 0.00%New York State Urban Development Corp. $100,000 3.90% 15/3/2033 112,702 0.00%Federal National Mortgage Association $107,688 2.50% 1/6/2030 112,671 0.00%US Treasury Bond $86,000 6.13% 15/11/2027 112,553 0.00%Federal National Mortgage Association $105,081 3.50% 1/1/2035 112,536 0.00%Highwoods Realty LP $100,000 4.20% 15/4/2029 112,529 0.00%Rutgers The State University of New Jersey $100,000 3.92% 1/5/2119 112,517 0.00%County of Riverside CA $100,000 3.82% 15/2/2038 112,460 0.00%Mid-Atlantic Interstate Transmission LLC $100,000 4.10% 15/5/2028 112,435 0.00%Oklahoma Gas & Electric Co. $100,000 3.80% 15/8/2028 112,387 0.00%L3Harris Technologies, Inc. $100,000 3.85% 15/12/2026 112,272 0.00%Consolidated Edison Co. of New York, Inc. $100,000 3.88% 15/6/2047 112,222 0.00%BP Capital Markets America, Inc. $100,000 3.63% 6/4/2030 112,199 0.00%Highwoods Realty LP $100,000 4.13% 15/3/2028 112,150 0.00%

538
Vanguard Global Bond Index Fund
Principal CouponMaturity
DateFair Value
US Dollars ($)% of Total
Net AssetsBrookfield Property Finance ULC CA($)135,000 3.93% 15/1/2027 112,005 0.00%Black Hills Corp. $105,000 3.05% 15/10/2029 111,967 0.00%Tampa Electric Co. $100,000 3.63% 15/6/2050 111,884 0.00%Textron, Inc. $100,000 3.90% 17/9/2029 111,873 0.00%AutoZone, Inc. $100,000 3.75% 1/6/2027 111,813 0.00%Cigna Corp. $100,000 3.88% 15/10/2047 111,812 0.00%President & Fellows of Harvard College $100,000 3.15% 15/7/2046 111,785 0.00%Realty Income Corp. $100,000 3.65% 15/1/2028 111,753 0.00%Owens Corning $100,000 3.88% 1/6/2030 111,727 0.00%Georgetown University $89,000 4.32% 1/4/2049 111,687 0.00%UBS Commercial Mortgage Trust 2017^ $100,000 4.06% 15/12/2050 111,680 0.00%Vulcan Materials Co. $100,000 4.50% 1/4/2025 111,638 0.00%Roper Technologies, Inc. $100,000 3.80% 15/12/2026 111,613 0.00%Freddie Mac Multifamily Structured Pass Through Certificates $100,000 3.29% 25/11/2027 111,577 0.00%Baxter International, Inc. $100,000 3.50% 15/8/2046 111,569 0.00%TD Ameritrade Holding Corp. $102,000 3.63% 1/4/2025 111,539 0.00%Kroger Co. $100,000 3.70% 1/8/2027 111,320 0.00%Iowa Health System $100,000 3.67% 15/2/2050 111,298 0.00%Interstate Power & Light Co. $100,000 3.60% 1/4/2029 111,241 0.00%Oshkosh Corp. $105,000 3.10% 1/3/2030 111,238 0.00%Trimble, Inc. $100,000 4.75% 1/12/2024 111,209 0.00%Marsh & McLennan Cos, Inc. $100,000 3.75% 14/3/2026 111,150 0.00%Federal National Mortgage Association $106,641 2.50% 1/2/2037 111,075 0.00%Liberty Mutual Group, Inc. $95,000 4.57% 1/2/2029 111,041 0.00%Williams Cos, Inc. $100,000 3.75% 15/6/2027 111,030 0.00%Starbucks Corp. $100,000 3.75% 1/12/2047 110,977 0.00%WP Carey, Inc. $100,000 3.85% 15/7/2029 110,958 0.00%Federal National Mortgage Association $102,457 4.00% 1/9/2038 110,937 0.00%Roper Technologies, Inc. $100,000 3.85% 15/12/2025 110,852 0.00%Edison International $100,000 4.95% 15/4/2025 110,818 0.00%Morgan Stanley Bank of America Merrill Lynch Trust 2017 $100,000 3.54% 15/11/2052 110,818 0.00%E*TRADE Financial Corp. $100,000 3.80% 24/8/2027 110,782 0.00%Spectrum Health System Obligated Group $100,000 3.49% 15/7/2049 110,708 0.00%Wells Fargo Commercial Mortgage Trust 2016 $100,000 3.64% 15/12/2059 110,669 0.00%Prudential Financial, Inc.^ $100,000 5.38% 15/5/2045 110,658 0.00%O'Reilly Automotive, Inc. $100,000 3.55% 15/3/2026 110,594 0.00%Burlington Resources LLC $75,000 7.40% 1/12/2031 110,580 0.00%GATX Corp. $100,000 3.85% 30/3/2027 110,470 0.00%Constellation Brands, Inc. $100,000 3.50% 9/5/2027 110,332 0.00%Hyatt Hotels Corp. $100,000 4.38% 15/9/2028 110,314 0.00%ERAC USA Finance LLC $100,000 3.80% 1/11/2025 110,273 0.00%RenaissanceRe Holdings Ltd. $100,000 3.60% 15/4/2029 110,236 0.00%Energy Transfer LP $100,000 4.00% 1/10/2027 110,234 0.00%Martin Marietta Materials, Inc. $100,000 3.50% 15/12/2027 110,143 0.00%National Rural Utilities Cooperative Finance Corp. $100,000 3.40% 7/2/2028 110,102 0.00%JPMCC Commercial Mortgage Securities Trust 2017 $100,000 3.74% 15/7/2050 110,058 0.00%District of Columbia $85,000 5.59% 1/12/2034 110,011 0.00%Federal Home Loan Mortgage Corp. $96,604 5.00% 1/3/2038 109,962 0.00%Federal National Mortgage Association $99,453 4.00% 1/2/2045 109,954 0.00%PepsiCo, Inc. $100,000 3.50% 17/7/2025 109,824 0.00%Physicians Realty LP $100,000 3.95% 15/1/2028 109,816 0.00%Jackson National Life Global Funding $100,000 3.88% 11/6/2025 109,805 0.00%BANK 2017 $100,000 3.62% 15/6/2060 109,793 0.00%RPM International, Inc. $100,000 3.75% 15/3/2027 109,786 0.00%UBS Commercial Mortgage Trust 2017 $100,000 3.47% 15/11/2050 109,782 0.00%LC23 Commercial Mortgage Trust 2015 $100,000 3.77% 10/10/2048 109,722 0.00%Brown & Brown, Inc. $100,000 4.20% 15/9/2024 109,715 0.00%Discovery Communications LLC $100,000 3.95% 15/6/2025 109,651 0.00%Hubbell, Inc. $100,000 3.50% 15/2/2028 109,649 0.00%Automatic Data Processing, Inc. $100,000 3.38% 15/9/2025 109,646 0.00%JPMBB Commercial Mortgage Securities Trust 2015 $100,000 3.82% 15/7/2048 109,605 0.00%Hudson Pacific Properties LP $100,000 3.95% 1/11/2027 109,556 0.00%Micron Technology, Inc. $100,000 4.64% 6/2/2024 109,545 0.00%Lowe's Cos, Inc. $100,000 3.38% 15/9/2025 109,454 0.00%Wells Fargo Commercial Mortgage Trust 2015 $100,000 3.66% 15/9/2058 109,440 0.00%Sales Tax Securitization Corp. $100,000 3.59% 1/1/2043 109,385 0.00%NSTAR Electric Co. $100,000 3.20% 15/5/2027 109,363 0.00%Cleco Corporate Holdings LLC $100,000 3.74% 1/5/2026 109,361 0.00%Parker-Hannifin Corp. $100,000 3.25% 1/3/2027 109,357 0.00%Federal National Mortgage Association $93,115 6.00% 1/3/2036 109,348 0.00%Keurig Dr Pepper, Inc. $100,000 3.40% 15/11/2025 109,345 0.00%

539
Vanguard Global Bond Index Fund
Principal CouponMaturity
DateFair Value
US Dollars ($)% of Total
Net AssetsSabra Health Care LP $100,000 4.80% 1/6/2024 109,335 0.00%Wells Fargo Commercial Mortgage Trust 2017 $100,000 3.70% 15/9/2050 109,312 0.00%Adventist Health System $100,000 3.63% 1/3/2049 109,309 0.00%Roper Technologies, Inc. $95,000 4.20% 15/9/2028 109,308 0.00%BANK 2017^ $100,000 4.21% 15/11/2050 109,285 0.00%National Retail Properties, Inc. $100,000 3.60% 15/12/2026 109,264 0.00%MidAmerican Energy Co. $100,000 3.10% 1/5/2027 109,251 0.00%DBJPM 17-C6 Mortgage Trust^ $100,000 3.56% 10/6/2050 109,244 0.00%Kellogg Co. $100,000 3.25% 1/4/2026 109,180 0.00%Wells Fargo Commercial Mortgage Trust 2015 $100,000 3.64% 15/6/2048 109,164 0.00%Toyota Motor Credit Corp. $100,000 3.40% 14/4/2025 109,157 0.00%ITC Holdings Corp. $100,000 3.35% 15/11/2027 109,137 0.00%GLP Capital LP/GLP Financing II, Inc. $100,000 5.38% 1/11/2023 109,120 0.00%Mastercard, Inc. $100,000 2.95% 21/11/2026 109,082 0.00%Alexandria Real Estate Equities, Inc. $100,000 3.45% 30/4/2025 109,075 0.00%WP Carey, Inc. $100,000 4.00% 1/2/2025 109,048 0.00%Morgan Stanley Bank of America Merrill Lynch Trust 2015 $100,000 3.64% 15/10/2048 109,014 0.00%American Campus Communities Operating Partnership LP $100,000 4.13% 1/7/2024 108,992 0.00%Clorox Co. $100,000 3.10% 1/10/2027 108,987 0.00%Eaton Vance Corp. $100,000 3.50% 6/4/2027 108,982 0.00%Government National Mortgage Association $96,540 5.00% 15/11/2034 108,966 0.00%ERAC USA Finance LLC $100,000 3.30% 1/12/2026 108,952 0.00%Philip Morris International, Inc. $100,000 3.13% 2/3/2028 108,939 0.00%Northrop Grumman Corp. $100,000 3.20% 1/2/2027 108,893 0.00%San Jose Redevelopment Agency Successor Agency $100,000 3.38% 1/8/2034 108,882 0.00%Leggett & Platt, Inc. $100,000 3.50% 15/11/2027 108,877 0.00%Walt Disney Co. $100,000 3.70% 15/9/2024 108,802 0.00%Snap-on, Inc. $100,000 3.25% 1/3/2027 108,774 0.00%Freddie Mac Multifamily Structured Pass Through Certificates $100,000 3.15% 25/11/2025 108,750 0.00%Wells Fargo Commercial Mortgage Trust 2015 $100,000 3.54% 15/5/2048 108,733 0.00%Sysco Corp. $100,000 3.30% 15/7/2026 108,728 0.00%PacifiCorp $75,000 6.35% 15/7/2038 108,727 0.00%Texas Eastern Transmission LP $100,000 3.50% 15/1/2028 108,711 0.00%Caterpillar Financial Services Corp. $100,000 3.25% 1/12/2024 108,704 0.00%Affiliated Managers Group, Inc. $100,000 3.50% 1/8/2025 108,699 0.00%Whirlpool Corp. $100,000 4.00% 1/3/2024 108,672 0.00%Government National Mortgage Association $95,665 5.00% 20/5/2039 108,669 0.00%LC17 Commercial Mortgage Trust 2014 $100,000 3.92% 10/10/2047 108,607 0.00%Apollo Management Holdings LP $85,000 5.00% 15/3/2048 108,458 0.00%Wells Fargo Commercial Mortgage Trust 2017 $100,000 3.32% 15/10/2050 108,341 0.00%UnitedHealth Group, Inc. $105,000 3.35% 15/7/2022 108,338 0.00%Aflac, Inc. $100,000 3.25% 17/3/2025 108,326 0.00%Tanger Properties LP $100,000 3.88% 15/7/2027 108,279 0.00%Federal National Mortgage Association^ $99,189 3.09% 25/4/2027 108,255 0.00%WFRBS Commercial Mortgage Trust 2014 $100,000 3.63% 15/11/2047 108,253 0.00%DXC Technology Co. $100,000 4.25% 15/4/2024 108,243 0.00%Entergy Louisiana LLC $100,000 3.05% 1/6/2031 108,218 0.00%Government National Mortgage Association $99,694 4.50% 20/7/2047 108,174 0.00%Public Service Electric & Gas Co. $100,000 3.00% 15/5/2027 108,174 0.00%Atmos Energy Corp. $100,000 3.00% 15/6/2027 108,125 0.00%Packaging Corp. of America $100,000 4.50% 1/11/2023 108,099 0.00%American Electric Power Co., Inc. $100,000 3.20% 13/11/2027 108,097 0.00%Private Export Funding Corp. $105,000 1.75% 15/11/2024 107,996 0.00%Cigna Corp. $100,000 3.05% 15/10/2027 107,989 0.00%Agilent Technologies, Inc. $100,000 3.05% 22/9/2026 107,964 0.00%Phillips 66 Partners LP $100,000 3.61% 15/2/2025 107,842 0.00%Wells Fargo & Co. $100,000 3.30% 9/9/2024 107,780 0.00%Campbell Soup Co. $100,000 3.30% 19/3/2025 107,752 0.00%Caterpillar Financial Services Corp. $100,000 3.65% 7/12/2023 107,749 0.00%GLP Capital LP/GLP Financing II, Inc. $100,000 4.00% 15/1/2030 107,747 0.00%Fidelity National Financial, Inc. $100,000 3.40% 15/6/2030 107,712 0.00%IPALCO Enterprises, Inc. $100,000 3.70% 1/9/2024 107,691 0.00%National Fuel Gas Co. $100,000 3.95% 15/9/2027 107,656 0.00%Federal National Mortgage Association $96,895 4.50% 1/1/2045 107,647 0.00%Federal National Mortgage Association $98,497 4.00% 1/11/2046 107,631 0.00%LC15 Commercial Mortgage Trust 2014 $100,000 4.01% 10/4/2047 107,629 0.00%Federal Home Loan Mortgage Corp. $92,566 5.50% 1/7/2037 107,594 0.00%Freddie Mac Multifamily Structured Pass Through Certificates $100,000 3.17% 25/10/2024 107,584 0.00%Westinghouse Air Brake Technologies Corp. $100,000 3.45% 15/11/2026 107,515 0.00%MetLife, Inc. $100,000 3.00% 1/3/2025 107,470 0.00%Freddie Mac Multifamily Structured Pass Through Certificates $100,000 3.02% 25/4/2048 107,428 0.00%

540
Vanguard Global Bond Index Fund
Principal CouponMaturity
DateFair Value
US Dollars ($)% of Total
Net AssetsAssurant, Inc. $100,000 4.20% 27/9/2023 107,405 0.00%eBay, Inc. $100,000 3.45% 1/8/2024 107,378 0.00%Government National Mortgage Association $101,346 3.00% 20/2/2045 107,365 0.00%Southwest Gas Corp. $100,000 3.80% 29/9/2046 107,352 0.00%Federal National Mortgage Association $94,260 5.00% 1/12/2039 107,199 0.00%Ryder System, Inc. $100,000 2.90% 1/12/2026 107,117 0.00%Ameriprise Financial, Inc. $100,000 3.00% 2/4/2025 107,114 0.00%Penske Truck Leasing Co. LP/PTL Finance Corp. $100,000 3.35% 1/11/2029 107,094 0.00%Ventas Realty LP $100,000 3.50% 15/4/2024 107,087 0.00%Federal National Mortgage Association $100,340 3.50% 1/8/2032 107,059 0.00%Morgan Stanley Bank of America Merrill Lynch Trust 2013 $100,000 4.04% 15/11/2046 107,003 0.00%Aircastle Ltd. $100,000 5.00% 1/4/2023 106,976 0.00%Union Pacific Corp. $100,000 2.75% 1/3/2026 106,893 0.00%Reliance Standard Life Global Funding II $100,000 3.85% 19/9/2023 106,892 0.00%AmerisourceBergen Corp. $100,000 3.40% 15/5/2024 106,889 0.00%Pennsylvania Electric Co. $100,000 3.60% 1/6/2029 106,821 0.00%Aircastle Ltd. $100,000 4.13% 1/5/2024 106,779 0.00%Federal Home Loan Mortgage Corp. $100,289 4.00% 1/7/2048 106,759 0.00%Interstate Power & Light Co. $75,000 6.25% 15/7/2039 106,741 0.00%Federal National Mortgage Association $100,000 2.35% 25/2/2031 106,719 0.00%Federal Home Loan Mortgage Corp. $97,524 4.00% 1/11/2040 106,696 0.00%Flowserve Corp. $100,000 4.00% 15/11/2023 106,682 0.00%Citigroup Commercial Mortgage Trust 2015 $100,000 3.14% 10/2/2048 106,668 0.00%Federal National Mortgage Association $101,121 3.00% 1/10/2045 106,644 0.00%Hershey Co. $100,000 3.13% 15/11/2049 106,611 0.00%Stanley Black & Decker, Inc.^ $100,000 4.00% 15/3/2060 106,565 0.00%Black Hills Corp. $100,000 3.15% 15/1/2027 106,561 0.00%Las Vegas Sands Corp. $100,000 3.90% 8/8/2029 106,552 0.00%Dominion Energy South Carolina, Inc. $75,000 6.05% 15/1/2038 106,404 0.00%Baxter International, Inc. $100,000 2.60% 15/8/2026 106,387 0.00%Guardian Life Global Funding $100,000 2.90% 6/5/2024 106,303 0.00%PACCAR Financial Corp. $100,000 3.40% 9/8/2023 106,198 0.00%University of California $75,000 5.95% 15/5/2045 106,184 0.00%International Business Machines Corp. $100,000 3.38% 1/8/2023 106,159 0.00%American Honda Finance Corp. $100,000 3.45% 14/7/2023 106,131 0.00%Oncor Electric Delivery Co. LLC $100,000 2.75% 1/6/2024 106,123 0.00%Hershey Co. $100,000 2.30% 15/8/2026 106,099 0.00%Keurig Dr Pepper, Inc. $100,000 3.13% 15/12/2023 106,088 0.00%Dominion Energy, Inc. $100,000 3.07% 15/8/2024 106,085 0.00%Wells Fargo & Co. CA($)125,000 2.98% 19/5/2026 106,055 0.00%Southern Co.^ $100,000 4.00% 15/1/2051 106,052 0.00%3M Co. $100,000 3.13% 19/9/2046 105,968 0.00%Union Pacific Corp. $100,000 3.35% 15/8/2046 105,943 0.00%Eversource Energy $100,000 2.90% 1/10/2024 105,922 0.00%Government National Mortgage Association $93,223 5.00% 20/11/2039 105,895 0.00%Chevron Corp. $100,000 2.90% 3/3/2024 105,836 0.00%Northrop Grumman Corp. $100,000 3.25% 1/8/2023 105,802 0.00%International Lease Finance Corp. $100,000 5.88% 15/8/2022 105,754 0.00%Government National Mortgage Association $88,975 6.00% 20/10/2038 105,689 0.00%Cleveland Clinic Foundation $75,000 4.86% 1/1/2114 105,684 0.00%Duke Energy Florida Project Finance LLC $100,000 2.54% 1/9/2029 105,601 0.00%Phillips 66 $100,000 3.70% 6/4/2023 105,571 0.00%Kinder Morgan Energy Partners LP $100,000 3.50% 1/9/2023 105,567 0.00%Dallas Fort Worth International Airport $100,000 2.99% 1/11/2038 105,497 0.00%Adventist Health System $100,000 2.95% 1/3/2029 105,415 0.00%Magellan Midstream Partners LP $85,000 5.15% 15/10/2043 105,399 0.00%Baltimore Gas & Electric Co. $100,000 2.40% 15/8/2026 105,302 0.00%Freddie Mac Multifamily Structured Pass Through Certificates^ $100,000 3.53% 25/7/2023 105,292 0.00%Penske Truck Leasing Co. LP/PTL Finance Corp. $100,000 2.70% 1/11/2024 105,262 0.00%Wells Fargo Commercial Mortgage Trust 2016 $100,000 2.81% 15/11/2059 105,260 0.00%Global Payments, Inc. $100,000 3.75% 1/6/2023 105,241 0.00%ONEOK, Inc. $100,000 2.75% 1/9/2024 105,230 0.00%Altria Group, Inc. $100,000 2.63% 16/9/2026 105,225 0.00%Permanent University Fund - Texas A&M University System $100,000 3.10% 1/7/2049 105,210 0.00%TJX Cos, Inc. $100,000 2.25% 15/9/2026 105,160 0.00%Brixmor Operating Partnership LP $100,000 3.25% 15/9/2023 105,091 0.00%UDR, Inc. $100,000 3.00% 15/8/2031 105,080 0.00%University of Chicago $100,000 3.00% 1/10/2052 105,078 0.00%Georgia Power Co. $100,000 2.65% 15/9/2029 105,062 0.00%Southern California Edison Co. $100,000 3.40% 1/6/2023 105,046 0.00%Newmont Corp. $100,000 2.80% 1/10/2029 104,958 0.00%
541
Vanguard Global Bond Index Fund
Principal CouponMaturity
DateFair Value
US Dollars ($)% of Total
Net AssetsCubeSmart LP $100,000 3.00% 15/2/2030 104,898 0.00%Boston Properties LP $100,000 3.13% 1/9/2023 104,844 0.00%Wells Fargo & Co. $100,000 3.45% 13/2/2023 104,810 0.00%American Tower Corp. $100,000 3.50% 31/1/2023 104,759 0.00%Emory University $100,000 2.97% 1/9/2050 104,759 0.00%Government National Mortgage Association $95,409 4.50% 20/1/2045 104,730 0.00%CenterPoint Energy, Inc. $100,000 2.50% 1/9/2024 104,646 0.00%Black Hills Corp. $95,000 3.95% 15/1/2026 104,613 0.00%Wisconsin Electric Power Co. $100,000 2.05% 15/12/2024 104,588 0.00%PACCAR Financial Corp. $100,000 2.15% 15/8/2024 104,581 0.00%Brandywine Operating Partnership LP $100,000 3.95% 15/2/2023 104,473 0.00%Boston Properties LP $100,000 3.85% 1/2/2023 104,430 0.00%Mohawk Industries, Inc. $100,000 3.85% 1/2/2023 104,404 0.00%Connecticut Light & Power Co. $95,000 3.20% 15/3/2027 104,387 0.00%Bacardi Ltd. $100,000 2.75% 15/7/2026 104,368 0.00%Dollar General Corp. $100,000 3.25% 15/4/2023 104,349 0.00%BP Capital Markets America, Inc. $100,000 2.94% 6/4/2023 104,302 0.00%Federal Home Loan Mortgage Corp. $91,634 5.00% 1/5/2040 104,286 0.00%Benchmark 2018-B3 Mortgage Trust $100,000 3.85% 10/4/2051 104,283 0.00%BP Capital Markets America, Inc. $100,000 2.75% 10/5/2023 104,257 0.00%Principal Life Global Funding II $100,000 2.50% 16/9/2029 104,218 0.00%PacifiCorp $100,000 2.95% 1/6/2023 104,108 0.00%Southwestern Public Service Co. $90,000 3.75% 15/6/2049 104,018 0.00%Federal National Mortgage Association $97,148 3.50% 1/12/2029 104,002 0.00%Molson Coors International LP CA($)125,000 2.84% 15/7/2023 103,985 0.00%General Electric Co. $100,000 3.10% 9/1/2023 103,956 0.00%Zoetis, Inc. $100,000 3.25% 1/2/2023 103,856 0.00%Kimberly-Clark Corp. $100,000 2.40% 1/6/2023 103,851 0.00%Biogen, Inc. $100,000 3.63% 15/9/2022 103,838 0.00%Guardian Life Insurance Co. of America $100,000 3.70% 22/1/2070 103,787 0.00%Maryland Health & Higher Educational Facilities Authority $100,000 3.05% 1/7/2040 103,782 0.00%Benchmark 2018-B2 Mortgage Trust $100,000 3.66% 15/2/2051 103,748 0.00%Moody's Corp. $100,000 4.50% 1/9/2022 103,730 0.00%Altria Group, Inc. $80,000 6.20% 14/2/2059 103,695 0.00%Freddie Mac Multifamily Structured Pass Through Certificates $100,000 3.11% 25/2/2023 103,687 0.00%Kansas City Southern $100,000 3.00% 15/5/2023 103,666 0.00%Equitable Holdings, Inc. $98,000 3.90% 20/4/2023 103,662 0.00%DR Horton, Inc. $100,000 4.38% 15/9/2022 103,660 0.00%Federal National Mortgage Association $94,779 4.00% 1/8/2041 103,660 0.00%Arizona Public Service Co. $95,000 3.50% 1/12/2049 103,620 0.00%eBay, Inc. $100,000 2.75% 30/1/2023 103,567 0.00%Amgen, Inc. $100,000 2.25% 19/8/2023 103,547 0.00%Metropolitan Edison Co. $100,000 3.50% 15/3/2023 103,530 0.00%Cigna Corp. $100,000 3.05% 30/11/2022 103,508 0.00%Berkshire Hathaway Energy Co. $100,000 2.80% 15/1/2023 103,465 0.00%Oracle Corp. $100,000 2.63% 15/2/2023 103,409 0.00%NextEra Energy Capital Holdings, Inc. $100,000 2.80% 15/1/2023 103,363 0.00%Norfolk Southern Corp. $100,000 2.90% 15/2/2023 103,340 0.00%American Assets Trust LP $100,000 3.38% 1/2/2031 103,339 0.00%Freddie Mac Multifamily Structured Pass Through Certificates $100,000 2.45% 25/8/2023 103,315 0.00%General Electric Co. $100,000 3.15% 7/9/2022 103,258 0.00%Kinder Morgan Energy Partners LP $100,000 3.95% 1/9/2022 103,229 0.00%Welltower, Inc. $100,000 2.75% 15/1/2031 103,210 0.00%Air Lease Corp. $100,000 2.75% 15/1/2023 103,147 0.00%PACCAR Financial Corp. $100,000 1.80% 6/2/2025 103,024 0.00%Freddie Mac Multifamily Structured Pass Through Certificates $100,000 2.64% 25/1/2023 102,928 0.00%Raytheon Technologies Corp. $100,000 3.13% 1/7/2050 102,828 0.00%ITC Holdings Corp. $100,000 2.70% 15/11/2022 102,820 0.00%Microsoft Corp. $100,000 2.65% 3/11/2022 102,757 0.00%Air Products & Chemicals, Inc. $100,000 1.85% 15/5/2027 102,684 0.00%JB Hunt Transport Services, Inc. $100,000 3.30% 15/8/2022 102,665 0.00%American Honda Finance Corp. $100,000 2.00% 24/3/2028 102,602 0.00%BP Capital Markets America, Inc. $100,000 2.52% 19/9/2022 102,533 0.00%Freddie Mac Multifamily Structured Pass Through Certificates $100,000 2.51% 25/11/2022 102,516 0.00%AvalonBay Communities, Inc. $100,000 2.30% 1/3/2030 102,462 0.00%Aon Corp. $100,000 2.20% 15/11/2022 102,458 0.00%Eagle Materials, Inc. $100,000 4.50% 1/8/2026 102,410 0.00%Sempra Energy $100,000 2.88% 1/10/2022 102,369 0.00%Freddie Mac Multifamily Structured Pass Through Certificates $99,926 2.01% 25/7/2035 102,342 0.00%Maryland Health & Higher Educational Facilities Authority $100,000 3.20% 1/7/2050 102,336 0.00%Ameren Illinois Co. $95,000 3.25% 15/3/2050 102,324 0.00%
542
Vanguard Global Bond Index Fund
Principal CouponMaturity
DateFair Value
US Dollars ($)% of Total
Net AssetsBanner Health $100,000 2.34% 1/1/2030 102,284 0.00%Toledo Edison Co. $75,000 6.15% 15/5/2037 102,260 0.00%DTE Energy Co. $100,000 2.60% 15/6/2022 102,186 0.00%Intercontinental Exchange, Inc. $100,000 2.35% 15/9/2022 102,176 0.00%Public Service Co. of New Hampshire $90,000 3.60% 1/7/2049 102,138 0.00%Federal National Mortgage Association $75,000 6.25% 15/5/2029 102,130 0.00%PACCAR Financial Corp. $100,000 2.00% 26/9/2022 102,048 0.00%NSTAR Electric Co. $100,000 2.38% 15/10/2022 102,018 0.00%Boeing Co. $100,000 1.88% 15/6/2023 101,950 0.00%Air Products & Chemicals, Inc. $100,000 2.05% 15/5/2030 101,936 0.00%Cargill, Inc. $100,000 1.38% 23/7/2023 101,876 0.00%Federal National Mortgage Association $88,108 5.50% 1/9/2034 101,842 0.00%North Texas Tollway Authority $100,000 3.01% 1/1/2043 101,711 0.00%City of San Francisco CA Public Utilities Commission Water Revenue $100,000 2.83% 1/11/2041 101,685 0.00%Government National Mortgage Association $92,700 4.00% 20/6/2041 101,621 0.00%GM Financial Consumer Automobile Receivables Trust 2018 $100,000 3.02% 18/12/2023 101,567 0.00%Freddie Mac Multifamily Structured Pass Through Certificates $100,000 2.72% 25/6/2022 101,536 0.00%Federal Home Loan Mortgage Corp. $93,794 4.00% 1/4/2045 101,507 0.00%Federal National Mortgage Association $87,383 5.50% 1/2/2037 101,445 0.00%Freddie Mac Multifamily Structured Pass Through Certificates $92,468 3.59% 25/10/2027 101,426 0.00%Cargill, Inc. $100,000 2.13% 23/4/2030 101,349 0.00%Johnson Controls International plc $94,000 3.63% 2/7/2024 101,001 0.00%Hyundai Auto Receivables Trust 2018 $100,000 2.94% 17/6/2024 100,864 0.00%Southern Power Co. $100,000 2.50% 15/12/2021 100,817 0.00%ERAC USA Finance LLC $100,000 2.60% 1/12/2021 100,760 0.00%Analog Devices, Inc. $100,000 2.50% 5/12/2021 100,759 0.00%Lennox International, Inc. $100,000 1.35% 1/8/2025 100,654 0.00%City of Philadelphia PA Water & Wastewater Revenue $100,000 2.93% 1/7/2045 100,636 0.00%American Express Credit Account Master Trust $100,000 3.18% 15/4/2024 100,609 0.00%Kroger Co. $100,000 2.20% 1/5/2030 100,573 0.00%Commonwealth of Massachusetts $100,000 2.51% 1/7/2041 100,513 0.00%Plains All American Pipeline LP/PAA Finance Corp. $100,000 4.30% 31/1/2043 100,415 0.00%Government National Mortgage Association $96,331 2.50% 20/9/2046 100,410 0.00%Lockheed Martin Corp. $100,000 1.85% 15/6/2030 100,351 0.00%Federal National Mortgage Association $95,178 3.00% 1/12/2028 100,347 0.00%Baxalta, Inc. $75,000 5.25% 23/6/2045 100,278 0.00%Pioneer Natural Resources Co. $100,000 0.55% 15/5/2023 100,064 0.00%American Honda Finance Corp. $100,000 1.65% 12/7/2021 100,041 0.00%Federal National Mortgage Association $87,958 5.00% 1/5/2040 100,033 0.00%Federal Home Loan Mortgage Corp. $92,710 4.00% 1/10/2046 100,029 0.00%Spirit Realty LP $90,000 4.00% 15/7/2029 100,028 0.00%Pioneer Natural Resources Co. $100,000 0.75% 15/1/2024 99,995 0.00%Federal National Mortgage Association $100,000 1.66% 25/4/2031 99,670 0.00%Federal Home Loan Mortgage Corp. $90,143 4.00% 1/11/2041 99,600 0.00%Hershey Co. $100,000 1.70% 1/6/2030 99,450 0.00%Freddie Mac Multifamily Structured Pass Through Certificates $100,000 1.34% 25/9/2030 99,428 0.00%State of California $100,000 1.75% 1/11/2030 99,399 0.00%Mid-America Apartments LP $95,000 2.75% 15/3/2030 99,232 0.00%Ventas Realty LP $75,000 5.70% 30/9/2043 99,203 0.00%AXIS Specialty Finance LLC $90,000 3.90% 15/7/2029 99,176 0.00%University of Southern California $100,000 3.23% 1/10/2120 99,120 0.00%Federal Home Loan Mortgage Corp. $94,154 3.00% 1/11/2026 99,013 0.00%Pioneer Natural Resources Co. $100,000 1.13% 15/1/2026 99,001 0.00%Public Service Electric & Gas Co. $90,000 3.20% 15/5/2029 98,949 0.00%Healthcare Trust of America Holdings LP $90,000 3.50% 1/8/2026 98,884 0.00%Federal National Mortgage Association $85,847 5.50% 1/6/2033 98,778 0.00%ONE Gas, Inc. $100,000 2.00% 15/5/2030 98,733 0.00%MultiCare Health System $100,000 2.80% 15/8/2050 98,670 0.00%National Securities Clearing Corp. $100,000 0.75% 7/12/2025 98,666 0.00%Government National Mortgage Association $88,252 4.50% 20/7/2040 98,629 0.00%University of Michigan $100,000 2.56% 1/4/2050 97,871 0.00%CRH America, Inc. $75,000 5.13% 18/5/2045 97,860 0.00%Edison International $95,000 3.13% 15/11/2022 97,821 0.00%Federal National Mortgage Association $93,767 2.50% 1/11/2036 97,665 0.00%Home Depot, Inc. $100,000 0.90% 15/3/2028 97,476 0.00%National Retail Properties, Inc. $100,000 3.10% 15/4/2050 97,300 0.00%Johnson Controls International plc $72,000 4.95% 2/7/2064 97,265 0.00%Cabot Corp. $90,000 4.00% 1/7/2029 97,231 0.00%Federal National Mortgage Association $90,393 3.50% 1/2/2034 96,887 0.00%Government National Mortgage Association $88,291 4.00% 20/7/2041 96,787 0.00%Entergy Texas, Inc. $90,000 3.55% 30/9/2049 96,686 0.00%

543
Vanguard Global Bond Index Fund
Principal CouponMaturity
DateFair Value
US Dollars ($)% of Total
Net AssetsEnbridge Energy Partners LP $75,000 5.50% 15/9/2040 96,646 0.00%Citigroup, Inc.^ $85,000 4.08% 23/4/2029 96,488 0.00%Federal National Mortgage Association $89,174 3.50% 1/10/2031 96,044 0.00%Boeing Co. $90,000 3.45% 1/11/2028 96,036 0.00%Federal Home Loan Mortgage Corp. $92,095 3.00% 1/1/2040 96,032 0.00%Sixth Street Specialty Lending, Inc. $90,000 3.88% 1/11/2024 95,724 0.00%Federal National Mortgage Association $86,161 4.50% 1/3/2046 95,574 0.00%Federal National Mortgage Association^ $93,536 2.49% 25/3/2023 95,533 0.00%Federal Home Loan Mortgage Corp. $83,963 5.00% 1/8/2035 95,509 0.00%Blackstone Holdings Finance Co. LLC $100,000 1.60% 30/3/2031 95,214 0.00%DTE Energy Co. $90,000 2.95% 1/3/2030 95,214 0.00%Hudson Pacific Properties LP $90,000 3.25% 15/1/2030 95,005 0.00%Children's Hospital Corp. $100,000 2.59% 1/2/2050 94,993 0.00%Regency Centers LP $90,000 2.95% 15/9/2029 94,809 0.00%Interpublic Group of Cos, Inc. $87,000 4.20% 15/4/2024 94,727 0.00%Federal Home Loan Mortgage Corp. $89,705 3.00% 1/10/2028 94,602 0.00%PPL Capital Funding, Inc. $90,000 3.40% 1/6/2023 94,319 0.00%Goldman Sachs Group, Inc. £50,000 7.25% 10/4/2028 94,175 0.00%Government National Mortgage Association $85,998 4.00% 20/7/2043 94,175 0.00%Government National Mortgage Association $85,645 4.00% 20/9/2040 94,173 0.00%Freddie Mac Multifamily Structured Pass Through Certificates $93,158 2.79% 25/1/2022 93,919 0.00%AvalonBay Communities, Inc. $75,000 4.35% 15/4/2048 93,914 0.00%Wisconsin Electric Power Co. $75,000 4.30% 15/10/2048 93,842 0.00%Federal Home Loan Mortgage Corp. $84,566 4.50% 1/3/2042 93,756 0.00%Southern California Edison Co. $75,000 5.55% 15/1/2037 93,711 0.00%Sempra Energy $85,000 3.75% 15/11/2025 93,430 0.00%National Grid USA $75,000 5.80% 1/4/2035 93,381 0.00%Federal National Mortgage Association $84,280 4.50% 1/3/2040 93,373 0.00%Valmont Industries, Inc. $75,000 5.25% 1/10/2054 92,869 0.00%Boeing Co. $90,000 3.85% 1/11/2048 92,866 0.00%Parker-Hannifin Corp. $75,000 4.45% 21/11/2044 92,722 0.00%Kimco Realty Corp. $80,000 4.25% 1/4/2045 92,713 0.00%JP Morgan Chase Commercial Mortgage Securities Trust 2012 $90,748 2.83% 15/10/2045 92,672 0.00%Southwestern Public Service Co. $75,000 4.50% 15/8/2041 92,500 0.00%AEP Transmission Co. LLC $75,000 4.25% 15/9/2048 92,417 0.00%Federal Home Loan Mortgage Corp. $88,580 2.50% 1/7/2035 92,368 0.00%Northern Trust Corp. $90,000 2.38% 2/8/2022 92,092 0.00%Hasbro, Inc. $75,000 5.10% 15/5/2044 91,950 0.00%Principal Life Global Funding II $85,000 3.00% 18/4/2026 91,761 0.00%Federal National Mortgage Association $79,326 5.50% 1/8/2037 91,609 0.00%Federal National Mortgage Association $86,375 3.00% 1/6/2032 91,576 0.00%Public Service Co. of Colorado $75,000 4.10% 15/6/2048 91,563 0.00%Government National Mortgage Association $85,200 3.50% 15/3/2045 91,541 0.00%Commonwealth of Massachusetts $90,000 4.20% 1/12/2021 91,504 0.00%University of Southern California $75,000 3.84% 1/10/2047 91,167 0.00%Southern California Edison Co. $100,000 2.95% 1/2/2051 91,149 0.00%Northwestern University $75,000 3.66% 1/12/2057 91,010 0.00%Government National Mortgage Association $77,935 5.50% 20/8/2039 90,816 0.00%Orlando Health Obligated Group $75,000 4.09% 1/10/2048 90,813 0.00%Principal Financial Group, Inc. $75,000 4.30% 15/11/2046 90,735 0.00%Federal National Mortgage Association $82,882 4.00% 1/8/2043 90,538 0.00%Colgate-Palmolive Co. $75,000 3.70% 1/8/2047 90,532 0.00%STORE Capital Corp. $80,000 4.50% 15/3/2028 90,528 0.00%Federal National Mortgage Association $85,218 3.00% 1/10/2032 90,349 0.00%Federal National Mortgage Association $85,393 3.00% 1/2/2029 90,030 0.00%Dow Chemical Co. $75,000 4.80% 30/11/2028 89,955 0.00%Southern Power Co. $75,000 4.95% 15/12/2046 89,955 0.00%Kinder Morgan Energy Partners LP $75,000 5.00% 15/8/2042 89,789 0.00%Honeywell International, Inc. $75,000 3.81% 21/11/2047 89,619 0.00%Freddie Mac Multifamily Structured Pass Through Certificates^ $75,000 3.99% 25/5/2033 89,537 0.00%Government National Mortgage Association $76,985 5.50% 15/8/2038 89,534 0.00%Government National Mortgage Association $82,095 3.50% 15/11/2041 89,461 0.00%Corning, Inc. $75,000 4.70% 15/3/2037 89,451 0.00%Federal National Mortgage Association $80,452 4.50% 1/8/2044 89,380 0.00%UBS Commercial Mortgage Trust 2018 $83,908 4.21% 15/10/2051 89,046 0.00%Wells Fargo Commercial Mortgage Trust 2015 $83,862 3.57% 15/9/2058 88,662 0.00%Regency Centers LP $80,000 3.60% 1/2/2027 88,565 0.00%Loews Corp. $65,000 6.00% 1/2/2035 88,485 0.00%Dartmouth-Hitchcock Health $75,000 4.18% 1/8/2048 88,325 0.00%Kellogg Co. $84,000 2.65% 1/12/2023 88,195 0.00%Mercy Health $75,000 4.30% 1/7/2028 88,149 0.00%

544
Vanguard Global Bond Index Fund
Principal CouponMaturity
DateFair Value
US Dollars ($)% of Total
Net AssetsGovernment National Mortgage Association $73,489 6.50% 20/10/2038 88,148 0.00%Government National Mortgage Association $77,511 5.00% 20/5/2040 88,054 0.00%Church & Dwight Co., Inc. $75,000 3.95% 1/8/2047 87,959 0.00%Federal Home Loan Mortgage Corp. $75,394 5.50% 1/12/2039 87,828 0.00%Oncor Electric Delivery Co. LLC $75,000 3.80% 30/9/2047 87,758 0.00%State Public School Building Authority $75,000 5.00% 15/9/2027 87,733 0.00%Government National Mortgage Association $80,116 4.00% 15/5/2046 87,508 0.00%Indianapolis Power & Light Co. $75,000 4.05% 1/5/2046 87,273 0.00%California State University $75,000 3.90% 1/11/2047 86,835 0.00%United Airlines 2016-1 Class A Pass Through Trust $85,609 3.45% 7/7/2028 86,696 0.00%Federal National Mortgage Association $76,190 5.00% 1/6/2040 86,650 0.00%Government National Mortgage Association $81,749 3.00% 20/9/2045 86,560 0.00%Baltimore Gas & Electric Co. $75,000 3.75% 15/8/2047 86,539 0.00%Federal National Mortgage Association $82,341 2.59% 25/12/2024 86,532 0.00%UBS Commercial Mortgage Trust 2018^ $75,000 4.59% 15/10/2051 86,484 0.00%Hudson Pacific Properties LP $75,000 4.65% 1/4/2029 86,406 0.00%Eaton Corp. $75,000 3.92% 15/9/2047 86,234 0.00%Government National Mortgage Association $79,800 3.50% 20/2/2044 86,160 0.00%Government National Mortgage Association $74,782 5.00% 15/7/2040 86,011 0.00%Union Pacific Corp. $75,000 3.80% 1/10/2051 85,710 0.00%Government National Mortgage Association $81,531 3.00% 20/5/2027 85,707 0.00%Arch Capital Group US, Inc. $65,000 5.14% 1/11/2043 85,560 0.00%Nissan Auto Receivables 2018-A Owner Trust $84,506 2.89% 17/6/2024 85,411 0.00%Public Service Electric & Gas Co. $75,000 3.60% 1/12/2047 85,392 0.00%Northern States Power Co. $75,000 3.60% 15/5/2046 85,358 0.00%Federal National Mortgage Association $80,240 4.00% 1/11/2033 85,241 0.00%National Rural Utilities Cooperative Finance Corp. $75,000 3.90% 1/11/2028 85,195 0.00%Northwell Healthcare, Inc. $75,000 3.98% 1/11/2046 85,096 0.00%Advocate Health & Hospitals Corp. $75,000 3.83% 15/8/2028 84,916 0.00%Sysco Corp. $78,000 3.55% 15/3/2025 84,889 0.00%California Institute of Technology $75,000 3.65% 1/9/2119 84,783 0.00%Federal Home Loan Mortgage Corp. $72,574 6.00% 1/7/2033 84,763 0.00%Public Service Co. of Colorado $75,000 3.70% 15/6/2028 84,726 0.00%Government National Mortgage Association $79,019 4.00% 20/7/2046 84,710 0.00%Consolidated Edison Co. of New York, Inc. $75,000 4.00% 15/11/2057 84,691 0.00%State of California $75,000 3.50% 1/4/2028 84,472 0.00%Federal Home Loan Mortgage Corp. $79,108 3.50% 1/9/2032 84,444 0.00%Permanent University Fund-University of Texas System $75,000 3.38% 1/7/2047 84,420 0.00%Federal Home Loan Mortgage Corp. $72,841 5.50% 1/2/2034 84,388 0.00%Federal National Mortgage Association $72,220 6.00% 1/2/2034 84,379 0.00%BorgWarner, Inc. $78,000 3.38% 15/3/2025 84,369 0.00%Penske Truck Leasing Co. LP/PTL Finance Corp. $75,000 4.45% 29/1/2026 84,307 0.00%Sutter Health $75,000 3.70% 15/8/2028 83,915 0.00%Freddie Mac Multifamily Structured Pass Through Certificates^ $75,000 3.30% 25/11/2027 83,913 0.00%Freddie Mac Multifamily Structured Pass Through Certificates $75,000 3.08% 25/1/2031 83,890 0.00%Mount Sinai Hospitals Group, Inc. $75,000 3.98% 1/7/2048 83,790 0.00%AutoZone, Inc. $75,000 3.75% 18/4/2029 83,659 0.00%Sales Tax Securitization Corp. $75,000 3.82% 1/1/2048 83,531 0.00%Principal Life Global Funding II $80,000 2.25% 21/11/2024 83,435 0.00%S&P Global, Inc. $75,000 4.00% 15/6/2025 83,425 0.00%Federal National Mortgage Association $77,988 3.50% 1/12/2035 83,411 0.00%Southwest Gas Corp. $75,000 3.70% 1/4/2028 83,389 0.00%Federal National Mortgage Association $76,068 4.00% 1/10/2040 83,186 0.00%Healthpeak Properties, Inc. $75,000 3.50% 15/7/2029 82,989 0.00%Federal Home Loan Mortgage Corp. $75,730 4.50% 1/5/2046 82,902 0.00%State of Wisconsin $75,000 3.15% 1/5/2027 82,894 0.00%Federal National Mortgage Association $78,023 3.00% 1/2/2044 82,743 0.00%RenaissanceRe Finance, Inc. $76,000 3.70% 1/4/2025 82,734 0.00%Federal Home Loan Mortgage Corp. $78,040 3.50% 1/5/2037 82,729 0.00%JPMDB Commercial Mortgage Securities Trust 2017 $75,000 3.41% 15/10/2050 82,700 0.00%Wells Fargo Commercial Mortgage Trust 2015 $75,000 3.84% 15/9/2058 82,688 0.00%American Tower Corp. $75,000 4.00% 1/6/2025 82,568 0.00%State of California $75,000 3.05% 1/4/2029 82,543 0.00%UBS Commercial Mortgage Trust 2017^ $75,000 3.74% 15/8/2050 82,465 0.00%Phillips 66 Partners LP $75,000 3.75% 1/3/2028 82,150 0.00%LifeStorage LP $75,000 3.50% 1/7/2026 82,074 0.00%Entergy Louisiana LLC $75,000 3.12% 1/9/2027 81,843 0.00%Church & Dwight Co., Inc. $75,000 3.15% 1/8/2027 81,840 0.00%Federal National Mortgage Association $79,068 2.00% 1/8/2031 81,747 0.00%Citigroup, Inc. $75,000 3.75% 16/6/2024 81,597 0.00%Morgan Stanley Bank of America Merrill Lynch Trust 2017 $75,000 3.28% 15/11/2052 81,533 0.00%

545
Vanguard Global Bond Index Fund
Principal CouponMaturity
DateFair Value
US Dollars ($)% of Total
Net AssetsHealthpeak Properties, Inc. $75,000 3.25% 15/7/2026 81,529 0.00%Northern Trust Corp.^ $75,000 3.38% 8/5/2032 81,519 0.00%Morgan Stanley Bank of America Merrill Lynch Trust 2015 $75,000 3.53% 15/10/2048 81,493 0.00%Quest Diagnostics, Inc. $75,000 3.50% 30/3/2025 81,386 0.00%Consolidated Edison Co. of New York, Inc. $75,000 3.13% 15/11/2027 81,368 0.00%NextEra Energy Capital Holdings, Inc. $75,000 3.25% 1/4/2026 81,334 0.00%Wisconsin Power & Light Co. $75,000 3.05% 15/10/2027 81,151 0.00%Federal National Mortgage Association $74,842 4.50% 1/7/2031 81,130 0.00%CCRE15 Commercial Mortgage Trust 2014^ $75,000 4.86% 10/2/2047 81,113 0.00%Commonwealth Edison Co. $75,000 2.95% 15/8/2027 80,999 0.00%Freddie Mac Multifamily Structured Pass Through Certificates $75,000 3.01% 25/7/2025 80,922 0.00%BANK 2017 $75,000 3.25% 15/7/2060 80,906 0.00%CSAIL 2015-C1 Commercial Mortgage Trust $75,000 3.51% 15/4/2050 80,737 0.00%University of Nebraska Facilities Corp. $75,000 3.04% 1/10/2049 80,694 0.00%American Airlines 2016-1 Class AA Pass Through Trust $78,562 3.58% 15/1/2028 80,659 0.00%Federal National Mortgage Association $74,567 4.00% 1/9/2045 80,641 0.00%Emerson Electric Co. $80,000 2.63% 1/12/2021 80,634 0.00%Los Angeles County Public Works Financing Authority $50,000 7.62% 1/8/2040 80,613 0.00%Freddie Mac Multifamily Structured Pass Through Certificates $75,000 3.06% 25/12/2024 80,584 0.00%JPMDB Commercial Mortgage Securities Trust 2016 $75,000 3.14% 15/6/2049 80,568 0.00%AvalonBay Communities, Inc. $75,000 2.90% 15/10/2026 80,516 0.00%NetApp, Inc. $75,000 3.30% 29/9/2024 80,314 0.00%JPMBB Commercial Mortgage Securities Trust 2015 $75,000 3.23% 15/10/2048 80,275 0.00%Raytheon Technologies Corp. $75,000 3.70% 15/12/2023 80,209 0.00%UDR, Inc. $75,000 2.95% 1/9/2026 80,208 0.00%Morgan Stanley Bank of America Merrill Lynch Trust 2015 $75,000 3.25% 15/2/2048 80,200 0.00%Energy Transfer LP $75,000 4.20% 15/9/2023 80,194 0.00%IHS Markit Ltd. $75,000 4.13% 1/8/2023 80,182 0.00%Foothill-Eastern Transportation Corridor Agency $75,000 4.09% 15/1/2049 80,135 0.00%Oncor Electric Delivery Co. LLC $75,000 2.95% 1/4/2025 80,134 0.00%State of Texas $75,000 3.21% 1/4/2044 79,771 0.00%Packaging Corp. of America $75,000 3.00% 15/12/2029 79,716 0.00%Tampa Electric Co. $65,000 4.30% 15/6/2048 79,677 0.00%Federal Home Loan Mortgage Corp. $74,994 3.50% 1/6/2036 79,645 0.00%Federal National Mortgage Association $73,454 4.50% 1/5/2031 79,625 0.00%Federal National Mortgage Association $75,000 2.58% 25/3/2026 79,618 0.00%Federal National Mortgage Association $66,476 6.50% 1/11/2036 79,601 0.00%Duke Energy Progress LLC $75,000 3.38% 1/9/2023 79,590 0.00%L3Harris Technologies, Inc. $75,000 2.90% 15/12/2029 79,589 0.00%Agilent Technologies, Inc. $75,000 3.88% 15/7/2023 79,584 0.00%Eaton Vance Corp. $75,000 3.63% 15/6/2023 79,397 0.00%Federal Home Loan Mortgage Corp. $71,318 4.50% 1/3/2039 79,095 0.00%Burlington Northern Santa Fe LLC $65,000 4.13% 15/6/2047 79,001 0.00%SITE Centers Corp. $75,000 3.90% 15/8/2024 78,940 0.00%New York State Thruway Authority $75,000 3.50% 1/1/2042 78,936 0.00%Trinity Acquisition plc $70,000 4.40% 15/3/2026 78,912 0.00%Government National Mortgage Association $71,250 5.00% 20/7/2034 78,487 0.00%Alexandria Real Estate Equities, Inc. $75,000 2.75% 15/12/2029 78,420 0.00%Duke Energy Carolinas LLC $75,000 3.05% 15/3/2023 78,295 0.00%Federal National Mortgage Association $77,244 2.15% 25/1/2023 78,140 0.00%Federal National Mortgage Association $73,366 2.70% 25/2/2026 78,125 0.00%Federal Home Loan Mortgage Corp. $72,602 3.50% 1/2/2042 77,959 0.00%Caterpillar Financial Services Corp. $75,000 2.63% 1/3/2023 77,886 0.00%LYB International Finance BV $60,000 5.25% 15/7/2043 77,561 0.00%American Express Co. $75,000 2.65% 2/12/2022 77,454 0.00%Federal Home Loan Banks $75,000 2.13% 10/3/2023 77,361 0.00%RPM International, Inc. $75,000 3.45% 15/11/2022 77,343 0.00%Philip Morris International, Inc. $75,000 2.13% 10/5/2023 77,257 0.00%O'Reilly Automotive, Inc. $75,000 3.80% 1/9/2022 77,255 0.00%Government National Mortgage Association $68,867 4.50% 15/7/2039 77,182 0.00%Banc of America Commercial Mortgage Trust 2017 $70,000 3.75% 15/2/2050 77,103 0.00%JP Morgan Chase Commercial Mortgage Securities Trust 2013 $75,000 3.50% 15/4/2046 76,940 0.00%LC6 Commercial Mortgage Trust 2013^ $75,000 4.24% 10/1/2046 76,934 0.00%PSEG Power LLC $50,000 8.63% 15/4/2031 76,900 0.00%Federal National Mortgage Association $71,038 4.00% 1/8/2045 76,824 0.00%Church & Dwight Co., Inc. $75,000 2.45% 1/8/2022 76,577 0.00%Federal National Mortgage Association $69,096 4.50% 1/7/2041 76,577 0.00%Procter & Gamble Co. €50,000 4.88% 11/5/2027 76,380 0.00%Federal National Mortgage Association $68,870 4.50% 1/9/2041 76,326 0.00%Georgetown University $75,000 2.94% 1/4/2050 76,164 0.00%Citigroup Commercial Mortgage Trust 2018 $69,577 3.96% 10/6/2051 76,121 0.00%
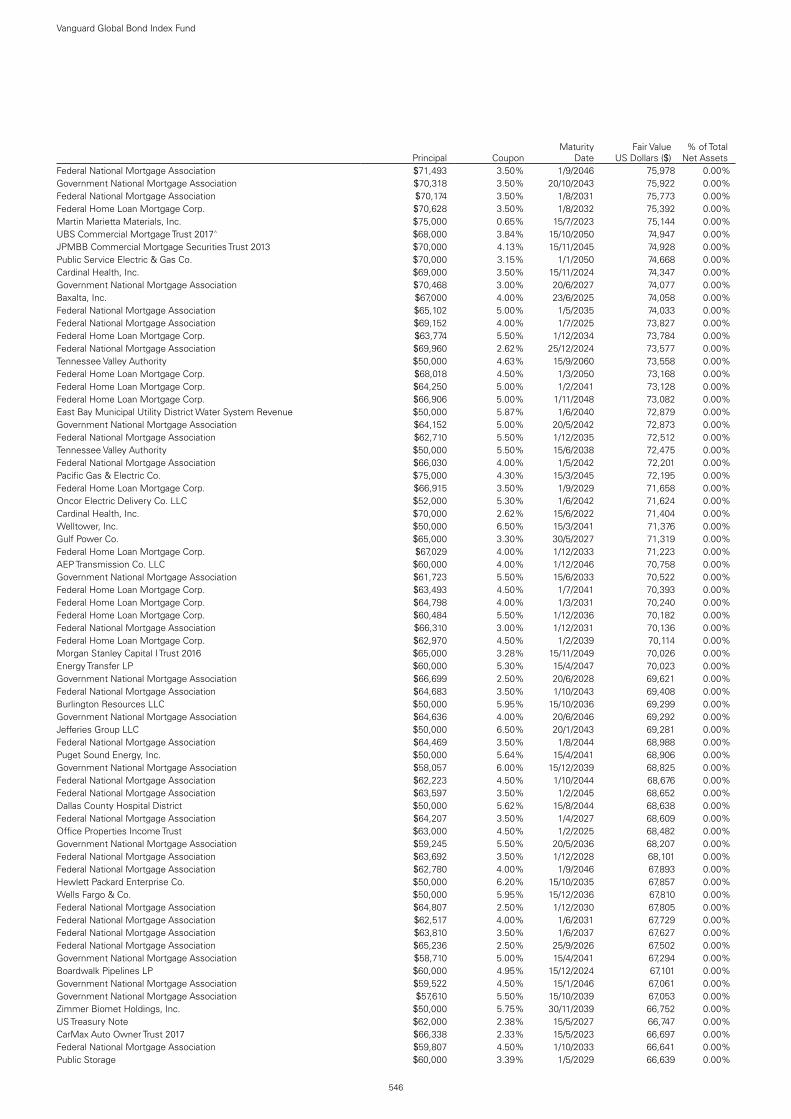
546
Vanguard Global Bond Index Fund
Principal CouponMaturity
DateFair Value
US Dollars ($)% of Total
Net AssetsFederal National Mortgage Association $71,493 3.50% 1/9/2046 75,978 0.00%Government National Mortgage Association $70,318 3.50% 20/10/2043 75,922 0.00%Federal National Mortgage Association $70,174 3.50% 1/8/2031 75,773 0.00%Federal Home Loan Mortgage Corp. $70,628 3.50% 1/8/2032 75,392 0.00%Martin Marietta Materials, Inc. $75,000 0.65% 15/7/2023 75,144 0.00%UBS Commercial Mortgage Trust 2017^ $68,000 3.84% 15/10/2050 74,947 0.00%JPMBB Commercial Mortgage Securities Trust 2013 $70,000 4.13% 15/11/2045 74,928 0.00%Public Service Electric & Gas Co. $70,000 3.15% 1/1/2050 74,668 0.00%Cardinal Health, Inc. $69,000 3.50% 15/11/2024 74,347 0.00%Government National Mortgage Association $70,468 3.00% 20/6/2027 74,077 0.00%Baxalta, Inc. $67,000 4.00% 23/6/2025 74,058 0.00%Federal National Mortgage Association $65,102 5.00% 1/5/2035 74,033 0.00%Federal National Mortgage Association $69,152 4.00% 1/7/2025 73,827 0.00%Federal Home Loan Mortgage Corp. $63,774 5.50% 1/12/2034 73,784 0.00%Federal National Mortgage Association $69,960 2.62% 25/12/2024 73,577 0.00%Tennessee Valley Authority $50,000 4.63% 15/9/2060 73,558 0.00%Federal Home Loan Mortgage Corp. $68,018 4.50% 1/3/2050 73,168 0.00%Federal Home Loan Mortgage Corp. $64,250 5.00% 1/2/2041 73,128 0.00%Federal Home Loan Mortgage Corp. $66,906 5.00% 1/11/2048 73,082 0.00%East Bay Municipal Utility District Water System Revenue $50,000 5.87% 1/6/2040 72,879 0.00%Government National Mortgage Association $64,152 5.00% 20/5/2042 72,873 0.00%Federal National Mortgage Association $62,710 5.50% 1/12/2035 72,512 0.00%Tennessee Valley Authority $50,000 5.50% 15/6/2038 72,475 0.00%Federal National Mortgage Association $66,030 4.00% 1/5/2042 72,201 0.00%Pacific Gas & Electric Co. $75,000 4.30% 15/3/2045 72,195 0.00%Federal Home Loan Mortgage Corp. $66,915 3.50% 1/9/2029 71,658 0.00%Oncor Electric Delivery Co. LLC $52,000 5.30% 1/6/2042 71,624 0.00%Cardinal Health, Inc. $70,000 2.62% 15/6/2022 71,404 0.00%Welltower, Inc. $50,000 6.50% 15/3/2041 71,376 0.00%Gulf Power Co. $65,000 3.30% 30/5/2027 71,319 0.00%Federal Home Loan Mortgage Corp. $67,029 4.00% 1/12/2033 71,223 0.00%AEP Transmission Co. LLC $60,000 4.00% 1/12/2046 70,758 0.00%Government National Mortgage Association $61,723 5.50% 15/6/2033 70,522 0.00%Federal Home Loan Mortgage Corp. $63,493 4.50% 1/7/2041 70,393 0.00%Federal Home Loan Mortgage Corp. $64,798 4.00% 1/3/2031 70,240 0.00%Federal Home Loan Mortgage Corp. $60,484 5.50% 1/12/2036 70,182 0.00%Federal National Mortgage Association $66,310 3.00% 1/12/2031 70,136 0.00%Federal Home Loan Mortgage Corp. $62,970 4.50% 1/2/2039 70,114 0.00%Morgan Stanley Capital I Trust 2016 $65,000 3.28% 15/11/2049 70,026 0.00%Energy Transfer LP $60,000 5.30% 15/4/2047 70,023 0.00%Government National Mortgage Association $66,699 2.50% 20/6/2028 69,621 0.00%Federal National Mortgage Association $64,683 3.50% 1/10/2043 69,408 0.00%Burlington Resources LLC $50,000 5.95% 15/10/2036 69,299 0.00%Government National Mortgage Association $64,636 4.00% 20/6/2046 69,292 0.00%Jefferies Group LLC $50,000 6.50% 20/1/2043 69,281 0.00%Federal National Mortgage Association $64,469 3.50% 1/8/2044 68,988 0.00%Puget Sound Energy, Inc. $50,000 5.64% 15/4/2041 68,906 0.00%Government National Mortgage Association $58,057 6.00% 15/12/2039 68,825 0.00%Federal National Mortgage Association $62,223 4.50% 1/10/2044 68,676 0.00%Federal National Mortgage Association $63,597 3.50% 1/2/2045 68,652 0.00%Dallas County Hospital District $50,000 5.62% 15/8/2044 68,638 0.00%Federal National Mortgage Association $64,207 3.50% 1/4/2027 68,609 0.00%Office Properties Income Trust $63,000 4.50% 1/2/2025 68,482 0.00%Government National Mortgage Association $59,245 5.50% 20/5/2036 68,207 0.00%Federal National Mortgage Association $63,692 3.50% 1/12/2028 68,101 0.00%Federal National Mortgage Association $62,780 4.00% 1/9/2046 67,893 0.00%Hewlett Packard Enterprise Co. $50,000 6.20% 15/10/2035 67,857 0.00%Wells Fargo & Co. $50,000 5.95% 15/12/2036 67,810 0.00%Federal National Mortgage Association $64,807 2.50% 1/12/2030 67,805 0.00%Federal National Mortgage Association $62,517 4.00% 1/6/2031 67,729 0.00%Federal National Mortgage Association $63,810 3.50% 1/6/2037 67,627 0.00%Federal National Mortgage Association $65,236 2.50% 25/9/2026 67,502 0.00%Government National Mortgage Association $58,710 5.00% 15/4/2041 67,294 0.00%Boardwalk Pipelines LP $60,000 4.95% 15/12/2024 67,101 0.00%Government National Mortgage Association $59,522 4.50% 15/1/2046 67,061 0.00%Government National Mortgage Association $57,610 5.50% 15/10/2039 67,053 0.00%Zimmer Biomet Holdings, Inc. $50,000 5.75% 30/11/2039 66,752 0.00%US Treasury Note $62,000 2.38% 15/5/2027 66,747 0.00%CarMax Auto Owner Trust 2017 $66,338 2.33% 15/5/2023 66,697 0.00%Federal National Mortgage Association $59,807 4.50% 1/10/2033 66,641 0.00%Public Storage $60,000 3.39% 1/5/2029 66,639 0.00%

547
Vanguard Global Bond Index Fund
Principal CouponMaturity
DateFair Value
US Dollars ($)% of Total
Net AssetsFederal Home Loan Mortgage Corp. $58,196 5.00% 1/10/2041 66,235 0.00%Boston Properties LP $60,000 3.65% 1/2/2026 66,138 0.00%Government National Mortgage Association $62,119 3.00% 15/9/2042 65,915 0.00%Federal National Mortgage Association $60,724 4.50% 1/10/2047 65,888 0.00%Federal National Mortgage Association $60,678 4.00% 1/4/2031 65,737 0.00%Government National Mortgage Association $58,728 4.50% 20/6/2041 65,550 0.00%Hackensack Meridian Health, Inc. $50,000 4.50% 1/7/2057 65,513 0.00%Raytheon Technologies Corp. $50,000 5.40% 1/5/2035 65,502 0.00%Federal Home Loan Mortgage Corp. $59,690 5.00% 1/7/2049 65,424 0.00%Federal Home Loan Mortgage Corp. $61,282 4.00% 1/2/2026 65,344 0.00%Government National Mortgage Association $57,209 5.00% 20/2/2044 64,955 0.00%Tyson Foods, Inc. $50,000 5.15% 15/8/2044 64,690 0.00%Allstate Corp. $50,000 5.35% 1/6/2033 64,659 0.00%Federal Home Loan Mortgage Corp. $56,723 5.00% 1/3/2041 64,561 0.00%UnitedHealth Group, Inc. $50,000 4.45% 15/12/2048 63,991 0.00%SC Johnson & Son, Inc. $50,000 4.80% 1/9/2040 63,888 0.00%Honda Auto Receivables 2018-1 Owner Trust $63,799 2.83% 15/5/2024 63,859 0.00%Government National Mortgage Association $57,018 5.00% 15/5/2033 63,811 0.00%Memorial Sloan-Kettering Cancer Center $50,000 4.20% 1/7/2055 63,795 0.00%California Institute of Technology $50,000 4.32% 1/8/2045 63,777 0.00%Federal National Mortgage Association $54,241 6.00% 1/11/2034 63,690 0.00%Federal Home Loan Mortgage Corp. $53,852 6.00% 1/5/2040 63,480 0.00%Trane Technologies Luxembourg Finance SA $50,000 4.65% 1/11/2044 63,307 0.00%Government National Mortgage Association $56,534 4.50% 20/7/2039 63,171 0.00%University of Virginia $50,000 4.18% 1/9/2117 63,142 0.00%General Motors Financial Co., Inc. AU($)80,000 3.85% 21/2/2023 62,884 0.00%Federal Home Loan Mortgage Corp. $58,896 3.50% 1/5/2026 62,882 0.00%Federal Home Loan Mortgage Corp. $57,745 4.50% 1/3/2047 62,690 0.00%Federal Home Loan Mortgage Corp. $53,879 5.50% 1/9/2035 62,565 0.00%Federal National Mortgage Association $53,301 6.00% 1/11/2035 62,506 0.00%New York & Presbyterian Hospital $50,000 4.06% 1/8/2056 62,423 0.00%Evergy Metro, Inc. $60,000 3.15% 15/3/2023 62,327 0.00%Federal Home Loan Mortgage Corp. $58,237 4.00% 1/4/2047 62,317 0.00%Government National Mortgage Association $55,588 5.00% 15/8/2033 62,310 0.00%Federal Home Loan Mortgage Corp. $58,642 3.00% 1/10/2043 62,277 0.00%Federal Home Loan Mortgage Corp. $59,425 2.50% 1/9/2030 62,187 0.00%Principal Financial Group, Inc. $50,000 4.63% 15/9/2042 62,127 0.00%Johnson Controls International plc $50,000 4.63% 2/7/2044 62,124 0.00%Government National Mortgage Association $58,281 3.00% 15/12/2042 61,841 0.00%Exelon Corp. $50,000 4.95% 15/6/2035 61,399 0.00%Public Storage $60,000 2.37% 15/9/2022 61,354 0.00%Government National Mortgage Association $57,805 3.00% 20/9/2044 61,238 0.00%Federal National Mortgage Association $51,536 6.00% 1/6/2036 60,707 0.00%Masco Corp. $50,000 4.50% 15/5/2047 60,669 0.00%El Paso Electric Co. $50,000 5.00% 1/12/2044 60,624 0.00%Federal Home Loan Mortgage Corp. $55,502 4.50% 1/5/2031 60,202 0.00%Government National Mortgage Association $53,756 5.00% 15/9/2039 60,137 0.00%Government National Mortgage Association $56,788 3.00% 20/7/2029 59,802 0.00%Consumers Energy Co. $50,000 3.95% 15/7/2047 59,750 0.00%Northern States Power Co. $50,000 4.00% 15/8/2045 59,746 0.00%Fortive Corp. $50,000 4.30% 15/6/2046 59,661 0.00%Federal National Mortgage Association $51,745 5.50% 1/7/2033 59,555 0.00%Port Authority of New York & New Jersey $50,000 4.03% 1/9/2048 59,540 0.00%Oklahoma Gas & Electric Co. $50,000 4.15% 1/4/2047 59,501 0.00%Federal Home Loan Mortgage Corp. $55,614 3.50% 1/1/2032 59,391 0.00%Federal Home Loan Mortgage Corp. $56,459 2.50% 1/3/2032 59,234 0.00%Federal National Mortgage Association $56,111 3.00% 1/8/2045 59,176 0.00%Federal Home Loan Mortgage Corp. $51,977 5.00% 1/7/2035 59,151 0.00%Marathon Oil Corp. $45,000 6.80% 15/3/2032 59,104 0.00%Consolidated Edison Co. of New York, Inc. $50,000 4.30% 1/12/2056 58,958 0.00%Federal Home Loan Mortgage Corp. $55,192 3.50% 1/6/2026 58,927 0.00%Federal Home Loan Mortgage Corp. $56,250 2.50% 1/5/2027 58,700 0.00%Boston Gas Co. $50,000 4.49% 15/2/2042 58,674 0.00%Federal National Mortgage Association $54,131 4.00% 1/7/2031 58,644 0.00%Federal Home Loan Mortgage Corp. $52,971 4.50% 1/5/2044 58,502 0.00%Tampa Electric Co. $50,000 4.10% 15/6/2042 58,372 0.00%Aptiv plc $50,000 4.40% 1/10/2046 58,368 0.00%Northrop Grumman Systems Corp. $40,000 7.75% 15/2/2031 58,293 0.00%Tyson Foods, Inc. $50,000 4.35% 1/3/2029 58,238 0.00%Aflac, Inc. $50,000 4.00% 15/10/2046 58,100 0.00%Prudential Financial, Inc. $50,000 3.91% 7/12/2047 58,087 0.00%
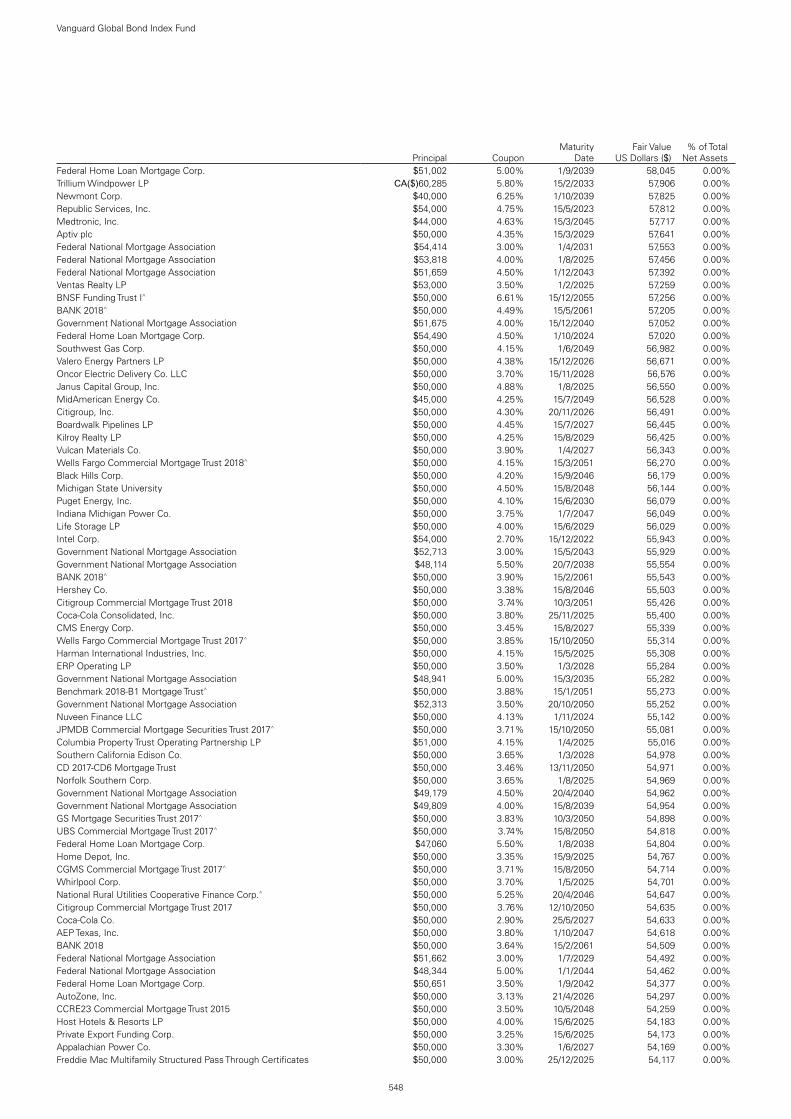
548
Vanguard Global Bond Index Fund
Principal CouponMaturity
DateFair Value
US Dollars ($)% of Total
Net AssetsFederal Home Loan Mortgage Corp. $51,002 5.00% 1/9/2039 58,045 0.00%Trillium Windpower LP CA($)60,285 5.80% 15/2/2033 57,906 0.00%Newmont Corp. $40,000 6.25% 1/10/2039 57,825 0.00%Republic Services, Inc. $54,000 4.75% 15/5/2023 57,812 0.00%Medtronic, Inc. $44,000 4.63% 15/3/2045 57,717 0.00%Aptiv plc $50,000 4.35% 15/3/2029 57,641 0.00%Federal National Mortgage Association $54,414 3.00% 1/4/2031 57,553 0.00%Federal National Mortgage Association $53,818 4.00% 1/8/2025 57,456 0.00%Federal National Mortgage Association $51,659 4.50% 1/12/2043 57,392 0.00%Ventas Realty LP $53,000 3.50% 1/2/2025 57,259 0.00%BNSF Funding Trust I^ $50,000 6.61% 15/12/2055 57,256 0.00%BANK 2018^ $50,000 4.49% 15/5/2061 57,205 0.00%Government National Mortgage Association $51,675 4.00% 15/12/2040 57,052 0.00%Federal Home Loan Mortgage Corp. $54,490 4.50% 1/10/2024 57,020 0.00%Southwest Gas Corp. $50,000 4.15% 1/6/2049 56,982 0.00%Valero Energy Partners LP $50,000 4.38% 15/12/2026 56,671 0.00%Oncor Electric Delivery Co. LLC $50,000 3.70% 15/11/2028 56,576 0.00%Janus Capital Group, Inc. $50,000 4.88% 1/8/2025 56,550 0.00%MidAmerican Energy Co. $45,000 4.25% 15/7/2049 56,528 0.00%Citigroup, Inc. $50,000 4.30% 20/11/2026 56,491 0.00%Boardwalk Pipelines LP $50,000 4.45% 15/7/2027 56,445 0.00%Kilroy Realty LP $50,000 4.25% 15/8/2029 56,425 0.00%Vulcan Materials Co. $50,000 3.90% 1/4/2027 56,343 0.00%Wells Fargo Commercial Mortgage Trust 2018^ $50,000 4.15% 15/3/2051 56,270 0.00%Black Hills Corp. $50,000 4.20% 15/9/2046 56,179 0.00%Michigan State University $50,000 4.50% 15/8/2048 56,144 0.00%Puget Energy, Inc. $50,000 4.10% 15/6/2030 56,079 0.00%Indiana Michigan Power Co. $50,000 3.75% 1/7/2047 56,049 0.00%Life Storage LP $50,000 4.00% 15/6/2029 56,029 0.00%Intel Corp. $54,000 2.70% 15/12/2022 55,943 0.00%Government National Mortgage Association $52,713 3.00% 15/5/2043 55,929 0.00%Government National Mortgage Association $48,114 5.50% 20/7/2038 55,554 0.00%BANK 2018^ $50,000 3.90% 15/2/2061 55,543 0.00%Hershey Co. $50,000 3.38% 15/8/2046 55,503 0.00%Citigroup Commercial Mortgage Trust 2018 $50,000 3.74% 10/3/2051 55,426 0.00%Coca-Cola Consolidated, Inc. $50,000 3.80% 25/11/2025 55,400 0.00%CMS Energy Corp. $50,000 3.45% 15/8/2027 55,339 0.00%Wells Fargo Commercial Mortgage Trust 2017^ $50,000 3.85% 15/10/2050 55,314 0.00%Harman International Industries, Inc. $50,000 4.15% 15/5/2025 55,308 0.00%ERP Operating LP $50,000 3.50% 1/3/2028 55,284 0.00%Government National Mortgage Association $48,941 5.00% 15/3/2035 55,282 0.00%Benchmark 2018-B1 Mortgage Trust^ $50,000 3.88% 15/1/2051 55,273 0.00%Government National Mortgage Association $52,313 3.50% 20/10/2050 55,252 0.00%Nuveen Finance LLC $50,000 4.13% 1/11/2024 55,142 0.00%JPMDB Commercial Mortgage Securities Trust 2017^ $50,000 3.71% 15/10/2050 55,081 0.00%Columbia Property Trust Operating Partnership LP $51,000 4.15% 1/4/2025 55,016 0.00%Southern California Edison Co. $50,000 3.65% 1/3/2028 54,978 0.00%CD 2017-CD6 Mortgage Trust $50,000 3.46% 13/11/2050 54,971 0.00%Norfolk Southern Corp. $50,000 3.65% 1/8/2025 54,969 0.00%Government National Mortgage Association $49,179 4.50% 20/4/2040 54,962 0.00%Government National Mortgage Association $49,809 4.00% 15/8/2039 54,954 0.00%GS Mortgage Securities Trust 2017^ $50,000 3.83% 10/3/2050 54,898 0.00%UBS Commercial Mortgage Trust 2017^ $50,000 3.74% 15/8/2050 54,818 0.00%Federal Home Loan Mortgage Corp. $47,060 5.50% 1/8/2038 54,804 0.00%Home Depot, Inc. $50,000 3.35% 15/9/2025 54,767 0.00%CGMS Commercial Mortgage Trust 2017^ $50,000 3.71% 15/8/2050 54,714 0.00%Whirlpool Corp. $50,000 3.70% 1/5/2025 54,701 0.00%National Rural Utilities Cooperative Finance Corp.^ $50,000 5.25% 20/4/2046 54,647 0.00%Citigroup Commercial Mortgage Trust 2017 $50,000 3.76% 12/10/2050 54,635 0.00%Coca-Cola Co. $50,000 2.90% 25/5/2027 54,633 0.00%AEP Texas, Inc. $50,000 3.80% 1/10/2047 54,618 0.00%BANK 2018 $50,000 3.64% 15/2/2061 54,509 0.00%Federal National Mortgage Association $51,662 3.00% 1/7/2029 54,492 0.00%Federal National Mortgage Association $48,344 5.00% 1/1/2044 54,462 0.00%Federal Home Loan Mortgage Corp. $50,651 3.50% 1/9/2042 54,377 0.00%AutoZone, Inc. $50,000 3.13% 21/4/2026 54,297 0.00%CCRE23 Commercial Mortgage Trust 2015 $50,000 3.50% 10/5/2048 54,259 0.00%Host Hotels & Resorts LP $50,000 4.00% 15/6/2025 54,183 0.00%Private Export Funding Corp. $50,000 3.25% 15/6/2025 54,173 0.00%Appalachian Power Co. $50,000 3.30% 1/6/2027 54,169 0.00%Freddie Mac Multifamily Structured Pass Through Certificates $50,000 3.00% 25/12/2025 54,117 0.00%

549
Vanguard Global Bond Index Fund
Principal CouponMaturity
DateFair Value
US Dollars ($)% of Total
Net AssetsArizona Public Service Co. $50,000 2.95% 15/9/2027 54,102 0.00%UDR, Inc. $50,000 3.20% 15/1/2030 54,098 0.00%WFRBS Commercial Mortgage Trust 2014 $50,000 3.75% 15/9/2057 54,090 0.00%Hubbell, Inc. $50,000 3.35% 1/3/2026 54,053 0.00%GS Mortgage Securities Trust 2014 $50,000 3.63% 10/11/2047 54,044 0.00%CSAIL 2015-C2 Commercial Mortgage Trust $50,000 3.50% 15/6/2057 53,997 0.00%UBS6 Commercial Mortgage Trust 2014 $50,000 3.64% 10/12/2047 53,993 0.00%AvalonBay Communities, Inc. $50,000 4.20% 15/12/2023 53,984 0.00%JPMBB Commercial Mortgage Securities Trust 2014 $50,000 3.67% 15/11/2047 53,984 0.00%Georgia Power Co. $50,000 3.25% 1/4/2026 53,978 0.00%Carlisle Cos, Inc. $50,000 3.50% 1/12/2024 53,941 0.00%AvalonBay Communities, Inc. $50,000 2.95% 11/5/2026 53,885 0.00%Federal Home Loan Mortgage Corp. $46,318 5.50% 1/11/2037 53,884 0.00%Government National Mortgage Association $48,033 4.50% 15/2/2039 53,794 0.00%Federal National Mortgage Association $49,164 4.00% 1/11/2041 53,771 0.00%John Deere Capital Corp. $50,000 3.65% 12/10/2023 53,729 0.00%DTE Electric Co. $50,000 3.65% 15/3/2024 53,673 0.00%Federal National Mortgage Association $50,869 3.00% 1/9/2045 53,647 0.00%Federal Home Loan Mortgage Corp. $47,147 5.00% 1/4/2035 53,631 0.00%Morgan Stanley Bank of America Merrill Lynch Trust 2015 $50,000 3.31% 15/4/2048 53,618 0.00%Public Service Electric & Gas Co. $50,000 3.00% 15/5/2025 53,611 0.00%Federal National Mortgage Association $50,816 3.00% 1/1/2030 53,600 0.00%LC19 Commercial Mortgage Trust 2015 $50,000 3.18% 10/2/2048 53,533 0.00%MPLX LP $50,000 4.50% 15/7/2023 53,514 0.00%Host Hotels & Resorts LP $50,000 3.88% 1/4/2024 53,404 0.00%Federal National Mortgage Association $49,747 3.50% 1/2/2044 53,381 0.00%Providence St Joseph Health Obligated Group $50,000 2.75% 1/10/2026 53,347 0.00%GS Mortgage Securities Trust 2013 $50,000 4.24% 10/8/2046 53,320 0.00%AutoZone, Inc. $50,000 3.13% 18/4/2024 53,233 0.00%Rutgers The State University of New Jersey $50,000 3.27% 1/5/2043 53,203 0.00%NextEra Energy Capital Holdings, Inc. $50,000 3.15% 1/4/2024 53,186 0.00%Caterpillar Financial Services Corp. $50,000 2.40% 9/8/2026 53,124 0.00%Federal National Mortgage Association $50,693 2.50% 1/6/2031 53,123 0.00%Federal National Mortgage Association^ $50,000 2.90% 25/1/2025 53,060 0.00%Southwestern Electric Power Co. $50,000 2.75% 1/10/2026 53,030 0.00%Amphenol Corp. $50,000 3.20% 1/4/2024 53,011 0.00%Eastern Energy Gas Holdings LLC $50,000 3.55% 1/11/2023 52,942 0.00%Owl Rock Capital Corp. $50,000 3.75% 22/7/2025 52,927 0.00%Bank of New York Mellon Corp. $50,000 3.50% 28/4/2023 52,881 0.00%Federal Home Loan Mortgage Corp. $49,304 3.50% 1/2/2034 52,862 0.00%Government National Mortgage Association $44,661 6.00% 20/8/2037 52,761 0.00%Government National Mortgage Association $48,178 4.00% 20/8/2042 52,759 0.00%Texas Instruments, Inc. $50,000 2.63% 15/5/2024 52,756 0.00%Boeing Co. $50,000 3.60% 1/5/2034 52,685 0.00%American Honda Finance Corp. $50,000 2.30% 9/9/2026 52,684 0.00%Government National Mortgage Association $47,291 4.50% 15/9/2034 52,681 0.00%Government National Mortgage Association $49,324 3.50% 20/7/2026 52,636 0.00%John Sevier Combined Cycle Generation LLC $43,098 4.63% 15/1/2042 52,586 0.00%CCRE8 Commercial Mortgage Trust 2013^ $50,000 3.61% 10/6/2046 52,547 0.00%Government National Mortgage Association $45,801 5.00% 15/4/2040 52,348 0.00%Government National Mortgage Association $46,690 4.50% 15/4/2039 52,290 0.00%Federal National Mortgage Association $48,942 3.50% 1/8/2026 52,243 0.00%Goldman Sachs Group, Inc. $50,000 3.20% 23/2/2023 52,151 0.00%Government National Mortgage Association $46,697 4.50% 20/6/2042 52,121 0.00%Citigroup Commercial Mortgage Trust 2018 $50,000 3.79% 10/3/2051 52,115 0.00%South Carolina Public Service Authority $50,000 2.39% 1/12/2023 51,943 0.00%Invesco Finance plc $50,000 3.13% 30/11/2022 51,867 0.00%ERAC USA Finance LLC $50,000 3.30% 15/10/2022 51,778 0.00%Federal National Mortgage Association $46,656 4.50% 1/3/2041 51,708 0.00%Edison International $50,000 2.95% 15/3/2023 51,627 0.00%Boardwalk Pipelines LP $50,000 3.38% 1/2/2023 51,610 0.00%Cox Communications, Inc. $42,000 4.70% 15/12/2042 51,480 0.00%United Airlines 2015-1 Class A Pass Through Trust $50,000 3.70% 1/12/2022 51,406 0.00%Virginia Electric & Power Co. $50,000 3.45% 1/9/2022 51,388 0.00%Teachers Insurance & Annuity Association of America $34,000 6.85% 16/12/2039 51,374 0.00%UnitedHealth Group, Inc. $50,000 2.38% 15/10/2022 51,327 0.00%Eli Lilly & Co. $48,000 2.75% 1/6/2025 51,312 0.00%Federal National Mortgage Association $47,127 4.00% 1/5/2031 51,055 0.00%Americredit Automobile Receivables Trust 2018 $50,000 3.50% 18/1/2024 51,050 0.00%Tapestry, Inc. $50,000 3.00% 15/7/2022 50,992 0.00%CarMax Auto Owner Trust 2018 $50,000 3.16% 17/7/2023 50,887 0.00%
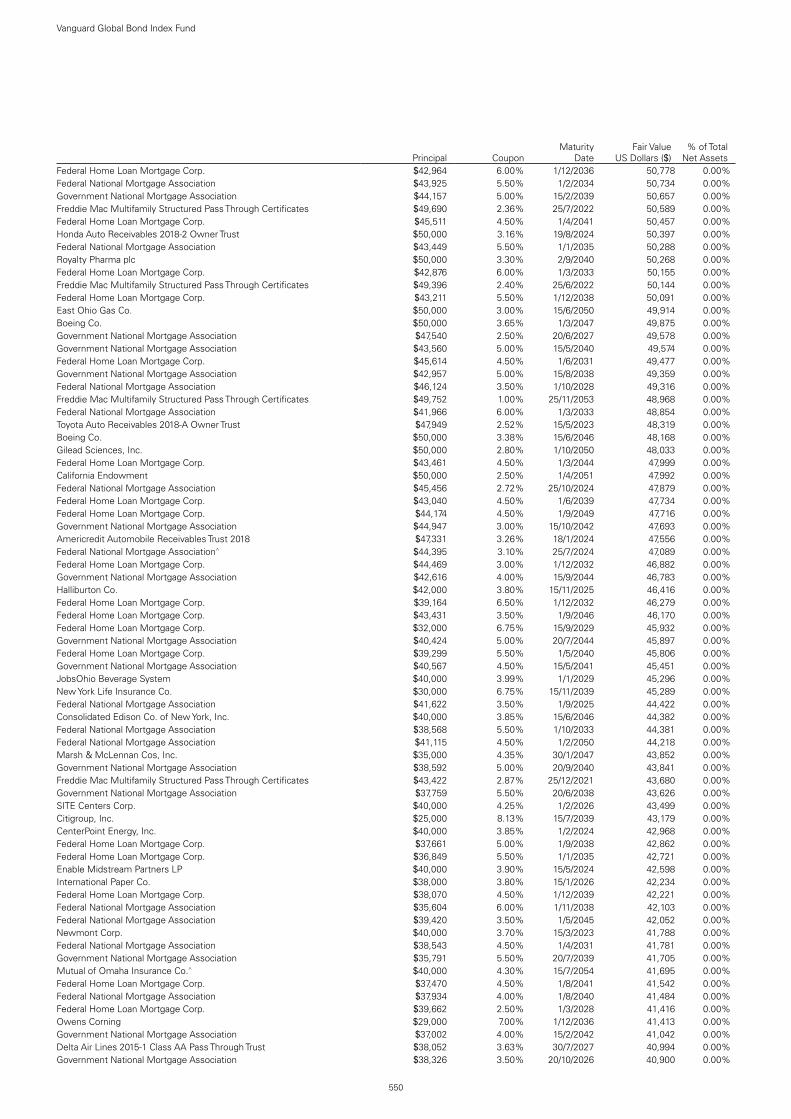
550
Vanguard Global Bond Index Fund
Principal CouponMaturity
DateFair Value
US Dollars ($)% of Total
Net AssetsFederal Home Loan Mortgage Corp. $42,964 6.00% 1/12/2036 50,778 0.00%Federal National Mortgage Association $43,925 5.50% 1/2/2034 50,734 0.00%Government National Mortgage Association $44,157 5.00% 15/2/2039 50,657 0.00%Freddie Mac Multifamily Structured Pass Through Certificates $49,690 2.36% 25/7/2022 50,589 0.00%Federal Home Loan Mortgage Corp. $45,511 4.50% 1/4/2041 50,457 0.00%Honda Auto Receivables 2018-2 Owner Trust $50,000 3.16% 19/8/2024 50,397 0.00%Federal National Mortgage Association $43,449 5.50% 1/1/2035 50,288 0.00%Royalty Pharma plc $50,000 3.30% 2/9/2040 50,268 0.00%Federal Home Loan Mortgage Corp. $42,876 6.00% 1/3/2033 50,155 0.00%Freddie Mac Multifamily Structured Pass Through Certificates $49,396 2.40% 25/6/2022 50,144 0.00%Federal Home Loan Mortgage Corp. $43,211 5.50% 1/12/2038 50,091 0.00%East Ohio Gas Co. $50,000 3.00% 15/6/2050 49,914 0.00%Boeing Co. $50,000 3.65% 1/3/2047 49,875 0.00%Government National Mortgage Association $47,540 2.50% 20/6/2027 49,578 0.00%Government National Mortgage Association $43,560 5.00% 15/5/2040 49,574 0.00%Federal Home Loan Mortgage Corp. $45,614 4.50% 1/6/2031 49,477 0.00%Government National Mortgage Association $42,957 5.00% 15/8/2038 49,359 0.00%Federal National Mortgage Association $46,124 3.50% 1/10/2028 49,316 0.00%Freddie Mac Multifamily Structured Pass Through Certificates $49,752 1.00% 25/11/2053 48,968 0.00%Federal National Mortgage Association $41,966 6.00% 1/3/2033 48,854 0.00%Toyota Auto Receivables 2018-A Owner Trust $47,949 2.52% 15/5/2023 48,319 0.00%Boeing Co. $50,000 3.38% 15/6/2046 48,168 0.00%Gilead Sciences, Inc. $50,000 2.80% 1/10/2050 48,033 0.00%Federal Home Loan Mortgage Corp. $43,461 4.50% 1/3/2044 47,999 0.00%California Endowment $50,000 2.50% 1/4/2051 47,992 0.00%Federal National Mortgage Association $45,456 2.72% 25/10/2024 47,879 0.00%Federal Home Loan Mortgage Corp. $43,040 4.50% 1/6/2039 47,734 0.00%Federal Home Loan Mortgage Corp. $44,174 4.50% 1/9/2049 47,716 0.00%Government National Mortgage Association $44,947 3.00% 15/10/2042 47,693 0.00%Americredit Automobile Receivables Trust 2018 $47,331 3.26% 18/1/2024 47,556 0.00%Federal National Mortgage Association^ $44,395 3.10% 25/7/2024 47,089 0.00%Federal Home Loan Mortgage Corp. $44,469 3.00% 1/12/2032 46,882 0.00%Government National Mortgage Association $42,616 4.00% 15/9/2044 46,783 0.00%Halliburton Co. $42,000 3.80% 15/11/2025 46,416 0.00%Federal Home Loan Mortgage Corp. $39,164 6.50% 1/12/2032 46,279 0.00%Federal Home Loan Mortgage Corp. $43,431 3.50% 1/9/2046 46,170 0.00%Federal Home Loan Mortgage Corp. $32,000 6.75% 15/9/2029 45,932 0.00%Government National Mortgage Association $40,424 5.00% 20/7/2044 45,897 0.00%Federal Home Loan Mortgage Corp. $39,299 5.50% 1/5/2040 45,806 0.00%Government National Mortgage Association $40,567 4.50% 15/5/2041 45,451 0.00%JobsOhio Beverage System $40,000 3.99% 1/1/2029 45,296 0.00%New York Life Insurance Co. $30,000 6.75% 15/11/2039 45,289 0.00%Federal National Mortgage Association $41,622 3.50% 1/9/2025 44,422 0.00%Consolidated Edison Co. of New York, Inc. $40,000 3.85% 15/6/2046 44,382 0.00%Federal National Mortgage Association $38,568 5.50% 1/10/2033 44,381 0.00%Federal National Mortgage Association $41,115 4.50% 1/2/2050 44,218 0.00%Marsh & McLennan Cos, Inc. $35,000 4.35% 30/1/2047 43,852 0.00%Government National Mortgage Association $38,592 5.00% 20/9/2040 43,841 0.00%Freddie Mac Multifamily Structured Pass Through Certificates $43,422 2.87% 25/12/2021 43,680 0.00%Government National Mortgage Association $37,759 5.50% 20/6/2038 43,626 0.00%SITE Centers Corp. $40,000 4.25% 1/2/2026 43,499 0.00%Citigroup, Inc. $25,000 8.13% 15/7/2039 43,179 0.00%CenterPoint Energy, Inc. $40,000 3.85% 1/2/2024 42,968 0.00%Federal Home Loan Mortgage Corp. $37,661 5.00% 1/9/2038 42,862 0.00%Federal Home Loan Mortgage Corp. $36,849 5.50% 1/1/2035 42,721 0.00%Enable Midstream Partners LP $40,000 3.90% 15/5/2024 42,598 0.00%International Paper Co. $38,000 3.80% 15/1/2026 42,234 0.00%Federal Home Loan Mortgage Corp. $38,070 4.50% 1/12/2039 42,221 0.00%Federal National Mortgage Association $35,604 6.00% 1/11/2038 42,103 0.00%Federal National Mortgage Association $39,420 3.50% 1/5/2045 42,052 0.00%Newmont Corp. $40,000 3.70% 15/3/2023 41,788 0.00%Federal National Mortgage Association $38,543 4.50% 1/4/2031 41,781 0.00%Government National Mortgage Association $35,791 5.50% 20/7/2039 41,705 0.00%Mutual of Omaha Insurance Co.^ $40,000 4.30% 15/7/2054 41,695 0.00%Federal Home Loan Mortgage Corp. $37,470 4.50% 1/8/2041 41,542 0.00%Federal National Mortgage Association $37,934 4.00% 1/8/2040 41,484 0.00%Federal Home Loan Mortgage Corp. $39,662 2.50% 1/3/2028 41,416 0.00%Owens Corning $29,000 7.00% 1/12/2036 41,413 0.00%Government National Mortgage Association $37,002 4.00% 15/2/2042 41,042 0.00%Delta Air Lines 2015-1 Class AA Pass Through Trust $38,052 3.63% 30/7/2027 40,994 0.00%Government National Mortgage Association $38,326 3.50% 20/10/2026 40,900 0.00%

551
Vanguard Global Bond Index Fund
Principal CouponMaturity
DateFair Value
US Dollars ($)% of Total
Net AssetsFederal National Mortgage Association $38,333 4.00% 1/5/2026 40,863 0.00%Kinder Morgan Energy Partners LP $35,000 4.70% 1/11/2042 40,714 0.00%Owens Corning $35,000 4.30% 15/7/2047 40,698 0.00%Federal Home Loan Mortgage Corp. $35,553 5.00% 1/11/2038 40,444 0.00%Federal Home Loan Mortgage Corp. $38,900 2.00% 1/8/2028 40,175 0.00%Government National Mortgage Association $36,151 4.00% 15/4/2045 39,487 0.00%Federal National Mortgage Association $36,827 3.50% 1/12/2026 39,311 0.00%Nissan Auto Receivables 2017-B Owner Trust $38,938 1.95% 16/10/2023 39,025 0.00%New York City Water & Sewer System $25,000 5.88% 15/6/2044 38,821 0.00%Federal National Mortgage Association $32,809 6.00% 1/1/2037 38,782 0.00%Federal Home Loan Mortgage Corp. $34,940 4.50% 1/6/2041 38,737 0.00%Federal Home Loan Mortgage Corp. $36,258 3.50% 1/9/2025 38,709 0.00%Federal Home Loan Mortgage Corp. $32,347 6.50% 1/3/2032 38,297 0.00%Eversource Energy $35,000 3.30% 15/1/2028 38,217 0.00%Federal National Mortgage Association $34,027 4.50% 1/9/2035 38,030 0.00%Federal Home Loan Mortgage Corp. $35,468 3.50% 1/3/2026 37,868 0.00%Government National Mortgage Association $33,643 5.00% 15/9/2033 37,826 0.00%Freddie Mac Multifamily Structured Pass Through Certificates $37,686 2.99% 25/9/2021 37,758 0.00%Federal National Mortgage Association $33,703 4.50% 1/9/2034 37,561 0.00%Federal Home Loan Mortgage Corp. $32,982 5.00% 1/9/2035 37,530 0.00%GE Capital Canada Funding Co. CA($)40,000 5.73% 22/10/2037 37,096 0.00%Federal Home Loan Mortgage Corp. $32,573 5.00% 1/8/2033 36,785 0.00%Federal National Mortgage Association $32,968 4.50% 1/5/2040 36,525 0.00%Federal Home Loan Mortgage Corp. $34,835 2.50% 1/11/2027 36,352 0.00%Chevron Corp. $35,000 2.57% 16/5/2023 36,327 0.00%Government National Mortgage Association $31,935 5.00% 20/6/2038 36,283 0.00%Federal National Mortgage Association $31,089 5.50% 1/7/2040 36,049 0.00%Government National Mortgage Association $31,225 5.50% 15/1/2034 35,852 0.00%Federal Home Loan Mortgage Corp. $34,138 2.50% 1/4/2033 35,697 0.00%Spirit Airlines Pass Through Trust 2015 $34,197 4.10% 1/4/2028 35,609 0.00%Government National Mortgage Association $30,649 5.50% 15/7/2034 35,304 0.00%Government National Mortgage Association $30,556 5.50% 20/4/2036 35,297 0.00%Federal National Mortgage Association $30,992 5.00% 1/1/2038 35,243 0.00%Bay Area Toll Authority $20,000 7.04% 1/4/2050 34,931 0.00%Government National Mortgage Association $31,707 5.00% 20/5/2036 34,873 0.00%Government National Mortgage Association $30,619 5.00% 15/9/2035 34,762 0.00%Government National Mortgage Association $31,568 5.00% 20/9/2033 34,746 0.00%Gilead Sciences, Inc. $25,000 5.65% 1/12/2041 34,405 0.00%Federal Home Loan Mortgage Corp. $29,047 6.00% 1/1/2038 34,396 0.00%Tennessee Valley Authority $32,000 2.88% 15/9/2024 34,354 0.00%Federal National Mortgage Association $29,449 6.00% 1/4/2033 34,260 0.00%Government National Mortgage Association $31,006 5.00% 20/10/2033 34,128 0.00%CD 2017-CD3 Mortgage Trust $31,000 3.83% 10/2/2050 33,980 0.00%Government National Mortgage Association $29,457 5.50% 15/2/2033 33,726 0.00%ViacomCBS, Inc. $25,000 5.90% 15/10/2040 33,325 0.00%BMW Vehicle Owner Trust 2018 $32,794 2.51% 25/6/2024 33,034 0.00%Government National Mortgage Association $28,619 5.50% 15/1/2035 32,822 0.00%Ally Auto Receivables Trust 2018 $32,720 2.53% 15/2/2023 32,798 0.00%Government National Mortgage Association $29,334 4.50% 20/11/2040 32,783 0.00%Federal National Mortgage Association $28,257 5.50% 1/3/2038 32,777 0.00%Monongahela Power Co. $25,000 5.40% 15/12/2043 32,712 0.00%Southern California Gas Co. $25,000 5.13% 15/11/2040 32,710 0.00%Federal National Mortgage Association $27,662 6.00% 1/6/2040 32,641 0.00%Texas Health Resources $25,000 4.33% 15/11/2055 32,606 0.00%Government National Mortgage Association $29,845 3.50% 15/7/2042 32,527 0.00%Quest Diagnostics, Inc. $26,000 5.75% 30/1/2040 32,456 0.00%Deere & Co. $29,000 3.10% 15/4/2030 32,034 0.00%Government National Mortgage Association $27,626 5.50% 20/1/2039 32,034 0.00%UnitedHealth Group, Inc. $25,000 4.63% 15/11/2041 31,839 0.00%Children's Hospital Medical Center $25,000 4.27% 15/5/2044 31,439 0.00%Unum Group $25,000 5.75% 15/8/2042 31,197 0.00%Federal National Mortgage Association $27,401 5.00% 1/9/2041 31,176 0.00%Federal National Mortgage Association $26,870 5.50% 1/11/2036 31,084 0.00%Mylan, Inc. $25,000 5.40% 29/11/2043 31,080 0.00%Federal National Mortgage Association $28,854 3.50% 1/7/2039 30,983 0.00%Louisville Gas & Electric Co. $25,000 4.25% 1/4/2049 30,878 0.00%Mass General Brigham, Inc. $25,000 4.12% 1/7/2055 30,870 0.00%Government National Mortgage Association $26,578 5.50% 15/6/2034 30,626 0.00%Cox Communications, Inc. $25,000 4.80% 1/2/2035 30,272 0.00%Ecolab, Inc. $25,000 3.95% 1/12/2047 30,178 0.00%Federal Home Loan Mortgage Corp. $26,106 5.50% 1/5/2033 30,129 0.00%

552
Vanguard Global Bond Index Fund
Principal CouponMaturity
DateFair Value
US Dollars ($)% of Total
Net AssetsFederal National Mortgage Association $26,969 4.50% 1/9/2033 30,050 0.00%Federal National Mortgage Association $27,575 4.50% 1/7/2029 29,900 0.00%Federal Home Loan Mortgage Corp. $25,416 6.00% 1/10/2033 29,862 0.00%Government National Mortgage Association $28,109 3.00% 20/10/2029 29,601 0.00%Mississippi Power Co. $25,000 4.25% 15/3/2042 29,546 0.00%Norfolk Southern Corp. $25,000 4.15% 28/2/2048 29,446 0.00%JPMCC Commercial Mortgage Securities Trust 2017 $28,678 3.05% 15/7/2050 29,142 0.00%Federal National Mortgage Association $27,498 2.50% 1/9/2028 28,688 0.00%JPMDB Commercial Mortgage Securities Trust 2018 $25,000 4.42% 15/6/2051 28,639 0.00%Government National Mortgage Association $24,430 5.50% 20/9/2041 28,525 0.00%General Electric Co. $19,000 6.88% 10/1/2039 28,515 0.00%Union Electric Co. $25,000 3.65% 15/4/2045 28,232 0.00%Federal National Mortgage Association $26,207 3.50% 1/11/2041 28,191 0.00%Federal Home Loan Mortgage Corp. $25,099 4.50% 1/6/2038 28,067 0.00%Federal National Mortgage Association $24,835 5.00% 1/12/2033 28,031 0.00%Oracle Corp. $25,000 3.90% 15/5/2035 27,975 0.00%Federal Home Loan Mortgage Corp. $26,060 3.50% 1/12/2025 27,876 0.00%Biogen, Inc. $25,000 4.05% 15/9/2025 27,836 0.00%Kinder Morgan Energy Partners LP $20,000 7.40% 15/3/2031 27,788 0.00%First American Financial Corp. $25,000 4.60% 15/11/2024 27,666 0.00%BANK 2017 $25,000 3.73% 15/11/2050 27,658 0.00%Government National Mortgage Association $24,266 5.00% 20/4/2042 27,564 0.00%Federal Home Loan Mortgage Corp. $24,798 4.50% 1/5/2040 27,485 0.00%Federal National Mortgage Association $25,333 4.50% 1/6/2030 27,460 0.00%Conagra Brands, Inc. $25,000 4.30% 1/5/2024 27,433 0.00%L3Harris Technologies, Inc. $25,000 3.83% 27/4/2025 27,418 0.00%Government National Mortgage Association $23,037 6.00% 15/2/2038 27,414 0.00%Owl Rock Capital Corp. $25,000 5.25% 15/4/2024 27,328 0.00%Federal National Mortgage Association $23,977 5.00% 1/4/2041 27,280 0.00%Federal National Mortgage Association $24,528 4.50% 1/9/2040 27,174 0.00%American Water Capital Corp. $25,000 3.40% 1/3/2025 27,159 0.00%JPMBB Commercial Mortgage Securities Trust 2014 $25,000 4.07% 15/11/2047 27,094 0.00%Xcel Energy, Inc. $25,000 3.30% 1/6/2025 26,945 0.00%Federal Farm Credit Banks Funding Corp. $25,000 3.50% 20/12/2023 26,914 0.00%CD 2017-CD3 Mortgage Trust $25,000 3.45% 10/2/2050 26,774 0.00%Federal National Mortgage Association $22,611 6.00% 1/8/2038 26,774 0.00%Boston Scientific Corp. $26,000 3.38% 15/5/2022 26,691 0.00%Freddie Mac Multifamily Structured Pass Through Certificates $25,000 3.49% 25/1/2024 26,686 0.00%Government National Mortgage Association $23,403 5.00% 15/3/2036 26,568 0.00%Government National Mortgage Association $23,727 4.50% 20/6/2039 26,513 0.00%Government National Mortgage Association $25,598 3.50% 20/12/2025 26,421 0.00%Private Export Funding Corp. $25,000 2.45% 15/7/2024 26,265 0.00%New York State Electric & Gas Corp. $25,000 3.30% 15/9/2049 25,982 0.00%Toyota Motor Credit Corp. $25,000 2.63% 10/1/2023 25,871 0.00%Tennessee Valley Authority $25,000 1.88% 15/8/2022 25,473 0.00%Toyota Auto Receivables 2018-B Owner Trust $25,000 3.11% 15/11/2023 25,464 0.00%Federal Home Loan Mortgage Corp. $23,782 3.50% 1/3/2049 25,026 0.00%Government National Mortgage Association $23,430 3.50% 15/5/2026 25,004 0.00%United Airlines 2013-1 Class A Pass Through Trust $23,726 4.30% 15/8/2025 24,967 0.00%Boeing Co. $25,000 3.63% 1/3/2048 24,932 0.00%Federal Home Loan Mortgage Corp. $22,459 4.00% 1/3/2041 24,572 0.00%Government National Mortgage Association $21,991 4.50% 15/8/2033 24,498 0.00%Freddie Mac Multifamily Structured Pass Through Certificates $24,835 0.86% 25/11/2030 24,244 0.00%Federal Home Loan Mortgage Corp. $22,545 3.50% 1/10/2042 24,203 0.00%Government National Mortgage Association $20,707 6.00% 20/3/2033 24,059 0.00%Federal National Mortgage Association $22,891 3.00% 1/1/2026 24,051 0.00%Toyota Auto Receivables 2018-B Owner Trust $23,440 2.96% 15/9/2022 23,534 0.00%Volkswagen Auto Loan Enhanced Trust 2018 $23,201 3.02% 21/11/2022 23,343 0.00%Government National Mortgage Association $20,326 5.00% 15/9/2040 23,325 0.00%Federal National Mortgage Association $20,374 5.00% 1/5/2036 23,169 0.00%Federal National Mortgage Association $19,599 6.00% 1/12/2036 23,115 0.00%Federal National Mortgage Association $19,196 6.50% 1/9/2036 22,931 0.00%GM Financial Consumer Automobile Receivables Trust 2018 $22,823 2.81% 16/12/2022 22,924 0.00%Federal National Mortgage Association $19,467 6.00% 1/3/2037 22,816 0.00%Federal National Mortgage Association $20,018 5.00% 1/6/2034 22,768 0.00%Government National Mortgage Association $19,222 5.50% 15/11/2038 22,346 0.00%Federal National Mortgage Association $21,089 3.00% 1/7/2027 22,174 0.00%Federal Home Loan Mortgage Corp. $19,530 5.00% 1/10/2033 22,055 0.00%Government National Mortgage Association $18,616 5.50% 15/7/2035 21,390 0.00%Federal National Mortgage Association $18,947 5.00% 1/7/2033 21,386 0.00%Government National Mortgage Association $18,516 5.50% 15/10/2032 21,088 0.00%

553
Vanguard Global Bond Index Fund
Principal CouponMaturity
DateFair Value
US Dollars ($)% of Total
Net AssetsHumana, Inc. $20,000 2.90% 15/12/2022 20,657 0.00%Federal Home Loan Mortgage Corp. $17,639 5.50% 1/4/2038 20,510 0.00%TWDC Enterprises 18 Corp. $18,000 3.70% 1/12/2042 20,423 0.00%Government National Mortgage Association $18,975 3.50% 15/2/2026 20,250 0.00%Federal Home Loan Mortgage Corp. $18,053 4.50% 1/4/2039 20,021 0.00%Government National Mortgage Association $17,073 5.50% 20/3/2035 19,729 0.00%Federal National Mortgage Association $17,292 5.00% 1/3/2038 19,676 0.00%Government National Mortgage Association $17,292 5.00% 15/3/2034 19,457 0.00%Government National Mortgage Association $17,447 4.00% 15/8/2044 19,142 0.00%Federal Home Loan Mortgage Corp. $15,947 6.50% 1/8/2032 18,896 0.00%Federal Home Loan Mortgage Corp. $16,556 5.50% 1/8/2037 18,881 0.00%Government National Mortgage Association $16,773 4.50% 15/1/2040 18,785 0.00%Government National Mortgage Association $16,994 4.00% 15/11/2039 18,749 0.00%CarMax Auto Owner Trust 2018 $18,621 2.98% 17/1/2023 18,706 0.00%Federal National Mortgage Association $15,421 7.00% 1/4/2037 18,686 0.00%Federal Home Loan Mortgage Corp. $17,440 4.00% 1/11/2024 18,594 0.00%Government National Mortgage Association $15,612 6.00% 20/7/2039 18,565 0.00%Government National Mortgage Association $15,443 6.50% 20/12/2037 18,400 0.00%Federal Home Loan Mortgage Corp. $15,658 6.00% 1/2/2033 18,366 0.00%Government National Mortgage Association $15,246 6.50% 20/11/2038 18,299 0.00%Federal Home Loan Mortgage Corp. $15,613 5.50% 1/5/2038 18,294 0.00%Government National Mortgage Association $16,088 4.50% 15/10/2039 18,018 0.00%Federal Home Loan Mortgage Corp. $16,232 4.50% 1/3/2045 17,927 0.00%Federal National Mortgage Association $16,227 4.50% 1/8/2046 17,910 0.00%Tennessee Valley Authority $14,000 6.75% 1/11/2025 17,534 0.00%Federal National Mortgage Association $14,483 6.50% 1/10/2039 17,398 0.00%Federal Home Loan Mortgage Corp. $14,824 6.00% 1/1/2032 17,211 0.00%Government National Mortgage Association $16,627 4.00% 15/1/2025 17,209 0.00%Federal National Mortgage Association $15,718 5.00% 1/9/2025 17,196 0.00%Federal Home Loan Mortgage Corp. $15,051 5.00% 1/1/2041 17,128 0.00%Government National Mortgage Association $14,361 6.00% 20/6/2038 16,996 0.00%Government National Mortgage Association $14,190 6.00% 15/12/2038 16,748 0.00%Federal Home Loan Mortgage Corp. $14,927 4.50% 1/4/2035 16,693 0.00%Federal National Mortgage Association $13,813 6.00% 1/9/2036 16,211 0.00%Federal Home Loan Mortgage Corp. $13,817 6.00% 1/1/2033 16,171 0.00%Government National Mortgage Association $15,464 3.00% 15/2/2026 15,847 0.00%Federal National Mortgage Association $13,674 5.50% 1/3/2036 15,815 0.00%Federal Home Loan Mortgage Corp. $14,143 5.50% 1/1/2028 15,529 0.00%Federal Home Loan Mortgage Corp. $14,409 4.00% 1/12/2026 15,362 0.00%Federal National Mortgage Association $13,105 5.50% 1/5/2038 15,248 0.00%Government National Mortgage Association $13,293 4.50% 15/6/2040 14,887 0.00%Federal Home Loan Mortgage Corp. $13,200 4.50% 1/10/2033 14,715 0.00%Federal Home Loan Mortgage Corp. $13,066 7.00% 1/1/2032 14,651 0.00%Federal Home Loan Mortgage Corp. $12,747 5.00% 1/10/2035 14,500 0.00%Federal Home Loan Mortgage Corp. $12,301 5.50% 1/6/2038 14,332 0.00%Federal National Mortgage Association $13,627 3.00% 1/11/2026 14,327 0.00%Federal Home Loan Mortgage Corp. $12,335 5.50% 1/12/2032 14,178 0.00%Federal National Mortgage Association $12,391 5.00% 1/7/2036 14,092 0.00%Federal Home Loan Mortgage Corp. $11,808 6.50% 1/8/2037 14,026 0.00%Government National Mortgage Association $13,039 3.00% 15/1/2026 13,354 0.00%Government National Mortgage Association $11,877 5.50% 15/12/2040 13,299 0.00%Federal Home Loan Mortgage Corp. $12,522 3.00% 1/6/2031 13,248 0.00%Government National Mortgage Association $11,369 6.00% 15/2/2033 13,148 0.00%Federal Home Loan Mortgage Corp. $11,262 5.50% 1/2/2036 13,073 0.00%Federal Home Loan Mortgage Corp. $11,565 5.00% 1/1/2034 13,061 0.00%Government National Mortgage Association $11,243 6.50% 15/9/2032 13,012 0.00%Federal National Mortgage Association $10,925 6.00% 1/2/2037 12,906 0.00%Government National Mortgage Association $11,186 5.50% 20/6/2034 12,885 0.00%Federal Home Loan Mortgage Corp. $11,990 4.50% 1/7/2025 12,633 0.00%Federal Home Loan Mortgage Corp. $11,331 4.50% 1/9/2039 12,566 0.00%Federal National Mortgage Association $10,642 6.00% 1/1/2036 12,557 0.00%Federal Home Loan Mortgage Corp. $11,183 4.00% 1/7/2039 12,237 0.00%Government National Mortgage Association $10,580 6.50% 15/7/2035 12,236 0.00%Government National Mortgage Association $10,939 4.00% 15/4/2039 12,069 0.00%Federal National Mortgage Association $10,009 6.50% 1/7/2036 11,993 0.00%Federal National Mortgage Association $9,985 7.00% 1/7/2032 11,898 0.00%Federal Home Loan Mortgage Corp. $10,324 5.50% 1/6/2028 11,482 0.00%Government National Mortgage Association $10,577 3.50% 15/10/2047 11,373 0.00%Federal Home Loan Mortgage Corp. $9,584 6.00% 1/12/2037 11,338 0.00%Federal National Mortgage Association $10,554 4.00% 1/5/2025 11,268 0.00%Federal National Mortgage Association $9,555 6.50% 1/2/2032 11,260 0.00%

554
Vanguard Global Bond Index Fund
Principal CouponMaturity
DateFair Value
US Dollars ($)% of Total
Net AssetsCD 2018-CD7 Mortgage Trust $10,000 4.21% 15/8/2051 11,215 0.00%Government National Mortgage Association $9,651 6.50% 15/2/2032 11,206 0.00%Timken Co. $10,000 4.50% 15/12/2028 11,172 0.00%Voya Financial, Inc. $10,000 3.65% 15/6/2026 11,082 0.00%Federal National Mortgage Association $9,077 7.00% 1/8/2037 10,940 0.00%Federal Home Loan Mortgage Corp. $9,752 4.50% 1/4/2040 10,809 0.00%Federal National Mortgage Association $9,969 3.50% 1/3/2024 10,642 0.00%Federal Home Loan Mortgage Corp. $9,317 6.00% 1/7/2029 10,620 0.00%Federal Home Loan Mortgage Corp. $8,882 7.00% 1/4/2032 10,576 0.00%Federal National Mortgage Association $8,944 6.00% 1/10/2035 10,484 0.00%O'Reilly Automotive, Inc. $9,000 4.20% 1/4/2030 10,385 0.00%Federal National Mortgage Association $10,028 4.50% 1/4/2023 10,295 0.00%Federal Home Loan Mortgage Corp. $8,334 6.50% 1/6/2034 9,910 0.00%Government National Mortgage Association $9,429 4.00% 15/9/2025 9,801 0.00%Federal National Mortgage Association $8,173 6.50% 1/7/2035 9,684 0.00%Federal Home Loan Mortgage Corp. $8,483 5.00% 1/4/2041 9,655 0.00%Federal National Mortgage Association $8,335 5.50% 1/1/2033 9,571 0.00%Government National Mortgage Association $8,112 5.00% 15/6/2039 9,350 0.00%Federal Home Loan Mortgage Corp. $7,944 5.50% 1/2/2039 9,283 0.00%Federal National Mortgage Association $7,798 6.50% 1/3/2035 9,213 0.00%Government National Mortgage Association $8,839 4.00% 20/9/2025 9,181 0.00%Federal Home Loan Mortgage Corp. $7,700 5.50% 1/7/2038 8,979 0.00%Government National Mortgage Association $8,124 5.00% 20/4/2036 8,936 0.00%Government National Mortgage Association $7,524 6.00% 20/8/2036 8,853 0.00%Federal Home Loan Mortgage Corp. $7,542 6.00% 1/1/2036 8,748 0.00%Federal National Mortgage Association $7,671 6.50% 1/12/2031 8,550 0.00%Federal National Mortgage Association $7,541 4.50% 1/8/2039 8,359 0.00%Government National Mortgage Association $7,307 5.00% 15/3/2040 8,311 0.00%CarMax Auto Owner Trust 2018 $8,272 2.48% 15/11/2022 8,288 0.00%Federal Home Loan Mortgage Corp. $6,967 6.00% 1/8/2037 8,160 0.00%Sherwin-Williams Co. $8,000 2.75% 1/6/2022 8,156 0.00%Federal National Mortgage Association $6,896 6.50% 1/7/2032 8,136 0.00%Federal National Mortgage Association $7,468 4.00% 1/8/2026 7,973 0.00%Government National Mortgage Association $6,586 6.50% 20/9/2036 7,847 0.00%Government National Mortgage Association $6,696 5.50% 20/8/2040 7,826 0.00%Federal Home Loan Mortgage Corp. $7,299 4.00% 1/8/2025 7,793 0.00%Federal Home Loan Mortgage Corp. $7,250 4.00% 1/5/2025 7,741 0.00%Federal National Mortgage Association $6,534 6.00% 1/10/2037 7,718 0.00%Government National Mortgage Association $6,668 6.00% 15/8/2032 7,636 0.00%Government National Mortgage Association $6,478 6.00% 20/12/2036 7,635 0.00%Federal Home Loan Mortgage Corp. $6,429 5.00% 1/2/2037 7,318 0.00%Federal National Mortgage Association $6,271 5.50% 1/7/2035 7,259 0.00%Federal National Mortgage Association $6,100 6.50% 1/9/2037 7,259 0.00%Federal National Mortgage Association $6,017 7.00% 1/9/2035 7,161 0.00%Government National Mortgage Association $6,043 6.00% 20/7/2036 7,114 0.00%Federal Home Loan Mortgage Corp. $6,024 7.00% 1/6/2032 7,033 0.00%Federal Home Loan Mortgage Corp. $5,831 6.00% 1/6/2037 6,915 0.00%Federal National Mortgage Association $5,778 7.00% 1/9/2031 6,846 0.00%Federal National Mortgage Association $5,701 6.50% 1/1/2039 6,841 0.00%Federal Home Loan Mortgage Corp. $5,902 6.00% 1/3/2029 6,710 0.00%Federal Home Loan Mortgage Corp. $5,579 6.50% 1/9/2038 6,697 0.00%Federal Home Loan Mortgage Corp. $6,067 5.00% 1/5/2024 6,628 0.00%Federal National Mortgage Association $5,532 6.00% 1/7/2040 6,542 0.00%Government National Mortgage Association $5,360 7.00% 20/11/2038 6,465 0.00%Halliburton Co. $6,000 3.50% 1/8/2023 6,323 0.00%Government National Mortgage Association $5,230 6.50% 20/1/2036 6,238 0.00%Federal Home Loan Mortgage Corp. $5,077 6.00% 1/5/2033 5,967 0.00%Government National Mortgage Association $5,026 6.00% 20/7/2034 5,901 0.00%Government National Mortgage Association $4,952 6.00% 20/1/2032 5,705 0.00%Federal Home Loan Mortgage Corp. $5,008 5.00% 1/2/2038 5,700 0.00%Federal National Mortgage Association $5,245 4.00% 1/6/2024 5,591 0.00%Government National Mortgage Association $4,718 5.50% 15/9/2038 5,561 0.00%Santander Drive Auto Receivables Trust 2018 $5,416 3.35% 17/7/2023 5,422 0.00%Federal National Mortgage Association $4,607 6.00% 1/1/2038 5,388 0.00%Federal Home Loan Mortgage Corp. $4,700 6.50% 1/1/2029 5,369 0.00%Federal Home Loan Mortgage Corp. $4,402 7.00% 1/1/2034 5,364 0.00%Federal Home Loan Mortgage Corp. $4,796 4.50% 1/11/2040 5,316 0.00%Prologis LP $5,000 2.25% 15/4/2030 5,103 0.00%Government National Mortgage Association $4,243 6.50% 20/12/2035 5,091 0.00%Freddie Mac Multifamily Structured Pass Through Certificates $4,882 3.45% 25/9/2024 5,019 0.00%Federal Home Loan Mortgage Corp. $4,658 4.00% 1/9/2033 5,013 0.00%

555
Vanguard Global Bond Index Fund
Principal CouponMaturity
DateFair Value
US Dollars ($)% of Total
Net AssetsFederal Home Loan Mortgage Corp. $4,187 6.00% 1/10/2036 4,940 0.00%Federal Home Loan Mortgage Corp. $4,656 4.50% 1/1/2025 4,872 0.00%Federal Home Loan Mortgage Corp. $4,201 5.50% 1/8/2035 4,829 0.00%Federal Home Loan Mortgage Corp. $4,173 5.50% 1/6/2033 4,790 0.00%Government National Mortgage Association $4,439 4.00% 20/2/2026 4,701 0.00%Government National Mortgage Association $4,032 5.50% 20/5/2037 4,651 0.00%Government National Mortgage Association $4,273 4.50% 15/10/2024 4,445 0.00%Federal Home Loan Mortgage Corp. $4,156 4.00% 1/6/2025 4,437 0.00%Federal Home Loan Mortgage Corp. $4,180 4.50% 1/3/2023 4,300 0.00%Honda Auto Receivables 2018-2 Owner Trust $4,268 3.01% 18/5/2022 4,275 0.00%Government National Mortgage Association $3,823 3.50% 15/12/2042 4,167 0.00%Government National Mortgage Association $3,492 6.50% 15/5/2034 4,083 0.00%Federal Home Loan Mortgage Corp. $3,467 5.00% 1/3/2035 3,944 0.00%Federal National Mortgage Association $3,440 5.00% 1/8/2034 3,913 0.00%Federal National Mortgage Association $3,386 5.00% 1/12/2032 3,825 0.00%Federal National Mortgage Association $3,197 6.00% 1/2/2036 3,731 0.00%Federal National Mortgage Association $3,157 6.00% 1/7/2038 3,730 0.00%Government National Mortgage Association $3,186 6.00% 15/6/2033 3,584 0.00%Government National Mortgage Association $3,103 5.50% 15/12/2032 3,540 0.00%Government National Mortgage Association $3,137 5.00% 15/6/2033 3,515 0.00%Government National Mortgage Association $3,020 4.50% 15/11/2040 3,389 0.00%Federal Home Loan Mortgage Corp. $2,872 5.00% 1/11/2039 3,268 0.00%Federal National Mortgage Association $2,848 4.50% 1/8/2035 3,183 0.00%Federal Home Loan Mortgage Corp. $2,883 7.00% 1/12/2034 3,180 0.00%Government National Mortgage Association $2,727 5.50% 15/10/2038 3,172 0.00%Federal Home Loan Mortgage Corp. $2,899 4.00% 1/1/2025 3,090 0.00%Federal Home Loan Mortgage Corp. $2,576 6.00% 1/11/2037 3,043 0.00%Government National Mortgage Association $2,759 5.00% 20/11/2033 3,037 0.00%Government National Mortgage Association $2,534 6.50% 20/8/2037 3,016 0.00%Government National Mortgage Association $2,580 6.50% 15/1/2033 3,004 0.00%Federal Home Loan Mortgage Corp. $2,835 5.00% 1/11/2023 2,950 0.00%Federal National Mortgage Association $2,626 6.50% 1/5/2038 2,906 0.00%Federal Home Loan Mortgage Corp. $2,405 7.00% 1/2/2037 2,817 0.00%Federal National Mortgage Association $2,471 5.00% 1/6/2030 2,727 0.00%Government National Mortgage Association $2,283 6.00% 15/9/2039 2,703 0.00%Federal Home Loan Mortgage Corp. $2,254 6.00% 1/12/2032 2,626 0.00%Federal Home Loan Mortgage Corp. $2,430 5.50% 1/2/2024 2,546 0.00%Federal National Mortgage Association $2,355 4.00% 1/6/2026 2,510 0.00%Government National Mortgage Association $2,078 7.00% 20/8/2038 2,501 0.00%Government National Mortgage Association $2,082 5.50% 20/1/2037 2,407 0.00%Federal Home Loan Mortgage Corp. $2,332 5.50% 1/10/2025 2,404 0.00%Federal Home Loan Mortgage Corp. $1,966 6.50% 1/10/2037 2,357 0.00%Government National Mortgage Association $2,075 4.50% 15/9/2045 2,336 0.00%Federal National Mortgage Association $2,146 4.50% 1/10/2023 2,303 0.00%Federal Home Loan Mortgage Corp. $2,201 4.50% 1/5/2023 2,264 0.00%Government National Mortgage Association $1,922 6.00% 15/12/2035 2,257 0.00%Federal Home Loan Mortgage Corp. $1,749 6.00% 1/10/2038 2,075 0.00%Federal Home Loan Mortgage Corp. $1,749 6.50% 1/11/2038 2,074 0.00%Federal National Mortgage Association $1,758 6.00% 1/9/2035 2,061 0.00%Federal Home Loan Mortgage Corp. $1,791 7.00% 1/1/2028 2,034 0.00%Federal National Mortgage Association $1,886 5.50% 1/5/2025 2,021 0.00%Federal National Mortgage Association $1,752 6.50% 1/8/2029 2,014 0.00%Federal National Mortgage Association $1,604 7.00% 1/4/2036 1,939 0.00%Federal National Mortgage Association $1,810 5.50% 1/11/2024 1,923 0.00%Federal Home Loan Mortgage Corp. $1,778 5.00% 1/4/2024 1,857 0.00%Federal Home Loan Mortgage Corp. $1,630 4.50% 1/12/2024 1,707 0.00%Government National Mortgage Association $1,374 6.50% 15/10/2038 1,618 0.00%Federal Home Loan Mortgage Corp. $1,325 4.50% 1/9/2024 1,386 0.00%Government National Mortgage Association $1,187 6.00% 15/2/2037 1,275 0.00%Federal National Mortgage Association $1,060 5.50% 1/2/2038 1,229 0.00%Government National Mortgage Association $1,059 6.00% 15/11/2031 1,203 0.00%Federal Home Loan Mortgage Corp. $1,162 6.00% 1/1/2024 1,195 0.00%Federal National Mortgage Association $1,076 5.50% 1/7/2024 1,115 0.00%Government National Mortgage Association $928 6.50% 15/12/2038 1,112 0.00%Federal Home Loan Mortgage Corp. $1,048 4.50% 1/11/2024 1,100 0.00%Federal National Mortgage Association $974 7.00% 1/4/2035 1,093 0.00%Government National Mortgage Association $864 6.50% 15/11/2032 1,050 0.00%Federal National Mortgage Association $901 5.50% 1/10/2039 1,048 0.00%Federal Home Loan Mortgage Corp. $741 4.00% 1/10/2025 790 0.00%Federal Home Loan Mortgage Corp. $710 4.00% 1/6/2024 757 0.00%Government National Mortgage Association $603 6.50% 15/1/2032 693 0.00%
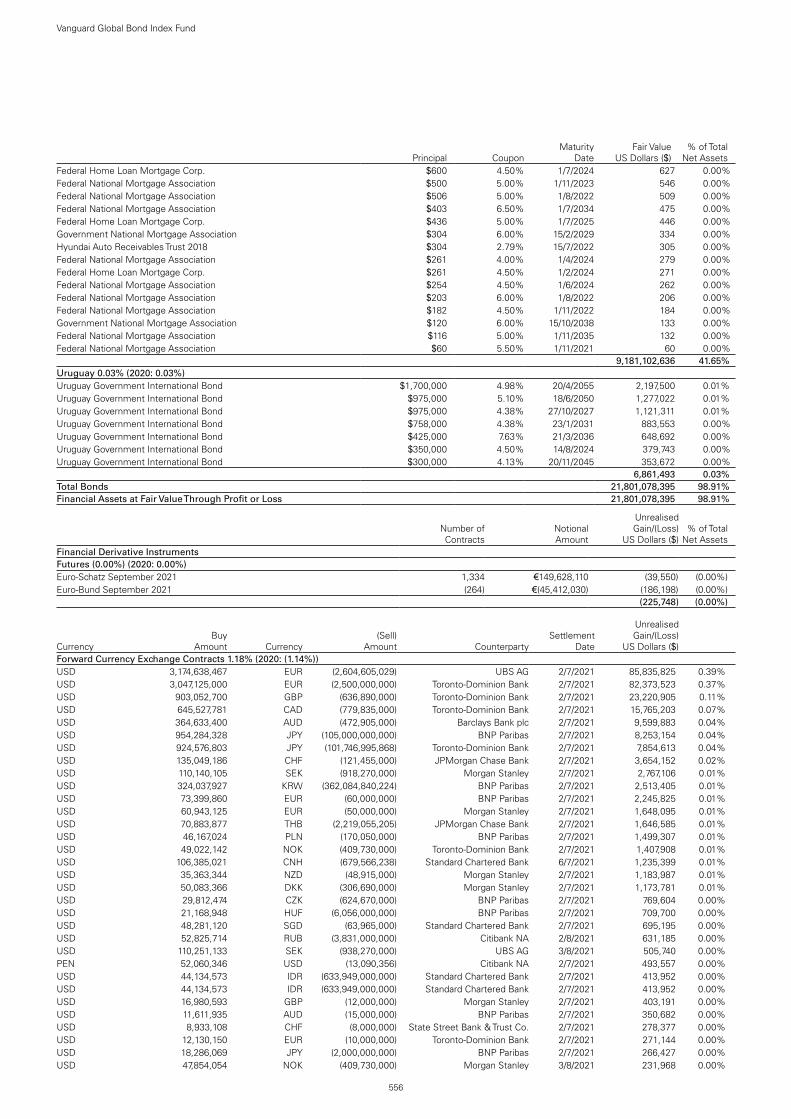
556
Vanguard Global Bond Index Fund
Principal CouponMaturity
DateFair Value
US Dollars ($)% of Total
Net AssetsFederal Home Loan Mortgage Corp. $600 4.50% 1/7/2024 627 0.00%Federal National Mortgage Association $500 5.00% 1/11/2023 546 0.00%Federal National Mortgage Association $506 5.00% 1/8/2022 509 0.00%Federal National Mortgage Association $403 6.50% 1/7/2034 475 0.00%Federal Home Loan Mortgage Corp. $436 5.00% 1/7/2025 446 0.00%Government National Mortgage Association $304 6.00% 15/2/2029 334 0.00%Hyundai Auto Receivables Trust 2018 $304 2.79% 15/7/2022 305 0.00%Federal National Mortgage Association $261 4.00% 1/4/2024 279 0.00%Federal Home Loan Mortgage Corp. $261 4.50% 1/2/2024 271 0.00%Federal National Mortgage Association $254 4.50% 1/6/2024 262 0.00%Federal National Mortgage Association $203 6.00% 1/8/2022 206 0.00%Federal National Mortgage Association $182 4.50% 1/11/2022 184 0.00%Government National Mortgage Association $120 6.00% 15/10/2038 133 0.00%Federal National Mortgage Association $116 5.00% 1/11/2035 132 0.00%Federal National Mortgage Association $60 5.50% 1/11/2021 60 0.00%test - - - 9,181,102,636 41.65%Uruguay 0.03% (2020: 0.03%)Uruguay Government International Bond $1,700,000 4.98% 20/4/2055 2,197,500 0.01%Uruguay Government International Bond $975,000 5.10% 18/6/2050 1,277,022 0.01%Uruguay Government International Bond $975,000 4.38% 27/10/2027 1,121,311 0.01%Uruguay Government International Bond $758,000 4.38% 23/1/2031 883,553 0.00%Uruguay Government International Bond $425,000 7.63% 21/3/2036 648,692 0.00%Uruguay Government International Bond $350,000 4.50% 14/8/2024 379,743 0.00%Uruguay Government International Bond $300,000 4.13% 20/11/2045 353,672 0.00%test - - - 6,861,493 0.03%Total Bonds 21,801,078,395 98.91%Financial Assets at Fair Value Through Profit or Loss 21,801,078,395 98.91%
testNumber of Contracts
Notional Amount
Unrealised Gain/(Loss)
US Dollars ($)% of Total
Net AssetsFinancial Derivative InstrumentsFutures (0.00%) (2020: 0.00%)Euro-Schatz September 2021 1,334 €149,628,110 (39,550 ) (0.00 %)Euro-Bund September 2021 (264) €(45,412,030) (186,198 ) (0.00 %)test test test (225,748 ) (0.00 %)
CurrencyBuy
Amount Currency(Sell)
Amount CounterpartySettlement
Date
Unrealised Gain/(Loss)
US Dollars ($) Forward Currency Exchange Contracts 1.18% (2020: (1.14%))USD 3,174,638,467 EUR (2,604,605,029) UBS AG 2/7/2021 85,835,825 0.39 %USD 3,047,125,000 EUR (2,500,000,000) Toronto-Dominion Bank 2/7/2021 82,373,523 0.37 %USD 903,052,700 GBP (636,890,000) Toronto-Dominion Bank 2/7/2021 23,220,905 0.11 %USD 645,527,781 CAD (779,835,000) Toronto-Dominion Bank 2/7/2021 15,765,203 0.07 %USD 364,633,400 AUD (472,905,000) Barclays Bank plc 2/7/2021 9,599,883 0.04 %USD 954,284,328 JPY (105,000,000,000) BNP Paribas 2/7/2021 8,253,154 0.04 %USD 924,576,803 JPY (101,746,995,868) Toronto-Dominion Bank 2/7/2021 7,854,613 0.04 %USD 135,049,186 CHF (121,455,000) JPMorgan Chase Bank 2/7/2021 3,654,152 0.02 %USD 110,140,105 SEK (918,270,000) Morgan Stanley 2/7/2021 2,767,106 0.01 %USD 324,037,927 KRW (362,084,840,224) BNP Paribas 2/7/2021 2,513,405 0.01 %USD 73,399,860 EUR (60,000,000) BNP Paribas 2/7/2021 2,245,825 0.01 %USD 60,943,125 EUR (50,000,000) Morgan Stanley 2/7/2021 1,648,095 0.01 %USD 70,883,877 THB (2,219,055,205) JPMorgan Chase Bank 2/7/2021 1,646,585 0.01 %USD 46,167,024 PLN (170,050,000) BNP Paribas 2/7/2021 1,499,307 0.01 %USD 49,022,142 NOK (409,730,000) Toronto-Dominion Bank 2/7/2021 1,407,908 0.01 %USD 106,385,021 CNH (679,566,238) Standard Chartered Bank 6/7/2021 1,235,399 0.01 %USD 35,363,344 NZD (48,915,000) Morgan Stanley 2/7/2021 1,183,987 0.01 %USD 50,083,366 DKK (306,690,000) Morgan Stanley 2/7/2021 1,173,781 0.01 %USD 29,812,474 CZK (624,670,000) BNP Paribas 2/7/2021 769,604 0.00 %USD 21,168,948 HUF (6,056,000,000) BNP Paribas 2/7/2021 709,700 0.00 %USD 48,281,120 SGD (63,965,000) Standard Chartered Bank 2/7/2021 695,195 0.00 %USD 52,825,714 RUB (3,831,000,000) Citibank NA 2/8/2021 631,185 0.00 %USD 110,251,133 SEK (938,270,000) UBS AG 3/8/2021 505,740 0.00 %PEN 52,060,346 USD (13,090,356) Citibank NA 2/7/2021 493,557 0.00 %USD 44,134,573 IDR (633,949,000,000) Standard Chartered Bank 2/7/2021 413,952 0.00 %USD 44,134,573 IDR (633,949,000,000) Standard Chartered Bank 2/7/2021 413,952 0.00 %USD 16,980,593 GBP (12,000,000) Morgan Stanley 2/7/2021 403,191 0.00 %USD 11,611,935 AUD (15,000,000) BNP Paribas 2/7/2021 350,682 0.00 %USD 8,933,108 CHF (8,000,000) State Street Bank & Trust Co. 2/7/2021 278,377 0.00 %USD 12,130,150 EUR (10,000,000) Toronto-Dominion Bank 2/7/2021 271,144 0.00 %USD 18,286,069 JPY (2,000,000,000) BNP Paribas 2/7/2021 266,427 0.00 %USD 47,854,054 NOK (409,730,000) Morgan Stanley 3/8/2021 231,968 0.00 %

557
Vanguard Global Bond Index Fund
CurrencyBuy
Amount Currency(Sell)
Amount CounterpartySettlement
Date
Unrealised Gain/(Loss)
US Dollars ($)% of Total
Net AssetsUSD 8,278,235 CAD (10,000,000) BNP Paribas 2/7/2021 202,647 0.00 %USD 7,314,281 EUR (6,000,000) Morgan Stanley 2/7/2021 198,878 0.00 %USD 7,087,036 GBP (5,000,000) Morgan Stanley 2/7/2021 179,785 0.00 %USD 1,818,379,251 JPY (201,746,995,868) Morgan Stanley 3/8/2021 179,724 0.00 %USD 25,543,977 COP (94,924,484,800) Citibank NA 3/8/2021 163,447 0.00 %USD 6,168,424 AUD (8,000,000) State Street Bank & Trust Co. 2/7/2021 162,422 0.00 %USD 3,538,378 PEN (13,000,000) Citibank NA 2/7/2021 146,336 0.00 %USD 6,606,187 CAD (8,000,000) JPMorgan Chase Bank 2/7/2021 145,717 0.00 %USD 9,143,034 JPY (1,000,000,000) BNP Paribas 2/7/2021 133,214 0.00 %USD 9,000,576 KRW (10,000,000,000) BNP Paribas 2/7/2021 120,764 0.00 %USD 9,125,761 JPY (1,000,000,000) JPMorgan Chase Bank 2/7/2021 115,940 0.00 %USD 80,299,364 MYR (333,402,958) BNP Paribas 3/8/2021 103,143 0.00 %USD 10,914,171 JPY (1,200,000,000) State Street Bank & Trust Co. 2/7/2021 102,386 0.00 %USD 6,943,191 RUB (500,000,000) JPMorgan Chase Bank 1/7/2021 98,916 0.00 %USD 8,370,750 GBP (6,000,000) BNP Paribas 2/7/2021 82,049 0.00 %USD 49,020,987 DKK (306,690,000) Bank of America 3/8/2021 81,080 0.00 %USD 29,112,644 CZK (624,670,000) BNP Paribas 3/8/2021 74,834 0.00 %USD 77,831,485 MYR (322,809,976) BNP Paribas 2/7/2021 74,054 0.00 %USD 10,256,636 PEN (39,060,346) Citibank NA 2/7/2021 64,765 0.00 %USD 33,736,966 ILS (109,745,000) BNP Paribas 2/7/2021 57,359 0.00 %USD 2,391,727 SEK (20,000,000) BNP Paribas 2/7/2021 53,134 0.00 %USD 6,691,849 EUR (5,600,000) BNP Paribas 2/7/2021 50,805 0.00 %USD 4,548,328 JPY (500,000,000) BNP Paribas 2/7/2021 43,417 0.00 %USD 1,087,401 NZD (1,500,000) State Street Bank & Trust Co. 2/7/2021 39,276 0.00 %USD 69,259,982 THB (2,219,055,205) BNP Paribas 3/8/2021 29,890 0.00 %USD 3,631,227 JPY (400,000,000) JPMorgan Chase Bank 2/7/2021 27,299 0.00 %USD 44,700,477 PLN (170,050,000) UBS AG 3/8/2021 25,707 0.00 %USD 2,093,072 IDR (30,000,000,000) Standard Chartered Bank 2/7/2021 24,106 0.00 %USD 770,864 AUD (1,000,000) BNP Paribas 2/7/2021 20,114 0.00 %USD 2,568,618 MYR (10,592,982) BNP Paribas 2/7/2021 17,015 0.00 %USD 104,948,425 CNH (679,566,238) Standard Chartered Bank 3/8/2021 15,184 0.00 %USD 47,593,254 SGD (63,965,000) UBS AG 3/8/2021 11,117 0.00 %USD 760,333 AUD (1,000,000) BNP Paribas 2/7/2021 9,583 0.00 %USD 58,445,782 MXN (1,168,195,000) State Street Bank & Trust Co. 3/8/2021 7,786 0.00 %USD 825,531 KRW (921,754,940) BNP Paribas 2/7/2021 7,030 0.00 %USD 447,108 KRW (497,076,598) Standard Chartered Bank 2/7/2021 5,713 0.00 %USD 90,192,460 EUR (76,000,000) Morgan Stanley 3/8/2021 3,051 0.00 %USD 2,065,547 IDR (30,000,000,000) Standard Chartered Bank 3/8/2021 1,923 0.00 %USD 1,932,741 HKD (15,000,000) JPMorgan Chase Bank 6/7/2021 1,191 0.00 %USD 6,461,561 CAD (8,000,000) BNP Paribas 2/7/2021 1,091 0.00 %USD 35,230,412 GBP (25,500,000) Morgan Stanley 3/8/2021 270 0.00 %USD 2,001,182 MXN (40,000,000) BNP Paribas 3/8/2021 215 0.00 %USD 4,463,299 SGD (6,000,000) BNP Paribas 3/8/2021 33 0.00 %USD 1,931,701 HKD (15,000,000) JPMorgan Chase Bank 3/8/2021 33 0.00 %HKD 15,000,000 USD (1,931,534) JPMorgan Chase Bank 6/7/2021 17 0.00 %USD 12,992,891 CHF (12,000,000) BNP Paribas 3/8/2021 (507 ) (0.00 %)USD 100,035,598 JPY (11,100,000,000) UBS AG 3/8/2021 (661 ) (0.00 %)USD 650,748,595 CAD (805,835,000) Toronto-Dominion Bank 3/8/2021 (2,102 ) (0.00 %)USD 911,684,227 GBP (659,890,000) Toronto-Dominion Bank 3/8/2021 (2,785 ) (0.00 %)USD 219,180,372 AUD (291,905,000) State Street Bank & Trust Co. 4/8/2021 (3,234 ) (0.00 %)USD 140,168,347 CHF (129,455,000) JPMorgan Chase Bank 3/8/2021 (3,339 ) (0.00 %)USD 157,678,920 AUD (210,000,000) BNP Paribas 4/8/2021 (4,426 ) (0.00 %)USD 20,444,195 HUF (6,056,000,000) BNP Paribas 3/8/2021 (7,792 ) (0.00 %)USD 2,993,512 AUD (4,000,000) Goldman Sachs International 2/7/2021 (9,489 ) (0.00 %)USD 33,678,160 ILS (109,745,000) BNP Paribas 3/8/2021 (10,845 ) (0.00 %)CNH 679,566,238 USD (105,161,175) Standard Chartered Bank 6/7/2021 (11,553 ) (0.00 %)USD 898,907,070 EUR (757,500,000) BNP Paribas 3/8/2021 (20,269 ) (0.00 %)USD 44,613,571 IDR (648,949,000,000) Standard Chartered Bank 3/8/2021 (25,983 ) (0.00 %)USD 44,613,571 IDR (648,949,000,000) Standard Chartered Bank 3/8/2021 (25,983 ) (0.00 %)USD 1,186,676,000 EUR (1,000,000,000) Citibank NA 3/8/2021 (26,758 ) (0.00 %)USD 2,324,362,939 EUR (1,958,705,029) Toronto-Dominion Bank 3/8/2021 (37,721 ) (0.00 %)USD 1,803,746,000 EUR (1,520,000,000) Morgan Stanley 3/8/2021 (42,193 ) (0.00 %)USD 35,182,561 NZD (50,415,000) Barclays Bank plc 3/8/2021 (42,877 ) (0.00 %)COP 94,924,484,800 USD (25,586,115) Citibank NA 2/7/2021 (164,453 ) (0.00 %)USD 25,240,503 COP (94,924,484,800) BNP Paribas 2/7/2021 (181,158 ) (0.00 %)USD 58,313,533 MXN (1,168,195,000) State Street Bank & Trust Co. 2/7/2021 (358,776 ) (0.00 %)USD 45,133,667 RUB (3,331,000,000) JPMorgan Chase Bank 1/7/2021 (462,898 ) (0.00 %)USD 13,110,135 PEN (52,060,346) Citibank NA 3/8/2021 (513,082 ) (0.00 %)USD 330,326,672 KRW (373,503,671,762) BNP Paribas 3/8/2021 (1,276,702 ) (0.00 %)test 259,960,204 1.18 %

558
Vanguard Global Bond Index Fund
CurrencyBuy
Amount Currency(Sell)
Amount CounterpartySettlement
Date
Unrealised Gain/(Loss)
US Dollars ($)% of Total
Net AssetsHedge Share Class Level Forward Currency Exchange Contracts (2.34%) (2020: 1.92%)USD 1,433,476,688 GBP (1,035,726,601) BNP Paribas 2/7/2021 2,672,005 0.01 %USD 1,384,060,000 GBP (1,000,000,000) BNP Paribas 2/7/2021 2,609,836 0.01 %USD 1,383,700,000 GBP (1,000,000,000) Morgan Stanley 2/7/2021 2,249,837 0.01 %USD 1,383,400,000 GBP (1,000,000,000) Toronto-Dominion Bank 2/7/2021 1,949,837 0.01 %USD 1,382,700,000 GBP (1,000,000,000) Toronto-Dominion Bank 2/7/2021 1,249,836 0.00 %USD 1,382,600,000 GBP (1,000,000,000) Goldman Sachs International 2/7/2021 1,149,837 0.00 %USD 1,382,300,000 GBP (1,000,000,000) BNP Paribas 2/7/2021 849,836 0.00 %GBP 747,000,000 USD (1,031,766,111) BNP Paribas 3/8/2021 269,832 0.00 %USD 31,199,184 GBP (22,417,668) BNP Paribas 2/7/2021 230,293 0.00 %USD 4,472,804 EUR (3,673,378) BNP Paribas 2/7/2021 116,543 0.00 %GBP 253,000,000 USD (349,446,889) BNP Paribas 3/8/2021 91,389 0.00 %USD 3,216,903 EUR (2,639,259) BNP Paribas 2/7/2021 87,004 0.00 %USD 10,592,048 EUR (8,867,764) BNP Paribas 2/7/2021 75,762 0.00 %USD 2,065,854 GBP (1,457,659) BNP Paribas 2/7/2021 52,171 0.00 %EUR 1,894,931,524 USD (2,248,683,973) Toronto-Dominion Bank 3/8/2021 36,493 0.00 %USD 6,043,756 EUR (5,067,183) Morgan Stanley 2/7/2021 34,581 0.00 %CHF 1,322,990,554 USD (1,432,477,689) JPMorgan Chase Bank 3/8/2021 34,123 0.00 %USD 1,173,546 EUR (960,866) Morgan Stanley 2/7/2021 34,055 0.00 %USD 1,044,042 EUR (856,441) Morgan Stanley 2/7/2021 28,388 0.00 %EUR 1,000,000,000 USD (1,186,676,000) Citibank NA 3/8/2021 26,758 0.00 %GBP 10,997,337 USD (15,183,587) Goldman Sachs International 2/7/2021 8,686 0.00 %USD 615,674 EUR (516,786) BNP Paribas 2/7/2021 2,817 0.00 %GBP 351,000,000 USD (484,931,070) Toronto-Dominion Bank 3/8/2021 1,482 0.00 %USD 244,232 CHF (224,423) BNP Paribas 2/7/2021 1,442 0.00 %USD 55,163 EUR (45,483) JPMorgan Chase Bank 2/7/2021 1,225 0.00 %JPY 15,944,853,492 USD (143,698,465) UBS AG 3/8/2021 949 0.00 %USD 238,798 EUR (200,580) Morgan Stanley 2/7/2021 930 0.00 %USD 33,577 EUR (27,576) BNP Paribas 2/7/2021 875 0.00 %EUR 52,240,641 USD (61,993,363) Morgan Stanley 3/8/2021 750 0.00 %USD 13,691 EUR (11,301) JPMorgan Chase Bank 2/7/2021 289 0.00 %EUR 11,359,546 USD (13,480,237) Citibank NA 3/8/2021 168 0.00 %EUR 2,094,745 USD (2,484,047) Goldman Sachs International 2/7/2021 112 0.00 %CHF 5,099,196 USD (5,521,234) JPMorgan Chase Bank 3/8/2021 90 0.00 %USD 17,152 EUR (14,407) Morgan Stanley 2/7/2021 67 0.00 %CHF 714,587 USD (773,715) Morgan Stanley 3/8/2021 28 0.00 %USD 3,630 JPY (399,991) BNP Paribas 2/7/2021 26 0.00 %USD 1,431,265,813 CHF (1,322,990,554) JPMorgan Chase Bank 2/7/2021 — 0.00 %USD 16,448 EUR (13,860) Morgan Stanley 3/8/2021 — 0.00 %JPY 65,866,024 USD (593,603) Morgan Stanley 3/8/2021 — 0.00 %JPY 14,500,003 USD (130,678) Morgan Stanley 3/8/2021 — 0.00 %USD 143,660,271 JPY (15,944,853,492) UBS AG 2/7/2021 — 0.00 %USD 78,742,650 GBP (57,000,000) Toronto-Dominion Bank 2/7/2021 (9 ) (0.00 %)USD 484,888,950 GBP (351,000,000) Toronto-Dominion Bank 2/7/2021 (57 ) (0.00 %)JPY 8,799,987 USD (79,430) BNP Paribas 2/7/2021 (143 ) (0.00 %)GBP 22,735,524 USD (31,411,054) Morgan Stanley 3/8/2021 (241 ) (0.00 %)GBP 57,000,000 USD (78,750,003) Toronto-Dominion Bank 3/8/2021 (272 ) (0.00 %)JPY 15,299,950 USD (138,137) BNP Paribas 2/7/2021 (287 ) (0.00 %)USD 2,597,126,000 GBP (1,880,000,000) State Street Bank & Trust Co. 2/7/2021 (307 ) (0.00 %)JPY 34,199,996 USD (308,541) BNP Paribas 2/7/2021 (405 ) (0.00 %)JPY 22,200,060 USD (200,507) BNP Paribas 2/7/2021 (488 ) (0.00 %)USD 1,185,900,000 EUR (1,000,000,000) Citibank NA 2/7/2021 (591 ) (0.00 %)JPY 24,000,044 USD (216,957) Morgan Stanley 2/7/2021 (721 ) (0.00 %)JPY 6,000,043 USD (54,840) Morgan Stanley 2/7/2021 (781 ) (0.00 %)CHF 29,769 USD (33,118) BNP Paribas 2/7/2021 (913 ) (0.00 %)CHF 501,692 USD (543,788) Goldman Sachs International 2/7/2021 (1,037 ) (0.00 %)JPY 8,999,943 USD (82,127) BNP Paribas 2/7/2021 (1,039 ) (0.00 %)USD 2,247,199,294 EUR (1,894,931,524) Toronto-Dominion Bank 2/7/2021 (1,119 ) (0.00 %)JPY 18,000,007 USD (163,410) BNP Paribas 2/7/2021 (1,233 ) (0.00 %)GBP 46,531,973 USD (64,288,616) Citibank NA 3/8/2021 (1,241 ) (0.00 %)GBP 1,880,000,000 USD (2,597,361,000) State Street Bank & Trust Co. 3/8/2021 (1,465 ) (0.00 %)JPY 13,499,993 USD (123,545) BNP Paribas 2/7/2021 (1,912 ) (0.00 %)JPY 17,000,016 USD (155,138) JPMorgan Chase Bank 2/7/2021 (1,971 ) (0.00 %)EUR 302,845 USD (361,222) BNP Paribas 2/7/2021 (2,078 ) (0.00 %)JPY 19,000,102 USD (173,376) Morgan Stanley 2/7/2021 (2,189 ) (0.00 %)EUR 235,265 USD (281,206) BNP Paribas 2/7/2021 (2,205 ) (0.00 %)CHF 249,599 USD (272,276) BNP Paribas 2/7/2021 (2,250 ) (0.00 %)EUR 78,691 USD (95,762) BNP Paribas 2/7/2021 (2,442 ) (0.00 %)JPY 25,999,939 USD (237,458) BNP Paribas 2/7/2021 (3,203 ) (0.00 %)EUR 127,289 USD (154,207) JPMorgan Chase Bank 2/7/2021 (3,255 ) (0.00 %)

559
Vanguard Global Bond Index Fund
CurrencyBuy
Amount Currency(Sell)
Amount CounterpartySettlement
Date
Unrealised Gain/(Loss)
US Dollars ($)% of Total
Net AssetsCHF 386,785 USD (422,219) BNP Paribas 2/7/2021 (3,779 ) (0.00 %)JPY 54,000,050 USD (490,593) BNP Paribas 2/7/2021 (4,063 ) (0.00 %)JPY 42,500,153 USD (387,255) JPMorgan Chase Bank 2/7/2021 (4,337 ) (0.00 %)USD 6,150,065 GBP (4,454,639) Barclays Bank plc 3/8/2021 (4,349 ) (0.00 %)JPY 68,499,989 USD (621,527) BNP Paribas 2/7/2021 (4,354 ) (0.00 %)CHF 151,645 USD (168,622) JPMorgan Chase Bank 2/7/2021 (4,566 ) (0.00 %)JPY 36,113,113 USD (330,183) BNP Paribas 2/7/2021 (4,811 ) (0.00 %)JPY 134,999,857 USD (1,221,687) Morgan Stanley 2/7/2021 (5,363 ) (0.00 %)EUR 199,298 USD (241,750) BNP Paribas 2/7/2021 (5,403 ) (0.00 %)CHF 509,022 USD (556,357) BNP Paribas 2/7/2021 (5,676 ) (0.00 %)CHF 834,048 USD (908,346) BNP Paribas 2/7/2021 (6,039 ) (0.00 %)EUR 1,448,024 USD (1,723,283) JPMorgan Chase Bank 2/7/2021 (6,071 ) (0.00 %)JPY 78,499,915 USD (713,978) Morgan Stanley 2/7/2021 (6,708 ) (0.00 %)JPY 97,000,026 USD (882,376) BNP Paribas 2/7/2021 (8,423 ) (0.00 %)CHF 2,194,828 USD (2,383,823) Morgan Stanley 2/7/2021 (9,367 ) (0.00 %)GBP 1,067,740 USD (1,484,670) BNP Paribas 2/7/2021 (9,640 ) (0.00 %)CHF 1,624,200 USD (1,767,045) Morgan Stanley 2/7/2021 (9,918 ) (0.00 %)JPY 83,999,989 USD (768,008) BNP Paribas 2/7/2021 (11,183 ) (0.00 %)EUR 500,583 USD (607,853) BNP Paribas 2/7/2021 (14,211 ) (0.00 %)CHF 411,144 USD (459,120) BNP Paribas 2/7/2021 (14,327 ) (0.00 %)EUR 521,733 USD (636,119) BNP Paribas 2/7/2021 (17,395 ) (0.00 %)CHF 566,392 USD (630,230) JPMorgan Chase Bank 2/7/2021 (17,484 ) (0.00 %)CHF 560,479 USD (623,895) JPMorgan Chase Bank 2/7/2021 (17,546 ) (0.00 %)CHF 598,066 USD (666,089) Morgan Stanley 2/7/2021 (19,076 ) (0.00 %)EUR 2,293,657 USD (2,740,858) BNP Paribas 2/7/2021 (20,809 ) (0.00 %)CHF 880,416 USD (974,087) BNP Paribas 2/7/2021 (21,617 ) (0.00 %)JPY 265,599,981 USD (2,415,268) JPMorgan Chase Bank 2/7/2021 (22,259 ) (0.00 %)CHF 740,282 USD (824,302) BNP Paribas 2/7/2021 (23,435 ) (0.00 %)CHF 763,943 USD (853,071) Morgan Stanley 2/7/2021 (26,606 ) (0.00 %)GBP 2,108,035 USD (2,940,972) BNP Paribas 2/7/2021 (28,827 ) (0.00 %)CHF 982,863 USD (1,093,773) BNP Paribas 2/7/2021 (30,471 ) (0.00 %)CHF 7,287,627 USD (7,918,347) BNP Paribas 2/7/2021 (34,291 ) (0.00 %)GBP 21,279,549 USD (29,436,085) Bank of America 2/7/2021 (39,449 ) (0.00 %)CHF 1,402,766 USD (1,562,988) BNP Paribas 2/7/2021 (45,418 ) (0.00 %)CHF 1,378,749 USD (1,541,072) BNP Paribas 2/7/2021 (49,484 ) (0.00 %)CHF 1,479,451 USD (1,652,342) JPMorgan Chase Bank 2/7/2021 (51,811 ) (0.00 %)GBP 1,798,196 USD (2,543,221) BNP Paribas 2/7/2021 (59,103 ) (0.00 %)EUR 1,524,689 USD (1,868,023) JPMorgan Chase Bank 2/7/2021 (59,893 ) (0.00 %)EUR 2,447,864 USD (2,967,418) BNP Paribas 2/7/2021 (64,495 ) (0.00 %)CHF 2,262,508 USD (2,517,638) BNP Paribas 2/7/2021 (69,963 ) (0.00 %)GBP 10,651,885 USD (14,801,178) BNP Paribas 2/7/2021 (86,129 ) (0.00 %)USD 349,415,770 GBP (253,000,000) BNP Paribas 2/7/2021 (91,121 ) (0.00 %)GBP 3,374,638 USD (4,766,998) Morgan Stanley 2/7/2021 (105,104 ) (0.00 %)GBP 2,906,168 USD (4,120,740) JPMorgan Chase Bank 2/7/2021 (106,014 ) (0.00 %)GBP 24,443,436 USD (33,951,603) BNP Paribas 2/7/2021 (184,214 ) (0.00 %)EUR 5,562,604 USD (6,804,906) BNP Paribas 2/7/2021 (208,211 ) (0.00 %)GBP 6,873,013 USD (9,708,055) JPMorgan Chase Bank 2/7/2021 (213,330 ) (0.00 %)USD 1,031,674,230 GBP (747,000,000) BNP Paribas 2/7/2021 (269,042 ) (0.00 %)GBP 8,458,051 USD (11,968,560) Morgan Stanley 2/7/2021 (284,184 ) (0.00 %)GBP 20,735,333 USD (28,966,389) BNP Paribas 2/7/2021 (321,560 ) (0.00 %)GBP 32,813,360 USD (45,652,079) BNP Paribas 2/7/2021 (322,058 ) (0.00 %)GBP 10,025,163 USD (14,207,681) JPMorgan Chase Bank 2/7/2021 (358,418 ) (0.00 %)EUR 12,359,619 USD (15,068,834) Morgan Stanley 2/7/2021 (411,554 ) (0.00 %)GBP 12,214,120 USD (17,305,258) BNP Paribas 2/7/2021 (432,060 ) (0.00 %)GBP 17,337,603 USD (24,425,369) Citibank NA 2/7/2021 (474,335 ) (0.00 %)GBP 16,584,973 USD (23,392,093) BNP Paribas 2/7/2021 (480,779 ) (0.00 %)GBP 18,667,948 USD (26,346,112) BNP Paribas 2/7/2021 (557,273 ) (0.00 %)GBP 18,525,505 USD (26,241,741) Morgan Stanley 2/7/2021 (649,679 ) (0.00 %)GBP 26,248,282 USD (37,063,808) JPMorgan Chase Bank 2/7/2021 (803,114 ) (0.00 %)GBP 1,000,000,000 USD (1,382,423,000) BNP Paribas 3/8/2021 (848,779 ) (0.00 %)GBP 24,454,753 USD (34,700,610) JPMorgan Chase Bank 2/7/2021 (917,587 ) (0.00 %)GBP 1,000,000,000 USD (1,382,716,000) Goldman Sachs International 3/8/2021 (1,141,779 ) (0.01 %)JPY 14,871,040,330 USD (135,133,414) Toronto-Dominion Bank 2/7/2021 (1,148,007 ) (0.01 %)GBP 1,000,000,000 USD (1,382,812,000) Toronto-Dominion Bank 3/8/2021 (1,237,779 ) (0.01 %)GBP 1,000,000,000 USD (1,383,509,000) Toronto-Dominion Bank 3/8/2021 (1,934,779 ) (0.01 %)GBP 1,000,000,000 USD (1,383,809,000) Morgan Stanley 3/8/2021 (2,234,779 ) (0.01 %)GBP 1,000,000,000 USD (1,384,168,000) BNP Paribas 3/8/2021 (2,593,779 ) (0.01 %)GBP 1,035,726,601 USD (1,433,595,796) BNP Paribas 3/8/2021 (2,662,624 ) (0.01 %)EUR 87,000,000 USD (106,039,950) Toronto-Dominion Bank 2/7/2021 (2,866,599 ) (0.01 %)GBP 709,036,840 USD (1,005,449,691) Toronto-Dominion Bank 2/7/2021 (25,950,632 ) (0.12 %)

560
Vanguard Global Bond Index Fund
CurrencyBuy
Amount Currency(Sell)
Amount CounterpartySettlement
Date
Unrealised Gain/(Loss)
US Dollars ($)% of Total
Net AssetsGBP 1,000,000,000 USD (1,417,850,000) HSBC Bank 2/7/2021 (36,399,837 ) (0.17 %)GBP 1,000,000,000 USD (1,417,956,000) Morgan Stanley 2/7/2021 (36,505,837 ) (0.17 %)GBP 1,000,000,000 USD (1,418,449,000) Goldman Sachs International 2/7/2021 (36,998,837 ) (0.17 %)GBP 1,000,000,000 USD (1,418,453,000) Morgan Stanley 2/7/2021 (37,002,837 ) (0.17 %)GBP 1,000,000,000 USD (1,419,450,000) Morgan Stanley 2/7/2021 (37,999,837 ) (0.17 %)GBP 1,000,000,000 USD (1,419,550,000) Toronto-Dominion Bank 2/7/2021 (38,099,837 ) (0.17 %)GBP 1,000,000,000 USD (1,419,850,000) Goldman Sachs International 2/7/2021 (38,399,837 ) (0.17 %)CHF 1,297,418,703 USD (1,442,635,873) JPMorgan Chase Bank 2/7/2021 (39,034,744 ) (0.18 %)GBP 1,131,000,000 USD (1,603,657,907) BNP Paribas 2/7/2021 (41,237,772 ) (0.19 %)GBP 1,216,000,000 USD (1,724,178,560) Toronto-Dominion Bank 2/7/2021 (44,335,161 ) (0.20 %)EUR 2,801,115,642 USD (3,414,156,607) UBS AG 2/7/2021 (92,311,912 ) (0.42 %)test (515,249,272 ) (2.34 %)Total Financial Derivative Instruments (255,514,816 ) (1.16 %)
Fair Value US Dollars ($)
% of Total Net Assets
Other Assets and Liabilities 496,554,741 2.25 %Net Assets 22,042,118,320 100.00 %
Analysis of Total Net Assets US Dollars ($)% of Total
Net Assets(a) Transferable securities admitted to an official stock exchange listing 16,070,496,595 72.91%(b) Transferable securities dealt in on another regulated market 4,996,323,781 22.67%(c) Transferable securities other than those admitted to an official stock exchange listing or dealt in on another regulated
market 734,258,019 3.33%
(d) Financial derivative instruments (255,514,816) (1.16%)(e) Other assets and liabilities 496,554,741 2.25%Total Net Assets 22,042,118,320 100.00%
^ Floating Rate Note (FRN). The effective interest rate is at 30 June 2021.1 Denotes securities pledged in full or part thereof as collateral for derivatives.2 Centrally cleared swap contracts.

The accompanying notes form an integral part of the financial statements.
561
Vanguard Global Bond Index Fund
Statement of Assets and Liabilities
US Dollars ($)
As at 30 June 2021
US Dollars ($)
As at 31 December 2020
Current AssetsFinancial Assets at Fair Value Through Profit or Loss 21,801,078,395 19,842,933,989 Financial Derivative Instruments 277,064,142 406,900,327 Cash 499,495,962 496,168,218 Receivables: Interest and Dividends 103,248,482 101,755,578 Capital Shares Issued 156,255,187 131,004,475 Investments Sold 268,800,897 71,840,416 Futures Margin Cash 71,412 —
Total Current Assets 23,106,014,477 21,050,603,003
Current LiabilitiesFinancial Derivative Instruments 532,578,958 248,783,887 Bank Overdraft 66,992 125,283 Unrealised Depreciation on Spot Currency Contracts 583,332 4,263,563 Payables and Other Liabilities: Investments Purchased 498,242,208 463,396,480 Income Distribution Payable 6,656,104 6,078,000 Capital Shares Redeemed 23,273,506 8,118,347 Futures Margin Cash Due to Broker — 11,121 Management Fees Payable 2,485,951 2,262,535 Other Payables 9,106 —
Total Current Liabilities 1,063,896,157 733,039,216
Net Assets Attributable to Holders of Redeemable Participating Shares (“Net Assets”) 22,042,118,320 20,317,563,787
Net Asset Value Per Share
.As at
30 June 2021As at
31 December 2020As at
31 December 2019CHF Hedged AccUS ($) Equivalent 614,569,691 806,207,974 792,559,475Net Assets 568,077,494 712,647,539 767,474,968Number of Shares Outstanding 4,160,516 5,094,460 5,729,251Net Asset Value Per Share1 136.54 139.89 133.96
CHF Hedged Dist2
US ($) Equivalent 33,305,974 — —Net Assets 30,786,377 — —Number of Shares Outstanding 315,011 — —Net Asset Value Per Share1 97.73 — —
Institutional Plus CHF Hedged AccUS ($) Equivalent 791,296,866 782,844,542 488,937,942Net Assets 731,435,258 691,995,433 473,463,056Number of Shares Outstanding 6,706,743 6,194,755 4,427,672Net Asset Value Per Share1 109.06 111.71 106.93
EUR Hedged AccUS ($) Equivalent 2,064,829,780 1,587,453,314 1,113,250,529Net Assets 1,741,150,008 1,297,415,993 991,759,945Number of Shares Outstanding 15,939,414 11,609,118 9,299,596Net Asset Value Per Share1 109.24 111.76 106.65
EUR Hedged Dist2
US ($) Equivalent 47,356,591 — —Net Assets 39,933,039 — —Number of Shares Outstanding 408,044 — —Net Asset Value Per Share1 97.86 — —

562
Vanguard Global Bond Index Fund
The accompanying notes form an integral part of the financial statements.
Net Asset Value Per Share (continued)
.As at
30 June 2021As at
31 December 2020As at
31 December 2019Institutional Plus EUR Hedged AccUS ($) Equivalent 1,399,856,532 1,839,424,136 3,140,376,572Net Assets 1,180,417,018 1,503,350,222 2,797,662,893Number of Shares Outstanding 10,056,287 12,521,503 24,429,862Net Asset Value Per Share1 117.38 120.06 114.52
GBP Hedged AccUS ($) Equivalent 10,836,361,425 9,121,882,321 6,129,100,961Net Assets 7,844,193,985 6,673,164,802 4,626,609,684Number of Shares Outstanding 48,040,009 40,090,217 29,332,754Net Asset Value Per Share1 163.28 166.45 157.73
GBP Hedged DistUS ($) Equivalent 1,205,490,364 1,079,545,705 732,421,840Net Assets 872,626,880 789,747,790 552,875,536Number of Shares Outstanding 6,278,871 5,537,529 4,027,969Net Asset Value Per Share1 138.98 142.62 137.26
Institutional Plus GBP Hedged AccUS ($) Equivalent 1,641,977,151 1,560,267,913 1,088,139,130Net Assets 1,188,589,674 1,141,422,850 821,392,088Number of Shares Outstanding 9,825,682 9,258,469 7,035,043Net Asset Value Per Share1 120.97 123.28 116.76
Institutional Plus GBP Hedged DistUS ($) Equivalent 673,918,926 658,133,074 717,082,499Net Assets 487,834,484 481,460,987 541,296,490Number of Shares Outstanding 4,536,746 4,363,228 5,096,560Net Asset Value Per Share1 107.53 110.35 106.21
Institutional Plus JPY Hedged AccUS ($) Equivalent 144,448,347 56,865 51,408Net Assets 16,032,322,034 5,871,027 5,586,764Number of Shares Outstanding 1,519,454 545 545Net Asset Value Per Share1 10,551.37 10,772.53 10,250.94
USD Hedged AccNet Assets 1,692,808,438 1,508,526,410 1,097,877,881Number of Shares Outstanding 10,170,846 8,894,648 6,869,857Net Asset Value Per Share1 166.44 169.60 159.81
USD Hedged Dist2
Net Assets 13,750,766 — —Number of Shares Outstanding 140,017 — —Net Asset Value Per Share1 98.21 — —
Investor USD HedgedNet Assets 37,764,755 48,725,075 46,169,706Number of Shares Outstanding 309,488 391,865 394,057Net Asset Value Per Share1 122.02 124.34 117.17
Institutional Plus USD Hedged AccNet Assets 800,151,741 1,178,899,530 1,377,866,186Number of Shares Outstanding 6,521,714 9,431,928 11,704,847Net Asset Value Per Share1 122.69 124.99 117.72
Institutional Plus USD Hedged DistNet Assets 44,230,973 40,960,943 51,996,097Number of Shares Outstanding 404,693 365,370 484,633Net Asset Value Per Share1 109.30 112.11 107.29
1 The net asset value per share shown may diverge from the net asset value per share used for dealing purposes because of any adjustments for swing pricing and trade date accounting.2 The share class was launched on 21 January 2021.
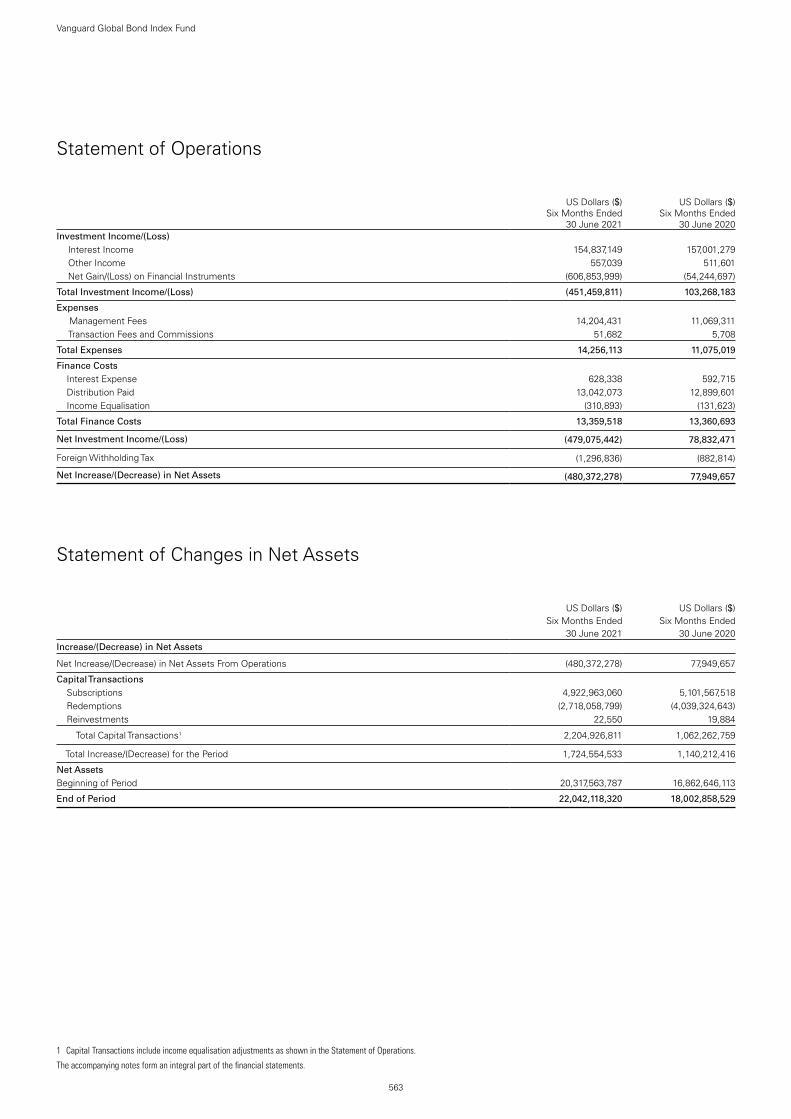
563
Vanguard Global Bond Index Fund
The accompanying notes form an integral part of the financial statements.
Statement of Operations
US Dollars ($)
Six Months Ended 30 June 2021
US Dollars ($)
Six Months Ended 30 June 2020
Investment Income/(Loss) Interest Income 154,837,149 157,001,279 Other Income 557,039 511,601 Net Gain/(Loss) on Financial Instruments (606,853,999) (54,244,697)
Total Investment Income/(Loss) (451,459,811) 103,268,183
Expenses Management Fees 14,204,431 11,069,311 Transaction Fees and Commissions 51,682 5,708
Total Expenses 14,256,113 11,075,019
Finance Costs Interest Expense 628,338 592,715 Distribution Paid 13,042,073 12,899,601 Income Equalisation (310,893) (131,623)
Total Finance Costs 13,359,518 13,360,693
Net Investment Income/(Loss) (479,075,442) 78,832,471
Foreign Withholding Tax (1,296,836) (882,814)
Net Increase/(Decrease) in Net Assets (480,372,278) 77,949,657
Statement of Changes in Net Assets
US Dollars ($)
US Dollars ($)
Six Months Ended Six Months Ended30 June 2021 30 June 2020
Increase/(Decrease) in Net Assets
Net Increase/(Decrease) in Net Assets From Operations (480,372,278) 77,949,657
Capital Transactions Subscriptions 4,922,963,060 5,101,567,518 Redemptions (2,718,058,799) (4,039,324,643) Reinvestments 22,550 19,884
Total Capital Transactions1 2,204,926,811 1,062,262,759
Total Increase/(Decrease) for the Period 1,724,554,533 1,140,212,416
Net AssetsBeginning of Period 20,317,563,787 16,862,646,113
End of Period 22,042,118,320 18,002,858,529
1 Capital Transactions include income equalisation adjustments as shown in the Statement of Operations.

Vanguard Global Corporate Bond Index FundManaged by Vanguard Global Advisers, LLC.
564
Investment ObjectiveThe fund seeks to provide returns consistent with the performance of the Bloomberg Barclays Global Aggregate Float Adjusted Corporate Index Hedged, a market-weighted index of global corporate fixed income investments with maturities greater than 1 year.
Performance SummaryThe Performance Summary does not form part of the Financial Statements.
• As the six months ended 30 June 2021 came to a close, macroeconomic indicators signalled a faster global economic rebound than many had expected after the sharpest contraction in modern history. Yet the recovery has been uneven. Countries that have contained the virus more successfully, whether through vaccinations, lockdowns or both, generally have fared better economically. And the COVID-19 pandemic remained far from over, with new variants of the virus surfacing where vaccination rates have lagged and the human toll continuing to mount, especially in less developed economies.
• Swift and extensive support from governments and central banks has been a key to the rebound. So far in 2021, it has included fiscal stimulus – including the $1.9 trillion American Rescue Plan in the United States and the €673 billion Recovery and Resilience Facility in Europe – and pledges by a number of central banks to keep interest rates low for some time.
• Stock markets worldwide continued the rally that began in 2020, bolstered by reopening economies, more consumer spending and rising corporate profits. They posted strong gains for the six months ended 30 June 2021.
• Fixed income securities struggled amid concerns that an upturn in inflation might persist or even accelerate given the stronger-than-expected rebound in global growth, extraordinary monetary and fiscal stimulus and a jump in demand for goods and services as economies reopened and supply gradually picked up. With longer-term yields rising and prices falling, returns were negative for the half year.
• In this environment, the fund’s benchmark returned –0.89% for the six months.
• By country, the United States, which accounts for more than half the index’s market value, was among the laggards, as were Canada and the United Kingdom. Some of the other heavyweights in the index, including Spain and China, posted positive returns.
• By sector, bonds issued by financial institutions and industrial companies outperformed those issued by utility companies.
• By maturity, longer-dated bonds underperformed. From a credit-quality perspective, results were mixed.
Benchmark returns in the commentary above are in US dollars.

565
Vanguard Global Corporate Bond Index Fund
Benchmark: Bloomberg Barclays Global Aggregate Float Adjusted Corporate Index Hedged
Total ReturnsPeriods Ended 30 June 2021
(Annualised for periods over one year)
Six MonthsTen Years or
Since Inception1
CHF Hedged Acc — -0.40 %
Benchmark — -0.66
Tracking Difference* 0.26
EUR Hedged Acc — -0.27 %
Benchmark — -0.52
Tracking Difference* 0.25
Institutional Plus EUR Hedged Acc -1.04 % 3.42 %
Benchmark -1.32 3.51
Tracking Difference* 0.28
GBP Hedged Acc -0.71 % 3.63 %
Benchmark -0.93 3.79
Tracking Difference* 0.22
GBP Hedged Dist — -0.22 %
Benchmark — -0.18
Tracking Difference* -0.04
Institutional Plus GBP Hedged Acc -0.68 % 3.73 %
Benchmark -0.93 3.79
Tracking Difference* 0.25
USD Hedged Acc -0.67 % 5.08 %
Benchmark -0.89 5.11
Tracking Difference* 0.22
Each benchmark is in its respective currency.Sources: Vanguard Global Advisers, LLC, and Bloomberg.Performance is based on NAV with net income reinvested.
All of the returns in this report represent past performance, which is not a guarantee of future results that may be achieved by the fund. For performance data current to the most recent month-end, which may be higher or lower than that cited, visit our website at http://global.vanguard.com. Note, too, that both investment returns and principal value can fluctuate widely, so an investor's shares, when sold, could be worth more or less than their original cost.* The tracking difference between the fund return and the index return over a stated period of time can be attributed to a number of factors, including, without limitation, small differences in
weightings, trading activity, transaction costs and differences in the valuation and withholding tax treatment between the fund and the index vendor.1 Since-inception returns: CHF Hedged Acc and EUR Hedged Acc, 21 January 2021; Institutional Plus EUR Hedged Acc, 7 February 2018; GBP Hedged Acc, 2 November 2017; GBP Hedged Dist, 21
January 2021; Institutional Plus GBP Hedged Acc and USD Hedged Acc, 2 November 2017.

Significant Portfolio ChangesFor the Six Months Ended 30 June 2021
566
Vanguard Global Corporate Bond Index Fund
The Central Bank of Ireland requires a schedule of material changes in the composition of the portfolio during the period. These are defined as aggregate purchases of a security exceeding 1% of the total value of purchases for the period and aggregate disposals greater than 1% of the total value of sales. At a minimum, the largest 20 purchases and 20 sales must be shown; all purchases and sales must be shown if there are fewer than 20. A full listing of the portfolio changes for the period is available, upon request, at no extra cost from the Administrator.
PrincipalCost
US Dollars ($)
Purchases
US Treasury Note 1.13% 15/2/2031 $13,550,000 13,008,920US Treasury Bond 1.63% 15/11/2050 $6,733,000 5,741,420US Treasury Note 0.50% 28/2/2026 $4,764,000 4,692,188US Treasury Note 0.88% 15/11/2030 $4,742,000 4,661,857US Treasury Note 1.63% 15/5/2031 $4,409,000 4,435,764US Treasury Note 0.38% 31/1/2026 $4,245,000 4,211,219US Treasury Note 0.75% 30/4/2026 $3,964,000 3,950,720US Treasury Bond 1.88% 15/2/2051 $4,209,000 3,868,811US Treasury Note 0.25% 15/3/2024 $3,119,000 3,112,423US Treasury Note 0.75% 31/5/2026 $3,074,000 3,067,370US Treasury Note 0.38% 31/12/2025 $3,045,000 3,037,689US Treasury Bond 1.88% 15/2/2041 $3,067,000 2,925,814US Treasury Note 0.13% 15/2/2024 $2,370,000 2,359,883US Treasury Bond 1.38% 15/8/2050 $2,535,000 2,288,057US Treasury Note 0.13% 28/2/2023 $2,225,000 2,223,766Apple, Inc. 0.70% 8/2/2026 $2,250,000 2,221,966US Treasury Note 1.25% 31/5/2028 $2,210,000 2,209,710JPMorgan Chase & Co. 3.21%
1/4/2023 $2,025,000 2,089,456US Treasury Note 0.13% 15/1/2024 $2,035,000 2,031,569Citigroup, Inc. 1.12% 28/1/2027 $2,000,000 1,980,900
PrincipalProceeds
US Dollars ($)
Sales
US Treasury Note 1.13% 15/2/2031 $13,545,000 13,001,150US Treasury Bond 1.63% 15/11/2050 $6,733,000 5,737,449US Treasury Note 0.88% 15/11/2030 $4,795,000 4,709,500US Treasury Note 0.50% 28/2/2026 $4,764,000 4,693,563US Treasury Note 1.63% 15/5/2031 $4,279,000 4,306,432US Treasury Note 0.38% 31/1/2026 $4,245,000 4,210,145US Treasury Note 0.75% 30/4/2026 $3,964,000 3,952,146US Treasury Bond 1.88% 15/2/2051 $4,204,000 3,874,857US Treasury Note 0.25% 15/3/2024 $3,119,000 3,112,388US Treasury Note 0.75% 31/5/2026 $3,059,000 3,053,200US Treasury Note 0.38% 31/12/2025 $3,045,000 3,037,938US Treasury Bond 1.88% 15/2/2041 $2,673,000 2,535,948JPMorgan Chase & Co. 3.21%
1/4/2023 $2,375,000 2,436,940US Treasury Note 0.13% 15/2/2024 $2,370,000 2,358,485US Treasury Bond 1.38% 15/8/2050 $2,535,000 2,274,284EDP Finance BV 2.63% 18/1/2022 €1,800,000 2,241,696US Treasury Note 0.13% 28/2/2023 $2,205,000 2,203,988US Treasury Note 1.25% 31/5/2028 $2,195,000 2,195,039US Treasury Note 0.13% 15/1/2024 $2,035,000 2,031,655Total Capital Canada Ltd. 1.13%
18/3/2022 €1,500,000 1,786,128
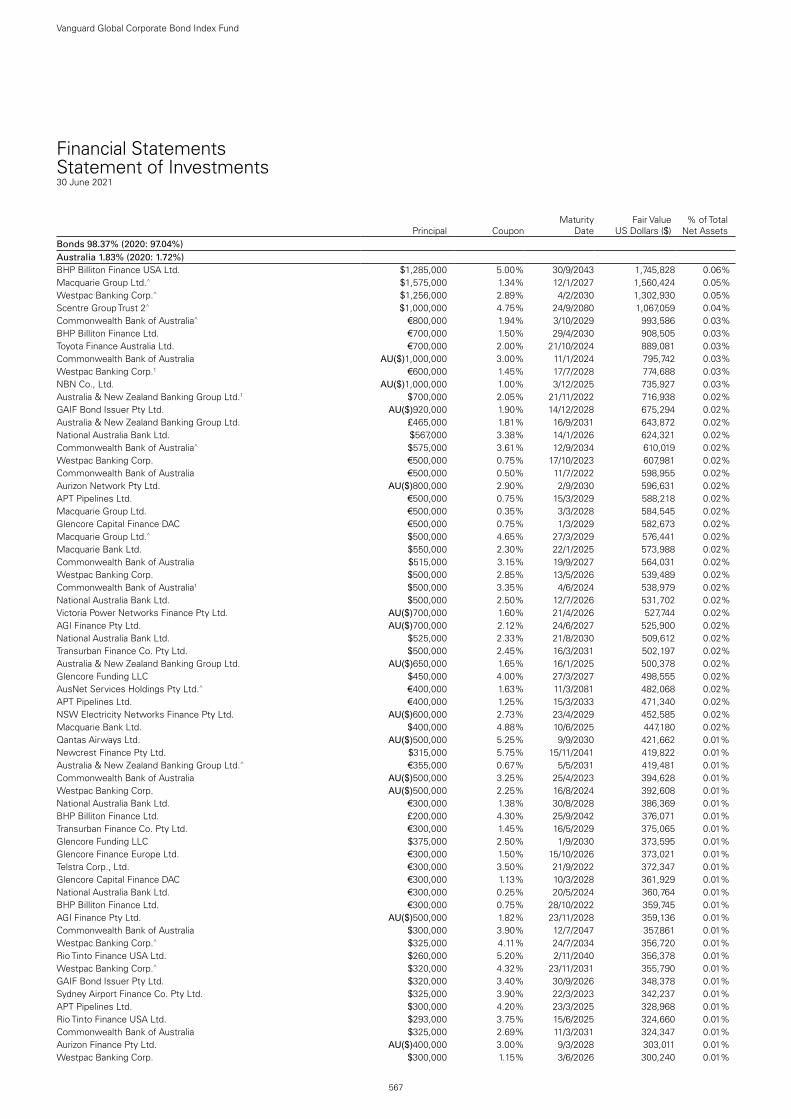
567
Vanguard Global Corporate Bond Index Fund
Financial StatementsStatement of Investments30 June 2021
Principal CouponMaturity
DateFair Value
US Dollars ($)% of Total
Net AssetsBonds 98.37% (2020: 97.04%)Australia 1.83% (2020: 1.72%)BHP Billiton Finance USA Ltd. $1,285,000 5.00% 30/9/2043 1,745,828 0.06%Macquarie Group Ltd.^ $1,575,000 1.34% 12/1/2027 1,560,424 0.05%Westpac Banking Corp.^ $1,256,000 2.89% 4/2/2030 1,302,930 0.05%Scentre Group Trust 2^ $1,000,000 4.75% 24/9/2080 1,067,059 0.04%Commonwealth Bank of Australia^ €800,000 1.94% 3/10/2029 993,586 0.03%BHP Billiton Finance Ltd. €700,000 1.50% 29/4/2030 908,505 0.03%Toyota Finance Australia Ltd. €700,000 2.00% 21/10/2024 889,081 0.03%Commonwealth Bank of Australia AU($)1,000,000 3.00% 11/1/2024 795,742 0.03%Westpac Banking Corp.1 €600,000 1.45% 17/7/2028 774,688 0.03%NBN Co., Ltd. AU($)1,000,000 1.00% 3/12/2025 735,927 0.03%Australia & New Zealand Banking Group Ltd.1 $700,000 2.05% 21/11/2022 716,938 0.02%GAIF Bond Issuer Pty Ltd. AU($)920,000 1.90% 14/12/2028 675,294 0.02%Australia & New Zealand Banking Group Ltd. £465,000 1.81% 16/9/2031 643,872 0.02%National Australia Bank Ltd. $567,000 3.38% 14/1/2026 624,321 0.02%Commonwealth Bank of Australia^ $575,000 3.61% 12/9/2034 610,019 0.02%Westpac Banking Corp. €500,000 0.75% 17/10/2023 607,981 0.02%Commonwealth Bank of Australia €500,000 0.50% 11/7/2022 598,955 0.02%Aurizon Network Pty Ltd. AU($)800,000 2.90% 2/9/2030 596,631 0.02%APT Pipelines Ltd. €500,000 0.75% 15/3/2029 588,218 0.02%Macquarie Group Ltd. €500,000 0.35% 3/3/2028 584,545 0.02%Glencore Capital Finance DAC €500,000 0.75% 1/3/2029 582,673 0.02%Macquarie Group Ltd.^ $500,000 4.65% 27/3/2029 576,441 0.02%Macquarie Bank Ltd. $550,000 2.30% 22/1/2025 573,988 0.02%Commonwealth Bank of Australia $515,000 3.15% 19/9/2027 564,031 0.02%Westpac Banking Corp. $500,000 2.85% 13/5/2026 539,489 0.02%Commonwealth Bank of Australia1 $500,000 3.35% 4/6/2024 538,979 0.02%National Australia Bank Ltd. $500,000 2.50% 12/7/2026 531,702 0.02%Victoria Power Networks Finance Pty Ltd. AU($)700,000 1.60% 21/4/2026 527,744 0.02%AGI Finance Pty Ltd. AU($)700,000 2.12% 24/6/2027 525,900 0.02%National Australia Bank Ltd. $525,000 2.33% 21/8/2030 509,612 0.02%Transurban Finance Co. Pty Ltd. $500,000 2.45% 16/3/2031 502,197 0.02%Australia & New Zealand Banking Group Ltd. AU($)650,000 1.65% 16/1/2025 500,378 0.02%Glencore Funding LLC $450,000 4.00% 27/3/2027 498,555 0.02%AusNet Services Holdings Pty Ltd.^ €400,000 1.63% 11/3/2081 482,068 0.02%APT Pipelines Ltd. €400,000 1.25% 15/3/2033 471,340 0.02%NSW Electricity Networks Finance Pty Ltd. AU($)600,000 2.73% 23/4/2029 452,585 0.02%Macquarie Bank Ltd. $400,000 4.88% 10/6/2025 447,180 0.02%Qantas Airways Ltd. AU($)500,000 5.25% 9/9/2030 421,662 0.01%Newcrest Finance Pty Ltd. $315,000 5.75% 15/11/2041 419,822 0.01%Australia & New Zealand Banking Group Ltd.^ €355,000 0.67% 5/5/2031 419,481 0.01%Commonwealth Bank of Australia AU($)500,000 3.25% 25/4/2023 394,628 0.01%Westpac Banking Corp. AU($)500,000 2.25% 16/8/2024 392,608 0.01%National Australia Bank Ltd. €300,000 1.38% 30/8/2028 386,369 0.01%BHP Billiton Finance Ltd. £200,000 4.30% 25/9/2042 376,071 0.01%Transurban Finance Co. Pty Ltd. €300,000 1.45% 16/5/2029 375,065 0.01%Glencore Funding LLC $375,000 2.50% 1/9/2030 373,595 0.01%Glencore Finance Europe Ltd. €300,000 1.50% 15/10/2026 373,021 0.01%Telstra Corp., Ltd. €300,000 3.50% 21/9/2022 372,347 0.01%Glencore Capital Finance DAC €300,000 1.13% 10/3/2028 361,929 0.01%National Australia Bank Ltd. €300,000 0.25% 20/5/2024 360,764 0.01%BHP Billiton Finance Ltd. €300,000 0.75% 28/10/2022 359,745 0.01%AGI Finance Pty Ltd. AU($)500,000 1.82% 23/11/2028 359,136 0.01%Commonwealth Bank of Australia $300,000 3.90% 12/7/2047 357,861 0.01%Westpac Banking Corp.^ $325,000 4.11% 24/7/2034 356,720 0.01%Rio Tinto Finance USA Ltd. $260,000 5.20% 2/11/2040 356,378 0.01%Westpac Banking Corp.^ $320,000 4.32% 23/11/2031 355,790 0.01%GAIF Bond Issuer Pty Ltd. $320,000 3.40% 30/9/2026 348,378 0.01%Sydney Airport Finance Co. Pty Ltd. $325,000 3.90% 22/3/2023 342,237 0.01%APT Pipelines Ltd. $300,000 4.20% 23/3/2025 328,968 0.01%Rio Tinto Finance USA Ltd. $293,000 3.75% 15/6/2025 324,660 0.01%Commonwealth Bank of Australia $325,000 2.69% 11/3/2031 324,347 0.01%Aurizon Finance Pty Ltd. AU($)400,000 3.00% 9/3/2028 303,011 0.01%Westpac Banking Corp. $300,000 1.15% 3/6/2026 300,240 0.01%

568
Vanguard Global Corporate Bond Index Fund
Principal CouponMaturity
DateFair Value
US Dollars ($)% of Total
Net AssetsWestpac Banking Corp.^ €250,000 0.77% 13/5/2031 296,082 0.01%Australia & New Zealand Banking Group Ltd.^ $300,000 2.57% 25/11/2035 291,400 0.01%BHP Billiton Finance Ltd. €200,000 3.25% 24/9/2027 281,893 0.01%Commonwealth Bank of Australia $275,000 3.31% 11/3/2041 280,353 0.01%National Australia Bank Ltd.^ $250,000 3.93% 2/8/2034 270,460 0.01%Westpac Banking Corp. $250,000 3.30% 26/2/2024 268,007 0.01%Woodside Finance Ltd. $250,000 3.65% 5/3/2025 266,716 0.01%Commonwealth Bank of Australia $225,000 4.32% 10/1/2048 265,063 0.01%Glencore Funding LLC $245,000 4.13% 12/3/2024 264,187 0.01%Australia & New Zealand Banking Group Ltd. $234,000 4.40% 19/5/2026 263,426 0.01%Australia & New Zealand Banking Group Ltd. $250,000 2.63% 9/11/2022 257,771 0.01%WSO Finance Pty Ltd. AU($)300,000 4.50% 31/3/2027 257,697 0.01%Westpac Banking Corp. $240,000 2.65% 16/1/2030 257,178 0.01%National Australia Bank Ltd. $250,000 1.88% 13/12/2022 255,682 0.01%Telstra Corp., Ltd. €200,000 1.38% 26/3/2029 255,453 0.01%Sydney Airport Finance Co. Pty Ltd. €200,000 1.75% 26/4/2028 254,156 0.01%Telstra Corp., Ltd. €200,000 1.00% 23/4/2030 247,890 0.01%Amcor UK Finance plc €200,000 1.13% 23/6/2027 247,241 0.01%Westpac Banking Corp.^ $250,000 2.67% 15/11/2035 246,144 0.01%Vicinity Centres Trust €200,000 1.13% 7/11/2029 244,445 0.01%Scentre Group Trust 1/Scentre Group Trust 2 €200,000 1.38% 22/3/2023 242,718 0.01%AusNet Services Holdings Pty Ltd. €200,000 0.63% 25/8/2030 238,842 0.01%National Australia Bank Ltd. $250,000 2.65% 14/1/2041 233,792 0.01%Westpac Banking Corp. $225,000 2.00% 13/1/2023 230,774 0.01%Goodman US Finance Four LLC $200,000 4.50% 15/10/2037 229,803 0.01%Argentum Netherlands BV for Swiss Re Ltd.^ $200,000 5.63% 15/8/2052 229,222 0.01%QBE Insurance Group Ltd.^ $200,000 6.75% 2/12/2044 227,179 0.01%Wesfarmers Ltd. AU($)300,000 1.94% 23/6/2028 226,221 0.01%Westpac Banking Corp. $200,000 3.35% 8/3/2027 221,194 0.01%Glencore Funding LLC $200,000 3.88% 27/10/2027 220,327 0.01%Australia & New Zealand Banking Group Ltd. $200,000 4.50% 19/3/2024 218,828 0.01%Commonwealth Bank of Australia $200,000 3.74% 12/9/2039 218,629 0.01%Telstra Corp., Ltd. $200,000 3.13% 7/4/2025 214,200 0.01%Westpac Banking Corp. $200,000 3.65% 15/5/2023 212,218 0.01%Australia & New Zealand Banking Group Ltd.^ $200,000 2.95% 22/7/2030 208,000 0.01%Westpac Banking Corp. $200,000 2.75% 11/1/2023 207,405 0.01%Commonwealth Bank of Australia $200,000 2.50% 18/9/2022 205,246 0.01%Macquarie Bank Ltd.^ $200,000 3.05% 3/3/2036 199,124 0.01%Commonwealth Bank of Australia $170,000 3.90% 16/3/2028 194,787 0.01%AusNet Services Holdings Pty Ltd. AU($)250,000 2.60% 31/7/2029 193,202 0.01%Sydney Airport Finance Co. Pty Ltd. $175,000 3.63% 28/4/2026 190,066 0.01%APT Pipelines Ltd. $150,000 4.25% 15/7/2027 169,567 0.01%National Australia Bank Ltd.^ CA($)200,000 3.52% 12/6/2030 169,558 0.01%Woodside Finance Ltd. $150,000 4.50% 4/3/2029 168,257 0.01%Australia & New Zealand Banking Group Ltd. €133,000 0.63% 21/2/2023 160,423 0.01%Lonsdale Finance Pty Ltd. AU($)200,000 2.45% 20/11/2026 154,571 0.01%Scentre Group Trust 1 £100,000 3.88% 16/7/2026 154,531 0.01%Woolworths Group Ltd. AU($)200,000 1.85% 20/5/2025 153,512 0.01%Transurban Queensland Finance Pty Ltd. AU($)200,000 3.25% 5/8/2031 153,480 0.01%Woolworths Group Ltd. AU($)200,000 2.80% 20/5/2030 152,842 0.01%Optus Finance Pty Ltd. AU($)200,000 2.50% 1/7/2030 152,838 0.01%Optus Finance Pty Ltd. AU($)200,000 1.60% 1/7/2025 152,402 0.01%Network Finance Co. Pty Ltd. AU($)200,000 2.58% 3/10/2028 151,852 0.01%Wesfarmers Ltd. AU($)200,000 2.55% 23/6/2031 151,432 0.01%APT Pipelines Ltd. £100,000 3.13% 18/7/2031 149,963 0.01%BHP Billiton Finance Ltd. £100,000 3.25% 25/9/2024 149,470 0.01%Ausgrid Finance Pty Ltd. AU($)200,000 1.81% 5/2/2027 147,780 0.01%Glencore Finance Europe Ltd. £100,000 3.13% 26/3/2026 147,489 0.01%Westpac Banking Corp. $150,000 2.96% 16/11/2040 147,268 0.01%Westpac Banking Corp. £100,000 2.13% 2/5/2025 145,279 0.01%NSW Electricity Networks Finance Pty Ltd. AU($)200,000 2.54% 23/9/2030 145,115 0.01%Coles Group Treasury Pty Ltd. AU($)200,000 2.10% 27/8/2030 144,469 0.01%APT Pipelines Ltd. £100,000 2.50% 15/3/2036 139,288 0.01%Transurban Finance Co. Pty Ltd. $125,000 4.13% 2/2/2026 139,241 0.01%Amcor Finance USA, Inc. $125,000 3.63% 28/4/2026 137,162 0.01%Rio Tinto Finance USA Ltd. $100,000 7.13% 15/7/2028 135,583 0.00%Transurban Finance Co. Pty Ltd. CA($)150,000 4.56% 14/11/2028 134,615 0.00%Toyota Finance Australia Ltd.1 €100,000 2.28% 21/10/2027 134,614 0.00%Rio Tinto Finance USA plc $100,000 4.75% 22/3/2042 130,871 0.00%APT Pipelines Ltd. €100,000 2.00% 22/3/2027 129,939 0.00%Scentre Group Trust 1/Scentre Group Trust 2 €100,000 1.75% 11/4/2028 128,500 0.00%

569
Vanguard Global Corporate Bond Index Fund
Principal CouponMaturity
DateFair Value
US Dollars ($)% of Total
Net AssetsAPT Pipelines Ltd. €100,000 2.00% 15/7/2030 128,341 0.00%AusNet Services Holdings Pty Ltd. €100,000 3.00% 13/2/2024 128,056 0.00%Transurban Finance Co. Pty Ltd. €100,000 1.75% 29/3/2028 127,735 0.00%Scentre Group Trust 1/Scentre Group Trust 2 €100,000 1.45% 28/3/2029 126,298 0.00%Scentre Group Trust 1 €100,000 2.25% 16/7/2024 126,218 0.00%Telstra Corp., Ltd. €100,000 1.13% 14/4/2026 124,644 0.00%Westpac Banking Corp. €100,000 0.88% 17/4/2027 124,122 0.00%Ausgrid Finance Pty Ltd. €100,000 1.25% 30/7/2025 123,584 0.00%National Australia Bank Ltd. €100,000 2.75% 8/8/2022 122,802 0.00%Ampol Ltd. AU($)150,000 4.00% 17/4/2025 121,766 0.00%Ausgrid Finance Pty Ltd. AU($)150,000 3.75% 30/10/2024 121,195 0.00%Macquarie Group Ltd. €100,000 0.63% 3/2/2027 120,253 0.00%Toyota Finance Australia Ltd. €100,000 0.25% 9/4/2024 119,967 0.00%National Australia Bank Ltd. €100,000 0.35% 7/9/2022 119,723 0.00%Macquarie Group Ltd.^ $100,000 5.03% 15/1/2030 118,828 0.00%Westpac Banking Corp. $100,000 4.42% 24/7/2039 118,167 0.00%Origin Energy Finance Ltd. €100,000 1.00% 17/9/2029 117,354 0.00%Macquarie Bank Ltd. $100,000 3.90% 15/1/2026 111,487 0.00%National Australia Bank Ltd. $100,000 3.50% 10/1/2027 110,959 0.00%National Australia Bank Ltd. CHF100,000 0.30% 31/10/2025 110,669 0.00%Macquarie Group Ltd.^ $100,000 3.76% 28/11/2028 109,782 0.00%BHP Billiton Finance USA Ltd. $100,000 3.85% 30/9/2023 107,494 0.00%Woodside Finance Ltd. $100,000 3.70% 15/3/2028 107,439 0.00%Scentre Group Trust 1/Scentre Group Trust 2 $100,000 3.25% 28/10/2025 107,238 0.00%Macquarie Group Ltd.^ $100,000 4.15% 27/3/2024 105,874 0.00%Macquarie Group Ltd.^ $100,000 3.19% 28/11/2023 103,598 0.00%Woodside Finance Ltd. $80,000 3.70% 15/9/2026 86,445 0.00%DBNGP Finance Co. Pty Ltd. AU($)100,000 4.23% 28/5/2025 82,658 0.00%United Energy Distribution Pty Ltd. AU($)100,000 3.85% 23/10/2024 81,826 0.00%AusNet Services Holdings Pty Ltd. AU($)80,000 4.40% 16/8/2027 69,344 0.00%National Australia Bank Ltd. €50,000 1.25% 18/5/2026 63,085 0.00%BHP Billiton Finance Ltd. CA($)75,000 3.23% 15/5/2023 63,007 0.00%Ausgrid Finance Pty Ltd. $60,000 3.85% 1/5/2023 62,662 0.00%Rio Tinto Finance USA plc $50,000 4.13% 21/8/2042 60,935 0.00%AusNet Services Holdings Pty Ltd. AU($)60,000 4.20% 21/8/2028 51,880 0.00%ETSA Utilities Finance Pty Ltd. AU($)50,000 3.50% 29/8/2024 40,337 0.00%APT Pipelines Ltd. $31,000 5.00% 23/3/2035 37,794 0.00%United Energy Distribution Pty Ltd. AU($)40,000 3.50% 12/9/2023 31,507 0.00%Ausgrid Finance Pty Ltd. $25,000 4.35% 1/8/2028 28,185 0.00%test - - - 53,378,429 1.83%Austria 0.27% (2020: 0.30%)JAB Holdings BV €800,000 2.50% 17/4/2027 1,054,845 0.04%JAB Holdings BV €500,000 1.63% 30/4/2025 625,102 0.02%OMV AG €500,000 0.75% 4/12/2023 606,560 0.02%Erste Group Bank AG €500,000 0.38% 16/4/2024 602,275 0.02%OMV AG^ €400,000 2.50% Perpetual 496,352 0.02%OMV AG €400,000 0.00% 16/6/2023 476,421 0.02%JAB Holdings BV $475,000 2.20% 23/11/2030 462,755 0.02%OMV AG €300,000 0.75% 16/6/2030 365,346 0.01%UNIQA Insurance Group AG €200,000 1.38% 9/7/2030 253,450 0.01%JAB Holdings BV €200,000 1.75% 25/6/2026 253,321 0.01%JAB Holdings BV €200,000 1.00% 20/12/2027 242,836 0.01%OMV AG €200,000 1.00% 3/7/2034 239,986 0.01%Vienna Insurance Group AG Wiener Versicherung Gruppe €200,000 1.00% 26/3/2036 238,084 0.01%OMV AG €200,000 0.00% 3/7/2025 237,623 0.01%BAWAG PSK Bank fuer Arbeit und Wirtschaft und Oesterreichische
Postsparkasse AG €200,000 0.38% 3/9/2027 234,485 0.01%Suzano Austria GmbH $225,000 3.13% 15/1/2032 222,658 0.01%Vienna Insurance Group AG Wiener Versicherung Gruppe^ €100,000 3.75% 2/3/2046 134,119 0.01%JAB Holdings BV €100,000 2.50% 25/6/2029 133,707 0.01%Mondi Finance Europe GmbH €100,000 2.38% 1/4/2028 133,353 0.00%OMV AG €100,000 2.00% 9/4/2028 132,578 0.00%Borealis AG €100,000 1.75% 10/12/2025 126,898 0.00%OMV AG^ €100,000 2.88% Perpetual 125,223 0.00%JAB Holdings BV €100,000 2.25% 19/12/2039 124,608 0.00%OMV AG €100,000 1.50% 9/4/2024 123,962 0.00%OMV AG^ €100,000 2.88% Perpetual 123,527 0.00%Volksbank Wien AG^ €100,000 2.75% 6/10/2027 121,635 0.00%CA Immobilien Anlagen AG €100,000 0.88% 5/2/2027 119,171 0.00%test - - - 8,010,880 0.27%

570
Vanguard Global Corporate Bond Index Fund
Principal CouponMaturity
DateFair Value
US Dollars ($)% of Total
Net AssetsBelgium 1.18% (2020: 1.29%)Anheuser-Busch Cos LLC/Anheuser-Busch InBev Worldwide, Inc. $2,665,000 4.90% 1/2/2046 3,370,987 0.12%Anheuser-Busch InBev Worldwide, Inc. $1,250,000 5.45% 23/1/2039 1,649,048 0.06%Anheuser-Busch InBev SA €1,300,000 1.15% 22/1/2027 1,628,552 0.06%Anheuser-Busch Cos LLC/Anheuser-Busch InBev Worldwide, Inc. $1,175,000 4.70% 1/2/2036 1,441,106 0.05%Anheuser-Busch InBev Worldwide, Inc. $1,150,000 4.75% 23/1/2029 1,369,790 0.05%Anheuser-Busch InBev SA1 €700,000 2.75% 17/3/2036 1,005,356 0.03%Euroclear Bank SA €830,000 0.13% 7/7/2025 991,010 0.03%Anheuser-Busch InBev Worldwide, Inc. $710,000 5.55% 23/1/2049 976,221 0.03%Belfius Bank SA €800,000 0.13% 8/2/2028 940,455 0.03%KBC Group NV^ €800,000 0.13% 14/1/2029 927,685 0.03%Anheuser-Busch InBev SA €600,000 2.88% 2/4/2032 864,876 0.03%Anheuser-Busch InBev Worldwide, Inc. $700,000 4.38% 15/4/2038 834,217 0.03%Anheuser-Busch Cos LLC/Anheuser-Busch InBev Worldwide, Inc. $672,000 3.65% 1/2/2026 742,897 0.03%Anheuser-Busch InBev Worldwide, Inc. $500,000 5.80% 23/1/2059 722,588 0.03%AG Insurance SA^ €500,000 3.50% 30/6/2047 674,366 0.02%Anheuser-Busch InBev SA €400,000 3.70% 2/4/2040 644,201 0.02%Elia Transmission Belgium SA €500,000 1.38% 14/1/2026 628,134 0.02%Argenta Spaarbank NV €500,000 1.00% 6/2/2024 609,669 0.02%Anheuser-Busch InBev Finance, Inc. $500,000 4.63% 1/2/2044 607,256 0.02%KBC Group NV €500,000 0.75% 18/10/2023 606,674 0.02%Belfius Bank SA €500,000 0.01% 15/10/2025 593,220 0.02%KBC Group NV^ €500,000 0.50% 3/12/2029 593,197 0.02%Anheuser-Busch InBev SA £400,000 2.25% 24/5/2029 580,761 0.02%Anheuser-Busch InBev Worldwide, Inc. $500,000 3.50% 1/6/2030 555,707 0.02%Anheuser-Busch InBev Worldwide, Inc. $400,000 4.50% 1/6/2050 487,754 0.02%Solvay SA €400,000 0.50% 6/9/2029 480,222 0.02%Anheuser-Busch InBev Worldwide, Inc. $350,000 4.95% 15/1/2042 441,451 0.02%Anheuser-Busch InBev Worldwide, Inc. $350,000 4.60% 15/4/2048 427,902 0.02%Anheuser-Busch InBev Worldwide, Inc. $350,000 4.00% 13/4/2028 398,495 0.01%Anheuser-Busch InBev SA €300,000 2.13% 2/12/2027 398,199 0.01%Anheuser-Busch InBev SA €300,000 1.65% 28/3/2031 389,773 0.01%Anheuser-Busch InBev SA €300,000 1.13% 1/7/2027 376,034 0.01%Elia Group SA^ €300,000 2.75% Perpetual 374,495 0.01%Argenta Spaarbank NV €300,000 1.00% 29/1/2027 363,508 0.01%Anheuser-Busch InBev Worldwide, Inc. $300,000 4.35% 1/6/2040 357,003 0.01%Anheuser-Busch InBev SA £200,000 9.75% 30/7/2024 351,178 0.01%Anheuser-Busch InBev Worldwide, Inc. $200,000 8.20% 15/1/2039 331,936 0.01%Anheuser-Busch InBev Worldwide, Inc. $250,000 4.75% 15/4/2058 313,208 0.01%Anheuser-Busch InBev Finance, Inc. $250,000 4.90% 1/2/2046 312,204 0.01%Anheuser-Busch InBev Finance, Inc. $275,000 3.65% 1/2/2026 303,391 0.01%Anheuser-Busch InBev SA £200,000 2.85% 25/5/2037 302,736 0.01%Anheuser-Busch InBev Worldwide, Inc. $225,000 4.60% 1/6/2060 276,888 0.01%Ageas SA^ €200,000 3.25% 2/7/2049 268,109 0.01%Anheuser-Busch InBev SA €200,000 2.00% 23/1/2035 264,747 0.01%Anheuser-Busch InBev Finance, Inc. CA($)306,000 4.32% 15/5/2047 264,302 0.01%Euroclear Investments SA €200,000 1.50% 11/4/2030 259,917 0.01%Lonza Finance International NV €200,000 1.63% 21/4/2027 255,794 0.01%KBC Group NV €200,000 1.13% 25/1/2024 245,093 0.01%Belfius Bank SA €200,000 1.00% 26/10/2024 244,830 0.01%Elia Transmission Belgium SA €200,000 0.88% 28/4/2030 244,583 0.01%Argenta Spaarbank NV €200,000 1.00% 13/10/2026 242,711 0.01%Brussels Airport Co. NV €200,000 1.00% 3/5/2024 242,106 0.01%Groupe Bruxelles Lambert SA €200,000 0.13% 28/1/2031 229,948 0.01%Anheuser-Busch InBev Finance, Inc. $150,000 4.70% 1/2/2036 183,713 0.01%Anheuser-Busch InBev Worldwide, Inc. $125,000 4.90% 23/1/2031 153,726 0.01%Anheuser-Busch InBev Worldwide, Inc. $125,000 4.44% 6/10/2048 149,462 0.01%Solvay SA €100,000 2.75% 2/12/2027 137,828 0.01%Belfius Bank SA €100,000 3.13% 11/5/2026 133,890 0.00%Euroclear Investments SA €100,000 1.13% 7/12/2026 125,695 0.00%KBC Group NV^ €100,000 1.63% 18/9/2029 123,365 0.00%Euroclear Bank SA €100,000 0.50% 10/7/2023 120,404 0.00%Belfius Bank SA €100,000 0.75% 12/9/2022 120,115 0.00%Euroclear Bank SA €100,000 0.25% 7/9/2022 119,473 0.00%Belfius Bank SA €100,000 0.00% 28/8/2026 118,019 0.00%test - - - 34,492,180 1.18%Bermuda 0.01% (2020: 0.00%)Triton Container International Ltd. $200,000 1.15% 7/6/2024 199,503 0.01%Triton Container International Ltd. $100,000 3.15% 15/6/2031 100,639 0.00%test - - - 300,142 0.01%

571
Vanguard Global Corporate Bond Index Fund
Principal CouponMaturity
DateFair Value
US Dollars ($)% of Total
Net AssetsBrazil 0.18% (2020: 0.18%)Vale Overseas Ltd. $561,000 6.88% 21/11/2036 768,810 0.03%Vale Overseas Ltd. $400,000 6.88% 10/11/2039 558,264 0.02%Suzano Austria GmbH $450,000 6.00% 15/1/2029 535,680 0.02%Suzano Austria GmbH $400,000 3.75% 15/1/2031 418,813 0.01%GTL Trade Finance, Inc./Gerdau Holdings, Inc. $350,000 5.89% 29/4/2024 393,251 0.01%Suzano Austria GmbH $250,000 7.00% 16/3/2047 337,722 0.01%Vale Overseas Ltd. $300,000 3.75% 8/7/2030 319,064 0.01%Vale Overseas Ltd. $200,000 8.25% 17/1/2034 291,298 0.01%Votorantim Cimentos International SA $200,000 7.25% 5/4/2041 271,077 0.01%Fibria Overseas Finance Ltd. $200,000 5.50% 17/1/2027 232,602 0.01%Raizen Fuels Finance SA $200,000 5.30% 20/1/2027 226,593 0.01%Suzano Austria GmbH $200,000 5.00% 15/1/2030 226,480 0.01%Gerdau Trade, Inc. $200,000 4.88% 24/10/2027 224,596 0.01%Vale Overseas Ltd. $175,000 6.25% 10/8/2026 210,318 0.01%Fibria Overseas Finance Ltd. $100,000 5.25% 12/5/2024 111,901 0.00%Gerdau Trade, Inc. $100,000 4.75% 15/4/2023 106,905 0.00%Fibria Overseas Finance Ltd. $83,000 4.00% 14/1/2025 89,656 0.00%Vale SA $25,000 5.63% 11/9/2042 31,275 0.00%test - - - 5,354,305 0.18%Canada 4.62% (2020: 4.52%)Toronto-Dominion Bank1 $1,225,000 0.75% 12/6/2023 1,233,817 0.04%Canadian Imperial Bank of Commerce^ CA($)1,360,000 2.01% 21/7/2030 1,109,017 0.04%Cenovus Energy, Inc. $900,000 5.38% 15/7/2025 1,029,646 0.04%Bank of Nova Scotia CA($)1,220,000 2.38% 1/5/2023 1,011,581 0.04%Royal Bank of Canada1 $925,000 0.43% 19/1/2024 922,198 0.03%TransCanada PipeLines Ltd. $800,000 4.10% 15/4/2030 918,361 0.03%Cenovus Energy, Inc. $675,000 6.75% 15/11/2039 915,372 0.03%Suncor Energy, Inc. $640,000 6.50% 15/6/2038 903,288 0.03%Bank of Nova Scotia1 $875,000 2.00% 15/11/2022 894,907 0.03%TransCanada PipeLines Ltd. $600,000 6.10% 1/6/2040 825,125 0.03%Royal Bank of Canada1 $750,000 1.60% 17/4/2023 766,396 0.03%Nutrien Ltd. $715,000 2.95% 13/5/2030 754,737 0.03%Toronto-Dominion Bank €600,000 0.38% 25/4/2024 721,784 0.03%Empower Finance 2020 LP $750,000 1.78% 17/3/2031 719,788 0.03%Toronto-Dominion Bank^ CA($)810,000 3.11% 22/4/2030 689,072 0.02%Canadian Natural Resources Ltd. $650,000 2.95% 15/7/2030 674,221 0.02%TransCanada PipeLines Ltd. $500,000 5.85% 15/3/2036 662,048 0.02%Toronto-Dominion Bank CA($)780,000 2.50% 2/12/2024 654,592 0.02%Canadian Government Bond CA($)805,000 0.25% 1/5/2023 647,720 0.02%Bank of Montreal CA($)720,000 3.19% 1/3/2028 633,959 0.02%Magna International, Inc. €500,000 1.90% 24/11/2023 620,236 0.02%Bank of Montreal1 $600,000 1.85% 1/5/2025 619,978 0.02%Canadian Imperial Bank of Commerce $580,000 2.25% 28/1/2025 606,335 0.02%Toronto-Dominion Bank €500,000 0.63% 20/7/2023 604,772 0.02%Royal Bank of Canada €500,000 0.13% 23/7/2024 597,819 0.02%AIMCo Realty Investors LP CA($)710,000 2.71% 1/6/2029 595,051 0.02%Brookfield Finance, Inc. $455,000 4.70% 20/9/2047 554,794 0.02%Canadian Imperial Bank of Commerce CHF500,000 0.15% 31/7/2023 547,380 0.02%Bank of Montreal CA($)645,000 2.89% 20/6/2023 542,148 0.02%Rogers Communications, Inc. $450,000 4.35% 1/5/2049 529,668 0.02%Royal Bank of Canada $500,000 2.25% 1/11/2024 523,992 0.02%Canadian Natural Resources Ltd. $475,000 3.85% 1/6/2027 523,181 0.02%Royal Bank of Canada CA($)625,000 2.35% 2/7/2024 521,387 0.02%Alimentation Couche-Tard, Inc. $500,000 2.95% 25/1/2030 520,349 0.02%Canadian Pacific Railway Co. $400,000 4.80% 1/8/2045 516,677 0.02%Cenovus Energy, Inc. $425,000 5.25% 15/6/2037 508,606 0.02%HSBC Bank Canada CA($)610,000 2.54% 31/1/2023 505,874 0.02%Toronto-Dominion Bank CA($)600,000 3.01% 30/5/2023 504,997 0.02%Toronto-Dominion Bank $500,000 0.45% 11/9/2023 500,320 0.02%Canadian Imperial Bank of Commerce $500,000 0.50% 14/12/2023 498,584 0.02%Royal Bank of Canada $500,000 0.88% 20/1/2026 493,403 0.02%Saputo, Inc. CA($)600,000 2.24% 16/6/2027 487,682 0.02%BCI QuadReal Realty CA($)620,000 1.75% 24/7/2030 480,948 0.02%Toronto-Dominion Bank^ $430,000 3.63% 15/9/2031 475,798 0.02%Bell Telephone Co. of Canada or Bell Canada CA($)590,000 2.50% 14/5/2030 471,664 0.02%Toronto-Dominion Bank CA($)555,000 2.85% 8/3/2024 468,797 0.02%Manulife Financial Corp.^ $410,000 4.06% 24/2/2032 452,326 0.02%Royal Bank of Canada CA($)535,000 2.61% 1/11/2024 450,265 0.02%Royal Bank of Canada CA($)535,000 2.95% 1/5/2023 449,280 0.02%Bank of Montreal CA($)545,000 2.27% 11/7/2022 448,388 0.02%

572
Vanguard Global Corporate Bond Index Fund
Principal CouponMaturity
DateFair Value
US Dollars ($)% of Total
Net AssetsCanadian Natural Resources Ltd. $350,000 4.95% 1/6/2047 436,567 0.02%Bank of Nova Scotia $425,000 1.95% 1/2/2023 435,628 0.02%Toronto-Dominion Bank $425,000 1.90% 1/12/2022 434,564 0.02%Enbridge, Inc. $411,000 2.50% 15/1/2025 431,122 0.02%Toronto-Dominion Bank^ CA($)505,000 3.06% 26/1/2032 430,018 0.02%Bell Telephone Co. of Canada or Bell Canada CA($)485,000 3.80% 21/8/2028 429,517 0.02%Suncor Energy, Inc. $397,000 3.60% 1/12/2024 428,879 0.02%Canadian Pacific Railway Co. $275,000 6.13% 15/9/2115 427,352 0.02%Royal Bank of Canada £300,000 1.13% 15/12/2025 417,830 0.01%Canadian Imperial Bank of Commerce^ CA($)495,000 3.45% 4/4/2028 416,192 0.01%OMERS Realty Corp. CA($)460,000 3.63% 5/6/2030 413,635 0.01%Nutrien Ltd. $400,000 3.15% 1/10/2022 410,655 0.01%Nutrien Ltd. $310,000 5.00% 1/4/2049 408,664 0.01%Toronto-Dominion Bank $400,000 1.15% 12/6/2025 402,974 0.01%Canadian Imperial Bank of Commerce $400,000 0.45% 22/6/2023 399,949 0.01%Bank of Nova Scotia^ CA($)475,000 2.84% 3/7/2029 399,136 0.01%Royal Bank of Canada CA($)480,000 2.33% 28/1/2027 398,473 0.01%Canadian Imperial Bank of Commerce $400,000 1.25% 22/6/2026 397,998 0.01%Canadian National Railway Co. $375,000 3.20% 2/8/2046 388,617 0.01%Bank of Nova Scotia $375,000 1.63% 1/5/2023 383,363 0.01%Teck Resources Ltd. $290,000 6.25% 15/7/2041 381,224 0.01%Canadian Imperial Bank of Commerce CA($)440,000 3.29% 15/1/2024 374,778 0.01%Toronto-Dominion Bank $375,000 0.25% 6/1/2023 374,663 0.01%Bank of Nova Scotia^ CA($)430,000 3.89% 18/1/2029 369,671 0.01%Reliance LP CA($)450,000 2.68% 1/12/2027 368,668 0.01%Manulife Financial Corp.^ CA($)445,000 2.24% 12/5/2030 367,925 0.01%Bank of Montreal CA($)430,000 2.70% 11/9/2024 364,355 0.01%Royal Bank of Canada^ CA($)425,000 2.88% 23/12/2029 358,298 0.01%Hydro One, Inc. CA($)355,000 4.89% 13/3/2037 357,274 0.01%Rio Tinto Alcan, Inc. $250,000 7.25% 15/3/2031 355,434 0.01%AltaGas Ltd. CA($)400,000 3.98% 4/10/2027 353,430 0.01%Loblaw Cos Ltd. CA($)445,000 2.28% 7/5/2030 353,347 0.01%Bank of Montreal CA($)420,000 2.28% 29/7/2024 349,734 0.01%Bank of Nova Scotia $327,000 2.20% 3/2/2025 341,400 0.01%Toronto-Dominion Bank CA($)410,000 1.89% 8/3/2028 330,572 0.01%Air Canada 2017-1 Class AA Pass Through Trust $327,000 3.30% 15/1/2030 330,337 0.01%Rogers Communications, Inc. CA($)380,000 3.65% 31/3/2027 329,382 0.01%Sun Life Financial, Inc.^ CA($)395,000 2.58% 10/5/2032 328,857 0.01%Canadian Natural Resources Ltd. $300,000 3.90% 1/2/2025 326,622 0.01%Shaw Communications, Inc. CA($)300,000 6.75% 9/11/2039 325,643 0.01%Toronto-Dominion Bank CA($)410,000 1.13% 9/12/2025 325,089 0.01%TransCanada PipeLines Ltd. CA($)370,000 3.80% 5/4/2027 324,721 0.01%Brookfield Finance, Inc. $300,000 4.00% 1/4/2024 324,342 0.01%Enbridge, Inc. $275,000 4.50% 10/6/2044 323,717 0.01%Suncor Energy, Inc. $300,000 3.10% 15/5/2025 321,193 0.01%CU, Inc. CA($)295,000 5.90% 20/11/2034 316,590 0.01%TransCanada PipeLines Ltd. $275,000 4.25% 15/5/2028 316,258 0.01%TransCanada PipeLines Ltd. $250,000 4.88% 15/5/2048 316,159 0.01%Federation des Caisses Desjardins du Quebec CA($)400,000 1.09% 21/1/2026 315,381 0.01%Enbridge, Inc. CA($)300,000 7.22% 24/7/2030 312,855 0.01%Royal Bank of Canada CA($)375,000 2.36% 5/12/2022 310,322 0.01%Royal Bank of Canada CA($)385,000 1.59% 4/5/2026 309,964 0.01%CI Financial Corp. $300,000 3.20% 17/12/2030 307,998 0.01%TransCanada PipeLines Ltd. $300,000 2.50% 1/8/2022 306,975 0.01%Bank of Nova Scotia CA($)350,000 3.10% 2/2/2028 306,357 0.01%Royal Bank of Canada CA($)360,000 3.30% 26/9/2023 305,393 0.01%CU, Inc. CA($)345,000 3.81% 10/9/2042 305,327 0.01%Barrick PD Australia Finance Pty Ltd. $220,000 5.95% 15/10/2039 304,476 0.01%Royal Bank of Canada^ CA($)370,000 2.09% 30/6/2030 303,345 0.01%TransCanada PipeLines Ltd. CA($)365,000 4.18% 3/7/2048 302,154 0.01%HSBC Bank Canada CA($)355,000 3.25% 15/9/2023 300,392 0.01%Canadian Pacific Railway Co. $300,000 2.05% 5/3/2030 298,959 0.01%Inter Pipeline Ltd. CA($)335,000 4.23% 1/6/2027 297,094 0.01%Bell Telephone Co. of Canada or Bell Canada CA($)340,000 3.60% 29/9/2027 296,694 0.01%Canadian Imperial Bank of Commerce^ CA($)365,000 1.96% 21/4/2031 294,779 0.01%Toronto-Dominion Bank CA($)355,000 1.91% 18/7/2023 293,061 0.01%Bell Telephone Co. of Canada or Bell Canada CA($)350,000 3.35% 22/3/2023 292,361 0.01%407 International, Inc. CA($)345,000 2.43% 4/5/2027 288,731 0.01%bcIMC Realty Corp. CA($)335,000 3.00% 31/3/2027 288,143 0.01%Fairfax Financial Holdings Ltd. $250,000 4.85% 17/4/2028 287,577 0.01%Suncor Energy, Inc. $200,000 6.80% 15/5/2038 287,393 0.01%

573
Vanguard Global Corporate Bond Index Fund
Principal CouponMaturity
DateFair Value
US Dollars ($)% of Total
Net AssetsEnbridge, Inc. CA($)345,000 2.99% 3/10/2029 287,255 0.01%Bank of Montreal CA($)340,000 2.85% 6/3/2024 286,945 0.01%Suncor Energy, Inc. CA($)300,000 5.00% 9/4/2030 284,723 0.01%Bank of Nova Scotia $250,000 4.50% 16/12/2025 283,590 0.01%Royal Bank of Canada £200,000 1.38% 9/12/2024 281,862 0.01%Bank of Nova Scotia CA($)330,000 2.62% 2/12/2026 281,448 0.01%Canadian Natural Resources Ltd. $200,000 6.75% 1/2/2039 280,711 0.01%Canadian Imperial Bank of Commerce CA($)335,000 2.35% 28/8/2024 279,468 0.01%Canadian Natural Resources Ltd. $205,000 7.20% 15/1/2032 278,490 0.01%Greater Toronto Airports Authority CA($)300,300 3.26% 1/6/2037 277,675 0.01%Brookfield Asset Management, Inc. CA($)305,000 4.82% 28/1/2026 277,299 0.01%Toronto-Dominion Bank^ CA($)325,000 3.59% 14/9/2028 276,216 0.01%Manulife Financial Corp.^ CA($)335,000 2.82% 13/5/2035 276,144 0.01%Bank of Montreal^ $250,000 3.80% 15/12/2032 275,609 0.01%Bank of Montreal $275,000 0.45% 8/12/2023 275,101 0.01%Toronto-Dominion Bank CA($)320,000 3.23% 24/7/2024 275,026 0.01%TELUS Corp. CA($)320,000 3.30% 2/5/2029 274,425 0.01%Canadian Imperial Bank of Commerce CA($)315,000 3.30% 26/5/2025 274,363 0.01%Fairfax Financial Holdings Ltd. CA($)325,000 3.95% 3/3/2031 271,738 0.01%Hydro One, Inc. CA($)305,000 3.64% 5/4/2050 269,241 0.01%Rogers Communications, Inc. CA($)260,000 6.11% 25/8/2040 268,049 0.01%Enbridge Gas, Inc. CA($)320,000 2.37% 9/8/2029 263,763 0.01%Pembina Pipeline Corp. CA($)305,000 3.62% 3/4/2029 263,211 0.01%TransCanada PipeLines Ltd. $200,000 5.10% 15/3/2049 262,575 0.01%Canadian Imperial Bank of Commerce^ CA($)310,000 2.95% 19/6/2029 261,012 0.01%Royal Bank of Canada CA($)315,000 1.94% 1/5/2025 259,235 0.01%Bell Telephone Co. of Canada or Bell Canada CA($)330,000 1.65% 16/8/2027 259,106 0.01%Canadian Natural Resources Ltd. CA($)300,000 3.42% 1/12/2026 258,017 0.01%Royal Bank of Canada $225,000 4.65% 27/1/2026 257,853 0.01%Bell Telephone Co. of Canada or Bell Canada CA($)300,000 3.35% 12/3/2025 257,323 0.01%Federation des Caisses Desjardins du Quebec^ CA($)315,000 1.99% 28/5/2031 253,831 0.01%Bank of Nova Scotia CA($)305,000 2.16% 3/2/2025 253,045 0.01%Nutrien Ltd. $200,000 4.90% 1/6/2043 252,760 0.01%Manulife Bank of Canada CA($)315,000 1.34% 26/2/2026 251,753 0.01%National Bank of Canada^ $250,000 0.55% 15/11/2024 248,904 0.01%Bell Telephone Co. of Canada or Bell Canada CA($)295,000 4.05% 17/3/2051 246,250 0.01%National Bank of Canada $240,000 2.10% 1/2/2023 246,243 0.01%Bank of Montreal^ $250,000 0.95% 22/1/2027 245,615 0.01%Teranet Holdings LP CA($)285,000 3.54% 11/6/2025 244,506 0.01%AltaLink LP CA($)265,000 3.99% 30/6/2042 243,473 0.01%Royal Bank of Canada CA($)290,000 2.33% 5/12/2023 242,162 0.01%Canadian Imperial Bank of Commerce €200,000 0.75% 22/3/2023 241,835 0.01%Barrick Gold Corp. $175,000 6.45% 15/10/2035 241,503 0.01%Canadian Natural Resources Ltd. $180,000 6.25% 15/3/2038 240,665 0.01%Canadian Imperial Bank of Commerce €200,000 0.38% 3/5/2024 240,501 0.01%Rogers Communications, Inc. $225,000 3.70% 15/11/2049 239,576 0.01%Emera US Finance LP $200,000 4.75% 15/6/2046 238,712 0.01%TELUS Corp. CA($)280,000 3.35% 1/4/2024 237,707 0.01%Manulife Financial Corp. $225,000 2.48% 19/5/2027 237,591 0.01%OMERS Realty Corp. CA($)270,000 3.33% 5/6/2025 233,814 0.01%RioCan CA($)290,000 2.36% 10/3/2027 233,789 0.01%Enbridge, Inc. CA($)280,000 3.19% 5/12/2022 233,387 0.01%Bank of Montreal CA($)290,000 1.55% 28/5/2026 232,946 0.01%CU, Inc. CA($)270,000 3.55% 22/11/2047 231,987 0.01%Canadian Natural Resources Ltd. $225,000 2.05% 15/7/2025 231,410 0.01%Royal Bank of Canada^ CA($)295,000 1.67% 28/1/2033 230,547 0.01%Brookfield Infrastructure Finance ULC CA($)270,000 3.41% 9/10/2029 229,742 0.01%Enbridge Pipelines, Inc. CA($)280,000 2.82% 12/5/2031 228,532 0.01%Royal Bank of Canada $225,000 1.15% 10/6/2025 226,242 0.01%Bank of Montreal $220,000 2.55% 6/11/2022 226,215 0.01%Metro, Inc. CA($)255,000 4.27% 4/12/2047 225,557 0.01%Hydro One, Inc. CA($)295,000 1.69% 16/1/2031 225,298 0.01%Cenovus Energy, Inc. $200,000 4.25% 15/4/2027 223,637 0.01%Bank of Nova Scotia CA($)285,000 1.40% 1/11/2027 223,372 0.01%FortisBC Energy, Inc. CA($)200,000 6.05% 15/2/2038 223,278 0.01%Bank of Nova Scotia CA($)265,000 2.98% 17/4/2023 222,489 0.01%Honda Canada Finance, Inc. CA($)280,000 1.65% 25/2/2028 221,752 0.01%Brookfield Asset Management, Inc. $200,000 4.00% 15/1/2025 219,007 0.01%Rogers Communications, Inc. $175,000 5.00% 15/3/2044 218,894 0.01%Bell Telephone Co. of Canada or Bell Canada $200,000 3.65% 17/3/2051 218,873 0.01%Westcoast Energy, Inc. CA($)250,000 3.77% 8/12/2025 218,784 0.01%

574
Vanguard Global Corporate Bond Index Fund
Principal CouponMaturity
DateFair Value
US Dollars ($)% of Total
Net AssetsCanadian Imperial Bank of Commerce CA($)265,000 2.00% 17/4/2025 218,480 0.01%55 Ontario School Board Trust CA($)200,000 5.90% 2/6/2033 218,418 0.01%Energir, Inc. CA($)265,000 2.10% 16/4/2027 217,953 0.01%Bank of Montreal CA($)260,000 2.37% 3/2/2025 217,162 0.01%Suncor Energy, Inc. $175,000 5.35% 15/7/2033 215,709 0.01%Fortis, Inc. $200,000 3.06% 4/10/2026 215,036 0.01%Canadian Natural Resources Ltd. $200,000 3.80% 15/4/2024 214,968 0.01%Enbridge Gas, Inc. CA($)245,000 3.65% 1/4/2050 214,689 0.01%Bank of Montreal $200,000 3.30% 5/2/2024 214,187 0.01%Brookfield Renewable Partners ULC CA($)245,000 3.38% 15/1/2030 213,076 0.01%Toronto-Dominion Bank $200,000 3.50% 19/7/2023 212,693 0.01%Bank of Montreal CA($)260,000 1.76% 10/3/2026 211,261 0.01%Bank of Montreal $200,000 2.50% 28/6/2024 211,095 0.01%Royal Bank of Canada $200,000 2.55% 16/7/2024 211,024 0.01%Enbridge Gas, Inc. CA($)270,000 3.01% 9/8/2049 210,794 0.01%Bruce Power LP CA($)235,000 4.00% 21/6/2030 210,448 0.01%CCL Industries, Inc. $200,000 3.05% 1/6/2030 209,893 0.01%Bank of Nova Scotia CA($)250,000 2.49% 23/9/2024 209,575 0.01%AltaLink LP CA($)200,000 4.92% 17/9/2043 209,159 0.01%Bank of Nova Scotia CA($)250,000 2.29% 28/6/2024 209,100 0.01%Hydro One, Inc. CA($)200,000 5.36% 20/5/2036 209,084 0.01%Enbridge, Inc. CA($)245,000 3.20% 8/6/2027 208,745 0.01%Toyota Credit Canada, Inc. CA($)250,000 2.31% 23/10/2024 208,557 0.01%National Bank of Canada^ CA($)250,000 3.18% 1/2/2028 208,528 0.01%Bank of Nova Scotia CA($)250,000 2.36% 8/11/2022 206,680 0.01%Federation des Caisses Desjardins du Quebec $200,000 2.05% 10/2/2025 206,477 0.01%Bank of Nova Scotia $200,000 2.45% 19/9/2022 205,234 0.01%Bank of Nova Scotia^ $200,000 4.65% Perpetual 204,826 0.01%Bank of Montreal $200,000 2.05% 1/11/2022 204,666 0.01%Hydro One Ltd. CA($)260,000 1.41% 15/10/2027 204,057 0.01%Nutrien Ltd. $150,000 5.88% 1/12/2036 203,926 0.01%TransCanada PipeLines Ltd. CA($)200,000 8.29% 5/2/2026 203,052 0.01%Enbridge Gas, Inc. CA($)200,000 4.88% 21/6/2041 201,067 0.01%Canadian Western Bank CA($)240,000 2.92% 15/12/2022 199,636 0.01%Hydro One, Inc. CA($)200,000 4.59% 9/10/2043 198,959 0.01%HSBC Bank Canada CA($)245,000 1.78% 20/5/2026 198,187 0.01%Bank of Montreal^ CA($)235,000 2.88% 17/9/2029 197,839 0.01%Rogers Communications, Inc. $150,000 5.45% 1/10/2043 197,596 0.01%Barrick Gold Corp. $150,000 5.25% 1/4/2042 197,505 0.01%Choice Properties CA($)240,000 2.98% 4/3/2030 197,339 0.01%Canadian Imperial Bank of Commerce CA($)250,000 1.10% 19/1/2026 197,261 0.01%University of Toronto CA($)200,000 4.25% 7/12/2051 197,123 0.01%TELUS Corp. CA($)215,000 4.85% 5/4/2044 196,768 0.01%TransCanada PipeLines Ltd. CA($)235,000 3.00% 18/9/2029 196,173 0.01%Greater Toronto Airports Authority CA($)250,000 2.75% 17/10/2039 194,962 0.01%407 International, Inc. CA($)225,000 3.60% 21/5/2047 194,285 0.01%Shaw Communications, Inc. CA($)240,000 2.90% 9/12/2030 193,795 0.01%Sun Life Financial, Inc.^ CA($)230,000 3.05% 19/9/2028 193,362 0.01%Alimentation Couche-Tard, Inc. $175,000 3.55% 26/7/2027 192,571 0.01%Cenovus Energy, Inc. CA($)227,000 3.50% 7/2/2028 192,024 0.01%Enbridge Gas, Inc. CA($)220,000 3.59% 22/11/2047 190,117 0.01%407 International, Inc. CA($)215,000 3.72% 11/5/2048 189,964 0.01%Suncor Energy, Inc. CA($)225,000 3.10% 24/5/2029 189,923 0.01%British Columbia Ferry Services, Inc. CA($)245,000 2.79% 15/10/2049 189,774 0.01%TELUS Corp. CA($)200,000 5.15% 26/11/2043 189,599 0.01%NAV Canada CA($)220,000 3.29% 30/3/2048 187,502 0.01%Greater Toronto Airports Authority CA($)150,150 6.98% 15/10/2032 187,054 0.01%TransCanada PipeLines Ltd. CA($)220,000 4.34% 15/10/2049 186,952 0.01%Bank of Nova Scotia $175,000 2.70% 3/8/2026 186,906 0.01%Loblaw Cos Ltd. CA($)200,000 4.49% 11/12/2028 185,496 0.01%Bell Telephone Co. of Canada or Bell Canada CA($)245,000 3.50% 30/9/2050 185,429 0.01%Toronto-Dominion Bank $175,000 2.65% 12/6/2024 185,268 0.01%Granite Holdings LP CA($)235,000 2.38% 18/12/2030 184,195 0.01%Cenovus Energy, Inc. CA($)215,000 3.55% 12/3/2025 183,514 0.01%Toronto-Dominion Bank^ CA($)200,000 4.86% 4/3/2031 183,173 0.01%Bell Telephone Co. of Canada or Bell Canada CA($)200,000 4.75% 29/9/2044 183,148 0.01%Barrick North America Finance LLC $130,000 5.75% 1/5/2043 183,011 0.01%North West Redwater Partnership/NWR Financing Co., Ltd. CA($)225,000 3.70% 23/2/2043 182,916 0.01%IGM Financial, Inc. CA($)200,000 4.21% 21/3/2050 182,363 0.01%Thomson Reuters Corp. CA($)220,000 2.24% 14/5/2025 182,241 0.01%North West Redwater Partnership/NWR Financing Co., Ltd. CA($)200,000 4.25% 1/6/2029 182,011 0.01%

575
Vanguard Global Corporate Bond Index Fund
Principal CouponMaturity
DateFair Value
US Dollars ($)% of Total
Net AssetsBell Telephone Co. of Canada or Bell Canada $150,000 4.30% 29/7/2049 181,954 0.01%Bell Telephone Co. of Canada or Bell Canada CA($)175,000 6.10% 16/3/2035 181,432 0.01%TELUS Corp. $150,000 4.30% 15/6/2049 181,027 0.01%Capital Power Corp. CA($)200,000 4.42% 8/2/2030 180,142 0.01%Bruce Power LP CA($)200,000 4.01% 21/6/2029 179,549 0.01%Enbridge Pipelines, Inc. CA($)215,000 4.13% 9/8/2046 179,473 0.01%407 International, Inc. CA($)200,000 3.83% 11/5/2046 178,445 0.01%Hydro One, Inc. CA($)200,000 3.72% 18/11/2047 178,058 0.01%407 International, Inc. CA($)200,000 3.67% 8/3/2049 175,279 0.01%Canadian National Railway Co. $164,000 2.95% 21/11/2024 174,863 0.01%Royal Bank of Canada $175,000 1.20% 27/4/2026 174,811 0.01%OMERS Realty Corp. CA($)200,000 3.24% 4/10/2027 174,514 0.01%Aeroports de Montreal CA($)220,000 3.03% 21/4/2050 174,231 0.01%Metro, Inc. CA($)200,000 3.39% 6/12/2027 174,142 0.01%Intact Financial Corp. CA($)200,000 3.69% 24/3/2025 174,137 0.01%TransCanada PipeLines Ltd. CA($)200,000 4.55% 15/11/2041 174,005 0.01%Pembina Pipeline Corp. CA($)200,000 3.71% 11/8/2026 173,612 0.01%TELUS Corp. CA($)215,000 3.95% 16/2/2050 173,443 0.01%Pembina Pipeline Corp. CA($)200,000 4.75% 26/3/2048 173,210 0.01%Canadian Pacific Railway Co. CA($)200,000 3.15% 13/3/2029 172,919 0.01%AltaGas Ltd. CA($)200,000 4.50% 15/8/2044 172,880 0.01%Enbridge Pipelines, Inc. CA($)200,000 4.33% 22/2/2049 172,660 0.01%TransCanada PipeLines Ltd. $150,000 4.88% 15/1/2026 172,421 0.01%Choice Properties CA($)200,000 3.53% 11/6/2029 172,235 0.01%Sobeys, Inc. CA($)200,000 4.70% 8/8/2023 172,052 0.01%Teck Resources Ltd. $145,000 5.20% 1/3/2042 171,979 0.01%Rogers Communications, Inc. CA($)200,000 4.00% 13/3/2024 171,813 0.01%AltaLink LP CA($)200,000 3.40% 6/6/2024 171,686 0.01%Enbridge Gas, Inc. CA($)200,000 2.88% 22/11/2027 171,255 0.01%SmartCentres CA($)200,000 3.44% 28/8/2026 170,833 0.01%Canadian National Railway Co. CA($)200,000 3.00% 8/2/2029 170,575 0.01%Enbridge Pipelines, Inc. CA($)200,000 3.00% 10/8/2026 170,409 0.01%Suncor Energy, Inc. CA($)200,000 3.00% 14/9/2026 170,137 0.01%Nova Scotia Power, Inc. CA($)200,000 3.61% 1/5/2045 169,901 0.01%Granite Holdings LP CA($)200,000 3.06% 4/6/2027 169,729 0.01%TELUS Corp. CA($)195,000 3.75% 17/1/2025 169,064 0.01%Brookfield Finance, Inc. $150,000 4.25% 2/6/2026 168,941 0.01%Industrial Alliance Insurance & Financial Services, Inc.^ CA($)200,000 3.30% 15/9/2028 168,787 0.01%CI Financial Corp. CA($)200,000 3.22% 22/7/2024 168,653 0.01%National Bank of Canada CA($)200,000 2.58% 3/2/2025 168,282 0.01%Pembina Pipeline Corp. CA($)200,000 4.54% 3/4/2049 168,245 0.01%Federation des Caisses Desjardins du Quebec^ CA($)200,000 2.86% 26/5/2030 168,180 0.01%Pembina Pipeline Corp. CA($)200,000 3.31% 1/2/2030 168,042 0.01%Manulife Bank of Canada CA($)200,000 2.38% 19/11/2024 167,619 0.01%First Capital CA($)200,000 3.95% 5/12/2022 167,606 0.01%TransCanada PipeLines Ltd. CA($)195,000 3.30% 17/7/2025 167,286 0.01%Alectra, Inc. CA($)215,000 1.75% 11/2/2031 166,986 0.01%Sun Life Financial, Inc.^ CA($)200,000 2.38% 13/8/2029 166,297 0.01%Enbridge, Inc. CA($)200,000 4.24% 27/8/2042 165,636 0.01%Canadian National Railway Co. CA($)200,000 3.60% 1/8/2047 165,259 0.01%National Bank of Canada CA($)195,000 2.98% 4/3/2024 165,085 0.01%Sagen MI Canada, Inc. CA($)200,000 2.96% 1/3/2027 165,047 0.01%Rogers Communications, Inc. CA($)195,000 3.25% 1/5/2029 164,676 0.01%Canadian Imperial Bank of Commerce CA($)200,000 2.30% 11/7/2022 164,591 0.01%Scotiabank Capital Trust^ CA($)155,000 5.65% 31/12/2056 164,552 0.01%Toyota Credit Canada, Inc. CA($)200,000 2.35% 18/7/2022 164,449 0.01%407 International, Inc. CA($)200,000 3.30% 27/3/2045 164,443 0.01%Hydro One, Inc. CA($)200,000 1.76% 28/2/2025 164,369 0.01%Algonquin Power Co. CA($)200,000 2.85% 15/7/2031 163,964 0.01%H&R CA($)200,000 2.91% 2/6/2026 163,441 0.01%Reliance LP CA($)200,000 2.67% 1/8/2028 163,175 0.01%TELUS Corp. CA($)200,000 2.35% 27/1/2028 163,060 0.01%Crombie CA($)200,000 3.21% 9/10/2030 163,046 0.01%Great-West Lifeco, Inc. CA($)200,000 2.38% 14/5/2030 163,026 0.01%Canadian Pacific Railway Co. $153,000 2.90% 1/2/2025 162,450 0.01%Suncor Energy, Inc. CA($)200,000 3.95% 4/3/2051 161,892 0.01%National Bank of Canada^ CA($)200,000 1.57% 18/8/2026 161,622 0.01%Great-West Lifeco, Inc. CA($)145,000 6.00% 16/11/2039 161,283 0.01%Central 1 Credit Union CA($)195,000 2.60% 7/11/2022 161,278 0.01%Toronto-Dominion Bank $150,000 3.25% 11/3/2024 160,658 0.01%Bank of Nova Scotia $150,000 3.40% 11/2/2024 160,634 0.01%
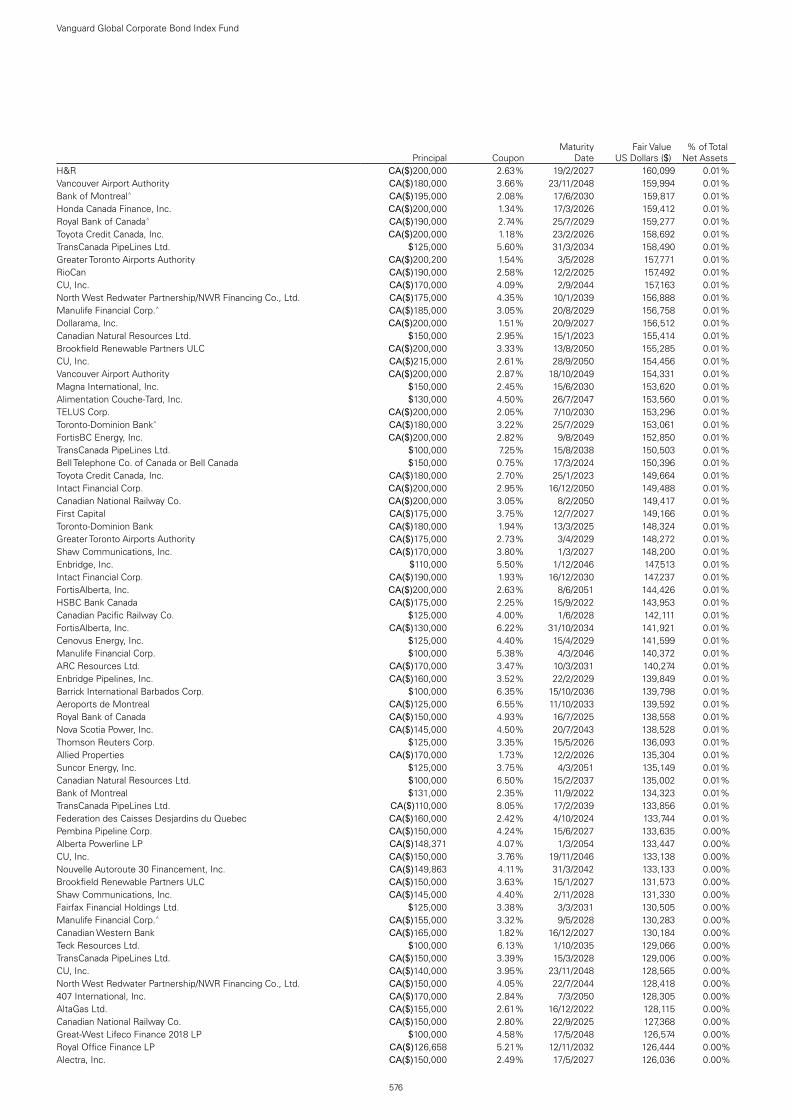
576
Vanguard Global Corporate Bond Index Fund
Principal CouponMaturity
DateFair Value
US Dollars ($)% of Total
Net AssetsH&R CA($)200,000 2.63% 19/2/2027 160,099 0.01%Vancouver Airport Authority CA($)180,000 3.66% 23/11/2048 159,994 0.01%Bank of Montreal^ CA($)195,000 2.08% 17/6/2030 159,817 0.01%Honda Canada Finance, Inc. CA($)200,000 1.34% 17/3/2026 159,412 0.01%Royal Bank of Canada^ CA($)190,000 2.74% 25/7/2029 159,277 0.01%Toyota Credit Canada, Inc. CA($)200,000 1.18% 23/2/2026 158,692 0.01%TransCanada PipeLines Ltd. $125,000 5.60% 31/3/2034 158,490 0.01%Greater Toronto Airports Authority CA($)200,200 1.54% 3/5/2028 157,771 0.01%RioCan CA($)190,000 2.58% 12/2/2025 157,492 0.01%CU, Inc. CA($)170,000 4.09% 2/9/2044 157,163 0.01%North West Redwater Partnership/NWR Financing Co., Ltd. CA($)175,000 4.35% 10/1/2039 156,888 0.01%Manulife Financial Corp.^ CA($)185,000 3.05% 20/8/2029 156,758 0.01%Dollarama, Inc. CA($)200,000 1.51% 20/9/2027 156,512 0.01%Canadian Natural Resources Ltd. $150,000 2.95% 15/1/2023 155,414 0.01%Brookfield Renewable Partners ULC CA($)200,000 3.33% 13/8/2050 155,285 0.01%CU, Inc. CA($)215,000 2.61% 28/9/2050 154,456 0.01%Vancouver Airport Authority CA($)200,000 2.87% 18/10/2049 154,331 0.01%Magna International, Inc. $150,000 2.45% 15/6/2030 153,620 0.01%Alimentation Couche-Tard, Inc. $130,000 4.50% 26/7/2047 153,560 0.01%TELUS Corp. CA($)200,000 2.05% 7/10/2030 153,296 0.01%Toronto-Dominion Bank^ CA($)180,000 3.22% 25/7/2029 153,061 0.01%FortisBC Energy, Inc. CA($)200,000 2.82% 9/8/2049 152,850 0.01%TransCanada PipeLines Ltd. $100,000 7.25% 15/8/2038 150,503 0.01%Bell Telephone Co. of Canada or Bell Canada $150,000 0.75% 17/3/2024 150,396 0.01%Toyota Credit Canada, Inc. CA($)180,000 2.70% 25/1/2023 149,664 0.01%Intact Financial Corp. CA($)200,000 2.95% 16/12/2050 149,488 0.01%Canadian National Railway Co. CA($)200,000 3.05% 8/2/2050 149,417 0.01%First Capital CA($)175,000 3.75% 12/7/2027 149,166 0.01%Toronto-Dominion Bank CA($)180,000 1.94% 13/3/2025 148,324 0.01%Greater Toronto Airports Authority CA($)175,000 2.73% 3/4/2029 148,272 0.01%Shaw Communications, Inc. CA($)170,000 3.80% 1/3/2027 148,200 0.01%Enbridge, Inc. $110,000 5.50% 1/12/2046 147,513 0.01%Intact Financial Corp. CA($)190,000 1.93% 16/12/2030 147,237 0.01%FortisAlberta, Inc. CA($)200,000 2.63% 8/6/2051 144,426 0.01%HSBC Bank Canada CA($)175,000 2.25% 15/9/2022 143,953 0.01%Canadian Pacific Railway Co. $125,000 4.00% 1/6/2028 142,111 0.01%FortisAlberta, Inc. CA($)130,000 6.22% 31/10/2034 141,921 0.01%Cenovus Energy, Inc. $125,000 4.40% 15/4/2029 141,599 0.01%Manulife Financial Corp. $100,000 5.38% 4/3/2046 140,372 0.01%ARC Resources Ltd. CA($)170,000 3.47% 10/3/2031 140,274 0.01%Enbridge Pipelines, Inc. CA($)160,000 3.52% 22/2/2029 139,849 0.01%Barrick International Barbados Corp. $100,000 6.35% 15/10/2036 139,798 0.01%Aeroports de Montreal CA($)125,000 6.55% 11/10/2033 139,592 0.01%Royal Bank of Canada CA($)150,000 4.93% 16/7/2025 138,558 0.01%Nova Scotia Power, Inc. CA($)145,000 4.50% 20/7/2043 138,528 0.01%Thomson Reuters Corp. $125,000 3.35% 15/5/2026 136,093 0.01%Allied Properties CA($)170,000 1.73% 12/2/2026 135,304 0.01%Suncor Energy, Inc. $125,000 3.75% 4/3/2051 135,149 0.01%Canadian Natural Resources Ltd. $100,000 6.50% 15/2/2037 135,002 0.01%Bank of Montreal $131,000 2.35% 11/9/2022 134,323 0.01%TransCanada PipeLines Ltd. CA($)110,000 8.05% 17/2/2039 133,856 0.01%Federation des Caisses Desjardins du Quebec CA($)160,000 2.42% 4/10/2024 133,744 0.01%Pembina Pipeline Corp. CA($)150,000 4.24% 15/6/2027 133,635 0.00%Alberta Powerline LP CA($)148,371 4.07% 1/3/2054 133,447 0.00%CU, Inc. CA($)150,000 3.76% 19/11/2046 133,138 0.00%Nouvelle Autoroute 30 Financement, Inc. CA($)149,863 4.11% 31/3/2042 133,133 0.00%Brookfield Renewable Partners ULC CA($)150,000 3.63% 15/1/2027 131,573 0.00%Shaw Communications, Inc. CA($)145,000 4.40% 2/11/2028 131,330 0.00%Fairfax Financial Holdings Ltd. $125,000 3.38% 3/3/2031 130,505 0.00%Manulife Financial Corp.^ CA($)155,000 3.32% 9/5/2028 130,283 0.00%Canadian Western Bank CA($)165,000 1.82% 16/12/2027 130,184 0.00%Teck Resources Ltd. $100,000 6.13% 1/10/2035 129,066 0.00%TransCanada PipeLines Ltd. CA($)150,000 3.39% 15/3/2028 129,006 0.00%CU, Inc. CA($)140,000 3.95% 23/11/2048 128,565 0.00%North West Redwater Partnership/NWR Financing Co., Ltd. CA($)150,000 4.05% 22/7/2044 128,418 0.00%407 International, Inc. CA($)170,000 2.84% 7/3/2050 128,305 0.00%AltaGas Ltd. CA($)155,000 2.61% 16/12/2022 128,115 0.00%Canadian National Railway Co. CA($)150,000 2.80% 22/9/2025 127,368 0.00%Great-West Lifeco Finance 2018 LP $100,000 4.58% 17/5/2048 126,574 0.00%Royal Office Finance LP CA($)126,658 5.21% 12/11/2032 126,444 0.00%Alectra, Inc. CA($)150,000 2.49% 17/5/2027 126,036 0.00%
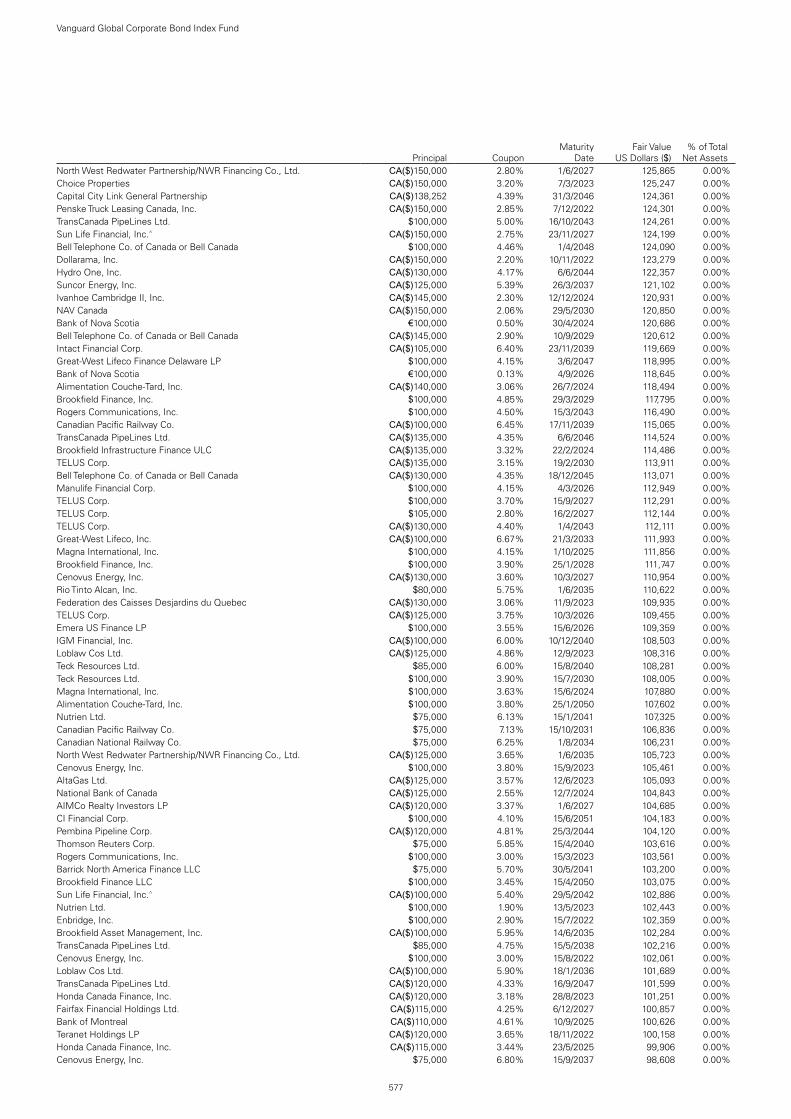
577
Vanguard Global Corporate Bond Index Fund
Principal CouponMaturity
DateFair Value
US Dollars ($)% of Total
Net AssetsNorth West Redwater Partnership/NWR Financing Co., Ltd. CA($)150,000 2.80% 1/6/2027 125,865 0.00%Choice Properties CA($)150,000 3.20% 7/3/2023 125,247 0.00%Capital City Link General Partnership CA($)138,252 4.39% 31/3/2046 124,361 0.00%Penske Truck Leasing Canada, Inc. CA($)150,000 2.85% 7/12/2022 124,301 0.00%TransCanada PipeLines Ltd. $100,000 5.00% 16/10/2043 124,261 0.00%Sun Life Financial, Inc.^ CA($)150,000 2.75% 23/11/2027 124,199 0.00%Bell Telephone Co. of Canada or Bell Canada $100,000 4.46% 1/4/2048 124,090 0.00%Dollarama, Inc. CA($)150,000 2.20% 10/11/2022 123,279 0.00%Hydro One, Inc. CA($)130,000 4.17% 6/6/2044 122,357 0.00%Suncor Energy, Inc. CA($)125,000 5.39% 26/3/2037 121,102 0.00%Ivanhoe Cambridge II, Inc. CA($)145,000 2.30% 12/12/2024 120,931 0.00%NAV Canada CA($)150,000 2.06% 29/5/2030 120,850 0.00%Bank of Nova Scotia €100,000 0.50% 30/4/2024 120,686 0.00%Bell Telephone Co. of Canada or Bell Canada CA($)145,000 2.90% 10/9/2029 120,612 0.00%Intact Financial Corp. CA($)105,000 6.40% 23/11/2039 119,669 0.00%Great-West Lifeco Finance Delaware LP $100,000 4.15% 3/6/2047 118,995 0.00%Bank of Nova Scotia €100,000 0.13% 4/9/2026 118,645 0.00%Alimentation Couche-Tard, Inc. CA($)140,000 3.06% 26/7/2024 118,494 0.00%Brookfield Finance, Inc. $100,000 4.85% 29/3/2029 117,795 0.00%Rogers Communications, Inc. $100,000 4.50% 15/3/2043 116,490 0.00%Canadian Pacific Railway Co. CA($)100,000 6.45% 17/11/2039 115,065 0.00%TransCanada PipeLines Ltd. CA($)135,000 4.35% 6/6/2046 114,524 0.00%Brookfield Infrastructure Finance ULC CA($)135,000 3.32% 22/2/2024 114,486 0.00%TELUS Corp. CA($)135,000 3.15% 19/2/2030 113,911 0.00%Bell Telephone Co. of Canada or Bell Canada CA($)130,000 4.35% 18/12/2045 113,071 0.00%Manulife Financial Corp. $100,000 4.15% 4/3/2026 112,949 0.00%TELUS Corp. $100,000 3.70% 15/9/2027 112,291 0.00%TELUS Corp. $105,000 2.80% 16/2/2027 112,144 0.00%TELUS Corp. CA($)130,000 4.40% 1/4/2043 112,111 0.00%Great-West Lifeco, Inc. CA($)100,000 6.67% 21/3/2033 111,993 0.00%Magna International, Inc. $100,000 4.15% 1/10/2025 111,856 0.00%Brookfield Finance, Inc. $100,000 3.90% 25/1/2028 111,747 0.00%Cenovus Energy, Inc. CA($)130,000 3.60% 10/3/2027 110,954 0.00%Rio Tinto Alcan, Inc. $80,000 5.75% 1/6/2035 110,622 0.00%Federation des Caisses Desjardins du Quebec CA($)130,000 3.06% 11/9/2023 109,935 0.00%TELUS Corp. CA($)125,000 3.75% 10/3/2026 109,455 0.00%Emera US Finance LP $100,000 3.55% 15/6/2026 109,359 0.00%IGM Financial, Inc. CA($)100,000 6.00% 10/12/2040 108,503 0.00%Loblaw Cos Ltd. CA($)125,000 4.86% 12/9/2023 108,316 0.00%Teck Resources Ltd. $85,000 6.00% 15/8/2040 108,281 0.00%Teck Resources Ltd. $100,000 3.90% 15/7/2030 108,005 0.00%Magna International, Inc. $100,000 3.63% 15/6/2024 107,880 0.00%Alimentation Couche-Tard, Inc. $100,000 3.80% 25/1/2050 107,602 0.00%Nutrien Ltd. $75,000 6.13% 15/1/2041 107,325 0.00%Canadian Pacific Railway Co. $75,000 7.13% 15/10/2031 106,836 0.00%Canadian National Railway Co. $75,000 6.25% 1/8/2034 106,231 0.00%North West Redwater Partnership/NWR Financing Co., Ltd. CA($)125,000 3.65% 1/6/2035 105,723 0.00%Cenovus Energy, Inc. $100,000 3.80% 15/9/2023 105,461 0.00%AltaGas Ltd. CA($)125,000 3.57% 12/6/2023 105,093 0.00%National Bank of Canada CA($)125,000 2.55% 12/7/2024 104,843 0.00%AIMCo Realty Investors LP CA($)120,000 3.37% 1/6/2027 104,685 0.00%CI Financial Corp. $100,000 4.10% 15/6/2051 104,183 0.00%Pembina Pipeline Corp. CA($)120,000 4.81% 25/3/2044 104,120 0.00%Thomson Reuters Corp. $75,000 5.85% 15/4/2040 103,616 0.00%Rogers Communications, Inc. $100,000 3.00% 15/3/2023 103,561 0.00%Barrick North America Finance LLC $75,000 5.70% 30/5/2041 103,200 0.00%Brookfield Finance LLC $100,000 3.45% 15/4/2050 103,075 0.00%Sun Life Financial, Inc.^ CA($)100,000 5.40% 29/5/2042 102,886 0.00%Nutrien Ltd. $100,000 1.90% 13/5/2023 102,443 0.00%Enbridge, Inc. $100,000 2.90% 15/7/2022 102,359 0.00%Brookfield Asset Management, Inc. CA($)100,000 5.95% 14/6/2035 102,284 0.00%TransCanada PipeLines Ltd. $85,000 4.75% 15/5/2038 102,216 0.00%Cenovus Energy, Inc. $100,000 3.00% 15/8/2022 102,061 0.00%Loblaw Cos Ltd. CA($)100,000 5.90% 18/1/2036 101,689 0.00%TransCanada PipeLines Ltd. CA($)120,000 4.33% 16/9/2047 101,599 0.00%Honda Canada Finance, Inc. CA($)120,000 3.18% 28/8/2023 101,251 0.00%Fairfax Financial Holdings Ltd. CA($)115,000 4.25% 6/12/2027 100,857 0.00%Bank of Montreal CA($)110,000 4.61% 10/9/2025 100,626 0.00%Teranet Holdings LP CA($)120,000 3.65% 18/11/2022 100,158 0.00%Honda Canada Finance, Inc. CA($)115,000 3.44% 23/5/2025 99,906 0.00%Cenovus Energy, Inc. $75,000 6.80% 15/9/2037 98,608 0.00%

578
Vanguard Global Corporate Bond Index Fund
Principal CouponMaturity
DateFair Value
US Dollars ($)% of Total
Net AssetsPlenary Properties LTAP LP CA($)90,320 6.29% 31/1/2044 97,750 0.00%Bruce Power LP CA($)100,000 4.75% 21/6/2049 97,338 0.00%CU, Inc. CA($)125,000 2.96% 7/9/2049 96,871 0.00%AltaLink LP CA($)95,000 4.87% 15/11/2040 96,671 0.00%Northwestern Hydro Acquisition Co. III LP CA($)112,000 3.94% 31/12/2038 96,511 0.00%Hydro One, Inc. CA($)100,000 4.39% 26/9/2041 96,303 0.00%Enbridge Pipelines, Inc. CA($)100,000 5.33% 6/4/2040 96,233 0.00%Teranet Holdings LP CA($)100,000 5.75% 17/12/2040 95,986 0.00%TELUS Corp. CA($)105,000 4.70% 6/3/2048 95,002 0.00%TransCanada PipeLines Ltd. $80,000 4.63% 1/3/2034 94,893 0.00%Northern Courier Pipeline LP CA($)113,482 3.37% 30/6/2042 94,205 0.00%Canadian Tire Corp., Ltd. CA($)100,000 5.61% 4/9/2035 93,457 0.00%Canadian National Railway Co. $75,000 4.45% 20/1/2049 93,330 0.00%407 International, Inc. CA($)100,000 4.19% 25/4/2042 93,015 0.00%Brookfield Renewable Partners ULC CA($)100,000 4.25% 15/1/2029 91,841 0.00%Manufacturers Life Insurance Co.^ CA($)110,000 3.18% 22/11/2027 91,692 0.00%Canadian Natural Resources Ltd. CA($)100,000 4.85% 30/5/2047 91,290 0.00%Hospital Infrastructure Partners NOH Partnership CA($)90,986 5.44% 31/1/2045 90,166 0.00%Choice Properties CA($)100,000 4.18% 8/3/2028 89,441 0.00%FortisBC Energy, Inc. CA($)105,000 2.58% 8/4/2026 88,670 0.00%Bruce Power LP CA($)100,000 3.97% 23/6/2026 88,432 0.00%Pembina Pipeline Corp. CA($)100,000 4.02% 27/3/2028 88,410 0.00%Bell Telephone Co. of Canada or Bell Canada CA($)100,000 4.45% 27/2/2047 88,391 0.00%TELUS Corp. CA($)105,000 2.75% 8/7/2026 88,233 0.00%Vancouver Airport Authority CA($)97,000 3.86% 10/11/2045 88,211 0.00%Brookfield Asset Management, Inc. CA($)100,000 3.80% 16/3/2027 88,129 0.00%Rogers Communications, Inc. CA($)80,000 6.68% 4/11/2039 86,990 0.00%IGM Financial, Inc. CA($)100,000 3.44% 26/1/2027 86,884 0.00%Loblaw Cos Ltd. CA($)100,000 3.92% 10/6/2024 86,725 0.00%Pembina Pipeline Corp. CA($)100,000 4.74% 21/1/2047 86,452 0.00%British Columbia Ferry Services, Inc. CA($)84,000 4.70% 23/10/2043 86,027 0.00%Alectra, Inc. CA($)100,000 3.24% 21/11/2024 85,978 0.00%Suncor Energy, Inc. $65,000 5.95% 1/12/2034 85,951 0.00%AltaLink LP CA($)100,000 3.67% 6/11/2023 85,896 0.00%Bruce Power LP CA($)95,000 4.13% 21/6/2033 85,734 0.00%Choice Properties CA($)100,000 3.56% 9/9/2024 85,697 0.00%Westcoast Energy, Inc. CA($)100,000 3.43% 12/9/2024 85,641 0.00%Bank of Montreal CA($)100,000 2.70% 9/12/2026 85,610 0.00%Canadian Natural Resources Ltd. CA($)100,000 3.55% 3/6/2024 85,389 0.00%Brookfield Infrastructure Finance ULC CA($)95,000 4.19% 11/9/2028 85,153 0.00%North West Redwater Partnership/NWR Financing Co., Ltd. CA($)90,000 4.75% 1/6/2037 85,138 0.00%OMERS Realty Corp. CA($)100,000 3.36% 5/6/2023 84,571 0.00%Bell Telephone Co. of Canada or Bell Canada CA($)100,000 2.90% 12/8/2026 84,559 0.00%TransCanada PipeLines Ltd. CA($)100,000 3.69% 19/7/2023 84,489 0.00%Crombie CA($)95,000 4.80% 31/1/2025 84,308 0.00%Enbridge Gas, Inc. CA($)100,000 2.50% 5/8/2026 84,059 0.00%Kinross Gold Corp. $75,000 5.95% 15/3/2024 83,871 0.00%North West Redwater Partnership/NWR Financing Co., Ltd. CA($)94,000 4.15% 1/6/2033 83,866 0.00%H&R CA($)100,000 3.37% 30/1/2024 83,774 0.00%Honda Canada Finance, Inc. CA($)100,000 2.50% 4/6/2024 83,677 0.00%Great-West Lifeco, Inc. CA($)110,000 2.98% 8/7/2050 83,313 0.00%Canadian National Railway Co. $75,000 3.65% 3/2/2048 83,226 0.00%Brookfield Infrastructure Finance ULC CA($)105,000 2.86% 1/9/2032 83,217 0.00%Canadian Imperial Bank of Commerce CA($)100,000 2.47% 5/12/2022 82,872 0.00%RioCan CA($)100,000 2.83% 3/10/2022 82,588 0.00%Canadian National Railway Co. CA($)100,000 3.60% 8/2/2049 82,550 0.00%Federation des Caisses Desjardins du Quebec CA($)100,000 2.39% 25/8/2022 82,488 0.00%Honda Canada Finance, Inc. CA($)100,000 2.27% 15/7/2022 82,159 0.00%TELUS Corp. CA($)95,000 4.40% 29/1/2046 82,023 0.00%Enbridge, Inc. CA($)90,000 4.87% 21/11/2044 81,333 0.00%CT CA($)95,000 3.29% 1/6/2026 81,050 0.00%Thomson Reuters Corp. $75,000 4.30% 23/11/2023 80,858 0.00%Enbridge Gas, Inc. CA($)95,000 2.90% 1/4/2030 80,780 0.00%Greater Toronto Airports Authority CA($)75,000 5.30% 25/2/2041 80,367 0.00%Toyota Credit Canada, Inc. CA($)95,000 3.04% 12/7/2023 79,921 0.00%Crosslinx Transit Solutions GP CA($)90,000 4.65% 30/9/2046 79,660 0.00%TELUS Corp. CA($)95,000 3.35% 15/3/2023 79,331 0.00%Canadian National Railway Co. $55,000 6.38% 15/11/2037 79,294 0.00%407 International, Inc. CA($)90,000 3.14% 6/3/2030 78,446 0.00%407 International, Inc. CA($)90,000 3.65% 8/9/2044 78,084 0.00%Hydro One, Inc. CA($)105,000 2.71% 28/2/2050 78,040 0.00%

579
Vanguard Global Corporate Bond Index Fund
Principal CouponMaturity
DateFair Value
US Dollars ($)% of Total
Net AssetsAlimentation Couche-Tard, Inc. CA($)90,000 3.60% 2/6/2025 77,864 0.00%Pembina Pipeline Corp. CA($)90,000 4.75% 30/4/2043 77,386 0.00%Pembina Pipeline Corp. CA($)90,000 3.54% 3/2/2025 77,145 0.00%Gibson Energy, Inc. CA($)90,000 3.60% 17/9/2029 77,107 0.00%TELUS Corp. CA($)85,000 4.75% 17/1/2045 76,943 0.00%Original Wempi, Inc. CA($)93,042 4.06% 13/2/2024 76,863 0.00%TMX Group Ltd. CA($)90,000 3.00% 11/12/2024 76,600 0.00%Power Corp. of Canada CA($)80,000 4.46% 27/7/2048 76,012 0.00%Rogers Communications, Inc. $50,000 7.50% 15/8/2038 75,999 0.00%Bell Telephone Co. of Canada or Bell Canada CA($)90,000 2.70% 27/2/2024 75,252 0.00%Canadian Western Bank CA($)90,000 2.60% 6/9/2024 75,210 0.00%Canadian Utilities Ltd. CA($)90,000 3.12% 9/11/2022 75,006 0.00%Great-West Lifeco, Inc. CA($)85,000 3.34% 28/2/2028 74,442 0.00%Hydro One, Inc. CA($)65,000 6.93% 1/6/2032 73,544 0.00%Manulife Finance Delaware LP^ CA($)75,000 5.06% 15/12/2041 73,329 0.00%Inter Pipeline Ltd. CA($)85,000 4.64% 30/5/2044 71,816 0.00%Algonquin Power Co. CA($)80,000 4.09% 17/2/2027 71,423 0.00%Manulife Bank of Canada CA($)85,000 2.84% 12/1/2023 70,815 0.00%Canadian National Railway Co. $50,000 6.20% 1/6/2036 70,548 0.00%Rogers Communications, Inc. CA($)65,000 6.56% 22/3/2041 70,437 0.00%Shaw Communications, Inc. CA($)85,000 4.25% 9/12/2049 70,212 0.00%Fairfax Financial Holdings Ltd. CA($)80,000 4.23% 14/6/2029 69,783 0.00%Enbridge, Inc. CA($)80,000 4.57% 11/3/2044 69,372 0.00%Canadian Pacific Railway Co. $50,000 5.95% 15/5/2037 69,186 0.00%Choice Properties CA($)80,000 4.29% 8/2/2024 69,098 0.00%TransCanada PipeLines Ltd. $50,000 6.20% 15/10/2037 68,684 0.00%North West Redwater Partnership/NWR Financing Co., Ltd. CA($)80,000 3.20% 24/4/2026 68,389 0.00%Canadian National Railway Co. $75,000 2.45% 1/5/2050 67,873 0.00%Saputo, Inc. CA($)80,000 2.88% 19/11/2024 67,628 0.00%Allied Properties CA($)80,000 3.11% 8/4/2027 67,231 0.00%Fairfax Financial Holdings Ltd. CA($)75,000 4.70% 16/12/2026 67,223 0.00%Thomson Reuters Corp. $50,000 5.65% 23/11/2043 67,169 0.00%Honda Canada Finance, Inc. CA($)80,000 2.54% 1/3/2023 66,410 0.00%Capital Power Corp. CA($)75,000 4.28% 18/9/2024 65,486 0.00%Allied Properties CA($)80,000 3.12% 21/2/2030 65,330 0.00%Reliance LP CA($)75,000 3.84% 15/3/2025 64,957 0.00%Shaw Communications, Inc. CA($)75,000 4.35% 31/1/2024 64,769 0.00%Nova Scotia Power, Inc. CA($)75,000 3.57% 5/4/2049 63,509 0.00%SmartCentres CA($)75,000 3.53% 20/12/2029 63,313 0.00%Shaw Communications, Inc. CA($)75,000 3.30% 10/12/2029 63,220 0.00%Alimentation Couche-Tard, Inc. CA($)75,000 3.90% 1/11/2022 63,046 0.00%Fortis, Inc. CA($)75,000 2.85% 12/12/2023 63,025 0.00%Pembina Pipeline Corp. CA($)75,000 2.99% 22/1/2024 62,924 0.00%Inter Pipeline Ltd. CA($)75,000 2.73% 18/4/2024 62,564 0.00%Magna International, Inc. CA($)75,000 3.10% 15/12/2022 62,445 0.00%Sun Life Financial, Inc.^ CA($)80,000 2.06% 1/10/2035 62,270 0.00%Pembina Pipeline Corp. CA($)75,000 2.56% 1/6/2023 62,175 0.00%Laurentian Bank of Canada CA($)75,000 3.00% 12/9/2022 62,171 0.00%Canadian National Railway Co. CA($)75,000 3.60% 31/7/2048 62,018 0.00%Cameco Corp. CA($)75,000 2.95% 21/10/2027 61,926 0.00%Hydro One, Inc. CA($)70,000 3.63% 25/6/2049 61,604 0.00%British Columbia Ferry Services, Inc. CA($)60,000 5.02% 20/3/2037 61,583 0.00%Algonquin Power Co. CA($)66,000 4.60% 29/1/2029 61,545 0.00%Nutrien Ltd. $45,000 5.63% 1/12/2040 61,379 0.00%TELUS Corp. CA($)70,000 3.63% 1/3/2028 61,259 0.00%AltaLink LP CA($)65,000 4.05% 21/11/2044 60,635 0.00%Nova Scotia Power, Inc. CA($)75,000 3.31% 25/4/2050 60,586 0.00%CT CA($)70,000 3.47% 16/6/2027 60,326 0.00%Hydro One, Inc. CA($)55,000 5.49% 16/7/2040 59,794 0.00%SmartCentres CA($)75,000 2.31% 18/12/2028 58,796 0.00%Hydro One, Inc. CA($)70,000 2.54% 5/4/2024 58,744 0.00%TMX Group Ltd. CA($)65,000 3.78% 5/6/2028 58,437 0.00%Inter Pipeline Ltd. CA($)68,000 3.48% 16/12/2026 58,281 0.00%FortisBC Energy, Inc. CA($)65,000 3.69% 30/10/2047 57,863 0.00%Clover LP CA($)65,805 4.22% 31/3/2034 57,554 0.00%Nutrien Ltd. $50,000 4.13% 15/3/2035 57,165 0.00%Kinross Gold Corp. $50,000 4.50% 15/7/2027 57,143 0.00%Keyera Corp. CA($)65,000 3.96% 29/5/2030 56,219 0.00%Hospital for Sick Children CA($)65,000 3.42% 7/12/2057 55,923 0.00%Northwestern Hydro Acquisition Co. II LP CA($)63,000 3.88% 31/12/2036 55,771 0.00%407 International, Inc. CA($)60,000 3.98% 11/9/2052 55,503 0.00%

580
Vanguard Global Corporate Bond Index Fund
Principal CouponMaturity
DateFair Value
US Dollars ($)% of Total
Net AssetsSuncor Energy, Inc. $50,000 4.00% 15/11/2047 55,257 0.00%SmartCentres CA($)65,000 3.99% 30/5/2023 55,210 0.00%SSL Finance, Inc. CA($)62,461 4.10% 31/10/2045 55,195 0.00%SEC LP & Arci Ltd. CA($)63,121 5.19% 29/8/2033 54,888 0.00%SmartCentres CA($)65,000 3.65% 11/12/2030 54,850 0.00%North Battleford Power LP CA($)58,522 4.96% 31/12/2032 54,413 0.00%AltaLink LP CA($)60,000 3.72% 3/12/2046 53,645 0.00%Cenovus Energy, Inc. $50,000 4.00% 15/4/2024 53,545 0.00%Enbridge, Inc. $50,000 4.00% 1/10/2023 53,394 0.00%TransCanada PipeLines Ltd. $50,000 3.75% 16/10/2023 53,213 0.00%Enbridge Pipelines, Inc. CA($)60,000 4.55% 17/8/2043 52,895 0.00%Keyera Corp. CA($)60,000 3.93% 21/6/2028 52,436 0.00%Nutrien Ltd. $50,000 3.50% 1/6/2023 52,370 0.00%Alectra, Inc. CA($)60,000 3.46% 12/4/2049 52,037 0.00%Pembina Pipeline Corp. CA($)60,000 4.67% 28/5/2050 51,554 0.00%AIMCo Realty Investors LP CA($)60,000 3.04% 1/6/2028 51,538 0.00%Granite Holdings LP CA($)60,000 3.87% 30/11/2023 51,381 0.00%Aeroports de Montreal CA($)50,000 5.17% 17/9/2035 50,863 0.00%RioCan CA($)60,000 3.29% 12/2/2024 50,635 0.00%InPower BC General Partnership CA($)56,536 4.47% 31/3/2033 50,216 0.00%Hydro One, Inc. CA($)55,000 3.91% 23/2/2046 50,192 0.00%Brookfield Renewable Partners ULC CA($)55,000 4.29% 5/11/2049 50,149 0.00%Emera, Inc. CA($)60,000 2.90% 16/6/2023 50,129 0.00%Canadian Pacific Railway Co. CA($)65,000 3.05% 9/3/2050 49,565 0.00%Kingston Solar LP CA($)56,488 3.57% 31/7/2035 47,807 0.00%Ivanhoe Cambridge II, Inc. CA($)57,000 2.91% 27/6/2023 47,738 0.00%Dollarama, Inc. CA($)55,000 3.55% 6/11/2023 46,776 0.00%Bell Telephone Co. of Canada or Bell Canada CA($)55,000 2.75% 29/1/2025 46,247 0.00%RioCan CA($)55,000 3.21% 29/9/2023 46,141 0.00%Gibson Energy, Inc. CA($)55,000 2.45% 14/7/2025 45,441 0.00%McGill University Health Centre CA($)40,000 5.36% 31/12/2043 45,276 0.00%Gibson Energy, Inc. CA($)54,000 2.85% 14/7/2027 44,802 0.00%Fairfax Financial Holdings Ltd. CA($)50,000 4.95% 3/3/2025 44,725 0.00%Enbridge Gas, Inc. CA($)50,000 3.80% 1/6/2046 44,525 0.00%Inter Pipeline Ltd. CA($)53,000 2.61% 13/9/2023 43,984 0.00%Reliance LP CA($)50,000 3.75% 15/3/2026 43,281 0.00%Hydro One, Inc. CA($)50,000 2.97% 26/6/2025 42,871 0.00%North West Redwater Partnership/NWR Financing Co., Ltd. CA($)50,000 3.20% 22/7/2024 42,465 0.00%Bruce Power LP CA($)50,000 3.00% 21/6/2024 42,281 0.00%Enbridge, Inc. CA($)50,000 3.94% 13/1/2023 42,197 0.00%Bridging North America GP CA($)49,000 4.34% 31/8/2053 42,129 0.00%Allied Properties CA($)50,000 3.39% 15/8/2029 41,988 0.00%Saputo, Inc. CA($)50,000 2.83% 21/11/2023 41,842 0.00%Pembina Pipeline Corp. CA($)50,000 3.77% 24/10/2022 41,830 0.00%Canadian Western Bank CA($)50,000 2.61% 30/1/2025 41,799 0.00%AltaLink LP CA($)50,000 2.98% 28/11/2022 41,664 0.00%AIMCo Realty Investors LP CA($)50,000 2.27% 26/6/2024 41,577 0.00%Equitable Bank CA($)50,000 2.95% 26/9/2022 41,311 0.00%Bow Centre Street LP CA($)50,000 3.80% 13/6/2023 41,009 0.00%Capital Power Corp. CA($)45,000 4.99% 23/1/2026 40,882 0.00%Co.-operators Financial Services Ltd. CA($)50,000 3.33% 13/5/2030 40,629 0.00%Westcoast Energy, Inc. CA($)43,000 4.79% 28/10/2041 39,593 0.00%Brookfield Renewable Partners ULC CA($)45,000 3.75% 2/6/2025 39,131 0.00%Enbridge, Inc. CA($)45,000 3.95% 19/11/2024 39,100 0.00%CI Financial Corp. CA($)45,000 3.90% 27/9/2027 38,948 0.00%CIBC Capital Trust^ CA($)45,000 10.25% 30/6/2108 38,544 0.00%407 International, Inc. CA($)45,000 3.35% 16/5/2024 38,469 0.00%Hydro One Inc CA($)45,000 2.77% 24/2/2026 38,328 0.00%Enbridge Pipelines, Inc. CA($)45,000 3.79% 17/8/2023 38,183 0.00%Inter Pipeline Ltd. CA($)45,000 3.17% 24/3/2025 38,111 0.00%Laurentian Bank of Canada CA($)45,000 3.45% 27/6/2023 38,012 0.00%First Capital CA($)45,000 3.46% 22/1/2027 37,864 0.00%Allied Properties CA($)45,000 3.13% 15/5/2028 37,579 0.00%iA Financial Corp., Inc.^ CA($)45,000 2.40% 21/2/2030 37,320 0.00%Alectra, Inc. CA($)40,000 3.96% 30/7/2042 36,751 0.00%FortisBC Energy, Inc. CA($)40,000 3.85% 7/12/2048 36,640 0.00%McGill University CA($)39,000 3.98% 29/1/2056 36,628 0.00%Teck Resources Ltd. $30,000 5.40% 1/2/2043 36,557 0.00%Metro, Inc. CA($)35,000 5.97% 15/10/2035 36,014 0.00%Choice Properties CA($)40,000 4.06% 24/11/2025 35,168 0.00%TransEd Partners GP CA($)41,631 3.95% 30/9/2050 34,609 0.00%

581
Vanguard Global Corporate Bond Index Fund
Principal CouponMaturity
DateFair Value
US Dollars ($)% of Total
Net AssetsCrombie CA($)40,000 3.68% 26/8/2026 34,480 0.00%Allied Properties CA($)40,000 3.64% 21/4/2025 34,414 0.00%Choice Properties CA($)40,000 3.55% 10/1/2025 34,361 0.00%TriSummit Utilities, Inc. CA($)40,000 3.15% 6/4/2026 34,269 0.00%Toyota Credit Canada, Inc. CA($)40,000 2.62% 11/10/2022 33,090 0.00%AltaLink LP CA($)35,000 4.09% 30/6/2045 32,882 0.00%Aeroports de Montreal CA($)30,000 5.67% 16/10/2037 32,527 0.00%Plenary Health Care Partnerships Humber LP CA($)34,216 4.90% 31/5/2039 32,500 0.00%CCL Industries, Inc. CA($)36,000 3.86% 13/4/2028 31,583 0.00%FortisBC, Inc. CA($)35,000 4.00% 28/10/2044 31,422 0.00%Saputo, Inc. CA($)35,000 3.60% 14/8/2025 30,372 0.00%Cameco Corp. CA($)35,000 4.19% 24/6/2024 30,195 0.00%bcIMC Realty Corp. CA($)35,000 2.84% 3/6/2025 29,752 0.00%Canadian Western Bank^ CA($)35,000 3.67% 11/6/2029 29,703 0.00%Cogeco Communications, Inc. CA($)35,000 4.18% 26/5/2023 29,642 0.00%Empire Life Insurance Co.^ CA($)35,000 3.66% 15/3/2028 29,466 0.00%Federated Co.-Operatives Ltd. CA($)34,000 3.92% 17/6/2025 29,011 0.00%TriSummit Utilities, Inc. CA($)30,000 4.26% 5/12/2028 27,491 0.00%IGM Financial, Inc. CA($)30,000 4.17% 13/7/2048 27,136 0.00%Enbridge Gas, Inc. CA($)25,000 4.95% 22/11/2050 26,907 0.00%Canadian National Railway Co. $25,000 2.75% 1/3/2026 26,834 0.00%FortisAlberta, Inc. CA($)30,000 3.73% 18/9/2048 26,676 0.00%CT CA($)30,000 3.87% 7/12/2027 26,378 0.00%THP Partnership CA($)27,897 4.39% 31/10/2046 25,810 0.00%Plenary Health Bridgepoint LP CA($)22,436 7.25% 31/8/2042 25,743 0.00%Coast Capital Savings Federal Credit Union^ CA($)30,000 5.00% 3/5/2028 25,666 0.00%Enbridge Gas, Inc. CA($)30,000 3.51% 29/11/2047 25,582 0.00%First National Financial Corp. CA($)30,000 3.58% 25/11/2024 25,294 0.00%FortisBC Energy, Inc. CA($)34,000 2.54% 13/7/2050 24,455 0.00%Enbridge Gas, Inc. CA($)25,000 4.50% 23/11/2043 24,311 0.00%Metro, Inc. CA($)25,000 5.03% 1/12/2044 24,136 0.00%407 International, Inc. CA($)25,000 4.45% 15/11/2041 24,009 0.00%IGM Financial, Inc. CA($)25,000 4.56% 25/1/2047 23,802 0.00%Hydro One, Inc. CA($)25,000 4.00% 22/12/2051 23,436 0.00%Liberty Utilities Canada LP CA($)30,000 3.32% 14/2/2050 22,880 0.00%FortisBC Energy, Inc. CA($)20,000 6.00% 2/10/2037 22,225 0.00%University of Western Ontario CA($)21,000 4.80% 24/5/2047 21,847 0.00%TMX Group Ltd. CA($)25,000 4.46% 3/10/2023 21,623 0.00%Chartwell Retirement Residences CA($)25,000 4.21% 28/4/2025 21,453 0.00%iA Financial Corp., Inc.^ CA($)25,000 3.07% 24/9/2031 21,279 0.00%Canadian Imperial Bank of Commerce CA($)25,000 2.43% 9/6/2023 20,772 0.00%Metro, Inc. CA($)25,000 2.68% 5/12/2022 20,679 0.00%Edmonton Regional Airports Authority CA($)19,814 7.21% 1/11/2030 20,142 0.00%CU, Inc. CA($)20,000 3.96% 27/7/2045 18,231 0.00%North West Redwater Partnership/NWR Financing Co., Ltd. CA($)200 4.25% 1/6/2029 18,073 0.00%North West Redwater Partnership/NWR Financing Co., Ltd. CA($)225 3.70% 23/2/2043 18,060 0.00%Trillium Health Partners Volunteers CA($)20,000 3.70% 20/12/2058 17,987 0.00%Bankers Hall LP CA($)21,401 4.38% 20/11/2023 17,871 0.00%Vancouver Airport Authority CA($)17,000 7.43% 7/12/2026 17,780 0.00%FortisAlberta, Inc. CA($)20,000 3.67% 9/9/2047 17,534 0.00%Alliance Pipeline LP CA($)18,741 6.77% 31/12/2025 17,486 0.00%SmartCentres CA($)20,000 3.19% 11/6/2027 16,832 0.00%Morguard Corp. CA($)20,000 4.33% 15/9/2022 16,342 0.00%Aeroports de Montreal CA($)15,000 5.47% 16/4/2040 16,210 0.00%North West Redwater Partnership/NWR Financing Co., Ltd. CA($)175 4.35% 10/1/2039 15,559 0.00%CU, Inc. CA($)15,000 4.09% 19/10/2054 14,223 0.00%Canadian National Railway Co. CA($)15,000 3.95% 22/9/2045 13,137 0.00%SmartCentres CA($)15,000 3.83% 21/12/2027 13,025 0.00%North West Redwater Partnership/NWR Financing Co., Ltd. CA($)150 4.05% 22/7/2044 12,594 0.00%FortisAlberta, Inc. CA($)15,000 3.34% 21/9/2046 12,447 0.00%Canada Life Capital Trust CA($)10,000 7.53% 30/6/2032 11,682 0.00%Loblaw Cos Ltd. CA($)10,000 7.00% 7/6/2040 11,161 0.00%CU, Inc. CA($)10,000 3.83% 11/9/2062 9,111 0.00%FortisBC Energy, Inc. CA($)10,000 3.78% 6/3/2047 9,014 0.00%NAV Canada CA($)10,000 2.92% 29/9/2051 7,971 0.00%North West Redwater Partnership/NWR Financing Co., Ltd. CA($)125 3.65% 1/6/2035 105 0.00%North West Redwater Partnership/NWR Financing Co., Ltd. CA($)50 3.20% 22/7/2024 42 0.00%test - - - 134,726,521 4.62%Chile 0.18% (2020: 0.18%)Empresa Nacional de Telecomunicaciones SA $400,000 4.75% 1/8/2026 442,746 0.01%Banco Santander Chile $300,000 3.88% 20/9/2022 312,308 0.01%

582
Vanguard Global Corporate Bond Index Fund
Principal CouponMaturity
DateFair Value
US Dollars ($)% of Total
Net AssetsColbun SA $300,000 3.15% 6/3/2030 307,098 0.01%Celulosa Arauco y Constitucion SA $200,000 5.15% 29/1/2050 229,255 0.01%Sociedad Quimica y Minera de Chile SA $200,000 4.25% 7/5/2029 225,022 0.01%Cencosud SA $200,000 5.15% 12/2/2025 221,027 0.01%Cencosud SA $200,000 4.38% 17/7/2027 219,176 0.01%GNL Quintero SA $200,000 4.63% 31/7/2029 217,826 0.01%Sociedad Quimica y Minera de Chile SA $200,000 4.25% 22/1/2050 216,935 0.01%Celulosa Arauco y Constitucion SA $200,000 4.20% 29/1/2030 216,395 0.01%Celulosa Arauco y Constitucion SA $200,000 4.20% 29/1/2030 216,395 0.01%Banco de Credito e Inversiones SA $200,000 3.50% 12/10/2027 214,703 0.01%Falabella SA $200,000 3.75% 30/10/2027 214,090 0.01%Inversiones CMPC SA $200,000 3.85% 13/1/2030 213,138 0.01%Inversiones CMPC SA $200,000 4.38% 15/5/2023 210,038 0.01%Engie Energia Chile SA $200,000 3.40% 28/1/2030 205,225 0.01%Engie Energia Chile SA $175,000 4.50% 29/1/2025 191,104 0.01%Enel Chile SA $145,000 4.88% 12/6/2028 167,467 0.01%Embotelladora Andina SA $150,000 3.95% 21/1/2050 159,017 0.00%Banco Santander Chile $150,000 2.70% 10/1/2025 156,585 0.00%Celulosa Arauco y Constitucion SA $100,000 5.50% 2/11/2047 119,667 0.00%Celulosa Arauco y Constitucion SA $100,000 4.50% 1/8/2024 107,814 0.00%Empresa Nacional de Telecomunicaciones SA $100,000 4.88% 30/10/2024 106,747 0.00%Enel Americas SA $75,000 4.00% 25/10/2026 81,708 0.00%Transelec SA $75,000 3.88% 12/1/2029 81,348 0.00%Enel Generacion Chile SA $50,000 4.25% 15/4/2024 53,510 0.00%Telefonica Chile SA $50,000 3.88% 12/10/2022 51,712 0.00%Colbun SA $25,000 3.95% 11/10/2027 27,370 0.00%test - - - 5,185,426 0.18%China 1.17% (2020: 1.08%)Tencent Holdings Ltd. $1,075,000 3.98% 11/4/2029 1,202,927 0.04%Tencent Holdings Ltd. $1,000,000 2.39% 3/6/2030 996,446 0.03%Alibaba Group Holding Ltd. $900,000 3.60% 28/11/2024 978,175 0.03%Vanke Real Estate Hong Kong Co., Ltd. $900,000 3.15% 12/5/2025 935,620 0.03%Tencent Holdings Ltd. $600,000 3.60% 19/1/2028 655,885 0.02%Tencent Holdings Ltd. $650,000 3.24% 3/6/2050 633,743 0.02%China Railway Resources Huitung Ltd. $600,000 3.85% 5/2/2023 623,328 0.02%Baidu, Inc. $500,000 4.13% 30/6/2025 552,217 0.02%Sinosing Services Pte Ltd. $500,000 2.25% 20/2/2025 509,322 0.02%Tencent Holdings Ltd. $500,000 1.81% 26/1/2026 508,339 0.02%Coastal Emerald Ltd. $500,000 3.95% 1/8/2022 502,494 0.02%Horse Gallop Finance Ltd. $500,000 1.70% 28/7/2025 498,046 0.02%Tencent Holdings Ltd. $500,000 3.29% 3/6/2060 485,607 0.01%Alibaba Group Holding Ltd. $400,000 4.20% 6/12/2047 461,563 0.01%Vanke Real Estate Hong Kong Co., Ltd. $400,000 5.35% 11/3/2024 439,469 0.01%Baidu, Inc. $400,000 3.43% 7/4/2030 433,884 0.01%Tencent Holdings Ltd. $400,000 3.84% 22/4/2051 431,818 0.01%Longfor Group Holdings Ltd. $400,000 3.95% 16/9/2029 431,578 0.01%Vanke Real Estate Hong Kong Co., Ltd. $400,000 3.98% 9/11/2027 429,589 0.01%JD.com, Inc. $400,000 3.38% 14/1/2030 427,235 0.01%China Mengniu Dairy Co., Ltd. $400,000 3.00% 18/7/2024 419,330 0.01%Lenovo Group Ltd. $400,000 3.42% 2/11/2030 417,466 0.01%CICC Hong Kong Finance 2016 MTN Ltd. $400,000 1.63% 26/1/2024 401,894 0.01%Coastal Emerald Ltd.^ $400,000 4.30% Perpetual 400,317 0.01%Alibaba Group Holding Ltd. $400,000 3.15% 9/2/2051 393,548 0.01%Alibaba Group Holding Ltd. $400,000 3.25% 9/2/2061 387,306 0.01%Guangzhou Metro Investment Finance BVI Ltd. $400,000 2.31% 17/9/2030 381,776 0.01%Tencent Holdings Ltd. $325,000 3.93% 19/1/2038 354,133 0.01%Prosus NV $325,000 3.68% 21/1/2030 347,363 0.01%China Merchants Finance Co., Ltd. $300,000 4.75% 3/8/2025 332,977 0.01%ZhongAn Online P&C Insurance Co., Ltd. $325,000 3.50% 8/3/2026 328,091 0.01%Country Garden Holdings Co., Ltd. $300,000 5.63% 14/1/2030 325,765 0.01%GLP China Holdings Ltd. $300,000 4.97% 26/2/2024 321,970 0.01%Shanghai Port Group BVI Development Co., Ltd. $300,000 2.88% 18/6/2024 314,659 0.01%Country Garden Holdings Co., Ltd. $300,000 4.80% 6/8/2030 313,426 0.01%Longfor Group Holdings Ltd. $300,000 3.88% 13/7/2022 307,286 0.01%Prosus NV $325,000 3.83% 8/2/2051 301,615 0.01%Westwood Group Holdings Ltd. $275,000 2.80% 20/1/2026 278,412 0.01%Mega Advance Investments Ltd. $200,000 6.38% 12/5/2041 272,446 0.01%Vigorous Champion International Ltd. $250,000 4.38% 10/9/2023 265,272 0.01%Alibaba Group Holding Ltd. $275,000 2.70% 9/2/2041 263,611 0.01%Sunshine Life Insurance Corp., Ltd. $250,000 4.50% 20/4/2026 256,159 0.01%Shanghai Port Group BVI Development 2 Co., Ltd. $250,000 2.38% 13/7/2030 251,255 0.01%
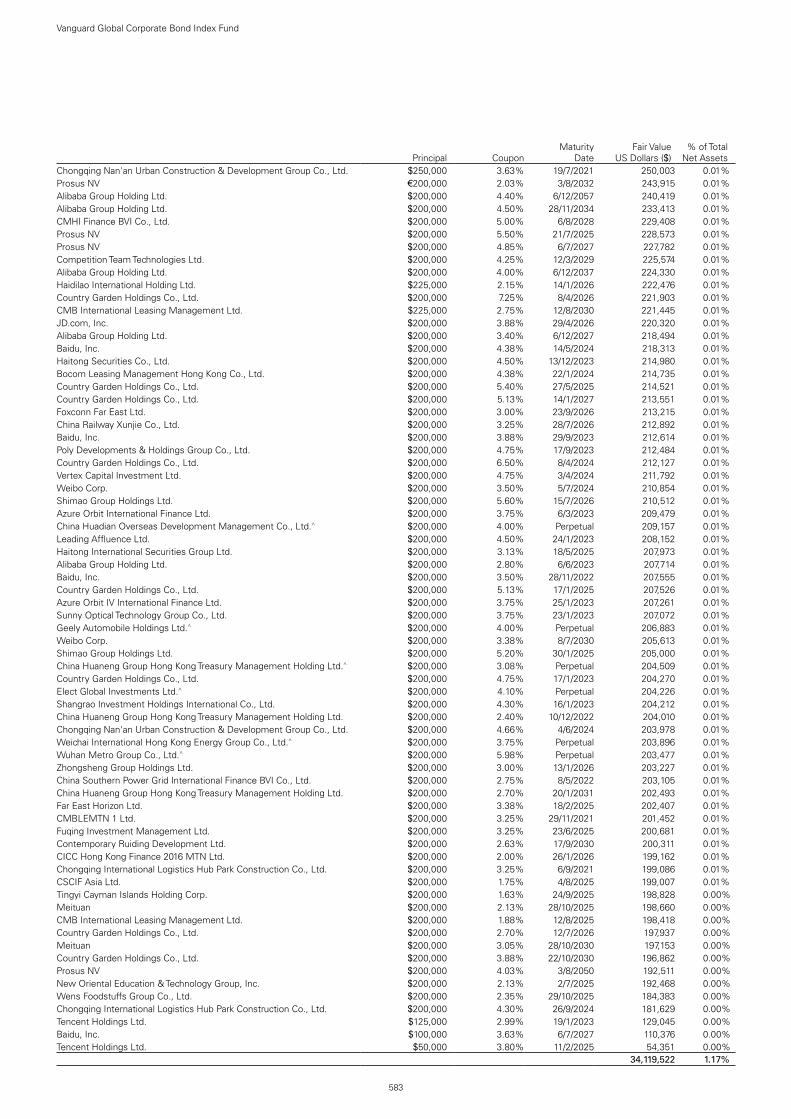
583
Vanguard Global Corporate Bond Index Fund
Principal CouponMaturity
DateFair Value
US Dollars ($)% of Total
Net AssetsChongqing Nan'an Urban Construction & Development Group Co., Ltd. $250,000 3.63% 19/7/2021 250,003 0.01%Prosus NV €200,000 2.03% 3/8/2032 243,915 0.01%Alibaba Group Holding Ltd. $200,000 4.40% 6/12/2057 240,419 0.01%Alibaba Group Holding Ltd. $200,000 4.50% 28/11/2034 233,413 0.01%CMHI Finance BVI Co., Ltd. $200,000 5.00% 6/8/2028 229,408 0.01%Prosus NV $200,000 5.50% 21/7/2025 228,573 0.01%Prosus NV $200,000 4.85% 6/7/2027 227,782 0.01%Competition Team Technologies Ltd. $200,000 4.25% 12/3/2029 225,574 0.01%Alibaba Group Holding Ltd. $200,000 4.00% 6/12/2037 224,330 0.01%Haidilao International Holding Ltd. $225,000 2.15% 14/1/2026 222,476 0.01%Country Garden Holdings Co., Ltd. $200,000 7.25% 8/4/2026 221,903 0.01%CMB International Leasing Management Ltd. $225,000 2.75% 12/8/2030 221,445 0.01%JD.com, Inc. $200,000 3.88% 29/4/2026 220,320 0.01%Alibaba Group Holding Ltd. $200,000 3.40% 6/12/2027 218,494 0.01%Baidu, Inc. $200,000 4.38% 14/5/2024 218,313 0.01%Haitong Securities Co., Ltd. $200,000 4.50% 13/12/2023 214,980 0.01%Bocom Leasing Management Hong Kong Co., Ltd. $200,000 4.38% 22/1/2024 214,735 0.01%Country Garden Holdings Co., Ltd. $200,000 5.40% 27/5/2025 214,521 0.01%Country Garden Holdings Co., Ltd. $200,000 5.13% 14/1/2027 213,551 0.01%Foxconn Far East Ltd. $200,000 3.00% 23/9/2026 213,215 0.01%China Railway Xunjie Co., Ltd. $200,000 3.25% 28/7/2026 212,892 0.01%Baidu, Inc. $200,000 3.88% 29/9/2023 212,614 0.01%Poly Developments & Holdings Group Co., Ltd. $200,000 4.75% 17/9/2023 212,484 0.01%Country Garden Holdings Co., Ltd. $200,000 6.50% 8/4/2024 212,127 0.01%Vertex Capital Investment Ltd. $200,000 4.75% 3/4/2024 211,792 0.01%Weibo Corp. $200,000 3.50% 5/7/2024 210,854 0.01%Shimao Group Holdings Ltd. $200,000 5.60% 15/7/2026 210,512 0.01%Azure Orbit International Finance Ltd. $200,000 3.75% 6/3/2023 209,479 0.01%China Huadian Overseas Development Management Co., Ltd.^ $200,000 4.00% Perpetual 209,157 0.01%Leading Affluence Ltd. $200,000 4.50% 24/1/2023 208,152 0.01%Haitong International Securities Group Ltd. $200,000 3.13% 18/5/2025 207,973 0.01%Alibaba Group Holding Ltd. $200,000 2.80% 6/6/2023 207,714 0.01%Baidu, Inc. $200,000 3.50% 28/11/2022 207,555 0.01%Country Garden Holdings Co., Ltd. $200,000 5.13% 17/1/2025 207,526 0.01%Azure Orbit IV International Finance Ltd. $200,000 3.75% 25/1/2023 207,261 0.01%Sunny Optical Technology Group Co., Ltd. $200,000 3.75% 23/1/2023 207,072 0.01%Geely Automobile Holdings Ltd.^ $200,000 4.00% Perpetual 206,883 0.01%Weibo Corp. $200,000 3.38% 8/7/2030 205,613 0.01%Shimao Group Holdings Ltd. $200,000 5.20% 30/1/2025 205,000 0.01%China Huaneng Group Hong Kong Treasury Management Holding Ltd.^ $200,000 3.08% Perpetual 204,509 0.01%Country Garden Holdings Co., Ltd. $200,000 4.75% 17/1/2023 204,270 0.01%Elect Global Investments Ltd.^ $200,000 4.10% Perpetual 204,226 0.01%Shangrao Investment Holdings International Co., Ltd. $200,000 4.30% 16/1/2023 204,212 0.01%China Huaneng Group Hong Kong Treasury Management Holding Ltd. $200,000 2.40% 10/12/2022 204,010 0.01%Chongqing Nan'an Urban Construction & Development Group Co., Ltd. $200,000 4.66% 4/6/2024 203,978 0.01%Weichai International Hong Kong Energy Group Co., Ltd.^ $200,000 3.75% Perpetual 203,896 0.01%Wuhan Metro Group Co., Ltd.^ $200,000 5.98% Perpetual 203,477 0.01%Zhongsheng Group Holdings Ltd. $200,000 3.00% 13/1/2026 203,227 0.01%China Southern Power Grid International Finance BVI Co., Ltd. $200,000 2.75% 8/5/2022 203,105 0.01%China Huaneng Group Hong Kong Treasury Management Holding Ltd. $200,000 2.70% 20/1/2031 202,493 0.01%Far East Horizon Ltd. $200,000 3.38% 18/2/2025 202,407 0.01%CMBLEMTN 1 Ltd. $200,000 3.25% 29/11/2021 201,452 0.01%Fuqing Investment Management Ltd. $200,000 3.25% 23/6/2025 200,681 0.01%Contemporary Ruiding Development Ltd. $200,000 2.63% 17/9/2030 200,311 0.01%CICC Hong Kong Finance 2016 MTN Ltd. $200,000 2.00% 26/1/2026 199,162 0.01%Chongqing International Logistics Hub Park Construction Co., Ltd. $200,000 3.25% 6/9/2021 199,086 0.01%CSCIF Asia Ltd. $200,000 1.75% 4/8/2025 199,007 0.01%Tingyi Cayman Islands Holding Corp. $200,000 1.63% 24/9/2025 198,828 0.00%Meituan $200,000 2.13% 28/10/2025 198,660 0.00%CMB International Leasing Management Ltd. $200,000 1.88% 12/8/2025 198,418 0.00%Country Garden Holdings Co., Ltd. $200,000 2.70% 12/7/2026 197,937 0.00%Meituan $200,000 3.05% 28/10/2030 197,153 0.00%Country Garden Holdings Co., Ltd. $200,000 3.88% 22/10/2030 196,862 0.00%Prosus NV $200,000 4.03% 3/8/2050 192,511 0.00%New Oriental Education & Technology Group, Inc. $200,000 2.13% 2/7/2025 192,468 0.00%Wens Foodstuffs Group Co., Ltd. $200,000 2.35% 29/10/2025 184,383 0.00%Chongqing International Logistics Hub Park Construction Co., Ltd. $200,000 4.30% 26/9/2024 181,629 0.00%Tencent Holdings Ltd. $125,000 2.99% 19/1/2023 129,045 0.00%Baidu, Inc. $100,000 3.63% 6/7/2027 110,376 0.00%Tencent Holdings Ltd. $50,000 3.80% 11/2/2025 54,351 0.00%test - - - 34,119,522 1.17%

584
Vanguard Global Corporate Bond Index Fund
Principal CouponMaturity
DateFair Value
US Dollars ($)% of Total
Net AssetsColombia 0.02% (2020: 0.03%)Bancolombia SA $400,000 3.00% 29/1/2025 410,121 0.01%SURA Asset Management SA $150,000 4.38% 11/4/2027 162,303 0.01%test - - - 572,424 0.02%Czech Republic 0.06% (2020: 0.04%)EP Infrastructure A.S. €500,000 1.70% 30/7/2026 617,195 0.02%EP Infrastructure A.S. €500,000 1.82% 2/3/2031 601,939 0.02%CPI Property Group SA £200,000 2.75% 22/1/2028 282,563 0.01%CPI Property Group SA €200,000 1.63% 23/4/2027 244,004 0.01%test - - - 1,745,701 0.06%Denmark 0.47% (2020: 0.44%)AP Moller-Maersk A/S €1,400,000 1.75% 16/3/2026 1,783,611 0.06%AP Moller-Maersk A/S £800,000 4.00% 4/4/2025 1,225,712 0.04%Danske Bank A/S^ $1,100,000 3.24% 20/12/2025 1,170,769 0.04%Danske Bank A/S^ $875,000 1.17% 8/12/2023 878,975 0.03%Jyske Bank A/S^ €500,000 0.63% 20/6/2024 601,225 0.02%Nykredit Realkredit A/S^ €500,000 0.88% 28/7/2031 593,328 0.02%Nykredit Realkredit A/S €500,000 0.25% 13/1/2026 593,314 0.02%Nykredit Realkredit A/S €500,000 0.38% 17/1/2028 585,736 0.02%Nykredit Realkredit A/S €400,000 0.75% 20/1/2027 483,601 0.02%Danske Bank A/S €400,000 0.75% 2/6/2023 483,245 0.02%Danske Bank A/S^ €400,000 0.50% 27/8/2025 479,271 0.02%Danske Bank A/S $400,000 5.38% 12/1/2024 443,685 0.02%Danske Bank A/S^ €300,000 1.38% 12/2/2030 362,633 0.01%Carlsberg Breweries A/S €300,000 0.50% 6/9/2023 360,570 0.01%Carlsberg Breweries A/S €300,000 0.38% 30/6/2027 359,791 0.01%Danfoss Finance I BV €300,000 0.13% 28/4/2026 355,254 0.01%Danske Bank A/S €200,000 0.63% 26/5/2025 242,736 0.01%Carlsberg Breweries A/S €200,000 0.63% 9/3/2030 239,235 0.01%Danske Bank A/S €200,000 0.25% 28/11/2022 239,113 0.01%Danske Bank A/S^ €190,000 1.00% 15/5/2031 225,548 0.01%Danske Bank A/S $200,000 4.38% 12/6/2028 224,503 0.01%Danske Bank A/S^ £150,000 2.25% 14/1/2028 212,751 0.01%ISS Global A/S €150,000 1.50% 31/8/2027 184,282 0.01%Danica Pension Livsforsikrings AB^ €100,000 4.38% 29/9/2045 134,176 0.01%Nykredit Realkredit A/S^ €100,000 2.75% 17/11/2027 122,937 0.01%Sydbank A/S €100,000 1.38% 18/9/2023 122,251 0.01%Nykredit Realkredit A/S €100,000 0.63% 17/1/2025 121,034 0.00%Danske Bank A/S €100,000 0.88% 22/5/2023 120,722 0.00%H Lundbeck A/S €100,000 0.88% 14/10/2027 120,659 0.00%Danske Bank A/S €100,000 1.38% 24/5/2022 120,376 0.00%ISS Global A/S €100,000 0.88% 18/6/2026 120,005 0.00%Nykredit Realkredit A/S €100,000 0.25% 20/1/2023 119,467 0.00%Danfoss Finance II BV €100,000 0.75% 28/4/2031 118,662 0.00%AP Moller-Maersk A/S $100,000 3.88% 28/9/2025 109,852 0.00%AP Moller-Maersk A/S $25,000 4.50% 20/6/2029 28,920 0.00%test - - - 13,687,949 0.47%Estonia 0.01% (2020: 0.01%)Luminor Bank A/S €150,000 0.79% 3/12/2024 179,982 0.01%test - - - 179,982 0.01%Finland 0.37% (2020: 0.39%)Nordea Bank Abp CHF1,000,000 0.55% 23/6/2025 1,118,732 0.04%OP Corporate Bank plc €730,000 0.38% 16/6/2028 860,091 0.03%OP Corporate Bank plc €600,000 0.38% 11/10/2022 718,532 0.03%Sampo OYJ^ €500,000 2.50% 3/9/2052 628,951 0.02%Nordea Bank Abp €500,000 3.25% 5/7/2022 615,397 0.02%OP Corporate Bank plc^ €500,000 1.63% 9/6/2030 613,674 0.02%OP Corporate Bank plc €500,000 0.13% 1/7/2024 598,628 0.02%OP Corporate Bank plc €500,000 0.25% 24/3/2026 594,538 0.02%Nordea Bank Abp^ €500,000 0.63% 18/8/2031 591,678 0.02%Stora Enso OYJ €400,000 0.63% 2/12/2030 472,295 0.02%Nordea Bank Abp $400,000 4.25% 21/9/2022 417,804 0.02%OP Corporate Bank plc €300,000 0.60% 18/1/2027 361,713 0.01%OP Corporate Bank plc €300,000 0.10% 16/11/2027 354,334 0.01%Nordea Bank Abp $350,000 0.75% 28/8/2025 346,037 0.01%Nordea Bank Abp €200,000 0.50% 14/5/2027 243,204 0.01%OP Corporate Bank plc €200,000 0.38% 26/2/2024 241,265 0.01%Elenia Verkko OYJ €200,000 0.38% 6/2/2027 237,877 0.01%Kojamo OYJ €200,000 0.88% 28/5/2029 237,762 0.01%Transmission Finance DAC €200,000 0.38% 18/6/2028 235,114 0.01%Nordea Bank Abp $175,000 1.00% 9/6/2023 177,032 0.01%

585
Vanguard Global Corporate Bond Index Fund
Principal CouponMaturity
DateFair Value
US Dollars ($)% of Total
Net AssetsStora Enso OYJ €100,000 2.50% 21/3/2028 134,059 0.01%Kojamo OYJ €100,000 1.88% 27/5/2027 126,946 0.01%Citycon Treasury BV €100,000 2.50% 1/10/2024 125,269 0.00%Nordea Bank Abp €100,000 1.13% 12/2/2025 124,261 0.00%SATO OYJ €100,000 1.38% 24/2/2028 123,027 0.00%Nordea Bank Abp €100,000 0.38% 28/5/2026 121,227 0.00%Nordea Bank Abp €100,000 0.88% 26/6/2023 121,178 0.00%OP Corporate Bank plc €100,000 0.38% 19/6/2024 120,091 0.00%test - - - 10,660,716 0.37%France 6.28% (2020: 6.36%)BNP Paribas SA^ €1,400,000 2.13% 23/1/2027 1,791,977 0.06%APRR SA €1,200,000 1.25% 18/1/2028 1,529,081 0.05%Capgemini SE €1,200,000 0.63% 23/6/2025 1,458,248 0.05%Societe Generale SA^ €1,200,000 0.50% 12/6/2029 1,392,554 0.05%Sanofi €1,100,000 1.00% 1/4/2025 1,362,020 0.05%LVMH Moet Hennessy Louis Vuitton SE €1,100,000 0.00% 11/2/2024 1,314,222 0.05%Credit Agricole SA^ €1,000,000 1.00% 22/4/2026 1,223,643 0.04%TotalEnergies SE^ €1,000,000 1.75% Perpetual 1,215,053 0.04%EssilorLuxottica SA €1,000,000 0.38% 5/1/2026 1,212,523 0.04%Banque Federative du Credit Mutuel SA1 €1,000,000 0.01% 11/5/2026 1,181,837 0.04%Orange SA1 $750,000 9.00% 1/3/2031 1,181,501 0.04%BPCE SA1 €1,000,000 0.01% 14/1/2027 1,175,491 0.04%Banque Federative du Credit Mutuel SA1 €1,000,000 0.63% 21/2/2031 1,173,096 0.04%Engie SA^ €900,000 1.38% Perpetual 1,086,228 0.04%TotalEnergies Capital International SA $975,000 2.83% 10/1/2030 1,046,715 0.04%Orange SA €800,000 1.13% 15/7/2024 984,063 0.03%Capgemini SE €700,000 2.38% 15/4/2032 976,974 0.03%Credit Agricole SA1 €800,000 0.50% 24/6/2024 963,763 0.03%Orange SA £600,000 3.25% 15/1/2032 943,132 0.03%BNP Paribas SA^ €800,000 0.50% 19/1/2030 933,737 0.03%Credit Agricole SA ¥100,000,000 0.84% 9/6/2027 910,893 0.03%BNP Paribas SA1 €750,000 0.75% 11/11/2022 903,845 0.03%BNP Paribas SA^ $900,000 1.32% 13/1/2027 888,844 0.03%Danone SA €700,000 1.25% 30/5/2024 865,179 0.03%Credit Mutuel Arkea SA €700,000 0.88% 7/5/2027 861,740 0.03%Credit Agricole SA^ $875,000 1.25% 26/1/2027 861,076 0.03%Societe Generale SA1 €700,000 1.13% 23/1/2025 858,650 0.03%BNP Paribas SA1 $800,000 3.80% 10/1/2024 858,432 0.03%Banque Federative du Credit Mutuel SA1 €700,000 0.75% 8/6/2026 857,664 0.03%BNP Paribas SA1 €700,000 1.13% 22/11/2023 856,235 0.03%BPCE SA €700,000 0.63% 28/4/2025 850,821 0.03%Pernod Ricard SA1 $800,000 4.25% 15/7/2022 830,368 0.03%HSBC Continental Europe SA1 €700,000 0.10% 3/9/2027 825,452 0.03%BNP Paribas SA^ $775,000 3.05% 13/1/2031 816,489 0.03%Credit Agricole SA^ $800,000 1.91% 16/6/2026 815,351 0.03%AXA SA^ €600,000 3.38% 6/7/2047 814,668 0.03%Orange SA €600,000 1.88% 12/9/2030 805,999 0.03%Societe Generale SA^ $800,000 1.49% 14/12/2026 793,172 0.03%Orange SA €600,000 1.63% 7/4/2032 792,174 0.03%BPCE SA1 $700,000 5.70% 22/10/2023 775,763 0.03%Airbus SE €600,000 1.63% 9/6/2030 774,006 0.03%TotalEnergies Capital International SA €600,000 1.49% 8/4/2027 768,052 0.03%Banque Federative du Credit Mutuel SA1 €600,000 1.88% 18/6/2029 765,662 0.03%Airbus SE €600,000 1.63% 7/4/2025 753,995 0.03%TotalEnergies Capital International SA €600,000 0.95% 18/5/2031 749,153 0.03%Banque Federative du Credit Mutuel SA1 €600,000 1.25% 14/1/2025 745,415 0.03%LVMH Moet Hennessy Louis Vuitton SE €600,000 0.75% 7/4/2025 735,986 0.03%TotalEnergies Capital International SA €600,000 0.63% 4/10/2024 731,088 0.03%Societe Generale SA^ €600,000 1.38% 23/2/2028 722,762 0.03%Sanofi €600,000 0.50% 21/3/2023 721,014 0.03%La Mondiale SAM €600,000 0.75% 20/4/2026 720,382 0.03%Unibail-Rodamco-Westfield SE €600,000 0.75% 25/10/2028 717,878 0.03%AXA SA^ €527,000 3.25% 28/5/2049 715,483 0.03%BPCE SA^ €600,000 0.50% 15/9/2027 714,357 0.03%TotalEnergies SE^ €600,000 1.63% Perpetual 711,673 0.02%Societe Generale SA^ €600,000 1.00% 24/11/2030 711,017 0.02%BNP Paribas SA1 $675,000 3.50% 1/3/2023 708,092 0.02%TotalEnergies Capital International SA $650,000 3.46% 12/7/2049 700,373 0.02%Societe Generale SA1 $650,000 3.88% 28/3/2024 699,307 0.02%Banque Federative du Credit Mutuel SA £500,000 1.25% 5/12/2025 697,759 0.02%Alstom SA €600,000 0.00% 11/1/2029 691,850 0.02%
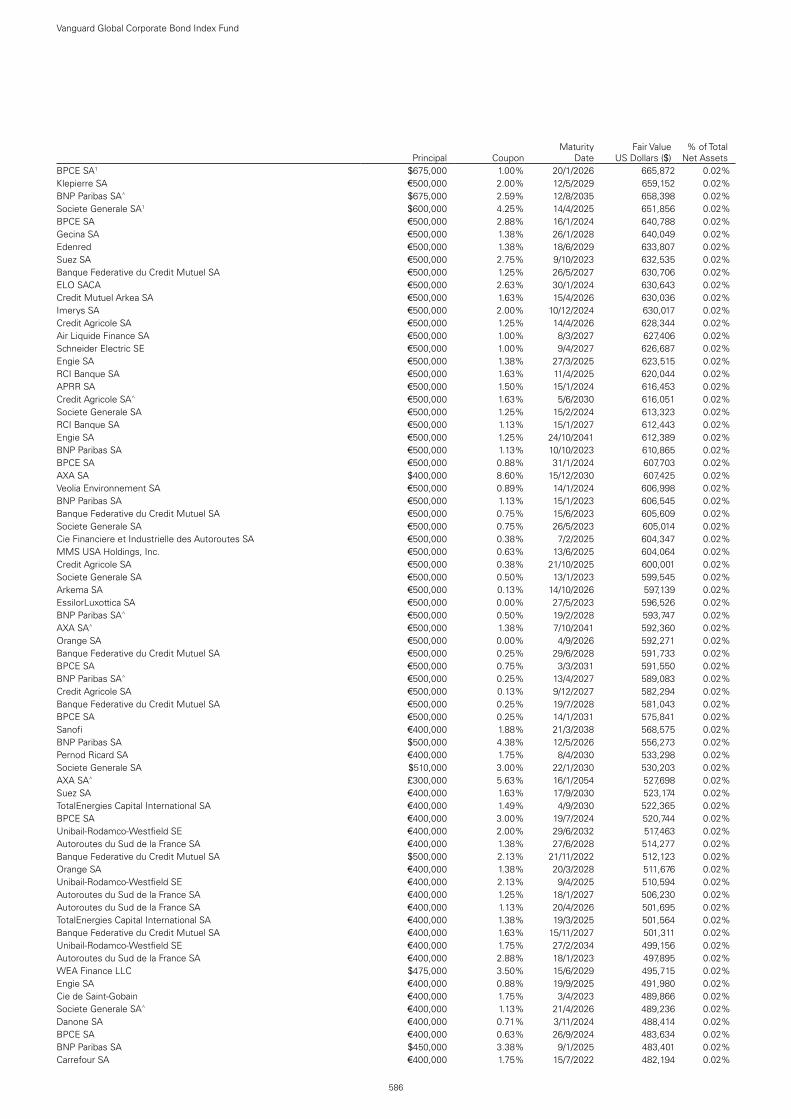
586
Vanguard Global Corporate Bond Index Fund
Principal CouponMaturity
DateFair Value
US Dollars ($)% of Total
Net AssetsBPCE SA1 $675,000 1.00% 20/1/2026 665,872 0.02%Klepierre SA €500,000 2.00% 12/5/2029 659,152 0.02%BNP Paribas SA^ $675,000 2.59% 12/8/2035 658,398 0.02%Societe Generale SA1 $600,000 4.25% 14/4/2025 651,856 0.02%BPCE SA €500,000 2.88% 16/1/2024 640,788 0.02%Gecina SA €500,000 1.38% 26/1/2028 640,049 0.02%Edenred €500,000 1.38% 18/6/2029 633,807 0.02%Suez SA €500,000 2.75% 9/10/2023 632,535 0.02%Banque Federative du Credit Mutuel SA €500,000 1.25% 26/5/2027 630,706 0.02%ELO SACA €500,000 2.63% 30/1/2024 630,643 0.02%Credit Mutuel Arkea SA €500,000 1.63% 15/4/2026 630,036 0.02%Imerys SA €500,000 2.00% 10/12/2024 630,017 0.02%Credit Agricole SA €500,000 1.25% 14/4/2026 628,344 0.02%Air Liquide Finance SA €500,000 1.00% 8/3/2027 627,406 0.02%Schneider Electric SE €500,000 1.00% 9/4/2027 626,687 0.02%Engie SA €500,000 1.38% 27/3/2025 623,515 0.02%RCI Banque SA €500,000 1.63% 11/4/2025 620,044 0.02%APRR SA €500,000 1.50% 15/1/2024 616,453 0.02%Credit Agricole SA^ €500,000 1.63% 5/6/2030 616,051 0.02%Societe Generale SA €500,000 1.25% 15/2/2024 613,323 0.02%RCI Banque SA €500,000 1.13% 15/1/2027 612,443 0.02%Engie SA €500,000 1.25% 24/10/2041 612,389 0.02%BNP Paribas SA €500,000 1.13% 10/10/2023 610,865 0.02%BPCE SA €500,000 0.88% 31/1/2024 607,703 0.02%AXA SA $400,000 8.60% 15/12/2030 607,425 0.02%Veolia Environnement SA €500,000 0.89% 14/1/2024 606,998 0.02%BNP Paribas SA €500,000 1.13% 15/1/2023 606,545 0.02%Banque Federative du Credit Mutuel SA €500,000 0.75% 15/6/2023 605,609 0.02%Societe Generale SA €500,000 0.75% 26/5/2023 605,014 0.02%Cie Financiere et Industrielle des Autoroutes SA €500,000 0.38% 7/2/2025 604,347 0.02%MMS USA Holdings, Inc. €500,000 0.63% 13/6/2025 604,064 0.02%Credit Agricole SA €500,000 0.38% 21/10/2025 600,001 0.02%Societe Generale SA €500,000 0.50% 13/1/2023 599,545 0.02%Arkema SA €500,000 0.13% 14/10/2026 597,139 0.02%EssilorLuxottica SA €500,000 0.00% 27/5/2023 596,526 0.02%BNP Paribas SA^ €500,000 0.50% 19/2/2028 593,747 0.02%AXA SA^ €500,000 1.38% 7/10/2041 592,360 0.02%Orange SA €500,000 0.00% 4/9/2026 592,271 0.02%Banque Federative du Credit Mutuel SA €500,000 0.25% 29/6/2028 591,733 0.02%BPCE SA €500,000 0.75% 3/3/2031 591,550 0.02%BNP Paribas SA^ €500,000 0.25% 13/4/2027 589,083 0.02%Credit Agricole SA €500,000 0.13% 9/12/2027 582,294 0.02%Banque Federative du Credit Mutuel SA €500,000 0.25% 19/7/2028 581,043 0.02%BPCE SA €500,000 0.25% 14/1/2031 575,841 0.02%Sanofi €400,000 1.88% 21/3/2038 568,575 0.02%BNP Paribas SA $500,000 4.38% 12/5/2026 556,273 0.02%Pernod Ricard SA €400,000 1.75% 8/4/2030 533,298 0.02%Societe Generale SA $510,000 3.00% 22/1/2030 530,203 0.02%AXA SA^ £300,000 5.63% 16/1/2054 527,698 0.02%Suez SA €400,000 1.63% 17/9/2030 523,174 0.02%TotalEnergies Capital International SA €400,000 1.49% 4/9/2030 522,365 0.02%BPCE SA €400,000 3.00% 19/7/2024 520,744 0.02%Unibail-Rodamco-Westfield SE €400,000 2.00% 29/6/2032 517,463 0.02%Autoroutes du Sud de la France SA €400,000 1.38% 27/6/2028 514,277 0.02%Banque Federative du Credit Mutuel SA $500,000 2.13% 21/11/2022 512,123 0.02%Orange SA €400,000 1.38% 20/3/2028 511,676 0.02%Unibail-Rodamco-Westfield SE €400,000 2.13% 9/4/2025 510,594 0.02%Autoroutes du Sud de la France SA €400,000 1.25% 18/1/2027 506,230 0.02%Autoroutes du Sud de la France SA €400,000 1.13% 20/4/2026 501,695 0.02%TotalEnergies Capital International SA €400,000 1.38% 19/3/2025 501,564 0.02%Banque Federative du Credit Mutuel SA €400,000 1.63% 15/11/2027 501,311 0.02%Unibail-Rodamco-Westfield SE €400,000 1.75% 27/2/2034 499,156 0.02%Autoroutes du Sud de la France SA €400,000 2.88% 18/1/2023 497,895 0.02%WEA Finance LLC $475,000 3.50% 15/6/2029 495,715 0.02%Engie SA €400,000 0.88% 19/9/2025 491,980 0.02%Cie de Saint-Gobain €400,000 1.75% 3/4/2023 489,866 0.02%Societe Generale SA^ €400,000 1.13% 21/4/2026 489,236 0.02%Danone SA €400,000 0.71% 3/11/2024 488,414 0.02%BPCE SA €400,000 0.63% 26/9/2024 483,634 0.02%BNP Paribas SA $450,000 3.38% 9/1/2025 483,401 0.02%Carrefour SA €400,000 1.75% 15/7/2022 482,194 0.02%

587
Vanguard Global Corporate Bond Index Fund
Principal CouponMaturity
DateFair Value
US Dollars ($)% of Total
Net AssetsDanone SA $450,000 2.95% 2/11/2026 482,048 0.02%WEA Finance LLC/Westfield UK & Europe Finance plc $450,000 3.75% 17/9/2024 481,580 0.02%Unibail-Rodamco-Westfield SE €400,000 0.63% 4/5/2027 480,182 0.02%TotalEnergies Capital International SA €400,000 0.25% 12/7/2023 479,932 0.02%Societe Generale SA €400,000 0.75% 25/1/2027 479,847 0.02%AXA SA^ £300,000 5.45% Perpetual 479,494 0.02%Holding d'Infrastructures de Transport SASU €400,000 0.63% 27/3/2023 479,434 0.02%BNP Paribas SA^ €400,000 1.13% 15/1/2032 478,373 0.02%Thales SA €400,000 0.00% 31/5/2022 476,050 0.02%Societe Generale SA^ €400,000 1.13% 30/6/2031 474,238 0.02%Engie SA €400,000 0.00% 4/3/2027 471,452 0.02%Credit Agricole SA €400,000 0.38% 20/4/2028 469,469 0.02%BNP Paribas SA $400,000 4.40% 14/8/2028 461,082 0.02%BNP Paribas SA £300,000 3.38% 23/1/2026 452,531 0.02%TotalEnergies SE^ €350,000 2.63% Perpetual 438,752 0.02%BNP Paribas SA^ $400,000 4.71% 10/1/2025 436,454 0.02%BNP Paribas SA^ $425,000 2.87% 19/4/2032 436,025 0.02%Credit Agricole Assurances SA^ €300,000 4.75% 27/9/2048 434,460 0.02%BPCE SA £300,000 1.38% 23/12/2026 420,077 0.01%Pernod Ricard SA $300,000 5.50% 15/1/2042 407,748 0.01%CNP Assurances^ €300,000 4.25% 5/6/2045 405,298 0.01%Orange SA £200,000 8.13% 20/11/2028 404,974 0.01%Cie de Saint-Gobain €300,000 1.88% 15/3/2031 404,106 0.01%Caisse Nationale de Reassurance Mutuelle Agricole Groupama €300,000 3.38% 24/9/2028 403,532 0.01%Credit Agricole SA $425,000 2.81% 11/1/2041 402,594 0.01%BNP Paribas SA^ $400,000 1.90% 30/9/2028 396,663 0.01%ELO SACA €300,000 2.88% 29/1/2026 396,139 0.01%Credit Agricole Assurances SA^ €300,000 4.25% Perpetual 395,312 0.01%Sanofi €300,000 1.50% 1/4/2030 394,648 0.01%AXA SA^ €300,000 3.94% Perpetual 394,192 0.01%TotalEnergies Capital International SA €300,000 1.62% 18/5/2040 392,486 0.01%Orange SA £200,000 5.63% 23/1/2034 391,410 0.01%Vinci SA €300,000 1.63% 18/1/2029 391,384 0.01%Engie SA €300,000 1.75% 27/3/2028 391,155 0.01%TotalEnergies Capital International SA €300,000 1.54% 31/5/2039 389,893 0.01%Sanofi €300,000 1.75% 10/9/2026 389,058 0.01%Banque Federative du Credit Mutuel SA €300,000 3.00% 21/5/2024 386,269 0.01%Unibail-Rodamco-Westfield SE €300,000 1.88% 15/1/2031 385,564 0.01%Banque Federative du Credit Mutuel SA €300,000 2.63% 18/3/2024 383,109 0.01%Klepierre SA €300,000 1.63% 13/12/2032 382,948 0.01%Engie SA £200,000 7.00% 30/10/2028 382,670 0.01%Credit Agricole SA €300,000 1.38% 3/5/2027 381,296 0.01%BNP Paribas SA €300,000 2.88% 26/9/2023 381,184 0.01%APRR SA €300,000 1.25% 6/1/2027 380,233 0.01%TotalEnergies Capital International SA $350,000 3.75% 10/4/2024 380,155 0.01%Groupe VYV €300,000 1.63% 2/7/2029 379,550 0.01%Engie SA €300,000 1.38% 21/6/2039 378,821 0.01%BPCE SA^ $375,000 1.65% 6/10/2026 376,536 0.01%Sanofi €300,000 0.88% 21/3/2029 376,100 0.01%Cie Financiere et Industrielle des Autoroutes SA €300,000 0.75% 9/9/2028 372,662 0.01%Legrand SA €300,000 1.00% 6/3/2026 372,353 0.01%Vinci SA €300,000 1.00% 26/9/2025 372,065 0.01%Engie SA €300,000 1.00% 13/3/2026 371,840 0.01%Orange SA €300,000 1.00% 12/9/2025 371,549 0.01%Air Liquide Finance SA $350,000 2.50% 27/9/2026 371,524 0.01%Air Liquide Finance SA €300,000 1.00% 2/4/2025 371,064 0.01%Kering SA €300,000 0.75% 13/5/2028 370,278 0.01%Unibail-Rodamco-Westfield SE €300,000 1.13% 15/9/2025 370,208 0.01%Cie Generale des Etablissements Michelin SCA €300,000 0.88% 3/9/2025 369,975 0.01%Airbus Finance BV €300,000 0.88% 13/5/2026 369,569 0.01%BPCE SA €300,000 1.00% 15/7/2024 368,572 0.01%BNP Paribas SA €300,000 1.00% 17/4/2024 366,861 0.01%GELF Bond Issuer I SA €300,000 1.13% 18/7/2029 366,676 0.01%Unibail-Rodamco-Westfield SE €300,000 1.38% 4/12/2031 365,928 0.01%Orange SA^ €300,000 1.75% Perpetual 364,936 0.01%HSBC Continental Europe SA €300,000 0.60% 20/3/2023 361,706 0.01%Safran SA €300,000 0.75% 17/3/2031 361,438 0.01%Danone SA €300,000 0.40% 10/6/2029 361,023 0.01%Publicis Groupe SA €300,000 0.50% 3/11/2023 360,968 0.01%Schneider Electric SE €300,000 0.25% 9/9/2024 360,910 0.01%LVMH Moet Hennessy Louis Vuitton SE €300,000 0.38% 11/2/2031 360,732 0.01%

588
Vanguard Global Corporate Bond Index Fund
Principal CouponMaturity
DateFair Value
US Dollars ($)% of Total
Net AssetsHSBC Continental Europe SA €300,000 0.25% 17/5/2024 360,493 0.01%Banque Federative du Credit Mutuel SA €300,000 0.50% 16/11/2022 360,395 0.01%Veolia Environnement SA €300,000 0.66% 15/1/2031 359,505 0.01%RCI Banque SA €300,000 0.75% 26/9/2022 359,247 0.01%LVMH Moet Hennessy Louis Vuitton SE €300,000 0.13% 11/2/2028 359,043 0.01%Icade Sante SAS €300,000 0.88% 4/11/2029 358,929 0.01%Dassault Systemes SE €300,000 0.13% 16/9/2026 358,251 0.01%Dassault Systemes SE €300,000 0.00% 16/9/2022 357,223 0.01%Thales SA €300,000 0.25% 29/1/2027 357,056 0.01%Engie SA^ €300,000 1.50% Perpetual 356,761 0.01%Banque Federative du Credit Mutuel SA €300,000 0.63% 3/11/2028 356,685 0.01%Caisse Nationale de Reassurance Mutuelle Agricole Groupama €300,000 0.75% 7/7/2028 354,009 0.01%Teleperformance €300,000 0.25% 26/11/2027 351,085 0.01%Orange SA^ €300,000 1.38% Perpetual 350,623 0.01%TotalEnergies SE^ €300,000 2.13% Perpetual 350,095 0.01%La Mondiale SAM^ $300,000 5.88% 26/1/2047 341,649 0.01%Engie SA £150,000 5.00% 1/10/2060 339,021 0.01%Legrand France SA $268,000 8.50% 15/2/2025 338,707 0.01%BPCE SA $325,000 2.38% 14/1/2025 338,366 0.01%Air Liquide Finance SA $325,000 2.25% 27/9/2023 337,064 0.01%Credit Agricole SA €250,000 2.63% 17/3/2027 329,087 0.01%Veolia Environnement SA £150,000 6.13% 29/10/2037 321,727 0.01%RCI Banque SA €267,000 0.75% 10/4/2023 320,691 0.01%Societe Generale SA $305,000 2.63% 22/1/2025 318,741 0.01%Orange SA $225,000 5.38% 13/1/2042 303,702 0.01%Cie Generale des Etablissements Michelin SCA €200,000 2.50% 3/9/2038 303,467 0.01%Caisse Nationale de Reassurance Mutuelle Agricole Groupama €200,000 6.00% 23/1/2027 298,310 0.01%Vinci SA £200,000 2.25% 15/3/2027 293,466 0.01%BPCE SA $250,000 4.63% 12/9/2028 291,884 0.01%Credit Mutuel Arkea SA €200,000 3.38% 11/3/2031 285,914 0.01%Credit Mutuel Arkea SA €200,000 3.50% 9/2/2029 283,262 0.01%BPCE SA £200,000 2.13% 16/12/2022 282,935 0.01%Banque Federative du Credit Mutuel SA £200,000 1.50% 7/10/2026 281,623 0.01%RCI Banque SA £200,000 1.88% 8/11/2022 279,875 0.01%BPCE SA $250,000 5.15% 21/7/2024 278,788 0.01%BNP Paribas SA^ £200,000 2.00% 24/5/2031 278,569 0.01%LVMH Moet Hennessy Louis Vuitton SE £200,000 1.13% 11/2/2027 278,123 0.01%Airbus SE €200,000 2.38% 9/6/2040 275,652 0.01%Unibail-Rodamco-Westfield SE €200,000 2.63% 9/4/2030 274,880 0.01%Engie SA €200,000 2.13% 30/3/2032 274,457 0.01%TotalEnergies Capital International SA €200,000 1.99% 8/4/2032 274,153 0.01%BPCE SA $250,000 3.25% 11/1/2028 272,429 0.01%TotalEnergies Capital Canada Ltd. €200,000 2.13% 18/9/2029 272,408 0.01%Credit Agricole SA^ $250,000 4.00% 10/1/2033 271,794 0.01%BPCE SA $250,000 3.50% 23/10/2027 271,627 0.01%TotalEnergies Capital International SA £200,000 1.41% 3/9/2031 271,033 0.01%Airbus SE $250,000 3.15% 10/4/2027 268,947 0.01%Engie SA €200,000 1.88% 19/9/2033 268,539 0.01%Orange SA €200,000 2.00% 15/1/2029 267,974 0.01%Credit Agricole SA $250,000 3.25% 4/10/2024 267,934 0.01%Veolia Environnement SA €200,000 1.94% 7/1/2030 266,429 0.01%Orange SA^ €200,000 5.25% Perpetual 266,249 0.01%Credit Agricole SA $250,000 3.75% 24/4/2023 264,666 0.01%Credit Agricole SA $250,000 3.25% 14/1/2030 263,532 0.01%Gecina SA €200,000 1.63% 29/5/2034 263,134 0.01%APRR SA €200,000 1.50% 25/1/2030 262,939 0.01%Airbus SE €200,000 2.00% 7/4/2028 262,386 0.01%Sanofi €200,000 1.25% 21/3/2034 261,772 0.01%BPCE SA $250,000 2.70% 1/10/2029 261,154 0.01%AXA SA^ €200,000 5.13% 4/7/2043 260,887 0.01%Unibail-Rodamco-Westfield SE €200,000 2.25% 14/5/2038 260,535 0.01%BPCE SA €200,000 4.63% 18/7/2023 259,923 0.01%Schneider Electric SE €200,000 1.50% 15/1/2028 258,976 0.01%BNP Paribas SA £200,000 1.25% 13/7/2031 258,929 0.01%Orange SA €200,000 1.38% 16/1/2030 258,143 0.01%TotalEnergies Capital SA $225,000 3.88% 11/10/2028 257,941 0.01%BNP Paribas SA^ $250,000 2.22% 9/6/2026 257,763 0.01%MMS USA Holdings, Inc. €200,000 1.75% 13/6/2031 257,190 0.01%Engie SA^ €200,000 3.25% Perpetual 256,976 0.01%Kering SA €200,000 1.50% 5/4/2027 256,711 0.01%ELO SACA €200,000 2.38% 25/4/2025 256,024 0.01%

589
Vanguard Global Corporate Bond Index Fund
Principal CouponMaturity
DateFair Value
US Dollars ($)% of Total
Net AssetsGecina SA €200,000 1.38% 30/6/2027 256,005 0.01%Arkema SA €200,000 1.50% 20/4/2027 255,906 0.01%Credit Agricole SA €200,000 2.00% 25/3/2029 255,825 0.01%Danone SA €200,000 1.21% 3/11/2028 255,678 0.01%Covivio €200,000 1.63% 23/6/2030 255,490 0.01%Holding d'Infrastructures de Transport SASU €200,000 2.25% 24/3/2025 255,479 0.01%BNP Paribas SA €200,000 2.38% 17/2/2025 255,391 0.01%Banque Federative du Credit Mutuel SA €200,000 1.63% 19/1/2026 254,579 0.01%Carmila SA €200,000 2.38% 16/9/2024 254,419 0.01%Eutelsat SA €200,000 2.00% 2/10/2025 253,883 0.01%CNP Assurances^ €200,000 2.50% 30/6/2051 253,701 0.01%Orange SA €200,000 1.25% 7/7/2027 253,108 0.01%Bouygues SA €200,000 1.13% 24/7/2028 253,048 0.01%Societe Fonciere Lyonnaise SA €200,000 1.50% 5/6/2027 252,763 0.01%RCI Banque SA €200,000 1.75% 10/4/2026 251,617 0.01%Credit Agricole SA €200,000 1.00% 3/7/2029 250,050 0.01%APRR SA €200,000 1.13% 9/1/2026 250,006 0.01%Carmila SA €200,000 2.13% 7/3/2028 249,935 0.01%Cie de Saint-Gobain €200,000 1.13% 23/3/2026 249,866 0.01%BPCE SA €200,000 1.38% 23/3/2026 249,809 0.01%MMS USA Holdings, Inc. €200,000 1.25% 13/6/2028 249,337 0.01%Orange SA^ €200,000 2.38% Perpetual 249,150 0.01%Icade Sante SAS €200,000 1.38% 17/9/2030 249,065 0.01%Sodexo SA €200,000 1.00% 27/4/2029 249,005 0.01%Credit Agricole Assurances SA €200,000 2.00% 17/7/2030 248,398 0.01%Carrefour SA €200,000 1.00% 17/5/2027 248,275 0.01%BNP Paribas SA €200,000 1.63% 2/7/2031 247,523 0.01%Sodexo SA €200,000 1.13% 22/5/2025 247,267 0.01%Pernod Ricard SA €200,000 1.88% 28/9/2023 247,247 0.01%Arkema SA €200,000 0.75% 3/12/2029 246,438 0.01%TotalEnergies Capital International SA €200,000 0.70% 31/5/2028 245,910 0.01%EssilorLuxottica SA €200,000 0.75% 27/11/2031 245,513 0.01%Schneider Electric SE €200,000 1.50% 8/9/2023 245,480 0.01%Air Liquide Finance SA €200,000 0.63% 20/6/2030 245,420 0.01%Capgemini SE €200,000 1.00% 18/10/2024 245,243 0.01%Legrand SA €200,000 0.63% 24/6/2028 245,219 0.01%BPCE SA^ $250,000 2.28% 20/1/2032 245,148 0.01%Banque Federative du Credit Mutuel SA €200,000 0.75% 17/7/2025 244,551 0.01%Danone SA €200,000 0.57% 17/3/2027 244,138 0.01%Sodexo SA €200,000 0.75% 27/4/2025 244,103 0.01%EssilorLuxottica SA €200,000 0.50% 5/6/2028 243,655 0.01%Pernod Ricard SA €200,000 0.50% 24/10/2027 243,295 0.01%Danone SA^ €200,000 1.75% Perpetual 243,088 0.01%Sanofi €200,000 0.63% 5/4/2024 242,901 0.01%Cie de Saint-Gobain €200,000 0.63% 15/3/2024 242,378 0.01%Klepierre SA €200,000 1.00% 17/4/2023 241,694 0.01%BNP Paribas SA^ $225,000 7.20% Perpetual 240,250 0.01%Worldline SA €200,000 0.50% 30/6/2023 240,229 0.01%PSA Banque France SA €200,000 0.63% 10/10/2022 239,880 0.01%Orange SA €200,000 1.38% 4/9/2049 239,228 0.01%Banque Federative du Credit Mutuel SA €200,000 0.13% 5/2/2024 239,202 0.01%Arkema SA^ €200,000 1.50% Perpetual 238,971 0.01%Schneider Electric SE €200,000 0.00% 12/6/2023 238,767 0.01%Air Liquide Finance SA €200,000 0.50% 13/6/2022 238,720 0.01%TotalEnergies SE^ €200,000 2.00% Perpetual 238,675 0.01%APRR SA €200,000 0.00% 20/1/2023 238,556 0.01%Credit Mutuel Arkea SA €200,000 0.38% 3/10/2028 237,808 0.01%Safran SA €200,000 0.13% 16/3/2026 237,599 0.01%SCOR SE^ €200,000 1.38% 17/9/2051 237,457 0.01%Orange SA €200,000 0.75% 29/6/2034 236,857 0.01%APRR SA €200,000 0.13% 18/1/2029 236,554 0.01%BNP Paribas SA $250,000 2.82% 26/1/2041 236,128 0.01%Mutuelle Assurance Des Commercants et Industriels de France et Des
Cadres et Sal €200,000 0.63% 21/6/2027 235,853 0.01%Imerys SA €200,000 1.00% 15/7/2031 235,715 0.01%Orange SA €200,000 0.50% 4/9/2032 235,527 0.01%TotalEnergies Capital International SA $210,000 3.46% 19/2/2029 234,143 0.01%Cie Generale des Etablissements Michelin SCA €200,000 0.00% 2/11/2028 233,496 0.01%Societe Generale SA $200,000 4.75% 14/9/2028 232,350 0.01%ICADE €200,000 0.63% 18/1/2031 231,226 0.01%AXA SA^ $200,000 5.13% 17/1/2047 227,740 0.01%

590
Vanguard Global Corporate Bond Index Fund
Principal CouponMaturity
DateFair Value
US Dollars ($)% of Total
Net AssetsBNP Paribas SA $200,000 4.63% 13/3/2027 225,891 0.01%BPCE SA $200,000 4.88% 1/4/2026 225,721 0.01%Vinci SA $200,000 3.75% 10/4/2029 225,719 0.01%Societe Generale SA $200,000 4.75% 24/11/2025 222,982 0.01%BNP Paribas SA $200,000 4.38% 28/9/2025 221,529 0.01%Societe Generale SA $200,000 4.00% 12/1/2027 221,191 0.01%BPCE SA $200,000 4.50% 15/3/2025 220,650 0.01%Credit Agricole SA $200,000 4.38% 17/3/2025 220,285 0.01%BPCE SA $200,000 4.63% 11/7/2024 219,737 0.01%Societe Generale SA $200,000 4.25% 19/8/2026 219,038 0.01%BNP Paribas SA $200,000 3.50% 16/11/2027 217,709 0.01%Banque Federative du Credit Mutuel SA $200,000 3.75% 20/7/2023 213,138 0.01%TotalEnergies Capital International SA $200,000 3.39% 29/6/2060 211,183 0.01%TotalEnergies Capital International SA $195,000 3.70% 15/1/2024 210,217 0.01%TotalEnergies Capital Canada Ltd. $200,000 2.75% 15/7/2023 209,480 0.01%Banque Federative du Credit Mutuel SA $200,000 2.38% 21/11/2024 209,298 0.01%Societe Generale SA^ $200,000 3.65% 8/7/2035 207,682 0.01%Air Liquide Finance SA $200,000 2.25% 10/9/2029 206,423 0.01%Banque Federative du Credit Mutuel SA $200,000 2.70% 20/7/2022 204,928 0.01%Sodexo, Inc. $200,000 2.72% 16/4/2031 204,128 0.01%Sodexo, Inc. $200,000 1.63% 16/4/2026 201,415 0.01%AXA SA €150,000 1.13% 15/5/2028 193,108 0.01%Sanofi $175,000 3.38% 19/6/2023 184,889 0.01%PSA Tresorerie GIE €100,000 6.00% 19/9/2033 178,463 0.01%Veolia Environnement SA $120,000 6.75% 1/6/2038 176,113 0.01%BPCE SA £100,000 5.25% 16/4/2029 170,669 0.01%BPCE SA AU($)200,000 4.50% 26/4/2028 170,100 0.01%Bouygues SA £100,000 5.50% 6/10/2026 169,620 0.01%Vinci SA £100,000 2.75% 15/9/2034 155,058 0.01%Orange SA^ £100,000 5.75% Perpetual 148,867 0.01%TotalEnergies Capital International SA £100,000 1.75% 7/7/2025 143,252 0.01%Banque Federative du Credit Mutuel SA £100,000 1.75% 19/12/2024 142,485 0.01%CNP Assurances^ €100,000 4.50% 10/6/2047 142,220 0.01%Orange SA^ €100,000 5.00% Perpetual 141,582 0.01%Westfield America Management Ltd. £100,000 2.63% 30/3/2029 140,982 0.01%SCOR SE^ €100,000 3.63% 27/5/2048 139,380 0.01%AXA SA^ $100,000 6.38% Perpetual 139,009 0.01%LVMH Moet Hennessy Louis Vuitton SE £100,000 1.00% 14/6/2022 138,813 0.01%La Mondiale SAM^ €100,000 5.05% Perpetual 137,965 0.01%ELO SACA €100,000 3.25% 23/7/2027 137,594 0.01%Airbus SE €100,000 2.38% 7/4/2032 137,194 0.01%Carrefour SA €100,000 2.63% 15/12/2027 136,180 0.01%Societe Generale SA $125,000 5.00% 17/1/2024 136,060 0.01%Cie de Saint-Gobain €100,000 2.38% 4/10/2027 134,542 0.01%Engie SA €100,000 2.38% 19/5/2026 132,393 0.01%Cie de Saint-Gobain €100,000 1.88% 21/9/2028 132,237 0.01%SCOR SE^ €100,000 3.00% 8/6/2046 132,126 0.01%Engie Alliance GIE €100,000 5.75% 24/6/2023 132,075 0.01%Unibail-Rodamco-Westfield SE €100,000 2.50% 4/6/2026 131,930 0.01%TotalEnergies SE^ €100,000 3.37% Perpetual 131,509 0.01%Gecina SA €100,000 1.63% 14/3/2030 131,401 0.01%BNP Paribas SA €100,000 2.75% 27/1/2026 131,126 0.01%Capgemini SE €100,000 1.75% 18/4/2028 130,302 0.01%Air Liquide Finance SA €100,000 1.38% 2/4/2030 130,265 0.01%Autoroutes du Sud de la France SA €100,000 1.38% 22/1/2030 130,057 0.01%Autoroutes du Sud de la France SA €100,000 1.38% 21/2/2031 129,691 0.01%Banque Federative du Credit Mutuel SA €100,000 2.38% 24/3/2026 129,177 0.01%Credit Agricole SA €100,000 1.75% 5/3/2029 128,893 0.01%Veolia Environnement SA €100,000 1.59% 10/1/2028 128,787 0.00%TDF Infrastructure SASU €100,000 2.50% 7/4/2026 128,719 0.00%Bouygues SA €100,000 1.38% 7/6/2027 128,262 0.00%Klepierre SA €100,000 1.88% 19/2/2026 128,213 0.00%Carrefour SA €100,000 1.75% 4/5/2026 128,097 0.00%Banque Federative du Credit Mutuel SA €100,000 3.00% 28/11/2023 127,984 0.00%Engie SA €100,000 1.38% 22/6/2028 127,587 0.00%Sanofi €100,000 1.13% 5/4/2028 127,375 0.00%Pernod Ricard SA €100,000 1.50% 18/5/2026 127,188 0.00%Teleperformance €100,000 1.88% 2/7/2025 126,340 0.00%Airbus Finance BV €100,000 2.38% 2/4/2024 126,042 0.00%Klepierre SA €100,000 1.38% 16/2/2027 125,936 0.00%Klepierre SA €100,000 1.75% 6/11/2024 125,668 0.00%

591
Vanguard Global Corporate Bond Index Fund
Principal CouponMaturity
DateFair Value
US Dollars ($)% of Total
Net AssetsAtos SE €100,000 1.75% 7/5/2025 125,423 0.00%Altarea SCA €100,000 2.25% 5/7/2024 125,405 0.00%RCI Banque SA €100,000 1.63% 26/5/2026 125,405 0.00%Credit Mutuel Arkea SA €100,000 1.13% 23/5/2029 125,369 0.00%Arkema SA^ €100,000 2.75% Perpetual 125,296 0.00%Capgemini SE €100,000 1.13% 23/6/2030 125,008 0.00%Holding d'Infrastructures de Transport SASU €100,000 1.63% 18/9/2029 125,001 0.00%Suez SA^ €100,000 2.88% Perpetual 124,895 0.00%La Mondiale SAM €100,000 2.13% 23/6/2031 124,420 0.00%Credit Agricole SA €100,000 1.38% 13/3/2025 124,188 0.00%ICADE €100,000 1.13% 17/11/2025 124,107 0.00%Eutelsat SA €100,000 1.50% 13/10/2028 123,843 0.00%Pernod Ricard SA €100,000 1.13% 7/4/2025 123,795 0.00%Credit Mutuel Arkea SA^ €100,000 1.25% 11/6/2029 123,581 0.00%Cie de Saint-Gobain €100,000 1.00% 17/3/2025 123,534 0.00%Danone SA €100,000 1.00% 26/3/2025 123,235 0.00%Covivio €100,000 1.13% 17/9/2031 122,903 0.00%Credit Mutuel Arkea SA €100,000 1.25% 31/5/2024 122,763 0.00%BPCE SA €100,000 1.00% 1/4/2025 122,611 0.00%BNP Paribas SA^ €100,000 2.63% 14/10/2027 122,484 0.00%LVMH Moet Hennessy Louis Vuitton SE €100,000 0.75% 26/5/2024 121,863 0.00%Credit Agricole SA €100,000 0.75% 5/12/2023 121,653 0.00%Credit Mutuel Arkea SA €100,000 0.88% 5/10/2023 121,625 0.00%CNP Assurances €100,000 1.88% 20/10/2022 121,549 0.00%SANEF SA €100,000 0.95% 19/10/2028 121,404 0.00%Orange SA €100,000 0.75% 11/9/2023 121,074 0.00%BPCE SA €100,000 0.63% 26/9/2023 121,072 0.00%PSA Banque France SA €100,000 0.63% 21/6/2024 120,632 0.00%BPCE SA €100,000 0.63% 15/1/2030 120,564 0.00%Sodexo SA €100,000 0.50% 17/1/2024 120,537 0.00%Legrand SA €100,000 0.50% 9/10/2023 120,428 0.00%BNP Paribas SA^ €100,000 0.50% 4/6/2026 120,412 0.00%BPCE SA €100,000 0.38% 5/10/2023 120,404 0.00%Engie SA €100,000 0.38% 11/6/2027 120,241 0.00%EssilorLuxottica SA €100,000 0.25% 5/1/2024 120,188 0.00%Dassault Systemes SE €100,000 0.38% 16/9/2029 119,926 0.00%ALD SA €100,000 0.38% 18/7/2023 119,786 0.00%BPCE SA €100,000 0.13% 4/12/2024 119,776 0.00%Engie SA €100,000 0.38% 28/2/2023 119,726 0.00%BPCE SA €100,000 0.25% 15/1/2026 119,694 0.00%Mutuelle Assurance Des Commercants et Industriels de France et Des
Cadres et Sal^ €100,000 2.13% 21/6/2052 119,630 0.00%Veolia Environnement SA €100,000 0.80% 15/1/2032 119,624 0.00%Worldline SA €100,000 0.25% 18/9/2024 119,537 0.00%Terega SA €100,000 0.88% 17/9/2030 119,452 0.00%Pernod Ricard SA €100,000 0.00% 24/10/2023 119,206 0.00%Engie SA €100,000 0.50% 24/10/2030 119,200 0.00%Carrefour Banque SA €100,000 0.11% 14/6/2025 118,807 0.00%Altarea SCA €100,000 1.75% 16/1/2030 118,509 0.00%Terega SASU €100,000 0.63% 27/2/2028 118,117 0.00%Suez SA €100,000 0.50% 14/10/2031 117,340 0.00%Vinci SA €100,000 0.00% 27/11/2028 117,094 0.00%Orange SA €100,000 0.13% 16/9/2029 117,059 0.00%Unibail-Rodamco-Westfield SE €100,000 0.88% 29/3/2032 115,701 0.00%Cie Generale des Etablissements Michelin SCA €100,000 0.25% 2/11/2032 115,490 0.00%Engie SA €50,000 5.95% 16/3/2111 115,239 0.00%Airbus SE $100,000 3.95% 10/4/2047 113,688 0.00%Cie Generale des Etablissements Michelin SCA €100,000 0.63% 2/11/2040 113,009 0.00%Unibail-Rodamco-Westfield SE €100,000 1.75% 1/7/2049 112,985 0.00%TotalEnergies Capital International SA $100,000 2.43% 10/1/2025 105,166 0.00%Orange SA $75,000 5.50% 6/2/2044 104,404 0.00%TotalEnergies Capital International SA $100,000 2.70% 25/1/2023 103,657 0.00%Schneider Electric SE $100,000 2.95% 27/9/2022 103,060 0.00%WEA Finance LLC $95,000 4.63% 20/9/2048 101,273 0.00%Engie SA $75,000 2.88% 10/10/2022 77,218 0.00%WEA Finance LLC $65,000 2.88% 15/1/2027 67,081 0.00%BNP Paribas SA €50,000 2.38% 20/5/2024 63,727 0.00%Societe Generale SA $50,000 3.63% 1/3/2041 50,357 0.00%Sanofi $25,000 3.63% 19/6/2028 28,537 0.00%WEA Finance LLC $25,000 4.13% 20/9/2028 27,183 0.00%test - - - 183,200,718 6.28%

592
Vanguard Global Corporate Bond Index Fund
Principal CouponMaturity
DateFair Value
US Dollars ($)% of Total
Net AssetsGermany 4.89% (2020: 4.75%)Eurogrid GmbH €1,500,000 1.63% 3/11/2023 1,848,080 0.06%Deutsche Telekom International Finance BV $1,225,000 8.75% 15/6/2030 1,834,681 0.06%Santander Consumer Bank AG1 €1,300,000 0.25% 15/10/2024 1,553,577 0.05%Deutsche Telekom International Finance BV €1,000,000 1.50% 3/4/2028 1,287,010 0.04%Vonovia Finance BV €1,000,000 1.80% 29/6/2025 1,265,290 0.04%Deutsche Bank AG^ €1,000,000 1.75% 19/11/2030 1,252,885 0.04%Deutsche Telekom International Finance BV €1,000,000 0.88% 30/1/2024 1,218,790 0.04%Vonovia Finance BV €1,000,000 0.63% 9/7/2026 1,212,331 0.04%E.ON SE €900,000 0.88% 20/8/2031 1,100,239 0.04%Bayer US Finance II LLC $925,000 4.38% 15/12/2028 1,060,881 0.04%Volkswagen International Finance NV^ €800,000 3.88% Perpetual 1,053,328 0.04%Volkswagen International Finance NV^ €800,000 3.50% Perpetual 1,025,046 0.04%BMW US Capital LLC $1,000,000 0.80% 1/4/2024 1,005,282 0.04%Bayer Capital Corp. BV €800,000 1.50% 26/6/2026 1,002,818 0.04%BASF SE €800,000 0.88% 15/11/2027 998,200 0.03%Deutsche Bank AG^ $900,000 3.96% 26/11/2025 973,916 0.03%BMW Finance NV €800,000 0.63% 6/10/2023 967,729 0.03%Volkswagen Bank GmbH €800,000 1.25% 1/8/2022 964,055 0.03%BMW Finance NV €800,000 0.00% 24/3/2023 953,969 0.03%Siemens Financieringsmaatschappij NV $750,000 4.20% 16/3/2047 942,265 0.03%Allianz SE^ €700,000 5.63% 17/10/2042 889,917 0.03%Deutsche Post AG €700,000 0.75% 20/5/2029 866,559 0.03%Bayer AG €700,000 1.13% 6/1/2030 852,922 0.03%Deutsche Bank AG1 €700,000 1.13% 30/8/2023 852,690 0.03%Siemens Financieringsmaatschappij NV $850,000 0.65% 11/3/2024 850,810 0.03%Deutsche Telekom AG €700,000 0.50% 5/7/2027 849,192 0.03%Vonovia Finance BV €700,000 0.88% 3/7/2023 845,349 0.03%BMW Finance NV €700,000 0.50% 22/11/2022 840,614 0.03%BMW Finance NV €680,000 1.00% 14/11/2024 838,098 0.03%Deutsche Bank AG^ €700,000 0.75% 17/2/2027 835,355 0.03%Volkswagen Leasing GmbH €700,000 0.25% 12/1/2026 832,718 0.03%Daimler AG €600,000 2.38% 22/5/2030 827,771 0.03%Daimler AG €600,000 2.00% 22/8/2026 782,244 0.03%Aroundtown SA £500,000 3.63% 10/4/2031 766,409 0.03%BASF SE €600,000 0.88% 22/5/2025 742,164 0.03%Deutsche Telekom AG $700,000 3.63% 21/1/2050 741,943 0.03%BASF SE €600,000 0.25% 5/6/2027 723,388 0.03%E.ON International Finance BV €600,000 0.75% 30/11/2022 720,128 0.03%Bayer Capital Corp. BV €600,000 0.63% 15/12/2022 719,567 0.03%SAP SE €600,000 0.13% 18/5/2026 718,842 0.03%Daimler AG €600,000 0.75% 11/3/2033 714,821 0.03%Daimler International Finance BV €564,000 1.38% 26/6/2026 714,440 0.03%LEG Immobilien SE €600,000 0.75% 30/6/2031 710,937 0.02%Bayer AG €600,000 0.05% 12/1/2025 710,103 0.02%Volkswagen Financial Services AG €500,000 3.38% 6/4/2028 705,971 0.02%Volkswagen Financial Services NV £500,000 1.63% 10/2/2024 704,453 0.02%Daimler International Finance BV €576,000 0.63% 27/2/2023 693,596 0.02%BMW Finance NV €580,000 0.13% 13/7/2022 691,646 0.02%Volkswagen International Finance NV^ €500,000 4.63% Perpetual 686,302 0.02%Volkswagen Group of America Finance LLC $675,000 1.25% 24/11/2025 671,312 0.02%E.ON International Finance BV £300,000 6.75% 27/1/2039 670,720 0.02%Hannover Rueck SE^ €500,000 3.38% Perpetual 661,079 0.02%Volkswagen International Finance NV^ €500,000 3.88% Perpetual 655,242 0.02%Daimler AG €500,000 2.63% 7/4/2025 652,930 0.02%E.ON SE €560,000 0.10% 19/12/2028 652,906 0.02%HeidelbergCement Finance Luxembourg SA €500,000 2.50% 9/10/2024 640,189 0.02%HeidelbergCement AG €500,000 1.50% 7/2/2025 622,988 0.02%Conti-Gummi Finance BV €500,000 2.13% 27/11/2023 622,899 0.02%Deutsche Bank AG^ €500,000 1.38% 10/6/2026 622,724 0.02%Hannover Rueck SE^ €500,000 1.75% 8/10/2040 621,900 0.02%BMW Finance NV €500,000 1.00% 29/8/2025 620,511 0.02%Volkswagen Leasing GmbH €500,000 1.38% 20/1/2025 620,156 0.02%Wurth Finance International BV €500,000 1.00% 26/5/2025 618,882 0.02%Daimler AG €500,000 1.63% 22/8/2023 615,919 0.02%Volkswagen Bank GmbH €500,000 1.25% 10/6/2024 614,658 0.02%DVB Bank SE €500,000 1.25% 16/6/2023 610,931 0.02%Deutsche Bank AG^ $600,000 2.13% 24/11/2026 609,253 0.02%Daimler AG €500,000 0.75% 8/2/2030 606,454 0.02%Deutsche Bank AG^ €500,000 1.00% 19/11/2025 605,284 0.02%Aroundtown SA €500,000 0.63% 9/7/2025 602,133 0.02%

593
Vanguard Global Corporate Bond Index Fund
Principal CouponMaturity
DateFair Value
US Dollars ($)% of Total
Net AssetsDeutsche Bank AG^ €500,000 1.38% 17/2/2032 601,352 0.02%Deutsche Telekom International Finance BV €500,000 0.63% 1/12/2022 601,179 0.02%Siemens Financieringsmaatschappij NV €500,000 0.25% 5/6/2024 601,060 0.02%Siemens Financieringsmaatschappij NV €500,000 0.50% 20/2/2032 600,536 0.02%Fresenius SE & Co. KGaA €500,000 0.38% 28/9/2026 599,619 0.02%Allianz Finance II BV €500,000 0.00% 14/1/2025 596,667 0.02%HOCHTIEF AG €500,000 0.50% 3/9/2027 595,937 0.02%Daimler AG €500,000 0.00% 8/2/2024 595,537 0.02%Commerzbank AG €500,000 0.38% 1/9/2027 595,479 0.02%Volkswagen Leasing GmbH €500,000 0.63% 19/7/2029 592,563 0.02%Volkswagen Leasing GmbH €500,000 0.00% 19/7/2024 592,416 0.02%Siemens Financieringsmaatschappij NV €487,000 0.30% 28/2/2024 586,354 0.02%E.ON International Finance BV €450,000 1.50% 31/7/2029 579,495 0.02%Bayer US Finance II LLC $500,000 5.50% 15/8/2025 570,927 0.02%Daimler Finance North America LLC $500,000 3.75% 22/2/2028 561,089 0.02%Deutsche Bank AG £400,000 1.88% 22/12/2028 551,833 0.02%Daimler Finance North America LLC $550,000 0.75% 1/3/2024 549,793 0.02%Deutsche Telekom International Finance BV $525,000 2.49% 19/9/2023 545,855 0.02%Volkswagen Leasing GmbH €450,000 0.50% 12/1/2029 530,348 0.02%Volkswagen Financial Services AG €400,000 2.25% 1/10/2027 527,673 0.02%Volkswagen Financial Services AG €400,000 2.25% 16/10/2026 525,094 0.02%Deutsche Telekom International Finance BV €400,000 2.75% 24/10/2024 521,248 0.02%BMW Finance NV €400,000 1.50% 6/2/2029 520,572 0.02%SAP SE €400,000 1.25% 10/3/2028 510,656 0.02%Daimler Finance North America LLC $500,000 1.75% 10/3/2023 510,014 0.02%Volkswagen International Finance NV^ €400,000 3.38% Perpetual 506,629 0.02%Deutsche Telekom International Finance BV €400,000 1.38% 1/12/2025 504,134 0.02%Volkswagen Leasing GmbH €400,000 1.50% 19/6/2026 503,272 0.02%Siemens Financieringsmaatschappij NV €400,000 1.00% 6/9/2027 503,197 0.02%Deutsche Bank AG €400,000 1.63% 20/1/2027 498,613 0.02%Volkswagen Financial Services AG €400,000 1.50% 1/10/2024 496,853 0.02%Brenntag Finance BV €400,000 1.13% 27/9/2025 493,869 0.02%ATF Netherlands BV^ €400,000 3.75% Perpetual 493,110 0.02%Volkswagen International Finance NV^ €400,000 2.70% Perpetual 488,435 0.02%Vonovia Finance BV €400,000 1.00% 9/7/2030 487,518 0.02%Fresenius SE & Co. KGaA €400,000 0.75% 15/1/2028 483,870 0.02%Wintershall Dea Finance BV €400,000 0.84% 25/9/2025 483,460 0.02%BMW Finance NV €400,000 0.38% 14/1/2027 483,294 0.02%SAP SE €400,000 0.38% 18/5/2029 482,183 0.02%Muenchener Rueckversicherungs-Gesellschaft AG in Muenchen^ €400,000 1.25% 26/5/2041 481,397 0.02%Evonik Finance BV €400,000 0.38% 7/9/2024 480,964 0.02%Allianz SE^ €400,000 1.30% 25/9/2049 479,705 0.02%Traton Finance Luxembourg SA €400,000 0.75% 24/3/2029 479,353 0.02%Allianz Finance II BV €400,000 0.25% 6/6/2023 479,167 0.02%E.ON SE €400,000 0.00% 29/9/2022 476,274 0.02%Mercedes-Benz Finance Co., Ltd. €400,000 0.00% 21/8/2022 475,967 0.02%Volkswagen Leasing GmbH €400,000 0.38% 20/7/2026 475,904 0.02%Traton Finance Luxembourg SA €400,000 0.13% 24/3/2025 475,448 0.02%Vantage Towers AG €400,000 0.38% 31/3/2027 473,477 0.02%Fresenius Finance Ireland plc €400,000 0.00% 1/10/2025 473,257 0.02%Siemens Financieringsmaatschappij NV €400,000 0.50% 5/9/2034 471,852 0.02%Volkswagen Financial Services NV £300,000 4.25% 9/10/2025 468,728 0.02%E.ON International Finance BV £250,000 6.25% 3/6/2030 467,844 0.02%Vier Gas Transport GmbH €400,000 0.13% 10/9/2029 464,424 0.02%Aroundtown SA €400,000 0.00% 16/7/2026 463,566 0.02%Grand City Properties SA €400,000 0.13% 11/1/2028 461,086 0.02%Aroundtown SA £300,000 3.25% 18/7/2027 450,463 0.02%Bayer US Finance II LLC $375,000 4.63% 25/6/2038 445,908 0.02%BMW US Capital LLC $400,000 2.55% 1/4/2031 418,042 0.01%Siemens Financieringsmaatschappij NV £300,000 0.88% 5/6/2023 417,591 0.01%Fresenius Medical Care US Finance III, Inc. $425,000 2.38% 16/2/2031 415,194 0.01%BMW Finance NV $400,000 2.25% 12/8/2022 408,490 0.01%Vonovia Finance BV €300,000 2.25% 7/4/2030 403,498 0.01%Volkswagen Group of America Finance LLC1 $400,000 0.88% 22/11/2023 401,269 0.01%Siemens Financieringsmaatschappij NV $400,000 0.40% 11/3/2023 400,314 0.01%Deutsche Bank AG^ $375,000 3.55% 18/9/2031 399,060 0.01%Volkswagen Bank GmbH €300,000 2.50% 31/7/2026 395,573 0.01%Volkswagen Financial Services AG €300,000 3.00% 6/4/2025 394,314 0.01%Fresenius SE & Co. KGaA €300,000 4.00% 1/2/2024 392,604 0.01%Deutsche Wohnen SE €300,000 1.50% 30/4/2030 383,938 0.01%Infineon Technologies AG €300,000 1.63% 24/6/2029 383,156 0.01%
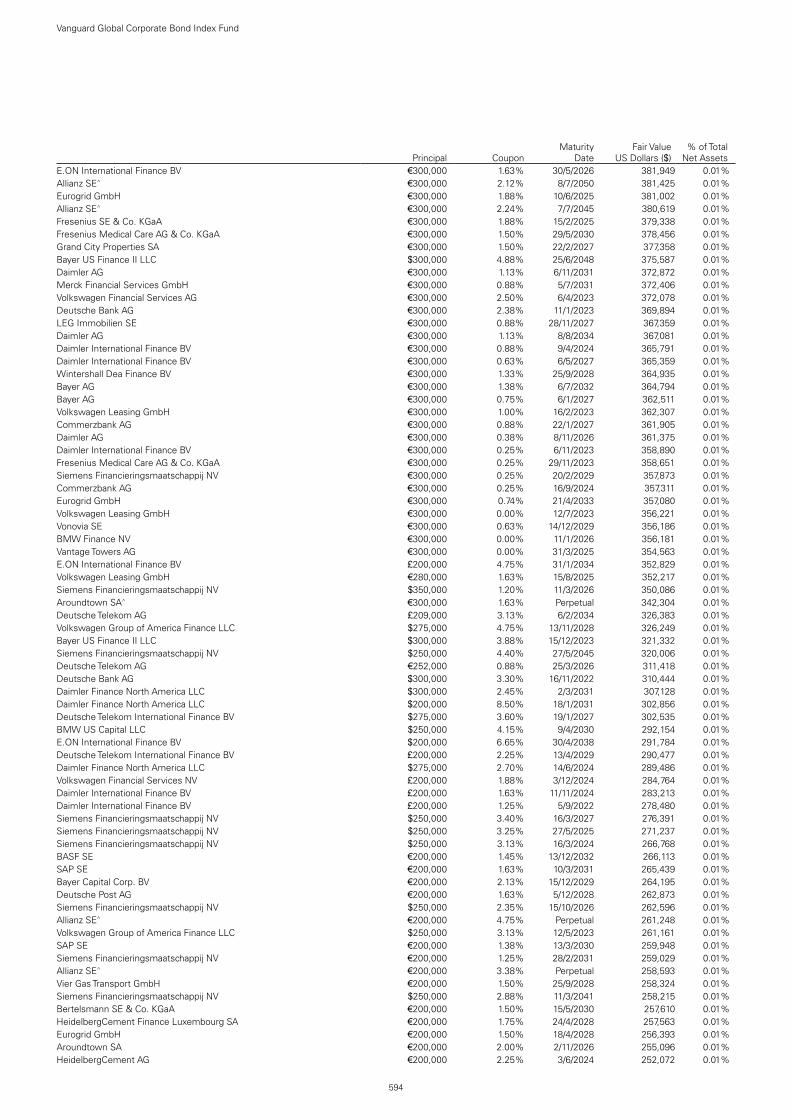
594
Vanguard Global Corporate Bond Index Fund
Principal CouponMaturity
DateFair Value
US Dollars ($)% of Total
Net AssetsE.ON International Finance BV €300,000 1.63% 30/5/2026 381,949 0.01%Allianz SE^ €300,000 2.12% 8/7/2050 381,425 0.01%Eurogrid GmbH €300,000 1.88% 10/6/2025 381,002 0.01%Allianz SE^ €300,000 2.24% 7/7/2045 380,619 0.01%Fresenius SE & Co. KGaA €300,000 1.88% 15/2/2025 379,338 0.01%Fresenius Medical Care AG & Co. KGaA €300,000 1.50% 29/5/2030 378,456 0.01%Grand City Properties SA €300,000 1.50% 22/2/2027 377,358 0.01%Bayer US Finance II LLC $300,000 4.88% 25/6/2048 375,587 0.01%Daimler AG €300,000 1.13% 6/11/2031 372,872 0.01%Merck Financial Services GmbH €300,000 0.88% 5/7/2031 372,406 0.01%Volkswagen Financial Services AG €300,000 2.50% 6/4/2023 372,078 0.01%Deutsche Bank AG €300,000 2.38% 11/1/2023 369,894 0.01%LEG Immobilien SE €300,000 0.88% 28/11/2027 367,359 0.01%Daimler AG €300,000 1.13% 8/8/2034 367,081 0.01%Daimler International Finance BV €300,000 0.88% 9/4/2024 365,791 0.01%Daimler International Finance BV €300,000 0.63% 6/5/2027 365,359 0.01%Wintershall Dea Finance BV €300,000 1.33% 25/9/2028 364,935 0.01%Bayer AG €300,000 1.38% 6/7/2032 364,794 0.01%Bayer AG €300,000 0.75% 6/1/2027 362,511 0.01%Volkswagen Leasing GmbH €300,000 1.00% 16/2/2023 362,307 0.01%Commerzbank AG €300,000 0.88% 22/1/2027 361,905 0.01%Daimler AG €300,000 0.38% 8/11/2026 361,375 0.01%Daimler International Finance BV €300,000 0.25% 6/11/2023 358,890 0.01%Fresenius Medical Care AG & Co. KGaA €300,000 0.25% 29/11/2023 358,651 0.01%Siemens Financieringsmaatschappij NV €300,000 0.25% 20/2/2029 357,873 0.01%Commerzbank AG €300,000 0.25% 16/9/2024 357,311 0.01%Eurogrid GmbH €300,000 0.74% 21/4/2033 357,080 0.01%Volkswagen Leasing GmbH €300,000 0.00% 12/7/2023 356,221 0.01%Vonovia SE €300,000 0.63% 14/12/2029 356,186 0.01%BMW Finance NV €300,000 0.00% 11/1/2026 356,181 0.01%Vantage Towers AG €300,000 0.00% 31/3/2025 354,563 0.01%E.ON International Finance BV £200,000 4.75% 31/1/2034 352,829 0.01%Volkswagen Leasing GmbH €280,000 1.63% 15/8/2025 352,217 0.01%Siemens Financieringsmaatschappij NV $350,000 1.20% 11/3/2026 350,086 0.01%Aroundtown SA^ €300,000 1.63% Perpetual 342,304 0.01%Deutsche Telekom AG £209,000 3.13% 6/2/2034 326,383 0.01%Volkswagen Group of America Finance LLC $275,000 4.75% 13/11/2028 326,249 0.01%Bayer US Finance II LLC $300,000 3.88% 15/12/2023 321,332 0.01%Siemens Financieringsmaatschappij NV $250,000 4.40% 27/5/2045 320,006 0.01%Deutsche Telekom AG €252,000 0.88% 25/3/2026 311,418 0.01%Deutsche Bank AG $300,000 3.30% 16/11/2022 310,444 0.01%Daimler Finance North America LLC $300,000 2.45% 2/3/2031 307,128 0.01%Daimler Finance North America LLC $200,000 8.50% 18/1/2031 302,856 0.01%Deutsche Telekom International Finance BV $275,000 3.60% 19/1/2027 302,535 0.01%BMW US Capital LLC $250,000 4.15% 9/4/2030 292,154 0.01%E.ON International Finance BV $200,000 6.65% 30/4/2038 291,784 0.01%Deutsche Telekom International Finance BV £200,000 2.25% 13/4/2029 290,477 0.01%Daimler Finance North America LLC $275,000 2.70% 14/6/2024 289,486 0.01%Volkswagen Financial Services NV £200,000 1.88% 3/12/2024 284,764 0.01%Daimler International Finance BV £200,000 1.63% 11/11/2024 283,213 0.01%Daimler International Finance BV £200,000 1.25% 5/9/2022 278,480 0.01%Siemens Financieringsmaatschappij NV $250,000 3.40% 16/3/2027 276,391 0.01%Siemens Financieringsmaatschappij NV $250,000 3.25% 27/5/2025 271,237 0.01%Siemens Financieringsmaatschappij NV $250,000 3.13% 16/3/2024 266,768 0.01%BASF SE €200,000 1.45% 13/12/2032 266,113 0.01%SAP SE €200,000 1.63% 10/3/2031 265,439 0.01%Bayer Capital Corp. BV €200,000 2.13% 15/12/2029 264,195 0.01%Deutsche Post AG €200,000 1.63% 5/12/2028 262,873 0.01%Siemens Financieringsmaatschappij NV $250,000 2.35% 15/10/2026 262,596 0.01%Allianz SE^ €200,000 4.75% Perpetual 261,248 0.01%Volkswagen Group of America Finance LLC $250,000 3.13% 12/5/2023 261,161 0.01%SAP SE €200,000 1.38% 13/3/2030 259,948 0.01%Siemens Financieringsmaatschappij NV €200,000 1.25% 28/2/2031 259,029 0.01%Allianz SE^ €200,000 3.38% Perpetual 258,593 0.01%Vier Gas Transport GmbH €200,000 1.50% 25/9/2028 258,324 0.01%Siemens Financieringsmaatschappij NV $250,000 2.88% 11/3/2041 258,215 0.01%Bertelsmann SE & Co. KGaA €200,000 1.50% 15/5/2030 257,610 0.01%HeidelbergCement Finance Luxembourg SA €200,000 1.75% 24/4/2028 257,563 0.01%Eurogrid GmbH €200,000 1.50% 18/4/2028 256,393 0.01%Aroundtown SA €200,000 2.00% 2/11/2026 255,096 0.01%HeidelbergCement AG €200,000 2.25% 3/6/2024 252,072 0.01%
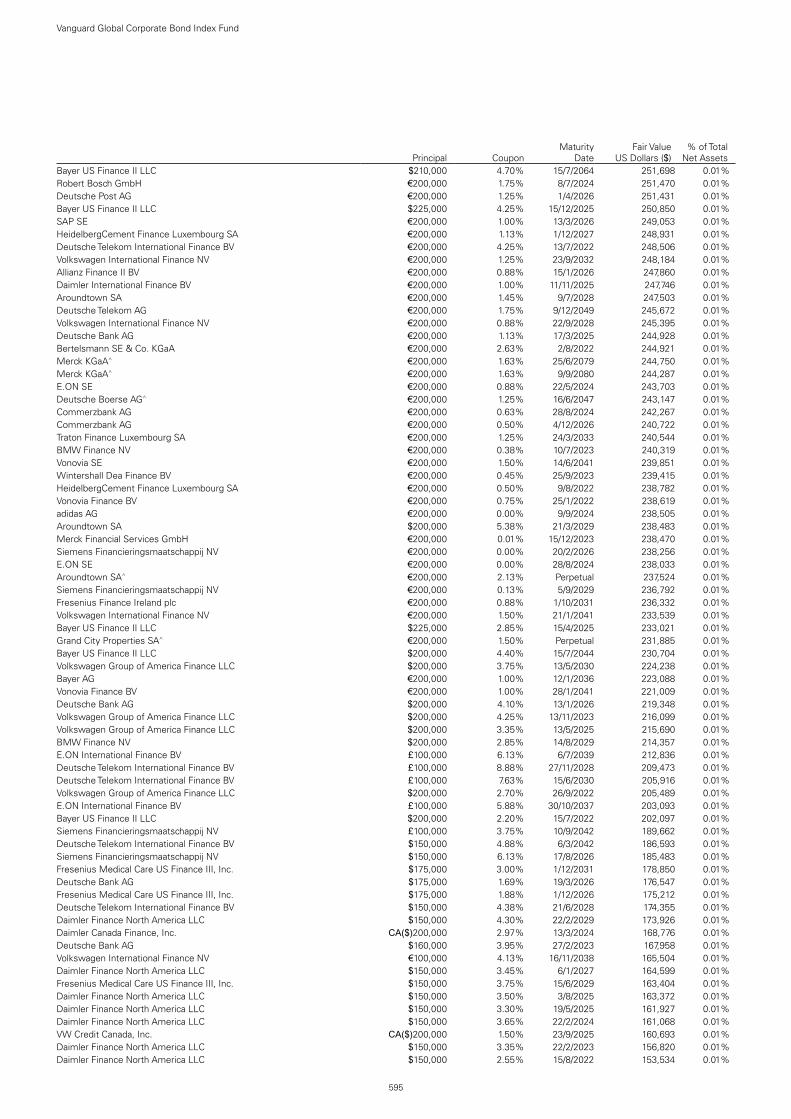
595
Vanguard Global Corporate Bond Index Fund
Principal CouponMaturity
DateFair Value
US Dollars ($)% of Total
Net AssetsBayer US Finance II LLC $210,000 4.70% 15/7/2064 251,698 0.01%Robert Bosch GmbH €200,000 1.75% 8/7/2024 251,470 0.01%Deutsche Post AG €200,000 1.25% 1/4/2026 251,431 0.01%Bayer US Finance II LLC $225,000 4.25% 15/12/2025 250,850 0.01%SAP SE €200,000 1.00% 13/3/2026 249,053 0.01%HeidelbergCement Finance Luxembourg SA €200,000 1.13% 1/12/2027 248,931 0.01%Deutsche Telekom International Finance BV €200,000 4.25% 13/7/2022 248,506 0.01%Volkswagen International Finance NV €200,000 1.25% 23/9/2032 248,184 0.01%Allianz Finance II BV €200,000 0.88% 15/1/2026 247,860 0.01%Daimler International Finance BV €200,000 1.00% 11/11/2025 247,746 0.01%Aroundtown SA €200,000 1.45% 9/7/2028 247,503 0.01%Deutsche Telekom AG €200,000 1.75% 9/12/2049 245,672 0.01%Volkswagen International Finance NV €200,000 0.88% 22/9/2028 245,395 0.01%Deutsche Bank AG €200,000 1.13% 17/3/2025 244,928 0.01%Bertelsmann SE & Co. KGaA €200,000 2.63% 2/8/2022 244,921 0.01%Merck KGaA^ €200,000 1.63% 25/6/2079 244,750 0.01%Merck KGaA^ €200,000 1.63% 9/9/2080 244,287 0.01%E.ON SE €200,000 0.88% 22/5/2024 243,703 0.01%Deutsche Boerse AG^ €200,000 1.25% 16/6/2047 243,147 0.01%Commerzbank AG €200,000 0.63% 28/8/2024 242,267 0.01%Commerzbank AG €200,000 0.50% 4/12/2026 240,722 0.01%Traton Finance Luxembourg SA €200,000 1.25% 24/3/2033 240,544 0.01%BMW Finance NV €200,000 0.38% 10/7/2023 240,319 0.01%Vonovia SE €200,000 1.50% 14/6/2041 239,851 0.01%Wintershall Dea Finance BV €200,000 0.45% 25/9/2023 239,415 0.01%HeidelbergCement Finance Luxembourg SA €200,000 0.50% 9/8/2022 238,782 0.01%Vonovia Finance BV €200,000 0.75% 25/1/2022 238,619 0.01%adidas AG €200,000 0.00% 9/9/2024 238,505 0.01%Aroundtown SA $200,000 5.38% 21/3/2029 238,483 0.01%Merck Financial Services GmbH €200,000 0.01% 15/12/2023 238,470 0.01%Siemens Financieringsmaatschappij NV €200,000 0.00% 20/2/2026 238,256 0.01%E.ON SE €200,000 0.00% 28/8/2024 238,033 0.01%Aroundtown SA^ €200,000 2.13% Perpetual 237,524 0.01%Siemens Financieringsmaatschappij NV €200,000 0.13% 5/9/2029 236,792 0.01%Fresenius Finance Ireland plc €200,000 0.88% 1/10/2031 236,332 0.01%Volkswagen International Finance NV €200,000 1.50% 21/1/2041 233,539 0.01%Bayer US Finance II LLC $225,000 2.85% 15/4/2025 233,021 0.01%Grand City Properties SA^ €200,000 1.50% Perpetual 231,885 0.01%Bayer US Finance II LLC $200,000 4.40% 15/7/2044 230,704 0.01%Volkswagen Group of America Finance LLC $200,000 3.75% 13/5/2030 224,238 0.01%Bayer AG €200,000 1.00% 12/1/2036 223,088 0.01%Vonovia Finance BV €200,000 1.00% 28/1/2041 221,009 0.01%Deutsche Bank AG $200,000 4.10% 13/1/2026 219,348 0.01%Volkswagen Group of America Finance LLC $200,000 4.25% 13/11/2023 216,099 0.01%Volkswagen Group of America Finance LLC $200,000 3.35% 13/5/2025 215,690 0.01%BMW Finance NV $200,000 2.85% 14/8/2029 214,357 0.01%E.ON International Finance BV £100,000 6.13% 6/7/2039 212,836 0.01%Deutsche Telekom International Finance BV £100,000 8.88% 27/11/2028 209,473 0.01%Deutsche Telekom International Finance BV £100,000 7.63% 15/6/2030 205,916 0.01%Volkswagen Group of America Finance LLC $200,000 2.70% 26/9/2022 205,489 0.01%E.ON International Finance BV £100,000 5.88% 30/10/2037 203,093 0.01%Bayer US Finance II LLC $200,000 2.20% 15/7/2022 202,097 0.01%Siemens Financieringsmaatschappij NV £100,000 3.75% 10/9/2042 189,662 0.01%Deutsche Telekom International Finance BV $150,000 4.88% 6/3/2042 186,593 0.01%Siemens Financieringsmaatschappij NV $150,000 6.13% 17/8/2026 185,483 0.01%Fresenius Medical Care US Finance III, Inc. $175,000 3.00% 1/12/2031 178,850 0.01%Deutsche Bank AG $175,000 1.69% 19/3/2026 176,547 0.01%Fresenius Medical Care US Finance III, Inc. $175,000 1.88% 1/12/2026 175,212 0.01%Deutsche Telekom International Finance BV $150,000 4.38% 21/6/2028 174,355 0.01%Daimler Finance North America LLC $150,000 4.30% 22/2/2029 173,926 0.01%Daimler Canada Finance, Inc. CA($)200,000 2.97% 13/3/2024 168,776 0.01%Deutsche Bank AG $160,000 3.95% 27/2/2023 167,958 0.01%Volkswagen International Finance NV €100,000 4.13% 16/11/2038 165,504 0.01%Daimler Finance North America LLC $150,000 3.45% 6/1/2027 164,599 0.01%Fresenius Medical Care US Finance III, Inc. $150,000 3.75% 15/6/2029 163,404 0.01%Daimler Finance North America LLC $150,000 3.50% 3/8/2025 163,372 0.01%Daimler Finance North America LLC $150,000 3.30% 19/5/2025 161,927 0.01%Daimler Finance North America LLC $150,000 3.65% 22/2/2024 161,068 0.01%VW Credit Canada, Inc. CA($)200,000 1.50% 23/9/2025 160,693 0.01%Daimler Finance North America LLC $150,000 3.35% 22/2/2023 156,820 0.01%Daimler Finance North America LLC $150,000 2.55% 15/8/2022 153,534 0.01%

596
Vanguard Global Corporate Bond Index Fund
Principal CouponMaturity
DateFair Value
US Dollars ($)% of Total
Net AssetsDeutsche Bank AG £100,000 3.88% 12/2/2024 147,829 0.01%Aroundtown SA £100,000 3.00% 16/10/2029 147,275 0.01%Aroundtown SA^ £100,000 4.75% Perpetual 145,850 0.01%Volkswagen International Finance NV €100,000 3.25% 18/11/2030 145,718 0.01%Volkswagen Financial Services NV £100,000 2.75% 10/7/2023 143,665 0.01%BASF SE £100,000 1.75% 11/3/2025 143,242 0.01%BASF SE £100,000 1.38% 21/6/2022 139,522 0.01%Volkswagen Financial Services NV £100,000 1.13% 18/9/2023 139,243 0.01%BMW Finance NV £100,000 0.88% 16/8/2022 138,900 0.01%Fresenius SE & Co. KGaA €100,000 2.88% 15/2/2029 138,558 0.01%Deutsche Telekom AG €100,000 2.25% 29/3/2039 138,254 0.01%Infineon Technologies AG €100,000 2.00% 24/6/2032 131,721 0.01%Allianz Finance II BV €100,000 1.38% 21/4/2031 131,448 0.01%BMW US Capital LLC $125,000 3.45% 12/4/2023 131,308 0.01%Deutsche Post AG €100,000 2.88% 11/12/2024 131,145 0.01%Merck KGaA^ €100,000 2.88% 25/6/2079 129,271 0.01%Commerzbank AG €100,000 1.88% 28/2/2028 127,708 0.01%Fresenius SE & Co. KGaA €100,000 1.63% 8/10/2027 127,601 0.00%Deutsche Boerse AG €100,000 1.63% 8/10/2025 127,567 0.00%Talanx AG^ €100,000 2.25% 5/12/2047 127,314 0.00%Aroundtown SA €100,000 1.88% 19/1/2026 127,136 0.00%Deutsche Telekom International Finance BV €100,000 1.38% 30/1/2027 127,029 0.00%Vonovia Finance BV €100,000 1.50% 14/1/2028 127,017 0.00%Daimler AG €100,000 1.50% 9/3/2026 126,871 0.00%Vier Gas Transport GmbH €100,000 3.13% 10/7/2023 126,714 0.00%Roadster Finance DAC €100,000 2.38% 8/12/2027 126,637 0.00%Deutsche Telekom AG €100,000 1.38% 5/7/2034 126,472 0.00%Covestro AG €100,000 1.38% 12/6/2030 126,127 0.00%Deutsche Post AG €100,000 1.00% 13/12/2027 126,085 0.00%O2 Telefonica Deutschland Finanzierungs GmbH €100,000 1.75% 5/7/2025 125,667 0.00%Vonovia Finance BV €100,000 2.25% 15/12/2023 125,542 0.00%Fresenius Medical Care AG & Co. KGaA €100,000 1.50% 11/7/2025 125,391 0.00%Grand City Properties SA €100,000 1.38% 3/8/2026 125,361 0.00%Aroundtown SA €100,000 1.63% 31/1/2028 125,156 0.00%Eurogrid GmbH €100,000 1.11% 15/5/2032 124,923 0.00%Volkswagen Bank GmbH €100,000 1.88% 31/1/2024 124,360 0.00%Vonovia Finance BV €100,000 1.13% 8/9/2025 124,078 0.00%Vonovia Finance BV €100,000 1.63% 7/10/2039 123,976 0.00%Berlin Hyp AG €100,000 1.25% 22/1/2025 123,914 0.00%LANXESS AG €100,000 1.13% 16/5/2025 123,894 0.00%E.ON SE €100,000 1.00% 7/10/2025 123,431 0.00%Commerzbank AG €100,000 1.00% 4/3/2026 123,313 0.00%BMW Finance NV €100,000 0.75% 13/7/2026 123,301 0.00%Deutsche Wohnen SE €100,000 1.00% 30/4/2025 122,914 0.00%alstria office-AG €100,000 2.13% 12/4/2023 122,352 0.00%Aroundtown SA €100,000 1.00% 7/1/2025 121,762 0.00%E.ON SE €100,000 0.75% 18/12/2030 121,459 0.00%Siemens Financieringsmaatschappij NV €100,000 0.38% 5/6/2026 121,240 0.00%Volkswagen Financial Services AG €100,000 0.88% 12/4/2023 120,634 0.00%Allianz Finance II BV €100,000 0.50% 14/1/2031 120,619 0.00%Infineon Technologies AG €100,000 0.75% 24/6/2023 120,615 0.00%Volkswagen Bank GmbH €100,000 0.75% 15/6/2023 120,534 0.00%Deutsche Pfandbriefbank AG €100,000 0.75% 7/2/2023 120,402 0.00%Berlin Hyp AG €100,000 0.50% 26/9/2023 120,069 0.00%E.ON SE €100,000 0.38% 29/9/2027 120,051 0.00%Continental AG €100,000 0.38% 27/6/2025 119,813 0.00%Merck Financial Services GmbH €100,000 0.13% 16/7/2025 119,713 0.00%alstria office-AG €100,000 0.50% 26/9/2025 119,610 0.00%E.ON SE €100,000 0.25% 24/10/2026 119,532 0.00%Siemens Financieringsmaatschappij NV €100,000 0.00% 5/9/2024 119,312 0.00%Aroundtown SA €100,000 0.38% 23/9/2022 119,278 0.00%Vonovia Finance BV €100,000 0.13% 6/4/2023 119,181 0.00%Hannover Rueck SE^ €100,000 1.13% 9/10/2039 119,096 0.00%Vonovia SE €100,000 0.00% 16/9/2024 118,903 0.00%E.ON SE €100,000 0.63% 7/11/2031 118,846 0.00%Clearstream Banking AG €100,000 0.00% 1/12/2025 118,756 0.00%adidas AG €100,000 0.63% 10/9/2035 118,185 0.00%E.ON SE €100,000 0.35% 28/2/2030 117,832 0.00%adidas AG €100,000 0.00% 5/10/2028 117,729 0.00%BMW US Capital LLC $100,000 2.80% 11/4/2026 106,736 0.00%BMW US Capital LLC $100,000 3.15% 18/4/2024 106,652 0.00%
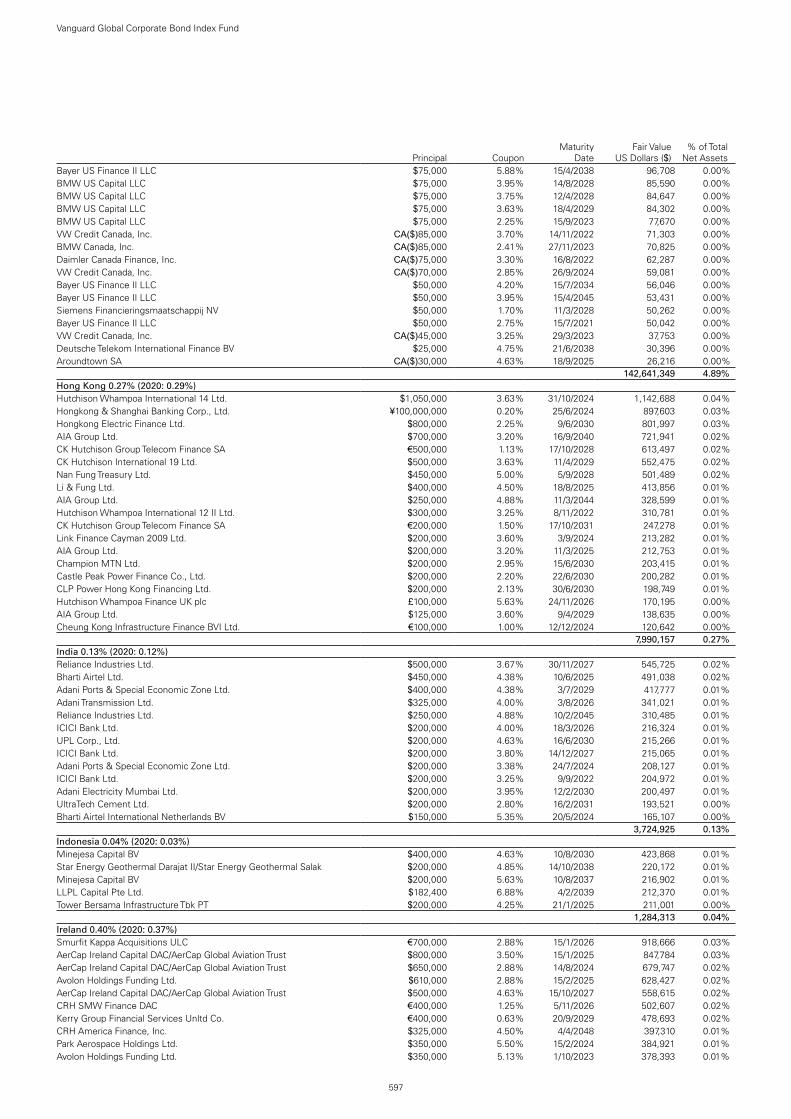
597
Vanguard Global Corporate Bond Index Fund
Principal CouponMaturity
DateFair Value
US Dollars ($)% of Total
Net AssetsBayer US Finance II LLC $75,000 5.88% 15/4/2038 96,708 0.00%BMW US Capital LLC $75,000 3.95% 14/8/2028 85,590 0.00%BMW US Capital LLC $75,000 3.75% 12/4/2028 84,647 0.00%BMW US Capital LLC $75,000 3.63% 18/4/2029 84,302 0.00%BMW US Capital LLC $75,000 2.25% 15/9/2023 77,670 0.00%VW Credit Canada, Inc. CA($)85,000 3.70% 14/11/2022 71,303 0.00%BMW Canada, Inc. CA($)85,000 2.41% 27/11/2023 70,825 0.00%Daimler Canada Finance, Inc. CA($)75,000 3.30% 16/8/2022 62,287 0.00%VW Credit Canada, Inc. CA($)70,000 2.85% 26/9/2024 59,081 0.00%Bayer US Finance II LLC $50,000 4.20% 15/7/2034 56,046 0.00%Bayer US Finance II LLC $50,000 3.95% 15/4/2045 53,431 0.00%Siemens Financieringsmaatschappij NV $50,000 1.70% 11/3/2028 50,262 0.00%Bayer US Finance II LLC $50,000 2.75% 15/7/2021 50,042 0.00%VW Credit Canada, Inc. CA($)45,000 3.25% 29/3/2023 37,753 0.00%Deutsche Telekom International Finance BV $25,000 4.75% 21/6/2038 30,396 0.00%Aroundtown SA CA($)30,000 4.63% 18/9/2025 26,216 0.00%test - - - 142,641,349 4.89%Hong Kong 0.27% (2020: 0.29%)Hutchison Whampoa International 14 Ltd. $1,050,000 3.63% 31/10/2024 1,142,688 0.04%Hongkong & Shanghai Banking Corp., Ltd. ¥100,000,000 0.20% 25/6/2024 897,603 0.03%Hongkong Electric Finance Ltd. $800,000 2.25% 9/6/2030 801,997 0.03%AIA Group Ltd. $700,000 3.20% 16/9/2040 721,941 0.02%CK Hutchison Group Telecom Finance SA €500,000 1.13% 17/10/2028 613,497 0.02%CK Hutchison International 19 Ltd. $500,000 3.63% 11/4/2029 552,475 0.02%Nan Fung Treasury Ltd. $450,000 5.00% 5/9/2028 501,489 0.02%Li & Fung Ltd. $400,000 4.50% 18/8/2025 413,856 0.01%AIA Group Ltd. $250,000 4.88% 11/3/2044 328,599 0.01%Hutchison Whampoa International 12 II Ltd. $300,000 3.25% 8/11/2022 310,781 0.01%CK Hutchison Group Telecom Finance SA €200,000 1.50% 17/10/2031 247,278 0.01%Link Finance Cayman 2009 Ltd. $200,000 3.60% 3/9/2024 213,282 0.01%AIA Group Ltd. $200,000 3.20% 11/3/2025 212,753 0.01%Champion MTN Ltd. $200,000 2.95% 15/6/2030 203,415 0.01%Castle Peak Power Finance Co., Ltd. $200,000 2.20% 22/6/2030 200,282 0.01%CLP Power Hong Kong Financing Ltd. $200,000 2.13% 30/6/2030 198,749 0.01%Hutchison Whampoa Finance UK plc £100,000 5.63% 24/11/2026 170,195 0.00%AIA Group Ltd. $125,000 3.60% 9/4/2029 138,635 0.00%Cheung Kong Infrastructure Finance BVI Ltd. €100,000 1.00% 12/12/2024 120,642 0.00%test - - - 7,990,157 0.27%India 0.13% (2020: 0.12%)Reliance Industries Ltd. $500,000 3.67% 30/11/2027 545,725 0.02%Bharti Airtel Ltd. $450,000 4.38% 10/6/2025 491,038 0.02%Adani Ports & Special Economic Zone Ltd. $400,000 4.38% 3/7/2029 417,777 0.01%Adani Transmission Ltd. $325,000 4.00% 3/8/2026 341,021 0.01%Reliance Industries Ltd. $250,000 4.88% 10/2/2045 310,485 0.01%ICICI Bank Ltd. $200,000 4.00% 18/3/2026 216,324 0.01%UPL Corp., Ltd. $200,000 4.63% 16/6/2030 215,266 0.01%ICICI Bank Ltd. $200,000 3.80% 14/12/2027 215,065 0.01%Adani Ports & Special Economic Zone Ltd. $200,000 3.38% 24/7/2024 208,127 0.01%ICICI Bank Ltd. $200,000 3.25% 9/9/2022 204,972 0.01%Adani Electricity Mumbai Ltd. $200,000 3.95% 12/2/2030 200,497 0.01%UltraTech Cement Ltd. $200,000 2.80% 16/2/2031 193,521 0.00%Bharti Airtel International Netherlands BV $150,000 5.35% 20/5/2024 165,107 0.00%test - - - 3,724,925 0.13%Indonesia 0.04% (2020: 0.03%)Minejesa Capital BV $400,000 4.63% 10/8/2030 423,868 0.01%Star Energy Geothermal Darajat II/Star Energy Geothermal Salak $200,000 4.85% 14/10/2038 220,172 0.01%Minejesa Capital BV $200,000 5.63% 10/8/2037 216,902 0.01%LLPL Capital Pte Ltd. $182,400 6.88% 4/2/2039 212,370 0.01%Tower Bersama Infrastructure Tbk PT $200,000 4.25% 21/1/2025 211,001 0.00%test - - - 1,284,313 0.04%Ireland 0.40% (2020: 0.37%)Smurfit Kappa Acquisitions ULC €700,000 2.88% 15/1/2026 918,666 0.03%AerCap Ireland Capital DAC/AerCap Global Aviation Trust $800,000 3.50% 15/1/2025 847,784 0.03%AerCap Ireland Capital DAC/AerCap Global Aviation Trust $650,000 2.88% 14/8/2024 679,747 0.02%Avolon Holdings Funding Ltd. $610,000 2.88% 15/2/2025 628,427 0.02%AerCap Ireland Capital DAC/AerCap Global Aviation Trust $500,000 4.63% 15/10/2027 558,615 0.02%CRH SMW Finance DAC €400,000 1.25% 5/11/2026 502,607 0.02%Kerry Group Financial Services Unltd Co. €400,000 0.63% 20/9/2029 478,693 0.02%CRH America Finance, Inc. $325,000 4.50% 4/4/2048 397,310 0.01%Park Aerospace Holdings Ltd. $350,000 5.50% 15/2/2024 384,921 0.01%Avolon Holdings Funding Ltd. $350,000 5.13% 1/10/2023 378,393 0.01%

598
Vanguard Global Corporate Bond Index Fund
Principal CouponMaturity
DateFair Value
US Dollars ($)% of Total
Net AssetsCRH Finance DAC €300,000 3.13% 3/4/2023 376,582 0.01%AerCap Ireland Capital DAC/AerCap Global Aviation Trust $350,000 3.65% 21/7/2027 374,140 0.01%Bank of Ireland Group plc €300,000 1.38% 29/8/2023 366,878 0.01%Ryanair DAC €289,000 0.88% 25/5/2026 344,042 0.01%Avolon Holdings Funding Ltd. $315,000 4.38% 1/5/2026 342,289 0.01%AIB Group plc $300,000 4.75% 12/10/2023 325,666 0.01%AerCap Ireland Capital DAC/AerCap Global Aviation Trust $300,000 3.30% 23/1/2023 310,895 0.01%Park Aerospace Holdings Ltd. $265,000 4.50% 15/3/2023 278,602 0.01%Avolon Holdings Funding Ltd. $250,000 5.25% 15/5/2024 274,889 0.01%Park Aerospace Holdings Ltd. $250,000 5.25% 15/8/2022 261,728 0.01%Avolon Holdings Funding Ltd. $250,000 2.75% 21/2/2028 247,381 0.01%CRH America Finance, Inc. $200,000 3.95% 4/4/2028 225,978 0.01%Bank of Ireland Group plc $200,000 4.50% 25/11/2023 216,410 0.01%SMBC Aviation Capital Finance DAC $200,000 4.13% 15/7/2023 212,738 0.01%SMBC Aviation Capital Finance DAC $200,000 2.65% 15/7/2021 200,160 0.01%Freshwater Finance plc £100,000 5.18% 20/4/2035 186,898 0.01%AerCap Ireland Capital DAC/AerCap Global Aviation Trust $150,000 4.63% 1/7/2022 156,016 0.01%CRH Funding BV €100,000 1.63% 5/5/2030 130,411 0.01%Ryanair DAC €100,000 2.88% 15/9/2025 129,770 0.01%CRH Finance DAC €100,000 1.38% 18/10/2028 127,676 0.01%AIB Group plc €100,000 1.25% 28/5/2024 122,906 0.01%Bank of Ireland Group plc^ €100,000 1.00% 25/11/2025 121,836 0.00%CRH Finland Services OYJ €100,000 0.88% 5/11/2023 121,415 0.00%Ryanair DAC €100,000 1.13% 10/3/2023 120,790 0.00%CRH America Finance, Inc. $100,000 3.40% 9/5/2027 109,757 0.00%Avolon Holdings Funding Ltd. $90,000 3.95% 1/7/2024 95,956 0.00%Avolon Holdings Funding Ltd. $80,000 3.25% 15/2/2027 82,550 0.00%CRH America Finance, Inc. $50,000 4.40% 9/5/2047 59,987 0.00%AerCap Ireland Capital DAC/AerCap Global Aviation Trust $50,000 4.88% 16/1/2024 54,453 0.00%AerCap Ireland Capital DAC/AerCap Global Aviation Trust $25,000 4.45% 1/10/2025 27,522 0.00%test - - - 11,781,484 0.40%Israel 0.02% (2020: 0.01%)ICL Group Ltd. $225,000 6.38% 31/5/2038 289,647 0.01%Delek & Avner Tamar Bond Ltd. $150,000 5.41% 30/12/2025 150,946 0.01%test - - - 440,593 0.02%Italy 1.33% (2020: 1.25%)Enel Finance International NV €1,000,000 0.38% 17/6/2027 1,200,582 0.04%Intesa Sanpaolo SpA €850,000 2.13% 26/5/2025 1,082,578 0.04%UniCredit SpA^ €850,000 1.25% 25/6/2025 1,038,031 0.04%UniCredit SpA^ €800,000 2.20% 22/7/2027 1,009,524 0.04%Intesa Sanpaolo SpA $775,000 3.25% 23/9/2024 824,286 0.03%Enel Finance International NV $750,000 3.50% 6/4/2028 822,283 0.03%Eni SpA €600,000 1.25% 18/5/2026 752,269 0.03%UniCredit SpA^ €610,000 1.25% 16/6/2026 748,340 0.03%Intesa Sanpaolo SpA $675,000 4.00% 23/9/2029 741,189 0.03%Assicurazioni Generali SpA €560,000 2.43% 14/7/2031 715,037 0.02%Enel SpA £350,000 5.75% 22/6/2037 701,020 0.02%Enel Finance International NV €590,000 0.00% 17/6/2027 691,906 0.02%Enel SpA €500,000 5.25% 20/5/2024 686,355 0.02%Intesa Sanpaolo SpA €500,000 1.75% 4/7/2029 635,026 0.02%Intesa Sanpaolo SpA €500,000 1.75% 20/3/2028 633,539 0.02%Eni SpA €500,000 1.50% 2/2/2026 633,246 0.02%Mediobanca Banca di Credito Finanziario SpA €500,000 0.63% 27/9/2022 599,352 0.02%Eni SpA^ €500,000 2.75% Perpetual 596,620 0.02%Terna SPA €500,000 0.38% 23/6/2029 592,828 0.02%Enel Finance International NV €500,000 0.88% 17/6/2036 588,726 0.02%Enel Finance International NV £430,000 1.00% 20/10/2027 583,679 0.02%UniCredit SpA €500,000 0.85% 19/1/2031 582,631 0.02%Enel Finance International NV $375,000 6.00% 7/10/2039 522,519 0.02%Enel Finance International NV $350,000 6.80% 15/9/2037 511,712 0.02%Eni SpA^ €400,000 3.38% Perpetual 503,900 0.02%Intesa Sanpaolo SpA €400,000 2.13% 30/8/2023 497,415 0.02%Enel Finance International NV €400,000 1.13% 17/10/2034 495,258 0.02%Intesa Sanpaolo SpA €400,000 1.00% 4/7/2024 488,498 0.02%UniCredit SpA^ €410,000 0.80% 5/7/2029 487,246 0.02%Intesa Sanpaolo SpA €400,000 1.00% 22/7/2022 480,642 0.02%Intesa Sanpaolo SpA €400,000 0.75% 17/10/2022 480,438 0.02%Eni SpA €400,000 0.63% 23/1/2030 477,952 0.02%Enel Finance International NV $400,000 4.88% 14/6/2029 477,787 0.02%Intesa Sanpaolo SpA $400,000 4.70% 23/9/2049 470,265 0.02%Intesa Sanpaolo SpA $450,000 3.13% 14/7/2022 461,742 0.02%
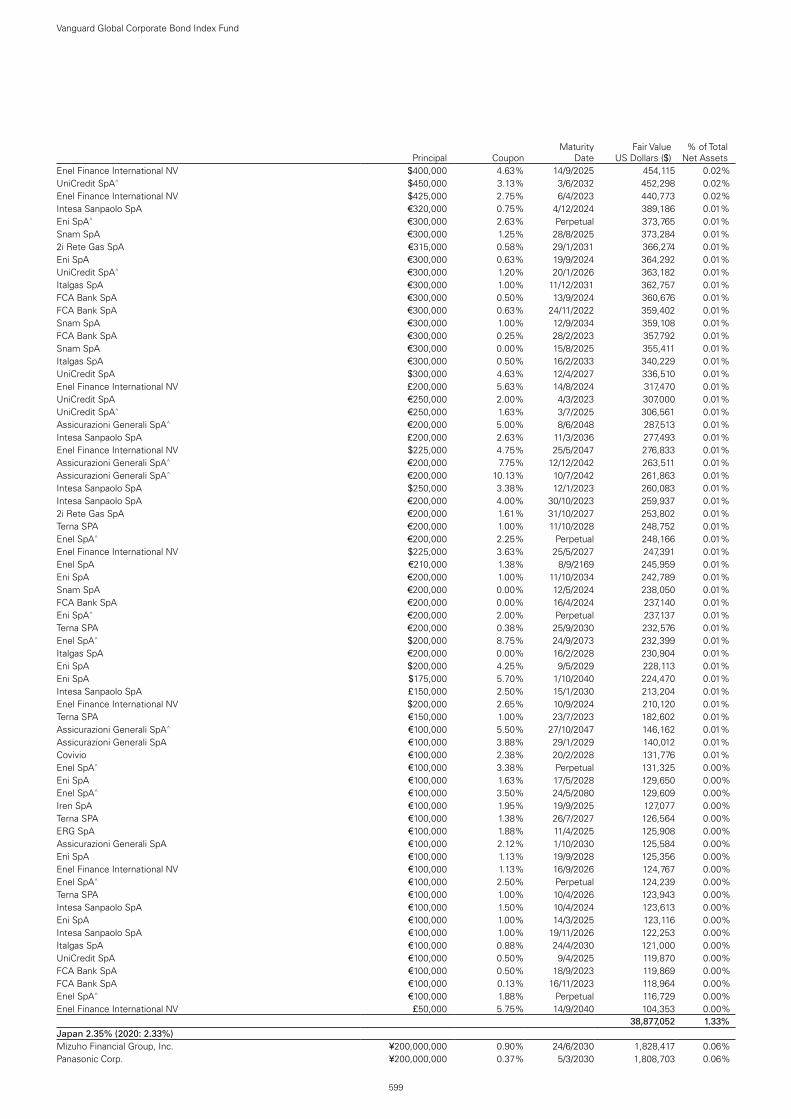
599
Vanguard Global Corporate Bond Index Fund
Principal CouponMaturity
DateFair Value
US Dollars ($)% of Total
Net AssetsEnel Finance International NV $400,000 4.63% 14/9/2025 454,115 0.02%UniCredit SpA^ $450,000 3.13% 3/6/2032 452,298 0.02%Enel Finance International NV $425,000 2.75% 6/4/2023 440,773 0.02%Intesa Sanpaolo SpA €320,000 0.75% 4/12/2024 389,186 0.01%Eni SpA^ €300,000 2.63% Perpetual 373,765 0.01%Snam SpA €300,000 1.25% 28/8/2025 373,284 0.01%2i Rete Gas SpA €315,000 0.58% 29/1/2031 366,274 0.01%Eni SpA €300,000 0.63% 19/9/2024 364,292 0.01%UniCredit SpA^ €300,000 1.20% 20/1/2026 363,182 0.01%Italgas SpA €300,000 1.00% 11/12/2031 362,757 0.01%FCA Bank SpA €300,000 0.50% 13/9/2024 360,676 0.01%FCA Bank SpA €300,000 0.63% 24/11/2022 359,402 0.01%Snam SpA €300,000 1.00% 12/9/2034 359,108 0.01%FCA Bank SpA €300,000 0.25% 28/2/2023 357,792 0.01%Snam SpA €300,000 0.00% 15/8/2025 355,411 0.01%Italgas SpA €300,000 0.50% 16/2/2033 340,229 0.01%UniCredit SpA $300,000 4.63% 12/4/2027 336,510 0.01%Enel Finance International NV £200,000 5.63% 14/8/2024 317,470 0.01%UniCredit SpA €250,000 2.00% 4/3/2023 307,000 0.01%UniCredit SpA^ €250,000 1.63% 3/7/2025 306,561 0.01%Assicurazioni Generali SpA^ €200,000 5.00% 8/6/2048 287,513 0.01%Intesa Sanpaolo SpA £200,000 2.63% 11/3/2036 277,493 0.01%Enel Finance International NV $225,000 4.75% 25/5/2047 276,833 0.01%Assicurazioni Generali SpA^ €200,000 7.75% 12/12/2042 263,511 0.01%Assicurazioni Generali SpA^ €200,000 10.13% 10/7/2042 261,863 0.01%Intesa Sanpaolo SpA $250,000 3.38% 12/1/2023 260,083 0.01%Intesa Sanpaolo SpA €200,000 4.00% 30/10/2023 259,937 0.01%2i Rete Gas SpA €200,000 1.61% 31/10/2027 253,802 0.01%Terna SPA €200,000 1.00% 11/10/2028 248,752 0.01%Enel SpA^ €200,000 2.25% Perpetual 248,166 0.01%Enel Finance International NV $225,000 3.63% 25/5/2027 247,391 0.01%Enel SpA €210,000 1.38% 8/9/2169 245,959 0.01%Eni SpA €200,000 1.00% 11/10/2034 242,789 0.01%Snam SpA €200,000 0.00% 12/5/2024 238,050 0.01%FCA Bank SpA €200,000 0.00% 16/4/2024 237,140 0.01%Eni SpA^ €200,000 2.00% Perpetual 237,137 0.01%Terna SPA €200,000 0.38% 25/9/2030 232,576 0.01%Enel SpA^ $200,000 8.75% 24/9/2073 232,399 0.01%Italgas SpA €200,000 0.00% 16/2/2028 230,904 0.01%Eni SpA $200,000 4.25% 9/5/2029 228,113 0.01%Eni SpA $175,000 5.70% 1/10/2040 224,470 0.01%Intesa Sanpaolo SpA £150,000 2.50% 15/1/2030 213,204 0.01%Enel Finance International NV $200,000 2.65% 10/9/2024 210,120 0.01%Terna SPA €150,000 1.00% 23/7/2023 182,602 0.01%Assicurazioni Generali SpA^ €100,000 5.50% 27/10/2047 146,162 0.01%Assicurazioni Generali SpA €100,000 3.88% 29/1/2029 140,012 0.01%Covivio €100,000 2.38% 20/2/2028 131,776 0.01%Enel SpA^ €100,000 3.38% Perpetual 131,325 0.00%Eni SpA €100,000 1.63% 17/5/2028 129,650 0.00%Enel SpA^ €100,000 3.50% 24/5/2080 129,609 0.00%Iren SpA €100,000 1.95% 19/9/2025 127,077 0.00%Terna SPA €100,000 1.38% 26/7/2027 126,564 0.00%ERG SpA €100,000 1.88% 11/4/2025 125,908 0.00%Assicurazioni Generali SpA €100,000 2.12% 1/10/2030 125,584 0.00%Eni SpA €100,000 1.13% 19/9/2028 125,356 0.00%Enel Finance International NV €100,000 1.13% 16/9/2026 124,767 0.00%Enel SpA^ €100,000 2.50% Perpetual 124,239 0.00%Terna SPA €100,000 1.00% 10/4/2026 123,943 0.00%Intesa Sanpaolo SpA €100,000 1.50% 10/4/2024 123,613 0.00%Eni SpA €100,000 1.00% 14/3/2025 123,116 0.00%Intesa Sanpaolo SpA €100,000 1.00% 19/11/2026 122,253 0.00%Italgas SpA €100,000 0.88% 24/4/2030 121,000 0.00%UniCredit SpA €100,000 0.50% 9/4/2025 119,870 0.00%FCA Bank SpA €100,000 0.50% 18/9/2023 119,869 0.00%FCA Bank SpA €100,000 0.13% 16/11/2023 118,964 0.00%Enel SpA^ €100,000 1.88% Perpetual 116,729 0.00%Enel Finance International NV £50,000 5.75% 14/9/2040 104,353 0.00%test - - - 38,877,052 1.33%Japan 2.35% (2020: 2.33%)Mizuho Financial Group, Inc. ¥200,000,000 0.90% 24/6/2030 1,828,417 0.06%Panasonic Corp. ¥200,000,000 0.37% 5/3/2030 1,808,703 0.06%

600
Vanguard Global Corporate Bond Index Fund
Principal CouponMaturity
DateFair Value
US Dollars ($)% of Total
Net AssetsNissan Motor Co., Ltd. $1,400,000 4.35% 17/9/2027 1,540,407 0.05%Mitsubishi UFJ Financial Group, Inc.^ $1,475,000 0.85% 15/9/2024 1,482,083 0.05%Mitsubishi UFJ Financial Group, Inc. $1,200,000 1.41% 17/7/2025 1,212,913 0.04%Takeda Pharmaceutical Co., Ltd. $1,200,000 2.05% 31/3/2030 1,189,627 0.04%Sumitomo Mitsui Financial Group, Inc. $1,200,000 0.95% 12/1/2026 1,185,239 0.04%Mizuho Financial Group, Inc.^ $1,100,000 0.85% 8/9/2024 1,104,934 0.04%Kyushu Electric Power Co., Inc. ¥120,000,000 0.17% 23/8/2024 1,083,049 0.04%Toyota Motor Corp. $1,050,000 0.68% 25/3/2024 1,051,572 0.04%Mitsubishi Corp. ¥100,000,000 1.52% 25/6/2032 1,004,559 0.03%Sumitomo Mitsui Financial Group, Inc. $900,000 2.70% 16/7/2024 951,275 0.03%Panasonic Corp. ¥100,000,000 0.93% 19/3/2025 928,561 0.03%Sumitomo Mitsui Financial Group, Inc. ¥100,000,000 0.88% 29/5/2025 916,389 0.03%Fast Retailing Co., Ltd. ¥100,000,000 0.41% 6/6/2028 914,677 0.03%MUFG Bank Ltd. ¥100,000,000 1.39% 31/5/2022 910,902 0.03%NTT Finance Corp. ¥100,000,000 0.38% 20/9/2030 910,632 0.03%Bridgestone Corp. ¥100,000,000 0.30% 21/4/2027 906,947 0.03%NTT Finance Corp. ¥100,000,000 0.28% 20/12/2027 906,938 0.03%Sumitomo Mitsui Trust Bank Ltd. $900,000 0.80% 12/9/2023 905,301 0.03%Mizuho Financial Group, Inc. ¥100,000,000 0.61% 21/6/2027 901,820 0.03%Nomura Holdings, Inc. $775,000 2.65% 16/1/2025 813,968 0.03%Asahi Group Holdings Ltd. €675,000 0.16% 23/10/2024 805,842 0.03%Nissan Motor Co., Ltd. $700,000 4.81% 17/9/2030 789,330 0.03%Sumitomo Mitsui Financial Group, Inc. $700,000 2.75% 15/1/2030 736,074 0.03%Toyota Motor Corp. $700,000 1.34% 25/3/2026 708,161 0.02%Meiji Yasuda Life Insurance Co.^ $600,000 5.20% 20/10/2045 677,563 0.02%Mitsubishi UFJ Financial Group, Inc. $625,000 3.20% 18/7/2029 676,197 0.02%Mizuho Financial Group, Inc. $600,000 3.55% 5/3/2023 631,358 0.02%Mitsubishi UFJ Financial Group, Inc. $575,000 3.41% 7/3/2024 615,926 0.02%Takeda Pharmaceutical Co., Ltd. €500,000 0.75% 9/7/2027 608,173 0.02%Nippon Life Insurance Co.^ $575,000 3.40% 23/1/2050 595,165 0.02%Takeda Pharmaceutical Co., Ltd. €400,000 3.00% 21/11/2030 568,609 0.02%Mitsubishi UFJ Financial Group, Inc. $500,000 3.78% 2/3/2025 548,951 0.02%NTT Finance Corp. $550,000 1.16% 3/4/2026 548,396 0.02%Mizuho Financial Group Cayman 3 Ltd. $500,000 4.60% 27/3/2024 544,863 0.02%Mizuho Financial Group, Inc.^ $550,000 1.23% 22/5/2027 541,788 0.02%Nissan Motor Co., Ltd. €400,000 3.20% 17/9/2028 537,034 0.02%Sumitomo Mitsui Financial Group, Inc. $500,000 3.20% 17/9/2029 532,401 0.02%Mizuho Financial Group, Inc.^ $500,000 2.84% 16/7/2025 527,723 0.02%Sumitomo Mitsui Financial Group, Inc. $500,000 3.10% 17/1/2023 521,047 0.02%Mizuho Financial Group, Inc.^ $500,000 2.20% 10/7/2031 499,250 0.02%Nomura Holdings, Inc. $475,000 3.10% 16/1/2030 498,480 0.02%Sumitomo Mitsui Financial Group, Inc. $450,000 3.54% 17/1/2028 498,052 0.02%Takeda Pharmaceutical Co., Ltd. €400,000 1.00% 9/7/2029 490,018 0.02%Mizuho Financial Group, Inc. €400,000 0.80% 15/4/2030 482,664 0.02%Sumitomo Mitsui Financial Group, Inc. $450,000 3.04% 16/7/2029 482,407 0.02%Takeda Pharmaceutical Co., Ltd. $400,000 5.00% 26/11/2028 481,779 0.02%Mizuho Financial Group, Inc.^ $400,000 4.25% 11/9/2029 460,903 0.02%Kansai Electric Power Co., Inc. ¥50,000,000 0.46% 20/12/2027 458,055 0.02%MUFG Bank Ltd. $425,000 3.25% 8/9/2024 457,042 0.02%Mitsubishi UFJ Financial Group, Inc. $425,000 2.80% 18/7/2024 449,906 0.02%Dai-ichi Life Insurance Co., Ltd.^ $400,000 4.00% Perpetual 433,364 0.01%Takeda Pharmaceutical Co., Ltd. $425,000 3.18% 9/7/2050 428,837 0.01%Sumitomo Mitsui Financial Group, Inc. $400,000 2.63% 14/7/2026 424,859 0.01%Toyota Motor Finance Netherlands BV £300,000 1.38% 23/5/2023 421,897 0.01%Nippon Life Insurance Co.^ $400,000 5.00% 18/10/2042 418,247 0.01%Nissan Motor Co., Ltd. $400,000 3.04% 15/9/2023 417,204 0.01%ORIX Corp. $400,000 2.90% 18/7/2022 410,311 0.01%Sumitomo Mitsui Financial Group, Inc. $400,000 2.78% 12/7/2022 410,156 0.01%Mitsubishi UFJ Financial Group, Inc. $400,000 2.62% 18/7/2022 409,590 0.01%Nissan Motor Co., Ltd. $375,000 3.52% 17/9/2025 400,229 0.01%Sumitomo Mitsui Financial Group, Inc. $400,000 0.51% 12/1/2024 398,532 0.01%Takeda Pharmaceutical Co., Ltd. €300,000 2.00% 9/7/2040 382,942 0.01%Sumitomo Mitsui Financial Group, Inc. $350,000 3.36% 12/7/2027 382,650 0.01%Mitsubishi UFJ Financial Group, Inc. $350,000 3.76% 26/7/2023 373,686 0.01%Mitsubishi UFJ Financial Group, Inc. $325,000 3.75% 18/7/2039 370,055 0.01%Mitsubishi UFJ Financial Group, Inc. €300,000 0.98% 9/10/2023 365,328 0.01%Toyota Finance Australia Ltd. €300,000 0.50% 6/4/2023 360,790 0.01%Sumitomo Mitsui Financial Group, Inc. €300,000 0.63% 23/10/2029 358,038 0.01%Mizuho Financial Group, Inc. €300,000 0.18% 13/4/2026 355,958 0.01%Mitsubishi UFJ Financial Group, Inc. ¥39,000,000 0.55% 12/1/2028 352,001 0.01%Mitsubishi UFJ Financial Group, Inc. $300,000 4.05% 11/9/2028 344,872 0.01%

601
Vanguard Global Corporate Bond Index Fund
Principal CouponMaturity
DateFair Value
US Dollars ($)% of Total
Net AssetsToyota Motor Corp.1 $325,000 2.36% 2/7/2024 341,823 0.01%Sumitomo Mitsui Financial Group, Inc. $300,000 3.94% 19/7/2028 340,846 0.01%Mitsubishi UFJ Financial Group, Inc. $300,000 3.85% 1/3/2026 335,300 0.01%Sumitomo Mitsui Financial Group, Inc. $300,000 3.75% 19/7/2023 320,046 0.01%Mitsubishi HC Capital, Inc. $300,000 3.96% 19/9/2023 319,784 0.01%Mitsubishi UFJ Financial Group, Inc. ¥35,000,000 0.65% 26/7/2027 317,851 0.01%Mizuho Financial Group, Inc. $275,000 4.02% 5/3/2028 313,654 0.01%Sumitomo Life Insurance Co.^ $300,000 3.38% 15/4/2081 309,274 0.01%Mitsubishi UFJ Financial Group, Inc. $300,000 2.67% 25/7/2022 307,504 0.01%Mizuho Financial Group, Inc. $275,000 3.48% 12/4/2026 301,045 0.01%Mitsubishi UFJ Financial Group, Inc. $300,000 2.05% 17/7/2030 299,293 0.01%Mizuho Financial Group, Inc. $250,000 4.35% 20/10/2025 277,324 0.01%Sumitomo Life Insurance Co.^ $250,000 6.50% 20/9/2073 277,159 0.01%NTT Finance Corp. $275,000 0.58% 1/3/2024 274,496 0.01%Sumitomo Mitsui Financial Group, Inc. $250,000 4.44% 2/4/2024 272,183 0.01%Sumitomo Mitsui Banking Corp. $250,000 3.95% 10/1/2024 270,650 0.01%Mizuho Bank Ltd. $250,000 3.75% 16/4/2024 270,231 0.01%Sumitomo Mitsui Banking Corp. $250,000 3.40% 11/7/2024 269,317 0.01%Mizuho Financial Group, Inc.^ $250,000 3.92% 11/9/2024 267,737 0.01%Sumitomo Mitsui Financial Group, Inc. $250,000 2.72% 27/9/2029 262,490 0.01%Sumitomo Mitsui Financial Group, Inc. $250,000 2.45% 27/9/2024 262,336 0.01%Takeda Pharmaceutical Co., Ltd. €200,000 2.25% 21/11/2026 262,118 0.01%MUFG Bank Ltd. $200,000 4.70% 10/3/2044 261,245 0.01%JT International Financial Services BV^ €200,000 2.88% 7/10/2083 258,565 0.01%Nissan Motor Acceptance Corp. $250,000 2.65% 13/7/2022 254,366 0.01%NTT Finance Corp. $250,000 2.07% 3/4/2031 253,471 0.01%Sumitomo Mitsui Financial Group, Inc. €200,000 1.55% 15/6/2026 253,384 0.01%NTT Finance Corp. $250,000 0.37% 3/3/2023 249,933 0.01%JT International Financial Services BV^ €200,000 2.38% 7/4/2081 249,378 0.01%NTT Finance Corp. $250,000 1.59% 3/4/2028 249,208 0.01%Sumitomo Mitsui Financial Group, Inc. €200,000 0.93% 11/10/2024 245,169 0.01%Mitsubishi UFJ Financial Group, Inc. €200,000 0.98% 9/6/2024 244,971 0.01%JT International Financial Services BV €200,000 1.00% 26/11/2029 244,145 0.01%Mitsubishi UFJ Financial Group, Inc. $200,000 4.29% 26/7/2038 243,003 0.01%American Honda Finance Corp. €200,000 0.75% 17/1/2024 242,475 0.01%Mitsubishi UFJ Financial Group, Inc. €200,000 0.34% 19/7/2024 240,428 0.01%Mizuho Financial Group, Inc. €200,000 0.12% 6/9/2024 238,607 0.01%Asahi Group Holdings Ltd. €200,000 0.34% 19/4/2027 238,208 0.01%NTT Finance Corp. €200,000 0.01% 3/3/2025 237,863 0.01%Asahi Group Holdings Ltd. €200,000 0.01% 19/4/2024 237,801 0.01%Nidec Corp. €200,000 0.05% 30/3/2026 237,161 0.01%Sumitomo Mitsui Financial Group, Inc. €200,000 0.30% 28/10/2027 235,774 0.01%Mizuho Financial Group, Inc. €200,000 0.40% 6/9/2029 234,116 0.01%Mitsubishi HC Capital, Inc. $200,000 3.97% 13/4/2030 226,463 0.01%Nippon Life Insurance Co.^ $200,000 4.70% 20/1/2046 222,456 0.01%Nippon Life Insurance Co.^ $200,000 5.10% 16/10/2044 221,001 0.01%Nippon Life Insurance Co.^ $225,000 2.75% 21/1/2051 220,573 0.01%Toyota Motor Corp. $215,000 2.16% 2/7/2022 219,130 0.01%Mizuho Financial Group, Inc. $200,000 3.17% 11/9/2027 217,693 0.01%Nippon Life Insurance Co.^ $200,000 4.00% 19/9/2047 217,016 0.01%Sumitomo Life Insurance Co.^ $200,000 4.00% 14/9/2077 216,333 0.01%Mizuho Financial Group, Inc. $200,000 2.84% 13/9/2026 214,151 0.01%Mitsubishi UFJ Financial Group, Inc. $200,000 2.76% 13/9/2026 212,776 0.01%Toyota Industries Corp. $200,000 3.24% 16/3/2023 208,987 0.01%Sumitomo Mitsui Financial Group, Inc. $200,000 2.78% 18/10/2022 206,120 0.01%Mizuho Financial Group, Inc. $200,000 2.60% 11/9/2022 205,292 0.01%Sumitomo Mitsui Financial Group, Inc. $200,000 1.47% 8/7/2025 202,301 0.01%Dai-ichi Life Insurance Co., Ltd.^ $200,000 7.25% Perpetual 200,834 0.01%Sumitomo Mitsui Trust Bank Ltd. $200,000 0.85% 25/3/2024 200,434 0.01%Mizuho Financial Group, Inc.^ $200,000 2.17% 22/5/2032 198,748 0.01%East Japan Railway Co. £100,000 4.88% 14/6/2034 188,749 0.01%Sumitomo Mitsui Financial Group, Inc. $200,000 2.30% 12/1/2041 187,310 0.01%East Japan Railway Co. £100,000 4.50% 25/1/2036 186,089 0.01%Mizuho Financial Group, Inc. €150,000 0.96% 16/10/2024 183,826 0.01%Kansai Electric Power Co., Inc. ¥20,000,000 0.49% 23/7/2027 183,503 0.01%ORIX Corp. $150,000 3.70% 18/7/2027 167,514 0.01%Takeda Pharmaceutical Co., Ltd. $150,000 3.38% 9/7/2060 153,833 0.01%ORIX Corp. $140,000 4.05% 16/1/2024 151,620 0.01%JT International Financial Services BV £100,000 2.75% 28/9/2033 149,797 0.01%Panasonic Corp. $125,000 2.68% 19/7/2024 131,405 0.00%Panasonic Corp. $120,000 2.54% 19/7/2022 122,338 0.00%

602
Vanguard Global Corporate Bond Index Fund
Principal CouponMaturity
DateFair Value
US Dollars ($)% of Total
Net AssetsMizuho Financial Group, Inc. €100,000 1.02% 11/10/2023 121,845 0.00%Sumitomo Mitsui Financial Group, Inc. €100,000 0.82% 23/7/2023 121,128 0.00%Toyota Motor Finance Netherlands BV €100,000 0.63% 26/9/2023 120,934 0.00%Asahi Group Holdings Ltd. €100,000 0.54% 23/10/2028 119,529 0.00%NTT Finance Corp. €100,000 0.34% 3/3/2030 118,218 0.00%Mitsubishi UFJ Financial Group, Inc. $100,000 3.96% 2/3/2028 113,628 0.00%Mitsubishi UFJ Financial Group, Inc. $100,000 3.74% 7/3/2029 112,573 0.00%Sumitomo Mitsui Financial Group, Inc. $100,000 3.94% 16/10/2023 107,872 0.00%Mizuho Financial Group, Inc.^ $100,000 3.15% 16/7/2030 107,737 0.00%Mitsubishi UFJ Financial Group, Inc. $100,000 3.46% 2/3/2023 105,049 0.00%Takeda Pharmaceutical Co., Ltd. $100,000 3.03% 9/7/2040 101,057 0.00%ORIX Corp. $100,000 2.25% 9/3/2031 100,816 0.00%Sumitomo Mitsui Financial Group, Inc. $100,000 2.44% 19/10/2021 100,669 0.00%Toyota Motor Corp. $100,000 3.18% 20/7/2021 100,149 0.00%Kyushu Electric Power Co., Inc. ¥10,000,000 1.06% 23/2/2024 92,418 0.00%Toyota Motor Corp. $80,000 3.42% 20/7/2023 84,925 0.00%Toyota Motor Corp. $75,000 2.76% 2/7/2029 80,810 0.00%Panasonic Corp. $50,000 3.11% 19/7/2029 53,635 0.00%Kansai Electric Power Co., Inc. ¥5,000,000 0.47% 25/5/2027 45,810 0.00%Kyushu Electric Power Co., Inc. ¥4,000,000 0.43% 25/5/2029 36,502 0.00%Toyota Motor Corp. $25,000 3.67% 20/7/2028 28,358 0.00%test - - - 68,663,302 2.35%Jordan 0.01% (2020: 0.00%)Hikma Finance USA LLC $200,000 3.25% 9/7/2025 208,583 0.01%test - - - 208,583 0.01%Kazakhstan 0.02% (2020: 0.01%)Tengizchevroil Finance Co. International Ltd. $300,000 3.25% 15/8/2030 305,398 0.01%Tengizchevroil Finance Co. International Ltd. $200,000 2.63% 15/8/2025 205,566 0.01%test - - - 510,964 0.02%Kuwait 0.03% (2020: 0.02%)Warba Sukuk Ltd. $200,000 2.98% 24/9/2024 210,999 0.01%NBK Tier 1 Financing 2 Ltd.^ $200,000 4.50% Perpetual 209,018 0.01%Boubyan Sukuk Ltd. $200,000 2.59% 18/2/2025 208,371 0.01%KIB Sukuk Ltd.^ $200,000 2.38% 30/11/2030 195,768 0.00%test - - - 824,156 0.03%Luxembourg 0.22% (2020: 0.19%)Logicor Financing Sarl £500,000 2.75% 15/1/2030 724,326 0.02%Blackstone Property Partners Europe Holdings Sarl €500,000 2.00% 15/2/2024 617,879 0.02%Blackstone Property Partners Europe Holdings Sarl €500,000 1.25% 26/4/2027 605,982 0.02%Blackstone Property Partners Europe Holdings Sarl €500,000 1.00% 4/5/2028 590,224 0.02%Logicor Financing Sarl €480,000 1.50% 14/11/2022 579,575 0.02%Logicor Financing Sarl €400,000 0.88% 14/1/2031 458,788 0.02%Blackstone Property Partners Europe Holdings Sarl €350,000 2.20% 24/7/2025 443,322 0.02%Prologis International Funding II SA €300,000 0.75% 23/3/2033 348,628 0.01%Bevco Lux Sarl €249,000 1.00% 16/1/2030 292,655 0.01%Logicor Financing Sarl €200,000 3.25% 13/11/2028 275,789 0.01%Logicor Financing Sarl €200,000 2.25% 13/5/2025 254,183 0.01%Blackstone Property Partners Europe Holdings Sarl €200,000 1.40% 6/7/2022 239,722 0.01%Eurofins Scientific SE €200,000 0.88% 19/5/2031 235,403 0.01%Logicor Financing Sarl €150,000 1.50% 13/7/2026 186,965 0.01%Prologis International Funding II SA €125,000 0.88% 9/7/2029 152,574 0.01%Czech Gas Networks Investments Sarl €100,000 1.00% 16/7/2027 122,787 0.00%SES SA €100,000 0.88% 4/11/2027 121,420 0.00%Logicor Financing Sarl €100,000 0.75% 15/7/2024 120,571 0.00%SES GLOBAL Americas Holdings GP $50,000 5.30% 25/3/2044 58,314 0.00%test - - - 6,429,107 0.22%Macau 0.06% (2020: 0.05%)Sands China Ltd. $600,000 5.40% 8/8/2028 697,278 0.02%Sands China Ltd. $400,000 5.13% 8/8/2025 447,807 0.02%Sands China Ltd. $400,000 4.60% 8/8/2023 424,759 0.01%Sands China Ltd. $200,000 4.38% 18/6/2030 217,008 0.01%test - - - 1,786,852 0.06%Malaysia 0.02% (2020: 0.04%)Gohl Capital Ltd. $400,000 4.25% 24/1/2027 420,630 0.01%Genm Capital Labuan Ltd. $200,000 3.88% 19/4/2031 199,997 0.01%test - - - 620,627 0.02%Mexico 0.56% (2020: 0.55%)America Movil SAB de CV £550,000 5.00% 27/10/2026 903,078 0.03%Grupo Televisa SAB $600,000 5.25% 24/5/2049 753,780 0.03%Fomento Economico Mexicano SAB de CV $700,000 3.50% 16/1/2050 736,852 0.02%America Movil SAB de CV $500,000 4.38% 22/4/2049 617,721 0.02%Southern Copper Corp. $430,000 5.88% 23/4/2045 601,039 0.02%

603
Vanguard Global Corporate Bond Index Fund
Principal CouponMaturity
DateFair Value
US Dollars ($)% of Total
Net AssetsAmerica Movil SAB de CV $400,000 6.13% 30/3/2040 567,027 0.02%America Movil SAB de CV £300,000 5.75% 28/6/2030 546,968 0.02%BBVA Bancomer SA $500,000 4.38% 10/4/2024 543,283 0.02%Coca-Cola Femsa SAB de CV $500,000 1.85% 1/9/2032 482,280 0.02%Orbia Advance Corp. SAB de CV $400,000 5.50% 15/1/2048 469,494 0.02%Trust Fibra Uno $400,000 6.39% 15/1/2050 467,071 0.02%Alfa SAB de CV $400,000 5.25% 25/3/2024 436,006 0.01%America Movil SAB de CV $350,000 4.38% 16/7/2042 421,518 0.01%Coca-Cola Femsa SAB de CV $400,000 2.75% 22/1/2030 418,135 0.01%Infraestructura Energetica Nova SAB de CV $400,000 4.75% 15/1/2051 405,981 0.01%Orbia Advance Corp. SAB de CV $400,000 1.88% 11/5/2026 402,651 0.01%Southern Copper Corp. $275,000 7.50% 27/7/2035 399,037 0.01%Banco Santander Mexico SA Institucion de Banca Multiple Grupo
Financiero Santand $350,000 4.13% 9/11/2022 364,430 0.01%America Movil SAB de CV $250,000 6.38% 1/3/2035 358,035 0.01%Banco Santander Mexico SA Institucion de Banca Multiple Grupo
Financiero Santand $300,000 5.38% 17/4/2025 340,462 0.01%Grupo Televisa SAB $250,000 5.00% 13/5/2045 298,043 0.01%Southern Copper Corp. $205,000 6.75% 16/4/2040 292,726 0.01%America Movil SAB de CV^ €200,000 6.38% 6/9/2073 267,607 0.01%Southern Copper Corp. $200,000 5.25% 8/11/2042 255,622 0.01%Industrias Penoles SAB de CV $200,000 5.65% 12/9/2049 239,945 0.01%Grupo Bimbo SAB de CV $200,000 4.70% 10/11/2047 234,611 0.01%Trust Fibra Uno $200,000 5.25% 30/1/2026 225,094 0.01%Minera Mexico SA de CV $200,000 4.50% 26/1/2050 223,913 0.01%Grupo Televisa SAB $200,000 4.63% 30/1/2026 222,282 0.01%Trust Fibra Uno $200,000 4.87% 15/1/2030 219,949 0.01%Industrias Penoles SAB de CV $200,000 4.75% 6/8/2050 216,187 0.01%Infraestructura Energetica Nova SAB de CV $200,000 3.75% 14/1/2028 215,887 0.01%Banco Inbursa SA Institucion de Banca Multiple Grupo Financiero Inbursa $200,000 4.38% 11/4/2027 214,369 0.01%Grupo Bimbo SAB de CV $200,000 4.00% 6/9/2049 214,188 0.01%FEL Energy VI Sarl $198,923 5.75% 1/12/2040 211,273 0.01%America Movil SAB de CV $200,000 2.88% 7/5/2030 210,812 0.01%Fresnillo plc $200,000 4.25% 2/10/2050 202,292 0.01%Alpek SAB de CV $200,000 3.25% 25/2/2031 202,283 0.01%Coca-Cola Femsa SAB de CV $150,000 5.25% 26/11/2043 201,503 0.01%Kimberly-Clark de Mexico SAB de CV $200,000 2.43% 1/7/2031 198,415 0.01%America Movil SAB de CV £100,000 4.95% 22/7/2033 181,029 0.01%Mexico Generadora de Energia S de rl $150,930 5.50% 6/12/2032 169,695 0.01%Becle SAB de CV $150,000 3.75% 13/5/2025 163,154 0.01%Southern Copper Corp. $150,000 3.50% 8/11/2022 155,603 0.00%America Movil SAB de CV $150,000 3.13% 16/7/2022 154,080 0.00%America Movil SAB de CV €100,000 1.50% 10/3/2024 123,445 0.00%America Movil SAB de CV €100,000 0.75% 26/6/2027 121,043 0.00%Grupo Televisa SAB $75,000 6.63% 18/3/2025 88,958 0.00%Fomento Economico Mexicano SAB de CV $74,000 4.38% 10/5/2043 88,407 0.00%Grupo Bimbo SAB de CV $75,000 3.88% 27/6/2024 81,064 0.00%Grupo Televisa SAB $50,000 6.63% 15/1/2040 69,038 0.00%test - - - 16,197,365 0.56%Netherlands 2.21% (2020: 2.19%)Cooperatieve Rabobank UA1 $1,300,000 3.75% 21/7/2026 1,429,348 0.05%Cooperatieve Rabobank UA1 $1,125,000 3.88% 26/9/2023 1,207,971 0.04%Heineken NV €900,000 1.63% 30/3/2025 1,135,788 0.04%Cooperatieve Rabobank UA^ €900,000 0.88% 5/5/2028 1,106,280 0.04%Nationale-Nederlanden Levensverzekering Maatschappij NV^ €800,000 9.00% 29/8/2042 1,047,240 0.04%Shell International Finance BV €800,000 1.50% 7/4/2028 1,031,617 0.04%Shell International Finance BV $950,000 2.50% 12/9/2026 1,011,598 0.04%ING Groep NV^ $975,000 1.40% 1/7/2026 978,311 0.03%NN Group NV^ €700,000 4.63% 8/4/2044 925,440 0.03%Cooperatieve Rabobank UA $650,000 5.75% 1/12/2043 918,611 0.03%Shell International Finance BV $850,000 2.75% 6/4/2030 906,201 0.03%LeasePlan Corp. NV $850,000 2.88% 24/10/2024 893,337 0.03%Shell International Finance BV $725,000 4.38% 11/5/2045 889,081 0.03%ING Groep NV1 €700,000 1.00% 20/9/2023 853,088 0.03%Shell International Finance BV $575,000 6.38% 15/12/2038 852,817 0.03%ING Groep NV^ €700,000 0.10% 3/9/2025 831,698 0.03%Shell International Finance BV $700,000 3.88% 13/11/2028 803,529 0.03%Cooperatieve Rabobank UA1 €600,000 3.88% 25/7/2023 769,856 0.03%Cooperatieve Rabobank UA1 €600,000 1.25% 23/3/2026 757,615 0.03%Cooperatieve Rabobank UA £500,000 1.25% 14/1/2025 697,472 0.02%ING Groep NV^ €600,000 0.25% 18/2/2029 697,405 0.02%

604
Vanguard Global Corporate Bond Index Fund
Principal CouponMaturity
DateFair Value
US Dollars ($)% of Total
Net AssetsAegon NV^ $600,000 5.50% 11/4/2048 681,030 0.02%ABN AMRO Bank NV1 $600,000 4.80% 18/4/2026 680,939 0.02%Shell International Finance BV €500,000 1.88% 7/4/2032 670,065 0.02%NN Group NV^ €500,000 4.38% Perpetual 653,533 0.02%Cooperatieve Rabobank UA1 $650,000 0.38% 12/1/2024 647,458 0.02%ING Groep NV1 $600,000 3.55% 9/4/2024 645,985 0.02%Koninklijke Philips NV €500,000 1.38% 30/3/2025 623,247 0.02%ABN AMRO Bank NV €500,000 1.25% 28/5/2025 619,629 0.02%Shell International Finance BV €500,000 1.13% 7/4/2024 615,420 0.02%ABN AMRO Bank NV €500,000 0.50% 15/4/2026 608,735 0.02%Cooperatieve Rabobank UA €500,000 0.75% 29/8/2023 605,623 0.02%Cooperatieve Rabobank UA €500,000 0.63% 27/2/2024 605,493 0.02%ABN AMRO Bank NV €500,000 0.60% 15/1/2027 602,036 0.02%Shell International Finance BV $500,000 4.00% 10/5/2046 584,820 0.02%ING Groep NV^ €500,000 0.25% 1/2/2030 576,188 0.02%Cooperatieve Rabobank UA $550,000 3.95% 9/11/2022 575,700 0.02%Shell International Finance BV $525,000 3.25% 6/4/2050 558,882 0.02%Siemens Financieringsmaatschappij NV $550,000 2.15% 11/3/2031 555,864 0.02%Shell International Finance BV €400,000 1.88% 15/9/2025 514,461 0.02%ABN AMRO Bank NV €400,000 7.13% 6/7/2022 508,732 0.02%ING Groep NV^ €400,000 2.13% 26/5/2031 504,403 0.02%Signify NV €400,000 2.00% 11/5/2024 499,614 0.02%Shell International Finance BV $475,000 2.25% 6/1/2023 488,909 0.02%Shell International Finance BV $450,000 3.25% 11/5/2025 488,617 0.02%NIBC Bank NV €400,000 0.88% 8/7/2025 488,315 0.02%NIBC Bank NV €400,000 1.13% 19/4/2023 485,042 0.02%Shell International Finance BV €400,000 0.50% 11/5/2024 484,273 0.02%Nationale-Nederlanden Bank NV €400,000 0.38% 26/2/2025 481,641 0.02%LeasePlan Corp. NV €400,000 0.75% 3/10/2022 480,183 0.02%Shell International Finance BV €400,000 0.13% 8/11/2027 474,319 0.02%de Volksbank NV €400,000 0.38% 3/3/2028 469,321 0.02%NXP BV/NXP Funding LLC $425,000 4.88% 1/3/2024 467,898 0.02%ING Groep NV^ $450,000 2.73% 1/4/2032 463,505 0.02%Cooperatieve Rabobank UA $325,000 5.25% 24/5/2041 448,404 0.02%NIBC Bank NV £300,000 3.13% 15/11/2023 435,541 0.02%ABN AMRO Bank NV £300,000 1.38% 16/1/2025 421,925 0.02%Shell International Finance BV $400,000 2.38% 6/4/2025 420,949 0.01%Heineken NV €300,000 2.25% 30/3/2030 411,683 0.01%Shell International Finance BV $395,000 3.13% 7/11/2049 408,845 0.01%Shell International Finance BV £300,000 1.00% 10/12/2030 392,983 0.01%Euronext NV €325,000 0.13% 17/5/2026 386,359 0.01%ASML Holding NV €300,000 1.38% 7/7/2026 380,280 0.01%EXOR NV €300,000 1.75% 14/10/2034 376,105 0.01%Shell International Finance BV €300,000 0.75% 12/5/2024 365,748 0.01%Koninklijke KPN NV €300,000 0.63% 9/4/2025 362,820 0.01%Cooperatieve Rabobank UA $350,000 2.75% 10/1/2023 362,714 0.01%NXP BV/NXP Funding LLC/NXP USA, Inc. $350,000 3.25% 11/5/2041 358,881 0.01%ABN AMRO Bank NV €300,000 1.00% 2/6/2033 357,157 0.01%Enel Finance International NV €300,000 0.50% 17/6/2030 355,716 0.01%Wolters Kluwer NV €300,000 0.25% 30/3/2028 355,258 0.01%de Volksbank NV €300,000 0.25% 22/6/2026 353,921 0.01%Koninklijke Ahold Delhaize NV €300,000 0.38% 18/3/2030 353,236 0.01%Shell International Finance BV $295,000 4.13% 11/5/2035 350,369 0.01%Cooperatieve Rabobank UA £200,000 4.55% 30/8/2029 348,037 0.01%Koninklijke KPN NV £200,000 5.75% 17/9/2029 343,921 0.01%Cooperatieve Rabobank UA $250,000 5.25% 4/8/2045 335,165 0.01%NXP BV/NXP Funding LLC/NXP USA, Inc. $275,000 4.30% 18/6/2029 315,594 0.01%Shell International Finance BV $250,000 4.55% 12/8/2043 312,051 0.01%ING Groep NV £200,000 3.00% 18/2/2026 299,059 0.01%ABN AMRO Bank NV^ $300,000 1.54% 16/6/2027 298,311 0.01%NN Group NV^ €200,000 4.63% 13/1/2048 282,541 0.01%ING Groep NV €200,000 2.50% 15/11/2030 282,183 0.01%Shell International Finance BV $275,000 0.38% 15/9/2023 275,016 0.01%NN Group NV^ €200,000 4.50% Perpetual 271,296 0.01%ING Groep NV^ £200,000 1.13% 7/12/2028 270,716 0.01%Shell International Finance BV $250,000 2.88% 10/5/2026 270,223 0.01%Cooperatieve Rabobank UA £100,000 5.38% 3/8/2060 269,003 0.01%Heineken NV €200,000 1.75% 17/3/2031 264,991 0.01%Heineken NV €200,000 1.75% 7/5/2040 253,774 0.01%NXP BV/NXP Funding LLC/NXP USA, Inc. $250,000 2.50% 11/5/2031 253,486 0.01%Heineken NV €200,000 1.25% 17/3/2027 251,936 0.01%

605
Vanguard Global Corporate Bond Index Fund
Principal CouponMaturity
DateFair Value
US Dollars ($)% of Total
Net AssetsCooperatieve Rabobank UA^ $250,000 1.34% 24/6/2026 250,902 0.01%Euronext NV €200,000 1.13% 12/6/2029 248,618 0.01%ING Groep NV €200,000 1.13% 14/2/2025 246,748 0.01%Koninklijke DSM NV €200,000 0.75% 28/9/2026 246,030 0.01%ING Groep NV^ €200,000 1.63% 26/9/2029 245,974 0.01%NXP BV/NXP Funding LLC $200,000 5.55% 1/12/2028 245,218 0.01%Shell International Finance BV €200,000 0.75% 15/8/2028 244,978 0.01%LeasePlan Corp. NV €200,000 1.00% 2/5/2023 242,444 0.01%Shell International Finance BV €200,000 0.38% 15/2/2025 241,875 0.01%de Volksbank NV €200,000 0.75% 25/6/2023 241,729 0.01%NN Group NV €200,000 0.88% 13/1/2023 240,728 0.01%Koninklijke DSM NV €200,000 0.63% 23/6/2032 240,329 0.01%Nationale-Nederlanden Bank NV €200,000 0.38% 31/5/2023 239,909 0.01%Euronext NV €200,000 1.50% 17/5/2041 239,860 0.01%LeasePlan Corp. NV €200,000 0.13% 13/9/2023 238,559 0.01%ASML Holding NV €200,000 0.25% 25/2/2030 236,134 0.01%ING Groep NV $200,000 4.55% 2/10/2028 234,731 0.01%CTP NV €200,000 1.25% 21/6/2029 234,439 0.01%ING Groep NV $200,000 4.63% 6/1/2026 227,989 0.01%Cooperatieve Rabobank UA $150,000 5.80% 30/9/2110 226,990 0.01%ING Groep NV $200,000 3.95% 29/3/2027 224,571 0.01%NXP BV/NXP Funding LLC/NXP USA, Inc. $200,000 3.88% 18/6/2026 221,447 0.01%NXP BV/NXP Funding LLC $200,000 4.63% 1/6/2023 214,922 0.01%Shell International Finance BV $200,000 3.40% 12/8/2023 212,482 0.01%EXOR NV €180,000 0.88% 19/1/2031 211,572 0.01%ING Groep NV^ $200,000 4.70% 22/3/2028 211,435 0.01%ABN AMRO Bank NV^ $200,000 4.40% 27/3/2028 210,545 0.01%NXP BV/NXP Funding LLC $200,000 3.88% 1/9/2022 207,467 0.01%Viterra Finance BV $200,000 3.20% 21/4/2031 201,285 0.01%Viterra Finance BV $200,000 2.00% 21/4/2026 200,267 0.01%Aegon NV £100,000 6.13% 15/12/2031 197,902 0.01%Cooperatieve Rabobank UA £100,000 5.25% 14/9/2027 166,276 0.01%Cooperatieve Rabobank UA £100,000 4.63% 23/5/2029 164,490 0.01%Koninklijke KPN NV £100,000 5.00% 18/11/2026 159,775 0.01%Shell International Finance BV $135,000 3.63% 21/8/2042 151,758 0.01%Cooperatieve Rabobank UA £100,000 4.88% 10/1/2023 147,495 0.01%Shell International Finance BV $125,000 3.75% 12/9/2046 141,393 0.01%ASR Nederland NV^ €100,000 5.13% 29/9/2045 140,024 0.01%Cooperatieve Rabobank UA €100,000 4.13% 14/7/2025 139,273 0.01%Heineken NV $125,000 3.50% 29/1/2028 138,123 0.01%ELM BV for Helvetia Schweizerische Versicherungsgesellschaft AG^ €100,000 3.38% 29/9/2047 133,189 0.01%Koninklijke Philips NV $100,000 5.00% 15/3/2042 132,987 0.01%Heineken NV €100,000 2.88% 4/8/2025 132,832 0.01%ASR Nederland NV^ €100,000 3.38% 2/5/2049 132,813 0.01%Achmea BV^ €100,000 6.00% 4/4/2043 130,428 0.01%Akzo Nobel NV €100,000 1.63% 14/4/2030 130,161 0.00%Koninklijke Ahold Delhaize NV €100,000 1.75% 2/4/2027 129,075 0.00%Vesteda Finance BV €100,000 2.00% 10/7/2026 128,973 0.00%Shell International Finance BV €100,000 1.63% 20/1/2027 128,928 0.00%Shell International Finance BV $125,000 2.38% 21/8/2022 127,954 0.00%Koninklijke Philips NV €100,000 1.38% 2/5/2028 127,778 0.00%EXOR NV €100,000 1.75% 18/1/2028 127,621 0.00%Shell International Finance BV €100,000 1.25% 12/5/2028 126,864 0.00%Vesteda Finance BV €100,000 1.50% 24/5/2027 126,764 0.00%Akzo Nobel NV €100,000 1.75% 7/11/2024 126,463 0.00%Koninklijke DSM NV €100,000 2.38% 3/4/2024 126,430 0.00%ING Groep NV^ €100,000 2.50% 15/2/2029 125,382 0.00%Heineken NV €100,000 1.50% 7/12/2024 124,829 0.00%Koninklijke Ahold Delhaize NV €100,000 1.13% 19/3/2026 124,439 0.00%ING Groep NV^ €100,000 3.00% 11/4/2028 124,430 0.00%Heineken NV €100,000 1.00% 4/5/2026 124,247 0.00%ABN AMRO Bank NV^ €100,000 2.88% 18/1/2028 123,655 0.00%Akzo Nobel NV €100,000 2.63% 27/7/2022 122,445 0.00%PostNL NV €100,000 1.00% 21/11/2024 122,269 0.00%ASML Holding NV €100,000 0.63% 7/5/2029 122,263 0.00%ABN AMRO Bank NV €100,000 0.88% 15/1/2024 122,029 0.00%Koninklijke Philips NV €100,000 0.50% 22/5/2026 121,489 0.00%ABN AMRO Bank NV €100,000 0.50% 17/7/2023 120,564 0.00%ING Groep NV^ €100,000 1.00% 13/11/2030 120,177 0.00%Koninklijke Ahold Delhaize NV €100,000 0.25% 26/6/2025 119,830 0.00%de Volksbank NV €100,000 0.01% 16/9/2024 119,317 0.00%

606
Vanguard Global Corporate Bond Index Fund
Principal CouponMaturity
DateFair Value
US Dollars ($)% of Total
Net AssetsCitycon Treasury BV €100,000 1.25% 8/9/2026 118,935 0.00%JDE Peet's NV €100,000 1.13% 16/6/2033 118,933 0.00%Shell International Finance BV £100,000 1.75% 10/9/2052 118,346 0.00%Koninklijke KPN NV €100,000 0.88% 14/12/2032 118,283 0.00%Shell International Finance BV €100,000 0.50% 8/11/2031 117,683 0.00%Shell International Finance BV €100,000 0.88% 8/11/2039 112,220 0.00%Heineken NV $75,000 4.35% 29/3/2047 93,897 0.00%Heineken NV $75,000 4.00% 1/10/2042 88,654 0.00%Shell International Finance BV $80,000 2.38% 7/11/2029 83,143 0.00%Koninklijke KPN NV $50,000 8.38% 1/10/2030 70,798 0.00%Koninklijke Ahold Delhaize NV $22,000 5.70% 1/10/2040 30,142 0.00%NXP BV/NXP Funding LLC $25,000 5.35% 1/3/2026 29,159 0.00%test - - - 64,493,884 2.21%New Zealand 0.10% (2020: 0.13%)ANZ New Zealand Int'l Ltd. $450,000 3.40% 19/3/2024 483,423 0.02%ASB Bank Ltd. NZ($)631,000 1.83% 19/8/2024 447,198 0.02%ANZ New Zealand Int'l Ltd. €300,000 0.38% 17/9/2029 358,955 0.01%Westpac Securities NZ Ltd. CHF300,000 0.38% 5/2/2024 330,971 0.01%BNZ International Funding Ltd. $250,000 3.38% 1/3/2023 262,296 0.01%Bank of New Zealand $250,000 2.00% 21/2/2025 258,548 0.01%ANZ New Zealand Int'l Ltd. $200,000 3.45% 21/1/2028 221,279 0.01%ANZ New Zealand Int'l Ltd. $200,000 2.55% 13/2/2030 208,833 0.01%Chorus Ltd. €100,000 0.88% 5/12/2026 121,833 0.00%BNZ International Funding Ltd. €100,000 0.50% 13/5/2023 120,404 0.00%test - - - 2,813,740 0.10%Norway 0.17% (2020: 0.20%)Santander Consumer Bank A.S.1 €600,000 0.13% 11/9/2024 714,837 0.02%DNB Bank A.S.A €500,000 0.05% 14/11/2023 597,810 0.02%DNB Bank A.S.A^ €500,000 0.25% 23/2/2029 585,001 0.02%DNB Bank A.S.A^ $500,000 1.13% 16/9/2026 496,086 0.02%SpareBank 1 SMN €400,000 0.75% 3/7/2023 484,000 0.02%DNB Bank A.S.A^ €400,000 1.13% 20/3/2028 483,205 0.02%Aker BP A.S.A $360,000 3.75% 15/1/2030 387,770 0.01%Santander Consumer Bank A.S. €300,000 0.13% 14/4/2026 353,957 0.01%Yara International A.S.A $300,000 3.15% 4/6/2030 321,743 0.01%Aker BP A.S.A $200,000 3.00% 15/1/2025 210,171 0.01%DNB Bank A.S.A $200,000 2.15% 2/12/2022 205,176 0.01%Yara International A.S.A $100,000 4.75% 1/6/2028 117,729 0.00%test - - - 4,957,485 0.17%Panama 0.03% (2020: 0.02%)Global Bank Corp.^ $200,000 5.25% 16/4/2029 210,470 0.01%AES Panama Generation Holdings SRL $200,000 4.38% 31/5/2030 209,386 0.01%Banco Latinoamericano de Comercio Exterior SA $200,000 2.38% 14/9/2025 205,038 0.01%ENA Master Trust $200,000 4.00% 19/5/2048 201,950 0.00%test - - - 826,844 0.03%Peru 0.08% (2020: 0.08%)Banco de Credito del Peru $500,000 4.25% 1/4/2023 523,819 0.02%Banco Internacional del Peru SAA Interbank $275,000 3.25% 4/10/2026 280,413 0.01%Banco BBVA Peru SA $250,000 5.00% 26/8/2022 260,631 0.01%Transportadora de Gas del Peru SA $200,000 4.25% 30/4/2028 214,685 0.01%Lima Metro Line 2 Finance Ltd. $200,000 4.35% 5/4/2036 207,158 0.01%Banco de Credito del Peru $200,000 2.70% 11/1/2025 206,212 0.01%Kallpa Generacion SA $200,000 4.13% 16/8/2027 206,016 0.01%Banco de Credito del Peru^ $150,000 3.13% 1/7/2030 149,184 0.00%Banco de Credito del Peru^ $100,000 3.25% 30/9/2031 99,499 0.00%Consorcio Transmantaro SA $50,000 4.38% 7/5/2023 52,251 0.00%test - - - 2,199,868 0.08%Philippines 0.05% (2020: 0.05%)BDO Unibank, Inc. $600,000 2.95% 6/3/2023 621,088 0.02%PLDT, Inc. $300,000 2.50% 23/1/2031 297,884 0.01%Bank of the Philippine Islands $200,000 4.25% 4/9/2023 214,741 0.01%Philippine National Bank $200,000 3.28% 27/9/2024 211,365 0.01%BDO Unibank, Inc. $200,000 2.13% 13/1/2026 205,886 0.00%test - - - 1,550,964 0.05%Poland 0.00% (2020: 0.01%)ORLEN Capital AB €100,000 2.50% 7/6/2023 123,961 0.00%test - - - 123,961 0.00%Portugal 0.12% (2020: 0.24%)EDP Finance BV €700,000 1.63% 26/1/2026 887,866 0.03%EDP Finance BV €500,000 2.00% 22/4/2025 638,003 0.02%EDP Finance BV £350,000 8.63% 4/1/2024 576,428 0.02%EDP-Energias de Portugal SA €400,000 1.63% 15/4/2027 510,036 0.02%

607
Vanguard Global Corporate Bond Index Fund
Principal CouponMaturity
DateFair Value
US Dollars ($)% of Total
Net AssetsBrisa-Concessao Rodoviaria SA €200,000 2.00% 22/3/2023 246,021 0.01%EDP Finance BV $200,000 3.63% 15/7/2024 214,823 0.01%EDP Finance BV $200,000 1.71% 24/1/2028 197,642 0.01%Ren Finance BV €150,000 1.75% 18/1/2028 193,179 0.00%test - - - 3,463,998 0.12%Qatar 0.04% (2020: 0.05%)QIB Sukuk Ltd. $400,000 3.98% 26/3/2024 429,620 0.01%ABQ Finance Ltd. $400,000 1.88% 8/9/2025 400,017 0.01%QIIB Senior Sukuk Ltd. $200,000 4.26% 5/3/2024 215,823 0.01%CBQ Finance Ltd. $200,000 2.00% 15/9/2025 201,642 0.01%test - - - 1,247,102 0.04%Romania 0.02% (2020: 0.03%)NE Property BV €300,000 3.38% 14/7/2027 395,121 0.01%NE Property BV €200,000 1.88% 9/10/2026 243,694 0.01%test - - - 638,815 0.02%Russia 0.13% (2020: 0.13%)Lukoil International Finance BV $600,000 4.56% 24/4/2023 636,083 0.02%MMC Norilsk Nickel OJSC Via MMC Finance DAC $400,000 6.63% 14/10/2022 427,250 0.01%Lukoil Securities BV $400,000 3.88% 6/5/2030 424,103 0.01%Sibur Securities DAC $400,000 3.45% 23/9/2024 417,411 0.01%MMC Norilsk Nickel OJSC Via MMC Finance DAC $400,000 3.38% 28/10/2024 417,034 0.01%Lukoil International Finance BV $200,000 4.75% 2/11/2026 225,302 0.01%Novolipetsk Steel Via Steel Funding DAC $200,000 4.70% 30/5/2026 222,085 0.01%ALROSA Finance SA $200,000 4.65% 9/4/2024 216,140 0.01%Severstal OAO Via Steel Capital SA $200,000 5.90% 17/10/2022 212,240 0.01%Novatek OAO Via Novatek Finance DAC $200,000 4.42% 13/12/2022 209,557 0.01%Severstal OAO Via Steel Capital SA $200,000 3.15% 16/9/2024 208,599 0.01%Phosagro OAO Via Phosagro Bond Funding DAC $200,000 3.95% 24/4/2023 208,238 0.01%test - - - 3,824,042 0.13%Saudi Arabia 0.05% (2020: 0.05%)Riyad Bank^ $500,000 3.17% 25/2/2030 511,314 0.02%Acwa Power Management & Investments One Ltd. $199,786 5.95% 15/12/2039 238,468 0.01%Almarai Sukuk Ltd. $200,000 4.31% 5/3/2024 216,097 0.01%Samba Funding Ltd. $200,000 2.90% 29/1/2027 209,039 0.01%Samba Funding Ltd. $200,000 2.75% 2/10/2024 208,999 0.00%Arab National Bank^ $200,000 3.33% 28/10/2030 206,316 0.00%test - - - 1,590,233 0.05%Singapore 0.11% (2020: 0.11%)DBS Group Holdings Ltd.^ €500,000 1.50% 11/4/2028 608,915 0.02%Oversea-Chinese Banking Corp., Ltd. $500,000 4.25% 19/6/2024 545,222 0.02%GLP Pte Ltd. $400,000 3.88% 4/6/2025 423,411 0.01%NTUC Income Insurance Co.-Operative Ltd.^ SG($)500,000 3.10% 20/7/2050 393,210 0.01%Oversea-Chinese Banking Corp., Ltd.^ SG($)500,000 4.00% Perpetual 389,080 0.01%United Overseas Bank Ltd.^ $200,000 3.75% 15/4/2029 212,955 0.01%DBS Group Holdings Ltd.^ $200,000 3.30% Perpetual 205,957 0.01%United Overseas Bank Ltd.^ $200,000 3.50% 16/9/2026 200,987 0.01%United Overseas Bank Ltd.^ $200,000 1.75% 16/3/2031 198,703 0.01%test - - - 3,178,440 0.11%South Africa 0.07% (2020: 0.09%)Anglo American Capital plc $500,000 2.63% 10/9/2030 500,727 0.02%Anglo American Capital plc $300,000 4.00% 11/9/2027 332,611 0.01%Anglo American Capital plc $200,000 4.50% 15/3/2028 228,797 0.01%AngloGold Ashanti Holdings plc $200,000 3.75% 1/10/2030 207,631 0.01%Anglo American Capital plc $200,000 2.88% 17/3/2031 204,682 0.01%Anglo American Capital plc £119,000 3.38% 11/3/2029 179,786 0.01%Anglo American Capital plc €100,000 1.63% 18/9/2025 125,888 0.00%Anglo American Capital plc €100,000 1.63% 11/3/2026 125,727 0.00%Anglo American Capital plc $100,000 4.75% 10/4/2027 115,118 0.00%test - - - 2,020,967 0.07%South Korea 0.44% (2020: 0.34%)Shinhan Bank Co., Ltd. ₩1,500,000,000 1.34% 27/8/2022 1,335,372 0.04%Hyundai Capital America $500,000 5.75% 6/4/2023 543,064 0.02%SK Hynix, Inc. $500,000 3.00% 17/9/2024 528,184 0.02%Hyundai Capital America $500,000 2.38% 10/2/2023 512,713 0.02%Hyundai Capital America $500,000 1.80% 15/10/2025 506,704 0.02%Shinhan Financial Group Co., Ltd.^ $400,000 5.88% Perpetual 430,117 0.01%LG Chem Ltd. $400,000 3.25% 15/10/2024 429,620 0.01%Shinhan Bank Co., Ltd. $400,000 3.88% 5/11/2023 429,457 0.01%Hyundai Capital America $400,000 1.30% 8/1/2026 394,925 0.01%Kookmin Bank $350,000 2.88% 25/3/2023 363,374 0.01%Hyundai Capital America $340,000 3.00% 10/2/2027 359,928 0.01%SK Battery America, Inc. $300,000 1.63% 26/1/2024 300,476 0.01%

608
Vanguard Global Corporate Bond Index Fund
Principal CouponMaturity
DateFair Value
US Dollars ($)% of Total
Net AssetsKookmin Bank $300,000 2.50% 4/11/2030 299,778 0.01%Hyundai Capital America $200,000 6.38% 8/4/2030 259,339 0.01%Heungkuk Life Insurance Co., Ltd.^ $250,000 4.48% Perpetual 253,570 0.01%Woori Bank $200,000 5.13% 6/8/2028 235,981 0.01%Hyundai Capital Services, Inc. $200,000 3.63% 29/8/2027 219,790 0.01%Woori Bank $200,000 4.75% 30/4/2024 219,643 0.01%Hana Bank $200,000 4.25% 14/10/2024 219,617 0.01%Shinhan Bank Co., Ltd. $200,000 3.75% 20/9/2027 219,473 0.01%Hyundai Capital America $200,000 3.50% 2/11/2026 216,485 0.01%Daegu Bank Ltd. $200,000 3.75% 13/8/2023 211,851 0.01%Mirae Asset Securities Co., Ltd. $200,000 3.38% 7/5/2024 211,294 0.01%GS Caltex Corp. $200,000 3.00% 4/6/2024 211,144 0.01%SK Telecom Co., Ltd. $200,000 3.75% 16/4/2023 210,684 0.01%KT Corp. $200,000 2.50% 18/7/2026 209,796 0.01%Hyundai Capital Services, Inc. $200,000 3.75% 5/3/2023 209,753 0.01%Hanwha Life Insurance Co., Ltd.^ $200,000 4.70% Perpetual 208,385 0.01%Kia Corp. $200,000 3.00% 25/4/2023 208,042 0.01%Hankook Tire & Technology Co., Ltd. $200,000 3.50% 30/1/2023 207,931 0.01%POSCO $200,000 2.50% 17/1/2025 207,494 0.01%POSCO $200,000 2.38% 17/1/2023 204,766 0.01%Hyundai Capital Services, Inc. $200,000 3.00% 6/3/2022 203,083 0.01%Shinhan Bank Co., Ltd.^ $200,000 3.88% 7/12/2026 202,333 0.01%Hyundai Capital America $200,000 1.25% 18/9/2023 201,798 0.01%Hyundai Capital America $200,000 0.88% 14/6/2024 199,102 0.01%Hyundai Capital America $200,000 1.50% 15/6/2026 198,428 0.01%Hyundai Capital America $200,000 2.00% 15/6/2028 198,312 0.00%SK Hynix, Inc. $200,000 1.50% 19/1/2026 197,721 0.00%SK Hynix, Inc. $200,000 2.38% 19/1/2031 195,450 0.00%Hyundai Capital America $150,000 2.65% 10/2/2025 156,554 0.00%Hyundai Capital America $125,000 2.75% 27/9/2026 130,650 0.00%SK Telecom Co., Ltd. $100,000 6.63% 20/7/2027 127,552 0.00%LG Chem Ltd. €100,000 0.50% 15/4/2023 119,686 0.00%test - - - 12,709,419 0.44%Spain 1.64% (2020: 1.67%)Iberdrola International BV^ €1,300,000 1.45% Perpetual 1,555,892 0.05%Telefonica Emisiones SA €1,200,000 1.07% 5/2/2024 1,464,948 0.05%Telefonica Emisiones SA $1,275,000 4.10% 8/3/2027 1,435,246 0.05%Iberdrola International BV €1,000,000 1.13% 27/1/2023 1,213,079 0.04%Banco Bilbao Vizcaya Argentaria SA €1,000,000 0.75% 11/9/2022 1,201,592 0.04%Iberdrola International BV^ €900,000 1.87% Perpetual 1,100,812 0.04%Redexis Gas Finance BV €800,000 1.88% 27/4/2027 1,018,761 0.04%Telefonica Emisiones SA €700,000 1.72% 12/1/2028 906,484 0.03%Repsol International Finance BV €700,000 2.00% 15/12/2025 899,865 0.03%Red Electrica Corp. SA €700,000 0.88% 14/4/2025 859,618 0.03%Banco Bilbao Vizcaya Argentaria SA €700,000 1.13% 28/2/2024 856,645 0.03%Telefonica Emisiones SA €600,000 1.79% 12/3/2029 785,887 0.03%Banco Santander SA €600,000 1.38% 5/1/2026 745,933 0.03%Criteria Caixa SA €600,000 1.50% 10/5/2023 732,282 0.03%CaixaBank SA €600,000 1.13% 12/1/2023 725,774 0.03%Santander Consumer Finance SA €600,000 0.38% 17/1/2025 720,084 0.03%Merlin Properties Socimi SA €600,000 1.38% 1/6/2030 706,195 0.02%Telefonica Emisiones SA $550,000 5.21% 8/3/2047 688,555 0.02%Telefonica Emisiones SA €500,000 3.99% 23/1/2023 633,158 0.02%Banco Santander SA $600,000 2.71% 27/6/2024 631,576 0.02%IE2 Holdco SAU €500,000 2.38% 27/11/2023 622,634 0.02%CaixaBank SA €500,000 1.75% 24/10/2023 617,664 0.02%Naturgy Capital Markets SA €500,000 1.13% 11/4/2024 611,277 0.02%Santander Consumer Finance SA €500,000 1.13% 9/10/2023 610,838 0.02%Banco Santander SA €500,000 1.38% 14/12/2022 607,416 0.02%Banco Bilbao Vizcaya Argentaria SA $600,000 0.88% 18/9/2023 601,968 0.02%Banco Santander SA €500,000 0.30% 4/10/2026 597,517 0.02%CaixaBank SA^ €500,000 1.25% 18/6/2031 596,974 0.02%Banco Bilbao Vizcaya Argentaria SA^ €500,000 0.13% 24/3/2027 591,953 0.02%Banco Santander SA £400,000 2.75% 12/9/2023 576,739 0.02%Telefonica Emisiones SA $450,000 4.90% 6/3/2048 538,205 0.02%Telefonica Emisiones SA $500,000 4.57% 27/4/2023 535,490 0.02%Abertis Infraestructuras SA €400,000 2.38% 27/9/2027 523,110 0.02%Merlin Properties Socimi SA €400,000 2.38% 13/7/2027 517,636 0.02%Banco Santander SA €400,000 2.50% 18/3/2025 513,319 0.02%Iberdrola Finanzas SA €400,000 1.25% 13/9/2027 509,887 0.02%Abertis Infraestructuras SA €400,000 1.13% 26/3/2028 484,639 0.02%
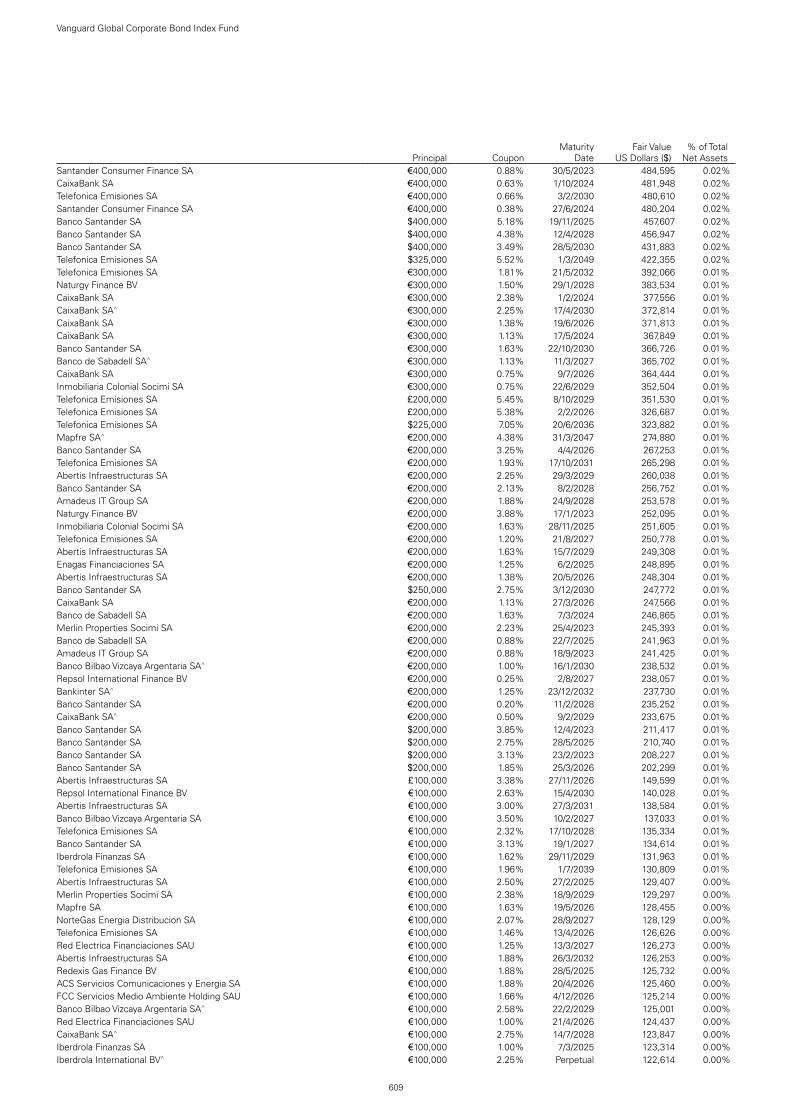
609
Vanguard Global Corporate Bond Index Fund
Principal CouponMaturity
DateFair Value
US Dollars ($)% of Total
Net AssetsSantander Consumer Finance SA €400,000 0.88% 30/5/2023 484,595 0.02%CaixaBank SA €400,000 0.63% 1/10/2024 481,948 0.02%Telefonica Emisiones SA €400,000 0.66% 3/2/2030 480,610 0.02%Santander Consumer Finance SA €400,000 0.38% 27/6/2024 480,204 0.02%Banco Santander SA $400,000 5.18% 19/11/2025 457,607 0.02%Banco Santander SA $400,000 4.38% 12/4/2028 456,947 0.02%Banco Santander SA $400,000 3.49% 28/5/2030 431,883 0.02%Telefonica Emisiones SA $325,000 5.52% 1/3/2049 422,355 0.02%Telefonica Emisiones SA €300,000 1.81% 21/5/2032 392,066 0.01%Naturgy Finance BV €300,000 1.50% 29/1/2028 383,534 0.01%CaixaBank SA €300,000 2.38% 1/2/2024 377,556 0.01%CaixaBank SA^ €300,000 2.25% 17/4/2030 372,814 0.01%CaixaBank SA €300,000 1.38% 19/6/2026 371,813 0.01%CaixaBank SA €300,000 1.13% 17/5/2024 367,849 0.01%Banco Santander SA €300,000 1.63% 22/10/2030 366,726 0.01%Banco de Sabadell SA^ €300,000 1.13% 11/3/2027 365,702 0.01%CaixaBank SA €300,000 0.75% 9/7/2026 364,444 0.01%Inmobiliaria Colonial Socimi SA €300,000 0.75% 22/6/2029 352,504 0.01%Telefonica Emisiones SA £200,000 5.45% 8/10/2029 351,530 0.01%Telefonica Emisiones SA £200,000 5.38% 2/2/2026 326,687 0.01%Telefonica Emisiones SA $225,000 7.05% 20/6/2036 323,882 0.01%Mapfre SA^ €200,000 4.38% 31/3/2047 274,880 0.01%Banco Santander SA €200,000 3.25% 4/4/2026 267,253 0.01%Telefonica Emisiones SA €200,000 1.93% 17/10/2031 265,298 0.01%Abertis Infraestructuras SA €200,000 2.25% 29/3/2029 260,038 0.01%Banco Santander SA €200,000 2.13% 8/2/2028 256,752 0.01%Amadeus IT Group SA €200,000 1.88% 24/9/2028 253,578 0.01%Naturgy Finance BV €200,000 3.88% 17/1/2023 252,095 0.01%Inmobiliaria Colonial Socimi SA €200,000 1.63% 28/11/2025 251,605 0.01%Telefonica Emisiones SA €200,000 1.20% 21/8/2027 250,778 0.01%Abertis Infraestructuras SA €200,000 1.63% 15/7/2029 249,308 0.01%Enagas Financiaciones SA €200,000 1.25% 6/2/2025 248,895 0.01%Abertis Infraestructuras SA €200,000 1.38% 20/5/2026 248,304 0.01%Banco Santander SA $250,000 2.75% 3/12/2030 247,772 0.01%CaixaBank SA €200,000 1.13% 27/3/2026 247,566 0.01%Banco de Sabadell SA €200,000 1.63% 7/3/2024 246,865 0.01%Merlin Properties Socimi SA €200,000 2.23% 25/4/2023 245,393 0.01%Banco de Sabadell SA €200,000 0.88% 22/7/2025 241,963 0.01%Amadeus IT Group SA €200,000 0.88% 18/9/2023 241,425 0.01%Banco Bilbao Vizcaya Argentaria SA^ €200,000 1.00% 16/1/2030 238,532 0.01%Repsol International Finance BV €200,000 0.25% 2/8/2027 238,057 0.01%Bankinter SA^ €200,000 1.25% 23/12/2032 237,730 0.01%Banco Santander SA €200,000 0.20% 11/2/2028 235,252 0.01%CaixaBank SA^ €200,000 0.50% 9/2/2029 233,675 0.01%Banco Santander SA $200,000 3.85% 12/4/2023 211,417 0.01%Banco Santander SA $200,000 2.75% 28/5/2025 210,740 0.01%Banco Santander SA $200,000 3.13% 23/2/2023 208,227 0.01%Banco Santander SA $200,000 1.85% 25/3/2026 202,299 0.01%Abertis Infraestructuras SA £100,000 3.38% 27/11/2026 149,599 0.01%Repsol International Finance BV €100,000 2.63% 15/4/2030 140,028 0.01%Abertis Infraestructuras SA €100,000 3.00% 27/3/2031 138,584 0.01%Banco Bilbao Vizcaya Argentaria SA €100,000 3.50% 10/2/2027 137,033 0.01%Telefonica Emisiones SA €100,000 2.32% 17/10/2028 135,334 0.01%Banco Santander SA €100,000 3.13% 19/1/2027 134,614 0.01%Iberdrola Finanzas SA €100,000 1.62% 29/11/2029 131,963 0.01%Telefonica Emisiones SA €100,000 1.96% 1/7/2039 130,809 0.01%Abertis Infraestructuras SA €100,000 2.50% 27/2/2025 129,407 0.00%Merlin Properties Socimi SA €100,000 2.38% 18/9/2029 129,297 0.00%Mapfre SA €100,000 1.63% 19/5/2026 128,455 0.00%NorteGas Energia Distribucion SA €100,000 2.07% 28/9/2027 128,129 0.00%Telefonica Emisiones SA €100,000 1.46% 13/4/2026 126,626 0.00%Red Electrica Financiaciones SAU €100,000 1.25% 13/3/2027 126,273 0.00%Abertis Infraestructuras SA €100,000 1.88% 26/3/2032 126,253 0.00%Redexis Gas Finance BV €100,000 1.88% 28/5/2025 125,732 0.00%ACS Servicios Comunicaciones y Energia SA €100,000 1.88% 20/4/2026 125,460 0.00%FCC Servicios Medio Ambiente Holding SAU €100,000 1.66% 4/12/2026 125,214 0.00%Banco Bilbao Vizcaya Argentaria SA^ €100,000 2.58% 22/2/2029 125,001 0.00%Red Electrica Financiaciones SAU €100,000 1.00% 21/4/2026 124,437 0.00%CaixaBank SA^ €100,000 2.75% 14/7/2028 123,847 0.00%Iberdrola Finanzas SA €100,000 1.00% 7/3/2025 123,314 0.00%Iberdrola International BV^ €100,000 2.25% Perpetual 122,614 0.00%

610
Vanguard Global Corporate Bond Index Fund
Principal CouponMaturity
DateFair Value
US Dollars ($)% of Total
Net AssetsCaixaBank SA €100,000 1.13% 12/11/2026 122,449 0.00%Banco Bilbao Vizcaya Argentaria SA €100,000 0.75% 4/6/2025 122,169 0.00%Santander Consumer Finance SA €100,000 1.00% 27/2/2024 122,036 0.00%Iberdrola International BV^ €100,000 1.88% Perpetual 121,652 0.00%FCC Servicios Medio Ambiente Holding SAU €100,000 0.82% 4/12/2023 120,578 0.00%Red Electrica Financiaciones SAU €100,000 0.38% 24/7/2028 120,560 0.00%Santander Consumer Finance SA €100,000 0.50% 14/11/2026 120,291 0.00%Banco de Sabadell SA^ €100,000 0.63% 7/11/2025 119,564 0.00%Iberdrola International BV^ €100,000 1.83% Perpetual 119,183 0.00%Merlin Properties Socimi SA €100,000 1.88% 4/12/2034 117,420 0.00%NorteGas Energia Distribucion SA €100,000 0.91% 22/1/2031 117,078 0.00%Iberdrola International BV $50,000 6.75% 15/7/2036 75,872 0.00%Iberdrola Finanzas SA £50,000 6.00% 1/7/2022 72,850 0.00%test - - - 47,978,330 1.64%Sweden 0.67% (2020: 0.59%)Swedbank AB €800,000 0.20% 12/1/2028 932,935 0.03%Akelius Residential Property AB £600,000 2.38% 15/8/2025 866,984 0.03%Svenska Handelsbanken AB €500,000 0.13% 18/6/2024 599,626 0.02%Lansforsakringar Bank AB €500,000 0.05% 15/4/2026 590,668 0.02%Essity AB €500,000 0.25% 8/2/2031 574,869 0.02%Telia Co. AB €500,000 0.13% 27/11/2030 569,981 0.02%Swedbank AB $500,000 1.30% 2/6/2023 507,700 0.02%Akelius Residential Property AB €400,000 1.75% 7/2/2025 500,166 0.02%Skandinaviska Enskilda Banken AB $500,000 0.55% 1/9/2023 500,123 0.02%Swedbank AB €400,000 0.75% 5/5/2025 489,444 0.02%Akelius Residential Property Financing BV €400,000 1.13% 11/1/2029 486,279 0.02%Balder Finland OYJ €400,000 1.38% 24/5/2030 473,548 0.02%SBB Treasury OYJ €400,000 1.13% 26/11/2029 472,472 0.02%SBB Treasury OYJ €400,000 0.75% 14/12/2028 464,766 0.02%Svenska Handelsbanken AB €310,000 1.00% 15/4/2025 384,109 0.01%Swedbank AB^ €320,000 0.30% 20/5/2027 379,658 0.01%Svenska Handelsbanken AB^ €300,000 1.63% 5/3/2029 369,534 0.01%Heimstaden Bostad Treasury BV €300,000 1.38% 3/3/2027 368,549 0.01%Scania CV AB €300,000 0.13% 13/2/2023 356,930 0.01%Sagax Euro Mtn NL BV €300,000 1.00% 17/5/2029 354,413 0.01%Balder Finland OYJ €300,000 1.00% 20/1/2029 350,301 0.01%Akelius Residential Property Financing BV €300,000 0.75% 22/2/2030 349,788 0.01%Telia Co. AB €200,000 3.88% 1/10/2025 276,516 0.01%Telia Co. AB €200,000 2.13% 20/2/2034 273,081 0.01%Svenska Handelsbanken AB $250,000 3.90% 20/11/2023 270,894 0.01%Investor AB €200,000 1.50% 20/6/2039 261,254 0.01%Telia Co. AB €200,000 3.63% 14/2/2024 260,830 0.01%EQT AB €220,000 0.88% 14/5/2031 258,840 0.01%Skandinaviska Enskilda Banken AB $250,000 2.20% 12/12/2022 256,667 0.01%Svenska Handelsbanken AB $250,000 0.63% 30/6/2023 251,133 0.01%Svenska Handelsbanken AB^ $250,000 1.42% 11/6/2027 249,251 0.01%Svenska Handelsbanken AB $250,000 0.55% 11/6/2024 248,926 0.01%Tele2 AB €200,000 1.13% 15/5/2024 244,400 0.01%Heimstaden Bostad AB €200,000 1.13% 21/1/2026 243,750 0.01%Skandinaviska Enskilda Banken AB^ €200,000 1.38% 31/10/2028 243,727 0.01%Akelius Residential Property AB €200,000 1.13% 14/3/2024 243,711 0.01%Samhallsbyggnadsbolaget i Norden AB €200,000 1.13% 4/9/2026 243,167 0.01%Lansforsakringar Bank AB €200,000 0.88% 25/9/2023 243,044 0.01%Akelius Residential Property Financing BV €200,000 1.00% 17/1/2028 242,327 0.01%Skandinaviska Enskilda Banken AB €200,000 0.63% 12/11/2029 240,965 0.01%Swedbank AB^ €200,000 1.00% 22/11/2027 240,035 0.01%Samhallsbyggnadsbolaget i Norden AB €200,000 1.00% 12/8/2027 239,627 0.01%Skandinaviska Enskilda Banken AB €200,000 0.05% 1/7/2024 239,237 0.01%Telefonaktiebolaget LM Ericsson €200,000 1.00% 26/5/2029 238,860 0.01%Castellum AB €200,000 0.75% 4/9/2026 238,490 0.01%Essity AB €200,000 0.50% 3/2/2030 237,546 0.01%Securitas AB €200,000 0.25% 22/2/2028 233,112 0.01%H&M Finance BV €200,000 0.25% 25/8/2029 232,340 0.01%Swedbank AB $200,000 0.60% 25/9/2023 200,305 0.01%Svenska Handelsbanken AB €150,000 1.13% 14/12/2022 182,011 0.01%Svenska Handelsbanken AB £100,000 1.63% 15/12/2023 142,003 0.01%Swedbank AB £100,000 1.63% 28/12/2022 140,672 0.00%Tele2 AB €100,000 2.13% 15/5/2028 130,794 0.00%Molnlycke Holding AB €100,000 1.88% 28/2/2025 126,077 0.00%Fastighets AB Balder €100,000 1.88% 23/1/2026 125,132 0.00%Fastighets AB Balder €100,000 1.88% 14/3/2025 124,635 0.00%
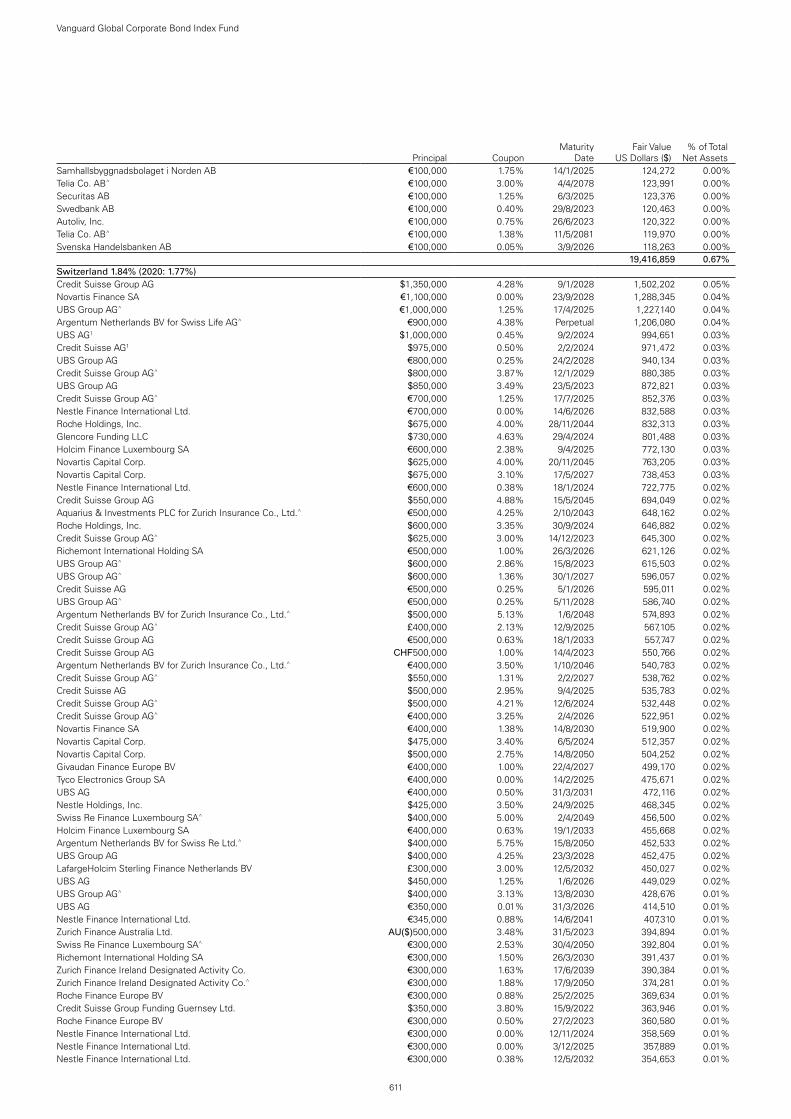
611
Vanguard Global Corporate Bond Index Fund
Principal CouponMaturity
DateFair Value
US Dollars ($)% of Total
Net AssetsSamhallsbyggnadsbolaget i Norden AB €100,000 1.75% 14/1/2025 124,272 0.00%Telia Co. AB^ €100,000 3.00% 4/4/2078 123,991 0.00%Securitas AB €100,000 1.25% 6/3/2025 123,376 0.00%Swedbank AB €100,000 0.40% 29/8/2023 120,463 0.00%Autoliv, Inc. €100,000 0.75% 26/6/2023 120,322 0.00%Telia Co. AB^ €100,000 1.38% 11/5/2081 119,970 0.00%Svenska Handelsbanken AB €100,000 0.05% 3/9/2026 118,263 0.00%test - - - 19,416,859 0.67%Switzerland 1.84% (2020: 1.77%)Credit Suisse Group AG $1,350,000 4.28% 9/1/2028 1,502,202 0.05%Novartis Finance SA €1,100,000 0.00% 23/9/2028 1,288,345 0.04%UBS Group AG^ €1,000,000 1.25% 17/4/2025 1,227,140 0.04%Argentum Netherlands BV for Swiss Life AG^ €900,000 4.38% Perpetual 1,206,080 0.04%UBS AG1 $1,000,000 0.45% 9/2/2024 994,651 0.03%Credit Suisse AG1 $975,000 0.50% 2/2/2024 971,472 0.03%UBS Group AG €800,000 0.25% 24/2/2028 940,134 0.03%Credit Suisse Group AG^ $800,000 3.87% 12/1/2029 880,385 0.03%UBS Group AG $850,000 3.49% 23/5/2023 872,821 0.03%Credit Suisse Group AG^ €700,000 1.25% 17/7/2025 852,376 0.03%Nestle Finance International Ltd. €700,000 0.00% 14/6/2026 832,588 0.03%Roche Holdings, Inc. $675,000 4.00% 28/11/2044 832,313 0.03%Glencore Funding LLC $730,000 4.63% 29/4/2024 801,488 0.03%Holcim Finance Luxembourg SA €600,000 2.38% 9/4/2025 772,130 0.03%Novartis Capital Corp. $625,000 4.00% 20/11/2045 763,205 0.03%Novartis Capital Corp. $675,000 3.10% 17/5/2027 738,453 0.03%Nestle Finance International Ltd. €600,000 0.38% 18/1/2024 722,775 0.02%Credit Suisse Group AG $550,000 4.88% 15/5/2045 694,049 0.02%Aquarius & Investments PLC for Zurich Insurance Co., Ltd.^ €500,000 4.25% 2/10/2043 648,162 0.02%Roche Holdings, Inc. $600,000 3.35% 30/9/2024 646,882 0.02%Credit Suisse Group AG^ $625,000 3.00% 14/12/2023 645,300 0.02%Richemont International Holding SA €500,000 1.00% 26/3/2026 621,126 0.02%UBS Group AG^ $600,000 2.86% 15/8/2023 615,503 0.02%UBS Group AG^ $600,000 1.36% 30/1/2027 596,057 0.02%Credit Suisse AG €500,000 0.25% 5/1/2026 595,011 0.02%UBS Group AG^ €500,000 0.25% 5/11/2028 586,740 0.02%Argentum Netherlands BV for Zurich Insurance Co., Ltd.^ $500,000 5.13% 1/6/2048 574,893 0.02%Credit Suisse Group AG^ £400,000 2.13% 12/9/2025 567,105 0.02%Credit Suisse Group AG €500,000 0.63% 18/1/2033 557,747 0.02%Credit Suisse Group AG CHF500,000 1.00% 14/4/2023 550,766 0.02%Argentum Netherlands BV for Zurich Insurance Co., Ltd.^ €400,000 3.50% 1/10/2046 540,783 0.02%Credit Suisse Group AG^ $550,000 1.31% 2/2/2027 538,762 0.02%Credit Suisse AG $500,000 2.95% 9/4/2025 535,783 0.02%Credit Suisse Group AG^ $500,000 4.21% 12/6/2024 532,448 0.02%Credit Suisse Group AG^ €400,000 3.25% 2/4/2026 522,951 0.02%Novartis Finance SA €400,000 1.38% 14/8/2030 519,900 0.02%Novartis Capital Corp. $475,000 3.40% 6/5/2024 512,357 0.02%Novartis Capital Corp. $500,000 2.75% 14/8/2050 504,252 0.02%Givaudan Finance Europe BV €400,000 1.00% 22/4/2027 499,170 0.02%Tyco Electronics Group SA €400,000 0.00% 14/2/2025 475,671 0.02%UBS AG €400,000 0.50% 31/3/2031 472,116 0.02%Nestle Holdings, Inc. $425,000 3.50% 24/9/2025 468,345 0.02%Swiss Re Finance Luxembourg SA^ $400,000 5.00% 2/4/2049 456,500 0.02%Holcim Finance Luxembourg SA €400,000 0.63% 19/1/2033 455,668 0.02%Argentum Netherlands BV for Swiss Re Ltd.^ $400,000 5.75% 15/8/2050 452,533 0.02%UBS Group AG $400,000 4.25% 23/3/2028 452,475 0.02%LafargeHolcim Sterling Finance Netherlands BV £300,000 3.00% 12/5/2032 450,027 0.02%UBS AG $450,000 1.25% 1/6/2026 449,029 0.02%UBS Group AG^ $400,000 3.13% 13/8/2030 428,676 0.01%UBS AG €350,000 0.01% 31/3/2026 414,510 0.01%Nestle Finance International Ltd. €345,000 0.88% 14/6/2041 407,310 0.01%Zurich Finance Australia Ltd. AU($)500,000 3.48% 31/5/2023 394,894 0.01%Swiss Re Finance Luxembourg SA^ €300,000 2.53% 30/4/2050 392,804 0.01%Richemont International Holding SA €300,000 1.50% 26/3/2030 391,437 0.01%Zurich Finance Ireland Designated Activity Co. €300,000 1.63% 17/6/2039 390,384 0.01%Zurich Finance Ireland Designated Activity Co.^ €300,000 1.88% 17/9/2050 374,281 0.01%Roche Finance Europe BV €300,000 0.88% 25/2/2025 369,634 0.01%Credit Suisse Group Funding Guernsey Ltd. $350,000 3.80% 15/9/2022 363,946 0.01%Roche Finance Europe BV €300,000 0.50% 27/2/2023 360,580 0.01%Nestle Finance International Ltd. €300,000 0.00% 12/11/2024 358,569 0.01%Nestle Finance International Ltd. €300,000 0.00% 3/12/2025 357,889 0.01%Nestle Finance International Ltd. €300,000 0.38% 12/5/2032 354,653 0.01%

612
Vanguard Global Corporate Bond Index Fund
Principal CouponMaturity
DateFair Value
US Dollars ($)% of Total
Net AssetsUBS Group AG €300,000 0.63% 24/2/2033 350,078 0.01%Tyco Electronics Group SA €300,000 0.00% 16/2/2029 344,569 0.01%UBS Group AG $300,000 4.13% 15/4/2026 336,246 0.01%UBS Group AG $300,000 4.13% 24/9/2025 334,484 0.01%Holcim Finance Luxembourg SA €250,000 2.25% 26/5/2028 332,807 0.01%Nestle Finance International Ltd. €300,000 0.38% 3/12/2040 327,943 0.01%LafargeHolcim Finance US LLC $300,000 3.50% 22/9/2026 327,299 0.01%Tyco Electronics Group SA $285,000 3.70% 15/2/2026 312,520 0.01%Credit Suisse Group AG^ $300,000 2.59% 11/9/2025 312,209 0.01%UBS AG $300,000 0.38% 1/6/2023 299,580 0.01%Tyco Electronics Group SA $275,000 3.13% 15/8/2027 296,660 0.01%Credit Suisse Group AG $250,000 4.55% 17/4/2026 282,921 0.01%Nestle Finance International Ltd. €200,000 1.75% 2/11/2037 276,570 0.01%Glencore Funding LLC $260,000 4.13% 30/5/2023 276,535 0.01%Richemont International Holding SA €200,000 2.00% 26/3/2038 274,131 0.01%Credit Suisse AG $250,000 3.63% 9/9/2024 271,497 0.01%Credit Suisse Group AG $250,000 3.75% 26/3/2025 271,152 0.01%Credit Suisse Group AG $250,000 3.80% 9/6/2023 264,759 0.01%UBS AG $200,000 4.50% 26/6/2048 261,578 0.01%Firmenich Productions Participations SAS €200,000 1.75% 30/4/2030 261,361 0.01%Coca-Cola HBC Finance BV €200,000 1.63% 14/5/2031 260,863 0.01%Sika Capital BV €200,000 1.50% 29/4/2031 259,947 0.01%Adecco International Financial Services BV €200,000 1.25% 20/11/2029 254,774 0.01%Novartis Finance SA €200,000 1.13% 30/9/2027 252,647 0.01%Richemont International Holding SA €200,000 0.75% 26/5/2028 246,751 0.01%UBS Group AG €200,000 1.50% 30/11/2024 246,198 0.01%UBS Group AG €200,000 1.75% 16/11/2022 244,015 0.01%ABB Finance BV €200,000 0.75% 16/5/2024 242,886 0.01%Credit Suisse Group AG^ €200,000 1.00% 24/6/2027 241,984 0.01%UBS AG €200,000 0.75% 21/4/2023 241,573 0.01%Novartis Finance SA €200,000 0.50% 14/8/2023 241,014 0.01%UBS Group AG^ €200,000 0.25% 29/1/2026 238,110 0.01%Holcim Finance Luxembourg SA €200,000 0.50% 23/4/2031 231,971 0.01%Cloverie plc for Zurich Insurance Co., Ltd.^ $200,000 5.63% 24/6/2046 231,801 0.01%ABB Finance BV €200,000 0.00% 19/1/2030 229,497 0.01%Novartis Capital Corp. $175,000 4.40% 6/5/2044 224,266 0.01%Zurich Finance Ireland Designated Activity Co.^ $225,000 3.00% 19/4/2051 223,042 0.01%Roche Holdings, Inc. $200,000 2.63% 15/5/2026 213,568 0.01%Alcon Finance Corp. $200,000 2.75% 23/9/2026 211,723 0.01%Swiss Re Finance Luxembourg SA^ $200,000 4.25% Perpetual 211,416 0.01%Alcon Finance Corp. $200,000 3.00% 23/9/2029 210,749 0.01%Roche Holdings, Inc. $200,000 2.38% 28/1/2027 210,717 0.01%Glencore Funding LLC $200,000 3.00% 27/10/2022 205,809 0.01%Roche Holdings, Inc. $200,000 0.45% 5/3/2024 199,470 0.01%Roche Holdings, Inc. $200,000 0.99% 5/3/2026 199,328 0.01%Swiss Re Treasury US Corp. $150,000 4.25% 6/12/2042 182,325 0.01%Novartis Capital Corp. $175,000 2.00% 14/2/2027 181,973 0.01%Novartis Capital Corp. $175,000 1.75% 14/2/2025 180,625 0.01%Glencore Finance Canada Ltd. $125,000 6.00% 15/11/2041 165,608 0.01%Credit Suisse Group AG £110,000 2.25% 9/6/2028 156,038 0.01%Tyco Electronics Group SA $100,000 7.13% 1/10/2037 153,106 0.01%UBS Group AG^ $150,000 2.10% 11/2/2032 146,778 0.01%Credit Suisse USA, Inc. $100,000 7.13% 15/7/2032 144,975 0.01%Novartis Finance SA €100,000 1.70% 14/8/2038 136,500 0.00%Argentum Netherlands BV for Givaudan SA €100,000 2.00% 17/9/2030 135,493 0.00%Glencore Finance Canada Ltd. $105,000 5.55% 25/10/2042 135,012 0.00%Argentum Netherlands BV for Zurich Insurance Co., Ltd.^ €100,000 2.75% 19/2/2049 132,945 0.00%Givaudan Finance Europe BV €100,000 1.63% 22/4/2032 131,854 0.00%Nestle Finance International Ltd. €100,000 1.50% 1/4/2030 131,371 0.00%Swiss Re Finance UK plc^ €100,000 2.71% 4/6/2052 130,584 0.00%Holcim Finance Luxembourg SA €100,000 1.75% 29/8/2029 129,806 0.00%Richemont International Holding SA €100,000 1.63% 26/5/2040 129,640 0.00%Nestle Finance International Ltd. €100,000 1.25% 2/11/2029 128,579 0.00%Helvetia Europe SA^ €100,000 2.75% 30/9/2041 128,157 0.00%Barry Callebaut Services NV €100,000 2.38% 24/5/2024 125,651 0.00%Swiss Re Finance UK plc €100,000 1.38% 27/5/2023 122,033 0.00%Holcim Finance Luxembourg SA €100,000 1.38% 26/5/2023 121,749 0.00%Glencore Funding LLC $100,000 4.88% 12/3/2029 116,500 0.00%Tyco Electronics Group SA $100,000 3.45% 1/8/2024 107,098 0.00%Novartis Capital Corp. $75,000 3.70% 21/9/2042 87,471 0.00%

613
Vanguard Global Corporate Bond Index Fund
Principal CouponMaturity
DateFair Value
US Dollars ($)% of Total
Net AssetsNovartis Capital Corp. $50,000 2.40% 21/9/2022 51,283 0.00%test - - - 53,578,408 1.84%Taiwan 0.06% (2020: 0.04%)TSMC Global Ltd. $600,000 1.38% 28/9/2030 565,286 0.02%TSMC Global Ltd. $500,000 0.75% 28/9/2025 489,782 0.01%TSMC Global Ltd. $400,000 1.00% 28/9/2027 385,748 0.01%Competition Team Technologies Ltd. $200,000 3.75% 12/3/2024 214,228 0.01%Formosa Group Cayman Ltd. $200,000 3.38% 22/4/2025 212,050 0.01%test - - - 1,867,094 0.06%Thailand 0.07% (2020: 0.09%)Siam Commercial Bank PCL $500,000 3.90% 11/2/2024 536,845 0.02%Thaioil Treasury Center Co., Ltd. $400,000 3.50% 17/10/2049 366,680 0.01%Bangkok Bank PCL^ $350,000 3.73% 25/9/2034 363,105 0.01%PTTEP Canada International Finance Ltd. $200,000 6.35% 12/6/2042 279,656 0.01%Thaioil Treasury Center Co., Ltd. $200,000 4.63% 20/11/2028 228,276 0.01%Bangkok Bank PCL $200,000 3.88% 27/9/2022 207,754 0.01%Thaioil Treasury Center Co., Ltd. $200,000 2.50% 18/6/2030 195,785 0.00%test - - - 2,178,101 0.07%United Arab Emirates 0.13% (2020: 0.11%)Galaxy Pipeline Assets Bidco Ltd. $825,000 2.94% 30/9/2040 816,951 0.03%Galaxy Pipeline Assets Bidco Ltd. $440,000 3.25% 30/9/2040 437,555 0.01%MAF Sukuk Ltd. $400,000 3.93% 28/2/2030 432,802 0.01%DIB Sukuk Ltd. $300,000 3.63% 6/2/2023 312,698 0.01%BOS Funding Ltd. $250,000 4.23% 7/3/2022 254,999 0.01%Aldar Sukuk No 2 Ltd. $200,000 3.88% 22/10/2029 216,182 0.01%Mashreqbank PSC $200,000 4.25% 26/2/2024 214,434 0.01%DIB Sukuk Ltd. $200,000 2.95% 20/2/2025 209,446 0.01%Esic Sukuk Ltd. $200,000 3.94% 30/7/2024 209,246 0.01%DIB Sukuk Ltd. $200,000 2.95% 16/1/2026 209,031 0.01%SIB Sukuk Co. III Ltd. $200,000 2.85% 23/6/2025 207,546 0.01%Galaxy Pipeline Assets Bidco Ltd. $200,000 1.75% 30/9/2027 201,996 0.00%test - - - 3,722,886 0.13%United Kingdom 7.95% (2020: 8.14%)Barclays plc1 €1,500,000 1.88% 8/12/2023 1,865,668 0.06%WPP Finance SA €1,200,000 2.38% 19/5/2027 1,596,489 0.05%Nationwide Building Society €1,300,000 0.25% 22/7/2025 1,557,190 0.05%HSBC Holdings plc1 $1,100,000 6.50% 2/5/2036 1,515,344 0.05%Barclays plc1 €1,200,000 1.50% 3/9/2023 1,475,258 0.05%Lloyds Banking Group plc1 $1,279,000 4.58% 10/12/2025 1,437,202 0.05%BP Capital Markets plc1 €1,100,000 1.88% 7/4/2024 1,378,199 0.05%WPP Finance 2016 €1,100,000 1.38% 20/3/2025 1,369,116 0.05%HSBC Holdings plc1 $1,100,000 4.95% 31/3/2030 1,327,542 0.05%HSBC Holdings plc^ £900,000 1.75% 24/7/2027 1,257,113 0.04%Natwest Group plc^ €1,000,000 1.75% 2/3/2026 1,249,820 0.04%Cadent Finance plc £817,000 3.13% 21/3/2040 1,244,907 0.04%Thames Water Utilities Finance plc £640,000 6.75% 16/11/2028 1,193,189 0.04%HSBC Holdings plc1 $1,050,000 4.30% 8/3/2026 1,185,307 0.04%Reynolds American, Inc. $1,050,000 4.45% 12/6/2025 1,164,098 0.04%Heathrow Funding Ltd. £800,000 2.75% 13/10/2029 1,150,230 0.04%Vodafone Group plc1 €900,000 1.13% 20/11/2025 1,118,252 0.04%Lloyds Banking Group plc1 $975,000 4.65% 24/3/2026 1,102,919 0.04%CK Hutchison International 17 II Ltd. $1,050,000 2.75% 29/3/2023 1,088,857 0.04%RELX Finance BV €900,000 0.00% 18/3/2024 1,071,568 0.04%HSBC Holdings plc^ $950,000 3.97% 22/5/2030 1,062,800 0.04%Vodafone Group plc1 €800,000 1.63% 24/11/2030 1,035,609 0.04%HSBC Holdings plc^ $1,025,000 1.59% 24/5/2027 1,026,360 0.04%Barclays plc1 $925,000 3.65% 16/3/2025 1,003,095 0.03%Skipton Building Society^ £700,000 2.00% 2/10/2026 987,593 0.03%BAT International Finance plc £705,000 2.25% 26/6/2028 976,644 0.03%HSBC Holdings plc1 €800,000 0.88% 6/9/2024 976,051 0.03%easyJet FinCo BV €816,000 1.88% 3/3/2028 970,755 0.03%Lloyds Banking Group plc^ €800,000 0.50% 12/11/2025 962,656 0.03%Lloyds Bank Corporate Markets plc €800,000 0.25% 4/10/2022 956,116 0.03%AstraZeneca plc $859,000 3.38% 16/11/2025 940,684 0.03%British Telecommunications plc $600,000 9.63% 15/12/2030 930,423 0.03%Aviva plc^ €700,000 3.38% 4/12/2045 926,754 0.03%HSBC Holdings plc^ £600,000 3.00% 22/7/2028 894,016 0.03%THFC Funding No 2 plc £400,000 6.35% 8/7/2039 892,742 0.03%CK Hutchison Europe Finance 18 Ltd. €700,000 1.25% 13/4/2025 866,622 0.03%Vodafone Group plc1 €700,000 0.90% 24/11/2026 864,448 0.03%Standard Chartered plc $675,000 5.70% 26/3/2044 863,770 0.03%

614
Vanguard Global Corporate Bond Index Fund
Principal CouponMaturity
DateFair Value
US Dollars ($)% of Total
Net AssetsBP Capital Markets plc1 $793,000 3.54% 4/11/2024 863,433 0.03%Natwest Group plc^ $800,000 4.52% 25/6/2024 858,832 0.03%Motability Operations Group plc £600,000 1.75% 3/7/2029 855,846 0.03%HSBC Holdings plc1 $750,000 4.38% 23/11/2026 846,342 0.03%Motability Operations Group plc1 €700,000 0.38% 3/1/2026 844,346 0.03%HSBC Holdings plc1 €600,000 3.13% 7/6/2028 834,491 0.03%Barclays plc^ $800,000 3.56% 23/9/2035 833,416 0.03%GlaxoSmithKline Capital, Inc. $800,000 2.80% 18/3/2023 833,088 0.03%GlaxoSmithKline Capital plc £600,000 1.25% 12/10/2028 826,282 0.03%Experian Finance plc £600,000 0.74% 29/10/2025 820,344 0.03%Natwest Group plc^ $700,000 4.89% 18/5/2029 819,930 0.03%BAT Netherlands Finance BV €600,000 3.13% 7/4/2028 810,063 0.03%GlaxoSmithKline Capital plc £600,000 1.63% 12/5/2035 803,837 0.03%Standard Chartered plc^ $765,000 2.82% 30/1/2026 802,888 0.03%BAT International Finance plc $800,000 1.67% 25/3/2026 800,992 0.03%HSBC Holdings plc1 $735,000 4.25% 14/3/2024 796,512 0.03%Legal & General Group plc^ £500,000 4.50% 1/11/2050 794,330 0.03%Vodafone Group plc1 €600,000 2.20% 25/8/2026 786,893 0.03%AstraZeneca plc $800,000 0.70% 8/4/2026 779,430 0.03%BP Capital Markets plc^ €600,000 3.63% Perpetual 774,742 0.03%HSBC Holdings plc1 $700,000 4.25% 18/8/2025 774,397 0.03%Santander UK Group Holdings plc^ $700,000 4.80% 15/11/2024 765,517 0.03%Anglian Water Services Financing plc £500,000 2.75% 26/10/2029 761,613 0.03%Standard Chartered plc^ $650,000 4.64% 1/4/2031 760,245 0.03%Western Power Distribution West Midlands plc £500,000 3.88% 17/10/2024 753,146 0.03%Nationwide Building Society^ €600,000 2.00% 25/7/2029 748,687 0.03%Nationwide Building Society^ €600,000 1.50% 8/3/2026 748,261 0.03%RELX Finance BV €620,000 0.50% 10/3/2028 744,648 0.03%Yorkshire Building Society^ £500,000 3.00% 18/4/2025 728,829 0.02%HSBC Holdings plc $500,000 6.10% 14/1/2042 727,558 0.02%Yorkshire Building Society €600,000 0.88% 20/3/2023 727,498 0.02%HSBC Holdings plc^ €600,000 0.31% 13/11/2026 714,173 0.02%Centrica plc £400,000 4.25% 12/9/2044 712,939 0.02%HSBC Holdings plc^ €600,000 0.77% 13/11/2031 711,177 0.02%AstraZeneca plc $475,000 6.45% 15/9/2037 708,030 0.02%Phoenix Group Holdings plc £410,000 5.63% 28/4/2031 691,718 0.02%Southern Water Services Finance Ltd. £500,000 1.63% 30/3/2027 688,401 0.02%Close Brothers Finance plc £500,000 1.63% 3/12/2030 682,185 0.02%BP Capital Markets plc €500,000 2.52% 7/4/2028 677,540 0.02%Peabody Capital No 2 plc £400,000 3.25% 14/9/2048 668,104 0.02%Sky Ltd. €500,000 2.50% 15/9/2026 666,992 0.02%M&G plc^ £400,000 5.56% 20/7/2055 664,414 0.02%Centrica plc £400,000 4.38% 13/3/2029 656,785 0.02%Barclays plc^ $550,000 4.97% 16/5/2029 644,471 0.02%Vodafone Group plc $550,000 4.38% 19/2/2043 641,816 0.02%National Grid plc €550,000 0.16% 20/1/2028 641,601 0.02%Natwest Group plc $600,000 3.88% 12/9/2023 640,949 0.02%Vodafone Group plc $550,000 4.25% 17/9/2050 640,229 0.02%British Telecommunications plc $600,000 3.25% 8/11/2029 638,037 0.02%WPP Finance SA £400,000 3.75% 19/5/2032 631,719 0.02%HSBC Holdings plc^ $600,000 2.63% 7/11/2025 629,772 0.02%Coca-Cola Europacific Partners plc €500,000 2.63% 6/11/2023 627,880 0.02%Standard Chartered plc1 $600,000 3.95% 11/1/2023 625,985 0.02%Vodafone Group plc1 $578,000 3.75% 16/1/2024 625,832 0.02%Unilever Finance Netherlands BV €500,000 1.25% 25/3/2025 624,544 0.02%Annington Funding plc €500,000 1.65% 12/7/2024 619,943 0.02%Unilever Finance Netherlands BV €500,000 0.88% 31/7/2025 617,752 0.02%BP Capital Markets plc €500,000 1.08% 26/6/2025 617,441 0.02%Heathrow Funding Ltd. €500,000 1.50% 11/2/2030 610,747 0.02%Nationwide Building Society £400,000 3.00% 6/5/2026 608,441 0.02%GlaxoSmithKline Capital, Inc. $575,000 3.38% 15/5/2023 607,086 0.02%British Telecommunications plc €500,000 1.13% 10/3/2023 606,415 0.02%DS Smith plc €500,000 0.88% 12/9/2026 605,972 0.02%Unilever Finance Netherlands BV €500,000 0.50% 12/8/2023 603,492 0.02%Lloyds Banking Group plc^ $585,000 2.91% 7/11/2023 603,258 0.02%Barclays plc^ $600,000 1.01% 10/12/2024 602,239 0.02%Notting Hill Genesis £400,000 2.88% 31/1/2029 601,959 0.02%GlaxoSmithKline Capital, Inc. $400,000 6.38% 15/5/2038 598,896 0.02%Barclays plc^ €500,000 1.11% 12/5/2032 598,204 0.02%GlaxoSmithKline Capital plc €500,000 0.13% 12/5/2023 598,006 0.02%Yorkshire Building Society^ £400,000 3.38% 13/9/2028 595,863 0.02%
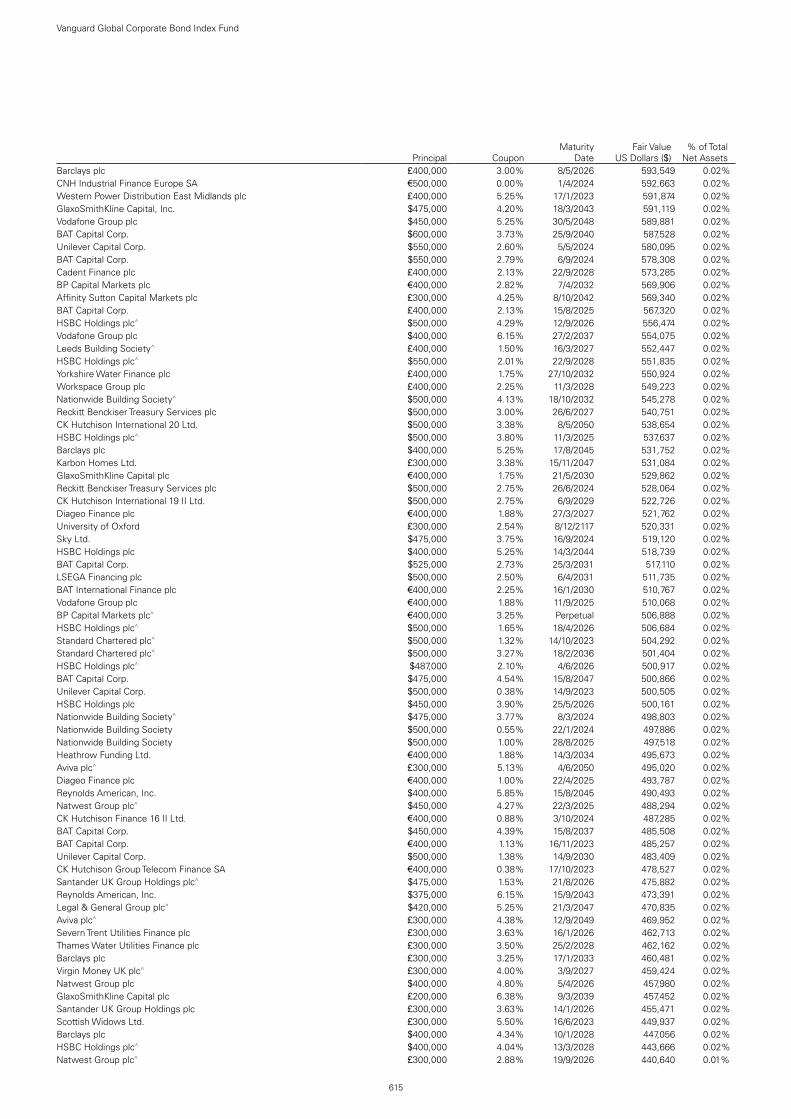
615
Vanguard Global Corporate Bond Index Fund
Principal CouponMaturity
DateFair Value
US Dollars ($)% of Total
Net AssetsBarclays plc £400,000 3.00% 8/5/2026 593,549 0.02%CNH Industrial Finance Europe SA €500,000 0.00% 1/4/2024 592,663 0.02%Western Power Distribution East Midlands plc £400,000 5.25% 17/1/2023 591,874 0.02%GlaxoSmithKline Capital, Inc. $475,000 4.20% 18/3/2043 591,119 0.02%Vodafone Group plc $450,000 5.25% 30/5/2048 589,881 0.02%BAT Capital Corp. $600,000 3.73% 25/9/2040 587,528 0.02%Unilever Capital Corp. $550,000 2.60% 5/5/2024 580,095 0.02%BAT Capital Corp. $550,000 2.79% 6/9/2024 578,308 0.02%Cadent Finance plc £400,000 2.13% 22/9/2028 573,285 0.02%BP Capital Markets plc €400,000 2.82% 7/4/2032 569,906 0.02%Affinity Sutton Capital Markets plc £300,000 4.25% 8/10/2042 569,340 0.02%BAT Capital Corp. £400,000 2.13% 15/8/2025 567,320 0.02%HSBC Holdings plc^ $500,000 4.29% 12/9/2026 556,474 0.02%Vodafone Group plc $400,000 6.15% 27/2/2037 554,075 0.02%Leeds Building Society^ £400,000 1.50% 16/3/2027 552,447 0.02%HSBC Holdings plc^ $550,000 2.01% 22/9/2028 551,835 0.02%Yorkshire Water Finance plc £400,000 1.75% 27/10/2032 550,924 0.02%Workspace Group plc £400,000 2.25% 11/3/2028 549,223 0.02%Nationwide Building Society^ $500,000 4.13% 18/10/2032 545,278 0.02%Reckitt Benckiser Treasury Services plc $500,000 3.00% 26/6/2027 540,751 0.02%CK Hutchison International 20 Ltd. $500,000 3.38% 8/5/2050 538,654 0.02%HSBC Holdings plc^ $500,000 3.80% 11/3/2025 537,637 0.02%Barclays plc $400,000 5.25% 17/8/2045 531,752 0.02%Karbon Homes Ltd. £300,000 3.38% 15/11/2047 531,084 0.02%GlaxoSmithKline Capital plc €400,000 1.75% 21/5/2030 529,862 0.02%Reckitt Benckiser Treasury Services plc $500,000 2.75% 26/6/2024 528,064 0.02%CK Hutchison International 19 II Ltd. $500,000 2.75% 6/9/2029 522,726 0.02%Diageo Finance plc €400,000 1.88% 27/3/2027 521,762 0.02%University of Oxford £300,000 2.54% 8/12/2117 520,331 0.02%Sky Ltd. $475,000 3.75% 16/9/2024 519,120 0.02%HSBC Holdings plc $400,000 5.25% 14/3/2044 518,739 0.02%BAT Capital Corp. $525,000 2.73% 25/3/2031 517,110 0.02%LSEGA Financing plc $500,000 2.50% 6/4/2031 511,735 0.02%BAT International Finance plc €400,000 2.25% 16/1/2030 510,767 0.02%Vodafone Group plc €400,000 1.88% 11/9/2025 510,068 0.02%BP Capital Markets plc^ €400,000 3.25% Perpetual 506,888 0.02%HSBC Holdings plc^ $500,000 1.65% 18/4/2026 506,684 0.02%Standard Chartered plc^ $500,000 1.32% 14/10/2023 504,292 0.02%Standard Chartered plc^ $500,000 3.27% 18/2/2036 501,404 0.02%HSBC Holdings plc^ $487,000 2.10% 4/6/2026 500,917 0.02%BAT Capital Corp. $475,000 4.54% 15/8/2047 500,866 0.02%Unilever Capital Corp. $500,000 0.38% 14/9/2023 500,505 0.02%HSBC Holdings plc $450,000 3.90% 25/5/2026 500,161 0.02%Nationwide Building Society^ $475,000 3.77% 8/3/2024 498,803 0.02%Nationwide Building Society $500,000 0.55% 22/1/2024 497,886 0.02%Nationwide Building Society $500,000 1.00% 28/8/2025 497,518 0.02%Heathrow Funding Ltd. €400,000 1.88% 14/3/2034 495,673 0.02%Aviva plc^ £300,000 5.13% 4/6/2050 495,020 0.02%Diageo Finance plc €400,000 1.00% 22/4/2025 493,787 0.02%Reynolds American, Inc. $400,000 5.85% 15/8/2045 490,493 0.02%Natwest Group plc^ $450,000 4.27% 22/3/2025 488,294 0.02%CK Hutchison Finance 16 II Ltd. €400,000 0.88% 3/10/2024 487,285 0.02%BAT Capital Corp. $450,000 4.39% 15/8/2037 485,508 0.02%BAT Capital Corp. €400,000 1.13% 16/11/2023 485,257 0.02%Unilever Capital Corp. $500,000 1.38% 14/9/2030 483,409 0.02%CK Hutchison Group Telecom Finance SA €400,000 0.38% 17/10/2023 478,527 0.02%Santander UK Group Holdings plc^ $475,000 1.53% 21/8/2026 475,882 0.02%Reynolds American, Inc. $375,000 6.15% 15/9/2043 473,391 0.02%Legal & General Group plc^ $420,000 5.25% 21/3/2047 470,835 0.02%Aviva plc^ £300,000 4.38% 12/9/2049 469,952 0.02%Severn Trent Utilities Finance plc £300,000 3.63% 16/1/2026 462,713 0.02%Thames Water Utilities Finance plc £300,000 3.50% 25/2/2028 462,162 0.02%Barclays plc £300,000 3.25% 17/1/2033 460,481 0.02%Virgin Money UK plc^ £300,000 4.00% 3/9/2027 459,424 0.02%Natwest Group plc $400,000 4.80% 5/4/2026 457,980 0.02%GlaxoSmithKline Capital plc £200,000 6.38% 9/3/2039 457,452 0.02%Santander UK Group Holdings plc £300,000 3.63% 14/1/2026 455,471 0.02%Scottish Widows Ltd. £300,000 5.50% 16/6/2023 449,937 0.02%Barclays plc $400,000 4.34% 10/1/2028 447,056 0.02%HSBC Holdings plc^ $400,000 4.04% 13/3/2028 443,666 0.02%Natwest Group plc^ £300,000 2.88% 19/9/2026 440,640 0.01%

616
Vanguard Global Corporate Bond Index Fund
Principal CouponMaturity
DateFair Value
US Dollars ($)% of Total
Net AssetsBP Capital Markets plc^ £300,000 4.25% Perpetual 439,431 0.01%Sanctuary Capital plc £300,000 2.38% 14/4/2050 438,169 0.01%Southern Gas Networks plc £300,000 2.50% 3/2/2025 437,818 0.01%Aviva plc^ £200,000 6.88% 20/5/2058 437,415 0.01%Barclays plc $400,000 4.38% 11/9/2024 436,505 0.01%United Utilities Water Finance plc £300,000 2.00% 14/2/2025 431,910 0.01%BP Capital Markets plc $400,000 3.99% 26/9/2023 431,182 0.01%Lloyds Banking Group plc $400,000 4.05% 16/8/2023 428,733 0.01%GlaxoSmithKline Capital plc £200,000 5.25% 10/4/2042 426,944 0.01%HSBC Holdings plc £200,000 7.00% 7/4/2038 426,414 0.01%Assura Financing plc £310,000 1.50% 15/9/2030 425,656 0.01%Natwest Group plc^ $400,000 3.75% 1/11/2029 425,558 0.01%Lloyds Bank Corporate Markets plc £300,000 1.75% 11/7/2024 425,392 0.01%BAT Capital Corp. $400,000 3.22% 15/8/2024 424,906 0.01%HSBC Holdings plc^ $400,000 3.95% 18/5/2024 424,778 0.01%United Utilities Water Finance plc £320,000 0.88% 28/10/2029 423,576 0.01%BUPA Finance plc £300,000 1.75% 14/6/2027 423,088 0.01%Canary Wharf Group Investment Holdings plc £300,000 2.63% 23/4/2025 419,613 0.01%Notting Hill Genesis £250,000 3.25% 12/10/2048 414,899 0.01%Vodafone Group plc $325,000 5.00% 30/5/2038 409,372 0.01%CK Hutchison International 21 Ltd. $400,000 2.50% 15/4/2031 407,933 0.01%Imperial Brands Finance plc $375,000 3.88% 26/7/2029 406,716 0.01%Unilever Finance Netherlands BV €300,000 1.75% 25/3/2030 400,801 0.01%BAT Capital Corp. $375,000 3.22% 6/9/2026 397,886 0.01%HSBC Holdings plc £200,000 6.00% 29/3/2040 397,663 0.01%Vodafone Group plc £200,000 5.90% 26/11/2032 394,946 0.01%HSBC Holdings plc €300,000 3.00% 30/6/2025 393,707 0.01%Vodafone Group plc $350,000 4.13% 30/5/2025 390,698 0.01%London Stock Exchange Group plc €300,000 1.75% 6/12/2027 390,358 0.01%GlaxoSmithKline Capital plc $350,000 3.38% 1/6/2029 389,048 0.01%Barclays plc^ €300,000 3.38% 2/4/2025 387,621 0.01%Coca-Cola Europacific Partners plc €300,000 2.38% 7/5/2025 386,933 0.01%BG Energy Capital plc £200,000 5.00% 4/11/2036 385,906 0.01%Coca-Cola Europacific Partners plc €300,000 1.75% 27/3/2026 382,962 0.01%Standard Chartered plc £200,000 4.38% 18/1/2038 378,905 0.01%CNH Industrial Finance Europe SA €300,000 1.63% 3/7/2029 378,300 0.01%Vodafone Group plc $300,000 4.88% 19/6/2049 378,282 0.01%Barclays plc $330,000 5.20% 12/5/2026 377,736 0.01%Prudential plc $350,000 3.13% 14/4/2030 377,005 0.01%Swan Housing Capital plc £250,000 3.63% 5/3/2048 376,705 0.01%Experian Finance plc €300,000 1.38% 25/6/2026 376,068 0.01%Coca-Cola Europacific Partners plc €300,000 1.13% 26/5/2024 367,870 0.01%Southern Electric Power Distribution plc £200,000 4.63% 20/2/2037 367,301 0.01%Tesco Corporate Treasury Services plc €300,000 1.38% 24/10/2023 366,809 0.01%BP Capital Markets plc €300,000 0.83% 8/11/2027 366,806 0.01%Santander UK Group Holdings plc^ £250,000 2.92% 8/5/2026 366,165 0.01%Reckitt Benckiser Treasury Services Nederland BV €300,000 0.75% 19/5/2030 365,887 0.01%Unilever Capital Corp. $350,000 2.00% 28/7/2026 364,883 0.01%Barclays plc^ €300,000 2.00% 7/2/2028 364,765 0.01%Barclays plc $325,000 4.84% 9/5/2028 364,748 0.01%Yorkshire Building Society €300,000 0.63% 21/9/2025 364,324 0.01%NatWest Markets plc $350,000 3.63% 29/9/2022 363,996 0.01%Cadent Finance plc €300,000 0.63% 22/9/2024 363,340 0.01%Natwest Group plc^ €300,000 0.75% 15/11/2025 363,019 0.01%M&G plc^ £200,000 6.34% 19/12/2063 362,592 0.01%HSBC Holdings plc £200,000 6.75% 11/9/2028 361,162 0.01%HSBC Holdings plc $250,000 6.80% 1/6/2038 359,740 0.01%Imperial Brands Finance Netherlands BV €300,000 1.75% 18/3/2033 359,342 0.01%Canary Wharf Group Investment Holdings plc €300,000 1.75% 7/4/2026 358,226 0.01%AstraZeneca plc €300,000 0.38% 3/6/2029 356,100 0.01%CCEP Finance Ireland DAC €300,000 0.50% 6/9/2029 355,546 0.01%CCEP Finance Ireland DAC €300,000 0.88% 6/5/2033 355,366 0.01%Coca-Cola Europacific Partners plc €300,000 0.20% 2/12/2028 351,130 0.01%AstraZeneca plc $275,000 4.38% 17/8/2048 346,836 0.01%Thames Water Utilities Finance plc £200,000 4.38% 3/7/2034 346,224 0.01%AstraZeneca plc $275,000 4.38% 16/11/2045 342,106 0.01%Virgin Money UK plc^ £233,000 3.38% 24/4/2026 342,106 0.01%Southern Water Services Finance Ltd. £200,000 6.64% 31/3/2026 340,321 0.01%Pension Insurance Corp. plc £200,000 5.63% 20/9/2030 339,390 0.01%Santander UK plc $330,000 2.10% 13/1/2023 338,580 0.01%Clarion Funding plc £200,000 3.13% 19/4/2048 333,214 0.01%

617
Vanguard Global Corporate Bond Index Fund
Principal CouponMaturity
DateFair Value
US Dollars ($)% of Total
Net AssetsStandard Chartered plc $300,000 4.05% 12/4/2026 331,634 0.01%Gatwick Funding Ltd. £200,000 6.13% 2/3/2026 331,220 0.01%Lloyds Banking Group plc $300,000 3.75% 11/1/2027 331,082 0.01%BP Capital Markets BV €300,000 0.93% 4/12/2040 330,395 0.01%Anglian Water Services Financing plc £200,000 4.50% 5/10/2027 330,139 0.01%Lloyds Banking Group plc^ $300,000 3.57% 7/11/2028 327,696 0.01%BAE Systems plc $300,000 3.40% 15/4/2030 325,989 0.01%Imperial Brands Finance plc £200,000 4.88% 7/6/2032 325,522 0.01%Natwest Group plc^ $325,000 3.03% 28/11/2035 325,146 0.01%Unilever Capital Corp. $300,000 2.90% 5/5/2027 325,072 0.01%Standard Chartered plc^ $325,000 0.99% 12/1/2025 324,237 0.01%Heathrow Funding Ltd. £233,000 2.63% 16/3/2028 324,215 0.01%Barclays plc^ $300,000 3.93% 7/5/2025 323,687 0.01%Natwest Group plc $300,000 6.13% 15/12/2022 322,444 0.01%BAT Capital Corp. $300,000 3.56% 15/8/2027 321,017 0.01%Annington Funding plc £200,000 3.69% 12/7/2034 320,083 0.01%Diageo Capital plc $300,000 3.50% 18/9/2023 319,299 0.01%Society of Lloyd's^ £200,000 4.88% 7/2/2047 318,616 0.01%Vodafone Group plc £200,000 3.38% 8/8/2049 318,404 0.01%HSBC Holdings plc $300,000 3.60% 25/5/2023 317,621 0.01%Blend Funding plc £200,000 2.92% 5/4/2054 316,231 0.01%HSBC Holdings plc $225,000 6.50% 15/9/2037 313,400 0.01%Direct Line Insurance Group plc £200,000 4.00% 5/6/2032 310,893 0.01%Yorkshire Water Finance plc £200,000 2.75% 18/4/2041 303,514 0.01%Legal & General Group plc^ £200,000 3.75% 26/11/2049 300,806 0.01%LSEGA Financing plc $300,000 1.38% 6/4/2026 300,515 0.01%Heathrow Funding Ltd. $300,000 4.88% 15/7/2021 300,448 0.01%HSBC Holdings plc^ $300,000 2.36% 18/8/2031 300,170 0.01%Santander UK Group Holdings plc^ $300,000 1.67% 14/6/2027 299,437 0.01%HSBC Holdings plc^ £200,000 3.00% 29/5/2030 298,244 0.01%Rothesay Life plc £200,000 3.38% 12/7/2026 297,639 0.01%Vodafone Group plc £200,000 3.00% 12/8/2056 296,919 0.01%Motability Operations Group plc £200,000 2.38% 3/7/2039 296,060 0.01%Natwest Group plc^ £200,000 3.62% 14/8/2030 294,788 0.01%Mead Johnson Nutrition Co. $205,000 5.90% 1/11/2039 293,675 0.01%BAE Systems plc $300,000 3.00% 15/9/2050 293,391 0.01%University of Southampton £200,000 2.25% 11/4/2057 293,122 0.01%Western Power Distribution plc £200,000 3.63% 6/11/2023 292,503 0.01%Land Securities Capital Markets plc £200,000 2.40% 8/2/2029 292,195 0.01%Vodafone Group plc €200,000 2.88% 20/11/2037 291,449 0.01%Barclays plc £200,000 3.13% 17/1/2024 291,374 0.01%Gatwick Funding Ltd. £200,000 3.25% 26/2/2048 289,294 0.01%BAT Capital Corp. $250,000 5.28% 2/4/2050 289,053 0.01%Cadent Finance plc £200,000 2.75% 22/9/2046 288,207 0.01%HSBC Bank plc £150,000 4.75% 24/3/2046 288,174 0.01%Eastern Power Networks plc £200,000 2.13% 25/11/2033 287,132 0.01%Sage Group plc £212,000 1.63% 25/2/2031 286,546 0.01%Lloyds Banking Group plc^ £206,000 1.99% 15/12/2031 286,227 0.01%Natwest Group plc $255,000 6.00% 19/12/2023 285,907 0.01%Close Brothers Group plc £200,000 2.75% 26/4/2023 285,861 0.01%Phoenix Group Holdings plc £200,000 4.13% 20/7/2022 285,757 0.01%Diageo Finance plc €200,000 2.50% 27/3/2032 284,309 0.01%Yorkshire Water Finance plc £200,000 1.75% 26/11/2026 283,944 0.01%CK Hutchison Group Telecom Finance SA £200,000 2.00% 17/10/2027 282,353 0.01%Scottish Hydro Electric Transmission plc £200,000 2.25% 27/9/2035 282,335 0.01%Wm Morrison Supermarkets plc £200,000 2.50% 1/10/2031 281,254 0.01%Reckitt Benckiser Treasury Services plc £200,000 1.75% 19/5/2032 280,475 0.01%National Grid Electricity Transmission plc £200,000 1.38% 16/9/2026 278,961 0.01%Barclays plc^ $240,000 5.09% 20/6/2030 278,956 0.01%Heathrow Funding Ltd. CA($)325,000 3.66% 13/1/2031 278,161 0.01%Thames Water Utilities Finance plc £200,000 2.38% 22/4/2040 277,995 0.01%Manchester Airport Group Funding plc £200,000 2.88% 30/9/2044 277,413 0.01%Scottish Hydro Electric Transmission plc £200,000 1.50% 24/3/2028 276,953 0.01%Guinness Partnership Ltd. £200,000 2.00% 22/4/2055 276,409 0.01%Nationwide Building Society $250,000 4.00% 14/9/2026 275,970 0.01%Heathrow Funding Ltd. £200,000 2.75% 9/8/2049 273,653 0.01%Wessex Water Services Finance plc £200,000 1.50% 17/9/2029 273,614 0.01%Eastern Power Networks plc £200,000 1.88% 1/6/2035 273,029 0.01%National Grid Electricity Transmission plc £200,000 2.00% 16/9/2038 272,531 0.01%Severn Trent Utilities Finance plc £200,000 2.00% 2/6/2040 271,827 0.01%DWR Cymru Financing UK plc £200,000 1.38% 31/3/2033 271,177 0.01%
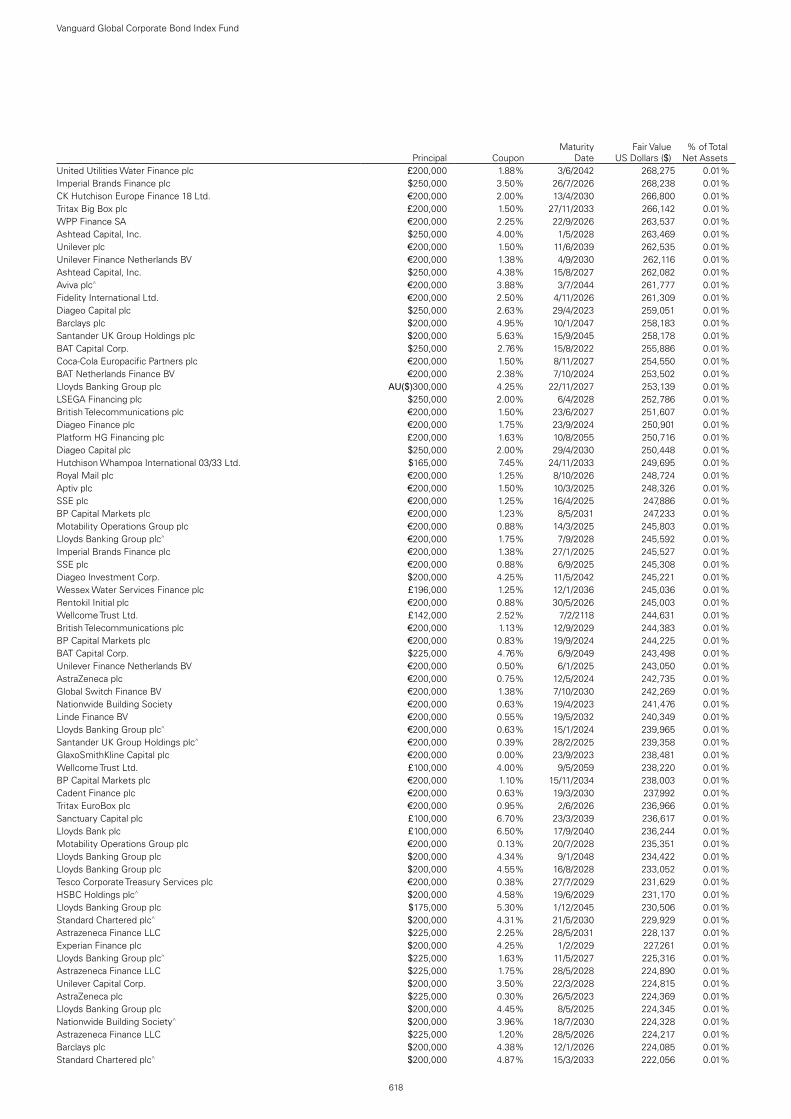
618
Vanguard Global Corporate Bond Index Fund
Principal CouponMaturity
DateFair Value
US Dollars ($)% of Total
Net AssetsUnited Utilities Water Finance plc £200,000 1.88% 3/6/2042 268,275 0.01%Imperial Brands Finance plc $250,000 3.50% 26/7/2026 268,238 0.01%CK Hutchison Europe Finance 18 Ltd. €200,000 2.00% 13/4/2030 266,800 0.01%Tritax Big Box plc £200,000 1.50% 27/11/2033 266,142 0.01%WPP Finance SA €200,000 2.25% 22/9/2026 263,537 0.01%Ashtead Capital, Inc. $250,000 4.00% 1/5/2028 263,469 0.01%Unilever plc €200,000 1.50% 11/6/2039 262,535 0.01%Unilever Finance Netherlands BV €200,000 1.38% 4/9/2030 262,116 0.01%Ashtead Capital, Inc. $250,000 4.38% 15/8/2027 262,082 0.01%Aviva plc^ €200,000 3.88% 3/7/2044 261,777 0.01%Fidelity International Ltd. €200,000 2.50% 4/11/2026 261,309 0.01%Diageo Capital plc $250,000 2.63% 29/4/2023 259,051 0.01%Barclays plc $200,000 4.95% 10/1/2047 258,183 0.01%Santander UK Group Holdings plc $200,000 5.63% 15/9/2045 258,178 0.01%BAT Capital Corp. $250,000 2.76% 15/8/2022 255,886 0.01%Coca-Cola Europacific Partners plc €200,000 1.50% 8/11/2027 254,550 0.01%BAT Netherlands Finance BV €200,000 2.38% 7/10/2024 253,502 0.01%Lloyds Banking Group plc AU($)300,000 4.25% 22/11/2027 253,139 0.01%LSEGA Financing plc $250,000 2.00% 6/4/2028 252,786 0.01%British Telecommunications plc €200,000 1.50% 23/6/2027 251,607 0.01%Diageo Finance plc €200,000 1.75% 23/9/2024 250,901 0.01%Platform HG Financing plc £200,000 1.63% 10/8/2055 250,716 0.01%Diageo Capital plc $250,000 2.00% 29/4/2030 250,448 0.01%Hutchison Whampoa International 03/33 Ltd. $165,000 7.45% 24/11/2033 249,695 0.01%Royal Mail plc €200,000 1.25% 8/10/2026 248,724 0.01%Aptiv plc €200,000 1.50% 10/3/2025 248,326 0.01%SSE plc €200,000 1.25% 16/4/2025 247,886 0.01%BP Capital Markets plc €200,000 1.23% 8/5/2031 247,233 0.01%Motability Operations Group plc €200,000 0.88% 14/3/2025 245,803 0.01%Lloyds Banking Group plc^ €200,000 1.75% 7/9/2028 245,592 0.01%Imperial Brands Finance plc €200,000 1.38% 27/1/2025 245,527 0.01%SSE plc €200,000 0.88% 6/9/2025 245,308 0.01%Diageo Investment Corp. $200,000 4.25% 11/5/2042 245,221 0.01%Wessex Water Services Finance plc £196,000 1.25% 12/1/2036 245,036 0.01%Rentokil Initial plc €200,000 0.88% 30/5/2026 245,003 0.01%Wellcome Trust Ltd. £142,000 2.52% 7/2/2118 244,631 0.01%British Telecommunications plc €200,000 1.13% 12/9/2029 244,383 0.01%BP Capital Markets plc €200,000 0.83% 19/9/2024 244,225 0.01%BAT Capital Corp. $225,000 4.76% 6/9/2049 243,498 0.01%Unilever Finance Netherlands BV €200,000 0.50% 6/1/2025 243,050 0.01%AstraZeneca plc €200,000 0.75% 12/5/2024 242,735 0.01%Global Switch Finance BV €200,000 1.38% 7/10/2030 242,269 0.01%Nationwide Building Society €200,000 0.63% 19/4/2023 241,476 0.01%Linde Finance BV €200,000 0.55% 19/5/2032 240,349 0.01%Lloyds Banking Group plc^ €200,000 0.63% 15/1/2024 239,965 0.01%Santander UK Group Holdings plc^ €200,000 0.39% 28/2/2025 239,358 0.01%GlaxoSmithKline Capital plc €200,000 0.00% 23/9/2023 238,481 0.01%Wellcome Trust Ltd. £100,000 4.00% 9/5/2059 238,220 0.01%BP Capital Markets plc €200,000 1.10% 15/11/2034 238,003 0.01%Cadent Finance plc €200,000 0.63% 19/3/2030 237,992 0.01%Tritax EuroBox plc €200,000 0.95% 2/6/2026 236,966 0.01%Sanctuary Capital plc £100,000 6.70% 23/3/2039 236,617 0.01%Lloyds Bank plc £100,000 6.50% 17/9/2040 236,244 0.01%Motability Operations Group plc €200,000 0.13% 20/7/2028 235,351 0.01%Lloyds Banking Group plc $200,000 4.34% 9/1/2048 234,422 0.01%Lloyds Banking Group plc $200,000 4.55% 16/8/2028 233,052 0.01%Tesco Corporate Treasury Services plc €200,000 0.38% 27/7/2029 231,629 0.01%HSBC Holdings plc^ $200,000 4.58% 19/6/2029 231,170 0.01%Lloyds Banking Group plc $175,000 5.30% 1/12/2045 230,506 0.01%Standard Chartered plc^ $200,000 4.31% 21/5/2030 229,929 0.01%Astrazeneca Finance LLC $225,000 2.25% 28/5/2031 228,137 0.01%Experian Finance plc $200,000 4.25% 1/2/2029 227,261 0.01%Lloyds Banking Group plc^ $225,000 1.63% 11/5/2027 225,316 0.01%Astrazeneca Finance LLC $225,000 1.75% 28/5/2028 224,890 0.01%Unilever Capital Corp. $200,000 3.50% 22/3/2028 224,815 0.01%AstraZeneca plc $225,000 0.30% 26/5/2023 224,369 0.01%Lloyds Banking Group plc $200,000 4.45% 8/5/2025 224,345 0.01%Nationwide Building Society^ $200,000 3.96% 18/7/2030 224,328 0.01%Astrazeneca Finance LLC $225,000 1.20% 28/5/2026 224,217 0.01%Barclays plc $200,000 4.38% 12/1/2026 224,085 0.01%Standard Chartered plc^ $200,000 4.87% 15/3/2033 222,056 0.01%
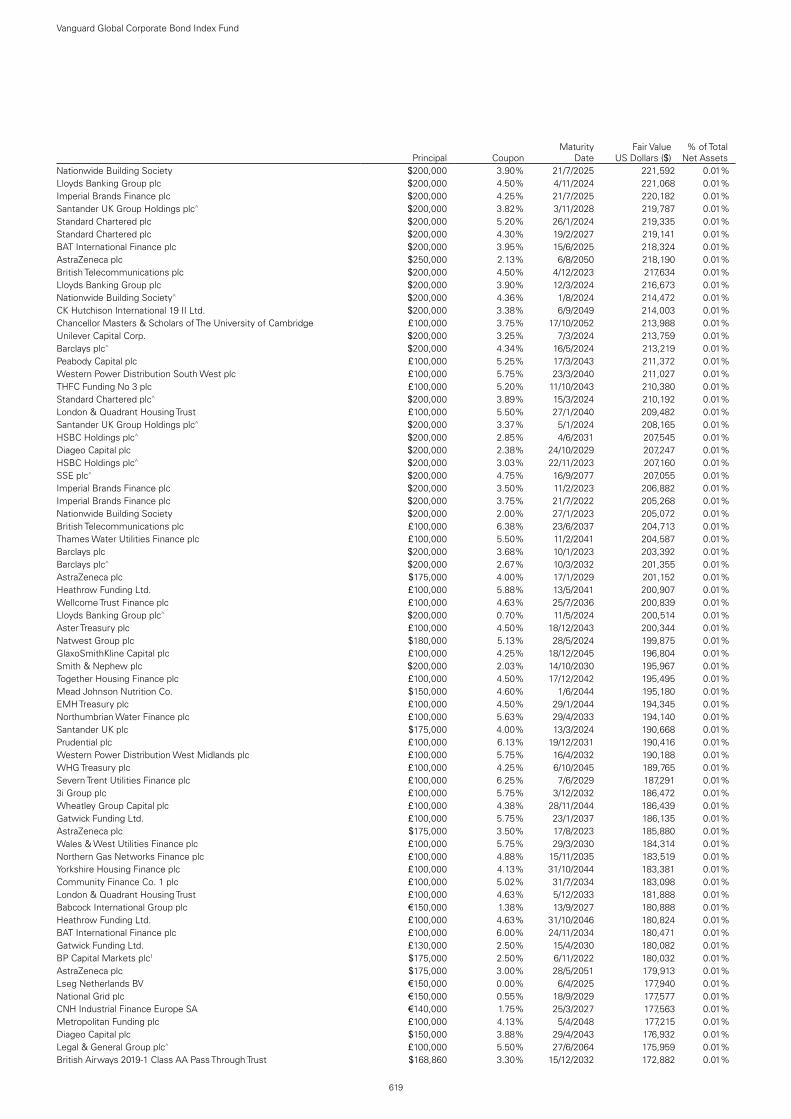
619
Vanguard Global Corporate Bond Index Fund
Principal CouponMaturity
DateFair Value
US Dollars ($)% of Total
Net AssetsNationwide Building Society $200,000 3.90% 21/7/2025 221,592 0.01%Lloyds Banking Group plc $200,000 4.50% 4/11/2024 221,068 0.01%Imperial Brands Finance plc $200,000 4.25% 21/7/2025 220,182 0.01%Santander UK Group Holdings plc^ $200,000 3.82% 3/11/2028 219,787 0.01%Standard Chartered plc $200,000 5.20% 26/1/2024 219,335 0.01%Standard Chartered plc $200,000 4.30% 19/2/2027 219,141 0.01%BAT International Finance plc $200,000 3.95% 15/6/2025 218,324 0.01%AstraZeneca plc $250,000 2.13% 6/8/2050 218,190 0.01%British Telecommunications plc $200,000 4.50% 4/12/2023 217,634 0.01%Lloyds Banking Group plc $200,000 3.90% 12/3/2024 216,673 0.01%Nationwide Building Society^ $200,000 4.36% 1/8/2024 214,472 0.01%CK Hutchison International 19 II Ltd. $200,000 3.38% 6/9/2049 214,003 0.01%Chancellor Masters & Scholars of The University of Cambridge £100,000 3.75% 17/10/2052 213,988 0.01%Unilever Capital Corp. $200,000 3.25% 7/3/2024 213,759 0.01%Barclays plc^ $200,000 4.34% 16/5/2024 213,219 0.01%Peabody Capital plc £100,000 5.25% 17/3/2043 211,372 0.01%Western Power Distribution South West plc £100,000 5.75% 23/3/2040 211,027 0.01%THFC Funding No 3 plc £100,000 5.20% 11/10/2043 210,380 0.01%Standard Chartered plc^ $200,000 3.89% 15/3/2024 210,192 0.01%London & Quadrant Housing Trust £100,000 5.50% 27/1/2040 209,482 0.01%Santander UK Group Holdings plc^ $200,000 3.37% 5/1/2024 208,165 0.01%HSBC Holdings plc^ $200,000 2.85% 4/6/2031 207,545 0.01%Diageo Capital plc $200,000 2.38% 24/10/2029 207,247 0.01%HSBC Holdings plc^ $200,000 3.03% 22/11/2023 207,160 0.01%SSE plc^ $200,000 4.75% 16/9/2077 207,055 0.01%Imperial Brands Finance plc $200,000 3.50% 11/2/2023 206,882 0.01%Imperial Brands Finance plc $200,000 3.75% 21/7/2022 205,268 0.01%Nationwide Building Society $200,000 2.00% 27/1/2023 205,072 0.01%British Telecommunications plc £100,000 6.38% 23/6/2037 204,713 0.01%Thames Water Utilities Finance plc £100,000 5.50% 11/2/2041 204,587 0.01%Barclays plc $200,000 3.68% 10/1/2023 203,392 0.01%Barclays plc^ $200,000 2.67% 10/3/2032 201,355 0.01%AstraZeneca plc $175,000 4.00% 17/1/2029 201,152 0.01%Heathrow Funding Ltd. £100,000 5.88% 13/5/2041 200,907 0.01%Wellcome Trust Finance plc £100,000 4.63% 25/7/2036 200,839 0.01%Lloyds Banking Group plc^ $200,000 0.70% 11/5/2024 200,514 0.01%Aster Treasury plc £100,000 4.50% 18/12/2043 200,344 0.01%Natwest Group plc $180,000 5.13% 28/5/2024 199,875 0.01%GlaxoSmithKline Capital plc £100,000 4.25% 18/12/2045 196,804 0.01%Smith & Nephew plc $200,000 2.03% 14/10/2030 195,967 0.01%Together Housing Finance plc £100,000 4.50% 17/12/2042 195,495 0.01%Mead Johnson Nutrition Co. $150,000 4.60% 1/6/2044 195,180 0.01%EMH Treasury plc £100,000 4.50% 29/1/2044 194,345 0.01%Northumbrian Water Finance plc £100,000 5.63% 29/4/2033 194,140 0.01%Santander UK plc $175,000 4.00% 13/3/2024 190,668 0.01%Prudential plc £100,000 6.13% 19/12/2031 190,416 0.01%Western Power Distribution West Midlands plc £100,000 5.75% 16/4/2032 190,188 0.01%WHG Treasury plc £100,000 4.25% 6/10/2045 189,765 0.01%Severn Trent Utilities Finance plc £100,000 6.25% 7/6/2029 187,291 0.01%3i Group plc £100,000 5.75% 3/12/2032 186,472 0.01%Wheatley Group Capital plc £100,000 4.38% 28/11/2044 186,439 0.01%Gatwick Funding Ltd. £100,000 5.75% 23/1/2037 186,135 0.01%AstraZeneca plc $175,000 3.50% 17/8/2023 185,880 0.01%Wales & West Utilities Finance plc £100,000 5.75% 29/3/2030 184,314 0.01%Northern Gas Networks Finance plc £100,000 4.88% 15/11/2035 183,519 0.01%Yorkshire Housing Finance plc £100,000 4.13% 31/10/2044 183,381 0.01%Community Finance Co. 1 plc £100,000 5.02% 31/7/2034 183,098 0.01%London & Quadrant Housing Trust £100,000 4.63% 5/12/2033 181,888 0.01%Babcock International Group plc €150,000 1.38% 13/9/2027 180,888 0.01%Heathrow Funding Ltd. £100,000 4.63% 31/10/2046 180,824 0.01%BAT International Finance plc £100,000 6.00% 24/11/2034 180,471 0.01%Gatwick Funding Ltd. £130,000 2.50% 15/4/2030 180,082 0.01%BP Capital Markets plc1 $175,000 2.50% 6/11/2022 180,032 0.01%AstraZeneca plc $175,000 3.00% 28/5/2051 179,913 0.01%Lseg Netherlands BV €150,000 0.00% 6/4/2025 177,940 0.01%National Grid plc €150,000 0.55% 18/9/2029 177,577 0.01%CNH Industrial Finance Europe SA €140,000 1.75% 25/3/2027 177,563 0.01%Metropolitan Funding plc £100,000 4.13% 5/4/2048 177,215 0.01%Diageo Capital plc $150,000 3.88% 29/4/2043 176,932 0.01%Legal & General Group plc^ £100,000 5.50% 27/6/2064 175,959 0.01%British Airways 2019-1 Class AA Pass Through Trust $168,860 3.30% 15/12/2032 172,882 0.01%

620
Vanguard Global Corporate Bond Index Fund
Principal CouponMaturity
DateFair Value
US Dollars ($)% of Total
Net AssetsAnnington Funding plc £100,000 3.94% 12/7/2047 172,598 0.01%Unilever Capital Corp. $125,000 5.90% 15/11/2032 172,379 0.01%Aviva plc CA($)200,000 4.00% 2/10/2030 172,176 0.01%Rl Finance Bonds No 3 plc £100,000 6.13% 13/11/2028 171,707 0.01%Lloyds Bank plc £100,000 7.63% 22/4/2025 171,324 0.01%Orbit Capital plc £100,000 3.50% 24/3/2045 170,052 0.01%Citizen Treasury plc £100,000 3.25% 20/10/2048 169,854 0.01%HSBC Holdings plc CA($)200,000 3.20% 5/12/2023 169,254 0.01%Bromford Housing Group Ltd. £100,000 3.13% 3/5/2048 168,829 0.01%Mead Johnson Nutrition Co. $150,000 4.13% 15/11/2025 168,696 0.01%Narragansett Electric Co. $150,000 3.92% 1/8/2028 167,813 0.01%SP Manweb plc £100,000 4.88% 20/9/2027 167,379 0.01%CNH Industrial NV $150,000 3.85% 15/11/2027 166,329 0.01%HSBC Capital Funding Dollar 1 LP^ $100,000 10.18% Perpetual 165,272 0.01%CRH Finance UK plc £100,000 4.13% 2/12/2029 165,059 0.01%New England Power Co. $150,000 3.80% 5/12/2047 164,970 0.01%Sky Ltd. £100,000 4.00% 26/11/2029 164,885 0.01%BG Energy Capital plc £100,000 5.13% 1/12/2025 163,790 0.01%Martlet Homes Ltd. £100,000 3.00% 9/5/2052 163,520 0.01%AstraZeneca plc $150,000 3.13% 12/6/2027 163,394 0.01%Vodafone Group plc $125,000 5.13% 19/6/2059 163,122 0.01%Porterbrook Rail Finance Ltd. £100,000 4.63% 4/4/2029 162,864 0.01%BUPA Finance plc £100,000 5.00% 8/12/2026 161,288 0.01%Just Group plc^ £100,000 7.00% 15/4/2031 160,565 0.01%Legal & General Group plc^ £100,000 5.38% 27/10/2045 159,160 0.01%Home Group Ltd. £100,000 3.13% 27/3/2043 158,913 0.01%BAT Capital Corp. $150,000 3.46% 6/9/2029 158,590 0.01%Diageo Investment Corp. $100,000 7.45% 15/4/2035 157,896 0.01%Heathrow Funding Ltd. £100,000 7.13% 14/2/2024 157,829 0.01%RL Finance Bonds NO 4 plc^ £100,000 4.88% 7/10/2049 157,678 0.01%3i Group plc £100,000 3.75% 5/6/2040 157,161 0.01%BAE Systems Holdings, Inc. $125,000 4.75% 7/10/2044 156,618 0.01%Segro plc £100,000 2.88% 11/10/2037 156,526 0.01%Wales & West Utilities Finance plc £100,000 3.00% 3/8/2038 156,213 0.01%Accent Capital plc £100,000 2.63% 18/7/2049 155,661 0.01%Tritax Big Box plc £100,000 3.13% 14/12/2031 155,361 0.01%Land Securities Capital Markets plc £100,000 2.75% 22/9/2057 155,222 0.01%Eversholt Funding plc £100,000 3.53% 7/8/2042 154,429 0.01%Yorkshire Building Society £100,000 3.50% 21/4/2026 154,269 0.01%London & Quadrant Housing Trust £100,000 2.75% 20/7/2057 154,256 0.01%Pearson Funding plc £100,000 3.75% 4/6/2030 154,120 0.01%Southern Gas Networks plc £100,000 3.10% 15/9/2036 153,934 0.01%CPUK Finance Ltd. £100,000 3.69% 28/8/2028 153,395 0.01%A2Dominion Housing Group Ltd. £100,000 3.50% 15/11/2028 152,402 0.01%Next Group plc £100,000 3.63% 18/5/2028 152,254 0.01%Scotland Gas Networks plc £100,000 3.25% 8/3/2027 152,254 0.01%Linde Finance BV £100,000 5.88% 24/4/2023 151,769 0.01%Places For People Treasury plc £100,000 2.88% 17/8/2026 150,044 0.01%National Grid Electricity Transmission plc £100,000 2.75% 6/2/2035 149,898 0.01%Wrekin Housing Group Ltd. £100,000 2.50% 22/10/2048 149,535 0.01%Barclays plc^ £100,000 3.75% 22/11/2030 149,313 0.01%London & Quadrant Housing Trust £100,000 2.63% 28/2/2028 149,293 0.01%London Power Networks plc £100,000 2.63% 1/3/2029 149,170 0.01%Segro plc £100,000 2.38% 11/10/2029 148,622 0.00%Motability Operations Group plc £100,000 2.38% 14/3/2032 148,608 0.00%Natwest Group plc^ £100,000 3.13% 28/3/2027 148,576 0.00%Quadgas Finance plc £100,000 3.38% 17/9/2029 148,416 0.00%Bazalgette Finance plc £100,000 2.38% 29/11/2027 147,733 0.00%Sovereign Housing Capital plc £100,000 2.38% 4/11/2048 147,733 0.00%Tesco Corporate Treasury Services plc £100,000 2.75% 27/4/2030 147,550 0.00%WPP Finance 2010 $135,000 3.75% 19/9/2024 147,007 0.00%Coventry Building Society £100,000 5.88% 28/9/2022 147,003 0.00%HSBC Holdings plc £100,000 2.63% 16/8/2028 146,726 0.00%Hastings Group Finance plc £100,000 3.00% 24/5/2025 146,626 0.00%Thames Water Utilities Finance plc £100,000 2.63% 24/1/2032 146,412 0.00%Northumbrian Water Finance plc £100,000 2.38% 5/10/2027 146,239 0.00%SSE plc^ £100,000 3.74% Perpetual 146,031 0.00%Annington Funding plc £100,000 2.65% 12/7/2025 145,575 0.00%Compass Group plc £100,000 2.00% 3/7/2029 145,395 0.00%Compass Group plc £100,000 2.00% 5/9/2025 144,585 0.00%Wm Morrison Supermarkets plc £100,000 3.50% 27/7/2026 144,274 0.00%

621
Vanguard Global Corporate Bond Index Fund
Principal CouponMaturity
DateFair Value
US Dollars ($)% of Total
Net AssetsNewRiver plc £100,000 3.50% 7/3/2028 144,130 0.00%Logicor 2019-1 UK plc £100,000 1.88% 17/11/2026 143,741 0.00%Diageo Finance plc £100,000 1.75% 12/10/2026 143,609 0.00%HSBC Holdings plc^ £100,000 2.26% 13/11/2026 143,439 0.00%Connect Plus M25 Issuer plc £93,463 2.61% 31/3/2039 143,161 0.00%British Airways 2020-1 Class A Pass Through Trust $133,353 4.25% 15/11/2032 143,011 0.00%United Utilities Water Finance plc £100,000 2.00% 3/7/2033 142,961 0.00%National Express Group plc £100,000 2.38% 20/11/2028 142,579 0.00%Principality Building Society £100,000 2.38% 23/11/2023 142,422 0.00%Gatwick Funding Ltd. £100,000 3.13% 28/9/2039 141,942 0.00%SP Transmission plc £100,000 2.00% 13/11/2031 141,872 0.00%British Land Co. plc £100,000 2.38% 14/9/2029 141,398 0.00%Northumbrian Water Finance plc £100,000 1.63% 11/10/2026 141,282 0.00%Barclays plc^ £100,000 2.38% 6/10/2023 141,169 0.00%Eversholt Funding plc £97,436 2.74% 30/6/2040 140,488 0.00%Virgin Money UK plc^ £100,000 2.63% 19/8/2031 140,149 0.00%New England Power Co. $150,000 2.81% 6/10/2050 140,010 0.00%Phoenix Group Holdings plc €100,000 4.38% 24/1/2029 139,341 0.00%Clarion Funding plc £100,000 1.88% 22/1/2035 138,409 0.00%Orbit Capital plc £100,000 2.00% 24/11/2038 136,363 0.00%BG Energy Capital plc €100,000 2.25% 21/11/2029 135,594 0.00%Gatwick Funding Ltd. £100,000 2.88% 5/7/2049 134,844 0.00%National Grid Electricity Transmission plc £100,000 2.00% 17/4/2040 134,722 0.00%BP Capital Markets plc €100,000 2.97% 27/2/2026 134,441 0.00%Unilever Finance Netherlands BV1 €100,000 1.63% 12/2/2033 134,334 0.00%BG Energy Capital plc $100,000 5.13% 15/10/2041 132,471 0.00%Northern Powergrid Northeast plc £100,000 1.88% 16/6/2062 130,856 0.00%British Telecommunications plc €100,000 2.13% 26/9/2028 130,737 0.00%Sky Ltd. €100,000 2.25% 17/11/2025 130,238 0.00%Diageo Finance plc €100,000 1.50% 22/10/2027 128,594 0.00%Motability Operations Group plc £100,000 1.50% 20/1/2041 128,295 0.00%Vodafone Group plc €100,000 1.50% 24/7/2027 127,835 0.00%Heathrow Funding Ltd. CA($)150,000 3.25% 21/5/2025 127,567 0.00%Imperial Brands Finance plc €100,000 2.13% 12/2/2027 127,036 0.00%CNH Industrial Finance Europe SA €100,000 1.88% 19/1/2026 126,944 0.00%Mondi Finance plc €100,000 1.63% 27/4/2026 126,546 0.00%CNH Industrial Finance Europe SA €100,000 1.75% 12/9/2025 125,921 0.00%Hyde Housing Association Ltd. £100,000 1.75% 18/8/2055 124,916 0.00%GlaxoSmithKline Capital plc €100,000 1.00% 12/9/2026 124,691 0.00%SELP Finance Sarl €100,000 1.50% 20/11/2025 124,672 0.00%Lloyds Bank plc €100,000 1.25% 13/1/2025 124,478 0.00%ITV plc €100,000 1.38% 26/9/2026 123,988 0.00%Natwest Group plc €100,000 2.50% 22/3/2023 123,922 0.00%SSE plc €100,000 1.75% 8/9/2023 123,655 0.00%Greater Gabbard OFTO plc £76,897 4.14% 29/11/2032 123,228 0.00%Mondi Finance plc €100,000 1.50% 15/4/2024 123,179 0.00%NatWest Markets plc €100,000 1.00% 28/5/2024 122,376 0.00%Standard Chartered plc^ €100,000 0.90% 2/7/2027 122,208 0.00%London Stock Exchange Group plc €100,000 0.88% 19/9/2024 122,170 0.00%Informa plc €100,000 1.50% 5/7/2023 122,104 0.00%RELX Finance BV €100,000 1.00% 22/3/2024 122,006 0.00%Tesco Corporate Treasury Services plc €100,000 0.88% 29/5/2026 121,951 0.00%DS Smith plc €100,000 2.25% 16/9/2022 121,266 0.00%Compass Group Finance Netherlands BV €100,000 0.63% 3/7/2024 121,100 0.00%Imperial Brands Finance plc €100,000 1.13% 14/8/2023 121,033 0.00%RELX Finance BV €100,000 0.88% 10/3/2032 120,866 0.00%Informa plc €100,000 1.25% 22/4/2028 120,754 0.00%BG Energy Capital plc €100,000 1.25% 21/11/2022 120,740 0.00%Reynolds American, Inc. $100,000 5.70% 15/8/2035 120,737 0.00%Barclays plc^ €100,000 0.75% 9/6/2025 120,648 0.00%British Telecommunications plc €100,000 0.50% 12/9/2025 120,227 0.00%National Grid Electricity Transmission plc €100,000 0.82% 7/7/2032 119,813 0.00%AstraZeneca plc $100,000 4.00% 18/9/2042 119,313 0.00%Lseg Netherlands BV €100,000 0.75% 6/4/2033 118,688 0.00%Cadent Finance plc €100,000 0.75% 11/3/2032 117,785 0.00%BAT International Finance plc €100,000 2.00% 13/3/2045 114,486 0.00%Yorkshire Water Finance plc £50,000 6.38% 19/8/2039 113,185 0.00%Electricity North West Ltd. £60,000 8.88% 25/3/2026 112,362 0.00%BAE Systems Holdings, Inc. $100,000 3.80% 7/10/2024 108,860 0.00%Diageo Capital plc $75,000 5.88% 30/9/2036 106,947 0.00%GlaxoSmithKline Capital plc $100,000 3.00% 1/6/2024 106,646 0.00%

622
Vanguard Global Corporate Bond Index Fund
Principal CouponMaturity
DateFair Value
US Dollars ($)% of Total
Net AssetsBAT International Finance plc £100,000 2.25% 9/9/2052 103,545 0.00%Unilever Capital Corp. $100,000 2.13% 6/9/2029 102,918 0.00%Vodafone Group plc $75,000 6.25% 30/11/2032 101,235 0.00%South Eastern Power Networks plc £50,000 6.38% 12/11/2031 99,269 0.00%United Utilities Water Ltd. £50,000 5.00% 28/2/2035 94,996 0.00%London Power Networks plc £50,000 6.13% 7/6/2027 88,053 0.00%Affinity Water Finance plc £50,000 5.88% 13/7/2026 85,018 0.00%BAT Capital Corp. $75,000 3.98% 25/9/2050 73,250 0.00%BAE Systems plc $50,000 5.80% 11/10/2041 69,567 0.00%Lloyds Banking Group plc CA($)75,000 3.50% 3/2/2025 64,501 0.00%BP Capital Markets plc CA($)70,000 3.47% 15/5/2025 60,739 0.00%Niagara Mohawk Power Corp. $50,000 4.12% 28/11/2042 56,913 0.00%RELX Capital, Inc. $50,000 4.00% 18/3/2029 56,792 0.00%Heathrow Funding Ltd. CA($)65,000 3.40% 8/3/2028 55,338 0.00%CNH Industrial NV $50,000 4.50% 15/8/2023 53,907 0.00%Centrica plc $50,000 4.00% 16/10/2023 52,577 0.00%WPP Finance 2010 $50,000 3.63% 7/9/2022 51,809 0.00%Heathrow Funding Ltd. CA($)60,000 3.78% 4/9/2030 51,729 0.00%Sky Group Finance Ltd. $25,000 6.50% 15/10/2035 35,903 0.00%GlaxoSmithKline Capital, Inc. $25,000 5.38% 15/4/2034 33,702 0.00%United Utilities plc $25,000 6.88% 15/8/2028 32,115 0.00%GlaxoSmithKline Capital, Inc. $25,000 3.63% 15/5/2025 27,582 0.00%RELX Capital, Inc. $25,000 3.50% 16/3/2023 26,227 0.00%Thames Water Utilities Finance plc CA($)25,000 2.88% 12/12/2024 20,927 0.00%Nvent Finance Sarl $20,000 3.95% 15/4/2023 20,896 0.00%Nvent Finance Sarl $10,000 4.55% 15/4/2028 10,999 0.00%test - - - 231,989,381 7.95%United States 55.39% (2020: 54.36%)GE Capital International Funding Co. Unlimited Co. $2,525,000 4.42% 15/11/2035 3,032,696 0.10%Mileage Plus Holdings LLC/Mileage Plus Intellectual Property Assets Ltd. $2,275,000 6.50% 20/6/2027 2,504,789 0.09%Morgan Stanley €1,800,000 1.75% 30/1/2025 2,270,071 0.08%Apple, Inc. $2,250,000 0.70% 8/2/2026 2,225,277 0.08%Goldman Sachs Group, Inc. $1,525,000 6.75% 1/10/2037 2,220,768 0.08%Microsoft Corp. $1,953,000 2.92% 17/3/2052 2,071,631 0.07%CVS Health Corp. $1,775,000 3.75% 1/4/2030 1,989,874 0.07%Citigroup, Inc.^ $2,000,000 1.12% 28/1/2027 1,971,931 0.07%Wells Fargo & Co.^ $1,415,000 5.01% 4/4/2051 1,938,439 0.07%Ally Financial, Inc. $1,305,000 8.00% 1/11/2031 1,876,900 0.06%Bank of America Corp.^ €1,500,000 1.38% 7/2/2025 1,845,460 0.06%AT&T, Inc. $1,832,000 3.55% 15/9/2055 1,835,704 0.06%Apple, Inc. $1,375,000 4.65% 23/2/2046 1,824,466 0.06%Wells Fargo & Co.^ $1,750,000 1.65% 2/6/2024 1,787,681 0.06%Bank of America Corp.^ $1,700,000 3.00% 20/12/2023 1,762,028 0.06%CVS Health Corp. $1,425,000 4.78% 25/3/2038 1,752,802 0.06%Oracle Corp. $1,700,000 1.65% 25/3/2026 1,723,572 0.06%Bank of America Corp.^ $1,570,000 3.56% 23/4/2027 1,718,906 0.06%Boeing Co. $1,450,000 5.15% 1/5/2030 1,718,329 0.06%Boeing Co. $1,250,000 5.81% 1/5/2050 1,686,608 0.06%Apple, Inc.1 €1,300,000 1.63% 10/11/2026 1,677,932 0.06%Delta Air Lines, Inc./SkyMiles IP Ltd. $1,500,000 4.75% 20/10/2028 1,669,305 0.06%JPMorgan Chase & Co. $1,526,000 3.30% 1/4/2026 1,668,825 0.06%Boeing Co. $1,650,000 2.20% 4/2/2026 1,665,593 0.06%JPMorgan Chase & Co.^ $1,600,000 2.08% 22/4/2026 1,654,550 0.06%AT&T, Inc. $1,579,000 3.80% 1/12/2057 1,650,053 0.06%Wells Fargo & Co.^ $1,575,000 2.16% 11/2/2026 1,634,111 0.06%Charter Communications Operating LLC/Charter Communications
Operating Capital $1,425,000 4.91% 23/7/2025 1,615,774 0.06%Exxon Mobil Corp.1 $1,575,000 1.57% 15/4/2023 1,609,082 0.06%AT&T, Inc. €1,300,000 1.95% 15/9/2023 1,606,366 0.06%T-Mobile USA, Inc. $1,350,000 4.50% 15/4/2050 1,605,963 0.06%T-Mobile USA, Inc. $1,480,000 3.50% 15/4/2025 1,605,011 0.06%Verizon Communications, Inc.1 $1,325,000 4.27% 15/1/2036 1,580,371 0.05%AT&T, Inc. $1,555,000 3.50% 15/9/2053 1,559,546 0.05%AbbVie, Inc. $1,300,000 4.25% 21/11/2049 1,558,684 0.05%AbbVie, Inc.1 $1,500,000 2.90% 6/11/2022 1,549,779 0.05%Bristol-Myers Squibb Co. $1,400,000 3.20% 15/6/2026 1,536,934 0.05%JPMorgan Chase & Co.^ $1,500,000 2.18% 1/6/2028 1,535,183 0.05%Bank of America Corp.^ $1,407,000 3.42% 20/12/2028 1,534,093 0.05%Bank of America Corp.^ $1,280,000 4.08% 20/3/2051 1,527,697 0.05%CVS Health Corp. $1,175,000 5.13% 20/7/2045 1,525,080 0.05%AbbVie, Inc. $1,400,000 3.20% 21/11/2029 1,519,488 0.05%

623
Vanguard Global Corporate Bond Index Fund
Principal CouponMaturity
DateFair Value
US Dollars ($)% of Total
Net AssetsLennar Corp. $1,300,000 4.75% 29/11/2027 1,502,206 0.05%Microsoft Corp. $1,237,000 3.70% 8/8/2046 1,493,671 0.05%Cintas Corp. No 2 $1,320,000 3.70% 1/4/2027 1,477,560 0.05%Morgan Stanley^ $1,400,000 2.70% 22/1/2031 1,466,500 0.05%Comcast Corp. $1,300,000 3.40% 1/4/2030 1,435,813 0.05%Morgan Stanley^ $1,475,000 1.93% 28/4/2032 1,434,547 0.05%Broadcom, Inc. $1,315,000 3.46% 15/9/2026 1,431,212 0.05%Wells Fargo & Co.^ $1,300,000 3.20% 17/6/2027 1,404,270 0.05%Exxon Mobil Corp. $1,300,000 2.99% 19/3/2025 1,394,850 0.05%Verizon Communications, Inc. $1,075,000 4.86% 21/8/2046 1,388,664 0.05%Goldman Sachs Group, Inc. £1,000,000 1.00% 16/12/2025 1,377,792 0.05%Bank of America Corp.^ $1,175,000 4.08% 23/4/2040 1,374,053 0.05%Costco Wholesale Corp. $1,250,000 3.00% 18/5/2027 1,371,881 0.05%BP Capital Markets America, Inc. $1,300,000 2.94% 6/4/2023 1,355,921 0.05%JPMorgan Chase & Co.^ €1,100,000 1.00% 25/7/2031 1,340,641 0.05%T-Mobile USA, Inc. $1,200,000 3.88% 15/4/2030 1,339,431 0.05%Berkshire Hathaway Energy Co.1 $950,000 6.13% 1/4/2036 1,338,662 0.05%Bristol-Myers Squibb Co. $974,000 5.00% 15/8/2045 1,332,781 0.05%Goldman Sachs Group, Inc. €1,000,000 3.38% 27/3/2025 1,329,864 0.05%Broadcom, Inc. $1,350,000 2.45% 15/2/2031 1,328,553 0.05%Morgan Stanley^ €1,100,000 0.64% 26/7/2024 1,325,260 0.05%Morgan Stanley^ $1,325,000 0.53% 25/1/2024 1,324,574 0.05%Oracle Corp. $1,250,000 2.50% 1/4/2025 1,313,034 0.05%Boeing Co. $950,000 5.93% 1/5/2060 1,310,372 0.05%CVS Health Corp. $1,100,000 4.25% 1/4/2050 1,307,477 0.05%Intel Corp. $1,240,000 2.45% 15/11/2029 1,306,059 0.05%Bank of America Corp. $950,000 6.11% 29/1/2037 1,303,736 0.05%Dell International LLC/EMC Corp. $1,075,000 6.02% 15/6/2026 1,289,302 0.04%Visa, Inc. $1,000,000 4.30% 14/12/2045 1,285,860 0.04%Charter Communications Operating LLC/Charter Communications
Operating Capital $1,000,000 5.75% 1/4/2048 1,276,146 0.04%Abbott Laboratories $1,300,000 1.15% 30/1/2028 1,274,236 0.04%Exxon Mobil Corp. $1,155,000 3.45% 15/4/2051 1,256,831 0.04%GE Capital Funding LLC $1,075,000 4.40% 15/5/2030 1,253,026 0.04%Booking Holdings, Inc. $1,125,000 3.60% 1/6/2026 1,247,162 0.04%Oracle Corp. $1,180,000 2.95% 1/4/2030 1,243,682 0.04%FedEx Corp. $1,025,000 4.55% 1/4/2046 1,240,859 0.04%Citigroup, Inc.^ $1,200,000 2.67% 29/1/2031 1,240,564 0.04%Dell International LLC/EMC Corp. $1,025,000 5.30% 1/10/2029 1,236,232 0.04%Wells Fargo & Co. $900,000 5.61% 15/1/2044 1,230,975 0.04%T-Mobile USA, Inc. $1,050,000 4.38% 15/4/2040 1,230,731 0.04%Wells Fargo & Co.^ €1,000,000 1.34% 4/5/2025 1,229,686 0.04%Morgan Stanley^ $1,225,000 0.73% 5/4/2024 1,227,673 0.04%Charles Schwab Corp. $1,200,000 2.30% 13/5/2031 1,226,055 0.04%Boeing Co. $950,000 5.71% 1/5/2040 1,225,745 0.04%Bank of America Corp.^ $1,075,000 3.97% 7/2/2030 1,218,916 0.04%Bank of America Corp.^ $1,175,000 2.02% 13/2/2026 1,211,427 0.04%Charter Communications Operating LLC/Charter Communications
Operating Capital $875,000 6.48% 23/10/2045 1,207,684 0.04%Goldman Sachs Group, Inc.^ $1,175,000 2.91% 24/7/2023 1,204,430 0.04%Bristol-Myers Squibb Co. $1,075,000 3.40% 26/7/2029 1,204,212 0.04%Goldman Sachs Group, Inc. $1,100,000 3.50% 16/11/2026 1,195,955 0.04%Apple, Inc.1 $1,127,000 2.50% 9/2/2025 1,195,617 0.04%Morgan Stanley^ $1,150,000 2.19% 28/4/2026 1,194,540 0.04%Verizon Communications, Inc. $1,175,000 1.45% 20/3/2026 1,185,856 0.04%Dell International LLC/EMC Corp. $775,000 8.10% 15/7/2036 1,185,350 0.04%JPMorgan Chase & Co.^ $1,000,000 4.49% 24/3/2031 1,185,187 0.04%Wyeth LLC $825,000 5.95% 1/4/2037 1,183,784 0.04%Southwest Airlines Co. $1,150,000 2.63% 10/2/2030 1,179,512 0.04%VMware, Inc. $990,000 4.70% 15/5/2030 1,171,955 0.04%Walt Disney Co. $875,000 4.70% 23/3/2050 1,167,902 0.04%Oracle Corp. $1,125,000 2.40% 15/9/2023 1,167,039 0.04%Fidelity National Information Services, Inc. €925,000 1.50% 21/5/2027 1,164,497 0.04%Southern Co.^ $1,150,000 3.75% 15/9/2051 1,164,111 0.04%MPLX LP $1,010,000 4.50% 15/4/2038 1,154,646 0.04%Microsoft Corp. $1,175,000 2.53% 1/6/2050 1,154,638 0.04%Goldman Sachs Group, Inc.^ $1,100,000 3.21% 22/4/2042 1,151,036 0.04%Altria Group, Inc. $985,000 4.80% 14/2/2029 1,142,256 0.04%Wells Fargo & Co.^ $1,100,000 2.19% 30/4/2026 1,142,005 0.04%Shire Acquisitions Investments Ireland DAC $1,050,000 3.20% 23/9/2026 1,139,725 0.04%JPMorgan Chase & Co.^ $1,075,000 2.96% 13/5/2031 1,129,815 0.04%
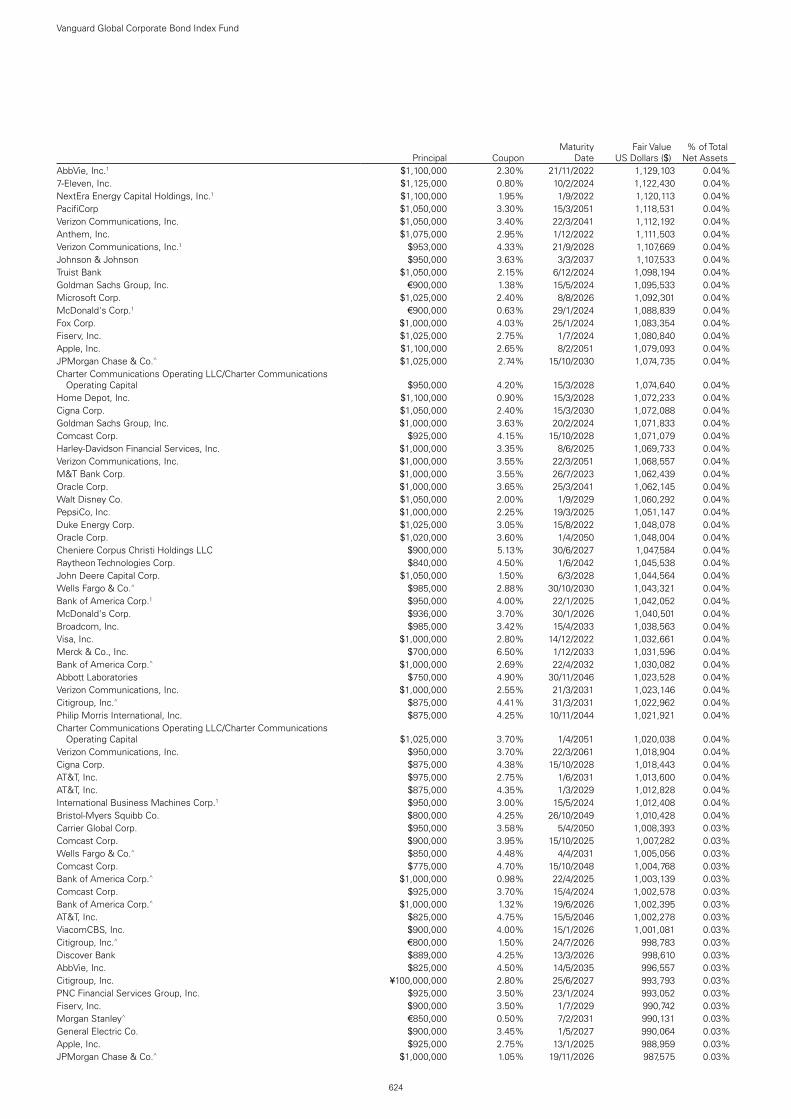
624
Vanguard Global Corporate Bond Index Fund
Principal CouponMaturity
DateFair Value
US Dollars ($)% of Total
Net AssetsAbbVie, Inc.1 $1,100,000 2.30% 21/11/2022 1,129,103 0.04%7-Eleven, Inc. $1,125,000 0.80% 10/2/2024 1,122,430 0.04%NextEra Energy Capital Holdings, Inc.1 $1,100,000 1.95% 1/9/2022 1,120,113 0.04%PacifiCorp $1,050,000 3.30% 15/3/2051 1,118,531 0.04%Verizon Communications, Inc. $1,050,000 3.40% 22/3/2041 1,112,192 0.04%Anthem, Inc. $1,075,000 2.95% 1/12/2022 1,111,503 0.04%Verizon Communications, Inc.1 $953,000 4.33% 21/9/2028 1,107,669 0.04%Johnson & Johnson $950,000 3.63% 3/3/2037 1,107,533 0.04%Truist Bank $1,050,000 2.15% 6/12/2024 1,098,194 0.04%Goldman Sachs Group, Inc. €900,000 1.38% 15/5/2024 1,095,533 0.04%Microsoft Corp. $1,025,000 2.40% 8/8/2026 1,092,301 0.04%McDonald's Corp.1 €900,000 0.63% 29/1/2024 1,088,839 0.04%Fox Corp. $1,000,000 4.03% 25/1/2024 1,083,354 0.04%Fiserv, Inc. $1,025,000 2.75% 1/7/2024 1,080,840 0.04%Apple, Inc. $1,100,000 2.65% 8/2/2051 1,079,093 0.04%JPMorgan Chase & Co.^ $1,025,000 2.74% 15/10/2030 1,074,735 0.04%Charter Communications Operating LLC/Charter Communications
Operating Capital $950,000 4.20% 15/3/2028 1,074,640 0.04%Home Depot, Inc. $1,100,000 0.90% 15/3/2028 1,072,233 0.04%Cigna Corp. $1,050,000 2.40% 15/3/2030 1,072,088 0.04%Goldman Sachs Group, Inc. $1,000,000 3.63% 20/2/2024 1,071,833 0.04%Comcast Corp. $925,000 4.15% 15/10/2028 1,071,079 0.04%Harley-Davidson Financial Services, Inc. $1,000,000 3.35% 8/6/2025 1,069,733 0.04%Verizon Communications, Inc. $1,000,000 3.55% 22/3/2051 1,068,557 0.04%M&T Bank Corp. $1,000,000 3.55% 26/7/2023 1,062,439 0.04%Oracle Corp. $1,000,000 3.65% 25/3/2041 1,062,145 0.04%Walt Disney Co. $1,050,000 2.00% 1/9/2029 1,060,292 0.04%PepsiCo, Inc. $1,000,000 2.25% 19/3/2025 1,051,147 0.04%Duke Energy Corp. $1,025,000 3.05% 15/8/2022 1,048,078 0.04%Oracle Corp. $1,020,000 3.60% 1/4/2050 1,048,004 0.04%Cheniere Corpus Christi Holdings LLC $900,000 5.13% 30/6/2027 1,047,584 0.04%Raytheon Technologies Corp. $840,000 4.50% 1/6/2042 1,045,538 0.04%John Deere Capital Corp. $1,050,000 1.50% 6/3/2028 1,044,564 0.04%Wells Fargo & Co.^ $985,000 2.88% 30/10/2030 1,043,321 0.04%Bank of America Corp.1 $950,000 4.00% 22/1/2025 1,042,052 0.04%McDonald's Corp. $936,000 3.70% 30/1/2026 1,040,501 0.04%Broadcom, Inc. $985,000 3.42% 15/4/2033 1,038,563 0.04%Visa, Inc. $1,000,000 2.80% 14/12/2022 1,032,661 0.04%Merck & Co., Inc. $700,000 6.50% 1/12/2033 1,031,596 0.04%Bank of America Corp.^ $1,000,000 2.69% 22/4/2032 1,030,082 0.04%Abbott Laboratories $750,000 4.90% 30/11/2046 1,023,528 0.04%Verizon Communications, Inc. $1,000,000 2.55% 21/3/2031 1,023,146 0.04%Citigroup, Inc.^ $875,000 4.41% 31/3/2031 1,022,962 0.04%Philip Morris International, Inc. $875,000 4.25% 10/11/2044 1,021,921 0.04%Charter Communications Operating LLC/Charter Communications
Operating Capital $1,025,000 3.70% 1/4/2051 1,020,038 0.04%Verizon Communications, Inc. $950,000 3.70% 22/3/2061 1,018,904 0.04%Cigna Corp. $875,000 4.38% 15/10/2028 1,018,443 0.04%AT&T, Inc. $975,000 2.75% 1/6/2031 1,013,600 0.04%AT&T, Inc. $875,000 4.35% 1/3/2029 1,012,828 0.04%International Business Machines Corp.1 $950,000 3.00% 15/5/2024 1,012,408 0.04%Bristol-Myers Squibb Co. $800,000 4.25% 26/10/2049 1,010,428 0.04%Carrier Global Corp. $950,000 3.58% 5/4/2050 1,008,393 0.03%Comcast Corp. $900,000 3.95% 15/10/2025 1,007,282 0.03%Wells Fargo & Co.^ $850,000 4.48% 4/4/2031 1,005,056 0.03%Comcast Corp. $775,000 4.70% 15/10/2048 1,004,768 0.03%Bank of America Corp.^ $1,000,000 0.98% 22/4/2025 1,003,139 0.03%Comcast Corp. $925,000 3.70% 15/4/2024 1,002,578 0.03%Bank of America Corp.^ $1,000,000 1.32% 19/6/2026 1,002,395 0.03%AT&T, Inc. $825,000 4.75% 15/5/2046 1,002,278 0.03%ViacomCBS, Inc. $900,000 4.00% 15/1/2026 1,001,081 0.03%Citigroup, Inc.^ €800,000 1.50% 24/7/2026 998,783 0.03%Discover Bank $889,000 4.25% 13/3/2026 998,610 0.03%AbbVie, Inc. $825,000 4.50% 14/5/2035 996,557 0.03%Citigroup, Inc. ¥100,000,000 2.80% 25/6/2027 993,793 0.03%PNC Financial Services Group, Inc. $925,000 3.50% 23/1/2024 993,052 0.03%Fiserv, Inc. $900,000 3.50% 1/7/2029 990,742 0.03%Morgan Stanley^ €850,000 0.50% 7/2/2031 990,131 0.03%General Electric Co. $900,000 3.45% 1/5/2027 990,064 0.03%Apple, Inc. $925,000 2.75% 13/1/2025 988,959 0.03%JPMorgan Chase & Co.^ $1,000,000 1.05% 19/11/2026 987,575 0.03%

625
Vanguard Global Corporate Bond Index Fund
Principal CouponMaturity
DateFair Value
US Dollars ($)% of Total
Net AssetsGoldman Sachs Group, Inc. $910,000 3.50% 23/1/2025 983,773 0.03%Microsoft Corp. $987,000 2.68% 1/6/2060 982,700 0.03%Amazon.com, Inc. $825,000 3.88% 22/8/2037 982,084 0.03%Kinder Morgan Energy Partners LP $950,000 3.95% 1/9/2022 980,675 0.03%Phillips 66 $780,000 4.88% 15/11/2044 976,655 0.03%CVS Health Corp. $850,000 4.30% 25/3/2028 976,483 0.03%Amazon.com, Inc. $800,000 4.05% 22/8/2047 975,365 0.03%Verizon Communications, Inc. $1,037,000 2.99% 30/10/2056 975,018 0.03%American Express Co. $930,000 3.40% 27/2/2023 973,653 0.03%Nissan Motor Acceptance Corp. $952,000 2.60% 28/9/2022 971,880 0.03%Bank of America Corp.1 $884,000 3.95% 21/4/2025 970,696 0.03%Gilead Sciences, Inc. $765,000 4.80% 1/4/2044 968,578 0.03%Bank of America Corp.1 $925,000 3.30% 11/1/2023 965,319 0.03%Wells Fargo & Co.^ $875,000 3.58% 22/5/2028 963,363 0.03%Goldman Sachs Group, Inc. $650,000 6.25% 1/2/2041 962,696 0.03%Goldman Sachs Group, Inc. $870,000 3.75% 25/2/2026 962,471 0.03%Citigroup, Inc.^ $900,000 3.35% 24/4/2025 959,925 0.03%Visa, Inc. $875,000 3.15% 14/12/2025 957,333 0.03%Mastercard, Inc. $850,000 3.35% 26/3/2030 956,877 0.03%Citigroup, Inc.^ €800,000 0.50% 8/10/2027 956,391 0.03%Bank of America Corp. $950,000 2.50% 21/10/2022 956,326 0.03%Apple, Inc. €800,000 0.00% 15/11/2025 955,406 0.03%Oracle Corp. $875,000 4.00% 15/11/2047 953,898 0.03%Stellantis NV €700,000 3.88% 5/1/2026 953,729 0.03%Comcast Corp. €800,000 0.25% 20/5/2027 953,089 0.03%General Electric Co. $850,000 3.63% 1/5/2030 948,851 0.03%Verizon Communications, Inc. $825,000 4.02% 3/12/2029 946,357 0.03%Amazon.com, Inc. $900,000 3.10% 12/5/2051 946,081 0.03%Cheniere Corpus Christi Holdings LLC $860,000 3.70% 15/11/2029 939,256 0.03%Oracle Corp. $900,000 2.88% 25/3/2031 937,155 0.03%Comcast Corp. $675,000 4.95% 15/10/2058 933,894 0.03%Goldman Sachs Group, Inc. €800,000 0.25% 26/1/2028 932,071 0.03%Valero Energy Corp. $860,000 3.40% 15/9/2026 931,395 0.03%PNC Bank NA $850,000 3.10% 25/10/2027 930,767 0.03%JPMorgan Chase & Co.^ $800,000 3.90% 23/1/2049 929,626 0.03%AT&T, Inc. $935,000 2.55% 1/12/2033 926,701 0.03%Morgan Stanley^ $925,000 0.56% 10/11/2023 926,020 0.03%Honeywell International, Inc. $925,000 0.48% 19/8/2022 925,216 0.03%Bank of America Corp.^ $750,000 4.33% 15/3/2050 924,648 0.03%Apple, Inc. $950,000 2.38% 8/2/2041 924,229 0.03%Bank of America Corp.^ $900,000 2.82% 21/7/2023 922,388 0.03%John Deere Capital Corp. $900,000 1.75% 9/3/2027 922,055 0.03%Caterpillar, Inc. $775,000 3.80% 15/8/2042 921,792 0.03%Berkshire Hathaway, Inc. ¥100,000,000 0.88% 16/4/2025 921,605 0.03%Goldman Sachs Group, Inc.^ $900,000 2.62% 22/4/2032 920,431 0.03%Anthem, Inc. $879,000 2.38% 15/1/2025 920,352 0.03%AT&T, Inc. €700,000 2.05% 19/5/2032 919,814 0.03%Discovery Communications LLC $825,000 3.95% 20/3/2028 918,536 0.03%Unum Group $850,000 4.00% 15/3/2024 917,901 0.03%Global Payments, Inc. $870,000 2.65% 15/2/2025 916,459 0.03%Honeywell International, Inc. $898,000 1.35% 1/6/2025 915,344 0.03%Expedia Group, Inc. $875,000 3.25% 15/2/2030 914,121 0.03%Devon Energy Corp. $822,000 5.88% 15/6/2028 913,528 0.03%Altria Group, Inc. $850,000 3.80% 14/2/2024 913,336 0.03%Goldman Sachs Group, Inc.^ $800,000 4.22% 1/5/2029 913,336 0.03%Southwest Airlines Co. $775,000 5.13% 15/6/2027 912,614 0.03%AbbVie, Inc. $750,000 4.40% 6/11/2042 911,546 0.03%Comcast Corp.1 $625,000 6.50% 15/11/2035 909,458 0.03%Enstar Group Ltd. $790,000 4.95% 1/6/2029 907,068 0.03%Morgan Stanley^ $900,000 1.59% 4/5/2027 906,201 0.03%JPMorgan Chase & Co. €750,000 0.63% 25/1/2024 906,139 0.03%Bank of America Corp.^ $800,000 3.97% 5/3/2029 901,897 0.03%AbbVie, Inc. $875,000 3.25% 1/10/2022 899,437 0.03%International Business Machines Corp. $900,000 1.95% 15/5/2030 899,162 0.03%PepsiCo, Inc. $800,000 3.45% 6/10/2046 897,987 0.03%Verizon Communications, Inc.1 $750,000 4.50% 10/8/2033 897,458 0.03%Berkshire Hathaway, Inc. ¥100,000,000 0.17% 13/9/2024 895,986 0.03%Wells Fargo & Co.^ €700,000 1.74% 4/5/2030 895,103 0.03%Mondelez International, Inc. $850,000 2.75% 13/4/2030 894,716 0.03%John Deere Capital Corp. $815,000 3.45% 13/3/2025 893,621 0.03%Home Depot, Inc. $625,000 5.88% 16/12/2036 893,173 0.03%

626
Vanguard Global Corporate Bond Index Fund
Principal CouponMaturity
DateFair Value
US Dollars ($)% of Total
Net AssetsJPMorgan Chase & Co.^ $800,000 3.96% 29/1/2027 890,774 0.03%Dow Chemical Co. $745,000 4.38% 15/11/2042 887,941 0.03%Stellantis NV €600,000 4.50% 7/7/2028 887,618 0.03%ConocoPhillips $600,000 6.50% 1/2/2039 887,445 0.03%Lowe's Cos, Inc. $900,000 3.00% 15/10/2050 886,654 0.03%Molson Coors Beverage Co. $825,000 3.00% 15/7/2026 884,804 0.03%Broadcom, Inc. $760,000 4.75% 15/4/2029 884,085 0.03%Verizon Communications, Inc. $815,000 3.15% 22/3/2030 879,015 0.03%Verizon Communications, Inc. €600,000 2.88% 15/1/2038 877,780 0.03%Morgan Stanley $700,000 4.38% 22/1/2047 877,376 0.03%Cisco Systems, Inc. $619,000 5.50% 15/1/2040 875,783 0.03%Baker Hughes a GE Co. LLC/Baker Hughes Co.-Obligor, Inc. $800,000 3.34% 15/12/2027 875,033 0.03%Oracle Corp. $800,000 3.95% 25/3/2051 874,164 0.03%Citigroup, Inc.^ $850,000 2.57% 3/6/2031 873,534 0.03%Amgen, Inc. $675,000 4.66% 15/6/2051 871,751 0.03%Virginia Electric & Power Co. $600,000 6.35% 30/11/2037 870,594 0.03%NIKE, Inc. $800,000 2.85% 27/3/2030 869,224 0.03%Verizon Communications, Inc. $900,000 2.65% 20/11/2040 868,342 0.03%Goldman Sachs Group, Inc. $800,000 3.50% 1/4/2025 867,647 0.03%Merck & Co., Inc. $750,000 3.70% 10/2/2045 867,268 0.03%Chubb Corp. $600,000 6.00% 11/5/2037 867,135 0.03%AT&T, Inc. €600,000 3.15% 4/9/2036 865,650 0.03%Sabine Pass Liquefaction LLC $757,000 5.63% 1/3/2025 865,355 0.03%Apple, Inc. $925,000 2.55% 20/8/2060 862,615 0.03%Discover Bank $800,000 4.20% 8/8/2023 861,573 0.03%Verizon Communications, Inc. $650,000 5.01% 15/4/2049 860,064 0.03%American Tower Corp. $770,000 3.80% 15/8/2029 858,813 0.03%Home Depot, Inc. $775,000 3.35% 15/4/2050 857,629 0.03%Citigroup, Inc. $750,000 4.45% 29/9/2027 856,573 0.03%Broadcom Corp./Broadcom Cayman Finance Ltd. $775,000 3.88% 15/1/2027 856,545 0.03%Cimarex Energy Co. $775,000 3.90% 15/5/2027 854,992 0.03%JPMorgan Chase & Co.^ $800,000 3.33% 22/4/2052 853,780 0.03%AutoZone, Inc. $750,000 4.00% 15/4/2030 853,185 0.03%General Electric Co. €700,000 0.88% 17/5/2025 852,928 0.03%Aflac, Inc. $755,000 3.60% 1/4/2030 851,117 0.03%Intel Corp. $800,000 2.88% 11/5/2024 850,549 0.03%Oracle Corp. $800,000 3.85% 1/4/2060 847,052 0.03%Microsoft Corp. $800,000 2.88% 6/2/2024 846,526 0.03%Charles Schwab Corp. $850,000 0.90% 11/3/2026 843,942 0.03%Fidelity National Information Services, Inc. €700,000 0.75% 21/5/2023 843,581 0.03%Equifax, Inc. $800,000 2.60% 1/12/2024 843,207 0.03%ConocoPhillips $750,000 3.75% 1/10/2027 842,421 0.03%Carrier Global Corp. $800,000 3.38% 5/4/2040 841,839 0.03%Target Corp.1 $775,000 3.50% 1/7/2024 840,897 0.03%AbbVie, Inc. $725,000 4.25% 14/11/2028 840,719 0.03%International Business Machines Corp.1 €700,000 0.38% 31/1/2023 839,387 0.03%New York Life Global Funding £600,000 1.25% 17/12/2026 839,200 0.03%Truist Bank $825,000 1.25% 9/3/2023 837,340 0.03%Morgan Stanley $750,000 4.00% 23/7/2025 835,076 0.03%JPMorgan Chase & Co.^ €700,000 0.39% 24/2/2028 833,082 0.03%General Electric Co.1 $600,000 6.75% 15/3/2032 832,098 0.03%Plains All American Pipeline LP/PAA Finance Corp. $775,000 3.80% 15/9/2030 829,968 0.03%Verizon Communications, Inc.1 $780,000 2.63% 15/8/2026 828,677 0.03%American Express Co. $785,000 2.50% 30/7/2024 827,316 0.03%Viatris, Inc. $775,000 3.85% 22/6/2040 827,192 0.03%Philip Morris International, Inc. €700,000 0.13% 3/8/2026 826,816 0.03%Danaher Corp. €600,000 2.50% 30/3/2030 826,512 0.03%Mondelez International Holdings Netherlands BV €700,000 0.38% 22/9/2029 825,847 0.03%American International Group, Inc.^ $725,000 5.75% 1/4/2048 825,199 0.03%Amazon.com, Inc. $750,000 3.80% 5/12/2024 825,135 0.03%Coca-Cola Co. $850,000 1.00% 15/3/2028 824,669 0.03%Verizon Communications, Inc. €700,000 0.38% 22/3/2029 823,223 0.03%CVS Health Corp. $800,000 2.75% 1/12/2022 822,238 0.03%Bank of America Corp.^ €700,000 0.65% 26/10/2031 822,005 0.03%JPMorgan Chase & Co.^ $800,000 2.58% 22/4/2032 821,912 0.03%AbbVie, Inc. €600,000 2.63% 15/11/2028 821,163 0.03%TJX Cos, Inc. $850,000 1.15% 15/5/2028 820,804 0.03%Walmart, Inc. $775,000 3.40% 26/6/2023 820,716 0.03%Texas Instruments, Inc. $825,000 1.75% 4/5/2030 820,091 0.03%Amgen, Inc. $675,000 4.40% 1/5/2045 818,542 0.03%Oracle Corp. $735,000 4.13% 15/5/2045 818,411 0.03%

627
Vanguard Global Corporate Bond Index Fund
Principal CouponMaturity
DateFair Value
US Dollars ($)% of Total
Net AssetsBank of America Corp.^ $800,000 2.50% 13/2/2031 817,950 0.03%US Bancorp $800,000 1.45% 12/5/2025 817,828 0.03%Walmart, Inc. £400,000 5.63% 27/3/2034 817,813 0.03%JPMorgan Chase & Co. $750,000 3.88% 10/9/2024 817,637 0.03%General Electric Co. $600,000 5.88% 14/1/2038 817,143 0.03%Verizon Communications, Inc. $800,000 2.10% 22/3/2028 816,942 0.03%Exxon Mobil Corp. $745,000 3.57% 6/3/2045 816,210 0.03%Citigroup, Inc. $750,000 3.20% 21/10/2026 812,602 0.03%NVIDIA Corp. $750,000 2.85% 1/4/2030 812,023 0.03%International Business Machines Corp. $800,000 1.70% 15/5/2027 810,384 0.03%Cigna Corp. $650,000 4.80% 15/8/2038 809,585 0.03%JPMorgan Chase & Co. $550,000 6.40% 15/5/2038 809,533 0.03%Microsoft Corp. $756,000 3.04% 17/3/2062 808,344 0.03%Boeing Co. $750,000 3.63% 1/2/2031 806,724 0.03%Apple, Inc.1 $800,000 0.75% 11/5/2023 806,631 0.03%Charter Communications Operating LLC/Charter Communications
Operating Capital $700,000 4.80% 1/3/2050 806,474 0.03%Corporate Office Properties LP $800,000 2.75% 15/4/2031 806,205 0.03%Verizon Communications, Inc. $700,000 4.00% 22/3/2050 805,599 0.03%JPMorgan Chase & Co.^ $800,000 1.58% 22/4/2027 804,295 0.03%Berkshire Hathaway Finance Corp. $650,000 4.20% 15/8/2048 802,532 0.03%Toyota Motor Credit Corp. $800,000 0.45% 22/7/2022 801,771 0.03%AmerisourceBergen Corp. $800,000 0.74% 15/3/2023 801,584 0.03%Altria Group, Inc. $650,000 5.80% 14/2/2039 801,375 0.03%ConocoPhillips $610,000 4.88% 1/10/2047 801,186 0.03%Berry Global, Inc. $800,000 1.57% 15/1/2026 801,031 0.03%Microchip Technology, Inc. $800,000 0.97% 15/2/2024 799,848 0.03%Entergy Corp. $775,000 4.00% 15/7/2022 799,281 0.03%Bank of America Corp.1 $725,000 3.50% 19/4/2026 798,026 0.03%Exelon Corp. $700,000 4.05% 15/4/2030 796,974 0.03%Comcast Corp. $630,000 4.65% 15/7/2042 796,097 0.03%Nestle Holdings, Inc.1 $800,000 0.38% 15/1/2024 795,934 0.03%Fidelity National Information Services, Inc. $800,000 1.65% 1/3/2028 795,164 0.03%Citigroup, Inc. $625,000 4.75% 18/5/2046 795,060 0.03%Apple, Inc. £500,000 3.05% 31/7/2029 794,517 0.03%National Rural Utilities Cooperative Finance Corp. $800,000 1.00% 15/6/2026 793,598 0.03%Duke Energy Florida LLC $700,000 3.80% 15/7/2028 792,835 0.03%HCA, Inc. $700,000 4.13% 15/6/2029 789,374 0.03%Mastercard, Inc. $650,000 3.85% 26/3/2050 787,310 0.03%Apple, Inc. $800,000 1.65% 8/2/2031 787,273 0.03%BP Capital Markets America, Inc. $730,000 3.19% 6/4/2025 786,436 0.03%AbbVie, Inc. $675,000 4.05% 21/11/2039 783,574 0.03%Danaher Corp. €600,000 2.10% 30/9/2026 783,198 0.03%Walmart, Inc. $575,000 5.25% 1/9/2035 783,117 0.03%AT&T, Inc. $675,000 4.30% 15/2/2030 780,435 0.03%JPMorgan Chase & Co.^ $740,000 3.56% 23/4/2024 780,335 0.03%Microsoft Corp. $700,000 3.30% 6/2/2027 779,062 0.03%Goldman Sachs Group, Inc. $720,000 3.85% 8/7/2024 778,683 0.03%VMware, Inc. $700,000 3.90% 21/8/2027 777,944 0.03%Ally Financial, Inc. $690,000 5.13% 30/9/2024 777,775 0.03%Wells Fargo & Co.^ $750,000 2.39% 2/6/2028 777,690 0.03%Oracle Corp. $600,000 5.38% 15/7/2040 777,628 0.03%Williams Cos, Inc. $700,000 3.75% 15/6/2027 777,209 0.03%Alexandria Real Estate Equities, Inc. $650,000 4.70% 1/7/2030 774,543 0.03%Morgan Stanley $715,000 3.13% 27/7/2026 774,051 0.03%Verizon Communications, Inc. $810,000 1.68% 30/10/2030 773,835 0.03%Apple, Inc.1 $650,000 3.85% 4/5/2043 773,643 0.03%Johnson & Johnson $726,000 2.63% 15/1/2025 772,970 0.03%DTE Energy Co. $725,000 2.85% 1/10/2026 772,876 0.03%Abbott Laboratories $600,000 4.75% 30/11/2036 772,723 0.03%McDonald's Corp. $600,000 4.88% 9/12/2045 772,437 0.03%American Express Co. $725,000 3.70% 3/8/2023 771,993 0.03%Chevron Phillips Chemical Co. LLC/Chevron Phillips Chemical Co. LP $700,000 3.40% 1/12/2026 771,719 0.03%Edison International $725,000 4.13% 15/3/2028 771,715 0.03%Goldman Sachs Group, Inc.^ €650,000 0.01% 30/4/2024 771,285 0.03%QUALCOMM, Inc. $788,000 1.30% 20/5/2028 771,266 0.03%JPMorgan Chase & Co.^ $750,000 2.52% 22/4/2031 770,792 0.03%Citigroup, Inc.^ $725,000 2.98% 5/11/2030 769,025 0.03%United Parcel Service, Inc. $525,000 5.30% 1/4/2050 768,802 0.03%Northrop Grumman Corp. $650,000 4.40% 1/5/2030 768,748 0.03%Burlington Northern Santa Fe LLC $750,000 3.05% 1/9/2022 768,457 0.03%

628
Vanguard Global Corporate Bond Index Fund
Principal CouponMaturity
DateFair Value
US Dollars ($)% of Total
Net AssetsEcolab, Inc. $625,000 4.80% 24/3/2030 766,297 0.03%Citigroup, Inc.^ $750,000 1.68% 15/5/2024 765,876 0.03%CSX Corp. $675,000 3.80% 1/11/2046 763,757 0.03%ERAC USA Finance LLC $700,000 3.85% 15/11/2024 763,480 0.03%Comcast Corp. $725,000 2.65% 1/2/2030 762,843 0.03%National Securities Clearing Corp. $750,000 1.20% 23/4/2023 761,704 0.03%Citigroup, Inc. $675,000 4.13% 25/7/2028 761,184 0.03%Goldman Sachs Group, Inc. €600,000 1.63% 27/7/2026 759,562 0.03%Dell International LLC/EMC Corp. $700,000 5.45% 15/6/2023 759,323 0.03%Intel Corp. $600,000 4.60% 25/3/2040 759,318 0.03%Delta Air Lines, Inc. $650,000 7.00% 1/5/2025 758,462 0.03%Morgan Stanley^ $675,000 3.77% 24/1/2029 757,998 0.03%Mastercard, Inc. $750,000 1.90% 15/3/2031 757,685 0.03%Apple, Inc. $600,000 4.50% 23/2/2036 757,656 0.03%Principal Financial Group, Inc. $700,000 3.10% 15/11/2026 757,455 0.03%Stellantis NV €600,000 2.00% 20/3/2025 756,485 0.03%Intel Corp. $650,000 3.90% 25/3/2030 755,784 0.03%Lockheed Martin Corp. $525,000 6.15% 1/9/2036 754,992 0.03%National Rural Utilities Cooperative Finance Corp.^ $720,000 4.75% 30/4/2043 754,078 0.03%JPMorgan Chase & Co.^ $725,000 3.11% 22/4/2051 751,558 0.03%Berry Global, Inc. $750,000 0.95% 15/2/2024 751,547 0.03%Berkshire Hathaway, Inc. €600,000 1.13% 16/3/2027 749,970 0.03%Verizon Communications, Inc. €600,000 1.25% 8/4/2030 749,937 0.03%Morgan Stanley $675,000 3.63% 20/1/2027 749,123 0.03%Nuveen LLC $650,000 4.00% 1/11/2028 748,875 0.03%Pacific Gas & Electric Co. $700,000 4.55% 1/7/2030 748,816 0.03%Wells Fargo & Co.^ $715,000 2.41% 30/10/2025 748,076 0.03%Equitable Holdings, Inc. $585,000 5.00% 20/4/2048 746,255 0.03%AbbVie, Inc. $575,000 4.88% 14/11/2048 745,583 0.03%Procter & Gamble Co.1 $675,000 3.00% 25/3/2030 744,406 0.03%Archer-Daniels-Midland Co. €600,000 1.00% 12/9/2025 743,371 0.03%Medtronic, Inc. $597,000 4.38% 15/3/2035 743,019 0.03%Apple, Inc. $680,000 2.90% 12/9/2027 741,266 0.03%Raytheon Technologies Corp. $625,000 4.15% 15/5/2045 741,202 0.03%Morgan Stanley^ $700,000 3.22% 22/4/2042 740,688 0.03%Broadcom, Inc. $650,000 4.30% 15/11/2032 740,100 0.03%Digital Realty Trust LP $665,000 3.60% 1/7/2029 739,351 0.03%Costco Wholesale Corp. $750,000 1.75% 20/4/2032 738,952 0.03%Wells Fargo & Co.1 $675,000 4.48% 16/1/2024 738,883 0.03%AbbVie, Inc. $700,000 2.60% 21/11/2024 738,391 0.03%AbbVie, Inc. $675,000 3.80% 15/3/2025 738,208 0.03%Morgan Stanley $675,000 3.70% 23/10/2024 735,983 0.03%AT&T, Inc. $675,000 3.40% 15/5/2025 735,501 0.03%NVIDIA Corp. $650,000 3.50% 1/4/2050 735,074 0.03%Intercontinental Exchange, Inc. $620,000 4.25% 21/9/2048 732,838 0.03%Upjohn Finance BV €600,000 1.02% 23/6/2024 731,589 0.03%AT&T, Inc. $700,000 3.65% 1/6/2051 731,565 0.03%Comcast Corp. $675,000 3.45% 1/2/2050 731,181 0.03%American Tower Corp. $695,000 2.90% 15/1/2030 730,640 0.03%Lockheed Martin Corp. $660,000 3.55% 15/1/2026 729,605 0.03%Pfizer, Inc. £465,000 2.74% 15/6/2043 729,538 0.03%Eli Lilly & Co. $650,000 3.38% 15/3/2029 729,464 0.03%Digital Stout Holding LLC £500,000 2.75% 19/7/2024 728,657 0.03%AT&T, Inc. $725,000 0.90% 25/3/2024 726,558 0.03%Bank of America Corp.1 €600,000 0.75% 26/7/2023 725,880 0.03%Microsoft Corp. €500,000 3.13% 6/12/2028 724,817 0.03%Chevron Corp. $700,000 3.08% 11/5/2050 724,794 0.03%Goldman Sachs Group, Inc. €600,000 1.38% 26/7/2022 724,399 0.03%Walmart, Inc. $575,000 4.05% 29/6/2048 723,478 0.03%Ecolab, Inc. $675,000 2.70% 1/11/2026 723,179 0.03%Emerson Electric Co. €600,000 0.38% 22/5/2024 721,559 0.03%ViacomCBS, Inc. $625,000 4.20% 19/5/2032 721,085 0.03%Pacific Gas & Electric Co. $700,000 4.95% 1/7/2050 721,040 0.03%Citigroup, Inc. $700,000 2.70% 27/10/2022 720,021 0.03%Merck & Co., Inc. $725,000 0.75% 24/2/2026 719,447 0.03%T-Mobile USA, Inc. $650,000 3.75% 15/4/2027 718,312 0.03%Wells Fargo & Co.^ $700,000 3.07% 30/4/2041 717,806 0.03%Medtronic Global Holdings SCA €600,000 0.38% 15/10/2028 717,743 0.03%UnitedHealth Group, Inc. $665,000 2.88% 15/8/2029 717,272 0.03%LYB International Finance III LLC $675,000 2.88% 1/5/2025 717,122 0.03%Chevron Corp. $700,000 1.55% 11/5/2025 716,804 0.02%
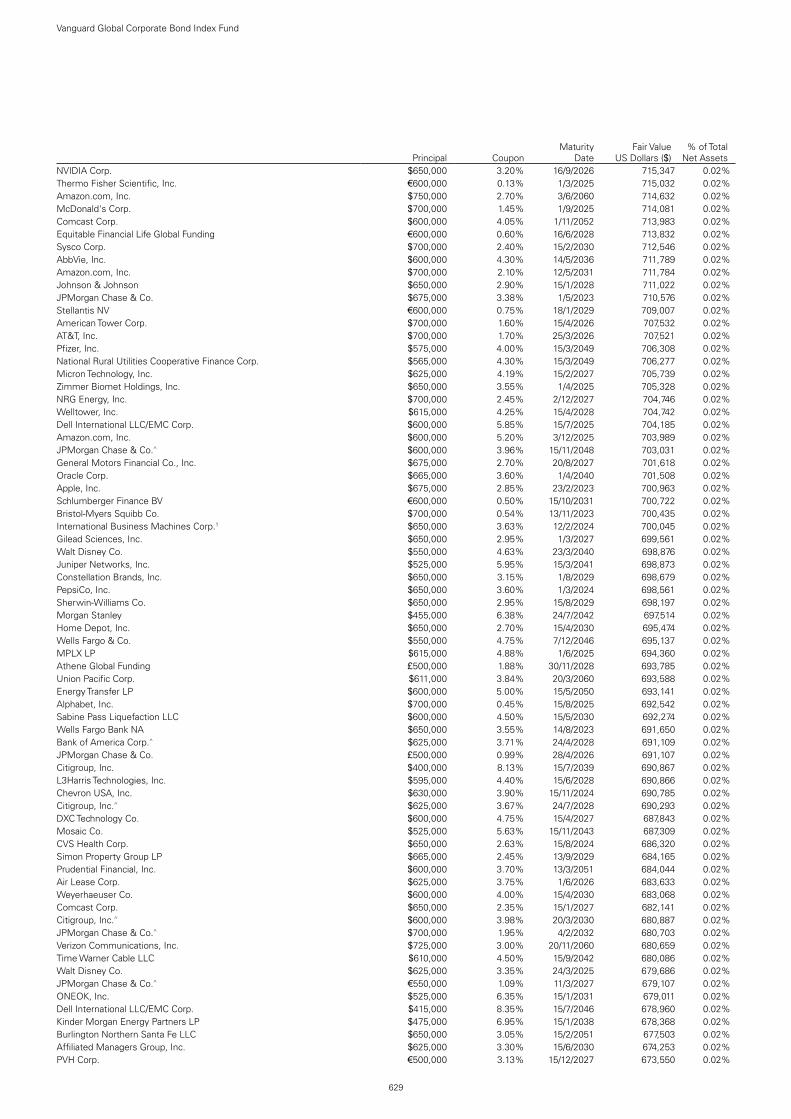
629
Vanguard Global Corporate Bond Index Fund
Principal CouponMaturity
DateFair Value
US Dollars ($)% of Total
Net AssetsNVIDIA Corp. $650,000 3.20% 16/9/2026 715,347 0.02%Thermo Fisher Scientific, Inc. €600,000 0.13% 1/3/2025 715,032 0.02%Amazon.com, Inc. $750,000 2.70% 3/6/2060 714,632 0.02%McDonald's Corp. $700,000 1.45% 1/9/2025 714,081 0.02%Comcast Corp. $600,000 4.05% 1/11/2052 713,983 0.02%Equitable Financial Life Global Funding €600,000 0.60% 16/6/2028 713,832 0.02%Sysco Corp. $700,000 2.40% 15/2/2030 712,546 0.02%AbbVie, Inc. $600,000 4.30% 14/5/2036 711,789 0.02%Amazon.com, Inc. $700,000 2.10% 12/5/2031 711,784 0.02%Johnson & Johnson $650,000 2.90% 15/1/2028 711,022 0.02%JPMorgan Chase & Co. $675,000 3.38% 1/5/2023 710,576 0.02%Stellantis NV €600,000 0.75% 18/1/2029 709,007 0.02%American Tower Corp. $700,000 1.60% 15/4/2026 707,532 0.02%AT&T, Inc. $700,000 1.70% 25/3/2026 707,521 0.02%Pfizer, Inc. $575,000 4.00% 15/3/2049 706,308 0.02%National Rural Utilities Cooperative Finance Corp. $565,000 4.30% 15/3/2049 706,277 0.02%Micron Technology, Inc. $625,000 4.19% 15/2/2027 705,739 0.02%Zimmer Biomet Holdings, Inc. $650,000 3.55% 1/4/2025 705,328 0.02%NRG Energy, Inc. $700,000 2.45% 2/12/2027 704,746 0.02%Welltower, Inc. $615,000 4.25% 15/4/2028 704,742 0.02%Dell International LLC/EMC Corp. $600,000 5.85% 15/7/2025 704,185 0.02%Amazon.com, Inc. $600,000 5.20% 3/12/2025 703,989 0.02%JPMorgan Chase & Co.^ $600,000 3.96% 15/11/2048 703,031 0.02%General Motors Financial Co., Inc. $675,000 2.70% 20/8/2027 701,618 0.02%Oracle Corp. $665,000 3.60% 1/4/2040 701,508 0.02%Apple, Inc. $675,000 2.85% 23/2/2023 700,963 0.02%Schlumberger Finance BV €600,000 0.50% 15/10/2031 700,722 0.02%Bristol-Myers Squibb Co. $700,000 0.54% 13/11/2023 700,435 0.02%International Business Machines Corp.1 $650,000 3.63% 12/2/2024 700,045 0.02%Gilead Sciences, Inc. $650,000 2.95% 1/3/2027 699,561 0.02%Walt Disney Co. $550,000 4.63% 23/3/2040 698,876 0.02%Juniper Networks, Inc. $525,000 5.95% 15/3/2041 698,873 0.02%Constellation Brands, Inc. $650,000 3.15% 1/8/2029 698,679 0.02%PepsiCo, Inc. $650,000 3.60% 1/3/2024 698,561 0.02%Sherwin-Williams Co. $650,000 2.95% 15/8/2029 698,197 0.02%Morgan Stanley $455,000 6.38% 24/7/2042 697,514 0.02%Home Depot, Inc. $650,000 2.70% 15/4/2030 695,474 0.02%Wells Fargo & Co. $550,000 4.75% 7/12/2046 695,137 0.02%MPLX LP $615,000 4.88% 1/6/2025 694,360 0.02%Athene Global Funding £500,000 1.88% 30/11/2028 693,785 0.02%Union Pacific Corp. $611,000 3.84% 20/3/2060 693,588 0.02%Energy Transfer LP $600,000 5.00% 15/5/2050 693,141 0.02%Alphabet, Inc. $700,000 0.45% 15/8/2025 692,542 0.02%Sabine Pass Liquefaction LLC $600,000 4.50% 15/5/2030 692,274 0.02%Wells Fargo Bank NA $650,000 3.55% 14/8/2023 691,650 0.02%Bank of America Corp.^ $625,000 3.71% 24/4/2028 691,109 0.02%JPMorgan Chase & Co. £500,000 0.99% 28/4/2026 691,107 0.02%Citigroup, Inc. $400,000 8.13% 15/7/2039 690,867 0.02%L3Harris Technologies, Inc. $595,000 4.40% 15/6/2028 690,866 0.02%Chevron USA, Inc. $630,000 3.90% 15/11/2024 690,785 0.02%Citigroup, Inc.^ $625,000 3.67% 24/7/2028 690,293 0.02%DXC Technology Co. $600,000 4.75% 15/4/2027 687,843 0.02%Mosaic Co. $525,000 5.63% 15/11/2043 687,309 0.02%CVS Health Corp. $650,000 2.63% 15/8/2024 686,320 0.02%Simon Property Group LP $665,000 2.45% 13/9/2029 684,165 0.02%Prudential Financial, Inc. $600,000 3.70% 13/3/2051 684,044 0.02%Air Lease Corp. $625,000 3.75% 1/6/2026 683,633 0.02%Weyerhaeuser Co. $600,000 4.00% 15/4/2030 683,068 0.02%Comcast Corp. $650,000 2.35% 15/1/2027 682,141 0.02%Citigroup, Inc.^ $600,000 3.98% 20/3/2030 680,887 0.02%JPMorgan Chase & Co.^ $700,000 1.95% 4/2/2032 680,703 0.02%Verizon Communications, Inc. $725,000 3.00% 20/11/2060 680,659 0.02%Time Warner Cable LLC $610,000 4.50% 15/9/2042 680,086 0.02%Walt Disney Co. $625,000 3.35% 24/3/2025 679,686 0.02%JPMorgan Chase & Co.^ €550,000 1.09% 11/3/2027 679,107 0.02%ONEOK, Inc. $525,000 6.35% 15/1/2031 679,011 0.02%Dell International LLC/EMC Corp. $415,000 8.35% 15/7/2046 678,960 0.02%Kinder Morgan Energy Partners LP $475,000 6.95% 15/1/2038 678,368 0.02%Burlington Northern Santa Fe LLC $650,000 3.05% 15/2/2051 677,503 0.02%Affiliated Managers Group, Inc. $625,000 3.30% 15/6/2030 674,253 0.02%PVH Corp. €500,000 3.13% 15/12/2027 673,550 0.02%

630
Vanguard Global Corporate Bond Index Fund
Principal CouponMaturity
DateFair Value
US Dollars ($)% of Total
Net AssetsWells Fargo & Co. $585,000 4.15% 24/1/2029 673,252 0.02%Spectra Energy Partners LP $573,000 4.50% 15/3/2045 673,032 0.02%Boeing Co. $600,000 4.88% 1/5/2025 672,479 0.02%Boston Scientific Corp. $525,000 4.70% 1/3/2049 671,987 0.02%Microsoft Corp. $650,000 2.00% 8/8/2023 671,283 0.02%Amazon.com, Inc. $650,000 2.88% 12/5/2041 671,053 0.02%Charter Communications Operating LLC/Charter Communications
Operating Capital $500,000 6.38% 23/10/2035 670,049 0.02%HP, Inc. $625,000 3.40% 17/6/2030 669,655 0.02%Teledyne Technologies, Inc. $650,000 2.75% 1/4/2031 668,231 0.02%CVS Health Corp. $575,000 4.13% 1/4/2040 666,566 0.02%Citigroup, Inc.^ $650,000 2.88% 24/7/2023 666,557 0.02%JPMorgan Chase & Co.^ $600,000 3.78% 1/2/2028 665,861 0.02%Metropolitan Life Global Funding I £500,000 0.63% 8/12/2027 665,751 0.02%Metropolitan Life Global Funding I $650,000 1.95% 13/1/2023 665,620 0.02%Oracle Corp. $600,000 4.10% 25/3/2061 664,936 0.02%Morgan Stanley^ $600,000 3.59% 22/7/2028 664,797 0.02%Goldman Sachs Group, Inc. €550,000 0.88% 21/1/2030 664,634 0.02%American International Group, Inc. $595,000 3.90% 1/4/2026 664,207 0.02%Intel Corp. $500,000 4.75% 25/3/2050 663,871 0.02%Becton Dickinson & Co. $532,000 4.69% 15/12/2044 663,392 0.02%Discovery Communications LLC $525,000 5.30% 15/5/2049 662,045 0.02%Walmart, Inc. $600,000 3.55% 26/6/2025 661,713 0.02%Wells Fargo & Co. CHF600,000 0.50% 2/11/2023 660,028 0.02%Home Depot, Inc. $475,000 5.40% 15/9/2040 657,108 0.02%Southwest Airlines Co. $575,000 5.25% 4/5/2025 656,820 0.02%Cigna Corp. $609,000 3.25% 15/4/2025 656,370 0.02%Wells Fargo & Co. $575,000 4.30% 22/7/2027 655,221 0.02%Citigroup, Inc. $500,000 4.65% 23/7/2048 654,920 0.02%Capital One Financial Corp. $580,000 3.80% 31/1/2028 654,608 0.02%Intercontinental Exchange, Inc. $650,000 0.70% 15/6/2023 652,859 0.02%CVS Health Corp. $600,000 3.25% 15/8/2029 652,479 0.02%Citigroup, Inc.^ $650,000 0.78% 30/10/2024 651,533 0.02%Williams Cos, Inc. $475,000 6.30% 15/4/2040 650,836 0.02%Comcast Corp. $525,000 4.60% 15/10/2038 650,755 0.02%Roper Technologies, Inc. $675,000 1.75% 15/2/2031 648,859 0.02%Simon Property Group LP $625,000 2.75% 1/6/2023 648,850 0.02%Athene Global Funding €550,000 0.63% 12/1/2028 648,190 0.02%Goldman Sachs Group, Inc.^ $650,000 1.43% 9/3/2027 648,090 0.02%JPMorgan Chase & Co.^ $600,000 4.02% 5/12/2024 647,582 0.02%Oracle Corp. $610,000 2.80% 1/4/2027 646,790 0.02%Entergy Louisiana LLC $530,000 4.20% 1/9/2048 646,726 0.02%Cigna Corp. $500,000 4.90% 15/12/2048 646,249 0.02%3M Co. $620,000 2.00% 14/2/2025 645,914 0.02%Union Pacific Corp. $625,000 2.40% 5/2/2030 645,187 0.02%Metropolitan Life Global Funding I $600,000 3.60% 11/1/2024 644,675 0.02%Enterprise Products Operating LLC $545,000 4.45% 15/2/2043 644,185 0.02%Discovery Communications LLC $600,000 3.45% 15/3/2025 644,129 0.02%DuPont de Nemours, Inc. $540,000 4.73% 15/11/2028 643,574 0.02%AT&T, Inc. $635,000 3.65% 15/9/2059 643,334 0.02%PepsiCo, Inc. $575,000 3.38% 29/7/2049 642,825 0.02%Duke Energy Florida LLC $435,000 6.35% 15/9/2037 642,285 0.02%Johnson & Johnson €500,000 1.15% 20/11/2028 640,671 0.02%Marathon Petroleum Corp. $544,000 5.13% 15/12/2026 640,425 0.02%Pfizer, Inc. $600,000 2.63% 1/4/2030 639,833 0.02%Bank of America Corp.^ €500,000 1.66% 25/4/2028 638,178 0.02%Travelers Cos, Inc. $525,000 4.00% 30/5/2047 637,057 0.02%Exelon Corp. $525,000 4.45% 15/4/2046 636,876 0.02%Verisk Analytics, Inc. $560,000 4.13% 15/3/2029 636,410 0.02%Harley-Davidson Financial Services, Inc. €500,000 3.88% 19/5/2023 635,993 0.02%Bank of America Corp.^ $590,000 3.19% 23/7/2030 635,175 0.02%Evergy, Inc. $600,000 2.90% 15/9/2029 635,125 0.02%Bank of America Corp. $400,000 7.75% 14/5/2038 633,693 0.02%Philip Morris International, Inc.1 $625,000 1.13% 1/5/2023 633,247 0.02%Exxon Mobil Corp. $600,000 2.61% 15/10/2030 632,861 0.02%Chubb INA Holdings, Inc. €500,000 1.40% 15/6/2031 632,196 0.02%Bank of America Corp.^ $600,000 2.88% 22/10/2030 631,627 0.02%Consolidated Edison Co. of New York, Inc. $525,000 4.45% 15/3/2044 631,436 0.02%Apple, Inc. $575,000 3.25% 23/2/2026 631,417 0.02%Nucor Corp. $609,000 2.00% 1/6/2025 629,887 0.02%Wells Fargo & Co. €500,000 1.50% 24/5/2027 628,924 0.02%

631
Vanguard Global Corporate Bond Index Fund
Principal CouponMaturity
DateFair Value
US Dollars ($)% of Total
Net AssetsPacific Gas & Electric Co. $600,000 3.45% 1/7/2025 628,762 0.02%Amgen, Inc. $500,000 4.56% 15/6/2048 628,647 0.02%Walmart, Inc. $535,000 3.63% 15/12/2047 627,577 0.02%ONEOK, Inc. $565,000 4.45% 1/9/2049 627,481 0.02%Microsoft Corp. $575,000 3.13% 3/11/2025 627,412 0.02%Energy Transfer LP $530,000 5.40% 1/10/2047 627,320 0.02%VEREIT Operating Partnership LP $575,000 3.40% 15/1/2028 626,885 0.02%UnitedHealth Group, Inc. $610,000 2.38% 15/10/2022 626,189 0.02%General Electric Co. €500,000 1.50% 17/5/2029 625,891 0.02%Energy Transfer LP/Regency Energy Finance Corp. $600,000 5.00% 1/10/2022 625,365 0.02%AbbVie, Inc. $500,000 4.70% 14/5/2045 623,829 0.02%Dover Corp. €500,000 1.25% 9/11/2026 623,326 0.02%Union Electric Co. $525,000 4.00% 1/4/2048 622,852 0.02%Apple, Inc.1 $600,000 2.40% 3/5/2023 622,514 0.02%Goldman Sachs Group, Inc. $600,000 2.60% 7/2/2030 622,252 0.02%Starbucks Corp. $600,000 2.55% 15/11/2030 621,561 0.02%Sabine Pass Liquefaction LLC $525,000 5.88% 30/6/2026 621,281 0.02%Berkshire Hathaway Finance Corp. $500,000 4.25% 15/1/2049 620,961 0.02%Exxon Mobil Corp. $525,000 4.11% 1/3/2046 620,549 0.02%Appalachian Power Co. $600,000 2.70% 1/4/2031 620,473 0.02%Morgan Stanley $500,000 4.30% 27/1/2045 620,123 0.02%General Dynamics Corp. $572,000 3.25% 1/4/2025 619,970 0.02%Alphabet, Inc. $700,000 2.05% 15/8/2050 619,551 0.02%Equifax, Inc. $575,000 3.10% 15/5/2030 618,831 0.02%Honeywell International, Inc. $600,000 2.80% 1/6/2050 618,568 0.02%JPMorgan Chase & Co. $450,000 5.40% 6/1/2042 618,494 0.02%International Business Machines Corp. $500,000 4.25% 15/5/2049 618,448 0.02%AT&T, Inc. $525,000 4.50% 9/3/2048 618,395 0.02%Aon plc $575,000 3.50% 14/6/2024 618,352 0.02%Penske Truck Leasing Co. LP/PTL Finance Corp. $550,000 4.45% 29/1/2026 618,249 0.02%Broadcom, Inc. $584,000 3.47% 15/4/2034 618,106 0.02%DuPont de Nemours, Inc. $445,000 5.42% 15/11/2048 617,985 0.02%CVS Health Corp. $600,000 3.50% 20/7/2022 616,777 0.02%Nestle Holdings, Inc. €500,000 0.88% 18/7/2025 616,697 0.02%Wells Fargo & Co. $500,000 4.65% 4/11/2044 616,122 0.02%Broadcom, Inc. $600,000 3.50% 15/2/2041 615,731 0.02%Oracle Corp. $583,000 2.65% 15/7/2026 615,317 0.02%Teachers Insurance & Annuity Association of America $515,000 4.27% 15/5/2047 615,251 0.02%Goldman Sachs Group, Inc.^ $575,000 3.27% 29/9/2025 615,009 0.02%Roper Technologies, Inc. $575,000 2.95% 15/9/2029 614,932 0.02%PPG Industries, Inc. €500,000 0.88% 3/11/2025 614,870 0.02%Becton Dickinson & Co. $553,000 3.70% 6/6/2027 614,696 0.02%AT&T, Inc. $475,000 5.15% 15/2/2050 614,540 0.02%Digital Euro Finco LLC €500,000 1.13% 9/4/2028 613,442 0.02%Goldman Sachs Group, Inc. £400,000 3.13% 25/7/2029 613,437 0.02%Comcast Corp. $525,000 3.97% 1/11/2047 612,469 0.02%Viatris, Inc. $600,000 2.30% 22/6/2027 612,090 0.02%Arch Capital Group US, Inc. $465,000 5.14% 1/11/2043 612,080 0.02%Merck & Co., Inc. $574,000 2.75% 10/2/2025 611,582 0.02%Nasdaq, Inc. €500,000 1.75% 19/5/2023 611,333 0.02%Teledyne Technologies, Inc. $600,000 2.25% 1/4/2028 611,324 0.02%State Street Corp.^ $600,000 2.83% 30/3/2023 611,260 0.02%Bank of America Corp.^ $600,000 1.49% 19/5/2024 610,604 0.02%Raytheon Technologies Corp. $475,000 4.63% 16/11/2048 609,928 0.02%Bank of America Corp.^ €500,000 0.81% 9/5/2026 609,785 0.02%MetLife, Inc. $475,000 6.40% 15/12/2036 608,816 0.02%Exxon Mobil Corp. $550,000 3.29% 19/3/2027 608,319 0.02%Bank of America Corp.^ $625,000 2.68% 19/6/2041 608,128 0.02%Berkshire Hathaway, Inc. $475,000 4.50% 11/2/2043 608,081 0.02%Wells Fargo & Co. $475,000 4.90% 17/11/2045 607,997 0.02%Procter & Gamble Co.1 €500,000 0.50% 25/10/2024 607,942 0.02%Bank of America Corp. $475,000 4.75% 21/4/2045 607,160 0.02%Johnson & Johnson $650,000 2.25% 1/9/2050 606,763 0.02%Stryker Corp. €500,000 0.75% 1/3/2029 606,532 0.02%Fifth Third Bancorp $565,000 3.65% 25/1/2024 605,542 0.02%Pfizer, Inc. $550,000 3.00% 15/12/2026 603,876 0.02%General Motors Financial Co., Inc. €500,000 0.85% 26/2/2026 603,727 0.02%GE Capital UK Funding Unlimited Co. £250,000 8.00% 14/1/2039 603,252 0.02%Gilead Sciences, Inc. $475,000 4.75% 1/3/2046 602,302 0.02%Cheniere Corpus Christi Holdings LLC $525,000 5.88% 31/3/2025 602,284 0.02%Walmart, Inc. $550,000 3.05% 8/7/2026 602,090 0.02%

632
Vanguard Global Corporate Bond Index Fund
Principal CouponMaturity
DateFair Value
US Dollars ($)% of Total
Net AssetsBristol-Myers Squibb Co. $541,000 3.88% 15/8/2025 602,013 0.02%Wells Fargo Bank NA £400,000 5.25% 1/8/2023 601,843 0.02%Becton Dickinson Euro Finance Sarl €500,000 0.63% 4/6/2023 601,155 0.02%AvalonBay Communities, Inc. $550,000 3.45% 1/6/2025 600,728 0.02%JPMorgan Chase & Co. $575,000 3.20% 25/1/2023 600,621 0.02%Illinois Tool Works, Inc. €500,000 0.25% 5/12/2024 600,415 0.02%WRKCo, Inc. $500,000 4.90% 15/3/2029 599,669 0.02%Southern Co. $600,000 0.60% 26/2/2024 598,842 0.02%Enable Midstream Partners LP $550,000 5.00% 15/5/2044 598,621 0.02%General Motors Co. $475,000 6.80% 1/10/2027 597,984 0.02%T-Mobile USA, Inc. $600,000 3.30% 15/2/2051 597,870 0.02%Hewlett Packard Enterprise Co. $525,000 4.90% 15/10/2025 597,823 0.02%Abbott Ireland Financing DAC €500,000 0.10% 19/11/2024 597,804 0.02%Exxon Mobil Corp. €500,000 0.14% 26/6/2024 597,786 0.02%Cigna Corp. $525,000 4.50% 25/2/2026 597,752 0.02%Dow Chemical Co. €500,000 0.50% 15/3/2027 597,329 0.02%BorgWarner, Inc. €500,000 1.00% 19/5/2031 597,270 0.02%Prudential Financial, Inc.^ $550,000 4.50% 15/9/2047 597,055 0.02%Comcast Corp. $505,000 4.20% 15/8/2034 596,911 0.02%Verizon Communications, Inc. $625,000 2.88% 20/11/2050 596,860 0.02%International Business Machines Corp. $595,000 2.95% 15/5/2050 596,817 0.02%Bank of America Corp. $550,000 3.25% 21/10/2027 596,606 0.02%Medtronic Global Holdings SCA €500,000 0.00% 15/3/2023 596,384 0.02%Fidelity National Information Services, Inc. €500,000 0.13% 3/12/2022 595,849 0.02%Truist Financial Corp. $557,000 2.85% 26/10/2024 595,826 0.02%AT&T, Inc. $600,000 1.65% 1/2/2028 595,535 0.02%JPMorgan Chase & Co.^ $525,000 4.01% 23/4/2029 594,652 0.02%Goldman Sachs Group, Inc. €500,000 1.00% 18/3/2033 594,216 0.02%Medtronic Global Holdings SCA €500,000 0.00% 15/10/2025 594,194 0.02%Apple, Inc. $500,000 3.85% 4/8/2046 593,890 0.02%Eaton Capital Unlimited Co. €500,000 0.58% 8/3/2030 593,517 0.02%Bank of America Corp.^ €500,000 0.69% 22/3/2031 591,422 0.02%Oracle Corp. $575,000 2.50% 15/10/2022 590,355 0.02%VMware, Inc. $575,000 2.95% 21/8/2022 590,025 0.02%Morgan Stanley^ €500,000 0.50% 26/10/2029 589,799 0.02%Burlington Northern Santa Fe LLC $550,000 3.85% 1/9/2023 586,907 0.02%Cargill, Inc.1 $600,000 1.70% 2/2/2031 585,585 0.02%JPMorgan Chase & Co. $529,000 3.90% 15/7/2025 585,012 0.02%General Electric Co. $500,000 4.25% 1/5/2040 584,990 0.02%Fiserv, Inc. $485,000 4.40% 1/7/2049 584,244 0.02%JPMorgan Chase & Co.^ $550,000 3.22% 1/3/2025 584,177 0.02%Bank of America Corp. £400,000 2.30% 25/7/2025 583,976 0.02%Mondelez International, Inc. €500,000 0.75% 17/3/2033 581,269 0.02%BP Capital Markets America, Inc. $500,000 4.23% 6/11/2028 579,900 0.02%AT&T, Inc. $450,000 5.35% 1/9/2040 579,593 0.02%Utah Acquisition Sub, Inc. $525,000 3.95% 15/6/2026 578,370 0.02%Caterpillar Financial Services Corp. $575,000 0.65% 7/7/2023 578,106 0.02%Pacific Gas & Electric Co. $600,000 4.30% 15/3/2045 577,563 0.02%Morgan Stanley $500,000 5.00% 24/11/2025 576,699 0.02%Kinder Morgan, Inc. $400,000 7.75% 15/1/2032 576,434 0.02%DTE Energy Co. $575,000 0.55% 1/11/2022 576,220 0.02%Altria Group, Inc. €450,000 2.20% 15/6/2027 576,192 0.02%Aviation Capital Group LLC $550,000 3.88% 1/5/2023 576,011 0.02%Philip Morris International, Inc. €500,000 1.45% 1/8/2039 575,916 0.02%Wells Fargo & Co. $535,000 3.75% 24/1/2024 575,390 0.02%Southern California Edison Co. $545,000 4.00% 1/4/2047 573,887 0.02%Southwestern Public Service Co. $465,000 4.50% 15/8/2041 573,500 0.02%UnitedHealth Group, Inc. $450,000 4.63% 15/11/2041 573,108 0.02%AT&T, Inc. $550,000 3.50% 1/6/2041 572,520 0.02%Broadcom, Inc. $510,000 4.25% 15/4/2026 571,913 0.02%AT&T, Inc. £250,000 7.00% 30/4/2040 571,390 0.02%Wells Fargo & Co. £400,000 2.13% 20/12/2023 570,363 0.02%Teachers Insurance & Annuity Association of America $550,000 3.30% 15/5/2050 570,242 0.02%Waste Management, Inc. $575,000 0.75% 15/11/2025 569,943 0.02%JPMorgan Chase & Co.^ $550,000 3.11% 22/4/2041 569,931 0.02%Cigna Corp. $450,000 4.80% 15/7/2046 569,640 0.02%Alphabet, Inc. $625,000 1.90% 15/8/2040 568,973 0.02%Amgen, Inc. $550,000 1.90% 21/2/2025 568,908 0.02%United Parcel Service, Inc. $385,000 6.20% 15/1/2038 567,945 0.02%Walt Disney Co. $550,000 3.00% 15/9/2022 567,466 0.02%US Bank NA $535,000 3.40% 24/7/2023 567,293 0.02%

633
Vanguard Global Corporate Bond Index Fund
Principal CouponMaturity
DateFair Value
US Dollars ($)% of Total
Net AssetsBank of America Corp. $500,000 4.45% 3/3/2026 567,157 0.02%Marathon Oil Corp. $500,000 4.40% 15/7/2027 566,165 0.02%Conagra Brands, Inc. $475,000 4.85% 1/11/2028 565,803 0.02%Home Depot, Inc. $525,000 3.75% 15/2/2024 565,678 0.02%AT&T, Inc. $575,000 2.25% 1/2/2032 565,160 0.02%QUALCOMM, Inc. $591,000 1.65% 20/5/2032 565,110 0.02%Public Service Co. of Colorado $500,000 3.60% 15/9/2042 564,814 0.02%Johnson & Johnson $475,000 3.70% 1/3/2046 564,087 0.02%Morgan Stanley^ $480,000 4.43% 23/1/2030 562,881 0.02%JPMorgan Chase & Co. $425,000 4.95% 1/6/2045 562,828 0.02%Goldman Sachs Group, Inc.^ $480,000 4.02% 31/10/2038 562,809 0.02%Goldman Sachs Group, Inc. $500,000 3.80% 15/3/2030 562,556 0.02%Lockheed Martin Corp. $425,000 4.70% 15/5/2046 562,370 0.02%Broadcom, Inc. $500,000 4.15% 15/11/2030 561,085 0.02%Toyota Motor Credit Corp. $500,000 3.38% 1/4/2030 560,713 0.02%Tyson Foods, Inc. $425,000 5.10% 28/9/2048 560,695 0.02%Sempra Energy $500,000 4.00% 1/2/2048 560,689 0.02%Keurig Dr Pepper, Inc. $560,000 0.75% 15/3/2024 560,537 0.02%International Business Machines Corp. $500,000 3.50% 15/5/2029 559,761 0.02%Marriott International, Inc. $550,000 2.85% 15/4/2031 558,922 0.02%Energy Transfer LP $425,000 6.25% 15/4/2049 558,887 0.02%Morgan Stanley $500,000 3.95% 23/4/2027 558,542 0.02%BP Capital Markets America, Inc. $575,000 3.00% 24/2/2050 558,489 0.02%CVS Health Corp. $400,000 6.13% 15/9/2039 558,068 0.02%Berkshire Hathaway Energy Co. $405,000 5.95% 15/5/2037 558,019 0.02%Berkshire Hathaway, Inc. $510,000 3.13% 15/3/2026 557,540 0.02%Walmart, Inc. $525,000 2.95% 24/9/2049 557,417 0.02%ConocoPhillips Co. $410,000 6.95% 15/4/2029 557,394 0.02%T-Mobile USA, Inc. $550,000 2.05% 15/2/2028 557,329 0.02%International Business Machines Corp. $550,000 2.85% 15/5/2040 556,090 0.02%Capital One Financial Corp. $500,000 3.65% 11/5/2027 555,950 0.02%Bank of America Corp.^ $550,000 1.66% 11/3/2027 554,640 0.02%Bank of America Corp.^ $550,000 2.09% 14/6/2029 554,492 0.02%Metropolitan Life Global Funding I $500,000 3.45% 18/12/2026 554,356 0.02%Citizens Bank NA $500,000 3.75% 18/2/2026 554,223 0.02%MetLife, Inc. $400,000 5.70% 15/6/2035 553,819 0.02%Lowe's Cos, Inc. $500,000 4.00% 15/4/2025 553,460 0.02%Amgen, Inc. $525,000 3.38% 21/2/2050 553,241 0.02%Thermo Fisher Scientific, Inc. €400,000 2.38% 15/4/2032 552,940 0.02%Amazon.com, Inc. $407,000 4.95% 5/12/2044 552,526 0.02%Intel Corp. $500,000 3.70% 29/7/2025 552,513 0.02%MetLife, Inc. $500,000 3.60% 13/11/2025 552,462 0.02%Amazon.com, Inc. $500,000 3.15% 22/8/2027 552,400 0.02%HP, Inc. $420,000 6.00% 15/9/2041 552,377 0.02%Nestle Holdings, Inc. £400,000 1.38% 23/6/2033 552,032 0.02%Utah Acquisition Sub, Inc. €400,000 3.13% 22/11/2028 551,385 0.02%Constellation Brands, Inc. $525,000 2.88% 1/5/2030 551,380 0.02%Providence St Joseph Health Obligated Group $525,000 2.53% 1/10/2029 550,328 0.02%International Business Machines Corp. $500,000 3.30% 15/5/2026 549,860 0.02%Wells Fargo & Co. $500,000 3.55% 29/9/2025 549,783 0.02%Sempra Energy $500,000 3.40% 1/2/2028 549,396 0.02%MassMutual Global Funding II $500,000 3.40% 8/3/2026 549,273 0.02%JPMorgan Chase & Co.^ $500,000 3.54% 1/5/2028 549,061 0.02%Cigna Corp. $490,000 3.88% 15/10/2047 547,877 0.02%Halliburton Co. $400,000 6.70% 15/9/2038 547,707 0.02%KeyBank NA $500,000 3.30% 1/6/2025 546,411 0.02%Coca-Cola Co. $550,000 2.50% 1/6/2040 545,606 0.02%Simon Property Group LP $500,000 3.38% 1/12/2027 544,951 0.02%American Honda Finance Corp. £400,000 0.75% 25/11/2026 544,899 0.02%Steel Dynamics, Inc. $500,000 3.45% 15/4/2030 544,793 0.02%Consolidated Edison Co. of New York, Inc. $450,000 4.50% 1/12/2045 544,408 0.02%Simon Property Group LP $500,000 3.30% 15/1/2026 544,141 0.02%PNC Bank NA $500,000 3.25% 1/6/2025 543,751 0.02%Wells Fargo & Co. $450,000 4.40% 14/6/2046 543,430 0.02%Energy Transfer LP $500,000 4.05% 15/3/2025 542,714 0.02%Visa, Inc. $525,000 1.90% 15/4/2027 542,446 0.02%Equitable Holdings, Inc. $473,000 4.35% 20/4/2028 542,282 0.02%Apple, Inc. $425,000 4.38% 13/5/2045 541,766 0.02%Dow Chemical Co. $475,000 4.55% 30/11/2025 541,749 0.02%HSBC USA, Inc. $500,000 3.50% 23/6/2024 541,590 0.02%Colonial Enterprises, Inc. $500,000 3.25% 15/5/2030 541,336 0.02%

634
Vanguard Global Corporate Bond Index Fund
Principal CouponMaturity
DateFair Value
US Dollars ($)% of Total
Net AssetsCoca-Cola Co. $550,000 1.65% 1/6/2030 540,702 0.02%Conagra Brands, Inc. $425,000 5.30% 1/11/2038 540,553 0.02%Fox Corp. $400,000 5.58% 25/1/2049 540,158 0.02%Marsh & McLennan Cos, Inc. $395,000 4.90% 15/3/2049 539,734 0.02%Oracle Corp. $525,000 2.30% 25/3/2028 539,085 0.02%Ally Financial, Inc. $500,000 3.88% 21/5/2024 538,927 0.02%Home Depot, Inc. $425,000 4.40% 15/3/2045 538,923 0.02%Zoetis, Inc. $475,000 4.50% 13/11/2025 538,910 0.02%Kinder Morgan Energy Partners LP $450,000 5.00% 15/8/2042 538,736 0.02%Citibank NA $500,000 3.65% 23/1/2024 538,083 0.02%AbbVie, Inc. $500,000 2.95% 21/11/2026 537,518 0.02%AT&T, Inc. €400,000 2.35% 5/9/2029 537,349 0.02%JPMorgan Chase & Co. $500,000 3.13% 23/1/2025 536,554 0.02%Cigna Corp. $500,000 3.50% 15/6/2024 536,454 0.02%Microsoft Corp. $500,000 2.70% 12/2/2025 535,440 0.02%Target Corp. $500,000 2.65% 15/9/2030 535,258 0.02%Boston Properties LP $500,000 3.80% 1/2/2024 535,169 0.02%Altria Group, Inc. $450,000 5.38% 31/1/2044 534,715 0.02%Northrop Grumman Corp. $450,000 4.03% 15/10/2047 534,517 0.02%Bank of America Corp.^ $500,000 3.46% 15/3/2025 534,423 0.02%Pacific Gas & Electric Co. $600,000 3.50% 1/8/2050 534,016 0.02%Schlumberger Investment SA $500,000 3.65% 1/12/2023 533,812 0.02%Boeing Co. $500,000 4.51% 1/5/2023 532,926 0.02%Marriott International, Inc. $500,000 3.50% 15/10/2032 531,593 0.02%NRG Energy, Inc. $525,000 2.00% 2/12/2025 531,480 0.02%MPLX LP $475,000 4.00% 15/3/2028 531,159 0.02%Toyota Motor Credit Corp. $500,000 2.90% 17/4/2024 531,148 0.02%MPLX LP $474,000 4.88% 1/12/2024 530,901 0.02%Keurig Dr Pepper, Inc. $500,000 2.55% 15/9/2026 530,807 0.02%Morgan Stanley $500,000 4.88% 1/11/2022 528,994 0.02%Walt Disney Co. $450,000 3.80% 13/5/2060 528,961 0.02%Bank of America Corp.^ $500,000 3.31% 22/4/2042 528,819 0.02%Morgan Stanley^ $500,000 3.74% 24/4/2024 528,689 0.02%Enterprise Products Operating LLC $500,000 2.80% 31/1/2030 528,287 0.02%CyrusOne LP/CyrusOne Finance Corp. $500,000 2.90% 15/11/2024 527,861 0.02%American International Group, Inc. $500,000 2.50% 30/6/2025 527,476 0.02%Dollar General Corp. $450,000 4.13% 3/4/2050 527,423 0.02%Boston Scientific Corp. $475,000 3.75% 1/3/2026 527,357 0.02%Walt Disney Co. $360,000 6.40% 15/12/2035 527,222 0.02%NextEra Energy Capital Holdings, Inc. $525,000 0.65% 1/3/2023 526,819 0.02%General Motors Financial Co., Inc. $500,000 2.75% 20/6/2025 526,544 0.02%Goldman Sachs Group, Inc.^ $470,000 3.81% 23/4/2029 525,569 0.02%JPMorgan Chase & Co. $375,000 5.60% 15/7/2041 525,413 0.02%Bank of America Corp.^ $510,000 2.59% 29/4/2031 524,999 0.02%AmerisourceBergen Corp. $450,000 4.30% 15/12/2047 524,960 0.02%AT&T, Inc. £300,000 4.25% 1/6/2043 524,890 0.02%Energy Transfer LP $500,000 4.25% 15/3/2023 524,751 0.02%Goldman Sachs Group, Inc. $500,000 3.63% 22/1/2023 524,648 0.02%Goldman Sachs Group, Inc.^ $475,000 3.69% 5/6/2028 524,594 0.02%Appalachian Power Co. $350,000 7.00% 1/4/2038 523,347 0.02%Capital One Bank USA NA $500,000 3.38% 15/2/2023 523,053 0.02%Morgan Stanley $500,000 3.13% 23/1/2023 521,386 0.02%Alexandria Real Estate Equities, Inc. $475,000 3.38% 15/8/2031 521,283 0.02%Athene Global Funding $500,000 2.80% 26/5/2023 520,830 0.02%Global Payments, Inc. $525,000 1.20% 1/3/2026 520,590 0.02%Adobe, Inc. $500,000 2.30% 1/2/2030 520,568 0.02%Altria Group, Inc. $525,000 3.88% 16/9/2046 520,546 0.02%Apple, Inc. $500,000 2.20% 11/9/2029 520,177 0.02%Sherwin-Williams Co. $415,000 4.50% 1/6/2047 519,907 0.02%JPMorgan Chase & Co. $500,000 2.70% 18/5/2023 519,721 0.02%Fiserv, Inc. $500,000 2.25% 1/6/2027 518,870 0.02%Lowe's Cos, Inc. $450,000 4.05% 3/5/2047 518,496 0.02%GE Capital International Funding Co. Unlimited Co. $475,000 3.37% 15/11/2025 518,222 0.02%Comcast Corp. $440,000 4.00% 1/11/2049 518,194 0.02%Intel Corp. $500,000 2.70% 15/12/2022 517,993 0.02%AT&T, Inc. $425,000 4.85% 1/3/2039 516,695 0.02%Philip Morris International, Inc. $477,000 3.25% 10/11/2024 516,244 0.02%McCormick & Co., Inc. $525,000 0.90% 15/2/2026 515,939 0.02%Boston Scientific Corp. $500,000 1.90% 1/6/2025 515,916 0.02%Oracle Corp. $475,000 3.25% 15/11/2027 515,896 0.02%Johnson & Johnson $525,000 0.95% 1/9/2027 515,639 0.02%
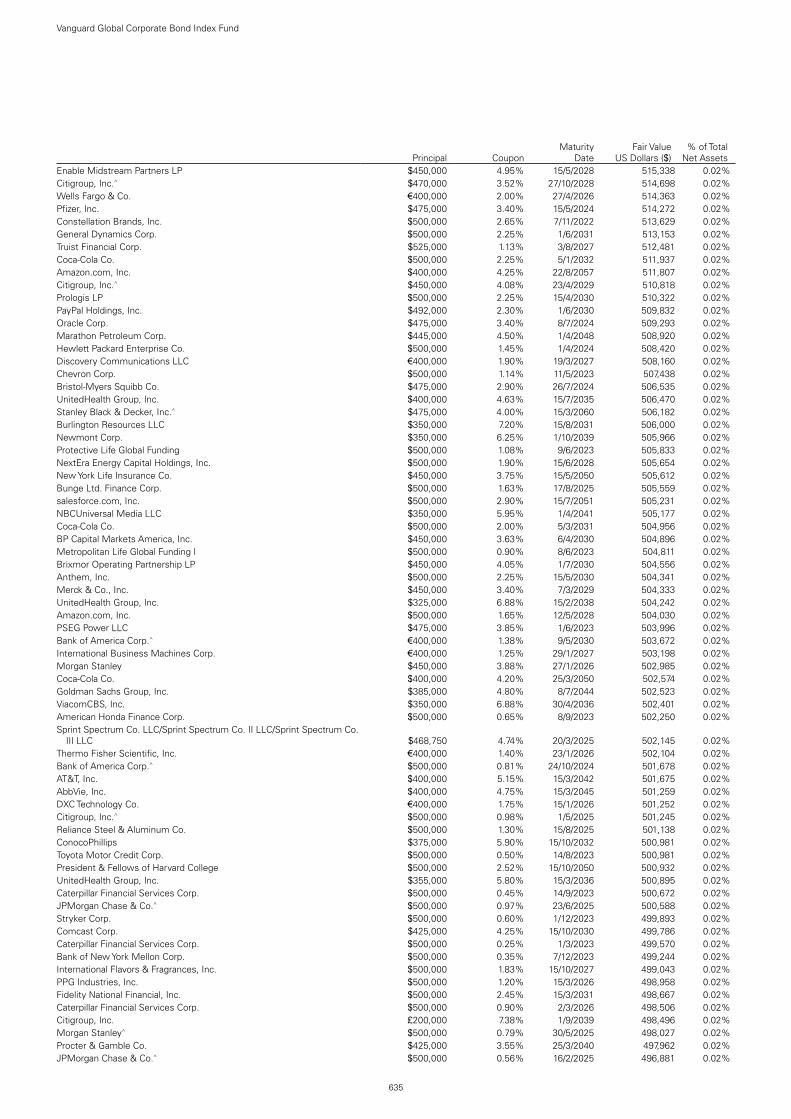
635
Vanguard Global Corporate Bond Index Fund
Principal CouponMaturity
DateFair Value
US Dollars ($)% of Total
Net AssetsEnable Midstream Partners LP $450,000 4.95% 15/5/2028 515,338 0.02%Citigroup, Inc.^ $470,000 3.52% 27/10/2028 514,698 0.02%Wells Fargo & Co. €400,000 2.00% 27/4/2026 514,363 0.02%Pfizer, Inc. $475,000 3.40% 15/5/2024 514,272 0.02%Constellation Brands, Inc. $500,000 2.65% 7/11/2022 513,629 0.02%General Dynamics Corp. $500,000 2.25% 1/6/2031 513,153 0.02%Truist Financial Corp. $525,000 1.13% 3/8/2027 512,481 0.02%Coca-Cola Co. $500,000 2.25% 5/1/2032 511,937 0.02%Amazon.com, Inc. $400,000 4.25% 22/8/2057 511,807 0.02%Citigroup, Inc.^ $450,000 4.08% 23/4/2029 510,818 0.02%Prologis LP $500,000 2.25% 15/4/2030 510,322 0.02%PayPal Holdings, Inc. $492,000 2.30% 1/6/2030 509,832 0.02%Oracle Corp. $475,000 3.40% 8/7/2024 509,293 0.02%Marathon Petroleum Corp. $445,000 4.50% 1/4/2048 508,920 0.02%Hewlett Packard Enterprise Co. $500,000 1.45% 1/4/2024 508,420 0.02%Discovery Communications LLC €400,000 1.90% 19/3/2027 508,160 0.02%Chevron Corp. $500,000 1.14% 11/5/2023 507,438 0.02%Bristol-Myers Squibb Co. $475,000 2.90% 26/7/2024 506,535 0.02%UnitedHealth Group, Inc. $400,000 4.63% 15/7/2035 506,470 0.02%Stanley Black & Decker, Inc.^ $475,000 4.00% 15/3/2060 506,182 0.02%Burlington Resources LLC $350,000 7.20% 15/8/2031 506,000 0.02%Newmont Corp. $350,000 6.25% 1/10/2039 505,966 0.02%Protective Life Global Funding $500,000 1.08% 9/6/2023 505,833 0.02%NextEra Energy Capital Holdings, Inc. $500,000 1.90% 15/6/2028 505,654 0.02%New York Life Insurance Co. $450,000 3.75% 15/5/2050 505,612 0.02%Bunge Ltd. Finance Corp. $500,000 1.63% 17/8/2025 505,559 0.02%salesforce.com, Inc. $500,000 2.90% 15/7/2051 505,231 0.02%NBCUniversal Media LLC $350,000 5.95% 1/4/2041 505,177 0.02%Coca-Cola Co. $500,000 2.00% 5/3/2031 504,956 0.02%BP Capital Markets America, Inc. $450,000 3.63% 6/4/2030 504,896 0.02%Metropolitan Life Global Funding I $500,000 0.90% 8/6/2023 504,811 0.02%Brixmor Operating Partnership LP $450,000 4.05% 1/7/2030 504,556 0.02%Anthem, Inc. $500,000 2.25% 15/5/2030 504,341 0.02%Merck & Co., Inc. $450,000 3.40% 7/3/2029 504,333 0.02%UnitedHealth Group, Inc. $325,000 6.88% 15/2/2038 504,242 0.02%Amazon.com, Inc. $500,000 1.65% 12/5/2028 504,030 0.02%PSEG Power LLC $475,000 3.85% 1/6/2023 503,996 0.02%Bank of America Corp.^ €400,000 1.38% 9/5/2030 503,672 0.02%International Business Machines Corp. €400,000 1.25% 29/1/2027 503,198 0.02%Morgan Stanley $450,000 3.88% 27/1/2026 502,985 0.02%Coca-Cola Co. $400,000 4.20% 25/3/2050 502,574 0.02%Goldman Sachs Group, Inc. $385,000 4.80% 8/7/2044 502,523 0.02%ViacomCBS, Inc. $350,000 6.88% 30/4/2036 502,401 0.02%American Honda Finance Corp. $500,000 0.65% 8/9/2023 502,250 0.02%Sprint Spectrum Co. LLC/Sprint Spectrum Co. II LLC/Sprint Spectrum Co.
III LLC $468,750 4.74% 20/3/2025 502,145 0.02%Thermo Fisher Scientific, Inc. €400,000 1.40% 23/1/2026 502,104 0.02%Bank of America Corp.^ $500,000 0.81% 24/10/2024 501,678 0.02%AT&T, Inc. $400,000 5.15% 15/3/2042 501,675 0.02%AbbVie, Inc. $400,000 4.75% 15/3/2045 501,259 0.02%DXC Technology Co. €400,000 1.75% 15/1/2026 501,252 0.02%Citigroup, Inc.^ $500,000 0.98% 1/5/2025 501,245 0.02%Reliance Steel & Aluminum Co. $500,000 1.30% 15/8/2025 501,138 0.02%ConocoPhillips $375,000 5.90% 15/10/2032 500,981 0.02%Toyota Motor Credit Corp. $500,000 0.50% 14/8/2023 500,981 0.02%President & Fellows of Harvard College $500,000 2.52% 15/10/2050 500,932 0.02%UnitedHealth Group, Inc. $355,000 5.80% 15/3/2036 500,895 0.02%Caterpillar Financial Services Corp. $500,000 0.45% 14/9/2023 500,672 0.02%JPMorgan Chase & Co.^ $500,000 0.97% 23/6/2025 500,588 0.02%Stryker Corp. $500,000 0.60% 1/12/2023 499,893 0.02%Comcast Corp. $425,000 4.25% 15/10/2030 499,786 0.02%Caterpillar Financial Services Corp. $500,000 0.25% 1/3/2023 499,570 0.02%Bank of New York Mellon Corp. $500,000 0.35% 7/12/2023 499,244 0.02%International Flavors & Fragrances, Inc. $500,000 1.83% 15/10/2027 499,043 0.02%PPG Industries, Inc. $500,000 1.20% 15/3/2026 498,958 0.02%Fidelity National Financial, Inc. $500,000 2.45% 15/3/2031 498,667 0.02%Caterpillar Financial Services Corp. $500,000 0.90% 2/3/2026 498,506 0.02%Citigroup, Inc. £200,000 7.38% 1/9/2039 498,496 0.02%Morgan Stanley^ $500,000 0.79% 30/5/2025 498,027 0.02%Procter & Gamble Co. $425,000 3.55% 25/3/2040 497,962 0.02%JPMorgan Chase & Co.^ $500,000 0.56% 16/2/2025 496,881 0.02%

636
Vanguard Global Corporate Bond Index Fund
Principal CouponMaturity
DateFair Value
US Dollars ($)% of Total
Net AssetsGeneral Motors Financial Co., Inc. $500,000 1.25% 8/1/2026 496,682 0.02%Upjohn Finance BV €400,000 1.36% 23/6/2027 496,569 0.02%Nuveen Finance LLC $450,000 4.13% 1/11/2024 496,281 0.02%Chevron USA, Inc. $500,000 0.69% 12/8/2025 496,092 0.02%Bank of America Corp.^ $500,000 1.20% 24/10/2026 495,926 0.02%Republic Services, Inc. $500,000 0.88% 15/11/2025 495,807 0.02%Apple, Inc. $500,000 1.65% 11/5/2030 495,627 0.02%American Tower Corp. €400,000 1.38% 4/4/2025 495,166 0.02%HCA, Inc. $380,000 5.50% 15/6/2047 494,856 0.02%Burlington Northern Santa Fe LLC $400,000 4.38% 1/9/2042 494,780 0.02%Verizon Communications, Inc. $375,000 5.25% 16/3/2037 494,653 0.02%Intel Corp. $350,000 4.95% 25/3/2060 494,545 0.02%American International Group, Inc. $450,000 3.40% 30/6/2030 493,596 0.02%Morgan Stanley^ $500,000 0.99% 10/12/2026 492,590 0.02%Equitable Financial Life Global Funding $500,000 1.00% 9/1/2026 492,444 0.02%Kilroy Realty LP $500,000 2.50% 15/11/2032 492,202 0.02%United Parcel Service, Inc. $475,000 2.50% 1/4/2023 492,070 0.02%Berkshire Hathaway, Inc. €400,000 1.30% 15/3/2024 491,659 0.02%Northwestern Mutual Life Insurance Co. $450,000 3.63% 30/9/2059 491,131 0.02%7-Eleven, Inc. $500,000 0.95% 10/2/2026 490,849 0.02%Verizon Communications, Inc. €400,000 0.88% 8/4/2027 490,757 0.02%Apple, Inc. $450,000 3.20% 13/5/2025 490,681 0.02%Royalty Pharma plc $500,000 2.20% 2/9/2030 490,461 0.02%Realty Income Corp. $500,000 0.75% 15/3/2026 490,388 0.02%UnitedHealth Group, Inc. $400,000 4.25% 15/3/2043 490,333 0.02%AT&T, Inc. $500,000 3.10% 1/2/2043 490,163 0.02%Apple, Inc. $500,000 2.65% 11/5/2050 490,056 0.02%Home Depot, Inc. $450,000 3.00% 1/4/2026 489,890 0.02%Crown Castle International Corp. $440,000 4.00% 15/11/2049 489,448 0.02%JPMorgan Chase & Co.^ $425,000 3.88% 24/7/2038 489,406 0.02%Verizon Communications, Inc. €400,000 1.30% 18/5/2033 489,386 0.02%Kimberly-Clark Corp. $500,000 1.05% 15/9/2027 489,167 0.02%Virginia Electric & Power Co. $275,000 8.88% 15/11/2038 488,665 0.02%Walmart, Inc. €300,000 4.88% 21/9/2029 488,646 0.02%UnitedHealth Group, Inc. $425,000 3.85% 15/6/2028 488,268 0.02%Apple, Inc. CA($)580,000 2.51% 19/8/2024 487,977 0.02%Lowe's Cos, Inc. $500,000 1.30% 15/4/2028 487,710 0.02%Liberty Mutual Group, Inc. $417,000 4.57% 1/2/2029 487,411 0.02%Prudential Financial, Inc. $450,000 3.50% 15/5/2024 487,214 0.02%Chevron USA, Inc. $500,000 1.02% 12/8/2027 487,128 0.02%PepsiCo, Inc. €400,000 0.50% 6/5/2028 486,949 0.02%Honeywell International, Inc. €400,000 1.30% 22/2/2023 486,849 0.02%AT&T, Inc. €400,000 1.05% 5/9/2023 485,916 0.02%PacifiCorp $400,000 4.15% 15/2/2050 485,695 0.02%Discover Financial Services $445,000 3.75% 4/3/2025 485,608 0.02%Wells Fargo & Co. $450,000 3.00% 23/10/2026 485,204 0.02%JPMorgan Chase & Co. $450,000 2.95% 1/10/2026 484,858 0.02%Campbell Soup Co. $425,000 4.15% 15/3/2028 484,467 0.02%Charter Communications Operating LLC/Charter Communications
Operating Capital $450,000 4.40% 1/12/2061 483,998 0.02%Philip Morris International, Inc. €400,000 0.63% 8/11/2024 483,849 0.02%Air Products & Chemicals, Inc. €400,000 0.50% 5/5/2028 483,657 0.02%Eli Lilly & Co. €400,000 0.63% 1/11/2031 483,313 0.02%General Motors Co. $350,000 6.25% 2/10/2043 483,105 0.02%General Motors Co. $390,000 5.20% 1/4/2045 482,935 0.02%Chevron Corp. $460,000 3.19% 24/6/2023 482,828 0.02%Honeywell International, Inc. $450,000 2.70% 15/8/2029 482,798 0.02%Microsoft Corp. $450,000 3.63% 15/12/2023 482,674 0.02%Becton Dickinson & Co. $450,000 3.36% 6/6/2024 482,098 0.02%FedEx Corp. 2020-1 Class AA Pass Through Trust $486,632 1.88% 20/2/2034 481,901 0.02%Morgan Stanley $425,000 4.35% 8/9/2026 481,642 0.02%Duke Energy Carolinas LLC $350,000 6.45% 15/10/2032 481,433 0.02%Coca-Cola Co. $500,000 2.60% 1/6/2050 481,327 0.02%Verizon Communications, Inc. $350,000 5.85% 15/9/2035 481,317 0.02%AES Corp. $450,000 3.30% 15/7/2025 481,237 0.02%New York Life Global Funding $475,000 1.10% 5/5/2023 481,131 0.02%Morgan Stanley^ $500,000 1.79% 13/2/2032 480,965 0.02%Dow Chemical Co. $375,000 4.80% 15/5/2049 480,247 0.02%UnitedHealth Group, Inc. $375,000 4.45% 15/12/2048 479,934 0.02%Abbott Laboratories $450,000 3.40% 30/11/2023 479,639 0.02%Bank of America Corp.^ $450,000 3.86% 23/7/2024 479,580 0.02%

637
Vanguard Global Corporate Bond Index Fund
Principal CouponMaturity
DateFair Value
US Dollars ($)% of Total
Net AssetsBP Capital Markets America, Inc. $500,000 2.94% 4/6/2051 479,509 0.02%NIKE, Inc. $400,000 3.88% 1/11/2045 479,350 0.02%Omega Healthcare Investors, Inc. $420,000 5.25% 15/1/2026 479,281 0.02%American Tower Corp. €400,000 0.88% 21/5/2029 478,342 0.02%American Tower Corp. $450,000 2.95% 15/1/2025 478,047 0.02%General Motors Financial Co., Inc. $450,000 4.15% 19/6/2023 478,015 0.02%Nestle Holdings, Inc. $500,000 1.25% 15/9/2030 477,660 0.02%General Mills, Inc. $450,000 2.88% 15/4/2030 477,156 0.02%Verizon Communications, Inc. $400,000 4.40% 1/11/2034 476,967 0.02%DH Europe Finance II Sarl €400,000 0.20% 18/3/2026 476,896 0.02%AT&T, Inc. £250,000 4.88% 1/6/2044 476,880 0.02%Medtronic Global Holdings SCA €400,000 0.00% 2/12/2022 476,853 0.02%Amgen, Inc. $363,000 5.15% 15/11/2041 476,841 0.02%Bank of America Corp.^ €400,000 0.58% 8/8/2029 476,791 0.02%Honeywell International, Inc. €400,000 0.00% 10/3/2024 476,613 0.02%Citigroup, Inc. $350,000 6.63% 15/6/2032 476,267 0.02%Comcast Corp. $400,000 4.25% 15/1/2033 476,259 0.02%Time Warner Cable LLC $350,000 6.55% 1/5/2037 475,888 0.02%International Business Machines Corp. €400,000 0.30% 11/2/2028 475,887 0.02%ViacomCBS, Inc. $400,000 4.60% 15/1/2045 475,803 0.02%Gilead Sciences, Inc. $475,000 0.75% 29/9/2023 475,346 0.02%DH Europe Finance II Sarl €400,000 0.75% 18/9/2031 474,964 0.02%Principal Financial Group, Inc. $475,000 2.13% 15/6/2030 474,399 0.02%Boeing Co. $450,000 3.60% 1/5/2034 474,164 0.02%Campbell Soup Co. $451,000 3.65% 15/3/2023 473,855 0.02%UnitedHealth Group, Inc. $400,000 3.88% 15/8/2059 473,790 0.02%Alexandria Real Estate Equities, Inc. $425,000 3.80% 15/4/2026 473,649 0.02%Applied Materials, Inc. $475,000 2.75% 1/6/2050 473,575 0.02%Walt Disney Co. $450,000 2.65% 13/1/2031 472,598 0.02%General Motors Financial Co., Inc. $450,000 3.70% 9/5/2023 472,574 0.02%Owens Corning $400,000 4.40% 30/1/2048 472,098 0.02%Hewlett Packard Enterprise Co. $450,000 4.40% 15/10/2022 469,657 0.02%AT&T, Inc. $400,000 4.55% 9/3/2049 469,461 0.02%International Business Machines Corp. $425,000 3.45% 19/2/2026 469,167 0.02%Stellantis NV €400,000 1.25% 20/6/2033 468,612 0.02%Wells Fargo & Co. $400,000 3.90% 1/5/2045 468,596 0.02%JPMorgan Chase & Co.^ $450,000 2.30% 15/10/2025 468,304 0.02%Amgen, Inc. $450,000 3.15% 21/2/2040 468,001 0.02%PepsiCo, Inc. $400,000 3.63% 19/3/2050 467,899 0.02%Diamondback Energy, Inc. $450,000 3.13% 24/3/2031 467,888 0.02%McDonald's Corp. $325,000 6.30% 15/10/2037 467,563 0.02%NiSource, Inc. $425,000 3.49% 15/5/2027 467,559 0.02%AT&T, Inc. €350,000 2.45% 15/3/2035 467,551 0.02%Verizon Communications, Inc. £300,000 3.13% 2/11/2035 466,319 0.02%Time Warner Cable LLC $375,000 5.50% 1/9/2041 466,293 0.02%Pioneer Natural Resources Co. $475,000 2.15% 15/1/2031 466,136 0.02%Bank of America Corp. $350,000 5.00% 21/1/2044 466,129 0.02%Target Corp. $375,000 4.00% 1/7/2042 466,041 0.02%Autodesk, Inc. $450,000 3.60% 15/12/2022 465,993 0.02%American International Group, Inc. $405,000 4.20% 1/4/2028 465,332 0.02%Johnson & Johnson $400,000 3.55% 1/3/2036 465,056 0.02%Nasdaq, Inc. $500,000 2.50% 21/12/2040 464,384 0.02%Union Pacific Corp. $450,000 4.16% 15/7/2022 463,658 0.02%Walt Disney Co. $325,000 6.15% 1/3/2037 463,331 0.02%UnitedHealth Group, Inc. $415,000 3.50% 15/8/2039 463,275 0.02%Duke Energy Carolinas LLC $400,000 3.88% 15/3/2046 462,049 0.02%Bank of America Corp.^ $450,000 2.65% 11/3/2032 461,959 0.02%US Bancorp $450,000 2.95% 15/7/2022 461,633 0.02%Dell International LLC/EMC Corp. $400,000 4.90% 1/10/2026 461,584 0.02%MetLife, Inc. $350,000 4.88% 13/11/2043 461,410 0.02%Bank of New York Mellon Corp. $400,000 3.85% 28/4/2028 461,307 0.02%Bank of America Corp.^ $475,000 1.90% 23/7/2031 460,908 0.02%Johnson & Johnson $475,000 1.30% 1/9/2030 460,814 0.02%Aflac, Inc. $350,000 4.75% 15/1/2049 460,679 0.02%US Bancorp $400,000 3.90% 26/4/2028 460,388 0.02%Apple, Inc. $425,000 3.45% 6/5/2024 460,046 0.02%Waste Management, Inc. $475,000 1.15% 15/3/2028 459,995 0.02%Molson Coors Beverage Co. $375,000 5.00% 1/5/2042 459,960 0.02%Cisco Systems, Inc. $425,000 3.63% 4/3/2024 459,917 0.02%Prudential Financial, Inc.^ $425,000 5.63% 15/6/2043 457,488 0.02%HCA, Inc. $395,000 5.25% 15/6/2026 456,924 0.02%

638
Vanguard Global Corporate Bond Index Fund
Principal CouponMaturity
DateFair Value
US Dollars ($)% of Total
Net AssetsSabine Pass Liquefaction LLC $425,000 5.63% 15/4/2023 456,773 0.02%Molson Coors Beverage Co. $410,000 4.20% 15/7/2046 456,352 0.02%PepsiCo, Inc. $400,000 3.50% 19/3/2040 456,346 0.02%Mid-America Apartments LP $425,000 4.30% 15/10/2023 456,253 0.02%Union Pacific Corp. $475,000 2.97% 16/9/2062 456,124 0.02%JPMorgan Chase & Co.^ $375,000 4.26% 22/2/2048 456,092 0.02%Walt Disney Co. $350,000 4.75% 15/9/2044 455,774 0.02%Chevron Corp. $445,000 2.36% 5/12/2022 455,763 0.02%Walmart, Inc. $400,000 3.70% 26/6/2028 455,353 0.02%Vistra Operations Co. LLC $430,000 3.55% 15/7/2024 454,550 0.02%AbbVie, Inc. $375,000 4.45% 14/5/2046 454,222 0.02%Texas Health Resources $500,000 2.33% 15/11/2050 453,663 0.02%Microsoft Corp. $350,000 4.25% 6/2/2047 453,652 0.02%Walt Disney Co. $400,000 3.60% 13/1/2051 453,363 0.02%Berkshire Hathaway Energy Co. $400,000 3.70% 15/7/2030 453,337 0.02%Chubb INA Holdings, Inc. $300,000 6.70% 15/5/2036 452,852 0.02%Comcast Corp. $400,000 3.75% 1/4/2040 452,240 0.02%Sabine Pass Liquefaction LLC $400,000 4.20% 15/3/2028 451,809 0.02%Caterpillar, Inc. $450,000 1.90% 12/3/2031 450,870 0.02%Pfizer, Inc. $275,000 7.20% 15/3/2039 450,422 0.02%General Electric Co. $300,000 6.88% 10/1/2039 450,231 0.02%Amazon.com, Inc. $450,000 1.00% 12/5/2026 450,158 0.02%Pacific Gas & Electric Co. $450,000 4.50% 1/7/2040 450,023 0.02%Bank of America Corp.^ $450,000 0.98% 25/9/2025 449,475 0.02%Amazon.com, Inc. $450,000 0.45% 12/5/2024 449,126 0.02%Visa, Inc. $365,000 4.15% 14/12/2035 448,689 0.02%General Dynamics Corp. $350,000 4.25% 1/4/2050 448,287 0.02%Boeing Co. $424,000 3.25% 1/3/2028 447,307 0.02%Citigroup, Inc. $400,000 4.40% 10/6/2025 446,853 0.02%Morgan Stanley^ $300,000 5.60% 24/3/2051 446,807 0.02%Five Corners Funding Trust $410,000 4.42% 15/11/2023 446,688 0.02%Roper Technologies, Inc. $400,000 3.80% 15/12/2026 446,452 0.02%Morgan Stanley^ €375,000 0.41% 29/10/2027 446,283 0.02%ERAC USA Finance LLC $375,000 4.20% 1/11/2046 445,308 0.02%Aircastle Ltd. $410,000 4.25% 15/6/2026 445,024 0.02%Goldman Sachs Group, Inc. $365,000 5.95% 15/1/2027 444,818 0.02%Raytheon Technologies Corp. $400,000 3.95% 16/8/2025 444,803 0.02%Crown Castle International Corp. $400,000 3.80% 15/2/2028 444,463 0.02%Morgan Stanley £300,000 2.63% 9/3/2027 444,345 0.02%Fifth Third Bank NA $400,000 3.85% 15/3/2026 443,994 0.02%Verizon Communications, Inc. $350,000 4.81% 15/3/2039 443,795 0.02%Interstate Power & Light Co. $412,000 3.25% 1/12/2024 443,304 0.02%Kroger Co. $325,000 5.40% 15/1/2049 443,060 0.02%Williams Cos, Inc. $350,000 5.40% 4/3/2044 442,954 0.02%American Express Credit Corp. $400,000 3.30% 3/5/2027 442,588 0.02%Applied Materials, Inc. $400,000 3.30% 1/4/2027 442,314 0.02%General Motors Financial Co., Inc. $400,000 4.30% 13/7/2025 442,203 0.02%AT&T, Inc. $387,000 4.35% 15/6/2045 442,161 0.02%Morgan Stanley^ $450,000 2.80% 25/1/2052 441,986 0.02%Home Depot, Inc. $340,000 4.50% 6/12/2048 441,953 0.02%QUALCOMM, Inc. $400,000 3.25% 20/5/2027 441,728 0.02%Halliburton Co. $375,000 4.85% 15/11/2035 441,657 0.02%CVS Health Corp. $400,000 3.88% 20/7/2025 441,655 0.02%AT&T, Inc. $350,000 5.25% 1/3/2037 441,466 0.02%Goldman Sachs Group, Inc. $400,000 3.85% 26/1/2027 441,135 0.02%Bank of New York Mellon Corp.^ $400,000 3.44% 7/2/2028 440,584 0.02%AT&T, Inc. $425,000 2.30% 1/6/2027 439,825 0.02%Anthem, Inc. $400,000 3.60% 15/3/2051 439,569 0.02%Verizon Communications, Inc. $340,000 4.67% 15/3/2055 439,296 0.02%Bank of America Corp. $400,000 4.20% 26/8/2024 439,039 0.02%Wells Fargo & Co. £300,000 2.50% 2/5/2029 438,644 0.02%Anthem, Inc. $350,000 4.65% 15/8/2044 438,338 0.02%Starbucks Corp. $425,000 2.00% 12/3/2027 437,058 0.02%Comcast Corp. $400,000 3.38% 15/8/2025 436,611 0.02%Realty Income Corp. $400,000 3.25% 15/1/2031 436,511 0.02%Starbucks Corp. $350,000 4.50% 15/11/2048 436,128 0.02%JPMorgan Chase & Co. $400,000 3.20% 15/6/2026 435,584 0.02%JPMorgan Chase & Co.^ $395,000 3.51% 23/1/2029 435,192 0.02%Progress Energy, Inc. $305,000 7.75% 1/3/2031 434,992 0.02%Devon Energy Corp. $350,000 5.60% 15/7/2041 434,157 0.02%Philip Morris International, Inc. $425,000 2.38% 17/8/2022 434,070 0.02%

639
Vanguard Global Corporate Bond Index Fund
Principal CouponMaturity
DateFair Value
US Dollars ($)% of Total
Net AssetsAltria Group, Inc. $450,000 4.00% 4/2/2061 433,726 0.02%Fifth Third Bancorp $260,000 8.25% 1/3/2038 433,709 0.02%AbbVie, Inc. $400,000 3.20% 14/5/2026 433,557 0.02%Verizon Communications, Inc. CA($)530,000 2.38% 22/3/2028 433,298 0.02%Microsoft Corp. $350,000 4.10% 6/2/2037 431,710 0.02%Broadcom, Inc. $384,000 4.11% 15/9/2028 431,706 0.02%Northrop Grumman Corp. $375,000 3.85% 15/4/2045 431,604 0.02%Capital One Financial Corp. $401,000 3.20% 5/2/2025 430,962 0.02%CME Group, Inc. $300,000 5.30% 15/9/2043 430,803 0.02%Bank of New York Mellon Corp. $400,000 2.80% 4/5/2026 430,669 0.02%Wells Fargo & Co. $400,000 3.00% 22/4/2026 430,202 0.02%Norfolk Southern Corp. $365,000 4.15% 28/2/2048 429,909 0.02%Enterprise Products Operating LLC $350,000 4.85% 15/3/2044 429,426 0.02%International Paper Co. $320,000 5.15% 15/5/2046 428,442 0.02%Union Electric Co. $250,000 8.45% 15/3/2039 428,239 0.02%Gilead Sciences, Inc. $350,000 4.60% 1/9/2035 428,124 0.02%Anthem, Inc. $325,000 5.10% 15/1/2044 427,892 0.02%Santander Holdings USA, Inc. $400,000 3.24% 5/10/2026 427,370 0.02%Johnson & Johnson $450,000 2.10% 1/9/2040 427,141 0.02%BP Capital Markets America, Inc. $425,000 3.38% 8/2/2061 427,096 0.02%Ascension Health $350,000 3.95% 15/11/2046 427,092 0.02%AEP Transmission Co. LLC $375,000 3.65% 1/4/2050 426,657 0.02%Johnson & Johnson $400,000 2.45% 1/3/2026 426,011 0.02%International Business Machines Corp. €360,000 0.65% 11/2/2032 425,773 0.02%Toyota Motor Credit Corp. $425,000 0.35% 14/10/2022 425,450 0.02%ViacomCBS, Inc. $350,000 4.90% 15/8/2044 425,355 0.02%Midwest Connector Capital Co. LLC $400,000 4.63% 1/4/2029 425,013 0.01%Bank of America Corp.^ $425,000 0.52% 14/6/2024 424,877 0.01%Valero Energy Corp. $310,000 6.63% 15/6/2037 424,633 0.01%Citigroup, Inc. £300,000 1.75% 23/10/2026 424,100 0.01%Virginia Electric & Power Co. $375,000 3.80% 1/4/2028 424,024 0.01%Steel Dynamics, Inc. $425,000 1.65% 15/10/2027 423,643 0.01%Amazon.com, Inc. $400,000 3.25% 12/5/2061 423,451 0.01%Ryder System, Inc. $375,000 4.63% 1/6/2025 423,049 0.01%Burlington Northern Santa Fe LLC $350,000 4.05% 15/6/2048 422,970 0.01%Pfizer, Inc. $350,000 4.00% 15/12/2036 422,904 0.01%Duke Energy Progress LLC $350,000 4.15% 1/12/2044 422,683 0.01%AT&T, Inc. $400,000 3.85% 1/6/2060 421,939 0.01%Dollar General Corp. $375,000 3.88% 15/4/2027 421,812 0.01%Bank of America Corp.^ $340,000 4.44% 20/1/2048 421,405 0.01%KeyBank NA $375,000 3.90% 13/4/2029 420,649 0.01%CSX Corp. $325,000 4.75% 15/11/2048 420,505 0.01%Digital Realty Trust LP $375,000 3.70% 15/8/2027 420,238 0.01%PacifiCorp $400,000 2.70% 15/9/2030 420,121 0.01%Goldman Sachs Capital I $300,000 6.35% 15/2/2034 420,008 0.01%Bank of America Corp. $375,000 4.18% 25/11/2027 419,879 0.01%JM Smucker Co. $385,000 3.50% 15/3/2025 419,380 0.01%Discovery Communications LLC $350,000 4.88% 1/4/2043 419,350 0.01%Exxon Mobil Corp. $350,000 4.23% 19/3/2040 418,823 0.01%Discover Bank $400,000 2.70% 6/2/2030 418,793 0.01%American International Group, Inc. $300,000 6.25% 1/5/2036 418,708 0.01%Booking Holdings, Inc. $350,000 4.63% 13/4/2030 418,692 0.01%Shire Acquisitions Investments Ireland DAC $400,000 2.88% 23/9/2023 418,608 0.01%Discover Bank $400,000 2.45% 12/9/2024 418,494 0.01%Ventas Realty LP $400,000 3.00% 15/1/2030 418,240 0.01%JPMorgan Chase & Co. £300,000 1.90% 28/4/2033 417,841 0.01%Nordstrom, Inc. $400,000 4.25% 1/8/2031 417,651 0.01%Time Warner Entertainment Co. LP $275,000 8.38% 15/7/2033 417,319 0.01%Goldman Sachs Group, Inc. $400,000 3.20% 23/2/2023 417,206 0.01%Owl Rock Capital Corp. $400,000 3.40% 15/7/2026 417,142 0.01%GLP Capital LP/GLP Financing II, Inc. $350,000 5.75% 1/6/2028 416,604 0.01%Crown Castle International Corp. $425,000 1.05% 15/7/2026 415,793 0.01%Parker-Hannifin Corp. $350,000 4.00% 14/6/2049 415,313 0.01%John Deere Financial, Inc. CA($)530,000 1.34% 8/9/2027 415,234 0.01%Berkshire Hathaway, Inc. $400,000 2.75% 15/3/2023 415,084 0.01%HCA, Inc. $325,000 5.25% 15/6/2049 414,823 0.01%LYB International Finance III LLC $400,000 3.38% 1/10/2040 414,616 0.01%Goldman Sachs Group, Inc. £300,000 1.50% 7/12/2027 414,538 0.01%Otis Worldwide Corp. $400,000 2.57% 15/2/2030 414,509 0.01%Bank of New York Mellon Corp. $400,000 2.20% 16/8/2023 414,398 0.01%Lowe's Cos, Inc. $350,000 4.50% 15/4/2030 414,143 0.01%

640
Vanguard Global Corporate Bond Index Fund
Principal CouponMaturity
DateFair Value
US Dollars ($)% of Total
Net AssetsWells Fargo & Co.^ $400,000 2.57% 11/2/2031 414,069 0.01%GATX Corp. $435,000 1.90% 1/6/2031 414,020 0.01%Teachers Insurance & Annuity Association of America $274,000 6.85% 16/12/2039 414,017 0.01%Charter Communications Operating LLC/Charter Communications
Operating Capital $350,000 5.05% 30/3/2029 413,735 0.01%Walgreens Boots Alliance, Inc. $345,000 4.80% 18/11/2044 412,633 0.01%Advocate Health & Hospitals Corp. $400,000 3.01% 15/6/2050 412,458 0.01%JPMorgan Chase & Co.^ $350,000 4.03% 24/7/2048 412,262 0.01%Enterprise Products Operating LLC^ $400,000 5.38% 15/2/2078 411,947 0.01%Apple, Inc. $351,000 3.75% 12/9/2047 411,897 0.01%Gilead Sciences, Inc. $350,000 4.15% 1/3/2047 411,862 0.01%Verizon Communications, Inc. $350,000 4.13% 15/8/2046 411,063 0.01%Keurig Dr Pepper, Inc. $350,000 4.60% 25/5/2028 411,040 0.01%FedEx Corp. €349,000 0.95% 4/5/2033 410,967 0.01%AT&T, Inc. $350,000 4.50% 15/5/2035 410,754 0.01%Comcast Corp. $450,000 2.65% 15/8/2062 410,697 0.01%Colgate-Palmolive Co. $400,000 2.25% 15/11/2022 410,687 0.01%AbbVie, Inc. $375,000 3.60% 14/5/2025 409,378 0.01%Toyota Motor Credit Corp. £300,000 0.75% 19/11/2026 409,285 0.01%Marathon Petroleum Corp. $375,000 4.75% 15/12/2023 409,131 0.01%Berkshire Hathaway Finance Corp. $325,000 4.40% 15/5/2042 408,225 0.01%Quest Diagnostics, Inc. $385,000 2.95% 30/6/2030 407,998 0.01%Fifth Third Bancorp $400,000 1.63% 5/5/2023 407,994 0.01%VMware, Inc. $365,000 4.50% 15/5/2025 407,958 0.01%Eli Lilly & Co. $450,000 2.25% 15/5/2050 407,756 0.01%eBay, Inc. $400,000 2.60% 10/5/2031 407,085 0.01%Sempra Energy $375,000 3.25% 15/6/2027 406,757 0.01%Halliburton Co. $368,000 3.80% 15/11/2025 406,695 0.01%Westinghouse Air Brake Technologies Corp. $375,000 4.40% 15/3/2024 406,674 0.01%Fiserv, Inc. $375,000 3.20% 1/7/2026 406,248 0.01%Walmart, Inc. £200,000 5.25% 28/9/2035 406,227 0.01%Air Lease Corp. $375,000 4.25% 1/2/2024 406,198 0.01%Marsh & McLennan Cos, Inc. $400,000 2.25% 15/11/2030 405,304 0.01%Amgen, Inc. $400,000 2.30% 25/2/2031 405,088 0.01%Kaiser Foundation Hospitals $325,000 4.15% 1/5/2047 404,809 0.01%Progressive Corp. $325,000 4.20% 15/3/2048 404,787 0.01%Apple, Inc. $400,000 1.13% 11/5/2025 404,782 0.01%Marriott International, Inc. $350,000 5.75% 1/5/2025 404,139 0.01%Lennar Corp. $350,000 5.25% 1/6/2026 403,977 0.01%Healthpeak Properties, Inc. $365,000 3.50% 15/7/2029 403,878 0.01%NextEra Energy Capital Holdings, Inc. $400,000 2.25% 1/6/2030 403,716 0.01%Brixmor Operating Partnership LP $360,000 4.13% 15/5/2029 403,680 0.01%Verizon Communications, Inc. £300,000 1.13% 3/11/2028 402,980 0.01%AIG Global Funding $400,000 0.80% 7/7/2023 402,951 0.01%Enterprise Products Operating LLC $375,000 3.70% 31/1/2051 402,945 0.01%Southern California Edison Co. $400,000 1.10% 1/4/2024 402,876 0.01%Kimberly-Clark Corp. $390,000 2.88% 7/2/2050 402,385 0.01%Citigroup, Inc.^ $300,000 5.32% 26/3/2041 402,359 0.01%Bank of America Corp.^ $350,000 4.27% 23/7/2029 402,234 0.01%Athene Global Funding $400,000 2.55% 19/11/2030 402,191 0.01%CF Industries, Inc. $350,000 4.50% 1/12/2026 402,156 0.01%State Street Corp. $369,000 3.30% 16/12/2024 402,103 0.01%CommonSpirit Health $350,000 4.19% 1/10/2049 401,958 0.01%JPMorgan Chase & Co.^ $350,000 4.20% 23/7/2029 401,896 0.01%Verizon Communications, Inc. $400,000 0.75% 22/3/2024 401,742 0.01%Philip Morris International, Inc. €300,000 2.88% 3/3/2026 401,737 0.01%Ryder System, Inc. $375,000 2.90% 1/12/2026 401,688 0.01%Merck & Co., Inc. $350,000 3.60% 15/9/2042 401,687 0.01%Athene Global Funding $385,000 2.50% 14/1/2025 401,642 0.01%Boeing Co. $400,000 1.17% 4/2/2023 401,494 0.01%Norfolk Southern Corp. $400,000 3.05% 15/5/2050 400,996 0.01%Cheniere Corpus Christi Holdings LLC $350,000 7.00% 30/6/2024 400,817 0.01%HCA, Inc. $350,000 5.25% 15/4/2025 400,810 0.01%EOG Resources, Inc. $300,000 4.95% 15/4/2050 400,792 0.01%Goldman Sachs Group, Inc.^ $400,000 0.67% 8/3/2024 400,721 0.01%PepsiCo, Inc. $400,000 0.40% 7/10/2023 400,328 0.01%7-Eleven, Inc. $400,000 0.63% 10/2/2023 400,232 0.01%Duke Energy Corp. $375,000 3.75% 1/9/2046 399,822 0.01%Fidelity National Information Services, Inc. $400,000 0.60% 1/3/2024 399,363 0.01%Apple, Inc. €300,000 2.00% 17/9/2027 399,284 0.01%JPMorgan Chase & Co.^ $375,000 3.80% 23/7/2024 399,256 0.01%

641
Vanguard Global Corporate Bond Index Fund
Principal CouponMaturity
DateFair Value
US Dollars ($)% of Total
Net AssetsAbbVie, Inc. €300,000 2.13% 1/6/2029 398,930 0.01%Archer-Daniels-Midland Co. $375,000 2.50% 11/8/2026 398,840 0.01%QUALCOMM, Inc. $300,000 4.80% 20/5/2045 398,683 0.01%General Electric Co. $386,000 3.15% 7/9/2022 398,574 0.01%Mastercard, Inc. €300,000 2.10% 1/12/2027 398,443 0.01%Norfolk Southern Corp. $375,000 3.40% 1/11/2049 398,143 0.01%General Motors Financial Co., Inc. $400,000 1.50% 10/6/2026 397,891 0.01%United Airlines 2020-1 Class A Pass Through Trust $356,869 5.88% 15/10/2027 396,962 0.01%San Diego Gas & Electric Co. $375,000 2.50% 15/5/2026 396,913 0.01%CVS Health Corp. $300,000 5.30% 5/12/2043 396,710 0.01%Verizon Communications, Inc. $365,000 3.38% 15/2/2025 396,559 0.01%DuPont de Nemours, Inc. $300,000 5.32% 15/11/2038 396,496 0.01%US Bank NA $371,000 2.80% 27/1/2025 396,418 0.01%UnitedHealth Group, Inc. $345,000 3.70% 15/8/2049 395,796 0.01%JPMorgan Chase & Co. $365,000 3.63% 13/5/2024 395,612 0.01%American International Group, Inc. $350,000 3.88% 15/1/2035 395,607 0.01%Truist Financial Corp. $375,000 2.50% 1/8/2024 395,392 0.01%Stellantis NV €300,000 2.75% 15/5/2026 394,635 0.01%Coca-Cola Co. €300,000 1.63% 9/3/2035 393,857 0.01%Magellan Midstream Partners LP $325,000 4.85% 1/2/2049 393,751 0.01%Ventas Realty LP $350,000 4.00% 1/3/2028 393,519 0.01%CME Group, Inc. $367,000 3.00% 15/3/2025 393,418 0.01%Jefferies Group LLC/Jefferies Group Capital Finance, Inc. $350,000 4.15% 23/1/2030 393,413 0.01%Aetna, Inc. $350,000 3.88% 15/8/2047 393,160 0.01%Morgan Stanley^ $335,000 3.97% 22/7/2038 393,037 0.01%Bristol-Myers Squibb Co. $325,000 4.13% 15/6/2039 392,927 0.01%MassMutual Global Funding II $376,000 2.35% 14/1/2027 392,901 0.01%McDonald's Corp. $325,000 4.20% 1/4/2050 392,327 0.01%Enterprise Products Operating LLC $350,000 3.95% 15/2/2027 391,784 0.01%Walmart, Inc. $350,000 3.25% 8/7/2029 391,773 0.01%Goldman Sachs Group, Inc. $300,000 4.75% 21/10/2045 391,754 0.01%Goldman Sachs Group, Inc. $350,000 4.25% 21/10/2025 391,586 0.01%Bristol-Myers Squibb Co. $300,000 4.55% 20/2/2048 391,569 0.01%Fox Corp. $355,000 3.50% 8/4/2030 391,248 0.01%Capital One Financial Corp. $350,000 4.20% 29/10/2025 390,720 0.01%KKR Group Finance Co. III LLC $300,000 5.13% 1/6/2044 390,564 0.01%Walmart, Inc. $325,000 3.95% 28/6/2038 390,485 0.01%AT&T, Inc. $350,000 3.80% 15/2/2027 390,411 0.01%CVS Health Corp. $300,000 5.05% 25/3/2048 390,139 0.01%Walt Disney Co. $350,000 3.50% 13/5/2040 389,969 0.01%Bank of America Corp.^ $400,000 1.92% 24/10/2031 389,873 0.01%Merck & Co., Inc. €300,000 1.38% 2/11/2036 389,367 0.01%General Electric Co. £200,000 5.38% 18/12/2040 389,104 0.01%Apple, Inc. $350,000 3.35% 9/2/2027 388,514 0.01%Sysco Corp. $250,000 6.60% 1/4/2050 388,508 0.01%Goldman Sachs Group, Inc.^ $400,000 1.99% 27/1/2032 388,424 0.01%Liberty Mutual Group, Inc. $350,000 3.95% 15/10/2050 388,345 0.01%PPL Capital Funding, Inc. $375,000 3.50% 1/12/2022 388,061 0.01%Raymond James Financial, Inc. $300,000 4.95% 15/7/2046 387,981 0.01%Amgen, Inc. €300,000 2.00% 25/2/2026 387,843 0.01%Morgan Stanley €300,000 1.88% 27/4/2027 387,699 0.01%Regency Centers LP $350,000 3.60% 1/2/2027 387,474 0.01%General Electric Co. €300,000 2.13% 17/5/2037 386,875 0.01%Electronic Arts, Inc. $400,000 1.85% 15/2/2031 386,799 0.01%Northrop Grumman Corp. $275,000 5.25% 1/5/2050 386,698 0.01%Citigroup, Inc. $300,000 4.65% 30/7/2045 386,600 0.01%Omnicom Group, Inc./Omnicom Capital, Inc. $350,000 3.60% 15/4/2026 386,355 0.01%US Treasury Bond $394,000 1.88% 15/2/2041 385,812 0.01%Vulcan Materials Co. $350,000 3.50% 1/6/2030 385,772 0.01%RPM International, Inc. $335,000 4.55% 1/3/2029 385,406 0.01%Bank of America Corp.^ $350,000 3.59% 21/7/2028 384,994 0.01%PepsiCo, Inc. $350,000 3.00% 15/10/2027 384,597 0.01%Citigroup, Inc. ¥40,000,000 2.40% 31/10/2025 384,533 0.01%General Electric Co. €300,000 1.88% 28/5/2027 383,800 0.01%Philip Morris International, Inc. $325,000 4.38% 15/11/2041 383,753 0.01%Lowe's Cos, Inc. $400,000 1.70% 15/10/2030 383,708 0.01%Eli Lilly & Co. €300,000 1.63% 2/6/2026 383,525 0.01%CNA Financial Corp. $350,000 3.45% 15/8/2027 383,487 0.01%Ameren Corp. $350,000 3.50% 15/1/2031 383,376 0.01%AT&T, Inc. €300,000 1.80% 5/9/2026 383,281 0.01%Albemarle Corp. $350,000 4.15% 1/12/2024 383,266 0.01%

642
Vanguard Global Corporate Bond Index Fund
Principal CouponMaturity
DateFair Value
US Dollars ($)% of Total
Net AssetsLinde, Inc. €300,000 1.63% 1/12/2025 383,183 0.01%Procter & Gamble Co. $375,000 2.15% 11/8/2022 382,944 0.01%Metropolitan Life Global Funding I $375,000 2.40% 17/6/2022 382,833 0.01%Duke Energy Carolinas LLC $325,000 4.00% 30/9/2042 382,698 0.01%Atmos Energy Corp. $325,000 4.13% 15/10/2044 382,606 0.01%Home Depot, Inc. $350,000 2.95% 15/6/2029 382,503 0.01%Union Pacific Corp. $345,000 3.80% 6/4/2071 382,153 0.01%Williams Cos, Inc. $350,000 3.50% 15/11/2030 382,029 0.01%FedEx Corp. €300,000 1.63% 11/1/2027 382,023 0.01%Energy Transfer LP $300,000 6.13% 15/12/2045 381,898 0.01%Coca-Cola Co. €300,000 1.25% 8/3/2031 381,879 0.01%Energy Transfer LP $300,000 6.05% 1/6/2041 381,293 0.01%Exelon Corp. $350,000 3.40% 15/4/2026 381,221 0.01%Prudential Financial, Inc. $375,000 1.50% 10/3/2026 381,124 0.01%TWDC Enterprises 18 Corp. $350,000 2.95% 15/6/2027 381,054 0.01%Boston Properties LP $350,000 3.40% 21/6/2029 380,560 0.01%Energy Transfer LP $350,000 3.75% 15/5/2030 380,512 0.01%Morgan Stanley $350,000 3.88% 29/4/2024 380,512 0.01%HSBC Bank USA NA $290,000 5.88% 1/11/2034 380,483 0.01%Truist Bank $375,000 2.25% 11/3/2030 380,337 0.01%UnitedHealth Group, Inc. $290,000 4.75% 15/7/2045 380,183 0.01%Bank of America Corp. £200,000 7.00% 31/7/2028 380,065 0.01%JPMorgan Chase & Co.^ $325,000 4.45% 5/12/2029 379,883 0.01%Goldman Sachs Group, Inc. €300,000 2.13% 30/9/2024 379,687 0.01%Intercontinental Exchange, Inc. $400,000 1.85% 15/9/2032 379,685 0.01%American Honda Finance Corp. €300,000 1.95% 18/10/2024 379,425 0.01%Union Pacific Corp. $360,000 3.25% 5/2/2050 379,224 0.01%Amgen, Inc. $365,000 2.20% 21/2/2027 379,024 0.01%Ares Capital Corp. $350,000 4.25% 1/3/2025 378,321 0.01%Bank of America Corp. $335,000 4.25% 22/10/2026 378,214 0.01%Verizon Communications, Inc. €300,000 1.38% 27/10/2026 378,189 0.01%General Mills, Inc. $375,000 3.00% 1/2/2051 377,831 0.01%ACE Capital Trust II $250,000 9.70% 1/4/2030 377,267 0.01%Coca-Cola Co. €300,000 1.13% 9/3/2027 376,935 0.01%Goldman Sachs Group, Inc. £200,000 7.25% 10/4/2028 376,700 0.01%Air Lease Corp. $360,000 3.00% 15/9/2023 376,623 0.01%Dollar Tree, Inc. $330,000 4.20% 15/5/2028 376,474 0.01%Wells Fargo & Co. €300,000 1.38% 26/10/2026 376,000 0.01%Boeing Co. $375,000 1.43% 4/2/2024 375,964 0.01%Amazon.com, Inc. $375,000 0.40% 3/6/2023 375,806 0.01%Southwest Airlines Co. $350,000 4.75% 4/5/2023 375,649 0.01%Medtronic Global Holdings SCA €300,000 1.13% 7/3/2027 375,609 0.01%Southern California Edison Co. $300,000 5.35% 15/7/2035 374,752 0.01%Charles Schwab Corp. $325,000 4.00% 1/2/2029 374,636 0.01%Goldman Sachs Group, Inc.^ $375,000 0.66% 10/9/2024 374,332 0.01%Bank of America Corp. €300,000 1.38% 26/3/2025 374,320 0.01%Steel Dynamics, Inc. $375,000 3.25% 15/10/2050 374,205 0.01%JPMorgan Chase & Co.^ $375,000 0.82% 1/6/2025 374,189 0.01%Becton Dickinson & Co. $300,000 4.67% 6/6/2047 373,851 0.01%McCormick & Co., Inc. $350,000 3.15% 15/8/2024 373,314 0.01%7-Eleven, Inc. $400,000 2.80% 10/2/2051 373,301 0.01%Lincoln National Corp. $350,000 3.05% 15/1/2030 373,254 0.01%Air Lease Corp. CA($)450,000 2.63% 5/12/2024 372,643 0.01%Morgan Stanley $350,000 4.10% 22/5/2023 372,444 0.01%Mondelez International, Inc. $400,000 2.63% 4/9/2050 372,425 0.01%Schlumberger Holdings Corp. $325,000 4.30% 1/5/2029 372,343 0.01%Verizon Communications, Inc. €300,000 1.63% 1/3/2024 372,293 0.01%BP Capital Markets America, Inc. $400,000 2.77% 10/11/2050 372,239 0.01%Nestle Holdings, Inc. $350,000 3.35% 24/9/2023 371,824 0.01%Apple, Inc. $350,000 3.00% 9/2/2024 371,362 0.01%Kinder Morgan, Inc. $300,000 5.30% 1/12/2034 371,043 0.01%CC Holdings GS V LLC/Crown Castle GS III Corp. $350,000 3.85% 15/4/2023 370,744 0.01%Verizon Communications, Inc. $375,000 0.85% 20/11/2025 370,421 0.01%Merck & Co., Inc. $300,000 4.15% 18/5/2043 370,272 0.01%Kansas City Southern $350,000 3.50% 1/5/2050 370,231 0.01%Medtronic Global Holdings SCA €300,000 1.00% 2/7/2031 370,196 0.01%US Bancorp $350,000 2.38% 22/7/2026 370,068 0.01%Boston Scientific Corp. $325,000 4.00% 1/3/2029 369,857 0.01%Campbell Soup Co. $300,000 4.80% 15/3/2048 369,851 0.01%Parker-Hannifin Corp. €300,000 1.13% 1/3/2025 369,633 0.01%AbbVie, Inc. €300,000 1.38% 17/5/2024 369,363 0.01%

643
Vanguard Global Corporate Bond Index Fund
Principal CouponMaturity
DateFair Value
US Dollars ($)% of Total
Net AssetsMPLX LP $285,000 5.50% 15/2/2049 368,761 0.01%McDonald's Corp. $350,000 2.63% 1/9/2029 368,472 0.01%Xylem, Inc. €300,000 2.25% 11/3/2023 368,451 0.01%Duke Energy Florida LLC $300,000 4.20% 15/7/2048 367,829 0.01%JPMorgan Chase & Co. $325,000 4.13% 15/12/2026 367,807 0.01%Wells Fargo & Co. €300,000 2.63% 16/8/2022 367,786 0.01%Republic Services, Inc. $350,000 2.50% 15/8/2024 367,642 0.01%Consolidated Edison Co. of New York, Inc. $275,000 5.85% 15/3/2036 367,559 0.01%Utah Acquisition Sub, Inc. $300,000 5.25% 15/6/2046 367,367 0.01%Newmont Corp. $350,000 2.80% 1/10/2029 367,354 0.01%Fidelity National Information Services, Inc. €300,000 1.10% 15/7/2024 367,112 0.01%Crown Castle International Corp. $325,000 4.45% 15/2/2026 366,901 0.01%Goldman Sachs Group, Inc. $275,000 5.15% 22/5/2045 366,751 0.01%Eastern Energy Gas Holdings LLC $339,000 3.60% 15/12/2024 366,710 0.01%Raytheon Technologies Corp. $325,000 3.75% 1/11/2046 366,518 0.01%Oracle Corp. $344,000 2.95% 15/11/2024 366,501 0.01%Lennar Corp. $350,000 4.75% 15/11/2022 366,159 0.01%Cigna Corp. $350,000 3.40% 15/3/2051 366,089 0.01%Nestle Holdings, Inc. $300,000 4.00% 24/9/2048 365,587 0.01%AbbVie, Inc. €300,000 0.75% 18/11/2027 365,534 0.01%Medtronic Global Holdings SCA €300,000 1.63% 15/10/2050 365,410 0.01%Metropolitan Life Global Funding I €300,000 0.55% 16/6/2027 365,287 0.01%State Street Corp. $350,000 2.40% 24/1/2030 365,216 0.01%General Motors Co. $300,000 5.15% 1/4/2038 365,180 0.01%JPMorgan Chase & Co. €300,000 1.50% 26/10/2022 364,776 0.01%Abbott Ireland Financing DAC €300,000 0.88% 27/9/2023 364,706 0.01%Santander Holdings USA, Inc. $325,000 4.40% 13/7/2027 364,619 0.01%PepsiCo, Inc. $300,000 4.00% 5/3/2042 364,546 0.01%Energy Transfer LP/Regency Energy Finance Corp. $340,000 4.50% 1/11/2023 364,460 0.01%Carrier Global Corp. $350,000 2.24% 15/2/2025 364,133 0.01%Union Pacific Corp. $350,000 2.89% 6/4/2036 364,086 0.01%Kinder Morgan, Inc. $300,000 5.05% 15/2/2046 363,989 0.01%Digital Dutch Finco BV €300,000 1.25% 1/2/2031 363,620 0.01%Cisco Systems, Inc. $350,000 2.60% 28/2/2023 363,364 0.01%Autodesk, Inc. $325,000 4.38% 15/6/2025 363,354 0.01%Comcast Corp. $250,000 7.05% 15/3/2033 363,214 0.01%Textron, Inc. $325,000 4.00% 15/3/2026 363,121 0.01%Coca-Cola Co. €300,000 0.50% 8/3/2024 363,062 0.01%Medtronic Global Holdings SCA €300,000 1.38% 15/10/2040 362,951 0.01%Walmart, Inc. $250,000 5.63% 15/4/2041 362,891 0.01%AT&T, Inc. $275,000 5.45% 1/3/2047 362,881 0.01%Carrier Global Corp. $350,000 2.72% 15/2/2030 362,864 0.01%Progressive Corp. $300,000 3.95% 26/3/2050 362,599 0.01%Morgan Stanley €300,000 1.00% 2/12/2022 362,308 0.01%National Grid North America, Inc. €300,000 0.75% 8/8/2023 362,252 0.01%Mars, Inc. $330,000 3.20% 1/4/2030 361,738 0.01%Lockheed Martin Corp. $315,000 3.60% 1/3/2035 361,416 0.01%Altria Group, Inc. €300,000 1.00% 15/2/2023 361,320 0.01%LYB International Finance III LLC $315,000 4.20% 1/5/2050 361,312 0.01%Nasdaq, Inc. €300,000 0.88% 13/2/2030 361,251 0.01%DTE Electric Co. $300,000 3.95% 1/3/2049 361,091 0.01%Boston Scientific Corp. €300,000 0.63% 1/12/2027 361,025 0.01%JPMorgan Chase & Co. $275,000 4.85% 1/2/2044 360,569 0.01%Toyota Motor Credit Corp. €300,000 0.25% 16/7/2026 360,367 0.01%Essex Portfolio LP $355,000 2.65% 15/3/2032 360,294 0.01%BlackRock, Inc. $325,000 3.20% 15/3/2027 360,065 0.01%Thermo Fisher Scientific, Inc. €300,000 0.50% 1/3/2028 359,744 0.01%Comcast Corp. €300,000 1.25% 20/2/2040 359,742 0.01%Omega Healthcare Investors, Inc. $350,000 3.38% 1/2/2031 359,617 0.01%Activision Blizzard, Inc. $400,000 2.50% 15/9/2050 359,549 0.01%AmerisourceBergen Corp. $350,000 2.70% 15/3/2031 359,405 0.01%HCA, Inc. $325,000 5.00% 15/3/2024 359,214 0.01%Oncor Electric Delivery Co. LLC $340,000 3.10% 15/9/2049 359,157 0.01%Lam Research Corp. $326,000 3.80% 15/3/2025 358,720 0.01%Marathon Petroleum Corp. $300,000 5.00% 15/9/2054 358,708 0.01%UDR, Inc. $375,000 2.10% 15/6/2033 358,692 0.01%Kroger Co. $300,000 4.45% 1/2/2047 358,560 0.01%PayPal Holdings, Inc. $350,000 2.20% 26/9/2022 358,424 0.01%Medtronic Global Holdings SCA €300,000 0.75% 15/10/2032 358,383 0.01%Coca-Cola Co. €300,000 0.95% 6/5/2036 358,379 0.01%Blackstone Holdings Finance Co. LLC $360,000 2.80% 30/9/2050 358,317 0.01%

644
Vanguard Global Corporate Bond Index Fund
Principal CouponMaturity
DateFair Value
US Dollars ($)% of Total
Net AssetsSysco Corp. $300,000 4.45% 15/3/2048 358,244 0.01%NBCUniversal Media LLC $240,000 6.40% 30/4/2040 358,217 0.01%Kinder Morgan, Inc. $350,000 3.60% 15/2/2051 357,613 0.01%Aflac, Inc. $326,000 3.63% 15/11/2024 357,469 0.01%Pfizer, Inc. €300,000 0.25% 6/3/2022 357,314 0.01%Public Service Electric & Gas Co. $325,000 3.20% 15/5/2029 357,314 0.01%Verizon Communications, Inc. €300,000 0.88% 19/3/2032 357,296 0.01%Nestle Holdings, Inc. $300,000 3.90% 24/9/2038 356,890 0.01%Booking Holdings, Inc. €300,000 0.10% 8/3/2025 356,850 0.01%Conagra Brands, Inc. $325,000 4.30% 1/5/2024 356,623 0.01%Massachusetts Mutual Life Insurance Co. $275,000 4.90% 1/4/2077 356,614 0.01%Comcast Corp. $325,000 3.15% 15/2/2028 356,385 0.01%PayPal Holdings, Inc. $350,000 1.35% 1/6/2023 356,331 0.01%Coca-Cola Co. €300,000 0.40% 6/5/2030 356,127 0.01%Regeneron Pharmaceuticals, Inc. $375,000 1.75% 15/9/2030 355,723 0.01%Fox Corp. $275,000 5.48% 25/1/2039 355,562 0.01%NVIDIA Corp. $300,000 3.70% 1/4/2060 355,415 0.01%Apollo Management Holdings LP $350,000 2.65% 5/6/2030 355,369 0.01%Duke Energy Florida LLC $325,000 3.20% 15/1/2027 355,010 0.01%Amgen, Inc. $330,000 3.13% 1/5/2025 354,967 0.01%Bristol-Myers Squibb Co. $310,000 3.90% 20/2/2028 354,680 0.01%AmerisourceBergen Corp. $325,000 3.45% 15/12/2027 354,647 0.01%Philip Morris International, Inc. $325,000 3.38% 11/8/2025 354,535 0.01%Procter & Gamble Co.1 $325,000 2.85% 11/8/2027 354,280 0.01%Walgreens Boots Alliance, Inc. $325,000 3.80% 18/11/2024 354,164 0.01%Time Warner Cable LLC £200,000 5.75% 2/6/2031 354,014 0.01%MPLX LP $350,000 1.75% 1/3/2026 353,981 0.01%Intel Corp. $310,000 3.73% 8/12/2047 353,737 0.01%Georgia-Pacific LLC $325,000 3.60% 1/3/2025 353,446 0.01%Citigroup, Inc. $325,000 3.30% 27/4/2025 353,408 0.01%Consolidated Edison Co. of New York, Inc. $240,000 6.75% 1/4/2038 353,341 0.01%Raytheon Technologies Corp. $320,000 3.50% 15/3/2027 353,115 0.01%JPMorgan Chase & Co. $250,000 5.63% 16/8/2043 353,054 0.01%Medtronic, Inc. $269,000 4.63% 15/3/2045 352,859 0.01%Mondelez International Holdings Netherlands BV €300,000 0.00% 22/9/2026 352,758 0.01%Digital Dutch Finco BV €300,000 1.00% 15/1/2032 352,535 0.01%FedEx Corp. $325,000 3.10% 5/8/2029 352,394 0.01%Charter Communications Operating LLC/Charter Communications
Operating Capital $350,000 3.50% 1/6/2041 352,372 0.01%Coca-Cola Co. €300,000 0.13% 9/3/2029 352,173 0.01%Boston Gas Co. $300,000 4.49% 15/2/2042 352,045 0.01%Southern Co. $300,000 4.40% 1/7/2046 351,959 0.01%Pfizer, Inc. $325,000 2.75% 3/6/2026 351,643 0.01%Apple, Inc. AU($)450,000 3.70% 28/8/2022 351,270 0.01%Athene Global Funding $350,000 0.95% 8/1/2024 351,010 0.01%Exxon Mobil Corp. €300,000 1.41% 26/6/2039 350,840 0.01%Prudential Financial, Inc. $275,000 4.60% 15/5/2044 350,709 0.01%Amazon.com, Inc. $350,000 0.80% 3/6/2025 350,681 0.01%salesforce.com, Inc. $350,000 1.95% 15/7/2031 350,542 0.01%GLP Capital LP/GLP Financing II, Inc. $300,000 5.30% 15/1/2029 350,294 0.01%Time Warner Cable LLC $250,000 6.75% 15/6/2039 349,999 0.01%Aviation Capital Group LLC $350,000 1.95% 30/1/2026 349,992 0.01%Western Union Co. $350,000 2.75% 15/3/2031 349,959 0.01%salesforce.com, Inc. $350,000 1.50% 15/7/2028 349,957 0.01%Bank of America NA $250,000 6.00% 15/10/2036 349,859 0.01%Goldman Sachs Group, Inc.^ CA($)440,000 2.01% 28/2/2029 349,775 0.01%Citigroup, Inc. $300,000 5.50% 13/9/2025 349,585 0.01%Raytheon Technologies Corp. $250,000 6.05% 1/6/2036 349,491 0.01%Starbucks Corp. $325,000 3.50% 15/11/2050 349,342 0.01%Corning, Inc. $250,000 5.45% 15/11/2079 349,218 0.01%Pfizer, Inc. $350,000 2.70% 28/5/2050 348,959 0.01%Enterprise Products Operating LLC $275,000 5.10% 15/2/2045 348,945 0.01%NextEra Energy Capital Holdings, Inc. $330,000 2.75% 1/11/2029 348,693 0.01%Bristol-Myers Squibb Co. $275,000 4.35% 15/11/2047 348,601 0.01%Amazon.com, Inc. $350,000 1.20% 3/6/2027 348,197 0.01%Teachers Insurance & Annuity Association of America $270,000 4.90% 15/9/2044 348,161 0.01%Southern Co. $300,000 4.25% 1/7/2036 347,985 0.01%Kimco Realty Corp. $300,000 4.25% 1/4/2045 347,675 0.01%Federal Realty Investment Trust $350,000 1.25% 15/2/2026 347,563 0.01%JPMorgan Chase & Co. €300,000 0.60% 17/2/2033 347,540 0.01%CBRE Services, Inc. $300,000 4.88% 1/3/2026 347,319 0.01%

645
Vanguard Global Corporate Bond Index Fund
Principal CouponMaturity
DateFair Value
US Dollars ($)% of Total
Net AssetsEverest Reinsurance Holdings, Inc. $325,000 3.50% 15/10/2050 346,868 0.01%Athene Holding Ltd. $325,000 3.50% 15/1/2031 346,845 0.01%JPMorgan Chase & Co. $320,000 3.88% 1/2/2024 346,815 0.01%AES Corp. $350,000 1.38% 15/1/2026 346,514 0.01%Walmart, Inc. $325,000 2.85% 8/7/2024 346,416 0.01%Oracle Corp. $250,000 6.13% 8/7/2039 346,211 0.01%Prologis Euro Finance LLC €300,000 0.50% 16/2/2032 346,050 0.01%General Mills, Inc. $300,000 4.20% 17/4/2028 345,914 0.01%UnitedHealth Group, Inc. $300,000 3.75% 15/10/2047 345,801 0.01%Dominion Energy, Inc. $275,000 4.60% 15/3/2049 345,794 0.01%NSTAR Electric Co. $300,000 3.95% 1/4/2030 345,733 0.01%Caterpillar Financial Services Corp. $350,000 1.10% 14/9/2027 345,721 0.01%Wyeth LLC $300,000 6.45% 1/2/2024 345,704 0.01%Enterprise Products Operating LLC $310,000 3.95% 31/1/2060 344,634 0.01%American Tower Corp. $350,000 2.10% 15/6/2030 344,318 0.01%Coca-Cola Co. €300,000 0.38% 15/3/2033 344,298 0.01%Biogen, Inc. $350,000 3.15% 1/5/2050 344,173 0.01%Pacific Life Global Funding II $350,000 1.45% 20/1/2028 344,073 0.01%Hess Corp. $275,000 5.60% 15/2/2041 343,922 0.01%Pacific LifeCorp $325,000 3.35% 15/9/2050 343,814 0.01%Digital Intrepid Holding BV €300,000 0.63% 15/7/2031 343,741 0.01%Aon plc $275,000 4.60% 14/6/2044 343,696 0.01%HCA, Inc. $275,000 5.13% 15/6/2039 343,384 0.01%Wells Fargo Bank NA $250,000 5.85% 1/2/2037 343,191 0.01%Walt Disney Co. $300,000 3.80% 22/3/2030 342,816 0.01%Wells Fargo Bank NA $250,000 5.95% 26/8/2036 342,757 0.01%Evergy Kansas Central, Inc. $325,000 3.25% 1/9/2049 342,699 0.01%NiSource, Inc. $250,000 5.65% 1/2/2045 342,481 0.01%Medtronic, Inc. $312,000 3.50% 15/3/2025 342,463 0.01%JPMorgan Chase & Co. $250,000 5.50% 15/10/2040 342,430 0.01%Apple, Inc. $350,000 2.80% 8/2/2061 342,356 0.01%Kimberly-Clark Corp. $250,000 5.30% 1/3/2041 342,160 0.01%JPMorgan Chase & Co. $300,000 4.25% 1/10/2027 342,086 0.01%AT&T, Inc. $300,000 4.30% 15/12/2042 341,694 0.01%Verizon Communications, Inc. $300,000 4.13% 16/3/2027 341,436 0.01%Enterprise Products Operating LLC^ $325,000 5.25% 16/8/2077 340,409 0.01%Nestle Holdings, Inc. $300,000 3.63% 24/9/2028 340,378 0.01%KeyCorp $325,000 2.55% 1/10/2029 340,375 0.01%Marsh & McLennan Cos, Inc. $275,000 4.20% 1/3/2048 340,129 0.01%Realty Income Corp. $300,000 4.13% 15/10/2026 340,102 0.01%Walt Disney Co. $225,000 6.65% 15/11/2037 340,094 0.01%Bank of America Corp.^ $325,000 2.46% 22/10/2025 340,091 0.01%NVIDIA Corp. $300,000 3.50% 1/4/2040 340,009 0.01%Altria Group, Inc. $325,000 4.25% 9/8/2042 339,526 0.01%Estee Lauder Cos, Inc. $325,000 2.38% 1/12/2029 339,522 0.01%ViacomCBS, Inc. $300,000 4.75% 15/5/2025 339,418 0.01%Air Lease Corp. $335,000 3.00% 1/2/2030 339,401 0.01%Hewlett Packard Enterprise Co. $250,000 6.20% 15/10/2035 339,284 0.01%Anthem, Inc. $305,000 3.70% 15/9/2049 339,093 0.01%AT&T, Inc. £200,000 5.50% 15/3/2027 338,443 0.01%Trinity Acquisition plc $300,000 4.40% 15/3/2026 338,196 0.01%ONEOK, Inc. $300,000 7.50% 1/9/2023 337,883 0.01%Biogen, Inc. $325,000 3.63% 15/9/2022 337,474 0.01%ONEOK, Inc. $275,000 5.20% 15/7/2048 337,310 0.01%New York Life Global Funding $325,000 2.00% 22/1/2025 336,934 0.01%Lennar Corp. $300,000 4.75% 30/5/2025 336,770 0.01%WP Carey, Inc. $350,000 2.25% 1/4/2033 336,770 0.01%Walmart, Inc. $325,000 2.55% 11/4/2023 336,728 0.01%Sempra Energy $325,000 2.90% 1/2/2023 336,529 0.01%Apple, Inc. $300,000 3.45% 9/2/2045 336,466 0.01%JPMorgan Chase & Co.^ $350,000 1.76% 19/11/2031 336,147 0.01%Gilead Sciences, Inc. $275,000 4.50% 1/2/2045 335,829 0.01%Nationwide Mutual Insurance Co. $300,000 4.35% 30/4/2050 335,702 0.01%Comcast Corp. $300,000 3.55% 1/5/2028 335,691 0.01%Citigroup, Inc. $250,000 5.30% 6/5/2044 335,428 0.01%Kirby Corp. $300,000 4.20% 1/3/2028 335,395 0.01%Stanley Black & Decker, Inc. $323,000 2.30% 15/3/2030 335,283 0.01%Bristol-Myers Squibb Co. $350,000 2.55% 13/11/2050 335,190 0.01%General Motors Financial Co., Inc. $275,000 5.65% 17/1/2029 335,173 0.01%Public Service Co. of New Hampshire $315,000 3.50% 1/11/2023 334,959 0.01%General Motors Co. $300,000 4.20% 1/10/2027 334,760 0.01%

646
Vanguard Global Corporate Bond Index Fund
Principal CouponMaturity
DateFair Value
US Dollars ($)% of Total
Net AssetsGilead Sciences, Inc. $325,000 3.25% 1/9/2022 334,301 0.01%Cox Communications, Inc. $350,000 1.80% 1/10/2030 333,771 0.01%United Parcel Service, Inc. $325,000 2.45% 1/10/2022 333,668 0.01%American Honda Finance Corp. $325,000 2.05% 10/1/2023 333,407 0.01%Bank of America Corp.^ $300,000 3.82% 20/1/2028 333,187 0.01%US Treasury Bond1 $320,000 2.25% 15/5/2041 333,000 0.01%UnitedHealth Group, Inc. $300,000 3.75% 15/7/2025 332,825 0.01%Constellation Brands, Inc. $275,000 4.50% 9/5/2047 332,556 0.01%Tyson Foods, Inc. $300,000 3.55% 2/6/2027 331,972 0.01%Hartford Financial Services Group, Inc. $315,000 2.80% 19/8/2029 331,866 0.01%AT&T, Inc. CA($)375,000 4.00% 25/11/2025 331,775 0.01%ONEOK, Inc. $300,000 4.00% 13/7/2027 331,519 0.01%Welltower, Inc. $300,000 4.00% 1/6/2025 331,139 0.01%Caterpillar, Inc. $300,000 3.25% 19/9/2049 330,776 0.01%Mars, Inc. $275,000 3.95% 1/4/2049 330,509 0.01%Welltower, Inc. £200,000 4.80% 20/11/2028 330,432 0.01%SC Johnson & Son, Inc. $250,000 4.75% 15/10/2046 330,391 0.01%Norfolk Southern Corp. $314,000 2.55% 1/11/2029 330,208 0.01%AEP Transmission Co. LLC $285,000 3.80% 15/6/2049 329,897 0.01%Connecticut Light & Power Co. $300,000 3.20% 15/3/2027 329,644 0.01%International Business Machines Corp. $300,000 3.30% 27/1/2027 329,452 0.01%Narragansett Electric Co. $300,000 3.40% 9/4/2030 329,223 0.01%CRH America, Inc. $300,000 3.88% 18/5/2025 328,859 0.01%Union Pacific Corp. $300,000 3.38% 1/2/2035 328,832 0.01%Florida Power & Light Co. $250,000 4.95% 1/6/2035 328,368 0.01%Northrop Grumman Corp. $250,000 5.15% 1/5/2040 328,225 0.01%BP Capital Markets America, Inc. $325,000 3.06% 17/6/2041 328,213 0.01%Coca-Cola Co. $325,000 1.45% 1/6/2027 328,133 0.01%Sutter Health $325,000 2.29% 15/8/2030 328,049 0.01%GLP Capital LP/GLP Financing II, Inc. $285,000 5.38% 15/4/2026 327,976 0.01%Phillips 66 $275,000 4.65% 15/11/2034 327,930 0.01%AT&T, Inc. $300,000 4.45% 1/4/2024 327,799 0.01%Camden Property Trust $300,000 3.35% 1/11/2049 327,688 0.01%WRKCo, Inc. $300,000 3.75% 15/3/2025 327,676 0.01%Valero Energy Corp. $325,000 1.20% 15/3/2024 327,629 0.01%Smithfield Foods, Inc. $300,000 4.25% 1/2/2027 327,576 0.01%Arizona Public Service Co. $300,000 3.50% 1/12/2049 327,222 0.01%Kinder Morgan Energy Partners LP $300,000 4.30% 1/5/2024 327,055 0.01%General Motors Financial Co., Inc. $300,000 4.00% 15/1/2025 326,856 0.01%United Parcel Service, Inc. $240,000 5.20% 1/4/2040 326,855 0.01%Affiliated Managers Group, Inc. $300,000 4.25% 15/2/2024 326,781 0.01%Royalty Pharma plc $325,000 3.30% 2/9/2040 326,741 0.01%Energy Transfer LP $300,000 4.50% 15/4/2024 326,739 0.01%Bank of America Corp. $300,000 4.13% 22/1/2024 326,651 0.01%General Motors Co. $300,000 4.88% 2/10/2023 326,553 0.01%Comcast Corp. $300,000 3.15% 1/3/2026 326,447 0.01%Walgreens Boots Alliance, Inc. $300,000 3.45% 1/6/2026 326,405 0.01%Raytheon Technologies Corp. $300,000 3.13% 4/5/2027 326,249 0.01%GE Capital Funding LLC $300,000 3.45% 15/5/2025 326,174 0.01%JPMorgan Chase & Co.^ $325,000 0.70% 16/3/2024 326,038 0.01%Oracle Corp. $300,000 4.00% 15/7/2046 325,981 0.01%3M Co. $300,000 2.88% 15/10/2027 325,913 0.01%Goldman Sachs Group, Inc. $300,000 4.00% 3/3/2024 325,865 0.01%Exxon Mobil Corp. $300,000 3.04% 1/3/2026 325,629 0.01%Allstate Corp.^ $300,000 5.75% 15/8/2053 325,627 0.01%Hess Corp. $240,000 7.30% 15/8/2031 325,253 0.01%Brighthouse Financial, Inc. $293,000 4.70% 22/6/2047 325,219 0.01%Agilent Technologies, Inc. $325,000 2.30% 12/3/2031 325,218 0.01%Biogen, Inc. $325,000 3.25% 15/2/2051 325,115 0.01%Abbott Laboratories $287,000 3.75% 30/11/2026 324,644 0.01%PerkinElmer, Inc. $300,000 3.30% 15/9/2029 324,610 0.01%New York Life Insurance Co. $215,000 6.75% 15/11/2039 324,569 0.01%SBL Holdings, Inc. $300,000 5.00% 18/2/2031 324,439 0.01%BlackRock, Inc. $300,000 3.50% 18/3/2024 324,250 0.01%Comcast Corp. $300,000 3.60% 1/3/2024 323,954 0.01%Stellantis NV $300,000 5.25% 15/4/2023 323,475 0.01%Cargill, Inc. $325,000 0.40% 2/2/2024 323,386 0.01%Kinder Morgan, Inc. $250,000 5.55% 1/6/2045 323,357 0.01%Virginia Electric & Power Co. $300,000 2.88% 15/7/2029 323,222 0.01%Zimmer Biomet Holdings, Inc. $300,000 3.05% 15/1/2026 323,215 0.01%Amgen, Inc. $300,000 3.63% 22/5/2024 323,005 0.01%

647
Vanguard Global Corporate Bond Index Fund
Principal CouponMaturity
DateFair Value
US Dollars ($)% of Total
Net AssetsTime Warner Cable LLC $250,000 5.88% 15/11/2040 322,632 0.01%PepsiCo, Inc. $300,000 2.63% 19/3/2027 322,232 0.01%JM Smucker Co. $275,000 4.25% 15/3/2035 322,097 0.01%Comcast Corp. $275,000 4.00% 1/3/2048 321,846 0.01%Bank of America Corp. £200,000 4.25% 10/12/2026 321,822 0.01%Union Electric Co. $300,000 3.50% 15/4/2024 321,419 0.01%Verizon Communications, Inc. £200,000 3.38% 27/10/2036 320,795 0.01%UnitedHealth Group, Inc. $300,000 3.25% 15/5/2051 320,726 0.01%3M Co. $300,000 3.25% 14/2/2024 320,610 0.01%Baker Hughes Holdings LLC $250,000 5.13% 15/9/2040 320,538 0.01%Athene Global Funding $305,000 2.75% 25/6/2024 320,129 0.01%CVS Health Corp. $304,000 3.70% 9/3/2023 320,045 0.01%Altria Group, Inc. $250,000 5.95% 14/2/2049 320,039 0.01%Comcast Corp. $275,000 4.00% 15/8/2047 319,718 0.01%Ally Financial, Inc. $275,000 5.80% 1/5/2025 319,692 0.01%Walmart, Inc. $300,000 2.65% 15/12/2024 319,583 0.01%Bank of America Corp.^ $300,000 3.09% 1/10/2025 319,520 0.01%Charter Communications Operating LLC/Charter Communications
Operating Capital $325,000 3.85% 1/4/2061 319,476 0.01%Raytheon Technologies Corp. $300,000 3.20% 15/3/2024 319,184 0.01%American Airlines 2016-2 Class AA Pass Through Trust $314,800 3.20% 15/6/2028 318,965 0.01%KKR Group Finance Co. VI LLC $285,000 3.75% 1/7/2029 318,875 0.01%PPL Capital Funding, Inc. $275,000 4.13% 15/4/2030 318,484 0.01%Costco Wholesale Corp. $300,000 2.75% 18/5/2024 318,009 0.01%AbbVie, Inc. $250,000 4.85% 15/6/2044 317,716 0.01%Chevron Corp. $300,000 2.90% 3/3/2024 317,508 0.01%Walt Disney Co. $225,000 6.20% 15/12/2034 317,026 0.01%Dollar Tree, Inc. $300,000 3.70% 15/5/2023 316,932 0.01%Las Vegas Sands Corp. $304,000 2.90% 25/6/2025 316,818 0.01%Southern California Edison Co. $275,000 4.65% 1/10/2043 316,232 0.01%ViacomCBS, Inc. $250,000 4.95% 19/5/2050 315,904 0.01%Memorial Sloan-Kettering Cancer Center $250,000 4.13% 1/7/2052 315,885 0.01%PNC Financial Services Group, Inc. $300,000 2.55% 22/1/2030 315,865 0.01%Interstate Power & Light Co. $275,000 4.10% 26/9/2028 315,862 0.01%Moody's Corp. $240,000 4.88% 17/12/2048 315,798 0.01%Pacific Gas & Electric Co. $325,000 2.10% 1/8/2027 315,714 0.01%Capital One Financial Corp. $293,000 3.30% 30/10/2024 315,678 0.01%Enbridge Energy Partners LP $200,000 7.38% 15/10/2045 315,655 0.01%Equitable Holdings, Inc. $298,000 3.90% 20/4/2023 315,217 0.01%Host Hotels & Resorts LP $300,000 3.38% 15/12/2029 315,081 0.01%QUALCOMM, Inc. $250,000 4.30% 20/5/2047 314,760 0.01%WRKCo, Inc. $300,000 3.00% 15/6/2033 314,599 0.01%ConocoPhillips $225,000 5.90% 15/5/2038 314,584 0.01%Cargill, Inc. $300,000 3.25% 1/3/2023 314,382 0.01%Leland Stanford Junior University $260,000 3.65% 1/5/2048 314,298 0.01%Newmont Corp. $230,000 5.45% 9/6/2044 314,233 0.01%Pfizer, Inc. $250,000 4.30% 15/6/2043 314,229 0.01%FMR LLC $250,000 4.95% 1/2/2033 314,101 0.01%Ecolab, Inc. $260,000 3.95% 1/12/2047 313,850 0.01%Johnson Controls International plc $250,000 4.50% 15/2/2047 313,601 0.01%National Retail Properties, Inc. $300,000 3.50% 15/4/2051 313,493 0.01%Burlington Northern Santa Fe LLC $250,000 4.45% 15/3/2043 313,380 0.01%Anthem, Inc. $250,000 4.55% 1/3/2048 313,351 0.01%American International Group, Inc. $250,000 4.80% 10/7/2045 313,325 0.01%PECO Energy Co. $300,000 3.05% 15/3/2051 313,213 0.01%DuPont de Nemours, Inc. $275,000 4.49% 15/11/2025 312,635 0.01%Indiana Michigan Power Co. $250,000 4.55% 15/3/2046 312,595 0.01%Citigroup, Inc. €250,000 1.25% 10/4/2029 312,459 0.01%JPMorgan Chase & Co.^ $300,000 3.16% 22/4/2042 312,372 0.01%Assured Guaranty US Holdings, Inc. $300,000 3.15% 15/6/2031 311,647 0.01%Corning, Inc. $275,000 3.90% 15/11/2049 311,453 0.01%Coca-Cola Co. $300,000 3.00% 5/3/2051 311,333 0.01%International Paper Co. $250,000 4.35% 15/8/2048 311,234 0.01%Air Products & Chemicals, Inc. $300,000 2.75% 3/2/2023 311,093 0.01%Lockheed Martin Corp. $310,000 1.85% 15/6/2030 311,089 0.01%Bristol-Myers Squibb Co. $300,000 2.75% 15/2/2023 310,940 0.01%Citigroup, Inc.^ $250,000 4.28% 24/4/2048 310,846 0.01%Fidelity National Information Services, Inc. £200,000 3.36% 21/5/2031 310,829 0.01%JPMorgan Chase & Co. $300,000 3.25% 23/9/2022 310,766 0.01%eBay, Inc. $300,000 2.75% 30/1/2023 310,700 0.01%Consolidated Edison Co. of New York, Inc. $250,000 4.65% 1/12/2048 310,223 0.01%

648
Vanguard Global Corporate Bond Index Fund
Principal CouponMaturity
DateFair Value
US Dollars ($)% of Total
Net AssetsConnecticut Light & Power Co. $250,000 4.30% 15/4/2044 310,026 0.01%Simon Property Group LP $250,000 4.75% 15/3/2042 309,972 0.01%Microsoft Corp. $300,000 2.38% 1/5/2023 309,939 0.01%American Express Co. $300,000 2.65% 2/12/2022 309,815 0.01%JPMorgan Chase & Co.^ $325,000 2.53% 19/11/2041 309,624 0.01%Pacific Gas & Electric Co. $300,000 3.15% 1/1/2026 309,559 0.01%Boeing Co. $300,000 3.75% 1/2/2050 309,466 0.01%Kaiser Foundation Hospitals $300,000 3.00% 1/6/2051 309,452 0.01%Vornado Realty LP $300,000 3.40% 1/6/2031 309,343 0.01%Burlington Northern Santa Fe LLC $255,000 4.15% 1/4/2045 308,940 0.01%Dominion Energy, Inc. $300,000 2.45% 15/1/2023 308,891 0.01%American Tower Corp. $295,000 2.40% 15/3/2025 308,340 0.01%McCormick & Co., Inc. $300,000 2.50% 15/4/2030 308,176 0.01%Dow Chemical Co. $175,000 9.40% 15/5/2039 308,152 0.01%Altria Group, Inc. $300,000 2.85% 9/8/2022 308,082 0.01%Charles Schwab Corp. $300,000 2.00% 20/3/2028 307,977 0.01%Bank of New York Mellon Corp. $300,000 1.60% 24/4/2025 307,969 0.01%General Motors Co. $225,000 6.60% 1/4/2036 307,825 0.01%Oracle Corp. $275,000 3.90% 15/5/2035 307,730 0.01%Linde, Inc. €250,000 1.20% 12/2/2024 307,702 0.01%JPMorgan Chase & Co.^ $275,000 3.70% 6/5/2030 307,560 0.01%AT&T, Inc. $280,000 3.60% 15/7/2025 307,116 0.01%Brookfield Property Finance ULC CA($)370,000 3.93% 15/1/2027 306,978 0.01%Chevron Phillips Chemical Co. LLC/Chevron Phillips Chemical Co. LP $275,000 3.70% 1/6/2028 306,833 0.01%Pacific Gas & Electric Co. $300,000 2.95% 1/3/2026 306,712 0.01%Tyson Foods, Inc. $275,000 4.00% 1/3/2026 306,577 0.01%Progressive Corp. $250,000 4.13% 15/4/2047 306,552 0.01%Kaiser Foundation Hospitals $300,000 2.81% 1/6/2041 306,515 0.01%General Motors Co. $225,000 5.95% 1/4/2049 306,332 0.01%Apple, Inc. $295,000 1.80% 11/9/2024 306,173 0.01%Gray Oak Pipeline LLC $300,000 2.00% 15/9/2023 306,122 0.01%Hasbro, Inc. $275,000 3.90% 19/11/2029 305,842 0.01%Illinois Tool Works, Inc. $285,000 2.65% 15/11/2026 305,677 0.01%MetLife, Inc. $180,000 10.75% 1/8/2039 305,504 0.01%McDonald's Corp. $275,000 3.63% 1/5/2043 305,285 0.01%Charter Communications Operating LLC/Charter Communications
Operating Capital $300,000 3.90% 1/6/2052 305,276 0.01%Apple, Inc. $300,000 1.70% 11/9/2022 305,115 0.01%Capital One Financial Corp. $300,000 3.05% 9/3/2022 304,962 0.01%salesforce.com, Inc. $300,000 3.05% 15/7/2061 304,865 0.01%Bristol-Myers Squibb Co.1 $275,000 3.25% 27/2/2027 304,580 0.01%Digital Stout Holding LLC £200,000 3.30% 19/7/2029 304,543 0.01%Florida Power & Light Co. $250,000 4.05% 1/10/2044 304,291 0.01%Citigroup, Inc. $275,000 3.70% 12/1/2026 303,923 0.01%Hewlett Packard Enterprise Co. $225,000 6.35% 15/10/2045 303,826 0.01%Chubb INA Holdings, Inc. $250,000 4.15% 13/3/2043 303,640 0.01%American International Group, Inc. $250,000 4.50% 16/7/2044 303,457 0.01%Puget Energy, Inc. $300,000 2.38% 15/6/2028 303,036 0.01%General Motors Financial Co., Inc. $275,000 5.10% 17/1/2024 302,872 0.01%CenterPoint Energy Houston Electric LLC $275,000 3.35% 1/4/2051 302,768 0.01%UnitedHealth Group, Inc. $300,000 2.90% 15/5/2050 302,536 0.01%Otis Worldwide Corp. $291,000 2.06% 5/4/2025 302,467 0.01%Healthcare Realty Trust, Inc. $300,000 2.40% 15/3/2030 301,937 0.01%salesforce.com, Inc. $300,000 2.70% 15/7/2041 301,881 0.01%Pacific Gas & Electric Co. $300,000 3.00% 15/6/2028 301,341 0.01%Wells Fargo & Co. $225,000 5.38% 2/11/2043 301,279 0.01%Alabama Power Co. $275,000 3.45% 1/10/2049 300,491 0.01%PayPal Holdings, Inc. $280,000 2.65% 1/10/2026 300,307 0.01%Phillips 66 $300,000 0.90% 15/2/2024 300,299 0.01%Amazon.com, Inc. $300,000 0.25% 12/5/2023 300,100 0.01%BlackRock, Inc. $300,000 1.90% 28/1/2031 300,044 0.01%Altria Group, Inc. $265,000 4.40% 14/2/2026 299,772 0.01%Becton Dickinson & Co. $275,000 3.73% 15/12/2024 299,533 0.01%Consumers Energy Co. $300,000 0.35% 1/6/2023 299,520 0.01%Virginia Electric & Power Co. $250,000 4.20% 15/5/2045 299,307 0.01%American Express Co. $250,000 4.05% 3/12/2042 299,185 0.01%Cox Communications, Inc. $275,000 3.35% 15/9/2026 299,050 0.01%AT&T, Inc. £200,000 2.90% 4/12/2026 299,046 0.01%Crown Castle International Corp. $300,000 3.25% 15/1/2051 298,827 0.01%Home Depot, Inc. $240,000 4.25% 1/4/2046 298,818 0.01%Public Service Electric & Gas Co. $300,000 0.95% 15/3/2026 298,691 0.01%

649
Vanguard Global Corporate Bond Index Fund
Principal CouponMaturity
DateFair Value
US Dollars ($)% of Total
Net AssetsTWDC Enterprises 18 Corp. $290,000 1.85% 30/7/2026 298,660 0.01%ERAC USA Finance LLC $200,000 7.00% 15/10/2037 298,638 0.01%Southern Co. Gas Capital Corp. $275,000 3.25% 15/6/2026 298,483 0.01%Ares Capital Corp. $300,000 2.15% 15/7/2026 298,477 0.01%International Flavors & Fragrances, Inc. $300,000 2.30% 1/11/2030 298,372 0.01%Verizon Communications, Inc. AU($)400,000 2.65% 6/5/2030 298,120 0.01%Altria Group, Inc. $275,000 4.00% 31/1/2024 298,030 0.01%Williams Cos, Inc. $275,000 4.50% 15/11/2023 297,976 0.01%Massachusetts Institute of Technology $175,000 5.60% 1/7/2111 297,959 0.01%Comcast Corp. $280,000 3.25% 1/11/2039 297,950 0.01%Protective Life Corp. $280,000 3.40% 15/1/2030 297,928 0.01%DuPont de Nemours, Inc. $275,000 4.21% 15/11/2023 297,719 0.01%Masco Corp. $300,000 3.13% 15/2/2051 297,704 0.01%Fidelity National Information Services, Inc. $300,000 1.15% 1/3/2026 297,629 0.01%Berkshire Hathaway Finance Corp. £200,000 2.38% 19/6/2039 297,231 0.01%Bank of America Corp.^ $250,000 4.24% 24/4/2038 297,121 0.01%International Business Machines Corp. $250,000 4.15% 15/5/2039 297,052 0.01%Discover Financial Services $265,000 4.10% 9/2/2027 296,959 0.01%Comcast Corp. $200,000 6.40% 1/3/2040 296,827 0.01%Oncor Electric Delivery Co. LLC $250,000 3.80% 1/6/2049 296,724 0.01%MPLX LP $255,000 4.70% 15/4/2048 296,489 0.01%New York Life Global Funding $300,000 0.85% 15/1/2026 296,481 0.01%Union Pacific Corp. $285,000 2.15% 5/2/2027 295,822 0.01%Wells Fargo & Co. $275,000 4.13% 15/8/2023 295,570 0.01%Air Lease Corp. $275,000 3.38% 1/7/2025 295,218 0.01%AHS Hospital Corp. $300,000 2.78% 1/7/2051 295,202 0.01%Cisco Systems, Inc. $275,000 2.50% 20/9/2026 295,060 0.01%Sysco Corp. $200,000 6.60% 1/4/2040 294,945 0.01%Diamondback Energy, Inc. $275,000 3.25% 1/12/2026 294,724 0.01%Bank of New York Mellon Corp. $274,000 3.00% 24/2/2025 294,580 0.01%IHS Markit Ltd. $250,000 4.75% 1/8/2028 294,444 0.01%Keurig Dr Pepper, Inc. $276,000 4.06% 25/5/2023 294,184 0.01%Mars, Inc. $300,000 0.88% 16/7/2026 294,016 0.01%WRKCo, Inc. $260,000 3.90% 1/6/2028 293,757 0.01%Valero Energy Corp. $235,000 4.90% 15/3/2045 293,266 0.01%WEC Energy Group, Inc. $300,000 1.38% 15/10/2027 293,242 0.01%Stryker Corp. $250,000 4.10% 1/4/2043 293,054 0.01%Apple, Inc. $250,000 3.75% 13/11/2047 292,912 0.01%PulteGroup, Inc. $250,000 5.50% 1/3/2026 292,870 0.01%Florida Power & Light Co. $200,000 5.96% 1/4/2039 292,555 0.01%GE Capital European Funding Unlimited Co. €150,000 6.03% 1/3/2038 292,291 0.01%Baxter International, Inc. $300,000 1.73% 1/4/2031 292,030 0.01%Progressive Corp. $275,000 2.45% 15/1/2027 291,809 0.01%Phillips 66 $275,000 3.70% 6/4/2023 290,319 0.01%Berkshire Hathaway Finance Corp. $200,000 5.75% 15/1/2040 290,125 0.01%Cboe Global Markets, Inc. $300,000 1.63% 15/12/2030 289,439 0.01%Intel Corp. $265,000 3.40% 25/3/2025 289,287 0.01%Intercontinental Exchange, Inc. $300,000 3.00% 15/9/2060 289,173 0.01%PNC Bank NA $250,000 4.05% 26/7/2028 289,070 0.01%Deere & Co. $200,000 7.13% 3/3/2031 289,069 0.01%Bank of America Corp.^ $275,000 3.55% 5/3/2024 288,898 0.01%DTE Electric Co. $250,000 3.75% 15/8/2047 288,896 0.01%CenterPoint Energy Resources Corp. $275,000 3.55% 1/4/2023 288,846 0.01%ViacomCBS, Inc. $250,000 4.38% 15/3/2043 288,598 0.01%Chevron USA, Inc. $215,000 5.05% 15/11/2044 288,531 0.01%O'Reilly Automotive, Inc. $300,000 1.75% 15/3/2031 288,453 0.01%Union Pacific Corp. $269,000 3.65% 15/2/2024 288,405 0.01%McDonald's Corp. $200,000 6.30% 1/3/2038 288,307 0.01%Weyerhaeuser Co. $200,000 7.38% 15/3/2032 288,288 0.01%PepsiCo, Inc. $225,000 4.45% 14/4/2046 288,037 0.01%Raytheon Technologies Corp. $250,000 4.13% 16/11/2028 287,944 0.01%Walmart, Inc. $280,000 2.35% 15/12/2022 287,924 0.01%Magellan Midstream Partners LP $250,000 5.00% 1/3/2026 287,854 0.01%Equinix, Inc. $300,000 3.00% 15/7/2050 287,667 0.01%Exxon Mobil Corp. $270,000 3.18% 15/3/2024 287,628 0.01%Alexandria Real Estate Equities, Inc. $275,000 2.75% 15/12/2029 287,542 0.01%Bank of America Corp. $200,000 5.88% 7/2/2042 287,538 0.01%Fidelity National Information Services, Inc. £200,000 2.25% 3/12/2029 287,397 0.01%Cardinal Health, Inc. $275,000 3.20% 15/3/2023 287,226 0.01%Citigroup, Inc.^ $250,000 3.88% 24/1/2039 286,926 0.01%7-Eleven, Inc. $300,000 1.80% 10/2/2031 286,712 0.01%

650
Vanguard Global Corporate Bond Index Fund
Principal CouponMaturity
DateFair Value
US Dollars ($)% of Total
Net AssetsVirginia Electric & Power Co. $250,000 3.80% 15/9/2047 286,585 0.01%Healthpeak Properties, Inc. $270,000 3.00% 15/1/2030 286,395 0.01%Transcontinental Gas Pipe Line Co. LLC $235,000 4.60% 15/3/2048 285,870 0.01%Halliburton Co. $275,000 2.92% 1/3/2030 285,834 0.01%DTE Electric Co. $250,000 3.70% 15/3/2045 285,627 0.01%Chubb INA Holdings, Inc. $300,000 1.38% 15/9/2030 285,398 0.01%Northwestern University $215,000 4.64% 1/12/2044 284,924 0.01%Motorola Solutions, Inc. $260,000 4.00% 1/9/2024 284,671 0.01%Waste Management, Inc. $300,000 1.50% 15/3/2031 283,924 0.01%FMC Corp. $260,000 3.45% 1/10/2029 283,605 0.01%Consumers Energy Co. $250,000 3.50% 1/8/2051 283,539 0.01%American Water Capital Corp. $250,000 3.75% 1/9/2028 283,337 0.01%PacifiCorp $200,000 6.00% 15/1/2039 283,144 0.01%Northern States Power Co. $275,000 2.25% 1/4/2031 282,895 0.01%Alexandria Real Estate Equities, Inc. $250,000 3.95% 15/1/2028 282,869 0.01%Energy Transfer LP $250,000 5.15% 1/2/2043 282,731 0.01%Assurant, Inc. $260,000 3.70% 22/2/2030 282,438 0.01%ONEOK, Inc. $250,000 4.35% 15/3/2029 282,277 0.01%Linde, Inc. $300,000 1.10% 10/8/2030 282,043 0.01%KLA Corp. $252,000 4.65% 1/11/2024 281,388 0.01%Lockheed Martin Corp. $225,000 4.09% 15/9/2052 281,221 0.01%Wells Fargo & Co. £200,000 2.13% 24/9/2031 280,975 0.01%Northwestern Mutual Life Insurance Co. $200,000 6.06% 30/3/2040 280,667 0.01%eBay, Inc. $250,000 4.00% 15/7/2042 280,454 0.01%Discovery Communications LLC $225,000 5.20% 20/9/2047 280,270 0.01%Truist Bank $250,000 3.80% 30/10/2026 279,792 0.01%Marathon Oil Corp. $210,000 6.60% 1/10/2037 279,643 0.01%CenterPoint Energy, Inc. $260,000 3.70% 1/9/2049 279,202 0.01%Verizon Communications, Inc. £200,000 1.88% 19/9/2030 279,008 0.01%Duke Energy Progress LLC $250,000 3.60% 15/9/2047 278,835 0.01%MidAmerican Energy Co. $225,000 4.40% 15/10/2044 278,763 0.01%S&P Global, Inc. $265,000 2.50% 1/12/2029 278,260 0.01%UnitedHealth Group, Inc. $250,000 3.45% 15/1/2027 277,483 0.01%Comcast Corp. £200,000 1.50% 20/2/2029 277,358 0.01%Spectra Energy Partners LP $255,000 3.38% 15/10/2026 277,231 0.01%Constellation Brands, Inc. $250,000 3.60% 15/2/2028 277,222 0.01%JPMorgan Chase & Co.^ $275,000 2.07% 1/6/2029 277,120 0.01%Edison International $250,000 4.95% 15/4/2025 277,046 0.01%Prudential Financial, Inc.^ $250,000 5.38% 15/5/2045 276,644 0.01%FS KKR Capital Corp. $260,000 4.13% 1/2/2025 276,577 0.01%Rohm & Haas Co. $200,000 7.85% 15/7/2029 276,472 0.01%Progressive Corp. $200,000 6.25% 1/12/2032 276,400 0.01%Ascension Health $262,000 2.53% 15/11/2029 276,330 0.01%Apple, Inc. $250,000 3.20% 11/5/2027 276,158 0.01%Marsh & McLennan Cos, Inc. $215,000 4.75% 15/3/2039 275,943 0.01%US Bancorp $255,000 3.00% 30/7/2029 275,910 0.01%Puget Sound Energy, Inc. $225,000 4.22% 15/6/2048 275,895 0.01%Manufacturers & Traders Trust Co. $250,000 3.40% 17/8/2027 275,728 0.01%ERAC USA Finance LLC $250,000 3.80% 1/11/2025 275,682 0.01%Nestle Holdings, Inc. £200,000 0.63% 18/12/2025 275,614 0.01%Alabama Power Co. $225,000 4.30% 2/1/2046 275,539 0.01%Charles Schwab Corp. $250,000 3.45% 13/2/2026 275,489 0.01%Medtronic Global Holdings SCA $250,000 3.35% 1/4/2027 275,311 0.01%Truist Bank $250,000 3.63% 16/9/2025 275,154 0.01%Dollar General Corp. $250,000 3.50% 3/4/2030 274,954 0.01%Chubb INA Holdings, Inc. $250,000 3.35% 3/5/2026 274,816 0.01%Estee Lauder Cos, Inc. $220,000 4.15% 15/3/2047 274,768 0.01%Toyota Motor Credit Corp. $250,000 3.20% 11/1/2027 274,752 0.01%Astrazeneca Finance LLC $275,000 0.70% 28/5/2024 274,687 0.01%Apple, Inc. $250,000 3.00% 20/6/2027 274,675 0.01%Martin Marietta Materials, Inc. $275,000 3.20% 15/7/2051 274,646 0.01%Public Storage $250,000 3.09% 15/9/2027 274,495 0.01%Keurig Dr Pepper, Inc. $225,000 4.50% 15/11/2045 274,476 0.01%CVS Health Corp. $225,000 4.88% 20/7/2035 274,323 0.01%National Rural Utilities Cooperative Finance Corp. $275,000 0.35% 8/2/2024 274,282 0.01%Oracle Corp. $250,000 3.80% 15/11/2037 274,097 0.01%Kaiser Foundation Hospitals $250,000 3.15% 1/5/2027 273,788 0.01%Schlumberger Holdings Corp. $245,000 3.90% 17/5/2028 273,562 0.01%Comcast Corp. £200,000 1.88% 20/2/2036 273,475 0.01%Parker-Hannifin Corp. $250,000 3.25% 14/6/2029 273,469 0.01%Florida Power & Light Co. $225,000 3.95% 1/3/2048 273,415 0.01%

651
Vanguard Global Corporate Bond Index Fund
Principal CouponMaturity
DateFair Value
US Dollars ($)% of Total
Net AssetsTTX Co. $250,000 3.60% 15/1/2025 273,257 0.01%National Rural Utilities Cooperative Finance Corp.^ $250,000 5.25% 20/4/2046 273,235 0.01%Eli Lilly & Co. $225,000 3.95% 15/3/2049 273,122 0.01%Altria Group, Inc. €200,000 3.13% 15/6/2031 273,111 0.01%Kellogg Co. $250,000 3.25% 1/4/2026 272,950 0.01%ERAC USA Finance LLC $200,000 5.63% 15/3/2042 272,789 0.01%Jackson National Life Global Funding $260,000 2.65% 21/6/2024 272,783 0.01%AbbVie, Inc. $225,000 4.55% 15/3/2035 272,691 0.01%New York Life Global Funding $250,000 3.00% 10/1/2028 272,452 0.01%ERAC USA Finance LLC $250,000 3.30% 1/12/2026 272,381 0.01%Bank of New York Mellon Corp. $275,000 0.75% 28/1/2026 272,202 0.01%Williams Cos, Inc. $225,000 4.90% 15/1/2045 272,114 0.01%Broadcom, Inc. $230,000 5.00% 15/4/2030 271,859 0.01%Phillips 66 Partners LP $250,000 3.55% 1/10/2026 271,847 0.01%Sysco Corp. $250,000 3.30% 15/7/2026 271,819 0.01%Duke Energy Carolinas LLC $200,000 5.30% 15/2/2040 271,792 0.01%Office Properties Income Trust $250,000 4.50% 1/2/2025 271,753 0.01%American Water Capital Corp. $225,000 4.15% 1/6/2049 271,711 0.01%United Parcel Service, Inc. $254,000 2.80% 15/11/2024 271,464 0.01%FedEx Corp. $200,000 5.25% 15/5/2050 271,317 0.01%Verizon Communications, Inc. $200,000 5.01% 21/8/2054 271,293 0.01%Southern Co. $250,000 3.25% 1/7/2026 271,212 0.01%Marsh & McLennan Cos, Inc. $250,000 3.88% 15/3/2024 271,211 0.01%Deere & Co. $254,000 2.75% 15/4/2025 271,106 0.01%Consolidated Edison Co. of New York, Inc. $200,000 5.70% 15/6/2040 270,817 0.01%ERP Operating LP $250,000 3.38% 1/6/2025 270,598 0.01%Enterprise Products Operating LLC $235,000 4.25% 15/2/2048 270,307 0.01%Laboratory Corp. of America Holdings $225,000 4.70% 1/2/2045 270,292 0.01%Zoetis, Inc. $250,000 3.00% 12/9/2027 269,945 0.01%Clorox Co. $248,000 3.50% 15/12/2024 269,589 0.01%US Bancorp $250,000 3.70% 30/1/2024 269,399 0.01%Mayo Clinic $250,000 3.20% 15/11/2061 269,169 0.01%CSX Corp. $250,000 3.40% 1/8/2024 269,109 0.01%Bristol-Myers Squibb Co. $250,000 3.25% 1/8/2042 269,027 0.01%MetLife, Inc. $225,000 4.13% 13/8/2042 268,979 0.01%Honeywell International, Inc. €200,000 2.25% 22/2/2028 268,636 0.01%Halliburton Co. $220,000 5.00% 15/11/2045 268,617 0.01%Cameron LNG LLC $250,000 3.30% 15/1/2035 268,335 0.01%Lockheed Martin Corp. $250,000 2.90% 1/3/2025 268,045 0.01%Walmart, Inc. $250,000 3.30% 22/4/2024 267,910 0.01%Santander Holdings USA, Inc. $250,000 3.50% 7/6/2024 267,542 0.01%McKesson Corp. $225,000 4.75% 30/5/2029 267,500 0.01%LyondellBasell Industries NV $220,000 4.63% 26/2/2055 267,388 0.01%Lazard Group LLC $235,000 4.38% 11/3/2029 267,373 0.01%Toyota Motor Credit Corp. $250,000 3.35% 8/1/2024 267,315 0.01%DTE Energy Co. $250,000 3.50% 1/6/2024 267,155 0.01%Baltimore Gas & Electric Co. $255,000 3.20% 15/9/2049 267,149 0.01%PepsiCo, Inc. €200,000 2.63% 28/4/2026 266,974 0.01%UnitedHealth Group, Inc. $225,000 3.95% 15/10/2042 266,944 0.01%Northwestern Mutual Life Insurance Co. $250,000 3.45% 30/3/2051 266,914 0.01%Constellation Brands, Inc. $250,000 4.25% 1/5/2023 266,600 0.01%Huntington National Bank $250,000 3.55% 6/10/2023 266,480 0.01%Citigroup, Inc.^ $250,000 4.04% 1/6/2024 266,386 0.01%Westinghouse Air Brake Technologies Corp. $250,000 3.20% 15/6/2025 266,384 0.01%PNC Bank NA $250,000 3.80% 25/7/2023 266,321 0.01%Duke Energy Progress LLC $225,000 4.10% 15/5/2042 266,177 0.01%Marriott International, Inc. $250,000 3.13% 15/6/2026 266,087 0.01%XLIT Ltd.^ €200,000 3.25% 29/6/2047 266,045 0.01%Nucor Corp. $275,000 2.98% 15/12/2055 265,949 0.01%Burlington Northern Santa Fe LLC $200,000 5.05% 1/3/2041 265,476 0.01%Raytheon Technologies Corp. €200,000 2.15% 18/5/2030 265,285 0.01%Agilent Technologies, Inc. $250,000 3.88% 15/7/2023 265,281 0.01%BorgWarner, Inc. $250,000 2.65% 1/7/2027 265,123 0.01%Home Depot, Inc. $250,000 3.13% 15/12/2049 264,979 0.01%PulteGroup, Inc. $200,000 6.38% 15/5/2033 264,922 0.01%TJX Cos, Inc. $200,000 4.50% 15/4/2050 264,902 0.01%PNC Bank NA $250,000 2.70% 22/10/2029 264,847 0.01%Nationwide Financial Services, Inc. $240,000 3.90% 30/11/2049 264,834 0.01%American Honda Finance Corp. $250,000 2.90% 16/2/2024 264,820 0.01%AT&T, Inc. $225,000 4.65% 1/6/2044 264,756 0.01%PNC Bank NA $250,000 3.50% 8/6/2023 264,631 0.01%

652
Vanguard Global Corporate Bond Index Fund
Principal CouponMaturity
DateFair Value
US Dollars ($)% of Total
Net AssetsCargill, Inc. $250,000 3.13% 25/5/2051 264,359 0.01%Applied Materials, Inc. $200,000 5.10% 1/10/2035 264,224 0.01%Sabra Health Care LP $250,000 3.90% 15/10/2029 264,095 0.01%International Business Machines Corp. €200,000 1.75% 31/1/2031 263,830 0.01%Pacific Gas & Electric Co. $250,000 3.75% 1/7/2028 263,730 0.01%Eli Lilly & Co. €200,000 1.70% 1/11/2049 263,460 0.01%Cigna Corp. $235,000 4.13% 15/11/2025 263,408 0.01%3M Co. €200,000 1.50% 2/6/2031 263,310 0.01%Morgan Stanley^ $250,000 2.72% 22/7/2025 263,198 0.01%BBVA USA $250,000 2.50% 27/8/2024 263,137 0.01%Schlumberger Investment SA $250,000 2.65% 26/6/2030 262,958 0.01%Energy Transfer LP $225,000 5.30% 15/4/2047 262,585 0.01%Mastercard, Inc. $250,000 2.95% 15/3/2051 262,089 0.01%Exelon Corp. $200,000 5.10% 15/6/2045 262,022 0.01%Raytheon Technologies Corp. $200,000 5.40% 1/5/2035 262,008 0.01%Cigna Corp. $250,000 3.00% 15/7/2023 261,728 0.01%Enterprise Products Operating LLC $240,000 3.75% 15/2/2025 261,645 0.01%United Parcel Service, Inc. €200,000 1.50% 15/11/2032 261,624 0.01%Merck & Co., Inc. $250,000 2.80% 18/5/2023 261,510 0.01%International Paper Co. $205,000 4.80% 15/6/2044 261,380 0.01%Prudential Financial, Inc.^ $250,000 3.70% 1/10/2050 261,369 0.01%Amcor Finance USA, Inc. $225,000 4.50% 15/5/2028 261,282 0.01%Bristol-Myers Squibb Co. $250,000 3.25% 20/2/2023 261,186 0.01%Bristol-Myers Squibb Co. $200,000 4.63% 15/5/2044 261,152 0.01%Carlisle Cos, Inc. $250,000 2.75% 1/3/2030 260,819 0.01%Louisville Gas & Electric Co. $240,000 3.30% 1/10/2025 260,747 0.01%Xcel Energy, Inc. $250,000 2.60% 1/12/2029 260,735 0.01%Huntington Bancshares, Inc. $250,000 2.55% 4/2/2030 260,572 0.01%Duke University $250,000 2.83% 1/10/2055 260,558 0.01%Intel Corp. $200,000 4.80% 1/10/2041 260,507 0.01%Toyota Motor Credit Corp. $250,000 2.25% 18/10/2023 260,193 0.01%Consolidated Edison Co. of New York, Inc. $250,000 3.60% 15/6/2061 260,143 0.01%International Flavors & Fragrances, Inc. $250,000 3.47% 1/12/2050 260,113 0.01%Chubb INA Holdings, Inc. $250,000 2.70% 13/3/2023 260,005 0.01%McDonald's Corp. €200,000 1.60% 15/3/2031 259,866 0.01%Coca-Cola Co. $250,000 1.75% 6/9/2024 259,787 0.01%Essential Utilities, Inc. $250,000 2.70% 15/4/2030 259,728 0.01%Energy Transfer LP $200,000 6.50% 1/2/2042 259,626 0.01%HP, Inc. $250,000 2.20% 17/6/2025 259,530 0.01%Quanta Services, Inc. $250,000 2.90% 1/10/2030 259,327 0.01%American Water Capital Corp. $175,000 6.59% 15/10/2037 259,276 0.01%Apple, Inc. €200,000 1.38% 24/5/2029 259,202 0.01%MidAmerican Energy Co. $200,000 4.80% 15/9/2043 259,158 0.01%Toyota Motor Credit Corp. $250,000 2.63% 10/1/2023 258,711 0.01%FS KKR Capital Corp. $250,000 3.40% 15/1/2026 258,579 0.01%Essential Utilities, Inc. $250,000 3.35% 15/4/2050 258,481 0.01%Micron Technology, Inc. $250,000 2.50% 24/4/2023 258,351 0.01%MetLife, Inc. $250,000 3.05% 15/12/2022 258,323 0.01%Eaton Corp. $250,000 2.75% 2/11/2022 258,102 0.01%Northwestern Mutual Life Insurance Co. $226,000 3.85% 30/9/2047 258,092 0.01%Procter & Gamble Co. €200,000 1.25% 25/10/2029 258,058 0.01%Welltower, Inc. $250,000 2.75% 15/1/2031 258,025 0.01%Pacific Gas & Electric Co. $275,000 2.50% 1/2/2031 258,021 0.01%Carrier Global Corp. $250,000 2.70% 15/2/2031 257,997 0.01%Massachusetts Mutual Life Insurance Co.^ $210,000 5.08% 15/2/2069 257,848 0.01%Amazon.com, Inc. $200,000 4.80% 5/12/2034 257,624 0.01%PNC Bank NA $250,000 2.70% 1/11/2022 257,465 0.01%Appalachian Power Co. $210,000 4.50% 1/3/2049 257,417 0.01%Anthem, Inc. $230,000 3.65% 1/12/2027 257,326 0.01%Sammons Financial Group, Inc. $250,000 3.35% 16/4/2031 257,253 0.01%McDonald's Corp. €200,000 1.50% 28/11/2029 257,238 0.01%Gray Oak Pipeline LLC $250,000 2.60% 15/10/2025 257,182 0.01%FedEx Corp. $200,000 5.10% 15/1/2044 256,792 0.01%Mars, Inc. $205,000 4.20% 1/4/2059 256,754 0.01%PayPal Holdings, Inc. $250,000 1.65% 1/6/2025 256,714 0.01%Citizens Financial Group, Inc. $250,000 2.50% 6/2/2030 256,663 0.01%Tyson Foods, Inc. $210,000 4.55% 2/6/2047 256,638 0.01%Amazon.com, Inc. $250,000 2.50% 29/11/2022 256,605 0.01%CNH Industrial Capital LLC $250,000 1.95% 2/7/2023 256,300 0.01%Citigroup, Inc. $225,000 4.60% 9/3/2026 256,292 0.01%Georgia-Pacific LLC $250,000 1.75% 30/9/2025 256,267 0.01%

653
Vanguard Global Corporate Bond Index Fund
Principal CouponMaturity
DateFair Value
US Dollars ($)% of Total
Net AssetsCleveland Electric Illuminating Co. $225,000 5.50% 15/8/2024 256,195 0.01%UnitedHealth Group, Inc. $250,000 2.30% 15/5/2031 256,033 0.01%American Tower Corp. €200,000 1.95% 22/5/2026 255,877 0.01%Charter Communications Operating LLC/Charter Communications
Operating Capital $250,000 2.80% 1/4/2031 255,749 0.01%Georgia-Pacific LLC $250,000 2.30% 30/4/2030 255,744 0.01%Conagra Brands, Inc. $225,000 4.60% 1/11/2025 255,739 0.01%Duke Energy Indiana LLC $175,000 6.35% 15/8/2038 255,686 0.01%Mondelez International, Inc. €200,000 1.63% 8/3/2027 255,430 0.01%Church & Dwight Co., Inc. $250,000 2.45% 1/8/2022 255,258 0.01%LYB International Finance II BV €200,000 1.63% 17/9/2031 255,025 0.01%Burlington Northern Santa Fe LLC $200,000 4.55% 1/9/2044 254,920 0.01%Consolidated Edison Co. of New York, Inc. $275,000 3.00% 1/12/2060 254,466 0.01%US Treasury Note $255,000 0.13% 31/5/2023 254,462 0.01%HCA, Inc. $225,000 4.50% 15/2/2027 254,395 0.01%Boeing Co. $255,000 3.65% 1/3/2047 254,365 0.01%Baxter International, Inc. €200,000 1.30% 15/5/2029 254,315 0.01%Owens Corning $225,000 3.95% 15/8/2029 254,308 0.01%PepsiCo, Inc. €200,000 1.13% 18/3/2031 254,225 0.01%Cardinal Health, Inc. $225,000 4.37% 15/6/2047 253,880 0.01%Vornado Realty LP $250,000 2.15% 1/6/2026 253,598 0.01%Ares Capital Corp. $250,000 2.88% 15/6/2028 253,544 0.01%Williams Cos, Inc. $250,000 2.60% 15/3/2031 253,434 0.01%Utah Acquisition Sub, Inc. €200,000 2.25% 22/11/2024 253,342 0.01%Boeing Co. $245,000 2.70% 1/2/2027 253,166 0.01%Simon Property Group LP $250,000 3.25% 13/9/2049 253,133 0.01%Atmos Energy Corp. $210,000 4.13% 15/3/2049 253,006 0.01%Air Products & Chemicals, Inc. $250,000 2.70% 15/5/2040 253,004 0.01%Westlake Chemical Corp. $200,000 5.00% 15/8/2046 253,002 0.01%Lam Research Corp. $250,000 2.88% 15/6/2050 252,958 0.01%Chubb INA Holdings, Inc. $200,000 4.35% 3/11/2045 252,893 0.01%T-Mobile USA, Inc. $250,000 2.55% 15/2/2031 252,849 0.01%Plains All American Pipeline LP/PAA Finance Corp. $225,000 4.50% 15/12/2026 252,780 0.01%USAA Capital Corp. $250,000 2.13% 1/5/2030 252,772 0.01%General Motors Co. $175,000 6.75% 1/4/2046 252,689 0.01%Viatris, Inc. $250,000 2.70% 22/6/2030 252,633 0.01%Allstate Corp. $240,000 3.15% 15/6/2023 252,588 0.01%Exelon Corp. $200,000 4.70% 15/4/2050 252,535 0.01%Raytheon Technologies Corp. $200,000 4.80% 15/12/2043 252,535 0.01%Medtronic Global Holdings SCA €200,000 1.75% 2/7/2049 252,448 0.01%Florida Power & Light Co. $175,000 5.95% 1/2/2038 252,380 0.01%Schlumberger Finance BV €200,000 1.38% 28/10/2026 252,364 0.01%Thermo Fisher Scientific, Inc. €200,000 1.88% 1/10/2049 252,286 0.01%UnitedHealth Group, Inc. $250,000 1.25% 15/1/2026 252,145 0.01%State Street Corp. $250,000 2.20% 3/3/2031 252,079 0.01%Morgan Stanley €200,000 1.38% 27/10/2026 251,871 0.01%Ford Foundation $250,000 2.82% 1/6/2070 251,482 0.01%Kroger Co. $250,000 2.20% 1/5/2030 251,433 0.01%Universal Health Services, Inc. $250,000 2.65% 15/10/2030 251,230 0.01%Wells Fargo & Co. €200,000 1.63% 2/6/2025 251,196 0.01%Vistra Operations Co. LLC $235,000 3.70% 30/1/2027 251,061 0.01%Illinois Tool Works, Inc. €200,000 1.00% 5/6/2031 250,831 0.01%Southern California Edison Co. $250,000 2.50% 1/6/2031 250,830 0.01%Baylor Scott & White Holdings $250,000 2.84% 15/11/2050 250,784 0.01%Royalty Pharma plc $250,000 0.75% 2/9/2023 250,747 0.01%Hess Corp. $225,000 4.30% 1/4/2027 250,640 0.01%Biogen, Inc. $225,000 4.05% 15/9/2025 250,524 0.01%RWJ Barnabas Health, Inc. $225,000 3.48% 1/7/2049 250,363 0.01%Capital One Financial Corp. $225,000 3.75% 9/3/2027 250,256 0.01%UnitedHealth Group, Inc. $250,000 1.15% 15/5/2026 250,169 0.01%Stellantis NV €200,000 2.00% 23/3/2024 250,112 0.01%JPMorgan Chase & Co. €200,000 1.50% 27/1/2025 250,104 0.01%Truist Financial Corp.^ $250,000 1.27% 2/3/2027 249,777 0.01%Anthem, Inc. $200,000 4.65% 15/1/2043 249,622 0.01%Duke Energy Florida LLC $230,000 3.40% 1/10/2046 249,592 0.01%Philip Morris International, Inc. $250,000 2.10% 1/5/2030 249,373 0.01%PartnerRe Ireland Finance DAC €200,000 1.25% 15/9/2026 249,309 0.01%Intercontinental Exchange, Inc. $225,000 3.75% 1/12/2025 249,223 0.01%Morgan Stanley €200,000 1.75% 11/3/2024 249,130 0.01%Spirit Realty LP $250,000 2.10% 15/3/2028 249,111 0.01%Dow Chemical Co. $225,000 3.63% 15/5/2026 248,962 0.01%

654
Vanguard Global Corporate Bond Index Fund
Principal CouponMaturity
DateFair Value
US Dollars ($)% of Total
Net AssetsDominion Energy, Inc. $225,000 3.90% 1/10/2025 248,816 0.01%Charles Schwab Corp. $225,000 3.85% 21/5/2025 248,805 0.01%DH Europe Finance II Sarl €200,000 1.80% 18/9/2049 248,671 0.01%Cummins, Inc. $250,000 0.75% 1/9/2025 248,399 0.01%Markel Corp. $215,000 4.15% 17/9/2050 248,354 0.01%Williams Cos, Inc. $200,000 5.10% 15/9/2045 248,311 0.01%Whirlpool Finance Luxembourg Sarl €200,000 1.10% 9/11/2027 248,296 0.01%Pacific Gas & Electric Co. $250,000 4.45% 15/4/2042 248,270 0.01%Johnson Controls International plc €200,000 1.38% 25/2/2025 248,168 0.01%Whirlpool Corp. $200,000 4.60% 15/5/2050 248,112 0.01%Equinix, Inc. $250,000 1.00% 15/9/2025 248,069 0.01%Penske Truck Leasing Co. LP/PTL Finance Corp. $250,000 1.20% 15/11/2025 248,024 0.01%Energy Transfer LP $200,000 5.80% 15/6/2038 248,022 0.01%Spirit Realty LP $250,000 2.70% 15/2/2032 247,903 0.01%Comcast Corp. $200,000 4.50% 15/1/2043 247,882 0.01%Royalty Pharma plc $250,000 1.20% 2/9/2025 247,880 0.01%John Deere Cash Management SA €200,000 1.38% 2/4/2024 247,776 0.01%Citigroup, Inc.^ €200,000 1.25% 6/7/2026 247,638 0.01%Goldman Sachs Group, Inc. €200,000 2.00% 27/7/2023 247,561 0.01%UnitedHealth Group, Inc. $200,000 4.25% 15/6/2048 247,547 0.01%Applied Materials, Inc. $250,000 1.75% 1/6/2030 247,470 0.01%Silgan Holdings, Inc. $250,000 1.40% 1/4/2026 247,410 0.01%Farmers Exchange Capital $200,000 7.05% 15/7/2028 247,372 0.01%Hackensack Meridian Health, Inc. $250,000 2.88% 1/9/2050 247,116 0.01%Zimmer Biomet Holdings, Inc. €200,000 1.16% 15/11/2027 247,106 0.01%PepsiCo, Inc. €200,000 0.75% 18/3/2027 247,045 0.01%Comcast Corp. $225,000 3.30% 1/2/2027 247,033 0.01%QUALCOMM, Inc. $225,000 3.45% 20/5/2025 246,905 0.01%Amgen, Inc. £150,000 4.00% 13/9/2029 246,893 0.01%Broadcom Corp./Broadcom Cayman Finance Ltd. $225,000 3.50% 15/1/2028 246,838 0.01%Precision Castparts Corp. $240,000 2.50% 15/1/2023 246,762 0.01%Morgan Stanley^ $200,000 4.46% 22/4/2039 246,754 0.01%Duke Energy Corp. $225,000 3.40% 15/6/2029 246,517 0.01%Zimmer Biomet Holdings, Inc. $225,000 3.55% 20/3/2030 246,379 0.01%Exelon Generation Co. LLC $200,000 6.25% 1/10/2039 246,377 0.01%Costco Wholesale Corp. $250,000 1.60% 20/4/2030 246,360 0.01%Apple, Inc. $250,000 1.20% 8/2/2028 246,277 0.01%Bank of America Corp.^ $225,000 3.48% 13/3/2052 246,196 0.01%Thermo Fisher Scientific, Inc. €200,000 1.50% 1/10/2039 246,184 0.01%Boardwalk Pipelines LP $220,000 4.95% 15/12/2024 246,036 0.01%Southern California Edison Co. $230,000 4.13% 1/3/2048 246,023 0.01%Citigroup, Inc. $225,000 3.40% 1/5/2026 245,941 0.01%JPMorgan Chase & Co.^ $250,000 1.04% 4/2/2027 245,728 0.01%Chubb INA Holdings, Inc. €200,000 0.88% 15/6/2027 245,726 0.01%Wells Fargo & Co. CA($)290,000 3.18% 8/2/2024 245,681 0.01%Discover Financial Services $225,000 3.95% 6/11/2024 245,633 0.01%Burlington Northern Santa Fe LLC $200,000 4.15% 15/12/2048 245,357 0.01%Southern California Edison Co. $225,000 3.70% 1/8/2025 245,203 0.01%Duke Energy Corp. $200,000 4.80% 15/12/2045 245,163 0.01%Charter Communications Operating LLC/Charter Communications
Operating Capital $225,000 4.50% 1/2/2024 245,075 0.01%AT&T, Inc. $250,000 3.50% 1/2/2061 245,055 0.01%Verizon Communications, Inc. €200,000 0.88% 2/4/2025 244,998 0.01%Omnicom Finance Holdings plc €200,000 0.80% 8/7/2027 244,830 0.01%Arrow Electronics, Inc. $230,000 3.25% 8/9/2024 244,817 0.01%Molson Coors Beverage Co. €200,000 1.25% 15/7/2024 244,792 0.01%Omnicom Group, Inc./Omnicom Capital, Inc. $225,000 3.65% 1/11/2024 244,268 0.01%Boston Scientific Corp. $200,000 4.55% 1/3/2039 244,258 0.01%Illinois Tool Works, Inc. €200,000 0.63% 5/12/2027 244,206 0.01%Walmart, Inc. $200,000 4.00% 11/4/2043 244,143 0.01%ERAC USA Finance LLC $200,000 4.50% 15/2/2045 244,048 0.01%Fidelity National Information Services, Inc. €200,000 1.00% 3/12/2028 244,033 0.01%Sysco Corp. $225,000 3.25% 15/7/2027 243,980 0.01%Aptiv Corp. $225,000 4.15% 15/3/2024 243,953 0.01%Gilead Sciences, Inc. $225,000 3.50% 1/2/2025 243,801 0.01%Chubb INA Holdings, Inc. €171,000 2.50% 15/3/2038 243,771 0.01%US Bancorp €200,000 0.85% 7/6/2024 243,744 0.01%AT&T, Inc. $200,000 4.90% 15/6/2042 243,609 0.01%Eaton Capital Unlimited Co. €200,000 0.70% 14/5/2025 243,600 0.01%Verizon Communications, Inc. $225,000 3.50% 1/11/2024 243,472 0.01%Thermo Fisher Scientific, Inc. $200,000 4.10% 15/8/2047 243,462 0.01%
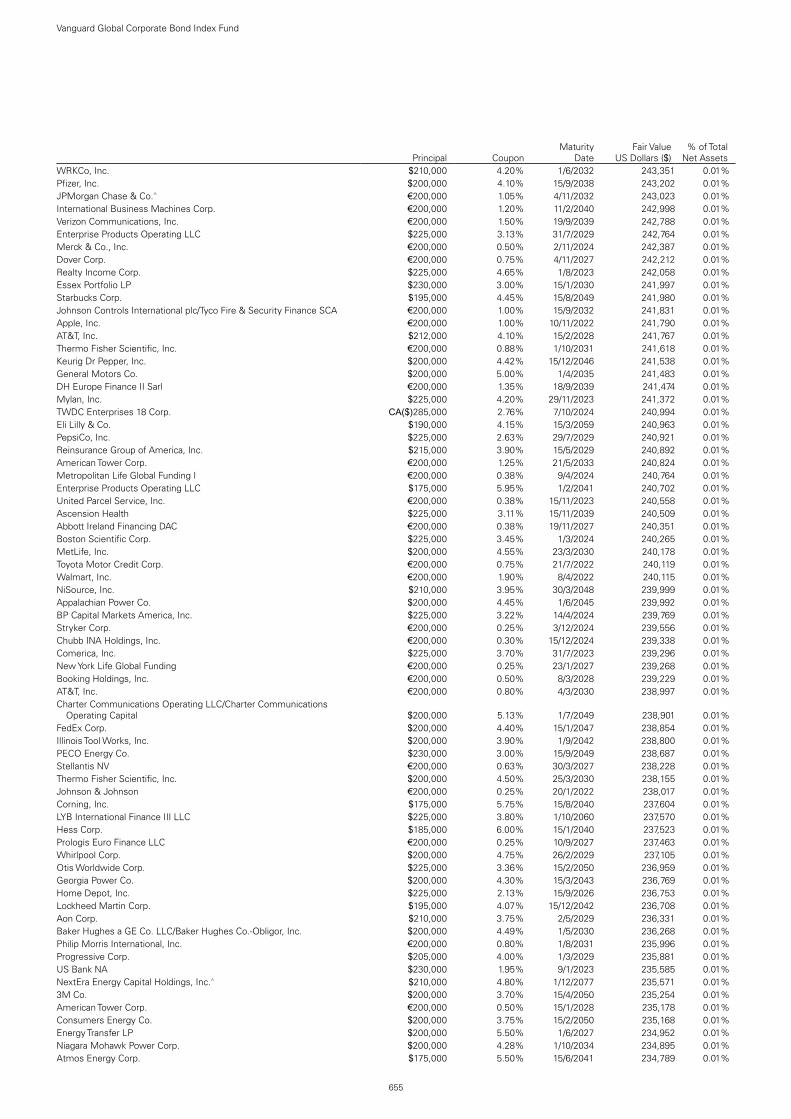
655
Vanguard Global Corporate Bond Index Fund
Principal CouponMaturity
DateFair Value
US Dollars ($)% of Total
Net AssetsWRKCo, Inc. $210,000 4.20% 1/6/2032 243,351 0.01%Pfizer, Inc. $200,000 4.10% 15/9/2038 243,202 0.01%JPMorgan Chase & Co.^ €200,000 1.05% 4/11/2032 243,023 0.01%International Business Machines Corp. €200,000 1.20% 11/2/2040 242,998 0.01%Verizon Communications, Inc. €200,000 1.50% 19/9/2039 242,788 0.01%Enterprise Products Operating LLC $225,000 3.13% 31/7/2029 242,764 0.01%Merck & Co., Inc. €200,000 0.50% 2/11/2024 242,387 0.01%Dover Corp. €200,000 0.75% 4/11/2027 242,212 0.01%Realty Income Corp. $225,000 4.65% 1/8/2023 242,058 0.01%Essex Portfolio LP $230,000 3.00% 15/1/2030 241,997 0.01%Starbucks Corp. $195,000 4.45% 15/8/2049 241,980 0.01%Johnson Controls International plc/Tyco Fire & Security Finance SCA €200,000 1.00% 15/9/2032 241,831 0.01%Apple, Inc. €200,000 1.00% 10/11/2022 241,790 0.01%AT&T, Inc. $212,000 4.10% 15/2/2028 241,767 0.01%Thermo Fisher Scientific, Inc. €200,000 0.88% 1/10/2031 241,618 0.01%Keurig Dr Pepper, Inc. $200,000 4.42% 15/12/2046 241,538 0.01%General Motors Co. $200,000 5.00% 1/4/2035 241,483 0.01%DH Europe Finance II Sarl €200,000 1.35% 18/9/2039 241,474 0.01%Mylan, Inc. $225,000 4.20% 29/11/2023 241,372 0.01%TWDC Enterprises 18 Corp. CA($)285,000 2.76% 7/10/2024 240,994 0.01%Eli Lilly & Co. $190,000 4.15% 15/3/2059 240,963 0.01%PepsiCo, Inc. $225,000 2.63% 29/7/2029 240,921 0.01%Reinsurance Group of America, Inc. $215,000 3.90% 15/5/2029 240,892 0.01%American Tower Corp. €200,000 1.25% 21/5/2033 240,824 0.01%Metropolitan Life Global Funding I €200,000 0.38% 9/4/2024 240,764 0.01%Enterprise Products Operating LLC $175,000 5.95% 1/2/2041 240,702 0.01%United Parcel Service, Inc. €200,000 0.38% 15/11/2023 240,558 0.01%Ascension Health $225,000 3.11% 15/11/2039 240,509 0.01%Abbott Ireland Financing DAC €200,000 0.38% 19/11/2027 240,351 0.01%Boston Scientific Corp. $225,000 3.45% 1/3/2024 240,265 0.01%MetLife, Inc. $200,000 4.55% 23/3/2030 240,178 0.01%Toyota Motor Credit Corp. €200,000 0.75% 21/7/2022 240,119 0.01%Walmart, Inc. €200,000 1.90% 8/4/2022 240,115 0.01%NiSource, Inc. $210,000 3.95% 30/3/2048 239,999 0.01%Appalachian Power Co. $200,000 4.45% 1/6/2045 239,992 0.01%BP Capital Markets America, Inc. $225,000 3.22% 14/4/2024 239,769 0.01%Stryker Corp. €200,000 0.25% 3/12/2024 239,556 0.01%Chubb INA Holdings, Inc. €200,000 0.30% 15/12/2024 239,338 0.01%Comerica, Inc. $225,000 3.70% 31/7/2023 239,296 0.01%New York Life Global Funding €200,000 0.25% 23/1/2027 239,268 0.01%Booking Holdings, Inc. €200,000 0.50% 8/3/2028 239,229 0.01%AT&T, Inc. €200,000 0.80% 4/3/2030 238,997 0.01%Charter Communications Operating LLC/Charter Communications
Operating Capital $200,000 5.13% 1/7/2049 238,901 0.01%FedEx Corp. $200,000 4.40% 15/1/2047 238,854 0.01%Illinois Tool Works, Inc. $200,000 3.90% 1/9/2042 238,800 0.01%PECO Energy Co. $230,000 3.00% 15/9/2049 238,687 0.01%Stellantis NV €200,000 0.63% 30/3/2027 238,228 0.01%Thermo Fisher Scientific, Inc. $200,000 4.50% 25/3/2030 238,155 0.01%Johnson & Johnson €200,000 0.25% 20/1/2022 238,017 0.01%Corning, Inc. $175,000 5.75% 15/8/2040 237,604 0.01%LYB International Finance III LLC $225,000 3.80% 1/10/2060 237,570 0.01%Hess Corp. $185,000 6.00% 15/1/2040 237,523 0.01%Prologis Euro Finance LLC €200,000 0.25% 10/9/2027 237,463 0.01%Whirlpool Corp. $200,000 4.75% 26/2/2029 237,105 0.01%Otis Worldwide Corp. $225,000 3.36% 15/2/2050 236,959 0.01%Georgia Power Co. $200,000 4.30% 15/3/2043 236,769 0.01%Home Depot, Inc. $225,000 2.13% 15/9/2026 236,753 0.01%Lockheed Martin Corp. $195,000 4.07% 15/12/2042 236,708 0.01%Aon Corp. $210,000 3.75% 2/5/2029 236,331 0.01%Baker Hughes a GE Co. LLC/Baker Hughes Co.-Obligor, Inc. $200,000 4.49% 1/5/2030 236,268 0.01%Philip Morris International, Inc. €200,000 0.80% 1/8/2031 235,996 0.01%Progressive Corp. $205,000 4.00% 1/3/2029 235,881 0.01%US Bank NA $230,000 1.95% 9/1/2023 235,585 0.01%NextEra Energy Capital Holdings, Inc.^ $210,000 4.80% 1/12/2077 235,571 0.01%3M Co. $200,000 3.70% 15/4/2050 235,254 0.01%American Tower Corp. €200,000 0.50% 15/1/2028 235,178 0.01%Consumers Energy Co. $200,000 3.75% 15/2/2050 235,168 0.01%Energy Transfer LP $200,000 5.50% 1/6/2027 234,952 0.01%Niagara Mohawk Power Corp. $200,000 4.28% 1/10/2034 234,895 0.01%Atmos Energy Corp. $175,000 5.50% 15/6/2041 234,789 0.01%

656
Vanguard Global Corporate Bond Index Fund
Principal CouponMaturity
DateFair Value
US Dollars ($)% of Total
Net AssetsStarbucks Corp. $210,000 3.50% 1/3/2028 234,761 0.01%Reliance Standard Life Global Funding II $225,000 2.50% 30/10/2024 234,587 0.01%General Motors Co. $200,000 5.00% 1/10/2028 234,465 0.01%Verizon Communications, Inc. €200,000 1.13% 19/9/2035 234,436 0.01%Enterprise Products Operating LLC $225,000 3.35% 15/3/2023 234,307 0.01%Prudential Financial, Inc.^ $200,000 5.70% 15/9/2048 234,195 0.01%Aetna, Inc. $225,000 2.80% 15/6/2023 234,189 0.01%Athene Global Funding $220,000 2.95% 12/11/2026 234,058 0.01%PepsiCo, Inc. €200,000 0.40% 9/10/2032 233,998 0.01%Globe Life, Inc. $200,000 4.55% 15/9/2028 233,970 0.01%Home Depot, Inc. $160,000 5.95% 1/4/2041 233,933 0.01%Prologis Euro Finance LLC €200,000 1.50% 10/9/2049 233,748 0.01%Hess Corp. $220,000 3.50% 15/7/2024 233,685 0.01%Allstate Corp.^ $177,000 6.50% 15/5/2057 233,665 0.01%JPMorgan Chase & Co.^ CA($)290,000 1.90% 5/3/2028 233,421 0.01%Colonial Pipeline Co. $200,000 4.25% 15/4/2048 233,345 0.01%WPC Eurobond BV €200,000 0.95% 1/6/2030 233,260 0.01%Tucson Electric Power Co. $200,000 4.00% 15/6/2050 233,213 0.01%FedEx Corp. $200,000 4.25% 15/5/2030 233,098 0.01%Coca-Cola Co. €200,000 0.50% 9/3/2033 233,002 0.01%Health Care Service Corp. A Mutual Legal Reserve Co. $225,000 3.20% 1/6/2050 232,737 0.01%Westinghouse Air Brake Technologies Corp. $200,000 4.95% 15/9/2028 232,306 0.01%Halliburton Co. $200,000 4.75% 1/8/2043 232,235 0.01%San Diego Gas & Electric Co. $165,000 6.00% 1/6/2039 232,028 0.01%Waste Management, Inc. $225,000 2.95% 1/6/2041 231,972 0.01%Sysco Corp. $200,000 5.65% 1/4/2025 231,960 0.01%Coca-Cola Co. €200,000 1.00% 9/3/2041 231,758 0.01%Keurig Dr Pepper, Inc. $175,000 5.09% 25/5/2048 231,551 0.01%Home Depot, Inc. $195,000 3.90% 15/6/2047 231,542 0.01%3M Co. $200,000 3.63% 15/10/2047 231,507 0.01%Enterprise Products Operating LLC $200,000 4.20% 31/1/2050 231,476 0.01%Willis North America, Inc. $200,000 4.50% 15/9/2028 231,448 0.01%American Honda Finance Corp. $225,000 1.95% 10/5/2023 231,414 0.01%Mondelez International, Inc. CA($)270,000 3.25% 7/3/2025 231,354 0.01%Enterprise Products Operating LLC $165,000 6.13% 15/10/2039 231,327 0.01%Baxalta, Inc. $173,000 5.25% 23/6/2045 231,307 0.01%ONEOK Partners LP $225,000 3.38% 1/10/2022 231,208 0.01%Raytheon Technologies Corp. $225,000 2.50% 15/12/2022 230,903 0.01%Metropolitan Life Global Funding I CA($)265,000 3.39% 9/4/2030 230,717 0.01%AvalonBay Communities, Inc. $225,000 2.30% 1/3/2030 230,539 0.01%Sprint Spectrum Co. LLC/Sprint Spectrum Co. II LLC/Sprint Spectrum Co.
III LLC $200,000 5.15% 20/3/2028 230,530 0.01%United Parcel Service, Inc. $175,000 4.88% 15/11/2040 230,430 0.01%Emerson Electric Co. $225,000 1.80% 15/10/2027 230,402 0.01%Energy Transfer LP $195,000 5.25% 15/4/2029 230,339 0.01%Synchrony Financial $225,000 2.85% 25/7/2022 230,295 0.01%Marriott International, Inc. $200,000 4.63% 15/6/2030 230,291 0.01%Carrier Global Corp. $220,000 2.49% 15/2/2027 230,223 0.01%AEP Texas, Inc. $225,000 2.40% 1/10/2022 230,104 0.01%Marriott International, Inc. $214,000 3.75% 15/3/2025 230,016 0.01%ERP Operating LP $200,000 4.15% 1/12/2028 229,819 0.01%American Express Co. $225,000 2.50% 1/8/2022 229,812 0.01%Visa, Inc. $225,000 2.15% 15/9/2022 229,710 0.01%Honeywell International, Inc. $165,000 5.38% 1/3/2041 229,540 0.01%National Securities Clearing Corp. $225,000 1.50% 23/4/2025 229,417 0.01%Bank of New York Mellon Corp. $225,000 1.95% 23/8/2022 229,338 0.01%United Parcel Service, Inc. £100,000 5.13% 12/2/2050 229,178 0.01%LYB International Finance III LLC $200,000 4.20% 15/10/2049 229,112 0.01%Dominion Energy, Inc. $200,000 4.05% 15/9/2042 228,661 0.01%Comcast Corp. $150,000 6.95% 15/8/2037 228,566 0.01%Philip Morris International, Inc. $200,000 4.13% 4/3/2043 228,560 0.01%Franciscan Missionaries of Our Lady Health System, Inc. $200,000 3.91% 1/7/2049 228,515 0.01%Georgetown University $225,000 2.94% 1/4/2050 228,491 0.01%Kinder Morgan, Inc. $200,000 4.30% 1/3/2028 228,440 0.01%General Motors Financial Co., Inc. $225,000 2.40% 10/4/2028 228,337 0.01%Brooklyn Union Gas Co. $200,000 4.27% 15/3/2048 228,234 0.01%Chevron USA, Inc. $200,000 3.85% 15/1/2028 228,006 0.01%BankUnited, Inc. $200,000 4.88% 17/11/2025 227,929 0.01%Anthem, Inc. $225,000 1.50% 15/3/2026 227,744 0.01%MetLife, Inc. $175,000 4.72% 15/12/2044 227,426 0.01%Apollo Management Holdings LP $200,000 4.40% 27/5/2026 227,154 0.01%

657
Vanguard Global Corporate Bond Index Fund
Principal CouponMaturity
DateFair Value
US Dollars ($)% of Total
Net AssetsKennametal, Inc. $225,000 2.80% 1/3/2031 227,104 0.01%PepsiCo, Inc. $225,000 0.75% 1/5/2023 226,874 0.01%Alabama Power Co. $200,000 3.70% 1/12/2047 226,777 0.01%Consumers Energy Co. $250,000 2.50% 1/5/2060 226,727 0.01%Highwoods Realty LP $225,000 2.60% 1/2/2031 226,641 0.01%General Motors Financial Co., Inc. $225,000 2.70% 10/6/2031 226,547 0.01%MPLX LP $200,000 4.25% 1/12/2027 226,321 0.01%Willis North America, Inc. $200,000 3.88% 15/9/2049 226,249 0.01%Flowserve Corp. $212,000 4.00% 15/11/2023 226,165 0.01%Berkshire Hathaway Energy Co. $209,000 3.50% 1/2/2025 225,996 0.01%Public Service Electric & Gas Co. $200,000 3.65% 1/9/2028 225,882 0.01%MetLife, Inc. $175,000 4.60% 13/5/2046 225,877 0.01%Avangrid, Inc. $200,000 3.80% 1/6/2029 225,868 0.01%Alleghany Corp. $180,000 4.90% 15/9/2044 225,792 0.01%Protective Life Corp. $200,000 4.30% 30/9/2028 225,788 0.01%NIKE, Inc. $200,000 3.38% 27/3/2050 225,764 0.01%Ares Capital Corp. $210,000 4.20% 10/6/2024 225,717 0.01%NewMarket Corp. $225,000 2.70% 18/3/2031 225,375 0.01%VEREIT Operating Partnership LP $200,000 3.95% 15/8/2027 225,347 0.01%Boeing Co. $220,000 2.95% 1/2/2030 225,278 0.01%HCA, Inc. $225,000 3.50% 15/7/2051 225,062 0.01%Pfizer, Inc. $200,000 3.45% 15/3/2029 224,997 0.01%Nasdaq, Inc. $225,000 0.45% 21/12/2022 224,960 0.01%Boeing Co. $175,000 5.88% 15/2/2040 224,884 0.01%Eastman Chemical Co. $185,000 4.65% 15/10/2044 224,767 0.01%Wells Fargo & Co. $200,000 4.10% 3/6/2026 224,614 0.01%Halliburton Co. $200,000 4.50% 15/11/2041 224,516 0.01%Nordstrom, Inc. $225,000 5.00% 15/1/2044 224,510 0.01%Sammons Financial Group, Inc. $200,000 4.45% 12/5/2027 224,447 0.01%Fifth Third Bank NA $200,000 3.95% 28/7/2025 224,184 0.01%Williams Cos, Inc. $205,000 3.90% 15/1/2025 224,131 0.01%O'Reilly Automotive, Inc. $200,000 3.60% 1/9/2027 224,087 0.01%Stryker Corp. $175,000 4.63% 15/3/2046 224,085 0.01%Prologis Euro Finance LLC €200,000 1.00% 16/2/2041 224,043 0.01%Devon Energy Corp. $160,000 7.88% 30/9/2031 224,020 0.01%Raytheon Technologies Corp. $185,000 4.45% 16/11/2038 223,909 0.01%Guardian Life Insurance Co. of America $175,000 4.85% 24/1/2077 223,423 0.01%Valero Energy Corp. $200,000 4.00% 1/4/2029 223,315 0.01%CommonSpirit Health $200,000 3.82% 1/10/2049 223,280 0.01%Dayton Power & Light Co. $200,000 3.95% 15/6/2049 223,251 0.01%Abbott Laboratories $200,000 3.88% 15/9/2025 223,186 0.01%Healthcare Trust of America Holdings LP $200,000 3.75% 1/7/2027 223,099 0.01%Sempra Energy $200,000 3.80% 1/2/2038 223,096 0.01%CMS Energy Corp.^ $200,000 4.75% 1/6/2050 222,979 0.01%Marsh & McLennan Cos, Inc. $190,000 4.38% 15/3/2029 222,863 0.01%Mid-America Apartments LP $200,000 3.60% 1/6/2027 222,802 0.01%Kinder Morgan, Inc. $200,000 4.30% 1/6/2025 222,760 0.01%HCA, Inc. $225,000 2.38% 15/7/2031 222,682 0.01%Brown-Forman Corp. $204,000 3.50% 15/4/2025 222,557 0.01%Synchrony Financial $200,000 3.95% 1/12/2027 222,554 0.01%Cigna Corp. $209,000 3.75% 15/7/2023 222,520 0.01%Marsh & McLennan Cos, Inc. $200,000 3.75% 14/3/2026 222,301 0.01%FedEx Corp. $200,000 3.40% 15/2/2028 222,198 0.01%Truist Financial Corp. $200,000 4.00% 1/5/2025 222,142 0.01%Bank of America Corp. $200,000 3.88% 1/8/2025 222,126 0.01%NOV, Inc. $225,000 3.95% 1/12/2042 222,089 0.01%Eversource Energy $225,000 0.80% 15/8/2025 222,068 0.01%QUALCOMM, Inc. $175,000 4.65% 20/5/2035 222,040 0.01%Santander Holdings USA, Inc. $200,000 4.50% 17/7/2025 221,918 0.01%Duke Energy Carolinas LLC $200,000 3.45% 15/4/2051 221,799 0.01%Royalty Pharma plc $225,000 1.75% 2/9/2027 221,769 0.01%Southern Co. Gas Capital Corp. $160,000 5.88% 15/3/2041 221,604 0.01%Archer-Daniels-Midland Co. $200,000 3.25% 27/3/2030 221,460 0.01%NiSource, Inc. $200,000 3.60% 1/5/2030 221,421 0.01%Wells Fargo Bank NA $150,000 6.60% 15/1/2038 221,388 0.01%Kroger Co. $150,000 6.90% 15/4/2038 221,334 0.01%Motorola Solutions, Inc. $225,000 2.30% 15/11/2030 221,330 0.01%CommonSpirit Health $200,000 3.91% 1/10/2050 220,899 0.01%Allstate Corp. $200,000 3.28% 15/12/2026 220,860 0.01%Kroger Co. $200,000 3.88% 15/10/2046 220,809 0.01%ERP Operating LP $175,000 4.50% 1/7/2044 220,507 0.01%
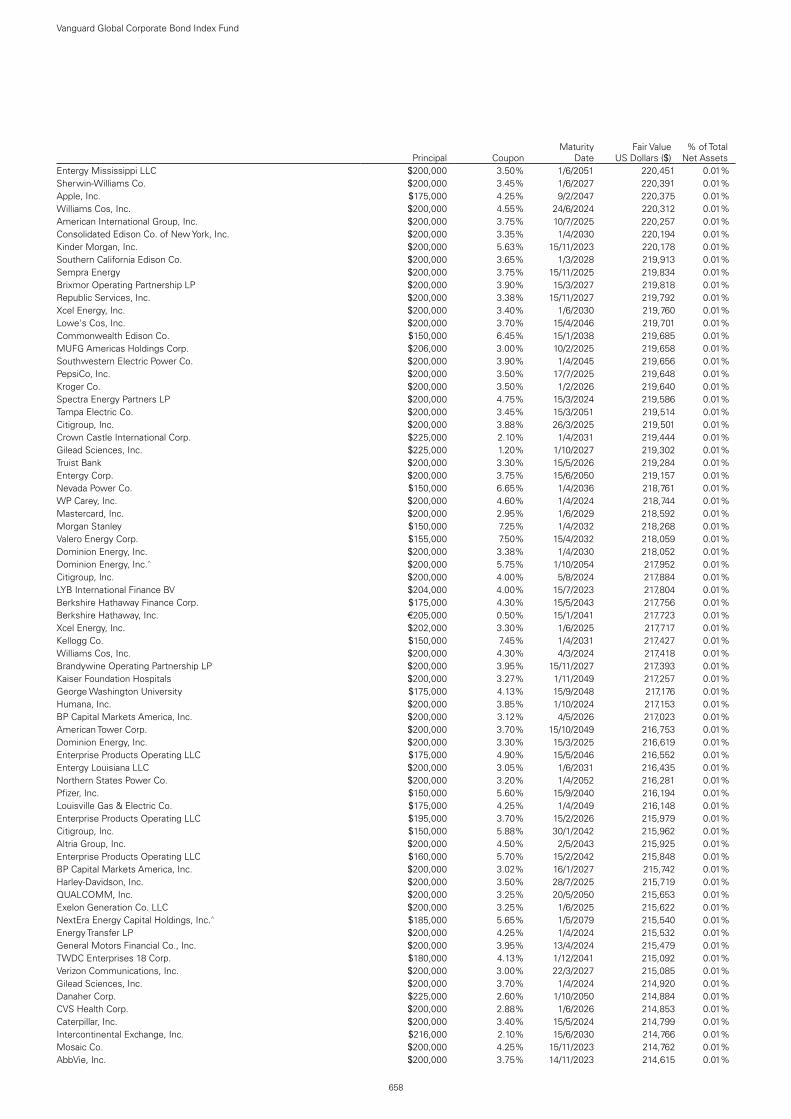
658
Vanguard Global Corporate Bond Index Fund
Principal CouponMaturity
DateFair Value
US Dollars ($)% of Total
Net AssetsEntergy Mississippi LLC $200,000 3.50% 1/6/2051 220,451 0.01%Sherwin-Williams Co. $200,000 3.45% 1/6/2027 220,391 0.01%Apple, Inc. $175,000 4.25% 9/2/2047 220,375 0.01%Williams Cos, Inc. $200,000 4.55% 24/6/2024 220,312 0.01%American International Group, Inc. $200,000 3.75% 10/7/2025 220,257 0.01%Consolidated Edison Co. of New York, Inc. $200,000 3.35% 1/4/2030 220,194 0.01%Kinder Morgan, Inc. $200,000 5.63% 15/11/2023 220,178 0.01%Southern California Edison Co. $200,000 3.65% 1/3/2028 219,913 0.01%Sempra Energy $200,000 3.75% 15/11/2025 219,834 0.01%Brixmor Operating Partnership LP $200,000 3.90% 15/3/2027 219,818 0.01%Republic Services, Inc. $200,000 3.38% 15/11/2027 219,792 0.01%Xcel Energy, Inc. $200,000 3.40% 1/6/2030 219,760 0.01%Lowe's Cos, Inc. $200,000 3.70% 15/4/2046 219,701 0.01%Commonwealth Edison Co. $150,000 6.45% 15/1/2038 219,685 0.01%MUFG Americas Holdings Corp. $206,000 3.00% 10/2/2025 219,658 0.01%Southwestern Electric Power Co. $200,000 3.90% 1/4/2045 219,656 0.01%PepsiCo, Inc. $200,000 3.50% 17/7/2025 219,648 0.01%Kroger Co. $200,000 3.50% 1/2/2026 219,640 0.01%Spectra Energy Partners LP $200,000 4.75% 15/3/2024 219,586 0.01%Tampa Electric Co. $200,000 3.45% 15/3/2051 219,514 0.01%Citigroup, Inc. $200,000 3.88% 26/3/2025 219,501 0.01%Crown Castle International Corp. $225,000 2.10% 1/4/2031 219,444 0.01%Gilead Sciences, Inc. $225,000 1.20% 1/10/2027 219,302 0.01%Truist Bank $200,000 3.30% 15/5/2026 219,284 0.01%Entergy Corp. $200,000 3.75% 15/6/2050 219,157 0.01%Nevada Power Co. $150,000 6.65% 1/4/2036 218,761 0.01%WP Carey, Inc. $200,000 4.60% 1/4/2024 218,744 0.01%Mastercard, Inc. $200,000 2.95% 1/6/2029 218,592 0.01%Morgan Stanley $150,000 7.25% 1/4/2032 218,268 0.01%Valero Energy Corp. $155,000 7.50% 15/4/2032 218,059 0.01%Dominion Energy, Inc. $200,000 3.38% 1/4/2030 218,052 0.01%Dominion Energy, Inc.^ $200,000 5.75% 1/10/2054 217,952 0.01%Citigroup, Inc. $200,000 4.00% 5/8/2024 217,884 0.01%LYB International Finance BV $204,000 4.00% 15/7/2023 217,804 0.01%Berkshire Hathaway Finance Corp. $175,000 4.30% 15/5/2043 217,756 0.01%Berkshire Hathaway, Inc. €205,000 0.50% 15/1/2041 217,723 0.01%Xcel Energy, Inc. $202,000 3.30% 1/6/2025 217,717 0.01%Kellogg Co. $150,000 7.45% 1/4/2031 217,427 0.01%Williams Cos, Inc. $200,000 4.30% 4/3/2024 217,418 0.01%Brandywine Operating Partnership LP $200,000 3.95% 15/11/2027 217,393 0.01%Kaiser Foundation Hospitals $200,000 3.27% 1/11/2049 217,257 0.01%George Washington University $175,000 4.13% 15/9/2048 217,176 0.01%Humana, Inc. $200,000 3.85% 1/10/2024 217,153 0.01%BP Capital Markets America, Inc. $200,000 3.12% 4/5/2026 217,023 0.01%American Tower Corp. $200,000 3.70% 15/10/2049 216,753 0.01%Dominion Energy, Inc. $200,000 3.30% 15/3/2025 216,619 0.01%Enterprise Products Operating LLC $175,000 4.90% 15/5/2046 216,552 0.01%Entergy Louisiana LLC $200,000 3.05% 1/6/2031 216,435 0.01%Northern States Power Co. $200,000 3.20% 1/4/2052 216,281 0.01%Pfizer, Inc. $150,000 5.60% 15/9/2040 216,194 0.01%Louisville Gas & Electric Co. $175,000 4.25% 1/4/2049 216,148 0.01%Enterprise Products Operating LLC $195,000 3.70% 15/2/2026 215,979 0.01%Citigroup, Inc. $150,000 5.88% 30/1/2042 215,962 0.01%Altria Group, Inc. $200,000 4.50% 2/5/2043 215,925 0.01%Enterprise Products Operating LLC $160,000 5.70% 15/2/2042 215,848 0.01%BP Capital Markets America, Inc. $200,000 3.02% 16/1/2027 215,742 0.01%Harley-Davidson, Inc. $200,000 3.50% 28/7/2025 215,719 0.01%QUALCOMM, Inc. $200,000 3.25% 20/5/2050 215,653 0.01%Exelon Generation Co. LLC $200,000 3.25% 1/6/2025 215,622 0.01%NextEra Energy Capital Holdings, Inc.^ $185,000 5.65% 1/5/2079 215,540 0.01%Energy Transfer LP $200,000 4.25% 1/4/2024 215,532 0.01%General Motors Financial Co., Inc. $200,000 3.95% 13/4/2024 215,479 0.01%TWDC Enterprises 18 Corp. $180,000 4.13% 1/12/2041 215,092 0.01%Verizon Communications, Inc. $200,000 3.00% 22/3/2027 215,085 0.01%Gilead Sciences, Inc. $200,000 3.70% 1/4/2024 214,920 0.01%Danaher Corp. $225,000 2.60% 1/10/2050 214,884 0.01%CVS Health Corp. $200,000 2.88% 1/6/2026 214,853 0.01%Caterpillar, Inc. $200,000 3.40% 15/5/2024 214,799 0.01%Intercontinental Exchange, Inc. $216,000 2.10% 15/6/2030 214,766 0.01%Mosaic Co. $200,000 4.25% 15/11/2023 214,762 0.01%AbbVie, Inc. $200,000 3.75% 14/11/2023 214,615 0.01%

659
Vanguard Global Corporate Bond Index Fund
Principal CouponMaturity
DateFair Value
US Dollars ($)% of Total
Net AssetsUnion Pacific Corp. $200,000 3.55% 20/5/2061 214,578 0.01%General Motors Financial Co., Inc. $200,000 3.50% 7/11/2024 214,577 0.01%Trane Technologies Global Holding Co., Ltd. $200,000 4.25% 15/6/2023 214,484 0.01%Fortune Brands Home & Security, Inc. $200,000 4.00% 21/9/2023 214,407 0.01%Diamondback Energy, Inc. $200,000 3.50% 1/12/2029 214,368 0.01%Chevron USA, Inc. $160,000 4.95% 15/8/2047 214,357 0.01%Philip Morris International, Inc. $150,000 6.38% 16/5/2038 214,312 0.01%Illinois Tool Works, Inc. $200,000 3.50% 1/3/2024 214,220 0.01%Athene Holding Ltd. $200,000 3.95% 25/5/2051 214,118 0.01%Laboratory Corp. of America Holdings $200,000 3.25% 1/9/2024 214,096 0.01%Raytheon Technologies Corp. $150,000 6.13% 15/7/2038 214,089 0.01%3M Co. $175,000 4.00% 14/9/2048 214,051 0.01%US Bancorp $200,000 3.38% 5/2/2024 214,025 0.01%AmerisourceBergen Corp. $200,000 3.40% 15/5/2024 213,779 0.01%Florida Power & Light Co. $200,000 2.85% 1/4/2025 213,725 0.01%US Treasury Note $215,000 0.25% 15/6/2024 213,707 0.01%Sysco Corp. $166,000 5.95% 1/4/2030 213,290 0.01%Northrop Grumman Corp. $200,000 2.93% 15/1/2025 213,235 0.01%Virginia Electric & Power Co. $200,000 3.45% 15/2/2024 213,217 0.01%Intel Corp. $200,000 3.25% 15/11/2049 213,153 0.01%Spirit Realty LP $200,000 3.40% 15/1/2030 213,142 0.01%Oracle Corp. $200,000 2.95% 15/5/2025 212,991 0.01%Nucor Corp. $200,000 4.00% 1/8/2023 212,988 0.01%Allegion US Holding Co., Inc. $200,000 3.20% 1/10/2024 212,795 0.01%Hasbro, Inc. $200,000 3.00% 19/11/2024 212,731 0.01%Southern California Gas Co. $200,000 2.60% 15/6/2026 212,696 0.01%Burlington Northern Santa Fe LLC $175,000 4.13% 15/6/2047 212,695 0.01%W R Berkley Corp. $200,000 3.55% 30/3/2052 212,580 0.01%General Motors Financial Co., Inc. $200,000 4.25% 15/5/2023 212,571 0.01%CenterPoint Energy Houston Electric LLC $150,000 6.95% 15/3/2033 212,502 0.01%CSX Corp. $175,000 4.30% 1/3/2048 212,475 0.01%STERIS Irish FinCo UnLtd Co. $200,000 3.75% 15/3/2051 212,422 0.01%Blackstone Secured Lending Fund $200,000 3.63% 15/1/2026 212,399 0.01%Novant Health, Inc. $200,000 3.32% 1/11/2061 212,122 0.01%MassMutual Global Funding II $200,000 2.75% 22/6/2024 212,102 0.01%Boeing Co. $200,000 3.25% 1/2/2028 212,096 0.01%eBay, Inc. $200,000 3.65% 10/5/2051 211,948 0.01%LYB International Finance III LLC $200,000 3.63% 1/4/2051 211,770 0.01%New York Life Global Funding $200,000 2.90% 17/1/2024 211,722 0.01%VF Corp. $200,000 2.95% 23/4/2030 211,664 0.01%Georgia-Pacific LLC $200,000 3.73% 15/7/2023 211,455 0.01%Entergy Louisiana LLC $200,000 3.10% 15/6/2041 211,375 0.01%Energy Transfer LP $150,000 7.50% 1/7/2038 211,286 0.01%Travelers Cos, Inc. $140,000 6.75% 20/6/2036 211,276 0.01%Schlumberger Holdings Corp. $190,000 4.00% 21/12/2025 211,140 0.01%Cameron LNG LLC $200,000 3.40% 15/1/2038 210,848 0.01%Rady Children's Hospital-San Diego $200,000 3.15% 15/8/2051 210,827 0.01%ITC Holdings Corp. $200,000 2.95% 14/5/2030 210,825 0.01%PayPal Holdings, Inc. $200,000 2.40% 1/10/2024 210,814 0.01%Comcast Corp. $175,000 4.40% 15/8/2035 210,764 0.01%Voya Financial, Inc.^ $200,000 4.70% 23/1/2048 210,516 0.01%General Dynamics Corp. $185,000 3.75% 15/5/2028 210,378 0.01%State Street Corp.^ $200,000 2.35% 1/11/2025 210,360 0.01%Norfolk Southern Corp. $208,000 3.16% 15/5/2055 210,329 0.01%Wells Fargo Canada Corp. CA($)250,000 3.46% 24/1/2023 210,192 0.01%Aviation Capital Group LLC $200,000 3.50% 1/11/2027 210,033 0.01%Las Vegas Sands Corp. $200,000 3.20% 8/8/2024 209,887 0.01%Dominion Energy, Inc. $200,000 3.30% 15/4/2041 209,856 0.01%KKR Group Finance Co. VIII LLC $200,000 3.50% 25/8/2050 209,843 0.01%Arthur J Gallagher & Co. $200,000 3.50% 20/5/2051 209,715 0.01%ONE Gas, Inc. $175,000 4.50% 1/11/2048 209,585 0.01%UnitedHealth Group, Inc. $200,000 3.05% 15/5/2041 209,555 0.01%American Tower Corp. $200,000 3.50% 31/1/2023 209,519 0.01%American Tower Corp. $200,000 3.00% 15/6/2023 209,488 0.01%Dominion Energy South Carolina, Inc. $150,000 6.63% 1/2/2032 209,485 0.01%NiSource, Inc. $175,000 4.38% 15/5/2047 209,332 0.01%Deere & Co. $164,000 5.38% 16/10/2029 209,055 0.01%American Honda Finance Corp. $200,000 2.15% 10/9/2024 209,047 0.01%Broadcom, Inc. $200,000 3.75% 15/2/2051 209,005 0.01%Walmart, Inc. $140,000 6.20% 15/4/2038 208,964 0.01%Eaton Corp. $175,000 4.15% 2/11/2042 208,850 0.01%

660
Vanguard Global Corporate Bond Index Fund
Principal CouponMaturity
DateFair Value
US Dollars ($)% of Total
Net AssetsSouthern Co. $200,000 2.95% 1/7/2023 208,849 0.01%Exelon Corp. $170,000 4.95% 15/6/2035 208,755 0.01%Southern Co. Gas Capital Corp. $175,000 4.40% 1/6/2043 208,674 0.01%Kimco Realty Corp. $200,000 3.13% 1/6/2023 208,672 0.01%Xylem, Inc. $175,000 4.38% 1/11/2046 208,577 0.01%Western Union Co. $197,000 2.85% 10/1/2025 208,566 0.01%Intel Corp. $195,000 2.60% 19/5/2026 208,540 0.01%Thermo Fisher Scientific, Inc. $150,000 5.30% 1/2/2044 208,497 0.01%Capital One Financial Corp. $200,000 3.20% 30/1/2023 208,311 0.01%Republic Services, Inc. $145,000 6.20% 1/3/2040 208,297 0.01%Raytheon Technologies Corp. $150,000 5.70% 15/4/2040 208,269 0.01%Hormel Foods Corp. $200,000 3.05% 3/6/2051 208,187 0.01%CSX Corp. $150,000 6.00% 1/10/2036 208,174 0.01%Santander Holdings USA, Inc. $200,000 3.40% 18/1/2023 208,140 0.01%Discovery Communications LLC $200,000 2.95% 20/3/2023 208,076 0.01%eBay, Inc. $200,000 2.70% 11/3/2030 208,046 0.01%Duke Energy Carolinas LLC $200,000 2.55% 15/4/2031 207,969 0.01%Metropolitan Life Global Funding I $200,000 3.00% 10/1/2023 207,915 0.01%Realty Income Corp. $160,000 4.65% 15/3/2047 207,848 0.01%Highwoods Realty LP $185,000 4.13% 15/3/2028 207,477 0.01%United Parcel Service, Inc. CA($)250,000 2.13% 21/5/2024 207,402 0.01%Public Service Electric & Gas Co. $200,000 3.00% 1/3/2051 207,387 0.01%Marvell Technology, Inc. $200,000 2.95% 15/4/2031 207,361 0.01%Amgen, Inc. $218,000 2.77% 1/9/2053 207,197 0.01%Stanford Health Care $200,000 3.03% 15/8/2051 206,992 0.01%Berkshire Hathaway Energy Co. $200,000 2.80% 15/1/2023 206,931 0.01%Oncor Electric Delivery Co. LLC $142,000 5.35% 1/10/2052 206,832 0.01%American Assets Trust LP $200,000 3.38% 1/2/2031 206,678 0.01%Resorts World Las Vegas LLC/RWLV Capital, Inc. $200,000 4.63% 16/4/2029 206,627 0.01%American Tower Corp. $200,000 2.70% 15/4/2031 206,619 0.01%Goldman Sachs BDC, Inc. $200,000 2.88% 15/1/2026 206,557 0.01%Gilead Sciences, Inc. $150,000 5.65% 1/12/2041 206,428 0.01%Walmart, Inc. £100,000 4.88% 19/1/2039 206,369 0.01%Caterpillar Financial Services Corp. $200,000 2.55% 29/11/2022 206,367 0.01%GE Capital UK Funding Unlimited Co. £100,000 6.25% 5/5/2038 206,364 0.01%Chevron Corp. $200,000 2.24% 11/5/2030 206,254 0.01%Markel Corp. $200,000 3.45% 7/5/2052 206,247 0.01%Humana, Inc. $200,000 3.15% 1/12/2022 206,207 0.01%Camden Property Trust $200,000 2.95% 15/12/2022 206,079 0.01%Constellation Brands, Inc. $175,000 4.65% 15/11/2028 206,028 0.01%Exxon Mobil Corp. $200,000 3.00% 16/8/2039 205,665 0.01%Norfolk Southern Corp. $175,000 4.10% 15/5/2049 205,620 0.01%Equinix, Inc. $200,000 3.40% 15/2/2052 205,562 0.01%Microsoft Corp. $200,000 2.65% 3/11/2022 205,514 0.01%Bunge Ltd. Finance Corp. $200,000 3.00% 25/9/2022 205,475 0.01%ViacomCBS, Inc. $150,000 5.85% 1/9/2043 205,459 0.01%CenterPoint Energy Houston Electric LLC $200,000 2.35% 1/4/2031 205,264 0.01%American Honda Finance Corp. $200,000 2.00% 24/3/2028 205,204 0.01%Microsoft Corp. $200,000 2.13% 15/11/2022 205,111 0.01%Entergy Louisiana LLC $175,000 4.00% 15/3/2033 205,042 0.01%Boeing Co. $200,000 1.95% 1/2/2024 204,963 0.01%Tampa Electric Co. $200,000 2.40% 15/3/2031 204,876 0.01%Oncor Electric Delivery Co. LLC $175,000 3.80% 30/9/2047 204,768 0.01%KeyBank NA $200,000 2.30% 14/9/2022 204,699 0.01%Northern Trust Corp. $200,000 2.38% 2/8/2022 204,650 0.01%Aon Corp. $175,000 4.50% 15/12/2028 204,619 0.01%Anthem, Inc. $200,000 3.13% 15/5/2050 204,585 0.01%Reliance Standard Life Global Funding II $200,000 2.63% 22/7/2022 204,585 0.01%Public Storage $200,000 2.37% 15/9/2022 204,514 0.01%Perrigo Finance Unlimited Co. $200,000 3.15% 15/6/2030 204,352 0.01%Toyota Motor Credit Corp. $200,000 2.15% 8/9/2022 204,295 0.01%New York Life Global Funding $200,000 2.25% 12/7/2022 204,204 0.01%Boston Properties LP $175,000 4.50% 1/12/2028 204,183 0.01%CenterPoint Energy, Inc. $200,000 2.65% 1/6/2031 204,079 0.01%Lockheed Martin Corp. $175,000 3.80% 1/3/2045 204,064 0.01%Eversource Energy $175,000 4.25% 1/4/2029 204,044 0.01%Exxon Mobil Corp. $200,000 3.10% 16/8/2049 203,966 0.01%Union Pacific Corp. $175,000 4.10% 15/9/2067 203,918 0.01%Public Service Co. of New Hampshire $200,000 2.20% 15/6/2031 203,910 0.01%Consolidated Edison Co. of New York, Inc. $200,000 2.40% 15/6/2031 203,902 0.01%Amcor Flexibles North America, Inc. $200,000 2.69% 25/5/2031 203,897 0.01%

661
Vanguard Global Corporate Bond Index Fund
Principal CouponMaturity
DateFair Value
US Dollars ($)% of Total
Net AssetsSTERIS Irish FinCo UnLtd Co. $200,000 2.70% 15/3/2031 203,887 0.01%Novant Health, Inc. $200,000 2.64% 1/11/2036 203,841 0.01%Air Lease Corp. $200,000 2.63% 1/7/2022 203,755 0.01%Toyota Motor Credit Corp. $200,000 1.90% 6/4/2028 203,703 0.01%Mastercard, Inc. $175,000 3.65% 1/6/2049 203,697 0.01%Interpublic Group of Cos, Inc. $187,000 4.20% 15/4/2024 203,609 0.01%Ameriprise Financial, Inc. $190,000 3.00% 2/4/2025 203,517 0.01%Laboratory Corp. of America Holdings $200,000 2.70% 1/6/2031 203,507 0.01%Alexander Funding Trust $200,000 1.84% 15/11/2023 203,506 0.01%Expedia Group, Inc. $200,000 2.95% 15/3/2031 203,480 0.01%Ameriprise Financial, Inc. $186,000 3.70% 15/10/2024 203,446 0.01%CSX Corp. $175,000 4.25% 15/3/2029 203,438 0.01%DTE Electric Co. $200,000 1.90% 1/4/2028 203,410 0.01%CoStar Group, Inc. $200,000 2.80% 15/7/2030 203,327 0.01%Linde, Inc. $200,000 2.20% 15/8/2022 203,302 0.01%Oracle Corp. $175,000 4.30% 8/7/2034 203,243 0.01%Jersey Central Power & Light Co. $200,000 2.75% 1/3/2032 203,003 0.01%Georgia Power Co. $200,000 3.25% 15/3/2051 202,972 0.01%Illumina, Inc. $200,000 2.55% 23/3/2031 202,930 0.01%Entergy Louisiana LLC $200,000 2.35% 15/6/2032 202,838 0.01%Blackstone Secured Lending Fund $200,000 2.75% 16/9/2026 202,738 0.01%Gilead Sciences, Inc. $175,000 4.00% 1/9/2036 202,737 0.01%Southwestern Electric Power Co. $200,000 1.65% 15/3/2026 202,642 0.01%Piedmont Natural Gas Co., Inc. $200,000 2.50% 15/3/2031 202,623 0.01%Mylan, Inc. $165,000 5.20% 15/4/2048 202,609 0.01%Florida Gas Transmission Co. LLC $200,000 2.55% 1/7/2030 202,563 0.01%Flex Intermediate Holdco LLC $200,000 3.36% 30/6/2031 202,541 0.01%Schlumberger Finance Canada Ltd. $200,000 1.40% 17/9/2025 202,493 0.01%Banner Health $200,000 2.91% 1/1/2051 202,484 0.01%Commonwealth Edison Co. $175,000 3.75% 15/8/2047 202,476 0.01%Bank of America Corp.^ $175,000 3.95% 23/1/2049 202,473 0.01%Newmont Corp. $150,000 5.88% 1/4/2035 202,442 0.01%GA Global Funding Trust $200,000 1.63% 15/1/2026 202,417 0.01%Athene Global Funding $200,000 2.67% 7/6/2031 202,337 0.01%Bunge Ltd. Finance Corp. $200,000 2.75% 14/5/2031 202,293 0.01%Arthur J Gallagher & Co. $200,000 2.50% 20/5/2031 202,129 0.01%ViacomCBS, Inc. $190,000 2.90% 15/1/2027 202,035 0.01%Duquesne Light Holdings, Inc. $200,000 2.78% 7/1/2032 201,878 0.01%Kaiser Foundation Hospitals $150,000 4.88% 1/4/2042 201,870 0.01%Whirlpool Corp. $200,000 2.40% 15/5/2031 201,773 0.01%National Fuel Gas Co. $200,000 2.95% 1/3/2031 201,737 0.01%Sixth Street Specialty Lending, Inc. $200,000 2.50% 1/8/2026 201,704 0.01%Automatic Data Processing, Inc. $200,000 1.70% 15/5/2028 201,648 0.01%Dominion Energy, Inc. $200,000 1.45% 15/4/2026 201,483 0.01%Crown Castle International Corp. $200,000 2.50% 15/7/2031 201,442 0.01%T-Mobile USA, Inc. $200,000 1.50% 15/2/2026 201,399 0.01%John Deere Capital Corp. $200,000 0.70% 5/7/2023 201,379 0.01%General Motors Financial Co., Inc. $200,000 1.05% 8/3/2024 201,210 0.01%American Electric Power Co., Inc. $200,000 2.30% 1/3/2030 201,176 0.01%Boston Properties LP $200,000 2.55% 1/4/2032 201,124 0.01%Hormel Foods Corp. $200,000 1.70% 3/6/2028 201,096 0.01%Truist Financial Corp.^ $200,000 1.89% 7/6/2029 201,048 0.01%Mylan, Inc. $175,000 4.55% 15/4/2028 200,837 0.01%Hubbell, Inc. $200,000 2.30% 15/3/2031 200,787 0.01%Lam Research Corp. $200,000 1.90% 15/6/2030 200,762 0.01%WRKCo, Inc. $175,000 4.65% 15/3/2026 200,721 0.01%Jefferies Group LLC $150,000 6.25% 15/1/2036 200,649 0.01%Pfizer, Inc. $200,000 2.55% 28/5/2040 200,604 0.01%Cigna Corp. $200,000 1.25% 15/3/2026 200,602 0.01%Interpublic Group of Cos, Inc. $200,000 2.40% 1/3/2031 200,596 0.01%Pacific Life Global Funding II $200,000 1.38% 14/4/2026 200,586 0.01%Equinix, Inc. $200,000 1.25% 15/7/2025 200,575 0.01%Biogen, Inc. $200,000 2.25% 1/5/2030 200,532 0.01%Baker Hughes a GE Co. LLC/Baker Hughes Co.-Obligor, Inc. $175,000 4.08% 15/12/2047 200,525 0.01%Southern California Edison Co. $200,000 3.65% 1/2/2050 200,509 0.01%Hormel Foods Corp. $200,000 0.65% 3/6/2024 200,384 0.01%CenterPoint Energy, Inc. $200,000 1.45% 1/6/2026 200,319 0.01%Northwestern Mutual Global Funding $200,000 1.70% 1/6/2028 200,282 0.01%Entergy Louisiana LLC $200,000 0.62% 17/11/2023 200,258 0.01%Southern California Edison Co. $200,000 0.70% 3/4/2023 200,254 0.01%Toyota Motor Credit Corp. $200,000 0.40% 6/4/2023 200,123 0.01%

662
Vanguard Global Corporate Bond Index Fund
Principal CouponMaturity
DateFair Value
US Dollars ($)% of Total
Net AssetsGoldman Sachs Group, Inc. $200,000 0.52% 8/3/2023 200,118 0.01%Goldman Sachs Group, Inc.^ $200,000 0.63% 17/11/2023 200,109 0.01%JPMorgan Chase & Co.^ $200,000 0.65% 16/9/2024 200,106 0.01%Broadcom, Inc. $200,000 1.95% 15/2/2028 200,093 0.01%Enbridge, Inc. $200,000 2.50% 1/8/2033 200,090 0.01%Atmos Energy Corp. $200,000 0.63% 9/3/2023 200,053 0.01%Omega Healthcare Investors, Inc. $187,000 3.63% 1/10/2029 200,039 0.01%Cigna Corp. $200,000 0.61% 15/3/2024 200,019 0.01%Laboratory Corp. of America Holdings $200,000 1.55% 1/6/2026 200,015 0.01%Union Pacific Corp. $175,000 3.80% 1/10/2051 199,991 0.01%Brown & Brown, Inc. $200,000 2.38% 15/3/2031 199,958 0.01%Burlington Northern Santa Fe LLC $150,000 4.90% 1/4/2044 199,928 0.01%UnitedHealth Group, Inc. $190,000 2.38% 15/8/2024 199,895 0.01%Newmont Corp. $200,000 2.25% 1/10/2030 199,869 0.01%Entergy Corp. $200,000 2.40% 15/6/2031 199,855 0.01%Kroger Co. $175,000 3.95% 15/1/2050 199,799 0.01%Brighthouse Financial, Inc. $183,000 3.70% 22/6/2027 199,791 0.01%East Ohio Gas Co. $200,000 3.00% 15/6/2050 199,655 0.01%Guardian Life Global Funding $200,000 1.25% 13/5/2026 199,599 0.01%Georgia-Pacific LLC $200,000 0.63% 15/5/2024 199,436 0.01%PECO Energy Co. $200,000 2.80% 15/6/2050 199,386 0.01%American Honda Finance Corp. $200,000 0.55% 12/7/2024 199,306 0.01%Northrop Grumman Corp. $183,000 3.20% 1/2/2027 199,274 0.01%PACCAR Financial Corp. $200,000 0.35% 2/2/2024 199,143 0.01%GXO Logistics, Inc. $200,000 1.65% 15/7/2026 198,985 0.01%HP, Inc. $200,000 1.45% 17/6/2026 198,945 0.01%International Flavors & Fragrances, Inc. $200,000 1.23% 1/10/2025 198,929 0.01%Public Service Co. of Colorado $200,000 1.88% 15/6/2031 198,905 0.01%Valero Energy Partners LP $175,000 4.38% 15/12/2026 198,348 0.01%Ameren Corp. $200,000 1.75% 15/3/2028 198,317 0.01%Southern Co. $200,000 1.75% 15/3/2028 198,016 0.01%Fortinet, Inc. $200,000 1.00% 15/3/2026 197,971 0.01%John Deere Capital Corp. $200,000 0.70% 15/1/2026 197,968 0.01%Cargill, Inc. $200,000 0.75% 2/2/2026 197,607 0.01%Owl Rock Technology Finance Corp. $200,000 2.50% 15/1/2027 197,500 0.01%American Honda Finance Corp. $200,000 1.80% 13/1/2031 197,349 0.01%Duke Energy Carolinas LLC $175,000 3.70% 1/12/2047 197,182 0.01%Prudential Financial, Inc. $168,000 3.94% 7/12/2049 197,150 0.01%Public Service Co. of Colorado $200,000 2.70% 15/1/2051 197,050 0.01%CenterPoint Energy Resources Corp. $175,000 4.00% 1/4/2028 196,918 0.01%Pacific Gas & Electric Co. $200,000 4.20% 1/6/2041 196,826 0.01%Georgia-Pacific LLC $200,000 0.95% 15/5/2026 196,798 0.01%American Tower Corp. $175,000 3.95% 15/3/2029 196,691 0.01%Alexandria Real Estate Equities, Inc. $200,000 3.00% 18/5/2051 196,283 0.01%Coca-Cola Co. $200,000 2.75% 1/6/2060 196,066 0.01%Starbucks Corp. $175,000 3.55% 15/8/2029 195,848 0.01%Tampa Electric Co. $175,000 3.63% 15/6/2050 195,796 0.01%Healthpeak Properties, Inc. $180,000 3.25% 15/7/2026 195,669 0.01%EOG Resources, Inc. $165,000 4.38% 15/4/2030 195,572 0.01%Lear Corp. $155,000 5.25% 15/5/2049 195,430 0.01%Camden Property Trust $170,000 4.10% 15/10/2028 195,418 0.01%Stanley Black & Decker, Inc. $200,000 2.75% 15/11/2050 195,084 0.01%AT&T, Inc. $200,000 3.30% 1/2/2052 194,795 0.01%Marathon Petroleum Corp. $140,000 6.50% 1/3/2041 194,614 0.01%Bank of New York Mellon Corp. $190,000 1.85% 27/1/2023 194,422 0.01%Charles Schwab Corp. $200,000 1.65% 11/3/2031 194,286 0.01%CenterPoint Energy Houston Electric LLC $150,000 4.50% 1/4/2044 194,027 0.01%Kimco Realty Corp. $175,000 3.80% 1/4/2027 193,760 0.01%Transcontinental Gas Pipe Line Co. LLC $150,000 5.40% 15/8/2041 193,742 0.01%Marsh & McLennan Cos, Inc. $180,000 3.50% 3/6/2024 193,640 0.01%Oracle Corp. $175,000 3.85% 15/7/2036 193,345 0.01%Lowe's Cos, Inc. $150,000 5.00% 15/4/2040 193,262 0.01%Genuine Parts Co. $200,000 1.88% 1/11/2030 192,940 0.01%American Tower Corp. $175,000 4.00% 1/6/2025 192,659 0.01%Ameren Illinois Co. $200,000 1.55% 15/11/2030 192,468 0.01%Mars, Inc. $200,000 2.38% 16/7/2040 192,429 0.01%Duke Realty LP $200,000 1.75% 1/2/2031 192,394 0.01%Entergy Arkansas LLC $175,000 3.50% 1/4/2026 192,370 0.01%Masco Corp. $175,000 3.50% 15/11/2027 192,315 0.01%Raymond James Financial, Inc. $175,000 3.75% 1/4/2051 192,286 0.01%Citigroup, Inc. $125,000 6.68% 13/9/2043 192,177 0.01%

663
Vanguard Global Corporate Bond Index Fund
Principal CouponMaturity
DateFair Value
US Dollars ($)% of Total
Net AssetsCox Communications, Inc. $175,000 3.50% 15/8/2027 192,177 0.01%AT&T, Inc. $150,000 5.15% 15/11/2046 192,141 0.01%Welltower, Inc. $150,000 4.95% 1/9/2048 192,030 0.01%Kroger Co. $200,000 1.70% 15/1/2031 191,797 0.01%Kansas City Southern $150,000 4.95% 15/8/2045 191,643 0.01%Entergy Louisiana LLC $200,000 1.60% 15/12/2030 191,573 0.01%Lowe's Cos, Inc. $175,000 3.38% 15/9/2025 191,545 0.01%Union Electric Co. $200,000 2.63% 15/3/2051 191,462 0.01%Verizon Communications, Inc. AU($)250,000 2.10% 6/5/2026 191,407 0.01%SVB Financial Group $200,000 1.80% 2/2/2031 191,329 0.01%American Transmission Systems, Inc. $150,000 5.00% 1/9/2044 191,215 0.01%Alabama Power Co. $200,000 1.45% 15/9/2030 191,077 0.01%General Motors Co. $150,000 5.40% 1/4/2048 190,989 0.01%Huntington Ingalls Industries, Inc. $175,000 3.48% 1/12/2027 190,865 0.01%Entergy Arkansas LLC $200,000 2.65% 15/6/2051 190,680 0.01%Nationwide Mutual Insurance Co. $110,000 9.38% 15/8/2039 190,555 0.01%UnitedHealth Group, Inc. $175,000 2.95% 15/10/2027 190,501 0.01%Cummins, Inc. $200,000 2.60% 1/9/2050 190,464 0.01%Invesco Finance plc $145,000 5.38% 30/11/2043 190,132 0.01%Alphabet, Inc. $200,000 1.10% 15/8/2030 189,977 0.01%Massachusetts Mutual Life Insurance Co. $179,000 3.73% 15/10/2070 189,837 0.01%Principal Financial Group, Inc. $175,000 3.40% 15/5/2025 189,746 0.01%CommonSpirit Health $175,000 3.35% 1/10/2029 189,647 0.01%GE Capital UK Funding Unlimited Co. £100,000 5.88% 18/1/2033 189,156 0.01%Ameriprise Financial, Inc. $175,000 4.00% 15/10/2023 189,133 0.01%Chubb INA Holdings, Inc. $175,000 3.15% 15/3/2025 189,100 0.01%Pfizer, Inc. $150,000 4.20% 15/9/2048 188,964 0.01%Amazon.com, Inc. $200,000 2.50% 3/6/2050 188,902 0.01%Brooklyn Union Gas Co. $175,000 3.41% 10/3/2026 188,873 0.01%Consolidated Edison Co. of New York, Inc. $150,000 4.63% 1/12/2054 188,617 0.01%Bank of New York Mellon Corp. $175,000 3.40% 15/5/2024 188,550 0.01%Merck & Co., Inc. $200,000 2.45% 24/6/2050 188,526 0.01%Air Lease Corp. $175,000 3.63% 1/12/2027 188,152 0.01%Bank of America Corp. $175,000 4.10% 24/7/2023 188,052 0.01%Equinix, Inc. $175,000 3.20% 18/11/2029 188,045 0.01%Wells Fargo & Co.^ CA($)225,000 2.57% 1/5/2026 187,973 0.01%New York Life Global Funding $200,000 1.20% 7/8/2030 187,847 0.01%AT&T, Inc. $170,000 3.95% 15/1/2025 187,727 0.01%DH Europe Finance II Sarl $175,000 3.25% 15/11/2039 187,711 0.01%American Express Co. $175,000 3.00% 30/10/2024 187,686 0.01%Danaher Corp. $150,000 4.38% 15/9/2045 187,517 0.01%Southern California Edison Co. $150,000 5.55% 15/1/2037 187,422 0.01%Aircastle Ltd. $175,000 4.40% 25/9/2023 187,403 0.01%Activision Blizzard, Inc. $200,000 1.35% 15/9/2030 187,304 0.01%American Express Co. $171,000 3.63% 5/12/2024 187,145 0.01%Honeywell International, Inc. $175,000 3.35% 1/12/2023 187,071 0.01%Jefferies Group LLC $135,000 6.50% 20/1/2043 187,059 0.01%FedEx Corp. $150,000 4.75% 15/11/2045 186,963 0.01%Truist Bank^ $175,000 3.69% 2/8/2024 186,686 0.01%New York Life Insurance Co. $150,000 4.45% 15/5/2069 186,638 0.01%New York Life Global Funding CA($)230,000 2.00% 17/4/2028 186,629 0.01%ONEOK, Inc. $175,000 3.40% 1/9/2029 186,582 0.01%Norfolk Southern Corp. $145,000 4.84% 1/10/2041 186,215 0.01%Pfizer, Inc. $150,000 4.13% 15/12/2046 186,147 0.01%Energy Transfer LP $150,000 6.10% 15/2/2042 186,063 0.01%New York & Presbyterian Hospital $200,000 2.61% 1/8/2060 186,023 0.01%Wells Fargo & Co. CA($)225,000 2.49% 18/2/2027 185,938 0.01%Healthcare Trust of America Holdings LP $175,000 3.10% 15/2/2030 185,814 0.01%Pacific Gas & Electric Co. $200,000 3.95% 1/12/2047 185,813 0.01%Amgen, Inc. $175,000 2.60% 19/8/2026 185,784 0.01%CSX Corp. $150,000 4.25% 1/11/2066 185,614 0.01%Apple, Inc. €150,000 1.38% 17/1/2024 185,485 0.01%Nationwide Financial Services, Inc. $150,000 6.75% 15/5/2037 185,433 0.01%Snap-on, Inc. $175,000 3.10% 1/5/2050 185,331 0.01%PepsiCo, Inc. $150,000 3.88% 19/3/2060 185,031 0.01%Home Depot, Inc. $200,000 2.38% 15/3/2051 185,013 0.01%IDEX Corp. $175,000 3.00% 1/5/2030 184,998 0.01%Diamondback Energy, Inc. $175,000 2.88% 1/12/2024 184,988 0.01%NYU Langone Hospitals $175,000 3.38% 1/7/2055 184,703 0.01%Aetna, Inc. $125,000 6.75% 15/12/2037 184,631 0.01%AT&T, Inc. $150,000 4.90% 15/8/2037 184,592 0.01%

664
Vanguard Global Corporate Bond Index Fund
Principal CouponMaturity
DateFair Value
US Dollars ($)% of Total
Net AssetsAllstate Corp. $150,000 4.20% 15/12/2046 184,542 0.01%Host Hotels & Resorts LP $175,000 3.75% 15/10/2023 184,423 0.01%Virginia Electric & Power Co. $200,000 2.45% 15/12/2050 184,214 0.01%Cox Communications, Inc. $175,000 3.60% 15/6/2051 184,107 0.01%NBCUniversal Media LLC $150,000 4.45% 15/1/2043 184,102 0.01%Berkshire Hathaway Energy Co. $150,000 4.25% 15/10/2050 184,072 0.01%TJX Cos, Inc. $175,000 2.25% 15/9/2026 184,030 0.01%Time Warner Cable LLC £100,000 5.25% 15/7/2042 183,992 0.01%McDonald's Corp. $150,000 4.45% 1/3/2047 183,885 0.01%Honeywell International, Inc. $175,000 2.30% 15/8/2024 183,785 0.01%Walt Disney Co. CA($)215,000 3.06% 30/3/2027 183,735 0.01%Arizona Public Service Co. $150,000 4.50% 1/4/2042 183,720 0.01%Enterprise Products Operating LLC $150,000 4.85% 15/8/2042 183,660 0.01%McDonald's Corp. $175,000 3.35% 1/4/2023 183,557 0.01%Southern California Edison Co. $175,000 3.90% 15/3/2043 183,506 0.01%Home Depot, Inc. $150,000 4.20% 1/4/2043 183,500 0.01%Johnson Controls International plc €151,000 1.00% 15/9/2023 183,211 0.01%Florida Power & Light Co. $135,000 5.63% 1/4/2034 183,109 0.01%Phillips 66 Partners LP $160,000 4.68% 15/2/2045 183,105 0.01%MPLX LP $150,000 5.20% 1/12/2047 183,102 0.01%Apple, Inc. $175,000 2.05% 11/9/2026 183,082 0.01%Duke Energy Corp. $170,000 3.75% 15/4/2024 183,067 0.01%Eli Lilly & Co. $200,000 2.50% 15/9/2060 183,058 0.01%Anthem, Inc. $150,000 4.38% 1/12/2047 182,991 0.01%FMR LLC $125,000 6.45% 15/11/2039 182,935 0.01%Massachusetts Institute of Technology $125,000 4.68% 1/7/2114 182,806 0.01%Starbucks Corp. $175,000 3.10% 1/3/2023 182,673 0.01%Boeing Co. $175,000 2.80% 1/3/2024 182,626 0.01%Essential Utilities, Inc. $165,000 3.57% 1/5/2029 182,521 0.01%Public Service Electric & Gas Co. $150,000 4.05% 1/5/2048 182,504 0.01%AT&T, Inc. £100,000 5.20% 18/11/2033 182,485 0.01%American International Group, Inc. $150,000 4.38% 15/1/2055 182,286 0.01%American Water Capital Corp. $150,000 4.20% 1/9/2048 182,280 0.01%AvalonBay Communities, Inc. $150,000 4.15% 1/7/2047 182,161 0.01%PepsiCo, Inc. $175,000 2.75% 1/3/2023 182,073 0.01%Celanese US Holdings LLC €150,000 1.13% 26/9/2023 182,071 0.01%Cisco Systems, Inc. $125,000 5.90% 15/2/2039 181,935 0.01%MPLX LP $175,000 3.50% 1/12/2022 181,809 0.01%Discovery Communications LLC $150,000 5.00% 20/9/2037 181,646 0.01%General Electric Co. $150,000 4.35% 1/5/2050 181,581 0.01%United Parcel Service, Inc. $150,000 4.45% 1/4/2030 181,566 0.01%Securian Financial Group, Inc. $150,000 4.80% 15/4/2048 181,466 0.01%Comcast Corp. £100,000 5.50% 23/11/2029 181,148 0.01%National Rural Utilities Cooperative Finance Corp. $175,000 2.70% 15/2/2023 180,951 0.01%Charles Schwab Corp. $175,000 2.65% 25/1/2023 180,929 0.01%Duke Energy Progress LLC $150,000 4.20% 15/8/2045 180,819 0.01%Walt Disney Co. $175,000 1.75% 30/8/2024 180,815 0.01%Air Lease Corp. $175,000 2.30% 1/2/2025 180,767 0.01%EOG Resources, Inc. $175,000 2.63% 15/3/2023 180,702 0.01%FedEx Corp. $140,000 4.95% 17/10/2048 180,667 0.01%CME Group, Inc. $175,000 3.00% 15/9/2022 180,585 0.01%Dover Corp. $168,000 2.95% 4/11/2029 180,571 0.01%Wells Fargo & Co. £100,000 4.63% 2/11/2035 180,550 0.01%Amgen, Inc. $175,000 2.45% 21/2/2030 180,407 0.01%Verizon Communications, Inc. £100,000 4.75% 17/2/2034 180,374 0.01%Precision Castparts Corp. $166,000 3.25% 15/6/2025 180,059 0.01%Public Service Enterprise Group, Inc. $175,000 2.65% 15/11/2022 180,021 0.01%PepsiCo, Inc. $175,000 2.88% 15/10/2049 179,820 0.01%Fidelity National Information Services, Inc. $175,000 3.10% 1/3/2041 179,790 0.01%Burlington Northern Santa Fe LLC $145,000 4.40% 15/3/2042 179,204 0.01%Simon Property Group LP $120,000 6.75% 1/2/2040 179,129 0.01%AT&T, Inc. CA($)200,000 4.85% 25/5/2047 179,102 0.01%BlackRock, Inc. $160,000 3.25% 30/4/2029 178,937 0.01%Waste Connections, Inc. $173,000 2.60% 1/2/2030 178,932 0.01%Corning, Inc. $150,000 4.38% 15/11/2057 178,756 0.01%Flex Ltd. $160,000 4.75% 15/6/2025 178,425 0.01%Honeywell International, Inc. $175,000 2.15% 8/8/2022 178,332 0.01%Hartford Financial Services Group, Inc. $150,000 4.30% 15/4/2043 178,127 0.01%Enterprise Products Operating LLC $125,000 6.88% 1/3/2033 178,099 0.01%PPL Electric Utilities Corp. $150,000 3.95% 1/6/2047 178,086 0.01%Omnicom Group, Inc. $175,000 2.60% 1/8/2031 177,981 0.01%

665
Vanguard Global Corporate Bond Index Fund
Principal CouponMaturity
DateFair Value
US Dollars ($)% of Total
Net AssetsEcolab, Inc. $200,000 2.13% 15/8/2050 177,759 0.01%Cox Communications, Inc. $175,000 2.60% 15/6/2031 177,669 0.01%Alabama Power Co. $125,000 6.00% 1/3/2039 177,549 0.01%Travelers Cos, Inc. $135,000 4.60% 1/8/2043 177,429 0.01%Dominion Energy South Carolina, Inc. $125,000 6.05% 15/1/2038 177,340 0.01%Walmart, Inc. $135,000 4.75% 2/10/2043 176,997 0.01%AEP Transmission Co. LLC $150,000 4.00% 1/12/2046 176,896 0.01%Roper Technologies, Inc. $175,000 2.80% 15/12/2021 176,625 0.01%Prologis LP $150,000 4.38% 1/2/2029 176,455 0.01%Exelon Generation Co. LLC $150,000 5.60% 15/6/2042 176,033 0.01%Aircastle Ltd. $175,000 2.85% 26/1/2028 176,028 0.01%Nissan Motor Acceptance Corp. $175,000 2.00% 9/3/2026 175,983 0.01%Golub Capital BDC, Inc. $175,000 2.50% 24/8/2026 175,900 0.01%Energy Transfer LP $150,000 5.95% 1/12/2025 175,769 0.01%Liberty Mutual Group, Inc. $160,000 3.95% 15/5/2060 175,734 0.01%eBay, Inc. $175,000 1.40% 10/5/2026 175,456 0.01%Boeing Co. $167,000 2.85% 30/10/2024 175,408 0.01%Air Products & Chemicals, Inc. $175,000 2.80% 15/5/2050 175,357 0.01%Mars, Inc. $165,000 2.70% 1/4/2025 175,276 0.01%Dominion Energy, Inc. $165,000 3.07% 15/8/2024 175,041 0.01%CenterPoint Energy Resources Corp. $175,000 0.70% 2/3/2023 175,011 0.01%International Flavors & Fragrances, Inc. $135,000 5.00% 26/9/2048 174,853 0.01%American Homes 4 Rent LP $150,000 4.90% 15/2/2029 174,813 0.01%International Business Machines Corp. $125,000 5.60% 30/11/2039 174,804 0.01%Simon Property Group LP $150,000 4.25% 30/11/2046 174,802 0.01%Owens Corning $150,000 4.30% 15/7/2047 174,422 0.01%Broadridge Financial Solutions, Inc. $165,000 2.90% 1/12/2029 174,406 0.01%Bacardi Ltd. $150,000 4.70% 15/5/2028 174,205 0.01%Kinder Morgan Energy Partners LP $125,000 6.50% 1/9/2039 174,070 0.01%Johnson & Johnson $150,000 3.50% 15/1/2048 174,048 0.01%ConocoPhillips $150,000 4.30% 15/8/2028 173,993 0.01%Sempra Energy $125,000 6.00% 15/10/2039 173,919 0.01%Public Storage $175,000 0.88% 15/2/2026 173,909 0.01%Microsoft Corp. $150,000 3.50% 12/2/2035 173,878 0.01%Fidelity National Information Services, Inc. €120,000 2.95% 21/5/2039 173,783 0.01%Hormel Foods Corp. $175,000 1.80% 11/6/2030 173,735 0.01%Bank of America Corp.^ $161,000 3.37% 23/1/2026 173,528 0.01%HollyFrontier Corp. $150,000 5.88% 1/4/2026 173,448 0.01%Massachusetts Electric Co. $125,000 5.90% 15/11/2039 173,439 0.01%Marvell Technology, Inc. $150,000 4.88% 22/6/2028 173,264 0.01%Sabine Pass Liquefaction LLC $150,000 5.00% 15/3/2027 173,210 0.01%Carlyle Holdings II Finance LLC $130,000 5.63% 30/3/2043 173,076 0.01%Alexandria Real Estate Equities, Inc. $150,000 4.00% 1/2/2050 173,009 0.01%Fifth Third Bancorp $150,000 3.95% 14/3/2028 172,778 0.01%CenterPoint Energy, Inc. $165,000 2.50% 1/9/2024 172,667 0.01%Willis-Knighton Medical Center $175,000 3.07% 1/3/2051 172,664 0.01%ViacomCBS, Inc. $150,000 4.20% 1/6/2029 172,576 0.01%Trinity Health Corp. $175,000 2.63% 1/12/2040 172,462 0.01%MetLife Capital Trust IV $125,000 7.88% 15/12/2037 172,370 0.01%Alexandria Real Estate Equities, Inc. $158,000 3.45% 30/4/2025 172,339 0.01%General Electric Co. £100,000 5.25% 7/12/2028 172,250 0.01%Verizon Communications, Inc. CA($)213,000 2.50% 16/5/2030 171,783 0.01%International Paper Co. $110,000 7.30% 15/11/2039 171,774 0.01%Johnson Controls International plc $155,000 3.90% 14/2/2026 171,751 0.01%Federal Realty Investment Trust $145,000 4.50% 1/12/2044 171,729 0.01%Niagara Mohawk Power Corp. $150,000 4.28% 15/12/2028 171,657 0.01%Anthem, Inc. $150,000 4.10% 1/3/2028 171,650 0.01%Goldman Sachs Group, Inc. £100,000 7.13% 7/8/2025 171,219 0.01%Oglethorpe Power Corp. $135,000 5.38% 1/11/2040 170,787 0.01%salesforce.com, Inc. $150,000 3.70% 11/4/2028 170,779 0.01%ONEOK Partners LP $125,000 6.85% 15/10/2037 170,693 0.01%TWDC Enterprises 18 Corp. $150,000 3.70% 1/12/2042 170,188 0.01%Johnson & Johnson $150,000 3.40% 15/1/2038 170,033 0.01%Commonwealth Edison Co. $150,000 3.65% 15/6/2046 169,993 0.01%Tri-State Generation & Transmission Association, Inc. $125,000 6.00% 15/6/2040 169,937 0.01%Wells Fargo & Co. CA($)200,000 2.98% 19/5/2026 169,688 0.01%Omega Healthcare Investors, Inc. $150,000 4.75% 15/1/2028 169,504 0.01%Coca-Cola Co. €150,000 0.80% 15/3/2040 169,490 0.01%Citigroup, Inc. $150,000 4.30% 20/11/2026 169,472 0.01%NiSource, Inc. $160,000 2.95% 1/9/2029 169,360 0.01%AEP Texas, Inc. $150,000 3.95% 1/6/2028 169,048 0.01%

666
Vanguard Global Corporate Bond Index Fund
Principal CouponMaturity
DateFair Value
US Dollars ($)% of Total
Net AssetsMorgan Stanley CA($)200,000 3.00% 7/2/2024 168,952 0.01%General Motors Financial of Canada Ltd. CA($)200,000 3.25% 7/11/2023 168,899 0.01%Lincoln National Corp. $110,000 7.00% 15/6/2040 168,897 0.01%Welltower, Inc. £100,000 4.50% 1/12/2034 168,885 0.01%Indiana Michigan Power Co. $150,000 3.85% 15/5/2028 168,730 0.01%General Motors Financial Co., Inc. $150,000 4.35% 17/1/2027 168,694 0.01%Columbia Pipeline Group, Inc. $150,000 4.50% 1/6/2025 168,609 0.01%Bank of America Corp.^ CA($)200,000 3.30% 24/4/2024 168,294 0.01%Intel Corp. $140,000 4.10% 19/5/2046 168,197 0.01%Franklin Resources, Inc. $175,000 1.60% 30/10/2030 168,159 0.01%PNC Financial Services Group, Inc. $150,000 3.45% 23/4/2029 167,863 0.01%President & Fellows of Harvard College $150,000 3.15% 15/7/2046 167,677 0.01%NIKE, Inc. $150,000 3.38% 1/11/2046 167,611 0.01%Interpublic Group of Cos, Inc. $125,000 5.40% 1/10/2048 167,418 0.01%Baxter International, Inc. $150,000 3.50% 15/8/2046 167,354 0.01%Conagra Brands, Inc. $125,000 5.40% 1/11/2048 167,078 0.01%JB Hunt Transport Services, Inc. $150,000 3.88% 1/3/2026 167,041 0.01%Kroger Co. $150,000 3.70% 1/8/2027 166,980 0.01%Juniper Networks, Inc. $150,000 3.75% 15/8/2029 166,971 0.01%Loews Corp. $150,000 3.75% 1/4/2026 166,829 0.01%Hewlett Packard Enterprise Co. $150,000 4.65% 1/10/2024 166,731 0.01%AutoNation, Inc. $150,000 4.50% 1/10/2025 166,690 0.01%First American Financial Corp. $150,000 4.00% 15/5/2030 166,657 0.01%Illinois Tool Works, Inc. $125,000 4.88% 15/9/2041 166,622 0.01%Wells Fargo & Co. CA($)200,000 2.51% 27/10/2023 166,621 0.01%Hershey Co. $150,000 3.38% 15/8/2046 166,508 0.01%Home Depot, Inc. $125,000 4.88% 15/2/2044 166,481 0.01%IHS Markit Ltd. $150,000 4.00% 1/3/2026 166,381 0.01%State Street Corp. $150,000 3.55% 18/8/2025 166,253 0.01%Caterpillar, Inc. $150,000 3.25% 9/4/2050 166,246 0.01%General Mills, Inc. $150,000 4.00% 17/4/2025 166,137 0.01%Global Atlantic Finance Co. $150,000 4.40% 15/10/2029 166,047 0.01%Northern States Power Co. $150,000 3.40% 15/8/2042 166,020 0.01%NextEra Energy Capital Holdings, Inc. $150,000 3.55% 1/5/2027 165,929 0.01%Mylan, Inc. $160,000 3.13% 15/1/2023 165,854 0.01%Pernod Ricard International Finance LLC $175,000 1.63% 1/4/2031 165,696 0.01%Boston Scientific Corp. $150,000 3.85% 15/5/2025 165,633 0.01%United Airlines 2014-1 Class A Pass Through Trust $157,343 4.00% 11/4/2026 165,480 0.01%Bunge Ltd. Finance Corp. $150,000 3.75% 25/9/2027 165,400 0.01%Crown Castle International Corp. $150,000 3.65% 1/9/2027 165,388 0.01%Campbell Soup Co. $150,000 3.95% 15/3/2025 165,349 0.01%Boston Properties LP $150,000 3.65% 1/2/2026 165,344 0.01%Walgreens Boots Alliance, Inc. $150,000 4.10% 15/4/2050 165,305 0.01%Stryker Corp. $150,000 3.50% 15/3/2026 165,251 0.01%American Tower Corp. $150,000 3.60% 15/1/2028 165,199 0.01%Crown Castle International Corp. $150,000 3.70% 15/6/2026 165,054 0.01%Mass General Brigham, Inc. $150,000 3.34% 1/7/2060 164,972 0.01%Anthem, Inc. $155,000 2.88% 15/9/2029 164,913 0.01%Markel Corp. $150,000 3.50% 1/11/2027 164,888 0.01%Baltimore Gas & Electric Co. $150,000 3.50% 15/8/2046 164,861 0.01%Cigna Corp. $150,000 3.40% 1/3/2027 164,596 0.01%Bank of America Corp.^ CA($)195,000 2.93% 25/4/2025 164,482 0.01%AES Corp. $150,000 3.95% 15/7/2030 164,295 0.01%Charles Schwab Corp. $150,000 3.20% 2/3/2027 164,194 0.01%Citigroup, Inc. £100,000 5.15% 21/5/2026 164,122 0.01%Evergy Kansas Central, Inc. $150,000 3.45% 15/4/2050 164,077 0.01%Nasdaq, Inc. $150,000 4.25% 1/6/2024 164,072 0.01%CSX Corp. $150,000 3.35% 1/11/2025 164,039 0.01%New York Life Insurance Co. $125,000 5.88% 15/5/2033 163,832 0.01%ITC Holdings Corp. $125,000 5.30% 1/7/2043 163,759 0.01%Discovery Communications LLC $150,000 3.63% 15/5/2030 163,758 0.01%Host Hotels & Resorts LP $151,000 4.00% 15/6/2025 163,634 0.01%Mastercard, Inc. $150,000 2.95% 21/11/2026 163,623 0.01%Adobe, Inc. $160,000 1.70% 1/2/2023 163,600 0.01%Athene Global Funding CA($)200,000 2.10% 24/9/2025 163,585 0.01%American Campus Communities Operating Partnership LP $150,000 4.13% 1/7/2024 163,488 0.01%Kinder Morgan, Inc. $130,000 5.20% 1/3/2048 163,430 0.01%Texas Instruments, Inc. $150,000 2.90% 3/11/2027 163,372 0.01%Intercontinental Exchange, Inc. $150,000 3.10% 15/9/2027 163,254 0.01%Walt Disney Co. $150,000 3.70% 15/9/2024 163,202 0.01%Tyson Foods, Inc. $150,000 3.95% 15/8/2024 163,189 0.01%
667
Vanguard Global Corporate Bond Index Fund
Principal CouponMaturity
DateFair Value
US Dollars ($)% of Total
Net AssetsGATX Corp. $150,000 4.35% 15/2/2024 163,184 0.01%Bank of America Corp. $125,000 4.88% 1/4/2044 163,062 0.01%Pacific Life Insurance Co. $100,000 9.25% 15/6/2039 163,049 0.01%AEP Transmission Co. LLC $150,000 3.10% 1/12/2026 162,967 0.01%American Water Capital Corp. $150,000 3.40% 1/3/2025 162,952 0.01%Florida Power & Light Co. $150,000 3.15% 1/10/2049 162,879 0.01%McDonald's Corp. $150,000 3.38% 26/5/2025 162,854 0.01%Metropolitan Life Global Funding I $150,000 3.00% 19/9/2027 162,659 0.01%Invesco Finance plc $150,000 4.00% 30/1/2024 162,614 0.01%Home Depot, Inc. $150,000 2.80% 14/9/2027 162,575 0.01%CNA Financial Corp. $150,000 3.95% 15/5/2024 162,534 0.01%Keurig Dr Pepper, Inc. $150,000 3.20% 1/5/2030 162,529 0.01%Burlington Northern Santa Fe LLC $150,000 3.40% 1/9/2024 162,309 0.01%MetLife, Inc. $150,000 3.60% 10/4/2024 162,240 0.01%Public Service Co. of Colorado $150,000 3.20% 1/3/2050 162,201 0.01%Block Financial LLC $150,000 3.88% 15/8/2030 162,197 0.01%Marriott International, Inc. $150,000 3.75% 1/10/2025 162,193 0.01%Ventas Realty LP $150,000 3.50% 1/2/2025 162,054 0.01%Target Corp. $100,000 7.00% 15/1/2038 161,862 0.01%State Street Corp. $150,000 3.70% 20/11/2023 161,841 0.01%CVS Health Corp. $150,000 3.00% 15/8/2026 161,755 0.01%Kroger Co. $150,000 4.00% 1/2/2024 161,503 0.01%Essex Portfolio LP $150,000 3.88% 1/5/2024 161,498 0.01%Enterprise Products Operating LLC $150,000 3.90% 15/2/2024 161,464 0.01%Philip Morris International, Inc. $150,000 3.60% 15/11/2023 161,461 0.01%AutoZone, Inc. $150,000 3.25% 15/4/2025 161,421 0.01%Marathon Petroleum Corp. $150,000 3.63% 15/9/2024 161,393 0.01%Schlumberger Holdings Corp. $150,000 3.75% 1/5/2024 161,366 0.01%Target Corp. $150,000 2.50% 15/4/2026 161,328 0.01%Lear Corp. $150,000 3.50% 30/5/2030 161,288 0.01%American Campus Communities Operating Partnership LP $150,000 3.30% 15/7/2026 161,284 0.01%American Honda Finance Corp. $150,000 3.55% 12/1/2024 161,255 0.01%Abbott Laboratories $150,000 2.95% 15/3/2025 161,152 0.01%eBay, Inc. $150,000 3.45% 1/8/2024 161,068 0.01%PacifiCorp $150,000 3.60% 1/4/2024 161,011 0.01%Continental Airlines 2012-1 Class A Pass Through Trust $151,562 4.15% 11/4/2024 160,960 0.01%Zoetis, Inc. $125,000 4.70% 1/2/2043 160,923 0.01%Aon plc $150,000 4.00% 27/11/2023 160,922 0.01%HCA, Inc. $150,000 4.75% 1/5/2023 160,788 0.01%Amphenol Corp. $155,000 2.05% 1/3/2025 160,760 0.01%HP, Inc. $150,000 3.00% 17/6/2027 160,759 0.01%Lowe's Cos, Inc. $150,000 3.13% 15/9/2024 160,668 0.01%State Street Corp. $150,000 2.65% 19/5/2026 160,640 0.01%General Electric Co. $150,000 3.45% 15/5/2024 160,617 0.01%Fiserv, Inc. $150,000 3.80% 1/10/2023 160,531 0.01%Procter & Gamble Co.1 $150,000 2.45% 3/11/2026 160,522 0.01%Dominion Energy South Carolina, Inc. $125,000 4.60% 15/6/2043 160,461 0.01%Amcor Flexibles North America, Inc. $150,000 3.10% 15/9/2026 160,458 0.01%PepsiCo, Inc. $150,000 2.75% 30/4/2025 160,419 0.01%Pfizer, Inc. $125,000 4.40% 15/5/2044 160,321 0.01%Walgreens Boots Alliance, Inc. $150,000 3.20% 15/4/2030 160,063 0.01%Penske Truck Leasing Co. LP/PTL Finance Corp. $150,000 4.13% 1/8/2023 160,033 0.01%Roper Technologies, Inc. $150,000 3.65% 15/9/2023 159,951 0.01%Berkshire Hathaway Finance Corp. £100,000 2.63% 19/6/2059 159,923 0.01%Honeywell International, Inc. $150,000 2.50% 1/11/2026 159,846 0.01%PepsiCo, Inc. $150,000 2.38% 6/10/2026 159,771 0.01%Consumers Energy Co. $125,000 4.35% 15/4/2049 159,756 0.01%CMS Energy Corp. $125,000 4.88% 1/3/2044 159,748 0.01%CSX Corp. $150,000 2.60% 1/11/2026 159,736 0.01%Ralph Lauren Corp. $150,000 2.95% 15/6/2030 159,590 0.01%Regeneron Pharmaceuticals, Inc. $175,000 2.80% 15/9/2050 159,529 0.01%Memorial Sloan-Kettering Cancer Center $125,000 4.20% 1/7/2055 159,489 0.01%Western & Southern Life Insurance Co. $150,000 3.75% 28/4/2061 159,450 0.01%MetLife, Inc. £100,000 5.38% 9/12/2024 159,431 0.01%KLA Corp. $150,000 3.30% 1/3/2050 159,373 0.01%Sutter Health $150,000 3.36% 15/8/2050 159,362 0.01%New York Life Global Funding $150,000 2.88% 10/4/2024 159,221 0.01%Lowe's Cos, Inc. $150,000 2.50% 15/4/2026 159,206 0.01%Crown Castle International Corp. $150,000 3.10% 15/11/2029 159,200 0.01%Kroger Co. $150,000 3.85% 1/8/2023 159,187 0.01%Southern Co. Gas Capital Corp. $135,000 4.40% 30/5/2047 159,021 0.01%

668
Vanguard Global Corporate Bond Index Fund
Principal CouponMaturity
DateFair Value
US Dollars ($)% of Total
Net AssetsHershey Co. $151,000 2.45% 15/11/2029 158,986 0.01%Amphenol Corp. $150,000 2.80% 15/2/2030 158,756 0.01%Union Pacific Corp. $150,000 3.50% 8/6/2023 158,735 0.01%Commonwealth Edison Co. $150,000 3.20% 15/11/2049 158,669 0.01%Oglethorpe Power Corp. $150,000 3.75% 1/8/2050 158,598 0.01%Union Pacific Corp. $150,000 3.20% 20/5/2041 158,589 0.01%Kentucky Utilities Co. $150,000 3.30% 1/6/2050 158,467 0.01%Plains All American Pipeline LP/PAA Finance Corp. $150,000 3.55% 15/12/2029 158,201 0.01%Citigroup, Inc. $150,000 3.50% 15/5/2023 158,107 0.01%DTE Electric Co. $150,000 2.63% 1/3/2031 158,082 0.01%Laboratory Corp. of America Holdings $150,000 2.95% 1/12/2029 157,969 0.01%Equinix, Inc. $150,000 2.63% 18/11/2024 157,911 0.01%Cleveland Electric Illuminating Co. $150,000 3.50% 1/4/2028 157,893 0.01%Ares Capital Corp. $150,000 3.25% 15/7/2025 157,830 0.01%Aon Corp. $150,000 2.80% 15/5/2030 157,806 0.01%Vulcan Materials Co. $140,000 3.90% 1/4/2027 157,760 0.01%Tapestry, Inc. $145,000 4.25% 1/4/2025 157,707 0.01%Keurig Dr Pepper, Inc. $150,000 3.35% 15/3/2051 157,671 0.01%SSM Health Care Corp. $150,000 3.69% 1/6/2023 157,654 0.01%Boeing Co. $150,000 3.90% 1/5/2049 157,648 0.01%Crown Castle International Corp. $150,000 3.15% 15/7/2023 157,595 0.01%Thermo Fisher Scientific, Inc. $150,000 2.60% 1/10/2029 157,543 0.01%Verizon Communications, Inc. CA($)200,000 3.63% 16/5/2050 157,445 0.01%Vulcan Materials Co. $125,000 4.70% 1/3/2048 157,439 0.01%CVS Health Corp. $150,000 4.75% 1/12/2022 157,372 0.01%PPL Capital Funding, Inc. $150,000 3.40% 1/6/2023 157,198 0.01%Adobe, Inc. $150,000 2.15% 1/2/2027 157,123 0.01%Kimco Realty Corp. $150,000 2.70% 1/3/2024 156,930 0.01%Exxon Mobil Corp. $150,000 2.44% 16/8/2029 156,922 0.01%Moody's Corp. $150,000 3.25% 20/5/2050 156,904 0.01%Deere & Co. $150,000 2.88% 7/9/2049 156,893 0.01%Ryder System, Inc. $150,000 3.40% 1/3/2023 156,811 0.01%Wells Fargo & Co. £100,000 3.50% 12/9/2029 156,684 0.01%Boston Properties LP $150,000 3.85% 1/2/2023 156,646 0.01%DH Europe Finance II Sarl $150,000 2.20% 15/11/2024 156,628 0.01%Bacardi Ltd. $150,000 2.75% 15/7/2026 156,552 0.01%Anthem, Inc. $150,000 3.30% 15/1/2023 156,504 0.01%Lam Research Corp. $150,000 3.13% 15/6/2060 156,411 0.01%Chevron USA, Inc. $115,000 5.25% 15/11/2043 156,357 0.01%Lowe's Cos, Inc. $125,000 4.55% 5/4/2049 156,331 0.01%Prologis LP $150,000 2.13% 15/4/2027 156,327 0.01%CenterPoint Energy Resources Corp. $135,000 4.10% 1/9/2047 156,196 0.01%Global Payments, Inc. $150,000 2.90% 15/5/2030 156,181 0.01%Analog Devices, Inc. $150,000 2.88% 1/6/2023 156,114 0.01%Truist Bank $150,000 3.00% 2/2/2023 156,040 0.01%Gilead Sciences, Inc. $150,000 2.50% 1/9/2023 156,034 0.01%Leidos, Inc. $150,000 2.95% 15/5/2023 155,952 0.01%General Electric Co. $150,000 3.10% 9/1/2023 155,934 0.01%Aetna, Inc. $107,000 6.63% 15/6/2036 155,897 0.01%Puget Energy, Inc. $150,000 5.63% 15/7/2022 155,861 0.01%PPG Industries, Inc. $150,000 2.55% 15/6/2030 155,798 0.01%LYB International Finance BV $125,000 4.88% 15/3/2044 155,753 0.01%Penn Mutual Life Insurance Co. $150,000 3.80% 29/4/2061 155,547 0.01%Valero Energy Corp. $150,000 2.70% 15/4/2023 155,539 0.01%Parker-Hannifin Corp. $150,000 3.50% 15/9/2022 155,515 0.01%Mylan, Inc. $125,000 5.40% 29/11/2043 155,398 0.01%WW Grainger, Inc. $150,000 1.85% 15/2/2025 155,297 0.01%Carlyle Finance LLC $115,000 5.65% 15/9/2048 155,231 0.01%Florida Power & Light Co. $150,000 2.75% 1/6/2023 155,220 0.01%Interpublic Group of Cos, Inc. $150,000 3.38% 1/3/2041 155,133 0.01%Duke Energy Corp. $150,000 3.50% 15/6/2051 155,086 0.01%Boeing Co. $150,000 2.80% 1/3/2023 155,066 0.01%McDonald's Corp. $125,000 4.70% 9/12/2035 154,962 0.01%AbbVie, Inc. $150,000 3.20% 6/11/2022 154,884 0.01%NIKE, Inc. $150,000 2.25% 1/5/2023 154,625 0.01%UnitedHealth Group, Inc. $150,000 3.13% 15/5/2060 154,603 0.01%McDonald's Corp. £100,000 2.95% 15/3/2034 154,392 0.01%United Airlines 2020-1 Class B Pass Through Trust $145,575 4.88% 15/1/2026 154,386 0.01%Franklin Resources, Inc. $150,000 2.80% 15/9/2022 154,368 0.01%Hewlett Packard Enterprise Co. $150,000 2.25% 1/4/2023 154,332 0.01%Connecticut Light & Power Co. $150,000 2.50% 15/1/2023 154,047 0.01%

669
Vanguard Global Corporate Bond Index Fund
Principal CouponMaturity
DateFair Value
US Dollars ($)% of Total
Net AssetsRPM International, Inc. $140,000 4.25% 15/1/2048 154,018 0.01%JB Hunt Transport Services, Inc. $150,000 3.30% 15/8/2022 153,997 0.01%International Flavors & Fragrances, Inc. $150,000 3.27% 15/11/2040 153,975 0.01%General Mills, Inc. $150,000 2.60% 12/10/2022 153,901 0.01%Pricoa Global Funding I $150,000 2.45% 21/9/2022 153,877 0.01%Alabama Power Co. $150,000 3.13% 15/7/2051 153,850 0.01%Protective Life Global Funding $150,000 2.62% 22/8/2022 153,815 0.01%PSEG Power LLC $100,000 8.63% 15/4/2031 153,800 0.01%Deere & Co. $125,000 3.90% 9/6/2042 153,701 0.01%Berkshire Hathaway Finance Corp. $150,000 3.00% 15/5/2022 153,542 0.01%Southern Power Co. $125,000 5.25% 15/7/2043 153,366 0.01%John Deere Capital Corp. $150,000 2.15% 8/9/2022 153,343 0.01%Charter Communications Operating LLC/Charter Communications
Operating Capital $125,000 5.38% 1/5/2047 153,278 0.01%Union Pacific Corp. $150,000 2.38% 20/5/2031 153,253 0.01%Truist Bank $150,000 2.45% 1/8/2022 153,243 0.01%Massachusetts Institute of Technology $125,000 3.89% 1/7/2116 153,231 0.01%Berkshire Hathaway Energy Co. $125,000 4.50% 1/2/2045 153,111 0.01%Apple, Inc. $150,000 2.10% 12/9/2022 153,101 0.01%Exxon Mobil Corp. $150,000 1.90% 16/8/2022 152,793 0.01%UnitedHealth Group, Inc. $125,000 4.20% 15/1/2047 152,773 0.01%Amgen, Inc. $140,000 3.20% 2/11/2027 152,757 0.01%Valero Energy Corp. $140,000 3.65% 15/3/2025 152,575 0.01%Newmont Corp. $120,000 4.88% 15/3/2042 152,459 0.01%Walt Disney Co. $150,000 1.65% 1/9/2022 152,346 0.01%Kentucky Utilities Co. $125,000 4.38% 1/10/2045 152,331 0.01%American International Group, Inc. $125,000 4.38% 30/6/2050 152,224 0.01%Mastercard, Inc. $125,000 3.95% 26/2/2048 152,123 0.01%Duke Energy Corp. $150,000 2.55% 15/6/2031 152,097 0.01%Arizona Public Service Co. $125,000 4.35% 15/11/2045 151,970 0.01%UnitedHealth Group, Inc. $150,000 2.88% 15/12/2021 151,845 0.01%Baltimore Gas & Electric Co. $150,000 2.25% 15/6/2031 151,787 0.01%Masco Corp. $125,000 4.50% 15/5/2047 151,672 0.01%Aon Corp. $105,000 6.25% 30/9/2040 151,468 0.01%Connecticut Light & Power Co. $125,000 4.00% 1/4/2048 151,321 0.01%McKesson Corp. £100,000 3.13% 17/2/2029 151,262 0.01%Southern Power Co. $150,000 2.50% 15/12/2021 151,226 0.01%American Honda Finance Corp. $150,000 1.20% 8/7/2025 151,202 0.01%Prudential Financial, Inc. $100,000 6.63% 21/6/2040 151,119 0.01%PPL Capital Funding, Inc. $115,000 5.00% 15/3/2044 151,054 0.01%Costco Wholesale Corp. $150,000 1.38% 20/6/2027 151,030 0.01%Kinder Morgan Energy Partners LP $110,000 6.50% 1/2/2037 151,010 0.01%High Street Funding Trust II $125,000 4.68% 15/2/2048 150,964 0.01%Omega Healthcare Investors, Inc. $138,000 4.50% 15/1/2025 150,907 0.01%Athene Holding Ltd. $135,000 4.13% 12/1/2028 150,876 0.01%Equinix, Inc. $150,000 1.45% 15/5/2026 150,726 0.01%Stryker Corp. $150,000 2.90% 15/6/2050 150,680 0.01%Plains All American Pipeline LP/PAA Finance Corp. $150,000 4.30% 31/1/2043 150,623 0.01%F&G Global Funding $150,000 1.75% 30/6/2026 150,584 0.01%CommonSpirit Health $143,000 2.76% 1/10/2024 150,525 0.01%Wisconsin Electric Power Co. $150,000 1.70% 15/6/2028 150,500 0.01%WEC Energy Group, Inc. $150,000 0.80% 15/3/2024 150,388 0.01%Amdocs Ltd. $150,000 2.54% 15/6/2030 150,352 0.01%Prospect Capital Corp. $150,000 3.36% 15/11/2026 150,307 0.01%Johnson & Johnson $125,000 3.75% 3/3/2047 150,262 0.01%S&P Global, Inc. $175,000 2.30% 15/8/2060 150,262 0.01%MetLife, Inc. $100,000 9.25% 8/4/2038 150,196 0.01%Protective Life Global Funding $150,000 0.50% 12/4/2023 150,148 0.01%Intel Corp. $125,000 4.10% 11/5/2047 149,962 0.01%John Deere Capital Corp. $150,000 0.25% 17/1/2023 149,930 0.01%Estee Lauder Cos, Inc. $150,000 1.95% 15/3/2031 149,912 0.01%Commonwealth Edison Co. $125,000 4.00% 1/3/2048 149,837 0.01%American Tower Corp. $140,000 3.38% 15/5/2024 149,791 0.01%AT&T, Inc. €100,000 3.55% 17/12/2032 149,776 0.01%Unum Group $120,000 5.75% 15/8/2042 149,745 0.01%Toyota Motor Credit Corp. $150,000 1.13% 18/6/2026 149,556 0.01%Metropolitan Life Global Funding I $150,000 0.55% 7/6/2024 149,518 0.01%Pfizer, Inc. $150,000 1.70% 28/5/2030 149,197 0.01%Protective Life Global Funding $150,000 0.47% 12/1/2024 149,115 0.01%Sutter Health $125,000 4.09% 15/8/2048 148,987 0.01%American International Group, Inc. £100,000 5.00% 26/4/2023 148,867 0.01%

670
Vanguard Global Corporate Bond Index Fund
Principal CouponMaturity
DateFair Value
US Dollars ($)% of Total
Net AssetsComcast Corp. $110,000 5.65% 15/6/2035 148,841 0.01%Duke Energy Corp. $150,000 0.90% 15/9/2025 148,518 0.01%Sysco Canada, Inc. CA($)172,000 3.65% 25/4/2025 148,471 0.01%Public Service Electric & Gas Co. $125,000 3.85% 1/5/2049 148,325 0.01%BorgWarner, Inc. $137,000 3.38% 15/3/2025 148,186 0.01%Simon Property Group LP $150,000 2.20% 1/2/2031 148,172 0.01%ONE Gas, Inc. $150,000 2.00% 15/5/2030 148,100 0.01%Wells Fargo & Co. CA($)170,000 3.87% 21/5/2025 148,095 0.01%Archer-Daniels-Midland Co. $125,000 3.75% 15/9/2047 148,094 0.01%L3Harris Technologies, Inc. $135,000 3.83% 27/4/2025 148,055 0.01%Johns Hopkins Health System Corp. $125,000 3.84% 15/5/2046 147,971 0.01%Zoetis, Inc. $125,000 3.95% 12/9/2047 147,969 0.01%Zimmer Biomet Holdings, Inc. $125,000 4.45% 15/8/2045 147,967 0.01%Walt Disney Co. $100,000 6.15% 15/2/2041 147,921 0.01%Cantor Fitzgerald LP $135,000 4.88% 1/5/2024 147,905 0.01%Northwell Healthcare, Inc. $125,000 4.26% 1/11/2047 147,838 0.01%Belrose Funding Trust $150,000 2.33% 15/8/2030 147,668 0.01%Kinder Morgan Energy Partners LP $100,000 7.50% 15/11/2040 147,652 0.01%Guardian Life Insurance Co. of America $115,000 4.88% 19/6/2064 147,626 0.01%Owl Rock Capital Corp. $135,000 5.25% 15/4/2024 147,573 0.01%New York & Presbyterian Hospital $125,000 3.95% 1/8/2119 147,450 0.01%Enbridge Energy Partners LP $100,000 7.50% 15/4/2038 147,213 0.01%Evergy Kansas Central, Inc. $125,000 4.13% 1/3/2042 147,153 0.01%Prologis LP £100,000 2.25% 30/6/2029 147,140 0.01%Duke Energy Indiana LLC $100,000 6.45% 1/4/2039 147,105 0.01%Boeing Co. $105,000 6.88% 15/3/2039 147,099 0.01%Public Service Electric & Gas Co. $125,000 3.80% 1/3/2046 147,019 0.01%Raytheon Technologies Corp. $125,000 4.05% 4/5/2047 146,916 0.01%Electronic Arts, Inc. $150,000 2.95% 15/2/2051 146,854 0.01%Southwestern Electric Power Co. $105,000 6.20% 15/3/2040 146,812 0.01%Thermo Fisher Scientific, Inc. €100,000 2.88% 24/7/2037 146,748 0.01%CSX Corp. $100,000 6.22% 30/4/2040 146,690 0.01%Bank of America Corp.^ $150,000 2.83% 24/10/2051 146,618 0.01%National Rural Utilities Cooperative Finance Corp. $125,000 4.02% 1/11/2032 146,594 0.01%Atmos Energy Corp. $125,000 4.15% 15/1/2043 146,367 0.01%Chevron USA, Inc. $100,000 6.00% 1/3/2041 146,264 0.01%Nestle Holdings, Inc. $150,000 1.00% 15/9/2027 146,211 0.01%CommonSpirit Health $125,000 4.35% 1/11/2042 146,084 0.01%Procter & Gamble Co. £100,000 1.80% 3/5/2029 146,041 0.01%Rockefeller Foundation $150,000 2.49% 1/10/2050 145,914 0.01%CubeSmart LP $150,000 2.00% 15/2/2031 145,828 0.01%Alphabet, Inc. $150,000 0.80% 15/8/2027 145,689 0.01%QUALCOMM, Inc. $137,000 2.90% 20/5/2024 145,571 0.01%Yale University $150,000 2.40% 15/4/2050 145,536 0.01%Trustees of Princeton University $100,000 5.70% 1/3/2039 145,516 0.01%Ferguson Finance plc $125,000 4.50% 24/10/2028 145,438 0.01%Assured Guaranty US Holdings, Inc. $130,000 5.00% 1/7/2024 145,433 0.01%Molson Coors International LP CA($)170,000 3.44% 15/7/2026 145,381 0.01%United Parcel Service, Inc. $115,000 4.25% 15/3/2049 145,331 0.01%Xcel Energy, Inc. $100,000 6.50% 1/7/2036 145,331 0.01%Home Depot, Inc. $125,000 3.90% 6/12/2028 145,286 0.01%PepsiCo, Inc. CA($)175,000 2.15% 6/5/2024 145,284 0.01%Prudential Financial, Inc. $125,000 3.91% 7/12/2047 145,217 0.01%KeyCorp $140,000 2.25% 6/4/2027 145,211 0.01%Citigroup, Inc. £100,000 2.75% 24/1/2024 144,927 0.01%PepsiCo, Inc. $125,000 3.60% 13/8/2042 144,757 0.01%Burlington Northern Santa Fe LLC $100,000 6.15% 1/5/2037 144,463 0.01%MetLife, Inc. $100,000 5.88% 6/2/2041 144,278 0.01%American International Group, Inc. $125,000 4.25% 15/3/2029 144,273 0.01%Gilead Sciences, Inc. $150,000 2.80% 1/10/2050 144,099 0.01%Hudson Pacific Properties LP $125,000 4.65% 1/4/2029 144,011 0.01%Linde, Inc. $125,000 3.55% 7/11/2042 144,009 0.01%Kentucky Utilities Co. $110,000 5.13% 1/11/2040 143,910 0.01%Global Payments, Inc. $125,000 4.15% 15/8/2049 143,856 0.01%Starbucks Corp. $125,000 4.00% 15/11/2028 143,854 0.01%Estee Lauder Cos, Inc. $100,000 6.00% 15/5/2037 143,848 0.01%DXC Technology Co. £100,000 2.75% 15/1/2025 143,755 0.01%L3Harris Technologies, Inc. $100,000 6.15% 15/12/2040 143,718 0.01%Aetna, Inc. $120,000 4.50% 15/5/2042 143,675 0.01%General Motors Financial Co., Inc. £100,000 2.35% 3/9/2025 143,670 0.01%Eversource Energy $150,000 1.65% 15/8/2030 143,550 0.01%
671
Vanguard Global Corporate Bond Index Fund
Principal CouponMaturity
DateFair Value
US Dollars ($)% of Total
Net AssetsLas Vegas Sands Corp. $135,000 3.50% 18/8/2026 143,516 0.01%Comcast Corp. $125,000 3.90% 1/3/2038 143,344 0.01%Dollar General Corp. $125,000 4.13% 1/5/2028 143,239 0.01%MetLife, Inc. $100,000 6.38% 15/6/2034 143,093 0.01%Healthcare Trust of America Holdings LP $130,000 3.50% 1/8/2026 142,833 0.01%Southern Power Co. €111,000 1.85% 20/6/2026 142,697 0.01%Weyerhaeuser Co. $125,000 4.00% 15/11/2029 142,670 0.01%NiSource, Inc. $115,000 4.80% 15/2/2044 142,604 0.01%Alabama Power Co. $125,000 3.75% 1/3/2045 142,559 0.01%Procter & Gamble Co. £100,000 1.38% 3/5/2025 142,534 0.01%Duke Realty LP $125,000 4.00% 15/9/2028 142,474 0.01%Devon Energy Corp. $100,000 7.95% 15/4/2032 142,397 0.01%Mid-America Apartments LP $150,000 1.70% 15/2/2031 142,371 0.01%Honeywell International, Inc. $140,000 1.95% 1/6/2030 142,241 0.01%Xcel Energy, Inc. $125,000 4.00% 15/6/2028 142,225 0.01%PepsiCo, Inc. £100,000 2.50% 1/11/2022 142,170 0.01%Trustees of the University of Pennsylvania $125,000 3.61% 15/2/2119 142,104 0.01%Duke Energy Carolinas LLC $100,000 6.05% 15/4/2038 142,101 0.01%Mid-America Apartments LP $125,000 3.95% 15/3/2029 141,950 0.01%Johnson Controls International plc $132,000 3.63% 2/7/2024 141,831 0.01%Northwell Healthcare, Inc. $125,000 3.98% 1/11/2046 141,826 0.01%Emerson Electric Co. $131,000 3.15% 1/6/2025 141,785 0.01%Goldman Sachs Group, Inc. $100,000 6.45% 1/5/2036 141,757 0.01%Burlington Northern Santa Fe LLC $100,000 5.75% 1/5/2040 141,753 0.01%California Institute of Technology $100,000 4.70% 1/11/2111 141,692 0.01%Regions Bank/Birmingham AL $100,000 6.45% 26/6/2037 141,559 0.01%NYU Langone Hospitals $100,000 5.75% 1/7/2043 141,399 0.01%Nationwide Mutual Insurance Co. $100,000 8.25% 1/12/2031 141,278 0.01%FMR LLC $100,000 7.57% 15/6/2029 141,243 0.01%CSX Corp. $100,000 6.15% 1/5/2037 141,177 0.01%American Tower Corp. $125,000 4.40% 15/2/2026 141,157 0.01%Kinder Morgan Energy Partners LP $100,000 7.30% 15/8/2033 141,155 0.01%Ross Stores, Inc. $125,000 4.60% 15/4/2025 141,096 0.01%Procter & Gamble Co. €100,000 1.88% 30/10/2038 140,968 0.01%Becton Dickinson Euro Finance Sarl €120,000 1.21% 12/2/2036 140,934 0.01%CSX Corp. $125,000 3.80% 1/3/2028 140,922 0.01%ERAC USA Finance LLC $136,000 3.30% 15/10/2022 140,835 0.01%EOG Resources, Inc. $125,000 4.15% 15/1/2026 140,755 0.01%John Deere Canada Funding, Inc. CA($)170,000 2.63% 21/9/2022 140,656 0.01%Aetna, Inc. $130,000 3.50% 15/11/2024 140,640 0.01%Phillips 66 $125,000 3.90% 15/3/2028 140,615 0.01%Mastercard, Inc. $125,000 3.50% 26/2/2028 140,599 0.01%Oklahoma Gas & Electric Co. $125,000 3.80% 15/8/2028 140,484 0.01%Walt Disney Co. $125,000 3.70% 23/3/2027 140,404 0.01%Lincoln National Corp. $100,000 6.30% 9/10/2037 140,366 0.01%Principal Life Global Funding II $130,000 3.00% 18/4/2026 140,341 0.01%Bank of America Corp.^ CA($)170,000 2.60% 4/4/2029 140,279 0.01%Puget Energy, Inc. $125,000 4.10% 15/6/2030 140,198 0.01%Massachusetts Electric Co. $125,000 4.00% 15/8/2046 140,166 0.01%Consumers Energy Co. $130,000 3.25% 15/8/2046 140,137 0.01%3M Co. $125,000 3.38% 1/3/2029 140,044 0.01%LyondellBasell Industries NV $125,000 5.75% 15/4/2024 140,018 0.01%Lincoln National Corp. $125,000 3.80% 1/3/2028 139,990 0.01%John Deere Cash Management SA €100,000 2.20% 2/4/2032 139,931 0.01%Legg Mason, Inc. $100,000 5.63% 15/1/2044 139,906 0.01%AutoZone, Inc. $125,000 3.75% 1/6/2027 139,766 0.01%AT&T, Inc. $100,000 5.70% 1/3/2057 139,722 0.01%Crown Castle International Corp. $130,000 3.30% 1/7/2030 139,630 0.01%Morgan Stanley^ $125,000 3.62% 1/4/2031 139,617 0.01%JPMorgan Chase & Co. €100,000 2.88% 24/5/2028 139,585 0.01%3M Co. $100,000 5.70% 15/3/2037 139,525 0.01%Duke Energy Florida LLC $100,000 5.65% 1/4/2040 139,505 0.01%Puget Sound Energy, Inc. $100,000 5.80% 15/3/2040 139,184 0.01%Virginia Electric & Power Co. $100,000 6.00% 15/5/2037 139,125 0.01%Medtronic Global Holdings SCA €100,000 2.25% 7/3/2039 139,057 0.01%Texas Eastern Transmission LP $100,000 7.00% 15/7/2032 138,801 0.01%Dow Chemical Co. $100,000 7.38% 1/11/2029 138,797 0.01%Prologis LP $135,000 3.00% 15/4/2050 138,745 0.01%Kilroy Realty LP $125,000 4.38% 1/10/2025 138,678 0.01%Virginia Electric & Power Co. $100,000 6.00% 15/1/2036 138,650 0.01%WPC Eurobond BV €108,000 2.13% 15/4/2027 138,611 0.01%

672
Vanguard Global Corporate Bond Index Fund
Principal CouponMaturity
DateFair Value
US Dollars ($)% of Total
Net AssetsBank of New York Mellon Corp. $125,000 3.30% 23/8/2029 138,568 0.01%Voya Financial, Inc. $125,000 3.65% 15/6/2026 138,522 0.01%Kimberly-Clark Corp. $125,000 3.20% 25/4/2029 138,457 0.01%Invesco Finance plc $125,000 3.75% 15/1/2026 138,441 0.01%CMS Energy Corp. $125,000 3.45% 15/8/2027 138,349 0.01%Discovery Communications LLC $100,000 6.35% 1/6/2040 138,307 0.01%General Motors Financial Co., Inc. $125,000 4.35% 9/4/2025 138,225 0.01%Caterpillar, Inc. $100,000 5.20% 27/5/2041 138,215 0.01%Citigroup, Inc. $100,000 6.13% 25/8/2036 138,210 0.01%Progress Energy, Inc. $100,000 7.00% 30/10/2031 138,128 0.01%Advocate Health & Hospitals Corp. $125,000 3.39% 15/10/2049 137,949 0.01%Simon Property Group LP $128,000 3.38% 1/10/2024 137,795 0.01%McCormick & Co., Inc. $125,000 3.40% 15/8/2027 137,753 0.01%Waste Connections, Inc. $125,000 3.50% 1/5/2029 137,700 0.01%Prudential Financial, Inc. $100,000 5.70% 14/12/2036 137,664 0.01%Sysco Corp. $125,000 3.75% 1/10/2025 137,513 0.01%DH Europe Finance II Sarl $125,000 3.40% 15/11/2049 137,500 0.01%Procter & Gamble Co. $113,000 3.60% 25/3/2050 137,432 0.01%Burlington Northern Santa Fe LLC $100,000 5.40% 1/6/2041 137,396 0.01%Eli Lilly & Co. €100,000 2.13% 3/6/2030 137,389 0.01%DXC Technology Co. $125,000 4.13% 15/4/2025 137,369 0.01%Mohawk Industries, Inc. $125,000 3.63% 15/5/2030 137,280 0.01%Jackson National Life Global Funding $125,000 3.88% 11/6/2025 137,256 0.01%TD Ameritrade Holding Corp. $125,000 3.30% 1/4/2027 137,216 0.01%Illinois Tool Works, Inc. €100,000 2.13% 22/5/2030 137,150 0.01%JM Smucker Co. $125,000 3.38% 15/12/2027 137,100 0.01%Public Service Electric & Gas Co. $100,000 5.50% 1/3/2040 137,097 0.01%PacifiCorp $100,000 5.75% 1/4/2037 137,040 0.01%McDonald's Corp. CA($)160,000 3.13% 4/3/2025 137,037 0.01%Home Depot, Inc. $125,000 3.35% 15/9/2025 136,918 0.01%McDonald's Corp. $100,000 5.70% 1/2/2039 136,861 0.01%ViacomCBS, Inc. $125,000 3.38% 15/2/2028 136,813 0.01%LifeStorage LP $125,000 3.50% 1/7/2026 136,791 0.01%KeySpan Gas East Corp. $100,000 5.82% 1/4/2041 136,695 0.01%DR Horton, Inc. $125,000 5.75% 15/8/2023 136,629 0.01%3M Co. $125,000 3.25% 26/8/2049 136,589 0.01%MidAmerican Energy Co. $125,000 3.10% 1/5/2027 136,563 0.01%AEP Texas, Inc. $125,000 3.80% 1/10/2047 136,546 0.01%CSX Corp. $150,000 2.50% 15/5/2051 136,517 0.01%Loews Corp. $115,000 4.13% 15/5/2043 136,371 0.01%ERP Operating LP $125,000 3.25% 1/8/2027 136,359 0.01%Wisconsin Electric Power Co. $100,000 5.70% 1/12/2036 136,357 0.01%Aetna, Inc. $110,000 4.75% 15/3/2044 136,329 0.01%Sherwin-Williams Co. $110,000 4.55% 1/8/2045 136,255 0.01%Kimberly-Clark Corp. $125,000 3.20% 30/7/2046 136,254 0.01%XLIT Ltd. $100,000 5.50% 31/3/2045 136,245 0.01%American International Group, Inc. $125,000 4.13% 15/2/2024 136,102 0.01%Memorial Sloan-Kettering Cancer Center $100,000 5.00% 1/7/2042 136,072 0.01%Plains All American Pipeline LP/PAA Finance Corp. $125,000 4.90% 15/2/2045 135,976 0.01%Vistra Operations Co. LLC $125,000 4.30% 15/7/2029 135,924 0.01%AT&T, Inc. €100,000 2.60% 19/5/2038 135,886 0.01%Whirlpool Corp. $125,000 4.00% 1/3/2024 135,840 0.01%Duquesne Light Holdings, Inc. $125,000 3.62% 1/8/2027 135,805 0.01%TWDC Enterprises 18 Corp. $125,000 3.00% 13/2/2026 135,765 0.01%Owens Corning $125,000 3.40% 15/8/2026 135,589 0.01%CSX Corp. $100,000 5.50% 15/4/2041 135,545 0.01%Penske Truck Leasing Co. LP/PTL Finance Corp. $125,000 3.40% 15/11/2026 135,526 0.01%Welltower, Inc. $125,000 4.50% 15/1/2024 135,465 0.01%3M Co. $125,000 3.00% 7/8/2025 135,440 0.01%Textron, Inc. $125,000 3.38% 1/3/2028 135,432 0.01%Appalachian Power Co. $125,000 3.30% 1/6/2027 135,422 0.01%Evergy Kansas Central, Inc. $125,000 3.10% 1/4/2027 135,419 0.01%L3Harris Technologies, Inc. $125,000 3.95% 28/5/2024 135,381 0.01%Packaging Corp. of America $125,000 3.65% 15/9/2024 135,291 0.01%Prologis LP €100,000 3.00% 2/6/2026 135,257 0.01%John Deere Cash Management SA €100,000 1.65% 13/6/2039 135,235 0.01%Public Service Electric & Gas Co. $125,000 3.00% 15/5/2027 135,218 0.01%Trans-Allegheny Interstate Line Co. $125,000 3.85% 1/6/2025 135,197 0.01%Northern Natural Gas Co. $115,000 4.30% 15/1/2049 135,184 0.01%American Water Capital Corp. $125,000 3.45% 1/5/2050 135,169 0.01%Dominion Energy, Inc. $100,000 5.95% 15/6/2035 135,126 0.01%

673
Vanguard Global Corporate Bond Index Fund
Principal CouponMaturity
DateFair Value
US Dollars ($)% of Total
Net AssetsJPMorgan Chase & Co. $100,000 8.00% 29/4/2027 135,016 0.01%PayPal Holdings, Inc. $125,000 2.85% 1/10/2029 134,982 0.01%JPMorgan Chase & Co. €100,000 3.00% 19/2/2026 134,897 0.01%Bristol-Myers Squibb Co. €100,000 1.75% 15/5/2035 134,891 0.01%Citigroup, Inc.^ €100,000 4.25% 25/2/2030 134,881 0.01%Stanley Black & Decker, Inc. $100,000 4.85% 15/11/2048 134,818 0.01%Chubb INA Holdings, Inc. $125,000 3.35% 15/5/2024 134,779 0.01%University of Chicago $110,000 4.00% 1/10/2053 134,701 0.01%Kimco Realty Corp. $125,000 3.30% 1/2/2025 134,694 0.01%Caterpillar Financial Services Corp. $125,000 3.65% 7/12/2023 134,686 0.01%ONEOK Partners LP $100,000 6.65% 1/10/2036 134,642 0.01%Procter & Gamble Co. $113,000 3.50% 25/10/2047 134,525 0.01%Pharmacia LLC $100,000 6.60% 1/12/2028 134,484 0.01%ERP Operating LP $125,000 3.00% 1/7/2029 134,465 0.01%Eversource Energy $125,000 3.80% 1/12/2023 134,194 0.01%Colgate-Palmolive Co. $125,000 3.25% 15/3/2024 134,186 0.01%DTE Electric Co. $125,000 3.65% 15/3/2024 134,183 0.01%Sempra Energy $125,000 4.05% 1/12/2023 134,086 0.01%Magellan Midstream Partners LP $120,000 4.20% 3/10/2047 134,083 0.01%Discovery Communications LLC $125,000 3.80% 13/3/2024 134,019 0.01%KKR Group Finance Co. II LLC $100,000 5.50% 1/2/2043 133,849 0.01%DENTSPLY SIRONA, Inc. $125,000 3.25% 1/6/2030 133,777 0.01%Virginia Electric & Power Co. $125,000 3.10% 15/5/2025 133,769 0.01%Johnson & Johnson $100,000 4.85% 15/5/2041 133,563 0.01%Comcast Corp. $125,000 3.40% 15/7/2046 133,556 0.01%FMC Corp. $110,000 4.50% 1/10/2049 133,522 0.01%Intel Corp. $100,000 4.90% 29/7/2045 133,516 0.01%Entergy Mississippi LLC $125,000 2.85% 1/6/2028 133,510 0.00%Eversource Energy $125,000 3.15% 15/1/2025 133,496 0.00%Entergy Louisiana LLC $125,000 4.05% 1/9/2023 133,379 0.00%Toyota Motor Credit Corp. $125,000 3.45% 20/9/2023 133,365 0.00%Regions Financial Corp. $125,000 3.80% 14/8/2023 133,299 0.00%Welltower, Inc. $125,000 3.10% 15/1/2030 133,214 0.00%Southern California Edison Co. $100,000 6.05% 15/3/2039 133,208 0.00%Air Lease Corp. $125,000 3.25% 1/3/2025 133,195 0.00%Voya Financial, Inc. $105,000 4.80% 15/6/2046 132,927 0.00%Guardian Life Global Funding $125,000 2.90% 6/5/2024 132,879 0.00%Packaging Corp. of America $125,000 3.00% 15/12/2029 132,860 0.00%Intel Corp. $130,000 3.10% 15/2/2060 132,805 0.00%DTE Energy Co. $125,000 3.70% 1/8/2023 132,777 0.00%Old Republic International Corp. $125,000 3.85% 11/6/2051 132,773 0.00%KeyCorp $115,000 4.10% 30/4/2028 132,739 0.00%Duke Energy Progress LLC $125,000 3.38% 1/9/2023 132,651 0.00%American Water Capital Corp. $125,000 2.80% 1/5/2030 132,505 0.00%Abbott Laboratories $100,000 4.75% 15/4/2043 132,416 0.00%Liberty Mutual Group, Inc. €100,000 2.75% 4/5/2026 132,381 0.00%Xilinx, Inc. $125,000 2.95% 1/6/2024 132,310 0.00%Prudential Financial, Inc. $100,000 5.75% 15/7/2033 132,153 0.00%Energy Transfer LP $100,000 6.63% 15/10/2036 132,151 0.00%Williams Cos, Inc. $100,000 5.80% 15/11/2043 132,061 0.00%American Honda Finance Corp. $125,000 2.35% 8/1/2027 132,045 0.00%US Treasury Note $130,000 1.63% 15/5/2031 132,031 0.00%Mass General Brigham, Inc. $125,000 3.19% 1/7/2049 131,924 0.00%John Deere Cash Management SA €100,000 1.85% 2/4/2028 131,906 0.00%American University $115,000 3.67% 1/4/2049 131,903 0.00%Stryker Corp. €100,000 2.13% 30/11/2027 131,853 0.00%AT&T, Inc. $100,000 5.55% 15/8/2041 131,835 0.00%John Deere Capital Corp. $125,000 2.60% 7/3/2024 131,811 0.00%Verizon Communications, Inc. £100,000 1.88% 3/11/2038 131,741 0.00%Boston Gas Co. $125,000 3.00% 1/8/2029 131,639 0.00%US Bancorp $125,000 2.40% 30/7/2024 131,603 0.00%Allied World Assurance Co. Holdings Ltd. $120,000 4.35% 29/10/2025 131,563 0.00%Liberty Mutual Group, Inc. $123,000 4.25% 15/6/2023 131,557 0.00%General Dynamics Corp. $120,000 3.50% 15/5/2025 131,523 0.00%Wisconsin Electric Power Co. $100,000 5.63% 15/5/2033 131,389 0.00%Kroger Co. $100,000 5.40% 15/7/2040 131,382 0.00%Boeing Co. $125,000 3.20% 1/3/2029 131,292 0.00%Host Hotels & Resorts LP $125,000 3.50% 15/9/2030 131,188 0.00%Aon Corp. $100,000 8.21% 1/1/2027 131,161 0.00%Pine Street Trust II $100,000 5.57% 15/2/2049 131,144 0.00%Ingredion, Inc. $125,000 2.90% 1/6/2030 131,018 0.00%

674
Vanguard Global Corporate Bond Index Fund
Principal CouponMaturity
DateFair Value
US Dollars ($)% of Total
Net AssetsMidwest Connector Capital Co. LLC $125,000 3.90% 1/4/2024 131,007 0.00%University of Southern California $125,000 2.95% 1/10/2051 130,809 0.00%American Water Capital Corp. $125,000 3.25% 1/6/2051 130,794 0.00%McDonald's Corp. €100,000 1.88% 26/5/2027 130,771 0.00%Medtronic Global Holdings SCA €100,000 1.63% 7/3/2031 130,728 0.00%MPLX LP $125,000 3.38% 15/3/2023 130,660 0.00%Mastercard, Inc. $125,000 2.00% 3/3/2025 130,656 0.00%Motorola Solutions, Inc. $100,000 5.50% 1/9/2044 130,610 0.00%JPMorgan Chase & Co. $100,000 7.63% 15/10/2026 130,564 0.00%Target Corp. $125,000 2.35% 15/2/2030 130,501 0.00%US Bank NA $125,000 2.05% 21/1/2025 130,467 0.00%International Business Machines Corp. $100,000 4.70% 19/2/2046 130,437 0.00%Colgate-Palmolive Co. €100,000 1.38% 6/3/2034 130,407 0.00%AT&T, Inc. CA($)140,000 5.10% 25/11/2048 130,385 0.00%Arch Capital Finance LLC $100,000 5.03% 15/12/2046 130,347 0.00%Goldman Sachs Group, Inc. €100,000 2.00% 22/3/2028 130,305 0.00%Ventas Realty LP $125,000 3.13% 15/6/2023 130,291 0.00%NiSource, Inc. $100,000 5.25% 15/2/2043 130,282 0.00%Dow Chemical Co. $100,000 5.25% 15/11/2041 130,281 0.00%Burlington Northern Santa Fe LLC $100,000 4.70% 1/9/2045 130,196 0.00%American Equity Investment Life Holding Co. $115,000 5.00% 15/6/2027 130,127 0.00%Citigroup, Inc. €100,000 2.13% 10/9/2026 130,079 0.00%Kilroy Realty LP $125,000 3.80% 15/1/2023 130,038 0.00%Merck & Co., Inc. €100,000 1.88% 15/10/2026 130,013 0.00%Zoetis, Inc. $125,000 3.25% 1/2/2023 129,820 0.00%Tennessee Gas Pipeline Co. LLC $100,000 7.00% 15/10/2028 129,812 0.00%DH Europe Finance Sarl €100,000 2.50% 8/7/2025 129,731 0.00%Kohl's Corp. $125,000 3.38% 1/5/2031 129,490 0.00%Wachovia Corp. $100,000 5.50% 1/8/2035 129,327 0.00%Mars, Inc. $110,000 3.88% 1/4/2039 129,316 0.00%Oracle Corp. $125,000 2.63% 15/2/2023 129,261 0.00%Humana, Inc. $100,000 4.95% 1/10/2044 129,181 0.00%Walgreens Boots Alliance, Inc. €100,000 2.13% 20/11/2026 129,170 0.00%WW Grainger, Inc. $100,000 4.60% 15/6/2045 129,144 0.00%Mount Sinai Hospitals Group, Inc. $125,000 3.39% 1/7/2050 129,121 0.00%Penske Truck Leasing Co. LP/PTL Finance Corp. $125,000 2.70% 14/3/2023 129,086 0.00%General Motors Financial Co., Inc. $125,000 3.55% 8/7/2022 128,965 0.00%Thermo Fisher Scientific, Inc. €100,000 1.75% 15/4/2027 128,949 0.00%ONEOK Partners LP $100,000 6.13% 1/2/2041 128,923 0.00%Aon plc $100,000 4.75% 15/5/2045 128,906 0.00%Nasdaq, Inc. €100,000 1.75% 28/3/2029 128,880 0.00%International Business Machines Corp. €100,000 1.50% 23/5/2029 128,825 0.00%Northrop Grumman Corp. $100,000 4.75% 1/6/2043 128,769 0.00%WPC Eurobond BV €100,000 2.25% 9/4/2026 128,718 0.00%General Dynamics Corp. $125,000 1.88% 15/8/2023 128,679 0.00%Hess Corp. $95,000 7.13% 15/3/2033 128,636 0.00%NetApp, Inc. $125,000 1.88% 22/6/2025 128,607 0.00%General Motors Financial Co., Inc. €108,000 0.20% 2/9/2022 128,595 0.00%Alexandria Real Estate Equities, Inc. $100,000 4.85% 15/4/2049 128,586 0.00%Booking Holdings, Inc. €100,000 1.80% 3/3/2027 128,554 0.00%Celanese US Holdings LLC €100,000 2.13% 1/3/2027 128,535 0.00%Eastman Chemical Co. $125,000 3.60% 15/8/2022 128,448 0.00%Schlumberger Finance Canada Ltd. $125,000 2.65% 20/11/2022 128,427 0.00%Bristol-Myers Squibb Co. $100,000 4.50% 1/3/2044 128,420 0.00%International Paper Co. $90,000 6.00% 15/11/2041 128,336 0.00%Kinder Morgan Energy Partners LP $100,000 5.80% 15/3/2035 128,236 0.00%Goldman Sachs Group, Inc.^ CA($)150,000 3.31% 31/10/2025 128,233 0.00%Eastman Chemical Co. €100,000 1.88% 23/11/2026 128,198 0.00%Kinder Morgan Energy Partners LP $100,000 5.63% 1/9/2041 128,013 0.00%Expedia Group, Inc. $110,000 6.25% 1/5/2025 127,962 0.00%Verizon Communications, Inc. €100,000 1.85% 18/5/2040 127,808 0.00%Duke Energy Carolinas LLC $100,000 6.00% 1/12/2028 127,800 0.00%Emory University $125,000 2.14% 1/9/2030 127,759 0.00%Jackson National Life Global Funding $125,000 2.50% 27/6/2022 127,678 0.00%International Flavors & Fragrances, Inc. €100,000 1.80% 25/9/2026 127,657 0.00%First Republic Bank $100,000 4.63% 13/2/2047 127,650 0.00%Bank of America Corp.^ €100,000 1.78% 4/5/2027 127,625 0.00%Texas Eastern Transmission LP $125,000 2.80% 15/10/2022 127,585 0.00%Merck & Co., Inc. $125,000 2.40% 15/9/2022 127,576 0.00%Omnicom Finance Holdings plc €100,000 1.40% 8/7/2031 127,405 0.00%Fiserv, Inc. €100,000 1.63% 1/7/2030 127,351 0.00%

675
Vanguard Global Corporate Bond Index Fund
Principal CouponMaturity
DateFair Value
US Dollars ($)% of Total
Net AssetsJPMorgan Chase & Co. €100,000 1.50% 29/10/2026 127,323 0.00%Abbott Ireland Financing DAC €100,000 1.50% 27/9/2026 127,307 0.00%Bank of America Corp. €100,000 2.38% 19/6/2024 127,282 0.00%McKesson Corp €100,000 1.63% 30/10/2026 127,212 0.00%ManpowerGroup, Inc. €100,000 1.75% 22/6/2026 127,138 0.00%United Parcel Service, Inc. €100,000 1.63% 15/11/2025 127,074 0.00%Health Care Service Corp. A Mutual Legal Reserve Co. $125,000 1.50% 1/6/2025 127,047 0.00%Transcontinental Gas Pipe Line Co. LLC $100,000 7.85% 1/2/2026 127,046 0.00%University of Southern California $125,000 2.81% 1/10/2050 127,019 0.00%KKR Group Finance Co. V LLC €100,000 1.63% 22/5/2029 127,007 0.00%Mohawk Capital Finance SA €100,000 1.75% 12/6/2027 126,935 0.00%Walmart, Inc. $100,000 4.30% 22/4/2044 126,912 0.00%Digital Euro Finco LLC €100,000 2.63% 15/4/2024 126,886 0.00%Dow Chemical Co. €100,000 1.88% 15/3/2040 126,857 0.00%National Rural Utilities Cooperative Finance Corp. $100,000 4.40% 1/11/2048 126,795 0.00%CSX Corp. $100,000 4.50% 1/8/2054 126,772 0.00%SVB Financial Group $125,000 2.10% 15/5/2028 126,758 0.00%Prudential Financial, Inc.^ $120,000 5.88% 15/9/2042 126,679 0.00%Viatris, Inc. $125,000 1.65% 22/6/2025 126,652 0.00%Eastman Chemical Co. $125,000 3.50% 1/12/2021 126,640 0.00%Principal Financial Group, Inc. $90,000 6.05% 15/10/2036 126,629 0.00%Devon Energy Corp. $115,000 4.50% 15/1/2030 126,534 0.00%Commonwealth Edison Co. $100,000 4.60% 15/8/2043 126,450 0.00%Nissan Motor Acceptance Corp. $125,000 2.75% 9/3/2028 126,298 0.00%Upjohn Finance BV €100,000 1.91% 23/6/2032 126,223 0.00%WPC Eurobond BV €100,000 2.25% 19/7/2024 126,165 0.00%Prologis LP $100,000 4.38% 15/9/2048 126,120 0.00%Emerson Electric Co. $125,000 2.63% 1/12/2021 125,990 0.00%George Washington University $100,000 4.30% 15/9/2044 125,989 0.00%Allstate Corp. $100,000 4.50% 15/6/2043 125,953 0.00%Kinder Morgan Energy Partners LP $100,000 5.50% 1/3/2044 125,778 0.00%Oglethorpe Power Corp. $100,000 5.05% 1/10/2048 125,738 0.00%Colgate-Palmolive Co. $100,000 4.00% 15/8/2045 125,715 0.00%Stryker Corp. $125,000 1.15% 15/6/2025 125,693 0.00%MidAmerican Energy Co. $116,000 3.50% 15/10/2024 125,663 0.00%William Marsh Rice University $100,000 3.77% 15/5/2055 125,642 0.00%McKesson Corp. €100,000 1.50% 17/11/2025 125,589 0.00%Health Care Service Corp. A Mutual Legal Reserve Co. $125,000 2.20% 1/6/2030 125,484 0.00%Southern California Edison Co. $125,000 3.65% 1/6/2051 125,435 0.00%Owl Rock Capital Corp. $125,000 2.63% 15/1/2027 125,370 0.00%Union Electric Co. $125,000 2.15% 15/3/2032 125,325 0.00%General Motors Financial Co., Inc. €100,000 2.20% 1/4/2024 125,297 0.00%Brighthouse Financial Global Funding $125,000 1.00% 12/4/2024 125,230 0.00%Southern California Edison Co. $100,000 5.50% 15/3/2040 125,222 0.00%Capital One Financial Corp. $125,000 4.75% 15/7/2021 125,203 0.00%Roper Technologies, Inc. $125,000 0.45% 15/8/2022 125,074 0.00%McKesson Corp. $100,000 4.88% 15/3/2044 125,021 0.00%Kinder Morgan Energy Partners LP $100,000 5.40% 1/9/2044 124,983 0.00%ERP Operating LP $100,000 4.50% 1/6/2045 124,943 0.00%Southern California Gas Co. $100,000 4.30% 15/1/2049 124,888 0.00%New York & Presbyterian Hospital $100,000 4.06% 1/8/2056 124,846 0.00%Sysco Corp. $100,000 4.85% 1/10/2045 124,770 0.00%John Deere Capital Corp. $125,000 1.05% 17/6/2026 124,705 0.00%Altria Group, Inc. €100,000 1.70% 15/6/2025 124,692 0.00%Baxter International, Inc. €100,000 1.30% 30/5/2025 124,681 0.00%Southern California Edison Co. $120,000 2.85% 1/8/2029 124,603 0.00%FedEx Corp. €100,000 1.30% 5/8/2031 124,532 0.00%Oncor Electric Delivery Co. LLC $110,000 3.70% 15/11/2028 124,468 0.00%Medtronic Global Holdings SCA €100,000 1.50% 2/7/2039 124,434 0.00%IHC Health Services, Inc. $100,000 4.13% 15/5/2048 124,426 0.00%Florida Power & Light Co. $100,000 4.13% 1/6/2048 124,381 0.00%CNH Industrial Capital LLC $125,000 1.45% 15/7/2026 124,329 0.00%Monongahela Power Co. $95,000 5.40% 15/12/2043 124,306 0.00%Johnson Controls International plc $100,000 4.63% 2/7/2044 124,248 0.00%Commonwealth Edison Co. $100,000 4.35% 15/11/2045 124,206 0.00%Progress Energy, Inc. $90,000 6.00% 1/12/2039 124,151 0.00%Philip Morris International, Inc. €100,000 1.88% 6/11/2037 123,940 0.00%Cargill, Inc. €100,000 2.50% 15/2/2023 123,885 0.00%Enterprise Products Operating LLC $125,000 3.20% 15/2/2052 123,852 0.00%Energy Transfer LP $110,000 4.75% 15/1/2026 123,831 0.00%Schlumberger Finance France SAS €100,000 1.00% 18/2/2026 123,777 0.00%

676
Vanguard Global Corporate Bond Index Fund
Principal CouponMaturity
DateFair Value
US Dollars ($)% of Total
Net AssetsVerizon Communications, Inc. AU($)150,000 4.05% 17/2/2025 123,687 0.00%Unum Group $110,000 4.00% 15/6/2029 123,644 0.00%Bacardi Ltd. $100,000 5.15% 15/5/2038 123,594 0.00%Entergy Corp. $125,000 0.90% 15/9/2025 123,509 0.00%Duke Energy Ohio, Inc. $100,000 4.30% 1/2/2049 123,457 0.00%McDonald's Corp. €100,000 0.90% 15/6/2026 123,450 0.00%National Rural Utilities Cooperative Finance Corp. $110,000 3.70% 15/3/2029 123,357 0.00%Dover Corp. $95,000 5.38% 1/3/2041 123,293 0.00%Blackstone Holdings Finance Co. LLC €100,000 1.00% 5/10/2026 123,290 0.00%Apple, Inc. €100,000 0.88% 24/5/2025 123,239 0.00%International Business Machines Corp. €100,000 0.95% 23/5/2025 123,230 0.00%American Homes 4 Rent LP $125,000 2.38% 15/7/2031 123,141 0.00%Morgan Stanley €100,000 1.88% 30/3/2023 123,011 0.00%UnitedHealth Group, Inc. $100,000 4.25% 15/4/2047 122,971 0.00%Baltimore Gas & Electric Co. $100,000 4.25% 15/9/2048 122,900 0.00%Kellogg Co. $117,000 2.65% 1/12/2023 122,844 0.00%MUFG Union Bank NA $120,000 2.10% 9/12/2022 122,820 0.00%Eastman Chemical Co. $100,000 4.80% 1/9/2042 122,739 0.00%International Business Machines Corp. €100,000 0.88% 31/1/2025 122,736 0.00%American Water Capital Corp. $100,000 4.30% 1/12/2042 122,701 0.00%AbbVie, Inc. €100,000 1.25% 1/6/2024 122,687 0.00%Walmart, Inc. $85,000 5.63% 1/4/2040 122,474 0.00%Stryker Corp. €100,000 1.00% 3/12/2031 122,456 0.00%First Republic Bank $100,000 4.38% 1/8/2046 122,424 0.00%Stryker Corp. €100,000 1.13% 30/11/2023 122,424 0.00%Citigroup, Inc.^ $110,000 3.89% 10/1/2028 122,399 0.00%Amphenol Technologies Holding GmbH €100,000 0.75% 4/5/2026 122,353 0.00%Kellogg Co. €100,000 1.00% 17/5/2024 122,298 0.00%Merck & Co., Inc. $100,000 4.00% 7/3/2049 122,291 0.00%PepsiCo, Inc. $100,000 4.00% 2/5/2047 121,991 0.00%Procter & Gamble Co. €100,000 0.63% 30/10/2024 121,973 0.00%Johnson Controls International plc $92,000 5.13% 14/9/2045 121,844 0.00%Kinder Morgan Energy Partners LP $111,000 4.25% 1/9/2024 121,843 0.00%Ecolab, Inc. €100,000 1.00% 15/1/2024 121,701 0.00%Eaton Capital Unlimited Co. €100,000 0.75% 20/9/2024 121,690 0.00%Brixmor Operating Partnership LP $112,000 3.85% 1/2/2025 121,674 0.00%Idaho Power Co. $100,000 4.20% 1/3/2048 121,630 0.00%Thermo Fisher Scientific, Inc. €100,000 0.75% 12/9/2024 121,630 0.00%Kimberly-Clark Corp. €100,000 0.63% 7/9/2024 121,585 0.00%University of Southern California $100,000 3.84% 1/10/2047 121,556 0.00%3M Co. €100,000 0.95% 15/5/2023 121,515 0.00%AT&T, Inc. €100,000 1.80% 14/9/2039 121,511 0.00%AXIS Specialty Finance LLC^ $115,000 4.90% 15/1/2040 121,494 0.00%Nationwide Mutual Insurance Co. $85,000 7.88% 1/4/2033 121,494 0.00%BayCare Health System, Inc. $100,000 3.83% 15/11/2050 121,423 0.00%Trane Technologies Global Holding Co., Ltd. $84,000 5.75% 15/6/2043 121,399 0.00%Vulcan Materials Co. $100,000 4.50% 15/6/2047 121,273 0.00%S&P Global, Inc. $109,000 4.00% 15/6/2025 121,244 0.00%Philip Morris International, Inc. $125,000 1.75% 1/11/2030 121,165 0.00%Cox Communications, Inc. $100,000 4.80% 1/2/2035 121,086 0.00%Air Products & Chemicals, Inc. €100,000 0.80% 5/5/2032 120,956 0.00%Tyco Electronics Group SA €100,000 1.10% 1/3/2023 120,956 0.00%PPL Electric Utilities Corp. $100,000 4.15% 1/10/2045 120,893 0.00%Citigroup, Inc. €100,000 0.75% 26/10/2023 120,882 0.00%Evergy Metro, Inc. $100,000 4.13% 1/4/2049 120,688 0.00%Humana, Inc. $100,000 4.88% 1/4/2030 120,679 0.00%FedEx Corp. €100,000 0.45% 5/8/2025 120,630 0.00%Mastercard, Inc. €100,000 1.10% 1/12/2022 120,615 0.00%Becton Dickinson & Co. €100,000 1.00% 15/12/2022 120,526 0.00%American Water Capital Corp. $100,000 4.30% 1/9/2045 120,496 0.00%Johnson Controls International plc/Tyco Fire & Security Finance SCA $125,000 1.75% 15/9/2030 120,471 0.00%Wells Fargo & Co. €100,000 0.50% 26/4/2024 120,464 0.00%CSX Corp. $100,000 4.40% 1/3/2043 120,456 0.00%Intel Corp.1 $100,000 4.00% 15/12/2032 120,443 0.00%BlackRock, Inc. $115,000 2.40% 30/4/2030 120,402 0.00%Berkshire Hathaway, Inc. €100,000 0.75% 16/3/2023 120,390 0.00%PepsiCo, Inc. €100,000 0.25% 6/5/2024 120,370 0.00%Massachusetts Institute of Technology $100,000 3.96% 1/7/2038 120,326 0.00%Honeywell International, Inc. €100,000 0.75% 10/3/2032 120,316 0.00%Apple, Inc. €100,000 0.50% 15/11/2031 120,308 0.00%Dignity Health $100,000 4.50% 1/11/2042 120,244 0.00%
677
Vanguard Global Corporate Bond Index Fund
Principal CouponMaturity
DateFair Value
US Dollars ($)% of Total
Net AssetsAmerican Honda Finance Corp. €100,000 0.55% 17/3/2023 120,232 0.00%Euronet Worldwide, Inc. €100,000 1.38% 22/5/2026 120,223 0.00%DTE Energy Co. $110,000 3.40% 15/6/2029 120,219 0.00%Indiana University Health, Inc. Obligated Group $100,000 3.97% 1/11/2048 120,177 0.00%Medtronic Global Holdings SCA €100,000 0.38% 7/3/2023 119,972 0.00%Nationwide Mutual Insurance Co. $100,000 4.95% 22/4/2044 119,901 0.00%Prologis Euro Finance LLC €100,000 0.38% 6/2/2028 119,548 0.00%International Paper Co. $95,000 5.00% 15/9/2035 119,540 0.00%New York State Electric & Gas Corp. $115,000 3.30% 15/9/2049 119,518 0.00%Colgate-Palmolive Co. €100,000 0.88% 12/11/2039 119,505 0.00%PPL Electric Utilities Corp. $100,000 4.13% 15/6/2044 119,479 0.00%Lincoln National Corp. $100,000 4.35% 1/3/2048 119,477 0.00%CenterPoint Energy Houston Electric LLC $100,000 3.95% 1/3/2048 119,369 0.00%Corning, Inc. $100,000 4.70% 15/3/2037 119,268 0.00%Mastercard, Inc. $100,000 3.80% 21/11/2046 119,201 0.00%Avery Dennison Corp. $100,000 4.88% 6/12/2028 119,192 0.00%Pfizer, Inc. $100,000 3.90% 15/3/2039 119,184 0.00%PECO Energy Co. $100,000 3.90% 1/3/2048 119,160 0.00%Simon Property Group LP $115,000 2.00% 13/9/2024 119,141 0.00%Digital Dutch Finco BV €100,000 0.13% 15/10/2022 119,052 0.00%Comcast Corp. €100,000 0.75% 20/2/2032 119,028 0.00%PepsiCo, Inc. €100,000 0.88% 16/10/2039 118,776 0.00%Children's Hospital Corp. $125,000 2.59% 1/2/2050 118,741 0.00%Public Storage €100,000 0.88% 24/1/2032 118,589 0.00%Georgia-Pacific LLC $75,000 8.88% 15/5/2031 118,373 0.00%McDonald's Corp. $95,000 4.45% 1/9/2048 118,354 0.00%TD Ameritrade Holding Corp. $110,000 2.75% 1/10/2029 118,327 0.00%Enbridge Energy Partners LP $100,000 5.88% 15/10/2025 118,150 0.00%Prologis Euro Finance LLC €100,000 1.00% 6/2/2035 118,035 0.00%Level 3 Financing, Inc. $110,000 3.88% 15/11/2029 117,986 0.00%Visa, Inc. $100,000 3.65% 15/9/2047 117,790 0.00%VF Corp. €100,000 0.25% 25/2/2028 117,755 0.00%PacifiCorp $100,000 4.10% 1/2/2042 117,691 0.00%Prologis Euro Finance LLC €100,000 0.63% 10/9/2031 117,609 0.00%Florida Power & Light Co. $100,000 3.70% 1/12/2047 117,605 0.00%Burlington Northern Santa Fe LLC $100,000 3.90% 1/8/2046 117,422 0.00%Caterpillar, Inc. $110,000 2.60% 19/9/2029 117,410 0.00%Discover Bank $100,000 4.65% 13/9/2028 117,330 0.00%Mayo Clinic $100,000 3.77% 15/11/2043 117,322 0.00%Church & Dwight Co., Inc. $100,000 3.95% 1/8/2047 117,279 0.00%Trimble, Inc. $100,000 4.90% 15/6/2028 117,251 0.00%MPLX LP $100,000 4.80% 15/2/2029 117,225 0.00%GATX Corp. $100,000 4.70% 1/4/2029 117,204 0.00%Medtronic, Inc. $100,000 4.00% 1/4/2043 117,147 0.00%Travelers Cos, Inc. $100,000 3.75% 15/5/2046 117,118 0.00%CSX Corp. $100,000 4.10% 15/3/2044 117,037 0.00%University of Notre Dame du Lac $100,000 3.39% 15/2/2048 117,012 0.00%Oracle Corp. $100,000 4.50% 8/7/2044 116,815 0.00%Public Service Co. of Colorado $100,000 3.80% 15/6/2047 116,811 0.00%GATX Corp. $100,000 4.55% 7/11/2028 116,754 0.00%Tampa Electric Co. $100,000 4.10% 15/6/2042 116,743 0.00%Welltower, Inc. $110,000 2.70% 15/2/2027 116,716 0.00%Black Hills Corp. $100,000 4.35% 1/5/2033 116,629 0.00%GLP Capital LP/GLP Financing II, Inc. $110,000 3.35% 1/9/2024 116,544 0.00%Union Pacific Corp. $110,000 3.35% 15/8/2046 116,537 0.00%Smithfield Foods, Inc. $100,000 5.20% 1/4/2029 116,405 0.00%Neuberger Berman Group LLC/Neuberger Berman Finance Corp. $100,000 4.88% 15/4/2045 116,203 0.00%Steelcase, Inc. $100,000 5.13% 18/1/2029 116,076 0.00%Flex Ltd. $100,000 4.88% 12/5/2030 116,028 0.00%Energy Transfer LP $100,000 4.95% 15/6/2028 115,963 0.00%Energy Transfer LP $100,000 5.30% 1/4/2044 115,830 0.00%AmerisourceBergen Corp. $100,000 4.25% 1/3/2045 115,744 0.00%Energy Transfer LP $100,000 5.35% 15/5/2045 115,729 0.00%IHS Markit Ltd. $100,000 4.25% 1/5/2029 115,616 0.00%UDR, Inc. $110,000 3.00% 15/8/2031 115,588 0.00%UDR, Inc. $110,000 3.10% 1/11/2034 115,538 0.00%General Motors Financial Co., Inc. $100,000 5.25% 1/3/2026 115,530 0.00%Oncor Electric Delivery Co. LLC $100,000 3.75% 1/4/2045 115,404 0.00%Evergy, Inc. $110,000 2.45% 15/9/2024 115,206 0.00%Commonwealth Edison Co. $100,000 3.80% 1/10/2042 115,112 0.00%PepsiCo, Inc. €100,000 1.05% 9/10/2050 115,104 0.00%

678
Vanguard Global Corporate Bond Index Fund
Principal CouponMaturity
DateFair Value
US Dollars ($)% of Total
Net AssetsRoper Technologies, Inc. $100,000 4.20% 15/9/2028 115,061 0.00%Norfolk Southern Corp. $100,000 3.95% 1/10/2042 115,047 0.00%Southern California Edison Co. $100,000 4.50% 1/9/2040 115,013 0.00%Eaton Corp. $100,000 3.92% 15/9/2047 114,978 0.00%Comerica, Inc. $100,000 4.00% 1/2/2029 114,930 0.00%Sherwin-Williams Co. $100,000 3.80% 15/8/2049 114,860 0.00%Pacific Life Insurance Co.^ $100,000 4.30% 24/10/2067 114,859 0.00%Consolidated Edison Co. of New York, Inc. $100,000 4.00% 1/12/2028 114,713 0.00%Humana, Inc. $100,000 3.95% 15/8/2049 114,709 0.00%Duke Energy Carolinas LLC $100,000 3.95% 15/11/2028 114,689 0.00%Alabama Power Co. $100,000 3.85% 1/12/2042 114,651 0.00%Union Electric Co. $100,000 3.90% 15/9/2042 114,623 0.00%NGPL PipeCo LLC $100,000 4.88% 15/8/2027 114,533 0.00%Huntington Ingalls Industries, Inc. $100,000 4.20% 1/5/2030 114,461 0.00%Cardinal Health, Inc. $100,000 4.50% 15/11/2044 114,446 0.00%Oncor Electric Delivery Co. LLC $83,000 5.30% 1/6/2042 114,323 0.00%Blackstone Holdings Finance Co. LLC $110,000 2.50% 10/1/2030 114,318 0.00%Boston Scientific Corp. $100,000 4.00% 1/3/2028 114,212 0.00%CH Robinson Worldwide, Inc. $100,000 4.20% 15/4/2028 114,178 0.00%UnitedHealth Group, Inc. $75,000 6.63% 15/11/2037 114,164 0.00%Expedia Group, Inc. $100,000 5.00% 15/2/2026 114,115 0.00%Oklahoma Gas & Electric Co. $100,000 3.85% 15/8/2047 114,059 0.00%Texas Instruments, Inc. $95,000 3.88% 15/3/2039 114,055 0.00%Southwest Gas Corp. $100,000 4.15% 1/6/2049 113,965 0.00%Edison International $100,000 5.75% 15/6/2027 113,920 0.00%Northern States Power Co. $100,000 3.60% 15/9/2047 113,875 0.00%Truist Financial Corp. $100,000 3.88% 19/3/2029 113,859 0.00%3M Co. $100,000 3.63% 14/9/2028 113,806 0.00%Verizon Communications, Inc. $100,000 3.88% 8/2/2029 113,776 0.00%Athene Holding Ltd. $90,000 6.15% 3/4/2030 113,670 0.00%Devon Energy Corp. $100,000 4.75% 15/5/2042 113,640 0.00%Berkshire Hathaway Energy Co. $100,000 3.80% 15/7/2048 113,585 0.00%Ventas Realty LP $100,000 4.38% 1/2/2045 113,563 0.00%Leidos, Inc. $100,000 4.38% 15/5/2030 113,458 0.00%Burlington Northern Santa Fe LLC $100,000 3.55% 15/2/2050 113,266 0.00%Pfizer, Inc. $100,000 3.60% 15/9/2028 113,260 0.00%Arch Capital Finance LLC $100,000 4.01% 15/12/2026 113,108 0.00%California Institute of Technology $100,000 3.65% 1/9/2119 113,044 0.00%WRKCo, Inc. $100,000 4.00% 15/3/2028 112,982 0.00%Public Service Co. of Colorado $100,000 3.70% 15/6/2028 112,969 0.00%Diamondback Energy, Inc. $100,000 4.40% 24/3/2051 112,958 0.00%Essex Portfolio LP $100,000 4.00% 1/3/2029 112,947 0.00%Arizona Public Service Co. $100,000 3.75% 15/5/2046 112,911 0.00%American Water Capital Corp. $100,000 3.75% 1/9/2047 112,887 0.00%Trane Technologies Luxembourg Finance SA $100,000 3.80% 21/3/2029 112,885 0.00%Northern Trust Corp. $100,000 3.95% 30/10/2025 112,860 0.00%Kilroy Realty LP $100,000 4.25% 15/8/2029 112,850 0.00%Farmers Insurance Exchange^ $100,000 4.75% 1/11/2057 112,816 0.00%Welltower, Inc. $100,000 4.25% 1/4/2026 112,783 0.00%Marathon Petroleum Corp. $100,000 4.70% 1/5/2025 112,779 0.00%Duke Energy Indiana LLC $100,000 3.75% 15/5/2046 112,658 0.00%Integris Baptist Medical Center, Inc. $100,000 3.88% 15/8/2050 112,592 0.00%Southern California Gas Co. $100,000 3.75% 15/9/2042 112,528 0.00%Consolidated Edison Co. of New York, Inc. $100,000 3.95% 1/3/2043 112,394 0.00%Target Corp. $100,000 3.38% 15/4/2029 112,324 0.00%United Parcel Service, Inc. $100,000 3.40% 15/3/2029 112,322 0.00%Transcontinental Gas Pipe Line Co. LLC $100,000 3.95% 15/5/2050 112,307 0.00%Discovery Communications LLC $100,000 4.13% 15/5/2029 112,299 0.00%Keurig Dr Pepper, Inc. $100,000 4.42% 25/5/2025 112,272 0.00%Ingredion, Inc. $100,000 3.90% 1/6/2050 112,266 0.00%Enterprise Products Operating LLC $90,000 4.95% 15/10/2054 112,249 0.00%Plains All American Pipeline LP/PAA Finance Corp. $100,000 5.15% 1/6/2042 112,164 0.00%XLIT Ltd. $100,000 4.45% 31/3/2025 112,146 0.00%Humana, Inc. $100,000 3.95% 15/3/2027 112,097 0.00%Comcast Corp. $75,000 6.55% 1/7/2039 111,988 0.00%Synchrony Financial $100,000 4.50% 23/7/2025 111,979 0.00%International Flavors & Fragrances, Inc. $95,000 4.38% 1/6/2047 111,911 0.00%Plains All American Pipeline LP/PAA Finance Corp. $100,000 4.65% 15/10/2025 111,893 0.00%Metropolitan Edison Co. $100,000 4.30% 15/1/2029 111,882 0.00%IHS Markit Ltd. $100,000 4.75% 15/2/2025 111,880 0.00%McDonald's Corp. $100,000 3.70% 15/2/2042 111,876 0.00%

679
Vanguard Global Corporate Bond Index Fund
Principal CouponMaturity
DateFair Value
US Dollars ($)% of Total
Net AssetsTextron, Inc. $100,000 3.90% 17/9/2029 111,873 0.00%Estee Lauder Cos, Inc. $107,000 2.00% 1/12/2024 111,848 0.00%Duke Energy Ohio, Inc. $100,000 3.70% 15/6/2046 111,773 0.00%Omega Healthcare Investors, Inc. $100,000 4.50% 1/4/2027 111,756 0.00%Level 3 Financing, Inc. $105,000 3.40% 1/3/2027 111,623 0.00%PVH Corp. $100,000 4.63% 10/7/2025 111,579 0.00%Bristol-Myers Squibb Co. $100,000 3.45% 15/11/2027 111,514 0.00%Devon Energy Corp. $100,000 5.25% 15/9/2024 111,445 0.00%Capital One Financial Corp. $100,000 4.25% 30/4/2025 111,437 0.00%Iowa Health System $100,000 3.67% 15/2/2050 111,298 0.00%Northwell Healthcare, Inc. $100,000 3.81% 1/11/2049 111,224 0.00%Jabil, Inc. $100,000 3.95% 12/1/2028 111,193 0.00%Cameron LNG LLC $100,000 3.70% 15/1/2039 111,102 0.00%Darden Restaurants, Inc. $100,000 3.85% 1/5/2027 111,049 0.00%Florida Gas Transmission Co. LLC $100,000 4.35% 15/7/2025 111,025 0.00%Cox Communications, Inc. $104,000 3.15% 15/8/2024 111,013 0.00%WP Carey, Inc. $100,000 3.85% 15/7/2029 110,958 0.00%Virginia Electric & Power Co. $100,000 3.50% 15/3/2027 110,928 0.00%Crane Co. $100,000 4.20% 15/3/2048 110,916 0.00%National Retail Properties, Inc. $100,000 4.00% 15/11/2025 110,839 0.00%E*TRADE Financial Corp. $100,000 3.80% 24/8/2027 110,782 0.00%United Parcel Service, Inc. $100,000 3.05% 15/11/2027 110,773 0.00%Duke Energy Florida LLC $75,000 6.40% 15/6/2038 110,706 0.00%Energy Transfer LP $100,000 4.20% 15/4/2027 110,651 0.00%Jersey Central Power & Light Co. $100,000 4.30% 15/1/2026 110,628 0.00%PacifiCorp $75,000 7.70% 15/11/2031 110,605 0.00%Charter Communications Operating LLC/Charter Communications
Operating Capital $75,000 6.83% 23/10/2055 110,594 0.00%ERP Operating LP $100,000 3.50% 1/3/2028 110,569 0.00%Philip Morris International, Inc. $100,000 3.38% 15/8/2029 110,538 0.00%GATX Corp. $100,000 3.85% 30/3/2027 110,470 0.00%General Motors Financial Co., Inc. $100,000 4.00% 6/10/2026 110,462 0.00%TC PipeLines LP $100,000 3.90% 25/5/2027 110,430 0.00%Southern Co. $100,000 3.70% 30/4/2030 110,388 0.00%Capital One Financial Corp. $100,000 3.75% 28/7/2026 110,313 0.00%Thermo Fisher Scientific, Inc. $100,000 3.65% 15/12/2025 110,222 0.00%Markel Corp. $85,000 5.00% 20/5/2049 110,184 0.00%General Motors Financial Co., Inc. $100,000 3.85% 5/1/2028 110,153 0.00%Martin Marietta Materials, Inc. $100,000 3.50% 15/12/2027 110,143 0.00%Kellogg Co. $100,000 3.40% 15/11/2027 110,097 0.00%Activision Blizzard, Inc. $100,000 3.40% 15/9/2026 110,087 0.00%Potomac Electric Power Co. $75,000 6.50% 15/11/2037 110,051 0.00%Bon Secours Mercy Health, Inc. $100,000 3.46% 1/6/2030 110,037 0.00%Union Pacific Corp. $100,000 3.75% 5/2/2070 109,997 0.00%Marriott International, Inc. $100,000 4.00% 15/4/2028 109,955 0.00%Hartford Financial Services Group, Inc. $100,000 3.60% 19/8/2049 109,950 0.00%Berkshire Hathaway Energy Co. $100,000 3.25% 15/4/2028 109,893 0.00%Abbott Laboratories $75,000 6.00% 1/4/2039 109,863 0.00%AvalonBay Communities, Inc. $100,000 3.35% 15/5/2027 109,837 0.00%Moody's Corp. $100,000 4.88% 15/2/2024 109,791 0.00%Stifel Financial Corp. $100,000 4.25% 18/7/2024 109,724 0.00%AvalonBay Communities, Inc. $100,000 3.50% 15/11/2025 109,608 0.00%Hasbro, Inc. $100,000 3.55% 19/11/2026 109,597 0.00%Phillips 66 Partners LP $100,000 3.75% 1/3/2028 109,533 0.00%Expedia Group, Inc. $100,000 4.50% 15/8/2024 109,530 0.00%FedEx Corp. $100,000 3.25% 1/4/2026 109,494 0.00%Owens Corning $100,000 4.20% 1/12/2024 109,452 0.00%Entergy Louisiana LLC $100,000 3.25% 1/4/2028 109,451 0.00%Waste Management, Inc. $100,000 3.15% 15/11/2027 109,433 0.00%Norfolk Southern Corp. $100,000 4.10% 15/5/2121 109,427 0.00%PNC Financial Services Group, Inc. $100,000 3.15% 19/5/2027 109,427 0.00%TD Ameritrade Holding Corp. $100,000 3.63% 1/4/2025 109,352 0.00%Tapestry, Inc. $100,000 4.13% 15/7/2027 109,344 0.00%Martin Marietta Materials, Inc. $100,000 3.45% 1/6/2027 109,287 0.00%Wyeth LLC $75,000 6.50% 1/2/2034 109,239 0.00%RenaissanceRe Finance, Inc. $100,000 3.45% 1/7/2027 109,231 0.00%WRKCo, Inc. $100,000 3.38% 15/9/2027 109,149 0.00%Huntington Ingalls Industries, Inc. $100,000 3.84% 1/5/2025 109,143 0.00%Time Warner Cable LLC $75,000 7.30% 1/7/2038 109,135 0.00%Martin Marietta Materials, Inc. $100,000 4.25% 2/7/2024 109,134 0.00%Kansas City Southern $95,000 4.30% 15/5/2043 109,056 0.00%
680
Vanguard Global Corporate Bond Index Fund
Principal CouponMaturity
DateFair Value
US Dollars ($)% of Total
Net AssetsNorfolk Southern Corp. $95,000 3.94% 1/11/2047 109,043 0.00%American Campus Communities Operating Partnership LP $100,000 3.63% 15/11/2027 109,040 0.00%Bank of America Corp. $100,000 4.00% 1/4/2024 109,030 0.00%Comcast Corp. $75,000 6.45% 15/3/2037 108,988 0.00%Marathon Oil Corp. $100,000 3.85% 1/6/2025 108,924 0.00%US Bancorp $100,000 3.10% 27/4/2026 108,878 0.00%Omega Healthcare Investors, Inc. $100,000 4.95% 1/4/2024 108,839 0.00%Eaton Corp. $100,000 3.10% 15/9/2027 108,802 0.00%TWDC Enterprises 18 Corp. $100,000 3.15% 17/9/2025 108,769 0.00%Dell International LLC/EMC Corp. $100,000 4.00% 15/7/2024 108,704 0.00%National Rural Utilities Cooperative Finance Corp. $100,000 3.25% 1/11/2025 108,676 0.00%UPMC $100,000 3.60% 3/4/2025 108,666 0.00%Southern California Gas Co. $105,000 2.55% 1/2/2030 108,643 0.00%Leidos, Inc. $100,000 3.63% 15/5/2025 108,603 0.00%Comcast Corp. $100,000 3.38% 15/2/2025 108,520 0.00%Union Pacific Corp. $100,000 3.25% 15/8/2025 108,504 0.00%PerkinElmer, Inc. $100,000 3.63% 15/3/2051 108,474 0.00%Fifth Third Bancorp $100,000 4.30% 16/1/2024 108,453 0.00%Cottage Health Obligated Group $100,000 3.30% 1/11/2049 108,396 0.00%Aflac, Inc. $100,000 3.25% 17/3/2025 108,326 0.00%Adobe, Inc. $100,000 3.25% 1/2/2025 108,314 0.00%Realty Income Corp. $100,000 3.88% 15/7/2024 108,306 0.00%ITC Holdings Corp. $100,000 3.25% 30/6/2026 108,283 0.00%National Retail Properties, Inc. $100,000 3.50% 15/10/2027 108,270 0.00%DXC Technology Co. $100,000 4.25% 15/4/2024 108,243 0.00%SVB Financial Group $100,000 3.50% 29/1/2025 108,225 0.00%DTE Electric Co. $100,000 3.25% 1/4/2051 108,191 0.00%Potomac Electric Power Co. $90,000 4.15% 15/3/2043 108,189 0.00%Capital One Financial Corp. $100,000 3.75% 24/4/2024 108,154 0.00%Wisconsin Power & Light Co. $100,000 3.00% 1/7/2029 108,143 0.00%Visa, Inc. $100,000 2.75% 15/9/2027 108,130 0.00%Atmos Energy Corp. $100,000 3.00% 15/6/2027 108,125 0.00%John Deere Capital Corp. $100,000 3.35% 12/6/2024 108,074 0.00%Realty Income Corp. $100,000 3.00% 15/1/2027 108,019 0.00%American Water Capital Corp. $100,000 2.95% 1/9/2027 108,008 0.00%Baptist Healthcare System Obligated Group $100,000 3.54% 15/8/2050 107,993 0.00%Burlington Northern Santa Fe LLC $100,000 3.75% 1/4/2024 107,967 0.00%Thermo Fisher Scientific, Inc. $100,000 2.95% 19/9/2026 107,967 0.00%Procter & Gamble Co.1 $100,000 2.70% 2/2/2026 107,960 0.00%Spectra Energy Partners LP $100,000 3.50% 15/3/2025 107,924 0.00%Carlisle Cos, Inc. $100,000 3.50% 1/12/2024 107,881 0.00%GLP Capital LP/GLP Financing II, Inc. $100,000 4.00% 15/1/2031 107,846 0.00%JM Smucker Co. $100,000 3.55% 15/3/2050 107,846 0.00%Phillips 66 Partners LP $100,000 3.61% 15/2/2025 107,842 0.00%Mastercard, Inc. $100,000 3.38% 1/4/2024 107,833 0.00%Federal Realty Investment Trust $100,000 3.25% 15/7/2027 107,826 0.00%Burlington Northern Santa Fe LLC $100,000 3.00% 1/4/2025 107,784 0.00%AvalonBay Communities, Inc. $100,000 2.95% 11/5/2026 107,771 0.00%Brixmor Operating Partnership LP $100,000 3.65% 15/6/2024 107,764 0.00%State Street Corp.^ $100,000 3.78% 3/12/2024 107,755 0.00%GLP Capital LP/GLP Financing II, Inc. $100,000 4.00% 15/1/2030 107,747 0.00%Ameren Illinois Co. $100,000 3.25% 15/3/2050 107,710 0.00%Fortune Brands Home & Security, Inc. $100,000 3.25% 15/9/2029 107,706 0.00%John Deere Capital Corp. $100,000 2.65% 10/6/2026 107,699 0.00%Humana, Inc. $100,000 3.13% 15/8/2029 107,676 0.00%Anthem, Inc. $100,000 3.50% 15/8/2024 107,668 0.00%Magellan Midstream Partners LP $100,000 3.25% 1/6/2030 107,646 0.00%Aflac, Inc. $100,000 2.88% 15/10/2026 107,586 0.00%Transcontinental Gas Pipe Line Co. LLC $95,000 4.00% 15/3/2028 107,580 0.00%Willis North America, Inc. $100,000 3.60% 15/5/2024 107,541 0.00%CVS Health Corp. $100,000 3.38% 12/8/2024 107,506 0.00%Southwestern Public Service Co. $100,000 3.40% 15/8/2046 107,470 0.00%McDonald's Corp. $100,000 3.25% 10/6/2024 107,419 0.00%John Deere Capital Corp. $100,000 3.45% 10/1/2024 107,398 0.00%AmerisourceBergen Corp. $100,000 3.25% 1/3/2025 107,386 0.00%University of Southern California $70,000 5.25% 1/10/2111 107,381 0.00%HollyFrontier Corp. $100,000 4.50% 1/10/2030 107,372 0.00%ITC Holdings Corp. $100,000 3.65% 15/6/2024 107,358 0.00%Lowe's Cos, Inc. $100,000 3.50% 1/4/2051 107,332 0.00%Entergy Arkansas LLC $100,000 3.35% 15/6/2052 107,308 0.00%

681
Vanguard Global Corporate Bond Index Fund
Principal CouponMaturity
DateFair Value
US Dollars ($)% of Total
Net AssetsBrown University in Providence in the State of Rhode Island &
Providence Plant $100,000 2.92% 1/9/2050 107,306 0.00%Hubbell, Inc. $100,000 3.15% 15/8/2027 107,302 0.00%Alabama Power Co. $100,000 3.55% 1/12/2023 107,272 0.00%Penske Truck Leasing Co. LP/PTL Finance Corp. $100,000 3.45% 1/7/2024 107,262 0.00%University of Southern California $100,000 3.03% 1/10/2039 107,203 0.00%American Tower Corp. $100,000 3.13% 15/1/2027 107,133 0.00%Owens Corning $75,000 7.00% 1/12/2036 107,102 0.00%CubeSmart LP $100,000 3.13% 1/9/2026 107,099 0.00%Avangrid, Inc. $100,000 3.15% 1/12/2024 107,096 0.00%Equinix, Inc. $100,000 2.90% 18/11/2026 107,058 0.00%Boston Properties LP $100,000 3.20% 15/1/2025 107,053 0.00%Unum Group $100,000 4.50% 15/12/2049 107,031 0.00%Verisk Analytics, Inc. $100,000 3.63% 15/5/2050 106,981 0.00%Raytheon Technologies Corp. $100,000 3.70% 15/12/2023 106,945 0.00%Hartford Financial Services Group, Inc. $75,000 6.10% 1/10/2041 106,927 0.00%Union Pacific Corp. $100,000 2.75% 1/3/2026 106,893 0.00%Sonoco Products Co. $100,000 3.13% 1/5/2030 106,847 0.00%Florida Power & Light Co. $100,000 3.25% 1/6/2024 106,823 0.00%Global Payments, Inc. $100,000 3.20% 15/8/2029 106,817 0.00%Philip Morris International, Inc. $100,000 2.75% 25/2/2026 106,717 0.00%Marathon Petroleum Corp. $100,000 4.50% 1/5/2023 106,683 0.00%Republic Services, Inc. $105,000 2.30% 1/3/2030 106,665 0.00%Microchip Technology, Inc. $100,000 4.33% 1/6/2023 106,627 0.00%Citizens Financial Group, Inc. $100,000 2.85% 27/7/2026 106,626 0.00%Union Electric Co. $100,000 3.25% 1/10/2049 106,625 0.00%Owl Rock Capital Corp. $100,000 4.00% 30/3/2025 106,614 0.00%PNC Financial Services Group, Inc. $100,000 2.60% 23/7/2026 106,580 0.00%Black Hills Corp. $100,000 3.15% 15/1/2027 106,561 0.00%Cameron LNG LLC $100,000 2.90% 15/7/2031 106,536 0.00%JetBlue 2020-1 Class A Pass Through Trust $96,728 4.00% 15/11/2032 106,509 0.00%Marsh & McLennan Cos, Inc. $85,000 4.35% 30/1/2047 106,498 0.00%Enable Midstream Partners LP $100,000 3.90% 15/5/2024 106,495 0.00%Cummins, Inc. $100,000 3.65% 1/10/2023 106,458 0.00%Bristol-Myers Squibb Co.1 $100,000 3.25% 1/11/2023 106,448 0.00%Duke Energy Ohio, Inc. $100,000 3.80% 1/9/2023 106,431 0.00%Altria Group, Inc. $100,000 4.45% 6/5/2050 106,409 0.00%John Deere Capital Corp. $100,000 2.65% 24/6/2024 106,408 0.00%Commonwealth Edison Co. $100,000 2.55% 15/6/2026 106,396 0.00%Baxter International, Inc. $100,000 2.60% 15/8/2026 106,387 0.00%National Rural Utilities Cooperative Finance Corp. $100,000 2.85% 27/1/2025 106,323 0.00%NextEra Energy Capital Holdings, Inc. $100,000 2.75% 1/5/2025 106,255 0.00%State Street Corp.^ $100,000 3.03% 1/11/2034 106,255 0.00%Oracle Corp. $100,000 3.63% 15/7/2023 106,250 0.00%Caterpillar Financial Services Corp. $100,000 2.40% 9/8/2026 106,248 0.00%Oncor Electric Delivery Co. LLC $100,000 2.75% 1/6/2024 106,123 0.00%Hershey Co. $100,000 2.30% 15/8/2026 106,099 0.00%Public Service Enterprise Group, Inc. $100,000 2.88% 15/6/2024 106,074 0.00%WRKCo, Inc. $100,000 3.00% 15/9/2024 106,056 0.00%Banner Health $100,000 3.18% 1/1/2050 106,033 0.00%Viatris, Inc. $100,000 4.00% 22/6/2050 105,966 0.00%3M Co. $100,000 2.25% 19/9/2026 105,804 0.00%Duke Energy Corp. $100,000 2.65% 1/9/2026 105,775 0.00%Bank of New York Mellon Corp. $100,000 3.50% 28/4/2023 105,763 0.00%Assurant, Inc. $100,000 4.00% 15/3/2023 105,760 0.00%International Lease Finance Corp. $100,000 5.88% 15/8/2022 105,754 0.00%Avnet, Inc. $100,000 4.88% 1/12/2022 105,745 0.00%Steel Dynamics, Inc. $100,000 2.80% 15/12/2024 105,541 0.00%Columbia Property Trust Operating Partnership LP $100,000 3.65% 15/8/2026 105,538 0.00%SITE Centers Corp. $100,000 3.63% 1/2/2025 105,514 0.00%Exxon Mobil Corp. $100,000 2.28% 16/8/2026 105,485 0.00%American Honda Finance Corp. $100,000 2.30% 9/9/2026 105,368 0.00%John Deere Capital Corp. $100,000 2.25% 14/9/2026 105,321 0.00%Energy Transfer LP $100,000 2.90% 15/5/2025 105,275 0.00%Citrix Systems, Inc. $100,000 3.30% 1/3/2030 105,261 0.00%Willis North America, Inc. $100,000 2.95% 15/9/2029 105,177 0.00%Pfizer, Inc. $100,000 3.00% 15/6/2023 105,130 0.00%Lockheed Martin Corp. $75,000 5.72% 1/6/2040 105,104 0.00%Chevron Phillips Chemical Co. LLC/Chevron Phillips Chemical Co. LP $100,000 3.30% 1/5/2023 105,081 0.00%DTE Energy Co. $100,000 2.53% 1/10/2024 105,057 0.00%KeySpan Gas East Corp. $100,000 2.74% 15/8/2026 104,942 0.00%

682
Vanguard Global Corporate Bond Index Fund
Principal CouponMaturity
DateFair Value
US Dollars ($)% of Total
Net Assetssalesforce.com, Inc. $100,000 3.25% 11/4/2023 104,910 0.00%American Campus Communities Operating Partnership LP $100,000 3.75% 15/4/2023 104,883 0.00%Dollar Tree, Inc. $95,000 4.00% 15/5/2025 104,845 0.00%Boston Properties LP $100,000 3.13% 1/9/2023 104,844 0.00%3M Co. $100,000 2.38% 26/8/2029 104,809 0.00%Tanger Properties LP $100,000 3.13% 1/9/2026 104,808 0.00%Zions Bancorp NA $100,000 3.25% 29/10/2029 104,808 0.00%Fifth Third Bancorp $100,000 2.38% 28/1/2025 104,796 0.00%Emory University $100,000 2.97% 1/9/2050 104,759 0.00%Sutter Health $100,000 3.16% 15/8/2040 104,748 0.00%DH Europe Finance II Sarl $100,000 2.60% 15/11/2029 104,708 0.00%Indiana Michigan Power Co. $100,000 3.25% 1/5/2051 104,705 0.00%Alphabet, Inc. $100,000 2.00% 15/8/2026 104,637 0.00%Allstate Corp. $75,000 5.95% 1/4/2036 104,549 0.00%General Dynamics Corp. $100,000 2.13% 15/8/2026 104,534 0.00%Quest Diagnostics, Inc. $100,000 2.80% 30/6/2031 104,482 0.00%Eagle Materials, Inc. $102,000 4.50% 1/8/2026 104,458 0.00%AutoNation, Inc. $97,000 3.50% 15/11/2024 104,392 0.00%National Fuel Gas Co. $100,000 3.75% 1/3/2023 104,320 0.00%Penske Truck Leasing Co. LP/PTL Finance Corp. $100,000 4.88% 11/7/2022 104,301 0.00%Verisk Analytics, Inc. $100,000 4.13% 12/9/2022 104,258 0.00%Eli Lilly & Co. $75,000 5.55% 15/3/2037 104,226 0.00%Consolidated Edison Co. of New York, Inc. $75,000 6.20% 15/6/2036 104,181 0.00%OhioHealth Corp. $100,000 3.04% 15/11/2050 104,140 0.00%Abbott Laboratories $75,000 5.30% 27/5/2040 104,050 0.00%Entergy Corp. $100,000 2.80% 15/6/2030 103,995 0.00%Molson Coors International LP CA($)125,000 2.84% 15/7/2023 103,985 0.00%Otis Worldwide Corp. $100,000 2.29% 5/4/2027 103,909 0.00%Kimberly-Clark Corp. $100,000 2.40% 1/6/2023 103,851 0.00%Caterpillar Financial Services Corp. $100,000 2.63% 1/3/2023 103,849 0.00%Kinder Morgan, Inc. $100,000 3.15% 15/1/2023 103,839 0.00%PeaceHealth Obligated Group $100,000 3.22% 15/11/2050 103,836 0.00%Philip Morris International, Inc. $100,000 2.63% 6/3/2023 103,831 0.00%Energy Transfer LP $100,000 3.60% 1/2/2023 103,754 0.00%Invesco Finance plc $100,000 3.13% 30/11/2022 103,735 0.00%Kinder Morgan Energy Partners LP $75,000 6.38% 1/3/2041 103,706 0.00%Bon Secours Mercy Health, Inc. $100,000 3.21% 1/6/2050 103,676 0.00%Kansas City Southern $100,000 3.00% 15/5/2023 103,666 0.00%Home Depot, Inc. $100,000 2.70% 1/4/2023 103,664 0.00%Liberty Mutual Group, Inc. $100,000 4.95% 1/5/2022 103,613 0.00%ERP Operating LP $100,000 2.50% 15/2/2030 103,597 0.00%Keysight Technologies, Inc. $93,000 4.55% 30/10/2024 103,586 0.00%John Deere Capital Corp. $100,000 2.70% 6/1/2023 103,581 0.00%Nucor Corp. $100,000 4.13% 15/9/2022 103,565 0.00%Republic Services, Inc. $75,000 5.70% 15/5/2041 103,478 0.00%TJX Cos, Inc. $100,000 2.50% 15/5/2023 103,464 0.00%Dignity Health $100,000 3.13% 1/11/2022 103,379 0.00%Zoetis, Inc. $100,000 3.00% 15/5/2050 103,352 0.00%Norfolk Southern Corp. $100,000 2.90% 15/2/2023 103,340 0.00%Welltower, Inc. $100,000 2.80% 1/6/2031 103,332 0.00%Duke Energy Carolinas LLC $100,000 2.50% 15/3/2023 103,295 0.00%Chevron Corp. $100,000 2.00% 11/5/2027 103,294 0.00%Georgia Power Co. $100,000 2.10% 30/7/2023 103,290 0.00%Amazon.com, Inc. $100,000 2.40% 22/2/2023 103,275 0.00%Williams Cos, Inc. $75,000 7.50% 15/1/2031 103,271 0.00%Boardwalk Pipelines LP $100,000 3.38% 1/2/2023 103,221 0.00%UnitedHealth Group, Inc. $100,000 3.35% 15/7/2022 103,179 0.00%3M Co. $100,000 2.25% 15/3/2023 103,119 0.00%Piedmont Natural Gas Co., Inc. $100,000 3.35% 1/6/2050 103,074 0.00%Prudential Financial, Inc. $70,000 6.63% 1/12/2037 102,983 0.00%Chubb INA Holdings, Inc. $100,000 2.88% 3/11/2022 102,982 0.00%FedEx Corp. $100,000 3.25% 15/5/2041 102,964 0.00%Commonwealth Edison Co. $100,000 3.00% 1/3/2050 102,865 0.00%Flex Intermediate Holdco LLC $100,000 4.32% 30/12/2039 102,851 0.00%ITC Holdings Corp. $100,000 2.70% 15/11/2022 102,820 0.00%Nestle Holdings, Inc. $100,000 2.38% 17/11/2022 102,793 0.00%International Business Machines Corp. $75,000 5.88% 29/11/2032 102,757 0.00%Main Street Capital Corp. $100,000 3.00% 14/7/2026 102,704 0.00%Air Products & Chemicals, Inc. $100,000 1.85% 15/5/2027 102,684 0.00%Plains All American Pipeline LP/PAA Finance Corp. $100,000 2.85% 31/1/2023 102,641 0.00%AT&T, Inc. $100,000 2.63% 1/12/2022 102,611 0.00%

683
Vanguard Global Corporate Bond Index Fund
Principal CouponMaturity
DateFair Value
US Dollars ($)% of Total
Net AssetsCenterPoint Energy Resources Corp. $75,000 5.85% 15/1/2041 102,575 0.00%Athene Global Funding $100,000 3.00% 1/7/2022 102,504 0.00%Williams Cos, Inc. $100,000 3.35% 15/8/2022 102,497 0.00%Athene Global Funding $100,000 2.50% 24/3/2028 102,465 0.00%Skyworks Solutions, Inc. $100,000 3.00% 1/6/2031 102,455 0.00%Pacific LifeCorp $80,000 5.13% 30/1/2043 102,424 0.00%Cincinnati Financial Corp. $75,000 6.13% 1/11/2034 102,419 0.00%Southern California Edison Co. $95,000 4.05% 15/3/2042 102,336 0.00%DH Europe Finance II Sarl $100,000 2.05% 15/11/2022 102,313 0.00%Columbia Pipeline Group, Inc. $75,000 5.80% 1/6/2045 102,305 0.00%Banner Health $100,000 2.34% 1/1/2030 102,284 0.00%Memorial Sloan-Kettering Cancer Center $100,000 2.96% 1/1/2050 102,251 0.00%Catholic Health Services of Long Island Obligated Group $100,000 3.37% 1/7/2050 102,229 0.00%AmFam Holdings, Inc. $100,000 2.81% 11/3/2031 102,168 0.00%Boeing Co. $100,000 2.25% 15/6/2026 102,096 0.00%Duke Energy Corp. $100,000 2.40% 15/8/2022 102,094 0.00%DTE Energy Co. $75,000 6.38% 15/4/2033 102,065 0.00%Motorola Solutions, Inc. $100,000 2.75% 24/5/2031 102,060 0.00%Toyota Motor Credit Corp. $100,000 1.35% 25/8/2023 101,951 0.00%Caterpillar Financial Services Corp. $100,000 1.90% 6/9/2022 101,904 0.00%FedEx Corp. $100,000 2.40% 15/5/2031 101,861 0.00%American Financial Group, Inc. $85,000 4.50% 15/6/2047 101,763 0.00%Americo Life, Inc. $100,000 3.45% 15/4/2031 101,761 0.00%Northeastern University $100,000 2.89% 1/10/2050 101,755 0.00%Huntsman International LLC $100,000 2.95% 15/6/2031 101,713 0.00%American Water Capital Corp. $100,000 2.30% 1/6/2031 101,665 0.00%George Washington University $75,000 4.87% 15/9/2045 101,616 0.00%CMS Energy Corp.^ $100,000 3.75% 1/12/2050 101,570 0.00%Omnicom Group, Inc. $100,000 2.45% 30/4/2030 101,569 0.00%Cleco Corporate Holdings LLC $85,000 4.97% 1/5/2046 101,425 0.00%JPMorgan Chase & Co. $100,000 2.97% 15/1/2023 101,421 0.00%Skyworks Solutions, Inc. $100,000 1.80% 1/6/2026 101,413 0.00%Atlantic City Electric Co. $100,000 2.30% 15/3/2031 101,394 0.00%Advocate Health & Hospitals Corp. $100,000 2.21% 15/6/2030 101,349 0.00%CBRE Services, Inc. $100,000 2.50% 1/4/2031 101,346 0.00%Equinix, Inc. $100,000 1.80% 15/7/2027 101,232 0.00%Las Vegas Sands Corp. $95,000 3.90% 8/8/2029 101,225 0.00%Duke Energy Corp. $100,000 2.45% 1/6/2030 101,215 0.00%Xylem, Inc. $100,000 1.95% 30/1/2028 101,173 0.00%Southern California Edison Co. $85,000 4.88% 1/3/2049 101,128 0.00%Highmark, Inc. $100,000 2.55% 10/5/2031 101,123 0.00%NIKE, Inc. $95,000 2.38% 1/11/2026 101,054 0.00%CenterPoint Energy Houston Electric LLC $100,000 2.90% 1/7/2050 101,050 0.00%Analog Devices, Inc. $75,000 5.30% 15/12/2045 101,014 0.00%Allstate Corp. $85,000 3.85% 10/8/2049 100,999 0.00%Ameren Illinois Co. $100,000 2.90% 15/6/2051 100,993 0.00%Unum Group $100,000 4.13% 15/6/2051 100,916 0.00%American Honda Finance Corp. $100,000 0.88% 7/7/2023 100,888 0.00%PeaceHealth Obligated Group $100,000 1.38% 15/11/2025 100,882 0.00%Xylem, Inc. $100,000 2.25% 30/1/2031 100,880 0.00%Brighthouse Financial Global Funding $100,000 1.55% 24/5/2026 100,856 0.00%UnitedHealth Group, Inc. $100,000 2.00% 15/5/2030 100,829 0.00%Boeing Co. $100,000 3.50% 1/3/2039 100,792 0.00%ERAC USA Finance LLC $100,000 2.60% 1/12/2021 100,760 0.00%Pinnacle West Capital Corp. $100,000 1.30% 15/6/2025 100,742 0.00%Penske Truck Leasing Co. LP/PTL Finance Corp. $100,000 1.70% 15/6/2026 100,693 0.00%Yale University $100,000 0.87% 15/4/2025 100,593 0.00%East Ohio Gas Co. $100,000 1.30% 15/6/2025 100,590 0.00%Principal Life Global Funding II $100,000 1.25% 23/6/2025 100,530 0.00%Indiana University Health, Inc. Obligated Group $100,000 2.85% 1/11/2051 100,491 0.00%Norfolk Southern Corp. $100,000 3.25% 1/12/2021 100,486 0.00%Mississippi Power Co. $100,000 3.10% 30/7/2051 100,464 0.00%Blackstone Holdings Finance Co. LLC $75,000 5.00% 15/6/2044 100,428 0.00%Athene Global Funding $100,000 1.00% 16/4/2024 100,339 0.00%American Tower Corp. $100,000 1.30% 15/9/2025 100,219 0.00%Intuit, Inc. $100,000 0.95% 15/7/2025 100,211 0.00%West Virginia United Health System Obligated Group $100,000 3.13% 1/6/2050 100,189 0.00%Security Benefit Global Funding $100,000 1.25% 17/5/2024 100,132 0.00%Teledyne Technologies, Inc. $100,000 0.95% 1/4/2024 100,131 0.00%Oaktree Specialty Lending Corp. $100,000 2.70% 15/1/2027 100,130 0.00%Anthem, Inc. $100,000 0.45% 15/3/2023 100,109 0.00%

684
Vanguard Global Corporate Bond Index Fund
Principal CouponMaturity
DateFair Value
US Dollars ($)% of Total
Net AssetsInternational Flavors & Fragrances, Inc. $100,000 0.70% 15/9/2022 100,099 0.00%Lennox International, Inc. $100,000 1.70% 1/8/2027 100,095 0.00%Pioneer Natural Resources Co. $100,000 0.55% 15/5/2023 100,064 0.00%American Electric Power Co., Inc. $100,000 0.75% 1/11/2023 100,052 0.00%Citizens Financial Group, Inc. $100,000 2.64% 30/9/2032 100,031 0.00%Phillips 66 $100,000 1.30% 15/2/2026 100,023 0.00%Diamondback Energy, Inc. $100,000 0.90% 24/3/2023 100,022 0.00%Pacific Gas & Electric Co. $100,000 1.37% 10/3/2023 100,010 0.00%Pioneer Natural Resources Co. $100,000 0.75% 15/1/2024 99,995 0.00%Teledyne Technologies, Inc. $100,000 0.65% 1/4/2023 99,967 0.00%Juniper Networks, Inc. $100,000 1.20% 10/12/2025 99,873 0.00%CenterPoint Energy Houston Electric LLC $80,000 4.25% 1/2/2049 99,869 0.00%New York Life Global Funding $100,000 1.15% 9/6/2026 99,850 0.00%Highmark, Inc. $100,000 1.45% 10/5/2026 99,741 0.00%Nissan Motor Acceptance Corp. $100,000 1.05% 8/3/2024 99,684 0.00%Agree LP $100,000 2.60% 15/6/2033 99,680 0.00%Vontier Corp. $100,000 1.80% 1/4/2026 99,676 0.00%Anthem, Inc. $80,000 4.63% 15/5/2042 99,554 0.00%Johns Hopkins University $100,000 2.81% 1/1/2060 99,541 0.00%Community Health Network, Inc. $100,000 3.10% 1/5/2050 99,523 0.00%Air Lease Corp. $100,000 0.70% 15/2/2024 99,520 0.00%Western Union Co. $100,000 1.35% 15/3/2026 99,429 0.00%Zoetis, Inc. $100,000 2.00% 15/5/2030 99,342 0.00%Evergy Metro, Inc. $75,000 5.30% 1/10/2041 99,313 0.00%Charles Schwab Corp. $90,000 3.25% 22/5/2029 99,308 0.00%Public Service Co. of Colorado $100,000 1.90% 15/1/2031 99,256 0.00%Agree LP $100,000 2.00% 15/6/2028 99,190 0.00%Berry Global, Inc. $100,000 1.65% 15/1/2027 99,156 0.00%Acuity Brands Lighting, Inc. $100,000 2.15% 15/12/2030 99,146 0.00%Berkshire Hathaway Energy Co. $75,000 5.15% 15/11/2043 99,087 0.00%AES Corp. $100,000 2.45% 15/1/2031 99,035 0.00%East Ohio Gas Co. $100,000 2.00% 15/6/2030 99,015 0.00%Agilent Technologies, Inc. $100,000 2.10% 4/6/2030 99,002 0.00%Pioneer Natural Resources Co. $100,000 1.13% 15/1/2026 99,001 0.00%L3Harris Technologies, Inc. $75,000 5.05% 27/4/2045 98,810 0.00%Procter & Gamble Co. $100,000 0.55% 29/10/2025 98,772 0.00%Trustees of Princeton University $100,000 2.52% 1/7/2050 98,757 0.00%Philip Morris International, Inc. $100,000 0.88% 1/5/2026 98,739 0.00%Duke Realty LP $100,000 3.05% 1/3/2050 98,728 0.00%UnitedHealth Group, Inc. $80,000 4.38% 15/3/2042 98,687 0.00%MultiCare Health System $100,000 2.80% 15/8/2050 98,670 0.00%ONEOK Partners LP $75,000 6.20% 15/9/2043 98,642 0.00%Niagara Mohawk Power Corp. $100,000 1.96% 27/6/2030 98,612 0.00%Roper Technologies, Inc. $100,000 2.00% 30/6/2030 98,598 0.00%McKesson Corp. $100,000 0.90% 3/12/2025 98,574 0.00%Children's Hospital/DC $100,000 2.93% 15/7/2050 98,514 0.00%Marathon Oil Corp. $75,000 6.80% 15/3/2032 98,507 0.00%T-Mobile USA, Inc. $100,000 2.25% 15/11/2031 98,484 0.00%Intercontinental Exchange, Inc. $100,000 3.00% 15/6/2050 98,446 0.00%William Marsh Rice University $85,000 3.57% 15/5/2045 98,395 0.00%Pacific Gas & Electric Co. $100,000 3.25% 1/6/2031 98,390 0.00%Clorox Co. $100,000 1.80% 15/5/2030 98,350 0.00%AvalonBay Communities, Inc. $90,000 3.30% 1/6/2029 98,305 0.00%Energy Transfer LP $85,000 4.90% 15/3/2035 98,153 0.00%Seattle Children's Hospital $100,000 2.72% 1/10/2050 98,099 0.00%Baylor Scott & White Holdings $100,000 1.78% 15/11/2030 98,007 0.00%American Homes 4 Rent LP $100,000 3.38% 15/7/2051 97,962 0.00%Global Payments, Inc. $85,000 4.80% 1/4/2026 97,462 0.00%Crown Castle International Corp. $75,000 5.20% 15/2/2049 97,452 0.00%American Tower Corp. $100,000 1.50% 31/1/2028 97,404 0.00%AEP Transmission Co. LLC $85,000 3.75% 1/12/2047 97,295 0.00%Tyson Foods, Inc. $75,000 5.15% 15/8/2044 97,036 0.00%Amgen, Inc. $75,000 4.95% 1/10/2041 96,997 0.00%National Health Investors, Inc. $100,000 3.00% 1/2/2031 96,883 0.00%Johns Hopkins University $75,000 4.08% 1/7/2053 96,835 0.00%John Deere Capital Corp. $100,000 1.45% 15/1/2031 96,681 0.00%Toledo Hospital $80,000 5.75% 15/11/2038 96,542 0.00%Magellan Midstream Partners LP $85,000 4.25% 15/9/2046 96,286 0.00%Wisconsin Public Service Corp. $75,000 4.75% 1/11/2044 96,259 0.00%NYU Langone Hospitals $75,000 4.78% 1/7/2044 96,230 0.00%Ohio Power Co. $100,000 1.63% 15/1/2031 96,170 0.00%

685
Vanguard Global Corporate Bond Index Fund
Principal CouponMaturity
DateFair Value
US Dollars ($)% of Total
Net AssetsUDR, Inc. $100,000 2.10% 1/8/2032 96,089 0.00%Western & Southern Life Insurance Co. $75,000 5.15% 15/1/2049 96,024 0.00%Juniper Networks, Inc. $100,000 2.00% 10/12/2030 95,977 0.00%United Airlines 2019-2 Class AA Pass Through Trust $96,111 2.70% 1/5/2032 95,973 0.00%Mercury General Corp. $85,000 4.40% 15/3/2027 95,970 0.00%Southern Power Co. $80,000 4.95% 15/12/2046 95,952 0.00%University of Chicago $100,000 2.55% 1/4/2050 95,898 0.00%NRG Energy, Inc. $90,000 3.75% 15/6/2024 95,842 0.00%JetBlue 2019-1 Class AA Pass Through Trust $93,904 2.75% 15/5/2032 95,554 0.00%Keurig Dr Pepper, Inc. $75,000 4.99% 25/5/2038 95,512 0.00%Verizon Communications, Inc. $100,000 1.50% 18/9/2030 95,440 0.00%Tractor Supply Co. $100,000 1.75% 1/11/2030 95,422 0.00%Texas Instruments, Inc. $75,000 4.15% 15/5/2048 95,065 0.00%Aptiv plc $70,000 5.40% 15/3/2049 95,023 0.00%Virginia Electric & Power Co. $75,000 4.65% 15/8/2043 94,995 0.00%Old Republic International Corp. $85,000 4.88% 1/10/2024 94,962 0.00%Parker-Hannifin Corp. $90,000 2.70% 14/6/2024 94,869 0.00%Altria Group, Inc. $100,000 3.70% 4/2/2051 94,780 0.00%Cox Communications, Inc. $100,000 2.95% 1/10/2050 94,673 0.00%DTE Energy Co. $85,000 3.80% 15/3/2027 94,532 0.00%Estee Lauder Cos, Inc. $75,000 4.38% 15/6/2045 94,383 0.00%Comcast Corp. $75,000 4.60% 15/8/2045 94,237 0.00%Dominion Energy, Inc. $75,000 5.25% 1/8/2033 93,965 0.00%CSX Corp. $75,000 4.50% 15/3/2049 93,757 0.00%Travelers Cos, Inc. $75,000 4.30% 25/8/2045 93,628 0.00%AvalonBay Communities, Inc. $80,000 3.90% 15/10/2046 93,511 0.00%McDonald's Corp. $75,000 4.60% 26/5/2045 93,439 0.00%Mars, Inc. $100,000 2.45% 16/7/2050 93,281 0.00%Kellogg Co. $75,000 4.50% 1/4/2046 93,098 0.00%Children's Health System of Texas $100,000 2.51% 15/8/2050 92,888 0.00%Blackstone Holdings Finance Co. LLC $75,000 4.45% 15/7/2045 92,832 0.00%ITC Holdings Corp. $85,000 3.35% 15/11/2027 92,766 0.00%Parker-Hannifin Corp. $75,000 4.45% 21/11/2044 92,722 0.00%Georgia Power Co. $75,000 4.75% 1/9/2040 92,651 0.00%Lazard Group LLC $85,000 3.63% 1/3/2027 92,645 0.00%Travelers Cos, Inc. $75,000 4.10% 4/3/2049 92,627 0.00%Baylor Scott & White Holdings $75,000 4.19% 15/11/2045 92,387 0.00%VEREIT Operating Partnership LP $80,000 4.88% 1/6/2026 92,339 0.00%Yale-New Haven Health Services Corp. $100,000 2.50% 1/7/2050 92,316 0.00%Chevron USA, Inc. $75,000 4.20% 15/10/2049 92,288 0.00%Florida Power & Light Co. $75,000 3.99% 1/3/2049 92,217 0.00%MPLX LP $75,000 5.20% 1/3/2047 92,066 0.00%Anthem, Inc. $65,000 6.38% 15/6/2037 91,974 0.00%Hasbro, Inc. $75,000 5.10% 15/5/2044 91,950 0.00%Sherwin-Williams Co. $80,000 4.00% 15/12/2042 91,901 0.00%Raytheon Technologies Corp. $75,000 4.35% 15/4/2047 91,867 0.00%Weyerhaeuser Co. $71,000 6.95% 1/10/2027 91,796 0.00%Anthem, Inc. $85,000 3.35% 1/12/2024 91,693 0.00%Piedmont Natural Gas Co., Inc. $75,000 4.65% 1/8/2043 91,669 0.00%Dow Chemical Co. $75,000 4.63% 1/10/2044 91,662 0.00%ONE Gas, Inc. $75,000 4.66% 1/2/2044 91,608 0.00%International Business Machines Corp. $90,000 1.88% 1/8/2022 91,502 0.00%Southern Power Co. $75,000 5.15% 15/9/2041 91,317 0.00%Essex Portfolio LP $75,000 4.50% 15/3/2048 91,141 0.00%Montefiore Obligated Group $85,000 4.29% 1/9/2050 91,103 0.00%Kinder Morgan Energy Partners LP $65,000 6.55% 15/9/2040 90,964 0.00%Trane Technologies Global Holding Co., Ltd. $75,000 4.30% 21/2/2048 90,947 0.00%El Paso Electric Co. $75,000 5.00% 1/12/2044 90,936 0.00%Crown Castle International Corp. $85,000 3.20% 1/9/2024 90,847 0.00%American International Group, Inc. $75,000 4.70% 10/7/2035 90,830 0.00%PECO Energy Co. $75,000 4.15% 1/10/2044 90,763 0.00%Micron Technology, Inc. $75,000 5.33% 6/2/2029 90,702 0.00%Black Hills Corp. $85,000 3.05% 15/10/2029 90,640 0.00%San Diego Gas & Electric Co. $75,000 4.10% 15/6/2049 90,448 0.00%Eli Lilly & Co. $75,000 3.95% 15/5/2047 90,055 0.00%Bank of America Corp.^ CA($)105,000 3.41% 20/9/2025 90,044 0.00%Parker-Hannifin Corp. $75,000 4.10% 1/3/2047 89,760 0.00%Consumers Energy Co. $75,000 3.95% 15/7/2047 89,624 0.00%Fortive Corp. $75,000 4.30% 15/6/2046 89,492 0.00%Cox Communications, Inc. $75,000 4.50% 30/6/2043 89,430 0.00%CNO Financial Group, Inc. $75,000 5.25% 30/5/2029 89,329 0.00%
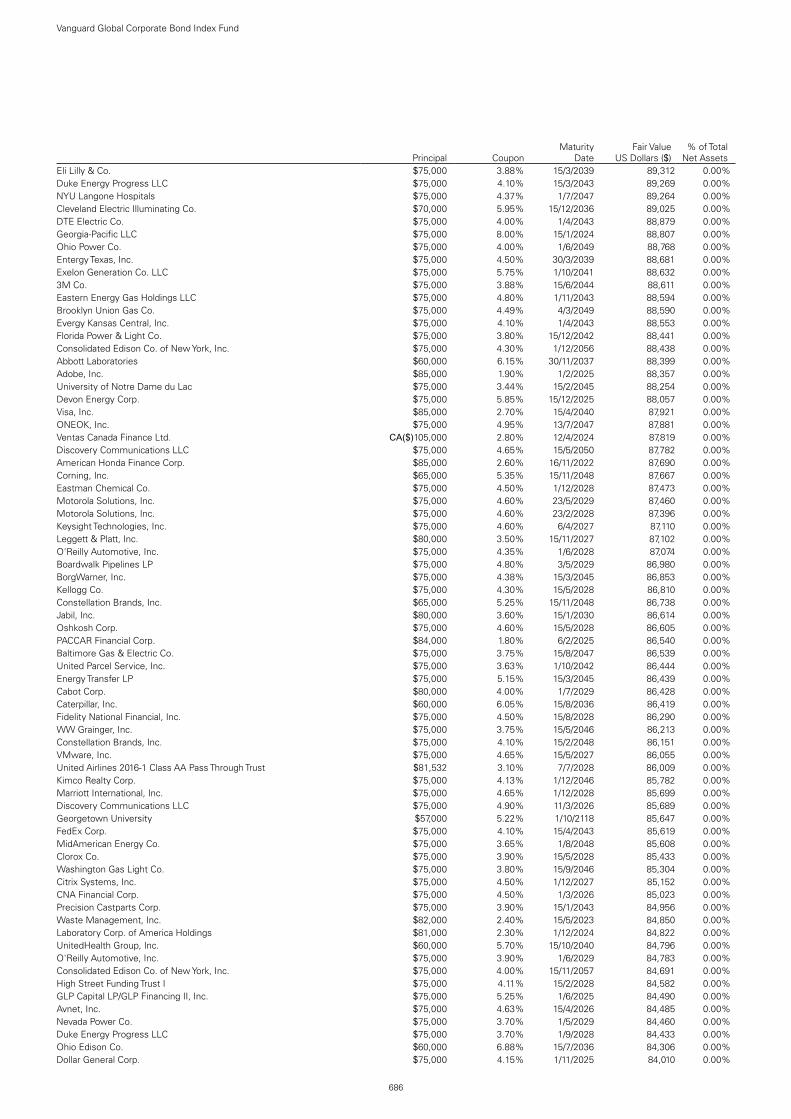
686
Vanguard Global Corporate Bond Index Fund
Principal CouponMaturity
DateFair Value
US Dollars ($)% of Total
Net AssetsEli Lilly & Co. $75,000 3.88% 15/3/2039 89,312 0.00%Duke Energy Progress LLC $75,000 4.10% 15/3/2043 89,269 0.00%NYU Langone Hospitals $75,000 4.37% 1/7/2047 89,264 0.00%Cleveland Electric Illuminating Co. $70,000 5.95% 15/12/2036 89,025 0.00%DTE Electric Co. $75,000 4.00% 1/4/2043 88,879 0.00%Georgia-Pacific LLC $75,000 8.00% 15/1/2024 88,807 0.00%Ohio Power Co. $75,000 4.00% 1/6/2049 88,768 0.00%Entergy Texas, Inc. $75,000 4.50% 30/3/2039 88,681 0.00%Exelon Generation Co. LLC $75,000 5.75% 1/10/2041 88,632 0.00%3M Co. $75,000 3.88% 15/6/2044 88,611 0.00%Eastern Energy Gas Holdings LLC $75,000 4.80% 1/11/2043 88,594 0.00%Brooklyn Union Gas Co. $75,000 4.49% 4/3/2049 88,590 0.00%Evergy Kansas Central, Inc. $75,000 4.10% 1/4/2043 88,553 0.00%Florida Power & Light Co. $75,000 3.80% 15/12/2042 88,441 0.00%Consolidated Edison Co. of New York, Inc. $75,000 4.30% 1/12/2056 88,438 0.00%Abbott Laboratories $60,000 6.15% 30/11/2037 88,399 0.00%Adobe, Inc. $85,000 1.90% 1/2/2025 88,357 0.00%University of Notre Dame du Lac $75,000 3.44% 15/2/2045 88,254 0.00%Devon Energy Corp. $75,000 5.85% 15/12/2025 88,057 0.00%Visa, Inc. $85,000 2.70% 15/4/2040 87,921 0.00%ONEOK, Inc. $75,000 4.95% 13/7/2047 87,881 0.00%Ventas Canada Finance Ltd. CA($)105,000 2.80% 12/4/2024 87,819 0.00%Discovery Communications LLC $75,000 4.65% 15/5/2050 87,782 0.00%American Honda Finance Corp. $85,000 2.60% 16/11/2022 87,690 0.00%Corning, Inc. $65,000 5.35% 15/11/2048 87,667 0.00%Eastman Chemical Co. $75,000 4.50% 1/12/2028 87,473 0.00%Motorola Solutions, Inc. $75,000 4.60% 23/5/2029 87,460 0.00%Motorola Solutions, Inc. $75,000 4.60% 23/2/2028 87,396 0.00%Keysight Technologies, Inc. $75,000 4.60% 6/4/2027 87,110 0.00%Leggett & Platt, Inc. $80,000 3.50% 15/11/2027 87,102 0.00%O'Reilly Automotive, Inc. $75,000 4.35% 1/6/2028 87,074 0.00%Boardwalk Pipelines LP $75,000 4.80% 3/5/2029 86,980 0.00%BorgWarner, Inc. $75,000 4.38% 15/3/2045 86,853 0.00%Kellogg Co. $75,000 4.30% 15/5/2028 86,810 0.00%Constellation Brands, Inc. $65,000 5.25% 15/11/2048 86,738 0.00%Jabil, Inc. $80,000 3.60% 15/1/2030 86,614 0.00%Oshkosh Corp. $75,000 4.60% 15/5/2028 86,605 0.00%PACCAR Financial Corp. $84,000 1.80% 6/2/2025 86,540 0.00%Baltimore Gas & Electric Co. $75,000 3.75% 15/8/2047 86,539 0.00%United Parcel Service, Inc. $75,000 3.63% 1/10/2042 86,444 0.00%Energy Transfer LP $75,000 5.15% 15/3/2045 86,439 0.00%Cabot Corp. $80,000 4.00% 1/7/2029 86,428 0.00%Caterpillar, Inc. $60,000 6.05% 15/8/2036 86,419 0.00%Fidelity National Financial, Inc. $75,000 4.50% 15/8/2028 86,290 0.00%WW Grainger, Inc. $75,000 3.75% 15/5/2046 86,213 0.00%Constellation Brands, Inc. $75,000 4.10% 15/2/2048 86,151 0.00%VMware, Inc. $75,000 4.65% 15/5/2027 86,055 0.00%United Airlines 2016-1 Class AA Pass Through Trust $81,532 3.10% 7/7/2028 86,009 0.00%Kimco Realty Corp. $75,000 4.13% 1/12/2046 85,782 0.00%Marriott International, Inc. $75,000 4.65% 1/12/2028 85,699 0.00%Discovery Communications LLC $75,000 4.90% 11/3/2026 85,689 0.00%Georgetown University $57,000 5.22% 1/10/2118 85,647 0.00%FedEx Corp. $75,000 4.10% 15/4/2043 85,619 0.00%MidAmerican Energy Co. $75,000 3.65% 1/8/2048 85,608 0.00%Clorox Co. $75,000 3.90% 15/5/2028 85,433 0.00%Washington Gas Light Co. $75,000 3.80% 15/9/2046 85,304 0.00%Citrix Systems, Inc. $75,000 4.50% 1/12/2027 85,152 0.00%CNA Financial Corp. $75,000 4.50% 1/3/2026 85,023 0.00%Precision Castparts Corp. $75,000 3.90% 15/1/2043 84,956 0.00%Waste Management, Inc. $82,000 2.40% 15/5/2023 84,850 0.00%Laboratory Corp. of America Holdings $81,000 2.30% 1/12/2024 84,822 0.00%UnitedHealth Group, Inc. $60,000 5.70% 15/10/2040 84,796 0.00%O'Reilly Automotive, Inc. $75,000 3.90% 1/6/2029 84,783 0.00%Consolidated Edison Co. of New York, Inc. $75,000 4.00% 15/11/2057 84,691 0.00%High Street Funding Trust I $75,000 4.11% 15/2/2028 84,582 0.00%GLP Capital LP/GLP Financing II, Inc. $75,000 5.25% 1/6/2025 84,490 0.00%Avnet, Inc. $75,000 4.63% 15/4/2026 84,485 0.00%Nevada Power Co. $75,000 3.70% 1/5/2029 84,460 0.00%Duke Energy Progress LLC $75,000 3.70% 1/9/2028 84,433 0.00%Ohio Edison Co. $60,000 6.88% 15/7/2036 84,306 0.00%Dollar General Corp. $75,000 4.15% 1/11/2025 84,010 0.00%
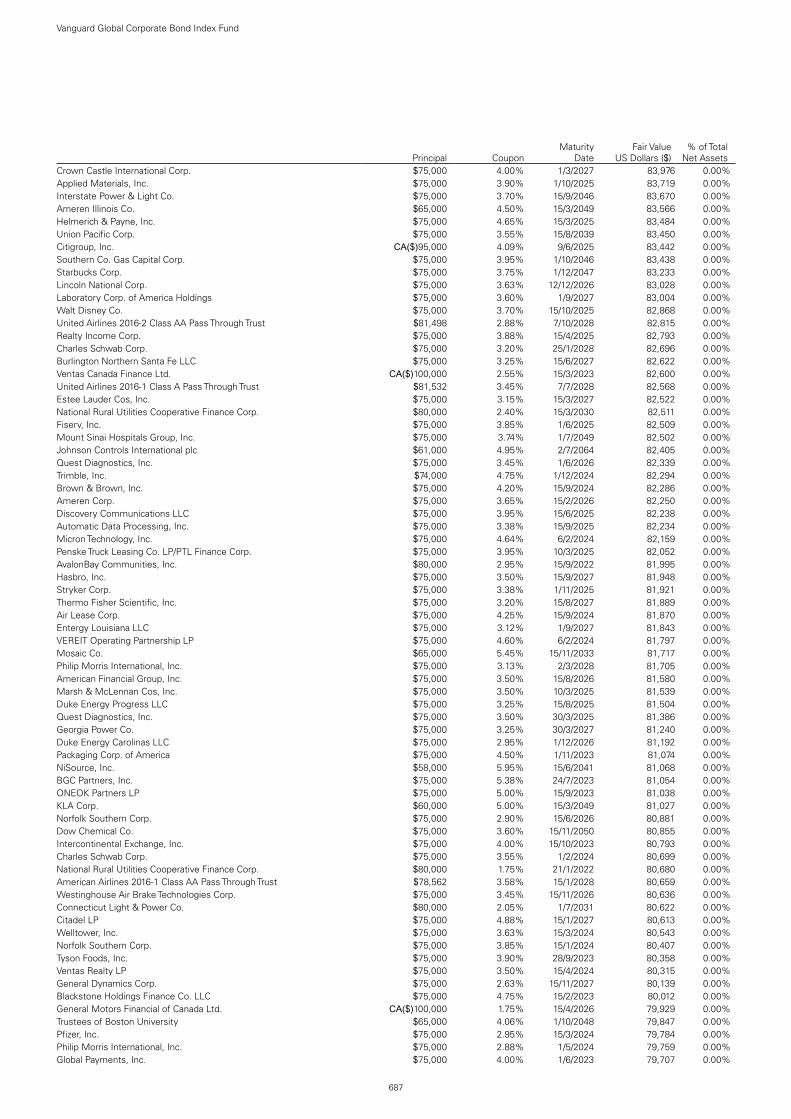
687
Vanguard Global Corporate Bond Index Fund
Principal CouponMaturity
DateFair Value
US Dollars ($)% of Total
Net AssetsCrown Castle International Corp. $75,000 4.00% 1/3/2027 83,976 0.00%Applied Materials, Inc. $75,000 3.90% 1/10/2025 83,719 0.00%Interstate Power & Light Co. $75,000 3.70% 15/9/2046 83,670 0.00%Ameren Illinois Co. $65,000 4.50% 15/3/2049 83,566 0.00%Helmerich & Payne, Inc. $75,000 4.65% 15/3/2025 83,484 0.00%Union Pacific Corp. $75,000 3.55% 15/8/2039 83,450 0.00%Citigroup, Inc. CA($)95,000 4.09% 9/6/2025 83,442 0.00%Southern Co. Gas Capital Corp. $75,000 3.95% 1/10/2046 83,438 0.00%Starbucks Corp. $75,000 3.75% 1/12/2047 83,233 0.00%Lincoln National Corp. $75,000 3.63% 12/12/2026 83,028 0.00%Laboratory Corp. of America Holdings $75,000 3.60% 1/9/2027 83,004 0.00%Walt Disney Co. $75,000 3.70% 15/10/2025 82,868 0.00%United Airlines 2016-2 Class AA Pass Through Trust $81,498 2.88% 7/10/2028 82,815 0.00%Realty Income Corp. $75,000 3.88% 15/4/2025 82,793 0.00%Charles Schwab Corp. $75,000 3.20% 25/1/2028 82,696 0.00%Burlington Northern Santa Fe LLC $75,000 3.25% 15/6/2027 82,622 0.00%Ventas Canada Finance Ltd. CA($)100,000 2.55% 15/3/2023 82,600 0.00%United Airlines 2016-1 Class A Pass Through Trust $81,532 3.45% 7/7/2028 82,568 0.00%Estee Lauder Cos, Inc. $75,000 3.15% 15/3/2027 82,522 0.00%National Rural Utilities Cooperative Finance Corp. $80,000 2.40% 15/3/2030 82,511 0.00%Fiserv, Inc. $75,000 3.85% 1/6/2025 82,509 0.00%Mount Sinai Hospitals Group, Inc. $75,000 3.74% 1/7/2049 82,502 0.00%Johnson Controls International plc $61,000 4.95% 2/7/2064 82,405 0.00%Quest Diagnostics, Inc. $75,000 3.45% 1/6/2026 82,339 0.00%Trimble, Inc. $74,000 4.75% 1/12/2024 82,294 0.00%Brown & Brown, Inc. $75,000 4.20% 15/9/2024 82,286 0.00%Ameren Corp. $75,000 3.65% 15/2/2026 82,250 0.00%Discovery Communications LLC $75,000 3.95% 15/6/2025 82,238 0.00%Automatic Data Processing, Inc. $75,000 3.38% 15/9/2025 82,234 0.00%Micron Technology, Inc. $75,000 4.64% 6/2/2024 82,159 0.00%Penske Truck Leasing Co. LP/PTL Finance Corp. $75,000 3.95% 10/3/2025 82,052 0.00%AvalonBay Communities, Inc. $80,000 2.95% 15/9/2022 81,995 0.00%Hasbro, Inc. $75,000 3.50% 15/9/2027 81,948 0.00%Stryker Corp. $75,000 3.38% 1/11/2025 81,921 0.00%Thermo Fisher Scientific, Inc. $75,000 3.20% 15/8/2027 81,889 0.00%Air Lease Corp. $75,000 4.25% 15/9/2024 81,870 0.00%Entergy Louisiana LLC $75,000 3.12% 1/9/2027 81,843 0.00%VEREIT Operating Partnership LP $75,000 4.60% 6/2/2024 81,797 0.00%Mosaic Co. $65,000 5.45% 15/11/2033 81,717 0.00%Philip Morris International, Inc. $75,000 3.13% 2/3/2028 81,705 0.00%American Financial Group, Inc. $75,000 3.50% 15/8/2026 81,580 0.00%Marsh & McLennan Cos, Inc. $75,000 3.50% 10/3/2025 81,539 0.00%Duke Energy Progress LLC $75,000 3.25% 15/8/2025 81,504 0.00%Quest Diagnostics, Inc. $75,000 3.50% 30/3/2025 81,386 0.00%Georgia Power Co. $75,000 3.25% 30/3/2027 81,240 0.00%Duke Energy Carolinas LLC $75,000 2.95% 1/12/2026 81,192 0.00%Packaging Corp. of America $75,000 4.50% 1/11/2023 81,074 0.00%NiSource, Inc. $58,000 5.95% 15/6/2041 81,068 0.00%BGC Partners, Inc. $75,000 5.38% 24/7/2023 81,054 0.00%ONEOK Partners LP $75,000 5.00% 15/9/2023 81,038 0.00%KLA Corp. $60,000 5.00% 15/3/2049 81,027 0.00%Norfolk Southern Corp. $75,000 2.90% 15/6/2026 80,881 0.00%Dow Chemical Co. $75,000 3.60% 15/11/2050 80,855 0.00%Intercontinental Exchange, Inc. $75,000 4.00% 15/10/2023 80,793 0.00%Charles Schwab Corp. $75,000 3.55% 1/2/2024 80,699 0.00%National Rural Utilities Cooperative Finance Corp. $80,000 1.75% 21/1/2022 80,680 0.00%American Airlines 2016-1 Class AA Pass Through Trust $78,562 3.58% 15/1/2028 80,659 0.00%Westinghouse Air Brake Technologies Corp. $75,000 3.45% 15/11/2026 80,636 0.00%Connecticut Light & Power Co. $80,000 2.05% 1/7/2031 80,622 0.00%Citadel LP $75,000 4.88% 15/1/2027 80,613 0.00%Welltower, Inc. $75,000 3.63% 15/3/2024 80,543 0.00%Norfolk Southern Corp. $75,000 3.85% 15/1/2024 80,407 0.00%Tyson Foods, Inc. $75,000 3.90% 28/9/2023 80,358 0.00%Ventas Realty LP $75,000 3.50% 15/4/2024 80,315 0.00%General Dynamics Corp. $75,000 2.63% 15/11/2027 80,139 0.00%Blackstone Holdings Finance Co. LLC $75,000 4.75% 15/2/2023 80,012 0.00%General Motors Financial of Canada Ltd. CA($)100,000 1.75% 15/4/2026 79,929 0.00%Trustees of Boston University $65,000 4.06% 1/10/2048 79,847 0.00%Pfizer, Inc. $75,000 2.95% 15/3/2024 79,784 0.00%Philip Morris International, Inc. $75,000 2.88% 1/5/2024 79,759 0.00%Global Payments, Inc. $75,000 4.00% 1/6/2023 79,707 0.00%

688
Vanguard Global Corporate Bond Index Fund
Principal CouponMaturity
DateFair Value
US Dollars ($)% of Total
Net AssetsPlains All American Pipeline LP/PAA Finance Corp. $75,000 4.70% 15/6/2044 79,508 0.00%Walmart, Inc. $75,000 2.38% 24/9/2029 79,461 0.00%CSX Corp. $75,000 3.35% 15/9/2049 79,455 0.00%Boeing Co. $75,000 3.10% 1/5/2026 79,401 0.00%Keysight Technologies, Inc. $75,000 3.00% 30/10/2029 79,334 0.00%Starbucks Corp. $75,000 2.45% 15/6/2026 79,199 0.00%Consumers Energy Co. $75,000 3.38% 15/8/2023 79,183 0.00%Kinder Morgan Energy Partners LP $75,000 3.50% 1/9/2023 79,175 0.00%National Rural Utilities Cooperative Finance Corp. $75,000 2.95% 7/2/2024 79,172 0.00%Equifax, Inc. $75,000 2.60% 15/12/2025 79,028 0.00%Phillips 66 Partners LP $75,000 3.15% 15/12/2029 78,826 0.00%Intercontinental Exchange, Inc. $70,000 3.75% 21/9/2028 78,804 0.00%Hartford HealthCare Corp. $75,000 3.45% 1/7/2054 78,780 0.00%Basin Electric Power Cooperative $65,000 4.75% 26/4/2047 78,758 0.00%Roper Technologies, Inc. $75,000 2.35% 15/9/2024 78,571 0.00%Caterpillar Financial Services Corp. $75,000 2.15% 8/11/2024 78,553 0.00%Ryder System, Inc. $75,000 2.50% 1/9/2024 78,506 0.00%PACCAR Financial Corp. $75,000 2.15% 15/8/2024 78,436 0.00%NOV, Inc. $75,000 3.60% 1/12/2029 78,426 0.00%Kilroy Realty LP $75,000 3.05% 15/2/2030 78,354 0.00%Dollar General Corp. $75,000 3.25% 15/4/2023 78,261 0.00%Weingarten Realty Investors $75,000 3.50% 15/4/2023 78,237 0.00%Principal Life Global Funding II $75,000 2.50% 16/9/2029 78,164 0.00%Cardinal Health, Inc. $65,000 4.90% 15/9/2045 78,148 0.00%Southern Co. Gas Capital Corp. $75,000 2.45% 1/10/2023 77,955 0.00%General Motors Financial Co., Inc. $75,000 3.25% 5/1/2023 77,831 0.00%Loews Corp. $75,000 2.63% 15/5/2023 77,698 0.00%Carlisle Cos, Inc. $75,000 3.75% 15/11/2022 77,674 0.00%QUALCOMM, Inc. $75,000 2.60% 30/1/2023 77,663 0.00%NVR, Inc. $75,000 3.95% 15/9/2022 77,455 0.00%Moody's Corp. $75,000 2.63% 15/1/2023 77,431 0.00%Enbridge Energy Partners LP $60,000 5.50% 15/9/2040 77,317 0.00%Coca-Cola Co. $75,000 2.13% 6/9/2029 77,314 0.00%AutoZone, Inc. $75,000 2.88% 15/1/2023 77,302 0.00%Fiserv, Inc. $75,000 3.50% 1/10/2022 77,276 0.00%Avery Dennison Corp. $75,000 2.65% 30/4/2030 77,193 0.00%Visa, Inc. $75,000 2.05% 15/4/2030 77,149 0.00%E*TRADE Financial Corp. $75,000 2.95% 24/8/2022 77,013 0.00%Flowserve Corp. $75,000 3.50% 15/9/2022 76,973 0.00%DTE Electric Co. $75,000 2.95% 1/3/2050 76,929 0.00%Waste Management, Inc. $75,000 2.90% 15/9/2022 76,808 0.00%CenterPoint Energy, Inc. $75,000 2.50% 1/9/2022 76,673 0.00%Vornado Realty LP $72,000 3.50% 15/1/2025 76,642 0.00%Duquesne Light Holdings, Inc. $75,000 5.90% 1/12/2021 76,625 0.00%PACCAR Financial Corp. $75,000 2.00% 26/9/2022 76,536 0.00%New York Life Global Funding $75,000 2.30% 10/6/2022 76,489 0.00%Markel Corp. $65,000 4.30% 1/11/2047 76,455 0.00%National Retail Properties, Inc. $75,000 2.50% 15/4/2030 76,366 0.00%Waste Connections, Inc. $75,000 3.05% 1/4/2050 76,333 0.00%Packaging Corp. of America $65,000 4.05% 15/12/2049 76,249 0.00%Main Street Capital Corp. $70,000 5.20% 1/5/2024 76,196 0.00%Caterpillar Financial Services Corp. $70,000 3.25% 1/12/2024 76,093 0.00%Brookfield Property Finance ULC CA($)90,000 4.30% 1/3/2024 76,051 0.00%University of Chicago $75,000 2.76% 1/4/2045 75,999 0.00%Duke Realty LP $70,000 3.25% 30/6/2026 75,967 0.00%S&P Global, Inc. $70,000 3.25% 1/12/2049 75,416 0.00%Jefferies Financial Group, Inc. $70,000 5.50% 18/10/2023 75,268 0.00%Brookfield Property Finance ULC CA($)90,000 3.93% 24/8/2025 75,262 0.00%Dow Chemical Co. $65,000 4.25% 1/10/2034 75,179 0.00%Martin Marietta Materials, Inc. $75,000 0.65% 15/7/2023 75,144 0.00%Northwestern University $75,000 2.64% 1/12/2050 75,050 0.00%ONE Gas, Inc. $75,000 0.85% 11/3/2023 75,039 0.00%UnitedHealth Group, Inc. $50,000 6.50% 15/6/2037 75,036 0.00%American Honda Finance Corp. $75,000 1.65% 12/7/2021 75,030 0.00%VEREIT Operating Partnership LP $70,000 3.10% 15/12/2029 74,965 0.00%Prudential Financial, Inc. $60,000 4.42% 27/3/2048 74,895 0.00%Edison International $70,000 3.55% 15/11/2024 74,561 0.00%Office Properties Income Trust $70,000 4.25% 15/5/2024 74,556 0.00%Magellan Midstream Partners LP $60,000 5.15% 15/10/2043 74,399 0.00%Leggett & Platt, Inc. $65,000 4.40% 15/3/2029 74,386 0.00%Eastman Chemical Co. $68,000 3.80% 15/3/2025 74,285 0.00%

689
Vanguard Global Corporate Bond Index Fund
Principal CouponMaturity
DateFair Value
US Dollars ($)% of Total
Net AssetsJohnson & Johnson $75,000 0.55% 1/9/2025 74,249 0.00%Dominion Energy, Inc. $50,000 7.00% 15/6/2038 74,180 0.00%Aetna, Inc. $72,000 2.75% 15/11/2022 73,947 0.00%Mars, Inc. $65,000 3.60% 1/4/2034 73,944 0.00%Public Service Electric & Gas Co. $65,000 3.65% 1/9/2042 73,647 0.00%Applied Materials, Inc. $50,000 5.85% 15/6/2041 73,610 0.00%Eastern Energy Gas Holdings LLC $70,000 2.50% 15/11/2024 73,453 0.00%Crown Castle International Corp. $60,000 4.75% 15/5/2047 73,300 0.00%Northern States Power Co. $50,000 6.20% 1/7/2037 73,294 0.00%Indiana Michigan Power Co. $65,000 3.75% 1/7/2047 72,863 0.00%American Airlines 2019-1 Class AA Pass Through Trust $70,939 3.15% 15/2/2032 72,662 0.00%7-Eleven, Inc. $75,000 1.30% 10/2/2028 72,378 0.00%Nevada Power Co. $70,000 3.13% 1/8/2050 72,342 0.00%Energy Transfer LP $70,000 3.45% 15/1/2023 72,340 0.00%PartnerRe Finance B LLC $65,000 3.70% 2/7/2029 72,294 0.00%Boeing Co. $75,000 3.38% 15/6/2046 72,251 0.00%Nevada Power Co. $70,000 2.40% 1/5/2030 72,168 0.00%Georgia-Pacific LLC $50,000 7.75% 15/11/2029 72,059 0.00%Caterpillar, Inc. $50,000 4.75% 15/5/2064 72,042 0.00%Sabal Trail Transmission LLC $60,000 4.68% 1/5/2038 72,032 0.00%California Endowment $75,000 2.50% 1/4/2051 71,988 0.00%Marathon Oil Corp. $60,000 5.20% 1/6/2045 71,980 0.00%NRG Energy, Inc. $65,000 4.45% 15/6/2029 71,868 0.00%Oncor Electric Delivery Co. LLC $50,000 7.00% 1/5/2032 71,814 0.00%Johnson & Johnson $55,000 4.50% 5/12/2043 71,557 0.00%Cigna Corp. $50,000 6.13% 15/11/2041 71,404 0.00%Welltower, Inc. $50,000 6.50% 15/3/2041 71,376 0.00%Florida Power & Light Co. $50,000 5.69% 1/3/2040 71,374 0.00%PacifiCorp $50,000 6.25% 15/10/2037 71,281 0.00%Andeavor Logistics LP/Tesoro Logistics Finance Corp. $75,000 5.20% 1/12/2047 71,156 0.00%Parker-Hannifin Corp. $50,000 6.25% 15/5/2038 70,976 0.00%WestRock MWV LLC $50,000 8.20% 15/1/2030 70,747 0.00%Cleveland Clinic Foundation $50,000 4.86% 1/1/2114 70,456 0.00%Puget Sound Energy, Inc. $50,000 6.27% 15/3/2037 70,266 0.00%Puget Energy, Inc. $65,000 3.65% 15/5/2025 70,051 0.00%PacifiCorp $50,000 6.10% 1/8/2036 69,956 0.00%US Treasury Note $70,000 0.13% 31/3/2023 69,899 0.00%Fidelity National Information Services, Inc. $62,000 3.75% 21/5/2029 69,870 0.00%International Business Machines Corp. $40,000 7.13% 1/12/2096 69,823 0.00%Walt Disney Co. $50,000 5.40% 1/10/2043 69,813 0.00%7-Eleven, Inc. $75,000 2.50% 10/2/2041 69,759 0.00%Hasbro, Inc. $50,000 6.35% 15/3/2040 69,639 0.00%Healthpeak Properties, Inc. $63,000 4.00% 1/6/2025 69,551 0.00%Burlington Resources LLC $50,000 5.95% 15/10/2036 69,299 0.00%Trustees of the University of Pennsylvania $50,000 4.67% 1/9/2112 69,165 0.00%Puget Sound Energy, Inc. $50,000 5.76% 1/10/2039 68,951 0.00%Prudential Financial, Inc. $50,000 6.20% 15/11/2040 68,797 0.00%Voya Financial, Inc. $50,000 5.70% 15/7/2043 68,712 0.00%President & Fellows of Harvard College $50,000 4.88% 15/10/2040 68,647 0.00%Hartford Financial Services Group, Inc. $50,000 5.95% 15/10/2036 68,449 0.00%NSTAR Electric Co. $50,000 5.50% 15/3/2040 68,424 0.00%STORE Capital Corp. $60,000 4.63% 15/3/2029 68,413 0.00%Allstate Corp. $50,000 5.55% 9/5/2035 68,388 0.00%Duke Energy Carolinas LLC $65,000 3.20% 15/8/2049 68,318 0.00%Mars, Inc. $55,000 4.13% 1/4/2054 68,247 0.00%Loews Corp. $50,000 6.00% 1/2/2035 68,066 0.00%Wisconsin Power & Light Co. $60,000 3.65% 1/4/2050 67,961 0.00%STORE Capital Corp. $60,000 4.50% 15/3/2028 67,896 0.00%Oncor Electric Delivery Co. LLC $50,000 5.25% 30/9/2040 67,763 0.00%American Financial Group, Inc. $55,000 5.25% 2/4/2030 67,524 0.00%Verisk Analytics, Inc. $50,000 5.50% 15/6/2045 67,450 0.00%Moody's Corp. $50,000 5.25% 15/7/2044 67,445 0.00%Emerson Electric Co. $50,000 5.25% 15/11/2039 67,431 0.00%Waste Management of Canada Corp. CA($)80,000 2.60% 23/9/2026 67,264 0.00%Oglethorpe Power Corp. $50,000 5.95% 1/11/2039 66,728 0.00%Archer-Daniels-Midland Co. $50,000 4.50% 15/3/2049 66,620 0.00%SBL Holdings, Inc. $60,000 5.13% 13/11/2026 66,561 0.00%Hyatt Hotels Corp. $60,000 4.38% 15/9/2028 66,188 0.00%Progressive Corp. $50,000 6.63% 1/3/2029 66,055 0.00%NSTAR Electric Co. $60,000 3.25% 15/5/2029 66,009 0.00%Kohl's Corp. $55,000 5.55% 17/7/2045 65,954 0.00%
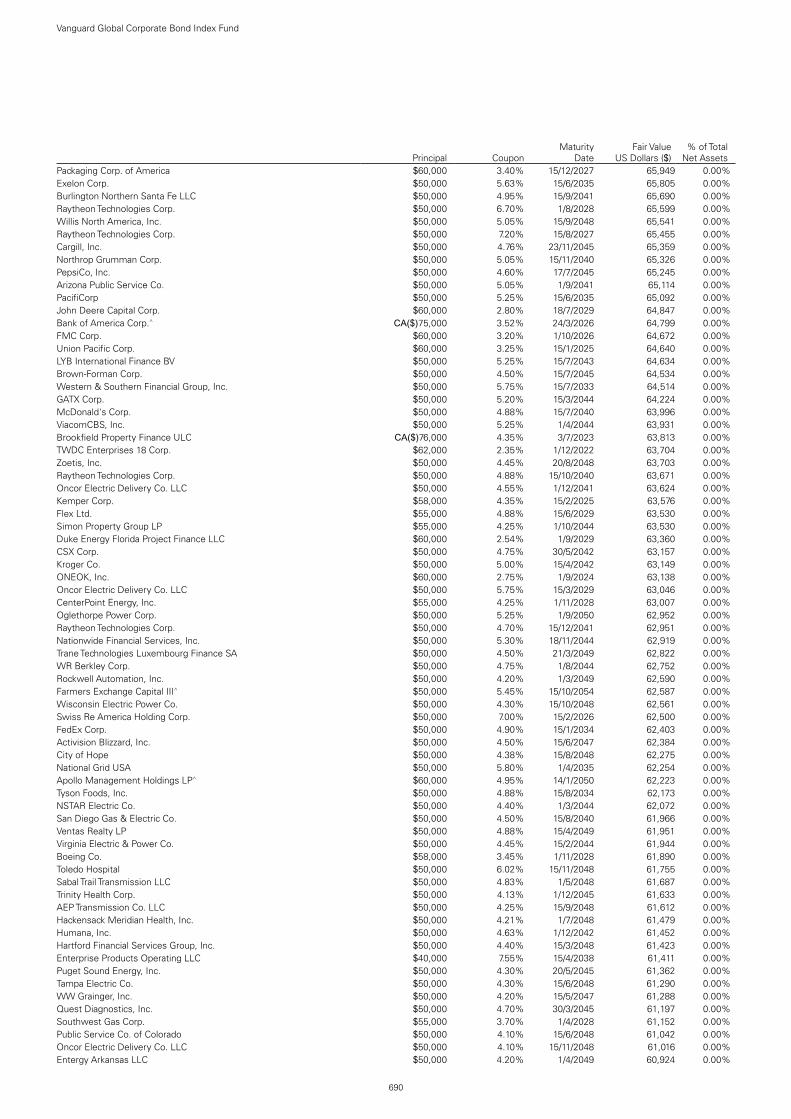
690
Vanguard Global Corporate Bond Index Fund
Principal CouponMaturity
DateFair Value
US Dollars ($)% of Total
Net AssetsPackaging Corp. of America $60,000 3.40% 15/12/2027 65,949 0.00%Exelon Corp. $50,000 5.63% 15/6/2035 65,805 0.00%Burlington Northern Santa Fe LLC $50,000 4.95% 15/9/2041 65,690 0.00%Raytheon Technologies Corp. $50,000 6.70% 1/8/2028 65,599 0.00%Willis North America, Inc. $50,000 5.05% 15/9/2048 65,541 0.00%Raytheon Technologies Corp. $50,000 7.20% 15/8/2027 65,455 0.00%Cargill, Inc. $50,000 4.76% 23/11/2045 65,359 0.00%Northrop Grumman Corp. $50,000 5.05% 15/11/2040 65,326 0.00%PepsiCo, Inc. $50,000 4.60% 17/7/2045 65,245 0.00%Arizona Public Service Co. $50,000 5.05% 1/9/2041 65,114 0.00%PacifiCorp $50,000 5.25% 15/6/2035 65,092 0.00%John Deere Capital Corp. $60,000 2.80% 18/7/2029 64,847 0.00%Bank of America Corp.^ CA($)75,000 3.52% 24/3/2026 64,799 0.00%FMC Corp. $60,000 3.20% 1/10/2026 64,672 0.00%Union Pacific Corp. $60,000 3.25% 15/1/2025 64,640 0.00%LYB International Finance BV $50,000 5.25% 15/7/2043 64,634 0.00%Brown-Forman Corp. $50,000 4.50% 15/7/2045 64,534 0.00%Western & Southern Financial Group, Inc. $50,000 5.75% 15/7/2033 64,514 0.00%GATX Corp. $50,000 5.20% 15/3/2044 64,224 0.00%McDonald's Corp. $50,000 4.88% 15/7/2040 63,996 0.00%ViacomCBS, Inc. $50,000 5.25% 1/4/2044 63,931 0.00%Brookfield Property Finance ULC CA($)76,000 4.35% 3/7/2023 63,813 0.00%TWDC Enterprises 18 Corp. $62,000 2.35% 1/12/2022 63,704 0.00%Zoetis, Inc. $50,000 4.45% 20/8/2048 63,703 0.00%Raytheon Technologies Corp. $50,000 4.88% 15/10/2040 63,671 0.00%Oncor Electric Delivery Co. LLC $50,000 4.55% 1/12/2041 63,624 0.00%Kemper Corp. $58,000 4.35% 15/2/2025 63,576 0.00%Flex Ltd. $55,000 4.88% 15/6/2029 63,530 0.00%Simon Property Group LP $55,000 4.25% 1/10/2044 63,530 0.00%Duke Energy Florida Project Finance LLC $60,000 2.54% 1/9/2029 63,360 0.00%CSX Corp. $50,000 4.75% 30/5/2042 63,157 0.00%Kroger Co. $50,000 5.00% 15/4/2042 63,149 0.00%ONEOK, Inc. $60,000 2.75% 1/9/2024 63,138 0.00%Oncor Electric Delivery Co. LLC $50,000 5.75% 15/3/2029 63,046 0.00%CenterPoint Energy, Inc. $55,000 4.25% 1/11/2028 63,007 0.00%Oglethorpe Power Corp. $50,000 5.25% 1/9/2050 62,952 0.00%Raytheon Technologies Corp. $50,000 4.70% 15/12/2041 62,951 0.00%Nationwide Financial Services, Inc. $50,000 5.30% 18/11/2044 62,919 0.00%Trane Technologies Luxembourg Finance SA $50,000 4.50% 21/3/2049 62,822 0.00%WR Berkley Corp. $50,000 4.75% 1/8/2044 62,752 0.00%Rockwell Automation, Inc. $50,000 4.20% 1/3/2049 62,590 0.00%Farmers Exchange Capital III^ $50,000 5.45% 15/10/2054 62,587 0.00%Wisconsin Electric Power Co. $50,000 4.30% 15/10/2048 62,561 0.00%Swiss Re America Holding Corp. $50,000 7.00% 15/2/2026 62,500 0.00%FedEx Corp. $50,000 4.90% 15/1/2034 62,403 0.00%Activision Blizzard, Inc. $50,000 4.50% 15/6/2047 62,384 0.00%City of Hope $50,000 4.38% 15/8/2048 62,275 0.00%National Grid USA $50,000 5.80% 1/4/2035 62,254 0.00%Apollo Management Holdings LP^ $60,000 4.95% 14/1/2050 62,223 0.00%Tyson Foods, Inc. $50,000 4.88% 15/8/2034 62,173 0.00%NSTAR Electric Co. $50,000 4.40% 1/3/2044 62,072 0.00%San Diego Gas & Electric Co. $50,000 4.50% 15/8/2040 61,966 0.00%Ventas Realty LP $50,000 4.88% 15/4/2049 61,951 0.00%Virginia Electric & Power Co. $50,000 4.45% 15/2/2044 61,944 0.00%Boeing Co. $58,000 3.45% 1/11/2028 61,890 0.00%Toledo Hospital $50,000 6.02% 15/11/2048 61,755 0.00%Sabal Trail Transmission LLC $50,000 4.83% 1/5/2048 61,687 0.00%Trinity Health Corp. $50,000 4.13% 1/12/2045 61,633 0.00%AEP Transmission Co. LLC $50,000 4.25% 15/9/2048 61,612 0.00%Hackensack Meridian Health, Inc. $50,000 4.21% 1/7/2048 61,479 0.00%Humana, Inc. $50,000 4.63% 1/12/2042 61,452 0.00%Hartford Financial Services Group, Inc. $50,000 4.40% 15/3/2048 61,423 0.00%Enterprise Products Operating LLC $40,000 7.55% 15/4/2038 61,411 0.00%Puget Sound Energy, Inc. $50,000 4.30% 20/5/2045 61,362 0.00%Tampa Electric Co. $50,000 4.30% 15/6/2048 61,290 0.00%WW Grainger, Inc. $50,000 4.20% 15/5/2047 61,288 0.00%Quest Diagnostics, Inc. $50,000 4.70% 30/3/2045 61,197 0.00%Southwest Gas Corp. $55,000 3.70% 1/4/2028 61,152 0.00%Public Service Co. of Colorado $50,000 4.10% 15/6/2048 61,042 0.00%Oncor Electric Delivery Co. LLC $50,000 4.10% 15/11/2048 61,016 0.00%Entergy Arkansas LLC $50,000 4.20% 1/4/2049 60,924 0.00%

691
Vanguard Global Corporate Bond Index Fund
Principal CouponMaturity
DateFair Value
US Dollars ($)% of Total
Net AssetsIndiana Michigan Power Co. $50,000 4.25% 15/8/2048 60,850 0.00%Arizona Public Service Co. $50,000 4.25% 1/3/2049 60,811 0.00%Ventas Canada Finance Ltd. CA($)70,000 4.13% 30/9/2024 60,811 0.00%Massachusetts Institute of Technology $55,000 2.99% 1/7/2050 60,783 0.00%Ameren Illinois Co. $50,000 4.15% 15/3/2046 60,777 0.00%Florida Power & Light Co. $50,000 4.05% 1/6/2042 60,741 0.00%DTE Electric Co. $50,000 4.05% 15/5/2048 60,700 0.00%AXIS Specialty Finance LLC $55,000 3.90% 15/7/2029 60,608 0.00%Regency Centers LP $50,000 4.65% 15/3/2049 60,592 0.00%Montefiore Obligated Group $50,000 5.25% 1/11/2048 60,405 0.00%Valmont Industries, Inc. $50,000 5.00% 1/10/2044 60,402 0.00%Principal Financial Group, Inc. $50,000 4.35% 15/5/2043 60,206 0.00%Ohio Power Co. $50,000 4.15% 1/4/2048 60,077 0.00%Whirlpool Corp. $50,000 4.50% 1/6/2046 60,073 0.00%MetLife, Inc. $50,000 4.05% 1/3/2045 60,030 0.00%Duke University Health System, Inc. $50,000 3.92% 1/6/2047 60,002 0.00%Commonwealth Edison Co. $50,000 4.00% 1/3/2049 59,922 0.00%Kimco Realty Corp. $50,000 4.45% 1/9/2047 59,860 0.00%Northern States Power Co. $50,000 4.00% 15/8/2045 59,746 0.00%Starbucks Corp. $50,000 4.30% 15/6/2045 59,477 0.00%Black Hills Corp. $55,000 3.88% 15/10/2049 59,315 0.00%General Electric Co. $50,000 5.55% 5/1/2026 59,298 0.00%MidAmerican Energy Co. $50,000 3.95% 1/8/2047 59,271 0.00%Sysco Corp. $50,000 4.50% 1/4/2046 59,223 0.00%Mississippi Power Co. $50,000 4.25% 15/3/2042 59,093 0.00%Blackstone Holdings Finance Co. LLC $50,000 4.00% 2/10/2047 59,089 0.00%General Motors Financial of Canada Ltd. CA($)65,000 5.95% 14/5/2024 59,029 0.00%Public Service Electric & Gas Co. $50,000 3.95% 1/5/2042 59,021 0.00%Dartmouth-Hitchcock Health $50,000 4.18% 1/8/2048 58,883 0.00%Mercy Health $50,000 4.30% 1/7/2028 58,766 0.00%NorthWestern Corp. $50,000 4.18% 15/11/2044 58,719 0.00%Lowe's Cos, Inc. $55,000 3.88% 15/9/2023 58,705 0.00%Apollo Management Holdings LP $50,000 4.87% 15/2/2029 58,621 0.00%Westlake Chemical Corp. $50,000 4.38% 15/11/2047 58,616 0.00%John Deere Financial, Inc. CA($)70,000 2.41% 14/1/2025 58,603 0.00%Eastern Energy Gas Holdings LLC $50,000 4.60% 15/12/2044 58,546 0.00%HCN Canadian Holdings-1 LP CA($)70,000 2.95% 15/1/2027 58,535 0.00%Martin Marietta Materials, Inc. $50,000 4.25% 15/12/2047 58,415 0.00%Aptiv plc $50,000 4.40% 1/10/2046 58,368 0.00%Toledo Hospital $50,000 5.33% 15/11/2028 58,325 0.00%Assurant, Inc. $50,000 4.90% 27/3/2028 58,273 0.00%Eaton Corp. $50,000 4.00% 2/11/2032 58,246 0.00%Legg Mason, Inc. $50,000 4.75% 15/3/2026 58,233 0.00%Micron Technology, Inc. $50,000 4.66% 15/2/2030 58,212 0.00%Cardinal Health, Inc. $50,000 4.60% 15/3/2043 58,183 0.00%Kinder Morgan Energy Partners LP $50,000 4.70% 1/11/2042 58,163 0.00%Lam Research Corp. $50,000 4.00% 15/3/2029 58,153 0.00%Regency Centers LP $50,000 4.40% 1/2/2047 58,111 0.00%Aflac, Inc. $50,000 4.00% 15/10/2046 58,100 0.00%Providence St Joseph Health Obligated Group $50,000 3.93% 1/10/2048 58,027 0.00%NIKE, Inc. $50,000 3.63% 1/5/2043 58,010 0.00%CenterPoint Energy, Inc. $55,000 2.95% 1/3/2030 57,994 0.00%International Flavors & Fragrances, Inc. $50,000 4.45% 26/9/2028 57,864 0.00%President & Fellows of Harvard College $50,000 3.30% 15/7/2056 57,814 0.00%Republic Services, Inc. $54,000 4.75% 15/5/2023 57,812 0.00%Global Payments, Inc. $50,000 4.45% 1/6/2028 57,617 0.00%General Dynamics Corp. $50,000 3.60% 15/11/2042 57,590 0.00%Brown & Brown, Inc. $50,000 4.50% 15/3/2029 57,424 0.00%Aetna, Inc. $50,000 4.13% 15/11/2042 57,294 0.00%Prologis LP $50,000 3.88% 15/9/2028 57,210 0.00%Ameren Illinois Co. $50,000 3.70% 1/12/2047 57,194 0.00%FedEx Corp. $50,000 4.10% 1/2/2045 57,147 0.00%San Diego Gas & Electric Co. $50,000 3.75% 1/6/2047 57,146 0.00%TTX Co. $50,000 3.90% 1/2/2045 57,130 0.00%Commonwealth Edison Co. $50,000 3.70% 1/3/2045 57,124 0.00%Toyota Motor Credit Corp. $50,000 3.65% 8/1/2029 57,055 0.00%Caterpillar, Inc. $45,000 4.30% 15/5/2044 57,000 0.00%Public Service Electric & Gas Co. $50,000 3.60% 1/12/2047 56,928 0.00%PPL Capital Funding, Inc. $45,000 4.70% 1/6/2043 56,886 0.00%National Retail Properties, Inc. $50,000 4.30% 15/10/2028 56,858 0.00%Consumers Energy Co. $50,000 3.80% 15/11/2028 56,828 0.00%
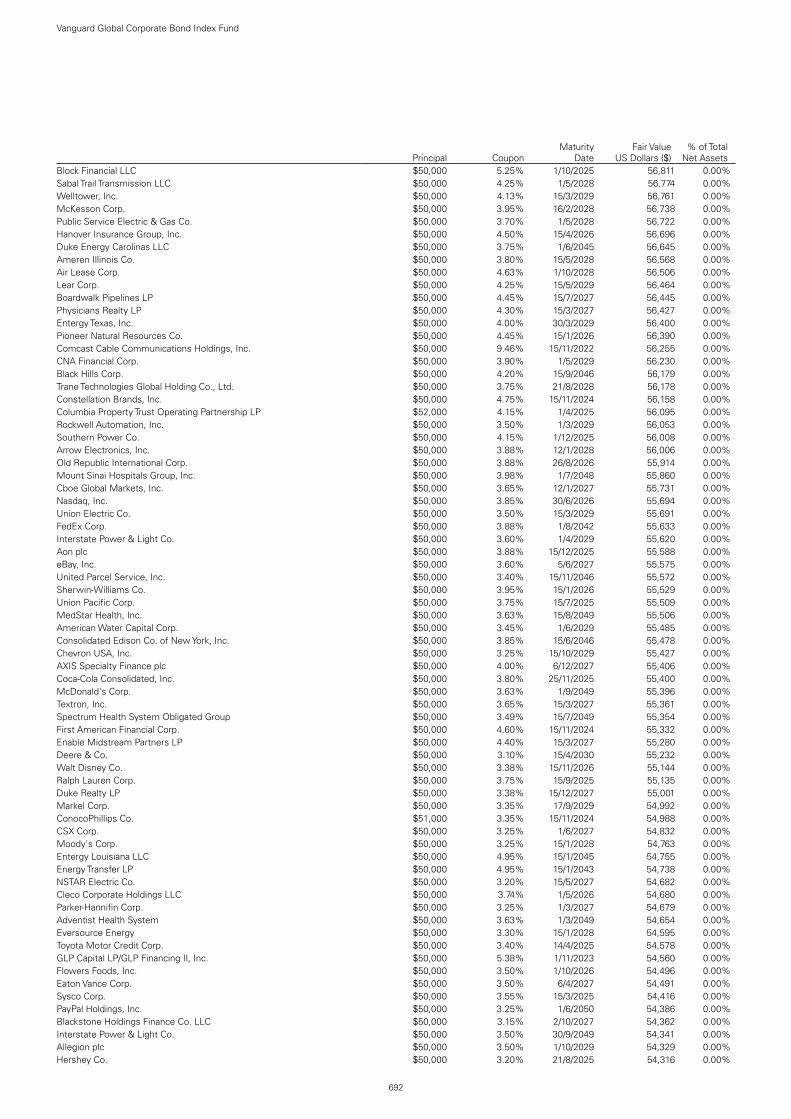
692
Vanguard Global Corporate Bond Index Fund
Principal CouponMaturity
DateFair Value
US Dollars ($)% of Total
Net AssetsBlock Financial LLC $50,000 5.25% 1/10/2025 56,811 0.00%Sabal Trail Transmission LLC $50,000 4.25% 1/5/2028 56,774 0.00%Welltower, Inc. $50,000 4.13% 15/3/2029 56,761 0.00%McKesson Corp. $50,000 3.95% 16/2/2028 56,738 0.00%Public Service Electric & Gas Co. $50,000 3.70% 1/5/2028 56,722 0.00%Hanover Insurance Group, Inc. $50,000 4.50% 15/4/2026 56,696 0.00%Duke Energy Carolinas LLC $50,000 3.75% 1/6/2045 56,645 0.00%Ameren Illinois Co. $50,000 3.80% 15/5/2028 56,568 0.00%Air Lease Corp. $50,000 4.63% 1/10/2028 56,506 0.00%Lear Corp. $50,000 4.25% 15/5/2029 56,464 0.00%Boardwalk Pipelines LP $50,000 4.45% 15/7/2027 56,445 0.00%Physicians Realty LP $50,000 4.30% 15/3/2027 56,427 0.00%Entergy Texas, Inc. $50,000 4.00% 30/3/2029 56,400 0.00%Pioneer Natural Resources Co. $50,000 4.45% 15/1/2026 56,390 0.00%Comcast Cable Communications Holdings, Inc. $50,000 9.46% 15/11/2022 56,255 0.00%CNA Financial Corp. $50,000 3.90% 1/5/2029 56,230 0.00%Black Hills Corp. $50,000 4.20% 15/9/2046 56,179 0.00%Trane Technologies Global Holding Co., Ltd. $50,000 3.75% 21/8/2028 56,178 0.00%Constellation Brands, Inc. $50,000 4.75% 15/11/2024 56,158 0.00%Columbia Property Trust Operating Partnership LP $52,000 4.15% 1/4/2025 56,095 0.00%Rockwell Automation, Inc. $50,000 3.50% 1/3/2029 56,053 0.00%Southern Power Co. $50,000 4.15% 1/12/2025 56,008 0.00%Arrow Electronics, Inc. $50,000 3.88% 12/1/2028 56,006 0.00%Old Republic International Corp. $50,000 3.88% 26/8/2026 55,914 0.00%Mount Sinai Hospitals Group, Inc. $50,000 3.98% 1/7/2048 55,860 0.00%Cboe Global Markets, Inc. $50,000 3.65% 12/1/2027 55,731 0.00%Nasdaq, Inc. $50,000 3.85% 30/6/2026 55,694 0.00%Union Electric Co. $50,000 3.50% 15/3/2029 55,691 0.00%FedEx Corp. $50,000 3.88% 1/8/2042 55,633 0.00%Interstate Power & Light Co. $50,000 3.60% 1/4/2029 55,620 0.00%Aon plc $50,000 3.88% 15/12/2025 55,588 0.00%eBay, Inc. $50,000 3.60% 5/6/2027 55,575 0.00%United Parcel Service, Inc. $50,000 3.40% 15/11/2046 55,572 0.00%Sherwin-Williams Co. $50,000 3.95% 15/1/2026 55,529 0.00%Union Pacific Corp. $50,000 3.75% 15/7/2025 55,509 0.00%MedStar Health, Inc. $50,000 3.63% 15/8/2049 55,506 0.00%American Water Capital Corp. $50,000 3.45% 1/6/2029 55,485 0.00%Consolidated Edison Co. of New York, Inc. $50,000 3.85% 15/6/2046 55,478 0.00%Chevron USA, Inc. $50,000 3.25% 15/10/2029 55,427 0.00%AXIS Specialty Finance plc $50,000 4.00% 6/12/2027 55,406 0.00%Coca-Cola Consolidated, Inc. $50,000 3.80% 25/11/2025 55,400 0.00%McDonald's Corp. $50,000 3.63% 1/9/2049 55,396 0.00%Textron, Inc. $50,000 3.65% 15/3/2027 55,361 0.00%Spectrum Health System Obligated Group $50,000 3.49% 15/7/2049 55,354 0.00%First American Financial Corp. $50,000 4.60% 15/11/2024 55,332 0.00%Enable Midstream Partners LP $50,000 4.40% 15/3/2027 55,280 0.00%Deere & Co. $50,000 3.10% 15/4/2030 55,232 0.00%Walt Disney Co. $50,000 3.38% 15/11/2026 55,144 0.00%Ralph Lauren Corp. $50,000 3.75% 15/9/2025 55,135 0.00%Duke Realty LP $50,000 3.38% 15/12/2027 55,001 0.00%Markel Corp. $50,000 3.35% 17/9/2029 54,992 0.00%ConocoPhillips Co. $51,000 3.35% 15/11/2024 54,988 0.00%CSX Corp. $50,000 3.25% 1/6/2027 54,832 0.00%Moody's Corp. $50,000 3.25% 15/1/2028 54,763 0.00%Entergy Louisiana LLC $50,000 4.95% 15/1/2045 54,755 0.00%Energy Transfer LP $50,000 4.95% 15/1/2043 54,738 0.00%NSTAR Electric Co. $50,000 3.20% 15/5/2027 54,682 0.00%Cleco Corporate Holdings LLC $50,000 3.74% 1/5/2026 54,680 0.00%Parker-Hannifin Corp. $50,000 3.25% 1/3/2027 54,679 0.00%Adventist Health System $50,000 3.63% 1/3/2049 54,654 0.00%Eversource Energy $50,000 3.30% 15/1/2028 54,595 0.00%Toyota Motor Credit Corp. $50,000 3.40% 14/4/2025 54,578 0.00%GLP Capital LP/GLP Financing II, Inc. $50,000 5.38% 1/11/2023 54,560 0.00%Flowers Foods, Inc. $50,000 3.50% 1/10/2026 54,496 0.00%Eaton Vance Corp. $50,000 3.50% 6/4/2027 54,491 0.00%Sysco Corp. $50,000 3.55% 15/3/2025 54,416 0.00%PayPal Holdings, Inc. $50,000 3.25% 1/6/2050 54,386 0.00%Blackstone Holdings Finance Co. LLC $50,000 3.15% 2/10/2027 54,362 0.00%Interstate Power & Light Co. $50,000 3.50% 30/9/2049 54,341 0.00%Allegion plc $50,000 3.50% 1/10/2029 54,329 0.00%Hershey Co. $50,000 3.20% 21/8/2025 54,316 0.00%
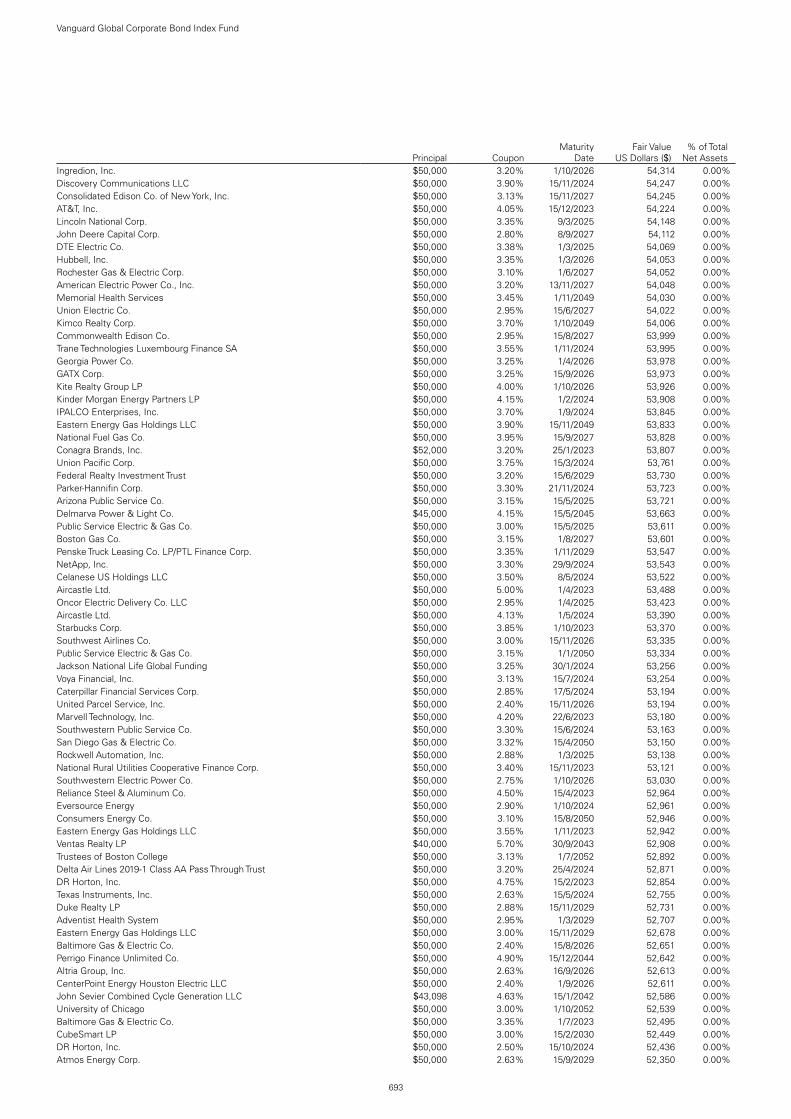
693
Vanguard Global Corporate Bond Index Fund
Principal CouponMaturity
DateFair Value
US Dollars ($)% of Total
Net AssetsIngredion, Inc. $50,000 3.20% 1/10/2026 54,314 0.00%Discovery Communications LLC $50,000 3.90% 15/11/2024 54,247 0.00%Consolidated Edison Co. of New York, Inc. $50,000 3.13% 15/11/2027 54,245 0.00%AT&T, Inc. $50,000 4.05% 15/12/2023 54,224 0.00%Lincoln National Corp. $50,000 3.35% 9/3/2025 54,148 0.00%John Deere Capital Corp. $50,000 2.80% 8/9/2027 54,112 0.00%DTE Electric Co. $50,000 3.38% 1/3/2025 54,069 0.00%Hubbell, Inc. $50,000 3.35% 1/3/2026 54,053 0.00%Rochester Gas & Electric Corp. $50,000 3.10% 1/6/2027 54,052 0.00%American Electric Power Co., Inc. $50,000 3.20% 13/11/2027 54,048 0.00%Memorial Health Services $50,000 3.45% 1/11/2049 54,030 0.00%Union Electric Co. $50,000 2.95% 15/6/2027 54,022 0.00%Kimco Realty Corp. $50,000 3.70% 1/10/2049 54,006 0.00%Commonwealth Edison Co. $50,000 2.95% 15/8/2027 53,999 0.00%Trane Technologies Luxembourg Finance SA $50,000 3.55% 1/11/2024 53,995 0.00%Georgia Power Co. $50,000 3.25% 1/4/2026 53,978 0.00%GATX Corp. $50,000 3.25% 15/9/2026 53,973 0.00%Kite Realty Group LP $50,000 4.00% 1/10/2026 53,926 0.00%Kinder Morgan Energy Partners LP $50,000 4.15% 1/2/2024 53,908 0.00%IPALCO Enterprises, Inc. $50,000 3.70% 1/9/2024 53,845 0.00%Eastern Energy Gas Holdings LLC $50,000 3.90% 15/11/2049 53,833 0.00%National Fuel Gas Co. $50,000 3.95% 15/9/2027 53,828 0.00%Conagra Brands, Inc. $52,000 3.20% 25/1/2023 53,807 0.00%Union Pacific Corp. $50,000 3.75% 15/3/2024 53,761 0.00%Federal Realty Investment Trust $50,000 3.20% 15/6/2029 53,730 0.00%Parker-Hannifin Corp. $50,000 3.30% 21/11/2024 53,723 0.00%Arizona Public Service Co. $50,000 3.15% 15/5/2025 53,721 0.00%Delmarva Power & Light Co. $45,000 4.15% 15/5/2045 53,663 0.00%Public Service Electric & Gas Co. $50,000 3.00% 15/5/2025 53,611 0.00%Boston Gas Co. $50,000 3.15% 1/8/2027 53,601 0.00%Penske Truck Leasing Co. LP/PTL Finance Corp. $50,000 3.35% 1/11/2029 53,547 0.00%NetApp, Inc. $50,000 3.30% 29/9/2024 53,543 0.00%Celanese US Holdings LLC $50,000 3.50% 8/5/2024 53,522 0.00%Aircastle Ltd. $50,000 5.00% 1/4/2023 53,488 0.00%Oncor Electric Delivery Co. LLC $50,000 2.95% 1/4/2025 53,423 0.00%Aircastle Ltd. $50,000 4.13% 1/5/2024 53,390 0.00%Starbucks Corp. $50,000 3.85% 1/10/2023 53,370 0.00%Southwest Airlines Co. $50,000 3.00% 15/11/2026 53,335 0.00%Public Service Electric & Gas Co. $50,000 3.15% 1/1/2050 53,334 0.00%Jackson National Life Global Funding $50,000 3.25% 30/1/2024 53,256 0.00%Voya Financial, Inc. $50,000 3.13% 15/7/2024 53,254 0.00%Caterpillar Financial Services Corp. $50,000 2.85% 17/5/2024 53,194 0.00%United Parcel Service, Inc. $50,000 2.40% 15/11/2026 53,194 0.00%Marvell Technology, Inc. $50,000 4.20% 22/6/2023 53,180 0.00%Southwestern Public Service Co. $50,000 3.30% 15/6/2024 53,163 0.00%San Diego Gas & Electric Co. $50,000 3.32% 15/4/2050 53,150 0.00%Rockwell Automation, Inc. $50,000 2.88% 1/3/2025 53,138 0.00%National Rural Utilities Cooperative Finance Corp. $50,000 3.40% 15/11/2023 53,121 0.00%Southwestern Electric Power Co. $50,000 2.75% 1/10/2026 53,030 0.00%Reliance Steel & Aluminum Co. $50,000 4.50% 15/4/2023 52,964 0.00%Eversource Energy $50,000 2.90% 1/10/2024 52,961 0.00%Consumers Energy Co. $50,000 3.10% 15/8/2050 52,946 0.00%Eastern Energy Gas Holdings LLC $50,000 3.55% 1/11/2023 52,942 0.00%Ventas Realty LP $40,000 5.70% 30/9/2043 52,908 0.00%Trustees of Boston College $50,000 3.13% 1/7/2052 52,892 0.00%Delta Air Lines 2019-1 Class AA Pass Through Trust $50,000 3.20% 25/4/2024 52,871 0.00%DR Horton, Inc. $50,000 4.75% 15/2/2023 52,854 0.00%Texas Instruments, Inc. $50,000 2.63% 15/5/2024 52,755 0.00%Duke Realty LP $50,000 2.88% 15/11/2029 52,731 0.00%Adventist Health System $50,000 2.95% 1/3/2029 52,707 0.00%Eastern Energy Gas Holdings LLC $50,000 3.00% 15/11/2029 52,678 0.00%Baltimore Gas & Electric Co. $50,000 2.40% 15/8/2026 52,651 0.00%Perrigo Finance Unlimited Co. $50,000 4.90% 15/12/2044 52,642 0.00%Altria Group, Inc. $50,000 2.63% 16/9/2026 52,613 0.00%CenterPoint Energy Houston Electric LLC $50,000 2.40% 1/9/2026 52,611 0.00%John Sevier Combined Cycle Generation LLC $43,098 4.63% 15/1/2042 52,586 0.00%University of Chicago $50,000 3.00% 1/10/2052 52,539 0.00%Baltimore Gas & Electric Co. $50,000 3.35% 1/7/2023 52,495 0.00%CubeSmart LP $50,000 3.00% 15/2/2030 52,449 0.00%DR Horton, Inc. $50,000 2.50% 15/10/2024 52,436 0.00%Atmos Energy Corp. $50,000 2.63% 15/9/2029 52,350 0.00%

694
Vanguard Global Corporate Bond Index Fund
Principal CouponMaturity
DateFair Value
US Dollars ($)% of Total
Net AssetsPPG Industries, Inc. $50,000 2.40% 15/8/2024 52,314 0.00%Wisconsin Electric Power Co. $50,000 2.05% 15/12/2024 52,294 0.00%Hershey Co. $50,000 2.05% 15/11/2024 52,206 0.00%Mohawk Industries, Inc. $50,000 3.85% 1/2/2023 52,202 0.00%Duke Energy Carolinas LLC $50,000 3.05% 15/3/2023 52,196 0.00%Phillips 66 Partners LP $50,000 2.45% 15/12/2024 52,189 0.00%Primerica, Inc. $50,000 4.75% 15/7/2022 52,117 0.00%Maxim Integrated Products, Inc. $50,000 3.38% 15/3/2023 52,091 0.00%Hyatt Hotels Corp. $50,000 3.38% 15/7/2023 52,065 0.00%Texas Instruments, Inc. $50,000 2.25% 4/9/2029 52,059 0.00%Williams Cos, Inc. $50,000 3.70% 15/1/2023 52,050 0.00%Block Financial LLC $50,000 5.50% 1/11/2022 52,001 0.00%Piedmont Operating Partnership LP $50,000 3.40% 1/6/2023 51,972 0.00%Harley-Davidson Financial Services, Inc. $50,000 3.35% 15/2/2023 51,946 0.00%Globe Life, Inc. $50,000 3.80% 15/9/2022 51,937 0.00%Ares Capital Corp. $50,000 3.50% 10/2/2023 51,900 0.00%Guardian Life Insurance Co. of America $50,000 3.70% 22/1/2070 51,893 0.00%AEP Texas, Inc. $50,000 3.45% 15/1/2050 51,855 0.00%DR Horton, Inc. $50,000 4.38% 15/9/2022 51,830 0.00%Mosaic Co. $50,000 3.25% 15/11/2022 51,757 0.00%Virginia Electric & Power Co. $50,000 2.75% 15/3/2023 51,725 0.00%Equifax, Inc. $50,000 3.30% 15/12/2022 51,715 0.00%Office Properties Income Trust $50,000 4.00% 15/7/2022 51,625 0.00%PPL Electric Utilities Corp. $50,000 3.00% 1/10/2049 51,625 0.00%Emerson Electric Co. $50,000 2.63% 15/2/2023 51,589 0.00%Roper Technologies, Inc. $50,000 3.13% 15/11/2022 51,513 0.00%American Electric Power Co., Inc. $50,000 2.95% 15/12/2022 51,489 0.00%SL Green Operating Partnership LP $50,000 3.25% 15/10/2022 51,459 0.00%Niagara Mohawk Power Corp. $50,000 2.72% 28/11/2022 51,447 0.00%McKesson Corp. $50,000 2.70% 15/12/2022 51,334 0.00%TWDC Enterprises 18 Corp. $50,000 3.00% 30/7/2046 51,325 0.00%Eli Lilly & Co. $48,000 2.75% 1/6/2025 51,312 0.00%WEC Energy Group, Inc. $47,000 3.55% 15/6/2025 51,239 0.00%PPL Capital Funding, Inc. $50,000 4.20% 15/6/2022 51,224 0.00%ConocoPhillips Co. $50,000 2.40% 15/12/2022 51,199 0.00%Caterpillar Financial Services Corp. $50,000 1.45% 15/5/2025 51,192 0.00%DTE Energy Co. $50,000 2.25% 1/11/2022 51,184 0.00%3M Co. $50,000 1.75% 14/2/2023 51,121 0.00%Ecolab, Inc. $50,000 2.38% 10/8/2022 51,046 0.00%NSTAR Electric Co. $50,000 2.38% 15/10/2022 51,009 0.00%Boeing Co. $50,000 1.88% 15/6/2023 50,975 0.00%Bristol-Myers Squibb Co. $50,000 2.00% 1/8/2022 50,946 0.00%Edison International $50,000 2.40% 15/9/2022 50,872 0.00%Martin Marietta Materials, Inc. $50,000 2.50% 15/3/2030 50,846 0.00%Midwest Connector Capital Co. LLC $50,000 3.63% 1/4/2022 50,815 0.00%Public Service Co. of Colorado $50,000 2.25% 15/9/2022 50,671 0.00%Cadence Design Systems, Inc. $46,000 4.38% 15/10/2024 50,593 0.00%John Deere Financial, Inc. CA($)60,000 2.58% 16/10/2026 50,590 0.00%Amazon.com, Inc. $50,000 3.30% 5/12/2021 50,399 0.00%Duke Energy Ohio, Inc. $50,000 2.13% 1/6/2030 50,242 0.00%Sysco Corp. $50,000 3.30% 15/2/2050 50,178 0.00%Southern California Edison Co. $50,000 3.60% 1/2/2045 50,155 0.00%LYB International Finance III LLC $50,000 1.25% 1/10/2025 49,939 0.00%Boeing Co. $50,000 3.63% 1/3/2048 49,865 0.00%Continental Airlines 2012-2 Class A Pass Through Trust $46,906 4.00% 29/10/2024 49,598 0.00%University of Southern California $50,000 3.23% 1/10/2120 49,560 0.00%Valmont Industries, Inc. $40,000 5.25% 1/10/2054 49,530 0.00%Yale University $50,000 1.48% 15/4/2030 49,370 0.00%Leidos, Inc. $50,000 2.30% 15/2/2031 48,988 0.00%Berkshire Hathaway Finance Corp. $50,000 1.45% 15/10/2030 48,868 0.00%CNH Industrial Capital LLC $45,000 4.20% 15/1/2024 48,717 0.00%National Retail Properties, Inc. $50,000 3.10% 15/4/2050 48,650 0.00%Cardinal Health, Inc. $45,000 3.50% 15/11/2024 48,487 0.00%Gilead Sciences, Inc. $50,000 2.60% 1/10/2040 48,164 0.00%Oshkosh Corp. $45,000 3.10% 1/3/2030 47,673 0.00%Spectra Energy Partners LP $35,000 5.95% 25/9/2043 47,428 0.00%NiSource, Inc. $50,000 1.70% 15/2/2031 47,354 0.00%Principal Life Global Funding II $45,000 2.25% 21/11/2024 46,932 0.00%Edison International $45,000 3.13% 15/11/2022 46,336 0.00%Markel Corp. $35,000 5.00% 5/4/2046 44,980 0.00%Timken Co. $40,000 4.50% 15/12/2028 44,688 0.00%

695
Vanguard Global Corporate Bond Index Fund
Principal CouponMaturity
DateFair Value
US Dollars ($)% of Total
Net AssetsApollo Management Holdings LP $35,000 5.00% 15/3/2048 44,659 0.00%Blackstone Holdings Finance Co. LLC $40,000 3.50% 10/9/2049 44,584 0.00%ONEOK, Inc. $35,000 6.00% 15/6/2035 43,868 0.00%AutoNation, Inc. $40,000 3.80% 15/11/2027 43,839 0.00%National Retail Properties, Inc. $35,000 4.80% 15/10/2048 43,516 0.00%Johnson Controls International plc $31,000 6.00% 15/1/2036 43,416 0.00%Pennsylvania Electric Co. $40,000 3.60% 1/6/2029 42,728 0.00%Sixth Street Specialty Lending, Inc. $40,000 3.88% 1/11/2024 42,544 0.00%BGC Partners, Inc. $40,000 3.75% 1/10/2024 42,350 0.00%DTE Energy Co. $40,000 2.95% 1/3/2030 42,317 0.00%International Paper Co. $38,000 3.80% 15/1/2026 42,234 0.00%Hudson Pacific Properties LP $40,000 3.25% 15/1/2030 42,224 0.00%General Dynamics Corp. $40,000 3.38% 15/5/2023 42,163 0.00%AT&T, Inc. CA($)50,000 2.85% 25/5/2024 42,088 0.00%Oaktree Specialty Lending Corp. $40,000 3.50% 25/2/2025 41,944 0.00%Public Service Electric & Gas Co. $40,000 2.45% 15/1/2030 41,711 0.00%Mutual of Omaha Insurance Co.^ $40,000 4.30% 15/7/2054 41,695 0.00%Kinder Morgan Energy Partners LP $30,000 7.40% 15/3/2031 41,682 0.00%John Deere Canada Funding, Inc. CA($)50,000 2.70% 17/1/2023 41,604 0.00%Apple, Inc. $40,000 2.95% 11/9/2049 41,475 0.00%Duke Energy Indiana LLC $30,000 6.12% 15/10/2035 41,234 0.00%Plains All American Pipeline LP/PAA Finance Corp. $38,000 3.60% 1/11/2024 40,740 0.00%Bank of America Corp.^ CA($)50,000 1.98% 15/9/2027 40,342 0.00%Nucor Corp. $35,000 3.95% 1/5/2028 39,892 0.00%CSX Corp. $30,000 4.65% 1/3/2068 39,378 0.00%Washington Gas Light Co. $35,000 3.65% 15/9/2049 39,306 0.00%Transatlantic Holdings, Inc. $25,000 8.00% 30/11/2039 38,687 0.00%UDR, Inc. $35,000 3.50% 15/1/2028 38,289 0.00%California Institute of Technology $30,000 4.32% 1/8/2045 38,266 0.00%Church & Dwight Co., Inc. $35,000 3.15% 1/8/2027 38,192 0.00%John Deere Capital Corp. $35,000 3.65% 12/10/2023 37,610 0.00%Newmont Corp. $36,000 3.70% 15/3/2023 37,609 0.00%Entergy Texas, Inc. $35,000 3.55% 30/9/2049 37,600 0.00%Healthpeak Properties, Inc. $25,000 6.75% 1/2/2041 37,331 0.00%Regency Centers LP $35,000 2.95% 15/9/2029 36,870 0.00%Nevada Power Co. $25,000 6.75% 1/7/2037 36,349 0.00%American International Group, Inc.^ $25,000 8.18% 15/5/2058 36,076 0.00%Wisconsin Power & Light Co. $25,000 6.38% 15/8/2037 35,738 0.00%Interstate Power & Light Co. $25,000 6.25% 15/7/2039 35,580 0.00%Boston Scientific Corp. $25,000 7.00% 15/11/2035 35,331 0.00%Darden Restaurants, Inc. $30,000 4.55% 15/2/2048 35,240 0.00%General Dynamics Corp. $34,000 2.25% 15/11/2022 34,737 0.00%Honeywell International, Inc. $25,000 5.70% 15/3/2037 34,695 0.00%Public Service Electric & Gas Co. $25,000 5.80% 1/5/2037 34,623 0.00%O'Reilly Automotive, Inc. $30,000 4.20% 1/4/2030 34,615 0.00%Dominion Energy South Carolina, Inc. $25,000 5.45% 1/2/2041 34,261 0.00%Toledo Edison Co. $25,000 6.15% 15/5/2037 34,087 0.00%Boeing Co. $33,000 3.85% 1/11/2048 34,051 0.00%Arrow Electronics, Inc. $31,000 4.00% 1/4/2025 33,641 0.00%Dominion Energy, Inc. $25,000 6.30% 15/3/2033 33,577 0.00%PeaceHealth Obligated Group $25,000 4.79% 15/11/2048 33,382 0.00%Walmart, Inc. $25,000 4.88% 8/7/2040 33,073 0.00%Bacardi Ltd. $25,000 5.30% 15/5/2048 32,493 0.00%Lowe's Cos, Inc. $28,000 4.25% 15/9/2044 32,134 0.00%Trane Technologies Luxembourg Finance SA $25,000 4.65% 1/11/2044 31,654 0.00%Western Union Co. $25,000 6.20% 17/11/2036 31,615 0.00%Albemarle Corp. $25,000 5.45% 1/12/2044 31,568 0.00%Everest Reinsurance Holdings, Inc. $25,000 4.87% 1/6/2044 31,525 0.00%Advocate Health & Hospitals Corp. $25,000 4.27% 15/8/2048 31,523 0.00%General Motors Financial Co., Inc. AU($)40,000 3.85% 21/2/2023 31,442 0.00%Avista Corp. $25,000 4.35% 1/6/2048 31,351 0.00%Southwestern Public Service Co. $25,000 4.40% 15/11/2048 31,341 0.00%Altria Group, Inc. $24,000 6.20% 14/2/2059 31,109 0.00%Southern Natural Gas Co. LLC $25,000 4.80% 15/3/2047 30,530 0.00%Evergy Metro, Inc. $25,000 4.20% 15/3/2048 30,417 0.00%San Diego Gas & Electric Co. $25,000 4.15% 15/5/2048 30,285 0.00%Colgate-Palmolive Co. $25,000 3.70% 1/8/2047 30,177 0.00%Evergy Metro, Inc. $25,000 4.20% 15/6/2047 30,155 0.00%US Treasury Note $30,000 1.25% 30/4/2028 30,103 0.00%Georgia Power Co. $25,000 4.30% 15/3/2042 29,615 0.00%Parker-Hannifin Corp. $25,000 4.20% 21/11/2034 29,414 0.00%

696
Vanguard Global Corporate Bond Index Fund
Principal CouponMaturity
DateFair Value
US Dollars ($)% of Total
Net AssetsDuke Energy Carolinas LLC $25,000 3.95% 15/3/2048 29,339 0.00%American Water Capital Corp. $25,000 4.00% 1/12/2046 29,215 0.00%Indianapolis Power & Light Co. $25,000 4.05% 1/5/2046 29,091 0.00%Kilroy Realty LP $25,000 4.75% 15/12/2028 29,032 0.00%Edwards Lifesciences Corp. $25,000 4.30% 15/6/2028 28,992 0.00%Best Buy Co., Inc. $25,000 4.45% 1/10/2028 28,980 0.00%Allina Health System $25,000 3.89% 15/4/2049 28,917 0.00%Cleveland Electric Illuminating Co. $25,000 4.55% 15/11/2030 28,885 0.00%Quest Diagnostics, Inc. $25,000 4.20% 30/6/2029 28,837 0.00%Electronic Arts, Inc. $25,000 4.80% 1/3/2026 28,801 0.00%UnitedHealth Group, Inc. $25,000 3.88% 15/12/2028 28,789 0.00%CHRISTUS Health $25,000 4.34% 1/7/2028 28,747 0.00%CubeSmart LP $25,000 4.38% 15/2/2029 28,599 0.00%Valero Energy Partners LP $25,000 4.50% 15/3/2028 28,484 0.00%Zoetis, Inc. $25,000 3.90% 20/8/2028 28,469 0.00%Alliant Energy Finance LLC $25,000 4.25% 15/6/2028 28,465 0.00%National Rural Utilities Cooperative Finance Corp. $25,000 3.90% 1/11/2028 28,398 0.00%Wisconsin Public Service Corp. $25,000 3.67% 1/12/2042 28,373 0.00%VEREIT Operating Partnership LP $25,000 4.63% 1/11/2025 28,336 0.00%Advocate Health & Hospitals Corp. $25,000 3.83% 15/8/2028 28,305 0.00%Time Warner Entertainment Co. LP $25,000 8.38% 15/3/2023 28,249 0.00%Constellation Brands, Inc. $25,000 4.40% 15/11/2025 28,234 0.00%CenterPoint Energy Houston Electric LLC $25,000 3.55% 1/8/2042 28,129 0.00%Mid-Atlantic Interstate Transmission LLC $25,000 4.10% 15/5/2028 28,109 0.00%Penske Truck Leasing Co. LP/PTL Finance Corp. $25,000 4.20% 1/4/2027 28,093 0.00%L3Harris Technologies, Inc. $25,000 3.85% 15/12/2026 28,068 0.00%Union Pacific Corp. $25,000 3.60% 15/9/2037 27,988 0.00%Sutter Health $25,000 3.70% 15/8/2028 27,972 0.00%Public Storage $25,000 3.39% 1/5/2029 27,766 0.00%Brooklyn Union Gas Co. $25,000 3.87% 4/3/2029 27,719 0.00%Harley-Davidson, Inc. $25,000 4.63% 28/7/2045 27,581 0.00%Honeywell International, Inc. $20,000 5.70% 15/3/2036 27,548 0.00%Stanley Black & Decker, Inc. $25,000 3.40% 1/3/2026 27,496 0.00%Norfolk Southern Corp. $25,000 3.65% 1/8/2025 27,485 0.00%Highwoods Realty LP $25,000 3.88% 1/3/2027 27,471 0.00%Broadridge Financial Solutions, Inc. $25,000 3.40% 27/6/2026 27,456 0.00%Cargill, Inc. $25,000 3.25% 23/5/2029 27,448 0.00%RPM International, Inc. $25,000 3.75% 15/3/2027 27,447 0.00%Sabra Health Care LP $25,000 4.80% 1/6/2024 27,334 0.00%LYB International Finance II BV $25,000 3.50% 2/3/2027 27,281 0.00%Realty Income Corp. $25,000 3.25% 15/6/2029 27,238 0.00%RenaissanceRe Finance, Inc. $25,000 3.70% 1/4/2025 27,215 0.00%Oklahoma Gas & Electric Co. $25,000 3.25% 1/4/2030 27,194 0.00%Affiliated Managers Group, Inc. $25,000 3.50% 1/8/2025 27,175 0.00%Aspen Insurance Holdings Ltd. $25,000 4.65% 15/11/2023 27,171 0.00%Kimberly-Clark Corp. $25,000 2.75% 15/2/2026 27,131 0.00%AbbVie, Inc. $25,000 3.85% 15/6/2024 27,107 0.00%Arizona Public Service Co. $25,000 2.95% 15/9/2027 27,051 0.00%Wisconsin Power & Light Co. $25,000 3.05% 15/10/2027 27,050 0.00%UDR, Inc. $25,000 3.20% 15/1/2030 27,049 0.00%Piedmont Natural Gas Co., Inc. $25,000 3.64% 1/11/2046 26,978 0.00%Ameren Illinois Co. $25,000 3.25% 1/3/2025 26,891 0.00%Alphabet, Inc. $25,000 3.38% 25/2/2024 26,882 0.00%Niagara Mohawk Power Corp. $25,000 3.51% 1/10/2024 26,882 0.00%Ryder System, Inc. $25,000 3.65% 18/3/2024 26,872 0.00%IHS Markit Ltd. $25,000 3.63% 1/5/2024 26,839 0.00%Southwest Gas Corp. $25,000 3.80% 29/9/2046 26,838 0.00%Comcast Corp. $25,000 3.20% 15/7/2036 26,766 0.00%Energy Transfer LP $25,000 4.20% 15/9/2023 26,731 0.00%IHS Markit Ltd. $25,000 4.13% 1/8/2023 26,727 0.00%Union Pacific Corp. $25,000 3.15% 1/3/2024 26,672 0.00%NextEra Energy Capital Holdings, Inc. $25,000 3.15% 1/4/2024 26,593 0.00%Equifax, Inc. $25,000 3.95% 15/6/2023 26,563 0.00%PACCAR Financial Corp. $25,000 3.40% 9/8/2023 26,550 0.00%Air Lease Corp. $25,000 3.88% 3/7/2023 26,531 0.00%L3Harris Technologies, Inc. $25,000 2.90% 15/12/2029 26,530 0.00%Amphenol Corp. $25,000 3.20% 1/4/2024 26,505 0.00%Ryder System, Inc. $25,000 3.75% 9/6/2023 26,472 0.00%Eaton Vance Corp. $25,000 3.63% 15/6/2023 26,466 0.00%Pfizer, Inc. $25,000 3.20% 15/9/2023 26,465 0.00%Alliant Energy Finance LLC $25,000 3.75% 15/6/2023 26,424 0.00%

697
Vanguard Global Corporate Bond Index Fund
Principal CouponMaturity
DateFair Value
US Dollars ($)% of Total
Net AssetsPenske Truck Leasing Co. LP/PTL Finance Corp. $25,000 2.70% 1/11/2024 26,315 0.00%Hershey Co. $25,000 3.38% 15/5/2023 26,307 0.00%Southern California Edison Co. $25,000 3.40% 1/6/2023 26,262 0.00%Boeing Co. $25,000 3.95% 1/8/2059 26,123 0.00%Essex Portfolio LP $25,000 3.25% 1/5/2023 26,077 0.00%PacifiCorp $25,000 2.95% 1/6/2023 26,027 0.00%Boeing Co. $25,000 2.60% 30/10/2025 26,020 0.00%Cigna Corp. $25,000 3.40% 15/3/2050 26,005 0.00%Boeing Co. $25,000 2.80% 1/3/2027 25,957 0.00%Moody's Corp. $25,000 4.50% 1/9/2022 25,933 0.00%Metropolitan Edison Co. $25,000 3.50% 15/3/2023 25,883 0.00%Intercontinental Exchange, Inc. $25,000 2.35% 15/9/2022 25,544 0.00%Trillium Windpower LP CA($)26,375 5.80% 15/2/2033 25,334 0.00%Analog Devices, Inc. $25,000 2.50% 5/12/2021 25,190 0.00%Duke Realty LP $23,000 3.75% 1/12/2024 24,987 0.00%Bristol-Myers Squibb Co. $25,000 2.35% 13/11/2040 24,062 0.00%Republic Services, Inc. $25,000 1.75% 15/2/2032 23,820 0.00%Philip Morris International, Inc. $20,000 4.50% 20/3/2042 23,701 0.00%Virginia Electric & Power Co. $20,000 4.00% 15/11/2046 23,513 0.00%Republic Services, Inc. $25,000 1.45% 15/2/2031 23,439 0.00%E*TRADE Financial Corp. $20,000 4.50% 20/6/2028 23,199 0.00%GE Capital Canada Funding Co. CA($)25,000 5.73% 22/10/2037 23,185 0.00%Kennametal, Inc. $20,000 4.63% 15/6/2028 22,714 0.00%US Treasury Note $22,500 1.13% 29/2/2028 22,437 0.00%Lam Research Corp. $20,000 3.75% 15/3/2026 22,408 0.00%PacifiCorp $20,000 3.50% 15/6/2029 22,218 0.00%Assurant, Inc. $20,000 4.20% 27/9/2023 21,481 0.00%Caterpillar Financial Services Corp. $20,000 3.45% 15/5/2023 21,161 0.00%US Treasury Note $20,000 0.13% 28/2/2023 19,977 0.00%ERP Operating LP $15,000 4.00% 1/8/2047 17,734 0.00%Texas Eastern Transmission LP $15,000 4.15% 15/1/2048 16,734 0.00%Piedmont Natural Gas Co., Inc. $15,000 3.50% 1/6/2029 16,517 0.00%Goldman Sachs BDC, Inc. $15,000 3.75% 10/2/2025 16,036 0.00%Ventas Realty LP $15,000 2.65% 15/1/2025 15,788 0.00%American Honda Finance Corp. $15,000 2.40% 27/6/2024 15,765 0.00%Northern States Power Co. $15,000 2.90% 1/3/2050 15,352 0.00%US Treasury Note $15,000 1.25% 31/5/2028 15,040 0.00%US Treasury Note $15,000 1.25% 30/6/2028 15,026 0.00%US Treasury Note $15,000 0.13% 30/4/2023 14,974 0.00%US Treasury Note $15,000 0.25% 15/5/2024 14,920 0.00%US Treasury Note $15,000 0.75% 31/5/2026 14,917 0.00%CenterPoint Energy, Inc. $13,000 3.85% 1/2/2024 13,965 0.00%Hershey Co. $13,000 1.70% 1/6/2030 12,929 0.00%Halliburton Co. $11,000 3.50% 1/8/2023 11,592 0.00%Cimarex Energy Co. $10,000 4.38% 15/3/2029 11,370 0.00%Public Service Co. of New Hampshire $10,000 3.60% 1/7/2049 11,349 0.00%Southern California Edison Co. $10,000 4.20% 1/3/2029 11,296 0.00%National Fuel Gas Co. $10,000 4.75% 1/9/2028 11,287 0.00%UnitedHealth Group, Inc. $10,000 3.70% 15/12/2025 11,134 0.00%RenaissanceRe Holdings Ltd. $10,000 3.60% 15/4/2029 11,024 0.00%Hewlett Packard Enterprise Co. $10,000 4.45% 2/10/2023 10,820 0.00%Nissan Motor Acceptance Corp. $10,000 3.88% 21/9/2023 10,613 0.00%John Deere Capital Corp. $10,000 3.45% 7/6/2023 10,598 0.00%Owl Rock Capital Corp. $10,000 3.75% 22/7/2025 10,585 0.00%Toyota Motor Credit Corp. $10,000 1.80% 13/2/2025 10,315 0.00%American Campus Communities Operating Partnership LP $10,000 2.85% 1/2/2030 10,300 0.00%DTE Energy Co. $10,000 2.60% 15/6/2022 10,219 0.00%American Honda Finance Corp. $10,000 3.38% 10/12/2021 10,140 0.00%Georgetown University $8,000 4.32% 1/4/2049 10,039 0.00%Ecolab, Inc. $7,000 5.50% 8/12/2041 9,758 0.00%Assurant, Inc. $5,000 6.75% 15/2/2034 6,561 0.00%AvalonBay Communities, Inc. $5,000 4.35% 15/4/2048 6,261 0.00%Texas Eastern Transmission LP $5,000 3.50% 15/1/2028 5,436 0.00%American Honda Finance Corp. $5,000 3.45% 14/7/2023 5,307 0.00%Toyota Motor Credit Corp. $5,000 2.15% 13/2/2030 5,132 0.00%US Treasury Note $5,000 1.13% 15/2/2031 4,855 0.00%US Treasury Bond1 $5,000 1.88% 15/2/2051 4,771 0.00%US Treasury Note $4,000 0.38% 15/4/2024 3,995 0.00%Southern California Edison Co. $3,571 1.85% 1/2/2022 3,571 0.00%

698
Vanguard Global Corporate Bond Index Fund
Principal CouponMaturity
DateFair Value
US Dollars ($)% of Total
Net AssetsUS Treasury Note $3,000 1.25% 31/3/2028 3,012 0.00%test - - - 1,615,725,806 55.39%Total Bonds 2,869,692,351 98.37%Financial Assets at Fair Value Through Profit or Loss 2,869,692,351 98.37%
testNumber of Contracts
Notional Amount
Unrealised Gain/(Loss)
US Dollars ($)% of Total
Net AssetsFinancial Derivative InstrumentsFutures 0.00% (2020: (0.00%))US Treasury Long Bond September 2021 77 $12,062,783 314,967 0.01 %Euro-Buxl 30 Year Bond September 2021 5 €999,500 19,805 0.00 %Long Gilt September 2021 6 £763,680 6,797 0.00 %AUS 10-Year Bond September 2021 (7) AU($)(990,978) 1,993 0.00 %Euro-Bobl September 2021 19 €2,547,330 1,803 0.00 %AUS 10-Year Bond September 2021 1 ¥151,670,000 180 0.00 %US Treasury Note 5 Year September 2021 10 $1,235,150 (853 ) (0.00 %)Euro-Schatz September 2021 49 €5,496,085 (1,453 ) (0.00 %)US Treasury Ultra 10 Year September 2021 (4) $(586,313) (2,500 ) (0.00 %)Euro-Bund September 2021 (13) €(2,240,660) (3,878 ) (0.00 %)US Treasury Note 10 Year September 2021 (30) $(3,968,547) (6,453 ) (0.00 %)US Ultra Bond September 2021 (13) $(2,461,156) (43,781 ) (0.00 %)US Treasury Long Bond September 2021 (77) $(12,102,942) (274,808 ) (0.01 %)test test test 11,819 0.00 %
CurrencyBuy
Amount Currency(Sell)
Amount CounterpartySettlement
Date
Unrealised Gain/(Loss)
US Dollars ($)% of Total
Net AssetsForward Currency Exchange Contracts 0.90% (2020: (0.71%))USD 704,025,088 EUR (577,600,000) State Street Bank & Trust Co. 2/7/2021 19,048,907 0.65 %USD 142,996,224 GBP (100,850,000) Toronto-Dominion Bank 2/7/2021 3,676,975 0.13 %USD 97,189,042 CAD (117,410,000) Toronto-Dominion Bank 2/7/2021 2,373,569 0.08 %USD 13,163,715 EUR (10,800,000) Morgan Stanley 2/7/2021 355,989 0.01 %USD 11,141,673 AUD (14,450,000) Barclays Bank plc 2/7/2021 293,332 0.01 %USD 8,563,317 EUR (7,000,000) BNP Paribas 2/7/2021 262,013 0.01 %USD 20,645,705 JPY (2,272,000,000) Toronto-Dominion Bank 2/7/2021 175,393 0.01 %USD 4,892,482 CHF (4,400,000) JPMorgan Chase Bank 2/7/2021 132,380 0.00 %USD 2,694,047 GBP (1,900,000) Morgan Stanley 2/7/2021 69,291 0.00 %USD 1,159,904 NZD (1,600,000) Toronto-Dominion Bank 2/7/2021 41,904 0.00 %USD 1,395,144 GBP (1,000,000) JPMorgan Chase Bank 2/7/2021 13,694 0.00 %USD 830,286 SGD (1,100,000) Standard Chartered Bank 2/7/2021 11,955 0.00 %USD 1,342,384 KRW (1,500,000,000) BNP Paribas 2/7/2021 10,412 0.00 %USD 818,258 SGD (1,100,000) UBS AG 3/8/2021 (8 ) (0.00 %)USD 4,764,132 CHF (4,400,000) JPMorgan Chase Bank 3/8/2021 (113 ) (0.00 %)USD 20,475,755 JPY (2,272,000,000) UBS AG 3/8/2021 (135 ) (0.00 %)USD 94,813,941 CAD (117,410,000) Toronto-Dominion Bank 3/8/2021 (306 ) (0.00 %)USD 11,600,663 AUD (15,450,000) BNP Paribas 4/8/2021 (326 ) (0.00 %)USD 143,337,888 GBP (103,750,000) Toronto-Dominion Bank 3/8/2021 (438 ) (0.00 %)USD 1,116,574 NZD (1,600,000) Barclays Bank plc 3/8/2021 (1,361 ) (0.00 %)USD 748,378 AUD (1,000,000) Goldman Sachs International 2/7/2021 (2,372 ) (0.00 %)USD 1,326,600 KRW (1,500,000,000) BNP Paribas 3/8/2021 (5,127 ) (0.00 %)USD 703,577,829 EUR (592,900,000) JPMorgan Chase Bank 3/8/2021 (18,237 ) (0.00 %)EUR 2,500,000 USD (3,035,725) BNP Paribas 2/7/2021 (70,974 ) (0.00 %)test 26,366,417 0.90 %Hedge Share Class Level Forward Currency Exchange Contracts (2.60%) (2020: 2.23%)USD 2,640,107 GBP (1,866,700) BNP Paribas 2/7/2021 61,354 0.00 %GBP 1,890,396,940 USD (2,611,716,078) Morgan Stanley 3/8/2021 7,601 0.00 %USD 1,191,469 GBP (857,458) BNP Paribas 2/7/2021 6,933 0.00 %EUR 214,360,802 USD (254,375,962) JPMorgan Chase Bank 3/8/2021 6,593 0.00 %USD 177,450 EUR (145,817) BNP Paribas 2/7/2021 4,526 0.00 %USD 118,836 EUR (97,983) JPMorgan Chase Bank 2/7/2021 2,638 0.00 %USD 260,193 GBP (187,125) BNP Paribas 2/7/2021 1,689 0.00 %GBP 1,202,577 USD (1,660,350) Goldman Sachs International 2/7/2021 950 0.00 %USD 31,418 EUR (25,769) Morgan Stanley 2/7/2021 858 0.00 %USD 86,443 EUR (72,559) BNP Paribas 2/7/2021 396 0.00 %CHF 8,059,544 USD (8,726,521) BNP Paribas 3/8/2021 217 0.00 %USD 7,269 CHF (6,674) BNP Paribas 2/7/2021 48 0.00 %EUR 2,113,382 USD (2,507,925) Citibank NA 3/8/2021 31 0.00 %USD 998 CHF (897) BNP Paribas 2/7/2021 28 0.00 %EUR 177,735 USD (210,767) Goldman Sachs International 2/7/2021 10 0.00 %CHF 208,256 USD (225,488) Morgan Stanley 3/8/2021 8 0.00 %CHF 76,553 USD (82,887) Morgan Stanley 3/8/2021 3 0.00 %

699
Vanguard Global Corporate Bond Index Fund
CurrencyBuy
Amount Currency(Sell)
Amount CounterpartySettlement
Date
Unrealised Gain/(Loss)
US Dollars ($)% of Total
Net AssetsUSD 8,719,148 CHF (8,059,544) BNP Paribas 2/7/2021 — 0.00 %USD 267,196 EUR (225,161) Morgan Stanley 3/8/2021 (3 ) (0.00 %)EUR 13,081 USD (15,568) JPMorgan Chase Bank 2/7/2021 (55 ) (0.00 %)GBP 8,470,373 USD (11,702,539) Morgan Stanley 3/8/2021 (90 ) (0.00 %)USD 254,210,475 EUR (214,360,802) JPMorgan Chase Bank 2/7/2021 (127 ) (0.00 %)EUR 33,110 USD (39,566) BNP Paribas 2/7/2021 (300 ) (0.00 %)USD 2,611,488,853 GBP (1,890,396,940) Morgan Stanley 2/7/2021 (309 ) (0.00 %)GBP 12,307 USD (17,442) BNP Paribas 2/7/2021 (440 ) (0.00 %)EUR 49,419 USD (59,069) BNP Paribas 2/7/2021 (463 ) (0.00 %)GBP 19,646,576 USD (27,143,727) Citibank NA 3/8/2021 (524 ) (0.00 %)EUR 81,252 USD (96,911) Morgan Stanley 2/7/2021 (555 ) (0.00 %)USD 1,141,397 GBP (826,741) Barclays Bank plc 3/8/2021 (807 ) (0.00 %)EUR 36,829 USD (44,617) JPMorgan Chase Bank 2/7/2021 (942 ) (0.00 %)CHF 30,625 USD (34,078) BNP Paribas 2/7/2021 (947 ) (0.00 %)GBP 556,405 USD (769,714) Morgan Stanley 2/7/2021 (1,068 ) (0.00 %)EUR 39,862 USD (48,594) Morgan Stanley 2/7/2021 (1,321 ) (0.00 %)EUR 173,059 USD (206,709) BNP Paribas 2/7/2021 (1,479 ) (0.00 %)EUR 354,026 USD (421,482) Morgan Stanley 2/7/2021 (1,642 ) (0.00 %)CHF 46,658 USD (52,151) BNP Paribas 2/7/2021 (1,675 ) (0.00 %)CHF 48,114 USD (53,728) BNP Paribas 2/7/2021 (1,677 ) (0.00 %)EUR 66,190 USD (80,289) BNP Paribas 2/7/2021 (1,794 ) (0.00 %)EUR 274,343 USD (327,226) BNP Paribas 2/7/2021 (1,882 ) (0.00 %)EUR 123,840 USD (150,125) BNP Paribas 2/7/2021 (3,263 ) (0.00 %)CHF 130,981 USD (145,847) BNP Paribas 2/7/2021 (4,146 ) (0.00 %)EUR 154,685 USD (188,540) BNP Paribas 2/7/2021 (5,099 ) (0.00 %)GBP 755,737 USD (1,051,777) BNP Paribas 2/7/2021 (7,764 ) (0.00 %)EUR 256,432 USD (312,239) BNP Paribas 2/7/2021 (8,136 ) (0.00 %)GBP 1,267,382 USD (1,760,124) Morgan Stanley 2/7/2021 (9,299 ) (0.00 %)GBP 738,791 USD (1,030,706) BNP Paribas 2/7/2021 (10,103 ) (0.00 %)GBP 1,260,673 USD (1,753,930) BNP Paribas 2/7/2021 (12,373 ) (0.00 %)EUR 440,648 USD (535,074) BNP Paribas 2/7/2021 (12,510 ) (0.00 %)EUR 648,723 USD (794,804) JPMorgan Chase Bank 2/7/2021 (25,483 ) (0.00 %)EUR 852,425 USD (1,039,312) BNP Paribas 2/7/2021 (28,421 ) (0.00 %)GBP 786,111 USD (1,114,650) JPMorgan Chase Bank 2/7/2021 (28,676 ) (0.00 %)GBP 978,459 USD (1,382,063) JPMorgan Chase Bank 2/7/2021 (30,370 ) (0.00 %)GBP 1,044,488 USD (1,475,439) Morgan Stanley 2/7/2021 (32,531 ) (0.00 %)EUR 870,074 USD (1,064,389) BNP Paribas 2/7/2021 (32,567 ) (0.00 %)GBP 1,126,114 USD (1,590,126) JPMorgan Chase Bank 2/7/2021 (34,456 ) (0.00 %)GBP 1,150,276 USD (1,627,697) Morgan Stanley 2/7/2021 (38,648 ) (0.00 %)GBP 1,439,582 USD (2,030,443) BNP Paribas 2/7/2021 (41,732 ) (0.00 %)GBP 1,618,376 USD (2,292,954) BNP Paribas 2/7/2021 (57,248 ) (0.00 %)GBP 2,244,675 USD (3,162,318) Citibank NA 2/7/2021 (61,411 ) (0.00 %)GBP 3,963,812 USD (5,537,279) BNP Paribas 2/7/2021 (61,470 ) (0.00 %)EUR 1,767,914 USD (2,159,228) Morgan Stanley 2/7/2021 (62,658 ) (0.00 %)GBP 2,139,879 USD (3,020,016) BNP Paribas 2/7/2021 (63,879 ) (0.00 %)GBP 4,772,001 USD (6,759,633) Morgan Stanley 2/7/2021 (167,351 ) (0.01 %)GBP 5,472,555 USD (7,755,716) JPMorgan Chase Bank 2/7/2021 (195,654 ) (0.01 %)CHF 7,810,737 USD (8,685,101) BNP Paribas 2/7/2021 (235,123 ) (0.01 %)GBP 8,489,763 USD (12,046,736) JPMorgan Chase Bank 2/7/2021 (318,552 ) (0.01 %)EUR 208,289,283 USD (253,878,600) Morgan Stanley 2/7/2021 (6,868,216 ) (0.24 %)GBP 1,852,288,260 USD (2,626,373,416) Morgan Stanley 2/7/2021 (67,529,496 ) (2.32 %)test (75,910,852 ) (2.60 %)Total Financial Derivative Instruments (49,532,616 ) (1.70 %)
Fair Value US Dollars ($)
% of Total Net Assets
Other Assets and Liabilities 96,937,511 3.33 %Net Assets 2,917,097,246 100.00 %

700
Vanguard Global Corporate Bond Index Fund
Analysis of Total Net Assets US Dollars ($)% of Total
Net Assets(a) Transferable securities admitted to an official stock exchange listing 1,954,580,008 67.00%(b) Transferable securities dealt in on another regulated market 807,831,988 27.69%(c) Transferable securities other than those admitted to an official stock exchange listing or dealt in on another regulated
market 107,280,355 3.68%
(d) Financial derivative instruments (49,532,616) (1.70%)(e) Other assets and liabilities 96,937,511 3.33%Total Net Assets 2,917,097,246 100.00%
^ Floating Rate Note (FRN). The effective interest rate is at 30 June 2021.1 Denotes securities pledged in full or part thereof as collateral for derivatives.

The accompanying notes form an integral part of the financial statements.
701
Vanguard Global Corporate Bond Index Fund
Statement of Assets and Liabilities
US Dollars ($)
As at 30 June 2021
US Dollars ($)
As at 31 December 2020
Current AssetsFinancial Assets at Fair Value Through Profit or Loss 2,869,692,351 2,381,417,028 Financial Derivative Instruments 26,905,242 54,734,966 Cash 55,789,976 31,861,051 Unrealised Appreciation on Spot Currency Contracts 8,519 — Receivables: Interest and Dividends 21,865,304 19,651,493 Capital Shares Issued 14,118,639 1,510,707 Investments Sold 16,710,520 1,789,104 Futures Margin Cash 13,212 6,097 Other Receivables 3,101 16,000
Total Current Assets 3,005,106,864 2,490,986,446
Current LiabilitiesFinancial Derivative Instruments 76,437,858 17,412,542 Bank Overdraft 11,548 11,374 Unrealised Depreciation on Spot Currency Contracts — 3,023 Payables and Other Liabilities: Investments Purchased 8,809,127 19,075,830 Income Distribution Payable 1,159,107 — Capital Shares Redeemed 1,265,406 242,480 Management Fees Payable 326,572 266,146
Total Current Liabilities 88,009,618 37,011,395
Net Assets Attributable to Holders of Redeemable Participating Shares (“Net Assets”) 2,917,097,246 2,453,975,051
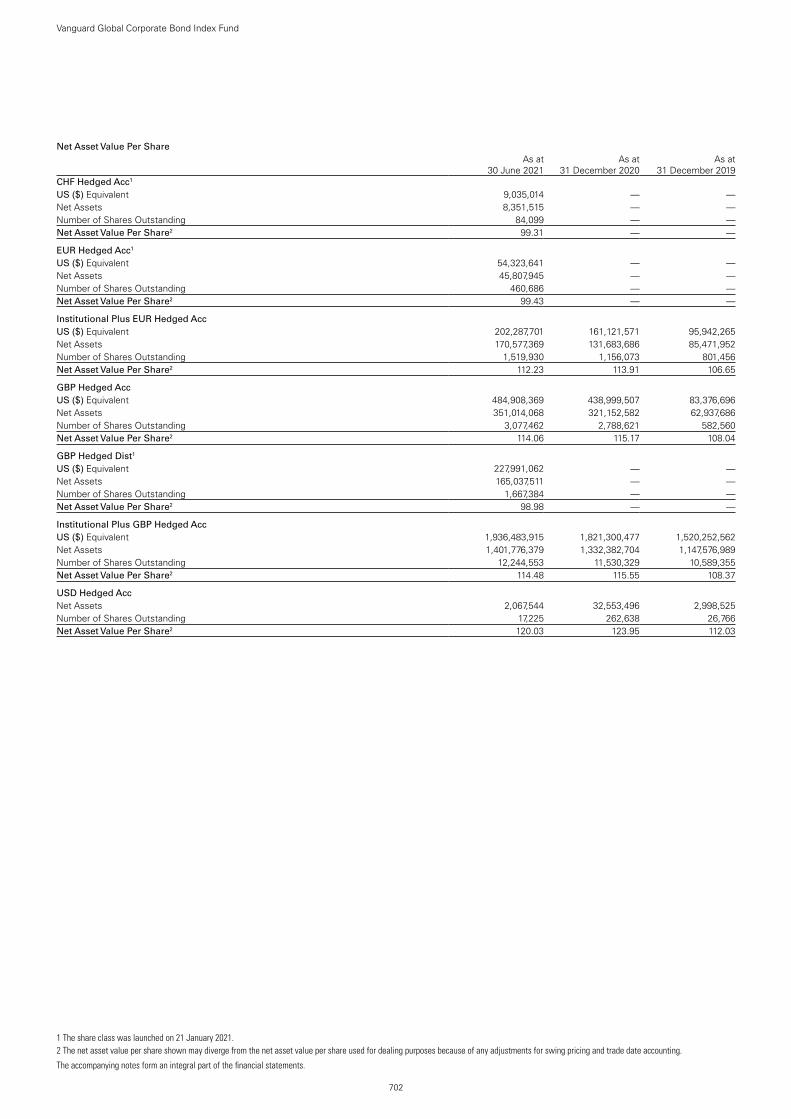
702
Vanguard Global Corporate Bond Index Fund
The accompanying notes form an integral part of the financial statements.
Net Asset Value Per Share
.As at
30 June 2021As at
31 December 2020As at
31 December 2019CHF Hedged Acc1
US ($) Equivalent 9,035,014 — —Net Assets 8,351,515 — —Number of Shares Outstanding 84,099 — —Net Asset Value Per Share2 99.31 — —
EUR Hedged Acc1
US ($) Equivalent 54,323,641 — —Net Assets 45,807,945 — —Number of Shares Outstanding 460,686 — —Net Asset Value Per Share2 99.43 — —
Institutional Plus EUR Hedged AccUS ($) Equivalent 202,287,701 161,121,571 95,942,265Net Assets 170,577,369 131,683,686 85,471,952Number of Shares Outstanding 1,519,930 1,156,073 801,456Net Asset Value Per Share2 112.23 113.91 106.65
GBP Hedged AccUS ($) Equivalent 484,908,369 438,999,507 83,376,696Net Assets 351,014,068 321,152,582 62,937,686Number of Shares Outstanding 3,077,462 2,788,621 582,560Net Asset Value Per Share2 114.06 115.17 108.04
GBP Hedged Dist1
US ($) Equivalent 227,991,062 — —Net Assets 165,037,511 — —Number of Shares Outstanding 1,667,384 — —Net Asset Value Per Share2 98.98 — —
Institutional Plus GBP Hedged AccUS ($) Equivalent 1,936,483,915 1,821,300,477 1,520,252,562Net Assets 1,401,776,379 1,332,382,704 1,147,576,989Number of Shares Outstanding 12,244,553 11,530,329 10,589,355Net Asset Value Per Share2 114.48 115.55 108.37
USD Hedged AccNet Assets 2,067,544 32,553,496 2,998,525Number of Shares Outstanding 17,225 262,638 26,766Net Asset Value Per Share2 120.03 123.95 112.03
1 The share class was launched on 21 January 2021.2 The net asset value per share shown may diverge from the net asset value per share used for dealing purposes because of any adjustments for swing pricing and trade date accounting.
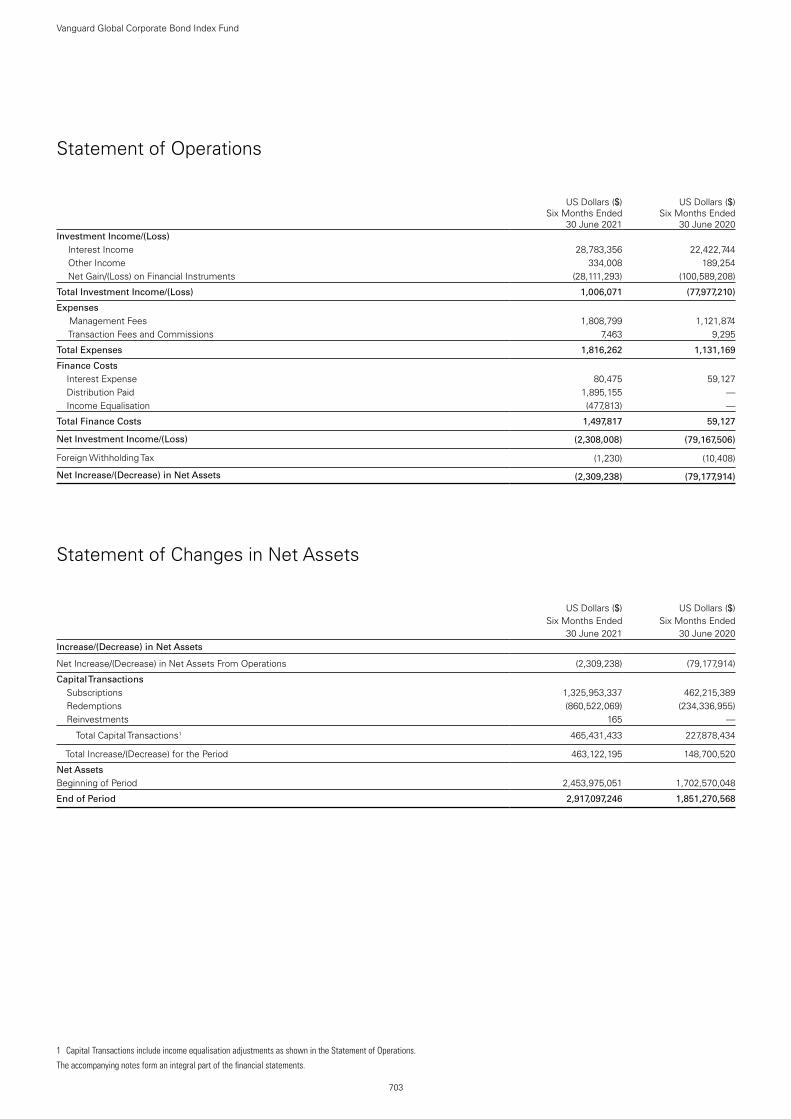
703
Vanguard Global Corporate Bond Index Fund
The accompanying notes form an integral part of the financial statements.
Statement of Operations
US Dollars ($)
Six Months Ended 30 June 2021
US Dollars ($)
Six Months Ended 30 June 2020
Investment Income/(Loss) Interest Income 28,783,356 22,422,744 Other Income 334,008 189,254 Net Gain/(Loss) on Financial Instruments (28,111,293) (100,589,208)
Total Investment Income/(Loss) 1,006,071 (77,977,210)
Expenses Management Fees 1,808,799 1,121,874 Transaction Fees and Commissions 7,463 9,295
Total Expenses 1,816,262 1,131,169
Finance Costs Interest Expense 80,475 59,127 Distribution Paid 1,895,155 — Income Equalisation (477,813) —
Total Finance Costs 1,497,817 59,127
Net Investment Income/(Loss) (2,308,008) (79,167,506)
Foreign Withholding Tax (1,230) (10,408)
Net Increase/(Decrease) in Net Assets (2,309,238) (79,177,914)
Statement of Changes in Net Assets
US Dollars ($)
US Dollars ($)
Six Months Ended Six Months Ended30 June 2021 30 June 2020
Increase/(Decrease) in Net Assets
Net Increase/(Decrease) in Net Assets From Operations (2,309,238) (79,177,914)
Capital Transactions Subscriptions 1,325,953,337 462,215,389 Redemptions (860,522,069) (234,336,955) Reinvestments 165 —
Total Capital Transactions1 465,431,433 227,878,434
Total Increase/(Decrease) for the Period 463,122,195 148,700,520
Net AssetsBeginning of Period 2,453,975,051 1,702,570,048
End of Period 2,917,097,246 1,851,270,568
1 Capital Transactions include income equalisation adjustments as shown in the Statement of Operations.
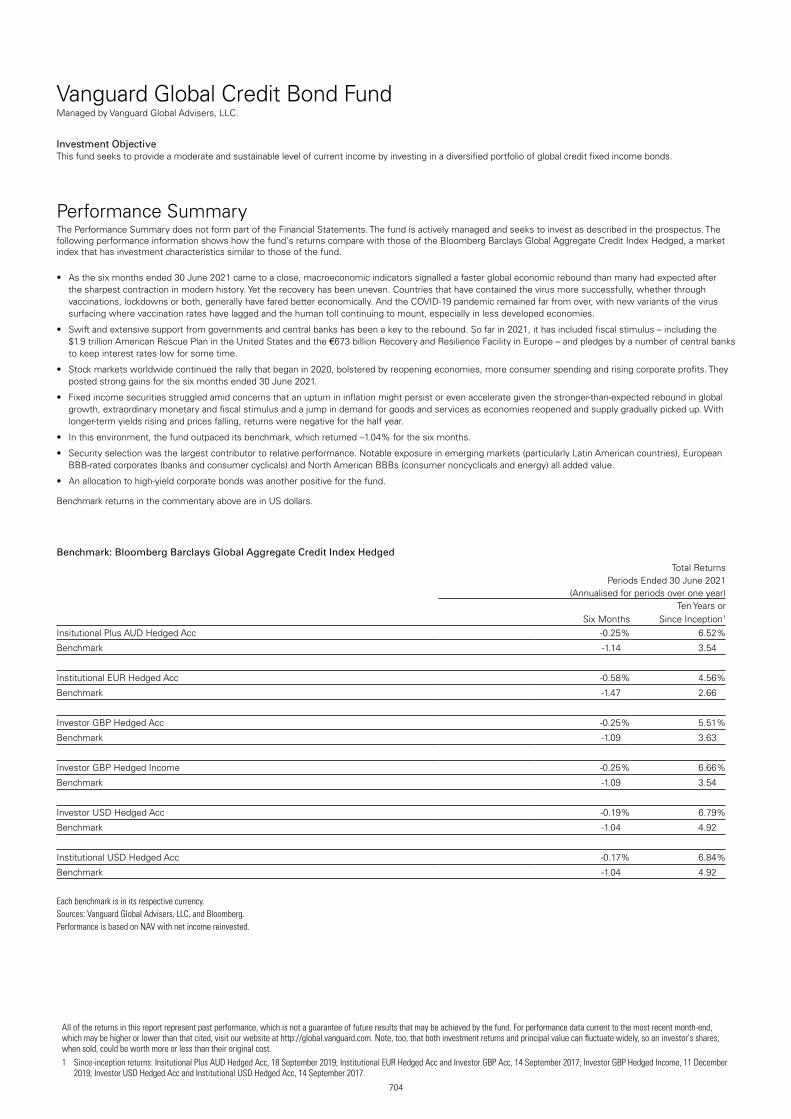
Vanguard Global Credit Bond FundManaged by Vanguard Global Advisers, LLC.
704
Investment ObjectiveThis fund seeks to provide a moderate and sustainable level of current income by investing in a diversified portfolio of global credit fixed income bonds.
Performance SummaryThe Performance Summary does not form part of the Financial Statements. The fund is actively managed and seeks to invest as described in the prospectus. The following performance information shows how the fund's returns compare with those of the Bloomberg Barclays Global Aggregate Credit Index Hedged, a market index that has investment characteristics similar to those of the fund.
• As the six months ended 30 June 2021 came to a close, macroeconomic indicators signalled a faster global economic rebound than many had expected after the sharpest contraction in modern history. Yet the recovery has been uneven. Countries that have contained the virus more successfully, whether through vaccinations, lockdowns or both, generally have fared better economically. And the COVID-19 pandemic remained far from over, with new variants of the virus surfacing where vaccination rates have lagged and the human toll continuing to mount, especially in less developed economies.
• Swift and extensive support from governments and central banks has been a key to the rebound. So far in 2021, it has included fiscal stimulus – including the $1.9 trillion American Rescue Plan in the United States and the €673 billion Recovery and Resilience Facility in Europe – and pledges by a number of central banks to keep interest rates low for some time.
• Stock markets worldwide continued the rally that began in 2020, bolstered by reopening economies, more consumer spending and rising corporate profits. They posted strong gains for the six months ended 30 June 2021.
• Fixed income securities struggled amid concerns that an upturn in inflation might persist or even accelerate given the stronger-than-expected rebound in global growth, extraordinary monetary and fiscal stimulus and a jump in demand for goods and services as economies reopened and supply gradually picked up. With longer-term yields rising and prices falling, returns were negative for the half year.
• In this environment, the fund outpaced its benchmark, which returned –1.04% for the six months.
• Security selection was the largest contributor to relative performance. Notable exposure in emerging markets (particularly Latin American countries), European BBB-rated corporates (banks and consumer cyclicals) and North American BBBs (consumer noncyclicals and energy) all added value.
• An allocation to high-yield corporate bonds was another positive for the fund.
Benchmark returns in the commentary above are in US dollars.
Benchmark: Bloomberg Barclays Global Aggregate Credit Index Hedged
Total ReturnsPeriods Ended 30 June 2021
(Annualised for periods over one year)
Six MonthsTen Years or
Since Inception1
Insitutional Plus AUD Hedged Acc -0.25 % 6.52 %
Benchmark -1.14 3.54
Institutional EUR Hedged Acc -0.58 % 4.56 %
Benchmark -1.47 2.66
Investor GBP Hedged Acc -0.25 % 5.51 %
Benchmark -1.09 3.63
Investor GBP Hedged Income -0.25 % 6.66 %
Benchmark -1.09 3.54
Investor USD Hedged Acc -0.19 % 6.79 %
Benchmark -1.04 4.92
Institutional USD Hedged Acc -0.17 % 6.84 %
Benchmark -1.04 4.92
Each benchmark is in its respective currency.Sources: Vanguard Global Advisers, LLC, and Bloomberg.Performance is based on NAV with net income reinvested.
All of the returns in this report represent past performance, which is not a guarantee of future results that may be achieved by the fund. For performance data current to the most recent month-end, which may be higher or lower than that cited, visit our website at http://global.vanguard.com. Note, too, that both investment returns and principal value can fluctuate widely, so an investor's shares, when sold, could be worth more or less than their original cost.1 Since-inception returns: Insitutional Plus AUD Hedged Acc, 18 September 2019; Institutional EUR Hedged Acc and Investor GBP Acc, 14 September 2017; Investor GBP Hedged Income, 11 December
2019; Investor USD Hedged Acc and Institutional USD Hedged Acc, 14 September 2017.

Significant Portfolio ChangesFor the Six Months Ended 30 June 2021
705
Vanguard Global Credit Bond Fund
The Central Bank of Ireland requires a schedule of material changes in the composition of the portfolio during the period. These are defined as aggregate purchases of a security exceeding 1% of the total value of purchases for the period and aggregate disposals greater than 1% of the total value of sales. At a minimum, the largest 20 purchases and 20 sales must be shown; all purchases and sales must be shown if there are fewer than 20. A full listing of the portfolio changes for the period is available, upon request, at no extra cost from the Administrator.
PrincipalCost
US Dollars ($)
Purchases
Goldman Sachs Group, Inc. 1.00% 16/12/2025 £8,200,000 11,551,451
US Treasury Note 0.13% 28/2/2023 $11,200,000 11,200,000US Treasury Note 1.13% 15/2/2031 $8,800,000 8,599,688ING Groep NV 0.00% 7/12/2028 £5,400,000 7,421,578Nestle Holdings, Inc. 0.63%
18/12/2025 £5,000,000 7,041,915DNB Bank A.S.A 0.25% 23/2/2029 €4,800,000 5,750,072Leeds Building Society 1.50%
16/3/2027 £4,000,000 5,522,435Credit Suisse AG 1.13% 15/12/2025 £3,900,000 5,480,944Morgan Stanley 0.41% 29/10/2027 €4,154,000 5,018,655UniCredit SpA 1.20% 20/1/2026 €4,051,000 4,993,243Athene Global Funding 1.88%
30/11/2028 £3,400,000 4,629,498Ascendas Real Estate Investment
Trust 0.75% 23/6/2028 €3,800,000 4,598,036Goldman Sachs Group, Inc. 0.25%
26/1/2028 €3,800,000 4,590,410IE2 Holdco SAU 2.88% 1/6/2026 €3,400,000 4,546,017HSBC Holdings plc 1.75% 24/7/2027 £3,100,000 4,298,547Athene Global Funding 0.63%
12/1/2028 €3,500,000 4,271,285SBAB Bank AB 0.13% 27/8/2026 €3,500,000 4,260,931US Treasury Bond 3.00% 15/2/2047 $3,550,000 4,127,857Toyota Motor Credit Corp.0.13%
5/11/2027 €3,000,000 3,610,457Glencore Finance Europe Ltd. 6.00%
3/4/2022 £2,400,000 3,546,926
PrincipalProceeds
US Dollars ($)
Sales
US Treasury Note 0.13% 15/10/2023 $8,850,000 8,823,381ING Groep NV 0.00% 7/12/2028 £5,400,000 7,428,130Nestle Holdings, Inc. 0.63%
18/12/2025 £5,000,000 7,055,943DNB Bank A.S.A 0.25% 23/2/2029 €4,800,000 5,771,046Credit Suisse AG 1.13% 15/12/2025 £3,900,000 5,494,921Morgan Stanley 0.41% 29/10/2027 €4,154,000 4,983,139Panama Government International
Bond 3.75% 16/3/2025 $4,500,000 4,923,000Colombia Government International
Bond 4.50% 28/1/2026 $4,390,000 4,801,106Goldman Sachs Group, Inc. 0.25%
26/1/2028 €3,800,000 4,562,205Ascendas Real Estate Investment
Trust 0.75% 23/6/2028 €3,800,000 4,505,280SBAB Bank AB 0.13% 27/8/2026 €3,500,000 4,265,548Athene Global Funding 0.63%
12/1/2028 €3,500,000 4,135,366Nationwide Building Society 2.00%
25/7/2029 €3,200,000 3,997,034Toyota Motor Credit Corp. 0.13%
5/11/2027 €3,000,000 3,615,541US Treasury Inflation Indexed Bonds
0.13% 15/1/2031 $2,999,160 3,364,331Swedbank AB 1.38% 8/12/2027 £2,350,000 3,329,573Banque Federative du Credit Mutuel
SA 0.88% 7/12/2027 £2,400,000 3,313,699Realty Income Corp. 1.63%
15/12/2030 £2,340,000 3,285,973Volkswagen Financial Services AG
2.25% 16/10/2026 €2,400,000 3,241,112Enel Finance International NV 0.88%
17/6/2036 €2,700,000 3,240,858

706
Vanguard Global Credit Bond Fund
Financial StatementsStatement of Investments30 June 2021
Principal CouponMaturity
DateFair Value
US Dollars ($)% of Total
Net AssetsBonds 95.65% (2020: 93.93%)Armenia 0.04% (2020: 0.00%)Republic of Armenia International Bond $200,000 3.60% 2/2/2031 188,955 0.04%test - - - 188,955 0.04%Australia 2.70% (2020: 1.87%)Glencore Finance Europe Ltd. £2,400,000 6.00% 3/4/2022 3,448,439 0.70%Vicinity Centres Trust €1,757,000 1.13% 7/11/2029 2,147,447 0.44%Lonsdale Finance Pty Ltd. AU($)2,000,000 3.90% 15/10/2025 1,645,587 0.34%Australia & New Zealand Banking Group Ltd.^ $1,000,000 2.95% 22/7/2030 1,040,002 0.21%Westpac Banking Corp.^ $950,000 2.89% 4/2/2030 985,496 0.20%Macquarie Group Ltd.^ $885,000 1.34% 12/1/2027 876,810 0.18%APT Pipelines Ltd. €700,000 1.25% 15/3/2033 824,845 0.17%Westpac Banking Corp. AU($)1,000,000 1.59% 29/1/2031 759,503 0.16%Macquarie Bank Ltd. AU($)500,000 2.94% 28/5/2030 396,799 0.08%Ausgrid Finance Pty Ltd. AU($)500,000 1.81% 5/2/2027 369,450 0.08%Pacific National Finance Pty Ltd. AU($)300,000 5.40% 12/5/2027 252,955 0.05%Macquarie Group Ltd.^ AU($)200,000 3.25% 15/12/2022 152,010 0.03%Macquarie Group Ltd. AU($)200,000 1.17% 15/12/2022 150,618 0.03%Westpac Banking Corp. $150,000 2.96% 16/11/2040 147,268 0.03%FMG Resources August 2006 Pty Ltd. $10,000 4.50% 15/9/2027 10,870 0.00%test - - - 13,208,099 2.70%Austria 0.25% (2020: 0.32%)JAB Holdings BV €500,000 3.38% 17/4/2035 729,313 0.15%JAB Holdings BV €400,000 2.25% 19/12/2039 498,431 0.10%test - - - 1,227,744 0.25%Azerbaijan 0.16% (2020: 0.13%)Republic of Azerbaijan International Bond $400,000 4.75% 18/3/2024 433,500 0.09%Republic of Azerbaijan International Bond $347,000 3.50% 1/9/2032 359,740 0.07%test - - - 793,240 0.16%Belgium 0.48% (2020: 1.42%)Anheuser-Busch Cos LLC/Anheuser-Busch InBev Worldwide, Inc. $770,000 4.70% 1/2/2036 944,384 0.19%Anheuser-Busch Cos LLC/Anheuser-Busch InBev Worldwide, Inc. $280,000 4.90% 1/2/2046 354,175 0.07%Anheuser-Busch InBev Worldwide, Inc. $225,000 5.55% 23/1/2049 309,366 0.07%Anheuser-Busch InBev Worldwide, Inc. $220,000 5.45% 23/1/2039 290,233 0.06%Anheuser-Busch InBev Worldwide, Inc. $150,000 4.60% 15/4/2048 183,387 0.04%Anheuser-Busch InBev Worldwide, Inc. $143,000 3.75% 15/7/2042 155,787 0.03%Anheuser-Busch InBev Worldwide, Inc. $75,000 4.38% 15/4/2038 89,380 0.02%test - - - 2,326,712 0.48%Bermuda 0.20% (2020: 0.31%)Bermuda Government International Bond $500,000 4.85% 6/2/2024 550,944 0.11%Bermuda Government International Bond $400,000 3.72% 25/1/2027 437,528 0.09%test - - - 988,472 0.20%Brazil 0.56% (2020: 0.68%)Petrobras Global Finance BV $1,330,000 5.50% 10/6/2051 1,330,196 0.27%Embraer SA $700,000 5.15% 15/6/2022 720,961 0.15%Embraer Netherlands Finance BV $330,000 5.05% 15/6/2025 348,896 0.07%Brazilian Government International Bond $320,000 4.63% 13/1/2028 346,515 0.07%test - - - 2,746,568 0.56%Canada 1.70% (2020: 1.71%)Toronto-Dominion Bank CA($)2,333,000 2.85% 8/3/2024 1,970,637 0.40%Great-West Lifeco US Finance 2020 LP $580,000 0.90% 12/8/2025 573,843 0.12%Cenovus Energy, Inc. $486,000 5.38% 15/7/2025 556,009 0.11%Cenovus Energy, Inc. $433,000 4.25% 15/4/2027 484,175 0.10%Ontario Teachers' Cadillac Fairview Properties Trust $400,000 3.88% 20/3/2027 441,462 0.09%Canadian Natural Resources Ltd. $360,000 3.85% 1/6/2027 396,516 0.08%Nutrien Ltd. $300,000 4.20% 1/4/2029 344,908 0.07%Suncor Energy, Inc. $315,000 3.10% 15/5/2025 337,252 0.07%TransCanada PipeLines Ltd. $250,000 4.63% 1/3/2034 296,540 0.06%TransCanada PipeLines Ltd. $240,000 4.10% 15/4/2030 275,508 0.06%Ontario Teachers' Cadillac Fairview Properties Trust $200,000 4.13% 1/2/2029 228,069 0.05%Canadian Government Bond CA($)185,000 5.00% 1/6/2037 220,302 0.05%Canadian Government Bond CA($)226,000 2.75% 1/12/2048 219,021 0.05%Suncor Energy, Inc. $195,000 3.75% 4/3/2051 210,832 0.04%Canadian Natural Resources Ltd. $200,000 2.95% 15/7/2030 207,453 0.04%TransCanada PipeLines Ltd. $140,000 6.20% 15/10/2037 192,314 0.04%TransCanada PipeLines Ltd. $100,000 4.88% 15/5/2048 126,464 0.03%

707
Vanguard Global Credit Bond Fund
Principal CouponMaturity
DateFair Value
US Dollars ($)% of Total
Net AssetsSuncor Energy, Inc. $85,000 6.50% 15/6/2038 119,968 0.02%Canadian Natural Resources Ltd. $100,000 2.95% 15/1/2023 103,610 0.02%Nutrien Ltd. $90,000 4.13% 15/3/2035 102,898 0.02%Canadian Natural Resources Ltd. $90,000 3.80% 15/4/2024 96,735 0.02%Enbridge, Inc. $85,000 3.70% 15/7/2027 93,928 0.02%Canadian Natural Resources Ltd. $70,000 6.25% 15/3/2038 93,592 0.02%Cenovus Energy, Inc. $75,000 5.40% 15/6/2047 93,124 0.02%Canadian Natural Resources Ltd. $60,000 3.90% 1/2/2025 65,324 0.01%1011778 BC ULC/New Red Finance, Inc. $67,000 4.00% 15/10/2030 64,834 0.01%Canadian Natural Resources Ltd. $60,000 2.05% 15/7/2025 61,709 0.01%Hudbay Minerals, Inc. $55,000 4.50% 1/4/2026 55,261 0.01%Enbridge, Inc. $48,000 3.13% 15/11/2029 51,407 0.01%Cenovus Energy, Inc. $40,000 5.25% 15/6/2037 47,869 0.01%1011778 BC ULC/New Red Finance, Inc. $35,000 4.38% 15/1/2028 35,521 0.01%MEG Energy Corp. $33,000 6.50% 15/1/2025 34,131 0.01%Parkland Corp. $30,000 4.50% 1/10/2029 30,466 0.01%1011778 BC ULC/New Red Finance, Inc. $25,000 3.88% 15/1/2028 25,313 0.01%Videotron Ltd. $21,000 3.63% 15/6/2029 21,307 0.00%Bausch Health Cos, Inc. $20,000 5.25% 15/2/2031 18,665 0.00%Cenovus Energy, Inc. $17,000 3.00% 15/8/2022 17,350 0.00%Raptor Acquisition Corp./Raptor Co.-Issuer LLC $15,000 4.88% 1/11/2026 15,222 0.00%MEG Energy Corp. $5,000 5.88% 1/2/2029 5,253 0.00%test - - - 8,334,792 1.70%Chile 0.15% (2020: 0.20%)Empresa de Transporte de Pasajeros Metro SA $615,000 5.00% 25/1/2047 712,001 0.15%test - - - 712,001 0.15%China 0.11% (2020: 0.39%)Sinopec Group Overseas Development 2016 Ltd. $500,000 3.50% 3/5/2026 546,381 0.11%test - - - 546,381 0.11%Colombia 0.47% (2020: 2.04%)Colombia Government International Bond $1,077,000 3.88% 15/2/2061 963,111 0.20%Colombia Government International Bond $800,000 3.00% 30/1/2030 783,893 0.16%Ecopetrol SA $310,000 5.88% 18/9/2023 335,756 0.07%Colombia Government International Bond $150,000 10.38% 28/1/2033 224,393 0.04%test - - - 2,307,153 0.47%Czech Republic 0.27% (2020: 0.00%)EP Infrastructure A.S. €1,110,000 1.82% 2/3/2031 1,336,304 0.27%test - - - 1,336,304 0.27%Denmark 1.01% (2020: 0.32%)DSV Panalpina Finance BV €2,000,000 0.75% 5/7/2033 2,362,253 0.48%Danske Bank A/S^ €1,800,000 1.00% 15/5/2031 2,136,772 0.44%Danske Bank A/S^ $425,000 1.17% 8/12/2023 426,931 0.09%test - - - 4,925,956 1.01%Dominican Republic 0.20% (2020: 0.14%)Dominican Republic International Bond $900,000 5.88% 18/4/2024 957,945 0.20%test - - - 957,945 0.20%Ecuador 0.20% (2020: 0.21%)Ecuador Government International Bond $840,000 0.00% 31/7/2030 466,339 0.09%Ecuador Government International Bond $490,000 0.00% 31/7/2030 272,031 0.06%Ecuador Government International Bond $262,069 0.50% 31/7/2030 224,798 0.05%test - - - 963,168 0.20%El Salvador 0.04% (2020: 0.00%)El Salvador Government International Bond $200,000 9.50% 15/7/2052 197,715 0.04%test - - - 197,715 0.04%Finland 0.47% (2020: 1.21%)Elenia Verkko OYJ €1,925,000 0.38% 6/2/2027 2,289,568 0.47%test - - - 2,289,568 0.47%France 1.04% (2020: 1.84%)Westfield America Management Ltd. £2,171,000 2.13% 30/3/2025 3,070,977 0.63%BNP Paribas SA^ $805,000 1.32% 13/1/2027 795,021 0.16%BNP Paribas SA^ $400,000 2.22% 9/6/2026 412,421 0.09%BNP Paribas SA^ $385,000 2.82% 19/11/2025 404,975 0.08%BNP Paribas SA $425,000 2.82% 26/1/2041 401,418 0.08%test - - - 5,084,812 1.04%Georgia 0.24% (2020: 0.00%)Georgia Government International Bond $1,130,000 2.75% 22/4/2026 1,152,102 0.24%test - - - 1,152,102 0.24%Germany 4.02% (2020: 3.58%)Volkswagen Leasing GmbH €2,750,000 0.38% 20/7/2026 3,271,843 0.67%Volkswagen Leasing GmbH €2,526,000 1.38% 20/1/2025 3,133,029 0.64%Bundesrepublik Deutschland Bundesanleihe €2,000,000 0.50% 15/2/2028 2,528,518 0.52%Volkswagen Financial Services NV £1,800,000 1.13% 5/7/2026 2,478,266 0.51%

708
Vanguard Global Credit Bond Fund
Principal CouponMaturity
DateFair Value
US Dollars ($)% of Total
Net AssetsVolkswagen Financial Services NV £1,500,000 1.13% 18/9/2023 2,088,650 0.43%Bundesobligation €1,500,000 0.00% 10/10/2025 1,827,511 0.37%Aroundtown SA £856,000 3.63% 10/4/2031 1,312,092 0.27%Daimler Finance North America LLC $635,000 0.75% 1/3/2024 634,761 0.13%Deutsche Bank AG^ $515,000 2.13% 24/11/2026 522,942 0.11%Deutsche Bank AG^ $500,000 2.22% 18/9/2024 513,419 0.10%Deutsche Bank AG^ $400,000 3.04% 28/5/2032 406,881 0.08%Bayer US Finance II LLC $275,000 4.38% 15/12/2028 315,397 0.06%Siemens Financieringsmaatschappij NV $300,000 1.20% 11/3/2026 300,074 0.06%Volkswagen Group of America Finance LLC $200,000 3.13% 12/5/2023 208,929 0.04%Volkswagen Group of America Finance LLC $150,000 1.63% 24/11/2027 148,210 0.03%test - - - 19,690,522 4.02%Guatemala 0.11% (2020: 0.00%)Guatemala Government Bond $510,000 4.38% 5/6/2027 556,358 0.11%test - - - 556,358 0.11%Hungary 0.08% (2020: 0.29%)Hungary Government International Bond €300,000 1.63% 28/4/2032 378,529 0.08%test - - - 378,529 0.08%India 0.20% (2020: 0.23%)Export-Import Bank of India $700,000 3.88% 12/3/2024 747,847 0.15%Export-Import Bank of India $200,000 3.88% 1/2/2028 216,465 0.05%test - - - 964,312 0.20%Indonesia 0.97% (2020: 1.58%)Indonesia Government International Bond €2,850,000 1.75% 24/4/2025 3,550,102 0.72%Indonesia Government International Bond €500,000 1.45% 18/9/2026 616,880 0.13%Perusahaan Perseroan Persero PT Perusahaan Listrik Negara $400,000 4.13% 15/5/2027 434,685 0.09%Perusahaan Perseroan Persero PT Perusahaan Listrik Negara €140,000 1.88% 5/11/2031 161,758 0.03%test - - - 4,763,425 0.97%Ireland 0.44% (2020: 0.39%)AerCap Ireland Capital DAC/AerCap Global Aviation Trust $625,000 4.45% 3/4/2026 686,555 0.14%AerCap Ireland Capital DAC/AerCap Global Aviation Trust $565,000 4.50% 15/9/2023 606,023 0.12%Avolon Holdings Funding Ltd. $425,000 4.25% 15/4/2026 460,831 0.09%Avolon Holdings Funding Ltd. $225,000 2.13% 21/2/2026 223,036 0.05%Trafigura Securitisation Finance plc 2018 $200,000 3.73% 15/3/2022 201,174 0.04%test - - - 2,177,619 0.44%Israel 0.19% (2020: 0.32%)State of Israel $411,000 3.80% 13/5/2060 468,455 0.10%Israel Government International Bond $365,000 4.50% 3/4/2120 461,563 0.09%test - - - 930,018 0.19%Italy 2.10% (2020: 0.62%)UniCredit SpA^ €4,051,000 1.20% 20/1/2026 4,904,173 1.00%UniCredit SpA^ €2,750,000 0.80% 5/7/2029 3,268,112 0.67%Intesa Sanpaolo SpA £750,000 2.50% 15/1/2030 1,066,020 0.22%Intesa Sanpaolo SpA £565,000 2.63% 11/3/2036 783,918 0.16%Intesa Sanpaolo SpA $250,000 3.25% 23/9/2024 265,898 0.05%test - - - 10,288,121 2.10%Japan 0.81% (2020: 1.11%)Nissan Motor Co., Ltd. $1,200,000 4.35% 17/9/2027 1,320,349 0.27%Nissan Motor Co., Ltd. $600,000 3.04% 15/9/2023 625,806 0.13%Takeda Pharmaceutical Co., Ltd. $410,000 4.40% 26/11/2023 445,072 0.09%Takeda Pharmaceutical Co., Ltd. $350,000 3.18% 9/7/2050 353,160 0.07%Mizuho Financial Group, Inc.^ $340,000 1.23% 22/5/2027 334,923 0.07%Takeda Pharmaceutical Co., Ltd. $325,000 3.03% 9/7/2040 328,436 0.07%Sumitomo Mitsui Financial Group, Inc. $250,000 3.54% 17/1/2028 276,696 0.05%Japan Government Bond ¥15,000,000 1.50% 20/6/2032 155,708 0.03%Japan Government Bond ¥9,000,000 0.10% 20/6/2029 81,948 0.02%NTT Finance Corp. $50,000 2.07% 3/4/2031 50,694 0.01%test - - - 3,972,792 0.81%Kazakhstan 0.28% (2020: 0.09%)Development Bank of Kazakhstan JSC $1,100,000 2.95% 6/5/2031 1,094,529 0.22%Kazakhstan Temir Zholy Finance BV $200,000 6.95% 10/7/2042 275,278 0.06%test - - - 1,369,807 0.28%Luxembourg 0.93% (2020: 1.42%)Blackstone Property Partners Europe Holdings Sarl €2,760,000 0.50% 12/9/2023 3,300,917 0.68%Blackstone Property Partners Europe Holdings Sarl €1,000,000 1.75% 12/3/2029 1,231,141 0.25%test - - - 4,532,058 0.93%Macedonia 0.14% (2020: 0.00%)North Macedonia Government International Bond €585,000 1.63% 10/3/2028 683,748 0.14%test - - - 683,748 0.14%Malaysia 0.22% (2020: 0.35%)Petronas Capital Ltd. $1,000,000 3.50% 21/4/2030 1,093,790 0.22%test - - - 1,093,790 0.22%

709
Vanguard Global Credit Bond Fund
Principal CouponMaturity
DateFair Value
US Dollars ($)% of Total
Net AssetsMexico 0.59% (2020: 0.96%)Mexico Government International Bond €1,100,000 3.63% 9/4/2029 1,526,961 0.31%Mexico Government International Bond $579,000 3.25% 16/4/2030 598,469 0.12%Mexico Government International Bond $350,000 4.75% 27/4/2032 400,723 0.08%Mexico Government International Bond $343,000 3.75% 11/1/2028 374,542 0.08%test - - - 2,900,695 0.59%Morocco 0.41% (2020: 0.52%)Morocco Government International Bond €1,210,000 2.00% 30/9/2030 1,420,590 0.29%OCP SA $565,000 5.13% 23/6/2051 573,826 0.12%test - - - 1,994,416 0.41%Netherlands 1.57% (2020: 0.36%)NIBC Bank NV £2,300,000 3.13% 15/11/2023 3,339,148 0.68%ING Groep NV^ €2,300,000 1.00% 13/11/2030 2,764,064 0.56%Shell International Finance BV $400,000 2.38% 7/11/2029 415,716 0.08%NXP BV/NXP Funding LLC/NXP USA, Inc. $400,000 3.25% 11/5/2041 410,150 0.08%Cooperatieve Rabobank UA $250,000 4.63% 1/12/2023 273,237 0.06%Shell International Finance BV $220,000 4.38% 11/5/2045 269,790 0.06%Shell International Finance BV $200,000 3.75% 12/9/2046 226,228 0.05%test - - - 7,698,333 1.57%Panama 0.69% (2020: 1.50%)Panama Bonos del Tesoro $1,903,000 3.36% 30/6/2031 1,905,637 0.39%Panama Government International Bond $1,000,000 3.87% 23/7/2060 1,021,488 0.21%Panama Government International Bond $215,000 3.75% 16/3/2025 234,009 0.05%Panama Government International Bond $200,000 4.50% 16/4/2050 227,615 0.04%test - - - 3,388,749 0.69%Peru 0.17% (2020: 0.24%)Petroleos del Peru SA $500,000 5.63% 19/6/2047 530,810 0.11%Peruvian Government International Bond $287,000 2.39% 23/1/2026 296,228 0.06%test - - - 827,038 0.17%Philippines 0.56% (2020: 0.00%)Philippine Government International Bond €2,350,000 1.75% 28/4/2041 2,759,657 0.56%test - - - 2,759,657 0.56%Romania 0.26% (2020: 0.71%)Romanian Government International Bond €600,000 2.50% 8/2/2030 764,442 0.16%Romanian Government International Bond €200,000 3.38% 28/1/2050 253,223 0.05%Romanian Government International Bond €147,000 2.63% 2/12/2040 173,121 0.04%Romanian Government International Bond €60,000 2.75% 14/4/2041 70,820 0.01%test - - - 1,261,606 0.26%Russia 0.23% (2020: 0.38%)Gazprom PJSC Via Gaz Capital SA $800,000 5.15% 11/2/2026 901,109 0.19%Gazprom PJSC Via Gaz Capital SA $200,000 6.51% 7/3/2022 207,977 0.04%test - - - 1,109,086 0.23%Saudi Arabia 0.58% (2020: 0.46%)SA Global Sukuk Ltd. $1,102,000 2.69% 17/6/2031 1,114,821 0.23%Saudi Government International Bond $720,000 4.00% 17/4/2025 795,157 0.16%KSA Sukuk Ltd. $505,000 3.63% 20/4/2027 556,443 0.11%Saudi Arabian Oil Co. $365,000 3.50% 16/4/2029 395,125 0.08%test - - - 2,861,546 0.58%Serbia 0.40% (2020: 0.39%)Serbia International Bond €1,489,000 3.13% 15/5/2027 1,964,625 0.40%test - - - 1,964,625 0.40%South Korea 0.00% (2020: 0.00%)Clark Equipment Co. $10,000 5.88% 1/6/2025 10,578 0.00%test - - - 10,578 0.00%Spain 1.56% (2020: 0.88%)IE2 Holdco SAU €4,600,000 2.88% 1/6/2026 6,078,990 1.24%Telefonica Emisiones SA $450,000 4.67% 6/3/2038 529,402 0.11%Banco Santander SA $530,000 2.75% 3/12/2030 525,276 0.11%Telefonica Emisiones SA $445,000 4.10% 8/3/2027 500,929 0.10%Atlantica Sustainable Infrastructure plc $12,000 4.13% 15/6/2028 12,234 0.00%test - - - 7,646,831 1.56%Sweden 0.74% (2020: 0.50%)Akelius Residential Property AB £1,388,000 2.38% 15/8/2025 2,005,622 0.41%Balder Finland OYJ €1,401,000 1.00% 20/1/2029 1,635,907 0.33%test - - - 3,641,529 0.74%Switzerland 0.99% (2020: 0.57%)Helvetia Europe SA^ €1,400,000 2.75% 30/9/2041 1,794,198 0.37%Credit Suisse Group AG €900,000 0.63% 18/1/2033 1,003,944 0.20%UBS Group AG $850,000 4.13% 24/9/2025 947,706 0.19%Credit Suisse Group AG^ $700,000 3.09% 14/5/2032 721,254 0.15%UBS Group AG $200,000 2.65% 1/2/2022 202,758 0.04%Novartis Capital Corp. $100,000 2.00% 14/2/2027 103,985 0.02%

710
Vanguard Global Credit Bond Fund
Principal CouponMaturity
DateFair Value
US Dollars ($)% of Total
Net AssetsNovartis Capital Corp. $90,000 2.75% 14/8/2050 90,765 0.02%test - - - 4,864,610 0.99%Ukraine 0.17% (2020: 0.00%)Ukraine Government International Bond $800,000 6.88% 21/5/2029 829,908 0.17%test - - - 829,908 0.17%United Arab Emirates 0.54% (2020: 0.67%)Sharjah Sukuk Program Ltd. $1,100,000 3.85% 3/4/2026 1,183,549 0.24%Finance Department Government of Sharjah $1,000,000 4.00% 28/7/2050 916,842 0.19%Sharjah Sukuk Program Ltd. $533,000 2.94% 10/6/2027 550,699 0.11%test - - - 2,651,090 0.54%United Kingdom 5.97% (2020: 6.34%)Leeds Building Society^ £2,400,000 1.50% 16/3/2027 3,314,684 0.68%HSBC Holdings plc^ £1,500,000 1.75% 24/7/2027 2,095,188 0.43%Aviva plc^ £1,200,000 6.13% 14/11/2036 2,025,826 0.41%easyJet FinCo BV €1,400,000 1.88% 3/3/2028 1,665,511 0.34%Heathrow Funding Ltd. £700,000 6.75% 3/12/2026 1,222,223 0.25%HSBC Holdings plc^ $1,100,000 0.98% 24/5/2025 1,099,406 0.22%BAT Capital Corp. $917,000 4.39% 15/8/2037 989,358 0.20%Gatwick Funding Ltd. £700,000 2.50% 15/4/2030 969,672 0.20%Lloyds Banking Group plc^ $860,000 0.70% 11/5/2024 862,212 0.18%Reckitt Benckiser Treasury Services plc $700,000 3.00% 26/6/2027 757,052 0.15%United Kingdom Gilt £350,000 4.25% 7/9/2039 730,205 0.15%Lloyds Banking Group plc^ $700,000 2.86% 17/3/2023 711,797 0.15%Vodafone Group plc $489,000 5.25% 30/5/2048 641,004 0.13%Barclays plc^ $515,000 5.09% 20/6/2030 598,593 0.12%Anglian Water Osprey Financing plc £400,000 2.00% 31/7/2028 553,214 0.11%Barclays plc^ $550,000 1.01% 10/12/2024 552,052 0.11%HSBC Holdings plc^ $525,000 2.10% 4/6/2026 540,003 0.11%Barclays plc^ $475,000 3.93% 7/5/2025 512,504 0.10%Vodafone Group plc $456,000 4.13% 30/5/2025 509,024 0.10%Barclays plc $450,000 4.38% 11/9/2024 491,068 0.10%HSBC Holdings plc^ $450,000 2.01% 22/9/2028 451,502 0.09%Natwest Group plc^ $400,000 4.27% 22/3/2025 434,039 0.09%Lloyds Banking Group plc^ $400,000 3.87% 9/7/2025 433,446 0.09%HSBC Holdings plc^ $423,000 1.65% 18/4/2026 428,655 0.09%Barclays plc^ $400,000 2.85% 7/5/2026 422,532 0.09%Natwest Group plc^ $400,000 3.07% 22/5/2028 422,022 0.09%WPP Finance 2013 £300,000 2.88% 14/9/2046 415,200 0.08%WPP Finance SA £250,000 3.75% 19/5/2032 394,824 0.08%Vodafone Group plc $310,000 3.75% 16/1/2024 335,654 0.07%Vodafone Group plc^ $310,000 4.13% 4/6/2081 309,072 0.06%HSBC Holdings plc^ $300,000 2.80% 24/5/2032 307,949 0.06%Barclays plc $275,000 3.68% 10/1/2023 279,664 0.06%AstraZeneca plc $235,000 4.00% 17/1/2029 270,118 0.05%Barclays plc $225,000 5.20% 12/5/2026 257,547 0.05%HSBC Holdings plc^ $240,000 2.63% 7/11/2025 251,909 0.05%Barclays plc $200,000 4.34% 10/1/2028 223,528 0.05%HSBC Holdings plc^ $220,000 1.59% 24/5/2027 220,292 0.04%Natwest Group plc $200,000 3.88% 12/9/2023 213,650 0.04%Standard Chartered plc^ $200,000 1.32% 14/10/2023 201,717 0.04%United Kingdom Gilt £100,000 3.25% 22/1/2044 193,310 0.04%BAT Capital Corp. $175,000 4.54% 15/8/2047 184,529 0.04%GlaxoSmithKline Capital plc $175,000 0.53% 1/10/2023 175,275 0.04%Astrazeneca Finance LLC $175,000 1.20% 28/5/2026 174,391 0.04%BP Capital Markets plc $150,000 3.51% 17/3/2025 164,172 0.03%HSBC Holdings plc $100,000 6.50% 15/9/2037 139,289 0.03%GlaxoSmithKline Capital plc $123,000 3.00% 1/6/2024 131,174 0.03%United Kingdom Gilt £50,000 3.50% 22/7/2068 128,948 0.03%Astrazeneca Finance LLC $125,000 1.75% 28/5/2028 124,939 0.03%United Kingdom Gilt £75,000 1.75% 22/1/2049 116,043 0.02%Sky Group Finance Ltd. $75,000 6.50% 15/10/2035 107,710 0.02%RELX Capital, Inc. $100,000 3.00% 22/5/2030 106,854 0.02%AstraZeneca plc $100,000 1.38% 6/8/2030 94,754 0.02%Rolls-Royce plc $80,000 5.75% 15/10/2027 87,799 0.02%United Kingdom Gilt £50,000 1.50% 22/7/2047 73,069 0.01%Clarivate Science Holdings Corp. $40,000 4.88% 30/6/2029 41,044 0.01%AstraZeneca plc $25,000 4.38% 17/8/2048 31,530 0.01%Clarivate Science Holdings Corp. $30,000 3.88% 30/6/2028 30,168 0.01%United Kingdom Gilt £12,000 4.25% 7/12/2049 28,620 0.01%INEOS Quattro Finance 2 plc $12,000 3.38% 15/1/2026 12,121 0.00%test - - - 29,259,655 5.97%

711
Vanguard Global Credit Bond Fund
Principal CouponMaturity
DateFair Value
US Dollars ($)% of Total
Net AssetsUnited States 59.44% (2020: 56.39%)Goldman Sachs Group, Inc. £8,200,000 1.00% 16/12/2025 11,297,893 2.31%US Treasury Note1 $11,200,000 0.13% 28/2/2023 11,187,313 2.28%US Treasury Note1 $6,950,000 1.13% 15/2/2031 6,749,102 1.38%US Treasury Note $5,300,000 0.13% 30/9/2022 5,299,379 1.08%Athene Global Funding £3,400,000 1.88% 30/11/2028 4,717,736 0.96%US Treasury Note1 $4,600,000 0.13% 15/12/2023 4,575,922 0.93%US Treasury Bond $3,800,000 3.00% 15/2/2047 4,512,500 0.92%US Treasury Note $4,000,000 0.13% 30/6/2022 4,001,094 0.82%Mylan, Inc. €3,110,000 2.13% 23/5/2025 3,935,144 0.80%US Treasury Bond1 $2,700,000 5.00% 15/5/2037 3,932,719 0.80%Wells Fargo Bank NA £2,050,000 5.25% 1/8/2023 3,084,443 0.63%US Treasury Bond1 $2,845,000 1.88% 15/2/2041 2,785,877 0.57%Philip Morris International, Inc. €1,800,000 2.88% 3/3/2026 2,410,419 0.49%Simon International Finance SCA €2,000,000 1.13% 19/3/2033 2,383,233 0.49%Bank of America Corp.^ £1,700,000 1.67% 2/6/2029 2,361,114 0.48%Verizon Communications, Inc. AU($)2,950,000 3.50% 17/2/2023 2,314,574 0.47%US Treasury Note $2,000,000 0.13% 31/8/2022 2,000,156 0.41%US Treasury Note $2,000,000 0.13% 31/10/2022 1,999,375 0.41%US Treasury Note $2,000,000 0.13% 31/1/2023 1,998,203 0.41%Exxon Mobil Corp. €1,660,000 1.41% 26/6/2039 1,941,313 0.40%US Treasury Note1 $1,700,000 0.13% 15/1/2024 1,689,906 0.35%Wells Fargo & Co. £1,200,000 2.13% 24/9/2031 1,685,850 0.34%Sabra Health Care LP $1,465,000 5.13% 15/8/2026 1,648,900 0.34%Philip Morris International, Inc. €1,200,000 2.00% 9/5/2036 1,531,273 0.31%Digital Dutch Finco BV €1,200,000 1.00% 15/1/2032 1,410,142 0.29%US Treasury Note $1,400,000 0.13% 30/11/2022 1,399,344 0.29%Goldman Sachs Group, Inc. $1,255,000 3.75% 22/5/2025 1,373,208 0.28%Omega Healthcare Investors, Inc. $1,190,000 5.25% 15/1/2026 1,357,963 0.28%Wells Fargo & Co.^ $1,208,000 2.19% 30/4/2026 1,254,129 0.26%Bank of America Corp.^ $1,155,000 0.98% 25/9/2025 1,153,652 0.24%Delta Air Lines, Inc./SkyMiles IP Ltd. $1,010,000 4.75% 20/10/2028 1,123,999 0.23%Medtronic Global Holdings SCA €895,000 1.38% 15/10/2040 1,082,803 0.22%Goldman Sachs Group, Inc.^ $1,000,000 2.91% 24/7/2023 1,025,047 0.21%Dell International LLC/EMC Corp. $845,000 5.30% 1/10/2029 1,019,137 0.21%Expedia Group, Inc. $1,000,000 2.95% 15/3/2031 1,017,402 0.21%Upjohn Finance BV €800,000 1.91% 23/6/2032 1,009,787 0.21%salesforce.com, Inc. $1,000,000 2.70% 15/7/2041 1,006,270 0.21%US Treasury Note $1,000,000 1.25% 31/3/2028 1,004,062 0.21%AutoZone, Inc. $890,000 3.63% 15/4/2025 973,594 0.20%Boeing Co. $850,000 4.88% 1/5/2025 952,678 0.19%Goldman Sachs Group, Inc. €800,000 1.00% 18/3/2033 950,745 0.19%Omega Healthcare Investors, Inc. $900,000 3.38% 1/2/2031 924,729 0.19%Simon Property Group LP $825,000 3.50% 1/9/2025 903,516 0.18%American Tower Corp. €750,000 1.25% 21/5/2033 903,091 0.18%JPMorgan Chase & Co.^ $810,000 3.54% 1/5/2028 889,478 0.18%Wells Fargo & Co.^ $850,000 2.16% 11/2/2026 881,901 0.18%Verizon Communications, Inc. $800,000 3.55% 22/3/2051 854,846 0.17%Wabtec Transportation Netherlands BV €700,000 1.25% 3/12/2027 837,469 0.17%BorgWarner, Inc. $786,000 2.65% 1/7/2027 833,546 0.17%Synchrony Financial $740,000 3.95% 1/12/2027 823,450 0.17%Energy Transfer LP $755,000 3.75% 15/5/2030 820,819 0.17%Lennar Corp. $700,000 5.25% 1/6/2026 807,954 0.17%Toyota Motor Credit Corp. $800,000 0.50% 14/8/2023 801,570 0.16%Keurig Dr Pepper, Inc. $750,000 3.35% 15/3/2051 788,355 0.16%BP Capital Markets America, Inc. $710,000 3.59% 14/4/2027 786,044 0.16%Dell International LLC/EMC Corp. $510,000 8.10% 15/7/2036 780,037 0.16%ViacomCBS, Inc. $675,000 4.38% 15/3/2043 779,214 0.16%JPMorgan Chase & Co.^ $750,000 2.58% 22/4/2032 770,542 0.16%CNH Industrial Capital LLC $750,000 1.95% 2/7/2023 768,901 0.16%JPMorgan Chase & Co.^ $707,000 4.02% 5/12/2024 763,067 0.16%Morgan Stanley^ $725,000 2.19% 28/4/2026 753,080 0.15%Boeing Co. $555,000 5.81% 1/5/2050 748,854 0.15%Oracle Corp. $710,000 2.50% 1/4/2025 745,803 0.15%Entergy Louisiana LLC $675,000 3.25% 1/4/2028 738,794 0.15%Xcel Energy, Inc. $680,000 3.30% 1/6/2025 732,909 0.15%Charter Communications Operating LLC/Charter Communications
Operating Capital $671,000 4.50% 1/2/2024 730,867 0.15%Morgan Stanley^ $690,000 2.72% 22/7/2025 726,427 0.15%NextEra Energy Capital Holdings, Inc. $680,000 2.75% 1/5/2025 722,531 0.15%Boston Scientific Corp. $650,000 3.75% 1/3/2026 721,646 0.15%

712
Vanguard Global Credit Bond Fund
Principal CouponMaturity
DateFair Value
US Dollars ($)% of Total
Net AssetsMarriott International, Inc. $625,000 4.63% 15/6/2030 719,661 0.15%Citigroup, Inc.^ $629,000 3.67% 24/7/2028 694,711 0.14%AbbVie, Inc. $590,000 4.05% 21/11/2039 684,901 0.14%Crown Castle International Corp. $614,000 3.70% 15/6/2026 675,622 0.14%Southwest Airlines Co. $555,000 5.25% 4/5/2025 633,974 0.13%Wells Fargo & Co.^ $610,000 3.07% 30/4/2041 625,517 0.13%Bank of America Corp.^ $585,000 3.86% 23/7/2024 623,453 0.13%Altria Group, Inc. $536,000 4.80% 14/2/2029 621,573 0.13%Honeywell International, Inc. $605,000 1.35% 1/6/2025 616,685 0.13%CVS Health Corp. $570,000 3.00% 15/8/2026 614,668 0.13%T-Mobile USA, Inc. $610,000 1.50% 15/2/2026 614,268 0.13%Wells Fargo & Co.^ $575,000 2.88% 30/10/2030 609,045 0.12%Oracle Corp. $600,000 1.65% 25/3/2026 608,320 0.12%Kimberly-Clark Corp. $525,000 3.95% 1/11/2028 607,543 0.12%Bank of America Corp.^ $605,000 1.32% 19/6/2026 606,449 0.12%Citigroup, Inc. $555,000 3.20% 21/10/2026 601,326 0.12%AbbVie, Inc. $550,000 3.60% 14/5/2025 600,421 0.12%American Express Co. $559,000 3.00% 30/10/2024 599,523 0.12%Berkshire Hathaway, Inc. €564,000 0.50% 15/1/2041 599,004 0.12%Pioneer Natural Resources Co. $620,000 1.90% 15/8/2030 597,508 0.12%Brixmor Operating Partnership LP $530,000 4.05% 1/7/2030 594,255 0.12%AT&T, Inc. $585,000 1.70% 25/3/2026 591,285 0.12%AT&T, Inc. $508,000 4.35% 1/3/2029 588,019 0.12%Evergy, Inc. $550,000 2.90% 15/9/2029 582,198 0.12%DTE Energy Co. $565,000 2.60% 15/6/2022 577,351 0.12%ViacomCBS, Inc. $508,000 4.75% 15/5/2025 574,749 0.12%Boeing Co. $445,000 5.71% 1/5/2040 574,165 0.12%Cheniere Corpus Christi Holdings LLC $500,000 5.88% 31/3/2025 573,604 0.12%UnitedHealth Group, Inc. $545,000 2.38% 15/8/2024 573,384 0.12%Capital One Bank USA NA^ $550,000 2.28% 28/1/2026 570,256 0.12%Walt Disney Co. $550,000 1.75% 30/8/2024 568,275 0.12%Bank of America Corp.^ $520,000 3.42% 20/12/2028 566,971 0.12%CMS Energy Corp. $510,000 3.45% 15/8/2027 564,462 0.12%Pioneer Natural Resources Co. $570,000 2.15% 15/1/2031 559,363 0.11%Bristol-Myers Squibb Co. $495,000 3.40% 26/7/2029 554,498 0.11%AT&T, Inc. $548,000 3.55% 15/9/2055 549,108 0.11%Exelon Corp. $480,000 4.05% 15/4/2030 546,496 0.11%Wells Fargo & Co. $475,000 4.30% 22/7/2027 541,270 0.11%Prudential Financial, Inc. $460,000 3.94% 7/12/2049 539,815 0.11%JPMorgan Chase & Co.^ $476,000 4.01% 23/4/2029 539,151 0.11%Morgan Stanley $517,000 3.13% 23/1/2023 539,113 0.11%T-Mobile USA, Inc. $525,000 3.60% 15/11/2060 536,021 0.11%Phillips 66 Partners LP $509,000 3.15% 15/12/2029 534,966 0.11%Ralph Lauren Corp. $500,000 2.95% 15/6/2030 531,967 0.11%AT&T, Inc. $530,000 3.50% 15/9/2053 531,550 0.11%Discovery Communications LLC $465,000 4.90% 11/3/2026 531,272 0.11%Caterpillar Financial Services Corp. $530,000 0.45% 14/9/2023 530,713 0.11%Fox Corp. $410,000 5.48% 25/1/2039 530,110 0.11%Plains All American Pipeline LP/PAA Finance Corp. $500,000 3.55% 15/12/2029 527,338 0.11%Bristol-Myers Squibb Co. $480,000 3.20% 15/6/2026 526,949 0.11%General Motors Co. $425,000 5.20% 1/4/2045 526,276 0.11%Cheniere Corpus Christi Holdings LLC $450,000 5.13% 30/6/2027 523,792 0.11%General Dynamics Corp. $460,000 3.75% 15/5/2028 523,103 0.11%Anthem, Inc. $465,000 3.65% 1/12/2027 520,246 0.11%Citigroup, Inc. $450,000 4.45% 29/9/2027 513,944 0.10%Federal Realty Investment Trust $475,000 3.95% 15/1/2024 509,660 0.10%Enstar Group Ltd. $442,000 4.95% 1/6/2029 507,499 0.10%JPMorgan Chase & Co.^ $500,000 1.58% 22/4/2027 502,684 0.10%VMware, Inc. $450,000 3.90% 21/8/2027 500,107 0.10%Toyota Motor Credit Corp. $484,000 1.80% 13/2/2025 499,265 0.10%General Motors Financial Co., Inc. $500,000 1.25% 8/1/2026 496,682 0.10%UnitedHealth Group, Inc. $400,000 4.38% 15/3/2042 493,436 0.10%Morgan Stanley^ $490,000 1.59% 4/5/2027 493,376 0.10%Apple, Inc. $401,000 3.85% 4/8/2046 476,299 0.10%General Motors Financial Co., Inc. $445,000 2.75% 20/6/2025 468,624 0.10%Exelon Corp. $385,000 4.45% 15/4/2046 467,042 0.10%GE Capital Funding LLC $400,000 4.40% 15/5/2030 466,242 0.10%BP Capital Markets America, Inc. $440,000 3.22% 28/11/2023 466,036 0.10%Mileage Plus Holdings LLC/Mileage Plus Intellectual Property Assets Ltd. $421,000 6.50% 20/6/2027 463,524 0.09%Nestle Holdings, Inc. $380,000 4.00% 24/9/2048 463,076 0.09%Viatris, Inc. $455,000 2.70% 22/6/2030 459,791 0.09%

713
Vanguard Global Credit Bond Fund
Principal CouponMaturity
DateFair Value
US Dollars ($)% of Total
Net AssetsGeneral Motors Financial Co., Inc. $408,000 4.35% 17/1/2027 458,848 0.09%L3Harris Technologies, Inc. $395,000 4.40% 15/6/2028 458,486 0.09%Enable Midstream Partners LP $410,000 4.40% 15/3/2027 453,300 0.09%California Institute of Technology $400,000 3.65% 1/9/2119 452,178 0.09%Cigna Corp. $361,000 4.80% 15/8/2038 449,631 0.09%Santander Holdings USA, Inc. $400,000 4.40% 13/7/2027 448,762 0.09%Affiliated Managers Group, Inc. $415,000 3.30% 15/6/2030 447,704 0.09%General Motors Financial Co., Inc. $417,000 3.50% 7/11/2024 447,393 0.09%CSX Corp. $345,000 4.75% 15/11/2048 446,382 0.09%Dominion Energy, Inc. $405,000 3.38% 1/4/2030 441,556 0.09%Connecticut Light & Power Co. $400,000 3.20% 15/3/2027 439,526 0.09%Plains All American Pipeline LP/PAA Finance Corp. $390,000 4.50% 15/12/2026 438,152 0.09%PacifiCorp $360,000 4.15% 15/2/2050 437,126 0.09%Union Pacific Corp. $380,000 3.95% 10/9/2028 436,306 0.09%Intuit, Inc. $435,000 0.95% 15/7/2025 435,916 0.09%Marathon Petroleum Corp. $385,000 4.70% 1/5/2025 434,199 0.09%Virginia Electric & Power Co. $400,000 2.88% 15/7/2029 430,963 0.09%Altria Group, Inc. $450,000 3.40% 4/2/2041 428,495 0.09%JPMorgan Chase & Co.^ $400,000 3.33% 22/4/2052 426,890 0.09%Comcast Corp. $405,000 2.65% 1/2/2030 426,140 0.09%US Treasury Bond $300,000 4.75% 15/2/2037 425,625 0.09%Oracle Corp. $400,000 3.65% 25/3/2041 424,858 0.09%Chubb INA Holdings, Inc. $335,000 4.35% 3/11/2045 423,596 0.09%Morgan Stanley^ $440,000 1.79% 13/2/2032 423,249 0.09%Boeing Co. $400,000 2.75% 1/2/2026 417,503 0.09%PepsiCo, Inc. $370,000 3.45% 6/10/2046 415,319 0.08%Bank of America Corp.^ $400,000 2.69% 22/4/2032 412,033 0.08%VEREIT Operating Partnership LP $405,000 2.20% 15/6/2028 411,878 0.08%Adobe, Inc. $390,000 2.15% 1/2/2027 408,520 0.08%Verizon Communications, Inc. $400,000 2.10% 22/3/2028 408,471 0.08%Citigroup, Inc.^ $400,000 2.56% 1/5/2032 407,504 0.08%Oncor Electric Delivery Co. LLC $381,000 2.95% 1/4/2025 407,080 0.08%Boeing Co. $390,000 2.80% 1/3/2024 406,995 0.08%7-Eleven, Inc. $435,000 2.80% 10/2/2051 405,965 0.08%Carrier Global Corp. $385,000 3.38% 5/4/2040 405,135 0.08%Philip Morris International, Inc. $345,000 4.25% 10/11/2044 402,929 0.08%Sabine Pass Liquefaction LLC $355,000 4.20% 15/3/2028 400,980 0.08%Raytheon Technologies Corp. $348,000 4.13% 16/11/2028 400,818 0.08%John Deere Capital Corp. $400,000 0.70% 15/1/2026 395,935 0.08%American Honda Finance Corp. $390,000 0.65% 8/9/2023 391,755 0.08%Nestle Holdings, Inc. $400,000 1.00% 15/9/2027 389,896 0.08%Boeing Co. $329,000 5.15% 1/5/2030 389,883 0.08%Goldman Sachs Group, Inc.^ $400,000 1.99% 27/1/2032 388,424 0.08%General Electric Co. $350,000 3.45% 1/5/2027 385,025 0.08%Home Depot, Inc. $400,000 1.38% 15/3/2031 382,876 0.08%Skyworks Solutions, Inc. $370,000 3.00% 1/6/2031 379,083 0.08%Kroger Co. $355,000 2.65% 15/10/2026 376,802 0.08%Verizon Communications, Inc. $380,000 0.85% 20/11/2025 375,359 0.08%SVB Financial Group $370,000 2.10% 15/5/2028 375,204 0.08%Pfizer, Inc. $374,000 2.55% 28/5/2040 375,129 0.08%Charter Communications Operating LLC/Charter Communications
Operating Capital $325,000 4.80% 1/3/2050 374,434 0.08%Goldman Sachs Group, Inc.^ $375,000 1.43% 9/3/2027 373,898 0.08%Citigroup, Inc.^ $350,000 2.98% 5/11/2030 371,253 0.08%Verizon Communications, Inc. $345,000 3.00% 22/3/2027 371,021 0.08%Exxon Mobil Corp. $310,000 4.23% 19/3/2040 370,958 0.08%Abbott Laboratories $271,000 4.90% 30/11/2046 369,835 0.08%JPMorgan Chase & Co.^ $320,000 3.88% 24/7/2038 368,494 0.08%Walt Disney Co. $330,000 3.50% 13/5/2040 367,685 0.08%Newmont Corp. $350,000 2.80% 1/10/2029 367,354 0.08%FedEx Corp. $360,000 2.40% 15/5/2031 366,699 0.07%Bank of America Corp.^ $365,000 0.81% 24/10/2024 366,225 0.07%T-Mobile USA, Inc. $370,000 3.00% 15/2/2041 365,891 0.07%DTE Energy Co. $365,000 1.05% 1/6/2025 364,407 0.07%GE Capital International Funding Co. Unlimited Co. $300,000 4.42% 15/11/2035 360,320 0.07%Corporate Office Properties LP $350,000 2.25% 15/3/2026 359,784 0.07%Cboe Global Markets, Inc. $370,000 1.63% 15/12/2030 356,975 0.07%AT&T, Inc. $319,000 3.80% 15/2/2027 355,832 0.07%Sabine Pass Liquefaction LLC $300,000 5.88% 30/6/2026 355,018 0.07%Morgan Stanley^ $335,000 3.22% 22/4/2042 354,472 0.07%Comcast Corp. $285,000 4.50% 15/1/2043 353,232 0.07%

714
Vanguard Global Credit Bond Fund
Principal CouponMaturity
DateFair Value
US Dollars ($)% of Total
Net AssetsAnthem, Inc. $345,000 3.13% 15/5/2050 352,909 0.07%Bank of America Corp.^ $325,000 3.19% 23/7/2030 349,885 0.07%Raytheon Technologies Corp. $269,000 4.63% 16/11/2048 345,412 0.07%Oracle Corp. $330,000 2.88% 25/3/2031 343,624 0.07%Verizon Communications, Inc. $271,000 4.81% 15/3/2039 343,624 0.07%American Homes 4 Rent LP $350,000 3.38% 15/7/2051 342,867 0.07%Chubb INA Holdings, Inc. $360,000 1.38% 15/9/2030 342,478 0.07%Air Lease Corp. $335,000 3.13% 1/12/2030 340,628 0.07%Northwell Healthcare, Inc. $300,000 3.98% 1/11/2046 340,383 0.07%Berkshire Hathaway Energy Co. $350,000 2.85% 15/5/2051 339,831 0.07%AT&T, Inc. $325,000 3.65% 1/6/2051 339,655 0.07%MPLX LP $300,000 4.88% 1/6/2025 338,712 0.07%Kaiser Foundation Hospitals $309,000 3.15% 1/5/2027 338,402 0.07%TJX Cos, Inc. $320,000 2.25% 15/9/2026 336,512 0.07%Citigroup, Inc.^ $335,000 0.98% 1/5/2025 335,834 0.07%Plains All American Pipeline LP/PAA Finance Corp. $300,000 4.65% 15/10/2025 335,678 0.07%DH Europe Finance II Sarl $320,000 2.60% 15/11/2029 335,064 0.07%DTE Electric Co. $325,000 2.25% 1/3/2030 333,833 0.07%Northrop Grumman Corp. $280,000 4.03% 15/10/2047 332,588 0.07%Delta Air Lines, Inc. $285,000 7.00% 1/5/2025 332,556 0.07%Dow Chemical Co. $300,000 3.63% 15/5/2026 331,950 0.07%Burlington Northern Santa Fe LLC $300,000 3.65% 1/9/2025 330,974 0.07%Charter Communications Operating LLC/Charter Communications
Operating Capital $330,000 3.70% 1/4/2051 328,403 0.07%VEREIT Operating Partnership LP $300,000 3.40% 15/1/2028 327,070 0.07%Lowe's Cos, Inc. $299,000 3.10% 3/5/2027 326,292 0.07%Morgan Stanley^ $294,000 3.59% 22/7/2028 325,750 0.07%Kroger Co. $295,000 3.88% 15/10/2046 325,694 0.07%Bank of America Corp.^ $335,000 1.90% 23/7/2031 325,061 0.07%CVS Health Corp. $280,000 4.13% 1/4/2040 324,589 0.07%Merck & Co., Inc. $265,000 4.00% 7/3/2049 324,070 0.07%Viatris, Inc. $319,000 1.65% 22/6/2025 323,217 0.07%NextEra Energy Capital Holdings, Inc. $320,000 2.25% 1/6/2030 322,973 0.07%Home Depot, Inc. $272,000 3.90% 15/6/2047 322,971 0.07%Duke Energy Progress LLC $350,000 2.50% 15/8/2050 322,749 0.07%Diamondback Energy, Inc. $300,000 3.25% 1/12/2026 321,517 0.07%Dominion Energy, Inc. $280,000 4.05% 15/9/2042 320,126 0.07%Lockheed Martin Corp. $274,000 3.80% 1/3/2045 319,505 0.07%Corporate Office Properties LP $315,000 2.75% 15/4/2031 317,443 0.06%Viatris, Inc. $295,000 3.85% 22/6/2040 314,867 0.06%Cigna Corp. $300,000 3.40% 15/3/2051 313,791 0.06%T-Mobile USA, Inc. $280,000 3.88% 15/4/2030 312,534 0.06%Comcast Corp. $285,000 3.15% 15/2/2028 312,523 0.06%Amgen, Inc. $300,000 2.20% 21/2/2027 311,527 0.06%American International Group, Inc. $255,000 4.50% 16/7/2044 309,526 0.06%Kinder Morgan, Inc. $250,000 5.30% 1/12/2034 309,203 0.06%Oracle Corp. $300,000 2.30% 25/3/2028 308,049 0.06%DH Europe Finance II Sarl $280,000 3.40% 15/11/2049 307,999 0.06%Comcast Corp. $237,000 4.70% 15/10/2048 307,264 0.06%ConocoPhillips $300,000 2.40% 15/2/2031 307,118 0.06%Goldman Sachs Group, Inc.^ $300,000 2.62% 22/4/2032 306,810 0.06%Bank of America Corp.^ $315,000 2.68% 19/6/2041 306,496 0.06%Oracle Corp. $290,000 3.60% 1/4/2040 305,921 0.06%RPM International, Inc. $265,000 4.55% 1/3/2029 304,874 0.06%Duke Energy Carolinas LLC $250,000 4.25% 15/12/2041 302,793 0.06%General Motors Financial Co., Inc. $295,000 3.15% 30/6/2022 302,236 0.06%Kroger Co. $300,000 2.20% 1/5/2030 301,719 0.06%Hormel Foods Corp. $300,000 0.65% 3/6/2024 300,577 0.06%Kroger Co. $250,000 4.45% 1/2/2047 298,800 0.06%Verizon Communications, Inc. $290,000 2.55% 21/3/2031 296,712 0.06%Simon Property Group LP $300,000 2.20% 1/2/2031 296,344 0.06%American International Group, Inc. $240,000 4.38% 30/6/2050 292,269 0.06%TWDC Enterprises 18 Corp. $268,000 3.00% 13/2/2026 291,080 0.06%Best Buy Co., Inc. $250,000 4.45% 1/10/2028 289,797 0.06%AbbVie, Inc. $222,000 4.88% 14/11/2048 287,860 0.06%AEP Transmission Co. LLC $233,000 4.25% 15/9/2048 287,110 0.06%Chevron Phillips Chemical Co. LLC/Chevron Phillips Chemical Co. LP $260,000 3.40% 1/12/2026 286,638 0.06%Amgen, Inc. $275,000 3.15% 21/2/2040 286,001 0.06%CenterPoint Energy, Inc. $280,000 2.65% 1/6/2031 285,711 0.06%Alexandria Real Estate Equities, Inc. $290,000 3.00% 18/5/2051 284,611 0.06%Burlington Northern Santa Fe LLC $250,000 3.55% 15/2/2050 283,166 0.06%

715
Vanguard Global Credit Bond Fund
Principal CouponMaturity
DateFair Value
US Dollars ($)% of Total
Net AssetsAmerican Tower Corp. $260,000 3.38% 15/10/2026 282,930 0.06%Gilead Sciences, Inc. $240,000 4.15% 1/3/2047 282,420 0.06%Bank of America Corp.^ $280,000 1.73% 22/7/2027 282,313 0.06%Bank of America Corp.^ $275,000 2.50% 13/2/2031 281,170 0.06%TJX Cos, Inc. $245,000 3.88% 15/4/2030 280,429 0.06%PPG Industries, Inc. $280,000 1.20% 15/3/2026 279,417 0.06%FedEx Corp. $270,000 3.25% 15/5/2041 278,002 0.06%HCA, Inc. $240,000 5.25% 15/6/2026 277,625 0.06%General Electric Co. $199,000 6.75% 15/3/2032 275,979 0.06%Verizon Communications, Inc. $270,000 1.45% 20/3/2026 272,494 0.06%Virginia Electric & Power Co. $240,000 3.80% 1/4/2028 271,376 0.06%Virginia Electric & Power Co. $251,000 2.95% 15/11/2026 271,171 0.06%Southwest Airlines Co. $230,000 5.13% 15/6/2027 270,840 0.06%Fox Corp. $250,000 4.03% 25/1/2024 270,839 0.06%Bank of America Corp.^ $251,000 3.37% 23/1/2026 270,531 0.06%Duke Energy Florida LLC $275,000 1.75% 15/6/2030 269,611 0.06%CenterPoint Energy, Inc. $235,000 4.25% 1/11/2028 269,214 0.06%FS KKR Capital Corp. $260,000 3.40% 15/1/2026 268,922 0.05%Air Lease Corp. $255,000 2.88% 15/1/2026 268,195 0.05%Goldman Sachs Group, Inc.^ $220,000 4.41% 23/4/2039 267,941 0.05%Metropolitan Transportation Authority $200,000 5.87% 15/11/2039 266,402 0.05%Verizon Communications, Inc. $223,000 4.40% 1/11/2034 265,909 0.05%CVS Health Corp. $215,000 4.78% 25/3/2038 264,458 0.05%Mastercard, Inc. $250,000 2.95% 15/3/2051 262,089 0.05%Boston Scientific Corp. $254,000 1.90% 1/6/2025 262,085 0.05%Dell International LLC/EMC Corp. $160,000 8.35% 15/7/2046 261,768 0.05%Athene Global Funding $260,000 0.95% 8/1/2024 260,750 0.05%Gilead Sciences, Inc. $260,000 0.75% 29/9/2023 260,189 0.05%Lennar Corp. $225,000 4.75% 29/11/2027 259,997 0.05%Electronic Arts, Inc. $265,000 2.95% 15/2/2051 259,442 0.05%Duke Energy Corp. $250,000 3.50% 15/6/2051 258,477 0.05%Eli Lilly & Co. $230,000 3.38% 15/3/2029 258,118 0.05%Energy Transfer LP/Regency Energy Finance Corp. $240,000 4.50% 1/11/2023 257,266 0.05%Goldman Sachs Group, Inc.^ $225,000 4.22% 1/5/2029 256,876 0.05%Marathon Petroleum Corp. $235,000 4.75% 15/12/2023 256,389 0.05%Dell International LLC/EMC Corp. $199,000 6.20% 15/7/2030 255,859 0.05%Cimarex Energy Co. $225,000 4.38% 15/3/2029 255,817 0.05%Microsoft Corp. $260,000 2.53% 1/6/2050 255,494 0.05%McKesson Corp. $225,000 3.95% 16/2/2028 255,323 0.05%Weyerhaeuser Co. $222,000 4.00% 15/11/2029 253,383 0.05%Verizon Communications, Inc. $195,000 4.86% 21/8/2046 251,897 0.05%Enterprise Products Operating LLC $205,000 4.85% 15/3/2044 251,521 0.05%Cigna Corp. $250,000 1.25% 15/3/2026 250,752 0.05%DuPont de Nemours, Inc. $230,000 4.21% 15/11/2023 249,001 0.05%MPLX LP $245,000 1.75% 1/3/2026 247,787 0.05%Northrop Grumman Corp. $175,000 5.25% 1/5/2050 246,081 0.05%MPLX LP $215,000 4.50% 15/4/2038 245,791 0.05%Xcel Energy, Inc. $225,000 3.50% 1/12/2049 243,225 0.05%VMware, Inc. $205,000 4.70% 15/5/2030 242,678 0.05%Coca-Cola Co. $250,000 1.00% 15/3/2028 242,550 0.05%McDonald's Corp. $200,000 4.20% 1/4/2050 241,432 0.05%Verizon Communications, Inc. $225,000 3.70% 22/3/2061 241,319 0.05%Intel Corp. $180,000 4.75% 25/3/2050 238,994 0.05%Bank of America Corp.^ $200,000 4.08% 20/3/2051 238,703 0.05%Dow Chemical Co. $200,000 4.38% 15/11/2042 238,373 0.05%Florida Power & Light Co. $200,000 3.80% 15/12/2042 235,842 0.05%Broadcom, Inc. $217,000 3.63% 15/10/2024 235,117 0.05%Everest Reinsurance Holdings, Inc. $219,000 3.50% 15/10/2050 233,736 0.05%Tyson Foods, Inc. $200,000 4.35% 1/3/2029 232,952 0.05%UnitedHealth Group, Inc. $230,000 2.75% 15/5/2040 232,749 0.05%Verizon Communications, Inc. $200,000 4.33% 21/9/2028 232,459 0.05%Goldman Sachs Group, Inc. AU($)300,000 1.59% 2/5/2024 230,912 0.05%Sabine Pass Liquefaction LLC $200,000 4.50% 15/5/2030 230,758 0.05%7-Eleven, Inc. $235,000 0.95% 10/2/2026 230,699 0.05%Broadcom, Inc. $195,000 5.00% 15/4/2030 230,489 0.05%ViacomCBS, Inc. $200,000 4.20% 1/6/2029 230,102 0.05%Ameren Corp. $210,000 3.50% 15/1/2031 230,026 0.05%Entergy Corp. $230,000 1.90% 15/6/2028 229,626 0.05%Spectra Energy Partners LP $195,000 4.50% 15/3/2045 229,042 0.05%Zoetis, Inc. $220,000 3.00% 15/5/2050 227,374 0.05%AbbVie, Inc. $215,000 2.60% 21/11/2024 226,791 0.05%

716
Vanguard Global Credit Bond Fund
Principal CouponMaturity
DateFair Value
US Dollars ($)% of Total
Net AssetsCitigroup, Inc. $200,000 4.30% 20/11/2026 225,963 0.05%Southern California Edison Co. $200,000 4.20% 1/3/2029 225,924 0.05%Toll Brothers Finance Corp. $205,000 4.35% 15/2/2028 225,846 0.05%Allina Health System $195,000 3.89% 15/4/2049 225,552 0.05%Kinder Morgan Energy Partners LP $175,000 5.80% 15/3/2035 224,412 0.05%Nationwide Mutual Insurance Co. $200,000 4.35% 30/4/2050 223,801 0.05%L3Harris Technologies, Inc. $230,000 1.80% 15/1/2031 223,553 0.05%Union Pacific Corp. $211,000 3.25% 5/2/2050 222,267 0.05%Cameron LNG LLC $200,000 3.70% 15/1/2039 222,204 0.05%Dell International LLC/EMC Corp. $180,000 6.10% 15/7/2027 220,531 0.05%Exxon Mobil Corp. $185,000 4.11% 1/3/2046 218,670 0.04%Home Depot, Inc. $200,000 2.95% 15/6/2029 218,573 0.04%General Electric Co. $185,000 4.25% 1/5/2040 216,446 0.04%Dell International LLC/EMC Corp. $180,000 6.02% 15/6/2026 215,883 0.04%T-Mobile USA, Inc. $195,000 3.75% 15/4/2027 215,493 0.04%UnitedHealth Group, Inc. $200,000 3.25% 15/5/2051 213,818 0.04%Boeing Co. $200,000 3.45% 1/11/2028 213,414 0.04%AT&T, Inc. $210,000 3.65% 15/9/2059 212,756 0.04%LYB International Finance III LLC $205,000 3.38% 1/10/2040 212,491 0.04%Amgen, Inc. $200,000 3.38% 21/2/2050 210,758 0.04%AbbVie, Inc. $175,000 4.25% 21/11/2049 209,823 0.04%JPMorgan Chase & Co.^ $220,000 2.53% 19/11/2041 209,591 0.04%Anthem, Inc. $200,000 2.38% 15/1/2025 209,409 0.04%Discovery Communications LLC $198,000 4.00% 15/9/2055 209,405 0.04%AutoZone, Inc. $220,000 1.65% 15/1/2031 209,368 0.04%Goldman Sachs Group, Inc.^ $200,000 3.21% 22/4/2042 209,279 0.04%Nasdaq, Inc. $225,000 2.50% 21/12/2040 208,973 0.04%Cigna Corp. $200,000 3.40% 15/3/2050 208,043 0.04%Simon Property Group LP $205,000 3.25% 13/9/2049 207,569 0.04%General Motors Co. $175,000 6.13% 1/10/2025 207,163 0.04%Zimmer Biomet Holdings, Inc. $190,000 3.55% 1/4/2025 206,173 0.04%Southwest Airlines Co. $200,000 2.63% 10/2/2030 205,133 0.04%Comcast Corp. $170,000 4.40% 15/8/2035 204,742 0.04%Apple, Inc. $210,000 2.38% 8/2/2041 204,303 0.04%Electronic Arts, Inc. $210,000 1.85% 15/2/2031 203,070 0.04%Asbury Automotive Group, Inc. $195,000 4.50% 1/3/2028 201,717 0.04%Charles Schwab Corp. $200,000 0.75% 18/3/2024 201,116 0.04%Hormel Foods Corp. $200,000 1.70% 3/6/2028 201,096 0.04%Oncor Electric Delivery Co. LLC $170,000 3.80% 30/9/2047 198,918 0.04%Waste Management, Inc. $200,000 0.75% 15/11/2025 198,241 0.04%Tyson Foods, Inc. $150,000 5.10% 28/9/2048 197,892 0.04%Kraft Heinz Foods Co. $180,000 3.75% 1/4/2030 197,483 0.04%Kimco Realty Corp. $170,000 4.25% 1/4/2045 197,016 0.04%PECO Energy Co. $165,000 3.90% 1/3/2048 196,614 0.04%Charter Communications Operating LLC/Charter Communications
Operating Capital $200,000 3.85% 1/4/2061 196,601 0.04%Intercontinental Exchange, Inc. $205,000 2.65% 15/9/2040 196,456 0.04%LYB International Finance III LLC $180,000 3.38% 1/5/2030 195,561 0.04%BlackRock, Inc. $195,000 1.90% 28/1/2031 195,029 0.04%Prudential Financial, Inc. $155,000 4.35% 25/2/2050 194,267 0.04%Entergy Louisiana LLC $195,000 2.90% 15/3/2051 193,931 0.04%Morgan Stanley^ $185,000 2.70% 22/1/2031 193,788 0.04%Connecticut Light & Power Co. $160,000 4.00% 1/4/2048 193,691 0.04%John Deere Capital Corp. $200,000 1.45% 15/1/2031 193,363 0.04%7-Eleven, Inc. $200,000 1.30% 10/2/2028 193,007 0.04%Verizon Communications, Inc. $170,000 3.85% 1/11/2042 192,655 0.04%Nucor Corp. $185,000 2.00% 1/6/2025 191,345 0.04%International Paper Co. $150,000 4.80% 15/6/2044 191,254 0.04%Oracle Corp. $175,000 3.95% 25/3/2051 191,223 0.04%Entergy Arkansas LLC $200,000 2.65% 15/6/2051 190,680 0.04%Discovery Communications LLC $162,000 4.65% 15/5/2050 189,608 0.04%Mondelez International, Inc. $200,000 1.50% 4/2/2031 189,443 0.04%McDonald's Corp. $170,000 3.63% 1/9/2049 188,345 0.04%PacifiCorp $160,000 4.10% 1/2/2042 188,305 0.04%Duke Energy Carolinas LLC $180,000 2.55% 15/4/2031 187,172 0.04%Comcast Corp. $135,000 4.95% 15/10/2058 186,779 0.04%Honeywell International, Inc. $180,000 2.80% 1/6/2050 185,570 0.04%Wells Fargo & Co.^ $135,000 5.01% 4/4/2051 184,939 0.04%Citigroup, Inc. $140,000 4.65% 23/7/2048 183,377 0.04%Enable Midstream Partners LP $160,000 4.95% 15/5/2028 183,231 0.04%Ameren Illinois Co. $180,000 2.90% 15/6/2051 181,788 0.04%

717
Vanguard Global Credit Bond Fund
Principal CouponMaturity
DateFair Value
US Dollars ($)% of Total
Net AssetsComcast Corp. $170,000 3.25% 1/11/2039 180,898 0.04%Kellogg Co. $145,000 4.50% 1/4/2046 179,990 0.04%AT&T, Inc. $172,000 3.80% 1/12/2057 179,740 0.04%Willis North America, Inc. $170,000 2.95% 15/9/2029 178,800 0.04%Devon Energy Corp. $162,000 4.50% 15/1/2030 178,248 0.04%Duke Energy Progress LLC $150,000 4.10% 15/5/2042 177,451 0.04%General Dynamics Corp. $145,000 4.25% 1/4/2040 177,348 0.04%General Mills, Inc. $150,000 4.15% 15/2/2043 177,151 0.04%Diamondback Energy, Inc. $155,000 4.40% 24/3/2051 175,085 0.04%Amazon.com, Inc. $185,000 2.50% 3/6/2050 174,734 0.04%Georgia-Pacific LLC $170,000 1.75% 30/9/2025 174,261 0.04%Willis North America, Inc. $150,000 4.50% 15/9/2028 173,586 0.04%Gilead Sciences, Inc. $180,000 2.80% 1/10/2050 172,919 0.04%Morgan Stanley^ $140,000 4.46% 22/4/2039 172,727 0.04%DTE Electric Co. $150,000 3.70% 1/6/2046 171,569 0.04%Verisk Analytics, Inc. $155,000 4.00% 15/6/2025 171,501 0.04%DuPont de Nemours, Inc. $150,000 4.49% 15/11/2025 170,528 0.03%Entergy Corp. $170,000 2.40% 15/6/2031 169,877 0.03%HCA, Inc. $133,000 5.25% 15/6/2049 169,758 0.03%FedEx Corp. $125,000 5.25% 15/5/2050 169,573 0.03%Sherwin-Williams Co. $135,000 4.50% 1/6/2047 169,126 0.03%Southern California Edison Co. $160,000 4.00% 1/4/2047 168,480 0.03%Delta Air Lines, Inc./SkyMiles IP Ltd. $156,000 4.50% 20/10/2025 167,946 0.03%Crown Castle International Corp. $129,000 5.20% 15/2/2049 167,618 0.03%Chevron Phillips Chemical Co. LLC/Chevron Phillips Chemical Co. LP $150,000 3.70% 1/6/2028 167,364 0.03%Commonwealth Edison Co. $145,000 3.80% 1/10/2042 166,912 0.03%Dominion Energy, Inc. $145,000 4.25% 1/6/2028 166,631 0.03%Entergy Texas, Inc. $155,000 3.55% 30/9/2049 166,515 0.03%Altria Group, Inc. $140,000 5.38% 31/1/2044 166,356 0.03%Fox Corp. $155,000 3.05% 7/4/2025 165,933 0.03%JPMorgan Chase & Co.^ $160,000 3.11% 22/4/2051 165,861 0.03%Charter Communications Operating LLC/Charter Communications
Operating Capital $140,000 5.05% 30/3/2029 165,494 0.03%Constellation Brands, Inc. $150,000 3.75% 1/5/2050 165,393 0.03%National Rural Utilities Cooperative Finance Corp. $147,000 3.70% 15/3/2029 164,850 0.03%Willis North America, Inc. $145,000 3.88% 15/9/2049 164,030 0.03%General Electric Co. $135,000 4.35% 1/5/2050 163,423 0.03%PECO Energy Co. $135,000 4.15% 1/10/2044 163,374 0.03%GE Capital Funding LLC $150,000 3.45% 15/5/2025 163,087 0.03%Verizon Communications, Inc. $150,000 3.38% 15/2/2025 162,969 0.03%Dominion Energy, Inc. $130,000 4.70% 1/12/2044 162,259 0.03%Public Service Co. of Colorado $150,000 3.20% 1/3/2050 162,201 0.03%General Mills, Inc. $160,000 3.00% 1/2/2051 161,208 0.03%Altria Group, Inc. $142,000 4.40% 14/2/2026 160,632 0.03%Bank of America Corp.^ $150,000 3.31% 22/4/2042 158,646 0.03%Exxon Mobil Corp. $150,000 2.61% 15/10/2030 158,215 0.03%Burlington Northern Santa Fe LLC $111,000 5.75% 1/5/2040 157,346 0.03%Morgan Stanley^ $134,000 3.97% 22/7/2038 157,215 0.03%Bank of America Corp.^ $160,000 2.83% 24/10/2051 156,392 0.03%General Motors Financial Co., Inc. $145,000 5.20% 20/3/2023 156,124 0.03%Coca-Cola Co. $150,000 3.00% 5/3/2051 155,666 0.03%Interpublic Group of Cos, Inc. $130,000 4.65% 1/10/2028 152,620 0.03%Air Products & Chemicals, Inc. $150,000 2.70% 15/5/2040 151,802 0.03%American Airlines, Inc./AAdvantage Loyalty IP Ltd. $140,000 5.75% 20/4/2029 151,399 0.03%Home Depot, Inc. $130,000 3.90% 6/12/2028 151,098 0.03%Starbucks Corp. $140,000 3.50% 15/11/2050 150,486 0.03%Brixmor Operating Partnership LP $150,000 2.25% 1/4/2028 150,082 0.03%CVS Health Corp. $125,000 4.25% 1/4/2050 148,577 0.03%Children's Hospital of Philadelphia $150,000 2.70% 1/7/2050 148,384 0.03%Consolidated Edison Co. of New York, Inc. $130,000 3.95% 1/4/2050 147,849 0.03%Entergy Corp. $141,000 2.80% 15/6/2030 146,633 0.03%Public Service Co. of Colorado $100,000 6.25% 1/9/2037 146,475 0.03%NextEra Energy Capital Holdings, Inc. $135,000 3.25% 1/4/2026 146,401 0.03%CVS Health Corp. $150,000 2.70% 21/8/2040 145,453 0.03%Marathon Petroleum Corp. $130,000 3.80% 1/4/2028 144,805 0.03%Cedar Fair LP/Canada's Wonderland Co./Magnum Management Corp./
Millennium Op $138,000 5.50% 1/5/2025 144,293 0.03%Bank of America Corp. $130,000 4.00% 22/1/2025 142,597 0.03%Fiserv, Inc. $129,000 3.50% 1/7/2029 142,006 0.03%Johnson & Johnson $150,000 2.45% 1/9/2060 141,428 0.03%Nucor Corp. $135,000 2.70% 1/6/2030 141,031 0.03%

718
Vanguard Global Credit Bond Fund
Principal CouponMaturity
DateFair Value
US Dollars ($)% of Total
Net AssetsCity of Hope $113,000 4.38% 15/8/2048 140,741 0.03%Phillips 66 $125,000 3.90% 15/3/2028 140,615 0.03%Churchill Downs, Inc. $134,000 5.50% 1/4/2027 139,821 0.03%Conagra Brands, Inc. $117,000 4.85% 1/11/2028 139,366 0.03%Walt Disney Co. $92,000 6.65% 15/11/2037 139,061 0.03%ONEOK, Inc. $130,000 3.40% 1/9/2029 138,604 0.03%Mount Sinai Hospitals Group, Inc. $125,000 3.74% 1/7/2049 137,503 0.03%Vail Resorts, Inc. $128,000 6.25% 15/5/2025 136,976 0.03%Air Lease Corp. $125,000 3.75% 1/6/2026 136,727 0.03%Enterprise Products Operating LLC $110,000 4.90% 15/5/2046 136,118 0.03%Intercontinental Exchange, Inc. $140,000 3.00% 15/9/2060 134,947 0.03%Sempra Energy $120,000 4.00% 1/2/2048 134,565 0.03%Public Service Electric & Gas Co. $125,000 3.00% 15/5/2025 134,028 0.03%Cimarex Energy Co. $120,000 3.90% 15/5/2027 132,386 0.03%Bank of America Corp. $100,000 4.88% 1/4/2044 130,450 0.03%Energy Transfer LP $100,000 6.50% 1/2/2042 129,813 0.03%Verizon Communications, Inc. $100,000 4.67% 15/3/2055 129,205 0.03%Public Service Electric & Gas Co. $120,000 3.20% 1/8/2049 128,687 0.03%Dominion Energy South Carolina, Inc. $100,000 4.60% 15/6/2043 128,369 0.03%AT&T, Inc. $110,000 4.30% 15/2/2030 127,182 0.03%Wells Fargo & Co. $105,000 4.40% 14/6/2046 126,800 0.03%Verizon Communications, Inc. $110,000 4.02% 3/12/2029 126,181 0.03%General Motors Co. $114,000 5.40% 2/10/2023 125,499 0.03%Public Service Electric & Gas Co. $120,000 2.45% 15/1/2030 125,132 0.03%Charter Communications Operating LLC/Charter Communications
Operating Capital $110,000 4.20% 15/3/2028 124,432 0.03%Morgan Stanley $100,000 4.30% 27/1/2045 124,025 0.03%Avis Budget Rental Car Funding AESOP LLC $120,000 3.07% 20/9/2023 123,307 0.03%Wells Fargo & Co. $100,000 4.65% 4/11/2044 123,224 0.03%Kimberly-Clark Corp. $125,000 1.05% 15/9/2027 122,292 0.03%Verizon Communications, Inc. $130,000 3.00% 20/11/2060 122,049 0.02%Williams Cos, Inc. $100,000 4.85% 1/3/2048 121,715 0.02%Altria Group, Inc. $95,000 5.95% 14/2/2049 121,615 0.02%Ameren Illinois Co. $100,000 4.15% 15/3/2046 121,555 0.02%Intercontinental Exchange, Inc. $120,000 0.70% 15/6/2023 120,528 0.02%Norfolk Southern Corp. $120,000 3.05% 15/5/2050 120,299 0.02%Ohio Power Co. $125,000 1.63% 15/1/2031 120,212 0.02%Marathon Petroleum Corp. $100,000 5.00% 15/9/2054 119,569 0.02%MetLife, Inc. $100,000 4.13% 13/8/2042 119,546 0.02%ONEOK, Inc. $100,000 5.85% 15/1/2026 118,359 0.02%Apple, Inc. $120,000 1.65% 8/2/2031 118,091 0.02%NRG Energy, Inc. $117,000 2.45% 2/12/2027 117,793 0.02%Lowe's Cos, Inc. $120,000 1.30% 15/4/2028 117,050 0.02%AT&T, Inc. $95,000 4.90% 15/8/2037 116,908 0.02%Live Nation Entertainment, Inc. $104,000 6.50% 15/5/2027 115,415 0.02%Verizon Communications, Inc. $100,000 4.00% 22/3/2050 115,086 0.02%Northern States Power Co. $80,000 6.25% 1/6/2036 114,593 0.02%Berkshire Hathaway Energy Co. $100,000 3.70% 15/7/2030 113,334 0.02%TransDigm, Inc. $107,000 6.25% 15/3/2026 112,864 0.02%JPMorgan Chase & Co.^ $95,000 3.96% 15/11/2048 111,313 0.02%MPLX LP $95,000 4.70% 15/4/2048 110,457 0.02%Boeing Co. $80,000 5.93% 1/5/2060 110,347 0.02%International Business Machines Corp. $100,000 3.30% 15/5/2026 109,972 0.02%Xcel Energy, Inc. $100,000 3.40% 1/6/2030 109,880 0.02%Williams Cos, Inc. $80,000 6.30% 15/4/2040 109,614 0.02%Aon plc $85,000 4.75% 15/5/2045 109,570 0.02%Hilton USA Trust 2016 $100,000 3.72% 5/11/2038 109,239 0.02%Verisk Analytics, Inc. $96,000 4.13% 15/3/2029 109,099 0.02%Steel Dynamics, Inc. $100,000 3.45% 15/4/2030 108,959 0.02%Energy Transfer LP $85,000 6.05% 1/6/2041 108,033 0.02%Ford Credit Auto Owner Trust 2018 $100,000 3.19% 15/7/2031 107,937 0.02%AbbVie, Inc. $100,000 2.95% 21/11/2026 107,504 0.02%Allison Transmission, Inc. $103,000 4.75% 1/10/2027 107,373 0.02%Broadcom Corp./Broadcom Cayman Finance Ltd. $96,000 3.88% 15/1/2027 106,101 0.02%Union Electric Co. $89,000 4.00% 1/4/2048 105,588 0.02%Ameren Corp. $100,000 2.50% 15/9/2024 105,333 0.02%Invesco Finance plc $80,000 5.38% 30/11/2043 104,901 0.02%National Rural Utilities Cooperative Finance Corp. $95,000 3.05% 25/4/2027 103,576 0.02%Chevron Corp. $100,000 2.24% 11/5/2030 103,127 0.02%Sempra Energy $95,000 3.25% 15/6/2027 103,045 0.02%CenterPoint Energy Houston Electric LLC $100,000 2.35% 1/4/2031 102,632 0.02%

719
Vanguard Global Credit Bond Fund
Principal CouponMaturity
DateFair Value
US Dollars ($)% of Total
Net AssetsDTE Electric Co. $100,000 2.95% 1/3/2050 102,573 0.02%Seagate HDD Cayman $100,000 4.13% 15/1/2031 102,250 0.02%Santander Drive Auto Receivables Trust 2018 $100,000 4.19% 16/12/2024 102,197 0.02%Duke Energy Carolinas LLC $90,000 3.75% 1/6/2045 101,960 0.02%Tidewater Auto Receivables Trust 2018 $100,000 4.30% 15/11/2024 101,585 0.02%Skyworks Solutions, Inc. $100,000 1.80% 1/6/2026 101,413 0.02%Broadcom, Inc. $90,000 4.70% 15/4/2025 101,291 0.02%Hilton Domestic Operating Co., Inc. $95,000 5.38% 1/5/2025 100,058 0.02%Broadcom, Inc. $100,000 1.95% 15/2/2028 100,047 0.02%Newmont Corp. $100,000 2.25% 1/10/2030 99,934 0.02%AT&T, Inc. $85,000 4.50% 15/5/2035 99,755 0.02%Steel Dynamics, Inc. $100,000 1.65% 15/10/2027 99,681 0.02%Broadcom, Inc. $95,000 3.75% 15/2/2051 99,277 0.02%Energy Transfer LP $75,000 6.25% 15/4/2049 98,627 0.02%Meritage Homes Corp. $95,000 3.88% 15/4/2029 98,308 0.02%Morgan Stanley^ $100,000 2.80% 25/1/2052 98,219 0.02%CVS Health Corp. $75,000 5.05% 25/3/2048 97,535 0.02%Energy Transfer LP $90,000 4.25% 1/4/2024 96,989 0.02%Duke Energy Indiana LLC $100,000 2.75% 1/4/2050 96,894 0.02%Waste Management, Inc. $100,000 1.15% 15/3/2028 96,841 0.02%Charter Communications Operating LLC/Charter Communications
Operating Capital $100,000 2.30% 1/2/2032 96,313 0.02%Union Electric Co. $90,000 3.25% 1/10/2049 95,962 0.02%HCA, Inc. $85,000 4.13% 15/6/2029 95,853 0.02%Raytheon Technologies Corp. $90,000 3.20% 15/3/2024 95,755 0.02%7-Eleven, Inc. $100,000 1.80% 10/2/2031 95,571 0.02%Republic Services, Inc. $100,000 1.75% 15/2/2032 95,281 0.02%Amgen, Inc. $100,000 2.77% 1/9/2053 95,044 0.02%JPMorgan Chase & Co.^ $86,000 3.51% 23/1/2029 94,751 0.02%Performance Food Group, Inc. $90,000 5.50% 15/10/2027 94,706 0.02%Aon plc $75,000 4.60% 14/6/2044 93,735 0.02%RPM International, Inc. $85,000 3.75% 15/3/2027 93,318 0.02%Chevron Corp. $85,000 2.95% 16/5/2026 92,173 0.02%Netflix, Inc. $75,000 5.88% 15/11/2028 92,134 0.02%Eli Lilly & Co. $100,000 2.50% 15/9/2060 91,529 0.02%Ally Financial, Inc. $90,000 1.45% 2/10/2023 91,417 0.02%Florida Power & Light Co. $75,000 4.13% 1/2/2042 91,399 0.02%Public Service Electric & Gas Co. $80,000 3.60% 1/12/2047 91,084 0.02%General Electric Co. $81,000 3.63% 1/5/2030 90,420 0.02%ConocoPhillips Co. $75,000 4.30% 15/11/2044 90,385 0.02%Fiserv, Inc. $75,000 4.40% 1/7/2049 90,347 0.02%Crown Castle International Corp. $81,000 3.80% 15/2/2028 90,004 0.02%Agree LP $90,000 2.60% 15/6/2033 89,712 0.02%Appalachian Power Co. $80,000 3.70% 1/5/2050 88,133 0.02%Kinder Morgan Energy Partners LP $70,000 5.50% 1/3/2044 88,044 0.02%Phillips 66 Partners LP $80,000 3.75% 1/3/2028 87,626 0.02%Mondelez International, Inc. $75,000 4.13% 7/5/2028 87,203 0.02%Florida Power & Light Co. $80,000 3.15% 1/10/2049 86,869 0.02%Enterprise Products Operating LLC $75,000 4.25% 15/2/2048 86,268 0.02%Occidental Petroleum Corp. $85,000 3.20% 15/8/2026 85,664 0.02%Amgen, Inc. $65,000 5.15% 15/11/2041 85,385 0.02%Transcontinental Gas Pipe Line Co. LLC $70,000 4.60% 15/3/2048 85,153 0.02%Essex Portfolio LP $70,000 4.50% 15/3/2048 85,065 0.02%Walt Disney Co. $75,000 3.60% 13/1/2051 85,006 0.02%FMC Corp. $70,000 4.50% 1/10/2049 84,969 0.02%Tenet Healthcare Corp. $81,000 4.88% 1/1/2026 83,905 0.02%Virginia Electric & Power Co. $70,000 4.20% 15/5/2045 83,806 0.02%Starbucks Corp. $75,000 3.75% 1/12/2047 83,233 0.02%CVS Health Corp. $79,000 3.70% 9/3/2023 83,170 0.02%CenterPoint Energy Houston Electric LLC $75,000 3.35% 1/4/2051 82,573 0.02%AbbVie, Inc. $75,000 3.80% 15/3/2025 82,023 0.02%Exxon Mobil Corp. $75,000 3.45% 15/4/2051 81,612 0.02%American International Group, Inc. $65,000 4.80% 10/7/2045 81,464 0.02%Aflac, Inc. $80,000 1.13% 15/3/2026 80,169 0.02%Sysco Corp. $69,000 5.65% 1/4/2025 80,026 0.02%Valero Energy Corp. $70,000 4.35% 1/6/2028 79,760 0.02%Northern States Power Co. $70,000 3.60% 15/9/2047 79,713 0.02%Lockheed Martin Corp. $60,000 4.70% 15/5/2046 79,393 0.02%Agree LP $80,000 2.00% 15/6/2028 79,352 0.02%Union Electric Co. $70,000 3.65% 15/4/2045 79,049 0.02%Calpine Corp. $77,500 4.50% 15/2/2028 79,033 0.02%

720
Vanguard Global Credit Bond Fund
Principal CouponMaturity
DateFair Value
US Dollars ($)% of Total
Net AssetsFreeport-McMoRan, Inc. $75,000 4.13% 1/3/2028 78,218 0.02%Wyndham Hotels & Resorts, Inc. $75,000 4.38% 15/8/2028 77,986 0.02%FedEx Corp. $70,000 3.88% 1/8/2042 77,887 0.02%Stanley Black & Decker, Inc. $75,000 2.30% 15/3/2030 77,852 0.02%TEGNA, Inc. $75,000 4.63% 15/3/2028 77,806 0.02%Enterprise Products Operating LLC $63,000 4.80% 1/2/2049 77,583 0.02%CSC Holdings LLC $79,000 4.63% 1/12/2030 77,487 0.02%Southern Co. $70,000 3.70% 30/4/2030 77,272 0.02%Boston Scientific Corp. $60,000 4.70% 1/3/2049 76,799 0.02%Encompass Health Corp. $74,000 4.50% 1/2/2028 76,775 0.02%Ford Motor Credit Co. LLC $75,000 3.09% 9/1/2023 76,518 0.02%BP Capital Markets America, Inc. $70,000 3.12% 4/5/2026 75,958 0.02%ConocoPhillips Co. $65,000 4.95% 15/3/2026 75,465 0.02%SBA Communications Corp. $78,000 3.13% 1/2/2029 75,325 0.02%Southern California Edison Co. $65,000 4.50% 1/9/2040 74,758 0.02%Berkshire Hathaway Finance Corp. $60,000 4.20% 15/8/2048 74,080 0.02%Walt Disney Co. $75,000 2.75% 1/9/2049 73,862 0.02%Chevron USA, Inc. $60,000 4.20% 15/10/2049 73,830 0.02%Hill-Rom Holdings, Inc. $70,000 4.38% 15/9/2027 72,917 0.01%DuPont de Nemours, Inc. $55,000 5.32% 15/11/2038 72,691 0.01%United Airlines, Inc. $70,000 4.38% 15/4/2026 72,466 0.01%Verizon Communications, Inc. $75,000 2.65% 20/11/2040 72,362 0.01%Berry Global, Inc. $68,000 5.63% 15/7/2027 71,891 0.01%Nationwide Financial Services, Inc. $65,000 3.90% 30/11/2049 71,726 0.01%Phillips 66 $60,000 4.65% 15/11/2034 71,548 0.01%Altria Group, Inc. $68,000 2.35% 6/5/2025 71,128 0.01%Energy Transfer LP $60,000 5.40% 1/10/2047 71,017 0.01%Tesla Auto Lease Trust 2018 $70,000 4.36% 20/10/2021 70,181 0.01%Transcontinental Gas Pipe Line Co. LLC $65,000 3.25% 15/5/2030 70,081 0.01%Lowe's Cos, Inc. $60,000 4.05% 3/5/2047 69,133 0.01%Union Pacific Corp. $60,000 3.84% 20/3/2060 68,110 0.01%ONEOK, Inc. $60,000 4.35% 15/3/2029 67,746 0.01%Ameren Illinois Co. $70,000 1.55% 15/11/2030 67,364 0.01%Visa, Inc. $75,000 2.00% 15/8/2050 66,291 0.01%Comcast Corp. $57,000 4.15% 15/10/2028 66,002 0.01%Scripps Escrow II, Inc. $66,000 3.88% 15/1/2029 65,479 0.01%Plains All American Pipeline LP/PAA Finance Corp. $60,000 4.90% 15/2/2045 65,269 0.01%General Dynamics Corp. $60,000 3.25% 1/4/2025 65,032 0.01%Home Depot, Inc. $50,000 4.50% 6/12/2048 64,993 0.01%Block Financial LLC $60,000 3.88% 15/8/2030 64,879 0.01%Kinder Morgan, Inc. $50,000 5.55% 1/6/2045 64,671 0.01%LYB International Finance III LLC $60,000 2.88% 1/5/2025 63,744 0.01%United Airlines, Inc. $60,000 4.63% 15/4/2029 62,148 0.01%Enterprise Products Operating LLC $45,000 5.95% 1/2/2041 61,895 0.01%ConocoPhillips $55,000 3.75% 1/10/2027 61,778 0.01%Aramark Services, Inc. $58,000 6.38% 1/5/2025 61,612 0.01%Appalachian Power Co. $50,000 4.50% 1/3/2049 61,290 0.01%Berkshire Hathaway Energy Co. $50,000 4.50% 1/2/2045 61,244 0.01%Lamb Weston Holdings, Inc. $55,000 4.88% 15/5/2028 60,871 0.01%CSC Holdings LLC $60,000 4.50% 15/11/2031 60,400 0.01%Duke Energy Florida LLC $55,000 3.40% 1/10/2046 59,685 0.01%Florida Power & Light Co. $50,000 3.70% 1/12/2047 58,803 0.01%ONEOK, Inc. $50,000 4.95% 13/7/2047 58,587 0.01%Kimberly-Clark Corp. $53,000 3.10% 26/3/2030 58,486 0.01%3M Co. $49,000 3.70% 15/4/2050 57,637 0.01%General Dynamics Corp. $50,000 3.60% 15/11/2042 57,590 0.01%Nucor Corp. $50,000 3.95% 1/5/2028 56,989 0.01%Walt Disney Co. $50,000 3.70% 23/3/2027 56,162 0.01%Antero Resources Corp. $55,000 5.38% 1/3/2030 56,128 0.01%McDonald's Corp. $50,000 3.70% 15/2/2042 55,938 0.01%Citigroup Commercial Mortgage Trust 2017 $50,000 4.19% 15/9/2050 55,927 0.01%TransDigm, Inc. $55,000 4.88% 1/5/2029 55,577 0.01%Chevron USA, Inc. $50,000 3.25% 15/10/2029 55,427 0.01%Ladder Capital Finance Holdings LLLP/Ladder Capital Finance Corp. $55,000 4.75% 15/6/2029 54,988 0.01%FirstEnergy Corp. $50,000 4.40% 15/7/2027 54,476 0.01%MGM Growth Properties Operating Partnership LP/MGP Finance Co.-
Issuer, Inc. $51,000 4.63% 15/6/2025 54,470 0.01%Dominion Energy, Inc. $50,000 3.30% 15/3/2025 54,155 0.01%CNX Resources Corp. $50,000 6.00% 15/1/2029 54,054 0.01%Uniti Group LP/Uniti Fiber Holdings, Inc./CSL Capital LLC $53,000 6.50% 15/2/2029 53,249 0.01%American Airlines, Inc./AAdvantage Loyalty IP Ltd. $50,000 5.50% 20/4/2026 53,082 0.01%

721
Vanguard Global Credit Bond Fund
Principal CouponMaturity
DateFair Value
US Dollars ($)% of Total
Net AssetsSofi Professional Loan Program $51,648 2.84% 25/1/2041 52,716 0.01%Oracle Corp. $50,000 2.95% 1/4/2030 52,698 0.01%Ford Motor Credit Co. LLC $50,000 3.38% 13/11/2025 51,848 0.01%Lithia Motors, Inc. $50,000 3.88% 1/6/2029 51,788 0.01%Amgen, Inc. $40,000 4.66% 15/6/2051 51,659 0.01%NCL Corp., Ltd. $49,000 5.88% 15/3/2026 51,329 0.01%Boston Scientific Corp. $45,000 4.00% 1/3/2029 51,211 0.01%Equitable Holdings, Inc. $40,000 5.00% 20/4/2048 51,026 0.01%Organon & Co./Organon Foreign Debt Co.-Issuer BV $50,000 4.13% 30/4/2028 51,014 0.01%Level 3 Financing, Inc. $50,000 4.25% 1/7/2028 50,737 0.01%American Honda Finance Corp. $50,000 1.20% 8/7/2025 50,401 0.01%Valero Energy Corp. $40,000 4.90% 15/3/2045 49,918 0.01%Clean Harbors, Inc. $46,000 4.88% 15/7/2027 48,279 0.01%Tenet Healthcare Corp. $47,000 4.25% 1/6/2029 47,650 0.01%Vistra Operations Co. LLC $46,000 5.50% 1/9/2026 47,462 0.01%Packaging Corp. of America $40,000 4.05% 15/12/2049 46,922 0.01%Precision Castparts Corp. $43,000 3.25% 15/6/2025 46,642 0.01%T-Mobile USA, Inc. $45,000 3.38% 15/4/2029 46,492 0.01%MSCI, Inc. $45,000 3.63% 1/11/2031 46,267 0.01%Cargo Aircraft Management, Inc. $45,000 4.75% 1/2/2028 46,076 0.01%Booz Allen Hamilton, Inc. $45,000 4.00% 1/7/2029 46,018 0.01%Bristol-Myers Squibb Co. $40,000 3.90% 20/2/2028 45,765 0.01%Sabine Pass Liquefaction LLC $40,000 5.63% 1/3/2025 45,725 0.01%LPL Holdings, Inc. $45,000 4.38% 15/5/2031 45,613 0.01%SS&C Technologies, Inc. $43,000 5.50% 30/9/2027 45,612 0.01%Chevron USA, Inc. $50,000 2.34% 12/8/2050 45,320 0.01%Welltower, Inc. $40,000 4.25% 1/4/2026 45,113 0.01%Enbridge Energy Partners LP $35,000 5.50% 15/9/2040 45,101 0.01%American Builders & Contractors Supply Co., Inc. $45,000 3.88% 15/11/2029 44,708 0.01%T-Mobile USA, Inc. $45,000 2.63% 15/2/2029 44,451 0.01%Freeport-McMoRan, Inc. $42,000 4.38% 1/8/2028 44,324 0.01%Becton Dickinson & Co. $35,000 4.69% 15/12/2044 43,644 0.01%Exelon Corp. $40,000 3.40% 15/4/2026 43,568 0.01%Phillips 66 Partners LP $40,000 3.61% 15/2/2025 43,137 0.01%ONEOK, Inc. $35,000 5.20% 15/7/2048 42,930 0.01%CommonSpirit Health $40,000 2.76% 1/10/2024 42,105 0.01%Vine Energy Holdings LLC $40,000 6.75% 15/4/2029 42,103 0.01%ONEOK, Inc. $40,000 3.10% 15/3/2030 41,824 0.01%Aramark Services, Inc. $40,000 5.00% 1/2/2028 41,819 0.01%Devon Energy Corp. $37,000 5.88% 15/6/2028 41,120 0.01%Hilton Domestic Operating Co., Inc. $38,000 5.75% 1/5/2028 41,113 0.01%Ladder Capital Finance Holdings LLLP/Ladder Capital Finance Corp. $41,000 4.25% 1/2/2027 41,055 0.01%United Rentals North America, Inc. $40,000 3.88% 15/2/2031 40,723 0.01%Sprint Corp. $35,000 7.13% 15/6/2024 40,451 0.01%LGI Homes, Inc. $40,000 4.00% 15/7/2029 40,239 0.01%Vistra Operations Co. LLC $40,000 4.38% 1/5/2029 40,211 0.01%Dollar General Corp. $35,000 4.13% 1/5/2028 40,107 0.01%Playtika Holding Corp. $40,000 4.25% 15/3/2029 40,039 0.01%FirstEnergy Corp. $40,000 2.65% 1/3/2030 39,780 0.01%Keurig Dr Pepper, Inc. $30,000 5.09% 25/5/2048 39,695 0.01%Centene Corp. $40,000 2.50% 1/3/2031 39,488 0.01%ConocoPhillips $30,000 4.88% 1/10/2047 39,403 0.01%H&E Equipment Services, Inc. $40,000 3.88% 15/12/2028 39,324 0.01%Time Warner Cable LLC $35,000 4.50% 15/9/2042 39,021 0.01%Post Holdings, Inc. $39,000 4.50% 15/9/2031 38,927 0.01%DCP Midstream Operating LP $35,000 5.13% 15/5/2029 38,698 0.01%Boyd Gaming Corp. $35,000 8.63% 1/6/2025 38,548 0.01%CommScope, Inc. $36,000 8.25% 1/3/2027 38,508 0.01%Graphic Packaging International LLC $38,000 3.50% 15/3/2028 38,272 0.01%TransDigm, Inc. $35,000 8.00% 15/12/2025 37,810 0.01%Bank of America Corp.^ $30,000 4.44% 20/1/2048 37,183 0.01%Florida Power & Light Co. $30,000 3.99% 1/3/2049 36,887 0.01%Enterprise Products Operating LLC $30,000 4.85% 15/8/2042 36,732 0.01%Cheniere Energy Partners LP $35,000 4.00% 1/3/2031 36,596 0.01%Lithia Motors, Inc. $34,000 4.38% 15/1/2031 36,423 0.01%Kraft Heinz Foods Co. $30,000 4.88% 1/10/2049 36,357 0.01%NRG Energy, Inc. $35,000 7.25% 15/5/2026 36,357 0.01%Mosaic Co. $30,000 4.88% 15/11/2041 35,282 0.01%Devon Energy Corp. $30,000 5.85% 15/12/2025 35,223 0.01%Delta Air Lines, Inc. $35,000 3.75% 28/10/2029 34,971 0.01%BP Capital Markets America, Inc. $30,000 4.23% 6/11/2028 34,794 0.01%
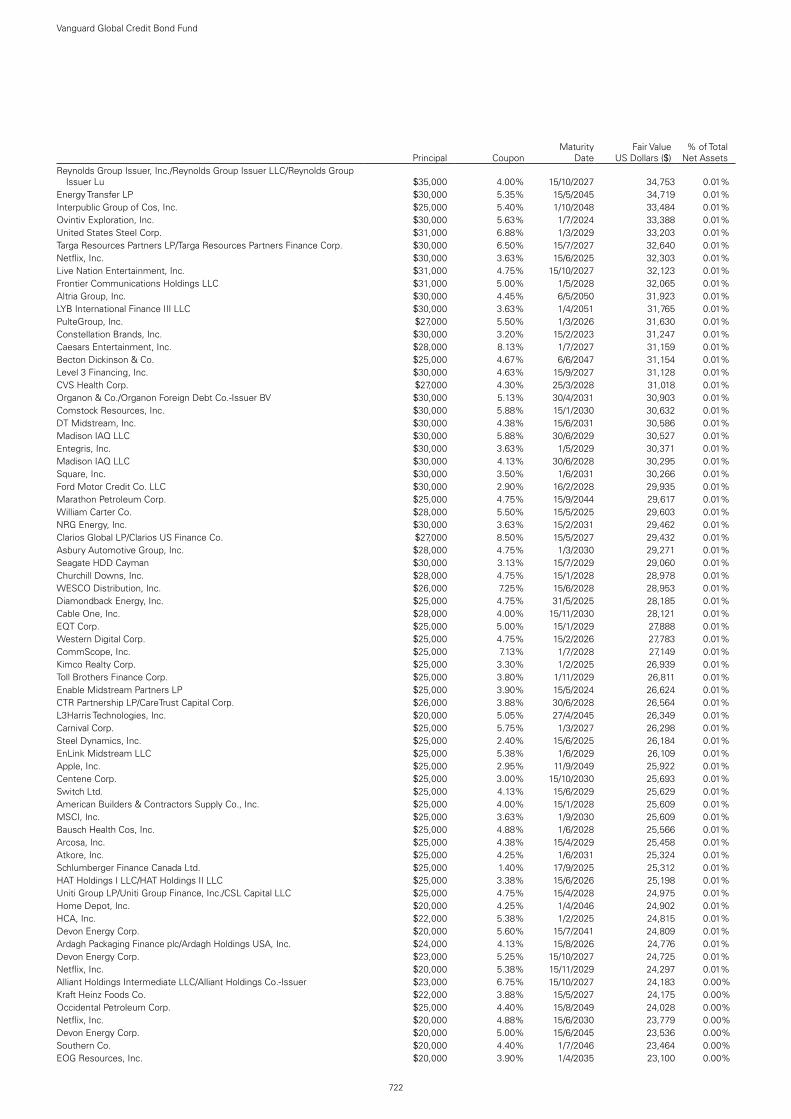
722
Vanguard Global Credit Bond Fund
Principal CouponMaturity
DateFair Value
US Dollars ($)% of Total
Net AssetsReynolds Group Issuer, Inc./Reynolds Group Issuer LLC/Reynolds Group
Issuer Lu $35,000 4.00% 15/10/2027 34,753 0.01%Energy Transfer LP $30,000 5.35% 15/5/2045 34,719 0.01%Interpublic Group of Cos, Inc. $25,000 5.40% 1/10/2048 33,484 0.01%Ovintiv Exploration, Inc. $30,000 5.63% 1/7/2024 33,388 0.01%United States Steel Corp. $31,000 6.88% 1/3/2029 33,203 0.01%Targa Resources Partners LP/Targa Resources Partners Finance Corp. $30,000 6.50% 15/7/2027 32,640 0.01%Netflix, Inc. $30,000 3.63% 15/6/2025 32,303 0.01%Live Nation Entertainment, Inc. $31,000 4.75% 15/10/2027 32,123 0.01%Frontier Communications Holdings LLC $31,000 5.00% 1/5/2028 32,065 0.01%Altria Group, Inc. $30,000 4.45% 6/5/2050 31,923 0.01%LYB International Finance III LLC $30,000 3.63% 1/4/2051 31,765 0.01%PulteGroup, Inc. $27,000 5.50% 1/3/2026 31,630 0.01%Constellation Brands, Inc. $30,000 3.20% 15/2/2023 31,247 0.01%Caesars Entertainment, Inc. $28,000 8.13% 1/7/2027 31,159 0.01%Becton Dickinson & Co. $25,000 4.67% 6/6/2047 31,154 0.01%Level 3 Financing, Inc. $30,000 4.63% 15/9/2027 31,128 0.01%CVS Health Corp. $27,000 4.30% 25/3/2028 31,018 0.01%Organon & Co./Organon Foreign Debt Co.-Issuer BV $30,000 5.13% 30/4/2031 30,903 0.01%Comstock Resources, Inc. $30,000 5.88% 15/1/2030 30,632 0.01%DT Midstream, Inc. $30,000 4.38% 15/6/2031 30,586 0.01%Madison IAQ LLC $30,000 5.88% 30/6/2029 30,527 0.01%Entegris, Inc. $30,000 3.63% 1/5/2029 30,371 0.01%Madison IAQ LLC $30,000 4.13% 30/6/2028 30,295 0.01%Square, Inc. $30,000 3.50% 1/6/2031 30,266 0.01%Ford Motor Credit Co. LLC $30,000 2.90% 16/2/2028 29,935 0.01%Marathon Petroleum Corp. $25,000 4.75% 15/9/2044 29,617 0.01%William Carter Co. $28,000 5.50% 15/5/2025 29,603 0.01%NRG Energy, Inc. $30,000 3.63% 15/2/2031 29,462 0.01%Clarios Global LP/Clarios US Finance Co. $27,000 8.50% 15/5/2027 29,432 0.01%Asbury Automotive Group, Inc. $28,000 4.75% 1/3/2030 29,271 0.01%Seagate HDD Cayman $30,000 3.13% 15/7/2029 29,060 0.01%Churchill Downs, Inc. $28,000 4.75% 15/1/2028 28,978 0.01%WESCO Distribution, Inc. $26,000 7.25% 15/6/2028 28,953 0.01%Diamondback Energy, Inc. $25,000 4.75% 31/5/2025 28,185 0.01%Cable One, Inc. $28,000 4.00% 15/11/2030 28,121 0.01%EQT Corp. $25,000 5.00% 15/1/2029 27,888 0.01%Western Digital Corp. $25,000 4.75% 15/2/2026 27,783 0.01%CommScope, Inc. $25,000 7.13% 1/7/2028 27,149 0.01%Kimco Realty Corp. $25,000 3.30% 1/2/2025 26,939 0.01%Toll Brothers Finance Corp. $25,000 3.80% 1/11/2029 26,811 0.01%Enable Midstream Partners LP $25,000 3.90% 15/5/2024 26,624 0.01%CTR Partnership LP/CareTrust Capital Corp. $26,000 3.88% 30/6/2028 26,564 0.01%L3Harris Technologies, Inc. $20,000 5.05% 27/4/2045 26,349 0.01%Carnival Corp. $25,000 5.75% 1/3/2027 26,298 0.01%Steel Dynamics, Inc. $25,000 2.40% 15/6/2025 26,184 0.01%EnLink Midstream LLC $25,000 5.38% 1/6/2029 26,109 0.01%Apple, Inc. $25,000 2.95% 11/9/2049 25,922 0.01%Centene Corp. $25,000 3.00% 15/10/2030 25,693 0.01%Switch Ltd. $25,000 4.13% 15/6/2029 25,629 0.01%American Builders & Contractors Supply Co., Inc. $25,000 4.00% 15/1/2028 25,609 0.01%MSCI, Inc. $25,000 3.63% 1/9/2030 25,609 0.01%Bausch Health Cos, Inc. $25,000 4.88% 1/6/2028 25,566 0.01%Arcosa, Inc. $25,000 4.38% 15/4/2029 25,458 0.01%Atkore, Inc. $25,000 4.25% 1/6/2031 25,324 0.01%Schlumberger Finance Canada Ltd. $25,000 1.40% 17/9/2025 25,312 0.01%HAT Holdings I LLC/HAT Holdings II LLC $25,000 3.38% 15/6/2026 25,198 0.01%Uniti Group LP/Uniti Group Finance, Inc./CSL Capital LLC $25,000 4.75% 15/4/2028 24,975 0.01%Home Depot, Inc. $20,000 4.25% 1/4/2046 24,902 0.01%HCA, Inc. $22,000 5.38% 1/2/2025 24,815 0.01%Devon Energy Corp. $20,000 5.60% 15/7/2041 24,809 0.01%Ardagh Packaging Finance plc/Ardagh Holdings USA, Inc. $24,000 4.13% 15/8/2026 24,776 0.01%Devon Energy Corp. $23,000 5.25% 15/10/2027 24,725 0.01%Netflix, Inc. $20,000 5.38% 15/11/2029 24,297 0.01%Alliant Holdings Intermediate LLC/Alliant Holdings Co.-Issuer $23,000 6.75% 15/10/2027 24,183 0.00%Kraft Heinz Foods Co. $22,000 3.88% 15/5/2027 24,175 0.00%Occidental Petroleum Corp. $25,000 4.40% 15/8/2049 24,028 0.00%Netflix, Inc. $20,000 4.88% 15/6/2030 23,779 0.00%Devon Energy Corp. $20,000 5.00% 15/6/2045 23,536 0.00%Southern Co. $20,000 4.40% 1/7/2046 23,464 0.00%EOG Resources, Inc. $20,000 3.90% 1/4/2035 23,100 0.00%

723
Vanguard Global Credit Bond Fund
Principal CouponMaturity
DateFair Value
US Dollars ($)% of Total
Net AssetsOncor Electric Delivery Co. LLC $20,000 3.75% 1/4/2045 23,081 0.00%Virginia Electric & Power Co. $20,000 3.80% 15/9/2047 22,927 0.00%Union Electric Co. $20,000 3.90% 15/9/2042 22,925 0.00%Public Service Electric & Gas Co. $20,000 3.65% 1/9/2042 22,661 0.00%Arconic Corp. $21,000 6.13% 15/2/2028 22,519 0.00%Western Midstream Operating LP $20,000 5.30% 1/2/2030 22,460 0.00%Starbucks Corp. $20,000 3.50% 1/3/2028 22,358 0.00%Big River Steel LLC/BRS Finance Corp. $20,000 6.63% 31/1/2029 22,086 0.00%CCRE25 Commercial Mortgage Trust 2015 $20,000 3.76% 10/8/2048 21,982 0.00%MGM Growth Properties Operating Partnership LP/MGP Finance Co.-
Issuer, Inc. $20,000 5.63% 1/5/2024 21,681 0.00%Ford Motor Credit Co. LLC $20,000 4.27% 9/1/2027 21,422 0.00%Cheniere Energy, Inc. $20,000 4.63% 15/10/2028 21,099 0.00%Midcap Financial Issuer Trust $21,000 5.63% 15/1/2030 21,083 0.00%CrownRock LP/CrownRock Finance, Inc. $20,000 5.63% 15/10/2025 20,694 0.00%XHR LP $20,000 4.88% 1/6/2029 20,650 0.00%T-Mobile USA, Inc. $20,000 3.50% 15/4/2031 20,640 0.00%Allison Transmission, Inc. $21,000 3.75% 30/1/2031 20,606 0.00%Mueller Water Products, Inc. $20,000 4.00% 15/6/2029 20,560 0.00%T-Mobile USA, Inc. $20,000 4.50% 1/2/2026 20,477 0.00%Cogent Communications Group, Inc. $20,000 3.50% 1/5/2026 20,471 0.00%Boeing Co. $20,000 2.25% 15/6/2026 20,419 0.00%DT Midstream, Inc. $20,000 4.13% 15/6/2029 20,305 0.00%Charles River Laboratories International, Inc. $20,000 3.75% 15/3/2029 20,265 0.00%News Corp. $20,000 3.88% 15/5/2029 20,199 0.00%Ambience Merger Sub, Inc. $20,000 7.13% 15/7/2029 20,181 0.00%International Paper Co. $16,000 4.35% 15/8/2048 19,919 0.00%Lamb Weston Holdings, Inc. $19,000 4.88% 1/11/2026 19,641 0.00%Ladder Capital Finance Holdings LLLP/Ladder Capital Finance Corp. $19,000 5.25% 1/10/2025 19,344 0.00%Level 3 Financing, Inc. $20,000 3.63% 15/1/2029 19,324 0.00%Carnival Corp. $17,000 11.50% 1/4/2023 19,196 0.00%Allied Universal Holdco LLC/Allied Universal Finance Corp./Atlas Luxco 4
Sarl $19,000 4.63% 1/6/2028 19,070 0.00%Nielsen Finance LLC/Nielsen Finance Co. $18,000 5.63% 1/10/2028 19,014 0.00%Clearway Energy Operating LLC $18,000 5.00% 15/9/2026 18,501 0.00%Zayo Group Holdings, Inc. $18,000 6.13% 1/3/2028 18,379 0.00%Zayo Group Holdings, Inc. $18,000 4.00% 1/3/2027 17,882 0.00%Sabre GLBL, Inc. $15,000 9.25% 15/4/2025 17,833 0.00%PulteGroup, Inc. $15,000 5.00% 15/1/2027 17,529 0.00%Clearway Energy Operating LLC $16,000 4.75% 15/3/2028 16,786 0.00%NuStar Logistics LP $15,000 6.38% 1/10/2030 16,570 0.00%Packaging Corp. of America $15,000 3.40% 15/12/2027 16,487 0.00%Freeport-McMoRan, Inc. $15,000 4.63% 1/8/2030 16,416 0.00%MGM Growth Properties Operating Partnership LP/MGP Finance Co.-
Issuer, Inc. $15,000 4.50% 1/9/2026 16,020 0.00%Nexstar Broadcasting, Inc. $15,000 5.63% 15/7/2027 15,951 0.00%Twitter, Inc. $15,000 3.88% 15/12/2027 15,934 0.00%Ford Motor Credit Co. LLC $15,000 4.13% 17/8/2027 15,920 0.00%CSC Holdings LLC $15,000 5.38% 1/2/2028 15,854 0.00%CrownRock LP/CrownRock Finance, Inc. $15,000 5.00% 1/5/2029 15,732 0.00%CDW LLC/CDW Finance Corp. $15,000 4.13% 1/5/2025 15,670 0.00%United Airlines Holdings, Inc. $15,000 4.88% 15/1/2025 15,598 0.00%Jazz Securities DAC $15,000 4.38% 15/1/2029 15,563 0.00%Bausch Health Cos, Inc. $15,000 7.00% 15/1/2028 15,487 0.00%Nexstar Broadcasting, Inc. $15,000 4.75% 1/11/2028 15,419 0.00%EQT Corp. $15,000 3.13% 15/5/2026 15,368 0.00%Square, Inc. $15,000 2.75% 1/6/2026 15,261 0.00%Uniti Group LP/Uniti Fiber Holdings, Inc./CSL Capital LLC $14,000 7.88% 15/2/2025 14,995 0.00%Ingevity Corp. $15,000 3.88% 1/11/2028 14,969 0.00%Occidental Petroleum Corp. $15,000 3.00% 15/2/2027 14,888 0.00%Berry Global, Inc. $14,000 4.88% 15/7/2026 14,811 0.00%FirstEnergy Corp. $15,000 3.40% 1/3/2050 14,662 0.00%TransDigm, Inc. $14,000 5.50% 15/11/2027 14,598 0.00%NRG Energy, Inc. $14,000 6.63% 15/1/2027 14,493 0.00%Lamar Media Corp. $14,000 3.75% 15/2/2028 14,242 0.00%TEGNA, Inc. $13,000 4.75% 15/3/2026 13,851 0.00%Ardagh Packaging Finance plc/Ardagh Holdings USA, Inc. $13,000 5.25% 30/4/2025 13,631 0.00%Pattern Energy Operations LP/Pattern Energy Operations, Inc. $13,000 4.50% 15/8/2028 13,456 0.00%Bausch Health Cos, Inc. $13,000 6.13% 15/4/2025 13,321 0.00%Vistra Operations Co. LLC $12,500 5.00% 31/7/2027 12,832 0.00%Freeport-McMoRan, Inc. $10,000 5.45% 15/3/2043 12,226 0.00%

724
Vanguard Global Credit Bond Fund
Principal CouponMaturity
DateFair Value
US Dollars ($)% of Total
Net AssetsMarathon Oil Corp. $10,000 5.20% 1/6/2045 11,997 0.00%Weyerhaeuser Co. $10,000 4.00% 15/4/2030 11,384 0.00%Element Solutions, Inc. $11,000 3.88% 1/9/2028 11,221 0.00%Kraton Polymers LLC/Kraton Polymers Capital Corp. $11,000 4.25% 15/12/2025 11,219 0.00%Honeywell International, Inc. $11,000 1.95% 1/6/2030 11,176 0.00%EQM Midstream Partners LP $10,000 6.50% 1/7/2027 11,148 0.00%Raytheon Technologies Corp. $10,000 3.95% 16/8/2025 11,120 0.00%Occidental Petroleum Corp. $10,000 5.55% 15/3/2026 11,063 0.00%Benchmark 2018-B1 Mortgage Trust^ $10,000 3.88% 15/1/2051 11,055 0.00%BANK 2017 $10,000 3.74% 15/7/2060 11,047 0.00%Ford Motor Credit Co. LLC $10,000 5.13% 16/6/2025 11,009 0.00%Yum! Brands, Inc. $10,000 7.75% 1/4/2025 10,899 0.00%Tenet Healthcare Corp. $10,000 7.50% 1/4/2025 10,789 0.00%UDR, Inc. $10,000 2.95% 1/9/2026 10,694 0.00%QualityTech LP/QTS Finance Corp. $10,000 3.88% 1/10/2028 10,693 0.00%Frontier Communications Holdings LLC $10,000 6.75% 1/5/2029 10,639 0.00%Lithia Motors, Inc. $10,000 4.63% 15/12/2027 10,579 0.00%CenterPoint Energy, Inc. $10,000 2.95% 1/3/2030 10,544 0.00%Axalta Coating Systems LLC/Axalta Coating Systems Dutch Holding B BV $10,000 4.75% 15/6/2027 10,484 0.00%Ford Motor Credit Co. LLC $10,000 3.82% 2/11/2027 10,414 0.00%International Game Technology plc $10,000 4.13% 15/4/2026 10,414 0.00%Colgate Energy Partners III LLC $10,000 5.88% 1/7/2029 10,365 0.00%Sirius XM Radio, Inc. $10,000 4.00% 15/7/2028 10,317 0.00%Occidental Petroleum Corp. $10,000 3.50% 15/6/2025 10,229 0.00%BroadStreet Partners, Inc. $10,000 5.88% 15/4/2029 10,197 0.00%CD 2016-CD1 Mortgage Trust^ $10,000 3.63% 10/8/2049 10,031 0.00%Ambience Merger Sub, Inc. $10,000 4.88% 15/7/2028 10,025 0.00%Ball Corp. $10,000 2.88% 15/8/2030 9,807 0.00%Carnival Corp. $9,000 7.63% 1/3/2026 9,806 0.00%Bausch Health Cos, Inc. $9,000 5.75% 15/8/2027 9,457 0.00%Tenet Healthcare Corp. $9,000 6.25% 1/2/2027 9,405 0.00%Live Nation Entertainment, Inc. $9,000 3.75% 15/1/2028 9,044 0.00%Sabre GLBL, Inc. $8,000 7.38% 1/9/2025 8,696 0.00%Performance Food Group, Inc. $8,000 6.88% 1/5/2025 8,568 0.00%EnLink Midstream LLC $8,000 5.63% 15/1/2028 8,481 0.00%Delta Air Lines, Inc. $8,000 2.90% 28/10/2024 8,142 0.00%Goodyear Tire & Rubber Co. $7,000 9.50% 31/5/2025 7,823 0.00%Hilcorp Energy I LP/Hilcorp Finance Co. $7,000 6.00% 1/2/2031 7,417 0.00%Tallgrass Energy Partners LP/Tallgrass Energy Finance Corp. $7,000 6.00% 31/12/2030 7,293 0.00%Williams Scotsman International, Inc. $7,000 4.63% 15/8/2028 7,228 0.00%T-Mobile USA, Inc. $7,000 2.88% 15/2/2031 6,942 0.00%Johnson Controls International plc $5,000 5.13% 14/9/2045 6,622 0.00%CommScope, Inc. $6,000 6.00% 1/3/2026 6,335 0.00%Sprint Corp. $5,000 7.63% 1/3/2026 6,117 0.00%Royal Caribbean Cruises Ltd. $5,000 11.50% 1/6/2025 5,768 0.00%DCP Midstream Operating LP $5,000 5.63% 15/7/2027 5,697 0.00%Transcontinental Gas Pipe Line Co. LLC $5,000 4.00% 15/3/2028 5,662 0.00%Tri Pointe Homes, Inc. $5,000 5.70% 15/6/2028 5,509 0.00%NuStar Logistics LP $5,000 5.75% 1/10/2025 5,440 0.00%Realogy Group LLC/Realogy Co.-Issuer Corp. $5,000 7.63% 15/6/2025 5,425 0.00%Frontier Communications Holdings LLC $5,000 5.88% 15/10/2027 5,359 0.00%Clarios Global LP $5,000 6.75% 15/5/2025 5,335 0.00%Endeavor Energy Resources LP/EER Finance, Inc. $5,000 5.75% 30/1/2028 5,331 0.00%Arconic Corp. $5,000 6.00% 15/5/2025 5,326 0.00%Rattler Midstream LP $5,000 5.63% 15/7/2025 5,254 0.00%Sirius XM Radio, Inc. $5,000 5.00% 1/8/2027 5,251 0.00%Post Holdings, Inc. $5,000 5.75% 1/3/2027 5,236 0.00%Hilcorp Energy I LP/Hilcorp Finance Co. $5,000 5.75% 1/2/2029 5,212 0.00%Lamb Weston Holdings, Inc. $5,000 4.63% 1/11/2024 5,172 0.00%Ball Corp. $5,000 5.00% 15/3/2022 5,140 0.00%Sirius XM Radio, Inc. $5,000 4.63% 15/7/2024 5,134 0.00%Tenet Healthcare Corp. $5,000 4.63% 1/9/2024 5,131 0.00%Occidental Petroleum Corp. $5,000 3.40% 15/4/2026 5,114 0.00%Suburban Propane Partners LP/Suburban Energy Finance Corp. $5,000 5.00% 1/6/2031 5,114 0.00%Alliant Holdings Intermediate LLC/Alliant Holdings Co.-Issuer $5,000 4.25% 15/10/2027 5,074 0.00%Allied Universal Holdco LLC/Allied Universal Finance Corp. $5,000 6.00% 1/6/2029 5,066 0.00%Graphic Packaging International LLC $5,000 3.50% 1/3/2029 4,955 0.00%Expedia Group, Inc. $4,000 6.25% 1/5/2025 4,653 0.00%Bausch Health Cos, Inc. $4,000 5.50% 1/11/2025 4,104 0.00%Endeavor Energy Resources LP/EER Finance, Inc. $3,000 6.63% 15/7/2025 3,215 0.00%International Game Technology plc $2,000 6.25% 15/1/2027 2,281 0.00%

725
Vanguard Global Credit Bond Fund
Principal CouponMaturity
DateFair Value
US Dollars ($)% of Total
Net AssetsRoyal Caribbean Cruises Ltd. $2,000 10.88% 1/6/2023 2,280 0.00%Royal Caribbean Cruises Ltd. $2,000 9.13% 15/6/2023 2,195 0.00%Tallgrass Energy Partners LP/Tallgrass Energy Finance Corp. $2,000 7.50% 1/10/2025 2,179 0.00%EQT Corp. $2,000 3.00% 1/10/2022 2,041 0.00%Live Nation Entertainment, Inc. $1,500 5.63% 15/3/2026 1,564 0.00%Caesars Resort Collection LLC/CRC Finco, Inc. $1,000 5.75% 1/7/2025 1,054 0.00%test - - - 291,185,824 59.44%Total Bonds 468,544,562 95.65%Financial Assets at Fair Value Through Profit or Loss 468,544,562 95.65%
testNumber of Contracts
Notional Amount
Unrealised Gain/(Loss)
US Dollars ($)% of Total
Net AssetsFinancial Derivative InstrumentsFutures (0.01%) (2020: 0.01%)CAN 10-Year Bond September 2021 52 CA($)7,481,540 69,046 0.01 %Euro-Bund September 2021 87 €14,981,550 42,123 0.01 %US Long Bond September 2021 8 $1,276,375 9,625 0.00 %Euro-Buxl 30 Year Bond September 2021 8 €1,620,503 6,424 0.00 %10-Year Mini JGB September 2021 11 ¥166,782,000 1,388 0.00 %US Treasury Note 5 Year September 2021 24 $2,961,010 1,302 0.00 %AUS 10-Year Bond September 2021 (3) AU($)(424,713) 860 0.00 %US Treasury Note 2 Year September 2021 14 $3,084,527 (43 ) (0.00 %)Euro-Bobl September 2021 70 €9,392,940 (2,894 ) (0.00 %)Euro-Schatz September 2021 110 €12,338,005 (3,089 ) (0.00 %)AUS 3-Year Bond September 2021 9 AU($)1,052,767 (3,291 ) (0.00 %)CAN 5-Year Bond September 2021 30 CA($)3,740,160 (3,440 ) (0.00 %)US Treasury Note 10 Year September 2021 (187) $(24,771,676) (5,824 ) (0.00 %)Long Gilt September 2021 (83) £(10,589,451) (59,193 ) (0.01 %)US Treasury Ultra 10 Year September 2021 (74) $(10,800,479) (92,552 ) (0.02 %)test test test (39,558 ) (0.01 %)
CurrencyBuy
Amount Currency(Sell)
Amount CounterpartySettlement
Date
Unrealised Gain/(Loss)
US Dollars ($)% of Total
Net AssetsForward Currency Exchange Contracts 0.24% (2020: (0.51%))USD 76,955,234 EUR (64,284,609) State Street Bank & Trust Co. 27/7/2021 679,735 0.14 %USD 48,474,846 GBP (34,816,755) UBS AG 27/7/2021 373,712 0.08 %USD 1,015,000 JPY (101,900,925) BNP Paribas 22/7/2022 92,526 0.02 %USD 6,363,376 AUD (8,362,356) JPMorgan Chase Bank 27/7/2021 84,540 0.02 %USD 476,649 JPY (48,833,269) Barclays Bank plc 22/7/2022 34,579 0.01 %USD 4,296,044 GBP (3,090,170) State Street Bank & Trust Co. 27/7/2021 26,816 0.00 %USD 2,392,032 CAD (2,950,625) State Street Bank & Trust Co. 27/7/2021 9,255 0.00 %USD 1,232,722 EUR (1,031,728) State Street Bank & Trust Co. 27/7/2021 8,548 0.00 %USD 810,949 EUR (680,778) State Street Bank & Trust Co. 27/7/2021 3,186 0.00 %USD 243,631 JPY (26,830,277) Bank of America 29/7/2021 1,840 0.00 %USD 91 MXN (1,798) Goldman Sachs International 27/7/2021 1 0.00 %JPY 26,830,277 USD (242,070) UBS AG 29/7/2021 (279 ) (0.00 %)GBP 181,857 USD (251,807) Bank of America 27/7/2021 (563 ) (0.00 %)JPY 19,765,238 USD (178,852) Standard Chartered Bank 27/7/2021 (733 ) (0.00 %)USD 2,788,336 CLP (2,053,024,009) Citibank NA 29/7/2021 (29,121 ) (0.01 %)JPY 101,469,550 USD (1,015,000) BNP Paribas 22/7/2022 (96,431 ) (0.02 %)test 1,187,611 0.24 %Hedge Share Class Level Forward Currency Exchange Contracts (2.22%) (2020: 1.74%)USD 2,868,592 EUR (2,364,819) Barclays Bank plc 2/7/2021 64,152 0.01 %USD 340,963 GBP (241,467) JPMorgan Chase Bank 2/7/2021 7,388 0.00 %USD 257,346 GBP (181,639) Barclays Bank plc 2/7/2021 6,421 0.00 %USD 232,082 EUR (191,122) Barclays Bank plc 2/7/2021 5,431 0.00 %USD 116,175 GBP (82,370) Barclays Bank plc 2/7/2021 2,385 0.00 %EUR 37,438,383 USD (44,427,081) JPMorgan Chase Bank 3/8/2021 1,152 0.00 %GBP 269,778,405 USD (372,717,751) Toronto-Dominion Bank 3/8/2021 1,139 0.00 %USD 22,636 GBP (16,067) Barclays Bank plc 2/7/2021 440 0.00 %USD 95,352 EUR (80,121) UBS AG 2/7/2021 336 0.00 %GBP 217,072 USD (299,703) Goldman Sachs International 2/7/2021 171 0.00 %USD 26,050 EUR (21,840) Citibank NA 2/7/2021 150 0.00 %AUD 2,661,564 USD (1,998,441) BNP Paribas 4/8/2021 56 0.00 %EUR 354,437 USD (420,606) Citibank NA 3/8/2021 5 0.00 %AUD 24,785 USD (18,610) BNP Paribas 4/8/2021 — 0.00 %USD 1,998,169 AUD (2,661,564) BNP Paribas 2/7/2021 — 0.00 %EUR 25,456 USD (30,208) Citibank NA 3/8/2021 — 0.00 %USD 8,388 EUR (7,073) Goldman Sachs International 2/7/2021 — 0.00 %AUD 3,000 USD (2,254) JPMorgan Chase Bank 2/7/2021 (2 ) (0.00 %)
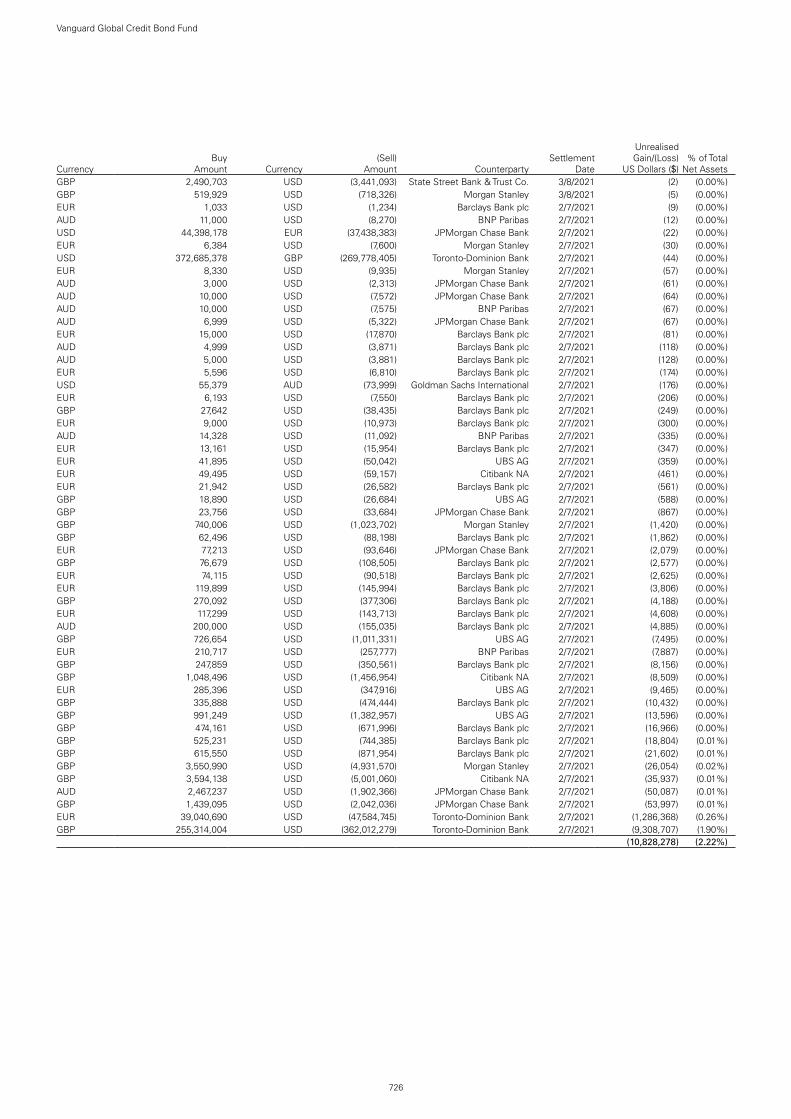
726
Vanguard Global Credit Bond Fund
CurrencyBuy
Amount Currency(Sell)
Amount CounterpartySettlement
Date
Unrealised Gain/(Loss)
US Dollars ($)% of Total
Net AssetsGBP 2,490,703 USD (3,441,093) State Street Bank & Trust Co. 3/8/2021 (2 ) (0.00 %)GBP 519,929 USD (718,326) Morgan Stanley 3/8/2021 (5 ) (0.00 %)EUR 1,033 USD (1,234) Barclays Bank plc 2/7/2021 (9 ) (0.00 %)AUD 11,000 USD (8,270) BNP Paribas 2/7/2021 (12 ) (0.00 %)USD 44,398,178 EUR (37,438,383) JPMorgan Chase Bank 2/7/2021 (22 ) (0.00 %)EUR 6,384 USD (7,600) Morgan Stanley 2/7/2021 (30 ) (0.00 %)USD 372,685,378 GBP (269,778,405) Toronto-Dominion Bank 2/7/2021 (44 ) (0.00 %)EUR 8,330 USD (9,935) Morgan Stanley 2/7/2021 (57 ) (0.00 %)AUD 3,000 USD (2,313) JPMorgan Chase Bank 2/7/2021 (61 ) (0.00 %)AUD 10,000 USD (7,572) JPMorgan Chase Bank 2/7/2021 (64 ) (0.00 %)AUD 10,000 USD (7,575) BNP Paribas 2/7/2021 (67 ) (0.00 %)AUD 6,999 USD (5,322) JPMorgan Chase Bank 2/7/2021 (67 ) (0.00 %)EUR 15,000 USD (17,870) Barclays Bank plc 2/7/2021 (81 ) (0.00 %)AUD 4,999 USD (3,871) Barclays Bank plc 2/7/2021 (118 ) (0.00 %)AUD 5,000 USD (3,881) Barclays Bank plc 2/7/2021 (128 ) (0.00 %)EUR 5,596 USD (6,810) Barclays Bank plc 2/7/2021 (174 ) (0.00 %)USD 55,379 AUD (73,999) Goldman Sachs International 2/7/2021 (176 ) (0.00 %)EUR 6,193 USD (7,550) Barclays Bank plc 2/7/2021 (206 ) (0.00 %)GBP 27,642 USD (38,435) Barclays Bank plc 2/7/2021 (249 ) (0.00 %)EUR 9,000 USD (10,973) Barclays Bank plc 2/7/2021 (300 ) (0.00 %)AUD 14,328 USD (11,092) BNP Paribas 2/7/2021 (335 ) (0.00 %)EUR 13,161 USD (15,954) Barclays Bank plc 2/7/2021 (347 ) (0.00 %)EUR 41,895 USD (50,042) UBS AG 2/7/2021 (359 ) (0.00 %)EUR 49,495 USD (59,157) Citibank NA 2/7/2021 (461 ) (0.00 %)EUR 21,942 USD (26,582) Barclays Bank plc 2/7/2021 (561 ) (0.00 %)GBP 18,890 USD (26,684) UBS AG 2/7/2021 (588 ) (0.00 %)GBP 23,756 USD (33,684) JPMorgan Chase Bank 2/7/2021 (867 ) (0.00 %)GBP 740,006 USD (1,023,702) Morgan Stanley 2/7/2021 (1,420 ) (0.00 %)GBP 62,496 USD (88,198) Barclays Bank plc 2/7/2021 (1,862 ) (0.00 %)EUR 77,213 USD (93,646) JPMorgan Chase Bank 2/7/2021 (2,079 ) (0.00 %)GBP 76,679 USD (108,505) Barclays Bank plc 2/7/2021 (2,577 ) (0.00 %)EUR 74,115 USD (90,518) Barclays Bank plc 2/7/2021 (2,625 ) (0.00 %)EUR 119,899 USD (145,994) Barclays Bank plc 2/7/2021 (3,806 ) (0.00 %)GBP 270,092 USD (377,306) Barclays Bank plc 2/7/2021 (4,188 ) (0.00 %)EUR 117,299 USD (143,713) Barclays Bank plc 2/7/2021 (4,608 ) (0.00 %)AUD 200,000 USD (155,035) Barclays Bank plc 2/7/2021 (4,885 ) (0.00 %)GBP 726,654 USD (1,011,331) UBS AG 2/7/2021 (7,495 ) (0.00 %)EUR 210,717 USD (257,777) BNP Paribas 2/7/2021 (7,887 ) (0.00 %)GBP 247,859 USD (350,561) Barclays Bank plc 2/7/2021 (8,156 ) (0.00 %)GBP 1,048,496 USD (1,456,954) Citibank NA 2/7/2021 (8,509 ) (0.00 %)EUR 285,396 USD (347,916) UBS AG 2/7/2021 (9,465 ) (0.00 %)GBP 335,888 USD (474,444) Barclays Bank plc 2/7/2021 (10,432 ) (0.00 %)GBP 991,249 USD (1,382,957) UBS AG 2/7/2021 (13,596 ) (0.00 %)GBP 474,161 USD (671,996) Barclays Bank plc 2/7/2021 (16,966 ) (0.00 %)GBP 525,231 USD (744,385) Barclays Bank plc 2/7/2021 (18,804 ) (0.01 %)GBP 615,550 USD (871,954) Barclays Bank plc 2/7/2021 (21,602 ) (0.01 %)GBP 3,550,990 USD (4,931,570) Morgan Stanley 2/7/2021 (26,054 ) (0.02 %)GBP 3,594,138 USD (5,001,060) Citibank NA 2/7/2021 (35,937 ) (0.01 %)AUD 2,467,237 USD (1,902,366) JPMorgan Chase Bank 2/7/2021 (50,087 ) (0.01 %)GBP 1,439,095 USD (2,042,036) JPMorgan Chase Bank 2/7/2021 (53,997 ) (0.01 %)EUR 39,040,690 USD (47,584,745) Toronto-Dominion Bank 2/7/2021 (1,286,368 ) (0.26 %)GBP 255,314,004 USD (362,012,279) Toronto-Dominion Bank 2/7/2021 (9,308,707 ) (1.90 %)test (10,828,278 ) (2.22 %)

727
Vanguard Global Credit Bond Fund
CurrencyNotional Amount
Expiration Date Counterparty Referenced Obligation
Premium paid/received
Fair Value US Dollars ($)
% of Total Net Assets
Credit Default Swap Contracts (0.03%) (2020: 0.12%)USD 7,400,000 20/6/2024 Morgan Stanley2 Selling default protection on CDX.NA.IG.36.V1 1.00% 187,481 0.04 %USD 3,040,000 20/6/2026 Goldman Sachs Buying default protection on Colombia
Government International Bond, 10.38% 28/1/2033 1.00% 52,337 0.01 %
USD 370,000 20/6/2026 Morgan Stanley Buying default protection on Colombia Government International Bond, 10.38% 28/1/2033 1.00%
6,370 0.00 %
USD 402,000 20/6/2026 BNP Paribas Selling default protection on Peruvian Government International Bond, 8.75% 21/11/2033 1.00%
3,449 0.00 %
EUR 2,100,000 20/6/2026 Goldman Sachs Selling default protection on Unibail-Roadmco-Westfield SE, 1.38% 9/3/2026 1.00%
2,583 0.00 %
USD 200,000 20/6/2026 Barclays Bank plc Selling default protection on Indonesia Government International Bond, 3.70% 8/1/2022 1.00%
2,471 0.00 %
USD 200,000 20/6/2026 Barclays Bank plc Selling default protection on Indonesia Government International Bond, 3.70% 8/1/2022 1.00%
2,471 0.00 %
USD 430,000 20/6/2026 Goldman Sachs Selling default protection on Russian Foreign Bond - Eurobond, 7.50% 31/3/2030 1.00%
2,072 0.00 %
USD 175,000 20/6/2026 JPMorgan Chase Bank Selling default protection on Peruvian Government International Bond, 8.75% 21/11/2033 1.00%
1,503 0.00 %
USD 100,000 20/6/2026 Barclays Bank plc Selling default protection on Peruvian Government International Bond, 8.75% 21/11/2033 1.00%
858 0.00 %
USD 8,308,333 20/6/2026 Morgan Stanley2 Buying default protection on CDX.NA.IG.36.V1 1.00% (210,494 ) (0.04 %)USD 2,225,000 20/6/2026 Morgan Stanley2 Buying default protection on CDX.NA.HY.36.V1 5.00% (226,505 ) (0.04 %)
(175,404 ) (0.03 %)
Number of Contracts Expiration Date
Premium US Dollars ($)
Fair Value US Dollars ($)
% of Total Net Assets
Swaptions 0.01% (2020: 0.00%)Put Swaption on Credit Default Index Swap North America Investment Grade 5-Year, Strike Price 55 25,392,000 21/7/2021 22,853 6,930 0.01 %Put Swaption on Credit Default Index Swap North America High Yield 5-Year, Strike Price 106 3,360,000 18/8/2021 32,592 5,868 0.00 %Put Swaption on Credit Default Index Swap North America High Yield 5-Year, Strike Price 106 2,225,000 18/8/2021 17,355 3,886 0.00 %Put Swaption on Credit Default Index Swap North America High Yield 5-Year, Strike Price 106 11,115,000 21/7/2021 74,470 2,681 0.00 %Put Swaption on Credit Default Index Swap North America High Yield 5-Year, Strike Price 106 630,000 18/8/2021 4,883 1,100 0.00 %Put Swaption on Credit Default Index Swap North America Investment Grade 5-Year, Strike Price 62.5 2,450,000 21/7/2021 4,165 172 0.00 %Put Swaption on Credit Default Index Swap North America Investment Grade 5-Year, Strike Price 65 (40,674,000) 21/7/2021 (16,676) (1,975 ) (0.00 %)
18,662 0.01 %Total Financial Derivative Instruments (9,836,967 ) (2.01 %)
Fair Value US Dollars ($)
% of Total Net Assets
Other Assets and Liabilities 31,138,499 6.36 %Net Assets 489,846,094 100.00 %
Analysis of Total Net Assets US Dollars ($)% of Total
Net Assets(a) Transferable securities admitted to an official stock exchange listing 342,974,669 70.02%(b) Transferable securities dealt in on another regulated market 120,927,764 24.69%(c) Transferable securities other than those admitted to an official stock exchange listing or dealt in on another regulated
market 4,642,129 0.94%
(d) Financial derivative instruments (9,836,967) (2.01%)(e) Other assets and liabilities 31,138,499 6.36%Total Net Assets 489,846,094 100.00%
^ Floating Rate Note (FRN). The effective interest rate is at 30 June 2021.1 Denotes securities pledged in full or part thereof as collateral for derivatives. 2 Centrally cleared swap contracts.
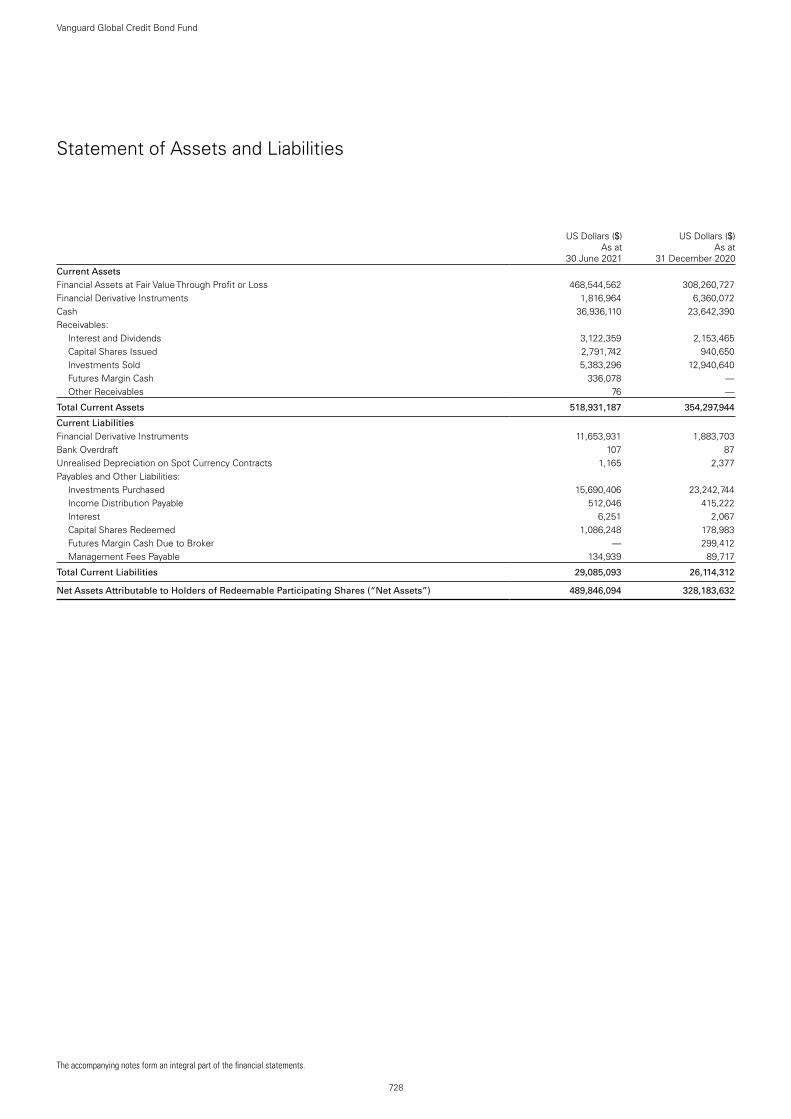
The accompanying notes form an integral part of the financial statements.
728
Vanguard Global Credit Bond Fund
Statement of Assets and Liabilities
US Dollars ($)
As at 30 June 2021
US Dollars ($)
As at 31 December 2020
Current AssetsFinancial Assets at Fair Value Through Profit or Loss 468,544,562 308,260,727 Financial Derivative Instruments 1,816,964 6,360,072 Cash 36,936,110 23,642,390 Receivables: Interest and Dividends 3,122,359 2,153,465 Capital Shares Issued 2,791,742 940,650 Investments Sold 5,383,296 12,940,640 Futures Margin Cash 336,078 — Other Receivables 76 —
Total Current Assets 518,931,187 354,297,944
Current LiabilitiesFinancial Derivative Instruments 11,653,931 1,883,703 Bank Overdraft 107 87 Unrealised Depreciation on Spot Currency Contracts 1,165 2,377 Payables and Other Liabilities: Investments Purchased 15,690,406 23,242,744 Income Distribution Payable 512,046 415,222 Interest 6,251 2,067 Capital Shares Redeemed 1,086,248 178,983 Futures Margin Cash Due to Broker — 299,412 Management Fees Payable 134,939 89,717
Total Current Liabilities 29,085,093 26,114,312
Net Assets Attributable to Holders of Redeemable Participating Shares (“Net Assets”) 489,846,094 328,183,632

729
Vanguard Global Credit Bond Fund
The accompanying notes form an integral part of the financial statements.
Net Asset Value Per Share
.As at
30 June 2021As at
31 December 2020As at
31 December 2019Insitutional Plus AUD Hedged Acc1
US ($) Equivalent 2,016,813 1,645,145 64,167Net Assets 2,686,398 2,131,983 91,282Number of Shares Outstanding 24,009 18,933 902Net Asset Value Per Share2 111.89 112.61 101.20
Institutional EUR Hedged AccUS ($) Equivalent 44,872,331 33,659,297 24,543,594Net Assets 37,838,208 27,509,540 21,865,117Number of Shares Outstanding 320,738 230,948 203,370Net Asset Value Per Share2 117.97 119.12 107.51
Investor GBP Hedged AccUS ($) Equivalent 229,245,155 103,405,769 64,787,870Net Assets 165,945,320 75,647,077 48,905,735Number of Shares Outstanding 1,359,531 615,837 443,499Net Asset Value Per Share2 122.06 122.84 110.27
Investor GBP Hedged Income3
US ($) Equivalent 147,034,056 119,574,725 6,592Net Assets 106,434,587 87,475,569 4,976Number of Shares Outstanding 987,696 801,087 50Net Asset Value Per Share2 107.76 109.20 99.52
Investor USD Hedged Acc Net Assets 9,071,324 12,582,205 17,064,119Number of Shares Outstanding 70,979 97,894 149,196Net Asset Value Per Share2 127.80 128.53 114.37
Institutional USD Hedged Acc Net Assets 57,606,415 57,316,491 15,513,988Number of Shares Outstanding 449,892 445,207 135,487Net Asset Value Per Share2 128.04 128.74 114.51
1 The share class was launched on 18 September 2019.2 The net asset value per share shown may diverge from the net asset value per share used for dealing purposes because of any adjustments for swing pricing and trade date accounting.3 The share class was launched on 11 December 2019.

730
Vanguard Global Credit Bond Fund
The accompanying notes form an integral part of the financial statements.
Statement of Operations
US Dollars ($)
Six Months Ended 30 June 2021
US Dollars ($)
Six Months Ended 30 June 2020
Investment Income/(Loss) Interest Income 3,611,511 1,721,938 Other Income 5,013 20,800 Net Gain/(Loss) on Financial Instruments (4,005,004) 470,521
Total Investment Income/(Loss) (388,480) 2,213,259
Expenses Management Fees 693,165 228,915 Transaction Fees and Commissions 11,459 8,820
Total Expenses 704,624 237,735
Finance Costs Interest Expense 67,471 41,311 Distribution Paid 985,112 154,286 Income Equalisation (41,687) (54,547)
Total Finance Costs 1,010,896 141,050
Net Investment Income/(Loss) (2,104,000) 1,834,474
Foreign Withholding Tax (4,891) (1,871)
Net Increase/(Decrease) in Net Assets (2,108,891) 1,832,603
Statement of Changes in Net Assets
US Dollars ($)
US Dollars ($)
Six Months Ended Six Months Ended30 June 2021 30 June 2020
Increase/(Decrease) in Net Assets
Net Increase/(Decrease) in Net Assets From Operations (2,108,891) 1,832,603
Capital Transactions Subscriptions 243,292,211 62,498,745 Redemptions (79,520,858) (37,666,838) Reinvestments — 31
Total Capital Transactions1 163,771,353 24,831,938
Total Increase/(Decrease) for the Period 161,662,462 26,664,541
Net AssetsBeginning of Period 328,183,632 121,980,330
End of Period 489,846,094 148,644,871
1 Capital Transactions include income equalisation adjustments as shown in the Statement of Operations.

Vanguard Global Short-Term Bond Index FundManaged by Vanguard Global Advisers, LLC, and sub-managed by Vanguard Investments Australia Ltd.
731
Investment ObjectiveThis fund seeks to provide returns consistent with the performance of the Bloomberg Barclays Global Aggregate Ex US MBS 1–5 Year Float Adjusted and Scaled Index, a market-weighted index of global government, government-related agency, corporate and securitised bonds, excluding US mortgage-backed securities, with maturities between 1 and 5 years.
Performance SummaryThe Perfomance Summary does not form part of the Financial Statements.
• As the six months ended 30 June 2021 came to a close, macroeconomic indicators signalled a faster global economic rebound than many had expected after the sharpest contraction in modern history. Yet the recovery has been uneven. Countries that have contained the virus more successfully, whether through vaccinations, lockdowns or both, generally have fared better economically. And the COVID-19 pandemic remained far from over, with new variants of the virus surfacing where vaccination rates have lagged and the human toll continuing to mount, especially in less developed economies.
• Swift and extensive support from governments and central banks has been a key to the rebound. So far in 2021, it has included fiscal stimulus – including the $1.9 trillion American Rescue Plan in the United States and the €673 billion Recovery and Resilience Facility in Europe – and pledges by a number of central banks to keep interest rates low for some time.
• Stock markets worldwide continued the rally that began in 2020, bolstered by reopening economies, more consumer spending and rising corporate profits. They posted strong gains for the six months ended 30 June 2021.
• Fixed income securities struggled amid concerns that an upturn in inflation might persist or even accelerate given the stronger-than-expected rebound in global growth, extraordinary monetary and fiscal stimulus and a jump in demand for goods and services as economies reopened and supply gradually picked up. With longer-term yields rising and prices falling, returns were negative for the half year.
• In this environment, the fund’s benchmark returned –0.10% for the six months.
• By country, the United States, which has the largest weighting in the index, turned in a poor performance, as did Canada and South Korea. Other index heavyweights, including Japan, China and Italy, posted positive returns.
• By sector, Treasuries, which make up about half the fund, returned about –0.3%. On the other hand, corporate bonds, noncorporate bonds and securitised debt outpaced the index as a whole.
Benchmark returns in the commentary above are in US dollars.
Benchmark: Bloomberg Barclays Global Aggregate Ex US MBS 1–5 Year Float Adjusted and Scaled Index Hedged
Total ReturnsPeriods Ended 30 June 2021
(Annualised for periods over one year)
Six Months Five YearsTen Years or
Since Inception1
CHF Hedged Acc -0.71 % -0.32 % 0.05 %
Benchmark2 -0.63 -0.16 0.17
Tracking Difference* -0.08
Institutional Plus CHF Hedged Acc -0.69 % -0.26 % 0.12 %
Benchmark2 -0.63 -0.16 0.17
Tracking Difference* -0.06
EUR Hedged Acc -0.60 % 0.14 % 0.59 %
Benchmark2 -0.50 0.27 0.68
Tracking Difference* -0.10
Investor EUR Hedged -0.60 % 0.11 % 0.56 %
Benchmark2 -0.50 0.27 0.68
Tracking Difference* -0.10
Institutional Plus EUR Hedged Acc -0.57 % 0.19 % 0.64 %
Benchmark2 -0.50 0.27 0.68
Tracking Difference* -0.07
GBP Hedged Acc -0.29 % 1.07 % 1.45 %
Benchmark2 -0.18 1.23 1.55
Tracking Difference* -0.11
GBP Hedged Dist -0.29 % 1.07 % 1.45 %
Benchmark2 -0.18 1.23 1.55
Tracking Difference* -0.11

732
Vanguard Global Short-Term Bond Index Fund
Total ReturnsPeriods Ended 30 June 2021
(Annualised for periods over one year)
Six Months Five YearsTen Years or
Since Inception1
Institutional Plus GBP Hedged Acc -0.26 % 1.12 % 1.43 %
Benchmark2 -0.18 1.23 1.48
Tracking Difference* -0.08
Institutional Plus GBP Hedged Dist -0.26 % 1.12 % 1.44 %
Benchmark2 -0.18 1.23 1.48
Tracking Difference* -0.08
USD Hedged Acc -0.21 % 2.15 % 2.10 %
Benchmark2 -0.10 2.34 2.24
Tracking Difference* -0.11
USD Hedged Dist -0.21 % — 0.04 %
Benchmark2 -0.10 — 0.17
Tracking Difference* -0.11
Institutional Plus USD Hedged Acc -0.18 % 2.20 % 2.18 %
Benchmark2 -0.10 2.34 2.29
Tracking Difference* -0.08
Each benchmark is in its respective currency.Sources: Vanguard Global Advisers, LLC, and Bloomberg.Performance is based on NAV with net income reinvested.
All of the returns in this report represent past performance, which is not a guarantee of future results that may be achieved by the fund. For performance data current to the most recent month-end, which may be higher or lower than that cited, visit our website at http://global.vanguard.com. Note, too, that both investment returns and principal value can fluctuate widely, so an investor's shares, when sold, could be worth more or less than their original cost.* The tracking difference between the fund return and the index return over a stated period of time can be attributed to a number of factors, including, without limitation, small differences in
weightings, trading activity, transaction costs and differences in the valuation and withholding tax treatment between the fund and the index vendor.1 Since-inception returns: CHF Hedged Acc, Institutional Plus CHF Hedged Acc, EUR Hedged Acc, Investor EUR Hedged and Institutional Plus EUR Hedged Acc, 31 March 2014; GBP Hedged Acc
and GBP Hedged Dist, 31 January 2014; Institutional Plus GBP Hedged Acc and Institutional Plus GBP Hedged Dist, 2 September 2014; USD Hedged Acc, 31 January 2014; USD Hedged Dist, 17 November 2020; Institutional Plus USD Hedged Acc, 10 March 2015.
2 Bloomberg Barclays Global Aggregate Ex US MBS 1–5 Year Float Adjusted Index Hedged through 28 April 2019; Bloomberg Barclays Global Aggregate Ex US MBS 1–5 Year Float Adjusted and Scaled Index Hedged thereafter.

Significant Portfolio ChangesFor the Six Months Ended 30 June 2021
733
Vanguard Global Short-Term Bond Index Fund
The Central Bank of Ireland requires a schedule of material changes in the composition of the portfolio during the period. These are defined as aggregate purchases of a security exceeding 1% of the total value of purchases for the period and aggregate disposals greater than 1% of the total value of sales. At a minimum, the largest 20 purchases and 20 sales must be shown; all purchases and sales must be shown if there are fewer than 20. A full listing of the portfolio changes for the period is available, upon request, at no extra cost from the Administrator.
PrincipalCost
US Dollars ($)
Purchases
French Republic Government Bond OAT 0.00% 25/2/2024 €26,223,000 32,459,368
US Treasury Note 0.38% 31/1/2026 $27,385,000 27,274,781Bundesobligation 0.00% 7/10/2022 €20,000,000 24,098,517French Republic Government Bond
OAT 0.00% 25/2/2026 €19,200,000 23,563,713US Treasury Note 0.75% 30/4/2026 $20,200,000 20,110,383US Treasury Note 0.13% 31/1/2023 $19,387,000 19,391,271US Treasury Note 0.13% 15/1/2024 $17,815,000 17,784,455US Treasury Note 0.13% 30/4/2023 $17,270,000 17,258,551US Treasury Note 0.25% 15/3/2024 $17,275,000 17,233,923US Treasury Note 0.75% 31/5/2026 $17,000,000 16,954,766French Republic Government Bond
OAT 1.75% 25/5/2023 €13,400,000 16,827,692Italy Buoni Poliennali Del Tesoro
0.00% 29/11/2022 €13,101,000 15,618,102US Treasury Note 0.50% 28/2/2026 $15,540,000 15,307,351US Treasury Note 0.75% 31/3/2026 $14,875,000 14,788,115US Treasury Note 0.38% 15/4/2024 $14,165,600 14,184,889Spain Government Bond 0.00%
31/1/2026 €10,962,000 13,436,438US Treasury Note 0.25% 15/5/2024 $13,171,000 13,133,601US Treasury Note 0.13% 15/2/2024 $13,095,000 13,040,522US Treasury Note 0.88% 30/6/2026 $11,550,000 11,545,402Japan Government Bond 0.01%
20/3/2026 ¥1,230,000,000 11,256,558
PrincipalProceeds
US Dollars ($)
Sales
Bundesrepublik Deutschland Bundesanleihe 0.50% 15/2/2025 €17,606,000 22,283,915
French Republic Government Bond OAT 0.00% 25/3/2024 €13,873,857 17,138,568
US Treasury Note 0.38% 31/3/2022 $16,971,000 17,023,182French Republic Government Bond
OAT 0.50% 25/5/2025 €11,100,000 13,824,726US Treasury Note 0.13% 31/1/2023 $12,060,000 12,057,609US Treasury Note 0.13% 30/4/2022 $12,016,000 12,020,694US Treasury Note 0.38% 31/12/2025 $11,430,000 11,394,755French Republic Government Bond
OAT 1.75% 25/5/2023 €8,000,000 10,109,801Bundesschatzanweisungen 0.00%
10/6/2022 €8,000,000 9,696,890US Treasury Note 0.38% 31/1/2026 $9,070,000 8,975,597Bundesobligation 0.00% 5/4/2024 €7,300,000 8,894,502US Treasury Note 1.88% 31/3/2022 $8,325,000 8,466,035Netherlands Government Bond
0.25% 15/7/2025 €6,700,000 8,289,925French Republic Government Bond
OAT 0.00% 25/5/2022 €6,700,000 8,186,150US Treasury Note 2.00% 15/2/2022 $8,000,000 8,140,938US Treasury Note 0.75% 31/5/2026 $8,084,000 8,057,443US Treasury Note 0.13% 15/12/2023 $7,940,000 7,919,301US Treasury Note 1.88% 28/2/2022 $7,740,000 7,856,402Japan Government Bond 0.10%
1/6/2022 ¥800,000,000 7,323,088Portugal Obrigacoes do Tesouro OT
2.88% 15/10/2025 €5,100,000 7,090,878Spain Government Bond 0.40%
30/4/2022 €5,619,000 6,832,534Italy Buoni Poliennali Del Tesoro
1.35% 15/4/2022 €5,459,000 6,692,031Japan Government Two Year Bond
0.10% 1/4/2022 ¥720,000,000 6,581,278

734
Vanguard Global Short-Term Bond Index Fund
Financial StatementsStatement of Investments30 June 2021
Principal CouponMaturity
DateFair Value
US Dollars ($)% of Total
Net AssetsBonds 98.14% (2020: 97.14%)Australia 1.82% (2020: 1.71%)Australia Government Bond AU($)8,400,000 0.25% 21/11/2024 6,268,665 0.19%Australia Government Bond AU($)5,800,000 4.25% 21/4/2026 5,075,022 0.16%Australia Government Bond AU($)5,250,000 3.25% 21/4/2025 4,343,559 0.13%Australia Government Bond AU($)4,700,000 5.50% 21/4/2023 3,873,894 0.12%Australia Government Bond AU($)4,440,000 2.75% 21/4/2024 3,580,199 0.11%Australia Government Bond AU($)4,150,000 0.25% 21/11/2025 3,058,941 0.09%New South Wales Treasury Corp. AU($)3,000,000 5.00% 20/8/2024 2,566,982 0.08%Queensland Treasury Corp. AU($)2,500,000 5.75% 22/7/2024 2,177,922 0.07%Treasury Corp. of Victoria AU($)1,750,000 5.50% 17/12/2024 1,534,716 0.05%Western Australian Treasury Corp. AU($)1,400,000 5.00% 23/7/2025 1,230,148 0.04%New South Wales Treasury Corp. AU($)1,500,000 4.00% 20/4/2023 1,204,958 0.04%Queensland Treasury Corp. AU($)1,400,000 4.25% 21/7/2023 1,138,793 0.04%Queensland Treasury Corp. AU($)1,300,000 4.75% 21/7/2025 1,131,722 0.04%Ausgrid Finance Pty Ltd. AU($)1,400,000 3.75% 30/10/2024 1,131,157 0.04%Australia Government Bond AU($)1,200,000 2.25% 21/11/2022 928,894 0.03%NBN Co., Ltd. AU($)1,000,000 1.00% 3/12/2025 735,927 0.02%Scentre Group Trust 1/Scentre Group Trust 2 €500,000 1.38% 22/3/2023 606,795 0.02%Glencore Finance Europe Ltd. €500,000 0.63% 11/9/2024 602,066 0.02%Commonwealth Bank of Australia €500,000 0.38% 24/4/2023 601,823 0.02%Australia & New Zealand Banking Group Ltd. €500,000 0.25% 29/11/2022 598,972 0.02%Bank of Queensland Ltd. €500,000 0.50% 10/7/2022 598,506 0.02%Australia & New Zealand Banking Group Ltd.^ €500,000 0.67% 5/5/2031 590,818 0.02%Treasury Corp. of Victoria AU($)700,000 6.00% 17/10/2022 566,053 0.02%Macquarie Bank Ltd. $550,000 2.10% 17/10/2022 562,450 0.02%Queensland Treasury Corp. AU($)700,000 6.00% 21/7/2022 558,445 0.02%Macquarie Bank Ltd. $525,000 2.30% 22/1/2025 547,897 0.02%Western Australian Treasury Corp. AU($)700,000 2.75% 20/10/2022 544,124 0.02%BHP Billiton Finance USA Ltd. $500,000 3.85% 30/9/2023 537,469 0.02%Westpac Banking Corp. $500,000 3.30% 26/2/2024 536,014 0.02%Macquarie Group Ltd.^ $500,000 1.34% 12/1/2027 495,373 0.02%Westpac Banking Corp. €400,000 0.50% 4/12/2023 484,963 0.02%Westpac Banking Corp. $450,000 2.00% 16/1/2025 468,808 0.01%Victoria Power Networks Finance Pty Ltd. AU($)600,000 1.60% 21/4/2026 452,352 0.01%ANZ Bank New Zealand Ltd. NZ($)600,000 3.03% 20/3/2024 439,257 0.01%National Australia Bank Ltd. AU($)550,000 1.65% 21/1/2025 423,483 0.01%Westpac Banking Corp. AU($)500,000 5.25% 21/11/2023 417,357 0.01%Glencore Funding LLC $400,000 1.63% 1/9/2025 404,890 0.01%Australia & New Zealand Banking Group Ltd. €333,000 0.63% 21/2/2023 401,660 0.01%National Australia Bank Ltd. AU($)500,000 3.00% 16/3/2023 392,361 0.01%Australia & New Zealand Banking Group Ltd. AU($)500,000 1.65% 16/1/2025 384,906 0.01%Westpac Banking Corp. €300,000 0.75% 17/10/2023 364,788 0.01%QBE Insurance Group Ltd.^ $300,000 7.50% 24/11/2043 337,947 0.01%Westpac Banking Corp. $300,000 2.35% 19/2/2025 315,339 0.01%Western Australian Treasury Corp. AU($)350,000 6.00% 16/10/2023 297,675 0.01%Westpac Banking Corp.^ €250,000 0.77% 13/5/2031 296,082 0.01%Bank of Queensland Ltd. €240,000 0.13% 4/6/2024 288,048 0.01%National Australia Bank Ltd. $250,000 3.63% 20/6/2023 265,934 0.01%Sydney Airport Finance Co. Pty Ltd. $250,000 3.90% 22/3/2023 263,259 0.01%National Australia Bank Ltd. $250,000 1.88% 13/12/2022 255,682 0.01%National Australia Bank Ltd. €200,000 0.75% 30/1/2026 247,802 0.01%Toyota Finance Australia Ltd. €200,000 0.25% 9/4/2024 239,934 0.01%Westpac Banking Corp. AU($)300,000 3.00% 24/4/2024 239,718 0.01%Australia & New Zealand Banking Group Ltd. AU($)300,000 3.35% 9/5/2023 237,450 0.01%Commonwealth Bank of Australia AU($)300,000 3.25% 25/4/2023 236,777 0.01%Scentre Group Trust 1/Scentre Group Trust 2 $200,000 3.63% 28/1/2026 217,928 0.01%Australia & New Zealand Banking Group Ltd.^ $200,000 2.95% 22/7/2030 208,000 0.01%National Australia Bank Ltd.^ CA($)200,000 3.52% 12/6/2030 169,558 0.01%APT Pipelines Ltd. $150,000 4.20% 23/3/2025 164,484 0.01%Westpac Banking Corp.^ $150,000 2.89% 4/2/2030 155,605 0.00%Woolworths Group Ltd. AU($)200,000 1.85% 20/5/2025 153,512 0.00%South Australian Government Financing Authority AU($)200,000 1.50% 22/9/2022 152,807 0.00%Optus Finance Pty Ltd. AU($)200,000 1.60% 1/7/2025 152,402 0.00%Toyota Finance Australia Ltd. AU($)180,000 3.30% 22/11/2023 143,466 0.00%

735
Vanguard Global Short-Term Bond Index Fund
Principal CouponMaturity
DateFair Value
US Dollars ($)% of Total
Net AssetsWoodside Finance Ltd. $125,000 3.65% 5/3/2025 133,358 0.00%Westpac Banking Corp. $125,000 2.00% 13/1/2023 128,208 0.00%Sydney Airport Finance Co. Pty Ltd. €100,000 2.75% 23/4/2024 127,769 0.00%Scentre Group Trust 2 €100,000 3.25% 11/9/2023 127,536 0.00%Australia Pacific Airports Melbourne Pty Ltd. €100,000 3.13% 26/9/2023 126,832 0.00%BHP Billiton Finance Ltd. €100,000 0.75% 28/10/2022 119,915 0.00%Macquarie Group Ltd.^ $100,000 4.15% 27/3/2024 105,874 0.00%Westpac Banking Corp. $100,000 2.75% 11/1/2023 103,703 0.00%Macquarie Group Ltd.^ $100,000 3.19% 28/11/2023 103,598 0.00%Westpac Banking Corp. $75,000 3.65% 15/5/2023 79,582 0.00%BHP Billiton Finance Ltd. CA($)75,000 3.23% 15/5/2023 63,007 0.00%Suncorp-Metway Ltd. $50,000 3.30% 15/4/2024 53,430 0.00%Ausgrid Finance Pty Ltd. $50,000 3.85% 1/5/2023 52,218 0.00%Australia & New Zealand Banking Group Ltd. $50,000 2.63% 9/11/2022 51,554 0.00%Commonwealth Bank of Australia $25,000 2.50% 18/9/2022 25,656 0.00%United Energy Distribution Pty Ltd. AU($)30,000 3.50% 12/9/2023 23,630 0.00%test - - - 59,028,408 1.82%Austria 0.72% (2020: 0.78%)Republic of Austria Government Bond €4,600,000 1.20% 20/10/2025 5,866,512 0.18%Republic of Austria Government Bond €2,500,000 0.00% 20/9/2022 2,989,113 0.09%Republic of Austria Government Bond €1,600,000 3.40% 22/11/2022 2,004,972 0.06%Republic of Austria Government Bond €1,600,000 1.75% 20/10/2023 2,002,664 0.06%Republic of Austria Government Bond €1,657,000 0.00% 20/4/2023 1,987,909 0.06%Republic of Austria Government Bond €847,000 0.00% 20/4/2025 1,024,890 0.03%Oesterreichische Kontrollbank AG £600,000 1.13% 15/12/2022 839,718 0.03%Oesterreichische Kontrollbank AG £600,000 0.50% 15/12/2025 826,710 0.03%Erste Group Bank AG €500,000 0.75% 5/2/2025 616,950 0.02%Raiffeisen Bank International AG €500,000 0.25% 22/1/2025 598,927 0.02%UNIQA Insurance Group AG^ €400,000 6.88% 31/7/2043 537,961 0.02%Raiffeisenlandesbank Niederoesterreich-Wien AG €400,000 0.38% 13/9/2024 486,070 0.02%OMV AG €400,000 0.75% 4/12/2023 485,248 0.02%Oesterreichische Kontrollbank AG CHF400,000 2.63% 22/11/2024 479,244 0.01%Republic of Austria Government Bond €313,000 0.00% 15/7/2023 376,017 0.01%JAB Holdings BV €300,000 1.25% 22/5/2024 368,498 0.01%Erste Group Bank AG^ €300,000 1.00% 10/6/2030 358,901 0.01%OMV AG €300,000 0.00% 16/6/2023 357,316 0.01%Oesterreichische Kontrollbank AG $335,000 3.13% 7/11/2023 356,128 0.01%Oesterreichische Kontrollbank AG $300,000 0.38% 17/9/2025 294,537 0.01%Oesterreichische Kontrollbank AG $170,000 2.88% 13/3/2023 177,445 0.01%Republic of Austria Government Bond €102,000 1.65% 21/10/2024 130,090 0.00%Telekom Finanzmanagement GmbH €100,000 3.50% 4/7/2023 127,385 0.00%Erste Group Bank AG €100,000 0.05% 16/9/2025 119,115 0.00%test - - - 23,412,320 0.72%Belgium 1.03% (2020: 0.91%)Kingdom of Belgium Government Bond €8,400,000 0.20% 22/10/2023 10,159,722 0.31%Kingdom of Belgium Government Bond €4,700,000 0.80% 22/6/2025 5,875,834 0.18%Kingdom of Belgium Government Bond €1,500,000 2.60% 22/6/2024 1,951,443 0.06%Kingdom of Belgium Government Bond €1,500,000 1.00% 22/6/2026 1,909,435 0.06%Kingdom of Belgium Government Bond €1,500,000 2.25% 22/6/2023 1,882,289 0.06%Kingdom of Belgium Government Bond €1,500,000 0.50% 22/10/2024 1,845,067 0.06%Anheuser-Busch Cos LLC/Anheuser-Busch InBev Worldwide, Inc. $1,275,000 3.65% 1/2/2026 1,409,514 0.04%Elia Transmission Belgium SA €1,000,000 1.38% 14/1/2026 1,256,268 0.04%Region Wallonne Belgium €700,000 0.05% 22/6/2025 840,310 0.03%Euroclear Bank SA £500,000 1.25% 30/9/2024 704,061 0.02%Kingdom of Belgium Government Bond €500,000 4.25% 28/9/2022 629,524 0.02%Belfius Bank SA €500,000 1.00% 26/10/2024 612,076 0.02%Belfius Bank SA €500,000 0.38% 24/10/2023 604,088 0.02%Belfius Bank SA €500,000 0.38% 2/9/2025 597,930 0.02%Euroclear Bank SA €465,000 0.13% 7/7/2025 555,204 0.02%KBC Group NV €400,000 1.13% 25/1/2024 490,185 0.02%Argenta Spaarbank NV €400,000 1.00% 13/10/2026 485,423 0.01%Euroclear Bank SA €400,000 0.50% 10/7/2023 481,615 0.01%Elia Transmission Belgium SA €300,000 1.38% 27/5/2024 370,235 0.01%Belfius Bank SA €300,000 0.75% 12/9/2022 360,344 0.01%KBC Group NV^ €200,000 0.50% 3/12/2029 237,279 0.01%Euroclear Bank SA €100,000 0.25% 7/9/2022 119,473 0.00%test - - - 33,377,319 1.03%Bermuda 0.02% (2020: 0.02%)Bermuda Government International Bond $200,000 4.85% 6/2/2024 220,378 0.01%Bermuda Government International Bond $200,000 4.14% 3/1/2023 210,606 0.01%

736
Vanguard Global Short-Term Bond Index Fund
Principal CouponMaturity
DateFair Value
US Dollars ($)% of Total
Net AssetsTriton Container International Ltd. $200,000 1.15% 7/6/2024 199,503 0.00%test - - - 630,487 0.02%Brazil 0.01% (2020: 0.01%)GTL Trade Finance, Inc./Gerdau Holdings, Inc. $150,000 5.89% 29/4/2024 168,536 0.01%Gerdau Trade, Inc. $100,000 4.75% 15/4/2023 106,905 0.00%Fibria Overseas Finance Ltd. $19,000 4.00% 14/1/2025 20,524 0.00%test - - - 295,965 0.01%Bulgaria 0.08% (2020: 0.00%)Bulgaria Government International Bond €2,000,000 1.88% 21/3/2023 2,461,014 0.08%test - - - 2,461,014 0.08%Canada 4.32% (2020: 4.40%)Canadian Government Bond CA($)4,410,000 0.25% 1/5/2023 3,548,379 0.11%Canadian Government Bond CA($)3,935,000 0.25% 1/4/2024 3,143,451 0.10%Canadian Government Bond CA($)3,725,000 0.25% 1/11/2022 3,004,143 0.09%Canadian Government Bond CA($)3,430,000 0.25% 1/2/2023 2,763,907 0.09%Canadian Government Bond CA($)3,050,000 1.00% 1/9/2022 2,482,882 0.08%Canadian Government Bond CA($)3,120,000 0.50% 1/9/2025 2,480,228 0.08%Federation des Caisses Desjardins du Quebec €1,900,000 0.01% 24/9/2025 2,281,071 0.07%Canada Housing Trust No 1 CA($)2,400,000 2.40% 15/12/2022 1,994,696 0.06%Canadian Government Bond CA($)2,385,000 2.00% 1/9/2023 1,987,741 0.06%Canadian Government Bond CA($)2,369,000 1.75% 1/3/2023 1,955,841 0.06%Canada Housing Trust No 1 CA($)2,180,000 2.90% 15/6/2024 1,870,013 0.06%Ontario Teachers' Finance Trust €1,500,000 0.50% 6/5/2025 1,829,979 0.06%Canadian Government Bond CA($)2,340,000 0.25% 1/3/2026 1,827,087 0.06%Province of Ontario Canada CA($)2,130,000 2.60% 2/6/2025 1,819,137 0.06%Canadian Government Bond CA($)2,247,000 0.25% 1/8/2022 1,813,990 0.06%Canadian Government Bond CA($)2,140,000 1.50% 1/9/2024 1,771,782 0.06%Canada Housing Trust No 1 CA($)2,085,000 1.95% 15/12/2025 1,743,654 0.05%Toronto-Dominion Bank $1,550,000 2.50% 18/1/2022 1,568,880 0.05%Province of Ontario Canada CA($)1,685,000 3.50% 2/6/2024 1,465,121 0.05%Province of Ontario Canada CA($)1,690,000 2.85% 2/6/2023 1,424,505 0.04%Canada Housing Trust No 1 CA($)1,690,000 2.35% 15/6/2023 1,413,463 0.04%Province of Quebec Canada $1,303,000 2.50% 20/4/2026 1,395,439 0.04%Canadian Government Bond CA($)1,610,000 2.25% 1/3/2024 1,356,887 0.04%Province of Ontario Canada CA($)1,620,000 1.75% 8/9/2025 1,340,415 0.04%Canada Housing Trust No 1 CA($)1,535,000 2.35% 15/9/2023 1,287,890 0.04%Canada Housing Trust No 1 CA($)1,515,000 2.55% 15/12/2023 1,280,654 0.04%Province of Quebec Canada €1,000,000 2.25% 17/7/2023 1,251,646 0.04%OMERS Finance Trust €1,000,000 0.45% 13/5/2025 1,213,686 0.04%Province of Ontario Canada €1,000,000 0.38% 14/6/2024 1,212,123 0.04%Canada Housing Trust No 1 CA($)1,495,000 0.95% 15/6/2025 1,204,219 0.04%Canada Housing Trust No 1 CA($)1,445,000 1.80% 15/12/2024 1,203,350 0.04%Bank of Nova Scotia €1,000,000 0.01% 18/3/2025 1,200,346 0.04%Bank of Montreal €1,000,000 0.13% 26/3/2023 1,197,828 0.04%CDP Financial, Inc. $1,170,000 0.88% 10/6/2025 1,172,449 0.04%Canadian Government Bond CA($)1,380,000 1.25% 1/3/2025 1,133,455 0.04%Canadian Government Bond CA($)1,362,000 1.50% 1/6/2023 1,121,958 0.04%Province of Quebec Canada CA($)1,280,000 2.75% 1/9/2025 1,102,893 0.03%Province of Ontario Canada £700,000 0.50% 15/12/2023 971,390 0.03%Royal Bank of Canada $900,000 1.15% 10/6/2025 904,967 0.03%Province of Quebec Canada CA($)990,000 3.50% 1/12/2022 834,197 0.03%Canada Housing Trust No 1 CA($)975,000 2.55% 15/3/2025 833,144 0.03%Canada Housing Trust No 1 CA($)1,000,000 1.25% 15/6/2026 808,412 0.03%Province of Quebec Canada CA($)910,000 3.75% 1/9/2024 801,367 0.03%Bank of Nova Scotia €600,000 0.25% 28/9/2022 717,999 0.02%Royal Bank of Canada €600,000 0.13% 23/7/2024 717,383 0.02%Province of Ontario Canada $700,000 1.05% 14/4/2026 702,110 0.02%Canada Government International Bond $700,000 0.75% 19/5/2026 695,721 0.02%Province of Quebec Canada $700,000 0.60% 23/7/2025 694,235 0.02%Province of Quebec Canada CA($)755,000 3.00% 1/9/2023 641,464 0.02%Province of Quebec Canada CA($)735,000 2.60% 6/7/2025 629,865 0.02%Federation des Caisses Desjardins du Quebec €500,000 0.38% 30/5/2023 602,239 0.02%National Bank of Canada €500,000 0.25% 24/7/2023 601,509 0.02%Bank of Nova Scotia €500,000 0.38% 10/3/2023 601,245 0.02%Royal Bank of Canada €500,000 0.25% 28/6/2023 601,228 0.02%Cenovus Energy, Inc. $525,000 5.38% 15/7/2025 600,627 0.02%Canadian Imperial Bank of Commerce €500,000 0.25% 24/1/2023 599,446 0.02%Bank of Montreal €500,000 0.20% 26/1/2023 599,121 0.02%Toronto-Dominion Bank AU($)750,000 2.05% 10/7/2024 582,201 0.02%Province of Quebec Canada $564,000 1.50% 11/2/2025 579,646 0.02%Province of Ontario Canada CA($)640,000 9.50% 13/7/2022 565,070 0.02%
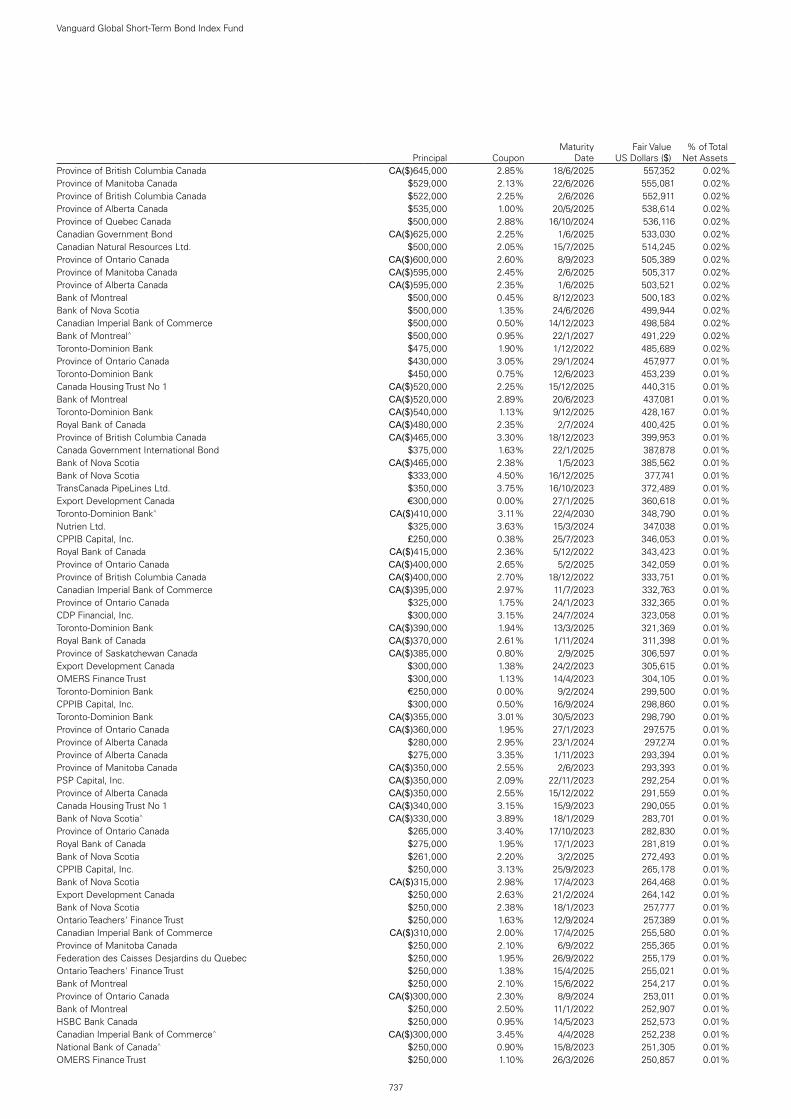
737
Vanguard Global Short-Term Bond Index Fund
Principal CouponMaturity
DateFair Value
US Dollars ($)% of Total
Net AssetsProvince of British Columbia Canada CA($)645,000 2.85% 18/6/2025 557,352 0.02%Province of Manitoba Canada $529,000 2.13% 22/6/2026 555,081 0.02%Province of British Columbia Canada $522,000 2.25% 2/6/2026 552,911 0.02%Province of Alberta Canada $535,000 1.00% 20/5/2025 538,614 0.02%Province of Quebec Canada $500,000 2.88% 16/10/2024 536,116 0.02%Canadian Government Bond CA($)625,000 2.25% 1/6/2025 533,030 0.02%Canadian Natural Resources Ltd. $500,000 2.05% 15/7/2025 514,245 0.02%Province of Ontario Canada CA($)600,000 2.60% 8/9/2023 505,389 0.02%Province of Manitoba Canada CA($)595,000 2.45% 2/6/2025 505,317 0.02%Province of Alberta Canada CA($)595,000 2.35% 1/6/2025 503,521 0.02%Bank of Montreal $500,000 0.45% 8/12/2023 500,183 0.02%Bank of Nova Scotia $500,000 1.35% 24/6/2026 499,944 0.02%Canadian Imperial Bank of Commerce $500,000 0.50% 14/12/2023 498,584 0.02%Bank of Montreal^ $500,000 0.95% 22/1/2027 491,229 0.02%Toronto-Dominion Bank $475,000 1.90% 1/12/2022 485,689 0.02%Province of Ontario Canada $430,000 3.05% 29/1/2024 457,977 0.01%Toronto-Dominion Bank $450,000 0.75% 12/6/2023 453,239 0.01%Canada Housing Trust No 1 CA($)520,000 2.25% 15/12/2025 440,315 0.01%Bank of Montreal CA($)520,000 2.89% 20/6/2023 437,081 0.01%Toronto-Dominion Bank CA($)540,000 1.13% 9/12/2025 428,167 0.01%Royal Bank of Canada CA($)480,000 2.35% 2/7/2024 400,425 0.01%Province of British Columbia Canada CA($)465,000 3.30% 18/12/2023 399,953 0.01%Canada Government International Bond $375,000 1.63% 22/1/2025 387,878 0.01%Bank of Nova Scotia CA($)465,000 2.38% 1/5/2023 385,562 0.01%Bank of Nova Scotia $333,000 4.50% 16/12/2025 377,741 0.01%TransCanada PipeLines Ltd. $350,000 3.75% 16/10/2023 372,489 0.01%Export Development Canada €300,000 0.00% 27/1/2025 360,618 0.01%Toronto-Dominion Bank^ CA($)410,000 3.11% 22/4/2030 348,790 0.01%Nutrien Ltd. $325,000 3.63% 15/3/2024 347,038 0.01%CPPIB Capital, Inc. £250,000 0.38% 25/7/2023 346,053 0.01%Royal Bank of Canada CA($)415,000 2.36% 5/12/2022 343,423 0.01%Province of Ontario Canada CA($)400,000 2.65% 5/2/2025 342,059 0.01%Province of British Columbia Canada CA($)400,000 2.70% 18/12/2022 333,751 0.01%Canadian Imperial Bank of Commerce CA($)395,000 2.97% 11/7/2023 332,763 0.01%Province of Ontario Canada $325,000 1.75% 24/1/2023 332,365 0.01%CDP Financial, Inc. $300,000 3.15% 24/7/2024 323,058 0.01%Toronto-Dominion Bank CA($)390,000 1.94% 13/3/2025 321,369 0.01%Royal Bank of Canada CA($)370,000 2.61% 1/11/2024 311,398 0.01%Province of Saskatchewan Canada CA($)385,000 0.80% 2/9/2025 306,597 0.01%Export Development Canada $300,000 1.38% 24/2/2023 305,615 0.01%OMERS Finance Trust $300,000 1.13% 14/4/2023 304,105 0.01%Toronto-Dominion Bank €250,000 0.00% 9/2/2024 299,500 0.01%CPPIB Capital, Inc. $300,000 0.50% 16/9/2024 298,860 0.01%Toronto-Dominion Bank CA($)355,000 3.01% 30/5/2023 298,790 0.01%Province of Ontario Canada CA($)360,000 1.95% 27/1/2023 297,575 0.01%Province of Alberta Canada $280,000 2.95% 23/1/2024 297,274 0.01%Province of Alberta Canada $275,000 3.35% 1/11/2023 293,394 0.01%Province of Manitoba Canada CA($)350,000 2.55% 2/6/2023 293,393 0.01%PSP Capital, Inc. CA($)350,000 2.09% 22/11/2023 292,254 0.01%Province of Alberta Canada CA($)350,000 2.55% 15/12/2022 291,559 0.01%Canada Housing Trust No 1 CA($)340,000 3.15% 15/9/2023 290,055 0.01%Bank of Nova Scotia^ CA($)330,000 3.89% 18/1/2029 283,701 0.01%Province of Ontario Canada $265,000 3.40% 17/10/2023 282,830 0.01%Royal Bank of Canada $275,000 1.95% 17/1/2023 281,819 0.01%Bank of Nova Scotia $261,000 2.20% 3/2/2025 272,493 0.01%CPPIB Capital, Inc. $250,000 3.13% 25/9/2023 265,178 0.01%Bank of Nova Scotia CA($)315,000 2.98% 17/4/2023 264,468 0.01%Export Development Canada $250,000 2.63% 21/2/2024 264,142 0.01%Bank of Nova Scotia $250,000 2.38% 18/1/2023 257,777 0.01%Ontario Teachers' Finance Trust $250,000 1.63% 12/9/2024 257,389 0.01%Canadian Imperial Bank of Commerce CA($)310,000 2.00% 17/4/2025 255,580 0.01%Province of Manitoba Canada $250,000 2.10% 6/9/2022 255,365 0.01%Federation des Caisses Desjardins du Quebec $250,000 1.95% 26/9/2022 255,179 0.01%Ontario Teachers' Finance Trust $250,000 1.38% 15/4/2025 255,021 0.01%Bank of Montreal $250,000 2.10% 15/6/2022 254,217 0.01%Province of Ontario Canada CA($)300,000 2.30% 8/9/2024 253,011 0.01%Bank of Montreal $250,000 2.50% 11/1/2022 252,907 0.01%HSBC Bank Canada $250,000 0.95% 14/5/2023 252,573 0.01%Canadian Imperial Bank of Commerce^ CA($)300,000 3.45% 4/4/2028 252,238 0.01%National Bank of Canada^ $250,000 0.90% 15/8/2023 251,305 0.01%OMERS Finance Trust $250,000 1.10% 26/3/2026 250,857 0.01%

738
Vanguard Global Short-Term Bond Index Fund
Principal CouponMaturity
DateFair Value
US Dollars ($)% of Total
Net AssetsToronto-Dominion Bank $250,000 0.45% 11/9/2023 250,160 0.01%Canadian Imperial Bank of Commerce $250,000 0.45% 22/6/2023 249,968 0.01%Royal Bank of Canada $250,000 1.20% 27/4/2026 249,730 0.01%Royal Bank of Canada $250,000 0.43% 19/1/2024 249,243 0.01%Canadian Imperial Bank of Commerce $250,000 1.25% 22/6/2026 248,748 0.01%Toronto-Dominion Bank^ CA($)290,000 3.59% 14/9/2028 246,470 0.01%Canada Government International Bond $240,000 2.00% 15/11/2022 245,766 0.01%Province of Alberta Canada CA($)285,000 3.10% 1/6/2024 245,149 0.01%Toronto-Dominion Bank €200,000 0.38% 25/4/2024 240,595 0.01%H&R CA($)285,000 3.42% 23/1/2023 236,847 0.01%Royal Bank of Canada^ CA($)280,000 2.74% 25/7/2029 234,724 0.01%City of Toronto Canada CA($)270,000 3.40% 21/5/2024 233,759 0.01%Export Development Canada $225,000 2.50% 24/1/2023 232,870 0.01%Ontario Electricity Financial Corp. CA($)225,000 8.50% 26/5/2025 231,873 0.01%Province of Ontario Canada $225,000 2.20% 3/10/2022 230,422 0.01%Royal Bank of Canada $225,000 1.60% 17/4/2023 229,919 0.01%Sun Life Financial, Inc.^ CA($)275,000 2.38% 13/8/2029 228,658 0.01%Toronto-Dominion Bank^ CA($)260,000 3.22% 25/7/2029 221,088 0.01%Bank of Montreal CA($)275,000 1.55% 28/5/2026 220,897 0.01%Royal Bank of Canada CA($)270,000 1.59% 4/5/2026 217,377 0.01%Bank of Montreal CA($)265,000 1.76% 10/3/2026 215,324 0.01%Province of Ontario Canada $200,000 3.20% 16/5/2024 214,865 0.01%Suncor Energy, Inc. $200,000 3.10% 15/5/2025 214,129 0.01%Toronto-Dominion Bank $200,000 3.50% 19/7/2023 212,693 0.01%Suncor Energy, Inc. $200,000 2.80% 15/5/2023 207,874 0.01%Alimentation Couche-Tard, Inc. CA($)240,000 3.60% 2/6/2025 207,637 0.01%Canadian Natural Resources Ltd. $200,000 2.95% 15/1/2023 207,219 0.01%Federation des Caisses Desjardins du Quebec $200,000 2.05% 10/2/2025 206,477 0.01%Bank of Nova Scotia^ CA($)245,000 2.84% 3/7/2029 205,870 0.01%407 International, Inc. CA($)250,000 1.80% 22/5/2025 205,812 0.01%Granite Holdings LP CA($)240,000 3.87% 30/11/2023 205,524 0.01%Nutrien Ltd. $200,000 3.15% 1/10/2022 205,328 0.01%Canadian Pacific Railway Co. $193,000 2.90% 1/2/2025 204,921 0.01%Bank of Nova Scotia $200,000 2.00% 15/11/2022 204,550 0.01%Canadian Imperial Bank of Commerce $200,000 2.35% 27/7/2022 204,468 0.01%Brookfield Renewable Partners ULC CA($)235,000 3.75% 2/6/2025 204,353 0.01%Ivanhoe Cambridge II, Inc. CA($)245,000 2.30% 12/12/2024 204,332 0.01%bcIMC Realty Corp. CA($)240,000 2.84% 3/6/2025 204,013 0.01%OMERS Realty Corp. CA($)235,000 3.33% 5/6/2025 203,505 0.01%Bank of Nova Scotia $200,000 1.30% 11/6/2025 201,913 0.01%Province of Quebec Canada CA($)220,000 9.38% 16/1/2023 201,833 0.01%Canadian Imperial Bank of Commerce $200,000 1.15% 8/7/2026 199,834 0.01%Toronto-Dominion Bank $200,000 0.25% 6/1/2023 199,820 0.01%Toronto-Dominion Bank CA($)230,000 3.23% 24/7/2024 197,675 0.01%Bank of Nova Scotia CA($)235,000 2.29% 28/6/2024 196,554 0.01%Canadian Imperial Bank of Commerce CA($)225,000 3.30% 26/5/2025 195,974 0.01%Toronto-Dominion Bank CA($)230,000 2.85% 8/3/2024 194,276 0.01%Bank of Montreal CA($)225,000 2.85% 6/3/2024 189,890 0.01%Province of Ontario Canada CA($)200,000 7.50% 7/2/2024 189,103 0.01%Toronto-Dominion Bank CA($)225,000 2.50% 2/12/2024 188,825 0.01%Bank of Montreal^ CA($)230,000 2.08% 17/6/2030 188,502 0.01%Royal Bank of Canada $175,000 3.70% 5/10/2023 187,682 0.01%Hydro-Quebec CA($)210,000 9.63% 15/7/2022 185,691 0.01%Royal Bank of Canada $175,000 2.55% 16/7/2024 184,646 0.01%Royal Bank of Canada^ CA($)225,000 2.09% 30/6/2030 184,467 0.01%AIMCo Realty Investors LP CA($)220,000 2.27% 26/6/2024 182,938 0.01%Province of Quebec Canada CA($)215,000 2.25% 22/2/2024 180,724 0.01%Penske Truck Leasing Canada, Inc. CA($)215,000 2.85% 7/12/2022 178,165 0.01%Canadian Imperial Bank of Commerce CA($)225,000 1.10% 19/1/2026 177,535 0.01%Allied Properties CA($)205,000 3.64% 21/4/2025 176,370 0.01%Federation des Caisses Desjardins du Quebec CA($)205,000 3.06% 11/9/2023 173,359 0.01%Royal Bank of Canada CA($)210,000 1.94% 1/5/2025 172,823 0.01%Hydro One, Inc. CA($)210,000 1.76% 28/2/2025 172,587 0.01%Bank of Nova Scotia CA($)205,000 2.49% 23/9/2024 171,851 0.01%Royal Bank of Canada CA($)200,000 3.30% 26/9/2023 169,663 0.01%TransCanada PipeLines Ltd. CA($)200,000 3.69% 19/7/2023 168,979 0.01%Export Development Canada CA($)205,000 1.80% 1/9/2022 168,367 0.01%Alimentation Couche-Tard, Inc. CA($)200,000 3.90% 1/11/2022 168,123 0.01%Manulife Financial Corp.^ CA($)200,000 3.32% 9/5/2028 168,107 0.01%Royal Bank of Canada CA($)200,000 2.95% 1/5/2023 167,955 0.01%Kinross Gold Corp. $150,000 5.95% 15/3/2024 167,742 0.01%
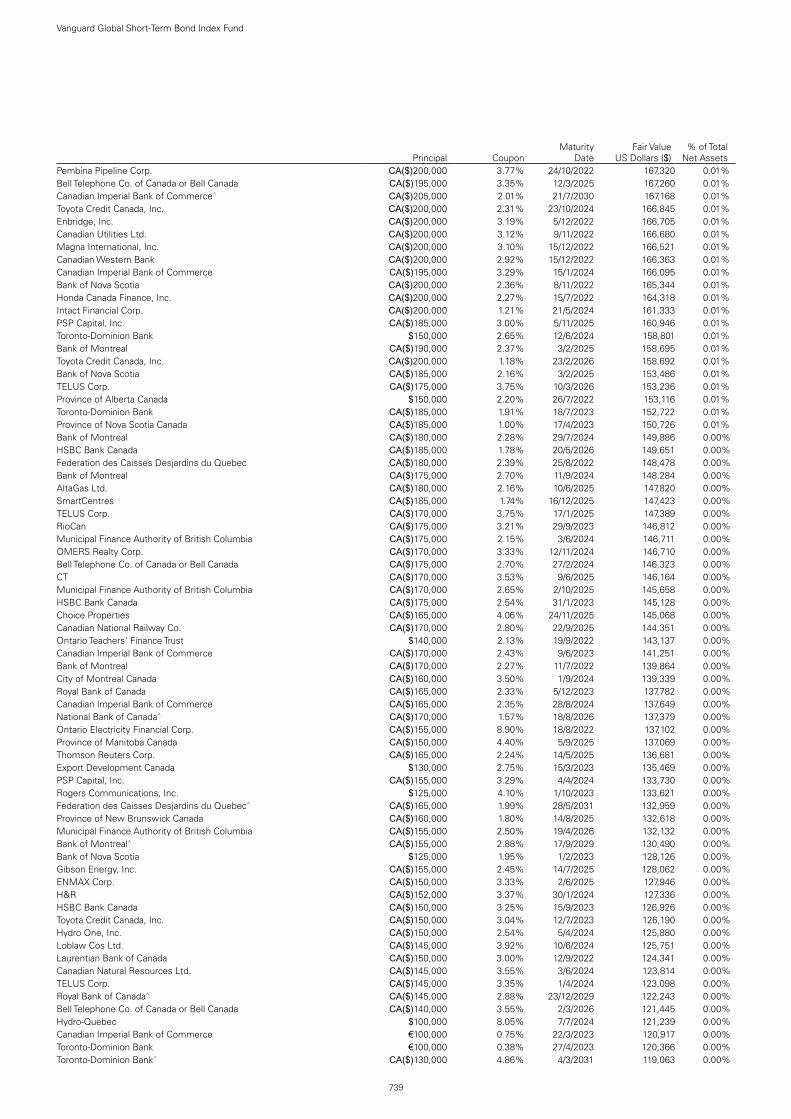
739
Vanguard Global Short-Term Bond Index Fund
Principal CouponMaturity
DateFair Value
US Dollars ($)% of Total
Net AssetsPembina Pipeline Corp. CA($)200,000 3.77% 24/10/2022 167,320 0.01%Bell Telephone Co. of Canada or Bell Canada CA($)195,000 3.35% 12/3/2025 167,260 0.01%Canadian Imperial Bank of Commerce^ CA($)205,000 2.01% 21/7/2030 167,168 0.01%Toyota Credit Canada, Inc. CA($)200,000 2.31% 23/10/2024 166,845 0.01%Enbridge, Inc. CA($)200,000 3.19% 5/12/2022 166,705 0.01%Canadian Utilities Ltd. CA($)200,000 3.12% 9/11/2022 166,680 0.01%Magna International, Inc. CA($)200,000 3.10% 15/12/2022 166,521 0.01%Canadian Western Bank CA($)200,000 2.92% 15/12/2022 166,363 0.01%Canadian Imperial Bank of Commerce CA($)195,000 3.29% 15/1/2024 166,095 0.01%Bank of Nova Scotia CA($)200,000 2.36% 8/11/2022 165,344 0.01%Honda Canada Finance, Inc. CA($)200,000 2.27% 15/7/2022 164,318 0.01%Intact Financial Corp. CA($)200,000 1.21% 21/5/2024 161,333 0.01%PSP Capital, Inc. CA($)185,000 3.00% 5/11/2025 160,946 0.01%Toronto-Dominion Bank $150,000 2.65% 12/6/2024 158,801 0.01%Bank of Montreal CA($)190,000 2.37% 3/2/2025 158,695 0.01%Toyota Credit Canada, Inc. CA($)200,000 1.18% 23/2/2026 158,692 0.01%Bank of Nova Scotia CA($)185,000 2.16% 3/2/2025 153,486 0.01%TELUS Corp. CA($)175,000 3.75% 10/3/2026 153,236 0.01%Province of Alberta Canada $150,000 2.20% 26/7/2022 153,116 0.01%Toronto-Dominion Bank CA($)185,000 1.91% 18/7/2023 152,722 0.01%Province of Nova Scotia Canada CA($)185,000 1.00% 17/4/2023 150,726 0.01%Bank of Montreal CA($)180,000 2.28% 29/7/2024 149,886 0.00%HSBC Bank Canada CA($)185,000 1.78% 20/5/2026 149,651 0.00%Federation des Caisses Desjardins du Quebec CA($)180,000 2.39% 25/8/2022 148,478 0.00%Bank of Montreal CA($)175,000 2.70% 11/9/2024 148,284 0.00%AltaGas Ltd. CA($)180,000 2.16% 10/6/2025 147,820 0.00%SmartCentres CA($)185,000 1.74% 16/12/2025 147,423 0.00%TELUS Corp. CA($)170,000 3.75% 17/1/2025 147,389 0.00%RioCan CA($)175,000 3.21% 29/9/2023 146,812 0.00%Municipal Finance Authority of British Columbia CA($)175,000 2.15% 3/6/2024 146,711 0.00%OMERS Realty Corp. CA($)170,000 3.33% 12/11/2024 146,710 0.00%Bell Telephone Co. of Canada or Bell Canada CA($)175,000 2.70% 27/2/2024 146,323 0.00%CT CA($)170,000 3.53% 9/6/2025 146,164 0.00%Municipal Finance Authority of British Columbia CA($)170,000 2.65% 2/10/2025 145,658 0.00%HSBC Bank Canada CA($)175,000 2.54% 31/1/2023 145,128 0.00%Choice Properties CA($)165,000 4.06% 24/11/2025 145,068 0.00%Canadian National Railway Co. CA($)170,000 2.80% 22/9/2025 144,351 0.00%Ontario Teachers' Finance Trust $140,000 2.13% 19/9/2022 143,137 0.00%Canadian Imperial Bank of Commerce CA($)170,000 2.43% 9/6/2023 141,251 0.00%Bank of Montreal CA($)170,000 2.27% 11/7/2022 139,864 0.00%City of Montreal Canada CA($)160,000 3.50% 1/9/2024 139,339 0.00%Royal Bank of Canada CA($)165,000 2.33% 5/12/2023 137,782 0.00%Canadian Imperial Bank of Commerce CA($)165,000 2.35% 28/8/2024 137,649 0.00%National Bank of Canada^ CA($)170,000 1.57% 18/8/2026 137,379 0.00%Ontario Electricity Financial Corp. CA($)155,000 8.90% 18/8/2022 137,102 0.00%Province of Manitoba Canada CA($)150,000 4.40% 5/9/2025 137,069 0.00%Thomson Reuters Corp. CA($)165,000 2.24% 14/5/2025 136,681 0.00%Export Development Canada $130,000 2.75% 15/3/2023 135,469 0.00%PSP Capital, Inc. CA($)155,000 3.29% 4/4/2024 133,730 0.00%Rogers Communications, Inc. $125,000 4.10% 1/10/2023 133,621 0.00%Federation des Caisses Desjardins du Quebec^ CA($)165,000 1.99% 28/5/2031 132,959 0.00%Province of New Brunswick Canada CA($)160,000 1.80% 14/8/2025 132,618 0.00%Municipal Finance Authority of British Columbia CA($)155,000 2.50% 19/4/2026 132,132 0.00%Bank of Montreal^ CA($)155,000 2.88% 17/9/2029 130,490 0.00%Bank of Nova Scotia $125,000 1.95% 1/2/2023 128,126 0.00%Gibson Energy, Inc. CA($)155,000 2.45% 14/7/2025 128,062 0.00%ENMAX Corp. CA($)150,000 3.33% 2/6/2025 127,946 0.00%H&R CA($)152,000 3.37% 30/1/2024 127,336 0.00%HSBC Bank Canada CA($)150,000 3.25% 15/9/2023 126,926 0.00%Toyota Credit Canada, Inc. CA($)150,000 3.04% 12/7/2023 126,190 0.00%Hydro One, Inc. CA($)150,000 2.54% 5/4/2024 125,880 0.00%Loblaw Cos Ltd. CA($)145,000 3.92% 10/6/2024 125,751 0.00%Laurentian Bank of Canada CA($)150,000 3.00% 12/9/2022 124,341 0.00%Canadian Natural Resources Ltd. CA($)145,000 3.55% 3/6/2024 123,814 0.00%TELUS Corp. CA($)145,000 3.35% 1/4/2024 123,098 0.00%Royal Bank of Canada^ CA($)145,000 2.88% 23/12/2029 122,243 0.00%Bell Telephone Co. of Canada or Bell Canada CA($)140,000 3.55% 2/3/2026 121,445 0.00%Hydro-Quebec $100,000 8.05% 7/7/2024 121,239 0.00%Canadian Imperial Bank of Commerce €100,000 0.75% 22/3/2023 120,917 0.00%Toronto-Dominion Bank €100,000 0.38% 27/4/2023 120,366 0.00%Toronto-Dominion Bank^ CA($)130,000 4.86% 4/3/2031 119,063 0.00%

740
Vanguard Global Short-Term Bond Index Fund
Principal CouponMaturity
DateFair Value
US Dollars ($)% of Total
Net AssetsBell Telephone Co. of Canada or Bell Canada CA($)140,000 2.75% 29/1/2025 117,719 0.00%Canadian Imperial Bank of Commerce^ CA($)145,000 1.96% 21/4/2031 117,104 0.00%Canadian Government Bond CA($)136,000 2.50% 1/6/2024 115,707 0.00%Province of Alberta Canada CA($)135,000 2.65% 1/9/2023 113,808 0.00%Province of Newfoundland & Labrador Canada CA($)135,000 2.30% 2/6/2025 113,734 0.00%Province of Quebec Canada CA($)135,000 2.45% 1/3/2023 112,658 0.00%Canadian Imperial Bank of Commerce^ CA($)130,000 2.95% 19/6/2029 109,457 0.00%Federation des Caisses Desjardins du Quebec^ CA($)130,000 2.86% 26/5/2030 109,317 0.00%Brookfield Asset Management, Inc. CA($)120,000 4.82% 28/1/2026 109,101 0.00%Municipal Finance Authority of British Columbia CA($)135,000 1.10% 1/6/2025 109,012 0.00%Enbridge Pipelines, Inc. CA($)125,000 3.45% 29/9/2025 108,389 0.00%Toronto-Dominion Bank $100,000 3.25% 11/3/2024 107,106 0.00%Bank of Montreal $100,000 3.30% 5/2/2024 107,093 0.00%Bank of Nova Scotia $100,000 3.40% 11/2/2024 107,089 0.00%Canadian Imperial Bank of Commerce $100,000 3.50% 13/9/2023 106,788 0.00%Canadian Imperial Bank of Commerce $100,000 3.10% 2/4/2024 106,312 0.00%Bank of Montreal $100,000 2.50% 28/6/2024 105,547 0.00%Province of Saskatchewan Canada CA($)120,000 3.20% 3/6/2024 103,515 0.00%Manulife Financial Corp.^ CA($)125,000 2.24% 12/5/2030 103,350 0.00%AltaLink LP CA($)120,000 3.40% 6/6/2024 103,012 0.00%Federation des Caisses Desjardins du Quebec CA($)130,000 1.09% 21/1/2026 102,499 0.00%Nutrien Ltd. $100,000 1.90% 13/5/2023 102,443 0.00%TransCanada PipeLines Ltd. $100,000 2.50% 1/8/2022 102,325 0.00%Canadian Imperial Bank of Commerce $100,000 0.95% 23/6/2023 100,916 0.00%Toronto-Dominion Bank $100,000 1.15% 12/6/2025 100,744 0.00%Federation des Caisses Desjardins du Quebec CA($)120,000 2.42% 4/10/2024 100,308 0.00%Manulife Bank of Canada CA($)120,000 2.84% 12/1/2023 99,973 0.00%Honda Canada Finance, Inc. CA($)125,000 1.34% 17/3/2026 99,632 0.00%National Bank of Canada CA($)115,000 2.55% 12/7/2024 96,455 0.00%AltaLink LP CA($)110,000 3.67% 6/11/2023 94,486 0.00%First Capital CA($)110,000 3.90% 30/10/2023 93,445 0.00%Province of New Brunswick Canada CA($)110,000 2.85% 2/6/2023 92,696 0.00%Manulife Bank of Canada CA($)115,000 1.34% 26/2/2026 91,910 0.00%Province of New Brunswick Canada CA($)105,000 3.65% 3/6/2024 91,632 0.00%Ontario Power Generation, Inc. CA($)115,000 1.17% 22/4/2026 91,177 0.00%AltaGas Ltd. CA($)110,000 2.61% 16/12/2022 90,921 0.00%Province of Alberta Canada CA($)105,000 3.40% 1/12/2023 90,316 0.00%Teranet Holdings LP CA($)105,000 3.54% 11/6/2025 90,081 0.00%Manufacturers Life Insurance Co.^ CA($)105,000 3.18% 22/11/2027 87,525 0.00%Westcoast Energy, Inc. CA($)100,000 3.77% 8/12/2025 87,514 0.00%Enbridge Gas, Inc. CA($)100,000 3.31% 11/9/2025 86,822 0.00%Reliance LP CA($)100,000 3.84% 15/3/2025 86,610 0.00%Bank of Montreal^ $80,000 4.34% 5/10/2028 85,839 0.00%Cenovus Energy, Inc. CA($)100,000 3.55% 12/3/2025 85,355 0.00%Shaw Communications, Inc. CA($)100,000 3.80% 2/11/2023 85,320 0.00%Fairfax Financial Holdings Ltd. CA($)95,000 4.95% 3/3/2025 84,977 0.00%Enbridge, Inc. CA($)100,000 3.94% 30/6/2023 84,693 0.00%OMERS Realty Corp. CA($)100,000 3.36% 5/6/2023 84,571 0.00%Industrial Alliance Insurance & Financial Services, Inc.^ CA($)100,000 3.30% 15/9/2028 84,393 0.00%Municipal Finance Authority of British Columbia CA($)100,000 2.60% 23/4/2023 83,753 0.00%Honda Canada Finance, Inc. CA($)100,000 2.50% 4/6/2024 83,677 0.00%Bell Telephone Co. of Canada or Bell Canada CA($)100,000 3.35% 22/3/2023 83,532 0.00%National Bank of Canada^ CA($)100,000 3.18% 1/2/2028 83,411 0.00%Canadian Imperial Bank of Commerce CA($)100,000 2.47% 5/12/2022 82,872 0.00%Canadian Imperial Bank of Commerce CA($)100,000 2.30% 11/7/2022 82,296 0.00%Province of Alberta Canada CA($)100,000 1.60% 1/9/2022 81,967 0.00%CI Financial Corp. CA($)95,000 3.76% 26/5/2025 81,793 0.00%National Bank of Canada CA($)95,000 2.58% 3/2/2025 79,934 0.00%Enbridge, Inc. $75,000 2.90% 15/7/2022 76,769 0.00%Cenovus Energy, Inc. $75,000 3.00% 15/8/2022 76,546 0.00%Brookfield Finance, Inc. $70,000 4.00% 1/4/2024 75,680 0.00%Manulife Bank of Canada CA($)90,000 2.38% 19/11/2024 75,429 0.00%Cenovus Energy, Inc. $70,000 4.00% 15/4/2024 74,963 0.00%bcIMC Realty Corp. CA($)90,000 2.15% 11/8/2022 73,856 0.00%Canadian Western Bank CA($)90,000 1.93% 16/4/2026 72,835 0.00%Westcoast Energy, Inc. CA($)80,000 3.43% 12/9/2024 68,513 0.00%Brookfield Infrastructure Finance ULC CA($)80,000 3.32% 22/2/2024 67,843 0.00%National Bank of Canada CA($)80,000 2.98% 4/3/2024 67,727 0.00%Pembina Pipeline Corp. CA($)80,000 2.99% 22/1/2024 67,119 0.00%Export Development Canada $65,000 1.75% 18/7/2022 66,064 0.00%Honda Canada Finance, Inc. CA($)75,000 3.44% 23/5/2025 65,156 0.00%

741
Vanguard Global Short-Term Bond Index Fund
Principal CouponMaturity
DateFair Value
US Dollars ($)% of Total
Net AssetsLoblaw Cos Ltd. CA($)75,000 4.86% 12/9/2023 64,990 0.00%Province of Manitoba Canada CA($)75,000 3.30% 2/6/2024 64,865 0.00%Shaw Communications, Inc. CA($)75,000 4.35% 31/1/2024 64,769 0.00%Bell Telephone Co. of Canada or Bell Canada CA($)75,000 4.70% 11/9/2023 64,719 0.00%Rogers Communications, Inc. CA($)75,000 4.00% 13/3/2024 64,430 0.00%North West Redwater Partnership/NWR Financing Co., Ltd. CA($)75,000 3.20% 24/4/2026 64,115 0.00%Summit Industrial Income CA($)80,000 1.82% 1/4/2026 64,049 0.00%Enbridge, Inc. $61,000 2.50% 15/1/2025 63,986 0.00%SmartCentres CA($)75,000 3.99% 30/5/2023 63,704 0.00%North West Redwater Partnership/NWR Financing Co., Ltd. CA($)75,000 3.20% 22/7/2024 63,697 0.00%First Capital CA($)75,000 3.60% 6/5/2026 63,633 0.00%Bruce Power LP CA($)75,000 3.00% 21/6/2024 63,422 0.00%Sun Life Financial, Inc.^ CA($)75,000 3.05% 19/9/2028 63,053 0.00%Canadian Imperial Bank of Commerce $60,000 2.25% 28/1/2025 62,724 0.00%Enbridge, Inc. CA($)75,000 2.44% 2/6/2025 62,450 0.00%Export Development Canada CA($)75,000 1.65% 31/7/2024 62,134 0.00%AltaGas Ltd. CA($)70,000 4.40% 15/3/2024 60,706 0.00%Choice Properties CA($)70,000 4.90% 5/7/2023 60,245 0.00%Fortis, Inc. CA($)70,000 2.85% 12/12/2023 58,823 0.00%RioCan CA($)70,000 2.58% 12/2/2025 58,023 0.00%Municipal Finance Authority of British Columbia CA($)65,000 2.80% 3/12/2023 55,163 0.00%Canadian Natural Resources Ltd. $50,000 3.80% 15/4/2024 53,742 0.00%ARC Resources Ltd. CA($)65,000 2.35% 10/3/2026 52,938 0.00%Cenovus Energy, Inc. $50,000 3.80% 15/9/2023 52,731 0.00%Saputo, Inc. CA($)60,000 3.60% 14/8/2025 52,067 0.00%Equitable Bank CA($)65,000 1.88% 26/11/2025 51,880 0.00%City of Montreal Canada CA($)60,000 3.50% 1/9/2023 51,409 0.00%Enbridge Gas, Inc. CA($)60,000 3.79% 10/7/2023 50,915 0.00%OMERS Realty Corp. CA($)60,000 2.86% 23/2/2024 50,669 0.00%Central 1 Credit Union CA($)60,000 2.58% 6/12/2023 50,135 0.00%Capital Power Corp. CA($)55,000 4.99% 23/1/2026 49,967 0.00%Central 1 Credit Union CA($)60,000 2.60% 7/11/2022 49,624 0.00%Cameco Corp. CA($)55,000 4.19% 24/6/2024 47,449 0.00%TransCanada PipeLines Ltd. CA($)55,000 3.30% 17/7/2025 47,183 0.00%407 International, Inc. CA($)55,000 3.35% 16/5/2024 47,018 0.00%Province of Ontario Canada CA($)50,000 8.10% 8/9/2023 46,907 0.00%Saputo, Inc. CA($)55,000 2.88% 19/11/2024 46,495 0.00%CI Financial Corp. CA($)55,000 3.22% 22/7/2024 46,380 0.00%OPB Finance Trust CA($)55,000 2.90% 24/5/2023 46,238 0.00%Canadian Western Bank CA($)55,000 2.60% 6/9/2024 45,962 0.00%Toronto Hydro Corp. CA($)55,000 2.91% 10/4/2023 45,832 0.00%Municipal Finance Authority of British Columbia CA($)55,000 2.15% 1/12/2022 45,533 0.00%Inter Pipeline Ltd. CA($)54,000 2.73% 18/4/2024 45,046 0.00%Brookfield Asset Management, Inc. $41,000 4.00% 15/1/2025 44,896 0.00%Brookfield Asset Management, Inc. CA($)50,000 5.04% 8/3/2024 44,030 0.00%Choice Properties CA($)50,000 3.55% 10/1/2025 42,951 0.00%Pembina Pipeline Corp. CA($)50,000 3.54% 3/2/2025 42,858 0.00%Choice Properties CA($)50,000 3.56% 9/9/2024 42,849 0.00%Capital Power Corp. CA($)49,000 4.28% 18/9/2024 42,784 0.00%Canadian Western Bank^ CA($)50,000 3.67% 11/6/2029 42,433 0.00%Emera, Inc. CA($)50,000 2.90% 16/6/2023 41,774 0.00%Sun Life Financial, Inc.^ CA($)50,000 2.75% 23/11/2027 41,400 0.00%Province of New Brunswick Canada $40,000 2.50% 12/12/2022 41,130 0.00%Dollarama, Inc. CA($)45,000 3.55% 6/11/2023 38,271 0.00%Ivanhoe Cambridge II, Inc. CA($)45,000 2.91% 27/6/2023 37,688 0.00%First Capital CA($)40,000 4.32% 31/7/2025 34,936 0.00%Inter Pipeline Ltd. CA($)40,000 3.17% 24/3/2025 33,876 0.00%Province of Saskatchewan Canada $30,000 8.50% 15/7/2022 32,399 0.00%Canadian Natural Resources Ltd. $29,000 3.90% 1/2/2025 31,573 0.00%Cogeco Communications, Inc. CA($)37,000 4.18% 26/5/2023 31,335 0.00%Empire Life Insurance Co.^ CA($)35,000 3.66% 15/3/2028 29,466 0.00%Crombie CA($)25,000 4.80% 31/1/2025 22,186 0.00%TMX Group Ltd. CA($)25,000 4.46% 3/10/2023 21,623 0.00%Sagen MI Canada, Inc. CA($)25,000 4.24% 1/4/2024 21,560 0.00%Metro, Inc. CA($)25,000 2.68% 5/12/2022 20,679 0.00%Morguard Corp. CA($)25,000 4.72% 25/1/2024 20,626 0.00%Dollarama, Inc. CA($)25,000 2.20% 10/11/2022 20,547 0.00%Bankers Hall LP CA($)21,401 4.38% 20/11/2023 17,871 0.00%Morguard Corp. CA($)20,000 4.33% 15/9/2022 16,342 0.00%National Bank of Canada $10,000 2.10% 1/2/2023 10,260 0.00%

742
Vanguard Global Short-Term Bond Index Fund
Principal CouponMaturity
DateFair Value
US Dollars ($)% of Total
Net AssetsNorth West Redwater Partnership/NWR Financing Co., Ltd. CA($)75 3.20% 22/7/2024 64 0.00%test - - - 139,699,243 4.32%Chile 0.08% (2020: 0.07%)Chile Government International Bond €500,000 1.75% 20/1/2026 638,215 0.02%Chile Government International Bond $400,000 3.13% 21/1/2026 433,329 0.01%Chile Government International Bond €200,000 1.63% 30/1/2025 250,745 0.01%Cencosud SA $200,000 5.15% 12/2/2025 221,027 0.01%Empresa Nacional del Petroleo $200,000 4.38% 30/10/2024 215,893 0.01%Celulosa Arauco y Constitucion SA $200,000 4.50% 1/8/2024 215,627 0.01%Banco Santander Chile $200,000 2.70% 10/1/2025 208,780 0.01%Banco Santander Chile $200,000 3.88% 20/9/2022 208,206 0.00%Corp. Nacional del Cobre de Chile $150,000 4.50% 13/8/2023 161,579 0.00%test - - - 2,553,401 0.08%China 1.73% (2020: 1.99%)China Development Bank CNY21,200,000 3.03% 18/1/2022 3,292,655 0.10%Sinopec Group Overseas Development 2018 Ltd. $1,949,000 2.50% 12/11/2024 2,045,504 0.06%Export-Import Bank of China CNY10,000,000 3.23% 4/11/2022 1,558,221 0.05%Export-Import Bank of China CNY10,000,000 3.43% 23/10/2025 1,558,206 0.05%China Development Bank CNY10,000,000 3.00% 7/8/2023 1,551,425 0.05%China Development Bank CNY10,000,000 1.86% 9/4/2023 1,522,602 0.05%Agricultural Development Bank of China CNY10,000,000 2.25% 22/4/2025 1,495,267 0.05%Export-Import Bank of China $1,300,000 3.63% 31/7/2024 1,415,535 0.04%China Cinda Finance 2015 I Ltd. $1,300,000 4.25% 23/4/2025 1,360,637 0.04%China Government Bond CNY8,000,000 3.19% 11/4/2024 1,252,978 0.04%China Government Bond CNY8,000,000 1.99% 9/4/2025 1,197,489 0.04%Bank of China Ltd. $1,000,000 3.88% 30/6/2025 1,097,900 0.03%China Government Bond CNY7,000,000 2.88% 5/11/2023 1,087,542 0.03%China Railway Resources Huitung Ltd. $900,000 3.85% 5/2/2023 934,991 0.03%China Development Bank CNY6,000,000 3.23% 10/1/2025 931,618 0.03%Sinopec Group Overseas Development 2014 Ltd. $850,000 4.38% 10/4/2024 929,248 0.03%China Development Bank CNY5,900,000 3.30% 1/2/2024 920,135 0.03%Industrial & Commercial Bank of China Ltd. £570,000 1.50% 31/7/2022 793,242 0.02%Agricultural Development Bank of China CNY5,000,000 3.45% 23/9/2025 779,841 0.02%China Development Bank CNY5,000,000 3.34% 14/7/2025 777,636 0.02%China Development Bank CNY5,000,000 3.30% 3/3/2026 775,994 0.02%Vanke Real Estate Hong Kong Co., Ltd. $700,000 4.20% 7/6/2024 751,559 0.02%China Southern Power Grid International Finance BVI 2018 Co., Ltd. $700,000 3.88% 18/9/2023 743,717 0.02%Export-Import Bank of China CNY4,000,000 3.28% 11/2/2024 623,187 0.02%China Development Bank €500,000 0.63% 12/12/2022 598,590 0.02%China Government International Bond €500,000 0.00% 25/11/2025 594,196 0.02%Baidu, Inc. $500,000 4.13% 30/6/2025 552,217 0.02%Vanke Real Estate Hong Kong Co., Ltd. $500,000 5.35% 11/3/2024 549,336 0.02%China Taiping New Horizon Ltd. $500,000 6.00% 18/10/2023 546,577 0.02%ICBCIL Finance Co., Ltd. $500,000 3.75% 5/3/2024 531,397 0.02%State Grid Overseas Investment 2016 Ltd. $500,000 3.75% 2/5/2023 526,410 0.02%China Government International Bond $500,000 1.95% 3/12/2024 522,150 0.02%China Construction Bank Corp. $500,000 3.00% 4/12/2022 515,579 0.01%Sinopec Group Overseas Development 2018 Ltd. $500,000 2.15% 13/5/2025 513,854 0.01%Minmetals Bounteous Finance BVI Ltd.^ $500,000 3.38% Perpetual 512,945 0.01%Chouzhou International Investment Ltd. $500,000 4.00% 18/2/2025 507,159 0.01%MCC Holding Hong Kong Corp., Ltd.^ $500,000 3.25% Perpetual 506,471 0.01%China Government International Bond $500,000 0.40% 21/10/2023 499,557 0.01%China Development Bank $500,000 0.63% 12/1/2024 499,087 0.01%CSCIF Asia Ltd. $500,000 1.75% 4/8/2025 497,517 0.01%Hengjian International Investment Ltd. $500,000 1.88% 23/6/2025 496,583 0.01%Joy Treasure Assets Holdings, Inc. $500,000 1.88% 17/11/2025 478,907 0.01%China Resources Land Ltd. $400,000 6.00% 27/2/2024 446,940 0.01%Bank of China Ltd. $400,000 5.00% 13/11/2024 446,495 0.01%Bank of China Hong Kong Ltd.^ $400,000 5.90% Perpetual 430,762 0.01%China Construction Bank Corp.^ $400,000 4.25% 27/2/2029 429,082 0.01%Longfor Group Holdings Ltd. $400,000 3.90% 16/4/2023 416,684 0.01%Dianjian Haiyu Ltd.^ $400,000 4.30% Perpetual 415,718 0.01%Tencent Holdings Ltd. $400,000 2.99% 19/1/2023 412,943 0.01%Tencent Holdings Ltd. $400,000 1.81% 26/1/2026 406,671 0.01%CICC Hong Kong Finance 2016 MTN Ltd. $400,000 1.63% 26/1/2024 401,894 0.01%BOC Aviation Ltd. $400,000 2.38% 15/9/2021 400,585 0.01%Guangxi Financial Investment Group Co., Ltd. $420,000 3.60% 18/11/2023 390,323 0.01%Prosus NV $300,000 5.50% 21/7/2025 342,860 0.01%Country Garden Holdings Co., Ltd. $300,000 6.15% 17/9/2025 329,543 0.01%Bocom Leasing Management Hong Kong Co., Ltd. $300,000 4.38% 22/1/2024 322,103 0.01%Tencent Holdings Ltd. $300,000 3.28% 11/4/2024 319,612 0.01%

743
Vanguard Global Short-Term Bond Index Fund
Principal CouponMaturity
DateFair Value
US Dollars ($)% of Total
Net AssetsBOC Aviation Ltd. $300,000 3.25% 29/4/2025 315,824 0.01%BOC Aviation Ltd. $290,000 3.88% 27/4/2026 313,818 0.01%COSCO Finance 2011 Ltd. $300,000 4.00% 3/12/2022 311,366 0.01%Azure Orbit IV International Finance Ltd. $300,000 3.75% 25/1/2023 310,891 0.01%China Construction Bank Corp.^ $300,000 2.45% 24/6/2030 306,465 0.01%Chongqing Nan'an Urban Construction & Development Group Co., Ltd. $300,000 4.66% 4/6/2024 305,966 0.01%Industrial & Commercial Bank of China Ltd. $300,000 2.25% 16/9/2022 305,154 0.01%China Mengniu Dairy Co., Ltd. $300,000 1.88% 17/6/2025 301,589 0.01%CMB International Leasing Management Ltd. $300,000 1.88% 12/8/2025 297,627 0.01%China Cinda Finance 2017 I Ltd. $275,000 4.10% 9/3/2024 284,941 0.01%King Power Capital Ltd. $250,000 5.63% 3/11/2024 283,496 0.01%Alibaba Group Holding Ltd. $250,000 3.60% 28/11/2024 271,715 0.01%SPIC MTN Co., Ltd. $250,000 1.63% 27/7/2025 249,070 0.01%Baidu, Inc. $225,000 2.88% 6/7/2022 229,800 0.01%Industrial & Commercial Bank of China Ltd. $200,000 4.88% 21/9/2025 224,098 0.01%Leader Goal International Ltd.^ $215,000 4.25% Perpetual 220,158 0.01%Sino-Ocean Land Treasure Finance I Ltd. $200,000 6.00% 30/7/2024 219,048 0.01%Charming Light Investments Ltd. $200,000 5.00% 3/9/2024 215,168 0.01%Country Garden Holdings Co., Ltd. $200,000 6.50% 8/4/2024 212,127 0.01%China Huadian Overseas Development Management Co., Ltd.^ $200,000 4.00% Perpetual 209,157 0.01%State Grid Overseas Investment 2013 Ltd. $200,000 3.13% 22/5/2023 208,664 0.01%Leading Affluence Ltd. $200,000 4.50% 24/1/2023 208,152 0.01%Sinopec Capital 2013 Ltd. $200,000 3.13% 24/4/2023 207,736 0.01%Industrial & Commercial Bank of China Macau Ltd.^ $200,000 2.88% 12/9/2029 207,603 0.01%Amber Circle Funding Ltd. $200,000 3.25% 4/12/2022 207,147 0.01%Sunrise Cayman Ltd. $200,000 5.25% 11/3/2024 206,676 0.01%China Huadian Overseas Development 2018 Ltd.^ $200,000 3.38% Perpetual 206,150 0.01%Sinopec Group Overseas Development 2012 Ltd. $200,000 3.90% 17/5/2022 205,427 0.01%ICBCIL Finance Co., Ltd. $200,000 3.13% 15/11/2022 205,031 0.01%CNPC General Capital Ltd. $200,000 3.95% 19/4/2022 204,996 0.01%China Minmetals Corp.^ $200,000 3.75% Perpetual 204,305 0.01%Elect Global Investments Ltd.^ $200,000 4.10% Perpetual 204,226 0.01%Voyage Bonds Ltd. $200,000 3.38% 28/9/2022 204,125 0.01%Sinopec Group Overseas Development 2017 Ltd. $200,000 2.50% 13/9/2022 204,123 0.01%Sinopec Group Overseas Development 2017 Ltd. $200,000 3.00% 12/4/2022 203,546 0.01%State Grid Overseas Investment 2016 Ltd. $200,000 2.75% 4/5/2022 203,370 0.01%Zhongsheng Group Holdings Ltd. $200,000 3.00% 13/1/2026 203,227 0.01%China Southern Power Grid International Finance BVI Co., Ltd. $200,000 2.75% 8/5/2022 203,105 0.01%Country Garden Holdings Co., Ltd. $200,000 3.13% 22/10/2025 201,023 0.01%Fuqing Investment Management Ltd. $200,000 3.25% 23/6/2025 200,680 0.01%CCBL Cayman 1 Corp., Ltd. $200,000 1.99% 21/7/2025 200,456 0.01%Kunming Rail Transit Group Co., Ltd. $200,000 3.50% 12/12/2022 200,348 0.01%Meituan $200,000 2.13% 28/10/2025 198,660 0.01%Yunda Holding Investment Ltd. $200,000 2.25% 19/8/2025 197,094 0.00%China Government International Bond $200,000 0.55% 21/10/2025 196,481 0.00%Huarong Finance 2019 Co., Ltd. $250,000 2.50% 24/2/2023 192,492 0.00%Huarong Finance II Co., Ltd. $250,000 5.50% 16/1/2025 184,979 0.00%Wens Foodstuffs Group Co., Ltd. $200,000 2.35% 29/10/2025 184,383 0.00%Chongqing International Logistics Hub Park Construction Co., Ltd. $200,000 4.30% 26/9/2024 181,629 0.00%Huarong Finance 2019 Co., Ltd. $200,000 3.75% 29/5/2024 147,990 0.00%test - - - 56,129,178 1.73%Colombia 0.08% (2020: 0.15%)Colombian TES COP3,300,000,000 10.00% 24/7/2024 1,008,788 0.03%Colombia Government International Bond $600,000 2.63% 15/3/2023 613,502 0.02%Colombia Government International Bond $300,000 8.13% 21/5/2024 355,109 0.01%Ecopetrol SA $300,000 5.88% 18/9/2023 324,925 0.01%Bancolombia SA $200,000 3.00% 29/1/2025 205,060 0.01%Ecopetrol SA $174,000 4.13% 16/1/2025 183,148 0.00%test - - - 2,690,532 0.08%Croatia 0.10% (2020: 0.05%)Croatia Government International Bond €1,700,000 3.00% 11/3/2025 2,238,684 0.07%Croatia Government International Bond $700,000 6.00% 26/1/2024 793,637 0.02%Croatia Government International Bond $200,000 5.50% 4/4/2023 217,169 0.01%test - - - 3,249,490 0.10%Cyprus 0.01% (2020: 0.00%)Cyprus Government International Bond €220,000 0.00% 9/2/2026 262,330 0.01%test - - - 262,330 0.01%Czech Republic 0.17% (2020: 0.23%)Czech Republic Government Bond Kč38,000,000 0.45% 25/10/2023 1,734,032 0.05%Czech Republic Government Bond Kč33,000,000 1.25% 14/2/2025 1,516,848 0.05%Czech Republic Government Bond Kč21,500,000 2.40% 17/9/2025 1,030,697 0.03%

744
Vanguard Global Short-Term Bond Index Fund
Principal CouponMaturity
DateFair Value
US Dollars ($)% of Total
Net AssetsCzech Republic Government Bond Kč20,000,000 4.70% 12/9/2022 976,938 0.03%EP Infrastructure A.S. €100,000 1.66% 26/4/2024 122,612 0.01%test - - - 5,381,127 0.17%Denmark 0.56% (2020: 0.49%)Kommunekredit £2,000,000 0.38% 15/11/2024 2,755,485 0.09%Denmark Government Bond DKK(kr)11,000,000 1.50% 15/11/2023 1,840,098 0.06%Nordea Kredit Realkreditaktieselskab DKK(kr)10,000,000 1.00% 1/4/2026 1,675,728 0.05%AP Moller-Maersk A/S €1,000,000 1.75% 16/3/2026 1,274,008 0.04%Denmark Government Bond DKK(kr)7,000,000 1.75% 15/11/2025 1,223,838 0.04%Denmark Government Bond DKK(kr)5,000,000 0.25% 15/11/2022 806,266 0.02%AP Moller-Maersk A/S £500,000 4.00% 4/4/2025 766,070 0.02%Denmark Government Bond DKK(kr)4,000,000 3.00% 15/11/2021 646,259 0.02%Danske Bank A/S^ €500,000 1.00% 15/5/2031 593,548 0.02%Nordea Kredit Realkreditaktieselskab DKK(kr)3,000,000 1.00% 1/10/2024 497,666 0.02%Danske Bank A/S €400,000 1.38% 24/5/2022 481,505 0.01%Carlsberg Breweries A/S €400,000 0.38% 30/6/2027 479,721 0.01%Danfoss Finance I BV €400,000 0.13% 28/4/2026 473,673 0.01%Danske Bank A/S €300,000 0.75% 2/6/2023 362,433 0.01%Jyske Bank A/S^ €300,000 0.63% 20/6/2024 360,735 0.01%Nykredit Realkredit A/S^ €300,000 0.88% 28/7/2031 355,997 0.01%Nykredit Realkredit A/S €300,000 0.25% 13/1/2026 355,988 0.01%Kommunekredit $300,000 0.63% 10/6/2025 298,116 0.01%Nykredit Realkredit A/S DKK(kr)1,772,000 1.00% 1/1/2022 284,571 0.01%Orsted A/S €200,000 2.63% 19/9/2022 245,753 0.01%Danske Bank A/S €200,000 0.63% 26/5/2025 242,736 0.01%Danske Bank A/S^ €200,000 1.38% 12/2/2030 241,756 0.01%Danske Bank A/S €200,000 0.88% 22/5/2023 241,444 0.01%Kommunekredit €200,000 0.13% 28/8/2023 240,361 0.01%Danske Bank A/S $200,000 5.38% 12/1/2024 221,843 0.01%Danske Bank A/S $200,000 3.88% 12/9/2023 212,926 0.01%Danske Bank A/S^ $200,000 1.17% 8/12/2023 200,909 0.01%Denmark Government International Bond $175,000 0.13% 27/10/2022 174,877 0.01%Nordea Kredit Realkreditaktieselskab DKK(kr)1,000,000 1.00% 1/10/2021 159,966 0.00%Orsted A/S^ €100,000 2.25% 24/11/3017 123,958 0.00%Danske Bank A/S^ €100,000 0.50% 27/8/2025 119,818 0.00%Denmark Government Bond DKK(kr)500,000 0.50% 15/11/2027 83,586 0.00%Kommunekredit $50,000 2.25% 16/11/2022 51,373 0.00%test - - - 18,093,011 0.56%Finland 0.58% (2020: 0.54%)Finland Government Bond €2,600,000 0.00% 15/9/2024 3,145,890 0.10%Finland Government Bond €2,000,000 0.50% 15/4/2026 2,486,746 0.08%Oma Saastopankki OYJ €2,000,000 0.13% 3/4/2024 2,405,029 0.07%Kuntarahoitus OYJ €1,100,000 0.00% 22/4/2025 1,325,143 0.04%Nordea Kiinnitysluottopankki OYJ €1,000,000 0.25% 18/3/2026 1,217,154 0.04%OP Corporate Bank plc^ €900,000 1.63% 9/6/2030 1,104,614 0.03%Finland Government Bond €716,000 0.00% 15/9/2023 861,459 0.03%Sampo OYJ €500,000 1.25% 30/5/2025 629,737 0.02%OP Corporate Bank plc €500,000 0.13% 1/7/2024 598,628 0.02%Nordea Bank Abp €400,000 1.00% 22/2/2023 485,063 0.01%Nordea Kiinnitysluottopankki OYJ €400,000 0.25% 28/2/2023 480,387 0.01%OP Mortgage Bank €400,000 0.05% 22/2/2023 478,821 0.01%OP Corporate Bank plc €330,000 0.25% 24/3/2026 392,395 0.01%Danske Mortgage Bank plc €300,000 0.38% 21/11/2023 362,878 0.01%Kuntarahoitus OYJ €300,000 0.00% 15/11/2024 361,067 0.01%Nordea Bank Abp $300,000 0.75% 28/8/2025 296,603 0.01%SP-Kiinnitysluottopankki OYJ €230,000 0.13% 24/10/2022 274,977 0.01%OP Corporate Bank plc €200,000 0.38% 19/6/2024 240,183 0.01%Nordea Bank Abp $200,000 3.75% 30/8/2023 213,417 0.01%Kuntarahoitus OYJ $200,000 2.50% 15/11/2023 209,788 0.01%Finnvera OYJ $200,000 1.63% 23/10/2024 206,434 0.01%Kuntarahoitus OYJ $200,000 1.38% 12/9/2022 202,743 0.01%Kuntarahoitus OYJ $200,000 0.38% 1/9/2023 200,005 0.01%Nordea Bank Abp $200,000 0.63% 24/5/2024 199,978 0.01%Kuntarahoitus OYJ $200,000 0.63% 20/3/2026 197,489 0.00%Nordea Bank Abp €100,000 0.88% 26/6/2023 121,178 0.00%Fortum OYJ €100,000 0.88% 27/2/2023 120,630 0.00%Kuntarahoitus OYJ $75,000 2.88% 7/3/2023 78,262 0.00%test - - - 18,896,698 0.58%France 7.01% (2020: 7.19%)French Republic Government Bond OAT €26,223,000 0.00% 25/2/2024 31,601,092 0.98%French Republic Government Bond OAT €19,200,000 0.00% 25/2/2026 23,239,238 0.72%
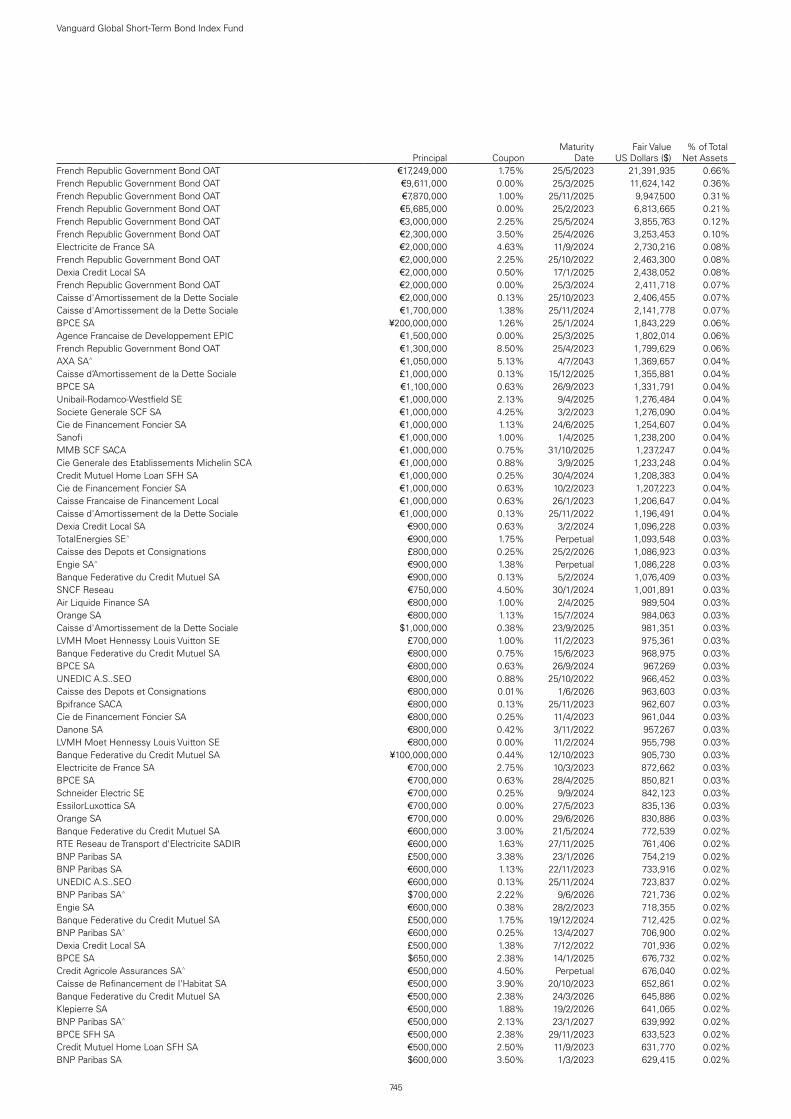
745
Vanguard Global Short-Term Bond Index Fund
Principal CouponMaturity
DateFair Value
US Dollars ($)% of Total
Net AssetsFrench Republic Government Bond OAT €17,249,000 1.75% 25/5/2023 21,391,935 0.66%French Republic Government Bond OAT €9,611,000 0.00% 25/3/2025 11,624,142 0.36%French Republic Government Bond OAT €7,870,000 1.00% 25/11/2025 9,947,500 0.31%French Republic Government Bond OAT €5,685,000 0.00% 25/2/2023 6,813,665 0.21%French Republic Government Bond OAT €3,000,000 2.25% 25/5/2024 3,855,763 0.12%French Republic Government Bond OAT €2,300,000 3.50% 25/4/2026 3,253,453 0.10%Electricite de France SA €2,000,000 4.63% 11/9/2024 2,730,216 0.08%French Republic Government Bond OAT €2,000,000 2.25% 25/10/2022 2,463,300 0.08%Dexia Credit Local SA €2,000,000 0.50% 17/1/2025 2,438,052 0.08%French Republic Government Bond OAT €2,000,000 0.00% 25/3/2024 2,411,718 0.07%Caisse d'Amortissement de la Dette Sociale €2,000,000 0.13% 25/10/2023 2,406,455 0.07%Caisse d'Amortissement de la Dette Sociale €1,700,000 1.38% 25/11/2024 2,141,778 0.07%BPCE SA ¥200,000,000 1.26% 25/1/2024 1,843,229 0.06%Agence Francaise de Developpement EPIC €1,500,000 0.00% 25/3/2025 1,802,014 0.06%French Republic Government Bond OAT €1,300,000 8.50% 25/4/2023 1,799,629 0.06%AXA SA^ €1,050,000 5.13% 4/7/2043 1,369,657 0.04%Caisse d’Amortissement de la Dette Sociale £1,000,000 0.13% 15/12/2025 1,355,881 0.04%BPCE SA €1,100,000 0.63% 26/9/2023 1,331,791 0.04%Unibail-Rodamco-Westfield SE €1,000,000 2.13% 9/4/2025 1,276,484 0.04%Societe Generale SCF SA €1,000,000 4.25% 3/2/2023 1,276,090 0.04%Cie de Financement Foncier SA €1,000,000 1.13% 24/6/2025 1,254,607 0.04%Sanofi €1,000,000 1.00% 1/4/2025 1,238,200 0.04%MMB SCF SACA €1,000,000 0.75% 31/10/2025 1,237,247 0.04%Cie Generale des Etablissements Michelin SCA €1,000,000 0.88% 3/9/2025 1,233,248 0.04%Credit Mutuel Home Loan SFH SA €1,000,000 0.25% 30/4/2024 1,208,383 0.04%Cie de Financement Foncier SA €1,000,000 0.63% 10/2/2023 1,207,223 0.04%Caisse Francaise de Financement Local €1,000,000 0.63% 26/1/2023 1,206,647 0.04%Caisse d'Amortissement de la Dette Sociale €1,000,000 0.13% 25/11/2022 1,196,491 0.04%Dexia Credit Local SA €900,000 0.63% 3/2/2024 1,096,228 0.03%TotalEnergies SE^ €900,000 1.75% Perpetual 1,093,548 0.03%Caisse des Depots et Consignations £800,000 0.25% 25/2/2026 1,086,923 0.03%Engie SA^ €900,000 1.38% Perpetual 1,086,228 0.03%Banque Federative du Credit Mutuel SA €900,000 0.13% 5/2/2024 1,076,409 0.03%SNCF Reseau €750,000 4.50% 30/1/2024 1,001,891 0.03%Air Liquide Finance SA €800,000 1.00% 2/4/2025 989,504 0.03%Orange SA €800,000 1.13% 15/7/2024 984,063 0.03%Caisse d'Amortissement de la Dette Sociale $1,000,000 0.38% 23/9/2025 981,351 0.03%LVMH Moet Hennessy Louis Vuitton SE £700,000 1.00% 11/2/2023 975,361 0.03%Banque Federative du Credit Mutuel SA €800,000 0.75% 15/6/2023 968,975 0.03%BPCE SA €800,000 0.63% 26/9/2024 967,269 0.03%UNEDIC A.S..SEO €800,000 0.88% 25/10/2022 966,452 0.03%Caisse des Depots et Consignations €800,000 0.01% 1/6/2026 963,603 0.03%Bpifrance SACA €800,000 0.13% 25/11/2023 962,607 0.03%Cie de Financement Foncier SA €800,000 0.25% 11/4/2023 961,044 0.03%Danone SA €800,000 0.42% 3/11/2022 957,267 0.03%LVMH Moet Hennessy Louis Vuitton SE €800,000 0.00% 11/2/2024 955,798 0.03%Banque Federative du Credit Mutuel SA ¥100,000,000 0.44% 12/10/2023 905,730 0.03%Electricite de France SA €700,000 2.75% 10/3/2023 872,662 0.03%BPCE SA €700,000 0.63% 28/4/2025 850,821 0.03%Schneider Electric SE €700,000 0.25% 9/9/2024 842,123 0.03%EssilorLuxottica SA €700,000 0.00% 27/5/2023 835,136 0.03%Orange SA €700,000 0.00% 29/6/2026 830,886 0.03%Banque Federative du Credit Mutuel SA €600,000 3.00% 21/5/2024 772,539 0.02%RTE Reseau de Transport d'Electricite SADIR €600,000 1.63% 27/11/2025 761,406 0.02%BNP Paribas SA £500,000 3.38% 23/1/2026 754,219 0.02%BNP Paribas SA €600,000 1.13% 22/11/2023 733,916 0.02%UNEDIC A.S..SEO €600,000 0.13% 25/11/2024 723,837 0.02%BNP Paribas SA^ $700,000 2.22% 9/6/2026 721,736 0.02%Engie SA €600,000 0.38% 28/2/2023 718,355 0.02%Banque Federative du Credit Mutuel SA £500,000 1.75% 19/12/2024 712,425 0.02%BNP Paribas SA^ €600,000 0.25% 13/4/2027 706,900 0.02%Dexia Credit Local SA £500,000 1.38% 7/12/2022 701,936 0.02%BPCE SA $650,000 2.38% 14/1/2025 676,732 0.02%Credit Agricole Assurances SA^ €500,000 4.50% Perpetual 676,040 0.02%Caisse de Refinancement de l'Habitat SA €500,000 3.90% 20/10/2023 652,861 0.02%Banque Federative du Credit Mutuel SA €500,000 2.38% 24/3/2026 645,886 0.02%Klepierre SA €500,000 1.88% 19/2/2026 641,065 0.02%BNP Paribas SA^ €500,000 2.13% 23/1/2027 639,992 0.02%BPCE SFH SA €500,000 2.38% 29/11/2023 633,523 0.02%Credit Mutuel Home Loan SFH SA €500,000 2.50% 11/9/2023 631,770 0.02%BNP Paribas SA $600,000 3.50% 1/3/2023 629,415 0.02%
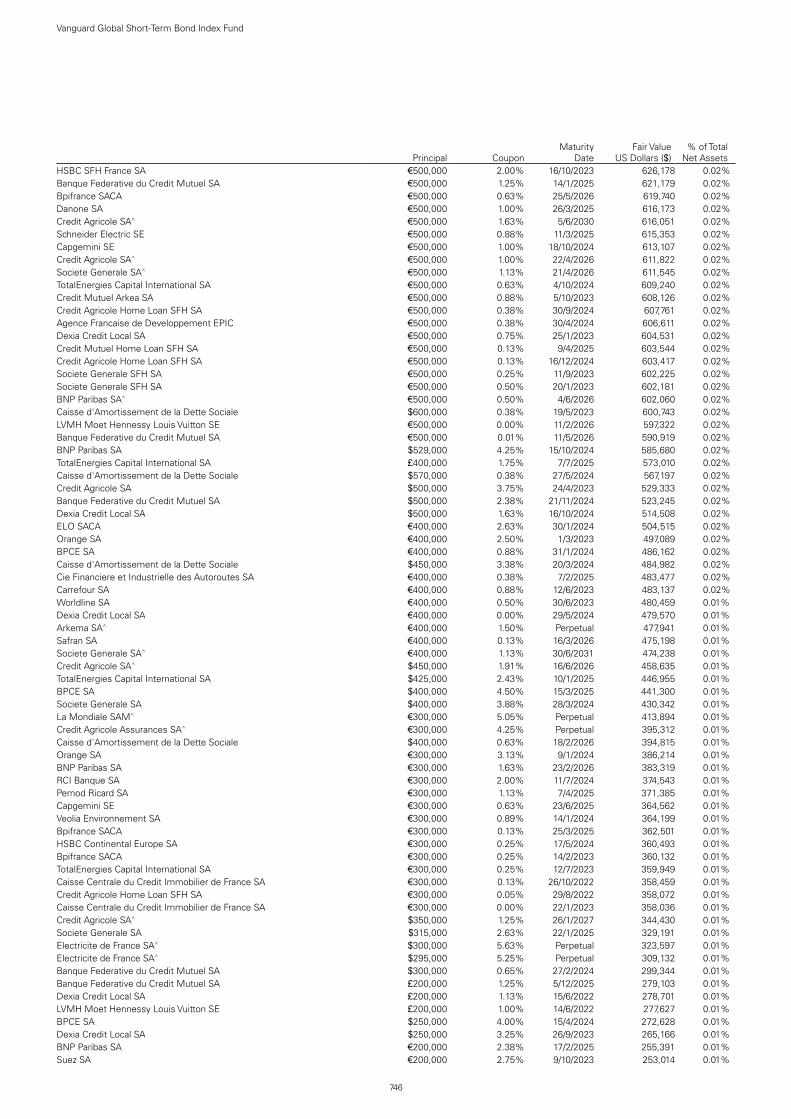
746
Vanguard Global Short-Term Bond Index Fund
Principal CouponMaturity
DateFair Value
US Dollars ($)% of Total
Net AssetsHSBC SFH France SA €500,000 2.00% 16/10/2023 626,178 0.02%Banque Federative du Credit Mutuel SA €500,000 1.25% 14/1/2025 621,179 0.02%Bpifrance SACA €500,000 0.63% 25/5/2026 619,740 0.02%Danone SA €500,000 1.00% 26/3/2025 616,173 0.02%Credit Agricole SA^ €500,000 1.63% 5/6/2030 616,051 0.02%Schneider Electric SE €500,000 0.88% 11/3/2025 615,353 0.02%Capgemini SE €500,000 1.00% 18/10/2024 613,107 0.02%Credit Agricole SA^ €500,000 1.00% 22/4/2026 611,822 0.02%Societe Generale SA^ €500,000 1.13% 21/4/2026 611,545 0.02%TotalEnergies Capital International SA €500,000 0.63% 4/10/2024 609,240 0.02%Credit Mutuel Arkea SA €500,000 0.88% 5/10/2023 608,126 0.02%Credit Agricole Home Loan SFH SA €500,000 0.38% 30/9/2024 607,761 0.02%Agence Francaise de Developpement EPIC €500,000 0.38% 30/4/2024 606,611 0.02%Dexia Credit Local SA €500,000 0.75% 25/1/2023 604,531 0.02%Credit Mutuel Home Loan SFH SA €500,000 0.13% 9/4/2025 603,544 0.02%Credit Agricole Home Loan SFH SA €500,000 0.13% 16/12/2024 603,417 0.02%Societe Generale SFH SA €500,000 0.25% 11/9/2023 602,225 0.02%Societe Generale SFH SA €500,000 0.50% 20/1/2023 602,181 0.02%BNP Paribas SA^ €500,000 0.50% 4/6/2026 602,060 0.02%Caisse d'Amortissement de la Dette Sociale $600,000 0.38% 19/5/2023 600,743 0.02%LVMH Moet Hennessy Louis Vuitton SE €500,000 0.00% 11/2/2026 597,322 0.02%Banque Federative du Credit Mutuel SA €500,000 0.01% 11/5/2026 590,919 0.02%BNP Paribas SA $529,000 4.25% 15/10/2024 585,680 0.02%TotalEnergies Capital International SA £400,000 1.75% 7/7/2025 573,010 0.02%Caisse d'Amortissement de la Dette Sociale $570,000 0.38% 27/5/2024 567,197 0.02%Credit Agricole SA $500,000 3.75% 24/4/2023 529,333 0.02%Banque Federative du Credit Mutuel SA $500,000 2.38% 21/11/2024 523,245 0.02%Dexia Credit Local SA $500,000 1.63% 16/10/2024 514,508 0.02%ELO SACA €400,000 2.63% 30/1/2024 504,515 0.02%Orange SA €400,000 2.50% 1/3/2023 497,089 0.02%BPCE SA €400,000 0.88% 31/1/2024 486,162 0.02%Caisse d'Amortissement de la Dette Sociale $450,000 3.38% 20/3/2024 484,982 0.02%Cie Financiere et Industrielle des Autoroutes SA €400,000 0.38% 7/2/2025 483,477 0.02%Carrefour SA €400,000 0.88% 12/6/2023 483,137 0.02%Worldline SA €400,000 0.50% 30/6/2023 480,459 0.01%Dexia Credit Local SA €400,000 0.00% 29/5/2024 479,570 0.01%Arkema SA^ €400,000 1.50% Perpetual 477,941 0.01%Safran SA €400,000 0.13% 16/3/2026 475,198 0.01%Societe Generale SA^ €400,000 1.13% 30/6/2031 474,238 0.01%Credit Agricole SA^ $450,000 1.91% 16/6/2026 458,635 0.01%TotalEnergies Capital International SA $425,000 2.43% 10/1/2025 446,955 0.01%BPCE SA $400,000 4.50% 15/3/2025 441,300 0.01%Societe Generale SA $400,000 3.88% 28/3/2024 430,342 0.01%La Mondiale SAM^ €300,000 5.05% Perpetual 413,894 0.01%Credit Agricole Assurances SA^ €300,000 4.25% Perpetual 395,312 0.01%Caisse d'Amortissement de la Dette Sociale $400,000 0.63% 18/2/2026 394,815 0.01%Orange SA €300,000 3.13% 9/1/2024 386,214 0.01%BNP Paribas SA €300,000 1.63% 23/2/2026 383,319 0.01%RCI Banque SA €300,000 2.00% 11/7/2024 374,543 0.01%Pernod Ricard SA €300,000 1.13% 7/4/2025 371,385 0.01%Capgemini SE €300,000 0.63% 23/6/2025 364,562 0.01%Veolia Environnement SA €300,000 0.89% 14/1/2024 364,199 0.01%Bpifrance SACA €300,000 0.13% 25/3/2025 362,501 0.01%HSBC Continental Europe SA €300,000 0.25% 17/5/2024 360,493 0.01%Bpifrance SACA €300,000 0.25% 14/2/2023 360,132 0.01%TotalEnergies Capital International SA €300,000 0.25% 12/7/2023 359,949 0.01%Caisse Centrale du Credit Immobilier de France SA €300,000 0.13% 26/10/2022 358,459 0.01%Credit Agricole Home Loan SFH SA €300,000 0.05% 29/8/2022 358,072 0.01%Caisse Centrale du Credit Immobilier de France SA €300,000 0.00% 22/1/2023 358,036 0.01%Credit Agricole SA^ $350,000 1.25% 26/1/2027 344,430 0.01%Societe Generale SA $315,000 2.63% 22/1/2025 329,191 0.01%Electricite de France SA^ $300,000 5.63% Perpetual 323,597 0.01%Electricite de France SA^ $295,000 5.25% Perpetual 309,132 0.01%Banque Federative du Credit Mutuel SA $300,000 0.65% 27/2/2024 299,344 0.01%Banque Federative du Credit Mutuel SA £200,000 1.25% 5/12/2025 279,103 0.01%Dexia Credit Local SA £200,000 1.13% 15/6/2022 278,701 0.01%LVMH Moet Hennessy Louis Vuitton SE £200,000 1.00% 14/6/2022 277,627 0.01%BPCE SA $250,000 4.00% 15/4/2024 272,628 0.01%Dexia Credit Local SA $250,000 3.25% 26/9/2023 265,166 0.01%BNP Paribas SA €200,000 2.38% 17/2/2025 255,391 0.01%Suez SA €200,000 2.75% 9/10/2023 253,014 0.01%

747
Vanguard Global Short-Term Bond Index Fund
Principal CouponMaturity
DateFair Value
US Dollars ($)% of Total
Net AssetsBPCE SA $250,000 2.75% 2/12/2021 252,743 0.01%Dexia Credit Local SA $250,000 0.75% 7/5/2023 251,706 0.01%Airbus SE €200,000 1.63% 7/4/2025 251,332 0.01%JCDecaux SA €200,000 2.00% 24/10/2024 251,120 0.01%Engie SA €200,000 3.00% 1/2/2023 249,816 0.01%Orange SA^ €200,000 2.38% Perpetual 249,150 0.01%Autoroutes du Sud de la France SA €200,000 2.88% 18/1/2023 248,948 0.01%Dexia Credit Local SA $240,000 2.38% 20/9/2022 245,960 0.01%Societe Generale SA €200,000 1.25% 15/2/2024 245,329 0.01%Societe Generale SA €200,000 1.13% 23/1/2025 245,329 0.01%TDF Infrastructure SASU €200,000 2.88% 19/10/2022 244,421 0.01%Air Liquide Finance SA €200,000 0.75% 13/6/2024 243,781 0.01%BNP Paribas SA €200,000 1.13% 15/1/2023 242,618 0.01%Sodexo SA €200,000 0.50% 17/1/2024 241,075 0.01%Caisse des Depots et Consignations €200,000 0.01% 15/9/2025 240,966 0.01%EssilorLuxottica SA €200,000 0.25% 5/1/2024 240,375 0.01%Holding d'Infrastructures de Transport SASU €200,000 0.63% 27/3/2023 239,717 0.01%BPCE SA €200,000 0.13% 4/12/2024 239,552 0.01%BPCE SA $200,000 5.70% 22/10/2023 221,646 0.01%Pernod Ricard SA $200,000 4.25% 15/7/2022 207,592 0.01%TotalEnergies Capital International SA $200,000 2.70% 25/1/2023 207,315 0.01%Banque Federative du Credit Mutuel SA $200,000 2.70% 20/7/2022 204,928 0.01%Sodexo, Inc. $200,000 1.63% 16/4/2026 201,415 0.01%RCI Banque SA €167,000 0.75% 10/4/2023 200,582 0.01%TotalEnergies SE^ €150,000 2.71% Perpetual 185,099 0.01%Banque Federative du Credit Mutuel SA £100,000 1.50% 7/10/2026 140,811 0.00%BNP Paribas SA^ £100,000 2.00% 24/5/2031 139,284 0.00%Orange SA^ €100,000 5.25% Perpetual 133,125 0.00%Sanofi $125,000 3.38% 19/6/2023 132,064 0.00%Capgemini SE €100,000 1.63% 15/4/2026 127,164 0.00%Electricite de France SA^ €100,000 4.00% Perpetual 126,949 0.00%APRR SA €100,000 1.88% 15/1/2025 126,788 0.00%Arkema SA^ €100,000 2.75% Perpetual 125,296 0.00%Credit Agricole Public Sector SCF SA €100,000 1.88% 7/6/2023 123,997 0.00%TotalEnergies Capital International SA $115,000 3.70% 15/1/2024 123,974 0.00%Bpifrance SACA €100,000 0.75% 25/11/2024 123,325 0.00%Suez SA €100,000 1.00% 3/4/2025 123,172 0.00%Cie de Saint-Gobain €100,000 0.88% 21/9/2023 121,476 0.00%Cie de Saint-Gobain €100,000 0.63% 15/3/2024 121,189 0.00%Vivendi SE €100,000 0.63% 11/6/2025 120,939 0.00%PSA Banque France SA €100,000 0.63% 21/6/2024 120,632 0.00%BPCE SA €100,000 0.38% 5/10/2023 120,404 0.00%SFIL SA €100,000 0.00% 24/5/2024 119,956 0.00%Caisse Centrale du Credit Immobilier de France SA €100,000 0.05% 25/3/2025 119,880 0.00%ALD SA €100,000 0.38% 18/7/2023 119,786 0.00%RCI Banque SA €100,000 0.75% 26/9/2022 119,749 0.00%Worldline SA €100,000 0.25% 18/9/2024 119,537 0.00%LVMH Moet Hennessy Louis Vuitton SE €100,000 0.13% 28/2/2023 119,395 0.00%APRR SA €100,000 0.00% 20/1/2023 119,278 0.00%Pernod Ricard SA €100,000 0.00% 24/10/2023 119,206 0.00%Carrefour Banque SA €100,000 0.11% 14/6/2025 118,807 0.00%Schneider Electric SE $100,000 2.95% 27/9/2022 103,060 0.00%Engie SA $100,000 2.88% 10/10/2022 102,958 0.00%TotalEnergies Capital Canada Ltd. $25,000 2.75% 15/7/2023 26,185 0.00%test - - - 227,052,471 7.01%Germany 6.61% (2020: 7.02%)Bundesobligation €20,000,000 0.00% 7/10/2022 23,928,163 0.74%Bundesobligation €9,888,000 0.00% 11/4/2025 12,017,100 0.37%Bundesobligation €9,734,000 0.00% 18/10/2024 11,801,140 0.36%Bundesobligation €8,668,249 0.00% 10/4/2026 10,573,403 0.33%Bundesobligation €7,044,016 0.00% 10/10/2025 8,582,012 0.27%Bundesrepublik Deutschland Bundesanleihe €4,600,000 0.50% 15/2/2026 5,741,658 0.18%KFW €3,500,000 0.00% 30/6/2023 4,200,252 0.13%KFW €3,030,000 0.00% 15/6/2026 3,662,043 0.11%Landwirtschaftliche Rentenbank €2,500,000 0.05% 12/6/2023 3,000,081 0.09%State of Rhineland-Palatinate €2,500,000 0.01% 16/1/2023 2,990,799 0.09%KFW $2,533,000 2.50% 20/11/2024 2,693,414 0.08%KFW €2,000,000 0.01% 31/3/2025 2,414,181 0.07%Bundesobligation €2,000,000 0.00% 13/10/2023 2,410,530 0.07%KFW €2,000,000 0.00% 4/7/2024 2,409,651 0.07%DZ HYP AG €2,000,000 0.25% 30/6/2023 2,407,034 0.07%

748
Vanguard Global Short-Term Bond Index Fund
Principal CouponMaturity
DateFair Value
US Dollars ($)% of Total
Net AssetsLand Berlin €2,000,000 0.01% 21/11/2023 2,400,683 0.07%Bundesrepublik Deutschland Bundesanleihe €1,900,000 1.00% 15/8/2024 2,373,940 0.07%UniCredit Bank AG €1,900,000 0.63% 20/11/2025 2,347,313 0.07%KFW €1,750,000 0.00% 2/4/2024 2,107,274 0.07%EnBW International Finance BV €1,700,000 0.63% 17/4/2025 2,067,467 0.06%Bundesrepublik Deutschland Bundesanleihe €1,500,000 1.00% 15/8/2025 1,901,272 0.06%Free State of Bavaria €1,500,000 0.01% 20/3/2023 1,796,936 0.06%State of North Rhine-Westphalia Germany €1,500,000 0.00% 5/12/2022 1,792,884 0.06%Bundesrepublik Deutschland Bundesanleihe €1,400,000 1.75% 15/2/2024 1,768,204 0.05%Bundesrepublik Deutschland Bundesanleihe €1,375,000 1.50% 15/5/2024 1,734,571 0.05%NRW Bank €1,300,000 0.13% 7/7/2023 1,561,178 0.05%FMS Wertmanagement £1,000,000 1.13% 7/9/2023 1,407,552 0.04%State of Hesse €1,100,000 0.13% 27/4/2023 1,320,444 0.04%State of Lower Saxony €1,000,000 0.13% 7/3/2025 1,209,597 0.04%Landesbank Hessen-Thueringen Girozentrale €1,000,000 0.38% 12/5/2025 1,208,952 0.04%KFW €1,000,000 0.00% 18/2/2025 1,206,330 0.04%State of Lower Saxony €1,000,000 0.00% 15/9/2025 1,204,911 0.04%State of Hesse €1,000,000 0.00% 10/3/2025 1,204,522 0.04%KFW €1,000,000 0.63% 4/7/2022 1,200,902 0.04%Landesbank Baden-Wuerttemberg €1,000,000 0.13% 27/6/2023 1,200,734 0.04%State of North Rhine-Westphalia Germany €1,000,000 0.13% 16/3/2023 1,199,216 0.04%KFW $1,200,000 0.25% 19/10/2023 1,196,948 0.04%Land Berlin €1,000,000 0.00% 15/9/2022 1,194,039 0.04%Deutsche Kreditbank AG €1,000,000 0.01% 23/2/2026 1,185,815 0.04%KFW $1,125,000 2.00% 4/10/2022 1,150,580 0.04%Landesbank Baden-Wuerttemberg €900,000 0.38% 24/5/2024 1,083,730 0.03%KFW $1,000,000 1.63% 15/2/2023 1,022,480 0.03%State of North Rhine-Westphalia Germany $1,000,000 0.63% 28/4/2023 1,005,735 0.03%KFW €800,000 0.00% 15/12/2022 957,415 0.03%Commerzbank AG €800,000 0.05% 1/8/2022 954,626 0.03%BMW Finance NV €800,000 0.00% 14/4/2023 954,414 0.03%Traton Finance Luxembourg SA €800,000 0.13% 24/3/2025 950,897 0.03%Landwirtschaftliche Rentenbank $900,000 0.50% 27/5/2025 891,929 0.03%KFW $900,000 0.38% 18/7/2025 887,791 0.03%E.ON SE €700,000 0.38% 20/4/2023 839,099 0.03%Aroundtown SA^ €700,000 2.13% Perpetual 831,334 0.03%NRW Bank £600,000 0.38% 16/12/2024 826,297 0.03%Land Baden-Wuerttemberg €675,000 0.01% 8/4/2025 813,458 0.03%BMW US Capital LLC $800,000 0.80% 1/4/2024 804,226 0.02%KFW $800,000 0.63% 22/1/2026 792,450 0.02%Daimler Finance North America LLC $750,000 3.35% 22/2/2023 784,099 0.02%KFW AU($)1,000,000 2.80% 7/3/2023 783,197 0.02%KFW €600,000 4.63% 4/1/2023 768,287 0.02%Vonovia Finance BV €600,000 0.88% 3/7/2023 724,585 0.02%State of Lower Saxony €600,000 0.13% 7/3/2023 719,602 0.02%Fresenius Medical Care AG & Co. KGaA €600,000 0.25% 29/11/2023 717,302 0.02%KFW £500,000 0.88% 18/7/2024 701,081 0.02%Siemens Financieringsmaatschappij NV £500,000 0.88% 5/6/2023 695,985 0.02%Landeskreditbank Baden-Wuerttemberg Foerderbank £500,000 0.38% 9/12/2024 688,586 0.02%Volkswagen Financial Services AG €500,000 3.00% 6/4/2025 657,190 0.02%Daimler AG €500,000 2.63% 7/4/2025 652,930 0.02%Gemeinsame Deutsche Bundeslaender €500,000 1.13% 30/9/2024 623,560 0.02%Vonovia Finance BV €500,000 1.13% 8/9/2025 620,389 0.02%Volkswagen Leasing GmbH €500,000 1.38% 20/1/2025 620,156 0.02%BMW Finance NV €520,000 0.13% 13/7/2022 620,096 0.02%BASF SE €500,000 0.88% 22/5/2025 618,470 0.02%Deutsche Bank AG^ €500,000 1.38% 3/9/2026 614,376 0.02%Daimler Finance North America LLC $600,000 2.55% 15/8/2022 614,137 0.02%E.ON International Finance BV €500,000 1.00% 13/4/2025 613,866 0.02%Volkswagen Financial Services AG €500,000 1.38% 16/10/2023 613,186 0.02%Deutsche Pfandbriefbank AG €500,000 0.50% 22/5/2024 608,434 0.02%Norddeutsche Landesbank-Girozentrale €500,000 0.38% 9/10/2024 607,593 0.02%Deutsche Hypothekenbank AG €500,000 0.25% 10/12/2024 606,158 0.02%NRW Bank €500,000 0.25% 16/5/2024 604,887 0.02%Volkswagen Leasing GmbH €500,000 1.00% 16/2/2023 603,844 0.02%State of Schleswig-Holstein Germany €500,000 0.05% 4/11/2024 602,684 0.02%ING-DiBa AG €500,000 0.25% 9/10/2023 602,644 0.02%Volkswagen Bank GmbH €500,000 1.25% 1/8/2022 602,534 0.02%State of Schleswig-Holstein Germany €500,000 0.01% 16/7/2025 602,446 0.02%State of North Rhine-Westphalia Germany €500,000 0.00% 5/5/2025 602,396 0.02%Aroundtown SA €500,000 0.63% 9/7/2025 602,133 0.02%

749
Vanguard Global Short-Term Bond Index Fund
Principal CouponMaturity
DateFair Value
US Dollars ($)% of Total
Net AssetsDZ HYP AG €500,000 0.01% 12/9/2025 601,850 0.02%Commerzbank AG €500,000 0.13% 9/1/2024 601,504 0.02%State of Lower Saxony €500,000 0.01% 15/4/2024 601,202 0.02%Deutsche Bank AG €500,000 0.25% 15/5/2023 600,943 0.02%Commerzbank AG €500,000 0.50% 13/9/2023 600,233 0.02%E.ON International Finance BV €500,000 0.75% 30/11/2022 600,107 0.02%Gemeinsame Deutsche Bundeslaender €500,000 0.13% 14/4/2023 599,975 0.02%Bayer AG €500,000 0.38% 6/7/2024 599,546 0.02%Aareal Bank AG €500,000 0.13% 1/2/2023 598,882 0.02%KFW $580,000 2.38% 29/12/2022 598,666 0.02%State of Hesse €500,000 0.38% 4/7/2022 598,639 0.02%Daimler International Finance BV €500,000 0.25% 6/11/2023 598,150 0.02%Siemens Financieringsmaatschappij NV €500,000 0.00% 20/2/2023 596,445 0.02%Landesbank Hessen-Thueringen Girozentrale €500,000 0.00% 18/7/2022 596,267 0.02%BMW Finance NV €500,000 0.00% 24/3/2023 596,230 0.02%Daimler AG €500,000 0.00% 8/2/2024 595,537 0.02%Fresenius Finance Ireland plc €500,000 0.00% 1/10/2025 591,572 0.02%KFW €489,000 0.13% 7/11/2023 589,565 0.02%Hannover Rueck SE^ €400,000 3.38% Perpetual 528,863 0.02%KFW $500,000 2.63% 28/2/2024 528,846 0.02%Daimler International Finance BV €439,000 0.63% 27/2/2023 528,626 0.02%Deutsche Bank AG^ $500,000 2.22% 18/9/2024 513,420 0.02%Daimler International Finance BV €400,000 0.88% 9/4/2024 487,721 0.02%Infineon Technologies AG €400,000 0.75% 24/6/2023 482,460 0.02%Niedersachsen Invest GmbH €400,000 0.00% 16/7/2025 480,567 0.01%Wintershall Dea Finance BV €400,000 0.45% 25/9/2023 478,830 0.01%Vonovia SE €400,000 0.00% 16/9/2024 475,613 0.01%BMW Finance NV €400,000 0.00% 11/1/2026 474,908 0.01%FMS Wertmanagement £300,000 1.13% 20/3/2023 420,893 0.01%Landwirtschaftliche Rentenbank $400,000 2.38% 23/1/2024 419,665 0.01%Daimler International Finance BV £300,000 1.25% 5/9/2022 417,720 0.01%Landeskreditbank Baden-Wuerttemberg Foerderbank $400,000 2.00% 23/7/2024 417,301 0.01%Volkswagen Group of America Finance LLC $400,000 0.88% 22/11/2023 401,269 0.01%Landwirtschaftliche Rentenbank $400,000 0.88% 30/3/2026 399,800 0.01%KFW $400,000 0.25% 8/3/2024 397,957 0.01%Deutsche Post AG €300,000 2.88% 11/12/2024 393,434 0.01%NRW Bank AU($)500,000 1.60% 31/7/2024 385,364 0.01%Volkswagen International Finance NV^ €300,000 3.50% Perpetual 384,392 0.01%Volkswagen International Finance NV^ €300,000 3.38% Perpetual 379,971 0.01%HeidelbergCement AG €300,000 2.25% 3/6/2024 378,108 0.01%FMS Wertmanagement $370,000 2.00% 1/8/2022 376,957 0.01%Deutsche Telekom International Finance BV €300,000 4.25% 13/7/2022 372,760 0.01%Deutsche Telekom International Finance BV €300,000 0.88% 30/1/2024 365,637 0.01%Deutsche Bank AG €300,000 1.13% 30/8/2023 365,439 0.01%Aroundtown SA €300,000 1.00% 7/1/2025 365,285 0.01%FMS Wertmanagement $345,000 2.75% 30/1/2024 365,250 0.01%Commerzbank AG €300,000 0.63% 28/8/2024 363,400 0.01%Bayer US Finance II LLC $325,000 4.25% 15/12/2025 362,338 0.01%Hamburg Commercial Bank AG €300,000 0.38% 12/7/2023 361,585 0.01%SAP SE €300,000 0.13% 18/5/2026 359,421 0.01%Santander Consumer Bank AG €300,000 0.25% 15/10/2024 358,518 0.01%HeidelbergCement Finance Luxembourg SA €300,000 0.50% 9/8/2022 358,174 0.01%SAP SE €300,000 0.00% 17/5/2023 357,800 0.01%Merck Financial Services GmbH €300,000 0.01% 15/12/2023 357,704 0.01%Commerzbank AG €300,000 0.25% 26/1/2022 357,352 0.01%E.ON SE €300,000 0.00% 29/9/2022 357,206 0.01%Volkswagen Leasing GmbH €300,000 0.38% 20/7/2026 356,928 0.01%EEW Energy from Waste GmbH €300,000 0.36% 30/6/2026 356,609 0.01%Vantage Towers AG €300,000 0.00% 31/3/2025 354,563 0.01%Landwirtschaftliche Rentenbank AU($)400,000 2.70% 5/9/2022 309,444 0.01%NRW Bank $280,000 1.88% 31/7/2024 290,964 0.01%Volkswagen Financial Services NV £200,000 1.88% 3/12/2024 284,764 0.01%BMW International Investment BV £200,000 1.88% 11/9/2023 284,349 0.01%Daimler International Finance BV £200,000 2.00% 4/9/2023 284,069 0.01%Daimler International Finance BV £200,000 1.63% 11/11/2024 283,213 0.01%Volkswagen Financial Services NV £200,000 1.63% 10/2/2024 281,781 0.01%Henkel AG & Co. KGaA £200,000 1.00% 30/9/2022 278,301 0.01%Deutsche Bank AG $253,000 4.10% 13/1/2026 277,398 0.01%Deutsche Bank AG^ $250,000 3.96% 26/11/2025 270,532 0.01%Hannover Finance Luxembourg SA^ €200,000 5.00% 30/6/2043 260,234 0.01%Siemens Financieringsmaatschappij NV $250,000 2.00% 15/9/2023 258,209 0.01%
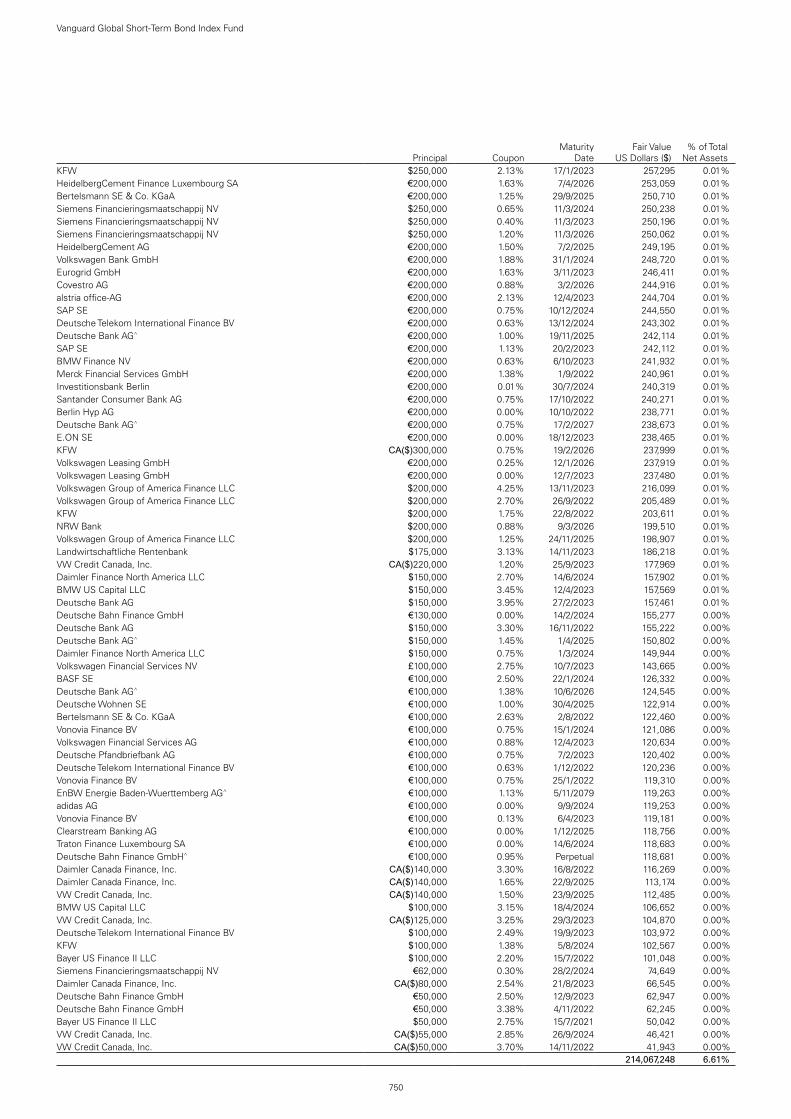
750
Vanguard Global Short-Term Bond Index Fund
Principal CouponMaturity
DateFair Value
US Dollars ($)% of Total
Net AssetsKFW $250,000 2.13% 17/1/2023 257,295 0.01%HeidelbergCement Finance Luxembourg SA €200,000 1.63% 7/4/2026 253,059 0.01%Bertelsmann SE & Co. KGaA €200,000 1.25% 29/9/2025 250,710 0.01%Siemens Financieringsmaatschappij NV $250,000 0.65% 11/3/2024 250,238 0.01%Siemens Financieringsmaatschappij NV $250,000 0.40% 11/3/2023 250,196 0.01%Siemens Financieringsmaatschappij NV $250,000 1.20% 11/3/2026 250,062 0.01%HeidelbergCement AG €200,000 1.50% 7/2/2025 249,195 0.01%Volkswagen Bank GmbH €200,000 1.88% 31/1/2024 248,720 0.01%Eurogrid GmbH €200,000 1.63% 3/11/2023 246,411 0.01%Covestro AG €200,000 0.88% 3/2/2026 244,916 0.01%alstria office-AG €200,000 2.13% 12/4/2023 244,704 0.01%SAP SE €200,000 0.75% 10/12/2024 244,550 0.01%Deutsche Telekom International Finance BV €200,000 0.63% 13/12/2024 243,302 0.01%Deutsche Bank AG^ €200,000 1.00% 19/11/2025 242,114 0.01%SAP SE €200,000 1.13% 20/2/2023 242,112 0.01%BMW Finance NV €200,000 0.63% 6/10/2023 241,932 0.01%Merck Financial Services GmbH €200,000 1.38% 1/9/2022 240,961 0.01%Investitionsbank Berlin €200,000 0.01% 30/7/2024 240,319 0.01%Santander Consumer Bank AG €200,000 0.75% 17/10/2022 240,271 0.01%Berlin Hyp AG €200,000 0.00% 10/10/2022 238,771 0.01%Deutsche Bank AG^ €200,000 0.75% 17/2/2027 238,673 0.01%E.ON SE €200,000 0.00% 18/12/2023 238,465 0.01%KFW CA($)300,000 0.75% 19/2/2026 237,999 0.01%Volkswagen Leasing GmbH €200,000 0.25% 12/1/2026 237,919 0.01%Volkswagen Leasing GmbH €200,000 0.00% 12/7/2023 237,480 0.01%Volkswagen Group of America Finance LLC $200,000 4.25% 13/11/2023 216,099 0.01%Volkswagen Group of America Finance LLC $200,000 2.70% 26/9/2022 205,489 0.01%KFW $200,000 1.75% 22/8/2022 203,611 0.01%NRW Bank $200,000 0.88% 9/3/2026 199,510 0.01%Volkswagen Group of America Finance LLC $200,000 1.25% 24/11/2025 198,907 0.01%Landwirtschaftliche Rentenbank $175,000 3.13% 14/11/2023 186,218 0.01%VW Credit Canada, Inc. CA($)220,000 1.20% 25/9/2023 177,969 0.01%Daimler Finance North America LLC $150,000 2.70% 14/6/2024 157,902 0.01%BMW US Capital LLC $150,000 3.45% 12/4/2023 157,569 0.01%Deutsche Bank AG $150,000 3.95% 27/2/2023 157,461 0.01%Deutsche Bahn Finance GmbH €130,000 0.00% 14/2/2024 155,277 0.00%Deutsche Bank AG $150,000 3.30% 16/11/2022 155,222 0.00%Deutsche Bank AG^ $150,000 1.45% 1/4/2025 150,802 0.00%Daimler Finance North America LLC $150,000 0.75% 1/3/2024 149,944 0.00%Volkswagen Financial Services NV £100,000 2.75% 10/7/2023 143,665 0.00%BASF SE €100,000 2.50% 22/1/2024 126,332 0.00%Deutsche Bank AG^ €100,000 1.38% 10/6/2026 124,545 0.00%Deutsche Wohnen SE €100,000 1.00% 30/4/2025 122,914 0.00%Bertelsmann SE & Co. KGaA €100,000 2.63% 2/8/2022 122,460 0.00%Vonovia Finance BV €100,000 0.75% 15/1/2024 121,086 0.00%Volkswagen Financial Services AG €100,000 0.88% 12/4/2023 120,634 0.00%Deutsche Pfandbriefbank AG €100,000 0.75% 7/2/2023 120,402 0.00%Deutsche Telekom International Finance BV €100,000 0.63% 1/12/2022 120,236 0.00%Vonovia Finance BV €100,000 0.75% 25/1/2022 119,310 0.00%EnBW Energie Baden-Wuerttemberg AG^ €100,000 1.13% 5/11/2079 119,263 0.00%adidas AG €100,000 0.00% 9/9/2024 119,253 0.00%Vonovia Finance BV €100,000 0.13% 6/4/2023 119,181 0.00%Clearstream Banking AG €100,000 0.00% 1/12/2025 118,756 0.00%Traton Finance Luxembourg SA €100,000 0.00% 14/6/2024 118,683 0.00%Deutsche Bahn Finance GmbH^ €100,000 0.95% Perpetual 118,681 0.00%Daimler Canada Finance, Inc. CA($)140,000 3.30% 16/8/2022 116,269 0.00%Daimler Canada Finance, Inc. CA($)140,000 1.65% 22/9/2025 113,174 0.00%VW Credit Canada, Inc. CA($)140,000 1.50% 23/9/2025 112,485 0.00%BMW US Capital LLC $100,000 3.15% 18/4/2024 106,652 0.00%VW Credit Canada, Inc. CA($)125,000 3.25% 29/3/2023 104,870 0.00%Deutsche Telekom International Finance BV $100,000 2.49% 19/9/2023 103,972 0.00%KFW $100,000 1.38% 5/8/2024 102,567 0.00%Bayer US Finance II LLC $100,000 2.20% 15/7/2022 101,048 0.00%Siemens Financieringsmaatschappij NV €62,000 0.30% 28/2/2024 74,649 0.00%Daimler Canada Finance, Inc. CA($)80,000 2.54% 21/8/2023 66,545 0.00%Deutsche Bahn Finance GmbH €50,000 2.50% 12/9/2023 62,947 0.00%Deutsche Bahn Finance GmbH €50,000 3.38% 4/11/2022 62,245 0.00%Bayer US Finance II LLC $50,000 2.75% 15/7/2021 50,042 0.00%VW Credit Canada, Inc. CA($)55,000 2.85% 26/9/2024 46,421 0.00%VW Credit Canada, Inc. CA($)50,000 3.70% 14/11/2022 41,943 0.00%test - - - 214,067,248 6.61%

751
Vanguard Global Short-Term Bond Index Fund
Principal CouponMaturity
DateFair Value
US Dollars ($)% of Total
Net AssetsHong Kong 0.04% (2020: 0.07%)Hong Kong Government Bond Programme HKD6,850,000 2.22% 7/8/2024 930,622 0.03%Swire Pacific MTN Financing Ltd. $200,000 4.50% 9/10/2023 215,986 0.01%Li & Fung Ltd. $200,000 4.50% 18/8/2025 206,928 0.00%test - - - 1,353,536 0.04%Hungary 0.24% (2020: 0.20%)Hungary Government Bond HUF622,140,000 2.50% 24/10/2024 2,153,778 0.07%Hungary Government Bond HUF452,000,000 1.50% 23/8/2023 1,532,654 0.05%Hungary Government International Bond €1,000,000 1.25% 22/10/2025 1,250,020 0.04%Hungary Government International Bond $750,000 5.38% 21/2/2023 810,868 0.02%Hungary Government Bond HUF200,000,000 1.00% 26/11/2025 648,537 0.02%Hungary Government Bond HUF133,000,000 7.00% 24/6/2022 475,912 0.01%MFB Magyar Fejlesztesi Bank Zrt €250,000 1.38% 24/6/2025 310,271 0.01%Hungary Government International Bond $275,000 5.75% 22/11/2023 308,894 0.01%Hungary Government Bond HUF50,000,000 1.75% 26/10/2022 170,749 0.01%test - - - 7,661,683 0.24%India 0.10% (2020: 0.13%)NTPC Ltd. $900,000 4.38% 26/11/2024 976,319 0.03%Export-Import Bank of India $650,000 4.00% 14/1/2023 678,812 0.02%Indian Oil Corp., Ltd. $400,000 5.75% 1/8/2023 435,030 0.01%ICICI Bank Ltd. $300,000 3.25% 9/9/2022 307,459 0.01%Adani Ports & Special Economic Zone Ltd. $250,000 3.38% 24/7/2024 260,159 0.01%ONGC Videsh Ltd. $200,000 4.63% 15/7/2024 217,549 0.01%State Bank of India $200,000 4.50% 28/9/2023 214,229 0.01%REC Ltd. $200,000 3.50% 12/12/2024 209,853 0.00%test - - - 3,299,410 0.10%Indonesia 0.54% (2020: 0.46%)Indonesia Treasury Bond IDR41,000,000,000 6.50% 15/6/2025 2,967,274 0.09%Indonesia Treasury Bond IDR39,833,000,000 5.63% 15/5/2023 2,810,088 0.09%Indonesia Treasury Bond IDR35,000,000,000 5.50% 15/4/2026 2,426,192 0.07%Indonesia Government International Bond $1,750,000 4.75% 8/1/2026 1,998,517 0.06%Indonesia Treasury Bond IDR25,000,000,000 8.13% 15/5/2024 1,880,770 0.06%Indonesia Government International Bond $1,000,000 4.13% 15/1/2025 1,104,930 0.03%Indonesia Treasury Bond IDR10,000,000,000 8.38% 15/3/2024 753,872 0.02%Indonesia Treasury Bond IDR10,000,000,000 7.00% 15/5/2022 710,361 0.02%Indonesia Government International Bond $500,000 5.88% 15/1/2024 564,154 0.02%Perusahaan Penerbit SBSN Indonesia III $500,000 3.75% 1/3/2023 526,381 0.01%Bank Mandiri Persero Tbk PT $400,000 3.75% 11/4/2024 426,015 0.01%Perusahaan Penerbit SBSN Indonesia III $250,000 2.30% 23/6/2025 259,679 0.01%Indonesia Government International Bond €200,000 2.63% 14/6/2023 248,909 0.01%Pelabuhan Indonesia III Persero PT $200,000 4.88% 1/10/2024 221,061 0.01%Indonesia Asahan Aluminium Persero PT $200,000 4.75% 15/5/2025 220,390 0.01%Indonesia Government International Bond $200,000 4.45% 11/2/2024 218,988 0.01%Pertamina Persero PT $200,000 4.30% 20/5/2023 212,551 0.01%test - - - 17,550,132 0.54%Ireland 0.56% (2020: 0.47%)Ireland Government Bond €2,400,000 1.00% 15/5/2026 3,041,605 0.09%Ireland Government Bond €2,000,000 5.40% 13/3/2025 2,893,054 0.09%Ireland Government Bond €2,050,000 3.40% 18/3/2024 2,693,894 0.08%Ireland Government Bond €1,724,645 0.00% 18/10/2022 2,061,319 0.06%NIE Finance plc £500,000 2.50% 27/10/2025 731,616 0.02%Avolon Holdings Funding Ltd. $645,000 2.88% 15/2/2025 664,484 0.02%AerCap Ireland Capital DAC/AerCap Global Aviation Trust $624,000 3.50% 15/1/2025 661,272 0.02%AerCap Ireland Capital DAC/AerCap Global Aviation Trust $500,000 1.75% 30/1/2026 494,253 0.02%AIB Group plc $400,000 4.75% 12/10/2023 434,221 0.01%Ryanair DAC €348,000 0.88% 25/5/2026 414,279 0.01%AerCap Ireland Capital DAC/AerCap Global Aviation Trust $350,000 4.50% 15/9/2023 375,413 0.01%Bank of Ireland Group plc^ €300,000 1.00% 25/11/2025 365,507 0.01%AIB Group plc €250,000 1.25% 28/5/2024 307,265 0.01%Avolon Holdings Funding Ltd. $250,000 2.13% 21/2/2026 247,818 0.01%CRH Finland Services OYJ €200,000 0.88% 5/11/2023 242,830 0.01%Ryanair DAC €200,000 1.13% 15/8/2023 242,411 0.01%AerCap Ireland Capital DAC/AerCap Global Aviation Trust $225,000 4.63% 1/7/2022 234,024 0.01%Avolon Holdings Funding Ltd. $200,000 5.25% 15/5/2024 219,911 0.01%Bank of Ireland Group plc $200,000 4.50% 25/11/2023 216,410 0.01%Park Aerospace Holdings Ltd. $200,000 5.25% 15/8/2022 209,382 0.01%AerCap Ireland Capital DAC/AerCap Global Aviation Trust $200,000 3.30% 23/1/2023 207,263 0.01%SMBC Aviation Capital Finance DAC $200,000 3.00% 15/7/2022 204,517 0.01%AerCap Ireland Capital DAC/AerCap Global Aviation Trust $150,000 4.45% 1/10/2025 165,134 0.01%AerCap Ireland Capital DAC/AerCap Global Aviation Trust $150,000 2.88% 14/8/2024 156,865 0.01%Park Aerospace Holdings Ltd. $125,000 5.50% 15/2/2024 137,472 0.00%

752
Vanguard Global Short-Term Bond Index Fund
Principal CouponMaturity
DateFair Value
US Dollars ($)% of Total
Net AssetsRyanair DAC €100,000 2.88% 15/9/2025 129,770 0.00%Ryanair DAC €100,000 1.13% 10/3/2023 120,790 0.00%GAS Networks Ireland €100,000 0.13% 4/12/2024 119,435 0.00%AerCap Ireland Capital DAC/AerCap Global Aviation Trust $25,000 4.88% 16/1/2024 27,226 0.00%test - - - 18,019,440 0.56%Israel 0.24% (2020: 0.23%)Israel Government Bond-Fixed ILS6,800,000 0.50% 30/4/2025 2,102,710 0.06%Israel Government Bond-Fixed ILS5,000,000 1.50% 30/11/2023 1,596,900 0.05%Israel Government Bond-Fixed ILS4,000,000 1.25% 30/11/2022 1,257,266 0.04%Israel Government Bond-Fixed ILS3,600,000 0.75% 31/7/2022 1,121,154 0.03%Israel Government Bond-Fixed ILS2,000,000 1.75% 31/8/2025 658,033 0.02%Israel Government International Bond $548,000 2.88% 16/3/2026 591,021 0.02%Israel Government International Bond €300,000 2.88% 29/1/2024 384,229 0.01%Delek & Avner Tamar Bond Ltd. $200,000 5.08% 30/12/2023 201,511 0.01%test - - - 7,912,824 0.24%Italy 4.60% (2020: 4.46%)Italy Buoni Poliennali Del Tesoro €15,899,000 1.85% 1/7/2025 20,270,962 0.63%Italy Buoni Poliennali Del Tesoro €13,101,000 0.00% 29/11/2022 15,620,014 0.48%Italy Buoni Poliennali Del Tesoro €9,089,000 0.00% 15/4/2024 10,838,564 0.33%Italy Buoni Poliennali Del Tesoro €8,259,000 0.50% 1/2/2026 9,992,789 0.31%Italy Buoni Poliennali Del Tesoro €7,200,000 1.75% 1/7/2024 9,034,634 0.28%Italy Buoni Poliennali Del Tesoro €7,000,000 0.60% 15/6/2023 8,458,119 0.26%Italy Buoni Poliennali Del Tesoro €7,031,000 0.30% 15/8/2023 8,447,648 0.26%Italy Buoni Poliennali Del Tesoro €6,173,000 0.35% 1/2/2025 7,440,103 0.23%Italy Certificati di Credito del Tesoro €5,553,000 0.00% 28/9/2022 6,618,185 0.20%Italy Buoni Poliennali Del Tesoro €5,200,000 0.00% 15/1/2024 6,204,902 0.19%Italy Buoni Poliennali Del Tesoro €4,853,000 2.45% 1/10/2023 6,114,491 0.19%Italy Buoni Poliennali Del Tesoro €4,055,000 0.95% 1/3/2023 4,915,866 0.15%Italy Buoni Poliennali Del Tesoro €3,500,000 1.00% 15/7/2022 4,212,887 0.13%Italy Buoni Poliennali Del Tesoro €3,337,000 1.45% 15/11/2024 4,170,103 0.13%Italy Buoni Poliennali Del Tesoro €2,000,000 0.00% 1/4/2026 2,361,573 0.07%Italy Buoni Poliennali Del Tesoro €1,700,000 3.75% 1/9/2024 2,267,057 0.07%Intesa Sanpaolo SpA €1,500,000 0.50% 5/3/2024 1,823,503 0.06%Enel Finance International NV £846,000 5.63% 14/8/2024 1,342,898 0.04%Cassa Depositi e Prestiti SpA €800,000 2.13% 27/9/2023 997,397 0.03%Intesa Sanpaolo SpA €600,000 2.13% 30/8/2023 746,122 0.02%Enel Finance International NV $675,000 4.25% 14/9/2023 726,892 0.02%Republic of Italy Government International Bond $662,000 1.25% 17/2/2026 653,206 0.02%UniCredit SpA^ €500,000 2.20% 22/7/2027 630,952 0.02%A2A SpA €500,000 1.75% 25/2/2025 627,430 0.02%Credit Agricole Italia SpA €500,000 1.13% 21/3/2025 624,507 0.02%Eni SpA €500,000 1.00% 14/3/2025 615,581 0.02%Cassa Depositi e Prestiti SpA €500,000 1.50% 20/4/2023 611,506 0.02%Intesa Sanpaolo SpA €500,000 0.50% 15/7/2024 608,985 0.02%Enel Finance International NV €500,000 0.00% 17/6/2024 596,596 0.02%UniCredit SpA €500,000 0.33% 19/1/2026 592,015 0.02%Enel SpA^ $500,000 8.75% 24/9/2073 580,998 0.02%Intesa Sanpaolo SpA $500,000 3.25% 23/9/2024 531,797 0.02%Eni SpA €400,000 1.25% 18/5/2026 501,513 0.02%Republic of Italy Government International Bond $475,000 2.38% 17/10/2024 493,945 0.02%Intesa Sanpaolo SpA €400,000 0.75% 17/10/2022 480,438 0.02%Mediobanca Banca di Credito Finanziario SpA €400,000 0.63% 27/9/2022 479,482 0.01%Snam SpA €400,000 0.00% 15/8/2025 473,882 0.01%Intesa Sanpaolo SpA €360,000 1.00% 4/7/2024 439,648 0.01%Enel SpA^ €300,000 3.50% 24/5/2080 388,828 0.01%Republic of Italy Government International Bond $340,000 6.88% 27/9/2023 384,959 0.01%Enel SpA^ €300,000 2.50% Perpetual 372,718 0.01%FCA Bank SpA €300,000 0.50% 13/9/2024 360,676 0.01%FCA Bank SpA €300,000 0.63% 24/11/2022 359,402 0.01%FCA Bank SpA €300,000 0.00% 16/4/2024 355,710 0.01%UniCredit SpA^ $350,000 2.57% 22/9/2026 354,687 0.01%UniCredit SpA^ €280,000 1.25% 16/6/2026 343,500 0.01%Intesa Sanpaolo SpA €250,000 2.13% 26/5/2025 318,405 0.01%ACEA SpA €260,000 0.00% 28/9/2025 308,254 0.01%2i Rete Gas SpA €200,000 3.00% 16/7/2024 258,791 0.01%UniCredit SpA €200,000 3.00% 31/1/2024 258,189 0.01%Banco BPM SpA €200,000 0.88% 14/9/2022 240,822 0.01%UniCredit SpA €200,000 0.50% 9/4/2025 239,739 0.01%FCA Bank SpA €200,000 0.25% 28/2/2023 238,528 0.01%FCA Bank SpA €200,000 0.13% 16/11/2023 237,929 0.01%Enel Finance International NV $200,000 4.63% 14/9/2025 227,058 0.01%

753
Vanguard Global Short-Term Bond Index Fund
Principal CouponMaturity
DateFair Value
US Dollars ($)% of Total
Net AssetsEni SpA $200,000 4.00% 12/9/2023 213,658 0.01%Intesa Sanpaolo SpA $200,000 3.38% 12/1/2023 208,067 0.01%Republic of Italy Government International Bond $200,000 0.88% 6/5/2024 199,371 0.01%Intesa Sanpaolo SpA €160,000 0.75% 4/12/2024 194,593 0.01%Eni SpA €100,000 1.75% 18/1/2024 124,391 0.00%UniCredit SpA^ €100,000 1.25% 25/6/2025 122,121 0.00%Terna SPA €100,000 1.00% 23/7/2023 121,734 0.00%Intesa Sanpaolo SpA €100,000 1.00% 27/1/2023 121,286 0.00%FCA Bank SpA €100,000 0.50% 18/9/2023 119,869 0.00%Enel Finance International NV $100,000 2.75% 6/4/2023 103,711 0.00%test - - - 148,924,186 4.60%Japan 7.07% (2020: 7.96%)Japan Government Bond ¥1,520,000,000 0.10% 20/9/2025 13,822,736 0.43%Japan Government Bond ¥1,230,000,000 0.01% 20/3/2026 11,137,242 0.34%Japan Government Bond ¥1,165,000,000 0.10% 20/12/2025 10,595,444 0.33%Japan Government Bond ¥1,035,000,000 0.10% 20/6/2025 9,409,640 0.29%Japan Government Bond ¥820,800,000 0.10% 20/12/2023 7,437,389 0.23%Japan Government Bond ¥787,400,000 0.10% 20/3/2024 7,138,895 0.22%Japan Government Bond ¥750,000,000 0.10% 1/2/2023 6,780,874 0.21%Japan Government Bond ¥715,200,000 0.10% 20/9/2022 6,460,063 0.20%Japan Government Bond ¥669,250,000 0.01% 1/5/2023 6,043,658 0.19%Japan Government Bond ¥655,000,000 0.10% 20/6/2024 5,941,968 0.18%Japan Government Bond ¥630,000,000 0.01% 1/6/2023 5,689,238 0.17%Japan Government Bond ¥555,000,000 0.10% 20/3/2025 5,042,590 0.15%Japan Government Bond ¥530,000,000 0.10% 20/9/2024 4,809,532 0.15%Japan Government Bond ¥520,000,000 0.10% 20/12/2022 4,700,354 0.14%Japan Government Bond ¥431,800,000 0.10% 20/3/2023 3,904,907 0.12%Japan Government Bond ¥425,000,000 0.80% 20/6/2023 3,898,002 0.12%Japan Government Bond ¥425,000,000 0.80% 20/12/2022 3,880,273 0.12%Japan Government Bond ¥416,150,000 0.60% 20/9/2023 3,809,648 0.12%Japan Government Bond ¥415,250,000 0.10% 20/6/2023 3,757,562 0.12%Japan Government Bond ¥413,000,000 0.10% 20/12/2024 3,750,671 0.11%Japan Government Bond ¥400,000,000 0.10% 1/7/2022 3,611,749 0.11%Japan Government Bond ¥390,000,000 0.10% 1/9/2022 3,522,834 0.11%Japan Government Bond ¥375,000,000 0.10% 1/10/2022 3,388,189 0.10%Japan Government Bond ¥360,000,000 0.10% 1/8/2022 3,251,075 0.10%Japan Government Bond ¥350,000,000 0.50% 20/9/2024 3,217,302 0.10%Japan Expressway Holding & Debt Repayment Agency ¥350,000,000 0.61% 31/5/2023 3,190,879 0.10%Japan Government Bond ¥350,000,000 0.10% 1/3/2023 3,164,783 0.10%Major Joint Local Government Bond ¥300,000,000 0.61% 25/7/2024 2,753,133 0.08%Tokyo Metropolitan Government ¥300,000,000 0.86% 20/3/2023 2,742,758 0.08%Japan Government Bond ¥300,000,000 0.10% 1/1/2023 2,711,348 0.08%Japan Finance Corp. ¥300,000,000 0.00% 31/7/2024 2,704,996 0.08%Japan Government Bond ¥275,000,000 0.60% 20/3/2023 2,508,002 0.08%Japan Government Bond ¥270,000,000 0.10% 1/12/2022 2,440,355 0.07%Japan Government Bond ¥270,000,000 0.10% 1/11/2022 2,439,905 0.07%Japan Highway Public Corp. ¥250,000,000 2.42% 20/3/2024 2,395,160 0.07%Japan Expressway Holding & Debt Repayment Agency ¥250,000,000 0.80% 29/9/2023 2,294,588 0.07%Japan Government Bond ¥230,000,000 0.40% 20/3/2025 2,113,270 0.06%Japan Expressway Holding & Debt Repayment Agency ¥230,000,000 0.91% 31/7/2023 2,112,258 0.06%Japan Government Bond ¥200,000,000 0.40% 20/6/2025 1,839,703 0.06%New Kansai International Airport Co., Ltd. ¥200,000,000 0.88% 27/6/2023 1,834,206 0.06%East Nippon Expressway Co., Ltd. ¥170,000,000 0.07% 20/6/2025 1,533,140 0.05%Major Joint Local Government Bond ¥150,000,000 0.69% 25/4/2024 1,377,556 0.04%Japan Government Bond ¥127,000,000 2.10% 20/9/2024 1,226,483 0.04%Sumitomo Mitsui Banking Corp. €1,000,000 0.55% 6/11/2023 1,209,367 0.04%Nissan Motor Co., Ltd. $1,100,000 3.04% 15/9/2023 1,147,311 0.03%Sumitomo Mitsui Financial Group, Inc. $1,000,000 2.70% 16/7/2024 1,056,972 0.03%Major Joint Local Government Bond ¥100,000,000 0.55% 25/7/2025 920,982 0.03%Japan Government Bond ¥100,000,000 0.60% 20/6/2024 920,585 0.03%Japan Finance Organization for Municipalities ¥100,000,000 0.60% 16/7/2024 918,056 0.03%Major Joint Local Government Bond ¥100,000,000 0.87% 23/6/2023 916,433 0.03%Tokyo Metropolitan Government ¥100,000,000 0.51% 20/9/2024 915,385 0.03%Japan Finance Organization for Municipalities ¥100,000,000 0.81% 14/11/2022 911,181 0.03%Major Joint Local Government Bond ¥100,000,000 0.80% 25/10/2022 910,482 0.03%Tokyo Metropolitan Government ¥100,000,000 0.77% 20/9/2022 909,467 0.03%Japan Finance Organization for Municipalities ¥100,000,000 0.80% 15/8/2022 909,308 0.03%Panasonic Corp. ¥100,000,000 0.30% 20/9/2023 905,397 0.03%West Nippon Expressway Co., Ltd. ¥100,000,000 0.09% 20/9/2022 901,685 0.03%Tokyo Metropolitan Government ¥100,000,000 0.01% 20/6/2024 900,941 0.03%Major Joint Local Government Bond ¥97,300,000 0.68% 25/10/2023 890,399 0.03%
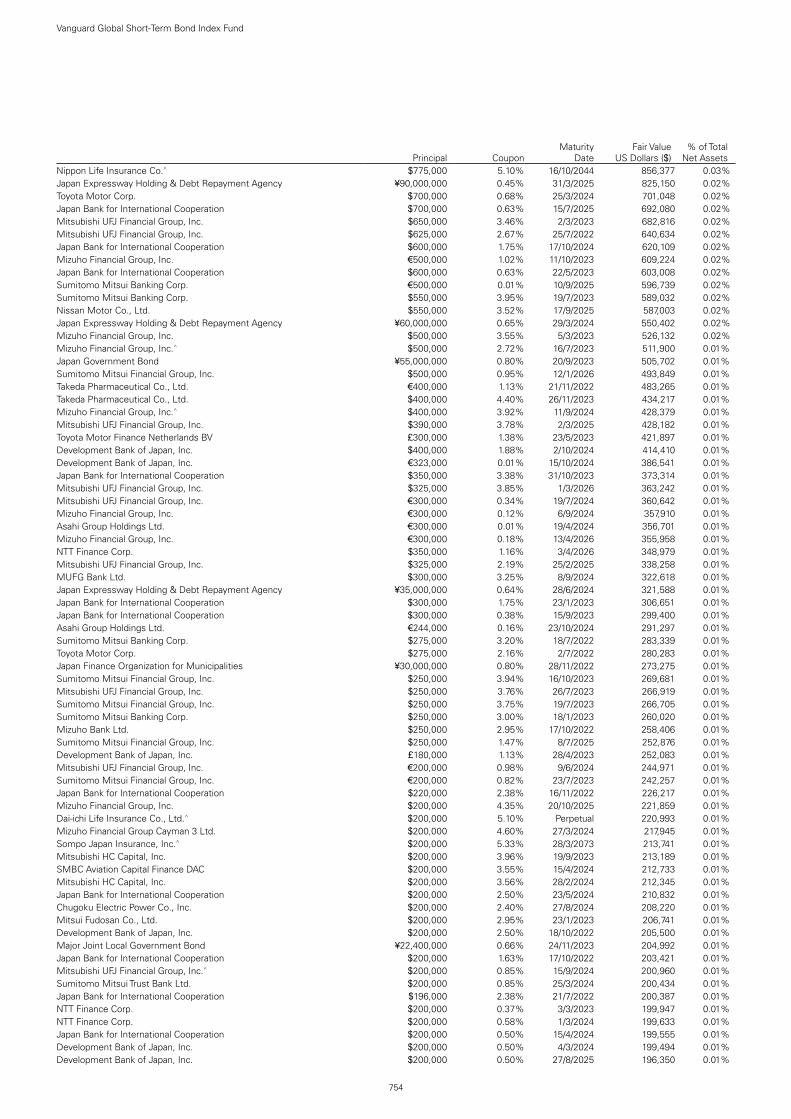
754
Vanguard Global Short-Term Bond Index Fund
Principal CouponMaturity
DateFair Value
US Dollars ($)% of Total
Net AssetsNippon Life Insurance Co.^ $775,000 5.10% 16/10/2044 856,377 0.03%Japan Expressway Holding & Debt Repayment Agency ¥90,000,000 0.45% 31/3/2025 825,150 0.02%Toyota Motor Corp. $700,000 0.68% 25/3/2024 701,048 0.02%Japan Bank for International Cooperation $700,000 0.63% 15/7/2025 692,080 0.02%Mitsubishi UFJ Financial Group, Inc. $650,000 3.46% 2/3/2023 682,816 0.02%Mitsubishi UFJ Financial Group, Inc. $625,000 2.67% 25/7/2022 640,634 0.02%Japan Bank for International Cooperation $600,000 1.75% 17/10/2024 620,109 0.02%Mizuho Financial Group, Inc. €500,000 1.02% 11/10/2023 609,224 0.02%Japan Bank for International Cooperation $600,000 0.63% 22/5/2023 603,008 0.02%Sumitomo Mitsui Banking Corp. €500,000 0.01% 10/9/2025 596,739 0.02%Sumitomo Mitsui Banking Corp. $550,000 3.95% 19/7/2023 589,032 0.02%Nissan Motor Co., Ltd. $550,000 3.52% 17/9/2025 587,003 0.02%Japan Expressway Holding & Debt Repayment Agency ¥60,000,000 0.65% 29/3/2024 550,402 0.02%Mizuho Financial Group, Inc. $500,000 3.55% 5/3/2023 526,132 0.02%Mizuho Financial Group, Inc.^ $500,000 2.72% 16/7/2023 511,900 0.01%Japan Government Bond ¥55,000,000 0.80% 20/9/2023 505,702 0.01%Sumitomo Mitsui Financial Group, Inc. $500,000 0.95% 12/1/2026 493,849 0.01%Takeda Pharmaceutical Co., Ltd. €400,000 1.13% 21/11/2022 483,265 0.01%Takeda Pharmaceutical Co., Ltd. $400,000 4.40% 26/11/2023 434,217 0.01%Mizuho Financial Group, Inc.^ $400,000 3.92% 11/9/2024 428,379 0.01%Mitsubishi UFJ Financial Group, Inc. $390,000 3.78% 2/3/2025 428,182 0.01%Toyota Motor Finance Netherlands BV £300,000 1.38% 23/5/2023 421,897 0.01%Development Bank of Japan, Inc. $400,000 1.88% 2/10/2024 414,410 0.01%Development Bank of Japan, Inc. €323,000 0.01% 15/10/2024 386,541 0.01%Japan Bank for International Cooperation $350,000 3.38% 31/10/2023 373,314 0.01%Mitsubishi UFJ Financial Group, Inc. $325,000 3.85% 1/3/2026 363,242 0.01%Mitsubishi UFJ Financial Group, Inc. €300,000 0.34% 19/7/2024 360,642 0.01%Mizuho Financial Group, Inc. €300,000 0.12% 6/9/2024 357,910 0.01%Asahi Group Holdings Ltd. €300,000 0.01% 19/4/2024 356,701 0.01%Mizuho Financial Group, Inc. €300,000 0.18% 13/4/2026 355,958 0.01%NTT Finance Corp. $350,000 1.16% 3/4/2026 348,979 0.01%Mitsubishi UFJ Financial Group, Inc. $325,000 2.19% 25/2/2025 338,258 0.01%MUFG Bank Ltd. $300,000 3.25% 8/9/2024 322,618 0.01%Japan Expressway Holding & Debt Repayment Agency ¥35,000,000 0.64% 28/6/2024 321,588 0.01%Japan Bank for International Cooperation $300,000 1.75% 23/1/2023 306,651 0.01%Japan Bank for International Cooperation $300,000 0.38% 15/9/2023 299,400 0.01%Asahi Group Holdings Ltd. €244,000 0.16% 23/10/2024 291,297 0.01%Sumitomo Mitsui Banking Corp. $275,000 3.20% 18/7/2022 283,339 0.01%Toyota Motor Corp. $275,000 2.16% 2/7/2022 280,283 0.01%Japan Finance Organization for Municipalities ¥30,000,000 0.80% 28/11/2022 273,275 0.01%Sumitomo Mitsui Financial Group, Inc. $250,000 3.94% 16/10/2023 269,681 0.01%Mitsubishi UFJ Financial Group, Inc. $250,000 3.76% 26/7/2023 266,919 0.01%Sumitomo Mitsui Financial Group, Inc. $250,000 3.75% 19/7/2023 266,705 0.01%Sumitomo Mitsui Banking Corp. $250,000 3.00% 18/1/2023 260,020 0.01%Mizuho Bank Ltd. $250,000 2.95% 17/10/2022 258,406 0.01%Sumitomo Mitsui Financial Group, Inc. $250,000 1.47% 8/7/2025 252,876 0.01%Development Bank of Japan, Inc. £180,000 1.13% 28/4/2023 252,083 0.01%Mitsubishi UFJ Financial Group, Inc. €200,000 0.98% 9/6/2024 244,971 0.01%Sumitomo Mitsui Financial Group, Inc. €200,000 0.82% 23/7/2023 242,257 0.01%Japan Bank for International Cooperation $220,000 2.38% 16/11/2022 226,217 0.01%Mizuho Financial Group, Inc. $200,000 4.35% 20/10/2025 221,859 0.01%Dai-ichi Life Insurance Co., Ltd.^ $200,000 5.10% Perpetual 220,993 0.01%Mizuho Financial Group Cayman 3 Ltd. $200,000 4.60% 27/3/2024 217,945 0.01%Sompo Japan Insurance, Inc.^ $200,000 5.33% 28/3/2073 213,741 0.01%Mitsubishi HC Capital, Inc. $200,000 3.96% 19/9/2023 213,189 0.01%SMBC Aviation Capital Finance DAC $200,000 3.55% 15/4/2024 212,733 0.01%Mitsubishi HC Capital, Inc. $200,000 3.56% 28/2/2024 212,345 0.01%Japan Bank for International Cooperation $200,000 2.50% 23/5/2024 210,832 0.01%Chugoku Electric Power Co., Inc. $200,000 2.40% 27/8/2024 208,220 0.01%Mitsui Fudosan Co., Ltd. $200,000 2.95% 23/1/2023 206,741 0.01%Development Bank of Japan, Inc. $200,000 2.50% 18/10/2022 205,500 0.01%Major Joint Local Government Bond ¥22,400,000 0.66% 24/11/2023 204,992 0.01%Japan Bank for International Cooperation $200,000 1.63% 17/10/2022 203,421 0.01%Mitsubishi UFJ Financial Group, Inc.^ $200,000 0.85% 15/9/2024 200,960 0.01%Sumitomo Mitsui Trust Bank Ltd. $200,000 0.85% 25/3/2024 200,434 0.01%Japan Bank for International Cooperation $196,000 2.38% 21/7/2022 200,387 0.01%NTT Finance Corp. $200,000 0.37% 3/3/2023 199,947 0.01%NTT Finance Corp. $200,000 0.58% 1/3/2024 199,633 0.01%Japan Bank for International Cooperation $200,000 0.50% 15/4/2024 199,555 0.01%Development Bank of Japan, Inc. $200,000 0.50% 4/3/2024 199,494 0.01%Development Bank of Japan, Inc. $200,000 0.50% 27/8/2025 196,350 0.01%
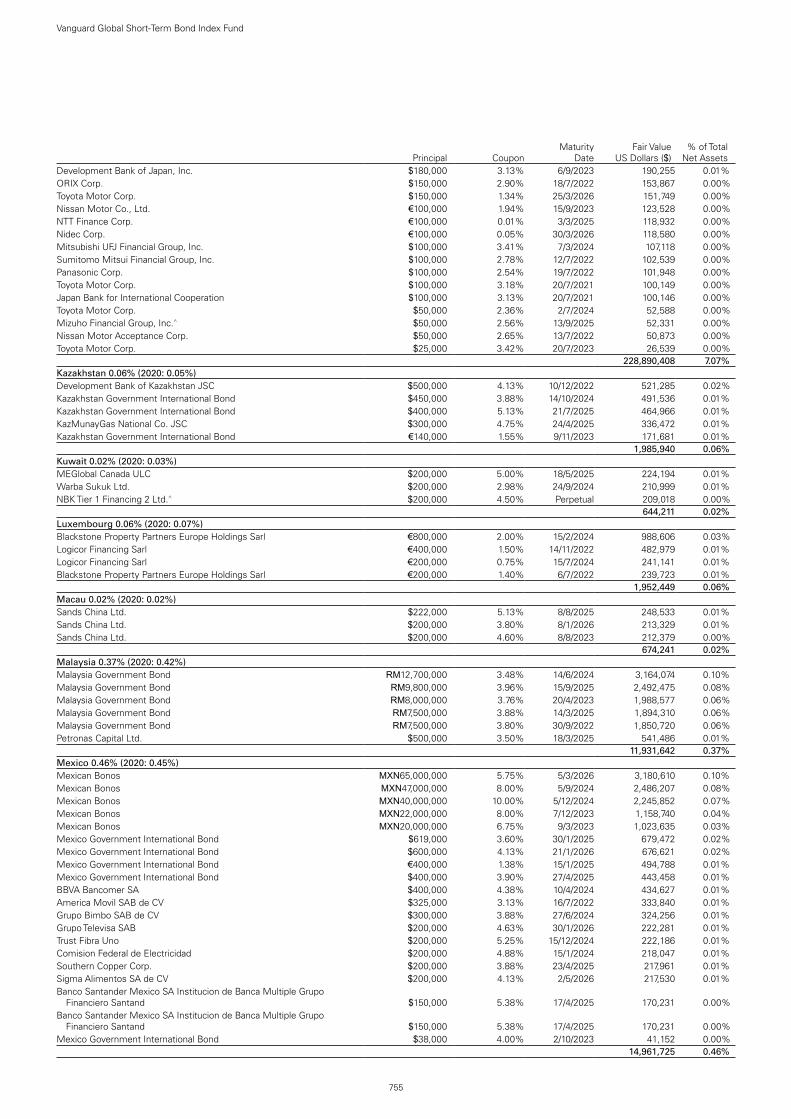
755
Vanguard Global Short-Term Bond Index Fund
Principal CouponMaturity
DateFair Value
US Dollars ($)% of Total
Net AssetsDevelopment Bank of Japan, Inc. $180,000 3.13% 6/9/2023 190,255 0.01%ORIX Corp. $150,000 2.90% 18/7/2022 153,867 0.00%Toyota Motor Corp. $150,000 1.34% 25/3/2026 151,749 0.00%Nissan Motor Co., Ltd. €100,000 1.94% 15/9/2023 123,528 0.00%NTT Finance Corp. €100,000 0.01% 3/3/2025 118,932 0.00%Nidec Corp. €100,000 0.05% 30/3/2026 118,580 0.00%Mitsubishi UFJ Financial Group, Inc. $100,000 3.41% 7/3/2024 107,118 0.00%Sumitomo Mitsui Financial Group, Inc. $100,000 2.78% 12/7/2022 102,539 0.00%Panasonic Corp. $100,000 2.54% 19/7/2022 101,948 0.00%Toyota Motor Corp. $100,000 3.18% 20/7/2021 100,149 0.00%Japan Bank for International Cooperation $100,000 3.13% 20/7/2021 100,146 0.00%Toyota Motor Corp. $50,000 2.36% 2/7/2024 52,588 0.00%Mizuho Financial Group, Inc.^ $50,000 2.56% 13/9/2025 52,331 0.00%Nissan Motor Acceptance Corp. $50,000 2.65% 13/7/2022 50,873 0.00%Toyota Motor Corp. $25,000 3.42% 20/7/2023 26,539 0.00%test - - - 228,890,408 7.07%Kazakhstan 0.06% (2020: 0.05%)Development Bank of Kazakhstan JSC $500,000 4.13% 10/12/2022 521,285 0.02%Kazakhstan Government International Bond $450,000 3.88% 14/10/2024 491,536 0.01%Kazakhstan Government International Bond $400,000 5.13% 21/7/2025 464,966 0.01%KazMunayGas National Co. JSC $300,000 4.75% 24/4/2025 336,472 0.01%Kazakhstan Government International Bond €140,000 1.55% 9/11/2023 171,681 0.01%test - - - 1,985,940 0.06%Kuwait 0.02% (2020: 0.03%)MEGlobal Canada ULC $200,000 5.00% 18/5/2025 224,194 0.01%Warba Sukuk Ltd. $200,000 2.98% 24/9/2024 210,999 0.01%NBK Tier 1 Financing 2 Ltd.^ $200,000 4.50% Perpetual 209,018 0.00%test - - - 644,211 0.02%Luxembourg 0.06% (2020: 0.07%)Blackstone Property Partners Europe Holdings Sarl €800,000 2.00% 15/2/2024 988,606 0.03%Logicor Financing Sarl €400,000 1.50% 14/11/2022 482,979 0.01%Logicor Financing Sarl €200,000 0.75% 15/7/2024 241,141 0.01%Blackstone Property Partners Europe Holdings Sarl €200,000 1.40% 6/7/2022 239,723 0.01%test - - - 1,952,449 0.06%Macau 0.02% (2020: 0.02%)Sands China Ltd. $222,000 5.13% 8/8/2025 248,533 0.01%Sands China Ltd. $200,000 3.80% 8/1/2026 213,329 0.01%Sands China Ltd. $200,000 4.60% 8/8/2023 212,379 0.00%test - - - 674,241 0.02%Malaysia 0.37% (2020: 0.42%)Malaysia Government Bond RM12,700,000 3.48% 14/6/2024 3,164,074 0.10%Malaysia Government Bond RM9,800,000 3.96% 15/9/2025 2,492,475 0.08%Malaysia Government Bond RM8,000,000 3.76% 20/4/2023 1,988,577 0.06%Malaysia Government Bond RM7,500,000 3.88% 14/3/2025 1,894,310 0.06%Malaysia Government Bond RM7,500,000 3.80% 30/9/2022 1,850,720 0.06%Petronas Capital Ltd. $500,000 3.50% 18/3/2025 541,486 0.01%test - - - 11,931,642 0.37%Mexico 0.46% (2020: 0.45%)Mexican Bonos MXN65,000,000 5.75% 5/3/2026 3,180,610 0.10%Mexican Bonos MXN47,000,000 8.00% 5/9/2024 2,486,207 0.08%Mexican Bonos MXN40,000,000 10.00% 5/12/2024 2,245,852 0.07%Mexican Bonos MXN22,000,000 8.00% 7/12/2023 1,158,740 0.04%Mexican Bonos MXN20,000,000 6.75% 9/3/2023 1,023,635 0.03%Mexico Government International Bond $619,000 3.60% 30/1/2025 679,472 0.02%Mexico Government International Bond $600,000 4.13% 21/1/2026 676,621 0.02%Mexico Government International Bond €400,000 1.38% 15/1/2025 494,788 0.01%Mexico Government International Bond $400,000 3.90% 27/4/2025 443,458 0.01%BBVA Bancomer SA $400,000 4.38% 10/4/2024 434,627 0.01%America Movil SAB de CV $325,000 3.13% 16/7/2022 333,840 0.01%Grupo Bimbo SAB de CV $300,000 3.88% 27/6/2024 324,256 0.01%Grupo Televisa SAB $200,000 4.63% 30/1/2026 222,281 0.01%Trust Fibra Uno $200,000 5.25% 15/12/2024 222,186 0.01%Comision Federal de Electricidad $200,000 4.88% 15/1/2024 218,047 0.01%Southern Copper Corp. $200,000 3.88% 23/4/2025 217,961 0.01%Sigma Alimentos SA de CV $200,000 4.13% 2/5/2026 217,530 0.01%Banco Santander Mexico SA Institucion de Banca Multiple Grupo
Financiero Santand $150,000 5.38% 17/4/2025 170,231 0.00%Banco Santander Mexico SA Institucion de Banca Multiple Grupo
Financiero Santand $150,000 5.38% 17/4/2025 170,231 0.00%Mexico Government International Bond $38,000 4.00% 2/10/2023 41,152 0.00%test - - - 14,961,725 0.46%

756
Vanguard Global Short-Term Bond Index Fund
Principal CouponMaturity
DateFair Value
US Dollars ($)% of Total
Net AssetsNetherlands 1.67% (2020: 1.65%)Netherlands Government Bond €4,400,000 2.25% 15/7/2022 5,378,125 0.17%Netherlands Government Bond €3,500,000 0.00% 15/1/2024 4,224,511 0.13%Netherlands Government Bond €2,500,000 0.25% 15/7/2025 3,066,544 0.09%Nederlandse Waterschapsbank NV £1,900,000 0.25% 15/12/2025 2,587,881 0.08%Royal Schiphol Group NV €2,060,000 0.00% 22/4/2025 2,446,277 0.07%NIBC Bank NV €1,900,000 1.13% 19/4/2023 2,303,951 0.07%Netherlands Government Bond €1,500,000 3.75% 15/1/2023 1,902,188 0.06%Netherlands Government Bond €1,400,000 2.00% 15/7/2024 1,796,434 0.05%Netherlands Government Bond €1,400,000 1.75% 15/7/2023 1,744,004 0.05%BNG Bank NV €1,300,000 0.05% 2/4/2025 1,569,109 0.05%BNG Bank NV €1,000,000 3.88% 26/5/2023 1,285,700 0.04%Shell International Finance BV €1,000,000 0.50% 11/5/2024 1,210,683 0.04%BNG Bank NV €1,000,000 0.25% 10/1/2024 1,208,082 0.04%ING Groep NV^ €1,000,000 0.10% 3/9/2025 1,188,140 0.04%de Volksbank NV €800,000 0.25% 22/6/2026 943,790 0.03%Nationale-Nederlanden Levensverzekering Maatschappij NV^ €700,000 9.00% 29/8/2042 916,335 0.03%Cooperatieve Rabobank UA $757,000 4.38% 4/8/2025 843,994 0.03%BNG Bank NV $800,000 0.75% 17/4/2023 806,668 0.02%NN Group NV^ €600,000 4.63% 8/4/2044 793,234 0.02%ABN AMRO Bank NV^ $775,000 1.54% 16/6/2027 770,636 0.02%JDE Peet’s NV €600,000 0.00% 16/1/2026 707,370 0.02%Cooperatieve Rabobank UA £500,000 1.25% 14/1/2025 697,472 0.02%Heineken NV €500,000 1.63% 30/3/2025 630,994 0.02%Cooperatieve Rabobank UA^ $625,000 1.34% 24/6/2026 627,254 0.02%TenneT Holding BV €500,000 1.00% 13/6/2026 621,964 0.02%ABN AMRO Bank NV €500,000 0.88% 15/1/2024 610,145 0.02%Nederlandse Waterschapsbank NV €500,000 0.25% 7/6/2024 605,370 0.02%Cooperatieve Rabobank UA €500,000 0.25% 31/5/2024 604,633 0.02%Aegon Bank NV €500,000 0.25% 25/5/2023 600,340 0.02%Nederlandse Waterschapsbank NV €500,000 0.00% 14/4/2023 598,502 0.02%Cooperatieve Rabobank UA $550,000 2.75% 10/1/2023 569,979 0.02%Cooperatieve Rabobank UA $500,000 3.88% 26/9/2023 536,876 0.02%LeasePlan Corp. NV $500,000 2.88% 24/10/2024 525,493 0.02%Nederlandse Waterschapsbank NV $500,000 1.75% 15/1/2025 518,837 0.02%Shell International Finance BV $500,000 0.38% 15/9/2023 500,030 0.01%Shell International Finance BV €400,000 1.13% 7/4/2024 492,336 0.01%Cooperatieve Rabobank UA €400,000 0.75% 29/8/2023 484,498 0.01%Nationale-Nederlanden Bank NV €400,000 0.38% 26/2/2025 481,641 0.01%Shell International Finance BV $400,000 3.25% 11/5/2025 434,326 0.01%BNG Bank NV $400,000 3.00% 20/9/2023 423,106 0.01%Nederlandse Waterschapsbank NV €300,000 0.13% 17/1/2024 361,550 0.01%Achmea Bank NV €300,000 0.01% 16/6/2025 359,798 0.01%Shell International Finance BV $325,000 3.40% 12/8/2023 345,284 0.01%NXP BV/NXP Funding LLC $250,000 4.88% 1/3/2024 275,234 0.01%Cooperatieve Rabobank UA $250,000 4.63% 1/12/2023 273,237 0.01%NXP BV/NXP Funding LLC $250,000 4.63% 1/6/2023 268,652 0.01%Cooperatieve Rabobank UA $250,000 3.95% 9/11/2022 261,682 0.01%Nederlandse Waterschapsbank NV $250,000 0.13% 15/2/2023 249,413 0.01%ABN AMRO Bank NV €200,000 1.25% 28/5/2025 247,852 0.01%NIBC Bank NV €200,000 2.00% 9/4/2024 247,645 0.01%ING Groep NV €200,000 1.00% 20/9/2023 243,739 0.01%LeasePlan Corp. NV €200,000 1.00% 2/5/2023 242,444 0.01%ING Groep NV $200,000 4.10% 2/10/2023 215,555 0.01%NXP BV/NXP Funding LLC $200,000 3.88% 1/9/2022 207,467 0.01%BNG Bank NV $200,000 1.50% 16/10/2024 205,743 0.01%BNG Bank NV $200,000 1.50% 6/9/2022 203,079 0.01%Viterra Finance BV $200,000 2.00% 21/4/2026 200,267 0.01%Nederlandse Waterschapsbank NV $200,000 0.50% 2/12/2025 196,908 0.01%LeasePlan Corp. NV €162,000 0.75% 3/10/2022 194,474 0.01%Euronext NV €155,000 0.13% 17/5/2026 184,263 0.01%Shell International Finance BV $125,000 2.00% 7/11/2024 130,078 0.00%Heineken NV $125,000 2.75% 1/4/2023 129,658 0.00%LeasePlan Corp. NV €100,000 1.38% 7/3/2024 123,253 0.00%Akzo Nobel NV €100,000 2.63% 27/7/2022 122,445 0.00%de Volksbank NV €100,000 0.01% 16/9/2024 119,317 0.00%Shell International Finance BV $100,000 3.50% 13/11/2023 106,909 0.00%Shell International Finance BV $100,000 2.38% 6/4/2025 105,237 0.00%Shell International Finance BV $75,000 2.25% 6/1/2023 77,196 0.00%test - - - 54,155,831 1.67%

757
Vanguard Global Short-Term Bond Index Fund
Principal CouponMaturity
DateFair Value
US Dollars ($)% of Total
Net AssetsNew Zealand 0.34% (2020: 0.37%)New Zealand Government Bond NZ($)2,960,000 2.75% 15/4/2025 2,207,548 0.07%New Zealand Government Bond NZ($)2,050,000 5.50% 15/4/2023 1,559,297 0.05%BNZ International Funding Ltd. €1,000,000 0.50% 3/7/2024 1,215,779 0.04%ANZ New Zealand Int'l Ltd. €1,000,000 0.50% 17/1/2024 1,211,318 0.04%New Zealand Local Government Funding Agency Bond NZ($)1,000,000 2.75% 15/4/2025 737,286 0.02%New Zealand Local Government Funding Agency Bond NZ($)1,000,000 2.25% 15/4/2024 722,680 0.02%New Zealand Government Bond NZ($)1,000,000 0.50% 15/5/2026 677,764 0.02%ASB Finance Ltd. €500,000 0.63% 18/10/2024 610,833 0.02%Westpac Securities NZ Ltd. CHF500,000 0.38% 5/2/2024 551,618 0.02%New Zealand Government Bond NZ($)565,000 0.50% 15/5/2024 392,041 0.01%BNZ International Funding Ltd. $250,000 3.38% 1/3/2023 262,296 0.01%BNZ International Funding Ltd. $250,000 2.65% 3/11/2022 257,639 0.01%Westpac Securities NZ Ltd. €200,000 0.30% 25/6/2024 240,671 0.01%ASB Bank Ltd. $200,000 3.13% 23/5/2024 213,395 0.00%test - - - 10,860,165 0.34%Norway 0.64% (2020: 0.63%)Sparebanken Vest Boligkreditt A.S. €2,000,000 0.01% 24/11/2025 2,401,496 0.07%Norway Government Bond NOK(kr)20,000,000 1.50% 19/2/2026 2,366,102 0.07%Kommunalbanken A.S. AU($)2,000,000 4.50% 17/4/2023 1,614,473 0.05%Kommunalbanken A.S. £1,000,000 0.25% 15/12/2025 1,361,923 0.04%Eika Boligkreditt A.S. €1,000,000 0.38% 26/2/2025 1,216,732 0.04%DNB Boligkreditt A.S. €1,000,000 0.25% 23/1/2023 1,199,551 0.04%Norway Government Bond NOK(kr)10,000,000 2.00% 24/5/2023 1,191,552 0.04%Kommunalbanken A.S. $1,000,000 0.88% 12/3/2025 1,005,154 0.03%Equinor A.S.A €800,000 0.88% 17/2/2023 964,531 0.03%DNB Bank A.S.A €700,000 0.05% 14/11/2023 836,934 0.03%Norway Government Bond NOK(kr)6,000,000 3.00% 14/3/2024 736,838 0.02%Norway Government Bond NOK(kr)6,000,000 1.75% 13/3/2025 715,875 0.02%Sparebanken Soer Boligkreditt A.S. €400,000 0.38% 20/2/2023 480,926 0.02%Equinor A.S.A $400,000 2.88% 6/4/2025 427,379 0.01%Sparebank 1 Oestlandet €300,000 0.88% 13/3/2023 362,952 0.01%DNB Boligkreditt A.S. €300,000 0.38% 14/11/2023 362,619 0.01%Santander Consumer Bank A.S. €300,000 0.13% 14/4/2026 353,957 0.01%DNB Boligkreditt A.S. $300,000 2.50% 28/3/2022 305,012 0.01%DNB Bank A.S.A^ $300,000 1.13% 16/9/2026 297,651 0.01%Equinor A.S.A $250,000 2.65% 15/1/2024 262,843 0.01%Santander Consumer Bank A.S. €200,000 0.13% 25/2/2025 237,536 0.01%Kommunalbanken A.S. $200,000 2.00% 19/6/2024 208,556 0.01%Kommunalbanken A.S. $200,000 0.25% 4/11/2022 200,088 0.01%Kommunalbanken A.S. $200,000 0.25% 8/12/2023 199,181 0.01%Kommunalbanken A.S. $200,000 0.50% 13/1/2026 196,616 0.01%Aker BP A.S.A $150,000 3.00% 15/1/2025 157,628 0.01%Equinor A.S.A $140,000 2.45% 17/1/2023 144,483 0.01%Kommunalbanken A.S. £100,000 1.00% 12/12/2024 140,690 0.00%Telenor A.S.A €100,000 2.63% 6/12/2024 130,073 0.00%Santander Consumer Bank A.S. €100,000 0.75% 1/3/2023 120,534 0.00%Sparebanken Vest Boligkreditt A.S. €100,000 0.13% 15/3/2023 119,818 0.00%Santander Consumer Bank A.S. €100,000 0.13% 11/9/2024 119,140 0.00%Equinor A.S.A $100,000 3.70% 1/3/2024 108,101 0.00%Kommunalbanken A.S. $80,000 2.50% 11/1/2023 82,724 0.00%test - - - 20,629,668 0.64%Panama 0.03% (2020: 0.03%)Panama Government International Bond $400,000 7.13% 29/1/2026 496,467 0.02%Panama Government International Bond $355,000 3.75% 16/3/2025 386,386 0.01%test - - - 882,853 0.03%Peru 0.06% (2020: 0.05%)Peruvian Government International Bond $400,000 7.35% 21/7/2025 490,538 0.02%Banco de Credito del Peru $400,000 4.25% 1/4/2023 419,055 0.01%Peru Government Bond PEN800,000 5.70% 12/8/2024 233,581 0.01%Kallpa Generacion SA $200,000 4.88% 24/5/2026 210,748 0.01%Peruvian Government International Bond $200,000 2.39% 23/1/2026 206,431 0.01%Banco de Credito del Peru^ $150,000 3.13% 1/7/2030 149,184 0.00%Consorcio Transmantaro SA $100,000 4.38% 7/5/2023 104,502 0.00%Peru Government Bond PEN150,000 5.20% 12/9/2023 42,826 0.00%test - - - 1,856,865 0.06%Philippines 0.10% (2020: 0.07%)Philippine Government International Bond €1,000,000 0.00% 3/2/2023 1,185,057 0.04%Philippine Government International Bond $600,000 5.50% 30/3/2026 725,926 0.02%Rizal Commercial Banking Corp. $400,000 3.00% 11/9/2024 421,677 0.01%Philippine Government International Bond €273,000 0.25% 28/4/2025 324,985 0.01%
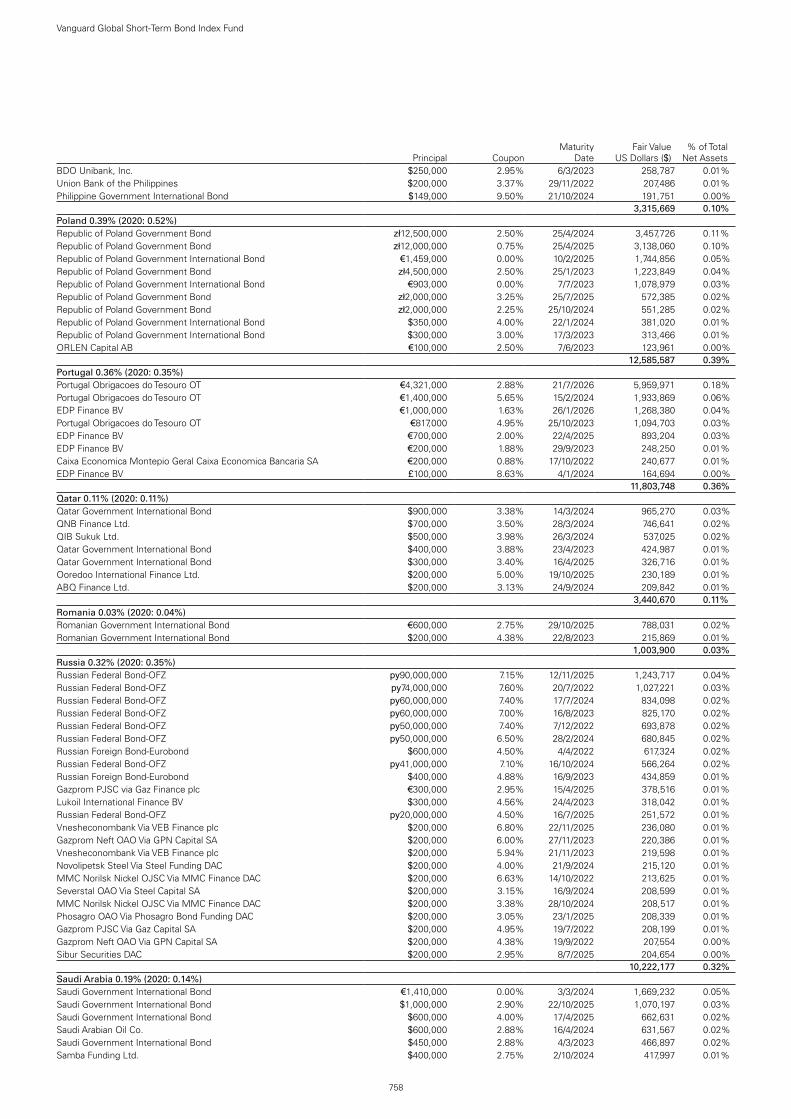
758
Vanguard Global Short-Term Bond Index Fund
Principal CouponMaturity
DateFair Value
US Dollars ($)% of Total
Net AssetsBDO Unibank, Inc. $250,000 2.95% 6/3/2023 258,787 0.01%Union Bank of the Philippines $200,000 3.37% 29/11/2022 207,486 0.01%Philippine Government International Bond $149,000 9.50% 21/10/2024 191,751 0.00%test - - - 3,315,669 0.10%Poland 0.39% (2020: 0.52%)Republic of Poland Government Bond zł12,500,000 2.50% 25/4/2024 3,457,726 0.11%Republic of Poland Government Bond zł12,000,000 0.75% 25/4/2025 3,138,060 0.10%Republic of Poland Government International Bond €1,459,000 0.00% 10/2/2025 1,744,856 0.05%Republic of Poland Government Bond zł4,500,000 2.50% 25/1/2023 1,223,849 0.04%Republic of Poland Government International Bond €903,000 0.00% 7/7/2023 1,078,979 0.03%Republic of Poland Government Bond zł2,000,000 3.25% 25/7/2025 572,385 0.02%Republic of Poland Government Bond zł2,000,000 2.25% 25/10/2024 551,285 0.02%Republic of Poland Government International Bond $350,000 4.00% 22/1/2024 381,020 0.01%Republic of Poland Government International Bond $300,000 3.00% 17/3/2023 313,466 0.01%ORLEN Capital AB €100,000 2.50% 7/6/2023 123,961 0.00%test - - - 12,585,587 0.39%Portugal 0.36% (2020: 0.35%)Portugal Obrigacoes do Tesouro OT €4,321,000 2.88% 21/7/2026 5,959,971 0.18%Portugal Obrigacoes do Tesouro OT €1,400,000 5.65% 15/2/2024 1,933,869 0.06%EDP Finance BV €1,000,000 1.63% 26/1/2026 1,268,380 0.04%Portugal Obrigacoes do Tesouro OT €817,000 4.95% 25/10/2023 1,094,703 0.03%EDP Finance BV €700,000 2.00% 22/4/2025 893,204 0.03%EDP Finance BV €200,000 1.88% 29/9/2023 248,250 0.01%Caixa Economica Montepio Geral Caixa Economica Bancaria SA €200,000 0.88% 17/10/2022 240,677 0.01%EDP Finance BV £100,000 8.63% 4/1/2024 164,694 0.00%test - - - 11,803,748 0.36%Qatar 0.11% (2020: 0.11%)Qatar Government International Bond $900,000 3.38% 14/3/2024 965,270 0.03%QNB Finance Ltd. $700,000 3.50% 28/3/2024 746,641 0.02%QIB Sukuk Ltd. $500,000 3.98% 26/3/2024 537,025 0.02%Qatar Government International Bond $400,000 3.88% 23/4/2023 424,987 0.01%Qatar Government International Bond $300,000 3.40% 16/4/2025 326,716 0.01%Ooredoo International Finance Ltd. $200,000 5.00% 19/10/2025 230,189 0.01%ABQ Finance Ltd. $200,000 3.13% 24/9/2024 209,842 0.01%test - - - 3,440,670 0.11%Romania 0.03% (2020: 0.04%)Romanian Government International Bond €600,000 2.75% 29/10/2025 788,031 0.02%Romanian Government International Bond $200,000 4.38% 22/8/2023 215,869 0.01%test - - - 1,003,900 0.03%Russia 0.32% (2020: 0.35%)Russian Federal Bond-OFZ py90,000,000 7.15% 12/11/2025 1,243,717 0.04%Russian Federal Bond-OFZ py74,000,000 7.60% 20/7/2022 1,027,221 0.03%Russian Federal Bond-OFZ py60,000,000 7.40% 17/7/2024 834,098 0.02%Russian Federal Bond-OFZ py60,000,000 7.00% 16/8/2023 825,170 0.02%Russian Federal Bond-OFZ py50,000,000 7.40% 7/12/2022 693,878 0.02%Russian Federal Bond-OFZ py50,000,000 6.50% 28/2/2024 680,845 0.02%Russian Foreign Bond-Eurobond $600,000 4.50% 4/4/2022 617,324 0.02%Russian Federal Bond-OFZ py41,000,000 7.10% 16/10/2024 566,264 0.02%Russian Foreign Bond-Eurobond $400,000 4.88% 16/9/2023 434,859 0.01%Gazprom PJSC via Gaz Finance plc €300,000 2.95% 15/4/2025 378,516 0.01%Lukoil International Finance BV $300,000 4.56% 24/4/2023 318,042 0.01%Russian Federal Bond-OFZ py20,000,000 4.50% 16/7/2025 251,572 0.01%Vnesheconombank Via VEB Finance plc $200,000 6.80% 22/11/2025 236,080 0.01%Gazprom Neft OAO Via GPN Capital SA $200,000 6.00% 27/11/2023 220,386 0.01%Vnesheconombank Via VEB Finance plc $200,000 5.94% 21/11/2023 219,598 0.01%Novolipetsk Steel Via Steel Funding DAC $200,000 4.00% 21/9/2024 215,120 0.01%MMC Norilsk Nickel OJSC Via MMC Finance DAC $200,000 6.63% 14/10/2022 213,625 0.01%Severstal OAO Via Steel Capital SA $200,000 3.15% 16/9/2024 208,599 0.01%MMC Norilsk Nickel OJSC Via MMC Finance DAC $200,000 3.38% 28/10/2024 208,517 0.01%Phosagro OAO Via Phosagro Bond Funding DAC $200,000 3.05% 23/1/2025 208,339 0.01%Gazprom PJSC Via Gaz Capital SA $200,000 4.95% 19/7/2022 208,199 0.01%Gazprom Neft OAO Via GPN Capital SA $200,000 4.38% 19/9/2022 207,554 0.00%Sibur Securities DAC $200,000 2.95% 8/7/2025 204,654 0.00%test - - - 10,222,177 0.32%Saudi Arabia 0.19% (2020: 0.14%)Saudi Government International Bond €1,410,000 0.00% 3/3/2024 1,669,232 0.05%Saudi Government International Bond $1,000,000 2.90% 22/10/2025 1,070,197 0.03%Saudi Government International Bond $600,000 4.00% 17/4/2025 662,631 0.02%Saudi Arabian Oil Co. $600,000 2.88% 16/4/2024 631,567 0.02%Saudi Government International Bond $450,000 2.88% 4/3/2023 466,897 0.02%Samba Funding Ltd. $400,000 2.75% 2/10/2024 417,997 0.01%
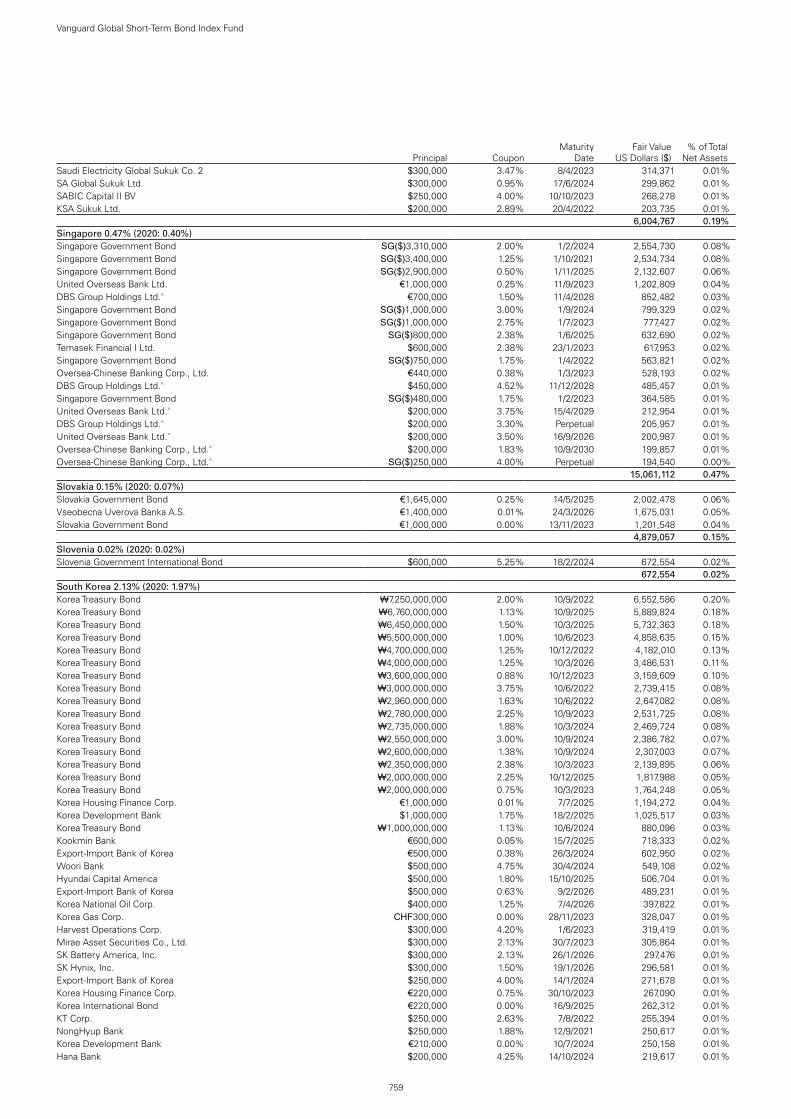
759
Vanguard Global Short-Term Bond Index Fund
Principal CouponMaturity
DateFair Value
US Dollars ($)% of Total
Net AssetsSaudi Electricity Global Sukuk Co. 2 $300,000 3.47% 8/4/2023 314,371 0.01%SA Global Sukuk Ltd. $300,000 0.95% 17/6/2024 299,862 0.01%SABIC Capital II BV $250,000 4.00% 10/10/2023 268,278 0.01%KSA Sukuk Ltd. $200,000 2.89% 20/4/2022 203,735 0.01%test - - - 6,004,767 0.19%Singapore 0.47% (2020: 0.40%)Singapore Government Bond SG($)3,310,000 2.00% 1/2/2024 2,554,730 0.08%Singapore Government Bond SG($)3,400,000 1.25% 1/10/2021 2,534,734 0.08%Singapore Government Bond SG($)2,900,000 0.50% 1/11/2025 2,132,607 0.06%United Overseas Bank Ltd. €1,000,000 0.25% 11/9/2023 1,202,809 0.04%DBS Group Holdings Ltd.^ €700,000 1.50% 11/4/2028 852,482 0.03%Singapore Government Bond SG($)1,000,000 3.00% 1/9/2024 799,329 0.02%Singapore Government Bond SG($)1,000,000 2.75% 1/7/2023 777,427 0.02%Singapore Government Bond SG($)800,000 2.38% 1/6/2025 632,690 0.02%Temasek Financial I Ltd. $600,000 2.38% 23/1/2023 617,953 0.02%Singapore Government Bond SG($)750,000 1.75% 1/4/2022 563,821 0.02%Oversea-Chinese Banking Corp., Ltd. €440,000 0.38% 1/3/2023 528,193 0.02%DBS Group Holdings Ltd.^ $450,000 4.52% 11/12/2028 485,457 0.01%Singapore Government Bond SG($)480,000 1.75% 1/2/2023 364,585 0.01%United Overseas Bank Ltd.^ $200,000 3.75% 15/4/2029 212,954 0.01%DBS Group Holdings Ltd.^ $200,000 3.30% Perpetual 205,957 0.01%United Overseas Bank Ltd.^ $200,000 3.50% 16/9/2026 200,987 0.01%Oversea-Chinese Banking Corp., Ltd.^ $200,000 1.83% 10/9/2030 199,857 0.01%Oversea-Chinese Banking Corp., Ltd.^ SG($)250,000 4.00% Perpetual 194,540 0.00%test - - - 15,061,112 0.47%Slovakia 0.15% (2020: 0.07%)Slovakia Government Bond €1,645,000 0.25% 14/5/2025 2,002,478 0.06%Vseobecna Uverova Banka A.S. €1,400,000 0.01% 24/3/2026 1,675,031 0.05%Slovakia Government Bond €1,000,000 0.00% 13/11/2023 1,201,548 0.04%test - - - 4,879,057 0.15%Slovenia 0.02% (2020: 0.02%)Slovenia Government International Bond $600,000 5.25% 18/2/2024 672,554 0.02%test - - - 672,554 0.02%South Korea 2.13% (2020: 1.97%)Korea Treasury Bond ₩7,250,000,000 2.00% 10/9/2022 6,552,586 0.20%Korea Treasury Bond ₩6,760,000,000 1.13% 10/9/2025 5,889,824 0.18%Korea Treasury Bond ₩6,450,000,000 1.50% 10/3/2025 5,732,363 0.18%Korea Treasury Bond ₩5,500,000,000 1.00% 10/6/2023 4,858,635 0.15%Korea Treasury Bond ₩4,700,000,000 1.25% 10/12/2022 4,182,010 0.13%Korea Treasury Bond ₩4,000,000,000 1.25% 10/3/2026 3,486,531 0.11%Korea Treasury Bond ₩3,600,000,000 0.88% 10/12/2023 3,159,609 0.10%Korea Treasury Bond ₩3,000,000,000 3.75% 10/6/2022 2,739,415 0.08%Korea Treasury Bond ₩2,960,000,000 1.63% 10/6/2022 2,647,082 0.08%Korea Treasury Bond ₩2,780,000,000 2.25% 10/9/2023 2,531,725 0.08%Korea Treasury Bond ₩2,735,000,000 1.88% 10/3/2024 2,469,724 0.08%Korea Treasury Bond ₩2,550,000,000 3.00% 10/9/2024 2,386,782 0.07%Korea Treasury Bond ₩2,600,000,000 1.38% 10/9/2024 2,307,003 0.07%Korea Treasury Bond ₩2,350,000,000 2.38% 10/3/2023 2,139,895 0.06%Korea Treasury Bond ₩2,000,000,000 2.25% 10/12/2025 1,817,988 0.05%Korea Treasury Bond ₩2,000,000,000 0.75% 10/3/2023 1,764,248 0.05%Korea Housing Finance Corp. €1,000,000 0.01% 7/7/2025 1,194,272 0.04%Korea Development Bank $1,000,000 1.75% 18/2/2025 1,025,517 0.03%Korea Treasury Bond ₩1,000,000,000 1.13% 10/6/2024 880,096 0.03%Kookmin Bank €600,000 0.05% 15/7/2025 718,333 0.02%Export-Import Bank of Korea €500,000 0.38% 26/3/2024 602,950 0.02%Woori Bank $500,000 4.75% 30/4/2024 549,108 0.02%Hyundai Capital America $500,000 1.80% 15/10/2025 506,704 0.01%Export-Import Bank of Korea $500,000 0.63% 9/2/2026 489,231 0.01%Korea National Oil Corp. $400,000 1.25% 7/4/2026 397,822 0.01%Korea Gas Corp. CHF300,000 0.00% 28/11/2023 328,047 0.01%Harvest Operations Corp. $300,000 4.20% 1/6/2023 319,419 0.01%Mirae Asset Securities Co., Ltd. $300,000 2.13% 30/7/2023 305,864 0.01%SK Battery America, Inc. $300,000 2.13% 26/1/2026 297,476 0.01%SK Hynix, Inc. $300,000 1.50% 19/1/2026 296,581 0.01%Export-Import Bank of Korea $250,000 4.00% 14/1/2024 271,678 0.01%Korea Housing Finance Corp. €220,000 0.75% 30/10/2023 267,090 0.01%Korea International Bond €220,000 0.00% 16/9/2025 262,312 0.01%KT Corp. $250,000 2.63% 7/8/2022 255,394 0.01%NongHyup Bank $250,000 1.88% 12/9/2021 250,617 0.01%Korea Development Bank €210,000 0.00% 10/7/2024 250,158 0.01%Hana Bank $200,000 4.25% 14/10/2024 219,617 0.01%

760
Vanguard Global Short-Term Bond Index Fund
Principal CouponMaturity
DateFair Value
US Dollars ($)% of Total
Net AssetsHyundai Capital America $200,000 5.75% 6/4/2023 217,226 0.01%Shinhan Bank Co., Ltd. $200,000 3.88% 5/11/2023 214,729 0.01%Korea East-West Power Co., Ltd. $200,000 3.88% 19/7/2023 213,226 0.01%NongHyup Bank $200,000 3.88% 30/7/2023 213,070 0.01%POSCO $200,000 2.75% 15/7/2024 210,196 0.01%Hanwha Life Insurance Co., Ltd.^ $200,000 4.70% Perpetual 208,385 0.01%Kia Corp. $200,000 3.00% 25/4/2023 208,042 0.01%Hankook Tire & Technology Co., Ltd. $200,000 3.50% 30/1/2023 207,931 0.01%Kookmin Bank $200,000 2.88% 25/3/2023 207,642 0.01%POSCO $200,000 2.50% 17/1/2025 207,494 0.01%Korea Gas Corp. $200,000 2.75% 20/7/2022 204,747 0.01%Korea East-West Power Co., Ltd. $200,000 2.63% 19/6/2022 204,026 0.01%Korea Resources Corp. $200,000 3.00% 24/4/2022 203,688 0.01%Hyundai Capital Services, Inc. $200,000 3.00% 6/3/2022 203,083 0.01%Industrial Bank of Korea $200,000 1.04% 22/6/2025 199,567 0.01%Hyundai Capital America $200,000 1.30% 8/1/2026 197,463 0.00%SK Telecom Co., Ltd. $150,000 3.75% 16/4/2023 158,013 0.00%Hyundai Capital America $125,000 3.95% 1/2/2022 127,370 0.00%Hyundai Capital America $120,000 2.38% 10/2/2023 123,051 0.00%LG Chem Ltd. €100,000 0.50% 15/4/2023 119,686 0.00%Hyundai Capital America $100,000 1.25% 18/9/2023 100,899 0.00%Hyundai Capital America $100,000 0.80% 8/1/2024 99,679 0.00%Hyundai Capital America $100,000 0.88% 14/6/2024 99,551 0.00%Hyundai Capital America $100,000 1.50% 15/6/2026 99,214 0.00%Hyundai Capital America $75,000 2.85% 1/11/2022 77,117 0.00%Hyundai Capital America $50,000 2.65% 10/2/2025 52,185 0.00%Hyundai Capital America $25,000 4.30% 1/2/2024 27,072 0.00%Hyundai Capital America $25,000 4.13% 8/6/2023 26,584 0.00%Hyundai Capital America $25,000 3.10% 5/4/2022 25,455 0.00%test - - - 68,810,097 2.13%Spain 2.56% (2020: 2.82%)Spain Government Bond €10,962,000 0.00% 31/1/2026 13,147,210 0.41%Spain Government Bond €8,769,000 0.00% 30/4/2023 10,496,483 0.32%Spain Government Bond €8,400,000 0.00% 31/1/2025 10,095,037 0.31%Spain Government Bond €5,476,000 0.25% 30/7/2024 6,630,368 0.21%Spain Government Bond €3,000,000 4.65% 30/7/2025 4,290,837 0.13%Spain Government Bond €3,000,000 4.40% 31/10/2023 3,967,416 0.12%Spain Government Bond €3,094,000 0.00% 31/5/2024 3,713,228 0.12%Banco Santander SA €2,000,000 0.01% 27/2/2025 2,399,983 0.07%Spain Government Bond €1,692,000 2.75% 31/10/2024 2,220,531 0.07%Spain Government Bond €1,574,000 3.80% 30/4/2024 2,092,394 0.06%Spain Government Bond €1,500,000 4.80% 31/1/2024 2,022,808 0.06%Spain Government Bond €1,346,000 0.35% 30/7/2023 1,624,349 0.05%Autonomous Community of Madrid Spain €1,065,000 1.00% 30/9/2024 1,315,727 0.04%CaixaBank SA €1,000,000 1.00% 14/3/2023 1,214,574 0.04%CaixaBank SA €800,000 1.75% 24/10/2023 988,263 0.03%Fondo de Titulizacion Del Deficit Del Sistema Electrico FTA €800,000 0.50% 17/3/2023 963,655 0.03%Santander Consumer Finance SA €800,000 0.38% 17/1/2025 960,111 0.03%Banco Santander SA $800,000 5.18% 19/11/2025 915,214 0.03%Telefonica Emisiones SA €700,000 1.07% 5/2/2024 854,553 0.03%CaixaBank SA €700,000 1.13% 5/8/2022 844,351 0.03%Banco Bilbao Vizcaya Argentaria SA €500,000 4.00% 25/2/2025 687,602 0.02%Adif Alta Velocidad €500,000 1.25% 4/5/2026 631,436 0.02%Banco Bilbao Vizcaya Argentaria SA €500,000 1.38% 14/5/2025 622,720 0.02%Bankinter SA €500,000 1.00% 5/2/2025 619,638 0.02%Banco de Sabadell SA €500,000 1.63% 7/3/2024 617,161 0.02%Iberdrola International BV^ €500,000 1.87% Perpetual 611,562 0.02%Santander Consumer Finance SA €500,000 1.00% 27/2/2024 610,177 0.02%Instituto de Credito Oficial €500,000 0.75% 31/10/2023 609,433 0.02%Cajamar Caja Rural SCC €500,000 0.88% 18/6/2023 606,848 0.02%Banco Santander SA €500,000 0.75% 9/9/2022 601,215 0.02%Naturgy Finance BV €300,000 2.88% 11/3/2024 384,188 0.01%Banco Santander SA €300,000 1.38% 5/1/2026 372,967 0.01%Criteria Caixa SA €300,000 1.38% 10/4/2024 368,276 0.01%Santander Consumer Finance SA €300,000 1.13% 9/10/2023 366,503 0.01%Fondo de Titulizacion Del Deficit Del Sistema Electrico FTA €300,000 0.85% 17/12/2023 366,447 0.01%CaixaBank SA €300,000 0.63% 1/10/2024 361,461 0.01%Santander Consumer Finance SA €300,000 0.38% 27/6/2024 360,153 0.01%Fondo de Titulizacion Del Deficit Del Sistema Electrico FTA €300,000 0.01% 17/9/2025 359,794 0.01%Iberdrola International BV €200,000 1.88% 8/10/2024 253,178 0.01%Banco Santander SA €200,000 1.38% 14/12/2022 242,967 0.01%

761
Vanguard Global Short-Term Bond Index Fund
Principal CouponMaturity
DateFair Value
US Dollars ($)% of Total
Net AssetsAbertis Infraestructuras SA €200,000 0.63% 15/7/2025 241,591 0.01%Instituto de Credito Oficial €200,000 0.25% 30/4/2024 241,550 0.01%FCC Servicios Medio Ambiente Holding SAU €200,000 0.82% 4/12/2023 241,157 0.01%Banco Santander SA $200,000 3.85% 12/4/2023 211,417 0.01%Banco Santander SA $200,000 1.85% 25/3/2026 202,299 0.01%Iberdrola Finanzas SA £100,000 7.38% 29/1/2024 161,498 0.01%Telefonica Emisiones SA $150,000 4.57% 27/4/2023 160,647 0.01%Redexis Gas Finance BV €100,000 1.88% 28/5/2025 125,732 0.00%Banco Bilbao Vizcaya Argentaria SA^ €100,000 2.58% 22/2/2029 125,001 0.00%Ferrovial Emisiones SA €100,000 1.38% 31/3/2025 124,455 0.00%Merlin Properties Socimi SA €100,000 2.23% 25/4/2023 122,697 0.00%Naturgy Finance BV €100,000 0.88% 15/5/2025 122,581 0.00%Banco Bilbao Vizcaya Argentaria SA €100,000 0.75% 4/6/2025 122,169 0.00%Iberdrola International BV €100,000 1.13% 27/1/2023 121,308 0.00%Banco de Sabadell SA^ €100,000 0.63% 7/11/2025 119,564 0.00%test - - - 82,854,484 2.56%Supranational 3.57% (2020: 3.58%)European Investment Bank $3,736,000 0.38% 26/3/2026 3,652,070 0.11%European Investment Bank €3,000,000 0.00% 25/3/2025 3,619,241 0.11%European Stability Mechanism €3,000,000 0.10% 31/7/2023 3,604,845 0.11%European Investment Bank €2,500,000 0.00% 13/3/2026 3,020,563 0.09%Asian Development Bank €2,500,000 0.20% 25/5/2023 3,004,433 0.09%European Investment Bank €2,400,000 0.05% 15/12/2023 2,889,875 0.09%European Union €2,210,000 0.00% 4/3/2026 2,672,215 0.08%European Financial Stability Facility €2,220,000 0.00% 19/4/2024 2,668,583 0.08%European Financial Stability Facility €2,100,000 0.13% 17/10/2023 2,527,110 0.08%African Development Bank £1,800,000 0.50% 22/6/2026 2,475,494 0.08%European Investment Bank $2,129,000 2.50% 15/10/2024 2,262,662 0.07%Asian Development Bank $2,000,000 0.63% 29/4/2025 1,993,161 0.06%European Union €1,500,000 0.00% 6/7/2026 1,813,395 0.06%Nordic Investment Bank €1,500,000 0.13% 10/6/2024 1,812,113 0.06%European Financial Stability Facility €1,500,000 0.00% 24/4/2023 1,797,769 0.06%European Financial Stability Facility €1,500,000 0.00% 17/11/2022 1,793,658 0.06%European Investment Bank $1,645,000 1.88% 10/2/2025 1,717,236 0.05%European Financial Stability Facility €1,400,000 0.00% 20/7/2026 1,688,655 0.05%Asian Development Bank AU($)1,925,000 3.75% 12/3/2025 1,602,850 0.05%International Bank for Reconstruction & Development $1,500,000 0.63% 22/4/2025 1,496,384 0.05%Inter-American Development Bank AU($)1,700,000 4.75% 27/8/2024 1,443,046 0.04%European Union €1,100,000 1.88% 4/4/2024 1,392,199 0.04%Asian Development Bank $1,350,000 1.75% 13/9/2022 1,375,050 0.04%European Financial Stability Facility €1,100,000 0.50% 20/1/2023 1,327,056 0.04%International Bank for Reconstruction & Development $1,300,000 0.75% 11/3/2025 1,303,438 0.04%Corp. Andina de Fomento €1,070,000 0.25% 4/2/2026 1,268,224 0.04%European Investment Bank $1,263,000 0.63% 25/7/2025 1,257,962 0.04%International Bank for Reconstruction & Development $1,230,000 2.13% 1/7/2022 1,253,990 0.04%European Investment Bank €1,000,000 0.88% 13/9/2024 1,239,068 0.04%Asian Development Bank €1,000,000 0.35% 16/7/2025 1,220,802 0.04%European Investment Bank €1,000,000 0.05% 24/5/2024 1,206,266 0.04%European Stability Mechanism €1,000,000 0.00% 14/3/2025 1,204,648 0.04%Council Of Europe Development Bank €1,000,000 0.38% 27/10/2022 1,200,856 0.04%European Investment Bank €1,000,000 0.00% 23/5/2023 1,199,212 0.04%European Stability Mechanism €980,000 0.00% 16/12/2024 1,180,976 0.04%Asian Development Bank $1,090,000 0.38% 11/6/2024 1,086,193 0.03%International Bank for Reconstruction & Development $1,000,000 2.50% 19/3/2024 1,055,038 0.03%Inter-American Development Bank $1,000,000 0.88% 3/4/2025 1,006,232 0.03%International Finance Corp. £700,000 0.25% 15/12/2025 954,954 0.03%Inter-American Development Bank $950,000 0.50% 24/5/2023 954,065 0.03%International Bank for Reconstruction & Development $950,000 0.25% 24/11/2023 947,126 0.03%European Investment Bank €700,000 0.50% 15/11/2023 852,039 0.03%Inter-American Development Bank $800,000 0.25% 15/11/2023 797,543 0.02%European Investment Bank $768,000 1.63% 14/3/2025 794,949 0.02%International Bank for Reconstruction & Development $750,000 3.00% 27/9/2023 793,929 0.02%Inter-American Development Bank $733,000 2.13% 15/1/2025 770,197 0.02%African Development Bank €609,000 0.25% 24/1/2024 735,472 0.02%International Bank for Reconstruction & Development $700,000 1.88% 19/6/2023 721,737 0.02%Inter-American Development Bank £500,000 1.25% 15/12/2025 712,456 0.02%Nordic Investment Bank £500,000 1.13% 15/12/2023 705,190 0.02%European Investment Bank £500,000 0.75% 15/11/2024 698,870 0.02%International Bank for Reconstruction & Development £500,000 0.50% 24/7/2023 694,689 0.02%European Investment Bank $600,000 3.25% 29/1/2024 643,363 0.02%European Financial Stability Facility €500,000 2.13% 19/2/2024 634,400 0.02%

762
Vanguard Global Short-Term Bond Index Fund
Principal CouponMaturity
DateFair Value
US Dollars ($)% of Total
Net AssetsEuropean Financial Stability Facility €500,000 1.75% 27/6/2024 633,144 0.02%European Investment Bank €500,000 1.63% 15/3/2023 615,558 0.02%IDB Trust Services Ltd. $600,000 2.26% 26/9/2022 612,329 0.02%European Financial Stability Facility €500,000 0.40% 17/2/2025 610,642 0.02%European Bank for Reconstruction & Development $600,000 0.25% 10/7/2023 599,187 0.02%Nordic Investment Bank €500,000 0.00% 6/4/2023 599,010 0.02%Nordic Investment Bank NOK(kr)5,000,000 1.38% 19/6/2023 586,008 0.02%European Investment Bank £400,000 2.50% 31/10/2022 569,702 0.02%European Investment Bank $560,000 1.38% 6/9/2022 567,885 0.02%European Investment Bank $535,000 2.88% 15/8/2023 563,727 0.02%European Investment Bank $525,000 2.00% 15/12/2022 538,570 0.02%International Bank for Reconstruction & Development $500,000 2.50% 29/7/2025 535,373 0.02%European Investment Bank $500,000 3.13% 14/12/2023 533,320 0.02%Asian Development Bank $500,000 2.63% 30/1/2024 528,156 0.02%Asian Development Bank $500,000 1.63% 24/1/2023 510,848 0.02%IDB Trust Services Ltd. $500,000 0.91% 25/6/2025 496,278 0.02%International Bank for Reconstruction & Development $500,000 0.50% 28/10/2025 493,929 0.02%International Finance Corp. $500,000 0.38% 16/7/2025 492,912 0.02%Asian Development Bank $500,000 0.50% 4/2/2026 491,988 0.02%International Development Association $500,000 0.38% 23/9/2025 491,087 0.02%African Development Bank $470,000 2.13% 16/11/2022 482,295 0.01%Nordic Investment Bank €400,000 0.38% 19/9/2022 479,870 0.01%International Bank for Reconstruction & Development CA($)600,000 0.63% 14/1/2026 472,955 0.01%European Investment Bank CA($)565,000 1.75% 30/7/2024 468,748 0.01%Asian Development Bank $435,000 2.75% 17/3/2023 453,431 0.01%Inter-American Development Bank $425,000 3.00% 21/2/2024 453,407 0.01%European Union €360,000 0.00% 4/11/2025 435,194 0.01%Arab Petroleum Investments Corp. $400,000 4.13% 18/9/2023 429,359 0.01%Inter-American Development Bank $400,000 2.63% 16/1/2024 422,210 0.01%International Finance Corp. $400,000 2.88% 31/7/2023 421,088 0.01%Nordic Investment Bank £300,000 1.13% 15/12/2022 420,038 0.01%European Investment Bank £300,000 0.75% 14/7/2023 418,840 0.01%International Bank for Reconstruction & Development $400,000 1.63% 15/1/2025 413,757 0.01%Asian Development Bank $400,000 0.25% 6/10/2023 398,978 0.01%Inter-American Development Bank $385,000 2.50% 18/1/2023 398,480 0.01%European Bank for Reconstruction & Development $400,000 0.50% 25/11/2025 394,504 0.01%International Bank for Reconstruction & Development $400,000 0.38% 28/7/2025 394,235 0.01%New Development Bank $400,000 0.63% 29/9/2025 393,810 0.01%Asian Development Bank $400,000 0.38% 3/9/2025 393,580 0.01%Inter-American Development Bank CA($)475,000 0.75% 15/10/2025 377,495 0.01%Asian Infrastructure Investment Bank $370,000 0.50% 27/1/2026 363,818 0.01%Asian Development Bank NZ($)500,000 3.00% 17/1/2023 361,865 0.01%Council Of Europe Development Bank €300,000 0.13% 25/5/2023 360,408 0.01%IDB Trust Services Ltd. $350,000 2.39% 12/4/2022 354,945 0.01%International Bank for Reconstruction & Development £250,000 0.88% 13/12/2024 350,599 0.01%International Bank for Reconstruction & Development AU($)450,000 2.60% 20/9/2022 347,962 0.01%Asian Infrastructure Investment Bank $300,000 2.25% 16/5/2024 314,720 0.01%Asian Development Bank AU($)400,000 2.65% 11/1/2023 311,480 0.01%African Development Bank $300,000 1.63% 16/9/2022 305,101 0.01%African Development Bank $300,000 0.88% 23/3/2026 299,723 0.01%Inter-American Development Bank $300,000 0.63% 15/7/2025 298,743 0.01%European Bank for Reconstruction & Development $300,000 0.50% 19/5/2025 297,424 0.01%European Stability Mechanism $290,000 2.13% 3/11/2022 297,293 0.01%European Bank for Reconstruction & Development $300,000 0.50% 28/1/2026 295,221 0.01%European Stability Mechanism $300,000 0.38% 10/9/2025 294,846 0.01%Inter-American Development Bank £200,000 1.38% 15/12/2024 285,176 0.01%Inter-American Development Bank $274,000 1.75% 14/3/2025 284,668 0.01%African Development Bank $250,000 3.00% 20/9/2023 264,487 0.01%Inter-American Development Bank $250,000 1.75% 14/9/2022 254,705 0.01%European Investment Bank $240,000 2.25% 15/8/2022 245,554 0.01%Council Of Europe Development Bank $245,000 0.38% 10/6/2024 244,034 0.01%European Bank for Reconstruction & Development $225,000 2.75% 7/3/2023 234,348 0.01%Corp. Andina de Fomento $220,000 2.75% 6/1/2023 226,909 0.01%Inter-American Development Bank $211,000 2.00% 2/6/2026 221,901 0.01%African Export-Import Bank $200,000 4.13% 20/6/2024 213,546 0.01%Black Sea Trade & Development Bank $200,000 3.50% 25/6/2024 211,857 0.01%Nordic Investment Bank $200,000 2.88% 19/7/2023 210,270 0.01%Nordic Investment Bank $200,000 2.25% 21/5/2024 209,964 0.01%Africa Finance Corp. $200,000 3.13% 16/6/2025 207,804 0.01%European Investment Bank $200,000 2.50% 15/3/2023 207,584 0.01%Inter-American Development Bank $200,000 3.00% 26/9/2022 206,923 0.01%

763
Vanguard Global Short-Term Bond Index Fund
Principal CouponMaturity
DateFair Value
US Dollars ($)% of Total
Net AssetsAsian Development Bank $200,000 1.50% 18/10/2024 205,947 0.01%International Finance Corp. $200,000 1.38% 16/10/2024 205,058 0.01%European Stability Mechanism $200,000 1.38% 11/9/2024 204,905 0.01%Nordic Investment Bank $200,000 1.38% 17/10/2022 202,966 0.01%Corp. Andina de Fomento $200,000 1.63% 23/9/2025 201,844 0.01%Arab Petroleum Investments Corp. $200,000 1.46% 30/6/2025 201,735 0.01%Nordic Investment Bank $200,000 0.38% 19/5/2023 200,296 0.01%International Development Association $200,000 0.88% 28/4/2026 199,492 0.01%Asian Infrastructure Investment Bank $200,000 0.50% 28/5/2025 198,016 0.01%Nordic Investment Bank $200,000 0.50% 21/1/2026 196,898 0.01%Nordic Investment Bank $200,000 0.38% 11/9/2025 196,560 0.01%International Bank for Reconstruction & Development CA($)211,000 1.80% 26/7/2024 175,316 0.01%European Investment Bank $150,000 2.63% 15/3/2024 158,772 0.00%Council Of Europe Development Bank $150,000 2.50% 27/2/2024 158,079 0.00%Council Of Europe Development Bank $150,000 2.63% 13/2/2023 155,602 0.00%International Bank for Reconstruction & Development CA($)185,000 2.25% 17/1/2023 153,519 0.00%Corp. Andina de Fomento $145,000 4.38% 15/6/2022 150,279 0.00%International Development Association $125,000 2.75% 24/4/2023 130,539 0.00%Council Of Europe Development Bank $125,000 1.38% 27/2/2025 128,109 0.00%European Bank for Reconstruction & Development $120,000 1.63% 27/9/2024 123,952 0.00%International Bank for Reconstruction & Development CA($)130,000 1.90% 16/1/2025 108,378 0.00%International Bank for Reconstruction & Development $100,000 1.50% 28/8/2024 102,982 0.00%Council Of Europe Development Bank $100,000 0.25% 10/6/2023 99,912 0.00%European Investment Bank $100,000 0.25% 15/9/2023 99,797 0.00%Council Of Europe Development Bank $100,000 0.25% 20/10/2023 99,728 0.00%International Bank for Reconstruction & Development $80,000 1.75% 19/4/2023 82,101 0.00%International Finance Corp. CA($)100,000 1.38% 13/9/2024 82,057 0.00%Asian Development Bank $75,000 1.88% 19/7/2022 76,340 0.00%European Stability Mechanism €62,893 0.00% 17/1/2022 74,807 0.00%International Bank for Reconstruction & Development $65,000 7.63% 19/1/2023 72,403 0.00%International Finance Corp. $70,000 2.00% 24/10/2022 71,641 0.00%European Investment Bank CA($)85,000 2.38% 18/1/2023 70,667 0.00%European Bank for Reconstruction & Development $25,000 1.50% 13/2/2025 25,740 0.00%test - - - 115,533,789 3.57%Sweden 1.40% (2020: 1.62%)Stadshypotek AB SEK(kr)32,000,000 1.50% 1/6/2023 3,849,717 0.12%Sveriges Sakerstallda Obligationer AB SEK(kr)24,000,000 0.50% 11/6/2025 2,829,149 0.09%Sweden Government Bond SEK(kr)22,575,000 1.50% 13/11/2023 2,749,178 0.08%Sweden Government Bond SEK(kr)20,000,000 2.50% 12/5/2025 2,579,921 0.08%Kommuninvest I Sverige AB SEK(kr)15,000,000 1.00% 12/5/2025 1,805,686 0.05%Nordea Hypotek AB SEK(kr)12,000,000 1.00% 17/9/2025 1,443,134 0.04%Svensk Exportkredit AB £1,000,000 0.13% 15/12/2025 1,354,774 0.04%Stadshypotek AB €1,100,000 0.38% 13/3/2026 1,345,108 0.04%Stadshypotek AB SEK(kr)10,000,000 1.50% 3/12/2024 1,221,365 0.04%Sweden Government Bond SEK(kr)10,000,000 3.50% 1/6/2022 1,210,411 0.04%Lansforsakringar Hypotek AB SEK(kr)10,000,000 1.25% 20/9/2023 1,200,932 0.04%Swedbank Hypotek AB SEK(kr)10,000,000 1.00% 18/9/2024 1,200,747 0.04%Nordea Hypotek AB SEK(kr)10,000,000 1.00% 18/9/2024 1,200,700 0.04%Skandinaviska Enskilda Banken AB SEK(kr)10,000,000 1.00% 20/12/2023 1,196,267 0.04%Kommuninvest I Sverige AB SEK(kr)10,000,000 0.38% 10/6/2026 1,165,995 0.03%Stadshypotek AB SEK(kr)8,000,000 0.50% 1/6/2026 938,386 0.03%Samhallsbyggnadsbolaget i Norden AB €700,000 1.75% 14/1/2025 869,904 0.03%Akelius Residential Property AB €700,000 1.13% 14/3/2024 852,989 0.03%Kommuninvest I Sverige AB SEK(kr)7,000,000 1.00% 13/11/2023 836,932 0.02%Svensk Exportkredit AB $800,000 0.50% 26/8/2025 789,050 0.02%Svensk Exportkredit AB $700,000 0.63% 14/5/2025 695,632 0.02%Skandinaviska Enskilda Banken AB SEK(kr)5,500,000 1.50% 15/12/2021 647,799 0.02%Akelius Residential Property AB €500,000 1.75% 7/2/2025 625,208 0.02%Stadshypotek AB €500,000 0.50% 11/7/2025 613,010 0.02%SBAB Bank AB €500,000 0.75% 14/6/2023 605,036 0.02%Swedbank Hypotek AB €500,000 0.45% 23/8/2023 604,799 0.02%Skandinaviska Enskilda Banken AB €500,000 0.63% 30/1/2023 603,475 0.02%Svenska Handelsbanken AB €500,000 0.13% 18/6/2024 599,626 0.02%Danske Hypotek AB SEK(kr)5,000,000 1.00% 21/12/2022 593,726 0.02%Lansforsakringar Bank AB €500,000 0.05% 15/4/2026 590,668 0.02%Svenska Handelsbanken AB €420,000 1.00% 15/4/2025 520,406 0.02%Skandinaviska Enskilda Banken AB $500,000 2.20% 12/12/2022 513,334 0.01%Sweden Government International Bond $500,000 0.13% 14/10/2022 499,612 0.01%Kommuninvest I Sverige AB $500,000 0.25% 9/8/2023 498,776 0.01%Skandinaviska Enskilda Banken AB €400,000 0.05% 1/7/2024 478,473 0.01%Svenska Handelsbanken AB $425,000 0.63% 30/6/2023 426,927 0.01%

764
Vanguard Global Short-Term Bond Index Fund
Principal CouponMaturity
DateFair Value
US Dollars ($)% of Total
Net AssetsSwedbank AB $400,000 0.60% 25/9/2023 400,609 0.01%Kommuninvest I Sverige AB $400,000 0.38% 16/2/2024 399,037 0.01%Swedbank AB^ €320,000 0.30% 20/5/2027 379,658 0.01%Lansforsakringar Bank AB €300,000 0.88% 25/9/2023 364,567 0.01%Sweden Government International Bond €300,000 0.13% 24/4/2023 360,176 0.01%Swedbank AB^ €300,000 1.00% 22/11/2027 360,053 0.01%Svenska Handelsbanken AB $300,000 3.90% 20/11/2023 325,073 0.01%Telia Co. AB €200,000 3.63% 14/2/2024 260,830 0.01%Swedbank AB €200,000 0.75% 5/5/2025 244,722 0.01%Swedbank AB €200,000 0.40% 29/8/2023 240,925 0.01%Stadshypotek AB SEK(kr)2,000,000 1.50% 15/12/2021 235,592 0.01%Svensk Exportkredit AB $200,000 1.63% 14/11/2022 203,754 0.01%Swedbank AB $200,000 1.30% 2/6/2023 203,080 0.01%Swedbank AB $200,000 0.85% 18/3/2024 200,692 0.01%Kommuninvest I Sverige AB $200,000 0.25% 1/12/2022 200,031 0.01%Kommuninvest I Sverige AB $200,000 0.25% 15/9/2023 199,557 0.01%Kommuninvest I Sverige AB $200,000 0.38% 19/6/2024 199,033 0.01%Kommuninvest I Sverige AB $200,000 0.50% 29/11/2024 199,022 0.01%Svensk Exportkredit AB $200,000 0.38% 30/7/2024 198,617 0.01%Svensk Exportkredit AB $150,000 2.88% 14/3/2023 156,538 0.00%Sweden Government International Bond $150,000 2.38% 15/2/2023 155,142 0.00%Autoliv, Inc. €100,000 0.75% 26/6/2023 120,322 0.00%Svensk Exportkredit AB $100,000 2.00% 30/8/2022 102,050 0.00%test - - - 45,465,932 1.40%Switzerland 1.01% (2020: 0.90%)Pfandbriefzentrale der schweizerischen Kantonalbanken AG CHF3,000,000 1.13% 28/4/2023 3,348,626 0.10%Swiss Confederation Government Bond CHF2,000,000 1.25% 28/5/2026 2,358,825 0.07%Swiss Confederation Government Bond CHF2,000,000 1.25% 11/6/2024 2,291,187 0.07%Pfandbriefbank schweizerischer Hypothekarinstitute AG CHF2,000,000 0.13% 26/4/2024 2,203,758 0.07%Credit Suisse Group AG $1,061,000 4.55% 17/4/2026 1,200,718 0.04%Nestle Finance International Ltd. €1,000,000 0.00% 14/6/2026 1,189,411 0.04%Pfandbriefzentrale der schweizerischen Kantonalbanken AG CHF1,000,000 0.13% 17/7/2024 1,102,760 0.03%Pfandbriefzentrale der schweizerischen Kantonalbanken AG CHF1,000,000 0.00% 25/7/2023 1,095,178 0.03%UBS AG $1,000,000 0.45% 9/2/2024 994,651 0.03%Aquarius & Investments PLC for Zurich Insurance Co., Ltd.^ €700,000 4.25% 2/10/2043 907,426 0.03%Credit Suisse Group AG $819,000 3.75% 26/3/2025 888,294 0.03%Nestle Finance International Ltd. €700,000 0.00% 3/12/2025 835,074 0.03%UBS Group AG^ €700,000 0.25% 29/1/2026 833,385 0.03%Swiss Confederation Government Bond CHF700,000 1.50% 24/7/2025 824,045 0.02%Credit Suisse Group AG $800,000 3.57% 9/1/2023 812,594 0.02%UBS Group AG €600,000 1.75% 16/11/2022 732,045 0.02%Nestle Finance International Ltd. €600,000 0.00% 12/11/2024 717,139 0.02%Credit Suisse Group AG^ €500,000 3.25% 2/4/2026 653,689 0.02%ELM BV for Swiss Reinsurance Co., Ltd.^ €500,000 2.60% Perpetual 637,541 0.02%Novartis Finance SA €500,000 0.50% 14/8/2023 602,534 0.02%Credit Suisse AG €500,000 0.25% 5/1/2026 595,011 0.02%Credit Suisse Group AG CHF500,000 1.00% 14/4/2023 550,766 0.02%Argentum Netherlands BV for Swiss Life AG^ €400,000 4.38% Perpetual 536,035 0.02%Credit Suisse Group AG $500,000 3.80% 9/6/2023 529,519 0.02%Credit Suisse AG $400,000 0.50% 2/2/2024 398,552 0.01%Zurich Finance Australia Ltd. AU($)500,000 3.48% 31/5/2023 394,894 0.01%Tyco Electronics Group SA €300,000 0.00% 14/2/2025 356,754 0.01%UBS AG €300,000 0.01% 31/3/2026 355,295 0.01%Swiss Confederation Government Bond CHF295,000 4.00% 11/2/2023 343,862 0.01%Argentum Netherlands BV for Swiss Re Ltd.^ $300,000 5.75% 15/8/2050 339,400 0.01%Canton of Basel-Landschaft CHF300,000 0.50% 30/3/2022 327,601 0.01%Glencore Finance Canada Ltd. $300,000 4.25% 25/10/2022 313,987 0.01%Glencore Funding LLC $300,000 3.00% 27/10/2022 308,713 0.01%UBS Group AG^ $300,000 1.01% 30/7/2024 302,101 0.01%UBS AG $300,000 0.38% 1/6/2023 299,580 0.01%Credit Suisse AG $250,000 2.95% 9/4/2025 267,891 0.01%UBS Group AG $250,000 3.49% 23/5/2023 256,712 0.01%Credit Suisse AG $250,000 1.00% 5/5/2023 252,547 0.01%Roche Holdings, Inc. $250,000 0.45% 5/3/2024 249,338 0.01%UBS AG €200,000 0.75% 21/4/2023 241,573 0.01%Roche Holdings, Inc. $200,000 3.35% 30/9/2024 215,627 0.01%UBS Group AG^ $200,000 2.86% 15/8/2023 205,168 0.01%Roche Holdings, Inc. $200,000 0.99% 5/3/2026 199,328 0.01%Novartis Capital Corp. $175,000 2.40% 21/9/2022 179,490 0.00%Credit Suisse Group Funding Guernsey Ltd. $125,000 3.80% 15/9/2022 129,981 0.00%Glencore Finance Europe Ltd. €100,000 1.88% 13/9/2023 122,916 0.00%

765
Vanguard Global Short-Term Bond Index Fund
Principal CouponMaturity
DateFair Value
US Dollars ($)% of Total
Net AssetsNovartis Capital Corp. $105,000 1.75% 14/2/2025 108,375 0.00%test - - - 32,609,896 1.01%Taiwan 0.02% (2020: 0.01%)TSMC Global Ltd. $500,000 0.75% 28/9/2025 489,782 0.01%Competition Team Technologies Ltd. $200,000 3.75% 12/3/2024 214,228 0.01%test - - - 704,010 0.02%Thailand 0.28% (2020: 0.30%)Thailand Government Bond ฿74,500,000 1.45% 17/12/2024 2,389,493 0.07%Thailand Government Bond ฿60,000,000 0.95% 17/6/2025 1,892,517 0.06%Thailand Government Bond ฿57,000,000 2.40% 17/12/2023 1,859,509 0.06%Thailand Government Bond ฿25,000,000 2.00% 17/12/2022 797,305 0.03%Thailand Government Bond ฿20,000,000 3.85% 12/12/2025 708,324 0.02%Thailand Government Bond ฿22,000,000 0.75% 17/6/2024 689,519 0.02%Siam Commercial Bank PCL $600,000 3.90% 11/2/2024 644,214 0.02%test - - - 8,980,881 0.28%United Arab Emirates 0.22% (2020: 0.28%)Abu Dhabi National Energy Co. PJSC $1,000,000 4.38% 23/4/2025 1,122,769 0.03%DIB Sukuk Ltd. $500,000 3.63% 6/2/2023 521,164 0.01%Abu Dhabi Government International Bond $400,000 2.50% 16/4/2025 424,986 0.01%RAK Capital $400,000 3.09% 31/3/2025 424,497 0.01%DP World Crescent Ltd. $400,000 3.91% 31/5/2023 421,582 0.01%Abu Dhabi Government International Bond $400,000 2.50% 11/10/2022 411,109 0.01%BOS Funding Ltd. $400,000 4.23% 7/3/2022 407,999 0.01%Fab Sukuk Co., Ltd. $300,000 3.88% 22/1/2024 322,655 0.01%ADCB Finance Cayman Ltd. $300,000 4.50% 6/3/2023 317,638 0.01%MDGH-GMTN BV $300,000 2.50% 7/11/2024 315,035 0.01%Abu Dhabi Government International Bond $300,000 2.13% 30/9/2024 314,007 0.01%First Abu Dhabi Bank PJSC £220,000 0.88% 9/12/2025 301,259 0.01%First Abu Dhabi Bank PJSC £170,000 1.38% 19/2/2023 237,050 0.01%MAF Sukuk Ltd. $200,000 4.50% 3/11/2025 221,553 0.01%Emirates Development Bank PJSC $200,000 3.52% 6/3/2024 213,509 0.01%DAE Sukuk Difc Ltd. $200,000 3.75% 15/2/2026 211,830 0.01%Esic Sukuk Ltd. $200,000 3.94% 30/7/2024 209,246 0.01%DIB Sukuk Ltd. $200,000 2.95% 16/1/2026 209,030 0.01%SIB Sukuk Co. III Ltd. $200,000 2.85% 23/6/2025 207,546 0.01%DAE Funding LLC $200,000 5.00% 1/8/2024 205,054 0.01%DAE Funding LLC $200,000 1.55% 1/8/2024 199,536 0.00%test - - - 7,219,054 0.22%United Kingdom 3.64% (2020: 3.65%)United Kingdom Gilt £11,280,000 0.13% 31/1/2024 15,562,023 0.48%United Kingdom Gilt £7,500,000 0.13% 31/1/2023 10,372,105 0.32%United Kingdom Gilt £5,500,000 0.63% 7/6/2025 7,712,178 0.24%United Kingdom Gilt £3,065,000 0.50% 22/7/2022 4,255,428 0.13%United Kingdom Gilt £1,891,000 1.75% 7/9/2022 2,665,343 0.08%United Kingdom Gilt £1,500,000 5.00% 7/3/2025 2,434,965 0.07%United Kingdom Gilt £1,675,000 0.75% 22/7/2023 2,346,576 0.07%Lloyds Banking Group plc $1,928,000 4.58% 10/12/2025 2,166,478 0.07%United Kingdom Gilt £1,200,000 0.13% 30/1/2026 1,641,995 0.05%Vodafone Group plc €1,300,000 0.50% 30/1/2024 1,569,105 0.05%Yorkshire Building Society^ £1,000,000 3.00% 18/4/2025 1,457,658 0.04%Barclays plc $1,179,000 3.65% 16/3/2025 1,278,539 0.04%BP Capital Markets plc €1,000,000 1.88% 7/4/2024 1,252,908 0.04%HSBC Holdings plc^ $1,250,000 1.59% 24/5/2027 1,251,658 0.04%Santander UK plc €1,000,000 0.50% 10/1/2025 1,218,454 0.04%Lloyds Bank plc €1,000,000 0.25% 25/3/2024 1,205,364 0.04%Santander UK Group Holdings plc^ €1,000,000 0.39% 28/2/2025 1,196,788 0.04%CCEP Finance Ireland DAC €1,000,000 0.00% 6/9/2025 1,186,351 0.04%WPP Finance 2016 €900,000 1.38% 20/3/2025 1,120,185 0.03%Natwest Group plc^ $1,025,000 4.27% 22/3/2025 1,112,224 0.03%Barclays plc $944,000 4.38% 12/1/2026 1,057,682 0.03%Motability Operations Group plc €800,000 0.88% 14/3/2025 983,212 0.03%Vodafone Group plc AU($)1,200,000 3.25% 13/12/2022 935,134 0.03%HSBC Holdings plc $800,000 4.30% 8/3/2026 903,091 0.03%Astrazeneca Finance LLC $900,000 1.20% 28/5/2026 896,868 0.03%Nationwide Building Society^ €700,000 2.00% 25/7/2029 873,469 0.03%HSBC Holdings plc^ $850,000 3.26% 13/3/2023 867,160 0.03%Phoenix Group Holdings plc £600,000 4.13% 20/7/2022 857,272 0.03%Lloyds Banking Group plc €700,000 1.00% 9/11/2023 852,376 0.03%HSBC Holdings plc^ $800,000 2.63% 7/11/2025 839,696 0.03%Heathrow Funding Ltd. €673,000 1.50% 12/10/2025 832,491 0.03%United Kingdom Gilt £550,000 2.00% 7/9/2025 814,657 0.02%

766
Vanguard Global Short-Term Bond Index Fund
Principal CouponMaturity
DateFair Value
US Dollars ($)% of Total
Net AssetsLeeds Building Society^ £550,000 1.50% 16/3/2027 759,615 0.02%Standard Chartered plc^ $700,000 3.89% 15/3/2024 735,673 0.02%Lloyds Banking Group plc^ $700,000 2.91% 7/11/2023 721,848 0.02%HSBC Holdings plc^ £500,000 2.26% 13/11/2026 717,197 0.02%Lloyds Bank Corporate Markets plc €600,000 0.25% 4/10/2022 717,087 0.02%Canary Wharf Group Investment Holdings plc €600,000 1.75% 7/4/2026 716,453 0.02%CNH Industrial Finance Europe SA €600,000 0.00% 1/4/2024 711,196 0.02%Skipton Building Society^ £500,000 2.00% 2/10/2026 705,423 0.02%Nationwide Building Society £500,000 1.00% 24/1/2023 696,472 0.02%Aviva plc^ €500,000 3.38% 4/12/2045 661,967 0.02%Nationwide Building Society^ $600,000 4.36% 1/8/2024 643,417 0.02%Anglian Water Services Financing plc £400,000 4.50% 22/2/2026 634,878 0.02%Natwest Group plc^ €500,000 1.75% 2/3/2026 624,910 0.02%SSE plc €500,000 1.25% 16/4/2025 619,714 0.02%Barclays plc^ €500,000 1.38% 24/1/2026 617,582 0.02%CK Hutchison International 21 Ltd. $600,000 1.50% 15/4/2026 603,428 0.02%CK Hutchison Group Telecom Finance SA €500,000 0.38% 17/10/2023 598,158 0.02%Barclays plc^ €500,000 1.13% 22/3/2031 596,202 0.02%GlaxoSmithKline Capital plc €500,000 0.00% 23/9/2023 596,202 0.02%BAT Capital Corp. $550,000 3.22% 15/8/2024 584,245 0.02%BAT Netherlands Finance BV €400,000 2.38% 7/10/2024 507,003 0.02%Phoenix Group Holdings plc £300,000 6.63% 18/12/2025 500,639 0.02%Natwest Group plc^ €400,000 2.00% 4/3/2025 498,840 0.02%Nationwide Building Society $500,000 1.00% 28/8/2025 497,518 0.02%Gatwick Funding Ltd. £300,000 6.13% 2/3/2026 496,830 0.02%Barclays plc $427,000 5.20% 12/5/2026 488,768 0.01%Reckitt Benckiser Treasury Services plc $475,000 2.38% 24/6/2022 484,051 0.01%Anglian Water Services Financing plc £338,000 1.63% 10/8/2025 483,550 0.01%Standard Chartered plc^ €400,000 0.75% 3/10/2023 479,621 0.01%HSBC Holdings plc^ €400,000 0.31% 13/11/2026 476,115 0.01%BAT International Finance plc $434,000 1.67% 25/3/2026 434,538 0.01%HSBC Holdings plc^ $400,000 3.95% 18/5/2024 424,778 0.01%Reckitt Benckiser Treasury Services plc $400,000 3.63% 21/9/2023 423,952 0.01%Coventry Building Society £300,000 1.50% 23/1/2023 419,908 0.01%HSBC Holdings plc^ £300,000 1.75% 24/7/2027 419,038 0.01%Standard Chartered plc $400,000 3.95% 11/1/2023 417,323 0.01%Santander UK Group Holdings plc^ $400,000 1.53% 21/8/2026 400,743 0.01%HSBC Holdings plc^ $400,000 0.98% 24/5/2025 399,784 0.01%Santander UK Group Holdings plc^ $400,000 1.67% 14/6/2027 399,249 0.01%Rio Tinto Finance plc €300,000 2.88% 11/12/2024 393,585 0.01%Vodafone Group plc $350,000 4.13% 30/5/2025 390,698 0.01%BAT Capital Corp. $375,000 2.76% 15/8/2022 383,829 0.01%RELX Capital, Inc. €300,000 1.30% 12/5/2025 373,169 0.01%HSBC Holdings plc^ €300,000 1.50% 4/12/2024 369,530 0.01%Imperial Brands Finance plc $350,000 3.13% 26/7/2024 368,372 0.01%Barclays plc^ €300,000 2.00% 7/2/2028 364,765 0.01%Yorkshire Building Society €300,000 0.63% 21/9/2025 364,324 0.01%Imperial Brands Finance plc €300,000 1.13% 14/8/2023 363,100 0.01%Santander UK plc €300,000 0.38% 20/9/2023 361,879 0.01%AstraZeneca plc $324,000 3.38% 16/11/2025 354,810 0.01%Reynolds American, Inc. $317,000 4.45% 12/6/2025 351,447 0.01%HSBC Holdings plc^ $325,000 3.80% 11/3/2025 349,464 0.01%HSBC Holdings plc $300,000 4.25% 14/3/2024 325,107 0.01%Lloyds Banking Group plc^ $300,000 3.87% 9/7/2025 325,085 0.01%Lloyds Banking Group plc $300,000 4.05% 16/8/2023 321,550 0.01%Pension Insurance Corp. plc £200,000 6.50% 3/7/2024 316,823 0.01%Standard Chartered plc^ $300,000 2.82% 30/1/2026 314,858 0.01%AA Bond Co., Ltd. £200,000 6.27% 31/7/2025 312,051 0.01%Society of Lloyd's £200,000 4.75% 30/10/2024 306,085 0.01%HSBC Holdings plc^ $300,000 1.65% 18/4/2026 304,011 0.01%RAC Bond Co. plc £200,000 4.87% 6/5/2026 302,925 0.01%Barclays plc^ £200,000 3.75% 22/11/2030 298,626 0.01%Heathrow Funding Ltd. £200,000 5.23% 15/2/2023 295,629 0.01%Virgin Money UK plc^ £200,000 3.38% 24/4/2026 293,653 0.01%Southern Gas Networks plc £200,000 2.50% 3/2/2025 291,878 0.01%Yorkshire Building Society €236,000 0.88% 20/3/2023 286,149 0.01%AstraZeneca plc $289,000 0.70% 8/4/2026 281,569 0.01%Santander UK plc €230,000 0.10% 12/5/2024 276,264 0.01%Natwest Group plc $234,000 4.80% 5/4/2026 267,918 0.01%Lloyds Bank plc $250,000 2.13% 24/7/2022 254,959 0.01%Sky Ltd. €200,000 1.88% 24/11/2023 249,063 0.01%

767
Vanguard Global Short-Term Bond Index Fund
Principal CouponMaturity
DateFair Value
US Dollars ($)% of Total
Net AssetsNatWest Markets plc €200,000 1.00% 28/5/2024 244,752 0.01%British Telecommunications plc €200,000 1.00% 21/11/2024 244,231 0.01%Informa plc €200,000 1.50% 5/7/2023 244,208 0.01%CNH Industrial NV $225,000 4.50% 15/8/2023 242,582 0.01%Barclays plc^ €200,000 0.75% 9/6/2025 241,295 0.01%Babcock International Group plc €200,000 1.75% 6/10/2022 241,213 0.01%Skipton Building Society €200,000 0.01% 22/9/2024 239,636 0.01%easyJet plc €200,000 0.88% 11/6/2025 237,640 0.01%Tritax EuroBox plc €200,000 0.95% 2/6/2026 236,966 0.01%Channel Link Enterprises Finance plc^ €200,000 1.76% 30/6/2050 236,500 0.01%Mead Johnson Nutrition Co. $200,000 4.13% 15/11/2025 224,928 0.01%HSBC Holdings plc $200,000 4.25% 18/8/2025 221,256 0.01%Santander UK Group Holdings plc^ $200,000 4.80% 15/11/2024 218,719 0.01%Lloyds Banking Group plc $200,000 3.90% 12/3/2024 216,673 0.01%BP Capital Markets plc $200,000 3.81% 10/2/2024 216,380 0.01%Natwest Group plc^ $200,000 4.52% 25/6/2024 214,708 0.01%Natwest Group plc $200,000 3.88% 12/9/2023 213,650 0.01%Barclays plc^ $200,000 4.34% 16/5/2024 213,219 0.01%GlaxoSmithKline Capital, Inc. $200,000 3.38% 15/5/2023 211,160 0.01%Nationwide Building Society^ $200,000 3.77% 8/3/2024 210,022 0.01%Diageo Capital plc $200,000 2.13% 24/10/2024 208,931 0.01%Heathrow Funding Ltd. CA($)245,000 3.25% 21/5/2025 208,360 0.01%HSBC Holdings plc^ $200,000 3.03% 22/11/2023 207,159 0.01%NatWest Markets plc $200,000 2.38% 21/5/2023 207,060 0.01%SSE plc^ $200,000 4.75% 16/9/2077 207,055 0.01%BP Capital Markets plc $200,000 2.50% 6/11/2022 205,750 0.01%Santander UK plc $200,000 2.10% 13/1/2023 205,200 0.01%Santander UK plc $200,000 1.63% 12/2/2023 204,039 0.01%Barclays plc $200,000 3.68% 10/1/2023 203,392 0.01%Standard Chartered plc^ $200,000 1.21% 23/3/2025 200,989 0.01%Santander UK Group Holdings plc^ $200,000 1.09% 15/3/2025 200,766 0.01%Barclays plc^ $200,000 1.01% 10/12/2024 200,746 0.01%Heathrow Funding Ltd. $200,000 4.88% 15/7/2021 200,298 0.01%Standard Chartered plc^ $200,000 0.99% 12/1/2025 199,531 0.01%Bank of England Euro Note $200,000 0.25% 8/3/2024 198,898 0.01%Yorkshire Building Society €165,000 0.13% 8/5/2024 198,241 0.01%BP Capital Markets plc $175,000 3.99% 26/9/2023 188,642 0.01%GlaxoSmithKline Capital plc $175,000 3.00% 1/6/2024 186,630 0.01%Lseg Netherlands BV €150,000 0.00% 6/4/2025 177,940 0.01%Vodafone Group plc $150,000 3.75% 16/1/2024 162,413 0.00%Heathrow Funding Ltd. £100,000 7.13% 14/2/2024 157,829 0.00%Virgin Money UK plc^ £100,000 5.13% 11/12/2030 154,177 0.00%Linde Finance BV £100,000 5.88% 24/4/2023 151,769 0.00%Northern Powergrid Holdings Co. £100,000 7.25% 15/12/2022 151,353 0.00%Unilever Capital Corp. $150,000 0.38% 14/9/2023 150,151 0.00%AstraZeneca plc $150,000 0.30% 26/5/2023 149,580 0.00%Natwest Group plc^ £100,000 3.62% 14/8/2030 147,394 0.00%Informa plc £100,000 3.13% 5/7/2026 147,268 0.00%Western Power Distribution plc £100,000 3.63% 6/11/2023 146,252 0.00%Severn Trent Utilities Finance plc £100,000 1.63% 4/12/2022 140,225 0.00%Natwest Group plc $120,000 5.13% 28/5/2024 133,250 0.00%WPP Finance 2013 €100,000 3.00% 20/11/2023 127,600 0.00%Lloyds Banking Group plc^ $125,000 2.86% 17/3/2023 127,107 0.00%CNH Industrial Finance Europe SA €100,000 2.88% 17/5/2023 125,118 0.00%Unilever Finance Netherlands BV €100,000 1.25% 25/3/2025 124,909 0.00%Cadent Finance plc €100,000 0.63% 22/9/2024 121,113 0.00%Lloyds Banking Group plc^ €100,000 0.50% 12/11/2025 120,332 0.00%National Grid Electricity Transmission plc €100,000 0.19% 20/1/2025 119,436 0.00%Santander UK plc $100,000 4.00% 13/3/2024 108,953 0.00%Standard Chartered plc^ $100,000 3.79% 21/5/2025 107,406 0.00%HSBC Holdings plc CA($)125,000 3.20% 5/12/2023 105,784 0.00%Unilever Capital Corp. $100,000 2.60% 5/5/2024 105,472 0.00%BAT Capital Corp. $100,000 2.79% 6/9/2024 105,147 0.00%WPP Finance 2010 $100,000 3.63% 7/9/2022 103,618 0.00%Standard Chartered plc^ $100,000 1.46% 14/1/2027 99,070 0.00%AstraZeneca plc $75,000 3.50% 17/8/2023 79,663 0.00%RELX Capital, Inc. $50,000 3.50% 16/3/2023 52,454 0.00%BP Capital Markets plc CA($)50,000 3.47% 15/5/2025 43,385 0.00%test - - - 117,994,116 3.64%United States 39.12% (2020: 36.62%)US Treasury Note1 $24,690,400 0.50% 31/3/2025 24,568,877 0.76%

768
Vanguard Global Short-Term Bond Index Fund
Principal CouponMaturity
DateFair Value
US Dollars ($)% of Total
Net AssetsUS Treasury Note1 $23,582,000 0.38% 30/11/2025 23,158,261 0.72%US Treasury Note1 $19,905,600 0.25% 15/4/2023 19,918,041 0.62%US Treasury Note1 $19,018,000 0.13% 15/12/2023 18,918,453 0.58%US Treasury Note1 $18,315,000 0.38% 31/1/2026 17,950,131 0.55%US Treasury Note1 $17,095,000 0.25% 15/11/2023 17,068,289 0.53%US Treasury Note1 $15,350,000 0.13% 15/1/2024 15,258,859 0.47%US Treasury Note $14,979,000 0.75% 30/4/2026 14,904,105 0.46%US Treasury Note $14,440,000 1.63% 15/12/2022 14,747,414 0.46%US Treasury Note1 $14,093,000 0.13% 30/4/2023 14,068,227 0.44%US Treasury Note $13,243,600 0.38% 15/4/2024 13,228,080 0.41%US Treasury Note1 $12,380,000 0.25% 15/3/2024 12,331,641 0.38%US Treasury Note $12,565,000 0.25% 31/7/2025 12,326,461 0.38%US Treasury Note $12,305,000 0.13% 31/8/2022 12,305,961 0.38%US Treasury Note $11,385,500 2.75% 31/7/2023 11,974,344 0.37%US Treasury Note $11,200,000 2.38% 15/8/2024 11,858,000 0.37%US Treasury Note $11,350,000 0.88% 30/6/2026 11,346,453 0.35%US Treasury Note $10,445,000 2.25% 30/4/2024 10,982,754 0.34%US Treasury Note $9,800,000 3.00% 30/9/2025 10,727,937 0.33%US Treasury Note $10,922,000 0.38% 31/12/2025 10,713,799 0.33%US Treasury Note1 $10,332,000 1.38% 31/1/2025 10,616,937 0.33%US Treasury Note $9,895,000 2.75% 31/5/2023 10,370,424 0.32%US Treasury Note $9,884,000 1.75% 31/7/2024 10,273,182 0.32%US Treasury Note $10,043,000 1.38% 15/10/2022 10,203,060 0.32%US Treasury Note $9,375,000 2.13% 31/3/2024 9,815,918 0.30%US Treasury Note $9,940,000 0.25% 31/8/2025 9,741,200 0.30%US Treasury Note $9,316,000 1.25% 31/8/2024 9,535,799 0.30%US Treasury Note $8,901,000 2.00% 15/2/2025 9,345,355 0.29%US Treasury Note1 $8,825,000 2.25% 15/11/2024 9,329,680 0.29%US Treasury Note $9,113,000 0.13% 30/11/2022 9,108,728 0.28%US Treasury Note $9,084,000 0.13% 31/5/2022 9,086,484 0.28%US Treasury Note $8,922,800 1.75% 30/6/2022 9,069,887 0.28%US Treasury Note1 $9,024,000 0.75% 31/3/2026 8,984,520 0.28%US Treasury Note $8,410,000 2.25% 15/11/2025 8,948,109 0.28%US Treasury Note1 $8,780,000 1.63% 31/8/2022 8,933,650 0.28%US Treasury Note1 $9,009,000 0.50% 28/2/2026 8,873,161 0.27%US Treasury Note $8,916,000 0.75% 31/5/2026 8,866,544 0.27%US Treasury Note $7,850,000 2.13% 15/5/2025 8,287,883 0.26%US Treasury Note $7,901,000 2.00% 31/5/2024 8,257,780 0.26%US Treasury Note $8,085,000 0.13% 31/10/2022 8,082,473 0.25%US Treasury Note $7,670,000 1.63% 15/2/2026 7,950,434 0.25%US Treasury Note $7,650,000 0.25% 15/6/2023 7,651,494 0.24%US Treasury Note $7,650,000 0.13% 31/7/2022 7,651,494 0.24%US Treasury Note1 $7,725,000 0.38% 30/4/2025 7,641,715 0.24%US Treasury Note $7,580,000 0.13% 15/2/2024 7,531,441 0.23%US Treasury Note $7,210,000 1.50% 30/11/2024 7,439,819 0.23%US Treasury Note $7,327,000 0.13% 31/1/2023 7,320,417 0.23%US Treasury Note1 $7,380,000 0.25% 31/5/2025 7,257,192 0.22%US Treasury Note $7,280,000 0.25% 30/6/2025 7,150,894 0.22%US Treasury Note $7,161,000 0.25% 15/5/2024 7,122,957 0.22%US Treasury Note $6,532,900 2.50% 15/5/2024 6,920,791 0.21%US Treasury Note $6,606,000 1.75% 30/6/2024 6,861,466 0.21%US Treasury Note $6,435,000 2.75% 15/2/2024 6,834,674 0.21%US Treasury Note $6,350,000 2.50% 15/8/2023 6,649,641 0.21%US Treasury Note $6,775,000 0.25% 30/9/2025 6,632,090 0.21%US Treasury Note $6,342,000 1.75% 31/12/2024 6,600,139 0.20%US Treasury Note $6,171,100 2.63% 31/12/2023 6,520,153 0.20%US Treasury Note $6,375,000 0.13% 30/9/2022 6,374,253 0.20%US Treasury Note $6,088,000 1.50% 15/1/2023 6,211,900 0.19%US Treasury Note $5,497,000 2.63% 28/2/2023 5,719,242 0.18%US Treasury Note1 $5,485,000 2.50% 31/3/2023 5,703,972 0.18%US Treasury Note $5,533,000 2.13% 15/5/2022 5,630,908 0.17%US Treasury Note $5,600,000 0.13% 15/9/2023 5,579,875 0.17%US Treasury Note $5,215,200 2.88% 30/11/2023 5,534,631 0.17%US Treasury Note $5,480,000 0.13% 15/5/2023 5,469,725 0.17%US Treasury Note $5,275,000 1.13% 28/2/2025 5,371,434 0.17%US Treasury Note $5,056,000 2.75% 31/8/2023 5,325,390 0.17%US Treasury Note $5,000,000 1.88% 30/6/2026 5,243,359 0.16%US Treasury Note $5,126,000 1.50% 15/8/2022 5,205,693 0.16%US Treasury Note1 $4,878,000 2.75% 15/11/2023 5,157,723 0.16%US Treasury Note $5,150,000 0.13% 31/5/2023 5,139,137 0.16%US Treasury Note $4,700,000 2.13% 31/5/2026 4,984,937 0.15%

769
Vanguard Global Short-Term Bond Index Fund
Principal CouponMaturity
DateFair Value
US Dollars ($)% of Total
Net AssetsUS Treasury Note $4,706,000 2.13% 31/12/2022 4,843,320 0.15%US Treasury Note $4,535,000 1.63% 15/5/2026 4,700,811 0.15%US Treasury Note $4,592,000 0.13% 30/6/2022 4,593,256 0.14%US Treasury Note $4,420,000 1.75% 31/1/2023 4,529,291 0.14%US Treasury Note $4,432,000 1.88% 30/9/2022 4,528,257 0.14%US Treasury Note $4,475,000 0.13% 28/2/2023 4,469,931 0.14%US Treasury Note $4,410,700 0.50% 15/3/2023 4,433,270 0.14%US Treasury Note $4,000,000 2.25% 31/3/2026 4,263,125 0.13%US Treasury Note $3,990,000 2.25% 31/1/2024 4,183,577 0.13%US Treasury Note $3,950,000 1.75% 15/5/2023 4,061,711 0.13%US Treasury Note $3,917,100 1.50% 30/9/2024 4,041,958 0.13%US Treasury Note $3,830,000 2.00% 15/8/2025 4,030,477 0.13%US Treasury Note1 $3,790,000 2.88% 30/9/2023 4,009,109 0.12%US Treasury Note $3,650,000 2.63% 31/1/2026 3,948,273 0.12%US Treasury Note $3,905,000 0.13% 15/8/2023 3,893,407 0.12%US Treasury Note $3,800,000 1.38% 30/9/2023 3,892,031 0.12%US Treasury Note $3,500,000 3.00% 31/10/2025 3,834,141 0.12%US Treasury Note $3,500,000 2.88% 30/11/2025 3,818,555 0.12%US Treasury Note $3,650,000 2.13% 30/11/2023 3,807,406 0.12%US Treasury Note $3,745,000 1.75% 15/6/2022 3,804,247 0.12%US Treasury Note $3,557,000 1.63% 31/5/2023 3,651,066 0.11%US Treasury Note $3,350,000 2.75% 31/8/2025 3,627,945 0.11%US Treasury Note $3,355,000 2.50% 28/2/2026 3,612,654 0.11%US Treasury Note $3,387,000 2.88% 31/10/2023 3,588,368 0.11%US Treasury Note1 $3,100,000 2.13% 30/9/2024 3,260,812 0.10%US Treasury Note $2,989,000 2.38% 29/2/2024 3,146,623 0.10%US Treasury Note $2,950,000 2.75% 30/4/2023 3,086,092 0.10%US Treasury Note $2,953,000 2.00% 31/10/2022 3,025,671 0.09%US Treasury Note $3,000,000 0.13% 15/10/2023 2,987,109 0.09%US Treasury Note $3,010,000 0.25% 31/10/2025 2,942,980 0.09%US Treasury Note $2,832,000 1.63% 30/4/2023 2,904,238 0.09%US Treasury Note $2,738,500 0.13% 31/12/2022 2,736,575 0.09%US Treasury Note $2,635,000 1.38% 30/6/2023 2,694,493 0.08%US Treasury Note $2,664,000 0.13% 31/3/2023 2,660,150 0.08%US Treasury Note $2,503,000 2.50% 31/1/2024 2,640,665 0.08%US Treasury Note $2,451,000 1.50% 31/10/2024 2,529,317 0.08%US Treasury Note $2,435,000 1.75% 31/5/2022 2,471,810 0.08%US Treasury Note $2,244,000 2.00% 30/11/2022 2,302,379 0.07%Otis Worldwide Corp. $2,200,000 2.06% 5/4/2025 2,286,694 0.07%US Treasury Note $2,190,000 1.63% 15/11/2022 2,234,313 0.07%Federal National Mortgage Association $2,000,000 0.25% 10/7/2023 1,999,721 0.06%US Treasury Note $1,920,000 1.88% 31/7/2022 1,956,675 0.06%US Treasury Note $1,900,000 1.88% 31/10/2022 1,943,641 0.06%Federal Home Loan Mortgage Corp. $1,950,000 0.38% 23/9/2025 1,920,561 0.06%Wells Fargo & Co. $1,634,000 3.00% 22/4/2026 1,757,377 0.05%Bank of America Corp.^ $1,750,000 1.32% 19/6/2026 1,754,192 0.05%Federal National Mortgage Association^ $1,610,000 2.91% 25/4/2025 1,711,708 0.05%US Treasury Note $1,677,500 0.13% 30/6/2023 1,673,437 0.05%Dell International LLC/EMC Corp. $1,400,000 5.85% 15/7/2025 1,643,098 0.05%Bank of America Corp.^ $1,500,000 3.46% 15/3/2025 1,603,270 0.05%Boeing Co. $1,550,000 2.20% 4/2/2026 1,564,648 0.05%US Treasury Note $1,400,000 2.38% 30/4/2026 1,501,062 0.05%Federal Home Loan Mortgage Corp. $1,500,000 0.13% 25/7/2022 1,500,368 0.05%Federal Home Loan Mortgage Corp. $1,500,000 0.25% 26/6/2023 1,499,704 0.05%Federal Home Loan Banks $1,500,000 0.13% 12/8/2022 1,499,551 0.05%Federal Home Loan Mortgage Corp. $1,500,000 0.25% 6/11/2023 1,498,213 0.05%Federal Home Loan Banks $1,500,000 0.13% 17/3/2023 1,497,485 0.05%Verizon Communications, Inc. €1,100,000 3.25% 17/2/2026 1,495,287 0.05%Federal Home Loan Mortgage Corp. $1,500,000 0.13% 16/10/2023 1,494,776 0.05%T-Mobile USA, Inc. $1,295,000 3.50% 15/4/2025 1,404,385 0.04%Charter Communications Operating LLC/Charter Communications
Operating Capital $1,275,000 4.50% 1/2/2024 1,388,757 0.04%Goldman Sachs Group, Inc. £1,000,000 1.00% 16/12/2025 1,377,792 0.04%US Treasury Note $1,350,000 1.63% 15/8/2022 1,372,992 0.04%US Treasury Note $1,325,000 1.50% 28/2/2023 1,353,674 0.04%JPMorgan Chase & Co.^ $1,300,000 0.82% 1/6/2025 1,297,188 0.04%JPMorgan Chase & Co.^ $1,250,000 2.08% 22/4/2026 1,292,618 0.04%AbbVie, Inc. $1,225,000 2.60% 21/11/2024 1,292,184 0.04%JPMBB Commercial Mortgage Securities Trust 2013 $1,200,000 4.13% 15/11/2045 1,284,472 0.04%Wells Fargo Commercial Mortgage Trust 2015 $1,164,000 3.64% 15/6/2048 1,270,672 0.04%Mylan, Inc. €1,000,000 2.13% 23/5/2025 1,265,319 0.04%

770
Vanguard Global Short-Term Bond Index Fund
Principal CouponMaturity
DateFair Value
US Dollars ($)% of Total
Net AssetsGeneral Motors Financial Co., Inc. $1,200,000 2.75% 20/6/2025 1,263,705 0.04%Bristol-Myers Squibb Co. $1,142,000 3.20% 15/6/2026 1,253,699 0.04%Apple, Inc. $1,200,000 2.85% 23/2/2023 1,246,156 0.04%John Deere Cash Management SA €1,000,000 1.38% 2/4/2024 1,238,879 0.04%Chase Issuance Trust $1,198,000 2.16% 15/9/2024 1,225,580 0.04%Wells Fargo & Co.^ $1,150,000 2.41% 30/10/2025 1,203,199 0.04%Visa, Inc. $1,150,000 2.80% 14/12/2022 1,187,560 0.04%Apple, Inc. $1,200,000 0.70% 8/2/2026 1,186,815 0.04%Eaton Capital Unlimited Co. €1,000,000 0.13% 8/3/2026 1,186,605 0.04%Goldman Sachs Group, Inc.^ €1,000,000 0.01% 30/4/2024 1,186,593 0.04%US Treasury Note $1,150,000 2.13% 30/6/2022 1,173,180 0.04%Bank of America Corp. $1,050,000 4.20% 26/8/2024 1,152,478 0.04%Goldman Sachs Group, Inc. CHF1,000,000 1.00% 24/11/2025 1,128,053 0.04%Benchmark 2018-B7 Mortgage Trust $1,050,000 4.38% 15/5/2053 1,124,263 0.04%Federal Home Loan Banks $1,100,000 1.38% 17/2/2023 1,120,692 0.04%Verizon Communications, Inc. €900,000 0.88% 2/4/2025 1,102,489 0.03%AbbVie, Inc. $1,000,000 3.60% 14/5/2025 1,091,674 0.03%JPMorgan Chase & Co. $1,000,000 3.88% 10/9/2024 1,090,183 0.03%CVS Health Corp. $1,020,000 3.70% 9/3/2023 1,073,835 0.03%Citigroup Commercial Mortgage Trust 2013^ $1,000,000 4.37% 10/9/2046 1,073,515 0.03%JPMorgan Chase & Co. $1,000,000 3.13% 23/1/2025 1,073,107 0.03%BP Capital Markets America, Inc. $979,000 3.41% 11/2/2026 1,071,055 0.03%CVS Health Corp. $959,000 3.88% 20/7/2025 1,058,868 0.03%Freddie Mac Multifamily Structured Pass Through Certificates^ $1,000,000 3.30% 25/4/2023 1,047,377 0.03%Goldman Sachs Group, Inc. $960,000 3.50% 23/1/2025 1,037,826 0.03%CCRE6 Commercial Mortgage Trust 2013 $1,000,000 3.10% 10/3/2046 1,034,611 0.03%VMware, Inc. $925,000 4.50% 15/5/2025 1,033,865 0.03%Southwest Airlines Co. $900,000 5.25% 4/5/2025 1,028,067 0.03%Boeing Co. $1,000,000 1.95% 1/2/2024 1,024,813 0.03%Apple, Inc. $1,015,000 0.75% 11/5/2023 1,023,413 0.03%CSX Corp. $950,000 3.40% 1/8/2024 1,022,613 0.03%Southwest Airlines Co. $950,000 4.75% 4/5/2023 1,019,618 0.03%Ally Financial, Inc. $1,000,000 1.45% 2/10/2023 1,015,747 0.03%Microsoft Corp. $950,000 2.88% 6/2/2024 1,005,250 0.03%Federal National Mortgage Association $1,000,000 0.25% 22/5/2023 1,000,397 0.03%Federal Home Loan Banks1 $1,000,000 0.13% 21/10/2022 999,334 0.03%Federal Home Loan Mortgage Corp. $1,000,000 0.25% 8/9/2023 999,012 0.03%Federal National Mortgage Association $1,000,000 0.25% 27/11/2023 998,494 0.03%Federal Home Loan Mortgage Corp. $1,000,000 0.25% 4/12/2023 998,063 0.03%Energy Transfer LP $950,000 4.25% 15/3/2023 997,028 0.03%Federal Farm Credit Banks Funding Corp. $1,000,000 0.25% 26/2/2024 995,309 0.03%Bank of America Corp.^ $918,000 3.37% 23/1/2026 989,432 0.03%Federal National Mortgage Association $1,000,000 0.50% 7/11/2025 989,012 0.03%Citigroup, Inc. $900,000 3.88% 26/3/2025 987,756 0.03%Federal Home Loan Mortgage Corp. $1,000,000 0.38% 21/7/2025 985,780 0.03%Federal National Mortgage Association $1,000,000 0.38% 25/8/2025 985,667 0.03%Morgan Stanley^ $1,000,000 0.99% 10/12/2026 985,181 0.03%Freddie Mac Multifamily Structured Pass Through Certificates $900,000 3.24% 25/9/2024 968,105 0.03%Bank of America Corp. €800,000 0.75% 26/7/2023 967,840 0.03%Philip Morris International, Inc. €800,000 0.63% 8/11/2024 967,698 0.03%JPMorgan Chase & Co. €800,000 0.63% 25/1/2024 966,548 0.03%Morgan Stanley^ €800,000 0.64% 26/7/2024 963,826 0.03%Freddie Mac Multifamily Structured Pass Through Certificates $900,000 2.81% 25/1/2025 960,452 0.03%Bristol-Myers Squibb Co. $900,000 2.90% 26/7/2024 959,751 0.03%Exxon Mobil Corp. €800,000 0.14% 26/6/2024 956,458 0.03%Stellantis NV €700,000 3.88% 5/1/2026 953,729 0.03%Thermo Fisher Scientific, Inc. €800,000 0.13% 1/3/2025 953,376 0.03%Wells Fargo & Co. $875,000 4.13% 15/8/2023 940,451 0.03%Morgan Stanley^ $900,000 2.19% 28/4/2026 934,858 0.03%Wells Fargo & Co.^ $900,000 2.19% 30/4/2026 934,368 0.03%Discovery Communications LLC $850,000 3.45% 15/3/2025 912,516 0.03%Berkshire Hathaway, Inc. ¥100,000,000 0.17% 13/9/2024 895,986 0.03%Morgan Stanley Bank of America Merrill Lynch Trust 2015 $826,826 3.45% 15/7/2050 891,209 0.03%Carrier Global Corp. $850,000 2.24% 15/2/2025 884,324 0.03%Oracle Corp. $825,000 2.95% 15/11/2024 878,963 0.03%Verizon Communications, Inc. €700,000 1.63% 1/3/2024 868,684 0.03%Ameriprise Financial, Inc. $810,000 3.00% 2/4/2025 867,623 0.03%Devon Energy Corp. $775,000 5.25% 15/9/2024 863,702 0.03%Morgan Stanley €700,000 1.88% 30/3/2023 861,080 0.03%PepsiCo, Inc. $800,000 3.60% 1/3/2024 859,767 0.03%Freddie Mac Multifamily Structured Pass Through Certificates^ $800,000 3.16% 25/5/2025 857,510 0.03%

771
Vanguard Global Short-Term Bond Index Fund
Principal CouponMaturity
DateFair Value
US Dollars ($)% of Total
Net AssetsWalmart, Inc. $777,000 3.55% 26/6/2025 856,919 0.03%Microsoft Corp. $825,000 2.00% 8/8/2023 852,013 0.03%Federal Home Loan Banks $850,000 0.13% 2/6/2023 847,926 0.03%PepsiCo, Inc. €700,000 0.25% 6/5/2024 842,590 0.03%Comcast Corp. $772,000 3.38% 15/2/2025 837,775 0.03%Verizon Communications, Inc. $825,000 0.75% 22/3/2024 828,593 0.03%GS Mortgage Securities Trust 2015 $750,000 3.76% 10/7/2048 823,250 0.03%Prudential Financial, Inc.^ $750,000 5.20% 15/3/2044 808,598 0.03%Marriott International, Inc. $700,000 5.75% 1/5/2025 808,278 0.03%Cigna Corp. $707,000 4.13% 15/11/2025 792,466 0.03%Comcast Corp. $730,000 3.70% 15/4/2024 791,224 0.02%Marathon Petroleum Corp. $700,000 4.70% 1/5/2025 789,453 0.02%Morgan Stanley €650,000 1.00% 2/12/2022 785,000 0.02%Verizon Communications, Inc. $775,000 1.45% 20/3/2026 782,160 0.02%Exxon Mobil Corp. $760,000 1.57% 15/4/2023 776,446 0.02%Citigroup Commercial Mortgage Trust 2015 $700,000 3.82% 10/11/2048 772,115 0.02%Equifax, Inc. $725,000 3.95% 15/6/2023 770,328 0.02%UBS-Barclays Commercial Mortgage Trust 2012 $750,000 2.85% 10/12/2045 769,226 0.02%Bank of America Corp.^ $700,000 3.56% 23/4/2027 766,391 0.02%Visa, Inc. $700,000 3.15% 14/12/2025 765,866 0.02%Alexandria Real Estate Equities, Inc. $700,000 3.45% 30/4/2025 763,528 0.02%JPMorgan Chase & Co. $730,000 3.20% 25/1/2023 762,528 0.02%Exelon Corp. $700,000 3.40% 15/4/2026 762,442 0.02%Viatris, Inc. $750,000 1.65% 22/6/2025 759,914 0.02%Invesco Finance plc $700,000 4.00% 30/1/2024 758,865 0.02%JPMorgan Chase & Co.^ $750,000 1.58% 22/4/2027 754,027 0.02%Danaher Corp. €600,000 1.70% 30/3/2024 746,279 0.02%Altria Group, Inc. $725,000 2.85% 9/8/2022 744,532 0.02%Goldman Sachs Group, Inc. €600,000 2.00% 27/7/2023 742,684 0.02%Federal National Mortgage Association $700,000 2.47% 25/4/2026 740,691 0.02%Morgan Stanley^ $700,000 2.72% 22/7/2025 736,955 0.02%Air Lease Corp. $700,000 2.88% 15/1/2026 736,222 0.02%Federal Home Loan Banks $695,000 2.50% 13/2/2024 733,727 0.02%Digital Dutch Finco BV €600,000 0.63% 15/7/2025 725,531 0.02%Merck & Co., Inc. $730,000 0.75% 24/2/2026 724,409 0.02%Boston Scientific Corp. $700,000 1.90% 1/6/2025 722,282 0.02%Walmart, Inc. €600,000 1.90% 8/4/2022 720,345 0.02%Goldman Sachs Group, Inc.^ $700,000 2.91% 24/7/2023 717,533 0.02%Freddie Mac Multifamily Structured Pass Through Certificates $675,000 2.67% 25/12/2024 716,604 0.02%AutoZone, Inc. $650,000 3.63% 15/4/2025 711,052 0.02%US Treasury Note $698,000 1.75% 15/7/2022 709,942 0.02%Wells Fargo Commercial Mortgage Trust 2015 $668,414 2.91% 15/2/2048 704,926 0.02%Air Lease Corp. $650,000 4.25% 1/2/2024 704,077 0.02%Procter & Gamble Co. $650,000 2.70% 2/2/2026 701,740 0.02%Citigroup, Inc.^ $650,000 3.35% 24/4/2025 693,279 0.02%Intel Corp. $668,000 2.70% 15/12/2022 692,039 0.02%PepsiCo, Inc. $650,000 2.25% 19/3/2025 683,245 0.02%Federal Home Loan Banks $660,000 1.50% 15/8/2024 680,851 0.02%Citigroup, Inc. $622,000 3.40% 1/5/2026 679,889 0.02%Dell International LLC/EMC Corp. $625,000 4.00% 15/7/2024 679,399 0.02%Morgan Stanley $650,000 3.13% 23/1/2023 677,802 0.02%7-Eleven, Inc. $675,000 0.63% 10/2/2023 675,391 0.02%Boeing Co. $600,000 4.88% 1/5/2025 672,479 0.02%American Express Co. $625,000 3.70% 3/8/2023 665,511 0.02%Goldman Sachs Group, Inc. €500,000 3.38% 27/3/2025 664,932 0.02%Visa, Inc. $650,000 2.15% 15/9/2022 663,608 0.02%General Motors Financial Co., Inc. $600,000 4.35% 9/4/2025 663,481 0.02%ERAC USA Finance LLC $600,000 3.80% 1/11/2025 661,638 0.02%Wells Fargo & Co. CHF600,000 0.50% 2/11/2023 660,028 0.02%Chubb INA Holdings, Inc. $600,000 3.35% 3/5/2026 659,558 0.02%Apple, Inc. $621,000 2.50% 9/2/2025 658,809 0.02%Boeing Co. $650,000 1.43% 4/2/2024 651,670 0.02%Home Depot, Inc. $600,000 3.75% 15/2/2024 646,490 0.02%Sabine Pass Liquefaction LLC $575,000 5.75% 15/5/2024 645,655 0.02%Citigroup, Inc. $584,000 3.70% 12/1/2026 645,422 0.02%Wells Fargo & Co. €500,000 2.00% 27/4/2026 642,954 0.02%US Treasury Note $643,000 0.13% 15/7/2023 641,342 0.02%Bank of America Corp.^ $610,000 3.55% 5/3/2024 640,829 0.02%Georgia-Pacific LLC $625,000 1.75% 30/9/2025 640,666 0.02%Lockheed Martin Corp. $597,000 2.90% 1/3/2025 640,091 0.02%Bank of America Corp. €500,000 2.38% 19/6/2024 636,411 0.02%
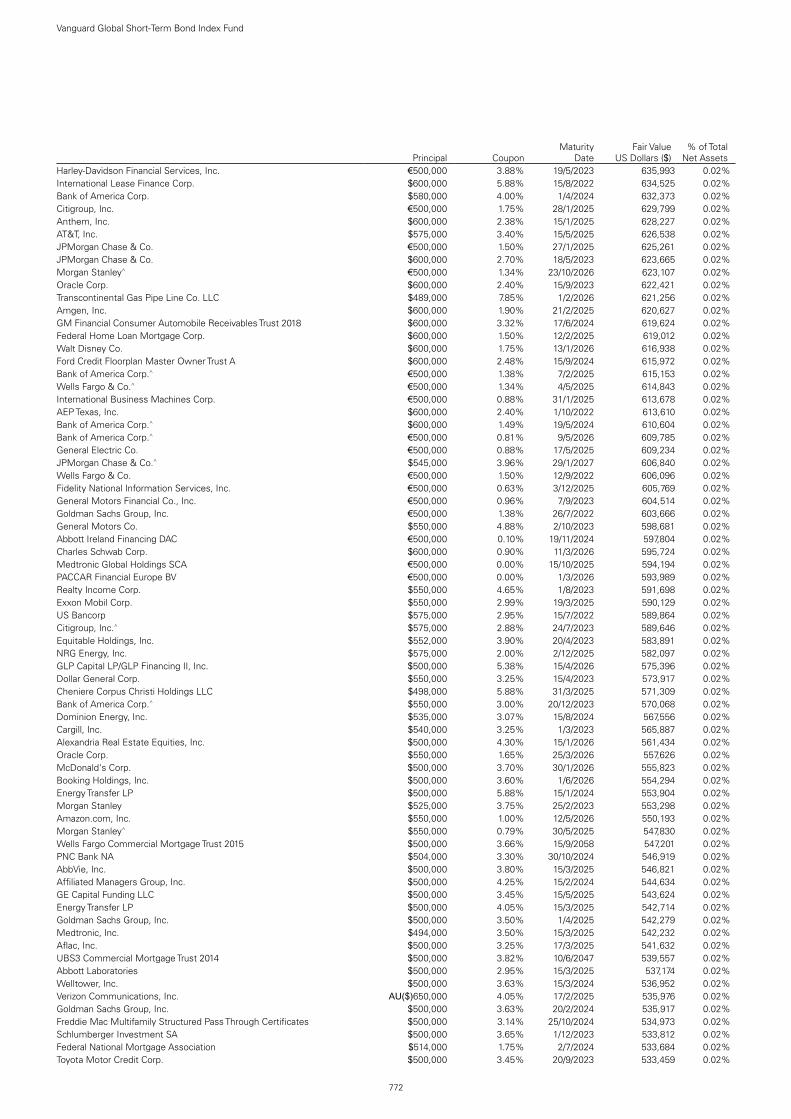
772
Vanguard Global Short-Term Bond Index Fund
Principal CouponMaturity
DateFair Value
US Dollars ($)% of Total
Net AssetsHarley-Davidson Financial Services, Inc. €500,000 3.88% 19/5/2023 635,993 0.02%International Lease Finance Corp. $600,000 5.88% 15/8/2022 634,525 0.02%Bank of America Corp. $580,000 4.00% 1/4/2024 632,373 0.02%Citigroup, Inc. €500,000 1.75% 28/1/2025 629,799 0.02%Anthem, Inc. $600,000 2.38% 15/1/2025 628,227 0.02%AT&T, Inc. $575,000 3.40% 15/5/2025 626,538 0.02%JPMorgan Chase & Co. €500,000 1.50% 27/1/2025 625,261 0.02%JPMorgan Chase & Co. $600,000 2.70% 18/5/2023 623,665 0.02%Morgan Stanley^ €500,000 1.34% 23/10/2026 623,107 0.02%Oracle Corp. $600,000 2.40% 15/9/2023 622,421 0.02%Transcontinental Gas Pipe Line Co. LLC $489,000 7.85% 1/2/2026 621,256 0.02%Amgen, Inc. $600,000 1.90% 21/2/2025 620,627 0.02%GM Financial Consumer Automobile Receivables Trust 2018 $600,000 3.32% 17/6/2024 619,624 0.02%Federal Home Loan Mortgage Corp. $600,000 1.50% 12/2/2025 619,012 0.02%Walt Disney Co. $600,000 1.75% 13/1/2026 616,938 0.02%Ford Credit Floorplan Master Owner Trust A $600,000 2.48% 15/9/2024 615,972 0.02%Bank of America Corp.^ €500,000 1.38% 7/2/2025 615,153 0.02%Wells Fargo & Co.^ €500,000 1.34% 4/5/2025 614,843 0.02%International Business Machines Corp. €500,000 0.88% 31/1/2025 613,678 0.02%AEP Texas, Inc. $600,000 2.40% 1/10/2022 613,610 0.02%Bank of America Corp.^ $600,000 1.49% 19/5/2024 610,604 0.02%Bank of America Corp.^ €500,000 0.81% 9/5/2026 609,785 0.02%General Electric Co. €500,000 0.88% 17/5/2025 609,234 0.02%JPMorgan Chase & Co.^ $545,000 3.96% 29/1/2027 606,840 0.02%Wells Fargo & Co. €500,000 1.50% 12/9/2022 606,096 0.02%Fidelity National Information Services, Inc. €500,000 0.63% 3/12/2025 605,769 0.02%General Motors Financial Co., Inc. €500,000 0.96% 7/9/2023 604,514 0.02%Goldman Sachs Group, Inc. €500,000 1.38% 26/7/2022 603,666 0.02%General Motors Co. $550,000 4.88% 2/10/2023 598,681 0.02%Abbott Ireland Financing DAC €500,000 0.10% 19/11/2024 597,804 0.02%Charles Schwab Corp. $600,000 0.90% 11/3/2026 595,724 0.02%Medtronic Global Holdings SCA €500,000 0.00% 15/10/2025 594,194 0.02%PACCAR Financial Europe BV €500,000 0.00% 1/3/2026 593,989 0.02%Realty Income Corp. $550,000 4.65% 1/8/2023 591,698 0.02%Exxon Mobil Corp. $550,000 2.99% 19/3/2025 590,129 0.02%US Bancorp $575,000 2.95% 15/7/2022 589,864 0.02%Citigroup, Inc.^ $575,000 2.88% 24/7/2023 589,646 0.02%Equitable Holdings, Inc. $552,000 3.90% 20/4/2023 583,891 0.02%NRG Energy, Inc. $575,000 2.00% 2/12/2025 582,097 0.02%GLP Capital LP/GLP Financing II, Inc. $500,000 5.38% 15/4/2026 575,396 0.02%Dollar General Corp. $550,000 3.25% 15/4/2023 573,917 0.02%Cheniere Corpus Christi Holdings LLC $498,000 5.88% 31/3/2025 571,309 0.02%Bank of America Corp.^ $550,000 3.00% 20/12/2023 570,068 0.02%Dominion Energy, Inc. $535,000 3.07% 15/8/2024 567,556 0.02%Cargill, Inc. $540,000 3.25% 1/3/2023 565,887 0.02%Alexandria Real Estate Equities, Inc. $500,000 4.30% 15/1/2026 561,434 0.02%Oracle Corp. $550,000 1.65% 25/3/2026 557,626 0.02%McDonald's Corp. $500,000 3.70% 30/1/2026 555,823 0.02%Booking Holdings, Inc. $500,000 3.60% 1/6/2026 554,294 0.02%Energy Transfer LP $500,000 5.88% 15/1/2024 553,904 0.02%Morgan Stanley $525,000 3.75% 25/2/2023 553,298 0.02%Amazon.com, Inc. $550,000 1.00% 12/5/2026 550,193 0.02%Morgan Stanley^ $550,000 0.79% 30/5/2025 547,830 0.02%Wells Fargo Commercial Mortgage Trust 2015 $500,000 3.66% 15/9/2058 547,201 0.02%PNC Bank NA $504,000 3.30% 30/10/2024 546,919 0.02%AbbVie, Inc. $500,000 3.80% 15/3/2025 546,821 0.02%Affiliated Managers Group, Inc. $500,000 4.25% 15/2/2024 544,634 0.02%GE Capital Funding LLC $500,000 3.45% 15/5/2025 543,624 0.02%Energy Transfer LP $500,000 4.05% 15/3/2025 542,714 0.02%Goldman Sachs Group, Inc. $500,000 3.50% 1/4/2025 542,279 0.02%Medtronic, Inc. $494,000 3.50% 15/3/2025 542,232 0.02%Aflac, Inc. $500,000 3.25% 17/3/2025 541,632 0.02%UBS3 Commercial Mortgage Trust 2014 $500,000 3.82% 10/6/2047 539,557 0.02%Abbott Laboratories $500,000 2.95% 15/3/2025 537,174 0.02%Welltower, Inc. $500,000 3.63% 15/3/2024 536,952 0.02%Verizon Communications, Inc. AU($)650,000 4.05% 17/2/2025 535,976 0.02%Goldman Sachs Group, Inc. $500,000 3.63% 20/2/2024 535,917 0.02%Freddie Mac Multifamily Structured Pass Through Certificates $500,000 3.14% 25/10/2024 534,973 0.02%Schlumberger Investment SA $500,000 3.65% 1/12/2023 533,812 0.02%Federal National Mortgage Association $514,000 1.75% 2/7/2024 533,684 0.02%Toyota Motor Credit Corp. $500,000 3.45% 20/9/2023 533,459 0.02%
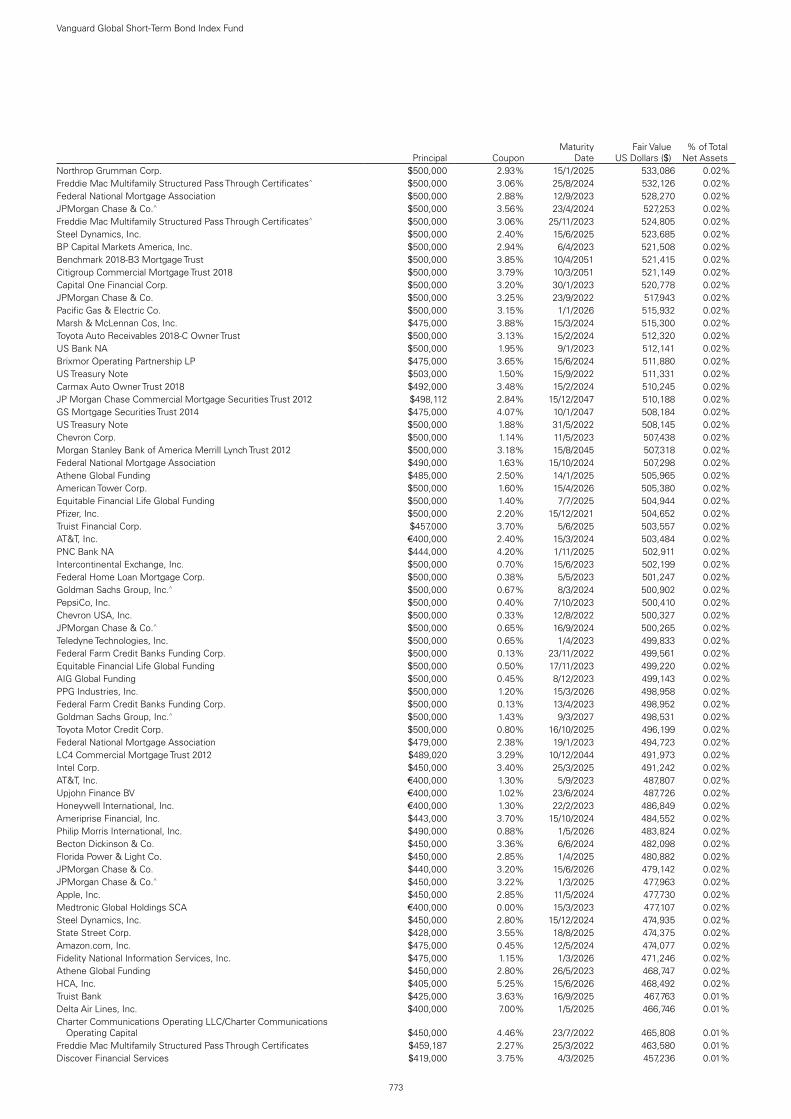
773
Vanguard Global Short-Term Bond Index Fund
Principal CouponMaturity
DateFair Value
US Dollars ($)% of Total
Net AssetsNorthrop Grumman Corp. $500,000 2.93% 15/1/2025 533,086 0.02%Freddie Mac Multifamily Structured Pass Through Certificates^ $500,000 3.06% 25/8/2024 532,126 0.02%Federal National Mortgage Association $500,000 2.88% 12/9/2023 528,270 0.02%JPMorgan Chase & Co.^ $500,000 3.56% 23/4/2024 527,253 0.02%Freddie Mac Multifamily Structured Pass Through Certificates^ $500,000 3.06% 25/11/2023 524,805 0.02%Steel Dynamics, Inc. $500,000 2.40% 15/6/2025 523,685 0.02%BP Capital Markets America, Inc. $500,000 2.94% 6/4/2023 521,508 0.02%Benchmark 2018-B3 Mortgage Trust $500,000 3.85% 10/4/2051 521,415 0.02%Citigroup Commercial Mortgage Trust 2018 $500,000 3.79% 10/3/2051 521,149 0.02%Capital One Financial Corp. $500,000 3.20% 30/1/2023 520,778 0.02%JPMorgan Chase & Co. $500,000 3.25% 23/9/2022 517,943 0.02%Pacific Gas & Electric Co. $500,000 3.15% 1/1/2026 515,932 0.02%Marsh & McLennan Cos, Inc. $475,000 3.88% 15/3/2024 515,300 0.02%Toyota Auto Receivables 2018-C Owner Trust $500,000 3.13% 15/2/2024 512,320 0.02%US Bank NA $500,000 1.95% 9/1/2023 512,141 0.02%Brixmor Operating Partnership LP $475,000 3.65% 15/6/2024 511,880 0.02%US Treasury Note $503,000 1.50% 15/9/2022 511,331 0.02%Carmax Auto Owner Trust 2018 $492,000 3.48% 15/2/2024 510,245 0.02%JP Morgan Chase Commercial Mortgage Securities Trust 2012 $498,112 2.84% 15/12/2047 510,188 0.02%GS Mortgage Securities Trust 2014 $475,000 4.07% 10/1/2047 508,184 0.02%US Treasury Note $500,000 1.88% 31/5/2022 508,145 0.02%Chevron Corp. $500,000 1.14% 11/5/2023 507,438 0.02%Morgan Stanley Bank of America Merrill Lynch Trust 2012 $500,000 3.18% 15/8/2045 507,318 0.02%Federal National Mortgage Association $490,000 1.63% 15/10/2024 507,298 0.02%Athene Global Funding $485,000 2.50% 14/1/2025 505,965 0.02%American Tower Corp. $500,000 1.60% 15/4/2026 505,380 0.02%Equitable Financial Life Global Funding $500,000 1.40% 7/7/2025 504,944 0.02%Pfizer, Inc. $500,000 2.20% 15/12/2021 504,652 0.02%Truist Financial Corp. $457,000 3.70% 5/6/2025 503,557 0.02%AT&T, Inc. €400,000 2.40% 15/3/2024 503,484 0.02%PNC Bank NA $444,000 4.20% 1/11/2025 502,911 0.02%Intercontinental Exchange, Inc. $500,000 0.70% 15/6/2023 502,199 0.02%Federal Home Loan Mortgage Corp. $500,000 0.38% 5/5/2023 501,247 0.02%Goldman Sachs Group, Inc.^ $500,000 0.67% 8/3/2024 500,902 0.02%PepsiCo, Inc. $500,000 0.40% 7/10/2023 500,410 0.02%Chevron USA, Inc. $500,000 0.33% 12/8/2022 500,327 0.02%JPMorgan Chase & Co.^ $500,000 0.65% 16/9/2024 500,265 0.02%Teledyne Technologies, Inc. $500,000 0.65% 1/4/2023 499,833 0.02%Federal Farm Credit Banks Funding Corp. $500,000 0.13% 23/11/2022 499,561 0.02%Equitable Financial Life Global Funding $500,000 0.50% 17/11/2023 499,220 0.02%AIG Global Funding $500,000 0.45% 8/12/2023 499,143 0.02%PPG Industries, Inc. $500,000 1.20% 15/3/2026 498,958 0.02%Federal Farm Credit Banks Funding Corp. $500,000 0.13% 13/4/2023 498,952 0.02%Goldman Sachs Group, Inc.^ $500,000 1.43% 9/3/2027 498,531 0.02%Toyota Motor Credit Corp. $500,000 0.80% 16/10/2025 496,199 0.02%Federal National Mortgage Association $479,000 2.38% 19/1/2023 494,723 0.02%LC4 Commercial Mortgage Trust 2012 $489,020 3.29% 10/12/2044 491,973 0.02%Intel Corp. $450,000 3.40% 25/3/2025 491,242 0.02%AT&T, Inc. €400,000 1.30% 5/9/2023 487,807 0.02%Upjohn Finance BV €400,000 1.02% 23/6/2024 487,726 0.02%Honeywell International, Inc. €400,000 1.30% 22/2/2023 486,849 0.02%Ameriprise Financial, Inc. $443,000 3.70% 15/10/2024 484,552 0.02%Philip Morris International, Inc. $490,000 0.88% 1/5/2026 483,824 0.02%Becton Dickinson & Co. $450,000 3.36% 6/6/2024 482,098 0.02%Florida Power & Light Co. $450,000 2.85% 1/4/2025 480,882 0.02%JPMorgan Chase & Co. $440,000 3.20% 15/6/2026 479,142 0.02%JPMorgan Chase & Co.^ $450,000 3.22% 1/3/2025 477,963 0.02%Apple, Inc. $450,000 2.85% 11/5/2024 477,730 0.02%Medtronic Global Holdings SCA €400,000 0.00% 15/3/2023 477,107 0.02%Steel Dynamics, Inc. $450,000 2.80% 15/12/2024 474,935 0.02%State Street Corp. $428,000 3.55% 18/8/2025 474,375 0.02%Amazon.com, Inc. $475,000 0.45% 12/5/2024 474,077 0.02%Fidelity National Information Services, Inc. $475,000 1.15% 1/3/2026 471,246 0.02%Athene Global Funding $450,000 2.80% 26/5/2023 468,747 0.02%HCA, Inc. $405,000 5.25% 15/6/2026 468,492 0.02%Truist Bank $425,000 3.63% 16/9/2025 467,763 0.01%Delta Air Lines, Inc. $400,000 7.00% 1/5/2025 466,746 0.01%Charter Communications Operating LLC/Charter Communications
Operating Capital $450,000 4.46% 23/7/2022 465,808 0.01%Freddie Mac Multifamily Structured Pass Through Certificates $459,187 2.27% 25/3/2022 463,580 0.01%Discover Financial Services $419,000 3.75% 4/3/2025 457,236 0.01%

774
Vanguard Global Short-Term Bond Index Fund
Principal CouponMaturity
DateFair Value
US Dollars ($)% of Total
Net AssetsWillis North America, Inc. $425,000 3.60% 15/5/2024 457,051 0.01%Johnson Controls International plc €376,000 1.00% 15/9/2023 456,207 0.01%CCRE27 Commercial Mortgage Trust 2015 $430,142 3.40% 10/10/2048 454,682 0.01%Wells Fargo Bank NA £300,000 5.25% 1/8/2023 451,382 0.01%Athene Global Funding $450,000 0.95% 8/1/2024 451,298 0.01%Ally Financial, Inc. $400,000 4.63% 30/3/2025 447,538 0.01%Fifth Third Bank NA $399,000 3.95% 28/7/2025 447,247 0.01%Santander Holdings USA, Inc. $403,000 4.50% 17/7/2025 447,165 0.01%Morgan Stanley $400,000 3.88% 27/1/2026 447,098 0.01%Federal National Mortgage Association $430,000 1.63% 7/1/2025 445,255 0.01%United Parcel Service, Inc. $400,000 3.90% 1/4/2025 442,887 0.01%Wells Fargo & Co.^ $425,000 2.16% 11/2/2026 440,951 0.01%International Business Machines Corp. $400,000 3.30% 15/5/2026 439,888 0.01%CSAIL 2015-C4 Commercial Mortgage Trust $400,000 3.81% 15/11/2048 439,846 0.01%Comcast Corp. $400,000 3.15% 1/3/2026 435,263 0.01%Federal National Mortgage Association $425,000 2.00% 5/10/2022 434,815 0.01%CCRE19 Commercial Mortgage Trust 2014 $400,000 3.80% 10/8/2047 432,980 0.01%ITC Holdings Corp. $400,000 3.65% 15/6/2024 429,431 0.01%Tyson Foods, Inc. $400,000 3.90% 28/9/2023 428,576 0.01%Citigroup, Inc.^ $400,000 3.11% 8/4/2026 427,935 0.01%JPMorgan Chase & Co.^ $425,000 0.97% 23/6/2025 425,499 0.01%Morgan Stanley $400,000 4.88% 1/11/2022 423,195 0.01%National Rural Utilities Cooperative Finance Corp. $400,000 2.95% 7/2/2024 422,249 0.01%AutoZone, Inc. $400,000 3.13% 15/7/2023 418,674 0.01%7-Eleven, Inc. $425,000 0.95% 10/2/2026 417,222 0.01%QUALCOMM, Inc. $425,000 1.30% 20/5/2028 415,974 0.01%HP, Inc. $400,000 2.20% 17/6/2025 415,248 0.01%Federal National Mortgage Association $393,000 2.50% 5/2/2024 414,235 0.01%Nestle Holdings, Inc. £300,000 0.63% 18/12/2025 413,421 0.01%AbbVie, Inc. $400,000 2.90% 6/11/2022 413,274 0.01%Toyota Motor Credit Corp. $400,000 1.80% 13/2/2025 412,616 0.01%Freddie Mac Multifamily Structured Pass Through Certificates $371,917 3.74% 25/4/2028 411,325 0.01%Philip Morris International, Inc. $376,000 3.38% 11/8/2025 410,170 0.01%Capital One Multi-Asset Execution Trust $400,000 2.29% 15/7/2025 409,896 0.01%PepsiCo, Inc. $400,000 0.75% 1/5/2023 403,331 0.01%Gilead Sciences, Inc. $365,000 3.65% 1/3/2026 402,565 0.01%AbbVie, Inc. $375,000 3.75% 14/11/2023 402,403 0.01%Nissan Motor Acceptance Corp. $400,000 2.00% 9/3/2026 402,247 0.01%Principal Life Global Funding II $400,000 1.25% 23/6/2025 402,119 0.01%Bank of America Corp.^ $400,000 0.81% 24/10/2024 401,343 0.01%Morgan Stanley^ $400,000 0.73% 5/4/2024 400,873 0.01%AmerisourceBergen Corp. $375,000 3.40% 15/5/2024 400,836 0.01%WRKCo, Inc. $375,000 3.00% 15/9/2024 397,710 0.01%Eastern Energy Gas Holdings LLC $375,000 3.55% 1/11/2023 397,064 0.01%Federal National Mortgage Association $400,000 0.50% 17/6/2025 396,977 0.01%Verizon Communications, Inc. $400,000 0.85% 20/11/2025 395,115 0.01%Johnson & Johnson $369,000 2.45% 1/3/2026 392,995 0.01%Broadcom, Inc. $361,000 3.46% 15/9/2026 392,903 0.01%Bank of America Corp.^ $375,000 2.46% 22/10/2025 392,412 0.01%Simon Property Group LP $363,000 3.38% 1/10/2024 390,778 0.01%State Street Corp. $358,000 3.30% 16/12/2024 390,116 0.01%Bristol-Myers Squibb Co. $347,000 3.88% 15/8/2025 386,134 0.01%Walmart, Inc. $375,000 2.35% 15/12/2022 385,613 0.01%JP Morgan Chase Commercial Mortgage Securities Trust 2012 $377,510 2.83% 15/10/2045 385,515 0.01%American International Group, Inc. $350,000 3.75% 10/7/2025 385,451 0.01%Crown Castle International Corp. $350,000 3.70% 15/6/2026 385,127 0.01%CCRE25 Commercial Mortgage Trust 2015 $350,000 3.76% 10/8/2048 384,678 0.01%Bank of America Corp.^ $375,000 2.82% 21/7/2023 384,328 0.01%Fiserv, Inc. $349,000 3.85% 1/6/2025 383,943 0.01%American Tower Corp. €300,000 1.95% 22/5/2026 383,815 0.01%American Express Co. $375,000 2.50% 1/8/2022 383,021 0.01%Synchrony Financial $350,000 4.25% 15/8/2024 382,522 0.01%ERAC USA Finance LLC $350,000 3.85% 15/11/2024 381,740 0.01%Apple, Inc. $350,000 3.20% 13/5/2025 381,641 0.01%Allstate Corp.^ $350,000 5.75% 15/8/2053 379,899 0.01%Dell International LLC/EMC Corp. $350,000 5.45% 15/6/2023 379,661 0.01%American Honda Finance Corp. €300,000 1.95% 18/10/2024 379,425 0.01%MetLife, Inc. $350,000 3.60% 10/4/2024 378,560 0.01%Capital One Financial Corp. $339,000 4.20% 29/10/2025 378,440 0.01%John Deere Capital Corp. $375,000 0.55% 5/7/2022 376,249 0.01%Bank of America Corp.^ $375,000 0.98% 22/4/2025 376,177 0.01%

775
Vanguard Global Short-Term Bond Index Fund
Principal CouponMaturity
DateFair Value
US Dollars ($)% of Total
Net AssetsDXC Technology Co. €300,000 1.75% 15/1/2026 375,939 0.01%International Business Machines Corp. $300,000 7.00% 30/10/2025 375,819 0.01%Truist Bank $350,000 3.20% 1/4/2024 374,461 0.01%Constellation Brands, Inc. $325,000 4.75% 1/12/2025 373,691 0.01%Becton Dickinson Euro Finance Sarl €300,000 1.21% 4/6/2026 372,346 0.01%US Treasury Note $358,000 1.63% 31/10/2023 368,880 0.01%Enterprise Products Operating LLC $333,000 3.70% 15/2/2026 368,826 0.01%Berkshire Hathaway, Inc. €300,000 1.30% 15/3/2024 368,744 0.01%Procter & Gamble Co. €300,000 1.13% 2/11/2023 368,054 0.01%Bunge Finance Europe BV €300,000 1.85% 16/6/2023 367,383 0.01%Mastercard, Inc. $350,000 2.00% 3/3/2025 365,838 0.01%UnitedHealth Group, Inc. $329,000 3.75% 15/7/2025 364,998 0.01%ERAC USA Finance LLC $350,000 3.30% 15/10/2022 362,443 0.01%Oracle Corp. $345,000 2.50% 1/4/2025 362,397 0.01%eBay, Inc. $350,000 1.90% 11/3/2025 361,920 0.01%Mastercard, Inc. €300,000 1.10% 1/12/2022 361,846 0.01%Precision Castparts Corp. $350,000 2.50% 15/1/2023 359,861 0.01%World Omni Auto Receivables Trust 2018 $350,000 3.27% 16/9/2024 359,670 0.01%Stryker Corp. €300,000 0.25% 3/12/2024 359,335 0.01%Chubb INA Holdings, Inc. €300,000 0.30% 15/12/2024 359,007 0.01%Apple, Inc. €300,000 0.00% 15/11/2025 358,277 0.01%US Treasury Note $342,000 2.63% 30/6/2023 358,205 0.01%Apple, Inc. CA($)425,000 2.51% 19/8/2024 357,569 0.01%Pfizer, Inc. €300,000 0.25% 6/3/2022 357,314 0.01%Booking Holdings, Inc. €300,000 0.10% 8/3/2025 356,850 0.01%Goldman Sachs Group, Inc. $325,000 3.75% 22/5/2025 355,612 0.01%Marsh & McLennan Cos, Inc. $339,000 3.30% 14/3/2023 353,898 0.01%Chevron Corp. $325,000 2.95% 16/5/2026 352,426 0.01%JPMorgan Chase & Co. $325,000 3.63% 13/5/2024 352,258 0.01%DuPont de Nemours, Inc. $325,000 4.21% 15/11/2023 351,850 0.01%Bank of New York Mellon Corp. $325,000 3.65% 4/2/2024 350,309 0.01%Goldman Sachs Group, Inc.^ $350,000 0.66% 10/9/2024 349,377 0.01%Goldman Sachs Group, Inc.^ $350,000 1.54% 10/9/2027 348,926 0.01%General Motors Financial Co., Inc. $350,000 1.25% 8/1/2026 347,678 0.01%Intel Corp. $325,000 2.88% 11/5/2024 345,536 0.01%Entergy Louisiana LLC $300,000 5.40% 1/11/2024 344,352 0.01%Dow Chemical Co. $300,000 4.55% 30/11/2025 342,157 0.01%US Bank NA $320,000 2.80% 27/1/2025 341,924 0.01%Bank of America Corp. $300,000 4.45% 3/3/2026 340,294 0.01%L3Harris Technologies, Inc. $320,000 3.85% 15/6/2023 340,254 0.01%Southern Co. $325,000 2.95% 1/7/2023 339,380 0.01%Morgan Stanley Bank of America Merrill Lynch Trust 2013 $329,491 3.82% 15/10/2046 338,985 0.01%Anthem, Inc. $325,000 2.95% 1/12/2022 336,036 0.01%Goldman Sachs Group, Inc. $300,000 4.25% 21/10/2025 335,645 0.01%ViacomCBS, Inc. $300,000 4.00% 15/1/2026 333,694 0.01%Office Properties Income Trust $306,000 4.50% 1/2/2025 332,625 0.01%Edison International $300,000 4.95% 15/4/2025 332,455 0.01%John Deere Capital Corp. $325,000 2.15% 8/9/2022 332,244 0.01%MetLife, Inc. $300,000 3.60% 13/11/2025 331,477 0.01%Omnicom Group, Inc./Omnicom Capital, Inc. $300,000 3.60% 15/4/2026 331,161 0.01%Nuveen Finance LLC $300,000 4.13% 1/11/2024 330,854 0.01%Mondelez International, Inc. $325,000 1.50% 4/5/2025 330,490 0.01%General Motors Financial Co., Inc. $300,000 5.10% 17/1/2024 330,405 0.01%Entergy Gulf States Louisiana LLC $287,000 5.59% 1/10/2024 329,805 0.01%Bank of America Corp. $300,000 3.95% 21/4/2025 329,422 0.01%Simon Property Group LP $300,000 3.50% 1/9/2025 328,551 0.01%State Board of Administration Finance Corp. $325,000 1.26% 1/7/2025 327,737 0.01%JPMBB Commercial Mortgage Securities Trust 2015 $300,000 3.80% 15/8/2048 327,005 0.01%Lennar Corp. $300,000 4.88% 15/12/2023 326,306 0.01%EOG Resources, Inc. $315,000 2.63% 15/3/2023 325,263 0.01%Altria Group, Inc. $300,000 4.00% 31/1/2024 325,124 0.01%Chubb INA Holdings, Inc. $300,000 3.15% 15/3/2025 324,171 0.01%Chubb INA Holdings, Inc. $300,000 3.35% 15/5/2024 323,469 0.01%Ally Financial, Inc. $300,000 3.88% 21/5/2024 323,356 0.01%Caterpillar Financial Services Corp. $325,000 0.80% 13/11/2025 323,100 0.01%Anthem, Inc. $300,000 3.50% 15/8/2024 323,003 0.01%AES Corp. $325,000 1.38% 15/1/2026 321,763 0.01%Philip Morris International, Inc. $297,000 3.25% 10/11/2024 321,435 0.01%Microsoft Corp. $300,000 2.70% 12/2/2025 321,264 0.01%Goldman Sachs Group, Inc.^ $300,000 3.27% 29/9/2025 320,874 0.01%MPLX LP $284,000 4.88% 1/6/2025 320,648 0.01%

776
Vanguard Global Short-Term Bond Index Fund
Principal CouponMaturity
DateFair Value
US Dollars ($)% of Total
Net AssetsOracle Corp. $300,000 2.95% 15/5/2025 319,487 0.01%Nestle Holdings, Inc. $300,000 3.35% 24/9/2023 318,706 0.01%Lowe's Cos, Inc. $300,000 2.50% 15/4/2026 318,411 0.01%Valero Energy Corp. $300,000 2.85% 15/4/2025 318,092 0.01%Northrop Grumman Corp. $300,000 3.25% 1/8/2023 317,406 0.01%Allstate Corp. $300,000 3.15% 15/6/2023 315,736 0.01%Chevron Phillips Chemical Co. LLC/Chevron Phillips Chemical Co. LP $300,000 3.30% 1/5/2023 315,242 0.01%US Treasury Note $300,000 2.13% 31/7/2024 315,141 0.01%Jackson National Life Global Funding $300,000 2.65% 21/6/2024 314,750 0.01%Federal Home Loan Mortgage Corp. $300,000 2.75% 19/6/2023 314,672 0.01%Hewlett Packard Enterprise Co. $300,000 4.40% 15/10/2022 313,105 0.01%BP Capital Markets America, Inc. $300,000 2.75% 10/5/2023 312,771 0.01%Kansas City Southern $300,000 3.00% 15/5/2023 310,997 0.01%AbbVie, Inc. $300,000 3.20% 6/11/2022 309,769 0.01%United Airlines 2020-1 Class B Pass Through Trust $291,150 4.88% 15/1/2026 308,772 0.01%CVS Health Corp. $294,000 4.75% 1/12/2022 308,449 0.01%Chevron Corp. $300,000 1.55% 11/5/2025 307,202 0.01%McDonald's Corp. $281,000 3.30% 1/7/2025 305,110 0.01%AbbVie, Inc. $295,000 2.30% 21/11/2022 302,805 0.01%Crown Castle International Corp. $300,000 1.35% 15/7/2025 302,073 0.01%East Ohio Gas Co. $300,000 1.30% 15/6/2025 301,771 0.01%KeyBank NA $276,000 3.30% 1/6/2025 301,619 0.01%Teledyne Technologies, Inc. $300,000 1.60% 1/4/2026 300,912 0.01%AT&T, Inc. $300,000 0.90% 25/3/2024 300,645 0.01%Athene Global Funding $300,000 1.45% 8/1/2026 300,006 0.01%Caterpillar Financial Services Corp. $300,000 0.90% 2/3/2026 299,104 0.01%Morgan Stanley $275,000 3.88% 29/4/2024 298,973 0.01%National Rural Utilities Cooperative Finance Corp. $300,000 1.00% 15/6/2026 297,599 0.01%Cisco Systems, Inc. $275,000 3.63% 4/3/2024 297,593 0.01%Global Payments, Inc. $300,000 1.20% 1/3/2026 297,480 0.01%BlackRock, Inc. $275,000 3.50% 18/3/2024 297,229 0.01%Alphabet, Inc. $300,000 0.45% 15/8/2025 296,804 0.01%UnitedHealth Group, Inc. $275,000 3.50% 15/2/2024 296,181 0.01%Hewlett Packard Enterprise Co. $259,000 4.90% 15/10/2025 294,926 0.01%Union Pacific Corp. $285,000 2.95% 15/1/2023 294,338 0.01%Berkshire Hathaway Energy Co. $275,000 3.75% 15/11/2023 293,974 0.01%Comcast Corp. $267,000 3.38% 15/8/2025 291,438 0.01%ONEOK, Inc. $246,000 5.85% 15/1/2026 291,162 0.01%Shire Acquisitions Investments Ireland DAC $275,000 2.88% 23/9/2023 287,793 0.01%Comcast Corp. $257,000 3.95% 15/10/2025 287,635 0.01%Freddie Mac Multifamily Structured Pass Through Certificates $280,702 2.57% 25/9/2022 286,866 0.01%Puget Energy, Inc. $275,000 5.63% 15/7/2022 285,745 0.01%Gilead Sciences, Inc. $263,000 3.50% 1/2/2025 284,977 0.01%Toyota Motor Credit Corp. $275,000 2.80% 13/7/2022 282,213 0.01%Verisk Analytics, Inc. $254,000 4.00% 15/6/2025 281,041 0.01%Bank of New York Mellon Corp. $261,000 2.80% 4/5/2026 281,012 0.01%Lennar Corp. $250,000 4.75% 30/5/2025 280,642 0.01%Ventas Canada Finance Ltd. CA($)335,000 2.80% 12/4/2024 280,184 0.01%Walgreens Boots Alliance, Inc. $257,000 3.45% 1/6/2026 279,620 0.01%Fifth Third Bancorp $260,000 3.65% 25/1/2024 278,656 0.01%Oracle Corp. $271,000 2.50% 15/10/2022 278,237 0.01%AT&T, Inc. $275,000 1.70% 25/3/2026 277,955 0.01%American Express Co. $245,000 4.20% 6/11/2025 277,373 0.01%TD Ameritrade Holding Corp. $250,000 3.63% 1/4/2025 273,379 0.01%Simon Property Group LP $250,000 3.30% 15/1/2026 272,071 0.01%Truist Bank $260,000 2.15% 6/12/2024 271,934 0.01%Verizon Communications, Inc. $250,000 3.38% 15/2/2025 271,616 0.01%LC17 Commercial Mortgage Trust 2014 $250,000 3.92% 10/10/2047 271,517 0.01%McCormick & Co., Inc. $275,000 0.90% 15/2/2026 270,254 0.01%Kinder Morgan Energy Partners LP $250,000 4.15% 1/2/2024 269,539 0.01%Discover Financial Services $238,000 4.50% 30/1/2026 269,380 0.01%BP Capital Markets America, Inc. $250,000 3.19% 6/4/2025 269,327 0.01%Discover Bank $250,000 4.20% 8/8/2023 269,242 0.01%Duke Energy Corp. $250,000 3.75% 15/4/2024 269,216 0.01%Delta Air Lines, Inc./SkyMiles IP Ltd. $250,000 4.50% 20/10/2025 269,145 0.01%CCRE22 Commercial Mortgage Trust 2015^ $250,000 3.60% 10/3/2048 269,140 0.01%Sempra Energy $250,000 3.55% 15/6/2024 269,089 0.01%LC15 Commercial Mortgage Trust 2014 $250,000 4.01% 10/4/2047 269,072 0.01%Target Corp. $250,000 2.50% 15/4/2026 268,879 0.01%JPMBB Commercial Mortgage Securities Trust 2014 $250,000 4.08% 15/2/2047 268,816 0.01%Avangrid, Inc. $250,000 3.20% 15/4/2025 268,775 0.01%

777
Vanguard Global Short-Term Bond Index Fund
Principal CouponMaturity
DateFair Value
US Dollars ($)% of Total
Net AssetsSantander Holdings USA, Inc. $250,000 3.45% 2/6/2025 268,519 0.01%Johnson & Johnson $252,000 2.63% 15/1/2025 268,304 0.01%Marriott International, Inc. $250,000 4.15% 1/12/2023 268,047 0.01%Sherwin-Williams Co. $250,000 3.13% 1/6/2024 266,953 0.01%GS Mortgage Securities Trust 2013 $250,000 4.24% 10/8/2046 266,602 0.01%Huntington National Bank $250,000 3.55% 6/10/2023 266,480 0.01%Plains All American Pipeline LP/PAA Finance Corp. $238,000 4.65% 15/10/2025 266,305 0.01%Bank of America Corp.^ $250,000 3.09% 1/10/2025 266,267 0.01%AutoZone, Inc. $250,000 3.13% 18/4/2024 266,166 0.01%MUFG Union Bank NA $260,000 2.10% 9/12/2022 266,110 0.01%Aflac, Inc. $242,000 3.63% 15/11/2024 265,361 0.01%Public Service Enterprise Group, Inc. $250,000 2.88% 15/6/2024 265,185 0.01%Benchmark 2018-B6 Mortgage Trust $250,000 4.20% 10/10/2051 265,075 0.01%General Motors Financial Co., Inc. $250,000 2.90% 26/2/2025 264,623 0.01%Federal National Mortgage Association^ $261,676 2.90% 25/8/2022 264,387 0.01%Capital One Financial Corp. $246,000 3.20% 5/2/2025 264,381 0.01%JPMBB Commercial Mortgage Securities Trust 2014 $250,000 3.37% 15/11/2047 263,640 0.01%Parker-Hannifin Corp. $250,000 2.70% 14/6/2024 263,526 0.01%Quest Diagnostics, Inc. $240,000 3.45% 1/6/2026 263,485 0.01%Goldman Sachs Group, Inc. $250,000 3.63% 22/1/2023 262,324 0.01%Kinder Morgan, Inc. $235,000 4.30% 1/6/2025 261,742 0.01%Altria Group, Inc. $250,000 2.35% 6/5/2025 261,500 0.01%Chubb INA Holdings, Inc. $250,000 2.70% 13/3/2023 260,005 0.01%Cigna Corp. $250,000 3.05% 30/11/2022 258,769 0.01%IHS Markit Ltd. $247,000 5.00% 1/11/2022 258,630 0.01%NextEra Energy Capital Holdings, Inc. $250,000 2.80% 15/1/2023 258,407 0.01%American Honda Finance Corp. $250,000 2.60% 16/11/2022 257,912 0.01%Capital One Financial Corp. $231,000 4.25% 30/4/2025 257,419 0.01%ONEOK Partners LP $250,000 3.38% 1/10/2022 256,897 0.01%Constellation Brands, Inc. $250,000 2.65% 7/11/2022 256,815 0.01%Bank of New York Mellon Corp. $250,000 1.60% 24/4/2025 256,641 0.01%Huntington National Bank $250,000 2.50% 7/8/2022 255,617 0.01%Citigroup, Inc.^ $250,000 1.68% 15/5/2024 255,292 0.01%Aviation Capital Group LLC $225,000 5.50% 15/12/2024 254,551 0.01%Hewlett Packard Enterprise Co. $250,000 1.45% 1/4/2024 254,210 0.01%New York Life Global Funding $250,000 1.10% 5/5/2023 253,227 0.01%MassMutual Global Funding II $250,000 0.85% 9/6/2023 252,523 0.01%American Honda Finance Corp. $250,000 0.88% 7/7/2023 252,220 0.01%CCRE25 Commercial Mortgage Trust 2015 $234,735 3.51% 10/8/2048 251,921 0.01%Bank of America Corp. $250,000 2.50% 21/10/2022 251,665 0.01%Charles Schwab Corp. $250,000 0.75% 18/3/2024 251,395 0.01%Host Hotels & Resorts LP $235,000 3.88% 1/4/2024 251,000 0.01%Citadel Finance LLC $250,000 3.38% 9/3/2026 250,795 0.01%University of California $250,000 0.88% 15/5/2025 250,665 0.01%Reliance Steel & Aluminum Co. $250,000 1.30% 15/8/2025 250,569 0.01%Amazon.com, Inc. $250,000 0.40% 3/6/2023 250,537 0.01%Caterpillar Financial Services Corp. $250,000 0.45% 14/9/2023 250,336 0.01%International Flavors & Fragrances, Inc. $250,000 0.70% 15/9/2022 250,248 0.01%John Deere Capital Corp. $250,000 0.40% 10/10/2023 250,199 0.01%Federal Farm Credit Banks Funding Corp. $250,000 0.13% 3/2/2023 249,774 0.01%7-Eleven, Inc. $250,000 0.80% 10/2/2024 249,429 0.01%Nestle Holdings, Inc. $250,000 0.38% 15/1/2024 248,729 0.01%Goldman Sachs Group, Inc.^ $250,000 0.86% 12/2/2026 248,140 0.01%Republic Services, Inc. $250,000 0.88% 15/11/2025 247,904 0.01%Sempra Energy $225,000 3.75% 15/11/2025 247,314 0.01%Apple, Inc. €200,000 1.38% 17/1/2024 247,313 0.01%Citizens Bank NA $223,000 3.75% 18/2/2026 247,184 0.01%AT&T, Inc. €200,000 1.95% 15/9/2023 247,133 0.01%JPMorgan Chase & Co.^ $250,000 1.05% 19/11/2026 246,894 0.01%AT&T, Inc. €200,000 2.50% 15/3/2023 246,651 0.01%Citigroup, Inc.^ $250,000 1.12% 28/1/2027 246,491 0.01%Apple, Inc. €200,000 0.88% 24/5/2025 246,477 0.01%Expedia Group, Inc. $225,000 4.50% 15/8/2024 246,442 0.01%UnitedHealth Group, Inc. $226,000 3.10% 15/3/2026 246,422 0.01%Goldman Sachs Group, Inc.^ $250,000 1.09% 9/12/2026 246,171 0.01%Virginia Electric & Power Co. $225,000 3.15% 15/1/2026 244,940 0.01%Abbott Ireland Financing DAC €200,000 0.88% 27/9/2023 243,137 0.01%JPMorgan Chase & Co.^ $225,000 4.02% 5/12/2024 242,843 0.01%John Deere Financial, Inc. CA($)290,000 2.41% 14/1/2025 242,784 0.01%McDonald's Corp. €200,000 0.63% 29/1/2024 241,964 0.01%Apple, Inc. €200,000 1.00% 10/11/2022 241,790 0.01%

778
Vanguard Global Short-Term Bond Index Fund
Principal CouponMaturity
DateFair Value
US Dollars ($)% of Total
Net AssetsNational Grid North America, Inc. €200,000 0.75% 8/8/2023 241,502 0.01%FedEx Corp. €200,000 0.45% 5/8/2025 241,260 0.01%LC19 Commercial Mortgage Trust 2015 $225,000 3.53% 10/2/2048 241,042 0.01%Metropolitan Life Global Funding I €200,000 0.38% 9/4/2024 240,764 0.01%American Tower Corp. $230,000 2.40% 15/3/2025 240,401 0.01%Santander Holdings USA, Inc. $225,000 3.24% 5/10/2026 240,396 0.01%Berkshire Hathaway, Inc. €200,000 0.63% 17/1/2023 240,343 0.01%Illinois Tool Works, Inc. €200,000 0.25% 5/12/2024 240,166 0.01%JPMorgan Chase & Co.^ $225,000 3.80% 23/7/2024 239,553 0.01%QUALCOMM, Inc. $225,000 2.90% 20/5/2024 239,076 0.01%Southern Co.^ $225,000 4.00% 15/1/2051 238,618 0.01%GLP Capital LP/GLP Financing II, Inc. $225,000 3.35% 1/9/2024 238,385 0.01%Fidelity National Information Services, Inc. €200,000 0.13% 3/12/2022 238,340 0.01%Metropolitan Life Global Funding I €200,000 0.00% 23/9/2022 238,260 0.01%Citigroup, Inc. $235,000 2.90% 8/12/2021 237,202 0.01%PNC Bank NA $221,000 2.95% 23/2/2025 237,159 0.01%Ares Capital Corp. $220,000 4.20% 10/6/2024 236,465 0.01%United Parcel Service, Inc. CA($)285,000 2.13% 21/5/2024 236,438 0.01%AT&T, Inc. $213,000 3.95% 15/1/2025 235,210 0.01%Goldman Sachs Group, Inc. $225,000 3.20% 23/2/2023 234,679 0.01%Citigroup, Inc. $206,000 4.60% 9/3/2026 234,650 0.01%MPLX LP $232,000 1.75% 1/3/2026 234,639 0.01%American International Group, Inc. $210,000 3.90% 1/4/2026 234,426 0.01%Caterpillar Financial Services Corp. $225,000 2.63% 1/3/2023 233,659 0.01%Linde, Inc. $219,000 2.65% 5/2/2025 232,012 0.01%Conagra Brands, Inc. $204,000 4.60% 1/11/2025 231,870 0.01%Public Storage $225,000 2.37% 15/9/2022 230,079 0.01%Bank of New York Mellon Corp. $225,000 1.95% 23/8/2022 229,338 0.01%Bristol-Myers Squibb Co. $225,000 2.00% 1/8/2022 229,256 0.01%HCA, Inc. $200,000 5.25% 15/4/2025 229,034 0.01%Omega Healthcare Investors, Inc. $200,000 5.25% 15/1/2026 228,229 0.01%Trinity Acquisition plc $200,000 4.40% 15/3/2026 225,464 0.01%Broadcom, Inc. $200,000 4.70% 15/4/2025 225,091 0.01%Federal Farm Credit Banks Funding Corp. $225,000 0.13% 10/5/2023 224,714 0.01%Aircastle Ltd. $200,000 5.25% 11/8/2025 224,637 0.01%Humana, Inc. $200,000 4.50% 1/4/2025 224,002 0.01%Carmax Auto Owner Trust 2018 $220,608 3.36% 15/9/2023 223,650 0.01%Marsh & McLennan Cos, Inc. $200,000 3.75% 14/3/2026 222,301 0.01%UnitedHealth Group, Inc. $220,000 1.25% 15/1/2026 221,887 0.01%General Mills, Inc. $200,000 4.00% 17/4/2025 221,516 0.01%HCA, Inc. $200,000 5.00% 15/3/2024 221,055 0.01%MassMutual Global Funding II $200,000 3.40% 8/3/2026 219,709 0.01%Truist Bank $200,000 3.30% 15/5/2026 219,284 0.01%US Bancorp $201,000 3.10% 27/4/2026 218,845 0.01%GE Capital International Funding Co. Unlimited Co. $200,000 3.37% 15/11/2025 218,199 0.01%Brixmor Operating Partnership LP $200,000 3.85% 1/2/2025 217,275 0.01%MetLife, Inc. $200,000 4.37% 15/9/2023 216,737 0.01%Verizon Communications, Inc. $200,000 3.50% 1/11/2024 216,419 0.01%Aetna, Inc. $200,000 3.50% 15/11/2024 216,370 0.01%Mastercard, Inc. $200,000 3.38% 1/4/2024 215,666 0.01%Stellantis NV $200,000 5.25% 15/4/2023 215,650 0.01%Exelon Generation Co. LLC $200,000 3.25% 1/6/2025 215,622 0.01%Prudential Financial, Inc.^ $200,000 5.63% 15/6/2043 215,288 0.01%ViacomCBS, Inc. $200,000 3.50% 15/1/2025 215,063 0.01%Black Hills Corp. $200,000 4.25% 30/11/2023 214,980 0.01%Bayer US Finance LLC $200,000 3.38% 8/10/2024 214,784 0.01%PNC Financial Services Group, Inc. $200,000 3.50% 23/1/2024 214,714 0.01%Aon plc $200,000 4.00% 27/11/2023 214,563 0.01%Public Service Electric & Gas Co. $200,000 3.00% 15/5/2025 214,445 0.01%MassMutual Global Funding II $200,000 2.95% 11/1/2025 214,180 0.01%Eastman Chemical Co. $196,000 3.80% 15/3/2025 214,116 0.01%Reliance Standard Life Global Funding II $200,000 3.85% 19/9/2023 213,783 0.01%US Treasury Note $215,000 0.25% 15/6/2024 213,707 0.01%Florida Power & Light Co. $200,000 3.25% 1/6/2024 213,645 0.01%Laboratory Corp. of America Holdings $200,000 4.00% 1/11/2023 213,626 0.01%Virginia Electric & Power Co. $200,000 3.45% 15/2/2024 213,217 0.01%FS KKR Capital Corp. $206,000 3.40% 15/1/2026 213,069 0.01%Marvell Technology, Inc. $200,000 4.20% 22/6/2023 212,721 0.01%Mars, Inc. $200,000 2.70% 1/4/2025 212,456 0.01%Keurig Dr Pepper, Inc. $200,000 3.13% 15/12/2023 212,176 0.01%Teachers Insurance & Annuity Association of America^ $200,000 4.38% 15/9/2054 212,153 0.01%

779
Vanguard Global Short-Term Bond Index Fund
Principal CouponMaturity
DateFair Value
US Dollars ($)% of Total
Net AssetsPacific Gas & Electric Co. $200,000 4.25% 1/8/2023 211,909 0.01%Truist Financial Corp. $198,000 2.85% 26/10/2024 211,802 0.01%Huntington Bancshares, Inc. $200,000 2.63% 6/8/2024 211,226 0.01%Citibank Credit Card Issuance Trust $200,000 3.29% 23/5/2025 211,197 0.01%Air Lease Corp. CA($)255,000 2.63% 5/12/2024 211,164 0.01%Omega Healthcare Investors, Inc. $193,000 4.50% 15/1/2025 211,051 0.01%General Dynamics Corp. $200,000 3.38% 15/5/2023 210,814 0.01%Spectra Energy Partners LP $192,000 4.75% 15/3/2024 210,803 0.01%Pricoa Global Funding I $200,000 2.40% 23/9/2024 210,699 0.01%Capital One Financial Corp. $195,000 3.30% 30/10/2024 210,093 0.01%American Tower Corp. $200,000 3.50% 31/1/2023 209,519 0.01%John Deere Capital Corp. $200,000 2.05% 9/1/2025 209,000 0.01%Citibank Credit Card Issuance Trust $200,000 3.21% 7/12/2024 208,485 0.01%Regions Financial Corp. $200,000 2.25% 18/5/2025 208,374 0.01%JPMorgan Chase & Co.^ $200,000 2.30% 15/10/2025 208,135 0.01%GS Mortgage Securities Trust 2013 $200,000 3.96% 10/8/2046 207,967 0.01%General Electric Co. $200,000 3.10% 9/1/2023 207,912 0.01%Piedmont Operating Partnership LP $200,000 3.40% 1/6/2023 207,890 0.01%General Motors Financial Co., Inc. $200,000 3.25% 5/1/2023 207,550 0.01%PepsiCo, Inc. CA($)250,000 2.15% 6/5/2024 207,549 0.01%Berkshire Hathaway, Inc. $200,000 2.75% 15/3/2023 207,542 0.01%Parker-Hannifin Corp. $200,000 3.50% 15/9/2022 207,353 0.01%MetLife, Inc. $200,000 3.05% 15/12/2022 206,658 0.01%Penske Truck Leasing Co. LP/PTL Finance Corp. $200,000 2.70% 14/3/2023 206,538 0.01%Eaton Corp. $200,000 2.75% 2/11/2022 206,481 0.01%Walt Disney Co. $200,000 3.00% 15/9/2022 206,351 0.01%NetApp, Inc. $200,000 1.88% 22/6/2025 205,771 0.01%AbbVie, Inc. $200,000 3.25% 1/10/2022 205,585 0.01%Bunge Ltd. Finance Corp. $200,000 3.00% 25/9/2022 205,475 0.01%US Bancorp $200,000 1.45% 12/5/2025 204,457 0.01%General Dynamics Corp. $200,000 2.25% 15/11/2022 204,336 0.01%National Rural Utilities Cooperative Finance Corp. $200,000 2.30% 15/9/2022 204,271 0.01%Gray Oak Pipeline LLC $200,000 2.00% 15/9/2023 204,081 0.01%Alexander Funding Trust $200,000 1.84% 15/11/2023 203,506 0.01%Apple, Inc. $200,000 1.70% 11/9/2022 203,410 0.01%AbbVie, Inc. $200,000 5.00% 15/12/2021 201,900 0.01%CommonSpirit Health $200,000 1.55% 1/10/2025 201,753 0.01%Bank of America Corp.^ $200,000 1.66% 11/3/2027 201,687 0.01%Nissan Motor Acceptance Corp. $190,000 3.88% 21/9/2023 201,648 0.01%Southern California Edison Co. $200,000 1.10% 1/4/2024 201,438 0.01%Gilead Sciences, Inc. $200,000 4.40% 1/12/2021 201,350 0.01%F&G Global Funding $200,000 1.75% 30/6/2026 200,778 0.01%Boeing Co. $200,000 1.17% 4/2/2023 200,747 0.01%NextEra Energy Capital Holdings, Inc. $200,000 0.65% 1/3/2023 200,693 0.01%Athene Global Funding $200,000 1.00% 16/4/2024 200,678 0.01%Mondelez International, Inc. $200,000 0.63% 1/7/2022 200,656 0.01%JPMorgan Chase & Co.^ $200,000 0.70% 16/3/2024 200,639 0.01%Cigna Corp. $200,000 1.25% 15/3/2026 200,602 0.01%Pfizer, Inc. $200,000 0.80% 28/5/2025 200,549 0.01%Federal Home Loan Mortgage Corp. $200,000 0.38% 20/4/2023 200,484 0.01%AmerisourceBergen Corp. $200,000 0.74% 15/3/2023 200,396 0.01%Amazon.com, Inc. $200,000 0.80% 3/6/2025 200,389 0.01%CenterPoint Energy, Inc. $200,000 1.45% 1/6/2026 200,319 0.01%Security Benefit Global Funding $200,000 1.25% 17/5/2024 200,264 0.01%Berry Global, Inc. $200,000 1.57% 15/1/2026 200,258 0.01%Entergy Louisiana LLC $200,000 0.62% 17/11/2023 200,258 0.01%Protective Life Global Funding $200,000 0.50% 12/4/2023 200,198 0.01%Tennessee Valley Authority $200,000 0.75% 15/5/2025 200,195 0.01%Toyota Motor Credit Corp. $200,000 0.40% 6/4/2023 200,123 0.01%WEC Energy Group, Inc. $200,000 0.55% 15/9/2023 200,081 0.01%Atmos Energy Corp. $200,000 0.63% 9/3/2023 200,053 0.01%Diamondback Energy, Inc. $200,000 0.90% 24/3/2023 200,043 0.01%Laboratory Corp. of America Holdings $200,000 1.55% 1/6/2026 200,015 0.01%DTE Energy Co. $200,000 1.05% 1/6/2025 199,675 0.01%Metropolitan Life Global Funding I $200,000 0.55% 7/6/2024 199,357 0.01%American Honda Finance Corp. $200,000 0.55% 12/7/2024 199,306 0.01%PACCAR Financial Corp. $200,000 0.35% 2/2/2024 199,143 0.01%Cargill, Inc. $200,000 0.40% 2/2/2024 199,006 0.01%Penske Truck Leasing Co. LP/PTL Finance Corp. $200,000 1.20% 15/11/2025 198,419 0.01%Bank of America Corp.^ $200,000 1.20% 24/10/2026 198,371 0.01%Cargill, Inc. $200,000 0.75% 2/2/2026 197,607 0.01%
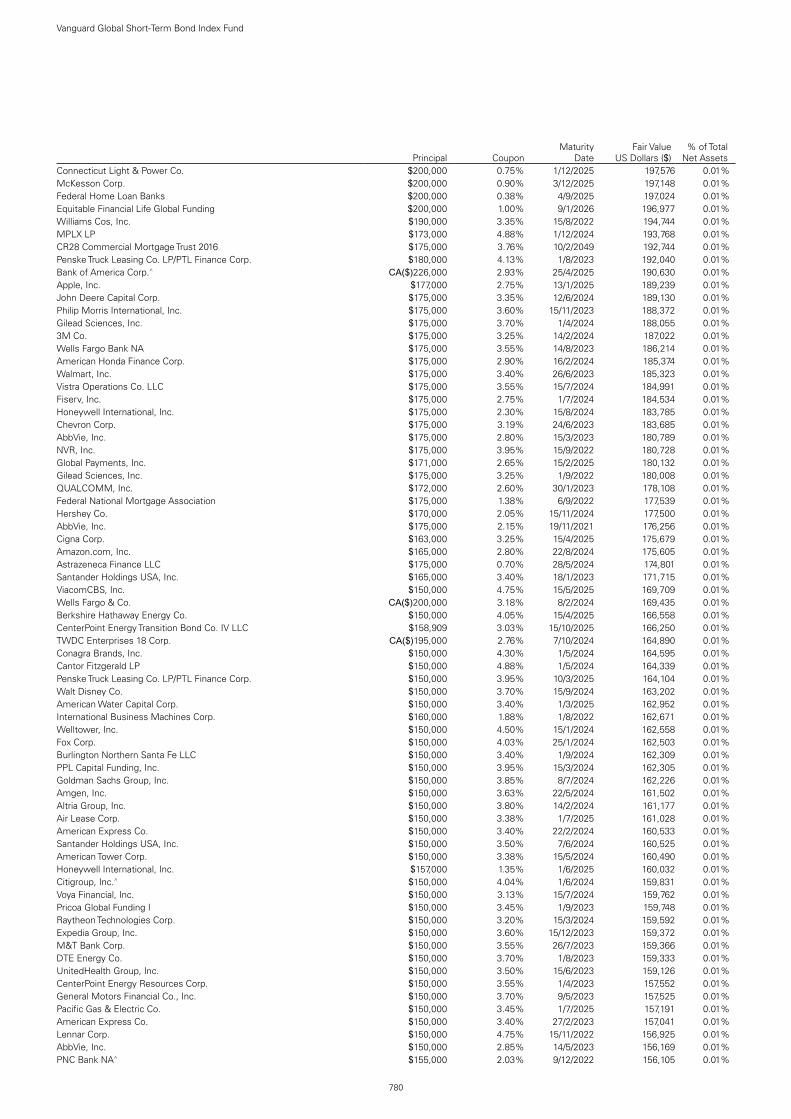
780
Vanguard Global Short-Term Bond Index Fund
Principal CouponMaturity
DateFair Value
US Dollars ($)% of Total
Net AssetsConnecticut Light & Power Co. $200,000 0.75% 1/12/2025 197,576 0.01%McKesson Corp. $200,000 0.90% 3/12/2025 197,148 0.01%Federal Home Loan Banks $200,000 0.38% 4/9/2025 197,024 0.01%Equitable Financial Life Global Funding $200,000 1.00% 9/1/2026 196,977 0.01%Williams Cos, Inc. $190,000 3.35% 15/8/2022 194,744 0.01%MPLX LP $173,000 4.88% 1/12/2024 193,768 0.01%CR28 Commercial Mortgage Trust 2016 $175,000 3.76% 10/2/2049 192,744 0.01%Penske Truck Leasing Co. LP/PTL Finance Corp. $180,000 4.13% 1/8/2023 192,040 0.01%Bank of America Corp.^ CA($)226,000 2.93% 25/4/2025 190,630 0.01%Apple, Inc. $177,000 2.75% 13/1/2025 189,239 0.01%John Deere Capital Corp. $175,000 3.35% 12/6/2024 189,130 0.01%Philip Morris International, Inc. $175,000 3.60% 15/11/2023 188,372 0.01%Gilead Sciences, Inc. $175,000 3.70% 1/4/2024 188,055 0.01%3M Co. $175,000 3.25% 14/2/2024 187,022 0.01%Wells Fargo Bank NA $175,000 3.55% 14/8/2023 186,214 0.01%American Honda Finance Corp. $175,000 2.90% 16/2/2024 185,374 0.01%Walmart, Inc. $175,000 3.40% 26/6/2023 185,323 0.01%Vistra Operations Co. LLC $175,000 3.55% 15/7/2024 184,991 0.01%Fiserv, Inc. $175,000 2.75% 1/7/2024 184,534 0.01%Honeywell International, Inc. $175,000 2.30% 15/8/2024 183,785 0.01%Chevron Corp. $175,000 3.19% 24/6/2023 183,685 0.01%AbbVie, Inc. $175,000 2.80% 15/3/2023 180,789 0.01%NVR, Inc. $175,000 3.95% 15/9/2022 180,728 0.01%Global Payments, Inc. $171,000 2.65% 15/2/2025 180,132 0.01%Gilead Sciences, Inc. $175,000 3.25% 1/9/2022 180,008 0.01%QUALCOMM, Inc. $172,000 2.60% 30/1/2023 178,108 0.01%Federal National Mortgage Association $175,000 1.38% 6/9/2022 177,539 0.01%Hershey Co. $170,000 2.05% 15/11/2024 177,500 0.01%AbbVie, Inc. $175,000 2.15% 19/11/2021 176,256 0.01%Cigna Corp. $163,000 3.25% 15/4/2025 175,679 0.01%Amazon.com, Inc. $165,000 2.80% 22/8/2024 175,605 0.01%Astrazeneca Finance LLC $175,000 0.70% 28/5/2024 174,801 0.01%Santander Holdings USA, Inc. $165,000 3.40% 18/1/2023 171,715 0.01%ViacomCBS, Inc. $150,000 4.75% 15/5/2025 169,709 0.01%Wells Fargo & Co. CA($)200,000 3.18% 8/2/2024 169,435 0.01%Berkshire Hathaway Energy Co. $150,000 4.05% 15/4/2025 166,558 0.01%CenterPoint Energy Transition Bond Co. IV LLC $158,909 3.03% 15/10/2025 166,250 0.01%TWDC Enterprises 18 Corp. CA($)195,000 2.76% 7/10/2024 164,890 0.01%Conagra Brands, Inc. $150,000 4.30% 1/5/2024 164,595 0.01%Cantor Fitzgerald LP $150,000 4.88% 1/5/2024 164,339 0.01%Penske Truck Leasing Co. LP/PTL Finance Corp. $150,000 3.95% 10/3/2025 164,104 0.01%Walt Disney Co. $150,000 3.70% 15/9/2024 163,202 0.01%American Water Capital Corp. $150,000 3.40% 1/3/2025 162,952 0.01%International Business Machines Corp. $160,000 1.88% 1/8/2022 162,671 0.01%Welltower, Inc. $150,000 4.50% 15/1/2024 162,558 0.01%Fox Corp. $150,000 4.03% 25/1/2024 162,503 0.01%Burlington Northern Santa Fe LLC $150,000 3.40% 1/9/2024 162,309 0.01%PPL Capital Funding, Inc. $150,000 3.95% 15/3/2024 162,305 0.01%Goldman Sachs Group, Inc. $150,000 3.85% 8/7/2024 162,226 0.01%Amgen, Inc. $150,000 3.63% 22/5/2024 161,502 0.01%Altria Group, Inc. $150,000 3.80% 14/2/2024 161,177 0.01%Air Lease Corp. $150,000 3.38% 1/7/2025 161,028 0.01%American Express Co. $150,000 3.40% 22/2/2024 160,533 0.01%Santander Holdings USA, Inc. $150,000 3.50% 7/6/2024 160,525 0.01%American Tower Corp. $150,000 3.38% 15/5/2024 160,490 0.01%Honeywell International, Inc. $157,000 1.35% 1/6/2025 160,032 0.01%Citigroup, Inc.^ $150,000 4.04% 1/6/2024 159,831 0.01%Voya Financial, Inc. $150,000 3.13% 15/7/2024 159,762 0.01%Pricoa Global Funding I $150,000 3.45% 1/9/2023 159,748 0.01%Raytheon Technologies Corp. $150,000 3.20% 15/3/2024 159,592 0.01%Expedia Group, Inc. $150,000 3.60% 15/12/2023 159,372 0.01%M&T Bank Corp. $150,000 3.55% 26/7/2023 159,366 0.01%DTE Energy Co. $150,000 3.70% 1/8/2023 159,333 0.01%UnitedHealth Group, Inc. $150,000 3.50% 15/6/2023 159,126 0.01%CenterPoint Energy Resources Corp. $150,000 3.55% 1/4/2023 157,552 0.01%General Motors Financial Co., Inc. $150,000 3.70% 9/5/2023 157,525 0.01%Pacific Gas & Electric Co. $150,000 3.45% 1/7/2025 157,191 0.01%American Express Co. $150,000 3.40% 27/2/2023 157,041 0.01%Lennar Corp. $150,000 4.75% 15/11/2022 156,925 0.01%AbbVie, Inc. $150,000 2.85% 14/5/2023 156,169 0.01%PNC Bank NA^ $155,000 2.03% 9/12/2022 156,105 0.01%

781
Vanguard Global Short-Term Bond Index Fund
Principal CouponMaturity
DateFair Value
US Dollars ($)% of Total
Net AssetsBristol-Myers Squibb Co. $150,000 3.55% 15/8/2022 155,356 0.01%Waste Management, Inc. $150,000 2.40% 15/5/2023 155,213 0.01%Walt Disney Co. $150,000 1.75% 30/8/2024 154,984 0.01%Humana, Inc. $150,000 3.15% 1/12/2022 154,655 0.01%Bank of America Corp.^ $150,000 2.02% 13/2/2026 154,650 0.01%Citigroup, Inc. $150,000 2.70% 27/10/2022 154,290 0.01%PayPal Holdings, Inc. $150,000 1.65% 1/6/2025 154,028 0.01%United Parcel Service, Inc. $150,000 2.45% 1/10/2022 154,001 0.01%Protective Life Global Funding $150,000 2.62% 22/8/2022 153,815 0.01%Digital Stout Holding LLC £100,000 4.25% 17/1/2025 153,588 0.01%Expedia Group, Inc. $132,000 6.25% 1/5/2025 153,554 0.01%Duke Energy Corp. $150,000 2.40% 15/8/2022 153,141 0.01%USAA Capital Corp. $150,000 1.50% 1/5/2023 153,053 0.01%Toyota Motor Credit Corp. $150,000 1.35% 25/8/2023 152,926 0.01%AutoNation, Inc. $142,000 3.50% 15/11/2024 152,821 0.01%Air Lease Corp. $150,000 2.63% 1/7/2022 152,817 0.01%Wells Fargo & Co. CA($)175,000 3.87% 21/5/2025 152,451 0.01%Las Vegas Sands Corp. $146,000 2.90% 25/6/2025 152,156 0.01%Verizon Communications, Inc. £100,000 4.07% 18/6/2024 151,961 0.01%Anthem, Inc. $150,000 1.50% 15/3/2026 151,829 0.01%Apple, Inc. $150,000 1.13% 11/5/2025 151,793 0.01%Protective Life Global Funding $150,000 1.08% 9/6/2023 151,750 0.01%Bunge Ltd. Finance Corp. $150,000 1.63% 17/8/2025 151,668 0.01%Metropolitan Life Global Funding I $150,000 0.90% 8/6/2023 151,443 0.01%Bank of America Corp. $137,000 4.00% 22/1/2025 150,275 0.01%Goldman Sachs Group, Inc.^ $150,000 0.63% 17/11/2023 150,081 0.01%Amazon.com, Inc. $150,000 0.25% 12/5/2023 150,050 0.01%Omnicom Group, Inc./Omnicom Capital, Inc. $138,000 3.65% 1/11/2024 149,818 0.01%Northwestern Mutual Global Funding $150,000 0.60% 25/3/2024 149,795 0.01%Guardian Life Global Funding $150,000 1.25% 13/5/2026 149,699 0.01%CCRE12 Commercial Mortgage Trust 2013 $140,000 4.05% 10/10/2046 149,485 0.01%GXO Logistics, Inc. $150,000 1.65% 15/7/2026 149,239 0.01%HP, Inc. $150,000 1.45% 17/6/2026 149,209 0.01%Royalty Pharma plc $150,000 1.20% 2/9/2025 148,728 0.01%Johnson & Johnson $150,000 0.55% 1/9/2025 148,499 0.01%New York Life Global Funding $150,000 0.85% 15/1/2026 148,241 0.01%General Motors Financial of Canada Ltd. CA($)175,000 3.25% 7/11/2023 147,786 0.01%Wells Fargo & Co.^ CA($)175,000 2.57% 1/5/2026 146,201 0.01%AT&T, Inc. CA($)165,000 4.00% 25/11/2025 145,981 0.01%Arrow Electronics, Inc. $137,000 3.25% 8/9/2024 145,826 0.01%Wells Fargo & Co. CA($)175,000 2.51% 27/10/2023 145,794 0.01%Citigroup, Inc. £100,000 2.75% 24/1/2024 144,927 0.01%Wells Fargo Commercial Mortgage Trust 2012 $141,156 2.92% 15/10/2045 144,165 0.00%Discovery Communications LLC £100,000 2.50% 20/9/2024 143,995 0.00%DXC Technology Co. £100,000 2.75% 15/1/2025 143,755 0.00%UBS Commercial Mortgage Trust 2018 $134,252 4.21% 15/10/2051 142,473 0.00%Caterpillar Financial Services Corp. $135,000 2.15% 8/11/2024 141,396 0.00%3M Co. $132,000 2.65% 15/4/2025 140,590 0.00%Enterprise Products Operating LLC $135,000 3.35% 15/3/2023 140,584 0.00%Amazon.com, Inc. $126,000 3.80% 5/12/2024 138,623 0.00%Halliburton Co. $125,000 3.80% 15/11/2025 138,144 0.00%Williams Cos, Inc. $125,000 4.55% 24/6/2024 137,695 0.00%Kinder Morgan Energy Partners LP $125,000 4.30% 1/5/2024 136,273 0.00%Tyson Foods, Inc. $125,000 3.95% 15/8/2024 135,991 0.00%Walt Disney Co. $125,000 3.35% 24/3/2025 135,937 0.00%Realty Income Corp. $125,000 3.88% 15/7/2024 135,382 0.00%Lincoln National Corp. $125,000 3.35% 9/3/2025 135,370 0.00%Sabine Pass Liquefaction LLC $125,000 5.63% 15/4/2023 134,345 0.00%DC1 Commercial Mortgage Trust 2015 $125,000 3.35% 10/2/2048 134,310 0.00%Discovery Communications LLC $125,000 3.80% 13/3/2024 134,019 0.00%HCA, Inc. $125,000 4.75% 1/5/2023 133,990 0.00%Boston Scientific Corp. $125,000 3.45% 1/3/2024 133,481 0.00%Westinghouse Air Brake Technologies Corp. $125,000 3.20% 15/6/2025 133,192 0.00%General Motors Financial Co., Inc. $125,000 4.15% 19/6/2023 132,782 0.00%International Business Machines Corp. $125,000 3.38% 1/8/2023 132,699 0.00%Kroger Co. $125,000 3.85% 1/8/2023 132,656 0.00%CC Holdings GS V LLC/Crown Castle GS III Corp. $125,000 3.85% 15/4/2023 132,409 0.00%Synchrony Credit Card Master Note Trust $125,000 3.47% 15/5/2026 132,177 0.00%Citigroup, Inc. $125,000 3.50% 15/5/2023 131,755 0.00%Liberty Mutual Group, Inc. $123,000 4.25% 15/6/2023 131,557 0.00%Bank of New York Mellon Corp. $125,000 2.10% 24/10/2024 131,022 0.00%

782
Vanguard Global Short-Term Bond Index Fund
Principal CouponMaturity
DateFair Value
US Dollars ($)% of Total
Net AssetsBank of America Corp. $125,000 3.30% 11/1/2023 130,448 0.00%Ventas Realty LP $125,000 3.13% 15/6/2023 130,291 0.00%Aetna, Inc. $125,000 2.80% 15/6/2023 130,105 0.00%Discovery Communications LLC $125,000 2.95% 20/3/2023 130,048 0.00%Oracle Corp. $125,000 2.63% 15/2/2023 129,261 0.00%Fortune Brands Home & Security, Inc. $117,000 4.00% 15/6/2025 128,947 0.00%Fiserv, Inc. $125,000 3.50% 1/10/2022 128,794 0.00%Dominion Energy, Inc. $125,000 2.45% 15/1/2023 128,705 0.00%General Motors Financial Co., Inc. €108,000 0.20% 2/9/2022 128,595 0.00%Colgate-Palmolive Co. $125,000 2.25% 15/11/2022 128,340 0.00%General Mills, Inc. $125,000 2.60% 12/10/2022 128,251 0.00%Burlington Northern Santa Fe LLC $125,000 3.05% 1/9/2022 128,076 0.00%American Express Co. $117,000 3.63% 5/12/2024 128,046 0.00%Chevron Corp. $125,000 2.36% 5/12/2022 128,023 0.00%Federal Home Loan Banks $125,000 2.00% 9/9/2022 127,729 0.00%Eversource Energy $119,000 3.15% 15/1/2025 127,088 0.00%Linde, Inc. $125,000 2.20% 15/8/2022 127,064 0.00%Fidelity National Information Services, Inc. €105,000 0.75% 21/5/2023 126,537 0.00%Bank of America Corp.^ CA($)150,000 3.30% 24/4/2024 126,220 0.00%WPC Eurobond BV €100,000 2.25% 19/7/2024 126,165 0.00%Roper Technologies, Inc. $125,000 2.80% 15/12/2021 126,161 0.00%Synchrony Card Issuance Trust $125,000 3.38% 15/9/2024 125,811 0.00%General Motors Financial Co., Inc. $125,000 1.05% 8/3/2024 125,756 0.00%eBay, Inc. $125,000 1.40% 10/5/2026 125,325 0.00%General Motors Financial Co., Inc. €100,000 2.20% 1/4/2024 125,297 0.00%Roper Technologies, Inc. $125,000 0.45% 15/8/2022 125,074 0.00%General Motors Financial Co., Inc. $115,000 3.95% 13/4/2024 123,901 0.00%AbbVie, Inc. €100,000 1.50% 15/11/2023 123,076 0.00%Spectra Energy Partners LP $114,000 3.50% 15/3/2025 123,034 0.00%Stryker Corp. €100,000 1.13% 30/11/2023 122,424 0.00%Columbia Pipeline Group, Inc. $108,000 4.50% 1/6/2025 121,398 0.00%Celanese US Holdings LLC €100,000 1.13% 26/9/2023 121,381 0.00%General Mills, Inc. €100,000 1.00% 27/4/2023 120,933 0.00%Altria Group, Inc. €100,000 1.00% 15/2/2023 120,440 0.00%Kellogg Co. €100,000 0.80% 17/11/2022 120,384 0.00%United Parcel Service, Inc. €100,000 0.38% 15/11/2023 120,279 0.00%Emerson Electric Co. €100,000 0.38% 22/5/2024 120,260 0.00%American Honda Finance Corp. €100,000 0.55% 17/3/2023 120,232 0.00%AT&T, Inc. $110,000 4.45% 1/4/2024 120,193 0.00%Medtronic Global Holdings SCA €100,000 0.38% 7/3/2023 119,972 0.00%International Business Machines Corp. €100,000 0.38% 31/1/2023 119,912 0.00%Fiserv, Inc. €100,000 0.38% 1/7/2023 119,682 0.00%LYB International Finance BV $112,000 4.00% 15/7/2023 119,579 0.00%American Honda Finance Corp. €100,000 0.35% 26/8/2022 119,573 0.00%CCRE3 Commercial Mortgage Trust 2012 $117,346 2.82% 15/10/2045 119,436 0.00%Johnson & Johnson €100,000 0.25% 20/1/2022 119,009 0.00%Boardwalk Pipelines LP $106,000 4.95% 15/12/2024 118,544 0.00%Enterprise Products Operating LLC^ $120,000 4.88% 16/8/2077 117,620 0.00%MPLX LP $107,000 4.00% 15/2/2025 116,778 0.00%Omega Healthcare Investors, Inc. $109,000 4.38% 1/8/2023 116,246 0.00%American Express Co. $110,000 2.50% 30/7/2024 115,930 0.00%Albemarle Corp. $105,000 4.15% 1/12/2024 114,980 0.00%Cheniere Corpus Christi Holdings LLC $100,000 7.00% 30/6/2024 114,519 0.00%Expedia Group, Inc. $100,000 5.00% 15/2/2026 114,115 0.00%Ross Stores, Inc. $100,000 4.60% 15/4/2025 112,877 0.00%Ryder System, Inc. $100,000 4.63% 1/6/2025 112,813 0.00%Diamondback Energy, Inc. $100,000 4.75% 31/5/2025 112,739 0.00%Assured Guaranty US Holdings, Inc. $100,000 5.00% 1/7/2024 111,872 0.00%Charles Schwab Corp. $100,000 4.20% 24/3/2025 111,665 0.00%Phillips 66 $100,000 3.85% 9/4/2025 110,063 0.00%DXC Technology Co. $100,000 4.13% 15/4/2025 109,895 0.00%CCRE26 Commercial Mortgage Trust 2015 $100,000 3.63% 10/10/2048 109,380 0.00%DR Horton, Inc. $100,000 5.75% 15/8/2023 109,303 0.00%Columbia Property Trust Operating Partnership LP $101,000 4.15% 1/4/2025 108,954 0.00%Synchrony Financial $100,000 4.38% 19/3/2024 108,910 0.00%Citigroup, Inc. $100,000 3.75% 16/6/2024 108,796 0.00%Energy Transfer LP $100,000 4.90% 1/2/2024 108,727 0.00%UPMC $100,000 3.60% 3/4/2025 108,666 0.00%Leidos, Inc. $100,000 3.63% 15/5/2025 108,603 0.00%Citigroup Commercial Mortgage Trust 2014 $100,000 3.64% 10/10/2047 108,318 0.00%Laboratory Corp. of America Holdings $100,000 3.60% 1/2/2025 108,194 0.00%

783
Vanguard Global Short-Term Bond Index Fund
Principal CouponMaturity
DateFair Value
US Dollars ($)% of Total
Net AssetsGS Mortgage Securities Trust 2015 $100,000 3.38% 10/5/2050 108,122 0.00%Morgan Stanley Capital I Trust 2016 $100,000 3.33% 15/3/2049 108,045 0.00%Comcast Corp. $100,000 3.60% 1/3/2024 107,985 0.00%Burlington Northern Santa Fe LLC $100,000 3.75% 1/4/2024 107,967 0.00%JPMBB Commercial Mortgage Securities Trust 2014 $100,000 3.49% 15/1/2048 107,957 0.00%Citigroup, Inc. $100,000 3.88% 25/10/2023 107,925 0.00%Capital One Financial Corp. $100,000 3.90% 29/1/2024 107,903 0.00%Energy Transfer LP $100,000 4.25% 1/4/2024 107,766 0.00%State Street Corp.^ $100,000 3.78% 3/12/2024 107,755 0.00%Bank of New York Mellon Corp. $100,000 3.40% 15/5/2024 107,743 0.00%Essex Portfolio LP $100,000 3.88% 1/5/2024 107,665 0.00%Schlumberger Holdings Corp. $100,000 3.75% 1/5/2024 107,578 0.00%Truist Financial Corp. $100,000 3.75% 6/12/2023 107,548 0.00%JP Morgan Chase Commercial Mortgage Securities Trust 2014 $100,000 3.80% 15/7/2047 107,498 0.00%Halliburton Co. $102,000 3.50% 1/8/2023 107,488 0.00%Marriott International, Inc. $100,000 3.75% 15/3/2025 107,484 0.00%Mosaic Co. $100,000 4.25% 15/11/2023 107,381 0.00%Plains All American Pipeline LP/PAA Finance Corp. $100,000 3.60% 1/11/2024 107,211 0.00%Walmart, Inc. $100,000 3.30% 22/4/2024 107,164 0.00%BorgWarner, Inc. $99,000 3.38% 15/3/2025 107,083 0.00%Laboratory Corp. of America Holdings $100,000 3.25% 1/9/2024 107,048 0.00%Celanese US Holdings LLC $100,000 3.50% 8/5/2024 107,044 0.00%Fiserv, Inc. $100,000 3.80% 1/10/2023 107,021 0.00%AES Corp. $100,000 3.30% 15/7/2025 106,942 0.00%Jefferies Group LLC $100,000 5.13% 20/1/2023 106,931 0.00%Aircastle Ltd. $100,000 4.13% 1/5/2024 106,779 0.00%Starbucks Corp. $100,000 3.85% 1/10/2023 106,740 0.00%Marathon Petroleum Corp. $100,000 4.50% 1/5/2023 106,683 0.00%Microchip Technology, Inc. $100,000 4.33% 1/6/2023 106,627 0.00%Walmart, Inc. $100,000 2.85% 8/7/2024 106,589 0.00%International Business Machines Corp. $100,000 3.00% 15/5/2024 106,569 0.00%BP Capital Markets America, Inc. $100,000 3.22% 14/4/2024 106,564 0.00%PNC Bank NA $100,000 3.80% 25/7/2023 106,528 0.00%Bristol-Myers Squibb Co. $100,000 3.25% 1/11/2023 106,448 0.00%Pfizer, Inc. $100,000 2.95% 15/3/2024 106,379 0.00%Global Payments, Inc. $100,000 4.00% 1/6/2023 106,276 0.00%NextEra Energy Capital Holdings, Inc. $100,000 2.75% 1/5/2025 106,255 0.00%National Rural Utilities Cooperative Finance Corp. $100,000 3.40% 15/11/2023 106,243 0.00%LYB International Finance III LLC $100,000 2.88% 1/5/2025 106,240 0.00%Toyota Motor Credit Corp. $100,000 2.90% 17/4/2024 106,230 0.00%Discover Bank^ $100,000 4.68% 9/8/2028 106,198 0.00%Oncor Electric Delivery Co. LLC $100,000 2.75% 1/6/2024 106,123 0.00%Plains All American Pipeline LP/PAA Finance Corp. $100,000 3.85% 15/10/2023 106,012 0.00%John Deere Capital Corp. $100,000 3.45% 7/6/2023 105,985 0.00%Xilinx, Inc. $100,000 2.95% 1/6/2024 105,848 0.00%Diamondback Energy, Inc. $100,000 2.88% 1/12/2024 105,708 0.00%BANK 2018 $100,000 4.13% 15/9/2060 105,690 0.00%Dollar Tree, Inc. $100,000 3.70% 15/5/2023 105,644 0.00%Phillips 66 $100,000 3.70% 6/4/2023 105,571 0.00%US Bancorp $100,000 2.40% 30/7/2024 105,282 0.00%Equinix, Inc. $100,000 2.63% 18/11/2024 105,274 0.00%Ares Capital Corp. $100,000 3.25% 15/7/2025 105,220 0.00%UnitedHealth Group, Inc. $100,000 2.38% 15/8/2024 105,208 0.00%SSM Health Care Corp. $100,000 3.69% 1/6/2023 105,102 0.00%Crown Castle International Corp. $100,000 3.15% 15/7/2023 105,063 0.00%Boeing Co. $100,000 2.85% 30/10/2024 105,035 0.00%salesforce.com, Inc. $100,000 3.25% 11/4/2023 104,910 0.00%Midwest Connector Capital Co. LLC $100,000 3.90% 1/4/2024 104,805 0.00%PPL Capital Funding, Inc. $100,000 3.40% 1/6/2023 104,799 0.00%Ford Credit Floorplan Master Owner Trust A $100,000 3.17% 15/3/2025 104,730 0.00%Cigna Corp. $100,000 3.00% 15/7/2023 104,691 0.00%American Express Credit Account Master Trust $100,000 3.01% 15/10/2025 104,607 0.00%Discover Card Execution Note Trust $100,000 3.03% 15/8/2025 104,460 0.00%Duke Energy Carolinas LLC $100,000 3.05% 15/3/2023 104,393 0.00%Primerica, Inc. $100,000 4.75% 15/7/2022 104,235 0.00%Energy Transfer LP/Regency Energy Finance Corp. $100,000 5.00% 1/10/2022 104,227 0.00%Williams Cos, Inc. $100,000 3.70% 15/1/2023 104,100 0.00%Leidos, Inc. $100,000 2.95% 15/5/2023 103,968 0.00%ERP Operating LP $100,000 3.00% 15/4/2023 103,960 0.00%Citigroup Commercial Mortgage Trust 2013 $100,000 3.09% 10/4/2046 103,948 0.00%Burlington Northern Santa Fe LLC $100,000 3.00% 15/3/2023 103,931 0.00%

784
Vanguard Global Short-Term Bond Index Fund
Principal CouponMaturity
DateFair Value
US Dollars ($)% of Total
Net AssetsCitigroup, Inc. $100,000 4.05% 30/7/2022 103,892 0.00%MPLX LP $100,000 3.50% 1/12/2022 103,891 0.00%Capital One Financial Corp. $100,000 2.60% 11/5/2023 103,842 0.00%Kinder Morgan, Inc. $100,000 3.15% 15/1/2023 103,839 0.00%Lockheed Martin Corp. $100,000 3.10% 15/1/2023 103,767 0.00%Welltower, Inc. $94,000 4.00% 1/6/2025 103,757 0.00%Invesco Finance plc $100,000 3.13% 30/11/2022 103,735 0.00%Valero Energy Corp. $100,000 2.70% 15/4/2023 103,693 0.00%Bank of America Corp.^ CA($)120,000 3.52% 24/3/2026 103,678 0.00%Home Depot, Inc. $100,000 2.70% 1/4/2023 103,664 0.00%Bristol-Myers Squibb Co. $100,000 2.75% 15/2/2023 103,647 0.00%LC13 Commercial Mortgage Trust 2013 $97,195 4.21% 10/8/2046 103,639 0.00%Simon Property Group LP $100,000 2.00% 13/9/2024 103,601 0.00%Nucor Corp. $100,000 4.13% 15/9/2022 103,565 0.00%Autodesk, Inc. $100,000 3.60% 15/12/2022 103,554 0.00%John Deere Canada Funding, Inc. CA($)125,000 2.63% 21/9/2022 103,424 0.00%Baker Hughes a GE Co. LLC/Baker Hughes Co.-Obligor, Inc. $100,000 2.77% 15/12/2022 103,288 0.00%Amazon.com, Inc. $100,000 2.40% 22/2/2023 103,275 0.00%Caterpillar Financial Services Corp. $100,000 2.55% 29/11/2022 103,184 0.00%Air Lease Corp. $100,000 2.75% 15/1/2023 103,147 0.00%RPM International, Inc. $100,000 3.45% 15/11/2022 103,124 0.00%Hewlett Packard Enterprise Co. $100,000 2.25% 1/4/2023 102,888 0.00%MassMutual Global Funding II $100,000 2.50% 17/10/2022 102,771 0.00%Philip Morris International, Inc. $100,000 2.50% 2/11/2022 102,718 0.00%American Express Credit Account Master Trust $100,000 2.35% 15/5/2025 102,711 0.00%JB Hunt Transport Services, Inc. $100,000 3.30% 15/8/2022 102,665 0.00%VMware, Inc. $100,000 2.95% 21/8/2022 102,613 0.00%Textron, Inc. $94,000 3.88% 1/3/2025 102,566 0.00%Clorox Co. $100,000 3.05% 15/9/2022 102,515 0.00%PayPal Holdings, Inc. $100,000 2.20% 26/9/2022 102,407 0.00%Caterpillar Financial Services Corp. $100,000 1.45% 15/5/2025 102,383 0.00%Merck & Co., Inc. $96,000 2.75% 10/2/2025 102,285 0.00%Ecolab, Inc. $100,000 2.38% 10/8/2022 102,092 0.00%Eli Lilly & Co. $100,000 2.35% 15/5/2022 101,862 0.00%Exxon Mobil Corp. $100,000 1.90% 16/8/2022 101,862 0.00%CCRE24 Commercial Mortgage Trust 2015 $94,855 3.43% 10/8/2048 101,768 0.00%MPLX LP $95,000 4.50% 15/7/2023 101,677 0.00%Health Care Service Corp. A Mutual Legal Reserve Co. $100,000 1.50% 1/6/2025 101,637 0.00%Midwest Connector Capital Co. LLC $100,000 3.63% 1/4/2022 101,630 0.00%CCRE4 Commercial Mortgage Trust 2012 $99,393 2.85% 15/10/2045 101,520 0.00%Freddie Mac Multifamily Structured Pass Through Certificates $92,468 3.59% 25/10/2027 101,426 0.00%Southwestern Electric Power Co. $100,000 1.65% 15/3/2026 101,321 0.00%Philip Morris International, Inc. $100,000 1.13% 1/5/2023 101,319 0.00%Discover Card Execution Note Trust $100,000 2.39% 15/7/2024 101,177 0.00%Sutter Health $100,000 1.32% 15/8/2025 100,904 0.00%PACCAR Financial Corp. $100,000 0.80% 8/6/2023 100,857 0.00%Brighthouse Financial Global Funding $100,000 1.55% 24/5/2026 100,856 0.00%Valero Energy Corp. $100,000 1.20% 15/3/2024 100,809 0.00%American Honda Finance Corp. $100,000 1.20% 8/7/2025 100,801 0.00%Amazon.com, Inc. $100,000 3.30% 5/12/2021 100,798 0.00%Emerson Electric Co. $100,000 2.63% 1/12/2021 100,792 0.00%Citibank Credit Card Issuance Trust $100,000 2.19% 20/11/2023 100,772 0.00%ERAC USA Finance LLC $100,000 2.60% 1/12/2021 100,760 0.00%Analog Devices, Inc. $100,000 2.50% 5/12/2021 100,759 0.00%Dominion Energy, Inc. $100,000 1.45% 15/4/2026 100,742 0.00%Motorola Solutions, Inc. $92,000 4.00% 1/9/2024 100,730 0.00%Lennox International, Inc. $100,000 1.35% 1/8/2025 100,654 0.00%Stryker Corp. $100,000 1.15% 15/6/2025 100,554 0.00%Equinix, Inc. $100,000 1.45% 15/5/2026 100,484 0.00%American Honda Finance Corp. $100,000 0.65% 8/9/2023 100,450 0.00%Freddie Mac Multifamily Structured Pass Through Certificates $97,633 3.45% 25/9/2024 100,379 0.00%Royalty Pharma plc $100,000 0.75% 2/9/2023 100,299 0.00%Equinix, Inc. $100,000 1.25% 15/7/2025 100,288 0.00%WEC Energy Group, Inc. $100,000 0.80% 15/3/2024 100,259 0.00%Toyota Motor Credit Corp. $100,000 0.50% 14/8/2023 100,196 0.00%Hormel Foods Corp. $100,000 0.65% 3/6/2024 100,192 0.00%Brighthouse Financial Global Funding $100,000 1.00% 12/4/2024 100,184 0.00%Illumina, Inc. $100,000 0.55% 23/3/2023 100,147 0.00%Teledyne Technologies, Inc. $100,000 0.95% 1/4/2024 100,131 0.00%ONE Gas, Inc. $100,000 1.10% 11/3/2024 100,124 0.00%Anthem, Inc. $100,000 0.45% 15/3/2023 100,108 0.00%

785
Vanguard Global Short-Term Bond Index Fund
Principal CouponMaturity
DateFair Value
US Dollars ($)% of Total
Net AssetsPhillips 66 $100,000 0.90% 15/2/2024 100,100 0.00%UnitedHealth Group, Inc. $100,000 1.15% 15/5/2026 100,068 0.00%Pioneer Natural Resources Co. $100,000 0.55% 15/5/2023 100,064 0.00%ONE Gas, Inc. $100,000 0.85% 11/3/2023 100,053 0.00%American Electric Power Co., Inc. $100,000 0.75% 1/11/2023 100,052 0.00%American Honda Finance Corp. $100,000 1.65% 12/7/2021 100,041 0.00%Honeywell International, Inc. $100,000 0.48% 19/8/2022 100,023 0.00%Phillips 66 $100,000 1.30% 15/2/2026 100,023 0.00%Cigna Corp. $100,000 0.61% 15/3/2024 100,009 0.00%American Honda Finance Corp. $100,000 1.00% 10/9/2025 100,004 0.00%Microchip Technology, Inc. $100,000 0.97% 15/2/2024 99,981 0.00%Bank of America Corp.^ $100,000 0.52% 14/6/2024 99,971 0.00%John Deere Capital Corp. $100,000 0.25% 17/1/2023 99,953 0.00%Caterpillar Financial Services Corp. $100,000 0.25% 1/3/2023 99,914 0.00%Charles Schwab Corp. $100,000 1.15% 13/5/2026 99,903 0.00%New York Life Global Funding $100,000 1.15% 9/6/2026 99,850 0.00%Consumers Energy Co. $100,000 0.35% 1/6/2023 99,840 0.00%Southern Co. $100,000 0.60% 26/2/2024 99,807 0.00%Highmark, Inc. $100,000 1.45% 10/5/2026 99,741 0.00%Georgia-Pacific LLC $100,000 0.63% 15/5/2024 99,718 0.00%Toyota Motor Credit Corp. $100,000 1.13% 18/6/2026 99,704 0.00%Vontier Corp. $100,000 1.80% 1/4/2026 99,676 0.00%CNH Industrial Capital LLC $100,000 1.45% 15/7/2026 99,463 0.00%Western Union Co. $100,000 1.35% 15/3/2026 99,429 0.00%American Electric Power Co., Inc. $100,000 1.00% 1/11/2025 99,234 0.00%JM Smucker Co. $91,000 3.50% 15/3/2025 99,126 0.00%Pioneer Natural Resources Co. $100,000 1.13% 15/1/2026 99,001 0.00%Fortinet, Inc. $100,000 1.00% 15/3/2026 98,985 0.00%John Deere Capital Corp. $100,000 0.70% 15/1/2026 98,984 0.00%Procter & Gamble Co. $100,000 0.55% 29/10/2025 98,772 0.00%SITE Centers Corp. $93,000 3.63% 1/2/2025 98,128 0.00%Tapestry, Inc. $89,000 4.25% 1/4/2025 96,799 0.00%Avangrid, Inc. $88,000 3.15% 1/12/2024 94,245 0.00%Apollo Management Holdings LP^ $90,000 4.95% 14/1/2050 93,334 0.00%Kinder Morgan Energy Partners LP $90,000 3.95% 1/9/2022 92,906 0.00%NextEra Energy Capital Holdings, Inc. $85,000 3.15% 1/4/2024 90,416 0.00%McDonald's Corp. CA($)105,000 3.13% 4/3/2025 89,931 0.00%Goldman Sachs Group, Inc.^ CA($)105,000 3.31% 31/10/2025 89,763 0.00%Western Union Co. $84,000 2.85% 10/1/2025 88,932 0.00%Kinder Morgan Energy Partners LP $81,000 4.25% 1/9/2024 88,913 0.00%Exelon Corp. $80,000 3.95% 15/6/2025 88,032 0.00%Nucor Corp. $85,000 2.00% 1/6/2025 87,915 0.00%Citigroup, Inc. CA($)100,000 4.09% 9/6/2025 87,834 0.00%Freddie Mac Multifamily Structured Pass Through Certificates $83,932 2.49% 25/4/2048 85,440 0.00%Morgan Stanley CA($)100,000 3.00% 7/2/2024 84,476 0.00%Prudential Financial, Inc.^ $80,000 5.88% 15/9/2042 84,453 0.00%Berkshire Hathaway Energy Co. $78,000 3.50% 1/2/2025 84,343 0.00%PayPal Holdings, Inc. $80,000 2.40% 1/10/2024 84,325 0.00%Athene Global Funding $80,000 2.75% 25/6/2024 83,968 0.00%Discover Financial Services $76,000 3.95% 6/11/2024 82,969 0.00%Baxalta, Inc. $75,000 4.00% 23/6/2025 82,900 0.00%Interpublic Group of Cos, Inc. $76,000 4.20% 15/4/2024 82,750 0.00%PC1 Commercial Mortgage Trust 2015 $75,000 3.90% 10/7/2050 82,274 0.00%Raytheon Technologies Corp. $80,000 2.50% 15/12/2022 82,099 0.00%Sabra Health Care LP $75,000 4.80% 1/6/2024 82,001 0.00%CSAIL 2015-C3 Commercial Mortgage Trust $75,000 3.72% 15/8/2048 81,877 0.00%Marathon Petroleum Corp. $75,000 4.75% 15/12/2023 81,826 0.00%CenterPoint Energy, Inc. $76,000 3.85% 1/2/2024 81,640 0.00%Aptiv Corp. $75,000 4.15% 15/3/2024 81,318 0.00%Host Hotels & Resorts LP $75,000 4.00% 15/6/2025 81,275 0.00%Capital One Financial Corp. $75,000 3.75% 24/4/2024 81,115 0.00%BGC Partners, Inc. $75,000 5.38% 24/7/2023 81,054 0.00%Owl Rock Capital Corp. $75,000 4.25% 15/1/2026 80,997 0.00%State Street Corp. $75,000 3.70% 20/11/2023 80,921 0.00%Intercontinental Exchange, Inc. $75,000 4.00% 15/10/2023 80,793 0.00%International Business Machines Corp. $75,000 3.63% 12/2/2024 80,774 0.00%Oncor Electric Delivery Co. LLC $75,000 7.00% 1/9/2022 80,741 0.00%Charles Schwab Corp. $75,000 3.55% 1/2/2024 80,699 0.00%Ryder System, Inc. $75,000 3.65% 18/3/2024 80,615 0.00%Lincoln National Corp. $75,000 4.00% 1/9/2023 80,532 0.00%Eversource Energy $75,000 3.80% 1/12/2023 80,517 0.00%

786
Vanguard Global Short-Term Bond Index Fund
Principal CouponMaturity
DateFair Value
US Dollars ($)% of Total
Net AssetsMylan, Inc. $75,000 4.20% 29/11/2023 80,457 0.00%Norfolk Southern Corp. $75,000 3.85% 15/1/2024 80,407 0.00%Energy Transfer LP/Regency Energy Finance Corp. $75,000 4.50% 1/11/2023 80,396 0.00%Raytheon Technologies Corp. $75,000 3.70% 15/12/2023 80,209 0.00%DTE Energy Co. $75,000 3.50% 1/6/2024 80,147 0.00%Stanley Black & Decker, Inc.^ $75,000 4.00% 15/3/2060 79,923 0.00%Bank of New York Mellon Corp. $75,000 3.45% 11/8/2023 79,874 0.00%Caterpillar Financial Services Corp. $75,000 2.85% 17/5/2024 79,791 0.00%Public Service Co. of New Hampshire $75,000 3.50% 1/11/2023 79,752 0.00%General Motors Financial Co., Inc. $75,000 4.25% 15/5/2023 79,714 0.00%Air Lease Corp. $75,000 3.88% 3/7/2023 79,592 0.00%Chevron Corp. $75,000 2.90% 3/3/2024 79,377 0.00%General Dynamics Corp. $75,000 2.38% 15/11/2024 79,084 0.00%Keurig Dr Pepper, Inc. $74,000 4.06% 25/5/2023 78,875 0.00%DTE Energy Co. $75,000 2.53% 1/10/2024 78,793 0.00%Republic Services, Inc. $75,000 2.50% 15/8/2024 78,780 0.00%Roper Technologies, Inc. $75,000 2.35% 15/9/2024 78,571 0.00%Aviation Capital Group LLC $75,000 3.88% 1/5/2023 78,547 0.00%Laboratory Corp. of America Holdings $75,000 2.30% 1/12/2024 78,539 0.00%Discover Bank $75,000 2.45% 12/9/2024 78,468 0.00%Air Lease Corp. $75,000 3.00% 15/9/2023 78,463 0.00%DH Europe Finance II Sarl $75,000 2.20% 15/11/2024 78,314 0.00%Starbucks Corp. $75,000 3.10% 1/3/2023 78,288 0.00%Keysight Technologies, Inc. $70,000 4.55% 30/10/2024 77,968 0.00%Biogen, Inc. $75,000 3.63% 15/9/2022 77,879 0.00%Apple, Inc. $75,000 1.80% 11/9/2024 77,841 0.00%New York Life Global Funding $75,000 2.00% 22/1/2025 77,754 0.00%Sempra Energy $75,000 2.90% 1/2/2023 77,661 0.00%Georgia Power Co. $75,000 2.10% 30/7/2023 77,467 0.00%Valero Energy Corp. $71,000 3.65% 15/3/2025 77,377 0.00%Union Pacific Corp. $75,000 4.16% 15/7/2022 77,276 0.00%Synchrony Credit Card Master Note Trust $75,000 2.62% 15/10/2025 77,272 0.00%Franklin Resources, Inc. $75,000 2.80% 15/9/2022 77,184 0.00%Microsoft Corp. $75,000 2.65% 3/11/2022 77,068 0.00%AvalonBay Communities, Inc. $75,000 2.95% 15/9/2022 76,870 0.00%Chevron USA, Inc. $70,000 3.90% 15/11/2024 76,754 0.00%DH Europe Finance II Sarl $75,000 2.05% 15/11/2022 76,735 0.00%3M Co. $75,000 1.75% 14/2/2023 76,682 0.00%Honeywell International, Inc. $75,000 2.15% 8/8/2022 76,428 0.00%Wells Fargo & Co. CA($)90,000 2.98% 19/5/2026 76,359 0.00%Enterprise Products Operating LLC $70,000 3.75% 15/2/2025 76,313 0.00%Energy Transfer LP $70,000 4.50% 15/4/2024 76,239 0.00%Capital One Multi-Asset Execution Trust $75,000 2.43% 15/1/2025 76,182 0.00%Eastman Chemical Co. $75,000 3.50% 1/12/2021 75,984 0.00%GA Global Funding Trust $75,000 1.63% 15/1/2026 75,906 0.00%Ares Capital Corp. $70,000 4.25% 1/3/2025 75,664 0.00%Interstate Power & Light Co. $70,000 3.25% 1/12/2024 75,319 0.00%Digital Realty Trust LP $65,000 4.75% 1/10/2025 73,903 0.00%General Motors Financial of Canada Ltd. CA($)80,000 5.95% 14/5/2024 72,651 0.00%Energy Transfer LP $70,000 3.60% 1/2/2023 72,628 0.00%XLIT Ltd. $63,000 4.45% 31/3/2025 70,652 0.00%Packaging Corp. of America $65,000 4.50% 1/11/2023 70,265 0.00%Lam Research Corp. $63,000 3.80% 15/3/2025 69,323 0.00%Fifth Third Bancorp $65,000 2.38% 28/1/2025 68,117 0.00%UnitedHealth Group, Inc. $65,000 3.35% 15/7/2022 67,066 0.00%Essex Portfolio LP $60,000 3.50% 1/4/2025 64,966 0.00%Aon plc $60,000 3.50% 14/6/2024 64,524 0.00%Fox Corp. $60,000 3.05% 7/4/2025 64,232 0.00%Marsh & McLennan Cos, Inc. $59,000 3.50% 10/3/2025 64,144 0.00%MidAmerican Energy Co. $59,000 3.50% 15/10/2024 63,915 0.00%Avnet, Inc. $60,000 4.88% 1/12/2022 63,447 0.00%CyrusOne LP/CyrusOne Finance Corp. $60,000 2.90% 15/11/2024 63,343 0.00%AT&T, Inc. CA($)75,000 2.85% 25/5/2024 63,133 0.00%Owl Rock Capital Corp. $59,000 4.00% 30/3/2025 62,902 0.00%Evergy, Inc. $60,000 2.45% 15/9/2024 62,839 0.00%Old Republic International Corp. $55,000 4.88% 1/10/2024 61,446 0.00%S&P Global, Inc. $54,000 4.00% 15/6/2025 60,066 0.00%Mondelez International, Inc. CA($)70,000 3.25% 7/3/2025 59,981 0.00%Republic Services, Inc. $56,000 4.75% 15/5/2023 59,954 0.00%Kinder Morgan Energy Partners LP $55,000 3.45% 15/2/2023 57,218 0.00%Camden Property Trust $55,000 2.95% 15/12/2022 56,672 0.00%

787
Vanguard Global Short-Term Bond Index Fund
Principal CouponMaturity
DateFair Value
US Dollars ($)% of Total
Net AssetsSysco Canada, Inc. CA($)65,000 3.65% 25/4/2025 56,108 0.00%GATX Corp. $52,000 3.25% 30/3/2025 55,660 0.00%Aviation Capital Group LLC $50,000 4.88% 1/10/2025 55,392 0.00%Cigna Corp. $52,000 3.75% 15/7/2023 55,364 0.00%Brookfield Property Finance ULC CA($)65,000 4.30% 1/3/2024 54,926 0.00%Morgan Stanley Bank of America Merrill Lynch Trust 2015 $50,000 3.73% 15/5/2048 54,716 0.00%WP Carey, Inc. $50,000 4.60% 1/4/2024 54,686 0.00%Morgan Stanley Bank of America Merrill Lynch Trust 2015 $50,000 3.64% 15/10/2048 54,507 0.00%Citigroup, Inc. $50,000 4.00% 5/8/2024 54,471 0.00%Becton Dickinson & Co. $50,000 3.73% 15/12/2024 54,461 0.00%Omega Healthcare Investors, Inc. $50,000 4.95% 1/4/2024 54,419 0.00%Brookfield Property Finance ULC CA($)65,000 3.93% 24/8/2025 54,356 0.00%Williams Cos, Inc. $50,000 4.30% 4/3/2024 54,354 0.00%Altera Corp. $50,000 4.10% 15/11/2023 54,264 0.00%Arrow Electronics, Inc. $50,000 4.00% 1/4/2025 54,259 0.00%AvalonBay Communities, Inc. $50,000 3.50% 15/11/2024 54,150 0.00%WFRBS Commercial Mortgage Trust 2014 $50,000 3.63% 15/11/2047 54,126 0.00%Ameriprise Financial, Inc. $50,000 4.00% 15/10/2023 54,038 0.00%Marsh & McLennan Cos, Inc. $50,000 3.50% 3/6/2024 53,789 0.00%ViacomCBS, Inc. $50,000 3.88% 1/4/2024 53,757 0.00%John Deere Capital Corp. $50,000 3.65% 12/10/2023 53,729 0.00%McDonald's Corp. $50,000 3.25% 10/6/2024 53,709 0.00%John Deere Capital Corp. $50,000 3.45% 10/1/2024 53,699 0.00%IHS Markit Ltd. $50,000 3.63% 1/5/2024 53,678 0.00%CCRE11 Commercial Mortgage Trust 2013 $50,000 4.26% 10/8/2050 53,632 0.00%Trane Technologies Global Holding Co., Ltd. $50,000 4.25% 15/6/2023 53,621 0.00%Simon Property Group LP $50,000 3.75% 1/2/2024 53,602 0.00%Campbell Soup Co. $51,000 3.65% 15/3/2023 53,584 0.00%Aircastle Ltd. $50,000 4.40% 25/9/2023 53,544 0.00%Ventas Realty LP $50,000 3.50% 15/4/2024 53,543 0.00%People's United Bank NA $50,000 4.00% 15/7/2024 53,502 0.00%Aircastle Ltd. $50,000 5.00% 1/4/2023 53,488 0.00%Energy Transfer LP $50,000 4.20% 15/9/2023 53,462 0.00%IHS Markit Ltd. $50,000 4.13% 1/8/2023 53,454 0.00%Truist Bank^ $50,000 3.69% 2/8/2024 53,339 0.00%Regions Financial Corp. $50,000 3.80% 14/8/2023 53,319 0.00%Edison International $50,000 3.55% 15/11/2024 53,258 0.00%NRG Energy, Inc. $50,000 3.75% 15/6/2024 53,246 0.00%Philip Morris International, Inc. $50,000 2.88% 1/5/2024 53,172 0.00%Athene Global Funding CA($)65,000 2.10% 24/9/2025 53,165 0.00%Southwestern Public Service Co. $50,000 3.30% 15/6/2024 53,163 0.00%Intercontinental Exchange, Inc. $50,000 3.45% 21/9/2023 53,111 0.00%Trimble, Inc. $50,000 4.15% 15/6/2023 53,111 0.00%American Honda Finance Corp. $50,000 3.45% 14/7/2023 53,066 0.00%PSEG Power LLC $50,000 3.85% 1/6/2023 53,052 0.00%Amphenol Corp. $50,000 3.20% 1/4/2024 53,011 0.00%Pfizer, Inc. $50,000 3.20% 15/9/2023 52,930 0.00%Caterpillar Financial Services Corp. $50,000 3.45% 15/5/2023 52,902 0.00%Assurant, Inc. $50,000 4.00% 15/3/2023 52,880 0.00%DR Horton, Inc. $50,000 4.75% 15/2/2023 52,854 0.00%Kinder Morgan Energy Partners LP $50,000 3.50% 1/9/2023 52,783 0.00%John Deere Capital Corp. $50,000 2.60% 7/3/2024 52,724 0.00%Truist Financial Corp. $50,000 2.50% 1/8/2024 52,719 0.00%Equifax, Inc. $50,000 2.60% 1/12/2024 52,700 0.00%CommonSpirit Health $50,000 2.76% 1/10/2024 52,631 0.00%ONEOK, Inc. $50,000 2.75% 1/9/2024 52,615 0.00%Hershey Co. $50,000 3.38% 15/5/2023 52,614 0.00%Zimmer Biomet Holdings, Inc. $50,000 3.70% 19/3/2023 52,560 0.00%American Honda Finance Corp. $50,000 2.40% 27/6/2024 52,551 0.00%CCRE8 Commercial Mortgage Trust 2013^ $50,000 3.61% 10/6/2046 52,547 0.00%Eastern Energy Gas Holdings LLC $50,000 2.50% 15/11/2024 52,467 0.00%McDonald's Corp. $50,000 3.35% 1/4/2023 52,445 0.00%DR Horton, Inc. $50,000 2.50% 15/10/2024 52,436 0.00%Ryder System, Inc. $50,000 2.50% 1/9/2024 52,338 0.00%PPG Industries, Inc. $50,000 2.40% 15/8/2024 52,314 0.00%Estee Lauder Cos, Inc. $50,000 2.00% 1/12/2024 52,266 0.00%MPLX LP $50,000 3.38% 15/3/2023 52,264 0.00%American Honda Finance Corp. $50,000 2.15% 10/9/2024 52,262 0.00%Brandywine Operating Partnership LP $50,000 3.95% 15/2/2023 52,236 0.00%Boeing Co. $50,000 2.80% 1/3/2024 52,179 0.00%Essex Portfolio LP $50,000 3.25% 1/5/2023 52,153 0.00%

788
Vanguard Global Short-Term Bond Index Fund
Principal CouponMaturity
DateFair Value
US Dollars ($)% of Total
Net AssetsHP, Inc. $50,000 4.05% 15/9/2022 52,139 0.00%Constellation Brands, Inc. $50,000 3.20% 15/2/2023 52,078 0.00%Cardinal Health, Inc. $49,000 3.08% 15/6/2024 51,990 0.00%Adobe, Inc. $50,000 1.90% 1/2/2025 51,975 0.00%Philip Morris International, Inc. $50,000 2.63% 6/3/2023 51,915 0.00%DR Horton, Inc. $50,000 4.38% 15/9/2022 51,830 0.00%Loews Corp. $50,000 2.63% 15/5/2023 51,798 0.00%WW Grainger, Inc. $50,000 1.85% 15/2/2025 51,766 0.00%People's United Financial, Inc. $50,000 3.65% 6/12/2022 51,755 0.00%Berkshire Hathaway Energy Co. $50,000 2.80% 15/1/2023 51,733 0.00%Duke Energy Carolinas LLC $50,000 2.50% 15/3/2023 51,648 0.00%General Electric Co. $50,000 3.15% 7/9/2022 51,629 0.00%Office Properties Income Trust $50,000 4.00% 15/7/2022 51,625 0.00%Entergy Corp. $50,000 4.00% 15/7/2022 51,567 0.00%SL Green Operating Partnership LP $50,000 3.25% 15/10/2022 51,459 0.00%Public Service Enterprise Group, Inc. $50,000 2.65% 15/11/2022 51,435 0.00%Private Export Funding Corp. $50,000 1.75% 15/11/2024 51,427 0.00%ITC Holdings Corp. $50,000 2.70% 15/11/2022 51,410 0.00%Schlumberger Finance Canada Ltd. $50,000 2.65% 20/11/2022 51,371 0.00%Connecticut Light & Power Co. $50,000 2.50% 15/1/2023 51,349 0.00%McKesson Corp. $50,000 2.70% 15/12/2022 51,334 0.00%UnitedHealth Group, Inc. $50,000 2.38% 15/10/2022 51,327 0.00%BP Capital Markets America, Inc. $50,000 2.52% 19/9/2022 51,266 0.00%ConocoPhillips Co. $50,000 2.40% 15/12/2022 51,199 0.00%Kroger Co. $50,000 2.80% 1/8/2022 51,189 0.00%Adobe, Inc. $50,000 1.70% 1/2/2023 51,125 0.00%CenterPoint Energy, Inc. $50,000 2.50% 1/9/2022 51,115 0.00%DTE Energy Co. $50,000 2.60% 15/6/2022 51,093 0.00%Intercontinental Exchange, Inc. $50,000 2.35% 15/9/2022 51,088 0.00%Ameren Illinois Co. $50,000 2.70% 1/9/2022 51,087 0.00%Philip Morris International, Inc. $50,000 2.38% 17/8/2022 51,067 0.00%Nissan Motor Acceptance Corp. $50,000 2.60% 28/9/2022 51,044 0.00%Texas Eastern Transmission LP $50,000 2.80% 15/10/2022 51,034 0.00%Commonwealth of Massachusetts $50,000 4.20% 1/12/2021 50,835 0.00%GM Financial Consumer Automobile Receivables Trust 2018 $50,000 3.02% 18/12/2023 50,783 0.00%Walt Disney Co. $50,000 1.65% 1/9/2022 50,782 0.00%Marriott International, Inc. $50,000 2.13% 3/10/2022 50,722 0.00%National Rural Utilities Cooperative Finance Corp. $50,000 1.75% 21/1/2022 50,425 0.00%Southern Power Co. $50,000 2.50% 15/12/2021 50,409 0.00%John Deere Capital Corp. $50,000 0.70% 5/7/2023 50,345 0.00%Yale University $50,000 0.87% 15/4/2025 50,296 0.00%Nissan Motor Acceptance Corp. $50,000 1.05% 8/3/2024 49,842 0.00%WFRBS Commercial Mortgage Trust 2014 $46,775 3.41% 15/8/2047 49,500 0.00%Campbell Soup Co. $43,000 3.95% 15/3/2025 47,400 0.00%Cardinal Health, Inc. $43,000 3.50% 15/11/2024 46,332 0.00%American Honda Finance Corp. $45,000 3.38% 10/12/2021 45,630 0.00%SVB Financial Group $41,000 3.50% 29/1/2025 44,372 0.00%FS KKR Capital Corp. $40,000 4.63% 15/7/2024 43,137 0.00%Kimco Realty Corp. $40,000 3.30% 1/2/2025 43,102 0.00%Bank of America Corp.^ CA($)50,000 3.41% 20/9/2025 42,878 0.00%Nissan Auto Receivables 2018-A Owner Trust $42,253 2.89% 17/6/2024 42,705 0.00%Vornado Realty LP $40,000 3.50% 15/1/2025 42,579 0.00%FS KKR Capital Corp. $40,000 4.13% 1/2/2025 42,550 0.00%National Rural Utilities Cooperative Finance Corp.^ $40,000 4.75% 30/4/2043 41,893 0.00%Newmont Corp. $40,000 3.70% 15/3/2023 41,788 0.00%Molson Coors International LP CA($)50,000 2.84% 15/7/2023 41,594 0.00%DTE Energy Co. $40,000 2.25% 1/11/2022 40,947 0.00%General Motors Financial Co., Inc. AU($)50,000 3.85% 21/2/2023 39,302 0.00%Baxalta, Inc. $38,000 3.60% 23/6/2022 38,954 0.00%Cadence Design Systems, Inc. $35,000 4.38% 15/10/2024 38,494 0.00%Martin Marietta Materials, Inc. $38,000 0.65% 15/7/2023 38,073 0.00%TD Ameritrade Holding Corp. $35,000 3.75% 1/4/2024 37,938 0.00%Ventas Realty LP $35,000 3.50% 1/2/2025 37,813 0.00%Carlisle Cos, Inc. $35,000 3.50% 1/12/2024 37,758 0.00%Freddie Mac Multifamily Structured Pass Through Certificates $37,686 2.99% 25/9/2021 37,758 0.00%Caterpillar Financial Services Corp. $35,000 3.65% 7/12/2023 37,712 0.00%John Deere Canada Funding, Inc. CA($)45,000 2.70% 17/1/2023 37,444 0.00%Hess Corp. $35,000 3.50% 15/7/2024 37,177 0.00%WestRock RKT LLC $35,000 4.00% 1/3/2023 36,689 0.00%Ventas Canada Finance Ltd. CA($)40,000 2.55% 15/3/2023 33,040 0.00%Union Electric Co. $30,000 3.50% 15/4/2024 32,142 0.00%

789
Vanguard Global Short-Term Bond Index Fund
Principal CouponMaturity
DateFair Value
US Dollars ($)% of Total
Net AssetsSixth Street Specialty Lending, Inc. $30,000 3.88% 1/11/2024 31,908 0.00%Guardian Life Global Funding $30,000 2.90% 6/5/2024 31,891 0.00%BGC Partners, Inc. $30,000 3.75% 1/10/2024 31,762 0.00%Mutual of Omaha Insurance Co.^ $30,000 4.30% 15/7/2054 31,271 0.00%Amphenol Corp. $30,000 2.05% 1/3/2025 31,115 0.00%Energy Transfer LP $30,000 3.45% 15/1/2023 31,003 0.00%PACCAR Financial Corp. $30,000 1.80% 6/2/2025 30,907 0.00%Edison International $30,000 3.13% 15/11/2022 30,891 0.00%Cabot Corp. $30,000 3.70% 15/7/2022 30,754 0.00%Brookfield Property Finance ULC CA($)35,000 4.35% 3/7/2023 29,388 0.00%CR14 Commercial Mortgage Trust 2014 $28,582 3.15% 10/2/2047 28,636 0.00%ONEOK, Inc. $25,000 7.50% 1/9/2023 28,157 0.00%Kemper Corp. $25,000 4.35% 15/2/2025 27,403 0.00%Micron Technology, Inc. $25,000 4.64% 6/2/2024 27,386 0.00%Owl Rock Capital Corp. $25,000 5.25% 15/4/2024 27,328 0.00%GATX Corp. $25,000 4.35% 15/2/2024 27,197 0.00%Quest Diagnostics, Inc. $25,000 4.25% 1/4/2024 27,145 0.00%CCRE15 Commercial Mortgage Trust 2014^ $25,000 4.86% 10/2/2047 27,038 0.00%Air Products & Chemicals, Inc. $25,000 3.35% 31/7/2024 26,890 0.00%Fortune Brands Home & Security, Inc. $25,000 4.00% 21/9/2023 26,801 0.00%American Honda Finance Corp. $25,000 3.63% 10/10/2023 26,787 0.00%General Mills, Inc. $25,000 3.70% 17/10/2023 26,750 0.00%PACCAR Financial Corp. $25,000 3.40% 9/8/2023 26,550 0.00%Duke Energy Progress LLC $25,000 3.38% 1/9/2023 26,530 0.00%Costco Wholesale Corp. $25,000 2.75% 18/5/2024 26,501 0.00%Eaton Vance Corp. $25,000 3.63% 15/6/2023 26,466 0.00%Bank of New York Mellon Corp. $25,000 3.50% 28/4/2023 26,441 0.00%Alliant Energy Finance LLC $25,000 3.75% 15/6/2023 26,424 0.00%Southern California Edison Co. $25,000 3.40% 1/6/2023 26,262 0.00%PACCAR Financial Corp. $25,000 2.15% 15/8/2024 26,145 0.00%Analog Devices, Inc. $25,000 2.88% 1/6/2023 26,019 0.00%Bank of New York Mellon Corp. $25,000 2.20% 16/8/2023 25,900 0.00%PPL Capital Funding, Inc. $25,000 3.50% 1/12/2022 25,871 0.00%American Express Co. $25,000 2.65% 2/12/2022 25,818 0.00%Boardwalk Pipelines LP $25,000 3.38% 1/2/2023 25,805 0.00%Church & Dwight Co., Inc. $25,000 2.88% 1/10/2022 25,759 0.00%General Dynamics Corp. $25,000 1.88% 15/8/2023 25,736 0.00%Niagara Mohawk Power Corp. $25,000 2.72% 28/11/2022 25,724 0.00%Virginia Electric & Power Co. $25,000 3.45% 1/9/2022 25,694 0.00%JP Morgan Chase Commercial Mortgage Securities Trust 2013 $25,000 3.50% 15/4/2046 25,647 0.00%LC6 Commercial Mortgage Trust 2013^ $25,000 4.24% 10/1/2046 25,645 0.00%PACCAR Financial Corp. $25,000 2.30% 10/8/2022 25,566 0.00%Duke Energy Corp. $25,000 3.05% 15/8/2022 25,563 0.00%Church & Dwight Co., Inc. $25,000 2.45% 1/8/2022 25,526 0.00%PACCAR Financial Corp. $25,000 2.00% 26/9/2022 25,512 0.00%Tapestry, Inc. $25,000 3.00% 15/7/2022 25,496 0.00%Boeing Co. $25,000 1.88% 15/6/2023 25,487 0.00%CarMax Auto Owner Trust 2018 $25,000 3.16% 17/7/2023 25,444 0.00%Edison International $25,000 2.40% 15/9/2022 25,436 0.00%Hyundai Auto Receivables Trust 2018 $25,000 2.94% 17/6/2024 25,216 0.00%Honda Auto Receivables 2018-2 Owner Trust $25,000 3.16% 19/8/2024 25,198 0.00%Pacific Life Global Funding II $25,000 1.20% 24/6/2025 25,094 0.00%KLA Corp. $22,000 4.65% 1/11/2024 24,566 0.00%Toyota Auto Receivables 2018-A Owner Trust $23,974 2.52% 15/5/2023 24,159 0.00%Federal National Mortgage Association^ $22,050 3.02% 25/8/2024 23,332 0.00%CarMax Auto Owner Trust 2017 $22,113 2.33% 15/5/2023 22,232 0.00%Freddie Mac Multifamily Structured Pass Through Certificates $21,245 2.87% 25/2/2023 21,775 0.00%Phillips 66 Partners LP $20,000 3.61% 15/2/2025 21,568 0.00%Honda Auto Receivables 2018-1 Owner Trust $21,266 2.83% 15/5/2024 21,286 0.00%Allegion US Holding Co., Inc. $20,000 3.20% 1/10/2024 21,280 0.00%Oaktree Specialty Lending Corp. $20,000 3.50% 25/2/2025 20,972 0.00%Wisconsin Electric Power Co. $20,000 2.05% 15/12/2024 20,918 0.00%Mosaic Co. $20,000 3.25% 15/11/2022 20,703 0.00%Ally Auto Receivables Trust 2018 $16,360 2.53% 15/2/2023 16,399 0.00%Nissan Auto Receivables 2017-B Owner Trust $15,696 1.95% 16/10/2023 15,731 0.00%Brown-Forman Corp. $12,000 3.50% 15/4/2025 13,092 0.00%RenaissanceRe Finance, Inc. $12,000 3.70% 1/4/2025 13,063 0.00%Americredit Automobile Receivables Trust 2018 $11,991 3.26% 18/1/2024 12,047 0.00%Owens Corning $11,000 4.20% 1/12/2024 12,040 0.00%CNH Industrial Capital LLC $10,000 4.20% 15/1/2024 10,826 0.00%GM Financial Consumer Automobile Receivables Trust 2018 $9,129 2.81% 16/12/2022 9,170 0.00%

790
Vanguard Global Short-Term Bond Index Fund
Principal CouponMaturity
DateFair Value
US Dollars ($)% of Total
Net AssetsCME Group, Inc. $8,000 3.00% 15/3/2025 8,576 0.00%Toyota Auto Receivables 2018-B Owner Trust $7,813 2.96% 15/9/2022 7,845 0.00%American Honda Finance Corp. $5,000 2.05% 10/1/2023 5,129 0.00%CarMax Auto Owner Trust 2018 $4,655 2.98% 17/1/2023 4,677 0.00%First American Financial Corp. $4,000 4.60% 15/11/2024 4,427 0.00%United Parcel Service, Inc. $4,000 2.80% 15/11/2024 4,275 0.00%CarMax Auto Owner Trust 2018 $4,136 2.48% 15/11/2022 4,144 0.00%Sherwin-Williams Co. $4,000 2.75% 1/6/2022 4,078 0.00%Healthpeak Properties, Inc. $3,000 3.40% 1/2/2025 3,223 0.00%GS Mortgage Securities Trust 2017 $2,600 3.22% 10/3/2050 2,612 0.00%Santander Drive Auto Receivables Trust 2018 $1,805 3.35% 17/7/2023 1,807 0.00%Honda Auto Receivables 2018-2 Owner Trust $1,423 3.01% 18/5/2022 1,425 0.00%Hyundai Auto Receivables Trust 2018 $101 2.79% 15/7/2022 102 0.00%test - - - 1,266,636,348 39.12%Total Bonds 3,177,225,299 98.14%Financial Assets at Fair Value Through Profit or Loss 3,177,225,299 98.14%
testNumber of Contracts
Notional Amount
Unrealised Gain/(Loss)
US Dollars ($)% of Total
Net AssetsFinancial Derivative InstrumentsFutures (0.00%) (2020: 0.00%)Euro-Bobl September 2021 40 €5,363,400 3,084 0.00 %US Treasury Note 5 Year September 2021 48 $5,938,253 (13,628 ) (0.00 %)US Treasury Note 2 Year September 2021 112 $24,720,485 (44,610 ) (0.00 %)test test test (55,154 ) (0.00 %)
CurrencyBuy
Amount Currency(Sell)
Amount CounterpartySettlement
Date
Unrealised Gain/(Loss)
US Dollars ($)% of Total
Net AssetsForward Currency Exchange Contracts 1.22% (2020: (1.02%))USD 950,263,869 EUR (779,620,528) State Street Bank & Trust Co. 2/7/2021 25,711,425 0.79 %USD 100,630,044 GBP (70,970,655) Citibank NA 2/7/2021 2,587,621 0.08 %USD 100,566,364 CAD (121,490,000) Toronto-Dominion Bank 2/7/2021 2,456,051 0.08 %USD 206,754,744 JPY (22,752,760,000) Toronto-Dominion Bank 2/7/2021 1,756,456 0.05 %USD 54,809,777 AUD (71,084,319) BNP Paribas 2/7/2021 1,443,212 0.05 %USD 27,157,948 EUR (22,200,000) BNP Paribas 2/7/2021 830,955 0.03 %USD 32,276,675 SEK (269,100,000) Morgan Stanley 2/7/2021 810,903 0.03 %USD 21,196,415 CHF (19,062,763) JPMorgan Chase Bank 2/7/2021 573,531 0.02 %USD 13,436,084 PLN (49,490,000) BNP Paribas 2/7/2021 436,346 0.01 %USD 52,368,041 KRW (58,516,834,422) BNP Paribas 2/7/2021 406,194 0.01 %USD 7,162,654 NZD (9,880,341) Toronto-Dominion Bank 2/7/2021 258,766 0.01 %USD 9,507,128 EUR (7,800,000) Morgan Stanley 2/7/2021 257,103 0.01 %USD 8,533,328 EUR (7,000,000) Morgan Stanley 2/7/2021 232,024 0.01 %USD 18,111,966 CNH (115,695,618) Standard Chartered Bank 6/7/2021 210,326 0.01 %USD 8,550,580 THB (267,680,185) JPMorgan Chase Bank 2/7/2021 198,624 0.01 %USD 6,619,957 NOK (55,330,000) Toronto-Dominion Bank 2/7/2021 190,124 0.01 %USD 7,993,677 DKK (48,950,000) Morgan Stanley 2/7/2021 187,344 0.01 %USD 4,760,916 HUF (1,362,000,000) BNP Paribas 2/7/2021 159,612 0.01 %USD 31,620,514 SEK (269,100,000) UBS AG 3/8/2021 145,048 0.00 %USD 5,526,573 CZK (115,800,000) BNP Paribas 2/7/2021 142,668 0.00 %USD 9,322,979 SGD (12,351,502) Standard Chartered Bank 2/7/2021 134,241 0.00 %USD 5,657,309 GBP (4,000,000) Morgan Stanley 2/7/2021 131,508 0.00 %USD 3,669,993 EUR (3,000,000) BNP Paribas 2/7/2021 112,291 0.00 %USD 10,152,673 IDR (145,833,000,000) Standard Chartered Bank 2/7/2021 95,225 0.00 %USD 3,652,902 EUR (3,000,000) JPMorgan Chase Bank 2/7/2021 95,200 0.00 %USD 7,000,683 RUB (507,700,000) Citibank NA 2/8/2021 83,647 0.00 %USD 2,310,597 AUD (3,000,000) BNP Paribas 2/7/2021 58,346 0.00 %USD 2,424,448 EUR (2,000,000) JPMorgan Chase Bank 2/7/2021 52,647 0.00 %USD 1,654,492 CAD (2,000,000) State Street Bank & Trust Co. 2/7/2021 39,375 0.00 %USD 6,462,219 NOK (55,330,000) Morgan Stanley 3/8/2021 31,325 0.00 %USD 2,277,944 JPY (250,000,000) BNP Paribas 2/7/2021 25,488 0.00 %USD 1,800,115 KRW (2,000,000,000) BNP Paribas 2/7/2021 24,153 0.00 %USD 211,834,288 JPY (23,502,760,000) Morgan Stanley 3/8/2021 20,937 0.00 %USD 2,442,128 CAD (3,000,000) BNP Paribas 2/7/2021 19,451 0.00 %USD 2,313,472 COP (8,597,137,800) Citibank NA 3/8/2021 14,803 0.00 %USD 10,905,180 MYR (45,278,306) BNP Paribas 3/8/2021 14,007 0.00 %USD 1,251,724 CNH (8,000,000) Citibank NA 6/7/2021 13,880 0.00 %USD 5,396,840 CZK (115,800,000) BNP Paribas 3/8/2021 13,872 0.00 %USD 7,824,113 DKK (48,950,000) Bank of America 3/8/2021 12,941 0.00 %USD 6,723,108 ILS (21,870,000) BNP Paribas 2/7/2021 11,430 0.00 %PEN 1,117,565 USD (281,007) Citibank NA 2/7/2021 10,595 0.00 %
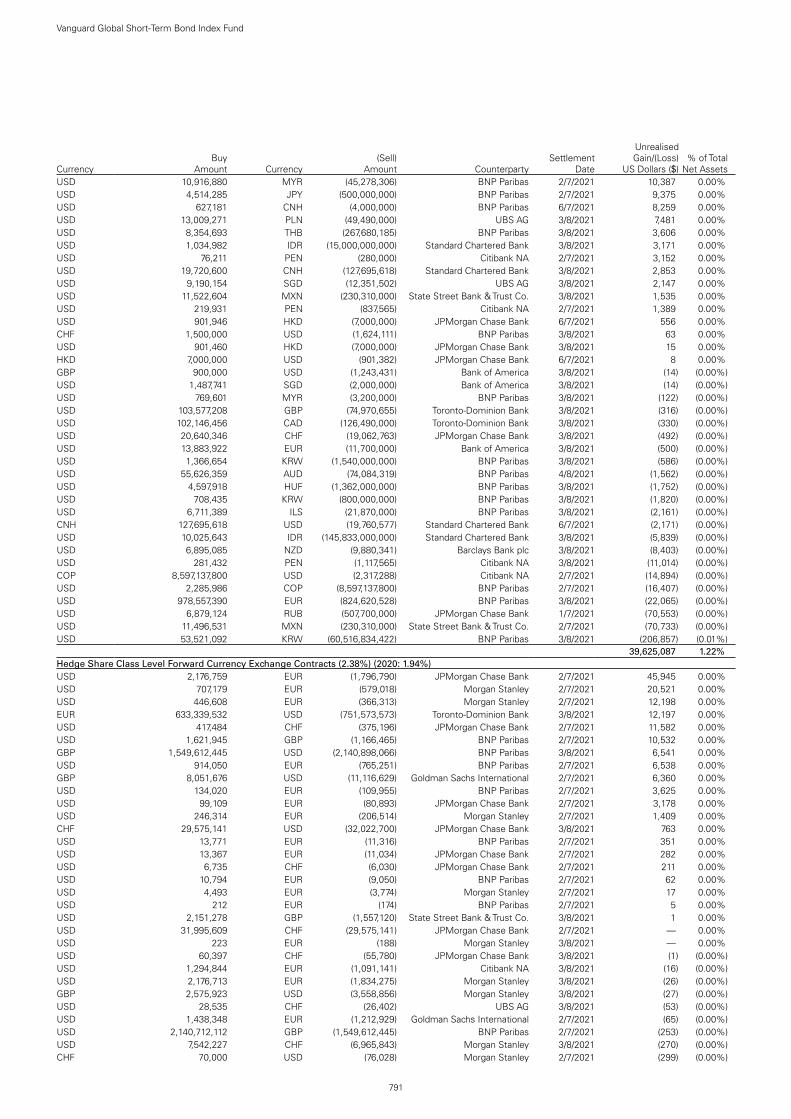
791
Vanguard Global Short-Term Bond Index Fund
CurrencyBuy
Amount Currency(Sell)
Amount CounterpartySettlement
Date
Unrealised Gain/(Loss)
US Dollars ($)% of Total
Net AssetsUSD 10,916,880 MYR (45,278,306) BNP Paribas 2/7/2021 10,387 0.00 %USD 4,514,285 JPY (500,000,000) BNP Paribas 2/7/2021 9,375 0.00 %USD 627,181 CNH (4,000,000) BNP Paribas 6/7/2021 8,259 0.00 %USD 13,009,271 PLN (49,490,000) UBS AG 3/8/2021 7,481 0.00 %USD 8,354,693 THB (267,680,185) BNP Paribas 3/8/2021 3,606 0.00 %USD 1,034,982 IDR (15,000,000,000) Standard Chartered Bank 3/8/2021 3,171 0.00 %USD 76,211 PEN (280,000) Citibank NA 2/7/2021 3,152 0.00 %USD 19,720,600 CNH (127,695,618) Standard Chartered Bank 3/8/2021 2,853 0.00 %USD 9,190,154 SGD (12,351,502) UBS AG 3/8/2021 2,147 0.00 %USD 11,522,604 MXN (230,310,000) State Street Bank & Trust Co. 3/8/2021 1,535 0.00 %USD 219,931 PEN (837,565) Citibank NA 2/7/2021 1,389 0.00 %USD 901,946 HKD (7,000,000) JPMorgan Chase Bank 6/7/2021 556 0.00 %CHF 1,500,000 USD (1,624,111) BNP Paribas 3/8/2021 63 0.00 %USD 901,460 HKD (7,000,000) JPMorgan Chase Bank 3/8/2021 15 0.00 %HKD 7,000,000 USD (901,382) JPMorgan Chase Bank 6/7/2021 8 0.00 %GBP 900,000 USD (1,243,431) Bank of America 3/8/2021 (14 ) (0.00 %)USD 1,487,741 SGD (2,000,000) Bank of America 3/8/2021 (14 ) (0.00 %)USD 769,601 MYR (3,200,000) BNP Paribas 3/8/2021 (122 ) (0.00 %)USD 103,577,208 GBP (74,970,655) Toronto-Dominion Bank 3/8/2021 (316 ) (0.00 %)USD 102,146,456 CAD (126,490,000) Toronto-Dominion Bank 3/8/2021 (330 ) (0.00 %)USD 20,640,346 CHF (19,062,763) JPMorgan Chase Bank 3/8/2021 (492 ) (0.00 %)USD 13,883,922 EUR (11,700,000) Bank of America 3/8/2021 (500 ) (0.00 %)USD 1,366,654 KRW (1,540,000,000) BNP Paribas 3/8/2021 (586 ) (0.00 %)USD 55,626,359 AUD (74,084,319) BNP Paribas 4/8/2021 (1,562 ) (0.00 %)USD 4,597,918 HUF (1,362,000,000) BNP Paribas 3/8/2021 (1,752 ) (0.00 %)USD 708,435 KRW (800,000,000) BNP Paribas 3/8/2021 (1,820 ) (0.00 %)USD 6,711,389 ILS (21,870,000) BNP Paribas 3/8/2021 (2,161 ) (0.00 %)CNH 127,695,618 USD (19,760,577) Standard Chartered Bank 6/7/2021 (2,171 ) (0.00 %)USD 10,025,643 IDR (145,833,000,000) Standard Chartered Bank 3/8/2021 (5,839 ) (0.00 %)USD 6,895,085 NZD (9,880,341) Barclays Bank plc 3/8/2021 (8,403 ) (0.00 %)USD 281,432 PEN (1,117,565) Citibank NA 3/8/2021 (11,014 ) (0.00 %)COP 8,597,137,800 USD (2,317,288) Citibank NA 2/7/2021 (14,894 ) (0.00 %)USD 2,285,986 COP (8,597,137,800) BNP Paribas 2/7/2021 (16,407 ) (0.00 %)USD 978,557,390 EUR (824,620,528) BNP Paribas 3/8/2021 (22,065 ) (0.00 %)USD 6,879,124 RUB (507,700,000) JPMorgan Chase Bank 1/7/2021 (70,553 ) (0.00 %)USD 11,496,531 MXN (230,310,000) State Street Bank & Trust Co. 2/7/2021 (70,733 ) (0.00 %)USD 53,521,092 KRW (60,516,834,422) BNP Paribas 3/8/2021 (206,857 ) (0.01 %)test 39,625,087 1.22 %Hedge Share Class Level Forward Currency Exchange Contracts (2.38%) (2020: 1.94%)USD 2,176,759 EUR (1,796,790) JPMorgan Chase Bank 2/7/2021 45,945 0.00 %USD 707,179 EUR (579,018) Morgan Stanley 2/7/2021 20,521 0.00 %USD 446,608 EUR (366,313) Morgan Stanley 2/7/2021 12,198 0.00 %EUR 633,339,532 USD (751,573,573) Toronto-Dominion Bank 3/8/2021 12,197 0.00 %USD 417,484 CHF (375,196) JPMorgan Chase Bank 2/7/2021 11,582 0.00 %USD 1,621,945 GBP (1,166,465) BNP Paribas 2/7/2021 10,532 0.00 %GBP 1,549,612,445 USD (2,140,898,066) BNP Paribas 3/8/2021 6,541 0.00 %USD 914,050 EUR (765,251) BNP Paribas 2/7/2021 6,538 0.00 %GBP 8,051,676 USD (11,116,629) Goldman Sachs International 2/7/2021 6,360 0.00 %USD 134,020 EUR (109,955) BNP Paribas 2/7/2021 3,625 0.00 %USD 99,109 EUR (80,893) JPMorgan Chase Bank 2/7/2021 3,178 0.00 %USD 246,314 EUR (206,514) Morgan Stanley 2/7/2021 1,409 0.00 %CHF 29,575,141 USD (32,022,700) JPMorgan Chase Bank 3/8/2021 763 0.00 %USD 13,771 EUR (11,316) BNP Paribas 2/7/2021 351 0.00 %USD 13,367 EUR (11,034) JPMorgan Chase Bank 2/7/2021 282 0.00 %USD 6,735 CHF (6,030) JPMorgan Chase Bank 2/7/2021 211 0.00 %USD 10,794 EUR (9,050) BNP Paribas 2/7/2021 62 0.00 %USD 4,493 EUR (3,774) Morgan Stanley 2/7/2021 17 0.00 %USD 212 EUR (174) BNP Paribas 2/7/2021 5 0.00 %USD 2,151,278 GBP (1,557,120) State Street Bank & Trust Co. 3/8/2021 1 0.00 %USD 31,995,609 CHF (29,575,141) JPMorgan Chase Bank 2/7/2021 — 0.00 %USD 223 EUR (188) Morgan Stanley 3/8/2021 — 0.00 %USD 60,397 CHF (55,780) JPMorgan Chase Bank 3/8/2021 (1 ) (0.00 %)USD 1,294,844 EUR (1,091,141) Citibank NA 3/8/2021 (16 ) (0.00 %)USD 2,176,713 EUR (1,834,275) Morgan Stanley 3/8/2021 (26 ) (0.00 %)GBP 2,575,923 USD (3,558,856) Morgan Stanley 3/8/2021 (27 ) (0.00 %)USD 28,535 CHF (26,402) UBS AG 3/8/2021 (53 ) (0.00 %)USD 1,438,348 EUR (1,212,929) Goldman Sachs International 2/7/2021 (65 ) (0.00 %)USD 2,140,712,112 GBP (1,549,612,445) BNP Paribas 2/7/2021 (253 ) (0.00 %)USD 7,542,227 CHF (6,965,843) Morgan Stanley 3/8/2021 (270 ) (0.00 %)CHF 70,000 USD (76,028) Morgan Stanley 2/7/2021 (299 ) (0.00 %)

792
Vanguard Global Short-Term Bond Index Fund
CurrencyBuy
Amount Currency(Sell)
Amount CounterpartySettlement
Date
Unrealised Gain/(Loss)
US Dollars ($)% of Total
Net AssetsCHF 10,050 USD (11,193) Morgan Stanley 2/7/2021 (321 ) (0.00 %)USD 751,077,351 EUR (633,339,532) Toronto-Dominion Bank 2/7/2021 (374 ) (0.00 %)CHF 20,910 USD (23,268) BNP Paribas 2/7/2021 (647 ) (0.00 %)CHF 22,342 USD (24,870) JPMorgan Chase Bank 2/7/2021 (699 ) (0.00 %)EUR 188,014 USD (223,754) JPMorgan Chase Bank 2/7/2021 (788 ) (0.00 %)USD 1,494,600 GBP (1,082,575) Barclays Bank plc 3/8/2021 (1,057 ) (0.00 %)EUR 121,978 USD (145,797) BNP Paribas 2/7/2021 (1,143 ) (0.00 %)EUR 324,057 USD (386,066) BNP Paribas 2/7/2021 (1,767 ) (0.00 %)EUR 106,156 USD (128,749) JPMorgan Chase Bank 2/7/2021 (2,858 ) (0.00 %)CHF 408,785 USD (445,925) BNP Paribas 2/7/2021 (3,685 ) (0.00 %)EUR 149,990 USD (182,131) BNP Paribas 2/7/2021 (4,258 ) (0.00 %)GBP 2,443,402 USD (3,380,128) Morgan Stanley 2/7/2021 (4,690 ) (0.00 %)CHF 200,000 USD (223,334) Morgan Stanley 2/7/2021 (6,966 ) (0.00 %)GBP 1,456,527 USD (2,022,806) Morgan Stanley 2/7/2021 (10,687 ) (0.00 %)GBP 863,353 USD (1,204,485) BNP Paribas 2/7/2021 (11,806 ) (0.00 %)EUR 2,864,971 USD (3,410,859) Morgan Stanley 2/7/2021 (13,288 ) (0.00 %)EUR 547,655 USD (669,963) BNP Paribas 2/7/2021 (20,499 ) (0.00 %)GBP 587,469 USD (832,989) JPMorgan Chase Bank 2/7/2021 (21,430 ) (0.00 %)GBP 2,944,012 USD (4,090,811) BNP Paribas 2/7/2021 (23,805 ) (0.00 %)GBP 1,558,380 USD (2,176,991) BNP Paribas 2/7/2021 (24,167 ) (0.00 %)GBP 890,638 USD (1,254,753) BNP Paribas 2/7/2021 (24,381 ) (0.00 %)EUR 2,904,307 USD (3,470,568) BNP Paribas 2/7/2021 (26,349 ) (0.00 %)GBP 2,931,813 USD (4,078,929) BNP Paribas 2/7/2021 (28,775 ) (0.00 %)GBP 1,217,319 USD (1,724,356) Morgan Stanley 2/7/2021 (42,691 ) (0.00 %)EUR 1,539,809 USD (1,877,099) Morgan Stanley 2/7/2021 (51,039 ) (0.00 %)EUR 2,000,154 USD (2,426,205) BNP Paribas 2/7/2021 (54,221 ) (0.00 %)GBP 1,608,114 USD (2,279,022) JPMorgan Chase Bank 2/7/2021 (57,493 ) (0.00 %)GBP 2,050,756 USD (2,896,888) Morgan Stanley 2/7/2021 (63,871 ) (0.00 %)GBP 2,249,747 USD (3,175,072) BNP Paribas 2/7/2021 (67,159 ) (0.00 %)GBP 2,406,237 USD (3,398,783) JPMorgan Chase Bank 2/7/2021 (74,687 ) (0.00 %)GBP 2,095,959 USD (2,974,107) JPMorgan Chase Bank 2/7/2021 (78,644 ) (0.00 %)GBP 2,663,559 USD (3,761,071) JPMorgan Chase Bank 2/7/2021 (81,497 ) (0.00 %)GBP 2,654,383 USD (3,754,142) BNP Paribas 2/7/2021 (87,244 ) (0.00 %)GBP 3,585,724 USD (5,057,445) BNP Paribas 2/7/2021 (103,946 ) (0.00 %)GBP 11,200,503 USD (15,587,998) BNP Paribas 2/7/2021 (115,061 ) (0.00 %)GBP 3,218,608 USD (4,561,543) BNP Paribas 2/7/2021 (115,197 ) (0.00 %)EUR 4,409,292 USD (5,368,873) BNP Paribas 2/7/2021 (139,891 ) (0.01 %)EUR 5,458,214 USD (6,616,709) BNP Paribas 2/7/2021 (143,810 ) (0.01 %)EUR 4,603,876 USD (5,613,345) JPMorgan Chase Bank 2/7/2021 (153,606 ) (0.01 %)GBP 5,272,226 USD (7,469,816) BNP Paribas 2/7/2021 (186,499 ) (0.01 %)GBP 8,938,874 USD (12,648,948) Morgan Stanley 2/7/2021 (300,339 ) (0.01 %)CHF 29,224,280 USD (32,495,288) JPMorgan Chase Bank 2/7/2021 (879,255 ) (0.03 %)EUR 613,274,070 USD (747,489,100) Toronto-Dominion Bank 2/7/2021 (20,207,018 ) (0.63 %)GBP 1,479,889,631 USD (2,098,346,607) Morgan Stanley 2/7/2021 (53,952,834 ) (1.67 %)test (77,049,134 ) (2.38 %)Total Financial Derivative Instruments (37,479,201 ) (1.16 %)
Fair Value US Dollars ($)
% of Total Net Assets
Other Assets and Liabilities 97,825,737 3.02 %Net Assets 3,237,571,835 100.00 %
Analysis of Total Net Assets US Dollars ($)% of Total
Net Assets(a) Transferable securities admitted to an official stock exchange listing 2,551,954,918 78.83%(b) Transferable securities dealt in on another regulated market 518,086,548 16.00%(c) Transferable securities other than those admitted to an official stock exchange listing or dealt in on another regulated
market 107,183,833 3.31%
(d) Financial derivative instruments (37,479,201) (1.16%)(e) Other assets and liabilities 97,825,737 3.02%Total Net Assets 3,237,571,835 100.00%
^ Floating Rate Note (FRN). The effective interest rate is at 30 June 2021.1 Denotes securities pledged in full or part thereof as collateral for derivatives.

The accompanying notes form an integral part of the financial statements.
793
Vanguard Global Short-Term Bond Index Fund
Statement of Assets and Liabilities
US Dollars ($)
As at 30 June 2021
US Dollars ($)
As at 31 December 2020
Current AssetsFinancial Assets at Fair Value Through Profit or Loss 3,177,225,299 2,723,484,008 Financial Derivative Instruments 40,209,094 55,141,292 Cash 83,411,349 89,191,416 Receivables: Interest and Dividends 13,189,799 13,295,736 Capital Shares Issued 16,935,686 10,527,254 Investments Sold 56,290,661 21,469,170 Futures Margin Cash 64,274 — Other Receivables 137 137
Total Current Assets 3,387,326,299 2,913,109,013
Current LiabilitiesFinancial Derivative Instruments 77,688,295 29,288,133 Bank Overdraft 12,030 11,541 Unrealised Depreciation on Spot Currency Contracts 109,830 86,567 Payables and Other Liabilities: Investments Purchased 57,135,212 59,704,126 Income Distribution Payable 1,201,855 1,363,226 Capital Shares Redeemed 13,226,794 18,776,289 Futures Margin Cash Due to Broker — 7,240 Management Fees Payable 380,448 323,931
Total Current Liabilities 149,754,464 109,561,053
Net Assets Attributable to Holders of Redeemable Participating Shares (“Net Assets”) 3,237,571,835 2,803,547,960
Net Asset Value Per Share
.As at
30 June 2021As at
31 December 2020As at
31 December 2019CHF Hedged AccUS ($) Equivalent 24,414,730 30,865,172 11,372,728Net Assets 22,567,756 27,283,269 11,012,781Number of Shares Outstanding 224,902 269,982 110,861Net Asset Value Per Share1 100.34 101.06 99.34
Institutional Plus CHF Hedged AccUS ($) Equivalent 5,446 5,735 5,143Net Assets 5,034 5,069 4,980Number of Shares Outstanding 50 50 50Net Asset Value Per Share1 100.68 101.38 99.60
EUR Hedged AccUS ($) Equivalent 573,346,908 540,129,096 391,955,675Net Assets 483,469,864 441,444,243 349,181,005Number of Shares Outstanding 4,632,830 4,204,875 3,393,899Net Asset Value Per Share1 104.36 104.98 102.88
Investor EUR HedgedUS ($) Equivalent 97,584,293 103,877,659 53,678,578Net Assets 82,287,118 84,898,582 47,820,560Number of Shares Outstanding 790,335 810,554 465,848Net Asset Value Per Share1 104.12 104.74 102.65
Institutional Plus EUR Hedged AccUS ($) Equivalent 77,140,198 58,355,075 42,970,543Net Assets 65,047,811 47,693,250 38,281,108Number of Shares Outstanding 621,133 452,811 371,048Net Asset Value Per Share1 104.72 105.33 103.17

794
Vanguard Global Short-Term Bond Index Fund
The accompanying notes form an integral part of the financial statements.
Net Asset Value Per Share (continued)
.As at
30 June 2021As at
31 December 2020As at
31 December 2019GBP Hedged AccUS ($) Equivalent 1,295,244,877 1,031,432,836 692,962,329Net Assets 937,598,117 754,550,547 523,089,152Number of Shares Outstanding 8,427,100 6,762,409 4,819,894Net Asset Value Per Share1 111.26 111.58 108.53
GBP Hedged DistUS ($) Equivalent 573,308,034 513,260,838 502,545,744Net Assets 415,004,562 375,478,880 379,351,396Number of Shares Outstanding 4,013,295 3,608,040 3,707,690Net Asset Value Per Share1 103.41 104.07 102.31
Institutional Plus GBP Hedged AccUS ($) Equivalent 125,972,033 124,716,661 93,176,440Net Assets 91,188,271 91,237,181 70,335,115Number of Shares Outstanding 827,883 826,154 655,143Net Asset Value Per Share1 110.15 110.44 107.36
Institutional Plus GBP Hedged DistUS ($) Equivalent 146,285,478 127,240,308 119,009,524Net Assets 105,892,709 93,083,370 89,835,462Number of Shares Outstanding 1,032,623 901,960 885,401Net Asset Value Per Share1 102.55 103.20 101.46
USD Hedged AccNet Assets 221,270,175 197,457,751 77,400,955Number of Shares Outstanding 1,897,076 1,689,434 684,334Net Asset Value Per Share1 116.64 116.88 113.10
USD Hedged Dist2
Net Assets 5,679,146 2,253,177 —Number of Shares Outstanding 57,020 22,498 —Net Asset Value Per Share1 99.60 100.15 —
Institutional Plus USD Hedged AccNet Assets 97,320,517 73,953,652 18,155,395Number of Shares Outstanding 849,235 644,164 163,499Net Asset Value Per Share1 114.60 114.81 111.04
1 The net asset value per share shown may diverge from the net asset value per share used for dealing purposes because of any adjustments for swing pricing and trade date accounting.
2 The share class was launched on 17 November 2020.

795
Vanguard Global Short-Term Bond Index Fund
The accompanying notes form an integral part of the financial statements.
Statement of Operations
US Dollars ($)
Six Months Ended 30 June 2021
US Dollars ($)
Six Months Ended 30 June 2020
Investment Income/(Loss) Interest Income 12,873,993 14,514,917 Other Income 87,790 149,339 Net Gain/(Loss) on Financial Instruments (29,381,752) (65,567,502)
Total Investment Income/(Loss) (16,419,969) (50,903,246)
Expenses Management Fees 2,154,263 1,517,956 Transaction Fees and Commissions 2,450 1,960 Other Expenses 47 —
Total Expenses 2,156,760 1,519,916
Finance Costs Interest Expense 81,433 31,129 Distribution Paid 2,436,209 3,697,274 Income Equalisation (77,121) 10,882
Total Finance Costs 2,440,521 3,739,285
Net Investment Income/(Loss) (21,017,250) (56,162,447)
Foreign Withholding Tax (182,930) (105,979)
Net Increase/(Decrease) in Net Assets (21,200,180) (56,268,426)
Statement of Changes in Net Assets
US Dollars ($)
US Dollars ($)
Six Months Ended Six Months Ended30 June 2021 30 June 2020
Increase/(Decrease) in Net Assets
Net Increase/(Decrease) in Net Assets From Operations (21,200,180) (56,268,426)
Capital Transactions Subscriptions 1,024,487,172 889,124,715 Redemptions (569,274,778) (487,086,356) Reinvestments 11,661 18,753
Total Capital Transactions1 455,224,055 402,057,112
Total Increase/(Decrease) for the Period 434,023,875 345,788,686
Net AssetsBeginning of Period 2,803,547,960 2,041,395,997
End of Period 3,237,571,835 2,387,184,683
1 Capital Transactions include income equalisation adjustments as shown in the Statement of Operations.

Vanguard Global Short-Term Corporate Bond Index FundManaged by Vanguard Global Advisers, LLC.
796
Investment ObjectiveThis fund seeks to provide returns consistent with the performance of the Bloomberg Barclays Global Aggregate Corporate 1–5 Year Float Adjusted Index, a market-weighted index of global corporate fixed income investments with maturities of between 1 and 5 years.
Performance SummaryThe Performance Summary does not form part of the Financial Statements.
• As the six months ended 30 June 2021 came to a close, macroeconomic indicators signalled a faster global economic rebound than many had expected after the sharpest contraction in modern history. Yet the recovery has been uneven. Countries that have contained the virus more successfully, whether through vaccinations, lockdowns or both, generally have fared better economically. And the COVID-19 pandemic remained far from over, with new variants of the virus surfacing where vaccination rates have lagged and the human toll continuing to mount, especially in less developed economies.
• Swift and extensive support from governments and central banks has been a key to the rebound. So far in 2021, it has included fiscal stimulus – including the $1.9 trillion American Rescue Plan in the United States and the €673 billion Recovery and Resilience Facility in Europe – and pledges by a number of central banks to keep interest rates low for some time.
• Stock markets worldwide continued the rally that began in 2020, bolstered by reopening economies, more consumer spending and rising corporate profits. They posted strong gains for the six months ended 30 June 2021.
• Fixed income securities struggled amid concerns that an upturn in inflation might persist or even accelerate given the stronger-than-expected rebound in global growth, extraordinary monetary and fiscal stimulus and a jump in demand for goods and services as economies reopened and supply gradually picked up. With longer-term yields rising and prices falling, returns were negative for the half year.
• In this environment, the fund’s benchmark returned 0.35% for the six months.
• By market, the United States, which has the largest weighting in the index, turned in one of the weaker performances, as did Canada and Switzerland. Other index heavyweights, including China and Spain, were among the best performers.
• By sector, bonds issued by industrial companies and financial institutions outperformed those issued by utilities.
• From a credit-quality perspective, bonds on the lowest rung of the investment-grade ladder returned the most.
Benchmark returns in the commentary above are in US dollars.
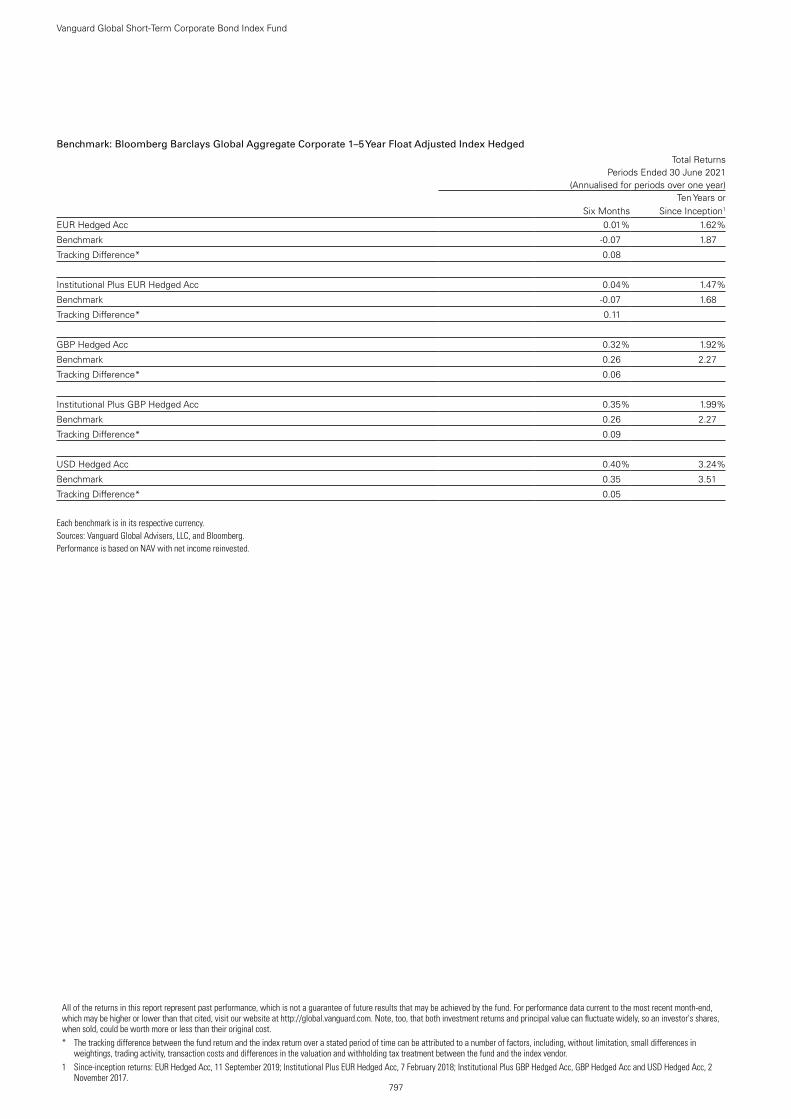
797
Vanguard Global Short-Term Corporate Bond Index Fund
Benchmark: Bloomberg Barclays Global Aggregate Corporate 1–5 Year Float Adjusted Index Hedged
Total ReturnsPeriods Ended 30 June 2021
(Annualised for periods over one year)
Six MonthsTen Years or
Since Inception1
EUR Hedged Acc 0.01 % 1.62 %
Benchmark -0.07 1.87
Tracking Difference* 0.08
Institutional Plus EUR Hedged Acc 0.04 % 1.47 %
Benchmark -0.07 1.68
Tracking Difference* 0.11
GBP Hedged Acc 0.32 % 1.92 %
Benchmark 0.26 2.27
Tracking Difference* 0.06
Institutional Plus GBP Hedged Acc 0.35 % 1.99 %
Benchmark 0.26 2.27
Tracking Difference* 0.09
USD Hedged Acc 0.40 % 3.24 %
Benchmark 0.35 3.51
Tracking Difference* 0.05
Each benchmark is in its respective currency.Sources: Vanguard Global Advisers, LLC, and Bloomberg.Performance is based on NAV with net income reinvested.
All of the returns in this report represent past performance, which is not a guarantee of future results that may be achieved by the fund. For performance data current to the most recent month-end, which may be higher or lower than that cited, visit our website at http://global.vanguard.com. Note, too, that both investment returns and principal value can fluctuate widely, so an investor's shares, when sold, could be worth more or less than their original cost.* The tracking difference between the fund return and the index return over a stated period of time can be attributed to a number of factors, including, without limitation, small differences in
weightings, trading activity, transaction costs and differences in the valuation and withholding tax treatment between the fund and the index vendor.1 Since-inception returns: EUR Hedged Acc, 11 September 2019; Institutional Plus EUR Hedged Acc, 7 February 2018; Institutional Plus GBP Hedged Acc, GBP Hedged Acc and USD Hedged Acc, 2
November 2017.

Significant Portfolio ChangesFor the Six Months Ended 30 June 2021
798
Vanguard Global Short-Term Corporate Bond Index Fund
The Central Bank of Ireland requires a schedule of material changes in the composition of the portfolio during the period. These are defined as aggregate purchases of a security exceeding 1% of the total value of purchases for the period and aggregate disposals greater than 1% of the total value of sales. At a minimum, the largest 20 purchases and 20 sales must be shown; all purchases and sales must be shown if there are fewer than 20. A full listing of the portfolio changes for the period is available, upon request, at no extra cost from the Administrator.
PrincipalCost
US Dollars ($)
Purchases
US Treasury Note 0.50% 28/2/2026 $7,570,000 7,488,140US Treasury Note 0.13% 28/2/2023 $6,055,000 6,052,346US Treasury Note 0.38% 31/12/2025 $4,970,000 4,960,457US Treasury Note 0.25% 15/5/2024 $4,719,000 4,709,459US Treasury Note 0.25% 15/3/2024 $4,288,000 4,279,305US Treasury Note 0.38% 31/1/2026 $4,190,000 4,170,982US Treasury Note 0.75% 31/5/2026 $3,299,000 3,290,655HSBC Holdings plc 4.30% 8/3/2026 $2,900,000 3,282,644US Treasury Note 0.13% 15/2/2024 $2,781,000 2,770,407Boeing Co. 2.20% 4/2/2026 $2,700,000 2,703,850AP Moller-Maersk A/S 1.75%
16/3/2026 €2,000,000 2,607,102US Treasury Note 0.75% 30/4/2026 $2,303,000 2,294,716JPMorgan Chase & Co. 3.30%
1/4/2026 $2,075,000 2,271,157US Treasury Note 0.13% 15/1/2024 $2,150,000 2,146,350Engie SA 2.38% 19/5/2026 €1,500,000 2,053,963US Treasury Note 0.13% 31/1/2023 $2,040,000 2,040,247US Treasury Note 0.13% 15/12/2023 $1,905,000 1,901,235NTT Finance Corp. 0.18%
19/12/2025 ¥200,000,000 1,891,177Toyota Finance Corp. 0.06%
15/4/2026 ¥200,000,000 1,831,078Canadian Government Bond 0.25%
1/2/2023 CA($)2,225,000 1,764,501
PrincipalProceeds
US Dollars ($)
Sales
US Treasury Note 0.50% 28/2/2026 $7,499,000 7,389,187US Treasury Note 0.13% 28/2/2023 $5,815,000 5,812,073US Treasury Note 0.38% 31/12/2025 $4,970,000 4,960,470US Treasury Note 0.25% 15/5/2024 $4,719,000 4,709,640US Treasury Note 0.25% 15/3/2024 $4,288,000 4,278,735US Treasury Note 0.38% 31/1/2026 $4,190,000 4,154,062US Treasury Note 0.75% 31/5/2026 $3,284,000 3,276,439US Treasury Note 0.13% 15/2/2024 $2,781,000 2,768,105HSBC Holdings plc 3.26% 13/3/2023 $2,625,000 2,698,054Lloyds Banking Group plc 4.58%
10/12/2025 $2,300,000 2,628,348US Treasury Note 0.75% 30/4/2026 $2,300,000 2,293,496US Treasury Note 0.13% 15/12/2023 $2,215,000 2,211,087US Treasury Note 0.13% 15/1/2024 $2,150,000 2,146,416US Treasury Note 0.13% 31/1/2023 $2,040,000 2,040,281JPMorgan Chase & Co. 2.08%
22/4/2026 $1,800,000 1,886,130Canadian Government Bond 0.25%
1/2/2023 CA($)2,225,000 1,776,389Toyota Motor Credit Corp. 2.60%
11/1/2022 $1,650,000 1,687,605Engie SA 1.38% 27/3/2025 €1,300,000 1,669,499GlaxoSmithKline Capital plc 2.88%
1/6/2022 $1,500,000 1,533,615US Treasury Note 0.13% 31/5/2023 $1,430,000 1,428,933

799
Vanguard Global Short-Term Corporate Bond Index Fund
Financial StatementsStatement of Investments30 June 2021
Principal CouponMaturity
DateFair Value
US Dollars ($)% of Total
Net AssetsBonds 97.89% (2020: 97.14%)Australia 1.78% (2020: 1.87%)Macquarie Group Ltd.^ $1,075,000 1.34% 12/1/2027 1,065,051 0.07%National Australia Bank Ltd. ¥100,000,000 0.33% 19/7/2023 901,397 0.06%BHP Billiton Finance USA Ltd. $830,000 3.85% 30/9/2023 892,199 0.06%Australia & New Zealand Banking Group Ltd. AU($)1,100,000 1.65% 16/1/2025 846,793 0.05%Westpac Banking Corp. $750,000 2.35% 19/2/2025 788,347 0.05%National Australia Bank Ltd. $750,000 3.00% 20/1/2023 780,650 0.05%Australia & New Zealand Banking Group Ltd. $700,000 4.50% 19/3/2024 765,896 0.05%Scentre Group Trust 1/Scentre Group Trust 2 $650,000 3.25% 28/10/2025 697,048 0.04%Macquarie Group Ltd.^ $625,000 4.15% 27/3/2024 661,715 0.04%Commonwealth Bank of Australia AU($)800,000 3.25% 25/4/2023 631,405 0.04%Scentre Group Trust 1 €500,000 2.25% 16/7/2024 631,092 0.04%Westpac Banking Corp.^ $600,000 2.89% 4/2/2030 622,419 0.04%Commonwealth Bank of Australia €500,000 0.50% 11/7/2022 598,955 0.04%Westpac Banking Corp.^ €500,000 0.77% 13/5/2031 592,163 0.04%Australia & New Zealand Banking Group Ltd.^ €500,000 0.67% 5/5/2031 590,818 0.04%Westpac Banking Corp. $547,000 2.85% 13/5/2026 590,201 0.04%National Australia Bank Ltd. $550,000 1.88% 13/12/2022 562,500 0.03%Westpac Banking Corp. $475,000 3.30% 26/2/2024 509,213 0.03%Toyota Finance Australia Ltd. €400,000 2.00% 21/10/2024 508,046 0.03%Commonwealth Bank of Australia^ €400,000 1.94% 3/10/2029 496,793 0.03%Macquarie Group Ltd.^ €400,000 1.25% 5/3/2025 489,902 0.03%Glencore Finance Europe Ltd. €400,000 0.63% 11/9/2024 481,653 0.03%Westpac Banking Corp. €400,000 0.38% 5/3/2023 480,470 0.03%QBE Insurance Group Ltd.^ $425,000 5.88% Perpetual 463,457 0.03%Westpac Banking Corp. $449,000 1.15% 3/6/2026 449,358 0.03%APT Pipelines Ltd. $400,000 4.20% 23/3/2025 438,623 0.03%Ausgrid Finance Pty Ltd. AU($)520,000 3.75% 30/10/2024 420,144 0.03%Glencore Funding LLC $375,000 4.13% 12/3/2024 404,369 0.03%Glencore Funding LLC $400,000 1.63% 27/4/2026 401,209 0.02%Australia & New Zealand Banking Group Ltd.^ $375,000 2.95% 22/7/2030 390,001 0.02%Sydney Airport Finance Co. Pty Ltd. €300,000 2.75% 23/4/2024 383,308 0.02%Telstra Corp., Ltd. €300,000 2.50% 15/9/2023 377,061 0.02%Telstra Corp., Ltd. €300,000 3.50% 21/9/2022 372,347 0.02%Macquarie Bank Ltd. $350,000 2.30% 22/1/2025 365,265 0.02%Commonwealth Bank of Australia $325,000 2.50% 18/9/2022 333,525 0.02%Sydney Airport Finance Co. Pty Ltd. $300,000 3.63% 28/4/2026 325,828 0.02%Westpac Banking Corp. $300,000 3.65% 15/5/2023 318,327 0.02%APT Pipelines Ltd. £200,000 4.25% 26/11/2024 306,056 0.02%Macquarie Bank Ltd. $300,000 0.44% 16/12/2022 300,182 0.02%BHP Billiton Finance Ltd. £200,000 3.25% 25/9/2024 298,940 0.02%Australia & New Zealand Banking Group Ltd. €233,000 0.63% 21/2/2023 281,041 0.02%Woodside Finance Ltd. $250,000 3.65% 5/3/2025 266,716 0.02%Australia & New Zealand Banking Group Ltd. $250,000 2.63% 9/11/2022 257,771 0.02%Australia & New Zealand Banking Group Ltd. $250,000 2.05% 21/11/2022 256,049 0.02%National Australia Bank Ltd.^ CA($)300,000 3.52% 12/6/2030 254,337 0.02%Australia Pacific Airports Melbourne Pty Ltd. €200,000 3.13% 26/9/2023 253,664 0.02%Commonwealth Bank of Australia^ $250,000 3.38% 20/10/2026 251,827 0.02%National Australia Bank Ltd. $219,000 3.38% 14/1/2026 241,140 0.01%Toyota Finance Australia Ltd. €200,000 0.25% 9/4/2024 239,934 0.01%Australia & New Zealand Banking Group Ltd. AU($)300,000 3.35% 9/5/2023 237,450 0.01%Australia & New Zealand Banking Group Ltd. $209,000 3.70% 16/11/2025 233,066 0.01%QBE Insurance Group Ltd.^ $200,000 6.75% 2/12/2044 227,179 0.01%QBE Insurance Group Ltd.^ $200,000 7.50% 24/11/2043 225,298 0.01%Macquarie Bank Ltd. $200,000 4.88% 10/6/2025 223,590 0.01%ANZ Bank New Zealand Ltd. NZ($)300,000 3.03% 20/3/2024 219,629 0.01%Macquarie Group Ltd.^ $200,000 3.19% 28/11/2023 207,195 0.01%Macquarie Bank Ltd. $200,000 2.10% 17/10/2022 204,527 0.01%Rio Tinto Finance USA Ltd. $177,000 3.75% 15/6/2025 196,126 0.01%Westpac Banking Corp. $175,000 2.00% 13/1/2023 179,491 0.01%Sydney Airport Finance Co. Pty Ltd. $150,000 3.38% 30/4/2025 160,864 0.01%BHP Billiton Finance Ltd. CA($)185,000 3.23% 15/5/2023 155,417 0.01%Woolworths Group Ltd. AU($)200,000 1.85% 20/5/2025 153,512 0.01%Optus Finance Pty Ltd. AU($)200,000 1.60% 1/7/2025 152,402 0.01%
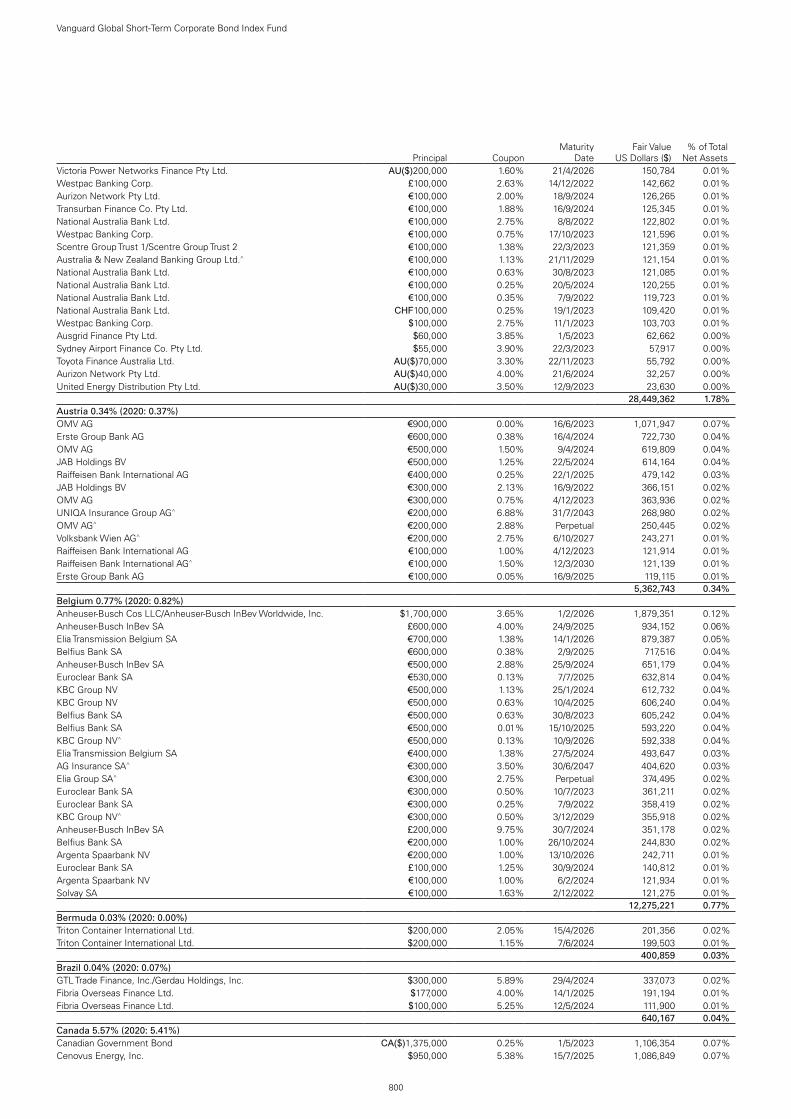
800
Vanguard Global Short-Term Corporate Bond Index Fund
Principal CouponMaturity
DateFair Value
US Dollars ($)% of Total
Net AssetsVictoria Power Networks Finance Pty Ltd. AU($)200,000 1.60% 21/4/2026 150,784 0.01%Westpac Banking Corp. £100,000 2.63% 14/12/2022 142,662 0.01%Aurizon Network Pty Ltd. €100,000 2.00% 18/9/2024 126,265 0.01%Transurban Finance Co. Pty Ltd. €100,000 1.88% 16/9/2024 125,345 0.01%National Australia Bank Ltd. €100,000 2.75% 8/8/2022 122,802 0.01%Westpac Banking Corp. €100,000 0.75% 17/10/2023 121,596 0.01%Scentre Group Trust 1/Scentre Group Trust 2 €100,000 1.38% 22/3/2023 121,359 0.01%Australia & New Zealand Banking Group Ltd.^ €100,000 1.13% 21/11/2029 121,154 0.01%National Australia Bank Ltd. €100,000 0.63% 30/8/2023 121,085 0.01%National Australia Bank Ltd. €100,000 0.25% 20/5/2024 120,255 0.01%National Australia Bank Ltd. €100,000 0.35% 7/9/2022 119,723 0.01%National Australia Bank Ltd. CHF100,000 0.25% 19/1/2023 109,420 0.01%Westpac Banking Corp. $100,000 2.75% 11/1/2023 103,703 0.01%Ausgrid Finance Pty Ltd. $60,000 3.85% 1/5/2023 62,662 0.00%Sydney Airport Finance Co. Pty Ltd. $55,000 3.90% 22/3/2023 57,917 0.00%Toyota Finance Australia Ltd. AU($)70,000 3.30% 22/11/2023 55,792 0.00%Aurizon Network Pty Ltd. AU($)40,000 4.00% 21/6/2024 32,257 0.00%United Energy Distribution Pty Ltd. AU($)30,000 3.50% 12/9/2023 23,630 0.00%test - - - 28,449,362 1.78%Austria 0.34% (2020: 0.37%)OMV AG €900,000 0.00% 16/6/2023 1,071,947 0.07%Erste Group Bank AG €600,000 0.38% 16/4/2024 722,730 0.04%OMV AG €500,000 1.50% 9/4/2024 619,809 0.04%JAB Holdings BV €500,000 1.25% 22/5/2024 614,164 0.04%Raiffeisen Bank International AG €400,000 0.25% 22/1/2025 479,142 0.03%JAB Holdings BV €300,000 2.13% 16/9/2022 366,151 0.02%OMV AG €300,000 0.75% 4/12/2023 363,936 0.02%UNIQA Insurance Group AG^ €200,000 6.88% 31/7/2043 268,980 0.02%OMV AG^ €200,000 2.88% Perpetual 250,445 0.02%Volksbank Wien AG^ €200,000 2.75% 6/10/2027 243,271 0.01%Raiffeisen Bank International AG €100,000 1.00% 4/12/2023 121,914 0.01%Raiffeisen Bank International AG^ €100,000 1.50% 12/3/2030 121,139 0.01%Erste Group Bank AG €100,000 0.05% 16/9/2025 119,115 0.01%test - - - 5,362,743 0.34%Belgium 0.77% (2020: 0.82%)Anheuser-Busch Cos LLC/Anheuser-Busch InBev Worldwide, Inc. $1,700,000 3.65% 1/2/2026 1,879,351 0.12%Anheuser-Busch InBev SA £600,000 4.00% 24/9/2025 934,152 0.06%Elia Transmission Belgium SA €700,000 1.38% 14/1/2026 879,387 0.05%Belfius Bank SA €600,000 0.38% 2/9/2025 717,516 0.04%Anheuser-Busch InBev SA €500,000 2.88% 25/9/2024 651,179 0.04%Euroclear Bank SA €530,000 0.13% 7/7/2025 632,814 0.04%KBC Group NV €500,000 1.13% 25/1/2024 612,732 0.04%KBC Group NV €500,000 0.63% 10/4/2025 606,240 0.04%Belfius Bank SA €500,000 0.63% 30/8/2023 605,242 0.04%Belfius Bank SA €500,000 0.01% 15/10/2025 593,220 0.04%KBC Group NV^ €500,000 0.13% 10/9/2026 592,338 0.04%Elia Transmission Belgium SA €400,000 1.38% 27/5/2024 493,647 0.03%AG Insurance SA^ €300,000 3.50% 30/6/2047 404,620 0.03%Elia Group SA^ €300,000 2.75% Perpetual 374,495 0.02%Euroclear Bank SA €300,000 0.50% 10/7/2023 361,211 0.02%Euroclear Bank SA €300,000 0.25% 7/9/2022 358,419 0.02%KBC Group NV^ €300,000 0.50% 3/12/2029 355,918 0.02%Anheuser-Busch InBev SA £200,000 9.75% 30/7/2024 351,178 0.02%Belfius Bank SA €200,000 1.00% 26/10/2024 244,830 0.02%Argenta Spaarbank NV €200,000 1.00% 13/10/2026 242,711 0.01%Euroclear Bank SA £100,000 1.25% 30/9/2024 140,812 0.01%Argenta Spaarbank NV €100,000 1.00% 6/2/2024 121,934 0.01%Solvay SA €100,000 1.63% 2/12/2022 121,275 0.01%test - - - 12,275,221 0.77%Bermuda 0.03% (2020: 0.00%)Triton Container International Ltd. $200,000 2.05% 15/4/2026 201,356 0.02%Triton Container International Ltd. $200,000 1.15% 7/6/2024 199,503 0.01%test - - - 400,859 0.03%Brazil 0.04% (2020: 0.07%)GTL Trade Finance, Inc./Gerdau Holdings, Inc. $300,000 5.89% 29/4/2024 337,073 0.02%Fibria Overseas Finance Ltd. $177,000 4.00% 14/1/2025 191,194 0.01%Fibria Overseas Finance Ltd. $100,000 5.25% 12/5/2024 111,900 0.01%test - - - 640,167 0.04%Canada 5.57% (2020: 5.41%)Canadian Government Bond CA($)1,375,000 0.25% 1/5/2023 1,106,354 0.07%Cenovus Energy, Inc. $950,000 5.38% 15/7/2025 1,086,849 0.07%

801
Vanguard Global Short-Term Corporate Bond Index Fund
Principal CouponMaturity
DateFair Value
US Dollars ($)% of Total
Net AssetsCanadian Natural Resources Ltd. $1,000,000 2.05% 15/7/2025 1,028,489 0.06%Bank of Nova Scotia CA($)1,090,000 2.38% 1/5/2023 903,789 0.06%Toronto-Dominion Bank^ CA($)1,030,000 3.11% 22/4/2030 876,227 0.05%Toronto-Dominion Bank $750,000 1.20% 3/6/2026 751,800 0.05%Royal Bank of Canada $725,000 1.60% 17/4/2023 740,849 0.05%Toronto-Dominion Bank $725,000 0.75% 12/6/2023 730,218 0.05%Toronto-Dominion Bank €600,000 0.38% 25/4/2024 721,784 0.05%Royal Bank of Canada €600,000 0.13% 23/7/2024 717,383 0.04%Bank of Nova Scotia1 $700,000 1.63% 1/5/2023 715,611 0.04%Toronto-Dominion Bank CA($)815,000 3.01% 30/5/2023 685,955 0.04%Royal Bank of Canada CA($)795,000 2.36% 5/12/2022 657,882 0.04%Bank of Montreal CA($)770,000 2.89% 20/6/2023 647,216 0.04%Canadian Pacific Railway Co. $601,000 2.90% 1/2/2025 638,122 0.04%Royal Bank of Canada $575,000 2.55% 16/7/2024 606,694 0.04%Toronto-Dominion Bank €500,000 0.63% 20/7/2023 604,772 0.04%Bank of Nova Scotia €500,000 0.50% 30/4/2024 603,430 0.04%Canadian Imperial Bank of Commerce CA($)700,000 2.97% 11/7/2023 589,707 0.04%Royal Bank of Canada1 $511,000 4.65% 27/1/2026 585,612 0.04%Bank of Nova Scotia^ CA($)680,000 3.89% 18/1/2029 584,596 0.04%Royal Bank of Canada CA($)670,000 3.30% 26/9/2023 568,370 0.04%Royal Bank of Canada £400,000 1.38% 9/12/2024 563,723 0.04%Bank of Montreal CA($)675,000 2.27% 11/7/2022 555,343 0.03%Royal Bank of Canada $525,000 1.95% 17/1/2023 538,018 0.03%Toronto-Dominion Bank CA($)625,000 3.23% 24/7/2024 537,160 0.03%Royal Bank of Canada $500,000 3.70% 5/10/2023 536,234 0.03%Bank of Montreal1 $500,000 3.30% 5/2/2024 535,467 0.03%Royal Bank of Canada $525,000 1.20% 27/4/2026 524,433 0.03%Royal Bank of Canada CA($)615,000 2.61% 1/11/2024 517,594 0.03%Toronto-Dominion Bank CA($)610,000 2.85% 8/3/2024 515,254 0.03%Toronto-Dominion Bank CA($)610,000 1.91% 18/7/2023 503,569 0.03%Bank of Nova Scotia $500,000 0.70% 15/4/2024 500,483 0.03%Toronto-Dominion Bank $500,000 0.25% 6/1/2023 499,550 0.03%Canadian Imperial Bank of Commerce $500,000 0.50% 14/12/2023 498,584 0.03%Bank of Montreal CA($)590,000 2.85% 6/3/2024 497,934 0.03%Toronto-Dominion Bank^ CA($)580,000 3.59% 14/9/2028 492,940 0.03%Bank of Montreal^ $500,000 0.95% 22/1/2027 491,229 0.03%Bank of Montreal $477,000 2.55% 6/11/2022 490,476 0.03%Canadian Imperial Bank of Commerce CA($)560,000 3.30% 26/5/2025 487,757 0.03%Royal Bank of Canada CA($)600,000 1.59% 4/5/2026 483,060 0.03%Toronto-Dominion Bank $455,000 2.65% 12/6/2024 481,698 0.03%Bank of Nova Scotia CA($)580,000 2.16% 3/2/2025 481,200 0.03%Manulife Financial Corp. $425,000 4.15% 4/3/2026 480,032 0.03%Royal Bank of Canada €400,000 0.25% 2/5/2024 479,679 0.03%Bank of Montreal CA($)570,000 2.37% 3/2/2025 476,085 0.03%Canadian Imperial Bank of Commerce^ CA($)540,000 3.45% 4/4/2028 454,028 0.03%Toronto-Dominion Bank $450,000 1.15% 12/6/2025 453,346 0.03%Royal Bank of Canada^ CA($)540,000 2.74% 25/7/2029 452,681 0.03%Toronto-Dominion Bank $425,000 3.50% 19/7/2023 451,972 0.03%Bank of Montreal CA($)535,000 2.28% 29/7/2024 445,495 0.03%Toronto-Dominion Bank CA($)540,000 1.94% 13/3/2025 444,972 0.03%Bank of Montreal CA($)525,000 2.70% 11/9/2024 444,852 0.03%Canadian Imperial Bank of Commerce CA($)530,000 2.00% 17/4/2025 436,960 0.03%Royal Bank of Canada CA($)530,000 1.94% 1/5/2025 436,173 0.03%Bank of Nova Scotia1 $425,000 2.45% 19/9/2022 436,122 0.03%Bank of Nova Scotia CA($)525,000 2.36% 8/11/2022 434,028 0.03%Royal Bank of Canada CA($)510,000 2.95% 1/5/2023 428,286 0.03%Bank of Nova Scotia CA($)510,000 2.49% 23/9/2024 427,532 0.03%HSBC Bank Canada CA($)520,000 1.78% 20/5/2026 420,641 0.03%Bell Telephone Co. of Canada or Bell Canada CA($)490,000 3.35% 12/3/2025 420,294 0.03%Canadian Imperial Bank of Commerce^ CA($)495,000 2.95% 19/6/2029 416,777 0.03%HSBC Bank Canada CA($)500,000 2.54% 31/1/2023 414,651 0.03%Canadian Natural Resources Ltd. $400,000 2.95% 15/1/2023 414,438 0.03%Bank of Montreal1 $400,000 1.85% 1/5/2025 413,319 0.03%Royal Bank of Canada^ CA($)495,000 2.09% 30/6/2030 405,827 0.03%Toronto-Dominion Bank CA($)480,000 2.50% 2/12/2024 402,826 0.03%Canadian Imperial Bank of Commerce $400,000 0.45% 22/6/2023 399,949 0.02%Canadian Imperial Bank of Commerce $400,000 1.25% 22/6/2026 397,998 0.02%Toronto-Dominion Bank^ CA($)430,000 4.86% 4/3/2031 393,823 0.02%Toronto-Dominion Bank AU($)500,000 2.05% 10/7/2024 388,134 0.02%Canadian Imperial Bank of Commerce $370,000 2.25% 28/1/2025 386,800 0.02%Enbridge, Inc. $375,000 2.90% 15/7/2022 383,847 0.02%

802
Vanguard Global Short-Term Corporate Bond Index Fund
Principal CouponMaturity
DateFair Value
US Dollars ($)% of Total
Net AssetsBank of Nova Scotia1 $338,000 4.50% 16/12/2025 383,413 0.02%Royal Bank of Canada $375,000 0.50% 26/10/2023 375,375 0.02%Royal Bank of Canada CA($)435,000 2.35% 2/7/2024 362,886 0.02%Canadian Imperial Bank of Commerce €300,000 0.38% 3/5/2024 360,751 0.02%HSBC Bank Canada CA($)425,000 3.25% 15/9/2023 359,624 0.02%407 International, Inc. CA($)435,000 1.80% 22/5/2025 358,112 0.02%Toronto-Dominion Bank $350,000 1.90% 1/12/2022 357,876 0.02%Cenovus Energy, Inc. $350,000 3.00% 15/8/2022 357,213 0.02%Bank of Nova Scotia CA($)425,000 2.98% 17/4/2023 356,823 0.02%National Bank of Canada^ CA($)440,000 1.57% 18/8/2026 355,569 0.02%Canadian Imperial Bank of Commerce CA($)430,000 2.30% 11/7/2022 353,871 0.02%Toronto-Dominion Bank $350,000 0.45% 11/9/2023 350,224 0.02%Bank of Nova Scotia^ CA($)415,000 2.84% 3/7/2029 348,719 0.02%Toronto-Dominion Bank $325,000 3.25% 11/3/2024 348,093 0.02%TransCanada PipeLines Ltd. $325,000 3.75% 16/10/2023 345,883 0.02%Royal Bank of Canada $350,000 0.88% 20/1/2026 345,382 0.02%Bank of Nova Scotia CA($)410,000 2.29% 28/6/2024 342,924 0.02%Suncor Energy, Inc. $325,000 2.80% 15/5/2023 337,796 0.02%Toronto-Dominion Bank CA($)425,000 1.13% 9/12/2025 336,983 0.02%Bank of Montreal $323,000 2.35% 11/9/2022 331,193 0.02%Canadian Imperial Bank of Commerce CA($)385,000 3.29% 15/1/2024 327,931 0.02%Bank of Montreal^ CA($)400,000 2.08% 17/6/2030 327,830 0.02%Bank of Nova Scotia1 $312,000 2.20% 3/2/2025 325,739 0.02%Toyota Credit Canada, Inc. CA($)390,000 2.31% 23/10/2024 325,348 0.02%Nutrien Ltd. $300,000 3.38% 15/3/2025 323,517 0.02%Canadian Imperial Bank of Commerce^ CA($)400,000 1.96% 21/4/2031 323,045 0.02%Canadian Imperial Bank of Commerce CA($)380,000 2.35% 28/8/2024 317,009 0.02%Bell MTS, Inc. CA($)365,000 4.00% 27/5/2024 315,178 0.02%Canadian Imperial Bank of Commerce CA($)380,000 2.47% 5/12/2022 314,912 0.02%Thomson Reuters Corp. CA($)380,000 2.24% 14/5/2025 314,780 0.02%Bell Telephone Co. of Canada or Bell Canada CA($)375,000 2.70% 27/2/2024 313,550 0.02%Manulife Financial Corp.^ CA($)370,000 3.05% 20/8/2029 313,516 0.02%Royal Bank of Canada^ CA($)370,000 2.88% 23/12/2029 311,930 0.02%Federation des Caisses Desjardins du Quebec $300,000 2.05% 10/2/2025 309,715 0.02%Bank of Montreal CA($)385,000 1.55% 28/5/2026 309,256 0.02%Federation des Caisses Desjardins du Quebec CA($)365,000 3.06% 11/9/2023 308,664 0.02%Nutrien Ltd. $300,000 3.15% 1/10/2022 307,991 0.02%Bank of Nova Scotia1 $300,000 1.95% 1/2/2023 307,502 0.02%Canadian Imperial Bank of Commerce^ $300,000 2.61% 22/7/2023 306,980 0.02%Royal Bank of Canada CA($)365,000 2.33% 5/12/2023 304,790 0.02%Bank of Nova Scotia1 $300,000 1.30% 11/6/2025 302,870 0.02%Canadian Imperial Bank of Commerce $300,000 0.95% 23/6/2023 302,749 0.02%Rogers Communications, Inc. $271,000 3.63% 15/12/2025 299,316 0.02%Royal Bank of Canada $300,000 0.43% 19/1/2024 299,091 0.02%Toronto-Dominion Bank^ CA($)350,000 3.22% 25/7/2029 297,619 0.02%Bank of Nova Scotia $300,000 1.05% 2/3/2026 297,036 0.02%Canadian Imperial Bank of Commerce CA($)355,000 2.43% 9/6/2023 294,966 0.02%Canadian Imperial Bank of Commerce $275,000 3.50% 13/9/2023 293,666 0.02%Allied Properties CA($)340,000 3.64% 21/4/2025 292,516 0.02%TELUS Corp. CA($)335,000 3.35% 1/4/2024 284,399 0.02%Federation des Caisses Desjardins du Quebec^ CA($)350,000 1.99% 28/5/2031 282,035 0.02%TELUS Corp. CA($)325,000 3.75% 17/1/2025 281,773 0.02%National Bank of Canada CA($)325,000 2.55% 12/7/2024 272,591 0.02%Toronto-Dominion Bank $275,000 0.75% 11/9/2025 272,377 0.02%Canadian Imperial Bank of Commerce CA($)340,000 1.10% 19/1/2026 268,275 0.02%H&R CA($)320,000 3.37% 30/1/2024 268,076 0.02%Bank of Nova Scotia1 $250,000 3.40% 11/2/2024 267,723 0.02%Canadian Imperial Bank of Commerce $250,000 3.10% 2/4/2024 265,781 0.02%Alimentation Couche-Tard, Inc. CA($)305,000 3.60% 2/6/2025 263,872 0.02%Federation des Caisses Desjardins du Quebec CA($)315,000 2.42% 4/10/2024 263,309 0.02%Enbridge, Inc. $251,000 2.50% 15/1/2025 263,288 0.02%National Bank of Canada $250,000 2.10% 1/2/2023 256,503 0.02%National Bank of Canada $250,000 2.15% 7/10/2022 255,434 0.02%Brookfield Finance, Inc. $235,000 4.00% 1/4/2024 254,068 0.02%Royal Bank of Canada CA($)275,000 4.93% 16/7/2025 254,024 0.02%National Bank of Canada^ $250,000 0.90% 15/8/2023 251,305 0.02%Bank of Montreal1 $250,000 0.45% 8/12/2023 250,092 0.02%Bank of Nova Scotia $250,000 1.35% 24/6/2026 249,972 0.02%National Bank of Canada^ $250,000 0.55% 15/11/2024 248,904 0.02%Cenovus Energy, Inc. CA($)290,000 3.55% 12/3/2025 247,530 0.02%Saputo, Inc. CA($)285,000 3.60% 14/8/2025 247,318 0.02%
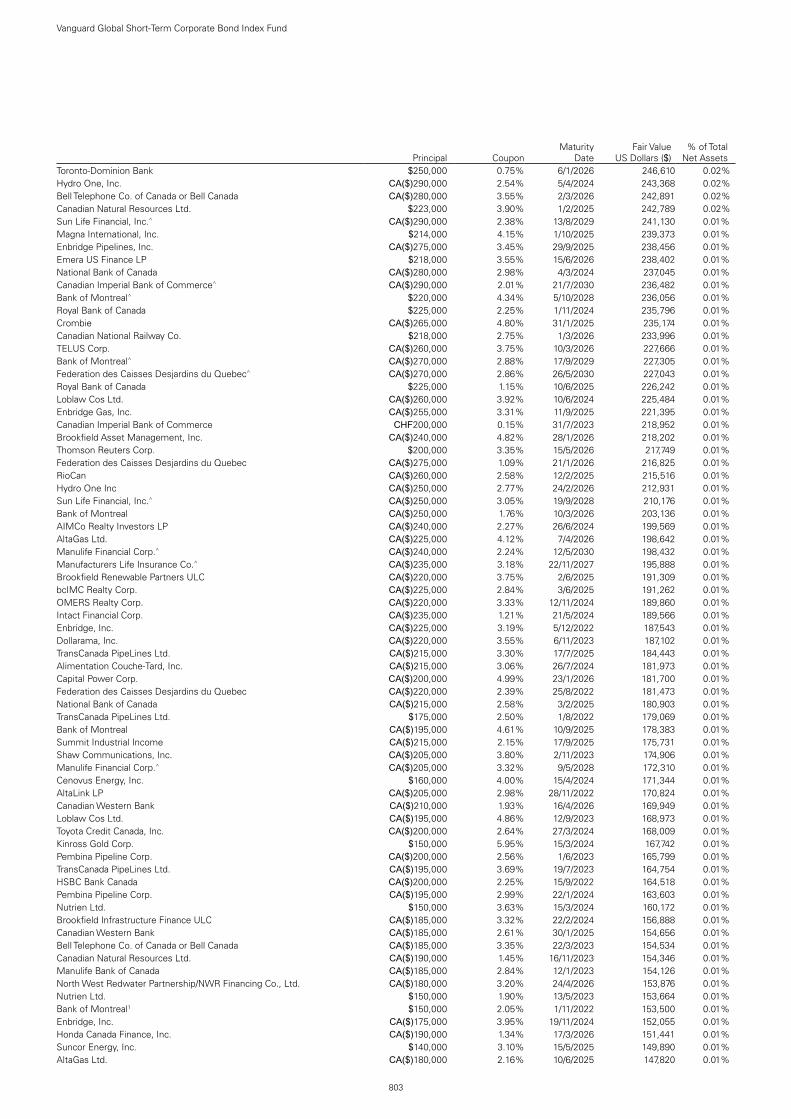
803
Vanguard Global Short-Term Corporate Bond Index Fund
Principal CouponMaturity
DateFair Value
US Dollars ($)% of Total
Net AssetsToronto-Dominion Bank $250,000 0.75% 6/1/2026 246,610 0.02%Hydro One, Inc. CA($)290,000 2.54% 5/4/2024 243,368 0.02%Bell Telephone Co. of Canada or Bell Canada CA($)280,000 3.55% 2/3/2026 242,891 0.02%Canadian Natural Resources Ltd. $223,000 3.90% 1/2/2025 242,789 0.02%Sun Life Financial, Inc.^ CA($)290,000 2.38% 13/8/2029 241,130 0.01%Magna International, Inc. $214,000 4.15% 1/10/2025 239,373 0.01%Enbridge Pipelines, Inc. CA($)275,000 3.45% 29/9/2025 238,456 0.01%Emera US Finance LP $218,000 3.55% 15/6/2026 238,402 0.01%National Bank of Canada CA($)280,000 2.98% 4/3/2024 237,045 0.01%Canadian Imperial Bank of Commerce^ CA($)290,000 2.01% 21/7/2030 236,482 0.01%Bank of Montreal^ $220,000 4.34% 5/10/2028 236,056 0.01%Royal Bank of Canada $225,000 2.25% 1/11/2024 235,796 0.01%Crombie CA($)265,000 4.80% 31/1/2025 235,174 0.01%Canadian National Railway Co. $218,000 2.75% 1/3/2026 233,996 0.01%TELUS Corp. CA($)260,000 3.75% 10/3/2026 227,666 0.01%Bank of Montreal^ CA($)270,000 2.88% 17/9/2029 227,305 0.01%Federation des Caisses Desjardins du Quebec^ CA($)270,000 2.86% 26/5/2030 227,043 0.01%Royal Bank of Canada $225,000 1.15% 10/6/2025 226,242 0.01%Loblaw Cos Ltd. CA($)260,000 3.92% 10/6/2024 225,484 0.01%Enbridge Gas, Inc. CA($)255,000 3.31% 11/9/2025 221,395 0.01%Canadian Imperial Bank of Commerce CHF200,000 0.15% 31/7/2023 218,952 0.01%Brookfield Asset Management, Inc. CA($)240,000 4.82% 28/1/2026 218,202 0.01%Thomson Reuters Corp. $200,000 3.35% 15/5/2026 217,749 0.01%Federation des Caisses Desjardins du Quebec CA($)275,000 1.09% 21/1/2026 216,825 0.01%RioCan CA($)260,000 2.58% 12/2/2025 215,516 0.01%Hydro One Inc CA($)250,000 2.77% 24/2/2026 212,931 0.01%Sun Life Financial, Inc.^ CA($)250,000 3.05% 19/9/2028 210,176 0.01%Bank of Montreal CA($)250,000 1.76% 10/3/2026 203,136 0.01%AIMCo Realty Investors LP CA($)240,000 2.27% 26/6/2024 199,569 0.01%AltaGas Ltd. CA($)225,000 4.12% 7/4/2026 198,642 0.01%Manulife Financial Corp.^ CA($)240,000 2.24% 12/5/2030 198,432 0.01%Manufacturers Life Insurance Co.^ CA($)235,000 3.18% 22/11/2027 195,888 0.01%Brookfield Renewable Partners ULC CA($)220,000 3.75% 2/6/2025 191,309 0.01%bcIMC Realty Corp. CA($)225,000 2.84% 3/6/2025 191,262 0.01%OMERS Realty Corp. CA($)220,000 3.33% 12/11/2024 189,860 0.01%Intact Financial Corp. CA($)235,000 1.21% 21/5/2024 189,566 0.01%Enbridge, Inc. CA($)225,000 3.19% 5/12/2022 187,543 0.01%Dollarama, Inc. CA($)220,000 3.55% 6/11/2023 187,102 0.01%TransCanada PipeLines Ltd. CA($)215,000 3.30% 17/7/2025 184,443 0.01%Alimentation Couche-Tard, Inc. CA($)215,000 3.06% 26/7/2024 181,973 0.01%Capital Power Corp. CA($)200,000 4.99% 23/1/2026 181,700 0.01%Federation des Caisses Desjardins du Quebec CA($)220,000 2.39% 25/8/2022 181,473 0.01%National Bank of Canada CA($)215,000 2.58% 3/2/2025 180,903 0.01%TransCanada PipeLines Ltd. $175,000 2.50% 1/8/2022 179,069 0.01%Bank of Montreal CA($)195,000 4.61% 10/9/2025 178,383 0.01%Summit Industrial Income CA($)215,000 2.15% 17/9/2025 175,731 0.01%Shaw Communications, Inc. CA($)205,000 3.80% 2/11/2023 174,906 0.01%Manulife Financial Corp.^ CA($)205,000 3.32% 9/5/2028 172,310 0.01%Cenovus Energy, Inc. $160,000 4.00% 15/4/2024 171,344 0.01%AltaLink LP CA($)205,000 2.98% 28/11/2022 170,824 0.01%Canadian Western Bank CA($)210,000 1.93% 16/4/2026 169,949 0.01%Loblaw Cos Ltd. CA($)195,000 4.86% 12/9/2023 168,973 0.01%Toyota Credit Canada, Inc. CA($)200,000 2.64% 27/3/2024 168,009 0.01%Kinross Gold Corp. $150,000 5.95% 15/3/2024 167,742 0.01%Pembina Pipeline Corp. CA($)200,000 2.56% 1/6/2023 165,799 0.01%TransCanada PipeLines Ltd. CA($)195,000 3.69% 19/7/2023 164,754 0.01%HSBC Bank Canada CA($)200,000 2.25% 15/9/2022 164,518 0.01%Pembina Pipeline Corp. CA($)195,000 2.99% 22/1/2024 163,603 0.01%Nutrien Ltd. $150,000 3.63% 15/3/2024 160,172 0.01%Brookfield Infrastructure Finance ULC CA($)185,000 3.32% 22/2/2024 156,888 0.01%Canadian Western Bank CA($)185,000 2.61% 30/1/2025 154,656 0.01%Bell Telephone Co. of Canada or Bell Canada CA($)185,000 3.35% 22/3/2023 154,534 0.01%Canadian Natural Resources Ltd. CA($)190,000 1.45% 16/11/2023 154,346 0.01%Manulife Bank of Canada CA($)185,000 2.84% 12/1/2023 154,126 0.01%North West Redwater Partnership/NWR Financing Co., Ltd. CA($)180,000 3.20% 24/4/2026 153,876 0.01%Nutrien Ltd. $150,000 1.90% 13/5/2023 153,664 0.01%Bank of Montreal1 $150,000 2.05% 1/11/2022 153,500 0.01%Enbridge, Inc. CA($)175,000 3.95% 19/11/2024 152,055 0.01%Honda Canada Finance, Inc. CA($)190,000 1.34% 17/3/2026 151,441 0.01%Suncor Energy, Inc. $140,000 3.10% 15/5/2025 149,890 0.01%AltaGas Ltd. CA($)180,000 2.16% 10/6/2025 147,820 0.01%

804
Vanguard Global Short-Term Corporate Bond Index Fund
Principal CouponMaturity
DateFair Value
US Dollars ($)% of Total
Net AssetsTransCanada PipeLines Ltd. $125,000 4.88% 15/1/2026 143,685 0.01%Central 1 Credit Union CA($)180,000 1.32% 29/1/2026 142,854 0.01%BCI QuadReal Realty CA($)175,000 1.07% 4/2/2026 138,262 0.01%National Bank of Canada^ CA($)165,000 3.18% 1/2/2028 137,629 0.01%Rogers Communications, Inc. CA($)160,000 4.00% 13/3/2024 137,450 0.01%Teranet Holdings LP CA($)160,000 3.54% 11/6/2025 137,267 0.01%Honda Canada Finance, Inc. CA($)160,000 3.18% 28/8/2023 135,001 0.01%Hydro One, Inc. CA($)165,000 0.71% 16/1/2023 133,205 0.01%Honda Canada Finance, Inc. CA($)160,000 2.54% 1/3/2023 132,819 0.01%Manulife Bank of Canada CA($)165,000 1.34% 26/2/2026 131,871 0.01%Cenovus Energy, Inc. $125,000 3.80% 15/9/2023 131,827 0.01%Honda Canada Finance, Inc. CA($)155,000 2.50% 4/6/2024 129,699 0.01%Sobeys, Inc. CA($)150,000 4.70% 8/8/2023 129,039 0.01%Westcoast Energy, Inc. CA($)125,000 8.85% 21/7/2025 128,063 0.01%Bank of Nova Scotia1 $125,000 2.00% 15/11/2022 127,844 0.01%Hyundai Capital Canada, Inc. CA($)155,000 2.01% 12/5/2026 125,459 0.01%Emera, Inc. CA($)150,000 2.90% 16/6/2023 125,322 0.01%CI Financial Corp. CA($)145,000 3.76% 26/5/2025 124,842 0.01%Choice Properties CA($)140,000 4.06% 24/11/2025 123,088 0.01%First Capital CA($)145,000 3.60% 6/5/2026 123,024 0.01%Canadian Imperial Bank of Commerce €100,000 0.75% 22/3/2023 120,917 0.01%Nissan Canada, Inc. CA($)150,000 1.63% 18/3/2024 120,700 0.01%Sun Life Financial, Inc.^ CA($)145,000 2.75% 23/11/2027 120,059 0.01%OMERS Realty Corp. CA($)140,000 2.86% 23/2/2024 118,228 0.01%NAV Canada CA($)150,000 0.94% 9/2/2026 118,224 0.01%Canadian Western Bank CA($)145,000 1.57% 14/9/2023 118,169 0.01%Inter Pipeline Ltd. CA($)141,000 2.73% 18/4/2024 117,620 0.01%Manulife Bank of Canada CA($)140,000 2.38% 19/11/2024 117,333 0.01%OMERS Realty Corp. CA($)135,000 3.33% 5/6/2025 116,907 0.01%Toyota Credit Canada, Inc. CA($)140,000 2.70% 25/1/2023 116,405 0.01%Laurentian Bank of Canada CA($)145,000 1.15% 3/6/2024 116,311 0.01%Pembina Pipeline Corp. CA($)135,000 3.54% 3/2/2025 115,717 0.01%TMX Group Ltd. CA($)135,000 3.00% 11/12/2024 114,900 0.01%Ivanhoe Cambridge II, Inc. CA($)135,000 2.91% 27/6/2023 113,063 0.01%Cameco Corp. CA($)130,000 4.19% 24/6/2024 112,152 0.01%ARC Resources Ltd. CA($)135,000 2.35% 10/3/2026 109,949 0.01%Enbridge, Inc. CA($)130,000 3.94% 13/1/2023 109,713 0.01%Toronto-Dominion Bank CA($)105,000 9.15% 26/5/2025 109,280 0.01%Central 1 Credit Union CA($)130,000 2.58% 6/12/2023 108,626 0.01%Canadian Utilities Ltd. CA($)130,000 3.12% 9/11/2022 108,342 0.01%Magna International, Inc. $100,000 3.63% 15/6/2024 107,880 0.01%Thomson Reuters Corp. $100,000 4.30% 23/11/2023 107,811 0.01%Canadian Natural Resources Ltd. CA($)125,000 3.55% 3/6/2024 106,736 0.01%Saputo, Inc. CA($)125,000 2.88% 19/11/2024 105,669 0.01%Bank of Montreal1 $100,000 2.50% 28/6/2024 105,547 0.01%First Capital CA($)120,000 4.79% 30/8/2024 105,425 0.01%Fortis, Inc. CA($)125,000 2.85% 12/12/2023 105,042 0.01%Nutrien Ltd. $100,000 3.50% 1/6/2023 104,740 0.01%TELUS Corp. CA($)125,000 3.35% 15/3/2023 104,383 0.01%Enbridge, Inc. CA($)125,000 2.44% 2/6/2025 104,083 0.01%Reliance LP CA($)120,000 3.75% 15/3/2026 103,875 0.01%iA Financial Corp., Inc.^ CA($)125,000 2.40% 21/2/2030 103,667 0.01%Shaw Communications, Inc. CA($)120,000 4.35% 31/1/2024 103,631 0.01%Sagen MI Canada, Inc. CA($)120,000 4.24% 1/4/2024 103,488 0.01%AltaGas Ltd. CA($)125,000 2.61% 16/12/2022 103,319 0.01%Bank of Nova Scotia1 $100,000 2.38% 18/1/2023 103,111 0.01%Choice Properties CA($)120,000 3.55% 10/1/2025 103,082 0.01%Hydro One, Inc. CA($)120,000 2.97% 26/6/2025 102,890 0.01%Choice Properties CA($)120,000 3.56% 9/9/2024 102,837 0.01%Granite Holdings LP CA($)120,000 3.87% 30/11/2023 102,762 0.01%Honda Canada Finance, Inc. CA($)125,000 2.27% 15/7/2022 102,699 0.01%Bank of Nova Scotia^ $100,000 4.65% Perpetual 102,413 0.01%TransCanada PipeLines Ltd. CA($)100,000 8.29% 5/2/2026 101,526 0.01%Manulife Bank of Canada CA($)125,000 1.50% 25/6/2025 101,454 0.01%Brookfield Asset Management, Inc. CA($)115,000 5.04% 8/3/2024 101,269 0.01%Bank of Nova Scotia1 $100,000 0.80% 15/6/2023 100,742 0.01%Honda Canada Finance, Inc. CA($)115,000 3.44% 23/5/2025 99,906 0.01%Capital Power Corp. CA($)114,000 4.28% 18/9/2024 99,539 0.01%AltaLink LP CA($)115,000 3.67% 6/11/2023 98,781 0.01%Fairfax Financial Holdings Ltd. CA($)110,000 4.95% 3/3/2025 98,395 0.01%Brookfield Asset Management, Inc. $88,000 4.00% 15/1/2025 96,363 0.01%

805
Vanguard Global Short-Term Corporate Bond Index Fund
Principal CouponMaturity
DateFair Value
US Dollars ($)% of Total
Net AssetsChoice Properties LP CA($)115,000 3.60% 20/9/2022 95,327 0.01%Reliance LP CA($)105,000 3.84% 15/3/2025 90,940 0.01%North West Redwater Partnership/NWR Financing Co., Ltd. CA($)105,000 3.20% 22/7/2024 89,176 0.01%Westcoast Energy, Inc. CA($)100,000 3.43% 12/9/2024 85,641 0.01%Enbridge Gas, Inc. CA($)100,000 3.79% 10/7/2023 84,858 0.01%Enbridge Pipelines, Inc. CA($)100,000 3.79% 17/8/2023 84,852 0.01%Enbridge, Inc. CA($)100,000 3.94% 30/6/2023 84,693 0.01%OMERS Realty Corp. CA($)100,000 3.36% 5/6/2023 84,571 0.01%Canadian Tire Corp., Ltd. CA($)100,000 3.17% 6/7/2023 83,919 0.01%RioCan CA($)100,000 3.21% 29/9/2023 83,893 0.01%Pembina Pipeline Corp. CA($)100,000 3.77% 24/10/2022 83,660 0.01%Choice Properties CA($)100,000 3.20% 7/3/2023 83,498 0.01%Canadian Western Bank CA($)100,000 2.92% 15/12/2022 83,182 0.01%H&R CA($)100,000 3.42% 23/1/2023 83,104 0.01%Laurentian Bank of Canada CA($)100,000 3.00% 12/9/2022 82,894 0.01%Toyota Credit Canada, Inc. CA($)100,000 2.62% 11/10/2022 82,724 0.01%RioCan CA($)100,000 2.83% 3/10/2022 82,588 0.01%Toyota Credit Canada, Inc. CA($)100,000 2.35% 18/7/2022 82,225 0.01%407 International, Inc. CA($)100,000 2.47% 8/9/2022 82,110 0.00%CI Financial Corp. CA($)97,000 3.22% 22/7/2024 81,797 0.00%Bruce Power LP CA($)95,000 3.00% 21/6/2024 80,334 0.00%Bank of Montreal^ $75,000 4.80% Perpetual 80,319 0.00%Rogers Communications, Inc. $75,000 4.10% 1/10/2023 80,173 0.00%Magna International, Inc. CA($)95,000 3.10% 15/12/2022 79,097 0.00%Penske Truck Leasing Canada, Inc. CA($)95,000 2.85% 7/12/2022 78,724 0.00%Hydro One, Inc. CA($)95,000 1.76% 28/2/2025 78,075 0.00%SmartCentres CA($)95,000 1.74% 16/12/2025 75,704 0.00%Saputo, Inc. CA($)90,000 2.83% 21/11/2023 75,316 0.00%Inter Pipeline Ltd. CA($)90,000 2.61% 13/9/2023 74,690 0.00%Central 1 Credit Union CA($)90,000 2.60% 7/11/2022 74,436 0.00%Bell Telephone Co. of Canada or Bell Canada CA($)85,000 4.70% 11/9/2023 73,348 0.00%Canadian National Railway Co. CA($)85,000 2.80% 22/9/2025 72,175 0.00%Equitable Bank CA($)90,000 1.88% 26/11/2025 71,834 0.00%Laurentian Bank of Canada CA($)85,000 3.45% 27/6/2023 71,801 0.00%BCI QuadReal Realty CA($)85,000 1.68% 3/3/2025 69,498 0.00%AltaGas Ltd. CA($)80,000 4.40% 15/3/2024 69,379 0.00%Canadian Pacific Railway Co. $65,000 4.45% 15/3/2023 68,689 0.00%First Capital CA($)80,000 3.90% 30/10/2023 67,960 0.00%Inter Pipeline Ltd. CA($)80,000 3.17% 24/3/2025 67,753 0.00%RioCan CA($)80,000 3.29% 12/2/2024 67,513 0.00%Gibson Energy, Inc. CA($)80,000 2.45% 14/7/2025 66,097 0.00%Intact Financial Corp. CA($)75,000 3.69% 24/3/2025 65,302 0.00%AltaGas Ltd. CA($)75,000 3.84% 15/1/2025 64,953 0.00%AltaLink LP CA($)75,000 2.75% 29/5/2026 63,937 0.00%Toyota Credit Canada, Inc. CA($)75,000 3.04% 12/7/2023 63,095 0.00%AltaGas Ltd. CA($)75,000 3.57% 12/6/2023 63,056 0.00%Canadian Western Bank CA($)75,000 2.60% 6/9/2024 62,675 0.00%Toyota Credit Canada, Inc. CA($)75,000 2.11% 26/2/2025 62,246 0.00%bcIMC Realty Corp. CA($)75,000 2.15% 11/8/2022 61,546 0.00%AltaLink LP CA($)70,000 3.40% 6/6/2024 60,090 0.00%Honda Canada Finance, Inc. CA($)70,000 2.49% 19/12/2022 57,923 0.00%SmartCentres CA($)65,000 3.56% 6/2/2025 55,682 0.00%Toyota Credit Canada, Inc. CA($)70,000 1.18% 23/2/2026 55,542 0.00%Canadian Natural Resources Ltd. $50,000 3.80% 15/4/2024 53,742 0.00%Enbridge, Inc. $50,000 4.00% 1/10/2023 53,394 0.00%Alectra, Inc. CA($)60,000 3.24% 21/11/2024 51,587 0.00%CT CA($)60,000 3.53% 9/6/2025 51,587 0.00%RioCan CA($)60,000 3.73% 18/4/2023 50,590 0.00%First Capital CA($)60,000 3.95% 5/12/2022 50,282 0.00%Metro, Inc. CA($)60,000 2.68% 5/12/2022 49,630 0.00%Equitable Bank CA($)60,000 1.77% 21/9/2023 48,866 0.00%Cogeco Communications, Inc. CA($)55,000 4.18% 26/5/2023 46,580 0.00%Industrial Alliance Insurance & Financial Services, Inc.^ CA($)55,000 3.30% 15/9/2028 46,416 0.00%Morguard Corp. CA($)55,000 4.72% 25/1/2024 45,378 0.00%Morguard Corp. CA($)55,000 4.33% 15/9/2022 44,940 0.00%Morguard Corp. CA($)55,000 4.20% 27/11/2024 44,726 0.00%First Capital CA($)50,000 4.32% 31/7/2025 43,669 0.00%Teranet Holdings LP CA($)50,000 3.65% 18/11/2022 41,733 0.00%Ivanhoe Cambridge II, Inc. CA($)50,000 2.30% 12/12/2024 41,700 0.00%Alimentation Couche-Tard, Inc. CA($)45,000 3.90% 1/11/2022 37,828 0.00%Dollarama, Inc. CA($)45,000 2.20% 10/11/2022 36,984 0.00%
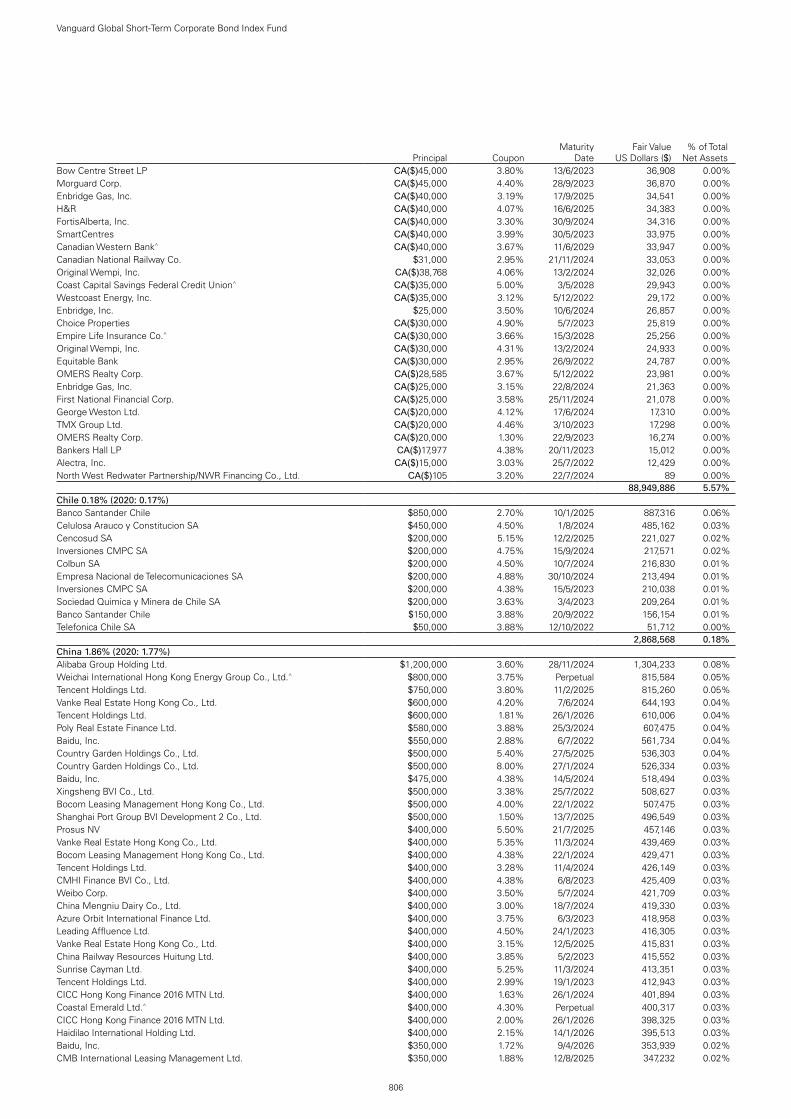
806
Vanguard Global Short-Term Corporate Bond Index Fund
Principal CouponMaturity
DateFair Value
US Dollars ($)% of Total
Net AssetsBow Centre Street LP CA($)45,000 3.80% 13/6/2023 36,908 0.00%Morguard Corp. CA($)45,000 4.40% 28/9/2023 36,870 0.00%Enbridge Gas, Inc. CA($)40,000 3.19% 17/9/2025 34,541 0.00%H&R CA($)40,000 4.07% 16/6/2025 34,383 0.00%FortisAlberta, Inc. CA($)40,000 3.30% 30/9/2024 34,316 0.00%SmartCentres CA($)40,000 3.99% 30/5/2023 33,975 0.00%Canadian Western Bank^ CA($)40,000 3.67% 11/6/2029 33,947 0.00%Canadian National Railway Co. $31,000 2.95% 21/11/2024 33,053 0.00%Original Wempi, Inc. CA($)38,768 4.06% 13/2/2024 32,026 0.00%Coast Capital Savings Federal Credit Union^ CA($)35,000 5.00% 3/5/2028 29,943 0.00%Westcoast Energy, Inc. CA($)35,000 3.12% 5/12/2022 29,172 0.00%Enbridge, Inc. $25,000 3.50% 10/6/2024 26,857 0.00%Choice Properties CA($)30,000 4.90% 5/7/2023 25,819 0.00%Empire Life Insurance Co.^ CA($)30,000 3.66% 15/3/2028 25,256 0.00%Original Wempi, Inc. CA($)30,000 4.31% 13/2/2024 24,933 0.00%Equitable Bank CA($)30,000 2.95% 26/9/2022 24,787 0.00%OMERS Realty Corp. CA($)28,585 3.67% 5/12/2022 23,981 0.00%Enbridge Gas, Inc. CA($)25,000 3.15% 22/8/2024 21,363 0.00%First National Financial Corp. CA($)25,000 3.58% 25/11/2024 21,078 0.00%George Weston Ltd. CA($)20,000 4.12% 17/6/2024 17,310 0.00%TMX Group Ltd. CA($)20,000 4.46% 3/10/2023 17,298 0.00%OMERS Realty Corp. CA($)20,000 1.30% 22/9/2023 16,274 0.00%Bankers Hall LP CA($)17,977 4.38% 20/11/2023 15,012 0.00%Alectra, Inc. CA($)15,000 3.03% 25/7/2022 12,429 0.00%North West Redwater Partnership/NWR Financing Co., Ltd. CA($)105 3.20% 22/7/2024 89 0.00%test - - - 88,949,886 5.57%Chile 0.18% (2020: 0.17%)Banco Santander Chile $850,000 2.70% 10/1/2025 887,316 0.06%Celulosa Arauco y Constitucion SA $450,000 4.50% 1/8/2024 485,162 0.03%Cencosud SA $200,000 5.15% 12/2/2025 221,027 0.02%Inversiones CMPC SA $200,000 4.75% 15/9/2024 217,571 0.02%Colbun SA $200,000 4.50% 10/7/2024 216,830 0.01%Empresa Nacional de Telecomunicaciones SA $200,000 4.88% 30/10/2024 213,494 0.01%Inversiones CMPC SA $200,000 4.38% 15/5/2023 210,038 0.01%Sociedad Quimica y Minera de Chile SA $200,000 3.63% 3/4/2023 209,264 0.01%Banco Santander Chile $150,000 3.88% 20/9/2022 156,154 0.01%Telefonica Chile SA $50,000 3.88% 12/10/2022 51,712 0.00%test - - - 2,868,568 0.18%China 1.86% (2020: 1.77%)Alibaba Group Holding Ltd. $1,200,000 3.60% 28/11/2024 1,304,233 0.08%Weichai International Hong Kong Energy Group Co., Ltd.^ $800,000 3.75% Perpetual 815,584 0.05%Tencent Holdings Ltd. $750,000 3.80% 11/2/2025 815,260 0.05%Vanke Real Estate Hong Kong Co., Ltd. $600,000 4.20% 7/6/2024 644,193 0.04%Tencent Holdings Ltd. $600,000 1.81% 26/1/2026 610,006 0.04%Poly Real Estate Finance Ltd. $580,000 3.88% 25/3/2024 607,475 0.04%Baidu, Inc. $550,000 2.88% 6/7/2022 561,734 0.04%Country Garden Holdings Co., Ltd. $500,000 5.40% 27/5/2025 536,303 0.04%Country Garden Holdings Co., Ltd. $500,000 8.00% 27/1/2024 526,334 0.03%Baidu, Inc. $475,000 4.38% 14/5/2024 518,494 0.03%Xingsheng BVI Co., Ltd. $500,000 3.38% 25/7/2022 508,627 0.03%Bocom Leasing Management Hong Kong Co., Ltd. $500,000 4.00% 22/1/2022 507,475 0.03%Shanghai Port Group BVI Development 2 Co., Ltd. $500,000 1.50% 13/7/2025 496,549 0.03%Prosus NV $400,000 5.50% 21/7/2025 457,146 0.03%Vanke Real Estate Hong Kong Co., Ltd. $400,000 5.35% 11/3/2024 439,469 0.03%Bocom Leasing Management Hong Kong Co., Ltd. $400,000 4.38% 22/1/2024 429,471 0.03%Tencent Holdings Ltd. $400,000 3.28% 11/4/2024 426,149 0.03%CMHI Finance BVI Co., Ltd. $400,000 4.38% 6/8/2023 425,409 0.03%Weibo Corp. $400,000 3.50% 5/7/2024 421,709 0.03%China Mengniu Dairy Co., Ltd. $400,000 3.00% 18/7/2024 419,330 0.03%Azure Orbit International Finance Ltd. $400,000 3.75% 6/3/2023 418,958 0.03%Leading Affluence Ltd. $400,000 4.50% 24/1/2023 416,305 0.03%Vanke Real Estate Hong Kong Co., Ltd. $400,000 3.15% 12/5/2025 415,831 0.03%China Railway Resources Huitung Ltd. $400,000 3.85% 5/2/2023 415,552 0.03%Sunrise Cayman Ltd. $400,000 5.25% 11/3/2024 413,351 0.03%Tencent Holdings Ltd. $400,000 2.99% 19/1/2023 412,943 0.03%CICC Hong Kong Finance 2016 MTN Ltd. $400,000 1.63% 26/1/2024 401,894 0.03%Coastal Emerald Ltd.^ $400,000 4.30% Perpetual 400,317 0.03%CICC Hong Kong Finance 2016 MTN Ltd. $400,000 2.00% 26/1/2026 398,325 0.03%Haidilao International Holding Ltd. $400,000 2.15% 14/1/2026 395,513 0.03%Baidu, Inc. $350,000 1.72% 9/4/2026 353,939 0.02%CMB International Leasing Management Ltd. $350,000 1.88% 12/8/2025 347,232 0.02%
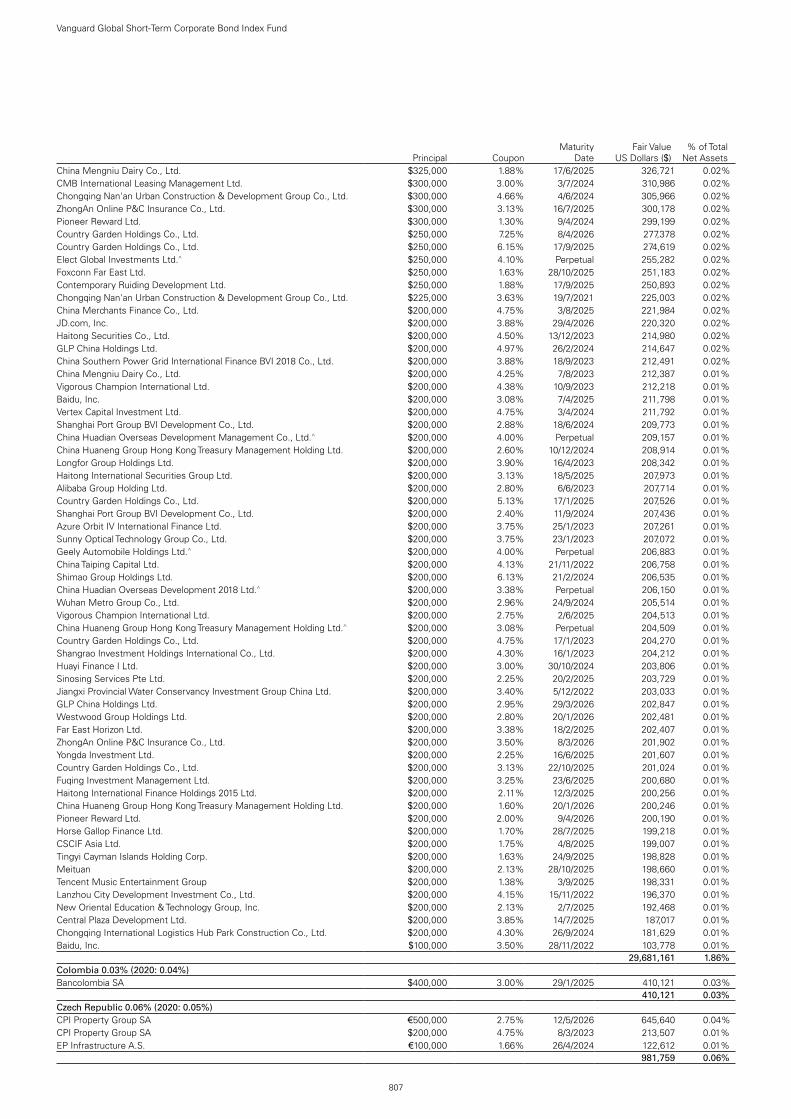
807
Vanguard Global Short-Term Corporate Bond Index Fund
Principal CouponMaturity
DateFair Value
US Dollars ($)% of Total
Net AssetsChina Mengniu Dairy Co., Ltd. $325,000 1.88% 17/6/2025 326,721 0.02%CMB International Leasing Management Ltd. $300,000 3.00% 3/7/2024 310,986 0.02%Chongqing Nan'an Urban Construction & Development Group Co., Ltd. $300,000 4.66% 4/6/2024 305,966 0.02%ZhongAn Online P&C Insurance Co., Ltd. $300,000 3.13% 16/7/2025 300,178 0.02%Pioneer Reward Ltd. $300,000 1.30% 9/4/2024 299,199 0.02%Country Garden Holdings Co., Ltd. $250,000 7.25% 8/4/2026 277,378 0.02%Country Garden Holdings Co., Ltd. $250,000 6.15% 17/9/2025 274,619 0.02%Elect Global Investments Ltd.^ $250,000 4.10% Perpetual 255,282 0.02%Foxconn Far East Ltd. $250,000 1.63% 28/10/2025 251,183 0.02%Contemporary Ruiding Development Ltd. $250,000 1.88% 17/9/2025 250,893 0.02%Chongqing Nan'an Urban Construction & Development Group Co., Ltd. $225,000 3.63% 19/7/2021 225,003 0.02%China Merchants Finance Co., Ltd. $200,000 4.75% 3/8/2025 221,984 0.02%JD.com, Inc. $200,000 3.88% 29/4/2026 220,320 0.02%Haitong Securities Co., Ltd. $200,000 4.50% 13/12/2023 214,980 0.02%GLP China Holdings Ltd. $200,000 4.97% 26/2/2024 214,647 0.02%China Southern Power Grid International Finance BVI 2018 Co., Ltd. $200,000 3.88% 18/9/2023 212,491 0.02%China Mengniu Dairy Co., Ltd. $200,000 4.25% 7/8/2023 212,387 0.01%Vigorous Champion International Ltd. $200,000 4.38% 10/9/2023 212,218 0.01%Baidu, Inc. $200,000 3.08% 7/4/2025 211,798 0.01%Vertex Capital Investment Ltd. $200,000 4.75% 3/4/2024 211,792 0.01%Shanghai Port Group BVI Development Co., Ltd. $200,000 2.88% 18/6/2024 209,773 0.01%China Huadian Overseas Development Management Co., Ltd.^ $200,000 4.00% Perpetual 209,157 0.01%China Huaneng Group Hong Kong Treasury Management Holding Ltd. $200,000 2.60% 10/12/2024 208,914 0.01%Longfor Group Holdings Ltd. $200,000 3.90% 16/4/2023 208,342 0.01%Haitong International Securities Group Ltd. $200,000 3.13% 18/5/2025 207,973 0.01%Alibaba Group Holding Ltd. $200,000 2.80% 6/6/2023 207,714 0.01%Country Garden Holdings Co., Ltd. $200,000 5.13% 17/1/2025 207,526 0.01%Shanghai Port Group BVI Development Co., Ltd. $200,000 2.40% 11/9/2024 207,436 0.01%Azure Orbit IV International Finance Ltd. $200,000 3.75% 25/1/2023 207,261 0.01%Sunny Optical Technology Group Co., Ltd. $200,000 3.75% 23/1/2023 207,072 0.01%Geely Automobile Holdings Ltd.^ $200,000 4.00% Perpetual 206,883 0.01%China Taiping Capital Ltd. $200,000 4.13% 21/11/2022 206,758 0.01%Shimao Group Holdings Ltd. $200,000 6.13% 21/2/2024 206,535 0.01%China Huadian Overseas Development 2018 Ltd.^ $200,000 3.38% Perpetual 206,150 0.01%Wuhan Metro Group Co., Ltd. $200,000 2.96% 24/9/2024 205,514 0.01%Vigorous Champion International Ltd. $200,000 2.75% 2/6/2025 204,513 0.01%China Huaneng Group Hong Kong Treasury Management Holding Ltd.^ $200,000 3.08% Perpetual 204,509 0.01%Country Garden Holdings Co., Ltd. $200,000 4.75% 17/1/2023 204,270 0.01%Shangrao Investment Holdings International Co., Ltd. $200,000 4.30% 16/1/2023 204,212 0.01%Huayi Finance I Ltd. $200,000 3.00% 30/10/2024 203,806 0.01%Sinosing Services Pte Ltd. $200,000 2.25% 20/2/2025 203,729 0.01%Jiangxi Provincial Water Conservancy Investment Group China Ltd. $200,000 3.40% 5/12/2022 203,033 0.01%GLP China Holdings Ltd. $200,000 2.95% 29/3/2026 202,847 0.01%Westwood Group Holdings Ltd. $200,000 2.80% 20/1/2026 202,481 0.01%Far East Horizon Ltd. $200,000 3.38% 18/2/2025 202,407 0.01%ZhongAn Online P&C Insurance Co., Ltd. $200,000 3.50% 8/3/2026 201,902 0.01%Yongda Investment Ltd. $200,000 2.25% 16/6/2025 201,607 0.01%Country Garden Holdings Co., Ltd. $200,000 3.13% 22/10/2025 201,024 0.01%Fuqing Investment Management Ltd. $200,000 3.25% 23/6/2025 200,680 0.01%Haitong International Finance Holdings 2015 Ltd. $200,000 2.11% 12/3/2025 200,256 0.01%China Huaneng Group Hong Kong Treasury Management Holding Ltd. $200,000 1.60% 20/1/2026 200,246 0.01%Pioneer Reward Ltd. $200,000 2.00% 9/4/2026 200,190 0.01%Horse Gallop Finance Ltd. $200,000 1.70% 28/7/2025 199,218 0.01%CSCIF Asia Ltd. $200,000 1.75% 4/8/2025 199,007 0.01%Tingyi Cayman Islands Holding Corp. $200,000 1.63% 24/9/2025 198,828 0.01%Meituan $200,000 2.13% 28/10/2025 198,660 0.01%Tencent Music Entertainment Group $200,000 1.38% 3/9/2025 198,331 0.01%Lanzhou City Development Investment Co., Ltd. $200,000 4.15% 15/11/2022 196,370 0.01%New Oriental Education & Technology Group, Inc. $200,000 2.13% 2/7/2025 192,468 0.01%Central Plaza Development Ltd. $200,000 3.85% 14/7/2025 187,017 0.01%Chongqing International Logistics Hub Park Construction Co., Ltd. $200,000 4.30% 26/9/2024 181,629 0.01%Baidu, Inc. $100,000 3.50% 28/11/2022 103,778 0.01%test - - - 29,681,161 1.86%Colombia 0.03% (2020: 0.04%)Bancolombia SA $400,000 3.00% 29/1/2025 410,121 0.03%test - - - 410,121 0.03%Czech Republic 0.06% (2020: 0.05%)CPI Property Group SA €500,000 2.75% 12/5/2026 645,640 0.04%CPI Property Group SA $200,000 4.75% 8/3/2023 213,507 0.01%EP Infrastructure A.S. €100,000 1.66% 26/4/2024 122,612 0.01%test - - - 981,759 0.06%

808
Vanguard Global Short-Term Corporate Bond Index Fund
Principal CouponMaturity
DateFair Value
US Dollars ($)% of Total
Net AssetsDenmark 0.97% (2020: 0.68%)AP Moller-Maersk A/S €2,000,000 1.75% 16/3/2026 2,548,016 0.16%Carlsberg Breweries A/S €1,500,000 0.50% 6/9/2023 1,802,848 0.11%Danske Bank A/S^ €800,000 0.50% 27/8/2025 958,541 0.06%Danske Bank A/S^ €700,000 1.00% 15/5/2031 830,967 0.05%AP Moller-Maersk A/S £500,000 4.00% 4/4/2025 766,070 0.05%ISS Finance BV €600,000 1.25% 7/7/2025 736,012 0.05%Jyske Bank A/S^ €500,000 0.38% 15/10/2025 599,092 0.04%Nykredit Realkredit A/S €500,000 0.13% 10/7/2024 595,656 0.04%Danske Bank A/S €450,000 0.63% 26/5/2025 546,156 0.03%Danske Bank A/S^ $500,000 3.24% 20/12/2025 532,168 0.03%Danske Bank A/S €400,000 0.88% 22/5/2023 482,889 0.03%Danske Bank A/S €400,000 1.38% 24/5/2022 481,505 0.03%Danske Bank A/S $400,000 5.38% 12/1/2024 443,685 0.03%Sydbank A/S €300,000 1.38% 18/9/2023 366,752 0.02%Nykredit Realkredit A/S^ €300,000 0.88% 28/7/2031 355,997 0.02%Danfoss Finance I BV €300,000 0.13% 28/4/2026 355,254 0.02%Danske Bank A/S^ $350,000 1.17% 8/12/2023 351,590 0.02%Danske Bank A/S $300,000 1.23% 22/6/2024 303,227 0.02%Danske Bank A/S €250,000 0.75% 2/6/2023 302,028 0.02%Danske Bank A/S $250,000 3.88% 12/9/2023 266,158 0.02%Nykredit Realkredit A/S^ €200,000 2.75% 17/11/2027 245,875 0.02%Danske Bank A/S^ €200,000 1.50% 2/9/2030 242,899 0.02%Nykredit Realkredit A/S €200,000 0.50% 10/7/2025 242,118 0.02%Danske Bank A/S^ €200,000 1.38% 12/2/2030 241,756 0.01%Danske Bank A/S €200,000 0.25% 28/11/2022 239,113 0.01%Danske Bank A/S^ $225,000 1.62% 11/9/2026 224,997 0.01%Jyske Bank A/S^ €100,000 0.63% 20/6/2024 120,245 0.01%Nykredit Realkredit A/S €100,000 0.25% 20/1/2023 119,467 0.01%AP Moller-Maersk A/S $100,000 3.75% 22/9/2024 107,846 0.01%test - - - 15,408,927 0.97%Estonia 0.01% (2020: 0.01%)Luminor Bank A/S €100,000 0.79% 3/12/2024 119,988 0.01%test - - - 119,988 0.01%Finland 0.49% (2020: 0.52%)Nordea Bank Abp CHF1,000,000 0.55% 23/6/2025 1,118,731 0.07%OP Corporate Bank plc^ €850,000 1.63% 9/6/2030 1,043,246 0.07%OP Corporate Bank plc €600,000 0.38% 19/6/2024 720,548 0.04%Nordea Bank Abp $700,000 0.75% 28/8/2025 692,073 0.04%OP Corporate Bank plc €500,000 0.50% 12/8/2025 607,214 0.04%Nordea Bank Abp €500,000 1.00% 22/2/2023 606,329 0.04%Nordea Bank Abp €500,000 0.88% 26/6/2023 605,892 0.04%OP Corporate Bank plc €500,000 0.38% 29/8/2023 601,802 0.04%Nordea Bank Abp €400,000 3.25% 5/7/2022 492,317 0.03%Nordea Bank Abp $475,000 0.63% 24/5/2024 474,949 0.03%OP Corporate Bank plc €330,000 0.25% 24/3/2026 392,395 0.02%Nordea Bank Abp $200,000 4.25% 21/9/2022 208,902 0.01%Citycon Treasury BV €100,000 2.50% 1/10/2024 125,269 0.01%Nordea Bank Abp $100,000 3.75% 30/8/2023 106,708 0.01%test - - - 7,796,375 0.49%France 8.07% (2020: 8.11%)Societe Generale SA ¥300,000,000 0.80% 12/10/2023 2,728,597 0.17%Engie SA €1,500,000 2.38% 19/5/2026 1,985,901 0.12%Banque Federative du Credit Mutuel SA €1,500,000 0.75% 15/6/2023 1,816,828 0.11%BPCE SA ¥200,000,000 0.22% 25/1/2023 1,802,973 0.11%BNP Paribas SA ¥200,000,000 0.37% 28/2/2023 1,801,225 0.11%Capgemini SE €1,200,000 1.00% 18/10/2024 1,471,458 0.09%BNP Paribas SA^ $1,350,000 2.82% 19/11/2025 1,420,040 0.09%Sanofi €1,000,000 1.00% 1/4/2025 1,238,200 0.08%BNP Paribas SA €1,000,000 1.13% 22/11/2023 1,223,193 0.08%Danone SA^ €1,000,000 1.75% Perpetual 1,215,442 0.08%BPCE SA €1,000,000 0.63% 26/9/2023 1,210,719 0.08%TotalEnergies Capital International SA €1,000,000 0.25% 12/7/2023 1,199,830 0.07%BNP Paribas SA1 $1,050,000 3.50% 1/3/2023 1,101,476 0.07%Credit Agricole SA^ €900,000 1.00% 22/4/2026 1,101,279 0.07%Credit Agricole SA €900,000 0.75% 5/12/2023 1,094,877 0.07%TotalEnergies SE^ €900,000 1.75% Perpetual 1,093,548 0.07%BPCE SA1 $1,100,000 1.00% 20/1/2026 1,085,125 0.07%Credit Agricole SA^ $1,000,000 1.91% 16/6/2026 1,019,189 0.06%Societe Generale SA €800,000 1.13% 23/1/2025 981,314 0.06%BPCE SA €800,000 0.63% 28/4/2025 972,367 0.06%

809
Vanguard Global Short-Term Corporate Bond Index Fund
Principal CouponMaturity
DateFair Value
US Dollars ($)% of Total
Net AssetsEngie SA^ €800,000 1.38% Perpetual 965,536 0.06%Schneider Electric SE €800,000 0.25% 9/9/2024 962,426 0.06%EssilorLuxottica SA €800,000 0.00% 27/5/2023 954,441 0.06%BNP Paribas SA^ €800,000 0.25% 13/4/2027 942,533 0.06%AXA SA^ €700,000 3.94% Perpetual 919,781 0.06%BNP Paribas SA €750,000 0.75% 11/11/2022 903,845 0.06%BPCE SA ¥100,000,000 0.50% 12/12/2024 903,108 0.06%Unibail-Rodamco-Westfield SE €700,000 2.13% 9/4/2025 893,539 0.06%TotalEnergies Capital International SA €700,000 1.38% 19/3/2025 877,737 0.05%Societe Generale SA^ €700,000 1.13% 21/4/2026 856,163 0.05%BPCE SA €700,000 0.63% 26/9/2024 846,360 0.05%Societe Generale SA $750,000 4.25% 14/4/2025 814,819 0.05%Sodexo SA €600,000 2.50% 24/6/2026 799,417 0.05%BPCE SA $750,000 2.38% 14/1/2025 780,845 0.05%Banque Federative du Credit Mutuel SA €600,000 3.00% 21/5/2024 772,539 0.05%BNP Paribas SA €600,000 2.38% 17/2/2025 766,173 0.05%BNP Paribas SA £500,000 3.38% 23/1/2026 754,219 0.05%Arkema SA €600,000 1.50% 20/1/2025 751,426 0.05%Societe Generale SA €600,000 4.25% 13/7/2022 746,375 0.05%Orange SA €600,000 1.00% 12/9/2025 743,099 0.05%Air Liquide Finance SA €600,000 1.00% 2/4/2025 742,128 0.05%Unibail-Rodamco-Westfield SE €600,000 1.13% 15/9/2025 740,415 0.05%BNP Paribas SA €600,000 1.13% 10/10/2023 733,038 0.05%BNP Paribas SA^ $735,000 1.32% 13/1/2027 725,889 0.05%BNP Paribas SA^ €600,000 0.50% 15/7/2025 720,895 0.04%Societe Generale SA €600,000 0.50% 13/1/2023 719,455 0.04%TotalEnergies Capital International SA £500,000 1.75% 7/7/2025 716,262 0.04%Danone SA €600,000 0.00% 1/12/2025 714,679 0.04%Banque Federative du Credit Mutuel SA £500,000 1.75% 19/12/2024 712,425 0.04%La Mondiale SAM^ €500,000 5.05% Perpetual 689,823 0.04%TotalEnergies Capital International SA €500,000 2.50% 25/3/2026 665,195 0.04%BPCE SA €500,000 2.88% 22/4/2026 662,559 0.04%BPCE SA $600,000 4.50% 15/3/2025 661,950 0.04%ELO SACA €500,000 2.88% 29/1/2026 660,231 0.04%Banque Federative du Credit Mutuel SA €500,000 3.00% 11/9/2025 659,296 0.04%TotalEnergies Capital International SA $625,000 2.43% 10/1/2025 657,287 0.04%Banque Federative du Credit Mutuel SA €500,000 2.38% 24/3/2026 645,886 0.04%Covivio €500,000 1.88% 20/5/2026 645,021 0.04%Klepierre SA €500,000 1.88% 19/2/2026 641,065 0.04%BNP Paribas SA^ €500,000 2.13% 23/1/2027 639,992 0.04%BNP Paribas SA €500,000 1.63% 23/2/2026 638,865 0.04%Banque Federative du Credit Mutuel SA €500,000 2.63% 18/3/2024 638,514 0.04%Autoroutes du Sud de la France SA €500,000 2.95% 17/1/2024 636,041 0.04%ELO SACA €500,000 2.63% 30/1/2024 630,643 0.04%AltaREIT SCA €500,000 2.88% 2/7/2025 629,173 0.04%Airbus SE €500,000 1.63% 7/4/2025 628,329 0.04%BNP Paribas SA €500,000 1.50% 17/11/2025 627,944 0.04%RCI Banque SA €500,000 1.63% 26/5/2026 627,025 0.04%Cie de Saint-Gobain €500,000 1.13% 23/3/2026 624,665 0.04%Credit Mutuel Arkea SA^ €500,000 1.88% 25/10/2029 619,161 0.04%Suez SA €500,000 1.00% 3/4/2025 615,861 0.04%BPCE SA €500,000 1.00% 15/7/2024 614,286 0.04%Societe Generale SA €500,000 1.25% 15/2/2024 613,323 0.04%LVMH Moet Hennessy Louis Vuitton SE €500,000 0.75% 7/4/2025 613,322 0.04%Cie de Saint-Gobain €500,000 0.63% 15/3/2024 605,944 0.04%Orange SA €500,000 0.75% 11/9/2023 605,372 0.04%Societe Generale SA €500,000 0.75% 26/5/2023 605,014 0.04%Klepierre SA €500,000 1.00% 17/4/2023 604,234 0.04%Carrefour SA €500,000 0.88% 12/6/2023 603,921 0.04%HSBC Continental Europe SA €500,000 0.60% 20/3/2023 602,844 0.04%Banque Federative du Credit Mutuel SA €500,000 0.50% 16/11/2022 600,659 0.04%La Mondiale SAM €500,000 0.75% 20/4/2026 600,318 0.04%ALD SA €500,000 0.38% 19/10/2023 598,587 0.04%BPCE SA €500,000 0.25% 15/1/2026 598,471 0.04%Danone SA €500,000 0.42% 3/11/2022 598,292 0.04%Banque Federative du Credit Mutuel SA €500,000 0.13% 5/2/2024 598,005 0.04%LVMH Moet Hennessy Louis Vuitton SE €500,000 0.00% 11/2/2026 597,322 0.04%Sanofi €500,000 0.00% 13/9/2022 595,470 0.04%BPCE SA^ €500,000 0.50% 15/9/2027 595,298 0.04%Societe Generale SA €500,000 0.13% 24/2/2026 595,248 0.04%Orange SA €500,000 0.00% 29/6/2026 593,490 0.04%

810
Vanguard Global Short-Term Corporate Bond Index Fund
Principal CouponMaturity
DateFair Value
US Dollars ($)% of Total
Net AssetsBNP Paribas SA^ $575,000 2.22% 9/6/2026 592,855 0.04%Credit Mutuel Arkea SA €500,000 0.01% 28/1/2026 591,923 0.04%PSA Banque France SA €500,000 0.00% 22/1/2025 591,701 0.04%Banque Federative du Credit Mutuel SA €500,000 0.01% 11/5/2026 590,919 0.04%BNP Paribas SA1 $550,000 3.38% 9/1/2025 590,823 0.04%Societe Generale SA $550,000 2.63% 22/1/2025 574,778 0.04%Pernod Ricard SA $550,000 4.25% 15/7/2022 570,878 0.04%Westfield America Management Ltd. £400,000 2.13% 30/3/2025 565,818 0.04%Credit Agricole SA^ $550,000 1.25% 26/1/2027 541,248 0.03%Credit Agricole Assurances SA^ €400,000 4.50% Perpetual 540,832 0.03%CNP Assurances^ €400,000 4.25% 5/6/2045 540,398 0.03%Orange SA^ €400,000 5.25% Perpetual 532,498 0.03%Societe Generale SA $475,000 5.00% 17/1/2024 517,028 0.03%Airbus SE €400,000 1.38% 9/6/2026 503,991 0.03%TotalEnergies SE^ €400,000 2.63% Perpetual 501,431 0.03%Societe Generale SA^ $500,000 1.49% 14/12/2026 495,733 0.03%Credit Agricole SA $450,000 4.38% 17/3/2025 495,641 0.03%BNP Paribas SA €400,000 2.88% 24/10/2022 495,126 0.03%APRR SA €400,000 1.50% 15/1/2024 493,163 0.03%RCI Banque SA €400,000 1.38% 8/3/2024 489,914 0.03%BPCE SA €400,000 1.13% 18/1/2023 484,276 0.03%MMS USA Holdings, Inc. €400,000 0.63% 13/6/2025 483,251 0.03%LVMH Moet Hennessy Louis Vuitton SE €400,000 0.00% 11/2/2024 477,899 0.03%Societe Generale SA^ €400,000 1.13% 30/6/2031 474,238 0.03%BPCE SA^ $450,000 1.65% 6/10/2026 451,843 0.03%Orange SA^ £300,000 5.75% Perpetual 446,602 0.03%BPCE SA $400,000 4.63% 11/7/2024 439,473 0.03%Societe Generale SA $400,000 3.88% 28/3/2024 430,342 0.03%WEA Finance LLC/Westfield UK & Europe Finance plc $400,000 3.75% 17/9/2024 428,071 0.03%Banque Federative du Credit Mutuel SA $400,000 3.75% 20/7/2023 426,276 0.03%Societe Generale SA £300,000 1.88% 3/10/2024 424,537 0.03%BPCE SA £300,000 2.13% 16/12/2022 424,402 0.03%LVMH Moet Hennessy Louis Vuitton SE £300,000 1.00% 11/2/2023 418,012 0.03%Caisse Nationale de Reassurance Mutuelle Agricole Groupama^ €300,000 6.38% Perpetual 410,381 0.03%Banque Federative du Credit Mutuel SA $400,000 0.65% 27/2/2024 399,125 0.02%AXA SA^ €300,000 5.13% 4/7/2043 391,331 0.02%Engie SA^ €300,000 3.88% Perpetual 391,270 0.02%BPCE SA €300,000 4.63% 18/7/2023 389,885 0.02%Orange SA €300,000 3.13% 9/1/2024 386,214 0.02%Engie SA^ €300,000 3.25% Perpetual 385,463 0.02%Banque Federative du Credit Mutuel SA €300,000 1.63% 19/1/2026 381,869 0.02%Carmila SA €300,000 2.38% 16/9/2024 381,628 0.02%Pernod Ricard SA €300,000 1.50% 18/5/2026 381,564 0.02%Airbus Finance BV €300,000 2.38% 2/4/2024 378,126 0.02%Imerys SA €300,000 2.00% 10/12/2024 378,010 0.02%TotalEnergies Capital International SA $350,000 3.70% 15/1/2024 377,313 0.02%Engie SA €300,000 3.00% 1/2/2023 374,724 0.02%Edenred €300,000 1.38% 10/3/2025 373,039 0.02%Capgemini SE €300,000 2.50% 1/7/2023 372,761 0.02%Banque Federative du Credit Mutuel SA €300,000 1.25% 14/1/2025 372,708 0.02%Credit Agricole SA €300,000 1.38% 13/3/2025 372,563 0.02%Pernod Ricard SA €300,000 1.13% 7/4/2025 371,385 0.02%Cie de Saint-Gobain €300,000 1.00% 17/3/2025 370,601 0.02%TotalEnergies SE^ €300,000 2.71% Perpetual 370,198 0.02%Credit Mutuel Arkea SA €300,000 1.25% 31/5/2024 368,289 0.02%BPCE SA €300,000 1.00% 1/4/2025 367,834 0.02%BNP Paribas SA €300,000 1.00% 27/6/2024 366,762 0.02%Thales SA €300,000 0.88% 19/4/2024 365,037 0.02%Credit Mutuel Arkea SA €300,000 0.88% 5/10/2023 364,876 0.02%BNP Paribas Cardif SA €300,000 1.00% 29/11/2024 364,649 0.02%BPCE SA €300,000 0.88% 31/1/2024 364,622 0.02%Capgemini SE €300,000 0.63% 23/6/2025 364,562 0.02%Carrefour SA €300,000 0.75% 26/4/2024 364,021 0.02%BNP Paribas SA €300,000 1.13% 15/1/2023 363,927 0.02%EssilorLuxottica SA €300,000 0.38% 5/1/2026 363,757 0.02%Legrand SA €300,000 0.50% 9/10/2023 361,284 0.02%Sanofi €300,000 0.50% 21/3/2023 360,507 0.02%Credit Agricole SA €300,000 0.38% 21/10/2025 360,001 0.02%EssilorLuxottica SA €300,000 0.13% 27/5/2025 359,766 0.02%Holding d'Infrastructures de Transport SASU €300,000 0.63% 27/3/2023 359,575 0.02%RCI Banque SA €300,000 0.75% 26/9/2022 359,247 0.02%

811
Vanguard Global Short-Term Corporate Bond Index Fund
Principal CouponMaturity
DateFair Value
US Dollars ($)% of Total
Net AssetsLVMH Moet Hennessy Louis Vuitton SE €300,000 0.13% 28/2/2023 358,185 0.02%Safran SA €300,000 0.13% 16/3/2026 356,398 0.02%Societe Generale SA^ €300,000 1.00% 24/11/2030 355,509 0.02%AXA SA^ £200,000 6.69% Perpetual 337,553 0.02%Societe Generale SA $300,000 4.25% 14/9/2023 322,748 0.02%RCI Banque SA €267,000 0.75% 10/4/2023 320,691 0.02%TotalEnergies Capital Canada Ltd. $300,000 2.75% 15/7/2023 314,221 0.02%Societe Generale SA $300,000 2.63% 16/10/2024 313,440 0.02%Engie SA $295,000 2.88% 10/10/2022 303,726 0.02%Banque Federative du Credit Mutuel SA £200,000 1.88% 13/12/2022 282,004 0.02%Banque Federative du Credit Mutuel SA $275,000 2.13% 21/11/2022 281,668 0.02%BNP Paribas SA^ £200,000 2.00% 24/5/2031 278,569 0.02%Credit Agricole SA $250,000 3.88% 15/4/2024 271,557 0.02%Credit Agricole SA $250,000 3.25% 4/10/2024 267,934 0.02%Credit Agricole SA $250,000 3.75% 24/4/2023 264,666 0.02%Credit Agricole Assurances SA^ €200,000 4.25% Perpetual 263,541 0.02%CNP Assurances^ €200,000 4.00% Perpetual 263,079 0.02%BPCE SA $250,000 2.75% 11/1/2023 259,063 0.02%Societe Generale SA €200,000 2.63% 27/2/2025 257,092 0.02%Kering SA €200,000 2.75% 8/4/2024 256,807 0.02%BPCE SA €200,000 2.88% 16/1/2024 256,315 0.02%ELO SACA €200,000 2.38% 25/4/2025 256,024 0.02%Unibail-Rodamco-Westfield SE €200,000 2.50% 26/2/2024 254,277 0.02%BNP Paribas SA €200,000 2.88% 26/9/2023 254,123 0.02%APRR SA €200,000 1.88% 15/1/2025 253,576 0.02%Credit Mutuel Arkea SA €200,000 1.38% 17/1/2025 249,473 0.02%Orange SA^ €200,000 2.38% Perpetual 249,150 0.02%RCI Banque SA €200,000 1.63% 11/4/2025 248,017 0.02%Danone SA €200,000 1.00% 26/3/2025 246,469 0.01%BPCE SA^ €200,000 2.75% 30/11/2027 246,226 0.01%Banque Federative du Credit Mutuel SA $235,000 2.38% 21/11/2024 245,925 0.01%BNP Paribas SA^ €200,000 2.63% 14/10/2027 244,968 0.01%Danone SA €200,000 0.71% 3/11/2024 244,207 0.01%TotalEnergies Capital International SA €200,000 0.63% 4/10/2024 243,696 0.01%Veolia Environnement SA €200,000 0.89% 14/1/2024 242,799 0.01%Vivendi SE €200,000 0.63% 11/6/2025 241,879 0.01%Cie Financiere et Industrielle des Autoroutes SA €200,000 0.38% 7/2/2025 241,739 0.01%JCDecaux SA €200,000 1.00% 1/6/2023 241,687 0.01%Worldline SA €200,000 0.50% 30/6/2023 240,229 0.01%PSA Banque France SA €200,000 0.63% 10/10/2022 239,880 0.01%Legrand France SA $189,000 8.50% 15/2/2025 238,865 0.01%Air Liquide Finance SA €200,000 0.50% 13/6/2022 238,720 0.01%Thales SA €200,000 0.00% 31/5/2022 238,025 0.01%BPCE SA $200,000 5.15% 21/7/2024 223,030 0.01%Societe Generale SA $200,000 4.75% 24/11/2025 222,982 0.01%BNP Paribas SA $200,000 4.38% 28/9/2025 221,529 0.01%BNP Paribas SA^ $200,000 4.71% 10/1/2025 218,227 0.01%BNP Paribas SA $200,000 3.80% 10/1/2024 214,608 0.01%Danone SA $200,000 2.59% 2/11/2023 208,472 0.01%LVMH Moet Hennessy Louis Vuitton SE £150,000 1.00% 14/6/2022 208,220 0.01%Air Liquide Finance SA $200,000 2.25% 27/9/2023 207,424 0.01%Banque Federative du Credit Mutuel SA $200,000 2.70% 20/7/2022 204,928 0.01%Sodexo, Inc. $200,000 1.63% 16/4/2026 201,415 0.01%BPCE SA $150,000 5.70% 22/10/2023 166,235 0.01%BPCE SA $150,000 4.00% 15/4/2024 163,577 0.01%Sanofi $150,000 3.38% 19/6/2023 158,476 0.01%TotalEnergies Capital International SA $150,000 2.70% 25/1/2023 155,486 0.01%Banque Federative du Credit Mutuel SA £100,000 1.50% 7/10/2026 140,812 0.01%RCI Banque SA £100,000 1.88% 8/11/2022 139,938 0.01%Banque Federative du Credit Mutuel SA £100,000 1.25% 5/12/2025 139,552 0.01%BNP Paribas SA £100,000 1.13% 16/8/2022 139,394 0.01%Engie Alliance GIE €100,000 5.75% 24/6/2023 132,075 0.01%TDF Infrastructure SASU €100,000 2.50% 7/4/2026 128,719 0.01%Wendel SE €100,000 2.75% 2/10/2024 128,302 0.01%Holding d'Infrastructures de Transport SASU €100,000 2.25% 24/3/2025 127,739 0.01%BNP Paribas SA €100,000 2.38% 20/5/2024 127,454 0.01%Eutelsat SA €100,000 2.00% 2/10/2025 126,942 0.01%Suez SA €100,000 2.75% 9/10/2023 126,507 0.01%Gecina SA €100,000 2.00% 17/6/2024 126,356 0.01%Bouygues SA €100,000 3.63% 16/1/2023 126,030 0.01%Autoroutes du Sud de la France SA €100,000 5.63% 4/7/2022 125,729 0.01%

812
Vanguard Global Short-Term Corporate Bond Index Fund
Principal CouponMaturity
DateFair Value
US Dollars ($)% of Total
Net AssetsJCDecaux SA €100,000 2.00% 24/10/2024 125,560 0.01%Gecina SA €100,000 1.50% 20/1/2025 125,443 0.01%Arkema SA^ €100,000 2.75% Perpetual 125,296 0.01%Suez SA^ €100,000 2.88% Perpetual 124,895 0.01%RCI Banque SA €100,000 2.00% 11/7/2024 124,848 0.01%Engie SA €100,000 3.50% 18/10/2022 124,551 0.01%Autoroutes du Sud de la France SA €100,000 2.88% 18/1/2023 124,474 0.01%Orange SA €100,000 2.50% 1/3/2023 124,272 0.01%Suez SA €100,000 4.13% 24/6/2022 123,940 0.01%Danone SA €100,000 1.25% 30/5/2024 123,597 0.01%Eutelsat SA €100,000 3.13% 10/10/2022 123,360 0.01%Credit Agricole SA^ €100,000 1.63% 5/6/2030 123,210 0.01%Teleperformance €100,000 1.50% 3/4/2024 122,953 0.01%Engie SA €100,000 2.63% 20/7/2022 122,289 0.01%Sodexo SA €100,000 0.75% 27/4/2025 122,052 0.01%Vivendi SE €100,000 1.13% 24/11/2023 121,945 0.01%Engie SA €100,000 0.88% 27/3/2024 121,870 0.01%Vivendi SE €100,000 0.88% 18/9/2024 121,721 0.01%CNP Assurances €100,000 1.88% 20/10/2022 121,549 0.01%Sanofi €100,000 0.63% 5/4/2024 121,450 0.01%Wendel SE €100,000 1.00% 20/4/2023 121,115 0.01%Sodexo SA €100,000 0.50% 17/1/2024 120,537 0.01%Societe Generale SA^ €100,000 1.38% 23/2/2028 120,460 0.01%BPCE SA €100,000 0.38% 5/10/2023 120,404 0.01%EssilorLuxottica SA €100,000 0.25% 5/1/2024 120,188 0.01%HSBC Continental Europe SA €100,000 0.25% 17/5/2024 120,164 0.01%ALD SA €100,000 0.88% 18/7/2022 120,004 0.01%Veolia Environnement SA €100,000 0.31% 4/10/2023 119,840 0.01%ALD SA €100,000 0.38% 18/7/2023 119,786 0.01%Worldline SA €100,000 0.25% 18/9/2024 119,537 0.01%Arkema SA^ €100,000 1.50% Perpetual 119,485 0.01%Dassault Systemes SE €100,000 0.00% 16/9/2024 119,251 0.01%Pernod Ricard SA €100,000 0.00% 24/10/2023 119,206 0.01%Dassault Systemes SE €100,000 0.00% 16/9/2022 119,074 0.01%Carrefour Banque SA €100,000 0.11% 14/6/2025 118,807 0.01%BPCE SA $100,000 4.88% 1/4/2026 112,860 0.01%Schneider Electric SE $75,000 2.95% 27/9/2022 77,295 0.00%test - - - 128,694,054 8.07%Germany 6.15% (2020: 6.30%)Eurogrid GmbH €1,400,000 1.63% 3/11/2023 1,724,875 0.11%Daimler AG €1,300,000 2.63% 7/4/2025 1,697,617 0.11%Volkswagen International Finance NV^ €1,200,000 3.50% Perpetual 1,537,568 0.10%Volkswagen Financial Services AG €1,000,000 2.50% 6/4/2023 1,240,259 0.08%Siemens Financieringsmaatschappij NV €1,000,000 0.00% 20/2/2023 1,192,891 0.07%Deutsche Bank AG €900,000 1.13% 30/8/2023 1,096,316 0.07%BMW Finance NV €900,000 0.63% 6/10/2023 1,088,695 0.07%BMW Finance NV €900,000 0.00% 14/4/2023 1,073,716 0.07%BMW Finance NV €900,000 0.00% 24/3/2023 1,073,215 0.07%Volkswagen International Finance NV^ €800,000 3.38% Perpetual 1,013,257 0.06%Bayer US Finance II LLC $900,000 4.25% 15/12/2025 1,003,399 0.06%Siemens Financieringsmaatschappij NV €825,000 0.30% 28/2/2024 993,311 0.06%Deutsche Bank AG^ €800,000 1.38% 3/9/2026 983,002 0.06%Daimler Finance North America LLC $950,000 1.75% 10/3/2023 969,027 0.06%Mercedes-Benz Finance Co., Ltd. €800,000 0.00% 21/8/2022 951,935 0.06%Deutsche Bank AG^ $850,000 3.96% 26/11/2025 919,810 0.06%HeidelbergCement Finance Luxembourg SA €700,000 1.63% 7/4/2026 885,708 0.06%Deutsche Bank AG^ $850,000 2.22% 18/9/2024 872,813 0.05%Conti-Gummi Finance BV €700,000 2.13% 27/11/2023 872,058 0.05%BASF SE €700,000 0.88% 22/5/2025 865,858 0.05%Siemens Financieringsmaatschappij NV $850,000 0.65% 11/3/2024 850,810 0.05%Volkswagen Bank GmbH €700,000 1.25% 1/8/2022 843,548 0.05%Aroundtown SA €700,000 0.63% 9/7/2025 842,986 0.05%Santander Consumer Bank AG €700,000 0.75% 17/10/2022 840,949 0.05%BMW Finance NV €700,000 0.50% 22/11/2022 840,614 0.05%Santander Consumer Bank AG €700,000 0.25% 15/10/2024 836,541 0.05%BASF SE €700,000 0.10% 5/6/2023 835,913 0.05%SAP SE €700,000 0.00% 17/5/2023 834,866 0.05%Daimler AG €700,000 0.00% 8/2/2024 833,752 0.05%Bayer AG €700,000 0.05% 12/1/2025 828,454 0.05%E.ON International Finance BV £500,000 5.63% 6/12/2023 772,977 0.05%E.ON International Finance BV €600,000 3.00% 17/1/2024 768,859 0.05%

813
Vanguard Global Short-Term Corporate Bond Index Fund
Principal CouponMaturity
DateFair Value
US Dollars ($)% of Total
Net AssetsVolkswagen Group of America Finance LLC $700,000 3.35% 13/5/2025 754,914 0.05%Bayer Capital Corp. BV €600,000 1.50% 26/6/2026 752,114 0.05%Siemens Financieringsmaatschappij NV $750,000 0.40% 11/3/2023 750,589 0.05%Deutsche Bank AG^ €600,000 1.38% 10/6/2026 747,269 0.05%Volkswagen Bank GmbH €600,000 1.88% 31/1/2024 746,160 0.05%BMW US Capital LLC $700,000 3.80% 6/4/2023 739,864 0.05%Wintershall Dea Finance BV €600,000 0.84% 25/9/2025 725,189 0.05%E.ON SE €600,000 0.38% 20/4/2023 719,228 0.04%SAP SE €600,000 0.13% 18/5/2026 718,842 0.04%Volkswagen Leasing GmbH €600,000 0.25% 12/1/2026 713,758 0.04%Volkswagen Financial Services NV £500,000 1.13% 18/9/2023 696,217 0.04%Volkswagen Group of America Finance LLC $650,000 3.13% 12/5/2023 679,019 0.04%Deutsche Post AG €500,000 2.88% 11/12/2024 655,724 0.04%Allianz SE^ €500,000 3.38% Perpetual 646,483 0.04%Aroundtown SA €500,000 1.88% 19/1/2026 635,682 0.04%Allianz SE^ €500,000 2.24% 7/7/2045 634,365 0.04%BMW US Capital LLC $575,000 3.90% 9/4/2025 634,240 0.04%Vonovia Finance BV €500,000 1.80% 29/6/2025 632,645 0.04%Fresenius SE & Co. KGaA €500,000 1.88% 15/2/2025 632,230 0.04%Deutsche Bank AG $625,000 1.69% 19/3/2026 630,523 0.04%Deutsche Telekom International Finance BV €500,000 1.38% 1/12/2025 630,167 0.04%Volkswagen Leasing GmbH €500,000 1.50% 19/6/2026 629,091 0.04%HOCHTIEF AG €500,000 1.75% 3/7/2025 627,313 0.04%Deutsche Telekom International Finance BV €500,000 1.13% 22/5/2026 624,821 0.04%Volkswagen Financial Services AG €500,000 1.50% 1/10/2024 621,066 0.04%BMW Finance NV €500,000 1.00% 29/8/2025 620,511 0.04%Daimler International Finance BV €500,000 1.00% 11/11/2025 619,364 0.04%Wurth Finance International BV €500,000 1.00% 26/5/2025 618,882 0.04%Commerzbank AG €500,000 1.00% 4/3/2026 616,565 0.04%BMW Finance NV €500,000 1.00% 14/11/2024 616,248 0.04%Deutsche Bank AG €500,000 1.13% 17/3/2025 612,321 0.04%Bundesobligation €500,000 0.00% 10/4/2026 609,893 0.04%Deutsche Telekom International Finance BV €500,000 0.88% 30/1/2024 609,395 0.04%Commerzbank AG €500,000 0.63% 28/8/2024 605,667 0.04%Deutsche Bank AG^ €500,000 1.00% 19/11/2025 605,284 0.04%Deutsche Telekom International Finance BV €500,000 0.63% 3/4/2023 602,312 0.04%Commerzbank AG €500,000 0.50% 28/8/2023 601,408 0.04%Deutsche Telekom International Finance BV €500,000 0.63% 1/12/2022 601,179 0.04%Bayer Capital Corp. BV €500,000 0.63% 15/12/2022 599,639 0.04%Merck Financial Services GmbH €500,000 0.13% 16/7/2025 598,566 0.04%HeidelbergCement Finance Luxembourg SA €500,000 0.50% 9/8/2022 596,956 0.04%Merck Financial Services GmbH €500,000 0.01% 15/12/2023 596,174 0.04%Traton Finance Luxembourg SA €500,000 0.13% 24/3/2025 594,311 0.04%Fresenius Finance Ireland plc €500,000 0.00% 1/10/2025 591,572 0.04%Grand City Properties SA^ €500,000 1.50% Perpetual 579,712 0.04%Siemens Financieringsmaatschappij NV £400,000 1.00% 20/2/2025 557,594 0.03%Siemens Financieringsmaatschappij NV $550,000 1.20% 11/3/2026 550,135 0.03%Deutsche Bank AG $500,000 3.30% 16/11/2022 517,407 0.03%Daimler Finance North America LLC $500,000 1.45% 2/3/2026 502,405 0.03%Vonovia Finance BV €400,000 1.50% 31/3/2025 501,043 0.03%HeidelbergCement AG €400,000 1.50% 7/2/2025 498,391 0.03%Volkswagen Group of America Finance LLC $500,000 1.25% 24/11/2025 497,268 0.03%Vonovia Finance BV €400,000 1.63% 7/4/2024 494,702 0.03%Deutsche Wohnen SE €400,000 1.00% 30/4/2025 491,656 0.03%Deutsche Boerse AG €400,000 2.38% 5/10/2022 491,066 0.03%Volkswagen International Finance NV^ €400,000 2.70% Perpetual 488,435 0.03%Deutsche Bank AG^ $475,000 2.13% 24/11/2026 482,325 0.03%Allianz Finance II BV €400,000 0.25% 6/6/2023 479,167 0.03%Volkswagen Leasing GmbH €400,000 0.38% 20/7/2026 475,904 0.03%BMW Finance NV €400,000 0.00% 11/1/2026 474,908 0.03%Daimler Finance North America LLC $450,000 3.35% 22/2/2023 470,459 0.03%Volkswagen Financial Services NV £300,000 4.25% 9/10/2025 468,728 0.03%Daimler Finance North America LLC $450,000 0.75% 1/3/2024 449,831 0.03%Aroundtown SA^ £300,000 4.75% Perpetual 437,549 0.03%Deutsche Bank AG £300,000 2.63% 16/12/2024 432,673 0.03%Volkswagen Financial Services NV £300,000 2.13% 27/6/2024 428,741 0.03%Volkswagen Financial Services NV £300,000 1.63% 30/11/2022 419,951 0.03%BMW International Investment BV £300,000 1.25% 11/7/2022 418,137 0.03%BMW Finance NV €350,000 0.13% 13/7/2022 417,372 0.03%Deutsche Telekom International Finance BV $400,000 2.49% 19/9/2023 415,890 0.03%Volkswagen Group of America Finance LLC $400,000 0.88% 22/11/2023 401,269 0.02%

814
Vanguard Global Short-Term Corporate Bond Index Fund
Principal CouponMaturity
DateFair Value
US Dollars ($)% of Total
Net AssetsHannover Rueck SE^ €300,000 3.38% Perpetual 396,647 0.02%Volkswagen Financial Services AG €300,000 3.00% 6/4/2025 394,314 0.02%Vier Gas Transport GmbH €300,000 3.13% 10/7/2023 380,141 0.02%Volkswagen Leasing GmbH €300,000 2.63% 15/1/2024 380,005 0.02%Daimler Finance North America LLC $350,000 3.30% 19/5/2025 377,830 0.02%Bertelsmann SE & Co. KGaA €300,000 1.75% 14/10/2024 377,438 0.02%EMD Finance LLC $350,000 3.25% 19/3/2025 375,907 0.02%Infineon Technologies AG €300,000 1.13% 24/6/2026 371,852 0.02%Daimler International Finance BV €300,000 0.85% 28/2/2025 367,923 0.02%Volkswagen Leasing GmbH €300,000 1.13% 4/4/2024 366,850 0.02%Evonik Industries AG €300,000 0.63% 18/9/2025 364,413 0.02%Daimler International Finance BV €300,000 0.63% 27/2/2023 361,248 0.02%Bayer AG €300,000 0.38% 6/7/2024 359,728 0.02%Daimler International Finance BV €300,000 0.25% 6/11/2023 358,890 0.02%Fresenius Medical Care AG & Co. KGaA €300,000 0.25% 29/11/2023 358,651 0.02%Vonovia Finance BV €300,000 0.13% 6/4/2023 357,543 0.02%E.ON SE €300,000 0.00% 29/9/2022 357,206 0.02%Aroundtown SA^ €300,000 2.13% Perpetual 356,286 0.02%Volkswagen Leasing GmbH €300,000 0.00% 12/7/2023 356,221 0.02%Vantage Towers AG €300,000 0.00% 31/3/2025 354,563 0.02%BMW US Capital LLC $300,000 2.80% 11/4/2026 320,207 0.02%BMW US Capital LLC $300,000 0.80% 1/4/2024 301,585 0.02%Daimler International Finance BV £200,000 1.63% 11/11/2024 283,213 0.02%Deutsche Telekom International Finance BV £200,000 1.25% 6/10/2023 280,765 0.02%Daimler International Finance BV £200,000 1.25% 5/9/2022 278,480 0.02%Siemens Financieringsmaatschappij NV £200,000 0.88% 5/6/2023 278,394 0.02%Volkswagen Financial Services NV £200,000 0.88% 20/2/2025 275,595 0.02%Allianz SE^ €200,000 4.75% Perpetual 261,248 0.02%AT Securities BV^ $250,000 5.25% Perpetual 261,234 0.02%Hannover Finance Luxembourg SA^ €200,000 5.00% 30/6/2043 260,234 0.02%Siemens Financieringsmaatschappij NV $250,000 2.00% 15/9/2023 258,209 0.02%HeidelbergCement AG €200,000 2.25% 3/6/2024 252,072 0.02%Bertelsmann SE & Co. KGaA €200,000 1.25% 29/9/2025 250,710 0.02%Allianz Finance II BV €200,000 0.88% 15/1/2026 247,860 0.02%SAP SE €200,000 1.00% 1/4/2025 247,144 0.02%Daimler AG €200,000 1.63% 22/8/2023 246,368 0.02%HeidelbergCement AG €200,000 2.25% 30/3/2023 245,903 0.02%Volkswagen Bank GmbH €200,000 1.25% 10/6/2024 245,863 0.02%Volkswagen Financial Services AG €200,000 1.38% 16/10/2023 245,274 0.02%BASF SE €200,000 2.00% 5/12/2022 245,159 0.02%Merck KGaA^ €200,000 1.63% 25/6/2079 244,750 0.02%alstria office-AG €200,000 2.13% 12/4/2023 244,704 0.02%SAP SE €200,000 0.75% 10/12/2024 244,550 0.02%Volkswagen Leasing GmbH €200,000 2.38% 6/9/2022 244,474 0.02%Commerzbank AG €200,000 1.25% 23/10/2023 244,245 0.01%Daimler International Finance BV €200,000 0.88% 9/4/2024 243,861 0.01%Aroundtown SA €200,000 1.00% 7/1/2025 243,523 0.01%Deutsche Telekom International Finance BV €200,000 0.63% 13/12/2024 243,302 0.01%Vonovia Finance BV €200,000 0.88% 3/7/2023 241,528 0.01%Vonovia Finance BV^ €200,000 4.00% Perpetual 241,283 0.01%Infineon Technologies AG €200,000 0.75% 24/6/2023 241,230 0.01%Siemens Financieringsmaatschappij NV €200,000 0.38% 6/9/2023 240,906 0.01%Evonik Finance BV €200,000 0.38% 7/9/2024 240,482 0.01%BMW Finance NV €200,000 0.38% 10/7/2023 240,319 0.01%Commerzbank AG €200,000 0.50% 13/9/2023 240,093 0.01%Wintershall Dea Finance BV €200,000 0.45% 25/9/2023 239,415 0.01%Aroundtown SA €200,000 0.38% 23/9/2022 238,556 0.01%Deutsche Pfandbriefbank AG €200,000 0.13% 5/9/2024 238,291 0.01%Vonovia SE €200,000 0.00% 16/9/2024 237,807 0.01%BMW US Capital LLC $225,000 3.45% 12/4/2023 236,354 0.01%Volkswagen Group of America Finance LLC $200,000 4.25% 13/11/2023 216,099 0.01%Bayer US Finance II LLC $200,000 3.88% 15/12/2023 214,221 0.01%BMW US Capital LLC $200,000 3.15% 18/4/2024 213,303 0.01%Bayer US Finance II LLC $200,000 3.38% 15/7/2024 212,960 0.01%Deutsche Bank AG $200,000 3.95% 27/2/2023 209,948 0.01%BMW Finance NV $200,000 2.25% 12/8/2022 204,245 0.01%Daimler Finance North America LLC $150,000 3.25% 1/8/2024 160,337 0.01%Daimler Canada Finance, Inc. CA($)190,000 1.65% 22/9/2025 153,594 0.01%Daimler Finance North America LLC $150,000 2.55% 15/8/2022 153,534 0.01%Deutsche Bank AG^ $150,000 1.45% 1/4/2025 150,802 0.01%Deutsche Bank AG £100,000 3.88% 12/2/2024 147,829 0.01%

815
Vanguard Global Short-Term Corporate Bond Index Fund
Principal CouponMaturity
DateFair Value
US Dollars ($)% of Total
Net AssetsVolkswagen Financial Services NV £100,000 2.75% 10/7/2023 143,665 0.01%Volkswagen Financial Services NV £100,000 1.88% 3/12/2024 142,382 0.01%BMW International Investment BV £100,000 1.88% 11/9/2023 142,175 0.01%VW Credit Canada, Inc. CA($)175,000 1.20% 25/9/2023 141,566 0.01%Deutsche Telekom International Finance BV €100,000 4.88% 22/4/2025 141,153 0.01%Volkswagen Financial Services NV £100,000 1.63% 10/2/2024 140,891 0.01%BASF SE £100,000 1.38% 21/6/2022 139,522 0.01%VW Credit Canada, Inc. CA($)165,000 1.50% 23/9/2025 132,571 0.01%Fresenius SE & Co. KGaA €100,000 4.00% 1/2/2024 130,868 0.01%Deutsche Telekom International Finance BV €100,000 2.75% 24/10/2024 130,312 0.01%VW Credit Canada, Inc. CA($)155,000 3.25% 29/3/2023 130,039 0.01%Allianz SE^ €100,000 5.63% 17/10/2042 127,131 0.01%Eurogrid GmbH €100,000 1.88% 10/6/2025 127,001 0.01%Vonovia Finance BV €100,000 2.25% 15/12/2023 125,542 0.01%Deutsche Telekom International Finance BV €100,000 4.25% 13/7/2022 124,253 0.01%Vonovia Finance BV €100,000 1.25% 6/12/2024 123,897 0.01%ATF Netherlands BV^ €100,000 3.75% Perpetual 123,277 0.01%Covestro AG €100,000 0.88% 3/2/2026 122,458 0.01%Commerzbank AG €100,000 1.13% 24/5/2024 122,449 0.01%Aroundtown SA^ €100,000 2.88% Perpetual 121,539 0.01%Grand City Properties SA^ €100,000 2.50% Perpetual 121,400 0.01%Volkswagen Leasing GmbH €100,000 1.00% 16/2/2023 120,769 0.01%Volkswagen Financial Services AG €100,000 0.88% 12/4/2023 120,634 0.01%Volkswagen Bank GmbH €100,000 0.75% 15/6/2023 120,534 0.01%Deutsche Pfandbriefbank AG €100,000 0.75% 7/2/2023 120,402 0.01%Deutsche Bank AG^ €100,000 0.75% 17/2/2027 119,336 0.01%adidas AG €100,000 0.00% 9/9/2024 119,253 0.01%E.ON SE €100,000 0.00% 18/12/2023 119,233 0.01%Commerzbank AG €100,000 0.25% 16/9/2024 119,104 0.01%Continental AG €100,000 0.00% 12/9/2023 118,783 0.01%Clearstream Banking AG €100,000 0.00% 1/12/2025 118,756 0.01%Traton Finance Luxembourg SA €100,000 0.00% 14/6/2024 118,683 0.01%VW Credit Canada, Inc. CA($)140,000 2.85% 26/9/2024 118,162 0.01%VW Credit Canada, Inc. CA($)140,000 3.70% 14/11/2022 117,440 0.01%BMW Canada, Inc. CA($)145,000 0.99% 14/1/2025 115,562 0.01%BMW International Investment BV CHF100,000 0.30% 5/9/2024 110,207 0.01%Daimler Canada Finance, Inc. CA($)130,000 2.54% 21/8/2023 108,135 0.01%Deutsche Bank AG $100,000 3.70% 30/5/2024 107,357 0.01%Siemens Financieringsmaatschappij NV $75,000 3.13% 16/3/2024 80,031 0.00%Daimler Finance North America LLC $75,000 3.70% 4/5/2023 79,182 0.00%Bayer US Finance II LLC $75,000 2.20% 15/7/2022 75,786 0.00%Daimler Canada Finance, Inc. CA($)90,000 3.30% 16/8/2022 74,744 0.00%Daimler Canada Finance, Inc. CA($)85,000 2.97% 13/3/2024 71,730 0.00%BMW Canada, Inc. CA($)85,000 2.41% 27/11/2023 70,825 0.00%Daimler Canada Finance, Inc. CA($)85,000 2.57% 22/11/2022 70,266 0.00%BMW US Capital LLC $50,000 2.25% 15/9/2023 51,780 0.00%Volkswagen Financial Services Australia Pty Ltd. AU($)50,000 3.10% 17/4/2023 39,018 0.00%test - - - 98,207,598 6.15%Hong Kong 0.30% (2020: 0.37%)Hongkong & Shanghai Banking Corp., Ltd. ¥200,000,000 0.20% 25/6/2024 1,795,207 0.11%Hutchison Whampoa International 14 Ltd. $1,000,000 3.63% 31/10/2024 1,088,274 0.07%Li & Fung Ltd. $400,000 4.50% 18/8/2025 413,857 0.03%AIA Group Ltd.^ $300,000 2.70% Perpetual 304,354 0.02%Swire Pacific MTN Financing Ltd. $200,000 4.50% 9/10/2023 215,986 0.02%CK Hutchison International 19 Ltd. $200,000 3.25% 11/4/2024 213,091 0.01%HPHT Finance 19 Ltd. $200,000 2.88% 5/11/2024 210,154 0.01%AIA Group Ltd. $200,000 3.13% 13/3/2023 207,817 0.01%Hutchison Whampoa International 12 II Ltd. $200,000 3.25% 8/11/2022 207,187 0.01%Cheung Kong Infrastructure Finance BVI Ltd. €100,000 1.00% 12/12/2024 120,642 0.01%test - - - 4,776,569 0.30%India 0.10% (2020: 0.13%)Adani Ports & Special Economic Zone Ltd. $400,000 3.38% 24/7/2024 416,254 0.03%Reliance Industries Ltd. $350,000 4.13% 28/1/2025 381,647 0.02%Bharti Airtel Ltd. $300,000 4.38% 10/6/2025 327,359 0.02%ICICI Bank Ltd. $250,000 4.00% 18/3/2026 270,405 0.02%Bharti Airtel International Netherlands BV $200,000 5.35% 20/5/2024 220,142 0.01%test - - - 1,615,807 0.10%Indonesia 0.01% (2020: 0.00%)Tower Bersama Infrastructure Tbk PT $200,000 2.75% 20/1/2026 203,203 0.01%test - - - 203,203 0.01%
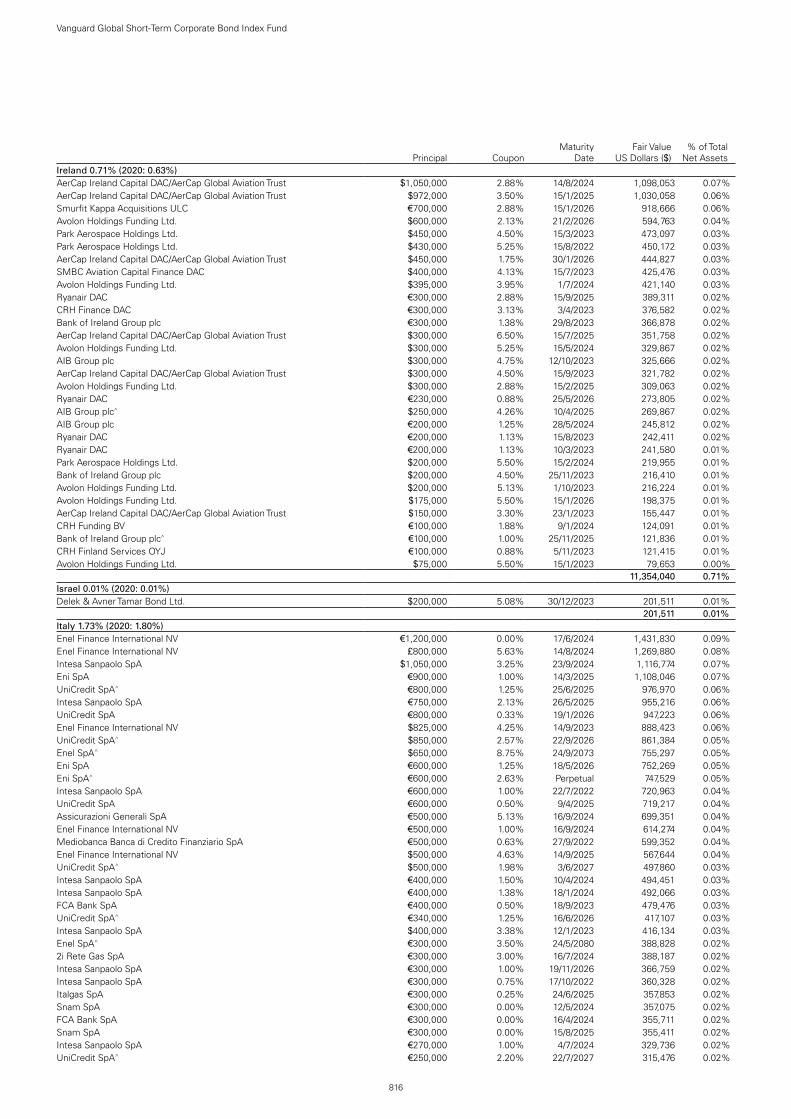
816
Vanguard Global Short-Term Corporate Bond Index Fund
Principal CouponMaturity
DateFair Value
US Dollars ($)% of Total
Net AssetsIreland 0.71% (2020: 0.63%)AerCap Ireland Capital DAC/AerCap Global Aviation Trust $1,050,000 2.88% 14/8/2024 1,098,053 0.07%AerCap Ireland Capital DAC/AerCap Global Aviation Trust $972,000 3.50% 15/1/2025 1,030,058 0.06%Smurfit Kappa Acquisitions ULC €700,000 2.88% 15/1/2026 918,666 0.06%Avolon Holdings Funding Ltd. $600,000 2.13% 21/2/2026 594,763 0.04%Park Aerospace Holdings Ltd. $450,000 4.50% 15/3/2023 473,097 0.03%Park Aerospace Holdings Ltd. $430,000 5.25% 15/8/2022 450,172 0.03%AerCap Ireland Capital DAC/AerCap Global Aviation Trust $450,000 1.75% 30/1/2026 444,827 0.03%SMBC Aviation Capital Finance DAC $400,000 4.13% 15/7/2023 425,476 0.03%Avolon Holdings Funding Ltd. $395,000 3.95% 1/7/2024 421,140 0.03%Ryanair DAC €300,000 2.88% 15/9/2025 389,311 0.02%CRH Finance DAC €300,000 3.13% 3/4/2023 376,582 0.02%Bank of Ireland Group plc €300,000 1.38% 29/8/2023 366,878 0.02%AerCap Ireland Capital DAC/AerCap Global Aviation Trust $300,000 6.50% 15/7/2025 351,758 0.02%Avolon Holdings Funding Ltd. $300,000 5.25% 15/5/2024 329,867 0.02%AIB Group plc $300,000 4.75% 12/10/2023 325,666 0.02%AerCap Ireland Capital DAC/AerCap Global Aviation Trust $300,000 4.50% 15/9/2023 321,782 0.02%Avolon Holdings Funding Ltd. $300,000 2.88% 15/2/2025 309,063 0.02%Ryanair DAC €230,000 0.88% 25/5/2026 273,805 0.02%AIB Group plc^ $250,000 4.26% 10/4/2025 269,867 0.02%AIB Group plc €200,000 1.25% 28/5/2024 245,812 0.02%Ryanair DAC €200,000 1.13% 15/8/2023 242,411 0.02%Ryanair DAC €200,000 1.13% 10/3/2023 241,580 0.01%Park Aerospace Holdings Ltd. $200,000 5.50% 15/2/2024 219,955 0.01%Bank of Ireland Group plc $200,000 4.50% 25/11/2023 216,410 0.01%Avolon Holdings Funding Ltd. $200,000 5.13% 1/10/2023 216,224 0.01%Avolon Holdings Funding Ltd. $175,000 5.50% 15/1/2026 198,375 0.01%AerCap Ireland Capital DAC/AerCap Global Aviation Trust $150,000 3.30% 23/1/2023 155,447 0.01%CRH Funding BV €100,000 1.88% 9/1/2024 124,091 0.01%Bank of Ireland Group plc^ €100,000 1.00% 25/11/2025 121,836 0.01%CRH Finland Services OYJ €100,000 0.88% 5/11/2023 121,415 0.01%Avolon Holdings Funding Ltd. $75,000 5.50% 15/1/2023 79,653 0.00%test - - - 11,354,040 0.71%Israel 0.01% (2020: 0.01%)Delek & Avner Tamar Bond Ltd. $200,000 5.08% 30/12/2023 201,511 0.01%test - - - 201,511 0.01%Italy 1.73% (2020: 1.80%)Enel Finance International NV €1,200,000 0.00% 17/6/2024 1,431,830 0.09%Enel Finance International NV £800,000 5.63% 14/8/2024 1,269,880 0.08%Intesa Sanpaolo SpA $1,050,000 3.25% 23/9/2024 1,116,774 0.07%Eni SpA €900,000 1.00% 14/3/2025 1,108,046 0.07%UniCredit SpA^ €800,000 1.25% 25/6/2025 976,970 0.06%Intesa Sanpaolo SpA €750,000 2.13% 26/5/2025 955,216 0.06%UniCredit SpA €800,000 0.33% 19/1/2026 947,223 0.06%Enel Finance International NV $825,000 4.25% 14/9/2023 888,423 0.06%UniCredit SpA^ $850,000 2.57% 22/9/2026 861,384 0.05%Enel SpA^ $650,000 8.75% 24/9/2073 755,297 0.05%Eni SpA €600,000 1.25% 18/5/2026 752,269 0.05%Eni SpA^ €600,000 2.63% Perpetual 747,529 0.05%Intesa Sanpaolo SpA €600,000 1.00% 22/7/2022 720,963 0.04%UniCredit SpA €600,000 0.50% 9/4/2025 719,217 0.04%Assicurazioni Generali SpA €500,000 5.13% 16/9/2024 699,351 0.04%Enel Finance International NV €500,000 1.00% 16/9/2024 614,274 0.04%Mediobanca Banca di Credito Finanziario SpA €500,000 0.63% 27/9/2022 599,352 0.04%Enel Finance International NV $500,000 4.63% 14/9/2025 567,644 0.04%UniCredit SpA^ $500,000 1.98% 3/6/2027 497,860 0.03%Intesa Sanpaolo SpA €400,000 1.50% 10/4/2024 494,451 0.03%Intesa Sanpaolo SpA €400,000 1.38% 18/1/2024 492,066 0.03%FCA Bank SpA €400,000 0.50% 18/9/2023 479,476 0.03%UniCredit SpA^ €340,000 1.25% 16/6/2026 417,107 0.03%Intesa Sanpaolo SpA $400,000 3.38% 12/1/2023 416,134 0.03%Enel SpA^ €300,000 3.50% 24/5/2080 388,828 0.02%2i Rete Gas SpA €300,000 3.00% 16/7/2024 388,187 0.02%Intesa Sanpaolo SpA €300,000 1.00% 19/11/2026 366,759 0.02%Intesa Sanpaolo SpA €300,000 0.75% 17/10/2022 360,328 0.02%Italgas SpA €300,000 0.25% 24/6/2025 357,853 0.02%Snam SpA €300,000 0.00% 12/5/2024 357,075 0.02%FCA Bank SpA €300,000 0.00% 16/4/2024 355,711 0.02%Snam SpA €300,000 0.00% 15/8/2025 355,411 0.02%Intesa Sanpaolo SpA €270,000 1.00% 4/7/2024 329,736 0.02%UniCredit SpA^ €250,000 2.20% 22/7/2027 315,476 0.02%

817
Vanguard Global Short-Term Corporate Bond Index Fund
Principal CouponMaturity
DateFair Value
US Dollars ($)% of Total
Net AssetsIntesa Sanpaolo SpA $300,000 3.13% 14/7/2022 307,828 0.02%UniCredit SpA^ €250,000 1.63% 3/7/2025 306,561 0.02%Iren SpA €250,000 0.88% 4/11/2024 305,133 0.02%Terna SPA €200,000 4.90% 28/10/2024 276,500 0.02%Intesa Sanpaolo SpA €220,000 0.75% 4/12/2024 267,565 0.02%Enel Finance International NV €200,000 5.25% 29/9/2023 266,480 0.02%Assicurazioni Generali SpA^ €200,000 7.75% 12/12/2042 263,512 0.02%Assicurazioni Generali SpA^ €200,000 10.13% 10/7/2042 261,863 0.02%Mediobanca Banca di Credito Finanziario SpA €200,000 1.13% 15/7/2025 245,782 0.02%UniCredit SpA €200,000 2.00% 4/3/2023 245,600 0.02%Terna SPA €200,000 1.00% 23/7/2023 243,469 0.02%FCA Bank SpA €200,000 0.50% 13/9/2024 240,450 0.01%FCA Bank SpA €200,000 0.63% 24/11/2022 239,601 0.01%FCA Bank SpA €200,000 0.13% 16/11/2023 237,929 0.01%Intesa Sanpaolo SpA $200,000 5.25% 12/1/2024 221,035 0.01%Eni SpA $200,000 4.00% 12/9/2023 213,658 0.01%Enel Finance International NV $200,000 2.65% 10/9/2024 210,120 0.01%Enel Finance International NV $200,000 2.75% 6/4/2023 207,423 0.01%Intesa Sanpaolo SpA €100,000 4.00% 30/10/2023 129,969 0.01%Eni SpA €100,000 1.75% 18/1/2024 124,391 0.01%Enel SpA^ €100,000 2.50% Perpetual 124,239 0.01%Azimut Holding SpA €100,000 1.63% 12/12/2024 123,342 0.01%Iren SpA €100,000 2.75% 2/11/2022 123,342 0.01%Eni SpA €100,000 0.63% 19/9/2024 121,431 0.01%FCA Bank SpA €100,000 0.25% 28/2/2023 119,264 0.01%test - - - 27,530,587 1.73%Japan 3.39% (2020: 3.06%)NTT Finance Corp. ¥200,000,000 0.18% 19/12/2025 1,805,063 0.11%Honda Motor Co., Ltd. ¥200,000,000 0.12% 5/3/2025 1,801,496 0.11%Toyota Finance Corp. ¥200,000,000 0.06% 15/4/2026 1,799,676 0.11%Nomura Holdings, Inc. $1,200,000 2.65% 16/1/2025 1,260,337 0.08%Mitsubishi UFJ Financial Group, Inc. $1,175,000 2.19% 25/2/2025 1,222,932 0.08%Mitsubishi UFJ Financial Group, Inc.1 $1,000,000 3.85% 1/3/2026 1,117,667 0.07%Nissan Motor Co., Ltd. $1,000,000 3.04% 15/9/2023 1,043,010 0.07%NTT Finance Corp. $1,025,000 1.16% 3/4/2026 1,022,010 0.06%Toyota Motor Corp. $950,000 3.42% 20/7/2023 1,008,488 0.06%Sumitomo Mitsui Financial Group, Inc. ¥100,000,000 0.88% 29/5/2025 916,389 0.06%Mizuho Financial Group, Inc. ¥100,000,000 0.95% 16/7/2024 915,848 0.06%Panasonic Corp. ¥100,000,000 0.30% 20/9/2023 905,397 0.06%Seven & i Holdings Co., Ltd. ¥100,000,000 0.19% 19/12/2025 904,604 0.06%Nomura Holdings, Inc. ¥100,000,000 0.30% 4/9/2023 901,532 0.06%Mizuho Financial Group, Inc.^ $875,000 0.85% 8/9/2024 878,925 0.06%Nippon Life Insurance Co.^ $775,000 5.10% 16/10/2044 856,377 0.05%Nissan Motor Co., Ltd. $800,000 3.52% 17/9/2025 853,823 0.05%Sumitomo Mitsui Financial Group, Inc. $717,000 3.78% 9/3/2026 798,040 0.05%Sumitomo Mitsui Financial Group, Inc. $725,000 2.70% 16/7/2024 766,304 0.05%Mitsubishi UFJ Financial Group, Inc. $700,000 3.76% 26/7/2023 747,373 0.05%Mizuho Bank Ltd. $700,000 2.95% 17/10/2022 723,536 0.05%Kyushu Electric Power Co., Inc. ¥80,000,000 0.17% 23/8/2024 722,033 0.05%Nippon Life Insurance Co.^ $660,000 5.00% 18/10/2042 690,108 0.04%Mitsubishi UFJ Financial Group, Inc. $650,000 3.46% 2/3/2023 682,816 0.04%Mitsubishi UFJ Financial Group, Inc.1 $650,000 2.62% 18/7/2022 665,584 0.04%Nissan Motor Co., Ltd. €500,000 2.65% 17/3/2026 646,369 0.04%Sumitomo Mitsui Financial Group, Inc. $600,000 2.78% 18/10/2022 618,361 0.04%Nissan Motor Co., Ltd. €500,000 1.94% 15/9/2023 617,639 0.04%JT International Financial Services BV €500,000 1.13% 28/9/2025 617,507 0.04%Nippon Life Insurance Co.^ $550,000 4.70% 20/1/2046 611,754 0.04%Toyota Motor Finance Netherlands BV €500,000 0.63% 26/9/2023 604,671 0.04%Takeda Pharmaceutical Co., Ltd. €500,000 1.13% 21/11/2022 604,082 0.04%Mizuho Financial Group, Inc. €500,000 0.52% 10/6/2024 603,597 0.04%Sumitomo Mitsui Financial Group, Inc. $600,000 0.51% 12/1/2024 597,797 0.04%Sumitomo Mitsui Financial Group, Inc. $575,000 1.47% 8/7/2025 581,615 0.04%Mizuho Financial Group, Inc.^ $550,000 2.56% 13/9/2025 575,637 0.04%Mizuho Financial Group, Inc. $525,000 3.48% 12/4/2026 574,723 0.04%Mizuho Financial Group Cayman 3 Ltd. $500,000 4.60% 27/3/2024 544,863 0.03%Sumitomo Mitsui Financial Group, Inc. $525,000 2.78% 12/7/2022 538,329 0.03%Mitsubishi UFJ Financial Group, Inc.1 $525,000 2.67% 25/7/2022 538,133 0.03%MUFG Bank Ltd.1 $500,000 3.25% 8/9/2024 537,697 0.03%Mitsubishi UFJ Financial Group, Inc.1 $500,000 3.41% 7/3/2024 535,588 0.03%Sumitomo Mitsui Trust Bank Ltd. $525,000 0.85% 25/3/2024 526,139 0.03%Kansai Electric Power Co., Inc. $500,000 2.55% 17/9/2024 522,962 0.03%
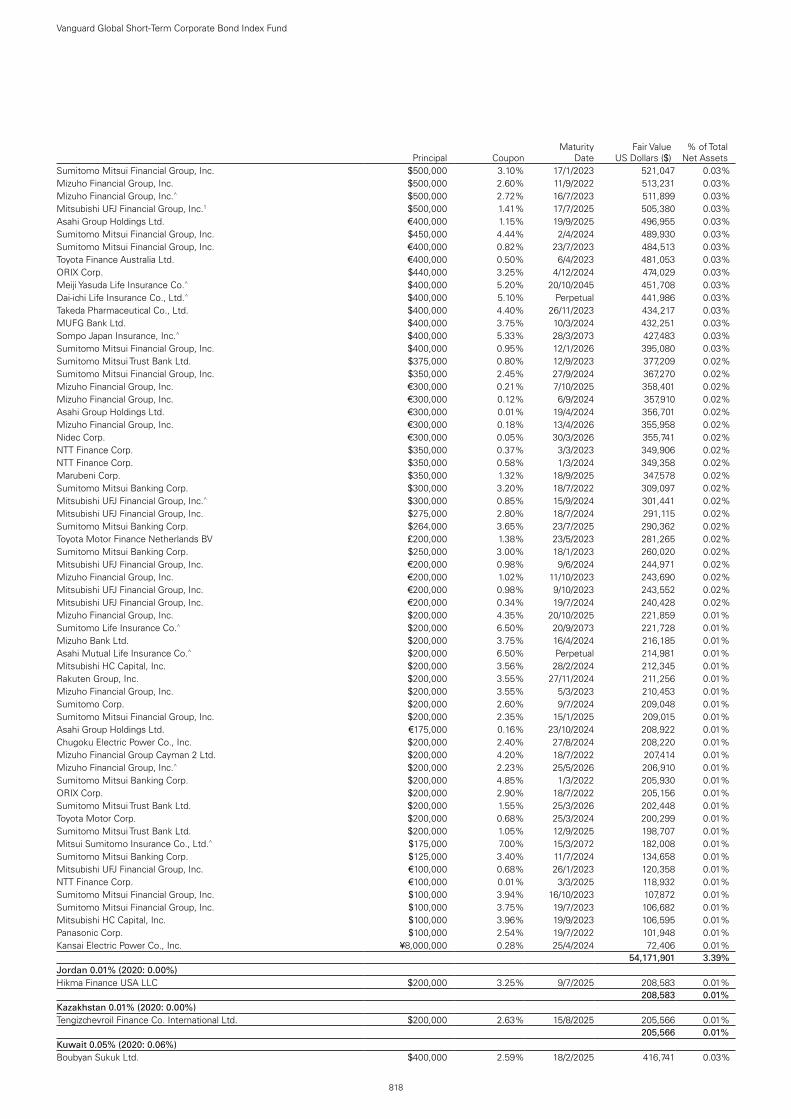
818
Vanguard Global Short-Term Corporate Bond Index Fund
Principal CouponMaturity
DateFair Value
US Dollars ($)% of Total
Net AssetsSumitomo Mitsui Financial Group, Inc. $500,000 3.10% 17/1/2023 521,047 0.03%Mizuho Financial Group, Inc. $500,000 2.60% 11/9/2022 513,231 0.03%Mizuho Financial Group, Inc.^ $500,000 2.72% 16/7/2023 511,899 0.03%Mitsubishi UFJ Financial Group, Inc.1 $500,000 1.41% 17/7/2025 505,380 0.03%Asahi Group Holdings Ltd. €400,000 1.15% 19/9/2025 496,955 0.03%Sumitomo Mitsui Financial Group, Inc. $450,000 4.44% 2/4/2024 489,930 0.03%Sumitomo Mitsui Financial Group, Inc. €400,000 0.82% 23/7/2023 484,513 0.03%Toyota Finance Australia Ltd. €400,000 0.50% 6/4/2023 481,053 0.03%ORIX Corp. $440,000 3.25% 4/12/2024 474,029 0.03%Meiji Yasuda Life Insurance Co.^ $400,000 5.20% 20/10/2045 451,708 0.03%Dai-ichi Life Insurance Co., Ltd.^ $400,000 5.10% Perpetual 441,986 0.03%Takeda Pharmaceutical Co., Ltd. $400,000 4.40% 26/11/2023 434,217 0.03%MUFG Bank Ltd. $400,000 3.75% 10/3/2024 432,251 0.03%Sompo Japan Insurance, Inc.^ $400,000 5.33% 28/3/2073 427,483 0.03%Sumitomo Mitsui Financial Group, Inc. $400,000 0.95% 12/1/2026 395,080 0.03%Sumitomo Mitsui Trust Bank Ltd. $375,000 0.80% 12/9/2023 377,209 0.02%Sumitomo Mitsui Financial Group, Inc. $350,000 2.45% 27/9/2024 367,270 0.02%Mizuho Financial Group, Inc. €300,000 0.21% 7/10/2025 358,401 0.02%Mizuho Financial Group, Inc. €300,000 0.12% 6/9/2024 357,910 0.02%Asahi Group Holdings Ltd. €300,000 0.01% 19/4/2024 356,701 0.02%Mizuho Financial Group, Inc. €300,000 0.18% 13/4/2026 355,958 0.02%Nidec Corp. €300,000 0.05% 30/3/2026 355,741 0.02%NTT Finance Corp. $350,000 0.37% 3/3/2023 349,906 0.02%NTT Finance Corp. $350,000 0.58% 1/3/2024 349,358 0.02%Marubeni Corp. $350,000 1.32% 18/9/2025 347,578 0.02%Sumitomo Mitsui Banking Corp. $300,000 3.20% 18/7/2022 309,097 0.02%Mitsubishi UFJ Financial Group, Inc.^ $300,000 0.85% 15/9/2024 301,441 0.02%Mitsubishi UFJ Financial Group, Inc. $275,000 2.80% 18/7/2024 291,115 0.02%Sumitomo Mitsui Banking Corp. $264,000 3.65% 23/7/2025 290,362 0.02%Toyota Motor Finance Netherlands BV £200,000 1.38% 23/5/2023 281,265 0.02%Sumitomo Mitsui Banking Corp. $250,000 3.00% 18/1/2023 260,020 0.02%Mitsubishi UFJ Financial Group, Inc. €200,000 0.98% 9/6/2024 244,971 0.02%Mizuho Financial Group, Inc. €200,000 1.02% 11/10/2023 243,690 0.02%Mitsubishi UFJ Financial Group, Inc. €200,000 0.98% 9/10/2023 243,552 0.02%Mitsubishi UFJ Financial Group, Inc. €200,000 0.34% 19/7/2024 240,428 0.02%Mizuho Financial Group, Inc. $200,000 4.35% 20/10/2025 221,859 0.01%Sumitomo Life Insurance Co.^ $200,000 6.50% 20/9/2073 221,728 0.01%Mizuho Bank Ltd. $200,000 3.75% 16/4/2024 216,185 0.01%Asahi Mutual Life Insurance Co.^ $200,000 6.50% Perpetual 214,981 0.01%Mitsubishi HC Capital, Inc. $200,000 3.56% 28/2/2024 212,345 0.01%Rakuten Group, Inc. $200,000 3.55% 27/11/2024 211,256 0.01%Mizuho Financial Group, Inc. $200,000 3.55% 5/3/2023 210,453 0.01%Sumitomo Corp. $200,000 2.60% 9/7/2024 209,048 0.01%Sumitomo Mitsui Financial Group, Inc. $200,000 2.35% 15/1/2025 209,015 0.01%Asahi Group Holdings Ltd. €175,000 0.16% 23/10/2024 208,922 0.01%Chugoku Electric Power Co., Inc. $200,000 2.40% 27/8/2024 208,220 0.01%Mizuho Financial Group Cayman 2 Ltd. $200,000 4.20% 18/7/2022 207,414 0.01%Mizuho Financial Group, Inc.^ $200,000 2.23% 25/5/2026 206,910 0.01%Sumitomo Mitsui Banking Corp. $200,000 4.85% 1/3/2022 205,930 0.01%ORIX Corp. $200,000 2.90% 18/7/2022 205,156 0.01%Sumitomo Mitsui Trust Bank Ltd. $200,000 1.55% 25/3/2026 202,448 0.01%Toyota Motor Corp. $200,000 0.68% 25/3/2024 200,299 0.01%Sumitomo Mitsui Trust Bank Ltd. $200,000 1.05% 12/9/2025 198,707 0.01%Mitsui Sumitomo Insurance Co., Ltd.^ $175,000 7.00% 15/3/2072 182,008 0.01%Sumitomo Mitsui Banking Corp. $125,000 3.40% 11/7/2024 134,658 0.01%Mitsubishi UFJ Financial Group, Inc. €100,000 0.68% 26/1/2023 120,358 0.01%NTT Finance Corp. €100,000 0.01% 3/3/2025 118,932 0.01%Sumitomo Mitsui Financial Group, Inc. $100,000 3.94% 16/10/2023 107,872 0.01%Sumitomo Mitsui Financial Group, Inc. $100,000 3.75% 19/7/2023 106,682 0.01%Mitsubishi HC Capital, Inc. $100,000 3.96% 19/9/2023 106,595 0.01%Panasonic Corp. $100,000 2.54% 19/7/2022 101,948 0.01%Kansai Electric Power Co., Inc. ¥8,000,000 0.28% 25/4/2024 72,406 0.01%test - - - 54,171,901 3.39%Jordan 0.01% (2020: 0.00%)Hikma Finance USA LLC $200,000 3.25% 9/7/2025 208,583 0.01%test - - - 208,583 0.01%Kazakhstan 0.01% (2020: 0.00%)Tengizchevroil Finance Co. International Ltd. $200,000 2.63% 15/8/2025 205,566 0.01%test - - - 205,566 0.01%Kuwait 0.05% (2020: 0.06%)Boubyan Sukuk Ltd. $400,000 2.59% 18/2/2025 416,741 0.03%

819
Vanguard Global Short-Term Corporate Bond Index Fund
Principal CouponMaturity
DateFair Value
US Dollars ($)% of Total
Net AssetsWarba Sukuk Ltd. $200,000 2.98% 24/9/2024 210,999 0.01%NBK Tier 1 Financing 2 Ltd.^ $200,000 4.50% Perpetual 209,018 0.01%test - - - 836,758 0.05%Luxembourg 0.15% (2020: 0.18%)Blackstone Property Partners Europe Holdings Sarl €600,000 2.00% 15/2/2024 741,455 0.05%Blackstone Property Partners Europe Holdings Sarl €300,000 2.20% 24/7/2025 379,990 0.02%Logicor Financing Sarl €300,000 0.75% 15/7/2024 361,712 0.02%Blackstone Property Partners Europe Holdings Sarl €300,000 1.40% 6/7/2022 359,584 0.02%Prologis International Funding II SA €200,000 1.88% 17/4/2025 254,133 0.02%Logicor Financing Sarl €120,000 1.50% 14/11/2022 144,894 0.01%SELP Finance Sarl €100,000 1.25% 25/10/2023 121,693 0.01%test - - - 2,363,461 0.15%Macau 0.09% (2020: 0.08%)Sands China Ltd. $854,000 5.13% 8/8/2025 956,067 0.06%Sands China Ltd. $400,000 4.60% 8/8/2023 424,759 0.03%test - - - 1,380,826 0.09%Mexico 0.34% (2020: 0.34%)Banco Santander Mexico SA Institucion de Banca Multiple Grupo
Financiero Santand $800,000 5.38% 17/4/2025 907,898 0.06%Grupo Bimbo SAB de CV $625,000 3.88% 27/6/2024 675,533 0.04%America Movil SAB de CV €300,000 1.50% 10/3/2024 370,335 0.02%Sigma Alimentos SA de CV $300,000 4.13% 2/5/2026 326,296 0.02%America Movil SAB de CV $300,000 3.13% 16/7/2022 308,160 0.02%America Movil SAB de CV €200,000 3.26% 22/7/2023 253,564 0.02%Grupo Televisa SAB $200,000 6.63% 18/3/2025 237,221 0.02%Trust Fibra Uno $200,000 5.25% 30/1/2026 225,094 0.02%Grupo Televisa SAB $200,000 4.63% 30/1/2026 222,281 0.02%Trust Fibra Uno $200,000 5.25% 15/12/2024 222,186 0.01%Alfa SAB de CV $200,000 5.25% 25/3/2024 218,003 0.01%BBVA Bancomer SA $200,000 4.38% 10/4/2024 217,313 0.01%Alpek SAB de CV $200,000 5.38% 8/8/2023 216,903 0.01%Banco Santander Mexico SA Institucion de Banca Multiple Grupo
Financiero Santand $200,000 4.13% 9/11/2022 208,246 0.01%BBVA Bancomer SA $200,000 1.88% 18/9/2025 202,392 0.01%Orbia Advance Corp. SAB de CV $200,000 1.88% 11/5/2026 201,325 0.01%Southern Copper Corp. $150,000 3.88% 23/4/2025 163,471 0.01%Fomento Economico Mexicano SAB de CV $150,000 2.88% 10/5/2023 155,793 0.01%America Movil SAB de CV^ €100,000 6.38% 6/9/2073 133,804 0.01%Southern Copper Corp. $25,000 3.50% 8/11/2022 25,934 0.00%test - - - 5,491,752 0.34%Netherlands 3.05% (2020: 3.01%)LeasePlan Corp. NV $1,285,000 2.88% 24/10/2024 1,350,516 0.08%ABN AMRO Bank NV €1,100,000 0.50% 17/7/2023 1,326,207 0.08%Shell International Finance BV $1,250,000 2.38% 6/4/2025 1,315,466 0.08%NIBC Bank NV €1,000,000 1.13% 19/4/2023 1,212,606 0.08%ING Groep NV^ $1,063,000 1.73% 1/4/2027 1,072,369 0.07%de Volksbank NV €800,000 0.25% 22/6/2026 943,790 0.06%Nationale-Nederlanden Levensverzekering Maatschappij NV^ €700,000 9.00% 29/8/2042 916,335 0.06%Cooperatieve Rabobank UA^ $900,000 1.34% 24/6/2026 903,246 0.06%Shell International Finance BV €700,000 1.88% 15/9/2025 900,307 0.06%Cooperatieve Rabobank UA^ $900,000 1.11% 24/2/2027 887,315 0.06%ABN AMRO Bank NV €700,000 1.25% 28/5/2025 867,481 0.05%Koninklijke DSM NV €700,000 1.00% 9/4/2025 864,714 0.05%Shell International Finance BV €700,000 1.13% 7/4/2024 861,588 0.05%Cooperatieve Rabobank UA AU($)1,000,000 5.50% 11/4/2024 847,950 0.05%Cooperatieve Rabobank UA $750,000 4.63% 1/12/2023 819,711 0.05%Cooperatieve Rabobank UA $775,000 3.95% 9/11/2022 811,213 0.05%ING Groep NV $750,000 4.10% 2/10/2023 808,332 0.05%NN Group NV^ €600,000 4.63% 8/4/2044 793,234 0.05%EXOR NV €600,000 2.50% 8/10/2024 771,128 0.05%Cooperatieve Rabobank UA €600,000 3.88% 25/7/2023 769,856 0.05%Signify NV €600,000 2.00% 11/5/2024 749,420 0.05%Cooperatieve Rabobank UA €600,000 4.13% 14/9/2022 747,822 0.05%Shell International Finance BV $725,000 2.25% 6/1/2023 746,230 0.05%Heineken NV €600,000 1.00% 4/5/2026 745,481 0.05%ABN AMRO Bank NV $650,000 4.75% 28/7/2025 729,857 0.05%Koninklijke KPN NV €600,000 0.63% 9/4/2025 725,639 0.04%ABN AMRO Bank NV £500,000 1.38% 16/1/2025 703,209 0.04%Cooperatieve Rabobank UA £500,000 1.25% 14/1/2025 697,472 0.04%Cooperatieve Rabobank UA €500,000 4.13% 14/7/2025 696,366 0.04%Heineken NV €500,000 2.88% 4/8/2025 664,160 0.04%Achmea BV^ €500,000 4.25% Perpetual 654,483 0.04%

820
Vanguard Global Short-Term Corporate Bond Index Fund
Principal CouponMaturity
DateFair Value
US Dollars ($)% of Total
Net AssetsABN AMRO Bank NV^ $600,000 4.40% 27/3/2028 631,634 0.04%Cooperatieve Rabobank UA €500,000 1.25% 23/3/2026 631,346 0.04%Koninklijke Ahold Delhaize NV €500,000 1.13% 19/3/2026 622,193 0.04%Shell International Finance BV $575,000 2.88% 10/5/2026 621,512 0.04%ING Groep NV^ €500,000 1.63% 26/9/2029 614,936 0.04%ING Groep NV €500,000 1.00% 20/9/2023 609,349 0.04%ABN AMRO Bank NV €500,000 0.50% 15/4/2026 608,735 0.04%Cooperatieve Rabobank UA €500,000 0.75% 29/8/2023 605,623 0.04%Cooperatieve Rabobank UA €500,000 0.63% 27/2/2024 605,493 0.04%ING Groep NV^ $600,000 1.40% 1/7/2026 602,037 0.04%Cooperatieve Rabobank UA €500,000 0.50% 6/12/2022 601,091 0.04%ING Groep NV^ €500,000 1.00% 13/11/2030 600,883 0.04%ING Groep NV^ €500,000 0.10% 3/9/2025 594,070 0.04%LeasePlan Corp. NV €500,000 0.25% 23/2/2026 591,174 0.04%Cooperatieve Rabobank UA $550,000 3.88% 26/9/2023 590,564 0.04%NXP BV/NXP Funding LLC/NXP USA, Inc. $500,000 3.88% 18/6/2026 553,618 0.03%NXP BV/NXP Funding LLC $489,000 4.88% 1/3/2024 538,358 0.03%Shell International Finance BV €400,000 0.50% 11/5/2024 484,273 0.03%Koninklijke Philips NV €400,000 0.50% 6/9/2023 481,315 0.03%Cooperatieve Rabobank UA $377,000 4.38% 4/8/2025 420,325 0.03%NN Group NV^ €300,000 4.50% Perpetual 406,944 0.02%ABN AMRO Bank NV^ $400,000 1.54% 16/6/2027 397,747 0.02%Cooperatieve Rabobank UA^ $400,000 1.00% 24/9/2026 395,747 0.02%ABN AMRO Bank NV^ €300,000 2.88% 18/1/2028 370,964 0.02%JAB Holdings BV €300,000 1.75% 25/5/2023 369,540 0.02%Euronext NV €300,000 1.00% 18/4/2025 367,648 0.02%ABN AMRO Bank NV €300,000 0.88% 15/1/2024 366,087 0.02%JDE Peet's NV €300,000 0.00% 16/1/2026 353,685 0.02%Cooperatieve Rabobank UA $300,000 2.75% 10/1/2023 310,897 0.02%Shell International Finance BV $250,000 3.25% 11/5/2025 271,454 0.02%Cooperatieve Rabobank UA $250,000 2.63% 22/7/2024 263,400 0.02%ASML Holding NV €200,000 3.38% 19/9/2023 256,825 0.02%ABN AMRO Bank NV €200,000 2.50% 29/11/2023 253,086 0.02%Akzo Nobel NV €200,000 1.75% 7/11/2024 252,926 0.02%Cooperatieve Rabobank UA €200,000 2.38% 22/5/2023 249,627 0.02%ING Bank NV $225,000 5.80% 25/9/2023 249,429 0.02%ING Groep NV^ €200,000 3.00% 11/4/2028 248,860 0.01%NIBC Bank NV €200,000 2.00% 9/4/2024 247,645 0.01%Nationale-Nederlanden Bank NV €200,000 0.38% 26/2/2025 240,820 0.01%LeasePlan Corp. NV €200,000 0.75% 3/10/2022 240,092 0.01%Nationale-Nederlanden Bank NV €200,000 0.38% 31/5/2023 239,909 0.01%ING Groep NV $200,000 3.55% 9/4/2024 215,328 0.01%NXP BV/NXP Funding LLC $200,000 4.63% 1/6/2023 214,922 0.01%Shell International Finance BV $200,000 3.40% 12/8/2023 212,482 0.01%ING Groep NV^ $200,000 4.70% 22/3/2028 211,435 0.01%NXP BV/NXP Funding LLC $200,000 3.88% 1/9/2022 207,467 0.01%Shell International Finance BV $195,000 2.00% 7/11/2024 202,922 0.01%Viterra Finance BV $200,000 2.00% 21/4/2026 200,267 0.01%Euronext NV €155,000 0.13% 17/5/2026 184,263 0.01%Shell International Finance BV $150,000 3.50% 13/11/2023 160,363 0.01%Shell International Finance BV $150,000 0.38% 15/9/2023 150,009 0.01%NIBC Bank NV £100,000 3.13% 15/11/2023 145,180 0.01%Koninklijke KPN NV €100,000 5.63% 30/9/2024 139,418 0.01%LeasePlan Corp. NV €100,000 3.50% 9/4/2025 133,578 0.01%NN Group NV^ €100,000 4.38% Perpetual 130,707 0.01%Heineken NV €100,000 3.50% 19/3/2024 130,507 0.01%Heineken NV $125,000 2.75% 1/4/2023 129,658 0.01%Shell International Finance BV $125,000 2.38% 21/8/2022 127,954 0.01%ABN AMRO Bank NV €100,000 7.13% 6/7/2022 127,183 0.01%Wolters Kluwer NV €100,000 2.50% 13/5/2024 126,877 0.01%Akzo Nobel NV €100,000 2.63% 27/7/2022 122,445 0.01%PostNL NV €100,000 1.00% 21/11/2024 122,269 0.01%Vesteda Finance BV €100,000 2.50% 27/10/2022 121,917 0.01%LeasePlan Corp. NV €100,000 1.00% 2/5/2023 121,222 0.01%NN Group NV €100,000 0.88% 13/1/2023 120,364 0.01%de Volksbank NV €100,000 0.01% 16/9/2024 119,317 0.01%test - - - 48,743,418 3.05%New Zealand 0.22% (2020: 0.29%)Westpac New Zealand Ltd. NZ($)1,098,000 3.72% 23/3/2023 804,075 0.05%BNZ International Funding Ltd. €400,000 0.50% 13/5/2023 481,618 0.03%ANZ New Zealand Int'l Ltd. $400,000 3.40% 19/3/2024 429,709 0.03%

821
Vanguard Global Short-Term Corporate Bond Index Fund
Principal CouponMaturity
DateFair Value
US Dollars ($)% of Total
Net AssetsASB Bank Ltd. NZ($)400,000 1.83% 19/8/2024 283,485 0.02%BNZ International Funding Ltd. $275,000 2.65% 3/11/2022 283,403 0.02%ASB Bank Ltd. $250,000 3.75% 14/6/2023 265,691 0.02%BNZ International Funding Ltd. $250,000 3.38% 1/3/2023 262,296 0.02%Bank of New Zealand $250,000 2.00% 21/2/2025 258,548 0.01%Bank of New Zealand $250,000 1.00% 3/3/2026 246,779 0.01%Westpac Securities NZ Ltd. CHF200,000 0.38% 5/2/2024 220,647 0.01%test - - - 3,536,251 0.22%Norway 0.31% (2020: 0.34%)DNB Bank A.S.A €1,000,000 0.05% 14/11/2023 1,195,620 0.07%SpareBank 1 SMN €500,000 0.75% 3/7/2023 605,001 0.04%DNB Bank A.S.A €300,000 0.60% 25/9/2023 362,849 0.02%Santander Consumer Bank A.S. €300,000 0.13% 11/9/2024 357,419 0.02%Santander Consumer Bank A.S. €300,000 0.13% 14/4/2026 353,957 0.02%DNB Bank A.S.A $325,000 2.15% 2/12/2022 333,410 0.02%DNB Bank A.S.A^ $300,000 1.13% 16/9/2026 297,652 0.02%DNB Bank A.S.A £200,000 1.38% 12/6/2023 281,257 0.02%DNB Bank A.S.A^ €200,000 1.13% 20/3/2028 241,603 0.02%Santander Consumer Bank A.S. €200,000 0.75% 1/3/2023 241,067 0.02%Santander Consumer Bank A.S. €200,000 0.13% 25/2/2025 237,536 0.01%Aker BP A.S.A $150,000 3.00% 15/1/2025 157,628 0.01%Sparebank 1 Oestlandet €100,000 0.88% 13/3/2023 120,984 0.01%Sparebank 1 Oestlandet €100,000 0.25% 30/9/2024 120,048 0.01%test - - - 4,906,031 0.31%Panama 0.01% (2020: 0.01%)Banco Latinoamericano de Comercio Exterior SA $200,000 2.38% 14/9/2025 205,038 0.01%test - - - 205,038 0.01%Peru 0.08% (2020: 0.09%)Banco de Credito del Peru $500,000 2.70% 11/1/2025 515,530 0.03%Banco de Credito del Peru $200,000 4.25% 1/4/2023 209,528 0.01%Credicorp Ltd. $200,000 2.75% 17/6/2025 201,899 0.01%Banco BBVA Peru SA $150,000 5.00% 26/8/2022 156,378 0.01%Banco de Credito del Peru^ $150,000 3.13% 1/7/2030 149,184 0.01%Consorcio Transmantaro SA $50,000 4.38% 7/5/2023 52,251 0.01%test - - - 1,284,770 0.08%Philippines 0.12% (2020: 0.11%)Rizal Commercial Banking Corp. $300,000 3.00% 11/9/2024 316,257 0.02%Union Bank of the Philippines $300,000 3.37% 29/11/2022 311,229 0.02%BDO Unibank, Inc. $300,000 2.95% 6/3/2023 310,544 0.02%BDO Unibank, Inc. $300,000 2.13% 13/1/2026 308,829 0.02%Bank of the Philippine Islands $200,000 4.25% 4/9/2023 214,741 0.02%Philippine National Bank $200,000 3.28% 27/9/2024 211,365 0.01%Philippine National Bank $200,000 4.25% 27/4/2023 211,323 0.01%test - - - 1,884,288 0.12%Poland 0.03% (2020: 0.04%)Powszechna Kasa Oszczednosci Bank Polski SA Via PKO Finance AB $400,000 4.63% 26/9/2022 418,697 0.02%ORLEN Capital AB €100,000 2.50% 7/6/2023 123,961 0.01%test - - - 542,658 0.03%Portugal 0.16% (2020: 0.14%)EDP Finance BV €1,100,000 2.00% 22/4/2025 1,403,607 0.09%EDP Finance BV €200,000 1.88% 29/9/2023 248,250 0.02%EDP Finance BV €200,000 2.38% 23/3/2023 248,002 0.01%EDP Finance BV €200,000 1.13% 12/2/2024 245,080 0.01%EDP Finance BV £100,000 8.63% 4/1/2024 164,694 0.01%EDP Finance BV $125,000 3.63% 15/7/2024 134,264 0.01%Galp Gas Natural Distribuicao SA €100,000 1.38% 19/9/2023 122,076 0.01%test - - - 2,565,973 0.16%Qatar 0.14% (2020: 0.15%)QIB Sukuk Ltd. $600,000 3.98% 26/3/2024 644,430 0.04%ABQ Finance Ltd. $400,000 1.88% 8/9/2025 400,018 0.03%AKCB Finance Ltd. $200,000 4.75% 9/10/2023 216,318 0.02%QIIB Senior Sukuk Ltd. $200,000 4.26% 5/3/2024 215,823 0.01%MAR Sukuk Ltd. $200,000 3.03% 13/11/2024 210,794 0.01%Qatar Reinsurance Co., Ltd.^ $200,000 4.95% Perpetual 202,810 0.01%CBQ Finance Ltd. $200,000 2.00% 15/9/2025 201,642 0.01%Doha Finance Ltd. $200,000 2.38% 31/3/2026 201,632 0.01%test - - - 2,293,467 0.14%Romania 0.02% (2020: 0.05%)NE Property BV €100,000 2.63% 22/5/2023 123,259 0.01%NE Property BV €100,000 1.75% 23/11/2024 121,978 0.01%test - - - 245,237 0.02%

822
Vanguard Global Short-Term Corporate Bond Index Fund
Principal CouponMaturity
DateFair Value
US Dollars ($)% of Total
Net AssetsRussia 0.22% (2020: 0.26%)Lukoil International Finance BV $400,000 4.56% 24/4/2023 424,055 0.03%Sibur Securities DAC $400,000 3.45% 23/9/2024 417,411 0.03%MMC Norilsk Nickel OJSC Via MMC Finance DAC $400,000 3.38% 28/10/2024 417,034 0.03%MMC Norilsk Nickel OJSC Via MMC Finance DAC $400,000 4.10% 11/4/2023 415,576 0.03%ALROSA Finance SA $200,000 4.65% 9/4/2024 216,140 0.02%Novolipetsk Steel Via Steel Funding DAC $200,000 4.00% 21/9/2024 215,120 0.01%MMK International Capital DAC $200,000 4.38% 13/6/2024 214,705 0.01%MMC Norilsk Nickel OJSC Via MMC Finance DAC $200,000 6.63% 14/10/2022 213,625 0.01%Severstal OAO Via Steel Capital SA $200,000 5.90% 17/10/2022 212,240 0.01%Novatek OAO Via Novatek Finance DAC $200,000 4.42% 13/12/2022 209,557 0.01%Severstal OAO Via Steel Capital SA $200,000 3.15% 16/9/2024 208,599 0.01%Phosagro OAO Via Phosagro Bond Funding DAC $200,000 3.05% 23/1/2025 208,339 0.01%Phosagro OAO Via Phosagro Bond Funding DAC $200,000 3.95% 24/4/2023 208,238 0.01%test - - - 3,580,639 0.22%Saudi Arabia 0.07% (2020: 0.08%)Riyad Bank^ $500,000 3.17% 25/2/2030 511,314 0.03%Almarai Sukuk Ltd. $200,000 4.31% 5/3/2024 216,097 0.02%Samba Funding Ltd. $200,000 2.75% 2/10/2024 208,999 0.01%Arab National Bank^ $200,000 3.33% 28/10/2030 206,316 0.01%test - - - 1,142,726 0.07%Singapore 0.28% (2020: 0.23%)DBS Group Holdings Ltd.^ SG($)1,000,000 3.98% Perpetual 783,509 0.05%Oversea-Chinese Banking Corp., Ltd. $600,000 4.25% 19/6/2024 654,266 0.04%DBS Group Holdings Ltd.^ €500,000 1.50% 11/4/2028 608,916 0.04%DBS Group Holdings Ltd.^ $400,000 4.52% 11/12/2028 431,517 0.03%DBS Group Holdings Ltd.^ $300,000 3.30% Perpetual 308,935 0.02%United Overseas Bank Ltd. $300,000 1.25% 14/4/2026 299,913 0.02%Oversea-Chinese Banking Corp., Ltd.^ $300,000 1.83% 10/9/2030 299,785 0.02%United Overseas Bank Ltd.^ $200,000 3.88% Perpetual 207,753 0.02%Vena Energy Capital Pte Ltd. $200,000 3.13% 26/2/2025 204,729 0.01%United Overseas Bank Ltd.^ $200,000 3.50% 16/9/2026 200,988 0.01%United Overseas Bank Ltd.^ $200,000 1.75% 16/3/2031 198,703 0.01%Oversea-Chinese Banking Corp., Ltd.^ SG($)250,000 4.00% Perpetual 194,540 0.01%test - - - 4,393,554 0.28%South Africa 0.06% (2020: 0.11%)Anglo American Capital plc €400,000 1.63% 11/3/2026 502,907 0.03%Anglo American Capital plc €200,000 3.25% 3/4/2023 250,920 0.02%Anglo American Capital plc $200,000 3.63% 11/9/2024 215,932 0.01%test - - - 969,759 0.06%South Korea 0.75% (2020: 0.58%)Hyundai Capital Services, Inc. $700,000 3.75% 5/3/2023 734,135 0.05%Hyundai Capital America $600,000 2.65% 10/2/2025 626,215 0.04%Hyundai Capital America $600,000 1.30% 8/1/2026 592,388 0.04%Hyundai Capital America $575,000 1.80% 15/10/2025 582,710 0.04%GS Caltex Corp. $425,000 3.88% 27/6/2023 449,675 0.03%Shinhan Bank Co., Ltd. ₩500,000,000 1.34% 27/8/2022 445,124 0.03%Shinhan Bank Co., Ltd. $400,000 3.88% 5/11/2023 429,457 0.03%Shinhan Financial Group Co., Ltd.^ $400,000 3.34% 5/2/2030 418,495 0.03%Hyundai Capital America $400,000 1.25% 18/9/2023 403,597 0.03%Hana Bank $300,000 4.25% 14/10/2024 329,426 0.02%Hana Bank $300,000 3.38% 30/1/2022 304,676 0.02%Hyundai Capital America1 $300,000 0.80% 8/1/2024 299,038 0.02%SK Hynix, Inc. $300,000 1.50% 19/1/2026 296,581 0.02%Mirae Asset Securities Co., Ltd. $250,000 3.38% 7/5/2024 264,118 0.02%Hyundai Capital America $250,000 0.88% 14/6/2024 248,878 0.02%Hyundai Capital America $250,000 1.50% 15/6/2026 248,036 0.02%SK Battery America, Inc. $250,000 2.13% 26/1/2026 247,897 0.02%Woori Bank $200,000 4.75% 30/4/2024 219,643 0.02%Kookmin Bank $217,000 3.63% 23/10/2021 219,072 0.02%Hyundai Capital America1 $200,000 5.75% 6/4/2023 217,225 0.01%Shinhan Financial Group Co., Ltd.^ $200,000 5.88% Perpetual 215,059 0.01%Hanwha Total Petrochemical Co., Ltd. $200,000 3.88% 23/1/2024 213,951 0.01%POSCO $200,000 4.00% 1/8/2023 212,978 0.01%SK Hynix, Inc. $200,000 3.00% 17/9/2024 211,273 0.01%Kookmin Bank^ $200,000 4.35% Perpetual 211,028 0.01%POSCO $200,000 2.75% 15/7/2024 210,196 0.01%Hanwha Life Insurance Co., Ltd.^ $200,000 4.70% Perpetual 208,385 0.01%Hankook Tire & Technology Co., Ltd. $200,000 3.50% 30/1/2023 207,931 0.01%Kookmin Bank $200,000 2.88% 25/3/2023 207,642 0.01%POSCO $200,000 2.38% 17/1/2023 204,766 0.01%

823
Vanguard Global Short-Term Corporate Bond Index Fund
Principal CouponMaturity
DateFair Value
US Dollars ($)% of Total
Net AssetsKyobo Life Insurance Co., Ltd.^ $200,000 3.95% Perpetual 204,493 0.01%Kookmin Bank $200,000 1.75% 4/5/2025 204,017 0.01%Hanwha Energy USA Holdings Corp. $200,000 2.38% 30/7/2022 203,570 0.01%Heungkuk Life Insurance Co., Ltd.^ $200,000 4.48% Perpetual 202,856 0.01%Korean Air Lines Co., Ltd. $200,000 2.00% 4/9/2022 202,439 0.01%Mirae Asset Securities Co., Ltd. $200,000 4.13% 7/11/2021 202,057 0.01%SK Battery America, Inc. $200,000 1.63% 26/1/2024 200,317 0.01%KT Corp. $200,000 1.00% 1/9/2025 197,896 0.01%Woori Bank $200,000 0.75% 1/2/2026 194,575 0.01%LG Chem Ltd. €100,000 0.50% 15/4/2023 119,686 0.01%SK Telecom Co., Ltd. $100,000 3.75% 16/4/2023 105,342 0.01%Hyundai Capital America $90,000 2.38% 10/2/2023 92,288 0.01%Hyundai Capital America $50,000 3.25% 20/9/2022 51,527 0.00%KT Corp. $50,000 2.63% 7/8/2022 51,079 0.00%Hyundai Capital America $35,000 3.40% 20/6/2024 37,364 0.00%Hyundai Capital America $15,000 2.85% 1/11/2022 15,423 0.00%test - - - 11,964,524 0.75%Spain 2.05% (2020: 2.15%)Iberdrola International BV^ €1,200,000 1.87% Perpetual 1,467,750 0.09%Telefonica Emisiones SA $1,000,000 4.57% 27/4/2023 1,070,981 0.07%Banco Bilbao Vizcaya Argentaria SA €800,000 1.00% 21/6/2026 987,230 0.06%Banco de Sabadell SA^ €800,000 0.63% 7/11/2025 956,515 0.06%Banco Santander SA ¥100,000,000 0.46% 5/12/2024 904,152 0.06%Telefonica Emisiones SA €600,000 1.50% 11/9/2025 754,764 0.05%Telefonica Emisiones SA €600,000 1.53% 17/1/2025 753,211 0.05%CaixaBank SA^ €600,000 2.25% 17/4/2030 745,627 0.05%Telefonica Emisiones SA €600,000 1.07% 5/2/2024 732,474 0.05%Santander Consumer Finance SA €600,000 1.00% 27/2/2024 732,213 0.05%CaixaBank SA €600,000 0.75% 18/4/2023 723,136 0.04%CaixaBank SA €600,000 0.63% 1/10/2024 722,923 0.04%CaixaBank SA €600,000 0.38% 3/2/2025 718,930 0.04%Banco Santander SA $700,000 1.85% 25/3/2026 708,047 0.04%CaixaBank SA €500,000 1.38% 19/6/2026 619,688 0.04%Banco Santander SA €500,000 1.13% 17/1/2025 613,389 0.04%CaixaBank SA €500,000 1.13% 12/1/2023 604,812 0.04%Banco Bilbao Vizcaya Argentaria SA €500,000 0.75% 11/9/2022 600,796 0.04%Santander Consumer Finance SA €500,000 0.38% 17/1/2025 600,070 0.04%Banco Santander SA €500,000 0.25% 19/6/2024 599,172 0.04%CaixaBank SA^ €500,000 0.38% 18/11/2026 593,846 0.04%Iberdrola International BV^ €400,000 3.25% Perpetual 516,156 0.03%Iberdrola International BV €400,000 1.88% 8/10/2024 506,356 0.03%Iberdrola Finanzas SA €400,000 1.00% 7/3/2025 493,254 0.03%CaixaBank SA €400,000 0.88% 25/3/2024 486,764 0.03%Santander Consumer Finance SA €400,000 0.88% 30/5/2023 484,595 0.03%Abertis Infraestructuras SA €400,000 0.63% 15/7/2025 483,182 0.03%Repsol International Finance BV €400,000 0.13% 5/10/2024 477,428 0.03%Banco Santander SA $400,000 5.18% 19/11/2025 457,607 0.03%Telefonica Emisiones SA £300,000 5.29% 9/12/2022 442,584 0.03%Banco Santander SA $400,000 2.75% 28/5/2025 421,481 0.03%Banco Santander SA $400,000 2.71% 27/6/2024 421,051 0.03%Banco Santander SA £300,000 1.50% 14/4/2026 416,735 0.03%Banco Bilbao Vizcaya Argentaria SA $400,000 0.88% 18/9/2023 401,312 0.02%Banco Santander SA €300,000 3.25% 4/4/2026 400,880 0.02%Banco Santander SA €300,000 2.50% 18/3/2025 384,990 0.02%Inmobiliaria Colonial Socimi SA €300,000 2.00% 17/4/2026 383,513 0.02%Banco Santander SA €300,000 1.38% 5/1/2026 372,967 0.02%Banco de Sabadell SA €300,000 1.63% 7/3/2024 370,297 0.02%Red Electrica Corp. SA €300,000 0.88% 14/4/2025 368,408 0.02%CaixaBank SA €300,000 1.13% 17/5/2024 367,849 0.02%Banco Bilbao Vizcaya Argentaria SA^ €300,000 0.13% 24/3/2027 355,172 0.02%Banco Santander SA £200,000 1.38% 31/7/2024 280,392 0.02%CaixaBank SA £200,000 1.50% 3/12/2026 276,652 0.02%Abertis Infraestructuras SA €200,000 3.75% 20/6/2023 255,250 0.02%Telefonica Emisiones SA €200,000 3.99% 23/1/2023 253,263 0.02%Naturgy Finance BV €200,000 3.88% 17/1/2023 252,095 0.02%Merlin Properties Socimi SA €200,000 1.75% 26/5/2025 250,213 0.02%Ferrovial Emisiones SA €200,000 1.38% 31/3/2025 248,911 0.02%Red Electrica Financiaciones SAU €200,000 2.13% 1/7/2023 248,289 0.02%CaixaBank SA^ €200,000 2.75% 14/7/2028 247,694 0.02%Criteria Caixa SA €200,000 1.38% 10/4/2024 245,517 0.01%Naturgy Finance BV €200,000 0.88% 15/5/2025 245,162 0.01%

824
Vanguard Global Short-Term Corporate Bond Index Fund
Principal CouponMaturity
DateFair Value
US Dollars ($)% of Total
Net AssetsCriteria Caixa SA €200,000 1.50% 10/5/2023 244,094 0.01%Iberdrola International BV^ €200,000 1.88% Perpetual 243,304 0.01%Banco Santander SA €200,000 1.38% 14/12/2022 242,967 0.01%Prosegur Compania de Seguridad SA €200,000 1.00% 8/2/2023 240,753 0.01%Banco de Sabadell SA €200,000 0.88% 5/3/2023 240,632 0.01%Santander Consumer Finance SA €200,000 0.38% 27/6/2024 240,102 0.01%Ferrovial Emisiones SA €200,000 0.38% 14/9/2022 238,903 0.01%Banco Bilbao Vizcaya Argentaria SA^ €200,000 1.00% 16/1/2030 238,532 0.01%Banco Santander SA $200,000 3.85% 12/4/2023 211,417 0.01%Banco Santander SA $200,000 3.13% 23/2/2023 208,227 0.01%Banco Bilbao Vizcaya Argentaria SA $200,000 1.13% 18/9/2025 198,377 0.01%Iberdrola Finanzas SA £100,000 6.00% 1/7/2022 145,699 0.01%Banco Santander SA £100,000 2.75% 12/9/2023 144,185 0.01%Abertis Infraestructuras SA €100,000 2.50% 27/2/2025 129,407 0.01%Redexis Gas Finance BV €100,000 1.88% 28/5/2025 125,732 0.01%Banco Bilbao Vizcaya Argentaria SA^ €100,000 2.58% 22/2/2029 125,001 0.01%Naturgy Finance BV €100,000 1.38% 21/1/2025 124,580 0.01%Iberdrola International BV €100,000 1.75% 17/9/2023 123,924 0.01%Iberdrola International BV €100,000 2.50% 24/10/2022 123,146 0.01%Merlin Properties Socimi SA €100,000 2.23% 25/4/2023 122,697 0.01%Naturgy Capital Markets SA €100,000 1.13% 11/4/2024 122,255 0.01%Iberdrola Finanzas SA €100,000 1.00% 7/3/2024 122,230 0.01%Banco Bilbao Vizcaya Argentaria SA €100,000 0.75% 4/6/2025 122,169 0.01%Santander Consumer Finance SA €100,000 1.13% 9/10/2023 122,167 0.01%Iberdrola International BV €100,000 1.13% 27/1/2023 121,308 0.01%Amadeus IT Group SA €100,000 0.88% 18/9/2023 120,712 0.01%FCC Servicios Medio Ambiente Holding SAU €100,000 0.82% 4/12/2023 120,578 0.01%Kutxabank SA €100,000 0.50% 25/9/2024 120,282 0.01%test - - - 32,709,125 2.05%Sweden 1.31% (2020: 1.36%)Telia Co. AB €800,000 3.88% 1/10/2025 1,106,066 0.07%Telia Co. AB €700,000 3.63% 14/2/2024 912,907 0.06%Svenska Handelsbanken AB €710,000 1.00% 15/4/2025 879,734 0.05%Akelius Residential Property AB €700,000 1.75% 7/2/2025 875,291 0.05%Swedbank AB $800,000 1.30% 2/6/2023 812,321 0.05%Svenska Handelsbanken AB £500,000 2.75% 5/12/2022 714,242 0.04%Svenska Handelsbanken AB $695,000 0.63% 30/6/2023 698,150 0.04%Molnlycke Holding AB €500,000 1.88% 28/2/2025 630,386 0.04%Samhallsbyggnadsbolaget i Norden AB €500,000 1.75% 14/1/2025 621,360 0.04%Alfa Laval Treasury International AB €500,000 1.38% 12/9/2022 601,933 0.04%Scania CV AB €500,000 0.50% 6/10/2023 600,135 0.04%Skandinaviska Enskilda Banken AB €500,000 0.25% 19/5/2023 599,446 0.04%Swedbank AB €500,000 0.25% 7/11/2022 598,425 0.04%Skandinaviska Enskilda Banken AB €500,000 0.05% 1/7/2024 598,091 0.04%Volvo Treasury AB €500,000 0.00% 11/2/2023 595,712 0.04%Lansforsakringar Bank AB €500,000 0.05% 15/4/2026 590,668 0.04%Svenska Handelsbanken AB^ €456,000 1.63% 5/3/2029 561,691 0.03%Skandinaviska Enskilda Banken AB $475,000 2.20% 12/12/2022 487,668 0.03%Svenska Handelsbanken AB €400,000 1.13% 14/12/2022 485,364 0.03%Swedbank AB €400,000 0.25% 9/10/2024 478,389 0.03%Skandinaviska Enskilda Banken AB $400,000 0.85% 2/9/2025 396,373 0.02%Swedbank AB^ €320,000 0.30% 20/5/2027 379,658 0.02%Fastighets AB Balder €300,000 1.88% 14/3/2025 373,905 0.02%Essity AB €300,000 1.13% 5/3/2025 370,007 0.02%Akelius Residential Property AB €300,000 1.13% 14/3/2024 365,567 0.02%Svenska Handelsbanken AB €300,000 0.50% 21/3/2023 361,254 0.02%Svenska Handelsbanken AB €300,000 0.13% 18/6/2024 359,775 0.02%Swedbank AB €300,000 0.30% 6/9/2022 358,887 0.02%Skandinaviska Enskilda Banken AB $300,000 0.55% 1/9/2023 300,074 0.02%Svenska Handelsbanken AB £200,000 1.63% 15/12/2023 284,006 0.02%Skandinaviska Enskilda Banken AB £200,000 1.25% 5/8/2022 279,175 0.02%Svenska Handelsbanken AB $250,000 3.90% 20/11/2023 270,894 0.02%Scania CV AB €200,000 2.25% 3/6/2025 256,619 0.02%Svenska Handelsbanken AB^ $250,000 1.42% 11/6/2027 249,251 0.02%Svenska Handelsbanken AB $250,000 0.55% 11/6/2024 248,926 0.02%Svenska Handelsbanken AB €200,000 2.63% 23/8/2022 245,647 0.02%Securitas AB €200,000 1.13% 20/2/2024 243,926 0.02%Svenska Handelsbanken AB^ €200,000 1.25% 2/3/2028 241,891 0.01%Skandinaviska Enskilda Banken AB €200,000 0.50% 13/3/2023 240,847 0.01%Swedbank AB^ €200,000 1.00% 22/11/2027 240,035 0.01%Swedbank AB $200,000 0.85% 18/3/2024 200,692 0.01%

825
Vanguard Global Short-Term Corporate Bond Index Fund
Principal CouponMaturity
DateFair Value
US Dollars ($)% of Total
Net AssetsSwedbank AB £100,000 1.63% 28/12/2022 140,672 0.01%Investor AB €100,000 4.50% 12/5/2023 129,292 0.01%Sagax AB €100,000 2.25% 13/3/2025 126,016 0.01%Castellum AB €100,000 2.13% 20/11/2023 124,345 0.01%Telia Co. AB^ €100,000 3.00% 4/4/2078 123,991 0.01%Heimstaden Bostad AB €100,000 2.13% 5/9/2023 123,867 0.01%Tele2 AB €100,000 1.13% 15/5/2024 122,200 0.01%Lansforsakringar Bank AB €100,000 0.88% 25/9/2023 121,522 0.01%Autoliv, Inc. €100,000 0.75% 26/6/2023 120,322 0.01%test - - - 20,847,615 1.31%Switzerland 2.55% (2020: 2.34%)Novartis Finance SA €1,200,000 0.13% 20/9/2023 1,437,967 0.09%UBS Group AG1 $1,200,000 4.13% 24/9/2025 1,337,938 0.08%Credit Suisse Group AG^ €1,000,000 3.25% 2/4/2026 1,307,377 0.08%Aquarius & Investments PLC for Zurich Insurance Co., Ltd.^ €900,000 4.25% 2/10/2043 1,166,691 0.07%Credit Suisse AG1 $1,075,000 1.00% 5/5/2023 1,085,954 0.07%Credit Suisse AG €900,000 0.25% 5/1/2026 1,071,020 0.07%UBS Group AG^ $965,000 1.01% 30/7/2024 971,757 0.06%Novartis Capital Corp. $894,000 3.00% 20/11/2025 969,885 0.06%Credit Suisse Group AG^ $880,000 2.59% 11/9/2025 915,814 0.06%Richemont International Holding SA €700,000 1.00% 26/3/2026 869,576 0.05%UBS Group AG^ €700,000 0.25% 29/1/2026 833,385 0.05%Nestle Finance International Ltd. €700,000 0.00% 14/6/2026 832,588 0.05%Argentum Netherlands BV for Swiss Life AG^ €600,000 4.38% Perpetual 804,053 0.05%Credit Suisse AG $750,000 2.95% 9/4/2025 803,675 0.05%ELM BV for Swiss Reinsurance Co., Ltd.^ €600,000 2.60% Perpetual 765,050 0.05%Glencore Finance Europe Ltd. €600,000 1.88% 13/9/2023 737,495 0.05%UBS AG €600,000 0.75% 21/4/2023 724,720 0.05%Glencore Funding LLC $600,000 4.63% 29/4/2024 658,757 0.04%Credit Suisse Group AG $600,000 3.75% 26/3/2025 650,765 0.04%Novartis Capital Corp. $600,000 3.40% 6/5/2024 647,187 0.04%Coca-Cola HBC Finance BV €500,000 1.88% 11/11/2024 632,962 0.04%Argentum Netherlands BV for Givaudan SA €500,000 1.13% 17/9/2025 621,454 0.04%Roche Finance Europe BV €500,000 0.88% 25/2/2025 616,056 0.04%UBS Group AG €500,000 1.50% 30/11/2024 615,495 0.04%Credit Suisse AG €500,000 1.00% 7/6/2023 606,753 0.04%Credit Suisse Group AG^ €500,000 1.00% 24/6/2027 604,960 0.04%ABB Finance BV €500,000 0.63% 3/5/2023 601,626 0.04%Roche Holdings, Inc. $600,000 0.99% 5/3/2026 597,983 0.04%Credit Suisse AG $550,000 3.63% 9/9/2024 597,293 0.04%Tyco Electronics Group SA €500,000 0.00% 14/2/2025 594,589 0.04%Glencore Funding LLC $550,000 4.13% 30/5/2023 584,978 0.04%Credit Suisse Group Funding Guernsey Ltd. $550,000 3.80% 15/9/2022 571,914 0.04%UBS Group AG^ $550,000 2.86% 15/8/2023 564,211 0.03%Credit Suisse Group AG^ $575,000 1.31% 2/2/2027 563,251 0.03%Credit Suisse Group AG CHF500,000 1.00% 14/4/2023 550,766 0.03%Credit Suisse Group AG $466,000 4.55% 17/4/2026 527,365 0.03%UBS Group AG $500,000 3.49% 23/5/2023 513,424 0.03%Nestle Finance International Ltd. €400,000 1.13% 1/4/2026 501,686 0.03%UBS AG $500,000 0.38% 1/6/2023 499,300 0.03%Roche Holdings, Inc. $500,000 0.45% 5/3/2024 498,676 0.03%Credit Suisse Group AG^ €400,000 1.25% 17/7/2025 487,072 0.03%Holcim Finance Luxembourg SA €400,000 1.38% 26/5/2023 486,995 0.03%Nestle Finance International Ltd. €400,000 0.38% 18/1/2024 481,850 0.03%Nestle Finance International Ltd. €400,000 0.00% 12/11/2024 478,092 0.03%Credit Suisse Group AG $465,000 3.57% 9/1/2023 472,321 0.03%Credit Suisse Group AG^ £300,000 2.13% 12/9/2025 425,329 0.03%Cloverie PLC for Swiss Reinsurance Co., Ltd.^ €300,000 6.63% 1/9/2042 383,077 0.02%UBS AG €300,000 0.63% 23/1/2023 360,802 0.02%Nestle Finance International Ltd. €300,000 0.00% 3/12/2025 357,889 0.02%UBS AG €300,000 0.01% 31/3/2026 355,295 0.02%Cloverie plc for Zurich Insurance Co., Ltd.^ $300,000 5.63% 24/6/2046 347,702 0.02%UBS Group AG^ $350,000 1.36% 30/1/2027 347,700 0.02%Novartis Capital Corp. $325,000 2.40% 21/9/2022 333,339 0.02%Credit Suisse Group AG^ $300,000 4.21% 12/6/2024 319,469 0.02%Glencore Finance Canada Ltd. $300,000 4.25% 25/10/2022 313,987 0.02%Credit Suisse Group AG £200,000 2.75% 8/8/2025 291,745 0.02%Credit Suisse Group AG^ $275,000 2.19% 5/6/2026 281,522 0.02%Credit Suisse Group AG $250,000 3.80% 9/6/2023 264,759 0.02%Credit Suisse Group AG^ $250,000 3.00% 14/12/2023 258,120 0.02%Holcim Finance Luxembourg SA €200,000 2.38% 9/4/2025 257,376 0.02%

826
Vanguard Global Short-Term Corporate Bond Index Fund
Principal CouponMaturity
DateFair Value
US Dollars ($)% of Total
Net AssetsArgentum Netherlands BV for Swiss Re Ltd.^ $250,000 4.63% Perpetual 256,700 0.02%UBS Group AG €200,000 2.13% 4/3/2024 251,475 0.02%Credit Suisse AG $250,000 0.50% 2/2/2024 249,095 0.02%UBS Group AG^ €200,000 1.25% 17/4/2025 245,428 0.01%ABB Finance BV €200,000 0.75% 16/5/2024 242,886 0.01%Roche Finance Europe BV €200,000 0.50% 27/2/2023 240,387 0.01%Cloverie plc for Swiss Reinsurance Co., Ltd.^ $200,000 4.50% 11/9/2044 216,433 0.01%Roche Holdings, Inc. $200,000 3.35% 30/9/2024 215,627 0.01%Swiss Re Finance Luxembourg SA^ $200,000 4.25% Perpetual 211,416 0.01%UBS AG $200,000 0.45% 9/2/2024 198,930 0.01%Zurich Finance Australia Ltd. AU($)200,000 3.48% 31/5/2023 157,958 0.01%Glencore Funding LLC $150,000 3.00% 27/10/2022 154,357 0.01%Novartis Capital Corp. $145,000 1.75% 14/2/2025 149,661 0.01%Zurich Finance UK plc^ £100,000 6.63% Perpetual 147,863 0.01%Adecco International Financial Services BV €100,000 1.00% 2/12/2024 123,175 0.01%Swiss Re Finance UK plc €100,000 1.38% 27/5/2023 122,033 0.01%Swiss Re Finance Luxembourg SA^ $100,000 5.00% 2/4/2049 114,125 0.01%Tyco Electronics Group SA $100,000 3.45% 1/8/2024 107,098 0.01%test - - - 40,765,484 2.55%Taiwan 0.08% (2020: 0.06%)TSMC Global Ltd. $700,000 0.75% 28/9/2025 685,695 0.04%Formosa Group Cayman Ltd. $300,000 3.38% 22/4/2025 318,075 0.02%Competition Team Technologies Ltd. $200,000 3.75% 12/3/2024 214,228 0.02%test - - - 1,217,998 0.08%Thailand 0.08% (2020: 0.09%)Siam Commercial Bank PCL $200,000 3.90% 11/2/2024 214,738 0.02%Kasikornbank PCL $200,000 3.26% 12/7/2023 209,830 0.02%Bangkok Bank PCL $200,000 3.88% 27/9/2022 207,755 0.01%PTT Global Chemical PCL $200,000 4.25% 19/9/2022 207,594 0.01%Siam Commercial Bank PCL $200,000 2.75% 16/5/2023 207,164 0.01%Minor International PCL^ $200,000 3.10% Perpetual 203,349 0.01%test - - - 1,250,430 0.08%United Arab Emirates 0.16% (2020: 0.17%)Mashreqbank PSC $400,000 4.25% 26/2/2024 428,868 0.03%DIB Sukuk Ltd. $400,000 2.95% 16/1/2026 418,061 0.03%BOS Funding Ltd. $400,000 4.00% 18/9/2024 413,285 0.03%MAF Global Securities Ltd. $350,000 4.75% 7/5/2024 381,676 0.03%SIB Sukuk Co. III Ltd. $200,000 4.23% 18/4/2023 211,266 0.01%DIB Sukuk Ltd. $200,000 2.95% 20/2/2025 209,446 0.01%Esic Sukuk Ltd. $200,000 3.94% 30/7/2024 209,246 0.01%DIB Sukuk Ltd. $200,000 3.63% 6/2/2023 208,466 0.01%test - - - 2,480,314 0.16%United Kingdom 8.19% (2020: 8.63%)HSBC Holdings plc1 $2,900,000 4.30% 8/3/2026 3,273,705 0.20%Lloyds Banking Group plc^ $1,750,000 2.91% 7/11/2023 1,804,619 0.11%BAT Capital Corp. $1,550,000 3.22% 15/8/2024 1,646,509 0.10%WPP Finance 2016 €1,300,000 1.38% 20/3/2025 1,618,046 0.10%Standard Chartered plc^ $1,400,000 2.82% 30/1/2026 1,469,338 0.09%HSBC Holdings plc^ $1,375,000 2.63% 7/11/2025 1,443,228 0.09%BP Capital Markets plc €1,000,000 2.97% 27/2/2026 1,344,407 0.08%Barclays plc^ €1,000,000 3.38% 2/4/2025 1,292,069 0.08%Phoenix Group Holdings plc £900,000 4.13% 20/7/2022 1,285,908 0.08%HSBC Holdings plc^ $1,250,000 0.98% 24/5/2025 1,249,325 0.08%Unilever Finance Netherlands BV €1,000,000 1.25% 25/3/2025 1,249,087 0.08%Reckitt Benckiser Treasury Services plc $1,170,000 2.75% 26/6/2024 1,235,670 0.08%HSBC Holdings plc^ €1,000,000 0.31% 13/11/2026 1,190,288 0.07%HSBC Holdings plc^ $1,050,000 4.29% 12/9/2026 1,168,596 0.07%Vodafone Group plc €950,000 0.50% 30/1/2024 1,146,654 0.07%Natwest Group plc^ $1,025,000 4.27% 22/3/2025 1,112,224 0.07%Santander UK Group Holdings plc^ €900,000 0.39% 28/2/2025 1,077,109 0.07%Lloyds Banking Group plc1 $946,000 4.58% 10/12/2025 1,063,012 0.07%HSBC Holdings plc €800,000 3.00% 30/6/2025 1,049,886 0.07%Natwest Group plc^ €800,000 1.75% 2/3/2026 999,856 0.06%Nationwide Building Society^ €800,000 2.00% 25/7/2029 998,250 0.06%Nationwide Building Society^ $950,000 3.77% 8/3/2024 997,606 0.06%HSBC Holdings plc^ €800,000 1.50% 4/12/2024 985,414 0.06%Natwest Group plc^ $925,000 2.36% 22/5/2024 953,180 0.06%Reynolds American, Inc. $850,000 4.45% 12/6/2025 942,365 0.06%Barclays plc $861,000 3.65% 16/3/2025 933,691 0.06%HSBC Holdings plc ¥100,000,000 0.84% 26/9/2023 909,632 0.06%BAT Netherlands Finance BV €700,000 2.38% 7/10/2024 887,255 0.06%
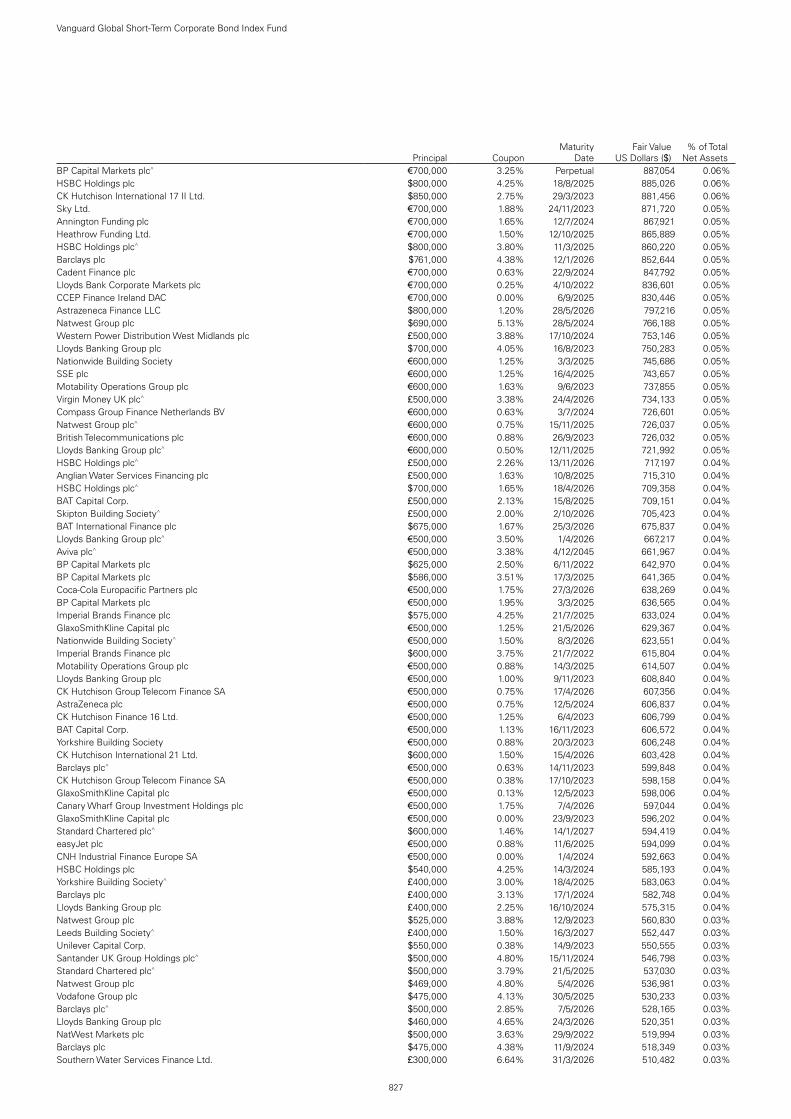
827
Vanguard Global Short-Term Corporate Bond Index Fund
Principal CouponMaturity
DateFair Value
US Dollars ($)% of Total
Net AssetsBP Capital Markets plc^ €700,000 3.25% Perpetual 887,054 0.06%HSBC Holdings plc $800,000 4.25% 18/8/2025 885,026 0.06%CK Hutchison International 17 II Ltd. $850,000 2.75% 29/3/2023 881,456 0.06%Sky Ltd. €700,000 1.88% 24/11/2023 871,720 0.05%Annington Funding plc €700,000 1.65% 12/7/2024 867,921 0.05%Heathrow Funding Ltd. €700,000 1.50% 12/10/2025 865,889 0.05%HSBC Holdings plc^ $800,000 3.80% 11/3/2025 860,220 0.05%Barclays plc $761,000 4.38% 12/1/2026 852,644 0.05%Cadent Finance plc €700,000 0.63% 22/9/2024 847,792 0.05%Lloyds Bank Corporate Markets plc €700,000 0.25% 4/10/2022 836,601 0.05%CCEP Finance Ireland DAC €700,000 0.00% 6/9/2025 830,446 0.05%Astrazeneca Finance LLC $800,000 1.20% 28/5/2026 797,216 0.05%Natwest Group plc $690,000 5.13% 28/5/2024 766,188 0.05%Western Power Distribution West Midlands plc £500,000 3.88% 17/10/2024 753,146 0.05%Lloyds Banking Group plc $700,000 4.05% 16/8/2023 750,283 0.05%Nationwide Building Society €600,000 1.25% 3/3/2025 745,686 0.05%SSE plc €600,000 1.25% 16/4/2025 743,657 0.05%Motability Operations Group plc €600,000 1.63% 9/6/2023 737,855 0.05%Virgin Money UK plc^ £500,000 3.38% 24/4/2026 734,133 0.05%Compass Group Finance Netherlands BV €600,000 0.63% 3/7/2024 726,601 0.05%Natwest Group plc^ €600,000 0.75% 15/11/2025 726,037 0.05%British Telecommunications plc €600,000 0.88% 26/9/2023 726,032 0.05%Lloyds Banking Group plc^ €600,000 0.50% 12/11/2025 721,992 0.05%HSBC Holdings plc^ £500,000 2.26% 13/11/2026 717,197 0.04%Anglian Water Services Financing plc £500,000 1.63% 10/8/2025 715,310 0.04%HSBC Holdings plc^ $700,000 1.65% 18/4/2026 709,358 0.04%BAT Capital Corp. £500,000 2.13% 15/8/2025 709,151 0.04%Skipton Building Society^ £500,000 2.00% 2/10/2026 705,423 0.04%BAT International Finance plc $675,000 1.67% 25/3/2026 675,837 0.04%Lloyds Banking Group plc^ €500,000 3.50% 1/4/2026 667,217 0.04%Aviva plc^ €500,000 3.38% 4/12/2045 661,967 0.04%BP Capital Markets plc $625,000 2.50% 6/11/2022 642,970 0.04%BP Capital Markets plc $586,000 3.51% 17/3/2025 641,365 0.04%Coca-Cola Europacific Partners plc €500,000 1.75% 27/3/2026 638,269 0.04%BP Capital Markets plc €500,000 1.95% 3/3/2025 636,565 0.04%Imperial Brands Finance plc $575,000 4.25% 21/7/2025 633,024 0.04%GlaxoSmithKline Capital plc €500,000 1.25% 21/5/2026 629,367 0.04%Nationwide Building Society^ €500,000 1.50% 8/3/2026 623,551 0.04%Imperial Brands Finance plc $600,000 3.75% 21/7/2022 615,804 0.04%Motability Operations Group plc €500,000 0.88% 14/3/2025 614,507 0.04%Lloyds Banking Group plc €500,000 1.00% 9/11/2023 608,840 0.04%CK Hutchison Group Telecom Finance SA €500,000 0.75% 17/4/2026 607,356 0.04%AstraZeneca plc €500,000 0.75% 12/5/2024 606,837 0.04%CK Hutchison Finance 16 Ltd. €500,000 1.25% 6/4/2023 606,799 0.04%BAT Capital Corp. €500,000 1.13% 16/11/2023 606,572 0.04%Yorkshire Building Society €500,000 0.88% 20/3/2023 606,248 0.04%CK Hutchison International 21 Ltd. $600,000 1.50% 15/4/2026 603,428 0.04%Barclays plc^ €500,000 0.63% 14/11/2023 599,848 0.04%CK Hutchison Group Telecom Finance SA €500,000 0.38% 17/10/2023 598,158 0.04%GlaxoSmithKline Capital plc €500,000 0.13% 12/5/2023 598,006 0.04%Canary Wharf Group Investment Holdings plc €500,000 1.75% 7/4/2026 597,044 0.04%GlaxoSmithKline Capital plc €500,000 0.00% 23/9/2023 596,202 0.04%Standard Chartered plc^ $600,000 1.46% 14/1/2027 594,419 0.04%easyJet plc €500,000 0.88% 11/6/2025 594,099 0.04%CNH Industrial Finance Europe SA €500,000 0.00% 1/4/2024 592,663 0.04%HSBC Holdings plc $540,000 4.25% 14/3/2024 585,193 0.04%Yorkshire Building Society^ £400,000 3.00% 18/4/2025 583,063 0.04%Barclays plc £400,000 3.13% 17/1/2024 582,748 0.04%Lloyds Banking Group plc £400,000 2.25% 16/10/2024 575,315 0.04%Natwest Group plc $525,000 3.88% 12/9/2023 560,830 0.03%Leeds Building Society^ £400,000 1.50% 16/3/2027 552,447 0.03%Unilever Capital Corp. $550,000 0.38% 14/9/2023 550,555 0.03%Santander UK Group Holdings plc^ $500,000 4.80% 15/11/2024 546,798 0.03%Standard Chartered plc^ $500,000 3.79% 21/5/2025 537,030 0.03%Natwest Group plc $469,000 4.80% 5/4/2026 536,981 0.03%Vodafone Group plc $475,000 4.13% 30/5/2025 530,233 0.03%Barclays plc^ $500,000 2.85% 7/5/2026 528,165 0.03%Lloyds Banking Group plc $460,000 4.65% 24/3/2026 520,351 0.03%NatWest Markets plc $500,000 3.63% 29/9/2022 519,994 0.03%Barclays plc $475,000 4.38% 11/9/2024 518,349 0.03%Southern Water Services Finance Ltd. £300,000 6.64% 31/3/2026 510,482 0.03%

828
Vanguard Global Short-Term Corporate Bond Index Fund
Principal CouponMaturity
DateFair Value
US Dollars ($)% of Total
Net AssetsBarclays plc^ $500,000 1.01% 10/12/2024 501,866 0.03%Phoenix Group Holdings plc £300,000 6.63% 18/12/2025 500,639 0.03%Santander UK Group Holdings plc^ $500,000 1.67% 14/6/2027 499,061 0.03%Nationwide Building Society $500,000 1.00% 28/8/2025 497,518 0.03%Vodafone Group plc €400,000 1.13% 20/11/2025 497,001 0.03%Barclays plc €400,000 1.50% 3/9/2023 491,753 0.03%Lloyds Banking Group plc $435,000 4.45% 8/5/2025 487,951 0.03%DS Smith plc €400,000 2.25% 16/9/2022 485,065 0.03%Imperial Brands Finance plc €400,000 1.13% 14/8/2023 484,133 0.03%Barclays plc^ €400,000 0.75% 9/6/2025 482,590 0.03%AstraZeneca plc $438,000 3.38% 16/11/2025 479,650 0.03%National Grid Electricity Transmission plc €400,000 0.19% 20/1/2025 477,743 0.03%Legal & General Group plc^ £300,000 5.38% 27/10/2045 477,479 0.03%Anglian Water Services Financing plc £300,000 4.50% 22/2/2026 476,159 0.03%RSA Insurance Group Ltd.^ £300,000 5.13% 10/10/2045 473,334 0.03%Standard Chartered plc $450,000 3.95% 11/1/2023 469,489 0.03%Yorkshire Building Society £300,000 3.50% 21/4/2026 462,806 0.03%HSBC Bank plc £300,000 6.50% 7/7/2023 461,012 0.03%Lloyds Banking Group plc^ $425,000 3.87% 9/7/2025 460,537 0.03%Barclays plc^ $425,000 3.93% 7/5/2025 458,556 0.03%Barclays plc $450,000 3.68% 10/1/2023 457,633 0.03%Barclays plc^ £300,000 3.75% 22/11/2030 447,939 0.03%Vodafone Group plc $412,000 3.75% 16/1/2024 446,095 0.03%BUPA Finance plc £300,000 5.00% 25/4/2023 444,619 0.03%Heathrow Funding Ltd. £300,000 5.23% 15/2/2023 443,443 0.03%Sky Ltd. $400,000 3.75% 16/9/2024 437,154 0.03%Annington Funding plc £300,000 2.65% 12/7/2025 436,726 0.03%Virgin Money UK plc^ £300,000 3.13% 22/6/2025 434,869 0.03%HSBC Holdings plc^ $400,000 3.95% 18/5/2024 424,778 0.03%Coventry Building Society £300,000 1.50% 23/1/2023 419,908 0.03%HSBC Holdings plc^ £300,000 1.75% 24/7/2027 419,038 0.03%Nationwide Building Society £300,000 1.00% 24/1/2023 417,883 0.03%Lloyds Banking Group plc^ €300,000 4.50% 18/3/2030 406,449 0.03%Standard Chartered plc^ $400,000 1.21% 23/3/2025 401,978 0.02%Santander UK Group Holdings plc^ $400,000 1.53% 21/8/2026 400,743 0.02%Standard Chartered plc^ $400,000 0.99% 12/1/2025 399,061 0.02%Sky Ltd. €300,000 2.25% 17/11/2025 390,714 0.02%Standard Chartered plc^ €300,000 2.50% 9/9/2030 377,693 0.02%CNH Industrial NV $350,000 4.50% 15/8/2023 377,349 0.02%BP Capital Markets plc €300,000 1.88% 7/4/2024 375,872 0.02%LSEGA Financing plc $375,000 1.38% 6/4/2026 375,644 0.02%Aptiv plc €300,000 1.50% 10/3/2025 372,489 0.02%CK Hutchison Europe Finance 18 Ltd. €300,000 1.25% 13/4/2025 371,409 0.02%SSE plc €300,000 1.75% 8/9/2023 370,966 0.02%BP Capital Markets plc €300,000 1.08% 26/6/2025 370,465 0.02%Diageo Finance plc €300,000 1.00% 22/4/2025 370,340 0.02%Aviva plc^ £250,000 6.13% Perpetual 367,540 0.02%London Stock Exchange Group plc €300,000 0.88% 19/9/2024 366,510 0.02%CK Hutchison Finance 16 II Ltd. €300,000 0.88% 3/10/2024 365,464 0.02%Yorkshire Building Society €300,000 0.63% 21/9/2025 364,324 0.02%Santander UK plc $355,000 2.10% 13/1/2023 364,230 0.02%British Telecommunications plc €300,000 1.13% 10/3/2023 363,849 0.02%Sky Ltd. $350,000 3.13% 26/11/2022 363,273 0.02%Barclays plc^ €300,000 1.13% 22/3/2031 357,721 0.02%GlaxoSmithKline Capital plc $350,000 0.53% 1/10/2023 350,550 0.02%Nationwide Building Society $350,000 0.55% 22/1/2024 348,520 0.02%Natwest Group plc $300,000 6.00% 19/12/2023 336,361 0.02%Gatwick Funding Ltd. £200,000 6.13% 2/3/2026 331,220 0.02%Reckitt Benckiser Treasury Services plc $325,000 2.38% 24/6/2022 331,193 0.02%Barclays plc $284,000 5.20% 12/5/2026 325,082 0.02%BP Capital Markets plc $300,000 3.81% 10/2/2024 324,570 0.02%HSBC Holdings plc £200,000 6.50% 20/5/2024 320,145 0.02%Pension Insurance Corp. plc £200,000 6.50% 3/7/2024 316,823 0.02%Severn Trent Utilities Finance plc £200,000 3.63% 16/1/2026 308,475 0.02%Society of Lloyd's £200,000 4.75% 30/10/2024 306,085 0.02%GlaxoSmithKline Capital, Inc. $275,000 3.63% 15/5/2025 303,400 0.02%Northumbrian Water Finance plc £200,000 6.88% 6/2/2023 303,400 0.02%Standard Chartered plc^ $300,000 1.32% 14/10/2023 302,575 0.02%Southern Gas Networks plc £200,000 4.88% 5/10/2023 301,872 0.02%Scottish Widows Ltd. £200,000 5.50% 16/6/2023 299,958 0.02%Heathrow Funding Ltd. £190,000 7.13% 14/2/2024 299,875 0.02%

829
Vanguard Global Short-Term Corporate Bond Index Fund
Principal CouponMaturity
DateFair Value
US Dollars ($)% of Total
Net AssetsAstraZeneca plc $300,000 0.30% 26/5/2023 299,159 0.02%CPUK Finance Ltd. £200,000 3.59% 28/8/2025 298,739 0.02%Natwest Group plc^ £200,000 3.62% 14/8/2030 294,788 0.02%Coventry Building Society £200,000 5.88% 28/9/2022 294,005 0.02%AstraZeneca plc $300,000 0.70% 8/4/2026 292,286 0.02%Santander UK plc $275,000 2.88% 18/6/2024 292,097 0.02%Southern Gas Networks plc £200,000 2.50% 3/2/2025 291,878 0.02%Experian Finance plc £200,000 2.13% 27/9/2024 286,959 0.02%Natwest Group plc^ $267,000 3.75% 1/11/2029 284,060 0.02%Lloyds Banking Group plc^ £200,000 1.88% 15/1/2026 283,004 0.02%Santander UK Group Holdings plc $250,000 4.75% 15/9/2025 280,451 0.02%Santander UK plc $250,000 5.00% 7/11/2023 273,192 0.02%Standard Chartered plc^ $250,000 3.52% 12/2/2030 262,689 0.02%Rio Tinto Finance plc €200,000 2.88% 11/12/2024 262,390 0.02%Aviva plc^ €200,000 3.88% 3/7/2044 261,777 0.02%Tesco Corporate Treasury Services plc €200,000 2.50% 1/7/2024 254,979 0.02%Royal Mail plc €200,000 2.38% 29/7/2024 254,058 0.02%Lloyds Banking Group plc $229,000 4.50% 4/11/2024 253,123 0.02%Informa plc €200,000 2.13% 6/10/2025 252,720 0.02%Linde Finance BV €200,000 1.88% 22/5/2024 252,013 0.02%Natwest Group plc^ €200,000 2.00% 4/3/2025 249,420 0.02%RELX Capital, Inc. €200,000 1.30% 12/5/2025 248,779 0.02%Linde Finance BV €200,000 2.00% 18/4/2023 247,277 0.02%Tesco Corporate Treasury Services plc €200,000 1.38% 24/10/2023 244,539 0.02%British Telecommunications plc €200,000 1.00% 21/11/2024 244,231 0.02%Barclays plc^ €200,000 2.00% 7/2/2028 243,176 0.01%Unilever Finance Netherlands BV1 €200,000 0.50% 12/8/2023 241,397 0.01%easyJet plc €200,000 1.13% 18/10/2023 241,380 0.01%Babcock International Group plc €200,000 1.75% 6/10/2022 241,213 0.01%Nationwide Building Society €200,000 0.25% 22/7/2025 239,568 0.01%Diageo Finance plc €200,000 0.13% 12/10/2023 239,094 0.01%RELX Finance BV €200,000 0.00% 18/3/2024 238,126 0.01%Lloyds Banking Group plc^ $225,000 2.44% 5/2/2026 234,851 0.01%Unilever Capital Corp. $203,000 3.38% 22/3/2025 221,159 0.01%Anglian Water Services Financing plc £150,000 5.84% 30/7/2022 219,183 0.01%Reynolds American, Inc. $200,000 4.85% 15/9/2023 218,134 0.01%Imperial Brands Finance plc $200,000 3.50% 26/7/2026 214,590 0.01%Nationwide Building Society^ $200,000 4.36% 1/8/2024 214,472 0.01%Barclays plc^ $200,000 4.34% 16/5/2024 213,219 0.01%Reckitt Benckiser Treasury Services plc $200,000 3.63% 21/9/2023 211,976 0.01%GlaxoSmithKline Capital, Inc. $200,000 3.38% 15/5/2023 211,160 0.01%Standard Chartered plc^ $200,000 3.89% 15/3/2024 210,192 0.01%Diageo Capital plc $200,000 2.13% 24/10/2024 208,931 0.01%Santander UK Group Holdings plc^ $200,000 3.37% 5/1/2024 208,165 0.01%HSBC Holdings plc^ $200,000 3.03% 22/11/2023 207,160 0.01%SSE plc^ $200,000 4.75% 16/9/2077 207,055 0.01%Diageo Capital plc $200,000 1.38% 29/9/2025 203,289 0.01%Santander UK Group Holdings plc $200,000 3.57% 10/1/2023 203,194 0.01%HSBC Holdings plc CA($)235,000 3.20% 5/12/2023 198,874 0.01%BAT Capital Corp. $175,000 2.79% 6/9/2024 184,007 0.01%Lseg Netherlands BV €150,000 0.00% 6/4/2025 177,940 0.01%Lloyds Bank plc £100,000 7.50% 15/4/2024 163,921 0.01%Firstgroup plc £100,000 6.88% 18/9/2024 161,108 0.01%BAT International Finance plc £100,000 7.25% 12/3/2024 160,392 0.01%Eastern Power Networks plc £100,000 5.75% 8/3/2024 156,605 0.01%Thames Water Utilities Finance plc £100,000 4.00% 19/6/2025 154,544 0.01%Virgin Money UK plc^ £100,000 5.13% 11/12/2030 154,177 0.01%Rothesay Life plc^ £100,000 5.50% 17/9/2029 154,128 0.01%BAT Capital Corp. $150,000 2.76% 15/8/2022 153,532 0.01%RL Finance Bonds No. 2 plc^ £100,000 6.13% 30/11/2043 153,459 0.01%Gatwick Funding Ltd. £100,000 5.25% 23/1/2024 152,584 0.01%Linde Finance BV £100,000 5.88% 24/4/2023 151,769 0.01%Prudential plc £100,000 6.88% 20/1/2023 151,737 0.01%Manchester Airport Group Funding plc £100,000 4.13% 2/4/2024 149,442 0.01%London Power Networks plc £100,000 5.13% 31/3/2023 149,106 0.01%Informa plc £100,000 3.13% 5/7/2026 147,268 0.01%SSE plc £100,000 5.88% 22/9/2022 147,206 0.01%Tesco Corporate Treasury Services plc £100,000 2.50% 2/5/2025 145,861 0.01%Investec Bank plc^ £100,000 4.25% 24/7/2028 145,243 0.01%Liberty Living Finance plc £100,000 2.63% 28/11/2024 144,807 0.01%Tesco plc £100,000 6.13% 24/2/2022 143,273 0.01%
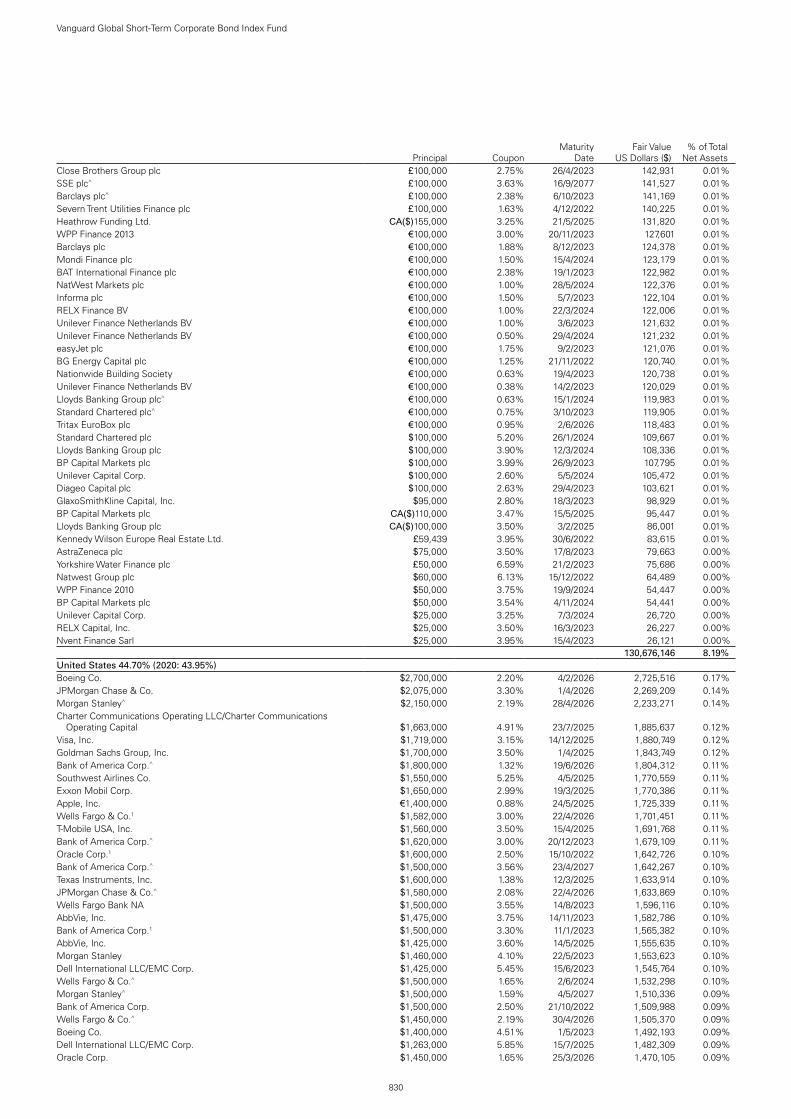
830
Vanguard Global Short-Term Corporate Bond Index Fund
Principal CouponMaturity
DateFair Value
US Dollars ($)% of Total
Net AssetsClose Brothers Group plc £100,000 2.75% 26/4/2023 142,931 0.01%SSE plc^ £100,000 3.63% 16/9/2077 141,527 0.01%Barclays plc^ £100,000 2.38% 6/10/2023 141,169 0.01%Severn Trent Utilities Finance plc £100,000 1.63% 4/12/2022 140,225 0.01%Heathrow Funding Ltd. CA($)155,000 3.25% 21/5/2025 131,820 0.01%WPP Finance 2013 €100,000 3.00% 20/11/2023 127,601 0.01%Barclays plc €100,000 1.88% 8/12/2023 124,378 0.01%Mondi Finance plc €100,000 1.50% 15/4/2024 123,179 0.01%BAT International Finance plc €100,000 2.38% 19/1/2023 122,982 0.01%NatWest Markets plc €100,000 1.00% 28/5/2024 122,376 0.01%Informa plc €100,000 1.50% 5/7/2023 122,104 0.01%RELX Finance BV €100,000 1.00% 22/3/2024 122,006 0.01%Unilever Finance Netherlands BV €100,000 1.00% 3/6/2023 121,632 0.01%Unilever Finance Netherlands BV €100,000 0.50% 29/4/2024 121,232 0.01%easyJet plc €100,000 1.75% 9/2/2023 121,076 0.01%BG Energy Capital plc €100,000 1.25% 21/11/2022 120,740 0.01%Nationwide Building Society €100,000 0.63% 19/4/2023 120,738 0.01%Unilever Finance Netherlands BV €100,000 0.38% 14/2/2023 120,029 0.01%Lloyds Banking Group plc^ €100,000 0.63% 15/1/2024 119,983 0.01%Standard Chartered plc^ €100,000 0.75% 3/10/2023 119,905 0.01%Tritax EuroBox plc €100,000 0.95% 2/6/2026 118,483 0.01%Standard Chartered plc $100,000 5.20% 26/1/2024 109,667 0.01%Lloyds Banking Group plc $100,000 3.90% 12/3/2024 108,336 0.01%BP Capital Markets plc $100,000 3.99% 26/9/2023 107,795 0.01%Unilever Capital Corp. $100,000 2.60% 5/5/2024 105,472 0.01%Diageo Capital plc $100,000 2.63% 29/4/2023 103,621 0.01%GlaxoSmithKline Capital, Inc. $95,000 2.80% 18/3/2023 98,929 0.01%BP Capital Markets plc CA($)110,000 3.47% 15/5/2025 95,447 0.01%Lloyds Banking Group plc CA($)100,000 3.50% 3/2/2025 86,001 0.01%Kennedy Wilson Europe Real Estate Ltd. £59,439 3.95% 30/6/2022 83,615 0.01%AstraZeneca plc $75,000 3.50% 17/8/2023 79,663 0.00%Yorkshire Water Finance plc £50,000 6.59% 21/2/2023 75,686 0.00%Natwest Group plc $60,000 6.13% 15/12/2022 64,489 0.00%WPP Finance 2010 $50,000 3.75% 19/9/2024 54,447 0.00%BP Capital Markets plc $50,000 3.54% 4/11/2024 54,441 0.00%Unilever Capital Corp. $25,000 3.25% 7/3/2024 26,720 0.00%RELX Capital, Inc. $25,000 3.50% 16/3/2023 26,227 0.00%Nvent Finance Sarl $25,000 3.95% 15/4/2023 26,121 0.00%test - - - 130,676,146 8.19%United States 44.70% (2020: 43.95%)Boeing Co. $2,700,000 2.20% 4/2/2026 2,725,516 0.17%JPMorgan Chase & Co. $2,075,000 3.30% 1/4/2026 2,269,209 0.14%Morgan Stanley^ $2,150,000 2.19% 28/4/2026 2,233,271 0.14%Charter Communications Operating LLC/Charter Communications
Operating Capital $1,663,000 4.91% 23/7/2025 1,885,637 0.12%Visa, Inc. $1,719,000 3.15% 14/12/2025 1,880,749 0.12%Goldman Sachs Group, Inc. $1,700,000 3.50% 1/4/2025 1,843,749 0.12%Bank of America Corp.^ $1,800,000 1.32% 19/6/2026 1,804,312 0.11%Southwest Airlines Co. $1,550,000 5.25% 4/5/2025 1,770,559 0.11%Exxon Mobil Corp. $1,650,000 2.99% 19/3/2025 1,770,386 0.11%Apple, Inc. €1,400,000 0.88% 24/5/2025 1,725,339 0.11%Wells Fargo & Co.1 $1,582,000 3.00% 22/4/2026 1,701,451 0.11%T-Mobile USA, Inc. $1,560,000 3.50% 15/4/2025 1,691,768 0.11%Bank of America Corp.^ $1,620,000 3.00% 20/12/2023 1,679,109 0.11%Oracle Corp.1 $1,600,000 2.50% 15/10/2022 1,642,726 0.10%Bank of America Corp.^ $1,500,000 3.56% 23/4/2027 1,642,267 0.10%Texas Instruments, Inc. $1,600,000 1.38% 12/3/2025 1,633,914 0.10%JPMorgan Chase & Co.^ $1,580,000 2.08% 22/4/2026 1,633,869 0.10%Wells Fargo Bank NA $1,500,000 3.55% 14/8/2023 1,596,116 0.10%AbbVie, Inc. $1,475,000 3.75% 14/11/2023 1,582,786 0.10%Bank of America Corp.1 $1,500,000 3.30% 11/1/2023 1,565,382 0.10%AbbVie, Inc. $1,425,000 3.60% 14/5/2025 1,555,635 0.10%Morgan Stanley $1,460,000 4.10% 22/5/2023 1,553,623 0.10%Dell International LLC/EMC Corp. $1,425,000 5.45% 15/6/2023 1,545,764 0.10%Wells Fargo & Co.^ $1,500,000 1.65% 2/6/2024 1,532,298 0.10%Morgan Stanley^ $1,500,000 1.59% 4/5/2027 1,510,336 0.09%Bank of America Corp. $1,500,000 2.50% 21/10/2022 1,509,988 0.09%Wells Fargo & Co.^ $1,450,000 2.19% 30/4/2026 1,505,370 0.09%Boeing Co. $1,400,000 4.51% 1/5/2023 1,492,193 0.09%Dell International LLC/EMC Corp. $1,263,000 5.85% 15/7/2025 1,482,309 0.09%Oracle Corp. $1,450,000 1.65% 25/3/2026 1,470,105 0.09%
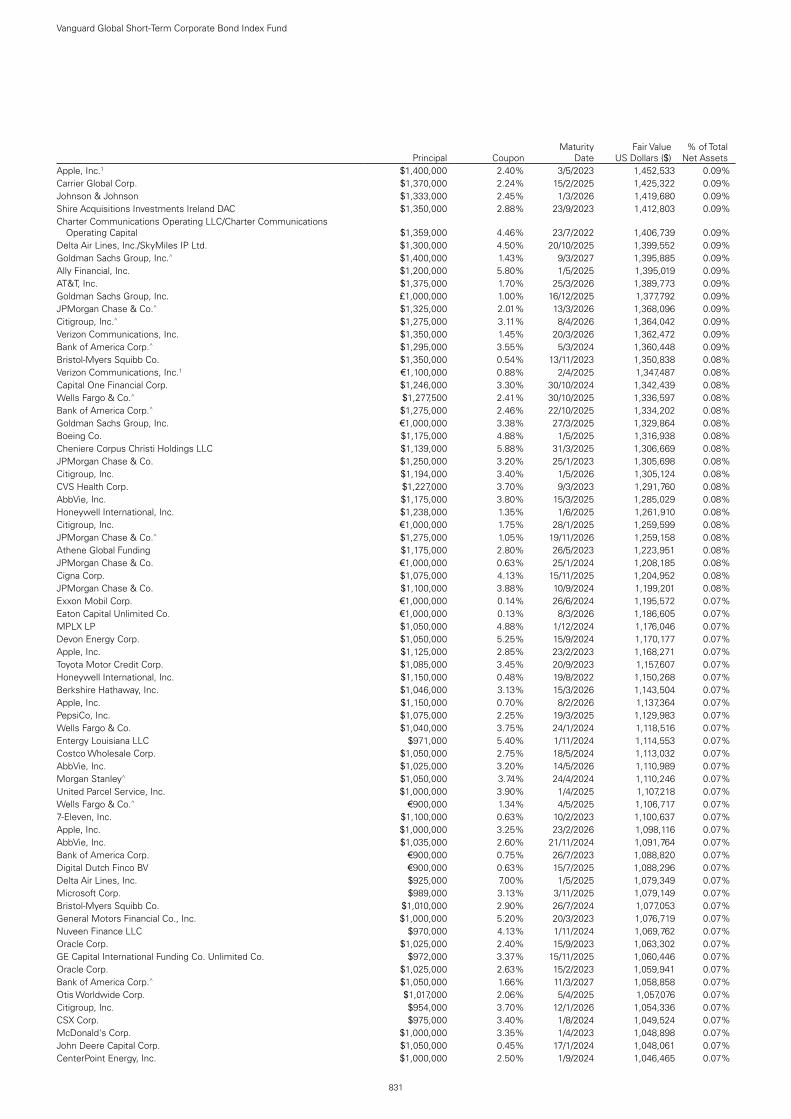
831
Vanguard Global Short-Term Corporate Bond Index Fund
Principal CouponMaturity
DateFair Value
US Dollars ($)% of Total
Net AssetsApple, Inc.1 $1,400,000 2.40% 3/5/2023 1,452,533 0.09%Carrier Global Corp. $1,370,000 2.24% 15/2/2025 1,425,322 0.09%Johnson & Johnson $1,333,000 2.45% 1/3/2026 1,419,680 0.09%Shire Acquisitions Investments Ireland DAC $1,350,000 2.88% 23/9/2023 1,412,803 0.09%Charter Communications Operating LLC/Charter Communications
Operating Capital $1,359,000 4.46% 23/7/2022 1,406,739 0.09%Delta Air Lines, Inc./SkyMiles IP Ltd. $1,300,000 4.50% 20/10/2025 1,399,552 0.09%Goldman Sachs Group, Inc.^ $1,400,000 1.43% 9/3/2027 1,395,885 0.09%Ally Financial, Inc. $1,200,000 5.80% 1/5/2025 1,395,019 0.09%AT&T, Inc. $1,375,000 1.70% 25/3/2026 1,389,773 0.09%Goldman Sachs Group, Inc. £1,000,000 1.00% 16/12/2025 1,377,792 0.09%JPMorgan Chase & Co.^ $1,325,000 2.01% 13/3/2026 1,368,096 0.09%Citigroup, Inc.^ $1,275,000 3.11% 8/4/2026 1,364,042 0.09%Verizon Communications, Inc. $1,350,000 1.45% 20/3/2026 1,362,472 0.09%Bank of America Corp.^ $1,295,000 3.55% 5/3/2024 1,360,448 0.09%Bristol-Myers Squibb Co. $1,350,000 0.54% 13/11/2023 1,350,838 0.08%Verizon Communications, Inc.1 €1,100,000 0.88% 2/4/2025 1,347,487 0.08%Capital One Financial Corp. $1,246,000 3.30% 30/10/2024 1,342,439 0.08%Wells Fargo & Co.^ $1,277,500 2.41% 30/10/2025 1,336,597 0.08%Bank of America Corp.^ $1,275,000 2.46% 22/10/2025 1,334,202 0.08%Goldman Sachs Group, Inc. €1,000,000 3.38% 27/3/2025 1,329,864 0.08%Boeing Co. $1,175,000 4.88% 1/5/2025 1,316,938 0.08%Cheniere Corpus Christi Holdings LLC $1,139,000 5.88% 31/3/2025 1,306,669 0.08%JPMorgan Chase & Co. $1,250,000 3.20% 25/1/2023 1,305,698 0.08%Citigroup, Inc. $1,194,000 3.40% 1/5/2026 1,305,124 0.08%CVS Health Corp. $1,227,000 3.70% 9/3/2023 1,291,760 0.08%AbbVie, Inc. $1,175,000 3.80% 15/3/2025 1,285,029 0.08%Honeywell International, Inc. $1,238,000 1.35% 1/6/2025 1,261,910 0.08%Citigroup, Inc. €1,000,000 1.75% 28/1/2025 1,259,599 0.08%JPMorgan Chase & Co.^ $1,275,000 1.05% 19/11/2026 1,259,158 0.08%Athene Global Funding $1,175,000 2.80% 26/5/2023 1,223,951 0.08%JPMorgan Chase & Co. €1,000,000 0.63% 25/1/2024 1,208,185 0.08%Cigna Corp. $1,075,000 4.13% 15/11/2025 1,204,952 0.08%JPMorgan Chase & Co. $1,100,000 3.88% 10/9/2024 1,199,201 0.08%Exxon Mobil Corp. €1,000,000 0.14% 26/6/2024 1,195,572 0.07%Eaton Capital Unlimited Co. €1,000,000 0.13% 8/3/2026 1,186,605 0.07%MPLX LP $1,050,000 4.88% 1/12/2024 1,176,046 0.07%Devon Energy Corp. $1,050,000 5.25% 15/9/2024 1,170,177 0.07%Apple, Inc. $1,125,000 2.85% 23/2/2023 1,168,271 0.07%Toyota Motor Credit Corp. $1,085,000 3.45% 20/9/2023 1,157,607 0.07%Honeywell International, Inc. $1,150,000 0.48% 19/8/2022 1,150,268 0.07%Berkshire Hathaway, Inc. $1,046,000 3.13% 15/3/2026 1,143,504 0.07%Apple, Inc. $1,150,000 0.70% 8/2/2026 1,137,364 0.07%PepsiCo, Inc. $1,075,000 2.25% 19/3/2025 1,129,983 0.07%Wells Fargo & Co. $1,040,000 3.75% 24/1/2024 1,118,516 0.07%Entergy Louisiana LLC $971,000 5.40% 1/11/2024 1,114,553 0.07%Costco Wholesale Corp. $1,050,000 2.75% 18/5/2024 1,113,032 0.07%AbbVie, Inc. $1,025,000 3.20% 14/5/2026 1,110,989 0.07%Morgan Stanley^ $1,050,000 3.74% 24/4/2024 1,110,246 0.07%United Parcel Service, Inc. $1,000,000 3.90% 1/4/2025 1,107,218 0.07%Wells Fargo & Co.^ €900,000 1.34% 4/5/2025 1,106,717 0.07%7-Eleven, Inc. $1,100,000 0.63% 10/2/2023 1,100,637 0.07%Apple, Inc. $1,000,000 3.25% 23/2/2026 1,098,116 0.07%AbbVie, Inc. $1,035,000 2.60% 21/11/2024 1,091,764 0.07%Bank of America Corp. €900,000 0.75% 26/7/2023 1,088,820 0.07%Digital Dutch Finco BV €900,000 0.63% 15/7/2025 1,088,296 0.07%Delta Air Lines, Inc. $925,000 7.00% 1/5/2025 1,079,349 0.07%Microsoft Corp. $989,000 3.13% 3/11/2025 1,079,149 0.07%Bristol-Myers Squibb Co. $1,010,000 2.90% 26/7/2024 1,077,053 0.07%General Motors Financial Co., Inc. $1,000,000 5.20% 20/3/2023 1,076,719 0.07%Nuveen Finance LLC $970,000 4.13% 1/11/2024 1,069,762 0.07%Oracle Corp. $1,025,000 2.40% 15/9/2023 1,063,302 0.07%GE Capital International Funding Co. Unlimited Co. $972,000 3.37% 15/11/2025 1,060,446 0.07%Oracle Corp. $1,025,000 2.63% 15/2/2023 1,059,941 0.07%Bank of America Corp.^ $1,050,000 1.66% 11/3/2027 1,058,858 0.07%Otis Worldwide Corp. $1,017,000 2.06% 5/4/2025 1,057,076 0.07%Citigroup, Inc. $954,000 3.70% 12/1/2026 1,054,336 0.07%CSX Corp. $975,000 3.40% 1/8/2024 1,049,524 0.07%McDonald's Corp. $1,000,000 3.35% 1/4/2023 1,048,898 0.07%John Deere Capital Corp. $1,050,000 0.45% 17/1/2024 1,048,061 0.07%CenterPoint Energy, Inc. $1,000,000 2.50% 1/9/2024 1,046,465 0.07%

832
Vanguard Global Short-Term Corporate Bond Index Fund
Principal CouponMaturity
DateFair Value
US Dollars ($)% of Total
Net AssetsAutoZone, Inc. $950,000 3.63% 15/4/2025 1,039,229 0.07%General Motors Financial Co., Inc. $950,000 4.00% 15/1/2025 1,035,043 0.06%Bristol-Myers Squibb Co. $925,000 3.88% 15/8/2025 1,029,320 0.06%Cigna Corp. $950,000 3.25% 15/4/2025 1,023,893 0.06%American Express Co. $1,000,000 2.50% 1/8/2022 1,021,388 0.06%Bank of America Corp.1 $900,000 4.45% 3/3/2026 1,020,882 0.06%Toyota Motor Credit Corp. $1,025,000 0.80% 16/10/2025 1,017,207 0.06%Bank of America Corp.^ $1,025,000 1.20% 24/10/2026 1,016,649 0.06%Viatris, Inc. $1,000,000 1.65% 22/6/2025 1,013,218 0.06%Lennar Corp. $900,000 4.75% 30/5/2025 1,010,311 0.06%Goldman Sachs Group, Inc. $925,000 4.00% 3/3/2024 1,004,752 0.06%Walmart, Inc. $945,000 3.40% 26/6/2023 1,000,744 0.06%Air Lease Corp. $950,000 2.88% 15/1/2026 999,158 0.06%JPMorgan Chase & Co.^ $1,000,000 0.82% 1/6/2025 997,837 0.06%International Business Machines Corp. $925,000 3.63% 12/2/2024 996,219 0.06%Danaher Corp. €800,000 1.70% 30/3/2024 995,039 0.06%Wells Fargo & Co. $886,000 4.10% 3/6/2026 995,039 0.06%Microsoft Corp. $935,000 2.88% 6/2/2024 989,377 0.06%VMware, Inc. $885,000 4.50% 15/5/2025 989,158 0.06%Morgan Stanley €800,000 1.88% 30/3/2023 984,091 0.06%International Business Machines Corp.1 €800,000 0.88% 31/1/2025 981,885 0.06%Bank of America Corp.1 $900,000 4.13% 22/1/2024 979,954 0.06%McDonald's Corp. €800,000 1.00% 15/11/2023 975,804 0.06%Fidelity National Information Services, Inc. €800,000 0.63% 3/12/2025 969,230 0.06%State Street Corp.^ $950,000 2.83% 30/3/2023 967,829 0.06%Hewlett Packard Enterprise Co. $848,000 4.90% 15/10/2025 965,626 0.06%Schlumberger Investment SA $950,000 2.40% 1/8/2022 965,292 0.06%PepsiCo, Inc. €800,000 0.25% 6/5/2024 962,960 0.06%Goldman Sachs Group, Inc. $890,000 3.85% 8/7/2024 962,539 0.06%Berkshire Hathaway, Inc. €800,000 0.63% 17/1/2023 961,373 0.06%Apple, Inc. $950,000 1.13% 11/5/2025 961,357 0.06%Capital One Financial Corp. $925,000 2.60% 11/5/2023 960,537 0.06%Walmart, Inc. €800,000 1.90% 8/4/2022 960,461 0.06%Citigroup, Inc.^ $900,000 3.35% 24/4/2025 959,925 0.06%Charles Schwab Corp. $950,000 0.75% 18/3/2024 955,303 0.06%JPMorgan Chase & Co.^ $950,000 1.58% 22/4/2027 955,100 0.06%AT&T, Inc. €800,000 0.25% 4/3/2026 953,994 0.06%Jersey Central Power & Light Co. $875,000 4.70% 1/4/2024 952,477 0.06%Boeing Co. $950,000 1.43% 4/2/2024 952,441 0.06%Comcast Corp. $875,000 3.15% 1/3/2026 952,137 0.06%Verizon Communications, Inc. €700,000 3.25% 17/2/2026 951,546 0.06%Amazon.com, Inc. $950,000 1.00% 12/5/2026 950,334 0.06%American International Group, Inc. $900,000 2.50% 30/6/2025 949,456 0.06%VMware, Inc. $925,000 2.95% 21/8/2022 949,170 0.06%Mastercard, Inc. $880,000 3.38% 1/4/2024 948,930 0.06%Morgan Stanley $845,000 3.88% 27/1/2026 944,494 0.06%Citibank NA $875,000 3.65% 23/1/2024 941,645 0.06%Williams Cos, Inc. $850,000 4.00% 15/9/2025 941,611 0.06%General Motors Financial Co., Inc. $850,000 4.35% 9/4/2025 939,931 0.06%Charles Schwab Corp. $850,000 3.85% 21/5/2025 939,930 0.06%ViacomCBS, Inc. $825,000 4.75% 15/5/2025 933,401 0.06%Caterpillar Financial Services Corp. $931,000 0.90% 2/3/2026 928,218 0.06%Bank of America Corp.1 $850,000 4.00% 1/4/2024 926,754 0.06%Citigroup, Inc. $900,000 2.70% 27/10/2022 925,741 0.06%Marriott International, Inc. $800,000 5.75% 1/5/2025 923,747 0.06%Equifax, Inc. $875,000 2.60% 1/12/2024 922,258 0.06%Apple, Inc.1 $850,000 3.45% 6/5/2024 920,092 0.06%Comcast Corp. $850,000 3.10% 1/4/2025 916,946 0.06%Chevron Phillips Chemical Co. LLC/Chevron Phillips Chemical Co. LP $800,000 5.13% 1/4/2025 916,106 0.06%Stellantis NV €700,000 3.75% 29/3/2024 913,256 0.06%Morgan Stanley $875,000 3.13% 23/1/2023 912,425 0.06%CVS Health Corp. $825,000 3.88% 20/7/2025 910,914 0.06%Gilead Sciences, Inc. $825,000 3.65% 1/3/2026 909,908 0.06%US Bancorp $850,000 3.38% 5/2/2024 909,607 0.06%Amazon.com, Inc.1 $900,000 0.40% 3/6/2023 901,934 0.06%UnitedHealth Group, Inc. $800,000 3.75% 15/7/2025 887,533 0.06%PNC Bank NA $826,000 2.95% 23/2/2025 886,396 0.06%Wells Fargo & Co.^ $850,000 2.16% 11/2/2026 881,901 0.06%AbbVie, Inc. $850,000 2.90% 6/11/2022 878,208 0.06%Bank of America Corp.1 $800,000 4.00% 22/1/2025 877,518 0.05%AT&T, Inc. €700,000 2.75% 19/5/2023 876,335 0.05%
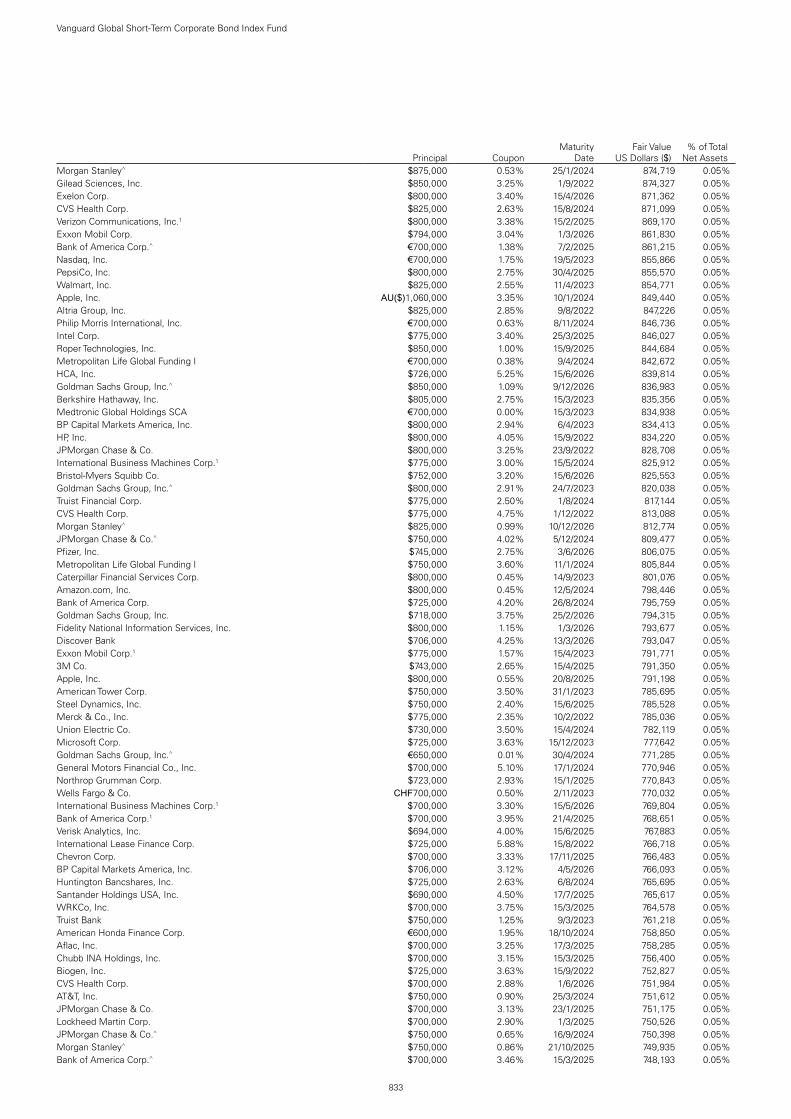
833
Vanguard Global Short-Term Corporate Bond Index Fund
Principal CouponMaturity
DateFair Value
US Dollars ($)% of Total
Net AssetsMorgan Stanley^ $875,000 0.53% 25/1/2024 874,719 0.05%Gilead Sciences, Inc. $850,000 3.25% 1/9/2022 874,327 0.05%Exelon Corp. $800,000 3.40% 15/4/2026 871,362 0.05%CVS Health Corp. $825,000 2.63% 15/8/2024 871,099 0.05%Verizon Communications, Inc.1 $800,000 3.38% 15/2/2025 869,170 0.05%Exxon Mobil Corp. $794,000 3.04% 1/3/2026 861,830 0.05%Bank of America Corp.^ €700,000 1.38% 7/2/2025 861,215 0.05%Nasdaq, Inc. €700,000 1.75% 19/5/2023 855,866 0.05%PepsiCo, Inc. $800,000 2.75% 30/4/2025 855,570 0.05%Walmart, Inc. $825,000 2.55% 11/4/2023 854,771 0.05%Apple, Inc. AU($)1,060,000 3.35% 10/1/2024 849,440 0.05%Altria Group, Inc. $825,000 2.85% 9/8/2022 847,226 0.05%Philip Morris International, Inc. €700,000 0.63% 8/11/2024 846,736 0.05%Intel Corp. $775,000 3.40% 25/3/2025 846,027 0.05%Roper Technologies, Inc. $850,000 1.00% 15/9/2025 844,684 0.05%Metropolitan Life Global Funding I €700,000 0.38% 9/4/2024 842,672 0.05%HCA, Inc. $726,000 5.25% 15/6/2026 839,814 0.05%Goldman Sachs Group, Inc.^ $850,000 1.09% 9/12/2026 836,983 0.05%Berkshire Hathaway, Inc. $805,000 2.75% 15/3/2023 835,356 0.05%Medtronic Global Holdings SCA €700,000 0.00% 15/3/2023 834,938 0.05%BP Capital Markets America, Inc. $800,000 2.94% 6/4/2023 834,413 0.05%HP, Inc. $800,000 4.05% 15/9/2022 834,220 0.05%JPMorgan Chase & Co. $800,000 3.25% 23/9/2022 828,708 0.05%International Business Machines Corp.1 $775,000 3.00% 15/5/2024 825,912 0.05%Bristol-Myers Squibb Co. $752,000 3.20% 15/6/2026 825,553 0.05%Goldman Sachs Group, Inc.^ $800,000 2.91% 24/7/2023 820,038 0.05%Truist Financial Corp. $775,000 2.50% 1/8/2024 817,144 0.05%CVS Health Corp. $775,000 4.75% 1/12/2022 813,088 0.05%Morgan Stanley^ $825,000 0.99% 10/12/2026 812,774 0.05%JPMorgan Chase & Co.^ $750,000 4.02% 5/12/2024 809,477 0.05%Pfizer, Inc. $745,000 2.75% 3/6/2026 806,075 0.05%Metropolitan Life Global Funding I $750,000 3.60% 11/1/2024 805,844 0.05%Caterpillar Financial Services Corp. $800,000 0.45% 14/9/2023 801,076 0.05%Amazon.com, Inc. $800,000 0.45% 12/5/2024 798,446 0.05%Bank of America Corp. $725,000 4.20% 26/8/2024 795,759 0.05%Goldman Sachs Group, Inc. $718,000 3.75% 25/2/2026 794,315 0.05%Fidelity National Information Services, Inc. $800,000 1.15% 1/3/2026 793,677 0.05%Discover Bank $706,000 4.25% 13/3/2026 793,047 0.05%Exxon Mobil Corp.1 $775,000 1.57% 15/4/2023 791,771 0.05%3M Co. $743,000 2.65% 15/4/2025 791,350 0.05%Apple, Inc. $800,000 0.55% 20/8/2025 791,198 0.05%American Tower Corp. $750,000 3.50% 31/1/2023 785,695 0.05%Steel Dynamics, Inc. $750,000 2.40% 15/6/2025 785,528 0.05%Merck & Co., Inc. $775,000 2.35% 10/2/2022 785,036 0.05%Union Electric Co. $730,000 3.50% 15/4/2024 782,119 0.05%Microsoft Corp. $725,000 3.63% 15/12/2023 777,642 0.05%Goldman Sachs Group, Inc.^ €650,000 0.01% 30/4/2024 771,285 0.05%General Motors Financial Co., Inc. $700,000 5.10% 17/1/2024 770,946 0.05%Northrop Grumman Corp. $723,000 2.93% 15/1/2025 770,843 0.05%Wells Fargo & Co. CHF700,000 0.50% 2/11/2023 770,032 0.05%International Business Machines Corp.1 $700,000 3.30% 15/5/2026 769,804 0.05%Bank of America Corp.1 $700,000 3.95% 21/4/2025 768,651 0.05%Verisk Analytics, Inc. $694,000 4.00% 15/6/2025 767,883 0.05%International Lease Finance Corp. $725,000 5.88% 15/8/2022 766,718 0.05%Chevron Corp. $700,000 3.33% 17/11/2025 766,483 0.05%BP Capital Markets America, Inc. $706,000 3.12% 4/5/2026 766,093 0.05%Huntington Bancshares, Inc. $725,000 2.63% 6/8/2024 765,695 0.05%Santander Holdings USA, Inc. $690,000 4.50% 17/7/2025 765,617 0.05%WRKCo, Inc. $700,000 3.75% 15/3/2025 764,578 0.05%Truist Bank $750,000 1.25% 9/3/2023 761,218 0.05%American Honda Finance Corp. €600,000 1.95% 18/10/2024 758,850 0.05%Aflac, Inc. $700,000 3.25% 17/3/2025 758,285 0.05%Chubb INA Holdings, Inc. $700,000 3.15% 15/3/2025 756,400 0.05%Biogen, Inc. $725,000 3.63% 15/9/2022 752,827 0.05%CVS Health Corp. $700,000 2.88% 1/6/2026 751,984 0.05%AT&T, Inc. $750,000 0.90% 25/3/2024 751,612 0.05%JPMorgan Chase & Co. $700,000 3.13% 23/1/2025 751,175 0.05%Lockheed Martin Corp. $700,000 2.90% 1/3/2025 750,526 0.05%JPMorgan Chase & Co.^ $750,000 0.65% 16/9/2024 750,398 0.05%Morgan Stanley^ $750,000 0.86% 21/10/2025 749,935 0.05%Bank of America Corp.^ $700,000 3.46% 15/3/2025 748,193 0.05%

834
Vanguard Global Short-Term Corporate Bond Index Fund
Principal CouponMaturity
DateFair Value
US Dollars ($)% of Total
Net AssetsAT&T, Inc. $682,000 3.60% 15/7/2025 748,046 0.05%Comcast Corp. $668,000 3.95% 15/10/2025 747,627 0.05%Bank of America Corp.^ $700,000 3.09% 1/10/2025 745,547 0.05%Enable Midstream Partners LP $700,000 3.90% 15/5/2024 745,465 0.05%American International Group, Inc. £500,000 5.00% 26/4/2023 744,337 0.05%John Deere Cash Management SA €600,000 1.38% 2/4/2024 743,327 0.05%Apple, Inc. €600,000 1.38% 17/1/2024 741,938 0.05%Morgan Stanley $700,000 3.75% 25/2/2023 737,731 0.05%AbbVie, Inc. €600,000 1.25% 1/6/2024 736,123 0.05%Goldman Sachs Group, Inc. $700,000 3.63% 22/1/2023 734,507 0.05%Oracle Corp. $689,000 2.95% 15/11/2024 734,067 0.05%Allstate Corp.^ $675,000 5.75% 15/8/2053 732,662 0.05%Bank of America Corp.^ €600,000 0.81% 9/5/2026 731,743 0.05%Merck & Co., Inc. $686,000 2.75% 10/2/2025 730,915 0.05%Goldman Sachs Group, Inc. €600,000 1.38% 15/5/2024 730,356 0.05%Bank of America Corp. £500,000 2.30% 25/7/2025 729,970 0.05%JPMorgan Chase & Co. $700,000 2.70% 18/5/2023 727,610 0.05%Wells Fargo & Co.1 $675,000 3.30% 9/9/2024 727,514 0.05%Cigna Corp. $725,000 1.25% 15/3/2026 727,182 0.05%Intel Corp. $700,000 2.70% 15/12/2022 725,191 0.05%Sabine Pass Liquefaction LLC $634,000 5.63% 1/3/2025 724,749 0.05%Morgan Stanley €600,000 1.00% 2/12/2022 724,616 0.05%Oracle Corp. $686,000 2.50% 1/4/2025 720,593 0.05%Bank of America Corp.^ $675,000 3.86% 23/7/2024 719,369 0.05%Bank of New York Mellon Corp. $700,000 1.60% 24/4/2025 718,593 0.05%Apple, Inc. $675,000 3.00% 9/2/2024 716,198 0.04%Procter & Gamble Co.1 $700,000 2.15% 11/8/2022 714,828 0.04%Citigroup, Inc.^ $725,000 1.12% 28/1/2027 714,825 0.04%DXC Technology Co. $650,000 4.13% 15/4/2025 714,319 0.04%Booking Holdings, Inc. €600,000 0.10% 8/3/2025 713,700 0.04%JPMorgan Chase & Co. $655,000 3.20% 15/6/2026 713,269 0.04%Medtronic Global Holdings SCA €600,000 0.00% 15/10/2025 713,033 0.04%Air Lease Corp. $690,000 2.30% 1/2/2025 712,740 0.04%Chevron Corp.1 $700,000 1.14% 11/5/2023 710,413 0.04%NRG Energy, Inc. $700,000 2.00% 2/12/2025 708,640 0.04%MassMutual Global Funding II $700,000 0.85% 9/6/2023 707,065 0.04%Walt Disney Co. $650,000 3.35% 24/3/2025 706,873 0.04%Sempra Energy $675,000 2.90% 1/2/2023 698,945 0.04%Goldman Sachs Group, Inc.^ $700,000 0.66% 10/9/2024 698,753 0.04%Bayer US Finance LLC $650,000 3.38% 8/10/2024 698,046 0.04%Tyson Foods, Inc. $650,000 3.90% 28/9/2023 696,436 0.04%Global Payments, Inc. $700,000 1.20% 1/3/2026 694,120 0.04%Nestle Holdings, Inc. $675,000 2.38% 17/11/2022 693,851 0.04%JPMorgan Chase & Co. £500,000 0.99% 28/4/2026 691,107 0.04%Nestle Holdings, Inc. $650,000 3.35% 24/9/2023 690,530 0.04%Citigroup, Inc. $606,000 4.60% 9/3/2026 690,280 0.04%7-Eleven, Inc. $700,000 0.95% 10/2/2026 687,189 0.04%Citigroup, Inc. $611,000 4.40% 10/6/2025 682,568 0.04%Walmart, Inc. $640,000 2.65% 15/12/2024 681,776 0.04%Stellantis NV €500,000 3.88% 5/1/2026 681,235 0.04%AT&T, Inc. $625,000 3.40% 15/5/2025 681,019 0.04%Mondelez International, Inc. $675,000 0.63% 1/7/2022 677,213 0.04%Broadcom, Inc. $600,000 4.70% 15/4/2025 675,273 0.04%JPMorgan Chase & Co. €500,000 3.00% 19/2/2026 674,483 0.04%JPMorgan Chase & Co.^ $635,000 3.22% 1/3/2025 674,459 0.04%Astrazeneca Finance LLC $675,000 0.70% 28/5/2024 674,231 0.04%American Express Co. $625,000 3.00% 30/10/2024 670,308 0.04%Philip Morris International, Inc. €500,000 2.88% 3/3/2026 669,561 0.04%American Honda Finance Corp. $650,000 1.95% 10/5/2023 668,531 0.04%Exelon Generation Co. LLC $650,000 4.25% 15/6/2022 667,607 0.04%Citigroup, Inc.^ $650,000 2.88% 24/7/2023 666,557 0.04%Booking Holdings, Inc. $600,000 3.60% 1/6/2026 665,153 0.04%Walt Disney Co. $600,000 3.70% 15/10/2025 662,941 0.04%Wells Fargo & Co.1 $600,000 3.55% 29/9/2025 659,740 0.04%Sempra Energy $600,000 3.75% 15/11/2025 659,503 0.04%Chubb INA Holdings, Inc. €550,000 0.30% 15/12/2024 658,180 0.04%Energy Transfer LP $625,000 2.90% 15/5/2025 657,970 0.04%UnitedHealth Group, Inc. $603,000 3.10% 15/3/2026 657,490 0.04%TD Ameritrade Holding Corp. $600,000 3.63% 1/4/2025 656,110 0.04%Morgan Stanley $600,000 3.70% 23/10/2024 654,208 0.04%Digital Euro Finco LLC €500,000 2.50% 16/1/2026 651,588 0.04%

835
Vanguard Global Short-Term Corporate Bond Index Fund
Principal CouponMaturity
DateFair Value
US Dollars ($)% of Total
Net AssetsJPMorgan Chase & Co.^ $625,000 2.30% 15/10/2025 650,423 0.04%Dominion Energy, Inc. $600,000 3.30% 15/3/2025 649,857 0.04%PPG Industries, Inc. $650,000 1.20% 15/3/2026 648,645 0.04%Fiserv, Inc. $615,000 2.75% 1/7/2024 648,504 0.04%Valero Energy Corp. $625,000 2.70% 15/4/2023 648,078 0.04%BP Capital Markets America, Inc. $600,000 3.19% 6/4/2025 646,386 0.04%PNC Financial Services Group, Inc. $625,000 2.85% 9/11/2022 646,166 0.04%Anthem, Inc. $600,000 3.50% 15/8/2024 646,006 0.04%Chevron Corp. $615,000 3.19% 24/6/2023 645,520 0.04%Southwest Airlines Co. $600,000 4.75% 4/5/2023 643,969 0.04%Oracle Corp. $600,000 3.40% 8/7/2024 643,317 0.04%MassMutual Global Funding II $600,000 2.95% 11/1/2025 642,541 0.04%Coca-Cola Co. AU($)800,000 3.25% 11/6/2024 642,438 0.04%Wells Fargo & Co.1 $600,000 3.00% 19/2/2025 642,167 0.04%Raytheon Technologies Corp. $600,000 3.70% 15/12/2023 641,672 0.04%Home Depot, Inc. $595,000 3.75% 15/2/2024 641,102 0.04%Crown Castle International Corp. $610,000 3.15% 15/7/2023 640,885 0.04%NextEra Energy Capital Holdings, Inc. $600,000 3.15% 1/4/2024 638,233 0.04%Bank of America Corp.^ €500,000 1.78% 4/5/2027 638,123 0.04%NextEra Energy Capital Holdings, Inc. $600,000 2.75% 1/5/2025 637,528 0.04%Bank of America Corp. €500,000 2.38% 19/6/2024 636,411 0.04%Harley-Davidson Financial Services, Inc. €500,000 3.88% 19/5/2023 635,993 0.04%Williams Cos, Inc. $575,000 4.55% 24/6/2024 633,396 0.04%Goldman Sachs Group, Inc. €500,000 1.63% 27/7/2026 632,968 0.04%Goldman Sachs Group, Inc. €500,000 2.13% 30/9/2024 632,812 0.04%Intel Corp. $572,000 3.70% 29/7/2025 632,075 0.04%Morgan Stanley^ $600,000 2.72% 22/7/2025 631,675 0.04%Morgan Stanley €500,000 1.75% 30/1/2025 630,575 0.04%Walgreens Boots Alliance, Inc. $578,000 3.80% 18/11/2024 629,867 0.04%JPMorgan Chase & Co.^ $565,000 3.96% 29/1/2027 629,109 0.04%Enterprise Products Operating LLC $577,000 3.75% 15/2/2025 629,038 0.04%McKesson Corp. €500,000 1.50% 17/11/2025 627,944 0.04%Southern Co. $600,000 2.95% 1/7/2023 626,547 0.04%Citigroup, Inc.^ €500,000 1.50% 24/7/2026 624,239 0.04%Morgan Stanley^ €500,000 1.34% 23/10/2026 623,107 0.04%Charles Schwab Corp. $600,000 2.65% 25/1/2023 620,329 0.04%Duke Energy Corp. $575,000 3.75% 15/4/2024 619,196 0.04%JPMorgan Chase & Co.^ €500,000 1.09% 11/3/2027 617,370 0.04%Nestle Holdings, Inc. €500,000 0.88% 18/7/2025 616,697 0.04%Goldman Sachs Group, Inc.^ $575,000 3.27% 29/9/2025 615,009 0.04%PPG Industries, Inc. €500,000 0.88% 3/11/2025 614,870 0.04%Caterpillar Financial Services Corp. $600,000 1.45% 15/5/2025 614,300 0.04%Apple, Inc. CA($)730,000 2.51% 19/8/2024 614,178 0.04%Goldman Sachs Group, Inc. €500,000 1.25% 1/5/2025 613,143 0.04%Wells Fargo & Co. €500,000 2.63% 16/8/2022 612,976 0.04%John Deere Capital Corp. $559,000 3.45% 13/3/2025 612,925 0.04%Abbott Laboratories $574,000 3.40% 30/11/2023 611,807 0.04%Air Lease Corp. $600,000 2.63% 1/7/2022 611,266 0.04%General Electric Co. €500,000 0.88% 17/5/2025 609,234 0.04%Eastman Chemical Co. €500,000 1.50% 26/5/2023 608,146 0.04%AT&T, Inc. €500,000 1.05% 5/9/2023 607,395 0.04%Omnicom Group, Inc./Omnicom Capital, Inc. $550,000 3.60% 15/4/2026 607,129 0.04%Walmart, Inc. $550,000 3.55% 26/6/2025 606,570 0.04%Fifth Third Bancorp $565,000 3.65% 25/1/2024 605,542 0.04%National Grid North America, Inc. €500,000 0.75% 8/8/2023 603,754 0.04%Intercontinental Exchange, Inc. $560,000 4.00% 15/10/2023 603,255 0.04%FedEx Corp. €500,000 0.45% 5/8/2025 603,149 0.04%Verizon Communications, Inc. $600,000 0.75% 22/3/2024 602,613 0.04%Energy Transfer LP $555,000 4.05% 15/3/2025 602,413 0.04%Simon Property Group LP $550,000 3.50% 1/9/2025 602,344 0.04%Baxter International, Inc. €500,000 0.40% 15/5/2024 602,285 0.04%NextEra Energy Capital Holdings, Inc. $600,000 0.65% 1/3/2023 602,079 0.04%Bank of America Corp.^ $600,000 0.98% 22/4/2025 601,884 0.04%Teledyne Technologies, Inc. $600,000 1.60% 1/4/2026 601,824 0.04%Truist Bank^ $575,000 2.64% 17/9/2029 601,817 0.04%Morgan Stanley^ $600,000 0.73% 5/4/2024 601,309 0.04%Toyota Motor Credit Corp. $600,000 0.50% 14/8/2023 601,178 0.04%Chevron USA, Inc. $600,000 0.33% 12/8/2022 600,393 0.04%International Business Machines Corp.1 €500,000 0.38% 31/1/2023 599,562 0.04%Becton Dickinson & Co. $550,000 3.73% 15/12/2024 599,066 0.04%Nestle Holdings, Inc.1 $600,000 0.38% 15/1/2024 596,950 0.04%

836
Vanguard Global Short-Term Corporate Bond Index Fund
Principal CouponMaturity
DateFair Value
US Dollars ($)% of Total
Net AssetsUS Bancorp $548,000 3.10% 27/4/2026 596,653 0.04%CVS Health Corp. $580,000 3.50% 20/7/2022 596,218 0.04%General Motors Financial Co., Inc. $600,000 1.25% 8/1/2026 596,019 0.04%Metropolitan Life Global Funding I €500,000 0.00% 23/9/2022 595,650 0.04%Republic Services, Inc. $600,000 0.88% 15/11/2025 594,969 0.04%Verizon Communications, Inc. $600,000 0.85% 20/11/2025 592,673 0.04%MetLife, Inc. $550,000 3.00% 1/3/2025 591,085 0.04%ONEOK Partners LP $575,000 3.38% 1/10/2022 590,864 0.04%Sabine Pass Liquefaction LLC $525,000 5.75% 15/5/2024 589,511 0.04%Broadcom, Inc. $541,000 3.46% 15/9/2026 588,811 0.04%Fifth Third Bank NA $525,000 3.95% 28/7/2025 588,483 0.04%Prudential Financial, Inc.^ $545,000 5.63% 15/6/2043 586,661 0.04%AT&T, Inc. $571,000 2.63% 1/12/2022 585,907 0.04%JPMorgan Chase & Co.^ $550,000 3.80% 23/7/2024 585,575 0.04%Toyota Motor Credit Corp. $550,000 2.90% 17/4/2024 584,262 0.04%Energy Transfer LP $525,000 5.88% 15/1/2024 581,599 0.04%Prudential Financial, Inc.^ $550,000 5.88% 15/9/2042 580,614 0.04%Fiserv, Inc. $526,000 3.85% 1/6/2025 578,664 0.04%General Motors Financial Co., Inc. $500,000 5.25% 1/3/2026 577,648 0.04%Campbell Soup Co. $536,000 3.30% 19/3/2025 577,549 0.04%Pacific Gas & Electric Co. $550,000 3.45% 1/7/2025 576,365 0.04%Discovery Communications LLC £400,000 2.50% 20/9/2024 575,981 0.04%Gilead Sciences, Inc. $575,000 0.75% 29/9/2023 575,419 0.04%Constellation Brands, Inc. $500,000 4.75% 1/12/2025 574,910 0.04%General Motors Financial Co., Inc. £400,000 2.35% 3/9/2025 574,680 0.04%Dollar General Corp. $550,000 3.25% 15/4/2023 573,917 0.04%Kinder Morgan, Inc. $514,000 4.30% 1/6/2025 572,492 0.04%Virginia Electric & Power Co. $525,000 3.15% 15/1/2026 571,526 0.04%Apple, Inc.1 $565,000 0.75% 11/5/2023 569,683 0.04%Gilead Sciences, Inc. $525,000 3.50% 1/2/2025 568,870 0.04%eBay, Inc. $550,000 1.90% 11/3/2025 568,731 0.04%Microsoft Corp. $550,000 2.00% 8/8/2023 568,009 0.04%Utah Acquisition Sub, Inc. $514,000 3.95% 15/6/2026 566,252 0.04%United Airlines 2020-1 Class B Pass Through Trust $533,775 4.88% 15/1/2026 566,083 0.04%Prudential Financial, Inc.^ $525,000 5.20% 15/3/2044 566,019 0.04%Goldman Sachs Group, Inc. CHF500,000 1.00% 24/11/2025 564,027 0.04%Athene Global Funding $540,000 2.50% 14/1/2025 563,343 0.04%Southern Co.^ $550,000 5.50% 15/3/2057 562,867 0.04%ONEOK, Inc. $475,000 5.85% 15/1/2026 562,203 0.04%Constellation Brands, Inc. $500,000 4.75% 15/11/2024 561,579 0.04%Alexandria Real Estate Equities, Inc. $500,000 4.30% 15/1/2026 561,434 0.04%Goldman Sachs Group, Inc. $500,000 4.25% 21/10/2025 559,409 0.04%Ally Financial, Inc. $550,000 1.45% 2/10/2023 558,661 0.03%American International Group, Inc. $500,000 3.90% 1/4/2026 558,157 0.03%Analog Devices, Inc. $500,000 3.90% 15/12/2025 556,307 0.03%Analog Devices, Inc. $525,000 3.13% 5/12/2023 555,699 0.03%JPMorgan Chase & Co.^ $525,000 3.56% 23/4/2024 553,616 0.03%HCA, Inc. $500,000 5.00% 15/3/2024 552,637 0.03%Eaton Corp.1 $535,000 2.75% 2/11/2022 552,338 0.03%International Business Machines Corp.1 $500,000 3.45% 19/2/2026 551,962 0.03%Chubb INA Holdings, Inc. $500,000 3.35% 3/5/2026 549,631 0.03%Citizens Bank NA $525,000 2.25% 28/4/2025 548,544 0.03%Cargill, Inc. $550,000 0.40% 2/2/2024 547,268 0.03%Philip Morris International, Inc. $500,000 3.38% 11/8/2025 545,439 0.03%ERAC USA Finance LLC $500,000 3.85% 15/11/2024 545,343 0.03%Lennar Corp. $500,000 4.88% 15/12/2023 543,843 0.03%Morgan Stanley $500,000 3.88% 29/4/2024 543,588 0.03%TWDC Enterprises 18 Corp. $500,000 3.00% 13/2/2026 543,060 0.03%JPMorgan Chase & Co. $500,000 3.63% 13/5/2024 541,935 0.03%Pacific Gas & Electric Co. $525,000 3.15% 1/1/2026 541,729 0.03%ERP Operating LP $500,000 3.38% 1/6/2025 541,196 0.03%Laboratory Corp. of America Holdings $499,000 3.60% 1/2/2025 539,887 0.03%Procter & Gamble Co.1 $500,000 2.70% 2/2/2026 539,800 0.03%Sabine Pass Liquefaction LLC $500,000 5.63% 15/4/2023 537,380 0.03%Altria Group, Inc. $500,000 3.80% 14/2/2024 537,257 0.03%Goldman Sachs Group, Inc. $500,000 3.63% 20/2/2024 535,917 0.03%Marathon Petroleum Corp. $475,000 4.70% 1/5/2025 535,700 0.03%Aircastle Ltd. $500,000 4.40% 25/9/2023 535,436 0.03%Fiserv, Inc. $500,000 3.80% 1/10/2023 535,103 0.03%Harley-Davidson Financial Services, Inc. $500,000 3.35% 8/6/2025 534,867 0.03%Bank of New York Mellon Corp.1 $500,000 3.45% 11/8/2023 532,491 0.03%

837
Vanguard Global Short-Term Corporate Bond Index Fund
Principal CouponMaturity
DateFair Value
US Dollars ($)% of Total
Net AssetsAmazon.com, Inc. $500,000 2.80% 22/8/2024 532,138 0.03%Exxon Mobil Corp. $500,000 2.71% 6/3/2025 531,820 0.03%International Business Machines Corp.1 $500,000 3.38% 1/8/2023 530,795 0.03%Morgan Stanley $500,000 4.88% 1/11/2022 528,994 0.03%Berry Global, Inc. $527,000 1.57% 15/1/2026 527,679 0.03%Stanley Black & Decker, Inc.^ $494,000 4.00% 15/3/2060 526,429 0.03%US Bancorp $500,000 2.40% 30/7/2024 526,410 0.03%Goldman Sachs Group, Inc.^ $525,000 0.67% 8/3/2024 525,947 0.03%State Street Corp.^ $500,000 2.35% 1/11/2025 525,899 0.03%Energy Transfer LP $500,000 4.25% 15/3/2023 524,751 0.03%Target Corp. $500,000 2.25% 15/4/2025 524,708 0.03%Wells Fargo & Co.1 $500,000 3.45% 13/2/2023 524,052 0.03%7-Eleven, Inc. $525,000 0.80% 10/2/2024 523,801 0.03%US Bancorp $465,000 3.95% 17/11/2025 522,752 0.03%Mastercard, Inc. $500,000 2.00% 3/3/2025 522,625 0.03%Toyota Motor Credit Corp. $500,000 2.90% 30/3/2023 522,138 0.03%Spectra Energy Partners LP $475,000 4.75% 15/3/2024 521,517 0.03%Constellation Brands, Inc. $500,000 3.20% 15/2/2023 520,778 0.03%Discovery Communications LLC $500,000 2.95% 20/3/2023 520,191 0.03%Truist Financial Corp. $472,000 3.70% 5/6/2025 520,085 0.03%Lockheed Martin Corp. $500,000 3.10% 15/1/2023 518,834 0.03%Procter & Gamble Co.1 $525,000 0.55% 29/10/2025 518,555 0.03%Anthem, Inc. $495,000 2.38% 15/1/2025 518,287 0.03%Equifax, Inc. $500,000 3.30% 15/12/2022 517,148 0.03%Micron Technology, Inc. $500,000 2.50% 24/4/2023 516,702 0.03%Visa, Inc. $500,000 2.80% 14/12/2022 516,331 0.03%Brixmor Operating Partnership LP $475,000 3.85% 1/2/2025 516,028 0.03%Boston Scientific Corp. $500,000 1.90% 1/6/2025 515,916 0.03%Williams Cos, Inc. $475,000 4.50% 15/11/2023 514,687 0.03%Air Lease Corp. $475,000 4.25% 1/2/2024 514,518 0.03%Dominion Energy, Inc. $485,000 3.07% 15/8/2024 514,513 0.03%Prudential Financial, Inc. $475,000 3.50% 15/5/2024 514,281 0.03%McDonald's Corp. AU($)650,000 3.00% 8/3/2024 513,966 0.03%Expedia Group, Inc. $450,000 5.00% 15/2/2026 513,515 0.03%UnitedHealth Group, Inc. $500,000 2.38% 15/10/2022 513,270 0.03%Georgia-Pacific LLC $500,000 1.75% 30/9/2025 512,533 0.03%Boeing Co. $500,000 1.95% 1/2/2024 512,407 0.03%Burlington Northern Santa Fe LLC $500,000 3.05% 1/9/2022 512,305 0.03%JPMorgan Chase & Co.^ $521,000 1.04% 4/2/2027 512,097 0.03%KeyBank NA1 $500,000 2.30% 14/9/2022 511,747 0.03%Toyota Motor Credit Corp. $500,000 2.15% 8/9/2022 510,738 0.03%Gilead Sciences, Inc. $475,000 3.70% 1/4/2024 510,434 0.03%McDonald's Corp. $500,000 1.45% 1/9/2025 510,058 0.03%JPMorgan Chase & Co.^ $500,000 1.51% 1/6/2024 509,447 0.03%Mondelez International, Inc. $500,000 1.50% 4/5/2025 508,447 0.03%National Securities Clearing Corp. $500,000 1.20% 23/4/2023 507,803 0.03%Starbucks Corp. $475,000 3.85% 1/10/2023 507,014 0.03%Metropolitan Life Global Funding I $500,000 0.90% 8/6/2023 504,811 0.03%American Honda Finance Corp. $500,000 0.88% 7/7/2023 504,439 0.03%T-Mobile USA, Inc. $500,000 1.50% 15/2/2026 503,498 0.03%Principal Life Global Funding II $500,000 1.25% 23/6/2025 502,649 0.03%Capital One Financial Corp. $450,000 4.20% 29/10/2025 502,355 0.03%Bank of America Corp.^ $500,000 0.81% 24/10/2024 501,678 0.03%Citigroup, Inc.^ $500,000 0.78% 30/10/2024 501,179 0.03%Teledyne Technologies, Inc. $500,000 0.95% 1/4/2024 500,657 0.03%Entergy Louisiana LLC $500,000 0.62% 17/11/2023 500,644 0.03%Morgan Stanley^ $500,000 0.56% 10/11/2023 500,551 0.03%Keurig Dr Pepper, Inc. $500,000 0.75% 15/3/2024 500,479 0.03%Athene Global Funding $500,000 1.61% 29/6/2026 500,355 0.03%Goldman Sachs Group, Inc.^ $500,000 0.63% 17/11/2023 500,271 0.03%JPMorgan Chase & Co. €400,000 1.50% 27/1/2025 500,209 0.03%Diamondback Energy, Inc. $500,000 0.90% 24/3/2023 500,108 0.03%Aon plc $465,000 3.50% 14/6/2024 500,058 0.03%Goldman Sachs Group, Inc. $500,000 0.48% 27/1/2023 500,016 0.03%Fidelity National Information Services, Inc. $500,000 0.38% 1/3/2023 499,576 0.03%Pfizer, Inc. $475,000 3.00% 15/6/2023 499,370 0.03%US Bank NA $467,000 2.80% 27/1/2025 498,996 0.03%Thermo Fisher Scientific, Inc. $450,000 4.13% 25/3/2025 498,903 0.03%General Motors Financial Co., Inc. $475,000 3.70% 9/5/2023 498,828 0.03%Georgia-Pacific LLC1 $500,000 0.63% 15/5/2024 498,590 0.03%Morgan Stanley €400,000 1.75% 11/3/2024 498,261 0.03%

838
Vanguard Global Short-Term Corporate Bond Index Fund
Principal CouponMaturity
DateFair Value
US Dollars ($)% of Total
Net AssetsAmerican Express Co. $475,000 3.40% 27/2/2023 497,296 0.03%Dollar Tree, Inc. $450,000 4.00% 15/5/2025 496,632 0.03%Wells Fargo & Co. €400,000 2.25% 2/5/2023 495,870 0.03%AT&T, Inc. €400,000 1.95% 15/9/2023 494,266 0.03%Connecticut Light & Power Co. $500,000 0.75% 1/12/2025 493,940 0.03%Bank of New York Mellon Corp. $475,000 2.95% 29/1/2023 493,842 0.03%Comcast Corp. $455,000 3.38% 15/2/2025 493,767 0.03%AbbVie, Inc. €400,000 1.38% 17/5/2024 492,484 0.03%Linde, Inc. €400,000 1.20% 12/2/2024 492,323 0.03%Fidelity National Information Services, Inc. €400,000 1.10% 15/7/2024 489,483 0.03%Upjohn Finance BV €400,000 1.02% 23/6/2024 487,726 0.03%JPMorgan Chase & Co. $450,000 3.88% 1/2/2024 487,708 0.03%Procter & Gamble Co. €400,000 2.00% 16/8/2022 487,517 0.03%Eaton Capital Unlimited Co. €400,000 0.70% 14/5/2025 487,200 0.03%DuPont de Nemours, Inc. $450,000 4.21% 15/11/2023 487,177 0.03%DXC Technology Co. $450,000 4.25% 15/4/2024 487,093 0.03%JPMorgan Chase & Co. €400,000 1.50% 26/10/2022 486,368 0.03%Vistra Operations Co. LLC $460,000 3.55% 15/7/2024 486,263 0.03%Johnson Controls International plc €400,000 1.00% 15/9/2023 485,327 0.03%Harley-Davidson Financial Services, Inc. €400,000 0.90% 19/11/2024 484,903 0.03%General Mills, Inc. €400,000 1.00% 27/4/2023 483,731 0.03%Citigroup, Inc. €400,000 0.75% 26/10/2023 483,530 0.03%Digital Realty Trust LP $425,000 4.75% 1/10/2025 483,214 0.03%Federal Realty Investment Trust $450,000 3.95% 15/1/2024 482,836 0.03%Goldman Sachs Group, Inc. $446,000 3.50% 23/1/2025 482,157 0.03%Fidelity National Information Services, Inc. €400,000 0.75% 21/5/2023 482,046 0.03%Illinois Tool Works, Inc. $450,000 3.50% 1/3/2024 481,995 0.03%Morgan Stanley^ €400,000 0.64% 26/7/2024 481,913 0.03%Apple, Inc. $450,000 2.75% 13/1/2025 481,115 0.03%ERAC USA Finance LLC $464,000 3.30% 15/10/2022 480,496 0.03%Penske Truck Leasing Co. LP/PTL Finance Corp. $450,000 4.13% 1/8/2023 480,099 0.03%Medtronic Global Holdings SCA €400,000 0.38% 7/3/2023 479,887 0.03%American Express Co. $450,000 3.70% 3/8/2023 479,168 0.03%Fiserv, Inc. €400,000 0.38% 1/7/2023 478,727 0.03%Microsoft Corp. $447,000 2.70% 12/2/2025 478,683 0.03%Intel Corp. $450,000 2.88% 11/5/2024 478,434 0.03%Thermo Fisher Scientific, Inc. €400,000 0.13% 1/3/2025 476,688 0.03%Fidelity National Information Services, Inc. €400,000 0.13% 3/12/2022 476,679 0.03%Chevron Corp. $465,000 2.36% 5/12/2022 476,247 0.03%AmerisourceBergen Corp. $475,000 0.74% 15/3/2023 475,940 0.03%Morgan Stanley^ $475,000 0.79% 30/5/2025 473,126 0.03%Goldman Sachs Group, Inc. $450,000 3.20% 23/2/2023 469,357 0.03%Gilead Sciences, Inc. $450,000 2.50% 1/9/2023 468,101 0.03%International Business Machines Corp.1 $450,000 2.88% 9/11/2022 465,624 0.03%Omega Healthcare Investors, Inc. $425,000 4.50% 15/1/2025 464,750 0.03%Amazon.com, Inc. $450,000 2.40% 22/2/2023 464,738 0.03%Bank of America Corp.^ $450,000 2.02% 13/2/2026 463,951 0.03%Hewlett Packard Enterprise Co. $450,000 2.25% 1/4/2023 462,996 0.03%NetApp, Inc. $450,000 1.88% 22/6/2025 462,984 0.03%General Motors Co. $425,000 4.88% 2/10/2023 462,617 0.03%TWDC Enterprises 18 Corp. $450,000 2.35% 1/12/2022 462,367 0.03%JB Hunt Transport Services, Inc. $450,000 3.30% 15/8/2022 461,992 0.03%Welltower, Inc. $430,000 3.63% 15/3/2024 461,779 0.03%Metropolitan Life Global Funding I $450,000 1.95% 13/1/2023 460,814 0.03%MUFG Union Bank NA $450,000 2.10% 9/12/2022 460,575 0.03%Stellantis NV $425,000 5.25% 15/4/2023 458,257 0.03%Wells Fargo & Co.1 $425,000 4.13% 15/8/2023 456,791 0.03%TWDC Enterprises 18 Corp. $450,000 2.45% 4/3/2022 456,686 0.03%Fifth Third Bank NA $411,000 3.85% 15/3/2026 456,204 0.03%Bank of America Corp.^ $423,000 3.37% 23/1/2026 455,915 0.03%Voya Financial, Inc.^ $425,000 5.65% 15/5/2053 455,010 0.03%Virginia Electric & Power Co. $425,000 3.10% 15/5/2025 454,814 0.03%Aviation Capital Group LLC $400,000 5.50% 15/12/2024 452,536 0.03%Stryker Corp. $450,000 1.15% 15/6/2025 452,493 0.03%Southwestern Public Service Co. $425,000 3.30% 15/6/2024 451,888 0.03%John Deere Capital Corp. $450,000 0.55% 5/7/2022 451,499 0.03%Wells Fargo Bank NA £300,000 5.25% 1/8/2023 451,382 0.03%American Tower Corp. $450,000 1.30% 15/9/2025 450,986 0.03%Energy Transfer LP $400,000 4.75% 15/1/2026 450,294 0.03%LyondellBasell Industries NV $400,000 5.75% 15/4/2024 448,057 0.03%DR Horton, Inc. $425,000 2.50% 15/10/2024 445,704 0.03%

839
Vanguard Global Short-Term Corporate Bond Index Fund
Principal CouponMaturity
DateFair Value
US Dollars ($)% of Total
Net AssetsKeyBank NA $407,000 3.30% 1/6/2025 444,779 0.03%Marsh & McLennan Cos, Inc. $399,000 3.75% 14/3/2026 443,490 0.03%AbbVie, Inc. $425,000 2.85% 14/5/2023 442,479 0.03%Ecolab, Inc. $430,000 2.38% 10/8/2022 438,996 0.03%Eli Lilly & Co. CHF400,000 0.15% 24/5/2024 438,844 0.03%General Dynamics Corp. $400,000 3.50% 15/5/2025 438,411 0.03%Chevron Corp. $425,000 1.55% 11/5/2025 435,202 0.03%Simon Property Group LP $420,000 2.00% 13/9/2024 435,124 0.03%GE Capital Funding LLC $400,000 3.45% 15/5/2025 434,899 0.03%Stellantis NV €350,000 2.38% 14/4/2023 433,651 0.03%Welltower, Inc. $400,000 4.50% 15/1/2024 433,489 0.03%Walgreens Boots Alliance, Inc. $398,000 3.45% 1/6/2026 433,030 0.03%Comcast Corp.1 $400,000 3.60% 1/3/2024 431,938 0.03%Citigroup, Inc. $400,000 3.88% 25/10/2023 431,701 0.03%Kinder Morgan Energy Partners LP $400,000 4.15% 1/2/2024 431,262 0.03%Energy Transfer LP $400,000 4.25% 1/4/2024 431,064 0.03%Brixmor Operating Partnership LP $400,000 3.65% 15/6/2024 431,057 0.03%JPMorgan Chase & Co. $425,000 2.97% 15/1/2023 431,039 0.03%General Motors Financial Co., Inc. $400,000 3.95% 13/4/2024 430,959 0.03%Ares Capital Corp. $400,000 4.20% 10/6/2024 429,937 0.03%PepsiCo, Inc.1 $425,000 0.75% 1/5/2023 428,540 0.03%General Mills, Inc. $400,000 3.70% 17/10/2023 427,994 0.03%Office Properties Income Trust $393,000 4.50% 1/2/2025 427,195 0.03%Marathon Petroleum Corp. $400,000 4.50% 1/5/2023 426,734 0.03%Citigroup, Inc.^ $400,000 4.04% 1/6/2024 426,217 0.03%American Tower Corp. $400,000 2.95% 15/1/2025 424,930 0.03%General Motors Financial Co., Inc. $400,000 4.15% 19/6/2023 424,902 0.03%DTE Energy Co. $400,000 3.70% 1/8/2023 424,888 0.03%Apple, Inc. $400,000 2.85% 11/5/2024 424,649 0.03%Lowe's Cos, Inc. $400,000 2.50% 15/4/2026 424,548 0.03%Cardinal Health, Inc. $400,000 3.08% 15/6/2024 424,410 0.03%Enterprise Products Operating LLC $383,000 3.70% 15/2/2026 424,205 0.03%HCA, Inc. $370,000 5.25% 15/4/2025 423,714 0.03%New York Life Global Funding £300,000 1.75% 15/12/2022 422,648 0.03%Ares Capital Corp. $400,000 3.25% 15/7/2025 420,880 0.03%Capital One Bank USA NA $400,000 3.38% 15/2/2023 418,442 0.03%Regions Financial Corp. $400,000 2.25% 18/5/2025 416,748 0.03%PepsiCo, Inc.1 $400,000 2.75% 1/3/2023 416,167 0.03%Sabine Pass Liquefaction LLC $350,000 5.88% 30/6/2026 414,187 0.03%Kimco Realty Corp. $400,000 3.40% 1/11/2022 413,796 0.03%American Express Co. $400,000 2.65% 2/12/2022 413,087 0.03%Apple, Inc. $400,000 2.40% 13/1/2023 412,553 0.03%Verizon Communications, Inc. AU($)500,000 4.05% 17/2/2025 412,289 0.03%Walt Disney Co. $400,000 1.75% 13/1/2026 411,292 0.03%Citigroup, Inc.^ $400,000 1.68% 15/5/2024 408,467 0.03%Apple, Inc. $400,000 2.10% 12/9/2022 408,270 0.03%Wells Fargo & Co. CA($)490,000 2.51% 27/10/2023 408,223 0.03%Citigroup, Inc. $350,000 5.50% 13/9/2025 407,849 0.03%Health Care Service Corp. A Mutual Legal Reserve Co. $400,000 1.50% 1/6/2025 406,550 0.03%MetLife, Inc. $375,000 4.37% 15/9/2023 406,382 0.03%Verizon Communications, Inc. $375,000 3.50% 1/11/2024 405,786 0.03%Bank of New York Mellon Corp. $375,000 3.65% 4/2/2024 404,203 0.03%Truist Financial Corp. $375,000 3.75% 6/12/2023 403,305 0.03%Cigna Corp. $385,000 3.00% 15/7/2023 403,061 0.03%F&G Global Funding $400,000 1.75% 30/6/2026 401,556 0.03%Boeing Co. $400,000 1.17% 4/2/2023 401,494 0.03%Williams Cos, Inc. $367,000 3.90% 15/1/2025 401,250 0.03%Citigroup, Inc.^ $400,000 0.98% 1/5/2025 400,996 0.03%Aflac, Inc. $400,000 1.13% 15/3/2026 400,845 0.03%Keurig Dr Pepper, Inc. $376,000 4.06% 25/5/2023 400,772 0.03%Anthem, Inc. $400,000 0.45% 15/3/2023 400,434 0.03%CenterPoint Energy Resources Corp. $400,000 0.70% 2/3/2023 400,025 0.03%Aviation Capital Group LLC $400,000 1.95% 30/1/2026 399,991 0.03%Constellation Brands, Inc. $375,000 4.25% 1/5/2023 399,901 0.03%PACCAR Financial Corp. $400,000 0.35% 11/8/2023 399,715 0.03%State Street Corp. $360,000 3.55% 18/8/2025 399,007 0.02%Ameriprise Financial, Inc. $370,000 3.00% 2/4/2025 396,322 0.02%John Deere Capital Corp. $400,000 0.70% 15/1/2026 395,935 0.02%Phillips 661 $375,000 3.70% 6/4/2023 395,890 0.02%National Securities Clearing Corp. $400,000 0.75% 7/12/2025 394,664 0.02%Liberty Mutual Group, Inc. $367,000 4.25% 15/6/2023 392,532 0.02%

840
Vanguard Global Short-Term Corporate Bond Index Fund
Principal CouponMaturity
DateFair Value
US Dollars ($)% of Total
Net AssetsPVH Corp. €300,000 3.63% 15/7/2024 390,601 0.02%Toyota Motor Credit Corp. $375,000 2.25% 18/10/2023 390,289 0.02%Citigroup, Inc. $375,000 4.05% 30/7/2022 389,597 0.02%Berkshire Hathaway Energy Co. $350,000 4.05% 15/4/2025 388,635 0.02%Bristol-Myers Squibb Co. $375,000 3.55% 15/8/2022 388,389 0.02%General Motors Financial Co., Inc. $350,000 4.30% 13/7/2025 386,927 0.02%General Motors Financial Co., Inc. $375,000 3.55% 8/7/2022 386,895 0.02%Thermo Fisher Scientific, Inc. €300,000 1.75% 15/4/2027 386,847 0.02%Burlington Northern Santa Fe LLC $350,000 3.65% 1/9/2025 386,137 0.02%Boston Properties LP $350,000 3.65% 1/2/2026 385,803 0.02%AbbVie, Inc. $375,000 2.30% 21/11/2022 384,921 0.02%American Tower Corp. €300,000 1.95% 22/5/2026 383,815 0.02%New York Life Global Funding $370,000 2.00% 22/1/2025 383,586 0.02%Truist Bank $375,000 1.50% 10/3/2025 383,467 0.02%FedEx Corp. $350,000 3.25% 1/4/2026 383,229 0.02%Bank of New York Mellon Corp.1 $375,000 1.95% 23/8/2022 382,229 0.02%Citigroup, Inc. $350,000 4.00% 5/8/2024 381,296 0.02%Santander Holdings USA, Inc. $365,000 3.40% 18/1/2023 379,855 0.02%Protective Life Global Funding $375,000 1.08% 9/6/2023 379,374 0.02%Adobe, Inc. $350,000 3.25% 1/2/2025 379,097 0.02%Cisco Systems, Inc.1 $350,000 3.63% 4/3/2024 378,755 0.02%Wells Fargo & Co. €300,000 2.13% 4/6/2024 378,653 0.02%Reliance Standard Life Global Funding II $370,000 2.63% 22/7/2022 378,483 0.02%PacifiCorp $375,000 2.95% 1/2/2022 378,390 0.02%Stellantis NV €300,000 2.00% 20/3/2025 378,243 0.02%Amgen, Inc. $350,000 3.63% 22/5/2024 376,839 0.02%Avangrid, Inc. $350,000 3.20% 15/4/2025 376,286 0.02%Bank of America Corp.1 $350,000 4.10% 24/7/2023 376,103 0.02%General Motors Financial Co., Inc. €300,000 2.20% 1/4/2024 375,892 0.02%Starbucks Corp. $360,000 3.10% 1/3/2023 375,784 0.02%PacifiCorp $350,000 3.60% 1/4/2024 375,693 0.02%Goldman Sachs Group, Inc. €300,000 3.25% 1/2/2023 375,164 0.02%Truist Financial Corp.^ $375,000 1.27% 2/3/2027 374,665 0.02%Manufacturers & Traders Trust Co. $350,000 2.90% 6/2/2025 374,395 0.02%Bank of America Corp. €300,000 1.38% 26/3/2025 374,320 0.02%Altria Group, Inc. €300,000 1.70% 15/6/2025 374,075 0.02%Conagra Brands, Inc. $340,000 4.30% 1/5/2024 373,082 0.02%General Dynamics Corp. $344,000 3.25% 1/4/2025 372,849 0.02%Caterpillar Financial Services Corp. $375,000 0.80% 13/11/2025 372,808 0.02%Healthpeak Properties, Inc. $347,000 3.40% 1/2/2025 372,750 0.02%Simon International Finance SCA €300,000 1.25% 13/5/2025 372,390 0.02%Charles Schwab Corp. $375,000 0.90% 11/3/2026 372,328 0.02%Johnson Controls International plc €300,000 1.38% 25/2/2025 372,251 0.02%Exelon Corp. $338,000 3.95% 15/6/2025 371,935 0.02%Waste Management, Inc. $375,000 0.75% 15/11/2025 371,702 0.02%Archer-Daniels-Midland Co. €300,000 1.00% 12/9/2025 371,685 0.02%AES Corp. $375,000 1.38% 15/1/2026 371,265 0.02%GLP Capital LP/GLP Financing II, Inc. $350,000 3.35% 1/9/2024 370,820 0.02%Welltower, Inc. $335,000 4.00% 1/6/2025 369,772 0.02%Parker-Hannifin Corp. €300,000 1.13% 1/3/2025 369,633 0.02%AbbVie, Inc. €300,000 1.50% 15/11/2023 369,227 0.02%Celanese US Holdings LLC €300,000 1.25% 11/2/2025 368,678 0.02%Procter & Gamble Co. €300,000 1.13% 2/11/2023 368,054 0.02%DTE Energy Co. $350,000 2.53% 1/10/2024 367,700 0.02%Altria Group, Inc. $325,000 4.40% 14/2/2026 367,645 0.02%Expedia Group, Inc. $316,000 6.25% 1/5/2025 367,600 0.02%MPLX LP $362,000 1.75% 1/3/2026 366,117 0.02%FS KKR Capital Corp. $353,000 3.40% 15/1/2026 365,114 0.02%Toyota Motor Credit Corp. €300,000 0.63% 21/11/2024 365,090 0.02%Capital One Financial Corp. $350,000 3.20% 30/1/2023 364,545 0.02%Enterprise Products Operating LLC $350,000 3.35% 15/3/2023 364,478 0.02%Synchrony Financial $325,000 4.50% 23/7/2025 363,933 0.02%General Electric Co.1 $350,000 3.10% 9/1/2023 363,847 0.02%Wells Fargo & Co. €300,000 1.50% 12/9/2022 363,658 0.02%McDonald's Corp. €300,000 0.63% 29/1/2024 362,946 0.02%General Motors Financial Co., Inc. €300,000 0.96% 7/9/2023 362,708 0.02%National Rural Utilities Cooperative Finance Corp. $355,000 2.30% 15/9/2022 362,580 0.02%Virginia Electric & Power Co. $350,000 2.75% 15/3/2023 362,076 0.02%Altria Group, Inc. €300,000 1.00% 15/2/2023 361,320 0.02%UnitedHealth Group, Inc. $350,000 3.35% 15/7/2022 361,125 0.02%Toyota Motor Credit Corp. $350,000 1.80% 13/2/2025 361,039 0.02%

841
Vanguard Global Short-Term Corporate Bond Index Fund
Principal CouponMaturity
DateFair Value
US Dollars ($)% of Total
Net AssetsUnited Parcel Service, Inc. €300,000 0.38% 15/11/2023 360,837 0.02%Chubb INA Holdings, Inc. $350,000 2.88% 3/11/2022 360,436 0.02%Toyota Motor Credit Corp. €300,000 0.75% 21/7/2022 360,179 0.02%Edison International $325,000 4.95% 15/4/2025 360,160 0.02%Franklin Resources, Inc. $336,000 2.85% 30/3/2025 359,737 0.02%CVS Health Corp. $350,000 2.75% 1/12/2022 359,729 0.02%Stryker Corp. €300,000 0.25% 3/12/2024 359,335 0.02%Protective Life Global Funding $350,000 2.62% 22/8/2022 358,901 0.02%Abbott Ireland Financing DAC €300,000 0.10% 19/11/2024 358,683 0.02%CNH Industrial Capital LLC $330,000 4.20% 15/1/2024 357,256 0.02%PACCAR Financial Europe BV €300,000 0.00% 1/3/2026 356,394 0.02%Bank of America Corp.^ $350,000 1.49% 19/5/2024 356,186 0.02%Home Depot, Inc. $325,000 3.35% 15/9/2025 355,986 0.02%General Motors Co. $300,000 6.13% 1/10/2025 355,137 0.02%AT&T, Inc. $325,000 4.45% 1/4/2024 355,116 0.02%Burlington Northern Santa Fe LLC $284,000 7.00% 15/12/2025 355,008 0.02%Comcast Corp. $325,000 3.70% 15/4/2024 352,257 0.02%Amazon.com, Inc. $320,000 3.80% 5/12/2024 352,058 0.02%Burlington Northern Santa Fe LLC $325,000 3.40% 1/9/2024 351,670 0.02%Pacific Life Global Funding II $350,000 1.38% 14/4/2026 351,025 0.02%Capital One Financial Corp. $325,000 3.90% 29/1/2024 350,685 0.02%ONE Gas, Inc. $350,000 1.10% 11/3/2024 350,433 0.02%Protective Life Global Funding $350,000 0.50% 12/4/2023 350,346 0.02%WEC Energy Group, Inc.1 $350,000 0.55% 15/9/2023 350,142 0.02%Marathon Petroleum Corp. $325,000 3.63% 15/9/2024 349,685 0.02%Alexandria Real Estate Equities, Inc. $320,000 3.45% 30/4/2025 349,041 0.02%National Fuel Gas Co. $301,000 5.50% 15/1/2026 348,579 0.02%Intercontinental Exchange, Inc. $314,000 3.75% 1/12/2025 347,804 0.02%NiSource, Inc. $350,000 0.95% 15/8/2025 347,358 0.02%Royalty Pharma plc $350,000 1.20% 2/9/2025 347,032 0.02%American International Group, Inc. $315,000 3.75% 10/7/2025 346,906 0.02%BP Capital Markets America, Inc. $325,000 3.22% 14/4/2024 346,334 0.02%New York Life Global Funding $350,000 0.85% 15/1/2026 345,895 0.02%Zimmer Biomet Holdings, Inc. $321,000 3.05% 15/1/2026 345,840 0.02%WRKCo, Inc. $325,000 3.00% 15/9/2024 344,682 0.02%Synchrony Financial $335,000 2.85% 25/7/2022 342,883 0.02%Discovery Communications LLC $300,000 4.90% 11/3/2026 342,756 0.02%Cigna Corp. $300,000 4.50% 25/2/2026 341,572 0.02%PPL Capital Funding, Inc. $325,000 3.40% 1/6/2023 340,596 0.02%Truist Bank $302,000 4.05% 3/11/2025 339,406 0.02%Time Warner Entertainment Co. LP $300,000 8.38% 15/3/2023 338,982 0.02%Crown Castle International Corp. $300,000 4.45% 15/2/2026 338,678 0.02%Aetna, Inc. $325,000 2.80% 15/6/2023 338,272 0.02%Penske Truck Leasing Co. LP/PTL Finance Corp. $300,000 4.45% 29/1/2026 337,227 0.02%Moody's Corp. $325,000 4.50% 1/9/2022 337,124 0.02%New York Life Global Funding $330,000 2.25% 12/7/2022 336,937 0.02%Autodesk, Inc. $325,000 3.60% 15/12/2022 336,551 0.02%Dow Chemical Co. $304,000 3.63% 15/5/2026 336,376 0.02%Baker Hughes a GE Co. LLC/Baker Hughes Co.-Obligor, Inc. $325,000 2.77% 15/12/2022 335,685 0.02%General Electric Co.1 $325,000 3.15% 7/9/2022 335,587 0.02%Humana, Inc. $325,000 3.15% 1/12/2022 335,086 0.02%Philip Morris International, Inc. $325,000 2.50% 2/11/2022 333,835 0.02%American Tower Corp. $300,000 5.00% 15/2/2024 332,674 0.02%CyrusOne LP/CyrusOne Finance Corp. $315,000 2.90% 15/11/2024 332,553 0.02%General Mills, Inc. $300,000 4.00% 17/4/2025 332,274 0.02%Lowe's Cos, Inc. $300,000 4.00% 15/4/2025 332,076 0.02%Ares Capital Corp. $309,000 3.88% 15/1/2026 331,235 0.02%Stryker Corp. $300,000 3.50% 15/3/2026 330,502 0.02%Johnson & Johnson $310,000 2.63% 15/1/2025 330,056 0.02%Starbucks Corp. $298,000 3.80% 15/8/2025 329,911 0.02%Comcast Corp. $302,000 3.38% 15/8/2025 329,641 0.02%Discover Bank^ $310,000 4.68% 9/8/2028 329,213 0.02%QUALCOMM, Inc. $300,000 3.45% 20/5/2025 329,206 0.02%CRH America, Inc. $300,000 3.88% 18/5/2025 328,859 0.02%Lowe's Cos, Inc. $300,000 3.38% 15/9/2025 328,363 0.02%Bank of America Corp.^ $320,000 2.82% 21/7/2023 327,960 0.02%Fox Corp. $305,000 3.05% 7/4/2025 326,514 0.02%Cisco Systems, Inc.1 $300,000 2.95% 28/2/2026 326,461 0.02%Affiliated Managers Group, Inc. $300,000 3.50% 1/8/2025 326,096 0.02%John Deere Capital Corp. $325,000 0.40% 10/10/2023 325,259 0.02%PepsiCo, Inc. $300,000 2.85% 24/2/2026 324,011 0.02%

842
Vanguard Global Short-Term Corporate Bond Index Fund
Principal CouponMaturity
DateFair Value
US Dollars ($)% of Total
Net AssetsMcKesson Corp. $300,000 3.80% 15/3/2024 322,780 0.02%Schlumberger Holdings Corp. $300,000 3.75% 1/5/2024 322,733 0.02%Ryder System, Inc. $300,000 3.65% 18/3/2024 322,462 0.02%HCA, Inc. $300,000 4.75% 1/5/2023 321,576 0.02%Discover Financial Services $294,000 3.75% 4/3/2025 320,829 0.02%Florida Power & Light Co. $300,000 2.85% 1/4/2025 320,588 0.02%McKesson Corp. $325,000 0.90% 3/12/2025 320,366 0.02%General Motors Financial Co., Inc. $300,000 4.25% 15/5/2023 318,856 0.02%Mars, Inc. $300,000 2.70% 1/4/2025 318,684 0.02%New York Life Global Funding $300,000 2.90% 17/1/2024 317,583 0.02%Morgan Stanley $275,000 5.00% 24/11/2025 317,185 0.02%Steel Dynamics, Inc. $300,000 2.80% 15/12/2024 316,623 0.02%American Express Co. $300,000 2.50% 30/7/2024 316,172 0.02%Equifax, Inc. $300,000 2.60% 15/12/2025 316,111 0.02%General Motors Financial Co., Inc. $300,000 2.75% 20/6/2025 315,926 0.02%JPMorgan Chase & Co. $300,000 3.38% 1/5/2023 315,811 0.02%Jackson National Life Global Funding $300,000 2.65% 21/6/2024 314,750 0.02%Union Pacific Corp. $290,000 3.25% 15/8/2025 314,660 0.02%Midwest Connector Capital Co. LLC $300,000 3.90% 1/4/2024 314,416 0.02%Lennar Corp. $300,000 4.75% 15/11/2022 313,851 0.02%Wells Fargo & Co. CA($)360,000 3.87% 21/5/2025 313,613 0.02%Boston Properties LP $300,000 3.85% 1/2/2023 313,291 0.02%Microchip Technology, Inc. $300,000 2.67% 1/9/2023 312,403 0.02%Zoetis, Inc. $300,000 3.25% 1/2/2023 311,567 0.02%eBay, Inc. $300,000 2.75% 30/1/2023 310,700 0.02%Duke Energy Carolinas LLC $300,000 2.50% 15/3/2023 309,885 0.02%EOG Resources, Inc. $300,000 2.63% 15/3/2023 309,774 0.02%AT&T, Inc. CA($)350,000 4.00% 25/11/2025 309,657 0.02%CME Group, Inc. $300,000 3.00% 15/9/2022 309,573 0.02%PayPal Holdings, Inc. $293,000 2.40% 1/10/2024 308,842 0.02%Keurig Dr Pepper, Inc. $275,000 4.42% 25/5/2025 308,747 0.02%General Electric Co.1 $300,000 2.70% 9/10/2022 308,327 0.02%Amazon.com, Inc. $300,000 2.50% 29/11/2022 307,926 0.02%Philip Morris International, Inc.1 $300,000 2.50% 22/8/2022 307,718 0.02%Public Service Enterprise Group, Inc. $290,000 2.88% 15/6/2024 307,614 0.02%PayPal Holdings, Inc.1 $300,000 2.20% 26/9/2022 307,221 0.02%Digital Stout Holding LLC £200,000 4.25% 17/1/2025 307,177 0.02%Air Products & Chemicals, Inc. $300,000 1.50% 15/10/2025 306,942 0.02%National Securities Clearing Corp. $300,000 1.50% 23/4/2025 305,889 0.02%Capital One NA $300,000 2.15% 6/9/2022 305,739 0.02%PayPal Holdings, Inc.1 $300,000 1.35% 1/6/2023 305,426 0.02%Alexander Funding Trust $300,000 1.84% 15/11/2023 305,259 0.02%Truist Financial Corp. $302,000 1.20% 5/8/2025 304,666 0.02%TWDC Enterprises 18 Corp. CA($)360,000 2.76% 7/10/2024 304,413 0.02%Prudential Financial, Inc.^ $275,000 5.38% 15/5/2045 304,308 0.02%Verizon Communications, Inc. £200,000 4.07% 18/6/2024 303,923 0.02%Halliburton Co. $275,000 3.80% 15/11/2025 303,916 0.02%Anthem, Inc. $300,000 1.50% 15/3/2026 303,659 0.02%Southern California Edison Co. $300,000 1.10% 1/4/2024 302,157 0.02%DTE Energy Co. $295,000 2.25% 1/11/2022 301,983 0.02%JPMorgan Chase & Co.^ $300,000 0.70% 16/3/2024 300,958 0.02%Amazon.com, Inc. $300,000 0.80% 3/6/2025 300,584 0.02%Security Benefit Global Funding $300,000 1.25% 17/5/2024 300,397 0.02%Ares Finance Co. III LLC $300,000 4.13% 30/6/2051 300,375 0.02%Goldman Sachs Group, Inc. $300,000 0.52% 8/3/2023 300,178 0.02%ONE Gas, Inc. $300,000 0.85% 11/3/2023 300,158 0.02%Atmos Energy Corp. $300,000 0.63% 9/3/2023 300,080 0.02%Consolidated Edison, Inc. $300,000 0.65% 1/12/2023 299,951 0.02%Microchip Technology, Inc. $300,000 0.97% 15/2/2024 299,943 0.02%Caterpillar Financial Services Corp. $300,000 0.25% 1/3/2023 299,742 0.02%Metropolitan Life Global Funding I $300,000 0.95% 2/7/2025 299,730 0.02%Equitable Financial Life Global Funding $300,000 0.50% 17/11/2023 299,532 0.02%Toyota Motor Credit Corp. $300,000 0.45% 11/1/2024 299,106 0.02%Graphic Packaging International LLC $300,000 1.51% 15/4/2026 298,449 0.02%HP, Inc. $300,000 1.45% 17/6/2026 298,417 0.02%International Flavors & Fragrances, Inc. $300,000 1.23% 1/10/2025 298,394 0.02%Chevron Corp. $275,000 2.95% 16/5/2026 298,206 0.02%Cummins, Inc. $300,000 0.75% 1/9/2025 298,079 0.02%Humana, Inc. $274,000 3.85% 1/10/2024 297,499 0.02%Kimberly-Clark Corp. $274,000 2.75% 15/2/2026 297,353 0.02%GE Capital UK Funding Unlimited Co. £200,000 4.13% 13/9/2023 297,137 0.02%

843
Vanguard Global Short-Term Corporate Bond Index Fund
Principal CouponMaturity
DateFair Value
US Dollars ($)% of Total
Net AssetsAvalonBay Communities, Inc. $275,000 4.20% 15/12/2023 296,910 0.02%Entergy Corp. $300,000 0.90% 15/9/2025 296,421 0.02%ViacomCBS, Inc. $275,000 3.50% 15/1/2025 295,711 0.02%American Honda Finance Corp. $275,000 3.55% 12/1/2024 295,634 0.02%Equitable Financial Life Global Funding $300,000 1.00% 9/1/2026 295,466 0.02%Hewlett Packard Enterprise Co. $283,000 4.40% 15/10/2022 295,362 0.02%PNC Financial Services Group, Inc. $275,000 3.50% 23/1/2024 295,232 0.02%General Motors Financial Co., Inc. $275,000 3.50% 7/11/2024 295,044 0.02%Principal Life Global Funding II $300,000 0.88% 12/1/2026 294,612 0.02%People's United Bank NA $275,000 4.00% 15/7/2024 294,264 0.02%Marathon Oil Corp. $270,000 3.85% 1/6/2025 294,095 0.02%Exxon Mobil Corp. $275,000 3.18% 15/3/2024 292,955 0.02%Marsh & McLennan Cos, Inc. $270,000 3.88% 15/3/2024 292,908 0.02%Oracle Corp. $275,000 2.95% 15/5/2025 292,863 0.02%Hasbro, Inc. $275,000 3.00% 19/11/2024 292,505 0.02%Air Lease Corp. $275,000 3.88% 3/7/2023 291,837 0.02%PSEG Power LLC $275,000 3.85% 1/6/2023 291,787 0.02%HollyFrontier Corp. $252,000 5.88% 1/4/2026 291,393 0.02%Truist Bank $270,000 3.20% 1/4/2024 288,870 0.02%Las Vegas Sands Corp. $275,000 3.20% 8/8/2024 288,595 0.02%Discover Financial Services $275,000 3.85% 21/11/2022 288,125 0.02%Wyeth LLC $250,000 6.45% 1/2/2024 288,087 0.02%DXC Technology Co. £200,000 2.75% 15/1/2025 287,510 0.02%Metropolitan Life Global Funding I £200,000 2.88% 11/1/2023 286,594 0.02%Wells Fargo & Co. £200,000 2.00% 28/7/2025 286,102 0.02%Kinder Morgan, Inc. $275,000 3.15% 15/1/2023 285,558 0.02%Sherwin-Williams Co. $257,000 3.95% 15/1/2026 285,420 0.02%FS KKR Capital Corp. $268,000 4.13% 1/2/2025 285,087 0.02%Emerson Electric Co. $275,000 2.63% 15/2/2023 283,738 0.02%Hewlett Packard Enterprise Co. $255,000 4.65% 1/10/2024 283,444 0.02%American Tower Corp. $250,000 4.40% 15/2/2026 282,314 0.02%Avnet, Inc. $250,000 4.63% 15/4/2026 281,618 0.02%Bank of New York Mellon Corp. $275,000 1.85% 27/1/2023 281,401 0.02%Boston Scientific Corp. $274,000 3.38% 15/5/2022 281,281 0.02%Wells Fargo & Co. CA($)330,000 2.98% 19/5/2026 279,985 0.02%Columbia Pipeline Group, Inc. $249,000 4.50% 1/6/2025 279,891 0.02%Tyson Foods, Inc. $250,000 4.00% 1/3/2026 278,707 0.02%Trane Technologies Luxembourg Finance SA $257,000 3.55% 1/11/2024 277,536 0.02%MassMutual Global Funding II $270,000 2.50% 17/10/2022 277,482 0.02%O'Reilly Automotive, Inc. $250,000 3.55% 15/3/2026 276,484 0.02%Realty Income Corp. $250,000 3.88% 15/4/2025 275,975 0.02%Nestle Holdings, Inc. £200,000 0.63% 18/12/2025 275,614 0.02%BBVA USA $250,000 3.88% 10/4/2025 275,497 0.02%Jackson National Life Global Funding $250,000 3.88% 11/6/2025 274,513 0.02%Citigroup, Inc. $250,000 3.88% 26/3/2025 274,377 0.02%Moody's Corp. $250,000 3.75% 24/3/2025 274,340 0.02%Automatic Data Processing, Inc. $250,000 3.38% 15/9/2025 274,114 0.02%Lennar Corp. $250,000 4.50% 30/4/2024 273,553 0.02%Goldman Sachs Group, Inc. $250,000 3.75% 22/5/2025 273,547 0.02%Penske Truck Leasing Co. LP/PTL Finance Corp. $275,000 1.20% 15/11/2025 272,826 0.02%GLP Capital LP/GLP Financing II, Inc. $250,000 5.38% 1/11/2023 272,800 0.02%Omega Healthcare Investors, Inc. $250,000 4.95% 1/4/2024 272,097 0.02%Simon Property Group LP $250,000 3.30% 15/1/2026 272,071 0.02%McCormick & Co., Inc. $255,000 3.15% 15/8/2024 271,986 0.02%Tyson Foods, Inc. $250,000 3.95% 15/8/2024 271,983 0.02%Medtronic, Inc. $247,000 3.50% 15/3/2025 271,116 0.02%Invesco Finance plc $250,000 4.00% 30/1/2024 271,023 0.02%American Honda Finance Corp. $255,000 3.45% 14/7/2023 270,634 0.02%Norfolk Southern Corp. $246,000 3.65% 1/8/2025 270,448 0.02%KLA Corp. $242,000 4.65% 1/11/2024 270,222 0.02%BlackRock, Inc. $250,000 3.50% 18/3/2024 270,209 0.02%International Business Machines Corp.1 $265,000 1.88% 1/8/2022 269,423 0.02%Discover Bank $250,000 4.20% 8/8/2023 269,242 0.02%Marsh & McLennan Cos, Inc. $250,000 3.50% 3/6/2024 268,945 0.02%Target Corp.1 $250,000 2.50% 15/4/2026 268,879 0.02%Johnson Controls International plc $250,000 3.63% 2/7/2024 268,619 0.02%Abbott Laboratories $250,000 2.95% 15/3/2025 268,587 0.02%Penske Truck Leasing Co. LP/PTL Finance Corp. $250,000 3.90% 1/2/2024 268,062 0.02%General Electric Co. $250,000 3.45% 15/5/2024 267,695 0.02%Norfolk Southern Corp. $248,000 2.90% 15/6/2026 267,448 0.02%AES Corp. $250,000 3.30% 15/7/2025 267,354 0.02%

844
Vanguard Global Short-Term Corporate Bond Index Fund
Principal CouponMaturity
DateFair Value
US Dollars ($)% of Total
Net AssetsJefferies Group LLC $250,000 5.13% 20/1/2023 267,329 0.02%DTE Energy Co. $250,000 3.50% 1/6/2024 267,155 0.02%Huntington National Bank $250,000 3.55% 6/10/2023 266,480 0.02%PNC Bank NA $250,000 3.80% 25/7/2023 266,321 0.02%AutoZone, Inc. $250,000 3.13% 18/4/2024 266,166 0.02%Marvell Technology, Inc. $250,000 4.20% 22/6/2023 265,901 0.02%National Rural Utilities Cooperative Finance Corp. $250,000 2.85% 27/1/2025 265,808 0.02%US Bank NA $250,000 3.40% 24/7/2023 265,090 0.02%PNC Bank NA $250,000 3.50% 8/6/2023 264,631 0.02%Capital One Financial Corp. $250,000 3.50% 15/6/2023 264,350 0.02%CommonSpirit Health $251,000 2.76% 1/10/2024 264,208 0.02%AutoZone, Inc. $250,000 3.13% 15/7/2023 261,671 0.02%Sysco Corp. $240,000 3.55% 15/3/2025 261,198 0.02%Kilroy Realty LP $250,000 3.80% 15/1/2023 260,076 0.02%Southern Co. Gas Capital Corp. $250,000 2.45% 1/10/2023 259,850 0.02%HP, Inc. $250,000 2.20% 17/6/2025 259,530 0.02%US Bank NA $250,000 2.85% 23/1/2023 259,436 0.02%Invesco Finance plc $250,000 3.13% 30/11/2022 259,336 0.02%Precision Castparts Corp. $239,000 3.25% 15/6/2025 259,242 0.02%PNC Bank NA $250,000 2.95% 30/1/2023 259,228 0.02%Kansas City Southern $250,000 3.00% 15/5/2023 259,164 0.02%Bank of New York Mellon Corp. $250,000 2.20% 16/8/2023 258,999 0.02%Amgen, Inc. $250,000 2.25% 19/8/2023 258,867 0.02%Waste Management, Inc. $250,000 2.40% 15/5/2023 258,689 0.02%Caterpillar Financial Services Corp. $250,000 2.55% 29/11/2022 257,959 0.02%PNC Bank NA $250,000 2.70% 1/11/2022 257,465 0.02%Bank of America Corp.^ CA($)305,000 2.93% 25/4/2025 257,266 0.02%Gray Oak Pipeline LLC $250,000 2.60% 15/10/2025 257,182 0.02%PayPal Holdings, Inc. $250,000 1.65% 1/6/2025 256,714 0.02%Air Lease Corp. CA($)310,000 2.63% 5/12/2024 256,709 0.02%Aviation Capital Group LLC $245,000 3.88% 1/5/2023 256,587 0.02%ERAC USA Finance LLC $245,000 2.70% 1/11/2023 256,054 0.02%Huntington National Bank $250,000 2.50% 7/8/2022 255,617 0.02%Zoetis, Inc. $225,000 4.50% 13/11/2025 255,273 0.02%US Treasury Note $255,000 0.13% 31/5/2023 254,462 0.02%Apple, Inc.1 $250,000 1.70% 11/9/2022 254,262 0.02%Citigroup, Inc. €200,000 2.38% 22/5/2024 254,148 0.02%Walt Disney Co. $250,000 1.65% 1/9/2022 253,910 0.02%BP Capital Markets America, Inc. $232,000 3.41% 11/2/2026 253,815 0.02%Digital Euro Finco LLC €200,000 2.63% 15/4/2024 253,772 0.02%Diamondback Energy, Inc. $225,000 4.75% 31/5/2025 253,662 0.02%Philip Morris International, Inc.1 $250,000 1.13% 1/5/2023 253,299 0.02%Mylan, Inc. €200,000 2.13% 23/5/2025 253,064 0.02%Essex Portfolio LP $232,000 3.38% 15/4/2026 252,205 0.02%Cheniere Corpus Christi Holdings LLC $220,000 7.00% 30/6/2024 251,942 0.02%Pinnacle West Capital Corp. $250,000 1.30% 15/6/2025 251,855 0.02%AIG Global Funding $250,000 0.80% 7/7/2023 251,844 0.02%Citadel Finance LLC $250,000 3.38% 9/3/2026 250,795 0.02%Athene Global Funding $250,000 0.95% 8/1/2024 250,721 0.02%Equinix, Inc. $250,000 1.25% 15/7/2025 250,719 0.02%GA Global Funding Trust $250,000 1.00% 8/4/2024 250,577 0.02%Reliance Steel & Aluminum Co. $250,000 1.30% 15/8/2025 250,569 0.02%Toyota Motor Credit Corp. $250,000 0.35% 14/10/2022 250,265 0.02%International Flavors & Fragrances, Inc. $250,000 0.70% 15/9/2022 250,248 0.02%American Honda Finance Corp. $250,000 1.00% 10/9/2025 250,009 0.02%KeyBank NA^ $250,000 0.42% 3/1/2024 249,995 0.02%General Motors Financial Co., Inc. €200,000 1.69% 26/3/2025 249,948 0.02%Stryker Corp. $250,000 0.60% 1/12/2023 249,947 0.02%DTE Energy Co. $250,000 1.05% 1/6/2025 249,594 0.02%AIG Global Funding $250,000 0.45% 8/12/2023 249,571 0.02%Toyota Motor Credit Corp. $250,000 1.13% 18/6/2026 249,260 0.02%GXO Logistics, Inc. $250,000 1.65% 15/7/2026 248,732 0.02%Bank of New York Mellon Corp. $231,000 2.80% 4/5/2026 248,712 0.02%Goldman Sachs Group, Inc.^ $250,000 0.86% 12/2/2026 248,140 0.02%Fortune Brands Home & Security, Inc. $225,000 4.00% 15/6/2025 247,975 0.02%Southern California Edison Co. $250,000 1.20% 1/2/2026 247,899 0.02%American Tower Corp. €200,000 1.38% 4/4/2025 247,583 0.02%Toyota Motor Credit Corp. $250,000 0.80% 9/1/2026 247,142 0.02%Host Hotels & Resorts LP $225,000 4.50% 1/2/2026 247,082 0.02%International Business Machines Corp. €200,000 0.95% 23/5/2025 246,460 0.02%Berkshire Hathaway, Inc. €200,000 1.30% 15/3/2024 245,830 0.02%

845
Vanguard Global Short-Term Corporate Bond Index Fund
Principal CouponMaturity
DateFair Value
US Dollars ($)% of Total
Net AssetsMcCormick & Co., Inc. $250,000 0.90% 15/2/2026 245,685 0.02%Molson Coors Beverage Co. €200,000 1.25% 15/7/2024 244,792 0.02%QUALCOMM, Inc. $250,000 1.30% 20/5/2028 244,691 0.02%Sysco Corp. $225,000 3.30% 15/7/2026 244,637 0.02%Kellogg Co. €200,000 1.00% 17/5/2024 244,596 0.02%Dell International LLC/EMC Corp. $225,000 4.00% 15/7/2024 244,584 0.02%National Grid North America, Inc. €200,000 1.00% 12/7/2024 244,296 0.02%McDonald's Corp. $225,000 3.38% 26/5/2025 244,280 0.02%International Business Machines Corp.1 €200,000 1.25% 26/5/2023 244,088 0.02%Bank of America Corp.^ CA($)290,000 3.30% 24/4/2024 244,026 0.02%Procter & Gamble Co. €200,000 0.63% 30/10/2024 243,946 0.02%AT&T, Inc. €200,000 1.30% 5/9/2023 243,904 0.02%Realty Income Corp. $225,000 3.88% 15/7/2024 243,688 0.02%Honeywell International, Inc. €200,000 1.30% 22/2/2023 243,425 0.02%Procter & Gamble Co. €200,000 0.50% 25/10/2024 243,177 0.02%Abbott Ireland Financing DAC €200,000 0.88% 27/9/2023 243,137 0.02%3M Co.1 €200,000 0.95% 15/5/2023 243,030 0.02%State Street Corp. $225,000 3.70% 20/11/2023 242,762 0.02%Merck & Co., Inc. €200,000 0.50% 2/11/2024 242,387 0.02%Coca-Cola Co. €200,000 0.50% 8/3/2024 242,041 0.02%PepsiCo, Inc. $225,000 3.60% 1/3/2024 241,810 0.02%Goldman Sachs Group, Inc. €200,000 1.38% 26/7/2022 241,466 0.02%LYB International Finance BV $226,000 4.00% 15/7/2023 241,293 0.02%Wells Fargo & Co. €200,000 0.50% 26/4/2024 240,929 0.02%Celanese US Holdings LLC $225,000 3.50% 8/5/2024 240,848 0.02%United Parcel Service, Inc. CA($)290,000 2.13% 21/5/2024 240,586 0.02%American Honda Finance Corp. €200,000 0.55% 17/3/2023 240,464 0.02%Philip Morris International, Inc. $225,000 2.75% 25/2/2026 240,112 0.02%Walmart, Inc. $225,000 2.85% 8/7/2024 239,826 0.02%US Treasury Note $240,000 0.13% 28/2/2023 239,728 0.02%Kroger Co. $218,000 3.50% 1/2/2026 239,407 0.01%Cox Communications, Inc. $224,000 3.15% 15/8/2024 239,104 0.01%Blackstone Secured Lending Fund $225,000 3.63% 15/1/2026 238,949 0.01%New York Life Global Funding $225,000 2.88% 10/4/2024 238,831 0.01%American Express Co. $218,000 3.63% 5/12/2024 238,582 0.01%Valero Energy Corp. $225,000 2.85% 15/4/2025 238,569 0.01%Medtronic Global Holdings SCA €200,000 0.00% 2/12/2022 238,427 0.01%Plains All American Pipeline LP/PAA Finance Corp. $213,000 4.65% 15/10/2025 238,331 0.01%Owl Rock Capital Corp. $225,000 3.75% 22/7/2025 238,172 0.01%Schlumberger Finance BV €200,000 0.00% 15/10/2024 238,118 0.01%Union Pacific Corp. $225,000 3.50% 8/6/2023 238,103 0.01%Aetna, Inc. $220,000 3.50% 15/11/2024 238,007 0.01%Discover Bank $225,000 2.45% 12/9/2024 235,403 0.01%Anthem, Inc. $225,000 3.30% 15/1/2023 234,756 0.01%Penske Truck Leasing Co. LP/PTL Finance Corp. $225,000 4.88% 11/7/2022 234,676 0.01%Eastern Energy Gas Holdings LLC $216,000 3.60% 15/12/2024 233,656 0.01%American Water Capital Corp. $215,000 3.40% 1/3/2025 233,565 0.01%Kinder Morgan Energy Partners LP $225,000 3.95% 1/9/2022 232,265 0.01%Aptiv plc $205,000 4.25% 15/1/2026 231,633 0.01%Kellogg Co. $212,000 3.25% 1/4/2026 231,461 0.01%Williams Cos, Inc. $225,000 3.35% 15/8/2022 230,618 0.01%Electronic Arts, Inc. $200,000 4.80% 1/3/2026 230,408 0.01%GLP Capital LP/GLP Financing II, Inc. $200,000 5.38% 15/4/2026 230,158 0.01%BorgWarner, Inc. $200,000 5.00% 1/10/2025 229,740 0.01%Appalachian Power Co. $212,000 3.40% 1/6/2025 229,349 0.01%Energy Transfer LP $210,000 4.50% 15/4/2024 228,718 0.01%Zimmer Biomet Holdings, Inc. $225,000 3.15% 1/4/2022 228,597 0.01%Capital One Financial Corp. $204,000 4.25% 30/4/2025 227,331 0.01%Conagra Brands, Inc. $200,000 4.60% 1/11/2025 227,323 0.01%American Express Co. $200,000 4.20% 6/11/2025 226,427 0.01%Nissan Motor Acceptance Corp. $225,000 2.00% 9/3/2026 226,264 0.01%Northern Trust Corp. $200,000 3.95% 30/10/2025 225,719 0.01%Pioneer Natural Resources Co. $200,000 4.45% 15/1/2026 225,559 0.01%Trinity Acquisition plc $200,000 4.40% 15/3/2026 225,464 0.01%Ally Financial, Inc. $200,000 5.13% 30/9/2024 225,442 0.01%Hormel Foods Corp. $225,000 0.65% 3/6/2024 225,433 0.01%ONEOK, Inc. $200,000 7.50% 1/9/2023 225,255 0.01%Highmark, Inc. $225,000 1.45% 10/5/2026 224,417 0.01%Silgan Holdings, Inc. $225,000 1.40% 1/4/2026 222,669 0.01%Halliburton Co. $211,000 3.50% 1/8/2023 222,352 0.01%Schlumberger Holdings Corp. $200,000 4.00% 21/12/2025 222,253 0.01%
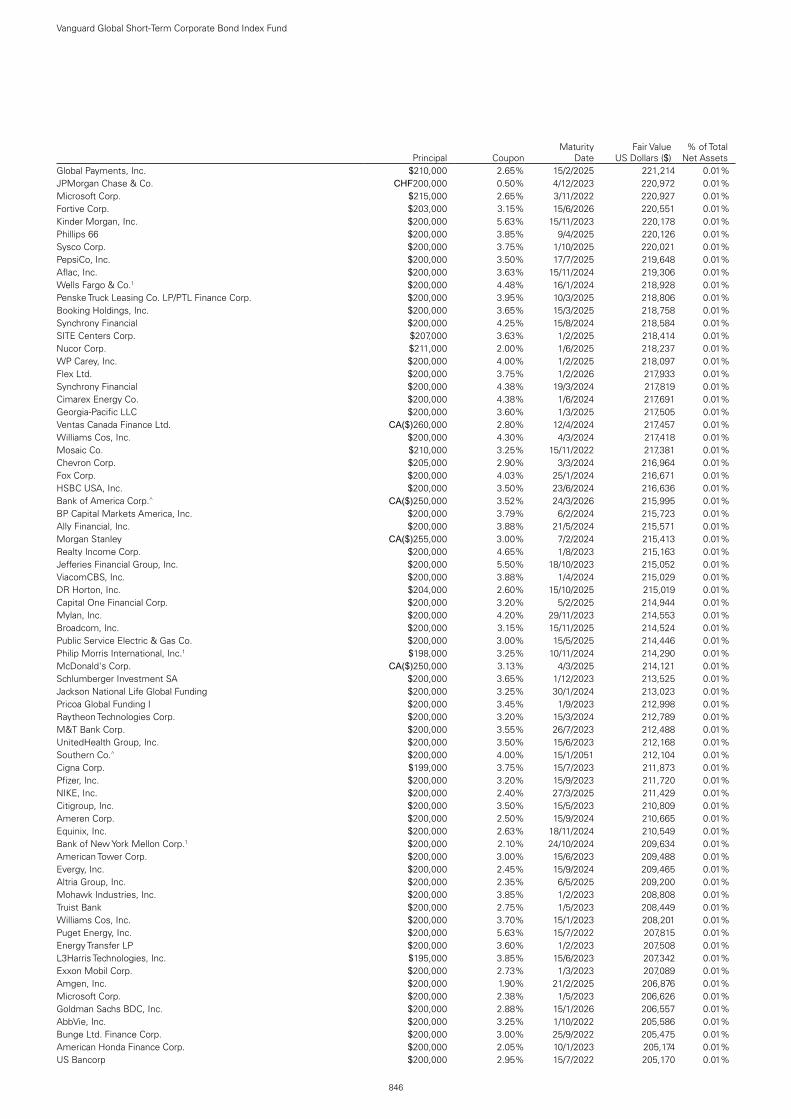
846
Vanguard Global Short-Term Corporate Bond Index Fund
Principal CouponMaturity
DateFair Value
US Dollars ($)% of Total
Net AssetsGlobal Payments, Inc. $210,000 2.65% 15/2/2025 221,214 0.01%JPMorgan Chase & Co. CHF200,000 0.50% 4/12/2023 220,972 0.01%Microsoft Corp. $215,000 2.65% 3/11/2022 220,927 0.01%Fortive Corp. $203,000 3.15% 15/6/2026 220,551 0.01%Kinder Morgan, Inc. $200,000 5.63% 15/11/2023 220,178 0.01%Phillips 66 $200,000 3.85% 9/4/2025 220,126 0.01%Sysco Corp. $200,000 3.75% 1/10/2025 220,021 0.01%PepsiCo, Inc. $200,000 3.50% 17/7/2025 219,648 0.01%Aflac, Inc. $200,000 3.63% 15/11/2024 219,306 0.01%Wells Fargo & Co.1 $200,000 4.48% 16/1/2024 218,928 0.01%Penske Truck Leasing Co. LP/PTL Finance Corp. $200,000 3.95% 10/3/2025 218,806 0.01%Booking Holdings, Inc. $200,000 3.65% 15/3/2025 218,758 0.01%Synchrony Financial $200,000 4.25% 15/8/2024 218,584 0.01%SITE Centers Corp. $207,000 3.63% 1/2/2025 218,414 0.01%Nucor Corp. $211,000 2.00% 1/6/2025 218,237 0.01%WP Carey, Inc. $200,000 4.00% 1/2/2025 218,097 0.01%Flex Ltd. $200,000 3.75% 1/2/2026 217,933 0.01%Synchrony Financial $200,000 4.38% 19/3/2024 217,819 0.01%Cimarex Energy Co. $200,000 4.38% 1/6/2024 217,691 0.01%Georgia-Pacific LLC $200,000 3.60% 1/3/2025 217,505 0.01%Ventas Canada Finance Ltd. CA($)260,000 2.80% 12/4/2024 217,457 0.01%Williams Cos, Inc. $200,000 4.30% 4/3/2024 217,418 0.01%Mosaic Co. $210,000 3.25% 15/11/2022 217,381 0.01%Chevron Corp. $205,000 2.90% 3/3/2024 216,964 0.01%Fox Corp. $200,000 4.03% 25/1/2024 216,671 0.01%HSBC USA, Inc. $200,000 3.50% 23/6/2024 216,636 0.01%Bank of America Corp.^ CA($)250,000 3.52% 24/3/2026 215,995 0.01%BP Capital Markets America, Inc. $200,000 3.79% 6/2/2024 215,723 0.01%Ally Financial, Inc. $200,000 3.88% 21/5/2024 215,571 0.01%Morgan Stanley CA($)255,000 3.00% 7/2/2024 215,413 0.01%Realty Income Corp. $200,000 4.65% 1/8/2023 215,163 0.01%Jefferies Financial Group, Inc. $200,000 5.50% 18/10/2023 215,052 0.01%ViacomCBS, Inc. $200,000 3.88% 1/4/2024 215,029 0.01%DR Horton, Inc. $204,000 2.60% 15/10/2025 215,019 0.01%Capital One Financial Corp. $200,000 3.20% 5/2/2025 214,944 0.01%Mylan, Inc. $200,000 4.20% 29/11/2023 214,553 0.01%Broadcom, Inc. $200,000 3.15% 15/11/2025 214,524 0.01%Public Service Electric & Gas Co. $200,000 3.00% 15/5/2025 214,446 0.01%Philip Morris International, Inc.1 $198,000 3.25% 10/11/2024 214,290 0.01%McDonald's Corp. CA($)250,000 3.13% 4/3/2025 214,121 0.01%Schlumberger Investment SA $200,000 3.65% 1/12/2023 213,525 0.01%Jackson National Life Global Funding $200,000 3.25% 30/1/2024 213,023 0.01%Pricoa Global Funding I $200,000 3.45% 1/9/2023 212,998 0.01%Raytheon Technologies Corp. $200,000 3.20% 15/3/2024 212,789 0.01%M&T Bank Corp. $200,000 3.55% 26/7/2023 212,488 0.01%UnitedHealth Group, Inc. $200,000 3.50% 15/6/2023 212,168 0.01%Southern Co.^ $200,000 4.00% 15/1/2051 212,104 0.01%Cigna Corp. $199,000 3.75% 15/7/2023 211,873 0.01%Pfizer, Inc. $200,000 3.20% 15/9/2023 211,720 0.01%NIKE, Inc. $200,000 2.40% 27/3/2025 211,429 0.01%Citigroup, Inc. $200,000 3.50% 15/5/2023 210,809 0.01%Ameren Corp. $200,000 2.50% 15/9/2024 210,665 0.01%Equinix, Inc. $200,000 2.63% 18/11/2024 210,549 0.01%Bank of New York Mellon Corp.1 $200,000 2.10% 24/10/2024 209,634 0.01%American Tower Corp. $200,000 3.00% 15/6/2023 209,488 0.01%Evergy, Inc. $200,000 2.45% 15/9/2024 209,465 0.01%Altria Group, Inc. $200,000 2.35% 6/5/2025 209,200 0.01%Mohawk Industries, Inc. $200,000 3.85% 1/2/2023 208,808 0.01%Truist Bank $200,000 2.75% 1/5/2023 208,449 0.01%Williams Cos, Inc. $200,000 3.70% 15/1/2023 208,201 0.01%Puget Energy, Inc. $200,000 5.63% 15/7/2022 207,815 0.01%Energy Transfer LP $200,000 3.60% 1/2/2023 207,508 0.01%L3Harris Technologies, Inc. $195,000 3.85% 15/6/2023 207,342 0.01%Exxon Mobil Corp. $200,000 2.73% 1/3/2023 207,089 0.01%Amgen, Inc. $200,000 1.90% 21/2/2025 206,876 0.01%Microsoft Corp. $200,000 2.38% 1/5/2023 206,626 0.01%Goldman Sachs BDC, Inc. $200,000 2.88% 15/1/2026 206,557 0.01%AbbVie, Inc. $200,000 3.25% 1/10/2022 205,586 0.01%Bunge Ltd. Finance Corp. $200,000 3.00% 25/9/2022 205,475 0.01%American Honda Finance Corp. $200,000 2.05% 10/1/2023 205,174 0.01%US Bancorp $200,000 2.95% 15/7/2022 205,170 0.01%
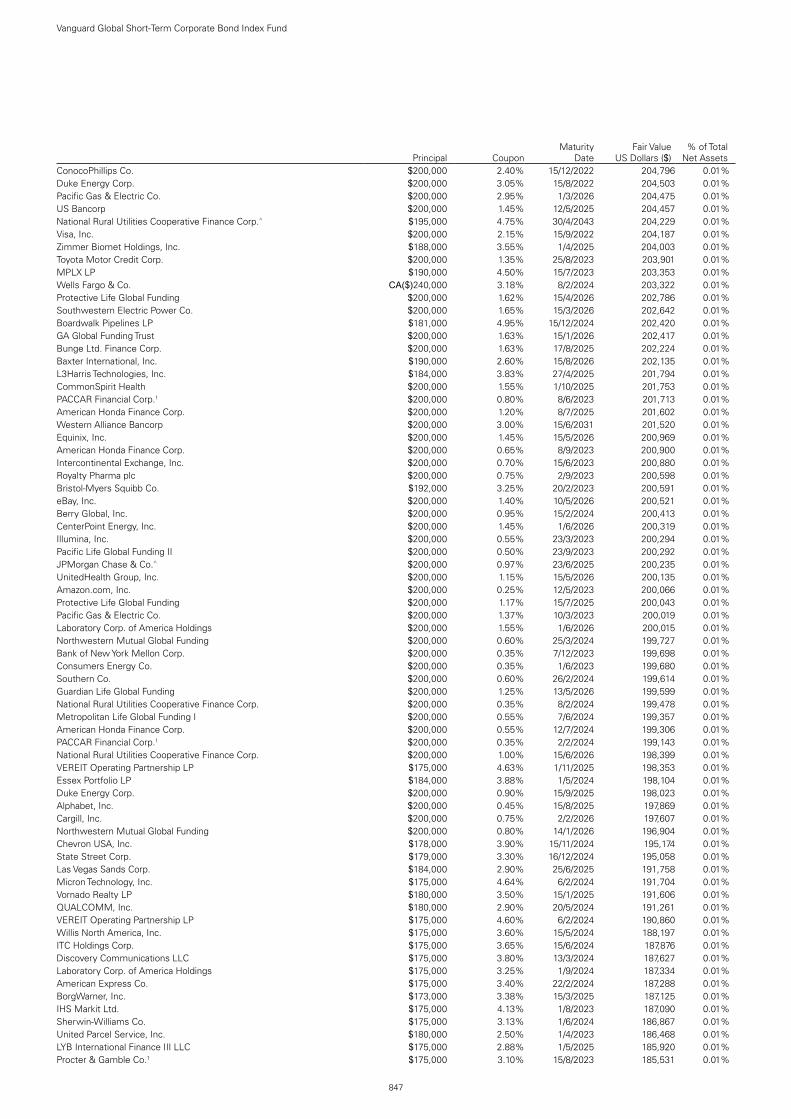
847
Vanguard Global Short-Term Corporate Bond Index Fund
Principal CouponMaturity
DateFair Value
US Dollars ($)% of Total
Net AssetsConocoPhillips Co. $200,000 2.40% 15/12/2022 204,796 0.01%Duke Energy Corp. $200,000 3.05% 15/8/2022 204,503 0.01%Pacific Gas & Electric Co. $200,000 2.95% 1/3/2026 204,475 0.01%US Bancorp $200,000 1.45% 12/5/2025 204,457 0.01%National Rural Utilities Cooperative Finance Corp.^ $195,000 4.75% 30/4/2043 204,229 0.01%Visa, Inc. $200,000 2.15% 15/9/2022 204,187 0.01%Zimmer Biomet Holdings, Inc. $188,000 3.55% 1/4/2025 204,003 0.01%Toyota Motor Credit Corp. $200,000 1.35% 25/8/2023 203,901 0.01%MPLX LP $190,000 4.50% 15/7/2023 203,353 0.01%Wells Fargo & Co. CA($)240,000 3.18% 8/2/2024 203,322 0.01%Protective Life Global Funding $200,000 1.62% 15/4/2026 202,786 0.01%Southwestern Electric Power Co. $200,000 1.65% 15/3/2026 202,642 0.01%Boardwalk Pipelines LP $181,000 4.95% 15/12/2024 202,420 0.01%GA Global Funding Trust $200,000 1.63% 15/1/2026 202,417 0.01%Bunge Ltd. Finance Corp. $200,000 1.63% 17/8/2025 202,224 0.01%Baxter International, Inc. $190,000 2.60% 15/8/2026 202,135 0.01%L3Harris Technologies, Inc. $184,000 3.83% 27/4/2025 201,794 0.01%CommonSpirit Health $200,000 1.55% 1/10/2025 201,753 0.01%PACCAR Financial Corp.1 $200,000 0.80% 8/6/2023 201,713 0.01%American Honda Finance Corp. $200,000 1.20% 8/7/2025 201,602 0.01%Western Alliance Bancorp $200,000 3.00% 15/6/2031 201,520 0.01%Equinix, Inc. $200,000 1.45% 15/5/2026 200,969 0.01%American Honda Finance Corp. $200,000 0.65% 8/9/2023 200,900 0.01%Intercontinental Exchange, Inc. $200,000 0.70% 15/6/2023 200,880 0.01%Royalty Pharma plc $200,000 0.75% 2/9/2023 200,598 0.01%Bristol-Myers Squibb Co. $192,000 3.25% 20/2/2023 200,591 0.01%eBay, Inc. $200,000 1.40% 10/5/2026 200,521 0.01%Berry Global, Inc. $200,000 0.95% 15/2/2024 200,413 0.01%CenterPoint Energy, Inc. $200,000 1.45% 1/6/2026 200,319 0.01%Illumina, Inc. $200,000 0.55% 23/3/2023 200,294 0.01%Pacific Life Global Funding II $200,000 0.50% 23/9/2023 200,292 0.01%JPMorgan Chase & Co.^ $200,000 0.97% 23/6/2025 200,235 0.01%UnitedHealth Group, Inc. $200,000 1.15% 15/5/2026 200,135 0.01%Amazon.com, Inc. $200,000 0.25% 12/5/2023 200,066 0.01%Protective Life Global Funding $200,000 1.17% 15/7/2025 200,043 0.01%Pacific Gas & Electric Co. $200,000 1.37% 10/3/2023 200,019 0.01%Laboratory Corp. of America Holdings $200,000 1.55% 1/6/2026 200,015 0.01%Northwestern Mutual Global Funding $200,000 0.60% 25/3/2024 199,727 0.01%Bank of New York Mellon Corp. $200,000 0.35% 7/12/2023 199,698 0.01%Consumers Energy Co. $200,000 0.35% 1/6/2023 199,680 0.01%Southern Co. $200,000 0.60% 26/2/2024 199,614 0.01%Guardian Life Global Funding $200,000 1.25% 13/5/2026 199,599 0.01%National Rural Utilities Cooperative Finance Corp. $200,000 0.35% 8/2/2024 199,478 0.01%Metropolitan Life Global Funding I $200,000 0.55% 7/6/2024 199,357 0.01%American Honda Finance Corp. $200,000 0.55% 12/7/2024 199,306 0.01%PACCAR Financial Corp.1 $200,000 0.35% 2/2/2024 199,143 0.01%National Rural Utilities Cooperative Finance Corp. $200,000 1.00% 15/6/2026 198,399 0.01%VEREIT Operating Partnership LP $175,000 4.63% 1/11/2025 198,353 0.01%Essex Portfolio LP $184,000 3.88% 1/5/2024 198,104 0.01%Duke Energy Corp. $200,000 0.90% 15/9/2025 198,023 0.01%Alphabet, Inc. $200,000 0.45% 15/8/2025 197,869 0.01%Cargill, Inc. $200,000 0.75% 2/2/2026 197,607 0.01%Northwestern Mutual Global Funding $200,000 0.80% 14/1/2026 196,904 0.01%Chevron USA, Inc. $178,000 3.90% 15/11/2024 195,174 0.01%State Street Corp. $179,000 3.30% 16/12/2024 195,058 0.01%Las Vegas Sands Corp. $184,000 2.90% 25/6/2025 191,758 0.01%Micron Technology, Inc. $175,000 4.64% 6/2/2024 191,704 0.01%Vornado Realty LP $180,000 3.50% 15/1/2025 191,606 0.01%QUALCOMM, Inc. $180,000 2.90% 20/5/2024 191,261 0.01%VEREIT Operating Partnership LP $175,000 4.60% 6/2/2024 190,860 0.01%Willis North America, Inc. $175,000 3.60% 15/5/2024 188,197 0.01%ITC Holdings Corp. $175,000 3.65% 15/6/2024 187,876 0.01%Discovery Communications LLC $175,000 3.80% 13/3/2024 187,627 0.01%Laboratory Corp. of America Holdings $175,000 3.25% 1/9/2024 187,334 0.01%American Express Co. $175,000 3.40% 22/2/2024 187,288 0.01%BorgWarner, Inc. $173,000 3.38% 15/3/2025 187,125 0.01%IHS Markit Ltd. $175,000 4.13% 1/8/2023 187,090 0.01%Sherwin-Williams Co. $175,000 3.13% 1/6/2024 186,867 0.01%United Parcel Service, Inc. $180,000 2.50% 1/4/2023 186,468 0.01%LYB International Finance III LLC $175,000 2.88% 1/5/2025 185,920 0.01%Procter & Gamble Co.1 $175,000 3.10% 15/8/2023 185,531 0.01%

848
Vanguard Global Short-Term Corporate Bond Index Fund
Principal CouponMaturity
DateFair Value
US Dollars ($)% of Total
Net AssetsCC Holdings GS V LLC/Crown Castle GS III Corp. $175,000 3.85% 15/4/2023 185,372 0.01%Flex Ltd. $165,000 4.75% 15/6/2025 184,000 0.01%VF Corp. $175,000 2.40% 23/4/2025 183,521 0.01%Roper Technologies, Inc. $175,000 2.35% 15/9/2024 183,332 0.01%UnitedHealth Group, Inc. $170,000 3.50% 15/2/2024 183,093 0.01%UnitedHealth Group, Inc. $175,000 2.88% 15/3/2023 182,543 0.01%S&P Global, Inc. $163,000 4.00% 15/6/2025 181,310 0.01%Florida Power & Light Co. $175,000 2.75% 1/6/2023 181,091 0.01%Cardinal Health, Inc. $167,000 3.50% 15/11/2024 179,941 0.01%Precision Castparts Corp. $175,000 2.50% 15/1/2023 179,930 0.01%Eastman Chemical Co. $175,000 3.60% 15/8/2022 179,827 0.01%E*TRADE Financial Corp. $175,000 2.95% 24/8/2022 179,698 0.01%General Mills, Inc. $175,000 2.60% 12/10/2022 179,552 0.01%John Deere Capital Corp. $175,000 2.15% 8/9/2022 178,900 0.01%Hewlett Packard Enterprise Co. $165,000 4.45% 2/10/2023 178,537 0.01%Equitable Financial Life Global Funding $175,000 1.40% 7/7/2025 176,730 0.01%Caterpillar Financial Services Corp. $175,000 0.65% 7/7/2023 175,945 0.01%Omnicom Group, Inc./Omnicom Capital, Inc. $162,000 3.65% 1/11/2024 175,873 0.01%AvalonBay Communities, Inc. $161,000 3.45% 1/6/2025 175,850 0.01%WEC Energy Group, Inc. $175,000 0.80% 15/3/2024 175,453 0.01%Nasdaq, Inc. $175,000 0.45% 21/12/2022 174,969 0.01%Owl Rock Capital Corp. $160,000 5.25% 15/4/2024 174,901 0.01%John Deere Capital Corp. $175,000 1.05% 17/6/2026 174,588 0.01%Union Pacific Corp. $162,000 3.25% 15/1/2025 174,528 0.01%Plains All American Pipeline LP/PAA Finance Corp. $162,000 3.60% 1/11/2024 173,681 0.01%JM Smucker Co. $159,000 3.50% 15/3/2025 173,198 0.01%Caterpillar Financial Services Corp. $165,000 2.15% 8/11/2024 172,818 0.01%Fidelity & Guaranty Life Holdings, Inc. $150,000 5.50% 1/5/2025 172,269 0.01%Trane Technologies Global Holding Co., Ltd. $160,000 4.25% 15/6/2023 171,587 0.01%Simon Property Group LP $160,000 3.75% 1/2/2024 171,526 0.01%Equitable Holdings, Inc. $162,000 3.90% 20/4/2023 171,359 0.01%Santander Holdings USA, Inc. $160,000 3.24% 5/10/2026 170,948 0.01%Block Financial LLC $150,000 5.25% 1/10/2025 170,434 0.01%Hyatt Hotels Corp. $150,000 5.38% 23/4/2025 169,483 0.01%Aetna, Inc. $165,000 2.75% 15/11/2022 169,462 0.01%General Motors Financial Co., Inc. $160,000 2.90% 26/2/2025 169,359 0.01%Charles Schwab Corp. $150,000 4.20% 24/3/2025 167,497 0.01%PVH Corp. $150,000 4.63% 10/7/2025 167,369 0.01%Aon plc $150,000 3.88% 15/12/2025 166,764 0.01%ERAC USA Finance LLC $150,000 3.80% 1/11/2025 165,409 0.01%Black Hills Corp. $150,000 3.95% 15/1/2026 165,178 0.01%Brown & Brown, Inc. $150,000 4.20% 15/9/2024 164,572 0.01%Allied World Assurance Co. Holdings Ltd. $150,000 4.35% 29/10/2025 164,454 0.01%US Treasury Note $165,000 0.25% 15/6/2024 164,007 0.01%Marathon Petroleum Corp. $150,000 4.75% 15/12/2023 163,653 0.01%NextEra Energy Capital Holdings, Inc. $160,000 1.95% 1/9/2022 162,925 0.01%Leidos, Inc. $150,000 3.63% 15/5/2025 162,904 0.01%Target Corp. $150,000 3.50% 1/7/2024 162,754 0.01%AbbVie, Inc. $150,000 3.85% 15/6/2024 162,640 0.01%QUALCOMM, Inc. $157,000 2.60% 30/1/2023 162,576 0.01%Host Hotels & Resorts LP $150,000 4.00% 15/6/2025 162,550 0.01%John Deere Capital Corp. $150,000 3.35% 12/6/2024 162,111 0.01%Exelon Generation Co. LLC $150,000 3.25% 1/6/2025 161,716 0.01%American Water Capital Corp. $150,000 3.85% 1/3/2024 161,545 0.01%Truist Financial Corp. $151,000 2.85% 26/10/2024 161,526 0.01%Kroger Co. $150,000 4.00% 1/2/2024 161,503 0.01%CVS Health Corp. $150,000 3.38% 12/8/2024 161,259 0.01%Assurant, Inc. $150,000 4.20% 27/9/2023 161,107 0.01%Mosaic Co. $150,000 4.25% 15/11/2023 161,071 0.01%Eversource Energy $150,000 3.80% 1/12/2023 161,033 0.01%Discovery Communications LLC $150,000 3.45% 15/3/2025 161,032 0.01%Simon Property Group LP $155,000 2.75% 1/6/2023 160,915 0.01%Sempra Energy $150,000 4.05% 1/12/2023 160,903 0.01%CME Group, Inc. $150,000 3.00% 15/3/2025 160,798 0.01%Energy Transfer LP/Regency Energy Finance Corp. $150,000 4.50% 1/11/2023 160,791 0.01%Becton Dickinson & Co. $150,000 3.36% 6/6/2024 160,699 0.01%AmerisourceBergen Corp. $150,000 3.40% 15/5/2024 160,334 0.01%3M Co. $150,000 3.25% 14/2/2024 160,305 0.01%Kilroy Realty LP $150,000 3.45% 15/12/2024 160,242 0.01%Boston Scientific Corp. $150,000 3.45% 1/3/2024 160,177 0.01%Aircastle Ltd. $150,000 4.13% 1/5/2024 160,169 0.01%

849
Vanguard Global Short-Term Corporate Bond Index Fund
Principal CouponMaturity
DateFair Value
US Dollars ($)% of Total
Net AssetsDuke Energy Ohio, Inc. $150,000 3.80% 1/9/2023 159,647 0.01%Protective Life Global Funding $150,000 3.10% 15/4/2024 159,273 0.01%Oncor Electric Delivery Co. LLC $150,000 2.75% 1/6/2024 159,185 0.01%Deere & Co. $149,000 2.75% 15/4/2025 159,034 0.01%American Honda Finance Corp. $150,000 2.90% 16/2/2024 158,892 0.01%Citadel LP $150,000 5.38% 17/1/2023 158,640 0.01%Berkshire Hathaway Energy Co. $146,000 3.50% 1/2/2025 157,873 0.01%Pacific Gas & Electric Co. $150,000 3.50% 15/6/2025 157,430 0.01%Jabil, Inc. $150,000 4.70% 15/9/2022 157,355 0.01%Ares Capital Corp. $145,000 4.25% 1/3/2025 156,733 0.01%Carlisle Cos, Inc. $145,000 3.50% 1/12/2024 156,428 0.01%Analog Devices, Inc. $150,000 2.88% 1/6/2023 156,114 0.01%General Motors Financial of Canada Ltd. CA($)195,000 1.75% 15/4/2026 155,861 0.01%MPLX LP $150,000 3.50% 1/12/2022 155,836 0.01%Philip Morris International, Inc. $150,000 2.63% 6/3/2023 155,746 0.01%Ares Capital Corp. $150,000 3.50% 10/2/2023 155,699 0.01%Apple, Inc. $150,000 1.80% 11/9/2024 155,681 0.01%Mylan, Inc. $150,000 3.13% 15/1/2023 155,488 0.01%Loews Corp. $150,000 2.63% 15/5/2023 155,395 0.01%People's United Financial, Inc. $150,000 3.65% 6/12/2022 155,266 0.01%Anthem, Inc. $150,000 2.95% 1/12/2022 155,094 0.01%Office Properties Income Trust $150,000 4.00% 15/7/2022 154,874 0.01%Bristol-Myers Squibb Co. $150,000 3.25% 15/8/2022 154,841 0.01%Entergy Corp. $150,000 4.00% 15/7/2022 154,700 0.01%Wells Fargo & Co.^ CA($)185,000 2.57% 1/5/2026 154,556 0.01%Goldman Sachs Group, Inc.^ CA($)180,000 3.31% 31/10/2025 153,879 0.01%CNH Industrial Capital LLC $150,000 1.95% 2/7/2023 153,780 0.01%Hershey Co. $146,000 3.38% 15/5/2023 153,632 0.01%Kroger Co. $150,000 2.80% 1/8/2022 153,568 0.01%PNC Bank NA $150,000 2.45% 28/7/2022 153,278 0.01%Philip Morris International, Inc. $150,000 2.38% 17/8/2022 153,201 0.01%USAA Capital Corp. $150,000 1.50% 1/5/2023 153,053 0.01%Honeywell International, Inc. $150,000 2.15% 8/8/2022 152,856 0.01%Midwest Connector Capital Co. LLC $150,000 3.63% 1/4/2022 152,445 0.01%Arrow Electronics, Inc. $140,000 4.00% 1/4/2025 151,926 0.01%American Tower Corp. $150,000 1.60% 15/4/2026 151,614 0.01%National Retail Properties, Inc. $140,000 3.90% 15/6/2024 151,266 0.01%Dominion Energy, Inc. $150,000 1.45% 15/4/2026 151,113 0.01%Crown Castle International Corp. $150,000 1.35% 15/7/2025 151,037 0.01%Pacific Life Global Funding II $150,000 1.20% 24/6/2025 150,562 0.01%IHS Markit Ltd. $140,000 3.63% 1/5/2024 150,300 0.01%Campbell Soup Co. $143,000 3.65% 15/3/2023 150,247 0.01%Aon plc $140,000 4.00% 27/11/2023 150,194 0.01%Roper Technologies, Inc. $150,000 0.45% 15/8/2022 150,089 0.01%Phillips 66 $150,000 1.30% 15/2/2026 150,035 0.01%Bank of America Corp.^ $150,000 0.52% 14/6/2024 149,957 0.01%Teledyne Technologies, Inc. $150,000 0.65% 1/4/2023 149,950 0.01%John Deere Capital Corp. $150,000 0.25% 17/1/2023 149,930 0.01%Vontier Corp. $150,000 1.80% 1/4/2026 149,513 0.01%Public Service Electric & Gas Co. $150,000 0.95% 15/3/2026 149,346 0.01%CNH Industrial Capital LLC $150,000 1.45% 15/7/2026 149,194 0.01%Public Storage $150,000 0.88% 15/2/2026 149,065 0.01%Fortinet, Inc. $150,000 1.00% 15/3/2026 148,478 0.01%Enbridge Energy Partners LP $125,000 5.88% 15/10/2025 147,688 0.01%Campbell Soup Co. $132,000 3.95% 15/3/2025 145,507 0.01%PepsiCo, Inc. CA($)175,000 2.15% 6/5/2024 145,284 0.01%Energy Transfer LP $135,000 4.20% 15/9/2023 144,349 0.01%AT&T, Inc. CA($)170,000 2.85% 25/5/2024 143,101 0.01%Cantor Fitzgerald LP $130,000 4.88% 1/5/2024 142,427 0.01%Penske Truck Leasing Co. LP/PTL Finance Corp. $135,000 4.25% 17/1/2023 142,393 0.01%Kimco Realty Corp. $132,000 3.30% 1/2/2025 142,236 0.01%Allstate Corp. $135,000 3.15% 15/6/2023 142,081 0.01%Ross Stores, Inc. $125,000 4.60% 15/4/2025 141,096 0.01%Assured Guaranty US Holdings, Inc. $125,000 5.00% 1/7/2024 139,840 0.01%Raytheon Technologies Corp. $135,000 2.50% 15/12/2022 138,542 0.01%Clorox Co. $127,000 3.50% 15/12/2024 138,056 0.01%Mondelez International, Inc. CA($)160,000 3.25% 7/3/2025 137,098 0.01%Lazard Group LLC $125,000 3.75% 13/2/2025 136,434 0.01%American Campus Communities Operating Partnership LP $130,000 3.75% 15/4/2023 136,348 0.01%US Bancorp $125,000 3.60% 11/9/2024 136,131 0.01%American International Group, Inc. $125,000 4.13% 15/2/2024 136,102 0.01%

850
Vanguard Global Short-Term Corporate Bond Index Fund
Principal CouponMaturity
DateFair Value
US Dollars ($)% of Total
Net AssetsBerkshire Hathaway, Inc. $130,000 3.00% 11/2/2023 135,616 0.01%Pfizer, Inc. $125,000 3.40% 15/5/2024 135,335 0.01%MetLife, Inc. $125,000 3.60% 10/4/2024 135,200 0.01%Ameriprise Financial, Inc. $125,000 4.00% 15/10/2023 135,095 0.01%Caterpillar Financial Services Corp. $125,000 3.30% 9/6/2024 134,786 0.01%EOG Resources, Inc. $125,000 3.15% 1/4/2025 134,708 0.01%Bank of New York Mellon Corp. $125,000 3.40% 15/5/2024 134,679 0.01%Simon Property Group LP $125,000 3.38% 1/10/2024 134,565 0.01%Enterprise Products Operating LLC $125,000 3.90% 15/2/2024 134,554 0.01%Omega Healthcare Investors, Inc. $126,000 4.38% 1/8/2023 134,377 0.01%DTE Electric Co. $125,000 3.65% 15/3/2024 134,183 0.01%Marriott International, Inc. $125,000 4.15% 1/12/2023 134,023 0.01%Union Pacific Corp. $125,000 3.65% 15/2/2024 134,017 0.01%Walmart, Inc. $125,000 3.30% 22/4/2024 133,955 0.01%PECO Energy Co. $125,000 3.15% 15/10/2025 133,767 0.01%Albemarle Corp. $122,000 4.15% 1/12/2024 133,595 0.01%Brookfield Property Finance ULC CA($)158,000 4.30% 1/3/2024 133,512 0.01%Regions Financial Corp. $125,000 3.80% 14/8/2023 133,299 0.01%Owl Rock Capital Corp. $125,000 4.00% 30/3/2025 133,267 0.01%Nucor Corp. $125,000 4.00% 1/8/2023 133,117 0.01%Comerica, Inc. $125,000 3.70% 31/7/2023 132,942 0.01%Guardian Life Global Funding $125,000 2.90% 6/5/2024 132,879 0.01%Ryder System, Inc. $125,000 3.75% 9/6/2023 132,359 0.01%Georgia-Pacific LLC $125,000 3.73% 15/7/2023 132,159 0.01%Citigroup, Inc. CA($)150,000 4.09% 9/6/2025 131,751 0.01%Chevron Phillips Chemical Co. LLC/Chevron Phillips Chemical Co. LP $125,000 3.30% 1/5/2023 131,351 0.01%State Street Corp. $125,000 3.10% 15/5/2023 131,310 0.01%Nasdaq, Inc. $120,000 4.25% 1/6/2024 131,258 0.01%Merck & Co., Inc. $125,000 2.80% 18/5/2023 130,755 0.01%Truist Bank $125,000 2.15% 6/12/2024 130,737 0.01%American Honda Finance Corp. $125,000 2.15% 10/9/2024 130,654 0.01%Blackstone Secured Lending Fund $125,000 3.65% 14/7/2023 130,259 0.01%Eastman Chemical Co. $119,000 3.80% 15/3/2025 129,999 0.01%John Deere Capital Corp. $125,000 2.80% 27/1/2023 129,896 0.01%Coca-Cola Co.1 $125,000 1.75% 6/9/2024 129,893 0.01%General Motors Financial Co., Inc. $125,000 3.25% 5/1/2023 129,719 0.01%American Honda Finance Corp. $125,000 2.60% 16/11/2022 128,956 0.01%Camden Property Trust $125,000 2.95% 15/12/2022 128,799 0.01%Truist Financial Corp. $125,000 2.20% 16/3/2023 128,686 0.01%WEC Energy Group, Inc. $118,000 3.55% 15/6/2025 128,643 0.01%Connecticut Light & Power Co. $125,000 2.50% 15/1/2023 128,372 0.01%Exelon Corp. $125,000 3.50% 1/6/2022 128,187 0.01%AEP Texas, Inc. $125,000 2.40% 1/10/2022 127,835 0.01%Exxon Mobil Corp.1 $125,000 1.90% 16/8/2022 127,327 0.01%Booking Holdings, Inc. €100,000 2.38% 23/9/2024 127,137 0.01%Caterpillar Financial Services Corp. $120,000 3.45% 15/5/2023 126,966 0.01%Quest Diagnostics, Inc. $117,000 3.50% 30/3/2025 126,962 0.01%Anthem, Inc. $116,000 3.35% 1/12/2024 125,135 0.01%Republic Services, Inc. $116,000 3.20% 15/3/2025 124,756 0.01%CNA Financial Corp. $115,000 3.95% 15/5/2024 124,609 0.01%Apollo Management Holdings LP^ $120,000 4.95% 14/1/2050 124,445 0.01%Conagra Brands, Inc. $120,000 3.20% 25/1/2023 124,170 0.01%AT&T, Inc. €100,000 2.50% 15/3/2023 123,326 0.01%Ventas Realty LP $114,000 3.50% 1/2/2025 123,161 0.01%Bunge Finance Europe BV €100,000 1.85% 16/6/2023 122,461 0.01%Stryker Corp. €100,000 1.13% 30/11/2023 122,424 0.01%Linde, Inc. $115,000 2.65% 5/2/2025 121,833 0.01%Johnson & Johnson €100,000 0.65% 20/5/2024 121,630 0.01%Thermo Fisher Scientific, Inc. €100,000 0.75% 12/9/2024 121,630 0.01%PNC Bank NA $112,000 3.30% 30/10/2024 121,538 0.01%Celanese US Holdings LLC €100,000 1.13% 26/9/2023 121,381 0.01%Allegion US Holding Co., Inc. $114,000 3.20% 1/10/2024 121,293 0.01%John Deere Financial, Inc. CA($)150,000 1.63% 9/4/2026 121,086 0.01%Tyco Electronics Group SA €100,000 1.10% 1/3/2023 120,956 0.01%Simon International Finance SCA €100,000 1.38% 18/11/2022 120,736 0.01%Becton Dickinson & Co. €100,000 1.00% 15/12/2022 120,526 0.01%Berkshire Hathaway, Inc. €100,000 0.75% 16/3/2023 120,390 0.01%Kellogg Co. €100,000 0.80% 17/11/2022 120,384 0.01%Emerson Electric Co. €100,000 0.38% 22/5/2024 120,260 0.01%Becton Dickinson Euro Finance Sarl €100,000 0.63% 4/6/2023 120,231 0.01%Euronet Worldwide, Inc. €100,000 1.38% 22/5/2026 120,223 0.01%

851
Vanguard Global Short-Term Corporate Bond Index Fund
Principal CouponMaturity
DateFair Value
US Dollars ($)% of Total
Net AssetsIllinois Tool Works, Inc. €100,000 0.25% 5/12/2024 120,083 0.01%Main Street Capital Corp. $110,000 5.20% 1/5/2024 119,736 0.01%Berry Global, Inc. €100,000 1.00% 15/1/2025 119,651 0.01%Lincoln National Corp. $110,000 3.35% 9/3/2025 119,126 0.01%Georgia-Pacific LLC $100,000 8.00% 15/1/2024 118,409 0.01%Host Hotels & Resorts LP $110,000 3.88% 1/4/2024 117,489 0.01%Plains All American Pipeline LP/PAA Finance Corp. $110,000 3.85% 15/10/2023 116,613 0.01%BGC Partners, Inc. $110,000 3.75% 1/10/2024 116,462 0.01%Consumers Energy Co. $110,000 3.38% 15/8/2023 116,135 0.01%Sysco Corp. $100,000 5.65% 1/4/2025 115,980 0.01%PNC Bank NA^ $115,000 2.03% 9/12/2022 115,820 0.01%Discover Financial Services $106,000 3.95% 6/11/2024 115,720 0.01%Ryder System, Inc. $100,000 4.63% 1/6/2025 112,813 0.01%Aircastle Ltd. $100,000 5.25% 11/8/2025 112,318 0.01%Phillips 66 Partners LP $104,000 3.61% 15/2/2025 112,156 0.01%Eversource Energy $105,000 3.15% 15/1/2025 112,137 0.01%ONEOK Partners LP $100,000 4.90% 15/3/2025 111,958 0.01%Valero Energy Corp. $102,000 3.65% 15/3/2025 111,162 0.01%Florida Gas Transmission Co. LLC $100,000 4.35% 15/7/2025 111,025 0.01%Aviation Capital Group LLC $100,000 4.88% 1/10/2025 110,784 0.01%Invesco Finance plc $100,000 3.75% 15/1/2026 110,753 0.01%Healthpeak Properties, Inc. $100,000 4.00% 1/6/2025 110,398 0.01%American Tower Corp. $100,000 4.00% 1/6/2025 110,091 0.01%Owl Rock Technology Finance Corp. $100,000 4.75% 15/12/2025 109,958 0.01%Kinder Morgan Energy Partners LP $100,000 4.25% 1/9/2024 109,769 0.01%WP Carey, Inc. $100,000 4.60% 1/4/2024 109,372 0.01%Apple, Inc. AU($)140,000 3.70% 28/8/2022 109,284 0.01%Brookfield Property Finance ULC CA($)130,000 4.35% 3/7/2023 109,154 0.01%MPLX LP $100,000 4.00% 15/2/2025 109,139 0.01%Kinder Morgan Energy Partners LP $100,000 4.30% 1/5/2024 109,018 0.01%Dominion Energy, Inc.^ $100,000 5.75% 1/10/2054 108,976 0.01%General Motors Financial of Canada Ltd. CA($)120,000 5.95% 14/5/2024 108,976 0.01%Five Corners Funding Trust $100,000 4.42% 15/11/2023 108,948 0.01%Affiliated Managers Group, Inc. $100,000 4.25% 15/2/2024 108,927 0.01%UPMC $100,000 3.60% 3/4/2025 108,666 0.01%Athene Global Funding CA($)135,000 1.25% 9/4/2024 108,522 0.01%Discovery Communications LLC $100,000 3.90% 15/11/2024 108,494 0.01%Fifth Third Bancorp $100,000 4.30% 16/1/2024 108,453 0.01%L3Harris Technologies, Inc. $100,000 3.95% 28/5/2024 108,305 0.01%Packaging Corp. of America $100,000 3.65% 15/9/2024 108,233 0.01%Packaging Corp. of America $100,000 4.50% 1/11/2023 108,099 0.01%Caterpillar Financial Services Corp. $100,000 3.75% 24/11/2023 107,975 0.01%Burlington Northern Santa Fe LLC $100,000 3.75% 1/4/2024 107,967 0.01%Sysco Canada, Inc. CA($)125,000 3.65% 25/4/2025 107,900 0.01%ConocoPhillips Co. $100,000 3.35% 15/11/2024 107,819 0.01%Philip Morris International, Inc. $100,000 3.60% 15/11/2023 107,641 0.01%Johnson & Johnson1 $100,000 3.38% 5/12/2023 107,406 0.01%eBay, Inc. $100,000 3.45% 1/8/2024 107,378 0.01%Potomac Electric Power Co. $100,000 3.60% 15/3/2024 107,265 0.01%Boston Properties LP $100,000 3.20% 15/1/2025 107,053 0.01%Boston Properties LP $100,000 3.80% 1/2/2024 107,034 0.01%Santander Holdings USA, Inc. $100,000 3.50% 7/6/2024 107,017 0.01%DTE Energy Co. $100,000 3.85% 1/12/2023 106,990 0.01%Aircastle Ltd. $100,000 5.00% 1/4/2023 106,976 0.01%Berkshire Hathaway Energy Co. $100,000 3.75% 15/11/2023 106,900 0.01%Crown Castle International Corp. $100,000 3.20% 1/9/2024 106,879 0.01%Laboratory Corp. of America Holdings $100,000 4.00% 1/11/2023 106,813 0.01%Burlington Northern Santa Fe LLC $100,000 3.85% 1/9/2023 106,710 0.01%Entergy Louisiana LLC $100,000 4.05% 1/9/2023 106,703 0.01%Union Pacific Corp. $100,000 3.15% 1/3/2024 106,690 0.01%Roper Technologies, Inc. $100,000 3.65% 15/9/2023 106,634 0.01%Microchip Technology, Inc. $100,000 4.33% 1/6/2023 106,627 0.01%Virginia Electric & Power Co. $100,000 3.45% 15/2/2024 106,608 0.01%Tapestry, Inc. $98,000 4.25% 1/4/2025 106,588 0.01%Interstate Power & Light Co. $99,000 3.25% 1/12/2024 106,522 0.01%Edison International $100,000 3.55% 15/11/2024 106,516 0.01%Voya Financial, Inc. $100,000 3.13% 15/7/2024 106,508 0.01%Bristol-Myers Squibb Co. $100,000 3.25% 1/11/2023 106,448 0.01%Philip Morris International, Inc. $100,000 2.88% 1/5/2024 106,345 0.01%Global Payments, Inc. $100,000 4.00% 1/6/2023 106,276 0.01%Expedia Group, Inc. $100,000 3.60% 15/12/2023 106,248 0.01%

852
Vanguard Global Short-Term Corporate Bond Index Fund
Principal CouponMaturity
DateFair Value
US Dollars ($)% of Total
Net AssetsHess Corp. $100,000 3.50% 15/7/2024 106,221 0.01%Kroger Co. $100,000 3.85% 1/8/2023 106,124 0.01%Teachers Insurance & Annuity Association of America^ $100,000 4.38% 15/9/2054 106,076 0.01%MassMutual Global Funding II $100,000 2.75% 22/6/2024 106,051 0.01%BP Capital Markets America, Inc. $100,000 3.22% 28/11/2023 105,917 0.01%Public Service Electric & Gas Co. $100,000 3.25% 1/9/2023 105,803 0.01%Northrop Grumman Corp. $100,000 3.25% 1/8/2023 105,802 0.01%Bank of New York Mellon Corp. $100,000 3.50% 28/4/2023 105,763 0.01%National Rural Utilities Cooperative Finance Corp. $100,000 2.95% 7/2/2024 105,562 0.01%Host Hotels & Resorts LP $100,000 3.75% 15/10/2023 105,385 0.01%KeyBank NA $100,000 3.38% 7/3/2023 105,004 0.01%WestRock RKT LLC $100,000 4.00% 1/3/2023 104,826 0.01%John Deere Financial, Inc. CA($)125,000 2.41% 14/1/2025 104,648 0.01%Air Lease Corp. $100,000 3.00% 15/9/2023 104,618 0.01%John Deere Financial, Inc. CA($)125,000 2.46% 4/4/2024 104,593 0.01%Brookfield Property Finance ULC CA($)125,000 3.93% 24/8/2025 104,530 0.01%Discover Bank $100,000 3.35% 6/2/2023 104,270 0.01%Energy Transfer LP/Regency Energy Finance Corp. $100,000 5.00% 1/10/2022 104,227 0.01%John Deere Capital Corp. $100,000 2.80% 6/3/2023 104,187 0.01%Leidos, Inc. $100,000 2.95% 15/5/2023 103,968 0.01%Metropolitan Life Global Funding I $100,000 3.00% 10/1/2023 103,957 0.01%Home Depot, Inc. $100,000 2.70% 1/4/2023 103,664 0.01%Toyota Motor Credit Corp. $100,000 2.63% 10/1/2023 103,484 0.01%HollyFrontier Corp. $100,000 2.63% 1/10/2023 103,481 0.01%John Deere Canada Funding, Inc. CA($)125,000 2.63% 21/9/2022 103,424 0.01%Principal Financial Group, Inc. $100,000 3.30% 15/9/2022 103,424 0.01%Walt Disney Co. $100,000 3.00% 15/9/2022 103,176 0.01%Union Pacific Corp. $100,000 4.16% 15/7/2022 103,035 0.01%Hasbro, Inc. $100,000 2.60% 19/11/2022 102,844 0.01%ITC Holdings Corp. $100,000 2.70% 15/11/2022 102,820 0.01%Schlumberger Finance Canada Ltd. $100,000 2.65% 20/11/2022 102,742 0.01%Lincoln National Corp. $100,000 4.20% 15/3/2022 102,675 0.01%Colgate-Palmolive Co.1 $100,000 2.25% 15/11/2022 102,672 0.01%United Parcel Service, Inc. $100,000 2.45% 1/10/2022 102,667 0.01%Flowserve Corp. $100,000 3.50% 15/9/2022 102,631 0.01%Athene Global Funding $100,000 3.00% 1/7/2022 102,504 0.01%Aon Corp. $100,000 2.20% 15/11/2022 102,458 0.01%Bain Capital Specialty Finance, Inc. $100,000 2.95% 10/3/2026 102,424 0.01%McCormick & Co., Inc. $100,000 2.70% 15/8/2022 102,356 0.01%DTE Energy Co. $100,000 3.30% 15/6/2022 102,316 0.01%Public Storage $100,000 2.37% 15/9/2022 102,257 0.01%Athene Global Funding CA($)125,000 2.10% 24/9/2025 102,241 0.01%CenterPoint Energy, Inc. $100,000 2.50% 1/9/2022 102,231 0.01%Nissan Motor Acceptance Corp. $100,000 2.60% 28/9/2022 102,088 0.01%Texas Eastern Transmission LP $100,000 2.80% 15/10/2022 102,068 0.01%Merck & Co., Inc. $100,000 2.40% 15/9/2022 102,060 0.01%Caterpillar Financial Services Corp. $100,000 1.90% 6/9/2022 101,904 0.01%General Motors Financial of Canada Ltd. CA($)120,000 3.25% 7/11/2023 101,339 0.01%Procter & Gamble Co. $100,000 2.30% 6/2/2022 101,262 0.01%Sutter Health $100,000 1.32% 15/8/2025 100,904 0.01%Brighthouse Financial Global Funding $100,000 1.55% 24/5/2026 100,856 0.01%Southern California Edison Co. $100,000 2.40% 1/2/2022 100,847 0.01%Valero Energy Corp. $100,000 1.20% 15/3/2024 100,809 0.01%Lennox International, Inc. $100,000 1.35% 1/8/2025 100,654 0.01%Athene Global Funding $100,000 1.00% 16/4/2024 100,339 0.01%Hershey Co. $100,000 0.90% 1/6/2025 100,295 0.01%Brighthouse Financial Global Funding $100,000 1.00% 12/4/2024 100,184 0.01%Equitable Financial Life Global Funding $100,000 0.50% 6/4/2023 100,133 0.01%Phillips 66 $100,000 0.90% 15/2/2024 100,100 0.01%Pioneer Natural Resources Co. $100,000 0.55% 15/5/2023 100,064 0.01%American Electric Power Co., Inc. $100,000 0.75% 1/11/2023 100,052 0.01%Cigna Corp. $100,000 0.61% 15/3/2024 100,009 0.01%Pioneer Natural Resources Co. $100,000 0.75% 15/1/2024 99,995 0.01%New York Life Global Funding $100,000 1.15% 9/6/2026 99,850 0.01%Molson Coors International LP CA($)120,000 2.84% 15/7/2023 99,826 0.01%XLIT Ltd. $89,000 4.45% 31/3/2025 99,810 0.01%Nissan Motor Acceptance Corp. $100,000 1.05% 8/3/2024 99,684 0.01%Western Union Co. $100,000 1.35% 15/3/2026 99,429 0.01%American Electric Power Co., Inc. $100,000 1.00% 1/11/2025 99,234 0.01%Allstate Corp. $100,000 0.75% 15/12/2025 99,127 0.01%Pioneer Natural Resources Co. $100,000 1.13% 15/1/2026 99,001 0.01%

853
Vanguard Global Short-Term Corporate Bond Index Fund
Principal CouponMaturity
DateFair Value
US Dollars ($)% of Total
Net AssetsAutoNation, Inc. $91,000 3.50% 15/11/2024 97,935 0.01%Avangrid, Inc. $90,000 3.15% 1/12/2024 96,387 0.01%Essex Portfolio LP $89,000 3.50% 1/4/2025 96,366 0.01%Trimble, Inc. $86,000 4.75% 1/12/2024 95,640 0.01%Reliance Steel & Aluminum Co. $90,000 4.50% 15/4/2023 95,335 0.01%Ryder System, Inc. $90,000 3.40% 1/3/2023 94,086 0.01%Ventas Realty LP $88,000 2.65% 15/1/2025 92,625 0.01%Wells Fargo Canada Corp. CA($)110,000 3.46% 24/1/2023 92,484 0.01%TD Ameritrade Holding Corp. $85,000 3.75% 1/4/2024 92,134 0.01%Adobe, Inc. $90,000 1.70% 1/2/2023 92,025 0.01%Motorola Solutions, Inc. $84,000 4.00% 1/9/2024 91,971 0.01%John Deere Canada Funding, Inc. CA($)110,000 2.70% 17/1/2023 91,529 0.01%NRG Energy, Inc. $85,000 3.75% 15/6/2024 90,518 0.01%Brixmor Operating Partnership LP $85,000 3.25% 15/9/2023 89,328 0.01%Columbia Property Trust Operating Partnership LP $82,000 4.15% 1/4/2025 88,457 0.01%Burlington Northern Santa Fe LLC $85,000 3.00% 15/3/2023 88,341 0.01%Parker-Hannifin Corp. $81,000 3.30% 21/11/2024 87,031 0.01%United Parcel Service, Inc. $80,000 2.80% 15/11/2024 85,501 0.01%Athene Global Funding $80,000 2.75% 25/6/2024 83,968 0.01%Stifel Financial Corp. $75,000 4.25% 18/7/2024 82,293 0.01%Expedia Group, Inc. $75,000 4.50% 15/8/2024 82,147 0.01%Plains All American Pipeline LP/PAA Finance Corp. $80,000 2.85% 31/1/2023 82,113 0.01%Air Lease Corp. $75,000 4.25% 15/9/2024 81,870 0.01%Apollo Management Holdings LP $75,000 4.00% 30/5/2024 81,797 0.01%Walt Disney Co. $75,000 3.70% 15/9/2024 81,601 0.01%Citigroup, Inc. $75,000 3.75% 16/6/2024 81,597 0.01%PNC Financial Services Group, Inc. $75,000 3.90% 29/4/2024 81,499 0.01%Textron, Inc. $75,000 4.30% 1/3/2024 81,204 0.01%PPL Capital Funding, Inc. $75,000 3.95% 15/3/2024 81,152 0.01%Kemper Corp. $74,000 4.35% 15/2/2025 81,114 0.01%GLP Capital LP/GLP Financing II, Inc. $72,000 5.25% 1/6/2025 81,110 0.01%BGC Partners, Inc. $75,000 5.38% 24/7/2023 81,054 0.01%Oncor Electric Delivery Co. LLC $75,000 7.00% 1/9/2022 80,741 0.01%Sempra Energy $75,000 3.55% 15/6/2024 80,727 0.01%Charles Schwab Corp. $75,000 3.55% 1/2/2024 80,699 0.01%Air Products & Chemicals, Inc. $75,000 3.35% 31/7/2024 80,671 0.01%Niagara Mohawk Power Corp. $75,000 3.51% 1/10/2024 80,645 0.01%Marriott International, Inc. $75,000 3.75% 15/3/2025 80,613 0.01%Caterpillar, Inc. $75,000 3.40% 15/5/2024 80,550 0.01%Colgate-Palmolive Co. $75,000 3.25% 15/3/2024 80,512 0.01%Alabama Power Co. $75,000 3.55% 1/12/2023 80,454 0.01%Ventas Realty LP $75,000 3.50% 15/4/2024 80,315 0.01%Truist Bank^ $75,000 3.69% 2/8/2024 80,008 0.00%Ameriprise Financial, Inc. $73,000 3.70% 15/10/2024 79,847 0.00%Keurig Dr Pepper, Inc. $75,000 3.13% 15/12/2023 79,566 0.00%Perrigo Finance Unlimited Co. $74,000 3.90% 15/12/2024 79,561 0.00%CenterPoint Energy, Inc. $74,000 3.85% 1/2/2024 79,491 0.00%San Diego Gas & Electric Co. $75,000 3.60% 1/9/2023 79,426 0.00%Xilinx, Inc. $75,000 2.95% 1/6/2024 79,386 0.00%Southern California Edison Co. $75,000 3.50% 1/10/2023 79,261 0.00%Zimmer Biomet Holdings, Inc. $75,000 3.70% 19/3/2023 78,840 0.00%Kellogg Co. $75,000 2.65% 1/12/2023 78,746 0.00%salesforce.com, Inc. $75,000 3.25% 11/4/2023 78,683 0.00%Boston Properties LP $75,000 3.13% 1/9/2023 78,633 0.00%Wisconsin Electric Power Co. $75,000 2.05% 15/12/2024 78,441 0.00%Enterprise Products Operating LLC^ $80,000 4.88% 16/8/2077 78,413 0.00%MPLX LP $75,000 3.38% 15/3/2023 78,396 0.00%Boeing Co. $75,000 2.80% 1/3/2024 78,268 0.00%Toyota Motor Credit Corp. $75,000 2.00% 7/10/2024 78,207 0.00%Ventas Realty LP $75,000 3.13% 15/6/2023 78,175 0.00%Block Financial LLC $75,000 5.50% 1/11/2022 78,002 0.00%Bristol-Myers Squibb Co. $75,000 2.75% 15/2/2023 77,735 0.00%NVR, Inc. $75,000 3.95% 15/9/2022 77,455 0.00%AbbVie, Inc. $75,000 3.20% 6/11/2022 77,442 0.00%Edison International $75,000 2.95% 15/3/2023 77,440 0.00%Public Service Enterprise Group, Inc. $75,000 2.65% 15/11/2022 77,152 0.00%Constellation Brands, Inc. $75,000 2.65% 7/11/2022 77,044 0.00%Johnson & Johnson $75,000 2.05% 1/3/2023 76,990 0.00%Waste Management, Inc. $75,000 2.90% 15/9/2022 76,808 0.00%Sempra Energy $75,000 2.88% 1/10/2022 76,777 0.00%DH Europe Finance II Sarl $75,000 2.05% 15/11/2022 76,735 0.00%

854
Vanguard Global Short-Term Corporate Bond Index Fund
Principal CouponMaturity
DateFair Value
US Dollars ($)% of Total
Net AssetsPACCAR Financial Corp. $75,000 2.30% 10/8/2022 76,697 0.00%Campbell Soup Co. $75,000 2.50% 2/8/2022 76,658 0.00%Ameren Illinois Co. $75,000 2.70% 1/9/2022 76,630 0.00%General Dynamics Corp. $75,000 2.25% 15/11/2022 76,626 0.00%Tapestry, Inc. $75,000 3.00% 15/7/2022 76,489 0.00%Baxalta, Inc. $69,000 4.00% 23/6/2025 76,268 0.00%Marriott International, Inc. $75,000 2.13% 3/10/2022 76,083 0.00%National Rural Utilities Cooperative Finance Corp. $75,000 3.05% 15/2/2022 75,780 0.00%Keysight Technologies, Inc. $68,000 4.55% 30/10/2024 75,740 0.00%Owens Corning $69,000 4.20% 1/12/2024 75,522 0.00%Martin Marietta Materials, Inc. $75,000 0.65% 15/7/2023 75,144 0.00%Ventas Canada Finance Ltd. CA($)85,000 4.13% 30/9/2024 73,843 0.00%Reliance Standard Life Global Funding II $70,000 2.50% 30/10/2024 72,982 0.00%Lam Research Corp. $66,000 3.80% 15/3/2025 72,624 0.00%Nucor Corp. $70,000 4.13% 15/9/2022 72,496 0.00%SVB Financial Group $66,938 3.50% 29/1/2025 72,444 0.00%Principal Financial Group, Inc. $67,000 3.13% 15/5/2023 70,327 0.00%US Treasury Note $71,000 0.50% 28/2/2026 69,929 0.00%Bank of America Corp.^ CA($)80,000 3.41% 20/9/2025 68,605 0.00%General Dynamics Corp. $65,000 3.38% 15/5/2023 68,515 0.00%NextEra Energy Capital Holdings, Inc. $65,000 2.80% 15/1/2023 67,186 0.00%Penske Truck Leasing Co. LP/PTL Finance Corp. $65,000 2.70% 14/3/2023 67,125 0.00%Air Lease Corp. $65,000 2.75% 15/1/2023 67,046 0.00%Continental Airlines 2012-2 Class A Pass Through Trust $63,167 4.00% 29/10/2024 66,792 0.00%Sabra Health Care LP $60,000 4.80% 1/6/2024 65,601 0.00%FS KKR Capital Corp. $60,000 4.63% 15/7/2024 64,705 0.00%Caterpillar Financial Services Corp. $60,000 3.65% 7/12/2023 64,649 0.00%Fortune Brands Home & Security, Inc. $60,000 4.00% 21/9/2023 64,322 0.00%General Motors Financial Co., Inc. AU($)80,000 3.85% 21/2/2023 62,884 0.00%Weyerhaeuser Co. $50,000 8.50% 15/1/2025 62,442 0.00%MetLife, Inc. $60,000 3.05% 15/12/2022 61,998 0.00%Reliance Standard Life Global Funding II $60,000 2.15% 21/1/2023 61,370 0.00%Vulcan Materials Co. $53,000 4.50% 1/4/2025 59,168 0.00%Oncor Electric Delivery Co. LLC $54,000 2.95% 1/4/2025 57,696 0.00%Comcast Cable Communications Holdings, Inc. $50,000 9.46% 15/11/2022 56,255 0.00%Eversource Energy $52,000 2.90% 1/10/2024 55,079 0.00%Martin Marietta Materials, Inc. $50,000 4.25% 2/7/2024 54,567 0.00%American Campus Communities Operating Partnership LP $50,000 4.13% 1/7/2024 54,496 0.00%Interpublic Group of Cos, Inc. $50,000 4.20% 15/4/2024 54,441 0.00%Whirlpool Corp. $50,000 4.00% 1/3/2024 54,336 0.00%Reinsurance Group of America, Inc. $50,000 4.70% 15/9/2023 54,320 0.00%Altera Corp. $50,000 4.10% 15/11/2023 54,264 0.00%Westinghouse Air Brake Technologies Corp. $50,000 4.40% 15/3/2024 54,223 0.00%Aptiv Corp. $50,000 4.15% 15/3/2024 54,212 0.00%Brandywine Operating Partnership LP $50,000 4.10% 1/10/2024 54,203 0.00%Cardinal Health, Inc. $53,000 2.62% 15/6/2022 54,063 0.00%Mid-America Apartments LP $50,000 3.75% 15/6/2024 54,025 0.00%ONEOK Partners LP $50,000 5.00% 15/9/2023 54,025 0.00%Unum Group $50,000 4.00% 15/3/2024 53,994 0.00%Entergy Arkansas LLC $50,000 3.70% 1/6/2024 53,989 0.00%US Bancorp $50,000 3.70% 30/1/2024 53,880 0.00%State Street Corp.^ $50,000 3.78% 3/12/2024 53,877 0.00%IPALCO Enterprises, Inc. $50,000 3.70% 1/9/2024 53,845 0.00%John Deere Capital Corp. $50,000 3.45% 10/1/2024 53,699 0.00%Penske Truck Leasing Co. LP/PTL Finance Corp. $50,000 3.45% 1/7/2024 53,631 0.00%Stryker Corp. $50,000 3.38% 15/5/2024 53,630 0.00%Norfolk Southern Corp. $50,000 3.85% 15/1/2024 53,605 0.00%General Mills, Inc. $50,000 3.65% 15/2/2024 53,557 0.00%FMC Corp. $50,000 4.10% 1/2/2024 53,528 0.00%Toyota Motor Credit Corp. $50,000 3.35% 8/1/2024 53,463 0.00%Reliance Standard Life Global Funding II $50,000 3.85% 19/9/2023 53,446 0.00%Florida Power & Light Co. $50,000 3.25% 1/6/2024 53,411 0.00%Blackstone Holdings Finance Co. LLC $50,000 4.75% 15/2/2023 53,341 0.00%Office Properties Income Trust $50,000 4.25% 15/5/2024 53,254 0.00%Cummins, Inc. $50,000 3.65% 1/10/2023 53,229 0.00%National Rural Utilities Cooperative Finance Corp. $50,000 3.40% 15/11/2023 53,121 0.00%Kinder Morgan Energy Partners LP $50,000 3.50% 1/9/2023 52,783 0.00%SSM Health Care Corp. $50,000 3.69% 1/6/2023 52,551 0.00%Old Republic International Corp. $47,000 4.88% 1/10/2024 52,508 0.00%Lennox International, Inc. $50,000 3.00% 15/11/2023 52,458 0.00%Oaktree Specialty Lending Corp. $50,000 3.50% 25/2/2025 52,430 0.00%

855
Vanguard Global Short-Term Corporate Bond Index Fund
Principal CouponMaturity
DateFair Value
US Dollars ($)% of Total
Net AssetsTextron, Inc. $48,000 3.88% 1/3/2025 52,374 0.00%PPG Industries, Inc. $50,000 2.40% 15/8/2024 52,314 0.00%Brandywine Operating Partnership LP $50,000 3.95% 15/2/2023 52,236 0.00%Duke Energy Carolinas LLC $50,000 3.05% 15/3/2023 52,196 0.00%Kimco Realty Corp. $50,000 3.13% 1/6/2023 52,168 0.00%National Fuel Gas Co. $50,000 3.75% 1/3/2023 52,160 0.00%SL Green Realty Corp. $50,000 4.50% 1/12/2022 52,077 0.00%Ecolab, Inc. $50,000 3.25% 14/1/2023 51,957 0.00%Evergy Metro, Inc. $50,000 3.15% 15/3/2023 51,939 0.00%Globe Life, Inc. $50,000 3.80% 15/9/2022 51,937 0.00%Kimberly-Clark Corp. $50,000 2.40% 1/6/2023 51,925 0.00%Toyota Motor Credit Corp. $50,000 2.70% 11/1/2023 51,807 0.00%PPL Capital Funding, Inc. $50,000 3.50% 1/12/2022 51,742 0.00%Berkshire Hathaway Energy Co. $50,000 2.80% 15/1/2023 51,733 0.00%Boeing Co. $50,000 2.80% 1/3/2023 51,689 0.00%AbbVie, Inc. $50,000 2.80% 15/3/2023 51,654 0.00%Boardwalk Pipelines LP $50,000 3.38% 1/2/2023 51,610 0.00%Linde, Inc. $50,000 2.70% 21/2/2023 51,610 0.00%Simon Property Group LP $50,000 2.75% 1/2/2023 51,552 0.00%Fiserv, Inc. $50,000 3.50% 1/10/2022 51,517 0.00%O'Reilly Automotive, Inc. $50,000 3.80% 1/9/2022 51,504 0.00%General Dynamics Corp. $50,000 1.88% 15/8/2023 51,472 0.00%WR Berkley Corp. $50,000 4.63% 15/3/2022 51,461 0.00%Franklin Resources, Inc. $50,000 2.80% 15/9/2022 51,456 0.00%Southwest Airlines Co. $50,000 2.75% 16/11/2022 51,363 0.00%McKesson Corp. $50,000 2.70% 15/12/2022 51,334 0.00%Toyota Motor Credit Corp. $50,000 2.80% 13/7/2022 51,311 0.00%Clorox Co. $50,000 3.05% 15/9/2022 51,257 0.00%AvalonBay Communities, Inc. $50,000 2.95% 15/9/2022 51,247 0.00%PPL Capital Funding, Inc. $50,000 4.20% 15/6/2022 51,224 0.00%Intercontinental Exchange, Inc. $50,000 2.35% 15/9/2022 51,088 0.00%Church & Dwight Co., Inc. $50,000 2.45% 1/8/2022 51,052 0.00%PACCAR Financial Corp. $50,000 2.00% 26/9/2022 51,024 0.00%Eli Lilly & Co. $50,000 2.35% 15/5/2022 50,931 0.00%Edison International $50,000 2.40% 15/9/2022 50,872 0.00%Linde, Inc. $50,000 2.20% 15/8/2022 50,826 0.00%Public Service Co. of Colorado $50,000 2.25% 15/9/2022 50,671 0.00%Goldman Sachs BDC, Inc. $45,000 3.75% 10/2/2025 48,108 0.00%Brown-Forman Corp. $44,000 3.50% 15/4/2025 48,002 0.00%United Parcel Service, Inc. $45,000 2.20% 1/9/2024 47,172 0.00%Kinder Morgan Energy Partners LP $45,000 3.45% 15/2/2023 46,815 0.00%RenaissanceRe Finance, Inc. $43,000 3.70% 1/4/2025 46,810 0.00%Carlisle Cos, Inc. $45,000 3.75% 15/11/2022 46,604 0.00%Leggett & Platt, Inc. $43,000 3.80% 15/11/2024 46,386 0.00%GATX Corp. $43,000 3.25% 30/3/2025 46,027 0.00%Cadence Design Systems, Inc. $38,000 4.38% 15/10/2024 41,794 0.00%Booking Holdings, Inc. $40,000 2.75% 15/3/2023 41,528 0.00%Caterpillar Financial Services Ltd. CA($)50,000 2.09% 12/9/2022 41,128 0.00%Newmont Corp. $39,000 3.70% 15/3/2023 40,743 0.00%AvalonBay Communities, Inc. $35,000 3.50% 15/11/2024 37,905 0.00%CubeSmart LP $35,000 4.38% 15/12/2023 37,825 0.00%John Deere Capital Corp. $35,000 3.65% 12/10/2023 37,610 0.00%Delmarva Power & Light Co. $35,000 3.50% 15/11/2023 37,282 0.00%Edison International $35,000 3.13% 15/11/2022 36,039 0.00%US Treasury Note $35,000 0.13% 31/3/2023 34,949 0.00%John Deere Canada Funding, Inc. CA($)40,000 3.02% 13/7/2023 33,688 0.00%First American Financial Corp. $30,000 4.60% 15/11/2024 33,199 0.00%Caterpillar Financial Services Corp. $30,000 2.85% 17/5/2024 31,916 0.00%Sixth Street Specialty Lending, Inc. $30,000 3.88% 1/11/2024 31,908 0.00%Amphenol Corp. $30,000 3.20% 1/4/2024 31,806 0.00%Mutual of Omaha Insurance Co.^ $30,000 4.30% 15/7/2054 31,271 0.00%Energy Transfer LP $30,000 3.45% 15/1/2023 31,003 0.00%Sherwin-Williams Co. $30,000 2.75% 1/6/2022 30,584 0.00%Duke Realty LP $28,000 3.75% 1/12/2024 30,419 0.00%Republic Services, Inc. $28,000 4.75% 15/5/2023 29,977 0.00%Ventas Canada Finance Ltd. CA($)35,000 2.55% 15/3/2023 28,910 0.00%Quest Diagnostics, Inc. $25,000 4.25% 1/4/2024 27,145 0.00%DTE Electric Co. $25,000 3.38% 1/3/2025 27,034 0.00%Piedmont Operating Partnership LP $25,000 4.45% 15/3/2024 26,975 0.00%Crane Co. $25,000 4.45% 15/12/2023 26,959 0.00%Union Pacific Corp. $25,000 3.75% 15/3/2024 26,881 0.00%

856
Vanguard Global Short-Term Corporate Bond Index Fund
Principal CouponMaturity
DateFair Value
US Dollars ($)% of Total
Net AssetsMid-America Apartments LP $25,000 4.30% 15/10/2023 26,838 0.00%Ventas Realty LP $25,000 3.75% 1/5/2024 26,827 0.00%Equifax, Inc. $25,000 3.95% 15/6/2023 26,563 0.00%Duke Energy Progress LLC $25,000 3.38% 1/9/2023 26,530 0.00%Eaton Vance Corp. $25,000 3.63% 15/6/2023 26,466 0.00%Avnet, Inc. $25,000 4.88% 1/12/2022 26,436 0.00%Delta Air Lines 2019-1 Class AA Pass Through Trust $25,000 3.20% 25/4/2024 26,435 0.00%DR Horton, Inc. $25,000 4.75% 15/2/2023 26,427 0.00%Alliant Energy Finance LLC $25,000 3.75% 15/6/2023 26,424 0.00%John Deere Capital Corp. $25,000 2.60% 7/3/2024 26,362 0.00%Fidelity National Financial, Inc. $25,000 5.50% 1/9/2022 26,358 0.00%Southern California Edison Co. $25,000 3.40% 1/6/2023 26,262 0.00%Sompo International Holdings Ltd. $25,000 4.70% 15/10/2022 26,250 0.00%PACCAR Financial Corp. $25,000 2.15% 15/8/2024 26,145 0.00%Essex Portfolio LP $25,000 3.25% 1/5/2023 26,077 0.00%Verisk Analytics, Inc. $25,000 4.13% 12/9/2022 26,064 0.00%Primerica, Inc. $25,000 4.75% 15/7/2022 26,059 0.00%Maxim Integrated Products, Inc. $25,000 3.38% 15/3/2023 26,045 0.00%Hyatt Hotels Corp. $25,000 3.38% 15/7/2023 26,032 0.00%Piedmont Operating Partnership LP $25,000 3.40% 1/6/2023 25,986 0.00%Parker-Hannifin Corp. $25,000 3.50% 15/9/2022 25,919 0.00%DR Horton, Inc. $25,000 4.38% 15/9/2022 25,915 0.00%Eversource Energy $25,000 2.80% 1/5/2023 25,903 0.00%John Deere Capital Corp. $25,000 2.70% 6/1/2023 25,895 0.00%RPM International, Inc. $25,000 3.45% 15/11/2022 25,781 0.00%3M Co. $25,000 2.25% 15/3/2023 25,780 0.00%AutoZone, Inc. $25,000 2.88% 15/1/2023 25,767 0.00%American Electric Power Co., Inc. $25,000 2.95% 15/12/2022 25,744 0.00%Niagara Mohawk Power Corp. $25,000 2.72% 28/11/2022 25,724 0.00%Virginia Electric & Power Co. $25,000 3.45% 1/9/2022 25,694 0.00%PepsiCo, Inc. $25,000 3.10% 17/7/2022 25,624 0.00%Dominion Energy, Inc. $25,000 2.75% 15/9/2022 25,529 0.00%NSTAR Electric Co. $25,000 2.38% 15/10/2022 25,504 0.00%Boeing Co. $25,000 1.88% 15/6/2023 25,488 0.00%Northern States Power Co. $25,000 2.15% 15/8/2022 25,280 0.00%US Treasury Note $20,000 0.75% 31/3/2026 19,913 0.00%American Honda Finance Corp. $15,000 2.40% 27/6/2024 15,765 0.00%Baxalta, Inc. $15,000 3.60% 23/6/2022 15,376 0.00%US Treasury Note $15,000 0.13% 30/4/2023 14,974 0.00%US Treasury Note $15,000 0.75% 31/5/2026 14,917 0.00%PACCAR Financial Corp. $10,000 3.40% 9/8/2023 10,620 0.00%Nissan Motor Acceptance Corp. $10,000 3.88% 21/9/2023 10,613 0.00%John Deere Capital Corp. $10,000 3.45% 7/6/2023 10,598 0.00%Humana, Inc. $10,000 2.90% 15/12/2022 10,328 0.00%DTE Energy Co. $10,000 2.60% 15/6/2022 10,219 0.00%AutoZone, Inc. $9,000 3.25% 15/4/2025 9,685 0.00%Southern California Edison Co. $7,143 1.85% 1/2/2022 7,142 0.00%US Treasury Note $4,000 0.38% 15/4/2024 3,995 0.00%US Treasury Note $3,000 0.75% 30/4/2026 2,985 0.00%test - - - 713,236,939 44.70%Total Bonds 1,562,029,737 97.89%Financial Assets at Fair Value Through Profit or Loss 1,562,029,737 97.89%
testNumber of Contracts
Notional Amount
Unrealised Gain/(Loss)
US Dollars ($)% of Total
Net AssetsFinancial Derivative InstrumentsFutures (0.00%) (2020: (0.00%))Long Gilt September 2021 5 £636,400 5,664 0.00 %Euro-Bobl September 2021 29 €3,887,810 3,012 0.00 %Euro-Schatz September 2021 11 €1,233,320 261 0.00 %US Treasury Note 5 Year September 2021 25 $3,085,731 11 0.00 %US Treasury Note 10 Year September 2021 (4) $(526,902) (3,098 ) (0.00 %)US Treasury Note 2 Year September 2021 35 $7,723,742 (12,531 ) (0.00 %)test test test (6,681 ) (0.00 %)
CurrencyBuy
Amount Currency(Sell)
Amount CounterpartySettlement
Date
Unrealised Gain/(Loss)
US Dollars ($)% of Total
Net AssetsForward Currency Exchange Contracts 1.08% (2020: (0.84%))USD 480,940,251 EUR (394,575,554) State Street Bank & Trust Co. 2/7/2021 13,012,869 0.82 %USD 63,109,553 CAD (76,240,000) Toronto-Dominion Bank 2/7/2021 1,541,274 0.10 %

857
Vanguard Global Short-Term Corporate Bond Index Fund
CurrencyBuy
Amount Currency(Sell)
Amount CounterpartySettlement
Date
Unrealised Gain/(Loss)
US Dollars ($)% of Total
Net AssetsUSD 57,713,770 GBP (40,703,391) Citibank NA 2/7/2021 1,484,063 0.09 %USD 14,626,350 EUR (12,000,000) Morgan Stanley 2/7/2021 395,543 0.03 %USD 7,920,117 AUD (10,271,859) Barclays Bank plc 2/7/2021 208,517 0.01 %USD 22,744,807 JPY (2,503,000,000) Toronto-Dominion Bank 2/7/2021 193,225 0.01 %USD 4,893,324 EUR (4,000,000) BNP Paribas 2/7/2021 149,722 0.01 %USD 4,408,794 CHF (3,965,000) JPMorgan Chase Bank 2/7/2021 119,293 0.01 %USD 3,327,939 CAD (4,000,000) Barclays Bank plc 2/7/2021 97,704 0.01 %USD 1,739,856 NZD (2,400,000) Toronto-Dominion Bank 2/7/2021 62,856 0.00 %USD 1,417,919 GBP (1,000,000) Morgan Stanley 2/7/2021 36,469 0.00 %USD 733,999 EUR (600,000) BNP Paribas 2/7/2021 22,458 0.00 %USD 1,018,987 SGD (1,350,000) Standard Chartered Bank 2/7/2021 14,672 0.00 %USD 697,572 GBP (500,000) JPMorgan Chase Bank 2/7/2021 6,847 0.00 %USD 447,461 KRW (500,000,000) BNP Paribas 2/7/2021 3,471 0.00 %USD 1,004,225 SGD (1,350,000) UBS AG 3/8/2021 (10 ) (0.00 %)GBP 1,000,000 USD (1,381,584) Morgan Stanley 3/8/2021 (10 ) (0.00 %)USD 5,340,096 EUR (4,500,000) Citibank NA 3/8/2021 (66 ) (0.00 %)USD 4,293,133 CHF (3,965,000) JPMorgan Chase Bank 3/8/2021 (102 ) (0.00 %)USD 22,557,577 JPY (2,503,000,000) UBS AG 3/8/2021 (149 ) (0.00 %)USD 58,306,939 GBP (42,203,391) Toronto-Dominion Bank 3/8/2021 (178 ) (0.00 %)USD 64,797,468 CAD (80,240,000) Toronto-Dominion Bank 3/8/2021 (209 ) (0.00 %)USD 7,712,646 AUD (10,271,859) BNP Paribas 4/8/2021 (217 ) (0.00 %)USD 442,200 KRW (500,000,000) BNP Paribas 3/8/2021 (1,709 ) (0.00 %)USD 1,674,862 NZD (2,400,000) Barclays Bank plc 3/8/2021 (2,041 ) (0.00 %)USD 482,471,826 EUR (406,575,554) JPMorgan Chase Bank 3/8/2021 (12,506 ) (0.00 %)EUR 4,600,000 USD (5,597,910) BNP Paribas 2/7/2021 (142,768 ) (0.01 %)test 17,189,018 1.08 %Hedge Share Class Level Forward Currency Exchange Contracts (2.60%) (2020: 2.21%)USD 9,066,884 GBP (6,397,560) BNP Paribas 2/7/2021 228,974 0.01 %USD 5,625,103 EUR (4,622,345) BNP Paribas 2/7/2021 143,461 0.01 %USD 4,161,057 EUR (3,432,513) BNP Paribas 2/7/2021 90,438 0.00 %USD 485,627 EUR (400,857) JPMorgan Chase Bank 2/7/2021 10,250 0.00 %USD 1,753,982 GBP (1,262,279) BNP Paribas 2/7/2021 10,207 0.00 %EUR 299,127,361 USD (354,966,064) JPMorgan Chase Bank 3/8/2021 9,201 0.00 %GBP 877,419,744 USD (1,212,216,796) Toronto-Dominion Bank 3/8/2021 3,703 0.00 %USD 20,233 EUR (16,617) BNP Paribas 2/7/2021 527 0.00 %GBP 486,883 USD (672,220) Goldman Sachs International 2/7/2021 385 0.00 %USD 25,937 EUR (21,700) BNP Paribas 2/7/2021 203 0.00 %USD 6,853 EUR (5,621) Morgan Stanley 2/7/2021 187 0.00 %USD 5,322 EUR (4,371) BNP Paribas 2/7/2021 139 0.00 %USD 698 EUR (576) JPMorgan Chase Bank 2/7/2021 15 0.00 %USD 2,747 EUR (2,307) Morgan Stanley 2/7/2021 11 0.00 %USD 204,770 GBP (148,212) Citibank NA 3/8/2021 4 0.00 %USD 418 EUR (352) Morgan Stanley 3/8/2021 — 0.00 %USD 245,211 EUR (206,635) Citibank NA 3/8/2021 (3 ) (0.00 %)USD 1,135,676 EUR (957,013) Morgan Stanley 3/8/2021 (14 ) (0.00 %)USD 792,809 EUR (668,559) Goldman Sachs International 2/7/2021 (36 ) (0.00 %)GBP 12,576,152 USD (17,375,020) Morgan Stanley 3/8/2021 (133 ) (0.00 %)USD 1,212,111,505 GBP (877,419,744) Toronto-Dominion Bank 2/7/2021 (143 ) (0.00 %)USD 354,735,137 EUR (299,127,361) JPMorgan Chase Bank 2/7/2021 (177 ) (0.00 %)GBP 71,716 USD (99,720) BNP Paribas 2/7/2021 (648 ) (0.00 %)EUR 123,508 USD (147,311) Morgan Stanley 2/7/2021 (843 ) (0.00 %)EUR 205,550 USD (244,624) JPMorgan Chase Bank 2/7/2021 (862 ) (0.00 %)EUR 40,080 USD (48,610) JPMorgan Chase Bank 2/7/2021 (1,079 ) (0.00 %)EUR 32,823 USD (40,013) Morgan Stanley 2/7/2021 (1,088 ) (0.00 %)EUR 183,262 USD (218,588) BNP Paribas 2/7/2021 (1,257 ) (0.00 %)EUR 179,760 USD (214,713) BNP Paribas 2/7/2021 (1,536 ) (0.00 %)EUR 187,392 USD (223,928) BNP Paribas 2/7/2021 (1,700 ) (0.00 %)GBP 1,228,691 USD (1,699,734) Morgan Stanley 2/7/2021 (2,358 ) (0.00 %)GBP 368,772 USD (512,146) Morgan Stanley 2/7/2021 (2,706 ) (0.00 %)GBP 299,570 USD (416,781) BNP Paribas 2/7/2021 (2,940 ) (0.00 %)EUR 126,745 USD (154,485) BNP Paribas 2/7/2021 (4,178 ) (0.00 %)EUR 1,212,204 USD (1,444,162) BNP Paribas 2/7/2021 (6,608 ) (0.00 %)GBP 228,337 USD (322,252) BNP Paribas 2/7/2021 (6,816 ) (0.00 %)EUR 253,998 USD (308,102) BNP Paribas 2/7/2021 (6,886 ) (0.00 %)GBP 756,489 USD (1,052,823) BNP Paribas 2/7/2021 (7,771 ) (0.00 %)GBP 261,313 USD (369,580) BNP Paribas 2/7/2021 (8,589 ) (0.00 %)GBP 302,303 USD (428,310) BNP Paribas 2/7/2021 (10,694 ) (0.00 %)GBP 806,496 USD (1,125,163) BNP Paribas 2/7/2021 (11,029 ) (0.00 %)EUR 394,240 USD (478,722) BNP Paribas 2/7/2021 (11,192 ) (0.00 %)GBP 396,487 USD (560,076) Morgan Stanley 2/7/2021 (12,349 ) (0.00 %)

858
Vanguard Global Short-Term Corporate Bond Index Fund
CurrencyBuy
Amount Currency(Sell)
Amount CounterpartySettlement
Date
Unrealised Gain/(Loss)
US Dollars ($)% of Total
Net AssetsGBP 518,870 USD (731,834) BNP Paribas 2/7/2021 (15,041 ) (0.00 %)GBP 497,018 USD (701,813) JPMorgan Chase Bank 2/7/2021 (15,207 ) (0.00 %)GBP 531,988 USD (752,789) Morgan Stanley 2/7/2021 (17,874 ) (0.00 %)EUR 470,737 USD (576,739) JPMorgan Chase Bank 2/7/2021 (18,492 ) (0.00 %)EUR 619,106 USD (757,372) BNP Paribas 2/7/2021 (23,173 ) (0.00 %)EUR 717,150 USD (874,379) BNP Paribas 2/7/2021 (23,911 ) (0.00 %)GBP 794,327 USD (1,121,978) JPMorgan Chase Bank 2/7/2021 (24,655 ) (0.00 %)GBP 1,011,289 USD (1,424,713) Citibank NA 2/7/2021 (27,668 ) (0.00 %)EUR 6,204,903 USD (7,387,177) Morgan Stanley 2/7/2021 (28,778 ) (0.00 %)EUR 1,313,768 USD (1,604,560) Morgan Stanley 2/7/2021 (46,562 ) (0.00 %)GBP 1,961,651 USD (2,778,717) Morgan Stanley 2/7/2021 (68,794 ) (0.01 %)GBP 5,121,511 USD (7,154,536) BNP Paribas 2/7/2021 (79,424 ) (0.01 %)GBP 2,224,477 USD (3,156,471) JPMorgan Chase Bank 2/7/2021 (83,467 ) (0.01 %)GBP 4,033,666 USD (5,716,520) JPMorgan Chase Bank 2/7/2021 (144,211 ) (0.01 %)GBP 5,400,837 USD (7,657,951) Morgan Stanley 2/7/2021 (196,964 ) (0.01 %)EUR 296,037,601 USD (360,832,831) Morgan Stanley 2/7/2021 (9,761,665 ) (0.61 %)GBP 857,776,892 USD (1,216,250,433) Toronto-Dominion Bank 2/7/2021 (31,274,405 ) (1.96 %)test (41,456,221 ) (2.60 %)Total Financial Derivative Instruments (24,273,884 ) (1.52 %)
Fair Value US Dollars ($)
% of Total Net Assets
Other Assets and Liabilities 57,934,351 3.63 %Net Assets 1,595,690,204 100.00 %
Analysis of Total Net Assets US Dollars ($)% of Total
Net Assets(a) Transferable securities admitted to an official stock exchange listing 1,080,598,203 67.72%(b) Transferable securities dealt in on another regulated market 406,447,362 25.47%(c) Transferable securities other than those admitted to an official stock exchange listing or dealt in on another regulated
market 74,984,172 4.70%
(d) Financial derivative instruments (24,273,884) (1.52%)(e) Other assets and liabilities 57,934,351 3.63%Total Net Assets 1,595,690,204 100.00%
^ Floating Rate Note (FRN). The effective interest rate is at 30 June 2021.1 Denotes securities pledged in full or part thereof as collateral for derivatives.

The accompanying notes form an integral part of the financial statements.
859
Vanguard Global Short-Term Corporate Bond Index Fund
Statement of Assets and Liabilities
US Dollars ($)
As at 30 June 2021
US Dollars ($)
As at 31 December 2020
Current AssetsFinancial Assets at Fair Value Through Profit or Loss 1,562,029,737 1,395,624,150 Financial Derivative Instruments 17,855,636 31,805,572 Cash 35,771,179 22,674,165 Unrealised Appreciation on Spot Currency Contracts 33,863 10 Receivables: Interest and Dividends 11,219,723 11,076,871 Capital Shares Issued 26,970,596 1,791,916 Investments Sold 16,469,386 2,037,037 Futures Margin Cash 20,080 — Other Receivables 2,929 —
Total Current Assets 1,670,373,129 1,465,009,721
Current LiabilitiesFinancial Derivative Instruments 42,129,520 12,173,659 Bank Overdraft 6,099 3,287 Payables and Other Liabilities: Investments Purchased 30,735,032 15,675,744 Capital Shares Redeemed 1,649,197 306,948 Futures Margin Cash Due to Broker — 347 Management Fees Payable 163,077 146,854
Total Current Liabilities 74,682,925 28,306,839
Net Assets Attributable to Holders of Redeemable Participating Shares (“Net Assets”) 1,595,690,204 1,436,702,882

860
Vanguard Global Short-Term Corporate Bond Index Fund
The accompanying notes form an integral part of the financial statements.
Net Asset Value Per Share
.As at
30 June 2021As at
31 December 2020As at
31 December 2019EUR Hedged Acc1
US ($) Equivalent 42,166,481 37,858,079 15,019,055Net Assets 35,556,524 30,941,179 13,380,005Number of Shares Outstanding 346,017 300,628 133,627Net Asset Value Per Share2 102.76 102.92 100.13
Institutional Plus EUR Hedged AccUS ($) Equivalent 311,317,374 238,190,374 50,418,648Net Assets 262,515,706 194,671,552 44,916,391Number of Shares Outstanding 2,496,506 1,848,994 438,674Net Asset Value Per Share2 105.15 105.29 102.39
GBP Hedged AccUS ($) Equivalent 69,972,738 46,393,381 31,615,460Net Assets 50,651,663 33,939,341 23,865,228Number of Shares Outstanding 472,219 316,896 229,650Net Asset Value Per Share2 107.26 107.10 103.92
Institutional Plus GBP Hedged AccUS ($) Equivalent 1,159,038,084 1,103,868,970 539,379,024Net Assets 839,001,138 807,541,612 407,155,345Number of Shares Outstanding 7,800,077 7,521,401 3,907,107Net Asset Value Per Share2 107.56 107.37 104.21
USD Hedged AccNet Assets 13,195,527 10,392,078 1,102,450Number of Shares Outstanding 117,330 92,624 10,237Net Asset Value Per Share2 112.47 112.20 107.69
1 The share class was launched on 11 September 2019.2 The net asset value per share shown may diverge from the net asset value per share used for dealing purposes because of any adjustments for swing pricing and trade date accounting.
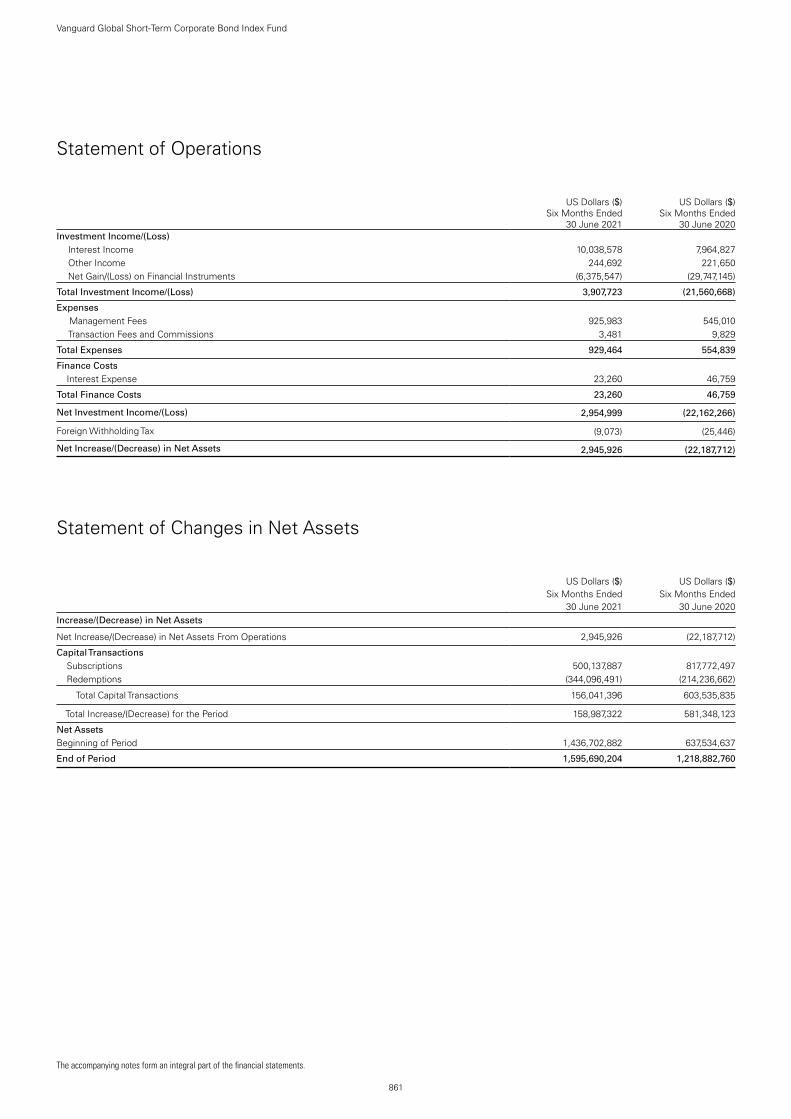
861
Vanguard Global Short-Term Corporate Bond Index Fund
The accompanying notes form an integral part of the financial statements.
Statement of Operations
US Dollars ($)
Six Months Ended 30 June 2021
US Dollars ($)
Six Months Ended 30 June 2020
Investment Income/(Loss) Interest Income 10,038,578 7,964,827 Other Income 244,692 221,650 Net Gain/(Loss) on Financial Instruments (6,375,547) (29,747,145)
Total Investment Income/(Loss) 3,907,723 (21,560,668)
Expenses Management Fees 925,983 545,010 Transaction Fees and Commissions 3,481 9,829
Total Expenses 929,464 554,839
Finance Costs Interest Expense 23,260 46,759
Total Finance Costs 23,260 46,759
Net Investment Income/(Loss) 2,954,999 (22,162,266)
Foreign Withholding Tax (9,073) (25,446)
Net Increase/(Decrease) in Net Assets 2,945,926 (22,187,712)
Statement of Changes in Net Assets
US Dollars ($)
US Dollars ($)
Six Months Ended Six Months Ended30 June 2021 30 June 2020
Increase/(Decrease) in Net Assets
Net Increase/(Decrease) in Net Assets From Operations 2,945,926 (22,187,712)
Capital Transactions Subscriptions 500,137,887 817,772,497 Redemptions (344,096,491) (214,236,662)
Total Capital Transactions 156,041,396 603,535,835
Total Increase/(Decrease) for the Period 158,987,322 581,348,123
Net AssetsBeginning of Period 1,436,702,882 637,534,637
End of Period 1,595,690,204 1,218,882,760
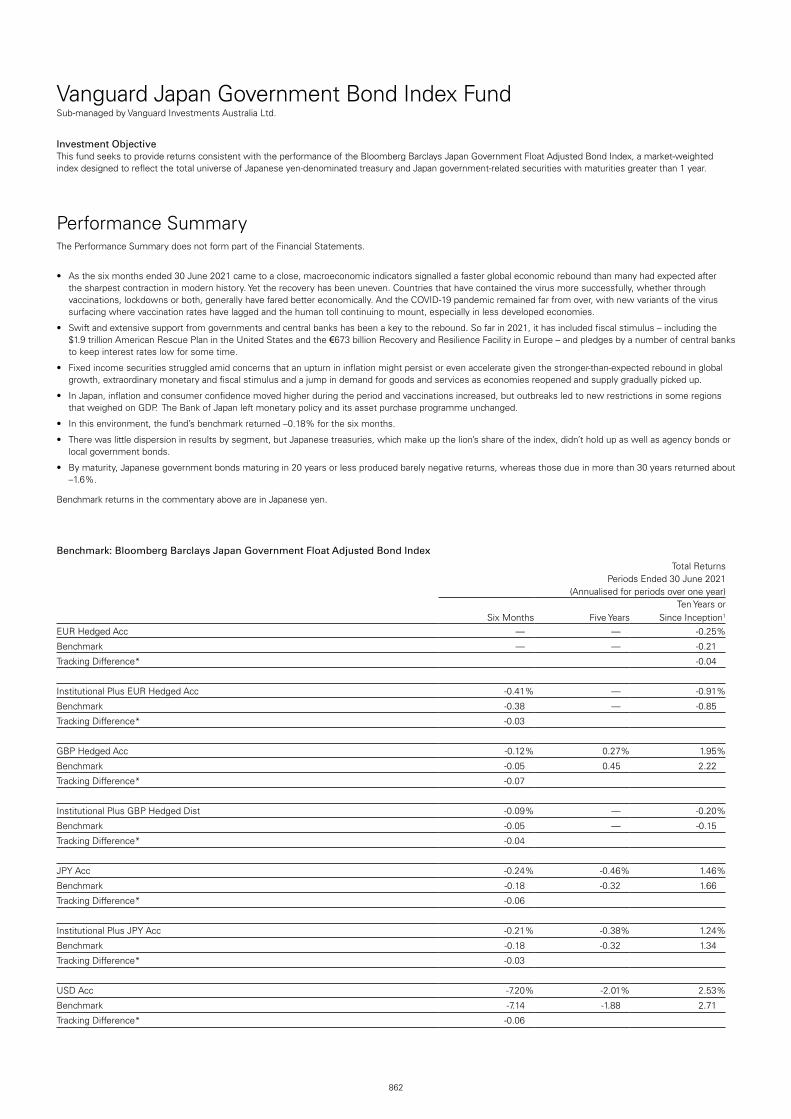
Vanguard Japan Government Bond Index FundSub-managed by Vanguard Investments Australia Ltd.
862
Investment ObjectiveThis fund seeks to provide returns consistent with the performance of the Bloomberg Barclays Japan Government Float Adjusted Bond Index, a market-weighted index designed to reflect the total universe of Japanese yen-denominated treasury and Japan government-related securities with maturities greater than 1 year.
Performance SummaryThe Performance Summary does not form part of the Financial Statements.
• As the six months ended 30 June 2021 came to a close, macroeconomic indicators signalled a faster global economic rebound than many had expected after the sharpest contraction in modern history. Yet the recovery has been uneven. Countries that have contained the virus more successfully, whether through vaccinations, lockdowns or both, generally have fared better economically. And the COVID-19 pandemic remained far from over, with new variants of the virus surfacing where vaccination rates have lagged and the human toll continuing to mount, especially in less developed economies.
• Swift and extensive support from governments and central banks has been a key to the rebound. So far in 2021, it has included fiscal stimulus – including the $1.9 trillion American Rescue Plan in the United States and the €673 billion Recovery and Resilience Facility in Europe – and pledges by a number of central banks to keep interest rates low for some time.
• Fixed income securities struggled amid concerns that an upturn in inflation might persist or even accelerate given the stronger-than-expected rebound in global growth, extraordinary monetary and fiscal stimulus and a jump in demand for goods and services as economies reopened and supply gradually picked up.
• In Japan, inflation and consumer confidence moved higher during the period and vaccinations increased, but outbreaks led to new restrictions in some regions that weighed on GDP. The Bank of Japan left monetary policy and its asset purchase programme unchanged.
• In this environment, the fund’s benchmark returned –0.18% for the six months.
• There was little dispersion in results by segment, but Japanese treasuries, which make up the lion’s share of the index, didn’t hold up as well as agency bonds or local government bonds.
• By maturity, Japanese government bonds maturing in 20 years or less produced barely negative returns, whereas those due in more than 30 years returned about –1.6%.
Benchmark returns in the commentary above are in Japanese yen.
Benchmark: Bloomberg Barclays Japan Government Float Adjusted Bond Index
Total ReturnsPeriods Ended 30 June 2021
(Annualised for periods over one year)
Six Months Five YearsTen Years or
Since Inception1
EUR Hedged Acc — — -0.25 %
Benchmark — — -0.21
Tracking Difference* -0.04
Institutional Plus EUR Hedged Acc -0.41 % — -0.91 %
Benchmark -0.38 — -0.85
Tracking Difference* -0.03
GBP Hedged Acc -0.12 % 0.27 % 1.95 %
Benchmark -0.05 0.45 2.22
Tracking Difference* -0.07
Institutional Plus GBP Hedged Dist -0.09 % — -0.20 %
Benchmark -0.05 — -0.15
Tracking Difference* -0.04
JPY Acc -0.24 % -0.46 % 1.46 %
Benchmark -0.18 -0.32 1.66
Tracking Difference* -0.06
Institutional Plus JPY Acc -0.21 % -0.38 % 1.24 %
Benchmark -0.18 -0.32 1.34
Tracking Difference* -0.03
USD Acc -7.20 % -2.01 % 2.53 %
Benchmark -7.14 -1.88 2.71
Tracking Difference* -0.06

863
Vanguard Japan Government Bond Index Fund
Total ReturnsPeriods Ended 30 June 2021
(Annualised for periods over one year)
Six Months Five YearsTen Years or
Since Inception1
Institutional Plus USD Hedged Acc -0.05 % — 0.16 %
Benchmark -0.01 — 0.19
Tracking Difference* -0.04
Each benchmark is in its respective currency.Sources: Vanguard Global Advisers, LLC, and Bloomberg.Performance is based on NAV with net income reinvested.
All of the returns in this report represent past performance, which is not a guarantee of future results that may be achieved by the fund. For performance data current to the most recent month-end, which may be higher or lower than that cited, visit our website at http://global.vanguard.com. Note, too, that both investment returns and principal value can fluctuate widely, so an investor's shares, when sold, could be worth more or less than their original cost.* The tracking difference between the fund return and the index return over a stated period of time can be attributed to a number of factors, including, without limitation, small differences in
weightings, trading activity, transaction costs and differences in the valuation and withholding tax treatment between the fund and the index vendor.1 Since-inception returns: EUR Hedged Acc, 21 January 2021; Institutional Plus EUR Hedged Acc, 11 December 2019; GBP Hedged Acc, 31 January 2014; Institutional Plus GBP Hedged Dist, 11
December 2019; Institutional Plus JPY Acc, 2 September 2014; USD Acc, 10 March 2015; Institutional Plus USD Hedged Acc, 15 January 2020.

Significant Portfolio ChangesFor the Six Months Ended 30 June 2021
864
Vanguard Japan Government Bond Index Fund
The Central Bank of Ireland requires a schedule of material changes in the composition of the portfolio during the period. These are defined as aggregate purchases of a security exceeding 1% of the total value of purchases for the period and aggregate disposals greater than 1% of the total value of sales. At a minimum, the largest 20 purchases and 20 sales must be shown; all purchases and sales must be shown if there are fewer than 20. A full listing of the portfolio changes for the period is available, upon request, at no extra cost from the Administrator.
Principal Japanese Yen (¥)
Cost Japanese Yen (¥)
PurchasesJapan Government Bond 0.10%
20/12/2030 1,582,700,000 1,582,907,782Japan Government Bond 0.10%
20/12/2025 1,199,000,000 1,209,942,990Japan Government Bond 0.10%
20/3/2031 1,045,000,000 1,047,802,550Japan Government Bond 0.01%
1/5/2023 1,020,000,000 1,022,720,450Japan Government Bond 0.50%
20/12/2040 841,900,000 841,749,214Japan Government Bond 0.10%
1/2/2023 832,000,000 835,584,890Japan Government Bond 0.01%
1/6/2023 830,000,000 831,926,400Japan Government Bond 0.01%
20/3/2026 790,000,000 793,949,750Japan Government Bond 0.50%
20/3/2041 745,000,000 752,474,400Japan Government Bond 0.50%
20/9/2036 620,000,000 638,877,400Japan Government Bond 0.01%
1/4/2023 590,000,000 591,533,450Japan Government Bond 0.70%
20/3/2051 541,700,000 545,317,250Japan Government Bond 0.70%
20/12/2050 519,000,000 519,881,000Japan Government Bond 0.10%
1/3/2023 440,000,000 442,081,750Japan Government Bond 0.40%
20/9/2040 400,000,000 397,130,250Japan Government Bond 0.50%
20/3/2038 355,000,000 362,610,250Japan Government Bond 0.10%
20/9/2029 350,000,000 351,998,500Japan Government Bond 0.10%
1/1/2023 300,000,000 301,347,000Japan Government Bond 0.50%
20/3/2060 318,850,000 298,493,280Japan Government Bond 0.10%
20/9/2022 279,000,000 279,912,330Japan Government Bond 0.80%
20/3/2048 255,000,000 264,655,350Japan Government Bond 0.10%
20/9/2025 240,000,000 242,480,800Japan Government Bond 0.10%
20/9/2027 225,000,000 227,416,850Japan Government Bond 1.60%
20/3/2033 180,000,000 210,634,200Central Nippon Expressway Co., Ltd.
0.04% 19/8/2024 200,000,000 200,144,000
Principal Japanese Yen (¥)
Proceeds Japanese Yen (¥)
SalesJapan Government Bond 0.10%
1/7/2022 760,000,000 762,214,900Japan Government Bond 0.10%
20/9/2025 625,000,000 630,982,250Japan Government Bond 0.10%
1/11/2022 625,000,000 626,862,500Japan Government Bond 0.10%
1/8/2022 540,000,000 541,392,050Japan Government Bond 1.00%
20/3/2022 505,000,000 511,105,700Japan Government Bond 0.10%
20/9/2022 500,000,000 501,285,000Japan Government Bond 0.10%
20/9/2029 485,950,000 489,036,082Japan Government Bond 0.80%
20/9/2022 420,000,000 424,666,000Japan Government Bond 0.80%
20/6/2022 387,600,000 391,840,840Japan Government Bond 0.10%
20/12/2024 380,000,000 383,259,500Japan Government Bond 0.10%
20/6/2022 357,300,000 358,230,321Japan Government Bond 0.10%
20/9/2030 350,000,000 352,625,000Japan Government Bond 0.50%
20/9/2036 340,000,000 351,810,900Japan Government Bond 0.90%
20/6/2022 337,000,000 341,188,910Japan Government Bond 0.10%
20/3/2029 335,000,000 337,941,300Japan Government Bond 0.10%
1/5/2022 330,000,000 330,805,200Japan Government Bond 0.50%
20/12/2040 290,050,000 292,672,227Japan Government Bond 0.40%
20/9/2040 285,000,000 282,595,200Japan Government Bond 0.10%
1/3/2022 280,000,000 280,691,200Japan Government Bond 0.10%
20/12/2030 273,800,000 274,266,662Japan Government Bond 0.10%
20/9/2024 260,000,000 262,146,800Japan Government Bond 0.10%
20/12/2023 250,000,000 251,640,000Japan Government Bond 0.10%
1/6/2022 250,000,000 250,662,500Japan Government Bond 0.80%
20/3/2048 235,000,000 245,285,000Japan Government Bond 0.10%
20/3/2022 241,900,000 242,489,556Japan Government Bond 0.10%
1/4/2022 225,350,000 225,866,051Japan Government Bond 0.10%
20/3/2025 202,000,000 203,733,160Japan Government Bond 0.50%
20/3/2038 200,000,000 203,434,000Japan Government Bond 0.10%
20/3/2024 200,000,000 201,404,000Japan Government Bond 0.10%
20/3/2030 175,000,000 176,667,750Japan Government Bond 1.00%
20/12/2035 155,000,000 171,343,200Japan Government Bond 0.10%
20/3/2031 170,000,000 170,392,700Japan Government Bond 0.10%
1/9/2022 169,050,000 169,513,197
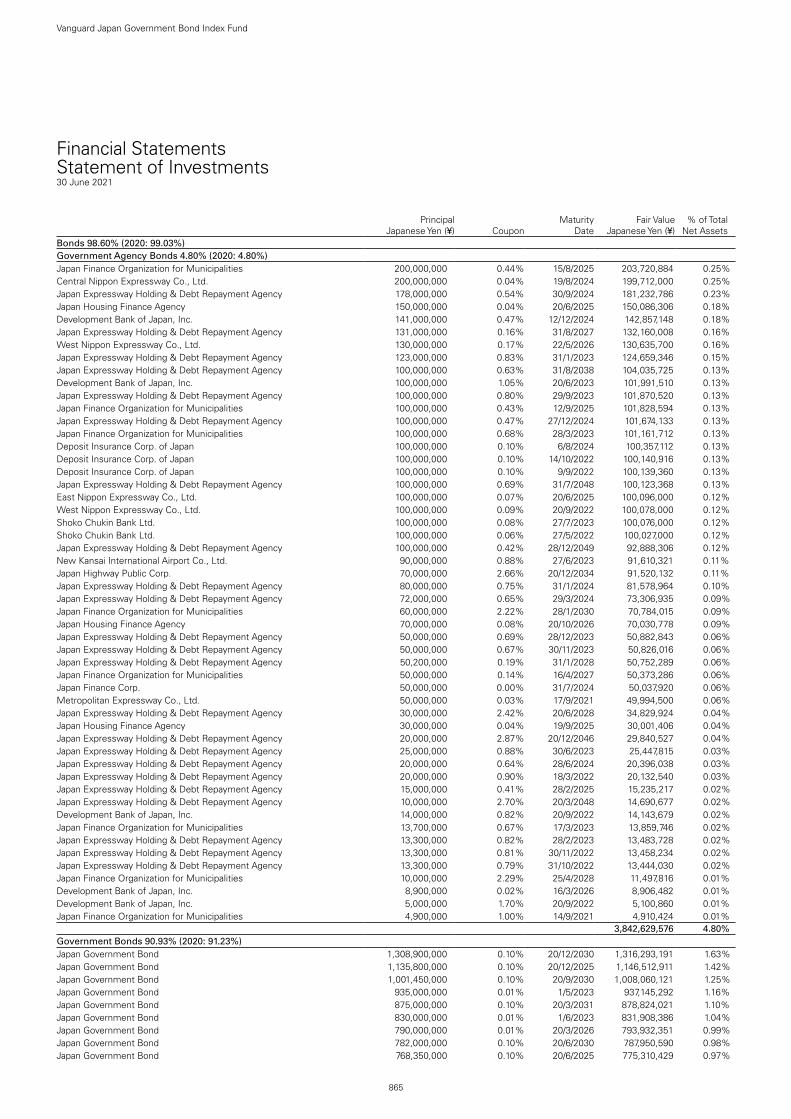
865
Vanguard Japan Government Bond Index Fund
Financial StatementsStatement of Investments30 June 2021
Principal Japanese Yen (¥) Coupon
Maturity Date
Fair Value Japanese Yen (¥)
% of Total Net Assets
Bonds 98.60% (2020: 99.03%)Government Agency Bonds 4.80% (2020: 4.80%) Japan Finance Organization for Municipalities 200,000,000 0.44% 15/8/2025 203,720,884 0.25%Central Nippon Expressway Co., Ltd. 200,000,000 0.04% 19/8/2024 199,712,000 0.25%Japan Expressway Holding & Debt Repayment Agency 178,000,000 0.54% 30/9/2024 181,232,786 0.23%Japan Housing Finance Agency 150,000,000 0.04% 20/6/2025 150,086,306 0.18%Development Bank of Japan, Inc. 141,000,000 0.47% 12/12/2024 142,857,148 0.18%Japan Expressway Holding & Debt Repayment Agency 131,000,000 0.16% 31/8/2027 132,160,008 0.16%West Nippon Expressway Co., Ltd. 130,000,000 0.17% 22/5/2026 130,635,700 0.16%Japan Expressway Holding & Debt Repayment Agency 123,000,000 0.83% 31/1/2023 124,659,346 0.15%Japan Expressway Holding & Debt Repayment Agency 100,000,000 0.63% 31/8/2038 104,035,725 0.13%Development Bank of Japan, Inc. 100,000,000 1.05% 20/6/2023 101,991,510 0.13%Japan Expressway Holding & Debt Repayment Agency 100,000,000 0.80% 29/9/2023 101,870,520 0.13%Japan Finance Organization for Municipalities 100,000,000 0.43% 12/9/2025 101,828,594 0.13%Japan Expressway Holding & Debt Repayment Agency 100,000,000 0.47% 27/12/2024 101,674,133 0.13%Japan Finance Organization for Municipalities 100,000,000 0.68% 28/3/2023 101,161,712 0.13%Deposit Insurance Corp. of Japan 100,000,000 0.10% 6/8/2024 100,357,112 0.13%Deposit Insurance Corp. of Japan 100,000,000 0.10% 14/10/2022 100,140,916 0.13%Deposit Insurance Corp. of Japan 100,000,000 0.10% 9/9/2022 100,139,360 0.13%Japan Expressway Holding & Debt Repayment Agency 100,000,000 0.69% 31/7/2048 100,123,368 0.13%East Nippon Expressway Co., Ltd. 100,000,000 0.07% 20/6/2025 100,096,000 0.12%West Nippon Expressway Co., Ltd. 100,000,000 0.09% 20/9/2022 100,078,000 0.12%Shoko Chukin Bank Ltd. 100,000,000 0.08% 27/7/2023 100,076,000 0.12%Shoko Chukin Bank Ltd. 100,000,000 0.06% 27/5/2022 100,027,000 0.12%Japan Expressway Holding & Debt Repayment Agency 100,000,000 0.42% 28/12/2049 92,888,306 0.12%New Kansai International Airport Co., Ltd. 90,000,000 0.88% 27/6/2023 91,610,321 0.11%Japan Highway Public Corp. 70,000,000 2.66% 20/12/2034 91,520,132 0.11%Japan Expressway Holding & Debt Repayment Agency 80,000,000 0.75% 31/1/2024 81,578,964 0.10%Japan Expressway Holding & Debt Repayment Agency 72,000,000 0.65% 29/3/2024 73,306,935 0.09%Japan Finance Organization for Municipalities 60,000,000 2.22% 28/1/2030 70,784,015 0.09%Japan Housing Finance Agency 70,000,000 0.08% 20/10/2026 70,030,778 0.09%Japan Expressway Holding & Debt Repayment Agency 50,000,000 0.69% 28/12/2023 50,882,843 0.06%Japan Expressway Holding & Debt Repayment Agency 50,000,000 0.67% 30/11/2023 50,826,016 0.06%Japan Expressway Holding & Debt Repayment Agency 50,200,000 0.19% 31/1/2028 50,752,289 0.06%Japan Finance Organization for Municipalities 50,000,000 0.14% 16/4/2027 50,373,286 0.06%Japan Finance Corp. 50,000,000 0.00% 31/7/2024 50,037,920 0.06%Metropolitan Expressway Co., Ltd. 50,000,000 0.03% 17/9/2021 49,994,500 0.06%Japan Expressway Holding & Debt Repayment Agency 30,000,000 2.42% 20/6/2028 34,829,924 0.04%Japan Housing Finance Agency 30,000,000 0.04% 19/9/2025 30,001,406 0.04%Japan Expressway Holding & Debt Repayment Agency 20,000,000 2.87% 20/12/2046 29,840,527 0.04%Japan Expressway Holding & Debt Repayment Agency 25,000,000 0.88% 30/6/2023 25,447,815 0.03%Japan Expressway Holding & Debt Repayment Agency 20,000,000 0.64% 28/6/2024 20,396,038 0.03%Japan Expressway Holding & Debt Repayment Agency 20,000,000 0.90% 18/3/2022 20,132,540 0.03%Japan Expressway Holding & Debt Repayment Agency 15,000,000 0.41% 28/2/2025 15,235,217 0.02%Japan Expressway Holding & Debt Repayment Agency 10,000,000 2.70% 20/3/2048 14,690,677 0.02%Development Bank of Japan, Inc. 14,000,000 0.82% 20/9/2022 14,143,679 0.02%Japan Finance Organization for Municipalities 13,700,000 0.67% 17/3/2023 13,859,746 0.02%Japan Expressway Holding & Debt Repayment Agency 13,300,000 0.82% 28/2/2023 13,483,728 0.02%Japan Expressway Holding & Debt Repayment Agency 13,300,000 0.81% 30/11/2022 13,458,234 0.02%Japan Expressway Holding & Debt Repayment Agency 13,300,000 0.79% 31/10/2022 13,444,030 0.02%Japan Finance Organization for Municipalities 10,000,000 2.29% 25/4/2028 11,497,816 0.01%Development Bank of Japan, Inc. 8,900,000 0.02% 16/3/2026 8,906,482 0.01%Development Bank of Japan, Inc. 5,000,000 1.70% 20/9/2022 5,100,860 0.01%Japan Finance Organization for Municipalities 4,900,000 1.00% 14/9/2021 4,910,424 0.01%test test test test 3,842,629,576 4.80%Government Bonds 90.93% (2020: 91.23%) Japan Government Bond 1,308,900,000 0.10% 20/12/2030 1,316,293,191 1.63%Japan Government Bond 1,135,800,000 0.10% 20/12/2025 1,146,512,911 1.42%Japan Government Bond 1,001,450,000 0.10% 20/9/2030 1,008,060,121 1.25%Japan Government Bond 935,000,000 0.01% 1/5/2023 937,145,292 1.16%Japan Government Bond 875,000,000 0.10% 20/3/2031 878,824,021 1.10%Japan Government Bond 830,000,000 0.01% 1/6/2023 831,908,386 1.04%Japan Government Bond 790,000,000 0.01% 20/3/2026 793,932,351 0.99%Japan Government Bond 782,000,000 0.10% 20/6/2030 787,950,590 0.98%Japan Government Bond 768,350,000 0.10% 20/6/2025 775,310,429 0.97%

866
Vanguard Japan Government Bond Index Fund
Principal
Japanese Yen (¥) CouponMaturity
DateFair Value
Japanese Yen (¥)% of Total
Net AssetsJapan Government Bond 593,350,000 1.90% 20/9/2042 761,999,965 0.95%Japan Government Bond 750,000,000 0.10% 1/1/2023 752,331,405 0.94%Japan Government Bond 733,650,000 0.10% 20/9/2029 741,183,228 0.93%Japan Government Bond 720,000,000 0.50% 20/3/2041 727,214,796 0.91%Japan Government Bond 707,000,000 0.10% 1/2/2023 709,459,604 0.89%Japan Government Bond 657,200,000 0.10% 20/12/2029 663,233,661 0.83%Japan Government Bond 630,850,000 0.80% 20/6/2023 642,189,410 0.80%Japan Government Bond 634,700,000 0.40% 20/9/2040 631,391,239 0.79%Japan Government Bond 481,200,000 2.00% 20/9/2041 623,584,915 0.78%Japan Government Bond 459,350,000 2.00% 20/3/2042 597,082,891 0.75%Japan Government Bond 457,600,000 2.00% 20/9/2040 590,074,948 0.74%Japan Government Bond 427,050,000 2.20% 20/3/2041 569,109,169 0.71%Japan Government Bond 551,850,000 0.50% 20/12/2040 558,324,050 0.70%Japan Government Bond 480,000,000 1.40% 20/9/2034 555,622,877 0.69%Japan Government Bond 412,550,000 2.30% 20/3/2040 553,239,484 0.69%Japan Government Bond 553,500,000 0.40% 20/6/2040 551,654,066 0.69%Japan Government Bond 457,400,000 2.10% 20/12/2030 546,312,486 0.68%Japan Government Bond 528,900,000 0.10% 20/6/2029 534,506,530 0.67%Japan Government Bond 529,150,000 0.10% 20/9/2025 534,088,324 0.67%Japan Government Bond 529,350,000 0.10% 20/3/2030 533,953,656 0.67%Japan Government Bond 501,300,000 0.50% 20/9/2036 518,536,905 0.65%Japan Government Bond 437,300,000 1.60% 20/12/2033 514,702,174 0.64%Japan Government Bond 502,850,000 0.40% 20/6/2025 513,381,288 0.64%Japan Government Bond1 498,400,000 0.50% 20/6/2038 511,259,318 0.64%Japan Government Bond 450,450,000 1.20% 20/3/2035 510,346,769 0.64%Japan Government Bond 444,150,000 1.20% 20/12/2034 503,080,977 0.63%Japan Government Bond 415,550,000 1.50% 20/6/2034 485,438,483 0.61%Japan Government Bond1 463,050,000 0.50% 20/3/2038 475,492,121 0.59%Japan Government Bond 402,900,000 1.50% 20/3/2034 470,180,722 0.59%Japan Government Bond 466,950,000 0.70% 20/3/2051 468,312,289 0.58%Japan Government Bond 465,000,000 0.01% 1/4/2023 466,017,225 0.58%Japan Government Bond 392,800,000 1.70% 20/6/2033 465,189,270 0.58%Japan Government Bond 462,050,000 0.10% 20/3/2023 463,768,082 0.58%Japan Government Bond 469,400,000 0.30% 20/12/2039 460,505,255 0.58%Japan Government Bond 498,600,000 0.50% 20/3/2060 457,111,180 0.57%Japan Government Bond 411,400,000 1.00% 20/12/2035 455,721,348 0.57%Japan Government Bond 449,000,000 0.70% 20/12/2050 451,189,849 0.56%Japan Government Bond 441,000,000 0.10% 20/12/2026 445,659,906 0.56%Japan Government Bond 440,000,000 0.10% 1/3/2023 441,583,054 0.55%Japan Government Bond 442,650,000 0.30% 20/6/2039 436,322,022 0.54%Japan Government Bond 424,700,000 0.50% 20/12/2038 434,549,264 0.54%Japan Government Bond 427,400,000 0.80% 20/9/2022 432,137,464 0.54%Japan Government Bond 425,900,000 0.10% 20/9/2026 430,154,937 0.54%Japan Government Bond 367,100,000 1.60% 20/3/2033 429,631,407 0.54%Japan Government Bond 422,650,000 0.10% 20/6/2023 424,483,938 0.53%Japan Government Bond 424,550,000 0.40% 20/3/2040 423,809,776 0.53%Japan Government Bond 354,100,000 1.70% 20/9/2033 420,360,870 0.52%Japan Government Bond 429,050,000 0.60% 20/9/2050 420,239,626 0.52%Japan Government Bond 311,350,000 2.40% 20/9/2038 417,780,944 0.52%Japan Government Bond 422,350,000 0.60% 20/6/2050 413,744,952 0.52%Japan Government Bond 350,150,000 1.70% 20/12/2032 412,787,213 0.52%Japan Government Bond 412,300,000 0.30% 20/9/2039 405,721,539 0.51%Japan Government Bond 401,100,000 0.40% 20/3/2039 403,082,938 0.50%Japan Government Bond 399,500,000 0.10% 20/6/2024 402,244,042 0.50%Japan Government Bond 316,600,000 1.80% 20/3/2043 401,603,465 0.50%Japan Government Bond 391,700,000 0.10% 20/9/2028 396,322,448 0.49%Japan Government Bond 387,850,000 0.10% 20/9/2024 390,638,067 0.49%Japan Government Bond 424,850,000 0.50% 20/3/2059 390,591,107 0.49%Japan Government Bond 367,250,000 0.70% 20/9/2038 388,397,485 0.49%Japan Government Bond 292,000,000 2.40% 20/3/2037 386,934,876 0.48%Japan Government Bond 368,700,000 0.60% 20/9/2037 385,473,660 0.48%Japan Government Bond 324,000,000 1.80% 20/3/2032 382,863,066 0.48%Japan Government Bond 361,200,000 0.90% 20/3/2057 379,652,736 0.47%Japan Government Bond 293,850,000 1.90% 20/6/2043 378,747,999 0.47%Japan Government Bond 373,700,000 0.10% 20/12/2028 377,946,058 0.47%Japan Government Bond 330,400,000 1.20% 20/9/2035 374,968,347 0.47%Japan Government Bond 357,400,000 0.60% 20/12/2036 374,490,500 0.47%Japan Government Bond 264,800,000 2.20% 20/3/2051 371,999,853 0.46%Japan Government Bond 281,650,000 2.20% 20/9/2039 370,950,555 0.46%Japan Government Bond 270,550,000 2.00% 20/3/2052 367,207,643 0.46%Japan Government Bond 309,000,000 2.00% 20/3/2031 367,130,406 0.46%

867
Vanguard Japan Government Bond Index Fund
Principal
Japanese Yen (¥) CouponMaturity
DateFair Value
Japanese Yen (¥)% of Total
Net AssetsJapan Government Bond 309,600,000 1.70% 20/9/2032 364,182,539 0.45%Japan Government Bond 300,000,000 2.20% 20/3/2031 362,375,487 0.45%Japan Government Bond 350,450,000 0.60% 20/12/2023 356,724,292 0.45%Japan Government Bond 354,000,000 0.20% 20/6/2036 350,651,426 0.44%Japan Government Bond 340,250,000 0.10% 20/3/2025 343,117,300 0.43%Japan Government Bond 298,600,000 1.30% 20/6/2035 343,011,536 0.43%Japan Government Bond 335,850,000 0.80% 20/3/2058 342,433,899 0.43%Japan Government Bond1 318,350,000 0.70% 20/3/2037 338,224,721 0.42%Japan Government Bond 250,750,000 2.50% 20/9/2037 337,606,217 0.42%Japan Government Bond 321,250,000 0.80% 20/3/2048 335,690,753 0.42%Japan Government Bond 329,350,000 0.70% 20/6/2048 335,685,301 0.42%Japan Government Bond 354,700,000 0.40% 20/9/2049 331,089,008 0.41%Japan Government Bond 324,050,000 0.70% 20/12/2048 329,039,352 0.41%Japan Government Bond 363,450,000 0.40% 20/3/2056 327,072,769 0.41%Japan Government Bond 351,200,000 0.40% 20/3/2050 326,546,856 0.41%Japan Government Bond1 243,000,000 2.30% 20/3/2039 323,164,667 0.40%Japan Government Bond 318,450,000 0.10% 20/6/2027 322,086,349 0.40%Japan Government Bond 332,400,000 0.50% 20/3/2049 320,375,909 0.40%Japan Government Bond 270,000,000 1.80% 20/12/2031 318,131,528 0.40%Japan Government Bond 311,200,000 0.60% 20/6/2024 317,971,015 0.40%Japan Government Bond 338,950,000 0.40% 20/6/2049 317,201,124 0.40%Japan Government Bond 312,850,000 0.10% 20/3/2028 316,544,383 0.40%Japan Government Bond 234,000,000 2.50% 20/3/2038 316,539,225 0.40%Japan Government Bond1 249,300,000 1.70% 20/3/2044 312,591,399 0.39%Japan Government Bond 305,000,000 0.60% 20/3/2024 311,037,560 0.39%Japan Government Bond 302,850,000 0.10% 20/9/2027 306,359,601 0.38%Japan Government Bond 300,000,000 0.60% 20/3/2023 303,668,904 0.38%Japan Government Bond 250,050,000 1.50% 20/3/2045 303,426,446 0.38%Japan Government Bond 294,800,000 0.40% 20/3/2036 300,943,193 0.38%Japan Government Bond 258,000,000 1.80% 20/9/2030 300,123,779 0.37%Japan Government Bond 259,350,000 2.10% 20/9/2028 300,006,974 0.37%Japan Government Bond 290,000,000 0.10% 20/12/2027 293,398,507 0.37%Japan Government Bond 278,400,000 0.80% 20/12/2047 291,277,615 0.36%Japan Government Bond 244,450,000 1.80% 20/9/2031 287,258,698 0.36%Japan Government Bond 228,550,000 1.70% 20/12/2043 286,300,924 0.36%Japan Government Bond 246,250,000 1.50% 20/3/2033 285,217,506 0.36%Japan Government Bond 224,350,000 1.80% 20/9/2043 285,036,655 0.36%Japan Government Bond 288,850,000 0.50% 20/9/2046 283,450,316 0.35%Japan Government Bond 279,800,000 0.10% 20/12/2024 282,026,844 0.35%Japan Government Bond 302,650,000 0.40% 20/12/2049 281,811,170 0.35%Japan Government Bond 269,350,000 0.60% 20/12/2037 281,391,701 0.35%Japan Government Bond 258,950,000 0.90% 20/9/2048 276,197,049 0.34%Japan Government Bond 191,350,000 2.20% 20/3/2049 267,423,688 0.33%Japan Government Bond 260,000,000 0.10% 20/12/2022 260,846,123 0.33%Japan Government Bond 249,200,000 0.60% 20/6/2037 260,609,188 0.33%Japan Government Bond 256,400,000 0.10% 20/3/2024 258,010,528 0.32%Japan Government Bond 256,550,000 0.10% 20/9/2022 257,196,550 0.32%Japan Government Bond 204,600,000 1.70% 20/9/2044 256,756,869 0.32%Japan Government Bond 216,450,000 1.90% 20/6/2031 255,868,543 0.32%Japan Government Bond 217,000,000 1.70% 20/3/2032 254,109,318 0.32%Japan Government Bond 230,000,000 2.00% 20/12/2025 251,750,702 0.31%Japan Government Bond 209,650,000 1.80% 20/12/2032 249,662,149 0.31%Japan Government Bond 238,100,000 0.80% 20/9/2047 249,426,448 0.31%Japan Government Bond 245,050,000 0.10% 20/12/2023 246,445,971 0.31%Japan Government Bond 228,650,000 0.80% 20/6/2047 239,882,518 0.30%Japan Government Bond 169,550,000 2.20% 20/3/2050 237,574,014 0.30%Japan Government Bond 200,000,000 2.00% 20/12/2030 237,008,438 0.30%Japan Government Bond 232,600,000 0.10% 20/3/2027 235,143,516 0.29%Japan Government Bond 220,600,000 0.80% 20/3/2046 232,592,326 0.29%Japan Government Bond 229,200,000 0.10% 20/6/2028 231,927,847 0.29%Japan Government Bond 197,100,000 2.20% 20/9/2028 229,483,288 0.29%Japan Government Bond 194,500,000 1.70% 20/12/2031 227,141,165 0.28%Japan Government Bond 190,000,000 2.10% 20/9/2029 223,189,686 0.28%Japan Government Bond 164,200,000 2.50% 20/3/2036 217,502,102 0.27%Japan Government Bond 173,500,000 1.70% 20/6/2044 217,488,789 0.27%Japan Government Bond 212,350,000 0.40% 20/9/2025 217,055,532 0.27%Japan Government Bond 189,800,000 1.60% 20/6/2030 216,772,478 0.27%Japan Government Bond 212,450,000 0.60% 20/12/2046 213,159,532 0.27%Japan Government Bond 195,000,000 2.00% 20/9/2025 212,507,669 0.27%Japan Government Bond 164,700,000 1.70% 20/3/2054 211,791,124 0.26%Japan Government Bond 157,350,000 1.90% 20/3/2053 210,376,020 0.26%

868
Vanguard Japan Government Bond Index Fund
Principal
Japanese Yen (¥) CouponMaturity
DateFair Value
Japanese Yen (¥)% of Total
Net AssetsJapan Government Bond 179,550,000 1.60% 20/3/2032 208,319,455 0.26%Japan Government Bond 172,400,000 1.40% 20/3/2055 206,965,909 0.26%Japan Government Bond 174,000,000 2.00% 20/6/2030 204,981,648 0.26%Japan Government Bond 199,550,000 0.10% 20/3/2029 201,800,305 0.25%Japan Government Bond 192,100,000 0.80% 20/3/2047 201,561,175 0.25%Japan Government Bond 198,000,000 0.60% 20/9/2023 201,179,623 0.25%Japan Government Bond 169,350,000 2.20% 20/12/2029 201,091,013 0.25%Japan Government Bond 164,400,000 1.50% 20/12/2044 199,231,635 0.25%Japan Government Bond 165,150,000 2.10% 20/12/2029 194,662,974 0.24%Japan Government Bond 191,600,000 0.70% 20/12/2022 193,868,161 0.24%Japan Government Bond 189,600,000 0.80% 20/9/2023 193,487,902 0.24%Japan Government Bond 159,300,000 2.40% 20/3/2028 185,848,807 0.23%Japan Government Bond 196,450,000 0.30% 20/6/2046 183,935,255 0.23%Japan Government Bond 158,350,000 1.90% 20/12/2028 181,566,626 0.23%Japan Government Bond 174,950,000 0.50% 20/9/2024 178,493,152 0.22%Japan Government Bond1 148,400,000 1.40% 20/12/2045 176,798,464 0.22%Japan Government Bond 147,000,000 1.80% 20/6/2031 172,366,180 0.22%Japan Government Bond 170,000,000 0.10% 1/12/2022 170,538,302 0.21%Japan Government Bond 145,000,000 1.80% 20/6/2030 168,188,258 0.21%Japan Government Bond 127,350,000 2.30% 20/3/2035 163,185,493 0.20%Japan Government Bond 127,000,000 2.40% 20/3/2034 162,420,075 0.20%Japan Government Bond 123,200,000 1.60% 20/6/2045 152,204,138 0.19%Japan Government Bond 147,900,000 0.10% 20/9/2023 148,624,710 0.19%Japan Government Bond 145,750,000 0.10% 20/6/2026 147,204,585 0.18%Japan Government Bond1 123,000,000 2.10% 20/12/2028 142,884,700 0.18%Japan Government Bond 128,650,000 2.10% 20/3/2026 142,041,503 0.18%Japan Government Bond 120,100,000 2.10% 20/12/2026 134,565,330 0.17%Japan Government Bond 135,000,000 0.70% 20/3/2061 132,488,525 0.17%Japan Government Bond 110,000,000 2.10% 20/6/2029 128,742,082 0.16%Japan Government Bond 101,900,000 1.40% 20/9/2045 121,383,271 0.15%Japan Government Bond 106,150,000 2.20% 20/9/2027 121,322,256 0.15%Japan Government Bond 119,800,000 0.10% 20/3/2026 120,935,704 0.15%Japan Government Bond 83,900,000 2.40% 20/3/2048 120,769,323 0.15%Japan Government Bond 106,650,000 1.10% 20/3/2033 118,601,574 0.15%Japan Government Bond 112,000,000 0.80% 20/12/2022 113,494,610 0.14%Japan Government Bond 110,000,000 0.50% 20/12/2024 112,398,004 0.14%Japan Government Bond 95,000,000 2.10% 20/3/2029 110,755,277 0.14%Japan Government Bond 93,900,000 1.60% 20/6/2032 109,189,228 0.14%Japan Government Bond 107,000,000 0.40% 20/3/2025 109,117,575 0.14%Japan Government Bond 83,850,000 2.50% 20/6/2034 108,700,008 0.14%Japan Government Bond 96,100,000 2.30% 20/6/2026 107,567,407 0.13%Japan Government Bond 99,000,000 2.00% 20/6/2025 107,376,919 0.13%Japan Government Bond 88,350,000 2.20% 20/5/2031 106,966,753 0.13%Japan Government Bond 93,050,000 2.10% 20/12/2027 106,245,691 0.13%Japan Government Bond 78,000,000 2.50% 20/9/2036 103,965,904 0.13%Japan Government Bond 87,000,000 2.20% 20/6/2029 102,502,046 0.13%Japan Government Bond 100,000,000 0.10% 1/10/2022 100,281,362 0.13%Japan Government Bond 76,350,000 2.30% 20/12/2036 99,775,970 0.12%Japan Government Bond 74,000,000 2.50% 20/6/2036 98,333,660 0.12%Japan Government Bond 87,500,000 2.20% 20/9/2026 98,015,837 0.12%Japan Government Bond 74,000,000 2.50% 20/9/2034 96,245,822 0.12%Japan Government Bond 83,150,000 2.20% 20/3/2028 95,922,691 0.12%Japan Government Bond 71,650,000 2.50% 20/9/2035 94,422,259 0.12%Japan Government Bond 88,000,000 1.90% 20/9/2022 90,166,208 0.11%Japan Government Bond 75,000,000 2.10% 20/3/2030 88,701,459 0.11%Japan Government Bond 76,000,000 1.70% 20/9/2031 88,547,772 0.11%Japan Government Bond 79,000,000 2.10% 20/12/2024 85,107,710 0.11%Japan Government Bond 65,000,000 2.30% 20/6/2035 83,590,273 0.10%Japan Government Bond 69,000,000 2.00% 20/3/2027 77,275,401 0.10%Japan Government Bond 64,500,000 1.90% 20/6/2025 69,700,118 0.09%Japan Government Bond 59,250,000 2.30% 20/6/2028 69,069,258 0.09%Japan Government Bond1 62,000,000 2.00% 20/12/2024 66,578,949 0.08%Japan Government Bond 57,000,000 1.50% 20/6/2032 65,671,778 0.08%Japan Government Bond 57,000,000 1.90% 20/3/2029 65,586,356 0.08%Japan Government Bond 60,000,000 2.10% 20/3/2025 64,979,417 0.08%Japan Government Bond 60,000,000 2.10% 20/9/2024 64,312,118 0.08%Japan Government Bond 54,000,000 2.30% 20/3/2026 60,128,850 0.08%Japan Government Bond 49,000,000 2.00% 20/12/2033 60,091,572 0.08%Japan Government Bond 51,850,000 2.20% 20/6/2024 55,438,441 0.07%Japan Government Bond 47,500,000 2.10% 20/3/2027 53,469,145 0.07%Japan Government Bond 45,000,000 1.70% 20/6/2032 52,824,634 0.07%
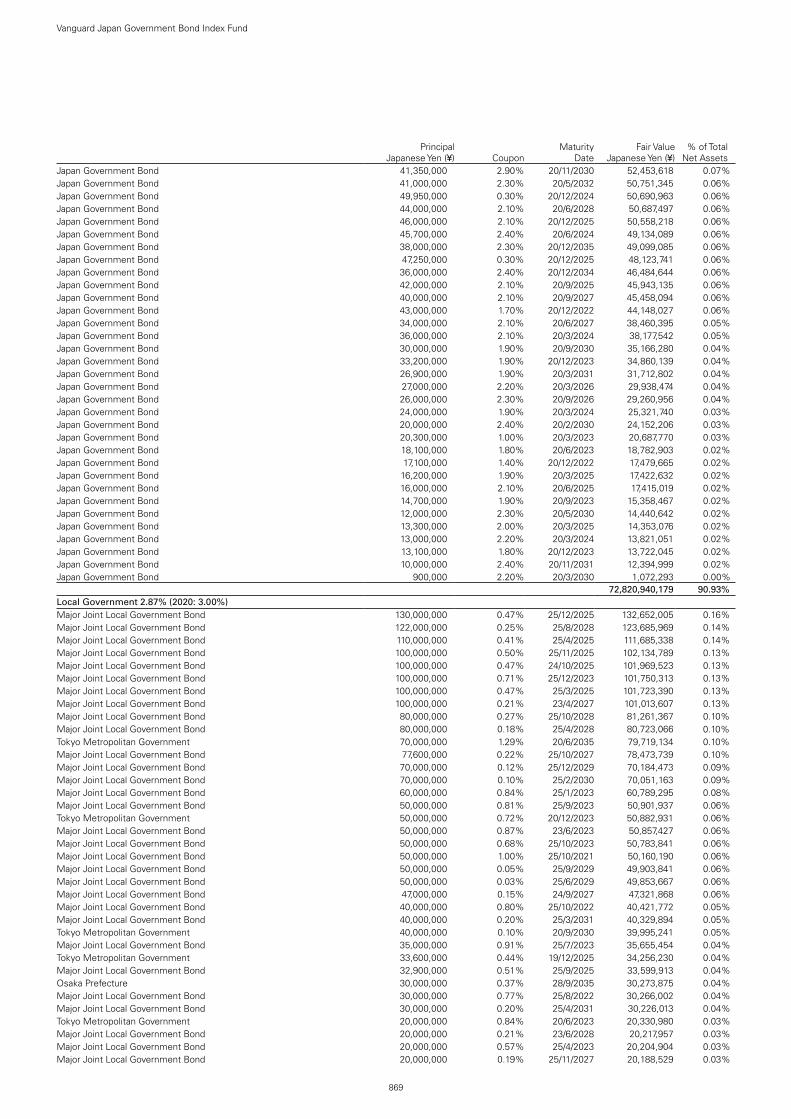
869
Vanguard Japan Government Bond Index Fund
Principal
Japanese Yen (¥) CouponMaturity
DateFair Value
Japanese Yen (¥)% of Total
Net AssetsJapan Government Bond 41,350,000 2.90% 20/11/2030 52,453,618 0.07%Japan Government Bond 41,000,000 2.30% 20/5/2032 50,751,345 0.06%Japan Government Bond 49,950,000 0.30% 20/12/2024 50,690,963 0.06%Japan Government Bond 44,000,000 2.10% 20/6/2028 50,687,497 0.06%Japan Government Bond 46,000,000 2.10% 20/12/2025 50,558,218 0.06%Japan Government Bond 45,700,000 2.40% 20/6/2024 49,134,089 0.06%Japan Government Bond 38,000,000 2.30% 20/12/2035 49,099,085 0.06%Japan Government Bond 47,250,000 0.30% 20/12/2025 48,123,741 0.06%Japan Government Bond 36,000,000 2.40% 20/12/2034 46,484,644 0.06%Japan Government Bond 42,000,000 2.10% 20/9/2025 45,943,135 0.06%Japan Government Bond 40,000,000 2.10% 20/9/2027 45,458,094 0.06%Japan Government Bond 43,000,000 1.70% 20/12/2022 44,148,027 0.06%Japan Government Bond 34,000,000 2.10% 20/6/2027 38,460,395 0.05%Japan Government Bond 36,000,000 2.10% 20/3/2024 38,177,542 0.05%Japan Government Bond 30,000,000 1.90% 20/9/2030 35,166,280 0.04%Japan Government Bond 33,200,000 1.90% 20/12/2023 34,860,139 0.04%Japan Government Bond 26,900,000 1.90% 20/3/2031 31,712,802 0.04%Japan Government Bond 27,000,000 2.20% 20/3/2026 29,938,474 0.04%Japan Government Bond 26,000,000 2.30% 20/9/2026 29,260,956 0.04%Japan Government Bond 24,000,000 1.90% 20/3/2024 25,321,740 0.03%Japan Government Bond 20,000,000 2.40% 20/2/2030 24,152,206 0.03%Japan Government Bond 20,300,000 1.00% 20/3/2023 20,687,770 0.03%Japan Government Bond 18,100,000 1.80% 20/6/2023 18,782,903 0.02%Japan Government Bond 17,100,000 1.40% 20/12/2022 17,479,665 0.02%Japan Government Bond 16,200,000 1.90% 20/3/2025 17,422,632 0.02%Japan Government Bond 16,000,000 2.10% 20/6/2025 17,415,019 0.02%Japan Government Bond 14,700,000 1.90% 20/9/2023 15,358,467 0.02%Japan Government Bond 12,000,000 2.30% 20/5/2030 14,440,642 0.02%Japan Government Bond 13,300,000 2.00% 20/3/2025 14,353,076 0.02%Japan Government Bond 13,000,000 2.20% 20/3/2024 13,821,051 0.02%Japan Government Bond 13,100,000 1.80% 20/12/2023 13,722,045 0.02%Japan Government Bond 10,000,000 2.40% 20/11/2031 12,394,999 0.02%Japan Government Bond 900,000 2.20% 20/3/2030 1,072,293 0.00%test test test test 72,820,940,179 90.93%Local Government 2.87% (2020: 3.00%) Major Joint Local Government Bond 130,000,000 0.47% 25/12/2025 132,652,005 0.16%Major Joint Local Government Bond 122,000,000 0.25% 25/8/2028 123,685,969 0.14%Major Joint Local Government Bond 110,000,000 0.41% 25/4/2025 111,685,338 0.14%Major Joint Local Government Bond 100,000,000 0.50% 25/11/2025 102,134,789 0.13%Major Joint Local Government Bond 100,000,000 0.47% 24/10/2025 101,969,523 0.13%Major Joint Local Government Bond 100,000,000 0.71% 25/12/2023 101,750,313 0.13%Major Joint Local Government Bond 100,000,000 0.47% 25/3/2025 101,723,390 0.13%Major Joint Local Government Bond 100,000,000 0.21% 23/4/2027 101,013,607 0.13%Major Joint Local Government Bond 80,000,000 0.27% 25/10/2028 81,261,367 0.10%Major Joint Local Government Bond 80,000,000 0.18% 25/4/2028 80,723,066 0.10%Tokyo Metropolitan Government 70,000,000 1.29% 20/6/2035 79,719,134 0.10%Major Joint Local Government Bond 77,600,000 0.22% 25/10/2027 78,473,739 0.10%Major Joint Local Government Bond 70,000,000 0.12% 25/12/2029 70,184,473 0.09%Major Joint Local Government Bond 70,000,000 0.10% 25/2/2030 70,051,163 0.09%Major Joint Local Government Bond 60,000,000 0.84% 25/1/2023 60,789,295 0.08%Major Joint Local Government Bond 50,000,000 0.81% 25/9/2023 50,901,937 0.06%Tokyo Metropolitan Government 50,000,000 0.72% 20/12/2023 50,882,931 0.06%Major Joint Local Government Bond 50,000,000 0.87% 23/6/2023 50,857,427 0.06%Major Joint Local Government Bond 50,000,000 0.68% 25/10/2023 50,783,841 0.06%Major Joint Local Government Bond 50,000,000 1.00% 25/10/2021 50,160,190 0.06%Major Joint Local Government Bond 50,000,000 0.05% 25/9/2029 49,903,841 0.06%Major Joint Local Government Bond 50,000,000 0.03% 25/6/2029 49,853,667 0.06%Major Joint Local Government Bond 47,000,000 0.15% 24/9/2027 47,321,868 0.06%Major Joint Local Government Bond 40,000,000 0.80% 25/10/2022 40,421,772 0.05%Major Joint Local Government Bond 40,000,000 0.20% 25/3/2031 40,329,894 0.05%Tokyo Metropolitan Government 40,000,000 0.10% 20/9/2030 39,995,241 0.05%Major Joint Local Government Bond 35,000,000 0.91% 25/7/2023 35,655,454 0.04%Tokyo Metropolitan Government 33,600,000 0.44% 19/12/2025 34,256,230 0.04%Major Joint Local Government Bond 32,900,000 0.51% 25/9/2025 33,599,913 0.04%Osaka Prefecture 30,000,000 0.37% 28/9/2035 30,273,875 0.04%Major Joint Local Government Bond 30,000,000 0.77% 25/8/2022 30,266,002 0.04%Major Joint Local Government Bond 30,000,000 0.20% 25/4/2031 30,226,013 0.04%Tokyo Metropolitan Government 20,000,000 0.84% 20/6/2023 20,330,980 0.03%Major Joint Local Government Bond 20,000,000 0.21% 23/6/2028 20,217,957 0.03%Major Joint Local Government Bond 20,000,000 0.57% 25/4/2023 20,204,904 0.03%Major Joint Local Government Bond 20,000,000 0.19% 25/11/2027 20,188,529 0.03%

870
Vanguard Japan Government Bond Index Fund
Principal
Japanese Yen (¥) CouponMaturity
DateFair Value
Japanese Yen (¥)% of Total
Net AssetsMajor Joint Local Government Bond 20,000,000 1.01% 25/3/2022 20,148,986 0.03%Tokyo Metropolitan Government 20,000,000 0.96% 18/3/2022 20,138,259 0.03%Fukuoka Prefecture 20,000,000 0.43% 18/6/2049 18,639,174 0.02%Tokyo Metropolitan Government 15,000,000 0.76% 20/12/2022 15,167,291 0.02%Major Joint Local Government Bond 15,000,000 1.01% 25/2/2022 15,100,025 0.02%Osaka Prefecture 10,000,000 1.45% 26/9/2034 11,543,682 0.01%Tokyo Metropolitan Government 3,100,000 0.08% 18/9/2026 3,109,462 0.00%test test test test 2,298,296,516 2.87%Total Bonds 78,961,866,271 98.60%Financial Assets at Fair Value Through Profit or Loss 78,961,866,271 98.60%
testNumber of Contracts
Notional Amount
Unrealised Gain/(Loss)
Japanese Yen (¥)% of Total
Net AssetsFinancial Derivative InstrumentsFutures 0.00% (2020: (0.00%))AUS 10-Year Bond September 2021 1 ¥151,680,000 10,000 0.00 %test test test 10,000 0.00 %
CurrencyBuy
Amount Currency(Sell)
Amount CounterpartySettlement
Date
Unrealised Gain/(Loss)
Japanese Yen (¥)% of Total
Net AssetsHedge Share Class Level Forward Currency Exchange Contracts (0.79%) (2020: 0.75%)GBP 293,151,139 JPY (44,905,038,047) Toronto-Dominion Bank 3/8/2021 36,114,643 0.05 %JPY 205,260,639 GBP (1,326,243) BNP Paribas 2/7/2021 1,911,513 0.00 %JPY 157,600,515 GBP (1,016,830) BNP Paribas 2/7/2021 1,692,818 0.00 %USD 50,071 JPY (5,476,250) Toronto-Dominion Bank 2/7/2021 81,020 0.00 %JPY 1,069,341 GBP (6,906) BNP Paribas 2/7/2021 10,464 0.00 %JPY 681,968 GBP (4,402) JPMorgan Chase Bank 2/7/2021 7,022 0.00 %GBP 8,261 JPY (1,262,840) Morgan Stanley 2/7/2021 3,796 0.00 %JPY 604,495 GBP (3,923) BNP Paribas 2/7/2021 2,992 0.00 %JPY 140,337 GBP (905) BNP Paribas 2/7/2021 1,576 0.00 %GBP 795 JPY (120,987) Goldman Sachs International 2/7/2021 908 0.00 %EUR 99,154 JPY (13,056,286) UBS AG 3/8/2021 601 0.00 %USD 50,079 JPY (5,556,790) UBS AG 3/8/2021 134 0.00 %JPY 5,558,268 USD (50,079) UBS AG 2/7/2021 110 0.00 %JPY 5,083 EUR (38) Morgan Stanley 2/7/2021 81 0.00 %GBP 6,469 JPY (991,708) Morgan Stanley 3/8/2021 14 0.00 %USD 8 JPY (875) UBS AG 2/7/2021 13 0.00 %EUR 65 JPY (8,558) UBS AG 3/8/2021 1 0.00 %USD 61 JPY (6,768) UBS AG 3/8/2021 1 0.00 %GBP 258,312 JPY (39,600,262) BNP Paribas 3/8/2021 (78 ) (0.00 %)GBP 1,100 JPY (169,424) BNP Paribas 2/7/2021 (764 ) (0.00 %)JPY 13,050,951 EUR (99,154) UBS AG 2/7/2021 (780 ) (0.00 %)JPY 1,168,013 GBP (7,624) BNP Paribas 2/7/2021 (954 ) (0.00 %)GBP 2,274 JPY (349,663) BNP Paribas 2/7/2021 (997 ) (0.00 %)GBP 6,494 JPY (997,678) Morgan Stanley 2/7/2021 (1,971 ) (0.00 %)GBP 3,364 JPY (520,714) Morgan Stanley 2/7/2021 (4,921 ) (0.00 %)GBP 3,014 JPY (467,323) BNP Paribas 2/7/2021 (5,195 ) (0.00 %)GBP 3,136 JPY (486,819) Morgan Stanley 2/7/2021 (5,985 ) (0.00 %)GBP 4,449 JPY (691,722) BNP Paribas 2/7/2021 (9,569 ) (0.00 %)GBP 14,228 JPY (2,193,247) BNP Paribas 2/7/2021 (11,708 ) (0.00 %)GBP 5,995 JPY (934,608) Morgan Stanley 2/7/2021 (15,412 ) (0.00 %)GBP 9,814 JPY (1,525,655) BNP Paribas 2/7/2021 (20,902 ) (0.00 %)GBP 16,748 JPY (2,592,954) Morgan Stanley 2/7/2021 (25,030 ) (0.00 %)GBP 27,723 JPY (4,302,046) BNP Paribas 2/7/2021 (51,356 ) (0.00 %)GBP 37,142 JPY (5,767,205) JPMorgan Chase Bank 2/7/2021 (72,326 ) (0.00 %)GBP 43,387 JPY (6,745,728) BNP Paribas 2/7/2021 (93,320 ) (0.00 %)EUR 99,192 JPY (13,271,755) Toronto-Dominion Bank 2/7/2021 (215,022 ) (0.00 %)JPY 44,913,099,703 GBP (293,151,139) Toronto-Dominion Bank 2/7/2021 (34,943,689 ) (0.04 %)GBP 295,330,048 JPY (45,915,228,359) UBS AG 2/7/2021 (633,098,951 ) (0.80 %)test (628,751,223 ) (0.79 %)Total Financial Derivative Instruments (628,741,223 ) (0.79 %)
Fair Value Japanese Yen (¥)
% of Total Net Assets
Other Assets and Liabilities 1,747,179,643 2.19 %Net Assets 80,080,304,691 100.00 %

871
Vanguard Japan Government Bond Index Fund
Analysis of Total Net Assets Japanese Yen (¥)% of Total
Net Assets(a) Transferable securities admitted to an official stock exchange listing 72,826,041,039 90.94%(b) Transferable securities dealt in on another regulated market — 0.00%(c) Transferable securities other than those admitted to an official stock exchange listing or dealt in on another regulated
market 6,135,825,232 7.66%
(d) Financial derivative instruments (628,741,223) (0.79%)(e) Other assets and liabilities 1,747,179,643 2.19%Total Net Assets 80,080,304,691 100.00%
1 Denotes securities pledged in full or part thereof as collateral for derivatives.

The accompanying notes form an integral part of the financial statements.
872
Vanguard Japan Government Bond Index Fund
Statement of Assets and Liabilities
Japanese Yen (¥)
As at 30 June 2021
Japanese Yen (¥)
As at 31 December 2020
Current AssetsFinancial Assets at Fair Value Through Profit or Loss 78,961,866,271 75,898,037,867 Financial Derivative Instruments 39,837,707 687,109,398 Cash 691,428,117 431,939,824 Unrealised Appreciation on Spot Currency Contracts — 9,851 Receivables: Interest and Dividends 230,121,889 125,572,492 Capital Shares Issued 35,413,833 12,718,397 Investments Sold 1,965,577,217 1,392,205,348
Total Current Assets 81,924,245,034 78,547,593,177
Current LiabilitiesFinancial Derivative Instruments 668,578,930 109,165,097 Bank Overdraft 81,906 89,459 Unrealised Depreciation on Spot Currency Contracts 6,393 — Payables and Other Liabilities: Investments Purchased 1,148,800,711 1,673,540,465 Income Distribution Payable 6,500 10,916 Capital Shares Redeemed 19,207,785 119,408,995 Futures Margin Cash Due to Broker 581 40,242 Management Fees Payable 7,257,537 7,310,931
Total Current Liabilities 1,843,940,343 1,909,566,105
Net Assets Attributable to Holders of Redeemable Participating Shares (“Net Assets”) 80,080,304,691 76,638,027,072

873
Vanguard Japan Government Bond Index Fund
The accompanying notes form an integral part of the financial statements.
Net Asset Value Per Share
.As at
30 June 2021As at
31 December 2020As at
31 December 2019EUR Hedged Acc1
JPY (¥) Equivalent 6,564,509 — —Net Assets 49,874 — —Number of Shares Outstanding 500 — —Net Asset Value Per Share2 99.75 — —
Institutional Plus EUR Hedged Acc3
JPY (¥) Equivalent 6,488,950 6,253,398 6,113,070Net Assets 49,299 49,502 50,112Number of Shares Outstanding 500 500 500Net Asset Value Per Share2 98.60 99.00 100.22
GBP Hedged AccJPY (¥) Equivalent 44,945,930,940 43,476,019,669 33,348,561,304Net Assets 293,137,514 308,054,923 231,640,002Number of Shares Outstanding 2,540,468 2,666,714 1,993,910Net Asset Value Per Share2 115.39 115.52 116.17
Institutional Plus GBP Hedged Dist3
JPY (¥) Equivalent 13,630,793 24,776,850 7,218,782Net Assets 88,900 175,560 50,142Number of Shares Outstanding 894 1,763 500Net Asset Value Per Share2 99.44 99.58 100.28
JPY AccNet Assets 16,689,075,977 16,367,461,009 9,720,438,219Number of Shares Outstanding 1,011,270 989,414 581,586Net Asset Value Per Share2 16,503.09 16,542.58 16,713.67
Institutional Plus JPY AccNet Assets 13,640,860,752 12,618,322,960 11,047,185,519Number of Shares Outstanding 1,253,964 1,157,540 1,003,641Net Asset Value Per Share2 10,878.19 10,900.98 11,007.11
USD AccJPY (¥) Equivalent 4,772,190,224 4,140,016,402 2,417,222,556Net Assets 42,996,580 40,098,954 22,242,674Number of Shares Outstanding 367,298 317,881 183,701Net Asset Value Per Share2 117.06 126.14 121.08
Institutional Plus USD Hedged Acc4
JPY (¥) Equivalent 5,562,546 5,176,784 —Net Assets 50,118 50,141 —Number of Shares Outstanding 500 500 —Net Asset Value Per Share2 100.24 100.28 —
1 The share class was launched on 21 January 2021.2 The net asset value per share shown may diverge from the net asset value per share used for dealing purposes because of any adjustments for swing pricing and trade date accounting.3 The share class was launched on 11 December 2019.4 The share class was launched on 15 January 2020.

874
Vanguard Japan Government Bond Index Fund
The accompanying notes form an integral part of the financial statements.
Statement of Operations
Japanese Yen (¥)
Six Months Ended 30 June 2021
Japanese Yen (¥)
Six Months Ended 30 June 2020
Investment Income/(Loss) Interest Income 102,161,143 79,526,541 Net Gain/(Loss) on Financial Instruments 3,387,405,750 (3,303,354,306)
Total Investment Income/(Loss) 3,489,566,893 (3,223,827,765)
Expenses Management Fees 42,232,218 33,942,004 Transaction Fees and Commissions 61,739 34,346
Total Expenses 42,293,957 33,976,350
Finance Costs Interest Expense 500,798 692,081 Distribution Paid 15,547 6,642 Income Equalisation 2,527 —
Total Finance Costs 518,872 698,723
Net Investment Income/(Loss) 3,446,754,064 (3,258,502,838)
Foreign Withholding Tax (529,913) —
Net Increase/(Decrease) in Net Assets 3,446,224,151 (3,258,502,838)
Statement of Changes in Net Assets
Japanese Yen (¥)
Japanese Yen (¥)
Six Months Ended Six Months Ended30 June 2021 30 June 2020
Increase/(Decrease) in Net Assets
Net Increase/(Decrease) in Net Assets From Operations 3,446,224,151 (3,258,502,838)
Capital Transactions Subscriptions 12,833,113,002 24,639,958,135 Redemptions (12,837,066,400) (18,803,709,738) Reinvestments 6,866 4,172
Total Capital Transactions1 (3,946,532) 5,836,252,569
Total Increase/(Decrease) for the Period 3,442,277,619 2,577,749,731
Net AssetsBeginning of Period 76,638,027,072 61,029,044,997
End of Period 80,080,304,691 63,606,794,728
1 Capital Transactions include income equalisation adjustments as shown in the Statement of Operations.

Vanguard SRI Euro Investment Grade Bond Index FundManaged by Vanguard Global Advisers, LLC.
875
Investment ObjectiveThis fund seeks to provide returns consistent with the performance of the Bloomberg Barclays EUR Non-Government Float Adjusted Bond Index, a market-weighted index of euro-denominated investment-grade fixed income securities excluding euro zone treasury and euro zone government-related securities, with maturities greater than 1 year.
Performance SummaryThe Performance Summary does not form part of the Financial Statements.
• As the six months ended 30 June 2021 came to a close, macroeconomic indicators signalled a faster global economic rebound than many had expected after the sharpest contraction in modern history. Yet the recovery has been uneven. Countries that have contained the virus more successfully, whether through vaccinations, lockdowns or both, generally have fared better economically. And the COVID-19 pandemic remained far from over, with new variants of the virus surfacing where vaccination rates have lagged and the human toll continuing to mount, especially in less developed economies.
• Swift and extensive support from governments and central banks has been a key to the rebound. So far in 2021, it has included fiscal stimulus – including the $1.9 trillion American Rescue Plan in the United States and the €673 billion Recovery and Resilience Facility in Europe – and pledges by a number of central banks to keep interest rates low for some time.
• Stock markets worldwide continued the rally that began in 2020, bolstered by reopening economies, more consumer spending and rising corporate profits. They posted strong gains for the six months ended 30 June 2021.
• Fixed income securities struggled amid concerns that an upturn in inflation might persist or even accelerate given the stronger-than-expected rebound in global growth, extraordinary monetary and fiscal stimulus and a jump in demand for goods and services as economies reopened and supply gradually picked up. With longer-term yields rising and prices falling, returns were negative for the half year.
• In this environment, the fund’s benchmark index returned –1.11% for the six months.
• Corporate bonds, which accounted for well over half the index, performed a little better than the index as a whole. Noncorporate bonds underperformed while securitised debt was roughly in line with the performance of the index.
• Among the larger constituents in the index, France and Denmark held up relatively well but still finished in negative territory. Supranational bonds were a laggard.
• By maturity, longer-dated bonds significantly underperformed. From a credit-quality perspective, bonds on the bottom rung of the investment-grade credit ladder held up best.
Benchmark returns in the commentary above are in euros.
Benchmark: Bloomberg Barclays EUR Non-Government Float Adjusted Bond Index
Total ReturnsPeriods Ended 30 June 2021
(Annualised for periods over one year)
Six MonthsTen Years or
Since Inception1
EUR Acc -1.20 % 1.76 %
Benchmark -1.11 1.90
Tracking Difference* -0.09
Institutional Plus EUR Acc -1.18 % 1.49 %
Benchmark -1.11 1.62
Tracking Difference* -0.07
Sources: Vanguard Global Advisers, LLC, and Bloomberg.Performance is based on NAV with net income reinvested.
All of the returns in this report represent past performance, which is not a guarantee of future results that may be achieved by the fund. For performance data current to the most recent month-end, which may be higher or lower than that cited, visit our website at http://global.vanguard.com. Note, too, that both investment returns and principal value can fluctuate widely, so an investor's shares, when sold, could be worth more or less than their original cost.* The tracking difference between the fund return and the index return over a stated period of time can be attributed to a number of factors, including, without limitation, small differences in
weightings, trading activity, transaction costs and differences in the valuation and withholding tax treatment between the fund and the index vendor.1 Since-inception returns: EUR Acc, 18 July 2017; Institutional Plus EUR Acc, 14 December 2017.

Significant Portfolio ChangesFor the Six Months Ended 30 June 2021
876
Vanguard SRI Euro Investment Grade Bond Index Fund
The Central Bank of Ireland requires a schedule of material changes in the composition of the portfolio during the period. These are defined as aggregate purchases of a security exceeding 1% of the total value of purchases for the period and aggregate disposals greater than 1% of the total value of sales. At a minimum, the largest 20 purchases and 20 sales must be shown; all purchases and sales must be shown if there are fewer than 20. A full listing of the portfolio changes for the period is available, upon request, at no extra cost from the Administrator.
Principal Euro (€)
Cost Euro (€)
Purchases
European Union 0.00% 4/7/2031 2,050,000 2,039,788European Union 0.00% 4/3/2026 1,610,000 1,648,040European Financial Stability Facility
0.00% 19/4/2024 1,280,000 1,301,406European Union 0.00% 2/6/2028 1,220,000 1,254,462European Union 0.20% 4/6/2036 1,180,000 1,165,448European Investment Bank 0.00%
17/6/2027 1,000,000 1,022,440Credit Mutuel Home Loan SFH SA
0.13% 9/4/2025 1,000,000 1,021,480Credit Agricole Home Loan SFH SA
0.25% 23/2/2024 1,000,000 1,021,000European Union 0.25% 22/4/2036 880,000 868,127European Financial Stability Facility
0.88% 10/4/2035 750,000 829,544DZ HYP AG 0.01% 20/4/2029 800,000 806,655E.ON SE 0.00% 18/12/2023 800,000 805,000European Stability Mechanism
0.00% 15/12/2026 760,000 776,873European Investment Bank 0.00%
14/1/2031 760,000 775,735European Investment Bank 2.13%
15/1/2024 700,000 752,262Muenchener Hypothekenbank eG
0.50% 22/4/2026 700,000 729,760European Union 0.00% 4/11/2025 700,000 720,598Caisse de Refinancement de
l'Habitat SA 0.01% 7/2/2028 700,000 709,065European Stability Mechanism
0.00% 10/2/2023 700,000 707,887European Union 0.45% 2/5/2046 695,000 690,964
Principal Euro (€)
Proceeds Euro (€)
Sales
European Union 0.00% 4/3/2026 1,000,000 1,018,673European Stability Mechanism
0.00% 17/1/2022 600,000 602,808European Financial Stability Facility
0.00% 13/10/2027 500,000 509,895European Investment Bank 0.38%
15/3/2022 500,000 503,550AT&T, Inc. 1.60% 19/5/2028 400,000 431,032Caisse de Refinancement de
l'Habitat SA 4.00% 17/6/2022 400,000 417,504Banco Santander SA 1.38%
14/12/2022 400,000 409,916Cooperatieve Rabobank UA 0.63%
27/2/2024 400,000 408,520European Financial Stability Facility
0.70% 20/1/2050 400,000 406,633DZ HYP AG 0.25% 30/6/2023 400,000 405,948Credit Suisse Group Funding
Guernsey Ltd. 1.25% 14/4/2022 400,000 405,384FCA Bank SpA 0.63% 24/11/2022 400,000 404,240Deutsche Pfandbriefbank AG 0.20%
1/3/2022 400,000 402,692SpareBank 1 Boligkreditt AS 0.05%
25/1/2022 400,000 402,440European Stability Mechanism
0.01% 4/3/2030 400,000 402,416Equinor A.S.A 1.38% 22/5/2032 300,000 330,771Talanx Finanz Luxembourg SA 8.37%
15/6/2042 300,000 324,045Harley-Davidson Financial Services,
Inc. 3.88% 19/5/2023 300,000 321,918ABN AMRO Bank NV 3.50%
18/1/2022 300,000 311,832Orange SA 1.13% 15/7/2024 300,000 311,133
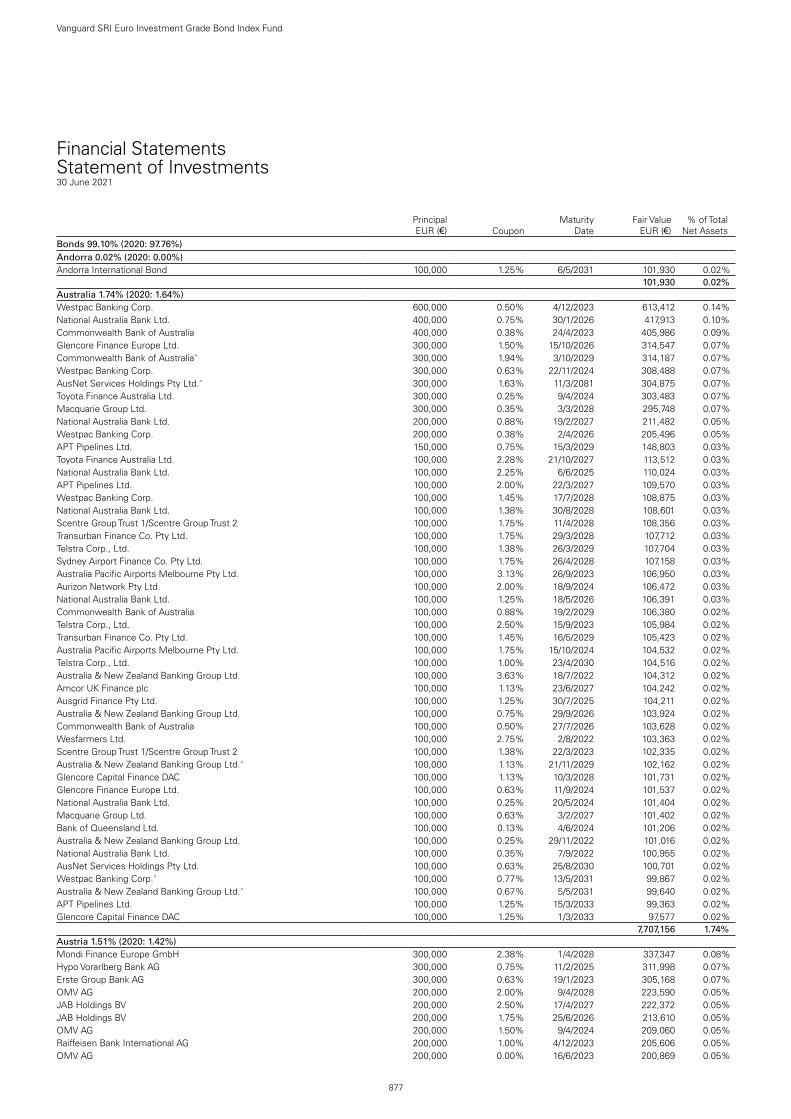
877
Vanguard SRI Euro Investment Grade Bond Index Fund
Financial StatementsStatement of Investments30 June 2021
Principal EUR (€) Coupon
Maturity Date
Fair Value EUR (€)
% of Total Net Assets
Bonds 99.10% (2020: 97.76%)Andorra 0.02% (2020: 0.00%)Andorra International Bond 100,000 1.25% 6/5/2031 101,930 0.02%test - - - 101,930 0.02%Australia 1.74% (2020: 1.64%)Westpac Banking Corp. 600,000 0.50% 4/12/2023 613,412 0.14%National Australia Bank Ltd. 400,000 0.75% 30/1/2026 417,913 0.10%Commonwealth Bank of Australia 400,000 0.38% 24/4/2023 405,986 0.09%Glencore Finance Europe Ltd. 300,000 1.50% 15/10/2026 314,547 0.07%Commonwealth Bank of Australia^ 300,000 1.94% 3/10/2029 314,187 0.07%Westpac Banking Corp. 300,000 0.63% 22/11/2024 308,488 0.07%AusNet Services Holdings Pty Ltd.^ 300,000 1.63% 11/3/2081 304,875 0.07%Toyota Finance Australia Ltd. 300,000 0.25% 9/4/2024 303,483 0.07%Macquarie Group Ltd. 300,000 0.35% 3/3/2028 295,748 0.07%National Australia Bank Ltd. 200,000 0.88% 19/2/2027 211,482 0.05%Westpac Banking Corp. 200,000 0.38% 2/4/2026 205,496 0.05%APT Pipelines Ltd. 150,000 0.75% 15/3/2029 148,803 0.03%Toyota Finance Australia Ltd. 100,000 2.28% 21/10/2027 113,512 0.03%National Australia Bank Ltd. 100,000 2.25% 6/6/2025 110,024 0.03%APT Pipelines Ltd. 100,000 2.00% 22/3/2027 109,570 0.03%Westpac Banking Corp. 100,000 1.45% 17/7/2028 108,875 0.03%National Australia Bank Ltd. 100,000 1.38% 30/8/2028 108,601 0.03%Scentre Group Trust 1/Scentre Group Trust 2 100,000 1.75% 11/4/2028 108,356 0.03%Transurban Finance Co. Pty Ltd. 100,000 1.75% 29/3/2028 107,712 0.03%Telstra Corp., Ltd. 100,000 1.38% 26/3/2029 107,704 0.03%Sydney Airport Finance Co. Pty Ltd. 100,000 1.75% 26/4/2028 107,158 0.03%Australia Pacific Airports Melbourne Pty Ltd. 100,000 3.13% 26/9/2023 106,950 0.03%Aurizon Network Pty Ltd. 100,000 2.00% 18/9/2024 106,472 0.03%National Australia Bank Ltd. 100,000 1.25% 18/5/2026 106,391 0.03%Commonwealth Bank of Australia 100,000 0.88% 19/2/2029 106,380 0.02%Telstra Corp., Ltd. 100,000 2.50% 15/9/2023 105,984 0.02%Transurban Finance Co. Pty Ltd. 100,000 1.45% 16/5/2029 105,423 0.02%Australia Pacific Airports Melbourne Pty Ltd. 100,000 1.75% 15/10/2024 104,532 0.02%Telstra Corp., Ltd. 100,000 1.00% 23/4/2030 104,516 0.02%Australia & New Zealand Banking Group Ltd. 100,000 3.63% 18/7/2022 104,312 0.02%Amcor UK Finance plc 100,000 1.13% 23/6/2027 104,242 0.02%Ausgrid Finance Pty Ltd. 100,000 1.25% 30/7/2025 104,211 0.02%Australia & New Zealand Banking Group Ltd. 100,000 0.75% 29/9/2026 103,924 0.02%Commonwealth Bank of Australia 100,000 0.50% 27/7/2026 103,628 0.02%Wesfarmers Ltd. 100,000 2.75% 2/8/2022 103,363 0.02%Scentre Group Trust 1/Scentre Group Trust 2 100,000 1.38% 22/3/2023 102,335 0.02%Australia & New Zealand Banking Group Ltd.^ 100,000 1.13% 21/11/2029 102,162 0.02%Glencore Capital Finance DAC 100,000 1.13% 10/3/2028 101,731 0.02%Glencore Finance Europe Ltd. 100,000 0.63% 11/9/2024 101,537 0.02%National Australia Bank Ltd. 100,000 0.25% 20/5/2024 101,404 0.02%Macquarie Group Ltd. 100,000 0.63% 3/2/2027 101,402 0.02%Bank of Queensland Ltd. 100,000 0.13% 4/6/2024 101,206 0.02%Australia & New Zealand Banking Group Ltd. 100,000 0.25% 29/11/2022 101,016 0.02%National Australia Bank Ltd. 100,000 0.35% 7/9/2022 100,955 0.02%AusNet Services Holdings Pty Ltd. 100,000 0.63% 25/8/2030 100,701 0.02%Westpac Banking Corp.^ 100,000 0.77% 13/5/2031 99,867 0.02%Australia & New Zealand Banking Group Ltd.^ 100,000 0.67% 5/5/2031 99,640 0.02%APT Pipelines Ltd. 100,000 1.25% 15/3/2033 99,363 0.02%Glencore Capital Finance DAC 100,000 1.25% 1/3/2033 97,577 0.02%test - - - 7,707,156 1.74%Austria 1.51% (2020: 1.42%)Mondi Finance Europe GmbH 300,000 2.38% 1/4/2028 337,347 0.08%Hypo Vorarlberg Bank AG 300,000 0.75% 11/2/2025 311,998 0.07%Erste Group Bank AG 300,000 0.63% 19/1/2023 305,168 0.07%OMV AG 200,000 2.00% 9/4/2028 223,590 0.05%JAB Holdings BV 200,000 2.50% 17/4/2027 222,372 0.05%JAB Holdings BV 200,000 1.75% 25/6/2026 213,610 0.05%OMV AG 200,000 1.50% 9/4/2024 209,060 0.05%Raiffeisen Bank International AG 200,000 1.00% 4/12/2023 205,606 0.05%OMV AG 200,000 0.00% 16/6/2023 200,869 0.05%

878
Vanguard SRI Euro Investment Grade Bond Index Fund
Principal EUR (€) Coupon
Maturity Date
Fair Value EUR (€)
% of Total Net Assets
BAWAG PSK Bank fuer Arbeit und Wirtschaft und Oesterreichische Postsparkasse AG 200,000 0.01% 23/9/2030 198,937 0.05%
Raiffeisenlandesbank Niederoesterreich-Wien AG 160,000 2.13% 12/9/2022 165,059 0.04%OMV AG 150,000 1.00% 3/7/2034 151,775 0.04%OMV AG 150,000 0.00% 3/7/2025 150,280 0.04%UNIQA Insurance Group AG^ 100,000 6.00% 27/7/2046 124,277 0.03%JAB Holdings BV 100,000 3.38% 17/4/2035 122,997 0.03%OMV AG 100,000 2.38% 9/4/2032 117,878 0.03%Raiffeisen-Landesbank Steiermark AG 100,000 1.38% 11/5/2033 113,128 0.03%JAB Holdings BV 100,000 2.50% 25/6/2029 112,747 0.03%Erste Group Bank AG 100,000 0.88% 15/5/2034 107,536 0.03%Telekom Finanzmanagement GmbH 100,000 3.50% 4/7/2023 107,417 0.03%Borealis AG 100,000 1.75% 10/12/2025 107,006 0.03%UNIQA Insurance Group AG 100,000 1.38% 9/7/2030 106,860 0.03%Raiffeisenlandesbank Niederoesterreich-Wien AG 100,000 0.88% 24/1/2028 106,555 0.03%OMV AG^ 100,000 2.88% Perpetual 105,593 0.02%UniCredit Bank Austria AG 100,000 0.63% 20/3/2029 105,226 0.02%JAB Holdings BV 100,000 2.25% 19/12/2039 105,075 0.02%Erste Group Bank AG 100,000 0.63% 18/1/2027 104,746 0.02%OMV AG^ 100,000 2.50% Perpetual 104,636 0.02%Erste Group Bank AG 100,000 0.63% 17/4/2026 104,361 0.02%Erste Group Bank AG 100,000 0.88% 13/5/2027 104,319 0.02%OMV AG^ 100,000 2.88% Perpetual 104,163 0.02%UniCredit Bank Austria AG 100,000 0.63% 16/1/2026 104,159 0.02%Erste Group Bank AG 100,000 0.88% 22/5/2026 104,125 0.02%UniCredit Bank Austria AG 100,000 0.75% 25/2/2025 104,064 0.02%JAB Holdings BV 100,000 1.25% 22/5/2024 103,578 0.02%Erste Group Bank AG^ 100,000 1.63% 8/9/2031 103,533 0.02%Hypo Vorarlberg Bank AG 100,000 0.25% 21/5/2027 102,341 0.02%Raiffeisen-Landesbank Steiermark AG 100,000 0.63% 20/1/2023 101,700 0.02%Raiffeisen Bank International AG 100,000 0.38% 25/9/2026 101,610 0.02%UniCredit Bank Austria AG 100,000 0.75% 8/9/2022 101,485 0.02%Raiffeisen Bank International AG 100,000 0.25% 22/1/2025 101,008 0.02%BAWAG PSK Bank fuer Arbeit und Wirtschaft und Oesterreichische
Postsparkasse AG 100,000 0.01% 21/1/2028 100,942 0.02%Raiffeisen Bank International AG 100,000 0.13% 3/12/2029 100,848 0.02%Volksbank Wien AG 100,000 0.13% 19/11/2029 100,819 0.02%Raiffeisenlandesbank Niederoesterreich-Wien AG 100,000 0.38% 15/1/2035 100,542 0.02%Erste Group Bank AG 100,000 0.05% 16/9/2025 100,443 0.02%Vienna Insurance Group AG Wiener Versicherung Gruppe 100,000 1.00% 26/3/2036 100,381 0.02%Erste Group Bank AG 100,000 0.01% 11/9/2029 100,228 0.02%BAWAG PSK Bank fuer Arbeit und Wirtschaft und Oesterreichische
Postsparkasse AG 100,000 0.38% 3/9/2027 98,864 0.02%test - - - 6,690,861 1.51%Belgium 1.55% (2020: 1.58%)Anheuser-Busch InBev SA 400,000 2.75% 17/3/2036 484,433 0.11%ING Belgium SA 400,000 0.01% 20/2/2030 399,666 0.09%Anheuser-Busch InBev SA 300,000 2.88% 2/4/2032 364,649 0.08%Anheuser-Busch InBev SA 300,000 1.15% 22/1/2027 316,907 0.07%Euroclear Bank SA 300,000 0.13% 7/7/2025 302,046 0.07%Anheuser-Busch InBev SA 200,000 2.13% 2/12/2027 223,852 0.05%Elia Transmission Belgium SA 200,000 1.38% 14/1/2026 211,867 0.05%Anheuser-Busch InBev SA 200,000 1.13% 1/7/2027 211,392 0.05%BNP Paribas Fortis SA 200,000 0.63% 4/10/2025 207,882 0.05%Belfius Bank SA 200,000 0.75% 12/9/2022 202,571 0.05%KBC Bank NV 200,000 0.38% 1/9/2022 202,098 0.05%Belfius Bank SA 200,000 0.13% 8/2/2028 198,257 0.05%KBC Group NV^ 200,000 0.13% 14/1/2029 195,566 0.05%Groupe Bruxelles Lambert SA 200,000 0.13% 28/1/2031 193,902 0.05%Anheuser-Busch InBev SA 150,000 2.70% 31/3/2026 169,246 0.04%Anheuser-Busch InBev SA 100,000 3.70% 2/4/2040 135,804 0.03%Ethias SA 100,000 5.00% 14/1/2026 117,307 0.03%Belfius Bank SA 100,000 3.13% 11/5/2026 112,902 0.03%Anheuser-Busch InBev SA 100,000 2.00% 17/3/2028 111,683 0.03%Anheuser-Busch InBev SA 100,000 2.00% 23/1/2035 111,623 0.03%Euroclear Investments SA^ 100,000 2.63% 11/4/2048 109,892 0.03%Anheuser-Busch InBev SA 100,000 1.65% 28/3/2031 109,558 0.03%BNP Paribas Fortis SA 100,000 0.88% 22/3/2028 106,663 0.03%ING Belgium SA 100,000 0.75% 28/9/2026 105,274 0.02%Elia Group SA^ 100,000 2.75% Perpetual 105,263 0.02%KBC Group NV 100,000 1.13% 25/1/2024 103,336 0.02%Belfius Bank SA 100,000 1.00% 26/10/2024 103,225 0.02%
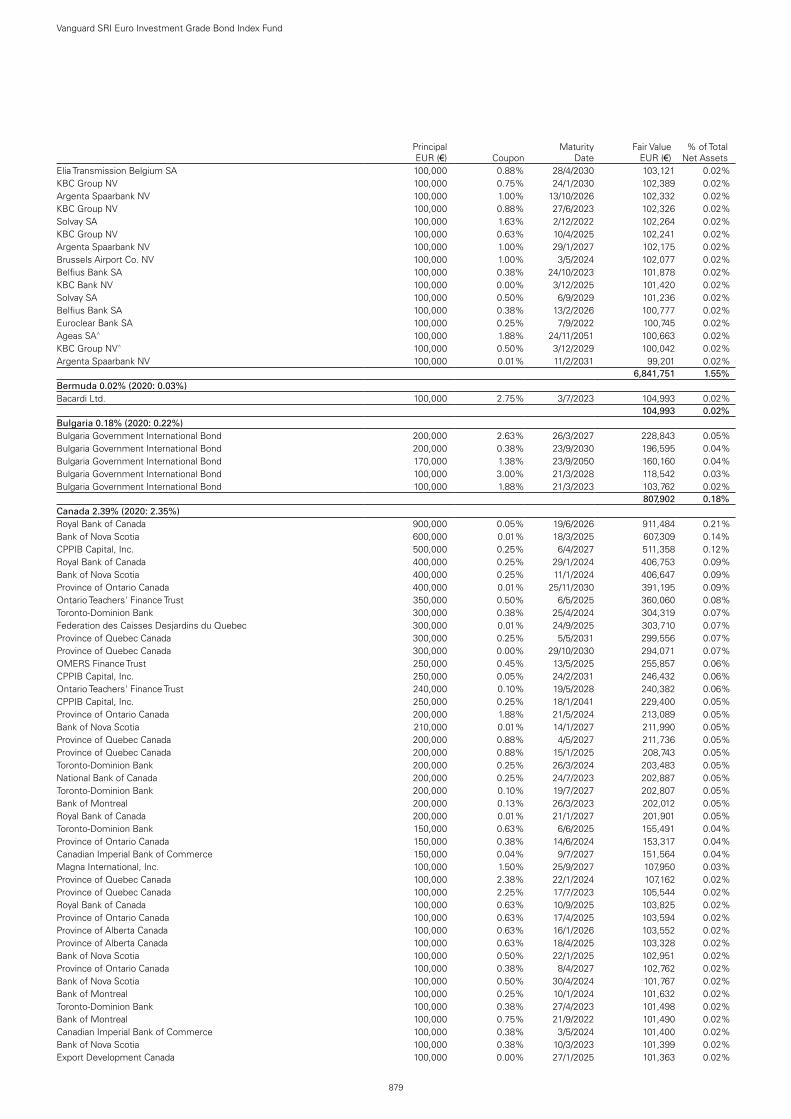
879
Vanguard SRI Euro Investment Grade Bond Index Fund
Principal EUR (€) Coupon
Maturity Date
Fair Value EUR (€)
% of Total Net Assets
Elia Transmission Belgium SA 100,000 0.88% 28/4/2030 103,121 0.02%KBC Group NV 100,000 0.75% 24/1/2030 102,389 0.02%Argenta Spaarbank NV 100,000 1.00% 13/10/2026 102,332 0.02%KBC Group NV 100,000 0.88% 27/6/2023 102,326 0.02%Solvay SA 100,000 1.63% 2/12/2022 102,264 0.02%KBC Group NV 100,000 0.63% 10/4/2025 102,241 0.02%Argenta Spaarbank NV 100,000 1.00% 29/1/2027 102,175 0.02%Brussels Airport Co. NV 100,000 1.00% 3/5/2024 102,077 0.02%Belfius Bank SA 100,000 0.38% 24/10/2023 101,878 0.02%KBC Bank NV 100,000 0.00% 3/12/2025 101,420 0.02%Solvay SA 100,000 0.50% 6/9/2029 101,236 0.02%Belfius Bank SA 100,000 0.38% 13/2/2026 100,777 0.02%Euroclear Bank SA 100,000 0.25% 7/9/2022 100,745 0.02%Ageas SA^ 100,000 1.88% 24/11/2051 100,663 0.02%KBC Group NV^ 100,000 0.50% 3/12/2029 100,042 0.02%Argenta Spaarbank NV 100,000 0.01% 11/2/2031 99,201 0.02%test - - - 6,841,751 1.55%Bermuda 0.02% (2020: 0.03%)Bacardi Ltd. 100,000 2.75% 3/7/2023 104,993 0.02%test - - - 104,993 0.02%Bulgaria 0.18% (2020: 0.22%)Bulgaria Government International Bond 200,000 2.63% 26/3/2027 228,843 0.05%Bulgaria Government International Bond 200,000 0.38% 23/9/2030 196,595 0.04%Bulgaria Government International Bond 170,000 1.38% 23/9/2050 160,160 0.04%Bulgaria Government International Bond 100,000 3.00% 21/3/2028 118,542 0.03%Bulgaria Government International Bond 100,000 1.88% 21/3/2023 103,762 0.02%test - - - 807,902 0.18%Canada 2.39% (2020: 2.35%)Royal Bank of Canada 900,000 0.05% 19/6/2026 911,484 0.21%Bank of Nova Scotia 600,000 0.01% 18/3/2025 607,309 0.14%CPPIB Capital, Inc. 500,000 0.25% 6/4/2027 511,358 0.12%Royal Bank of Canada 400,000 0.25% 29/1/2024 406,753 0.09%Bank of Nova Scotia 400,000 0.25% 11/1/2024 406,647 0.09%Province of Ontario Canada 400,000 0.01% 25/11/2030 391,195 0.09%Ontario Teachers' Finance Trust 350,000 0.50% 6/5/2025 360,060 0.08%Toronto-Dominion Bank 300,000 0.38% 25/4/2024 304,319 0.07%Federation des Caisses Desjardins du Quebec 300,000 0.01% 24/9/2025 303,710 0.07%Province of Quebec Canada 300,000 0.25% 5/5/2031 299,556 0.07%Province of Quebec Canada 300,000 0.00% 29/10/2030 294,071 0.07%OMERS Finance Trust 250,000 0.45% 13/5/2025 255,857 0.06%CPPIB Capital, Inc. 250,000 0.05% 24/2/2031 246,432 0.06%Ontario Teachers' Finance Trust 240,000 0.10% 19/5/2028 240,382 0.06%CPPIB Capital, Inc. 250,000 0.25% 18/1/2041 229,400 0.05%Province of Ontario Canada 200,000 1.88% 21/5/2024 213,089 0.05%Bank of Nova Scotia 210,000 0.01% 14/1/2027 211,990 0.05%Province of Quebec Canada 200,000 0.88% 4/5/2027 211,736 0.05%Province of Quebec Canada 200,000 0.88% 15/1/2025 208,743 0.05%Toronto-Dominion Bank 200,000 0.25% 26/3/2024 203,483 0.05%National Bank of Canada 200,000 0.25% 24/7/2023 202,887 0.05%Toronto-Dominion Bank 200,000 0.10% 19/7/2027 202,807 0.05%Bank of Montreal 200,000 0.13% 26/3/2023 202,012 0.05%Royal Bank of Canada 200,000 0.01% 21/1/2027 201,901 0.05%Toronto-Dominion Bank 150,000 0.63% 6/6/2025 155,491 0.04%Province of Ontario Canada 150,000 0.38% 14/6/2024 153,317 0.04%Canadian Imperial Bank of Commerce 150,000 0.04% 9/7/2027 151,564 0.04%Magna International, Inc. 100,000 1.50% 25/9/2027 107,950 0.03%Province of Quebec Canada 100,000 2.38% 22/1/2024 107,162 0.02%Province of Quebec Canada 100,000 2.25% 17/7/2023 105,544 0.02%Royal Bank of Canada 100,000 0.63% 10/9/2025 103,825 0.02%Province of Ontario Canada 100,000 0.63% 17/4/2025 103,594 0.02%Province of Alberta Canada 100,000 0.63% 16/1/2026 103,552 0.02%Province of Alberta Canada 100,000 0.63% 18/4/2025 103,328 0.02%Bank of Nova Scotia 100,000 0.50% 22/1/2025 102,951 0.02%Province of Ontario Canada 100,000 0.38% 8/4/2027 102,762 0.02%Bank of Nova Scotia 100,000 0.50% 30/4/2024 101,767 0.02%Bank of Montreal 100,000 0.25% 10/1/2024 101,632 0.02%Toronto-Dominion Bank 100,000 0.38% 27/4/2023 101,498 0.02%Bank of Montreal 100,000 0.75% 21/9/2022 101,490 0.02%Canadian Imperial Bank of Commerce 100,000 0.38% 3/5/2024 101,400 0.02%Bank of Nova Scotia 100,000 0.38% 10/3/2023 101,399 0.02%Export Development Canada 100,000 0.00% 27/1/2025 101,363 0.02%

880
Vanguard SRI Euro Investment Grade Bond Index Fund
Principal EUR (€) Coupon
Maturity Date
Fair Value EUR (€)
% of Total Net Assets
Royal Bank of Canada 100,000 0.25% 2/5/2024 101,121 0.02%Toronto-Dominion Bank 100,000 0.25% 12/1/2023 101,098 0.02%Toronto-Dominion Bank 100,000 0.00% 9/2/2024 101,020 0.02%Federation des Caisses Desjardins du Quebec 100,000 0.05% 26/11/2027 100,984 0.02%Bank of Nova Scotia 100,000 0.25% 28/9/2022 100,908 0.02%Canadian Imperial Bank of Commerce 100,000 0.00% 25/7/2022 100,512 0.02%Province of Quebec Canada 100,000 0.00% 15/10/2029 98,993 0.02%Ontario Teachers' Finance Trust 100,000 0.05% 25/11/2030 97,880 0.02%test - - - 10,541,286 2.39%Chile 0.27% (2020: 0.25%)Chile Government International Bond 500,000 0.83% 2/7/2031 506,697 0.12%Chile Government International Bond 200,000 1.63% 30/1/2025 211,438 0.05%Chile Government International Bond 150,000 1.75% 20/1/2026 161,451 0.04%Corp. Nacional del Cobre de Chile 100,000 2.25% 9/7/2024 106,248 0.02%Chile Government International Bond 100,000 1.25% 29/1/2040 98,020 0.02%Chile Government International Bond 100,000 1.25% 22/1/2051 89,364 0.02%test - - - 1,173,218 0.27%China 0.53% (2020: 0.69%)China Government International Bond 470,000 0.13% 12/11/2026 471,395 0.11%Export-Import Bank of China 200,000 0.75% 28/5/2023 203,035 0.05%China Development Bank 200,000 0.63% 12/12/2022 201,902 0.05%China Government International Bond 200,000 0.50% 12/11/2031 199,162 0.05%China Government International Bond 200,000 0.25% 25/11/2030 196,176 0.05%China Government International Bond 200,000 0.63% 25/11/2035 194,729 0.04%China Government International Bond 150,000 0.00% 25/11/2025 150,315 0.03%State Grid Overseas Investment 2016 Ltd. 100,000 2.13% 2/5/2030 109,124 0.03%Lunar Funding V for Swisscom AG 100,000 1.13% 12/10/2026 105,701 0.02%State Grid Overseas Investment 2016 Ltd. 100,000 1.30% 5/8/2032 103,894 0.02%Prosus NV 100,000 1.54% 3/8/2028 103,533 0.02%Prosus NV 100,000 2.03% 3/8/2032 102,840 0.02%State Grid Overseas Investment 2016 Ltd. 100,000 0.80% 5/8/2026 102,064 0.02%China Government International Bond 100,000 1.00% 12/11/2039 97,999 0.02%test - - - 2,341,869 0.53%Colombia 0.03% (2020: 0.03%)Colombia Government International Bond 100,000 3.88% 22/3/2026 111,614 0.03%test - - - 111,614 0.03%Croatia 0.32% (2020: 0.30%)Croatia Government International Bond 450,000 3.00% 11/3/2025 499,699 0.11%Croatia Government International Bond 310,000 1.50% 17/6/2031 323,064 0.07%Croatia Government International Bond 300,000 1.13% 19/6/2029 308,465 0.07%Croatia Government International Bond 200,000 1.13% 4/3/2033 198,778 0.05%Croatia Government International Bond 100,000 1.75% 4/3/2041 101,270 0.02%test - - - 1,431,276 0.32%Czech Republic 0.15% (2020: 0.17%)EP Infrastructure A.S. 125,000 1.82% 2/3/2031 126,895 0.03%CEZ A.S. 100,000 3.00% 5/6/2028 115,976 0.03%EP Infrastructure A.S. 100,000 1.70% 30/7/2026 104,089 0.03%CPI Property Group SA 100,000 1.63% 23/4/2027 102,877 0.02%CEZ A.S. 100,000 0.88% 2/12/2026 102,474 0.02%CPI Property Group SA 100,000 1.50% 27/1/2031 97,529 0.02%test - - - 649,840 0.15%Denmark 1.21% (2020: 1.28%)AP Moller-Maersk A/S 600,000 1.75% 16/3/2026 644,578 0.15%Nykredit Realkredit A/S 300,000 0.63% 17/1/2025 306,182 0.07%Carlsberg Breweries A/S 300,000 0.50% 6/9/2023 304,047 0.07%Orsted A/S 220,000 1.50% 26/11/2029 240,346 0.06%Danske Bank A/S^ 200,000 1.38% 12/2/2030 203,858 0.05%Danske Bank A/S 200,000 1.38% 24/5/2022 203,012 0.05%Nykredit Realkredit A/S 200,000 0.25% 13/1/2026 200,123 0.05%Kommunekredit 200,000 0.01% 4/5/2034 191,763 0.04%Carlsberg Breweries A/S 100,000 2.50% 28/5/2024 107,038 0.03%ISS Global A/S 100,000 2.13% 2/12/2024 106,220 0.03%Kommunekredit 100,000 0.75% 18/5/2027 105,711 0.03%Kommunekredit 100,000 0.63% 11/5/2026 104,477 0.03%Jyske Bank A/S^ 100,000 2.25% 5/4/2029 104,308 0.03%Nykredit Realkredit A/S^ 100,000 2.75% 17/11/2027 103,666 0.03%Orsted A/S 100,000 2.63% 19/9/2022 103,614 0.03%Kommunekredit 100,000 0.50% 24/1/2025 103,228 0.02%Sydbank A/S 100,000 1.38% 18/9/2023 103,087 0.02%Jyske Realkredit A/S 100,000 0.38% 1/4/2025 102,615 0.02%Orsted A/S^ 100,000 1.75% 9/12/3019 102,603 0.02%

881
Vanguard SRI Euro Investment Grade Bond Index Fund
Principal EUR (€) Coupon
Maturity Date
Fair Value EUR (€)
% of Total Net Assets
Danske Bank A/S 100,000 0.63% 26/5/2025 102,343 0.02%Nykredit Realkredit A/S 100,000 0.75% 20/1/2027 101,948 0.02%Danske Bank A/S 100,000 0.75% 2/6/2023 101,873 0.02%Kommunekredit 100,000 0.25% 15/5/2023 101,443 0.02%Jyske Realkredit A/S 100,000 0.25% 1/7/2023 101,407 0.02%Jyske Bank A/S^ 100,000 0.63% 20/6/2024 101,395 0.02%Kommunekredit 100,000 0.25% 29/3/2023 101,363 0.02%Kommunekredit 100,000 0.13% 28/8/2023 101,341 0.02%ISS Global A/S 100,000 0.88% 18/6/2026 101,193 0.02%Carlsberg Breweries A/S 100,000 0.38% 30/6/2027 101,130 0.02%Danske Mortgage Bank plc 100,000 0.01% 14/1/2028 101,064 0.02%Danske Bank A/S^ 100,000 0.50% 27/8/2025 101,035 0.02%Carlsberg Breweries A/S 100,000 0.63% 9/3/2030 100,866 0.02%Danske Bank A/S 100,000 0.25% 28/11/2022 100,815 0.02%Nykredit Realkredit A/S 100,000 0.25% 20/1/2023 100,740 0.02%Danske Bank A/S^ 100,000 1.00% 15/5/2031 100,101 0.02%Kommunekredit 100,000 0.00% 27/8/2030 99,176 0.02%Kommunekredit 100,000 0.00% 3/3/2031 98,909 0.02%Kommunekredit 100,000 0.13% 26/9/2040 91,209 0.02%Orsted A/S^ 10,000 6.25% 26/6/3013 11,191 0.00%test - - - 5,361,018 1.21%Estonia 0.02% (2020: 0.03%)Luminor Bank A/S 100,000 0.79% 3/12/2024 101,179 0.02%test - - - 101,179 0.02%Finland 1.40% (2020: 1.42%)OP Mortgage Bank 500,000 0.05% 22/2/2023 504,702 0.11%Nordea Bank Abp 300,000 3.25% 5/7/2022 311,357 0.07%Nordea Bank Abp 300,000 0.88% 26/6/2023 306,548 0.07%Oma Saastopankki OYJ 300,000 0.13% 3/4/2024 304,203 0.07%Nordea Kiinnitysluottopankki OYJ 300,000 0.25% 28/2/2023 303,812 0.07%OP Corporate Bank plc 300,000 0.13% 1/7/2024 302,873 0.07%OP Mortgage Bank 300,000 0.01% 19/11/2030 298,979 0.07%Sampo OYJ^ 200,000 2.50% 3/9/2052 212,143 0.05%Nordea Kiinnitysluottopankki OYJ 200,000 0.25% 18/3/2026 205,271 0.05%OP Mortgage Bank 200,000 0.25% 13/3/2024 203,903 0.05%OP Corporate Bank plc 200,000 0.38% 26/2/2024 203,444 0.05%OP Corporate Bank plc 200,000 0.60% 18/1/2027 203,341 0.05%Oma Saastopankki OYJ 200,000 0.13% 12/12/2022 201,724 0.05%OP Corporate Bank plc 200,000 0.25% 24/3/2026 200,536 0.05%Nordea Bank Abp^ 200,000 0.63% 18/8/2031 199,571 0.05%OP Corporate Bank plc 200,000 0.10% 16/11/2027 199,193 0.05%OP Corporate Bank plc^ 150,000 1.63% 9/6/2030 155,243 0.04%Sampo OYJ 100,000 2.25% 27/9/2030 116,767 0.03%Stora Enso OYJ 100,000 2.50% 21/3/2028 113,044 0.03%Kojamo OYJ 100,000 1.88% 27/5/2027 107,046 0.02%Citycon Treasury BV 100,000 2.50% 1/10/2024 105,632 0.02%OP Mortgage Bank 100,000 0.63% 15/2/2029 105,514 0.02%Aktia Bank OYJ 100,000 0.38% 5/3/2026 103,243 0.02%Nordea Bank Abp 100,000 0.50% 14/5/2027 102,540 0.02%Nordea Bank Abp 100,000 0.38% 28/5/2026 102,223 0.02%Nordea Kiinnitysluottopankki OYJ 100,000 0.13% 18/6/2027 102,092 0.02%Danske Mortgage Bank plc 100,000 0.38% 21/11/2023 101,998 0.02%Nordea Kiinnitysluottopankki OYJ 100,000 0.25% 21/11/2023 101,753 0.02%Nordea Kiinnitysluottopankki OYJ 100,000 0.63% 19/10/2022 101,510 0.02%OP Corporate Bank plc 100,000 0.38% 19/6/2024 101,266 0.02%SP-Kiinnitysluottopankki OYJ 100,000 0.13% 24/10/2022 100,814 0.02%Citycon Treasury BV 100,000 1.63% 12/3/2028 100,298 0.02%Elenia Verkko OYJ 100,000 0.38% 6/2/2027 100,294 0.02%OP Corporate Bank plc 100,000 0.38% 16/6/2028 99,351 0.02%Transmission Finance DAC 100,000 0.38% 18/6/2028 99,129 0.02%test - - - 6,181,357 1.40%France 16.43% (2020: 17.31%)Credit Mutuel Home Loan SFH SA 1,100,000 0.13% 9/4/2025 1,119,653 0.25%Credit Agricole Home Loan SFH SA 1,000,000 0.25% 23/2/2024 1,018,203 0.23%Caisse de Refinancement de l'Habitat SA 700,000 0.01% 7/2/2028 706,126 0.16%Caisse de Refinancement de l'Habitat SA 600,000 3.90% 20/10/2023 660,624 0.15%BPCE SA 600,000 0.63% 26/9/2023 612,557 0.14%Caisse Francaise de Financement Local 600,000 0.63% 26/1/2023 610,497 0.14%Suez SA 500,000 1.25% 2/4/2027 530,442 0.12%BPCE SA^ 500,000 2.75% 30/11/2027 519,070 0.12%BPCE SFH SA 500,000 0.38% 21/2/2024 510,682 0.12%
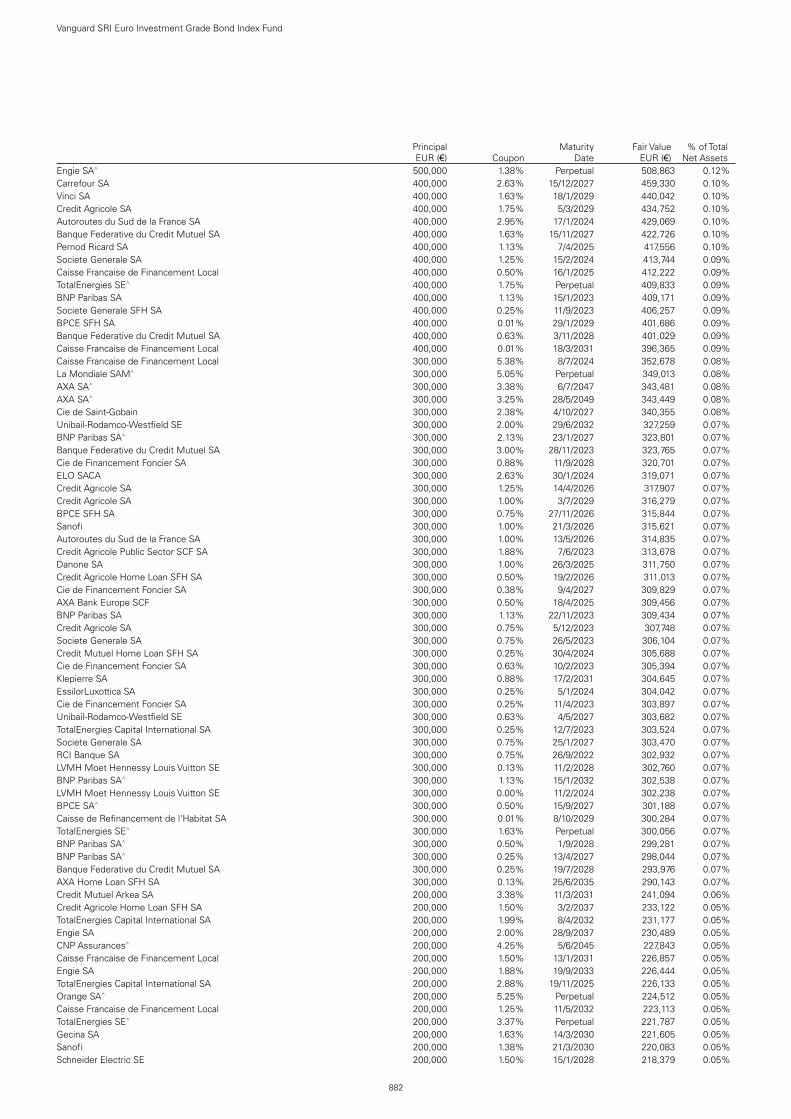
882
Vanguard SRI Euro Investment Grade Bond Index Fund
Principal EUR (€) Coupon
Maturity Date
Fair Value EUR (€)
% of Total Net Assets
Engie SA^ 500,000 1.38% Perpetual 508,863 0.12%Carrefour SA 400,000 2.63% 15/12/2027 459,330 0.10%Vinci SA 400,000 1.63% 18/1/2029 440,042 0.10%Credit Agricole SA 400,000 1.75% 5/3/2029 434,752 0.10%Autoroutes du Sud de la France SA 400,000 2.95% 17/1/2024 429,069 0.10%Banque Federative du Credit Mutuel SA 400,000 1.63% 15/11/2027 422,726 0.10%Pernod Ricard SA 400,000 1.13% 7/4/2025 417,556 0.10%Societe Generale SA 400,000 1.25% 15/2/2024 413,744 0.09%Caisse Francaise de Financement Local 400,000 0.50% 16/1/2025 412,222 0.09%TotalEnergies SE^ 400,000 1.75% Perpetual 409,833 0.09%BNP Paribas SA 400,000 1.13% 15/1/2023 409,171 0.09%Societe Generale SFH SA 400,000 0.25% 11/9/2023 406,257 0.09%BPCE SFH SA 400,000 0.01% 29/1/2029 401,686 0.09%Banque Federative du Credit Mutuel SA 400,000 0.63% 3/11/2028 401,029 0.09%Caisse Francaise de Financement Local 400,000 0.01% 18/3/2031 396,365 0.09%Caisse Francaise de Financement Local 300,000 5.38% 8/7/2024 352,678 0.08%La Mondiale SAM^ 300,000 5.05% Perpetual 349,013 0.08%AXA SA^ 300,000 3.38% 6/7/2047 343,481 0.08%AXA SA^ 300,000 3.25% 28/5/2049 343,449 0.08%Cie de Saint-Gobain 300,000 2.38% 4/10/2027 340,355 0.08%Unibail-Rodamco-Westfield SE 300,000 2.00% 29/6/2032 327,259 0.07%BNP Paribas SA^ 300,000 2.13% 23/1/2027 323,801 0.07%Banque Federative du Credit Mutuel SA 300,000 3.00% 28/11/2023 323,765 0.07%Cie de Financement Foncier SA 300,000 0.88% 11/9/2028 320,701 0.07%ELO SACA 300,000 2.63% 30/1/2024 319,071 0.07%Credit Agricole SA 300,000 1.25% 14/4/2026 317,907 0.07%Credit Agricole SA 300,000 1.00% 3/7/2029 316,279 0.07%BPCE SFH SA 300,000 0.75% 27/11/2026 315,844 0.07%Sanofi 300,000 1.00% 21/3/2026 315,621 0.07%Autoroutes du Sud de la France SA 300,000 1.00% 13/5/2026 314,835 0.07%Credit Agricole Public Sector SCF SA 300,000 1.88% 7/6/2023 313,678 0.07%Danone SA 300,000 1.00% 26/3/2025 311,750 0.07%Credit Agricole Home Loan SFH SA 300,000 0.50% 19/2/2026 311,013 0.07%Cie de Financement Foncier SA 300,000 0.38% 9/4/2027 309,829 0.07%AXA Bank Europe SCF 300,000 0.50% 18/4/2025 309,456 0.07%BNP Paribas SA 300,000 1.13% 22/11/2023 309,434 0.07%Credit Agricole SA 300,000 0.75% 5/12/2023 307,748 0.07%Societe Generale SA 300,000 0.75% 26/5/2023 306,104 0.07%Credit Mutuel Home Loan SFH SA 300,000 0.25% 30/4/2024 305,688 0.07%Cie de Financement Foncier SA 300,000 0.63% 10/2/2023 305,394 0.07%Klepierre SA 300,000 0.88% 17/2/2031 304,645 0.07%EssilorLuxottica SA 300,000 0.25% 5/1/2024 304,042 0.07%Cie de Financement Foncier SA 300,000 0.25% 11/4/2023 303,897 0.07%Unibail-Rodamco-Westfield SE 300,000 0.63% 4/5/2027 303,682 0.07%TotalEnergies Capital International SA 300,000 0.25% 12/7/2023 303,524 0.07%Societe Generale SA 300,000 0.75% 25/1/2027 303,470 0.07%RCI Banque SA 300,000 0.75% 26/9/2022 302,932 0.07%LVMH Moet Hennessy Louis Vuitton SE 300,000 0.13% 11/2/2028 302,760 0.07%BNP Paribas SA^ 300,000 1.13% 15/1/2032 302,538 0.07%LVMH Moet Hennessy Louis Vuitton SE 300,000 0.00% 11/2/2024 302,238 0.07%BPCE SA^ 300,000 0.50% 15/9/2027 301,188 0.07%Caisse de Refinancement de l'Habitat SA 300,000 0.01% 8/10/2029 300,284 0.07%TotalEnergies SE^ 300,000 1.63% Perpetual 300,056 0.07%BNP Paribas SA^ 300,000 0.50% 1/9/2028 299,281 0.07%BNP Paribas SA^ 300,000 0.25% 13/4/2027 298,044 0.07%Banque Federative du Credit Mutuel SA 300,000 0.25% 19/7/2028 293,976 0.07%AXA Home Loan SFH SA 300,000 0.13% 25/6/2035 290,143 0.07%Credit Mutuel Arkea SA 200,000 3.38% 11/3/2031 241,094 0.06%Credit Agricole Home Loan SFH SA 200,000 1.50% 3/2/2037 233,122 0.05%TotalEnergies Capital International SA 200,000 1.99% 8/4/2032 231,177 0.05%Engie SA 200,000 2.00% 28/9/2037 230,489 0.05%CNP Assurances^ 200,000 4.25% 5/6/2045 227,843 0.05%Caisse Francaise de Financement Local 200,000 1.50% 13/1/2031 226,857 0.05%Engie SA 200,000 1.88% 19/9/2033 226,444 0.05%TotalEnergies Capital International SA 200,000 2.88% 19/11/2025 226,133 0.05%Orange SA^ 200,000 5.25% Perpetual 224,512 0.05%Caisse Francaise de Financement Local 200,000 1.25% 11/5/2032 223,113 0.05%TotalEnergies SE^ 200,000 3.37% Perpetual 221,787 0.05%Gecina SA 200,000 1.63% 14/3/2030 221,605 0.05%Sanofi 200,000 1.38% 21/3/2030 220,083 0.05%Schneider Electric SE 200,000 1.50% 15/1/2028 218,379 0.05%

883
Vanguard SRI Euro Investment Grade Bond Index Fund
Principal EUR (€) Coupon
Maturity Date
Fair Value EUR (€)
% of Total Net Assets
TotalEnergies Capital International SA 200,000 1.38% 4/10/2029 217,733 0.05%Orange SA 200,000 1.38% 16/1/2030 217,677 0.05%Autoroutes du Sud de la France SA 200,000 1.38% 27/6/2028 216,830 0.05%ELO SACA 200,000 2.38% 25/4/2025 215,890 0.05%Schneider Electric SE 200,000 1.38% 21/6/2027 215,744 0.05%Orange SA 200,000 1.38% 20/3/2028 215,733 0.05%Credit Mutuel Home Loan SFH SA 200,000 1.00% 30/4/2028 215,220 0.05%APRR SA 200,000 1.25% 18/1/2028 214,897 0.05%Credit Agricole Home Loan SFH SA 200,000 0.88% 6/5/2034 214,695 0.05%CNP Assurances^ 200,000 2.50% 30/6/2051 213,931 0.05%BPCE SFH SA 200,000 2.38% 29/11/2023 213,685 0.05%BPCE SFH SA 200,000 0.88% 13/4/2028 213,455 0.05%Orange SA 200,000 1.25% 7/7/2027 213,431 0.05%Bouygues SA 200,000 1.13% 24/7/2028 213,380 0.05%Bouygues SA 200,000 3.63% 16/1/2023 212,548 0.05%TotalEnergies Capital International SA 200,000 1.38% 19/3/2025 211,470 0.05%Capgemini SE 200,000 1.13% 23/6/2030 210,824 0.05%Engie SA 200,000 3.00% 1/2/2023 210,655 0.05%Engie SA 200,000 1.38% 27/3/2025 210,310 0.05%Sodexo SA 200,000 1.00% 27/4/2029 209,971 0.05%Caisse de Refinancement de l'Habitat SA 200,000 3.30% 23/9/2022 209,427 0.05%Orange SA 200,000 0.88% 3/2/2027 208,835 0.05%Credit Mutuel Home Loan SFH SA 200,000 0.63% 2/2/2026 208,424 0.05%Legrand SA 200,000 0.75% 20/5/2030 208,340 0.05%Orange SA 200,000 1.00% 12/5/2025 208,116 0.05%Unibail-Rodamco-Westfield SE 200,000 1.00% 27/2/2027 208,038 0.05%Cie de Financement Foncier SA 200,000 0.75% 21/1/2025 207,960 0.05%Caisse Francaise de Financement Local 200,000 0.50% 19/2/2027 207,947 0.05%Credit Agricole SA^ 200,000 1.63% 5/6/2030 207,792 0.05%TotalEnergies Capital International SA 200,000 0.70% 31/5/2028 207,361 0.05%Caisse Francaise de Financement Local 200,000 0.50% 19/1/2026 207,209 0.05%Banque Federative du Credit Mutuel SA 200,000 0.75% 8/6/2026 206,634 0.05%Credit Agricole SA^ 200,000 1.00% 22/4/2026 206,365 0.05%BNP Paribas SA 200,000 1.13% 10/10/2023 206,043 0.05%Danone SA 200,000 0.71% 3/11/2024 205,925 0.05%Cie de Financement Foncier SA 200,000 0.50% 4/9/2024 205,653 0.05%Air Liquide Finance SA 200,000 0.75% 13/6/2024 205,567 0.05%Orange SA^ 200,000 1.75% Perpetual 204,937 0.05%Veolia Environnement SA 200,000 0.89% 14/1/2024 204,738 0.05%Banque Federative du Credit Mutuel SA 200,000 0.75% 15/6/2023 204,270 0.05%Arkea Home Loans SFH SA 200,000 0.38% 4/3/2024 204,222 0.05%BPCE SA 200,000 0.63% 26/9/2024 203,910 0.05%Klepierre SA 200,000 1.00% 17/4/2023 203,806 0.05%PSA Banque France SA 200,000 0.63% 21/6/2024 203,444 0.05%Societe Generale SA^ 200,000 0.88% 22/9/2028 203,182 0.05%Legrand SA 200,000 0.50% 9/10/2023 203,100 0.05%Engie SA 200,000 0.38% 21/6/2027 203,024 0.05%BPCE SFH SA 200,000 0.38% 10/2/2023 202,780 0.05%Banque Federative du Credit Mutuel SA 200,000 0.50% 16/11/2022 202,600 0.05%AXA Home Loan SFH SA 200,000 0.05% 5/7/2027 202,544 0.05%EssilorLuxottica SA 200,000 0.13% 27/5/2025 202,246 0.05%Credit Mutuel Home Loan SFH SA 200,000 0.38% 12/9/2022 202,120 0.05%Danone SA 200,000 0.42% 3/11/2022 201,802 0.05%Unibail-Rodamco-Westfield SE 200,000 0.75% 25/10/2028 201,781 0.05%Veolia Environnement SA 200,000 0.80% 15/1/2032 201,743 0.05%Banque Federative du Credit Mutuel SA 200,000 0.13% 5/2/2024 201,705 0.05%Cie de Financement Foncier SA 200,000 0.20% 16/9/2022 201,698 0.05%LVMH Moet Hennessy Louis Vuitton SE 200,000 0.13% 28/2/2023 201,358 0.05%Schneider Electric SE 200,000 0.25% 11/3/2029 201,315 0.05%EssilorLuxottica SA 200,000 0.00% 27/5/2023 201,206 0.05%Dassault Systemes SE 200,000 0.00% 16/9/2024 201,114 0.05%Caisse Francaise de Financement Local 200,000 0.01% 27/4/2029 200,939 0.05%Danone SA 200,000 0.00% 1/12/2025 200,882 0.05%BNP Paribas SA^ 200,000 0.50% 19/2/2028 200,269 0.05%SCOR SE^ 200,000 1.38% 17/9/2051 200,234 0.05%Societe Generale SA^ 200,000 1.13% 30/6/2031 199,948 0.05%Orange SA 200,000 0.75% 29/6/2034 199,728 0.05%Credit Mutuel Arkea SA 200,000 0.01% 28/1/2026 199,653 0.05%Banque Federative du Credit Mutuel SA 200,000 0.01% 11/5/2026 199,315 0.05%HSBC Continental Europe SA 200,000 0.10% 3/9/2027 198,873 0.05%Societe Generale SFH SA 200,000 0.01% 5/2/2031 198,530 0.05%

884
Vanguard SRI Euro Investment Grade Bond Index Fund
Principal EUR (€) Coupon
Maturity Date
Fair Value EUR (€)
% of Total Net Assets
BPCE SFH SA 200,000 0.01% 18/3/2031 197,906 0.05%BNP Paribas SA^ 200,000 0.50% 19/1/2030 196,841 0.05%Societe Generale SA^ 200,000 0.50% 12/6/2029 195,710 0.05%Caisse Francaise de Financement Local 200,000 0.38% 13/2/2040 195,653 0.04%BPCE SFH SA 200,000 0.38% 18/3/2041 193,764 0.04%Caisse Francaise de Financement Local 200,000 0.01% 19/10/2035 190,060 0.04%Cie de Financement Foncier SA 100,000 3.88% 25/4/2055 185,829 0.04%Cie Generale des Etablissements Michelin SCA 100,000 2.50% 3/9/2038 127,948 0.03%Caisse Nationale de Reassurance Mutuelle Agricole Groupama 100,000 6.00% 23/1/2027 125,774 0.03%Credit Agricole Assurances SA^ 100,000 4.75% 27/9/2048 122,118 0.03%CNP Assurances^ 100,000 4.50% 10/6/2047 119,926 0.03%Sanofi 100,000 1.88% 21/3/2038 119,861 0.03%Cie de Financement Foncier SA 100,000 4.00% 24/10/2025 118,755 0.03%Capgemini SE 100,000 2.38% 15/4/2032 117,689 0.03%Credit Agricole Home Loan SFH SA 100,000 1.50% 28/9/2038 117,547 0.03%ELO SACA 100,000 3.25% 23/7/2027 116,025 0.03%Unibail-Rodamco-Westfield SE 100,000 2.63% 9/4/2030 115,895 0.03%Engie SA 100,000 2.13% 30/3/2032 115,717 0.03%Caisse Nationale de Reassurance Mutuelle Agricole Groupama^ 100,000 6.38% Perpetual 115,350 0.03%Arkea Home Loans SFH SA 100,000 1.50% 1/6/2033 114,666 0.03%Caisse Francaise de Financement Local 100,000 1.45% 16/1/2034 114,635 0.03%Credit Agricole Assurances SA^ 100,000 4.50% Perpetual 114,013 0.03%Cie de Saint-Gobain 100,000 1.88% 15/3/2031 113,586 0.03%Caisse Nationale de Reassurance Mutuelle Agricole Groupama 100,000 3.38% 24/9/2028 113,425 0.03%Vinci SA 100,000 1.75% 26/9/2030 113,302 0.03%Cie Generale des Etablissements Michelin SCA 100,000 1.75% 3/9/2030 113,261 0.03%AXA Bank Europe SCF 100,000 1.38% 18/4/2033 113,146 0.03%Orange SA 100,000 2.00% 15/1/2029 112,984 0.03%APRR SA 100,000 1.63% 13/1/2032 112,968 0.03%Capgemini SE 100,000 2.00% 15/4/2029 112,453 0.03%Pernod Ricard SA 100,000 1.75% 8/4/2030 112,425 0.03%Veolia Environnement SA 100,000 1.94% 7/1/2030 112,332 0.03%Banque Federative du Credit Mutuel SA 100,000 2.50% 25/5/2028 111,731 0.03%Cie de Saint-Gobain 100,000 1.88% 21/9/2028 111,508 0.03%Holding d'Infrastructures de Transport SASU 100,000 2.50% 4/5/2027 111,473 0.03%SCOR SE^ 100,000 3.00% 8/6/2046 111,414 0.03%JCDecaux SA 100,000 2.63% 24/4/2028 111,399 0.03%ELO SACA 100,000 2.88% 29/1/2026 111,347 0.03%Orange SA 100,000 1.63% 7/4/2032 111,332 0.03%Credit Agricole Home Loan SFH SA 100,000 1.25% 24/3/2031 111,210 0.03%Credit Agricole Assurances SA^ 100,000 4.25% Perpetual 111,114 0.03%Credit Agricole SA 100,000 2.63% 17/3/2027 111,000 0.03%Gecina SA 100,000 1.63% 29/5/2034 110,943 0.03%Sanofi 100,000 1.50% 1/4/2030 110,928 0.03%BNP Paribas SA 100,000 2.75% 27/1/2026 110,571 0.03%Sanofi 100,000 1.25% 21/3/2034 110,368 0.03%TotalEnergies Capital International SA 100,000 1.62% 18/5/2040 110,320 0.03%Suez SA 100,000 1.63% 17/9/2030 110,291 0.03%TotalEnergies Capital International SA 100,000 1.49% 4/9/2030 110,120 0.03%Engie SA 100,000 1.75% 27/3/2028 109,946 0.03%Capgemini SE 100,000 1.75% 18/4/2028 109,876 0.03%Societe Generale SA 100,000 2.13% 27/9/2028 109,842 0.03%Orange SA 60,000 8.13% 28/1/2033 109,802 0.03%BPCE SA 100,000 3.00% 19/7/2024 109,778 0.03%TotalEnergies Capital International SA 100,000 1.54% 31/5/2039 109,591 0.03%BPCE SA 100,000 4.63% 18/7/2023 109,589 0.03%Autoroutes du Sud de la France SA 100,000 1.38% 21/2/2031 109,361 0.03%BNP Paribas SA 100,000 2.25% 11/1/2027 109,113 0.03%Air Liquide Finance SA 100,000 1.25% 13/6/2028 108,754 0.03%TDF Infrastructure SASU 100,000 2.50% 7/4/2026 108,541 0.03%Societe Generale SA 100,000 2.63% 27/2/2025 108,395 0.03%Unibail-Rodamco-Westfield SE 100,000 1.88% 15/1/2031 108,375 0.03%Engie SA^ 100,000 3.25% Perpetual 108,346 0.03%Edenred 100,000 1.88% 6/3/2026 108,330 0.03%Wendel SE 100,000 2.75% 2/10/2024 108,189 0.03%Credit Agricole Home Loan SFH SA 100,000 1.00% 16/1/2029 108,075 0.03%BPCE SA 100,000 2.88% 16/1/2024 108,068 0.03%Carrefour SA 100,000 1.75% 4/5/2026 108,017 0.03%Gecina SA 100,000 1.38% 26/1/2028 107,943 0.03%TotalEnergies Capital International SA 100,000 1.49% 8/4/2027 107,942 0.03%ICADE 100,000 1.75% 10/6/2026 107,910 0.03%

885
Vanguard SRI Euro Investment Grade Bond Index Fund
Principal EUR (€) Coupon
Maturity Date
Fair Value EUR (€)
% of Total Net Assets
Arkema SA 100,000 1.50% 20/4/2027 107,895 0.03%Credit Agricole SA 100,000 2.00% 25/3/2029 107,861 0.03%BNP Paribas SA 100,000 2.38% 17/2/2025 107,678 0.03%Klepierre SA 100,000 1.63% 13/12/2032 107,639 0.03%Unibail-Rodamco-Westfield SE 100,000 2.13% 9/4/2025 107,638 0.03%Banque Federative du Credit Mutuel SA 100,000 1.88% 18/6/2029 107,606 0.03%Societe Generale SCF SA 100,000 4.25% 3/2/2023 107,605 0.03%Engie SA 100,000 1.38% 22/6/2028 107,587 0.03%Sanofi 100,000 1.13% 5/4/2028 107,408 0.03%Banque Federative du Credit Mutuel SA 100,000 1.63% 19/1/2026 107,336 0.03%Pernod Ricard SA 100,000 1.50% 18/5/2026 107,250 0.02%Capgemini SE 100,000 1.63% 15/4/2026 107,230 0.02%La Banque Postale Home Loan SFH SA 100,000 2.38% 15/1/2024 107,177 0.02%Credit Agricole SA 100,000 1.38% 3/5/2027 107,175 0.02%BNP Paribas SA 100,000 2.88% 26/9/2023 107,143 0.02%Eutelsat SA 100,000 2.00% 2/10/2025 107,042 0.02%Banque Federative du Credit Mutuel SA 100,000 1.88% 4/11/2026 107,030 0.02%Credit Agricole Home Loan SFH SA 100,000 0.88% 11/8/2028 106,971 0.02%APRR SA 100,000 1.88% 15/1/2025 106,913 0.02%Sanofi 100,000 1.50% 22/9/2025 106,871 0.02%La Banque Postale Home Loan SFH SA 100,000 0.88% 7/2/2028 106,753 0.02%Unibail-Rodamco-Westfield SE 100,000 1.50% 29/5/2029 106,609 0.02%Societe Fonciere Lyonnaise SA 100,000 1.50% 5/6/2027 106,570 0.02%Cie Financiere et Industrielle des Autoroutes SA 100,000 1.13% 13/10/2027 106,552 0.02%Holding d'Infrastructures de Transport SASU 100,000 1.63% 27/11/2027 106,446 0.02%Kering SA 100,000 1.25% 10/5/2026 106,180 0.02%AltaREIT SCA 100,000 2.88% 2/7/2025 106,109 0.02%Unibail-Rodamco-Westfield SE 100,000 1.38% 9/3/2026 106,090 0.02%BNP Paribas SA 100,000 1.38% 28/5/2029 106,032 0.02%Autoroutes du Sud de la France SA 100,000 5.63% 4/7/2022 106,020 0.02%AXA Bank Europe SCF 100,000 0.75% 6/3/2029 106,019 0.02%Cie de Financement Foncier SA 100,000 1.00% 2/2/2026 105,956 0.02%Air Liquide SA 100,000 2.38% 6/9/2023 105,836 0.02%Autoroutes du Sud de la France SA 100,000 1.13% 20/4/2026 105,763 0.02%Altarea SCA 100,000 2.25% 5/7/2024 105,747 0.02%RCI Banque SA 100,000 1.63% 26/5/2026 105,747 0.02%Sanofi 100,000 0.88% 21/3/2029 105,714 0.02%TotalEnergies SE^ 100,000 2.63% Perpetual 105,707 0.02%Imerys SA 100,000 1.50% 15/1/2027 105,653 0.02%HSBC SFH France SA 100,000 2.00% 16/10/2023 105,604 0.02%Societe Fonciere Lyonnaise SA 100,000 1.50% 29/5/2025 105,594 0.02%Societe Generale SFH SA 100,000 0.75% 29/1/2027 105,409 0.02%Air Liquide Finance SA 100,000 1.25% 3/6/2025 105,391 0.02%Carmila SA 100,000 2.13% 7/3/2028 105,378 0.02%Cie de Saint-Gobain 100,000 1.13% 23/3/2026 105,349 0.02%Caisse Francaise de Financement Local 100,000 0.75% 11/1/2027 105,347 0.02%Wendel SE 100,000 1.38% 26/4/2026 105,229 0.02%Unibail-Rodamco-Westfield SE 100,000 1.75% 27/2/2034 105,227 0.02%MMS USA Holdings, Inc. 100,000 1.25% 13/6/2028 105,126 0.02%Credit Agricole Public Sector SCF SA 100,000 0.63% 29/3/2029 105,047 0.02%Orange SA^ 100,000 2.38% Perpetual 105,047 0.02%Cie de Financement Foncier SA 100,000 0.75% 29/5/2026 105,017 0.02%Icade Sante SAS 100,000 1.38% 17/9/2030 105,011 0.02%BPCE SFH SA 100,000 0.63% 29/5/2031 104,910 0.02%Carrefour SA 100,000 1.25% 3/6/2025 104,778 0.02%Banque Federative du Credit Mutuel SA 100,000 1.25% 14/1/2025 104,761 0.02%Credit Agricole Assurances SA 100,000 2.00% 17/7/2030 104,730 0.02%Credit Agricole SA 100,000 1.38% 13/3/2025 104,720 0.02%ICADE 100,000 1.13% 17/11/2025 104,653 0.02%Orange SA 100,000 1.00% 12/9/2025 104,435 0.02%Eutelsat SA 100,000 1.50% 13/10/2028 104,430 0.02%Sanofi 100,000 1.00% 1/4/2025 104,410 0.02%BNP Paribas SA 100,000 1.25% 19/3/2025 104,390 0.02%Vivendi SE 100,000 1.13% 11/12/2028 104,383 0.02%BNP Paribas SA 100,000 1.63% 2/7/2031 104,361 0.02%TotalEnergies Capital International SA 100,000 2.13% 15/3/2023 104,317 0.02%Indigo Group SAS 100,000 1.63% 19/4/2028 104,315 0.02%Caisse Francaise de Financement Local 100,000 0.63% 13/4/2026 104,285 0.02%Sodexo SA 100,000 1.13% 22/5/2025 104,253 0.02%Credit Mutuel Arkea SA^ 100,000 1.25% 11/6/2029 104,208 0.02%Veolia Environnement SA 100,000 0.93% 4/1/2029 104,175 0.02%
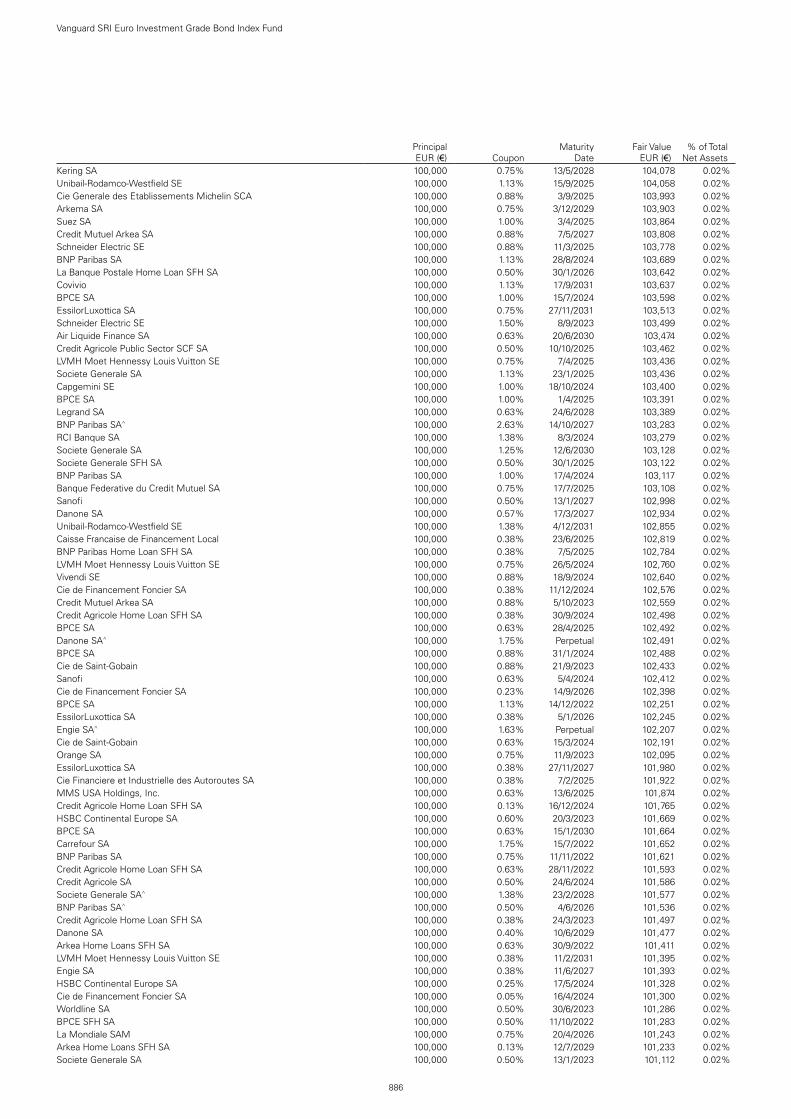
886
Vanguard SRI Euro Investment Grade Bond Index Fund
Principal EUR (€) Coupon
Maturity Date
Fair Value EUR (€)
% of Total Net Assets
Kering SA 100,000 0.75% 13/5/2028 104,078 0.02%Unibail-Rodamco-Westfield SE 100,000 1.13% 15/9/2025 104,058 0.02%Cie Generale des Etablissements Michelin SCA 100,000 0.88% 3/9/2025 103,993 0.02%Arkema SA 100,000 0.75% 3/12/2029 103,903 0.02%Suez SA 100,000 1.00% 3/4/2025 103,864 0.02%Credit Mutuel Arkea SA 100,000 0.88% 7/5/2027 103,808 0.02%Schneider Electric SE 100,000 0.88% 11/3/2025 103,778 0.02%BNP Paribas SA 100,000 1.13% 28/8/2024 103,689 0.02%La Banque Postale Home Loan SFH SA 100,000 0.50% 30/1/2026 103,642 0.02%Covivio 100,000 1.13% 17/9/2031 103,637 0.02%BPCE SA 100,000 1.00% 15/7/2024 103,598 0.02%EssilorLuxottica SA 100,000 0.75% 27/11/2031 103,513 0.02%Schneider Electric SE 100,000 1.50% 8/9/2023 103,499 0.02%Air Liquide Finance SA 100,000 0.63% 20/6/2030 103,474 0.02%Credit Agricole Public Sector SCF SA 100,000 0.50% 10/10/2025 103,462 0.02%LVMH Moet Hennessy Louis Vuitton SE 100,000 0.75% 7/4/2025 103,436 0.02%Societe Generale SA 100,000 1.13% 23/1/2025 103,436 0.02%Capgemini SE 100,000 1.00% 18/10/2024 103,400 0.02%BPCE SA 100,000 1.00% 1/4/2025 103,391 0.02%Legrand SA 100,000 0.63% 24/6/2028 103,389 0.02%BNP Paribas SA^ 100,000 2.63% 14/10/2027 103,283 0.02%RCI Banque SA 100,000 1.38% 8/3/2024 103,279 0.02%Societe Generale SA 100,000 1.25% 12/6/2030 103,128 0.02%Societe Generale SFH SA 100,000 0.50% 30/1/2025 103,122 0.02%BNP Paribas SA 100,000 1.00% 17/4/2024 103,117 0.02%Banque Federative du Credit Mutuel SA 100,000 0.75% 17/7/2025 103,108 0.02%Sanofi 100,000 0.50% 13/1/2027 102,998 0.02%Danone SA 100,000 0.57% 17/3/2027 102,934 0.02%Unibail-Rodamco-Westfield SE 100,000 1.38% 4/12/2031 102,855 0.02%Caisse Francaise de Financement Local 100,000 0.38% 23/6/2025 102,819 0.02%BNP Paribas Home Loan SFH SA 100,000 0.38% 7/5/2025 102,784 0.02%LVMH Moet Hennessy Louis Vuitton SE 100,000 0.75% 26/5/2024 102,760 0.02%Vivendi SE 100,000 0.88% 18/9/2024 102,640 0.02%Cie de Financement Foncier SA 100,000 0.38% 11/12/2024 102,576 0.02%Credit Mutuel Arkea SA 100,000 0.88% 5/10/2023 102,559 0.02%Credit Agricole Home Loan SFH SA 100,000 0.38% 30/9/2024 102,498 0.02%BPCE SA 100,000 0.63% 28/4/2025 102,492 0.02%Danone SA^ 100,000 1.75% Perpetual 102,491 0.02%BPCE SA 100,000 0.88% 31/1/2024 102,488 0.02%Cie de Saint-Gobain 100,000 0.88% 21/9/2023 102,433 0.02%Sanofi 100,000 0.63% 5/4/2024 102,412 0.02%Cie de Financement Foncier SA 100,000 0.23% 14/9/2026 102,398 0.02%BPCE SA 100,000 1.13% 14/12/2022 102,251 0.02%EssilorLuxottica SA 100,000 0.38% 5/1/2026 102,245 0.02%Engie SA^ 100,000 1.63% Perpetual 102,207 0.02%Cie de Saint-Gobain 100,000 0.63% 15/3/2024 102,191 0.02%Orange SA 100,000 0.75% 11/9/2023 102,095 0.02%EssilorLuxottica SA 100,000 0.38% 27/11/2027 101,980 0.02%Cie Financiere et Industrielle des Autoroutes SA 100,000 0.38% 7/2/2025 101,922 0.02%MMS USA Holdings, Inc. 100,000 0.63% 13/6/2025 101,874 0.02%Credit Agricole Home Loan SFH SA 100,000 0.13% 16/12/2024 101,765 0.02%HSBC Continental Europe SA 100,000 0.60% 20/3/2023 101,669 0.02%BPCE SA 100,000 0.63% 15/1/2030 101,664 0.02%Carrefour SA 100,000 1.75% 15/7/2022 101,652 0.02%BNP Paribas SA 100,000 0.75% 11/11/2022 101,621 0.02%Credit Agricole Home Loan SFH SA 100,000 0.63% 28/11/2022 101,593 0.02%Credit Agricole SA 100,000 0.50% 24/6/2024 101,586 0.02%Societe Generale SA^ 100,000 1.38% 23/2/2028 101,577 0.02%BNP Paribas SA^ 100,000 0.50% 4/6/2026 101,536 0.02%Credit Agricole Home Loan SFH SA 100,000 0.38% 24/3/2023 101,497 0.02%Danone SA 100,000 0.40% 10/6/2029 101,477 0.02%Arkea Home Loans SFH SA 100,000 0.63% 30/9/2022 101,411 0.02%LVMH Moet Hennessy Louis Vuitton SE 100,000 0.38% 11/2/2031 101,395 0.02%Engie SA 100,000 0.38% 11/6/2027 101,393 0.02%HSBC Continental Europe SA 100,000 0.25% 17/5/2024 101,328 0.02%Cie de Financement Foncier SA 100,000 0.05% 16/4/2024 101,300 0.02%Worldline SA 100,000 0.50% 30/6/2023 101,286 0.02%BPCE SFH SA 100,000 0.50% 11/10/2022 101,283 0.02%La Mondiale SAM 100,000 0.75% 20/4/2026 101,243 0.02%Arkea Home Loans SFH SA 100,000 0.13% 12/7/2029 101,233 0.02%Societe Generale SA 100,000 0.50% 13/1/2023 101,112 0.02%

887
Vanguard SRI Euro Investment Grade Bond Index Fund
Principal EUR (€) Coupon
Maturity Date
Fair Value EUR (€)
% of Total Net Assets
Holding d'Infrastructures de Transport SASU 100,000 0.63% 27/3/2023 101,070 0.02%Veolia Environnement SA 100,000 0.31% 4/10/2023 101,054 0.02%Veolia Environnement SA 100,000 0.66% 15/1/2031 101,050 0.02%RCI Banque SA 100,000 0.50% 15/9/2023 101,009 0.02%Cie de Financement Foncier SA 100,000 0.01% 10/11/2027 100,985 0.02%BPCE SA 100,000 0.25% 15/1/2026 100,931 0.02%Icade Sante SAS 100,000 0.88% 4/11/2029 100,888 0.02%Orange SA 100,000 1.38% 4/9/2049 100,863 0.02%Credit Mutuel Home Loan SFH SA 100,000 0.13% 28/1/2030 100,861 0.02%Worldline SA 100,000 0.25% 18/9/2024 100,798 0.02%Arkema SA^ 100,000 1.50% Perpetual 100,755 0.02%LVMH Moet Hennessy Louis Vuitton SE 100,000 0.00% 11/2/2026 100,737 0.02%BPCE SA 100,000 0.50% 24/2/2027 100,723 0.02%Arkema SA 100,000 0.13% 14/10/2026 100,707 0.02%Dassault Systemes SE 100,000 0.13% 16/9/2026 100,697 0.02%RCI Banque SA 100,000 0.25% 8/3/2023 100,551 0.02%Suez SA^ 100,000 1.63% Perpetual 100,532 0.02%Pernod Ricard SA 100,000 0.00% 24/10/2023 100,519 0.02%Engie SA 100,000 0.50% 24/10/2030 100,515 0.02%Credit Agricole Public Sector SCF SA 100,000 0.01% 13/9/2028 100,509 0.02%Alstom SA 100,000 0.25% 14/10/2026 100,454 0.02%Publicis Groupe SA 100,000 1.13% 16/12/2021 100,312 0.02%Engie SA^ 100,000 1.50% Perpetual 100,279 0.02%Credit Mutuel Arkea SA 100,000 0.38% 3/10/2028 100,265 0.02%La Banque Postale Home Loan SFH SA 100,000 0.01% 22/10/2029 100,110 0.02%Klepierre SA 100,000 0.63% 1/7/2030 100,095 0.02%Societe Generale SFH SA 100,000 0.01% 11/2/2030 99,933 0.02%AXA SA^ 100,000 1.38% 7/10/2041 99,901 0.02%Banque Federative du Credit Mutuel SA 100,000 0.25% 29/6/2028 99,795 0.02%BPCE SA 100,000 0.75% 3/3/2031 99,764 0.02%APRR SA 100,000 0.13% 18/1/2029 99,736 0.02%BPCE SFH SA 100,000 0.01% 27/5/2030 99,673 0.02%Caisse Francaise de Financement Local 100,000 0.01% 24/6/2030 99,667 0.02%Caisse Nationale de Reassurance Mutuelle Agricole Groupama 100,000 0.75% 7/7/2028 99,505 0.02%Engie SA 100,000 0.00% 4/3/2027 99,387 0.02%Imerys SA 100,000 1.00% 15/7/2031 99,382 0.02%BNP Paribas SA 100,000 0.13% 4/9/2026 99,283 0.02%BPCE SA 100,000 0.01% 14/1/2027 99,122 0.02%Credit Agricole SA 100,000 0.38% 20/4/2028 98,969 0.02%Banque Federative du Credit Mutuel SA 100,000 0.63% 21/2/2031 98,920 0.02%Societe Generale SA 100,000 0.13% 18/2/2028 98,845 0.02%La Banque Postale Home Loan SFH SA 100,000 0.25% 12/2/2035 98,774 0.02%Teleperformance 100,000 0.25% 26/11/2027 98,683 0.02%Tikehau Capital SCA 100,000 1.63% 31/3/2029 98,627 0.02%Credit Agricole Home Loan SFH SA 100,000 0.01% 3/11/2031 98,618 0.02%Orange SA^ 100,000 1.38% Perpetual 98,553 0.02%Cie Generale des Etablissements Michelin SCA 100,000 0.00% 2/11/2028 98,447 0.02%TotalEnergies SE^ 100,000 2.13% Perpetual 98,405 0.02%RCI Banque SA 97,000 0.75% 10/4/2023 98,242 0.02%ICADE 100,000 0.63% 18/1/2031 97,490 0.02%Cie Generale des Etablissements Michelin SCA 100,000 0.25% 2/11/2032 97,386 0.02%Alstom SA 100,000 0.00% 11/1/2029 97,233 0.02%BPCE SA 100,000 0.25% 14/1/2031 97,115 0.02%BNP Paribas SA 100,000 0.63% 3/12/2032 96,986 0.02%AXA Bank Europe SCF 100,000 0.25% 9/6/2040 95,370 0.02%Orange SA 50,000 3.38% 16/9/2022 52,297 0.01%MMB SCF SACA 50,000 0.75% 31/10/2025 52,165 0.01%Engie Alliance GIE 40,000 5.75% 24/6/2023 44,548 0.01%Engie SA 20,000 5.95% 16/3/2111 38,870 0.01%test - - - 72,628,553 16.43%Germany 12.06% (2020: 10.80%)E.ON SE 900,000 0.00% 18/12/2023 904,877 0.21%Aareal Bank AG 800,000 0.13% 1/2/2023 808,003 0.18%DZ HYP AG 800,000 0.01% 20/4/2029 804,510 0.18%Muenchener Hypothekenbank eG 700,000 0.50% 22/4/2026 726,650 0.17%Volkswagen International Finance NV^ 500,000 3.50% Perpetual 540,226 0.12%Volkswagen Financial Services AG 500,000 2.50% 6/4/2023 522,919 0.12%UniCredit Bank AG 500,000 0.63% 20/11/2025 520,882 0.12%Deutsche Hypothekenbank AG 500,000 0.25% 17/5/2024 509,502 0.12%Volkswagen Leasing GmbH 500,000 1.00% 16/2/2023 509,186 0.12%Vonovia Finance BV^ 500,000 4.00% Perpetual 508,649 0.12%

888
Vanguard SRI Euro Investment Grade Bond Index Fund
Principal EUR (€) Coupon
Maturity Date
Fair Value EUR (€)
% of Total Net Assets
Volkswagen Leasing GmbH 500,000 0.00% 12/7/2023 500,633 0.11%Berlin Hyp AG 500,000 0.01% 27/1/2031 497,767 0.11%Allianz SE^ 400,000 4.75% Perpetual 440,590 0.10%Daimler AG 400,000 2.00% 22/8/2026 439,747 0.10%Commerzbank AG 400,000 0.63% 13/3/2025 414,681 0.09%Deutsche Bank AG^ 400,000 1.38% 3/9/2026 414,454 0.09%Deutsche Bank AG 400,000 1.13% 30/8/2023 410,871 0.09%UniCredit Bank AG 400,000 0.25% 15/1/2032 404,753 0.09%Daimler AG 400,000 0.00% 8/2/2024 401,745 0.09%Commerzbank AG 340,000 0.88% 18/4/2028 363,314 0.08%Volkswagen Financial Services AG 300,000 3.38% 6/4/2028 357,182 0.08%Volkswagen International Finance NV^ 300,000 4.63% Perpetual 341,384 0.08%Volkswagen International Finance NV^ 300,000 3.88% Perpetual 333,079 0.08%HeidelbergCement Finance Luxembourg SA 300,000 2.50% 9/10/2024 323,900 0.07%Deutsche Bank AG^ 300,000 1.75% 19/11/2030 316,945 0.07%E.ON International Finance BV 290,000 1.50% 31/7/2029 314,911 0.07%Volkswagen Bank GmbH 300,000 1.88% 31/1/2024 314,596 0.07%Deutsche Post AG 300,000 0.75% 20/5/2029 313,165 0.07%Volkswagen Bank GmbH 300,000 1.25% 10/6/2024 310,983 0.07%DVB Bank SE 300,000 1.25% 16/6/2023 309,097 0.07%BMW Finance NV 300,000 0.63% 6/10/2023 306,011 0.07%Wintershall Dea Finance BV 300,000 0.84% 25/9/2025 305,755 0.07%BASF SE 300,000 0.25% 5/6/2027 304,995 0.07%DZ HYP AG 300,000 0.01% 12/9/2025 304,503 0.07%UniCredit Bank AG 300,000 0.13% 26/10/2023 304,037 0.07%BMW Finance NV 300,000 0.50% 22/11/2022 303,789 0.07%Aareal Bank AG 300,000 0.01% 1/2/2028 303,218 0.07%Siemens Financieringsmaatschappij NV 300,000 0.25% 20/2/2029 301,773 0.07%Landesbank Hessen-Thueringen Girozentrale 300,000 0.00% 18/7/2022 301,678 0.07%Volkswagen Leasing GmbH 300,000 0.25% 12/1/2026 300,935 0.07%Traton Finance Luxembourg SA 300,000 0.13% 24/3/2025 300,688 0.07%Aroundtown SA^ 300,000 2.13% Perpetual 300,435 0.07%Bayerische Landesbank 300,000 0.05% 30/4/2031 299,766 0.07%Muenchener Hypothekenbank eG 300,000 0.25% 2/5/2036 295,126 0.07%Deutsche Telekom AG 270,000 0.88% 25/3/2026 281,357 0.06%Volkswagen International Finance NV 200,000 4.13% 16/11/2038 279,119 0.06%Commerzbank AG 260,000 1.00% 4/3/2026 270,355 0.06%Daimler International Finance BV 246,000 1.38% 26/6/2026 262,769 0.06%Daimler AG 250,000 1.13% 8/8/2034 257,948 0.06%Muenchener Hypothekenbank eG 220,000 1.00% 18/4/2039 240,892 0.06%E.ON SE 240,000 0.10% 19/12/2028 235,953 0.05%Daimler AG 200,000 2.38% 22/5/2030 232,670 0.05%Muenchener Rueckversicherungs-Gesellschaft AG in Muenchen^ 200,000 3.25% 26/5/2049 232,566 0.05%Volkswagen International Finance NV^ 200,000 4.63% Perpetual 231,487 0.05%Vonovia Finance BV 200,000 2.25% 7/4/2030 226,831 0.05%SAP SE 200,000 1.63% 10/3/2031 223,829 0.05%Volkswagen Financial Services AG 200,000 2.25% 1/10/2027 222,478 0.05%Daimler AG 200,000 2.63% 7/4/2025 220,231 0.05%Deutsche Telekom International Finance BV 200,000 2.75% 24/10/2024 219,769 0.05%BMW Finance NV 200,000 1.50% 6/2/2029 219,484 0.05%SAP SE 200,000 1.75% 22/2/2027 219,229 0.05%Siemens Financieringsmaatschappij NV 200,000 1.25% 28/2/2031 218,424 0.05%Volkswagen International Finance NV 200,000 1.88% 30/3/2027 217,226 0.05%Deutsche Telekom International Finance BV 200,000 1.50% 3/4/2028 217,052 0.05%Allianz SE^ 200,000 2.12% 8/7/2050 214,422 0.05%Allianz SE^ 200,000 5.63% 17/10/2042 214,404 0.05%Vonovia Finance BV 200,000 1.50% 14/1/2028 214,211 0.05%Eurogrid GmbH 200,000 1.88% 10/6/2025 214,185 0.05%Deutsche Telekom AG 200,000 1.38% 5/7/2034 213,292 0.05%Vonovia Finance BV 200,000 1.50% 22/3/2026 213,131 0.05%HeidelbergCement AG 200,000 2.25% 3/6/2024 212,557 0.05%Bertelsmann SE & Co. KGaA 200,000 1.13% 27/4/2026 211,085 0.05%DZ HYP AG 200,000 0.75% 2/2/2026 209,822 0.05%Landesbank Hessen-Thueringen Girozentrale 200,000 0.63% 12/1/2027 209,620 0.05%Volkswagen International Finance NV 200,000 1.25% 23/9/2032 209,279 0.05%Allianz Finance II BV 200,000 0.88% 15/1/2026 209,006 0.05%BASF SE 200,000 0.88% 22/5/2025 208,608 0.05%Eurogrid GmbH 200,000 1.63% 3/11/2023 207,784 0.05%Daimler AG 200,000 1.63% 22/8/2023 207,747 0.05%Evonik Industries AG 200,000 0.75% 7/9/2028 207,678 0.05%DZ HYP AG 200,000 0.50% 13/11/2025 207,345 0.05%

889
Vanguard SRI Euro Investment Grade Bond Index Fund
Principal EUR (€) Coupon
Maturity Date
Fair Value EUR (€)
% of Total Net Assets
E.ON International Finance BV 200,000 1.00% 13/4/2025 207,055 0.05%Merck KGaA^ 200,000 1.63% 9/9/2080 205,993 0.05%Daimler AG 200,000 0.75% 10/9/2030 205,798 0.05%DZ HYP AG 200,000 0.38% 6/6/2025 205,756 0.05%Daimler International Finance BV 200,000 0.88% 9/4/2024 205,633 0.05%Deutsche Telekom International Finance BV 200,000 0.63% 13/12/2024 205,163 0.05%Deutsche Kreditbank AG 200,000 0.63% 22/9/2023 204,866 0.05%Merck Financial Services GmbH 200,000 0.50% 16/7/2028 204,439 0.05%Muenchener Hypothekenbank eG 200,000 0.25% 13/12/2023 203,510 0.05%SAP SE 200,000 0.38% 18/5/2029 203,298 0.05%Hamburg Commercial Bank AG 200,000 0.38% 12/7/2023 203,269 0.05%Aroundtown SA 200,000 0.63% 9/7/2025 203,097 0.05%Commerzbank AG 200,000 0.50% 4/12/2026 202,987 0.05%Berlin Hyp AG 200,000 0.13% 5/1/2024 202,953 0.05%Commerzbank AG 200,000 0.13% 9/1/2024 202,885 0.05%Aareal Bank AG 200,000 0.01% 3/8/2026 202,862 0.05%Deutsche Bank AG^ 200,000 1.38% 17/2/2032 202,834 0.05%Landesbank Hessen-Thueringen Girozentrale 200,000 0.00% 3/7/2024 202,572 0.05%Allianz Finance II BV 200,000 0.25% 6/6/2023 202,027 0.05%Berlin Hyp AG 200,000 0.01% 7/7/2028 201,884 0.05%Deutsche Wohnen SE 200,000 0.50% 7/4/2031 201,602 0.05%Santander Consumer Bank AG 200,000 0.25% 15/10/2024 201,545 0.05%DZ HYP AG 200,000 0.01% 27/10/2028 201,517 0.05%Deutsche Bank AG^ 200,000 0.75% 17/2/2027 201,259 0.05%BMW Finance NV 200,000 0.00% 14/4/2023 201,200 0.05%Siemens Financieringsmaatschappij NV 200,000 0.00% 20/2/2023 201,179 0.05%Commerzbank AG 200,000 0.38% 1/9/2027 200,853 0.05%Continental AG 200,000 0.00% 12/9/2023 200,325 0.05%Commerzbank AG 200,000 0.10% 11/9/2025 200,249 0.05%BMW Finance NV 200,000 0.00% 11/1/2026 200,231 0.05%Commerzbank AG 200,000 0.01% 11/3/2030 199,986 0.05%Vantage Towers AG 200,000 0.75% 31/3/2030 199,639 0.05%UniCredit Bank AG 200,000 0.01% 10/3/2031 198,645 0.05%HOCHTIEF AG 200,000 0.63% 26/4/2029 196,094 0.05%BMW Finance NV 180,000 0.75% 13/7/2026 187,150 0.04%Siemens Financieringsmaatschappij NV 180,000 0.38% 6/9/2023 182,828 0.04%Fresenius Finance Ireland plc 150,000 3.00% 30/1/2032 182,116 0.04%Siemens Financieringsmaatschappij NV 170,000 0.00% 5/9/2024 171,035 0.04%BMW Finance NV 170,000 0.13% 13/7/2022 170,945 0.04%Commerzbank AG 150,000 1.25% 9/1/2034 168,269 0.04%Deutsche Telekom AG 150,000 1.75% 25/3/2031 168,161 0.04%BMW Finance NV 150,000 1.00% 14/11/2024 155,894 0.04%E.ON International Finance BV 100,000 5.75% 14/2/2033 154,175 0.04%Siemens Financieringsmaatschappij NV 150,000 0.13% 5/9/2029 149,755 0.03%Siemens Financieringsmaatschappij NV 132,000 0.30% 28/2/2024 134,016 0.03%Commerzbank AG 130,000 0.50% 28/8/2023 131,854 0.03%Fresenius SE & Co. KGaA 120,000 1.88% 15/2/2025 127,950 0.03%Volkswagen International Finance NV 100,000 3.25% 18/11/2030 122,875 0.03%Commerzbank AG 120,000 0.63% 28/8/2024 122,574 0.03%Robert Bosch Investment Nederland BV 100,000 2.63% 24/5/2028 117,760 0.03%Deutsche Pfandbriefbank AG 100,000 2.38% 29/5/2028 117,163 0.03%Fresenius SE & Co. KGaA 100,000 2.88% 15/2/2029 116,838 0.03%Deutsche Telekom AG 100,000 2.25% 29/3/2039 116,581 0.03%Daimler AG 100,000 2.13% 3/7/2037 115,487 0.03%Deutsche Telekom International Finance BV 100,000 2.00% 1/12/2029 113,672 0.03%BASF SE 100,000 1.45% 13/12/2032 112,199 0.03%Bertelsmann SE & Co. KGaA 100,000 2.00% 1/4/2028 111,317 0.03%Infineon Technologies AG 100,000 2.00% 24/6/2032 111,072 0.03%Allianz Finance II BV 100,000 1.50% 15/1/2030 111,050 0.03%ING-DiBa AG 100,000 1.00% 23/5/2039 109,687 0.03%Deutsche Bank AG 100,000 2.63% 12/2/2026 109,639 0.03%Allianz SE^ 100,000 3.38% Perpetual 109,028 0.03%Vier Gas Transport GmbH 100,000 1.50% 25/9/2028 108,915 0.03%Daimler AG 100,000 1.50% 3/7/2029 108,832 0.03%HeidelbergCement Finance Luxembourg SA 100,000 1.75% 24/4/2028 108,594 0.03%Deutsche Wohnen SE 100,000 1.50% 30/4/2030 107,918 0.03%SAP SE 100,000 1.25% 10/3/2028 107,652 0.03%DZ HYP AG 100,000 0.88% 17/4/2034 107,595 0.03%Deutsche Boerse AG 100,000 1.63% 8/10/2025 107,570 0.03%E.ON International Finance BV 100,000 1.63% 30/5/2026 107,358 0.03%Aroundtown SA 100,000 1.88% 19/1/2026 107,207 0.03%
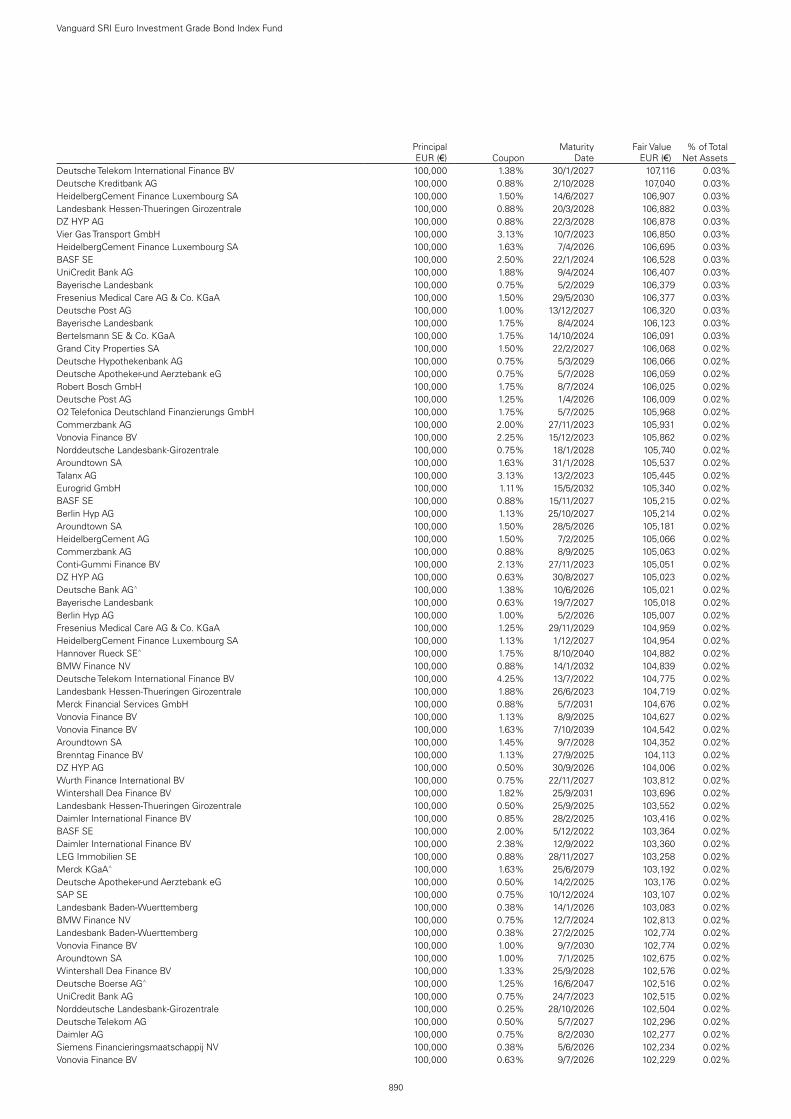
890
Vanguard SRI Euro Investment Grade Bond Index Fund
Principal EUR (€) Coupon
Maturity Date
Fair Value EUR (€)
% of Total Net Assets
Deutsche Telekom International Finance BV 100,000 1.38% 30/1/2027 107,116 0.03%Deutsche Kreditbank AG 100,000 0.88% 2/10/2028 107,040 0.03%HeidelbergCement Finance Luxembourg SA 100,000 1.50% 14/6/2027 106,907 0.03%Landesbank Hessen-Thueringen Girozentrale 100,000 0.88% 20/3/2028 106,882 0.03%DZ HYP AG 100,000 0.88% 22/3/2028 106,878 0.03%Vier Gas Transport GmbH 100,000 3.13% 10/7/2023 106,850 0.03%HeidelbergCement Finance Luxembourg SA 100,000 1.63% 7/4/2026 106,695 0.03%BASF SE 100,000 2.50% 22/1/2024 106,528 0.03%UniCredit Bank AG 100,000 1.88% 9/4/2024 106,407 0.03%Bayerische Landesbank 100,000 0.75% 5/2/2029 106,379 0.03%Fresenius Medical Care AG & Co. KGaA 100,000 1.50% 29/5/2030 106,377 0.03%Deutsche Post AG 100,000 1.00% 13/12/2027 106,320 0.03%Bayerische Landesbank 100,000 1.75% 8/4/2024 106,123 0.03%Bertelsmann SE & Co. KGaA 100,000 1.75% 14/10/2024 106,091 0.03%Grand City Properties SA 100,000 1.50% 22/2/2027 106,068 0.02%Deutsche Hypothekenbank AG 100,000 0.75% 5/3/2029 106,066 0.02%Deutsche Apotheker-und Aerztebank eG 100,000 0.75% 5/7/2028 106,059 0.02%Robert Bosch GmbH 100,000 1.75% 8/7/2024 106,025 0.02%Deutsche Post AG 100,000 1.25% 1/4/2026 106,009 0.02%O2 Telefonica Deutschland Finanzierungs GmbH 100,000 1.75% 5/7/2025 105,968 0.02%Commerzbank AG 100,000 2.00% 27/11/2023 105,931 0.02%Vonovia Finance BV 100,000 2.25% 15/12/2023 105,862 0.02%Norddeutsche Landesbank-Girozentrale 100,000 0.75% 18/1/2028 105,740 0.02%Aroundtown SA 100,000 1.63% 31/1/2028 105,537 0.02%Talanx AG 100,000 3.13% 13/2/2023 105,445 0.02%Eurogrid GmbH 100,000 1.11% 15/5/2032 105,340 0.02%BASF SE 100,000 0.88% 15/11/2027 105,215 0.02%Berlin Hyp AG 100,000 1.13% 25/10/2027 105,214 0.02%Aroundtown SA 100,000 1.50% 28/5/2026 105,181 0.02%HeidelbergCement AG 100,000 1.50% 7/2/2025 105,066 0.02%Commerzbank AG 100,000 0.88% 8/9/2025 105,063 0.02%Conti-Gummi Finance BV 100,000 2.13% 27/11/2023 105,051 0.02%DZ HYP AG 100,000 0.63% 30/8/2027 105,023 0.02%Deutsche Bank AG^ 100,000 1.38% 10/6/2026 105,021 0.02%Bayerische Landesbank 100,000 0.63% 19/7/2027 105,018 0.02%Berlin Hyp AG 100,000 1.00% 5/2/2026 105,007 0.02%Fresenius Medical Care AG & Co. KGaA 100,000 1.25% 29/11/2029 104,959 0.02%HeidelbergCement Finance Luxembourg SA 100,000 1.13% 1/12/2027 104,954 0.02%Hannover Rueck SE^ 100,000 1.75% 8/10/2040 104,882 0.02%BMW Finance NV 100,000 0.88% 14/1/2032 104,839 0.02%Deutsche Telekom International Finance BV 100,000 4.25% 13/7/2022 104,775 0.02%Landesbank Hessen-Thueringen Girozentrale 100,000 1.88% 26/6/2023 104,719 0.02%Merck Financial Services GmbH 100,000 0.88% 5/7/2031 104,676 0.02%Vonovia Finance BV 100,000 1.13% 8/9/2025 104,627 0.02%Vonovia Finance BV 100,000 1.63% 7/10/2039 104,542 0.02%Aroundtown SA 100,000 1.45% 9/7/2028 104,352 0.02%Brenntag Finance BV 100,000 1.13% 27/9/2025 104,113 0.02%DZ HYP AG 100,000 0.50% 30/9/2026 104,006 0.02%Wurth Finance International BV 100,000 0.75% 22/11/2027 103,812 0.02%Wintershall Dea Finance BV 100,000 1.82% 25/9/2031 103,696 0.02%Landesbank Hessen-Thueringen Girozentrale 100,000 0.50% 25/9/2025 103,552 0.02%Daimler International Finance BV 100,000 0.85% 28/2/2025 103,416 0.02%BASF SE 100,000 2.00% 5/12/2022 103,364 0.02%Daimler International Finance BV 100,000 2.38% 12/9/2022 103,360 0.02%LEG Immobilien SE 100,000 0.88% 28/11/2027 103,258 0.02%Merck KGaA^ 100,000 1.63% 25/6/2079 103,192 0.02%Deutsche Apotheker-und Aerztebank eG 100,000 0.50% 14/2/2025 103,176 0.02%SAP SE 100,000 0.75% 10/12/2024 103,107 0.02%Landesbank Baden-Wuerttemberg 100,000 0.38% 14/1/2026 103,083 0.02%BMW Finance NV 100,000 0.75% 12/7/2024 102,813 0.02%Landesbank Baden-Wuerttemberg 100,000 0.38% 27/2/2025 102,774 0.02%Vonovia Finance BV 100,000 1.00% 9/7/2030 102,774 0.02%Aroundtown SA 100,000 1.00% 7/1/2025 102,675 0.02%Wintershall Dea Finance BV 100,000 1.33% 25/9/2028 102,576 0.02%Deutsche Boerse AG^ 100,000 1.25% 16/6/2047 102,516 0.02%UniCredit Bank AG 100,000 0.75% 24/7/2023 102,515 0.02%Norddeutsche Landesbank-Girozentrale 100,000 0.25% 28/10/2026 102,504 0.02%Deutsche Telekom AG 100,000 0.50% 5/7/2027 102,296 0.02%Daimler AG 100,000 0.75% 8/2/2030 102,277 0.02%Siemens Financieringsmaatschappij NV 100,000 0.38% 5/6/2026 102,234 0.02%Vonovia Finance BV 100,000 0.63% 9/7/2026 102,229 0.02%

891
Vanguard SRI Euro Investment Grade Bond Index Fund
Principal EUR (€) Coupon
Maturity Date
Fair Value EUR (€)
% of Total Net Assets
Deutsche Hypothekenbank AG 100,000 0.25% 10/12/2024 102,228 0.02%Deutsche Bank AG^ 100,000 1.00% 19/11/2025 102,080 0.02%SAP SE 100,000 1.13% 20/2/2023 102,079 0.02%Fresenius SE & Co. KGaA 100,000 0.75% 15/1/2028 102,005 0.02%ING-DiBa AG 100,000 0.13% 23/5/2027 101,950 0.02%BMW Finance NV 100,000 0.38% 14/1/2027 101,883 0.02%Vonovia Finance BV 100,000 0.88% 3/7/2023 101,833 0.02%Deutsche Pfandbriefbank AG 100,000 0.25% 29/1/2024 101,753 0.02%Allianz Finance II BV 100,000 0.50% 14/1/2031 101,711 0.02%ING-DiBa AG 100,000 0.25% 9/10/2023 101,635 0.02%Deutsche Telekom International Finance BV 100,000 0.63% 3/4/2023 101,579 0.02%Deutsche Pfandbriefbank AG 100,000 0.75% 7/2/2023 101,528 0.02%Landesbank Baden-Wuerttemberg 100,000 0.01% 17/6/2026 101,451 0.02%Landesbank Hessen-Thueringen Girozentrale 100,000 0.01% 22/1/2025 101,430 0.02%Traton Finance Luxembourg SA 100,000 1.25% 24/3/2033 101,418 0.02%Deutsche Hypothekenbank AG 100,000 0.13% 23/11/2023 101,398 0.02%Deutsche Telekom International Finance BV 100,000 0.63% 1/12/2022 101,388 0.02%Deutsche Bank AG 100,000 0.25% 15/5/2023 101,348 0.02%Santander Consumer Bank AG 100,000 0.75% 17/10/2022 101,303 0.02%Siemens Financieringsmaatschappij NV 100,000 0.50% 20/2/2032 101,279 0.02%Deutsche Pfandbriefbank AG 100,000 0.25% 15/3/2023 101,248 0.02%Berlin Hyp AG 100,000 0.50% 26/9/2023 101,247 0.02%Berlin Hyp AG 100,000 0.25% 22/2/2023 101,243 0.02%E.ON SE 100,000 0.38% 29/9/2027 101,232 0.02%Landesbank Baden-Wuerttemberg 100,000 0.50% 4/8/2022 101,137 0.02%Deutsche Hypothekenbank AG 100,000 0.01% 18/2/2027 101,136 0.02%Allianz SE^ 100,000 1.30% 25/9/2049 101,127 0.02%Vonovia Finance BV 100,000 1.13% 14/9/2034 101,064 0.02%Traton Finance Luxembourg SA 100,000 0.75% 24/3/2029 101,053 0.02%Continental AG 100,000 0.38% 27/6/2025 101,032 0.02%SAP SE 100,000 0.13% 18/5/2026 101,026 0.02%Merck Financial Services GmbH 100,000 0.13% 16/7/2025 100,947 0.02%Wintershall Dea Finance BV 100,000 0.45% 25/9/2023 100,942 0.02%DZ HYP AG 100,000 0.01% 23/6/2028 100,893 0.02%Daimler International Finance BV 100,000 0.25% 6/11/2023 100,877 0.02%alstria office-AG 100,000 0.50% 26/9/2025 100,860 0.02%Landesbank Baden-Wuerttemberg 100,000 0.01% 18/9/2028 100,818 0.02%Fresenius Medical Care AG & Co. KGaA 100,000 0.25% 29/11/2023 100,810 0.02%E.ON SE 100,000 0.25% 24/10/2026 100,795 0.02%HeidelbergCement Finance Luxembourg SA 100,000 0.50% 9/8/2022 100,676 0.02%Deutsche Pfandbriefbank AG 100,000 0.05% 5/9/2022 100,647 0.02%Commerzbank AG 100,000 0.05% 1/8/2022 100,623 0.02%BMW Finance NV 100,000 0.00% 24/3/2023 100,553 0.02%Deutsche Apotheker-und Aerztebank eG 100,000 0.01% 6/2/2029 100,544 0.02%Merck Financial Services GmbH 100,000 0.01% 15/12/2023 100,544 0.02%HOCHTIEF AG 100,000 0.50% 3/9/2027 100,504 0.02%Hannover Rueck SE^ 100,000 1.38% 30/6/2042 100,496 0.02%Deutsche Pfandbriefbank AG 100,000 0.13% 5/9/2024 100,468 0.02%Daimler AG 100,000 0.75% 11/3/2033 100,461 0.02%Siemens Financieringsmaatschappij NV 100,000 0.00% 20/2/2026 100,454 0.02%Hannover Rueck SE^ 100,000 1.13% 9/10/2039 100,427 0.02%E.ON SE 100,000 0.00% 29/9/2022 100,404 0.02%E.ON SE 100,000 0.00% 28/8/2024 100,360 0.02%Volkswagen Leasing GmbH 100,000 0.38% 20/7/2026 100,326 0.02%Santander Consumer Bank AG 100,000 0.05% 14/2/2030 100,178 0.02%Deutsche Bank AG 100,000 0.01% 2/10/2029 100,121 0.02%Vonovia SE 100,000 0.38% 16/6/2027 100,113 0.02%Volkswagen Leasing GmbH 100,000 0.63% 19/7/2029 99,935 0.02%LEG Immobilien SE 100,000 0.75% 30/6/2031 99,915 0.02%Fresenius Finance Ireland plc 100,000 0.00% 1/10/2025 99,768 0.02%Fresenius Finance Ireland plc 100,000 0.88% 1/10/2031 99,642 0.02%Siemens Financieringsmaatschappij NV 100,000 0.50% 5/9/2034 99,471 0.02%E.ON SE 100,000 0.35% 28/2/2030 99,361 0.02%E.ON SE 100,000 0.60% 1/10/2032 99,124 0.02%Vier Gas Transport GmbH 100,000 0.13% 10/9/2029 97,905 0.02%Grand City Properties SA^ 100,000 1.50% Perpetual 97,767 0.02%Aroundtown SA 100,000 0.00% 16/7/2026 97,725 0.02%Grand City Properties SA 100,000 0.13% 11/1/2028 97,202 0.02%BMW Finance NV 100,000 0.20% 11/1/2033 96,295 0.02%Aroundtown SA^ 100,000 1.63% Perpetual 96,215 0.02%Vonovia Finance BV 100,000 1.00% 28/1/2041 93,182 0.02%
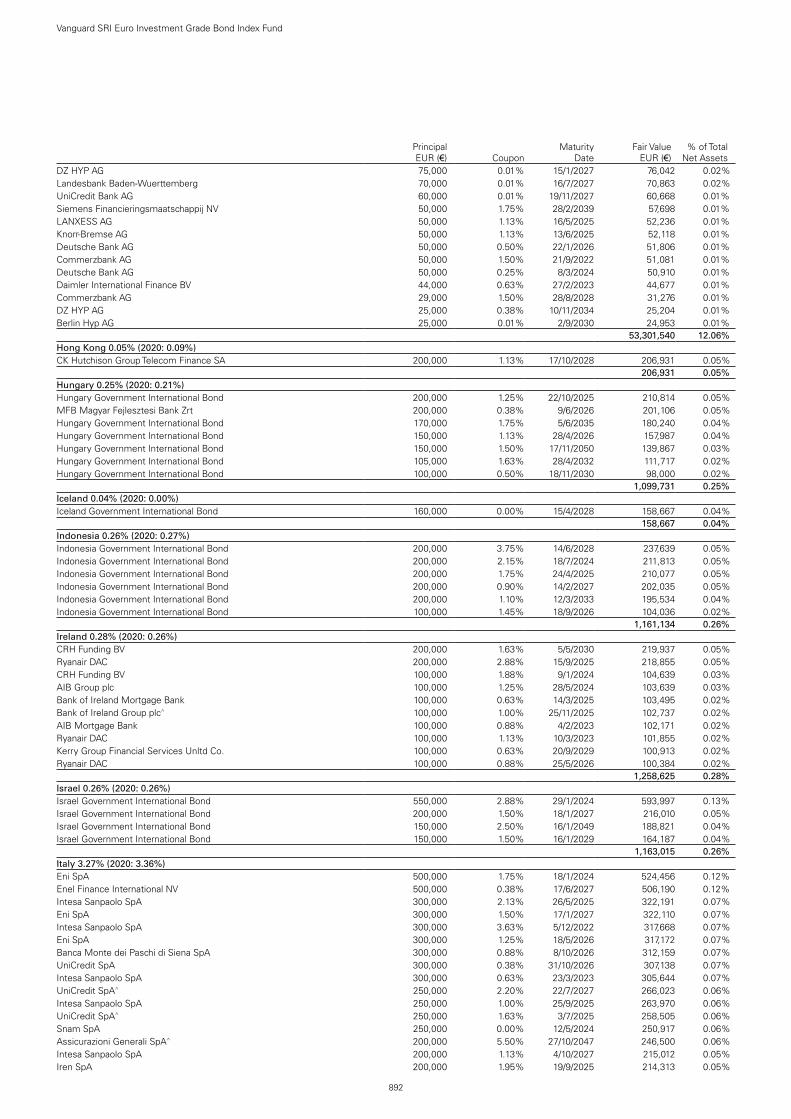
892
Vanguard SRI Euro Investment Grade Bond Index Fund
Principal EUR (€) Coupon
Maturity Date
Fair Value EUR (€)
% of Total Net Assets
DZ HYP AG 75,000 0.01% 15/1/2027 76,042 0.02%Landesbank Baden-Wuerttemberg 70,000 0.01% 16/7/2027 70,863 0.02%UniCredit Bank AG 60,000 0.01% 19/11/2027 60,668 0.01%Siemens Financieringsmaatschappij NV 50,000 1.75% 28/2/2039 57,698 0.01%LANXESS AG 50,000 1.13% 16/5/2025 52,236 0.01%Knorr-Bremse AG 50,000 1.13% 13/6/2025 52,118 0.01%Deutsche Bank AG 50,000 0.50% 22/1/2026 51,806 0.01%Commerzbank AG 50,000 1.50% 21/9/2022 51,081 0.01%Deutsche Bank AG 50,000 0.25% 8/3/2024 50,910 0.01%Daimler International Finance BV 44,000 0.63% 27/2/2023 44,677 0.01%Commerzbank AG 29,000 1.50% 28/8/2028 31,276 0.01%DZ HYP AG 25,000 0.38% 10/11/2034 25,204 0.01%Berlin Hyp AG 25,000 0.01% 2/9/2030 24,953 0.01%test - - - 53,301,540 12.06%Hong Kong 0.05% (2020: 0.09%)CK Hutchison Group Telecom Finance SA 200,000 1.13% 17/10/2028 206,931 0.05%test - - - 206,931 0.05%Hungary 0.25% (2020: 0.21%)Hungary Government International Bond 200,000 1.25% 22/10/2025 210,814 0.05%MFB Magyar Fejlesztesi Bank Zrt 200,000 0.38% 9/6/2026 201,106 0.05%Hungary Government International Bond 170,000 1.75% 5/6/2035 180,240 0.04%Hungary Government International Bond 150,000 1.13% 28/4/2026 157,987 0.04%Hungary Government International Bond 150,000 1.50% 17/11/2050 139,867 0.03%Hungary Government International Bond 105,000 1.63% 28/4/2032 111,717 0.02%Hungary Government International Bond 100,000 0.50% 18/11/2030 98,000 0.02%test - - - 1,099,731 0.25%Iceland 0.04% (2020: 0.00%)Iceland Government International Bond 160,000 0.00% 15/4/2028 158,667 0.04%test - - - 158,667 0.04%Indonesia 0.26% (2020: 0.27%)Indonesia Government International Bond 200,000 3.75% 14/6/2028 237,639 0.05%Indonesia Government International Bond 200,000 2.15% 18/7/2024 211,813 0.05%Indonesia Government International Bond 200,000 1.75% 24/4/2025 210,077 0.05%Indonesia Government International Bond 200,000 0.90% 14/2/2027 202,035 0.05%Indonesia Government International Bond 200,000 1.10% 12/3/2033 195,534 0.04%Indonesia Government International Bond 100,000 1.45% 18/9/2026 104,036 0.02%test - - - 1,161,134 0.26%Ireland 0.28% (2020: 0.26%)CRH Funding BV 200,000 1.63% 5/5/2030 219,937 0.05%Ryanair DAC 200,000 2.88% 15/9/2025 218,855 0.05%CRH Funding BV 100,000 1.88% 9/1/2024 104,639 0.03%AIB Group plc 100,000 1.25% 28/5/2024 103,639 0.03%Bank of Ireland Mortgage Bank 100,000 0.63% 14/3/2025 103,495 0.02%Bank of Ireland Group plc^ 100,000 1.00% 25/11/2025 102,737 0.02%AIB Mortgage Bank 100,000 0.88% 4/2/2023 102,171 0.02%Ryanair DAC 100,000 1.13% 10/3/2023 101,855 0.02%Kerry Group Financial Services Unltd Co. 100,000 0.63% 20/9/2029 100,913 0.02%Ryanair DAC 100,000 0.88% 25/5/2026 100,384 0.02%test - - - 1,258,625 0.28%Israel 0.26% (2020: 0.26%)Israel Government International Bond 550,000 2.88% 29/1/2024 593,997 0.13%Israel Government International Bond 200,000 1.50% 18/1/2027 216,010 0.05%Israel Government International Bond 150,000 2.50% 16/1/2049 188,821 0.04%Israel Government International Bond 150,000 1.50% 16/1/2029 164,187 0.04%test - - - 1,163,015 0.26%Italy 3.27% (2020: 3.36%)Eni SpA 500,000 1.75% 18/1/2024 524,456 0.12%Enel Finance International NV 500,000 0.38% 17/6/2027 506,190 0.12%Intesa Sanpaolo SpA 300,000 2.13% 26/5/2025 322,191 0.07%Eni SpA 300,000 1.50% 17/1/2027 322,110 0.07%Intesa Sanpaolo SpA 300,000 3.63% 5/12/2022 317,668 0.07%Eni SpA 300,000 1.25% 18/5/2026 317,172 0.07%Banca Monte dei Paschi di Siena SpA 300,000 0.88% 8/10/2026 312,159 0.07%UniCredit SpA 300,000 0.38% 31/10/2026 307,138 0.07%Intesa Sanpaolo SpA 300,000 0.63% 23/3/2023 305,644 0.07%UniCredit SpA^ 250,000 2.20% 22/7/2027 266,023 0.06%Intesa Sanpaolo SpA 250,000 1.00% 25/9/2025 263,970 0.06%UniCredit SpA^ 250,000 1.63% 3/7/2025 258,505 0.06%Snam SpA 250,000 0.00% 12/5/2024 250,917 0.06%Assicurazioni Generali SpA^ 200,000 5.50% 27/10/2047 246,500 0.06%Intesa Sanpaolo SpA 200,000 1.13% 4/10/2027 215,012 0.05%Iren SpA 200,000 1.95% 19/9/2025 214,313 0.05%

893
Vanguard SRI Euro Investment Grade Bond Index Fund
Principal EUR (€) Coupon
Maturity Date
Fair Value EUR (€)
% of Total Net Assets
Intesa Sanpaolo SpA 200,000 1.75% 4/7/2029 214,192 0.05%Eni SpA^ 200,000 2.63% Perpetual 210,116 0.05%Intesa Sanpaolo SpA 200,000 2.13% 30/8/2023 209,720 0.05%UniCredit SpA 200,000 2.00% 4/3/2023 207,100 0.05%Credit Agricole Italia SpA 200,000 0.25% 30/9/2024 203,671 0.05%Banco BPM SpA 200,000 0.88% 14/9/2022 203,071 0.05%Eni SpA 200,000 0.63% 23/1/2030 201,514 0.05%Enel Finance International NV 200,000 0.00% 17/6/2024 201,230 0.05%Intesa Sanpaolo SpA 200,000 0.75% 16/3/2028 201,073 0.05%2i Rete Gas SpA 205,000 0.58% 29/1/2031 201,002 0.05%UniCredit SpA 200,000 0.33% 19/1/2026 199,684 0.05%Mediobanca Banca di Credito Finanziario SpA 200,000 0.01% 3/2/2031 197,564 0.05%UniCredit SpA 200,000 0.85% 19/1/2031 196,519 0.05%Enel Finance International NV 150,000 0.00% 17/6/2027 148,333 0.03%UniCredit SpA^ 140,000 1.25% 16/6/2026 144,827 0.03%Assicurazioni Generali SpA 110,000 2.43% 14/7/2031 118,436 0.03%Assicurazioni Generali SpA 100,000 3.88% 29/1/2029 118,064 0.03%Assicurazioni Generali SpA 100,000 4.13% 4/5/2026 117,216 0.03%Eni SpA 100,000 3.75% 12/9/2025 115,821 0.03%Eni SpA 100,000 2.00% 18/5/2031 112,759 0.03%Credit Agricole Italia SpA 100,000 1.63% 21/3/2029 112,616 0.03%Covivio 100,000 2.38% 20/2/2028 111,119 0.03%Mediobanca Banca di Credito Finanziario SpA 100,000 1.25% 24/11/2029 110,235 0.03%Intesa Sanpaolo SpA 100,000 4.00% 30/10/2023 109,595 0.03%Enel SpA^ 100,000 3.50% 24/5/2080 109,292 0.03%Banca Monte dei Paschi di Siena SpA 100,000 2.88% 16/7/2024 109,185 0.03%2i Rete Gas SpA 100,000 3.00% 16/7/2024 109,112 0.03%2i Rete Gas SpA 100,000 2.20% 11/9/2025 108,053 0.03%Intesa Sanpaolo SpA 100,000 1.13% 16/6/2027 107,784 0.03%Intesa Sanpaolo SpA 100,000 1.75% 20/3/2028 106,845 0.03%Terna SPA 100,000 1.38% 26/7/2027 106,724 0.03%Credit Agricole Italia SpA 100,000 1.00% 25/3/2027 106,593 0.03%Eni SpA^ 100,000 3.38% Perpetual 106,227 0.03%ERG SpA 100,000 1.88% 11/4/2025 106,171 0.02%Intesa Sanpaolo SpA 100,000 1.13% 14/7/2025 105,955 0.02%Banca Monte dei Paschi di Siena SpA 100,000 2.00% 29/1/2024 105,801 0.02%Credit Agricole Italia SpA 100,000 1.13% 21/3/2025 105,322 0.02%Enel Finance International NV 100,000 1.13% 16/9/2026 105,209 0.02%Snam SpA 100,000 1.25% 28/8/2025 104,923 0.02%Enel SpA^ 100,000 2.50% Perpetual 104,764 0.02%Mediobanca Banca di Credito Finanziario SpA 100,000 1.13% 12/8/2024 104,716 0.02%Enel SpA^ 100,000 2.25% Perpetual 104,632 0.02%Terna SPA 100,000 1.00% 10/4/2026 104,514 0.02%Enel Finance International NV 100,000 1.13% 17/10/2034 104,406 0.02%Mediobanca Banca di Credito Finanziario SpA 100,000 0.50% 1/10/2026 103,957 0.02%Mediobanca Banca di Credito Finanziario SpA 100,000 1.13% 15/7/2025 103,627 0.02%Banco di Desio e della Brianza SpA 100,000 0.88% 12/9/2024 103,520 0.02%Banco BPM SpA 100,000 1.13% 25/9/2023 103,441 0.02%Intesa Sanpaolo SpA 100,000 1.00% 4/7/2024 102,980 0.02%Intesa Sanpaolo SpA 100,000 0.50% 15/7/2024 102,704 0.02%Terna SPA 100,000 1.00% 23/7/2023 102,651 0.02%Intesa Sanpaolo SpA 100,000 0.50% 5/3/2024 102,510 0.02%Credit Agricole Italia SpA 100,000 0.88% 16/6/2023 102,468 0.02%Mediobanca Banca di Credito Finanziario SpA 100,000 0.88% 15/1/2026 102,407 0.02%Eni SpA 100,000 1.00% 11/10/2034 102,365 0.02%Intesa Sanpaolo SpA 100,000 1.00% 27/1/2023 102,274 0.02%Credit Agricole Italia SpA 100,000 0.25% 17/1/2028 102,238 0.02%Italgas SpA 100,000 1.00% 11/12/2031 101,964 0.02%Snam SpA 100,000 0.75% 17/6/2030 101,506 0.02%FCA Bank SpA 100,000 0.50% 13/9/2024 101,379 0.02%Intesa Sanpaolo SpA 100,000 1.00% 22/7/2022 101,324 0.02%Intesa Sanpaolo SpA 100,000 0.75% 17/10/2022 101,281 0.02%UniCredit SpA 100,000 0.50% 9/4/2025 101,079 0.02%FCA Bank SpA 100,000 0.50% 18/9/2023 101,078 0.02%Snam SpA 100,000 1.00% 12/9/2034 100,938 0.02%Mediobanca Banca di Credito Finanziario SpA 100,000 0.75% 15/7/2027 100,716 0.02%FCA Bank SpA 100,000 0.25% 28/2/2023 100,568 0.02%FCA Bank SpA 100,000 0.13% 16/11/2023 100,316 0.02%UniCredit SpA^ 100,000 0.80% 5/7/2029 100,211 0.02%FCA Bank SpA 100,000 0.00% 16/4/2024 99,983 0.02%Eni SpA^ 100,000 2.00% Perpetual 99,982 0.02%

894
Vanguard SRI Euro Investment Grade Bond Index Fund
Principal EUR (€) Coupon
Maturity Date
Fair Value EUR (€)
% of Total Net Assets
Terna SPA 100,000 0.75% 24/7/2032 99,982 0.02%Enel Finance International NV 100,000 0.88% 17/6/2036 99,288 0.02%Enel SpA 100,000 1.38% 8/9/2169 98,763 0.02%Enel SpA^ 100,000 1.88% Perpetual 98,430 0.02%Italgas SpA 100,000 0.00% 16/2/2028 97,354 0.02%Italgas SpA 100,000 0.50% 16/2/2033 95,632 0.02%Terna SPA 50,000 4.90% 28/10/2024 58,289 0.01%test - - - 14,438,878 3.27%Japan 1.32% (2020: 1.53%)Sumitomo Mitsui Trust Bank Ltd. 500,000 0.01% 15/10/2027 497,774 0.11%Development Bank of Japan, Inc. 400,000 0.01% 15/10/2024 403,650 0.09%Sumitomo Mitsui Banking Corp. 400,000 0.01% 10/9/2025 402,556 0.09%Mizuho Financial Group, Inc. 400,000 0.12% 6/9/2024 402,406 0.09%Takeda Pharmaceutical Co., Ltd. 300,000 3.00% 21/11/2030 359,606 0.08%Development Bank of Japan, Inc. 200,000 4.75% 26/11/2027 260,196 0.06%Takeda Pharmaceutical Co., Ltd. 200,000 1.00% 9/7/2029 206,602 0.05%Mitsubishi UFJ Financial Group, Inc. 200,000 0.98% 9/6/2024 206,570 0.05%Sumitomo Mitsui Banking Corp. 200,000 0.55% 6/11/2023 203,958 0.05%Takeda Pharmaceutical Co., Ltd. 200,000 1.13% 21/11/2022 203,755 0.05%Asahi Group Holdings Ltd. 200,000 0.54% 23/10/2028 201,583 0.05%Mizuho Financial Group, Inc. 200,000 0.40% 6/9/2029 197,417 0.05%Nissan Motor Co., Ltd. 100,000 3.20% 17/9/2028 113,212 0.03%Takeda Pharmaceutical Co., Ltd. 100,000 2.25% 21/11/2026 110,515 0.03%Nissan Motor Co., Ltd. 100,000 2.65% 17/3/2026 109,009 0.03%Takeda Pharmaceutical Co., Ltd. 100,000 2.00% 9/7/2040 107,638 0.03%Sumitomo Mitsui Financial Group, Inc. 100,000 1.55% 15/6/2026 106,832 0.03%Development Bank of Japan, Inc. 100,000 0.88% 10/10/2025 104,328 0.03%Takeda Pharmaceutical Co., Ltd. 100,000 1.38% 9/7/2032 104,206 0.02%Nissan Motor Co., Ltd. 100,000 1.94% 15/9/2023 104,164 0.02%Mizuho Financial Group, Inc. 100,000 1.02% 11/10/2023 102,745 0.02%Mitsubishi UFJ Financial Group, Inc. 100,000 0.98% 9/10/2023 102,686 0.02%American Honda Finance Corp. 100,000 1.38% 10/11/2022 102,386 0.02%American Honda Finance Corp. 100,000 0.75% 17/1/2024 102,232 0.02%Sumitomo Mitsui Financial Group, Inc. 100,000 0.82% 23/7/2023 102,140 0.02%Toyota Motor Finance Netherlands BV 100,000 0.63% 26/9/2023 101,977 0.02%Sumitomo Mitsui Banking Corp. 100,000 0.41% 7/11/2029 101,868 0.02%Mizuho Financial Group, Inc. 100,000 0.80% 15/4/2030 101,751 0.02%Sumitomo Mitsui Financial Group, Inc. 100,000 0.63% 23/10/2029 100,637 0.02%Asahi Group Holdings Ltd. 100,000 0.34% 19/4/2027 100,433 0.02%Mizuho Financial Group, Inc. 100,000 0.69% 7/10/2030 100,392 0.02%Asahi Group Holdings Ltd. 100,000 0.01% 19/4/2024 100,262 0.02%Nidec Corp. 100,000 0.05% 30/3/2026 99,992 0.02%NTT Finance Corp. 100,000 0.34% 3/3/2030 99,686 0.02%test - - - 5,825,164 1.32%Kazakhstan 0.08% (2020: 0.06%)Kazakhstan Government International Bond 230,000 0.60% 30/9/2026 229,826 0.05%Kazakhstan Government International Bond 110,000 1.55% 9/11/2023 113,746 0.03%test - - - 343,572 0.08%Luxembourg 0.47% (2020: 0.47%)Prologis International Funding II SA 200,000 2.38% 14/11/2030 231,283 0.05%Blackstone Property Partners Europe Holdings Sarl 200,000 2.00% 15/2/2024 208,408 0.05%Logicor Financing Sarl 200,000 0.88% 14/1/2031 193,434 0.05%Logicor Financing Sarl 100,000 3.25% 13/11/2028 116,279 0.03%Blackstone Property Partners Europe Holdings Sarl 100,000 2.20% 24/7/2025 106,808 0.03%Logicor Financing Sarl 100,000 1.50% 13/7/2026 105,105 0.03%SELP Finance Sarl 100,000 1.25% 25/10/2023 102,617 0.03%SES SA 100,000 0.88% 4/11/2027 102,386 0.02%Blackstone Property Partners Europe Holdings Sarl 100,000 1.25% 26/4/2027 102,198 0.02%Logicor Financing Sarl 100,000 1.50% 14/11/2022 101,817 0.02%NORD/LB Luxembourg SA Covered Bond Bank 100,000 0.38% 7/3/2024 101,718 0.02%Logicor Financing Sarl 100,000 0.75% 15/7/2024 101,670 0.02%NORD/LB Luxembourg SA Covered Bond Bank 100,000 0.38% 15/6/2023 101,337 0.02%NORD/LB Luxembourg SA Covered Bond Bank 100,000 0.05% 28/1/2025 100,773 0.02%Blackstone Property Partners Europe Holdings Sarl 100,000 1.00% 4/5/2028 99,540 0.02%Eurofins Scientific SE 100,000 0.88% 19/5/2031 99,251 0.02%Bevco Lux Sarl 100,000 1.00% 16/1/2030 99,108 0.02%test - - - 2,073,732 0.47%Mexico 0.53% (2020: 0.59%)Mexico Government International Bond 450,000 1.63% 8/4/2026 474,791 0.11%Mexico Government International Bond 220,000 1.45% 25/10/2033 210,100 0.05%Mexico Government International Bond 200,000 1.75% 17/4/2028 209,990 0.05%

895
Vanguard SRI Euro Investment Grade Bond Index Fund
Principal EUR (€) Coupon
Maturity Date
Fair Value EUR (€)
% of Total Net Assets
Mexico Government International Bond 200,000 1.63% 6/3/2024 208,411 0.05%Mexico Government International Bond 200,000 2.88% 8/4/2039 208,143 0.05%Mexico Government International Bond 200,000 1.13% 17/1/2030 196,452 0.04%Mexico Government International Bond 222,000 2.13% 25/10/2051 187,319 0.04%Mexico Government International Bond 100,000 3.38% 23/2/2031 116,180 0.03%America Movil SAB de CV^ 100,000 6.38% 6/9/2073 112,829 0.03%America Movil SAB de CV 100,000 2.13% 10/3/2028 110,983 0.02%Mexico Government International Bond 100,000 4.00% 15/3/2115 107,737 0.02%Mexico Government International Bond 100,000 1.35% 18/9/2027 103,622 0.02%America Movil SAB de CV 100,000 0.75% 26/6/2027 102,069 0.02%test - - - 2,348,626 0.53%Netherlands 3.85% (2020: 4.16%)ABN AMRO Bank NV 800,000 0.38% 14/1/2035 805,013 0.18%NN Group NV^ 400,000 4.63% 8/4/2044 445,925 0.10%Nationale-Nederlanden Levensverzekering Maatschappij NV^ 400,000 9.00% 29/8/2042 441,538 0.10%Cooperatieve Rabobank UA 400,000 0.88% 1/2/2029 428,260 0.10%ABN AMRO Bank NV 300,000 1.13% 12/1/2032 330,565 0.08%EXOR NV 300,000 1.75% 18/1/2028 322,846 0.07%ABN AMRO Bank NV 300,000 0.50% 15/4/2026 307,987 0.07%Cooperatieve Rabobank UA 300,000 0.75% 29/8/2023 306,412 0.07%ABN AMRO Bank NV 300,000 0.60% 15/1/2027 304,597 0.07%de Volksbank NV 300,000 0.01% 16/9/2024 301,838 0.07%ING Groep NV^ 300,000 0.10% 3/9/2025 300,567 0.07%ING Groep NV^ 300,000 0.25% 18/2/2029 294,040 0.07%ABN AMRO Bank NV 200,000 1.25% 10/1/2033 223,624 0.05%Akzo Nobel NV 200,000 1.63% 14/4/2030 219,514 0.05%ABN AMRO Bank NV 200,000 1.00% 13/4/2031 217,698 0.05%Cooperatieve Rabobank UA 200,000 1.38% 3/2/2027 215,557 0.05%Cooperatieve Rabobank UA 200,000 1.25% 23/3/2026 212,951 0.05%ING Groep NV^ 200,000 2.13% 26/5/2031 212,667 0.05%Signify NV 200,000 2.00% 11/5/2024 210,647 0.05%ABN AMRO Bank NV 200,000 1.25% 28/5/2025 208,999 0.05%ING Bank NV 200,000 1.88% 22/5/2023 208,991 0.05%ING Groep NV 200,000 1.00% 20/9/2023 205,531 0.05%NIBC Bank NV 200,000 1.13% 19/4/2023 204,504 0.05%Koninklijke KPN NV 200,000 0.63% 9/4/2025 203,963 0.05%Cooperatieve Rabobank UA 200,000 0.25% 31/5/2024 203,941 0.05%Nationale-Nederlanden Bank NV 200,000 0.38% 26/2/2025 203,070 0.05%Koninklijke Ahold Delhaize NV 200,000 0.25% 26/6/2025 202,091 0.05%Koninklijke DSM NV 200,000 0.25% 23/6/2028 200,948 0.05%Nationale-Nederlanden Bank NV 200,000 0.01% 8/7/2030 199,179 0.05%Danfoss Finance I BV 200,000 0.38% 28/10/2028 198,432 0.05%de Volksbank NV 200,000 0.38% 3/3/2028 197,875 0.05%ING Groep NV^ 200,000 0.25% 1/2/2030 194,346 0.04%NN Group NV^ 100,000 4.63% 13/1/2048 119,125 0.03%ASR Nederland NV^ 100,000 5.13% 29/9/2045 118,074 0.03%Cooperatieve Rabobank UA 100,000 1.50% 26/4/2038 117,214 0.03%ABN AMRO Bank NV 100,000 1.45% 12/4/2038 116,349 0.03%Heineken NV 100,000 2.25% 30/3/2030 115,716 0.03%NN Group NV^ 100,000 4.50% Perpetual 114,384 0.03%ABN AMRO Bank NV 100,000 1.38% 10/1/2034 113,628 0.03%Koninklijke Philips NV 100,000 2.00% 30/3/2030 113,338 0.03%Heineken NV 100,000 1.75% 17/3/2031 111,726 0.03%Cooperatieve Rabobank UA 100,000 1.25% 31/5/2032 111,450 0.03%ABN AMRO Bank NV 100,000 1.13% 23/4/2039 111,308 0.03%Signify NV 100,000 2.38% 11/5/2027 110,849 0.03%Achmea BV^ 100,000 4.25% Perpetual 110,377 0.03%Heineken NV 100,000 3.50% 19/3/2024 110,049 0.03%Achmea BV^ 100,000 6.00% 4/4/2043 109,983 0.03%Heineken NV 100,000 1.50% 3/10/2029 109,114 0.03%ING Groep NV 100,000 2.13% 10/1/2026 109,072 0.03%ASML Holding NV 100,000 1.63% 28/5/2027 108,898 0.03%Vesteda Finance BV 100,000 2.00% 10/7/2026 108,755 0.03%ABN AMRO Bank NV 100,000 2.38% 23/1/2024 107,282 0.03%NIBC Bank NV 100,000 1.00% 11/9/2028 107,189 0.03%Heineken NV 100,000 1.75% 7/5/2040 106,996 0.03%ING Bank NV 100,000 0.88% 11/4/2028 106,994 0.03%ASML Holding NV 100,000 1.38% 7/7/2026 106,889 0.02%Cooperatieve Rabobank UA 100,000 1.13% 7/5/2031 106,758 0.02%ING Bank NV 100,000 0.75% 18/2/2029 106,300 0.02%Heineken NV 100,000 1.25% 17/3/2027 106,222 0.02%

896
Vanguard SRI Euro Investment Grade Bond Index Fund
Principal EUR (€) Coupon
Maturity Date
Fair Value EUR (€)
% of Total Net Assets
ING Groep NV^ 100,000 2.50% 15/2/2029 105,727 0.02%Van Lanschot Kempen Wealth Management NV 100,000 0.88% 15/2/2027 105,533 0.02%Wolters Kluwer NV 100,000 2.88% 21/3/2023 105,401 0.02%Heineken NV 100,000 1.50% 7/12/2024 105,261 0.02%Koninklijke Philips NV 100,000 1.38% 30/3/2025 105,109 0.02%Cooperatieve Rabobank UA 100,000 4.13% 14/9/2022 105,099 0.02%Heineken NV 100,000 1.25% 7/5/2033 105,069 0.02%Euronext NV 100,000 1.13% 12/6/2029 104,823 0.02%Cooperatieve Rabobank UA 100,000 0.75% 21/6/2039 104,583 0.02%NIBC Bank NV 100,000 2.00% 9/4/2024 104,412 0.02%Cooperatieve Rabobank UA 100,000 0.63% 26/4/2026 104,378 0.02%Koninklijke DSM NV 100,000 1.00% 9/4/2025 104,166 0.02%ING Groep NV 100,000 1.13% 14/2/2025 104,034 0.02%ABN AMRO Bank NV 100,000 0.88% 22/4/2025 103,937 0.02%LeasePlan Corp. NV 100,000 1.38% 7/3/2024 103,932 0.02%ING Groep NV^ 100,000 1.63% 26/9/2029 103,708 0.02%Cooperatieve Rabobank UA^ 100,000 0.88% 5/5/2028 103,651 0.02%de Volksbank NV 100,000 0.50% 30/1/2026 103,574 0.02%NIBC Bank NV 100,000 0.50% 19/3/2027 103,573 0.02%Akzo Nobel NV 100,000 2.63% 27/7/2022 103,251 0.02%Koninklijke KPN NV 100,000 1.13% 11/9/2028 103,221 0.02%ABN AMRO Bank NV 100,000 0.88% 15/1/2024 102,900 0.02%Nationale-Nederlanden Bank NV 100,000 0.50% 10/10/2024 102,757 0.02%Koninklijke Philips NV 100,000 0.50% 22/5/2026 102,444 0.02%Aegon Bank NV 100,000 0.38% 21/11/2024 102,339 0.02%LeasePlan Corp. NV 100,000 1.00% 2/5/2023 102,220 0.02%de Volksbank NV 100,000 0.75% 25/6/2023 101,918 0.02%Nationale-Nederlanden Bank NV 100,000 0.25% 27/2/2024 101,681 0.02%ABN AMRO Bank NV 100,000 0.50% 17/7/2023 101,665 0.02%Van Lanschot Kempen Wealth Management NV 100,000 0.38% 31/3/2023 101,391 0.02%Cooperatieve Rabobank UA 100,000 0.50% 6/12/2022 101,373 0.02%ING Groep NV^ 100,000 1.00% 13/11/2030 101,338 0.02%Koninklijke DSM NV 100,000 0.63% 23/6/2032 101,328 0.02%Cooperatieve Rabobank UA 100,000 0.25% 30/10/2026 101,207 0.02%Cooperatieve Rabobank UA 100,000 0.00% 21/6/2027 101,142 0.02%Euronext NV 100,000 1.50% 17/5/2041 101,130 0.02%LeasePlan Corp. NV 100,000 0.13% 13/9/2023 100,581 0.02%ABN AMRO Bank NV 100,000 1.00% 2/6/2033 100,390 0.02%JDE Peet's NV 100,000 1.13% 16/6/2033 100,289 0.02%Euronext NV 100,000 0.13% 17/5/2026 100,244 0.02%Enel Finance International NV 100,000 0.50% 17/6/2030 99,985 0.02%Wolters Kluwer NV 100,000 0.25% 30/3/2028 99,856 0.02%Cooperatieve Rabobank UA 100,000 0.63% 25/2/2033 99,613 0.02%ASML Holding NV 100,000 0.25% 25/2/2030 99,559 0.02%de Volksbank NV 100,000 0.25% 22/6/2026 99,480 0.02%NIBC Bank NV 100,000 0.01% 15/10/2029 99,361 0.02%JDE Peet's NV 100,000 0.50% 16/1/2029 99,348 0.02%Koninklijke Ahold Delhaize NV 100,000 0.38% 18/3/2030 99,288 0.02%EXOR NV 100,000 0.88% 19/1/2031 99,115 0.02%Nationale-Nederlanden Bank NV 100,000 0.38% 4/3/2041 97,540 0.02%Nationale-Nederlanden Bank NV 100,000 0.05% 24/9/2035 95,754 0.02%Cooperatieve Rabobank UA 100,000 0.01% 27/11/2040 90,508 0.02%test - - - 17,028,341 3.85%New Zealand 0.25% (2020: 0.28%)BNZ International Funding Ltd. 200,000 0.50% 3/7/2024 205,039 0.05%Westpac Securities NZ Ltd. 200,000 0.50% 17/1/2024 204,596 0.05%Auckland Council 200,000 0.13% 26/9/2029 198,817 0.05%ANZ New Zealand Int'l Ltd. 100,000 0.50% 17/1/2024 102,143 0.02%Westpac Securities NZ Ltd. 100,000 0.30% 25/6/2024 101,472 0.02%ANZ New Zealand Int'l Ltd. 100,000 0.13% 22/9/2023 101,147 0.02%ASB Finance Ltd. 100,000 0.13% 18/10/2023 101,128 0.02%ANZ New Zealand Int'l Ltd. 100,000 0.38% 17/9/2029 100,895 0.02%test - - - 1,115,237 0.25%Norway 1.91% (2020: 1.89%)DNB Boligkreditt A.S. 500,000 0.63% 14/1/2026 520,508 0.12%DNB Boligkreditt A.S. 500,000 0.01% 8/10/2027 504,846 0.12%SR-Boligkreditt A.S. 500,000 0.01% 10/3/2031 494,059 0.11%SpareBank 1 Boligkreditt A.S. 400,000 1.00% 30/1/2029 431,421 0.10%Equinor A.S.A 400,000 1.25% 17/2/2027 425,551 0.10%DNB Boligkreditt A.S. 400,000 0.01% 12/5/2028 402,706 0.09%SpareBank 1 Boligkreditt A.S. 400,000 0.13% 12/5/2031 399,432 0.09%

897
Vanguard SRI Euro Investment Grade Bond Index Fund
Principal EUR (€) Coupon
Maturity Date
Fair Value EUR (€)
% of Total Net Assets
Telenor A.S.A 350,000 0.25% 14/2/2028 350,527 0.08%DNB Bank A.S.A 300,000 0.60% 25/9/2023 305,970 0.07%Sparebanken Vest Boligkreditt A.S. 300,000 0.01% 24/11/2025 303,756 0.07%Equinor A.S.A 200,000 0.75% 22/5/2026 207,465 0.05%SpareBank 1 Boligkreditt A.S. 200,000 0.38% 26/6/2024 204,649 0.05%Sparebanken Vest Boligkreditt A.S. 200,000 0.38% 14/2/2024 204,208 0.05%DNB Boligkreditt A.S. 200,000 0.25% 23/1/2023 202,302 0.05%Kommunalbanken A.S. 200,000 0.05% 24/10/2029 199,829 0.05%Santander Consumer Bank A.S. 200,000 0.13% 14/4/2026 198,981 0.05%DNB Bank A.S.A^ 200,000 0.25% 23/2/2029 197,319 0.05%SpareBank 1 Boligkreditt A.S. 150,000 0.13% 14/5/2026 152,805 0.04%DNB Bank A.S.A 150,000 0.05% 14/11/2023 151,229 0.03%Telenor A.S.A 100,000 2.50% 22/5/2025 110,078 0.03%Equinor A.S.A 100,000 1.63% 17/2/2035 109,942 0.03%Statkraft A.S. 100,000 1.50% 26/3/2030 109,666 0.03%Equinor A.S.A 100,000 1.38% 22/5/2032 108,142 0.03%Kommunalbanken A.S. 100,000 0.63% 20/4/2026 104,231 0.02%Eika Boligkreditt A.S. 100,000 2.13% 30/1/2023 104,152 0.02%Avinor A.S. 100,000 1.00% 29/4/2025 103,948 0.02%Sparebanken Vest Boligkreditt A.S. 100,000 0.50% 12/2/2026 103,489 0.02%Sparebanken Soer Boligkreditt A.S. 100,000 0.50% 6/2/2026 103,407 0.02%Telenor A.S.A 100,000 0.75% 31/5/2026 103,388 0.02%Eika Boligkreditt A.S. 100,000 0.50% 28/8/2025 103,305 0.02%Statnett SF 100,000 0.88% 8/3/2025 103,275 0.02%SpareBank 1 SR-Bank A.S.A 100,000 0.63% 25/3/2024 102,058 0.02%Sparebank 1 Oestlandet 100,000 0.88% 13/3/2023 102,019 0.02%DNB Boligkreditt A.S. 100,000 0.38% 14/11/2023 101,925 0.02%DNB Bank A.S.A^ 100,000 1.13% 20/3/2028 101,865 0.02%Santander Consumer Bank A.S. 100,000 0.75% 1/3/2023 101,639 0.02%Telenor A.S.A 100,000 0.88% 14/2/2035 101,508 0.02%Sparebanken Soer Boligkreditt A.S. 100,000 0.38% 20/2/2023 101,384 0.02%DNB Boligkreditt A.S. 100,000 0.25% 18/4/2023 101,300 0.02%Eika Boligkreditt A.S. 100,000 0.01% 12/3/2027 101,046 0.02%Sparebanken Vest Boligkreditt A.S. 100,000 0.13% 15/3/2023 101,035 0.02%Sparebanken Vest Boligkreditt A.S. 100,000 0.01% 28/6/2027 100,972 0.02%SpareBank 1 Boligkreditt A.S. 100,000 0.13% 5/11/2029 100,776 0.02%Santander Consumer Bank A.S. 100,000 0.13% 25/2/2025 100,150 0.02%test - - - 8,442,263 1.91%Peru 0.05% (2020: 0.03%)Peruvian Government International Bond 100,000 3.75% 1/3/2030 120,133 0.03%Peruvian Government International Bond 100,000 1.25% 11/3/2033 97,279 0.02%test - - - 217,412 0.05%Philippines 0.09% (2020: 0.05%)Philippine Government International Bond 200,000 1.20% 28/4/2033 199,976 0.05%Philippine Government International Bond 100,000 0.88% 17/5/2027 101,798 0.02%Philippine Government International Bond 100,000 0.25% 28/4/2025 100,381 0.02%test - - - 402,155 0.09%Poland 0.64% (2020: 0.70%)Republic of Poland Government International Bond 800,000 0.00% 10/2/2025 806,763 0.18%Republic of Poland Government International Bond 300,000 3.00% 15/1/2024 325,881 0.07%Republic of Poland Government International Bond 300,000 0.88% 10/5/2027 316,903 0.07%Republic of Poland Government International Bond 250,000 2.38% 18/1/2036 303,721 0.07%Republic of Poland Government International Bond 241,000 0.00% 7/7/2023 242,825 0.06%Republic of Poland Government International Bond 230,000 4.50% 18/1/2022 236,183 0.05%Bank Gospodarstwa Krajowego 100,000 1.63% 30/4/2028 109,362 0.03%Bank Gospodarstwa Krajowego 100,000 1.75% 6/5/2026 108,331 0.03%Republic of Poland Government International Bond 100,000 3.75% 19/1/2023 106,559 0.03%Republic of Poland Government International Bond 80,000 2.00% 8/3/2049 98,572 0.02%Republic of Poland Government International Bond 50,000 5.25% 20/1/2025 59,847 0.01%Republic of Poland Government International Bond 50,000 1.13% 7/8/2026 53,254 0.01%Republic of Poland Government International Bond 35,000 2.00% 25/10/2046 43,177 0.01%test - - - 2,811,378 0.64%Portugal 0.38% (2020: 0.43%)EDP Finance BV 350,000 2.00% 22/4/2025 376,593 0.09%EDP Finance BV 200,000 1.63% 26/1/2026 213,910 0.05%Banco Santander Totta SA 200,000 0.88% 25/4/2024 206,895 0.05%EDP Finance BV 125,000 1.50% 22/11/2027 134,365 0.03%Brisa Concessao Rodoviaria SA 100,000 2.38% 10/5/2027 112,185 0.03%Banco Santander Totta SA 100,000 1.25% 26/9/2027 108,798 0.03%Ren Finance BV 100,000 1.75% 18/1/2028 108,598 0.02%EDP-Energias de Portugal SA 100,000 1.63% 15/4/2027 107,521 0.02%

898
Vanguard SRI Euro Investment Grade Bond Index Fund
Principal EUR (€) Coupon
Maturity Date
Fair Value EUR (€)
% of Total Net Assets
EDP Finance BV 100,000 1.13% 12/2/2024 103,331 0.02%EDP Finance BV 100,000 0.38% 16/9/2026 101,021 0.02%Caixa Economica Montepio Geral Caixa Economica Bancaria SA 100,000 0.13% 14/11/2024 100,939 0.02%test - - - 1,674,156 0.38%Romania 1.00% (2020: 0.85%)Romanian Government International Bond 550,000 3.63% 24/4/2024 606,285 0.14%Romanian Government International Bond 470,000 2.75% 26/2/2026 520,583 0.12%Romanian Government International Bond 280,000 3.62% 26/5/2030 324,153 0.07%Romanian Government International Bond 250,000 3.88% 29/10/2035 293,723 0.07%Romanian Government International Bond 250,000 1.38% 2/12/2029 249,458 0.06%Romanian Government International Bond 195,000 2.88% 26/5/2028 217,763 0.05%Romanian Government International Bond 200,000 2.75% 14/4/2041 199,062 0.05%Romanian Government International Bond 155,000 4.63% 3/4/2049 196,561 0.04%Romanian Government International Bond 190,000 2.63% 2/12/2040 188,685 0.04%Romanian Government International Bond 170,000 3.38% 8/2/2038 186,340 0.04%Romanian Government International Bond 180,000 2.00% 14/4/2033 178,701 0.04%Romanian Government International Bond 150,000 2.38% 19/4/2027 164,052 0.04%Romanian Government International Bond 155,000 2.12% 16/7/2031 160,042 0.04%NE Property BV 100,000 3.38% 14/7/2027 111,061 0.03%Romanian Government International Bond 100,000 2.88% 28/10/2024 109,250 0.02%Globalworth Real Estate Investments Ltd. 100,000 2.95% 29/7/2026 108,379 0.02%Romanian Government International Bond 100,000 2.50% 8/2/2030 107,435 0.02%Romanian Government International Bond 100,000 3.38% 28/1/2050 106,764 0.02%NE Property BV 100,000 2.63% 22/5/2023 103,937 0.02%Romanian Government International Bond 70,000 4.13% 11/3/2039 82,950 0.02%Romanian Government International Bond 70,000 2.88% 11/3/2029 77,556 0.02%Romanian Government International Bond 50,000 3.50% 3/4/2034 57,000 0.01%Romanian Government International Bond 50,000 2.00% 8/12/2026 53,833 0.01%Romanian Government International Bond 30,000 2.00% 28/1/2032 30,347 0.01%test - - - 4,433,920 1.00%Russia 0.30% (2020: 0.26%)Russian Foreign Bond-Eurobond 400,000 2.88% 4/12/2025 437,128 0.10%Gazprom PJSC Via Gaz Capital SA 300,000 3.13% 17/11/2023 316,602 0.07%Gazprom PJSC via Gaz Finance plc 150,000 1.50% 17/2/2027 149,763 0.04%Gazprom PJSC Via Gaz Capital SA 100,000 2.50% 21/3/2026 104,770 0.03%Russian Foreign Bond-Eurobond 100,000 2.65% 27/5/2036 101,433 0.02%Russian Foreign Bond - Eurobond 100,000 1.13% 20/11/2027 99,447 0.02%Russian Foreign Bond-Eurobond 100,000 1.85% 20/11/2032 97,653 0.02%test - - - 1,306,796 0.30%Saudi Arabia 0.16% (2020: 0.09%)Saudi Government International Bond 200,000 0.75% 9/7/2027 204,544 0.05%Saudi Government International Bond 200,000 0.63% 3/3/2030 196,763 0.05%Saudi Government International Bond 180,000 0.00% 3/3/2024 179,689 0.04%Saudi Government International Bond 100,000 2.00% 9/7/2039 103,287 0.02%test - - - 684,283 0.16%Singapore 0.17% (2020: 0.22%)United Overseas Bank Ltd. 300,000 0.25% 11/9/2023 304,277 0.07%Temasek Financial I Ltd. 150,000 0.50% 20/11/2031 150,697 0.04%Oversea-Chinese Banking Corp., Ltd. 100,000 0.63% 18/4/2025 103,339 0.02%DBS Bank Ltd. 100,000 0.38% 23/1/2024 101,852 0.02%Ascendas 100,000 0.75% 23/6/2028 99,925 0.02%test - - - 760,090 0.17%Slovakia 0.07% (2020: 0.03%)Vseobecna Uverova Banka A.S. 200,000 0.01% 24/3/2026 201,779 0.05%Granvia A.S. 79,698 4.78% 30/9/2039 101,510 0.02%test - - - 303,289 0.07%South Africa 0.05% (2020: 0.06%)Anglo American Capital plc 100,000 1.63% 18/9/2025 106,154 0.03%Anglo American Capital plc 100,000 1.63% 11/3/2026 106,018 0.02%test - - - 212,172 0.05%South Korea 0.41% (2020: 0.33%)Hana Bank 400,000 0.01% 26/1/2026 402,774 0.09%Kookmin Bank 300,000 0.05% 15/7/2025 302,864 0.07%Korea Housing Finance Corp. 300,000 0.01% 5/2/2025 302,280 0.07%Korea Housing Finance Corp. 200,000 0.01% 7/7/2025 201,412 0.05%Korea International Bond 100,000 2.13% 10/6/2024 106,901 0.03%Korea Housing Finance Corp. 100,000 0.75% 30/10/2023 102,373 0.02%Korea Development Bank 100,000 0.63% 17/7/2023 101,794 0.02%Export-Import Bank of Korea 100,000 0.38% 26/3/2024 101,687 0.02%LG Chem Ltd. 100,000 0.50% 15/4/2023 100,924 0.02%Korea International Bond 100,000 0.00% 16/9/2025 100,542 0.02%test - - - 1,823,551 0.41%
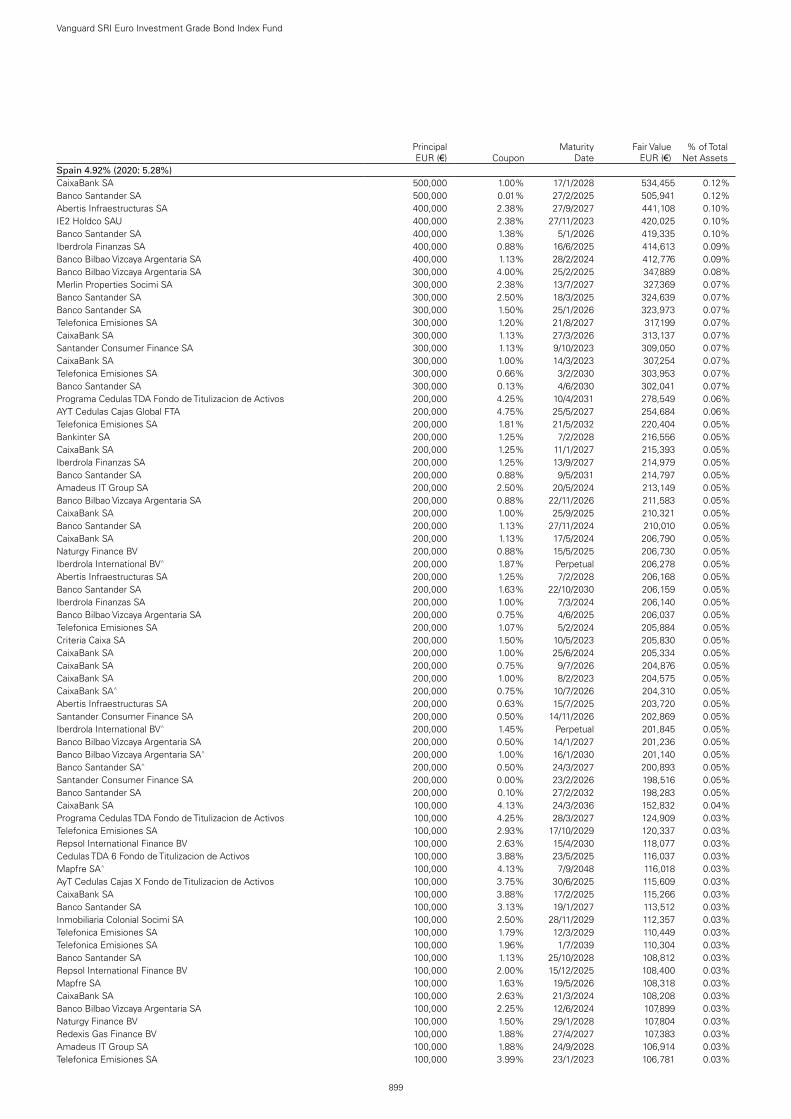
899
Vanguard SRI Euro Investment Grade Bond Index Fund
Principal EUR (€) Coupon
Maturity Date
Fair Value EUR (€)
% of Total Net Assets
Spain 4.92% (2020: 5.28%)CaixaBank SA 500,000 1.00% 17/1/2028 534,455 0.12%Banco Santander SA 500,000 0.01% 27/2/2025 505,941 0.12%Abertis Infraestructuras SA 400,000 2.38% 27/9/2027 441,108 0.10%IE2 Holdco SAU 400,000 2.38% 27/11/2023 420,025 0.10%Banco Santander SA 400,000 1.38% 5/1/2026 419,335 0.10%Iberdrola Finanzas SA 400,000 0.88% 16/6/2025 414,613 0.09%Banco Bilbao Vizcaya Argentaria SA 400,000 1.13% 28/2/2024 412,776 0.09%Banco Bilbao Vizcaya Argentaria SA 300,000 4.00% 25/2/2025 347,889 0.08%Merlin Properties Socimi SA 300,000 2.38% 13/7/2027 327,369 0.07%Banco Santander SA 300,000 2.50% 18/3/2025 324,639 0.07%Banco Santander SA 300,000 1.50% 25/1/2026 323,973 0.07%Telefonica Emisiones SA 300,000 1.20% 21/8/2027 317,199 0.07%CaixaBank SA 300,000 1.13% 27/3/2026 313,137 0.07%Santander Consumer Finance SA 300,000 1.13% 9/10/2023 309,050 0.07%CaixaBank SA 300,000 1.00% 14/3/2023 307,254 0.07%Telefonica Emisiones SA 300,000 0.66% 3/2/2030 303,953 0.07%Banco Santander SA 300,000 0.13% 4/6/2030 302,041 0.07%Programa Cedulas TDA Fondo de Titulizacion de Activos 200,000 4.25% 10/4/2031 278,549 0.06%AYT Cedulas Cajas Global FTA 200,000 4.75% 25/5/2027 254,684 0.06%Telefonica Emisiones SA 200,000 1.81% 21/5/2032 220,404 0.05%Bankinter SA 200,000 1.25% 7/2/2028 216,556 0.05%CaixaBank SA 200,000 1.25% 11/1/2027 215,393 0.05%Iberdrola Finanzas SA 200,000 1.25% 13/9/2027 214,979 0.05%Banco Santander SA 200,000 0.88% 9/5/2031 214,797 0.05%Amadeus IT Group SA 200,000 2.50% 20/5/2024 213,149 0.05%Banco Bilbao Vizcaya Argentaria SA 200,000 0.88% 22/11/2026 211,583 0.05%CaixaBank SA 200,000 1.00% 25/9/2025 210,321 0.05%Banco Santander SA 200,000 1.13% 27/11/2024 210,010 0.05%CaixaBank SA 200,000 1.13% 17/5/2024 206,790 0.05%Naturgy Finance BV 200,000 0.88% 15/5/2025 206,730 0.05%Iberdrola International BV^ 200,000 1.87% Perpetual 206,278 0.05%Abertis Infraestructuras SA 200,000 1.25% 7/2/2028 206,168 0.05%Banco Santander SA 200,000 1.63% 22/10/2030 206,159 0.05%Iberdrola Finanzas SA 200,000 1.00% 7/3/2024 206,140 0.05%Banco Bilbao Vizcaya Argentaria SA 200,000 0.75% 4/6/2025 206,037 0.05%Telefonica Emisiones SA 200,000 1.07% 5/2/2024 205,884 0.05%Criteria Caixa SA 200,000 1.50% 10/5/2023 205,830 0.05%CaixaBank SA 200,000 1.00% 25/6/2024 205,334 0.05%CaixaBank SA 200,000 0.75% 9/7/2026 204,876 0.05%CaixaBank SA 200,000 1.00% 8/2/2023 204,575 0.05%CaixaBank SA^ 200,000 0.75% 10/7/2026 204,310 0.05%Abertis Infraestructuras SA 200,000 0.63% 15/7/2025 203,720 0.05%Santander Consumer Finance SA 200,000 0.50% 14/11/2026 202,869 0.05%Iberdrola International BV^ 200,000 1.45% Perpetual 201,845 0.05%Banco Bilbao Vizcaya Argentaria SA 200,000 0.50% 14/1/2027 201,236 0.05%Banco Bilbao Vizcaya Argentaria SA^ 200,000 1.00% 16/1/2030 201,140 0.05%Banco Santander SA^ 200,000 0.50% 24/3/2027 200,893 0.05%Santander Consumer Finance SA 200,000 0.00% 23/2/2026 198,516 0.05%Banco Santander SA 200,000 0.10% 27/2/2032 198,283 0.05%CaixaBank SA 100,000 4.13% 24/3/2036 152,832 0.04%Programa Cedulas TDA Fondo de Titulizacion de Activos 100,000 4.25% 28/3/2027 124,909 0.03%Telefonica Emisiones SA 100,000 2.93% 17/10/2029 120,337 0.03%Repsol International Finance BV 100,000 2.63% 15/4/2030 118,077 0.03%Cedulas TDA 6 Fondo de Titulizacion de Activos 100,000 3.88% 23/5/2025 116,037 0.03%Mapfre SA^ 100,000 4.13% 7/9/2048 116,018 0.03%AyT Cedulas Cajas X Fondo de Titulizacion de Activos 100,000 3.75% 30/6/2025 115,609 0.03%CaixaBank SA 100,000 3.88% 17/2/2025 115,266 0.03%Banco Santander SA 100,000 3.13% 19/1/2027 113,512 0.03%Inmobiliaria Colonial Socimi SA 100,000 2.50% 28/11/2029 112,357 0.03%Telefonica Emisiones SA 100,000 1.79% 12/3/2029 110,449 0.03%Telefonica Emisiones SA 100,000 1.96% 1/7/2039 110,304 0.03%Banco Santander SA 100,000 1.13% 25/10/2028 108,812 0.03%Repsol International Finance BV 100,000 2.00% 15/12/2025 108,400 0.03%Mapfre SA 100,000 1.63% 19/5/2026 108,318 0.03%CaixaBank SA 100,000 2.63% 21/3/2024 108,208 0.03%Banco Bilbao Vizcaya Argentaria SA 100,000 2.25% 12/6/2024 107,899 0.03%Naturgy Finance BV 100,000 1.50% 29/1/2028 107,804 0.03%Redexis Gas Finance BV 100,000 1.88% 27/4/2027 107,383 0.03%Amadeus IT Group SA 100,000 1.88% 24/9/2028 106,914 0.03%Telefonica Emisiones SA 100,000 3.99% 23/1/2023 106,781 0.03%

900
Vanguard SRI Euro Investment Grade Bond Index Fund
Principal EUR (€) Coupon
Maturity Date
Fair Value EUR (€)
% of Total Net Assets
Telefonica Emisiones SA 100,000 1.46% 13/4/2026 106,776 0.03%Telefonica Emisiones SA 100,000 1.45% 22/1/2027 106,713 0.02%Merlin Properties Socimi SA 100,000 1.88% 2/11/2026 106,612 0.02%Naturgy Finance BV 100,000 1.38% 19/1/2027 106,503 0.02%Red Electrica Financiaciones SAU 100,000 1.25% 13/3/2027 106,479 0.02%Abertis Infraestructuras SA 100,000 1.88% 26/3/2032 106,462 0.02%Kutxabank SA 100,000 1.25% 22/9/2025 106,247 0.02%Inmobiliaria Colonial Socimi SA 100,000 1.63% 28/11/2025 106,082 0.02%Redexis Gas Finance BV 100,000 1.88% 28/5/2025 106,022 0.02%AYT Cedulas Cajas Global FTA 100,000 3.75% 14/12/2022 105,999 0.02%Iberdrola International BV 100,000 1.13% 21/4/2026 105,684 0.02%Abanca Corp. Bancaria SA 100,000 0.75% 28/5/2029 105,566 0.02%Banco Bilbao Vizcaya Argentaria SA^ 100,000 2.58% 22/2/2029 105,406 0.02%Naturgy Finance BV 100,000 1.25% 15/1/2026 105,338 0.02%Naturgy Finance BV 100,000 1.25% 19/4/2026 105,325 0.02%Naturgy Finance BV 100,000 1.38% 21/1/2025 105,051 0.02%Enagas Financiaciones SA 100,000 1.25% 6/2/2025 104,939 0.02%Inmobiliaria Colonial Socimi SA 100,000 1.35% 14/10/2028 104,850 0.02%CaixaBank SA^ 100,000 2.25% 17/4/2030 104,791 0.02%CaixaBank SA 100,000 1.38% 19/6/2026 104,509 0.02%CaixaBank SA^ 100,000 2.75% 14/7/2028 104,433 0.02%CaixaBank SA 100,000 1.75% 24/10/2023 104,168 0.02%Banco de Sabadell SA 100,000 1.63% 7/3/2024 104,083 0.02%Enagas Financiaciones SA 100,000 0.75% 27/10/2026 103,895 0.02%Deutsche Bank SA Espanola 100,000 0.88% 16/1/2025 103,885 0.02%Iberdrola International BV^ 100,000 2.25% Perpetual 103,393 0.02%Santander Consumer Finance SA 100,000 1.00% 27/2/2024 102,905 0.02%Banco de Sabadell SA 100,000 0.63% 10/6/2024 102,860 0.02%Banco de Sabadell SA^ 100,000 1.13% 11/3/2027 102,792 0.02%Abertis Infraestructuras SA 100,000 1.00% 27/2/2027 102,696 0.02%Cajamar Caja Rural SCC 100,000 0.88% 18/6/2023 102,344 0.02%Deutsche Bank SA Espanola 100,000 0.50% 11/3/2024 102,195 0.02%Banco Santander SA 100,000 0.25% 10/7/2029 102,178 0.02%Caja Rural de Navarra SCC 100,000 0.63% 1/12/2023 102,087 0.02%Banco de Sabadell SA 100,000 0.88% 22/7/2025 102,017 0.02%CaixaBank SA 100,000 1.13% 12/1/2023 102,000 0.02%Banco Bilbao Vizcaya Argentaria SA 100,000 0.63% 18/3/2023 101,824 0.02%CaixaBank SA 100,000 1.13% 5/8/2022 101,713 0.02%FCC Servicios Medio Ambiente Holding SAU 100,000 0.82% 4/12/2023 101,677 0.02%Red Electrica Financiaciones SAU 100,000 0.38% 24/7/2028 101,661 0.02%CaixaBank SA 100,000 0.63% 1/10/2024 101,600 0.02%Criteria Caixa SA 100,000 0.88% 28/10/2027 101,429 0.02%Santander Consumer Finance SA 100,000 0.38% 17/1/2025 101,201 0.02%Banco de Sabadell SA 100,000 0.13% 20/10/2023 101,174 0.02%Banco de Sabadell SA 100,000 0.13% 10/2/2028 101,160 0.02%Banco Santander SA 100,000 0.25% 19/6/2024 101,049 0.02%Banco de Sabadell SA^ 100,000 0.63% 7/11/2025 100,822 0.02%Banco Santander SA 100,000 0.30% 4/10/2026 100,770 0.02%Ferrovial Emisiones SA 100,000 0.38% 14/9/2022 100,727 0.02%CaixaBank SA^ 100,000 1.25% 18/6/2031 100,679 0.02%CaixaBank SA^ 100,000 0.75% 26/5/2028 100,598 0.02%Ferrovial Emisiones SA 100,000 0.54% 12/11/2028 100,573 0.02%Iberdrola International BV^ 100,000 1.83% Perpetual 100,500 0.02%Banco Santander SA 100,000 0.50% 4/2/2027 100,394 0.02%Repsol International Finance BV 100,000 0.25% 2/8/2027 100,370 0.02%Bankinter SA^ 100,000 1.25% 23/12/2032 100,232 0.02%Merlin Properties Socimi SA 100,000 1.38% 1/6/2030 99,249 0.02%Banco Santander SA 100,000 0.20% 11/2/2028 99,187 0.02%Inmobiliaria Colonial Socimi SA 100,000 0.75% 22/6/2029 99,082 0.02%NorteGas Energia Distribucion SA 100,000 0.91% 22/1/2031 98,725 0.02%CaixaBank SA^ 100,000 0.50% 9/2/2029 98,522 0.02%test - - - 21,743,224 4.92%Supranational 16.36% (2020: 14.46%)European Investment Bank 2,250,000 0.00% 23/5/2023 2,275,257 0.51%European Union 2,050,000 0.00% 4/7/2031 2,045,546 0.46%European Financial Stability Facility 1,780,000 0.00% 19/4/2024 1,804,262 0.41%European Financial Stability Facility 1,400,000 0.00% 15/10/2025 1,423,879 0.32%European Investment Bank 1,300,000 0.00% 17/6/2027 1,322,213 0.30%European Union 1,220,000 0.00% 2/6/2028 1,238,615 0.28%European Financial Stability Facility 1,125,000 0.88% 10/4/2035 1,210,443 0.27%European Investment Bank 1,040,000 0.00% 25/3/2025 1,057,990 0.24%

901
Vanguard SRI Euro Investment Grade Bond Index Fund
Principal EUR (€) Coupon
Maturity Date
Fair Value EUR (€)
% of Total Net Assets
European Investment Bank 1,020,000 0.05% 16/1/2030 1,030,700 0.23%European Union 990,000 0.00% 4/10/2030 992,719 0.22%European Investment Bank 900,000 2.13% 15/1/2024 961,998 0.22%European Investment Bank 900,000 0.20% 15/7/2024 920,071 0.21%European Investment Bank 895,000 0.10% 15/10/2026 916,842 0.21%European Financial Stability Facility 900,000 0.00% 24/4/2023 909,572 0.21%European Union 930,000 0.20% 4/6/2036 907,372 0.21%European Financial Stability Facility 780,000 1.20% 17/2/2045 879,945 0.20%European Union 965,000 0.30% 4/11/2050 876,935 0.20%European Investment Bank 850,000 0.05% 24/5/2024 864,598 0.20%European Investment Bank 800,000 0.63% 22/1/2029 846,931 0.19%European Union 815,000 0.00% 4/7/2035 778,645 0.18%European Union 760,000 0.00% 4/11/2025 774,721 0.18%European Stability Mechanism 760,000 0.00% 15/12/2026 772,518 0.17%European Stability Mechanism 760,000 0.00% 10/2/2023 767,063 0.17%European Investment Bank 760,000 0.00% 14/1/2031 759,305 0.17%European Union 820,000 0.10% 4/10/2040 758,991 0.17%European Investment Bank 700,000 0.38% 16/7/2025 723,281 0.16%European Financial Stability Facility 650,000 0.75% 3/5/2027 688,529 0.16%European Financial Stability Facility 630,000 0.95% 14/2/2028 678,626 0.15%European Stability Mechanism 525,000 1.80% 2/11/2046 678,438 0.15%European Union 680,000 0.25% 22/4/2036 667,082 0.15%European Union 575,000 1.25% 4/4/2033 646,074 0.15%European Financial Stability Facility 520,000 1.70% 13/2/2043 638,519 0.14%European Union 655,000 0.45% 2/5/2046 631,727 0.14%European Investment Bank 575,000 1.00% 14/3/2031 631,175 0.14%European Union 610,000 0.00% 4/3/2026 621,958 0.14%European Financial Stability Facility 600,000 0.50% 11/7/2025 621,623 0.14%European Investment Bank 600,000 0.00% 28/3/2028 608,568 0.14%European Stability Mechanism 575,000 0.10% 31/7/2023 582,620 0.13%European Investment Bank 500,000 2.75% 15/9/2025 567,588 0.13%European Investment Bank 575,000 0.20% 17/3/2036 563,099 0.13%European Stability Mechanism 550,000 0.00% 14/3/2025 558,695 0.13%European Investment Bank 550,000 0.00% 16/10/2023 557,138 0.13%European Union 521,000 0.50% 4/4/2025 540,164 0.12%European Union 515,000 0.75% 4/1/2047 529,750 0.12%European Stability Mechanism 520,000 0.00% 16/12/2024 528,409 0.12%European Investment Bank 500,000 2.25% 14/10/2022 518,652 0.12%European Financial Stability Facility 400,000 1.80% 10/7/2048 515,903 0.12%European Financial Stability Facility 508,000 0.00% 13/10/2027 514,837 0.12%European Investment Bank 500,000 0.13% 15/4/2025 511,183 0.12%European Financial Stability Facility 510,000 0.00% 20/1/2031 509,282 0.12%European Financial Stability Facility 500,000 0.20% 17/1/2024 508,996 0.12%European Financial Stability Facility 500,000 0.00% 20/7/2026 508,551 0.12%European Investment Bank 450,000 0.88% 14/1/2028 483,341 0.11%European Financial Stability Facility 475,000 0.70% 20/1/2050 482,201 0.11%European Investment Bank 450,000 0.50% 15/1/2027 470,919 0.11%European Financial Stability Facility 380,000 1.45% 5/9/2040 444,426 0.10%European Investment Bank 400,000 1.13% 13/4/2033 444,041 0.10%European Financial Stability Facility 330,000 1.75% 17/7/2053 430,900 0.10%International Bank for Reconstruction & Development 425,000 0.00% 21/2/2030 425,147 0.10%European Financial Stability Facility 355,000 1.38% 31/5/2047 416,005 0.09%European Investment Bank 400,000 0.38% 14/4/2026 414,742 0.09%European Financial Stability Facility 400,000 0.40% 17/2/2025 411,935 0.09%European Union 400,000 0.63% 4/11/2023 411,269 0.09%European Financial Stability Facility 400,000 0.38% 11/10/2024 410,887 0.09%European Stability Mechanism 400,000 0.13% 22/4/2024 407,137 0.09%European Financial Stability Facility 400,000 0.50% 20/1/2023 406,920 0.09%European Financial Stability Facility 400,000 0.00% 17/11/2022 403,330 0.09%European Stability Mechanism 400,000 0.01% 15/10/2031 397,777 0.09%European Investment Bank 410,000 0.01% 15/11/2035 392,621 0.09%European Stability Mechanism 350,000 1.20% 23/5/2033 392,145 0.09%European Investment Bank 395,000 0.05% 13/10/2034 384,016 0.09%European Union 350,000 0.75% 4/4/2031 375,054 0.08%European Stability Mechanism 350,000 0.50% 5/3/2029 366,763 0.08%European Financial Stability Facility 350,000 0.40% 26/1/2026 362,208 0.08%European Stability Mechanism 325,000 1.13% 3/5/2032 360,946 0.08%Asian Development Bank 350,000 0.20% 25/5/2023 354,685 0.08%European Financial Stability Facility 350,000 0.05% 17/10/2029 353,358 0.08%European Union 300,000 2.50% 4/11/2027 353,005 0.08%European Stability Mechanism 350,000 0.01% 4/3/2030 351,508 0.08%

902
Vanguard SRI Euro Investment Grade Bond Index Fund
Principal EUR (€) Coupon
Maturity Date
Fair Value EUR (€)
% of Total Net Assets
European Investment Bank 365,000 0.25% 15/6/2040 350,718 0.08%European Financial Stability Facility 250,000 2.35% 29/7/2044 346,090 0.08%European Union 250,000 3.38% 4/4/2032 336,734 0.08%European Stability Mechanism 314,000 0.75% 5/9/2028 334,780 0.08%European Stability Mechanism 255,000 1.75% 20/10/2045 324,602 0.07%European Investment Bank 200,000 3.63% 14/3/2042 323,896 0.07%European Financial Stability Facility 300,000 2.13% 19/2/2024 320,971 0.07%European Financial Stability Facility 300,000 1.75% 27/6/2024 320,336 0.07%European Stability Mechanism 230,000 1.85% 1/12/2055 316,519 0.07%African Development Bank 300,000 0.13% 7/10/2026 305,942 0.07%European Union 300,000 0.70% 6/7/2051 303,571 0.07%European Stability Mechanism 300,000 0.00% 18/10/2022 302,232 0.07%European Investment Bank 300,000 0.00% 9/9/2030 300,456 0.07%European Financial Stability Facility 200,000 3.88% 30/3/2032 282,092 0.06%European Financial Stability Facility 250,000 1.25% 24/5/2033 281,794 0.06%European Stability Mechanism 260,000 0.88% 18/7/2042 277,827 0.06%European Financial Stability Facility 200,000 3.00% 4/9/2034 271,858 0.06%European Investment Bank 220,000 1.50% 16/10/2048 270,228 0.06%European Investment Bank 260,000 0.50% 13/11/2037 266,786 0.06%European Financial Stability Facility 250,000 0.63% 16/10/2026 262,392 0.06%Council Of Europe Development Bank 250,000 0.00% 9/4/2027 254,505 0.06%Council Of Europe Development Bank 250,000 0.00% 15/4/2028 253,827 0.06%European Financial Stability Facility 250,000 0.00% 17/7/2023 252,740 0.06%European Union 250,000 0.00% 4/7/2029 252,638 0.06%European Investment Bank 225,000 1.13% 15/9/2036 250,364 0.06%International Development Association 250,000 0.35% 22/4/2036 248,010 0.06%European Investment Bank 196,000 1.75% 15/9/2045 247,237 0.06%European Investment Bank 200,000 3.50% 15/4/2027 245,053 0.06%European Investment Bank 200,000 1.50% 15/11/2047 244,589 0.06%European Union 150,000 3.75% 4/4/2042 243,639 0.06%European Financial Stability Facility 170,000 2.00% 28/2/2056 238,715 0.05%European Stability Mechanism 200,000 1.63% 17/11/2036 237,745 0.05%African Development Bank 225,000 0.50% 21/3/2029 233,834 0.05%European Investment Bank 200,000 1.13% 15/11/2032 222,739 0.05%European Investment Bank 200,000 1.00% 14/4/2032 220,069 0.05%European Financial Stability Facility 200,000 0.88% 26/7/2027 213,557 0.05%European Stability Mechanism 200,000 0.75% 15/3/2027 211,874 0.05%European Stability Mechanism 200,000 1.00% 23/9/2025 211,867 0.05%European Investment Bank 150,000 2.75% 15/3/2040 211,627 0.05%European Financial Stability Facility 200,000 1.88% 23/5/2023 209,382 0.05%European Investment Bank 200,000 3.00% 28/9/2022 209,078 0.05%European Investment Bank 200,000 0.88% 13/9/2024 208,967 0.05%European Stability Mechanism 200,000 0.50% 2/3/2026 208,117 0.05%European Financial Stability Facility 200,000 0.40% 31/5/2026 207,480 0.05%International Bank for Reconstruction & Development 239,000 0.13% 3/1/2051 206,586 0.05%European Union 200,000 0.00% 6/7/2026 203,884 0.05%Nordic Investment Bank 200,000 0.13% 10/6/2024 203,740 0.05%European Investment Bank 200,000 0.05% 15/12/2023 203,072 0.05%European Investment Bank 200,000 0.00% 15/3/2024 202,997 0.05%European Investment Bank 150,000 2.63% 15/3/2035 196,913 0.04%EUROFIMA 200,000 0.15% 10/10/2034 192,856 0.04%International Bank for Reconstruction & Development 190,000 0.00% 15/1/2027 192,835 0.04%International Bank for Reconstruction & Development 225,000 0.20% 21/1/2061 188,553 0.04%Council Of Europe Development Bank 175,000 0.13% 25/5/2023 177,281 0.04%European Union 150,000 1.50% 4/10/2035 174,333 0.04%European Investment Bank 100,000 4.00% 15/10/2037 157,850 0.04%International Bank for Reconstruction & Development 150,000 0.63% 12/1/2033 157,430 0.04%Council Of Europe Development Bank 150,000 0.38% 8/6/2026 155,536 0.04%European Financial Stability Facility 185,000 0.05% 18/1/2052 154,961 0.03%International Bank for Reconstruction & Development 159,000 0.10% 17/9/2035 153,878 0.03%International Bank for Reconstruction & Development 150,000 0.25% 21/5/2029 153,720 0.03%European Investment Bank 150,000 0.13% 20/6/2029 152,977 0.03%Asian Development Bank 150,000 0.03% 31/1/2030 150,174 0.03%European Investment Bank 175,000 0.05% 27/1/2051 148,484 0.03%European Union 120,000 2.88% 4/4/2028 145,298 0.03%European Investment Bank 134,000 0.88% 13/9/2047 143,356 0.03%Council Of Europe Development Bank 130,000 0.38% 27/10/2022 131,639 0.03%Corp. Andina de Fomento 130,000 0.25% 4/2/2026 129,929 0.03%Asian Development Bank 125,000 0.00% 24/10/2029 125,139 0.03%European Financial Stability Facility 100,000 2.75% 3/12/2029 123,891 0.03%European Investment Bank 125,000 0.01% 15/5/2041 114,209 0.03%

903
Vanguard SRI Euro Investment Grade Bond Index Fund
Principal EUR (€) Coupon
Maturity Date
Fair Value EUR (€)
% of Total Net Assets
European Union 100,000 1.38% 4/10/2029 112,351 0.03%European Union 100,000 1.13% 4/4/2036 110,866 0.03%Council of Europe Development Bank 100,000 1.75% 24/4/2024 106,415 0.02%Council Of Europe Development Bank 100,000 0.63% 30/1/2029 105,946 0.02%Corp. Andina de Fomento 100,000 1.63% 3/6/2025 105,674 0.02%International Bank for Reconstruction & Development 100,000 0.63% 22/11/2027 105,363 0.02%Banque Ouest Africaine de Developpement 100,000 2.75% 22/1/2033 104,543 0.02%International Bank for Reconstruction & Development 100,000 0.50% 16/4/2030 104,230 0.02%Corp. Andina de Fomento 100,000 1.13% 13/2/2025 103,510 0.02%Asian Development Bank 100,000 0.35% 16/7/2025 102,943 0.02%International Bank for Reconstruction & Development 100,000 0.50% 21/6/2035 102,452 0.02%Council Of Europe Development Bank 100,000 0.00% 10/4/2026 101,840 0.02%Nordic Investment Bank 100,000 0.00% 30/4/2027 101,666 0.02%EUROFIMA 100,000 0.25% 9/2/2024 101,661 0.02%EUROFIMA 100,000 0.00% 28/7/2026 101,183 0.02%International Development Association 100,000 0.00% 19/10/2026 101,149 0.02%International Bank for Reconstruction & Development 100,000 0.01% 24/4/2028 101,148 0.02%Nordic Investment Bank 100,000 0.00% 6/4/2023 101,022 0.02%EUROFIMA 100,000 0.10% 20/5/2030 99,800 0.02%European Financial Stability Facility 65,000 3.38% 3/4/2037 94,955 0.02%European Investment Bank 80,000 1.00% 14/11/2042 88,801 0.02%European Union 50,000 3.38% 4/4/2038 73,777 0.02%European Investment Bank 50,000 1.63% 15/3/2023 51,906 0.01%Nordic Investment Bank 50,000 0.00% 25/9/2026 50,860 0.01%African Development Bank 25,000 0.88% 24/5/2028 26,690 0.01%International Bank for Reconstruction & Development 25,000 0.25% 10/1/2050 22,457 0.01%test - - - 72,317,090 16.36%Sweden 1.89% (2020: 2.11%)Swedbank Hypotek AB 400,000 0.05% 28/5/2025 405,793 0.09%Swedbank AB 300,000 0.25% 7/11/2022 302,770 0.07%Scania CV AB 200,000 2.25% 3/6/2025 216,391 0.05%Svenska Handelsbanken AB 200,000 1.00% 15/4/2025 208,966 0.05%Svenska Handelsbanken AB^ 200,000 1.63% 5/3/2029 207,737 0.05%Stadshypotek AB 200,000 0.38% 13/3/2026 206,227 0.05%Heimstaden Bostad AB 200,000 1.13% 21/1/2026 205,540 0.05%Akelius Residential Property AB 200,000 1.13% 14/3/2024 205,507 0.05%Akelius Residential Property Financing BV 200,000 1.00% 17/1/2028 204,340 0.05%Autoliv, Inc. 200,000 0.75% 26/6/2023 202,920 0.05%Stadshypotek AB 200,000 0.38% 22/2/2023 202,869 0.05%Sweden Government International Bond 200,000 0.13% 24/4/2023 202,477 0.05%Skandinaviska Enskilda Banken AB 200,000 0.38% 11/2/2027 201,528 0.05%Lansforsakringar Bank AB 200,000 0.05% 15/4/2026 199,230 0.05%Telia Co. AB 150,000 2.13% 20/2/2034 172,705 0.04%Swedbank AB^ 120,000 0.30% 20/5/2027 120,054 0.03%Vattenfall AB 100,000 5.38% 29/4/2024 115,628 0.03%Sveriges Sakerstallda Obligationer AB 100,000 1.25% 19/4/2033 111,465 0.03%Investor AB 100,000 1.50% 12/9/2030 110,274 0.03%Investor AB 100,000 4.50% 12/5/2023 109,025 0.03%Volvo Treasury AB^ 100,000 4.85% 10/3/2078 107,248 0.03%Atlas Copco AB 100,000 2.50% 28/2/2023 104,620 0.03%Sveriges Sakerstallda Obligationer AB 100,000 0.63% 30/10/2025 104,015 0.03%Svenska Handelsbanken AB 100,000 2.63% 23/8/2022 103,570 0.03%Lansforsakringar Hypotek AB 100,000 0.63% 27/3/2025 103,489 0.03%Swedbank AB 100,000 0.75% 5/5/2025 103,180 0.03%Essity AB 100,000 1.13% 27/3/2024 103,118 0.02%Sveriges Sakerstallda Obligationer AB 100,000 0.50% 29/1/2025 103,108 0.02%Skandinaviska Enskilda Banken AB 100,000 0.38% 9/2/2026 103,063 0.02%Tele2 AB 100,000 1.13% 15/5/2024 103,044 0.02%Skandinaviska Enskilda Banken AB^ 100,000 1.38% 31/10/2028 102,760 0.02%Swedbank AB^ 100,000 1.50% 18/9/2028 102,732 0.02%Samhallsbyggnadsbolaget i Norden AB 100,000 1.13% 4/9/2026 102,524 0.02%Akelius Residential Property Financing BV 100,000 1.13% 11/1/2029 102,513 0.02%Lansforsakringar Bank AB 100,000 0.88% 25/9/2023 102,473 0.02%Skandinaviska Enskilda Banken AB 100,000 0.63% 30/1/2023 101,775 0.02%Alfa Laval Treasury International AB 100,000 1.38% 12/9/2022 101,515 0.02%Swedbank AB^ 100,000 1.00% 22/11/2027 101,204 0.02%Telia Co. AB^ 100,000 1.38% 11/5/2081 101,163 0.02%Svenska Handelsbanken AB 100,000 0.13% 18/6/2024 101,126 0.02%Fastighets AB Balder 100,000 1.25% 28/1/2028 101,080 0.02%Samhallsbyggnadsbolaget i Norden AB 100,000 1.00% 12/8/2027 101,032 0.02%Skandinaviska Enskilda Banken AB 100,000 0.05% 1/7/2024 100,867 0.02%

904
Vanguard SRI Euro Investment Grade Bond Index Fund
Principal EUR (€) Coupon
Maturity Date
Fair Value EUR (€)
% of Total Net Assets
SBAB Bank AB 100,000 0.25% 7/9/2022 100,775 0.02%Castellum AB 100,000 0.75% 4/9/2026 100,552 0.02%Molnlycke Holding AB 100,000 0.88% 5/9/2029 100,519 0.02%Vattenfall AB 100,000 0.05% 15/10/2025 100,311 0.02%Essity AB 100,000 0.50% 3/2/2030 100,154 0.02%Svenska Handelsbanken AB 100,000 0.50% 18/2/2030 99,989 0.02%Balder Finland OYJ 100,000 1.38% 24/5/2030 99,829 0.02%Svenska Handelsbanken AB 100,000 0.05% 3/9/2026 99,725 0.02%Sagax Euro Mtn NL BV 100,000 1.00% 17/5/2029 99,619 0.02%SBB Treasury OYJ 100,000 1.13% 26/11/2029 99,602 0.02%EQT AB 100,000 0.88% 14/5/2031 99,211 0.02%Vattenfall AB 100,000 0.13% 12/2/2029 98,468 0.02%Balder Finland OYJ 100,000 1.00% 20/1/2029 98,463 0.02%Swedbank AB 100,000 0.20% 12/1/2028 98,336 0.02%Akelius Residential Property Financing BV 100,000 0.75% 22/2/2030 98,318 0.02%Securitas AB 100,000 0.25% 22/2/2028 98,285 0.02%SBB Treasury OYJ 100,000 0.75% 14/12/2028 97,977 0.02%H&M Finance BV 100,000 0.25% 25/8/2029 97,959 0.02%Essity AB 100,000 0.25% 8/2/2031 96,951 0.02%Telia Co. AB 100,000 0.13% 27/11/2030 96,126 0.02%Investor AB 100,000 0.38% 29/10/2035 94,677 0.02%test - - - 8,348,511 1.89%Switzerland 2.19% (2020: 2.10%)Credit Suisse Group AG^ 400,000 3.25% 2/4/2026 440,974 0.10%Novartis Finance SA 300,000 1.13% 30/9/2027 319,564 0.07%Nestle Finance International Ltd. 300,000 1.13% 1/4/2026 317,282 0.07%Novartis Finance SA 300,000 0.50% 14/8/2023 304,849 0.07%Credit Suisse Group AG 300,000 0.63% 18/1/2033 282,189 0.06%ELM BV for Swiss Life Insurance & Pension Group^ 200,000 4.50% Perpetual 234,758 0.05%Givaudan Finance Europe BV 200,000 1.63% 22/4/2032 222,369 0.05%Firmenich Productions Participations SAS 200,000 1.75% 30/4/2030 220,391 0.05%Richemont International Holding SA 200,000 1.50% 26/3/2030 220,051 0.05%Coca-Cola HBC Finance BV 200,000 1.63% 14/5/2031 219,971 0.05%Holcim Finance Luxembourg SA 200,000 2.38% 9/4/2025 217,031 0.05%ELM BV for Swiss Reinsurance Co., Ltd.^ 200,000 2.60% Perpetual 215,041 0.05%Richemont International Holding SA 200,000 1.13% 26/5/2032 212,952 0.05%UBS Group AG 200,000 1.25% 1/9/2026 209,910 0.05%UBS Group AG^ 200,000 1.25% 17/4/2025 206,955 0.05%UBS AG 200,000 0.75% 21/4/2023 203,705 0.05%Nestle Finance International Ltd. 200,000 0.38% 18/1/2024 203,158 0.05%Roche Finance Europe BV 200,000 0.50% 27/2/2023 202,704 0.05%UBS Group AG^ 200,000 0.25% 29/1/2026 200,784 0.05%Credit Suisse AG 200,000 0.25% 5/1/2026 200,695 0.05%Nestle Finance International Ltd. 200,000 0.00% 14/6/2026 200,592 0.05%UBS AG 200,000 0.01% 31/3/2026 199,733 0.05%UBS AG 200,000 0.50% 31/3/2031 199,054 0.05%UBS Group AG 200,000 0.25% 24/2/2028 198,190 0.05%UBS Group AG^ 200,000 0.25% 5/11/2028 197,905 0.04%Novartis Finance SA 200,000 0.00% 23/9/2028 197,525 0.04%Argentum Netherlands BV for Zurich Insurance Co., Ltd.^ 150,000 3.50% 1/10/2046 171,004 0.04%Nestle Finance International Ltd. 100,000 1.75% 2/11/2037 116,608 0.03%Richemont International Holding SA 100,000 2.00% 26/3/2038 115,579 0.03%Novartis Finance SA 100,000 1.70% 14/8/2038 115,102 0.03%Argentum Netherlands BV for Givaudan SA 100,000 2.00% 17/9/2030 114,253 0.03%Argentum Netherlands BV for Zurich Insurance Co., Ltd.^ 100,000 2.75% 19/2/2049 112,105 0.03%Nestle Finance International Ltd. 100,000 1.50% 1/4/2030 110,777 0.03%Swiss Re Finance UK plc^ 100,000 2.71% 4/6/2052 110,114 0.03%Zurich Finance Ireland Designated Activity Co. 100,000 1.63% 17/6/2039 109,729 0.03%Sika Capital BV 100,000 1.50% 29/4/2031 109,599 0.03%Holcim Finance Luxembourg SA 100,000 1.75% 29/8/2029 109,458 0.02%Richemont International Holding SA 100,000 1.63% 26/5/2040 109,317 0.02%Aquarius & Investments PLC for Zurich Insurance Co., Ltd.^ 100,000 4.25% 2/10/2043 109,311 0.02%Barry Callebaut Services NV 100,000 2.38% 24/5/2024 105,954 0.02%Givaudan Finance Europe BV 100,000 1.00% 22/4/2027 105,230 0.02%Richemont International Holding SA 100,000 1.00% 26/3/2026 104,752 0.02%Coca-Cola HBC Finance BV 100,000 1.00% 14/5/2027 104,244 0.02%Roche Finance Europe BV 100,000 0.88% 25/2/2025 103,897 0.02%Swiss Re Finance UK plc 100,000 1.38% 27/5/2023 102,904 0.02%Holcim Finance Luxembourg SA 100,000 1.38% 26/5/2023 102,663 0.02%Wizz Air Finance Co. BV 100,000 1.35% 19/1/2024 102,218 0.02%Credit Suisse Group AG^ 100,000 1.00% 24/6/2027 102,025 0.02%

905
Vanguard SRI Euro Investment Grade Bond Index Fund
Principal EUR (€) Coupon
Maturity Date
Fair Value EUR (€)
% of Total Net Assets
Adecco International Financial Services BV 100,000 1.50% 22/11/2022 101,927 0.02%Holcim Finance Luxembourg SA 100,000 0.50% 29/11/2026 101,679 0.02%ABB Finance BV 100,000 0.63% 3/5/2023 101,463 0.02%Nestle Finance International Ltd. 100,000 0.00% 12/11/2024 100,787 0.02%Nestle Finance International Ltd. 100,000 0.00% 3/12/2025 100,595 0.02%Tyco Electronics Group SA 100,000 0.00% 14/2/2025 100,276 0.02%Credit Suisse Group AG^ 100,000 0.65% 14/1/2028 100,044 0.02%Nestle Finance International Ltd. 100,000 0.38% 12/5/2032 99,686 0.02%Holcim Finance Luxembourg SA 100,000 0.50% 23/4/2031 97,804 0.02%Holcim Finance Luxembourg SA 100,000 0.63% 19/1/2033 96,060 0.02%Nestle Finance International Ltd. 100,000 0.38% 3/12/2040 92,178 0.02%Nestle Finance International Ltd. 85,000 0.88% 14/6/2041 84,621 0.02%test - - - 9,672,295 2.19%United Arab Emirates 0.12% (2020: 0.06%)Emirates Telecommunications Group Co. PJSC 100,000 2.75% 18/6/2026 112,914 0.03%DP World plc 100,000 2.38% 25/9/2026 107,029 0.03%Emirates Telecommunications Group Co. PJSC 100,000 0.38% 17/5/2028 100,522 0.02%MDGH GMTN RSC Ltd. 100,000 1.00% 10/3/2034 99,757 0.02%Emirates Telecommunications Group Co. PJSC 100,000 0.88% 17/5/2033 98,669 0.02%test - - - 518,891 0.12%United Kingdom 5.87% (2020: 6.10%)HSBC Holdings plc 400,000 3.00% 30/6/2025 442,654 0.10%Nationwide Building Society^ 400,000 1.50% 8/3/2026 420,643 0.10%Natwest Group plc 400,000 2.50% 22/3/2023 417,985 0.10%Santander UK Group Holdings plc 400,000 1.13% 8/9/2023 410,773 0.09%Unilever Finance Netherlands BV 400,000 0.50% 12/8/2023 407,111 0.09%Lloyds Bank plc 400,000 0.25% 25/3/2024 406,565 0.09%HSBC Holdings plc^ 400,000 0.77% 13/11/2031 399,796 0.09%Lloyds Banking Group plc^ 350,000 0.50% 12/11/2025 355,141 0.08%BP Capital Markets plc 300,000 2.52% 7/4/2028 342,798 0.08%Vodafone Group plc 300,000 2.20% 25/8/2026 331,770 0.08%WPP Finance Deutschland GmbH 300,000 1.63% 23/3/2030 327,257 0.08%BP Capital Markets plc^ 300,000 3.63% Perpetual 326,647 0.07%InterContinental Hotels Group plc 300,000 2.13% 15/5/2027 323,091 0.07%CNH Industrial Finance Europe SA 300,000 1.75% 25/3/2027 320,846 0.07%GlaxoSmithKline Capital plc 300,000 1.25% 21/5/2026 318,425 0.07%Experian Finance plc 300,000 1.38% 25/6/2026 317,116 0.07%Nationwide Building Society^ 300,000 2.00% 25/7/2029 315,662 0.07%CK Hutchison Europe Finance 18 Ltd. 300,000 1.25% 13/4/2025 313,188 0.07%Vodafone Group plc 300,000 0.90% 24/11/2026 312,402 0.07%BP Capital Markets plc 300,000 0.83% 8/11/2027 309,306 0.07%British Telecommunications plc 300,000 1.00% 21/11/2024 308,918 0.07%Tesco Corporate Treasury Services plc 300,000 0.88% 29/5/2026 308,503 0.07%National Westminster Bank plc 300,000 0.50% 15/5/2024 307,273 0.07%DS Smith plc 300,000 0.88% 12/9/2026 306,588 0.07%Cadent Finance plc 300,000 0.63% 22/9/2024 306,383 0.07%Vodafone Group plc 300,000 0.50% 30/1/2024 305,339 0.07%Motability Operations Group plc 300,000 0.38% 3/1/2026 305,137 0.07%Santander UK plc 300,000 0.05% 12/1/2027 302,912 0.07%Lloyds Bank Corporate Markets plc 300,000 0.25% 4/10/2022 302,339 0.07%easyJet FinCo BV 300,000 1.88% 3/3/2028 300,949 0.07%Wellcome Trust Ltd. 230,000 1.13% 21/1/2027 244,474 0.06%WPP Finance SA 200,000 2.38% 19/5/2027 224,371 0.05%GlaxoSmithKline Capital plc 200,000 1.75% 21/5/2030 223,401 0.05%WPP Finance SA 200,000 2.25% 22/9/2026 222,225 0.05%Unilever plc 200,000 1.50% 11/6/2039 221,380 0.05%Diageo Finance plc 200,000 1.88% 27/3/2027 219,985 0.05%London Stock Exchange Group plc 200,000 1.75% 6/12/2027 219,444 0.05%Vodafone Group plc 200,000 1.63% 24/11/2030 218,317 0.05%Barclays plc^ 200,000 3.38% 2/4/2025 217,905 0.05%BP Capital Markets plc 200,000 1.59% 3/7/2028 216,041 0.05%Coca-Cola Europacific Partners plc 200,000 1.75% 27/3/2026 215,286 0.05%CNH Industrial Finance Europe SA 200,000 1.88% 19/1/2026 214,088 0.05%BP Capital Markets plc^ 200,000 3.25% Perpetual 213,715 0.05%BP Capital Markets plc 200,000 1.88% 7/4/2024 211,301 0.05%Royal Mail plc 200,000 1.25% 8/10/2026 209,734 0.05%Annington Funding plc 200,000 1.65% 12/7/2024 209,105 0.05%Barclays plc^ 200,000 1.38% 24/1/2026 208,308 0.05%HSBC Holdings plc^ 200,000 1.50% 4/12/2024 207,735 0.05%Tesco Corporate Treasury Services plc 200,000 1.38% 24/10/2023 206,206 0.05%Standard Chartered plc^ 200,000 0.85% 27/1/2028 205,007 0.05%

906
Vanguard SRI Euro Investment Grade Bond Index Fund
Principal EUR (€) Coupon
Maturity Date
Fair Value EUR (€)
% of Total Net Assets
CK Hutchison Finance 16 Ltd. 200,000 1.25% 6/4/2023 204,671 0.05%Natwest Group plc^ 200,000 0.75% 15/11/2025 204,075 0.05%Linde Finance BV 200,000 0.55% 19/5/2032 202,672 0.05%Santander UK plc 200,000 0.10% 12/5/2024 202,572 0.05%GlaxoSmithKline Capital plc 200,000 0.00% 23/9/2023 201,097 0.05%Yorkshire Building Society 200,000 0.01% 13/10/2027 200,920 0.05%CCEP Finance Ireland DAC 200,000 0.00% 6/9/2025 200,076 0.05%National Grid plc 170,000 0.16% 20/1/2028 167,226 0.04%BP Capital Markets BV 150,000 0.93% 4/12/2040 139,301 0.03%Vodafone Group plc 100,000 2.88% 20/11/2037 122,881 0.03%BP Capital Markets plc 100,000 2.82% 7/4/2032 120,142 0.03%Phoenix Group Holdings plc 100,000 4.38% 24/1/2029 117,498 0.03%Vodafone Group plc 100,000 2.50% 24/5/2039 116,732 0.03%Unilever Finance Netherlands BV 100,000 1.63% 12/2/2033 113,276 0.03%Lloyds Banking Group plc^ 100,000 3.50% 1/4/2026 112,525 0.03%CK Hutchison Europe Finance 18 Ltd. 100,000 2.00% 13/4/2030 112,489 0.03%Sky Ltd. 100,000 2.50% 15/9/2026 112,487 0.03%Aviva plc^ 100,000 3.38% 4/12/2045 111,640 0.03%Diageo Finance plc 100,000 2.38% 20/5/2026 111,332 0.03%CK Hutchison Finance 16 Ltd. 100,000 2.00% 6/4/2028 110,976 0.03%BP Capital Markets plc 100,000 2.21% 25/9/2026 110,687 0.03%Unilever Finance Netherlands BV 100,000 1.38% 4/9/2030 110,513 0.03%Aviva plc^ 100,000 3.88% 3/7/2044 110,370 0.03%Sky Ltd. 100,000 2.25% 17/11/2025 109,822 0.03%SSE plc 100,000 1.75% 16/4/2030 109,394 0.03%Nationwide Building Society 100,000 1.13% 31/5/2028 108,260 0.03%RELX Finance BV 100,000 1.50% 13/5/2027 107,468 0.03%Virgin Money UK plc^ 100,000 2.88% 24/6/2025 107,445 0.03%BP Capital Markets plc 100,000 1.95% 3/3/2025 107,356 0.03%Coca-Cola Europacific Partners plc 100,000 1.50% 8/11/2027 107,323 0.03%British Telecommunications plc 100,000 1.75% 10/3/2026 107,110 0.03%SSE plc 100,000 1.38% 4/9/2027 106,688 0.03%Linde Finance BV 100,000 1.00% 20/4/2028 106,345 0.03%CNH Industrial Finance Europe SA 100,000 1.63% 3/7/2029 106,333 0.03%AstraZeneca plc 100,000 1.25% 12/5/2028 106,325 0.03%British Telecommunications plc 100,000 1.50% 23/6/2027 106,083 0.03%Natwest Group plc^ 100,000 1.75% 2/3/2026 105,390 0.02%Coca-Cola Europacific Partners plc 100,000 1.13% 12/4/2029 105,079 0.02%Sky Ltd. 100,000 1.88% 24/11/2023 105,010 0.02%WPP Finance 2016 100,000 1.38% 20/3/2025 104,954 0.02%RELX Capital, Inc. 100,000 1.30% 12/5/2025 104,891 0.02%Vodafone Group plc 100,000 1.13% 20/11/2025 104,773 0.02%Aptiv plc 100,000 1.50% 10/3/2025 104,699 0.02%ITV plc 100,000 1.38% 26/9/2026 104,552 0.02%Heathrow Funding Ltd. 100,000 1.88% 14/3/2034 104,493 0.02%Heathrow Funding Ltd. 100,000 1.50% 12/10/2025 104,308 0.02%BP Capital Markets plc 100,000 1.23% 8/5/2031 104,239 0.02%Diageo Finance plc 100,000 1.00% 22/4/2025 104,095 0.02%Mondi Finance plc 100,000 1.50% 15/4/2024 103,870 0.02%Motability Operations Group plc 100,000 1.63% 9/6/2023 103,698 0.02%Barclays plc 100,000 1.50% 3/9/2023 103,667 0.02%Lloyds Banking Group plc^ 100,000 1.75% 7/9/2028 103,547 0.02%SSE plc 100,000 0.88% 6/9/2025 103,427 0.02%Lloyds Bank plc 100,000 0.63% 26/3/2025 103,421 0.02%Coca-Cola Europacific Partners plc 100,000 1.13% 26/5/2024 103,401 0.02%Rentokil Initial plc 100,000 0.88% 30/5/2026 103,298 0.02%Standard Chartered plc^ 100,000 0.90% 2/7/2027 103,051 0.02%London Stock Exchange Group plc 100,000 0.88% 19/9/2024 103,019 0.02%Heathrow Funding Ltd. 100,000 1.50% 11/2/2030 103,002 0.02%BP Capital Markets plc 100,000 0.83% 19/9/2024 102,970 0.02%Reckitt Benckiser Treasury Services Nederland BV 100,000 0.75% 19/5/2030 102,844 0.02%Unilever Finance Netherlands BV 100,000 0.50% 6/1/2025 102,475 0.02%CK Hutchison Group Telecom Finance SA 100,000 0.75% 17/4/2026 102,429 0.02%Yorkshire Building Society 100,000 0.63% 21/9/2025 102,404 0.02%AstraZeneca plc 100,000 0.75% 12/5/2024 102,342 0.02%DS Smith plc 100,000 2.25% 16/9/2022 102,257 0.02%Yorkshire Building Society 100,000 0.88% 20/3/2023 102,243 0.02%Global Switch Finance BV 100,000 1.38% 7/10/2030 102,146 0.02%Compass Group Finance Netherlands BV 100,000 0.63% 3/7/2024 102,117 0.02%Channel Link Enterprises Finance plc^ 100,000 2.71% 30/6/2050 102,070 0.02%RELX Finance BV 100,000 0.88% 10/3/2032 101,919 0.02%

907
Vanguard SRI Euro Investment Grade Bond Index Fund
Principal EUR (€) Coupon
Maturity Date
Fair Value EUR (€)
% of Total Net Assets
Nationwide Building Society 100,000 0.63% 19/4/2023 101,811 0.02%easyJet plc 100,000 1.13% 18/10/2023 101,771 0.02%Barclays plc^ 100,000 0.75% 9/6/2025 101,735 0.02%Santander UK plc 100,000 0.38% 20/9/2023 101,717 0.02%Reckitt Benckiser Treasury Services Nederland BV 100,000 0.38% 19/5/2026 101,679 0.02%Lloyds Bank plc 100,000 0.13% 18/6/2026 101,573 0.02%British Telecommunications plc 100,000 0.50% 12/9/2025 101,380 0.02%Yorkshire Building Society 100,000 0.13% 8/5/2024 101,312 0.02%RELX Finance BV 100,000 0.50% 10/3/2028 101,277 0.02%Unilever Finance Netherlands BV 100,000 0.38% 14/2/2023 101,213 0.02%Nationwide Building Society 100,000 0.25% 22/7/2025 101,007 0.02%Santander UK Group Holdings plc^ 100,000 0.39% 28/2/2025 100,918 0.02%Barclays plc^ 100,000 1.11% 12/5/2032 100,886 0.02%CK Hutchison Group Telecom Finance SA 100,000 0.38% 17/10/2023 100,878 0.02%CCEP Finance Ireland DAC 100,000 1.50% 6/5/2041 100,841 0.02%Diageo Finance plc 100,000 0.13% 12/10/2023 100,807 0.02%Barclays plc^ 100,000 1.13% 22/3/2031 100,548 0.02%Clydesdale Bank plc 100,000 0.01% 22/9/2026 100,512 0.02%HSBC Holdings plc^ 100,000 0.31% 13/11/2026 100,370 0.02%Cadent Finance plc 100,000 0.63% 19/3/2030 100,343 0.02%Standard Chartered plc^ 100,000 1.20% 23/9/2031 100,238 0.02%Lseg Netherlands BV 100,000 0.75% 6/4/2033 100,083 0.02%Lseg Netherlands BV 100,000 0.00% 6/4/2025 100,031 0.02%CNH Industrial Finance Europe SA 100,000 0.00% 1/4/2024 99,952 0.02%CCEP Finance Ireland DAC 100,000 0.50% 6/9/2029 99,937 0.02%CCEP Finance Ireland DAC 100,000 0.88% 6/5/2033 99,886 0.02%National Grid plc 100,000 0.55% 18/9/2029 99,827 0.02%Diageo Capital BV 100,000 0.13% 28/9/2028 99,619 0.02%Cadent Finance plc 100,000 0.75% 11/3/2032 99,321 0.02%Motability Operations Group plc 100,000 0.13% 20/7/2028 99,229 0.02%Heathrow Funding Ltd. 100,000 1.13% 8/10/2030 99,009 0.02%test - - - 25,955,465 5.87%United States 11.78% (2020: 11.65%)JPMorgan Chase & Co.^ 600,000 1.09% 11/3/2027 624,710 0.14%Citigroup, Inc. 600,000 0.75% 26/10/2023 611,599 0.14%JPMorgan Chase & Co. 600,000 0.63% 25/1/2024 611,275 0.14%Goldman Sachs Group, Inc. 500,000 3.38% 27/3/2025 560,698 0.13%Apple, Inc. 500,000 0.88% 24/5/2025 519,599 0.12%Verizon Communications, Inc. 500,000 0.88% 8/4/2027 517,283 0.12%Bank of America Corp.^ 400,000 3.65% 31/3/2029 483,336 0.11%Procter & Gamble Co. 430,000 1.13% 2/11/2023 444,847 0.10%Fidelity National Information Services, Inc. 400,000 1.50% 21/5/2027 424,628 0.10%Citigroup, Inc.^ 400,000 1.50% 24/7/2026 421,108 0.10%JPMorgan Chase & Co.^ 400,000 1.00% 25/7/2031 411,085 0.09%Morgan Stanley^ 400,000 0.64% 26/7/2024 406,369 0.09%JPMorgan Chase & Co.^ 400,000 0.39% 24/2/2028 401,423 0.09%Prologis Euro Finance LLC 400,000 0.25% 10/9/2027 400,478 0.09%Coca-Cola Co. 400,000 0.13% 15/3/2029 395,043 0.09%Goldman Sachs Group, Inc. 400,000 0.25% 26/1/2028 392,981 0.09%Morgan Stanley^ 350,000 0.50% 7/2/2031 343,790 0.08%International Business Machines Corp. 300,000 2.88% 7/11/2025 337,683 0.08%JPMorgan Chase & Co.^ 300,000 1.64% 18/5/2028 322,671 0.07%ManpowerGroup, Inc. 300,000 1.75% 22/6/2026 321,624 0.07%Utah Acquisition Sub, Inc. 300,000 2.25% 22/11/2024 320,442 0.07%Goldman Sachs Group, Inc. 300,000 2.13% 30/9/2024 320,168 0.07%Verizon Communications, Inc. 300,000 1.38% 2/11/2028 320,093 0.07%Schlumberger Finance BV 300,000 1.38% 28/10/2026 319,205 0.07%Verizon Communications, Inc. 300,000 1.38% 27/10/2026 318,905 0.07%Stellantis NV 300,000 3.38% 7/7/2023 318,356 0.07%Morgan Stanley^ 300,000 1.34% 23/10/2026 315,258 0.07%Becton Dickinson Euro Finance Sarl 300,000 1.21% 4/6/2026 313,977 0.07%Bank of America Corp.^ 300,000 1.38% 7/2/2025 311,234 0.07%Goldman Sachs Group, Inc. 300,000 1.25% 1/5/2025 310,217 0.07%Verizon Communications, Inc. 300,000 1.30% 18/5/2033 309,503 0.07%JPMorgan Chase & Co.^ 300,000 1.05% 4/11/2032 307,390 0.07%Morgan Stanley 300,000 1.00% 2/12/2022 305,513 0.07%Baxter International, Inc. 300,000 0.40% 15/5/2024 304,723 0.07%Medtronic Global Holdings SCA 300,000 0.38% 15/10/2028 302,615 0.07%Morgan Stanley^ 300,000 0.50% 26/10/2029 298,406 0.07%Bank of America Corp.^ 300,000 0.65% 26/10/2031 297,064 0.07%AT&T, Inc. 200,000 3.15% 4/9/2036 243,317 0.06%
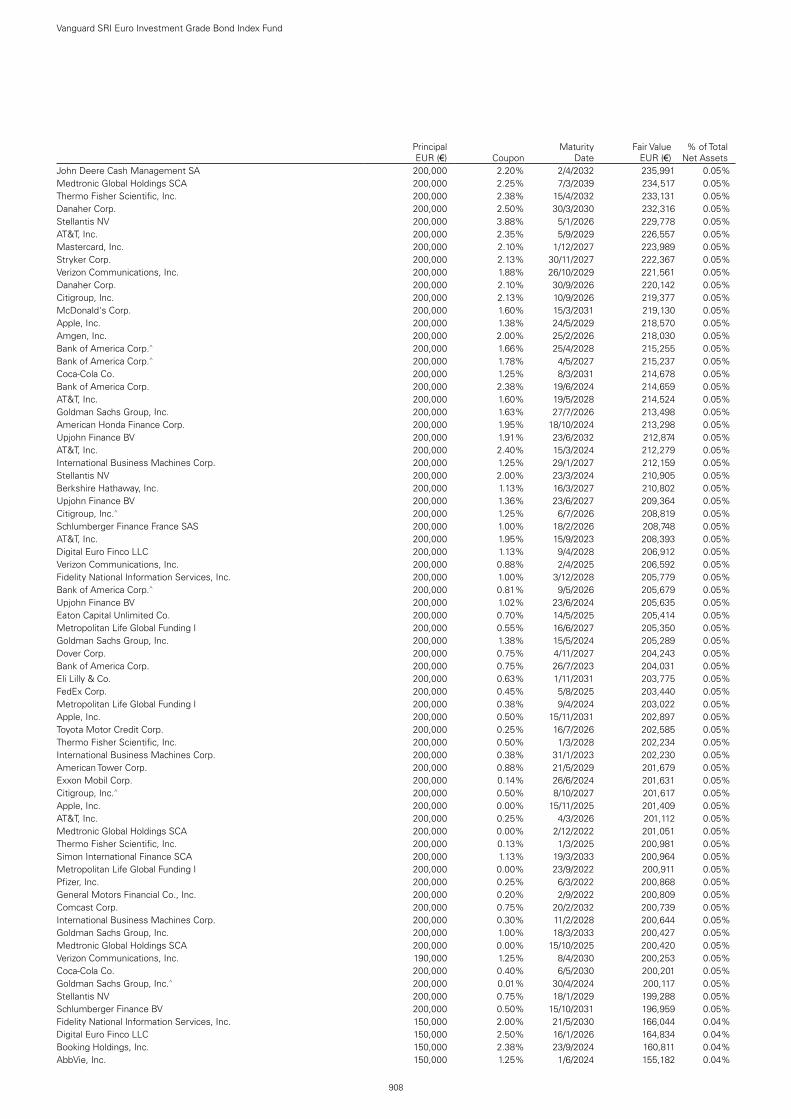
908
Vanguard SRI Euro Investment Grade Bond Index Fund
Principal EUR (€) Coupon
Maturity Date
Fair Value EUR (€)
% of Total Net Assets
John Deere Cash Management SA 200,000 2.20% 2/4/2032 235,991 0.05%Medtronic Global Holdings SCA 200,000 2.25% 7/3/2039 234,517 0.05%Thermo Fisher Scientific, Inc. 200,000 2.38% 15/4/2032 233,131 0.05%Danaher Corp. 200,000 2.50% 30/3/2030 232,316 0.05%Stellantis NV 200,000 3.88% 5/1/2026 229,778 0.05%AT&T, Inc. 200,000 2.35% 5/9/2029 226,557 0.05%Mastercard, Inc. 200,000 2.10% 1/12/2027 223,989 0.05%Stryker Corp. 200,000 2.13% 30/11/2027 222,367 0.05%Verizon Communications, Inc. 200,000 1.88% 26/10/2029 221,561 0.05%Danaher Corp. 200,000 2.10% 30/9/2026 220,142 0.05%Citigroup, Inc. 200,000 2.13% 10/9/2026 219,377 0.05%McDonald's Corp. 200,000 1.60% 15/3/2031 219,130 0.05%Apple, Inc. 200,000 1.38% 24/5/2029 218,570 0.05%Amgen, Inc. 200,000 2.00% 25/2/2026 218,030 0.05%Bank of America Corp.^ 200,000 1.66% 25/4/2028 215,255 0.05%Bank of America Corp.^ 200,000 1.78% 4/5/2027 215,237 0.05%Coca-Cola Co. 200,000 1.25% 8/3/2031 214,678 0.05%Bank of America Corp. 200,000 2.38% 19/6/2024 214,659 0.05%AT&T, Inc. 200,000 1.60% 19/5/2028 214,524 0.05%Goldman Sachs Group, Inc. 200,000 1.63% 27/7/2026 213,498 0.05%American Honda Finance Corp. 200,000 1.95% 18/10/2024 213,298 0.05%Upjohn Finance BV 200,000 1.91% 23/6/2032 212,874 0.05%AT&T, Inc. 200,000 2.40% 15/3/2024 212,279 0.05%International Business Machines Corp. 200,000 1.25% 29/1/2027 212,159 0.05%Stellantis NV 200,000 2.00% 23/3/2024 210,905 0.05%Berkshire Hathaway, Inc. 200,000 1.13% 16/3/2027 210,802 0.05%Upjohn Finance BV 200,000 1.36% 23/6/2027 209,364 0.05%Citigroup, Inc.^ 200,000 1.25% 6/7/2026 208,819 0.05%Schlumberger Finance France SAS 200,000 1.00% 18/2/2026 208,748 0.05%AT&T, Inc. 200,000 1.95% 15/9/2023 208,393 0.05%Digital Euro Finco LLC 200,000 1.13% 9/4/2028 206,912 0.05%Verizon Communications, Inc. 200,000 0.88% 2/4/2025 206,592 0.05%Fidelity National Information Services, Inc. 200,000 1.00% 3/12/2028 205,779 0.05%Bank of America Corp.^ 200,000 0.81% 9/5/2026 205,679 0.05%Upjohn Finance BV 200,000 1.02% 23/6/2024 205,635 0.05%Eaton Capital Unlimited Co. 200,000 0.70% 14/5/2025 205,414 0.05%Metropolitan Life Global Funding I 200,000 0.55% 16/6/2027 205,350 0.05%Goldman Sachs Group, Inc. 200,000 1.38% 15/5/2024 205,289 0.05%Dover Corp. 200,000 0.75% 4/11/2027 204,243 0.05%Bank of America Corp. 200,000 0.75% 26/7/2023 204,031 0.05%Eli Lilly & Co. 200,000 0.63% 1/11/2031 203,775 0.05%FedEx Corp. 200,000 0.45% 5/8/2025 203,440 0.05%Metropolitan Life Global Funding I 200,000 0.38% 9/4/2024 203,022 0.05%Apple, Inc. 200,000 0.50% 15/11/2031 202,897 0.05%Toyota Motor Credit Corp. 200,000 0.25% 16/7/2026 202,585 0.05%Thermo Fisher Scientific, Inc. 200,000 0.50% 1/3/2028 202,234 0.05%International Business Machines Corp. 200,000 0.38% 31/1/2023 202,230 0.05%American Tower Corp. 200,000 0.88% 21/5/2029 201,679 0.05%Exxon Mobil Corp. 200,000 0.14% 26/6/2024 201,631 0.05%Citigroup, Inc.^ 200,000 0.50% 8/10/2027 201,617 0.05%Apple, Inc. 200,000 0.00% 15/11/2025 201,409 0.05%AT&T, Inc. 200,000 0.25% 4/3/2026 201,112 0.05%Medtronic Global Holdings SCA 200,000 0.00% 2/12/2022 201,051 0.05%Thermo Fisher Scientific, Inc. 200,000 0.13% 1/3/2025 200,981 0.05%Simon International Finance SCA 200,000 1.13% 19/3/2033 200,964 0.05%Metropolitan Life Global Funding I 200,000 0.00% 23/9/2022 200,911 0.05%Pfizer, Inc. 200,000 0.25% 6/3/2022 200,868 0.05%General Motors Financial Co., Inc. 200,000 0.20% 2/9/2022 200,809 0.05%Comcast Corp. 200,000 0.75% 20/2/2032 200,739 0.05%International Business Machines Corp. 200,000 0.30% 11/2/2028 200,644 0.05%Goldman Sachs Group, Inc. 200,000 1.00% 18/3/2033 200,427 0.05%Medtronic Global Holdings SCA 200,000 0.00% 15/10/2025 200,420 0.05%Verizon Communications, Inc. 190,000 1.25% 8/4/2030 200,253 0.05%Coca-Cola Co. 200,000 0.40% 6/5/2030 200,201 0.05%Goldman Sachs Group, Inc.^ 200,000 0.01% 30/4/2024 200,117 0.05%Stellantis NV 200,000 0.75% 18/1/2029 199,288 0.05%Schlumberger Finance BV 200,000 0.50% 15/10/2031 196,959 0.05%Fidelity National Information Services, Inc. 150,000 2.00% 21/5/2030 166,044 0.04%Digital Euro Finco LLC 150,000 2.50% 16/1/2026 164,834 0.04%Booking Holdings, Inc. 150,000 2.38% 23/9/2024 160,811 0.04%AbbVie, Inc. 150,000 1.25% 1/6/2024 155,182 0.04%
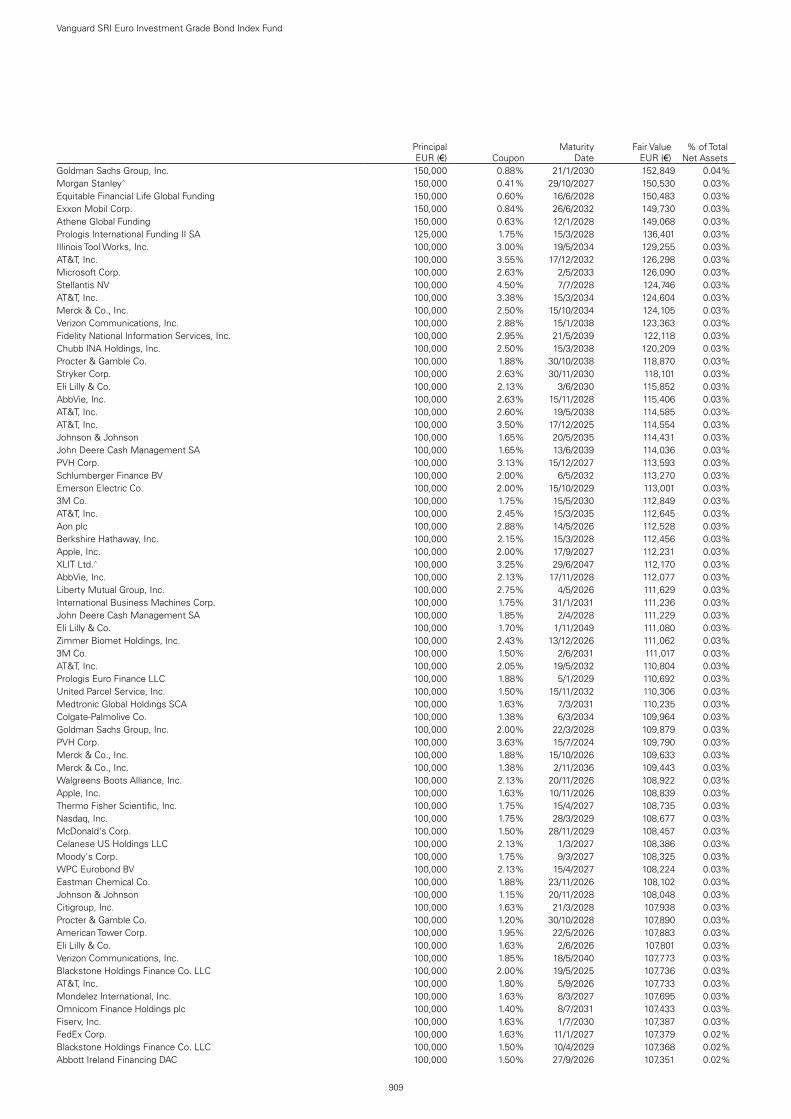
909
Vanguard SRI Euro Investment Grade Bond Index Fund
Principal EUR (€) Coupon
Maturity Date
Fair Value EUR (€)
% of Total Net Assets
Goldman Sachs Group, Inc. 150,000 0.88% 21/1/2030 152,849 0.04%Morgan Stanley^ 150,000 0.41% 29/10/2027 150,530 0.03%Equitable Financial Life Global Funding 150,000 0.60% 16/6/2028 150,483 0.03%Exxon Mobil Corp. 150,000 0.84% 26/6/2032 149,730 0.03%Athene Global Funding 150,000 0.63% 12/1/2028 149,068 0.03%Prologis International Funding II SA 125,000 1.75% 15/3/2028 136,401 0.03%Illinois Tool Works, Inc. 100,000 3.00% 19/5/2034 129,255 0.03%AT&T, Inc. 100,000 3.55% 17/12/2032 126,298 0.03%Microsoft Corp. 100,000 2.63% 2/5/2033 126,090 0.03%Stellantis NV 100,000 4.50% 7/7/2028 124,746 0.03%AT&T, Inc. 100,000 3.38% 15/3/2034 124,604 0.03%Merck & Co., Inc. 100,000 2.50% 15/10/2034 124,105 0.03%Verizon Communications, Inc. 100,000 2.88% 15/1/2038 123,363 0.03%Fidelity National Information Services, Inc. 100,000 2.95% 21/5/2039 122,118 0.03%Chubb INA Holdings, Inc. 100,000 2.50% 15/3/2038 120,209 0.03%Procter & Gamble Co. 100,000 1.88% 30/10/2038 118,870 0.03%Stryker Corp. 100,000 2.63% 30/11/2030 118,101 0.03%Eli Lilly & Co. 100,000 2.13% 3/6/2030 115,852 0.03%AbbVie, Inc. 100,000 2.63% 15/11/2028 115,406 0.03%AT&T, Inc. 100,000 2.60% 19/5/2038 114,585 0.03%AT&T, Inc. 100,000 3.50% 17/12/2025 114,554 0.03%Johnson & Johnson 100,000 1.65% 20/5/2035 114,431 0.03%John Deere Cash Management SA 100,000 1.65% 13/6/2039 114,036 0.03%PVH Corp. 100,000 3.13% 15/12/2027 113,593 0.03%Schlumberger Finance BV 100,000 2.00% 6/5/2032 113,270 0.03%Emerson Electric Co. 100,000 2.00% 15/10/2029 113,001 0.03%3M Co. 100,000 1.75% 15/5/2030 112,849 0.03%AT&T, Inc. 100,000 2.45% 15/3/2035 112,645 0.03%Aon plc 100,000 2.88% 14/5/2026 112,528 0.03%Berkshire Hathaway, Inc. 100,000 2.15% 15/3/2028 112,456 0.03%Apple, Inc. 100,000 2.00% 17/9/2027 112,231 0.03%XLIT Ltd.^ 100,000 3.25% 29/6/2047 112,170 0.03%AbbVie, Inc. 100,000 2.13% 17/11/2028 112,077 0.03%Liberty Mutual Group, Inc. 100,000 2.75% 4/5/2026 111,629 0.03%International Business Machines Corp. 100,000 1.75% 31/1/2031 111,236 0.03%John Deere Cash Management SA 100,000 1.85% 2/4/2028 111,229 0.03%Eli Lilly & Co. 100,000 1.70% 1/11/2049 111,080 0.03%Zimmer Biomet Holdings, Inc. 100,000 2.43% 13/12/2026 111,062 0.03%3M Co. 100,000 1.50% 2/6/2031 111,017 0.03%AT&T, Inc. 100,000 2.05% 19/5/2032 110,804 0.03%Prologis Euro Finance LLC 100,000 1.88% 5/1/2029 110,692 0.03%United Parcel Service, Inc. 100,000 1.50% 15/11/2032 110,306 0.03%Medtronic Global Holdings SCA 100,000 1.63% 7/3/2031 110,235 0.03%Colgate-Palmolive Co. 100,000 1.38% 6/3/2034 109,964 0.03%Goldman Sachs Group, Inc. 100,000 2.00% 22/3/2028 109,879 0.03%PVH Corp. 100,000 3.63% 15/7/2024 109,790 0.03%Merck & Co., Inc. 100,000 1.88% 15/10/2026 109,633 0.03%Merck & Co., Inc. 100,000 1.38% 2/11/2036 109,443 0.03%Walgreens Boots Alliance, Inc. 100,000 2.13% 20/11/2026 108,922 0.03%Apple, Inc. 100,000 1.63% 10/11/2026 108,839 0.03%Thermo Fisher Scientific, Inc. 100,000 1.75% 15/4/2027 108,735 0.03%Nasdaq, Inc. 100,000 1.75% 28/3/2029 108,677 0.03%McDonald's Corp. 100,000 1.50% 28/11/2029 108,457 0.03%Celanese US Holdings LLC 100,000 2.13% 1/3/2027 108,386 0.03%Moody's Corp. 100,000 1.75% 9/3/2027 108,325 0.03%WPC Eurobond BV 100,000 2.13% 15/4/2027 108,224 0.03%Eastman Chemical Co. 100,000 1.88% 23/11/2026 108,102 0.03%Johnson & Johnson 100,000 1.15% 20/11/2028 108,048 0.03%Citigroup, Inc. 100,000 1.63% 21/3/2028 107,938 0.03%Procter & Gamble Co. 100,000 1.20% 30/10/2028 107,890 0.03%American Tower Corp. 100,000 1.95% 22/5/2026 107,883 0.03%Eli Lilly & Co. 100,000 1.63% 2/6/2026 107,801 0.03%Verizon Communications, Inc. 100,000 1.85% 18/5/2040 107,773 0.03%Blackstone Holdings Finance Co. LLC 100,000 2.00% 19/5/2025 107,736 0.03%AT&T, Inc. 100,000 1.80% 5/9/2026 107,733 0.03%Mondelez International, Inc. 100,000 1.63% 8/3/2027 107,695 0.03%Omnicom Finance Holdings plc 100,000 1.40% 8/7/2031 107,433 0.03%Fiserv, Inc. 100,000 1.63% 1/7/2030 107,387 0.03%FedEx Corp. 100,000 1.63% 11/1/2027 107,379 0.02%Blackstone Holdings Finance Co. LLC 100,000 1.50% 10/4/2029 107,368 0.02%Abbott Ireland Financing DAC 100,000 1.50% 27/9/2026 107,351 0.02%
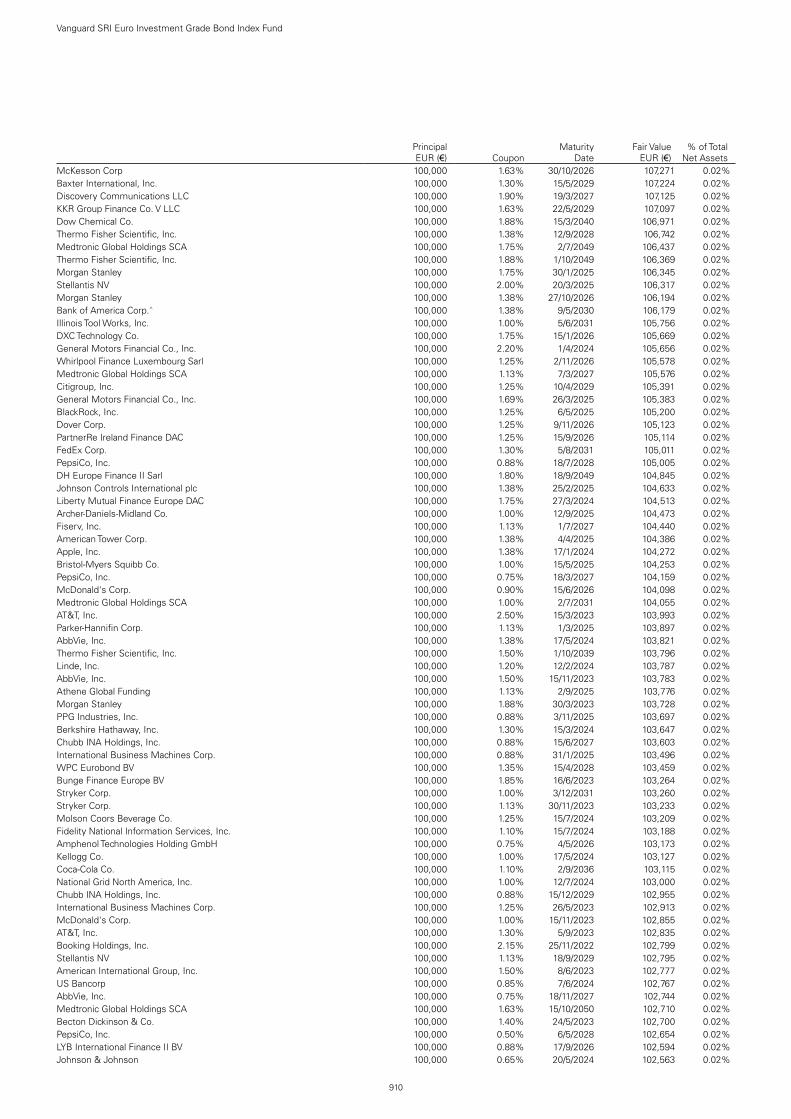
910
Vanguard SRI Euro Investment Grade Bond Index Fund
Principal EUR (€) Coupon
Maturity Date
Fair Value EUR (€)
% of Total Net Assets
McKesson Corp 100,000 1.63% 30/10/2026 107,271 0.02%Baxter International, Inc. 100,000 1.30% 15/5/2029 107,224 0.02%Discovery Communications LLC 100,000 1.90% 19/3/2027 107,125 0.02%KKR Group Finance Co. V LLC 100,000 1.63% 22/5/2029 107,097 0.02%Dow Chemical Co. 100,000 1.88% 15/3/2040 106,971 0.02%Thermo Fisher Scientific, Inc. 100,000 1.38% 12/9/2028 106,742 0.02%Medtronic Global Holdings SCA 100,000 1.75% 2/7/2049 106,437 0.02%Thermo Fisher Scientific, Inc. 100,000 1.88% 1/10/2049 106,369 0.02%Morgan Stanley 100,000 1.75% 30/1/2025 106,345 0.02%Stellantis NV 100,000 2.00% 20/3/2025 106,317 0.02%Morgan Stanley 100,000 1.38% 27/10/2026 106,194 0.02%Bank of America Corp.^ 100,000 1.38% 9/5/2030 106,179 0.02%Illinois Tool Works, Inc. 100,000 1.00% 5/6/2031 105,756 0.02%DXC Technology Co. 100,000 1.75% 15/1/2026 105,669 0.02%General Motors Financial Co., Inc. 100,000 2.20% 1/4/2024 105,656 0.02%Whirlpool Finance Luxembourg Sarl 100,000 1.25% 2/11/2026 105,578 0.02%Medtronic Global Holdings SCA 100,000 1.13% 7/3/2027 105,576 0.02%Citigroup, Inc. 100,000 1.25% 10/4/2029 105,391 0.02%General Motors Financial Co., Inc. 100,000 1.69% 26/3/2025 105,383 0.02%BlackRock, Inc. 100,000 1.25% 6/5/2025 105,200 0.02%Dover Corp. 100,000 1.25% 9/11/2026 105,123 0.02%PartnerRe Ireland Finance DAC 100,000 1.25% 15/9/2026 105,114 0.02%FedEx Corp. 100,000 1.30% 5/8/2031 105,011 0.02%PepsiCo, Inc. 100,000 0.88% 18/7/2028 105,005 0.02%DH Europe Finance II Sarl 100,000 1.80% 18/9/2049 104,845 0.02%Johnson Controls International plc 100,000 1.38% 25/2/2025 104,633 0.02%Liberty Mutual Finance Europe DAC 100,000 1.75% 27/3/2024 104,513 0.02%Archer-Daniels-Midland Co. 100,000 1.00% 12/9/2025 104,473 0.02%Fiserv, Inc. 100,000 1.13% 1/7/2027 104,440 0.02%American Tower Corp. 100,000 1.38% 4/4/2025 104,386 0.02%Apple, Inc. 100,000 1.38% 17/1/2024 104,272 0.02%Bristol-Myers Squibb Co. 100,000 1.00% 15/5/2025 104,253 0.02%PepsiCo, Inc. 100,000 0.75% 18/3/2027 104,159 0.02%McDonald's Corp. 100,000 0.90% 15/6/2026 104,098 0.02%Medtronic Global Holdings SCA 100,000 1.00% 2/7/2031 104,055 0.02%AT&T, Inc. 100,000 2.50% 15/3/2023 103,993 0.02%Parker-Hannifin Corp. 100,000 1.13% 1/3/2025 103,897 0.02%AbbVie, Inc. 100,000 1.38% 17/5/2024 103,821 0.02%Thermo Fisher Scientific, Inc. 100,000 1.50% 1/10/2039 103,796 0.02%Linde, Inc. 100,000 1.20% 12/2/2024 103,787 0.02%AbbVie, Inc. 100,000 1.50% 15/11/2023 103,783 0.02%Athene Global Funding 100,000 1.13% 2/9/2025 103,776 0.02%Morgan Stanley 100,000 1.88% 30/3/2023 103,728 0.02%PPG Industries, Inc. 100,000 0.88% 3/11/2025 103,697 0.02%Berkshire Hathaway, Inc. 100,000 1.30% 15/3/2024 103,647 0.02%Chubb INA Holdings, Inc. 100,000 0.88% 15/6/2027 103,603 0.02%International Business Machines Corp. 100,000 0.88% 31/1/2025 103,496 0.02%WPC Eurobond BV 100,000 1.35% 15/4/2028 103,459 0.02%Bunge Finance Europe BV 100,000 1.85% 16/6/2023 103,264 0.02%Stryker Corp. 100,000 1.00% 3/12/2031 103,260 0.02%Stryker Corp. 100,000 1.13% 30/11/2023 103,233 0.02%Molson Coors Beverage Co. 100,000 1.25% 15/7/2024 103,209 0.02%Fidelity National Information Services, Inc. 100,000 1.10% 15/7/2024 103,188 0.02%Amphenol Technologies Holding GmbH 100,000 0.75% 4/5/2026 103,173 0.02%Kellogg Co. 100,000 1.00% 17/5/2024 103,127 0.02%Coca-Cola Co. 100,000 1.10% 2/9/2036 103,115 0.02%National Grid North America, Inc. 100,000 1.00% 12/7/2024 103,000 0.02%Chubb INA Holdings, Inc. 100,000 0.88% 15/12/2029 102,955 0.02%International Business Machines Corp. 100,000 1.25% 26/5/2023 102,913 0.02%McDonald's Corp. 100,000 1.00% 15/11/2023 102,855 0.02%AT&T, Inc. 100,000 1.30% 5/9/2023 102,835 0.02%Booking Holdings, Inc. 100,000 2.15% 25/11/2022 102,799 0.02%Stellantis NV 100,000 1.13% 18/9/2029 102,795 0.02%American International Group, Inc. 100,000 1.50% 8/6/2023 102,777 0.02%US Bancorp 100,000 0.85% 7/6/2024 102,767 0.02%AbbVie, Inc. 100,000 0.75% 18/11/2027 102,744 0.02%Medtronic Global Holdings SCA 100,000 1.63% 15/10/2050 102,710 0.02%Becton Dickinson & Co. 100,000 1.40% 24/5/2023 102,700 0.02%PepsiCo, Inc. 100,000 0.50% 6/5/2028 102,654 0.02%LYB International Finance II BV 100,000 0.88% 17/9/2026 102,594 0.02%Johnson & Johnson 100,000 0.65% 20/5/2024 102,563 0.02%

911
Vanguard SRI Euro Investment Grade Bond Index Fund
Principal EUR (€) Coupon
Maturity Date
Fair Value EUR (€)
% of Total Net Assets
Colgate-Palmolive Co. 100,000 0.50% 6/3/2026 102,542 0.02%JPMorgan Chase & Co. 100,000 1.50% 26/10/2022 102,531 0.02%Abbott Ireland Financing DAC 100,000 0.88% 27/9/2023 102,512 0.02%Illinois Tool Works, Inc. 100,000 1.25% 22/5/2023 102,510 0.02%International Business Machines Corp. 100,000 1.20% 11/2/2040 102,453 0.02%Bank of America Corp. 100,000 1.63% 14/9/2022 102,418 0.02%Stryker Corp. 100,000 0.75% 1/3/2029 102,291 0.02%Dow Chemical Co. 100,000 1.13% 15/3/2032 102,246 0.02%Capital One Financial Corp. 100,000 0.80% 12/6/2024 102,237 0.02%Harley-Davidson Financial Services, Inc. 100,000 0.90% 19/11/2024 102,223 0.02%Digital Dutch Finco BV 100,000 1.25% 1/2/2031 102,206 0.02%Medtronic Global Holdings SCA 100,000 1.38% 15/10/2040 102,018 0.02%Johnson Controls International plc/Tyco Fire & Security Finance SCA 100,000 1.00% 15/9/2032 101,961 0.02%ManpowerGroup, Inc. 100,000 1.88% 11/9/2022 101,894 0.02%Mondelez International Holdings Netherlands BV 100,000 0.88% 1/10/2031 101,885 0.02%National Grid North America, Inc. 100,000 0.75% 8/8/2023 101,822 0.02%General Motors Financial Co., Inc. 100,000 0.85% 26/2/2026 101,817 0.02%DH Europe Finance II Sarl 100,000 1.35% 18/9/2039 101,810 0.02%Goldman Sachs Group, Inc. 100,000 1.38% 26/7/2022 101,807 0.02%Mastercard, Inc. 100,000 1.10% 1/12/2022 101,708 0.02%General Mills, Inc. 100,000 0.45% 15/1/2026 101,706 0.02%Fidelity National Information Services, Inc. 100,000 0.75% 21/5/2023 101,620 0.02%American Tower Corp. 100,000 1.25% 21/5/2033 101,536 0.02%PepsiCo, Inc. 100,000 0.25% 6/5/2024 101,501 0.02%Emerson Electric Co. 100,000 0.38% 22/5/2024 101,408 0.02%Exxon Mobil Corp. 100,000 0.52% 26/6/2028 101,388 0.02%Becton Dickinson Euro Finance Sarl 100,000 0.63% 4/6/2023 101,384 0.02%Euronet Worldwide, Inc. 100,000 1.38% 22/5/2026 101,377 0.02%Abbott Ireland Financing DAC 100,000 0.38% 19/11/2027 101,337 0.02%Comcast Corp. 100,000 1.25% 20/2/2040 101,117 0.02%Chubb INA Holdings, Inc. 100,000 0.30% 15/12/2024 100,910 0.02%American Honda Finance Corp. 100,000 0.35% 26/8/2022 100,829 0.02%Abbott Ireland Financing DAC 100,000 0.10% 19/11/2024 100,819 0.02%DH Europe Finance II Sarl 100,000 0.45% 18/3/2028 100,795 0.02%AT&T, Inc. 100,000 0.80% 4/3/2030 100,766 0.02%Dow Chemical Co. 100,000 0.50% 15/3/2027 100,738 0.02%Coca-Cola Co. 100,000 0.95% 6/5/2036 100,733 0.02%BorgWarner, Inc. 100,000 1.00% 19/5/2031 100,729 0.02%Medtronic Global Holdings SCA 100,000 0.00% 15/3/2023 100,579 0.02%DH Europe Finance II Sarl 100,000 0.20% 18/3/2026 100,535 0.02%Bank of America Corp.^ 100,000 0.58% 8/8/2029 100,513 0.02%Fidelity National Information Services, Inc. 100,000 0.13% 3/12/2022 100,489 0.02%Comcast Corp. 100,000 0.25% 20/5/2027 100,460 0.02%Stellantis NV 100,000 0.63% 30/3/2027 100,442 0.02%Johnson & Johnson 100,000 0.25% 20/1/2022 100,353 0.02%Booking Holdings, Inc. 100,000 0.10% 8/3/2025 100,304 0.02%Johnson Controls International plc/Tyco Fire & Security Finance SCA 100,000 0.38% 15/9/2027 100,232 0.02%PACCAR Financial Europe BV 100,000 0.00% 1/3/2026 100,175 0.02%PepsiCo, Inc. 100,000 0.88% 16/10/2039 100,156 0.02%DH Europe Finance II Sarl 100,000 0.75% 18/9/2031 100,127 0.02%Eaton Capital Unlimited Co. 100,000 0.13% 8/3/2026 100,059 0.02%Bank of America Corp.^ 100,000 0.69% 22/3/2031 99,742 0.02%Prologis Euro Finance LLC 100,000 1.00% 6/2/2035 99,532 0.02%FedEx Corp. 100,000 0.95% 4/5/2033 99,296 0.02%Verizon Communications, Inc. 100,000 0.38% 22/3/2029 99,168 0.02%American Tower Corp. 100,000 0.50% 15/1/2028 99,156 0.02%Mondelez International Holdings Netherlands BV 100,000 0.00% 22/9/2026 99,153 0.02%Digital Dutch Finco BV 100,000 1.00% 15/1/2032 99,091 0.02%Coca-Cola Co. 100,000 0.13% 9/3/2029 98,989 0.02%Verizon Communications, Inc. 100,000 1.13% 19/9/2035 98,843 0.02%Stellantis NV 100,000 1.25% 20/6/2033 98,788 0.02%Exxon Mobil Corp. 100,000 1.41% 26/6/2039 98,614 0.02%VF Corp. 100,000 0.63% 25/2/2032 98,543 0.02%Mondelez International, Inc. 100,000 1.38% 17/3/2041 98,343 0.02%Mondelez International, Inc. 100,000 0.75% 17/3/2033 98,030 0.02%JPMorgan Chase & Co. 100,000 0.60% 17/2/2033 97,687 0.02%PepsiCo, Inc. 100,000 1.05% 9/10/2050 97,061 0.02%Coca-Cola Co. 100,000 0.38% 15/3/2033 96,775 0.02%Digital Intrepid Holding BV 100,000 0.63% 15/7/2031 96,619 0.02%Coca-Cola Co. 100,000 0.80% 15/3/2040 95,280 0.02%Prologis Euro Finance LLC 100,000 1.00% 16/2/2041 94,461 0.02%

912
Vanguard SRI Euro Investment Grade Bond Index Fund
Principal EUR (€) Coupon
Maturity Date
Fair Value EUR (€)
% of Total Net Assets
Berkshire Hathaway, Inc. 100,000 0.50% 15/1/2041 89,558 0.02%Goldman Sachs Group, Inc. 50,000 3.00% 12/2/2031 60,768 0.01%test - - - 52,068,285 11.78%Total Bonds 437,994,222 99.10%Financial Assets at Fair Value Through Profit or Loss 437,994,222 99.10%
testNumber of Contracts
Notional Amount
Unrealised Gain/(Loss)
EUR (€)% of Total
Net AssetsFinancial Derivative InstrumentsFutures (0.00%) (2020: (0.00%))Euro-Schatz September 2021 33 €3,701,165 (545 ) (0.00 %)Euro-Bobl September 2021 (16) €(2,145,080) (1,320 ) (0.00 %)Euro-Buxl 30 Year Bond September 2021 (1) €(201,367) (1,873 ) (0.00 %)Euro-Bund September 2021 (18) €(3,102,680) (4,300 ) (0.00 %)Total Financial Derivative Instruments (8,038 ) (0.00 %)
Fair Value EUR (€)
% of Total Net Assets
Other Assets and Liabilities 3,996,990 0.90 %Net Assets 441,983,174 100.00 %
Analysis of Total Net Assets EUR (€)% of Total
Net Assets(a) Transferable securities admitted to an official stock exchange listing 405,703,057 91.80 %(b) Transferable securities dealt in on another regulated market 28,866,928 6.53 %(c) Transferable securities other than those admitted to an official stock exchange listing or dealt in on another regulated
market 3,424,237 0.77 %
(d) Financial derivative instruments (8,038 ) (0.00 %)(e) Other assets and liabilities 3,996,990 0.90 %Total Net Assets 441,983,174 100.00 %
^ Floating Rate Note (FRN). The effective interest rate is at 30 June 2021.

The accompanying notes form an integral part of the financial statements.
913
Vanguard SRI Euro Investment Grade Bond Index Fund
Statement of Assets and Liabilities
Euro (€)
As at 30 June 2021
Euro (€)
As at 31 December 2020
Current AssetsFinancial Assets at Fair Value Through Profit or Loss 437,994,222 357,202,082 Financial Derivative Instruments — 2,240 Cash 2,779,090 3,560,628 Receivables: Interest and Dividends 2,017,333 2,256,846 Capital Shares Issued 1,413,786 3,639,398 Investments Sold 125,732 2,460 Futures Margin Cash — 3,204
Total Current Assets 444,330,163 366,666,858
Current LiabilitiesFinancial Derivative Instruments 8,038 4,850 Bank Overdraft 3,676 2,245 Payables and Other Liabilities: Investments Purchased 2,159,454 970,166 Capital Shares Redeemed 107,637 265,022 Futures Margin Cash Due to Broker 9,180 — Management Fees Payable 59,004 48,454
Total Current Liabilities 2,346,989 1,290,737
Net Assets Attributable to Holders of Redeemable Participating Shares (“Net Assets”) 441,983,174 365,376,121
Net Asset Value Per Share
.As at
30 June 2021As at
31 December 2020As at
31 December 2019EUR AccNet Assets 412,135,212 349,258,998 246,628,567Number of Shares Outstanding 3,846,754 3,220,730 2,334,956Net Asset Value Per Share1 107.14 108.44 105.62
Institutional Plus EUR AccNet Assets 29,847,962 16,117,123 14,421,826Number of Shares Outstanding 282,546 150,765 138,559Net Asset Value Per Share1 105.64 106.90 104.08
1 The net asset value per share shown may diverge from the net asset value per share used for dealing purposes because of any adjustments for swing pricing and trade date accounting.

914
Vanguard SRI Euro Investment Grade Bond Index Fund
The accompanying notes form an integral part of the financial statements.
Statement of Operations
Euro (€)
Six Months Ended 30 June 2021
Euro (€)
Six Months Ended 30 June 2020
Investment Income/(Loss) Interest Income 1,159,370 931,458 Other Income — 375 Net Gain/(Loss) on Financial Instruments (5,712,775) (1,453,239)
Total Investment Income/(Loss) (4,553,405) (521,406)
Expenses Management Fees 320,739 215,781 Transaction Fees and Commissions 712 301
Total Expenses 321,451 216,082
Finance Costs Interest Expense 21,593 6,734
Total Finance Costs 21,593 6,734
Net Investment Income/(Loss) (4,896,449) (744,222)
Foreign Withholding Tax (757) (1,223)
Net Increase/(Decrease) in Net Assets (4,897,206) (745,445)
Statement of Changes in Net Assets
Euro (€)
Euro (€)
Six Months Ended Six Months Ended30 June 2021 30 June 2020
Increase/(Decrease) in Net Assets
Net Increase/(Decrease) in Net Assets From Operations (4,897,206) (745,445)
Capital Transactions Subscriptions 117,430,694 46,384,070 Redemptions (35,926,435) (14,330,147)
Total Capital Transactions 81,504,259 32,053,923
Total Increase/(Decrease) for the Period 76,607,053 31,308,478
Net AssetsBeginning of Period 365,376,121 261,050,393
End of Period 441,983,174 292,358,871

Vanguard U.K. Government Bond Index FundManaged by Vanguard Global Advisers, LLC.
915
Investment ObjectiveThis fund seeks to provide returns consistent with the performance of the Bloomberg Barclays U.K. Government Float Adjusted Bond Index, a market-weighted index designed to reflect the total universe of pound sterling-denominated UK treasury and government-related securities with maturities greater than 1 year.
Performance SummaryThe Performance Summary does not form part of the Financial Statements.
• As the six months ended 30 June 2021 came to a close, macroeconomic indicators signalled a faster global economic rebound than many had expected after the sharpest contraction in modern history. Yet the recovery has been uneven. Countries that have contained the virus more successfully, whether through vaccinations, lockdowns or both, generally have fared better economically. And the COVID-19 pandemic remained far from over, with new variants of the virus surfacing where vaccination rates have lagged and the human toll continuing to mount, especially in less developed economies.
• Swift and extensive support from governments and central banks has been a key to the rebound. So far in 2021, it has included fiscal stimulus – including the $1.9 trillion American Rescue Plan in the United States and the €673 billion Recovery and Resilience Facility in Europe – and pledges by a number of central banks to keep interest rates low for some time.
• Fixed income securities struggled amid concerns that an upturn in inflation might persist or even accelerate given the stronger-than-expected rebound in global growth, extraordinary monetary and fiscal stimulus and a jump in demand for goods and services as economies reopened and supply gradually picked up. With longer-term yields rising and prices falling, returns were negative for the half year.
• In the UK, inflation accelerated and the economy expanded amid strong pent-up demand, lockdowns easing and more furloughed workers back on the job. The Bank of England left monetary policy and its asset purchase programme unchanged. Government bond yields rose across the maturity spectrum.
• In this environment, the fund’s benchmark returned –6.16% for the six months.
• By maturity, longer-dated bonds significantly underperformed. For example, gilts maturing in more than 30 years posted double-digit declines while the returns of those maturing in less than five years were down less than 1%.
Benchmark returns in the commentary above are in British pounds.
Benchmark: Bloomberg Barclays U.K. Government Float Adjusted Bond Index
Total ReturnsPeriods Ended 30 June 2021
(Annualised for periods over one year)
Six Months Five YearsTen Years or
Since Inception1
EUR Hedged Acc — — -4.63 %
Benchmark — — -4.56
Tracking Difference* -0.07
GBP Acc -6.20 % 2.17 % 5.00 %
Benchmark -6.16 2.30 5.13
Tracking Difference* -0.04
GBP Dist -6.20 % 2.17 % 5.00 %
Benchmark -6.16 2.30 5.13
Tracking Difference* -0.04
Institutional Plus GBP Acc -6.17 % 2.25 % 4.44 %
Benchmark -6.16 2.30 4.49
Tracking Difference* -0.01
Institutional Plus GBP Dist -6.17 % 2.25 % 4.43 %
Benchmark -6.16 2.30 4.49
Tracking Difference* -0.01
Each benchmark is in its respective currency.Sources: Vanguard Global Advisers, LLC, and Bloomberg.Performance is based on NAV with net income reinvested.
All of the returns in this report represent past performance, which is not a guarantee of future results that may be achieved by the fund. For performance data current to the most recent month-end, which may be higher or lower than that cited, visit our website at http://global.vanguard.com. Note, too, that both investment returns and principal value can fluctuate widely, so an investor's shares, when sold, could be worth more or less than their original cost.* The tracking difference between the fund return and the index return over a stated period of time can be attributed to a number of factors, including, without limitation, small differences in
weightings, trading activity, transaction costs and differences in the valuation and withholding tax treatment between the fund and the index vendor.1 Since-inception returns: EUR Hedged Acc, 21 January 2021; Institutional Plus GBP Acc and Institutional Plus GBP Dist, 2 September 2014.

Significant Portfolio ChangesFor the Six Months Ended 30 June 2021
916
Vanguard U.K. Government Bond Index Fund
The Central Bank of Ireland requires a schedule of material changes in the composition of the portfolio during the period. These are defined as aggregate purchases of a security exceeding 1% of the total value of purchases for the period and aggregate disposals greater than 1% of the total value of sales. At a minimum, the largest 20 purchases and 20 sales must be shown; all purchases and sales must be shown if there are fewer than 20. A full listing of the portfolio changes for the period is available, upon request, at no extra cost from the Administrator.
Principal GBP (£)
Cost GBP (£)
Purchases
United Kingdom Gilt 0.13% 31/1/2024 242,018,000 242,028,120
United Kingdom Gilt 0.13% 31/1/2028 84,824,000 82,691,962
United Kingdom Gilt 4.75% 7/12/2030 57,680,000 78,912,692
United Kingdom Gilt 0.38% 22/10/2026 43,931,000 43,741,478
United Kingdom Gilt 1.25% 22/10/2041 41,496,000 41,979,592
United Kingdom Gilt 3.25% 22/1/2044 29,000,000 40,538,910
United Kingdom Gilt 0.13% 31/1/2023 38,250,000 38,315,020
United Kingdom Gilt 4.50% 7/9/2034 25,100,000 36,359,098United Kingdom Gilt 4.25%
7/12/2055 18,550,000 33,943,181United Kingdom Gilt 0.63%
31/7/2035 35,900,000 33,622,612United Kingdom Gilt 4.75%
7/12/2038 20,500,000 31,952,620United Kingdom Gilt 4.50%
7/12/2042 18,750,000 30,098,928United Kingdom Gilt 1.25%
31/7/2051 29,600,000 29,151,573United Kingdom Gilt 0.88%
31/1/2046 27,800,000 27,280,276United Kingdom Gilt 0.25%
31/7/2031 28,100,000 26,444,796United Kingdom Gilt 1.75%
22/7/2057 20,300,000 23,569,756United Kingdom Gilt 0.88%
22/10/2029 21,400,000 22,156,396United Kingdom Gilt 4.25%
7/12/2046 11,900,000 20,807,336United Kingdom Gilt 0.13%
30/1/2026 19,700,000 19,774,153United Kingdom Gilt 4.25% 7/3/2036 13,410,000 19,728,022United Kingdom Gilt 4.25%
7/12/2049 10,350,000 17,787,221United Kingdom Gilt 0.50%
22/10/2061 19,800,000 15,318,466United Kingdom Gilt 1.63%
22/10/2054 11,760,000 12,674,835United Kingdom Gilt 3.50%
22/7/2068 6,600,000 12,208,605
Principal GBP (£)
Proceeds GBP (£)
Sales
United Kingdom Gilt 2.25% 7/9/2023 65,795,000 69,455,547United Kingdom Gilt 1.63%
22/10/2028 56,872,000 61,502,856United Kingdom Gilt 4.00% 7/3/2022 57,452,228 59,640,905United Kingdom Gilt 2.75% 7/9/2024 44,900,000 49,214,441United Kingdom Gilt 4.25%
7/12/2027 35,490,000 43,930,567United Kingdom Gilt 4.75%
7/12/2030 29,400,000 40,210,025United Kingdom Gilt 0.38%
22/10/2030 36,200,000 34,737,314United Kingdom Gilt 4.50% 7/9/2034 18,500,000 26,154,205United Kingdom Gilt 1.50%
22/7/2026 23,054,000 24,544,674United Kingdom Gilt 1.25%
22/7/2027 21,600,000 22,653,052United Kingdom Gilt 1.50%
22/7/2047 18,283,000 20,495,149United Kingdom Gilt 0.63%
22/10/2050 24,020,000 20,211,932United Kingdom Gilt 0.75%
22/7/2023 15,000,000 15,222,750United Kingdom Gilt 3.50%
22/1/2045 9,568,000 13,929,455United Kingdom Gilt 4.25%
7/12/2055 7,200,000 13,285,193United Kingdom Gilt 4.25%
7/12/2040 8,650,000 13,146,270United Kingdom Gilt 4.25% 7/3/2036 7,700,000 11,048,567United Kingdom Gilt 0.50%
22/10/2061 13,950,000 10,687,864United Kingdom Gilt 0.50%
22/7/2022 8,000,000 8,046,220United Kingdom Gilt 3.25%
22/1/2044 5,000,000 6,781,950United Kingdom Gilt 1.75% 7/9/2037 6,000,000 6,559,440

917
Vanguard U.K. Government Bond Index Fund
Financial StatementsStatement of Investments30 June 2021
Principal GBP (£) Coupon
Maturity Date
Fair Value GBP (£)
% of Total Net Assets
Bonds 99.59% (2020: 99.22%)Government Agency Bonds 1.80% (2020: 1.70%) LCR Finance plc 4,420,000 5.10% 7/3/2051 8,272,342 0.18%Network Rail Infrastructure Finance plc 5,670,000 4.75% 29/11/2035 8,248,544 0.18%LCR Finance plc 5,975,000 4.50% 7/12/2028 7,528,621 0.17%Network Rail Infrastructure Finance plc 5,900,000 4.75% 22/1/2024 6,563,898 0.15%Affordable Housing Finance plc 5,175,000 2.89% 11/8/2043 6,562,797 0.15%Prs Finance plc 5,772,504 1.75% 24/11/2026 6,081,441 0.13%Prs Finance plc 4,914,000 2.00% 23/1/2029 5,257,527 0.12%Network Rail Infrastructure Finance plc 3,820,000 4.38% 9/12/2030 4,989,461 0.11%Transport for London 3,200,000 2.13% 24/4/2025 3,350,331 0.07%LCR Finance plc 2,160,000 4.50% 7/12/2038 3,219,664 0.07%Transport for London 2,450,000 3.88% 23/7/2042 3,170,688 0.07%Transport for London 2,300,000 3.63% 15/5/2045 2,918,968 0.07%Transport for London 1,700,000 4.00% 7/4/2064 2,590,191 0.06%Affordable Housing Finance plc 1,820,000 3.80% 20/5/2042 2,585,953 0.06%Merseylink Issuer plc 1,828,000 3.84% 31/3/2043 2,442,375 0.05%Transport for London 1,675,000 4.00% 12/9/2033 2,080,930 0.05%Network Rail Infrastructure Finance plc 1,700,000 3.00% 7/9/2023 1,802,300 0.04%Transport for London 1,750,000 2.25% 9/8/2022 1,783,027 0.04%Prs Finance plc 700,000 1.50% 24/8/2034 712,342 0.02%Transport for London 400,000 5.00% 31/3/2035 519,522 0.01%Transport for London 150,000 4.50% 31/3/2031 177,478 0.00%test test test test 80,858,400 1.80%Government Bonds 97.77% (2020: 97.49%) United Kingdom Gilt 336,293,000 0.13% 31/1/2024 335,845,563 7.50%United Kingdom Gilt 173,090,000 0.13% 31/1/2023 173,277,609 3.87%United Kingdom Gilt 169,224,000 0.13% 31/1/2028 164,813,418 3.67%United Kingdom Gilt 153,482,192 0.63% 7/6/2025 155,789,135 3.47%United Kingdom Gilt 104,335,000 3.25% 22/1/2044 145,998,582 3.24%United Kingdom Gilt 84,536,519 4.50% 7/12/2042 137,282,383 3.05%United Kingdom Gilt 73,392,434 4.25% 7/12/2055 136,354,343 3.04%United Kingdom Gilt 127,334,000 0.13% 30/1/2026 126,124,585 2.81%United Kingdom Gilt 91,489,594 4.75% 7/12/2030 125,052,853 2.79%United Kingdom Gilt 73,828,712 4.25% 7/12/2046 122,353,777 2.73%United Kingdom Gilt 120,671,000 1.25% 22/10/2041 121,444,485 2.71%United Kingdom Gilt 64,588,000 3.50% 22/7/2068 120,576,353 2.69%United Kingdom Gilt 126,917,679 0.63% 31/7/2035 119,535,408 2.66%United Kingdom Gilt 73,658,481 4.75% 7/12/2038 116,174,909 2.59%United Kingdom Gilt 77,717,000 3.50% 22/1/2045 113,867,813 2.54%United Kingdom Gilt 108,070,000 1.25% 22/7/2027 113,261,968 2.52%United Kingdom Gilt 98,193,983 1.75% 7/9/2037 107,350,920 2.39%United Kingdom Gilt 73,844,213 4.25% 7/3/2036 106,158,922 2.37%United Kingdom Gilt 83,970,318 1.75% 22/7/2057 97,640,807 2.18%United Kingdom Gilt 55,892,357 4.25% 7/12/2049 96,495,700 2.15%United Kingdom Gilt 93,914,000 1.75% 7/9/2022 95,820,141 2.14%United Kingdom Gilt 64,493,628 2.50% 22/7/2065 94,768,279 2.11%United Kingdom Gilt 56,930,000 3.75% 22/7/2052 94,057,463 2.10%United Kingdom Gilt 60,470,347 4.25% 7/12/2040 92,873,908 2.07%United Kingdom Gilt 87,307,371 1.50% 22/7/2047 92,359,447 2.06%United Kingdom Gilt 90,450,405 0.50% 22/7/2022 90,905,081 2.03%United Kingdom Gilt 65,337,134 4.25% 7/6/2032 88,538,443 1.97%United Kingdom Gilt 88,825,000 0.38% 22/10/2030 85,806,448 1.91%United Kingdom Gilt 44,551,215 4.00% 22/1/2060 83,769,488 1.87%United Kingdom Gilt 54,669,547 4.25% 7/9/2039 82,563,262 1.84%United Kingdom Gilt 79,370,000 0.88% 22/10/2029 80,746,992 1.80%United Kingdom Gilt 78,094,000 0.75% 22/7/2023 79,195,824 1.77%United Kingdom Gilt 76,459,693 0.63% 22/10/2050 64,969,220 1.45%United Kingdom Gilt 55,223,946 5.00% 7/3/2025 64,892,381 1.45%United Kingdom Gilt 56,193,330 1.63% 22/10/2054 62,343,887 1.39%United Kingdom Gilt 49,357,000 1.75% 22/1/2049 55,280,554 1.23%United Kingdom Gilt 57,600,000 0.25% 31/7/2031 54,342,221 1.21%United Kingdom Gilt 63,772,000 0.50% 22/10/2061 50,377,601 1.12%United Kingdom Gilt 34,151,877 4.50% 7/9/2034 49,060,622 1.09%United Kingdom Gilt 34,954,250 6.00% 7/12/2028 48,733,247 1.09%

918
Vanguard U.K. Government Bond Index Fund
Principal GBP (£) Coupon
Maturity Date
Fair Value GBP (£)
% of Total Net Assets
United Kingdom Gilt 43,931,000 0.38% 22/10/2026 43,818,932 0.98%United Kingdom Gilt 33,206,190 1.63% 22/10/2071 40,291,678 0.90%United Kingdom Gilt 25,600,000 1.25% 31/7/2051 25,615,697 0.57%United Kingdom Gilt 23,100,000 0.88% 31/1/2046 21,246,586 0.47%United Kingdom Gilt 7,400,000 2.00% 7/9/2025 7,934,301 0.18%test test test test 4,385,711,236 97.77%Local Government 0.02% (2020: 0.03%) UK Municipal Bonds Agency Finance Co. Designated Activity Co. 1,150,000 1.63% 26/8/2060 1,071,854 0.02%test test test test 1,071,854 0.02%Total Bonds 4,467,641,490 99.59%Financial Assets at Fair Value Through Profit or Loss 4,467,641,490 99.59%
CurrencyBuy
Amount Currency(Sell)
Amount CounterpartySettlement
Date
Unrealised Gain/(Loss)
GBP (£)% of Total
Net AssetsFinancial Derivative InstrumentsHedge Share Class Level Forward Currency Exchange Contracts (0.00%) (2020: 0.00%)EUR 47,345 GBP (40,666) Morgan Stanley 3/8/2021 1 0.00 %EUR 196 GBP (169) BNP Paribas 2/7/2021 — 0.00 %EUR 314 GBP (270) Morgan Stanley 3/8/2021 — 0.00 %GBP 40,643 EUR (47,345) Morgan Stanley 2/7/2021 — 0.00 %EUR 47,149 GBP (40,530) Morgan Stanley 2/7/2021 (56 ) (0.00 %)Total Financial Derivative Instruments (55 ) (0.00 %)
Fair Value GBP (£)
% of Total Net Assets
Other Assets and Liabilities 18,219,692 0.41 %Net Assets 4,485,861,127 100.00 %
Analysis of Total Net Assets GBP (£)% of Total
Net Assets(a) Transferable securities admitted to an official stock exchange listing 4,461,560,049 99.46%(b) Transferable securities dealt in on another regulated market 6,081,441 0.13%(c) Transferable securities other than those admitted to an official stock exchange listing or dealt in on another regulated
market — 0.00%
(d) Financial derivative instruments (55) (0.00%)(e) Other assets and liabilities 18,219,692 0.41%Total Net Assets 4,485,861,127 100.00%

The accompanying notes form an integral part of the financial statements.
919
Vanguard U.K. Government Bond Index Fund
Statement of Assets and Liabilities
GBP (£)
As at 30 June 2021
GBP (£)
As at 31 December 2020
Current AssetsFinancial Assets at Fair Value Through Profit or Loss 4,467,641,490 4,305,709,043 Financial Derivative Instruments 1 — Cash 33,646,289 3,106,574 Receivables: Interest and Dividends 17,683,513 18,195,282 Capital Shares Issued 6,712,719 19,832,736 Investments Sold 4,936,759 20,964,193
Total Current Assets 4,530,620,771 4,367,807,828
Current LiabilitiesFinancial Derivative Instruments 56 — Payables and Other Liabilities: Investments Purchased 21,441,672 20,266,121 Income Distribution Payable 1,853,599 1,988,726 Capital Shares Redeemed 21,052,615 5,577,396 Management Fees Payable 411,702 394,317
Total Current Liabilities 44,759,644 28,226,560
Net Assets Attributable to Holders of Redeemable Participating Shares (“Net Assets”) 4,485,861,127 4,339,581,268
Net Asset Value Per Share
.As at
30 June 2021As at
31 December 2020As at
31 December 2019EUR Hedged Acc1
GBP (£) Equivalent 40,936 — —Net Assets 47,686 — —Number of Shares Outstanding 500 — —Net Asset Value Per Share2 95.37 — —
GBP AccNet Assets 3,517,989,815 3,331,626,317 2,556,934,547Number of Shares Outstanding 19,502,354 17,324,198 14,555,966Net Asset Value Per Share2 180.39 192.31 175.66
GBP DistNet Assets 341,319,746 329,207,488 277,064,654Number of Shares Outstanding 2,413,329 2,174,320 1,984,204Net Asset Value Per Share2 141.43 151.41 139.64
Institutional Plus GBP AccNet Assets 105,602,997 106,128,849 53,966,875Number of Shares Outstanding 785,286 740,489 412,475Net Asset Value Per Share2 134.48 143.32 130.84
Institutional Plus GBP DistNet Assets 520,907,633 572,618,614 413,393,050Number of Shares Outstanding 4,280,011 4,394,854 3,440,381Net Asset Value Per Share2 121.71 130.29 120.16
1 The share class was launched on 21 January 2021.2 The net asset value per share shown may diverge from the net asset value per share used for dealing purposes because of any adjustments for swing pricing and trade date accounting.

920
Vanguard U.K. Government Bond Index Fund
The accompanying notes form an integral part of the financial statements.
Statement of Operations
GBP (£)
Six Months Ended 30 June 2021
GBP (£)
Six Months Ended 30 June 2020
Investment Income/(Loss) Interest Income 20,315,836 20,333,710 Net Gain/(Loss) on Financial Instruments (288,950,613) 332,697,248
Total Investment Income/(Loss) (268,634,777) 353,030,958
Expenses Management Fees 2,381,084 1,925,327
Total Expenses 2,381,084 1,925,327
Finance Costs Distribution Paid 3,660,044 4,069,351 Income Equalisation 14,144 21,581
Total Finance Costs 3,674,188 4,090,932
Net Investment Income/(Loss) (274,690,049) 347,014,699
Net Increase/(Decrease) in Net Assets (274,690,049) 347,014,699
Statement of Changes in Net Assets
GBP (£)
GBP (£)
Six Months Ended Six Months Ended30 June 2021 30 June 2020
Increase/(Decrease) in Net Assets
Net Increase/(Decrease) in Net Assets From Operations (274,690,049) 347,014,699
Capital Transactions Subscriptions 1,183,658,259 1,001,363,500 Redemptions (762,690,500) (958,169,565) Reinvestments 2,149 862
Total Capital Transactions1 420,969,908 43,194,797
Total Increase/(Decrease) for the Period 146,279,859 390,209,496
Net AssetsBeginning of Period 4,339,581,268 3,301,359,126
End of Period 4,485,861,127 3,691,568,622
1 Capital Transactions include income equalisation adjustments as shown in the Statement of Operations.
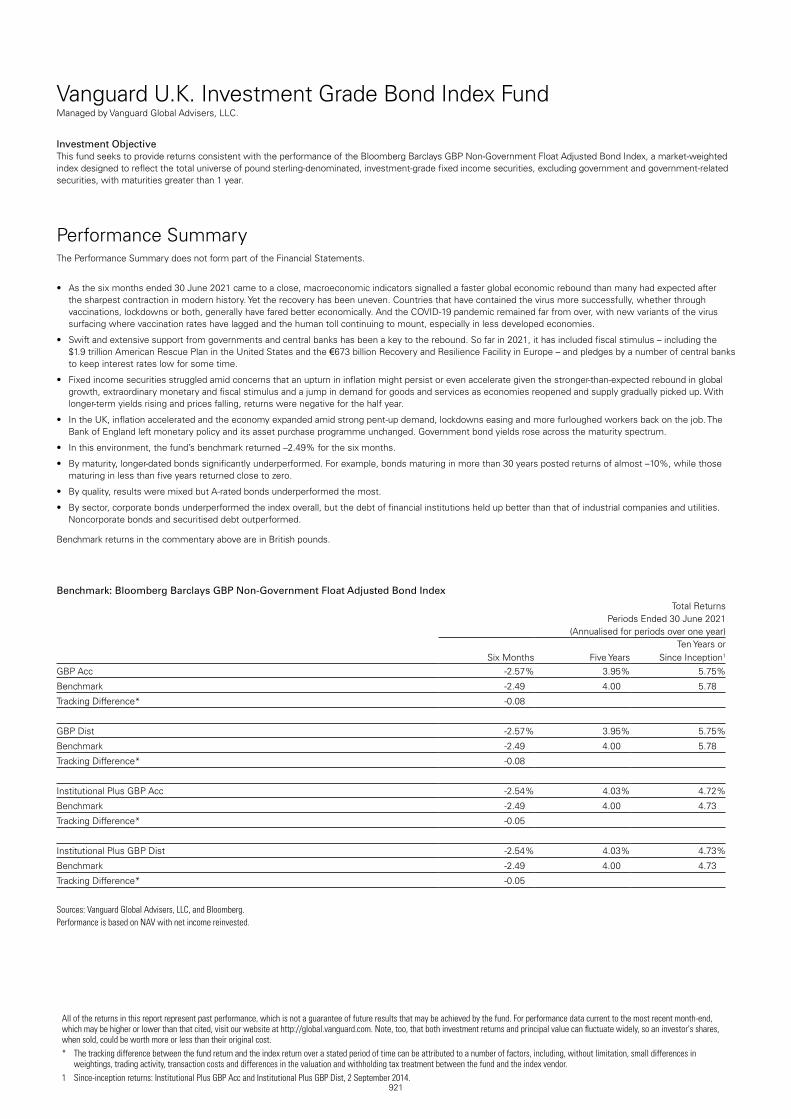
Vanguard U.K. Investment Grade Bond Index FundManaged by Vanguard Global Advisers, LLC.
921
Investment ObjectiveThis fund seeks to provide returns consistent with the performance of the Bloomberg Barclays GBP Non-Government Float Adjusted Bond Index, a market-weighted index designed to reflect the total universe of pound sterling-denominated, investment-grade fixed income securities, excluding government and government-related securities, with maturities greater than 1 year.
Performance SummaryThe Performance Summary does not form part of the Financial Statements.
• As the six months ended 30 June 2021 came to a close, macroeconomic indicators signalled a faster global economic rebound than many had expected after the sharpest contraction in modern history. Yet the recovery has been uneven. Countries that have contained the virus more successfully, whether through vaccinations, lockdowns or both, generally have fared better economically. And the COVID-19 pandemic remained far from over, with new variants of the virus surfacing where vaccination rates have lagged and the human toll continuing to mount, especially in less developed economies.
• Swift and extensive support from governments and central banks has been a key to the rebound. So far in 2021, it has included fiscal stimulus – including the $1.9 trillion American Rescue Plan in the United States and the €673 billion Recovery and Resilience Facility in Europe – and pledges by a number of central banks to keep interest rates low for some time.
• Fixed income securities struggled amid concerns that an upturn in inflation might persist or even accelerate given the stronger-than-expected rebound in global growth, extraordinary monetary and fiscal stimulus and a jump in demand for goods and services as economies reopened and supply gradually picked up. With longer-term yields rising and prices falling, returns were negative for the half year.
• In the UK, inflation accelerated and the economy expanded amid strong pent-up demand, lockdowns easing and more furloughed workers back on the job. The Bank of England left monetary policy and its asset purchase programme unchanged. Government bond yields rose across the maturity spectrum.
• In this environment, the fund’s benchmark returned –2.49% for the six months.
• By maturity, longer-dated bonds significantly underperformed. For example, bonds maturing in more than 30 years posted returns of almost –10%, while those maturing in less than five years returned close to zero.
• By quality, results were mixed but A-rated bonds underperformed the most.
• By sector, corporate bonds underperformed the index overall, but the debt of financial institutions held up better than that of industrial companies and utilities. Noncorporate bonds and securitised debt outperformed.
Benchmark returns in the commentary above are in British pounds.
Benchmark: Bloomberg Barclays GBP Non-Government Float Adjusted Bond Index
Total ReturnsPeriods Ended 30 June 2021
(Annualised for periods over one year)
Six Months Five YearsTen Years or
Since Inception1
GBP Acc -2.57 % 3.95 % 5.75 %
Benchmark -2.49 4.00 5.78
Tracking Difference* -0.08
GBP Dist -2.57 % 3.95 % 5.75 %
Benchmark -2.49 4.00 5.78
Tracking Difference* -0.08
Institutional Plus GBP Acc -2.54 % 4.03 % 4.72 %
Benchmark -2.49 4.00 4.73
Tracking Difference* -0.05
Institutional Plus GBP Dist -2.54 % 4.03 % 4.73 %
Benchmark -2.49 4.00 4.73
Tracking Difference* -0.05
Sources: Vanguard Global Advisers, LLC, and Bloomberg.Performance is based on NAV with net income reinvested.
All of the returns in this report represent past performance, which is not a guarantee of future results that may be achieved by the fund. For performance data current to the most recent month-end, which may be higher or lower than that cited, visit our website at http://global.vanguard.com. Note, too, that both investment returns and principal value can fluctuate widely, so an investor's shares, when sold, could be worth more or less than their original cost.* The tracking difference between the fund return and the index return over a stated period of time can be attributed to a number of factors, including, without limitation, small differences in
weightings, trading activity, transaction costs and differences in the valuation and withholding tax treatment between the fund and the index vendor.1 Since-inception returns: Institutional Plus GBP Acc and Institutional Plus GBP Dist, 2 September 2014.

Significant Portfolio ChangesFor the Six Months Ended 30 June 2021
922
Vanguard U.K. Investment Grade Bond Index Fund
The Central Bank of Ireland requires a schedule of material changes in the composition of the portfolio during the period. These are defined as aggregate purchases of a security exceeding 1% of the total value of purchases for the period and aggregate disposals greater than 1% of the total value of sales. At a minimum, the largest 20 purchases and 20 sales must be shown; all purchases and sales must be shown if there are fewer than 20. A full listing of the portfolio changes for the period is available, upon request, at no extra cost from the Administrator.
Principal GBP (£)
Cost GBP (£)
Purchases
United Kingdom Gilt 1.63% 22/10/2054 14,360,000 16,059,083
European Investment Bank 0.13% 14/12/2026 15,000,000 14,811,768
European Investment Bank 0.75% 14/7/2023 11,000,000 11,132,110
KFW 0.88% 18/7/2024 10,000,000 10,176,700Caisse d’Amortissement de la Dette
Sociale 0.13% 15/12/2025 10,000,000 9,957,000KFW 0.13% 30/12/2026 9,060,000 8,936,815Province of Ontario Canada 0.25%
15/12/2026 8,460,000 8,406,842KFW 1.38% 9/12/2024 8,000,000 8,260,000JPMorgan Chase & Co. 0.99%
28/4/2026 7,700,000 7,698,405BNP Paribas SA 1.25% 13/7/2031 7,300,000 7,127,440Bank of America Corp. 1.67%
2/6/2029 6,500,000 6,508,000Inter-American Development Bank
1.25% 15/12/2025 6,000,000 6,277,660European Investment Bank 6.00%
7/12/2028 4,500,000 6,194,960BNP Paribas SA 2.00% 24/5/2031 6,100,000 6,140,343Natwest Group plc 2.11%
28/11/2031 6,000,000 6,000,530JPMorgan Chase & Co. 1.90%
28/4/2033 5,900,000 5,912,990HSBC Holdings plc 1.75% 24/7/2027 5,500,000 5,517,050International Bank for Reconstruction
& Development 0.75% 15/12/2026 5,000,000 5,096,210Kommunalbanken A/S 0.63%
15/12/2026 5,000,000 4,994,150Asian Development Bank 0.75%
7/12/2027 5,000,000 4,989,470
Principal GBP (£)
Proceeds GBP (£)
Sales
KFW 0.88% 15/3/2022 22,670,000 22,824,156United Kingdom Gilt 1.63%
22/10/2054 10,300,000 11,483,210HSBC Holdings plc 2.18% 27/6/2023 7,500,000 7,615,875Imperial Brands Finance plc 9.00%
17/2/2022 6,700,000 7,256,770NRW Bank 1.00% 15/6/2022 6,800,000 6,859,436NGG Finance plc 5.63% 18/6/2073 5,300,000 5,951,460BNG Bank NV 1.00% 15/3/2022 5,500,000 5,542,515African Development Bank 0.88%
20/12/2021 5,200,000 5,239,364FMS Wertmanagement 0.63%
15/6/2022 5,200,000 5,223,920Barclays Bank UK plc 4.25%
12/1/2022 5,000,000 5,200,000European Investment Bank 4.50%
7/6/2029 3,400,000 4,356,080Credit Suisse Group Funding
Guernsey Ltd. 3.00% 27/5/2022 4,200,000 4,300,338Muenchener Rueckversicherungs-
Gesellschaft AG in Muenchen 6.63% 26/5/2042 3,900,000 4,127,799
BAE Systems plc 4.13% 8/6/2022 3,700,000 3,825,837ABN AMRO Bank NV 1.38%
7/6/2022 3,700,000 3,737,185KFW 1.13% 7/12/2021 3,600,000 3,638,880Deutsche Telekom International
Finance BV 6.50% 8/4/2022 3,266,000 3,457,113Wells Fargo & Co. 2.13% 22/4/2022 3,400,000 3,452,054European Investment Bank 4.25%
7/12/2021 3,250,000 3,378,473Nederlandse Waterschapsbank NV
0.88% 20/12/2021 3,200,000 3,227,296Province of Manitoba Canada 0.75%
15/12/2021 3,050,000 3,067,080Metropolitan Life Global Funding I
1.63% 9/6/2022 2,800,000 2,836,120Oesterreichische Kontrollbank AG
0.75% 7/3/2022 2,800,000 2,814,560Westpac Banking Corp. 1.00%
30/6/2022 2,700,000 2,721,870Friends Life Holdings plc 8.25%
21/4/2022 2,450,000 2,631,325International Bank for Reconstruction
& Development 0.75% 7/12/2021 2,588,000 2,606,556SNCF Reseau 5.50% 1/12/2021 2,435,000 2,549,689Bayerische Landesbank 1.25%
20/12/2021 2,400,000 2,426,928Council Of Europe Development
Bank 1.13% 15/12/2021 2,380,000 2,402,539Nordic Investment Bank 1.13%
16/3/2022 2,380,000 2,401,539

923
Vanguard U.K. Investment Grade Bond Index Fund
Financial StatementsStatement of Investments30 June 2021
Principal GBP (£) Coupon
Maturity Date
Fair Value GBP (£)
% of Total Net Assets
Bonds 98.11% (2020: 98.36%)Australia 1.41% (2020: 1.36%)BHP Billiton Finance Ltd. 6,450,000 4.30% 25/9/2042 8,779,394 0.22%Commonwealth Bank of Australia 5,000,000 3.00% 4/9/2026 5,561,026 0.14%APT Pipelines Ltd. 3,800,000 3.50% 22/3/2030 4,234,325 0.10%Glencore Finance Europe Ltd. 3,200,000 3.13% 26/3/2026 3,416,441 0.08%Australia & New Zealand Banking Group Ltd. 3,163,000 1.81% 16/9/2031 3,170,376 0.08%Rio Tinto Finance plc 2,500,000 4.00% 11/12/2029 3,006,933 0.07%BHP Billiton Finance Ltd. 2,700,000 3.25% 25/9/2024 2,921,344 0.07%Westpac Banking Corp. 2,800,000 2.63% 14/12/2022 2,891,548 0.07%BHP Billiton Finance Ltd.^ 2,700,000 6.50% 22/10/2077 2,885,850 0.07%APT Pipelines Ltd. 2,600,000 4.25% 26/11/2024 2,880,108 0.07%APT Pipelines Ltd. 2,500,000 3.13% 18/7/2031 2,713,865 0.07%Vicinity Centres Trust 2,270,000 3.38% 7/4/2026 2,474,796 0.06%Toyota Finance Australia Ltd. 2,400,000 1.63% 11/7/2022 2,431,731 0.06%Macquarie Bank Ltd. 2,300,000 1.13% 15/12/2025 2,304,114 0.06%Scentre Group Trust 1 1,500,000 3.88% 16/7/2026 1,677,927 0.04%APT Pipelines Ltd. 1,500,000 2.50% 15/3/2036 1,512,414 0.04%Pacific National Finance Pty Ltd. 1,400,000 5.00% 19/9/2023 1,507,994 0.04%Westpac Banking Corp. 1,420,000 2.13% 2/5/2025 1,493,330 0.04%National Australia Bank Ltd. 1,100,000 3.00% 4/9/2026 1,223,779 0.03%test - - - 57,087,295 1.41%Austria 0.35% (2020: 0.37%)Oesterreichische Kontrollbank AG 7,900,000 1.13% 15/12/2022 8,003,389 0.20%Oesterreichische Kontrollbank AG 3,500,000 0.50% 15/12/2025 3,490,878 0.08%Oesterreichische Kontrollbank AG 2,800,000 1.25% 15/12/2023 2,864,305 0.07%test - - - 14,358,572 0.35%Belgium 0.58% (2020: 0.60%)Anheuser-Busch InBev SA 5,094,000 2.85% 25/5/2037 5,581,591 0.14%Anheuser-Busch InBev SA 4,720,000 2.25% 24/5/2029 4,960,713 0.12%Anheuser-Busch InBev SA 4,000,000 4.00% 24/9/2025 4,508,076 0.11%Anheuser-Busch InBev SA 3,400,000 9.75% 30/7/2024 4,321,561 0.11%Euroclear Bank SA 3,850,000 1.25% 30/9/2024 3,924,332 0.10%test - - - 23,296,273 0.58%Canada 1.36% (2020: 1.40%)Province of Ontario Canada 12,000,000 0.50% 15/12/2023 12,054,286 0.30%Province of Ontario Canada 8,460,000 0.25% 15/12/2026 8,219,885 0.20%CPPIB Capital, Inc. 5,700,000 1.13% 14/12/2029 5,737,201 0.14%Royal Bank of Canada 4,383,000 1.38% 9/12/2024 4,471,387 0.11%CPPIB Capital, Inc. 4,000,000 0.88% 17/12/2024 4,055,316 0.10%Royal Bank of Canada 3,500,000 1.13% 15/12/2025 3,528,671 0.09%Bank of Montreal 3,000,000 1.50% 18/12/2024 3,075,390 0.08%Province of Quebec Canada 2,800,000 1.50% 15/12/2023 2,879,298 0.07%Province of Quebec Canada1 2,500,000 0.75% 13/12/2024 2,521,555 0.06%Bank of Nova Scotia 2,200,000 1.38% 5/12/2023 2,240,831 0.06%Export Development Canada 1,800,000 1.38% 8/12/2023 1,846,799 0.05%Bank of Nova Scotia 1,300,000 1.75% 23/12/2022 1,325,583 0.03%CPPIB Capital, Inc. 1,000,000 0.38% 25/7/2023 1,002,001 0.03%Province of Alberta Canada 900,000 1.50% 15/12/2022 915,856 0.02%Province of Manitoba Canada 550,000 1.50% 15/12/2022 558,879 0.01%Canadian Imperial Bank of Commerce 500,000 1.63% 25/9/2025 516,227 0.01%test - - - 54,949,165 1.36%China 0.22% (2020: 0.24%)China Development Bank 5,000,000 1.25% 21/1/2023 5,039,678 0.13%Industrial & Commercial Bank of China Ltd. 3,670,000 1.50% 31/7/2022 3,697,104 0.09%test - - - 8,736,782 0.22%Czech Republic 0.06% (2020: 0.04%)CPI Property Group SA 2,300,000 2.75% 22/1/2028 2,352,223 0.06%test - - - 2,352,223 0.06%Denmark 1.00% (2020: 0.76%)AP Moller-Maersk A/S 6,700,000 4.00% 4/4/2025 7,430,844 0.18%Orsted A/S 5,350,000 2.50% 16/5/2033 5,807,548 0.14%Orsted A/S 4,250,000 4.88% 12/1/2032 5,556,448 0.14%Kommunekredit 5,000,000 0.38% 15/11/2024 4,986,582 0.12%Orsted A/S 4,647,000 2.13% 17/5/2027 4,888,713 0.12%Danske Bank A/S^ 4,160,000 2.25% 14/1/2028 4,271,082 0.11%

924
Vanguard U.K. Investment Grade Bond Index Fund
Principal GBP (£) Coupon
Maturity Date
Fair Value GBP (£)
% of Total Net Assets
Orsted A/S 2,250,000 5.75% 9/4/2040 3,558,648 0.09%Orsted A/S^ 2,200,000 2.50% 18/2/3021 2,184,599 0.05%Kommunekredit 1,800,000 1.38% 12/10/2022 1,826,060 0.05%test - - - 40,510,524 1.00%Finland 0.10% (2020: 0.22%)Kuntarahoitus OYJ 3,900,000 1.25% 7/12/2022 3,956,151 0.10%test - - - 3,956,151 0.10%France 8.20% (2020: 7.64%)Electricite de France SA 11,100,000 5.50% 17/10/2041 16,525,722 0.41%Electricite de France SA 8,200,000 6.00% 23/1/2114 14,501,292 0.36%Electricite de France SA 8,100,000 6.13% 2/6/2034 11,757,406 0.29%Engie SA 6,450,000 5.00% 1/10/2060 10,552,608 0.26%Caisse d’Amortissement de la Dette Sociale 10,000,000 0.13% 15/12/2025 9,814,911 0.24%Electricite de France SA^ 8,300,000 6.00% Perpetual 9,273,157 0.23%Electricite de France SA 5,550,000 5.13% 22/9/2050 8,591,929 0.21%Dexia Credit Local SA 8,000,000 1.38% 7/12/2022 8,129,842 0.20%Electricite de France SA 5,420,000 5.88% 18/7/2031 7,356,011 0.18%BNP Paribas SA 7,300,000 1.25% 13/7/2031 6,841,307 0.17%SNCF Reseau 3,660,000 5.00% 11/3/2052 6,320,850 0.16%AXA SA^ 4,900,000 5.63% 16/1/2054 6,239,143 0.15%BNP Paribas SA^ 6,100,000 2.00% 24/5/2031 6,150,317 0.15%Orange SA 5,400,000 3.25% 15/1/2032 6,144,403 0.15%SNCF Reseau 3,425,000 4.83% 25/3/2060 6,091,086 0.15%BPCE SA 4,800,000 5.25% 16/4/2029 5,930,087 0.15%Electricite de France SA 4,400,000 6.25% 30/5/2028 5,756,036 0.14%Veolia Environnement SA 3,700,000 6.13% 29/10/2037 5,744,637 0.14%SNCF Reseau 4,288,000 5.25% 7/12/2028 5,587,964 0.14%BNP Paribas SA 5,100,000 3.38% 23/1/2026 5,568,811 0.14%Electricite de France SA 3,900,000 5.50% 27/3/2037 5,554,026 0.14%Dexia Credit Local SA 5,500,000 1.13% 15/6/2022 5,548,005 0.14%LVMH Moet Hennessy Louis Vuitton SE 5,500,000 1.13% 11/2/2027 5,536,483 0.14%AXA SA^ 4,750,000 5.45% Perpetual 5,495,666 0.14%Dexia Credit Local SA 5,500,000 0.25% 11/12/2024 5,449,974 0.13%BNP Paribas SA 5,100,000 1.88% 14/12/2027 5,206,004 0.13%Societe Nationale SNCF SA 4,162,000 5.38% 18/3/2027 5,153,160 0.13%Banque Federative du Credit Mutuel SA 4,800,000 1.75% 19/12/2024 4,950,799 0.12%SNCF Reseau 3,325,000 5.25% 31/1/2035 4,837,269 0.12%Dexia Credit Local SA 4,700,000 0.50% 22/7/2023 4,718,083 0.12%Orange SA 2,900,000 5.38% 22/11/2050 4,703,557 0.12%Orange SA 3,200,000 8.13% 20/11/2028 4,690,420 0.12%Dexia Credit Local SA 4,300,000 2.13% 12/2/2025 4,540,004 0.11%Electricite de France SA^ 3,900,000 5.88% Perpetual 4,428,594 0.11%Orange SA^ 4,087,000 5.75% Perpetual 4,404,220 0.11%Orange SA 3,099,000 5.63% 23/1/2034 4,390,246 0.11%BPCE SA 4,000,000 1.38% 23/12/2026 4,054,456 0.10%Bouygues SA 3,200,000 5.50% 6/10/2026 3,929,077 0.10%Dexia Credit Local SA 3,800,000 1.63% 8/12/2023 3,916,025 0.10%Westfield America Management Ltd. 3,700,000 2.63% 30/3/2029 3,775,995 0.09%Vinci SA 3,500,000 2.25% 15/3/2027 3,717,580 0.09%Vinci SA 3,000,000 2.75% 15/9/2034 3,367,298 0.08%LVMH Moet Hennessy Louis Vuitton SE 3,200,000 1.00% 11/2/2023 3,227,619 0.08%Engie SA 2,300,000 7.00% 30/10/2028 3,185,572 0.08%Banque Federative du Credit Mutuel SA 3,100,000 1.88% 13/12/2022 3,164,116 0.08%Banque Federative du Credit Mutuel SA 3,000,000 1.50% 7/10/2026 3,057,907 0.07%TotalEnergies Capital International SA 2,900,000 1.66% 22/7/2026 2,989,273 0.07%Societe Generale SA 3,000,000 1.25% 7/12/2027 2,921,651 0.07%TotalEnergies Capital International SA 2,668,000 1.75% 7/7/2025 2,766,639 0.07%AXA SA^ 2,100,000 6.69% Perpetual 2,565,645 0.06%LVMH Moet Hennessy Louis Vuitton SE 2,540,000 1.00% 14/6/2022 2,552,290 0.06%Credit Agricole SA 2,150,000 7.38% 18/12/2023 2,485,135 0.06%Dexia Credit Local SA 2,500,000 0.25% 10/12/2026 2,435,389 0.06%Banque Federative du Credit Mutuel SA 2,400,000 1.25% 5/12/2025 2,424,439 0.06%BNP Paribas SA 2,200,000 1.13% 16/8/2022 2,219,894 0.05%Cie de Saint-Gobain 1,700,000 4.63% 9/10/2029 2,090,605 0.05%BPCE SA 2,000,000 2.13% 16/12/2022 2,048,100 0.05%Bpifrance SACA 2,000,000 0.75% 22/7/2022 2,010,236 0.05%Caisse des Depots et Consignations 2,000,000 0.50% 21/7/2023 2,007,745 0.05%Credit Agricole SA^ 2,000,000 1.87% 9/12/2031 2,006,244 0.05%Cie de Financement Foncier SA 1,600,000 5.50% 26/1/2027 2,002,456 0.05%Banque Federative du Credit Mutuel SA 1,900,000 2.25% 18/12/2023 1,977,810 0.05%TotalEnergies Capital International SA 2,000,000 1.41% 3/9/2031 1,961,944 0.05%

925
Vanguard U.K. Investment Grade Bond Index Fund
Principal GBP (£) Coupon
Maturity Date
Fair Value GBP (£)
% of Total Net Assets
Banque Federative du Credit Mutuel SA 2,000,000 0.88% 7/12/2027 1,951,395 0.05%Orange SA 1,607,000 5.25% 5/12/2025 1,913,396 0.05%Cie de Saint-Gobain 1,450,000 5.63% 15/11/2024 1,681,722 0.04%Westfield America Management Ltd. 1,600,000 2.13% 30/3/2025 1,638,331 0.04%Societe Generale SA 1,500,000 1.88% 3/10/2024 1,536,565 0.04%Societe Nationale SNCF SA 1,500,000 0.88% 28/12/2026 1,503,427 0.04%Sodexo SA 1,300,000 1.75% 26/6/2028 1,325,505 0.03%TotalEnergies Capital International SA 1,000,000 1.25% 16/12/2024 1,017,935 0.02%Caisse des Depots et Consignations 800,000 0.25% 25/2/2026 786,799 0.02%RCI Banque SA 729,000 1.88% 8/11/2022 738,460 0.02%Suez SA 400,000 5.38% 2/12/2030 526,839 0.01%test - - - 331,965,543 8.20%Germany 9.46% (2020: 10.19%)KFW 19,012,000 6.00% 7/12/2028 26,168,952 0.65%KFW 18,796,000 1.38% 9/12/2024 19,399,939 0.48%KFW 18,480,000 0.88% 18/7/2024 18,757,063 0.46%KFW 10,044,000 5.75% 7/6/2032 14,912,074 0.37%E.ON International Finance BV 6,800,000 5.88% 30/10/2037 9,996,967 0.25%KFW 9,460,000 1.00% 15/12/2022 9,574,711 0.24%E.ON International Finance BV 6,410,000 6.25% 3/6/2030 8,683,280 0.21%E.ON International Finance BV 5,500,000 6.13% 6/7/2039 8,473,681 0.21%FMS Wertmanagement 7,400,000 1.13% 7/9/2023 7,539,823 0.19%E.ON International Finance BV 5,235,000 6.38% 7/6/2032 7,412,712 0.18%Allianz Finance II BV 4,700,000 4.50% 13/3/2043 7,087,771 0.18%KFW 6,900,000 1.25% 29/12/2023 7,068,813 0.17%KFW 7,060,000 0.13% 30/12/2026 6,869,793 0.17%Deutsche Bank AG 6,300,000 2.63% 16/12/2024 6,577,245 0.16%Deutsche Bahn Finance GmbH 6,248,000 1.88% 13/2/2026 6,565,034 0.16%E.ON International Finance BV 4,050,000 6.75% 27/1/2039 6,554,501 0.16%KFW 6,200,000 0.88% 15/9/2026 6,295,165 0.16%KFW 4,113,000 5.00% 9/6/2036 6,277,307 0.15%Siemens Financieringsmaatschappij NV 4,200,000 3.75% 10/9/2042 5,766,250 0.14%E.ON International Finance BV 4,500,000 4.75% 31/1/2034 5,746,614 0.14%Landwirtschaftliche Rentenbank 5,500,000 0.88% 15/12/2026 5,573,209 0.14%KFW 5,300,000 1.38% 15/12/2025 5,496,585 0.14%Landwirtschaftliche Rentenbank 5,312,000 1.13% 15/12/2023 5,424,034 0.13%FMS Wertmanagement 4,600,000 1.13% 20/3/2023 4,671,681 0.12%Volkswagen Financial Services NV 4,200,000 1.63% 10/2/2024 4,283,477 0.11%Siemens Financieringsmaatschappij NV 4,000,000 1.00% 20/2/2025 4,036,298 0.10%KFW 4,000,000 0.75% 7/12/2027 4,012,102 0.10%Volkswagen Financial Services NV 3,500,000 4.25% 9/10/2025 3,958,518 0.10%Aroundtown SA 3,600,000 3.25% 18/7/2027 3,912,955 0.10%FMS Wertmanagement 3,700,000 1.00% 7/9/2022 3,735,928 0.09%Deutsche Telekom AG 3,294,000 3.13% 6/2/2034 3,723,662 0.09%Deutsche Bank AG 3,600,000 1.88% 22/12/2028 3,595,133 0.09%Landwirtschaftliche Rentenbank 3,460,000 1.38% 8/9/2025 3,582,884 0.09%Landesbank Baden-Wuerttemberg 3,500,000 1.50% 3/2/2025 3,565,959 0.09%KFW 2,896,000 5.50% 18/6/2025 3,466,203 0.09%Aroundtown SA 3,233,000 3.00% 16/10/2029 3,446,677 0.09%KFW 2,990,000 5.00% 10/9/2024 3,426,161 0.08%Deutsche Bahn Finance GmbH 3,236,000 1.38% 7/7/2025 3,324,864 0.08%BMW International Investment BV 3,300,000 0.75% 8/3/2024 3,312,276 0.08%Volkswagen Financial Services NV 3,300,000 0.88% 20/2/2025 3,291,701 0.08%Deutsche Telekom International Finance BV 2,186,000 7.63% 15/6/2030 3,258,407 0.08%Deutsche Bahn Finance GmbH 2,850,000 3.13% 24/7/2026 3,182,197 0.08%Deutsche Bahn Finance GmbH 3,250,000 0.38% 3/12/2026 3,178,374 0.08%Volkswagen International Finance NV 2,600,000 4.13% 17/11/2031 3,147,690 0.08%Landesbank Baden-Wuerttemberg 3,100,000 1.13% 8/12/2025 3,119,738 0.08%Landwirtschaftliche Rentenbank 3,000,000 0.63% 15/12/2022 3,019,094 0.07%Aroundtown SA 2,700,000 3.63% 10/4/2031 2,995,844 0.07%Volkswagen Financial Services NV 2,900,000 1.13% 18/9/2023 2,923,056 0.07%Siemens Financieringsmaatschappij NV 2,700,000 2.75% 10/9/2025 2,917,816 0.07%Daimler International Finance BV 2,700,000 2.00% 4/9/2023 2,776,023 0.07%BMW International Investment BV 2,680,000 1.88% 11/9/2023 2,758,173 0.07%E.ON International Finance BV 2,550,000 5.50% 6/7/2022 2,679,061 0.07%Volkswagen International Finance NV 2,400,000 3.38% 16/11/2026 2,660,410 0.07%Daimler International Finance BV 2,600,000 1.25% 5/9/2022 2,620,607 0.06%BASF SE 2,564,000 0.88% 6/10/2023 2,590,945 0.06%FMS Wertmanagement 2,500,000 1.38% 7/3/2025 2,582,351 0.06%Henkel AG & Co. KGaA 2,500,000 1.25% 30/9/2026 2,540,645 0.06%BMW International Investment BV 2,500,000 1.25% 11/7/2022 2,522,333 0.06%

926
Vanguard U.K. Investment Grade Bond Index Fund
Principal GBP (£) Coupon
Maturity Date
Fair Value GBP (£)
% of Total Net Assets
BMW Finance NV 2,484,000 0.88% 16/8/2022 2,497,576 0.06%Aroundtown SA^ 2,360,000 4.75% Perpetual 2,491,624 0.06%Daimler International Finance BV 2,400,000 1.63% 11/11/2024 2,460,137 0.06%Volkswagen Financial Services NV 2,400,000 1.63% 30/11/2022 2,431,944 0.06%Deutsche Telekom International Finance BV 2,356,000 1.25% 6/10/2023 2,394,161 0.06%Henkel AG & Co. KGaA 2,300,000 1.00% 30/9/2022 2,316,737 0.06%Deutsche Telekom International Finance BV 2,132,000 2.50% 10/10/2025 2,280,201 0.06%Volkswagen Financial Services NV 2,200,000 1.88% 3/12/2024 2,267,473 0.06%Landeskreditbank Baden-Wuerttemberg Foerderbank 2,200,000 1.38% 15/12/2023 2,257,066 0.06%Volkswagen Financial Services NV 2,000,000 2.13% 27/6/2024 2,069,038 0.05%Commerzbank AG 2,000,000 1.75% 22/1/2025 2,024,308 0.05%E.ON International Finance BV 1,800,000 5.63% 6/12/2023 2,014,344 0.05%Landesbank Baden-Wuerttemberg 2,000,000 1.13% 8/12/2025 2,012,734 0.05%NRW Bank 2,000,000 0.50% 18/12/2026 1,982,715 0.05%Landwirtschaftliche Rentenbank 1,760,000 1.38% 16/12/2024 1,817,992 0.04%Siemens Financieringsmaatschappij NV 1,800,000 0.88% 5/6/2023 1,813,708 0.04%BASF SE 1,748,000 1.75% 11/3/2025 1,812,490 0.04%KFW 1,100,000 4.88% 15/3/2037 1,670,121 0.04%Henkel AG & Co. KGaA 1,646,000 0.88% 13/9/2022 1,654,466 0.04%NRW Bank 1,600,000 0.38% 16/12/2024 1,595,034 0.04%Volkswagen Financial Services NV 1,564,000 1.75% 12/9/2022 1,584,731 0.04%Deutsche Pfandbriefbank AG 1,500,000 1.75% 21/11/2022 1,517,819 0.04%Deutsche Telekom International Finance BV 1,000,000 8.88% 27/11/2028 1,516,326 0.04%Volkswagen Financial Services NV 1,380,000 2.25% 12/4/2025 1,442,686 0.04%Deutsche Bank AG 1,300,000 3.88% 12/2/2024 1,391,129 0.03%FMS Wertmanagement 1,200,000 0.88% 14/2/2022 1,205,448 0.03%BMW International Investment BV 1,000,000 1.38% 1/10/2024 1,021,243 0.03%BASF SE 1,000,000 1.38% 21/6/2022 1,009,966 0.02%Landeskreditbank Baden-Wuerttemberg Foerderbank 1,000,000 0.38% 9/12/2024 996,903 0.02%Volkswagen Financial Services NV 800,000 2.75% 10/7/2023 831,966 0.02%Deutsche Telekom International Finance BV 780,000 2.25% 13/4/2029 820,053 0.02%NRW Bank 700,000 1.38% 15/12/2023 717,559 0.02%test - - - 382,960,464 9.46%Guernsey 0.06% (2020: 0.06%)States of Guernsey Bond 2,000,000 3.38% 12/12/2046 2,637,970 0.06%test - - - 2,637,970 0.06%Hong Kong 0.11% (2020: 0.13%)CK Hutchison Group Telecom Finance SA 2,400,000 2.63% 17/10/2034 2,483,481 0.06%Hutchison Whampoa Finance UK plc 1,700,000 5.63% 24/11/2026 2,094,400 0.05%test - - - 4,577,881 0.11%Ireland 0.48% (2020: 0.45%)NIE Finance plc 5,150,000 6.38% 2/6/2026 6,451,292 0.16%Freshwater Finance plc 2,515,000 5.18% 20/4/2035 3,402,567 0.08%Freshwater Finance plc 1,850,000 4.61% 17/10/2036 2,376,002 0.06%NIE Finance plc 2,000,000 2.50% 27/10/2025 2,118,401 0.05%ESB Finance DAC 2,000,000 1.88% 21/7/2035 2,013,438 0.05%Dali Capital plc 1,350,000 4.80% 21/12/2037 1,810,790 0.05%Freshwater Finance plc 950,000 4.56% 3/4/2036 1,213,077 0.03%test - - - 19,385,567 0.48%Italy 1.22% (2020: 1.27%)Enel Finance International NV 8,778,000 5.75% 14/9/2040 13,261,554 0.33%Republic of Italy Government International Bond 9,326,000 6.00% 4/8/2028 12,037,580 0.30%Enel Finance International NV 5,570,000 5.63% 14/8/2024 6,400,186 0.16%Enel Finance International NV 6,190,000 1.00% 20/10/2027 6,082,203 0.15%Enel SpA 2,950,000 5.75% 22/6/2037 4,277,096 0.10%Intesa Sanpaolo SpA 2,450,000 2.50% 15/1/2030 2,520,780 0.06%Intesa Sanpaolo SpA 2,000,000 2.63% 11/3/2036 2,008,710 0.05%Republic of Italy Government International Bond 1,300,000 5.25% 7/12/2034 1,773,874 0.04%Aeroporti di Roma SpA 1,100,000 5.44% 20/2/2023 1,172,654 0.03%test - - - 49,534,637 1.22%Japan 0.50% (2020: 0.46%)JT International Financial Services BV 3,200,000 2.75% 28/9/2033 3,469,899 0.09%Japan Bank for International Cooperation 3,000,000 0.38% 22/7/2026 2,956,223 0.07%East Japan Railway Co. 2,100,000 4.75% 8/12/2031 2,760,830 0.07%Development Bank of Japan, Inc. 2,340,000 1.13% 28/4/2023 2,372,198 0.06%East Japan Railway Co. 1,450,000 4.88% 14/6/2034 1,981,149 0.05%American Honda Finance Corp. 1,800,000 2.63% 14/10/2022 1,849,834 0.04%Toyota Motor Finance Netherlands BV 1,800,000 1.38% 23/5/2023 1,832,410 0.04%East Japan Railway Co. 1,200,000 5.25% 22/4/2033 1,671,032 0.04%East Japan Railway Co. 1,150,000 4.50% 25/1/2036 1,549,118 0.04%test - - - 20,442,693 0.50%

927
Vanguard U.K. Investment Grade Bond Index Fund
Principal GBP (£) Coupon
Maturity Date
Fair Value GBP (£)
% of Total Net Assets
Jersey 0.05% (2020: 0.05%)Jersey International Bond 1,440,000 3.75% 9/6/2054 2,131,977 0.05%test - - - 2,131,977 0.05%Luxembourg 0.03% (2020: 0.01%)Logicor Financing Sarl 1,300,000 2.75% 15/1/2030 1,363,240 0.03%test - - - 1,363,240 0.03%Mexico 0.68% (2020: 0.70%)Mexico Government International Bond 6,199,000 5.63% 19/3/2114 6,774,449 0.17%America Movil SAB de CV 4,250,000 4.38% 7/8/2041 5,495,287 0.14%America Movil SAB de CV 3,825,000 5.75% 28/6/2030 5,048,202 0.12%America Movil SAB de CV 3,500,000 5.00% 27/10/2026 4,160,023 0.10%America Movil SAB de CV 2,450,000 4.95% 22/7/2033 3,210,546 0.08%Mexico Government International Bond 2,563,000 6.75% 6/2/2024 2,943,229 0.07%test - - - 27,631,736 0.68%Netherlands 2.25% (2020: 2.49%)Cooperatieve Rabobank UA 7,550,000 4.63% 23/5/2029 8,989,826 0.22%ING Groep NV 6,400,000 3.00% 18/2/2026 6,927,415 0.17%Nederlandse Waterschapsbank NV 7,000,000 0.25% 15/12/2025 6,901,659 0.17%Koninklijke KPN NV 4,900,000 5.75% 17/9/2029 6,099,440 0.15%Cooperatieve Rabobank UA 4,700,000 1.25% 14/1/2025 4,745,909 0.12%Aegon NV 2,600,000 6.63% 16/12/2039 4,482,374 0.11%ING Groep NV^ 4,500,000 1.13% 7/12/2028 4,409,215 0.11%BNG Bank NV 4,250,000 0.38% 15/12/2025 4,217,325 0.10%Cooperatieve Rabobank UA 2,300,000 5.25% 23/5/2041 3,629,880 0.09%Cooperatieve Rabobank UA 2,976,000 4.00% 19/9/2022 3,107,559 0.08%Koninklijke KPN NV 2,651,000 5.00% 18/11/2026 3,066,072 0.08%Cooperatieve Rabobank UA 1,550,000 5.38% 3/8/2060 3,018,234 0.07%NIBC Bank NV 2,800,000 3.13% 15/11/2023 2,942,596 0.07%Shell International Finance BV 3,100,000 1.00% 10/12/2030 2,939,536 0.07%BNG Bank NV 2,750,000 1.00% 17/6/2022 2,771,553 0.07%Shell International Finance BV 3,200,000 1.75% 10/9/2052 2,741,384 0.07%Cooperatieve Rabobank UA 2,050,000 5.25% 14/9/2027 2,467,454 0.06%ABN AMRO Bank NV 2,300,000 1.38% 16/1/2025 2,341,569 0.06%BNG Bank NV 2,000,000 1.63% 26/8/2025 2,091,709 0.05%BNG Bank NV 2,000,000 0.50% 21/12/2026 1,981,573 0.05%Nederlandse Waterschapsbank NV 1,325,000 5.38% 7/6/2032 1,902,905 0.05%UPP Bond 1 Issuer plc 1,538,416 4.90% 28/2/2040 1,866,810 0.05%Cooperatieve Rabobank UA 1,363,000 4.55% 30/8/2029 1,716,946 0.04%BNG Bank NV 1,200,000 5.20% 7/12/2028 1,566,250 0.04%Aegon NV 1,050,000 6.13% 15/12/2031 1,504,193 0.04%Unilever plc 1,400,000 1.88% 15/9/2029 1,486,920 0.04%Cooperatieve Rabobank UA 900,000 4.88% 10/1/2023 960,915 0.02%test - - - 90,877,221 2.25%New Zealand 0.03% (2020: 0.04%)Fonterra Cooperative Group Ltd. 1,079,000 9.38% 4/12/2023 1,296,696 0.03%test - - - 1,296,696 0.03%Norway 0.93% (2020: 0.74%)Equinor A.S.A 5,760,000 6.88% 11/3/2031 8,505,960 0.21%Kommunalbanken A/S 5,000,000 0.63% 15/12/2026 4,985,391 0.12%Kommunalbanken A/S 4,800,000 1.13% 30/11/2022 4,860,483 0.12%DNB Bank A.S.A 4,290,000 1.38% 12/6/2023 4,367,124 0.11%Kommunalbanken A/S 3,300,000 0.25% 15/12/2025 3,253,354 0.08%Equinor A.S.A 2,250,000 4.25% 10/4/2041 3,037,834 0.08%Kommunalbanken A/S 2,300,000 1.50% 15/12/2023 2,366,136 0.06%Equinor A.S.A 1,656,000 6.13% 27/11/2028 2,214,854 0.05%Kommunalbanken A/S 1,500,000 1.00% 12/12/2024 1,527,630 0.04%SpareBank 1 Boligkreditt A/S 1,400,000 1.75% 18/12/2023 1,444,733 0.04%DNB Bank A.S.A 900,000 1.63% 15/12/2023 924,377 0.02%test - - - 37,487,876 0.93%Portugal 0.05% (2020: 0.06%)EDP Finance BV 1,800,000 8.63% 4/1/2024 2,145,926 0.05%test - - - 2,145,926 0.05%Russia 0.26% (2020: 0.27%)Gazprom PJSC Via Gaz Capital SA 5,400,000 4.25% 6/4/2024 5,744,290 0.14%Russian Railways Via RZD Capital plc 3,500,000 7.49% 25/3/2031 4,647,899 0.12%test - - - 10,392,189 0.26%Singapore 0.18% (2020: 0.21%)Temasek Financial I Ltd. 2,400,000 5.13% 26/7/2040 3,748,006 0.09%Temasek Financial I Ltd. 3,300,000 4.63% 26/7/2022 3,445,050 0.09%test - - - 7,193,056 0.18%

928
Vanguard U.K. Investment Grade Bond Index Fund
Principal GBP (£) Coupon
Maturity Date
Fair Value GBP (£)
% of Total Net Assets
South Africa 0.06% (2020: 0.05%)Anglo American Capital plc 2,051,000 3.38% 11/3/2029 2,243,057 0.06%test - - - 2,243,057 0.06%South Korea 0.03% (2020: 0.03%)Korea Development Bank 1,200,000 1.75% 15/12/2022 1,222,307 0.03%test - - - 1,222,307 0.03%Spain 0.99% (2020: 0.83%)Telefonica Emisiones SA 3,950,000 5.38% 2/2/2026 4,670,503 0.12%Telefonica Emisiones SA 4,150,000 5.29% 9/12/2022 4,431,873 0.11%Banco Santander SA 4,000,000 2.75% 12/9/2023 4,174,883 0.10%Banco Santander SA 3,900,000 1.38% 31/7/2024 3,957,898 0.10%Telefonica Emisiones SA 3,050,000 5.45% 8/10/2029 3,880,584 0.10%CaixaBank SA 3,100,000 1.50% 3/12/2026 3,104,063 0.08%Banco Santander SA 3,000,000 1.75% 17/2/2027 3,034,077 0.08%Abertis Infraestructuras SA 2,800,000 3.38% 27/11/2026 3,032,154 0.07%Banco Santander SA 3,000,000 1.50% 14/4/2026 3,016,651 0.07%Iberdrola Finanzas SA 2,050,000 7.38% 29/1/2024 2,396,541 0.06%Banco Bilbao Vizcaya Argentaria SA^ 1,700,000 3.10% 15/7/2031 1,783,199 0.04%Iberdrola Finanzas SA 1,300,000 6.00% 1/7/2022 1,371,090 0.03%Spain Government International Bond 950,000 5.25% 6/4/2029 1,202,165 0.03%test - - - 40,055,681 0.99%Supranational 10.11% (2020: 9.63%)European Investment Bank 22,900,000 0.75% 14/7/2023 23,143,399 0.57%European Investment Bank 19,000,000 1.38% 7/3/2025 19,635,490 0.49%European Investment Bank 10,505,000 5.63% 7/6/2032 15,452,570 0.38%European Investment Bank 9,375,000 5.00% 15/4/2039 14,921,496 0.37%European Investment Bank 10,835,000 6.00% 7/12/2028 14,894,671 0.37%International Bank for Reconstruction & Development 14,700,000 1.00% 21/12/2029 14,852,707 0.37%European Investment Bank 15,000,000 0.13% 14/12/2026 14,594,059 0.36%Inter-American Development Bank 12,900,000 1.25% 15/12/2025 13,305,842 0.33%European Investment Bank 9,450,000 3.88% 8/6/2037 13,030,302 0.32%Inter-American Development Bank 11,920,000 1.25% 15/12/2023 12,203,629 0.30%European Investment Bank 11,800,000 2.50% 31/10/2022 12,165,629 0.30%International Bank for Reconstruction & Development 11,600,000 0.25% 23/9/2027 11,293,640 0.28%International Bank for Reconstruction & Development 10,910,000 0.75% 15/12/2026 10,983,786 0.27%European Investment Bank 10,500,000 0.88% 15/12/2023 10,654,232 0.26%European Investment Bank 9,320,000 1.00% 21/9/2026 9,521,843 0.24%European Investment Bank 7,765,000 5.50% 15/4/2025 9,232,574 0.23%European Investment Bank 5,615,000 4.50% 7/3/2044 9,064,924 0.22%International Development Association 8,700,000 0.75% 12/12/2024 8,796,401 0.22%European Investment Bank 4,640,000 4.63% 12/10/2054 8,577,971 0.21%Asian Development Bank 8,140,000 1.38% 15/12/2023 8,361,455 0.21%International Finance Corp. 7,500,000 0.25% 15/12/2025 7,406,458 0.18%Nordic Investment Bank 7,060,000 1.13% 15/12/2023 7,207,847 0.18%Asian Development Bank 7,000,000 0.25% 28/10/2027 6,800,961 0.17%International Bank for Reconstruction & Development 6,600,000 1.00% 19/12/2022 6,680,299 0.16%European Investment Bank 6,900,000 0.00% 7/12/2028 6,482,240 0.16%Asian Infrastructure Investment Bank 6,449,000 0.20% 15/12/2025 6,347,591 0.16%European Investment Bank 6,200,000 0.75% 15/11/2024 6,273,108 0.15%International Bank for Reconstruction & Development 6,000,000 0.50% 24/7/2023 6,034,432 0.15%European Investment Bank 4,700,000 4.50% 7/6/2029 6,005,153 0.15%European Investment Bank 5,500,000 0.75% 22/7/2027 5,525,780 0.14%Inter-American Development Bank 5,300,000 1.38% 15/12/2024 5,470,457 0.14%International Bank for Reconstruction & Development 5,500,000 0.25% 22/7/2026 5,405,028 0.13%International Bank for Reconstruction & Development 5,180,000 1.25% 7/9/2023 5,294,421 0.13%Council Of Europe Development Bank 5,060,000 1.13% 17/3/2022 5,094,501 0.13%Asian Development Bank 5,000,000 0.75% 7/12/2027 5,003,755 0.12%International Development Association 5,000,000 0.38% 22/9/2027 4,897,410 0.12%Nordic Investment Bank 4,500,000 0.13% 15/12/2026 4,379,400 0.11%Asian Development Bank 4,200,000 1.00% 15/12/2022 4,249,726 0.10%International Finance Corp. 4,024,000 1.25% 15/12/2023 4,121,573 0.10%International Bank for Reconstruction & Development 4,000,000 0.88% 13/12/2024 4,060,655 0.10%European Bank for Reconstruction & Development 3,018,000 5.63% 7/12/2028 4,051,689 0.10%International Finance Corp. 3,583,000 1.38% 7/3/2025 3,703,672 0.09%African Development Bank 3,600,000 0.50% 22/6/2026 3,583,907 0.09%Inter-American Development Bank 3,500,000 0.50% 15/9/2026 3,481,054 0.09%International Bank for Reconstruction & Development 1,886,000 5.75% 7/6/2032 2,790,228 0.07%International Bank for Reconstruction & Development 2,760,000 0.63% 15/12/2023 2,784,667 0.07%European Investment Bank 1,898,000 3.75% 7/12/2027 2,260,095 0.06%Asian Development Bank 2,000,000 0.75% 24/3/2022 2,009,025 0.05%Council Of Europe Development Bank 2,000,000 0.38% 15/12/2025 1,984,784 0.05%

929
Vanguard U.K. Investment Grade Bond Index Fund
Principal GBP (£) Coupon
Maturity Date
Fair Value GBP (£)
% of Total Net Assets
Asian Development Bank 2,000,000 0.13% 15/12/2026 1,946,030 0.05%Asian Development Bank 1,840,000 1.38% 7/3/2025 1,900,956 0.05%Inter-American Development Bank 1,840,000 1.25% 15/12/2022 1,868,378 0.05%Council Of Europe Development Bank 1,700,000 0.75% 22/7/2027 1,704,487 0.04%European Bank for Reconstruction & Development 1,500,000 1.25% 15/12/2022 1,522,743 0.04%Nordic Investment Bank 1,400,000 1.13% 15/12/2022 1,418,929 0.03%Asian Development Bank 1,380,000 1.13% 15/12/2025 1,415,647 0.03%International Bank for Reconstruction & Development 950,000 4.88% 7/12/2028 1,226,487 0.03%International Finance Corp. 1,000,000 0.75% 22/7/2027 1,002,438 0.02%Asian Development Bank 1,000,000 0.63% 15/9/2026 1,000,975 0.02%test - - - 409,083,606 10.11%Sweden 0.75% (2020: 0.93%)Vattenfall AB 4,375,000 6.88% 15/4/2039 7,588,414 0.19%Swedbank AB 3,500,000 1.63% 28/12/2022 3,564,033 0.09%Akelius Residential Property AB 3,100,000 2.38% 15/8/2025 3,242,547 0.08%Skandinaviska Enskilda Banken AB 3,200,000 1.25% 5/8/2022 3,233,419 0.08%Swedbank AB 2,500,000 1.38% 8/12/2027 2,504,527 0.06%Svenska Handelsbanken AB 2,300,000 1.63% 15/12/2023 2,364,232 0.06%Investor AB 1,350,000 5.50% 5/5/2037 1,975,243 0.05%Svensk Exportkredit AB 1,500,000 1.38% 15/12/2023 1,537,661 0.04%Telia Co. AB 1,200,000 4.38% 5/12/2042 1,530,761 0.04%Svenska Handelsbanken AB 1,450,000 2.75% 5/12/2022 1,499,367 0.03%Svensk Exportkredit AB 1,400,000 1.38% 15/12/2022 1,423,202 0.03%test - - - 30,463,406 0.75%Switzerland 0.67% (2020: 0.77%)Credit Suisse Group AG 5,010,000 2.25% 9/6/2028 5,144,466 0.13%Credit Suisse Group AG 4,700,000 2.75% 8/8/2025 4,962,911 0.12%Zurich Finance UK plc^ 3,700,000 6.63% Perpetual 3,960,278 0.10%Credit Suisse Group AG^ 3,400,000 2.13% 12/9/2025 3,489,372 0.09%Credit Suisse AG 3,000,000 1.13% 15/12/2025 2,991,011 0.07%LafargeHolcim Sterling Finance Netherlands BV 2,500,000 3.00% 12/5/2032 2,714,701 0.07%UBS AG 2,000,000 0.63% 18/12/2023 2,004,990 0.05%Nestle Finance International Ltd. 1,610,000 2.25% 30/11/2023 1,685,857 0.04%test - - - 26,953,586 0.67%United Arab Emirates 0.30% (2020: 0.27%)MDGH - GMTN BV 4,000,000 6.88% 14/3/2026 5,073,052 0.12%First Abu Dhabi Bank PJSC 2,545,000 1.38% 19/2/2023 2,568,885 0.06%First Abu Dhabi Bank PJSC 2,290,000 0.88% 9/12/2025 2,269,954 0.06%DP World plc 2,000,000 4.25% 25/9/2030 2,265,041 0.06%test - - - 12,176,932 0.30%United Kingdom 43.66% (2020: 44.45%)Lloyds Bank plc 7,500,000 6.00% 8/2/2029 10,233,516 0.25%Lloyds Banking Group plc 9,450,000 2.25% 16/10/2024 9,838,801 0.24%HSBC Holdings plc^ 9,000,000 3.00% 22/7/2028 9,707,365 0.24%THFC Funding No 3 plc 6,300,000 5.20% 11/10/2043 9,594,239 0.24%Lloyds Bank plc 8,100,000 5.13% 7/3/2025 9,450,354 0.23%Barclays plc 8,960,000 3.13% 17/1/2024 9,449,173 0.23%Lloyds Bank plc 7,600,000 4.88% 30/3/2027 9,340,641 0.23%GlaxoSmithKline Capital plc 5,975,000 5.25% 10/4/2042 9,233,014 0.23%HSBC Holdings plc 5,700,000 7.00% 7/4/2038 8,797,142 0.22%Barclays plc 7,900,000 3.25% 17/1/2033 8,777,730 0.22%BP Capital Markets plc^ 8,200,000 4.25% Perpetual 8,694,576 0.21%Lloyds Bank plc 5,025,000 6.50% 17/9/2040 8,593,342 0.21%Lloyds Banking Group plc^ 8,227,000 2.71% 3/12/2035 8,416,077 0.21%Heathrow Funding Ltd. 6,072,000 6.45% 10/12/2031 8,332,409 0.21%University of Oxford 6,350,000 2.54% 8/12/2117 7,972,545 0.20%GlaxoSmithKline Capital plc 5,537,000 5.25% 19/12/2033 7,781,175 0.19%GlaxoSmithKline Capital plc 5,200,000 4.25% 18/12/2045 7,408,005 0.18%Cadent Finance plc 7,100,000 2.13% 22/9/2028 7,366,031 0.18%Western Power Distribution West Midlands plc 5,240,000 5.75% 16/4/2032 7,214,069 0.18%Centrica plc 5,984,000 4.38% 13/3/2029 7,112,453 0.18%Heathrow Funding Ltd. 6,145,000 7.13% 14/2/2024 7,020,579 0.17%Tesco Property Finance 3 plc 5,220,675 5.74% 13/4/2040 6,981,011 0.17%Santander UK plc 5,230,000 5.25% 16/2/2029 6,856,815 0.17%GlaxoSmithKline Capital plc 4,100,000 6.38% 9/3/2039 6,788,356 0.17%Heathrow Funding Ltd. 4,625,000 5.88% 13/5/2041 6,726,234 0.17%HSBC Holdings plc 4,650,000 6.00% 29/3/2040 6,692,717 0.17%Centrica plc 4,350,000 7.00% 19/9/2033 6,641,859 0.16%HSBC Bank plc 4,913,000 5.38% 22/8/2033 6,599,379 0.16%Barclays plc 5,964,000 3.25% 12/2/2027 6,488,534 0.16%Gatwick Funding Ltd. 5,392,000 6.13% 2/3/2026 6,464,000 0.16%

930
Vanguard U.K. Investment Grade Bond Index Fund
Principal GBP (£) Coupon
Maturity Date
Fair Value GBP (£)
% of Total Net Assets
Vodafone Group plc 6,000,000 3.00% 12/8/2056 6,447,978 0.16%BG Energy Capital plc 4,600,000 5.00% 4/11/2036 6,425,020 0.16%HSBC Holdings plc^ 6,179,000 2.26% 13/11/2026 6,415,812 0.16%M&G plc^ 5,300,000 5.63% 20/10/2051 6,393,426 0.16%Vodafone Group plc 5,500,000 3.38% 8/8/2049 6,338,356 0.16%HSBC Holdings plc 5,105,000 5.75% 20/12/2027 6,255,126 0.15%Logicor 2019-1 UK plc 5,950,000 1.88% 17/11/2026 6,191,021 0.15%Santander UK plc 5,000,000 5.75% 2/3/2026 6,168,677 0.15%Nationwide Building Society 5,000,000 5.63% 28/1/2026 6,118,962 0.15%GlaxoSmithKline Capital plc 6,300,000 1.63% 12/5/2035 6,109,732 0.15%Natwest Group plc^ 5,700,000 3.62% 14/8/2030 6,081,618 0.15%Nationwide Building Society 5,340,000 3.25% 20/1/2028 6,056,020 0.15%Natwest Group plc^ 6,000,000 2.11% 28/11/2031 6,031,265 0.15%Aspire Defence Finance plc 4,576,324 4.67% 31/3/2040 6,014,567 0.15%M&G plc^ 4,550,000 6.34% 19/12/2063 5,971,234 0.15%Barclays plc^ 5,800,000 2.38% 6/10/2023 5,926,964 0.15%Cadent Finance plc 5,696,000 2.63% 22/9/2038 5,904,310 0.15%Heathrow Funding Ltd. 4,450,000 4.63% 31/10/2046 5,824,801 0.14%South Eastern Power Networks plc 4,801,000 5.50% 5/6/2026 5,803,727 0.14%London Power Networks plc 5,363,000 2.63% 1/3/2029 5,790,990 0.14%National Westminster Bank plc 5,150,000 5.13% 13/1/2024 5,759,956 0.14%Wellcome Trust Ltd. 4,593,000 2.52% 7/2/2118 5,727,749 0.14%Barclays plc 5,300,000 3.00% 8/5/2026 5,692,948 0.14%Severn Trent Utilities Finance plc 5,078,000 3.63% 16/1/2026 5,669,541 0.14%Tesco Property Finance 4 plc 4,224,107 5.80% 13/10/2040 5,647,078 0.14%HSBC Holdings plc^ 5,500,000 1.75% 24/7/2027 5,561,081 0.14%Annington Funding plc 4,400,000 3.94% 12/7/2047 5,497,348 0.14%Scottish Widows Ltd. 5,050,000 5.50% 16/6/2023 5,482,601 0.14%Electricity North West Ltd. 4,044,000 8.88% 25/3/2026 5,482,044 0.14%Aviva plc^ 5,150,000 6.13% Perpetual 5,480,713 0.14%Thames Water Utilities Finance plc 3,675,000 5.50% 11/2/2041 5,442,526 0.13%Thames Water Utilities Finance plc 3,925,000 5.13% 28/9/2037 5,426,741 0.13%HSBC Bank Capital Funding Sterling 1 LP^ 3,826,000 5.84% Perpetual 5,400,825 0.13%Aviva plc^ 3,400,000 6.88% 20/5/2058 5,382,792 0.13%Motability Operations Group plc 5,200,000 1.75% 3/7/2029 5,369,240 0.13%Scottish Widows Ltd. 3,555,000 7.00% 16/6/2043 5,363,205 0.13%HSBC Bank plc 3,775,000 4.75% 24/3/2046 5,249,837 0.13%National Grid Electricity Transmission plc 5,264,000 1.13% 7/7/2028 5,139,367 0.13%Anglian Water Services Financing plc 4,450,000 4.50% 22/2/2026 5,112,757 0.13%British Telecommunications plc 3,450,000 6.38% 23/6/2037 5,112,465 0.13%HSBC Holdings plc 3,900,000 6.75% 11/9/2028 5,098,019 0.13%Annington Funding plc 4,800,000 2.65% 12/7/2025 5,058,170 0.12%Legal & General Group plc^ 4,600,000 3.75% 26/11/2049 5,008,179 0.12%Natwest Group plc^ 4,700,000 2.88% 19/9/2026 4,997,189 0.12%Aviva plc^ 4,175,000 5.13% 4/6/2050 4,986,812 0.12%Lloyds Bank plc 4,004,000 7.63% 22/4/2025 4,965,647 0.12%BAT International Finance plc 4,866,000 2.25% 26/6/2028 4,879,598 0.12%Clarion Funding plc 4,041,000 3.13% 19/4/2048 4,873,573 0.12%Connect Plus M25 Issuer plc 4,392,761 2.61% 31/3/2039 4,870,663 0.12%Annington Funding plc 4,200,000 3.69% 12/7/2034 4,865,717 0.12%Westfield Stratford City Finance NO 2 plc 4,800,000 1.64% 4/8/2026 4,851,622 0.12%Aspire Defence Finance plc 3,707,174 4.67% 31/3/2040 4,849,313 0.12%South Eastern Power Networks plc 3,600,000 5.63% 30/9/2030 4,829,083 0.12%Motability Operations Group plc 3,900,000 3.63% 10/3/2036 4,804,081 0.12%M&G plc^ 3,976,000 5.56% 20/7/2055 4,780,685 0.12%HSBC Holdings plc 4,500,000 2.63% 16/8/2028 4,779,519 0.12%Clydesdale Bank plc 4,000,000 4.63% 8/6/2026 4,754,024 0.12%GlaxoSmithKline Capital plc 4,700,000 1.25% 12/10/2028 4,685,327 0.12%Santander UK Group Holdings plc 4,250,000 3.63% 14/1/2026 4,670,826 0.12%BG Energy Capital plc 3,920,000 5.13% 1/12/2025 4,647,702 0.11%Wellcome Trust Finance plc 3,185,000 4.63% 25/7/2036 4,630,433 0.11%Bank of Scotland plc 3,950,000 4.88% 20/12/2024 4,542,908 0.11%Southern Gas Networks plc 4,300,000 2.50% 3/2/2025 4,542,607 0.11%United Kingdom Gilt 4,060,000 1.63% 22/10/2054 4,504,381 0.11%Juturna European Loan Conduit No 16 plc 3,654,065 5.06% 10/8/2033 4,500,729 0.11%BAT International Finance plc 4,050,000 4.00% 4/9/2026 4,485,258 0.11%Southern Water Services Finance Ltd. 4,300,000 2.38% 28/5/2028 4,450,144 0.11%High Speed Rail Finance 1 plc 3,500,000 4.38% 1/11/2038 4,411,472 0.11%Heathrow Funding Ltd. 4,370,000 2.63% 16/3/2028 4,401,728 0.11%Legal & General Finance plc 3,073,000 5.88% 11/12/2031 4,337,385 0.11%HSBC Holdings plc^ 4,000,000 3.00% 29/5/2030 4,317,838 0.11%

931
Vanguard U.K. Investment Grade Bond Index Fund
Principal GBP (£) Coupon
Maturity Date
Fair Value GBP (£)
% of Total Net Assets
RL Finance Bonds NO 4 plc^ 3,775,000 4.88% 7/10/2049 4,308,762 0.11%Southern Water Services Finance Ltd. 4,000,000 3.00% 28/5/2037 4,305,654 0.11%RAC Bond Co. plc 3,925,000 4.87% 6/5/2026 4,303,383 0.11%Phoenix Group Holdings plc 3,500,000 5.87% 13/6/2029 4,298,579 0.11%Thames Water Utilities Finance plc 3,050,000 4.63% 4/6/2046 4,296,396 0.11%Eversholt Funding plc 4,092,312 2.74% 30/6/2040 4,271,227 0.11%Legal & General Group plc^ 3,350,000 5.50% 27/6/2064 4,266,976 0.11%Cadent Finance plc 4,050,000 2.75% 22/9/2046 4,224,692 0.10%Centrica plc 3,250,000 4.25% 12/9/2044 4,193,154 0.10%Tesco Property Finance 5 plc 3,127,368 5.66% 13/10/2041 4,186,348 0.10%Heathrow Funding Ltd. 3,875,000 5.23% 15/2/2023 4,146,232 0.10%Imperial Brands Finance plc 3,500,000 5.50% 28/9/2026 4,139,384 0.10%Artesian Finance II plc 2,800,000 6.00% 30/9/2033 4,108,434 0.10%SSE plc 2,800,000 8.38% 20/11/2028 4,101,333 0.10%Wellcome Trust Ltd. 2,375,000 4.00% 9/5/2059 4,095,489 0.10%Blend Funding plc 3,300,000 3.46% 21/9/2047 4,090,835 0.10%HSBC Holdings plc 3,500,000 6.50% 20/5/2024 4,055,545 0.10%Legal & General Group plc^ 3,496,000 4.50% 1/11/2050 4,020,382 0.10%Broadgate Financing plc 3,500,000 5.00% 5/10/2031 4,019,275 0.10%Aviva plc^ 3,600,000 4.00% 3/6/2055 4,010,024 0.10%Sanctuary Capital plc 2,335,000 6.70% 23/3/2039 3,999,427 0.10%Rothesay Life plc 3,700,000 3.38% 12/7/2026 3,985,894 0.10%AA Bond Co., Ltd. 3,500,000 6.27% 31/7/2025 3,953,018 0.10%Close Brothers Finance plc 4,000,000 1.63% 3/12/2030 3,950,542 0.10%Leeds Building Society^ 3,950,000 1.50% 16/3/2027 3,949,052 0.10%Imperial Brands Finance plc 3,350,000 4.88% 7/6/2032 3,946,934 0.10%Vodafone Group plc 2,750,000 5.90% 26/11/2032 3,931,020 0.10%Legal & General Group plc^ 3,400,000 5.38% 27/10/2045 3,917,206 0.10%Coventry Building Society 3,838,000 1.50% 23/1/2023 3,888,682 0.10%Peabody Capital No 2 plc 3,200,000 3.25% 14/9/2048 3,869,001 0.10%Heathrow Funding Ltd. 3,700,000 2.75% 13/10/2029 3,850,892 0.10%Sanctuary Capital plc 2,430,000 5.00% 26/4/2047 3,847,854 0.10%M&G plc^ 2,900,000 6.25% 20/10/2068 3,829,539 0.09%Annington Funding plc 3,500,000 3.18% 12/7/2029 3,816,425 0.09%Citizen Treasury plc 3,100,000 3.25% 20/10/2048 3,811,552 0.09%Phoenix Group Holdings plc 3,120,000 5.63% 28/4/2031 3,810,349 0.09%Tesco Property Finance 6 plc 2,913,208 5.41% 13/7/2044 3,804,911 0.09%Southern Gas Networks plc 3,400,000 3.10% 15/9/2036 3,788,599 0.09%Barclays plc^ 3,500,000 3.75% 22/11/2030 3,782,948 0.09%British Telecommunications plc 2,975,000 5.75% 7/12/2028 3,774,718 0.09%Thames Water Utilities Finance plc 1,700,000 7.74% 9/4/2058 3,774,355 0.09%Western Power Distribution South Wales plc 4,000,000 1.63% 7/10/2035 3,761,165 0.09%Community Finance Co. 1 plc 2,836,000 5.02% 31/7/2034 3,758,852 0.09%Aster Treasury plc 2,560,000 4.50% 18/12/2043 3,712,617 0.09%Standard Chartered plc 2,701,000 4.38% 18/1/2038 3,704,162 0.09%Anglian Water Services Financing plc 3,250,000 6.88% 21/8/2023 3,688,152 0.09%GlaxoSmithKline Capital plc 3,200,000 3.38% 20/12/2027 3,641,960 0.09%RMPA Services plc 2,748,248 5.34% 30/9/2038 3,632,804 0.09%Unilever plc 3,500,000 1.50% 22/7/2026 3,625,232 0.09%Santander UK Group Holdings plc^ 3,400,000 2.92% 8/5/2026 3,604,800 0.09%Land Securities Capital Markets plc 3,208,000 2.75% 22/9/2057 3,604,558 0.09%United Utilities Water Finance plc 3,700,000 1.88% 3/6/2042 3,592,672 0.09%Morhomes plc 3,200,000 3.40% 19/2/2038 3,589,335 0.09%Skipton Building Society^ 3,500,000 2.00% 2/10/2026 3,574,479 0.09%Lloyds Bank plc 3,010,000 7.50% 15/4/2024 3,571,636 0.09%Gatwick Funding Ltd. 3,400,000 3.25% 26/2/2048 3,560,022 0.09%Tesco Property Finance 1 plc 2,383,748 7.62% 13/7/2039 3,540,620 0.09%BAT International Finance plc 2,700,000 6.00% 24/11/2034 3,527,246 0.09%Notting Hill Genesis 2,907,000 3.25% 12/10/2048 3,492,305 0.09%Lloyds Bank Corporate Markets plc 3,400,000 1.75% 11/7/2024 3,489,892 0.09%Tesco Corporate Treasury Services plc 3,300,000 2.50% 2/5/2025 3,484,318 0.09%Reckitt Benckiser Treasury Services plc 3,400,000 1.75% 19/5/2032 3,451,494 0.09%Severn Trent Utilities Finance plc 3,500,000 2.00% 2/6/2040 3,443,465 0.09%Western Power Distribution South Wales plc 2,250,000 5.75% 23/3/2040 3,439,651 0.08%United Utilities Water Finance plc 3,300,000 2.00% 14/2/2025 3,439,147 0.08%BP Capital Markets plc 3,300,000 2.03% 14/2/2025 3,436,623 0.08%Peabody Capital No 2 plc 2,200,000 4.63% 12/12/2053 3,436,446 0.08%Standard Chartered plc 2,700,000 5.13% 6/6/2034 3,432,237 0.08%Motability Operations Group plc 3,200,000 2.38% 3/7/2039 3,428,979 0.08%AA Bond Co., Ltd. 3,200,000 4.88% 31/7/2024 3,408,225 0.08%Notting Hill Genesis 2,250,000 5.25% 7/7/2042 3,390,459 0.08%

932
Vanguard U.K. Investment Grade Bond Index Fund
Principal GBP (£) Coupon
Maturity Date
Fair Value GBP (£)
% of Total Net Assets
BAT Capital Corp. 3,300,000 2.13% 15/8/2025 3,388,030 0.08%Clarion Funding plc 3,500,000 1.25% 13/11/2032 3,359,426 0.08%Virgin Money UK plc^ 3,000,000 5.13% 11/12/2030 3,348,155 0.08%Southern Water Services Finance Ltd. 2,495,000 6.19% 31/3/2029 3,324,319 0.08%ABP Finance plc 2,700,000 6.25% 14/12/2026 3,315,083 0.08%Eversholt Funding plc 2,550,000 6.70% 22/2/2035 3,297,229 0.08%THFC Funding No 2 plc 2,040,000 6.35% 8/7/2039 3,295,803 0.08%Segro plc 2,900,000 2.88% 11/10/2037 3,285,863 0.08%Gatwick Funding Ltd. 3,266,000 2.50% 15/4/2030 3,274,976 0.08%Tesco Property Finance 2 plc 2,457,631 6.05% 13/10/2039 3,270,080 0.08%Notting Hill Genesis 3,000,000 2.88% 31/1/2029 3,268,084 0.08%Northern Gas Networks Finance plc 2,449,000 4.88% 15/11/2035 3,253,380 0.08%Cardiff University 2,600,000 3.00% 7/12/2055 3,250,699 0.08%3i Group plc 2,400,000 5.75% 3/12/2032 3,239,579 0.08%Manchester Airport Group Funding plc 2,600,000 4.75% 31/3/2034 3,232,056 0.08%Legal & General Group plc^ 2,720,000 5.13% 14/11/2048 3,215,249 0.08%Land Securities Capital Markets plc 3,000,000 2.63% 22/9/2037 3,212,113 0.08%Catalyst Housing Ltd. 2,700,000 3.13% 31/10/2047 3,204,286 0.08%Cadent Finance plc 2,902,000 3.13% 21/3/2040 3,200,936 0.08%Yorkshire Water Finance plc 1,950,000 6.38% 19/8/2039 3,195,347 0.08%London & Quadrant Housing Trust 2,050,000 5.49% 15/6/2042 3,195,106 0.08%Southern Water Services Finance Ltd. 3,200,000 1.63% 30/3/2027 3,189,232 0.08%British Telecommunications plc 2,950,000 3.13% 21/11/2031 3,183,581 0.08%CK Hutchison Group Telecom Finance SA 3,100,000 2.00% 17/10/2027 3,168,033 0.08%Heathrow Funding Ltd. 2,500,000 6.75% 3/12/2026 3,159,783 0.08%Thames Water Utilities Finance plc 2,800,000 3.50% 25/2/2028 3,122,455 0.08%Phoenix Group Holdings plc 2,580,000 6.63% 18/12/2025 3,116,651 0.08%CRH Finance UK plc 2,600,000 4.13% 2/12/2029 3,106,548 0.08%BPHA Finance plc 2,119,000 4.82% 11/4/2044 3,106,070 0.08%Sovereign Housing Capital plc 2,900,000 2.38% 4/11/2048 3,101,280 0.08%AstraZeneca plc 2,200,000 5.75% 13/11/2031 3,090,555 0.08%Orbit Capital plc 2,510,000 3.50% 24/3/2045 3,089,720 0.08%Martlet Homes Ltd. 2,600,000 3.00% 9/5/2052 3,077,583 0.08%Pension Insurance Corp. plc 2,500,000 5.63% 20/9/2030 3,070,961 0.08%Prudential plc 2,225,000 6.13% 19/12/2031 3,066,897 0.08%Great Places Housing Group Ltd. 2,135,000 4.75% 22/10/2042 3,059,827 0.08%Southern Electric Power Distribution plc 2,300,000 4.63% 20/2/2037 3,057,627 0.08%Western Power Distribution West Midlands plc 2,800,000 3.88% 17/10/2024 3,053,038 0.08%Paragon Treasury plc 3,000,000 2.00% 7/5/2036 3,039,323 0.08%Scottish Hydro Electric Transmission plc 3,000,000 2.13% 24/3/2036 3,031,932 0.07%Grainger plc 2,800,000 3.38% 24/4/2028 3,027,110 0.07%BAT International Finance plc 2,600,000 7.25% 12/3/2024 3,018,714 0.07%Pension Insurance Corp. plc 2,300,000 8.00% 23/11/2026 3,005,151 0.07%Chancellor Masters & Scholars of The University of Cambridge 2,200,000 2.35% 27/6/2078 3,005,003 0.07%London Stock Exchange Group plc 3,000,000 1.63% 6/4/2030 3,002,326 0.07%Hammerson plc 2,850,000 3.50% 27/10/2025 2,998,953 0.07%Society of Lloyd's 2,700,000 4.75% 30/10/2024 2,991,170 0.07%Tesco Corporate Treasury Services plc 2,800,000 2.75% 27/4/2030 2,990,619 0.07%SP Manweb plc 2,450,000 4.88% 20/9/2027 2,968,456 0.07%Northumbrian Water Finance plc 2,111,000 5.63% 29/4/2033 2,966,666 0.07%HSBC Bank plc 1,865,000 6.25% 30/1/2041 2,942,404 0.07%Gatwick Funding Ltd. 2,450,000 4.63% 27/3/2034 2,939,686 0.07%BAT International Finance plc 3,900,000 2.25% 9/9/2052 2,923,202 0.07%Northumbrian Water Finance plc 1,950,000 5.13% 23/1/2042 2,906,644 0.07%University of Manchester 1,850,000 4.25% 4/7/2053 2,906,259 0.07%Western Power Distribution East Midlands plc 2,710,000 5.25% 17/1/2023 2,902,710 0.07%Diageo Finance plc 3,000,000 1.25% 28/3/2033 2,889,993 0.07%THFC Funding No 1 plc 2,100,000 5.13% 21/12/2035 2,888,434 0.07%UNITE USAF II plc 2,765,000 3.37% 30/6/2023 2,884,797 0.07%Virgin Money UK plc^ 2,600,000 4.00% 3/9/2027 2,882,246 0.07%Gatwick Funding Ltd. 2,800,000 3.13% 28/9/2039 2,876,958 0.07%Nationwide Building Society 2,850,000 1.00% 24/1/2023 2,873,712 0.07%Blend Funding plc 2,500,000 2.92% 5/4/2054 2,861,402 0.07%Experian Finance plc 2,500,000 3.25% 7/4/2032 2,844,013 0.07%Places for People Homes Ltd. 2,480,000 3.63% 22/11/2028 2,839,905 0.07%Southern Electric Power Distribution plc 2,070,000 5.50% 7/6/2032 2,825,765 0.07%Orbit Capital plc 2,300,000 3.38% 14/6/2048 2,812,464 0.07%Circle Anglia Social Housing plc 1,800,000 5.20% 2/3/2044 2,799,486 0.07%Natwest Group plc^ 2,600,000 3.13% 28/3/2027 2,796,317 0.07%CPUK Finance Ltd. 2,500,000 3.69% 28/8/2028 2,775,983 0.07%Informa plc 2,600,000 3.13% 5/7/2026 2,771,710 0.07%

933
Vanguard U.K. Investment Grade Bond Index Fund
Principal GBP (£) Coupon
Maturity Date
Fair Value GBP (£)
% of Total Net Assets
Motability Operations Group plc 2,575,000 2.38% 14/3/2032 2,770,022 0.07%Gatwick Funding Ltd. 2,055,000 5.75% 23/1/2037 2,768,891 0.07%Lloyds Banking Group plc^ 2,700,000 1.88% 15/1/2026 2,765,609 0.07%Anglian Water Services Financing plc 2,500,000 2.75% 26/10/2029 2,756,572 0.07%Sanctuary Capital plc 2,600,000 2.38% 14/4/2050 2,748,900 0.07%Yorkshire Water Finance plc 2,500,000 2.75% 18/4/2041 2,746,332 0.07%Grainger plc 2,600,000 3.00% 3/7/2030 2,742,927 0.07%Circle Anglia Social Housing plc 1,542,000 7.25% 12/11/2038 2,733,214 0.07%South Eastern Power Networks plc 1,887,000 6.38% 12/11/2031 2,711,951 0.07%SSE plc^ 2,560,000 3.74% Perpetual 2,706,132 0.07%Guinness Partnership Ltd. 2,700,000 2.00% 22/4/2055 2,701,161 0.07%Southern Water Services Finance Ltd. 2,179,000 6.64% 31/3/2026 2,683,990 0.07%RSA Insurance Group Ltd.^ 2,350,000 5.13% 10/10/2045 2,683,979 0.07%Hyde Housing Association Ltd. 2,950,000 1.75% 18/8/2055 2,667,508 0.07%Severn Trent Utilities Finance plc 1,950,000 6.25% 7/6/2029 2,643,722 0.07%Aviva plc^ 2,160,000 6.13% 14/11/2036 2,639,608 0.07%WPP Finance SA 2,300,000 3.75% 19/5/2032 2,629,399 0.06%Eversholt Funding plc 2,350,000 3.53% 7/8/2042 2,627,003 0.06%Firstgroup plc 2,465,000 5.25% 29/11/2022 2,623,359 0.06%Hastings Group Finance plc 2,471,000 3.00% 24/5/2025 2,622,699 0.06%Northern Powergrid Yorkshire plc 2,500,000 2.25% 9/10/2059 2,619,042 0.06%Moat Homes Finance plc 1,800,000 5.00% 23/9/2041 2,611,473 0.06%Clarion Funding plc 2,400,000 2.63% 18/1/2029 2,610,045 0.06%GB Social Housing plc 1,900,000 5.19% 12/2/2038 2,609,481 0.06%BUPA Finance plc 2,229,000 5.00% 8/12/2026 2,602,422 0.06%Stagecoach Group plc 2,400,000 4.00% 29/9/2025 2,597,130 0.06%BUPA Finance plc 2,300,000 4.13% 14/6/2035 2,581,952 0.06%BUPA Finance plc 2,400,000 5.00% 25/4/2023 2,574,794 0.06%London & Quadrant Housing Trust 1,693,000 5.50% 27/1/2040 2,567,247 0.06%Bromford Housing Group Ltd. 2,100,000 3.13% 3/5/2048 2,566,445 0.06%Wales & West Utilities Finance plc 2,700,000 1.88% 28/5/2041 2,563,149 0.06%BUPA Finance plc 2,480,000 2.00% 5/4/2024 2,560,897 0.06%Notting Hill Genesis 2,135,000 3.75% 20/12/2032 2,559,240 0.06%Thames Water Utilities Finance plc 2,285,000 4.00% 19/6/2025 2,556,256 0.06%Thames Water Utilities Finance plc 1,890,000 6.75% 16/11/2028 2,550,681 0.06%Yorkshire Building Society 2,273,000 3.50% 21/4/2026 2,538,292 0.06%Barclays plc^ 2,500,000 1.70% 3/11/2026 2,537,519 0.06%Scottish Hydro Electric Transmission plc 2,472,000 2.25% 27/9/2035 2,526,082 0.06%National Grid Gas plc 2,760,000 1.13% 14/1/2033 2,523,979 0.06%Virgin Money UK plc^ 2,300,000 4.00% 25/9/2026 2,518,610 0.06%Motability Operations Group plc 2,700,000 1.50% 20/1/2041 2,507,479 0.06%3i Group plc 2,200,000 3.75% 5/6/2040 2,502,839 0.06%Wales & West Utilities Finance plc 2,200,000 3.00% 3/8/2038 2,487,745 0.06%Karbon Homes Ltd. 1,940,000 3.38% 15/11/2047 2,486,043 0.06%CTRL Section 1 Finance plc 1,834,991 5.23% 2/5/2035 2,485,369 0.06%Wessex Water Services Finance plc 2,500,000 1.50% 17/9/2029 2,475,783 0.06%Thames Water Utilities Finance plc 2,460,000 2.38% 22/4/2040 2,475,182 0.06%DWR Cymru Financing UK plc 1,895,000 6.02% 31/3/2028 2,473,788 0.06%Housing & Care 21 2,100,000 3.29% 8/11/2049 2,464,504 0.06%Canary Wharf Finance II plc 1,760,000 5.95% 22/1/2035 2,459,747 0.06%Rothesay Life plc^ 2,200,000 5.50% 17/9/2029 2,454,536 0.06%Bunzl Finance plc 2,500,000 1.50% 30/10/2030 2,441,738 0.06%Canary Wharf Group Investment Holdings plc 2,400,000 2.63% 23/4/2025 2,429,988 0.06%SSE plc 1,550,000 6.25% 27/8/2038 2,429,050 0.06%London & Quadrant Housing Trust 2,014,000 3.13% 28/2/2053 2,419,134 0.06%Yorkshire Building Society^ 2,292,000 3.00% 18/4/2025 2,418,439 0.06%Great Rolling Stock Co. plc 1,891,750 6.50% 5/4/2031 2,415,313 0.06%Manchester Airport Group Funding plc 2,400,000 2.88% 30/9/2044 2,409,756 0.06%Pension Insurance Corp. plc 2,100,000 4.63% 7/5/2031 2,408,390 0.06%Nationwide Building Society 2,187,000 3.00% 6/5/2026 2,408,088 0.06%Compass Group plc 2,300,000 2.00% 5/9/2025 2,407,221 0.06%Myriad Capital plc 1,700,000 4.75% 20/12/2043 2,402,577 0.06%CPUK Finance Ltd. 2,078,000 7.24% 28/2/2024 2,395,940 0.06%Diageo Finance plc 2,300,000 1.75% 12/10/2026 2,390,976 0.06%Derby Healthcare plc 1,729,084 5.56% 30/6/2041 2,382,723 0.06%United Utilities Water Finance plc 2,300,000 2.00% 3/7/2033 2,380,186 0.06%Phoenix Group Holdings plc 2,300,000 4.13% 20/7/2022 2,378,812 0.06%Western Power Distribution West Midlands plc 2,000,000 6.00% 9/5/2025 2,377,473 0.06%Accent Capital plc 2,100,000 2.63% 18/7/2049 2,366,273 0.06%Rl Finance Bonds No 3 plc 1,900,000 6.13% 13/11/2028 2,361,598 0.06%Imperial Brands Finance plc 2,000,000 8.13% 15/3/2024 2,359,242 0.06%
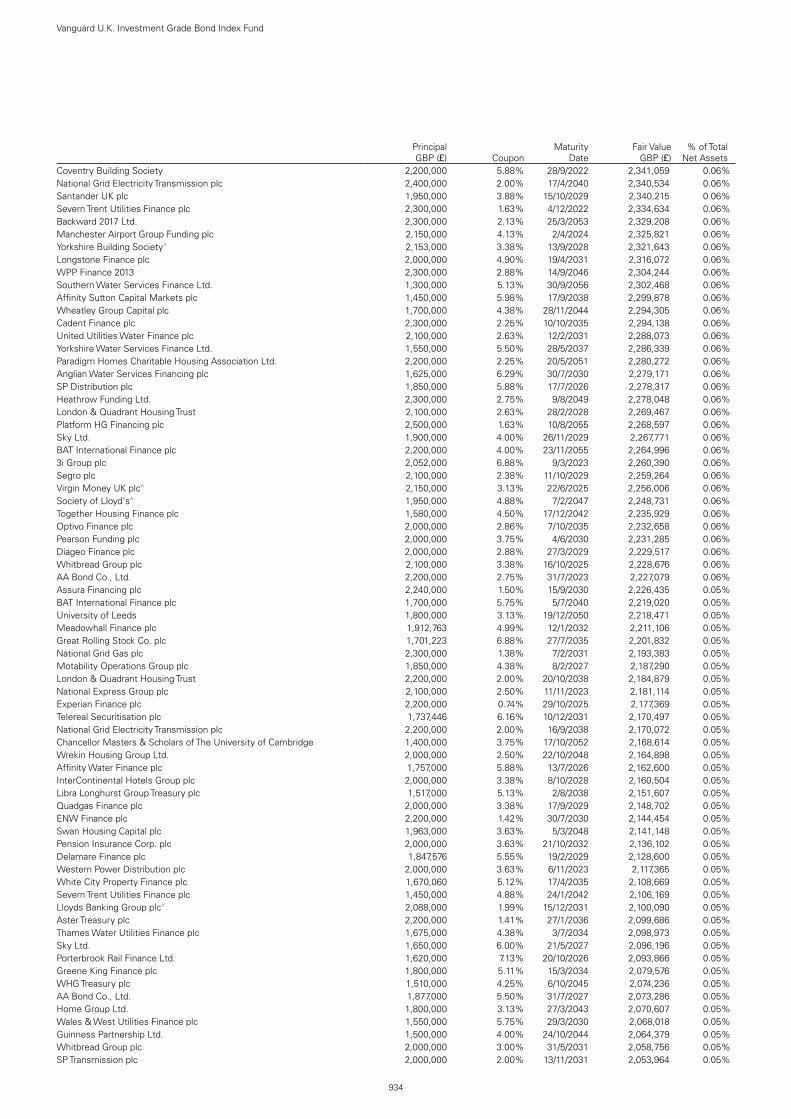
934
Vanguard U.K. Investment Grade Bond Index Fund
Principal GBP (£) Coupon
Maturity Date
Fair Value GBP (£)
% of Total Net Assets
Coventry Building Society 2,200,000 5.88% 28/9/2022 2,341,059 0.06%National Grid Electricity Transmission plc 2,400,000 2.00% 17/4/2040 2,340,534 0.06%Santander UK plc 1,950,000 3.88% 15/10/2029 2,340,215 0.06%Severn Trent Utilities Finance plc 2,300,000 1.63% 4/12/2022 2,334,634 0.06%Backward 2017 Ltd. 2,300,000 2.13% 25/3/2053 2,329,208 0.06%Manchester Airport Group Funding plc 2,150,000 4.13% 2/4/2024 2,325,821 0.06%Yorkshire Building Society^ 2,153,000 3.38% 13/9/2028 2,321,643 0.06%Longstone Finance plc 2,000,000 4.90% 19/4/2031 2,316,072 0.06%WPP Finance 2013 2,300,000 2.88% 14/9/2046 2,304,244 0.06%Southern Water Services Finance Ltd. 1,300,000 5.13% 30/9/2056 2,302,468 0.06%Affinity Sutton Capital Markets plc 1,450,000 5.98% 17/9/2038 2,299,878 0.06%Wheatley Group Capital plc 1,700,000 4.38% 28/11/2044 2,294,305 0.06%Cadent Finance plc 2,300,000 2.25% 10/10/2035 2,294,138 0.06%United Utilities Water Finance plc 2,100,000 2.63% 12/2/2031 2,288,073 0.06%Yorkshire Water Services Finance Ltd. 1,550,000 5.50% 28/5/2037 2,286,339 0.06%Paradigm Homes Charitable Housing Association Ltd. 2,200,000 2.25% 20/5/2051 2,280,272 0.06%Anglian Water Services Financing plc 1,625,000 6.29% 30/7/2030 2,279,171 0.06%SP Distribution plc 1,850,000 5.88% 17/7/2026 2,278,317 0.06%Heathrow Funding Ltd. 2,300,000 2.75% 9/8/2049 2,278,048 0.06%London & Quadrant Housing Trust 2,100,000 2.63% 28/2/2028 2,269,467 0.06%Platform HG Financing plc 2,500,000 1.63% 10/8/2055 2,268,597 0.06%Sky Ltd. 1,900,000 4.00% 26/11/2029 2,267,771 0.06%BAT International Finance plc 2,200,000 4.00% 23/11/2055 2,264,996 0.06%3i Group plc 2,052,000 6.88% 9/3/2023 2,260,390 0.06%Segro plc 2,100,000 2.38% 11/10/2029 2,259,264 0.06%Virgin Money UK plc^ 2,150,000 3.13% 22/6/2025 2,256,006 0.06%Society of Lloyd's^ 1,950,000 4.88% 7/2/2047 2,248,731 0.06%Together Housing Finance plc 1,580,000 4.50% 17/12/2042 2,235,929 0.06%Optivo Finance plc 2,000,000 2.86% 7/10/2035 2,232,658 0.06%Pearson Funding plc 2,000,000 3.75% 4/6/2030 2,231,285 0.06%Diageo Finance plc 2,000,000 2.88% 27/3/2029 2,229,517 0.06%Whitbread Group plc 2,100,000 3.38% 16/10/2025 2,228,676 0.06%AA Bond Co., Ltd. 2,200,000 2.75% 31/7/2023 2,227,079 0.06%Assura Financing plc 2,240,000 1.50% 15/9/2030 2,226,435 0.05%BAT International Finance plc 1,700,000 5.75% 5/7/2040 2,219,020 0.05%University of Leeds 1,800,000 3.13% 19/12/2050 2,218,471 0.05%Meadowhall Finance plc 1,912,763 4.99% 12/1/2032 2,211,106 0.05%Great Rolling Stock Co. plc 1,701,223 6.88% 27/7/2035 2,201,832 0.05%National Grid Gas plc 2,300,000 1.38% 7/2/2031 2,193,383 0.05%Motability Operations Group plc 1,850,000 4.38% 8/2/2027 2,187,290 0.05%London & Quadrant Housing Trust 2,200,000 2.00% 20/10/2038 2,184,879 0.05%National Express Group plc 2,100,000 2.50% 11/11/2023 2,181,114 0.05%Experian Finance plc 2,200,000 0.74% 29/10/2025 2,177,369 0.05%Telereal Securitisation plc 1,737,446 6.16% 10/12/2031 2,170,497 0.05%National Grid Electricity Transmission plc 2,200,000 2.00% 16/9/2038 2,170,072 0.05%Chancellor Masters & Scholars of The University of Cambridge 1,400,000 3.75% 17/10/2052 2,168,614 0.05%Wrekin Housing Group Ltd. 2,000,000 2.50% 22/10/2048 2,164,898 0.05%Affinity Water Finance plc 1,757,000 5.88% 13/7/2026 2,162,600 0.05%InterContinental Hotels Group plc 2,000,000 3.38% 8/10/2028 2,160,504 0.05%Libra Longhurst Group Treasury plc 1,517,000 5.13% 2/8/2038 2,151,607 0.05%Quadgas Finance plc 2,000,000 3.38% 17/9/2029 2,148,702 0.05%ENW Finance plc 2,200,000 1.42% 30/7/2030 2,144,454 0.05%Swan Housing Capital plc 1,963,000 3.63% 5/3/2048 2,141,148 0.05%Pension Insurance Corp. plc 2,000,000 3.63% 21/10/2032 2,136,102 0.05%Delamare Finance plc 1,847,576 5.55% 19/2/2029 2,128,600 0.05%Western Power Distribution plc 2,000,000 3.63% 6/11/2023 2,117,365 0.05%White City Property Finance plc 1,670,060 5.12% 17/4/2035 2,108,669 0.05%Severn Trent Utilities Finance plc 1,450,000 4.88% 24/1/2042 2,106,169 0.05%Lloyds Banking Group plc^ 2,088,000 1.99% 15/12/2031 2,100,090 0.05%Aster Treasury plc 2,200,000 1.41% 27/1/2036 2,099,686 0.05%Thames Water Utilities Finance plc 1,675,000 4.38% 3/7/2034 2,098,973 0.05%Sky Ltd. 1,650,000 6.00% 21/5/2027 2,096,196 0.05%Porterbrook Rail Finance Ltd. 1,620,000 7.13% 20/10/2026 2,093,866 0.05%Greene King Finance plc 1,800,000 5.11% 15/3/2034 2,079,576 0.05%WHG Treasury plc 1,510,000 4.25% 6/10/2045 2,074,236 0.05%AA Bond Co., Ltd. 1,877,000 5.50% 31/7/2027 2,073,286 0.05%Home Group Ltd. 1,800,000 3.13% 27/3/2043 2,070,607 0.05%Wales & West Utilities Finance plc 1,550,000 5.75% 29/3/2030 2,068,018 0.05%Guinness Partnership Ltd. 1,500,000 4.00% 24/10/2044 2,064,379 0.05%Whitbread Group plc 2,000,000 3.00% 31/5/2031 2,058,756 0.05%SP Transmission plc 2,000,000 2.00% 13/11/2031 2,053,964 0.05%

935
Vanguard U.K. Investment Grade Bond Index Fund
Principal GBP (£) Coupon
Maturity Date
Fair Value GBP (£)
% of Total Net Assets
Northern Gas Networks Finance plc 1,700,000 4.88% 30/6/2027 2,051,292 0.05%HSBC Bank plc 1,840,000 6.50% 7/7/2023 2,046,793 0.05%Fidelity International Ltd. 1,767,000 7.13% 13/2/2024 2,038,172 0.05%Eastern Power Networks plc 1,794,000 5.75% 8/3/2024 2,033,729 0.05%Coventry Building Society 2,000,000 2.00% 20/12/2030 2,031,467 0.05%Channel Link Enterprises Finance plc^ 2,000,000 3.04% 30/6/2050 2,026,623 0.05%Thames Water Utilities Finance plc 1,900,000 2.63% 24/1/2032 2,013,704 0.05%Wessex Water Services Finance plc 1,408,000 5.75% 14/10/2033 2,012,529 0.05%Liverpool Victoria Friendly Society Ltd.^ 1,850,000 6.50% 22/5/2043 2,008,407 0.05%Hiscox Ltd. 1,975,000 2.00% 14/12/2022 2,006,751 0.05%Clarion Funding plc 2,000,000 1.88% 22/1/2035 2,003,822 0.05%Notting Hill Genesis 2,000,000 2.00% 3/6/2036 2,002,980 0.05%University College London 2,000,000 1.63% 4/6/2061 2,000,742 0.05%Coventry Building Society 2,000,000 1.00% 21/9/2025 2,000,284 0.05%United Utilities Water Ltd. 1,450,000 5.00% 28/2/2035 1,994,196 0.05%Burberry Group plc 2,000,000 1.13% 21/9/2025 1,994,118 0.05%Channel Link Enterprises Finance plc 1,765,000 3.85% 30/6/2050 1,993,437 0.05%Riverside Finance plc 1,500,000 3.88% 5/12/2044 1,992,429 0.05%Peabody Capital plc 1,300,000 5.25% 17/3/2043 1,989,091 0.05%Just Group plc 1,500,000 9.00% 26/10/2026 1,988,357 0.05%Wessex Water Services Finance plc 1,592,000 5.38% 10/3/2028 1,983,674 0.05%Experian Finance plc 1,900,000 2.13% 27/9/2024 1,973,366 0.05%Anglian Water Services Financing plc 1,441,000 6.63% 15/1/2029 1,973,359 0.05%Hiscox Ltd.^ 1,700,000 6.13% 24/11/2045 1,966,632 0.05%Places For People Treasury plc 1,800,000 2.88% 17/8/2026 1,955,046 0.05%Land Securities Capital Markets plc 1,900,000 1.97% 8/2/2024 1,947,652 0.05%BUPA Finance plc 1,900,000 1.75% 14/6/2027 1,939,670 0.05%University of Liverpool 1,400,000 3.38% 25/6/2055 1,934,720 0.05%Affinity Sutton Capital Markets plc 1,400,000 4.25% 8/10/2042 1,923,284 0.05%University of Southampton 1,800,000 2.25% 11/4/2057 1,909,660 0.05%Linde Finance BV 1,730,000 5.88% 24/4/2023 1,900,614 0.05%Southern Housing Group Ltd. 1,600,000 3.50% 19/10/2047 1,898,449 0.05%Investec Bank plc^ 1,800,000 4.25% 24/7/2028 1,892,492 0.05%Haven Funding plc 1,226,994 8.13% 30/9/2037 1,889,684 0.05%Liberty Living Finance plc 1,800,000 2.63% 28/11/2024 1,886,799 0.05%Manchester Airport Group Funding plc 1,850,000 2.88% 31/3/2039 1,884,838 0.05%Assura Financing plc 1,700,000 3.00% 19/7/2028 1,881,706 0.05%Telereal Secured Finance plc 1,690,140 4.01% 10/12/2031 1,881,178 0.05%Arqiva Financing plc 1,610,049 4.88% 31/12/2032 1,877,597 0.05%Next Group plc 1,700,000 3.63% 18/5/2028 1,873,619 0.05%Tritax Big Box plc 1,941,000 1.50% 27/11/2033 1,869,707 0.05%Liberty Living Finance plc 1,700,000 3.38% 28/11/2029 1,869,174 0.05%Southern Water Services Finance Ltd. 1,200,000 4.50% 31/3/2052 1,863,321 0.05%Just Group plc^ 1,600,000 7.00% 15/4/2031 1,859,671 0.05%Principality Building Society 1,800,000 2.38% 23/11/2023 1,855,726 0.05%InterContinental Hotels Group plc 1,700,000 3.75% 14/8/2025 1,846,586 0.05%DWR Cymru Financing UK plc 1,816,000 1.63% 31/3/2026 1,845,380 0.05%Scotland Gas Networks plc 1,400,000 4.88% 21/12/2034 1,841,667 0.05%Western Power Distribution South West plc 1,200,000 5.75% 23/3/2040 1,833,089 0.05%Wm Morrison Supermarkets plc 1,800,000 2.50% 1/10/2031 1,832,341 0.05%Motability Operations Group plc 1,600,000 3.75% 16/7/2026 1,827,820 0.05%Aviva plc^ 1,600,000 4.38% 12/9/2049 1,814,334 0.04%Close Brothers Group plc^ 1,800,000 2.00% 11/9/2031 1,810,644 0.04%M&G plc^ 1,700,000 3.88% 20/7/2049 1,805,787 0.04%Optivo Finance plc 1,500,000 3.28% 22/3/2048 1,803,275 0.04%RAC Bond Co. plc 1,726,000 4.57% 6/5/2023 1,802,186 0.04%BP Capital Markets plc 1,700,000 2.27% 3/7/2026 1,800,775 0.04%Virgin Money UK plc^ 1,692,000 3.38% 24/4/2026 1,798,331 0.04%Metropolitan Funding plc 1,400,000 4.13% 5/4/2048 1,795,946 0.04%Global Switch Holdings Ltd. 1,700,000 4.38% 13/12/2022 1,786,849 0.04%Yorkshire Water Finance plc 1,550,000 3.63% 1/8/2029 1,786,781 0.04%London & Quadrant Housing Trust 1,350,000 4.63% 5/12/2033 1,777,474 0.04%Southern Gas Networks plc 1,100,000 6.38% 15/5/2040 1,774,708 0.04%NewRiver plc 1,700,000 3.50% 7/3/2028 1,773,657 0.04%Wm Morrison Supermarkets plc 1,600,000 4.75% 4/7/2029 1,773,474 0.04%Tritax Big Box plc 1,650,000 2.63% 14/12/2026 1,769,288 0.04%Scotland Gas Networks plc 1,600,000 3.25% 8/3/2027 1,763,405 0.04%Western Power Distribution plc 1,600,000 3.50% 16/10/2026 1,759,551 0.04%DWR Cymru Financing UK plc 1,600,000 2.50% 31/3/2036 1,753,207 0.04%Paragon Treasury plc 1,397,000 3.63% 21/1/2047 1,753,009 0.04%UNITE USAF II plc 1,600,000 3.92% 30/6/2025 1,750,833 0.04%

936
Vanguard U.K. Investment Grade Bond Index Fund
Principal GBP (£) Coupon
Maturity Date
Fair Value GBP (£)
% of Total Net Assets
Equity Release Funding No 3 plc 1,428,860 5.05% 26/4/2033 1,744,558 0.04%British Land Co. plc 1,700,000 2.38% 14/9/2029 1,740,028 0.04%Western Power Distribution South West plc 1,392,000 5.88% 25/3/2027 1,737,239 0.04%National Grid Electricity Transmission plc 1,600,000 2.75% 6/2/2035 1,736,127 0.04%Incommunities Treasury plc 1,400,000 3.25% 21/3/2049 1,735,135 0.04%Anglian Water Services Financing plc 1,450,000 4.50% 5/10/2027 1,732,604 0.04%Saxon Weald Capital plc 1,250,000 5.38% 6/6/2042 1,726,959 0.04%Sage Group plc 1,762,000 1.63% 25/2/2031 1,723,970 0.04%Pension Insurance Corp. plc 1,500,000 6.50% 3/7/2024 1,720,057 0.04%Next Group plc 1,600,000 3.00% 26/8/2025 1,714,389 0.04%Penarian Housing Finance plc 1,480,000 3.21% 7/6/2052 1,694,821 0.04%Land Securities Capital Markets plc 1,600,000 2.40% 8/2/2029 1,692,107 0.04%London & Quadrant Housing Trust 1,600,000 2.25% 20/7/2029 1,689,331 0.04%EMH Treasury plc 1,200,000 4.50% 29/1/2044 1,688,179 0.04%Land Securities Capital Markets plc 1,600,000 2.38% 29/3/2027 1,686,143 0.04%Direct Line Insurance Group plc 1,495,000 4.00% 5/6/2032 1,682,234 0.04%London Power Networks plc 1,550,000 5.13% 31/3/2023 1,672,988 0.04%DWR Cymru Financing UK plc 1,700,000 1.38% 31/3/2033 1,668,538 0.04%Genfinance II plc 1,045,000 6.06% 21/12/2039 1,662,659 0.04%Gatwick Funding Ltd. 1,700,000 2.88% 5/7/2049 1,659,382 0.04%A2Dominion Housing Group Ltd. 1,500,000 3.50% 15/11/2028 1,654,802 0.04%Northumbrian Water Finance plc 1,562,000 2.38% 5/10/2027 1,653,514 0.04%LiveWest Treasury plc 1,700,000 1.88% 18/2/2056 1,649,828 0.04%Prudential plc 1,224,000 5.88% 11/5/2029 1,647,930 0.04%Sovereign Housing Capital plc 1,100,000 4.77% 1/6/2043 1,647,595 0.04%Libra Longhurst Group Treasury NO 2 plc 1,400,000 3.25% 15/5/2043 1,634,330 0.04%Octagon Healthcare Funding plc 1,287,887 5.33% 31/12/2035 1,633,865 0.04%Close Brothers Finance plc 1,500,000 2.75% 19/10/2026 1,618,508 0.04%Canary Wharf Group Investment Holdings plc 1,600,000 3.38% 23/4/2028 1,614,537 0.04%National Grid Gas plc 1,830,000 1.63% 14/1/2043 1,613,763 0.04%Virgin Money UK plc^ 1,590,000 2.63% 19/8/2031 1,613,063 0.04%Babcock International Group plc 1,600,000 1.88% 5/10/2026 1,597,812 0.04%TC Dudgeon Ofto plc 1,413,725 3.16% 12/11/2038 1,594,231 0.04%Yorkshire Housing Finance plc 1,200,000 4.13% 31/10/2044 1,592,946 0.04%Workspace Group plc 1,600,000 2.25% 11/3/2028 1,590,278 0.04%Yorkshire Power Finance Ltd. 1,150,000 7.25% 4/8/2028 1,581,078 0.04%Admiral Group plc 1,400,000 5.50% 25/7/2024 1,579,987 0.04%Compass Group plc 1,500,000 2.00% 3/7/2029 1,578,718 0.04%UNITE Group plc 1,400,000 3.50% 15/10/2028 1,554,276 0.04%Greene King Finance plc 1,461,000 3.59% 15/3/2035 1,547,535 0.04%Segro plc 1,050,000 5.75% 20/6/2035 1,542,507 0.04%Vodafone Group plc 1,275,000 5.63% 4/12/2025 1,542,369 0.04%SSE plc^ 1,500,000 3.63% 16/9/2077 1,536,717 0.04%TP ICAP Ltd. 1,400,000 5.25% 26/1/2024 1,535,212 0.04%Trafford Centre Finance Ltd. 1,255,410 6.50% 28/7/2033 1,535,078 0.04%Northumbrian Water Finance plc 1,500,000 1.63% 11/10/2026 1,534,065 0.04%Hyde Housing Association Ltd. 1,050,000 5.13% 23/7/2040 1,532,638 0.04%Porterbrook Rail Finance Ltd. 1,300,000 4.63% 4/4/2029 1,532,616 0.04%InterContinental Hotels Group plc 1,500,000 2.13% 24/8/2026 1,525,647 0.04%Affinity Water Finance plc 1,150,000 4.50% 31/3/2036 1,524,278 0.04%Whitbread Group plc 1,500,000 2.38% 31/5/2027 1,522,498 0.04%Beyond Housing Ltd. 1,500,000 2.13% 17/5/2051 1,518,136 0.04%Greater Gabbard OFTO plc 1,307,242 4.14% 29/11/2032 1,516,433 0.04%National Grid Electricity Transmission plc 1,500,000 1.38% 16/9/2026 1,514,499 0.04%Harbour Funding plc 1,124,000 5.28% 31/3/2034 1,497,215 0.04%Hastoe Capital plc 1,000,000 5.60% 27/3/2042 1,494,401 0.04%Southern Gas Networks plc 1,200,000 4.88% 21/3/2029 1,494,209 0.04%Sunderland SHG Finance plc 1,063,000 6.38% 31/3/2042 1,493,081 0.04%Broadgate Financing plc 1,150,000 4.82% 5/7/2033 1,490,167 0.04%Futures Treasury plc 1,200,000 3.38% 8/2/2044 1,489,965 0.04%Notting Hill Genesis 1,000,000 4.38% 20/2/2054 1,488,811 0.04%Telereal Securitisation plc 1,199,588 5.95% 10/12/2031 1,487,862 0.04%Hammerson plc 1,288,000 6.00% 23/2/2026 1,487,468 0.04%TP ICAP Ltd. 1,300,000 5.25% 29/5/2026 1,483,099 0.04%Severn Trent Utilities Finance plc 1,300,000 6.13% 26/2/2024 1,482,458 0.04%British Telecommunications plc 1,300,000 3.63% 21/11/2047 1,481,200 0.04%DS Smith plc 1,400,000 2.88% 26/7/2029 1,479,196 0.04%Wessex Water Services Finance plc 1,628,000 1.25% 12/1/2036 1,473,304 0.04%Bunzl Finance plc 1,400,000 2.25% 11/6/2025 1,467,243 0.04%Barclays Bank plc 1,200,000 5.75% 14/9/2026 1,459,419 0.04%Santander UK plc^ 1,300,000 7.04% Perpetual 1,452,790 0.04%

937
Vanguard U.K. Investment Grade Bond Index Fund
Principal GBP (£) Coupon
Maturity Date
Fair Value GBP (£)
% of Total Net Assets
London & Quadrant Housing Trust 1,300,000 2.75% 20/7/2057 1,451,615 0.04%Thames Water Utilities Finance plc 1,400,000 1.88% 24/1/2024 1,438,904 0.04%Coventry Building Society 1,400,000 1.88% 24/10/2023 1,437,653 0.04%Lloyds Bank Corporate Markets plc 1,400,000 1.50% 23/6/2023 1,425,308 0.04%Gwynt y Mor OFTO plc 1,332,119 2.78% 17/2/2034 1,404,101 0.03%Scottish Power UK plc 1,250,000 6.75% 29/5/2023 1,396,689 0.03%London & Quadrant Housing Trust 1,300,000 2.63% 5/5/2026 1,395,358 0.03%Hammerson plc 1,100,000 7.25% 21/4/2028 1,387,859 0.03%Tesco Personal Finance Group plc 1,300,000 3.50% 25/7/2025 1,367,137 0.03%Next Group plc 1,200,000 4.38% 2/10/2026 1,360,166 0.03%Northern Powergrid Yorkshire plc 996,000 5.13% 4/5/2035 1,351,318 0.03%Anglian Water Services Financing plc 1,300,000 1.63% 10/8/2025 1,346,271 0.03%Close Brothers Group plc 1,300,000 2.75% 26/4/2023 1,345,035 0.03%London & Quadrant Housing Trust 1,000,000 3.75% 27/10/2049 1,320,554 0.03%Greene King Finance plc 1,122,750 5.32% 15/9/2031 1,293,143 0.03%Northern Powergrid Holdings Co. 1,180,000 7.25% 15/12/2022 1,292,823 0.03%Eastern Power Networks plc 1,300,000 1.88% 1/6/2035 1,284,658 0.03%Bazalgette Finance plc 1,200,000 2.38% 29/11/2027 1,283,287 0.03%Firstgroup plc 1,100,000 6.88% 18/9/2024 1,282,850 0.03%SSE plc 1,200,000 5.88% 22/9/2022 1,278,709 0.03%RSL Finance No 1 plc 904,561 6.63% 31/3/2038 1,275,807 0.03%United Utilities Water Finance plc 1,300,000 1.75% 10/2/2038 1,262,091 0.03%Eastern Power Networks plc 800,000 6.25% 12/11/2036 1,254,250 0.03%Yorkshire Water Finance plc^ 1,200,000 3.75% 22/3/2046 1,239,089 0.03%National Express Group plc 1,200,000 2.38% 20/11/2028 1,238,516 0.03%Wm Morrison Supermarkets plc 1,185,000 3.50% 27/7/2026 1,237,573 0.03%RHP Finance plc 1,022,000 3.25% 5/2/2048 1,221,595 0.03%Scottish Hydro Electric Transmission plc 1,200,000 1.50% 24/3/2028 1,202,881 0.03%Anglian Water Services Financing plc 1,100,000 2.63% 15/6/2027 1,181,132 0.03%Northumbrian Water Finance plc 1,068,000 6.88% 6/2/2023 1,172,792 0.03%Student Finance plc 1,150,000 2.67% 30/9/2024 1,163,224 0.03%London Power Networks plc 900,000 6.13% 7/6/2027 1,147,315 0.03%Wm Morrison Supermarkets plc 1,052,000 4.63% 8/12/2023 1,126,983 0.03%Severn Trent Utilities Finance plc 1,000,000 2.75% 5/12/2031 1,104,523 0.03%Yorkshire Water Finance plc 1,100,000 1.75% 27/10/2032 1,096,703 0.03%CPUK Finance Ltd. 1,000,000 3.59% 28/8/2025 1,081,253 0.03%DWR Cymru Financing UK plc 1,050,000 2.38% 31/3/2034 1,076,881 0.03%Wods Transmission plc 953,639 3.45% 24/8/2034 1,075,045 0.03%LiveWest Treasury plc 1,000,000 2.25% 10/10/2043 1,048,832 0.03%Tritax Big Box plc 925,000 3.13% 14/12/2031 1,040,279 0.03%Quilter plc^ 1,000,000 4.48% 28/2/2028 1,039,225 0.03%Yorkshire Water Finance plc 1,000,000 1.75% 26/11/2026 1,027,704 0.03%Western Power Distribution East Midlands plc 1,000,000 1.75% 9/9/2031 995,868 0.02%Northern Powergrid Northeast plc 1,050,000 1.88% 16/6/2062 994,595 0.02%Leeds Building Society^ 900,000 3.75% 25/4/2029 967,486 0.02%Longstone Finance plc 830,861 4.79% 19/4/2030 959,139 0.02%Motability Operations Group plc 700,000 5.63% 29/11/2030 955,845 0.02%Greene King Finance plc 855,740 4.06% 15/3/2035 937,340 0.02%HSBC Bank plc^ 796,000 5.38% 4/11/2030 932,021 0.02%Go-Ahead Group plc 900,000 2.50% 6/7/2024 925,733 0.02%Unilever plc 900,000 1.38% 15/9/2024 923,048 0.02%Compass Group plc 800,000 3.85% 26/6/2026 915,418 0.02%Gatwick Funding Ltd. 600,000 6.50% 2/3/2041 895,357 0.02%Prudential plc 770,000 6.88% 20/1/2023 845,761 0.02%Canary Wharf Finance II plc 664,537 6.46% 22/7/2030 813,376 0.02%Yorkshire Water Finance plc 550,000 6.60% 17/4/2031 785,729 0.02%United Utilities Water Finance plc 790,000 0.88% 28/10/2029 756,960 0.02%Anglian Water Osprey Financing plc 750,000 2.00% 31/7/2028 750,861 0.02%National Grid Electricity Transmission plc 650,000 4.00% 8/6/2027 747,575 0.02%Orbit Capital plc 750,000 2.00% 24/11/2038 740,326 0.02%Legal & General Finance plc 500,000 5.88% 5/4/2033 720,939 0.02%Places for People Homes Ltd. 600,000 5.09% 31/7/2024 676,352 0.02%Kennedy Wilson Europe Real Estate Ltd. 653,825 3.95% 30/6/2022 665,797 0.02%United Utilities Water Ltd. 478,000 5.63% 20/12/2027 609,119 0.02%Western Power Distribution South West plc 500,000 2.38% 16/5/2029 529,118 0.01%Rothesay Life plc 400,000 8.00% 30/10/2025 503,921 0.01%Gatwick Funding Ltd. 500,000 2.63% 7/10/2046 467,412 0.01%Northern Gas Networks Finance plc 300,000 5.63% 23/3/2040 449,542 0.01%RL Finance Bonds No. 2 plc^ 400,000 6.13% 30/11/2043 444,341 0.01%Thames Water Utilities Finance plc 300,000 6.50% 9/2/2032 427,598 0.01%Telereal Securitisation plc 385,748 1.37% 10/12/2031 390,775 0.01%

938
Vanguard U.K. Investment Grade Bond Index Fund
Principal GBP (£) Coupon
Maturity Date
Fair Value GBP (£)
% of Total Net Assets
Gatwick Funding Ltd. 350,000 5.25% 23/1/2024 386,583 0.01%Yorkshire Water Finance plc 305,000 6.59% 21/2/2023 334,205 0.01%Wales & West Utilities Finance plc 277,000 4.63% 13/12/2023 304,058 0.01%Citizen Treasury plc 108,000 4.63% 3/12/2042 153,125 0.00%test - - - 1,767,061,942 43.66%United States 11.97% (2020: 11.64%)Walmart, Inc. 8,400,000 5.63% 27/3/2034 12,431,914 0.31%AT&T, Inc. 7,350,000 7.00% 30/4/2040 12,160,325 0.30%Pfizer, Inc. 9,069,000 2.74% 15/6/2043 10,299,575 0.25%AT&T, Inc. 7,250,000 4.88% 1/6/2044 10,010,867 0.25%Bank of America Corp. 6,350,000 7.00% 31/7/2028 8,735,066 0.22%Wells Fargo & Co. 8,100,000 2.00% 28/7/2025 8,387,668 0.21%Walmart, Inc. 5,541,000 5.25% 28/9/2035 8,146,883 0.20%AT&T, Inc. 6,250,000 4.25% 1/6/2043 7,915,741 0.20%JPMorgan Chase & Co. 7,700,000 0.99% 28/4/2026 7,704,256 0.19%Berkshire Hathaway Finance Corp. 6,900,000 2.38% 19/6/2039 7,422,973 0.18%GE Capital UK Funding Unlimited Co. 4,088,000 8.00% 14/1/2039 7,140,602 0.18%Verizon Communications, Inc. 5,900,000 3.38% 27/10/2036 6,850,374 0.17%Verizon Communications, Inc. 6,700,000 1.88% 19/9/2030 6,765,902 0.17%Citigroup, Inc. 6,600,000 1.75% 23/10/2026 6,753,918 0.17%Morgan Stanley 6,162,000 2.63% 9/3/2027 6,606,720 0.16%Bank of America Corp.^ 6,500,000 1.67% 2/6/2029 6,535,009 0.16%Goldman Sachs Group, Inc. 5,844,000 3.13% 25/7/2029 6,487,613 0.16%AT&T, Inc. 5,400,000 4.38% 14/9/2029 6,462,715 0.16%Bank of America Corp. 5,800,000 2.30% 25/7/2025 6,129,538 0.15%JPMorgan Chase & Co. 5,900,000 1.90% 28/4/2033 5,948,488 0.15%Time Warner Cable LLC 4,430,000 5.25% 15/7/2042 5,900,199 0.15%Apple, Inc. 4,900,000 3.05% 31/7/2029 5,636,303 0.14%Wells Fargo Bank NA 5,150,000 5.25% 1/8/2023 5,609,123 0.14%Wells Fargo & Co. 4,250,000 4.63% 2/11/2035 5,554,573 0.14%Citigroup, Inc. 3,282,000 6.80% 25/6/2038 5,549,328 0.14%Citigroup, Inc. 5,100,000 2.75% 24/1/2024 5,350,361 0.13%Wells Fargo & Co. 4,100,000 4.88% 29/11/2035 5,339,854 0.13%Comcast Corp. 4,050,000 5.50% 23/11/2029 5,310,734 0.13%Fidelity National Information Services, Inc. 4,633,000 3.36% 21/5/2031 5,212,167 0.13%Comcast Corp. 5,200,000 1.88% 20/2/2036 5,147,026 0.13%Wells Fargo & Co. 4,800,000 2.50% 2/5/2029 5,080,394 0.13%AT&T, Inc. 4,600,000 2.90% 4/12/2026 4,978,863 0.12%Berkshire Hathaway Finance Corp. 4,300,000 2.63% 19/6/2059 4,977,889 0.12%Toyota Motor Credit Corp. 5,000,000 0.75% 19/11/2026 4,937,863 0.12%Fiserv, Inc. 4,700,000 2.25% 1/7/2025 4,931,877 0.12%GE Capital UK Funding Unlimited Co. 3,600,000 5.88% 18/1/2033 4,929,322 0.12%Wells Fargo & Co. 4,700,000 2.13% 24/9/2031 4,779,697 0.12%Pfizer, Inc. 2,800,000 6.50% 3/6/2038 4,724,555 0.12%Amgen, Inc. 3,950,000 4.00% 13/9/2029 4,706,300 0.12%New York Life Global Funding 4,500,000 1.63% 15/12/2023 4,621,522 0.11%Citigroup, Inc. 2,550,000 7.38% 1/9/2039 4,600,836 0.11%Digital Stout Holding LLC 4,000,000 3.75% 17/10/2030 4,577,555 0.11%Walmart, Inc. 3,220,000 5.75% 19/12/2030 4,513,685 0.11%Apple, Inc. 3,300,000 3.60% 31/7/2042 4,436,157 0.11%Goldman Sachs Group, Inc. 4,400,000 1.50% 7/12/2027 4,401,090 0.11%Nestle Holdings, Inc. 4,300,000 0.63% 18/12/2025 4,289,476 0.11%United Parcel Service, Inc. 2,550,000 5.13% 12/2/2050 4,230,368 0.10%Comcast Corp. 4,200,000 1.50% 20/2/2029 4,216,242 0.10%Goldman Sachs Group, Inc. 3,400,000 7.13% 7/8/2025 4,214,007 0.10%Verizon Communications, Inc. 4,300,000 1.88% 3/11/2038 4,100,664 0.10%Goldman Sachs Group, Inc. 3,000,000 7.25% 10/4/2028 4,090,266 0.10%McKesson Corp. 3,700,000 3.13% 17/2/2029 4,051,326 0.10%Verizon Communications, Inc. 4,000,000 1.13% 3/11/2028 3,889,443 0.10%Goldman Sachs Group, Inc. 3,400,000 4.25% 29/1/2026 3,858,218 0.10%Time Warner Cable LLC 3,000,000 5.75% 2/6/2031 3,843,941 0.10%American International Group, Inc. 3,550,000 5.00% 26/4/2023 3,825,540 0.09%Welltower, Inc. 3,146,000 4.80% 20/11/2028 3,762,496 0.09%AT&T, Inc. 3,000,000 5.50% 15/3/2027 3,674,863 0.09%Wells Fargo & Co. 3,400,000 2.13% 20/12/2023 3,509,417 0.09%Goldman Sachs Group, Inc. 3,500,000 1.88% 16/12/2030 3,504,773 0.09%Prologis LP 3,282,000 2.25% 30/6/2029 3,495,690 0.09%General Electric Co. 2,823,000 4.88% 18/9/2037 3,480,350 0.09%Realty Income Corp. 3,500,000 1.63% 15/12/2030 3,463,167 0.09%Welltower, Inc. 2,800,000 4.50% 1/12/2034 3,423,046 0.08%Verizon Communications, Inc. 2,600,000 4.75% 17/2/2034 3,394,777 0.08%
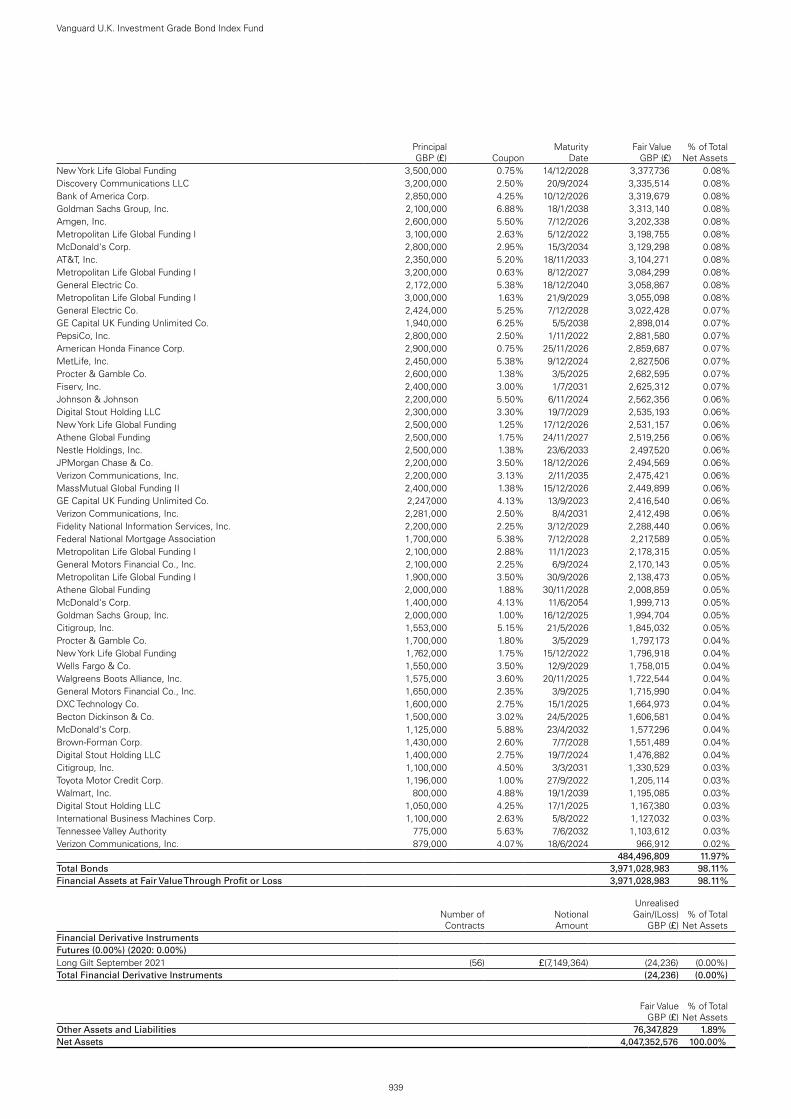
939
Vanguard U.K. Investment Grade Bond Index Fund
Principal GBP (£) Coupon
Maturity Date
Fair Value GBP (£)
% of Total Net Assets
New York Life Global Funding 3,500,000 0.75% 14/12/2028 3,377,736 0.08%Discovery Communications LLC 3,200,000 2.50% 20/9/2024 3,335,514 0.08%Bank of America Corp. 2,850,000 4.25% 10/12/2026 3,319,679 0.08%Goldman Sachs Group, Inc. 2,100,000 6.88% 18/1/2038 3,313,140 0.08%Amgen, Inc. 2,600,000 5.50% 7/12/2026 3,202,338 0.08%Metropolitan Life Global Funding I 3,100,000 2.63% 5/12/2022 3,198,755 0.08%McDonald's Corp. 2,800,000 2.95% 15/3/2034 3,129,298 0.08%AT&T, Inc. 2,350,000 5.20% 18/11/2033 3,104,271 0.08%Metropolitan Life Global Funding I 3,200,000 0.63% 8/12/2027 3,084,299 0.08%General Electric Co. 2,172,000 5.38% 18/12/2040 3,058,867 0.08%Metropolitan Life Global Funding I 3,000,000 1.63% 21/9/2029 3,055,098 0.08%General Electric Co. 2,424,000 5.25% 7/12/2028 3,022,428 0.07%GE Capital UK Funding Unlimited Co. 1,940,000 6.25% 5/5/2038 2,898,014 0.07%PepsiCo, Inc. 2,800,000 2.50% 1/11/2022 2,881,580 0.07%American Honda Finance Corp. 2,900,000 0.75% 25/11/2026 2,859,687 0.07%MetLife, Inc. 2,450,000 5.38% 9/12/2024 2,827,506 0.07%Procter & Gamble Co. 2,600,000 1.38% 3/5/2025 2,682,595 0.07%Fiserv, Inc. 2,400,000 3.00% 1/7/2031 2,625,312 0.07%Johnson & Johnson 2,200,000 5.50% 6/11/2024 2,562,356 0.06%Digital Stout Holding LLC 2,300,000 3.30% 19/7/2029 2,535,193 0.06%New York Life Global Funding 2,500,000 1.25% 17/12/2026 2,531,157 0.06%Athene Global Funding 2,500,000 1.75% 24/11/2027 2,519,256 0.06%Nestle Holdings, Inc. 2,500,000 1.38% 23/6/2033 2,497,520 0.06%JPMorgan Chase & Co. 2,200,000 3.50% 18/12/2026 2,494,569 0.06%Verizon Communications, Inc. 2,200,000 3.13% 2/11/2035 2,475,421 0.06%MassMutual Global Funding II 2,400,000 1.38% 15/12/2026 2,449,899 0.06%GE Capital UK Funding Unlimited Co. 2,247,000 4.13% 13/9/2023 2,416,540 0.06%Verizon Communications, Inc. 2,281,000 2.50% 8/4/2031 2,412,498 0.06%Fidelity National Information Services, Inc. 2,200,000 2.25% 3/12/2029 2,288,440 0.06%Federal National Mortgage Association 1,700,000 5.38% 7/12/2028 2,217,589 0.05%Metropolitan Life Global Funding I 2,100,000 2.88% 11/1/2023 2,178,315 0.05%General Motors Financial Co., Inc. 2,100,000 2.25% 6/9/2024 2,170,143 0.05%Metropolitan Life Global Funding I 1,900,000 3.50% 30/9/2026 2,138,473 0.05%Athene Global Funding 2,000,000 1.88% 30/11/2028 2,008,859 0.05%McDonald's Corp. 1,400,000 4.13% 11/6/2054 1,999,713 0.05%Goldman Sachs Group, Inc. 2,000,000 1.00% 16/12/2025 1,994,704 0.05%Citigroup, Inc. 1,553,000 5.15% 21/5/2026 1,845,032 0.05%Procter & Gamble Co. 1,700,000 1.80% 3/5/2029 1,797,173 0.04%New York Life Global Funding 1,762,000 1.75% 15/12/2022 1,796,918 0.04%Wells Fargo & Co. 1,550,000 3.50% 12/9/2029 1,758,015 0.04%Walgreens Boots Alliance, Inc. 1,575,000 3.60% 20/11/2025 1,722,544 0.04%General Motors Financial Co., Inc. 1,650,000 2.35% 3/9/2025 1,715,990 0.04%DXC Technology Co. 1,600,000 2.75% 15/1/2025 1,664,973 0.04%Becton Dickinson & Co. 1,500,000 3.02% 24/5/2025 1,606,581 0.04%McDonald's Corp. 1,125,000 5.88% 23/4/2032 1,577,296 0.04%Brown-Forman Corp. 1,430,000 2.60% 7/7/2028 1,551,489 0.04%Digital Stout Holding LLC 1,400,000 2.75% 19/7/2024 1,476,882 0.04%Citigroup, Inc. 1,100,000 4.50% 3/3/2031 1,330,529 0.03%Toyota Motor Credit Corp. 1,196,000 1.00% 27/9/2022 1,205,114 0.03%Walmart, Inc. 800,000 4.88% 19/1/2039 1,195,085 0.03%Digital Stout Holding LLC 1,050,000 4.25% 17/1/2025 1,167,380 0.03%International Business Machines Corp. 1,100,000 2.63% 5/8/2022 1,127,032 0.03%Tennessee Valley Authority 775,000 5.63% 7/6/2032 1,103,612 0.03%Verizon Communications, Inc. 879,000 4.07% 18/6/2024 966,912 0.02%test - - - 484,496,809 11.97%Total Bonds 3,971,028,983 98.11%Financial Assets at Fair Value Through Profit or Loss 3,971,028,983 98.11%
testNumber of Contracts
Notional Amount
Unrealised Gain/(Loss)
GBP (£)% of Total
Net AssetsFinancial Derivative InstrumentsFutures (0.00%) (2020: 0.00%)Long Gilt September 2021 (56) £(7,149,364) (24,236 ) (0.00 %)Total Financial Derivative Instruments (24,236 ) (0.00 %)
Fair Value GBP (£)
% of Total Net Assets
Other Assets and Liabilities 76,347,829 1.89 %Net Assets 4,047,352,576 100.00 %

940
Vanguard U.K. Investment Grade Bond Index Fund
Analysis of Total Net Assets GBP (£)% of Total
Net Assets(a) Transferable securities admitted to an official stock exchange listing 3,939,360,211 97.33%(b) Transferable securities dealt in on another regulated market 31,668,772 0.78%(c) Transferable securities other than those admitted to an official stock exchange listing or dealt in on another regulated
market — 0.00%
(d) Financial derivative instruments (24,236) (0.00%)(e) Other assets and liabilities 76,347,829 1.89%Total Net Assets 4,047,352,576 100.00%
^ Floating Rate Note (FRN). The effective interest rate is at 30 June 2021.1 Denotes securities pledged in full or part thereof as collateral for derivatives.

The accompanying notes form an integral part of the financial statements.
941
Vanguard U.K. Investment Grade Bond Index Fund
Statement of Assets and Liabilities
GBP (£)
As at 30 June 2021
GBP (£)
As at 31 December 2020
Current AssetsFinancial Assets at Fair Value Through Profit or Loss 3,971,028,983 3,629,413,939 Financial Derivative Instruments — 33,278 Cash 60,718,396 17,184,568 Receivables: Interest and Dividends 47,341,121 43,985,526 Capital Shares Issued 15,442,664 8,391,998 Investments Sold 21,570,529 — Futures Margin Cash 9,398 — Other Receivables — 23,249
Total Current Assets 4,116,111,091 3,699,032,558
Current LiabilitiesFinancial Derivative Instruments 24,236 — Payables and Other Liabilities: Investments Purchased 60,730,926 861,123 Income Distribution Payable 4,534,082 4,909,932 Capital Shares Redeemed 3,101,731 2,787,292 Futures Margin Cash Due to Broker — 29,727 Management Fees Payable 367,540 346,814
Total Current Liabilities 68,758,515 8,934,888
Net Assets Attributable to Holders of Redeemable Participating Shares (“Net Assets”) 4,047,352,576 3,690,097,670
Net Asset Value Per Share
.As at
30 June 2021As at
31 December 2020As at
31 December 2019GBP AccNet Assets 3,056,586,464 2,654,021,531 2,543,860,745Number of Shares Outstanding 28,510,487 24,117,477 24,946,046Net Asset Value Per Share1 107.21 110.05 101.97
GBP DistNet Assets 476,507,797 535,190,185 490,536,567Number of Shares Outstanding 7,767,256 8,411,689 8,138,219Net Asset Value Per Share1 61.35 63.62 60.28
Institutional Plus GBP AccNet Assets 114,169,863 116,005,457 145,380,047Number of Shares Outstanding 833,205 825,026 1,116,436Net Asset Value Per Share1 137.02 140.61 130.22
Institutional Plus GBP DistNet Assets 400,088,452 384,880,497 333,624,706Number of Shares Outstanding 3,511,393 3,257,118 2,980,168Net Asset Value Per Share1 113.94 118.17 111.95
1 The net asset value per share shown may diverge from the net asset value per share used for dealing purposes because of any adjustments for swing pricing and trade date accounting.

942
Vanguard U.K. Investment Grade Bond Index Fund
The accompanying notes form an integral part of the financial statements.
Statement of Operations
GBP (£)
Six Months Ended 30 June 2021
GBP (£)
Six Months Ended 30 June 2020
Investment Income/(Loss) Interest Income 41,371,034 40,866,156 Other Income 7,074 4,603 Net Gain/(Loss) on Financial Instruments (134,615,335) 62,482,039
Total Investment Income/(Loss) (93,237,227) 103,352,798
Expenses Management Fees 2,119,255 1,910,899 Transaction Fees and Commissions 1,334 3,559
Total Expenses 2,120,589 1,914,458
Finance Costs Interest Expense 52 510 Distribution Paid 9,187,473 9,263,468 Income Equalisation (15,302) 121,189
Total Finance Costs 9,172,223 9,385,167
Net Investment Income/(Loss) (104,530,039) 92,053,173
Foreign Withholding Tax (21,156) (12,075)
Net Increase/(Decrease) in Net Assets (104,551,195) 92,041,098
Statement of Changes in Net Assets
GBP (£)
GBP (£)
Six Months Ended Six Months Ended30 June 2021 30 June 2020
Increase/(Decrease) in Net Assets
Net Increase/(Decrease) in Net Assets From Operations (104,551,195) 92,041,098
Capital Transactions Subscriptions 830,749,814 768,083,550 Redemptions (368,959,904) (843,652,531) Reinvestments 16,191 37,540
Total Capital Transactions1 461,806,101 (75,531,441)
Total Increase/(Decrease) for the Period 357,254,906 16,509,657
Net AssetsBeginning of Period 3,690,097,670 3,513,402,065
End of Period 4,047,352,576 3,529,911,722
1 Capital Transactions include income equalisation adjustments as shown in the Statement of Operations.
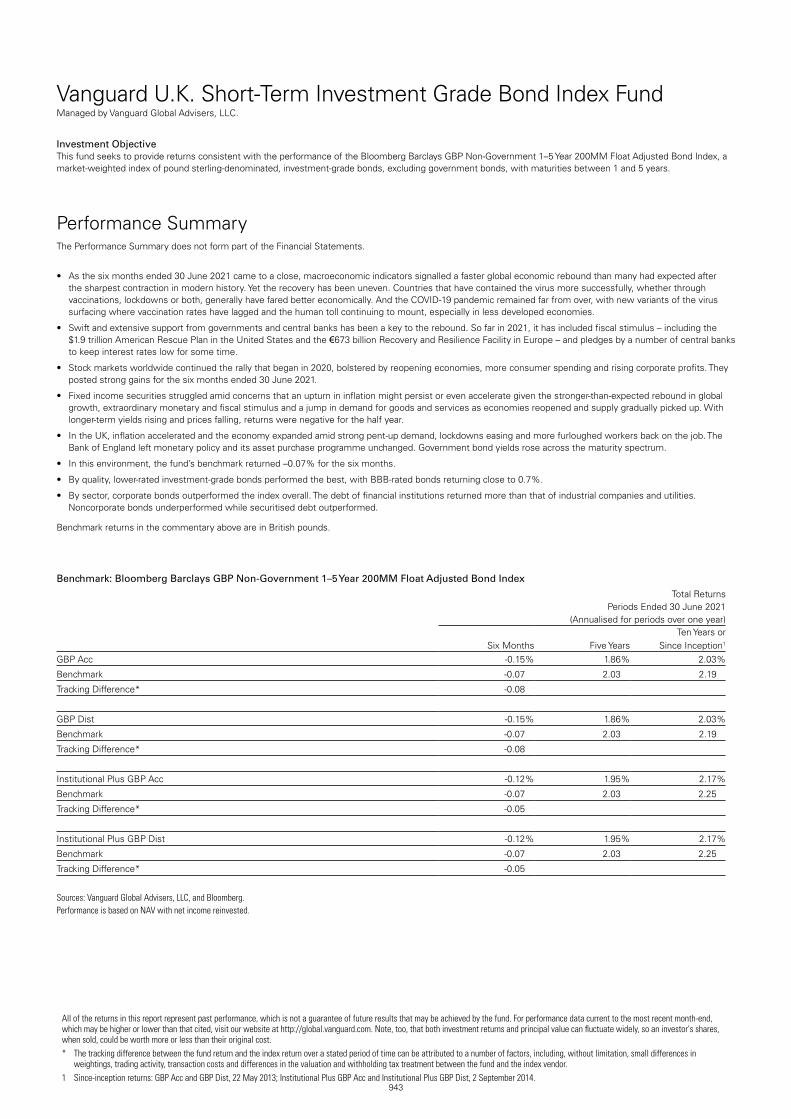
Vanguard U.K. Short-Term Investment Grade Bond Index FundManaged by Vanguard Global Advisers, LLC.
943
Investment ObjectiveThis fund seeks to provide returns consistent with the performance of the Bloomberg Barclays GBP Non-Government 1–5 Year 200MM Float Adjusted Bond Index, a market-weighted index of pound sterling-denominated, investment-grade bonds, excluding government bonds, with maturities between 1 and 5 years.
Performance SummaryThe Performance Summary does not form part of the Financial Statements.
• As the six months ended 30 June 2021 came to a close, macroeconomic indicators signalled a faster global economic rebound than many had expected after the sharpest contraction in modern history. Yet the recovery has been uneven. Countries that have contained the virus more successfully, whether through vaccinations, lockdowns or both, generally have fared better economically. And the COVID-19 pandemic remained far from over, with new variants of the virus surfacing where vaccination rates have lagged and the human toll continuing to mount, especially in less developed economies.
• Swift and extensive support from governments and central banks has been a key to the rebound. So far in 2021, it has included fiscal stimulus – including the $1.9 trillion American Rescue Plan in the United States and the €673 billion Recovery and Resilience Facility in Europe – and pledges by a number of central banks to keep interest rates low for some time.
• Stock markets worldwide continued the rally that began in 2020, bolstered by reopening economies, more consumer spending and rising corporate profits. They posted strong gains for the six months ended 30 June 2021.
• Fixed income securities struggled amid concerns that an upturn in inflation might persist or even accelerate given the stronger-than-expected rebound in global growth, extraordinary monetary and fiscal stimulus and a jump in demand for goods and services as economies reopened and supply gradually picked up. With longer-term yields rising and prices falling, returns were negative for the half year.
• In the UK, inflation accelerated and the economy expanded amid strong pent-up demand, lockdowns easing and more furloughed workers back on the job. The Bank of England left monetary policy and its asset purchase programme unchanged. Government bond yields rose across the maturity spectrum.
• In this environment, the fund’s benchmark returned –0.07% for the six months.
• By quality, lower-rated investment-grade bonds performed the best, with BBB-rated bonds returning close to 0.7%.
• By sector, corporate bonds outperformed the index overall. The debt of financial institutions returned more than that of industrial companies and utilities. Noncorporate bonds underperformed while securitised debt outperformed.
Benchmark returns in the commentary above are in British pounds.
Benchmark: Bloomberg Barclays GBP Non-Government 1–5 Year 200MM Float Adjusted Bond Index
Total ReturnsPeriods Ended 30 June 2021
(Annualised for periods over one year)
Six Months Five YearsTen Years or
Since Inception1
GBP Acc -0.15 % 1.86 % 2.03 %
Benchmark -0.07 2.03 2.19
Tracking Difference* -0.08
GBP Dist -0.15 % 1.86 % 2.03 %
Benchmark -0.07 2.03 2.19
Tracking Difference* -0.08
Institutional Plus GBP Acc -0.12 % 1.95 % 2.17 %
Benchmark -0.07 2.03 2.25
Tracking Difference* -0.05
Institutional Plus GBP Dist -0.12 % 1.95 % 2.17 %
Benchmark -0.07 2.03 2.25
Tracking Difference* -0.05
Sources: Vanguard Global Advisers, LLC, and Bloomberg.Performance is based on NAV with net income reinvested.
All of the returns in this report represent past performance, which is not a guarantee of future results that may be achieved by the fund. For performance data current to the most recent month-end, which may be higher or lower than that cited, visit our website at http://global.vanguard.com. Note, too, that both investment returns and principal value can fluctuate widely, so an investor's shares, when sold, could be worth more or less than their original cost.* The tracking difference between the fund return and the index return over a stated period of time can be attributed to a number of factors, including, without limitation, small differences in
weightings, trading activity, transaction costs and differences in the valuation and withholding tax treatment between the fund and the index vendor.1 Since-inception returns: GBP Acc and GBP Dist, 22 May 2013; Institutional Plus GBP Acc and Institutional Plus GBP Dist, 2 September 2014.

Significant Portfolio ChangesFor the Six Months Ended 30 June 2021
944
Vanguard U.K. Short-Term Investment Grade Bond Index Fund
The Central Bank of Ireland requires a schedule of material changes in the composition of the portfolio during the period. These are defined as aggregate purchases of a security exceeding 1% of the total value of purchases for the period and aggregate disposals greater than 1% of the total value of sales. At a minimum, the largest 20 purchases and 20 sales must be shown; all purchases and sales must be shown if there are fewer than 20. A full listing of the portfolio changes for the period is available, upon request, at no extra cost from the Administrator.
Principal GBP (£)
Cost GBP (£)
Purchases
United Kingdom Gilt 0.13% 30/1/2026 24,500,000 24,227,450
KFW 1.38% 15/12/2025 18,000,000 18,931,940Caisse d’Amortissement de la Dette
Sociale 0.13% 15/12/2025 16,800,000 16,727,544Electricite de France SA 6.00%
29/7/2169 13,700,000 15,619,385JPMorgan Chase & Co. 0.99%
28/4/2026 14,800,000 14,804,760European Investment Bank 0.75%
14/7/2023 12,000,000 12,141,350ING Groep NV 3.00% 18/2/2026 11,000,000 12,041,850BNP Paribas SA 3.38% 23/1/2026 10,500,000 11,781,200Nederlandse Waterschapsbank NV
0.25% 15/12/2025 11,200,000 11,211,920BNP Paribas SA 2.00% 24/5/2031 10,600,000 10,676,492Inter-American Development Bank
1.38% 15/12/2024 10,000,000 10,481,000Nationwide Building Society 5.63%
28/1/2026 7,790,000 9,758,941Goldman Sachs Group, Inc. 4.25%
29/1/2026 8,385,000 9,703,667European Investment Bank 5.50%
15/4/2025 8,000,000 9,570,180Severn Trent Utilities Finance plc
3.63% 16/1/2026 8,200,000 9,365,326Santander UK plc 5.75% 2/3/2026 7,500,000 9,355,195African Development Bank 0.50%
22/6/2026 8,600,000 8,567,488Kommunekredit 0.38% 15/11/2024 8,000,000 7,979,420Council Of Europe Development
Bank 0.38% 15/12/2025 8,000,000 7,944,400European Investment Bank 2.50%
31/10/2022 7,000,000 7,290,990Nestle Holdings, Inc. 0.63%
18/12/2025 7,300,000 7,277,715Electricity North West Ltd. 8.88%
25/3/2026 5,250,000 7,187,590Barclays plc 3.00% 8/5/2026 6,588,000 7,078,371MDGH - GMTN BV 6.88% 14/3/2026 5,512,000 7,041,796Banco Santander SA 1.50%
14/4/2026 7,000,000 6,979,830Kommunalbanken A.S. 0.25%
15/12/2025 7,000,000 6,915,390RAC Bond Co. plc 4.87% 6/5/2026 6,271,000 6,859,424
Principal GBP (£)
Proceeds GBP (£)
Sales
KFW 0.88% 15/3/2022 23,500,000 23,668,650United Kingdom Gilt 0.13%
30/1/2026 18,500,000 18,309,190KEW 1.13% 7/12/2021 15,500,000 15,670,500HSBC Holdings plc 2.18% 27/6/2023 15,281,000 15,541,061FMS Wertmanagement 0.88%
14/2/2022 14,500,000 14,620,290NRW Bank 1.00% 15/6/2022 13,000,000 13,114,180Barclays Bank UK plc 4.25%
12/1/2022 10,999,000 11,438,960Imperial Brands Finance plc 9.00%
17/2/2022 9,800,000 10,613,228NGG Finance plc 5.63% 18/6/2073 9,400,000 10,568,640European Investment Bank 1.38%
7/3/2025 10,000,000 10,456,700SNCF Reseau 5.50% 1/12/2021 8,800,000 9,214,480Council Of Europe Development
Bank 1.13% 17/3/2022 8,000,000 8,068,000Credit Suisse Group Funding
Guernsey Ltd. 3.00% 27/5/2022 7,700,000 7,900,223Cooperatieve Rabobank UA 2.25%
23/3/2022 7,218,000 7,363,787European Investment Bank 2.50%
31/10/2022 7,000,000 7,312,900Wells Fargo & Co. 1.38% 30/6/2022 7,194,000 7,256,084Dexia Credit Local SA 1.13%
15/6/2022 7,000,000 7,061,740Svenska Handelsbanken AB 2.38%
18/1/2022 6,700,000 6,842,442Deutsche Telekom International
Finance BV 6.50% 8/4/2022 6,310,000 6,704,374FMS Wertmanagement 0.63%
15/6/2022 6,400,000 6,429,440Westpac Banking Corp. 1.00%
30/6/2022 6,100,000 6,149,410Friends Life Holdings plc 8.25%
21/4/2022 5,700,000 6,121,857OP Corporate Bank plc 2.50%
20/5/2022 5,753,000 5,881,695ABN AMRO Bank NV 1.38%
7/6/2022 5,800,000 5,858,290Council Of Europe Development
Bank 1.13% 15/12/2021 5,500,000 5,552,800Wells Fargo & Co. 2.13% 22/4/2022 5,400,000 5,482,674Glencore Finance Europe Ltd. 6.00%
3/4/2022 5,206,000 5,462,239Muenchener Rueckversicherungs-
Gesellschaft AG in Muenchen 6.63% 26/5/2042 5,100,000 5,397,891
Svenska Handelsbanken AB 1.63% 18/6/2022 5,100,000 5,169,615
Motability Operations Group plc 5.38% 28/6/2022 4,910,000 5,159,232
Canadian Imperial Bank of Commerce 1.13% 30/6/2022 5,000,000 5,046,350
BNG Bank NV 1.00% 15/3/2022 5,000,000 5,045,610Landeskreditbank Baden-
Wuerttemberg Foerderbank 0.88% 7/3/2022 5,000,000 5,031,250
Oesterreichische Kontrollbank AG 0.75% 7/3/2022 5,000,000 5,028,960

945
Vanguard U.K. Short-Term Investment Grade Bond Index Fund
Financial StatementsStatement of Investments30 June 2021
Principal GBP (£) Coupon
Maturity Date
Fair Value GBP (£)
% of Total Net Assets
Bonds 98.13% (2020: 97.58%)Australia 1.93% (2020: 1.92%)BHP Billiton Finance Ltd. 6,500,000 3.25% 25/9/2024 7,032,866 0.29%APT Pipelines Ltd. 5,600,000 4.25% 26/11/2024 6,203,310 0.25%BHP Billiton Finance Ltd.^ 5,400,000 6.50% 22/10/2077 5,771,701 0.24%Glencore Finance Europe Ltd. 5,200,000 3.13% 26/3/2026 5,551,717 0.23%Westpac Banking Corp. 4,200,000 2.63% 14/12/2022 4,337,321 0.18%Westpac Banking Corp. 4,110,000 2.13% 2/5/2025 4,322,243 0.18%Macquarie Bank Ltd. 4,200,000 1.13% 15/12/2025 4,207,513 0.17%Toyota Finance Australia Ltd. 3,600,000 1.63% 11/7/2022 3,647,597 0.15%Vicinity Centres Trust 2,800,000 3.38% 7/4/2026 3,052,612 0.13%Pacific National Finance Pty Ltd. 2,540,000 5.00% 19/9/2023 2,735,931 0.11%test - - - 46,862,811 1.93%Austria 0.94% (2020: 1.03%)Oesterreichische Kontrollbank AG 13,100,000 1.13% 15/12/2022 13,271,443 0.55%Oesterreichische Kontrollbank AG 5,300,000 1.25% 15/12/2023 5,421,719 0.22%Oesterreichische Kontrollbank AG 4,100,000 0.50% 15/12/2025 4,089,314 0.17%test - - - 22,782,476 0.94%Belgium 0.80% (2020: 0.72%)Anheuser-Busch InBev SA 6,400,000 9.75% 30/7/2024 8,134,704 0.34%Anheuser-Busch InBev SA 5,874,000 4.00% 24/9/2025 6,620,109 0.27%Euroclear Bank SA 4,520,000 1.25% 30/9/2024 4,607,268 0.19%test - - - 19,362,081 0.80%Canada 2.90% (2020: 3.91%)Province of Ontario Canada 13,000,000 0.50% 15/12/2023 13,058,810 0.54%CPPIB Capital, Inc.1 11,000,000 0.38% 25/7/2023 11,022,006 0.45%Royal Bank of Canada 6,154,000 1.13% 15/12/2025 6,204,412 0.25%CPPIB Capital, Inc. 5,250,000 0.88% 17/12/2024 5,322,602 0.22%Province of Quebec Canada 4,900,000 1.50% 15/12/2023 5,038,772 0.21%Export Development Canada 4,500,000 1.38% 8/12/2023 4,616,996 0.19%Bank of Montreal 4,000,000 1.50% 18/12/2024 4,100,520 0.17%Bank of Nova Scotia 4,000,000 1.38% 5/12/2023 4,074,238 0.17%Royal Bank of Canada 3,417,000 1.38% 9/12/2024 3,485,907 0.14%Bank of Nova Scotia 3,200,000 1.75% 23/12/2022 3,262,973 0.13%Province of Alberta Canada 3,100,000 1.50% 15/12/2022 3,154,615 0.13%Canadian Imperial Bank of Commerce 2,725,000 1.63% 25/9/2025 2,813,436 0.12%Province of Manitoba Canada 2,350,000 1.50% 15/12/2022 2,387,939 0.10%Province of Quebec Canada 2,000,000 0.75% 13/12/2024 2,017,244 0.08%test - - - 70,560,470 2.90%China 0.62% (2020: 0.65%)China Development Bank 9,000,000 1.25% 21/1/2023 9,071,419 0.37%Industrial & Commercial Bank of China Ltd. 5,870,000 1.50% 31/7/2022 5,913,352 0.25%test - - - 14,984,771 0.62%Denmark 0.67% (2020: 0.29%)Kommunekredit 8,000,000 0.38% 15/11/2024 7,978,532 0.33%AP Moller-Maersk A/S 5,200,000 4.00% 4/4/2025 5,767,222 0.24%Kommunekredit 2,500,000 1.38% 12/10/2022 2,536,194 0.10%test - - - 16,281,948 0.67%Finland 0.38% (2020: 0.64%)Kuntarahoitus OYJ 5,200,000 1.25% 7/12/2022 5,274,868 0.22%Kuntarahoitus OYJ 4,000,000 0.38% 17/12/2025 3,965,896 0.16%test - - - 9,240,764 0.38%France 8.58% (2020: 6.66%)Caisse d’Amortissement de la Dette Sociale 16,800,000 0.13% 15/12/2025 16,489,051 0.68%Dexia Credit Local SA 15,100,000 1.38% 7/12/2022 15,345,077 0.63%Electricite de France SA^ 13,700,000 6.00% Perpetual 15,306,296 0.63%Dexia Credit Local SA 11,500,000 2.13% 12/2/2025 12,141,871 0.50%BNP Paribas SA 10,500,000 3.38% 23/1/2026 11,465,199 0.47%BNP Paribas SA^ 10,600,000 2.00% 24/5/2031 10,687,436 0.44%LVMH Moet Hennessy Louis Vuitton SE 8,400,000 1.00% 11/2/2023 8,472,500 0.35%Banque Federative du Credit Mutuel SA 7,900,000 1.25% 5/12/2025 7,980,445 0.33%Dexia Credit Local SA 7,300,000 0.50% 22/7/2023 7,328,086 0.30%Electricite de France SA 6,450,000 6.88% 12/12/2022 7,039,637 0.29%Orange SA^ 5,923,000 5.75% Perpetual 6,382,724 0.26%AXA SA^ 5,050,000 6.69% Perpetual 6,169,766 0.25%Credit Agricole SA 4,900,000 7.38% 18/12/2023 5,663,795 0.23%

946
Vanguard U.K. Short-Term Investment Grade Bond Index Fund
Principal GBP (£) Coupon
Maturity Date
Fair Value GBP (£)
% of Total Net Assets
Dexia Credit Local SA 5,000,000 1.63% 8/12/2023 5,152,665 0.21%Banque Federative du Credit Mutuel SA 4,900,000 2.25% 18/12/2023 5,100,668 0.21%Banque Federative du Credit Mutuel SA 4,800,000 1.88% 13/12/2022 4,899,276 0.20%Westfield America Management Ltd. 4,700,000 2.13% 30/3/2025 4,812,596 0.20%AXA SA^ 4,150,000 5.45% Perpetual 4,801,476 0.20%BPCE SA 4,700,000 % 22/12/2025 4,702,859 0.19%BNP Paribas SA 4,600,000 1.13% 16/8/2022 4,641,596 0.19%Banque Federative du Credit Mutuel SA 4,100,000 1.75% 19/12/2024 4,228,807 0.17%Cie de Saint-Gobain 3,500,000 5.63% 15/11/2024 4,059,330 0.17%TotalEnergies Capital International SA 3,887,000 1.75% 7/7/2025 4,030,707 0.17%Bpifrance SACA 4,000,000 0.75% 22/7/2022 4,020,473 0.16%Orange SA 3,200,000 5.25% 5/12/2025 3,810,122 0.16%LVMH Moet Hennessy Louis Vuitton SE 3,600,000 1.00% 14/6/2022 3,617,420 0.15%Caisse des Depots et Consignations 3,500,000 0.50% 21/7/2023 3,513,553 0.14%BPCE SA 3,300,000 2.13% 16/12/2022 3,379,365 0.14%Societe Generale SA 3,000,000 1.88% 3/10/2024 3,073,129 0.13%Dexia Credit Local SA 3,000,000 0.25% 11/12/2024 2,972,713 0.12%Dexia Credit Local SA 2,800,000 1.13% 15/6/2022 2,824,439 0.12%TotalEnergies Capital International SA 2,000,000 1.25% 16/12/2024 2,035,871 0.08%RCI Banque SA 1,853,000 1.88% 8/11/2022 1,877,046 0.08%Caisse des Depots et Consignations 800,000 0.25% 25/2/2026 786,799 0.03%test - - - 208,812,793 8.58%Germany 15.36% (2020: 18.61%)KFW 24,800,000 1.00% 15/12/2022 25,100,723 1.03%KFW 23,000,000 1.38% 9/12/2024 23,739,019 0.98%KFW 21,700,000 0.88% 18/7/2024 22,025,339 0.91%KFW 21,300,000 1.25% 29/12/2023 21,821,118 0.90%KFW 18,000,000 1.38% 15/12/2025 18,667,646 0.77%FMS Wertmanagement 12,500,000 1.13% 7/9/2023 12,736,187 0.52%Landwirtschaftliche Rentenbank 12,000,000 1.38% 8/9/2025 12,426,188 0.51%KFW 9,500,000 5.50% 18/6/2025 11,370,485 0.47%Deutsche Bank AG 10,800,000 2.63% 16/12/2024 11,275,278 0.46%Landwirtschaftliche Rentenbank 11,000,000 1.13% 15/12/2023 11,231,999 0.46%Siemens Financieringsmaatschappij NV 10,700,000 1.00% 20/2/2025 10,797,098 0.44%FMS Wertmanagement 9,600,000 1.00% 7/9/2022 9,693,218 0.40%E.ON International Finance BV 6,400,000 5.63% 6/12/2023 7,162,113 0.29%FMS Wertmanagement 7,000,000 1.13% 20/3/2023 7,109,079 0.29%Volkswagen Financial Services NV 6,600,000 1.13% 18/9/2023 6,652,473 0.27%Landeskreditbank Baden-Wuerttemberg Foerderbank 6,500,000 0.38% 9/12/2024 6,479,868 0.27%E.ON International Finance BV 5,750,000 5.50% 6/7/2022 6,041,019 0.25%Volkswagen Financial Services NV 5,000,000 4.25% 9/10/2025 5,655,026 0.23%Deutsche Telekom International Finance BV 5,000,000 2.50% 10/10/2025 5,347,564 0.22%Landesbank Baden-Wuerttemberg 5,200,000 1.50% 3/2/2025 5,297,997 0.22%Daimler International Finance BV 5,100,000 2.00% 4/9/2023 5,243,599 0.22%Deutsche Bahn Finance GmbH 5,000,000 1.38% 7/7/2025 5,137,306 0.21%Aroundtown SA^ 4,700,000 4.75% Perpetual 4,962,133 0.20%BMW International Investment BV 4,500,000 1.88% 11/9/2023 4,631,261 0.19%Volkswagen Financial Services NV 4,400,000 2.75% 10/7/2023 4,575,814 0.19%Henkel AG & Co. KGaA 4,500,000 1.00% 30/9/2022 4,532,746 0.19%BMW International Investment BV 4,400,000 1.25% 11/7/2022 4,439,306 0.18%BMW Finance NV 4,237,000 0.88% 16/8/2022 4,260,156 0.18%Deutsche Bahn Finance GmbH 4,000,000 1.88% 13/2/2026 4,202,967 0.17%Volkswagen Financial Services NV 4,000,000 2.13% 27/6/2024 4,138,077 0.17%Volkswagen Financial Services NV 4,000,000 1.88% 3/12/2024 4,122,678 0.17%Daimler International Finance BV 4,000,000 1.63% 11/11/2024 4,100,229 0.17%Volkswagen Financial Services NV 4,000,000 1.63% 10/2/2024 4,079,501 0.17%Deutsche Bank AG 3,800,000 3.88% 12/2/2024 4,066,377 0.17%Commerzbank AG 4,000,000 1.75% 22/1/2025 4,048,616 0.17%Siemens Financieringsmaatschappij NV 4,000,000 0.88% 5/6/2023 4,030,462 0.17%BMW International Investment BV 3,700,000 0.75% 8/3/2024 3,713,764 0.15%Landwirtschaftliche Rentenbank 3,470,000 1.38% 16/12/2024 3,584,336 0.15%BMW International Investment BV 3,400,000 1.38% 1/10/2024 3,472,227 0.14%Landesbank Baden-Wuerttemberg 3,400,000 1.13% 8/12/2025 3,421,648 0.14%Volkswagen Financial Services NV 3,300,000 0.88% 20/2/2025 3,291,701 0.14%Volkswagen Financial Services NV 3,200,000 1.63% 30/11/2022 3,242,592 0.13%NRW Bank 3,200,000 0.38% 16/12/2024 3,190,067 0.13%Volkswagen Financial Services NV 3,000,000 2.25% 12/4/2025 3,136,275 0.13%BASF SE 3,000,000 1.75% 11/3/2025 3,110,681 0.13%Siemens Financieringsmaatschappij NV 2,800,000 2.75% 10/9/2025 3,025,883 0.12%Landwirtschaftliche Rentenbank 3,000,000 0.63% 15/12/2022 3,019,094 0.12%Deutsche Telekom International Finance BV 2,900,000 1.25% 6/10/2023 2,946,972 0.12%

947
Vanguard U.K. Short-Term Investment Grade Bond Index Fund
Principal GBP (£) Coupon
Maturity Date
Fair Value GBP (£)
% of Total Net Assets
BASF SE 2,850,000 1.38% 21/6/2022 2,878,404 0.12%Daimler International Finance BV 2,600,000 1.25% 5/9/2022 2,620,607 0.11%Landeskreditbank Baden-Wuerttemberg Foerderbank 2,500,000 1.38% 15/12/2023 2,564,848 0.11%Deutsche Pfandbriefbank AG 2,500,000 1.75% 21/11/2022 2,529,699 0.10%Volkswagen Financial Services NV 2,300,000 1.75% 12/9/2022 2,330,486 0.10%FMS Wertmanagement 2,000,000 1.38% 7/3/2025 2,065,880 0.08%NRW Bank 2,000,000 1.38% 15/12/2023 2,050,168 0.08%Henkel AG & Co. KGaA 2,035,000 0.88% 13/9/2022 2,045,466 0.08%BASF SE 2,000,000 0.88% 6/10/2023 2,021,018 0.08%Volkswagen Financial Services NV 1,800,000 1.13% 5/7/2026 1,793,960 0.07%KFW 500,000 5.00% 10/9/2024 572,937 0.02%test - - - 373,829,378 15.36%Ireland 0.38% (2020: 0.16%)NIE Finance plc 4,030,000 6.38% 2/6/2026 5,048,293 0.21%NIE Finance plc 4,000,000 2.50% 27/10/2025 4,236,802 0.17%test - - - 9,285,095 0.38%Italy 0.62% (2020: 0.67%)Enel Finance International NV 10,800,000 5.63% 14/8/2024 12,409,696 0.51%Aeroporti di Roma SpA 2,500,000 5.44% 20/2/2023 2,665,124 0.11%test - - - 15,074,820 0.62%Japan 0.36% (2020: 0.38%)Toyota Motor Finance Netherlands BV 4,300,000 1.38% 23/5/2023 4,377,423 0.18%Development Bank of Japan, Inc. 2,340,000 1.13% 28/4/2023 2,372,198 0.10%American Honda Finance Corp. 2,000,000 2.63% 14/10/2022 2,055,372 0.08%test - - - 8,804,993 0.36%Mexico 0.24% (2020: 0.22%)Mexico Government International Bond 5,104,000 6.75% 6/2/2024 5,861,194 0.24%test - - - 5,861,194 0.24%Netherlands 2.80% (2020: 2.90%)ING Groep NV 11,000,000 3.00% 18/2/2026 11,906,495 0.49%BNG Bank NV 8,000,000 1.63% 26/8/2025 8,366,835 0.34%BNG Bank NV 8,250,000 1.00% 17/6/2022 8,314,659 0.34%ABN AMRO Bank NV 8,100,000 1.38% 16/1/2025 8,246,396 0.34%Cooperatieve Rabobank UA 7,464,000 4.00% 19/9/2022 7,793,958 0.32%Nederlandse Waterschapsbank NV 7,200,000 0.25% 15/12/2025 7,098,850 0.29%BNG Bank NV 7,000,000 0.38% 15/12/2025 6,946,182 0.29%Cooperatieve Rabobank UA 4,700,000 1.25% 14/1/2025 4,745,909 0.19%NIBC Bank NV 3,900,000 3.13% 15/11/2023 4,098,616 0.17%Cooperatieve Rabobank UA 650,000 4.88% 10/1/2023 693,994 0.03%test - - - 68,211,894 2.80%New Zealand 0.08% (2020: 0.09%)Fonterra Co.-operative Group Ltd. 1,600,000 9.38% 4/12/2023 1,922,812 0.08%test - - - 1,922,812 0.08%Norway 1.43% (2020: 1.04%)Kommunalbanken A.S. 7,800,000 1.50% 15/12/2023 8,024,287 0.33%Kommunalbanken A.S. 7,000,000 1.13% 30/11/2022 7,088,204 0.29%Kommunalbanken A.S. 7,000,000 0.25% 15/12/2025 6,901,053 0.28%DNB Bank A.S.A 4,300,000 1.38% 12/6/2023 4,377,304 0.18%DNB Bank A.S.A 3,600,000 1.63% 15/12/2023 3,697,508 0.15%Kommunalbanken A.S. 2,600,000 1.00% 12/12/2024 2,647,892 0.11%SpareBank 1 Boligkreditt A.S. 2,000,000 1.75% 18/12/2023 2,063,905 0.09%test - - - 34,800,153 1.43%Portugal 0.22% (2020: 0.16%)EDP Finance BV 4,470,000 8.63% 4/1/2024 5,329,049 0.22%test - - - 5,329,049 0.22%Russia 0.39% (2020: 0.36%)Gazprom PJSC Via Gaz Capital SA 8,900,000 4.25% 6/4/2024 9,467,442 0.39%test - - - 9,467,442 0.39%Singapore 0.13% (2020: 0.14%)Temasek Financial I Ltd. 3,000,000 4.63% 26/7/2022 3,131,863 0.13%test - - - 3,131,863 0.13%South Korea 0.08% (2020: 0.09%)Korea Development Bank 2,000,000 1.75% 15/12/2022 2,037,179 0.08%test - - - 2,037,179 0.08%Spain 1.85% (2020: 1.24%)Banco Santander SA 7,100,000 2.75% 12/9/2023 7,410,417 0.31%Telefonica Emisiones SA 6,800,000 5.29% 9/12/2022 7,261,865 0.30%Banco Santander SA 7,000,000 1.50% 14/4/2026 7,038,853 0.29%Banco Santander SA 6,100,000 1.38% 31/7/2024 6,190,559 0.25%Iberdrola Finanzas SA 4,600,000 7.38% 29/1/2024 5,377,604 0.22%CaixaBank SA 5,200,000 1.50% 3/12/2026 5,206,815 0.21%Telefonica Emisiones SA 4,000,000 5.38% 2/2/2026 4,729,623 0.19%
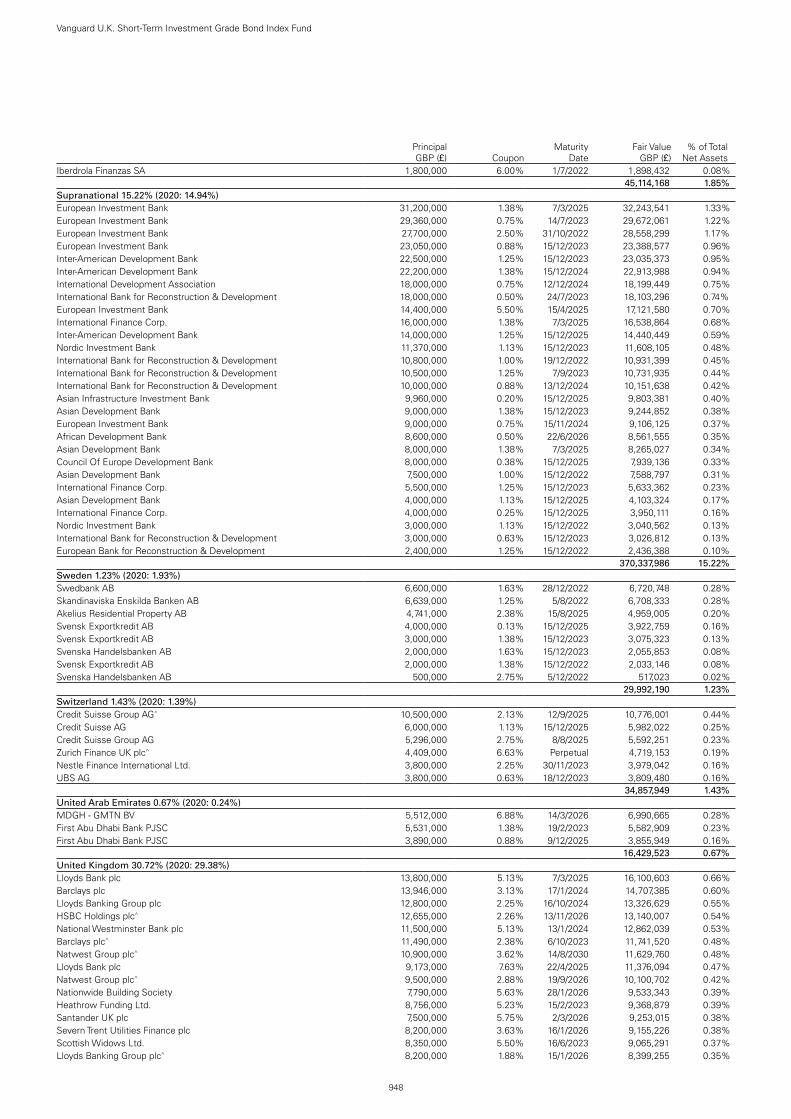
948
Vanguard U.K. Short-Term Investment Grade Bond Index Fund
Principal GBP (£) Coupon
Maturity Date
Fair Value GBP (£)
% of Total Net Assets
Iberdrola Finanzas SA 1,800,000 6.00% 1/7/2022 1,898,432 0.08%test - - - 45,114,168 1.85%Supranational 15.22% (2020: 14.94%)European Investment Bank 31,200,000 1.38% 7/3/2025 32,243,541 1.33%European Investment Bank 29,360,000 0.75% 14/7/2023 29,672,061 1.22%European Investment Bank 27,700,000 2.50% 31/10/2022 28,558,299 1.17%European Investment Bank 23,050,000 0.88% 15/12/2023 23,388,577 0.96%Inter-American Development Bank 22,500,000 1.25% 15/12/2023 23,035,373 0.95%Inter-American Development Bank 22,200,000 1.38% 15/12/2024 22,913,988 0.94%International Development Association 18,000,000 0.75% 12/12/2024 18,199,449 0.75%International Bank for Reconstruction & Development 18,000,000 0.50% 24/7/2023 18,103,296 0.74%European Investment Bank 14,400,000 5.50% 15/4/2025 17,121,580 0.70%International Finance Corp. 16,000,000 1.38% 7/3/2025 16,538,864 0.68%Inter-American Development Bank 14,000,000 1.25% 15/12/2025 14,440,449 0.59%Nordic Investment Bank 11,370,000 1.13% 15/12/2023 11,608,105 0.48%International Bank for Reconstruction & Development 10,800,000 1.00% 19/12/2022 10,931,399 0.45%International Bank for Reconstruction & Development 10,500,000 1.25% 7/9/2023 10,731,935 0.44%International Bank for Reconstruction & Development 10,000,000 0.88% 13/12/2024 10,151,638 0.42%Asian Infrastructure Investment Bank 9,960,000 0.20% 15/12/2025 9,803,381 0.40%Asian Development Bank 9,000,000 1.38% 15/12/2023 9,244,852 0.38%European Investment Bank 9,000,000 0.75% 15/11/2024 9,106,125 0.37%African Development Bank 8,600,000 0.50% 22/6/2026 8,561,555 0.35%Asian Development Bank 8,000,000 1.38% 7/3/2025 8,265,027 0.34%Council Of Europe Development Bank 8,000,000 0.38% 15/12/2025 7,939,136 0.33%Asian Development Bank 7,500,000 1.00% 15/12/2022 7,588,797 0.31%International Finance Corp. 5,500,000 1.25% 15/12/2023 5,633,362 0.23%Asian Development Bank 4,000,000 1.13% 15/12/2025 4,103,324 0.17%International Finance Corp. 4,000,000 0.25% 15/12/2025 3,950,111 0.16%Nordic Investment Bank 3,000,000 1.13% 15/12/2022 3,040,562 0.13%International Bank for Reconstruction & Development 3,000,000 0.63% 15/12/2023 3,026,812 0.13%European Bank for Reconstruction & Development 2,400,000 1.25% 15/12/2022 2,436,388 0.10%test - - - 370,337,986 15.22%Sweden 1.23% (2020: 1.93%)Swedbank AB 6,600,000 1.63% 28/12/2022 6,720,748 0.28%Skandinaviska Enskilda Banken AB 6,639,000 1.25% 5/8/2022 6,708,333 0.28%Akelius Residential Property AB 4,741,000 2.38% 15/8/2025 4,959,005 0.20%Svensk Exportkredit AB 4,000,000 0.13% 15/12/2025 3,922,759 0.16%Svensk Exportkredit AB 3,000,000 1.38% 15/12/2023 3,075,323 0.13%Svenska Handelsbanken AB 2,000,000 1.63% 15/12/2023 2,055,853 0.08%Svensk Exportkredit AB 2,000,000 1.38% 15/12/2022 2,033,146 0.08%Svenska Handelsbanken AB 500,000 2.75% 5/12/2022 517,023 0.02%test - - - 29,992,190 1.23%Switzerland 1.43% (2020: 1.39%)Credit Suisse Group AG^ 10,500,000 2.13% 12/9/2025 10,776,001 0.44%Credit Suisse AG 6,000,000 1.13% 15/12/2025 5,982,022 0.25%Credit Suisse Group AG 5,296,000 2.75% 8/8/2025 5,592,251 0.23%Zurich Finance UK plc^ 4,409,000 6.63% Perpetual 4,719,153 0.19%Nestle Finance International Ltd. 3,800,000 2.25% 30/11/2023 3,979,042 0.16%UBS AG 3,800,000 0.63% 18/12/2023 3,809,480 0.16%test - - - 34,857,949 1.43%United Arab Emirates 0.67% (2020: 0.24%)MDGH - GMTN BV 5,512,000 6.88% 14/3/2026 6,990,665 0.28%First Abu Dhabi Bank PJSC 5,531,000 1.38% 19/2/2023 5,582,909 0.23%First Abu Dhabi Bank PJSC 3,890,000 0.88% 9/12/2025 3,855,949 0.16%test - - - 16,429,523 0.67%United Kingdom 30.72% (2020: 29.38%)Lloyds Bank plc 13,800,000 5.13% 7/3/2025 16,100,603 0.66%Barclays plc 13,946,000 3.13% 17/1/2024 14,707,385 0.60%Lloyds Banking Group plc 12,800,000 2.25% 16/10/2024 13,326,629 0.55%HSBC Holdings plc^ 12,655,000 2.26% 13/11/2026 13,140,007 0.54%National Westminster Bank plc 11,500,000 5.13% 13/1/2024 12,862,039 0.53%Barclays plc^ 11,490,000 2.38% 6/10/2023 11,741,520 0.48%Natwest Group plc^ 10,900,000 3.62% 14/8/2030 11,629,760 0.48%Lloyds Bank plc 9,173,000 7.63% 22/4/2025 11,376,094 0.47%Natwest Group plc^ 9,500,000 2.88% 19/9/2026 10,100,702 0.42%Nationwide Building Society 7,790,000 5.63% 28/1/2026 9,533,343 0.39%Heathrow Funding Ltd. 8,756,000 5.23% 15/2/2023 9,368,879 0.39%Santander UK plc 7,500,000 5.75% 2/3/2026 9,253,015 0.38%Severn Trent Utilities Finance plc 8,200,000 3.63% 16/1/2026 9,155,226 0.38%Scottish Widows Ltd. 8,350,000 5.50% 16/6/2023 9,065,291 0.37%Lloyds Banking Group plc^ 8,200,000 1.88% 15/1/2026 8,399,255 0.35%

949
Vanguard U.K. Short-Term Investment Grade Bond Index Fund
Principal GBP (£) Coupon
Maturity Date
Fair Value GBP (£)
% of Total Net Assets
Heathrow Funding Ltd. 7,060,000 7.13% 14/2/2024 8,065,954 0.33%Nationwide Building Society 7,880,000 1.00% 24/1/2023 7,945,563 0.33%Annington Funding plc 7,500,000 2.65% 12/7/2025 7,903,390 0.32%BG Energy Capital plc 6,500,000 5.13% 1/12/2025 7,706,648 0.32%TP ICAP Ltd. 7,020,000 5.25% 26/1/2024 7,697,991 0.32%Santander UK Group Holdings plc 7,000,000 3.63% 14/1/2026 7,693,124 0.32%Aviva plc^ 7,200,000 6.13% Perpetual 7,662,356 0.31%Western Power Distribution East Midlands plc 7,150,000 5.25% 17/1/2023 7,658,442 0.31%HSBC Holdings plc 6,600,000 6.50% 20/5/2024 7,647,600 0.31%Lloyds Bank plc 6,300,000 7.50% 15/4/2024 7,475,518 0.31%Phoenix Group Holdings plc 7,165,000 4.13% 20/7/2022 7,410,516 0.30%Legal & General Group plc^ 6,268,000 5.38% 27/10/2045 7,221,485 0.30%Imperial Brands Finance plc 6,100,000 8.13% 15/3/2024 7,195,689 0.30%Electricity North West Ltd. 5,250,000 8.88% 25/3/2026 7,116,897 0.29%Barclays plc 6,588,000 3.00% 8/5/2026 7,076,442 0.29%Bank of Scotland plc 6,000,000 4.88% 20/12/2024 6,900,620 0.28%RAC Bond Co. plc 6,271,000 4.87% 6/5/2026 6,875,546 0.28%Western Power Distribution West Midlands plc 6,100,000 3.88% 17/10/2024 6,651,260 0.27%BAT International Finance plc 5,500,000 7.25% 12/3/2024 6,385,740 0.26%SSE plc^ 6,000,000 3.74% Perpetual 6,342,497 0.26%HSBC Bank plc 5,600,000 6.50% 7/7/2023 6,229,369 0.26%United Utilities Water Finance plc 5,900,000 2.00% 14/2/2025 6,148,777 0.25%AA Bond Co., Ltd. 5,763,000 4.88% 31/7/2024 6,138,000 0.25%Society of Lloyd's 5,400,000 4.75% 30/10/2024 5,982,340 0.25%AA Bond Co., Ltd. 5,280,000 6.27% 31/7/2025 5,963,409 0.25%Barclays plc^ 5,500,000 3.75% 22/11/2030 5,944,633 0.24%United Kingdom Gilt 6,000,000 0.13% 30/1/2026 5,943,012 0.24%BUPA Finance plc 5,500,000 5.00% 25/4/2023 5,900,571 0.24%Southern Water Services Finance Ltd. 4,748,000 6.64% 31/3/2026 5,848,364 0.24%Skipton Building Society^ 5,700,000 2.00% 2/10/2026 5,821,294 0.24%Virgin Money UK plc^ 5,075,000 5.13% 11/12/2030 5,663,962 0.23%Thames Water Utilities Finance plc 5,000,000 4.00% 19/6/2025 5,593,558 0.23%Yorkshire Building Society^ 5,296,000 3.00% 18/4/2025 5,588,155 0.23%CPUK Finance Ltd. 4,800,000 7.24% 28/2/2024 5,534,414 0.23%Tesco Corporate Treasury Services plc 5,200,000 2.50% 2/5/2025 5,490,440 0.23%Virgin Money UK plc^ 5,000,000 4.00% 25/9/2026 5,475,238 0.23%Natwest Group plc^ 5,000,000 3.13% 28/3/2027 5,377,533 0.22%Coventry Building Society 5,262,000 1.50% 23/1/2023 5,331,486 0.22%Phoenix Group Holdings plc 4,300,000 6.63% 18/12/2025 5,194,418 0.21%Santander UK Group Holdings plc^ 4,800,000 2.92% 8/5/2026 5,089,129 0.21%Lloyds Bank Corporate Markets plc 4,900,000 1.75% 11/7/2024 5,029,550 0.21%RSA Insurance Group LTD^ 4,380,000 5.13% 10/10/2045 5,002,480 0.21%Burberry Group plc 5,000,000 1.13% 21/9/2025 4,985,294 0.20%Virgin Money UK plc^ 4,696,000 3.13% 22/6/2025 4,927,536 0.20%Investec Bank plc^ 4,600,000 4.25% 24/7/2028 4,836,368 0.20%Gatwick Funding Ltd. 4,000,000 6.13% 2/3/2026 4,795,252 0.20%Western Power Distribution plc 4,500,000 3.63% 6/11/2023 4,764,071 0.20%Canary Wharf Group Investment Holdings plc 4,700,000 2.63% 23/4/2025 4,758,727 0.20%Experian Finance plc 4,500,000 2.13% 27/9/2024 4,673,763 0.19%Whitbread Group plc 4,391,000 3.38% 16/10/2025 4,660,055 0.19%BAT Capital Corp. 4,500,000 2.13% 15/8/2025 4,620,041 0.19%Nationwide Building Society 4,133,000 3.00% 6/5/2026 4,550,813 0.19%Rothesay Life plc^ 4,060,000 5.50% 17/9/2029 4,529,735 0.19%Coventry Building Society 4,500,000 1.00% 21/9/2025 4,500,640 0.18%RL Finance Bonds No. 2 plc^ 4,000,000 6.13% 30/11/2043 4,443,409 0.18%Hammerson plc 4,135,000 3.50% 27/10/2025 4,351,112 0.18%Leeds Building Society^ 4,350,000 1.50% 16/3/2027 4,348,956 0.18%Informa plc 4,000,000 3.13% 5/7/2026 4,264,169 0.18%Yorkshire Building Society 3,814,000 3.50% 21/4/2026 4,259,149 0.18%Anglian Water Services Financing plc 4,100,000 1.63% 10/8/2025 4,245,932 0.17%BP Capital Markets plc 4,000,000 2.03% 14/2/2025 4,165,604 0.17%Barclays plc^ 4,000,000 1.70% 3/11/2026 4,060,031 0.17%UNITE USAF II plc 3,700,000 3.92% 30/6/2025 4,048,801 0.17%Hammerson plc 3,479,000 6.00% 23/2/2026 4,017,780 0.17%Pension Insurance Corp. plc 3,500,000 6.50% 3/7/2024 4,013,466 0.16%Land Securities Capital Markets plc 3,900,000 1.97% 8/2/2024 3,997,811 0.16%Southern Gas Networks plc 3,637,000 4.88% 5/10/2023 3,973,755 0.16%National Express Group plc 3,800,000 2.50% 11/11/2023 3,946,778 0.16%Coventry Building Society 3,700,000 5.88% 28/9/2022 3,937,235 0.16%Hiscox Ltd.^ 3,378,000 6.13% 24/11/2045 3,907,813 0.16%Coventry Building Society 3,800,000 1.88% 24/10/2023 3,902,200 0.16%

950
Vanguard U.K. Short-Term Investment Grade Bond Index Fund
Principal GBP (£) Coupon
Maturity Date
Fair Value GBP (£)
% of Total Net Assets
UNITE USAF II plc 3,702,000 3.37% 30/6/2023 3,862,393 0.16%Experian Finance plc 3,900,000 0.74% 29/10/2025 3,859,881 0.16%Eastern Power Networks plc 3,400,000 5.75% 8/3/2024 3,854,336 0.16%Close Brothers Group plc 3,700,000 2.75% 26/4/2023 3,828,177 0.16%Hastings Group Finance plc 3,600,000 3.00% 24/5/2025 3,821,011 0.16%Stagecoach Group plc 3,500,000 4.00% 29/9/2025 3,787,481 0.16%Global Switch Holdings Ltd. 3,600,000 4.38% 13/12/2022 3,783,916 0.16%Virgin Money UK plc^ 3,500,000 3.38% 24/4/2026 3,719,952 0.15%Gatwick Funding Ltd. 3,350,000 5.25% 23/1/2024 3,700,155 0.15%Fidelity International Ltd. 3,200,000 7.13% 13/2/2024 3,691,088 0.15%Northumbrian Water Finance plc 3,350,000 6.88% 6/2/2023 3,678,702 0.15%London Power Networks plc 3,400,000 5.13% 31/3/2023 3,669,780 0.15%M&G plc^ 3,450,000 3.88% 20/7/2049 3,664,686 0.15%Manchester Airport Group Funding plc 3,300,000 4.13% 2/4/2024 3,569,865 0.15%Just Group plc^ 3,000,000 7.00% 15/4/2031 3,486,883 0.14%Southern Gas Networks plc 3,300,000 2.50% 3/2/2025 3,486,187 0.14%Compass Group plc 3,000,000 3.85% 26/6/2026 3,432,816 0.14%Admiral Group plc 3,020,000 5.50% 25/7/2024 3,408,259 0.14%Liverpool Victoria Friendly Society Ltd.^ 3,090,000 6.50% 22/5/2043 3,354,582 0.14%BUPA Finance plc 3,200,000 2.00% 5/4/2024 3,304,383 0.14%Principality Building Society 3,200,000 2.38% 23/11/2023 3,299,068 0.14%InterContinental Hotels Group plc 3,000,000 3.75% 14/8/2025 3,258,682 0.13%CPUK Finance Ltd. 3,000,000 3.59% 28/8/2025 3,243,758 0.13%Western Power Distribution West Midlands plc 2,710,000 6.00% 9/5/2025 3,221,476 0.13%Next Group plc 3,000,000 3.00% 26/8/2025 3,214,479 0.13%Rothesay Life plc 2,500,000 8.00% 30/10/2025 3,149,508 0.13%Liberty Living Finance plc 3,000,000 2.63% 28/11/2024 3,144,665 0.13%Bunzl Finance plc 3,000,000 2.25% 11/6/2025 3,144,092 0.13%Hiscox Ltd. 2,975,000 2.00% 14/12/2022 3,022,827 0.12%Firstgroup plc 2,825,000 5.25% 29/11/2022 3,006,487 0.12%Wm Morrison Supermarkets plc 2,800,000 4.63% 8/12/2023 2,999,574 0.12%Severn Trent Utilities Finance plc 2,600,000 6.13% 26/2/2024 2,964,916 0.12%SSE plc 2,782,000 5.88% 22/9/2022 2,964,473 0.12%Anglian Water Services Financing plc 2,700,000 5.84% 30/7/2022 2,855,902 0.12%Severn Trent Utilities Finance plc 2,800,000 1.63% 4/12/2022 2,842,164 0.12%AA Bond Co., Ltd. 2,800,000 2.75% 31/7/2023 2,834,464 0.12%RAC Bond Co. plc 2,700,000 4.57% 6/5/2023 2,819,179 0.12%Firstgroup plc 2,400,000 6.88% 18/9/2024 2,798,946 0.12%SSE plc^ 2,700,000 3.63% 16/9/2077 2,766,091 0.11%Linde Finance BV 2,400,000 5.88% 24/4/2023 2,636,690 0.11%Go-Ahead Group plc 2,400,000 2.50% 6/7/2024 2,468,622 0.10%Eversholt Funding plc 2,000,000 6.36% 2/12/2025 2,460,534 0.10%Santander UK plc^ 2,200,000 7.04% Perpetual 2,458,567 0.10%Scottish Power UK plc 2,200,000 6.75% 29/5/2023 2,458,172 0.10%Prudential plc 2,200,000 6.88% 20/1/2023 2,416,460 0.10%Thames Water Utilities Finance plc 2,300,000 1.88% 24/1/2024 2,363,913 0.10%Yorkshire Water Finance plc 2,100,000 6.59% 21/2/2023 2,301,081 0.09%DWR Cymru Financing UK plc 2,175,000 1.63% 31/3/2026 2,210,188 0.09%Anglian Water Services Financing plc 1,880,000 4.50% 22/2/2026 2,159,996 0.09%Rothesay Life plc 2,000,000 3.38% 12/7/2026 2,154,537 0.09%Student Finance plc 2,100,000 2.67% 30/9/2024 2,124,148 0.09%Tesco Personal Finance Group plc 2,000,000 3.50% 25/7/2025 2,103,288 0.09%Unilever plc 2,000,000 1.38% 15/9/2024 2,051,217 0.08%Northern Powergrid Holdings Co. 1,850,000 7.25% 15/12/2022 2,026,884 0.08%Vodafone Group plc 1,650,000 5.63% 4/12/2025 1,996,007 0.08%Lloyds Bank Corporate Markets plc 1,900,000 1.50% 23/6/2023 1,934,346 0.08%Yorkshire Water Finance plc^ 1,700,000 3.75% 22/3/2046 1,755,377 0.07%3i Group plc 1,500,000 6.88% 9/3/2023 1,652,332 0.07%Quilter plc^ 1,500,000 4.48% 28/2/2028 1,558,838 0.06%Anglian Water Services Financing plc 1,300,000 6.88% 21/8/2023 1,475,261 0.06%Kennedy Wilson Europe Real Estate Ltd. 1,069,895 3.95% 30/6/2022 1,089,486 0.04%Compass Group plc 1,000,000 2.00% 5/9/2025 1,046,618 0.04%HSBC Holdings plc^ 1,000,000 1.75% 24/7/2027 1,011,106 0.04%Wales & West Utilities Finance plc 664,000 4.63% 13/12/2023 728,862 0.03%South Eastern Power Networks plc 477,000 5.50% 5/6/2026 576,625 0.02%Places for People Homes Ltd. 400,000 5.09% 31/7/2024 450,902 0.02%Close Brothers Group plc^ 200,000 2.00% 11/9/2031 201,183 0.01%test - - - 747,555,978 30.72%United States 8.10% (2020: 7.82%)JPMorgan Chase & Co. 14,800,000 0.99% 28/4/2026 14,808,181 0.61%Wells Fargo & Co. 12,000,000 2.00% 28/7/2025 12,426,175 0.51%

951
Vanguard U.K. Short-Term Investment Grade Bond Index Fund
Principal GBP (£) Coupon
Maturity Date
Fair Value GBP (£)
% of Total Net Assets
Metropolitan Life Global Funding I 10,138,000 2.63% 5/12/2022 10,460,961 0.43%Goldman Sachs Group, Inc. 8,385,000 4.25% 29/1/2026 9,515,045 0.39%Bank of America Corp. 8,200,000 2.30% 25/7/2025 8,665,898 0.36%New York Life Global Funding 8,200,000 1.63% 15/12/2023 8,421,440 0.35%Wells Fargo Bank NA 7,400,000 5.25% 1/8/2023 8,059,711 0.33%Johnson & Johnson 6,500,000 5.50% 6/11/2024 7,570,596 0.31%Citigroup, Inc. 7,000,000 2.75% 24/1/2024 7,343,633 0.30%Fiserv, Inc. 6,994,000 2.25% 1/7/2025 7,339,053 0.30%Nestle Holdings, Inc. 7,300,000 0.63% 18/12/2025 7,282,134 0.30%Verizon Communications, Inc. 6,500,000 4.07% 18/6/2024 7,150,089 0.29%Procter & Gamble Co. 6,100,000 1.38% 3/5/2025 6,293,781 0.26%Goldman Sachs Group, Inc. 6,000,000 1.00% 16/12/2025 5,984,112 0.25%Citigroup, Inc. 5,796,000 1.75% 23/10/2026 5,931,168 0.24%GE Capital UK Funding Unlimited Co. 5,400,000 4.13% 13/9/2023 5,807,439 0.24%PepsiCo, Inc. 5,588,000 2.50% 1/11/2022 5,750,811 0.24%Digital Stout Holding LLC 5,000,000 4.25% 17/1/2025 5,558,955 0.23%Wells Fargo & Co. 5,180,000 2.13% 20/12/2023 5,346,699 0.22%Discovery Communications LLC 4,925,000 2.50% 20/9/2024 5,133,564 0.21%American International Group, Inc. 4,100,000 5.00% 26/4/2023 4,418,230 0.18%Goldman Sachs Group, Inc. 3,500,000 7.13% 7/8/2025 4,337,948 0.18%General Motors Financial Co., Inc. 4,000,000 2.35% 3/9/2025 4,159,976 0.17%General Motors Financial Co., Inc. 4,000,000 2.25% 6/9/2024 4,133,605 0.17%MetLife, Inc. 3,344,000 5.38% 9/12/2024 3,859,257 0.16%Becton Dickinson & Co. 3,000,000 3.02% 24/5/2025 3,213,161 0.13%International Business Machines Corp. 3,100,000 2.63% 5/8/2022 3,176,181 0.13%Digital Stout Holding LLC 3,000,000 2.75% 19/7/2024 3,164,747 0.13%DXC Technology Co. 2,800,000 2.75% 15/1/2025 2,913,703 0.12%Toyota Motor Credit Corp. 2,600,000 1.00% 27/9/2022 2,619,814 0.11%Citigroup, Inc. 1,936,000 5.15% 21/5/2026 2,300,052 0.09%Walgreens Boots Alliance, Inc. 1,700,000 3.60% 20/11/2025 1,859,254 0.08%New York Life Global Funding 1,288,000 1.75% 15/12/2022 1,313,525 0.05%Metropolitan Life Global Funding I 700,000 2.88% 11/1/2023 726,105 0.03%test - - - 197,045,003 8.10%Total Bonds 2,387,976,783 98.13%Financial Assets at Fair Value Through Profit or Loss 2,387,976,783 98.13%
testNumber of Contracts
Notional Amount
Unrealised Gain/(Loss)
GBP (£)% of Total
Net AssetsFinancial Derivative InstrumentsFutures (0.00%) (2020: 0.00%)Long Gilt September 2021 (62) £(7,918,990) (23,210 ) (0.00 %)Total Financial Derivative Instruments (23,210 ) (0.00 %)
Fair Value GBP (£)
% of Total Net Assets
Other Assets and Liabilities 45,436,151 1.87 %Net Assets 2,433,389,724 100.00 %
Analysis of Total Net Assets GBP (£)% of Total
Net Assets(a) Transferable securities admitted to an official stock exchange listing 2,375,026,967 97.60%(b) Transferable securities dealt in on another regulated market 12,949,816 0.53%(c) Transferable securities other than those admitted to an official stock exchange listing or dealt in on another regulated
market — 0.00%
(d) Financial derivative instruments (23,210) (0.00%)(e) Other assets and liabilities 45,436,151 1.87%Total Net Assets 2,433,389,724 100.00%
^ Floating Rate Note (FRN). The effective interest rate is at 30 June 2021.1 Denotes securities pledged in full or part thereof as collateral for derivatives.

The accompanying notes form an integral part of the financial statements.
952
Vanguard U.K. Short-Term Investment Grade Bond Index Fund
Statement of Assets and Liabilities
GBP (£)
As at 30 June 2021
GBP (£)
As at 31 December 2020
Current AssetsFinancial Assets at Fair Value Through Profit or Loss 2,387,976,783 2,255,589,108 Financial Derivative Instruments — 25,979 Cash 48,218,256 40,166,035 Receivables: Interest and Dividends 29,083,282 23,893,551 Capital Shares Issued 3,909,449 5,444,997 Investments Sold 38,984,742 16,866,677 Futures Margin Cash 8,186 —
Total Current Assets 2,508,180,698 2,341,986,347
Current LiabilitiesFinancial Derivative Instruments 23,210 — Payables and Other Liabilities: Investments Purchased 71,296,733 27,318,936 Income Distribution Payable 899,764 920,791 Capital Shares Redeemed 2,351,260 2,085,924 Futures Margin Cash Due to Broker — 14,810 Management Fees Payable 220,007 210,146
Total Current Liabilities 74,790,974 30,550,607
Net Assets Attributable to Holders of Redeemable Participating Shares (“Net Assets”) 2,433,389,724 2,311,435,740
Net Asset Value Per Share
.As at
30 June 2021As at
31 December 2020As at
31 December 2019GBP AccNet Assets 1,868,824,645 1,716,787,579 1,386,568,323Number of Shares Outstanding 15,873,098 14,559,438 12,108,762Net Asset Value Per Share1 117.74 117.92 114.51
GBP DistNet Assets 224,036,226 210,174,982 203,660,610Number of Shares Outstanding 2,161,399 2,012,537 1,982,126Net Asset Value Per Share1 103.65 104.43 102.75
Institutional Plus GBP AccNet Assets 261,462,043 308,810,217 304,125,959Number of Shares Outstanding 2,258,604 2,664,458 2,703,989Net Asset Value Per Share1 115.76 115.90 112.47
Institutional Plus GBP DistNet Assets 79,066,810 75,662,962 75,937,102Number of Shares Outstanding 761,898 723,665 738,185Net Asset Value Per Share1 103.78 104.56 102.87
1 The net asset value per share shown may diverge from the net asset value per share used for dealing purposes because of any adjustments for swing pricing and trade date accounting.
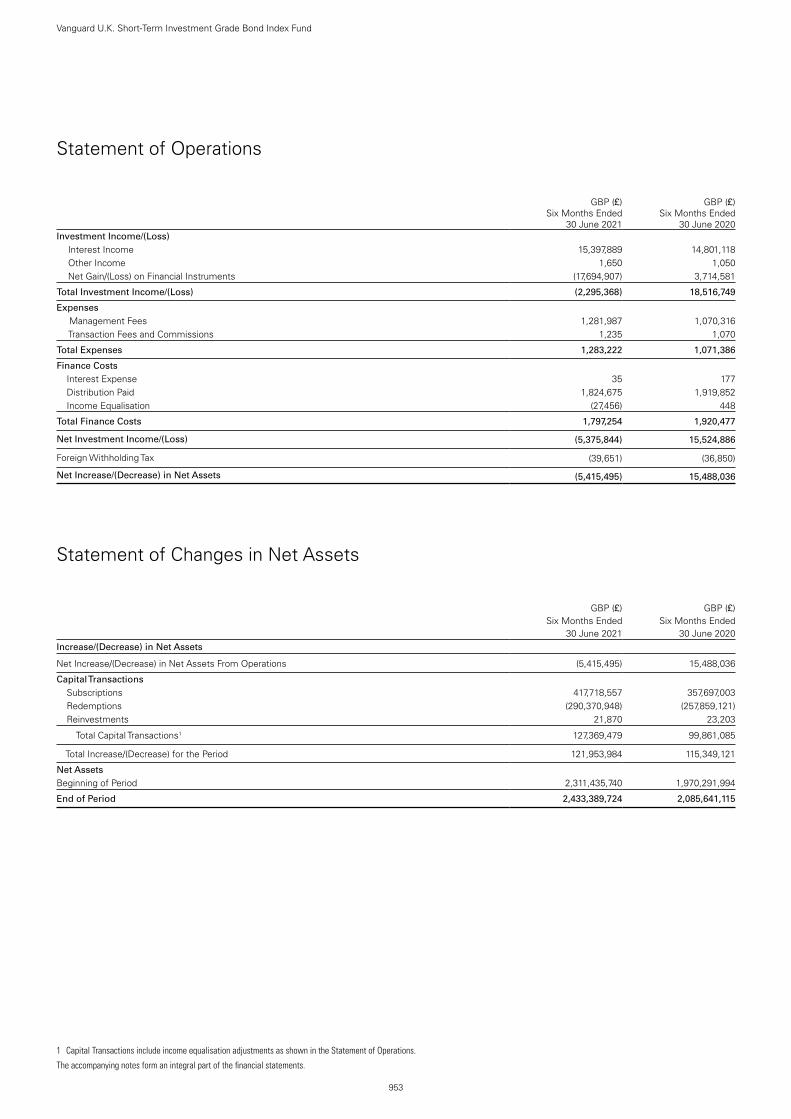
953
Vanguard U.K. Short-Term Investment Grade Bond Index Fund
The accompanying notes form an integral part of the financial statements.
Statement of Operations
GBP (£)
Six Months Ended 30 June 2021
GBP (£)
Six Months Ended 30 June 2020
Investment Income/(Loss) Interest Income 15,397,889 14,801,118 Other Income 1,650 1,050 Net Gain/(Loss) on Financial Instruments (17,694,907) 3,714,581
Total Investment Income/(Loss) (2,295,368) 18,516,749
Expenses Management Fees 1,281,987 1,070,316 Transaction Fees and Commissions 1,235 1,070
Total Expenses 1,283,222 1,071,386
Finance Costs Interest Expense 35 177 Distribution Paid 1,824,675 1,919,852 Income Equalisation (27,456) 448
Total Finance Costs 1,797,254 1,920,477
Net Investment Income/(Loss) (5,375,844) 15,524,886
Foreign Withholding Tax (39,651) (36,850)
Net Increase/(Decrease) in Net Assets (5,415,495) 15,488,036
Statement of Changes in Net Assets
GBP (£)
GBP (£)
Six Months Ended Six Months Ended30 June 2021 30 June 2020
Increase/(Decrease) in Net Assets
Net Increase/(Decrease) in Net Assets From Operations (5,415,495) 15,488,036
Capital Transactions Subscriptions 417,718,557 357,697,003 Redemptions (290,370,948) (257,859,121) Reinvestments 21,870 23,203
Total Capital Transactions1 127,369,479 99,861,085
Total Increase/(Decrease) for the Period 121,953,984 115,349,121
Net AssetsBeginning of Period 2,311,435,740 1,970,291,994
End of Period 2,433,389,724 2,085,641,115
1 Capital Transactions include income equalisation adjustments as shown in the Statement of Operations.
Vanguard U.S. Government Bond Index FundManaged by Vanguard Global Advisers, LLC.
954
Investment ObjectiveThis fund seeks to provide returns consistent with the performance of the Bloomberg Barclays U.S. Government Float Adjusted Bond Index, a market-weighted index designed to reflect the total universe of US dollar-denominated US Treasury and US government-related securities with maturities greater than 1 year.
Performance SummaryThe Performance Summary does not form part of the Financial Statements.
• As the six months ended 30 June 2021 came to a close, macroeconomic indicators signalled a faster global economic rebound than many had expected after the sharpest contraction in modern history. Yet the recovery has been uneven. Countries that have contained the virus more successfully, whether through vaccinations, lockdowns or both, generally have fared better economically. And the COVID-19 pandemic remained far from over, with new variants of the virus surfacing where vaccination rates have lagged and the human toll continuing to mount, especially in less developed economies.
• Swift and extensive support from governments and central banks has been a key to the rebound. So far in 2021, it has included fiscal stimulus – including the $1.9 trillion American Rescue Plan in the United States and the €673 billion Recovery and Resilience Facility in Europe – and pledges by a number of central banks to keep interest rates low for some time.
• Stock markets worldwide continued the rally that began in 2020. The FTSE Global All Cap Index returned roughly 13% in US dollars for the six months ended 30 June 2021.
• Fixed income securities struggled amid concerns that an upturn in inflation might persist or even accelerate given the stronger-than-expected rebound in global growth, extraordinary monetary and fiscal stimulus and a jump in demand for goods and services as economies reopened and supply gradually picked up. With longer-term yields rising and prices falling, bonds returned about –3% in US dollars for the half year, as measured by the Bloomberg Barclays Global Aggregate Bond Index.
• In the US, the Federal Reserve expressed optimism about the economy and signalled that it might tighten its monetary policy sooner than expected. For now, it kept its target for short-term interest rates at 0%–0.25%. The yield of the bellwether US 10-year Treasury note finished the period at 1.47%, up from 0.91% six months earlier.
• In this environment, the fund’s benchmark index returned –2.51% for the six months.
• US Treasuries, which make up the majority of the index, trailed US government agency securities for the period. Returns for shorter-term securities generally outpaced those of their longer-term counterparts.
Benchmark returns in the commentary above are in US dollars.

955
Vanguard U.S. Government Bond Index Fund
Benchmark: Bloomberg Barclays U.S. Government Float Adjusted Bond Index
Total ReturnsPeriods Ended 30 June 2021
(Annualised for periods over one year)
Six Months Five YearsTen Years or
Since Inception1
EUR Hedged Acc -2.96 % -0.05 % 0.28 %
Benchmark -2.96 0.09 0.42
Tracking Difference* —
Institutional Plus EUR Hedged Acc -2.93 % — 1.27 %
Benchmark -2.96 — 1.37
Tracking Difference* 0.03
GBP Dist -3.55 % — 2.51 %
Benchmark -3.53 — 2.72
Tracking Difference* -0.02
GBP Hedged Acc -2.58 % 0.94 % 1.97 %
Benchmark -2.56 1.13 2.18
Tracking Difference* -0.02
GBP Hedged Dist -2.58 % — 3.23 %
Benchmark -2.56 — 3.41
Tracking Difference* -0.02
USD Acc -2.53 % 1.98 % 2.61 %
Benchmark -2.51 2.18 2.79
Tracking Difference* -0.02
Investor USD -2.53 % 1.94 % 2.56 %
Benchmark -2.51 2.18 2.79
Tracking Difference* -0.02
Institutional Plus USD Acc -2.50 % 2.07 % 2.73 %
Benchmark -2.51 2.18 2.84
Tracking Difference* 0.01
Each benchmark is in its respective currency.Sources: Vanguard Global Advisers, LLC, and Bloomberg.Performance is based on NAV with net income reinvested.
All of the returns in this report represent past performance, which is not a guarantee of future results that may be achieved by the fund. For performance data current to the most recent month-end, which may be higher or lower than that cited, visit our website at http://global.vanguard.com. Note, too, that both investment returns and principal value can fluctuate widely, so an investor's shares, when sold, could be worth more or less than their original cost.* The tracking difference between the fund return and the index return over a stated period of time can be attributed to a number of factors, including, without limitation, small differences in
weightings, trading activity, transaction costs and differences in the valuation and withholding tax treatment between the fund and the index vendor.1 Since-inception returns: EUR Hedged Acc, 31 March 2016; Institutional Plus EUR Hedged Acc, 28 November 2017; GBP Dist, 14 December 2017; GBP Hedged Acc, 31 January 2014; GBP Hedged Dist,
8 March 2018; Institutional Plus USD Acc, 6 December 2013.

Significant Portfolio ChangesFor the Six Months Ended 30 June 2021
956
Vanguard U.S. Government Bond Index Fund
The Central Bank of Ireland requires a schedule of material changes in the composition of the portfolio during the period. These are defined as aggregate purchases of a security exceeding 1% of the total value of purchases for the period and aggregate disposals greater than 1% of the total value of sales. At a minimum, the largest 20 purchases and 20 sales must be shown; all purchases and sales must be shown if there are fewer than 20. A full listing of the portfolio changes for the period is available, upon request, at no extra cost from the Administrator.
Principal US Dollars ($)
Cost US Dollars ($)
Purchases
US Treasury Note 1.13% 15/2/2031 65,630,000 63,116,144US Treasury Note 0.13% 15/1/2024 39,000,000 38,930,586US Treasury Bond 1.88% 15/2/2041 36,950,000 35,253,203US Treasury Note 0.13% 15/2/2024 34,800,000 34,655,906US Treasury Note 0.38% 31/1/2026 31,000,000 30,912,461US Treasury Bond 1.88% 15/2/2051 32,591,000 30,041,017US Treasury Note 1.25% 31/5/2028 30,000,000 29,981,250US Treasury Note 0.25% 15/5/2024 30,000,000 29,958,984US Treasury Note 0.50% 28/2/2026 30,000,000 29,676,563US Treasury Note 0.75% 31/5/2026 29,000,000 28,933,164US Treasury Note 1.13% 29/2/2028 27,000,000 27,009,492US Treasury Note 0.75% 31/1/2028 25,000,000 24,968,750US Treasury Note 0.88% 15/11/2030 25,250,000 24,775,348US Treasury Note 0.25% 15/3/2024 24,500,000 24,444,316US Treasury Note 0.13% 31/1/2023 24,355,000 24,358,025US Treasury Note 1.25% 31/3/2028 23,500,000 23,309,023US Treasury Note 0.13% 31/10/2022 23,000,000 22,995,742US Treasury Note 0.13% 31/5/2023 23,000,000 22,991,914US Treasury Note 1.25% 30/4/2028 23,000,000 22,908,359US Treasury Note 0.13% 30/9/2022 21,000,000 21,006,406US Treasury Bond 5.38% 15/2/2031 15,500,000 20,951,328US Treasury Note 0.13% 31/5/2022 20,000,000 20,006,250US Treasury Note 2.50% 15/5/2024 18,500,000 19,756,484US Treasury Note 0.63% 31/12/2027 18,800,000 18,628,672US Treasury Bond 2.38% 15/5/2051 17,500,000 18,148,906US Treasury Note 0.13% 28/2/2023 18,000,000 17,999,297US Treasury Bond 1.63% 15/11/2050 18,600,000 17,567,121US Treasury Note 0.75% 30/4/2026 17,000,000 16,918,984US Treasury Note 0.13% 31/3/2023 16,400,000 16,389,156US Treasury Note 0.13% 30/4/2023 16,225,000 16,214,603US Treasury Bond 1.38% 15/11/2040 17,120,000 16,140,943US Treasury Note 2.13% 15/5/2025 14,500,000 15,383,164US Treasury Note 1.63% 15/5/2031 14,500,000 14,677,168US Treasury Note 1.75% 15/5/2022 13,000,000 13,243,750US Treasury Note 0.75% 31/3/2026 12,500,000 12,438,887US Treasury Note 0.13% 15/12/2023 12,350,000 12,322,512US Treasury Note 2.38% 15/5/2029 10,950,000 11,789,066US Treasury Note 2.25% 15/11/2027 10,900,000 11,762,195US Treasury Note 0.38% 15/4/2024 11,200,000 11,217,125US Treasury Bond 2.25% 15/5/2041 11,000,000 11,173,945US Treasury Note 0.25% 15/11/2023 10,750,000 10,775,254
Principal US Dollars ($)
Proceeds US Dollars ($)
Sales
US Treasury Note 0.13% 30/6/2022 27,184,000 27,196,743US Treasury Note 0.13% 31/5/2022 27,145,000 27,158,366US Treasury Note 0.13% 31/7/2022 25,005,000 25,016,667US Treasury Note 1.13% 28/2/2027 24,400,000 24,609,973US Treasury Note 1.88% 31/5/2022 22,000,000 22,424,531US Treasury Note 0.25% 15/4/2023 21,500,000 21,546,055US Treasury Note 1.75% 30/6/2022 20,000,000 20,359,336US Treasury Note 0.13% 15/12/2023 19,055,000 18,983,395US Treasury Note 0.13% 15/7/2023 19,000,000 18,962,266US Treasury Note 1.88% 31/7/2022 18,484,000 18,844,391US Treasury Note 1.75% 31/5/2022 18,493,000 18,826,018US Treasury Note 2.13% 15/5/2022 17,308,000 17,702,392US Treasury Note 1.75% 15/7/2022 17,360,000 17,663,903US Treasury Note 1.88% 28/2/2022 17,000,000 17,300,820US Treasury Note 0.13% 30/4/2022 17,030,000 17,037,911US Treasury Bond 2.00% 15/2/2050 17,640,000 16,945,747US Treasury Note 2.13% 30/6/2022 15,600,000 15,930,605US Treasury Note 1.75% 15/6/2022 15,635,000 15,906,170US Treasury Note 1.50% 15/2/2030 15,350,000 15,591,805US Treasury Note 1.88% 31/3/2022 14,475,000 14,750,487US Treasury Bond 7.25% 15/8/2022 12,391,000 13,392,532US Treasury Note 1.75% 15/5/2022 13,000,000 13,207,695US Treasury Bond 5.38% 15/2/2031 9,585,000 13,026,337US Treasury Note 1.75% 30/4/2022 12,535,000 12,771,500US Treasury Note 1.75% 31/3/2022 12,300,000 12,519,004US Treasury Note 0.25% 15/6/2023 12,275,000 12,298,282US Treasury Note 1.75% 28/2/2022 11,850,000 12,045,340US Treasury Note 0.13% 31/1/2023 12,000,000 11,992,656US Treasury Note 2.00% 31/7/2022 11,575,000 11,815,141US Treasury Note 2.75% 31/7/2023 10,000,000 10,524,609US Treasury Bond 3.00% 15/11/2045 8,500,000 10,451,738Federal Home Loan Banks 3.00%
12/10/2021 9,720,000 9,910,762US Treasury Note 0.38% 31/3/2022 9,292,000 9,319,949US Treasury Note 1.88% 31/7/2026 8,635,000 9,072,385US Treasury Note 3.00% 31/10/2025 8,000,000 8,824,453

957
Vanguard U.S. Government Bond Index Fund
Financial StatementsStatement of Investments30 June 2021
Principal US Dollars ($) Coupon
Maturity Date
Fair Value US Dollars ($)
% of Total Net Assets
Bonds 99.26% (2020: 98.00%)United States 99.26% (2020: 98.00%) . .US Treasury Note1 57,610,000 1.13% 15/2/2031 55,944,711 1.23%US Treasury Note1 56,470,000 0.88% 15/11/2030 53,708,264 1.18%US Treasury Note1 45,950,000 0.63% 15/8/2030 42,819,656 0.94%US Treasury Note1 43,450,000 0.63% 15/5/2030 40,618,961 0.89%US Treasury Note 37,956,000 2.38% 15/8/2024 40,185,915 0.88%US Treasury Note 37,302,400 1.50% 15/2/2030 37,675,424 0.82%US Treasury Note 33,020,000 2.88% 15/8/2028 36,719,272 0.80%US Treasury Note1 37,820,000 0.63% 31/12/2027 36,561,303 0.80%US Treasury Note 33,457,600 2.25% 15/11/2025 35,598,364 0.78%US Treasury Note 36,550,000 0.38% 31/7/2027 35,036,602 0.77%US Treasury Note 33,194,000 1.63% 15/11/2022 33,865,660 0.74%US Treasury Note 34,000,000 0.13% 15/1/2024 33,798,125 0.74%US Treasury Note 32,893,000 2.00% 30/11/2022 33,748,732 0.74%US Treasury Note 32,748,000 2.13% 31/12/2022 33,703,577 0.74%US Treasury Note 32,415,000 0.13% 15/8/2023 32,318,768 0.71%US Treasury Bond 35,160,000 1.63% 15/11/2050 31,567,087 0.69%US Treasury Bond 32,200,000 1.88% 15/2/2041 31,530,844 0.69%US Treasury Note 32,500,000 0.63% 30/11/2027 31,461,524 0.69%US Treasury Note 28,790,000 2.25% 15/2/2027 30,773,811 0.67%US Treasury Note 29,103,000 2.00% 15/11/2026 30,710,486 0.67%US Treasury Note 31,270,000 0.38% 31/12/2025 30,673,916 0.67%US Treasury Note 30,610,000 0.13% 15/12/2023 30,449,776 0.67%US Treasury Note 29,425,000 1.50% 15/8/2026 30,300,854 0.66%US Treasury Note 30,300,000 0.13% 15/2/2024 30,105,891 0.66%US Treasury Bond 31,491,000 1.88% 15/2/2051 30,049,303 0.66%US Treasury Note 29,900,000 1.25% 31/5/2028 29,979,422 0.66%US Treasury Bond 33,235,000 1.38% 15/11/2040 29,854,377 0.65%US Treasury Note 30,000,000 0.25% 15/5/2024 29,840,625 0.65%US Treasury Note 27,857,000 2.00% 15/8/2025 29,315,140 0.64%US Treasury Note 26,189,000 2.88% 15/5/2028 29,094,342 0.64%US Treasury Note 29,000,000 0.75% 31/5/2026 28,839,141 0.63%US Treasury Note 26,859,000 2.25% 15/8/2027 28,724,442 0.63%US Treasury Note 27,134,000 2.25% 15/11/2024 28,685,726 0.63%US Treasury Bond 33,533,000 1.38% 15/8/2050 28,262,032 0.62%US Treasury Note 28,525,000 0.38% 30/4/2025 28,217,465 0.62%US Treasury Note 25,600,000 2.75% 15/2/2028 28,208,000 0.62%US Treasury Note 27,720,000 0.25% 15/11/2023 27,676,687 0.61%US Treasury Note 28,000,000 0.38% 31/1/2026 27,442,188 0.60%US Treasury Note 28,200,000 0.50% 31/10/2027 27,116,062 0.59%US Treasury Note 26,513,000 1.38% 15/10/2022 26,935,551 0.59%US Treasury Note 27,415,000 0.63% 31/3/2027 26,821,722 0.59%US Treasury Note 27,230,000 0.25% 31/5/2025 26,776,876 0.59%US Treasury Note 26,018,000 1.63% 31/8/2022 26,473,315 0.58%US Treasury Bond 32,135,000 1.25% 15/5/2050 26,235,215 0.57%US Treasury Note 24,905,000 2.13% 31/3/2024 26,076,313 0.57%US Treasury Note 26,170,000 0.13% 15/10/2023 26,057,551 0.57%US Treasury Note 25,500,000 0.13% 30/11/2022 25,488,047 0.56%US Treasury Note 24,614,000 1.75% 15/11/2029 25,410,109 0.56%US Treasury Note 24,369,000 1.63% 15/5/2026 25,259,992 0.55%US Treasury Note 26,000,000 0.50% 31/8/2027 25,071,719 0.55%US Treasury Note 23,692,000 2.75% 15/11/2023 25,050,588 0.55%US Treasury Bond 23,967,000 2.25% 15/8/2049 24,820,824 0.54%US Treasury Note 21,860,000 3.13% 15/11/2028 24,729,125 0.54%US Treasury Note 25,465,000 0.50% 30/4/2027 24,697,071 0.54%US Treasury Note 24,760,000 1.13% 29/2/2028 24,690,362 0.54%US Treasury Note 25,000,000 0.38% 30/11/2025 24,550,781 0.54%US Treasury Note 24,500,000 0.25% 15/3/2024 24,404,297 0.53%US Treasury Note 25,000,000 0.75% 31/1/2028 24,339,844 0.53%US Treasury Bond 19,024,000 3.38% 15/11/2048 24,279,380 0.53%US Treasury Bond 24,366,100 2.00% 15/2/2050 23,932,079 0.52%US Treasury Note 22,736,000 2.00% 30/6/2024 23,780,435 0.52%US Treasury Bond 19,826,000 3.00% 15/8/2048 23,661,092 0.52%US Treasury Note 23,500,000 1.25% 31/3/2028 23,595,469 0.52%

958
Vanguard U.S. Government Bond Index Fund
Principal
US Dollars ($) CouponMaturity
DateFair Value
US Dollars ($)% of Total
Net AssetsUS Treasury Note 23,310,000 0.13% 31/10/2022 23,302,716 0.51%US Treasury Note 23,000,000 1.25% 30/4/2028 23,079,062 0.51%US Treasury Note 23,000,000 0.13% 15/5/2023 22,956,875 0.50%US Treasury Note 22,250,000 2.00% 15/2/2023 22,900,986 0.50%US Treasury Bond 19,065,000 3.00% 15/2/2048 22,714,160 0.50%US Treasury Bond 26,350,000 1.13% 15/8/2040 22,669,234 0.50%US Treasury Note 21,842,000 1.63% 15/2/2026 22,640,598 0.50%US Treasury Note 22,685,000 0.13% 15/7/2023 22,626,515 0.50%US Treasury Note 22,192,000 1.50% 15/8/2022 22,537,016 0.49%US Treasury Note 21,910,000 0.13% 30/9/2022 21,907,432 0.48%US Treasury Note 22,200,000 0.50% 28/2/2026 21,865,266 0.48%US Treasury Bond 17,714,000 3.13% 15/5/2048 21,597,241 0.47%US Treasury Note 20,280,000 2.75% 15/2/2024 21,539,578 0.47%US Treasury Bond 20,103,000 2.38% 15/11/2049 21,400,272 0.47%US Treasury Note 20,000,000 2.88% 30/9/2023 21,156,250 0.46%US Treasury Note 21,115,000 0.25% 15/6/2023 21,119,124 0.46%US Treasury Note 21,800,000 0.50% 31/5/2027 21,105,125 0.46%US Treasury Bond 17,472,000 3.00% 15/2/2049 20,909,070 0.46%US Treasury Note 20,433,000 1.63% 15/8/2029 20,899,128 0.46%US Treasury Note 20,875,000 0.13% 31/5/2023 20,830,967 0.46%US Treasury Note 19,945,000 1.88% 31/8/2024 20,806,686 0.46%US Treasury Note 20,815,000 0.13% 31/12/2022 20,800,365 0.46%US Treasury Note 20,845,000 0.50% 31/3/2025 20,742,404 0.45%US Treasury Note 19,435,000 2.25% 31/10/2024 20,535,811 0.45%US Treasury Note 19,949,500 1.75% 15/5/2023 20,513,697 0.45%US Treasury Note 18,597,000 2.75% 31/8/2025 20,139,970 0.44%US Treasury Note 20,000,000 0.13% 31/8/2022 20,001,563 0.44%US Treasury Note 19,010,000 2.13% 30/9/2024 19,996,144 0.44%US Treasury Note 19,613,900 1.13% 28/2/2027 19,753,343 0.43%US Treasury Note 20,100,000 0.25% 31/7/2025 19,718,414 0.43%US Treasury Bond 16,630,000 2.88% 15/5/2049 19,467,494 0.43%US Treasury Note 18,500,000 2.13% 31/7/2024 19,433,672 0.43%US Treasury Note 18,858,000 2.00% 31/10/2022 19,322,084 0.42%US Treasury Note 17,570,000 2.63% 15/2/2029 19,266,603 0.42%US Treasury Note 18,311,000 2.25% 30/4/2024 19,253,730 0.42%US Treasury Note 18,845,000 1.88% 31/8/2022 19,229,261 0.42%US Treasury Note 18,195,000 2.50% 31/1/2024 19,195,725 0.42%US Treasury Note 19,475,000 0.25% 31/8/2025 19,085,500 0.42%US Treasury Note 19,070,000 0.25% 15/4/2023 19,081,919 0.42%US Treasury Note 17,435,000 2.88% 30/11/2025 19,021,858 0.42%US Treasury Note 17,909,000 2.00% 15/2/2025 18,803,051 0.41%US Treasury Note 17,288,000 2.63% 31/12/2025 18,688,598 0.41%US Treasury Bond 17,500,000 2.38% 15/5/2051 18,683,984 0.41%US Treasury Note 17,645,000 2.00% 31/5/2024 18,441,782 0.40%US Treasury Note 18,104,000 1.50% 15/9/2022 18,403,847 0.40%US Treasury Note 17,650,000 1.63% 30/11/2026 18,274,645 0.40%US Treasury Note 17,789,000 1.63% 15/12/2022 18,167,711 0.40%US Treasury Bond 14,860,000 3.13% 15/8/2044 17,825,034 0.39%US Treasury Note 17,171,100 1.50% 30/9/2024 17,718,429 0.39%US Treasury Bond 20,431,000 1.13% 15/5/2040 17,640,892 0.39%US Treasury Note 17,900,000 0.25% 30/6/2025 17,582,555 0.38%US Treasury Note 16,567,000 2.75% 31/7/2023 17,423,825 0.38%US Treasury Note 16,400,000 2.00% 30/4/2024 17,130,312 0.38%US Treasury Note 16,115,000 2.63% 31/12/2023 17,026,505 0.37%US Treasury Note 16,435,000 1.63% 31/10/2026 17,021,781 0.37%US Treasury Bond 13,137,000 3.63% 15/2/2044 16,969,309 0.37%US Treasury Note 15,753,000 2.38% 15/5/2027 16,959,089 0.37%US Treasury Note 15,971,000 2.88% 31/10/2023 16,920,526 0.37%US Treasury Note 17,000,000 0.75% 30/4/2026 16,915,000 0.37%US Treasury Bond 14,788,000 2.75% 15/8/2047 16,812,107 0.37%US Treasury Note 16,470,000 0.13% 28/2/2023 16,451,343 0.36%US Treasury Note 16,092,700 1.13% 28/2/2025 16,386,895 0.36%US Treasury Bond 15,834,000 2.25% 15/8/2046 16,365,923 0.36%US Treasury Bond 14,224,000 2.88% 15/5/2043 16,346,488 0.36%US Treasury Note 16,200,000 0.50% 15/3/2023 16,282,898 0.36%US Treasury Note 15,852,000 1.88% 31/10/2022 16,216,101 0.36%US Treasury Bond 12,984,000 3.38% 15/5/2044 16,181,310 0.35%US Treasury Bond 12,511,000 3.63% 15/8/2043 16,100,093 0.35%US Treasury Note 15,121,000 2.13% 31/5/2026 16,037,711 0.35%US Treasury Note 16,450,000 0.38% 30/9/2027 15,718,746 0.34%US Treasury Note 15,260,000 1.88% 30/9/2022 15,591,428 0.34%

959
Vanguard U.S. Government Bond Index Fund
Principal
US Dollars ($) CouponMaturity
DateFair Value
US Dollars ($)% of Total
Net AssetsUS Treasury Note 14,945,000 1.75% 30/6/2024 15,522,951 0.34%US Treasury Bond 14,295,400 2.50% 15/2/2046 15,481,471 0.34%US Treasury Note 14,675,000 2.13% 30/11/2024 15,456,902 0.34%US Treasury Note 15,460,000 0.13% 15/9/2023 15,404,441 0.34%US Treasury Note 15,390,000 0.13% 31/3/2023 15,367,757 0.34%US Treasury Note 14,500,000 2.13% 15/5/2025 15,308,828 0.34%US Treasury Note 13,841,000 3.00% 31/10/2025 15,162,383 0.33%US Treasury Bond 12,575,000 3.00% 15/2/2047 14,932,812 0.33%US Treasury Bond 12,687,000 3.00% 15/11/2044 14,929,031 0.33%US Treasury Bond 10,909,000 5.38% 15/2/2031 14,819,195 0.32%US Treasury Bond 13,684,000 2.50% 15/2/2045 14,797,963 0.32%US Treasury Note 13,900,000 2.50% 15/5/2024 14,725,313 0.32%US Treasury Note 15,050,000 0.25% 31/10/2025 14,714,902 0.32%US Treasury Note 14,424,000 1.75% 30/9/2022 14,714,734 0.32%US Treasury Bond 12,554,000 2.88% 15/8/2045 14,509,678 0.32%US Treasury Note 13,927,000 1.75% 31/7/2024 14,475,376 0.32%US Treasury Note 13,750,000 1.88% 30/6/2026 14,419,238 0.32%US Treasury Note 13,936,000 1.50% 30/11/2024 14,380,210 0.31%US Treasury Note 13,230,000 2.88% 31/5/2025 14,362,819 0.31%US Treasury Note 13,242,000 2.88% 30/4/2025 14,361,363 0.31%US Treasury Note 13,378,000 2.38% 30/4/2026 14,343,724 0.31%US Treasury Note 14,225,000 0.13% 30/4/2023 14,199,995 0.31%US Treasury Note 13,855,000 1.63% 15/8/2022 14,090,968 0.31%US Treasury Bond 12,941,800 2.50% 15/5/2046 14,015,565 0.31%US Treasury Note 12,800,000 2.88% 31/7/2025 13,916,000 0.30%US Treasury Note 12,800,000 2.75% 30/6/2025 13,843,000 0.30%US Treasury Note 12,900,000 2.25% 31/1/2024 13,525,852 0.30%US Treasury Bond 10,305,000 3.75% 15/11/2043 13,520,482 0.30%US Treasury Note 12,800,000 2.38% 29/2/2024 13,475,000 0.30%US Treasury Note 12,843,000 2.25% 31/12/2023 13,450,032 0.29%US Treasury Bond 11,182,000 3.13% 15/2/2043 13,352,007 0.29%US Treasury Note 12,581,000 1.88% 31/7/2026 13,196,290 0.29%US Treasury Note 12,200,000 2.25% 31/3/2026 13,002,531 0.28%US Treasury Note 12,000,000 2.75% 30/4/2023 12,553,594 0.27%US Treasury Bond 10,529,000 3.00% 15/5/2047 12,513,058 0.27%US Treasury Note 12,300,000 1.63% 15/5/2031 12,492,187 0.27%US Treasury Note 12,500,000 0.75% 31/3/2026 12,445,312 0.27%US Treasury Note 12,800,000 0.50% 30/6/2027 12,383,000 0.27%US Treasury Note 12,355,000 0.13% 31/1/2023 12,343,900 0.27%US Treasury Note 11,854,000 2.50% 31/3/2023 12,327,234 0.27%US Treasury Note 11,500,000 2.50% 31/1/2025 12,280,742 0.27%US Treasury Note 11,726,000 2.13% 30/11/2023 12,231,684 0.27%US Treasury Note 11,373,000 2.88% 30/11/2023 12,069,596 0.26%US Treasury Bond 10,366,000 2.88% 15/11/2046 12,024,560 0.26%US Treasury Bond 10,552,000 2.75% 15/11/2047 12,006,197 0.26%US Treasury Note 12,170,000 0.25% 30/9/2025 11,913,289 0.26%US Treasury Note 10,950,000 2.38% 15/5/2029 11,817,445 0.26%US Treasury Note 10,900,000 2.25% 15/11/2027 11,659,594 0.26%US Treasury Bond 9,675,000 3.00% 15/5/2045 11,405,918 0.25%US Treasury Note 11,000,000 1.25% 31/8/2024 11,259,531 0.25%US Treasury Note 11,200,000 0.38% 15/4/2024 11,186,875 0.24%US Treasury Note 10,800,000 1.63% 30/4/2023 11,075,484 0.24%US Treasury Note 10,775,000 1.63% 31/5/2023 11,059,948 0.24%US Treasury Note 10,632,000 1.25% 31/7/2023 10,850,454 0.24%US Treasury Note 10,500,000 1.63% 31/10/2023 10,819,102 0.24%US Treasury Note 9,950,000 1.38% 30/6/2023 10,174,652 0.22%US Treasury Note 9,900,000 1.38% 31/8/2023 10,135,125 0.22%US Treasury Bond1 6,770,000 4.75% 15/2/2041 9,921,223 0.22%US Treasury Note 9,450,000 2.13% 29/2/2024 9,887,062 0.22%US Treasury Note 9,167,000 2.75% 28/2/2025 9,878,159 0.22%US Treasury Note 9,105,000 2.75% 31/5/2023 9,542,467 0.21%US Treasury Note 8,964,000 1.75% 31/12/2024 9,328,863 0.20%US Treasury Note 8,810,000 2.75% 31/8/2023 9,279,408 0.20%US Treasury Note 8,800,000 2.63% 28/2/2023 9,155,781 0.20%US Treasury Bond 7,577,000 3.13% 15/2/2042 9,034,389 0.20%US Treasury Note 9,000,000 1.25% 30/6/2028 9,015,469 0.20%US Treasury Bond 8,600,000 2.25% 15/5/2041 8,949,375 0.20%US Treasury Bond 6,415,000 4.25% 15/11/2040 8,841,674 0.19%US Treasury Bond1 6,164,000 4.38% 15/5/2041 8,652,715 0.19%US Treasury Note 8,255,000 1.50% 31/3/2023 8,441,382 0.19%US Treasury Bond 7,424,000 2.75% 15/8/2042 8,360,120 0.18%

960
Vanguard U.S. Government Bond Index Fund
Principal
US Dollars ($) CouponMaturity
DateFair Value
US Dollars ($)% of Total
Net AssetsUS Treasury Bond 5,948,000 4.38% 15/5/2040 8,304,895 0.18%US Treasury Bond 6,970,000 3.13% 15/11/2041 8,301,923 0.18%US Treasury Bond 7,048,000 3.00% 15/5/2042 8,245,059 0.18%US Treasury Bond 5,772,000 4.38% 15/11/2039 8,021,276 0.18%US Treasury Bond 5,591,000 4.50% 15/8/2039 7,872,827 0.17%US Treasury Bond 6,650,000 3.00% 15/11/2045 7,859,469 0.17%US Treasury Bond 6,912,000 2.75% 15/11/2042 7,779,240 0.17%US Treasury Note 7,545,000 1.38% 30/9/2023 7,727,730 0.17%US Treasury Bond 5,760,000 3.88% 15/8/2040 7,567,200 0.17%US Treasury Note 7,375,000 1.75% 31/1/2023 7,557,358 0.17%US Treasury Bond 5,068,000 4.63% 15/2/2040 7,267,829 0.16%US Treasury Bond 5,528,000 3.75% 15/8/2041 7,176,035 0.16%US Treasury Bond 5,800,000 6.00% 15/2/2026 7,159,828 0.16%US Treasury Bond 5,325,000 5.50% 15/8/2028 6,883,395 0.15%US Treasury Note 6,551,000 1.50% 28/2/2023 6,692,768 0.15%US Treasury Note 6,243,000 1.75% 31/12/2026 6,505,889 0.14%US Treasury Bond 4,742,000 4.25% 15/5/2039 6,482,462 0.14%US Treasury Bond 4,388,000 6.25% 15/5/2030 6,186,394 0.14%Federal Home Loan Banks 6,000,000 1.38% 17/2/2023 6,112,864 0.13%US Treasury Note 5,858,000 1.50% 31/1/2027 6,021,383 0.13%US Treasury Bond 4,500,000 7.50% 15/11/2024 5,550,469 0.12%US Treasury Note 5,000,000 2.50% 28/2/2026 5,383,984 0.12%US Treasury Bond 4,086,000 6.13% 15/11/2027 5,347,553 0.12%US Treasury Bond 3,911,000 6.50% 15/11/2026 5,046,107 0.11%US Treasury Bond 3,595,000 4.50% 15/5/2038 5,015,025 0.11%Federal National Mortgage Association 5,000,000 0.25% 10/7/2023 4,999,303 0.11%Federal Home Loan Mortgage Corp. 5,000,000 0.25% 26/6/2023 4,999,013 0.11%Federal Home Loan Mortgage Corp. 5,000,000 0.38% 23/9/2025 4,924,516 0.11%US Treasury Bond 3,174,000 5.00% 15/5/2037 4,623,129 0.10%US Treasury Bond 3,668,000 3.50% 15/2/2039 4,582,708 0.10%US Treasury Bond 3,258,000 4.38% 15/2/2038 4,480,259 0.10%Federal National Mortgage Association 4,320,000 1.63% 7/1/2025 4,473,264 0.10%US Treasury Note 4,240,000 1.50% 31/10/2024 4,375,481 0.10%US Treasury Bond 3,111,000 4.50% 15/2/2036 4,267,903 0.09%US Treasury Bond 3,200,000 6.75% 15/8/2026 4,134,750 0.09%Federal National Mortgage Association 3,890,000 1.63% 15/10/2024 4,027,322 0.09%Federal Home Loan Mortgage Corp. 4,025,000 0.25% 24/8/2023 4,023,365 0.09%Federal National Mortgage Association 4,000,000 0.25% 22/5/2023 4,001,587 0.09%Federal Home Loan Mortgage Corp. 2,710,000 6.25% 15/7/2032 3,982,469 0.09%Federal National Mortgage Association 4,000,000 0.50% 7/11/2025 3,956,050 0.09%Federal National Mortgage Association 4,000,000 0.38% 25/8/2025 3,942,669 0.09%Federal National Mortgage Association 2,625,000 6.63% 15/11/2030 3,797,783 0.08%US Treasury Bond 2,950,000 5.25% 15/11/2028 3,783,375 0.08%US Treasury Bond 2,746,000 6.63% 15/2/2027 3,593,613 0.08%US Treasury Note 3,500,000 1.38% 31/8/2026 3,582,578 0.08%US Treasury Note 3,550,000 0.13% 30/6/2023 3,541,402 0.08%Federal Home Loan Mortgage Corp. 3,500,000 0.38% 20/4/2023 3,508,478 0.08%US Treasury Bond 2,475,000 6.13% 15/8/2029 3,398,484 0.07%Tennessee Valley Authority 2,360,000 5.25% 15/9/2039 3,363,807 0.07%US Treasury Bond 2,322,000 4.75% 15/2/2037 3,294,338 0.07%US Treasury Note 3,000,000 2.50% 15/8/2023 3,141,563 0.07%US Treasury Note 3,000,000 2.38% 31/1/2023 3,103,828 0.07%Federal Home Loan Banks 3,000,000 1.50% 15/8/2024 3,094,779 0.07%Federal Home Loan Mortgage Corp. 3,000,000 0.13% 25/7/2022 3,000,736 0.07%Federal Home Loan Mortgage Corp. 3,000,000 0.25% 8/9/2023 2,997,036 0.07%Federal National Mortgage Association 3,000,000 0.25% 27/11/2023 2,995,483 0.07%Federal Home Loan Mortgage Corp. 3,000,000 0.25% 4/12/2023 2,994,189 0.07%Federal National Mortgage Association 2,150,000 6.25% 15/5/2029 2,927,727 0.06%US Treasury Bond 2,260,000 7.63% 15/2/2025 2,828,884 0.06%Federal National Mortgage Association 1,900,000 7.25% 15/5/2030 2,815,625 0.06%Federal Home Loan Banks 2,315,000 3.25% 16/11/2028 2,630,511 0.06%US Treasury Note 2,400,000 2.63% 30/6/2023 2,513,719 0.05%Federal National Mortgage Association 2,500,000 0.63% 22/4/2025 2,497,166 0.05%Federal Home Loan Mortgage Corp. 2,500,000 0.13% 16/10/2023 2,491,294 0.05%Federal Home Loan Mortgage Corp. 1,600,000 6.75% 15/3/2031 2,351,491 0.05%Federal Home Loan Banks 2,205,000 2.50% 13/2/2024 2,327,868 0.05%Federal Home Loan Banks 2,150,000 2.75% 13/12/2024 2,309,060 0.05%US Treasury Note 2,175,000 2.25% 31/12/2024 2,301,762 0.05%Federal Home Loan Banks 2,000,000 3.25% 9/6/2028 2,253,503 0.05%Federal National Mortgage Association 2,300,000 0.75% 8/10/2027 2,246,132 0.05%Federal Home Loan Mortgage Corp. 2,072,000 2.75% 19/6/2023 2,173,333 0.05%

961
Vanguard U.S. Government Bond Index Fund
Principal
US Dollars ($) CouponMaturity
DateFair Value
US Dollars ($)% of Total
Net AssetsFederal National Mortgage Association 2,055,000 1.75% 2/7/2024 2,133,699 0.05%Federal Home Loan Banks 2,125,000 0.13% 2/6/2023 2,119,814 0.05%Israel Government AID Bond 1,500,000 5.50% 18/9/2033 2,116,363 0.05%Federal National Mortgage Association 2,000,000 2.88% 12/9/2023 2,113,078 0.05%Federal Home Loan Mortgage Corp. 2,000,000 1.50% 12/2/2025 2,063,374 0.05%Federal Home Loan Banks 2,000,000 2.00% 9/9/2022 2,043,669 0.04%Federal Home Loan Mortgage Corp. 2,000,000 0.38% 5/5/2023 2,004,988 0.04%Federal Home Loan Banks 2,000,000 0.13% 12/8/2022 1,999,401 0.04%Federal Farm Credit Banks Funding Corp. 2,000,000 0.13% 23/11/2022 1,998,246 0.04%Federal Farm Credit Banks Funding Corp. 2,000,000 0.13% 3/2/2023 1,998,188 0.04%Federal Farm Credit Banks Funding Corp. 2,000,000 0.13% 10/5/2023 1,997,458 0.04%Federal National Mortgage Association 2,000,000 0.50% 17/6/2025 1,984,885 0.04%Federal National Mortgage Association 1,915,000 2.38% 19/1/2023 1,977,861 0.04%Federal Home Loan Mortgage Corp. 2,000,000 0.38% 21/7/2025 1,971,560 0.04%Federal National Mortgage Association 1,775,000 1.88% 24/9/2026 1,861,365 0.04%Federal Home Loan Banks 1,025,000 5.50% 15/7/2036 1,509,447 0.03%Federal Home Loan Mortgage Corp. 1,500,000 0.25% 6/11/2023 1,498,213 0.03%Federal Home Loan Banks 1,500,000 0.13% 17/3/2023 1,497,485 0.03%Federal Home Loan Banks 1,500,000 0.50% 14/4/2025 1,491,129 0.03%Federal National Mortgage Association 1,255,000 2.50% 5/2/2024 1,322,813 0.03%US Treasury Bond 1,000,000 6.38% 15/8/2027 1,315,234 0.03%Federal National Mortgage Association 1,275,000 2.00% 5/10/2022 1,304,446 0.03%Federal National Mortgage Association 800,000 5.63% 15/7/2037 1,212,177 0.03%Tennessee Valley Authority 750,000 4.63% 15/9/2060 1,103,372 0.02%Federal National Mortgage Association 1,000,000 1.38% 6/9/2022 1,014,509 0.02%Tennessee Valley Authority 1,000,000 0.75% 15/5/2025 1,000,975 0.02%Federal Home Loan Banks 1,000,000 0.13% 21/10/2022 999,334 0.02%Federal Farm Credit Banks Funding Corp. 1,000,000 0.13% 13/4/2023 997,903 0.02%Federal Farm Credit Banks Funding Corp. 1,000,000 0.25% 26/2/2024 995,309 0.02%Federal Home Loan Banks 1,000,000 0.38% 4/9/2025 985,118 0.02%Federal National Mortgage Association 1,000,000 0.88% 5/8/2030 947,665 0.02%Tennessee Valley Authority 625,000 4.25% 15/9/2065 874,413 0.02%Federal National Mortgage Association 650,000 2.13% 24/4/2026 688,889 0.02%Tennessee Valley Authority 581,000 3.50% 15/12/2042 683,221 0.02%Tennessee Valley Authority 375,000 5.38% 1/4/2056 599,979 0.01%Tennessee Valley Authority 500,000 2.88% 1/2/2027 546,972 0.01%Federal National Mortgage Association 412,000 2.63% 6/9/2024 439,930 0.01%Federal Home Loan Banks 400,000 2.88% 14/6/2024 427,665 0.01%Israel Government AID Bond 325,000 5.50% 26/4/2024 370,157 0.01%Federal National Mortgage Association 250,000 7.13% 15/1/2030 364,232 0.01%Tennessee Valley Authority 200,000 6.15% 15/1/2038 304,968 0.01%Tennessee Valley Authority 200,000 5.88% 1/4/2036 296,948 0.01%Tennessee Valley Authority 200,000 7.13% 1/5/2030 291,393 0.01%Federal Farm Credit Banks Funding Corp. 275,000 1.77% 26/6/2023 282,887 0.01%Tennessee Valley Authority 200,000 4.70% 15/7/2033 260,085 0.01%US Treasury Bond 200,000 7.63% 15/11/2022 220,234 0.00%Tennessee Valley Authority 150,000 4.88% 15/1/2048 215,597 0.01%Private Export Funding Corp. 155,000 1.75% 15/11/2024 159,423 0.01%Private Export Funding Corp. 100,000 1.40% 15/7/2028 99,862 0.00%Tennessee Valley Authority 80,000 2.88% 15/9/2024 85,886 0.00%Federal Home Loan Mortgage Corp. 56,000 6.75% 15/9/2029 80,381 0.00%Tennessee Valley Authority 50,000 5.50% 15/6/2038 72,475 0.00%Federal Farm Credit Banks Funding Corp. 50,000 3.50% 20/12/2023 53,828 0.00%Private Export Funding Corp. 50,000 3.55% 15/1/2024 53,673 0.00%Private Export Funding Corp. 50,000 2.45% 15/7/2024 52,529 0.00%Tennessee Valley Authority 35,000 6.75% 1/11/2025 43,836 0.00%Private Export Funding Corp. 25,000 2.05% 15/11/2022 25,520 0.00%Tennessee Valley Authority 25,000 1.88% 15/8/2022 25,473 0.00%Petroleos Mexicanos 10,000 2.38% 15/4/2025 10,250 0.00%Petroleos Mexicanos 7,500 2.29% 15/2/2024 7,600 0.00%test test test test 4,532,566,070 99.26%Total Bonds 4,532,566,070 99.26%Financial Assets at Fair Value Through Profit or Loss 4,532,566,070 99.26%
CurrencyBuy
Amount Currency(Sell)
Amount CounterpartySettlement
Date
Unrealised Gain/(Loss)
US Dollars ($)% of Total
Net AssetsFinancial Derivative InstrumentsForward Currency Exchange Contracts 0.00% (2020: 0.00%)EUR 168 USD (199) Morgan Stanley 6/7/2021 — 0.00 %test — 0.00 %

962
Vanguard U.S. Government Bond Index Fund
CurrencyBuy
Amount Currency(Sell)
Amount CounterpartySettlement
Date
Unrealised Gain/(Loss)
US Dollars ($)% of Total
Net AssetsHedge Share Class Level Forward Currency Exchange Contracts (1.62%) (2020: 1.32%)USD 21,954,061 GBP (15,522,719) BNP Paribas 2/7/2021 510,198 0.01 %USD 11,851,736 GBP (8,390,675) JPMorgan Chase Bank 2/7/2021 260,437 0.01 %USD 19,085,673 GBP (13,662,310) BNP Paribas 2/7/2021 211,873 0.01 %USD 28,396,269 GBP (20,403,679) BNP Paribas 2/7/2021 209,604 0.01 %USD 4,946,780 GBP (3,503,269) JPMorgan Chase Bank 2/7/2021 107,189 0.00 %USD 14,102,777 GBP (10,149,271) BNP Paribas 2/7/2021 82,065 0.00 %USD 1,769,700 EUR (1,454,225) BNP Paribas 2/7/2021 45,134 0.00 %USD 1,097,421 GBP (778,971) Citibank NA 2/7/2021 21,312 0.00 %USD 14,417,722 GBP (10,422,178) Morgan Stanley 2/7/2021 20,003 0.00 %USD 622,939 GBP (439,767) Morgan Stanley 2/7/2021 15,422 0.00 %USD 507,364 EUR (416,197) Morgan Stanley 2/7/2021 13,795 0.00 %USD 1,852,221 EUR (1,554,722) BNP Paribas 2/7/2021 8,475 0.00 %USD 350,568 EUR (289,007) BNP Paribas 2/7/2021 7,835 0.00 %EUR 372,998,132 USD (442,630,729) Toronto-Dominion Bank 3/8/2021 7,183 0.00 %GBP 1,656,299,349 USD (2,288,293,823) Morgan Stanley 3/8/2021 6,660 0.00 %USD 121,835 EUR (99,958) BNP Paribas 2/7/2021 3,295 0.00 %USD 107,311 EUR (88,018) Morgan Stanley 2/7/2021 2,931 0.00 %USD 412,370 GBP (296,399) BNP Paribas 2/7/2021 2,909 0.00 %USD 80,093 EUR (66,112) JPMorgan Chase Bank 2/7/2021 1,690 0.00 %USD 208,990 EUR (175,215) BNP Paribas 2/7/2021 1,202 0.00 %USD 100,647 EUR (84,384) Morgan Stanley 2/7/2021 576 0.00 %USD 16,544 EUR (13,647) BNP Paribas 2/7/2021 360 0.00 %USD 2,371 EUR (1,947) BNP Paribas 2/7/2021 62 0.00 %EUR 1,766,038 USD (2,095,736) Citibank NA 3/8/2021 26 0.00 %EUR 544,151 USD (645,738) Morgan Stanley 3/8/2021 8 0.00 %USD 297,216 GBP (215,127) Morgan Stanley 3/8/2021 2 0.00 %USD 371 EUR (312) Morgan Stanley 2/7/2021 1 0.00 %USD 199 EUR (168) Morgan Stanley 3/8/2021 — 0.00 %USD 21,382 EUR (18,031) Goldman Sachs International 2/7/2021 (1 ) (0.00 %)EUR 695 USD (842) JPMorgan Chase Bank 2/7/2021 (18 ) (0.00 %)USD 442,338,485 EUR (372,998,132) Toronto-Dominion Bank 2/7/2021 (220 ) (0.00 %)GBP 8,965,073 USD (12,386,153) Citibank NA 3/8/2021 (239 ) (0.00 %)USD 2,288,094,736 GBP (1,656,299,349) Morgan Stanley 2/7/2021 (271 ) (0.00 %)GBP 41,551 USD (57,776) BNP Paribas 2/7/2021 (375 ) (0.00 %)EUR 15,726 USD (19,073) JPMorgan Chase Bank 2/7/2021 (423 ) (0.00 %)EUR 69,278 USD (82,806) BNP Paribas 2/7/2021 (649 ) (0.00 %)USD 1,190,197 GBP (862,049) Goldman Sachs International 2/7/2021 (681 ) (0.00 %)USD 1,591,716 GBP (1,152,918) Barclays Bank plc 3/8/2021 (1,126 ) (0.00 %)EUR 50,364 USD (61,705) JPMorgan Chase Bank 2/7/2021 (1,978 ) (0.00 %)EUR 72,300 USD (87,793) BNP Paribas 2/7/2021 (2,053 ) (0.00 %)GBP 282,158 USD (391,857) Morgan Stanley 2/7/2021 (2,070 ) (0.00 %)GBP 158,437 USD (221,039) BNP Paribas 2/7/2021 (2,167 ) (0.00 %)EUR 531,585 USD (632,636) JPMorgan Chase Bank 2/7/2021 (2,229 ) (0.00 %)EUR 589,851 USD (704,856) BNP Paribas 2/7/2021 (5,351 ) (0.00 %)GBP 233,925 USD (329,937) BNP Paribas 2/7/2021 (6,781 ) (0.00 %)EUR 1,501,533 USD (1,787,633) Morgan Stanley 2/7/2021 (6,964 ) (0.00 %)EUR 382,387 USD (465,605) BNP Paribas 2/7/2021 (12,132 ) (0.00 %)EUR 1,559,986 USD (1,863,316) BNP Paribas 2/7/2021 (13,328 ) (0.00 %)GBP 914,431 USD (1,295,933) JPMorgan Chase Bank 2/7/2021 (32,693 ) (0.00 %)GBP 1,021,683 USD (1,447,971) BNP Paribas 2/7/2021 (36,567 ) (0.00 %)EUR 1,105,279 USD (1,347,603) BNP Paribas 2/7/2021 (36,852 ) (0.00 %)GBP 1,328,331 USD (1,876,394) Morgan Stanley 2/7/2021 (41,371 ) (0.00 %)GBP 1,170,722 USD (1,658,707) BNP Paribas 2/7/2021 (41,413 ) (0.00 %)GBP 1,173,311 USD (1,663,660) Morgan Stanley 2/7/2021 (42,790 ) (0.00 %)EUR 1,306,212 USD (1,597,930) BNP Paribas 2/7/2021 (48,892 ) (0.00 %)EUR 2,165,788 USD (2,645,169) Morgan Stanley 2/7/2021 (76,759 ) (0.00 %)GBP 2,852,436 USD (4,025,649) BNP Paribas 2/7/2021 (85,150 ) (0.00 %)GBP 6,686,365 USD (9,487,765) JPMorgan Chase Bank 2/7/2021 (250,885 ) (0.01 %)GBP 9,851,837 USD (13,940,836) Morgan Stanley 2/7/2021 (331,014 ) (0.01 %)EUR 367,908,923 USD (448,434,989) Morgan Stanley 2/7/2021 (12,131,579 ) (0.27 %)GBP 1,715,015,449 USD (2,431,733,268) Morgan Stanley 2/7/2021 (62,524,895 ) (1.37 %)test (74,199,669 ) (1.62 %)Total Financial Derivative Instruments (74,199,669 ) (1.62 %)
Fair Value US Dollars ($)
% of Total Net Assets
Other Assets and Liabilities 107,952,339 2.36 %Net Assets 4,566,318,740 100.00 %
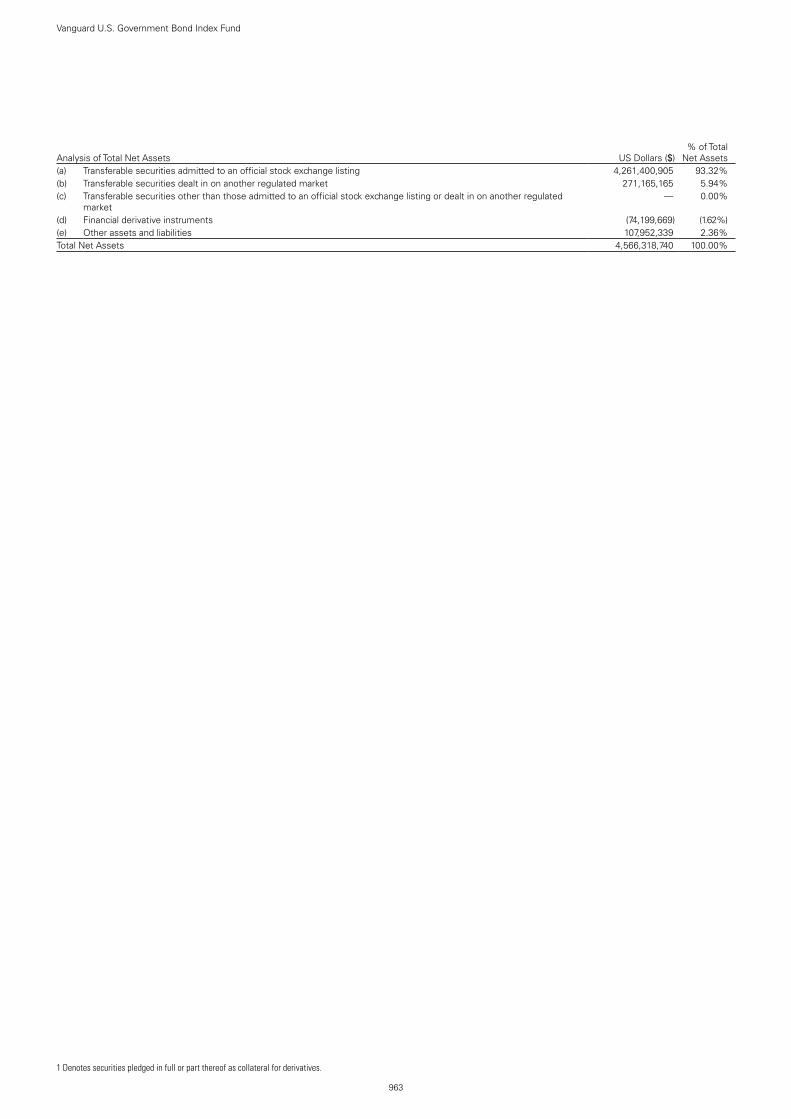
963
Vanguard U.S. Government Bond Index Fund
Analysis of Total Net Assets US Dollars ($)% of Total
Net Assets(a) Transferable securities admitted to an official stock exchange listing 4,261,400,905 93.32%(b) Transferable securities dealt in on another regulated market 271,165,165 5.94%(c) Transferable securities other than those admitted to an official stock exchange listing or dealt in on another regulated
market — 0.00%
(d) Financial derivative instruments (74,199,669) (1.62%)(e) Other assets and liabilities 107,952,339 2.36%Total Net Assets 4,566,318,740 100.00%
1 Denotes securities pledged in full or part thereof as collateral for derivatives.

The accompanying notes form an integral part of the financial statements.
964
Vanguard U.S. Government Bond Index Fund
Statement of Assets and Liabilities
US Dollars ($)
As at 30 June 2021
US Dollars ($)
As at 31 December 2020
Current AssetsFinancial Assets at Fair Value Through Profit or Loss 4,532,566,070 4,429,376,722 Financial Derivative Instruments 1,540,247 60,286,313 Cash 75,719,650 40,440,674 Unrealised Appreciation on Spot Currency Contracts — 5,425 Receivables: Interest and Dividends 17,232,720 17,711,663 Capital Shares Issued 10,154,901 25,179,160 Investments Sold 53,983,521 107,174,627
Total Current Assets 4,691,197,109 4,680,174,584
Current LiabilitiesFinancial Derivative Instruments 75,739,916 575,410 Bank Overdraft 93 79 Unrealised Depreciation on Spot Currency Contracts 12,031 — Payables and Other Liabilities: Investments Purchased 27,170,808 153,031,360 Income Distribution Payable 1,503,514 2,205,710 Capital Shares Redeemed 20,037,851 4,158,209 Management Fees Payable 414,156 413,413
Total Current Liabilities 124,878,369 160,384,181
Net Assets Attributable to Holders of Redeemable Participating Shares (“Net Assets”) 4,566,318,740 4,519,790,403

965
Vanguard U.S. Government Bond Index Fund
The accompanying notes form an integral part of the financial statements.
Net Asset Value Per Share
.As at
30 June 2021As at
31 December 2020As at
31 December 2019EUR Hedged AccUS ($) Equivalent 335,780,381 229,945,556 323,745,347Net Assets 283,143,927 187,933,112 288,414,565Number of Shares Outstanding 2,789,820 1,796,918 2,934,510Net Asset Value Per Share1 101.49 104.59 98.28
Institutional Plus EUR Hedged AccUS ($) Equivalent 109,742,434 111,878,451 94,149,914Net Assets 92,539,367 91,437,581 83,875,202Number of Shares Outstanding 884,029 847,902 828,374Net Asset Value Per Share1 104.68 107.84 101.25
GBP DistUS ($) Equivalent 128,939,387 283,410,971 111,098,848Net Assets 93,336,271 207,330,905 83,864,014Number of Shares Outstanding 909,672 1,935,440 803,874Net Asset Value Per Share1 102.60 107.12 104.32
GBP Hedged AccUS ($) Equivalent 1,984,297,426 1,990,764,577 1,735,054,970Net Assets 1,436,387,485 1,456,355,129 1,309,722,613Number of Shares Outstanding 12,427,189 12,274,583 11,855,913Net Asset Value Per Share1 115.58 118.65 110.47
GBP Hedged DistUS ($) Equivalent 315,771,960 323,237,499 264,829,817Net Assets 228,580,094 236,466,228 199,909,286Number of Shares Outstanding 2,184,522 2,186,209 1,952,328Net Asset Value Per Share1 104.64 108.16 102.40
USD AccNet Assets 724,997,904 722,972,477 986,614,917Number of Shares Outstanding 3,510,225 3,411,999 5,016,412Net Asset Value Per Share1 206.54 211.89 196.68
Investor USDNet Assets 147,393,307 177,058,806 169,113,339Number of Shares Outstanding 725,253 849,216 873,850Net Asset Value Per Share1 203.23 208.50 193.53
Institutional Plus USD AccNet Assets 819,395,941 680,522,066 850,061,307Number of Shares Outstanding 6,681,907 5,410,868 7,286,082Net Asset Value Per Share1 122.63 125.77 116.67
1 The net asset value per share shown may diverge from the net asset value per share used for dealing purposes because of any adjustments for swing pricing and trade date accounting.
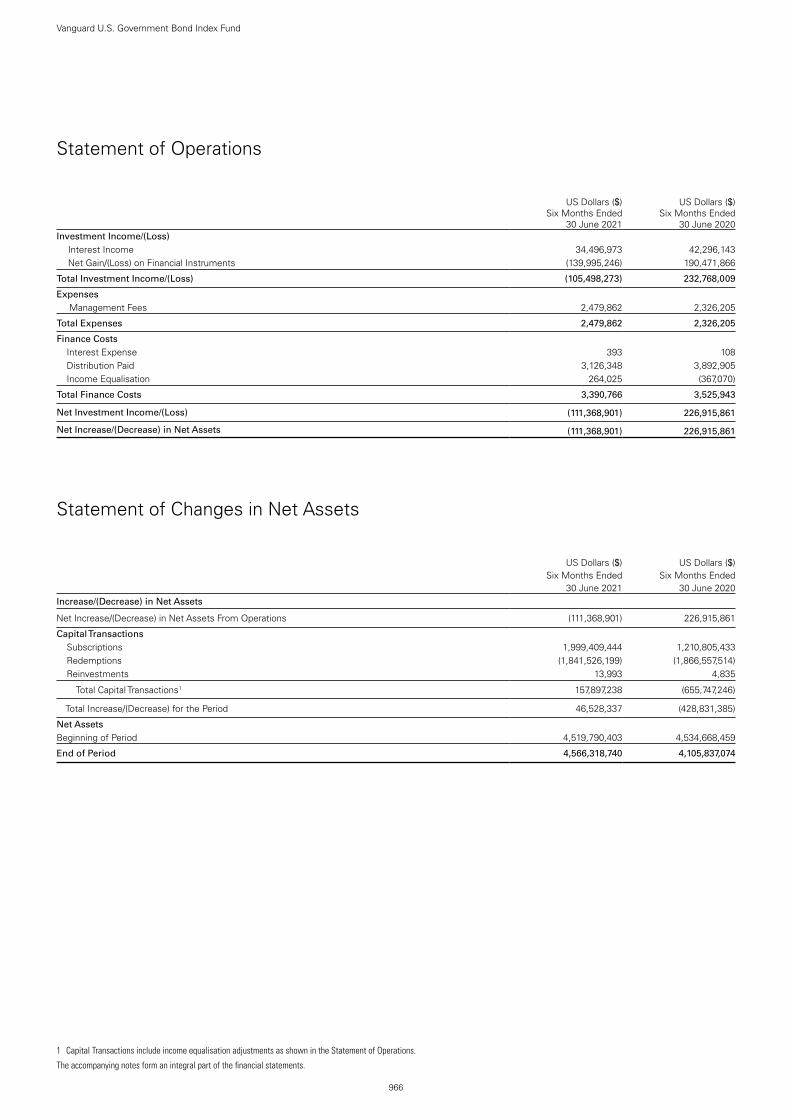
966
Vanguard U.S. Government Bond Index Fund
The accompanying notes form an integral part of the financial statements.
Statement of Operations
US Dollars ($)
Six Months Ended 30 June 2021
US Dollars ($)
Six Months Ended 30 June 2020
Investment Income/(Loss) Interest Income 34,496,973 42,296,143 Net Gain/(Loss) on Financial Instruments (139,995,246) 190,471,866
Total Investment Income/(Loss) (105,498,273) 232,768,009
Expenses Management Fees 2,479,862 2,326,205
Total Expenses 2,479,862 2,326,205
Finance Costs Interest Expense 393 108 Distribution Paid 3,126,348 3,892,905 Income Equalisation 264,025 (367,070)
Total Finance Costs 3,390,766 3,525,943
Net Investment Income/(Loss) (111,368,901) 226,915,861
Net Increase/(Decrease) in Net Assets (111,368,901) 226,915,861
Statement of Changes in Net Assets
US Dollars ($)
US Dollars ($)
Six Months Ended Six Months Ended30 June 2021 30 June 2020
Increase/(Decrease) in Net Assets
Net Increase/(Decrease) in Net Assets From Operations (111,368,901) 226,915,861
Capital Transactions Subscriptions 1,999,409,444 1,210,805,433 Redemptions (1,841,526,199) (1,866,557,514) Reinvestments 13,993 4,835
Total Capital Transactions1 157,897,238 (655,747,246)
Total Increase/(Decrease) for the Period 46,528,337 (428,831,385)
Net AssetsBeginning of Period 4,519,790,403 4,534,668,459
End of Period 4,566,318,740 4,105,837,074
1 Capital Transactions include income equalisation adjustments as shown in the Statement of Operations.

Vanguard U.S. Investment Grade Credit Index FundManaged by Vanguard Global Advisers, LLC.
967
Investment ObjectiveThis fund seeks to provide returns consistent with the performance of the Bloomberg Barclays Global Aggregate USD Credit Float Adjusted Bond Index, a market-weighted index designed to reflect the total universe of US dollar-denominated, investment-grade fixed income securities, excluding US Treasury, US government-related and securitised securities, with maturities greater than 1 year.
Performance SummaryThe Performance Summary does not form part of the Financial Statements.
• As the six months ended 30 June 2021 came to a close, macroeconomic indicators signalled a faster global economic rebound than many had expected after the sharpest contraction in modern history. Yet the recovery has been uneven. Countries that have contained the virus more successfully, whether through vaccinations, lockdowns or both, generally have fared better economically. And the COVID-19 pandemic remained far from over, with new variants of the virus surfacing where vaccination rates have lagged and the human toll continuing to mount, especially in less developed economies.
• Swift and extensive support from governments and central banks has been a key to the rebound. So far in 2021, it has included fiscal stimulus – including the $1.9 trillion American Rescue Plan in the United States and the €673 billion Recovery and Resilience Facility in Europe – and pledges by a number of central banks to keep interest rates low for some time.
• Stock markets worldwide continued the rally that began in 2020. The FTSE Global All Cap Index returned roughly 13% in US dollars for the six months ended 30 June 2021.
• Fixed income securities struggled amid concerns that an upturn in inflation might persist or even accelerate given the stronger-than-expected rebound in global growth, extraordinary monetary and fiscal stimulus and a jump in demand for goods and services as economies reopened and supply gradually picked up. With longer-term yields rising and prices falling, bonds returned about –3% in US dollars for the half year, as measured by the Bloomberg Barclays Global Aggregate Bond Index.
• In the US, the Federal Reserve expressed optimism about the economy and signalled that it might tighten its monetary policy sooner than expected. For now, it kept its target for short-term interest rates at 0%–0.25%. The yield of the bellwether US 10-year Treasury note finished the period at 1.47%, up from 0.91% six months earlier.
• In this environment, the fund’s benchmark returned –1.00% for the six months.
• Corporate bonds, which accounted for more than two-thirds of the index, slightly trailed the index as a whole. By sector, bonds issued by financial institutions held up better than those of industrial companies and utilities. By maturity, shorter-dated bonds outperformed those of longer maturities.
Benchmark returns in the commentary above are in US dollars.
Benchmark: Bloomberg Barclays Global Aggregate USD Credit Float Adjusted Bond Index
Total ReturnsPeriods Ended 30 June 2021
(Annualised for periods over one year)
Six Months Five YearsTen Years or
Since Inception1
EUR Acc 2.13 % 2.98 % 6.71 %
Benchmark 2.14 3.20 6.89
Tracking Difference* -0.01
Institutional Plus EUR Acc 2.15 % 3.13 % 6.78 %
Benchmark 2.14 3.20 6.77
Tracking Difference* 0.01
Institutional Plus EUR Hedged Acc -1.43 % 2.35 % 3.01 %
Benchmark -1.45 2.36 2.99
Tracking Difference* 0.02
GBP Hedged Acc -1.07 % 3.17 % 3.80 %
Benchmark -1.06 3.34 3.93
Tracking Difference* -0.01
Institutional Plus GBP Hedged Acc -1.05 % — 3.19 %
Benchmark -1.06 — 3.25
Tracking Difference* 0.01
Institutional Plus GBP Hedged Dist -1.05 % — 3.19 %
Benchmark -1.06 — 3.25
Tracking Difference* 0.01

968
Vanguard U.S. Investment Grade Credit Index Fund
Total ReturnsPeriods Ended 30 June 2021
(Annualised for periods over one year)
Six Months Five YearsTen Years or
Since Inception1
USD Acc -1.02 % 4.37 % 4.64 %
Benchmark -1.00 4.56 4.76
Tracking Difference* -0.02
Institutional Plus USD Acc -1.00 % 4.48 % 4.79 %
Benchmark -1.00 4.56 4.81
Tracking Difference* —
Institutional Plus USD Dist -1.00 % 4.48 % 5.02 %
Benchmark -1.00 4.56 5.06
Tracking Difference* —
Each benchmark is in its respective currency.Sources: Vanguard Global Advisers, LLC, and Bloomberg.Performance is based on NAV with net income reinvested.
All of the returns in this report represent past performance, which is not a guarantee of future results that may be achieved by the fund. For performance data current to the most recent month-end, which may be higher or lower than that cited, visit our website at http://global.vanguard.com. Note, too, that both investment returns and principal value can fluctuate widely, so an investor's shares, when sold, could be worth more or less than their original cost.* The tracking difference between the fund return and the index return over a stated period of time can be attributed to a number of factors, including, without limitation, small differences in
weightings, trading activity, transaction costs and differences in the valuation and withholding tax treatment between the fund and the index vendor.1 Since-inception returns: Institutional Plus EUR Acc, 19 December 2013; Institutional Plus EUR Hedged Acc, 24 September 2015; GBP Hedged Acc, 31 January 2014; Institutional Plus GBP Heged Acc
and Institutional Plus GBP Hedged Dist, 8 September 2016; Institutional Plus USD Acc, 6 December 2013; Institutional Plus USD Dist, 24 September 2015.

Significant Portfolio ChangesFor the Six Months Ended 30 June 2021
969
Vanguard U.S. Investment Grade Credit Index Fund
The Central Bank of Ireland requires a schedule of material changes in the composition of the portfolio during the period. These are defined as aggregate purchases of a security exceeding 1% of the total value of purchases for the period and aggregate disposals greater than 1% of the total value of sales. At a minimum, the largest 20 purchases and 20 sales must be shown; all purchases and sales must be shown if there are fewer than 20. A full listing of the portfolio changes for the period is available, upon request, at no extra cost from the Administrator.
Principal US Dollars ($)
Cost US Dollars ($)
Purchases
US Treasury Note 1.13% 15/2/2031 10,349,000 9,976,230US Treasury Note 0.88% 15/11/2030 8,592,000 8,432,905US Treasury Note 0.38% 31/12/2025 6,901,000 6,885,341US Treasury Note 0.13% 31/12/2022 5,579,000 5,577,812US Treasury Note 0.13% 31/3/2023 5,346,000 5,343,682US Treasury Note 1.63% 15/5/2031 4,454,000 4,479,322US Treasury Note 0.13% 15/1/2024 4,290,000 4,281,756US Treasury Note 0.25% 15/5/2024 4,171,000 4,162,945US Treasury Note 0.50% 28/2/2026 4,125,000 4,070,633US Treasury Note 0.13% 28/2/2023 3,784,000 3,782,051US Treasury Bond 1.63% 15/11/2050 4,315,000 3,695,165US Treasury Note 0.38% 31/1/2026 3,700,000 3,671,873US Treasury Bond 1.38% 15/8/2050 3,960,000 3,557,296US Treasury Note 0.75% 30/4/2026 3,053,000 3,044,706US Treasury Note 0.13% 15/2/2024 3,000,000 2,992,083US Treasury Bond 1.88% 15/2/2051 3,231,000 2,973,383US Treasury Note 0.75% 31/5/2026 2,735,000 2,729,398US Treasury Note 0.13% 15/12/2023 2,675,000 2,667,969JPMorgan Chase & Co. 3.30%
1/4/2026 1,374,000 1,501,397KFW 0.25% 19/10/2023 1,500,000 1,498,590
Principal US Dollars ($)
Proceeds US Dollars ($)
Sales
US Treasury Note 0.88% 15/11/2030 11,592,000 11,387,983US Treasury Note 1.13% 15/2/2031 10,349,000 9,960,234US Treasury Note 0.38% 31/12/2025 6,901,000 6,886,025US Treasury Note 0.13% 15/12/2023 6,780,000 6,770,733US Treasury Note 0.13% 31/12/2022 5,579,000 5,578,218US Treasury Note 0.13% 31/3/2023 5,346,000 5,342,581US Treasury Note 1.63% 15/5/2031 4,404,000 4,429,159US Treasury Note 0.13% 15/1/2024 4,290,000 4,279,008US Treasury Note 0.25% 15/5/2024 4,171,000 4,163,559US Treasury Note 0.50% 28/2/2026 4,125,000 4,068,181US Treasury Note 0.13% 28/2/2023 3,784,000 3,783,162US Treasury Bond 1.63% 15/11/2050 4,315,000 3,685,917US Treasury Note 0.38% 31/1/2026 3,700,000 3,667,527US Treasury Bond 1.38% 15/8/2050 3,960,000 3,534,807US Treasury Note 0.38% 30/11/2025 3,185,000 3,190,723US Treasury Note 0.75% 30/4/2026 3,053,000 3,044,943US Treasury Note 0.13% 15/2/2024 3,000,000 2,986,342US Treasury Bond 1.88% 15/2/2051 3,231,000 2,972,940US Treasury Note 0.75% 31/5/2026 2,720,000 2,714,329Bank of America Corp. 3.00%
20/12/2023 2,475,000 2,593,200
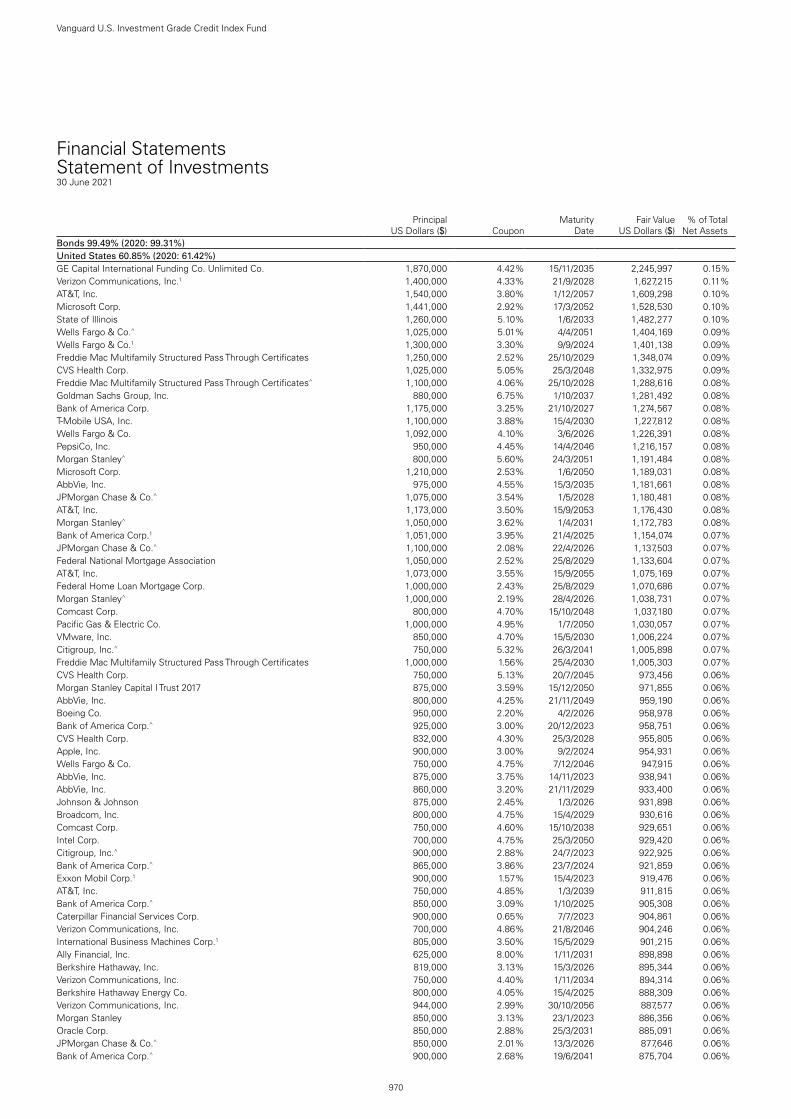
970
Vanguard U.S. Investment Grade Credit Index Fund
Financial StatementsStatement of Investments30 June 2021
Principal US Dollars ($) Coupon
Maturity Date
Fair Value US Dollars ($)
% of Total Net Assets
Bonds 99.49% (2020: 99.31%)United States 60.85% (2020: 61.42%) . .GE Capital International Funding Co. Unlimited Co. 1,870,000 4.42% 15/11/2035 2,245,997 0.15%Verizon Communications, Inc.1 1,400,000 4.33% 21/9/2028 1,627,215 0.11%AT&T, Inc. 1,540,000 3.80% 1/12/2057 1,609,298 0.10%Microsoft Corp. 1,441,000 2.92% 17/3/2052 1,528,530 0.10%State of Illinois 1,260,000 5.10% 1/6/2033 1,482,277 0.10%Wells Fargo & Co.^ 1,025,000 5.01% 4/4/2051 1,404,169 0.09%Wells Fargo & Co.1 1,300,000 3.30% 9/9/2024 1,401,138 0.09%Freddie Mac Multifamily Structured Pass Through Certificates 1,250,000 2.52% 25/10/2029 1,348,074 0.09%CVS Health Corp. 1,025,000 5.05% 25/3/2048 1,332,975 0.09%Freddie Mac Multifamily Structured Pass Through Certificates^ 1,100,000 4.06% 25/10/2028 1,288,616 0.08%Goldman Sachs Group, Inc. 880,000 6.75% 1/10/2037 1,281,492 0.08%Bank of America Corp. 1,175,000 3.25% 21/10/2027 1,274,567 0.08%T-Mobile USA, Inc. 1,100,000 3.88% 15/4/2030 1,227,812 0.08%Wells Fargo & Co. 1,092,000 4.10% 3/6/2026 1,226,391 0.08%PepsiCo, Inc. 950,000 4.45% 14/4/2046 1,216,157 0.08%Morgan Stanley^ 800,000 5.60% 24/3/2051 1,191,484 0.08%Microsoft Corp. 1,210,000 2.53% 1/6/2050 1,189,031 0.08%AbbVie, Inc. 975,000 4.55% 15/3/2035 1,181,661 0.08%JPMorgan Chase & Co.^ 1,075,000 3.54% 1/5/2028 1,180,481 0.08%AT&T, Inc. 1,173,000 3.50% 15/9/2053 1,176,430 0.08%Morgan Stanley^ 1,050,000 3.62% 1/4/2031 1,172,783 0.08%Bank of America Corp.1 1,051,000 3.95% 21/4/2025 1,154,074 0.07%JPMorgan Chase & Co.^ 1,100,000 2.08% 22/4/2026 1,137,503 0.07%Federal National Mortgage Association 1,050,000 2.52% 25/8/2029 1,133,604 0.07%AT&T, Inc. 1,073,000 3.55% 15/9/2055 1,075,169 0.07%Federal Home Loan Mortgage Corp. 1,000,000 2.43% 25/8/2029 1,070,686 0.07%Morgan Stanley^ 1,000,000 2.19% 28/4/2026 1,038,731 0.07%Comcast Corp. 800,000 4.70% 15/10/2048 1,037,180 0.07%Pacific Gas & Electric Co. 1,000,000 4.95% 1/7/2050 1,030,057 0.07%VMware, Inc. 850,000 4.70% 15/5/2030 1,006,224 0.07%Citigroup, Inc.^ 750,000 5.32% 26/3/2041 1,005,898 0.07%Freddie Mac Multifamily Structured Pass Through Certificates 1,000,000 1.56% 25/4/2030 1,005,303 0.07%CVS Health Corp. 750,000 5.13% 20/7/2045 973,456 0.06%Morgan Stanley Capital I Trust 2017 875,000 3.59% 15/12/2050 971,855 0.06%AbbVie, Inc. 800,000 4.25% 21/11/2049 959,190 0.06%Boeing Co. 950,000 2.20% 4/2/2026 958,978 0.06%Bank of America Corp.^ 925,000 3.00% 20/12/2023 958,751 0.06%CVS Health Corp. 832,000 4.30% 25/3/2028 955,805 0.06%Apple, Inc. 900,000 3.00% 9/2/2024 954,931 0.06%Wells Fargo & Co. 750,000 4.75% 7/12/2046 947,915 0.06%AbbVie, Inc. 875,000 3.75% 14/11/2023 938,941 0.06%AbbVie, Inc. 860,000 3.20% 21/11/2029 933,400 0.06%Johnson & Johnson 875,000 2.45% 1/3/2026 931,898 0.06%Broadcom, Inc. 800,000 4.75% 15/4/2029 930,616 0.06%Comcast Corp. 750,000 4.60% 15/10/2038 929,651 0.06%Intel Corp. 700,000 4.75% 25/3/2050 929,420 0.06%Citigroup, Inc.^ 900,000 2.88% 24/7/2023 922,925 0.06%Bank of America Corp.^ 865,000 3.86% 23/7/2024 921,859 0.06%Exxon Mobil Corp.1 900,000 1.57% 15/4/2023 919,476 0.06%AT&T, Inc. 750,000 4.85% 1/3/2039 911,815 0.06%Bank of America Corp.^ 850,000 3.09% 1/10/2025 905,308 0.06%Caterpillar Financial Services Corp. 900,000 0.65% 7/7/2023 904,861 0.06%Verizon Communications, Inc. 700,000 4.86% 21/8/2046 904,246 0.06%International Business Machines Corp.1 805,000 3.50% 15/5/2029 901,215 0.06%Ally Financial, Inc. 625,000 8.00% 1/11/2031 898,898 0.06%Berkshire Hathaway, Inc. 819,000 3.13% 15/3/2026 895,344 0.06%Verizon Communications, Inc. 750,000 4.40% 1/11/2034 894,314 0.06%Berkshire Hathaway Energy Co. 800,000 4.05% 15/4/2025 888,309 0.06%Verizon Communications, Inc. 944,000 2.99% 30/10/2056 887,577 0.06%Morgan Stanley 850,000 3.13% 23/1/2023 886,356 0.06%Oracle Corp. 850,000 2.88% 25/3/2031 885,091 0.06%JPMorgan Chase & Co.^ 850,000 2.01% 13/3/2026 877,646 0.06%Bank of America Corp.^ 900,000 2.68% 19/6/2041 875,704 0.06%

971
Vanguard U.S. Investment Grade Credit Index Fund
Principal
US Dollars ($) CouponMaturity
DateFair Value
US Dollars ($)% of Total
Net AssetsSouthern Co.^ 825,000 4.00% 15/1/2051 874,931 0.06%Verizon Communications, Inc.1 725,000 4.50% 10/8/2033 867,543 0.06%JPMorgan Chase & Co.^ 825,000 2.74% 15/10/2030 865,031 0.06%Boeing Co. 640,000 5.81% 1/5/2050 863,543 0.06%JPMorgan Chase & Co.^ 720,000 4.49% 24/3/2031 853,335 0.06%Charter Communications Operating LLC/Charter Communications
Operating Capital 750,000 4.91% 23/7/2025 850,407 0.06%CVS Health Corp. 688,000 4.78% 25/3/2038 846,265 0.05%GE Capital Funding LLC 725,000 4.40% 15/5/2030 845,064 0.05%Morgan Stanley 550,000 6.38% 24/7/2042 843,149 0.05%Bank of America Corp.^ 820,000 2.50% 13/2/2031 838,399 0.05%Wells Fargo & Co.^ 800,000 2.41% 30/10/2025 837,008 0.05%International Business Machines Corp. 675,000 4.25% 15/5/2049 834,904 0.05%Merck & Co., Inc. 715,000 3.70% 10/2/2045 826,796 0.05%Mileage Plus Holdings LLC/Mileage Plus Intellectual Property Assets Ltd. 750,000 6.50% 20/6/2027 825,755 0.05%Verizon Communications, Inc. 665,000 4.52% 15/9/2048 820,885 0.05%Oracle Corp. 750,000 3.95% 25/3/2051 819,528 0.05%Chevron Corp. 800,000 1.55% 11/5/2025 819,205 0.05%Walmart, Inc. 650,000 4.05% 29/6/2048 817,845 0.05%Bristol-Myers Squibb Co. 730,000 3.40% 26/7/2029 817,744 0.05%Carrier Global Corp. 785,000 2.24% 15/2/2025 816,699 0.05%Goldman Sachs Group, Inc. 750,000 3.50% 1/4/2025 813,419 0.05%Lennar Corp. 700,000 4.75% 29/11/2027 808,880 0.05%Dell International LLC/EMC Corp. 700,000 4.90% 1/10/2026 807,772 0.05%JPMorgan Chase & Co.^ 700,000 4.20% 23/7/2029 803,793 0.05%Verizon Communications, Inc. 700,000 4.02% 3/12/2029 802,970 0.05%Fidelity National Information Services, Inc. 800,000 1.15% 1/3/2026 793,677 0.05%Wells Fargo & Co.^ 670,000 4.48% 4/4/2031 792,220 0.05%WRKCo, Inc. 700,000 3.90% 1/6/2028 790,883 0.05%JPMorgan Chase & Co.^ 750,000 2.96% 13/5/2031 788,243 0.05%General Motors Co. 625,000 6.80% 1/10/2027 786,821 0.05%Toyota Motor Credit Corp. 750,000 2.90% 30/3/2023 783,207 0.05%Morgan Stanley^ 705,000 3.59% 22/7/2028 781,136 0.05%JPMBB Commercial Mortgage Securities Trust 2015 716,000 3.80% 15/8/2048 780,452 0.05%Bristol-Myers Squibb Co. 645,000 4.13% 15/6/2039 779,810 0.05%AbbVie, Inc. 725,000 2.95% 21/11/2026 779,402 0.05%Bank of America Corp. 585,000 5.00% 21/1/2044 779,102 0.05%Citigroup, Inc. 755,000 2.70% 27/10/2022 776,594 0.05%Mastercard, Inc. 700,000 3.30% 26/3/2027 774,003 0.05%T-Mobile USA, Inc. 700,000 3.75% 15/4/2027 773,566 0.05%Citigroup, Inc.^ 750,000 2.57% 3/6/2031 770,765 0.05%Bank of America Corp.1 700,000 3.50% 19/4/2026 770,508 0.05%Oracle Corp. 730,000 3.60% 1/4/2040 770,077 0.05%WFRBS Commercial Mortgage Trust 2014 725,010 3.41% 15/8/2047 767,245 0.05%Bank of America Corp.^ 750,000 1.49% 19/5/2024 763,255 0.05%Verizon Communications, Inc.1 700,000 3.38% 15/2/2025 760,524 0.05%Cigna Corp. 600,000 4.80% 15/7/2046 759,521 0.05%Charter Communications Operating LLC/Charter Communications
Operating Capital 550,000 6.48% 23/10/2045 759,116 0.05%CVS Health Corp. 684,000 3.88% 20/7/2025 755,230 0.05%Citigroup, Inc. 673,000 4.40% 10/6/2025 751,830 0.05%Boeing Co. 580,000 5.71% 1/5/2040 748,349 0.05%Verizon Communications, Inc. 700,000 3.55% 22/3/2051 747,990 0.05%Discover Financial Services 665,000 4.10% 9/2/2027 745,198 0.05%Exxon Mobil Corp. 600,000 4.33% 19/3/2050 744,810 0.05%Bank of America Corp. 470,000 7.75% 14/5/2038 744,589 0.05%AbbVie, Inc. 725,000 2.30% 21/11/2022 744,181 0.05%Bank of America Corp.^ 725,000 2.82% 21/7/2023 743,034 0.05%Cigna Corp. 725,000 2.40% 15/3/2030 740,251 0.05%Oracle Corp. 700,000 2.65% 15/7/2026 738,802 0.05%AbbVie, Inc. 700,000 2.60% 21/11/2024 738,391 0.05%AT&T, Inc. 637,000 4.30% 15/2/2030 736,500 0.05%Crown Castle International Corp. 650,000 4.45% 15/2/2026 733,802 0.05%Goldman Sachs Group, Inc. 495,000 6.25% 1/2/2041 733,130 0.05%Apple, Inc. 550,000 4.65% 23/2/2046 729,786 0.05%AT&T, Inc. 715,000 3.65% 15/9/2059 724,384 0.05%Dell International LLC/EMC Corp. 600,000 6.02% 15/6/2026 719,611 0.05%Gilead Sciences, Inc. 651,000 3.65% 1/3/2026 718,000 0.05%Exxon Mobil Corp. 600,000 4.23% 19/3/2040 717,982 0.05%Raytheon Technologies Corp. 575,000 4.50% 1/6/2042 715,695 0.05%Apple, Inc.1 705,000 0.75% 11/5/2023 710,844 0.05%

972
Vanguard U.S. Investment Grade Credit Index Fund
Principal
US Dollars ($) CouponMaturity
DateFair Value
US Dollars ($)% of Total
Net AssetsCigna Corp. 570,000 4.80% 15/8/2038 709,944 0.05%PacifiCorp 500,000 6.00% 15/1/2039 707,860 0.05%UnitedHealth Group, Inc. 635,000 3.70% 15/12/2025 707,007 0.05%Citigroup, Inc.^ 600,000 4.41% 31/3/2031 701,460 0.05%Prologis LP 727,000 1.63% 15/3/2031 700,566 0.05%Comcast Corp. 600,000 3.97% 1/11/2047 699,964 0.05%Wells Fargo & Co.1 650,000 3.00% 22/4/2026 699,079 0.05%Exxon Mobil Corp. 650,000 2.99% 19/3/2025 697,425 0.05%Microsoft Corp. 625,000 3.30% 6/2/2027 695,591 0.04%JPMorgan Chase & Co. 525,000 4.95% 1/6/2045 695,258 0.04%Broadcom, Inc. 656,000 3.47% 15/4/2034 694,311 0.04%Home Depot, Inc. 650,000 3.13% 15/12/2049 688,946 0.04%Truist Bank 613,000 4.05% 3/11/2025 688,927 0.04%Federal National Mortgage Association^ 600,000 3.70% 25/8/2028 688,012 0.04%Bank of America Corp.^ 575,000 4.08% 20/3/2051 686,270 0.04%Comcast Corp. 625,000 3.15% 15/2/2028 685,357 0.04%Bank of America Corp.^ 550,000 4.44% 20/1/2048 681,685 0.04%Walmart, Inc.1 500,000 5.25% 1/9/2035 680,972 0.04%Realty Income Corp. 600,000 4.13% 15/10/2026 680,203 0.04%Goldman Sachs Group, Inc. 629,000 3.50% 23/1/2025 679,992 0.04%MPLX LP 525,000 5.50% 15/2/2049 679,296 0.04%Enterprise Products Operating LLC 550,000 4.85% 15/3/2044 674,812 0.04%Halliburton Co. 550,000 5.00% 15/11/2045 671,542 0.04%Microsoft Corp. 650,000 2.38% 1/5/2023 671,535 0.04%Microsoft Corp. 615,000 3.13% 3/11/2025 671,058 0.04%Bank of America Corp.^ 650,000 2.59% 29/4/2031 669,116 0.04%JPMorgan Chase & Co.^ 550,000 4.26% 22/2/2048 668,935 0.04%Visa, Inc. 520,000 4.30% 14/12/2045 668,647 0.04%Walt Disney Co. 650,000 1.75% 13/1/2026 668,349 0.04%Bristol-Myers Squibb Co. 625,000 2.90% 26/7/2024 666,493 0.04%WFRBS Commercial Mortgage Trust 2013 649,005 3.07% 15/6/2046 665,558 0.04%QUALCOMM, Inc. 600,000 3.25% 20/5/2027 662,592 0.04%Oracle Corp. 625,000 3.85% 1/4/2060 661,760 0.04%Wells Fargo & Co.^ 600,000 3.58% 22/5/2028 660,591 0.04%State Street Corp. 615,000 2.65% 19/5/2026 658,625 0.04%Boeing Co. 475,000 5.93% 1/5/2060 655,186 0.04%Pfizer, Inc. 400,000 7.20% 15/3/2039 655,159 0.04%Pacific Gas & Electric Co. 625,000 3.45% 1/7/2025 654,961 0.04%Apple, Inc.1 550,000 3.85% 4/5/2043 654,621 0.04%PacifiCorp1 500,000 5.25% 15/6/2035 650,922 0.04%Union Pacific Corp. 625,000 2.89% 6/4/2036 650,154 0.04%Wells Fargo & Co.^ 625,000 2.19% 30/4/2026 648,866 0.04%Oracle Corp. 500,000 5.38% 15/7/2040 648,023 0.04%Sabine Pass Liquefaction LLC 600,000 5.63% 15/4/2023 644,856 0.04%Bank of America Corp.^ 625,000 2.69% 22/4/2032 643,802 0.04%Citigroup, Inc.^ 600,000 3.11% 8/4/2026 641,902 0.04%American Tower Corp. 650,000 2.10% 15/6/2030 639,447 0.04%PacifiCorp 600,000 3.30% 15/3/2051 639,160 0.04%NextEra Energy Capital Holdings, Inc. 600,000 2.75% 1/5/2025 637,528 0.04%State of California 375,000 7.55% 1/4/2039 636,360 0.04%Caterpillar Financial Services Corp. 637,000 0.90% 2/3/2026 635,097 0.04%Enterprise Products Operating LLC 600,000 2.80% 31/1/2030 633,945 0.04%GS Mortgage Securities Trust 2016 590,000 3.18% 10/11/2049 633,378 0.04%Fiserv, Inc. 600,000 2.75% 1/7/2024 632,687 0.04%Truist Financial Corp. 600,000 2.50% 1/8/2024 632,627 0.04%AT&T, Inc. 625,000 1.70% 25/3/2026 631,715 0.04%Bristol-Myers Squibb Co. 500,000 4.25% 26/10/2049 631,518 0.04%PepsiCo, Inc.1 625,000 0.75% 1/5/2023 630,205 0.04%ConocoPhillips 425,000 6.50% 1/2/2039 628,607 0.04%Duke Energy Florida LLC 425,000 6.40% 15/6/2038 627,335 0.04%T-Mobile USA, Inc. 525,000 4.50% 15/4/2050 624,541 0.04%Citigroup, Inc. 575,000 3.20% 21/10/2026 622,995 0.04%Boeing Co. 575,000 3.63% 1/2/2031 618,489 0.04%Lowe's Cos, Inc. 566,000 3.10% 3/5/2027 617,664 0.04%UnitedHealth Group, Inc. 470,000 4.75% 15/7/2045 616,159 0.04%JPMorgan Chase & Co.^ 525,000 3.96% 15/11/2048 615,152 0.04%Charter Communications Operating LLC/Charter Communications
Operating Capital 500,000 5.38% 1/5/2047 613,112 0.04%ConocoPhillips Co.1 450,000 6.95% 15/4/2029 611,774 0.04%Nestle Holdings, Inc. 500,000 4.00% 24/9/2048 609,311 0.04%Dell International LLC/EMC Corp. 372,000 8.35% 15/7/2046 608,610 0.04%
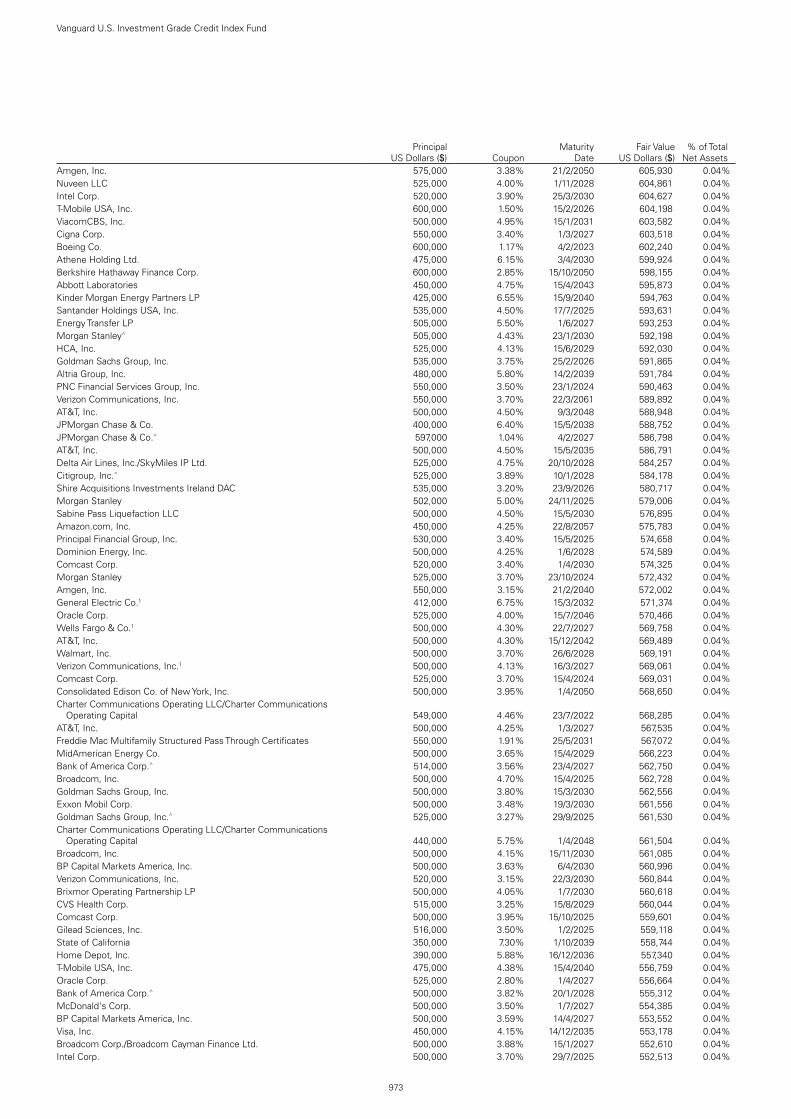
973
Vanguard U.S. Investment Grade Credit Index Fund
Principal
US Dollars ($) CouponMaturity
DateFair Value
US Dollars ($)% of Total
Net AssetsAmgen, Inc. 575,000 3.38% 21/2/2050 605,930 0.04%Nuveen LLC 525,000 4.00% 1/11/2028 604,861 0.04%Intel Corp. 520,000 3.90% 25/3/2030 604,627 0.04%T-Mobile USA, Inc. 600,000 1.50% 15/2/2026 604,198 0.04%ViacomCBS, Inc. 500,000 4.95% 15/1/2031 603,582 0.04%Cigna Corp. 550,000 3.40% 1/3/2027 603,518 0.04%Boeing Co. 600,000 1.17% 4/2/2023 602,240 0.04%Athene Holding Ltd. 475,000 6.15% 3/4/2030 599,924 0.04%Berkshire Hathaway Finance Corp. 600,000 2.85% 15/10/2050 598,155 0.04%Abbott Laboratories 450,000 4.75% 15/4/2043 595,873 0.04%Kinder Morgan Energy Partners LP 425,000 6.55% 15/9/2040 594,763 0.04%Santander Holdings USA, Inc. 535,000 4.50% 17/7/2025 593,631 0.04%Energy Transfer LP 505,000 5.50% 1/6/2027 593,253 0.04%Morgan Stanley^ 505,000 4.43% 23/1/2030 592,198 0.04%HCA, Inc. 525,000 4.13% 15/6/2029 592,030 0.04%Goldman Sachs Group, Inc. 535,000 3.75% 25/2/2026 591,865 0.04%Altria Group, Inc. 480,000 5.80% 14/2/2039 591,784 0.04%PNC Financial Services Group, Inc. 550,000 3.50% 23/1/2024 590,463 0.04%Verizon Communications, Inc. 550,000 3.70% 22/3/2061 589,892 0.04%AT&T, Inc. 500,000 4.50% 9/3/2048 588,948 0.04%JPMorgan Chase & Co. 400,000 6.40% 15/5/2038 588,752 0.04%JPMorgan Chase & Co.^ 597,000 1.04% 4/2/2027 586,798 0.04%AT&T, Inc. 500,000 4.50% 15/5/2035 586,791 0.04%Delta Air Lines, Inc./SkyMiles IP Ltd. 525,000 4.75% 20/10/2028 584,257 0.04%Citigroup, Inc.^ 525,000 3.89% 10/1/2028 584,178 0.04%Shire Acquisitions Investments Ireland DAC 535,000 3.20% 23/9/2026 580,717 0.04%Morgan Stanley 502,000 5.00% 24/11/2025 579,006 0.04%Sabine Pass Liquefaction LLC 500,000 4.50% 15/5/2030 576,895 0.04%Amazon.com, Inc. 450,000 4.25% 22/8/2057 575,783 0.04%Principal Financial Group, Inc. 530,000 3.40% 15/5/2025 574,658 0.04%Dominion Energy, Inc. 500,000 4.25% 1/6/2028 574,589 0.04%Comcast Corp. 520,000 3.40% 1/4/2030 574,325 0.04%Morgan Stanley 525,000 3.70% 23/10/2024 572,432 0.04%Amgen, Inc. 550,000 3.15% 21/2/2040 572,002 0.04%General Electric Co.1 412,000 6.75% 15/3/2032 571,374 0.04%Oracle Corp. 525,000 4.00% 15/7/2046 570,466 0.04%Wells Fargo & Co.1 500,000 4.30% 22/7/2027 569,758 0.04%AT&T, Inc. 500,000 4.30% 15/12/2042 569,489 0.04%Walmart, Inc. 500,000 3.70% 26/6/2028 569,191 0.04%Verizon Communications, Inc.1 500,000 4.13% 16/3/2027 569,061 0.04%Comcast Corp. 525,000 3.70% 15/4/2024 569,031 0.04%Consolidated Edison Co. of New York, Inc. 500,000 3.95% 1/4/2050 568,650 0.04%Charter Communications Operating LLC/Charter Communications
Operating Capital 549,000 4.46% 23/7/2022 568,285 0.04%AT&T, Inc. 500,000 4.25% 1/3/2027 567,535 0.04%Freddie Mac Multifamily Structured Pass Through Certificates 550,000 1.91% 25/5/2031 567,072 0.04%MidAmerican Energy Co. 500,000 3.65% 15/4/2029 566,223 0.04%Bank of America Corp.^ 514,000 3.56% 23/4/2027 562,750 0.04%Broadcom, Inc. 500,000 4.70% 15/4/2025 562,728 0.04%Goldman Sachs Group, Inc. 500,000 3.80% 15/3/2030 562,556 0.04%Exxon Mobil Corp. 500,000 3.48% 19/3/2030 561,556 0.04%Goldman Sachs Group, Inc.^ 525,000 3.27% 29/9/2025 561,530 0.04%Charter Communications Operating LLC/Charter Communications
Operating Capital 440,000 5.75% 1/4/2048 561,504 0.04%Broadcom, Inc. 500,000 4.15% 15/11/2030 561,085 0.04%BP Capital Markets America, Inc. 500,000 3.63% 6/4/2030 560,996 0.04%Verizon Communications, Inc. 520,000 3.15% 22/3/2030 560,844 0.04%Brixmor Operating Partnership LP 500,000 4.05% 1/7/2030 560,618 0.04%CVS Health Corp. 515,000 3.25% 15/8/2029 560,044 0.04%Comcast Corp. 500,000 3.95% 15/10/2025 559,601 0.04%Gilead Sciences, Inc. 516,000 3.50% 1/2/2025 559,118 0.04%State of California 350,000 7.30% 1/10/2039 558,744 0.04%Home Depot, Inc. 390,000 5.88% 16/12/2036 557,340 0.04%T-Mobile USA, Inc. 475,000 4.38% 15/4/2040 556,759 0.04%Oracle Corp. 525,000 2.80% 1/4/2027 556,664 0.04%Bank of America Corp.^ 500,000 3.82% 20/1/2028 555,312 0.04%McDonald's Corp. 500,000 3.50% 1/7/2027 554,385 0.04%BP Capital Markets America, Inc. 500,000 3.59% 14/4/2027 553,552 0.04%Visa, Inc. 450,000 4.15% 14/12/2035 553,178 0.04%Broadcom Corp./Broadcom Cayman Finance Ltd. 500,000 3.88% 15/1/2027 552,610 0.04%Intel Corp. 500,000 3.70% 29/7/2025 552,513 0.04%

974
Vanguard U.S. Investment Grade Credit Index Fund
Principal
US Dollars ($) CouponMaturity
DateFair Value
US Dollars ($)% of Total
Net AssetsAmazon.com, Inc. 500,000 3.15% 22/8/2027 552,400 0.04%Goldman Sachs Group, Inc.^ 500,000 3.69% 5/6/2028 552,205 0.04%PNC Bank NA 500,000 3.25% 22/1/2028 552,002 0.04%AT&T, Inc. 530,000 3.50% 1/6/2041 551,701 0.04%American Tower Corp. 500,000 4.00% 1/6/2025 550,455 0.04%General Motors Co. 500,000 5.40% 2/10/2023 550,432 0.04%Fiserv, Inc. 500,000 3.50% 1/7/2029 550,412 0.04%International Business Machines Corp.1 500,000 3.30% 15/5/2026 549,860 0.04%Apple, Inc. 500,000 3.25% 23/2/2026 549,058 0.04%Duke Energy Carolinas LLC 475,000 3.88% 15/3/2046 548,683 0.04%AT&T, Inc. 530,000 2.30% 1/6/2027 548,488 0.04%Citigroup Commercial Mortgage Trust 2016 500,000 3.62% 10/2/2049 548,032 0.04%Microsoft Corp. 550,000 2.68% 1/6/2060 547,604 0.04%Simon Property Group LP 500,000 3.50% 1/9/2025 547,586 0.04%Johnson & Johnson 500,000 2.90% 15/1/2028 546,940 0.04%Bank of America Corp.^ 507,000 3.37% 23/1/2026 546,451 0.04%Enterprise Products Operating LLC 500,000 3.75% 15/2/2025 545,093 0.04%Oracle Corp. 500,000 4.00% 15/11/2047 545,084 0.04%JPMorgan Chase & Co. 500,000 3.20% 15/6/2026 544,480 0.04%Exxon Mobil Corp. 500,000 3.45% 15/4/2051 544,083 0.04%Walt Disney Co. 500,000 3.35% 24/3/2025 543,749 0.04%Boeing Co. 510,000 4.51% 1/5/2023 543,584 0.04%Federal Home Loan Mortgage Corp. 500,000 2.65% 25/11/2029 543,521 0.04%LYB International Finance III LLC 500,000 3.38% 1/5/2030 543,226 0.04%Oracle Corp. 500,000 3.25% 15/11/2027 543,049 0.04%Amazon.com, Inc. 445,000 4.05% 22/8/2047 542,547 0.04%American Honda Finance Corp. 525,000 2.60% 16/11/2022 541,616 0.04%DuPont de Nemours, Inc. 500,000 4.21% 15/11/2023 541,308 0.04%Duke Energy Corp. 500,000 3.15% 15/8/2027 540,910 0.03%Federal Home Loan Mortgage Corp. 500,000 2.54% 25/10/2029 538,950 0.03%Bristol-Myers Squibb Co. 425,000 4.35% 15/11/2047 538,747 0.03%Delta Air Lines, Inc./SkyMiles IP Ltd. 500,000 4.50% 20/10/2025 538,289 0.03%CVS Health Corp. 500,000 2.88% 1/6/2026 537,132 0.03%Intercontinental Exchange, Inc. 484,000 3.75% 1/12/2025 536,106 0.03%Freddie Mac Multifamily Structured Pass Through Certificates^ 500,000 3.16% 25/5/2025 535,944 0.03%Goldman Sachs Group, Inc. 500,000 3.63% 20/2/2024 535,917 0.03%Pacific Gas & Electric Co. 500,000 4.55% 1/7/2030 534,869 0.03%Federal National Mortgage Association 500,000 2.47% 25/8/2029 534,437 0.03%Walt Disney Co. 400,000 4.70% 23/3/2050 533,898 0.03%JPMorgan Chase & Co.^ 500,000 3.33% 22/4/2052 533,613 0.03%Citigroup, Inc.^ 500,000 3.35% 24/4/2025 533,292 0.03%Huntington National Bank 500,000 3.55% 6/10/2023 532,960 0.03%Microsoft Corp. 500,000 2.40% 8/8/2026 532,830 0.03%Bank of New York Mellon Corp. 500,000 3.45% 11/8/2023 532,491 0.03%Oracle Corp. 500,000 2.95% 15/5/2025 532,478 0.03%KeyCorp1 472,000 4.15% 29/10/2025 532,298 0.03%Marriott International, Inc. 500,000 3.13% 15/6/2026 532,173 0.03%Morgan Stanley 500,000 4.10% 22/5/2023 532,063 0.03%ViacomCBS, Inc. 500,000 2.90% 15/1/2027 531,671 0.03%Oracle Corp. 500,000 3.63% 15/7/2023 531,248 0.03%Oracle Corp. 500,000 3.65% 25/3/2041 531,072 0.03%Oncor Electric Delivery Co. LLC 500,000 2.75% 1/6/2024 530,616 0.03%Comcast Corp. 450,000 4.00% 1/11/2049 529,971 0.03%Wells Fargo & Co.^ 500,000 2.88% 30/10/2030 529,605 0.03%Walmart, Inc. 500,000 3.40% 26/6/2023 529,494 0.03%Exxon Mobil Corp. 500,000 2.61% 15/10/2030 527,384 0.03%Entergy Louisiana LLC 450,000 4.00% 15/3/2033 527,252 0.03%Bank of America Corp.^ 500,000 2.88% 22/10/2030 526,356 0.03%Air Lease Corp. 500,000 2.88% 15/1/2026 525,873 0.03%American Honda Finance Corp. 500,000 2.40% 27/6/2024 525,506 0.03%DTE Energy Co. 500,000 2.53% 1/10/2024 525,285 0.03%Walt Disney Co. 500,000 2.65% 13/1/2031 525,109 0.03%Citigroup, Inc. 400,000 4.65% 23/7/2048 523,936 0.03%JPMorgan Chase & Co.^ 485,000 4.02% 5/12/2024 523,462 0.03%Bank of America Corp.^ 500,000 2.46% 22/10/2025 523,216 0.03%Medtronic, Inc. 420,000 4.38% 15/3/2035 522,727 0.03%Freddie Mac Multifamily Structured Pass Through Certificates 500,000 2.07% 25/1/2030 522,145 0.03%Hewlett Packard Enterprise Co. 500,000 4.40% 15/10/2022 521,841 0.03%Molson Coors Beverage Co. 425,000 5.00% 1/5/2042 521,288 0.03%Broadcom, Inc. 440,000 5.00% 15/4/2030 520,079 0.03%Verizon Communications, Inc. 393,000 5.01% 15/4/2049 520,008 0.03%

975
Vanguard U.S. Investment Grade Credit Index Fund
Principal
US Dollars ($) CouponMaturity
DateFair Value
US Dollars ($)% of Total
Net AssetsAT&T, Inc. 500,000 2.75% 1/6/2031 519,795 0.03%Apple, Inc. 500,000 2.85% 23/2/2023 519,232 0.03%Energy Transfer LP 500,000 3.60% 1/2/2023 518,771 0.03%Quanta Services, Inc. 500,000 2.90% 1/10/2030 518,655 0.03%Goldman Sachs Group, Inc. 500,000 2.60% 7/2/2030 518,543 0.03%Anthem, Inc. 425,000 4.38% 1/12/2047 518,475 0.03%Comcast Corp. 475,000 3.38% 15/8/2025 518,475 0.03%Raytheon Technologies Corp. 450,000 4.13% 16/11/2028 518,299 0.03%Visa, Inc. 500,000 1.90% 15/4/2027 516,616 0.03%Microsoft Corp. 500,000 2.00% 8/8/2023 516,372 0.03%Fiserv, Inc. 500,000 3.50% 1/10/2022 515,174 0.03%Morgan Stanley 475,000 3.13% 27/7/2026 514,230 0.03%Apple, Inc.1 475,000 3.45% 6/5/2024 514,169 0.03%CVS Health Corp. 500,000 3.50% 20/7/2022 513,981 0.03%Omega Healthcare Investors, Inc. 500,000 3.38% 1/2/2031 513,738 0.03%Goldman Sachs Group, Inc.^ 500,000 2.62% 22/4/2032 511,350 0.03%Apple, Inc. 430,000 3.85% 4/8/2046 510,745 0.03%Freddie Mac Multifamily Structured Pass Through Certificates 500,000 1.55% 25/1/2027 510,387 0.03%Time Warner Cable LLC 375,000 6.55% 1/5/2037 509,880 0.03%Teledyne Technologies, Inc. 500,000 2.25% 1/4/2028 509,437 0.03%Marathon Petroleum Corp. 425,000 5.00% 15/9/2054 508,170 0.03%Chevron Corp.1 500,000 1.14% 11/5/2023 507,438 0.03%Marriott International, Inc. 500,000 2.13% 3/10/2022 507,220 0.03%Oracle Corp. 500,000 1.65% 25/3/2026 506,933 0.03%Capital One Financial Corp. 471,000 3.20% 5/2/2025 506,192 0.03%Exelon Corp. 400,000 4.70% 15/4/2050 505,069 0.03%Coca-Cola Co.1 500,000 2.00% 5/3/2031 504,956 0.03%Lockheed Martin Corp. 404,000 4.09% 15/9/2052 504,948 0.03%Federal Home Loan Mortgage Corp. 498,047 2.37% 25/5/2022 504,887 0.03%Johnson & Johnson 425,000 3.70% 1/3/2046 504,709 0.03%Verizon Communications, Inc.1 475,000 2.63% 15/8/2026 504,643 0.03%Verizon Communications, Inc. 500,000 1.45% 20/3/2026 504,619 0.03%AT&T, Inc. 400,000 5.25% 1/3/2037 504,532 0.03%BlackRock, Inc. 451,000 3.25% 30/4/2029 504,378 0.03%Morgan Stanley^ 500,000 1.59% 4/5/2027 503,445 0.03%Pfizer, Inc. 475,000 3.20% 15/9/2023 502,836 0.03%MPLX LP 497,000 1.75% 1/3/2026 502,653 0.03%International Flavors & Fragrances, Inc. 500,000 0.70% 15/9/2022 500,495 0.03%Goldman Sachs Group, Inc.^ 500,000 0.63% 17/11/2023 500,271 0.03%Pacific Gas & Electric Co. 500,000 4.50% 1/7/2040 500,025 0.03%Morgan Stanley^ 500,000 0.53% 25/1/2024 499,839 0.03%JPMorgan Chase & Co.^ 500,000 0.82% 1/6/2025 498,918 0.03%Waste Management, Inc. 500,000 0.75% 15/11/2025 495,602 0.03%Apple, Inc. 505,000 2.65% 11/5/2050 494,956 0.03%KKR Group Finance Co. III LLC 380,000 5.13% 1/6/2044 494,714 0.03%Verisk Analytics, Inc. 447,000 4.00% 15/6/2025 494,588 0.03%Apple, Inc. 500,000 0.70% 8/2/2026 494,506 0.03%Bristol-Myers Squibb Co. 450,000 3.20% 15/6/2026 494,015 0.03%Bank of America Corp. 450,000 4.20% 26/8/2024 493,919 0.03%Berkshire Hathaway Finance Corp. 400,000 4.20% 15/8/2048 493,866 0.03%Comcast Corp. 410,000 4.40% 15/8/2035 493,789 0.03%Bank of America Corp.^ 400,000 4.33% 15/3/2050 493,146 0.03%Niagara Mohawk Power Corp. 500,000 1.96% 27/6/2030 493,061 0.03%Morgan Stanley^ 500,000 0.99% 10/12/2026 492,590 0.03%Broadcom, Inc. 500,000 2.45% 15/2/2031 492,057 0.03%JPMorgan Chase & Co. 475,000 3.25% 23/9/2022 492,046 0.03%American Express Co. 450,000 3.13% 20/5/2026 491,861 0.03%Coca-Cola Co.1 500,000 1.65% 1/6/2030 491,547 0.03%Oracle Corp. 461,000 2.95% 15/11/2024 491,154 0.03%Berkshire Hathaway Energy Co. 400,000 4.25% 15/10/2050 490,859 0.03%Cigna Corp. 437,000 4.13% 15/11/2025 489,827 0.03%Carrier Global Corp. 460,000 3.58% 5/4/2050 488,274 0.03%Entergy Louisiana LLC 400,000 4.20% 1/9/2048 488,095 0.03%Mylan, Inc. 425,000 4.55% 15/4/2028 487,746 0.03%Williams Cos, Inc. 446,000 3.90% 15/1/2025 487,622 0.03%Broadcom, Inc. 475,000 3.50% 15/2/2041 487,454 0.03%Morgan Stanley^ 500,000 1.93% 28/4/2032 486,287 0.03%Simon Property Group LP 480,000 3.25% 13/9/2049 486,015 0.03%BP Capital Markets America, Inc. 444,000 3.41% 11/2/2026 485,749 0.03%Chicago Transit Authority Sales & Transfer Tax Receipts Revenue 345,000 6.90% 1/12/2040 485,684 0.03%Berkshire Hathaway Energy Co. 500,000 2.85% 15/5/2051 485,473 0.03%

976
Vanguard U.S. Investment Grade Credit Index Fund
Principal
US Dollars ($) CouponMaturity
DateFair Value
US Dollars ($)% of Total
Net AssetsCoca-Cola Co. 500,000 1.00% 15/3/2028 485,099 0.03%Abbott Laboratories 355,000 4.90% 30/11/2046 484,470 0.03%John Deere Capital Corp. 500,000 1.45% 15/1/2031 483,407 0.03%FedEx Corp. 2020-1 Class AA Pass Through Trust 486,632 1.88% 20/2/2034 481,901 0.03%Morgan Stanley 425,000 4.35% 8/9/2026 481,642 0.03%Morgan Stanley^ 500,000 1.79% 13/2/2032 480,965 0.03%US Bank NA 450,000 2.80% 27/1/2025 480,831 0.03%JPMorgan Chase & Co. 350,000 5.50% 15/10/2040 479,403 0.03%Amazon.com, Inc. 450,000 2.80% 22/8/2024 478,924 0.03%Booking Holdings, Inc. 400,000 4.63% 13/4/2030 478,505 0.03%Energy Transfer LP 425,000 4.75% 15/1/2026 478,437 0.03%Charter Communications Operating LLC/Charter Communications
Operating Capital 480,000 3.70% 1/4/2051 477,677 0.03%Coca-Cola Co. 500,000 1.38% 15/3/2031 477,597 0.03%Eli Lilly & Co. 425,000 3.38% 15/3/2029 476,957 0.03%PNC Bank NA 421,000 4.20% 1/11/2025 476,859 0.03%Comcast Corp. 400,000 4.05% 1/11/2052 475,989 0.03%AutoZone, Inc. 500,000 1.65% 15/1/2031 475,837 0.03%Chubb INA Holdings, Inc. 500,000 1.38% 15/9/2030 475,664 0.03%Gilead Sciences, Inc. 375,000 4.75% 1/3/2046 475,502 0.03%General Electric Co. 316,000 6.88% 10/1/2039 474,243 0.03%Carrier Global Corp. 455,000 2.72% 15/2/2030 471,723 0.03%Marathon Petroleum Corp. 400,000 5.13% 15/12/2026 470,900 0.03%Mondelez International Holdings Netherlands BV 450,000 2.25% 19/9/2024 469,955 0.03%Phillips 66 375,000 4.88% 15/11/2044 469,545 0.03%Apple, Inc. 425,000 3.20% 11/5/2027 469,469 0.03%NBCUniversal Media LLC 325,000 5.95% 1/4/2041 469,093 0.03%JPMorgan Chase & Co. 448,000 3.20% 25/1/2023 467,962 0.03%Kinder Morgan, Inc. 450,000 3.15% 15/1/2023 467,276 0.03%Becton Dickinson & Co. 429,000 3.73% 15/12/2024 467,271 0.03%Delta Air Lines, Inc. 400,000 7.00% 1/5/2025 466,746 0.03%Jackson National Life Global Funding 425,000 3.88% 11/6/2025 466,672 0.03%Raymond James Financial, Inc. 360,000 4.95% 15/7/2046 465,577 0.03%Bank of America Corp.^ 423,000 3.59% 21/7/2028 465,293 0.03%Amazon.com, Inc. 450,000 2.88% 12/5/2041 464,575 0.03%General Motors Financial Co., Inc. 450,000 3.55% 8/7/2022 464,274 0.03%AEP Texas, Inc. 425,000 3.80% 1/10/2047 464,257 0.03%Comcast Corp. 400,000 4.15% 15/10/2028 463,169 0.03%Goldman Sachs Group, Inc. 425,000 4.00% 3/3/2024 461,643 0.03%Northern Trust Corp. 409,000 3.95% 30/10/2025 461,596 0.03%Cheniere Corpus Christi Holdings LLC 400,000 5.88% 31/3/2025 458,883 0.03%Gilead Sciences, Inc. 375,000 4.50% 1/2/2045 457,948 0.03%JPMorgan Chase & Co. 425,000 2.95% 1/10/2026 457,921 0.03%Goldman Sachs Group, Inc.^ 400,000 4.22% 1/5/2029 456,668 0.03%Energy Transfer LP 420,000 3.75% 15/5/2030 456,614 0.03%Discover Bank 406,000 4.25% 13/3/2026 456,058 0.03%Bank of America Corp.^ 418,000 3.42% 20/12/2028 455,758 0.03%Hewlett Packard Enterprise Co. 400,000 4.90% 15/10/2025 455,484 0.03%Broadcom, Inc. 400,000 4.30% 15/11/2032 455,446 0.03%Goldman Sachs Group, Inc. 416,000 3.75% 22/5/2025 455,183 0.03%Time Warner Cable LLC 325,000 6.75% 15/6/2039 454,999 0.03%Amgen, Inc. 375,000 4.40% 1/5/2045 454,746 0.03%Microsoft Corp. 425,000 3.04% 17/3/2062 454,426 0.03%Pfizer, Inc. 425,000 2.63% 1/4/2030 453,215 0.03%American Express Co. 400,000 4.20% 6/11/2025 452,854 0.03%Nevada Power Co. 439,000 2.40% 1/5/2030 452,598 0.03%Royalty Pharma plc 450,000 3.30% 2/9/2040 452,411 0.03%Wells Fargo Bank NA 425,000 3.55% 14/8/2023 452,233 0.03%Northrop Grumman Corp. 380,000 4.03% 15/10/2047 451,370 0.03%AbbVie, Inc. 371,000 4.40% 6/11/2042 450,911 0.03%Mastercard, Inc. 400,000 3.35% 26/3/2030 450,295 0.03%Columbia Pipeline Group, Inc. 400,000 4.50% 1/6/2025 449,624 0.03%AbbVie, Inc. 410,000 3.80% 15/3/2025 448,393 0.03%Oracle Corp. 400,000 3.90% 15/5/2035 447,608 0.03%AT&T, Inc. 400,000 3.80% 15/2/2027 446,184 0.03%CMS Energy Corp.^ 400,000 4.75% 1/6/2050 445,957 0.03%Pacific LifeCorp 348,000 5.13% 30/1/2043 445,545 0.03%Federal Home Loan Mortgage Corp. 400,000 3.24% 25/8/2027 445,238 0.03%Freddie Mac Multifamily Structured Pass Through Certificates 400,000 3.19% 25/7/2027 443,466 0.03%Oracle Corp. 320,000 6.13% 8/7/2039 443,150 0.03%Dominion Energy, Inc. 350,000 4.90% 1/8/2041 442,952 0.03%

977
Vanguard U.S. Investment Grade Credit Index Fund
Principal
US Dollars ($) CouponMaturity
DateFair Value
US Dollars ($)% of Total
Net AssetsAlphabet, Inc. 500,000 2.25% 15/8/2060 442,889 0.03%NiSource, Inc. 400,000 3.60% 1/5/2030 442,842 0.03%Starbucks Corp. 400,000 3.80% 15/8/2025 442,833 0.03%Lowe's Cos, Inc. 400,000 4.00% 15/4/2025 442,768 0.03%Goldman Sachs Group, Inc. 400,000 3.85% 26/1/2027 441,135 0.03%Comcast Corp. 400,000 3.30% 1/4/2027 441,009 0.03%Pfizer, Inc. 350,000 4.20% 15/9/2048 440,917 0.03%General Motors Co. 375,000 5.00% 1/10/2028 439,622 0.03%Toyota Motor Credit Corp. 425,000 1.80% 13/2/2025 438,405 0.03%State Street Corp.^ 400,000 3.15% 30/3/2031 438,354 0.03%DBJPM 17-C6 Mortgage Trust 400,000 3.33% 10/6/2050 437,828 0.03%WRKCo, Inc. 400,000 3.75% 15/3/2025 436,902 0.03%Federal Home Loan Mortgage Corp.^ 375,000 3.90% 25/8/2028 436,772 0.03%Bank of America Corp.^ 450,000 1.90% 23/7/2031 436,650 0.03%Cisco Systems, Inc. 300,000 5.90% 15/2/2039 436,643 0.03%Oracle Corp. 425,000 2.50% 15/10/2022 436,349 0.03%Apple, Inc. 400,000 2.90% 12/9/2027 436,039 0.03%Home Depot, Inc. 400,000 3.00% 1/4/2026 435,458 0.03%AbbVie, Inc. 375,000 4.05% 21/11/2039 435,319 0.03%DTE Energy Co. 425,000 2.25% 1/11/2022 435,060 0.03%Morgan Stanley 400,000 3.88% 29/4/2024 434,870 0.03%Charter Communications Operating LLC/Charter Communications
Operating Capital 425,000 2.80% 1/4/2031 434,774 0.03%Dell International LLC/EMC Corp. 400,000 5.45% 15/6/2023 433,899 0.03%Anthem, Inc. 390,000 3.70% 15/9/2049 433,595 0.03%Citigroup, Inc.^ 425,000 2.56% 1/5/2032 432,973 0.03%State of California 275,000 7.50% 1/4/2034 432,525 0.03%Weyerhaeuser Co. 300,000 7.38% 15/3/2032 432,433 0.03%Amazon.com, Inc. 425,000 2.10% 12/5/2031 432,155 0.03%Union Pacific Corp. 390,000 3.80% 6/4/2071 431,999 0.03%Freddie Mac Multifamily Structured Pass Through Certificates^ 375,000 3.78% 25/11/2051 431,688 0.03%US Bancorp 375,000 3.90% 26/4/2028 431,613 0.03%PepsiCo, Inc. 400,000 3.60% 1/3/2024 429,884 0.03%Verizon Communications, Inc. 450,000 2.88% 20/11/2050 429,739 0.03%Bayer US Finance LLC 400,000 3.38% 8/10/2024 429,567 0.03%Southwest Airlines Co. 400,000 4.75% 4/5/2023 429,313 0.03%MetLife, Inc. 300,000 6.38% 15/6/2034 429,279 0.03%T-Mobile USA, Inc. 395,000 3.50% 15/4/2025 428,364 0.03%Target Corp. 400,000 2.65% 15/9/2030 428,207 0.03%International Business Machines Corp.1 400,000 3.00% 15/5/2024 426,277 0.03%Honeywell International, Inc. 419,000 1.95% 1/6/2030 425,707 0.03%Marriott International, Inc. 400,000 3.50% 15/10/2032 425,275 0.03%Apple, Inc. 400,000 2.85% 11/5/2024 424,649 0.03%JPMorgan Chase & Co. 375,000 4.13% 15/12/2026 424,392 0.03%General Dynamics Corp. 375,000 3.63% 1/4/2030 424,224 0.03%New Jersey Turnpike Authority 265,000 7.10% 1/1/2041 424,080 0.03%Mastercard, Inc. 350,000 3.85% 26/3/2050 423,936 0.03%T-Mobile USA, Inc. 425,000 3.30% 15/2/2051 423,492 0.03%Morgan Stanley^ 400,000 3.22% 22/4/2042 423,251 0.03%McDonald's Corp. 350,000 4.20% 1/4/2050 422,506 0.03%Huntington Bancshares, Inc. 400,000 2.63% 6/8/2024 422,452 0.03%Intercontinental Exchange, Inc. 375,000 3.75% 21/9/2028 422,165 0.03%Dell International LLC/EMC Corp. 350,000 5.30% 1/10/2029 422,128 0.03%National Rural Utilities Cooperative Finance Corp. 425,000 1.00% 15/6/2026 421,599 0.03%Walt Disney Co. 375,000 3.70% 23/3/2027 421,214 0.03%MPLX LP 345,000 5.20% 1/12/2047 421,135 0.03%Walt Disney Co. 295,000 6.15% 1/3/2037 420,562 0.03%Port Authority of New York & New Jersey 320,000 4.46% 1/10/2062 420,365 0.03%Merck & Co., Inc. 375,000 3.40% 7/3/2029 420,278 0.03%NiSource, Inc. 350,000 4.38% 15/5/2047 418,664 0.03%Apple, Inc. 400,000 2.05% 11/9/2026 418,472 0.03%Boston Properties LP 400,000 3.85% 1/2/2023 417,721 0.03%Goldman Sachs Group, Inc. 320,000 4.80% 8/7/2044 417,681 0.03%JPMorgan Chase & Co.^ 375,000 3.78% 1/2/2028 416,163 0.03%Union Electric Co. 350,000 4.00% 1/4/2048 415,235 0.03%Apple, Inc. 325,000 4.38% 13/5/2045 414,291 0.03%General Motors Co. 300,000 6.25% 2/10/2043 414,090 0.03%Intel Corp. 405,000 3.10% 15/2/2060 413,740 0.03%Conagra Brands, Inc. 325,000 5.30% 1/11/2038 413,364 0.03%Walt Disney Co. 400,000 1.75% 30/8/2024 413,291 0.03%MetLife, Inc. 275,000 9.25% 8/4/2038 413,039 0.03%

978
Vanguard U.S. Investment Grade Credit Index Fund
Principal
US Dollars ($) CouponMaturity
DateFair Value
US Dollars ($)% of Total
Net AssetsSouthwest Airlines Co. 350,000 5.13% 15/6/2027 412,148 0.03%CSAIL 2016-C7 Commercial Mortgage Trust 375,000 3.50% 15/11/2049 411,210 0.03%Morgan Stanley Bank of America Merrill Lynch Trust 2014 379,000 3.92% 15/10/2047 411,024 0.03%Connecticut Light & Power Co. 400,000 2.50% 15/1/2023 410,792 0.03%ERAC USA Finance LLC 275,000 7.00% 15/10/2037 410,628 0.03%Toyota Motor Credit Corp. 400,000 2.15% 13/2/2030 410,543 0.03%CSX Corp. 325,000 4.75% 30/5/2042 410,520 0.03%Georgia-Pacific LLC 400,000 1.75% 30/9/2025 410,026 0.03%JPMorgan Chase & Co. 374,000 3.30% 1/4/2026 409,004 0.03%General Electric Co. 300,000 5.88% 14/1/2038 408,572 0.03%Federal National Mortgage Association^ 350,000 3.82% 25/9/2030 407,670 0.03%JPMorgan Chase & Co.^ 400,000 1.51% 1/6/2024 407,557 0.03%Sherwin-Williams Co. 325,000 4.50% 1/6/2047 407,156 0.03%Alexander Funding Trust 400,000 1.84% 15/11/2023 407,012 0.03%Fifth Third Bancorp 375,000 4.30% 16/1/2024 406,699 0.03%Ally Financial, Inc. 400,000 1.45% 2/10/2023 406,299 0.03%Union Pacific Corp. 385,000 3.25% 5/2/2050 405,559 0.03%Enterprise Products Operating LLC 350,000 4.20% 31/1/2050 405,083 0.03%Bank of America Corp. 295,000 6.11% 29/1/2037 404,844 0.03%Energy Transfer LP 350,000 5.00% 15/5/2050 404,332 0.03%Sabine Pass Liquefaction LLC 350,000 5.00% 15/3/2027 404,156 0.03%Equitable Financial Life Global Funding 400,000 1.40% 7/7/2025 403,955 0.03%NextEra Energy Capital Holdings, Inc. 400,000 2.25% 1/6/2030 403,716 0.03%CSAIL 2018-CX12 Commercial Mortgage Trust^ 350,000 4.22% 15/8/2051 402,959 0.03%Costco Wholesale Corp. 400,000 1.38% 20/6/2027 402,747 0.03%Goldman Sachs Group, Inc.^ 360,000 3.81% 23/4/2029 402,563 0.03%Bank of America Corp.^ 350,000 4.27% 23/7/2029 402,234 0.03%Diamondback Energy, Inc. 375,000 3.50% 1/12/2029 401,939 0.03%Becton Dickinson & Co. 375,000 3.36% 6/6/2024 401,748 0.03%Aflac, Inc. 305,000 4.75% 15/1/2049 401,448 0.03%Royalty Pharma plc 400,000 0.75% 2/9/2023 401,195 0.03%Southwestern Public Service Co. 320,000 4.40% 15/11/2048 401,168 0.03%Toyota Motor Credit Corp. 400,000 0.50% 14/8/2023 400,785 0.03%CCRE21 Commercial Mortgage Trust 2014 374,865 3.53% 10/12/2047 400,659 0.03%Federal Home Loan Mortgage Corp. 375,000 2.57% 25/7/2026 400,629 0.03%Amazon.com, Inc. 295,000 4.95% 5/12/2044 400,480 0.03%Morgan Stanley^ 400,000 0.56% 10/11/2023 400,441 0.03%Amazon.com, Inc. 400,000 1.00% 12/5/2026 400,141 0.03%Dow Chemical Co. 350,000 4.55% 30/11/2025 399,184 0.03%Apple, Inc. 375,000 2.45% 4/8/2026 398,888 0.03%Toyota Motor Credit Corp. 400,000 1.13% 18/6/2026 398,816 0.03%Boston Scientific Corp. 350,000 4.00% 1/3/2029 398,307 0.03%Consolidated Edison Co. of New York, Inc. 300,000 5.50% 1/12/2039 397,976 0.03%Verizon Communications, Inc. 375,000 3.40% 22/3/2041 397,211 0.03%Walmart, Inc. 325,000 4.00% 11/4/2043 396,733 0.03%Verizon Communications, Inc. 415,000 1.68% 30/10/2030 396,471 0.03%CVS Health Corp. 325,000 4.88% 20/7/2035 396,244 0.03%ViacomCBS, Inc. 350,000 4.75% 15/5/2025 395,988 0.03%Comcast Corp. 350,000 3.75% 1/4/2040 395,710 0.03%Wyeth LLC 275,000 5.95% 1/4/2037 394,595 0.03%Bank of America Corp.^ 350,000 3.97% 5/3/2029 394,580 0.03%Eli Lilly & Co. 325,000 3.95% 15/3/2049 394,510 0.03%Energy Transfer LP 300,000 6.25% 15/4/2049 394,509 0.03%Toyota Motor Credit Corp. 400,000 1.15% 13/8/2027 393,843 0.03%Energy Transfer LP 375,000 4.25% 15/3/2023 393,564 0.03%Keurig Dr Pepper, Inc. 350,000 4.42% 25/5/2025 392,950 0.03%7-Eleven, Inc. 400,000 0.95% 10/2/2026 392,680 0.03%Apple, Inc. 400,000 2.65% 8/2/2051 392,397 0.03%Alphabet, Inc. 375,000 2.00% 15/8/2026 392,390 0.03%Prudential Financial, Inc.^ 375,000 3.70% 1/10/2050 392,054 0.03%State of California 225,000 7.60% 1/11/2040 391,532 0.03%Goldman Sachs Group, Inc. 362,000 3.85% 8/7/2024 391,505 0.03%CSX Corp. 430,000 2.50% 15/5/2051 391,348 0.03%HCA, Inc. 300,000 5.50% 15/6/2047 390,676 0.03%Charles Schwab Corp. 354,000 3.45% 13/2/2026 390,092 0.03%Wells Fargo Commercial Mortgage Trust 2015 370,000 3.41% 15/5/2048 389,872 0.03%HCA, Inc. 340,000 5.25% 15/4/2025 389,358 0.03%Southern California Edison Co. 300,000 5.95% 1/2/2038 388,754 0.03%AT&T, Inc. 300,000 5.15% 15/2/2050 388,131 0.03%Kinder Morgan, Inc. 300,000 5.55% 1/6/2045 388,029 0.03%Air Lease Corp. 360,000 3.63% 1/4/2027 387,558 0.03%

979
Vanguard U.S. Investment Grade Credit Index Fund
Principal
US Dollars ($) CouponMaturity
DateFair Value
US Dollars ($)% of Total
Net AssetsTeachers Insurance & Annuity Association of America 300,000 4.90% 15/9/2044 386,846 0.03%Freddie Mac Multifamily Structured Pass Through Certificates 360,000 2.65% 25/8/2026 386,626 0.02%Dollar Tree, Inc. 350,000 4.00% 15/5/2025 386,270 0.02%Raytheon Technologies Corp. 300,000 4.63% 16/11/2048 385,217 0.02%Bank of America Corp.^ 360,000 3.46% 15/3/2025 384,785 0.02%DXC Technology Co. 350,000 4.13% 15/4/2025 384,634 0.02%Apple, Inc. 380,000 1.13% 11/5/2025 384,543 0.02%Wells Fargo & Co.^ 375,000 3.07% 30/4/2041 384,539 0.02%Goldman Sachs Group, Inc.^ 375,000 2.91% 24/7/2023 384,393 0.02%Equitable Holdings, Inc. 300,000 5.00% 20/4/2048 382,695 0.02%Gilead Sciences, Inc. 325,000 4.15% 1/3/2047 382,443 0.02%Freddie Mac Multifamily Structured Pass Through Certificates^ 325,000 4.05% 25/9/2028 381,851 0.02%Biogen, Inc. 381,000 3.25% 15/2/2051 381,135 0.02%Walmart, Inc. 250,000 6.50% 15/8/2037 380,719 0.02%General Electric Co. 325,000 4.25% 1/5/2040 380,243 0.02%McDonald's Corp. 350,000 3.30% 1/7/2025 380,030 0.02%Exxon Mobil Corp. 350,000 3.04% 1/3/2026 379,900 0.02%Gilead Sciences, Inc. 300,000 4.80% 1/4/2044 379,834 0.02%Public Service Electric & Gas Co. 320,000 3.85% 1/5/2049 379,711 0.02%Anthem, Inc. 305,000 4.63% 15/5/2042 379,549 0.02%Chubb INA Holdings, Inc. 300,000 4.35% 3/11/2045 379,340 0.02%Aflac, Inc. 350,000 3.25% 17/3/2025 379,142 0.02%ViacomCBS, Inc. 300,000 4.95% 19/5/2050 379,085 0.02%Ecolab, Inc. 400,000 1.30% 30/1/2031 378,102 0.02%JPMorgan Chase & Co.^ 375,000 2.07% 1/6/2029 377,891 0.02%CSX Corp. 325,000 4.25% 15/3/2029 377,813 0.02%Amazon.com, Inc. 400,000 2.50% 3/6/2050 377,803 0.02%Wells Fargo & Co.1 350,000 3.00% 23/10/2026 377,381 0.02%Travelers Cos, Inc. 250,000 6.75% 20/6/2036 377,279 0.02%Comcast Corp. 300,000 4.60% 15/8/2045 376,950 0.02%FMR LLC 300,000 4.95% 1/2/2033 376,921 0.02%Northwestern Mutual Life Insurance Co. 330,000 3.85% 30/9/2047 376,860 0.02%Williams Cos, Inc. 275,000 6.30% 15/4/2040 376,800 0.02%Teachers Insurance & Annuity Association of America 315,000 4.27% 15/5/2047 376,318 0.02%Lockheed Martin Corp. 310,000 4.07% 15/12/2042 376,305 0.02%Kellogg Co. 325,000 4.30% 15/5/2028 376,175 0.02%Wells Fargo & Co. 275,000 5.61% 15/1/2044 376,131 0.02%Apple, Inc. 320,000 3.75% 12/9/2047 375,518 0.02%Berry Global, Inc. 375,000 1.57% 15/1/2026 375,483 0.02%DuPont de Nemours, Inc. 315,000 4.73% 15/11/2028 375,418 0.02%Indiana Michigan Power Co. 300,000 4.55% 15/3/2046 375,114 0.02%HCA, Inc. 300,000 5.13% 15/6/2039 374,600 0.02%Baltimore Gas & Electric Co. 260,000 6.35% 1/10/2036 374,253 0.02%Los Angeles Unified School District 260,000 6.76% 1/7/2034 373,846 0.02%Starbucks Corp. 300,000 4.50% 15/11/2048 373,824 0.02%Sherwin-Williams Co. 350,000 3.13% 1/6/2024 373,734 0.02%Philip Morris International, Inc. 350,000 2.75% 25/2/2026 373,508 0.02%Federal National Mortgage Association^ 350,000 3.20% 25/11/2027 372,965 0.02%Connecticut Light & Power Co. 300,000 4.30% 15/4/2044 372,031 0.02%AbbVie, Inc. 298,000 4.70% 14/5/2045 371,802 0.02%Amgen, Inc. 350,000 2.60% 19/8/2026 371,569 0.02%Philip Morris International, Inc. 325,000 4.13% 4/3/2043 371,410 0.02%Federal Home Loan Mortgage Corp. 369,088 2.87% 25/12/2021 371,283 0.02%Intel Corp. 325,000 3.73% 8/12/2047 370,854 0.02%Alabama Power Co. 325,000 3.75% 1/3/2045 370,654 0.02%Amazon.com, Inc. 350,000 3.25% 12/5/2061 370,520 0.02%Microsoft Corp. 350,000 2.88% 6/2/2024 370,355 0.02%Eversource Energy 375,000 0.80% 15/8/2025 370,114 0.02%Kaiser Foundation Hospitals 275,000 4.88% 1/4/2042 370,095 0.02%Charter Communications Operating LLC/Charter Communications
Operating Capital 300,000 5.38% 1/4/2038 369,497 0.02%Prudential Financial, Inc.^ 350,000 5.88% 15/9/2042 369,482 0.02%LC19 Commercial Mortgage Trust 2015 345,000 3.18% 10/2/2048 369,375 0.02%Goldman Sachs Group, Inc.^ 315,000 4.02% 31/10/2038 369,344 0.02%Amazon.com, Inc. 350,000 3.10% 12/5/2051 367,921 0.02%UnitedHealth Group, Inc. 300,000 4.25% 15/3/2043 367,749 0.02%United Parcel Service, Inc. 250,000 5.30% 1/4/2050 366,096 0.02%ONEOK, Inc. 350,000 3.10% 15/3/2030 365,957 0.02%Federal National Mortgage Association 348,679 2.15% 25/10/2029 365,848 0.02%Discovery Communications LLC 333,000 3.95% 15/6/2025 365,137 0.02%ConocoPhillips 325,000 3.75% 1/10/2027 365,049 0.02%

980
Vanguard U.S. Investment Grade Credit Index Fund
Principal
US Dollars ($) CouponMaturity
DateFair Value
US Dollars ($)% of Total
Net AssetsJPMorgan Chase & Co.^ 350,000 3.16% 22/4/2042 364,434 0.02%Amgen, Inc. 282,000 4.66% 15/6/2051 364,198 0.02%Wells Fargo Commercial Mortgage Trust 2015 333,000 3.64% 15/6/2048 363,517 0.02%Freddie Mac Multifamily Structured Pass Through Certificates^ 347,000 3.30% 25/4/2023 363,440 0.02%Bank of America Corp.1 320,000 4.45% 3/3/2026 362,980 0.02%Williams Cos, Inc. 300,000 4.90% 15/1/2045 362,818 0.02%Sempra Energy 325,000 3.80% 1/2/2038 362,530 0.02%Wells Fargo & Co. 300,000 4.40% 14/6/2046 362,286 0.02%Morgan Stanley Bank of America Merrill Lynch Trust 2014 341,196 3.60% 15/6/2047 362,256 0.02%Capital One Financial Corp. 325,000 3.75% 9/3/2027 361,481 0.02%McKesson Corp. 350,000 2.85% 15/3/2023 361,436 0.02%Fiserv, Inc. 300,000 4.40% 1/7/2049 361,388 0.02%AT&T, Inc. 330,000 4.45% 1/4/2024 360,579 0.02%Verizon Communications, Inc. 279,000 4.67% 15/3/2055 360,481 0.02%Exelon Corp. 275,000 5.10% 15/6/2045 360,281 0.02%MetLife, Inc. 300,000 4.55% 23/3/2030 360,267 0.02%Federal Home Loan Mortgage Corp.^ 342,000 3.53% 25/7/2023 360,099 0.02%McDonald's Corp. 320,000 3.60% 1/7/2030 359,846 0.02%General Motors Financial Co., Inc. 325,000 4.30% 13/7/2025 359,290 0.02%Goldman Sachs Group, Inc. 275,000 4.75% 21/10/2045 359,108 0.02%Appalachian Power Co. 240,000 7.00% 1/4/2038 358,866 0.02%Procter & Gamble Co. 306,000 3.55% 25/3/2040 358,533 0.02%Walmart, Inc. 325,000 3.55% 26/6/2025 358,428 0.02%JPMorgan Chase & Co.^ 325,000 3.51% 23/1/2029 358,070 0.02%CGMS Commercial Mortgage Trust 2017 325,000 3.46% 15/8/2050 357,394 0.02%Ventas Realty LP 300,000 4.75% 15/11/2030 357,203 0.02%Philip Morris International, Inc. 250,000 6.38% 16/5/2038 357,186 0.02%Amazon.com, Inc. 300,000 3.88% 22/8/2037 357,122 0.02%ViacomCBS, Inc. 300,000 4.60% 15/1/2045 356,852 0.02%Bank of America Corp.^ 300,000 4.24% 24/4/2038 356,545 0.02%PPL Electric Utilities Corp. 300,000 3.95% 1/6/2047 356,171 0.02%Procter & Gamble Co.1 350,000 1.95% 23/4/2031 355,839 0.02%Becton Dickinson & Co. 320,000 3.70% 6/6/2027 355,701 0.02%General Motors Co. 300,000 6.13% 1/10/2025 355,137 0.02%Energy Transfer LP 300,000 5.40% 1/10/2047 355,087 0.02%Amgen, Inc. 330,000 3.13% 1/5/2025 354,967 0.02%Ares Capital Corp. 350,000 2.88% 15/6/2028 354,961 0.02%Interstate Power & Light Co. 350,000 2.30% 1/6/2030 354,656 0.02%JPMorgan Chase & Co. 325,000 3.88% 10/9/2024 354,310 0.02%Cimarex Energy Co. 325,000 4.38% 1/6/2024 353,748 0.02%Cisco Systems, Inc. 250,000 5.50% 15/1/2040 353,709 0.02%Benchmark 2018-B7 Mortgage Trust^ 300,000 4.51% 15/5/2053 352,626 0.02%Sempra Energy 325,000 3.25% 15/6/2027 352,522 0.02%Fox Corp. 300,000 4.71% 25/1/2029 352,476 0.02%Charter Communications Operating LLC/Charter Communications
Operating Capital 350,000 3.50% 1/6/2041 352,372 0.02%Apple, Inc. 355,000 1.65% 11/5/2030 351,895 0.02%Duke Energy Indiana LLC 275,000 4.90% 15/7/2043 351,090 0.02%Virginia Electric & Power Co. 300,000 4.00% 15/1/2043 350,216 0.02%7-Eleven, Inc. 350,000 0.63% 10/2/2023 350,203 0.02%Goldman Sachs Capital I 250,000 6.35% 15/2/2034 350,006 0.02%Cheniere Corpus Christi Holdings LLC 300,000 5.13% 30/6/2027 349,195 0.02%Mastercard, Inc. 300,000 3.65% 1/6/2049 349,194 0.02%Arch Capital Group US, Inc. 265,000 5.14% 1/11/2043 348,820 0.02%Adobe, Inc. 335,000 2.30% 1/2/2030 348,780 0.02%ConocoPhillips 300,000 4.30% 15/8/2028 347,985 0.02%Ascension Health 285,000 3.95% 15/11/2046 347,775 0.02%Truist Bank 325,000 3.20% 1/4/2024 347,714 0.02%PPL Capital Funding, Inc. 300,000 4.13% 15/4/2030 347,437 0.02%DuPont de Nemours, Inc. 250,000 5.42% 15/11/2048 347,183 0.02%Norfolk Southern Corp. 315,000 3.65% 1/8/2025 346,306 0.02%Duke Energy Florida LLC 300,000 3.85% 15/11/2042 346,231 0.02%Duke Energy Carolinas LLC 335,000 2.50% 15/3/2023 346,039 0.02%Sprint Spectrum Co. LLC/Sprint Spectrum Co. II LLC/Sprint Spectrum Co.
III LLC 300,000 5.15% 20/3/2028 345,795 0.02%Altria Group, Inc. 270,000 5.95% 14/2/2049 345,642 0.02%Charter Communications Operating LLC/Charter Communications
Operating Capital 300,000 4.80% 1/3/2050 345,632 0.02%Marriott International, Inc. 300,000 4.63% 15/6/2030 345,437 0.02%3M Co. 325,000 3.13% 19/9/2046 344,396 0.02%LYB International Finance III LLC 300,000 4.20% 1/5/2050 344,106 0.02%

981
Vanguard U.S. Investment Grade Credit Index Fund
Principal
US Dollars ($) CouponMaturity
DateFair Value
US Dollars ($)% of Total
Net AssetsAlabama Power Co. 300,000 3.85% 1/12/2042 343,954 0.02%Lowe's Cos, Inc. 275,000 4.55% 5/4/2049 343,929 0.02%Schlumberger Holdings Corp. 300,000 4.30% 1/5/2029 343,701 0.02%Northern States Power Co. 250,000 5.35% 1/11/2039 343,389 0.02%American Honda Finance Corp. 325,000 2.35% 8/1/2027 343,317 0.02%Wells Fargo Bank NA 250,000 5.85% 1/2/2037 343,191 0.02%Valero Energy Corp. 250,000 6.63% 15/6/2037 342,446 0.02%Nucor Corp. 300,000 3.95% 1/5/2028 341,935 0.02%Valero Energy Corp. 300,000 4.35% 1/6/2028 341,827 0.02%Citigroup, Inc. 300,000 4.60% 9/3/2026 341,723 0.02%American International Group, Inc.^ 300,000 5.75% 1/4/2048 341,462 0.02%Las Vegas Sands Corp. 325,000 3.20% 8/8/2024 341,067 0.02%Energy Transfer LP 275,000 5.80% 15/6/2038 341,031 0.02%NiSource, Inc. 275,000 4.80% 15/2/2044 341,009 0.02%Union Pacific Corp. 300,000 3.84% 20/3/2060 340,551 0.02%Alabama Power Co. 275,000 4.30% 15/7/2048 340,414 0.02%TWDC Enterprises 18 Corp. 300,000 3.70% 1/12/2042 340,376 0.02%Mid-America Apartments LP 325,000 2.75% 15/3/2030 339,479 0.02%Charter Communications Operating LLC/Charter Communications
Operating Capital 300,000 4.20% 15/3/2028 339,360 0.02%American Express Co. 310,000 3.63% 5/12/2024 339,268 0.02%Federal Home Loan Mortgage Corp.^ 325,000 3.25% 25/4/2023 339,053 0.02%AmerisourceBergen Corp. 325,000 2.80% 15/5/2030 338,963 0.02%Ross Stores, Inc. 300,000 4.60% 15/4/2025 338,630 0.02%Welltower, Inc. 300,000 4.25% 1/4/2026 338,349 0.02%Marathon Petroleum Corp. 300,000 4.70% 1/5/2025 338,337 0.02%Deere & Co. 275,000 3.90% 9/6/2042 338,142 0.02%Sabra Health Care LP 300,000 5.13% 15/8/2026 337,659 0.02%Dollar General Corp. 300,000 3.88% 15/4/2027 337,449 0.02%Marsh & McLennan Cos, Inc. 310,000 3.88% 15/3/2024 336,301 0.02%Bank of America Corp. 300,000 4.18% 25/11/2027 335,903 0.02%ONEOK Partners LP 300,000 4.90% 15/3/2025 335,874 0.02%JPMorgan Chase & Co.^ 300,000 3.70% 6/5/2030 335,520 0.02%Charles Schwab Corp. 300,000 4.20% 24/3/2025 334,994 0.02%MPLX LP 300,000 4.13% 1/3/2027 334,968 0.02%Goldman Sachs Group, Inc.^ 275,000 4.41% 23/4/2039 334,926 0.02%Roper Technologies, Inc. 300,000 3.80% 15/12/2026 334,839 0.02%Port Authority of New York & New Jersey 240,000 4.93% 1/10/2051 334,800 0.02%American Tower Corp. 300,000 3.80% 15/8/2029 334,602 0.02%New York Life Global Funding 330,000 1.10% 5/5/2023 334,259 0.02%Discovery Communications LLC 300,000 3.95% 20/3/2028 334,013 0.02%Freddie Mac Multifamily Structured Pass Through Certificates 315,000 2.25% 25/2/2052 333,491 0.02%eBay, Inc. 300,000 3.60% 5/6/2027 333,451 0.02%Williams Cos, Inc. 300,000 3.75% 15/6/2027 333,089 0.02%Apple, Inc. 300,000 3.35% 9/2/2027 333,012 0.02%Apple, Inc. 320,000 2.20% 11/9/2029 332,914 0.02%Juniper Networks, Inc. 250,000 5.95% 15/3/2041 332,797 0.02%Penske Truck Leasing Co. LP/PTL Finance Corp. 315,000 4.25% 17/1/2023 332,249 0.02%Morgan Stanley Bank of America Merrill Lynch Trust 2017 300,000 3.85% 15/5/2050 331,833 0.02%Bank of America Corp.^ 300,000 3.71% 24/4/2028 331,732 0.02%Halliburton Co. 300,000 3.80% 15/11/2025 331,545 0.02%Broadcom, Inc. 309,000 3.15% 15/11/2025 331,439 0.02%PepsiCo, Inc. 315,000 2.25% 19/3/2025 331,111 0.02%Procter & Gamble Co.1 300,000 3.00% 25/3/2030 330,847 0.02%Martin Marietta Materials, Inc. 325,000 2.50% 15/3/2030 330,499 0.02%Nasdaq, Inc. 350,000 1.65% 15/1/2031 330,499 0.02%Consolidated Edison Co. of New York, Inc. 300,000 3.35% 1/4/2030 330,291 0.02%General Electric Co. 300,000 3.45% 1/5/2027 330,021 0.02%Commonwealth Edison Co. 265,000 4.35% 15/11/2045 329,147 0.02%JM Smucker Co. 300,000 3.38% 15/12/2027 329,039 0.02%Air Products & Chemicals, Inc. 325,000 2.70% 15/5/2040 328,905 0.02%Verizon Communications, Inc. 350,000 3.00% 20/11/2060 328,594 0.02%PNC Bank NA 300,000 3.10% 25/10/2027 328,506 0.02%ViacomCBS, Inc. 300,000 3.38% 15/2/2028 328,351 0.02%Lennar Corp. 300,000 4.50% 30/4/2024 328,264 0.02%American International Group, Inc. 270,000 4.38% 15/1/2055 328,114 0.02%CSX Corp. 300,000 3.35% 1/11/2025 328,078 0.02%TTX Co. 300,000 3.60% 15/1/2025 327,909 0.02%Cheniere Corpus Christi Holdings LLC 300,000 3.70% 15/11/2029 327,648 0.02%Amazon.com, Inc. 325,000 1.65% 12/5/2028 327,620 0.02%General Mills, Inc. 325,000 3.00% 1/2/2051 327,453 0.02%

982
Vanguard U.S. Investment Grade Credit Index Fund
Principal
US Dollars ($) CouponMaturity
DateFair Value
US Dollars ($)% of Total
Net AssetsMPLX LP 300,000 4.00% 15/2/2025 327,416 0.02%Waste Management, Inc. 350,000 2.50% 15/11/2050 326,360 0.02%Raytheon Technologies Corp. 300,000 3.13% 4/5/2027 326,249 0.02%Citigroup, Inc.^ 325,000 0.98% 1/5/2025 325,809 0.02%GS Mortgage Securities Trust 2014 300,000 3.93% 10/9/2047 325,777 0.02%AT&T, Inc. 325,000 0.90% 25/3/2024 325,699 0.02%Visa, Inc. 315,000 2.80% 14/12/2022 325,288 0.02%FedEx Corp. 300,000 3.10% 5/8/2029 325,287 0.02%General Motors Financial Co., Inc. 300,000 3.60% 21/6/2030 325,189 0.02%Chubb Corp. 225,000 6.00% 11/5/2037 325,176 0.02%Owl Rock Capital Corp. 305,000 4.00% 30/3/2025 325,172 0.02%PerkinElmer, Inc. 300,000 3.30% 15/9/2029 324,610 0.02%Goldman Sachs Group, Inc.^ 325,000 0.66% 10/9/2024 324,421 0.02%Athene Holding Ltd. 290,000 4.13% 12/1/2028 324,103 0.02%Goldman Sachs Group, Inc.^ 325,000 1.54% 10/9/2027 324,003 0.02%Kinder Morgan Energy Partners LP 300,000 4.15% 1/2/2024 323,446 0.02%CenterPoint Energy Houston Electric LLC 250,000 4.50% 1/4/2044 323,379 0.02%Ally Financial, Inc. 300,000 3.88% 21/5/2024 323,356 0.02%John Deere Capital Corp. 325,000 1.50% 6/3/2028 323,317 0.02%General Motors Financial Co., Inc. 300,000 5.20% 20/3/2023 323,016 0.02%Atmos Energy Corp. 300,000 3.38% 15/9/2049 322,875 0.02%Republic Services, Inc. 300,000 2.90% 1/7/2026 321,674 0.02%Boeing Co. 315,000 2.25% 15/6/2026 321,603 0.02%Apple, Inc. 310,000 2.95% 11/9/2049 321,431 0.02%MPLX LP 300,000 4.50% 15/7/2023 321,084 0.02%Santander Holdings USA, Inc. 300,000 3.50% 7/6/2024 321,051 0.02%United Airlines 2016-1 Class AA Pass Through Trust 304,114 3.10% 7/7/2028 320,815 0.02%Eastman Chemical Co. 275,000 4.50% 1/12/2028 320,733 0.02%Goldman Sachs Group, Inc. 295,000 3.50% 16/11/2026 320,733 0.02%Black Hills Corp. 275,000 4.35% 1/5/2033 320,729 0.02%Citigroup, Inc. 275,000 5.50% 13/9/2025 320,453 0.02%CCRE12 Commercial Mortgage Trust 2013 300,000 4.05% 10/10/2046 320,326 0.02%Walgreens Boots Alliance, Inc. 300,000 3.20% 15/4/2030 320,125 0.02%GS Mortgage Securities Trust 2016 300,000 2.85% 10/10/2049 319,959 0.02%Intercontinental Exchange, Inc. 325,000 3.00% 15/6/2050 319,949 0.02%SC Johnson & Son, Inc. 250,000 4.80% 1/9/2040 319,439 0.02%Oracle Corp. 275,000 4.30% 8/7/2034 319,382 0.02%BP Capital Markets America, Inc. 275,000 4.23% 6/11/2028 318,945 0.02%Sherwin-Williams Co. 300,000 3.30% 15/5/2050 318,351 0.02%GLP Capital LP/GLP Financing II, Inc. 282,000 5.25% 1/6/2025 317,682 0.02%Bank of New York Mellon Corp. 295,000 2.80% 4/5/2026 317,619 0.02%Morgan Stanley 300,000 4.88% 1/11/2022 317,396 0.02%Essex Portfolio LP 293,000 3.50% 1/4/2025 317,251 0.02%Fifth Third Bancorp 300,000 2.55% 5/5/2027 317,212 0.02%Federal Home Loan Mortgage Corp. 300,000 2.95% 25/7/2024 317,136 0.02%Phillips 661 300,000 3.70% 6/4/2023 316,712 0.02%Five Corners Funding Trust II 300,000 2.85% 15/5/2030 316,075 0.02%Comcast Corp. 350,000 2.45% 15/8/2052 315,978 0.02%Morgan Stanley^ 300,000 2.72% 22/7/2025 315,838 0.02%Kroger Co. 250,000 5.00% 15/4/2042 315,745 0.02%Enbridge Energy Partners LP 200,000 7.38% 15/10/2045 315,655 0.02%Trinity Acquisition plc 280,000 4.40% 15/3/2026 315,649 0.02%Equitable Holdings, Inc. 275,000 4.35% 20/4/2028 315,280 0.02%Virginia Electric & Power Co. 275,000 3.80% 15/9/2047 315,244 0.02%ConocoPhillips 240,000 4.88% 1/10/2047 315,221 0.02%Lockheed Martin Corp. 285,000 3.55% 15/1/2026 315,057 0.02%Honeywell International, Inc. 309,000 1.35% 1/6/2025 314,968 0.02%AbbVie, Inc. 260,000 4.45% 14/5/2046 314,927 0.02%Chevron Phillips Chemical Co. LLC/Chevron Phillips Chemical Co. LP 275,000 5.13% 1/4/2025 314,912 0.02%Goldman Sachs Group, Inc. 300,000 3.63% 22/1/2023 314,789 0.02%Amgen, Inc. 250,000 4.56% 15/6/2048 314,323 0.02%National Rural Utilities Cooperative Finance Corp.^ 300,000 4.75% 30/4/2043 314,199 0.02%Goldman Sachs Group, Inc.^ 300,000 3.21% 22/4/2042 313,919 0.02%CVS Health Corp. 280,000 3.75% 1/4/2030 313,896 0.02%Citizens Bank NA 300,000 2.25% 28/4/2025 313,454 0.02%Anthem, Inc. 300,000 3.30% 15/1/2023 313,008 0.02%UnitedHealth Group, Inc. 300,000 2.88% 15/3/2023 312,931 0.02%Huntington Bancshares, Inc. 300,000 2.55% 4/2/2030 312,687 0.02%Arrow Electronics, Inc. 288,000 4.00% 1/4/2025 312,533 0.02%JPMorgan Chase & Co. 300,000 2.70% 18/5/2023 311,833 0.02%McDonald's Corp. 250,000 4.60% 26/5/2045 311,464 0.02%

983
Vanguard U.S. Investment Grade Credit Index Fund
Principal
US Dollars ($) CouponMaturity
DateFair Value
US Dollars ($)% of Total
Net AssetsUS Bank NA 300,000 2.85% 23/1/2023 311,324 0.02%Home Depot, Inc. 250,000 4.25% 1/4/2046 311,269 0.02%MPLX LP 275,000 4.25% 1/12/2027 311,192 0.02%Valero Energy Corp. 300,000 2.70% 15/4/2023 311,078 0.02%UnitedHealth Group, Inc. 220,000 5.70% 15/10/2040 310,918 0.02%Otis Worldwide Corp. 300,000 2.57% 15/2/2030 310,882 0.02%United Parcel Service, Inc. 300,000 2.50% 1/4/2023 310,781 0.02%Bank of America Corp. 289,000 4.10% 24/7/2023 310,554 0.02%Berkshire Hathaway Finance Corp. 250,000 4.25% 15/1/2049 310,481 0.02%Boardwalk Pipelines LP 275,000 4.45% 15/7/2027 310,450 0.02%Williams Cos, Inc. 250,000 5.10% 15/9/2045 310,388 0.02%UnitedHealth Group, Inc. 200,000 6.88% 15/2/2038 310,303 0.02%Pfizer, Inc. 250,000 4.13% 15/12/2046 310,244 0.02%Amazon.com, Inc. 301,000 2.50% 29/11/2022 308,953 0.02%Discover Financial Services 283,000 3.95% 6/11/2024 308,952 0.02%Aircastle Ltd. 275,000 5.25% 11/8/2025 308,876 0.02%AvalonBay Communities, Inc. 300,000 2.45% 15/1/2031 308,782 0.02%Precision Castparts Corp. 300,000 2.50% 15/1/2023 308,452 0.02%AbbVie, Inc. 260,000 4.30% 14/5/2036 308,442 0.02%Laboratory Corp. of America Holdings 285,000 3.60% 1/2/2025 308,352 0.02%Port Authority of New York & New Jersey 220,000 5.65% 1/11/2040 308,317 0.02%Federal National Mortgage Association 294,324 2.53% 25/9/2024 308,294 0.02%Boeing Co. 275,000 4.88% 1/5/2025 308,219 0.02%DTE Electric Co. 300,000 2.25% 1/3/2030 308,154 0.02%VMware, Inc. 300,000 2.95% 21/8/2022 307,839 0.02%Philip Morris International, Inc.1 300,000 2.50% 22/8/2022 307,718 0.02%Chevron Corp. 300,000 2.36% 5/12/2022 307,256 0.02%Commonwealth of Massachusetts 250,000 4.50% 1/8/2031 307,050 0.02%Capital One Financial Corp. 275,000 4.20% 29/10/2025 306,994 0.02%Wells Fargo & Co.^ 300,000 1.65% 2/6/2024 306,460 0.02%United Parcel Service, Inc. 225,000 5.20% 1/4/2040 306,427 0.02%Procter & Gamble Co.1 300,000 2.15% 11/8/2022 306,355 0.02%JPMorgan Chase & Co.^ 275,000 3.96% 29/1/2027 306,204 0.02%Federal Home Loan Mortgage Corp.^ 275,000 3.19% 25/9/2027 305,555 0.02%Dow Chemical Co. 250,000 4.63% 1/10/2044 305,540 0.02%Evergy Metro, Inc. 300,000 2.25% 1/6/2030 305,420 0.02%Marsh & McLennan Cos, Inc. 260,000 4.38% 15/3/2029 304,971 0.02%Schlumberger Investment SA 300,000 2.40% 1/8/2022 304,829 0.02%Citigroup, Inc. 275,000 3.70% 12/1/2026 303,923 0.02%Hewlett Packard Enterprise Co. 225,000 6.35% 15/10/2045 303,826 0.02%Cigna Corp. 235,000 4.90% 15/12/2048 303,737 0.02%New York Life Insurance Co. 270,000 3.75% 15/5/2050 303,367 0.02%ONEOK Partners LP 225,000 6.65% 1/10/2036 302,945 0.02%Coca-Cola Co.1 300,000 1.45% 1/6/2027 302,892 0.02%Metropolitan Life Global Funding I 300,000 0.90% 8/6/2023 302,887 0.02%Franklin Resources, Inc. 315,000 1.60% 30/10/2030 302,687 0.02%NVIDIA Corp. 275,000 3.20% 16/9/2026 302,647 0.02%Northrop Grumman Corp. 215,000 5.25% 1/5/2050 302,328 0.02%New York Life Insurance Co. 200,000 6.75% 15/11/2039 301,925 0.02%American Electric Power Co., Inc. 300,000 2.30% 1/3/2030 301,764 0.02%Bank of America Corp.^ 280,000 3.19% 23/7/2030 301,439 0.02%Energy Transfer LP 275,000 4.95% 15/1/2043 301,062 0.02%Mondelez International, Inc. 300,000 0.63% 1/7/2022 300,984 0.02%Bank of America Corp.^ 300,000 0.98% 22/4/2025 300,942 0.02%Biogen, Inc. 300,000 2.25% 1/5/2030 300,798 0.02%Southern California Edison Co. 300,000 3.65% 1/2/2050 300,763 0.02%Bank of America Corp.^ 300,000 1.32% 19/6/2026 300,719 0.02%JPMorgan Chase & Co. 200,000 8.75% 1/9/2030 300,091 0.02%NIKE, Inc. 250,000 3.88% 1/11/2045 299,594 0.02%Discovery Communications LLC 250,000 4.88% 1/4/2043 299,536 0.02%Virginia Electric & Power Co. 275,000 3.15% 15/1/2026 299,371 0.02%Cisco Systems, Inc. 271,000 3.50% 15/6/2025 299,256 0.02%Ventas Realty LP 275,000 3.25% 15/10/2026 299,216 0.02%AT&T, Inc. 301,000 2.55% 1/12/2033 298,328 0.02%Texas Instruments, Inc. 300,000 1.75% 4/5/2030 298,215 0.02%AbbVie, Inc. 275,000 3.20% 14/5/2026 298,070 0.02%American International Group, Inc. 267,000 3.90% 1/4/2026 298,056 0.02%Equitable Financial Life Global Funding 300,000 1.80% 8/3/2028 297,803 0.02%Keurig Dr Pepper, Inc. 272,000 3.40% 15/11/2025 297,419 0.02%Altria Group, Inc. 250,000 5.38% 31/1/2044 297,064 0.02%Altria Group, Inc. 275,000 4.50% 2/5/2043 296,896 0.02%

984
Vanguard U.S. Investment Grade Credit Index Fund
Principal
US Dollars ($) CouponMaturity
DateFair Value
US Dollars ($)% of Total
Net AssetsUnitedHealth Group, Inc. 275,000 2.88% 15/8/2029 296,616 0.02%Comcast Corp. 325,000 2.65% 15/8/2062 296,615 0.02%Bank of America Corp.1 267,000 3.88% 1/8/2025 296,538 0.02%DTE Electric Co. 250,000 4.00% 1/4/2043 296,265 0.02%Southern California Edison Co. 300,000 2.25% 1/6/2030 296,069 0.02%Zoetis, Inc. 250,000 3.95% 12/9/2047 295,939 0.02%Costco Wholesale Corp. 300,000 1.60% 20/4/2030 295,632 0.02%Virginia Electric & Power Co. 275,000 3.30% 1/12/2049 295,593 0.02%Wells Fargo Bank NA 200,000 6.60% 15/1/2038 295,184 0.02%Penske Truck Leasing Co. LP/PTL Finance Corp. 275,000 3.45% 1/7/2024 294,969 0.02%Alexandria Real Estate Equities, Inc. 300,000 3.00% 18/5/2051 294,425 0.02%Atmos Energy Corp. 250,000 4.13% 15/10/2044 294,312 0.02%Duke Energy Florida LLC 300,000 1.75% 15/6/2030 294,121 0.02%Enterprise Products Operating LLC^ 300,000 4.88% 16/8/2077 294,049 0.02%Amazon.com, Inc. 300,000 1.50% 3/6/2030 293,963 0.02%Federal National Mortgage Association 300,000 1.27% 25/7/2030 293,915 0.02%Apple, Inc. 300,000 2.80% 8/2/2061 293,448 0.02%Regions Financial Corp. 275,000 3.80% 14/8/2023 293,257 0.02%Northrop Grumman Corp. 275,000 2.93% 15/1/2025 293,198 0.02%Citigroup COmmercial Mortgage Trust 2018 250,000 4.41% 10/11/2051 293,116 0.02%Citigroup, Inc. 212,000 6.13% 25/8/2036 293,006 0.02%Apple, Inc. 250,000 3.75% 13/11/2047 292,912 0.02%CommonSpirit Health 265,000 3.91% 1/10/2050 292,691 0.02%Florida Power & Light Co. 200,000 5.96% 1/4/2039 292,555 0.02%Home Depot, Inc. 225,000 4.50% 6/12/2048 292,469 0.02%MUFG Americas Holdings Corp. 274,000 3.00% 10/2/2025 292,166 0.02%Intel Corp.1 282,000 2.70% 15/12/2022 292,148 0.02%Toyota Motor Credit Corp. 275,000 2.90% 17/4/2024 292,131 0.02%Energy Transfer LP 225,000 6.50% 1/2/2042 292,079 0.02%Abbott Laboratories 274,000 3.40% 30/11/2023 292,047 0.02%Bay Area Toll Authority 180,000 6.26% 1/4/2049 291,508 0.02%Brighthouse Financial, Inc. 267,000 3.70% 22/6/2027 291,498 0.02%Time Warner Cable LLC 200,000 7.30% 1/7/2038 291,027 0.02%WFRBS Commercial Mortgage Trust 2014 274,000 4.18% 15/5/2047 290,968 0.02%Altria Group, Inc. 250,000 4.80% 14/2/2029 289,913 0.02%Microsoft Corp. 250,000 3.50% 12/2/2035 289,796 0.02%Benchmark 2018-B8 Mortgage Trust 250,000 4.23% 15/1/2052 289,511 0.02%Mondelez International, Inc. 275,000 2.75% 13/4/2030 289,467 0.02%State of Texas 200,000 5.52% 1/4/2039 289,320 0.02%Federal Home Loan Mortgage Corp.^ 250,000 3.85% 25/5/2028 289,122 0.02%Pioneer Natural Resources Co. 300,000 1.90% 15/8/2030 289,117 0.02%Microsoft Corp. 250,000 3.45% 8/8/2036 288,922 0.02%Home Depot, Inc. 270,000 2.70% 15/4/2030 288,889 0.02%Baker Hughes Holdings LLC 225,000 5.13% 15/9/2040 288,484 0.02%O'Reilly Automotive, Inc. 300,000 1.75% 15/3/2031 288,453 0.02%Wells Fargo & Co.1 275,000 3.45% 13/2/2023 288,228 0.02%Dow Chemical Co. 225,000 4.80% 15/5/2049 288,148 0.02%Boston Scientific Corp. 225,000 4.70% 1/3/2049 287,994 0.02%Arizona Public Service Co. 255,000 3.75% 15/5/2046 287,924 0.02%New Jersey Turnpike Authority 175,000 7.41% 1/1/2040 287,738 0.02%Apple, Inc. 300,000 1.25% 20/8/2030 287,674 0.02%Progressive Corp. 250,000 4.00% 1/3/2029 287,659 0.02%Verizon Communications, Inc. 300,000 1.75% 20/1/2031 287,495 0.02%Expedia Group, Inc. 275,000 3.25% 15/2/2030 287,295 0.02%Burlington Northern Santa Fe LLC 265,000 3.40% 1/9/2024 286,746 0.02%Automatic Data Processing, Inc. 300,000 1.25% 1/9/2030 286,577 0.02%Enterprise Products Operating LLC 275,000 3.35% 15/3/2023 286,376 0.02%Verizon Communications, Inc. 300,000 1.50% 18/9/2030 286,319 0.02%AT&T, Inc. 250,000 4.35% 15/6/2045 285,634 0.02%Citigroup, Inc. 250,000 4.45% 29/9/2027 285,524 0.02%PepsiCo, Inc. 250,000 3.50% 19/3/2040 285,216 0.02%JPMorgan Chase & Co. 250,000 4.25% 1/10/2027 285,072 0.02%JP Morgan Chase Commercial Mortgage Securities Trust 2013 275,000 2.96% 15/4/2046 285,050 0.02%Alphabet, Inc. 300,000 1.10% 15/8/2030 284,965 0.02%Bristol-Myers Squibb Co. 275,000 3.55% 15/8/2022 284,819 0.02%Exelon Corp. 250,000 4.05% 15/4/2030 284,633 0.02%Commonwealth Edison Co. 250,000 3.70% 15/8/2028 284,435 0.02%Cox Communications, Inc. 300,000 2.95% 1/10/2050 284,019 0.02%Citigroup, Inc.^ 250,000 4.08% 23/4/2029 283,788 0.02%Citigroup, Inc.^ 250,000 3.98% 20/3/2030 283,703 0.02%Amgen, Inc. 275,000 2.45% 21/2/2030 283,497 0.02%
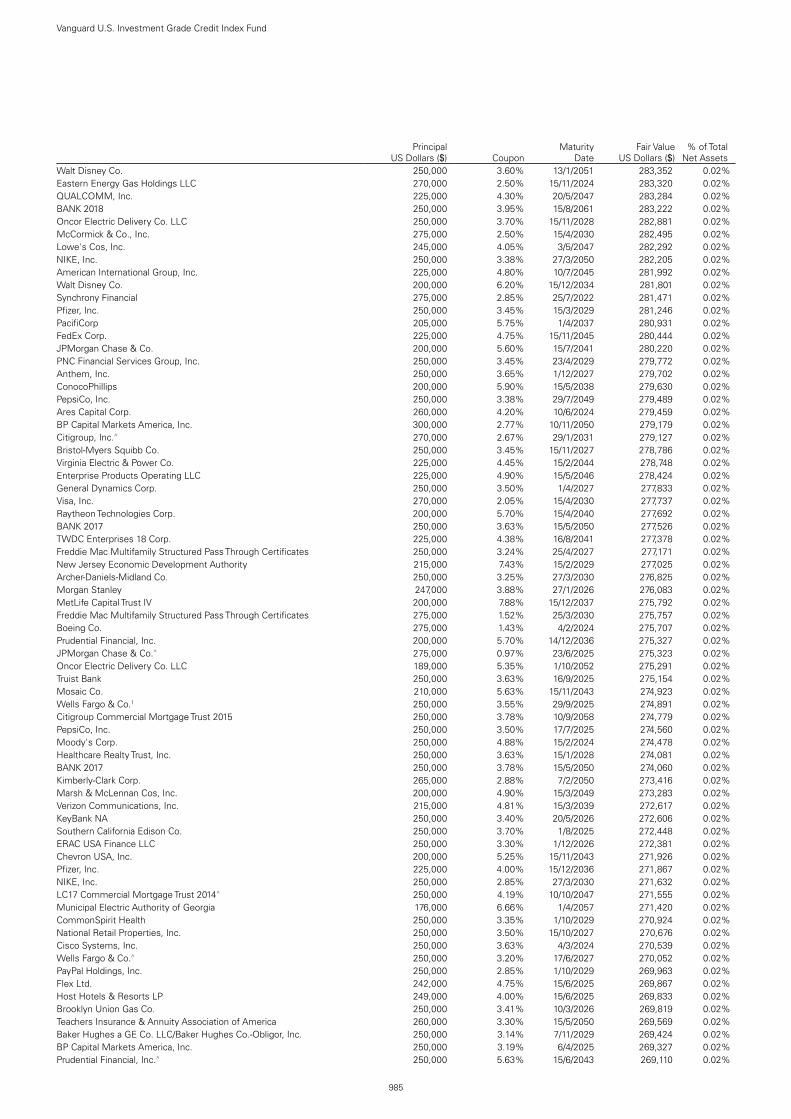
985
Vanguard U.S. Investment Grade Credit Index Fund
Principal
US Dollars ($) CouponMaturity
DateFair Value
US Dollars ($)% of Total
Net AssetsWalt Disney Co. 250,000 3.60% 13/1/2051 283,352 0.02%Eastern Energy Gas Holdings LLC 270,000 2.50% 15/11/2024 283,320 0.02%QUALCOMM, Inc. 225,000 4.30% 20/5/2047 283,284 0.02%BANK 2018 250,000 3.95% 15/8/2061 283,222 0.02%Oncor Electric Delivery Co. LLC 250,000 3.70% 15/11/2028 282,881 0.02%McCormick & Co., Inc. 275,000 2.50% 15/4/2030 282,495 0.02%Lowe's Cos, Inc. 245,000 4.05% 3/5/2047 282,292 0.02%NIKE, Inc. 250,000 3.38% 27/3/2050 282,205 0.02%American International Group, Inc. 225,000 4.80% 10/7/2045 281,992 0.02%Walt Disney Co. 200,000 6.20% 15/12/2034 281,801 0.02%Synchrony Financial 275,000 2.85% 25/7/2022 281,471 0.02%Pfizer, Inc. 250,000 3.45% 15/3/2029 281,246 0.02%PacifiCorp 205,000 5.75% 1/4/2037 280,931 0.02%FedEx Corp. 225,000 4.75% 15/11/2045 280,444 0.02%JPMorgan Chase & Co. 200,000 5.60% 15/7/2041 280,220 0.02%PNC Financial Services Group, Inc. 250,000 3.45% 23/4/2029 279,772 0.02%Anthem, Inc. 250,000 3.65% 1/12/2027 279,702 0.02%ConocoPhillips 200,000 5.90% 15/5/2038 279,630 0.02%PepsiCo, Inc. 250,000 3.38% 29/7/2049 279,489 0.02%Ares Capital Corp. 260,000 4.20% 10/6/2024 279,459 0.02%BP Capital Markets America, Inc. 300,000 2.77% 10/11/2050 279,179 0.02%Citigroup, Inc.^ 270,000 2.67% 29/1/2031 279,127 0.02%Bristol-Myers Squibb Co. 250,000 3.45% 15/11/2027 278,786 0.02%Virginia Electric & Power Co. 225,000 4.45% 15/2/2044 278,748 0.02%Enterprise Products Operating LLC 225,000 4.90% 15/5/2046 278,424 0.02%General Dynamics Corp. 250,000 3.50% 1/4/2027 277,833 0.02%Visa, Inc. 270,000 2.05% 15/4/2030 277,737 0.02%Raytheon Technologies Corp. 200,000 5.70% 15/4/2040 277,692 0.02%BANK 2017 250,000 3.63% 15/5/2050 277,526 0.02%TWDC Enterprises 18 Corp. 225,000 4.38% 16/8/2041 277,378 0.02%Freddie Mac Multifamily Structured Pass Through Certificates 250,000 3.24% 25/4/2027 277,171 0.02%New Jersey Economic Development Authority 215,000 7.43% 15/2/2029 277,025 0.02%Archer-Daniels-Midland Co. 250,000 3.25% 27/3/2030 276,825 0.02%Morgan Stanley 247,000 3.88% 27/1/2026 276,083 0.02%MetLife Capital Trust IV 200,000 7.88% 15/12/2037 275,792 0.02%Freddie Mac Multifamily Structured Pass Through Certificates 275,000 1.52% 25/3/2030 275,757 0.02%Boeing Co. 275,000 1.43% 4/2/2024 275,707 0.02%Prudential Financial, Inc. 200,000 5.70% 14/12/2036 275,327 0.02%JPMorgan Chase & Co.^ 275,000 0.97% 23/6/2025 275,323 0.02%Oncor Electric Delivery Co. LLC 189,000 5.35% 1/10/2052 275,291 0.02%Truist Bank 250,000 3.63% 16/9/2025 275,154 0.02%Mosaic Co. 210,000 5.63% 15/11/2043 274,923 0.02%Wells Fargo & Co.1 250,000 3.55% 29/9/2025 274,891 0.02%Citigroup Commercial Mortgage Trust 2015 250,000 3.78% 10/9/2058 274,779 0.02%PepsiCo, Inc. 250,000 3.50% 17/7/2025 274,560 0.02%Moody's Corp. 250,000 4.88% 15/2/2024 274,478 0.02%Healthcare Realty Trust, Inc. 250,000 3.63% 15/1/2028 274,081 0.02%BANK 2017 250,000 3.78% 15/5/2050 274,060 0.02%Kimberly-Clark Corp. 265,000 2.88% 7/2/2050 273,416 0.02%Marsh & McLennan Cos, Inc. 200,000 4.90% 15/3/2049 273,283 0.02%Verizon Communications, Inc. 215,000 4.81% 15/3/2039 272,617 0.02%KeyBank NA 250,000 3.40% 20/5/2026 272,606 0.02%Southern California Edison Co. 250,000 3.70% 1/8/2025 272,448 0.02%ERAC USA Finance LLC 250,000 3.30% 1/12/2026 272,381 0.02%Chevron USA, Inc. 200,000 5.25% 15/11/2043 271,926 0.02%Pfizer, Inc. 225,000 4.00% 15/12/2036 271,867 0.02%NIKE, Inc. 250,000 2.85% 27/3/2030 271,632 0.02%LC17 Commercial Mortgage Trust 2014^ 250,000 4.19% 10/10/2047 271,555 0.02%Municipal Electric Authority of Georgia 176,000 6.66% 1/4/2057 271,420 0.02%CommonSpirit Health 250,000 3.35% 1/10/2029 270,924 0.02%National Retail Properties, Inc. 250,000 3.50% 15/10/2027 270,676 0.02%Cisco Systems, Inc. 250,000 3.63% 4/3/2024 270,539 0.02%Wells Fargo & Co.^ 250,000 3.20% 17/6/2027 270,052 0.02%PayPal Holdings, Inc. 250,000 2.85% 1/10/2029 269,963 0.02%Flex Ltd. 242,000 4.75% 15/6/2025 269,867 0.02%Host Hotels & Resorts LP 249,000 4.00% 15/6/2025 269,833 0.02%Brooklyn Union Gas Co. 250,000 3.41% 10/3/2026 269,819 0.02%Teachers Insurance & Annuity Association of America 260,000 3.30% 15/5/2050 269,569 0.02%Baker Hughes a GE Co. LLC/Baker Hughes Co.-Obligor, Inc. 250,000 3.14% 7/11/2029 269,424 0.02%BP Capital Markets America, Inc. 250,000 3.19% 6/4/2025 269,327 0.02%Prudential Financial, Inc.^ 250,000 5.63% 15/6/2043 269,110 0.02%

986
Vanguard U.S. Investment Grade Credit Index Fund
Principal
US Dollars ($) CouponMaturity
DateFair Value
US Dollars ($)% of Total
Net AssetsCOR2 Commercial Mortgage Trust 2017 250,000 3.32% 10/9/2050 268,862 0.02%Aon plc 250,000 3.50% 14/6/2024 268,849 0.02%Niagara Mohawk Power Corp. 250,000 3.51% 1/10/2024 268,817 0.02%Penske Truck Leasing Co. LP/PTL Finance Corp. 260,000 2.70% 14/3/2023 268,500 0.02%Chevron USA, Inc. 200,000 5.05% 15/11/2044 268,401 0.02%Citigroup, Inc. 200,000 5.30% 6/5/2044 268,343 0.02%Cisco Systems, Inc. 250,000 2.50% 20/9/2026 268,237 0.02%Molson Coors Beverage Co. 250,000 3.00% 15/7/2026 268,123 0.02%Walt Disney Co. 200,000 4.95% 15/10/2045 267,967 0.02%International Paper Co. 200,000 5.15% 15/5/2046 267,776 0.02%Dell International LLC/EMC Corp. 175,000 8.10% 15/7/2036 267,660 0.02%Morgan Stanley Bank of America Merrill Lynch Trust 2015 248,048 3.45% 15/7/2050 267,363 0.02%Federal Home Loan Mortgage Corp. 250,000 2.85% 25/1/2026 267,189 0.02%Toyota Motor Credit Corp. 250,000 3.45% 20/9/2023 266,730 0.02%Union Pacific Corp. 250,000 3.15% 1/3/2024 266,724 0.02%QUALCOMM, Inc. 243,000 3.45% 20/5/2025 266,657 0.02%Home Depot, Inc. 250,000 2.50% 15/4/2027 266,580 0.02%Walgreens Boots Alliance, Inc. 245,000 3.45% 1/6/2026 266,564 0.02%Wells Fargo Commercial Mortgage Trust 2016 250,000 3.10% 15/6/2049 266,535 0.02%Marathon Oil Corp. 200,000 6.60% 1/10/2037 266,326 0.02%Northwell Healthcare, Inc. 225,000 4.26% 1/11/2047 266,108 0.02%QUALCOMM, Inc. 200,000 4.80% 20/5/2045 265,789 0.02%Citigroup, Inc. 200,000 6.00% 31/10/2033 265,681 0.02%International Business Machines Corp.1 250,000 3.38% 1/8/2023 265,397 0.02%Altria Group, Inc. 275,000 4.00% 4/2/2061 265,055 0.02%PulteGroup, Inc. 200,000 6.38% 15/5/2033 264,922 0.02%Viatris, Inc. 250,000 4.00% 22/6/2050 264,916 0.02%Evergy Metro, Inc. 200,000 5.30% 1/10/2041 264,834 0.02%Pacific Gas & Electric Co. 275,000 4.30% 15/3/2045 264,716 0.02%Lockheed Martin Corp. 200,000 4.70% 15/5/2046 264,645 0.02%Boston Properties LP 240,000 3.65% 1/2/2026 264,550 0.02%CVS Health Corp. 200,000 5.30% 5/12/2043 264,473 0.02%US Bancorp 250,000 2.38% 22/7/2026 264,334 0.02%DuPont de Nemours, Inc. 200,000 5.32% 15/11/2038 264,330 0.02%Tyson Foods, Inc. 200,000 5.10% 28/9/2048 263,856 0.02%Bank of America Corp.^ 225,000 4.08% 23/4/2040 263,116 0.02%Travelers Cos, Inc. 200,000 4.60% 1/8/2043 262,858 0.02%Fifth Third Bank NA 250,000 2.25% 1/2/2027 262,215 0.02%Entergy Louisiana LLC 250,000 2.40% 1/10/2026 261,867 0.02%Merck & Co., Inc. 250,000 2.80% 18/5/2023 261,510 0.02%Mastercard, Inc. 250,000 2.00% 3/3/2025 261,313 0.02%Bristol-Myers Squibb Co. 200,000 4.63% 15/5/2044 261,152 0.02%Burlington Northern Santa Fe LLC 250,000 3.05% 15/2/2051 260,578 0.02%HCA, Inc. 225,000 5.25% 15/6/2026 260,273 0.02%Public Service Electric & Gas Co. 300,000 2.05% 1/8/2050 259,679 0.02%Charles Schwab Corp. 225,000 4.00% 1/2/2029 259,364 0.02%AbbVie, Inc. 200,000 4.88% 14/11/2048 259,333 0.02%Abbott Laboratories 229,000 3.75% 30/11/2026 259,036 0.02%Lowe's Cos, Inc. 250,000 2.63% 1/4/2031 258,888 0.02%Activision Blizzard, Inc. 235,000 3.40% 15/9/2026 258,705 0.02%Enstar Group Ltd. 225,000 4.95% 1/6/2029 258,342 0.02%New York City Water & Sewer System 175,000 5.44% 15/6/2043 258,262 0.02%Liberty Mutual Group, Inc. 235,000 3.95% 15/5/2060 258,110 0.02%Eaton Corp. 250,000 2.75% 2/11/2022 258,102 0.02%Sysco Corp. 175,000 6.60% 1/4/2040 258,077 0.02%Burlington Resources LLC 175,000 7.40% 1/12/2031 258,019 0.02%Boeing Co. 250,000 3.75% 1/2/2050 257,888 0.02%International Business Machines Corp. 255,000 2.85% 15/5/2040 257,823 0.02%Markel Corp. 250,000 3.45% 7/5/2052 257,809 0.02%Amazon.com, Inc. 234,000 3.80% 5/12/2024 257,442 0.02%Avery Dennison Corp. 250,000 2.65% 30/4/2030 257,309 0.02%Walmart, Inc. 235,000 3.05% 8/7/2026 257,257 0.02%Alexandria Real Estate Equities, Inc. 200,000 4.85% 15/4/2049 257,172 0.02%Motiva Enterprises LLC 200,000 6.85% 15/1/2040 256,988 0.02%Eastman Chemical Co. 250,000 3.60% 15/8/2022 256,896 0.02%JPMorgan Chase & Co.^ 250,000 2.58% 22/4/2032 256,847 0.02%Hess Corp. 200,000 6.00% 15/1/2040 256,782 0.02%Colgate-Palmolive Co.1 250,000 2.25% 15/11/2022 256,680 0.02%Wells Fargo Commercial Mortgage Trust 2016 230,000 3.79% 15/12/2049 256,581 0.02%Kinder Morgan Energy Partners LP 200,000 5.80% 15/3/2035 256,471 0.02%Commonwealth Edison Co. 200,000 4.70% 15/1/2044 256,167 0.02%

987
Vanguard U.S. Investment Grade Credit Index Fund
Principal
US Dollars ($) CouponMaturity
DateFair Value
US Dollars ($)% of Total
Net AssetsComcast Corp. 200,000 4.75% 1/3/2044 256,074 0.02%Xcel Energy, Inc. 225,000 4.00% 15/6/2028 256,005 0.02%Expedia Group, Inc. 220,000 6.25% 1/5/2025 255,924 0.02%DuPont de Nemours, Inc. 225,000 4.49% 15/11/2025 255,792 0.02%7-Eleven, Inc. 275,000 2.50% 10/2/2041 255,784 0.02%3M Co. 240,000 2.65% 15/4/2025 255,618 0.02%Digital Realty Trust LP 220,000 4.45% 15/7/2028 255,133 0.02%Burlington Northern Santa Fe LLC 200,000 4.55% 1/9/2044 254,920 0.02%International Business Machines Corp. 255,000 1.95% 15/5/2030 254,763 0.02%General Motors Co. 200,000 5.40% 1/4/2048 254,653 0.02%Blackstone Holdings Finance Co. LLC 245,000 2.50% 10/1/2030 254,617 0.02%Wells Fargo Commercial Mortgage Trust 2015 242,706 3.41% 15/9/2058 254,430 0.02%CCRE24 Commercial Mortgage Trust 2015 237,138 3.43% 10/8/2048 254,419 0.02%Kimberly-Clark Corp. 235,000 3.05% 15/8/2025 254,187 0.02%International Business Machines Corp.1 250,000 1.88% 1/8/2022 254,173 0.02%Transcontinental Gas Pipe Line Co. LLC 200,000 7.85% 1/2/2026 254,092 0.02%Kroger Co. 250,000 3.40% 15/4/2022 254,055 0.02%salesforce.com, Inc. 250,000 3.05% 15/7/2061 254,054 0.02%Aircastle Ltd. 234,000 4.25% 15/6/2026 253,989 0.02%VEREIT Operating Partnership LP 220,000 4.88% 1/6/2026 253,933 0.02%National Rural Utilities Cooperative Finance Corp. 200,000 4.40% 1/11/2048 253,590 0.02%Truist Bank 250,000 2.25% 11/3/2030 253,558 0.02%Blackstone Secured Lending Fund 250,000 2.75% 16/9/2026 253,422 0.02%Intel Corp. 200,000 4.60% 25/3/2040 253,106 0.02%Anthem, Inc. 235,000 3.50% 15/8/2024 253,019 0.02%Oglethorpe Power Corp. 200,000 5.38% 1/11/2040 253,018 0.02%Comcast Corp. 215,000 4.25% 15/10/2030 252,833 0.02%Apple, Inc. 200,000 4.50% 23/2/2036 252,552 0.02%Eli Lilly & Co. 236,000 2.75% 1/6/2025 252,283 0.02%Discovery Communications LLC 200,000 5.30% 15/5/2049 252,208 0.02%Anthem, Inc. 250,000 2.25% 15/5/2030 252,170 0.02%Citibank Credit Card Issuance Trust 250,000 2.19% 20/11/2023 251,931 0.02%Highwoods Realty LP 250,000 2.60% 1/2/2031 251,824 0.02%Nationwide Mutual Insurance Co. 225,000 4.35% 30/4/2050 251,777 0.02%Boeing Co. 250,000 3.83% 1/3/2059 251,767 0.02%NextEra Energy Capital Holdings, Inc. 250,000 0.65% 1/3/2023 250,866 0.02%Baylor Scott & White Holdings 250,000 2.84% 15/11/2050 250,784 0.02%Dell International LLC/EMC Corp. 195,000 6.20% 15/7/2030 250,716 0.02%Prudential Financial, Inc. 200,000 4.35% 25/2/2050 250,667 0.02%Norfolk Southern Corp. 200,000 4.65% 15/1/2046 250,586 0.02%Oracle Corp. 225,000 4.13% 15/5/2045 250,534 0.02%Mars, Inc. 200,000 4.20% 1/4/2059 250,492 0.02%President & Fellows of Harvard College 250,000 2.52% 15/10/2050 250,466 0.02%Equitable Financial Life Global Funding 250,000 0.50% 6/4/2023 250,332 0.02%Fifth Third Bancorp 150,000 8.25% 1/3/2038 250,217 0.02%Hess Corp. 200,000 5.60% 15/2/2041 250,125 0.02%Citizens Financial Group, Inc. 250,000 2.64% 30/9/2032 250,076 0.02%Danaher Corp. 200,000 4.38% 15/9/2045 250,023 0.02%Truist Financial Corp.^ 250,000 1.27% 2/3/2027 249,777 0.02%Metropolitan Life Global Funding I 250,000 0.95% 2/7/2025 249,775 0.02%International Paper Co. 175,000 6.00% 15/11/2041 249,543 0.02%Freddie Mac Multifamily Structured Pass Through Certificates 250,000 1.50% 25/10/2030 249,342 0.02%Pfizer, Inc. 250,000 2.70% 28/5/2050 249,256 0.02%Vontier Corp. 250,000 1.80% 1/4/2026 249,189 0.02%GS Mortgage Securities Corp. II 241,000 2.94% 10/2/2046 248,790 0.02%Omnicom Group, Inc./Omnicom Capital, Inc. 225,000 3.60% 15/4/2026 248,371 0.02%Devon Energy Corp. 200,000 5.60% 15/7/2041 248,090 0.02%Walgreens Boots Alliance, Inc. 225,000 4.10% 15/4/2050 247,958 0.02%Leland Stanford Junior University 205,000 3.65% 1/5/2048 247,812 0.02%General Motors Financial Co., Inc. 225,000 5.10% 17/1/2024 247,804 0.02%Freddie Mac Multifamily Structured Pass Through Certificates 250,000 1.41% 25/8/2030 247,640 0.02%American Tower Corp. 220,000 3.95% 15/3/2029 247,269 0.02%Alexandria Real Estate Equities, Inc. 225,000 3.38% 15/8/2031 246,924 0.02%National Securities Clearing Corp. 250,000 0.75% 7/12/2025 246,665 0.02%Zimmer Biomet Holdings, Inc. 225,000 3.55% 20/3/2030 246,379 0.02%WFRBS Commercial Mortgage Trust 2012 240,115 2.88% 15/12/2045 246,137 0.02%Motorola Solutions, Inc. 250,000 2.30% 15/11/2030 245,922 0.02%Capital One Bank USA NA 235,000 3.38% 15/2/2023 245,835 0.02%Federal Home Loan Mortgage Corp.^ 225,000 3.33% 25/8/2025 245,597 0.02%General Electric Co. 220,000 3.63% 1/5/2030 245,585 0.02%ERAC USA Finance LLC 225,000 3.85% 15/11/2024 245,404 0.02%

988
Vanguard U.S. Investment Grade Credit Index Fund
Principal
US Dollars ($) CouponMaturity
DateFair Value
US Dollars ($)% of Total
Net AssetsAmerican Water Capital Corp. 200,000 4.30% 1/12/2042 245,402 0.02%Lincoln National Corp. 230,000 3.05% 15/1/2030 245,281 0.02%Las Vegas Sands Corp. 230,000 3.90% 8/8/2029 245,070 0.02%General Motors Co. 225,000 4.88% 2/10/2023 244,915 0.02%Healthpeak Properties, Inc. 225,000 3.25% 15/7/2026 244,586 0.02%Tyson Foods, Inc. 200,000 4.55% 2/6/2047 244,417 0.02%Walt Disney Co. 175,000 5.40% 1/10/2043 244,344 0.02%Quest Diagnostics, Inc. 225,000 3.50% 30/3/2025 244,157 0.02%Commonwealth of Massachusetts 175,000 5.46% 1/12/2039 244,048 0.02%Pfizer, Inc. 225,000 3.40% 15/5/2024 243,602 0.02%AT&T, Inc. 250,000 3.30% 1/2/2052 243,494 0.02%Capital One Financial Corp. 225,000 3.75% 24/4/2024 243,346 0.02%Philip Morris International, Inc. 223,000 3.38% 11/8/2025 243,266 0.02%Florida Power & Light Co. 200,000 3.95% 1/3/2048 243,036 0.02%AT&T, Inc. 200,000 4.75% 15/5/2046 242,976 0.02%Boston Scientific Corp. 235,000 2.65% 1/6/2030 242,943 0.02%Raytheon Technologies Corp. 200,000 4.45% 16/11/2038 242,064 0.02%Perrigo Finance Unlimited Co. 225,000 3.90% 15/12/2024 241,910 0.02%Caterpillar, Inc. 175,000 5.20% 27/5/2041 241,876 0.02%Nucor Corp. 250,000 2.98% 15/12/2055 241,771 0.02%General Dynamics Corp. 223,000 3.25% 1/4/2025 241,702 0.02%PepsiCo, Inc. 225,000 2.63% 19/3/2027 241,674 0.02%Altria Group, Inc. 250,000 2.45% 4/2/2032 241,639 0.02%Freddie Mac Multifamily Structured Pass Through Certificates 225,000 3.30% 25/7/2024 241,616 0.02%Federal Home Loan Mortgage Corp. 225,000 2.75% 25/1/2026 241,513 0.02%Intel Corp. 200,000 4.00% 15/12/2032 240,886 0.02%Federal Home Loan Mortgage Corp. 225,000 3.39% 25/3/2024 240,664 0.02%Morgan Stanley Bank of America Merrill Lynch Trust 2015 225,000 3.25% 15/2/2048 240,600 0.02%Walmart, Inc. 200,000 3.95% 28/6/2038 240,299 0.02%Intel Corp. 200,000 4.10% 19/5/2046 240,281 0.02%Bristol-Myers Squibb Co. 210,000 3.90% 20/2/2028 240,267 0.02%Mars, Inc. 250,000 1.63% 16/7/2032 240,187 0.02%Constellation Brands, Inc. 225,000 4.25% 1/5/2023 239,940 0.02%WRKCo, Inc. 200,000 4.90% 15/3/2029 239,868 0.02%BP Capital Markets America, Inc. 250,000 2.94% 4/6/2051 239,755 0.02%American Tower Corp. 225,000 2.95% 15/1/2025 239,023 0.02%CD 2017-CD3 Mortgage Trust 216,000 3.63% 10/2/2050 238,747 0.02%Merck & Co., Inc. 245,000 1.45% 24/6/2030 238,682 0.02%Northwestern Mutual Life Insurance Co. 170,000 6.06% 30/3/2040 238,567 0.02%Southern Co. Gas Capital Corp. 200,000 4.40% 1/6/2043 238,484 0.02%XLIT Ltd. 175,000 5.50% 31/3/2045 238,428 0.02%Dow Chemical Co. 200,000 4.38% 15/11/2042 238,373 0.02%Entergy Arkansas LLC 250,000 2.65% 15/6/2051 238,350 0.02%CNO Financial Group, Inc. 200,000 5.25% 30/5/2029 238,210 0.02%Verizon Communications, Inc. 220,000 3.50% 1/11/2024 238,061 0.02%Keurig Dr Pepper, Inc. 195,000 4.50% 15/11/2045 237,879 0.02%Phillips 66 Partners LP 200,000 4.90% 1/10/2046 237,878 0.02%Oncor Electric Delivery Co. LLC 200,000 3.80% 1/6/2049 237,379 0.02%Regeneron Pharmaceuticals, Inc. 250,000 1.75% 15/9/2030 237,149 0.02%Boeing Co. 225,000 3.60% 1/5/2034 237,082 0.02%EOG Resources, Inc. 200,000 4.38% 15/4/2030 237,057 0.02%Sysco Corp. 200,000 4.50% 1/4/2046 236,892 0.02%TJX Cos, Inc. 225,000 2.25% 15/9/2026 236,610 0.02%Los Angeles Unified School District 175,000 5.75% 1/7/2034 236,554 0.02%Johnson & Johnson 250,000 2.45% 1/9/2060 235,713 0.02%Halliburton Co. 200,000 4.85% 15/11/2035 235,551 0.02%Coca-Cola Co. 250,000 2.50% 15/3/2051 235,427 0.02%Altria Group, Inc. 225,000 2.35% 6/5/2025 235,350 0.02%Devon Energy Corp. 200,000 5.85% 15/12/2025 234,819 0.02%Federal Home Loan Mortgage Corp. 232,894 2.79% 25/1/2022 234,797 0.02%Dell International LLC/EMC Corp. 200,000 5.85% 15/7/2025 234,728 0.02%Prudential Financial, Inc. 200,000 3.94% 7/12/2049 234,702 0.02%Boston Gas Co. 200,000 4.49% 15/2/2042 234,696 0.02%Pernod Ricard International Finance LLC 250,000 2.75% 1/10/2050 234,460 0.02%ONEOK, Inc. 200,000 4.95% 13/7/2047 234,350 0.02%Global Payments, Inc. 225,000 2.90% 15/5/2030 234,272 0.02%Microsoft Corp. 194,000 3.70% 8/8/2046 234,254 0.02%Citibank Credit Card Issuance Trust 200,000 3.96% 13/10/2030 234,146 0.02%JPMorgan Chase & Co.^ 200,000 4.45% 5/12/2029 233,774 0.02%Equinix, Inc. 233,000 1.25% 15/7/2025 233,670 0.02%Healthcare Trust of America Holdings LP 220,000 3.10% 15/2/2030 233,595 0.02%

989
Vanguard U.S. Investment Grade Credit Index Fund
Principal
US Dollars ($) CouponMaturity
DateFair Value
US Dollars ($)% of Total
Net AssetsBurlington Northern Santa Fe LLC 175,000 4.90% 1/4/2044 233,250 0.02%JPMorgan Chase & Co.^ 225,000 3.11% 22/4/2051 233,242 0.02%JPMorgan Chase & Co. 215,000 3.88% 1/2/2024 233,016 0.02%Tyson Foods, Inc. 200,000 4.35% 1/3/2029 232,952 0.02%FedEx Corp. 200,000 4.20% 17/10/2028 232,834 0.02%Federal Home Loan Mortgage Corp. 200,000 3.93% 25/6/2028 232,567 0.02%State of Connecticut 175,000 5.85% 15/3/2032 232,557 0.02%Bacardi Ltd. 200,000 4.70% 15/5/2028 232,273 0.01%L3Harris Technologies, Inc. 200,000 4.40% 15/6/2028 232,145 0.01%Federal Home Loan Mortgage Corp. 229,593 2.27% 25/3/2022 231,790 0.01%AvalonBay Communities, Inc. 215,000 2.95% 11/5/2026 231,707 0.01%Walmart, Inc. 155,000 6.20% 15/4/2038 231,353 0.01%CVS Health Corp. 225,000 2.75% 1/12/2022 231,255 0.01%Motorola Solutions, Inc. 211,000 4.00% 1/9/2024 231,021 0.01%Federal Home Loan Mortgage Corp. 200,000 3.69% 25/1/2029 230,848 0.01%Citigroup, Inc. 150,000 6.68% 13/9/2043 230,613 0.01%UnitedHealth Group, Inc. 200,000 3.75% 15/10/2047 230,534 0.01%Baxter International, Inc. 200,000 3.95% 1/4/2030 230,224 0.01%Wells Fargo & Co. 200,000 4.15% 24/1/2029 230,172 0.01%Fiserv, Inc. 200,000 4.20% 1/10/2028 230,058 0.01%Southern California Edison Co. 200,000 4.50% 1/9/2040 230,025 0.01%Merck & Co., Inc. 200,000 3.60% 15/9/2042 229,535 0.01%Baker Hughes a GE Co. LLC/Baker Hughes Co.-Obligor, Inc. 200,000 4.08% 15/12/2047 229,171 0.01%Capital One Financial Corp. 225,000 3.05% 9/3/2022 228,722 0.01%Burlington Northern Santa Fe LLC 220,000 3.00% 15/3/2023 228,648 0.01%Sabine Pass Liquefaction LLC 200,000 5.63% 1/3/2025 228,627 0.01%Comcast Corp. 150,000 6.95% 15/8/2037 228,566 0.01%MetLife, Inc. 165,000 5.70% 15/6/2035 228,450 0.01%Ohio National Financial Services, Inc. 200,000 5.55% 24/1/2030 228,449 0.01%Berkshire Hathaway, Inc. 220,000 2.75% 15/3/2023 228,296 0.01%JPMorgan Chase & Co. 225,000 2.97% 15/1/2023 228,197 0.01%KeyCorp 220,000 2.25% 6/4/2027 228,189 0.01%Dollar Tree, Inc. 200,000 4.20% 15/5/2028 228,166 0.01%Southwestern Electric Power Co. 200,000 4.10% 15/9/2028 228,135 0.01%Dow Chemical Co. 175,000 5.25% 15/11/2041 227,992 0.01%Plains All American Pipeline LP/PAA Finance Corp. 215,000 4.70% 15/6/2044 227,922 0.01%salesforce.com, Inc. 200,000 3.70% 11/4/2028 227,705 0.01%Weyerhaeuser Co. 200,000 4.00% 15/4/2030 227,689 0.01%Bank of America Corp.^ 200,000 3.97% 7/2/2030 226,775 0.01%NVIDIA Corp. 200,000 3.50% 1/4/2040 226,673 0.01%Utah Acquisition Sub, Inc. 185,000 5.25% 15/6/2046 226,543 0.01%McDonald's Corp. 200,000 3.80% 1/4/2028 226,463 0.01%Synchrony Card Issuance Trust 225,000 3.38% 15/9/2024 226,460 0.01%GE Capital Funding LLC 200,000 4.05% 15/5/2027 226,356 0.01%Kroger Co. 225,000 2.20% 1/5/2030 226,289 0.01%Fox Corp. 175,000 5.48% 25/1/2039 226,267 0.01%Intel Corp. 200,000 3.75% 25/3/2027 225,899 0.01%Time Warner Cable LLC 175,000 5.88% 15/11/2040 225,842 0.01%Micron Technology, Inc. 200,000 4.19% 15/2/2027 225,836 0.01%FedEx Corp. 175,000 4.95% 17/10/2048 225,833 0.01%Protective Life Corp. 200,000 4.30% 30/9/2028 225,788 0.01%Trane Technologies Luxembourg Finance SA 200,000 3.80% 21/3/2029 225,770 0.01%Berry Global, Inc. 225,000 0.95% 15/2/2024 225,464 0.01%Northrop Grumman Corp. 175,000 4.75% 1/6/2043 225,346 0.01%McDonald's Corp. 175,000 4.88% 9/12/2045 225,294 0.01%Lowe's Cos, Inc. 205,000 3.70% 15/4/2046 225,194 0.01%Phillips 66 200,000 3.90% 15/3/2028 224,984 0.01%General Motors Financial Co., Inc. 200,000 4.35% 17/1/2027 224,925 0.01%Mid-Atlantic Interstate Transmission LLC 200,000 4.10% 15/5/2028 224,871 0.01%MassMutual Global Funding II 212,000 2.75% 22/6/2024 224,828 0.01%Transcontinental Gas Pipe Line Co. LLC 200,000 3.95% 15/5/2050 224,613 0.01%Consolidated Edison Co. of New York, Inc. 200,000 3.88% 15/6/2047 224,444 0.01%Texas Private Activity Bond Surface Transportation Corp. 200,000 3.92% 31/12/2049 224,238 0.01%Fifth Third Bank NA 200,000 3.95% 28/7/2025 224,184 0.01%Crown Castle International Corp. 225,000 3.25% 15/1/2051 224,120 0.01%Synchrony Financial 200,000 4.50% 23/7/2025 223,959 0.01%Discovery Communications LLC 205,000 3.63% 15/5/2030 223,802 0.01%KLA Corp. 200,000 4.65% 1/11/2024 223,324 0.01%UnitedHealth Group, Inc. 200,000 3.50% 15/8/2039 223,265 0.01%ONEOK, Inc. 200,000 4.50% 15/3/2050 223,235 0.01%Baxter International, Inc. 200,000 3.50% 15/8/2046 223,138 0.01%
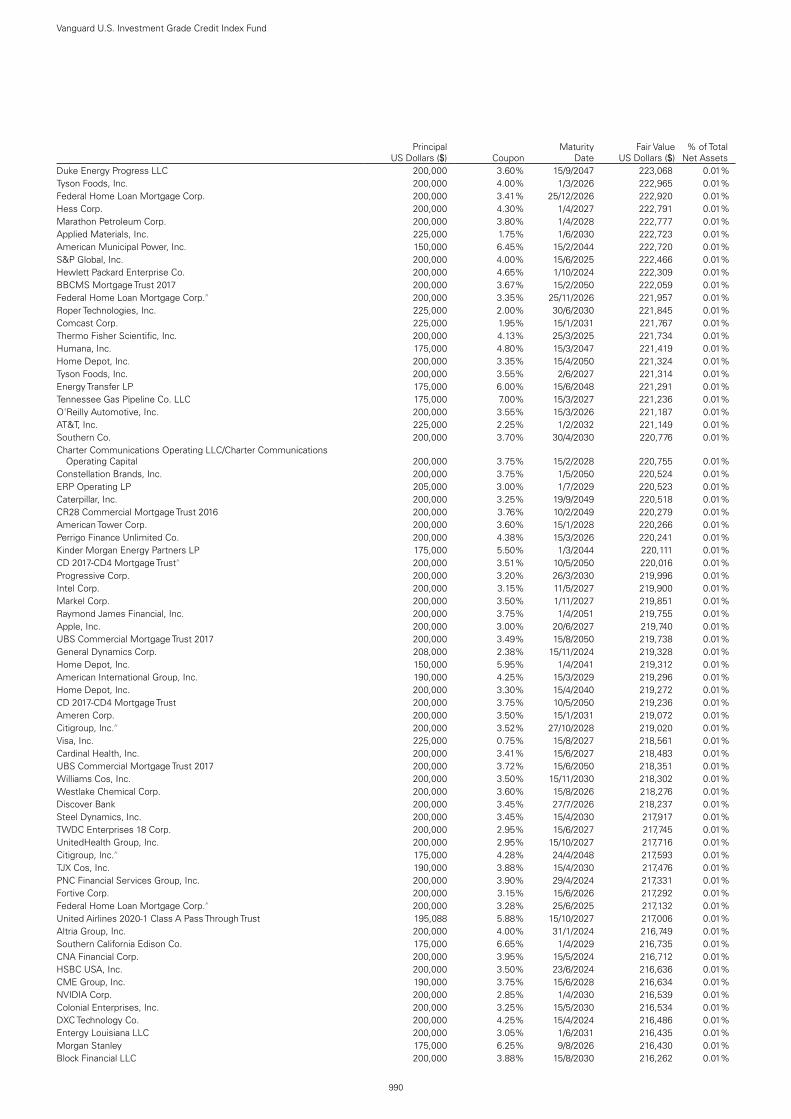
990
Vanguard U.S. Investment Grade Credit Index Fund
Principal
US Dollars ($) CouponMaturity
DateFair Value
US Dollars ($)% of Total
Net AssetsDuke Energy Progress LLC 200,000 3.60% 15/9/2047 223,068 0.01%Tyson Foods, Inc. 200,000 4.00% 1/3/2026 222,965 0.01%Federal Home Loan Mortgage Corp. 200,000 3.41% 25/12/2026 222,920 0.01%Hess Corp. 200,000 4.30% 1/4/2027 222,791 0.01%Marathon Petroleum Corp. 200,000 3.80% 1/4/2028 222,777 0.01%Applied Materials, Inc. 225,000 1.75% 1/6/2030 222,723 0.01%American Municipal Power, Inc. 150,000 6.45% 15/2/2044 222,720 0.01%S&P Global, Inc. 200,000 4.00% 15/6/2025 222,466 0.01%Hewlett Packard Enterprise Co. 200,000 4.65% 1/10/2024 222,309 0.01%BBCMS Mortgage Trust 2017 200,000 3.67% 15/2/2050 222,059 0.01%Federal Home Loan Mortgage Corp.^ 200,000 3.35% 25/11/2026 221,957 0.01%Roper Technologies, Inc. 225,000 2.00% 30/6/2030 221,845 0.01%Comcast Corp. 225,000 1.95% 15/1/2031 221,767 0.01%Thermo Fisher Scientific, Inc. 200,000 4.13% 25/3/2025 221,734 0.01%Humana, Inc. 175,000 4.80% 15/3/2047 221,419 0.01%Home Depot, Inc. 200,000 3.35% 15/4/2050 221,324 0.01%Tyson Foods, Inc. 200,000 3.55% 2/6/2027 221,314 0.01%Energy Transfer LP 175,000 6.00% 15/6/2048 221,291 0.01%Tennessee Gas Pipeline Co. LLC 175,000 7.00% 15/3/2027 221,236 0.01%O'Reilly Automotive, Inc. 200,000 3.55% 15/3/2026 221,187 0.01%AT&T, Inc. 225,000 2.25% 1/2/2032 221,149 0.01%Southern Co. 200,000 3.70% 30/4/2030 220,776 0.01%Charter Communications Operating LLC/Charter Communications
Operating Capital 200,000 3.75% 15/2/2028 220,755 0.01%Constellation Brands, Inc. 200,000 3.75% 1/5/2050 220,524 0.01%ERP Operating LP 205,000 3.00% 1/7/2029 220,523 0.01%Caterpillar, Inc. 200,000 3.25% 19/9/2049 220,518 0.01%CR28 Commercial Mortgage Trust 2016 200,000 3.76% 10/2/2049 220,279 0.01%American Tower Corp. 200,000 3.60% 15/1/2028 220,266 0.01%Perrigo Finance Unlimited Co. 200,000 4.38% 15/3/2026 220,241 0.01%Kinder Morgan Energy Partners LP 175,000 5.50% 1/3/2044 220,111 0.01%CD 2017-CD4 Mortgage Trust^ 200,000 3.51% 10/5/2050 220,016 0.01%Progressive Corp. 200,000 3.20% 26/3/2030 219,996 0.01%Intel Corp. 200,000 3.15% 11/5/2027 219,900 0.01%Markel Corp. 200,000 3.50% 1/11/2027 219,851 0.01%Raymond James Financial, Inc. 200,000 3.75% 1/4/2051 219,755 0.01%Apple, Inc. 200,000 3.00% 20/6/2027 219,740 0.01%UBS Commercial Mortgage Trust 2017 200,000 3.49% 15/8/2050 219,738 0.01%General Dynamics Corp. 208,000 2.38% 15/11/2024 219,328 0.01%Home Depot, Inc. 150,000 5.95% 1/4/2041 219,312 0.01%American International Group, Inc. 190,000 4.25% 15/3/2029 219,296 0.01%Home Depot, Inc. 200,000 3.30% 15/4/2040 219,272 0.01%CD 2017-CD4 Mortgage Trust 200,000 3.75% 10/5/2050 219,236 0.01%Ameren Corp. 200,000 3.50% 15/1/2031 219,072 0.01%Citigroup, Inc.^ 200,000 3.52% 27/10/2028 219,020 0.01%Visa, Inc. 225,000 0.75% 15/8/2027 218,561 0.01%Cardinal Health, Inc. 200,000 3.41% 15/6/2027 218,483 0.01%UBS Commercial Mortgage Trust 2017 200,000 3.72% 15/6/2050 218,351 0.01%Williams Cos, Inc. 200,000 3.50% 15/11/2030 218,302 0.01%Westlake Chemical Corp. 200,000 3.60% 15/8/2026 218,276 0.01%Discover Bank 200,000 3.45% 27/7/2026 218,237 0.01%Steel Dynamics, Inc. 200,000 3.45% 15/4/2030 217,917 0.01%TWDC Enterprises 18 Corp. 200,000 2.95% 15/6/2027 217,745 0.01%UnitedHealth Group, Inc. 200,000 2.95% 15/10/2027 217,716 0.01%Citigroup, Inc.^ 175,000 4.28% 24/4/2048 217,593 0.01%TJX Cos, Inc. 190,000 3.88% 15/4/2030 217,476 0.01%PNC Financial Services Group, Inc. 200,000 3.90% 29/4/2024 217,331 0.01%Fortive Corp. 200,000 3.15% 15/6/2026 217,292 0.01%Federal Home Loan Mortgage Corp.^ 200,000 3.28% 25/6/2025 217,132 0.01%United Airlines 2020-1 Class A Pass Through Trust 195,088 5.88% 15/10/2027 217,006 0.01%Altria Group, Inc. 200,000 4.00% 31/1/2024 216,749 0.01%Southern California Edison Co. 175,000 6.65% 1/4/2029 216,735 0.01%CNA Financial Corp. 200,000 3.95% 15/5/2024 216,712 0.01%HSBC USA, Inc. 200,000 3.50% 23/6/2024 216,636 0.01%CME Group, Inc. 190,000 3.75% 15/6/2028 216,634 0.01%NVIDIA Corp. 200,000 2.85% 1/4/2030 216,539 0.01%Colonial Enterprises, Inc. 200,000 3.25% 15/5/2030 216,534 0.01%DXC Technology Co. 200,000 4.25% 15/4/2024 216,486 0.01%Entergy Louisiana LLC 200,000 3.05% 1/6/2031 216,435 0.01%Morgan Stanley 175,000 6.25% 9/8/2026 216,430 0.01%Block Financial LLC 200,000 3.88% 15/8/2030 216,262 0.01%

991
Vanguard U.S. Investment Grade Credit Index Fund
Principal
US Dollars ($) CouponMaturity
DateFair Value
US Dollars ($)% of Total
Net AssetsCigna Corp. 203,000 3.75% 15/7/2023 216,132 0.01%Citigroup, Inc. 150,000 5.88% 30/1/2042 215,962 0.01%Principal Life Global Funding II 200,000 3.00% 18/4/2026 215,909 0.01%Federal National Mortgage Association^ 202,057 3.51% 25/12/2023 215,860 0.01%McDonald's Corp. 150,000 6.30% 15/10/2037 215,798 0.01%NIKE, Inc. 200,000 2.75% 27/3/2027 215,728 0.01%QUALCOMM, Inc. 200,000 3.25% 20/5/2050 215,653 0.01%Kimco Realty Corp. 206,000 2.70% 1/3/2024 215,517 0.01%Capital One Financial Corp. 200,000 3.30% 30/10/2024 215,480 0.01%Oncor Electric Delivery Co. LLC 150,000 7.00% 1/5/2032 215,442 0.01%Ameren Illinois Co. 200,000 3.25% 15/3/2050 215,419 0.01%Fortune Brands Home & Security, Inc. 200,000 3.25% 15/9/2029 215,412 0.01%International Business Machines Corp.1 200,000 3.63% 12/2/2024 215,399 0.01%Eastern Energy Gas Holdings LLC 200,000 3.90% 15/11/2049 215,332 0.01%Magellan Midstream Partners LP 200,000 3.25% 1/6/2030 215,291 0.01%Metropolitan Life Global Funding I 207,000 3.00% 10/1/2023 215,192 0.01%Charter Communications Operating LLC/Charter Communications
Operating Capital 200,000 4.40% 1/12/2061 215,110 0.01%Truist Financial Corp. 200,000 3.75% 6/12/2023 215,096 0.01%Wells Fargo Commercial Mortgage Trust 2015 199,317 3.79% 15/9/2048 215,069 0.01%JPMBB Commercial Mortgage Securities Trust 2014 200,000 4.08% 15/2/2047 215,053 0.01%Starbucks Corp. 200,000 3.50% 15/11/2050 214,980 0.01%Wells Fargo & Co. 200,000 4.13% 15/8/2023 214,960 0.01%Federal Home Loan Mortgage Corp. 200,000 3.02% 25/4/2048 214,856 0.01%Eaton Corp. 180,000 4.15% 2/11/2042 214,818 0.01%S&P Global, Inc. 250,000 2.30% 15/8/2060 214,660 0.01%Lockheed Martin Corp. 200,000 2.90% 1/3/2025 214,436 0.01%HCA, Inc. 200,000 4.75% 1/5/2023 214,384 0.01%Raytheon Technologies Corp. 175,000 4.35% 15/4/2047 214,355 0.01%Diamondback Energy, Inc. 200,000 3.25% 1/12/2026 214,345 0.01%HP, Inc. 200,000 3.00% 17/6/2027 214,345 0.01%Union Electric Co. 200,000 3.50% 15/4/2024 214,279 0.01%Illinois Tool Works, Inc. 200,000 3.50% 1/3/2024 214,220 0.01%AES Corp. 200,000 3.30% 15/7/2025 213,883 0.01%UnitedHealth Group, Inc. 200,000 3.25% 15/5/2051 213,818 0.01%Entergy Corp. 200,000 2.95% 1/9/2026 213,665 0.01%Massachusetts School Building Authority 200,000 3.40% 15/10/2040 213,532 0.01%Northwestern Mutual Life Insurance Co. 200,000 3.45% 30/3/2051 213,531 0.01%Starbucks Corp. 200,000 3.85% 1/10/2023 213,480 0.01%Viatris, Inc. 200,000 3.85% 22/6/2040 213,469 0.01%Sysco Corp. 166,000 5.95% 1/4/2030 213,290 0.01%Union Electric Co. 200,000 3.25% 1/10/2049 213,250 0.01%Duke Energy Corp. 200,000 3.75% 1/9/2046 213,238 0.01%ONEOK, Inc. 200,000 3.40% 1/9/2029 213,237 0.01%Federal Home Loan Mortgage Corp. 200,000 2.53% 25/5/2026 213,210 0.01%UnitedHealth Group, Inc. 180,000 3.88% 15/8/2059 213,206 0.01%Acuity Brands Lighting, Inc. 215,000 2.15% 15/12/2030 213,163 0.01%Duke Energy Carolinas LLC 150,000 6.05% 15/4/2038 213,151 0.01%Welltower, Inc. 200,000 3.10% 15/1/2030 213,143 0.01%Alexandria Real Estate Equities, Inc. 225,000 1.88% 1/2/2033 212,957 0.01%JPMorgan Chase & Co.^ 200,000 3.80% 23/7/2024 212,936 0.01%Ralph Lauren Corp. 200,000 2.95% 15/6/2030 212,787 0.01%Federal Home Loan Mortgage Corp.^ 200,000 3.53% 25/10/2023 212,722 0.01%Philip Morris International, Inc. 200,000 2.88% 1/5/2024 212,690 0.01%PepsiCo, Inc. 175,000 4.00% 5/3/2042 212,652 0.01%STERIS Irish FinCo UnLtd Co. 200,000 3.75% 15/3/2051 212,422 0.01%Crown Castle International Corp. 200,000 3.10% 15/11/2029 212,267 0.01%Keurig Dr Pepper, Inc. 200,000 3.13% 15/12/2023 212,176 0.01%Novant Health, Inc. 200,000 3.32% 1/11/2061 212,122 0.01%Procter & Gamble Co.1 200,000 3.10% 15/8/2023 212,035 0.01%American Water Capital Corp. 200,000 2.80% 1/5/2030 212,009 0.01%eBay, Inc. 200,000 3.65% 10/5/2051 211,948 0.01%Linde, Inc. 200,000 2.65% 5/2/2025 211,883 0.01%JPMorgan Chase & Co. 150,000 5.63% 16/8/2043 211,832 0.01%Amphenol Corp. 200,000 2.80% 15/2/2030 211,675 0.01%VF Corp. 200,000 2.95% 23/4/2030 211,664 0.01%Federal National Mortgage Association 200,000 2.47% 25/4/2026 211,626 0.01%State of Oregon 175,000 5.89% 1/6/2027 211,610 0.01%Burlington Northern Santa Fe LLC 175,000 4.05% 15/6/2048 211,485 0.01%LYB International Finance III LLC 200,000 3.80% 1/10/2060 211,173 0.01%SITE Centers Corp. 200,000 3.63% 1/2/2025 211,028 0.01%
992
Vanguard U.S. Investment Grade Credit Index Fund
Principal
US Dollars ($) CouponMaturity
DateFair Value
US Dollars ($)% of Total
Net AssetsFederal Home Loan Mortgage Corp. 200,000 3.00% 25/1/2024 211,009 0.01%Tapestry, Inc. 194,000 4.25% 1/4/2025 211,001 0.01%Pfizer, Inc. 195,000 2.75% 3/6/2026 210,986 0.01%Lincoln National Corp. 175,000 4.38% 15/6/2050 210,931 0.01%ITC Holdings Corp. 200,000 2.95% 14/5/2030 210,825 0.01%Otis Worldwide Corp. 200,000 3.36% 15/2/2050 210,630 0.01%General Motors Financial Co., Inc. 200,000 2.75% 20/6/2025 210,618 0.01%Equinix, Inc. 200,000 2.63% 18/11/2024 210,549 0.01%Carmax Auto Owner Trust 2018 207,631 3.36% 15/9/2023 210,494 0.01%Citigroup Commercial Mortgage Trust 2016 195,000 3.15% 15/11/2049 210,428 0.01%Aon Corp. 200,000 2.80% 15/5/2030 210,408 0.01%Coca-Cola Co. 175,000 4.13% 25/3/2040 210,265 0.01%Whirlpool Corp. 175,000 4.50% 1/6/2046 210,255 0.01%GATX Corp. 180,000 4.55% 7/11/2028 210,157 0.01%Constellation Brands, Inc. 200,000 2.88% 1/5/2030 210,049 0.01%Aviation Capital Group LLC 200,000 3.50% 1/11/2027 210,033 0.01%New York Life Global Funding 200,000 2.35% 14/7/2026 209,935 0.01%Host Hotels & Resorts LP 200,000 3.50% 15/9/2030 209,901 0.01%Dominion Energy, Inc. 200,000 3.30% 15/4/2041 209,856 0.01%DR Horton, Inc. 200,000 2.50% 15/10/2024 209,743 0.01%Federal Home Loan Mortgage Corp. 190,000 3.12% 25/6/2027 209,548 0.01%Enterprise Products Operating LLC^ 200,000 5.25% 16/8/2077 209,483 0.01%American Express Co. 175,000 4.05% 3/12/2042 209,429 0.01%Anthem, Inc. 200,000 2.38% 15/1/2025 209,409 0.01%American Express Co. 200,000 3.40% 27/2/2023 209,388 0.01%Cigna Corp. 200,000 3.00% 15/7/2023 209,382 0.01%PPG Industries, Inc. 200,000 2.40% 15/8/2024 209,255 0.01%Air Lease Corp. 200,000 3.00% 15/9/2023 209,235 0.01%Lennar Corp. 200,000 4.75% 15/11/2022 209,234 0.01%Chevron Corp. 200,000 2.98% 11/5/2040 209,138 0.01%MassMutual Global Funding II 200,000 2.35% 14/1/2027 208,990 0.01%Nordstrom, Inc. 200,000 4.25% 1/8/2031 208,826 0.01%Athene Global Funding 200,000 2.80% 26/5/2023 208,332 0.01%Hormel Foods Corp. 200,000 3.05% 3/6/2051 208,187 0.01%International Flavors & Fragrances, Inc. 200,000 3.47% 1/12/2050 208,090 0.01%Discovery Communications LLC 200,000 2.95% 20/3/2023 208,076 0.01%Gilead Sciences, Inc. 200,000 2.50% 1/9/2023 208,045 0.01%Entergy Corp. 200,000 2.80% 15/6/2030 207,990 0.01%Duke Energy Carolinas LLC 200,000 2.55% 15/4/2031 207,969 0.01%Allstate Corp. 175,000 3.85% 10/8/2049 207,940 0.01%Citigroup Commercial Mortgage Trust 2013 200,000 3.09% 10/4/2046 207,896 0.01%Essential Utilities, Inc. 200,000 2.70% 15/4/2030 207,782 0.01%Assured Guaranty US Holdings, Inc. 200,000 3.15% 15/6/2031 207,765 0.01%Zoetis, Inc. 200,000 3.25% 1/2/2023 207,711 0.01%Capital One Financial Corp. 200,000 2.60% 11/5/2023 207,684 0.01%Ares Capital Corp. 200,000 3.50% 10/2/2023 207,599 0.01%Discovery Communications LLC 150,000 6.35% 1/6/2040 207,461 0.01%Federal Home Loan Mortgage Corp. 200,000 3.11% 25/2/2023 207,374 0.01%Los Angeles Community College District 120,000 6.75% 1/8/2049 207,266 0.01%JPMorgan Chase & Co.^ 200,000 3.11% 22/4/2041 207,248 0.01%eBay, Inc. 200,000 2.75% 30/1/2023 207,133 0.01%Chevron Corp. 200,000 3.08% 11/5/2050 207,084 0.01%Wells Fargo & Co.^ 200,000 2.57% 11/2/2031 207,034 0.01%Charter Communications Operating LLC/Charter Communications
Operating Capital 175,000 5.05% 30/3/2029 206,867 0.01%Anthem, Inc. 200,000 2.95% 1/12/2022 206,791 0.01%Essential Utilities, Inc. 200,000 3.35% 15/4/2050 206,785 0.01%Federal Home Loan Mortgage Corp. 200,000 2.45% 25/8/2023 206,629 0.01%Chevron Corp. 200,000 2.00% 11/5/2027 206,588 0.01%United Parcel Service, Inc. 140,000 6.20% 15/1/2038 206,525 0.01%EOG Resources, Inc. 200,000 2.63% 15/3/2023 206,516 0.01%Pacific Gas & Electric Co. 200,000 3.15% 1/1/2026 206,373 0.01%Kaiser Foundation Hospitals 200,000 3.00% 1/6/2051 206,301 0.01%Chevron Corp. 200,000 2.24% 11/5/2030 206,254 0.01%Duke Energy Indiana LLC 150,000 6.12% 15/10/2035 206,169 0.01%GS Mortgage Securities Trust 2013 198,000 3.14% 10/6/2046 206,140 0.01%Voya Financial, Inc. 150,000 5.70% 15/7/2043 206,137 0.01%Synchrony Credit Card Master Note Trust 200,000 2.62% 15/10/2025 206,060 0.01%Devon Energy Corp. 175,000 5.00% 15/6/2045 205,936 0.01%Federal Home Loan Mortgage Corp. 200,000 2.64% 25/1/2023 205,856 0.01%United Airlines 2020-1 Class B Pass Through Trust 194,100 4.88% 15/1/2026 205,848 0.01%
993
Vanguard U.S. Investment Grade Credit Index Fund
Principal
US Dollars ($) CouponMaturity
DateFair Value
US Dollars ($)% of Total
Net AssetsTeledyne Technologies, Inc. 200,000 2.75% 1/4/2031 205,610 0.01%MassMutual Global Funding II 200,000 2.50% 17/10/2022 205,542 0.01%ONEOK Partners LP 200,000 3.38% 1/10/2022 205,518 0.01%Fidelity National Information Services, Inc. 200,000 3.10% 1/3/2041 205,474 0.01%Laboratory Corp. of America Holdings 195,000 2.95% 1/12/2029 205,360 0.01%US Bancorp 200,000 2.95% 15/7/2022 205,170 0.01%UBS-Barclays Commercial Mortgage Trust 2012 200,000 2.85% 10/12/2045 205,127 0.01%Exelon Corp. 200,000 3.50% 1/6/2022 205,099 0.01%Federal Home Loan Mortgage Corp. 200,000 2.51% 25/11/2022 205,032 0.01%UnitedHealth Group, Inc. 200,000 2.30% 15/5/2031 204,826 0.01%CSX Corp. 175,000 4.10% 15/3/2044 204,815 0.01%Metropolitan Life Global Funding I 200,000 1.95% 13/1/2023 204,806 0.01%Coca-Cola Co. 200,000 2.25% 5/1/2032 204,775 0.01%Pacific Gas & Electric Co. 200,000 2.95% 1/3/2026 204,475 0.01%Kinder Morgan, Inc. 200,000 3.60% 15/2/2051 204,350 0.01%Kaiser Foundation Hospitals 200,000 2.81% 1/6/2041 204,343 0.01%Freddie Mac Multifamily Structured Pass Through Certificates^ 175,000 3.92% 25/9/2028 204,177 0.01%Republic Services, Inc. 200,000 3.05% 1/3/2050 204,166 0.01%Mondelez International Holdings Netherlands BV 200,000 2.13% 19/9/2022 204,160 0.01%Texas Health Resources 225,000 2.33% 15/11/2050 204,149 0.01%Federal National Mortgage Association 175,000 3.61% 25/2/2031 204,118 0.01%Citigroup, Inc. 150,000 6.63% 15/6/2032 204,114 0.01%CenterPoint Energy, Inc. 200,000 2.65% 1/6/2031 204,079 0.01%Union Pacific Corp. 175,000 4.10% 15/9/2067 203,918 0.01%Consolidated Edison Co. of New York, Inc. 200,000 2.40% 15/6/2031 203,902 0.01%Amcor Flexibles North America, Inc. 200,000 2.69% 25/5/2031 203,897 0.01%eBay, Inc. 200,000 2.60% 10/5/2031 203,542 0.01%Charter Communications Operating LLC/Charter Communications
Operating Capital 200,000 3.90% 1/6/2052 203,517 0.01%Edison International 200,000 2.40% 15/9/2022 203,488 0.01%FedEx Corp. 150,000 5.25% 15/5/2050 203,488 0.01%Expedia Group, Inc. 200,000 2.95% 15/3/2031 203,480 0.01%Omnicom Group, Inc. 200,000 2.60% 1/8/2031 203,407 0.01%American Water Capital Corp. 200,000 2.30% 1/6/2031 203,331 0.01%Steelcase, Inc. 175,000 5.13% 18/1/2029 203,133 0.01%Cox Communications, Inc. 200,000 2.60% 15/6/2031 203,050 0.01%Lam Research Corp. 150,000 4.88% 15/3/2049 203,011 0.01%VeriSign, Inc. 200,000 2.70% 15/6/2031 202,972 0.01%Illumina, Inc. 200,000 2.55% 23/3/2031 202,930 0.01%SVB Financial Group 200,000 2.10% 15/5/2028 202,813 0.01%Cigna Corp. 200,000 2.38% 15/3/2031 202,793 0.01%Freddie Mac Multifamily Structured Pass Through Certificates 175,000 3.77% 25/12/2028 202,758 0.01%Marsh & McLennan Cos, Inc. 200,000 2.25% 15/11/2030 202,652 0.01%Freddie Mac Multifamily Structured Pass Through Certificates 200,000 1.64% 25/1/2030 202,598 0.01%Florida Gas Transmission Co. LLC 200,000 2.55% 1/7/2030 202,563 0.01%Flex Intermediate Holdco LLC 200,000 3.36% 30/6/2031 202,541 0.01%Schlumberger Finance Canada Ltd. 200,000 1.40% 17/9/2025 202,493 0.01%Southern Co.^ 200,000 3.75% 15/9/2051 202,454 0.01%Discover Card Execution Note Trust 200,000 2.39% 15/7/2024 202,353 0.01%Bunge Ltd. Finance Corp. 200,000 2.75% 14/5/2031 202,293 0.01%NextEra Energy Capital Holdings, Inc. 200,000 1.90% 15/6/2028 202,261 0.01%General Motors Financial Co., Inc. 175,000 5.25% 1/3/2026 202,177 0.01%salesforce.com, Inc. 200,000 2.90% 15/7/2051 202,092 0.01%Puget Energy, Inc. 200,000 2.38% 15/6/2028 202,024 0.01%BP Capital Markets America, Inc. 200,000 3.06% 17/6/2041 201,977 0.01%Sutter Health 200,000 2.29% 15/8/2030 201,877 0.01%General Mills, Inc. 175,000 4.20% 17/4/2028 201,783 0.01%Whirlpool Corp. 200,000 2.40% 15/5/2031 201,773 0.01%UnitedHealth Group, Inc. 200,000 2.90% 15/5/2050 201,691 0.01%CCRE9 Commercial Mortgage Trust 2013^ 190,000 4.39% 10/7/2045 201,678 0.01%UnitedHealth Group, Inc. 200,000 2.00% 15/5/2030 201,658 0.01%Automatic Data Processing, Inc. 200,000 1.70% 15/5/2028 201,648 0.01%Bank of America Corp.^ 200,000 2.09% 14/6/2029 201,634 0.01%American Municipal Power, Inc. 110,000 8.08% 15/2/2050 201,561 0.01%AIG Global Funding 200,000 0.80% 7/7/2023 201,475 0.01%Crown Castle International Corp. 200,000 2.50% 15/7/2031 201,442 0.01%Southern California Edison Co. 200,000 1.10% 1/4/2024 201,438 0.01%Broadcom, Inc. 191,000 3.42% 15/4/2033 201,386 0.01%General Motors Financial Co., Inc. 200,000 2.70% 10/6/2031 201,375 0.01%JP Morgan Chase Commercial Mortgage Securities Trust 2013 194,511 3.14% 15/12/2047 201,287 0.01%salesforce.com, Inc. 200,000 2.70% 15/7/2041 201,254 0.01%

994
Vanguard U.S. Investment Grade Credit Index Fund
Principal
US Dollars ($) CouponMaturity
DateFair Value
US Dollars ($)% of Total
Net AssetsTruist Financial Corp.^ 200,000 1.89% 7/6/2029 201,048 0.01%BP Capital Markets America, Inc. 200,000 3.38% 8/2/2061 200,986 0.01%Indiana University Health, Inc. Obligated Group 200,000 2.85% 1/11/2051 200,982 0.01%Duke Energy Ohio, Inc. 200,000 2.13% 1/6/2030 200,969 0.01%Verizon Communications, Inc. 200,000 0.75% 22/3/2024 200,871 0.01%Hubbell, Inc. 200,000 2.30% 15/3/2031 200,787 0.01%F&G Global Funding 200,000 1.75% 30/6/2026 200,778 0.01%Protective Life Global Funding 200,000 1.90% 6/7/2028 200,705 0.01%Comcast Corp. 175,000 3.90% 1/3/2038 200,682 0.01%Southern California Edison Co. 200,000 2.50% 1/6/2031 200,664 0.01%JPMorgan Chase & Co.^ 200,000 0.70% 16/3/2024 200,639 0.01%Interpublic Group of Cos, Inc. 200,000 2.40% 1/3/2031 200,596 0.01%eBay, Inc. 200,000 1.40% 10/5/2026 200,521 0.01%Hormel Foods Corp. 200,000 0.65% 3/6/2024 200,384 0.01%Brighthouse Financial Global Funding 200,000 1.00% 12/4/2024 200,368 0.01%AEP Transmission Co. LLC 175,000 3.75% 1/12/2047 200,312 0.01%salesforce.com, Inc. 200,000 1.95% 15/7/2031 200,310 0.01%Security Benefit Global Funding 200,000 1.25% 17/5/2024 200,264 0.01%Phillips 66 200,000 0.90% 15/2/2024 200,199 0.01%Amazon.com, Inc. 200,000 0.25% 12/5/2023 200,066 0.01%HCA, Inc. 200,000 3.50% 15/7/2051 200,055 0.01%CenterPoint Energy Resources Corp. 200,000 0.70% 2/3/2023 200,012 0.01%Union Pacific Corp. 175,000 3.80% 1/10/2051 199,991 0.01%salesforce.com, Inc. 200,000 1.50% 15/7/2028 199,975 0.01%Essential Properties LP 200,000 2.95% 15/7/2031 199,919 0.01%State of California 125,000 7.35% 1/11/2039 199,915 0.01%John Deere Capital Corp. 200,000 0.25% 17/1/2023 199,907 0.01%Newmont Corp. 200,000 2.25% 1/10/2030 199,869 0.01%Caterpillar Financial Services Corp. 200,000 0.25% 1/3/2023 199,828 0.01%Charles Schwab Corp. 200,000 1.15% 13/5/2026 199,805 0.01%Kroger Co. 175,000 3.95% 15/1/2050 199,799 0.01%Astrazeneca Finance LLC 200,000 0.70% 28/5/2024 199,772 0.01%New York Life Global Funding 200,000 1.15% 9/6/2026 199,700 0.01%Entergy Corp. 200,000 1.90% 15/6/2028 199,675 0.01%UDR, Inc. 190,000 3.00% 15/8/2031 199,652 0.01%Amazon.com, Inc. 200,000 0.45% 12/5/2024 199,611 0.01%Guardian Life Global Funding 200,000 1.25% 13/5/2026 199,599 0.01%PPG Industries, Inc. 200,000 1.20% 15/3/2026 199,583 0.01%7-Eleven, Inc. 200,000 0.80% 10/2/2024 199,543 0.01%Boeing Co. 200,000 3.65% 1/3/2047 199,502 0.01%Philip Morris International, Inc. 200,000 2.10% 1/5/2030 199,499 0.01%Georgia-Pacific LLC 200,000 0.63% 15/5/2024 199,436 0.01%Metropolitan Life Global Funding I 200,000 0.55% 7/6/2024 199,357 0.01%PACCAR Financial Corp. 200,000 0.35% 2/2/2024 199,143 0.01%AEP Transmission Co. LLC 175,000 3.65% 1/4/2050 199,106 0.01%GXO Logistics, Inc. 200,000 1.65% 15/7/2026 198,985 0.01%HP, Inc. 200,000 1.45% 17/6/2026 198,945 0.01%Western Union Co. 200,000 1.35% 15/3/2026 198,858 0.01%Northwestern University 150,000 4.64% 1/12/2044 198,784 0.01%Equinix, Inc. 200,000 2.15% 15/7/2030 198,676 0.01%Medtronic, Inc. 181,000 3.50% 15/3/2025 198,672 0.01%Enterprise Products Operating LLC 200,000 3.20% 15/2/2052 198,163 0.01%Newmont Corp. 145,000 5.45% 9/6/2044 198,104 0.01%East Ohio Gas Co. 200,000 2.00% 15/6/2030 198,029 0.01%AES Corp. 200,000 1.38% 15/1/2026 198,008 0.01%Fortinet, Inc. 200,000 1.00% 15/3/2026 197,971 0.01%HCA, Inc. 200,000 2.38% 15/7/2031 197,939 0.01%CSAIL 2017-CX10 Commercial Mortgage Trust^ 180,000 3.46% 15/11/2050 197,654 0.01%UBS6 Commercial Mortgage Trust 2014 184,000 4.05% 10/12/2047 197,566 0.01%American International Group, Inc. 180,000 3.40% 30/6/2030 197,438 0.01%Reliance Steel & Aluminum Co. 200,000 2.15% 15/8/2030 197,427 0.01%American Honda Finance Corp. 200,000 1.80% 13/1/2031 197,349 0.01%Benchmark 2018-B2 Mortgage Trust^ 175,000 4.08% 15/2/2051 197,315 0.01%Oracle Corp. 170,000 4.38% 15/5/2055 197,191 0.01%Trinity Health Corp. 200,000 2.63% 1/12/2040 197,100 0.01%Comcast Cable Communications Holdings, Inc. 175,000 9.46% 15/11/2022 196,893 0.01%Clorox Co. 200,000 1.80% 15/5/2030 196,700 0.01%Consolidated Edison Co. of New York, Inc. 175,000 3.95% 1/3/2043 196,690 0.01%Mosaic Co. 190,000 3.25% 15/11/2022 196,678 0.01%JPMorgan Chase & Co. 150,000 4.85% 1/2/2044 196,674 0.01%

995
Vanguard U.S. Investment Grade Credit Index Fund
Principal
US Dollars ($) CouponMaturity
DateFair Value
US Dollars ($)% of Total
Net AssetsCharter Communications Operating LLC/Charter Communications
Operating Capital 200,000 3.85% 1/4/2061 196,601 0.01%McCormick & Co., Inc. 200,000 0.90% 15/2/2026 196,548 0.01%Morgan Stanley^ 200,000 2.80% 25/1/2052 196,438 0.01%Stryker Corp. 175,000 3.65% 7/3/2028 196,413 0.01%JPMorgan Chase & Co. 150,000 7.63% 15/10/2026 195,847 0.01%Amgen, Inc. 206,000 2.77% 1/9/2053 195,791 0.01%Becton Dickinson & Co. 157,000 4.69% 15/12/2044 195,776 0.01%Home Depot, Inc. 160,000 4.20% 1/4/2043 195,733 0.01%Morgan Stanley 175,000 3.95% 23/4/2027 195,490 0.01%MetLife, Inc. 180,000 4.37% 15/9/2023 195,063 0.01%Crown Castle International Corp. 200,000 2.10% 1/4/2031 195,062 0.01%Devon Energy Corp. 175,000 5.25% 15/9/2024 195,030 0.01%Bank of New York Mellon Corp. 175,000 3.40% 29/1/2028 194,871 0.01%Charles Schwab Corp. 176,000 3.85% 21/5/2025 194,621 0.01%Apple, Inc. 200,000 2.38% 8/2/2041 194,575 0.01%Aon plc 175,000 3.88% 15/12/2025 194,558 0.01%VMware, Inc. 175,000 3.90% 21/8/2027 194,486 0.01%UBS Commercial Mortgage Trust 2017 175,000 3.68% 15/12/2050 194,160 0.01%Wachovia Corp. 150,000 5.50% 1/8/2035 193,990 0.01%BANK 2017 175,000 3.49% 15/11/2050 193,919 0.01%Aviation Capital Group LLC 175,000 4.88% 1/10/2025 193,872 0.01%JPMBB Commercial Mortgage Securities Trust 2013 181,000 4.13% 15/11/2045 193,741 0.01%American Express Credit Corp. 175,000 3.30% 3/5/2027 193,632 0.01%Wells Fargo Commercial Mortgage Trust 2017 175,000 3.58% 15/10/2050 193,626 0.01%Dominion Energy, Inc. 175,000 3.90% 1/10/2025 193,524 0.01%Applied Materials, Inc. 175,000 3.30% 1/4/2027 193,513 0.01%UBS Commercial Mortgage Trust 2017 175,000 3.56% 15/10/2050 193,165 0.01%Kimberly-Clark Corp. 175,000 3.10% 26/3/2030 193,115 0.01%Raytheon Technologies Corp. 175,000 3.50% 15/3/2027 193,110 0.01%Nuveen Finance LLC 175,000 4.13% 1/11/2024 192,998 0.01%Intercontinental Exchange, Inc. 200,000 3.00% 15/9/2060 192,782 0.01%Boeing Co. 150,000 5.88% 15/2/2040 192,758 0.01%Principal Financial Group, Inc. 160,000 4.35% 15/5/2043 192,659 0.01%Northern States Power Co. 200,000 2.60% 1/6/2051 192,652 0.01%Norfolk Southern Corp. 150,000 4.84% 1/10/2041 192,636 0.01%Sysco Corp. 175,000 3.75% 1/10/2025 192,518 0.01%DH Europe Finance II Sarl 175,000 3.40% 15/11/2049 192,499 0.01%Air Lease Corp. 190,000 3.00% 1/2/2030 192,496 0.01%Dollar General Corp. 175,000 3.50% 3/4/2030 192,468 0.01%Highwoods Realty LP 175,000 3.88% 1/3/2027 192,296 0.01%PSEG Power LLC 125,000 8.63% 15/4/2031 192,250 0.01%Cox Communications, Inc. 175,000 3.50% 15/8/2027 192,177 0.01%Allied World Assurance Co. Holdings Ltd. 175,000 4.35% 29/10/2025 191,863 0.01%Lowe's Cos, Inc. 200,000 1.70% 15/10/2030 191,854 0.01%Kroger Co. 200,000 1.70% 15/1/2031 191,797 0.01%AutoNation, Inc. 175,000 3.80% 15/11/2027 191,794 0.01%Home Depot, Inc. 175,000 3.35% 15/9/2025 191,685 0.01%Bristol-Myers Squibb Co. 200,000 2.55% 13/11/2050 191,537 0.01%Home Depot, Inc. 200,000 1.38% 15/3/2031 191,438 0.01%Parker-Hannifin Corp. 175,000 3.25% 1/3/2027 191,375 0.01%Applied Materials, Inc. 150,000 4.35% 1/4/2047 191,124 0.01%Cardinal Health, Inc. 180,000 3.08% 15/6/2024 190,984 0.01%Realty Income Corp. 175,000 3.25% 15/1/2031 190,974 0.01%Constellation Brands, Inc. 166,000 4.75% 1/12/2025 190,870 0.01%Tractor Supply Co. 200,000 1.75% 1/11/2030 190,845 0.01%Citigroup, Inc. 175,000 4.00% 5/8/2024 190,648 0.01%AbbVie, Inc. 150,000 4.85% 15/6/2044 190,629 0.01%JPMorgan Chase & Co.^ 200,000 2.53% 19/11/2041 190,538 0.01%Simon Property Group LP 175,000 3.30% 15/1/2026 190,449 0.01%Tyson Foods, Inc. 175,000 3.95% 15/8/2024 190,388 0.01%Vistra Operations Co. LLC 175,000 4.30% 15/7/2029 190,293 0.01%Wells Fargo Commercial Mortgage Trust 2015 175,000 3.54% 15/5/2048 190,283 0.01%BANK 2018 170,000 3.69% 15/2/2061 190,258 0.01%Eli Lilly & Co. 150,000 4.15% 15/3/2059 190,234 0.01%North Texas Tollway Authority 115,000 6.72% 1/1/2049 190,178 0.01%Federal National Mortgage Association^ 179,117 2.50% 25/10/2026 190,071 0.01%Home Depot, Inc. 160,000 3.90% 15/6/2047 189,983 0.01%UnitedHealth Group, Inc. 150,000 4.63% 15/7/2035 189,926 0.01%Memorial Sloan-Kettering Cancer Center 150,000 4.13% 1/7/2052 189,531 0.01%Tanger Properties LP 175,000 3.88% 15/7/2027 189,489 0.01%

996
Vanguard U.S. Investment Grade Credit Index Fund
Principal
US Dollars ($) CouponMaturity
DateFair Value
US Dollars ($)% of Total
Net AssetsPublic Service Electric & Gas Co. 175,000 3.00% 15/5/2027 189,305 0.01%Global Payments, Inc. 165,000 4.80% 1/4/2026 189,192 0.01%Agilent Technologies, Inc. 175,000 3.05% 22/9/2026 188,937 0.01%JPMBB Commercial Mortgage Securities Trust 2014 175,000 3.49% 15/1/2048 188,925 0.01%Federal Home Loan Mortgage Corp. 188,431 2.99% 25/9/2021 188,791 0.01%Consolidated Edison Co. of New York, Inc. 150,000 4.63% 1/12/2054 188,617 0.01%Kimco Realty Corp. 175,000 3.30% 1/2/2025 188,571 0.01%Merck & Co., Inc. 200,000 2.45% 24/6/2050 188,526 0.01%Carrier Global Corp. 180,000 2.49% 15/2/2027 188,364 0.01%Federal National Mortgage Association^ 177,579 3.10% 25/7/2024 188,356 0.01%Schlumberger Holdings Corp. 175,000 3.75% 1/5/2024 188,261 0.01%Constellation Brands, Inc. 175,000 3.15% 1/8/2029 188,106 0.01%Federal Home Loan Mortgage Corp. 175,000 3.06% 25/12/2024 188,029 0.01%Burlington Northern Santa Fe LLC 150,000 4.45% 15/3/2043 188,028 0.01%Metropolitan Transportation Authority 130,000 6.67% 15/11/2039 188,020 0.01%Philip Morris International, Inc. 170,000 3.38% 15/8/2029 187,915 0.01%Anthem, Inc. 150,000 4.65% 15/8/2044 187,859 0.01%Union Electric Co. 175,000 2.95% 15/3/2030 187,856 0.01%Oracle Corp. 175,000 3.40% 8/7/2024 187,634 0.01%Plains All American Pipeline LP/PAA Finance Corp. 175,000 3.80% 15/9/2030 187,412 0.01%Boston Properties LP 175,000 3.20% 15/1/2025 187,343 0.01%American Express Co. 175,000 3.40% 22/2/2024 187,288 0.01%General Electric Co. 180,000 3.10% 9/1/2023 187,121 0.01%DTE Energy Co. 175,000 3.50% 1/6/2024 187,009 0.01%Santander Holdings USA, Inc. 175,000 3.24% 5/10/2026 186,975 0.01%Progressive Corp. 150,000 4.35% 25/4/2044 186,887 0.01%Lowe's Cos, Inc. 175,000 3.88% 15/9/2023 186,789 0.01%Everest Reinsurance Holdings, Inc. 175,000 3.50% 15/10/2050 186,775 0.01%7-Eleven, Inc. 200,000 2.80% 10/2/2051 186,650 0.01%New York Life Insurance Co. 150,000 4.45% 15/5/2069 186,638 0.01%Brighthouse Financial, Inc. 168,000 4.70% 22/6/2047 186,474 0.01%Johnson Controls International plc 150,000 4.63% 2/7/2044 186,372 0.01%Mondelez International, Inc. 200,000 2.63% 4/9/2050 186,213 0.01%PepsiCo, Inc. 150,000 4.25% 22/10/2044 186,186 0.01%McDonald's Corp. 150,000 4.70% 9/12/2035 185,954 0.01%Bank of New York Mellon Corp. 175,000 2.45% 17/8/2026 185,843 0.01%UnitedHealth Group, Inc. 150,000 4.25% 15/6/2048 185,660 0.01%General Mills, Inc. 175,000 2.88% 15/4/2030 185,561 0.01%Altria Group, Inc. 175,000 3.40% 6/5/2030 185,423 0.01%Dow Chemical Co. 105,000 9.40% 15/5/2039 184,891 0.01%Kinder Morgan Energy Partners LP 175,000 3.50% 1/9/2023 184,742 0.01%ONEOK, Inc. 125,000 7.15% 15/1/2051 184,705 0.01%Thermo Fisher Scientific, Inc. 155,000 4.50% 25/3/2030 184,570 0.01%University of California 130,000 4.86% 15/5/2112 184,556 0.01%Baltimore Gas & Electric Co. 175,000 2.40% 15/8/2026 184,278 0.01%HP, Inc. 140,000 6.00% 15/9/2041 184,126 0.01%City of New York NY 150,000 5.21% 1/10/2031 184,113 0.01%ViacomCBS, Inc. 150,000 4.85% 1/7/2042 184,040 0.01%Enbridge Energy Partners LP 125,000 7.50% 15/4/2038 184,017 0.01%Hasbro, Inc. 150,000 5.10% 15/5/2044 183,900 0.01%Host Hotels & Resorts LP 175,000 3.38% 15/12/2029 183,797 0.01%Southwestern Public Service Co. 175,000 3.15% 1/5/2050 183,698 0.01%KeySpan Gas East Corp. 175,000 2.74% 15/8/2026 183,649 0.01%PayPal Holdings, Inc. 177,000 2.30% 1/6/2030 183,415 0.01%United Parcel Service, Inc. 165,000 3.40% 15/11/2046 183,387 0.01%WEC Energy Group, Inc. 168,000 3.55% 15/6/2025 183,152 0.01%Dollar General Corp. 175,000 3.25% 15/4/2023 182,610 0.01%Johnson & Johnson 125,000 5.85% 15/7/2038 182,424 0.01%Florida Power & Light Co. 150,000 4.05% 1/6/2042 182,222 0.01%Kinder Morgan Energy Partners LP 175,000 3.45% 15/2/2023 182,059 0.01%Duke Energy Carolinas LLC 150,000 4.25% 15/12/2041 181,676 0.01%Comcast Corp. 125,000 6.45% 15/3/2037 181,646 0.01%Comcast Corp.1 125,000 7.05% 15/3/2033 181,607 0.01%Corning, Inc. 130,000 5.45% 15/11/2079 181,594 0.01%General Electric Co. 150,000 4.35% 1/5/2050 181,581 0.01%Progressive Corp. 150,000 3.95% 26/3/2050 181,300 0.01%Walmart, Inc. 170,000 2.65% 15/12/2024 181,097 0.01%Intel Corp. 175,000 3.10% 29/7/2022 180,477 0.01%Coca-Cola Co. 175,000 2.13% 6/9/2029 180,400 0.01%Trane Technologies Luxembourg Finance SA 167,000 3.55% 1/11/2024 180,344 0.01%Aon Corp. 125,000 6.25% 30/9/2040 180,319 0.01%

997
Vanguard U.S. Investment Grade Credit Index Fund
Principal
US Dollars ($) CouponMaturity
DateFair Value
US Dollars ($)% of Total
Net AssetsRoper Technologies, Inc. 175,000 3.13% 15/11/2022 180,295 0.01%Mars, Inc. 150,000 3.95% 1/4/2049 180,277 0.01%PNC Bank NA 175,000 2.70% 1/11/2022 180,225 0.01%American Honda Finance Corp. 175,000 1.95% 10/5/2023 179,989 0.01%Marathon Oil Corp. 150,000 5.20% 1/6/2045 179,950 0.01%George Washington University 145,000 4.13% 15/9/2048 179,946 0.01%Lockheed Martin Corp. 125,000 6.15% 1/9/2036 179,760 0.01%Bank of America Corp. 125,000 5.88% 7/2/2042 179,711 0.01%Pacific Gas & Electric Co. 175,000 3.30% 1/12/2027 179,555 0.01%Southwest Airlines Co. 175,000 2.63% 10/2/2030 179,491 0.01%MetLife, Inc. 140,000 6.40% 15/12/2036 179,441 0.01%CNH Industrial Capital LLC 175,000 1.95% 2/7/2023 179,410 0.01%Williams Cos, Inc. 175,000 3.35% 15/8/2022 179,369 0.01%Honeywell International, Inc. 150,000 3.81% 21/11/2047 179,238 0.01%CenterPoint Energy, Inc. 175,000 2.50% 1/9/2022 178,903 0.01%Campbell Soup Co. 175,000 2.50% 2/8/2022 178,869 0.01%Massachusetts Institute of Technology 105,000 5.60% 1/7/2111 178,775 0.01%ERAC USA Finance LLC 150,000 4.20% 1/11/2046 178,123 0.01%Enterprise Products Operating LLC 125,000 6.88% 1/3/2033 178,099 0.01%Walmart, Inc.1 120,000 7.55% 15/2/2030 178,086 0.01%Parker-Hannifin Corp. 150,000 4.00% 14/6/2049 177,991 0.01%Raytheon Technologies Corp. 160,000 3.95% 16/8/2025 177,921 0.01%Newmont Corp. 140,000 4.88% 15/3/2042 177,869 0.01%Virginia Electric & Power Co. 100,000 8.88% 15/11/2038 177,696 0.01%Target Corp. 165,000 2.50% 15/4/2026 177,460 0.01%QUALCOMM, Inc. 167,000 2.90% 20/5/2024 177,448 0.01%Dominion Energy South Carolina, Inc. 125,000 6.05% 15/1/2038 177,340 0.01%Banc of America Commercial Mortgage Trust 2017 175,000 3.12% 15/2/2050 177,301 0.01%Amgen, Inc. 175,000 2.30% 25/2/2031 177,226 0.01%Goldman Sachs Group, Inc. 125,000 6.45% 1/5/2036 177,196 0.01%NRG Energy, Inc. 175,000 2.00% 2/12/2025 177,160 0.01%Viatris, Inc. 175,000 2.70% 22/6/2030 176,843 0.01%State Board of Administration Finance Corp. 175,000 1.26% 1/7/2025 176,474 0.01%UnitedHealth Group, Inc. 125,000 5.80% 15/3/2036 176,371 0.01%Kansas City Southern 170,000 3.00% 15/5/2023 176,232 0.01%Spectra Energy Partners LP 150,000 4.50% 15/3/2045 176,186 0.01%International Business Machines Corp. 150,000 4.00% 20/6/2042 175,747 0.01%PulteGroup, Inc. 150,000 5.50% 1/3/2026 175,722 0.01%Baker Hughes a GE Co. LLC/Baker Hughes Co.-Obligor, Inc. 170,000 2.77% 15/12/2022 175,589 0.01%Globe Life, Inc. 150,000 4.55% 15/9/2028 175,477 0.01%GLP Capital LP/GLP Financing II, Inc. 150,000 5.30% 15/1/2029 175,147 0.01%ONE Gas, Inc. 175,000 0.85% 11/3/2023 175,092 0.01%Atmos Energy Corp. 175,000 0.63% 9/3/2023 175,047 0.01%Colonial Pipeline Co. 150,000 4.25% 15/4/2048 175,009 0.01%Freddie Mac Multifamily Structured Pass Through Certificates^ 150,000 3.93% 25/7/2028 174,804 0.01%Eaton Corp. 150,000 4.00% 2/11/2032 174,739 0.01%Bay Area Toll Authority 100,000 7.04% 1/4/2050 174,653 0.01%US Treasury Note 175,000 0.13% 30/6/2023 174,576 0.01%American International Group, Inc. 125,000 6.25% 1/5/2036 174,462 0.01%Lam Research Corp. 150,000 4.00% 15/3/2029 174,459 0.01%Johnson & Johnson 150,000 3.55% 1/3/2036 174,396 0.01%Comcast Corp. 150,000 4.00% 15/8/2047 174,392 0.01%UBS Commercial Mortgage Trust 2018 150,000 4.45% 15/12/2051 174,280 0.01%Sysco Corp. 150,000 5.65% 1/4/2025 173,970 0.01%Spectra Energy Partners LP 160,000 3.38% 15/10/2026 173,949 0.01%Omega Healthcare Investors, Inc. 163,000 4.38% 1/8/2023 173,837 0.01%Kimberly-Clark Corp. 160,000 2.75% 15/2/2026 173,637 0.01%Commonwealth Edison Co. 150,000 3.75% 15/8/2047 173,551 0.01%Bank of America Corp.^ 150,000 3.95% 23/1/2049 173,549 0.01%Nationwide Mutual Insurance Co. 100,000 9.38% 15/8/2039 173,231 0.01%Phillips 66 145,000 4.65% 15/11/2034 172,908 0.01%Wyeth LLC 150,000 6.45% 1/2/2024 172,852 0.01%Progressive Corp. 125,000 6.25% 1/12/2032 172,750 0.01%GLP Capital LP/GLP Financing II, Inc. 150,000 5.38% 15/4/2026 172,619 0.01%CF Industries, Inc. 150,000 4.50% 1/12/2026 172,352 0.01%FedEx Corp. 150,000 4.05% 15/2/2048 172,304 0.01%Norfolk Southern Corp. 150,000 3.94% 1/11/2047 172,173 0.01%Welltower, Inc. 150,000 4.25% 15/4/2028 171,888 0.01%International Paper Co. 110,000 7.30% 15/11/2039 171,774 0.01%PayPal Holdings, Inc. 160,000 2.65% 1/10/2026 171,604 0.01%Federal Home Loan Mortgage Corp. 150,000 3.42% 25/4/2032 171,553 0.01%

998
Vanguard U.S. Investment Grade Credit Index Fund
Principal
US Dollars ($) CouponMaturity
DateFair Value
US Dollars ($)% of Total
Net AssetsBank of New York Mellon Corp. 165,000 2.95% 29/1/2023 171,545 0.01%JPMBB Commercial Mortgage Securities Trust 2015 164,953 3.04% 15/10/2048 171,293 0.01%Federal National Mortgage Association^ 175,000 1.36% 25/10/2030 171,213 0.01%Grand Parkway Transportation Corp. 125,000 5.18% 1/10/2042 171,139 0.01%Allstate Corp. 125,000 5.55% 9/5/2035 170,971 0.01%Federal National Mortgage Association^ 161,591 3.06% 25/6/2024 170,928 0.01%United Parcel Service, Inc. 145,000 3.75% 15/11/2047 170,694 0.01%Campbell Soup Co. 175,000 3.13% 24/4/2050 170,368 0.01%Nestle Holdings, Inc. 150,000 3.63% 24/9/2028 170,189 0.01%Aetna, Inc. 115,000 6.75% 15/12/2037 169,860 0.01%Corning, Inc. 125,000 5.75% 15/8/2040 169,717 0.01%Hewlett Packard Enterprise Co. 125,000 6.20% 15/10/2035 169,642 0.01%Expedia Group, Inc. 155,000 3.80% 15/2/2028 168,854 0.01%Sammons Financial Group, Inc. 150,000 4.45% 12/5/2027 168,335 0.01%3M Co. 150,000 3.38% 1/3/2029 168,053 0.01%Athene Global Funding 160,000 2.75% 25/6/2024 167,937 0.01%Starbucks Corp. 150,000 3.50% 1/3/2028 167,687 0.01%Interpublic Group of Cos, Inc. 125,000 5.40% 1/10/2048 167,418 0.01%Boeing Co. 145,000 5.04% 1/5/2027 167,394 0.01%Coca-Cola Co. 150,000 3.38% 25/3/2027 166,955 0.01%Intel Corp. 156,000 2.60% 19/5/2026 166,832 0.01%Alcon Finance Corp. 150,000 3.80% 23/9/2049 166,760 0.01%AutoNation, Inc. 150,000 4.50% 1/10/2025 166,690 0.01%Metropolitan Transportation Authority 125,000 5.18% 15/11/2049 166,542 0.01%Liberty Mutual Group, Inc. 150,000 3.95% 15/10/2050 166,434 0.01%Federal Home Loan Mortgage Corp. 150,000 2.86% 25/10/2034 166,405 0.01%E*TRADE Financial Corp. 150,000 3.80% 24/8/2027 166,173 0.01%Textron, Inc. 150,000 3.65% 15/3/2027 166,082 0.01%GATX Corp. 150,000 3.85% 30/3/2027 165,705 0.01%Caterpillar, Inc. 115,000 4.75% 15/5/2064 165,697 0.01%General Motors Financial Co., Inc. 150,000 4.00% 6/10/2026 165,693 0.01%Federal National Mortgage Association 157,411 2.62% 25/12/2024 165,548 0.01%Capital One Financial Corp. 150,000 3.75% 28/7/2026 165,470 0.01%ERAC USA Finance LLC 150,000 3.80% 1/11/2025 165,409 0.01%Wells Fargo Commercial Mortgage Trust 2015 150,000 3.84% 15/9/2058 165,377 0.01%Penske Truck Leasing Co. LP/PTL Finance Corp. 150,000 4.00% 15/7/2025 165,326 0.01%Stryker Corp. 150,000 3.50% 15/3/2026 165,251 0.01%Bank of New York Mellon Corp.^ 150,000 3.44% 7/2/2028 165,219 0.01%Martin Marietta Materials, Inc. 150,000 3.50% 15/12/2027 165,214 0.01%Prudential Financial, Inc. 125,000 5.75% 15/7/2033 165,191 0.01%National Rural Utilities Cooperative Finance Corp. 150,000 3.40% 7/2/2028 165,153 0.01%Kellogg Co. 150,000 3.40% 15/11/2027 165,145 0.01%3M Co. 150,000 3.05% 15/4/2030 165,135 0.01%Mass General Brigham, Inc. 150,000 3.34% 1/7/2060 164,972 0.01%CCRE25 Commercial Mortgage Trust 2015 150,000 3.76% 10/8/2048 164,862 0.01%Sempra Energy 150,000 3.40% 1/2/2028 164,819 0.01%Federal National Mortgage Association^ 150,000 3.06% 25/5/2027 164,553 0.01%CRH America, Inc. 150,000 3.88% 18/5/2025 164,430 0.01%CNA Financial Corp. 150,000 3.45% 15/8/2027 164,352 0.01%Amazon.com, Inc. 140,000 5.20% 3/12/2025 164,264 0.01%FedEx Corp. 150,000 3.25% 1/4/2026 164,241 0.01%Burlington Northern Santa Fe LLC 125,000 4.95% 15/9/2041 164,225 0.01%Enable Midstream Partners LP 150,000 4.15% 15/9/2029 164,225 0.01%Amazon.com, Inc. 165,000 1.20% 3/6/2027 164,150 0.01%Parker-Hannifin Corp. 150,000 3.25% 14/6/2029 164,082 0.01%Johnson & Johnson 150,000 2.95% 3/3/2027 163,977 0.01%Citigroup, Inc. 150,000 3.40% 1/5/2026 163,960 0.01%San Diego County Water Authority 110,000 6.14% 1/5/2049 163,939 0.01%Raytheon Technologies Corp. 125,000 5.40% 1/5/2035 163,755 0.01%Simon Property Group LP 150,000 3.25% 30/11/2026 163,718 0.01%AmerisourceBergen Corp. 150,000 3.45% 15/12/2027 163,683 0.01%Huntington Ingalls Industries, Inc. 150,000 3.48% 1/12/2027 163,598 0.01%VEREIT Operating Partnership LP 150,000 4.60% 6/2/2024 163,594 0.01%American Campus Communities Operating Partnership LP 150,000 3.63% 15/11/2027 163,560 0.01%Five Corners Funding Trust 150,000 4.42% 15/11/2023 163,422 0.01%Philip Morris International, Inc. 150,000 3.13% 2/3/2028 163,409 0.01%Newmont Corp. 113,000 6.25% 1/10/2039 163,355 0.01%Enable Midstream Partners LP 150,000 5.00% 15/5/2044 163,260 0.01%Federal Home Loan Mortgage Corp. 150,000 3.15% 25/11/2025 163,126 0.01%Cox Communications, Inc. 150,000 3.35% 15/9/2026 163,118 0.01%Texas Eastern Transmission LP 150,000 3.50% 15/1/2028 163,067 0.01%

999
Vanguard U.S. Investment Grade Credit Index Fund
Principal
US Dollars ($) CouponMaturity
DateFair Value
US Dollars ($)% of Total
Net AssetsCity of Houston TX 130,000 6.29% 1/3/2032 163,024 0.01%American Homes 4 Rent LP 145,000 4.25% 15/2/2028 162,994 0.01%University of California 165,000 1.61% 15/5/2030 162,926 0.01%Estee Lauder Cos, Inc. 150,000 3.13% 1/12/2049 162,915 0.01%AutoZone, Inc. 150,000 3.13% 21/4/2026 162,891 0.01%Federal National Mortgage Association^ 150,000 2.96% 25/2/2027 162,889 0.01%Florida Power & Light Co. 150,000 3.15% 1/10/2049 162,879 0.01%Southwest Airlines Co. 150,000 3.45% 16/11/2027 162,684 0.01%UBS5 Commercial Mortgage Trust 2014 150,000 3.84% 10/9/2047 162,628 0.01%Citigroup Commercial Mortgage Trust 2014 150,000 3.64% 10/10/2047 162,478 0.01%Marsh & McLennan Cos, Inc. 120,000 5.88% 1/8/2033 162,453 0.01%Valero Energy Corp. 150,000 3.40% 15/9/2026 162,453 0.01%Prudential Financial, Inc. 150,000 3.50% 15/5/2024 162,405 0.01%Lincoln National Corp. 145,000 3.80% 1/3/2028 162,389 0.01%Bank of New York Mellon Corp. 151,000 3.00% 24/2/2025 162,341 0.01%Los Angeles Department of Water & Power Power System Revenue 100,000 6.57% 1/7/2045 162,313 0.01%Aetna, Inc. 150,000 3.50% 15/11/2024 162,277 0.01%MetLife, Inc. 150,000 3.60% 10/4/2024 162,240 0.01%Bank of New York Mellon Corp. 150,000 3.25% 11/9/2024 162,136 0.01%Massachusetts Mutual Life Insurance Co. 125,000 4.90% 1/4/2077 162,097 0.01%CCRE7 Commercial Mortgage Trust 2013 155,759 3.21% 10/3/2046 162,065 0.01%Keurig Dr Pepper, Inc. 152,000 4.06% 25/5/2023 162,014 0.01%CSAIL 2015-C2 Commercial Mortgage Trust 150,000 3.50% 15/6/2057 161,992 0.01%Zoetis, Inc. 150,000 3.00% 12/9/2027 161,967 0.01%GATX Corp. 150,000 3.25% 15/9/2026 161,920 0.01%Citigroup, Inc. 150,000 3.88% 25/10/2023 161,888 0.01%Federal Home Loan Mortgage Corp. 150,000 3.01% 25/7/2025 161,844 0.01%Chubb INA Holdings, Inc. 150,000 3.35% 15/5/2024 161,734 0.01%Cigna Corp. 150,000 3.25% 15/4/2025 161,667 0.01%US Bancorp 150,000 3.70% 30/1/2024 161,639 0.01%Monongahela Power Co. 150,000 4.10% 15/4/2024 161,637 0.01%GLP Capital LP/GLP Financing II, Inc. 150,000 4.00% 15/1/2030 161,620 0.01%Fidelity National Financial, Inc. 150,000 3.40% 15/6/2030 161,568 0.01%American Water Capital Corp. 150,000 3.85% 1/3/2024 161,545 0.01%City of San Francisco CA Public Utilities Commission Water Revenue 150,000 3.30% 1/11/2039 161,453 0.01%Capital One Financial Corp. 155,000 3.20% 30/1/2023 161,441 0.01%Equinix, Inc. 150,000 3.20% 18/11/2029 161,182 0.01%Metropolitan Life Global Funding I 150,000 3.60% 11/1/2024 161,169 0.01%Jackson National Life Global Funding 150,000 3.05% 29/4/2026 161,087 0.01%Citigroup, Inc. 125,000 4.65% 30/7/2045 161,083 0.01%Metropolitan Life Global Funding I 150,000 2.95% 9/4/2030 160,901 0.01%Illinois Tool Works, Inc. 150,000 2.65% 15/11/2026 160,883 0.01%Discovery Communications LLC 152,000 4.00% 15/9/2055 160,755 0.01%American Honda Finance Corp. 150,000 3.63% 10/10/2023 160,721 0.01%Equinix, Inc. 150,000 2.90% 18/11/2026 160,587 0.01%DENTSPLY SIRONA, Inc. 150,000 3.25% 1/6/2030 160,532 0.01%General Mills, Inc. 150,000 3.70% 17/10/2023 160,498 0.01%Pfizer, Inc. 125,000 4.40% 15/5/2044 160,321 0.01%Florida Power & Light Co. 150,000 2.85% 1/4/2025 160,294 0.01%Massachusetts Institute of Technology 145,000 2.99% 1/7/2050 160,247 0.01%Boston Scientific Corp. 150,000 3.45% 1/3/2024 160,177 0.01%Boston Properties LP 150,000 2.75% 1/10/2026 160,169 0.01%UBS Commercial Mortgage Trust 2017 150,000 3.30% 15/10/2050 160,107 0.01%Stryker Corp. 125,000 4.63% 15/3/2046 160,061 0.01%Phillips 66 160,000 1.30% 15/2/2026 160,037 0.01%Marathon Petroleum Corp. 150,000 4.50% 1/5/2023 160,025 0.01%UnitedHealth Group, Inc. 125,000 4.45% 15/12/2048 159,978 0.01%GS Mortgage Securities Trust 2013 150,000 4.24% 10/8/2046 159,961 0.01%Roper Technologies, Inc. 150,000 3.65% 15/9/2023 159,951 0.01%Walmart, Inc. 150,000 2.85% 8/7/2024 159,884 0.01%CSX Corp. 150,000 2.60% 1/11/2026 159,736 0.01%Goldman Sachs Group, Inc. 131,000 5.95% 15/1/2027 159,647 0.01%Archer-Daniels-Midland Co. 150,000 2.50% 11/8/2026 159,536 0.01%Protective Life Global Funding 150,000 3.10% 15/4/2024 159,273 0.01%Lowe's Cos, Inc. 150,000 2.50% 15/4/2026 159,206 0.01%Bay Area Toll Authority 105,000 6.92% 1/4/2040 159,153 0.01%Public Service Enterprise Group, Inc. 150,000 2.88% 15/6/2024 159,111 0.01%Federal Home Loan Mortgage Corp. 150,000 3.37% 25/7/2025 159,052 0.01%Costco Wholesale Corp. 150,000 2.75% 18/5/2024 159,005 0.01%Hershey Co. 151,000 2.45% 15/11/2029 158,986 0.01%Federal National Mortgage Association 150,000 2.49% 25/5/2026 158,942 0.01%

1000
Vanguard U.S. Investment Grade Credit Index Fund
Principal
US Dollars ($) CouponMaturity
DateFair Value
US Dollars ($)% of Total
Net AssetsWalt Disney Co. 125,000 4.63% 23/3/2040 158,835 0.01%Chevron Corp. 150,000 2.90% 3/3/2024 158,754 0.01%Caterpillar Financial Services Corp. 150,000 3.45% 15/5/2023 158,707 0.01%Columbia Property Trust Operating Partnership LP 147,000 4.15% 1/4/2025 158,576 0.01%IDEX Corp. 150,000 3.00% 1/5/2030 158,569 0.01%Dollar Tree, Inc. 150,000 3.70% 15/5/2023 158,466 0.01%CVS Health Corp. 150,000 2.63% 15/8/2024 158,382 0.01%National Rural Utilities Cooperative Finance Corp. 150,000 2.95% 7/2/2024 158,343 0.01%Ascension Health 150,000 2.53% 15/11/2029 158,204 0.01%Citigroup, Inc. 150,000 3.50% 15/5/2023 158,107 0.01%Massachusetts Mutual Life Insurance Co. 149,000 3.73% 15/10/2070 158,021 0.01%John Deere Capital Corp. 150,000 2.25% 14/9/2026 157,981 0.01%Federal Home Loan Mortgage Corp.^ 150,000 3.46% 25/8/2023 157,979 0.01%Boston Gas Co. 150,000 3.00% 1/8/2029 157,967 0.01%Allstate Corp. 150,000 3.15% 15/6/2023 157,868 0.01%Willis North America, Inc. 150,000 2.95% 15/9/2029 157,765 0.01%John Sevier Combined Cycle Generation LLC 129,293 4.63% 15/1/2042 157,757 0.01%Boeing Co. 150,000 3.90% 1/5/2049 157,648 0.01%Lear Corp. 125,000 5.25% 15/5/2049 157,605 0.01%State Street Corp. 150,000 3.10% 15/5/2023 157,572 0.01%Boeing Co. 150,000 3.20% 1/3/2029 157,551 0.01%Vulcan Materials Co. 125,000 4.70% 1/3/2048 157,439 0.01%Ventas Realty LP 140,000 4.00% 1/3/2028 157,408 0.01%California State University 155,000 2.98% 1/11/2051 157,390 0.01%salesforce.com, Inc. 150,000 3.25% 11/4/2023 157,365 0.01%Evergy, Inc. 150,000 2.45% 15/9/2024 157,099 0.01%Hartford Financial Services Group, Inc. 110,000 6.10% 1/10/2041 156,826 0.01%General Dynamics Corp. 150,000 2.13% 15/8/2026 156,801 0.01%Burlington Northern Santa Fe LLC 115,000 5.15% 1/9/2043 156,798 0.01%McDonald's Corp. 140,000 3.70% 15/2/2042 156,626 0.01%Starbucks Corp. 150,000 3.10% 1/3/2023 156,577 0.01%General Motors Co. 115,000 5.95% 1/4/2049 156,570 0.01%Johnson & Johnson 125,000 4.38% 5/12/2033 156,480 0.01%Principal Life Global Funding II 150,000 2.50% 16/9/2029 156,328 0.01%John Deere Capital Corp. 150,000 2.80% 6/3/2023 156,281 0.01%Federal Home Loan Mortgage Corp.^ 150,000 3.32% 25/2/2023 156,277 0.01%Boston Properties LP 150,000 2.90% 15/3/2030 156,241 0.01%Texas Instruments, Inc. 150,000 2.25% 4/9/2029 156,176 0.01%Analog Devices, Inc. 150,000 2.88% 1/6/2023 156,114 0.01%Activision Blizzard, Inc. 125,000 4.50% 15/6/2047 155,960 0.01%Biogen, Inc. 150,000 3.63% 15/9/2022 155,757 0.01%Coca-Cola Co. 150,000 3.00% 5/3/2051 155,666 0.01%Aetna, Inc. 130,000 4.50% 15/5/2042 155,648 0.01%Oracle Corp. 150,000 2.40% 15/9/2023 155,605 0.01%Invesco Finance plc 150,000 3.13% 30/11/2022 155,602 0.01%PNC Bank NA 150,000 2.95% 30/1/2023 155,537 0.01%Bristol-Myers Squibb Co. 150,000 2.75% 15/2/2023 155,470 0.01%Walmart, Inc. 150,000 2.55% 11/4/2023 155,413 0.01%Sysco Corp. 100,000 6.60% 1/4/2050 155,403 0.01%Loews Corp. 150,000 2.63% 15/5/2023 155,395 0.01%John Deere Capital Corp. 150,000 2.70% 6/1/2023 155,372 0.01%Florida Power & Light Co. 150,000 2.75% 1/6/2023 155,220 0.01%International Business Machines Corp. 150,000 2.88% 9/11/2022 155,208 0.01%TJX Cos, Inc. 150,000 2.50% 15/5/2023 155,196 0.01%Humana, Inc. 150,000 2.90% 15/12/2022 154,925 0.01%Regents of the University of California Medical Center Pooled Revenue 100,000 6.55% 15/5/2048 154,917 0.01%Transatlantic Holdings, Inc. 100,000 8.00% 30/11/2039 154,746 0.01%Honeywell International, Inc. 150,000 2.80% 1/6/2050 154,642 0.01%TC PipeLines LP 140,000 3.90% 25/5/2027 154,602 0.01%Philip Morris International, Inc. 150,000 2.13% 10/5/2023 154,515 0.01%Chubb INA Holdings, Inc. 150,000 2.88% 3/11/2022 154,473 0.01%Sammons Financial Group, Inc. 150,000 3.35% 16/4/2031 154,352 0.01%Hewlett Packard Enterprise Co. 150,000 2.25% 1/4/2023 154,332 0.01%Public Service Enterprise Group, Inc. 150,000 2.65% 15/11/2022 154,304 0.01%Gilead Sciences, Inc. 150,000 3.25% 1/9/2022 154,293 0.01%Banc of America Commercial Mortgage Trust 2017 140,000 3.75% 15/2/2050 154,207 0.01%Oracle Corp. 150,000 3.60% 1/4/2050 154,118 0.01%Aetna, Inc. 150,000 2.75% 15/11/2022 154,056 0.01%McKesson Corp. 150,000 2.70% 15/12/2022 154,001 0.01%International Flavors & Fragrances, Inc. 150,000 3.27% 15/11/2040 153,975 0.01%Athene Global Funding 150,000 3.00% 1/7/2022 153,756 0.01%

1001
Vanguard U.S. Investment Grade Credit Index Fund
Principal
US Dollars ($) CouponMaturity
DateFair Value
US Dollars ($)% of Total
Net AssetsCity of Houston TX 130,000 3.96% 1/3/2047 153,631 0.01%Boeing Co. 150,000 2.95% 1/2/2030 153,598 0.01%Capital One Financial Corp. 145,000 3.50% 15/6/2023 153,323 0.01%Arizona Public Service Co. 125,000 4.50% 1/4/2042 153,100 0.01%Merck & Co., Inc. 150,000 2.40% 15/9/2022 153,091 0.01%Enterprise Products Operating LLC 125,000 4.85% 15/8/2042 153,050 0.01%Manufacturers & Traders Trust Co. 143,000 2.90% 6/2/2025 152,967 0.01%Oncor Electric Delivery Co. LLC 111,000 5.30% 1/6/2042 152,890 0.01%Global Payments, Inc. 145,000 2.65% 15/2/2025 152,743 0.01%PayPal Holdings, Inc.1 150,000 1.35% 1/6/2023 152,713 0.01%LC4 Commercial Mortgage Trust 2012 151,765 3.29% 10/12/2044 152,681 0.01%Equinix, Inc. 150,000 2.50% 15/5/2031 152,631 0.01%Massachusetts Electric Co. 110,000 5.90% 15/11/2039 152,626 0.01%Republic Services, Inc. 150,000 2.30% 1/3/2030 152,378 0.01%Florida Power & Light Co. 125,000 4.13% 1/2/2042 152,332 0.01%Federal Home Loan Mortgage Corp. 150,000 2.72% 25/6/2022 152,304 0.01%UnitedHealth Group, Inc. 100,000 6.63% 15/11/2037 152,218 0.01%Florida Power & Light Co. 125,000 4.05% 1/10/2044 152,146 0.01%Cargill, Inc. 150,000 2.13% 23/4/2030 152,024 0.01%Allstate Corp.^ 115,000 6.50% 15/5/2057 151,816 0.01%Lam Research Corp. 150,000 2.88% 15/6/2050 151,775 0.01%Protective Life Global Funding 150,000 1.08% 9/6/2023 151,750 0.01%Federal National Mortgage Association 144,097 2.59% 25/12/2024 151,431 0.01%Reinsurance Group of America, Inc. 135,000 3.90% 15/5/2029 151,258 0.01%Stryker Corp. 150,000 2.90% 15/6/2050 150,680 0.01%Plains All American Pipeline LP/PAA Finance Corp. 150,000 4.30% 31/1/2043 150,623 0.01%Lam Research Corp. 150,000 1.90% 15/6/2030 150,572 0.01%Southern California Edison Co. 150,000 3.65% 1/6/2051 150,522 0.01%Consolidated Edison Co. of New York, Inc. 125,000 4.45% 15/3/2044 150,342 0.01%UnitedHealth Group, Inc. 100,000 6.50% 15/6/2037 150,072 0.01%Freddie Mac Multifamily Structured Pass Through Certificates 150,000 1.48% 25/4/2030 149,859 0.01%Steel Dynamics, Inc. 150,000 3.25% 15/10/2050 149,682 0.01%Nordstrom, Inc. 150,000 5.00% 15/1/2044 149,673 0.01%MetLife, Inc. 125,000 4.13% 13/8/2042 149,433 0.01%Kroger Co. 125,000 4.45% 1/2/2047 149,400 0.01%General Motors Financial Co., Inc. 150,000 1.50% 10/6/2026 149,209 0.01%WFRBS Commercial Mortgage Trust 2013^ 140,000 4.15% 15/8/2046 149,042 0.01%Bon Secours Mercy Health, Inc. 150,000 2.10% 1/6/2031 148,960 0.01%Burlington Northern Santa Fe LLC 105,000 5.75% 1/5/2040 148,841 0.01%Global Payments, Inc. 150,000 1.20% 1/3/2026 148,740 0.01%Omnicom Group, Inc./Omnicom Capital, Inc. 137,000 3.65% 1/11/2024 148,732 0.01%Agilent Technologies, Inc. 150,000 2.10% 4/6/2030 148,503 0.01%Stryker Corp. 150,000 1.95% 15/6/2030 148,368 0.01%T-Mobile USA, Inc. 150,000 3.00% 15/2/2041 148,334 0.01%Hackensack Meridian Health, Inc. 150,000 2.88% 1/9/2050 148,270 0.01%BGC Partners, Inc. 140,000 3.75% 1/10/2024 148,224 0.01%American Water Capital Corp. 100,000 6.59% 15/10/2037 148,158 0.01%DTE Energy Co. 140,000 2.95% 1/3/2030 148,110 0.01%Crown Castle International Corp. 150,000 2.25% 15/1/2031 148,013 0.01%Federal National Mortgage Association^ 138,877 3.35% 25/3/2024 148,000 0.01%Johns Hopkins Health System Corp. 125,000 3.84% 15/5/2046 147,971 0.01%Avangrid, Inc. 138,000 3.15% 1/12/2024 147,793 0.01%Public Service Co. of Colorado 150,000 2.70% 15/1/2051 147,787 0.01%Lowe's Cos, Inc. 150,000 3.00% 15/10/2050 147,776 0.01%General Electric Co. 142,900 3.15% 7/9/2022 147,555 0.01%CNA Financial Corp. 130,000 4.50% 1/3/2026 147,373 0.01%Merck & Co., Inc. 100,000 6.50% 1/12/2033 147,371 0.01%LYB International Finance II BV 135,000 3.50% 2/3/2027 147,318 0.01%Comcast Corp. 100,000 6.40% 15/5/2038 147,270 0.01%Norfolk Southern Corp. 125,000 4.15% 28/2/2048 147,229 0.01%Prudential Financial, Inc. 100,000 6.63% 1/12/2037 147,119 0.01%3M Co. 125,000 3.70% 15/4/2050 147,034 0.01%Abbott Laboratories 150,000 1.15% 30/1/2028 147,027 0.01%Mars, Inc. 150,000 0.88% 16/7/2026 147,008 0.01%Florida Power & Light Co. 125,000 3.70% 1/12/2047 147,006 0.01%Federal Home Loan Mortgage Corp.^ 140,000 3.31% 25/5/2023 147,001 0.01%CSX Corp. 100,000 6.22% 30/4/2040 146,690 0.01%Public Service Co. of Colorado 100,000 6.25% 1/9/2037 146,475 0.01%Exelon Corp. 133,000 3.95% 15/6/2025 146,353 0.01%Massachusetts Mutual Life Insurance Co. 140,000 3.38% 15/4/2050 146,166 0.01%AmerisourceBergen Corp. 125,000 4.30% 15/12/2047 145,822 0.01%
1002
Vanguard U.S. Investment Grade Credit Index Fund
Principal
US Dollars ($) CouponMaturity
DateFair Value
US Dollars ($)% of Total
Net AssetsEast Bay Municipal Utility District Water System Revenue 100,000 5.87% 1/6/2040 145,757 0.01%Northrop Grumman Systems Corp. 100,000 7.75% 15/2/2031 145,733 0.01%BP Capital Markets America, Inc. 150,000 3.00% 24/2/2050 145,693 0.01%Trustees of Princeton University 100,000 5.70% 1/3/2039 145,516 0.01%Fortune Brands Home & Security, Inc. 132,000 4.00% 15/6/2025 145,479 0.01%Union Pacific Corp. 135,000 3.25% 15/1/2025 145,440 0.01%Home Depot, Inc. 125,000 3.90% 6/12/2028 145,286 0.01%Grand Parkway Transportation Corp. 140,000 3.24% 1/10/2052 145,106 0.01%Virginia Electric & Power Co. 100,000 6.35% 30/11/2037 145,099 0.01%Federal National Mortgage Association^ 138,524 2.64% 25/7/2024 144,925 0.01%General Motors Financial Co., Inc. 135,000 3.50% 7/11/2024 144,840 0.01%Travelers Cos, Inc. 150,000 2.55% 27/4/2050 144,545 0.01%Deere & Co. 100,000 7.13% 3/3/2031 144,535 0.01%General Motors Co. 100,000 6.75% 1/4/2046 144,394 0.01%Mars, Inc. 150,000 2.38% 16/7/2040 144,322 0.01%Corning, Inc. 100,000 5.85% 15/11/2068 144,204 0.01%Caterpillar, Inc. 121,000 3.80% 15/8/2042 143,918 0.01%Global Payments, Inc. 125,000 4.15% 15/8/2049 143,856 0.01%Starbucks Corp. 125,000 4.00% 15/11/2028 143,854 0.01%UnitedHealth Group, Inc. 125,000 3.85% 15/6/2028 143,608 0.01%TWDC Enterprises 18 Corp. 100,000 7.00% 1/3/2032 143,597 0.01%Kroger Co. 100,000 7.50% 1/4/2031 143,478 0.01%TWDC Enterprises 18 Corp. 120,000 4.13% 1/12/2041 143,395 0.01%Toyota Motor Credit Corp. 140,000 2.15% 8/9/2022 143,007 0.01%NGPL PipeCo LLC 100,000 7.77% 15/12/2037 142,957 0.01%Discovery Communications LLC 125,000 4.90% 11/3/2026 142,815 0.01%Cigna Corp. 100,000 6.13% 15/11/2041 142,808 0.01%Raytheon Technologies Corp. 100,000 6.13% 15/7/2038 142,726 0.01%Johnson & Johnson 150,000 2.10% 1/9/2040 142,380 0.01%Whirlpool Corp. 120,000 4.75% 26/2/2029 142,263 0.01%Huntsman International LLC 125,000 4.50% 1/5/2029 142,243 0.01%Devon Energy Corp. 125,000 4.75% 15/5/2042 142,050 0.01%MetLife, Inc. 100,000 6.50% 15/12/2032 141,920 0.01%University of California 100,000 5.95% 15/5/2045 141,579 0.01%Willis North America, Inc. 125,000 3.88% 15/9/2049 141,405 0.01%Energy Transfer LP 125,000 5.15% 1/2/2043 141,365 0.01%Municipal Electric Authority of Georgia 97,000 7.06% 1/4/2057 141,275 0.01%Aptiv plc 125,000 4.25% 15/1/2026 141,240 0.01%Essex Portfolio LP 125,000 4.00% 1/3/2029 141,183 0.01%Kinder Morgan Energy Partners LP 100,000 7.30% 15/8/2033 141,155 0.01%Bank of America Corp. 125,000 4.25% 22/10/2026 141,125 0.01%Energy Transfer LP 100,000 7.50% 1/7/2038 140,857 0.01%Valero Energy Corp. 100,000 7.50% 15/4/2032 140,683 0.01%Aon Corp. 125,000 3.75% 2/5/2029 140,673 0.01%University of California 100,000 4.77% 15/5/2115 140,590 0.01%Prudential Financial, Inc.^ 120,000 5.70% 15/9/2048 140,517 0.01%Camden Property Trust 129,000 3.15% 1/7/2029 140,506 0.01%Activision Blizzard, Inc. 150,000 1.35% 15/9/2030 140,478 0.01%Metropolitan Water Reclamation District of Greater Chicago 100,000 5.72% 1/12/2038 140,441 0.01%State of California 120,000 4.50% 1/4/2033 140,431 0.01%Target Corp. 125,000 3.38% 15/4/2029 140,405 0.01%Illinois State Toll Highway Authority 100,000 6.18% 1/1/2034 140,239 0.01%Enterprise Products Operating LLC 100,000 6.13% 15/10/2039 140,198 0.01%National Rural Utilities Cooperative Finance Corp. 125,000 3.70% 15/3/2029 140,179 0.01%O'Reilly Automotive, Inc. 125,000 3.60% 1/9/2027 140,055 0.01%Johnson & Johnson 150,000 2.25% 1/9/2050 140,022 0.01%Brandywine Operating Partnership LP 125,000 4.55% 1/10/2029 140,014 0.01%Starbucks Corp. 125,000 3.55% 15/8/2029 139,891 0.01%Home Depot, Inc. 105,000 4.88% 15/2/2044 139,844 0.01%Federal Home Loan Mortgage Corp. 125,000 3.08% 25/1/2031 139,817 0.01%Raytheon Technologies Corp. 100,000 7.50% 15/9/2029 139,796 0.01%New York City Water & Sewer System 90,000 5.88% 15/6/2044 139,757 0.01%Eastman Chemical Co. 115,000 4.65% 15/10/2044 139,720 0.01%Magellan Midstream Partners LP 125,000 4.20% 3/10/2047 139,670 0.01%Dayton Power & Light Co. 125,000 3.95% 15/6/2049 139,532 0.01%Federal Home Loan Mortgage Corp. 125,000 3.29% 25/11/2027 139,472 0.01%Benchmark 2018-B1 Mortgage Trust^ 125,000 3.67% 15/1/2051 139,338 0.01%Duke Energy Carolinas LLC 100,000 6.10% 1/6/2037 139,284 0.01%Bank of America Corp.^ 135,000 2.02% 13/2/2026 139,185 0.01%Kroger Co. 125,000 3.70% 1/8/2027 139,150 0.01%Juniper Networks, Inc. 125,000 3.75% 15/8/2029 139,143 0.01%

1003
Vanguard U.S. Investment Grade Credit Index Fund
Principal
US Dollars ($) CouponMaturity
DateFair Value
US Dollars ($)% of Total
Net AssetsVirginia Electric & Power Co. 100,000 6.00% 15/5/2037 139,125 0.01%Bristol-Myers Squibb Co. 125,000 3.88% 15/8/2025 139,097 0.01%Synchrony Financial 125,000 3.95% 1/12/2027 139,096 0.01%Thermo Fisher Scientific, Inc. 100,000 5.30% 1/2/2044 138,998 0.01%Capital One Financial Corp. 125,000 3.65% 11/5/2027 138,988 0.01%Foothill-Eastern Transportation Corridor Agency 130,000 4.09% 15/1/2049 138,900 0.01%Cameron LNG LLC 125,000 3.70% 15/1/2039 138,878 0.01%Public Storage 125,000 3.39% 1/5/2029 138,831 0.01%Honeywell International, Inc. 100,000 5.70% 15/3/2037 138,780 0.01%SITE Centers Corp. 125,000 4.70% 1/6/2027 138,716 0.01%Constellation Brands, Inc. 125,000 3.60% 15/2/2028 138,611 0.01%Burlington Resources LLC 100,000 5.95% 15/10/2036 138,599 0.01%Bank of New York Mellon Corp. 125,000 3.30% 23/8/2029 138,568 0.01%Caterpillar, Inc. 125,000 3.25% 9/4/2050 138,538 0.01%Southern Co. Gas Capital Corp. 100,000 5.88% 15/3/2041 138,502 0.01%MetLife, Inc. 105,000 4.88% 13/11/2043 138,423 0.01%Kinder Morgan Energy Partners LP 100,000 6.38% 1/3/2041 138,274 0.01%MidAmerican Energy Co. 100,000 5.80% 15/10/2036 138,092 0.01%Camden Property Trust 120,000 4.10% 15/10/2028 137,942 0.01%Constellation Brands, Inc. 125,000 3.50% 9/5/2027 137,915 0.01%Northrop Grumman Corp. 105,000 5.15% 1/5/2040 137,854 0.01%Bunge Ltd. Finance Corp. 125,000 3.75% 25/9/2027 137,834 0.01%Truist Financial Corp. 125,000 3.70% 5/6/2025 137,734 0.01%Waste Connections, Inc. 125,000 3.50% 1/5/2029 137,700 0.01%Freddie Mac Multifamily Structured Pass Through Certificates 125,000 2.80% 25/8/2034 137,648 0.01%Crown Castle International Corp. 125,000 3.70% 15/6/2026 137,545 0.01%Enterprise Products Operating LLC 100,000 5.95% 1/2/2041 137,544 0.01%Stanley Black & Decker, Inc. 125,000 3.40% 1/3/2026 137,480 0.01%Marriott International, Inc. 125,000 4.00% 15/4/2028 137,444 0.01%Bank of New York Mellon Corp. 125,000 3.25% 16/5/2027 137,420 0.01%Federal National Mortgage Association^ 125,000 3.00% 25/1/2028 137,398 0.01%Burlington Northern Santa Fe LLC 100,000 5.40% 1/6/2041 137,396 0.01%Masco Corp. 125,000 3.50% 15/11/2027 137,368 0.01%Kinder Morgan Energy Partners LP 100,000 6.50% 1/2/2037 137,282 0.01%Mohawk Industries, Inc. 125,000 3.63% 15/5/2030 137,280 0.01%Duke Energy Indiana LLC 130,000 3.25% 1/10/2049 137,263 0.01%UBS Commercial Mortgage Trust 2017 125,000 3.47% 15/11/2050 137,227 0.01%Conagra Brands, Inc. 125,000 4.30% 1/5/2024 137,163 0.01%Aflac, Inc. 125,000 3.63% 15/11/2024 137,066 0.01%Mars, Inc. 125,000 3.20% 1/4/2030 137,022 0.01%International Business Machines Corp. 100,000 5.88% 29/11/2032 137,009 0.01%Anthem, Inc. 127,000 3.35% 1/12/2024 137,001 0.01%ViacomCBS, Inc. 100,000 5.85% 1/9/2043 136,972 0.01%Hartford Financial Services Group, Inc. 100,000 5.95% 15/10/2036 136,899 0.01%Southern California Edison Co. 130,000 4.00% 1/4/2047 136,890 0.01%Wells Fargo & Co. 125,000 4.48% 16/1/2024 136,830 0.01%United Parcel Service, Inc. 128,000 2.80% 15/11/2024 136,801 0.01%LifeStorage LP 125,000 3.50% 1/7/2026 136,791 0.01%Waste Management, Inc. 125,000 3.15% 15/11/2027 136,791 0.01%Wells Fargo Commercial Mortgage Trust 2017 125,000 3.70% 15/9/2050 136,640 0.01%3M Co. 125,000 3.25% 26/8/2049 136,589 0.01%Western Union Co. 129,000 2.85% 10/1/2025 136,573 0.01%GS Mortgage Securities Trust 2017 125,000 3.66% 10/8/2050 136,485 0.01%Thermo Fisher Scientific, Inc. 125,000 3.20% 15/8/2027 136,481 0.01%Marathon Oil Corp. 125,000 3.85% 1/6/2025 136,155 0.01%Exelon Corp. 125,000 3.40% 15/4/2026 136,150 0.01%Loews Corp. 100,000 6.00% 1/2/2035 136,131 0.01%Boeing Co. 135,000 3.50% 1/3/2039 136,069 0.01%Cisco Systems, Inc. 125,000 2.95% 28/2/2026 136,025 0.01%American Tower Corp. 125,000 3.38% 15/10/2026 136,024 0.01%Citigroup, Inc. 125,000 3.75% 16/6/2024 135,995 0.01%Duke Energy Progress LLC 125,000 3.25% 15/8/2025 135,841 0.01%Kaiser Foundation Hospitals 125,000 3.27% 1/11/2049 135,786 0.01%Aptiv plc 100,000 5.40% 15/3/2049 135,747 0.01%Comcast Corp.1 114,000 4.25% 15/1/2033 135,734 0.01%Verizon Communications, Inc. 100,000 5.01% 21/8/2054 135,646 0.01%CSX Corp. 100,000 5.50% 15/4/2041 135,545 0.01%AbbVie, Inc. 125,000 3.85% 15/6/2024 135,533 0.01%Aptiv Corp. 125,000 4.15% 15/3/2024 135,529 0.01%Hess Corp. 100,000 7.30% 15/8/2031 135,522 0.01%American Tower Corp. 125,000 3.70% 15/10/2049 135,471 0.01%
1004
Vanguard U.S. Investment Grade Credit Index Fund
Principal
US Dollars ($) CouponMaturity
DateFair Value
US Dollars ($)% of Total
Net AssetsWells Fargo Commercial Mortgage Trust 2017 125,000 3.32% 15/10/2050 135,427 0.01%GATX Corp. 120,000 4.00% 30/6/2030 135,413 0.01%Chevron USA, Inc. 110,000 4.20% 15/10/2049 135,355 0.01%Ameriprise Financial, Inc. 125,000 4.00% 15/10/2023 135,095 0.01%Fox Corp. 100,000 5.58% 25/1/2049 135,040 0.01%Baptist Healthcare System Obligated Group 125,000 3.54% 15/8/2050 134,991 0.01%Corning, Inc. 100,000 5.35% 15/11/2048 134,872 0.01%Leggett & Platt, Inc. 125,000 3.80% 15/11/2024 134,844 0.01%Stanley Black & Decker, Inc. 100,000 4.85% 15/11/2048 134,818 0.01%JM Smucker Co. 125,000 3.55% 15/3/2050 134,807 0.01%CVS Health Corp. 125,000 3.00% 15/8/2026 134,796 0.01%CSAIL 2015-C1 Commercial Mortgage Trust 125,000 3.51% 15/4/2050 134,562 0.01%Pharmacia LLC 100,000 6.60% 1/12/2028 134,484 0.01%Wells Fargo & Co. 100,000 5.38% 2/11/2043 133,902 0.01%McKesson Corp. 100,000 6.00% 1/3/2041 133,874 0.01%New York City Transitional Finance Authority Future Tax Secured Revenue 100,000 5.51% 1/8/2037 133,833 0.01%Raytheon Technologies Corp. 125,000 3.70% 15/12/2023 133,682 0.01%Ascension Health 125,000 3.11% 15/11/2039 133,616 0.01%EOG Resources, Inc. 100,000 4.95% 15/4/2050 133,597 0.01%Comcast Corp. 125,000 3.40% 15/7/2046 133,556 0.01%Federal Home Loan Mortgage Corp. 125,000 3.49% 25/1/2024 133,429 0.01%Truist Bank^ 125,000 3.69% 2/8/2024 133,347 0.01%Archer-Daniels-Midland Co. 100,000 4.50% 15/3/2049 133,239 0.01%JetBlue 2020-1 Class A Pass Through Trust 120,910 4.00% 15/11/2032 133,136 0.01%Carlyle Holdings II Finance LLC 100,000 5.63% 30/3/2043 133,135 0.01%CyrusOne LP/CyrusOne Finance Corp. 125,000 3.45% 15/11/2029 133,132 0.01%National Grid USA 110,000 5.88% 1/4/2033 133,080 0.01%Bristol-Myers Squibb Co. 125,000 3.25% 1/11/2023 133,060 0.01%Duke Energy Ohio, Inc. 125,000 3.80% 1/9/2023 133,039 0.01%Board of Regents of the University of Texas System 100,000 4.79% 15/8/2046 133,017 0.01%Reliance Standard Life Global Funding II 130,000 2.63% 22/7/2022 132,981 0.01%Caterpillar Financial Services Corp. 130,000 1.95% 18/11/2022 132,891 0.01%M&T Bank Corp. 125,000 3.55% 26/7/2023 132,805 0.01%Freddie Mac Multifamily Structured Pass Through Certificates 125,000 2.67% 25/12/2024 132,704 0.01%State of California 125,000 2.50% 1/10/2029 132,700 0.01%Federal National Mortgage Association 125,000 2.58% 25/3/2026 132,696 0.01%New York Life Global Funding 125,000 2.88% 10/4/2024 132,684 0.01%L3Harris Technologies, Inc. 125,000 2.90% 15/12/2029 132,648 0.01%Nationwide Financial Services, Inc. 120,000 3.90% 30/11/2049 132,417 0.01%BP Capital Markets America, Inc. 125,000 3.22% 28/11/2023 132,397 0.01%Ryder System, Inc. 125,000 3.75% 9/6/2023 132,359 0.01%Xilinx, Inc. 125,000 2.95% 1/6/2024 132,310 0.01%International Lease Finance Corp. 125,000 5.88% 15/8/2022 132,193 0.01%Georgia-Pacific LLC 125,000 3.73% 15/7/2023 132,159 0.01%Duke Energy Florida Project Finance LLC 125,000 2.54% 1/9/2029 132,001 0.01%United Airlines 2013-1 Class A Pass Through Trust 125,408 4.30% 15/8/2025 131,969 0.01%Dallas Fort Worth International Airport 125,000 2.99% 1/11/2038 131,871 0.01%L3Harris Technologies, Inc. 100,000 5.05% 27/4/2045 131,747 0.01%Anthem, Inc. 100,000 5.10% 15/1/2044 131,659 0.01%Moody's Corp. 100,000 4.88% 17/12/2048 131,582 0.01%Home Depot, Inc. 125,000 2.13% 15/9/2026 131,529 0.01%QUALCOMM, Inc. 127,000 2.60% 30/1/2023 131,510 0.01%Farmers Exchange Capital III^ 105,000 5.45% 15/10/2054 131,432 0.01%Wisconsin Electric Power Co. 100,000 5.63% 15/5/2033 131,389 0.01%Duke Energy Carolinas LLC 125,000 3.20% 15/8/2049 131,381 0.01%Crown Castle International Corp. 125,000 3.15% 15/7/2023 131,329 0.01%Whirlpool Corp. 120,000 3.70% 1/5/2025 131,282 0.01%Interstate Power & Light Co. 122,000 3.25% 1/12/2024 131,270 0.01%CSX Corp. 100,000 4.65% 1/3/2068 131,261 0.01%New York State Dormitory Authority 100,000 5.63% 15/3/2039 131,184 0.01%Aetna, Inc. 90,000 6.63% 15/6/2036 131,129 0.01%McDonald's Corp. 125,000 3.35% 1/4/2023 131,112 0.01%Ingredion, Inc. 125,000 2.90% 1/6/2030 131,018 0.01%3M Co. 125,000 2.38% 26/8/2029 131,011 0.01%Discover Financial Services 125,000 3.85% 21/11/2022 130,966 0.01%Steel Dynamics, Inc. 125,000 2.40% 15/6/2025 130,921 0.01%American Water Capital Corp. 125,000 3.25% 1/6/2051 130,794 0.01%VEREIT Operating Partnership LP 125,000 2.85% 15/12/2032 130,728 0.01%Cargill, Inc. 100,000 4.76% 23/11/2045 130,717 0.01%NOV, Inc. 125,000 3.60% 1/12/2029 130,710 0.01%Quest Diagnostics, Inc. 125,000 2.80% 30/6/2031 130,603 0.01%

1005
Vanguard U.S. Investment Grade Credit Index Fund
Principal
US Dollars ($) CouponMaturity
DateFair Value
US Dollars ($)% of Total
Net AssetsDH Europe Finance II Sarl 125,000 2.20% 15/11/2024 130,524 0.01%Target Corp. 125,000 2.35% 15/2/2030 130,501 0.01%CRH America, Inc. 100,000 5.13% 18/5/2045 130,481 0.01%US Bank NA 125,000 2.05% 21/1/2025 130,467 0.01%Bank of America Corp. 100,000 4.88% 1/4/2044 130,450 0.01%Federal National Mortgage Association 122,277 2.70% 25/2/2026 130,208 0.01%Burlington Northern Santa Fe LLC 100,000 4.70% 1/9/2045 130,196 0.01%Farmers Exchange Capital II^ 100,000 6.15% 1/11/2053 130,157 0.01%AbbVie, Inc. 125,000 2.85% 14/5/2023 130,141 0.01%Johnson & Johnson 100,000 4.50% 5/12/2043 130,103 0.01%JPMorgan Chase & Co.^ 125,000 2.30% 15/10/2025 130,085 0.01%Bristol-Myers Squibb Co. 95,000 5.00% 15/8/2045 129,994 0.01%Diamondback Energy, Inc. 125,000 3.13% 24/3/2031 129,969 0.01%Halliburton Co. 125,000 2.92% 1/3/2030 129,925 0.01%Simon Property Group LP 125,000 2.75% 1/6/2023 129,770 0.01%Stanley Black & Decker, Inc. 125,000 2.30% 15/3/2030 129,753 0.01%JP Morgan Chase Commercial Mortgage Securities Trust 2012 127,047 2.83% 15/10/2045 129,741 0.01%John Deere Capital Corp. 120,000 3.35% 12/6/2024 129,689 0.01%Benchmark 2018-B2 Mortgage Trust 125,000 3.66% 15/2/2051 129,685 0.01%LYB International Finance III LLC 125,000 3.38% 1/10/2040 129,567 0.01%International Flavors & Fragrances, Inc. 100,000 5.00% 26/9/2048 129,521 0.01%Morgan Stanley Bank of America Merrill Lynch Trust 2013 121,000 4.04% 15/11/2046 129,474 0.01%District of Columbia 100,000 5.59% 1/12/2034 129,425 0.01%Metropolitan Edison Co. 125,000 3.50% 15/3/2023 129,413 0.01%Johnson & Johnson 100,000 4.50% 1/9/2040 129,388 0.01%CSX Corp. 100,000 4.75% 15/11/2048 129,386 0.01%Prudential Financial, Inc.^ 120,000 5.20% 15/3/2044 129,376 0.01%Southern California Gas Co. 125,000 2.55% 1/2/2030 129,337 0.01%Virginia Electric & Power Co. 125,000 2.75% 15/3/2023 129,313 0.01%Waste Connections, Inc. 125,000 2.60% 1/2/2030 129,286 0.01%LYB International Finance BV 100,000 5.25% 15/7/2043 129,268 0.01%Charles Schwab Corp. 125,000 2.65% 25/1/2023 129,235 0.01%Micron Technology, Inc. 125,000 2.50% 24/4/2023 129,176 0.01%UnitedHealth Group, Inc. 105,000 4.25% 15/4/2047 129,120 0.01%Brown-Forman Corp. 100,000 4.50% 15/7/2045 129,068 0.01%Moody's Corp. 125,000 2.63% 15/1/2023 129,052 0.01%Entergy Corp. 125,000 4.00% 15/7/2022 128,916 0.01%Regents of the University of California Medical Center Pooled Revenue 120,000 3.26% 15/5/2060 128,911 0.01%Lowe's Cos, Inc. 100,000 5.00% 15/4/2040 128,842 0.01%AT&T, Inc. 100,000 5.35% 1/9/2040 128,798 0.01%Zoetis, Inc. 100,000 4.70% 1/2/2043 128,738 0.01%Appalachian Power Co. 105,000 4.50% 1/3/2049 128,709 0.01%Freddie Mac Multifamily Structured Pass Through Certificates 125,000 1.76% 25/3/2028 128,667 0.01%PayPal Holdings, Inc. 122,000 2.40% 1/10/2024 128,596 0.01%Commonwealth Edison Co. 125,000 3.00% 1/3/2050 128,582 0.01%VEREIT Operating Partnership LP 120,000 3.10% 15/12/2029 128,512 0.01%Protective Life Global Funding 125,000 2.62% 22/8/2022 128,179 0.01%PPL Capital Funding, Inc. 125,000 4.20% 15/6/2022 128,061 0.01%Western & Southern Life Insurance Co. 100,000 5.15% 15/1/2049 128,031 0.01%Waste Management, Inc. 125,000 2.90% 15/9/2022 128,014 0.01%PayPal Holdings, Inc.1 125,000 2.20% 26/9/2022 128,009 0.01%Bank of America Corp. 100,000 4.75% 21/4/2045 127,823 0.01%Duke Energy Corp. 125,000 3.05% 15/8/2022 127,814 0.01%Kansas City Southern 100,000 4.95% 15/8/2045 127,762 0.01%American Airlines 2017-2 Class AA Pass Through Trust 125,645 3.35% 15/10/2029 127,686 0.01%Anthem, Inc. 120,000 2.88% 15/9/2029 127,674 0.01%Guardian Life Insurance Co. of America 100,000 4.85% 24/1/2077 127,671 0.01%Philip Morris International, Inc. 125,000 2.38% 17/8/2022 127,668 0.01%Nissan Motor Acceptance Corp. 125,000 2.60% 28/9/2022 127,610 0.01%NSTAR Electric Co. 125,000 2.38% 15/10/2022 127,522 0.01%American Transmission Systems, Inc. 100,000 5.00% 1/9/2044 127,477 0.01%Deere & Co. 100,000 5.38% 16/10/2029 127,472 0.01%National Securities Clearing Corp. 125,000 1.50% 23/4/2025 127,454 0.01%Raytheon Technologies Corp. 100,000 4.88% 15/10/2040 127,342 0.01%William Marsh Rice University 110,000 3.57% 15/5/2045 127,334 0.01%Lincoln National Corp. 115,000 3.63% 12/12/2026 127,309 0.01%State of Texas 95,000 4.68% 1/4/2040 127,267 0.01%Walmart, Inc. 120,000 2.38% 24/9/2029 127,138 0.01%Walt Disney Co. 125,000 1.65% 1/9/2022 126,955 0.01%QUALCOMM, Inc. 100,000 4.65% 20/5/2035 126,880 0.01%Georgia Power Co. 125,000 3.25% 15/3/2051 126,857 0.01%

1006
Vanguard U.S. Investment Grade Credit Index Fund
Principal
US Dollars ($) CouponMaturity
DateFair Value
US Dollars ($)% of Total
Net AssetsInternational Business Machines Corp. 100,000 6.22% 1/8/2027 126,638 0.01%Williams Cos, Inc. 100,000 5.40% 4/3/2044 126,558 0.01%Westlake Chemical Corp. 100,000 5.00% 15/8/2046 126,501 0.01%American Tower Corp. 125,000 1.60% 15/4/2026 126,345 0.01%Prologis LP 100,000 4.38% 15/9/2048 126,120 0.01%Xylem, Inc. 125,000 2.25% 30/1/2031 126,100 0.01%PACCAR Financial Corp. 125,000 0.80% 8/6/2023 126,071 0.01%State of California 75,000 7.63% 1/3/2040 125,893 0.01%Estee Lauder Cos, Inc. 100,000 4.38% 15/6/2045 125,844 0.01%Nationwide Financial Services, Inc. 100,000 5.30% 18/11/2044 125,838 0.01%Mosaic Co. 100,000 5.45% 15/11/2033 125,719 0.01%Nissan Motor Acceptance Corp. 125,000 2.00% 9/3/2026 125,702 0.01%Adobe, Inc. 120,000 2.15% 1/2/2027 125,698 0.01%Pfizer, Inc. 100,000 4.30% 15/6/2043 125,692 0.01%CCRE27 Commercial Mortgage Trust 2015 115,000 3.61% 10/10/2048 125,663 0.01%Trane Technologies Luxembourg Finance SA 100,000 4.50% 21/3/2049 125,644 0.01%Huntington Ingalls Industries, Inc. 115,000 3.84% 1/5/2025 125,515 0.01%AT&T, Inc. 100,000 5.15% 15/3/2042 125,419 0.01%AbbVie, Inc. 100,000 4.75% 15/3/2045 125,315 0.01%Caterpillar Financial Services Corp. 125,000 0.45% 14/9/2023 125,168 0.01%Liberty Mutual Group, Inc. 117,000 4.25% 15/6/2023 125,140 0.01%Corning, Inc. 100,000 4.75% 15/3/2042 125,106 0.01%National Rural Utilities Cooperative Finance Corp. 100,000 4.30% 15/3/2049 125,005 0.01%Southern California Edison Co. 100,000 5.55% 15/1/2037 124,948 0.01%New York & Presbyterian Hospital 100,000 4.06% 1/8/2056 124,846 0.01%Travelers Cos, Inc. 100,000 4.30% 25/8/2045 124,837 0.01%CenterPoint Energy Houston Electric LLC 100,000 4.25% 1/2/2049 124,836 0.01%Valero Energy Corp. 100,000 4.90% 15/3/2045 124,794 0.01%Sysco Corp. 100,000 4.85% 1/10/2045 124,770 0.01%Precision Castparts Corp. 115,000 3.25% 15/6/2025 124,740 0.01%New York State Dormitory Authority 120,000 3.14% 1/7/2043 124,700 0.01%Discovery Communications LLC 100,000 5.20% 20/9/2047 124,565 0.01%Kaiser Foundation Hospitals 100,000 4.15% 1/5/2047 124,557 0.01%Progressive Corp. 100,000 4.20% 15/3/2048 124,550 0.01%City of Hope 100,000 4.38% 15/8/2048 124,549 0.01%IHC Health Services, Inc. 100,000 4.13% 15/5/2048 124,426 0.01%Community Health Network, Inc. 125,000 3.10% 1/5/2050 124,404 0.01%Florida Power & Light Co. 100,000 4.13% 1/6/2048 124,381 0.01%Time Warner Cable LLC 100,000 5.50% 1/9/2041 124,345 0.01%Devon Energy Corp. 113,000 4.50% 15/1/2030 124,333 0.01%National Retail Properties, Inc. 100,000 4.80% 15/10/2048 124,333 0.01%Mylan, Inc. 100,000 5.40% 29/11/2043 124,318 0.01%Physicians Realty LP 110,000 4.30% 15/3/2027 124,138 0.01%Magellan Midstream Partners LP 100,000 5.15% 15/10/2043 123,999 0.01%Union Pacific Corp. 120,000 2.40% 5/2/2030 123,876 0.01%Burlington Northern Santa Fe LLC 100,000 4.38% 1/9/2042 123,695 0.01%Marsh & McLennan Cos, Inc. 100,000 4.20% 1/3/2048 123,683 0.01%Parker-Hannifin Corp. 100,000 4.45% 21/11/2044 123,629 0.01%Bacardi Ltd. 100,000 5.15% 15/5/2038 123,594 0.01%Freddie Mac Multifamily Structured Pass Through Certificates 125,000 1.35% 25/5/2030 123,487 0.01%Yale University 125,000 1.48% 15/4/2030 123,425 0.01%Exelon Generation Co. LLC 100,000 6.25% 1/10/2039 123,189 0.01%American Tower Corp. 115,000 3.38% 15/5/2024 123,042 0.01%Discovery Communications LLC 105,000 4.65% 15/5/2050 122,894 0.01%Pfizer, Inc. 100,000 4.00% 15/3/2049 122,836 0.01%Pioneer Natural Resources Co. 125,000 2.15% 15/1/2031 122,667 0.01%ONEOK, Inc. 100,000 5.20% 15/7/2048 122,658 0.01%Kroger Co. 100,000 4.65% 15/1/2048 122,599 0.01%Duke Energy Corp. 100,000 4.80% 15/12/2045 122,582 0.01%WW Grainger, Inc. 100,000 4.20% 15/5/2047 122,577 0.01%Berkshire Hathaway Energy Co. 100,000 4.50% 1/2/2045 122,489 0.01%Alabama Power Co. 100,000 4.30% 2/1/2046 122,462 0.01%Electronic Arts, Inc. 125,000 2.95% 15/2/2051 122,378 0.01%Gilead Sciences, Inc. 100,000 4.60% 1/9/2035 122,321 0.01%UnitedHealth Group, Inc. 100,000 4.20% 15/1/2047 122,218 0.01%Thermo Fisher Scientific, Inc. 100,000 4.10% 15/8/2047 121,731 0.01%Rockefeller Foundation 125,000 2.49% 1/10/2050 121,595 0.01%Baxalta, Inc. 110,000 4.00% 23/6/2025 121,587 0.01%CubeSmart LP 125,000 2.00% 15/2/2031 121,523 0.01%DTE Electric Co. 100,000 4.05% 15/5/2048 121,399 0.01%Target Corp. 75,000 7.00% 15/1/2038 121,397 0.01%

1007
Vanguard U.S. Investment Grade Credit Index Fund
Principal
US Dollars ($) CouponMaturity
DateFair Value
US Dollars ($)% of Total
Net AssetsBasin Electric Power Cooperative 100,000 4.75% 26/4/2047 121,165 0.01%Burlington Northern Santa Fe LLC 100,000 4.15% 1/4/2045 121,153 0.01%Chubb Corp. 80,000 6.50% 15/5/2038 121,111 0.01%American International Group, Inc. 100,000 4.70% 10/7/2035 121,106 0.01%Cox Communications, Inc. 100,000 4.80% 1/2/2035 121,086 0.01%Micron Technology, Inc. 100,000 5.33% 6/2/2029 120,936 0.01%Healthcare Trust of America Holdings LP 110,000 3.50% 1/8/2026 120,859 0.01%Air Lease Corp. 117,000 2.30% 1/2/2025 120,856 0.01%Montefiore Obligated Group 100,000 5.25% 1/11/2048 120,809 0.01%Energy Transfer LP 95,000 6.05% 1/6/2041 120,743 0.01%Ecolab, Inc. 100,000 3.95% 1/12/2047 120,711 0.01%Medtronic, Inc. 92,000 4.63% 15/3/2045 120,680 0.01%Humana, Inc. 100,000 4.88% 1/4/2030 120,679 0.01%Toledo Hospital 100,000 5.75% 15/11/2038 120,677 0.01%San Diego Gas & Electric Co. 100,000 4.10% 15/6/2049 120,598 0.01%Home Depot, Inc. 95,000 4.40% 15/3/2045 120,465 0.01%Cardinal Health, Inc. 100,000 4.90% 15/9/2045 120,228 0.01%Kinder Morgan Energy Partners LP 100,000 5.00% 1/3/2043 120,226 0.01%MetLife, Inc. 100,000 4.05% 1/3/2045 120,061 0.01%Texas Instruments, Inc. 100,000 3.88% 15/3/2039 120,057 0.01%Southern Power Co. 100,000 4.95% 15/12/2046 119,940 0.01%Nationwide Mutual Insurance Co. 100,000 4.95% 22/4/2044 119,901 0.01%Everest Reinsurance Holdings, Inc. 95,000 4.87% 1/6/2044 119,795 0.01%Kimco Realty Corp. 100,000 4.45% 1/9/2047 119,721 0.01%Kinder Morgan Energy Partners LP 100,000 5.00% 15/8/2042 119,719 0.01%Transcontinental Gas Pipe Line Co. LLC 100,000 4.45% 1/8/2042 119,440 0.01%FedEx Corp. 100,000 4.40% 15/1/2047 119,427 0.01%Allstate Corp.^ 110,000 5.75% 15/8/2053 119,397 0.01%Mastercard, Inc. 100,000 3.80% 21/11/2046 119,201 0.01%Alexandria Real Estate Equities, Inc. 100,000 4.70% 1/7/2030 119,160 0.01%Leidos, Inc. 105,000 4.38% 15/5/2030 119,131 0.01%Brooklyn Union Gas Co. 100,000 4.50% 10/3/2046 119,113 0.01%NYU Langone Hospitals 100,000 4.37% 1/7/2047 119,019 0.01%Chubb INA Holdings, Inc. 110,000 3.15% 15/3/2025 118,863 0.01%CVS Health Corp. 100,000 4.25% 1/4/2050 118,862 0.01%International Business Machines Corp. 100,000 4.15% 15/5/2039 118,821 0.01%Boardwalk Pipelines LP 100,000 5.95% 1/6/2026 118,512 0.01%Philip Morris International, Inc. 100,000 4.50% 20/3/2042 118,507 0.01%ERP Operating LP 100,000 4.00% 1/8/2047 118,228 0.01%Enbridge Energy Partners LP 100,000 5.88% 15/10/2025 118,150 0.01%Philip Morris International, Inc. 100,000 4.38% 15/11/2041 118,078 0.01%Owens Corning 100,000 4.40% 30/1/2048 118,024 0.01%New York & Presbyterian Hospital 100,000 3.95% 1/8/2119 117,960 0.01%Consumers Energy Co. 100,000 3.95% 15/5/2043 117,930 0.01%Consolidated Edison Co. of New York, Inc. 100,000 4.30% 1/12/2056 117,917 0.01%Visa, Inc. 100,000 3.65% 15/9/2047 117,790 0.01%County of Clark Department of Aviation 75,000 6.82% 1/7/2045 117,733 0.01%Evergy Kansas Central, Inc. 100,000 4.13% 1/3/2042 117,723 0.01%University of Notre Dame du Lac 100,000 3.44% 15/2/2045 117,671 0.01%General Motors Co. 95,000 5.20% 1/4/2045 117,638 0.01%Walt Disney Co. 100,000 3.80% 13/5/2060 117,547 0.01%Raytheon Technologies Corp. 100,000 4.05% 4/5/2047 117,533 0.01%Keurig Dr Pepper, Inc. 100,000 4.60% 25/5/2028 117,440 0.01%Interpublic Group of Cos, Inc. 100,000 4.65% 1/10/2028 117,400 0.01%Exelon Generation Co. LLC 100,000 5.60% 15/6/2042 117,355 0.01%Amphenol Corp. 100,000 4.35% 1/6/2029 117,299 0.01%Progress Energy, Inc. 85,000 6.00% 1/12/2039 117,254 0.01%Trimble, Inc. 100,000 4.90% 15/6/2028 117,251 0.01%Apollo Management Holdings LP 100,000 4.87% 15/2/2029 117,242 0.01%Westlake Chemical Corp. 100,000 4.38% 15/11/2047 117,232 0.01%Municipal Electric Authority of Georgia 77,000 6.64% 1/4/2057 117,227 0.01%Federal National Mortgage Association 115,866 2.15% 25/1/2023 117,210 0.01%Microsoft Corp. 95,000 4.10% 6/2/2037 117,178 0.01%Travelers Cos, Inc. 100,000 3.75% 15/5/2046 117,118 0.01%Oncor Electric Delivery Co. LLC 100,000 3.70% 15/5/2050 116,973 0.01%Wells Fargo Commercial Mortgage Trust 2018 100,000 4.44% 15/9/2061 116,930 0.01%CommonSpirit Health 100,000 4.35% 1/11/2042 116,867 0.01%Martin Marietta Materials, Inc. 100,000 4.25% 15/12/2047 116,829 0.01%Public Service Co. of Colorado 100,000 3.80% 15/6/2047 116,811 0.01%Toledo Hospital 100,000 5.33% 15/11/2028 116,650 0.01%Apple, Inc. 125,000 2.55% 20/8/2060 116,570 0.01%
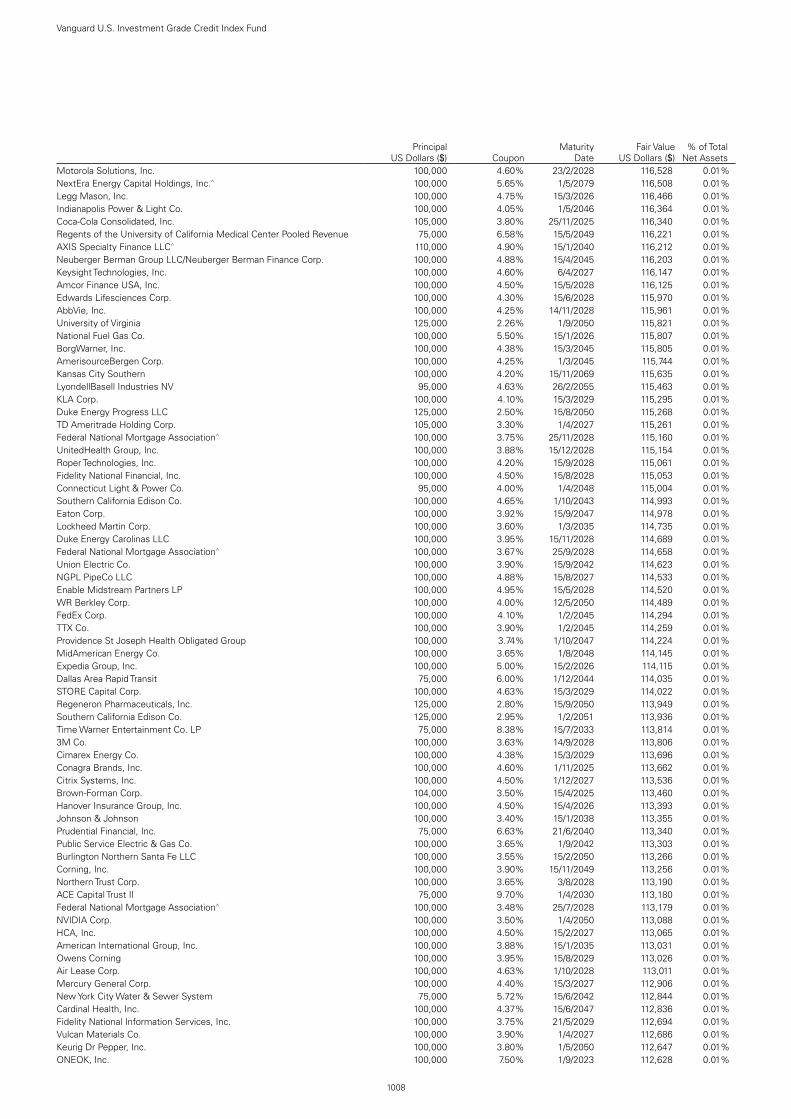
1008
Vanguard U.S. Investment Grade Credit Index Fund
Principal
US Dollars ($) CouponMaturity
DateFair Value
US Dollars ($)% of Total
Net AssetsMotorola Solutions, Inc. 100,000 4.60% 23/2/2028 116,528 0.01%NextEra Energy Capital Holdings, Inc.^ 100,000 5.65% 1/5/2079 116,508 0.01%Legg Mason, Inc. 100,000 4.75% 15/3/2026 116,466 0.01%Indianapolis Power & Light Co. 100,000 4.05% 1/5/2046 116,364 0.01%Coca-Cola Consolidated, Inc. 105,000 3.80% 25/11/2025 116,340 0.01%Regents of the University of California Medical Center Pooled Revenue 75,000 6.58% 15/5/2049 116,221 0.01%AXIS Specialty Finance LLC^ 110,000 4.90% 15/1/2040 116,212 0.01%Neuberger Berman Group LLC/Neuberger Berman Finance Corp. 100,000 4.88% 15/4/2045 116,203 0.01%Keysight Technologies, Inc. 100,000 4.60% 6/4/2027 116,147 0.01%Amcor Finance USA, Inc. 100,000 4.50% 15/5/2028 116,125 0.01%Edwards Lifesciences Corp. 100,000 4.30% 15/6/2028 115,970 0.01%AbbVie, Inc. 100,000 4.25% 14/11/2028 115,961 0.01%University of Virginia 125,000 2.26% 1/9/2050 115,821 0.01%National Fuel Gas Co. 100,000 5.50% 15/1/2026 115,807 0.01%BorgWarner, Inc. 100,000 4.38% 15/3/2045 115,805 0.01%AmerisourceBergen Corp. 100,000 4.25% 1/3/2045 115,744 0.01%Kansas City Southern 100,000 4.20% 15/11/2069 115,635 0.01%LyondellBasell Industries NV 95,000 4.63% 26/2/2055 115,463 0.01%KLA Corp. 100,000 4.10% 15/3/2029 115,295 0.01%Duke Energy Progress LLC 125,000 2.50% 15/8/2050 115,268 0.01%TD Ameritrade Holding Corp. 105,000 3.30% 1/4/2027 115,261 0.01%Federal National Mortgage Association^ 100,000 3.75% 25/11/2028 115,160 0.01%UnitedHealth Group, Inc. 100,000 3.88% 15/12/2028 115,154 0.01%Roper Technologies, Inc. 100,000 4.20% 15/9/2028 115,061 0.01%Fidelity National Financial, Inc. 100,000 4.50% 15/8/2028 115,053 0.01%Connecticut Light & Power Co. 95,000 4.00% 1/4/2048 115,004 0.01%Southern California Edison Co. 100,000 4.65% 1/10/2043 114,993 0.01%Eaton Corp. 100,000 3.92% 15/9/2047 114,978 0.01%Lockheed Martin Corp. 100,000 3.60% 1/3/2035 114,735 0.01%Duke Energy Carolinas LLC 100,000 3.95% 15/11/2028 114,689 0.01%Federal National Mortgage Association^ 100,000 3.67% 25/9/2028 114,658 0.01%Union Electric Co. 100,000 3.90% 15/9/2042 114,623 0.01%NGPL PipeCo LLC 100,000 4.88% 15/8/2027 114,533 0.01%Enable Midstream Partners LP 100,000 4.95% 15/5/2028 114,520 0.01%WR Berkley Corp. 100,000 4.00% 12/5/2050 114,489 0.01%FedEx Corp. 100,000 4.10% 1/2/2045 114,294 0.01%TTX Co. 100,000 3.90% 1/2/2045 114,259 0.01%Providence St Joseph Health Obligated Group 100,000 3.74% 1/10/2047 114,224 0.01%MidAmerican Energy Co. 100,000 3.65% 1/8/2048 114,145 0.01%Expedia Group, Inc. 100,000 5.00% 15/2/2026 114,115 0.01%Dallas Area Rapid Transit 75,000 6.00% 1/12/2044 114,035 0.01%STORE Capital Corp. 100,000 4.63% 15/3/2029 114,022 0.01%Regeneron Pharmaceuticals, Inc. 125,000 2.80% 15/9/2050 113,949 0.01%Southern California Edison Co. 125,000 2.95% 1/2/2051 113,936 0.01%Time Warner Entertainment Co. LP 75,000 8.38% 15/7/2033 113,814 0.01%3M Co. 100,000 3.63% 14/9/2028 113,806 0.01%Cimarex Energy Co. 100,000 4.38% 15/3/2029 113,696 0.01%Conagra Brands, Inc. 100,000 4.60% 1/11/2025 113,662 0.01%Citrix Systems, Inc. 100,000 4.50% 1/12/2027 113,536 0.01%Brown-Forman Corp. 104,000 3.50% 15/4/2025 113,460 0.01%Hanover Insurance Group, Inc. 100,000 4.50% 15/4/2026 113,393 0.01%Johnson & Johnson 100,000 3.40% 15/1/2038 113,355 0.01%Prudential Financial, Inc. 75,000 6.63% 21/6/2040 113,340 0.01%Public Service Electric & Gas Co. 100,000 3.65% 1/9/2042 113,303 0.01%Burlington Northern Santa Fe LLC 100,000 3.55% 15/2/2050 113,266 0.01%Corning, Inc. 100,000 3.90% 15/11/2049 113,256 0.01%Northern Trust Corp. 100,000 3.65% 3/8/2028 113,190 0.01%ACE Capital Trust II 75,000 9.70% 1/4/2030 113,180 0.01%Federal National Mortgage Association^ 100,000 3.48% 25/7/2028 113,179 0.01%NVIDIA Corp. 100,000 3.50% 1/4/2050 113,088 0.01%HCA, Inc. 100,000 4.50% 15/2/2027 113,065 0.01%American International Group, Inc. 100,000 3.88% 15/1/2035 113,031 0.01%Owens Corning 100,000 3.95% 15/8/2029 113,026 0.01%Air Lease Corp. 100,000 4.63% 1/10/2028 113,011 0.01%Mercury General Corp. 100,000 4.40% 15/3/2027 112,906 0.01%New York City Water & Sewer System 75,000 5.72% 15/6/2042 112,844 0.01%Cardinal Health, Inc. 100,000 4.37% 15/6/2047 112,836 0.01%Fidelity National Information Services, Inc. 100,000 3.75% 21/5/2029 112,694 0.01%Vulcan Materials Co. 100,000 3.90% 1/4/2027 112,686 0.01%Keurig Dr Pepper, Inc. 100,000 3.80% 1/5/2050 112,647 0.01%ONEOK, Inc. 100,000 7.50% 1/9/2023 112,628 0.01%

1009
Vanguard U.S. Investment Grade Credit Index Fund
Principal
US Dollars ($) CouponMaturity
DateFair Value
US Dollars ($)% of Total
Net AssetsSouthern California Gas Co. 100,000 3.75% 15/9/2042 112,528 0.01%CenterPoint Energy Houston Electric LLC 100,000 3.55% 1/8/2042 112,516 0.01%County of Riverside CA 100,000 3.82% 15/2/2038 112,460 0.01%Cummins, Inc. 85,000 4.88% 1/10/2043 112,388 0.01%Plains All American Pipeline LP/PAA Finance Corp. 100,000 4.50% 15/12/2026 112,347 0.01%Verisk Analytics, Inc. 105,000 3.63% 15/5/2050 112,330 0.01%United Parcel Service, Inc. 100,000 3.40% 15/3/2029 112,322 0.01%Federal National Mortgage Association^ 100,000 3.28% 25/4/2029 112,230 0.01%General Motors Financial Co., Inc. 103,000 4.00% 15/1/2025 112,220 0.01%NextEra Energy Capital Holdings, Inc.^ 100,000 4.80% 1/12/2077 112,177 0.01%County of Miami-Dade FL Aviation Revenue 100,000 4.28% 1/10/2041 112,169 0.01%Toyota Motor Credit Corp. 100,000 3.38% 1/4/2030 112,143 0.01%Sempra Energy 100,000 4.00% 1/2/2048 112,138 0.01%Massachusetts Electric Co. 100,000 4.00% 15/8/2046 112,133 0.01%United Parcel Service, Inc. 100,000 3.40% 1/9/2049 112,123 0.01%Humana, Inc. 100,000 3.95% 15/3/2027 112,097 0.01%Lam Research Corp. 100,000 3.75% 15/3/2026 112,041 0.01%Arrow Electronics, Inc. 100,000 3.88% 12/1/2028 112,013 0.01%Healthpeak Properties, Inc. 75,000 6.75% 1/2/2041 111,992 0.01%Simon Property Group LP 75,000 6.75% 1/2/2040 111,956 0.01%Cintas Corp. No 2 100,000 3.70% 1/4/2027 111,936 0.01%Goldman Sachs Group, Inc. 100,000 4.25% 21/10/2025 111,882 0.01%Assured Guaranty US Holdings, Inc. 100,000 5.00% 1/7/2024 111,872 0.01%Jefferies Financial Group, Inc. 104,000 5.50% 18/10/2023 111,827 0.01%Life Storage LP 100,000 3.88% 15/12/2027 111,763 0.01%Old Republic International Corp. 100,000 4.88% 1/10/2024 111,720 0.01%UBS Commercial Mortgage Trust 2017^ 100,000 4.06% 15/12/2050 111,680 0.01%Mayo Clinic 90,000 4.00% 15/11/2047 111,657 0.01%Level 3 Financing, Inc. 105,000 3.40% 1/3/2027 111,623 0.01%Abbott Laboratories 100,000 3.88% 15/9/2025 111,593 0.01%Altria Group, Inc. 86,000 6.20% 14/2/2059 111,472 0.01%Cboe Global Markets, Inc. 100,000 3.65% 12/1/2027 111,462 0.01%Nasdaq, Inc. 100,000 3.85% 30/6/2026 111,388 0.01%Keysight Technologies, Inc. 100,000 4.55% 30/10/2024 111,383 0.01%Reinsurance Group of America, Inc. 100,000 3.95% 15/9/2026 111,331 0.01%State of Wisconsin 100,000 3.95% 1/5/2036 111,326 0.01%Constellation Brands, Inc. 100,000 3.70% 6/12/2026 111,236 0.01%PartnerRe Finance B LLC 100,000 3.70% 2/7/2029 111,222 0.01%Jabil, Inc. 100,000 3.95% 12/1/2028 111,193 0.01%Digital Realty Trust LP 100,000 3.60% 1/7/2029 111,181 0.01%American Campus Communities Operating Partnership LP 100,000 3.88% 30/1/2031 111,176 0.01%Enterprise Products Operating LLC 100,000 3.95% 31/1/2060 111,172 0.01%Marsh & McLennan Cos, Inc. 100,000 3.75% 14/3/2026 111,150 0.01%International Paper Co. 100,000 3.80% 15/1/2026 111,141 0.01%Federal National Mortgage Association 100,000 2.98% 25/8/2029 111,027 0.01%Florida Gas Transmission Co. LLC 100,000 4.35% 15/7/2025 111,025 0.01%Union Pacific Corp. 100,000 3.75% 15/7/2025 111,017 0.01%Starbucks Corp. 100,000 3.75% 1/12/2047 110,977 0.01%Arch Capital Group Ltd. 75,000 7.35% 1/5/2034 110,956 0.01%Consolidated Edison Co. of New York, Inc. 100,000 3.85% 15/6/2046 110,956 0.01%PepsiCo, Inc. 85,000 4.60% 17/7/2045 110,917 0.01%Duke Energy Carolinas LLC 100,000 3.45% 15/4/2051 110,900 0.01%Brooklyn Union Gas Co. 100,000 3.87% 4/3/2029 110,877 0.01%Metropolitan Life Global Funding I 100,000 3.45% 18/12/2026 110,871 0.01%Metropolitan Washington Airports Authority Dulles Toll Road Revenue 65,000 7.46% 1/10/2046 110,870 0.01%Chevron USA, Inc. 100,000 3.25% 15/10/2029 110,853 0.01%Morgan Stanley Bank of America Merrill Lynch Trust 2017 100,000 3.54% 15/11/2052 110,818 0.01%Analog Devices, Inc. 100,000 3.50% 5/12/2026 110,812 0.01%Duke Energy Progress LLC 100,000 3.45% 15/3/2029 110,807 0.01%Invesco Finance plc 100,000 3.75% 15/1/2026 110,753 0.01%Kimco Realty Corp. 100,000 3.80% 1/4/2027 110,720 0.01%Northern States Power Co. 100,000 3.40% 15/8/2042 110,680 0.01%Harman International Industries, Inc. 100,000 4.15% 15/5/2025 110,616 0.01%Federal Home Loan Mortgage Corp. 100,000 3.22% 25/3/2027 110,592 0.01%ERP Operating LP 100,000 3.50% 1/3/2028 110,569 0.01%Abbott Laboratories 75,000 6.15% 30/11/2037 110,498 0.01%Eastman Chemical Co. 90,000 4.80% 1/9/2042 110,465 0.01%John Deere Capital Corp. 100,000 3.40% 11/9/2025 110,417 0.01%Applied Materials, Inc. 75,000 5.85% 15/6/2041 110,414 0.01%Massachusetts Institute of Technology 90,000 3.89% 1/7/2116 110,326 0.01%JPMDB Commercial Mortgage Securities Trust 2017 100,000 3.41% 15/10/2050 110,267 0.01%
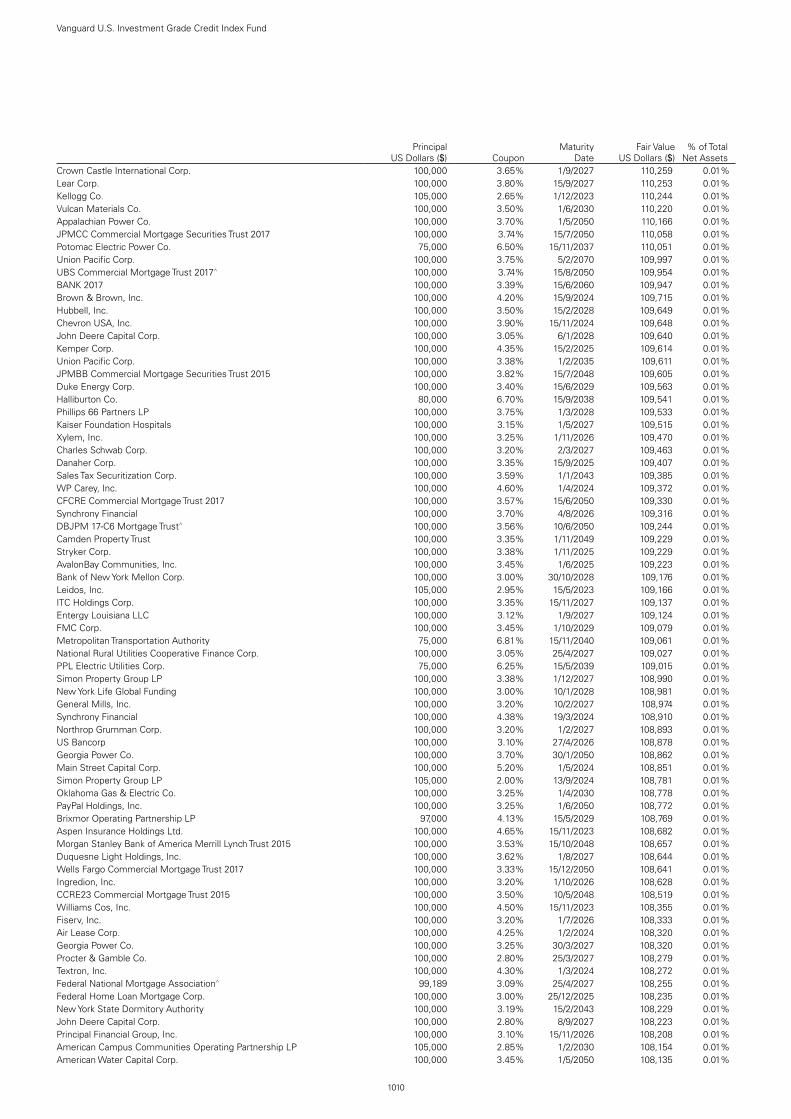
1010
Vanguard U.S. Investment Grade Credit Index Fund
Principal
US Dollars ($) CouponMaturity
DateFair Value
US Dollars ($)% of Total
Net AssetsCrown Castle International Corp. 100,000 3.65% 1/9/2027 110,259 0.01%Lear Corp. 100,000 3.80% 15/9/2027 110,253 0.01%Kellogg Co. 105,000 2.65% 1/12/2023 110,244 0.01%Vulcan Materials Co. 100,000 3.50% 1/6/2030 110,220 0.01%Appalachian Power Co. 100,000 3.70% 1/5/2050 110,166 0.01%JPMCC Commercial Mortgage Securities Trust 2017 100,000 3.74% 15/7/2050 110,058 0.01%Potomac Electric Power Co. 75,000 6.50% 15/11/2037 110,051 0.01%Union Pacific Corp. 100,000 3.75% 5/2/2070 109,997 0.01%UBS Commercial Mortgage Trust 2017^ 100,000 3.74% 15/8/2050 109,954 0.01%BANK 2017 100,000 3.39% 15/6/2060 109,947 0.01%Brown & Brown, Inc. 100,000 4.20% 15/9/2024 109,715 0.01%Hubbell, Inc. 100,000 3.50% 15/2/2028 109,649 0.01%Chevron USA, Inc. 100,000 3.90% 15/11/2024 109,648 0.01%John Deere Capital Corp. 100,000 3.05% 6/1/2028 109,640 0.01%Kemper Corp. 100,000 4.35% 15/2/2025 109,614 0.01%Union Pacific Corp. 100,000 3.38% 1/2/2035 109,611 0.01%JPMBB Commercial Mortgage Securities Trust 2015 100,000 3.82% 15/7/2048 109,605 0.01%Duke Energy Corp. 100,000 3.40% 15/6/2029 109,563 0.01%Halliburton Co. 80,000 6.70% 15/9/2038 109,541 0.01%Phillips 66 Partners LP 100,000 3.75% 1/3/2028 109,533 0.01%Kaiser Foundation Hospitals 100,000 3.15% 1/5/2027 109,515 0.01%Xylem, Inc. 100,000 3.25% 1/11/2026 109,470 0.01%Charles Schwab Corp. 100,000 3.20% 2/3/2027 109,463 0.01%Danaher Corp. 100,000 3.35% 15/9/2025 109,407 0.01%Sales Tax Securitization Corp. 100,000 3.59% 1/1/2043 109,385 0.01%WP Carey, Inc. 100,000 4.60% 1/4/2024 109,372 0.01%CFCRE Commercial Mortgage Trust 2017 100,000 3.57% 15/6/2050 109,330 0.01%Synchrony Financial 100,000 3.70% 4/8/2026 109,316 0.01%DBJPM 17-C6 Mortgage Trust^ 100,000 3.56% 10/6/2050 109,244 0.01%Camden Property Trust 100,000 3.35% 1/11/2049 109,229 0.01%Stryker Corp. 100,000 3.38% 1/11/2025 109,229 0.01%AvalonBay Communities, Inc. 100,000 3.45% 1/6/2025 109,223 0.01%Bank of New York Mellon Corp. 100,000 3.00% 30/10/2028 109,176 0.01%Leidos, Inc. 105,000 2.95% 15/5/2023 109,166 0.01%ITC Holdings Corp. 100,000 3.35% 15/11/2027 109,137 0.01%Entergy Louisiana LLC 100,000 3.12% 1/9/2027 109,124 0.01%FMC Corp. 100,000 3.45% 1/10/2029 109,079 0.01%Metropolitan Transportation Authority 75,000 6.81% 15/11/2040 109,061 0.01%National Rural Utilities Cooperative Finance Corp. 100,000 3.05% 25/4/2027 109,027 0.01%PPL Electric Utilities Corp. 75,000 6.25% 15/5/2039 109,015 0.01%Simon Property Group LP 100,000 3.38% 1/12/2027 108,990 0.01%New York Life Global Funding 100,000 3.00% 10/1/2028 108,981 0.01%General Mills, Inc. 100,000 3.20% 10/2/2027 108,974 0.01%Synchrony Financial 100,000 4.38% 19/3/2024 108,910 0.01%Northrop Grumman Corp. 100,000 3.20% 1/2/2027 108,893 0.01%US Bancorp 100,000 3.10% 27/4/2026 108,878 0.01%Georgia Power Co. 100,000 3.70% 30/1/2050 108,862 0.01%Main Street Capital Corp. 100,000 5.20% 1/5/2024 108,851 0.01%Simon Property Group LP 105,000 2.00% 13/9/2024 108,781 0.01%Oklahoma Gas & Electric Co. 100,000 3.25% 1/4/2030 108,778 0.01%PayPal Holdings, Inc. 100,000 3.25% 1/6/2050 108,772 0.01%Brixmor Operating Partnership LP 97,000 4.13% 15/5/2029 108,769 0.01%Aspen Insurance Holdings Ltd. 100,000 4.65% 15/11/2023 108,682 0.01%Morgan Stanley Bank of America Merrill Lynch Trust 2015 100,000 3.53% 15/10/2048 108,657 0.01%Duquesne Light Holdings, Inc. 100,000 3.62% 1/8/2027 108,644 0.01%Wells Fargo Commercial Mortgage Trust 2017 100,000 3.33% 15/12/2050 108,641 0.01%Ingredion, Inc. 100,000 3.20% 1/10/2026 108,628 0.01%CCRE23 Commercial Mortgage Trust 2015 100,000 3.50% 10/5/2048 108,519 0.01%Williams Cos, Inc. 100,000 4.50% 15/11/2023 108,355 0.01%Fiserv, Inc. 100,000 3.20% 1/7/2026 108,333 0.01%Air Lease Corp. 100,000 4.25% 1/2/2024 108,320 0.01%Georgia Power Co. 100,000 3.25% 30/3/2027 108,320 0.01%Procter & Gamble Co. 100,000 2.80% 25/3/2027 108,279 0.01%Textron, Inc. 100,000 4.30% 1/3/2024 108,272 0.01%Federal National Mortgage Association^ 99,189 3.09% 25/4/2027 108,255 0.01%Federal Home Loan Mortgage Corp. 100,000 3.00% 25/12/2025 108,235 0.01%New York State Dormitory Authority 100,000 3.19% 15/2/2043 108,229 0.01%John Deere Capital Corp. 100,000 2.80% 8/9/2027 108,223 0.01%Principal Financial Group, Inc. 100,000 3.10% 15/11/2026 108,208 0.01%American Campus Communities Operating Partnership LP 105,000 2.85% 1/2/2030 108,154 0.01%American Water Capital Corp. 100,000 3.45% 1/5/2050 108,135 0.01%

1011
Vanguard U.S. Investment Grade Credit Index Fund
Principal
US Dollars ($) CouponMaturity
DateFair Value
US Dollars ($)% of Total
Net AssetsVisa, Inc. 100,000 2.75% 15/9/2027 108,130 0.01%Atmos Energy Corp. 100,000 3.00% 15/6/2027 108,125 0.01%Morgan Stanley Capital I Trust 2016 100,000 3.33% 15/3/2049 108,045 0.01%State of Illinois 101,818 4.95% 1/6/2023 108,040 0.01%Simon Property Group LP 105,000 2.45% 13/9/2029 108,026 0.01%Caterpillar, Inc. 75,000 6.05% 15/8/2036 108,024 0.01%Entergy Gulf States Louisiana LLC 94,000 5.59% 1/10/2024 108,020 0.01%American Water Capital Corp. 100,000 2.95% 1/9/2027 108,008 0.01%Caterpillar Financial Services Corp. 100,000 3.75% 24/11/2023 107,975 0.01%Thermo Fisher Scientific, Inc. 100,000 2.95% 19/9/2026 107,967 0.01%Estee Lauder Cos, Inc. 75,000 6.00% 15/5/2037 107,886 0.01%Affiliated Managers Group, Inc. 100,000 3.30% 15/6/2030 107,880 0.01%Transcontinental Gas Pipe Line Co. LLC 100,000 3.25% 15/5/2030 107,817 0.01%American Financial Group, Inc. 90,000 4.50% 15/6/2047 107,749 0.01%Intercontinental Exchange, Inc. 100,000 4.00% 15/10/2023 107,724 0.01%Wells Fargo Commercial Mortgage Trust 2014 100,000 3.41% 15/12/2047 107,705 0.01%Westlake Chemical Corp. 100,000 3.38% 15/6/2030 107,693 0.01%ViacomCBS, Inc. 75,000 6.88% 30/4/2036 107,657 0.01%Simon Property Group LP 100,000 3.38% 1/10/2024 107,652 0.01%Equifax, Inc. 100,000 3.10% 15/5/2030 107,623 0.01%Citibank NA 100,000 3.65% 23/1/2024 107,617 0.01%Air Products & Chemicals, Inc. 100,000 3.35% 31/7/2024 107,561 0.01%Westinghouse Air Brake Technologies Corp. 100,000 3.45% 15/11/2026 107,515 0.01%JP Morgan Chase Commercial Mortgage Securities Trust 2014 100,000 3.80% 15/7/2047 107,498 0.01%Federal National Mortgage Association 100,000 2.44% 25/10/2029 107,466 0.01%Arizona Public Service Co. 100,000 3.15% 15/5/2025 107,443 0.01%Entergy Texas, Inc. 100,000 3.55% 30/9/2049 107,429 0.01%Crown Castle International Corp. 100,000 3.30% 1/7/2030 107,408 0.01%Johnson & Johnson1 100,000 3.38% 5/12/2023 107,406 0.01%Kinder Morgan, Inc. 75,000 7.80% 1/8/2031 107,353 0.01%Air Lease Corp. 100,000 3.38% 1/7/2025 107,352 0.01%Prologis LP 103,000 2.13% 15/4/2027 107,345 0.01%Cigna Corp. 100,000 3.50% 15/6/2024 107,291 0.01%Honeywell International, Inc. 100,000 2.70% 15/8/2029 107,289 0.01%Alabama Power Co. 100,000 3.55% 1/12/2023 107,272 0.01%American Express Co. 100,000 3.00% 30/10/2024 107,249 0.01%Trane Technologies Global Holding Co., Ltd. 100,000 4.25% 15/6/2023 107,242 0.01%Morgan Stanley Bank of America Merrill Lynch Trust 2015 100,000 3.31% 15/4/2048 107,237 0.01%Public Service Electric & Gas Co. 100,000 3.00% 15/5/2025 107,223 0.01%Plains All American Pipeline LP/PAA Finance Corp. 100,000 3.60% 1/11/2024 107,211 0.01%Simon Property Group LP 100,000 3.75% 1/2/2024 107,204 0.01%University of Southern California 100,000 3.03% 1/10/2039 107,203 0.01%Boston Gas Co. 100,000 3.15% 1/8/2027 107,201 0.01%HP, Inc. 100,000 3.40% 17/6/2030 107,145 0.01%Tyson Foods, Inc. 100,000 3.90% 28/9/2023 107,144 0.01%Timken Co. 100,000 3.88% 1/9/2024 107,125 0.01%Ameriprise Financial, Inc. 100,000 3.00% 2/4/2025 107,114 0.01%Lowe's Cos, Inc. 100,000 3.13% 15/9/2024 107,112 0.01%Kinder Morgan Energy Partners LP 75,000 6.95% 15/1/2038 107,111 0.01%CubeSmart LP 100,000 3.13% 1/9/2026 107,099 0.01%NetApp, Inc. 100,000 3.30% 29/9/2024 107,086 0.01%Ally Financial, Inc. 95,000 5.13% 30/9/2024 107,085 0.01%Athene Holding Ltd. 100,000 3.95% 25/5/2051 107,059 0.01%Laboratory Corp. of America Holdings 100,000 3.25% 1/9/2024 107,048 0.01%JPMBB Commercial Mortgage Securities Trust 2015 100,000 3.23% 15/10/2048 107,033 0.01%Unum Group 100,000 4.50% 15/12/2049 107,031 0.01%City of San Antonio TX Electric & Gas Systems Revenue 75,000 5.99% 1/2/2039 107,028 0.01%People's United Bank NA 100,000 4.00% 15/7/2024 107,005 0.01%ERP Operating LP 100,000 2.85% 1/11/2026 106,968 0.01%Progress Energy, Inc. 75,000 7.75% 1/3/2031 106,965 0.01%Federal National Mortgage Association^ 100,000 2.92% 25/10/2025 106,939 0.01%Federal National Mortgage Association^ 101,010 3.33% 25/10/2023 106,919 0.01%General Dynamics Corp. 100,000 2.63% 15/11/2027 106,853 0.01%Kilroy Realty LP 100,000 3.45% 15/12/2024 106,828 0.01%Citigroup Commercial Mortgage Trust 2016 100,000 3.35% 10/2/2049 106,746 0.01%Interstate Power & Light Co. 75,000 6.25% 15/7/2039 106,741 0.01%Caterpillar, Inc. 100,000 2.60% 9/4/2030 106,733 0.01%McCormick & Co., Inc. 100,000 3.15% 15/8/2024 106,661 0.01%Johnson Controls International plc 85,000 4.50% 15/2/2047 106,624 0.01%Federal Realty Investment Trust 90,000 4.50% 1/12/2044 106,591 0.01%Honeywell International, Inc. 100,000 2.50% 1/11/2026 106,564 0.01%

1012
Vanguard U.S. Investment Grade Credit Index Fund
Principal
US Dollars ($) CouponMaturity
DateFair Value
US Dollars ($)% of Total
Net AssetsAir Lease Corp. 100,000 3.25% 1/3/2025 106,556 0.01%Citigroup, Inc.^ 100,000 4.04% 1/6/2024 106,554 0.01%Cameron LNG LLC 100,000 2.90% 15/7/2031 106,536 0.01%Nucor Corp. 100,000 4.00% 1/8/2023 106,494 0.01%Johnson & Johnson 100,000 2.63% 15/1/2025 106,470 0.01%Pfizer, Inc. 100,000 2.95% 15/3/2024 106,379 0.01%Federal National Mortgage Association^ 100,000 2.56% 25/12/2026 106,367 0.01%Hasbro, Inc. 100,000 3.00% 19/11/2024 106,365 0.01%National Rural Utilities Cooperative Finance Corp. 100,000 2.85% 27/1/2025 106,323 0.01%United Parcel Service, Inc. 100,000 2.50% 1/9/2029 106,314 0.01%San Diego Gas & Electric Co. 100,000 3.32% 15/4/2050 106,300 0.01%Federal National Mortgage Association^ 98,523 2.89% 25/2/2027 106,297 0.01%State Street Corp.^ 100,000 3.03% 1/11/2034 106,255 0.01%Midwest Connector Capital Co. LLC 100,000 4.63% 1/4/2029 106,253 0.01%Salt River Project Agricultural Improvement & Power District 80,000 4.84% 1/1/2041 106,220 0.01%Discover Bank^ 100,000 4.68% 9/8/2028 106,198 0.01%New Jersey Transportation Trust Fund Authority 90,000 5.75% 15/12/2028 106,151 0.01%Air Lease Corp. 100,000 3.88% 3/7/2023 106,122 0.01%Agilent Technologies, Inc. 100,000 3.88% 15/7/2023 106,112 0.01%PSEG Power LLC 100,000 3.85% 1/6/2023 106,104 0.01%Teachers Insurance & Annuity Association of America^ 100,000 4.38% 15/9/2054 106,076 0.01%NYU Langone Hospitals 75,000 5.75% 1/7/2043 106,049 0.01%Banner Health 100,000 3.18% 1/1/2050 106,033 0.01%John Deere Capital Corp. 100,000 3.45% 7/6/2023 105,985 0.01%Federal National Mortgage Association^ 99,769 2.57% 25/9/2026 105,889 0.01%Eaton Vance Corp. 100,000 3.63% 15/6/2023 105,863 0.01%New York Life Global Funding 100,000 2.90% 17/1/2024 105,861 0.01%Analog Devices, Inc. 100,000 3.13% 5/12/2023 105,847 0.01%Wells Fargo Commercial Mortgage Trust 2016 100,000 2.65% 15/8/2049 105,840 0.01%Northrop Grumman Corp. 100,000 3.25% 1/8/2023 105,802 0.01%Bank of America Corp.^ 100,000 3.31% 22/4/2042 105,764 0.01%Assurant, Inc. 100,000 4.00% 15/3/2023 105,760 0.01%Cargill, Inc. 100,000 3.13% 25/5/2051 105,744 0.01%Berkshire Hathaway Energy Co. 75,000 6.13% 1/4/2036 105,684 0.01%State of California 90,000 4.60% 1/4/2038 105,603 0.01%Dallas Area Rapid Transit 75,000 5.02% 1/12/2048 105,591 0.01%Boeing Co. 100,000 3.25% 1/3/2028 105,497 0.01%Federal National Mortgage Association 100,000 2.21% 25/1/2030 105,468 0.01%Plains All American Pipeline LP/PAA Finance Corp. 100,000 3.55% 15/12/2029 105,468 0.01%Wilton Re Finance LLC^ 100,000 5.88% 30/3/2033 105,449 0.01%Enterprise Products Operating LLC 75,000 6.65% 15/10/2034 105,435 0.01%Cameron LNG LLC 100,000 3.40% 15/1/2038 105,424 0.01%Rady Children's Hospital-San Diego 100,000 3.15% 15/8/2051 105,413 0.01%Parker-Hannifin Corp. 100,000 2.70% 14/6/2024 105,410 0.01%Puget Sound Energy, Inc. 75,000 6.27% 15/3/2037 105,399 0.01%Comcast Corp. 85,000 4.50% 15/1/2043 105,350 0.01%Federal National Mortgage Association 100,000 2.29% 25/6/2026 105,291 0.01%Commonwealth of Massachusetts Transportation Fund Revenue 75,000 5.73% 1/6/2040 105,286 0.01%Citrix Systems, Inc. 100,000 3.30% 1/3/2030 105,261 0.01%Global Payments, Inc. 100,000 3.75% 1/6/2023 105,241 0.01%American Tower Corp. 100,000 2.90% 15/1/2030 105,128 0.01%SSM Health Care Corp. 100,000 3.69% 1/6/2023 105,102 0.01%Honeywell International, Inc. 100,000 2.30% 15/8/2024 105,020 0.01%Freddie Mac Multifamily Structured Pass Through Certificates^ 100,000 3.06% 25/11/2023 104,961 0.01%Duke Energy Florida LLC 100,000 2.50% 1/12/2029 104,944 0.01%CVS Health Corp. 100,000 4.75% 1/12/2022 104,915 0.01%Merck & Co., Inc. 85,000 4.15% 18/5/2043 104,910 0.01%American Campus Communities Operating Partnership LP 100,000 3.75% 15/4/2023 104,883 0.01%Arthur J Gallagher & Co. 100,000 3.50% 20/5/2051 104,857 0.01%Raytheon Technologies Corp. 75,000 6.05% 1/6/2036 104,847 0.01%Cargill, Inc.1 100,000 3.25% 1/3/2023 104,794 0.01%Becton Dickinson & Co. 100,000 2.82% 20/5/2030 104,729 0.01%Equitable Holdings, Inc. 99,000 3.90% 20/4/2023 104,720 0.01%WFRBS Commercial Mortgage Trust 2013 100,000 3.34% 15/6/2046 104,693 0.01%Monongahela Power Co. 80,000 5.40% 15/12/2043 104,679 0.01%AutoZone, Inc. 100,000 3.13% 15/7/2023 104,669 0.01%Shire Acquisitions Investments Ireland DAC 100,000 2.88% 23/9/2023 104,652 0.01%Black Hills Corp. 95,000 3.95% 15/1/2026 104,613 0.01%Estee Lauder Cos, Inc. 100,000 2.00% 1/12/2024 104,531 0.01%AT&T, Inc. 100,000 3.65% 1/6/2051 104,509 0.01%Estee Lauder Cos, Inc. 100,000 2.38% 1/12/2029 104,468 0.01%

1013
Vanguard U.S. Investment Grade Credit Index Fund
Principal
US Dollars ($) CouponMaturity
DateFair Value
US Dollars ($)% of Total
Net AssetsKinder Morgan Energy Partners LP 75,000 6.50% 1/9/2039 104,442 0.01%Merck & Co., Inc. 98,000 2.75% 10/2/2025 104,416 0.01%Mohawk Industries, Inc. 100,000 3.85% 1/2/2023 104,404 0.01%Citigroup Commercial Mortgage Trust 2016 100,000 2.65% 10/7/2049 104,370 0.01%New Jersey Transportation Trust Fund Authority 70,000 6.56% 15/12/2040 104,329 0.01%BP Capital Markets America, Inc. 100,000 2.94% 6/4/2023 104,302 0.01%Duke University 100,000 2.83% 1/10/2055 104,223 0.01%Kinder Morgan Energy Partners LP 75,000 7.40% 15/3/2031 104,205 0.01%McDonald's Corp. 85,000 4.45% 1/3/2047 104,201 0.01%Regions Financial Corp. 100,000 2.25% 18/5/2025 104,187 0.01%OhioHealth Corp. 100,000 3.04% 15/11/2050 104,140 0.01%CSX Corp. 75,000 6.00% 1/10/2036 104,087 0.01%Aetna, Inc. 100,000 2.80% 15/6/2023 104,084 0.01%New York City Water & Sewer System 70,000 5.75% 15/6/2041 103,993 0.01%Virginia Electric & Power Co. 75,000 6.00% 15/1/2036 103,988 0.01%UBS-Barclays Commercial Mortgage Trust 2013 100,000 3.24% 10/4/2046 103,978 0.01%Jefferies Group LLC 75,000 6.50% 20/1/2043 103,922 0.01%Dallas Independent School District 100,000 6.45% 15/2/2035 103,912 0.01%Puget Energy, Inc. 100,000 5.63% 15/7/2022 103,907 0.01%Citigroup, Inc. 100,000 4.05% 30/7/2022 103,892 0.01%Indiana Michigan Power Co. 75,000 6.05% 15/3/2037 103,873 0.01%Citigroup Commercial Mortgage Trust 2013 100,000 3.42% 10/4/2046 103,866 0.01%PPG Industries, Inc. 100,000 2.55% 15/6/2030 103,865 0.01%PeaceHealth Obligated Group 100,000 3.22% 15/11/2050 103,836 0.01%PECO Energy Co. 100,000 3.00% 15/9/2049 103,777 0.01%Tennessee Gas Pipeline Co. LLC 100,000 2.90% 1/3/2030 103,770 0.01%CCRE2 Commercial Mortgage Trust 2012 101,000 3.79% 15/8/2045 103,766 0.01%Wells Fargo & Co.^ 100,000 2.39% 2/6/2028 103,692 0.01%Mylan, Inc. 100,000 3.13% 15/1/2023 103,659 0.01%People's United Financial, Inc. 100,000 3.65% 6/12/2022 103,511 0.01%Republic Services, Inc. 75,000 5.70% 15/5/2041 103,478 0.01%Waste Management, Inc. 100,000 2.40% 15/5/2023 103,476 0.01%Equifax, Inc. 100,000 3.30% 15/12/2022 103,430 0.01%Duke Energy Corp. 100,000 3.50% 15/6/2051 103,391 0.01%Puget Sound Energy, Inc. 75,000 5.64% 15/4/2041 103,359 0.01%Morgan Stanley Bank of America Merrill Lynch Trust 2013 100,000 3.13% 15/12/2048 103,301 0.01%Mount Sinai Hospitals Group, Inc. 100,000 3.39% 1/7/2050 103,297 0.01%NVR, Inc. 100,000 3.95% 15/9/2022 103,273 0.01%UBS-Barclays Commercial Mortgage Trust 2013 100,000 3.18% 10/3/2046 103,197 0.01%Caterpillar Financial Services Corp. 100,000 2.55% 29/11/2022 103,184 0.01%Boston Scientific Corp. 100,000 1.90% 1/6/2025 103,183 0.01%Regents of the University of California Medical Center Pooled Revenue 100,000 3.01% 15/5/2050 103,145 0.01%NIKE, Inc. 100,000 2.25% 1/5/2023 103,083 0.01%Piedmont Natural Gas Co., Inc. 100,000 3.35% 1/6/2050 103,074 0.01%Camden Property Trust 100,000 2.95% 15/12/2022 103,039 0.01%Freddie Mac Multifamily Structured Pass Through Certificates 100,000 1.77% 25/5/2028 102,969 0.01%SL Green Operating Partnership LP 100,000 3.25% 15/10/2022 102,918 0.01%Freddie Mac Multifamily Structured Pass Through Certificates 92,979 3.74% 25/4/2028 102,831 0.01%TD Ameritrade Holding Corp. 94,000 3.63% 1/4/2025 102,791 0.01%American Express Credit Account Master Trust 100,000 2.35% 15/5/2025 102,711 0.01%Air Products & Chemicals, Inc. 100,000 1.85% 15/5/2027 102,684 0.01%JB Hunt Transport Services, Inc. 100,000 3.30% 15/8/2022 102,665 0.01%Johnson & Johnson 100,000 2.05% 1/3/2023 102,653 0.01%TWDC Enterprises 18 Corp. 100,000 3.00% 30/7/2046 102,651 0.01%Universal Health Services, Inc. 100,000 5.00% 1/6/2026 102,649 0.01%Plains All American Pipeline LP/PAA Finance Corp. 100,000 2.85% 31/1/2023 102,641 0.01%General Mills, Inc. 100,000 2.60% 12/10/2022 102,601 0.01%Georgia-Pacific LLC 65,000 8.88% 15/5/2031 102,590 0.01%EI du Pont de Nemours & Co. 100,000 2.30% 15/7/2030 102,542 0.01%ConocoPhillips 100,000 2.40% 15/2/2031 102,373 0.01%DH Europe Finance II Sarl 100,000 2.05% 15/11/2022 102,313 0.01%Columbia Pipeline Group, Inc. 75,000 5.80% 1/6/2045 102,305 0.01%Banner Health 100,000 2.34% 1/1/2030 102,284 0.01%AEP Texas, Inc. 100,000 2.40% 1/10/2022 102,268 0.01%Memorial Sloan-Kettering Cancer Center 100,000 2.96% 1/1/2050 102,251 0.01%Emory University 100,000 2.14% 1/9/2030 102,207 0.01%Ameren Illinois Co. 100,000 2.70% 1/9/2022 102,173 0.01%T-Mobile USA, Inc. 100,000 3.60% 15/11/2060 102,099 0.01%Visa, Inc. 100,000 2.15% 15/9/2022 102,094 0.01%Apple, Inc. 100,000 2.10% 12/9/2022 102,067 0.01%DTE Energy Co. 75,000 6.38% 15/4/2033 102,065 0.01%

1014
Vanguard U.S. Investment Grade Credit Index Fund
Principal
US Dollars ($) CouponMaturity
DateFair Value
US Dollars ($)% of Total
Net AssetsPublic Service Co. of New Hampshire 100,000 2.20% 15/6/2031 101,955 0.01%Guardian Life Global Funding 100,000 2.50% 8/5/2022 101,939 0.01%Honeywell International, Inc. 100,000 2.15% 8/8/2022 101,904 0.01%Bristol-Myers Squibb Co. 100,000 2.00% 1/8/2022 101,891 0.01%Federal National Mortgage Association 100,000 1.78% 25/5/2030 101,881 0.01%PECO Energy Co. 100,000 2.38% 15/9/2022 101,857 0.01%WFRBS Commercial Mortgage Trust 2012 101,564 3.44% 15/4/2045 101,812 0.01%Wells Fargo & Co. 75,000 5.95% 15/12/2036 101,715 0.01%Air Lease Corp. 100,000 3.13% 1/12/2030 101,680 0.01%Morgan Stanley Bank of America Merrill Lynch Trust 2012 100,000 3.18% 15/8/2045 101,464 0.01%Ohio State University 75,000 4.91% 1/6/2040 101,441 0.01%Duke Energy Corp. 100,000 2.55% 15/6/2031 101,398 0.01%Atlantic City Electric Co. 100,000 2.30% 15/3/2031 101,394 0.01%Advocate Health & Hospitals Corp. 100,000 2.21% 15/6/2030 101,349 0.01%CBRE Services, Inc. 100,000 2.50% 1/4/2031 101,346 0.01%Public Service Co. of Colorado 100,000 2.25% 15/9/2022 101,342 0.01%Philip Morris International, Inc. 100,000 1.13% 1/5/2023 101,319 0.01%Equinix, Inc. 100,000 1.80% 15/7/2027 101,232 0.01%Newmont Corp. 75,000 5.88% 1/4/2035 101,221 0.01%Baltimore Gas & Electric Co. 100,000 2.25% 15/6/2031 101,191 0.01%Federal Home Loan Mortgage Corp. 99,380 2.36% 25/7/2022 101,177 0.01%Athene Global Funding 100,000 2.67% 7/6/2031 101,169 0.01%PPL Capital Funding, Inc. 80,000 4.70% 1/6/2043 101,131 0.01%Highmark, Inc. 100,000 2.55% 10/5/2031 101,123 0.01%Emerson Electric Co. 100,000 1.95% 15/10/2030 101,120 0.01%Norfolk Southern Corp. 100,000 3.16% 15/5/2055 101,120 0.01%Arthur J Gallagher & Co. 100,000 2.50% 20/5/2031 101,065 0.01%Nissan Motor Acceptance Corp. 100,000 2.75% 9/3/2028 101,038 0.01%MassMutual Global Funding II 100,000 0.85% 9/6/2023 101,009 0.01%Duquesne Light Holdings, Inc. 100,000 2.78% 7/1/2032 100,939 0.01%University of Michigan 100,000 2.44% 1/4/2040 100,872 0.01%Loews Corp. 85,000 4.13% 15/5/2043 100,796 0.01%Norfolk Southern Corp. 75,000 7.80% 15/5/2027 100,786 0.01%President & Fellows of Harvard College 90,000 3.15% 15/7/2046 100,606 0.01%Ford Foundation 100,000 2.82% 1/6/2070 100,593 0.01%Commonwealth of Massachusetts 100,000 2.51% 1/7/2041 100,513 0.01%State of California 101,000 1.75% 1/11/2030 100,393 0.01%Norfolk Southern Corp. 100,000 3.05% 15/5/2050 100,249 0.01%Conagra Brands, Inc. 75,000 5.40% 1/11/2048 100,247 0.01%Massachusetts School Building Authority 100,000 1.75% 15/8/2030 100,124 0.01%Equifax, Inc. 95,000 2.60% 15/12/2025 100,102 0.01%Pioneer Natural Resources Co. 100,000 0.75% 15/1/2024 99,995 0.01%Los Angeles County Metropolitan Transportation Authority 75,000 5.74% 1/6/2039 99,988 0.01%Intuit, Inc. 100,000 1.35% 15/7/2027 99,922 0.01%Highmark, Inc. 100,000 1.45% 10/5/2026 99,741 0.01%University of Southern California 65,000 5.25% 1/10/2111 99,711 0.01%Applied Materials, Inc. 100,000 2.75% 1/6/2050 99,700 0.01%Port of Morrow OR 100,000 2.54% 1/9/2040 99,669 0.01%American Honda Finance Corp. 100,000 0.55% 12/7/2024 99,653 0.01%Federal National Mortgage Association^ 100,000 1.49% 25/5/2030 99,653 0.01%Federal National Mortgage Association^ 92,986 2.67% 25/12/2026 99,593 0.01%Burlington Northern Santa Fe LLC 75,000 5.05% 1/3/2041 99,553 0.01%NRG Energy, Inc. 90,000 4.45% 15/6/2029 99,509 0.01%Freddie Mac Multifamily Structured Pass Through Certificates 100,000 1.86% 25/10/2035 99,451 0.01%GS Mortgage Securities Trust 2012 99,243 3.48% 10/1/2045 99,386 0.01%Charles Schwab Corp. 90,000 3.25% 22/5/2029 99,308 0.01%AT&T, Inc. 100,000 1.65% 1/2/2028 99,256 0.01%Energy Transfer LP 75,000 6.63% 15/10/2036 99,113 0.01%Piedmont Natural Gas Co., Inc. 90,000 3.50% 1/6/2029 99,102 0.01%Applied Materials, Inc. 75,000 5.10% 1/10/2035 99,084 0.01%Williams Cos, Inc. 75,000 5.80% 15/11/2043 99,045 0.01%Pioneer Natural Resources Co. 100,000 1.13% 15/1/2026 99,001 0.01%Stanley Black & Decker, Inc. 75,000 5.20% 1/9/2040 98,846 0.01%Entergy Corp. 100,000 0.90% 15/9/2025 98,807 0.01%United Parcel Service, Inc. 75,000 4.88% 15/11/2040 98,756 0.01%Owl Rock Technology Finance Corp. 100,000 2.50% 15/1/2027 98,750 0.01%Exelon Corp. 75,000 5.63% 15/6/2035 98,707 0.01%NOV, Inc. 100,000 3.95% 1/12/2042 98,706 0.01%Willis-Knighton Medical Center 100,000 3.07% 1/3/2051 98,665 0.01%Walt Disney Co. 100,000 2.75% 1/9/2049 98,483 0.01%Intuit, Inc. 100,000 1.65% 15/7/2030 98,477 0.01%

1015
Vanguard U.S. Investment Grade Credit Index Fund
Principal
US Dollars ($) CouponMaturity
DateFair Value
US Dollars ($)% of Total
Net AssetsAHS Hospital Corp. 100,000 2.78% 1/7/2051 98,401 0.01%Raytheon Technologies Corp. 75,000 6.70% 1/8/2028 98,398 0.01%Hershey Co. 100,000 2.65% 1/6/2050 98,329 0.01%Plains All American Pipeline LP/PAA Finance Corp. 75,000 6.65% 15/1/2037 98,323 0.01%Nestle Holdings, Inc. 100,000 0.63% 15/1/2026 98,127 0.01%AT&T, Inc. 100,000 3.10% 1/2/2043 98,033 0.01%Northrop Grumman Corp. 75,000 5.05% 15/11/2040 97,989 0.01%Massachusetts School Building Authority 70,000 5.72% 15/8/2039 97,972 0.01%Dominion Energy South Carolina, Inc. 75,000 5.30% 15/5/2033 97,967 0.01%American Financial Group, Inc. 90,000 3.50% 15/8/2026 97,897 0.01%Boston Properties LP 90,000 3.40% 21/6/2029 97,858 0.01%Bank of America Corp.^ 100,000 2.83% 24/10/2051 97,745 0.01%Constellation Brands, Inc. 85,000 4.10% 15/2/2048 97,638 0.01%Cargill, Inc. 100,000 1.70% 2/2/2031 97,597 0.01%Appalachian Power Co. 90,000 3.30% 1/6/2027 97,504 0.01%Crown Castle International Corp. 75,000 5.20% 15/2/2049 97,452 0.01%National Retail Properties, Inc. 100,000 3.10% 15/4/2050 97,300 0.01%University of California 90,000 3.06% 1/7/2025 97,250 0.01%State of Mississippi 75,000 5.25% 1/11/2034 97,024 0.01%Yale University 100,000 2.40% 15/4/2050 97,024 0.01%Regency Centers LP 80,000 4.65% 15/3/2049 96,947 0.01%Methodist Hospital 100,000 2.71% 1/12/2050 96,923 0.01%Citigroup Commercial Mortgage Trust 2015 90,000 3.19% 10/4/2048 96,491 0.01%Genuine Parts Co. 100,000 1.88% 1/11/2030 96,470 0.01%Dominion Energy South Carolina, Inc. 75,000 4.60% 15/6/2043 96,277 0.01%WP Carey, Inc. 100,000 2.25% 1/4/2033 96,220 0.01%Welltower, Inc. 75,000 4.95% 1/9/2048 96,015 0.01%United Airlines 2019-2 Class AA Pass Through Trust 96,111 2.70% 1/5/2032 95,973 0.01%Equinix, Inc. 100,000 3.00% 15/7/2050 95,889 0.01%Consumers Energy Co. 75,000 4.35% 15/4/2049 95,853 0.01%Federal National Mortgage Association 90,912 2.72% 25/10/2024 95,759 0.01%Memorial Sloan-Kettering Cancer Center 75,000 4.20% 1/7/2055 95,693 0.01%JetBlue 2019-1 Class AA Pass Through Trust 93,904 2.75% 15/5/2032 95,554 0.01%Keurig Dr Pepper, Inc. 75,000 4.99% 25/5/2038 95,512 0.01%Welltower, Inc. 90,000 2.70% 15/2/2027 95,495 0.01%Sales Tax Securitization Corp. 75,000 4.79% 1/1/2048 95,365 0.01%Cummins, Inc. 100,000 2.60% 1/9/2050 95,232 0.01%Altria Group, Inc. 100,000 3.40% 4/2/2041 95,221 0.01%Children's Hospital Corp. 100,000 2.59% 1/2/2050 94,993 0.01%Voya Financial, Inc. 75,000 4.80% 15/6/2046 94,948 0.01%Intercontinental Exchange, Inc. 100,000 1.85% 15/9/2032 94,921 0.01%Mid-America Apartments LP 100,000 1.70% 15/2/2031 94,914 0.01%WFRBS Commercial Mortgage Trust 2013 92,020 3.07% 15/3/2045 94,739 0.01%Raytheon Technologies Corp. 75,000 4.80% 15/12/2043 94,701 0.01%Walmart, Inc. 70,000 5.00% 25/10/2040 94,685 0.01%Bon Secours Mercy Health, Inc. 86,000 3.46% 1/6/2030 94,632 0.01%Carlyle Finance LLC 70,000 5.65% 15/9/2048 94,488 0.01%Ohio State University 65,000 4.80% 1/6/2111 94,380 0.01%PPL Capital Funding, Inc. 90,000 3.40% 1/6/2023 94,319 0.01%Lockheed Martin Corp. 75,000 4.50% 15/5/2036 94,281 0.01%International Flavors & Fragrances, Inc. 80,000 4.38% 1/6/2047 94,241 0.01%CenterPoint Energy, Inc. 90,000 2.50% 1/9/2024 94,182 0.01%City of San Antonio TX Electric & Gas Systems Revenue 75,000 4.43% 1/2/2042 93,887 0.01%Philip Morris International, Inc. 75,000 4.88% 15/11/2043 93,856 0.01%Wisconsin Electric Power Co. 75,000 4.30% 15/10/2048 93,842 0.01%Burlington Northern Santa Fe LLC 75,000 7.00% 15/12/2025 93,752 0.01%Weyerhaeuser Co. 75,000 8.50% 15/1/2025 93,663 0.01%Walmart, Inc. 65,000 5.63% 1/4/2040 93,656 0.01%FedEx Corp. 75,000 4.90% 15/1/2034 93,605 0.01%Unum Group 75,000 5.75% 15/8/2042 93,590 0.01%Jefferies Group LLC 75,000 6.45% 8/6/2027 93,471 0.01%UBS2 Commercial Mortgage Trust 2014 87,000 3.96% 10/3/2047 93,447 0.01%Packaging Corp. of America 85,000 3.40% 15/12/2027 93,428 0.01%Federal National Mortgage Association^ 88,200 3.02% 25/8/2024 93,328 0.01%Berkshire Hathaway Finance Corp. 75,000 4.30% 15/5/2043 93,324 0.01%New York City Transitional Finance Authority Future Tax Secured Revenue 70,000 5.57% 1/11/2038 93,226 0.01%Target Corp. 75,000 4.00% 1/7/2042 93,208 0.01%Conagra Brands, Inc. 90,000 3.20% 25/1/2023 93,128 0.01%Mars, Inc. 75,000 4.13% 1/4/2054 93,064 0.01%Simon Property Group LP 75,000 4.75% 15/3/2042 92,991 0.01%Blackstone Holdings Finance Co. LLC 75,000 4.45% 15/7/2045 92,832 0.01%

1016
Vanguard U.S. Investment Grade Credit Index Fund
Principal
US Dollars ($) CouponMaturity
DateFair Value
US Dollars ($)% of Total
Net AssetsAbbVie, Inc. 75,000 4.63% 1/10/2042 92,712 0.01%Burlington Northern Santa Fe LLC 75,000 4.40% 15/3/2042 92,692 0.01%Sabal Trail Transmission LLC 75,000 4.83% 1/5/2048 92,531 0.01%UnitedHealth Group, Inc. 75,000 4.38% 15/3/2042 92,519 0.01%Southwestern Public Service Co. 75,000 4.50% 15/8/2041 92,500 0.01%Alabama Power Co. 65,000 6.00% 1/3/2039 92,325 0.01%Puget Sound Energy, Inc. 75,000 4.22% 15/6/2048 91,965 0.01%British Airways 2013-1 Class A Pass Through Trust 87,368 4.63% 20/6/2024 91,902 0.01%Morgan Stanley Bank of America Merrill Lynch Trust 2015 86,000 3.34% 15/3/2048 91,877 0.01%Connecticut Light & Power Co. 75,000 4.15% 1/6/2045 91,783 0.01%Norfolk Southern Corp. 75,000 4.45% 15/6/2045 91,687 0.01%Piedmont Natural Gas Co., Inc. 75,000 4.65% 1/8/2043 91,669 0.01%Crown Castle International Corp. 75,000 4.75% 15/5/2047 91,625 0.01%General Motors Financial Co., Inc. 75,000 5.65% 17/1/2029 91,411 0.01%Southern Power Co. 75,000 5.15% 15/9/2041 91,317 0.01%Chubb INA Holdings, Inc. 75,000 4.15% 13/3/2043 91,092 0.01%San Diego County Regional Transportation Commission 60,000 5.91% 1/4/2048 91,010 0.01%Southern California Edison Co. 70,000 6.00% 15/1/2034 90,975 0.01%El Paso Electric Co. 75,000 5.00% 1/12/2044 90,936 0.01%San Diego Gas & Electric Co. 75,000 4.15% 15/5/2048 90,854 0.01%City of San Francisco CA Public Utilities Commission Water Revenue 55,000 6.95% 1/11/2050 90,776 0.01%Dallas Convention Center Hotel Development Corp. 65,000 7.09% 1/1/2042 90,761 0.01%Consolidated Edison Co. of New York, Inc. 75,000 4.50% 1/12/2045 90,735 0.01%American Water Capital Corp. 75,000 4.15% 1/6/2049 90,570 0.01%Federal Home Loan Mortgage Corp. 75,000 3.79% 25/1/2034 90,478 0.01%American Airlines 2015-2 Class AA Pass Through Trust 87,764 3.60% 22/9/2027 90,440 0.01%American Water Capital Corp. 75,000 4.30% 1/9/2045 90,372 0.01%Federal National Mortgage Association 86,982 2.50% 25/9/2026 90,002 0.01%Dow Chemical Co. 75,000 4.80% 30/11/2028 89,955 0.01%Port Authority of New York & New Jersey 80,000 5.31% 1/8/2046 89,942 0.01%Activision Blizzard, Inc. 100,000 2.50% 15/9/2050 89,887 0.01%CyrusOne LP/CyrusOne Finance Corp. 85,000 2.90% 15/11/2024 89,736 0.01%Autodesk, Inc. 85,000 2.85% 15/1/2030 89,621 0.01%Fortive Corp. 75,000 4.30% 15/6/2046 89,492 0.01%Intercontinental Exchange, Inc. 90,000 2.10% 15/6/2030 89,486 0.01%Autodesk, Inc. 80,000 4.38% 15/6/2025 89,441 0.01%Delmarva Power & Light Co. 75,000 4.15% 15/5/2045 89,438 0.01%Avery Dennison Corp. 75,000 4.88% 6/12/2028 89,394 0.01%UBS Commercial Mortgage Trust 2017^ 81,000 3.84% 15/10/2050 89,275 0.01%GLP Capital LP/GLP Financing II, Inc. 75,000 5.75% 1/6/2028 89,272 0.01%Southern California Edison Co. 75,000 4.88% 1/3/2049 89,231 0.01%Healthpeak Properties, Inc. 83,000 3.40% 1/2/2025 89,159 0.01%Archer-Daniels-Midland Co. 75,000 3.75% 15/9/2047 88,856 0.01%NVIDIA Corp. 75,000 3.70% 1/4/2060 88,854 0.01%Georgia-Pacific LLC 75,000 8.00% 15/1/2024 88,807 0.01%Duke Energy Progress LLC 75,000 4.10% 15/5/2042 88,726 0.01%Wells Fargo Commercial Mortgage Trust 2015 83,862 3.57% 15/9/2058 88,662 0.01%Trane Technologies Luxembourg Finance SA 70,000 4.65% 1/11/2044 88,630 0.01%Energy Transfer LP 75,000 5.25% 15/4/2029 88,592 0.01%Norfolk Southern Corp. 75,000 4.05% 15/8/2052 88,575 0.01%Alphabet, Inc. 100,000 2.05% 15/8/2050 88,507 0.01%GS Mortgage Securities Trust 2013 85,000 3.38% 10/6/2046 88,458 0.01%Block Financial LLC 85,000 5.50% 1/11/2022 88,402 0.01%Dartmouth-Hitchcock Health 75,000 4.18% 1/8/2048 88,325 0.01%Constellation Brands, Inc. 75,000 4.65% 15/11/2028 88,298 0.01%Parker-Hannifin Corp. 75,000 4.20% 21/11/2034 88,243 0.01%Metropolitan Government of Nashville & Davidson County Convention
Center Auth 60,000 6.73% 1/7/2043 88,226 0.01%Fox Corp. 80,000 3.50% 8/4/2030 88,169 0.01%Verizon Communications, Inc. 75,000 4.13% 15/8/2046 88,085 0.01%NorthWestern Corp. 75,000 4.18% 15/11/2044 88,079 0.01%RWJ Barnabas Health, Inc. 75,000 3.95% 1/7/2046 88,018 0.01%Ameren Corp. 80,000 3.65% 15/2/2026 87,733 0.01%Tapestry, Inc. 80,000 4.13% 15/7/2027 87,476 0.01%Stanley Black & Decker, Inc. 75,000 4.25% 15/11/2028 87,466 0.01%Simon Property Group LP 75,000 4.25% 30/11/2046 87,401 0.01%Smithfield Foods, Inc. 75,000 5.20% 1/4/2029 87,304 0.01%JPMorgan Chase & Co.^ 75,000 3.90% 23/1/2049 87,152 0.01%Boardwalk Pipelines LP 75,000 4.80% 3/5/2029 86,980 0.01%United Airlines 2016-2 Class AA Pass Through Trust 85,573 2.88% 7/10/2028 86,956 0.01%Best Buy Co., Inc. 75,000 4.45% 1/10/2028 86,939 0.01%

1017
Vanguard U.S. Investment Grade Credit Index Fund
Principal
US Dollars ($) CouponMaturity
DateFair Value
US Dollars ($)% of Total
Net AssetsCBRE Services, Inc. 75,000 4.88% 1/3/2026 86,830 0.01%Ecolab, Inc. 85,000 2.38% 10/8/2022 86,778 0.01%Dow Chemical Co. 75,000 4.25% 1/10/2034 86,745 0.01%CD 2018-CD7 Mortgage Trust 75,000 4.28% 15/8/2051 86,738 0.01%Brandywine Operating Partnership LP 80,000 4.10% 1/10/2024 86,725 0.01%Cardinal Health, Inc. 85,000 2.62% 15/6/2022 86,705 0.01%Lazard Group LLC 75,000 4.50% 19/9/2028 86,683 0.01%Markel Corp. 75,000 4.15% 17/9/2050 86,635 0.01%Marvell Technology, Inc. 75,000 4.88% 22/6/2028 86,632 0.01%Alexandria Real Estate Equities, Inc. 75,000 4.00% 1/2/2050 86,504 0.01%Northrop Grumman Corp. 75,000 3.85% 15/4/2045 86,321 0.01%Georgetown University 85,000 2.94% 1/4/2050 86,319 0.01%Norfolk Southern Corp. 75,000 3.95% 1/10/2042 86,286 0.01%CHRISTUS Health 75,000 4.34% 1/7/2028 86,241 0.01%Micron Technology, Inc. 75,000 4.98% 6/2/2026 86,217 0.01%Interstate Power & Light Co. 75,000 4.10% 26/9/2028 86,144 0.01%American University 75,000 3.67% 1/4/2049 86,024 0.01%Aetna, Inc. 75,000 4.13% 15/11/2042 85,941 0.01%CenterPoint Energy, Inc. 75,000 4.25% 1/11/2028 85,919 0.01%Cheniere Corpus Christi Holdings LLC 75,000 7.00% 30/6/2024 85,889 0.01%Commonwealth Edison Co. 75,000 3.70% 1/3/2045 85,687 0.01%Campbell Soup Co. 85,000 2.38% 24/4/2030 85,626 0.01%FedEx Corp. 75,000 4.10% 15/4/2043 85,619 0.01%Brooklyn Union Gas Co. 75,000 4.27% 15/3/2048 85,588 0.01%Toyota Motor Credit Corp. 75,000 3.65% 8/1/2029 85,582 0.01%Oklahoma Gas & Electric Co. 75,000 3.85% 15/8/2047 85,544 0.01%Chevron USA, Inc. 75,000 3.85% 15/1/2028 85,502 0.01%Federal Home Loan Mortgage Corp. 83,932 2.49% 25/4/2048 85,440 0.01%Linde, Inc. 100,000 2.00% 10/8/2050 85,417 0.01%Zoetis, Inc. 75,000 3.90% 20/8/2028 85,406 0.01%Digital Realty Trust LP 75,000 4.75% 1/10/2025 85,273 0.01%Consumers Energy Co. 75,000 3.80% 15/11/2028 85,242 0.01%Verisk Analytics, Inc. 75,000 4.13% 15/3/2029 85,234 0.01%Apollo Management Holdings LP 75,000 4.40% 27/5/2026 85,183 0.01%Sabal Trail Transmission LLC 75,000 4.25% 1/5/2028 85,161 0.01%JPMBB Commercial Mortgage Securities Trust 2013 81,000 3.66% 15/7/2045 85,142 0.01%Wisconsin Public Service Corp. 75,000 3.67% 1/12/2042 85,120 0.01%Northwell Healthcare, Inc. 75,000 3.98% 1/11/2046 85,096 0.01%Citigroup Commercial Mortgage Trust 2018 75,000 4.01% 10/3/2051 85,038 0.01%VEREIT Operating Partnership LP 75,000 4.63% 1/11/2025 85,009 0.01%JobsOhio Beverage System 75,000 3.99% 1/1/2029 84,929 0.01%Discover Financial Services 75,000 4.50% 30/1/2026 84,889 0.01%Benchmark 2018-B2 Mortgage Trust^ 75,000 3.88% 15/2/2051 84,816 0.01%State of Utah 80,000 4.55% 1/7/2024 84,716 0.01%Vistra Operations Co. LLC 80,000 3.55% 15/7/2024 84,567 0.01%Invesco Finance plc 78,000 4.00% 30/1/2024 84,559 0.01%Cleveland Clinic Foundation 60,000 4.86% 1/1/2114 84,547 0.01%Avnet, Inc. 75,000 4.63% 15/4/2026 84,485 0.01%Kansas Development Finance Authority 65,000 4.93% 15/4/2045 84,481 0.01%State of California 75,000 3.50% 1/4/2028 84,472 0.01%Permanent University Fund-University of Texas System 75,000 3.38% 1/7/2047 84,420 0.01%Principal Financial Group, Inc. 60,000 6.05% 15/10/2036 84,419 0.01%Oklahoma Gas & Electric Co. 75,000 3.80% 15/8/2028 84,290 0.01%Penske Truck Leasing Co. LP/PTL Finance Corp. 75,000 4.20% 1/4/2027 84,280 0.01%Morgan Stanley^ 75,000 3.77% 24/1/2029 84,222 0.01%Essex Portfolio LP 80,000 3.00% 15/1/2030 84,173 0.01%Eastman Chemical Co. 77,000 3.80% 15/3/2025 84,117 0.01%State of Oregon Department of Transportation 60,000 5.83% 15/11/2034 83,971 0.01%KKR Group Finance Co. VI LLC 75,000 3.75% 1/7/2029 83,914 0.01%Federal Home Loan Mortgage Corp.^ 75,000 3.30% 25/11/2027 83,913 0.01%Kirby Corp. 75,000 4.20% 1/3/2028 83,849 0.01%Hyatt Hotels Corp. 75,000 4.85% 15/3/2026 83,846 0.01%SSM Health Care Corp. 75,000 3.82% 1/6/2027 83,798 0.01%Owens Corning 75,000 3.88% 1/6/2030 83,795 0.01%Vulcan Materials Co. 75,000 4.50% 1/4/2025 83,728 0.01%Brixmor Operating Partnership LP 75,000 4.13% 15/6/2026 83,615 0.01%ERAC USA Finance LLC 80,000 2.70% 1/11/2023 83,609 0.01%Morgan Stanley 75,000 4.00% 23/7/2025 83,508 0.01%Guardian Life Insurance Co. of America 65,000 4.88% 19/6/2064 83,441 0.01%Southern Co. Gas Capital Corp. 75,000 3.95% 1/10/2046 83,438 0.01%Marsh & McLennan Cos, Inc. 65,000 4.75% 15/3/2039 83,425 0.01%

1018
Vanguard U.S. Investment Grade Credit Index Fund
Principal
US Dollars ($) CouponMaturity
DateFair Value
US Dollars ($)% of Total
Net AssetsNorthwell Healthcare, Inc. 75,000 3.81% 1/11/2049 83,418 0.01%Carlisle Cos, Inc. 75,000 3.75% 1/12/2027 83,388 0.01%Hershey Co. 75,000 3.38% 15/8/2046 83,254 0.01%Albemarle Corp. 76,000 4.15% 1/12/2024 83,223 0.01%Kilroy Realty LP 75,000 4.38% 1/10/2025 83,207 0.01%Virginia Electric & Power Co. 75,000 3.50% 15/3/2027 83,196 0.01%United Parcel Service, Inc. 75,000 3.05% 15/11/2027 83,080 0.01%Kimberly-Clark Corp. 75,000 3.20% 25/4/2029 83,074 0.01%Trustees of the University of Pennsylvania 60,000 4.67% 1/9/2112 82,998 0.01%Healthpeak Properties, Inc. 75,000 3.50% 15/7/2029 82,989 0.01%Essential Utilities, Inc. 75,000 3.57% 1/5/2029 82,964 0.01%Advocate Health & Hospitals Corp. 75,000 3.39% 15/10/2049 82,769 0.01%Maxim Integrated Products, Inc. 75,000 3.45% 15/6/2027 82,756 0.01%Energy Transfer LP 65,000 6.13% 15/12/2045 82,745 0.01%Harley-Davidson, Inc. 75,000 4.63% 28/7/2045 82,744 0.01%Hyatt Hotels Corp. 75,000 4.38% 15/9/2028 82,735 0.01%Boeing Co. 80,000 2.80% 1/3/2023 82,702 0.01%American Airlines 2017-1 Class AA Pass Through Trust 80,500 3.65% 15/2/2029 82,692 0.01%Autodesk, Inc. 75,000 3.50% 15/6/2027 82,633 0.01%General Motors Financial Co., Inc. 75,000 3.85% 5/1/2028 82,615 0.01%American International Group, Inc. 65,000 4.75% 1/4/2048 82,571 0.01%Lam Research Corp. 75,000 3.80% 15/3/2025 82,528 0.01%Estee Lauder Cos, Inc. 75,000 3.15% 15/3/2027 82,522 0.01%RPM International, Inc. 75,000 4.25% 15/1/2048 82,510 0.01%Mount Sinai Hospitals Group, Inc. 75,000 3.74% 1/7/2049 82,502 0.01%CSAIL 2015-C4 Commercial Mortgage Trust 75,000 3.81% 15/11/2048 82,471 0.01%Hartford Financial Services Group, Inc. 75,000 3.60% 19/8/2049 82,463 0.01%Public Storage 75,000 3.09% 15/9/2027 82,349 0.01%Cargill, Inc. 75,000 3.25% 23/5/2029 82,345 0.01%Citigroup, Inc. 75,000 3.88% 26/3/2025 82,313 0.01%Stifel Financial Corp. 75,000 4.25% 18/7/2024 82,293 0.01%PC1 Commercial Mortgage Trust 2015 75,000 3.90% 10/7/2050 82,274 0.01%John Deere Capital Corp. 75,000 3.45% 13/3/2025 82,235 0.01%American Municipal Power, Inc. 50,000 7.83% 15/2/2041 82,217 0.01%Cantor Fitzgerald LP 75,000 4.88% 1/5/2024 82,169 0.01%Hudson Pacific Properties LP 75,000 3.95% 1/11/2027 82,167 0.01%CGMS Commercial Mortgage Trust 2017^ 75,000 3.71% 15/8/2050 82,071 0.01%Nasdaq, Inc. 75,000 4.25% 1/6/2024 82,036 0.01%NSTAR Electric Co. 75,000 3.20% 15/5/2027 82,022 0.01%Cleco Corporate Holdings LLC 75,000 3.74% 1/5/2026 82,020 0.01%Alabama Power Co. 75,000 3.45% 1/10/2049 81,952 0.01%RenaissanceRe Finance, Inc. 75,000 3.45% 1/7/2027 81,923 0.01%State Public School Building Authority 70,000 5.00% 15/9/2027 81,884 0.01%Air Lease Corp. 75,000 4.25% 15/9/2024 81,870 0.01%Allstate Corp. 65,000 4.50% 15/6/2043 81,870 0.01%GLP Capital LP/GLP Financing II, Inc. 75,000 5.38% 1/11/2023 81,840 0.01%ERAC USA Finance LLC 60,000 5.63% 15/3/2042 81,837 0.01%Alexandria Real Estate Equities, Inc. 75,000 3.45% 30/4/2025 81,807 0.01%Apollo Management Holdings LP 75,000 4.00% 30/5/2024 81,797 0.01%Maryland State Transportation Authority 60,000 5.89% 1/7/2043 81,790 0.01%New York State Electric & Gas Corp. 75,000 3.25% 1/12/2026 81,788 0.01%Apple, Inc. 75,000 3.20% 13/5/2025 81,780 0.01%Morgan Stanley Bank of America Merrill Lynch Trust 2015 75,000 3.64% 15/10/2048 81,760 0.01%American Campus Communities Operating Partnership LP 75,000 4.13% 1/7/2024 81,744 0.01%Dominion Energy, Inc.^ 75,000 5.75% 1/10/2054 81,732 0.01%Affiliated Managers Group, Inc. 75,000 4.25% 15/2/2024 81,695 0.01%San Jose Redevelopment Agency Successor Agency 75,000 3.38% 1/8/2034 81,662 0.01%Leggett & Platt, Inc. 75,000 3.50% 15/11/2027 81,658 0.01%Bunge Ltd. Finance Corp. 75,000 4.35% 15/3/2024 81,642 0.01%Jersey Central Power & Light Co. 75,000 4.70% 1/4/2024 81,641 0.01%Snap-on, Inc. 75,000 3.25% 1/3/2027 81,580 0.01%Marsh & McLennan Cos, Inc. 75,000 3.50% 10/3/2025 81,539 0.01%Alleghany Corp. 65,000 4.90% 15/9/2044 81,536 0.01%Morgan Stanley Bank of America Merrill Lynch Trust 2017 75,000 3.28% 15/11/2052 81,533 0.01%Dell International LLC/EMC Corp. 75,000 4.00% 15/7/2024 81,528 0.01%Office Properties Income Trust 75,000 4.50% 1/2/2025 81,526 0.01%Affiliated Managers Group, Inc. 75,000 3.50% 1/8/2025 81,524 0.01%Northern Trust Corp.^ 75,000 3.38% 8/5/2032 81,519 0.01%Allegion plc 75,000 3.50% 1/10/2029 81,493 0.01%Louisville Gas & Electric Co. 75,000 3.30% 1/10/2025 81,483 0.01%3M Co. 75,000 2.88% 15/10/2027 81,478 0.01%

1019
Vanguard U.S. Investment Grade Credit Index Fund
Principal
US Dollars ($) CouponMaturity
DateFair Value
US Dollars ($)% of Total
Net AssetsSanta Clara Valley Transportation Authority 65,000 5.88% 1/4/2032 81,435 0.01%Loews Corp. 75,000 3.20% 15/5/2030 81,382 0.01%Allegion US Holding Co., Inc. 75,000 3.55% 1/10/2027 81,375 0.01%Evergy Kansas Central, Inc. 75,000 3.10% 1/4/2027 81,251 0.01%Alameda County Joint Powers Authority 50,000 7.05% 1/12/2044 81,249 0.01%CNH Industrial Capital LLC 75,000 4.20% 15/1/2024 81,195 0.01%Packaging Corp. of America 75,000 3.65% 15/9/2024 81,175 0.01%Arizona Public Service Co. 75,000 2.95% 15/9/2027 81,152 0.01%Appalachian Power Co. 75,000 3.40% 1/6/2025 81,138 0.01%Trans-Allegheny Interstate Line Co. 75,000 3.85% 1/6/2025 81,118 0.01%BGC Partners, Inc. 75,000 5.38% 24/7/2023 81,054 0.01%Mid-America Apartments LP 75,000 3.75% 15/6/2024 81,037 0.01%S&P Global, Inc. 75,000 2.95% 22/1/2027 81,002 0.01%United Airlines 2014-1 Class A Pass Through Trust 76,998 4.00% 11/4/2026 80,980 0.01%Piedmont Operating Partnership LP 75,000 4.45% 15/3/2024 80,924 0.01%Crane Co. 75,000 4.45% 15/12/2023 80,878 0.01%Morgan Stanley Bank of America Merrill Lynch Trust 2014 75,000 3.53% 15/12/2047 80,656 0.01%UBS4 Commercial Mortgage Trust 2014 75,000 3.69% 10/8/2047 80,636 0.01%Ryder System, Inc. 75,000 3.65% 18/3/2024 80,615 0.01%DC1 Commercial Mortgage Trust 2015 75,000 3.35% 10/2/2048 80,586 0.01%Johnson Controls International plc 75,000 3.63% 2/7/2024 80,586 0.01%Aetna, Inc. 65,000 4.75% 15/3/2044 80,558 0.01%Caterpillar, Inc. 75,000 3.40% 15/5/2024 80,550 0.01%John Deere Capital Corp. 75,000 3.45% 10/1/2024 80,548 0.01%Mosaic Co. 75,000 4.25% 15/11/2023 80,536 0.01%Mid-America Apartments LP 75,000 4.30% 15/10/2023 80,515 0.01%Brown University in Providence in the State of Rhode Island & Providence
Plant 75,000 2.92% 1/9/2050 80,480 0.01%Sempra Energy 75,000 4.05% 1/12/2023 80,452 0.01%Union Pacific Corp. 75,000 3.65% 15/2/2024 80,410 0.01%Fortune Brands Home & Security, Inc. 75,000 4.00% 21/9/2023 80,403 0.01%JobsOhio Beverage System 65,000 4.53% 1/1/2035 80,384 0.01%UDR, Inc. 75,000 2.95% 1/9/2026 80,208 0.01%AmerisourceBergen Corp. 75,000 3.40% 15/5/2024 80,167 0.01%Crown Castle International Corp. 75,000 3.20% 1/9/2024 80,159 0.01%3M Co. 75,000 3.25% 14/2/2024 80,152 0.01%Entergy Mississippi LLC 75,000 2.85% 1/6/2028 80,106 0.01%Black Hills Corp. 75,000 3.15% 15/1/2027 79,921 0.01%Westinghouse Air Brake Technologies Corp. 75,000 3.20% 15/6/2025 79,915 0.01%Enable Midstream Partners LP 75,000 3.90% 15/5/2024 79,871 0.01%NRG Energy, Inc. 75,000 3.75% 15/6/2024 79,868 0.01%Cummins, Inc. 75,000 3.65% 1/10/2023 79,844 0.01%United Parcel Service, Inc. 75,000 2.40% 15/11/2026 79,791 0.01%Marvell Technology, Inc. 75,000 4.20% 22/6/2023 79,770 0.01%KLA Corp. 75,000 3.30% 1/3/2050 79,686 0.01%LYB International Finance III LLC 75,000 2.88% 1/5/2025 79,680 0.01%Nestle Holdings, Inc. 75,000 3.35% 24/9/2023 79,676 0.01%JPMorgan Chase & Co.^ 75,000 3.22% 1/3/2025 79,660 0.01%Norfolk Southern Corp. 75,000 3.40% 1/11/2049 79,629 0.01%American Honda Finance Corp. 75,000 3.45% 14/7/2023 79,598 0.01%Nissan Motor Acceptance Corp. 75,000 3.88% 21/9/2023 79,598 0.01%Federal National Mortgage Association^ 75,000 2.90% 25/1/2025 79,591 0.01%Bay Area Toll Authority 45,000 6.91% 1/10/2050 79,533 0.01%Camden Property Trust 75,000 2.80% 15/5/2030 79,474 0.01%CC Holdings GS V LLC/Crown Castle GS III Corp. 75,000 3.85% 15/4/2023 79,445 0.01%Snap-on, Inc. 75,000 3.10% 1/5/2050 79,428 0.01%Boeing Co. 75,000 3.10% 1/5/2026 79,401 0.01%San Diego Gas & Electric Co. 75,000 2.50% 15/5/2026 79,383 0.01%Avnet, Inc. 75,000 4.88% 1/12/2022 79,309 0.01%Delta Air Lines 2019-1 Class AA Pass Through Trust 75,000 3.20% 25/4/2024 79,306 0.01%Alliant Energy Finance LLC 75,000 3.75% 15/6/2023 79,271 0.01%Regional Transportation District Sales Tax Revenue 50,000 5.84% 1/11/2050 79,251 0.01%Kentucky Utilities Co. 75,000 3.30% 1/6/2050 79,234 0.01%Alexandria Real Estate Equities, Inc. 70,000 3.95% 15/1/2028 79,203 0.01%NYU Langone Hospitals 75,000 3.38% 1/7/2055 79,158 0.01%Boston Scientific Corp. 50,000 7.38% 15/1/2040 79,144 0.01%Texas Instruments, Inc. 75,000 2.63% 15/5/2024 79,133 0.01%JPMorgan Chase & Co.^ 75,000 3.56% 23/4/2024 79,088 0.01%American Honda Finance Corp. 75,000 2.30% 9/9/2026 79,026 0.01%CommonSpirit Health 75,000 2.76% 1/10/2024 78,947 0.01%Cleveland Electric Illuminating Co. 75,000 3.50% 1/4/2028 78,946 0.01%

1020
Vanguard U.S. Investment Grade Credit Index Fund
Principal
US Dollars ($) CouponMaturity
DateFair Value
US Dollars ($)% of Total
Net AssetsHershey Co. 75,000 3.38% 15/5/2023 78,920 0.01%Altria Group, Inc. 75,000 2.63% 16/9/2026 78,919 0.01%FedEx Corp. 65,000 4.55% 1/4/2046 78,689 0.01%Boston Properties LP 75,000 3.13% 1/9/2023 78,633 0.01%Tanger Properties LP 75,000 3.13% 1/9/2026 78,606 0.01%Roper Technologies, Inc. 75,000 2.35% 15/9/2024 78,571 0.01%Emory University 75,000 2.97% 1/9/2050 78,570 0.01%Pennsylvania Turnpike Commission 55,000 5.51% 1/12/2045 78,555 0.01%New Jersey Transportation Trust Fund Authority 70,000 4.08% 15/6/2039 78,541 0.01%Laboratory Corp. of America Holdings 75,000 2.30% 1/12/2024 78,539 0.01%Valmont Industries, Inc. 65,000 5.00% 1/10/2044 78,522 0.01%Alexandria Real Estate Equities, Inc. 75,000 2.75% 15/12/2029 78,420 0.01%District of Columbia Water & Sewer Authority 55,000 4.81% 1/10/2114 78,299 0.01%Marsh & McLennan Cos, Inc. 75,000 3.30% 14/3/2023 78,296 0.01%Boeing Co. 75,000 2.80% 1/3/2024 78,268 0.01%Berkshire Hathaway, Inc. 75,000 3.00% 11/2/2023 78,240 0.01%Mutual of Omaha Insurance Co.^ 75,000 4.30% 15/7/2054 78,179 0.01%Maxim Integrated Products, Inc. 75,000 3.38% 15/3/2023 78,136 0.01%Williams Cos, Inc. 75,000 3.70% 15/1/2023 78,075 0.01%Boeing Co. 75,000 2.60% 30/10/2025 78,059 0.01%Sabal Trail Transmission LLC 65,000 4.68% 1/5/2038 78,035 0.01%Piedmont Operating Partnership LP 75,000 3.40% 1/6/2023 77,959 0.00%Los Angeles Department of Water & Power Power System Revenue 55,000 5.72% 1/7/2039 77,955 0.00%California Institute of Technology 55,000 4.70% 1/11/2111 77,930 0.00%Golden State Tobacco Securitization Corp. 75,000 3.12% 1/6/2038 77,919 0.00%Booking Holdings, Inc. 75,000 2.75% 15/3/2023 77,866 0.00%JP Morgan Chase Commercial Mortgage Securities Trust 2013 75,000 3.37% 15/12/2047 77,864 0.00%Health Care Service Corp. A Mutual Legal Reserve Co. 75,000 3.20% 1/6/2050 77,579 0.00%PNC Financial Services Group, Inc. 75,000 2.85% 9/11/2022 77,540 0.00%Washington 75,000 3.95% 15/10/2022 77,472 0.00%Edison International 75,000 2.95% 15/3/2023 77,440 0.00%Office Properties Income Trust 75,000 4.00% 15/7/2022 77,437 0.00%Simon Property Group LP 75,000 2.75% 1/2/2023 77,328 0.00%Enterprise Products Operating LLC^ 75,000 5.38% 15/2/2078 77,240 0.00%American Electric Power Co., Inc. 75,000 2.95% 15/12/2022 77,233 0.00%Niagara Mohawk Power Corp. 75,000 2.72% 28/11/2022 77,171 0.00%ITC Holdings Corp. 75,000 2.70% 15/11/2022 77,115 0.00%Bunge Ltd. Finance Corp. 75,000 3.00% 25/9/2022 77,053 0.00%Flowserve Corp. 75,000 3.50% 15/9/2022 76,973 0.00%DTE Electric Co. 75,000 2.95% 1/3/2050 76,929 0.00%Central Puget Sound Regional Transit Authority 55,000 5.49% 1/11/2039 76,926 0.00%AvalonBay Communities, Inc. 75,000 2.30% 1/3/2030 76,846 0.00%Burlington Northern Santa Fe LLC 75,000 3.05% 1/9/2022 76,846 0.00%Public Storage 75,000 2.37% 15/9/2022 76,693 0.00%3M Co. 75,000 1.75% 14/2/2023 76,682 0.00%John Deere Capital Corp. 75,000 2.15% 8/9/2022 76,672 0.00%Ameriprise Financial, Inc. 70,000 3.70% 15/10/2024 76,566 0.00%Toyota Motor Credit Corp. 75,000 1.35% 25/8/2023 76,463 0.00%Northern Natural Gas Co. 65,000 4.30% 15/1/2049 76,408 0.00%Eli Lilly & Co. 75,000 2.35% 15/5/2022 76,397 0.00%Midwest Connector Capital Co. LLC 75,000 3.63% 1/4/2022 76,222 0.00%CCRE4 Commercial Mortgage Trust 2012 74,545 2.85% 15/10/2045 76,140 0.00%Federal National Mortgage Association^ 71,762 2.80% 25/6/2025 76,088 0.00%Viatris, Inc. 75,000 1.65% 22/6/2025 75,991 0.00%T-Mobile USA, Inc. 75,000 2.55% 15/2/2031 75,855 0.00%Chicago O'Hare International Airport 50,000 6.40% 1/1/2040 75,819 0.00%Sutter Health 75,000 1.32% 15/8/2025 75,678 0.00%Xcel Energy, Inc. 70,000 3.50% 1/12/2049 75,670 0.00%Wells Fargo Commercial Mortgage Trust 2017^ 69,000 3.67% 15/7/2050 75,593 0.00%E*TRADE Financial Corp. 65,000 4.50% 20/6/2028 75,398 0.00%Health Care Service Corp. A Mutual Legal Reserve Co. 75,000 2.20% 1/6/2030 75,290 0.00%Archer-Daniels-Midland Co. 55,000 5.38% 15/9/2035 75,251 0.00%Cigna Corp. 75,000 1.25% 15/3/2026 75,226 0.00%Federal Home Loan Mortgage Corp. 74,094 2.40% 25/6/2022 75,216 0.00%Georgetown University 50,000 5.22% 1/10/2118 75,129 0.00%Gilead Sciences, Inc. 75,000 0.75% 29/9/2023 75,055 0.00%Northwestern University 75,000 2.64% 1/12/2050 75,050 0.00%State Board of Administration Finance Corp. 75,000 2.64% 1/7/2021 75,005 0.00%County of Cook IL 55,000 6.23% 15/11/2034 74,967 0.00%Wells Fargo Commercial Mortgage Trust 2017 68,000 3.45% 15/7/2050 74,920 0.00%Honeywell International, Inc. 70,000 3.35% 1/12/2023 74,828 0.00%

1021
Vanguard U.S. Investment Grade Credit Index Fund
Principal
US Dollars ($) CouponMaturity
DateFair Value
US Dollars ($)% of Total
Net AssetsWFRBS Commercial Mortgage Trust 2013 72,076 3.20% 15/3/2048 74,760 0.00%State of Wisconsin 65,000 5.70% 1/5/2026 74,740 0.00%Johns Hopkins University 75,000 2.81% 1/1/2060 74,656 0.00%Public Service Co. of Colorado 75,000 1.88% 15/6/2031 74,589 0.00%VMware, Inc. 65,000 4.65% 15/5/2027 74,581 0.00%University of Southern California 75,000 3.23% 1/10/2120 74,340 0.00%Apple, Inc. 75,000 0.55% 20/8/2025 74,175 0.00%Duke Realty LP 75,000 3.05% 1/3/2050 74,046 0.00%Apollo Management Holdings LP 58,000 5.00% 15/3/2048 74,007 0.00%Kinder Morgan Energy Partners LP 50,000 7.50% 15/11/2040 73,826 0.00%Host Hotels & Resorts LP 70,000 3.75% 15/10/2023 73,769 0.00%Biogen, Inc. 75,000 3.15% 1/5/2050 73,751 0.00%Trustees of Boston University 60,000 4.06% 1/10/2048 73,705 0.00%Voya Financial, Inc.^ 70,000 4.70% 23/1/2048 73,681 0.00%Cox Communications, Inc. 69,000 3.15% 15/8/2024 73,653 0.00%S&P Global, Inc. 70,000 2.50% 1/12/2029 73,503 0.00%Abbott Laboratories 50,000 6.00% 1/4/2039 73,242 0.00%City of New York NY 50,000 6.27% 1/12/2037 73,135 0.00%Chevron USA, Inc. 50,000 6.00% 1/3/2041 73,132 0.00%Massachusetts Institute of Technology 50,000 4.68% 1/7/2114 73,122 0.00%United Airlines 2014-2 Class A Pass Through Trust 69,045 3.75% 3/9/2026 72,939 0.00%Georgia Power Co. 70,000 2.20% 15/9/2024 72,901 0.00%Air Lease Corp. 70,000 3.25% 1/10/2029 72,828 0.00%Trustees of the University of Pennsylvania 75,000 2.40% 1/10/2050 72,823 0.00%Target Corp. 47,000 6.50% 15/10/2037 72,625 0.00%UnitedHealth Group, Inc. 50,000 5.95% 15/2/2041 72,616 0.00%Health & Educational Facilities Authority of the State of Missouri 65,000 3.23% 15/5/2050 72,550 0.00%Teachers Insurance & Annuity Association of America 48,000 6.85% 16/12/2039 72,529 0.00%Lubrizol Corp. 50,000 6.50% 1/10/2034 72,415 0.00%Crown Castle International Corp. 65,000 4.00% 15/11/2049 72,305 0.00%Port Authority of New York & New Jersey 55,000 6.04% 1/12/2029 72,260 0.00%American Airlines 2016-3 Class AA Pass Through Trust 71,697 3.00% 15/10/2028 72,220 0.00%MetLife, Inc. 50,000 5.88% 6/2/2041 72,139 0.00%Republic Services, Inc. 50,000 6.20% 1/3/2040 71,827 0.00%Realty Income Corp. 75,000 1.80% 15/3/2033 71,612 0.00%Adobe, Inc. 70,000 1.70% 1/2/2023 71,575 0.00%Boardwalk Pipelines LP 64,000 4.95% 15/12/2024 71,574 0.00%Wisconsin Power & Light Co. 50,000 6.38% 15/8/2037 71,477 0.00%Burlington Northern Santa Fe LLC 50,000 6.20% 15/8/2036 71,455 0.00%Welltower, Inc. 50,000 6.50% 15/3/2041 71,376 0.00%Walt Disney Co. 50,000 6.55% 15/3/2033 70,977 0.00%CenterPoint Energy Houston Electric LLC 50,000 6.95% 15/3/2033 70,834 0.00%Boston Scientific Corp. 64,000 3.85% 15/5/2025 70,670 0.00%Boston Scientific Corp. 50,000 7.00% 15/11/2035 70,663 0.00%Essex Portfolio LP 65,000 3.38% 15/4/2026 70,661 0.00%Norfolk Southern Corp. 60,000 4.10% 15/5/2049 70,498 0.00%Packaging Corp. of America 60,000 4.05% 15/12/2049 70,384 0.00%Ohio Edison Co. 50,000 6.88% 15/7/2036 70,255 0.00%Morgan Stanley Capital I Trust 2016 65,000 3.28% 15/11/2049 70,026 0.00%Bank of America NA 50,000 6.00% 15/10/2036 69,972 0.00%South Carolina Public Service Authority 45,000 6.45% 1/1/2050 69,784 0.00%CVS Health Corp. 50,000 6.13% 15/9/2039 69,759 0.00%Wells Fargo Commercial Mortgage Trust 2015 65,000 3.18% 15/4/2050 69,744 0.00%WFRBS Commercial Mortgage Trust 2013 67,000 3.00% 15/5/2045 69,524 0.00%Flex Ltd. 60,000 4.88% 15/6/2029 69,305 0.00%Delmarva Power & Light Co. 65,000 3.50% 15/11/2023 69,239 0.00%Electronic Arts, Inc. 60,000 4.80% 1/3/2026 69,122 0.00%Dignity Health 50,000 5.27% 1/11/2064 69,094 0.00%Progress Energy, Inc. 50,000 7.00% 30/10/2031 69,064 0.00%Port Authority of New York & New Jersey 50,000 4.81% 15/10/2065 69,034 0.00%WR Berkley Corp. 55,000 4.75% 1/8/2044 69,028 0.00%State of Washington 50,000 5.14% 1/8/2040 68,935 0.00%Prudential Financial, Inc. 50,000 6.20% 15/11/2040 68,797 0.00%XLIT Ltd. 50,000 5.25% 15/12/2043 68,762 0.00%LYB International Finance III LLC 60,000 4.20% 15/10/2049 68,734 0.00%Eli Lilly & Co. 75,000 2.50% 15/9/2060 68,647 0.00%President & Fellows of Harvard College 50,000 4.88% 15/10/2040 68,647 0.00%Dallas County Hospital District 50,000 5.62% 15/8/2044 68,639 0.00%AHS Hospital Corp. 50,000 5.02% 1/7/2045 68,492 0.00%Rutgers The State University of New Jersey 50,000 5.67% 1/5/2040 68,482 0.00%Kimberly-Clark Corp. 50,000 5.30% 1/3/2041 68,432 0.00%

1022
Vanguard U.S. Investment Grade Credit Index Fund
Principal
US Dollars ($) CouponMaturity
DateFair Value
US Dollars ($)% of Total
Net AssetsNSTAR Electric Co. 50,000 5.50% 15/3/2040 68,424 0.00%CenterPoint Energy Resources Corp. 50,000 5.85% 15/1/2041 68,383 0.00%Cincinnati Financial Corp. 50,000 6.13% 1/11/2034 68,279 0.00%City of New York NY 50,000 5.52% 1/10/2037 68,001 0.00%Tri-State Generation & Transmission Association, Inc. 50,000 6.00% 15/6/2040 67,975 0.00%Health & Educational Facilities Authority of the State of Missouri 55,000 3.65% 15/8/2057 67,753 0.00%George Washington University 50,000 4.87% 15/9/2045 67,744 0.00%New York State Dormitory Authority 50,000 5.60% 15/3/2040 67,554 0.00%KLA Corp. 50,000 5.00% 15/3/2049 67,522 0.00%Verisk Analytics, Inc. 50,000 5.50% 15/6/2045 67,450 0.00%Boeing Co. 50,000 6.63% 15/2/2038 67,435 0.00%JP Morgan Chase Commercial Mortgage Securities Trust 2012 66,050 3.51% 15/5/2045 67,263 0.00%Union Pacific Corp. 60,000 3.60% 15/9/2037 67,172 0.00%Chicago O'Hare International Airport 50,000 4.57% 1/1/2054 66,938 0.00%Freddie Mac Multifamily Structured Pass Through Certificates 65,000 1.87% 25/3/2053 66,921 0.00%Jefferies Group LLC 50,000 6.25% 15/1/2036 66,883 0.00%Johnson & Johnson 50,000 4.85% 15/5/2041 66,782 0.00%PeaceHealth Obligated Group 50,000 4.79% 15/11/2048 66,763 0.00%Oglethorpe Power Corp. 50,000 5.95% 1/11/2039 66,728 0.00%CarMax Auto Owner Trust 2017 66,338 2.33% 15/5/2023 66,697 0.00%ViacomCBS, Inc. 50,000 5.90% 15/10/2040 66,650 0.00%Duke Realty LP 61,000 3.75% 1/12/2024 66,269 0.00%Kroger Co. 50,000 5.40% 15/7/2040 65,691 0.00%PPL Capital Funding, Inc. 50,000 5.00% 15/3/2044 65,676 0.00%Smithfield Foods, Inc. 60,000 4.25% 1/2/2027 65,515 0.00%ITC Holdings Corp. 50,000 5.30% 1/7/2043 65,503 0.00%Ohio State University 55,000 3.80% 1/12/2046 65,464 0.00%Cincinnati Financial Corp. 50,000 6.92% 15/5/2028 65,461 0.00%Munich Re America Corp. 50,000 7.45% 15/12/2026 65,456 0.00%Arch Capital Finance LLC 50,000 5.03% 15/12/2046 65,173 0.00%Boeing Co. 62,000 2.85% 30/10/2024 65,121 0.00%International Business Machines Corp. 50,000 6.50% 15/1/2028 65,013 0.00%Bacardi Ltd. 50,000 5.30% 15/5/2048 64,985 0.00%Realty Income Corp. 50,000 4.65% 15/3/2047 64,952 0.00%Dover Corp. 50,000 5.38% 1/3/2041 64,891 0.00%Markel Corp. 50,000 5.00% 20/5/2049 64,814 0.00%Southern Co. Gas Capital Corp. 55,000 4.40% 30/5/2047 64,787 0.00%Oracle Corp. 59,000 3.80% 15/11/2037 64,687 0.00%CD 2017-CD3 Mortgage Trust 59,000 3.83% 10/2/2050 64,672 0.00%Johns Hopkins University 50,000 4.08% 1/7/2053 64,557 0.00%Los Angeles County Public Works Financing Authority 40,000 7.62% 1/8/2040 64,490 0.00%GS Mortgage Securities Trust 2012 63,108 2.77% 10/11/2045 64,482 0.00%Equitable Holdings, Inc. 50,000 7.00% 1/4/2028 64,366 0.00%GATX Corp. 50,000 5.20% 15/3/2044 64,224 0.00%Bristol-Myers Squibb Co. 50,000 4.50% 1/3/2044 64,210 0.00%Willis-Knighton Medical Center 50,000 4.81% 1/9/2048 64,206 0.00%Dover Corp. 50,000 5.38% 15/10/2035 64,013 0.00%State of Utah 60,000 3.54% 1/7/2025 63,959 0.00%Regency Centers LP 55,000 4.40% 1/2/2047 63,922 0.00%California Institute of Technology 50,000 4.32% 1/8/2045 63,777 0.00%International Paper Co. 50,000 4.80% 15/6/2044 63,751 0.00%Cleveland Electric Illuminating Co. 50,000 5.95% 15/12/2036 63,589 0.00%Boeing Co. 50,000 6.13% 15/2/2033 63,488 0.00%Texas Instruments, Inc. 50,000 4.15% 15/5/2048 63,377 0.00%Tampa Electric Co. 50,000 4.45% 15/6/2049 63,346 0.00%KeyBank NA 50,000 6.95% 1/2/2028 63,309 0.00%Children's Hospital Corp. 50,000 4.12% 1/1/2047 63,257 0.00%Commonwealth Edison Co. 50,000 4.60% 15/8/2043 63,225 0.00%Lincoln National Corp. 45,000 6.30% 9/10/2037 63,165 0.00%Advocate Health & Hospitals Corp. 50,000 4.27% 15/8/2048 63,045 0.00%ERP Operating LP 50,000 4.50% 1/7/2044 63,002 0.00%George Washington University 50,000 4.30% 15/9/2044 62,995 0.00%Raytheon Technologies Corp. 50,000 4.70% 15/12/2041 62,951 0.00%GS Mortgage Securities Trust 2017 57,199 3.43% 10/5/2050 62,945 0.00%Mayo Clinic 50,000 4.13% 15/11/2052 62,920 0.00%Children's Hospital Medical Center 50,000 4.27% 15/5/2044 62,878 0.00%Commonwealth Financing Authority 55,000 3.86% 1/6/2038 62,801 0.00%Avista Corp. 50,000 4.35% 1/6/2048 62,702 0.00%University of Pittsburgh-of the Commonwealth System of Higher
Education 60,000 3.56% 15/9/2119 62,688 0.00%L3Harris Technologies, Inc. 50,000 4.85% 27/4/2035 62,654 0.00%

1023
Vanguard U.S. Investment Grade Credit Index Fund
Principal
US Dollars ($) CouponMaturity
DateFair Value
US Dollars ($)% of Total
Net AssetsLazard Group LLC 55,000 4.38% 11/3/2029 62,577 0.00%WFRBS Commercial Mortgage Trust 2012 61,092 2.87% 15/11/2045 62,529 0.00%ERP Operating LP 50,000 4.50% 1/6/2045 62,471 0.00%Southern California Edison Co. 50,000 5.35% 15/7/2035 62,459 0.00%New York State Urban Development Corp. 50,000 5.77% 15/3/2039 62,370 0.00%New York State Electric & Gas Corp. 60,000 3.30% 15/9/2049 62,357 0.00%Kansas City Southern 50,000 4.70% 1/5/2048 62,305 0.00%Valmont Industries, Inc. 50,000 5.25% 1/10/2054 61,913 0.00%Nationwide Financial Services, Inc. 50,000 6.75% 15/5/2037 61,811 0.00%Georgia Power Co. 50,000 4.75% 1/9/2040 61,767 0.00%Toledo Hospital 50,000 6.02% 15/11/2048 61,755 0.00%Mass General Brigham, Inc. 50,000 4.12% 1/7/2055 61,739 0.00%State of Kansas Department of Transportation 50,000 4.60% 1/9/2035 61,548 0.00%Hackensack Meridian Health, Inc. 50,000 4.21% 1/7/2048 61,479 0.00%Exelon Corp. 50,000 4.95% 15/6/2035 61,399 0.00%Mylan, Inc. 50,000 5.20% 15/4/2048 61,397 0.00%American Financial Group, Inc. 50,000 5.25% 2/4/2030 61,386 0.00%Puget Sound Energy, Inc. 50,000 4.30% 20/5/2045 61,362 0.00%Tampa Electric Co. 50,000 4.30% 15/6/2048 61,290 0.00%University of Chicago 50,000 4.00% 1/10/2053 61,228 0.00%General Dynamics Corp. 50,000 4.25% 1/4/2040 61,154 0.00%PepsiCo, Inc. 50,000 4.00% 2/5/2047 60,995 0.00%Campbell Soup Co. 58,000 3.65% 15/3/2023 60,939 0.00%Arizona Public Service Co. 50,000 4.25% 1/3/2049 60,811 0.00%Pfizer, Inc. 50,000 4.10% 15/9/2038 60,800 0.00%University of Southern California 50,000 3.84% 1/10/2047 60,778 0.00%CSX Corp. 50,000 4.30% 1/3/2048 60,707 0.00%Northwestern University 50,000 3.66% 1/12/2057 60,673 0.00%Masco Corp. 50,000 4.50% 15/5/2047 60,669 0.00%Orlando Health Obligated Group 50,000 4.09% 1/10/2048 60,542 0.00%Evergy Kansas Central, Inc. 50,000 4.25% 1/12/2045 60,468 0.00%Kimberly-Clark Corp. 50,000 3.90% 4/5/2047 60,454 0.00%Keurig Dr Pepper, Inc. 50,000 4.42% 15/12/2046 60,384 0.00%Tampa Electric Co. 50,000 4.35% 15/5/2044 60,310 0.00%Owens Corning 55,000 4.20% 1/12/2024 60,199 0.00%Dignity Health 50,000 4.50% 1/11/2042 60,122 0.00%Potomac Electric Power Co. 50,000 4.15% 15/3/2043 60,105 0.00%Southern California Gas Co. 50,000 4.13% 1/6/2048 60,056 0.00%Kohl's Corp. 50,000 5.55% 17/7/2045 59,958 0.00%ONE Gas, Inc. 50,000 4.50% 1/11/2048 59,881 0.00%PPL Electric Utilities Corp. 50,000 4.13% 15/6/2044 59,739 0.00%Target Corp. 55,000 3.50% 1/7/2024 59,677 0.00%Sutter Health 50,000 4.09% 15/8/2048 59,595 0.00%Xylem, Inc. 50,000 4.38% 1/11/2046 59,593 0.00%Packaging Corp. of America 55,000 4.50% 1/11/2023 59,455 0.00%Johnson Controls International plc 44,000 4.95% 2/7/2064 59,440 0.00%Southern California Gas Co. 50,000 3.95% 15/2/2050 59,282 0.00%Ohio Water Development Authority Water Pollution Control Loan Fund 50,000 4.88% 1/12/2034 59,248 0.00%Cargill, Inc. 50,000 3.88% 23/5/2049 59,217 0.00%Bristol-Myers Squibb Co. 55,000 3.25% 1/8/2042 59,186 0.00%Intercontinental Exchange, Inc. 50,000 4.25% 21/9/2048 59,100 0.00%Blackstone Holdings Finance Co. LLC 50,000 4.00% 2/10/2047 59,089 0.00%3M Co. 50,000 3.88% 15/6/2044 59,074 0.00%Brooklyn Union Gas Co. 50,000 4.49% 4/3/2049 59,060 0.00%Evergy Kansas Central, Inc. 50,000 4.10% 1/4/2043 59,035 0.00%Norfolk Southern Corp. 55,000 3.85% 15/1/2024 58,965 0.00%LC6 Commercial Mortgage Trust 2013 57,000 3.28% 10/1/2046 58,951 0.00%CCRE8 Commercial Mortgage Trust 2013^ 56,000 3.61% 10/6/2046 58,853 0.00%Federal Home Loan Mortgage Corp. 50,000 3.72% 25/1/2031 58,843 0.00%Mercy Health 50,000 4.30% 1/7/2028 58,766 0.00%Alexandria Real Estate Equities, Inc. 50,000 4.50% 30/7/2029 58,718 0.00%National Rural Utilities Cooperative Finance Corp. 50,000 4.02% 1/11/2032 58,638 0.00%Spirit Realty LP 55,000 3.20% 15/1/2027 58,618 0.00%Stryker Corp. 50,000 4.10% 1/4/2043 58,611 0.00%State Street Corp.^ 50,000 4.14% 3/12/2029 58,585 0.00%Eastern Energy Gas Holdings LLC 50,000 4.60% 15/12/2044 58,547 0.00%Federal National Mortgage Association^ 50,000 3.77% 25/8/2030 58,400 0.00%Tampa Electric Co. 50,000 4.10% 15/6/2042 58,372 0.00%Lockheed Martin Corp. 50,000 3.80% 1/3/2045 58,304 0.00%American Homes 4 Rent LP 50,000 4.90% 15/2/2029 58,271 0.00%Micron Technology, Inc. 50,000 4.66% 15/2/2030 58,212 0.00%
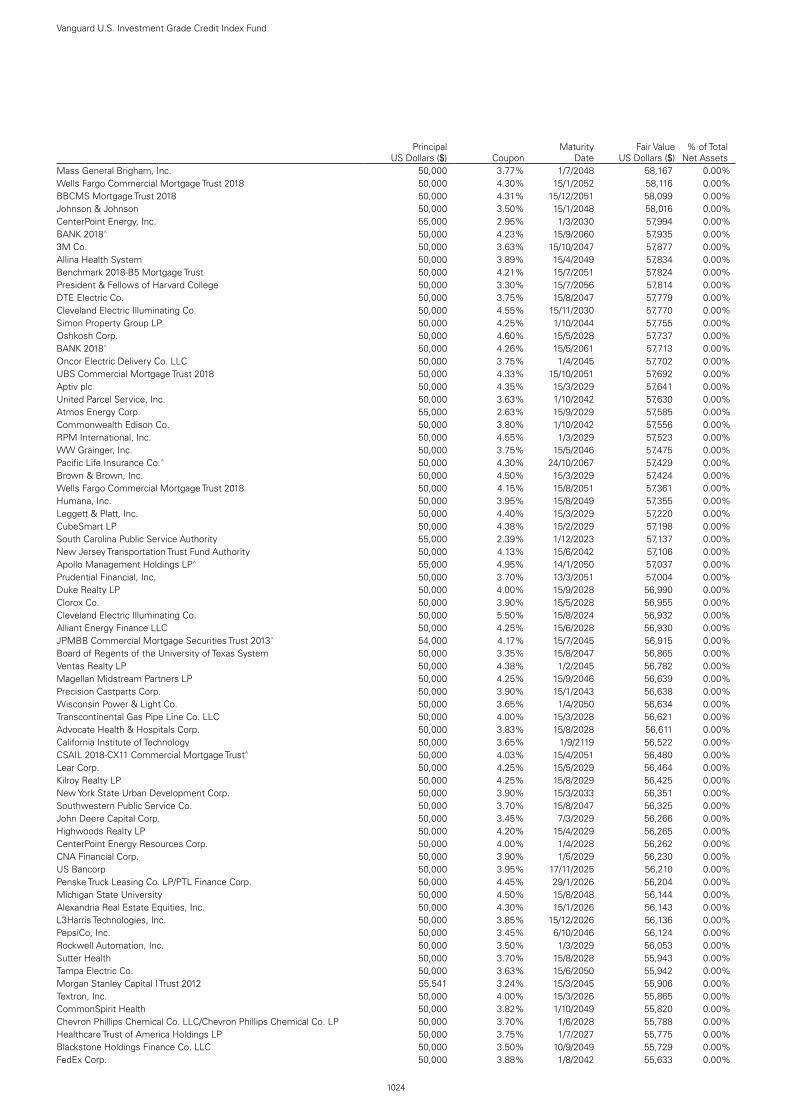
1024
Vanguard U.S. Investment Grade Credit Index Fund
Principal
US Dollars ($) CouponMaturity
DateFair Value
US Dollars ($)% of Total
Net AssetsMass General Brigham, Inc. 50,000 3.77% 1/7/2048 58,167 0.00%Wells Fargo Commercial Mortgage Trust 2018 50,000 4.30% 15/1/2052 58,116 0.00%BBCMS Mortgage Trust 2018 50,000 4.31% 15/12/2051 58,099 0.00%Johnson & Johnson 50,000 3.50% 15/1/2048 58,016 0.00%CenterPoint Energy, Inc. 55,000 2.95% 1/3/2030 57,994 0.00%BANK 2018^ 50,000 4.23% 15/9/2060 57,935 0.00%3M Co. 50,000 3.63% 15/10/2047 57,877 0.00%Allina Health System 50,000 3.89% 15/4/2049 57,834 0.00%Benchmark 2018-B5 Mortgage Trust 50,000 4.21% 15/7/2051 57,824 0.00%President & Fellows of Harvard College 50,000 3.30% 15/7/2056 57,814 0.00%DTE Electric Co. 50,000 3.75% 15/8/2047 57,779 0.00%Cleveland Electric Illuminating Co. 50,000 4.55% 15/11/2030 57,770 0.00%Simon Property Group LP 50,000 4.25% 1/10/2044 57,755 0.00%Oshkosh Corp. 50,000 4.60% 15/5/2028 57,737 0.00%BANK 2018^ 50,000 4.26% 15/5/2061 57,713 0.00%Oncor Electric Delivery Co. LLC 50,000 3.75% 1/4/2045 57,702 0.00%UBS Commercial Mortgage Trust 2018 50,000 4.33% 15/10/2051 57,692 0.00%Aptiv plc 50,000 4.35% 15/3/2029 57,641 0.00%United Parcel Service, Inc. 50,000 3.63% 1/10/2042 57,630 0.00%Atmos Energy Corp. 55,000 2.63% 15/9/2029 57,585 0.00%Commonwealth Edison Co. 50,000 3.80% 1/10/2042 57,556 0.00%RPM International, Inc. 50,000 4.55% 1/3/2029 57,523 0.00%WW Grainger, Inc. 50,000 3.75% 15/5/2046 57,475 0.00%Pacific Life Insurance Co.^ 50,000 4.30% 24/10/2067 57,429 0.00%Brown & Brown, Inc. 50,000 4.50% 15/3/2029 57,424 0.00%Wells Fargo Commercial Mortgage Trust 2018 50,000 4.15% 15/8/2051 57,361 0.00%Humana, Inc. 50,000 3.95% 15/8/2049 57,355 0.00%Leggett & Platt, Inc. 50,000 4.40% 15/3/2029 57,220 0.00%CubeSmart LP 50,000 4.38% 15/2/2029 57,198 0.00%South Carolina Public Service Authority 55,000 2.39% 1/12/2023 57,137 0.00%New Jersey Transportation Trust Fund Authority 50,000 4.13% 15/6/2042 57,106 0.00%Apollo Management Holdings LP^ 55,000 4.95% 14/1/2050 57,037 0.00%Prudential Financial, Inc. 50,000 3.70% 13/3/2051 57,004 0.00%Duke Realty LP 50,000 4.00% 15/9/2028 56,990 0.00%Clorox Co. 50,000 3.90% 15/5/2028 56,955 0.00%Cleveland Electric Illuminating Co. 50,000 5.50% 15/8/2024 56,932 0.00%Alliant Energy Finance LLC 50,000 4.25% 15/6/2028 56,930 0.00%JPMBB Commercial Mortgage Securities Trust 2013^ 54,000 4.17% 15/7/2045 56,915 0.00%Board of Regents of the University of Texas System 50,000 3.35% 15/8/2047 56,865 0.00%Ventas Realty LP 50,000 4.38% 1/2/2045 56,782 0.00%Magellan Midstream Partners LP 50,000 4.25% 15/9/2046 56,639 0.00%Precision Castparts Corp. 50,000 3.90% 15/1/2043 56,638 0.00%Wisconsin Power & Light Co. 50,000 3.65% 1/4/2050 56,634 0.00%Transcontinental Gas Pipe Line Co. LLC 50,000 4.00% 15/3/2028 56,621 0.00%Advocate Health & Hospitals Corp. 50,000 3.83% 15/8/2028 56,611 0.00%California Institute of Technology 50,000 3.65% 1/9/2119 56,522 0.00%CSAIL 2018-CX11 Commercial Mortgage Trust^ 50,000 4.03% 15/4/2051 56,480 0.00%Lear Corp. 50,000 4.25% 15/5/2029 56,464 0.00%Kilroy Realty LP 50,000 4.25% 15/8/2029 56,425 0.00%New York State Urban Development Corp. 50,000 3.90% 15/3/2033 56,351 0.00%Southwestern Public Service Co. 50,000 3.70% 15/8/2047 56,325 0.00%John Deere Capital Corp. 50,000 3.45% 7/3/2029 56,266 0.00%Highwoods Realty LP 50,000 4.20% 15/4/2029 56,265 0.00%CenterPoint Energy Resources Corp. 50,000 4.00% 1/4/2028 56,262 0.00%CNA Financial Corp. 50,000 3.90% 1/5/2029 56,230 0.00%US Bancorp 50,000 3.95% 17/11/2025 56,210 0.00%Penske Truck Leasing Co. LP/PTL Finance Corp. 50,000 4.45% 29/1/2026 56,204 0.00%Michigan State University 50,000 4.50% 15/8/2048 56,144 0.00%Alexandria Real Estate Equities, Inc. 50,000 4.30% 15/1/2026 56,143 0.00%L3Harris Technologies, Inc. 50,000 3.85% 15/12/2026 56,136 0.00%PepsiCo, Inc. 50,000 3.45% 6/10/2046 56,124 0.00%Rockwell Automation, Inc. 50,000 3.50% 1/3/2029 56,053 0.00%Sutter Health 50,000 3.70% 15/8/2028 55,943 0.00%Tampa Electric Co. 50,000 3.63% 15/6/2050 55,942 0.00%Morgan Stanley Capital I Trust 2012 55,541 3.24% 15/3/2045 55,906 0.00%Textron, Inc. 50,000 4.00% 15/3/2026 55,865 0.00%CommonSpirit Health 50,000 3.82% 1/10/2049 55,820 0.00%Chevron Phillips Chemical Co. LLC/Chevron Phillips Chemical Co. LP 50,000 3.70% 1/6/2028 55,788 0.00%Healthcare Trust of America Holdings LP 50,000 3.75% 1/7/2027 55,775 0.00%Blackstone Holdings Finance Co. LLC 50,000 3.50% 10/9/2049 55,729 0.00%FedEx Corp. 50,000 3.88% 1/8/2042 55,633 0.00%
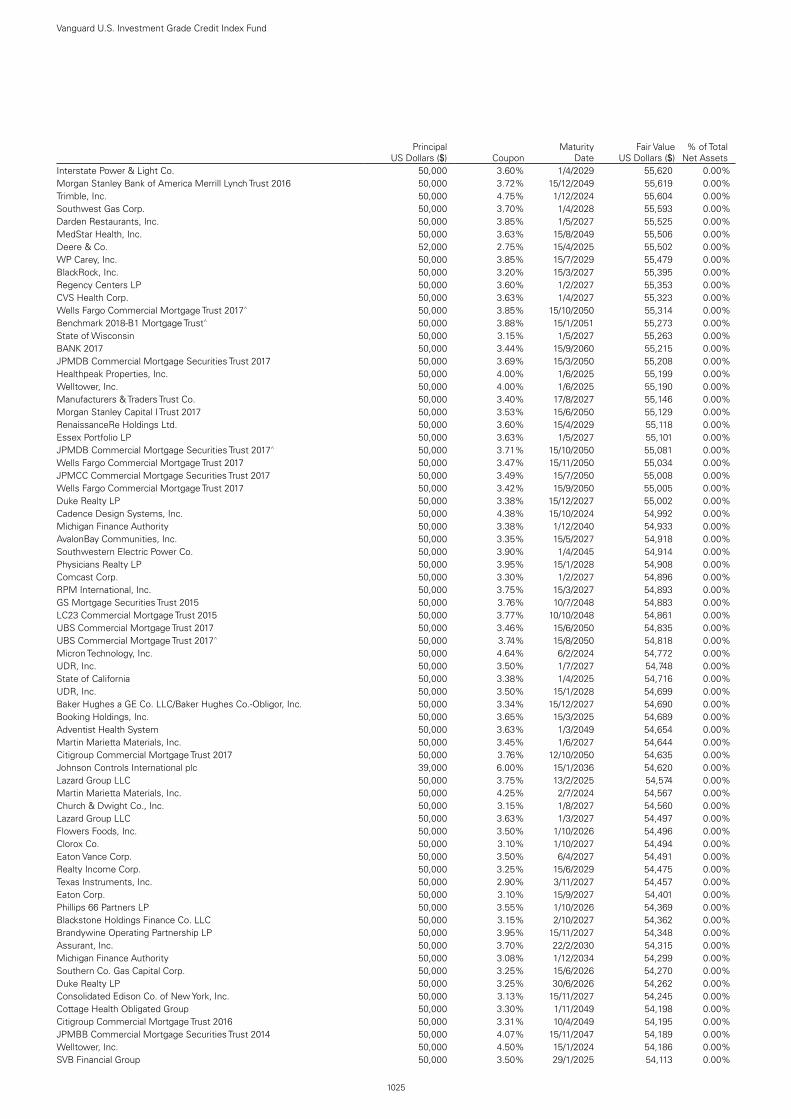
1025
Vanguard U.S. Investment Grade Credit Index Fund
Principal
US Dollars ($) CouponMaturity
DateFair Value
US Dollars ($)% of Total
Net AssetsInterstate Power & Light Co. 50,000 3.60% 1/4/2029 55,620 0.00%Morgan Stanley Bank of America Merrill Lynch Trust 2016 50,000 3.72% 15/12/2049 55,619 0.00%Trimble, Inc. 50,000 4.75% 1/12/2024 55,604 0.00%Southwest Gas Corp. 50,000 3.70% 1/4/2028 55,593 0.00%Darden Restaurants, Inc. 50,000 3.85% 1/5/2027 55,525 0.00%MedStar Health, Inc. 50,000 3.63% 15/8/2049 55,506 0.00%Deere & Co. 52,000 2.75% 15/4/2025 55,502 0.00%WP Carey, Inc. 50,000 3.85% 15/7/2029 55,479 0.00%BlackRock, Inc. 50,000 3.20% 15/3/2027 55,395 0.00%Regency Centers LP 50,000 3.60% 1/2/2027 55,353 0.00%CVS Health Corp. 50,000 3.63% 1/4/2027 55,323 0.00%Wells Fargo Commercial Mortgage Trust 2017^ 50,000 3.85% 15/10/2050 55,314 0.00%Benchmark 2018-B1 Mortgage Trust^ 50,000 3.88% 15/1/2051 55,273 0.00%State of Wisconsin 50,000 3.15% 1/5/2027 55,263 0.00%BANK 2017 50,000 3.44% 15/9/2060 55,215 0.00%JPMDB Commercial Mortgage Securities Trust 2017 50,000 3.69% 15/3/2050 55,208 0.00%Healthpeak Properties, Inc. 50,000 4.00% 1/6/2025 55,199 0.00%Welltower, Inc. 50,000 4.00% 1/6/2025 55,190 0.00%Manufacturers & Traders Trust Co. 50,000 3.40% 17/8/2027 55,146 0.00%Morgan Stanley Capital I Trust 2017 50,000 3.53% 15/6/2050 55,129 0.00%RenaissanceRe Holdings Ltd. 50,000 3.60% 15/4/2029 55,118 0.00%Essex Portfolio LP 50,000 3.63% 1/5/2027 55,101 0.00%JPMDB Commercial Mortgage Securities Trust 2017^ 50,000 3.71% 15/10/2050 55,081 0.00%Wells Fargo Commercial Mortgage Trust 2017 50,000 3.47% 15/11/2050 55,034 0.00%JPMCC Commercial Mortgage Securities Trust 2017 50,000 3.49% 15/7/2050 55,008 0.00%Wells Fargo Commercial Mortgage Trust 2017 50,000 3.42% 15/9/2050 55,005 0.00%Duke Realty LP 50,000 3.38% 15/12/2027 55,002 0.00%Cadence Design Systems, Inc. 50,000 4.38% 15/10/2024 54,992 0.00%Michigan Finance Authority 50,000 3.38% 1/12/2040 54,933 0.00%AvalonBay Communities, Inc. 50,000 3.35% 15/5/2027 54,918 0.00%Southwestern Electric Power Co. 50,000 3.90% 1/4/2045 54,914 0.00%Physicians Realty LP 50,000 3.95% 15/1/2028 54,908 0.00%Comcast Corp. 50,000 3.30% 1/2/2027 54,896 0.00%RPM International, Inc. 50,000 3.75% 15/3/2027 54,893 0.00%GS Mortgage Securities Trust 2015 50,000 3.76% 10/7/2048 54,883 0.00%LC23 Commercial Mortgage Trust 2015 50,000 3.77% 10/10/2048 54,861 0.00%UBS Commercial Mortgage Trust 2017 50,000 3.46% 15/6/2050 54,835 0.00%UBS Commercial Mortgage Trust 2017^ 50,000 3.74% 15/8/2050 54,818 0.00%Micron Technology, Inc. 50,000 4.64% 6/2/2024 54,772 0.00%UDR, Inc. 50,000 3.50% 1/7/2027 54,748 0.00%State of California 50,000 3.38% 1/4/2025 54,716 0.00%UDR, Inc. 50,000 3.50% 15/1/2028 54,699 0.00%Baker Hughes a GE Co. LLC/Baker Hughes Co.-Obligor, Inc. 50,000 3.34% 15/12/2027 54,690 0.00%Booking Holdings, Inc. 50,000 3.65% 15/3/2025 54,689 0.00%Adventist Health System 50,000 3.63% 1/3/2049 54,654 0.00%Martin Marietta Materials, Inc. 50,000 3.45% 1/6/2027 54,644 0.00%Citigroup Commercial Mortgage Trust 2017 50,000 3.76% 12/10/2050 54,635 0.00%Johnson Controls International plc 39,000 6.00% 15/1/2036 54,620 0.00%Lazard Group LLC 50,000 3.75% 13/2/2025 54,574 0.00%Martin Marietta Materials, Inc. 50,000 4.25% 2/7/2024 54,567 0.00%Church & Dwight Co., Inc. 50,000 3.15% 1/8/2027 54,560 0.00%Lazard Group LLC 50,000 3.63% 1/3/2027 54,497 0.00%Flowers Foods, Inc. 50,000 3.50% 1/10/2026 54,496 0.00%Clorox Co. 50,000 3.10% 1/10/2027 54,494 0.00%Eaton Vance Corp. 50,000 3.50% 6/4/2027 54,491 0.00%Realty Income Corp. 50,000 3.25% 15/6/2029 54,475 0.00%Texas Instruments, Inc. 50,000 2.90% 3/11/2027 54,457 0.00%Eaton Corp. 50,000 3.10% 15/9/2027 54,401 0.00%Phillips 66 Partners LP 50,000 3.55% 1/10/2026 54,369 0.00%Blackstone Holdings Finance Co. LLC 50,000 3.15% 2/10/2027 54,362 0.00%Brandywine Operating Partnership LP 50,000 3.95% 15/11/2027 54,348 0.00%Assurant, Inc. 50,000 3.70% 22/2/2030 54,315 0.00%Michigan Finance Authority 50,000 3.08% 1/12/2034 54,299 0.00%Southern Co. Gas Capital Corp. 50,000 3.25% 15/6/2026 54,270 0.00%Duke Realty LP 50,000 3.25% 30/6/2026 54,262 0.00%Consolidated Edison Co. of New York, Inc. 50,000 3.13% 15/11/2027 54,245 0.00%Cottage Health Obligated Group 50,000 3.30% 1/11/2049 54,198 0.00%Citigroup Commercial Mortgage Trust 2016 50,000 3.31% 10/4/2049 54,195 0.00%JPMBB Commercial Mortgage Securities Trust 2014 50,000 4.07% 15/11/2047 54,189 0.00%Welltower, Inc. 50,000 4.50% 15/1/2024 54,186 0.00%SVB Financial Group 50,000 3.50% 29/1/2025 54,113 0.00%

1026
Vanguard U.S. Investment Grade Credit Index Fund
Principal
US Dollars ($) CouponMaturity
DateFair Value
US Dollars ($)% of Total
Net AssetsWisconsin Power & Light Co. 50,000 3.05% 15/10/2027 54,101 0.00%CCRE15 Commercial Mortgage Trust 2014^ 50,000 4.86% 10/2/2047 54,076 0.00%Hubbell, Inc. 50,000 3.35% 1/3/2026 54,053 0.00%Rochester Gas & Electric Corp. 50,000 3.10% 1/6/2027 54,052 0.00%CubeSmart LP 50,000 4.38% 15/12/2023 54,035 0.00%JPMBB Commercial Mortgage Securities Trust 2014 50,000 3.77% 15/8/2047 54,009 0.00%Unum Group 50,000 4.00% 15/3/2024 53,994 0.00%Entergy Arkansas LLC 50,000 3.70% 1/6/2024 53,989 0.00%New York State Dormitory Authority 50,000 3.11% 15/2/2039 53,979 0.00%Georgia Power Co. 50,000 3.25% 1/4/2026 53,978 0.00%Citigroup Commercial Mortgage Trust 2014 50,000 3.86% 10/5/2047 53,944 0.00%Kite Realty Group LP 50,000 4.00% 1/10/2026 53,926 0.00%FMC Corp. 50,000 3.20% 1/10/2026 53,893 0.00%Xcel Energy, Inc. 50,000 3.30% 1/6/2025 53,890 0.00%State Street Corp.^ 50,000 3.78% 3/12/2024 53,877 0.00%Campbell Soup Co. 50,000 3.30% 19/3/2025 53,876 0.00%CCRE13 Commercial Mortgage Trust 2013^ 50,000 4.19% 10/11/2046 53,815 0.00%AutoZone, Inc. 50,000 3.25% 15/4/2025 53,807 0.00%Dover Corp. 50,000 3.15% 15/11/2025 53,778 0.00%Wells Fargo & Co. 50,000 3.75% 24/1/2024 53,775 0.00%John Deere Capital Corp. 50,000 3.65% 12/10/2023 53,729 0.00%GS Mortgage Securities Trust 2013 50,000 4.27% 10/11/2046 53,700 0.00%AvalonBay Communities, Inc. 50,000 2.90% 15/10/2026 53,677 0.00%Southwest Gas Corp. 50,000 3.80% 29/9/2046 53,676 0.00%DTE Electric Co. 50,000 3.65% 15/3/2024 53,673 0.00%Corning, Inc. 45,000 4.70% 15/3/2037 53,671 0.00%Hubbell, Inc. 50,000 3.15% 15/8/2027 53,651 0.00%Stryker Corp. 50,000 3.38% 15/5/2024 53,630 0.00%Ventas Realty LP 50,000 3.50% 15/4/2024 53,543 0.00%General Electric Co. 50,000 3.45% 15/5/2024 53,539 0.00%GATX Corp. 50,000 3.25% 30/3/2025 53,519 0.00%Roper Technologies, Inc. 50,000 2.95% 15/9/2029 53,472 0.00%Spirit Airlines Pass Through Trust 2015 51,296 4.10% 1/4/2028 53,413 0.00%Pennsylvania Electric Co. 50,000 3.60% 1/6/2029 53,410 0.00%Global Payments, Inc. 50,000 3.20% 15/8/2029 53,408 0.00%Boeing Co. 50,000 3.45% 1/11/2028 53,353 0.00%Entergy Louisiana LLC 50,000 4.05% 1/9/2023 53,351 0.00%Blackstone Holdings Finance Co. LLC 50,000 4.75% 15/2/2023 53,341 0.00%Flowserve Corp. 50,000 4.00% 15/11/2023 53,341 0.00%PNC Bank NA 50,000 3.80% 25/7/2023 53,264 0.00%Edison International 50,000 3.55% 15/11/2024 53,258 0.00%Voya Financial, Inc. 50,000 3.13% 15/7/2024 53,254 0.00%John Deere Capital Corp. 50,000 2.65% 24/6/2024 53,204 0.00%Caterpillar Financial Services Corp. 50,000 2.85% 17/5/2024 53,194 0.00%L3Harris Technologies, Inc. 50,000 3.85% 15/6/2023 53,165 0.00%Guardian Life Global Funding 50,000 2.90% 6/5/2024 53,152 0.00%Global Payments, Inc. 50,000 4.00% 1/6/2023 53,138 0.00%Equifax, Inc. 50,000 3.95% 15/6/2023 53,126 0.00%Trimble, Inc. 50,000 4.15% 15/6/2023 53,111 0.00%Bay Area Toll Authority 50,000 2.57% 1/4/2031 53,046 0.00%NVR, Inc. 50,000 3.00% 15/5/2030 52,986 0.00%GLP Capital LP/GLP Financing II, Inc. 50,000 3.35% 1/9/2024 52,974 0.00%San Diego Gas & Electric Co. 50,000 3.60% 1/9/2023 52,950 0.00%Eastern Energy Gas Holdings LLC 50,000 3.55% 1/11/2023 52,942 0.00%Union Pacific Corp. 50,000 3.50% 8/6/2023 52,912 0.00%3M Co. 50,000 2.25% 19/9/2026 52,902 0.00%Trustees of Boston College 50,000 3.13% 1/7/2052 52,892 0.00%Keysight Technologies, Inc. 50,000 3.00% 30/10/2029 52,889 0.00%Broadridge Financial Solutions, Inc. 50,000 2.90% 1/12/2029 52,850 0.00%Consumers Energy Co. 50,000 3.38% 15/8/2023 52,789 0.00%Columbia Property Trust Operating Partnership LP 50,000 3.65% 15/8/2026 52,769 0.00%Duke Realty LP 50,000 2.88% 15/11/2029 52,731 0.00%Adventist Health System 50,000 2.95% 1/3/2029 52,707 0.00%New York State Thruway Authority 50,000 3.50% 1/1/2042 52,624 0.00%CenterPoint Energy Houston Electric LLC 50,000 2.40% 1/9/2026 52,611 0.00%Permanent University Fund - Texas A&M University System 50,000 3.10% 1/7/2049 52,605 0.00%Hartford HealthCare Corp. 50,000 3.45% 1/7/2054 52,520 0.00%Target Corp. 50,000 2.25% 15/4/2025 52,471 0.00%Quest Diagnostics, Inc. 42,000 5.75% 30/1/2040 52,429 0.00%Bank of New York Mellon Corp. 50,000 2.10% 24/10/2024 52,409 0.00%Morgan Stanley Bank of America Merrill Lynch Trust 2013^ 50,000 4.30% 15/8/2046 52,383 0.00%

1027
Vanguard U.S. Investment Grade Credit Index Fund
Principal
US Dollars ($) CouponMaturity
DateFair Value
US Dollars ($)% of Total
Net AssetsWisconsin Electric Power Co. 50,000 2.05% 15/12/2024 52,294 0.00%Starbucks Corp. 50,000 3.35% 12/3/2050 52,224 0.00%Hershey Co. 50,000 2.05% 15/11/2024 52,206 0.00%Kimco Realty Corp. 50,000 3.13% 1/6/2023 52,168 0.00%Public Service Electric & Gas Co. 50,000 2.45% 15/1/2030 52,138 0.00%AEP Transmission Co. LLC 50,000 3.15% 15/9/2049 52,134 0.00%Reliance Standard Life Global Funding II 50,000 2.50% 30/10/2024 52,130 0.00%Primerica, Inc. 50,000 4.75% 15/7/2022 52,117 0.00%Markel Corp. 50,000 4.90% 1/7/2022 52,081 0.00%Kilroy Realty LP 50,000 3.80% 15/1/2023 52,015 0.00%Morgan Stanley Bank of America Merrill Lynch Trust 2013 50,000 3.10% 15/5/2046 51,987 0.00%San Diego County Regional Transportation Commission 50,000 3.25% 1/4/2048 51,963 0.00%Boeing Co. 50,000 2.80% 1/3/2027 51,914 0.00%Morgan Stanley Bank of America Merrill Lynch Trust 2013 50,000 3.46% 15/5/2046 51,907 0.00%Union Pacific Corp. 50,000 2.15% 5/2/2027 51,899 0.00%Lockheed Martin Corp. 50,000 3.10% 15/1/2023 51,883 0.00%Moody's Corp. 50,000 4.50% 1/9/2022 51,865 0.00%Penn Mutual Life Insurance Co. 50,000 3.80% 29/4/2061 51,849 0.00%DR Horton, Inc. 50,000 4.38% 15/9/2022 51,830 0.00%ERP Operating LP 50,000 2.50% 15/2/2030 51,798 0.00%JobsOhio Beverage System 50,000 2.83% 1/1/2038 51,784 0.00%Carlisle Cos, Inc. 50,000 3.75% 15/11/2022 51,783 0.00%Morgan Stanley Bank of America Merrill Lynch Trust 2013 50,000 3.38% 15/12/2048 51,781 0.00%Sempra Energy 50,000 2.90% 1/2/2023 51,774 0.00%Dignity Health 50,000 3.13% 1/11/2022 51,689 0.00%MetLife, Inc. 50,000 3.05% 15/12/2022 51,665 0.00%AbbVie, Inc. 50,000 2.80% 15/3/2023 51,654 0.00%Boardwalk Pipelines LP 50,000 3.38% 1/2/2023 51,610 0.00%UBS-Barclays Commercial Mortgage Trust 2013 50,000 3.47% 10/4/2046 51,581 0.00%RPM International, Inc. 50,000 3.45% 15/11/2022 51,562 0.00%UnitedHealth Group, Inc. 50,000 3.13% 15/5/2060 51,534 0.00%Kimco Realty Corp. 50,000 2.70% 1/10/2030 51,504 0.00%Synovus Financial Corp. 50,000 3.13% 1/11/2022 51,420 0.00%Weingarten Realty Investors 50,000 3.38% 15/10/2022 51,419 0.00%Constellation Brands, Inc. 50,000 2.65% 7/11/2022 51,363 0.00%Ohio Turnpike & Infrastructure Commission 50,000 3.22% 15/2/2048 51,343 0.00%PayPal Holdings, Inc. 50,000 1.65% 1/6/2025 51,343 0.00%Boston Scientific Corp. 50,000 3.38% 15/5/2022 51,329 0.00%Raytheon Technologies Corp. 50,000 2.50% 15/12/2022 51,312 0.00%American Honda Finance Corp. 50,000 2.00% 24/3/2028 51,301 0.00%American Honda Finance Corp. 50,000 2.05% 10/1/2023 51,293 0.00%JP Morgan Chase Commercial Mortgage Securities Trust 2013 50,000 3.50% 15/4/2046 51,293 0.00%LC6 Commercial Mortgage Trust 2013^ 50,000 4.24% 10/1/2046 51,289 0.00%BP Capital Markets America, Inc. 50,000 2.52% 19/9/2022 51,266 0.00%Prudential Financial, Inc. 50,000 3.00% 10/3/2040 51,255 0.00%Athene Global Funding 50,000 2.50% 24/3/2028 51,233 0.00%Pennsylvania State University 50,000 2.84% 1/9/2050 51,205 0.00%Georgia-Pacific LLC 50,000 2.30% 30/4/2030 51,149 0.00%Kaiser Foundation Hospitals 50,000 3.50% 1/4/2022 51,137 0.00%WFRBS Commercial Mortgage Trust 2012^ 50,000 4.09% 15/6/2045 51,133 0.00%American Express Co. 50,000 2.50% 1/8/2022 51,069 0.00%Church & Dwight Co., Inc. 50,000 2.45% 1/8/2022 51,052 0.00%Viatris, Inc. 50,000 2.30% 22/6/2027 51,008 0.00%Tapestry, Inc. 50,000 3.00% 15/7/2022 50,992 0.00%Boeing Co. 50,000 1.88% 15/6/2023 50,975 0.00%WFRBS Commercial Mortgage Trust 2012 50,000 3.00% 15/8/2045 50,940 0.00%National Retail Properties, Inc. 50,000 2.50% 15/4/2030 50,911 0.00%BANK 2017 46,000 3.52% 15/7/2060 50,908 0.00%Commonwealth of Massachusetts 50,000 4.20% 1/12/2021 50,836 0.00%CoStar Group, Inc. 50,000 2.80% 15/7/2030 50,832 0.00%US Treasury Note 50,000 1.63% 15/5/2031 50,781 0.00%CenterPoint Energy Houston Electric LLC 50,000 2.25% 1/8/2022 50,765 0.00%University of Chicago 50,000 2.76% 1/4/2045 50,666 0.00%University of Virginia 40,000 4.18% 1/9/2117 50,514 0.00%Ameren Illinois Co. 50,000 2.90% 15/6/2051 50,497 0.00%Sysco Corp. 50,000 3.30% 15/2/2050 50,178 0.00%Amdocs Ltd. 50,000 2.54% 15/6/2030 50,117 0.00%Boeing Co. 50,000 3.63% 1/3/2048 49,865 0.00%Nissan Motor Acceptance Corp. 50,000 1.05% 8/3/2024 49,842 0.00%Masco Corp. 50,000 3.13% 15/2/2051 49,617 0.00%Ameren Corp. 50,000 1.75% 15/3/2028 49,579 0.00%
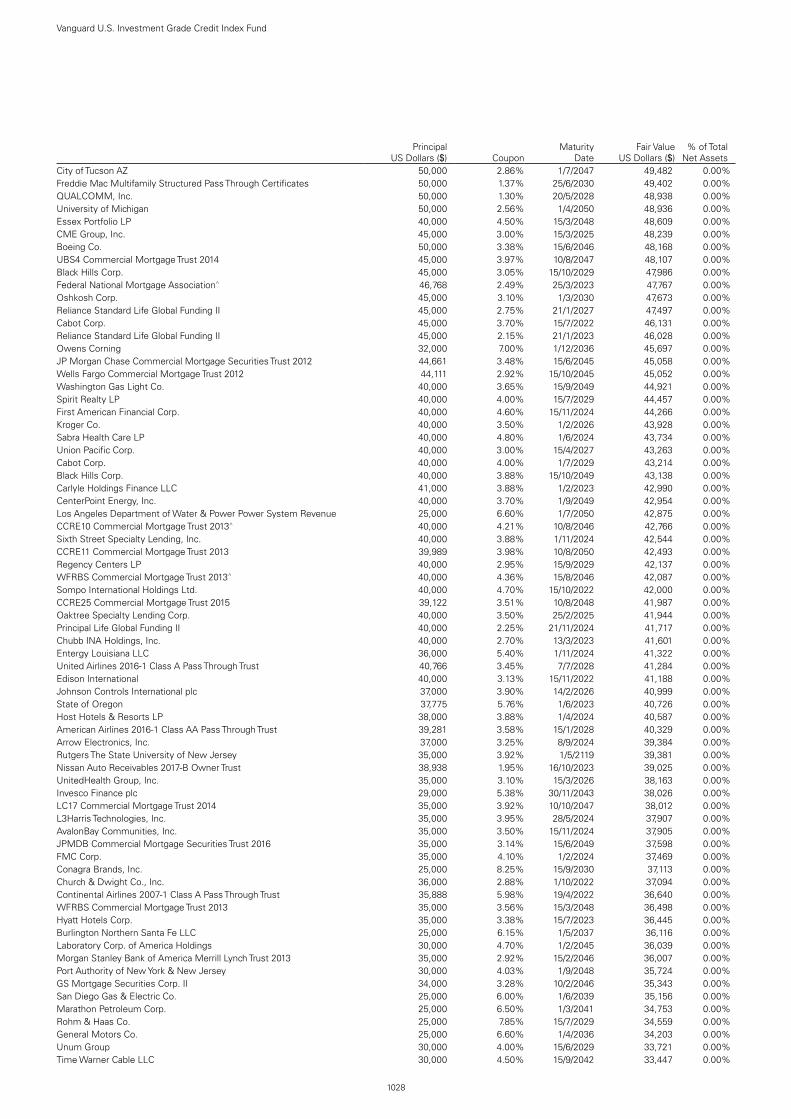
1028
Vanguard U.S. Investment Grade Credit Index Fund
Principal
US Dollars ($) CouponMaturity
DateFair Value
US Dollars ($)% of Total
Net AssetsCity of Tucson AZ 50,000 2.86% 1/7/2047 49,482 0.00%Freddie Mac Multifamily Structured Pass Through Certificates 50,000 1.37% 25/6/2030 49,402 0.00%QUALCOMM, Inc. 50,000 1.30% 20/5/2028 48,938 0.00%University of Michigan 50,000 2.56% 1/4/2050 48,936 0.00%Essex Portfolio LP 40,000 4.50% 15/3/2048 48,609 0.00%CME Group, Inc. 45,000 3.00% 15/3/2025 48,239 0.00%Boeing Co. 50,000 3.38% 15/6/2046 48,168 0.00%UBS4 Commercial Mortgage Trust 2014 45,000 3.97% 10/8/2047 48,107 0.00%Black Hills Corp. 45,000 3.05% 15/10/2029 47,986 0.00%Federal National Mortgage Association^ 46,768 2.49% 25/3/2023 47,767 0.00%Oshkosh Corp. 45,000 3.10% 1/3/2030 47,673 0.00%Reliance Standard Life Global Funding II 45,000 2.75% 21/1/2027 47,497 0.00%Cabot Corp. 45,000 3.70% 15/7/2022 46,131 0.00%Reliance Standard Life Global Funding II 45,000 2.15% 21/1/2023 46,028 0.00%Owens Corning 32,000 7.00% 1/12/2036 45,697 0.00%JP Morgan Chase Commercial Mortgage Securities Trust 2012 44,661 3.48% 15/6/2045 45,058 0.00%Wells Fargo Commercial Mortgage Trust 2012 44,111 2.92% 15/10/2045 45,052 0.00%Washington Gas Light Co. 40,000 3.65% 15/9/2049 44,921 0.00%Spirit Realty LP 40,000 4.00% 15/7/2029 44,457 0.00%First American Financial Corp. 40,000 4.60% 15/11/2024 44,266 0.00%Kroger Co. 40,000 3.50% 1/2/2026 43,928 0.00%Sabra Health Care LP 40,000 4.80% 1/6/2024 43,734 0.00%Union Pacific Corp. 40,000 3.00% 15/4/2027 43,263 0.00%Cabot Corp. 40,000 4.00% 1/7/2029 43,214 0.00%Black Hills Corp. 40,000 3.88% 15/10/2049 43,138 0.00%Carlyle Holdings Finance LLC 41,000 3.88% 1/2/2023 42,990 0.00%CenterPoint Energy, Inc. 40,000 3.70% 1/9/2049 42,954 0.00%Los Angeles Department of Water & Power Power System Revenue 25,000 6.60% 1/7/2050 42,875 0.00%CCRE10 Commercial Mortgage Trust 2013^ 40,000 4.21% 10/8/2046 42,766 0.00%Sixth Street Specialty Lending, Inc. 40,000 3.88% 1/11/2024 42,544 0.00%CCRE11 Commercial Mortgage Trust 2013 39,989 3.98% 10/8/2050 42,493 0.00%Regency Centers LP 40,000 2.95% 15/9/2029 42,137 0.00%WFRBS Commercial Mortgage Trust 2013^ 40,000 4.36% 15/8/2046 42,087 0.00%Sompo International Holdings Ltd. 40,000 4.70% 15/10/2022 42,000 0.00%CCRE25 Commercial Mortgage Trust 2015 39,122 3.51% 10/8/2048 41,987 0.00%Oaktree Specialty Lending Corp. 40,000 3.50% 25/2/2025 41,944 0.00%Principal Life Global Funding II 40,000 2.25% 21/11/2024 41,717 0.00%Chubb INA Holdings, Inc. 40,000 2.70% 13/3/2023 41,601 0.00%Entergy Louisiana LLC 36,000 5.40% 1/11/2024 41,322 0.00%United Airlines 2016-1 Class A Pass Through Trust 40,766 3.45% 7/7/2028 41,284 0.00%Edison International 40,000 3.13% 15/11/2022 41,188 0.00%Johnson Controls International plc 37,000 3.90% 14/2/2026 40,999 0.00%State of Oregon 37,775 5.76% 1/6/2023 40,726 0.00%Host Hotels & Resorts LP 38,000 3.88% 1/4/2024 40,587 0.00%American Airlines 2016-1 Class AA Pass Through Trust 39,281 3.58% 15/1/2028 40,329 0.00%Arrow Electronics, Inc. 37,000 3.25% 8/9/2024 39,384 0.00%Rutgers The State University of New Jersey 35,000 3.92% 1/5/2119 39,381 0.00%Nissan Auto Receivables 2017-B Owner Trust 38,938 1.95% 16/10/2023 39,025 0.00%UnitedHealth Group, Inc. 35,000 3.10% 15/3/2026 38,163 0.00%Invesco Finance plc 29,000 5.38% 30/11/2043 38,026 0.00%LC17 Commercial Mortgage Trust 2014 35,000 3.92% 10/10/2047 38,012 0.00%L3Harris Technologies, Inc. 35,000 3.95% 28/5/2024 37,907 0.00%AvalonBay Communities, Inc. 35,000 3.50% 15/11/2024 37,905 0.00%JPMDB Commercial Mortgage Securities Trust 2016 35,000 3.14% 15/6/2049 37,598 0.00%FMC Corp. 35,000 4.10% 1/2/2024 37,469 0.00%Conagra Brands, Inc. 25,000 8.25% 15/9/2030 37,113 0.00%Church & Dwight Co., Inc. 36,000 2.88% 1/10/2022 37,094 0.00%Continental Airlines 2007-1 Class A Pass Through Trust 35,888 5.98% 19/4/2022 36,640 0.00%WFRBS Commercial Mortgage Trust 2013 35,000 3.56% 15/3/2048 36,498 0.00%Hyatt Hotels Corp. 35,000 3.38% 15/7/2023 36,445 0.00%Burlington Northern Santa Fe LLC 25,000 6.15% 1/5/2037 36,116 0.00%Laboratory Corp. of America Holdings 30,000 4.70% 1/2/2045 36,039 0.00%Morgan Stanley Bank of America Merrill Lynch Trust 2013 35,000 2.92% 15/2/2046 36,007 0.00%Port Authority of New York & New Jersey 30,000 4.03% 1/9/2048 35,724 0.00%GS Mortgage Securities Corp. II 34,000 3.28% 10/2/2046 35,343 0.00%San Diego Gas & Electric Co. 25,000 6.00% 1/6/2039 35,156 0.00%Marathon Petroleum Corp. 25,000 6.50% 1/3/2041 34,753 0.00%Rohm & Haas Co. 25,000 7.85% 15/7/2029 34,559 0.00%General Motors Co. 25,000 6.60% 1/4/2036 34,203 0.00%Unum Group 30,000 4.00% 15/6/2029 33,721 0.00%Time Warner Cable LLC 30,000 4.50% 15/9/2042 33,447 0.00%

1029
Vanguard U.S. Investment Grade Credit Index Fund
Principal
US Dollars ($) CouponMaturity
DateFair Value
US Dollars ($)% of Total
Net AssetsConagra Brands, Inc. 25,000 7.00% 1/10/2028 33,222 0.00%BMW Vehicle Owner Trust 2018 32,794 2.51% 25/6/2024 33,034 0.00%NSTAR Electric Co. 30,000 3.25% 15/5/2029 33,004 0.00%Hackensack Meridian Health, Inc. 25,000 4.50% 1/7/2057 32,756 0.00%Motorola Solutions, Inc. 25,000 5.50% 1/9/2044 32,652 0.00%Piedmont Natural Gas Co., Inc. 30,000 3.64% 1/11/2046 32,374 0.00%CCRE11 Commercial Mortgage Trust 2013^ 30,000 4.72% 10/8/2050 32,342 0.00%Allstate Corp. 25,000 5.35% 1/6/2033 32,329 0.00%WFRBS Commercial Mortgage Trust 2013^ 30,000 4.67% 15/9/2046 32,255 0.00%Continental Airlines 2012-1 Class A Pass Through Trust 30,312 4.15% 11/4/2024 32,192 0.00%Morgan Stanley Bank of America Merrill Lynch Trust 2013^ 30,000 4.26% 15/10/2046 32,054 0.00%Ameren Corp. 30,000 2.50% 15/9/2024 31,600 0.00%Marsh & McLennan Cos, Inc. 25,000 4.35% 30/1/2047 31,323 0.00%RPM International, Inc. 25,000 5.25% 1/6/2045 31,270 0.00%Charles Schwab Corp. 29,000 3.55% 1/2/2024 31,204 0.00%LC13 Commercial Mortgage Trust 2013 29,159 4.21% 10/8/2046 31,092 0.00%Baxalta, Inc. 30,000 3.60% 23/6/2022 30,753 0.00%XLIT Ltd. 27,000 4.45% 31/3/2025 30,279 0.00%Sysco Corp. 25,000 4.45% 15/3/2048 29,854 0.00%Cleco Corporate Holdings LLC 25,000 4.97% 1/5/2046 29,831 0.00%Morgan Stanley Bank of America Merrill Lynch Trust 2013^ 30,000 4.50% 15/8/2046 29,564 0.00%Darden Restaurants, Inc. 25,000 4.55% 15/2/2048 29,367 0.00%Burlington Northern Santa Fe LLC 25,000 3.90% 1/8/2046 29,356 0.00%University of Notre Dame du Lac 25,000 3.39% 15/2/2048 29,253 0.00%Aon Corp. 25,000 4.50% 15/12/2028 29,231 0.00%JPMCC Commercial Mortgage Securities Trust 2017 28,678 3.05% 15/7/2050 29,142 0.00%Owens Corning 25,000 4.30% 15/7/2047 29,070 0.00%Enterprise Products Operating LLC 27,000 3.90% 15/2/2024 29,064 0.00%Westinghouse Air Brake Technologies Corp. 25,000 4.95% 15/9/2028 29,038 0.00%PepsiCo, Inc. 25,000 3.60% 13/8/2042 28,951 0.00%Energy Transfer LP 25,000 5.35% 15/5/2045 28,932 0.00%PNC Bank NA 25,000 4.05% 26/7/2028 28,907 0.00%Hudson Pacific Properties LP 25,000 4.65% 1/4/2029 28,802 0.00%CSX Corp. 25,000 3.80% 15/4/2050 28,663 0.00%CCRE2 Commercial Mortgage Trust 2012 28,000 3.15% 15/8/2045 28,573 0.00%CH Robinson Worldwide, Inc. 25,000 4.20% 15/4/2028 28,545 0.00%Mars, Inc. 25,000 3.60% 1/4/2034 28,440 0.00%Washington Gas Light Co. 25,000 3.80% 15/9/2046 28,435 0.00%Trustees of the University of Pennsylvania 25,000 3.61% 15/2/2119 28,421 0.00%STORE Capital Corp. 25,000 4.50% 15/3/2028 28,290 0.00%Janus Capital Group, Inc. 25,000 4.88% 1/8/2025 28,275 0.00%Brandywine Operating Partnership LP 27,000 3.95% 15/2/2023 28,208 0.00%Raytheon Technologies Corp. 25,000 3.75% 1/11/2046 28,194 0.00%Black Hills Corp. 25,000 4.20% 15/9/2046 28,090 0.00%AvalonBay Communities, Inc. 26,000 4.20% 15/12/2023 28,071 0.00%Cigna Corp. 25,000 3.88% 15/10/2047 27,953 0.00%Timken Co. 25,000 4.50% 15/12/2028 27,930 0.00%RWJ Barnabas Health, Inc. 25,000 3.48% 1/7/2049 27,818 0.00%American Water Capital Corp. 25,000 3.45% 1/6/2029 27,742 0.00%Williams Cos, Inc. 25,000 4.00% 15/9/2025 27,694 0.00%Enterprise Products Operating LLC 25,000 3.70% 15/2/2026 27,690 0.00%BANK 2017 25,000 3.73% 15/11/2050 27,658 0.00%Citigroup, Inc.^ 25,000 3.67% 24/7/2028 27,612 0.00%Chevron Phillips Chemical Co. LLC/Chevron Phillips Chemical Co. LP 25,000 3.40% 1/12/2026 27,561 0.00%Williams Cos, Inc. 25,000 4.55% 24/6/2024 27,539 0.00%Connecticut Light & Power Co. 25,000 3.20% 15/3/2027 27,470 0.00%JPMCC Commercial Mortgage Securities Trust 2017 25,000 3.45% 15/9/2050 27,449 0.00%Spectra Energy Partners LP 25,000 4.75% 15/3/2024 27,448 0.00%UBS Commercial Mortgage Trust 2017 25,000 3.43% 15/8/2050 27,405 0.00%AES Corp. 25,000 3.95% 15/7/2030 27,382 0.00%Owl Rock Capital Corp. 25,000 5.25% 15/4/2024 27,328 0.00%National Rural Utilities Cooperative Finance Corp.^ 25,000 5.25% 20/4/2046 27,324 0.00%Textron, Inc. 25,000 3.88% 1/3/2025 27,278 0.00%SITE Centers Corp. 25,000 4.25% 1/2/2026 27,187 0.00%PNC Bank NA 25,000 3.30% 30/10/2024 27,129 0.00%Owens Corning 25,000 3.40% 15/8/2026 27,118 0.00%Textron, Inc. 25,000 3.38% 1/3/2028 27,086 0.00%CCRE19 Commercial Mortgage Trust 2014 25,000 3.80% 10/8/2047 27,061 0.00%UDR, Inc. 25,000 3.20% 15/1/2030 27,049 0.00%CCRE16 Commercial Mortgage Trust 2014 26,067 3.65% 10/4/2047 27,012 0.00%CCRE17 Commercial Mortgage Trust 2014 25,000 3.98% 10/5/2047 27,004 0.00%

1030
Vanguard U.S. Investment Grade Credit Index Fund
Principal
US Dollars ($) CouponMaturity
DateFair Value
US Dollars ($)% of Total
Net AssetsJPMBB Commercial Mortgage Securities Trust 2014^ 25,000 4.24% 15/4/2047 26,995 0.00%WFRBS Commercial Mortgage Trust 2014 25,000 4.00% 15/5/2047 26,984 0.00%Carlisle Cos, Inc. 25,000 3.50% 1/12/2024 26,970 0.00%Federal Realty Investment Trust 25,000 3.25% 15/7/2027 26,957 0.00%Consumers Energy Co. 25,000 3.25% 15/8/2046 26,949 0.00%Caterpillar Financial Services Corp. 25,000 3.65% 7/12/2023 26,937 0.00%General Motors Financial Co., Inc. 25,000 3.95% 13/4/2024 26,935 0.00%JPMBB Commercial Mortgage Securities Trust 2014 25,000 4.00% 15/4/2047 26,921 0.00%Dover Corp. 25,000 2.95% 4/11/2029 26,871 0.00%Federal Realty Investment Trust 25,000 3.20% 15/6/2029 26,865 0.00%Sherwin-Williams Co. 25,000 2.95% 15/8/2029 26,854 0.00%ITC Holdings Corp. 25,000 3.65% 15/6/2024 26,839 0.00%Ecolab, Inc. 25,000 2.70% 1/11/2026 26,784 0.00%CD 2017-CD3 Mortgage Trust 25,000 3.45% 10/2/2050 26,774 0.00%New York State Thruway Authority 25,000 2.90% 1/1/2035 26,686 0.00%CCRE17 Commercial Mortgage Trust 2014 25,000 4.38% 10/5/2047 26,595 0.00%General Motors Financial Co., Inc. 25,000 4.15% 19/6/2023 26,556 0.00%Dominion Energy, Inc. 26,000 2.75% 15/9/2022 26,550 0.00%BorgWarner, Inc. 25,000 2.65% 1/7/2027 26,512 0.00%Fidelity National Financial, Inc. 25,000 5.50% 1/9/2022 26,358 0.00%Carrier Global Corp. 25,000 3.38% 5/4/2040 26,307 0.00%NetApp, Inc. 25,000 2.38% 22/6/2027 26,241 0.00%Weingarten Realty Investors 25,000 3.50% 15/4/2023 26,079 0.00%Essex Portfolio LP 25,000 3.25% 1/5/2023 26,077 0.00%Verisk Analytics, Inc. 25,000 4.13% 12/9/2022 26,064 0.00%3M Co. 25,000 2.00% 14/2/2025 26,045 0.00%International Flavors & Fragrances, Inc. 25,000 3.20% 1/5/2023 26,021 0.00%CCRE12 Commercial Mortgage Trust 2013 25,198 3.62% 10/10/2046 26,009 0.00%Otis Worldwide Corp. 25,000 2.06% 5/4/2025 25,985 0.00%HP, Inc. 25,000 2.20% 17/6/2025 25,953 0.00%Parker-Hannifin Corp. 25,000 3.50% 15/9/2022 25,919 0.00%Amgen, Inc. 25,000 2.25% 19/8/2023 25,887 0.00%Union Pacific Corp. 25,000 2.75% 15/4/2023 25,884 0.00%Boeing Co. 25,000 2.70% 1/2/2027 25,833 0.00%Boeing Co. 25,000 3.85% 1/11/2048 25,796 0.00%Northern States Power Co. 25,000 2.60% 15/5/2023 25,768 0.00%EI du Pont de Nemours & Co. 25,000 1.70% 15/7/2025 25,628 0.00%PNC Bank NA 25,000 2.45% 28/7/2022 25,546 0.00%Texas Eastern Transmission LP 25,000 2.80% 15/10/2022 25,517 0.00%Exxon Mobil Corp. 25,000 3.10% 16/8/2049 25,496 0.00%Toyota Auto Receivables 2018-B Owner Trust 25,000 3.11% 15/11/2023 25,464 0.00%Martin Marietta Materials, Inc. 25,000 0.65% 15/7/2023 25,048 0.00%John Deere Capital Corp. 25,000 0.40% 10/10/2023 25,020 0.00%Microchip Technology, Inc. 25,000 0.97% 15/2/2024 24,995 0.00%Altria Group, Inc. 25,000 3.88% 16/9/2046 24,788 0.00%Verizon Communications, Inc. 25,000 0.85% 20/11/2025 24,695 0.00%Lowe's Cos, Inc. 21,000 4.25% 15/9/2044 24,100 0.00%Ford Foundation 25,000 2.42% 1/6/2050 24,045 0.00%Board of Regents of the University of Texas System 25,000 2.44% 15/8/2049 24,034 0.00%Union Pacific Corp. 25,000 2.97% 16/9/2062 24,007 0.00%United Airlines 2019-1 Class AA Pass Through Trust 21,065 4.15% 25/8/2031 23,102 0.00%WFRBS Commercial Mortgage Trust 2013 22,000 3.35% 15/5/2045 22,932 0.00%Eli Lilly & Co. 25,000 2.25% 15/5/2050 22,653 0.00%Assurant, Inc. 17,000 6.75% 15/2/2034 22,308 0.00%JPMBB Commercial Mortgage Securities Trust 2013^ 21,286 3.76% 15/8/2046 22,040 0.00%Arizona Public Service Co. 20,000 3.50% 1/12/2049 21,815 0.00%WFRBS Commercial Mortgage Trust 2013 20,000 4.42% 15/9/2046 21,482 0.00%Ecolab, Inc. 14,000 5.50% 8/12/2041 19,515 0.00%GS Mortgage Securities Trust 2012 17,900 3.38% 10/5/2045 17,999 0.00%UBS Commercial Mortgage Trust 2018 16,782 4.21% 15/10/2051 17,809 0.00%Sales Tax Securitization Corp 15,000 3.82% 1/1/2048 16,706 0.00%Toyota Auto Receivables 2018-B Owner Trust 15,626 2.96% 15/9/2022 15,689 0.00%WFRBS Commercial Mortgage Trust 2013 15,130 3.72% 15/8/2046 15,609 0.00%CCRE11 Commercial Mortgage Trust 2013 14,694 3.66% 10/8/2050 15,185 0.00%US Treasury Note 15,000 1.25% 30/6/2028 15,026 0.00%US Treasury Note 15,000 0.75% 31/5/2026 14,917 0.00%US Treasury Note 15,000 0.25% 15/6/2024 14,910 0.00%CCRE17 Commercial Mortgage Trust 2014 14,257 3.60% 10/5/2047 14,796 0.00%Ventas Realty LP 13,000 2.65% 15/1/2025 13,683 0.00%GS Mortgage Securities Trust 2017^ 10,000 4.32% 10/5/2050 11,040 0.00%State of Texas 10,000 3.21% 1/4/2044 10,636 0.00%

1031
Vanguard U.S. Investment Grade Credit Index Fund
Principal
US Dollars ($) CouponMaturity
DateFair Value
US Dollars ($)% of Total
Net AssetsJPMBB Commercial Mortgage Securities Trust 2014 10,000 3.37% 15/11/2047 10,546 0.00%GS Mortgage Securities Trust 2013 10,204 3.82% 10/8/2046 10,498 0.00%Morgan Stanley Bank of America Merrill Lynch Trust 2013 10,000 3.21% 15/2/2046 10,249 0.00%WFRBS Commercial Mortgage Trust 2013 9,489 3.96% 15/9/2046 9,841 0.00%Citigroup Commercial Mortgage Trust 2014 8,175 3.58% 10/5/2047 8,715 0.00%JPMBB Commercial Mortgage Securities Trust 2014 8,328 3.67% 15/4/2047 8,455 0.00%CarMax Auto Owner Trust 2018 8,272 2.48% 15/11/2022 8,288 0.00%Athene Global Funding 5,000 2.50% 14/1/2025 5,216 0.00%test test test test 939,614,744 60.85%Non-US BondsAustralia 1.17% (2020: 1.06%) . .Westpac Banking Corp. 875,000 2.00% 16/1/2025 911,571 0.06%BHP Billiton Finance USA Ltd. 525,000 5.00% 30/9/2043 713,276 0.05%Glencore Funding LLC 500,000 4.00% 27/3/2027 553,950 0.04%Westpac Banking Corp. 500,000 3.30% 26/2/2024 536,014 0.03%Macquarie Group Ltd.^ 500,000 1.34% 12/1/2027 495,373 0.03%BHP Billiton Finance USA Ltd. 400,000 6.42% 1/3/2026 492,945 0.03%Westpac Banking Corp. 435,000 1.15% 3/6/2026 435,347 0.03%Westpac Banking Corp.^ 400,000 2.67% 15/11/2035 393,830 0.03%Scentre Group Trust 1/Scentre Group Trust 2 325,000 4.38% 28/5/2030 377,560 0.02%Westpac Banking Corp. 325,000 3.35% 8/3/2027 359,440 0.02%SGSP Australia Assets Pty Ltd. 325,000 3.30% 9/4/2023 338,857 0.02%Macquarie Bank Ltd. 300,000 3.90% 15/1/2026 334,462 0.02%APT Pipelines Ltd. 290,000 4.20% 23/3/2025 318,002 0.02%National Australia Bank Ltd. 300,000 3.00% 20/1/2023 312,260 0.02%Australia & New Zealand Banking Group Ltd. 275,000 3.70% 16/11/2025 306,665 0.02%Glencore Funding LLC 300,000 2.85% 27/4/2031 304,878 0.02%Westpac Banking Corp.^ 275,000 4.11% 24/7/2034 301,840 0.02%Transurban Finance Co. Pty Ltd. 300,000 2.45% 16/3/2031 301,318 0.02%Commonwealth Bank of Australia1 300,000 2.69% 11/3/2031 299,397 0.02%Commonwealth Bank of Australia 250,000 3.90% 12/7/2047 298,217 0.02%Macquarie Group Ltd.^ 250,000 5.03% 15/1/2030 297,070 0.02%Macquarie Bank Ltd. 275,000 2.30% 22/1/2025 286,994 0.02%Australia & New Zealand Banking Group Ltd. 250,000 4.40% 19/5/2026 281,438 0.02%Rio Tinto Finance USA Ltd. 200,000 5.20% 2/11/2040 274,137 0.02%National Australia Bank Ltd.^ 250,000 3.93% 2/8/2034 270,460 0.02%Telstra Corp., Ltd. 250,000 3.13% 7/4/2025 267,750 0.02%NBN Co., Ltd. 250,000 2.63% 5/5/2031 256,186 0.02%Australia & New Zealand Banking Group Ltd.^ 250,000 2.57% 25/11/2035 242,833 0.02%National Australia Bank Ltd. 250,000 2.33% 21/8/2030 242,673 0.02%Westpac Banking Corp. 225,000 2.70% 19/8/2026 241,311 0.02%Commonwealth Bank of Australia 200,000 4.32% 10/1/2048 235,612 0.02%Argentum Netherlands BV for Swiss Re Ltd.^ 200,000 5.63% 15/8/2052 229,222 0.02%Commonwealth Bank of Australia1 200,000 3.90% 16/3/2028 229,161 0.01%Westpac Banking Corp.^ 200,000 4.32% 23/11/2031 222,369 0.01%Brambles USA, Inc. 200,000 4.13% 23/10/2025 221,924 0.01%National Australia Bank Ltd. 200,000 3.38% 14/1/2026 220,219 0.01%Commonwealth Bank of Australia1 200,000 3.15% 19/9/2027 219,041 0.01%Australia & New Zealand Banking Group Ltd. 200,000 4.50% 19/3/2024 218,828 0.01%Commonwealth Bank of Australia 200,000 3.74% 12/9/2039 218,629 0.01%Newcrest Finance Pty Ltd. 200,000 3.25% 13/5/2030 214,591 0.01%Commonwealth Bank of Australia1 200,000 2.63% 6/9/2026 214,488 0.01%Woodside Finance Ltd. 200,000 3.65% 5/3/2025 213,372 0.01%Commonwealth Bank of Australia^ 200,000 3.61% 12/9/2034 212,180 0.01%Macquarie Bank Ltd. 200,000 3.62% 3/6/2030 211,464 0.01%BHP Billiton Finance USA Ltd. 195,000 3.85% 30/9/2023 209,613 0.01%Westpac Banking Corp. 200,000 2.75% 11/1/2023 207,405 0.01%Westpac Banking Corp. 175,000 4.42% 24/7/2039 206,792 0.01%AusNet Services Holdings Pty Ltd.^ 200,000 5.75% 17/3/2076 201,989 0.01%Glencore Funding LLC 200,000 1.63% 27/4/2026 200,605 0.01%Macquarie Bank Ltd.^ 200,000 3.05% 3/3/2036 199,124 0.01%Macquarie Group Ltd.^ 160,000 3.19% 28/11/2023 165,756 0.01%Woodside Finance Ltd. 150,000 3.70% 15/3/2028 161,158 0.01%Sydney Airport Finance Co. Pty Ltd. 150,000 3.38% 30/4/2025 160,864 0.01%Sydney Airport Finance Co. Pty Ltd. 145,000 3.90% 22/3/2023 152,690 0.01%Rio Tinto Finance USA plc 120,000 4.13% 21/8/2042 146,245 0.01%National Australia Bank Ltd. 150,000 2.65% 14/1/2041 140,275 0.01%Macquarie Bank Ltd. 125,000 4.88% 10/6/2025 139,744 0.01%Rio Tinto Finance USA Ltd. 100,000 7.13% 15/7/2028 135,583 0.01%Goodman US Finance Three LLC 125,000 3.70% 15/3/2028 135,403 0.01%Scentre Group Trust 1/Scentre Group Trust 2 125,000 3.25% 28/10/2025 134,048 0.01%

1032
Vanguard U.S. Investment Grade Credit Index Fund
Principal
US Dollars ($) CouponMaturity
DateFair Value
US Dollars ($)% of Total
Net AssetsCommonwealth Bank of Australia1 125,000 2.50% 18/9/2022 128,279 0.01%Transurban Finance Co. Pty Ltd. 110,000 4.13% 2/2/2026 122,532 0.01%Ausgrid Finance Pty Ltd. 100,000 4.35% 1/8/2028 112,740 0.01%Amcor Finance USA, Inc. 100,000 3.63% 28/4/2026 109,730 0.01%GAIF Bond Issuer Pty Ltd. 100,000 3.40% 30/9/2026 108,868 0.01%Westpac Banking Corp. 100,000 3.65% 15/5/2023 106,109 0.01%Newcrest Finance Pty Ltd. 75,000 5.75% 15/11/2041 99,958 0.01%Scentre Group Trust 1/Scentre Group Trust 2 75,000 3.75% 23/3/2027 82,305 0.01%Sydney Airport Finance Co. Pty Ltd. 75,000 3.63% 28/4/2026 81,457 0.01%Transurban Finance Co. Pty Ltd. 75,000 3.38% 22/3/2027 81,338 0.01%Australia & New Zealand Banking Group Ltd.^ 75,000 2.95% 22/7/2030 78,000 0.01%Ausgrid Finance Pty Ltd. 65,000 3.85% 1/5/2023 67,884 0.00%Rio Tinto Finance USA plc 50,000 4.75% 22/3/2042 65,435 0.00%Goodman US Finance Four LLC 50,000 4.50% 15/10/2037 57,451 0.00%test test test test 18,126,534 1.17%Austria 0.12% (2020: 0.08%) . .Oesterreichische Kontrollbank AG 1,000,000 1.50% 12/2/2025 1,028,699 0.07%JAB Holdings BV 250,000 2.20% 23/11/2030 243,555 0.02%Suzano Austria GmbH 200,000 3.13% 15/1/2032 197,918 0.01%Oesterreichische Kontrollbank AG 175,000 1.63% 17/9/2022 177,953 0.01%Oesterreichische Kontrollbank AG 100,000 3.13% 7/11/2023 106,307 0.01%Oesterreichische Kontrollbank AG 55,000 2.88% 13/3/2023 57,409 0.00%test test test test 1,811,841 0.12%Belgium 0.69% (2020: 0.70%) . .Anheuser-Busch Cos LLC/Anheuser-Busch InBev Worldwide, Inc. 1,260,000 4.90% 1/2/2046 1,593,787 0.10%Anheuser-Busch InBev Worldwide, Inc. 1,160,000 4.75% 23/1/2029 1,381,701 0.09%Anheuser-Busch InBev Worldwide, Inc. 625,000 4.60% 15/4/2048 764,112 0.05%Anheuser-Busch Cos LLC/Anheuser-Busch InBev Worldwide, Inc. 570,000 4.70% 1/2/2036 699,090 0.04%Anheuser-Busch InBev Worldwide, Inc. 525,000 4.38% 15/4/2038 625,662 0.04%Anheuser-Busch InBev Worldwide, Inc. 450,000 5.45% 23/1/2039 593,657 0.04%Anheuser-Busch InBev Worldwide, Inc. 425,000 4.60% 1/6/2060 523,010 0.03%Anheuser-Busch InBev Finance, Inc. 375,000 4.70% 1/2/2036 459,283 0.03%Anheuser-Busch InBev Worldwide, Inc. 400,000 4.00% 13/4/2028 455,423 0.03%Anheuser-Busch Cos LLC/Anheuser-Busch InBev Worldwide, Inc. 401,000 3.65% 1/2/2026 443,306 0.03%Anheuser-Busch InBev Finance, Inc. 325,000 4.90% 1/2/2046 405,866 0.03%Anheuser-Busch InBev Finance, Inc. 350,000 4.00% 17/1/2043 392,470 0.02%Kingdom of Belgium Government International Bond 300,000 1.00% 28/5/2030 286,378 0.02%Anheuser-Busch InBev Worldwide, Inc. 225,000 4.95% 15/1/2042 283,790 0.02%Anheuser-Busch InBev Worldwide, Inc. 233,000 4.44% 6/10/2048 278,597 0.02%Anheuser-Busch InBev Finance, Inc. 250,000 3.65% 1/2/2026 275,810 0.02%Kingdom of Belgium Government International Bond 250,000 2.88% 18/9/2024 268,036 0.02%Anheuser-Busch InBev Worldwide, Inc. 160,000 8.20% 15/1/2039 265,549 0.02%Anheuser-Busch InBev Worldwide, Inc. 175,000 5.80% 23/1/2059 252,906 0.02%Anheuser-Busch InBev Worldwide, Inc. 150,000 5.55% 23/1/2049 206,244 0.01%Anheuser-Busch InBev Worldwide, Inc. 150,000 4.75% 15/4/2058 187,925 0.01%Anheuser-Busch InBev Worldwide, Inc. 25,000 5.88% 15/6/2035 33,290 0.00%test test test test 10,675,892 0.69%Bermuda 0.05% (2020: 0.03%) . .Bermuda Government International Bond 350,000 3.72% 25/1/2027 382,837 0.02%Bermuda Government International Bond 250,000 2.38% 20/8/2030 250,032 0.01%Triton Container International Ltd. 100,000 3.15% 15/6/2031 100,638 0.01%Triton Container International Ltd. 100,000 1.15% 7/6/2024 99,752 0.01%test test test test 833,259 0.05%Brazil 0.22% (2020: 0.21%) . .Suzano Austria GmbH 700,000 6.00% 15/1/2029 833,280 0.05%Vale Overseas Ltd. 298,000 6.88% 21/11/2036 408,388 0.03%Vale Overseas Ltd. 250,000 6.88% 10/11/2039 348,915 0.02%GTL Trade Finance, Inc./Gerdau Holdings, Inc. 234,000 5.89% 29/4/2024 262,917 0.02%Vale Overseas Ltd. 200,000 6.25% 10/8/2026 240,363 0.02%Suzano Austria GmbH 200,000 5.00% 15/1/2030 226,480 0.02%GUSAP III LP 200,000 4.25% 21/1/2030 216,358 0.01%Vale SA 164,000 5.63% 11/9/2042 205,167 0.01%Vale Overseas Ltd. 150,000 3.75% 8/7/2030 159,532 0.01%Fibria Overseas Finance Ltd. 125,000 5.50% 17/1/2027 145,376 0.01%Suzano Austria GmbH 105,000 7.00% 16/3/2047 141,843 0.01%Fibria Overseas Finance Ltd. 100,000 4.00% 14/1/2025 108,019 0.01%Vale Overseas Ltd. 25,000 8.25% 17/1/2034 36,412 0.00%test test test test 3,333,050 0.22%Canada 3.11% (2020: 3.12%) . .Bank of Nova Scotia1 775,000 1.63% 1/5/2023 792,283 0.05%Province of Quebec Canada 650,000 2.50% 20/4/2026 696,113 0.04%

1033
Vanguard U.S. Investment Grade Credit Index Fund
Principal
US Dollars ($) CouponMaturity
DateFair Value
US Dollars ($)% of Total
Net AssetsCanada Government International Bond 700,000 0.75% 19/5/2026 695,721 0.04%Royal Bank of Canada1 675,000 1.60% 17/4/2023 689,756 0.04%TransCanada PipeLines Ltd. 500,000 4.10% 15/4/2030 573,976 0.04%Province of Ontario Canada 550,000 1.05% 14/4/2026 551,658 0.04%Bank of Montreal 500,000 2.10% 15/6/2022 508,434 0.03%Toronto-Dominion Bank 500,000 2.50% 18/1/2022 506,090 0.03%HSBC Bank Canada 500,000 0.95% 14/5/2023 505,146 0.03%Toronto-Dominion Bank 500,000 0.45% 11/9/2023 500,320 0.03%Ontario Teachers' Finance Trust 500,000 0.38% 29/9/2023 499,101 0.03%Province of Quebec Canada 500,000 1.35% 28/5/2030 489,062 0.03%Province of Alberta Canada 470,000 1.88% 13/11/2024 488,415 0.03%Canada Government International Bond 470,000 2.00% 15/11/2022 481,291 0.03%TransCanada PipeLines Ltd. 350,000 6.20% 15/10/2037 480,786 0.03%Empower Finance 2020 LP 500,000 1.78% 17/3/2031 479,859 0.03%Export Development Canada 450,000 2.63% 21/2/2024 475,455 0.03%National Bank of Canada 460,000 2.10% 1/2/2023 471,965 0.03%Ontario Teachers' Finance Trust 460,000 1.38% 15/4/2025 469,239 0.03%Province of Ontario Canada 450,000 2.00% 2/10/2029 464,764 0.03%Province of Quebec Canada 444,000 1.50% 11/2/2025 456,317 0.03%CDP Financial, Inc. 435,000 1.00% 17/4/2023 440,229 0.03%Province of Quebec Canada 300,000 7.50% 15/9/2029 431,600 0.03%Suncor Energy, Inc. 300,000 6.50% 15/6/2038 423,416 0.03%TransCanada PipeLines Ltd. 306,000 6.10% 1/6/2040 420,814 0.03%Royal Bank of Canada1 400,000 1.95% 17/1/2023 409,918 0.03%Province of British Columbia Canada 380,000 2.25% 2/6/2026 402,502 0.03%Royal Bank of Canada1 375,000 3.70% 5/10/2023 402,175 0.03%Province of Ontario Canada 375,000 2.30% 15/6/2026 397,488 0.03%Teck Resources Ltd. 300,000 6.25% 15/7/2041 394,370 0.03%Province of Alberta Canada 365,000 3.35% 1/11/2023 389,414 0.03%CPPIB Capital, Inc. 350,000 3.13% 25/9/2023 371,249 0.02%Province of Ontario Canada 355,000 1.75% 24/1/2023 363,045 0.02%Bank of Montreal1 350,000 1.85% 1/5/2025 361,654 0.02%Province of Manitoba Canada 350,000 2.10% 6/9/2022 357,510 0.02%Province of Quebec Canada 325,000 2.75% 12/4/2027 352,755 0.02%Export Development Canada 345,000 1.75% 18/7/2022 350,645 0.02%Bank of Nova Scotia1 350,000 1.05% 2/3/2026 346,542 0.02%Manulife Financial Corp. 300,000 4.15% 4/3/2026 338,846 0.02%Canadian Natural Resources Ltd. 300,000 3.85% 1/6/2027 330,430 0.02%Canadian Imperial Bank of Commerce 300,000 3.10% 2/4/2024 318,937 0.02%Bank of Montreal1 300,000 2.50% 28/6/2024 316,642 0.02%Nutrien Ltd. 250,000 4.90% 1/6/2043 315,950 0.02%Fairfax Financial Holdings Ltd. 275,000 4.63% 29/4/2030 314,607 0.02%CDP Financial, Inc. 225,000 5.60% 25/11/2039 314,086 0.02%Suncor Energy, Inc.1 300,000 2.80% 15/5/2023 311,811 0.02%Canadian Natural Resources Ltd. 300,000 2.95% 15/1/2023 310,829 0.02%Canadian Pacific Railway Co. 200,000 6.13% 15/9/2115 310,802 0.02%Canadian Natural Resources Ltd. 245,000 4.95% 1/6/2047 305,597 0.02%Royal Bank of Canada 249,000 4.65% 27/1/2026 285,357 0.02%Province of Alberta Canada 295,000 1.30% 22/7/2030 283,521 0.02%Barrick North America Finance LLC 200,000 5.75% 1/5/2043 281,556 0.02%Cenovus Energy, Inc. 225,000 5.40% 15/6/2047 279,373 0.02%Bank of Montreal^ 250,000 3.80% 15/12/2032 275,609 0.02%Canadian Imperial Bank of Commerce 275,000 0.50% 14/12/2023 274,221 0.02%OMERS Finance Trust 270,000 1.13% 14/4/2023 273,694 0.02%Canadian Natural Resources Ltd. 250,000 3.90% 1/2/2025 272,185 0.02%Ontario Teachers' Finance Trust 265,000 2.13% 19/9/2022 270,938 0.02%CDP Financial, Inc. 250,000 3.15% 24/7/2024 269,215 0.02%Province of Quebec Canada 250,000 2.88% 16/10/2024 268,058 0.02%Toronto-Dominion Bank 250,000 3.25% 11/3/2024 267,764 0.02%Toronto-Dominion Bank 250,000 3.50% 19/7/2023 265,866 0.02%Rogers Communications, Inc. 225,000 4.35% 1/5/2049 264,834 0.02%Toronto-Dominion Bank 250,000 2.65% 12/6/2024 264,669 0.02%OMERS Finance Trust 250,000 2.50% 2/5/2024 263,166 0.02%Hydro-Quebec 175,000 8.50% 1/12/2029 261,773 0.02%CI Financial Corp. 250,000 4.10% 15/6/2051 260,457 0.02%Province of Quebec Canada 250,000 2.63% 13/2/2023 259,392 0.02%TransCanada PipeLines Ltd. 225,000 4.25% 15/5/2028 258,757 0.02%Ontario Teachers' Finance Trust 250,000 1.63% 12/9/2024 257,389 0.02%Brookfield Finance, Inc. 211,000 4.70% 20/9/2047 257,278 0.02%Canadian Imperial Bank of Commerce 250,000 2.35% 27/7/2022 255,585 0.02%Federation des Caisses Desjardins du Quebec 250,000 1.95% 26/9/2022 255,179 0.02%

1034
Vanguard U.S. Investment Grade Credit Index Fund
Principal
US Dollars ($) CouponMaturity
DateFair Value
US Dollars ($)% of Total
Net AssetsTransCanada PipeLines Ltd. 200,000 4.88% 15/5/2048 252,927 0.02%Bank of Montreal 250,000 2.50% 11/1/2022 252,907 0.02%National Bank of Canada^ 250,000 0.90% 15/8/2023 251,305 0.02%Canadian Imperial Bank of Commerce 250,000 0.45% 22/6/2023 249,968 0.02%Toronto-Dominion Bank^ 225,000 3.63% 15/9/2031 248,964 0.02%Province of British Columbia Canada 235,000 1.75% 27/9/2024 243,556 0.02%Bell Telephone Co. of Canada or Bell Canada 200,000 4.30% 29/7/2049 242,606 0.02%Canadian Natural Resources Ltd. 225,000 3.80% 15/4/2024 241,839 0.02%Province of Ontario Canada 225,000 2.50% 27/4/2026 240,652 0.02%TransCanada PipeLines Ltd. 200,000 4.75% 15/5/2038 240,507 0.02%Emera US Finance LP 200,000 4.75% 15/6/2046 238,712 0.02%Province of Alberta Canada 235,000 1.00% 20/5/2025 236,587 0.02%Bank of Nova Scotia1 225,000 1.95% 1/2/2023 230,626 0.01%Magna International, Inc. 225,000 2.45% 15/6/2030 230,430 0.01%Enbridge, Inc. 215,000 3.13% 15/11/2029 230,260 0.01%Province of Alberta Canada 225,000 2.20% 26/7/2022 229,674 0.01%Ontario Teachers' Cadillac Fairview Properties Trust 200,000 4.13% 1/2/2029 228,069 0.01%Canadian National Railway Co. 200,000 3.65% 3/2/2048 221,936 0.01%Suncor Energy, Inc. 200,000 4.00% 15/11/2047 221,029 0.01%Alimentation Couche-Tard, Inc. 200,000 3.55% 26/7/2027 220,081 0.01%Emera US Finance LP 200,000 3.55% 15/6/2026 218,717 0.01%Suncor Energy, Inc. 200,000 3.75% 4/3/2051 216,238 0.01%Fortis, Inc. 200,000 3.06% 4/10/2026 215,036 0.01%Suncor Energy, Inc. 200,000 3.10% 15/5/2025 214,129 0.01%Province of Ontario Canada 225,000 1.13% 7/10/2030 213,971 0.01%Barrick North America Finance LLC 155,000 5.70% 30/5/2041 213,281 0.01%Province of Alberta Canada 190,000 3.30% 15/3/2028 212,559 0.01%Province of Alberta Canada 200,000 2.95% 23/1/2024 212,339 0.01%Alimentation Couche-Tard, Inc. 200,000 3.44% 13/5/2041 206,857 0.01%Nutrien Ltd. 200,000 1.90% 13/5/2023 204,886 0.01%Province of British Columbia Canada 200,000 2.00% 23/10/2022 204,632 0.01%Toronto-Dominion Bank 200,000 1.90% 1/12/2022 204,501 0.01%Cenovus Energy, Inc. 150,000 6.75% 15/11/2039 203,416 0.01%Toronto-Dominion Bank 200,000 0.75% 12/6/2023 201,440 0.01%Cenovus Energy, Inc. 175,000 5.38% 15/7/2025 200,209 0.01%Canadian Imperial Bank of Commerce 200,000 1.15% 8/7/2026 199,834 0.01%Royal Bank of Canada 200,000 1.20% 27/4/2026 199,784 0.01%Province of Manitoba Canada 190,000 2.13% 22/6/2026 199,368 0.01%Bank of Nova Scotia1 175,000 4.50% 16/12/2025 198,513 0.01%Rio Tinto Alcan, Inc. 140,000 6.13% 15/12/2033 197,038 0.01%Export Development Canada 190,000 2.50% 24/1/2023 196,646 0.01%Kinross Gold Corp. 175,000 5.95% 15/3/2024 195,699 0.01%Cenovus Energy, Inc. 175,000 4.25% 15/4/2027 195,683 0.01%Enbridge, Inc. 175,000 3.50% 10/6/2024 188,001 0.01%Enbridge, Inc. 170,000 3.70% 15/7/2027 187,855 0.01%Export Development Canada 180,000 1.38% 24/2/2023 183,369 0.01%Manulife Financial Corp. 130,000 5.38% 4/3/2046 182,484 0.01%Province of Ontario Canada 170,000 3.40% 17/10/2023 181,438 0.01%Nutrien Ltd. 175,000 3.15% 1/10/2022 179,662 0.01%Bank of Nova Scotia1 175,000 2.00% 15/11/2022 178,981 0.01%TransCanada PipeLines Ltd. 150,000 4.63% 1/3/2034 177,924 0.01%Rogers Communications, Inc. 150,000 4.30% 15/2/2048 173,482 0.01%Toronto-Dominion Bank 175,000 0.75% 11/9/2025 173,331 0.01%Nutrien Ltd. 125,000 5.63% 1/12/2040 170,497 0.01%Bank of Montreal1 164,000 2.35% 11/9/2022 168,160 0.01%Canadian Natural Resources Ltd. 125,000 6.25% 15/3/2038 167,128 0.01%TELUS Corp. 155,000 2.80% 16/2/2027 165,546 0.01%Thomson Reuters Corp. 125,000 5.50% 15/8/2035 165,087 0.01%Brookfield Finance, Inc. 140,000 4.85% 29/3/2029 164,913 0.01%CPPIB Capital, Inc. 150,000 2.75% 2/11/2027 163,660 0.01%Rogers Communications, Inc. 130,000 5.00% 15/3/2044 162,607 0.01%Bank of Montreal 157,000 2.55% 6/11/2022 161,435 0.01%Bank of Nova Scotia1 150,000 3.40% 11/2/2024 160,634 0.01%Province of Ontario Canada 150,000 3.05% 29/1/2024 159,760 0.01%TransCanada PipeLines Ltd. 150,000 3.75% 16/10/2023 159,638 0.01%Nutrien Ltd. 150,000 2.95% 13/5/2030 158,336 0.01%Brookfield Finance, Inc. 140,000 4.25% 2/6/2026 157,678 0.01%Royal Bank of Canada1 150,000 2.25% 1/11/2024 157,198 0.01%Province of Ontario Canada 150,000 2.20% 3/10/2022 153,614 0.01%Hydro-Quebec 125,000 8.05% 7/7/2024 151,549 0.01%CDP Financial, Inc. 150,000 0.88% 10/6/2025 150,314 0.01%

1035
Vanguard U.S. Investment Grade Credit Index Fund
Principal
US Dollars ($) CouponMaturity
DateFair Value
US Dollars ($)% of Total
Net AssetsRoyal Bank of Canada1 150,000 0.43% 19/1/2024 149,546 0.01%Great-West Lifeco Finance Delaware LP 120,000 4.15% 3/6/2047 142,794 0.01%Canadian Pacific Railway Co. 100,000 7.13% 15/10/2031 142,448 0.01%Canadian National Railway Co. 100,000 6.20% 1/6/2036 141,097 0.01%Rogers Communications, Inc. 125,000 3.63% 15/12/2025 138,061 0.01%Thomson Reuters Corp. 125,000 3.35% 15/5/2026 136,093 0.01%Nutrien Ltd. 100,000 5.88% 1/12/2036 135,951 0.01%Nutrien Ltd. 125,000 3.00% 1/4/2025 133,102 0.01%Canadian National Railway Co. 100,000 6.90% 15/7/2028 132,920 0.01%Barrick Gold Corp. 100,000 5.25% 1/4/2042 131,670 0.01%Canada Government International Bond 125,000 1.63% 22/1/2025 129,293 0.01%Canadian Pacific Railway Co. 100,000 4.80% 15/9/2035 124,155 0.01%Brookfield Finance LLC 120,000 3.45% 15/4/2050 123,690 0.01%Magna International, Inc. 110,000 4.15% 1/10/2025 123,042 0.01%Teck Resources Ltd. 100,000 5.40% 1/2/2043 121,856 0.01%Cenovus Energy, Inc. 100,000 5.25% 15/6/2037 119,672 0.01%Canadian National Railway Co. 80,000 6.38% 15/11/2037 115,336 0.01%Nutrien Ltd. 100,000 3.95% 13/5/2050 115,082 0.01%Canadian National Railway Co. 125,000 2.45% 1/5/2050 113,121 0.01%Canadian Pacific Railway Co. 80,000 5.95% 15/5/2037 110,697 0.01%Bell Telephone Co. of Canada or Bell Canada 100,000 3.65% 17/3/2051 109,437 0.01%Brookfield Finance, Inc. 100,000 4.00% 1/4/2024 108,114 0.01%Alimentation Couche-Tard, Inc. 100,000 3.80% 25/1/2050 107,602 0.01%CCL Industries, Inc. 100,000 3.25% 1/10/2026 107,313 0.01%Bank of Montreal^ 100,000 4.34% 5/10/2028 107,298 0.01%Cenovus Energy, Inc. 100,000 4.00% 15/4/2024 107,090 0.01%Bank of Nova Scotia1 100,000 2.70% 3/8/2026 106,803 0.01%Rogers Communications, Inc. 100,000 3.70% 15/11/2049 106,478 0.01%Suncor Energy, Inc. 75,000 7.15% 1/2/2032 104,791 0.01%Brookfield Finance, Inc. 90,000 4.35% 15/4/2030 103,996 0.01%Rogers Communications, Inc. 100,000 3.00% 15/3/2023 103,561 0.01%Enbridge, Inc. 100,000 2.90% 15/7/2022 102,359 0.01%Canadian Natural Resources Ltd. 75,000 6.50% 15/2/2037 101,252 0.01%Royal Bank of Canada 100,000 1.15% 10/6/2025 100,552 0.01%Cenovus Energy, Inc. 75,000 6.80% 15/9/2037 98,608 0.01%Province of New Brunswick Canada 95,000 2.50% 12/12/2022 97,683 0.01%Enbridge, Inc. 91,000 2.50% 15/1/2025 95,455 0.01%Export Development Canada 90,000 2.75% 15/3/2023 93,786 0.01%Magna International, Inc. 85,000 3.63% 15/6/2024 91,698 0.01%TELUS Corp. 75,000 4.30% 15/6/2049 90,513 0.01%Rio Tinto Alcan, Inc. 65,000 5.75% 1/6/2035 89,881 0.01%Enbridge, Inc. 75,000 4.50% 10/6/2044 88,286 0.01%Kinross Gold Corp. 75,000 4.50% 15/7/2027 85,714 0.01%Teck Resources Ltd. 75,000 3.90% 15/7/2030 81,004 0.01%Rogers Communications, Inc. 75,000 2.90% 15/11/2026 80,248 0.00%Canadian Pacific Railway Co. 75,000 4.45% 15/3/2023 79,257 0.00%Cenovus Energy, Inc. 75,000 3.80% 15/9/2023 79,096 0.00%Alimentation Couche-Tard, Inc. 75,000 2.95% 25/1/2030 78,052 0.00%Cenovus Energy, Inc. 75,000 3.00% 15/8/2022 76,546 0.00%Canadian Natural Resources Ltd. 50,000 6.45% 30/6/2033 65,934 0.00%Great-West Lifeco Finance 2018 LP 50,000 4.58% 17/5/2048 63,287 0.00%Alimentation Couche-Tard, Inc. 50,000 4.50% 26/7/2047 59,062 0.00%Province of New Brunswick Canada 50,000 3.63% 24/2/2028 57,100 0.00%Rogers Communications, Inc. 50,000 4.10% 1/10/2023 53,449 0.00%Canadian Pacific Railway Co. 50,000 2.90% 1/2/2025 53,088 0.00%Canadian National Railway Co. 50,000 3.20% 2/8/2046 51,816 0.00%Province of Saskatchewan Canada 41,000 8.50% 15/7/2022 44,279 0.00%Ontario Teachers' Cadillac Fairview Properties Trust 40,000 3.88% 20/3/2027 44,146 0.00%Air Canada 2017-1 Class AA Pass Through Trust 43,600 3.30% 15/1/2030 44,045 0.00%Barrick PD Australia Finance Pty Ltd. 25,000 5.95% 15/10/2039 34,600 0.00%Thomson Reuters Corp. 25,000 5.65% 23/11/2043 33,585 0.00%Nutrien Ltd. 25,000 4.13% 15/3/2035 28,583 0.00%Cenovus Energy, Inc. 25,000 4.40% 15/4/2029 28,320 0.00%Air Canada 2015-1 Class A Pass Through Trust 18,578 3.60% 15/3/2027 18,828 0.00%test test test test 48,029,363 3.11%Chile 0.58% (2020: 0.51%) . .Corp. Nacional del Cobre de Chile 400,000 3.70% 30/1/2050 423,797 0.03%Chile Government International Bond 400,000 3.50% 25/1/2050 420,148 0.03%Chile Government International Bond 400,000 2.25% 30/10/2022 409,580 0.03%Corp. Nacional del Cobre de Chile 300,000 4.88% 4/11/2044 369,359 0.02%Cencosud SA 300,000 4.38% 17/7/2027 328,764 0.02%
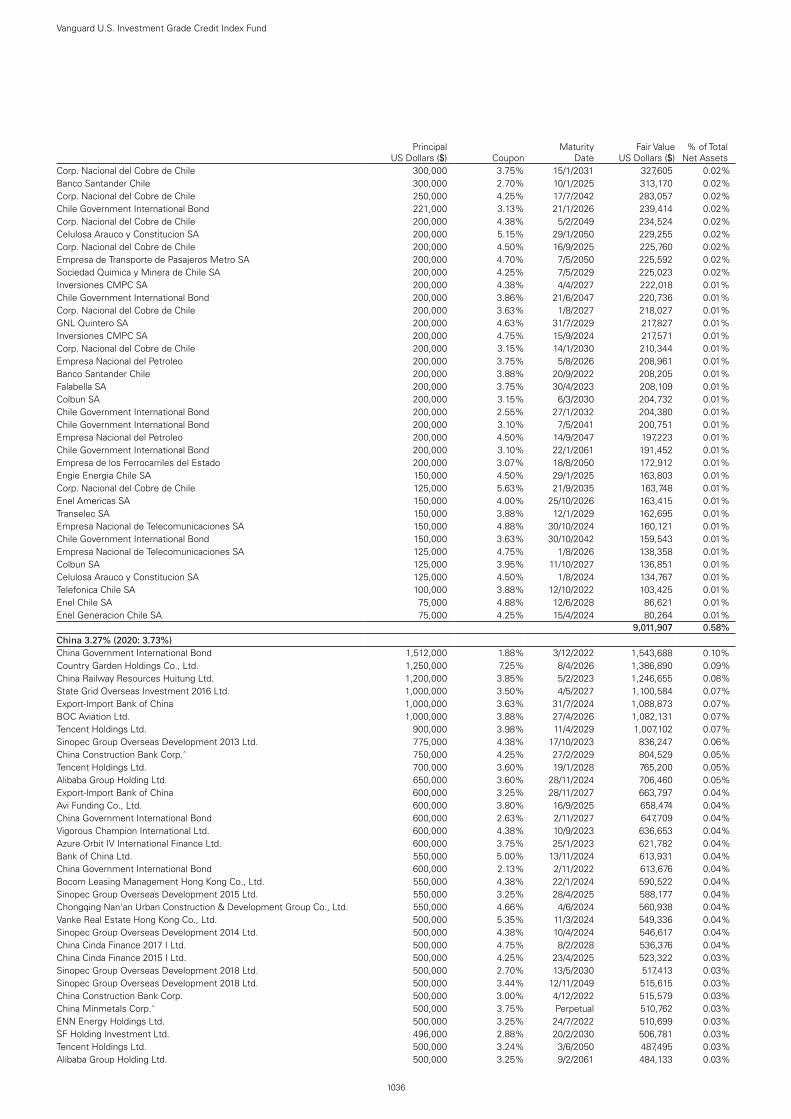
1036
Vanguard U.S. Investment Grade Credit Index Fund
Principal
US Dollars ($) CouponMaturity
DateFair Value
US Dollars ($)% of Total
Net AssetsCorp. Nacional del Cobre de Chile 300,000 3.75% 15/1/2031 327,605 0.02%Banco Santander Chile 300,000 2.70% 10/1/2025 313,170 0.02%Corp. Nacional del Cobre de Chile 250,000 4.25% 17/7/2042 283,057 0.02%Chile Government International Bond 221,000 3.13% 21/1/2026 239,414 0.02%Corp. Nacional del Cobre de Chile 200,000 4.38% 5/2/2049 234,524 0.02%Celulosa Arauco y Constitucion SA 200,000 5.15% 29/1/2050 229,255 0.02%Corp. Nacional del Cobre de Chile 200,000 4.50% 16/9/2025 225,760 0.02%Empresa de Transporte de Pasajeros Metro SA 200,000 4.70% 7/5/2050 225,592 0.02%Sociedad Quimica y Minera de Chile SA 200,000 4.25% 7/5/2029 225,023 0.02%Inversiones CMPC SA 200,000 4.38% 4/4/2027 222,018 0.01%Chile Government International Bond 200,000 3.86% 21/6/2047 220,736 0.01%Corp. Nacional del Cobre de Chile 200,000 3.63% 1/8/2027 218,027 0.01%GNL Quintero SA 200,000 4.63% 31/7/2029 217,827 0.01%Inversiones CMPC SA 200,000 4.75% 15/9/2024 217,571 0.01%Corp. Nacional del Cobre de Chile 200,000 3.15% 14/1/2030 210,344 0.01%Empresa Nacional del Petroleo 200,000 3.75% 5/8/2026 208,961 0.01%Banco Santander Chile 200,000 3.88% 20/9/2022 208,205 0.01%Falabella SA 200,000 3.75% 30/4/2023 208,109 0.01%Colbun SA 200,000 3.15% 6/3/2030 204,732 0.01%Chile Government International Bond 200,000 2.55% 27/1/2032 204,380 0.01%Chile Government International Bond 200,000 3.10% 7/5/2041 200,751 0.01%Empresa Nacional del Petroleo 200,000 4.50% 14/9/2047 197,223 0.01%Chile Government International Bond 200,000 3.10% 22/1/2061 191,452 0.01%Empresa de los Ferrocarriles del Estado 200,000 3.07% 18/8/2050 172,912 0.01%Engie Energia Chile SA 150,000 4.50% 29/1/2025 163,803 0.01%Corp. Nacional del Cobre de Chile 125,000 5.63% 21/9/2035 163,748 0.01%Enel Americas SA 150,000 4.00% 25/10/2026 163,415 0.01%Transelec SA 150,000 3.88% 12/1/2029 162,695 0.01%Empresa Nacional de Telecomunicaciones SA 150,000 4.88% 30/10/2024 160,121 0.01%Chile Government International Bond 150,000 3.63% 30/10/2042 159,543 0.01%Empresa Nacional de Telecomunicaciones SA 125,000 4.75% 1/8/2026 138,358 0.01%Colbun SA 125,000 3.95% 11/10/2027 136,851 0.01%Celulosa Arauco y Constitucion SA 125,000 4.50% 1/8/2024 134,767 0.01%Telefonica Chile SA 100,000 3.88% 12/10/2022 103,425 0.01%Enel Chile SA 75,000 4.88% 12/6/2028 86,621 0.01%Enel Generacion Chile SA 75,000 4.25% 15/4/2024 80,264 0.01%test test test test 9,011,907 0.58%China 3.27% (2020: 3.73%) . .China Government International Bond 1,512,000 1.88% 3/12/2022 1,543,688 0.10%Country Garden Holdings Co., Ltd. 1,250,000 7.25% 8/4/2026 1,386,890 0.09%China Railway Resources Huitung Ltd. 1,200,000 3.85% 5/2/2023 1,246,655 0.08%State Grid Overseas Investment 2016 Ltd. 1,000,000 3.50% 4/5/2027 1,100,584 0.07%Export-Import Bank of China 1,000,000 3.63% 31/7/2024 1,088,873 0.07%BOC Aviation Ltd. 1,000,000 3.88% 27/4/2026 1,082,131 0.07%Tencent Holdings Ltd. 900,000 3.98% 11/4/2029 1,007,102 0.07%Sinopec Group Overseas Development 2013 Ltd. 775,000 4.38% 17/10/2023 836,247 0.06%China Construction Bank Corp.^ 750,000 4.25% 27/2/2029 804,529 0.05%Tencent Holdings Ltd. 700,000 3.60% 19/1/2028 765,200 0.05%Alibaba Group Holding Ltd. 650,000 3.60% 28/11/2024 706,460 0.05%Export-Import Bank of China 600,000 3.25% 28/11/2027 663,797 0.04%Avi Funding Co., Ltd. 600,000 3.80% 16/9/2025 658,474 0.04%China Government International Bond 600,000 2.63% 2/11/2027 647,709 0.04%Vigorous Champion International Ltd. 600,000 4.38% 10/9/2023 636,653 0.04%Azure Orbit IV International Finance Ltd. 600,000 3.75% 25/1/2023 621,782 0.04%Bank of China Ltd. 550,000 5.00% 13/11/2024 613,931 0.04%China Government International Bond 600,000 2.13% 2/11/2022 613,676 0.04%Bocom Leasing Management Hong Kong Co., Ltd. 550,000 4.38% 22/1/2024 590,522 0.04%Sinopec Group Overseas Development 2015 Ltd. 550,000 3.25% 28/4/2025 588,177 0.04%Chongqing Nan'an Urban Construction & Development Group Co., Ltd. 550,000 4.66% 4/6/2024 560,938 0.04%Vanke Real Estate Hong Kong Co., Ltd. 500,000 5.35% 11/3/2024 549,336 0.04%Sinopec Group Overseas Development 2014 Ltd. 500,000 4.38% 10/4/2024 546,617 0.04%China Cinda Finance 2017 I Ltd. 500,000 4.75% 8/2/2028 536,376 0.04%China Cinda Finance 2015 I Ltd. 500,000 4.25% 23/4/2025 523,322 0.03%Sinopec Group Overseas Development 2018 Ltd. 500,000 2.70% 13/5/2030 517,413 0.03%Sinopec Group Overseas Development 2018 Ltd. 500,000 3.44% 12/11/2049 515,615 0.03%China Construction Bank Corp. 500,000 3.00% 4/12/2022 515,579 0.03%China Minmetals Corp.^ 500,000 3.75% Perpetual 510,762 0.03%ENN Energy Holdings Ltd. 500,000 3.25% 24/7/2022 510,699 0.03%SF Holding Investment Ltd. 496,000 2.88% 20/2/2030 506,781 0.03%Tencent Holdings Ltd. 500,000 3.24% 3/6/2050 487,495 0.03%Alibaba Group Holding Ltd. 500,000 3.25% 9/2/2061 484,133 0.03%
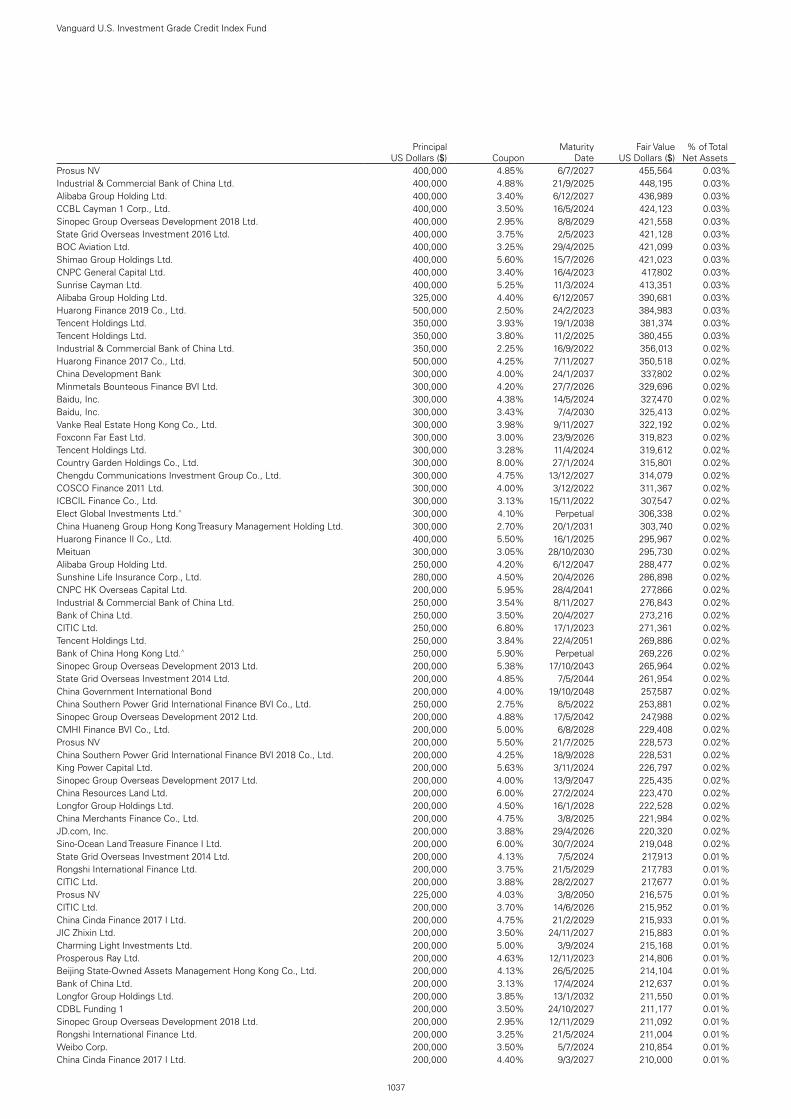
1037
Vanguard U.S. Investment Grade Credit Index Fund
Principal
US Dollars ($) CouponMaturity
DateFair Value
US Dollars ($)% of Total
Net AssetsProsus NV 400,000 4.85% 6/7/2027 455,564 0.03%Industrial & Commercial Bank of China Ltd. 400,000 4.88% 21/9/2025 448,195 0.03%Alibaba Group Holding Ltd. 400,000 3.40% 6/12/2027 436,989 0.03%CCBL Cayman 1 Corp., Ltd. 400,000 3.50% 16/5/2024 424,123 0.03%Sinopec Group Overseas Development 2018 Ltd. 400,000 2.95% 8/8/2029 421,558 0.03%State Grid Overseas Investment 2016 Ltd. 400,000 3.75% 2/5/2023 421,128 0.03%BOC Aviation Ltd. 400,000 3.25% 29/4/2025 421,099 0.03%Shimao Group Holdings Ltd. 400,000 5.60% 15/7/2026 421,023 0.03%CNPC General Capital Ltd. 400,000 3.40% 16/4/2023 417,802 0.03%Sunrise Cayman Ltd. 400,000 5.25% 11/3/2024 413,351 0.03%Alibaba Group Holding Ltd. 325,000 4.40% 6/12/2057 390,681 0.03%Huarong Finance 2019 Co., Ltd. 500,000 2.50% 24/2/2023 384,983 0.03%Tencent Holdings Ltd. 350,000 3.93% 19/1/2038 381,374 0.03%Tencent Holdings Ltd. 350,000 3.80% 11/2/2025 380,455 0.03%Industrial & Commercial Bank of China Ltd. 350,000 2.25% 16/9/2022 356,013 0.02%Huarong Finance 2017 Co., Ltd. 500,000 4.25% 7/11/2027 350,518 0.02%China Development Bank 300,000 4.00% 24/1/2037 337,802 0.02%Minmetals Bounteous Finance BVI Ltd. 300,000 4.20% 27/7/2026 329,696 0.02%Baidu, Inc. 300,000 4.38% 14/5/2024 327,470 0.02%Baidu, Inc. 300,000 3.43% 7/4/2030 325,413 0.02%Vanke Real Estate Hong Kong Co., Ltd. 300,000 3.98% 9/11/2027 322,192 0.02%Foxconn Far East Ltd. 300,000 3.00% 23/9/2026 319,823 0.02%Tencent Holdings Ltd. 300,000 3.28% 11/4/2024 319,612 0.02%Country Garden Holdings Co., Ltd. 300,000 8.00% 27/1/2024 315,801 0.02%Chengdu Communications Investment Group Co., Ltd. 300,000 4.75% 13/12/2027 314,079 0.02%COSCO Finance 2011 Ltd. 300,000 4.00% 3/12/2022 311,367 0.02%ICBCIL Finance Co., Ltd. 300,000 3.13% 15/11/2022 307,547 0.02%Elect Global Investments Ltd.^ 300,000 4.10% Perpetual 306,338 0.02%China Huaneng Group Hong Kong Treasury Management Holding Ltd. 300,000 2.70% 20/1/2031 303,740 0.02%Huarong Finance II Co., Ltd. 400,000 5.50% 16/1/2025 295,967 0.02%Meituan 300,000 3.05% 28/10/2030 295,730 0.02%Alibaba Group Holding Ltd. 250,000 4.20% 6/12/2047 288,477 0.02%Sunshine Life Insurance Corp., Ltd. 280,000 4.50% 20/4/2026 286,898 0.02%CNPC HK Overseas Capital Ltd. 200,000 5.95% 28/4/2041 277,866 0.02%Industrial & Commercial Bank of China Ltd. 250,000 3.54% 8/11/2027 276,843 0.02%Bank of China Ltd. 250,000 3.50% 20/4/2027 273,216 0.02%CITIC Ltd. 250,000 6.80% 17/1/2023 271,361 0.02%Tencent Holdings Ltd. 250,000 3.84% 22/4/2051 269,886 0.02%Bank of China Hong Kong Ltd.^ 250,000 5.90% Perpetual 269,226 0.02%Sinopec Group Overseas Development 2013 Ltd. 200,000 5.38% 17/10/2043 265,964 0.02%State Grid Overseas Investment 2014 Ltd. 200,000 4.85% 7/5/2044 261,954 0.02%China Government International Bond 200,000 4.00% 19/10/2048 257,587 0.02%China Southern Power Grid International Finance BVI Co., Ltd. 250,000 2.75% 8/5/2022 253,881 0.02%Sinopec Group Overseas Development 2012 Ltd. 200,000 4.88% 17/5/2042 247,988 0.02%CMHI Finance BVI Co., Ltd. 200,000 5.00% 6/8/2028 229,408 0.02%Prosus NV 200,000 5.50% 21/7/2025 228,573 0.02%China Southern Power Grid International Finance BVI 2018 Co., Ltd. 200,000 4.25% 18/9/2028 228,531 0.02%King Power Capital Ltd. 200,000 5.63% 3/11/2024 226,797 0.02%Sinopec Group Overseas Development 2017 Ltd. 200,000 4.00% 13/9/2047 225,435 0.02%China Resources Land Ltd. 200,000 6.00% 27/2/2024 223,470 0.02%Longfor Group Holdings Ltd. 200,000 4.50% 16/1/2028 222,528 0.02%China Merchants Finance Co., Ltd. 200,000 4.75% 3/8/2025 221,984 0.02%JD.com, Inc. 200,000 3.88% 29/4/2026 220,320 0.02%Sino-Ocean Land Treasure Finance I Ltd. 200,000 6.00% 30/7/2024 219,048 0.02%State Grid Overseas Investment 2014 Ltd. 200,000 4.13% 7/5/2024 217,913 0.01%Rongshi International Finance Ltd. 200,000 3.75% 21/5/2029 217,783 0.01%CITIC Ltd. 200,000 3.88% 28/2/2027 217,677 0.01%Prosus NV 225,000 4.03% 3/8/2050 216,575 0.01%CITIC Ltd. 200,000 3.70% 14/6/2026 215,952 0.01%China Cinda Finance 2017 I Ltd. 200,000 4.75% 21/2/2029 215,933 0.01%JIC Zhixin Ltd. 200,000 3.50% 24/11/2027 215,883 0.01%Charming Light Investments Ltd. 200,000 5.00% 3/9/2024 215,168 0.01%Prosperous Ray Ltd. 200,000 4.63% 12/11/2023 214,806 0.01%Beijing State-Owned Assets Management Hong Kong Co., Ltd. 200,000 4.13% 26/5/2025 214,104 0.01%Bank of China Ltd. 200,000 3.13% 17/4/2024 212,637 0.01%Longfor Group Holdings Ltd. 200,000 3.85% 13/1/2032 211,550 0.01%CDBL Funding 1 200,000 3.50% 24/10/2027 211,177 0.01%Sinopec Group Overseas Development 2018 Ltd. 200,000 2.95% 12/11/2029 211,092 0.01%Rongshi International Finance Ltd. 200,000 3.25% 21/5/2024 211,004 0.01%Weibo Corp. 200,000 3.50% 5/7/2024 210,854 0.01%China Cinda Finance 2017 I Ltd. 200,000 4.40% 9/3/2027 210,000 0.01%

1038
Vanguard U.S. Investment Grade Credit Index Fund
Principal
US Dollars ($) CouponMaturity
DateFair Value
US Dollars ($)% of Total
Net AssetsAzure Orbit International Finance Ltd. 200,000 3.75% 6/3/2023 209,479 0.01%State Grid Overseas Investment 2013 Ltd. 200,000 3.13% 22/5/2023 208,664 0.01%Shanghai Port Group BVI Development Co., Ltd. 200,000 2.85% 11/9/2029 208,532 0.01%Leading Affluence Ltd. 200,000 4.50% 24/1/2023 208,152 0.01%Sunny Express Enterprises Corp. 200,000 3.13% 23/4/2030 208,103 0.01%China Government International Bond 200,000 2.75% 3/12/2039 207,870 0.01%Sinopec Capital 2013 Ltd. 200,000 3.13% 24/4/2023 207,736 0.01%China Huaneng Group Hong Kong Treasury Management Holding Ltd. 200,000 3.00% 10/12/2029 207,379 0.01%Amber Circle Funding Ltd. 200,000 3.25% 4/12/2022 207,147 0.01%Poly Real Estate Finance Ltd. 200,000 3.95% 5/2/2023 206,580 0.01%Geely Automobile Holdings Ltd. 200,000 3.63% 25/1/2023 205,728 0.01%Weibo Corp. 200,000 3.38% 8/7/2030 205,613 0.01%Baidu, Inc. 200,000 2.88% 6/7/2022 204,267 0.01%CITIC Securities Finance MTN Co., Ltd. 200,000 2.75% 24/10/2022 204,052 0.01%China Great Wall International Holdings III Ltd. 200,000 3.88% 31/8/2027 203,915 0.01%Sepco Virgin Ltd.^ 200,000 3.55% Perpetual 203,362 0.01%Guohui International Bvi Co., Ltd. 200,000 4.37% 9/7/2022 202,228 0.01%Fuqing Investment Management Ltd. 200,000 3.25% 23/6/2025 200,680 0.01%Coastal Emerald Ltd.^ 200,000 4.30% Perpetual 200,159 0.01%ENN Energy Holdings Ltd. 200,000 2.63% 17/9/2030 199,552 0.01%Joy Treasure Assets Holdings, Inc. 200,000 3.50% 24/9/2029 196,424 0.01%Tencent Holdings Ltd. 200,000 3.29% 3/6/2060 194,243 0.01%Prosus NV 200,000 3.83% 8/2/2051 185,609 0.01%Chongqing International Logistics Hub Park Construction Co., Ltd. 200,000 4.30% 26/9/2024 181,629 0.01%Alibaba Group Holding Ltd. 150,000 2.80% 6/6/2023 155,786 0.01%Baidu, Inc. 125,000 3.63% 6/7/2027 137,970 0.01%Huarong Finance 2017 Co., Ltd. 200,000 4.95% 7/11/2047 134,059 0.01%Alibaba Group Holding Ltd. 100,000 4.50% 28/11/2034 116,707 0.01%Alibaba Group Holding Ltd. 100,000 4.00% 6/12/2037 112,165 0.01%Baidu, Inc. 100,000 4.13% 30/6/2025 110,443 0.01%China Development Bank 100,000 3.00% 1/6/2026 107,652 0.01%Baidu, Inc. 100,000 3.50% 28/11/2022 103,778 0.01%Baidu, Inc. 75,000 4.38% 29/3/2028 85,294 0.01%test test test test 50,543,885 3.27%Colombia 0.45% (2020: 0.44%) . .Colombia Government International Bond 600,000 5.00% 15/6/2045 637,530 0.04%Colombia Government International Bond 450,000 2.63% 15/3/2023 460,126 0.03%Colombia Government International Bond 425,000 3.88% 25/4/2027 450,997 0.03%Colombia Government International Bond 375,000 6.13% 18/1/2041 443,766 0.03%Empresas Publicas de Medellin ESP 400,000 4.38% 15/2/2031 396,042 0.03%Colombia Government International Bond 300,000 7.38% 18/9/2037 394,434 0.03%Ecopetrol SA 325,000 5.88% 18/9/2023 352,002 0.02%Colombia Government International Bond 300,000 4.00% 26/2/2024 317,789 0.02%Bancolombia SA 300,000 3.00% 29/1/2025 307,590 0.02%Colombia Government International Bond 250,000 5.63% 26/2/2044 282,837 0.02%Ecopetrol SA 235,000 4.13% 16/1/2025 247,355 0.02%Ecopetrol SA 200,000 7.38% 18/9/2043 246,561 0.02%Ecopetrol SA 200,000 6.88% 29/4/2030 241,345 0.02%Ecopetrol SA 200,000 5.38% 26/6/2026 220,523 0.02%Colombia Government International Bond 200,000 5.20% 15/5/2049 218,648 0.01%Colombia Government International Bond 200,000 4.50% 15/3/2029 218,149 0.01%Ecopetrol SA 200,000 5.88% 28/5/2045 213,952 0.01%Colombia Government International Bond 200,000 3.00% 30/1/2030 195,973 0.01%Colombia Government International Bond 200,000 3.25% 22/4/2032 195,696 0.01%Colombia Government International Bond 200,000 3.13% 15/4/2031 195,681 0.01%Colombia Government International Bond 200,000 4.13% 22/2/2042 194,233 0.01%Colombia Government International Bond 200,000 4.13% 15/5/2051 189,504 0.01%Colombia Government International Bond 200,000 3.88% 15/2/2061 178,851 0.01%SURA Asset Management SA 100,000 4.88% 17/4/2024 107,913 0.01%Colombia Government International Bond 50,000 8.13% 21/5/2024 59,185 0.00%Colombia Government International Bond 10,000 10.38% 28/1/2033 14,959 0.00%test test test test 6,981,641 0.45%Croatia 0.03% (2020: 0.03%) . .Croatia Government International Bond 200,000 6.00% 26/1/2024 226,754 0.02%Croatia Government International Bond 200,000 5.50% 4/4/2023 217,169 0.01%test test test test 443,923 0.03%Denmark 0.14% (2020: 0.14%) . .Denmark Government International Bond 900,000 0.13% 27/10/2022 899,367 0.06%Danske Bank A/S 250,000 5.38% 12/1/2024 277,303 0.02%AP Moller-Maersk A/S 200,000 4.50% 20/6/2029 231,356 0.02%Danske Bank A/S 200,000 4.38% 12/6/2028 224,504 0.02%

1039
Vanguard U.S. Investment Grade Credit Index Fund
Principal
US Dollars ($) CouponMaturity
DateFair Value
US Dollars ($)% of Total
Net AssetsDanske Bank A/S 200,000 3.88% 12/9/2023 212,926 0.01%Danske Bank A/S^ 200,000 1.17% 8/12/2023 200,909 0.01%Danske Bank A/S^ 50,000 3.24% 20/12/2025 53,217 0.00%test test test test 2,099,582 0.14%Finland 0.17% (2020: 0.14%) . .Finland Government International Bond 500,000 0.88% 20/5/2030 475,410 0.03%Nordea Bank Abp 400,000 1.00% 9/6/2023 404,645 0.03%Kuntarahoitus OYJ 400,000 0.38% 1/9/2023 400,010 0.03%Nordea Bank Abp^ 200,000 4.63% 13/9/2033 225,232 0.02%Nordea Bank Abp 200,000 3.75% 30/8/2023 213,417 0.01%Finnvera OYJ 200,000 3.00% 27/6/2023 210,274 0.01%Kuntarahoitus OYJ 200,000 2.50% 15/11/2023 209,788 0.01%Kuntarahoitus OYJ 200,000 1.38% 12/9/2022 202,743 0.01%Nordea Bank Abp 200,000 0.63% 24/5/2024 199,978 0.01%Finnvera OYJ 100,000 2.38% 4/6/2025 106,128 0.01%test test test test 2,647,625 0.17%France 1.90% (2020: 1.76%) . .Caisse d'Amortissement de la Dette Sociale 1,300,000 0.38% 19/5/2023 1,301,610 0.08%Dexia Credit Local SA 850,000 1.63% 16/10/2024 874,664 0.06%Societe Generale SA 770,000 3.00% 22/1/2030 800,502 0.05%TotalEnergies Capital International SA 725,000 2.43% 10/1/2025 762,453 0.05%Dexia Credit Local SA 750,000 0.75% 7/5/2023 755,119 0.05%Societe Generale SA 700,000 2.63% 16/10/2024 731,359 0.05%Caisse d'Amortissement de la Dette Sociale 700,000 1.38% 20/1/2031 683,529 0.04%AXA SA^ 600,000 5.13% 17/1/2047 683,221 0.04%BNP Paribas SA^ 600,000 4.71% 10/1/2025 654,681 0.04%Caisse d'Amortissement de la Dette Sociale 550,000 0.38% 27/5/2024 547,295 0.04%Banque Federative du Credit Mutuel SA 500,000 2.38% 21/11/2024 523,246 0.03%Caisse d'Amortissement de la Dette Sociale 485,000 3.38% 20/3/2024 522,703 0.03%TotalEnergies Capital International SA 500,000 3.13% 29/5/2050 507,427 0.03%Caisse d'Amortissement de la Dette Sociale 500,000 0.63% 18/2/2026 493,518 0.03%Danone SA 450,000 2.95% 2/11/2026 482,048 0.03%Caisse d'Amortissement de la Dette Sociale 500,000 1.00% 21/10/2030 473,814 0.03%BNP Paribas SA1 425,000 4.38% 28/9/2025 470,750 0.03%Electricite de France SA^ 400,000 5.63% Perpetual 431,463 0.03%BNP Paribas SA1 400,000 3.38% 9/1/2025 429,690 0.03%AXA SA 280,000 8.60% 15/12/2030 425,198 0.03%Electricite de France SA 275,000 6.95% 26/1/2039 412,932 0.03%BPCE SA 375,000 4.00% 15/4/2024 408,942 0.03%BNP Paribas SA^ 375,000 2.82% 19/11/2025 394,456 0.03%TotalEnergies Capital International SA 350,000 2.83% 10/1/2030 375,744 0.02%Orange SA 225,000 9.00% 1/3/2031 354,450 0.02%BPCE SA 300,000 4.88% 1/4/2026 338,581 0.02%BNP Paribas SA^ 300,000 4.38% 1/3/2033 331,763 0.02%BNP Paribas SA1 300,000 3.80% 10/1/2024 321,912 0.02%Banque Federative du Credit Mutuel SA 300,000 3.75% 20/7/2023 319,707 0.02%BPCE SA 300,000 1.00% 20/1/2026 295,943 0.02%BNP Paribas SA^ 300,000 2.59% 12/8/2035 292,621 0.02%BNP Paribas SA^ 270,000 3.05% 13/1/2031 284,454 0.02%BNP Paribas SA1 250,000 4.63% 13/3/2027 282,364 0.02%Societe Generale SA 270,000 2.63% 22/1/2025 282,164 0.02%BPCE SA 250,000 3.25% 11/1/2028 272,429 0.02%Credit Agricole SA^ 250,000 4.00% 10/1/2033 271,794 0.02%Societe Generale SA 250,000 4.25% 14/4/2025 271,606 0.02%Credit Agricole SA 250,000 3.25% 4/10/2024 267,934 0.02%Credit Agricole SA 250,000 3.75% 24/4/2023 264,666 0.02%Credit Agricole SA 250,000 3.25% 14/1/2030 263,532 0.02%Danone SA 250,000 2.59% 2/11/2023 260,590 0.02%Electricite de France SA 200,000 5.00% 21/9/2048 260,553 0.02%BPCE SA 250,000 2.75% 11/1/2023 259,063 0.02%Electricite de France SA 200,000 4.95% 13/10/2045 256,787 0.02%Credit Agricole SA^ 250,000 1.91% 16/6/2026 254,797 0.02%Orange SA 185,000 5.38% 13/1/2042 249,711 0.02%Credit Agricole SA^ 250,000 1.25% 26/1/2027 246,022 0.02%BPCE SA^ 250,000 2.28% 20/1/2032 245,148 0.02%BNP Paribas SA^ 200,000 5.20% 10/1/2030 240,701 0.02%Electricite de France SA 200,000 4.50% 4/12/2069 239,704 0.02%Electricite de France SA 200,000 4.50% 21/9/2028 233,150 0.02%Credit Agricole SA 210,000 4.38% 17/3/2025 231,299 0.02%BNP Paribas SA1 200,000 4.40% 14/8/2028 230,541 0.02%Electricite de France SA 170,000 5.60% 27/1/2040 227,155 0.01%

1040
Vanguard U.S. Investment Grade Credit Index Fund
Principal
US Dollars ($) CouponMaturity
DateFair Value
US Dollars ($)% of Total
Net AssetsDexia Credit Local SA 220,000 2.38% 20/9/2022 225,464 0.01%BPCE SA 200,000 5.15% 21/7/2024 223,030 0.01%BPCE SA 200,000 5.70% 22/10/2023 221,646 0.01%Societe Generale SA 200,000 4.00% 12/1/2027 221,191 0.01%BNP Paribas SA1 200,000 3.50% 16/11/2027 217,709 0.01%La Mondiale SAM^ 200,000 4.80% 18/1/2048 214,724 0.01%WEA Finance LLC/Westfield UK & Europe Finance plc 200,000 3.75% 17/9/2024 214,036 0.01%BNP Paribas SA^ 200,000 7.20% Perpetual 213,556 0.01%BNP Paribas SA1 200,000 3.50% 1/3/2023 209,805 0.01%Electricite de France SA^ 200,000 5.25% Perpetual 209,581 0.01%BNP Paribas SA 200,000 3.25% 3/3/2023 209,495 0.01%Banque Federative du Credit Mutuel SA 200,000 2.13% 21/11/2022 204,849 0.01%Electricite de France SA 150,000 5.25% 13/10/2055 201,185 0.01%BPCE SA^ 200,000 1.65% 6/10/2026 200,819 0.01%Sanofi 175,000 3.63% 19/6/2028 199,758 0.01%Agence Francaise de Developpement EPIC 200,000 0.63% 22/1/2026 197,199 0.01%SFIL SA 200,000 0.63% 9/2/2026 196,903 0.01%Electricite de France SA 170,000 3.63% 13/10/2025 186,731 0.01%Air Liquide Finance SA 175,000 2.50% 27/9/2026 185,762 0.01%TotalEnergies Capital International SA 175,000 2.70% 25/1/2023 181,400 0.01%Schneider Electric SE 175,000 2.95% 27/9/2022 180,355 0.01%Orange SA 125,000 5.50% 6/2/2044 174,007 0.01%Credit Agricole SA 175,000 2.81% 11/1/2041 165,774 0.01%Pernod Ricard SA 150,000 3.25% 8/6/2026 162,681 0.01%WEA Finance LLC 150,000 4.63% 20/9/2048 159,904 0.01%BPCE SA 150,000 2.38% 14/1/2025 156,169 0.01%Lafarge SA 100,000 7.13% 15/7/2036 148,084 0.01%Electricite de France SA 100,000 6.00% 22/1/2114 142,051 0.01%Sanofi 125,000 3.38% 19/6/2023 132,064 0.01%Electricite de France SA 100,000 4.88% 22/1/2044 125,993 0.01%TotalEnergies Capital SA 100,000 3.88% 11/10/2028 114,640 0.01%Vinci SA 100,000 3.75% 10/4/2029 112,860 0.01%Engie SA 105,000 2.88% 10/10/2022 108,106 0.01%Airbus SE 100,000 3.15% 10/4/2027 107,579 0.01%BNP Paribas SA^ 100,000 2.87% 19/4/2032 102,594 0.01%TotalEnergies Capital International SA 100,000 2.99% 29/6/2041 101,726 0.01%WEA Finance LLC 75,000 4.13% 20/9/2028 81,550 0.01%Air Liquide Finance SA 75,000 2.25% 27/9/2023 77,784 0.01%Air Liquide Finance SA 75,000 2.25% 10/9/2029 77,409 0.01%Societe Generale SA 75,000 3.63% 1/3/2041 75,535 0.01%WEA Finance LLC 70,000 2.88% 15/1/2027 72,241 0.00%Legrand France SA 55,000 8.50% 15/2/2025 69,511 0.00%Pernod Ricard SA 50,000 5.50% 15/1/2042 67,958 0.00%Air Liquide Finance SA 50,000 3.50% 27/9/2046 56,735 0.00%Societe Generale SA 50,000 4.25% 19/8/2026 54,760 0.00%Airbus SE 40,000 3.95% 10/4/2047 45,475 0.00%Veolia Environnement SA 20,000 6.75% 1/6/2038 29,352 0.00%test test test test 29,335,245 1.90%Germany 2.18% (2020: 2.20%) . .KFW 1,400,000 2.63% 28/2/2024 1,480,768 0.10%KFW 1,100,000 2.50% 20/11/2024 1,169,662 0.08%Deutsche Telekom International Finance BV 750,000 8.75% 15/6/2030 1,123,274 0.07%FMS Wertmanagement 1,000,000 2.75% 30/1/2024 1,058,697 0.07%State of North Rhine-Westphalia Germany 1,000,000 0.63% 28/4/2023 1,005,735 0.06%KFW 1,000,000 0.38% 18/7/2025 986,434 0.06%Deutsche Bank AG 900,000 3.70% 30/5/2024 965,201 0.06%KFW 900,000 1.63% 15/2/2023 920,232 0.06%Landeskreditbank Baden-Wuerttemberg Foerderbank 800,000 2.00% 23/7/2024 834,603 0.05%KFW 640,000 2.38% 29/12/2022 660,597 0.04%Landwirtschaftliche Rentenbank 600,000 3.13% 14/11/2023 638,463 0.04%KFW 600,000 2.13% 17/1/2023 617,508 0.04%NRW Bank 600,000 0.63% 19/5/2025 596,622 0.04%KFW 600,000 0.63% 22/1/2026 594,337 0.04%KFW 775,000 0.00% 18/4/2036 585,314 0.04%Siemens Financieringsmaatschappij NV 450,000 4.20% 16/3/2047 565,359 0.04%KFW 550,000 1.38% 5/8/2024 564,116 0.04%Daimler Finance North America LLC 500,000 3.65% 22/2/2024 536,893 0.03%Landwirtschaftliche Rentenbank1 500,000 2.00% 13/1/2025 523,058 0.03%KFW 500,000 0.25% 19/10/2023 498,729 0.03%KFW 500,000 0.25% 8/3/2024 497,446 0.03%Siemens Financieringsmaatschappij NV 475,000 2.88% 11/3/2041 490,609 0.03%

1041
Vanguard U.S. Investment Grade Credit Index Fund
Principal
US Dollars ($) CouponMaturity
DateFair Value
US Dollars ($)% of Total
Net AssetsLandwirtschaftliche Rentenbank 500,000 0.88% 3/9/2030 472,868 0.03%Siemens Financieringsmaatschappij NV 425,000 3.25% 27/5/2025 461,103 0.03%KFW 400,000 2.88% 3/4/2028 443,102 0.03%BMW US Capital LLC 400,000 3.90% 9/4/2025 441,211 0.03%Volkswagen Group of America Finance LLC1 400,000 3.35% 13/5/2025 431,379 0.03%Bayer US Finance II LLC 375,000 4.38% 15/12/2028 430,087 0.03%Siemens Financieringsmaatschappij NV 400,000 2.00% 15/9/2023 413,135 0.03%KFW 400,000 1.75% 22/8/2022 407,222 0.03%Siemens Financieringsmaatschappij NV 325,000 6.13% 17/8/2026 401,880 0.03%Bayer US Finance II LLC 350,000 5.50% 15/8/2025 399,649 0.03%BMW US Capital LLC 325,000 3.95% 14/8/2028 370,890 0.02%Deutsche Telekom International Finance BV 315,000 4.38% 21/6/2028 366,145 0.02%Deutsche Bank AG 350,000 3.30% 16/11/2022 362,185 0.02%Landwirtschaftliche Rentenbank 330,000 1.75% 27/7/2026 343,056 0.02%Daimler Finance North America LLC 225,000 8.50% 18/1/2031 340,713 0.02%Siemens Financieringsmaatschappij NV 300,000 3.40% 16/3/2027 331,669 0.02%FMS Wertmanagement 315,000 2.00% 1/8/2022 320,923 0.02%NRW Bank 300,000 1.88% 31/7/2024 311,748 0.02%Daimler Finance North America LLC 300,000 1.75% 10/3/2023 306,008 0.02%Bayer US Finance II LLC 250,000 4.20% 15/7/2034 280,232 0.02%Landwirtschaftliche Rentenbank 250,000 2.38% 10/6/2025 265,800 0.02%Daimler Finance North America LLC 250,000 2.45% 2/3/2031 255,940 0.02%Daimler Finance North America LLC 250,000 2.55% 15/8/2022 255,890 0.02%Bayer US Finance II LLC 250,000 2.20% 15/7/2022 252,621 0.02%Siemens Financieringsmaatschappij NV 250,000 0.65% 11/3/2024 250,238 0.02%Siemens Financieringsmaatschappij NV 250,000 0.40% 11/3/2023 250,196 0.02%Siemens Financieringsmaatschappij NV 250,000 1.20% 11/3/2026 250,062 0.02%Daimler Finance North America LLC 250,000 0.75% 1/3/2024 249,906 0.02%Deutsche Telekom International Finance BV 225,000 3.60% 19/1/2027 247,529 0.02%Bayer US Finance II LLC 200,000 4.63% 25/6/2038 237,817 0.02%Volkswagen Group of America Finance LLC 200,000 4.75% 13/11/2028 237,272 0.02%BMW US Capital LLC 220,000 2.80% 11/4/2026 234,818 0.02%BMW US Capital LLC 200,000 4.15% 9/4/2030 233,723 0.02%Bayer US Finance II LLC 200,000 4.40% 15/7/2044 230,704 0.01%Volkswagen Group of America Finance LLC1 200,000 4.63% 13/11/2025 227,433 0.01%Deutsche Telekom International Finance BV 175,000 4.88% 6/3/2042 217,691 0.01%Volkswagen Group of America Finance LLC1 200,000 4.25% 13/11/2023 216,099 0.01%Daimler Finance North America LLC 200,000 3.30% 19/5/2025 215,903 0.01%Deutsche Bank AG 200,000 3.95% 27/2/2023 209,948 0.01%Volkswagen Group of America Finance LLC 200,000 3.13% 12/5/2023 208,929 0.01%FMS Wertmanagement 200,000 2.75% 6/3/2023 208,290 0.01%BMW US Capital LLC 200,000 2.25% 15/9/2023 207,121 0.01%Landwirtschaftliche Rentenbank 200,000 1.88% 17/4/2023 205,684 0.01%KFW 200,000 2.00% 4/10/2022 204,548 0.01%Fresenius Medical Care US Finance III, Inc. 200,000 3.00% 1/12/2031 204,400 0.01%BMW US Capital LLC 200,000 0.80% 1/4/2024 201,056 0.01%Volkswagen Group of America Finance LLC 200,000 0.88% 22/11/2023 200,635 0.01%Fresenius Medical Care US Finance III, Inc. 200,000 1.88% 1/12/2026 200,242 0.01%Siemens Financieringsmaatschappij NV 150,000 4.40% 27/5/2045 192,003 0.01%Deutsche Bank AG 175,000 4.10% 13/1/2026 191,876 0.01%BMW US Capital LLC 175,000 3.80% 6/4/2023 184,966 0.01%Fresenius Medical Care US Finance III, Inc. 150,000 3.75% 15/6/2029 163,404 0.01%Deutsche Bank AG^ 150,000 3.96% 26/11/2025 162,319 0.01%Bayer US Finance II LLC 125,000 5.88% 15/4/2038 161,180 0.01%Deutsche Bank AG^ 150,000 3.55% 18/9/2031 159,624 0.01%BMW US Capital LLC 150,000 3.45% 12/4/2023 157,569 0.01%Landwirtschaftliche Rentenbank 150,000 0.50% 27/5/2025 148,655 0.01%KFW 130,000 2.00% 2/5/2025 136,378 0.01%EMD Finance LLC 120,000 3.25% 19/3/2025 128,882 0.01%KFW 125,000 1.75% 14/9/2029 128,788 0.01%Bayer US Finance II LLC 105,000 4.70% 15/7/2064 125,849 0.01%Deutsche Telekom International Finance BV 100,000 4.75% 21/6/2038 121,583 0.01%E.ON International Finance BV 75,000 6.65% 30/4/2038 109,419 0.01%Landwirtschaftliche Rentenbank 100,000 2.50% 15/11/2027 108,087 0.01%Daimler Finance North America LLC 100,000 3.10% 15/8/2029 107,667 0.01%BMW US Capital LLC 85,000 3.30% 6/4/2027 92,945 0.01%Bayer US Finance II LLC 75,000 3.95% 15/4/2045 80,147 0.01%BMW US Capital LLC 50,000 3.75% 12/4/2028 56,432 0.00%Daimler Finance North America LLC 50,000 3.45% 6/1/2027 54,866 0.00%Deutsche Telekom AG 25,000 3.63% 21/1/2050 26,498 0.00%test test test test 33,728,494 2.18%

1042
Vanguard U.S. Investment Grade Credit Index Fund
Principal
US Dollars ($) CouponMaturity
DateFair Value
US Dollars ($)% of Total
Net AssetsGuernsey 0.02% (2020: 0.02%) . .Pershing Square Holdings Ltd. 300,000 5.50% 15/7/2022 311,834 0.02%test test test test 311,834 0.02%Hong Kong 0.26% (2020: 0.25%) . .Hutchison Whampoa International 14 Ltd. 850,000 3.63% 31/10/2024 925,033 0.06%Airport Authority 500,000 1.63% 4/2/2031 483,860 0.03%AIA Group Ltd. 400,000 3.60% 9/4/2029 443,631 0.03%CLP Power Hong Kong Financing Ltd. 350,000 3.38% 26/10/2027 383,935 0.03%CK Hutchison International 16 Ltd. 300,000 2.75% 3/10/2026 319,644 0.02%AIA Group Ltd. 250,000 3.38% 7/4/2030 274,211 0.02%AIA Group Ltd. 200,000 4.50% 16/3/2046 252,402 0.02%CK Hutchison International 17 II Ltd. 200,000 3.25% 29/9/2027 217,975 0.01%AIA Group Ltd. 200,000 3.13% 13/3/2023 207,817 0.01%Nan Fung Treasury Ltd. 200,000 4.50% 20/9/2022 206,807 0.01%HPHT Finance 17 Ltd. 200,000 2.75% 11/9/2022 203,842 0.01%Link Finance Cayman 2009 Ltd. 150,000 3.60% 3/9/2024 159,961 0.01%test test test test 4,079,118 0.26%Hungary 0.08% (2020: 0.08%) . .Hungary Government International Bond 400,000 5.38% 21/2/2023 432,463 0.03%Hungary Government International Bond 180,000 7.63% 29/3/2041 295,326 0.02%Hungary Government International Bond 200,000 5.38% 25/3/2024 225,628 0.02%Hungary Government International Bond 200,000 5.75% 22/11/2023 224,650 0.01%test test test test 1,178,067 0.08%India 0.42% (2020: 0.39%) . .Reliance Industries Ltd. 400,000 3.67% 30/11/2027 436,580 0.03%State Bank of India 400,000 4.38% 24/1/2024 429,962 0.03%State Bank of India 350,000 4.50% 28/9/2023 374,901 0.03%Reliance Industries Ltd. 300,000 4.13% 28/1/2025 327,126 0.02%Export-Import Bank of India 300,000 3.88% 1/2/2028 324,698 0.02%Power Finance Corp., Ltd. 300,000 4.50% 18/6/2029 321,480 0.02%Export-Import Bank of India 300,000 3.38% 5/8/2026 320,127 0.02%ICICI Bank Ltd. 250,000 4.00% 18/3/2026 270,405 0.02%NTPC Ltd. 250,000 4.25% 26/2/2026 269,422 0.02%ONGC Videsh Vankorneft Pte Ltd. 250,000 3.75% 27/7/2026 265,966 0.02%Power Finance Corp., Ltd. 200,000 6.15% 6/12/2028 237,279 0.02%Oil India Ltd. 200,000 5.13% 4/2/2029 224,412 0.02%Bharti Airtel International Netherlands BV 200,000 5.35% 20/5/2024 220,142 0.02%State Bank of India 200,000 4.88% 17/4/2024 219,017 0.02%Bharti Airtel Ltd. 200,000 4.38% 10/6/2025 218,239 0.01%REC Ltd. 200,000 4.63% 22/3/2028 217,657 0.01%UPL Corp., Ltd. 200,000 4.63% 16/6/2030 215,266 0.01%Adani Transmission Ltd. 200,000 4.00% 3/8/2026 209,859 0.01%Bharat Petroleum Corp., Ltd. 200,000 4.63% 25/10/2022 208,923 0.01%Adani Ports & Special Economic Zone Ltd. 200,000 4.38% 3/7/2029 208,889 0.01%NTPC Ltd. 200,000 4.75% 3/10/2022 208,854 0.01%Export-Import Bank of India 200,000 3.25% 15/1/2030 203,385 0.01%Adani Electricity Mumbai Ltd. 200,000 3.95% 12/2/2030 200,497 0.01%Indian Railway Finance Corp., Ltd. 200,000 3.95% 13/2/2050 196,626 0.01%UPL Corp., Ltd. 100,000 4.50% 8/3/2028 107,372 0.01%Reliance Industries Ltd. 50,000 4.88% 10/2/2045 62,097 0.00%test test test test 6,499,181 0.42%Indonesia 1.08% (2020: 1.06%) . .Indonesia Government International Bond 1,300,000 5.88% 15/1/2024 1,466,801 0.10%Perusahaan Penerbit SBSN Indonesia III 1,000,000 4.55% 29/3/2026 1,135,577 0.07%Perusahaan Penerbit SBSN Indonesia III 800,000 4.45% 20/2/2029 920,569 0.06%Perusahaan Perseroan Persero PT Perusahaan Listrik Negara 800,000 4.13% 15/5/2027 869,369 0.06%Minejesa Capital BV 650,000 4.63% 10/8/2030 688,786 0.04%Indonesia Government International Bond 500,000 5.13% 15/1/2045 619,971 0.04%Indonesia Asahan Aluminium Persero PT 500,000 4.75% 15/5/2025 550,976 0.04%Indonesia Government International Bond 300,000 8.50% 12/10/2035 480,129 0.03%Indonesia Government International Bond 400,000 4.45% 15/4/2070 472,547 0.03%Indonesia Government International Bond 300,000 7.75% 17/1/2038 453,866 0.03%Indonesia Government International Bond 400,000 3.85% 15/10/2030 445,547 0.03%Perusahaan Perseroan Persero PT Perusahaan Listrik Negara 400,000 4.88% 17/7/2049 435,594 0.03%Indonesia Government International Bond 375,000 4.63% 15/4/2043 434,087 0.03%Indonesia Government International Bond 400,000 3.50% 14/2/2050 414,753 0.03%Pertamina Persero PT 300,000 6.45% 30/5/2044 390,646 0.03%Indonesia Government International Bond 300,000 5.25% 8/1/2047 381,889 0.03%Indonesia Government International Bond 300,000 5.25% 17/1/2042 373,988 0.02%Indonesia Government International Bond 250,000 6.63% 17/2/2037 344,954 0.02%Perusahaan Penerbit SBSN Indonesia III 300,000 4.40% 1/3/2028 342,438 0.02%

1043
Vanguard U.S. Investment Grade Credit Index Fund
Principal
US Dollars ($) CouponMaturity
DateFair Value
US Dollars ($)% of Total
Net AssetsPerusahaan Perseroan Persero PT Perusahaan Listrik Negara 300,000 5.25% 24/10/2042 339,415 0.02%Indonesia Government International Bond 300,000 4.10% 24/4/2028 339,392 0.02%Pelabuhan Indonesia II PT 300,000 4.25% 5/5/2025 327,849 0.02%Pertamina Persero PT 300,000 4.30% 20/5/2023 318,827 0.02%Indonesia Government International Bond 300,000 2.85% 14/2/2030 311,386 0.02%Pertamina Persero PT 300,000 4.15% 25/2/2060 301,227 0.02%Indonesia Government International Bond 200,000 6.75% 15/1/2044 295,572 0.02%Indonesia Government International Bond 200,000 5.95% 8/1/2046 275,375 0.02%Indonesia Government International Bond 200,000 5.35% 11/2/2049 259,807 0.02%Indonesia Asahan Aluminium Persero PT 200,000 6.76% 15/11/2048 259,262 0.02%Perusahaan Perseroan Persero PT Perusahaan Listrik Negara 200,000 6.25% 25/1/2049 253,957 0.02%Pertamina Persero PT 200,000 6.00% 3/5/2042 245,170 0.02%Indonesia Government International Bond 200,000 4.75% 8/1/2026 228,402 0.02%Perusahaan Gas Negara Tbk PT 200,000 5.13% 16/5/2024 221,865 0.01%Pelabuhan Indonesia III Persero PT 200,000 4.88% 1/10/2024 221,061 0.01%Hutama Karya Persero PT 200,000 3.75% 11/5/2030 214,126 0.01%Pertamina Persero PT 200,000 3.65% 30/7/2029 213,849 0.01%Bank Mandiri Persero Tbk PT 200,000 3.75% 11/4/2024 213,007 0.01%Indonesia Government International Bond 200,000 2.95% 11/1/2023 207,240 0.01%Pertamina Persero PT 200,000 4.18% 21/1/2050 205,910 0.01%Pertamina Persero PT 200,000 3.10% 27/8/2030 205,424 0.01%test test test test 16,680,610 1.08%Ireland 0.37% (2020: 0.31%) . .AerCap Ireland Capital DAC/AerCap Global Aviation Trust 600,000 4.45% 3/4/2026 659,093 0.04%Avolon Holdings Funding Ltd. 500,000 5.13% 1/10/2023 540,561 0.03%AerCap Ireland Capital DAC/AerCap Global Aviation Trust 500,000 4.13% 3/7/2023 530,223 0.03%AerCap Ireland Capital DAC/AerCap Global Aviation Trust 450,000 4.50% 15/9/2023 482,673 0.03%Park Aerospace Holdings Ltd. 400,000 5.25% 15/8/2022 418,764 0.03%AerCap Ireland Capital DAC/AerCap Global Aviation Trust 350,000 6.50% 15/7/2025 410,384 0.03%CRH America Finance, Inc. 300,000 4.40% 9/5/2047 359,919 0.02%Avolon Holdings Funding Ltd. 325,000 2.75% 21/2/2028 321,596 0.02%Avolon Holdings Funding Ltd. 300,000 2.88% 15/2/2025 309,063 0.02%AIB Group plc 250,000 4.75% 12/10/2023 271,388 0.02%AerCap Ireland Capital DAC/AerCap Global Aviation Trust 225,000 4.45% 1/10/2025 247,701 0.02%AerCap Ireland Capital DAC/AerCap Global Aviation Trust 200,000 3.65% 21/7/2027 213,794 0.01%Park Aerospace Holdings Ltd. 200,000 4.50% 15/3/2023 210,265 0.01%AerCap Ireland Capital DAC/AerCap Global Aviation Trust 150,000 2.88% 14/8/2024 156,865 0.01%AerCap Ireland Capital DAC/AerCap Global Aviation Trust 150,000 4.63% 1/7/2022 156,016 0.01%SMBC Aviation Capital Finance DAC 125,000 3.00% 15/7/2022 127,823 0.01%AerCap Ireland Capital DAC/AerCap Global Aviation Trust 105,000 3.30% 23/1/2023 108,813 0.01%Avolon Holdings Funding Ltd. 95,000 4.38% 1/5/2026 103,230 0.01%Avolon Holdings Funding Ltd. 100,000 2.13% 21/2/2026 99,127 0.01%Park Aerospace Holdings Ltd. 50,000 5.50% 15/2/2024 54,989 0.00%test test test test 5,782,287 0.37%Israel 0.28% (2020: 0.25%) . .State of Israel 600,000 3.80% 13/5/2060 683,876 0.05%State of Israel 500,000 2.50% 15/1/2030 524,472 0.03%Israel Electric Corp., Ltd. 450,000 5.00% 12/11/2024 503,105 0.03%Israel Government International Bond 400,000 3.88% 3/7/2050 463,112 0.03%Israel Government International Bond 250,000 4.50% 30/1/2043 311,660 0.02%Israel Electric Corp., Ltd. 250,000 4.25% 14/8/2028 280,200 0.02%Israel Government International Bond 250,000 2.75% 3/7/2030 267,305 0.02%Israel Government International Bond 200,000 4.50% 3/4/2120 252,911 0.02%Israel Government International Bond 200,000 3.25% 17/1/2028 220,337 0.02%Israel Government International Bond 200,000 2.88% 16/3/2026 215,701 0.01%State of Israel 200,000 3.38% 15/1/2050 214,142 0.01%Israel Government International Bond 150,000 3.15% 30/6/2023 158,119 0.01%Delek & Avner Tamar Bond Ltd. 90,000 5.41% 30/12/2025 90,568 0.01%ICL Group Ltd. 50,000 6.38% 31/5/2038 64,366 0.00%test test test test 4,249,874 0.28%Italy 0.55% (2020: 0.44%) . .UniCredit SpA^ 700,000 2.57% 22/9/2026 709,375 0.05%Republic of Italy Government International Bond 650,000 2.38% 17/10/2024 675,924 0.04%Enel Finance International NV 500,000 3.50% 6/4/2028 548,189 0.04%Enel Finance International NV 500,000 4.25% 14/9/2023 538,438 0.04%Republic of Italy Government International Bond 500,000 0.88% 6/5/2024 498,428 0.03%Republic of Italy Government International Bond 430,000 6.88% 27/9/2023 486,860 0.03%Enel Finance International NV 400,000 4.88% 14/6/2029 477,787 0.03%Intesa Sanpaolo SpA 400,000 3.25% 23/9/2024 425,438 0.03%UniCredit SpA^ 400,000 3.13% 3/6/2032 402,042 0.03%Republic of Italy Government International Bond 350,000 4.00% 17/10/2049 384,905 0.03%
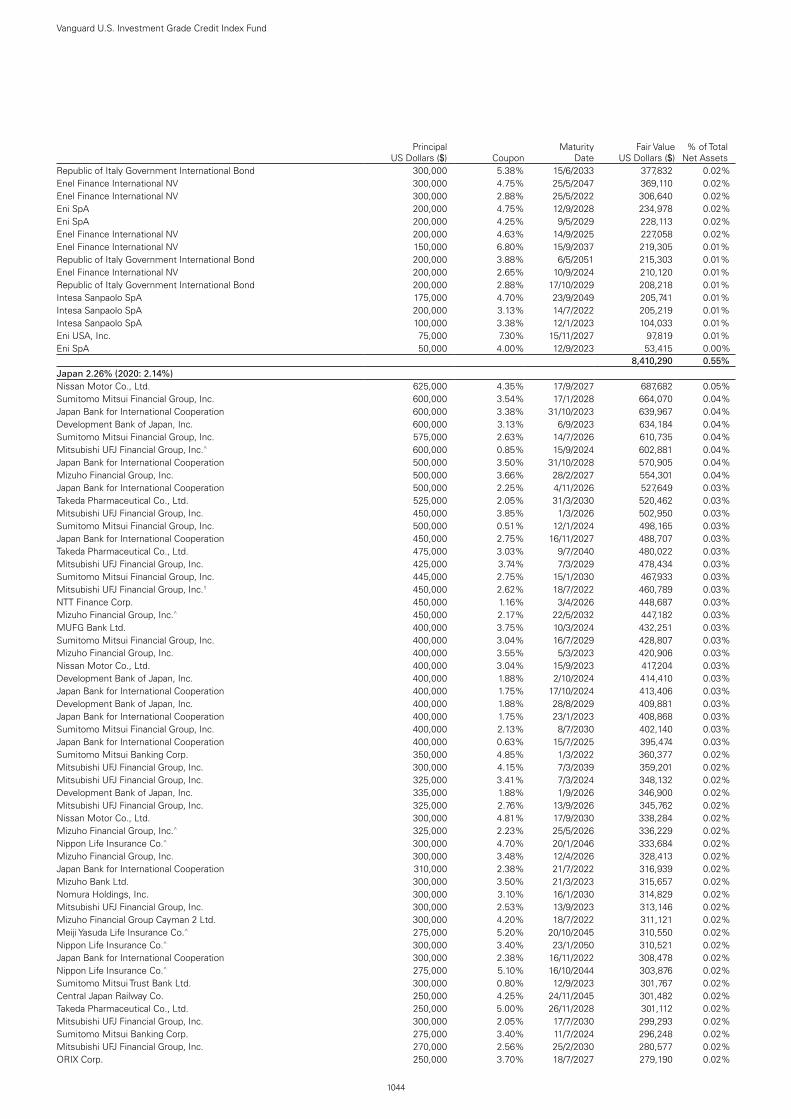
1044
Vanguard U.S. Investment Grade Credit Index Fund
Principal
US Dollars ($) CouponMaturity
DateFair Value
US Dollars ($)% of Total
Net AssetsRepublic of Italy Government International Bond 300,000 5.38% 15/6/2033 377,832 0.02%Enel Finance International NV 300,000 4.75% 25/5/2047 369,110 0.02%Enel Finance International NV 300,000 2.88% 25/5/2022 306,640 0.02%Eni SpA 200,000 4.75% 12/9/2028 234,978 0.02%Eni SpA 200,000 4.25% 9/5/2029 228,113 0.02%Enel Finance International NV 200,000 4.63% 14/9/2025 227,058 0.02%Enel Finance International NV 150,000 6.80% 15/9/2037 219,305 0.01%Republic of Italy Government International Bond 200,000 3.88% 6/5/2051 215,303 0.01%Enel Finance International NV 200,000 2.65% 10/9/2024 210,120 0.01%Republic of Italy Government International Bond 200,000 2.88% 17/10/2029 208,218 0.01%Intesa Sanpaolo SpA 175,000 4.70% 23/9/2049 205,741 0.01%Intesa Sanpaolo SpA 200,000 3.13% 14/7/2022 205,219 0.01%Intesa Sanpaolo SpA 100,000 3.38% 12/1/2023 104,033 0.01%Eni USA, Inc. 75,000 7.30% 15/11/2027 97,819 0.01%Eni SpA 50,000 4.00% 12/9/2023 53,415 0.00%test test test test 8,410,290 0.55%Japan 2.26% (2020: 2.14%) . .Nissan Motor Co., Ltd. 625,000 4.35% 17/9/2027 687,682 0.05%Sumitomo Mitsui Financial Group, Inc. 600,000 3.54% 17/1/2028 664,070 0.04%Japan Bank for International Cooperation 600,000 3.38% 31/10/2023 639,967 0.04%Development Bank of Japan, Inc. 600,000 3.13% 6/9/2023 634,184 0.04%Sumitomo Mitsui Financial Group, Inc. 575,000 2.63% 14/7/2026 610,735 0.04%Mitsubishi UFJ Financial Group, Inc.^ 600,000 0.85% 15/9/2024 602,881 0.04%Japan Bank for International Cooperation 500,000 3.50% 31/10/2028 570,905 0.04%Mizuho Financial Group, Inc. 500,000 3.66% 28/2/2027 554,301 0.04%Japan Bank for International Cooperation 500,000 2.25% 4/11/2026 527,649 0.03%Takeda Pharmaceutical Co., Ltd. 525,000 2.05% 31/3/2030 520,462 0.03%Mitsubishi UFJ Financial Group, Inc. 450,000 3.85% 1/3/2026 502,950 0.03%Sumitomo Mitsui Financial Group, Inc. 500,000 0.51% 12/1/2024 498,165 0.03%Japan Bank for International Cooperation 450,000 2.75% 16/11/2027 488,707 0.03%Takeda Pharmaceutical Co., Ltd. 475,000 3.03% 9/7/2040 480,022 0.03%Mitsubishi UFJ Financial Group, Inc. 425,000 3.74% 7/3/2029 478,434 0.03%Sumitomo Mitsui Financial Group, Inc. 445,000 2.75% 15/1/2030 467,933 0.03%Mitsubishi UFJ Financial Group, Inc.1 450,000 2.62% 18/7/2022 460,789 0.03%NTT Finance Corp. 450,000 1.16% 3/4/2026 448,687 0.03%Mizuho Financial Group, Inc.^ 450,000 2.17% 22/5/2032 447,182 0.03%MUFG Bank Ltd. 400,000 3.75% 10/3/2024 432,251 0.03%Sumitomo Mitsui Financial Group, Inc. 400,000 3.04% 16/7/2029 428,807 0.03%Mizuho Financial Group, Inc. 400,000 3.55% 5/3/2023 420,906 0.03%Nissan Motor Co., Ltd. 400,000 3.04% 15/9/2023 417,204 0.03%Development Bank of Japan, Inc. 400,000 1.88% 2/10/2024 414,410 0.03%Japan Bank for International Cooperation 400,000 1.75% 17/10/2024 413,406 0.03%Development Bank of Japan, Inc. 400,000 1.88% 28/8/2029 409,881 0.03%Japan Bank for International Cooperation 400,000 1.75% 23/1/2023 408,868 0.03%Sumitomo Mitsui Financial Group, Inc. 400,000 2.13% 8/7/2030 402,140 0.03%Japan Bank for International Cooperation 400,000 0.63% 15/7/2025 395,474 0.03%Sumitomo Mitsui Banking Corp. 350,000 4.85% 1/3/2022 360,377 0.02%Mitsubishi UFJ Financial Group, Inc. 300,000 4.15% 7/3/2039 359,201 0.02%Mitsubishi UFJ Financial Group, Inc. 325,000 3.41% 7/3/2024 348,132 0.02%Development Bank of Japan, Inc. 335,000 1.88% 1/9/2026 346,900 0.02%Mitsubishi UFJ Financial Group, Inc. 325,000 2.76% 13/9/2026 345,762 0.02%Nissan Motor Co., Ltd. 300,000 4.81% 17/9/2030 338,284 0.02%Mizuho Financial Group, Inc.^ 325,000 2.23% 25/5/2026 336,229 0.02%Nippon Life Insurance Co.^ 300,000 4.70% 20/1/2046 333,684 0.02%Mizuho Financial Group, Inc. 300,000 3.48% 12/4/2026 328,413 0.02%Japan Bank for International Cooperation 310,000 2.38% 21/7/2022 316,939 0.02%Mizuho Bank Ltd. 300,000 3.50% 21/3/2023 315,657 0.02%Nomura Holdings, Inc. 300,000 3.10% 16/1/2030 314,829 0.02%Mitsubishi UFJ Financial Group, Inc. 300,000 2.53% 13/9/2023 313,146 0.02%Mizuho Financial Group Cayman 2 Ltd. 300,000 4.20% 18/7/2022 311,121 0.02%Meiji Yasuda Life Insurance Co.^ 275,000 5.20% 20/10/2045 310,550 0.02%Nippon Life Insurance Co.^ 300,000 3.40% 23/1/2050 310,521 0.02%Japan Bank for International Cooperation 300,000 2.38% 16/11/2022 308,478 0.02%Nippon Life Insurance Co.^ 275,000 5.10% 16/10/2044 303,876 0.02%Sumitomo Mitsui Trust Bank Ltd. 300,000 0.80% 12/9/2023 301,767 0.02%Central Japan Railway Co. 250,000 4.25% 24/11/2045 301,482 0.02%Takeda Pharmaceutical Co., Ltd. 250,000 5.00% 26/11/2028 301,112 0.02%Mitsubishi UFJ Financial Group, Inc. 300,000 2.05% 17/7/2030 299,293 0.02%Sumitomo Mitsui Banking Corp. 275,000 3.40% 11/7/2024 296,248 0.02%Mitsubishi UFJ Financial Group, Inc. 270,000 2.56% 25/2/2030 280,577 0.02%ORIX Corp. 250,000 3.70% 18/7/2027 279,190 0.02%

1045
Vanguard U.S. Investment Grade Credit Index Fund
Principal
US Dollars ($) CouponMaturity
DateFair Value
US Dollars ($)% of Total
Net AssetsTakeda Pharmaceutical Co., Ltd. 275,000 3.18% 9/7/2050 277,483 0.02%Sumitomo Mitsui Financial Group, Inc. 250,000 3.45% 11/1/2027 275,175 0.02%Japan Bank for International Cooperation 250,000 2.88% 1/6/2027 272,612 0.02%Japan International Cooperation Agency 250,000 2.75% 27/4/2027 270,318 0.02%Sumitomo Mitsui Financial Group, Inc. 250,000 3.01% 19/10/2026 269,817 0.02%Japan Bank for International Cooperation 240,000 3.25% 20/7/2028 269,281 0.02%Development Bank of Japan, Inc. 250,000 2.88% 19/9/2024 266,910 0.02%Mitsubishi HC Capital, Inc. 250,000 3.96% 19/9/2023 266,487 0.02%Mitsubishi UFJ Financial Group, Inc. 250,000 3.46% 2/3/2023 262,622 0.02%Sumitomo Mitsui Financial Group, Inc. 250,000 3.10% 17/1/2023 260,524 0.02%Mizuho Financial Group, Inc.^ 250,000 2.59% 25/5/2031 257,034 0.02%Sumitomo Mitsui Financial Group, Inc. 250,000 2.78% 12/7/2022 256,347 0.02%Nomura Holdings, Inc. 250,000 2.68% 16/7/2030 253,969 0.02%Sumitomo Mitsui Financial Group, Inc. 225,000 3.78% 9/3/2026 250,431 0.02%Sumitomo Life Insurance Co.^ 225,000 6.50% 20/9/2073 249,444 0.02%Mizuho Financial Group, Inc. 200,000 4.02% 5/3/2028 228,112 0.02%NTT Finance Corp. 225,000 0.58% 1/3/2024 224,588 0.02%Development Bank of Japan, Inc. 200,000 3.25% 6/9/2028 224,359 0.02%Mitsui Fudosan Co., Ltd. 200,000 3.95% 24/1/2029 223,105 0.01%Dai-ichi Life Insurance Co., Ltd.^ 200,000 5.10% Perpetual 220,993 0.01%Sumitomo Mitsui Financial Group, Inc. 200,000 3.36% 12/7/2027 218,657 0.01%Takeda Pharmaceutical Co., Ltd. 200,000 4.40% 26/11/2023 217,108 0.01%Nippon Life Insurance Co.^ 200,000 4.00% 19/9/2047 217,016 0.01%Dai-ichi Life Insurance Co., Ltd.^ 200,000 4.00% Perpetual 216,682 0.01%Sumitomo Life Insurance Co.^ 200,000 4.00% 14/9/2077 216,333 0.01%Japan Bank for International Cooperation 200,000 2.75% 21/1/2026 215,381 0.01%Mizuho Financial Group, Inc. 200,000 2.84% 13/9/2026 214,151 0.01%Japan Bank for International Cooperation 200,000 3.00% 29/5/2024 213,741 0.01%Sompo Japan Insurance, Inc.^ 200,000 5.33% 28/3/2073 213,741 0.01%SMBC Aviation Capital Finance DAC 200,000 3.55% 15/4/2024 212,733 0.01%Mitsubishi HC Capital, Inc. 200,000 3.56% 28/2/2024 212,345 0.01%Japan Bank for International Cooperation 200,000 2.38% 20/4/2026 212,137 0.01%Japan Bank for International Cooperation 200,000 3.25% 20/7/2023 211,342 0.01%Mizuho Financial Group, Inc.^ 200,000 2.84% 16/7/2025 211,089 0.01%Japan Bank for International Cooperation 200,000 2.50% 23/5/2024 210,832 0.01%Japan Bank for International Cooperation 200,000 2.13% 10/2/2025 209,330 0.01%Nippon Life Insurance Co.^ 200,000 5.00% 18/10/2042 209,124 0.01%Toyota Industries Corp. 200,000 3.24% 16/3/2023 208,987 0.01%Sumitomo Life Insurance Co.^ 200,000 3.38% 15/4/2081 206,183 0.01%NTT Finance Corp. 200,000 2.07% 3/4/2031 202,777 0.01%Japan Bank for International Cooperation 200,000 0.63% 22/5/2023 201,003 0.01%NTT Finance Corp. 200,000 0.37% 3/3/2023 199,947 0.01%Mitsui Sumitomo Insurance Co., Ltd.^ 190,000 7.00% 15/3/2072 197,609 0.01%Japan International Cooperation Agency 200,000 1.00% 22/7/2030 189,409 0.01%Mitsubishi UFJ Financial Group, Inc. 150,000 3.75% 18/7/2039 170,795 0.01%Mizuho Bank Ltd. 150,000 3.60% 25/9/2024 162,749 0.01%Toyota Motor Corp.1 150,000 3.42% 20/7/2023 159,235 0.01%Sumitomo Mitsui Banking Corp. 150,000 3.20% 18/7/2022 154,548 0.01%Panasonic Corp. 150,000 2.54% 19/7/2022 152,922 0.01%Panasonic Corp. 125,000 2.68% 19/7/2024 131,405 0.01%Nissan Motor Acceptance Corp. 125,000 2.65% 13/7/2022 127,183 0.01%Mitsubishi UFJ Financial Group, Inc. 100,000 3.96% 2/3/2028 113,628 0.01%ORIX Corp. 100,000 4.05% 16/1/2024 108,300 0.01%Sumitomo Mitsui Financial Group, Inc. 100,000 3.94% 16/10/2023 107,872 0.01%Mitsubishi UFJ Financial Group, Inc. 100,000 1.41% 17/7/2025 101,076 0.01%ORIX Corp. 100,000 2.25% 9/3/2031 100,816 0.01%Japan Bank for International Cooperation 100,000 3.13% 20/7/2021 100,146 0.01%Toyota Motor Corp. 75,000 3.67% 20/7/2028 85,074 0.01%MUFG Bank Ltd. 75,000 4.10% 9/9/2023 80,912 0.01%Panasonic Corp. 75,000 3.11% 19/7/2029 80,452 0.01%Sumitomo Mitsui Financial Group, Inc. 75,000 3.20% 17/9/2029 79,860 0.01%Mizuho Financial Group, Inc.^ 75,000 2.56% 13/9/2025 78,496 0.01%Sumitomo Mitsui Financial Group, Inc. 50,000 4.31% 16/10/2028 58,008 0.00%Sumitomo Mitsui Financial Group, Inc. 50,000 3.94% 19/7/2028 56,808 0.00%Nomura Holdings, Inc. 50,000 2.65% 16/1/2025 52,514 0.00%Sumitomo Mitsui Financial Group, Inc. 25,000 4.44% 2/4/2024 27,218 0.00%Mitsubishi UFJ Financial Group, Inc. 25,000 3.76% 26/7/2023 26,692 0.00%test test test test 34,824,797 2.26%Kazakhstan 0.19% (2020: 0.21%) . .Kazakhstan Government International Bond 600,000 5.13% 21/7/2025 697,449 0.04%Kazakhstan Government International Bond 400,000 6.50% 21/7/2045 585,102 0.04%

1046
Vanguard U.S. Investment Grade Credit Index Fund
Principal
US Dollars ($) CouponMaturity
DateFair Value
US Dollars ($)% of Total
Net AssetsKazMunayGas National Co. JSC 300,000 6.38% 24/10/2048 397,769 0.03%KazMunayGas National Co. JSC 350,000 4.75% 24/4/2025 392,551 0.03%KazMunayGas National Co. JSC 300,000 5.75% 19/4/2047 374,899 0.02%Tengizchevroil Finance Co. International Ltd. 300,000 4.00% 15/8/2026 326,039 0.02%Development Bank of Kazakhstan JSC 200,000 4.13% 10/12/2022 208,514 0.01%test test test test 2,982,323 0.19%Kuwait 0.10% (2020: 0.15%) . .Kuwait International Government Bond 600,000 3.50% 20/3/2027 669,582 0.04%Equate Petrochemical BV 300,000 4.25% 3/11/2026 333,853 0.02%MEGlobal Canada ULC 200,000 5.88% 18/5/2030 246,609 0.02%NBK Tier 1 Financing 2 Ltd.^ 200,000 4.50% Perpetual 209,018 0.02%test test test test 1,459,062 0.10%Macau 0.06% (2020: 0.07%) . .Sands China Ltd. 250,000 5.13% 8/8/2025 279,879 0.02%Sands China Ltd. 200,000 5.40% 8/8/2028 232,426 0.02%Sands China Ltd. 200,000 4.38% 18/6/2030 217,008 0.01%Sands China Ltd. 200,000 4.60% 8/8/2023 212,380 0.01%test test test test 941,693 0.06%Malaysia 0.26% (2020: 0.24%) . .Petronas Capital Ltd. 600,000 4.55% 21/4/2050 739,157 0.05%Petronas Capital Ltd. 500,000 3.50% 18/3/2025 541,486 0.03%Petronas Capital Ltd. 400,000 3.50% 21/4/2030 437,516 0.03%Petronas Capital Ltd. 300,000 4.80% 21/4/2060 396,701 0.03%Petronas Capital Ltd. 250,000 4.50% 18/3/2045 305,892 0.02%Malaysia Sukuk Global Bhd 250,000 3.18% 27/4/2026 272,689 0.02%Gohl Capital Ltd. 250,000 4.25% 24/1/2027 262,894 0.02%Malaysia Wakala Sukuk Bhd 250,000 3.08% 28/4/2051 261,060 0.02%Malaysia Wakala Sukuk Bhd 250,000 2.07% 28/4/2031 252,482 0.02%TNB Global Ventures Capital Bhd 200,000 4.85% 1/11/2028 235,323 0.01%Axiata SPV2 Bhd 200,000 4.36% 24/3/2026 224,585 0.01%Tenaga Nasional Bhd 50,000 7.50% 1/11/2025 61,694 0.00%test test test test 3,991,479 0.26%Mexico 1.30% (2020: 1.25%) . .Mexico Government International Bond 749,000 4.75% 8/3/2044 828,039 0.05%Mexico Government International Bond 500,000 4.15% 28/3/2027 565,573 0.04%Mexico Government International Bond 500,000 4.28% 14/8/2041 525,463 0.03%Mexico Government International Bond 470,000 4.60% 23/1/2046 505,842 0.03%Southern Copper Corp. 345,000 5.88% 23/4/2045 482,229 0.03%America Movil SAB de CV 400,000 4.38% 16/7/2042 481,735 0.03%Mexico Government International Bond 400,000 4.75% 27/4/2032 457,969 0.03%Mexico Government International Bond 400,000 5.00% 27/4/2051 455,320 0.03%Banco Santander Mexico SA Institucion de Banca Multiple Grupo
Financiero Santand 400,000 5.38% 17/4/2025 453,949 0.03%Mexico Government International Bond 400,000 4.50% 22/4/2029 452,633 0.03%Mexico Government International Bond 366,000 5.75% 12/10/2110 436,728 0.03%Mexico Government International Bond 395,000 3.60% 30/1/2025 433,589 0.03%Mexico Government International Bond 400,000 4.60% 10/2/2048 429,866 0.03%Mexico Government International Bond 400,000 4.50% 31/1/2050 425,641 0.03%Mexico Government International Bond 335,000 6.05% 11/1/2040 420,499 0.03%Mexico Government International Bond 426,000 2.66% 24/5/2031 416,544 0.03%Mexico Government International Bond 400,000 3.25% 16/4/2030 413,450 0.03%Mexico City Airport Trust 384,000 5.50% 31/7/2047 387,649 0.03%Mexico Government International Bond 282,000 6.75% 27/9/2034 375,044 0.02%Mexico Government International Bond 400,000 3.75% 19/4/2071 366,296 0.02%Mexico Government International Bond 350,000 4.35% 15/1/2047 365,739 0.02%Grupo Televisa SAB 275,000 5.00% 13/5/2045 327,847 0.02%Alpek SAB de CV 300,000 5.38% 8/8/2023 325,355 0.02%Industrias Penoles SAB de CV 300,000 4.75% 6/8/2050 324,281 0.02%Mexico Government International Bond 265,000 4.13% 21/1/2026 298,841 0.02%America Movil SAB de CV 200,000 6.13% 30/3/2040 283,513 0.02%Mexico Government International Bond 300,000 3.77% 24/5/2061 279,545 0.02%Fomento Economico Mexicano SAB de CV 250,000 3.50% 16/1/2050 263,162 0.02%America Movil SAB de CV 250,000 3.13% 16/7/2022 256,800 0.02%America Movil SAB de CV 200,000 4.38% 22/4/2049 247,088 0.02%Orbia Advance Corp. SAB de CV 200,000 5.88% 17/9/2044 241,865 0.02%Comision Federal de Electricidad 200,000 6.13% 16/6/2045 239,708 0.02%Grupo Bimbo SAB de CV 200,000 4.88% 27/6/2044 238,730 0.02%Trust Fibra Uno 200,000 6.39% 15/1/2050 233,535 0.02%Trust Fibra Uno 200,000 5.25% 30/1/2026 225,094 0.02%Comision Federal de Electricidad 200,000 4.75% 23/2/2027 224,006 0.02%Minera Mexico SA de CV 200,000 4.50% 26/1/2050 223,913 0.02%

1047
Vanguard U.S. Investment Grade Credit Index Fund
Principal
US Dollars ($) CouponMaturity
DateFair Value
US Dollars ($)% of Total
Net AssetsTrust Fibra Uno 200,000 5.25% 15/12/2024 222,186 0.01%Mexico Government International Bond 200,000 3.90% 27/4/2025 221,729 0.01%Banco Nacional de Comercio Exterior SNC 200,000 4.38% 14/10/2025 221,145 0.01%America Movil SAB de CV 200,000 3.63% 22/4/2029 220,797 0.01%Alfa SAB de CV 200,000 5.25% 25/3/2024 218,003 0.01%Mexico Government International Bond 180,000 5.55% 21/1/2045 217,606 0.01%Sigma Alimentos SA de CV 200,000 4.13% 2/5/2026 217,530 0.01%BBVA Bancomer SA 200,000 4.38% 10/4/2024 217,313 0.01%Mexico City Airport Trust 200,000 4.25% 31/10/2026 216,863 0.01%El Puerto de Liverpool SAB de CV 200,000 3.88% 6/10/2026 215,006 0.01%Southern Copper Corp. 150,000 6.75% 16/4/2040 214,189 0.01%Banco Inbursa SA Institucion De Banca Multiple Grupo Financiero Inbursa 200,000 4.13% 6/6/2024 214,118 0.01%America Movil SAB de CV 200,000 2.88% 7/5/2030 210,812 0.01%Cometa Energia SA de CV 182,800 6.38% 24/4/2035 210,180 0.01%Coca-Cola Femsa SAB de CV 200,000 2.75% 22/1/2030 209,068 0.01%Banco Santander Mexico SA Institucion de Banca Multiple Grupo
Financiero Santand 200,000 4.13% 9/11/2022 208,246 0.01%Infraestructura Energetica Nova SAB de CV 200,000 4.75% 15/1/2051 202,990 0.01%Comision Federal de Electricidad 200,000 4.68% 9/2/2051 193,148 0.01%Fomento Economico Mexicano SAB de CV 150,000 4.38% 10/5/2043 179,204 0.01%Mexico Government International Bond 125,000 7.50% 8/4/2033 175,865 0.01%Becle SAB de CV 150,000 3.75% 13/5/2025 163,154 0.01%Grupo Bimbo SAB de CV 150,000 4.00% 6/9/2049 160,641 0.01%Grupo Televisa SAB 100,000 8.50% 11/3/2032 148,057 0.01%Southern Copper Corp. 100,000 7.50% 27/7/2035 145,104 0.01%America Movil SAB de CV 100,000 6.38% 1/3/2035 143,214 0.01%Grupo Televisa SAB 100,000 6.63% 15/1/2040 138,076 0.01%Coca-Cola Femsa SAB de CV 100,000 5.25% 26/11/2043 134,336 0.01%Southern Copper Corp. 125,000 3.50% 8/11/2022 129,669 0.01%Southern Copper Corp. 100,000 5.25% 8/11/2042 127,811 0.01%Mexico Government International Bond 116,000 4.00% 2/10/2023 125,620 0.01%Orbia Advance Corp. SAB de CV 100,000 5.50% 15/1/2048 117,374 0.01%Grupo Televisa SAB 100,000 4.63% 30/1/2026 111,141 0.01%Infraestructura Energetica Nova SAB de CV 100,000 3.75% 14/1/2028 107,944 0.01%Mexico Government International Bond 90,000 8.00% 24/9/2022 99,116 0.01%Infraestructura Energetica Nova SAB de CV 75,000 4.88% 14/1/2048 76,904 0.01%test test test test 20,047,239 1.30%Netherlands 1.17% (2020: 1.20%) . .Shell International Finance BV 775,000 4.38% 11/5/2045 950,397 0.06%Nederlandse Waterschapsbank NV 800,000 1.75% 15/1/2025 830,139 0.05%Shell International Finance BV 700,000 2.38% 6/4/2025 736,661 0.05%Shell International Finance BV 610,000 3.25% 11/5/2025 662,347 0.04%BNG Bank NV 600,000 1.50% 6/9/2022 609,237 0.04%Shell International Finance BV 395,000 6.38% 15/12/2038 585,848 0.04%Cooperatieve Rabobank UA 400,000 5.75% 1/12/2043 565,299 0.04%Shell International Finance BV 520,000 2.75% 6/4/2030 554,382 0.04%Cooperatieve Rabobank UA 375,000 5.25% 4/8/2045 502,747 0.03%BNG Bank NV 401,000 3.00% 20/9/2023 424,163 0.03%NXP BV/NXP Funding LLC 400,000 3.88% 1/9/2022 414,933 0.03%BNG Bank NV 400,000 1.00% 3/6/2030 381,933 0.02%Cooperatieve Rabobank UA 325,000 3.38% 21/5/2025 355,042 0.02%Cooperatieve Rabobank UA 300,000 4.38% 4/8/2025 334,476 0.02%Koninklijke Philips NV 250,000 5.00% 15/3/2042 332,467 0.02%NXP BV/NXP Funding LLC 300,000 4.88% 1/3/2024 330,281 0.02%Shell International Finance BV 300,000 2.88% 10/5/2026 324,267 0.02%ING Groep NV 300,000 3.55% 9/4/2024 322,992 0.02%Shell International Finance BV 275,000 4.00% 10/5/2046 321,651 0.02%Cooperatieve Rabobank UA 225,000 5.25% 24/5/2041 310,434 0.02%ABN AMRO Bank NV 275,000 4.75% 28/7/2025 308,785 0.02%ABN AMRO Bank NV^ 300,000 1.54% 16/6/2027 298,311 0.02%Shell International Finance BV 270,000 3.25% 6/4/2050 287,425 0.02%Nederlandse Waterschapsbank NV 300,000 1.00% 28/5/2030 286,528 0.02%ING Groep NV 250,000 3.95% 29/3/2027 280,714 0.02%Cooperatieve Rabobank UA 250,000 3.75% 21/7/2026 274,875 0.02%Cooperatieve Rabobank UA 250,000 3.88% 26/9/2023 268,438 0.02%NXP BV/NXP Funding LLC/NXP USA, Inc. 250,000 2.70% 1/5/2025 263,575 0.02%BNG Bank NV 252,000 2.50% 23/1/2023 260,797 0.02%ING Bank NV 250,000 2.63% 5/12/2022 258,240 0.02%Viterra Finance BV 250,000 2.00% 21/4/2026 250,333 0.02%Cooperatieve Rabobank UA 250,000 0.38% 12/1/2024 249,022 0.02%Shell International Finance BV 200,000 4.13% 11/5/2035 237,538 0.02%

1048
Vanguard U.S. Investment Grade Credit Index Fund
Principal
US Dollars ($) CouponMaturity
DateFair Value
US Dollars ($)% of Total
Net AssetsING Groep NV 200,000 4.55% 2/10/2028 234,731 0.02%Shell International Finance BV 225,000 2.25% 6/1/2023 231,589 0.02%Shell International Finance BV 200,000 3.88% 13/11/2028 229,580 0.02%ING Groep NV 200,000 4.05% 9/4/2029 228,391 0.01%Aegon NV^ 200,000 5.50% 11/4/2048 227,010 0.01%ABN AMRO Bank NV 200,000 4.80% 18/4/2026 226,980 0.01%NXP BV/NXP Funding LLC/NXP USA, Inc. 200,000 3.40% 1/5/2030 218,028 0.01%ING Groep NV 200,000 4.10% 2/10/2023 215,555 0.01%NXP BV/NXP Funding LLC/NXP USA, Inc. 200,000 3.15% 1/5/2027 214,271 0.01%BNG Bank NV 200,000 2.63% 27/2/2024 211,339 0.01%ABN AMRO Bank NV^ 200,000 4.40% 27/3/2028 210,545 0.01%Cooperatieve Rabobank UA 200,000 2.75% 10/1/2023 207,265 0.01%BNG Bank NV 200,000 1.50% 16/10/2024 205,743 0.01%Heineken NV 175,000 3.50% 29/1/2028 193,373 0.01%Cooperatieve Rabobank UA 175,000 4.63% 1/12/2023 191,266 0.01%Shell International Finance BV 150,000 4.55% 12/8/2043 187,231 0.01%NXP BV/NXP Funding LLC/NXP USA, Inc. 150,000 4.30% 18/6/2029 172,142 0.01%BNG Bank NV 150,000 2.38% 16/3/2026 160,131 0.01%Cooperatieve Rabobank UA 150,000 3.95% 9/11/2022 157,009 0.01%Heineken NV 150,000 2.75% 1/4/2023 155,589 0.01%Heineken NV 100,000 4.00% 1/10/2042 118,205 0.01%Ahold Finance USA LLC 75,000 6.88% 1/5/2029 100,976 0.01%Cooperatieve Rabobank UA^ 100,000 1.34% 24/6/2026 100,361 0.01%NXP BV/NXP Funding LLC 75,000 5.55% 1/12/2028 91,957 0.01%NXP BV/NXP Funding LLC 75,000 5.35% 1/3/2026 87,478 0.01%Heineken NV 50,000 4.35% 29/3/2047 62,598 0.00%Shell International Finance BV 50,000 3.63% 21/8/2042 56,207 0.00%Koninklijke KPN NV 25,000 8.38% 1/10/2030 35,399 0.00%test test test test 18,105,226 1.17%New Zealand 0.07% (2020: 0.07%) . .ASB Bank Ltd. 300,000 3.13% 23/5/2024 320,092 0.02%BNZ International Funding Ltd. 250,000 3.38% 1/3/2023 262,296 0.02%Bank of New Zealand 250,000 2.00% 21/2/2025 258,548 0.02%ANZ New Zealand Int'l Ltd. 200,000 3.45% 17/7/2027 221,480 0.01%test test test test 1,062,416 0.07%Norway 0.37% (2020: 0.41%) . .Aker BP A.S.A 500,000 2.88% 15/1/2026 527,437 0.03%Yara International A.S.A 350,000 3.15% 4/6/2030 375,367 0.02%Equinor A.S.A 250,000 7.25% 23/9/2027 331,861 0.02%Kommunalbanken A.S. 300,000 2.00% 19/6/2024 312,834 0.02%Kommunalbanken A.S. 300,000 0.50% 13/1/2026 294,924 0.02%Kommunalbanken A.S. 300,000 0.38% 11/9/2025 294,599 0.02%Kommunalbanken A.S. 300,000 1.13% 14/6/2030 289,067 0.02%Kommunalbanken A.S. 270,000 2.50% 11/1/2023 279,193 0.02%Equinor A.S.A 200,000 5.10% 17/8/2040 266,058 0.02%Equinor A.S.A 230,000 3.70% 6/4/2050 264,434 0.02%Kommunalbanken A.S. 250,000 2.13% 23/4/2025 263,002 0.02%Equinor A.S.A 250,000 2.65% 15/1/2024 262,843 0.02%Equinor A.S.A 250,000 2.38% 22/5/2030 257,820 0.02%Kommunalbanken A.S. 200,000 2.75% 5/2/2024 211,690 0.01%Equinor A.S.A 200,000 1.75% 22/1/2026 205,907 0.01%DNB Bank A.S.A^ 200,000 1.13% 16/9/2026 198,434 0.01%Aker BP A.S.A 150,000 3.75% 15/1/2030 161,571 0.01%Equinor A.S.A 150,000 3.25% 18/11/2049 158,799 0.01%Equinor A.S.A 150,000 2.45% 17/1/2023 154,803 0.01%Equinor A.S.A 125,000 4.25% 23/11/2041 152,166 0.01%Equinor A.S.A 100,000 4.80% 8/11/2043 130,272 0.01%Equinor A.S.A 100,000 3.13% 6/4/2030 108,919 0.01%Equinor A.S.A 100,000 3.25% 10/11/2024 108,185 0.01%Kommunalbanken A.S. 50,000 2.13% 11/2/2025 52,552 0.00%test test test test 5,662,737 0.37%Panama 0.29% (2020: 0.29%) . .Panama Government International Bond 500,000 3.75% 16/3/2025 544,206 0.04%Panama Government International Bond 400,000 4.50% 16/4/2050 455,230 0.03%Panama Government International Bond 400,000 3.87% 23/7/2060 408,595 0.03%Panama Government International Bond 350,000 3.88% 17/3/2028 384,851 0.03%Panama Government International Bond 277,000 6.70% 26/1/2036 376,592 0.02%Panama Government International Bond 300,000 3.16% 23/1/2030 314,322 0.02%Panama Government International Bond 275,000 4.50% 1/4/2056 311,950 0.02%Panama Government International Bond 210,000 8.88% 30/9/2027 290,436 0.02%Panama Government International Bond 200,000 4.50% 15/5/2047 227,247 0.02%
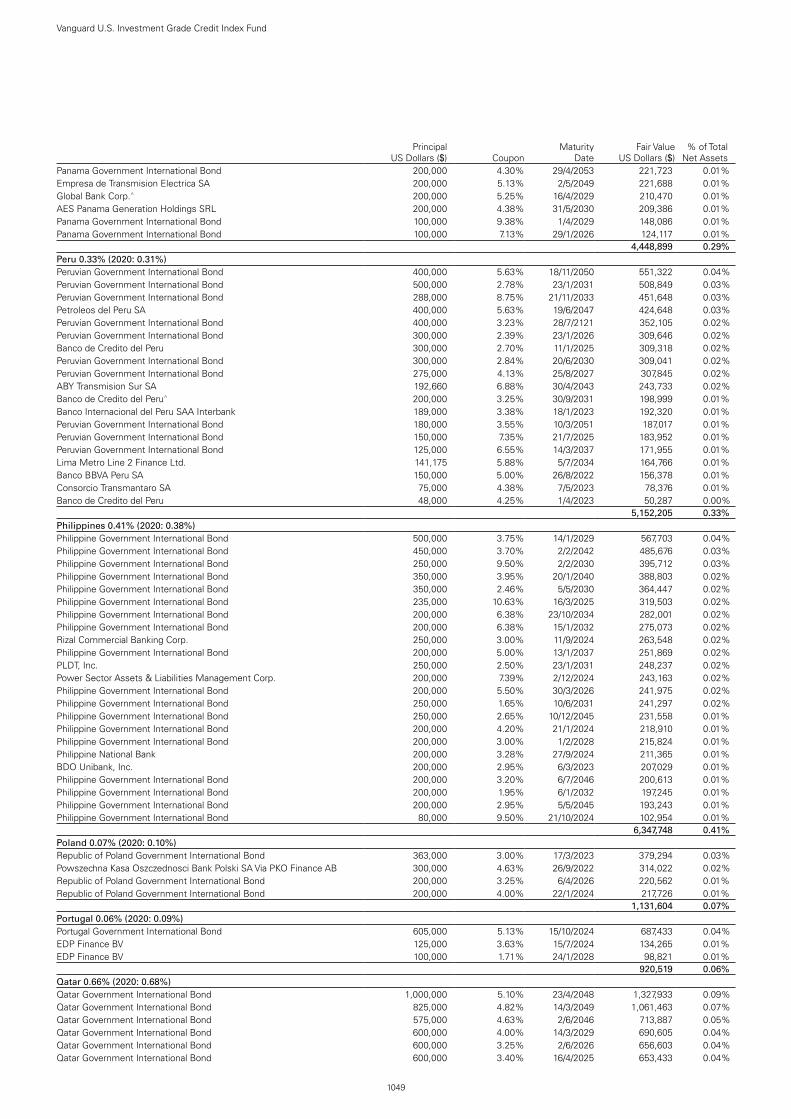
1049
Vanguard U.S. Investment Grade Credit Index Fund
Principal
US Dollars ($) CouponMaturity
DateFair Value
US Dollars ($)% of Total
Net AssetsPanama Government International Bond 200,000 4.30% 29/4/2053 221,723 0.01%Empresa de Transmision Electrica SA 200,000 5.13% 2/5/2049 221,688 0.01%Global Bank Corp.^ 200,000 5.25% 16/4/2029 210,470 0.01%AES Panama Generation Holdings SRL 200,000 4.38% 31/5/2030 209,386 0.01%Panama Government International Bond 100,000 9.38% 1/4/2029 148,086 0.01%Panama Government International Bond 100,000 7.13% 29/1/2026 124,117 0.01%test test test test 4,448,899 0.29%Peru 0.33% (2020: 0.31%) . .Peruvian Government International Bond 400,000 5.63% 18/11/2050 551,322 0.04%Peruvian Government International Bond 500,000 2.78% 23/1/2031 508,849 0.03%Peruvian Government International Bond 288,000 8.75% 21/11/2033 451,648 0.03%Petroleos del Peru SA 400,000 5.63% 19/6/2047 424,648 0.03%Peruvian Government International Bond 400,000 3.23% 28/7/2121 352,105 0.02%Peruvian Government International Bond 300,000 2.39% 23/1/2026 309,646 0.02%Banco de Credito del Peru 300,000 2.70% 11/1/2025 309,318 0.02%Peruvian Government International Bond 300,000 2.84% 20/6/2030 309,041 0.02%Peruvian Government International Bond 275,000 4.13% 25/8/2027 307,845 0.02%ABY Transmision Sur SA 192,660 6.88% 30/4/2043 243,733 0.02%Banco de Credito del Peru^ 200,000 3.25% 30/9/2031 198,999 0.01%Banco Internacional del Peru SAA Interbank 189,000 3.38% 18/1/2023 192,320 0.01%Peruvian Government International Bond 180,000 3.55% 10/3/2051 187,017 0.01%Peruvian Government International Bond 150,000 7.35% 21/7/2025 183,952 0.01%Peruvian Government International Bond 125,000 6.55% 14/3/2037 171,955 0.01%Lima Metro Line 2 Finance Ltd. 141,175 5.88% 5/7/2034 164,766 0.01%Banco BBVA Peru SA 150,000 5.00% 26/8/2022 156,378 0.01%Consorcio Transmantaro SA 75,000 4.38% 7/5/2023 78,376 0.01%Banco de Credito del Peru 48,000 4.25% 1/4/2023 50,287 0.00%test test test test 5,152,205 0.33%Philippines 0.41% (2020: 0.38%) . .Philippine Government International Bond 500,000 3.75% 14/1/2029 567,703 0.04%Philippine Government International Bond 450,000 3.70% 2/2/2042 485,676 0.03%Philippine Government International Bond 250,000 9.50% 2/2/2030 395,712 0.03%Philippine Government International Bond 350,000 3.95% 20/1/2040 388,803 0.02%Philippine Government International Bond 350,000 2.46% 5/5/2030 364,447 0.02%Philippine Government International Bond 235,000 10.63% 16/3/2025 319,503 0.02%Philippine Government International Bond 200,000 6.38% 23/10/2034 282,001 0.02%Philippine Government International Bond 200,000 6.38% 15/1/2032 275,073 0.02%Rizal Commercial Banking Corp. 250,000 3.00% 11/9/2024 263,548 0.02%Philippine Government International Bond 200,000 5.00% 13/1/2037 251,869 0.02%PLDT, Inc. 250,000 2.50% 23/1/2031 248,237 0.02%Power Sector Assets & Liabilities Management Corp. 200,000 7.39% 2/12/2024 243,163 0.02%Philippine Government International Bond 200,000 5.50% 30/3/2026 241,975 0.02%Philippine Government International Bond 250,000 1.65% 10/6/2031 241,297 0.02%Philippine Government International Bond 250,000 2.65% 10/12/2045 231,558 0.01%Philippine Government International Bond 200,000 4.20% 21/1/2024 218,910 0.01%Philippine Government International Bond 200,000 3.00% 1/2/2028 215,824 0.01%Philippine National Bank 200,000 3.28% 27/9/2024 211,365 0.01%BDO Unibank, Inc. 200,000 2.95% 6/3/2023 207,029 0.01%Philippine Government International Bond 200,000 3.20% 6/7/2046 200,613 0.01%Philippine Government International Bond 200,000 1.95% 6/1/2032 197,245 0.01%Philippine Government International Bond 200,000 2.95% 5/5/2045 193,243 0.01%Philippine Government International Bond 80,000 9.50% 21/10/2024 102,954 0.01%test test test test 6,347,748 0.41%Poland 0.07% (2020: 0.10%) . .Republic of Poland Government International Bond 363,000 3.00% 17/3/2023 379,294 0.03%Powszechna Kasa Oszczednosci Bank Polski SA Via PKO Finance AB 300,000 4.63% 26/9/2022 314,022 0.02%Republic of Poland Government International Bond 200,000 3.25% 6/4/2026 220,562 0.01%Republic of Poland Government International Bond 200,000 4.00% 22/1/2024 217,726 0.01%test test test test 1,131,604 0.07%Portugal 0.06% (2020: 0.09%) . .Portugal Government International Bond 605,000 5.13% 15/10/2024 687,433 0.04%EDP Finance BV 125,000 3.63% 15/7/2024 134,265 0.01%EDP Finance BV 100,000 1.71% 24/1/2028 98,821 0.01%test test test test 920,519 0.06%Qatar 0.66% (2020: 0.68%) . .Qatar Government International Bond 1,000,000 5.10% 23/4/2048 1,327,933 0.09%Qatar Government International Bond 825,000 4.82% 14/3/2049 1,061,463 0.07%Qatar Government International Bond 575,000 4.63% 2/6/2046 713,887 0.05%Qatar Government International Bond 600,000 4.00% 14/3/2029 690,605 0.04%Qatar Government International Bond 600,000 3.25% 2/6/2026 656,603 0.04%Qatar Government International Bond 600,000 3.40% 16/4/2025 653,433 0.04%
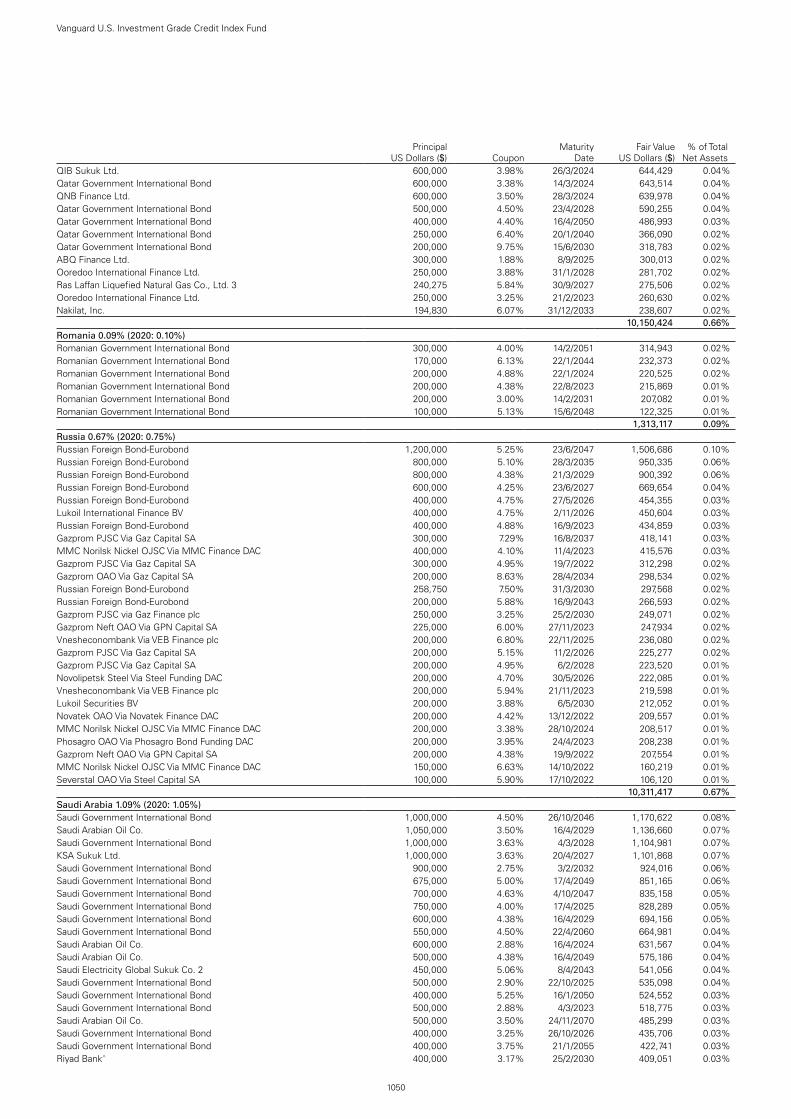
1050
Vanguard U.S. Investment Grade Credit Index Fund
Principal
US Dollars ($) CouponMaturity
DateFair Value
US Dollars ($)% of Total
Net AssetsQIB Sukuk Ltd. 600,000 3.98% 26/3/2024 644,429 0.04%Qatar Government International Bond 600,000 3.38% 14/3/2024 643,514 0.04%QNB Finance Ltd. 600,000 3.50% 28/3/2024 639,978 0.04%Qatar Government International Bond 500,000 4.50% 23/4/2028 590,255 0.04%Qatar Government International Bond 400,000 4.40% 16/4/2050 486,993 0.03%Qatar Government International Bond 250,000 6.40% 20/1/2040 366,090 0.02%Qatar Government International Bond 200,000 9.75% 15/6/2030 318,783 0.02%ABQ Finance Ltd. 300,000 1.88% 8/9/2025 300,013 0.02%Ooredoo International Finance Ltd. 250,000 3.88% 31/1/2028 281,702 0.02%Ras Laffan Liquefied Natural Gas Co., Ltd. 3 240,275 5.84% 30/9/2027 275,506 0.02%Ooredoo International Finance Ltd. 250,000 3.25% 21/2/2023 260,630 0.02%Nakilat, Inc. 194,830 6.07% 31/12/2033 238,607 0.02%test test test test 10,150,424 0.66%Romania 0.09% (2020: 0.10%) . .Romanian Government International Bond 300,000 4.00% 14/2/2051 314,943 0.02%Romanian Government International Bond 170,000 6.13% 22/1/2044 232,373 0.02%Romanian Government International Bond 200,000 4.88% 22/1/2024 220,525 0.02%Romanian Government International Bond 200,000 4.38% 22/8/2023 215,869 0.01%Romanian Government International Bond 200,000 3.00% 14/2/2031 207,082 0.01%Romanian Government International Bond 100,000 5.13% 15/6/2048 122,325 0.01%test test test test 1,313,117 0.09%Russia 0.67% (2020: 0.75%) . .Russian Foreign Bond-Eurobond 1,200,000 5.25% 23/6/2047 1,506,686 0.10%Russian Foreign Bond-Eurobond 800,000 5.10% 28/3/2035 950,335 0.06%Russian Foreign Bond-Eurobond 800,000 4.38% 21/3/2029 900,392 0.06%Russian Foreign Bond-Eurobond 600,000 4.25% 23/6/2027 669,654 0.04%Russian Foreign Bond-Eurobond 400,000 4.75% 27/5/2026 454,355 0.03%Lukoil International Finance BV 400,000 4.75% 2/11/2026 450,604 0.03%Russian Foreign Bond-Eurobond 400,000 4.88% 16/9/2023 434,859 0.03%Gazprom PJSC Via Gaz Capital SA 300,000 7.29% 16/8/2037 418,141 0.03%MMC Norilsk Nickel OJSC Via MMC Finance DAC 400,000 4.10% 11/4/2023 415,576 0.03%Gazprom PJSC Via Gaz Capital SA 300,000 4.95% 19/7/2022 312,298 0.02%Gazprom OAO Via Gaz Capital SA 200,000 8.63% 28/4/2034 298,534 0.02%Russian Foreign Bond-Eurobond 258,750 7.50% 31/3/2030 297,568 0.02%Russian Foreign Bond-Eurobond 200,000 5.88% 16/9/2043 266,593 0.02%Gazprom PJSC via Gaz Finance plc 250,000 3.25% 25/2/2030 249,071 0.02%Gazprom Neft OAO Via GPN Capital SA 225,000 6.00% 27/11/2023 247,934 0.02%Vnesheconombank Via VEB Finance plc 200,000 6.80% 22/11/2025 236,080 0.02%Gazprom PJSC Via Gaz Capital SA 200,000 5.15% 11/2/2026 225,277 0.02%Gazprom PJSC Via Gaz Capital SA 200,000 4.95% 6/2/2028 223,520 0.01%Novolipetsk Steel Via Steel Funding DAC 200,000 4.70% 30/5/2026 222,085 0.01%Vnesheconombank Via VEB Finance plc 200,000 5.94% 21/11/2023 219,598 0.01%Lukoil Securities BV 200,000 3.88% 6/5/2030 212,052 0.01%Novatek OAO Via Novatek Finance DAC 200,000 4.42% 13/12/2022 209,557 0.01%MMC Norilsk Nickel OJSC Via MMC Finance DAC 200,000 3.38% 28/10/2024 208,517 0.01%Phosagro OAO Via Phosagro Bond Funding DAC 200,000 3.95% 24/4/2023 208,238 0.01%Gazprom Neft OAO Via GPN Capital SA 200,000 4.38% 19/9/2022 207,554 0.01%MMC Norilsk Nickel OJSC Via MMC Finance DAC 150,000 6.63% 14/10/2022 160,219 0.01%Severstal OAO Via Steel Capital SA 100,000 5.90% 17/10/2022 106,120 0.01%test test test test 10,311,417 0.67%Saudi Arabia 1.09% (2020: 1.05%) . .Saudi Government International Bond 1,000,000 4.50% 26/10/2046 1,170,622 0.08%Saudi Arabian Oil Co. 1,050,000 3.50% 16/4/2029 1,136,660 0.07%Saudi Government International Bond 1,000,000 3.63% 4/3/2028 1,104,981 0.07%KSA Sukuk Ltd. 1,000,000 3.63% 20/4/2027 1,101,868 0.07%Saudi Government International Bond 900,000 2.75% 3/2/2032 924,016 0.06%Saudi Government International Bond 675,000 5.00% 17/4/2049 851,165 0.06%Saudi Government International Bond 700,000 4.63% 4/10/2047 835,158 0.05%Saudi Government International Bond 750,000 4.00% 17/4/2025 828,289 0.05%Saudi Government International Bond 600,000 4.38% 16/4/2029 694,156 0.05%Saudi Government International Bond 550,000 4.50% 22/4/2060 664,981 0.04%Saudi Arabian Oil Co. 600,000 2.88% 16/4/2024 631,567 0.04%Saudi Arabian Oil Co. 500,000 4.38% 16/4/2049 575,186 0.04%Saudi Electricity Global Sukuk Co. 2 450,000 5.06% 8/4/2043 541,056 0.04%Saudi Government International Bond 500,000 2.90% 22/10/2025 535,098 0.04%Saudi Government International Bond 400,000 5.25% 16/1/2050 524,552 0.03%Saudi Government International Bond 500,000 2.88% 4/3/2023 518,775 0.03%Saudi Arabian Oil Co. 500,000 3.50% 24/11/2070 485,299 0.03%Saudi Government International Bond 400,000 3.25% 26/10/2026 435,706 0.03%Saudi Government International Bond 400,000 3.75% 21/1/2055 422,741 0.03%Riyad Bank^ 400,000 3.17% 25/2/2030 409,051 0.03%
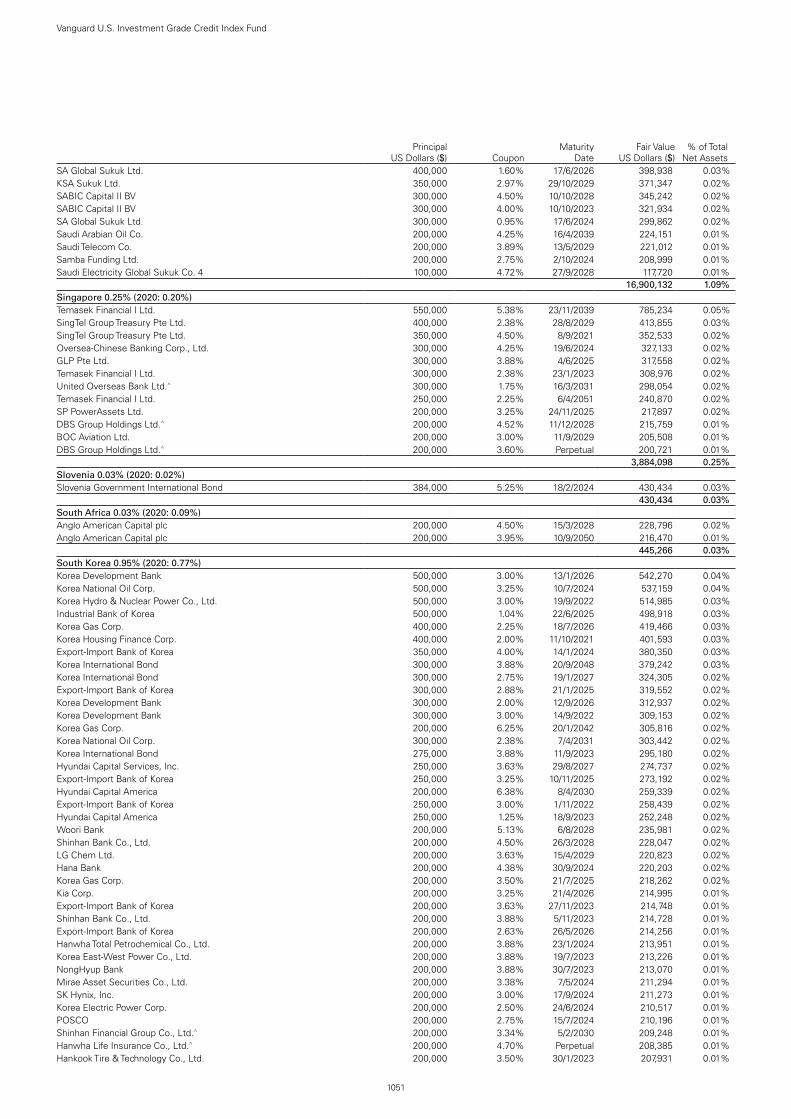
1051
Vanguard U.S. Investment Grade Credit Index Fund
Principal
US Dollars ($) CouponMaturity
DateFair Value
US Dollars ($)% of Total
Net AssetsSA Global Sukuk Ltd. 400,000 1.60% 17/6/2026 398,938 0.03%KSA Sukuk Ltd. 350,000 2.97% 29/10/2029 371,347 0.02%SABIC Capital II BV 300,000 4.50% 10/10/2028 345,242 0.02%SABIC Capital II BV 300,000 4.00% 10/10/2023 321,934 0.02%SA Global Sukuk Ltd. 300,000 0.95% 17/6/2024 299,862 0.02%Saudi Arabian Oil Co. 200,000 4.25% 16/4/2039 224,151 0.01%Saudi Telecom Co. 200,000 3.89% 13/5/2029 221,012 0.01%Samba Funding Ltd. 200,000 2.75% 2/10/2024 208,999 0.01%Saudi Electricity Global Sukuk Co. 4 100,000 4.72% 27/9/2028 117,720 0.01%test test test test 16,900,132 1.09%Singapore 0.25% (2020: 0.20%) . .Temasek Financial I Ltd. 550,000 5.38% 23/11/2039 785,234 0.05%SingTel Group Treasury Pte Ltd. 400,000 2.38% 28/8/2029 413,855 0.03%SingTel Group Treasury Pte Ltd. 350,000 4.50% 8/9/2021 352,533 0.02%Oversea-Chinese Banking Corp., Ltd. 300,000 4.25% 19/6/2024 327,133 0.02%GLP Pte Ltd. 300,000 3.88% 4/6/2025 317,558 0.02%Temasek Financial I Ltd. 300,000 2.38% 23/1/2023 308,976 0.02%United Overseas Bank Ltd.^ 300,000 1.75% 16/3/2031 298,054 0.02%Temasek Financial I Ltd. 250,000 2.25% 6/4/2051 240,870 0.02%SP PowerAssets Ltd. 200,000 3.25% 24/11/2025 217,897 0.02%DBS Group Holdings Ltd.^ 200,000 4.52% 11/12/2028 215,759 0.01%BOC Aviation Ltd. 200,000 3.00% 11/9/2029 205,508 0.01%DBS Group Holdings Ltd.^ 200,000 3.60% Perpetual 200,721 0.01%test test test test 3,884,098 0.25%Slovenia 0.03% (2020: 0.02%) . .Slovenia Government International Bond 384,000 5.25% 18/2/2024 430,434 0.03%test test test test 430,434 0.03%South Africa 0.03% (2020: 0.09%) . .Anglo American Capital plc 200,000 4.50% 15/3/2028 228,796 0.02%Anglo American Capital plc 200,000 3.95% 10/9/2050 216,470 0.01%test test test test 445,266 0.03%South Korea 0.95% (2020: 0.77%) . .Korea Development Bank 500,000 3.00% 13/1/2026 542,270 0.04%Korea National Oil Corp. 500,000 3.25% 10/7/2024 537,159 0.04%Korea Hydro & Nuclear Power Co., Ltd. 500,000 3.00% 19/9/2022 514,985 0.03%Industrial Bank of Korea 500,000 1.04% 22/6/2025 498,918 0.03%Korea Gas Corp. 400,000 2.25% 18/7/2026 419,466 0.03%Korea Housing Finance Corp. 400,000 2.00% 11/10/2021 401,593 0.03%Export-Import Bank of Korea 350,000 4.00% 14/1/2024 380,350 0.03%Korea International Bond 300,000 3.88% 20/9/2048 379,242 0.03%Korea International Bond 300,000 2.75% 19/1/2027 324,305 0.02%Export-Import Bank of Korea 300,000 2.88% 21/1/2025 319,552 0.02%Korea Development Bank 300,000 2.00% 12/9/2026 312,937 0.02%Korea Development Bank 300,000 3.00% 14/9/2022 309,153 0.02%Korea Gas Corp. 200,000 6.25% 20/1/2042 305,816 0.02%Korea National Oil Corp. 300,000 2.38% 7/4/2031 303,442 0.02%Korea International Bond 275,000 3.88% 11/9/2023 295,180 0.02%Hyundai Capital Services, Inc. 250,000 3.63% 29/8/2027 274,737 0.02%Export-Import Bank of Korea 250,000 3.25% 10/11/2025 273,192 0.02%Hyundai Capital America 200,000 6.38% 8/4/2030 259,339 0.02%Export-Import Bank of Korea 250,000 3.00% 1/11/2022 258,439 0.02%Hyundai Capital America 250,000 1.25% 18/9/2023 252,248 0.02%Woori Bank 200,000 5.13% 6/8/2028 235,981 0.02%Shinhan Bank Co., Ltd. 200,000 4.50% 26/3/2028 228,047 0.02%LG Chem Ltd. 200,000 3.63% 15/4/2029 220,823 0.02%Hana Bank 200,000 4.38% 30/9/2024 220,203 0.02%Korea Gas Corp. 200,000 3.50% 21/7/2025 218,262 0.02%Kia Corp. 200,000 3.25% 21/4/2026 214,995 0.01%Export-Import Bank of Korea 200,000 3.63% 27/11/2023 214,748 0.01%Shinhan Bank Co., Ltd. 200,000 3.88% 5/11/2023 214,728 0.01%Export-Import Bank of Korea 200,000 2.63% 26/5/2026 214,256 0.01%Hanwha Total Petrochemical Co., Ltd. 200,000 3.88% 23/1/2024 213,951 0.01%Korea East-West Power Co., Ltd. 200,000 3.88% 19/7/2023 213,226 0.01%NongHyup Bank 200,000 3.88% 30/7/2023 213,070 0.01%Mirae Asset Securities Co., Ltd. 200,000 3.38% 7/5/2024 211,294 0.01%SK Hynix, Inc. 200,000 3.00% 17/9/2024 211,273 0.01%Korea Electric Power Corp. 200,000 2.50% 24/6/2024 210,517 0.01%POSCO 200,000 2.75% 15/7/2024 210,196 0.01%Shinhan Financial Group Co., Ltd.^ 200,000 3.34% 5/2/2030 209,248 0.01%Hanwha Life Insurance Co., Ltd.^ 200,000 4.70% Perpetual 208,385 0.01%Hankook Tire & Technology Co., Ltd. 200,000 3.50% 30/1/2023 207,931 0.01%

1052
Vanguard U.S. Investment Grade Credit Index Fund
Principal
US Dollars ($) CouponMaturity
DateFair Value
US Dollars ($)% of Total
Net AssetsKorea Development Bank 200,000 2.75% 19/3/2023 207,649 0.01%POSCO 200,000 2.50% 17/1/2025 207,494 0.01%KT Corp. 200,000 2.63% 7/8/2022 204,315 0.01%Korea Resources Corp. 200,000 3.00% 24/4/2022 203,688 0.01%Hyundai Capital America1 200,000 0.80% 8/1/2024 199,358 0.01%Hyundai Capital America 200,000 0.88% 14/6/2024 199,102 0.01%Hyundai Capital America 200,000 2.00% 15/6/2028 198,312 0.01%Hyundai Capital America 200,000 1.80% 10/1/2028 198,005 0.01%Hyundai Capital America 200,000 1.30% 8/1/2026 197,463 0.01%Export-Import Bank of Korea 175,000 3.25% 12/8/2026 193,113 0.01%Hyundai Capital America1 175,000 2.85% 1/11/2022 179,940 0.01%Hyundai Capital America1 175,000 2.38% 10/2/2023 179,450 0.01%Korea Development Bank 150,000 3.75% 22/1/2024 162,127 0.01%Hyundai Capital America 150,000 4.13% 8/6/2023 159,502 0.01%SK Telecom Co., Ltd. 100,000 6.63% 20/7/2027 127,552 0.01%Woori Bank 100,000 4.75% 30/4/2024 109,822 0.01%KT Corp. 100,000 2.50% 18/7/2026 104,898 0.01%Hyundai Capital America 100,000 2.38% 15/10/2027 102,203 0.01%Hyundai Capital America 75,000 3.00% 10/2/2027 79,396 0.01%Hyundai Capital America 75,000 2.65% 10/2/2025 78,277 0.01%Hyundai Capital America 70,000 3.50% 2/11/2026 75,770 0.01%Hyundai Capital America 50,000 2.75% 27/9/2026 52,260 0.00%Hyundai Capital America 25,000 4.30% 1/2/2024 27,072 0.00%test test test test 14,700,225 0.95%Spain 0.31% (2020: 0.31%) . .Telefonica Emisiones SA 375,000 5.21% 8/3/2047 469,469 0.03%Banco Santander SA 400,000 3.85% 12/4/2023 422,833 0.03%Banco Santander SA 400,000 2.75% 28/5/2025 421,481 0.03%Banco Santander SA 400,000 3.13% 23/2/2023 416,454 0.03%Telefonica Emisiones SA 350,000 4.67% 6/3/2038 411,757 0.03%Telefonica Emisiones SA 280,000 7.05% 20/6/2036 403,054 0.03%Banco Santander SA 300,000 5.18% 19/11/2025 343,205 0.02%Telefonica Emisiones SA 300,000 4.57% 27/4/2023 321,294 0.02%Telefonica Europe BV 200,000 8.25% 15/9/2030 292,828 0.02%Telefonica Emisiones SA 200,000 4.90% 6/3/2048 239,202 0.02%Banco Santander SA 200,000 4.25% 11/4/2027 225,449 0.01%Banco Santander SA 200,000 3.80% 23/2/2028 221,044 0.01%Banco Santander SA 200,000 3.31% 27/6/2029 217,228 0.01%Banco Santander SA 200,000 2.71% 27/6/2024 210,525 0.01%Banco Santander SA 200,000 2.96% 25/3/2031 206,162 0.01%test test test test 4,821,985 0.31%Supranational 3.90% (2020: 3.56%) . .International Bank for Reconstruction & Development 1,700,000 0.75% 11/3/2025 1,704,496 0.11%International Bank for Reconstruction & Development 1,500,000 0.63% 22/4/2025 1,496,384 0.10%Inter-American Development Bank 1,200,000 0.88% 20/4/2026 1,199,643 0.08%IDB Trust Services Ltd. 1,100,000 2.84% 25/4/2024 1,163,380 0.08%Nordic Investment Bank 1,000,000 0.38% 19/5/2023 1,001,481 0.07%International Bank for Reconstruction & Development 940,000 2.50% 25/11/2024 999,900 0.07%European Investment Bank 1,000,000 0.25% 15/9/2023 997,967 0.06%Asian Development Bank 1,000,000 0.38% 11/6/2024 996,507 0.06%European Bank for Reconstruction & Development 1,000,000 0.50% 19/5/2025 991,412 0.06%International Bank for Reconstruction & Development 1,000,000 0.38% 28/7/2025 985,587 0.06%European Investment Bank 1,000,000 0.38% 26/3/2026 977,535 0.06%International Bank for Reconstruction & Development 865,000 3.00% 27/9/2023 915,665 0.06%Asian Development Bank 900,000 0.63% 29/4/2025 896,922 0.06%International Bank for Reconstruction & Development 801,000 3.13% 20/11/2025 881,444 0.06%Inter-American Development Bank 800,000 3.00% 4/10/2023 847,241 0.06%Asian Development Bank 800,000 1.75% 19/9/2029 822,432 0.05%Inter-American Development Bank 800,000 0.50% 24/5/2023 803,423 0.05%Asian Development Bank 750,000 2.75% 17/3/2023 781,778 0.05%International Bank for Reconstruction & Development 800,000 0.88% 14/5/2030 762,841 0.05%European Investment Bank 725,000 2.50% 15/3/2023 752,491 0.05%European Investment Bank 730,000 2.00% 15/12/2022 748,869 0.05%International Bank for Reconstruction & Development 750,000 0.25% 24/11/2023 747,731 0.05%European Investment Bank 750,000 1.25% 14/2/2031 733,727 0.05%International Bank for Reconstruction & Development 750,000 0.75% 24/11/2027 730,599 0.05%Asian Development Bank 693,000 2.00% 24/4/2026 728,744 0.05%Inter-American Development Bank 675,000 3.00% 21/2/2024 720,117 0.05%Council Of Europe Development Bank 700,000 0.25% 10/6/2023 699,385 0.05%European Investment Bank 640,000 1.38% 6/9/2022 649,011 0.04%European Investment Bank 595,000 3.13% 14/12/2023 634,651 0.04%

1053
Vanguard U.S. Investment Grade Credit Index Fund
Principal
US Dollars ($) CouponMaturity
DateFair Value
US Dollars ($)% of Total
Net AssetsInternational Bank for Reconstruction & Development 600,000 2.50% 19/3/2024 633,023 0.04%European Investment Bank 600,000 1.63% 14/3/2025 621,054 0.04%African Development Bank 605,000 2.13% 16/11/2022 620,826 0.04%Asian Development Bank 600,000 1.63% 24/1/2023 613,018 0.04%European Investment Bank 600,000 1.38% 15/5/2023 612,274 0.04%Asian Development Bank 550,000 2.63% 12/1/2027 596,814 0.04%European Investment Bank 555,000 3.25% 29/1/2024 595,110 0.04%Inter-American Development Bank 565,000 2.50% 18/1/2023 584,782 0.04%Inter-American Development Bank 550,000 2.63% 16/1/2024 580,539 0.04%International Bank for Reconstruction & Development 500,000 2.50% 29/7/2025 535,373 0.03%Inter-American Development Bank 495,000 2.38% 7/7/2027 530,725 0.03%European Investment Bank 500,000 2.88% 15/8/2023 526,847 0.03%International Bank for Reconstruction & Development 500,000 1.63% 15/1/2025 517,196 0.03%International Bank for Reconstruction & Development 500,000 1.50% 28/8/2024 514,910 0.03%Asian Development Bank 500,000 1.88% 19/7/2022 508,936 0.03%African Development Bank 500,000 1.63% 16/9/2022 508,502 0.03%Asian Development Bank 500,000 1.50% 4/3/2031 500,738 0.03%Inter-American Development Bank 500,000 0.25% 15/11/2023 498,464 0.03%Inter-American Development Bank 500,000 0.63% 15/7/2025 497,906 0.03%European Bank for Reconstruction & Development 500,000 0.50% 25/11/2025 493,130 0.03%New Development Bank 500,000 0.63% 29/9/2025 492,263 0.03%Asian Development Bank 500,000 0.38% 3/9/2025 491,975 0.03%Asian Infrastructure Investment Bank 500,000 0.50% 27/1/2026 491,646 0.03%European Stability Mechanism 500,000 0.38% 10/9/2025 491,410 0.03%International Development Association 500,000 0.38% 23/9/2025 491,087 0.03%European Investment Bank 500,000 0.38% 15/12/2025 490,657 0.03%International Bank for Reconstruction & Development 500,000 1.25% 10/2/2031 488,519 0.03%European Stability Mechanism 470,000 2.13% 3/11/2022 481,819 0.03%European Investment Bank 450,000 2.25% 24/6/2024 473,193 0.03%European Investment Bank 452,000 1.88% 10/2/2025 471,848 0.03%International Bank for Reconstruction & Development 460,000 1.38% 20/4/2028 464,024 0.03%International Bank for Reconstruction & Development 450,000 1.88% 7/10/2022 459,618 0.03%Asian Development Bank 425,000 2.50% 2/11/2027 459,415 0.03%Inter-American Development Bank 375,000 3.13% 18/9/2028 421,844 0.03%Inter-American Development Bank 400,000 1.75% 14/3/2025 415,573 0.03%IDB Trust Services Ltd. 400,000 1.81% 26/2/2025 411,360 0.03%Inter-American Development Bank 400,000 1.75% 14/9/2022 407,528 0.03%Asian Development Bank 400,000 1.75% 13/9/2022 407,422 0.03%African Development Bank 400,000 0.75% 3/4/2023 403,190 0.03%International Finance Corp. 400,000 0.50% 20/3/2023 401,693 0.03%European Investment Bank 400,000 0.63% 25/7/2025 398,404 0.03%International Finance Corp. 400,000 0.38% 16/7/2025 394,330 0.03%Inter-American Development Bank 386,000 0.88% 3/4/2025 388,405 0.03%Asian Infrastructure Investment Bank 350,000 2.25% 16/5/2024 367,174 0.02%European Investment Bank 345,000 2.13% 13/4/2026 365,151 0.02%International Bank for Reconstruction & Development 350,000 0.88% 15/7/2026 349,206 0.02%International Bank for Reconstruction & Development 300,000 2.50% 22/11/2027 324,739 0.02%Corp. Andina de Fomento 300,000 2.75% 6/1/2023 309,421 0.02%Asian Infrastructure Investment Bank 300,000 0.50% 28/5/2025 297,024 0.02%European Investment Bank 275,000 2.25% 15/8/2022 281,364 0.02%International Finance Corp. 265,000 2.88% 31/7/2023 278,971 0.02%Corp. Andina de Fomento 260,000 3.75% 23/11/2023 277,214 0.02%European Investment Bank 200,000 4.88% 15/2/2036 275,829 0.02%European Investment Bank 260,000 2.63% 15/3/2024 275,206 0.02%Inter-American Development Bank 200,000 4.38% 24/1/2044 273,791 0.02%Asian Development Bank 250,000 2.38% 10/8/2027 268,368 0.02%Arab Petroleum Investments Corp. 250,000 4.13% 18/9/2023 268,349 0.02%European Investment Bank 250,000 2.38% 24/5/2027 268,213 0.02%Asian Development Bank 250,000 2.63% 30/1/2024 264,078 0.02%International Development Association 250,000 2.75% 24/4/2023 261,079 0.02%European Stability Mechanism 250,000 1.38% 11/9/2024 256,131 0.02%Inter-American Development Bank 200,000 3.88% 28/10/2041 255,024 0.02%European Investment Bank 234,000 2.50% 15/10/2024 248,691 0.02%Inter-American Development Bank 195,000 7.00% 15/6/2025 241,214 0.02%International Development Association 250,000 1.00% 3/12/2030 238,901 0.02%International Finance Corp. 225,000 2.00% 24/10/2022 230,274 0.02%International Bank for Reconstruction & Development 215,000 1.88% 27/10/2026 224,629 0.01%International Bank for Reconstruction & Development 200,000 7.63% 19/1/2023 222,778 0.01%Africa Finance Corp. 200,000 4.38% 17/4/2026 217,982 0.01%Banque Ouest Africaine de Developpement 200,000 4.70% 22/10/2031 216,746 0.01%African Export-Import Bank 200,000 4.13% 20/6/2024 213,546 0.01%

1054
Vanguard U.S. Investment Grade Credit Index Fund
Principal
US Dollars ($) CouponMaturity
DateFair Value
US Dollars ($)% of Total
Net AssetsAfrica Finance Corp. 200,000 3.88% 13/4/2024 212,161 0.01%Asian Development Bank 200,000 2.13% 19/3/2025 210,510 0.01%Nordic Investment Bank 200,000 2.88% 19/7/2023 210,270 0.01%African Export-Import Bank 200,000 3.99% 21/9/2029 210,236 0.01%Asian Development Bank 200,000 1.88% 24/1/2030 207,240 0.01%International Bank for Reconstruction & Development 200,000 1.88% 19/6/2023 206,211 0.01%Corp. Andina de Fomento 200,000 2.38% 12/5/2023 206,086 0.01%Asian Development Bank 200,000 1.50% 18/10/2024 205,947 0.01%International Finance Corp. 200,000 1.38% 16/10/2024 205,058 0.01%Council Of Europe Development Bank 200,000 1.38% 27/2/2025 204,974 0.01%IDB Trust Services Ltd. 200,000 2.26% 26/9/2022 204,110 0.01%Council Of Europe Development Bank 200,000 1.75% 26/9/2022 203,792 0.01%Nordic Investment Bank 200,000 1.38% 17/10/2022 202,966 0.01%IDB Trust Services Ltd. 200,000 2.39% 12/4/2022 202,826 0.01%European Investment Bank 200,000 0.88% 17/5/2030 190,810 0.01%Corp. Andina de Fomento 184,000 4.38% 15/6/2022 190,699 0.01%International Finance Corp. 175,000 2.13% 7/4/2026 185,070 0.01%Inter-American Development Bank 150,000 3.20% 7/8/2042 172,976 0.01%Council Of Europe Development Bank 155,000 2.63% 13/2/2023 160,789 0.01%African Development Bank 150,000 3.00% 20/9/2023 158,692 0.01%International Bank for Reconstruction & Development 100,000 4.75% 15/2/2035 133,491 0.01%International Bank for Reconstruction & Development 110,000 1.75% 19/4/2023 112,889 0.01%Asian Development Bank 100,000 3.13% 26/9/2028 112,545 0.01%Asian Development Bank 112,000 0.50% 4/2/2026 110,205 0.01%Inter-American Development Bank 100,000 2.00% 23/7/2026 105,148 0.01%Inter-American Development Bank 100,000 2.13% 15/1/2025 105,075 0.01%North American Development Bank 85,000 2.40% 26/10/2022 86,637 0.01%European Investment Bank 75,000 1.63% 9/10/2029 76,588 0.01%Inter-American Development Bank 50,000 3.00% 26/9/2022 51,731 0.00%test test test test 60,175,578 3.90%Sweden 0.41% (2020: 0.43%) . .Swedbank AB 900,000 0.60% 25/9/2023 901,370 0.06%Kommuninvest I Sverige AB 800,000 1.63% 24/10/2022 814,724 0.05%Svensk Exportkredit AB 800,000 0.75% 6/4/2023 805,658 0.05%Svensk Exportkredit AB 700,000 0.63% 14/5/2025 695,632 0.05%Skandinaviska Enskilda Banken AB 500,000 2.20% 12/12/2022 513,334 0.03%Sweden Government International Bond 500,000 0.13% 14/10/2022 499,612 0.03%Kommuninvest I Sverige AB 500,000 0.38% 19/6/2024 497,583 0.03%Sweden Government International Bond 275,000 2.38% 15/2/2023 284,427 0.02%Svenska Handelsbanken AB 250,000 3.90% 20/11/2023 270,894 0.02%Svenska Handelsbanken AB^ 250,000 1.42% 11/6/2027 249,251 0.02%Svenska Handelsbanken AB 250,000 0.55% 11/6/2024 248,926 0.02%Svensk Exportkredit AB 200,000 2.00% 30/8/2022 204,099 0.01%Svensk Exportkredit AB 200,000 1.63% 14/11/2022 203,754 0.01%Kommuninvest I Sverige AB 200,000 0.25% 15/9/2023 199,557 0.01%test test test test 6,388,821 0.41%Switzerland 0.99% (2020: 0.94%) . .Nestle Holdings, Inc. 725,000 3.50% 24/9/2025 798,941 0.05%Credit Suisse Group AG 600,000 4.55% 17/4/2026 679,011 0.04%Credit Suisse Group AG^ 550,000 4.19% 1/4/2031 618,090 0.04%Credit Suisse AG1 475,000 2.95% 9/4/2025 508,994 0.03%UBS Group AG^ 500,000 1.01% 30/7/2024 503,501 0.03%Credit Suisse AG1 500,000 0.50% 2/2/2024 498,191 0.03%Credit Suisse Group AG 450,000 3.80% 9/6/2023 476,567 0.03%Credit Suisse Group AG^ 450,000 2.59% 11/9/2025 468,314 0.03%Novartis Capital Corp. 375,000 4.00% 20/11/2045 457,923 0.03%UBS Group AG 400,000 4.25% 23/3/2028 452,475 0.03%Credit Suisse Group AG 335,000 4.28% 9/1/2028 372,769 0.02%Roche Holdings, Inc. 350,000 2.38% 28/1/2027 368,754 0.02%Credit Suisse Group AG^ 325,000 3.87% 12/1/2029 357,656 0.02%Swiss Re Finance Luxembourg SA^ 300,000 5.00% 2/4/2049 342,375 0.02%Novartis Capital Corp. 325,000 2.20% 14/8/2030 336,101 0.02%Roche Holdings, Inc. 300,000 3.00% 10/11/2025 324,329 0.02%Novartis Capital Corp. 300,000 3.40% 6/5/2024 323,594 0.02%Glencore Finance Canada Ltd. 300,000 4.25% 25/10/2022 313,987 0.02%Roche Holdings, Inc. 250,000 4.00% 28/11/2044 308,264 0.02%UBS Group AG^ 300,000 2.86% 15/8/2023 307,751 0.02%Credit Suisse AG1 275,000 3.63% 9/9/2024 298,647 0.02%Novartis Capital Corp. 290,000 2.75% 14/8/2050 292,466 0.02%Glencore Funding LLC 250,000 4.88% 12/3/2029 291,251 0.02%UBS Group AG 250,000 4.13% 15/4/2026 280,205 0.02%

1055
Vanguard U.S. Investment Grade Credit Index Fund
Principal
US Dollars ($) CouponMaturity
DateFair Value
US Dollars ($)% of Total
Net AssetsNovartis Capital Corp. 250,000 3.00% 20/11/2025 271,221 0.02%Credit Suisse Group AG 250,000 3.75% 26/3/2025 271,152 0.02%Roche Holdings, Inc. 250,000 3.35% 30/9/2024 269,534 0.02%UBS AG 200,000 4.50% 26/6/2048 261,578 0.02%Credit Suisse Group AG^ 250,000 3.00% 14/12/2023 258,120 0.02%UBS Group AG 250,000 3.49% 23/5/2023 256,712 0.02%UBS AG 250,000 1.25% 1/6/2026 249,460 0.02%UBS AG 250,000 0.45% 9/2/2024 248,663 0.02%UBS Group AG^ 220,000 3.13% 13/8/2030 235,772 0.02%Cloverie plc for Zurich Insurance Co., Ltd.^ 200,000 5.63% 24/6/2046 231,801 0.02%Novartis Capital Corp. 225,000 2.40% 21/9/2022 230,773 0.01%UBS AG 200,000 0.38% 1/6/2023 199,720 0.01%Roche Holdings, Inc. 200,000 0.99% 5/3/2026 199,328 0.01%UBS Group AG^ 200,000 1.36% 30/1/2027 198,685 0.01%Zurich Finance Ireland Designated Activity Co.^ 200,000 3.00% 19/4/2051 198,259 0.01%UBS Group AG^ 200,000 2.10% 11/2/2032 195,704 0.01%Credit Suisse Group AG 155,000 4.88% 15/5/2045 195,596 0.01%Swiss Re Treasury US Corp. 160,000 4.25% 6/12/2042 194,480 0.01%Novartis Capital Corp. 150,000 3.10% 17/5/2027 164,101 0.01%Credit Suisse Group Funding Guernsey Ltd. 150,000 3.80% 15/9/2022 155,977 0.01%Credit Suisse USA, Inc. 85,000 7.13% 15/7/2032 123,228 0.01%Tyco Electronics Group SA 75,000 7.13% 1/10/2037 114,830 0.01%Tyco Electronics Group SA 100,000 3.13% 15/8/2027 107,876 0.01%Roche Holdings, Inc. 100,000 2.63% 15/5/2026 106,784 0.01%Glencore Funding LLC 100,000 3.00% 27/10/2022 102,904 0.01%Glencore Finance Canada Ltd. 75,000 5.55% 25/10/2042 96,437 0.01%Novartis Capital Corp. 75,000 3.70% 21/9/2042 87,471 0.01%Novartis Capital Corp. 70,000 2.00% 14/2/2027 72,789 0.00%Glencore Funding LLC 25,000 4.63% 29/4/2024 27,448 0.00%Credit Suisse AG 10,000 3.00% 29/10/2021 10,090 0.00%test test test test 15,316,649 0.99%Taiwan 0.07% (2020: 0.01%) . .TSMC Global Ltd. 350,000 1.38% 28/9/2030 329,750 0.02%TSMC Global Ltd. 325,000 1.00% 28/9/2027 313,421 0.02%TSMC Global Ltd. 300,000 0.75% 28/9/2025 293,869 0.02%Formosa Group Cayman Ltd. 200,000 3.38% 22/4/2025 212,050 0.01%test test test test 1,149,090 0.07%Thailand 0.14% (2020: 0.12%) . .Thaioil Treasury Center Co., Ltd. 400,000 4.63% 20/11/2028 456,552 0.03%Siam Commercial Bank PCL 300,000 3.90% 11/2/2024 322,107 0.02%PTT Treasury Center Co., Ltd. 300,000 3.70% 16/7/2070 305,195 0.02%PTTEP Canada International Finance Ltd. 200,000 6.35% 12/6/2042 279,656 0.02%Bangkok Bank PCL 225,000 3.88% 27/9/2022 233,724 0.02%PTT Global Chemical PCL 225,000 4.25% 19/9/2022 233,543 0.01%Thaioil Treasury Center Co., Ltd. 200,000 3.50% 17/10/2049 183,340 0.01%Bangkok Bank PCL 125,000 9.03% 15/3/2029 174,711 0.01%test test test test 2,188,828 0.14%United Arab Emirates 1.12% (2020: 1.02%) . .Abu Dhabi Government International Bond 1,200,000 3.13% 11/10/2027 1,318,401 0.09%DIB Sukuk Ltd. 1,100,000 3.63% 6/2/2023 1,146,560 0.08%Abu Dhabi Government International Bond 1,000,000 3.13% 16/4/2030 1,085,926 0.07%MDGH-GMTN BV 700,000 3.70% 7/11/2049 765,340 0.05%Emirates NBD Bank PJSC 700,000 2.63% 18/2/2025 733,420 0.05%Abu Dhabi Government International Bond 700,000 3.13% 30/9/2049 713,730 0.05%MDGH-GMTN BV 550,000 2.88% 7/11/2029 576,242 0.04%Sharjah Sukuk Program Ltd. 500,000 3.85% 3/4/2026 537,977 0.04%MDGH-GMTN BV 500,000 2.50% 7/11/2024 525,058 0.03%Abu Dhabi Government International Bond 400,000 4.13% 11/10/2047 476,505 0.03%DP World plc 350,000 6.85% 2/7/2037 474,199 0.03%Fab Sukuk Co., Ltd. 400,000 3.88% 22/1/2024 430,206 0.03%Abu Dhabi Government International Bond 400,000 2.50% 30/9/2029 417,588 0.03%Galaxy Pipeline Assets Bidco Ltd. 400,000 1.75% 30/9/2027 403,993 0.03%Abu Dhabi Government International Bond 350,000 3.88% 16/4/2050 403,447 0.03%Abu Dhabi Crude Oil Pipeline LLC 300,000 4.60% 2/11/2047 353,593 0.02%DP World Crescent Ltd. 300,000 4.85% 26/9/2028 345,132 0.02%Abu Dhabi Crude Oil Pipeline LLC 300,000 3.65% 2/11/2029 333,704 0.02%Ruwais Power Co. PJSC 250,000 6.00% 31/8/2036 332,846 0.02%Abu Dhabi Government International Bond 300,000 3.13% 3/5/2026 327,700 0.02%Abu Dhabi Government International Bond 300,000 1.63% 2/6/2028 298,697 0.02%Galaxy Pipeline Assets Bidco Ltd. 300,000 3.25% 30/9/2040 298,333 0.02%Galaxy Pipeline Assets Bidco Ltd. 300,000 2.63% 31/3/2036 294,558 0.02%

1056
Vanguard U.S. Investment Grade Credit Index Fund
Principal
US Dollars ($) CouponMaturity
DateFair Value
US Dollars ($)% of Total
Net AssetsAbu Dhabi National Energy Co. PJSC 250,000 3.88% 6/5/2024 271,260 0.02%Aldar Sukuk No 2 Ltd. 250,000 3.88% 22/10/2029 270,227 0.02%Abu Dhabi National Energy Co. PJSC 180,000 6.50% 27/10/2036 260,947 0.02%DP World plc 200,000 4.70% 30/9/2049 221,436 0.02%MAF Global Securities Ltd. 200,000 4.75% 7/5/2024 218,101 0.02%DP World Crescent Ltd. 200,000 3.88% 18/7/2029 217,010 0.02%MAF Sukuk Ltd. 200,000 3.93% 28/2/2030 216,401 0.01%Emirates Telecommunications Group Co. PJSC 200,000 3.50% 18/6/2024 215,985 0.01%First Abu Dhabi Bank PJSC^ 200,000 4.50% Perpetual 213,783 0.01%RAK Capital 200,000 3.09% 31/3/2025 212,249 0.01%ADCB Finance Cayman Ltd. 200,000 4.50% 6/3/2023 211,759 0.01%Abu Dhabi National Energy Co. PJSC 200,000 3.63% 12/1/2023 209,595 0.01%Abu Dhabi Government International Bond 200,000 2.13% 30/9/2024 209,338 0.01%Sharjah Sukuk Program Ltd. 200,000 2.94% 10/6/2027 206,641 0.01%Sharjah Sukuk Program Ltd. 200,000 3.23% 23/10/2029 206,608 0.01%Finance Department Government of Sharjah 225,000 4.00% 28/7/2050 206,290 0.01%DAE Funding LLC 200,000 3.38% 20/3/2028 205,263 0.01%DAE Funding LLC 200,000 5.00% 1/8/2024 205,054 0.01%BOS Funding Ltd. 200,000 4.23% 7/3/2022 203,999 0.01%DAE Funding LLC 200,000 4.50% 1/8/2022 200,632 0.01%Abu Dhabi Government International Bond 200,000 2.70% 2/9/2070 181,364 0.01%Abu Dhabi National Energy Co. PJSC 100,000 4.00% 3/10/2049 114,445 0.01%test test test test 17,271,542 1.12%United Kingdom 3.69% (2020: 3.80%) . .BAT Capital Corp. 900,000 4.70% 2/4/2027 1,016,808 0.07%Barclays plc 800,000 4.38% 12/1/2026 896,340 0.06%GlaxoSmithKline Capital, Inc. 719,000 3.63% 15/5/2025 793,253 0.05%Standard Chartered plc^ 775,000 0.99% 12/1/2025 773,181 0.05%AstraZeneca plc 703,000 3.38% 16/11/2025 769,849 0.05%HSBC Holdings plc^ 672,000 4.29% 12/9/2026 747,902 0.05%AstraZeneca plc 475,000 6.45% 15/9/2037 708,030 0.05%Bank of England Euro Note 700,000 0.50% 28/4/2023 703,064 0.05%HSBC Holdings plc 621,000 4.30% 8/3/2026 701,024 0.05%Vodafone Group plc 600,000 4.38% 30/5/2028 697,957 0.05%Lloyds Banking Group plc 600,000 4.38% 22/3/2028 689,055 0.04%HSBC Holdings plc 500,000 6.50% 2/5/2036 688,793 0.04%British Telecommunications plc 425,000 9.63% 15/12/2030 659,050 0.04%BP Capital Markets plc 600,000 3.28% 19/9/2027 656,938 0.04%Reynolds American, Inc. 530,000 5.85% 15/8/2045 649,903 0.04%HSBC Holdings plc 450,000 6.50% 15/9/2037 626,800 0.04%Reynolds American, Inc. 550,000 4.45% 12/6/2025 609,766 0.04%Santander UK Group Holdings plc 600,000 3.57% 10/1/2023 609,581 0.04%HSBC Holdings plc^ 550,000 3.80% 11/3/2025 591,401 0.04%Standard Chartered plc^ 500,000 4.64% 1/4/2031 584,804 0.04%Vodafone Group plc 430,000 5.25% 30/5/2048 563,664 0.04%BAT Capital Corp. 525,000 3.22% 15/8/2024 557,689 0.04%HSBC Holdings plc^ 500,000 4.04% 13/3/2028 554,582 0.04%Sky Ltd. 500,000 3.75% 16/9/2024 546,442 0.04%Barclays plc 475,000 5.20% 12/5/2026 543,711 0.04%HSBC Holdings plc 445,000 4.95% 31/3/2030 537,051 0.04%Barclays plc^ 500,000 2.85% 7/5/2026 528,165 0.03%Natwest Group plc 480,000 6.13% 15/12/2022 515,911 0.03%Lloyds Bank plc 500,000 2.13% 24/7/2022 509,919 0.03%Diageo Capital plc 500,000 2.00% 29/4/2030 500,895 0.03%HSBC Holdings plc^ 500,000 2.36% 18/8/2031 500,283 0.03%Nationwide Building Society^ 450,000 4.36% 1/8/2024 482,563 0.03%Standard Chartered plc 375,000 5.70% 26/3/2044 479,872 0.03%Natwest Group plc^ 400,000 5.08% 27/1/2030 474,268 0.03%Nationwide Building Society^ 450,000 3.77% 8/3/2024 472,550 0.03%Vodafone Group plc 325,000 7.88% 15/2/2030 464,878 0.03%HSBC Holdings plc^ 400,000 4.58% 19/6/2029 462,341 0.03%Hutchison Whampoa International 03/33 Ltd. 300,000 7.45% 24/11/2033 453,992 0.03%HSBC Holdings plc^ 400,000 3.97% 22/5/2030 447,495 0.03%HSBC Holdings plc^ 425,000 2.80% 24/5/2032 436,261 0.03%Nationwide Building Society^ 400,000 4.13% 18/10/2032 436,222 0.03%Lloyds Banking Group plc^ 400,000 3.87% 9/7/2025 433,446 0.03%Lloyds Banking Group plc 400,000 4.05% 16/8/2023 428,733 0.03%HSBC Holdings plc^ 425,000 0.98% 24/5/2025 424,771 0.03%Standard Chartered plc^ 400,000 2.82% 30/1/2026 419,811 0.03%LSEGA Financing plc 400,000 2.50% 6/4/2031 409,388 0.03%CK Hutchison International 20 Ltd. 400,000 2.50% 8/5/2030 409,235 0.03%

1057
Vanguard U.S. Investment Grade Credit Index Fund
Principal
US Dollars ($) CouponMaturity
DateFair Value
US Dollars ($)% of Total
Net AssetsLloyds Banking Group plc 350,000 4.65% 24/3/2026 395,920 0.03%HSBC Holdings plc 275,000 6.80% 1/6/2038 395,714 0.03%HSBC Holdings plc 350,000 4.38% 23/11/2026 394,960 0.03%Unilever Capital Corp. 350,000 3.50% 22/3/2028 393,426 0.03%AstraZeneca plc 450,000 2.13% 6/8/2050 392,743 0.03%Vodafone Group plc 300,000 4.88% 19/6/2049 378,282 0.02%Natwest Group plc 350,000 3.88% 12/9/2023 373,887 0.02%HSBC Holdings plc 350,000 3.60% 25/5/2023 370,558 0.02%Imperial Brands Finance plc 350,000 3.75% 21/7/2022 359,219 0.02%Natwest Group plc^ 300,000 4.89% 18/5/2029 351,399 0.02%Vodafone Group plc 300,000 4.25% 17/9/2050 349,216 0.02%Natwest Group plc 300,000 4.80% 5/4/2026 343,485 0.02%Reckitt Benckiser Treasury Services plc 325,000 2.75% 26/6/2024 343,242 0.02%BAT Capital Corp. 325,000 4.54% 15/8/2047 342,698 0.02%GlaxoSmithKline Capital, Inc. 250,000 5.38% 15/4/2034 337,015 0.02%GlaxoSmithKline Capital, Inc. 225,000 6.38% 15/5/2038 336,879 0.02%HSBC Holdings plc 300,000 3.90% 25/5/2026 333,441 0.02%New England Power Co. 300,000 3.80% 5/12/2047 329,941 0.02%CK Hutchison International 20 Ltd. 300,000 3.38% 8/5/2050 323,192 0.02%Barclays plc 250,000 4.95% 10/1/2047 322,729 0.02%HSBC Holdings plc 296,000 4.25% 14/3/2024 320,772 0.02%Barclays plc 285,000 4.84% 9/5/2028 319,855 0.02%British Airways 2020-1 Class A Pass Through Trust 296,341 4.25% 15/11/2032 317,801 0.02%Prudential plc 290,000 3.13% 14/4/2030 312,375 0.02%Santander UK plc 300,000 2.10% 13/1/2023 307,800 0.02%Nationwide Building Society 300,000 2.00% 27/1/2023 307,608 0.02%BAT Capital Corp. 275,000 4.76% 6/9/2049 297,609 0.02%BAE Systems plc 300,000 1.90% 15/2/2031 289,792 0.02%HSBC Capital Funding Dollar 1 LP^ 175,000 10.18% Perpetual 289,226 0.02%Mead Johnson Nutrition Co. 250,000 4.13% 15/11/2025 281,160 0.02%Nationwide Building Society^ 250,000 3.96% 18/7/2030 280,410 0.02%Barclays plc^ 240,000 5.09% 20/6/2030 278,956 0.02%CNH Industrial NV 250,000 3.85% 15/11/2027 277,214 0.02%Lloyds Banking Group plc 250,000 3.75% 11/1/2027 275,901 0.02%Barclays plc 200,000 5.25% 17/8/2045 265,876 0.02%Barclays plc^ 250,000 3.56% 23/9/2035 260,443 0.02%BAE Systems Finance, Inc. 200,000 7.50% 1/7/2027 259,778 0.02%Santander UK Group Holdings plc^ 250,000 2.90% 15/3/2032 257,850 0.02%Natwest Group plc^ 220,000 4.45% 8/5/2030 252,137 0.02%Vodafone Group plc 200,000 5.00% 30/5/2038 251,921 0.02%BAT International Finance plc 225,000 3.95% 15/6/2025 245,614 0.02%Smith & Nephew plc 250,000 2.03% 14/10/2030 244,959 0.02%British Telecommunications plc 200,000 5.13% 4/12/2028 238,523 0.02%Natwest Group plc^ 225,000 3.07% 22/5/2028 237,387 0.02%Barclays plc^ 200,000 4.97% 16/5/2029 234,353 0.02%HSBC Holdings plc^ 225,000 2.85% 4/6/2031 233,488 0.02%Lloyds Banking Group plc 200,000 4.55% 16/8/2028 233,052 0.02%Imperial Brands Finance plc 225,000 3.50% 11/2/2023 232,742 0.02%Standard Chartered plc^ 200,000 4.31% 21/5/2030 229,929 0.02%BAT Capital Corp. 200,000 4.91% 2/4/2030 229,852 0.02%Mead Johnson Nutrition Co. 175,000 4.60% 1/6/2044 227,710 0.02%BP Capital Markets plc 200,000 3.72% 28/11/2028 225,486 0.01%Santander UK Group Holdings plc 200,000 4.75% 15/9/2025 224,360 0.01%Lloyds Banking Group plc 200,000 4.45% 8/5/2025 224,345 0.01%Legal & General Group plc^ 200,000 5.25% 21/3/2047 224,207 0.01%CK Hutchison International 17 Ltd. 200,000 3.50% 5/4/2027 219,478 0.01%BP Capital Markets plc 200,000 3.51% 17/3/2025 218,896 0.01%Lloyds Banking Group plc^ 200,000 3.57% 7/11/2028 218,464 0.01%HSBC Holdings plc 150,000 6.10% 14/1/2042 218,267 0.01%Unilever Capital Corp. 200,000 3.38% 22/3/2025 217,891 0.01%BAE Systems plc 200,000 3.40% 15/4/2030 217,326 0.01%Imperial Brands Finance plc 200,000 3.88% 26/7/2029 216,915 0.01%Barclays plc 200,000 3.65% 16/3/2025 216,885 0.01%Lloyds Banking Group plc 200,000 3.90% 12/3/2024 216,673 0.01%Vodafone Group plc 200,000 3.75% 16/1/2024 216,551 0.01%Reckitt Benckiser Treasury Services plc 200,000 3.00% 26/6/2027 216,301 0.01%Ashtead Capital, Inc. 200,000 4.25% 1/11/2029 216,268 0.01%Barclays plc^ 200,000 3.93% 7/5/2025 215,791 0.01%Standard Chartered plc^ 200,000 3.79% 21/5/2025 214,812 0.01%Natwest Group plc^ 200,000 4.52% 25/6/2024 214,708 0.01%CK Hutchison International 19 II Ltd. 200,000 3.38% 6/9/2049 214,003 0.01%
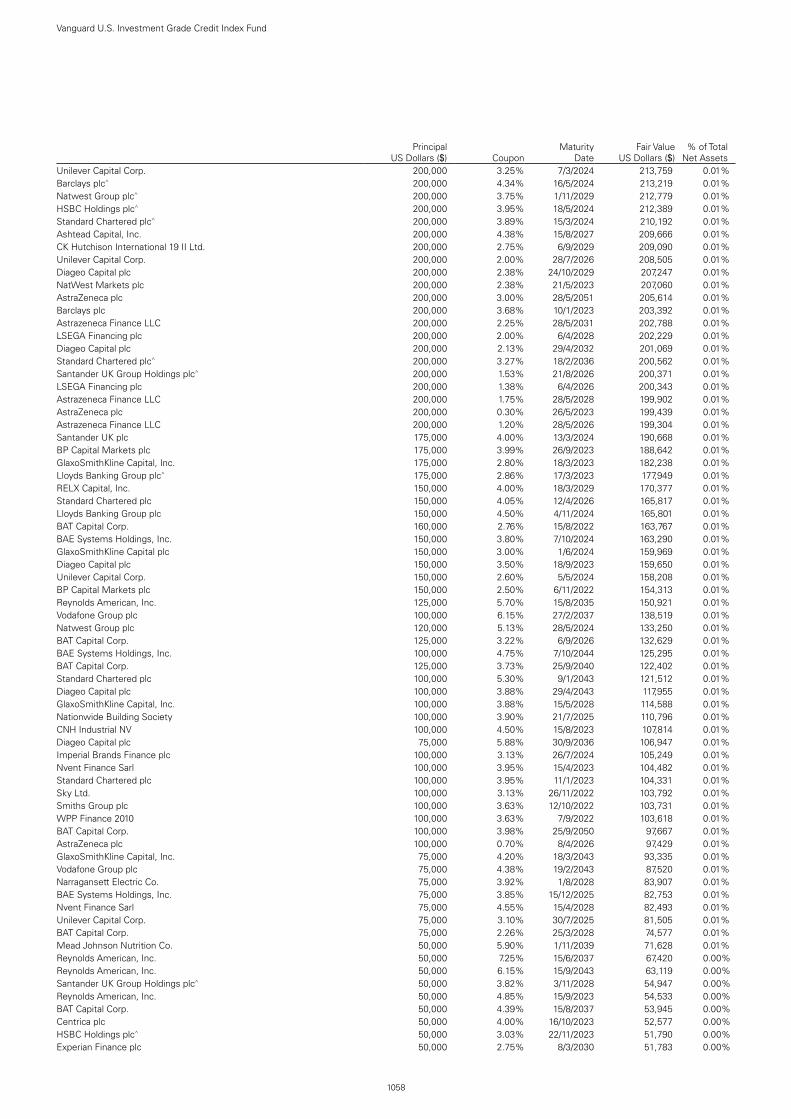
1058
Vanguard U.S. Investment Grade Credit Index Fund
Principal
US Dollars ($) CouponMaturity
DateFair Value
US Dollars ($)% of Total
Net AssetsUnilever Capital Corp. 200,000 3.25% 7/3/2024 213,759 0.01%Barclays plc^ 200,000 4.34% 16/5/2024 213,219 0.01%Natwest Group plc^ 200,000 3.75% 1/11/2029 212,779 0.01%HSBC Holdings plc^ 200,000 3.95% 18/5/2024 212,389 0.01%Standard Chartered plc^ 200,000 3.89% 15/3/2024 210,192 0.01%Ashtead Capital, Inc. 200,000 4.38% 15/8/2027 209,666 0.01%CK Hutchison International 19 II Ltd. 200,000 2.75% 6/9/2029 209,090 0.01%Unilever Capital Corp. 200,000 2.00% 28/7/2026 208,505 0.01%Diageo Capital plc 200,000 2.38% 24/10/2029 207,247 0.01%NatWest Markets plc 200,000 2.38% 21/5/2023 207,060 0.01%AstraZeneca plc 200,000 3.00% 28/5/2051 205,614 0.01%Barclays plc 200,000 3.68% 10/1/2023 203,392 0.01%Astrazeneca Finance LLC 200,000 2.25% 28/5/2031 202,788 0.01%LSEGA Financing plc 200,000 2.00% 6/4/2028 202,229 0.01%Diageo Capital plc 200,000 2.13% 29/4/2032 201,069 0.01%Standard Chartered plc^ 200,000 3.27% 18/2/2036 200,562 0.01%Santander UK Group Holdings plc^ 200,000 1.53% 21/8/2026 200,371 0.01%LSEGA Financing plc 200,000 1.38% 6/4/2026 200,343 0.01%Astrazeneca Finance LLC 200,000 1.75% 28/5/2028 199,902 0.01%AstraZeneca plc 200,000 0.30% 26/5/2023 199,439 0.01%Astrazeneca Finance LLC 200,000 1.20% 28/5/2026 199,304 0.01%Santander UK plc 175,000 4.00% 13/3/2024 190,668 0.01%BP Capital Markets plc 175,000 3.99% 26/9/2023 188,642 0.01%GlaxoSmithKline Capital, Inc. 175,000 2.80% 18/3/2023 182,238 0.01%Lloyds Banking Group plc^ 175,000 2.86% 17/3/2023 177,949 0.01%RELX Capital, Inc. 150,000 4.00% 18/3/2029 170,377 0.01%Standard Chartered plc 150,000 4.05% 12/4/2026 165,817 0.01%Lloyds Banking Group plc 150,000 4.50% 4/11/2024 165,801 0.01%BAT Capital Corp. 160,000 2.76% 15/8/2022 163,767 0.01%BAE Systems Holdings, Inc. 150,000 3.80% 7/10/2024 163,290 0.01%GlaxoSmithKline Capital plc 150,000 3.00% 1/6/2024 159,969 0.01%Diageo Capital plc 150,000 3.50% 18/9/2023 159,650 0.01%Unilever Capital Corp. 150,000 2.60% 5/5/2024 158,208 0.01%BP Capital Markets plc 150,000 2.50% 6/11/2022 154,313 0.01%Reynolds American, Inc. 125,000 5.70% 15/8/2035 150,921 0.01%Vodafone Group plc 100,000 6.15% 27/2/2037 138,519 0.01%Natwest Group plc 120,000 5.13% 28/5/2024 133,250 0.01%BAT Capital Corp. 125,000 3.22% 6/9/2026 132,629 0.01%BAE Systems Holdings, Inc. 100,000 4.75% 7/10/2044 125,295 0.01%BAT Capital Corp. 125,000 3.73% 25/9/2040 122,402 0.01%Standard Chartered plc 100,000 5.30% 9/1/2043 121,512 0.01%Diageo Capital plc 100,000 3.88% 29/4/2043 117,955 0.01%GlaxoSmithKline Capital, Inc. 100,000 3.88% 15/5/2028 114,588 0.01%Nationwide Building Society 100,000 3.90% 21/7/2025 110,796 0.01%CNH Industrial NV 100,000 4.50% 15/8/2023 107,814 0.01%Diageo Capital plc 75,000 5.88% 30/9/2036 106,947 0.01%Imperial Brands Finance plc 100,000 3.13% 26/7/2024 105,249 0.01%Nvent Finance Sarl 100,000 3.95% 15/4/2023 104,482 0.01%Standard Chartered plc 100,000 3.95% 11/1/2023 104,331 0.01%Sky Ltd. 100,000 3.13% 26/11/2022 103,792 0.01%Smiths Group plc 100,000 3.63% 12/10/2022 103,731 0.01%WPP Finance 2010 100,000 3.63% 7/9/2022 103,618 0.01%BAT Capital Corp. 100,000 3.98% 25/9/2050 97,667 0.01%AstraZeneca plc 100,000 0.70% 8/4/2026 97,429 0.01%GlaxoSmithKline Capital, Inc. 75,000 4.20% 18/3/2043 93,335 0.01%Vodafone Group plc 75,000 4.38% 19/2/2043 87,520 0.01%Narragansett Electric Co. 75,000 3.92% 1/8/2028 83,907 0.01%BAE Systems Holdings, Inc. 75,000 3.85% 15/12/2025 82,753 0.01%Nvent Finance Sarl 75,000 4.55% 15/4/2028 82,493 0.01%Unilever Capital Corp. 75,000 3.10% 30/7/2025 81,505 0.01%BAT Capital Corp. 75,000 2.26% 25/3/2028 74,577 0.01%Mead Johnson Nutrition Co. 50,000 5.90% 1/11/2039 71,628 0.01%Reynolds American, Inc. 50,000 7.25% 15/6/2037 67,420 0.00%Reynolds American, Inc. 50,000 6.15% 15/9/2043 63,119 0.00%Santander UK Group Holdings plc^ 50,000 3.82% 3/11/2028 54,947 0.00%Reynolds American, Inc. 50,000 4.85% 15/9/2023 54,533 0.00%BAT Capital Corp. 50,000 4.39% 15/8/2037 53,945 0.00%Centrica plc 50,000 4.00% 16/10/2023 52,577 0.00%HSBC Holdings plc^ 50,000 3.03% 22/11/2023 51,790 0.00%Experian Finance plc 50,000 2.75% 8/3/2030 51,783 0.00%

1059
Vanguard U.S. Investment Grade Credit Index Fund
Principal
US Dollars ($) CouponMaturity
DateFair Value
US Dollars ($)% of Total
Net AssetsImperial Brands Finance plc 25,000 4.25% 21/7/2025 27,523 0.00%test test test test 56,953,193 3.69%Uruguay 0.16% (2020: 0.15%) . .Uruguay Government International Bond 550,280 5.10% 18/6/2050 720,738 0.05%Uruguay Government International Bond 400,000 4.98% 20/4/2055 517,059 0.03%Uruguay Government International Bond 400,000 4.38% 23/1/2031 466,255 0.03%Uruguay Government International Bond 200,000 4.50% 14/8/2024 216,996 0.01%Uruguay Government International Bond 150,000 4.38% 27/10/2027 172,509 0.01%Uruguay Government International Bond 132,537 4.13% 20/11/2045 156,249 0.01%Uruguay Government International Bond 100,000 7.88% 15/1/2033 150,449 0.01%Uruguay Government International Bond 63,500 7.63% 21/3/2036 96,922 0.01%test test test test 2,497,177 0.16%Total Bonds 1,536,384,169 99.49%Financial Assets at Fair Value Through Profit or Loss 1,536,384,169 99.49%
testNumber of Contracts
Notional Amount
Unrealised Gain/(Loss)
US Dollars ($)% of Total
Net AssetsFinancial Derivative InstrumentsFutures 0.00% (2020: 0.00%)US Treasury Ultra 10 Year September 2021 45 $6,521,644 102,497 0.00 %US Ultra Bond September 2021 (8) $(1,535,790) (5,710 ) (0.00 %)US Treasury Note 5 Year September 2021 26 $3,220,036 (10,864 ) (0.00 %)US Treasury Note 2 Year September 2021 27 $5,959,598 (10,950 ) (0.00 %)US Treasury Note 10 Year September 2021 (58) $(7,658,412) (26,588 ) (0.00 %)test test test 48,385 0.00 %
CurrencyBuy
Amount Currency(Sell)
Amount CounterpartySettlement
Date
Unrealised Gain/(Loss)
US Dollars ($)% of Total
Net AssetsHedge Share Class Level Forward Currency Exchange Contracts (1.75%) (2020: 1.45%)USD 6,700,244 EUR (5,527,123) BNP Paribas 2/7/2021 145,625 0.01 %USD 1,861,183 EUR (1,528,533) BNP Paribas 2/7/2021 48,495 0.01 %USD 1,872,850 GBP (1,320,844) Morgan Stanley 2/7/2021 48,170 0.00 %USD 989,936 EUR (816,223) JPMorgan Chase Bank 2/7/2021 21,977 0.00 %USD 350,702 GBP (247,837) Morgan Stanley 2/7/2021 8,327 0.00 %USD 201,432 EUR (164,410) JPMorgan Chase Bank 2/7/2021 6,458 0.00 %USD 189,900 GBP (134,270) BNP Paribas 2/7/2021 4,413 0.00 %USD 196,387 GBP (139,026) Morgan Stanley 2/7/2021 4,330 0.00 %USD 121,215 EUR (99,449) BNP Paribas 2/7/2021 3,278 0.00 %GBP 681,611,506 USD (941,694,008) Toronto-Dominion Bank 3/8/2021 2,877 0.00 %EUR 67,423,598 USD (80,009,696) JPMorgan Chase Bank 3/8/2021 2,074 0.00 %USD 357,753 GBP (257,601) Morgan Stanley 2/7/2021 1,890 0.00 %USD 45,751 GBP (32,282) BNP Paribas 2/7/2021 1,155 0.00 %USD 22,054 EUR (18,162) BNP Paribas 2/7/2021 516 0.00 %USD 16,320 GBP (11,521) Morgan Stanley 2/7/2021 404 0.00 %USD 9,643 GBP (6,833) BNP Paribas 2/7/2021 204 0.00 %USD 9,274 GBP (6,568) JPMorgan Chase Bank 2/7/2021 201 0.00 %USD 28,420 GBP (20,439) BNP Paribas 2/7/2021 185 0.00 %USD 24,098 GBP (17,321) BNP Paribas 2/7/2021 170 0.00 %USD 25,412 EUR (21,305) BNP Paribas 2/7/2021 146 0.00 %USD 13,727,244 GBP (9,935,868) Morgan Stanley 3/8/2021 105 0.00 %GBP 83,225 USD (114,905) Goldman Sachs International 2/7/2021 66 0.00 %USD 5,084 GBP (3,644) BNP Paribas 2/7/2021 50 0.00 %USD 8,339 GBP (6,001) BNP Paribas 2/7/2021 49 0.00 %USD 12,891 EUR (10,832) JPMorgan Chase Bank 2/7/2021 45 0.00 %USD 6,007 GBP (4,316) BNP Paribas 2/7/2021 44 0.00 %EUR 2,571,668 USD (3,051,769) Morgan Stanley 3/8/2021 37 0.00 %EUR 805,451 USD (955,819) Citibank NA 3/8/2021 12 0.00 %USD 33,064 EUR (27,882) Goldman Sachs International 2/7/2021 (2 ) (0.00 %)EUR 1,176 USD (1,400) Morgan Stanley 2/7/2021 (5 ) (0.00 %)EUR 137 USD (167) Morgan Stanley 2/7/2021 (5 ) (0.00 %)EUR 2,408 USD (2,869) BNP Paribas 2/7/2021 (13 ) (0.00 %)USD 79,957,645 EUR (67,423,598) JPMorgan Chase Bank 2/7/2021 (40 ) (0.00 %)EUR 1,605 USD (1,957) Morgan Stanley 2/7/2021 (53 ) (0.00 %)EUR 1,637 USD (1,996) BNP Paribas 2/7/2021 (55 ) (0.00 %)EUR 10,276 USD (12,280) BNP Paribas 2/7/2021 (93 ) (0.00 %)USD 941,612,215 GBP (681,611,506) Toronto-Dominion Bank 2/7/2021 (111 ) (0.00 %)EUR 13,061 USD (15,601) BNP Paribas 2/7/2021 (112 ) (0.00 %)EUR 4,951 USD (6,006) BNP Paribas 2/7/2021 (134 ) (0.00 %)GBP 3,826 USD (5,421) BNP Paribas 2/7/2021 (135 ) (0.00 %)USD 199,834 GBP (144,745) Barclays Bank plc 3/8/2021 (141 ) (0.00 %)

1060
Vanguard U.S. Investment Grade Credit Index Fund
CurrencyBuy
Amount Currency(Sell)
Amount CounterpartySettlement
Date
Unrealised Gain/(Loss)
US Dollars ($)% of Total
Net AssetsEUR 25,518 USD (30,436) Morgan Stanley 2/7/2021 (174 ) (0.00 %)GBP 8,092,962 USD (11,181,244) Citibank NA 3/8/2021 (216 ) (0.00 %)GBP 124,155 USD (171,752) Morgan Stanley 2/7/2021 (238 ) (0.00 %)EUR 13,458 USD (16,437) Morgan Stanley 2/7/2021 (477 ) (0.00 %)EUR 55,571 USD (66,423) BNP Paribas 2/7/2021 (521 ) (0.00 %)GBP 16,692 USD (23,656) JPMorgan Chase Bank 2/7/2021 (597 ) (0.00 %)GBP 29,495 USD (41,601) BNP Paribas 2/7/2021 (855 ) (0.00 %)EUR 44,468 USD (54,115) BNP Paribas 2/7/2021 (1,380 ) (0.00 %)GBP 75,779 USD (107,037) JPMorgan Chase Bank 2/7/2021 (2,352 ) (0.00 %)GBP 285,164 USD (398,362) BNP Paribas 2/7/2021 (4,422 ) (0.00 %)GBP 550,196 USD (775,121) Citibank NA 2/7/2021 (15,053 ) (0.00 %)EUR 457,174 USD (559,275) BNP Paribas 2/7/2021 (17,112 ) (0.00 %)GBP 4,383,151 USD (6,219,569) JPMorgan Chase Bank 2/7/2021 (164,464 ) (0.01 %)EUR 75,006,077 USD (91,421,157) Toronto-Dominion Bank 2/7/2021 (2,471,406 ) (0.16 %)GBP 678,268,326 USD (961,723,442) Toronto-Dominion Bank 2/7/2021 (24,729,552 ) (1.60 %)test (27,108,415 ) (1.75 %)Total Financial Derivative Instruments (27,060,030 ) (1.75 %)
Fair Value US Dollars ($)
% of Total Net Assets
Other Assets and Liabilities 34,913,795 2.26 %Net Assets 1,544,237,934 100.00 %
Analysis of Total Net Assets US Dollars ($)% of Total
Net Assets(a) Transferable securities admitted to an official stock exchange listing 924,102,843 59.84 %(b) Transferable securities dealt in on another regulated market 585,787,833 37.93 %(c) Transferable securities other than those admitted to an official stock exchange listing or dealt in on another regulated
market 26,493,493 1.72 %
(d) Financial derivative instruments (27,060,030 ) (1.75 %)(e) Other assets and liabilities 34,913,795 2.26 %Total Net Assets 1,544,237,934 100.00 %
^ Floating Rate Note (FRN). The effective interest rate is at 30 June 2021.1 Denotes securities pledged in full or part thereof as collateral for derivatives.

The accompanying notes form an integral part of the financial statements.
1061
Vanguard U.S. Investment Grade Credit Index Fund
Statement of Assets and Liabilities
US Dollars ($)
As at 30 June 2021
US Dollars ($)
As at 31 December 2020
Current AssetsFinancial Assets at Fair Value Through Profit or Loss 1,536,384,169 2,021,014,461 Financial Derivative Instruments 403,800 30,177,938 Cash 10,743,999 8,188,620 Unrealised Appreciation on Spot Currency Contracts 2,345 — Receivables: Interest and Dividends 12,278,393 16,088,690 Capital Shares Issued 4,666,115 2,555,819 Investments Sold 26,181,355 3,108,135
Total Current Assets 1,590,660,176 2,081,133,663
Current LiabilitiesFinancial Derivative Instruments 27,463,830 644,303 Bank Overdraft 14 221 Unrealised Depreciation on Spot Currency Contracts — 373 Payables and Other Liabilities: Investments Purchased 4,559,660 32,760,061 Income Distribution Payable 223,278 259,360 Capital Shares Redeemed 13,976,807 12,164,358 Futures Margin Cash Due to Broker 40,611 35,081 Management Fees Payable 144,504 188,917 Other Payables 13,538 1,950
Total Current Liabilities 46,422,242 46,054,624
Net Assets Attributable to Holders of Redeemable Participating Shares (“Net Assets”) 1,544,237,934 2,035,079,039

1062
Vanguard U.S. Investment Grade Credit Index Fund
The accompanying notes form an integral part of the financial statements.
Net Asset Value Per Share
.As at
30 June 2021As at
31 December 2020As at
31 December 2019EUR AccUS ($) Equivalent 31,756,285 27,338,663 8,298,237Net Assets 26,778,215 22,343,725 7,392,639Number of Shares Outstanding 104,633 89,167 29,406Net Asset Value Per Share1 255.93 250.58 251.40
Institutional Plus EUR AccUS ($) Equivalent 13,550,813 13,914,824 14,327,505Net Assets 11,426,607 11,372,502 12,763,924Number of Shares Outstanding 69,752 70,916 79,368Net Asset Value Per Share1 163.82 160.37 160.82
Institutional Plus EUR Hedged AccUS ($) Equivalent 83,990,113 253,050,374 51,182,833Net Assets 70,823,943 206,816,539 45,597,179Number of Shares Outstanding 596,988 1,718,439 405,944Net Asset Value Per Share1 118.64 120.35 112.32
GBP Hedged AccUS ($) Equivalent 906,550,215 1,031,702,255 787,171,468Net Assets 656,230,949 754,747,642 594,203,809Number of Shares Outstanding 4,978,750 5,665,355 4,805,118Net Asset Value Per Share1 131.81 133.22 123.66
Institutional Plus GBP Hedged AccUS ($) Equivalent 9,334,859 15,723,361 8,166,976Net Assets 6,757,291 11,502,514 6,164,919Number of Shares Outstanding 58,096 97,865 56,528Net Asset Value Per Share1 116.31 117.53 109.06
Institutional Plus GBP Hedged DistUS ($) Equivalent 22,719,970 22,407,178 12,481,590Net Assets 16,446,466 16,392,098 9,421,846Number of Shares Outstanding 164,598 160,118 96,308Net Asset Value Per Share1 99.92 102.38 97.83
USD AccNet Assets 300,042,502 353,915,710 336,541,802Number of Shares Outstanding 1,360,272 1,588,288 1,640,964Net Asset Value Per Share1 220.58 222.83 205.09
Institutional Plus USD AccNet Assets 166,508,880 299,510,753 104,424,947Number of Shares Outstanding 1,169,163 2,082,202 789,078Net Asset Value Per Share1 142.42 143.84 132.34
Institutional Plus USD DistNet Assets 9,784,297 17,515,921 35,950,875Number of Shares Outstanding 88,571 154,822 335,474Net Asset Value Per Share1 110.47 113.14 107.16
1 The net asset value per share shown may diverge from the net asset value per share used for dealing purposes because of any adjustments for swing pricing and trade date accounting.

1063
Vanguard U.S. Investment Grade Credit Index Fund
The accompanying notes form an integral part of the financial statements.
Statement of Operations
US Dollars ($)
Six Months Ended 30 June 2021
US Dollars ($)
Six Months Ended 30 June 2020
Investment Income/(Loss) Interest Income 24,021,383 26,352,681 Other Income 231,033 168,174 Net Gain/(Loss) on Financial Instruments (46,359,346) 18,680,499
Total Investment Income/(Loss) (22,106,930) 45,201,354
Expenses Management Fees 941,384 913,859 Transaction Fees and Commissions 5,258 7,698
Total Expenses 946,642 921,557
Finance Costs Interest Expense 2,512 2,974 Distribution Paid 502,685 727,947 Income Equalisation (13,892) 2,854
Total Finance Costs 491,305 733,775
Net Investment Income/(Loss) (23,544,877) 43,546,022
Foreign Withholding Tax (7,071) (38,983)
Net Increase/(Decrease) in Net Assets (23,551,948) 43,507,039
Statement of Changes in Net Assets
US Dollars ($)
US Dollars ($)
Six Months Ended Six Months Ended30 June 2021 30 June 2020
Increase/(Decrease) in Net Assets
Net Increase/(Decrease) in Net Assets From Operations (23,551,948) 43,507,039
Capital Transactions Subscriptions 601,117,451 1,298,637,136 Redemptions (1,068,406,608) (417,794,643)
Total Capital Transactions1 (467,289,157) 880,842,493
Total Increase/(Decrease) for the Period (490,841,105) 924,349,532
Net AssetsBeginning of Period 2,035,079,039 1,401,365,617
End of Period 1,544,237,934 2,325,715,149
1 Capital Transactions include income equalisation adjustments as shown in the Statement of Operations.

Vanguard U.S. Treasury Inflation-Protected Securities Index FundManaged by Vanguard Global Advisers, LLC.
1064
Investment ObjectiveThis fund seeks to provide returns consistent with the performance of the Bloomberg Barclays U.S. Government Inflation-Linked 1–10 Year Index, a market-weighted index designed to measure the performance of US Treasury Inflation-Protected Securities ("TIPS") with maturities between 1 and 10 years.
Performance SummaryThe Performance Summary does not form part of the Financial Statements.
• As the six months ended 30 June 2021 came to a close, macroeconomic indicators signalled a faster global economic rebound than many had expected after the sharpest contraction in modern history. Yet the recovery has been uneven. Countries that have contained the virus more successfully, whether through vaccinations, lockdowns or both, generally have fared better economically. And the COVID-19 pandemic remained far from over, with new variants of the virus surfacing where vaccination rates have lagged and the human toll continuing to mount, especially in less developed economies.
• Swift and extensive support from governments and central banks has been a key to the rebound. So far in 2021, it has included fiscal stimulus – including the $1.9 trillion American Rescue Plan in the United States and the €673 billion Recovery and Resilience Facility in Europe – and pledges by a number of central banks to keep interest rates low for some time.
• Stock markets worldwide continued the rally that began in 2020. The FTSE Global All Cap Index returned roughly 13% in US dollars for the six months ended 30 June.
• Fixed income securities struggled amid concerns that an upturn in inflation might persist or even accelerate given the stronger-than-expected rebound in global growth, extraordinary monetary and fiscal stimulus and a jump in demand for goods and services as economies reopened and supply gradually picked up. With longer-term yields rising and prices falling, bonds returned about –3% in US dollars for the half year, as measured by the Bloomberg Barclays Global Aggregate Bond Index.
• Yields rose for longer-term US Treasury Inflation-Protected Securities as inflation measures increased over the period. The five-year break-even inflation rate, which implies the bond market’s expectation for the annualized rate of inflation over the coming five years, finished the period at 2.47%, up about 50 basis points six months earlier. (A basis point is one-hundredth of a percentage point).
• In this environment, the fund’s benchmark index returned 2.32% for the six months ended 30 June 2021.
Benchmark returns in the commentary above are in US dollars.
Benchmark: Bloomberg Barclays U.S. Government Inflation-Linked 1–10 Year Index
Total ReturnsPeriods Ended 30 June 2021
(Annualised for periods over one year)
Six MonthsTen Years or
Since Inception1
Select CHF Hedged Acc 1.75 % 1.15 %
Benchmark 1.74 1.20
Tracking Difference* 0.01
Select CHF Hedged Income 1.75 % 1.14 %
Benchmark 1.74 1.18
Tracking Difference* 0.01
Select EUR Hedged Acc 1.87 % 1.57 %
Benchmark 1.88 1.62
Tracking Difference* -0.01
Select EUR Hedged Income 1.87 % 1.57 %
Benchmark 1.88 1.62
Tracking Difference* -0.01
Select GBP Hedged Acc 2.20 % 2.54 %
Benchmark 2.22 2.60
Tracking Difference* -0.02
Select GBP Hedged Income 2.20 % 2.53 %
Benchmark 2.22 2.58
Tracking Difference* -0.02
Select SGD Hedged Acc 2.32 % 3.29 %
Benchmark 2.35 3.37
Tracking Difference* -0.03

1065
Vanguard U.S. Treasury Inflation-Protected Securities Index Fund
Total ReturnsPeriods Ended 30 June 2021
(Annualised for periods over one year)
Six MonthsTen Years or
Since Inception1
Select USD Acc 2.29 % 3.71 %
Benchmark 2.32 3.80
Tracking Difference* -0.03
Select USD Income 2.28 % 3.71 %
Benchmark 2.32 3.80
Tracking Difference* -0.04
Each benchmark is in its respective currency.Sources: Vanguard Global Advisers, LLC, and Bloomberg.Performance is based on NAV with net income reinvested.
All of the returns in this report represent past performance, which is not a guarantee of future results that may be achieved by the fund. For performance data current to the most recent month-end, which may be higher or lower than that cited, visit our website at http://global.vanguard.com. Note, too, that both investment returns and principal value can fluctuate widely, so an investor's shares, when sold, could be worth more or less than their original cost.* The tracking difference between the fund return and the index return over a stated period of time can be attributed to a number of factors, including, without limitation, small differences in
weightings, trading activity, transaction costs and differences in the valuation and withholding tax treatment between the fund and the index vendor.1 Since-inception returns: Select CHF Hedged Acc, 24 October 2016; Select CHF Hedged Income, 25 October 2016; Select EUR Hedged Acc, Select EUR Hedged Income and Select GBP Hedged Acc, 24
October 2016; Select GBP Hedged Income and Select SGD Hedged Acc, 25 October 2016; Select USD Acc and Select USD Income, 24 October 2016.

Significant Portfolio ChangesFor the Six Months Ended 30 June 2021
1066
Vanguard U.S. Treasury Inflation-Protected Securities Index Fund
The Central Bank of Ireland requires a schedule of material changes in the composition of the portfolio during the period. These are defined as aggregate purchases of a security exceeding 1% of the total value of purchases for the period and aggregate disposals greater than 1% of the total value of sales. At a minimum, the largest 20 purchases and 20 sales must be shown; all purchases and sales must be shown if there are fewer than 20. A full listing of the portfolio changes for the period is available, upon request, at no extra cost from the Administrator.
Principal US Dollars ($)
Cost US Dollars ($)
Purchases
US Treasury Inflation Indexed Bonds 0.13% 15/7/2022 102,485,595 106,506,742
US Treasury Inflation Indexed Bonds 0.13% 15/1/2031 82,540,054 90,531,037
US Treasury Inflation Indexed Bonds 0.13% 15/4/2026 61,594,100 67,333,669
US Treasury Inflation Indexed Bonds 0.13% 15/10/2025 43,301,984 47,328,990
US Treasury Inflation Indexed Bonds 0.13% 15/1/2023 32,969,615 34,525,517
US Treasury Inflation Indexed Bonds 0.63% 15/4/2023 26,478,990 28,140,815
US Treasury Inflation Indexed Bonds 0.38% 15/7/2023 24,223,198 25,876,409
US Treasury Inflation Indexed Bonds 0.63% 15/1/2026 20,384,962 22,737,468
US Treasury Inflation Indexed Bonds 0.25% 15/1/2025 20,712,188 22,539,284
US Treasury Inflation Indexed Bonds 0.13% 15/4/2022 21,507,000 22,095,742
US Treasury Inflation Indexed Bonds 0.13% 15/7/2024 20,258,205 21,912,512
US Treasury Inflation Indexed Bonds 0.63% 15/1/2024 20,184,246 21,890,439
US Treasury Inflation Indexed Bonds 0.75% 15/7/2028 18,808,018 21,665,390
US Treasury Inflation Indexed Bonds 0.50% 15/1/2028 18,080,679 20,322,621
US Treasury Inflation Indexed Bonds 0.38% 15/1/2027 16,185,322 17,994,357
US Treasury Inflation Indexed Bonds 0.13% 15/7/2030 16,320,378 17,947,517
US Treasury Inflation Indexed Bonds 0.25% 15/7/2029 15,962,342 17,741,817
US Treasury Inflation Indexed Bonds 0.13% 15/1/2030 15,701,247 17,181,963
US Treasury Inflation Indexed Bonds 3.63% 15/4/2028 12,538,215 17,020,297
US Treasury Inflation Indexed Bonds 0.38% 15/7/2027 13,976,743 15,650,290
US Treasury Inflation Indexed Bonds 3.88% 15/4/2029 10,951,061 15,523,413
US Treasury Inflation Indexed Bonds 2.38% 15/1/2025 13,115,299 15,396,707
US Treasury Inflation Indexed Bonds 0.38% 15/7/2025 13,787,933 15,230,487
US Treasury Inflation Indexed Bonds 0.50% 15/4/2024 14,003,186 15,182,802
US Treasury Inflation Indexed Bonds 0.88% 15/1/2029 12,194,291 14,136,927
US Treasury Inflation Indexed Bonds 0.13% 15/7/2026 12,853,059 14,110,268
US Treasury Inflation Indexed Bonds 1.75% 15/1/2028 11,246,695 13,644,604
US Treasury Inflation Indexed Bonds 2.00% 15/1/2026 11,463,375 13,608,440
US Treasury Inflation Indexed Bonds 0.13% 15/10/2024 11,574,560 12,542,731
US Treasury Inflation Indexed Bonds 0.13% 15/4/2025 11,349,899 12,309,324
US Treasury Inflation Indexed Bonds 2.50% 15/1/2029 9,436,303 12,193,905
US Treasury Inflation Indexed Bonds 2.38% 15/1/2027 9,473,918 11,670,845
Principal US Dollars ($)
Proceeds US Dollars ($)
Sales
US Treasury Inflation Indexed Bonds 0.13% 15/7/2022 104,430,943 108,513,949
US Treasury Inflation Indexed Bonds 0.13% 15/4/2022 85,019,291 87,267,521
US Treasury Inflation Indexed Bonds 0.13% 15/1/2022 46,358,940 47,309,733
US Treasury Inflation Indexed Bonds 0.13% 15/1/2023 21,159,037 22,136,583
US Treasury Inflation Indexed Bonds 0.13% 15/1/2031 12,715,305 13,958,998
US Treasury Inflation Indexed Bonds 0.63% 15/4/2023 12,984,408 13,773,106
US Treasury Inflation Indexed Bonds 0.13% 15/10/2025 12,017,987 13,180,900
US Treasury Inflation Indexed Bonds 0.38% 15/7/2023 12,136,473 12,933,147
US Treasury Inflation Indexed Bonds 0.75% 15/7/2028 8,857,490 10,223,297
US Treasury Inflation Indexed Bonds 0.25% 15/1/2025 8,774,080 9,521,506
US Treasury Inflation Indexed Bonds 0.13% 15/7/2024 8,292,846 8,938,366
US Treasury Inflation Indexed Bonds 0.63% 15/1/2026 7,869,270 8,747,954
US Treasury Inflation Indexed Bonds 0.63% 15/1/2024 8,004,163 8,658,243
US Treasury Inflation Indexed Bonds 0.50% 15/1/2028 7,270,130 8,169,093
US Treasury Inflation Indexed Bonds 3.63% 15/4/2028 5,680,626 7,692,218
US Treasury Inflation Indexed Bonds 1.75% 15/1/2028 5,788,304 6,999,930
US Treasury Inflation Indexed Bonds 0.13% 15/7/2030 6,268,284 6,963,924
US Treasury Inflation Indexed Bonds 0.50% 15/4/2024 5,600,132 6,030,598
US Treasury Inflation Indexed Bonds 2.50% 15/1/2029 4,644,063 5,970,529
US Treasury Inflation Indexed Bonds 0.25% 15/7/2029 5,121,639 5,674,201
US Treasury Inflation Indexed Bonds 0.38% 15/1/2027 4,592,171 5,106,074
US Treasury Inflation Indexed Bonds 0.13% 15/1/2030 4,515,716 4,997,317
US Treasury Inflation Indexed Bonds 2.00% 15/1/2026 4,118,266 4,858,552
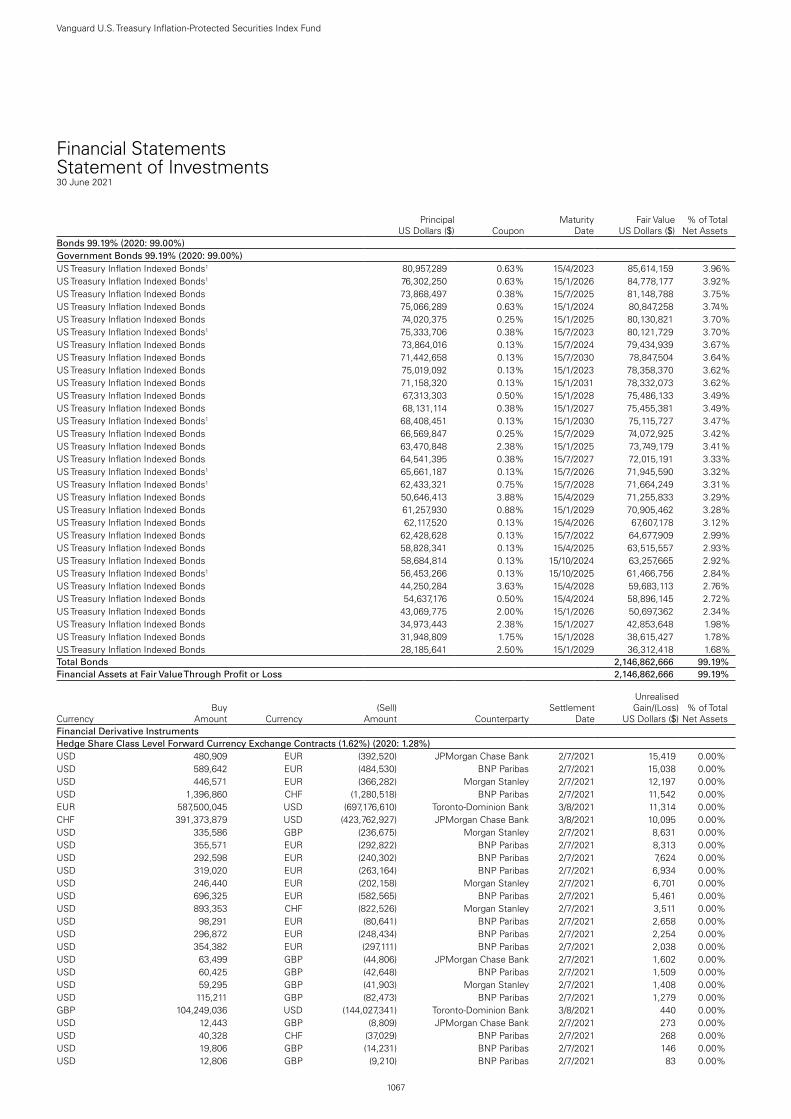
1067
Vanguard U.S. Treasury Inflation-Protected Securities Index Fund
Financial StatementsStatement of Investments30 June 2021
Principal US Dollars ($) Coupon
Maturity Date
Fair Value US Dollars ($)
% of Total Net Assets
Bonds 99.19% (2020: 99.00%)Government Bonds 99.19% (2020: 99.00%) US Treasury Inflation Indexed Bonds1 80,957,289 0.63% 15/4/2023 85,614,159 3.96%US Treasury Inflation Indexed Bonds1 76,302,250 0.63% 15/1/2026 84,778,177 3.92%US Treasury Inflation Indexed Bonds 73,868,497 0.38% 15/7/2025 81,148,788 3.75%US Treasury Inflation Indexed Bonds 75,066,289 0.63% 15/1/2024 80,847,258 3.74%US Treasury Inflation Indexed Bonds 74,020,375 0.25% 15/1/2025 80,130,821 3.70%US Treasury Inflation Indexed Bonds1 75,333,706 0.38% 15/7/2023 80,121,729 3.70%US Treasury Inflation Indexed Bonds 73,864,016 0.13% 15/7/2024 79,434,939 3.67%US Treasury Inflation Indexed Bonds 71,442,658 0.13% 15/7/2030 78,847,504 3.64%US Treasury Inflation Indexed Bonds 75,019,092 0.13% 15/1/2023 78,358,370 3.62%US Treasury Inflation Indexed Bonds 71,158,320 0.13% 15/1/2031 78,332,073 3.62%US Treasury Inflation Indexed Bonds 67,313,303 0.50% 15/1/2028 75,486,133 3.49%US Treasury Inflation Indexed Bonds 68,131,114 0.38% 15/1/2027 75,455,381 3.49%US Treasury Inflation Indexed Bonds1 68,408,451 0.13% 15/1/2030 75,115,727 3.47%US Treasury Inflation Indexed Bonds 66,569,847 0.25% 15/7/2029 74,072,925 3.42%US Treasury Inflation Indexed Bonds 63,470,848 2.38% 15/1/2025 73,749,179 3.41%US Treasury Inflation Indexed Bonds 64,541,395 0.38% 15/7/2027 72,015,191 3.33%US Treasury Inflation Indexed Bonds1 65,661,187 0.13% 15/7/2026 71,945,590 3.32%US Treasury Inflation Indexed Bonds1 62,433,321 0.75% 15/7/2028 71,664,249 3.31%US Treasury Inflation Indexed Bonds 50,646,413 3.88% 15/4/2029 71,255,833 3.29%US Treasury Inflation Indexed Bonds 61,257,930 0.88% 15/1/2029 70,905,462 3.28%US Treasury Inflation Indexed Bonds 62,117,520 0.13% 15/4/2026 67,607,178 3.12%US Treasury Inflation Indexed Bonds 62,428,628 0.13% 15/7/2022 64,677,909 2.99%US Treasury Inflation Indexed Bonds 58,828,341 0.13% 15/4/2025 63,515,557 2.93%US Treasury Inflation Indexed Bonds 58,684,814 0.13% 15/10/2024 63,257,665 2.92%US Treasury Inflation Indexed Bonds1 56,453,266 0.13% 15/10/2025 61,466,756 2.84%US Treasury Inflation Indexed Bonds 44,250,284 3.63% 15/4/2028 59,683,113 2.76%US Treasury Inflation Indexed Bonds 54,637,176 0.50% 15/4/2024 58,896,145 2.72%US Treasury Inflation Indexed Bonds 43,069,775 2.00% 15/1/2026 50,697,362 2.34%US Treasury Inflation Indexed Bonds 34,973,443 2.38% 15/1/2027 42,853,648 1.98%US Treasury Inflation Indexed Bonds 31,948,809 1.75% 15/1/2028 38,615,427 1.78%US Treasury Inflation Indexed Bonds 28,185,641 2.50% 15/1/2029 36,312,418 1.68%Total Bonds 2,146,862,666 99.19%Financial Assets at Fair Value Through Profit or Loss 2,146,862,666 99.19%
CurrencyBuy
Amount Currency(Sell)
Amount CounterpartySettlement
Date
Unrealised Gain/(Loss)
US Dollars ($)% of Total
Net AssetsFinancial Derivative InstrumentsHedge Share Class Level Forward Currency Exchange Contracts (1.62%) (2020: 1.28%)USD 480,909 EUR (392,520) JPMorgan Chase Bank 2/7/2021 15,419 0.00 %USD 589,642 EUR (484,530) BNP Paribas 2/7/2021 15,038 0.00 %USD 446,571 EUR (366,282) Morgan Stanley 2/7/2021 12,197 0.00 %USD 1,396,860 CHF (1,280,518) BNP Paribas 2/7/2021 11,542 0.00 %EUR 587,500,045 USD (697,176,610) Toronto-Dominion Bank 3/8/2021 11,314 0.00 %CHF 391,373,879 USD (423,762,927) JPMorgan Chase Bank 3/8/2021 10,095 0.00 %USD 335,586 GBP (236,675) Morgan Stanley 2/7/2021 8,631 0.00 %USD 355,571 EUR (292,822) BNP Paribas 2/7/2021 8,313 0.00 %USD 292,598 EUR (240,302) BNP Paribas 2/7/2021 7,624 0.00 %USD 319,020 EUR (263,164) BNP Paribas 2/7/2021 6,934 0.00 %USD 246,440 EUR (202,158) Morgan Stanley 2/7/2021 6,701 0.00 %USD 696,325 EUR (582,565) BNP Paribas 2/7/2021 5,461 0.00 %USD 893,353 CHF (822,526) Morgan Stanley 2/7/2021 3,511 0.00 %USD 98,291 EUR (80,641) BNP Paribas 2/7/2021 2,658 0.00 %USD 296,872 EUR (248,434) BNP Paribas 2/7/2021 2,254 0.00 %USD 354,382 EUR (297,111) BNP Paribas 2/7/2021 2,038 0.00 %USD 63,499 GBP (44,806) JPMorgan Chase Bank 2/7/2021 1,602 0.00 %USD 60,425 GBP (42,648) BNP Paribas 2/7/2021 1,509 0.00 %USD 59,295 GBP (41,903) Morgan Stanley 2/7/2021 1,408 0.00 %USD 115,211 GBP (82,473) BNP Paribas 2/7/2021 1,279 0.00 %GBP 104,249,036 USD (144,027,341) Toronto-Dominion Bank 3/8/2021 440 0.00 %USD 12,443 GBP (8,809) JPMorgan Chase Bank 2/7/2021 273 0.00 %USD 40,328 CHF (37,029) BNP Paribas 2/7/2021 268 0.00 %USD 19,806 GBP (14,231) BNP Paribas 2/7/2021 146 0.00 %USD 12,806 GBP (9,210) BNP Paribas 2/7/2021 83 0.00 %
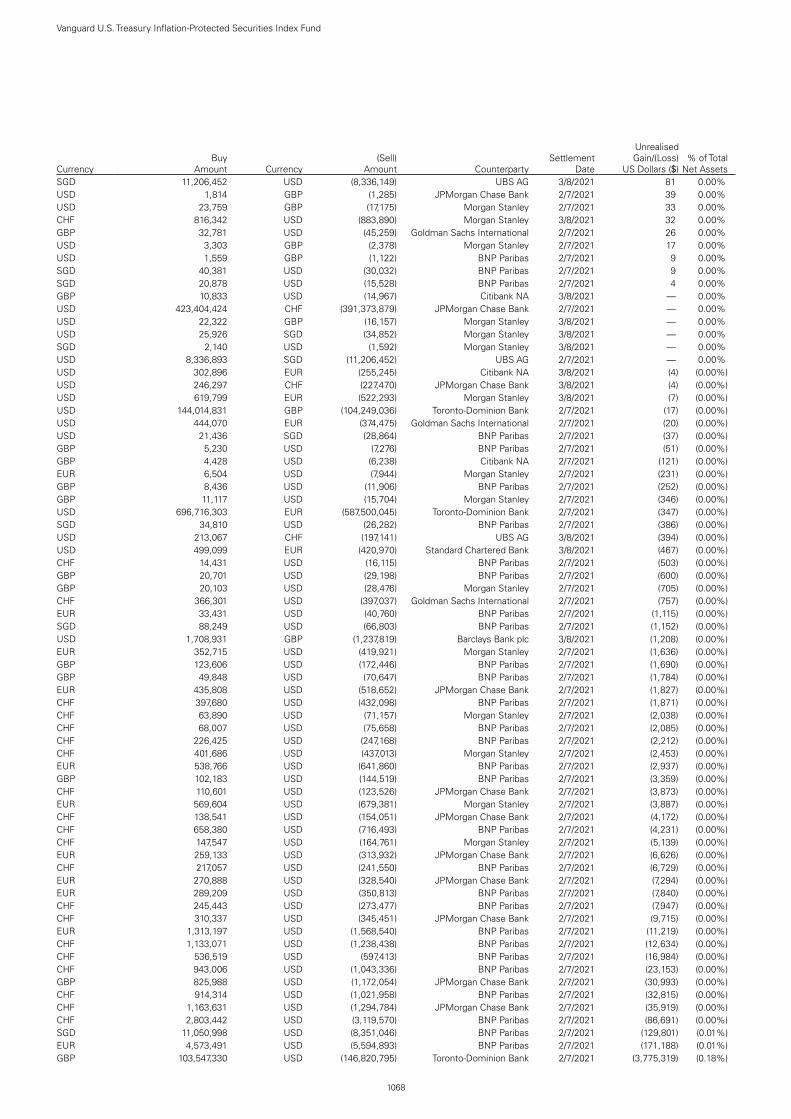
1068
Vanguard U.S. Treasury Inflation-Protected Securities Index Fund
CurrencyBuy
Amount Currency(Sell)
Amount CounterpartySettlement
Date
Unrealised Gain/(Loss)
US Dollars ($)% of Total
Net AssetsSGD 11,206,452 USD (8,336,149) UBS AG 3/8/2021 81 0.00 %USD 1,814 GBP (1,285) JPMorgan Chase Bank 2/7/2021 39 0.00 %USD 23,759 GBP (17,175) Morgan Stanley 2/7/2021 33 0.00 %CHF 816,342 USD (883,890) Morgan Stanley 3/8/2021 32 0.00 %GBP 32,781 USD (45,259) Goldman Sachs International 2/7/2021 26 0.00 %USD 3,303 GBP (2,378) Morgan Stanley 2/7/2021 17 0.00 %USD 1,559 GBP (1,122) BNP Paribas 2/7/2021 9 0.00 %SGD 40,381 USD (30,032) BNP Paribas 2/7/2021 9 0.00 %SGD 20,878 USD (15,528) BNP Paribas 2/7/2021 4 0.00 %GBP 10,833 USD (14,967) Citibank NA 3/8/2021 — 0.00 %USD 423,404,424 CHF (391,373,879) JPMorgan Chase Bank 2/7/2021 — 0.00 %USD 22,322 GBP (16,157) Morgan Stanley 3/8/2021 — 0.00 %USD 25,926 SGD (34,852) Morgan Stanley 3/8/2021 — 0.00 %SGD 2,140 USD (1,592) Morgan Stanley 3/8/2021 — 0.00 %USD 8,336,893 SGD (11,206,452) UBS AG 2/7/2021 — 0.00 %USD 302,896 EUR (255,245) Citibank NA 3/8/2021 (4 ) (0.00 %)USD 246,297 CHF (227,470) JPMorgan Chase Bank 3/8/2021 (4 ) (0.00 %)USD 619,799 EUR (522,293) Morgan Stanley 3/8/2021 (7 ) (0.00 %)USD 144,014,831 GBP (104,249,036) Toronto-Dominion Bank 2/7/2021 (17 ) (0.00 %)USD 444,070 EUR (374,475) Goldman Sachs International 2/7/2021 (20 ) (0.00 %)USD 21,436 SGD (28,864) BNP Paribas 2/7/2021 (37 ) (0.00 %)GBP 5,230 USD (7,276) BNP Paribas 2/7/2021 (51 ) (0.00 %)GBP 4,428 USD (6,238) Citibank NA 2/7/2021 (121 ) (0.00 %)EUR 6,504 USD (7,944) Morgan Stanley 2/7/2021 (231 ) (0.00 %)GBP 8,436 USD (11,906) BNP Paribas 2/7/2021 (252 ) (0.00 %)GBP 11,117 USD (15,704) Morgan Stanley 2/7/2021 (346 ) (0.00 %)USD 696,716,303 EUR (587,500,045) Toronto-Dominion Bank 2/7/2021 (347 ) (0.00 %)SGD 34,810 USD (26,282) BNP Paribas 2/7/2021 (386 ) (0.00 %)USD 213,067 CHF (197,141) UBS AG 3/8/2021 (394 ) (0.00 %)USD 499,099 EUR (420,970) Standard Chartered Bank 3/8/2021 (467 ) (0.00 %)CHF 14,431 USD (16,115) BNP Paribas 2/7/2021 (503 ) (0.00 %)GBP 20,701 USD (29,198) BNP Paribas 2/7/2021 (600 ) (0.00 %)GBP 20,103 USD (28,476) Morgan Stanley 2/7/2021 (705 ) (0.00 %)CHF 366,301 USD (397,037) Goldman Sachs International 2/7/2021 (757 ) (0.00 %)EUR 33,431 USD (40,760) BNP Paribas 2/7/2021 (1,115 ) (0.00 %)SGD 88,249 USD (66,803) BNP Paribas 2/7/2021 (1,152 ) (0.00 %)USD 1,708,931 GBP (1,237,819) Barclays Bank plc 3/8/2021 (1,208 ) (0.00 %)EUR 352,715 USD (419,921) Morgan Stanley 2/7/2021 (1,636 ) (0.00 %)GBP 123,606 USD (172,446) BNP Paribas 2/7/2021 (1,690 ) (0.00 %)GBP 49,848 USD (70,647) BNP Paribas 2/7/2021 (1,784 ) (0.00 %)EUR 435,808 USD (518,652) JPMorgan Chase Bank 2/7/2021 (1,827 ) (0.00 %)CHF 397,680 USD (432,098) BNP Paribas 2/7/2021 (1,871 ) (0.00 %)CHF 63,890 USD (71,157) Morgan Stanley 2/7/2021 (2,038 ) (0.00 %)CHF 68,007 USD (75,658) BNP Paribas 2/7/2021 (2,085 ) (0.00 %)CHF 226,425 USD (247,168) BNP Paribas 2/7/2021 (2,212 ) (0.00 %)CHF 401,686 USD (437,013) Morgan Stanley 2/7/2021 (2,453 ) (0.00 %)EUR 538,766 USD (641,860) BNP Paribas 2/7/2021 (2,937 ) (0.00 %)GBP 102,183 USD (144,519) BNP Paribas 2/7/2021 (3,359 ) (0.00 %)CHF 110,601 USD (123,526) JPMorgan Chase Bank 2/7/2021 (3,873 ) (0.00 %)EUR 569,604 USD (679,381) Morgan Stanley 2/7/2021 (3,887 ) (0.00 %)CHF 138,541 USD (154,051) JPMorgan Chase Bank 2/7/2021 (4,172 ) (0.00 %)CHF 658,380 USD (716,493) BNP Paribas 2/7/2021 (4,231 ) (0.00 %)CHF 147,547 USD (164,761) Morgan Stanley 2/7/2021 (5,139 ) (0.00 %)EUR 259,133 USD (313,932) JPMorgan Chase Bank 2/7/2021 (6,626 ) (0.00 %)CHF 217,057 USD (241,550) BNP Paribas 2/7/2021 (6,729 ) (0.00 %)EUR 270,888 USD (328,540) JPMorgan Chase Bank 2/7/2021 (7,294 ) (0.00 %)EUR 289,209 USD (350,813) BNP Paribas 2/7/2021 (7,840 ) (0.00 %)CHF 245,443 USD (273,477) BNP Paribas 2/7/2021 (7,947 ) (0.00 %)CHF 310,337 USD (345,451) JPMorgan Chase Bank 2/7/2021 (9,715 ) (0.00 %)EUR 1,313,197 USD (1,568,540) BNP Paribas 2/7/2021 (11,219 ) (0.00 %)CHF 1,133,071 USD (1,238,438) BNP Paribas 2/7/2021 (12,634 ) (0.00 %)CHF 536,519 USD (597,413) BNP Paribas 2/7/2021 (16,984 ) (0.00 %)CHF 943,006 USD (1,043,336) BNP Paribas 2/7/2021 (23,153 ) (0.00 %)GBP 825,988 USD (1,172,054) JPMorgan Chase Bank 2/7/2021 (30,993 ) (0.00 %)CHF 914,314 USD (1,021,958) BNP Paribas 2/7/2021 (32,815 ) (0.00 %)CHF 1,163,631 USD (1,294,784) JPMorgan Chase Bank 2/7/2021 (35,919 ) (0.00 %)CHF 2,803,442 USD (3,119,570) BNP Paribas 2/7/2021 (86,691 ) (0.00 %)SGD 11,050,998 USD (8,351,046) BNP Paribas 2/7/2021 (129,801 ) (0.01 %)EUR 4,573,491 USD (5,594,893) BNP Paribas 2/7/2021 (171,188 ) (0.01 %)GBP 103,547,330 USD (146,820,795) Toronto-Dominion Bank 2/7/2021 (3,775,319 ) (0.18 %)

1069
Vanguard U.S. Treasury Inflation-Protected Securities Index Fund
CurrencyBuy
Amount Currency(Sell)
Amount CounterpartySettlement
Date
Unrealised Gain/(Loss)
US Dollars ($)% of Total
Net AssetsCHF 382,653,643 USD (425,483,208) JPMorgan Chase Bank 2/7/2021 (11,512,696 ) (0.53 %)EUR 582,682,303 USD (710,202,325) Toronto-Dominion Bank 2/7/2021 (19,199,038 ) (0.89 %)Total Financial Derivative Instruments (35,001,531 ) (1.62 %)
Fair Value US Dollars ($)
% of Total Net Assets
Other Assets and Liabilities 52,470,149 2.43 %Net Assets 2,164,331,284 100.00 %
Analysis of Total Net Assets US Dollars ($)% of Total
Net Assets(a) Transferable securities admitted to an official stock exchange listing 1,820,059,115 84.09%(b) Transferable securities dealt in on another regulated market 198,867,977 9.19%(c) Transferable securities other than those admitted to an official stock exchange listing or dealt in on another regulated
market 127,935,574 5.91%
(d) Financial derivative instruments (35,001,531) (1.62%)(e) Other assets and liabilities 52,470,149 2.43%Total Net Assets 2,164,331,284 100.00%
1 Denotes securities pledged in full or part thereof as collateral for derivatives.
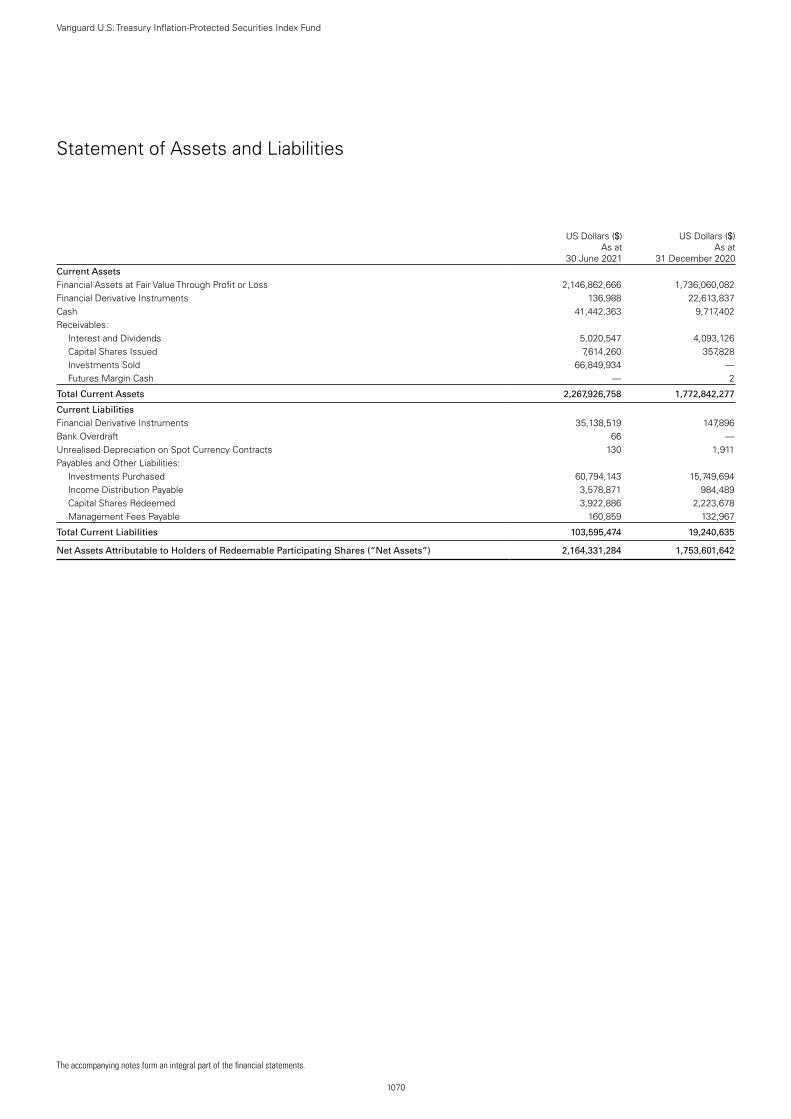
The accompanying notes form an integral part of the financial statements.
1070
Vanguard U.S. Treasury Inflation-Protected Securities Index Fund
Statement of Assets and Liabilities
US Dollars ($)
As at 30 June 2021
US Dollars ($)
As at 31 December 2020
Current AssetsFinancial Assets at Fair Value Through Profit or Loss 2,146,862,666 1,736,060,082 Financial Derivative Instruments 136,988 22,613,837 Cash 41,442,363 9,717,402 Receivables: Interest and Dividends 5,020,547 4,093,126 Capital Shares Issued 7,614,260 357,828 Investments Sold 66,849,934 — Futures Margin Cash — 2
Total Current Assets 2,267,926,758 1,772,842,277
Current LiabilitiesFinancial Derivative Instruments 35,138,519 147,896 Bank Overdraft 66 — Unrealised Depreciation on Spot Currency Contracts 130 1,911 Payables and Other Liabilities: Investments Purchased 60,794,143 15,749,694 Income Distribution Payable 3,578,871 984,489 Capital Shares Redeemed 3,922,886 2,223,678 Management Fees Payable 160,859 132,967
Total Current Liabilities 103,595,474 19,240,635
Net Assets Attributable to Holders of Redeemable Participating Shares (“Net Assets”) 2,164,331,284 1,753,601,642

1071
Vanguard U.S. Treasury Inflation-Protected Securities Index Fund
The accompanying notes form an integral part of the financial statements.
Net Asset Value Per Share
.As at
30 June 2021As at
31 December 2020As at
31 December 2019Select CHF Hedged AccUS ($) Equivalent 416,569,381 340,854,793 582,595,891Net Assets 385,055,907 301,298,594 564,156,731Number of Shares Outstanding 3,650,421 2,906,390 5,810,685Net Asset Value Per Share1 105.48 103.67 97.09
Select CHF Hedged Income US ($) Equivalent 8,789,593 5,336,679 8,969,384Net Assets 8,124,660 4,717,357 8,685,503Number of Shares Outstanding 85,406 49,452 96,090Net Asset Value Per Share1 95.13 95.39 90.39
Select EUR Hedged AccUS ($) Equivalent 675,366,610 530,105,553 708,495,908Net Assets 569,497,103 433,252,062 631,176,760Number of Shares Outstanding 5,293,925 4,102,901 6,399,135Net Asset Value Per Share1 107.58 105.60 98.63
Select EUR Hedged Income US ($) Equivalent 22,312,090 20,142,762 20,365,714Net Assets 18,814,479 16,462,558 18,143,175Number of Shares Outstanding 192,995 168,611 196,654Net Asset Value Per Share1 97.49 97.64 92.26
Select GBP Hedged AccUS ($) Equivalent 43,758,527 40,756,724 47,760,668Net Assets 31,675,796 29,815,813 36,052,591Number of Shares Outstanding 281,670 270,958 353,232Net Asset Value Per Share1 112.46 110.04 102.06
Select GBP Hedged Income US ($) Equivalent 98,942,091 94,166,705 102,686,173Net Assets 71,621,915 68,888,188 77,513,626Number of Shares Outstanding 704,232 678,485 813,827Net Asset Value Per Share1 101.70 101.53 95.25
Select SGD Hedged AccUS ($) Equivalent 8,333,959 3,655,808 7,496,853Net Assets 11,202,508 4,831,699 10,080,643Number of Shares Outstanding 96,287 42,493 96,076Net Asset Value Per Share1 116.34 113.71 104.92
Select USD AccNet Assets 812,122,182 648,259,153 863,260,731Number of Shares Outstanding 6,847,263 5,590,623 8,086,845Net Asset Value Per Share1 118.61 115.95 106.75
Select USD IncomeNet Assets 78,136,851 70,323,465 36,732,312Number of Shares Outstanding 726,827 655,912 367,990Net Asset Value Per Share1 107.50 107.21 99.82
1 The net asset value per share shown may diverge from the net asset value per share used for dealing purposes because of any adjustments for swing pricing and trade date accounting.

1072
Vanguard U.S. Treasury Inflation-Protected Securities Index Fund
The accompanying notes form an integral part of the financial statements.
Statement of Operations
US Dollars ($)
Six Months Ended 30 June 2021
US Dollars ($)
Six Months Ended 30 June 2020
Investment Income/(Loss) Interest Income 43,221,599 90,999 Net Gain/(Loss) on Financial Instruments (31,352,102) 24,043,608
Total Investment Income/(Loss) 11,869,497 24,134,607
Expenses Management Fees 880,569 1,026,980 Transaction Fees and Commissions — 2,777 Negative Yield on Financial Assets — 1,163,182
Total Expenses 880,569 2,192,939
Finance Costs Interest Expense 392 469 Distribution Paid 4,183,743 666,439 Income Equalisation (28,425) 242,654
Total Finance Costs 4,155,710 909,562
Net Investment Income/(Loss) 6,833,218 21,032,106
Net Increase/(Decrease) in Net Assets 6,833,218 21,032,106
Statement of Changes in Net Assets
US Dollars ($)
US Dollars ($)
Six Months Ended Six Months Ended30 June 2021 30 June 2020
Increase/(Decrease) in Net Assets
Net Increase/(Decrease) in Net Assets From Operations 6,833,218 21,032,106
Capital Transactions Subscriptions 633,621,030 1,519,123,381 Redemptions (229,896,797) (1,906,242,124) Reinvestments 172,191 541,466
Total Capital Transactions1 403,896,424 (386,577,277)
Total Increase/(Decrease) for the Period 410,729,642 (365,545,171)
Net AssetsBeginning of Period 1,753,601,642 2,378,363,634
End of Period 2,164,331,284 2,012,818,463
1 Capital Transactions include income equalisation adjustments as shown in the Statement of Operations.

Notes to the Financial Statements
1073
Notes to the Financial Statements
1. General Information. Vanguard Investment Series plc (“the Company”), an open-ended investment company with variable capital, was incorporated in Ireland as a public limited company on 4 March 1998. The Company is authorised by the Central Bank of Ireland (the “Central Bank”) as an undertaking for collective investment in transferable securities pursuant to the European Communities (Undertakings for Collective Investment in Transferable Securities) Regulations 2011 (as amended) (the “UCITS Regulations”).
Where applicable, shares are listed on the Global Exchange Market of the Euronext Dublin Exchange.
The Company is organised as an umbrella fund with segregated liabilities between sub-funds. During the period ended 30 June 2021 the Company had 31 constituent funds (30 operational funds and 1 closed fund) (each a “Fund”, collectively the “Funds”):
Commenced Operations
Vanguard Emerging Markets Stock Index Fund (the “Emerging Markets Stock Index Fund”) 7 June 2006
Vanguard ESG Developed World All Cap Equity Index Fund (the “ESG Developed World All Cap Equity Index Fund”) 7 February 2011
Vanguard ESG Emerging Markets All Cap Equity Index Fund (the “ESG Emerging Markets All Cap Equity Index Fund”) 9 June 2020
Vanguard European Stock Index Fund (the “European Stock Index Fund”) 14 September 1998
Vanguard Eurozone Stock Index Fund (the “Eurozone Stock Index Fund”) 25 October 2001
Vanguard Global Enhanced Equity Fund (the “Global Enhanced Equity Fund”)1 18 April 2007
Vanguard Global Small-Cap Index Fund (the “Global Small-Cap Index Fund”) 10 December 2009
Vanguard Global Stock Index Fund (the “Global Stock Index Fund”) 4 August 1998
Vanguard Japan Stock Index Fund (the “Japan Stock Index Fund”) 22 October 2003
Vanguard Pacific ex-Japan Stock Index Fund (the “Pacific ex-Japan Stock Index Fund”) 22 July 2005
Vanguard SRI European Stock Fund (the “SRI European Stock Fund”) 29 June 2010
Vanguard U.S. 500 Stock Index Fund (the “U.S. 500 Stock Index Fund”) 4 November 1998
Vanguard U.S. Opportunities Fund (the “U.S. Opportunities Fund”) 8 April 2002
Vanguard 20+ Year Euro Treasury Index Fund (the “20+ Year Euro Treasury Index Fund”) 29 August 2007
Vanguard Emerging Markets Bond Fund (the “Emerging Markets Bond Fund”) 3 December 2019
Vanguard Euro Government Bond Index Fund (the “Euro Government Bond Index Fund”) 29 September 2000
Vanguard Euro Investment Grade Bond Index Fund (the “Euro Investment Grade Bond Index Fund”) 29 September 2000
Vanguard Eurozone Inflation-Linked Bond Index Fund (the “Eurozone Inflation-Linked Bond Index Fund”) 31 May 2005
Vanguard Global Bond Index Fund (the “Global Bond Index Fund”) 31 March 2008
Vanguard Global Corporate Bond Index Fund (the “Global Corporate Bond Index Fund”) 2 November 2017
Vanguard Global Credit Bond Fund (the “Global Credit Bond Fund”) 14 September 2017
Vanguard Global Short-Term Bond Index Fund (the “Global Short-Term Bond Index Fund”) 31 January 2014
Vanguard Global Short-Term Corporate Bond Index Fund (the “Global Short-Term Corporate Bond Index Fund”) 2 November 2017
Vanguard Japan Government Bond Index Fund (the “Japan Government Bond Index Fund”) 1 April 2004
Vanguard SRI Euro Investment Grade Bond Index Fund (the “SRI Euro Investment Grade Bond Index Fund”) 18 July 2017
Vanguard U.K. Government Bond Index Fund (the “U.K. Government Bond Index Fund”) 23 June 2009
Vanguard U.K. Investment Grade Bond Index Fund (the “U.K. Investment Grade Bond Index Fund”) 20 March 2007
Vanguard U.K. Short-Term Investment Grade Bond Index Fund (the “U.K. Short-Term Investment Grade Bond Index Fund”) 22 May 2013
Vanguard U.S. Government Bond Index Fund (the “U.S. Government Bond Index Fund”) 31 January 2002
Vanguard U.S. Investment Grade Credit Index Fund (the “U.S. Investment Grade Credit Index Fund”) 16 December 2004
Vanguard U.S. Treasury Inflation-Protected Securities Index Fund (the “U.S. Treasury Inflation-Protected Securities Index Fund”) 24 October 2016
1 The Fund was liquidated on 14 January 2021. Financial information related to this Fund has been presented hereafter on a basis other than going concern.
2. Presentation of Financial Statements. The financial statements are prepared in accordance with accounting standards generally accepted in Ireland, including Financial Reporting Standard (“FRS”) 102 and FRS 104, Irish statute comprising the Companies Act 2014, as amended, the UCITS Regulations, the Central Bank (Supervision and Enforcement) Act 2013 (Section 48(1)) (Undertakings for Collective Investment in Transferable Securities) Regulations 2019 (the “CBI UCITS Regulations”) and the Listing Rules of the Euronext Dublin Exchange. Accounting standards generally accepted in Ireland in preparing financial statements which present a true and fair view are those published by the Institute of Chartered Accountants in Ireland and issued by the Financial Reporting Council (the “FRC”).
The Company has determined that the headings and sub-headings of the financial statements require adaptation from the requirements in the Companies Act 2014 to more appropriately reflect the Company’s business as an investment fund.
A Statement of Changes in Net Assets has been presented in place of a Cash Flow Statement due to the exemption contained in FRS 102, Section 7.1A.
The information required by FRS 102 to be included in a statement of comprehensive income is contained in the Statement of Operations of each Fund and the Company.
With the exception of the Global Enhanced Equity Fund the financial statements have been prepared on a going concern basis, subject to the historical cost convention, as modified by the revaluation of financial assets and liabilities at fair value through profit or loss (“FVTPL”). The Global Enhanced Equity Fund has liquidated and is no longer considered a going concern.
These unaudited financial statements have been prepared in accordance with FRS 104 and should be read in conjunction with the audited financial statements for the year ended 31 December 2020.

1074
Notes to the Financial Statements
3. Significant Accounting Policies.
(a) Critical Accounting Estimates and Judgements. The preparation of these financial statements requires the use of certain accounting estimates and requires the Company to exercise judgement when applying the Funds’ accounting policies. The estimates and associated judgements are based on historical experience and various other facts that are believed to be reasonable under the circumstances, the results of which form the basis of making judgements concerning the classification of financial assets and liabilities, the carrying values of financial instruments, as well as the fair value of certain financial instruments in instances where information is not readily apparent from other sources.
(b) Revenue Recognition. Dividends, whether cash or stock, are recognised when the securities are quoted ex-dividend. Special dividends are treated as either capital or revenue depending on the facts of each particular case.
In the case of debt securities, any difference between acquisition cost and maturity value is recognised as revenue over the life of the security using the effective yield basis of calculating amortisation.
The treatment of returns from derivatives is dependent upon the nature of the transaction and considers both motives and circumstances to determine whether returns should be treated as capital or revenue. Where positions are undertaken to protect or enhance capital, the returns are considered capital. Similarly, where positions are undertaken for generating or protecting revenue, the returns are considered revenue. Where positions generate total returns, an apportionment of any such return between capital and revenue is made to properly reflect the nature of the transaction.
Revenue is recognised gross of any withholding taxes incurred.
Bank interest is recognised on an accrual basis.
Securities lending revenue is accounted for on an accrual basis.
(c) Taxation. Current tax is recognised as the amount of income tax paid or payable in respect of the taxable overseas net profit. Deferred taxation is provided on all timing differences that have originated but not reversed by the reporting date. Deferred tax is measured at the rates expected to apply for the year in which the timing differences will reverse. Deferred taxes are not discounted to reflect the time value of money and are only recognised to the extent they are expected to crystallise.
Withholding taxes on foreign dividends and capital gains have been provided for in accordance with the Funds’ understanding of the applicable countries’ tax rules and rates. Foreign capital gains tax is accounted for based upon net unrealised gains.
(d) Financial Assets and Financial Liabilities. FRS 102 requires a reporting entity to apply either (a) the full requirements of FRS 102 relating to Basic Financial Instruments and Other Financial Instruments Issues; (b) the recognition and measurement provisions of International Accounting Standards (“IAS”) 39, Financial Instruments: Recognition and Measurement (“IAS 39”), and only the disclosure requirements of FRS 102 relating to Basic Financial Instruments and Other Financial Instruments; or (c) the recognition and measurement provisions of International Financial Reporting Standards (“IFRS”) 9, Financial Instruments, and the disclosure requirements of FRS 102 relating to Basic Financial Instruments and Other Financial Instruments. The Company has elected to apply the recognition and measurement provisions of IAS 39 and the disclosure requirements of FRS 102.
Classification and Measurement. Financial assets and financial liabilities, including derivative investments, are classified and measured at FVTPL from the launch date. Obligations for net assets attributable to holders of redeemable shares are presented at the redemption amount, which approximates their fair value. All other financial assets and liabilities are measured at amortised cost, which approximates fair value.
Recognition and Derecognition. Purchases and sales of financial instruments are recognised on the trade date, being the date on which the Fund commits itself to the purchase or sale. Financial instruments at FVTPL are initially recognised when the Funds become party to the contractual provisions of the instrument. Financial instruments are derecognised when the contractual rights to the cash flows from the instruments expire, or when substantially all the risks and rewards of ownership have been transferred. Realised gains and losses are specifically identified when securities are derecognised. Premiums received on expired options are realised as gains, while premiums paid on expired options are realised as losses. Premiums on exercised options will result in gains or losses by either increasing the proceeds received when selling the underlying security or decreasing the cost basis when purchasing the underlying security.
Equities. Equities (including warrants and rights) are valued at the latest available last traded value at year-end. Instruments traded on a recognised market are valued on the basis of valuations provided by a principal market maker or a pricing service. When applicable, unlisted and suspended instruments are based on the Investment Manager’s assessment of their net realisable value or the last traded price from broker-dealers for non-exchange-trade purposes.
Fixed Income. Fixed income securities traded in recognised markets are valued using the latest bid prices on the securities exchange in which they are principally traded or using valuations based on a matrix system (which considers such factors as security prices, yields, maturities and ratings), both as furnished by independent pricing services.
Derivatives. Futures contracts are valued in an active market if quoted prices are readily and regularly available; this represents the amount that would be required to close the position. Forward currency contracts are valued at the closing prices of the forward currency contract rates in the London foreign exchange markets on a daily basis as provided by a reliable bank or dealer. Credit default swaps are valued using a pricing service provider; where no pricing service provider is available, contracts are marked-to-market daily based upon quotations received from counterparties or based upon calculations using valuation models. Option contracts are valued at their quoted daily settlement prices. Swaptions are valued based on market quotations received from independent pricing services or recognized dealers.

1075
Notes to the Financial Statements
(e) Fair Value Measurement. The Funds classify financial instruments measured at fair value using a three-level hierarchy. Instruments are categorised in their entirety based on the lowest-level input that is significant to the fair value measurement. Assessing the significance and observability of a particular input requires significant judgement specific to an asset or liability. Inputs are considered to be observable when they are readily available, regularly distributed or updated, reliable and verifiable, not proprietary, and provided by independent sources that are actively involved in the relevant market.
Level 1—Quoted prices in active markets for identical securities.
Level 2—Other significant observable inputs (including quoted prices for similar securities, interest rates, prepayment speeds, credit risk, etc.).
Level 3—Significant unobservable inputs (including the Fund’s own assumptions used to determine the fair value of investments).
(f) Transaction Costs. Transaction costs are incremental costs that are directly attributable to the acquisition, issue or disposal of an investment. These costs include fees and commissions paid to agents, advisers, brokers and dealers. Transaction costs incurred in the purchase and sale of securities designated at FVTPL are expensed on an accrual basis.
(g) Foreign Currency. All transactions in foreign currencies are translated into each Fund’s functional currency at the exchange rates prevailing on the date of the transaction. At the reporting date, monetary assets and liabilities denominated in foreign currencies are translated at the prevailing exchange rates. Gains and losses arising on translation are included in total return and are reported on a net basis.
In preparing the aggregate Company financial statements, all transactions have been translated into USD at the prevailing exchange rates in effect.
The functional currency of each Fund is:
Fund Currency Fund Currency
Emerging Markets Stock Index Fund US dollar (US$) U.S. Investment Grade Credit Index Fund US dollar (US$)
ESG Developed World All Cap Equity Index Fund US dollar (US$) U.S. Treasury Inflation-Protected Securities Index Fund US dollar (US$)
ESG Emerging Markets All Cap Equity Index Fund US dollar (US$) Eurozone Stock Index Fund Euro (€)
European Stock Index Fund US dollar (US$) Japan Stock Index Fund Euro (€)
Global Enhanced Equity Fund1 US dollar (US$) Pacific ex-Japan Stock Index Fund Euro (€)
Global Small-Cap Index Fund US dollar (US$) SRI European Stock Fund Euro (€)
Global Stock Index Fund US dollar (US$) 20+ Year Euro Treasury Index Fund Euro (€)
U.S. 500 Stock Index Fund US dollar (US$) Euro Government Bond Index Fund Euro (€)
U.S. Opportunities Fund US dollar (US$) Euro Investment Grade Bond Index Fund Euro (€)
Emerging Markets Bond Fund US dollar (US$) Eurozone Inflation-Linked Bond Index Fund Euro (€)
Global Bond Index Fund US dollar (US$) SRI Euro Investment Grade Bond Index Fund Euro (€)
Global Corporate Bond Index Fund US dollar (US$) U.K. Government Bond Index Fund British pound (£)
Global Credit Bond Fund US dollar (US$) U.K. Investment Grade Bond Index Fund British pound (£)
Global Short-Term Bond Index Fund US dollar (US$) U.K. Short-Term Investment Grade Bond Index Fund British pound (£)
Global Short-Term Corporate Bond Index Fund US dollar (US$) Japan Government Bond Index Fund Japanese yen (¥)
U.S. Government Bond Index Fund US dollar (US$)
1 The Fund was liquidated on 14 January 2021.
(h) Cash and Bank Overdrafts. Cash is composed of demand deposits with financial institutions or bank overdrafts. Bank overdrafts, when applicable, are presented as current liabilities. Cash held or pledged as collateral against financial transactions or derivative instruments is not included within Cash and Bank Overdrafts but is segregated and presented separately on the Statement of Assets and Liabilities as Cash Collateral.
In respect to share issuances or redemptions, the Company operates an umbrella cash account. Monies received or proceeds due will be held and transmitted through this account and are included in Cash and Bank Overdrafts.
Margin. Upon entering into futures contracts, cash deposits are required (initial margin) in an amount equal to a certain percentage of the contract value. Subsequent payments (variation margin) are made or received by the Funds each day. Margin against these derivative instruments is not included within Cash or Bank Overdrafts but is segregated and presented separately as Futures Margin Cash or Futures Margin Cash Due to Broker, as applicable.
(i) Redeemable Participating Shares. Redeemable participating shares provide Shareholders with the right to redeem their shares for cash and are classified as financial liabilities.
(j) Trade Date Reporting. Investment transactions for financial statement purposes as at 30 June 2021 are accounted for on the trade date. This is different from the basis used for the daily dealing net asset value, which is accounted for using the trade date plus one business day.
(k) Offsetting. Financial assets and liabilities are offset and the net amount reported when there is both a legally enforceable right to set off the recognised amounts and an intention to settle on a net basis, or realise the assets and settle the liability simultaneously. As at 30 June 2021, there were no financial assets or liabilities offset.
(l) Equalisation. Equalisation occurs to reflect the pro rata payment of distributions based on the time period over which shares have been owned by an investor. If shares are purchased when the Funds have accrued income but not yet declared a distribution, the Funds will credit to the equalisation account the portion of the purchase price representing income accrued but directly attributable to those shares. Conversely, if shares are redeemed when the Funds have accrued income but not yet declared a distribution, the Funds will deduct from the equalisation account the portion of the redemption price representing income accrued but directly attributable to those shares. Equalisation is accounted for through the Statement of Operations as a finance cost.

1076
Notes to the Financial Statements
(m) Swing Pricing. The Funds employ swing pricing as a means to prevent dilution. Swing pricing results from the Company’s determination to adjust the Funds’ net asset value, on any dealing day, following a consideration of dealing activity (i.e. level of subscriptions and redemptions) and the level of costs associated with such activity. A dilution adjustment is exercised only for the purpose of reducing the negative effects of transaction charges in the interest of the non-dealing shareholders in the Funds and is applied consistently in respect of the Funds, and in respect of all assets of the Funds. The direction of the swing depends on whether there are net subscriptions or net redemptions in the Funds on the relevant dealing day, while the magnitude of the swing is based on pre-determined estimates of the average execution costs in the relevant asset classes in which the Funds are invested.
The dilution adjustment did not exceed 2% of the original net asset value per share of the Funds during the period (31 December 2020: none).
4. Risk Management Policies.
Price Risk. Price risk is the risk that the value of financial instruments will fluctuate because of changes in the market. The Investment Manager considers the asset allocation of the portfolio in order to minimise the risk associated with particular countries or industry sectors while continuing to follow the stated investment objective.
The investment objective for an index fund is to seek to track as closely as reasonably possible the performance of the benchmark index. In order to achieve this objective, an index fund invests primarily in securities held in the relevant benchmark index. An index fund places limitations on the amount by which a holding may deviate from the proportion in the benchmark to limit the market risk from mismatched positions.
All investments present a risk of loss of capital. The Investment Manager assesses market risk volatility to ensure that the effect of using financial derivative instruments is not significant enough to cause disproportionate losses to overall value. The Investment Manager moderates this risk through careful selection of financial instruments.
Currency Risk. Currency risk is the risk that the value of the Funds’ investments will fluctuate as a result of changes in currency exchange rates. Local interest rates and monetary policy, as well as other government fiscal and labour policies, can also adversely impact currency values. The Funds may enter into foreign currency contracts for hedging purposes, which can include the economic hedging of all or a portion of the currency exposure of an investment or group of investments. The Funds may also enter into these contracts for non-hedging purposes, which can include increasing the exposure to a foreign currency, or the shifting of exposure to foreign currency fluctuations from one country to another.

1077
Notes to the Financial Statements
All currency-hedged share classes for the period ended 30 June 2021 are listed in the following table:
Fund Currency
ESG Developed World All Cap Equity Index Fund
Institutional Plus EUR Hedged Acc EUR
Global Stock Index Fund
EUR Hedged Acc EUR
U.S. 500 Stock Index Fund
EUR Hedged Acc EUR
Emerging Markets Bond Fund
Institutional Plus CHF Hedged Acc CHF
Investor EUR Hedged Acc EUR
Institutional Plus EUR Hedged Acc EUR
Investor GBP Hedged Acc GBP
Euro Government Bond Index Fund
GBP Hedged Acc GBP
Euro Investment Grade Bond Index Fund
GBP Hedged Acc GBP
Global Bond Index Fund
CHF Hedged Acc CHF
CHF Hedged Dist CHF
Institutional Plus CHF Hedged Acc CHF
EUR Hedged Acc EUR
EUR Hedged Dist EUR
Institutional Plus EUR Hedged Acc EUR
GBP Hedged Acc GBP
GBP Hedged Dist GBP
Institutional Plus GBP Hedged Acc GBP
Institutional Plus GBP Hedged Dist GBP
Institutional Plus JPY Hedged Acc JPY
USD Hedged Acc USD
USD Hedged Dist USD
Investor USD Hedged USD
Institutional Plus USD Hedged Acc USD
Institutional Plus USD Hedged Dist USD
Global Corporate Bond Index Fund
CHF Hedged Acc CHF
EUR Hedged Acc EUR
Institutional Plus EUR Hedged Acc EUR
GBP Hedged Acc GBP
GBP Hedged Dist GBP
Institutional Plus GBP Hedged Acc GBP
USD Hedged Acc USD
Global Credit Bond Fund
Institutional Plus AUD Hedged Acc AUD
Institutional EUR Hedged Acc EUR
Investor GBP Hedged Acc GBP
Investor GBP Hedged Income GBP
Investor USD Hedged Acc USD
Institutional USD Hedged Acc USD
Fund Currency
Global Short-Term Bond Index Fund
CHF Hedged Acc CHF
Institutional Plus CHF Hedged Acc CHF
EUR Hedged Acc EUR
Investor EUR Hedged EUR
Institutional Plus EUR Hedged Acc EUR
GBP Hedged Acc GBP
GBP Hedged Dist GBP
Institutional Plus GBP Hedged Acc GBP
Institutional Plus GBP Hedged Dist GBP
USD Hedged Acc USD
USD Hedged Dist USD
Institutional Plus USD Hedged Acc USD
Global Short-Term Corporate Bond Index Fund
EUR Hedged Acc EUR
Institutional Plus EUR Hedged Acc EUR
GBP Hedged Acc GBP
Institutional Plus GBP Hedged Acc GBP
USD Hedged Acc USD
Japan Government Bond Index Fund
EUR Hedged Acc EUR
Institutional Plus EUR Hedged Acc EUR
GBP Hedged Acc GBP
Institutional Plus GBP Hedged Dist GBP
Institutional Plus USD Hedged Acc USD
U.K. Government Bond Index Fund
EUR Hedged Acc EUR
U.S. Government Bond Index Fund
EUR Hedged Acc EUR
Institutional Plus EUR Hedged Acc EUR
GBP Hedged Acc GBP
GBP Hedged Dist GBP
U.S. Investment Grade Credit Index Fund
Institutional Plus EUR Hedged Acc EUR
GBP Hedged Acc GBP
Institutional Plus GBP Hedged Acc GBP
Institutional Plus GBP Hedged Dist GBP
U.S. Treasury Inflation Protected Securities Index Fund
Select CHF Hedged Acc CHF
Select CHF Hedged Income CHF
Select EUR Hedged Acc EUR
Select EUR Hedged Income EUR
Select GBP Hedged Acc GBP
Select GBP Hedged Income GBP
Select SGD Hedged Acc SGD
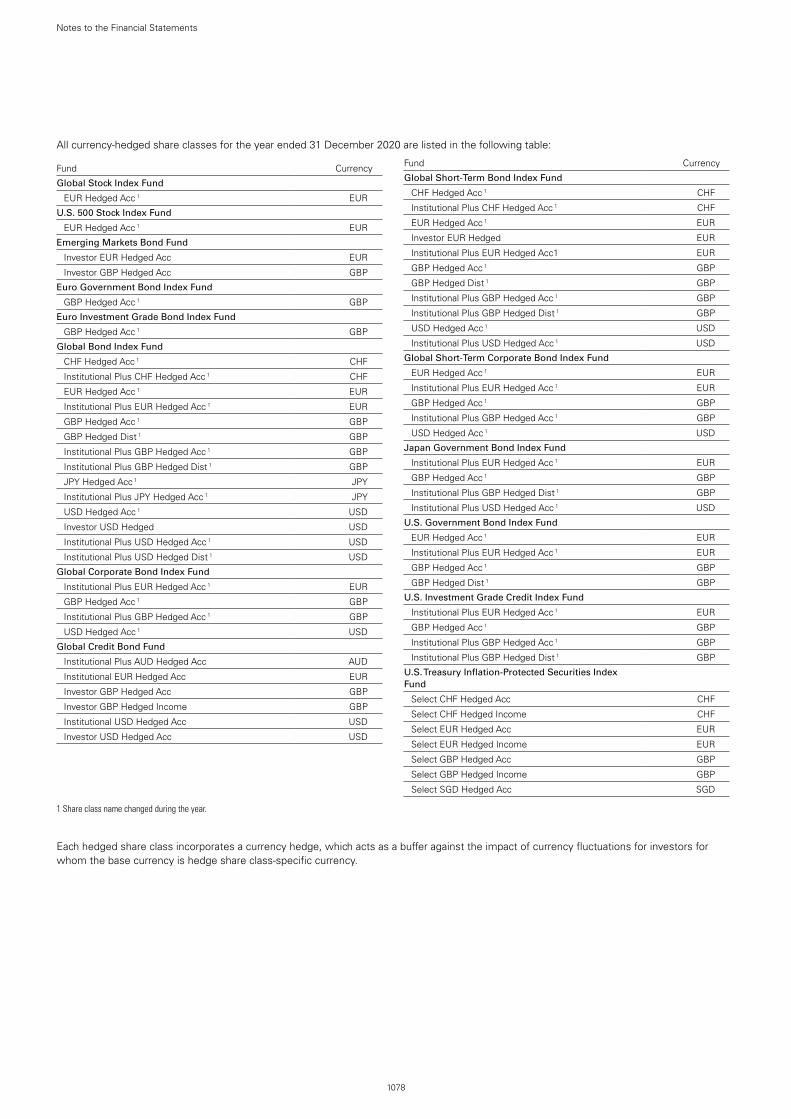
1078
Notes to the Financial Statements
All currency-hedged share classes for the year ended 31 December 2020 are listed in the following table:
Fund Currency
Global Stock Index Fund
EUR Hedged Acc 1 EUR
U.S. 500 Stock Index Fund
EUR Hedged Acc 1 EUR
Emerging Markets Bond Fund
Investor EUR Hedged Acc EUR
Investor GBP Hedged Acc GBP
Euro Government Bond Index Fund
GBP Hedged Acc 1 GBP
Euro Investment Grade Bond Index Fund
GBP Hedged Acc 1 GBP
Global Bond Index Fund
CHF Hedged Acc 1 CHF
Institutional Plus CHF Hedged Acc 1 CHF
EUR Hedged Acc 1 EUR
Institutional Plus EUR Hedged Acc 1 EUR
GBP Hedged Acc 1 GBP
GBP Hedged Dist 1 GBP
Institutional Plus GBP Hedged Acc 1 GBP
Institutional Plus GBP Hedged Dist 1 GBP
JPY Hedged Acc 1 JPY
Institutional Plus JPY Hedged Acc 1 JPY
USD Hedged Acc 1 USD
Investor USD Hedged USD
Institutional Plus USD Hedged Acc 1 USD
Institutional Plus USD Hedged Dist 1 USD
Global Corporate Bond Index Fund
Institutional Plus EUR Hedged Acc 1 EUR
GBP Hedged Acc 1 GBP
Institutional Plus GBP Hedged Acc 1 GBP
USD Hedged Acc 1 USD
Global Credit Bond Fund
Institutional Plus AUD Hedged Acc AUD
Institutional EUR Hedged Acc EUR
Investor GBP Hedged Acc GBP
Investor GBP Hedged Income GBP
Institutional USD Hedged Acc USD
Investor USD Hedged Acc USD
Fund Currency
Global Short-Term Bond Index Fund
CHF Hedged Acc 1 CHF
Institutional Plus CHF Hedged Acc 1 CHF
EUR Hedged Acc 1 EUR
Investor EUR Hedged EUR
Institutional Plus EUR Hedged Acc1 EUR
GBP Hedged Acc 1 GBP
GBP Hedged Dist 1 GBP
Institutional Plus GBP Hedged Acc 1 GBP
Institutional Plus GBP Hedged Dist 1 GBP
USD Hedged Acc 1 USD
Institutional Plus USD Hedged Acc 1 USD
Global Short-Term Corporate Bond Index Fund
EUR Hedged Acc 1 EUR
Institutional Plus EUR Hedged Acc 1 EUR
GBP Hedged Acc 1 GBP
Institutional Plus GBP Hedged Acc 1 GBP
USD Hedged Acc 1 USD
Japan Government Bond Index Fund
Institutional Plus EUR Hedged Acc 1 EUR
GBP Hedged Acc 1 GBP
Institutional Plus GBP Hedged Dist 1 GBP
Institutional Plus USD Hedged Acc 1 USD
U.S. Government Bond Index Fund
EUR Hedged Acc 1 EUR
Institutional Plus EUR Hedged Acc 1 EUR
GBP Hedged Acc 1 GBP
GBP Hedged Dist 1 GBP
U.S. Investment Grade Credit Index Fund
Institutional Plus EUR Hedged Acc 1 EUR
GBP Hedged Acc 1 GBP
Institutional Plus GBP Hedged Acc 1 GBP
Institutional Plus GBP Hedged Dist 1 GBP
U.S. Treasury Inflation-Protected Securities Index Fund
Select CHF Hedged Acc CHF
Select CHF Hedged Income CHF
Select EUR Hedged Acc EUR
Select EUR Hedged Income EUR
Select GBP Hedged Acc GBP
Select GBP Hedged Income GBP
Select SGD Hedged Acc SGD
1 Share class name changed during the year.
Each hedged share class incorporates a currency hedge, which acts as a buffer against the impact of currency fluctuations for investors for whom the base currency is hedge share class-specific currency.
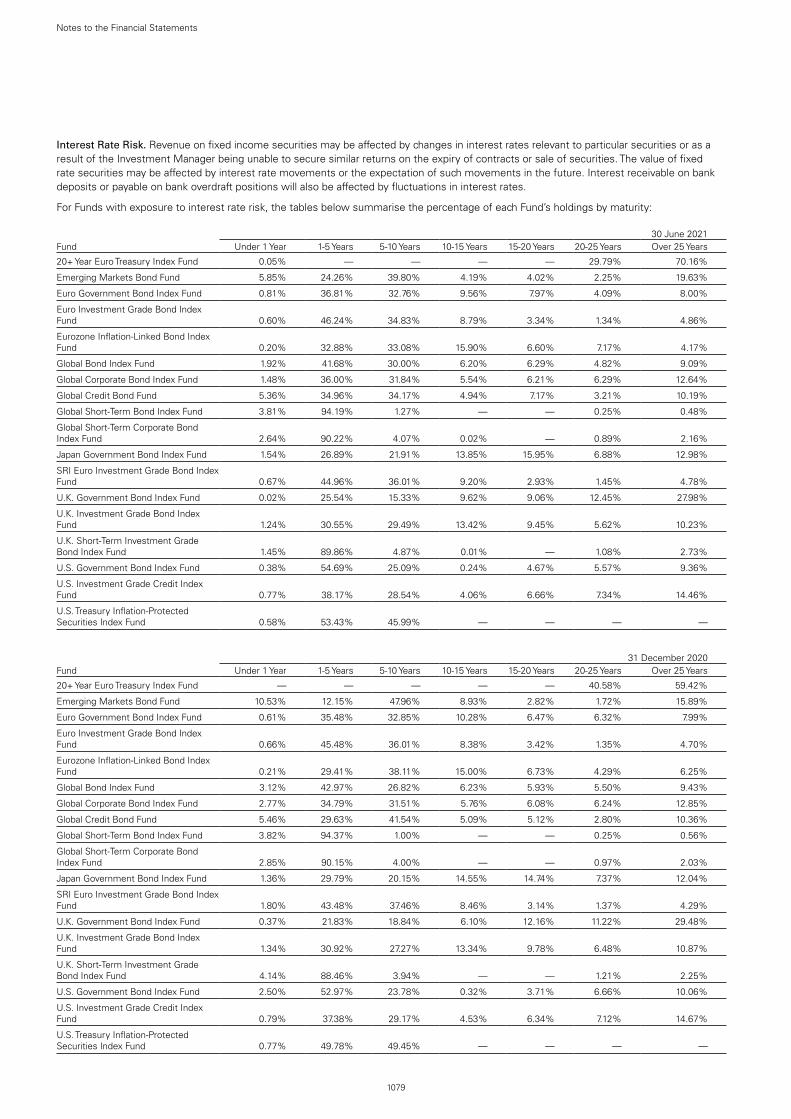
1079
Notes to the Financial Statements
Interest Rate Risk. Revenue on fixed income securities may be affected by changes in interest rates relevant to particular securities or as a result of the Investment Manager being unable to secure similar returns on the expiry of contracts or sale of securities. The value of fixed rate securities may be affected by interest rate movements or the expectation of such movements in the future. Interest receivable on bank deposits or payable on bank overdraft positions will also be affected by fluctuations in interest rates.
For Funds with exposure to interest rate risk, the tables below summarise the percentage of each Fund’s holdings by maturity:
30 June 2021Fund Under 1 Year 1-5 Years 5-10 Years 10-15 Years 15-20 Years 20-25 Years Over 25 Years
20+ Year Euro Treasury Index Fund 0.05% — — — — 29.79% 70.16%
Emerging Markets Bond Fund 5.85% 24.26% 39.80% 4.19% 4.02% 2.25% 19.63%
Euro Government Bond Index Fund 0.81% 36.81% 32.76% 9.56% 7.97% 4.09% 8.00%
Euro Investment Grade Bond Index Fund 0.60% 46.24% 34.83% 8.79% 3.34% 1.34% 4.86%
Eurozone Inflation-Linked Bond Index Fund 0.20% 32.88% 33.08% 15.90% 6.60% 7.17% 4.17%
Global Bond Index Fund 1.92% 41.68% 30.00% 6.20% 6.29% 4.82% 9.09%
Global Corporate Bond Index Fund 1.48% 36.00% 31.84% 5.54% 6.21% 6.29% 12.64%
Global Credit Bond Fund 5.36% 34.96% 34.17% 4.94% 7.17% 3.21% 10.19%
Global Short-Term Bond Index Fund 3.81% 94.19% 1.27% — — 0.25% 0.48%
Global Short-Term Corporate Bond Index Fund 2.64% 90.22% 4.07% 0.02% — 0.89% 2.16%
Japan Government Bond Index Fund 1.54% 26.89% 21.91% 13.85% 15.95% 6.88% 12.98%
SRI Euro Investment Grade Bond Index Fund 0.67% 44.96% 36.01% 9.20% 2.93% 1.45% 4.78%
U.K. Government Bond Index Fund 0.02% 25.54% 15.33% 9.62% 9.06% 12.45% 27.98%
U.K. Investment Grade Bond Index Fund 1.24% 30.55% 29.49% 13.42% 9.45% 5.62% 10.23%
U.K. Short-Term Investment Grade Bond Index Fund 1.45% 89.86% 4.87% 0.01% — 1.08% 2.73%
U.S. Government Bond Index Fund 0.38% 54.69% 25.09% 0.24% 4.67% 5.57% 9.36%
U.S. Investment Grade Credit Index Fund 0.77% 38.17% 28.54% 4.06% 6.66% 7.34% 14.46%
U.S. Treasury Inflation-Protected Securities Index Fund 0.58% 53.43% 45.99% — — — —
31 December 2020Fund Under 1 Year 1-5 Years 5-10 Years 10-15 Years 15-20 Years 20-25 Years Over 25 Years
20+ Year Euro Treasury Index Fund — — — — — 40.58% 59.42%
Emerging Markets Bond Fund 10.53% 12.15% 47.96% 8.93% 2.82% 1.72% 15.89%
Euro Government Bond Index Fund 0.61% 35.48% 32.85% 10.28% 6.47% 6.32% 7.99%
Euro Investment Grade Bond Index Fund 0.66% 45.48% 36.01% 8.38% 3.42% 1.35% 4.70%
Eurozone Inflation-Linked Bond Index Fund 0.21% 29.41% 38.11% 15.00% 6.73% 4.29% 6.25%
Global Bond Index Fund 3.12% 42.97% 26.82% 6.23% 5.93% 5.50% 9.43%
Global Corporate Bond Index Fund 2.77% 34.79% 31.51% 5.76% 6.08% 6.24% 12.85%
Global Credit Bond Fund 5.46% 29.63% 41.54% 5.09% 5.12% 2.80% 10.36%
Global Short-Term Bond Index Fund 3.82% 94.37% 1.00% — — 0.25% 0.56%
Global Short-Term Corporate Bond Index Fund 2.85% 90.15% 4.00% — — 0.97% 2.03%
Japan Government Bond Index Fund 1.36% 29.79% 20.15% 14.55% 14.74% 7.37% 12.04%
SRI Euro Investment Grade Bond Index Fund 1.80% 43.48% 37.46% 8.46% 3.14% 1.37% 4.29%
U.K. Government Bond Index Fund 0.37% 21.83% 18.84% 6.10% 12.16% 11.22% 29.48%
U.K. Investment Grade Bond Index Fund 1.34% 30.92% 27.27% 13.34% 9.78% 6.48% 10.87%
U.K. Short-Term Investment Grade Bond Index Fund 4.14% 88.46% 3.94% — — 1.21% 2.25%
U.S. Government Bond Index Fund 2.50% 52.97% 23.78% 0.32% 3.71% 6.66% 10.06%
U.S. Investment Grade Credit Index Fund 0.79% 37.38% 29.17% 4.53% 6.34% 7.12% 14.67%
U.S. Treasury Inflation-Protected Securities Index Fund 0.77% 49.78% 49.45% — — — —
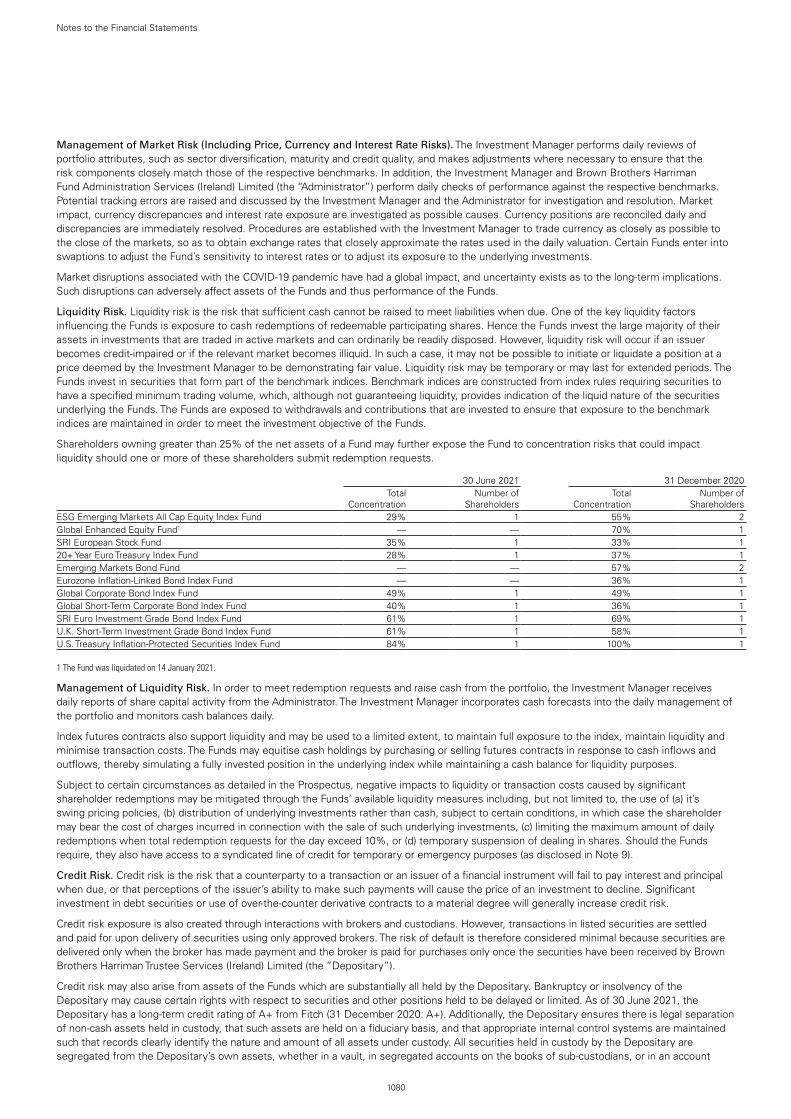
1080
Notes to the Financial Statements
Management of Market Risk (Including Price, Currency and Interest Rate Risks). The Investment Manager performs daily reviews of portfolio attributes, such as sector diversification, maturity and credit quality, and makes adjustments where necessary to ensure that the risk components closely match those of the respective benchmarks. In addition, the Investment Manager and Brown Brothers Harriman Fund Administration Services (Ireland) Limited (the “Administrator”) perform daily checks of performance against the respective benchmarks. Potential tracking errors are raised and discussed by the Investment Manager and the Administrator for investigation and resolution. Market impact, currency discrepancies and interest rate exposure are investigated as possible causes. Currency positions are reconciled daily and discrepancies are immediately resolved. Procedures are established with the Investment Manager to trade currency as closely as possible to the close of the markets, so as to obtain exchange rates that closely approximate the rates used in the daily valuation. Certain Funds enter into swaptions to adjust the Fund’s sensitivity to interest rates or to adjust its exposure to the underlying investments.
Market disruptions associated with the COVID-19 pandemic have had a global impact, and uncertainty exists as to the long-term implications. Such disruptions can adversely affect assets of the Funds and thus performance of the Funds.
Liquidity Risk. Liquidity risk is the risk that sufficient cash cannot be raised to meet liabilities when due. One of the key liquidity factors influencing the Funds is exposure to cash redemptions of redeemable participating shares. Hence the Funds invest the large majority of their assets in investments that are traded in active markets and can ordinarily be readily disposed. However, liquidity risk will occur if an issuer becomes credit-impaired or if the relevant market becomes illiquid. In such a case, it may not be possible to initiate or liquidate a position at a price deemed by the Investment Manager to be demonstrating fair value. Liquidity risk may be temporary or may last for extended periods. The Funds invest in securities that form part of the benchmark indices. Benchmark indices are constructed from index rules requiring securities to have a specified minimum trading volume, which, although not guaranteeing liquidity, provides indication of the liquid nature of the securities underlying the Funds. The Funds are exposed to withdrawals and contributions that are invested to ensure that exposure to the benchmark indices are maintained in order to meet the investment objective of the Funds.
Shareholders owning greater than 25% of the net assets of a Fund may further expose the Fund to concentration risks that could impact liquidity should one or more of these shareholders submit redemption requests.
30 June 2021 31 December 2020
Total
ConcentrationNumber of
ShareholdersTotal
ConcentrationNumber of
ShareholdersESG Emerging Markets All Cap Equity Index Fund 29% 1 55% 2Global Enhanced Equity Fund1 — — 70% 1SRI European Stock Fund 35% 1 33% 120+ Year Euro Treasury Index Fund 28% 1 37% 1Emerging Markets Bond Fund — — 57% 2Eurozone Inflation-Linked Bond Index Fund — — 36% 1Global Corporate Bond Index Fund 49% 1 49% 1Global Short-Term Corporate Bond Index Fund 40% 1 36% 1SRI Euro Investment Grade Bond Index Fund 61% 1 69% 1U.K. Short-Term Investment Grade Bond Index Fund 61% 1 58% 1U.S. Treasury Inflation-Protected Securities Index Fund 84% 1 100% 1
1 The Fund was liquidated on 14 January 2021.
Management of Liquidity Risk. In order to meet redemption requests and raise cash from the portfolio, the Investment Manager receives daily reports of share capital activity from the Administrator. The Investment Manager incorporates cash forecasts into the daily management of the portfolio and monitors cash balances daily.
Index futures contracts also support liquidity and may be used to a limited extent, to maintain full exposure to the index, maintain liquidity and minimise transaction costs. The Funds may equitise cash holdings by purchasing or selling futures contracts in response to cash inflows and outflows, thereby simulating a fully invested position in the underlying index while maintaining a cash balance for liquidity purposes.
Subject to certain circumstances as detailed in the Prospectus, negative impacts to liquidity or transaction costs caused by significant shareholder redemptions may be mitigated through the Funds’ available liquidity measures including, but not limited to, the use of (a) it’s swing pricing policies, (b) distribution of underlying investments rather than cash, subject to certain conditions, in which case the shareholder may bear the cost of charges incurred in connection with the sale of such underlying investments, (c) limiting the maximum amount of daily redemptions when total redemption requests for the day exceed 10%, or (d) temporary suspension of dealing in shares. Should the Funds require, they also have access to a syndicated line of credit for temporary or emergency purposes (as disclosed in Note 9).
Credit Risk. Credit risk is the risk that a counterparty to a transaction or an issuer of a financial instrument will fail to pay interest and principal when due, or that perceptions of the issuer’s ability to make such payments will cause the price of an investment to decline. Significant investment in debt securities or use of over-the-counter derivative contracts to a material degree will generally increase credit risk.
Credit risk exposure is also created through interactions with brokers and custodians. However, transactions in listed securities are settled and paid for upon delivery of securities using only approved brokers. The risk of default is therefore considered minimal because securities are delivered only when the broker has made payment and the broker is paid for purchases only once the securities have been received by Brown Brothers Harriman Trustee Services (Ireland) Limited (the “Depositary”).
Credit risk may also arise from assets of the Funds which are substantially all held by the Depositary. Bankruptcy or insolvency of the Depositary may cause certain rights with respect to securities and other positions held to be delayed or limited. As of 30 June 2021, the Depositary has a long-term credit rating of A+ from Fitch (31 December 2020: A+). Additionally, the Depositary ensures there is legal separation of non-cash assets held in custody, that such assets are held on a fiduciary basis, and that appropriate internal control systems are maintained such that records clearly identify the nature and amount of all assets under custody. All securities held in custody by the Depositary are segregated from the Depositary’s own assets, whether in a vault, in segregated accounts on the books of sub-custodians, or in an account

1081
Notes to the Financial Statements
maintained at a central securities depositary. The Depositary maintains segregated accounts per client on its own books as well as on the books of sub-custodians in local markets, where possible.
Certain Funds may use credit default swaps to a limited extent, for efficient replication of credit risk exposure or to transfer default protection on an underlying fixed income security. Credit protection purchased results in an asset which may increase credit risk, while credit protection sold results in a liability which may increase liquidity risk.
For Funds invested in debt securities the following is an analysis of the concentration of issuer credit ratings:
30 June 2021:
Fund AAA AA A BBBLess than
BBB NR
20+ Year Euro Treasury Index Fund 40.66% 59.29% — — — 0.05%
Emerging Markets Bond Fund — 0.18% 6.32% 39.02% 48.98% 5.50%
Euro Government Bond Index Fund 23.67% 36.08% 16.65% 22.79% — 0.81%
Euro Investment Grade Bond Index Fund 26.11% 13.33% 23.26% 36.71% — 0.59%
Eurozone Inflation-Linked Bond Index Fund 16.28% 37.18% 6.57% 39.77% — 0.20%
Global Bond Index Fund 41.51% 15.90% 21.81% 19.23% 0.01% 1.54%
Global Corporate Bond Index Fund 1.11% 7.57% 36.75% 53.05% 0.03% 1.49%
Global Credit Bond Fund 12.14% 2.50% 26.49% 50.95% 4.51% 3.41%
Global Short-Term Bond Index Fund 43.53% 15.04% 19.49% 19.06% 0.02% 2.86%
Global Short-Term Corporate Bond Index Fund 0.72% 8.83% 37.98% 50.32% 0.02% 2.13%
Japan Government Bond Index Fund — — 93.32% — — 6.68%
SRI Euro Investment Grade Bond Index Fund 26.23% 13.31% 22.88% 37.10% — 0.48%
U.K. Government Bond Index Fund — 99.58% 0.40% — — 0.02%
U.K. Investment Grade Bond Index Fund 18.65% 9.86% 28.31% 42.46% — 0.72%
U.K. Short-Term Investment Grade Bond Index Fund 29.46% 12.55% 20.02% 37.29% — 0.68%
U.S. Government Bond Index Fund 99.62% — — — — 0.38%
U.S. Investment Grade Credit Index Fund 11.16% 10.56% 33.28% 45.00% — —
U.S. Treasury Inflation-Protected Securities Index Fund 99.42% — — — — 0.58%
31 December 2020:
Fund AAA AA A BBBLess than
BBB NR
20+ Year Euro Treasury Index Fund 34.63% 65.37% — — — —
Emerging Markets Bond Fund 3.10% 2.01% 4.56% 34.32% 45.71% 10.30%
Euro Government Bond Index Fund 24.18% 36.94% 16.39% 22.35% — 0.14%
Euro Investment Grade Bond Index Fund 25.30% 15.03% 23.59% 35.44% — 0.64%
Eurozone Inflation-Linked Bond Index Fund 15.72% 36.74% 6.07% 41.26% — 0.21%
Global Bond Index Fund 39.38% 16.46% 22.86% 18.57% 0.01% 2.72%
Global Corporate Bond Index Fund 1.20% 7.56% 37.31% 51.11% 0.05% 2.77%
Global Credit Bond Fund 13.93% 4.24% 23.48% 49.20% 3.84% 5.31%
Global Short-Term Bond Index Fund 41.96% 15.31% 20.72% 18.12% 0.01% 3.88%
Global Short-Term Corporate Bond Index Fund 0.73% 9.25% 37.97% 49.11% 0.05% 2.89%
Japan Government Bond Index Fund — — 93.16% — — 6.84%
SRI Euro Investment Grade Bond Index Fund 25.40% 14.35% 23.55% 35.07% — 1.63%
U.K. Government Bond Index Fund — 99.24% 0.39% — — 0.37%
U.K. Investment Grade Bond Index Fund 19.16% 9.91% 29.36% 41.11% — 0.46%
U.K. Short-Term Investment Grade Bond Index Fund 30.93% 14.79% 19.32% 33.57% — 1.39%
U.S. Government Bond Index Fund 98.38% — — — — 1.62%
U.S. Investment Grade Credit Index Fund 12.49% 9.75% 33.66% 43.91% 0.06% 0.13%
U.S. Treasury Inflation-Protected Securities Index Fund 99.23% — — — — 0.77%

1082
Notes to the Financial Statements
Management of Credit Risk. Credit risk is managed by investment policies which restrict or place limits on acceptable portfolio and net asset concentrations as well as exposure to certain instruments, credit institutions, and counterparties. The Investment Manager performs daily reviews of portfolio attributes, such as sector diversification and credit quality, and makes adjustments where necessary to ensure that the credit risk components closely match those of the respective benchmarks. Credit ratings of debt instruments and counterparties are monitored and evaluated periodically by the Investment Manager; an approved counterparty list is maintained, and trading with approved counterparties is enforced. The Funds also enter into master netting arrangements with their counterparties and require the transfer of collateral to secure performance. The value of securities pledged or received as collateral against derivative contracts is disclosed in Note 11. Securities received as collateral from counterparties are not reflected in the Statement of Assets and Liabilities of the Funds.
5. Taxation. Under current law and practice, the Company qualifies as an investment undertaking as defined in Section 739B of the Taxes Consolidation Act, 1997, as amended. On that basis, it is not chargeable to Irish tax on its income or gains.
However, Irish tax may arise on the happening of a “chargeable event”. A chargeable event includes any distribution payments to shareholders, any encashment, redemption, cancellation or transfer of shares, or appropriation or cancellation of shares of a Shareholder by the Company for the purposes of meeting the amount of tax payable on a gain arising on a transfer. Any tax arising on a chargeable event is a liability of the Shareholders, albeit it is paid by the Company (although if the Company fails to deduct the correct amount of tax it becomes ultimately a liability of the Company).
No Irish tax will arise on the Company in respect of chargeable events in respect of:
(a) a shareholder who is neither Irish resident nor ordinarily resident in Ireland for tax purposes, at the time of the chargeable event, provided appropriate valid declarations in accordance with the provisions of the Taxes Consolidation Act, 1997, as amended, are held by the Company or the Company has been authorised by the Irish Revenue to make gross payments in the absence of appropriate declarations; and
(b) certain exempted Irish tax resident shareholders who have provided the necessary signed statutory declarations.
Dividends, interest and capital gains received on investments may be subject to withholding or other taxes imposed by the country from which the investment income/gains are received, and such taxes may not be recoverable.
Funds subject to foreign withholding taxes on dividends and interest are recognised when such taxes are not recoverable and are included in Foreign Withholding Tax/Reclaim Benefit. Funds may also be subject to tax on the realised and unrealised portion of their capital gains.
The Funds have filed tax reclaims for previously withheld taxes on dividends earned in certain European Union countries. These filings are subject to various administrative and judicial proceedings within these countries. Such tax reclaims received during the year, if any, are included in Foreign Withholding Tax. No other amounts for additional tax reclaims are reflected in the financial statements due to the uncertainty as to the ultimate resolution of proceedings, the likelihood of receipt of these reclaims and the potential timing of payment.
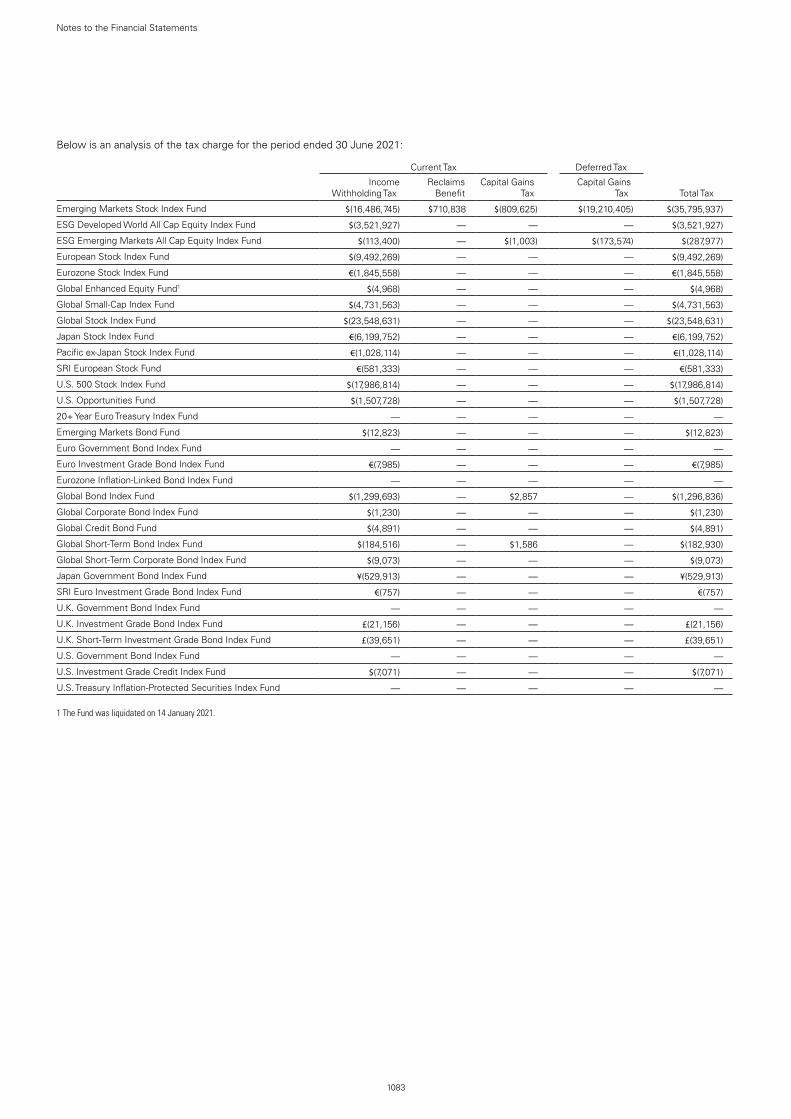
1083
Notes to the Financial Statements
Below is an analysis of the tax charge for the period ended 30 June 2021:
Current Tax Deferred Tax
Income Withholding Tax
Reclaims Benefit
Capital Gains Tax
Capital Gains Tax Total Tax
Emerging Markets Stock Index Fund $(16,486,745) $710,838 $(809,625) $(19,210,405) $(35,795,937)
ESG Developed World All Cap Equity Index Fund $(3,521,927) — — — $(3,521,927)
ESG Emerging Markets All Cap Equity Index Fund $(113,400) — $(1,003) $(173,574) $(287,977)
European Stock Index Fund $(9,492,269) — — — $(9,492,269)
Eurozone Stock Index Fund €(1,845,558) — — — €(1,845,558)
Global Enhanced Equity Fund1 $(4,968) — — — $(4,968)
Global Small-Cap Index Fund $(4,731,563) — — — $(4,731,563)
Global Stock Index Fund $(23,548,631) — — — $(23,548,631)
Japan Stock Index Fund €(6,199,752) — — — €(6,199,752)
Pacific ex-Japan Stock Index Fund €(1,028,114) — — — €(1,028,114)
SRI European Stock Fund €(581,333) — — — €(581,333)
U.S. 500 Stock Index Fund $(17,986,814) — — — $(17,986,814)
U.S. Opportunities Fund $(1,507,728) — — — $(1,507,728)
20+ Year Euro Treasury Index Fund — — — — —
Emerging Markets Bond Fund $(12,823) — — — $(12,823)
Euro Government Bond Index Fund — — — — —
Euro Investment Grade Bond Index Fund €(7,985) — — — €(7,985)
Eurozone Inflation-Linked Bond Index Fund — — — — —
Global Bond Index Fund $(1,299,693) — $2,857 — $(1,296,836)
Global Corporate Bond Index Fund $(1,230) — — — $(1,230)
Global Credit Bond Fund $(4,891) — — — $(4,891)
Global Short-Term Bond Index Fund $(184,516) — $1,586 — $(182,930)
Global Short-Term Corporate Bond Index Fund $(9,073) — — — $(9,073)
Japan Government Bond Index Fund ¥(529,913) — — — ¥(529,913)
SRI Euro Investment Grade Bond Index Fund €(757) — — — €(757)
U.K. Government Bond Index Fund — — — — —
U.K. Investment Grade Bond Index Fund £(21,156) — — — £(21,156)
U.K. Short-Term Investment Grade Bond Index Fund £(39,651) — — — £(39,651)
U.S. Government Bond Index Fund — — — — —
U.S. Investment Grade Credit Index Fund $(7,071) — — — $(7,071)
U.S. Treasury Inflation-Protected Securities Index Fund — — — — —
1 The Fund was liquidated on 14 January 2021.

1084
Notes to the Financial Statements
Below is an analysis of the tax charge for the period ended 30 June 2020:
Current Tax Deferred Tax
Income Withholding Tax
Reclaims Benefit
Capital Gains Tax
Capital Gains Tax Total Tax
Emerging Markets Stock Index Fund $(10,370,448) — — — $(10,370,448)
ESG Developed World All Cap Equity Index Fund $(2,042,755) — — — $(2,042,755)
ESG Emerging Markets All Cap Equity Index Fund $(4,171) — — — $(4,171)
European Stock Index Fund $(9,216,531) — — — $(9,216,531)
Eurozone Stock Index Fund €(2,238,941) — — — €(2,238,941)
Global Enhanced Equity Fund $(629,855) — — — $(629,855)
Global Small-Cap Index Fund $(4,148,316) — — — $(4,148,316)
Global Stock Index Fund $(24,902,051) — — — $(24,902,051)
Japan Stock Index Fund €(5,514,535) — — — €(5,514,535)
Pacific ex-Japan Stock Index Fund €(367,795) — — — €(367,795)
SRI European Stock Fund €(646,840) — — — €(646,840)
U.S. 500 Stock Index Fund $(20,550,902) — — — $(20,550,902)
U.S. Fundamental Value Fund1 $(90,785) — — — $(90,785)
U.S. Opportunities Fund $(2,720,852) — — — $(2,720,852)
20+ Year Euro Treasury Index Fund — — — — —
Emerging Markets Bond Fund $(14,043) — — — $(14,043)
Euro Government Bond Index Fund — — — — —
Euro Investment Grade Bond Index Fund €(16,347) — — — €(16,347)
Eurozone Inflation-Linked Bond Index Fund — — — — —
Global Bond Index Fund $(882,814) — — — $(882,814)
Global Corporate Bond Index Fund $(10,408) — — — $(10,408)
Global Credit Bond Fund $(1,871) — — — $(1,871)
Global Short-Term Bond Index Fund $(105,979) — — — $(105,979)
Global Short-Term Corporate Bond Index Fund $(25,446) — — — $(25,446)
Japan Government Bond Index Fund — — — — —
SRI Euro Investment Grade Bond Index Fund €(1,223) — — — €(1,223)
U.K. Government Bond Index Fund — — — — —
U.K. Investment Grade Bond Index Fund £(12,075) — — — £(12,075)
U.K. Short-Term Investment Grade Bond Index Fund £(36,850) — — — £(36,850)
U.S. Government Bond Index Fund — — — — —
U.S. Investment Grade Credit Index Fund $(38,983) — — — $(38,983)
U.S. Treasury Inflation-Protected Securities Index Fund — — — — —
1 The Fund was liquidated on 8 October 2020.
6. Distribution Policy. The following table presents the payment frequency with respect to distributing share classes. If a dividend has not been declared, income and gains of such Fund will be reflected in the net asset value per share.
Fund Dividend Fund Dividend
European Stock Index Fund Not declared Global Bond Index Fund Quarterly
Eurozone Stock Index Fund Not declared Global Corporate Bond Index Fund Quarterly
Global Enhanced Equity Fund1 Not declared Global Credit Bond Fund Quarterly
U.S. 500 Stock Index Fund Not declared Global Short-Term Bond Index Fund Quarterly
20+ Year Euro Treasury Index Fund Not declared Japan Government Bond Index Fund Quarterly
Emerging Markets Bond Fund Not declared SRI European Stock Fund Quarterly
Euro Government Bond Index Fund Not declared U.K. Government Bond Index Fund Quarterly
Euro Investment Grade Bond Index Fund Not declared U.K. Investment Grade Bond Index Fund Quarterly
Eurozone Inflation-Linked Bond Index Fund Not declared U.K. Short-Term Investment Grade Bond Index Fund Quarterly
Global Short-Term Corporate Bond Index Fund Not declared U.S. Government Bond Index Fund Quarterly
SRI Euro Investment Grade Bond Index Fund Not declared U.S. Investment Grade Credit Index Fund Quarterly
ESG Developed World All Cap Equity Index Fund Quarterly U.S. Treasury Inflation-Protected Securities Index Fund Quarterly
ESG Emerging Markets All Cap Equity Index Fund Quarterly Emerging Markets Stock Index Fund Annually
Global Small-Cap Index Fund Quarterly Japan Stock Index Fund Annually
Global Stock Index Fund Quarterly Pacific ex-Japan Stock Index Fund Annually
1 The Fund was liquidated on 14 January 2021

1085
Notes to the Financial Statements
The following Fund had no eligible income available for distribution:
Fund
U.S. Opportunities Fund
Dividends during the period ended 30 June 2021:
Ex-Dividend Date31 March
202130 June
2021ESG Developed World All Cap Equity Index Fund
GBP Dist £0.8280 £0.9918ESG Emerging Markets All Cap Equity Index Fund
GBP Dist £0.2127 £0.7454Institutional Plus GBP Dist £0.2356 £0.7669
Global Small-Cap Index FundEUR Dist €0.4344 €0.4696GBP Dist £1.0438 £1.1190Institutional Plus GBP Dist £0.6635 £0.7099
Global Stock Index FundUSD Dist $0.4931 $0.5594Institutional Plus USD Dist $0.5880 $0.6615
SRI European Stock FundGBP Dist £0.9980 £2.1042
Global Bond Index FundCHF Hedged Dist CHF0.2546 CHF0.3255EUR Hedged Dist €0.2522 €0.3256GBP Hedged Dist £0.4674 £0.4523Institutional Plus GBP Hedged Dist £0.3759 £0.3625USD Hedged Dist $0.2463 $0.3257Institutional Plus USD Hedged Dist $0.3828 $0.3633
Global Corporate Bond Index FundGBP Hedged Dist £0.2390 £0.5034
Global Credit Bond FundInvestor GBP Hedged Income £0.3624 £0.3748
Global Short-Term Bond Index FundGBP Hedged Dist £0.1920 £0.1690Institutional Plus GBP Hedged Dist £0.2032 £0.1796USD Hedged Dist $0.1823 $0.1618
Japan Government Bond Index FundInstitutional Plus GBP Hedged Dist £0.0498 £0.0474
U.K. Government Bond Index FundGBP Dist £0.2926 £0.2912Institutional Plus GBP Dist £0.2705 £0.2689
U.K. Investment Grade Bond Index FundGBP Dist £0.3196 £0.3133Institutional Plus GBP Dist £0.6096 £0.5981
U.K. Short-Term Investment Grade Bond Index FundGBP Dist £0.3144 £0.3039Institutional Plus GBP Dist £0.3340 £0.3199
U.S. Government Bond Index FundGBP Dist £0.3771 £0.3343GBP Hedged Dist £0.3692 £0.3589
U.S. Investment Grade Credit Index FundInstitutional Plus GBP Hedged Dist £0.6909 £0.6797Institutional Plus USD Dist $0.7473 $0.7755
U.S. Treasury Inflation-Protected Securities Index FundSelect CHF Hedged Income CHF0.2829 CHF1.6446Select EUR Hedged Income €0.2888 €1.6851Select GBP Hedged Income £0.3029 £1.7517Select USD Income $0.3146 $1.8398

1086
Notes to the Financial Statements
Dividends for the year ended 31 December 2020 are shown below:
Ex-Dividend Date31 March
202030 June
202030 September
202031 December
2020Emerging Markets Stock Index Fund
GBP Dist — — — £3.4493Institutional Plus GBP Dist — — — £2.3921
ESG Developed World All Cap Equity Index FundGBP Dist £1.0747 £0.7754 £0.7328 £0.6178
ESG Emerging Markets All Cap Equity Index Fund1
GBP Dist — £0.2922 £0.8304 £0.1567Institutional Plus GBP Dist — £0.2952 £0.8510 £0.1749
Global Small-Cap Index FundEUR Dist €0.4350 €0.3209 €0.2564 €0.4426GBP Dist £1.1212 £0.7674 £0.6622 £1.1098Institutional Plus GBP Dist £0.7083 £0.4863 £0.4255 £0.7008
Global Stock Index FundUSD Dist $0.4886 $0.4076 $0.4117 $0.3179Institutional Plus USD Dist — $0.5977 $0.4910 $0.3838
Japan Stock Index FundGBP Dist — — — £3.7599Institutional Plus GBP Dist — — — £2.9831
Pacific ex-Japan Stock Index FundGBP Dist — — — £5.5230Institutional Plus GBP Dist — — — £3.2955
SRI European Stock FundGBP Dist £0.8695 £1.3449 £0.7623 £0.5509
Global Bond Index FundGBP Hedged Dist £0.6677 £0.5171 £0.5329 £0.4784Institutional Plus GBP Hedged Dist £0.5309 £0.4148 £0.4252 £0.3870Institutional Plus USD Hedged Dist $0.4850 $0.4559 $0.4265 $0.4066
Global Credit Bond FundInvestor GBP Hedged Income £0.4658 £0.5581 £0.4963 £0.3792
Global Short-Term Bond Index FundGBP Hedged Dist £0.3711 £0.2694 £0.2598 £0.2188Institutional Plus GBP Hedged Dist £0.3816 £0.2794 £0.2710 £0.2288USD Hedged Dist — — — $0.0926
Japan Government Bond Index FundInstitutional Plus GBP Hedged Dist £0.0529 £0.0465 £0.0499 £0.0439
U.K. Government Bond Index FundGBP Dist £0.4020 £0.3779 £0.3507 £0.3219Institutional Plus GBP Dist £0.3646 £0.3455 £0.3211 £0.2932
U.K. Investment Grade Bond Index FundGBP Dist £0.3461 £0.3389 £0.3336 £0.3351Institutional Plus GBP Dist £0.6574 £0.6474 £0.6383 £0.6421
U.K. Short-Term Investment Grade Bond Index FundGBP Dist £0.3496 £0.3402 £0.3233 £0.3313Institutional Plus GBP Dist £0.3680 £0.3586 £0.3418 £0.3509
U.S. Government Bond Index FundGBP Dist £0.5970 £0.4647 £0.4744 £0.3990GBP Hedged Dist £0.5676 £0.4359 £0.4429 £0.3853
U.S. Investment Grade Credit Index FundInstitutional Plus GBP Hedged Dist £0.8998 £0.6345 £0.7021 £0.6643Institutional Plus USD Dist $0.9119 $0.7561 $0.7809 $0.7358
U.S. Treasury Inflation-Protected Securities Index FundSelect CHF Hedged Income CHF0.1856 — CHF0.4055 CHF0.4971Select EUR Hedged Income €0.1886 — €0.4104 €0.5224Select GBP Hedged Income £0.1960 — £0.4284 £0.5146Select USD Income $0.2011 — $0.4257 $0.5624
1 The Fund was launched on 9 June 2020.
7. Net Asset Value Per Share. The net asset value per share of each share class is calculated by dividing the total net assets of each share class by the number of shares in issue.

1087
Notes to the Financial Statements
8. Share Capital. The Company has variable share capital consisting of 500,000,030,000 authorised shares divided into 30,000 subscriber shares and 500,000,000,000 redeemable participating shares (no par value).
The Directors may issue shares of any class and create new classes of shares on such terms as the Directors may from time to time determine in relation to any Fund and in accordance with the requirements of the Central Bank. Shares may be divided into different classes to accommodate different subscription, redemption or fee arrangements, dividend provisions, or charges.
Subscriber Shares. There are two Subscriber Shares in issue, which are held by nominees for the Investment Manager. Subscriber Shares do not entitle the holders thereof to any dividend and on a winding-up entitle the holder to receive the amount paid up thereon but not otherwise to participate in the assets of the Company. The Subscriber Shares do not form part of the Shareholders’ funds and are not included in the net asset value of the Company.
Members who are individuals may attend and vote at general meetings in person or by proxy. Members who are corporations may attend and vote at general meetings by appointing a representative or proxy. Subject to any special terms as to voting upon which any shares may be issued or may for the time being be held, at any general meeting on a show of hands every Shareholder who (being an individual) is present in person or (being a corporation) is present by duly authorised representative shall have one vote. On a poll every such holder presents as aforesaid or by proxy shall have one vote for every share held.
Movement in shares for the period ended 30 June 2021:
Emerging Markets Stock Index Fund
Share ClassBalance at
Beginning of PeriodShares Issued During Period
Shares Redeemed During Period
Balance at End of Period
Institutional Plus CHF Acc 618,811 200 (227,480) 391,531EUR Acc 8,381,878 2,226,774 (1,030,606) 9,578,046Investor EUR 1,643,487 207,389 (156,039) 1,694,837Institutional Plus EUR Acc 9,590,313 980,364 (2,851,978) 7,718,699GBP Acc 10,493,509 2,294,148 (613,078) 12,174,579GBP Dist 1,255,543 340,427 (158,255) 1,437,715Institutional Plus GBP Acc 2,402,010 243,689 (446,773) 2,198,926Institutional Plus GBP Dist 4,382,897 1,133,142 (1,590,459) 3,925,580USD Acc 2,784,282 407,612 (509,409) 2,682,485Investor USD 5,920,172 80,444 (1,987,142) 4,013,474Institutional Plus USD Acc 7,090,303 1,159,707 (930,251) 7,319,759
54,563,205 9,073,896 (10,501,470) 53,135,631
ESG Developed World All Cap Equity Index Fund
Share ClassBalance at
Beginning of PeriodShares Issued During Period
Shares Redeemed During Period
Balance at End of Period
EUR Acc 1,396,812 1,179,435 (106,485) 2,469,762Institutional Plus EUR Acc 274,328 42,681 (49,472) 267,537Institutional Plus EUR Hedged Acc – 434,420 (2,374) 432,046GBP Acc 1,575,684 802,956 (187,662) 2,190,978GBP Dist 516,331 92,682 (122,454) 486,559Institutional Plus GBP Acc 172,343 29,930 (34,687) 167,586USD Acc 946,091 184,534 (13,364) 1,117,261
4,881,589 2,766,638 (516,498) 7,131,729
ESG Emerging Markets All Cap Equity Index Fund
Share ClassBalance at
Beginning of PeriodShares Issued During Period
Shares Redeemed During Period
Balance at End of Period
EUR Acc 72,959 318,943 (44,971) 346,931Institutional Plus EUR Acc – 662 – 662GBP Acc 100,230 337,393 (46,895) 390,728GBP Dist 43,297 24,469 (3,430) 64,336Institutional Plus GBP Dist 26,524 281,722 (2,248) 305,998USD Acc 48,437 580 (47,874) 1,143
291,447 963,769 (145,418) 1,109,798
European Stock Index Fund
Share ClassBalance at
Beginning of PeriodShares Issued During Period
Shares Redeemed During Period
Balance at End of Period
EUR Acc 113,806,148 10,779,651 (26,971,117) 97,614,682Investor EUR 12,437,393 1,274,556 (1,802,314) 11,909,635Institutional Plus EUR Acc 5,191,765 2,766,236 (798,684) 7,159,317USD Acc 11,953,643 877,269 (7,300,059) 5,530,853Institutional Plus USD Acc 2,854,719 191,899 (1,615,030) 1,431,588
146,243,668 15,889,611 (38,487,204) 123,646,075

1088
Notes to the Financial Statements
Eurozone Stock Index Fund
Share ClassBalance at
Beginning of PeriodShares Issued During Period
Shares Redeemed During Period
Balance at End of Period
EUR Acc 6,003,698 251,699 (1,105,935) 5,149,462Investor EUR 386,387 31,632 (102,557) 315,462Institutional Plus EUR Acc 3,350,463 362,974 (1,964,728) 1,748,709USD Acc 15,675 107,846 (412) 123,109Institutional Plus USD Acc 29,399 13,553 (10,010) 32,942
9,785,622 767,704 (3,183,642) 7,369,684
Global Enhanced Equity Fund1
Share ClassBalance at
Beginning of PeriodShares Issued During Period
Shares Redeemed During Period
Balance at End of Period
Institutional USD 36,944 – (36,944) –36,944 – (36,944) –
1 The Fund was liquidated on 14 January 2021.
Global Small-Cap Index Fund
Share ClassBalance at
Beginning of PeriodShares Issued During Period
Shares Redeemed During Period
Balance at End of Period
EUR Acc 1,155,049 481,569 (117,695) 1,518,923EUR Dist 1,313,613 248,686 (32,688) 1,529,611Investor EUR 250,134 41,456 (24,529) 267,061Institutional Plus EUR Acc 2,328,014 335,569 (357,703) 2,305,880GBP Acc 2,636,249 772,812 (1,228,691) 2,180,370GBP Dist 586,462 98,118 (69,921) 614,659Institutional Plus GBP Acc 215,061 64,824 (173,865) 106,020Institutional Plus GBP Dist 405,091 146,013 (193,471) 357,633USD Acc 756,765 253,957 (130,451) 880,271
9,646,438 2,443,004 (2,329,014) 9,760,428
Global Stock Index Fund
Share ClassBalance at
Beginning of PeriodShares Issued During Period
Shares Redeemed During Period
Balance at End of Period
EUR Acc 61,921,204 11,383,669 (5,794,576) 67,510,297Investor EUR 9,409,632 1,432,968 (1,723,306) 9,119,294Institutional Plus EUR Acc 2,344,513 375,217 (796,594) 1,923,136EUR Hedged Acc 50,073,748 13,252,461 (17,117,977) 46,208,232Institutional Plus GBP Acc 94,949 9,827 (6,831) 97,945USD Acc 153,548,113 51,550,125 (37,913,527) 167,184,711USD Dist 514,734 168,457 (3,426) 679,765Investor USD 7,736,705 1,403,679 (1,451,146) 7,689,238Institutional Plus USD Acc 2,318,387 2,880,699 (2,331,185) 2,867,901Institutional Plus USD Dist 118,575 18,510 (46,970) 90,115
288,080,560 82,475,612 (67,185,538) 303,370,634
Japan Stock Index Fund
Share ClassBalance at
Beginning of PeriodShares Issued During Period
Shares Redeemed During Period
Balance at End of Period
EUR Acc 1,216,830 284,626 (186,643) 1,314,813Investor EUR 614,682 35,168 (66,664) 583,186Institutional Plus EUR Acc 2,274,103 503,281 (215,598) 2,561,786GBP Acc 5,322,175 1,051,424 (378,150) 5,995,449GBP Dist 174,006 38,995 (24,495) 188,506Institutional Plus GBP Acc 90,370 125,868 (100,957) 115,281Institutional Plus GBP Dist 450,534 1,188,614 (191,795) 1,447,353JPY Acc 1,400,721 33,477 (93,842) 1,340,356Investor JPY 53,628 2,030 (1,792) 53,866Institutional Plus JPY Acc 600,359 121 (41,635) 558,845USD Acc 2,813,766 245,031 (693,509) 2,365,288Investor USD 162,771 5,568 (22,416) 145,923Institutional Plus USD Acc 63,514 7,037 (358) 70,193
15,237,459 3,521,240 (2,017,854) 16,740,845

1089
Notes to the Financial Statements
Pacific ex-Japan Stock Index Fund
Share ClassBalance at
Beginning of PeriodShares Issued During Period
Shares Redeemed During Period
Balance at End of Period
AUD Acc 3,276,238 367,202 – 3,643,440EUR Acc 2,040,316 462,460 (543,225) 1,959,551Institutional Plus EUR Acc 979,397 245,134 (261,471) 963,060GBP Acc 2,756,890 447,392 (203,136) 3,001,146GBP Dist 236,680 56,512 (35,786) 257,406Institutional Plus GBP Acc 637,147 162,625 (149,306) 650,466Institutional Plus GBP Dist 155,978 60,740 (24,874) 191,844USD Acc 3,466,042 182,743 (523,738) 3,125,047Institutional Plus USD Acc 1,659,157 375,837 (64,152) 1,970,842
15,207,845 2,360,645 (1,805,688) 15,762,802
SRI European Stock Fund
Share ClassBalance at
Beginning of PeriodShares Issued During Period
Shares Redeemed During Period
Balance at End of Period
EUR Acc 1,286,188 71,819 (242,969) 1,115,038Institutional Plus EUR Acc 151,875 1,204 (9,799) 143,280GBP Acc 162,280 84,801 (26,996) 220,085GBP Dist 48,869 32,966 (6,541) 75,294Institutional Plus GBP Acc 50 – – 50USD Acc 5,452 1,535 (1,220) 5,767
1,654,714 192,325 (287,525) 1,559,514
U.S. 500 Stock Index Fund
Share ClassBalance at
Beginning of PeriodShares Issued During Period
Shares Redeemed During Period
Balance at End of Period
EUR Acc 41,894,321 10,370,647 (7,607,462) 44,657,506Investor EUR 8,605,890 1,271,880 (966,565) 8,911,205Institutional Plus EUR Acc 1,100,306 370,689 (175,651) 1,295,344EUR Hedged Acc 34,183,067 6,923,955 (4,386,557) 36,720,465USD Acc 75,289,117 9,508,540 (31,939,127) 52,858,530Investor USD 14,268,938 1,038,227 (2,162,051) 13,145,114Institutional Plus USD Acc 7,035,452 534,408 (992,138) 6,577,722
182,377,091 30,018,346 (48,229,551) 164,165,886
U.S. Opportunities Fund
Share ClassBalance at
Beginning of PeriodShares Issued During Period
Shares Redeemed During Period
Balance at End of Period
Investor EUR 32,732 10,942 (5,778) 37,896Investor GBP Income 25,438 1,442 (5,123) 21,757Institutional USD 1,071,291 63,547 (123,128) 1,011,710Investor USD 272,997 20,148 (57,189) 235,956
1,402,458 96,079 (191,218) 1,307,319
20+ Year Euro Treasury Index Fund
Share ClassBalance at
Beginning of PeriodShares Issued During Period
Shares Redeemed During Period
Balance at End of Period
EUR Acc 2,886,767 139,964 (383,686) 2,643,045Institutional Plus EUR Acc 36,842 581,480 (5,377) 612,945
2,923,609 721,444 (389,063) 3,255,990
Emerging Markets Bond Fund
Share ClassBalance at
Beginning of PeriodShares Issued During Period
Shares Redeemed During Period
Balance at End of Period
Institutional Plus CHF Hedged Acc – 532,349 (4,161) 528,188Investor EUR Hedged Acc 96,977 242,827 (86,294) 253,510Institutional Plus EUR Hedged Acc – 41,385 (121) 41,264Investor GBP Hedged Acc 121,262 81,507 (25,331) 177,438Investor USD Acc 365,291 652,720 (115,975) 902,036Institutional Plus USD Acc 1,340,061 292,846 (420,829) 1,212,078
1,923,591 1,843,634 (652,711) 3,114,514

1090
Notes to the Financial Statements
Euro Government Bond Index Fund
Share ClassBalance at
Beginning of PeriodShares Issued During Period
Shares Redeemed During Period
Balance at End of Period
EUR Acc 11,223,599 1,546,405 (1,794,435) 10,975,569Investor EUR 784,694 46,891 (210,849) 620,736Institutional Plus EUR Acc 16,190,788 2,243,159 (3,525,002) 14,908,945GBP Hedged Acc 5,237,988 287,916 (169,240) 5,356,664USD Acc 167,097 27,481 (22,975) 171,603
33,604,166 4,151,852 (5,722,501) 32,033,517
Euro Investment Grade Bond Index Fund
Share ClassBalance at
Beginning of PeriodShares Issued During Period
Shares Redeemed During Period
Balance at End of Period
EUR Acc 7,428,839 1,636,079 (1,004,447) 8,060,471Investor EUR 596,153 49,808 (170,874) 475,087Institutional Plus EUR Acc 3,765,689 452,907 (2,077,737) 2,140,859GBP Hedged Acc 3,320,021 92,857 (18,743) 3,394,135
15,110,702 2,231,651 (3,271,801) 14,070,552
Eurozone Inflation-Linked Bond Index Fund
Share ClassBalance at
Beginning of PeriodShares Issued During Period
Shares Redeemed During Period
Balance at End of Period
EUR Acc 3,673,876 1,400,218 (468,239) 4,605,855Investor EUR 200,442 77,819 (29,798) 248,463Institutional Plus EUR Acc 6,497,056 1,792,684 (3,488,330) 4,801,410
10,371,374 3,270,721 (3,986,367) 9,655,728
Global Bond Index Fund
Share ClassBalance at
Beginning of PeriodShares Issued During Period
Shares Redeemed During Period
Balance at End of Period
CHF Hedged Acc 5,094,460 398,941 (1,332,885) 4,160,516CHF Hedged Dist – 319,522 (4,511) 315,011Institutional Plus CHF Hedged Acc 6,194,755 731,075 (219,087) 6,706,743EUR Hedged Acc 11,609,118 6,066,133 (1,735,837) 15,939,414EUR Hedged Dist – 439,578 (31,534) 408,044Institutional Plus EUR Hedged Acc 12,521,503 1,060,558 (3,525,774) 10,056,287GBP Hedged Acc 40,090,217 10,754,003 (2,804,211) 48,040,009GBP Hedged Dist 5,537,529 1,537,617 (796,275) 6,278,871Institutional Plus GBP Hedged Acc 9,258,469 1,924,841 (1,357,628) 9,825,682Institutional Plus GBP Hedged Dist 4,363,228 804,475 (630,957) 4,536,746JPY Hedged Acc 973,240 233,507 (1,206,747) –Institutional Plus JPY Hedged Acc 545 1,520,640 (1,731) 1,519,454USD Hedged Acc 8,894,648 1,934,295 (658,097) 10,170,846USD Hedged Dist – 143,757 (3,740) 140,017Investor USD Hedged 391,865 127,061 (209,438) 309,488Institutional Plus USD Hedged Acc 9,431,928 211,297 (3,121,511) 6,521,714Institutional Plus USD Hedged Dist 365,370 131,156 (91,833) 404,693
114,726,875 28,338,456 (17,731,796) 125,333,535
Global Corporate Bond Index Fund
Share ClassBalance at
Beginning of PeriodShares Issued During Period
Shares Redeemed During Period
Balance at End of Period
CHF Hedged Acc – 86,427 (2,328) 84,099EUR Hedged Acc – 468,549 (7,863) 460,686Institutional Plus EUR Hedged Acc 1,156,073 497,827 (133,970) 1,519,930GBP Hedged Acc 2,788,621 1,072,597 (783,756) 3,077,462GBP Hedged Dist – 2,566,169 (898,785) 1,667,384Institutional Plus GBP Hedged Acc 11,530,329 2,479,460 (1,765,236) 12,244,553USD Hedged Acc 262,638 13,915 (259,328) 17,225
15,737,661 7,184,944 (3,851,266) 19,071,339

1091
Notes to the Financial Statements
Global Credit Bond Fund
Share ClassBalance at
Beginning of PeriodShares Issued During Period
Shares Redeemed During Period
Balance at End of Period
Insitutional Plus AUD Hedged Acc 18,933 13,635 (8,559) 24,009Institutional EUR Hedged Acc 230,948 156,752 (66,962) 320,738Investor GBP Hedged Acc 615,837 899,524 (155,830) 1,359,531Investor GBP Hedged Income 801,087 348,666 (162,057) 987,696Investor USD Hedged Acc 97,894 13,207 (40,122) 70,979Institutional USD Hedged Acc 445,207 114,162 (109,477) 449,892
2,209,906 1,545,946 (543,007) 3,212,845
Global Short-Term Bond Index Fund
Share ClassBalance at
Beginning of PeriodShares Issued During Period
Shares Redeemed During Period
Balance at End of Period
CHF Hedged Acc 269,982 33,214 (78,294) 224,902Institutional Plus CHF Hedged Acc 50 – – 50EUR Hedged Acc 4,204,875 1,787,086 (1,359,131) 4,632,830Investor EUR Hedged 810,554 154,258 (174,477) 790,335Institutional Plus EUR Hedged Acc 452,811 303,659 (135,337) 621,133GBP Hedged Acc 6,762,409 2,902,582 (1,237,891) 8,427,100GBP Hedged Dist 3,608,040 875,251 (469,996) 4,013,295Institutional Plus GBP Hedged Acc 826,154 239,691 (237,962) 827,883Institutional Plus GBP Hedged Dist 901,960 224,474 (93,811) 1,032,623USD Hedged Acc 1,689,434 550,048 (342,406) 1,897,076USD Hedged Dist 22,498 34,522 – 57,020Institutional Plus USD Hedged Acc 644,164 218,233 (13,162) 849,235
20,192,931 7,323,018 (4,142,467) 23,373,482
Global Short-Term Corporate Bond Index Fund
Share ClassBalance at
Beginning of PeriodShares Issued During Period
Shares Redeemed During Period
Balance at End of Period
EUR Hedged Acc 300,628 196,040 (150,651) 346,017Institutional Plus EUR Hedged Acc 1,848,994 821,841 (174,329) 2,496,506GBP Hedged Acc 316,896 257,526 (102,203) 472,219Institutional Plus GBP Hedged Acc 7,521,401 1,712,995 (1,434,319) 7,800,077USD Hedged Acc 92,624 64,635 (39,929) 117,330
10,080,543 3,053,037 (1,901,431) 11,232,149
Japan Government Bond Index Fund
Share ClassBalance at
Beginning of PeriodShares Issued During Period
Shares Redeemed During Period
Balance at End of Period
EUR Hedged Acc – 500 – 500Institutional Plus EUR Hedged Acc 500 – – 500GBP Hedged Acc 2,666,714 43,853 (170,099) 2,540,468Institutional Plus GBP Hedged Dist 1,763 25 (894) 894JPY Acc 989,414 456,351 (434,495) 1,011,270Institutional Plus JPY Acc 1,157,540 229,025 (132,601) 1,253,964USD Acc 317,881 52,838 (3,421) 367,298Institutional Plus USD Hedged Acc 500 – – 500
5,134,312 782,592 (741,510) 5,175,394
SRI Euro Investment Grade Bond Index Fund
Share ClassBalance at
Beginning of PeriodShares Issued During Period
Shares Redeemed During Period
Balance at End of Period
EUR Acc 3,220,730 941,812 (315,788) 3,846,754Institutional Plus EUR Acc 150,765 151,501 (19,720) 282,546
3,371,495 1,093,313 (335,508) 4,129,300

1092
Notes to the Financial Statements
U.K. Government Bond Index Fund
Share ClassBalance at
Beginning of PeriodShares Issued During Period
Shares Redeemed During Period
Balance at End of Period
EUR Hedged Acc – 500 – 500GBP Acc 17,324,198 5,010,647 (2,832,491) 19,502,354GBP Dist 2,174,320 1,139,215 (900,206) 2,413,329Institutional Plus GBP Acc 740,489 80,361 (35,564) 785,286Institutional Plus GBP Dist 4,394,854 880,526 (995,369) 4,280,011
24,633,861 7,111,249 (4,763,630) 26,981,480
U.K. Investment Grade Bond Index Fund
Share ClassBalance at
Beginning of PeriodShares Issued During Period
Shares Redeemed During Period
Balance at End of Period
GBP Acc 24,117,477 6,038,444 (1,645,434) 28,510,487GBP Dist 8,411,689 1,378,954 (2,023,387) 7,767,256Institutional Plus GBP Acc 825,026 106,722 (98,543) 833,205Institutional Plus GBP Dist 3,257,118 733,348 (479,073) 3,511,393
36,611,310 8,257,468 (4,246,437) 40,622,341
U.K. Short-Term Investment Grade Bond Index Fund
Share ClassBalance at
Beginning of PeriodShares Issued During Period
Shares Redeemed During Period
Balance at End of Period
GBP Acc 14,559,438 2,549,919 (1,236,259) 15,873,098GBP Dist 2,012,537 622,996 (474,134) 2,161,399Institutional Plus GBP Acc 2,664,458 353,303 (759,157) 2,258,604Institutional Plus GBP Dist 723,665 113,711 (75,478) 761,898
19,960,098 3,639,929 (2,545,028) 21,054,999
U.S. Government Bond Index Fund
Share ClassBalance at
Beginning of PeriodShares Issued During Period
Shares Redeemed During Period
Balance at End of Period
EUR Hedged Acc 1,796,918 1,655,344 (662,442) 2,789,820Institutional Plus EUR Hedged Acc 847,902 323,143 (287,016) 884,029GBP Dist 1,935,440 434,541 (1,460,309) 909,672GBP Hedged Acc 12,274,583 2,761,509 (2,608,903) 12,427,189GBP Hedged Dist 2,186,209 650,373 (652,060) 2,184,522USD Acc 3,411,999 702,301 (604,075) 3,510,225Investor USD 849,216 109,706 (233,669) 725,253Institutional Plus USD Acc 5,410,868 1,491,810 (220,771) 6,681,907
28,713,135 8,128,727 (6,729,245) 30,112,617
U.S. Investment Grade Credit Index Fund
Share ClassBalance at
Beginning of PeriodShares Issued During Period
Shares Redeemed During Period
Balance at End of Period
EUR Acc 89,167 34,918 (19,452) 104,633Institutional Plus EUR Acc 70,916 2,404 (3,568) 69,752Institutional Plus EUR Hedged Acc 1,718,439 183,093 (1,304,544) 596,988GBP Hedged Acc 5,665,355 276,527 (963,132) 4,978,750Institutional Plus GBP Hedged Acc 97,865 12,671 (52,440) 58,096Institutional Plus GBP Hedged Dist 160,118 24,975 (20,495) 164,598USD Acc 1,588,288 129,685 (357,701) 1,360,272Institutional Plus USD Acc 2,082,202 521,123 (1,434,162) 1,169,163Institutional Plus USD Dist 154,822 57,603 (123,854) 88,571
11,627,172 1,242,999 (4,279,348) 8,590,823

1093
Notes to the Financial Statements
U.S. Treasury Inflation-Protected Securities Index Fund
Share ClassBalance at
Beginning of PeriodShares Issued During Period
Shares Redeemed During Period
Balance at End of Period
Select CHF Hedged Acc 2,906,390 1,079,257 (335,226) 3,650,421Select CHF Hedged Income 49,452 36,953 (999) 85,406Select EUR Hedged Acc 4,102,901 1,933,443 (742,419) 5,293,925Select EUR Hedged Income 168,611 29,571 (5,187) 192,995Select GBP Hedged Acc 270,958 45,306 (34,594) 281,670Select GBP Hedged Income 678,485 54,488 (28,741) 704,232Select SGD Hedged Acc 42,493 62,214 (8,420) 96,287Select USD Acc 5,590,623 1,963,328 (706,688) 6,847,263Select USD Income 655,912 96,645 (25,730) 726,827
14,465,825 5,301,205 (1,888,004) 17,879,026
Movement in shares for the year ended 31 December 2020:
Emerging Markets Stock Index Fund
Share ClassBalance at
Beginning of YearShares Issued
During YearShares Redeemed
During YearShares Merged on
19 June 2020Balance at
End of YearInstitutional Plus CHF Acc1 954,099 1,008 (336,296) – 618,811EUR Acc1 7,109,989 2,470,230 (1,198,341) – 8,381,878Investor EUR 2,212,999 674,761 (1,244,273) – 1,643,487Institutional Plus EUR Acc1 9,070,400 2,948,453 (2,428,540) – 9,590,313GBP Acc1 8,617,563 3,529,666 (1,653,720) – 10,493,509GBP Dist1 1,068,922 604,031 (417,410) – 1,255,543Institutional Plus GBP Acc1 2,165,449 928,405 (691,844) – 2,402,010Institutional Plus GBP Dist1 2,357,973 3,106,752 (1,081,828) – 4,382,897USD Acc1 4,516,054 828,059 (2,559,831) – 2,784,282Investor USD 5,005,214 1,569,406 (654,448) – 5,920,172Institutional Plus USD Acc1 5,880,691 3,714,987 (2,505,375) – 7,090,303
48,959,353 20,375,758 (14,771,906) – 54,563,205
ESG Developed World All Cap Equity Index Fund
Share ClassBalance at
Beginning of YearShares Issued
During YearShares Redeemed
During YearShares Merged on
19 June 2020Balance at
End of YearEUR Acc1 1,204,657 615,253 (471,857) 48,759 1,396,812Investor EUR2 32,824 29,225 (13,160) (48,889) –Institutional Plus EUR Acc1 320,940 84,609 (131,221) – 274,328GBP Acc1 789,986 1,011,286 (225,588) – 1,575,684GBP Dist1 567,056 146,735 (197,460) – 516,331Institutional Plus GBP Acc1 50 186,758 (14,465) – 172,343USD Acc1 249,374 772,120 (75,403) – 946,091
3,164,887 2,845,986 (1,129,154) (130) 4,881,589
ESG Emerging Markets All Cap Equity Index Fund3
Share ClassBalance at
Beginning of PeriodShares Issued During Period
Shares Redeemed During Period
Shares Merged on 19 June 2020
Balance at End of Period
EUR Acc – 73,075 (116) – 72,959GBP Acc – 107,956 (7,726) – 100,230GBP Dist – 43,392 (95) – 43,297Institutional Plus GBP Dist – 26,524 — – 26,524USD Acc – 48,437 — – 48,437
– 299,384 (7,937) – 291,447
European Stock Index Fund
Share ClassBalance at
Beginning of YearShares Issued
During YearShares Redeemed
During YearShares Merged on
19 June 2020Balance at
End of YearEUR Acc1 123,590,869 28,658,399 (38,443,120) – 113,806,148Investor EUR 5,921,401 8,283,978 (1,767,986) – 12,437,393Institutional Plus EUR Acc1 4,619,450 2,680,707 (2,108,392) – 5,191,765USD Acc1 22,721,775 6,814,871 (18,434,191) 851,188 11,953,643Investor USD2 1,406,808 320,987 (860,720) (867,075) —Institutional Plus USD Acc1 596,161 2,678,236 (419,678) – 2,854,719
158,856,464 49,437,178 (62,034,087) (15,887) 146,243,668

1094
Notes to the Financial Statements
Eurozone Stock Index Fund
Share ClassBalance at
Beginning of YearShares Issued
During YearShares Redeemed
During YearShares Merged on
19 June 2020Balance at
End of YearEUR Acc1 5,955,718 1,763,563 (1,715,583) – 6,003,698Investor EUR 552,098 370,595 (536,306) – 386,387Institutional Plus EUR Acc1 3,025,183 2,455,776 (2,130,496) – 3,350,463USD Acc1 3,804 1,368 (3,657) 14,160 15,675Investor USD2 16,099 412 (2,311) (14,200) –Institutional Plus USD Acc1 16,698 19,157 (6,456) – 29,399
9,569,600 4,610,871 (4,394,809) (40) 9,785,622
Global Enhanced Equity Fund
Share ClassBalance at
Beginning of YearShares Issued
During YearShares Redeemed
During YearShares Merged on
19 June 2020Balance at
End of YearInstitutional USD 1,237,271 54,021 (1,254,348) – 36,944
1,237,271 54,021 (1,254,348) – 36,944
Global Small-Cap Index Fund
Share ClassBalance at
Beginning of YearShares Issued
During YearShares Redeemed
During YearShares Merged on
19 June 2020Balance at
End of YearEUR Acc1 777,018 588,175 (210,144) – 1,155,049EUR Dist1 864,500 562,341 (113,228) – 1,313,613Investor EUR 200,262 125,440 (75,568) – 250,134Institutional Plus EUR Acc1 5,138,601 1,408,631 (4,219,218) – 2,328,014GBP Acc1 1,718,969 1,532,282 (615,002) – 2,636,249GBP Dist1 573,684 171,279 (158,501) – 586,462Institutional Plus GBP Acc1 192,702 57,874 (35,515) – 215,061Institutional Plus GBP Dist1 348,459 102,474 (45,842) – 405,091USD Acc1 584,400 225,372 (183,828) 130,821 756,765Investor USD2 233,548 35,770 (24,497) (244,821) –
10,632,143 4,809,638 (5,681,343) (114,000) 9,646,438
Global Stock Index Fund
Share ClassBalance at
Beginning of YearShares Issued
During YearShares Redeemed
During YearShares Merged on
19 June 2020Balance at
End of YearEUR Acc1 63,066,641 21,626,966 (22,772,403) – 61,921,204Investor EUR 7,231,774 4,033,647 (1,855,789) – 9,409,632Institutional Plus EUR Acc1 4,711,833 1,912,873 (4,280,193) – 2,344,513EUR Hedged Acc1 55,887,364 12,310,965 (18,124,581) – 50,073,748Institutional Plus GBP Acc1 1,952,940 745,021 (2,603,012) – 94,949USD Acc1 188,889,546 46,663,877 (82,005,310) – 153,548,113USD Dist1 1,609 568,379 (55,254) – 514,734Investor USD 7,540,987 2,043,248 (1,847,530) – 7,736,705Institutional Plus USD Acc1 1,623,445 2,513,563 (1,818,621) – 2,318,387Institutional Plus USD Dist – 483,945 (365,370) – 118,575
330,906,139 92,902,484 (135,728,063) – 288,080,560
Japan Stock Index Fund
Share ClassBalance at
Beginning of YearShares Issued
During YearShares Redeemed
During YearShares Merged on
19 June 2020Balance at
End of YearEUR Acc1 1,105,841 398,149 (287,160) – 1,216,830Investor EUR 372,991 291,008 (49,317) – 614,682Institutional Plus EUR Acc1 1,223,815 1,526,626 (476,338) – 2,274,103GBP Acc1 4,553,992 1,653,968 (885,785) – 5,322,175GBP Dist1 179,131 60,803 (65,928) – 174,006Institutional Plus GBP Acc1 48,425 282,145 (240,200) – 90,370Institutional Plus GBP Dist1 431,435 75,403 (56,304) – 450,534JPY Acc1 1,288,247 197,936 (85,462) – 1,400,721Investor JPY 67,601 9,769 (23,742) – 53,628Institutional Plus JPY Acc1 576,373 143,564 (119,578) – 600,359USD Acc1 3,149,231 953,810 (1,289,275) – 2,813,766Investor USD 166,374 34,985 (38,588) – 162,771Institutional Plus USD Acc1 52,047 23,805 (12,338) – 63,514
13,215,503 5,651,971 (3,630,015) – 15,237,459

1095
Notes to the Financial Statements
Pacific ex-Japan Stock Index Fund
Share ClassBalance at
Beginning of YearShares Issued
During YearShares Redeemed
During YearShares Merged on
19 June 2020Balance at
End of YearAUD Acc1 59,543 3,216,695 – – 3,276,238EUR Acc1 2,820,800 747,998 (1,537,100) 8,618 2,040,316Investor EUR2 10,489 3,152 (4,990) (8,651) –Institutional Plus EUR Acc1 2,058,775 475,569 (1,554,947) – 979,397GBP Acc1 2,524,196 1,006,546 (773,852) – 2,756,890GBP Dist1 223,235 87,440 (73,995) – 236,680Institutional Plus GBP Acc1 260,358 719,214 (342,425) – 637,147Institutional Plus GBP Dist1 259,653 82,008 (185,683) – 155,978USD Acc1 3,771,207 394,802 (723,289) 23,322 3,466,042Investor USD2 39,931 24,740 (15,843) (48,828) –Institutional Plus USD Acc1 3,339,812 456,901 (2,137,556) – 1,659,157
15,367,999 7,215,065 (7,349,680) (25,539) 15,207,845
SRI European Stock Fund
Share ClassBalance at
Beginning of YearShares Issued
During YearShares Redeemed
During YearShares Merged on
19 June 2020Balance at
End of YearEUR Acc1 1,237,728 186,084 (159,707) 22,083 1,286,188Investor EUR2 25,067 2,447 (5,377) (22,137) —Institutional Plus EUR Acc1 213,208 4,205 (65,538) – 151,875GBP Acc1 108,855 107,245 (53,820) – 162,280GBP Dist1 43,543 28,588 (23,262) – 48,869Institutional Plus GBP Acc1 50 — — – 50USD Acc1 3,223 3,155 (926) – 5,452
1,631,674 331,724 (308,630) (54) 1,654,714
U.S. 500 Stock Index Fund
Share ClassBalance at
Beginning of YearShares Issued
During YearShares Redeemed
During YearShares Merged on
19 June 2020Balance at
End of YearEUR Acc1 48,566,962 15,445,164 (22,117,805) – 41,894,321Investor EUR 2,623,249 8,240,601 (2,257,960) – 8,605,890Institutional Plus EUR Acc1 580,735 787,264 (267,693) – 1,100,306EUR Hedged Acc1 24,181,075 19,331,486 (9,329,494) – 34,183,067USD Acc1 89,425,092 25,775,595 (39,911,570) – 75,289,117Investor USD 15,482,821 5,367,587 (6,581,470) – 14,268,938Institutional Plus USD Acc1 5,911,543 2,370,964 (1,247,055) – 7,035,452
186,771,477 77,318,661 (81,713,047) – 182,377,091
U.S. Fundamental Value Fund4
Share ClassBalance at
Beginning of PeriodShares Issued During Period
Shares Redeemed During Period
Shares Merged on 19 June 2020
Balance at End of Period
Investor GBP Income 10,881 2,830 (13,711) – –Investor USD 130,901 26,063 (156,964) – –
141,782 28,893 (170,675) – –
U.S. Opportunities Fund
Share ClassBalance at
Beginning of YearShares Issued
During YearShares Redeemed
During YearShares Merged on
19 June 2020Balance at
End of YearInvestor EUR 96,905 17,774 (81,947) – 32,732Investor GBP Income 82,032 4,443 (61,037) – 25,438Institutional USD 1,593,987 248,473 (771,169) – 1,071,291Investor USD 399,791 33,707 (160,501) – 272,997
2,172,715 304,397 (1,074,654) – 1,402,458
20+ Year Euro Treasury Index Fund
Share ClassBalance at
Beginning of YearShares Issued
During YearShares Redeemed
During YearShares Merged on
19 June 2020Balance at
End of YearEUR Acc1 3,067,953 568,893 (750,079) – 2,886,767Institutional Plus EUR Acc1 121,627 5,434 (90,219) – 36,842
3,189,580 574,327 (840,298) – 2,923,609

1096
Notes to the Financial Statements
Emerging Markets Bond Fund
Share ClassBalance at
Beginning of YearShares Issued
During YearShares Redeemed
During YearShares Merged on
19 June 2020Balance at
End of YearInvestor EUR Hedged Acc 9,018 109,946 (21,987) – 96,977Investor GBP Hedged Acc 7,723 123,211 (9,672) – 121,262Investor USD Acc 9,965 369,387 (14,061) – 365,291Institutional Plus USD Acc 119,581 1,412,976 (192,496) – 1,340,061
146,287 2,015,520 (238,216) – 1,923,591
Euro Government Bond Index Fund
Share ClassBalance at
Beginning of YearShares Issued
During YearShares Redeemed
During YearShares Merged on
19 June 2020Balance at
End of YearEUR Acc1 15,593,947 2,492,626 (6,862,974) – 11,223,599Investor EUR 268,489 718,691 (202,486) – 784,694Institutional Plus EUR Acc1 18,408,525 6,973,003 (9,190,740) – 16,190,788GBP Hedged Acc1 3,923,546 2,004,403 (689,961) – 5,237,988USD Acc1 68,178 35,511 (90,069) 153,477 167,097Investor USD2 62,739 13,137 (7,010) (68,866) –
38,325,424 12,237,371 (17,043,240) 84,611 33,604,166
Euro Investment Grade Bond Index Fund
Share ClassBalance at
Beginning of YearShares Issued
During YearShares Redeemed
During YearShares Merged on
19 June 2020Balance at
End of YearEUR Acc1 6,918,363 2,533,141 (2,022,665) – 7,428,839Investor EUR 281,649 484,827 (170,323) – 596,153Institutional Plus EUR Acc1 3,797,269 5,250,045 (5,281,625) – 3,765,689GBP Hedged Acc1 2,439,608 1,436,876 (556,463) – 3,320,021
13,436,889 9,704,889 (8,031,076) – 15,110,702
Eurozone Inflation-Linked Bond Index Fund
Share ClassBalance at
Beginning of YearShares Issued
During YearShares Redeemed
During YearShares Merged on
19 June 2020Balance at
End of YearEUR Acc1 4,103,169 930,877 (1,360,170) – 3,673,876Investor EUR 176,675 79,684 (55,917) – 200,442Institutional Plus EUR Acc1 14,572,511 5,829,679 (13,905,134) – 6,497,056
18,852,355 6,840,240 (15,321,221) – 10,371,374
Global Bond Index Fund
Share ClassBalance at
Beginning of YearShares Issued
During YearShares Redeemed
During YearShares Merged on
19 June 2020Balance at
End of YearCHF Hedged Acc1 5,729,251 737,073 (1,434,317) 62,453 5,094,460Investor CHF Hedged2 63,672 31,260 (14,304) (80,628) —Institutional Plus CHF Hedged Acc1 4,427,672 3,541,856 (1,774,773) – 6,194,755EUR Hedged Acc1 9,299,596 7,176,786 (5,276,813) 409,549 11,609,118Investor EUR Hedged2 344,940 189,370 (125,383) (408,927) —Institutional Plus EUR Hedged Acc1 24,429,862 10,086,380 (21,994,739) – 12,521,503GBP Hedged Acc1 29,332,754 19,072,648 (8,315,185) – 40,090,217GBP Hedged Dist1 4,027,969 2,584,554 (1,074,994) – 5,537,529Institutional Plus GBP Hedged Acc1 7,035,043 4,949,349 (2,725,923) – 9,258,469Institutional Plus GBP Hedged Dist1 5,096,560 1,679,456 (2,412,788) – 4,363,228JPY Hedged Acc1 397,276 627,677 (51,713) – 973,240Institutional Plus JPY Hedged Acc1 545 – — – 545USD Hedged Acc1 6,869,857 4,519,658 (2,494,867) – 8,894,648Investor USD Hedged 394,057 415,464 (417,656) – 391,865Institutional Plus USD Hedged Acc1 11,704,847 3,558,980 (5,831,899) – 9,431,928Institutional Plus USD Hedged Dist1 484,633 229,899 (349,162) – 365,370
109,638,534 59,400,410 (54,294,516) (17,553) 114,726,875

1097
Notes to the Financial Statements
Global Corporate Bond Index Fund
Share ClassBalance at
Beginning of YearShares Issued
During YearShares Redeemed
During YearShares Merged on
19 June 2020Balance at
End of YearInstitutional Plus EUR Hedged Acc1 801,456 499,513 (144,896) – 1,156,073GBP Hedged Acc1 582,560 2,911,926 (705,865) – 2,788,621Institutional Plus GBP Hedged Acc1 10,589,355 2,847,138 (1,906,164) – 11,530,329USD Hedged Acc1 26,766 360,584 (124,712) – 262,638
12,000,137 6,619,161 (2,881,637) – 15,737,661
Global Credit Bond Fund
Share ClassBalance at
Beginning of YearShares Issued
During YearShares Redeemed
During YearShares Merged on
19 June 2020Balance at
End of YearInsitutional Plus AUD Hedged Acc 902 18,590 (559) – 18,933Institutional EUR Hedged Acc 203,370 182,698 (155,120) – 230,948Investor GBP Hedged Acc 443,499 508,277 (335,939) – 615,837Investor GBP Hedged Income 50 825,199 (24,162) – 801,087Investor USD Hedged Acc 149,196 78,196 (129,498) – 97,894Institutional USD Hedged Acc 135,487 446,743 (137,023) – 445,207
932,504 2,059,703 (782,301) – 2,209,906
Global Short-Term Bond Index Fund
Share ClassBalance at
Beginning of YearShares Issued
During YearShares Redeemed
During YearShares Merged on
19 June 2020Balance at
End of YearCHF Hedged Acc1 110,861 80,657 (47,484) 125,948 269,982Investor CHF Hedged2 138,612 24,378 (36,759) (126,231) –Institutional Plus CHF Hedged Acc1 50 – – – 50EUR Hedged Acc1 3,393,899 3,233,909 (2,422,933) – 4,204,875Investor EUR Hedged 465,848 618,251 (273,545) – 810,554Institutional Plus EUR Hedged Acc1 371,048 331,792 (250,029) – 452,811GBP Hedged Acc1 4,819,894 4,103,493 (2,160,978) – 6,762,409GBP Hedged Dist1 3,707,690 1,213,402 (1,313,052) – 3,608,040Institutional Plus GBP Hedged Acc1 655,143 284,681 (113,670) – 826,154Institutional Plus GBP Hedged Dist1 885,401 178,365 (161,806) – 901,960USD Hedged Acc1 684,334 1,044,655 (259,497) 219,942 1,689,434USD Hedged Dist – 22,498 – – 22,498Investor USD Hedged2 216,927 30,400 (22,248) (225,079) –Institutional Plus USD Hedged Acc1 163,499 1,062,495 (581,830) – 644,164
15,613,206 12,228,976 (7,643,831) (5,420) 20,192,931
Global Short-Term Corporate Bond Index Fund
Share ClassBalance at
Beginning of YearShares Issued
During YearShares Redeemed
During YearShares Merged on
19 June 2020Balance at
End of YearEUR Hedged Acc1 133,627 347,144 (180,143) – 300,628Institutional Plus EUR Hedged Acc1 438,674 1,836,457 (426,137) – 1,848,994GBP Hedged Acc1 229,650 244,038 (156,792) – 316,896Institutional Plus GBP Hedged Acc1 3,907,107 6,276,121 (2,661,827) – 7,521,401USD Hedged Acc1 10,237 92,574 (10,187) – 92,624
4,719,295 8,796,334 (3,435,086) – 10,080,543
Japan Government Bond Index Fund
Share ClassBalance at
Beginning of YearShares Issued
During YearShares Redeemed
During YearShares Merged on
19 June 2020Balance at
End of YearInstitutional Plus EUR Hedged Acc1 500 – – – 500GBP Hedged Acc1 1,993,910 810,662 (137,858) – 2,666,714Institutional Plus GBP Hedged Dist1 500 5,546 (4,283) – 1,763JPY Acc1 581,586 943,197 (796,135) 260,766 989,414Investor JPY2 263,073 91,384 (91,171) (263,286) –Institutional Plus JPY Acc1 1,003,641 306,957 (153,058) – 1,157,540USD Acc1 183,701 776,381 (652,900) 10,699 317,881Investor USD2 7,709 1,638 (834) (8,513) –Institutional Plus USD Hedged Acc1 – 500 – – 500
4,034,620 2,936,265 (1,836,239) (334) 5,134,312

1098
Notes to the Financial Statements
SRI Euro Investment Grade Bond Index Fund
Share ClassBalance at
Beginning of YearShares Issued
During YearShares Redeemed
During YearShares Merged on
19 June 2020Balance at
End of YearEUR Acc1 2,334,956 1,089,550 (203,776) – 3,220,730Institutional Plus EUR Acc1 138,559 57,541 (45,335) – 150,765
2,473,515 1,147,091 (249,111) – 3,371,495
U.K. Government Bond Index Fund
Share ClassBalance at
Beginning of YearShares Issued
During YearShares Redeemed
During YearShares Merged on
19 June 2020Balance at
End of YearGBP Acc1 14,555,966 8,791,059 (6,022,827) – 17,324,198GBP Dist1 1,984,204 1,051,870 (861,754) – 2,174,320Institutional Plus GBP Acc1 412,475 557,842 (229,828) – 740,489Institutional Plus GBP Dist1 3,440,381 2,062,509 (1,108,036) – 4,394,854
20,393,026 12,463,280 (8,222,445) – 24,633,861
U.K. Investment Grade Bond Index Fund
Share ClassBalance at
Beginning of YearShares Issued
During YearShares Redeemed
During YearShares Merged on
19 June 2020Balance at
End of YearGBP Acc1 24,946,046 9,282,284 (10,110,853) – 24,117,477GBP Dist1 8,138,219 3,250,465 (2,976,995) – 8,411,689Institutional Plus GBP Acc1 1,116,436 564,473 (855,883) – 825,026Institutional Plus GBP Dist1 2,980,168 1,367,723 (1,090,773) – 3,257,118
37,180,869 14,464,945 (15,034,504) – 36,611,310
U.K. Short-Term Investment Grade Bond Index Fund
Share ClassBalance at
Beginning of YearShares Issued
During YearShares Redeemed
During YearShares Merged on
19 June 2020Balance at
End of YearGBP Acc1 12,108,762 5,362,165 (2,911,489) – 14,559,438GBP Dist1 1,982,126 777,428 (747,017) – 2,012,537Institutional Plus GBP Acc1 2,703,989 450,403 (489,934) – 2,664,458Institutional Plus GBP Dist1 738,185 138,842 (153,362) – 723,665
17,533,062 6,728,838 (4,301,802) – 19,960,098
U.S. Government Bond Index Fund
Share ClassBalance at
Beginning of YearShares Issued
During YearShares Redeemed
During YearShares Merged on
19 June 2020Balance at
End of YearEUR Hedged Acc1 2,934,510 1,641,043 (2,778,635) – 1,796,918Institutional Plus EUR Hedged Acc1 828,374 500,372 (480,844) – 847,902GBP Dist1 803,874 2,089,651 (958,085) – 1,935,440GBP Hedged Acc1 11,855,913 5,782,863 (5,364,193) – 12,274,583GBP Hedged Dist1 1,952,328 1,332,044 (1,098,163) – 2,186,209USD Acc1 5,016,412 1,594,301 (3,198,714) – 3,411,999Investor USD 873,850 360,379 (385,013) – 849,216Institutional Plus USD Acc1 7,286,082 1,698,816 (3,574,030) – 5,410,868
31,551,343 14,999,469 (17,837,677) – 28,713,135
U.S. Investment Grade Credit Index Fund
Share ClassBalance at
Beginning of YearShares Issued
During YearShares Redeemed
During YearShares Merged on
19 June 2020Balance at
End of YearEUR Acc1 29,406 74,535 (14,774) – 89,167Institutional Plus EUR Acc1 79,368 16,522 (24,974) – 70,916Institutional Plus EUR Hedged Acc1 405,944 3,766,104 (2,453,609) – 1,718,439GBP Hedged Acc1 4,805,118 1,731,535 (871,298) – 5,665,355Institutional Plus GBP Hedged Acc1 56,528 59,483 (18,146) – 97,865Institutional Plus GBP Hedged Dist1 96,308 105,113 (41,303) – 160,118USD Acc1 1,640,964 1,278,411 (1,641,080) 309,993 1,588,288Investor USD2 352,956 294,625 (123,533) (524,048) —Institutional Plus USD Acc1 789,078 2,803,524 (1,510,400) – 2,082,202Institutional Plus USD Dist1 335,474 36,242 (216,894) – 154,822
8,591,144 10,166,094 (6,916,011) (214,055) 11,627,172

1099
Notes to the Financial Statements
U.S. Treasury Inflation-Protected Securities Index Fund
Share ClassBalance at
Beginning of YearShares Issued
During YearShares Redeemed
During YearShares Merged on
19 June 2020Balance at
End of YearSelect CHF Hedged Acc 5,810,685 2,246,777 (5,151,072) – 2,906,390Select CHF Hedged Income 96,090 112,133 (158,771) – 49,452Select EUR Hedged Acc 6,399,135 6,427,231 (8,723,465) – 4,102,901Select EUR Hedged Income 196,654 111,066 (139,109) – 168,611Select GBP Hedged Acc 353,232 205,977 (288,251) – 270,958Select GBP Hedged Income 813,827 1,336,671 (1,472,013) – 678,485Select SGD Hedged Acc 96,076 85,517 (139,100) – 42,493Select USD Acc 8,086,845 3,795,501 (6,291,723) – 5,590,623Select USD Income 367,990 702,434 (414,512) – 655,912
22,220,534 15,023,307 (22,778,016) – 14,465,825
1 Share class name changed during the year. 2 Share class was merged to Accumulation Shares on 19 June 2020. 3 The Fund was launched on 9 June 2020. 4 The Fund was liquidated on 8 October 2020.
9. Credit Facility. The Funds and certain other funds managed by the Manager or its affiliates participate in an annually renewable USD $4.3 billion (2020: $4.3 billion) committed credit facility. Each participating Fund is individually liable for its borrowings under the credit facility. Borrowings may be utilised for temporary or emergency purposes and are subject to the participating fund’s regulatory and contractual borrowing restrictions. Participating Funds are allocated an annual commitment fee of 0.10% of the undrawn facility amount as well as certain administrative fees. Any fees allocated to the Funds are paid by the Manager. Interest and direct borrowing costs associated with draws on the credit facility are charged to the Funds and recorded in the Statement of Operations.
Any borrowings under this facility denominated in euros bear interest at the Euro Interbank Offered Rate plus an applicable margin, while borrowings under this facility in denominations other than euros bear interest at a rate equal to the higher of the one-month London Interbank Offered Rate (or an acceptable alternate rate, if necessary), federal funds effective rate, or overnight bank funding rate plus an agreed-upon spread.
The Global Stock Index Fund made one borrowing in the amount of $1,000,000 to test the operational readiness of the credit facility process. The borrowing was outstanding for three business days and the related Interest Expense is recorded in the Statement of Operations; the Global Stock Index Fund had no amounts outstanding as at 30 June 2021 (31 December 2020: none).
No other funds had amounts outstanding as at 30 June 2021 or at any time during the period then ended (31 December 2020: none).
10. Efficient Portfolio Management. Investment techniques and financial derivative instruments (FDIs) may be employed for efficient portfolio management purposes, including hedging against market movements, currency exchange or interest rate risks. Any investment technique or use of FDIs must be one which is reasonably believed by the Investment Manager to be economically appropriate in that it is realised in a cost-effective way. Realised and unrealised gains or losses arising from financial derivative transactions are accounted for through the Statement of Operations as Net Gain/(Loss) on Investment Instruments.
Securities lending is also used for efficient portfolio management. During the period from 1 January 2020 through 1 October 2020, the securities lending agent was JPMorgan Chase Bank, N.A. Effective 2 October 2020, the securities lending agent is Brown Brothers Harriman & Co. All operational costs in support of the lending programme are borne by the lending agent and paid directly out of any lending agent fees. Securities lending revenue is net of any lending agent fees paid.
Securities on loan by the Funds and the value of collateral held in respect of the securities as at 30 June 2021:
FundValue of Outstanding
Securities on Loan Value of Collateral
Emerging Markets Stock Index Fund $73,104,711 $78,509,646
ESG Developed World All Cap Equity Index Fund $8,954,019 $9,610,654
ESG Emerging Markets All Cap Equity Index Fund $585,525 $628,846
European Stock Index Fund $20,235,592 $21,969,190
Eurozone Stock Index Fund €12,221,687 €13,341,823
Global Small-Cap Index Fund $116,458,054 $124,474,678
Global Stock Index Fund $78,532,511 $83,639,599
Japan Stock Index Fund €274,508,048 €290,943,143
SRI European Stock Fund €2,256,146 €2,413,304
U.S. 500 Stock Index Fund $1,287,963 $1,366,911
U.S. Opportunities Fund $23,521,956 $24,969,871
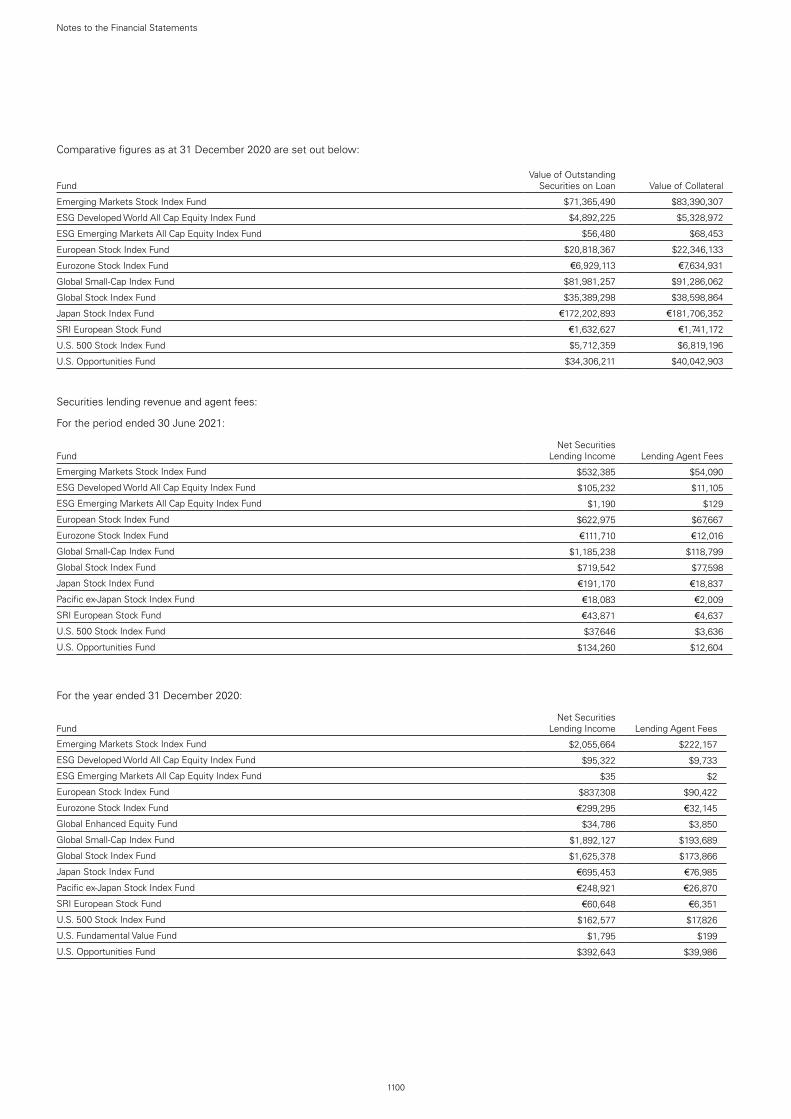
1100
Notes to the Financial Statements
Comparative figures as at 31 December 2020 are set out below:
FundValue of Outstanding
Securities on Loan Value of Collateral
Emerging Markets Stock Index Fund $71,365,490 $83,390,307
ESG Developed World All Cap Equity Index Fund $4,892,225 $5,328,972
ESG Emerging Markets All Cap Equity Index Fund $56,480 $68,453
European Stock Index Fund $20,818,367 $22,346,133
Eurozone Stock Index Fund €6,929,113 €7,634,931
Global Small-Cap Index Fund $81,981,257 $91,286,062
Global Stock Index Fund $35,389,298 $38,598,864
Japan Stock Index Fund €172,202,893 €181,706,352
SRI European Stock Fund €1,632,627 €1,741,172
U.S. 500 Stock Index Fund $5,712,359 $6,819,196
U.S. Opportunities Fund $34,306,211 $40,042,903
Securities lending revenue and agent fees:
For the period ended 30 June 2021:
FundNet Securities
Lending Income Lending Agent Fees
Emerging Markets Stock Index Fund $532,385 $54,090
ESG Developed World All Cap Equity Index Fund $105,232 $11,105
ESG Emerging Markets All Cap Equity Index Fund $1,190 $129
European Stock Index Fund $622,975 $67,667
Eurozone Stock Index Fund €111,710 €12,016
Global Small-Cap Index Fund $1,185,238 $118,799
Global Stock Index Fund $719,542 $77,598
Japan Stock Index Fund €191,170 €18,837
Pacific ex-Japan Stock Index Fund €18,083 €2,009
SRI European Stock Fund €43,871 €4,637
U.S. 500 Stock Index Fund $37,646 $3,636
U.S. Opportunities Fund $134,260 $12,604
For the year ended 31 December 2020:
FundNet Securities
Lending Income Lending Agent Fees
Emerging Markets Stock Index Fund $2,055,664 $222,157
ESG Developed World All Cap Equity Index Fund $95,322 $9,733
ESG Emerging Markets All Cap Equity Index Fund $35 $2
European Stock Index Fund $837,308 $90,422
Eurozone Stock Index Fund €299,295 €32,145
Global Enhanced Equity Fund $34,786 $3,850
Global Small-Cap Index Fund $1,892,127 $193,689
Global Stock Index Fund $1,625,378 $173,866
Japan Stock Index Fund €695,453 €76,985
Pacific ex-Japan Stock Index Fund €248,921 €26,870
SRI European Stock Fund €60,648 €6,351
U.S. 500 Stock Index Fund $162,577 $17,826
U.S. Fundamental Value Fund $1,795 $199
U.S. Opportunities Fund $392,643 $39,986
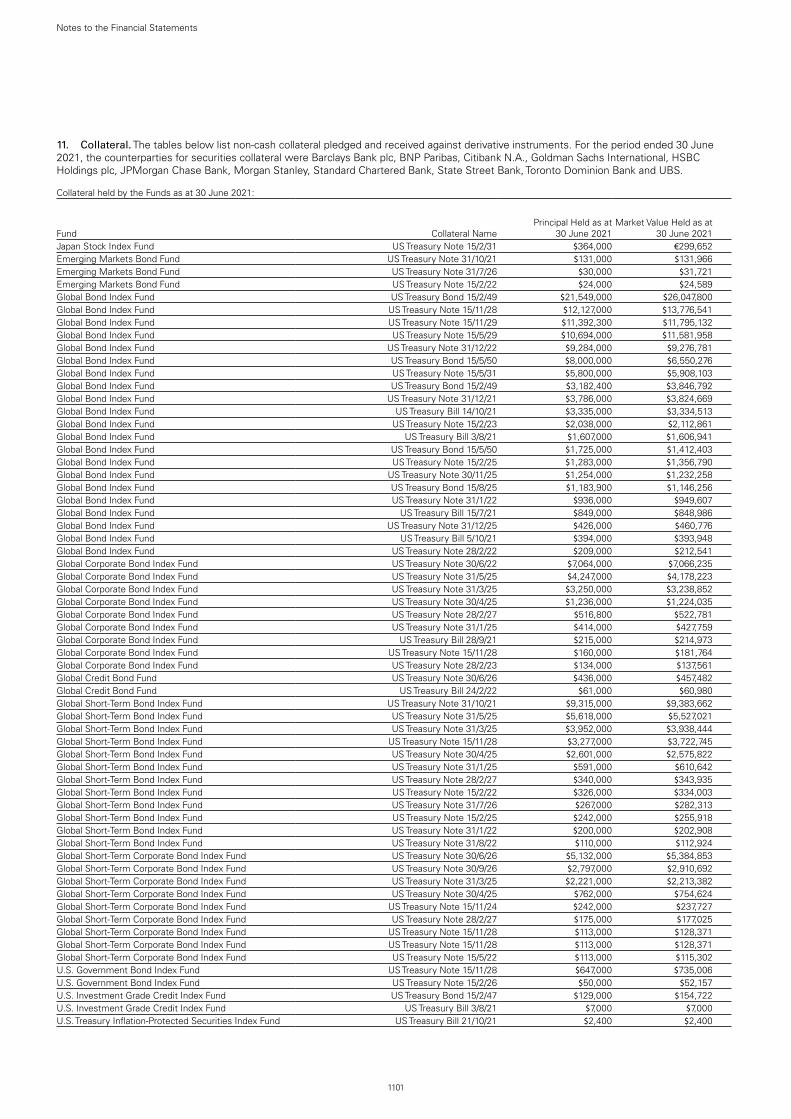
1101
Notes to the Financial Statements
11. Collateral. The tables below list non-cash collateral pledged and received against derivative instruments. For the period ended 30 June 2021, the counterparties for securities collateral were Barclays Bank plc, BNP Paribas, Citibank N.A., Goldman Sachs International, HSBC Holdings plc, JPMorgan Chase Bank, Morgan Stanley, Standard Chartered Bank, State Street Bank, Toronto Dominion Bank and UBS.
Collateral held by the Funds as at 30 June 2021:
Fund Collateral NamePrincipal Held as at
30 June 2021Market Value Held as at
30 June 2021Japan Stock Index Fund US Treasury Note 15/2/31 $364,000 €299,652Emerging Markets Bond Fund US Treasury Note 31/10/21 $131,000 $131,966Emerging Markets Bond Fund US Treasury Note 31/7/26 $30,000 $31,721Emerging Markets Bond Fund US Treasury Note 15/2/22 $24,000 $24,589Global Bond Index Fund US Treasury Bond 15/2/49 $21,549,000 $26,047,800Global Bond Index Fund US Treasury Note 15/11/28 $12,127,000 $13,776,541Global Bond Index Fund US Treasury Note 15/11/29 $11,392,300 $11,795,132Global Bond Index Fund US Treasury Note 15/5/29 $10,694,000 $11,581,958Global Bond Index Fund US Treasury Note 31/12/22 $9,284,000 $9,276,781Global Bond Index Fund US Treasury Bond 15/5/50 $8,000,000 $6,550,276Global Bond Index Fund US Treasury Note 15/5/31 $5,800,000 $5,908,103Global Bond Index Fund US Treasury Bond 15/2/49 $3,182,400 $3,846,792Global Bond Index Fund US Treasury Note 31/12/21 $3,786,000 $3,824,669Global Bond Index Fund US Treasury Bill 14/10/21 $3,335,000 $3,334,513Global Bond Index Fund US Treasury Note 15/2/23 $2,038,000 $2,112,861Global Bond Index Fund US Treasury Bill 3/8/21 $1,607,000 $1,606,941Global Bond Index Fund US Treasury Bond 15/5/50 $1,725,000 $1,412,403Global Bond Index Fund US Treasury Note 15/2/25 $1,283,000 $1,356,790Global Bond Index Fund US Treasury Note 30/11/25 $1,254,000 $1,232,258Global Bond Index Fund US Treasury Bond 15/8/25 $1,183,900 $1,146,256Global Bond Index Fund US Treasury Note 31/1/22 $936,000 $949,607Global Bond Index Fund US Treasury Bill 15/7/21 $849,000 $848,986Global Bond Index Fund US Treasury Note 31/12/25 $426,000 $460,776Global Bond Index Fund US Treasury Bill 5/10/21 $394,000 $393,948Global Bond Index Fund US Treasury Note 28/2/22 $209,000 $212,541Global Corporate Bond Index Fund US Treasury Note 30/6/22 $7,064,000 $7,066,235Global Corporate Bond Index Fund US Treasury Note 31/5/25 $4,247,000 $4,178,223Global Corporate Bond Index Fund US Treasury Note 31/3/25 $3,250,000 $3,238,852Global Corporate Bond Index Fund US Treasury Note 30/4/25 $1,236,000 $1,224,035Global Corporate Bond Index Fund US Treasury Note 28/2/27 $516,800 $522,781Global Corporate Bond Index Fund US Treasury Note 31/1/25 $414,000 $427,759Global Corporate Bond Index Fund US Treasury Bill 28/9/21 $215,000 $214,973Global Corporate Bond Index Fund US Treasury Note 15/11/28 $160,000 $181,764Global Corporate Bond Index Fund US Treasury Note 28/2/23 $134,000 $137,561Global Credit Bond Fund US Treasury Note 30/6/26 $436,000 $457,482Global Credit Bond Fund US Treasury Bill 24/2/22 $61,000 $60,980Global Short-Term Bond Index Fund US Treasury Note 31/10/21 $9,315,000 $9,383,662Global Short-Term Bond Index Fund US Treasury Note 31/5/25 $5,618,000 $5,527,021Global Short-Term Bond Index Fund US Treasury Note 31/3/25 $3,952,000 $3,938,444Global Short-Term Bond Index Fund US Treasury Note 15/11/28 $3,277,000 $3,722,745Global Short-Term Bond Index Fund US Treasury Note 30/4/25 $2,601,000 $2,575,822Global Short-Term Bond Index Fund US Treasury Note 31/1/25 $591,000 $610,642Global Short-Term Bond Index Fund US Treasury Note 28/2/27 $340,000 $343,935Global Short-Term Bond Index Fund US Treasury Note 15/2/22 $326,000 $334,003Global Short-Term Bond Index Fund US Treasury Note 31/7/26 $267,000 $282,313Global Short-Term Bond Index Fund US Treasury Note 15/2/25 $242,000 $255,918Global Short-Term Bond Index Fund US Treasury Note 31/1/22 $200,000 $202,908Global Short-Term Bond Index Fund US Treasury Note 31/8/22 $110,000 $112,924Global Short-Term Corporate Bond Index Fund US Treasury Note 30/6/26 $5,132,000 $5,384,853Global Short-Term Corporate Bond Index Fund US Treasury Note 30/9/26 $2,797,000 $2,910,692Global Short-Term Corporate Bond Index Fund US Treasury Note 31/3/25 $2,221,000 $2,213,382Global Short-Term Corporate Bond Index Fund US Treasury Note 30/4/25 $762,000 $754,624Global Short-Term Corporate Bond Index Fund US Treasury Note 15/11/24 $242,000 $237,727Global Short-Term Corporate Bond Index Fund US Treasury Note 28/2/27 $175,000 $177,025Global Short-Term Corporate Bond Index Fund US Treasury Note 15/11/28 $113,000 $128,371Global Short-Term Corporate Bond Index Fund US Treasury Note 15/11/28 $113,000 $128,371Global Short-Term Corporate Bond Index Fund US Treasury Note 15/5/22 $113,000 $115,302U.S. Government Bond Index Fund US Treasury Note 15/11/28 $647,000 $735,006U.S. Government Bond Index Fund US Treasury Note 15/2/26 $50,000 $52,157U.S. Investment Grade Credit Index Fund US Treasury Bond 15/2/47 $129,000 $154,722U.S. Investment Grade Credit Index Fund US Treasury Bill 3/8/21 $7,000 $7,000U.S. Treasury Inflation-Protected Securities Index Fund US Treasury Bill 21/10/21 $2,400 $2,400

1102
Notes to the Financial Statements
Collateral pledged by the Funds as at 30 June 2021:
Fund Collateral NamePrincipal Pledged as at
30 June 2021Market Value Pledged
as at 30 June 2021Euro Investment Grade Bond Index Fund International Business Machines Corp. 31/1/23 $(270,000) €(230,483)Euro Investment Grade Bond Index Fund Province of Quebec Canada 5/5/31 $(400,000) €(337,028)Global Bond Index Fund US Treasury Note 15/5/23 $(33,000) $(32,938)Global Bond Index Fund US Treasury Note 30/6/25 $(47,000) $(50,852)Global Bond Index Fund US Treasury Note 15/1/23 $(69,000) $(70,879)Global Bond Index Fund US Treasury Note 30/9/22 $(82,000) $(82,013)Global Bond Index Fund US Treasury Note 30/9/22 $(82,000) $(82,013)Global Bond Index Fund US Treasury Note 29/2/28 $(114,000) $(114,179)Global Bond Index Fund US Treasury Note 30/6/23 $(119,000) $(121,682)Global Bond Index Fund US Treasury Note 30/4/23 $(129,000) $(132,639)Global Bond Index Fund US Treasury Note 30/11/25 $(147,000) $(144,451)Global Bond Index Fund US Treasury Note 30/4/26 $(143,000) $(153,962)Global Bond Index Fund US Treasury Note 30/9/22 $(173,000) $(173,027)Global Bond Index Fund US Treasury Note 15/8/29 $(192,000) $(197,732)Global Bond Index Fund US Treasury Note 31/12/22 $(205,600) $(211,619)Global Bond Index Fund US Treasury Note 30/6/22 $(218,000) $(221,587)Global Bond Index Fund US Treasury Note 31/1/27 $(231,000) $(239,051)Global Bond Index Fund US Treasury Note 30/6/27 $(247,000) $(239,092)Global Bond Index Fund US Treasury Note 31/7/24 $(275,000) $(287,793)Global Bond Index Fund US Treasury Note 31/10/24 $(329,000) $(340,318)Global Bond Index Fund US Treasury Bond 15/2/40 $(408,500) $(593,487)Global Bond Index Fund US Treasury Bond 15/5/50 $(1,090,600) $(892,929)Global Bond Index Fund US Treasury Note 29/2/24 $(851,000) $(896,403)Global Bond Index Fund US Treasury Bond 15/2/40 $(681,100) $(989,533)Global Bond Index Fund US Treasury Bond 15/5/40 $(859,000) $(1,205,521)Global Bond Index Fund US Treasury Note 15/2/31 $(1,414,000) $(1,380,428)Global Bond Index Fund US Treasury Bond 15/11/42 $(1,436,000) $(1,622,563)Global Bond Index Fund US Treasury Bond 15/2/42 $(1,546,600) $(1,863,929)Global Bond Index Fund US Treasury Note 30/11/22 $(1,951,000) $(1,950,292)Global Bond Index Fund US Treasury Note 15/8/30 $(2,237,000) $(2,091,955)Global Bond Index Fund US Treasury Note 15/11/29 $(2,047,000) $(2,119,382)Global Bond Index Fund US Treasury Note 15/5/26 $(2,212,000) $(2,298,503)Global Bond Index Fund US Treasury Note 31/7/23 $(2,338,000) $(2,398,047)Global Bond Index Fund US Treasury Note 15/5/23 $(2,566,000) $(2,561,198)Global Bond Index Fund US Treasury Note 15/5/23 $(2,699,000) $(2,693,949)Global Bond Index Fund US Treasury Note 15/5/29 $(2,842,300) $(3,078,306)Global Bond Index Fund US Treasury Note 31/5/23 $(3,235,000) $(3,228,268)Global Bond Index Fund US Treasury Note 15/2/23 $(3,543,000) $(3,673,144)Global Bond Index Fund US Treasury Note 30/9/22 $(3,867,000) $(3,867,612)Global Bond Index Fund US Treasury Note 15/4/23 $(4,432,000) $(4,436,410)Global Bond Index Fund US Treasury Note 28/2/27 $(4,905,000) $(4,961,766)Global Bond Index Fund US Treasury Bond 15/2/36 $(3,691,000) $(5,131,181)Global Bond Index Fund US Treasury Bond 15/11/49 $(4,819,300) $(5,149,433)Global Bond Index Fund US Treasury Note 15/8/22 $(6,085,000) $(6,214,369)Global Bond Index Fund US Treasury Bond 15/5/42 $(5,403,800) $(6,348,220)Global Bond Index Fund US Treasury Bond 15/8/42 $(5,583,200) $(6,349,251)Global Bond Index Fund US Treasury Note 30/11/24 $(6,649,000) $(6,869,384)Global Bond Index Fund US Treasury Bond 15/11/42 $(6,118,000) $(6,912,840)Global Bond Index Fund US Treasury Note 15/2/31 $(7,168,000) $(6,997,814)Global Bond Index Fund US Treasury Note 15/11/30 $(8,738,000) $(8,328,612)Global Bond Index Fund US Treasury Note 28/2/25 $(8,849,400) $(9,045,841)Global Bond Index Fund US Treasury Note 31/5/23 $(10,000,000) $(9,979,189)Global Bond Index Fund US Treasury Note 15/5/23 $(10,000,000) $(9,981,286)Global Bond Index Fund US Treasury Note 30/9/22 $(10,000,000) $(10,001,582)Global Bond Index Fund US Treasury Note 15/10/22 $(10,000,000) $(10,188,308)Global Bond Index Fund US Treasury Note 28/2/25 $(10,000,000) $(10,221,982)Global Bond Index Fund US Treasury Note 31/12/26 $(9,819,000) $(10,239,848)Global Bond Index Fund US Treasury Note 31/8/23 $(10,000,000) $(10,624,726)Global Bond Index Fund US Treasury Note 15/8/28 $(10,000,000) $(11,236,141)Global Bond Index Fund US Treasury Note 30/11/25 $(11,766,000) $(11,561,997)Global Bond Index Fund US Treasury Note 15/2/31 $(12,024,000) $(11,738,520)Global Bond Index Fund US Treasury Note 30/9/22 $(15,590,000) $(15,592,466)Global Bond Index Fund US Treasury Note 15/5/24 $(18,500,000) $(18,407,635)Global Bond Index Fund US Treasury Note 29/2/24 $(18,944,300) $(20,092,214)Global Bond Index Fund US Treasury Note 15/5/22 $(19,798,100) $(20,201,387)Global Bond Index Fund US Treasury Note 15/11/22 $(20,000,000) $(20,444,628)Global Bond Index Fund US Treasury Note 31/10/26 $(20,000,000) $(20,779,755)Global Bond Index Fund US Treasury Note 30/11/22 $(21,352,000) $(21,344,247)Global Bond Index Fund US Treasury Note 30/11/22 $(22,113,000) $(22,104,970)

1103
Notes to the Financial Statements
Collateral pledged by the Funds as at 30 June 2021: (continued)
Fund Collateral NamePrincipal Pledged as at
30 June 2021Market Value Pledged
as at 30 June 2021Global Bond Index Fund US Treasury Note 15/5/22 $(23,787,000) $(24,271,541)Global Bond Index Fund US Treasury Note 30/6/25 $(50,632,000) $(49,746,284)
Global Corporate Bond Index FundVolkswagen Group of America Finance LLC
22/11/23 $(43,000) $(43,145)Global Corporate Bond Index Fund HSBC Holdings plc 31/3/30 $(51,000) $(61,776)Global Corporate Bond Index Fund US Treasury Bond 15/5/41 $(70,000) $(73,111)Global Corporate Bond Index Fund Toronto-Dominion Bank 12/6/23 $(74,000) $(74,441)Global Corporate Bond Index Fund NextEra Energy Capital Holdings, Inc. 1/9/22 $(85,000) $(87,074)Global Corporate Bond Index Fund Intel Corp. 15/12/32 $(83,000) $(99,730)Global Corporate Bond Index Fund Bristol-Myers Squibb Co. 1/11/23 $(100,000) $(106,943)Global Corporate Bond Index Fund Procter & Gamble Co. 2/2/26 $(100,000) $(108,910)Global Corporate Bond Index Fund Unilever Finance Netherlands BV 12/2/33 $(100,000) $(113,799)Global Corporate Bond Index Fund Toyota Finance Australia Ltd. 21/10/27 $(100,000) $(115,017)Global Corporate Bond Index Fund Procter & Gamble Co. 3/11/26 $(150,000) $(161,037)Global Corporate Bond Index Fund BP Capital Markets plc 6/11/22 $(175,000) $(180,719)Global Corporate Bond Index Fund Santander Consumer Bank AG 15/10/24 $(200,000) $(201,737)Global Corporate Bond Index Fund BP Capital Markets plc 7/4/24 $(200,000) $(212,054)Global Corporate Bond Index Fund Apple, Inc. 4/5/43 $(202,000) $(240,990)Global Corporate Bond Index Fund Toyota Motor Corp. 2/7/24 $(259,000) $(275,314)Global Corporate Bond Index Fund US Treasury Bond 15/2/51 $(298,000) $(286,689)Global Corporate Bond Index Fund Bristol-Myers Squibb Co. 27/2/27 $(275,000) $(307,712)Global Corporate Bond Index Fund Procter & Gamble Co. 11/8/27 $(325,000) $(358,191)Global Corporate Bond Index Fund Vodafone Group plc 20/11/25 $(400,000) $(421,581)Global Corporate Bond Index Fund UBS AG 9/2/24 $(435,000) $(432,833)Global Corporate Bond Index Fund AbbVie, Inc. 21/11/22 $(500,000) $(513,829)Global Corporate Bond Index Fund Procter & Gamble Co. 25/10/24 $(500,000) $(514,120)Global Corporate Bond Index Fund Commonwealth Bank of Australia 4/6/24 $(500,000) $(539,557)Global Corporate Bond Index Fund Cooperatieve Rabobank UA 25/7/23 $(500,000) $(558,836)Global Corporate Bond Index Fund Cargill, Inc. 2/2/31 $(600,000) $(589,902)Global Corporate Bond Index Fund Apple, Inc. 3/5/23 $(572,000) $(595,646)Global Corporate Bond Index Fund Santander Consumer Bank A.S. 11/9/24 $(600,000) $(602,972)Global Corporate Bond Index Fund Bank of America Corp. 26/7/23 $(600,000) $(616,150)Global Corporate Bond Index Fund Bank of Montreal 1/5/25 $(600,000) $(621,998)Global Corporate Bond Index Fund Banque Federative du Credit Mutuel SA 14/1/25 $(600,000) $(631,610)Global Corporate Bond Index Fund Philip Morris International, Inc. 1/5/23 $(625,000) $(634,040)Global Corporate Bond Index Fund Vodafone Group plc 16/1/24 $(578,000) $(634,291)Global Corporate Bond Index Fund Standard Chartered plc 11/1/23 $(600,000) $(637,037)Global Corporate Bond Index Fund Berkshire Hathaway Energy Co. 1/4/36 $(450,000) $(639,095)Global Corporate Bond Index Fund Cooperatieve Rabobank UA 23/3/26 $(600,000) $(640,641)Global Corporate Bond Index Fund Banque Federative du Credit Mutuel SA 18/6/29 $(600,000) $(644,897)Global Corporate Bond Index Fund Cooperatieve Rabobank UA 12/1/24 $(650,000) $(647,441)Global Corporate Bond Index Fund ING Groep NV 9/4/24 $(600,000) $(651,131)Global Corporate Bond Index Fund Societe Generale SA 14/4/25 $(600,000) $(656,838)Global Corporate Bond Index Fund Westpac Banking Corp. 17/7/28 $(600,000) $(660,843)Global Corporate Bond Index Fund BPCE SA 20/1/26 $(675,000) $(670,428)Global Corporate Bond Index Fund Vodafone Group plc 25/8/26 $(600,000) $(674,109)Global Corporate Bond Index Fund Barclays plc 16/3/25 $(625,000) $(682,572)Global Corporate Bond Index Fund ABN AMRO Bank NV 18/4/26 $(600,000) $(686,201)Global Corporate Bond Index Fund HSBC Continental Europe SA 3/9/27 $(700,000) $(696,209)Global Corporate Bond Index Fund HSBC Holdings plc 7/6/28 $(600,000) $(703,863)Global Corporate Bond Index Fund Societe Generale SA 28/3/24 $(650,000) $(706,134)Global Corporate Bond Index Fund International Business Machines Corp. 12/2/24 $(650,000) $(706,183)Global Corporate Bond Index Fund International Business Machines Corp. 31/1/23 $(700,000) $(708,632)Global Corporate Bond Index Fund Motability Operations Group plc 3/1/26 $(700,000) $(713,061)Global Corporate Bond Index Fund BNP Paribas SA 1/3/23 $(675,000) $(715,225)
Global Corporate Bond Index FundAustralia & New Zealand Banking Group Ltd.
21/11/22 $(700,000) $(718,359)Global Corporate Bond Index Fund Apple, Inc. 9/2/25 $(673,000) $(720,998)Global Corporate Bond Index Fund Banque Federative du Credit Mutuel SA 8/6/26 $(700,000) $(723,256)Global Corporate Bond Index Fund ING Groep NV 20/9/23 $(700,000) $(724,585)Global Corporate Bond Index Fund Deutsche Bank AG 30/8/23 $(700,000) $(725,480)Global Corporate Bond Index Fund BNP Paribas SA 22/11/23 $(700,000) $(726,496)Global Corporate Bond Index Fund Societe Generale SA 23/1/25 $(700,000) $(727,132)Global Corporate Bond Index Fund Vodafone Group plc 24/11/26 $(700,000) $(732,193)Global Corporate Bond Index Fund Procter & Gamble Co. 25/3/30 $(675,000) $(750,254)Global Corporate Bond Index Fund Wells Fargo & Co. 16/1/24 $(675,000) $(751,953)Global Corporate Bond Index Fund BNP Paribas SA 11/11/22 $(750,000) $(765,583)Global Corporate Bond Index Fund Royal Bank of Canada 17/4/23 $(750,000) $(768,404)Global Corporate Bond Index Fund BPCE SA 22/10/23 $(700,000) $(782,257)

1104
Notes to the Financial Statements
Collateral pledged by the Funds as at 30 June 2021: (continued)
Fund Collateral NamePrincipal Pledged as at
30 June 2021Market Value Pledged
as at 30 June 2021Global Corporate Bond Index Fund HSBC Holdings plc 18/8/25 $(700,000) $(783,507)Global Corporate Bond Index Fund Nestle Holdings, Inc. 15/1/24 $(800,000) $(798,466)Global Corporate Bond Index Fund Bank of America Corp. 19/4/26 $(725,000) $(800,676)Global Corporate Bond Index Fund HSBC Holdings plc 14/3/24 $(735,000) $(805,790)Global Corporate Bond Index Fund Apple, Inc. 11/5/23 $(800,000) $(807,536)Global Corporate Bond Index Fund Credit Agricole SA 24/6/24 $(800,000) $(812,525)Global Corporate Bond Index Fund HSBC Holdings plc 6/9/24 $(800,000) $(828,299)Global Corporate Bond Index Fund Verizon Communications, Inc. 15/8/26 $(780,000) $(835,303)Global Corporate Bond Index Fund General Electric Co. 15/3/32 $(600,000) $(843,761)Global Corporate Bond Index Fund Pernod Ricard SA 15/7/22 $(800,000) $(845,742)Global Corporate Bond Index Fund HSBC Holdings plc 23/11/26 $(750,000) $(847,699)Global Corporate Bond Index Fund Anheuser-Busch InBev SA 17/3/36 $(700,000) $(852,583)Global Corporate Bond Index Fund Target Corp. 1/7/24 $(775,000) $(854,288)Global Corporate Bond Index Fund BP Capital Markets plc 4/11/24 $(793,000) $(867,989)Global Corporate Bond Index Fund BNP Paribas SA 10/1/24 $(800,000) $(872,303)Global Corporate Bond Index Fund Vodafone Group plc 24/11/30 $(800,000) $(879,872)Global Corporate Bond Index Fund Cooperatieve Rabobank UA 26/9/23 $(825,000) $(893,816)Global Corporate Bond Index Fund Bank of Nova Scotia 15/11/22 $(875,000) $(896,930)Global Corporate Bond Index Fund Verizon Communications, Inc. 10/8/33 $(750,000) $(908,023)Global Corporate Bond Index Fund Comcast Corp. 15/11/35 $(625,000) $(913,982)Global Corporate Bond Index Fund McDonald's Corp. 29/1/24 $(900,000) $(920,286)Global Corporate Bond Index Fund NextEra Energy Capital Holdings, Inc. 1/9/22 $(900,000) $(921,962)Global Corporate Bond Index Fund Royal Bank of Canada 19/1/24 $(925,000) $(923,092)Global Corporate Bond Index Fund BP Capital Markets plc 7/4/24 $(900,000) $(954,242)Global Corporate Bond Index Fund Credit Suisse AG 2/2/24 $(975,000) $(973,549)Global Corporate Bond Index Fund Bank of America Corp. 21/4/25 $(884,000) $(977,730)Global Corporate Bond Index Fund Bank of America Corp. 11/1/23 $(925,000) $(979,826)Global Corporate Bond Index Fund Banque Federative du Credit Mutuel SA 21/2/31 $(1,000,000) $(990,406)Global Corporate Bond Index Fund BPCE SA 14/1/27 $(1,000,000) $(990,536)Global Corporate Bond Index Fund Banque Federative du Credit Mutuel SA 11/5/26 $(1,000,000) $(996,503)Global Corporate Bond Index Fund International Business Machines Corp. 15/5/24 $(950,000) $(1,015,179)Global Corporate Bond Index Fund Bank of America Corp. 22/1/25 $(950,000) $(1,057,158)Global Corporate Bond Index Fund Santander Consumer Bank AG 15/10/24 $(1,100,000) $(1,109,552)Global Corporate Bond Index Fund Lloyds Banking Group plc 24/3/26 $(975,000) $(1,115,093)Global Corporate Bond Index Fund Verizon Communications, Inc. 21/9/28 $(953,000) $(1,118,328)Global Corporate Bond Index Fund Toronto-Dominion Bank 12/6/23 $(1,151,000) $(1,157,855)Global Corporate Bond Index Fund HSBC Holdings plc 8/3/26 $(1,050,000) $(1,199,817)Global Corporate Bond Index Fund Orange SA 1/3/31 $(750,000) $(1,205,295)Global Corporate Bond Index Fund Barclays plc 3/9/23 $(1,200,000) $(1,258,404)Global Corporate Bond Index Fund HSBC Holdings plc 31/3/30 $(1,049,000) $(1,270,642)Global Corporate Bond Index Fund Apple, Inc. 10/11/26 $(1,300,000) $(1,427,742)Global Corporate Bond Index Fund Lloyds Banking Group plc 10/12/25 $(1,279,000) $(1,438,137)Global Corporate Bond Index Fund Cooperatieve Rabobank UA 21/7/26 $(1,300,000) $(1,451,002)Global Corporate Bond Index Fund HSBC Holdings plc 2/5/36 $(1,100,000) $(1,526,968)Global Corporate Bond Index Fund AbbVie, Inc. 6/11/22 $(1,500,000) $(1,556,396)Global Corporate Bond Index Fund Barclays plc 8/12/23 $(1,500,000) $(1,588,201)Global Corporate Bond Index Fund Verizon Communications, Inc. 15/1/36 $(1,325,000) $(1,604,663)Global Corporate Bond Index Fund Exxon Mobil Corp. 15/4/23 $(1,575,000) $(1,613,565)Global Credit Bond Fund US Treasury Note 28/2/23 $(6,800) $(6,795)Global Credit Bond Fund US Treasury Note 28/2/23 $(11,000) $(10,993)Global Credit Bond Fund US Treasury Note 15/1/24 $(61,000) $(60,673)Global Credit Bond Fund US Treasury Bond 15/2/41 $(86,200) $(85,083)Global Credit Bond Fund US Treasury Note 15/12/23 $(113,800) $(113,202)Global Credit Bond Fund US Treasury Bond 15/5/37 $(125,400) $(183,633)Global Credit Bond Fund US Treasury Note 15/12/23 $(975,500) $(970,371)Global Credit Bond Fund US Treasury Note 15/2/31 $(1,031,900) $(1,007,400)Global Credit Bond Fund US Treasury Bond 15/5/37 $(932,000) $(1,364,798)Global Credit Bond Fund US Treasury Note 15/2/31 $(2,145,400) $(2,094,463)Global Credit Bond Fund US Treasury Note 28/2/23 $(5,564,100) $(5,560,338)Global Short-Term Bond Index Fund US Treasury Note 31/1/26 $(42,000) $(41,239)Global Short-Term Bond Index Fund US Treasury Note 30/9/23 $(47,000) $(50,049)Global Short-Term Bond Index Fund US Treasury Note 30/4/25 $(52,000) $(51,497)Global Short-Term Bond Index Fund US Treasury Note 30/9/24 $(58,000) $(61,319)Global Short-Term Bond Index Fund US Treasury Note 31/3/26 $(82,000) $(81,822)Global Short-Term Bond Index Fund US Treasury Note 31/3/23 $(87,000) $(91,013)Global Short-Term Bond Index Fund US Treasury Note 31/5/25 $(125,000) $(122,976)Global Short-Term Bond Index Fund Federal Home Loan Banks 21/10/22 $(130,000) $(129,988)Global Short-Term Bond Index Fund US Treasury Note 31/1/25 $(129,000) $(133,287)Global Short-Term Bond Index Fund US Treasury Note 30/11/25 $(200,000) $(196,532)
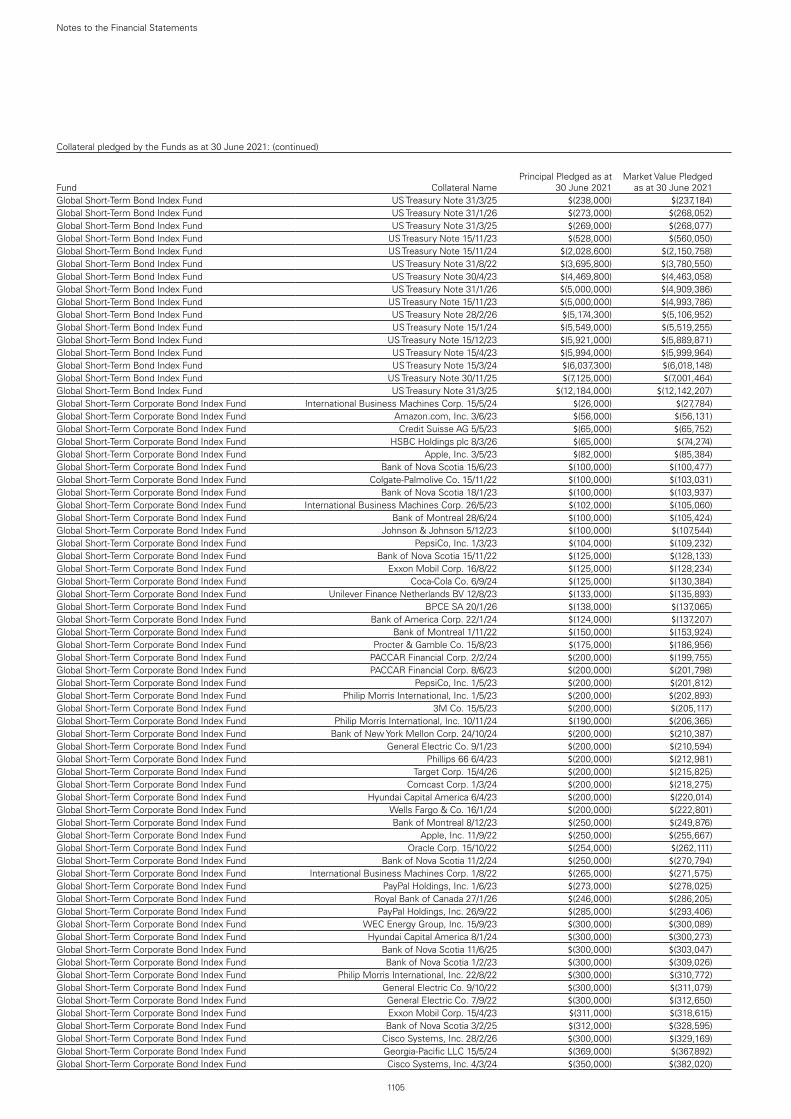
1105
Notes to the Financial Statements
Collateral pledged by the Funds as at 30 June 2021: (continued)
Fund Collateral NamePrincipal Pledged as at
30 June 2021Market Value Pledged
as at 30 June 2021Global Short-Term Bond Index Fund US Treasury Note 31/3/25 $(238,000) $(237,184)Global Short-Term Bond Index Fund US Treasury Note 31/1/26 $(273,000) $(268,052)Global Short-Term Bond Index Fund US Treasury Note 31/3/25 $(269,000) $(268,077)Global Short-Term Bond Index Fund US Treasury Note 15/11/23 $(528,000) $(560,050)Global Short-Term Bond Index Fund US Treasury Note 15/11/24 $(2,028,600) $(2,150,758)Global Short-Term Bond Index Fund US Treasury Note 31/8/22 $(3,695,800) $(3,780,550)Global Short-Term Bond Index Fund US Treasury Note 30/4/23 $(4,469,800) $(4,463,058)Global Short-Term Bond Index Fund US Treasury Note 31/1/26 $(5,000,000) $(4,909,386)Global Short-Term Bond Index Fund US Treasury Note 15/11/23 $(5,000,000) $(4,993,786)Global Short-Term Bond Index Fund US Treasury Note 28/2/26 $(5,174,300) $(5,106,952)Global Short-Term Bond Index Fund US Treasury Note 15/1/24 $(5,549,000) $(5,519,255)Global Short-Term Bond Index Fund US Treasury Note 15/12/23 $(5,921,000) $(5,889,871)Global Short-Term Bond Index Fund US Treasury Note 15/4/23 $(5,994,000) $(5,999,964)Global Short-Term Bond Index Fund US Treasury Note 15/3/24 $(6,037,300) $(6,018,148)Global Short-Term Bond Index Fund US Treasury Note 30/11/25 $(7,125,000) $(7,001,464)Global Short-Term Bond Index Fund US Treasury Note 31/3/25 $(12,184,000) $(12,142,207)Global Short-Term Corporate Bond Index Fund International Business Machines Corp. 15/5/24 $(26,000) $(27,784)Global Short-Term Corporate Bond Index Fund Amazon.com, Inc. 3/6/23 $(56,000) $(56,131)Global Short-Term Corporate Bond Index Fund Credit Suisse AG 5/5/23 $(65,000) $(65,752)Global Short-Term Corporate Bond Index Fund HSBC Holdings plc 8/3/26 $(65,000) $(74,274)Global Short-Term Corporate Bond Index Fund Apple, Inc. 3/5/23 $(82,000) $(85,384)Global Short-Term Corporate Bond Index Fund Bank of Nova Scotia 15/6/23 $(100,000) $(100,477)Global Short-Term Corporate Bond Index Fund Colgate-Palmolive Co. 15/11/22 $(100,000) $(103,031)Global Short-Term Corporate Bond Index Fund Bank of Nova Scotia 18/1/23 $(100,000) $(103,937)Global Short-Term Corporate Bond Index Fund International Business Machines Corp. 26/5/23 $(102,000) $(105,060)Global Short-Term Corporate Bond Index Fund Bank of Montreal 28/6/24 $(100,000) $(105,424)Global Short-Term Corporate Bond Index Fund Johnson & Johnson 5/12/23 $(100,000) $(107,544)Global Short-Term Corporate Bond Index Fund PepsiCo, Inc. 1/3/23 $(104,000) $(109,232)Global Short-Term Corporate Bond Index Fund Bank of Nova Scotia 15/11/22 $(125,000) $(128,133)Global Short-Term Corporate Bond Index Fund Exxon Mobil Corp. 16/8/22 $(125,000) $(128,234)Global Short-Term Corporate Bond Index Fund Coca-Cola Co. 6/9/24 $(125,000) $(130,384)Global Short-Term Corporate Bond Index Fund Unilever Finance Netherlands BV 12/8/23 $(133,000) $(135,893)Global Short-Term Corporate Bond Index Fund BPCE SA 20/1/26 $(138,000) $(137,065)Global Short-Term Corporate Bond Index Fund Bank of America Corp. 22/1/24 $(124,000) $(137,207)Global Short-Term Corporate Bond Index Fund Bank of Montreal 1/11/22 $(150,000) $(153,924)Global Short-Term Corporate Bond Index Fund Procter & Gamble Co. 15/8/23 $(175,000) $(186,956)Global Short-Term Corporate Bond Index Fund PACCAR Financial Corp. 2/2/24 $(200,000) $(199,755)Global Short-Term Corporate Bond Index Fund PACCAR Financial Corp. 8/6/23 $(200,000) $(201,798)Global Short-Term Corporate Bond Index Fund PepsiCo, Inc. 1/5/23 $(200,000) $(201,812)Global Short-Term Corporate Bond Index Fund Philip Morris International, Inc. 1/5/23 $(200,000) $(202,893)Global Short-Term Corporate Bond Index Fund 3M Co. 15/5/23 $(200,000) $(205,117)Global Short-Term Corporate Bond Index Fund Philip Morris International, Inc. 10/11/24 $(190,000) $(206,365)Global Short-Term Corporate Bond Index Fund Bank of New York Mellon Corp. 24/10/24 $(200,000) $(210,387)Global Short-Term Corporate Bond Index Fund General Electric Co. 9/1/23 $(200,000) $(210,594)Global Short-Term Corporate Bond Index Fund Phillips 66 6/4/23 $(200,000) $(212,981)Global Short-Term Corporate Bond Index Fund Target Corp. 15/4/26 $(200,000) $(215,825)Global Short-Term Corporate Bond Index Fund Comcast Corp. 1/3/24 $(200,000) $(218,275)Global Short-Term Corporate Bond Index Fund Hyundai Capital America 6/4/23 $(200,000) $(220,014)Global Short-Term Corporate Bond Index Fund Wells Fargo & Co. 16/1/24 $(200,000) $(222,801)Global Short-Term Corporate Bond Index Fund Bank of Montreal 8/12/23 $(250,000) $(249,876)Global Short-Term Corporate Bond Index Fund Apple, Inc. 11/9/22 $(250,000) $(255,667)Global Short-Term Corporate Bond Index Fund Oracle Corp. 15/10/22 $(254,000) $(262,111)Global Short-Term Corporate Bond Index Fund Bank of Nova Scotia 11/2/24 $(250,000) $(270,794)Global Short-Term Corporate Bond Index Fund International Business Machines Corp. 1/8/22 $(265,000) $(271,575)Global Short-Term Corporate Bond Index Fund PayPal Holdings, Inc. 1/6/23 $(273,000) $(278,025)Global Short-Term Corporate Bond Index Fund Royal Bank of Canada 27/1/26 $(246,000) $(286,205)Global Short-Term Corporate Bond Index Fund PayPal Holdings, Inc. 26/9/22 $(285,000) $(293,406)Global Short-Term Corporate Bond Index Fund WEC Energy Group, Inc. 15/9/23 $(300,000) $(300,089)Global Short-Term Corporate Bond Index Fund Hyundai Capital America 8/1/24 $(300,000) $(300,273)Global Short-Term Corporate Bond Index Fund Bank of Nova Scotia 11/6/25 $(300,000) $(303,047)Global Short-Term Corporate Bond Index Fund Bank of Nova Scotia 1/2/23 $(300,000) $(309,026)Global Short-Term Corporate Bond Index Fund Philip Morris International, Inc. 22/8/22 $(300,000) $(310,772)Global Short-Term Corporate Bond Index Fund General Electric Co. 9/10/22 $(300,000) $(311,079)Global Short-Term Corporate Bond Index Fund General Electric Co. 7/9/22 $(300,000) $(312,650)Global Short-Term Corporate Bond Index Fund Exxon Mobil Corp. 15/4/23 $(311,000) $(318,615)Global Short-Term Corporate Bond Index Fund Bank of Nova Scotia 3/2/25 $(312,000) $(328,595)Global Short-Term Corporate Bond Index Fund Cisco Systems, Inc. 28/2/26 $(300,000) $(329,169)Global Short-Term Corporate Bond Index Fund Georgia-Pacific LLC 15/5/24 $(369,000) $(367,892)Global Short-Term Corporate Bond Index Fund Cisco Systems, Inc. 4/3/24 $(350,000) $(382,020)

1106
Notes to the Financial Statements
Collateral pledged by the Funds as at 30 June 2021: (continued)
Fund Collateral NamePrincipal Pledged as at
30 June 2021Market Value Pledged
as at 30 June 2021Global Short-Term Corporate Bond Index Fund Bank of America Corp. 24/7/23 $(350,000) $(382,212)Global Short-Term Corporate Bond Index Fund Bank of Nova Scotia 16/12/25 $(338,000) $(383,816)Global Short-Term Corporate Bond Index Fund Bank of New York Mellon Corp. 23/8/22 $(375,000) $(384,635)Global Short-Term Corporate Bond Index Fund BNP Paribas SA 9/1/25 $(378,000) $(412,041)Global Short-Term Corporate Bond Index Fund Bank of Montreal 1/5/25 $(400,000) $(414,665)Global Short-Term Corporate Bond Index Fund Procter & Gamble Co. 2/2/26 $(400,000) $(435,640)Global Short-Term Corporate Bond Index Fund Bank of Nova Scotia 19/9/22 $(425,000) $(438,567)Global Short-Term Corporate Bond Index Fund Mitsubishi UFJ Financial Group, Inc. 25/7/22 $(446,000) $(462,282)Global Short-Term Corporate Bond Index Fund Wells Fargo & Co. 15/8/23 $(425,000) $(463,310)Global Short-Term Corporate Bond Index Fund International Business Machines Corp. 9/11/22 $(450,000) $(467,374)Global Short-Term Corporate Bond Index Fund Nestle Holdings, Inc. 15/1/24 $(500,000) $(499,041)Global Short-Term Corporate Bond Index Fund Procter & Gamble Co. 11/8/22 $(487,000) $(501,263)Global Short-Term Corporate Bond Index Fund Apple, Inc. 11/5/23 $(500,000) $(504,710)Global Short-Term Corporate Bond Index Fund International Business Machines Corp. 31/1/23 $(500,000) $(506,166)Global Short-Term Corporate Bond Index Fund Mitsubishi UFJ Financial Group, Inc. 17/7/25 $(500,000) $(507,880)Global Short-Term Corporate Bond Index Fund Chevron Corp. 11/5/23 $(500,000) $(508,293)Global Short-Term Corporate Bond Index Fund Hyundai Capital America 20/6/22 $(500,000) $(511,701)Global Short-Term Corporate Bond Index Fund KeyBank NA 14/9/22 $(500,000) $(515,078)Global Short-Term Corporate Bond Index Fund Procter & Gamble Co. 29/10/25 $(525,000) $(518,791)Global Short-Term Corporate Bond Index Fund Wells Fargo & Co. 13/2/23 $(500,000) $(530,313)Global Short-Term Corporate Bond Index Fund International Business Machines Corp. 1/8/23 $(500,000) $(537,519)Global Short-Term Corporate Bond Index Fund Bank of New York Mellon Corp. 11/8/23 $(500,000) $(538,541)Global Short-Term Corporate Bond Index Fund Mitsubishi UFJ Financial Group, Inc. 7/3/24 $(500,000) $(540,297)Global Short-Term Corporate Bond Index Fund Bank of Montreal 5/2/24 $(500,000) $(541,690)Global Short-Term Corporate Bond Index Fund MUFG Bank Ltd. 8/9/24 $(500,000) $(542,296)Global Short-Term Corporate Bond Index Fund Apple, Inc. 6/5/24 $(500,000) $(543,503)Global Short-Term Corporate Bond Index Fund International Business Machines Corp. 15/5/26 $(500,000) $(551,911)Global Short-Term Corporate Bond Index Fund Eaton Corp. 2/11/22 $(535,000) $(554,855)Global Short-Term Corporate Bond Index Fund International Business Machines Corp. 19/2/26 $(500,000) $(558,347)Global Short-Term Corporate Bond Index Fund UBS Group AG 24/9/25 $(540,000) $(608,591)Global Short-Term Corporate Bond Index Fund Wells Fargo & Co. 19/2/25 $(600,000) $(648,582)Global Short-Term Corporate Bond Index Fund Wells Fargo & Co. 29/9/25 $(600,000) $(665,168)Global Short-Term Corporate Bond Index Fund Mitsubishi UFJ Financial Group, Inc. 18/7/22 $(650,000) $(673,247)Global Short-Term Corporate Bond Index Fund Wells Fargo & Co. 9/9/24 $(619,000) $(673,550)Global Short-Term Corporate Bond Index Fund Bank of Nova Scotia 1/5/23 $(700,000) $(716,324)Global Short-Term Corporate Bond Index Fund Bank of America Corp. 21/4/25 $(700,000) $(774,221)Global Short-Term Corporate Bond Index Fund Verizon Communications, Inc. 2/4/25 $(781,000) $(808,216)Global Short-Term Corporate Bond Index Fund International Business Machines Corp. 31/1/25 $(800,000) $(830,456)Global Short-Term Corporate Bond Index Fund BNP Paribas SA 1/3/23 $(790,000) $(837,078)Global Short-Term Corporate Bond Index Fund Bank of America Corp. 22/1/24 $(776,000) $(858,651)Global Short-Term Corporate Bond Index Fund Verizon Communications, Inc. 15/2/25 $(800,000) $(876,985)Global Short-Term Corporate Bond Index Fund Bank of America Corp. 22/1/25 $(800,000) $(890,238)Global Short-Term Corporate Bond Index Fund Credit Suisse AG 5/5/23 $(915,000) $(925,580)Global Short-Term Corporate Bond Index Fund Bank of America Corp. 1/4/24 $(850,000) $(936,205)Global Short-Term Corporate Bond Index Fund Bank of America Corp. 3/3/26 $(900,000) $(1,033,153)Global Short-Term Corporate Bond Index Fund Lloyds Banking Group plc 10/12/25 $(946,000) $(1,063,704)Global Short-Term Corporate Bond Index Fund Wells Fargo & Co. 22/4/26 $(1,000,000) $(1,078,150)Global Short-Term Corporate Bond Index Fund Apple, Inc. 3/5/23 $(1,085,000) $(1,129,852)Global Short-Term Corporate Bond Index Fund Mitsubishi UFJ Financial Group, Inc. 1/3/26 $(1,000,000) $(1,129,952)Global Short-Term Corporate Bond Index Fund Bank of America Corp. 11/1/23 $(1,500,000) $(1,588,907)Global Short-Term Corporate Bond Index Fund HSBC Holdings plc 8/3/26 $(1,458,000) $(1,666,032)Japan Government Bond Index Fund Japan Government Bond 20/3/37 $(6,550,000) ¥(774,452,604)Japan Government Bond Index Fund Japan Government Bond 20/12/24 $(57,500,000) ¥(6,858,575,242)Japan Government Bond Index Fund Japan Government Bond 20/3/39 $(46,400,000) ¥(6,894,030,963)Japan Government Bond Index Fund Japan Government Bond 20/12/28 $(77,000,000) ¥(9,934,226,727)Japan Government Bond Index Fund Japan Government Bond 20/6/38 $(90,800,000) ¥(10,349,636,146)Japan Government Bond Index Fund Japan Government Bond 20/3/44 $(84,950,000) ¥(11,862,818,455)Japan Government Bond Index Fund Japan Government Bond 20/12/45 $(130,950,000) ¥(17,317,723,071)Japan Government Bond Index Fund Japan Government Bond 20/3/38 $(234,300,000) ¥(26,765,723,111)SRI Euro Investment Grade Bond Index Fund CPPIB Capital, Inc. 6/4/27 $(50,000) €(43,123)SRI Euro Investment Grade Bond Index Fund European Investment Bank 15/11/47 $(100,000) €(103,888)U.K. Investment Grade Bond Index Fund Province of Quebec Canada 13/12/24 $(900,000) £(659,626)U.K. Short-Term Investment Grade Bond Index Fund CPPIB Capital, Inc. 25/7/23 $(1,200,000) £(873,415)U.S. Government Bond Index Fund US Treasury Note 15/8/30 $(68,000) $(63,591)U.S. Government Bond Index Fund US Treasury Note 15/11/30 $(1,117,000) $(1,064,667)U.S. Government Bond Index Fund US Treasury Bond 15/2/41 $(939,000) $(1,394,152)U.S. Government Bond Index Fund US Treasury Bond 15/2/41 $(1,454,600) $(2,159,674)U.S. Government Bond Index Fund US Treasury Note 15/8/30 $(2,878,000) $(2,691,394)U.S. Government Bond Index Fund US Treasury Bond 15/5/41 $(2,418,600) $(3,411,647)

1107
Notes to the Financial Statements
Collateral pledged by the Funds as at 30 June 2021: (continued)
Fund Collateral NamePrincipal Pledged as at
30 June 2021Market Value Pledged
as at 30 June 2021U.S. Government Bond Index Fund US Treasury Note 31/12/27 $(5,135,000) $(4,968,200)U.S. Government Bond Index Fund US Treasury Note 15/2/31 $(5,190,000) $(5,066,777)U.S. Government Bond Index Fund US Treasury Note 15/8/30 $(10,000,000) $(9,351,611)U.S. Government Bond Index Fund US Treasury Note 15/5/30 $(10,000,000) $(9,365,792)U.S. Government Bond Index Fund US Treasury Note 15/2/31 $(11,369,000) $(11,099,072)U.S. Government Bond Index Fund US Treasury Note 15/11/30 $(20,762,000) $(19,789,270)U.S. Investment Grade Credit Index Fund Hyundai Capital America 1/11/22 $(9,000) $(9,292)U.S. Investment Grade Credit Index Fund Procter & Gamble Co. 23/4/31 $(20,000) $(20,389)U.S. Investment Grade Credit Index Fund Cargill, Inc. 1/3/23 $(26,000) $(27,515)U.S. Investment Grade Credit Index Fund Walmart, Inc. 15/2/30 $(21,000) $(31,504)U.S. Investment Grade Credit Index Fund Bank of America Corp. 19/4/26 $(53,000) $(58,532)U.S. Investment Grade Credit Index Fund Johnson & Johnson 5/12/23 $(81,000) $(87,111)U.S. Investment Grade Credit Index Fund Procter & Gamble Co. 15/8/23 $(90,000) $(96,149)U.S. Investment Grade Credit Index Fund PayPal Holdings, Inc. 1/6/23 $(100,000) $(101,841)U.S. Investment Grade Credit Index Fund Hyundai Capital America 10/2/23 $(100,000) $(103,543)U.S. Investment Grade Credit Index Fund Bank of Nova Scotia 3/8/26 $(100,000) $(107,754)U.S. Investment Grade Credit Index Fund Philip Morris International, Inc. 22/8/22 $(115,000) $(119,129)U.S. Investment Grade Credit Index Fund Comcast Corp. 15/1/33 $(100,000) $(121,144)U.S. Investment Grade Credit Index Fund PayPal Holdings, Inc. 26/9/22 $(125,000) $(128,687)U.S. Investment Grade Credit Index Fund Commonwealth Bank of Australia 18/9/22 $(125,000) $(129,130)U.S. Investment Grade Credit Index Fund Royal Bank of Canada 19/1/24 $(130,000) $(129,732)U.S. Investment Grade Credit Index Fund Apple, Inc. 4/5/43 $(111,000) $(132,425)U.S. Investment Grade Credit Index Fund Toyota Motor Corp. 20/7/23 $(127,000) $(136,757)U.S. Investment Grade Credit Index Fund International Business Machines Corp. 15/5/29 $(133,000) $(149,362)U.S. Investment Grade Credit Index Fund Mitsubishi UFJ Financial Group, Inc. 18/7/22 $(145,000) $(150,186)U.S. Investment Grade Credit Index Fund Royal Bank of Canada 1/11/24 $(150,000) $(157,752)U.S. Investment Grade Credit Index Fund Philip Morris International, Inc. 22/8/22 $(155,000) $(160,566)U.S. Investment Grade Credit Index Fund Bank of Nova Scotia 11/2/24 $(150,000) $(162,477)U.S. Investment Grade Credit Index Fund Royal Bank of Canada 5/10/23 $(155,000) $(167,642)U.S. Investment Grade Credit Index Fund Bank of Montreal 11/9/22 $(164,000) $(169,071)U.S. Investment Grade Credit Index Fund Bank of Nova Scotia 15/11/22 $(175,000) $(179,386)U.S. Investment Grade Credit Index Fund Comcast Corp. 15/3/33 $(125,000) $(183,905)U.S. Investment Grade Credit Index Fund Credit Suisse AG 9/4/25 $(183,000) $(196,590)U.S. Investment Grade Credit Index Fund Bank of Nova Scotia 16/12/25 $(175,000) $(198,721)U.S. Investment Grade Credit Index Fund Hyundai Capital America 8/1/24 $(200,000) $(200,182)U.S. Investment Grade Credit Index Fund International Business Machines Corp. 1/8/22 $(200,000) $(204,962)U.S. Investment Grade Credit Index Fund Coca-Cola Co. 1/6/27 $(203,000) $(205,392)U.S. Investment Grade Credit Index Fund Intel Corp. 15/12/22 $(200,000) $(207,165)U.S. Investment Grade Credit Index Fund BNP Paribas SA 1/3/23 $(200,000) $(211,919)U.S. Investment Grade Credit Index Fund Phillips 66 6/4/23 $(200,000) $(212,981)U.S. Investment Grade Credit Index Fund International Business Machines Corp. 1/8/23 $(200,000) $(215,008)U.S. Investment Grade Credit Index Fund Commonwealth Bank of Australia 6/9/26 $(200,000) $(216,310)U.S. Investment Grade Credit Index Fund International Business Machines Corp. 12/2/24 $(200,000) $(217,287)
U.S. Investment Grade Credit Index FundVolkswagen Group of America Finance LLC
13/11/23 $(200,000) $(217,295)U.S. Investment Grade Credit Index Fund BNP Paribas SA 16/11/27 $(200,000) $(220,315)U.S. Investment Grade Credit Index Fund Commonwealth Bank of Australia 19/9/27 $(200,000) $(221,151)U.S. Investment Grade Credit Index Fund Procter & Gamble Co. 25/3/30 $(200,000) $(222,298)
U.S. Investment Grade Credit Index FundVolkswagen Group of America Finance LLC
13/11/25 $(200,000) $(228,641)U.S. Investment Grade Credit Index Fund Commonwealth Bank of Australia 16/3/28 $(200,000) $(231,513)U.S. Investment Grade Credit Index Fund Bank of Nova Scotia 1/2/23 $(225,000) $(231,769)U.S. Investment Grade Credit Index Fund BNP Paribas SA 14/8/28 $(200,000) $(234,084)U.S. Investment Grade Credit Index Fund Colgate-Palmolive Co. 15/11/22 $(250,000) $(257,578)U.S. Investment Grade Credit Index Fund Wells Fargo & Co. 29/9/25 $(250,000) $(277,153)U.S. Investment Grade Credit Index Fund BNP Paribas SA 13/3/27 $(250,000) $(285,273)U.S. Investment Grade Credit Index Fund Wells Fargo & Co. 13/2/23 $(275,000) $(291,672)U.S. Investment Grade Credit Index Fund Bank of America Corp. 1/8/25 $(267,000) $(301,002)U.S. Investment Grade Credit Index Fund Commonwealth Bank of Australia 11/3/31 $(300,000) $(301,028)U.S. Investment Grade Credit Index Fund Credit Suisse AG 9/9/24 $(275,000) $(301,511)U.S. Investment Grade Credit Index Fund Procter & Gamble Co. 11/8/22 $(300,000) $(308,786)U.S. Investment Grade Credit Index Fund Suncor Energy, Inc. 15/5/23 $(300,000) $(312,682)U.S. Investment Grade Credit Index Fund Credit Suisse AG 2/2/24 $(314,000) $(313,533)U.S. Investment Grade Credit Index Fund Bank of Montreal 28/6/24 $(300,000) $(316,272)U.S. Investment Grade Credit Index Fund Walmart, Inc. 1/9/35 $(235,000) $(323,785)U.S. Investment Grade Credit Index Fund BNP Paribas SA 10/1/24 $(300,000) $(327,114)U.S. Investment Grade Credit Index Fund ConocoPhillips Co. 15/4/29 $(242,000) $(332,596)U.S. Investment Grade Credit Index Fund Bank of Nova Scotia 2/3/26 $(350,000) $(347,342)U.S. Investment Grade Credit Index Fund Bank of Montreal 1/5/25 $(350,000) $(362,832)

1108
Notes to the Financial Statements
Collateral pledged by the Funds as at 30 June 2021: (continued)
Fund Collateral NamePrincipal Pledged as at
30 June 2021Market Value Pledged
as at 30 June 2021U.S. Investment Grade Credit Index Fund Bank of America Corp. 3/3/26 $(320,000) $(367,343)U.S. Investment Grade Credit Index Fund Wells Fargo & Co. 23/10/26 $(350,000) $(379,379)U.S. Investment Grade Credit Index Fund Coca-Cola Co. 1/6/30 $(400,000) $(393,667)U.S. Investment Grade Credit Index Fund Royal Bank of Canada 17/1/23 $(400,000) $(413,373)U.S. Investment Grade Credit Index Fund International Business Machines Corp. 15/5/24 $(400,000) $(427,444)
U.S. Investment Grade Credit Index FundVolkswagen Group of America Finance LLC
13/5/25 $(400,000) $(433,172)U.S. Investment Grade Credit Index Fund BNP Paribas SA 9/1/25 $(400,000) $(436,022)U.S. Investment Grade Credit Index Fund International Business Machines Corp. 15/5/26 $(400,000) $(441,529)U.S. Investment Grade Credit Index Fund BNP Paribas SA 28/9/25 $(425,000) $(475,729)U.S. Investment Grade Credit Index Fund Chevron Corp. 11/5/23 $(500,000) $(508,293)U.S. Investment Grade Credit Index Fund Coca-Cola Co. 5/3/31 $(500,000) $(508,565)U.S. Investment Grade Credit Index Fund Verizon Communications, Inc. 15/8/26 $(475,000) $(508,678)U.S. Investment Grade Credit Index Fund Exxon Mobil Corp. 15/4/23 $(500,000) $(512,243)U.S. Investment Grade Credit Index Fund Apple, Inc. 6/5/24 $(475,000) $(516,328)U.S. Investment Grade Credit Index Fund Landwirtschaftliche Rentenbank 13/1/25 $(500,000) $(527,205)U.S. Investment Grade Credit Index Fund Wells Fargo & Co. 9/9/24 $(487,000) $(529,918)U.S. Investment Grade Credit Index Fund KeyCorp 29/10/25 $(472,000) $(535,510)U.S. Investment Grade Credit Index Fund General Electric Co. 15/3/32 $(400,000) $(562,508)U.S. Investment Grade Credit Index Fund Verizon Communications, Inc. 16/3/27 $(500,000) $(572,596)U.S. Investment Grade Credit Index Fund Wells Fargo & Co. 22/7/27 $(500,000) $(578,905)U.S. Investment Grade Credit Index Fund PepsiCo, Inc. 1/5/23 $(625,000) $(630,663)U.S. Investment Grade Credit Index Fund Bank of America Corp. 19/4/26 $(579,000) $(639,437)U.S. Investment Grade Credit Index Fund PacifiCorp 15/6/35 $(500,000) $(655,086)U.S. Investment Grade Credit Index Fund Royal Bank of Canada 17/4/23 $(675,000) $(691,564)U.S. Investment Grade Credit Index Fund Wells Fargo & Co. 22/4/26 $(650,000) $(700,798)U.S. Investment Grade Credit Index Fund Apple, Inc. 11/5/23 $(705,000) $(711,641)U.S. Investment Grade Credit Index Fund Verizon Communications, Inc. 15/2/25 $(700,000) $(767,362)U.S. Investment Grade Credit Index Fund Bank of Nova Scotia 1/5/23 $(775,000) $(793,073)U.S. Investment Grade Credit Index Fund Verizon Communications, Inc. 10/8/33 $(725,000) $(877,755)U.S. Investment Grade Credit Index Fund Bank of America Corp. 21/4/25 $(1,000,000) $(1,106,030)U.S. Investment Grade Credit Index Fund Verizon Communications, Inc. 21/9/28 $(1,400,000) $(1,642,875)U.S. Treasury Inflation-Protected Securities Index Fund US Treasury Inflation Indexed Bonds 15/7/26 $(86,000) $(104,121)U.S. Treasury Inflation-Protected Securities Index Fund US Treasury Inflation Indexed Bonds 15/4/23 $(100,000) $(112,866)U.S. Treasury Inflation-Protected Securities Index Fund US Treasury Inflation Indexed Bonds 15/4/23 $(109,000) $(123,024)U.S. Treasury Inflation-Protected Securities Index Fund US Treasury Inflation Indexed Bonds 15/10/25 $(622,000) $(691,121)U.S. Treasury Inflation-Protected Securities Index Fund US Treasury Inflation Indexed Bonds 15/7/23 $(589,000) $(713,913)U.S. Treasury Inflation-Protected Securities Index Fund US Treasury Inflation Indexed Bonds 15/1/26 $(931,000) $(1,155,528)U.S. Treasury Inflation-Protected Securities Index Fund US Treasury Inflation Indexed Bonds 15/1/30 $(3,126,100) $(3,536,693)U.S. Treasury Inflation-Protected Securities Index Fund US Treasury Inflation Indexed Bonds 15/7/28 $(6,315,000) $(7,672,018)U.S. Treasury Inflation-Protected Securities Index Fund US Treasury Inflation Indexed Bonds 15/1/30 $(15,251,500) $(17,254,688)
For the year ended 31 December 2020, the counterparties for securities collateral were Bank of America N.A., Barclays Bank plc, BNP Paribas, Citibank NA, Goldman Sachs International, JPMorgan Chase Bank, Merrill Lynch, Morgan Stanley, Standard Chartered Bank, State Street Bank, Toronto Dominion Bank and UBS.
Collateral held by the Funds as at 31 December 2020:
Fund Collateral NamePrincipal Held as at 31 December 2020
Market Value Held as at 31 December 2020
ESG Developed World All Cap Equity Index Fund US Treasury Bond 15/2/21 $330,000 $335,807European Stock Index Fund US Treasury Bond 31/10/21 $300,000 $304,193Global Small-Cap Index Fund US Treasury Note 15/11/29 $105,000 $113,704Global Stock Index Fund US Treasury Bond 15/8/47 $8,176,000 $10,340,696Global Stock Index Fund US Treasury Bond 15/11/49 $7,400,300 $8,720,488Global Stock Index Fund US Treasury Bond 15/8/49 $6,770,000 $7,809,186Global Stock Index Fund US Treasury Bond 15/8/46 $633,000 $728,285Global Stock Index Fund US Treasury Note 30/9/25 $573,000 $571,128Global Stock Index Fund US Treasury Bond 15/8/46 $384,000 $441,803Global Stock Index Fund US Treasury Note 15/11/25 $283,000 $309,916Global Stock Index Fund US Treasury Bond 15/7/21 $238,000 $244,047Global Stock Index Fund US Treasury Note 15/11/25 $189,000 $206,976Global Stock Index Fund US Treasury Note 15/8/25 $188,300 $204,257Global Stock Index Fund US Treasury Bond 15/9/21 $197,000 $202,218Global Stock Index Fund US Treasury Bond 31/1/21 $171,000 $172,144Global Stock Index Fund US Treasury Bond 15/5/21 $140,000 $141,746Global Stock Index Fund US Treasury Note 30/6/24 $126,000 $132,759Global Stock Index Fund US Treasury Note 30/9/22 $122,000 $122,039Global Stock Index Fund US Treasury Note 15/5/25 $95,000 $102,788

1109
Notes to the Financial Statements
Collateral held by the Funds as at 31 December 2020: (continued)
Fund Collateral NamePrincipal Held as at 31 December 2020
Market Value Held as at 31 December 2020
Global Stock Index Fund US Treasury Note 31/7/25 $90,000 $101,545Global Stock Index Fund US Treasury Bond 15/4/21 $40,000 $40,454Global Stock Index Fund US Treasury Note 31/1/25 $38,000 $39,929Global Stock Index Fund US Treasury Bond 15/6/21 $11,000 $11,137Global Stock Index Fund US Treasury Note 30/9/26 $9,000 $9,631Pacific ex-Japan Stock Index Fund US Treasury Bond 15/8/40 $339,000 €263,521Pacific ex-Japan Stock Index Fund US Treasury Note 15/2/30 $284,000 €246,918Pacific ex-Japan Stock Index Fund US Treasury Note 30/9/22 $275,000 €224,828Pacific ex-Japan Stock Index Fund US Treasury Note 30/4/25 $239,000 €217,965Pacific ex-Japan Stock Index Fund US Treasury Note 28/2/25 $255,000 €216,533U.S. 500 Stock Index Fund US Treasury Note 30/9/25 $27,364,000 $27,274,595U.S. 500 Stock Index Fund US Treasury Bond 15/8/47 $1,379,000 $1,744,107Emerging Markets Bond Fund US Treasury Bond 15/4/21 $312,000 $343,839Emerging Markets Bond Fund US Treasury Bond 1/4/21 $81,000 $80,984Emerging Markets Bond Fund US Treasury Bond 15/2/48 $7,600 $10,065Euro Government Bond Index Fund US Treasury Bond 15/8/47 $70,000 €72,358Euro Government Bond Index Fund US Treasury Note 31/8/22 $61,000 €49,876Euro Investment Grade Bond Index Fund US Treasury Bond 15/8/49 $67,000 €63,164Global Bond Index Fund US Treasury Note 15/4/23 $110,543,000 $110,878,577Global Bond Index Fund US Treasury Note 30/9/25 $39,309,000 $39,180,567Global Bond Index Fund US Treasury Bond 15/2/21 $33,500,000 $34,089,542Global Bond Index Fund US Treasury Bond 15/2/21 $25,850,000 $26,304,915Global Bond Index Fund US Treasury Inflation Indexed Bonds 15/4/22 $23,882,000 $26,096,498Global Bond Index Fund US Treasury Note 30/6/23 $13,195,500 $14,008,811Global Bond Index Fund US Treasury Bond 25/2/21 $7,203,000 $7,202,164Global Bond Index Fund US Treasury Note 31/10/23 $5,689,600 $5,942,799Global Bond Index Fund US Treasury Note 30/6/24 $4,821,000 $5,079,610Global Bond Index Fund US Treasury Note 31/3/22 $4,332,000 $4,438,685Global Bond Index Fund US Treasury Bond 15/11/48 $2,858,000 $4,028,013Global Bond Index Fund US Treasury Bond 11/3/21 $4,000,000 $3,999,376Global Bond Index Fund US Treasury Bond 31/12/21 $2,268,000 $2,313,139Global Bond Index Fund US Treasury Bond 15/8/26 $1,443,000 $1,983,489Global Bond Index Fund US Treasury Bond 31/3/21 $1,367,000 $1,374,997Global Bond Index Fund US Treasury Bond 4/3/21 $1,374,000 $1,373,831Global Bond Index Fund US Treasury Bond 15/5/45 $1,044,000 $1,358,983Global Bond Index Fund US Treasury Bond 25/2/21 $1,000,000 $999,884Global Bond Index Fund US Treasury Note 31/1/22 $961,000 $979,444Global Bond Index Fund US Treasury Note 30/9/25 $873,000 $870,148Global Bond Index Fund US Treasury Bond 15/8/47 $659,000 $833,478Global Bond Index Fund US Treasury Note 31/1/22 $789,000 $805,665Global Bond Index Fund US Treasury Note 28/2/23 $642,000 $664,131Global Bond Index Fund US Treasury Bond 31/1/21 $416,000 $418,784Global Bond Index Fund US Treasury Note 15/2/30 $392,000 $417,006Global Bond Index Fund US Treasury Note 31/8/22 $336,000 $336,143Global Bond Index Fund US Treasury Note 30/9/25 $328,000 $326,928Global Bond Index Fund US Treasury Note 30/4/23 $259,000 $275,881Global Bond Index Fund US Treasury Note 28/2/25 $243,900 $253,407Global Bond Index Fund US Treasury Bond 30/4/21 $210,000 $212,253Global Bond Index Fund US Treasury Note 31/8/22 $192,000 $198,773Global Bond Index Fund US Treasury Bond 15/8/21 $148,000 $151,942Global Bond Index Fund US Treasury Bond 15/12/21 $128,000 $131,197Global Bond Index Fund US Treasury Bond 30/9/21 $119,100 $120,354Global Bond Index Fund US Treasury Note 30/11/24 $109,000 $114,440Global Bond Index Fund US Treasury Bond 15/8/40 $100,000 $95,112Global Bond Index Fund US Treasury Note 15/5/22 $80,000 $82,396Global Bond Index Fund US Treasury Bond 15/9/21 $79,000 $81,092Global Bond Index Fund US Treasury Bond 15/8/49 $67,000 $77,284Global Bond Index Fund US Treasury Bond 30/4/21 $54,000 $54,579Global Bond Index Fund US Treasury Bond 30/4/21 $17,000 $17,106Global Bond Index Fund US Treasury Bond 15/5/40 $9,100 $8,653Global Corporate Bond Index Fund US Treasury Inflation Indexed Bonds 15/4/22 $36,654,000 $40,052,804Global Corporate Bond Index Fund US Treasury Bond 15/8/47 $850,000 $1,075,048Global Corporate Bond Index Fund US Treasury Note 31/10/22 $453,000 $469,982Global Corporate Bond Index Fund US Treasury Note 31/8/22 $248,000 $255,492Global Corporate Bond Index Fund Nestle Holdings, Inc. 15/1/24 $218,000 $218,348Global Corporate Bond Index Fund US Treasury Note 31/1/22 $79,000 $80,669Global Corporate Bond Index Fund US Treasury Note 15/2/30 $68,000 $72,338Global Corporate Bond Index Fund US Treasury Bond 15/9/21 $69,000 $70,827Global Corporate Bond Index Fund US Treasury Bond 15/11/43 $33,300 $48,088
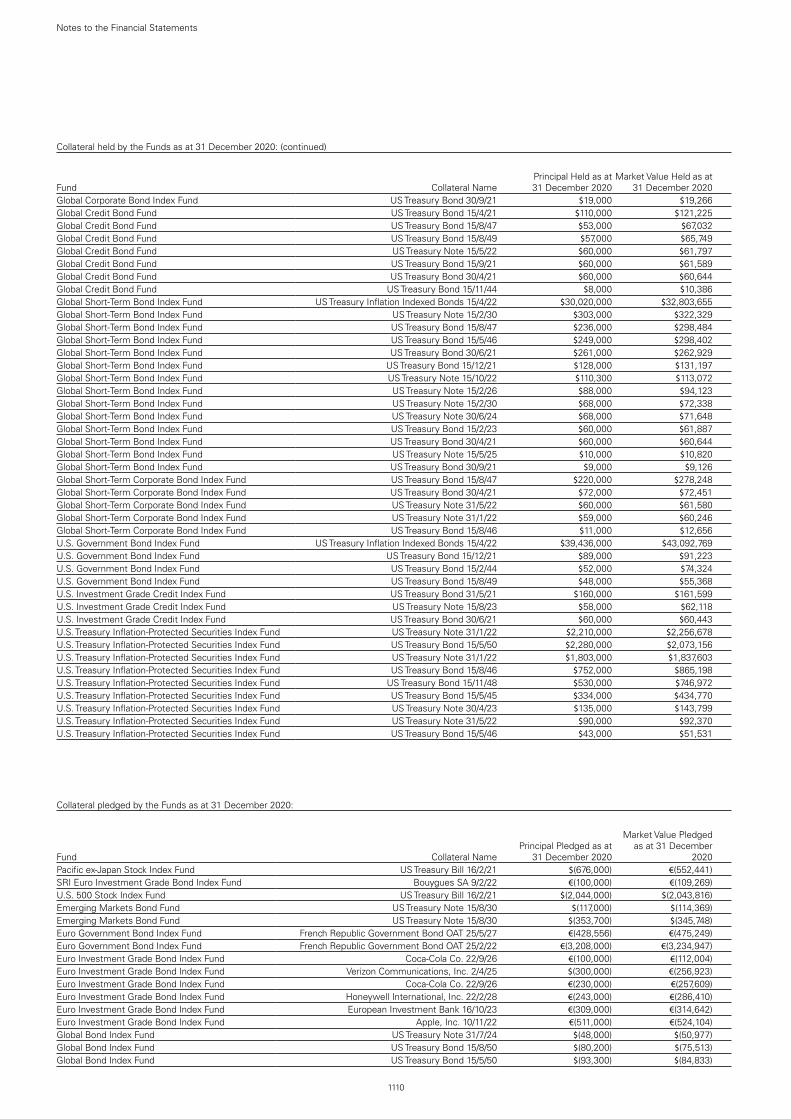
1110
Notes to the Financial Statements
Collateral held by the Funds as at 31 December 2020: (continued)
Fund Collateral NamePrincipal Held as at 31 December 2020
Market Value Held as at 31 December 2020
Global Corporate Bond Index Fund US Treasury Bond 30/9/21 $19,000 $19,266Global Credit Bond Fund US Treasury Bond 15/4/21 $110,000 $121,225Global Credit Bond Fund US Treasury Bond 15/8/47 $53,000 $67,032Global Credit Bond Fund US Treasury Bond 15/8/49 $57,000 $65,749Global Credit Bond Fund US Treasury Note 15/5/22 $60,000 $61,797Global Credit Bond Fund US Treasury Bond 15/9/21 $60,000 $61,589Global Credit Bond Fund US Treasury Bond 30/4/21 $60,000 $60,644Global Credit Bond Fund US Treasury Bond 15/11/44 $8,000 $10,386Global Short-Term Bond Index Fund US Treasury Inflation Indexed Bonds 15/4/22 $30,020,000 $32,803,655Global Short-Term Bond Index Fund US Treasury Note 15/2/30 $303,000 $322,329Global Short-Term Bond Index Fund US Treasury Bond 15/8/47 $236,000 $298,484Global Short-Term Bond Index Fund US Treasury Bond 15/5/46 $249,000 $298,402Global Short-Term Bond Index Fund US Treasury Bond 30/6/21 $261,000 $262,929Global Short-Term Bond Index Fund US Treasury Bond 15/12/21 $128,000 $131,197Global Short-Term Bond Index Fund US Treasury Note 15/10/22 $110,300 $113,072Global Short-Term Bond Index Fund US Treasury Note 15/2/26 $88,000 $94,123Global Short-Term Bond Index Fund US Treasury Note 15/2/30 $68,000 $72,338Global Short-Term Bond Index Fund US Treasury Note 30/6/24 $68,000 $71,648Global Short-Term Bond Index Fund US Treasury Bond 15/2/23 $60,000 $61,887Global Short-Term Bond Index Fund US Treasury Bond 30/4/21 $60,000 $60,644Global Short-Term Bond Index Fund US Treasury Note 15/5/25 $10,000 $10,820Global Short-Term Bond Index Fund US Treasury Bond 30/9/21 $9,000 $9,126Global Short-Term Corporate Bond Index Fund US Treasury Bond 15/8/47 $220,000 $278,248Global Short-Term Corporate Bond Index Fund US Treasury Bond 30/4/21 $72,000 $72,451Global Short-Term Corporate Bond Index Fund US Treasury Note 31/5/22 $60,000 $61,580Global Short-Term Corporate Bond Index Fund US Treasury Note 31/1/22 $59,000 $60,246Global Short-Term Corporate Bond Index Fund US Treasury Bond 15/8/46 $11,000 $12,656U.S. Government Bond Index Fund US Treasury Inflation Indexed Bonds 15/4/22 $39,436,000 $43,092,769U.S. Government Bond Index Fund US Treasury Bond 15/12/21 $89,000 $91,223U.S. Government Bond Index Fund US Treasury Bond 15/2/44 $52,000 $74,324U.S. Government Bond Index Fund US Treasury Bond 15/8/49 $48,000 $55,368U.S. Investment Grade Credit Index Fund US Treasury Bond 31/5/21 $160,000 $161,599U.S. Investment Grade Credit Index Fund US Treasury Note 15/8/23 $58,000 $62,118U.S. Investment Grade Credit Index Fund US Treasury Bond 30/6/21 $60,000 $60,443U.S. Treasury Inflation-Protected Securities Index Fund US Treasury Note 31/1/22 $2,210,000 $2,256,678U.S. Treasury Inflation-Protected Securities Index Fund US Treasury Bond 15/5/50 $2,280,000 $2,073,156U.S. Treasury Inflation-Protected Securities Index Fund US Treasury Note 31/1/22 $1,803,000 $1,837,603U.S. Treasury Inflation-Protected Securities Index Fund US Treasury Bond 15/8/46 $752,000 $865,198U.S. Treasury Inflation-Protected Securities Index Fund US Treasury Bond 15/11/48 $530,000 $746,972U.S. Treasury Inflation-Protected Securities Index Fund US Treasury Bond 15/5/45 $334,000 $434,770U.S. Treasury Inflation-Protected Securities Index Fund US Treasury Note 30/4/23 $135,000 $143,799U.S. Treasury Inflation-Protected Securities Index Fund US Treasury Note 31/5/22 $90,000 $92,370U.S. Treasury Inflation-Protected Securities Index Fund US Treasury Bond 15/5/46 $43,000 $51,531
Collateral pledged by the Funds as at 31 December 2020:
Fund Collateral NamePrincipal Pledged as at
31 December 2020
Market Value Pledged as at 31 December
2020Pacific ex-Japan Stock Index Fund US Treasury Bill 16/2/21 $(676,000) €(552,441)SRI Euro Investment Grade Bond Index Fund Bouygues SA 9/2/22 €(100,000) €(109,269)U.S. 500 Stock Index Fund US Treasury Bill 16/2/21 $(2,044,000) $(2,043,816)Emerging Markets Bond Fund US Treasury Note 15/8/30 $(117,000) $(114,369)Emerging Markets Bond Fund US Treasury Note 15/8/30 $(353,700) $(345,748)Euro Government Bond Index Fund French Republic Government Bond OAT 25/5/27 €(428,556) €(475,249)Euro Government Bond Index Fund French Republic Government Bond OAT 25/2/22 €(3,208,000) €(3,234,947)Euro Investment Grade Bond Index Fund Coca-Cola Co. 22/9/26 €(100,000) €(112,004)Euro Investment Grade Bond Index Fund Verizon Communications, Inc. 2/4/25 $(300,000) €(256,923)Euro Investment Grade Bond Index Fund Coca-Cola Co. 22/9/26 €(230,000) €(257,609)Euro Investment Grade Bond Index Fund Honeywell International, Inc. 22/2/28 €(243,000) €(286,410)Euro Investment Grade Bond Index Fund European Investment Bank 16/10/23 €(309,000) €(314,642)Euro Investment Grade Bond Index Fund Apple, Inc. 10/11/22 €(511,000) €(524,104)Global Bond Index Fund US Treasury Note 31/7/24 $(48,000) $(50,977)Global Bond Index Fund US Treasury Bond 15/8/50 $(80,200) $(75,513)Global Bond Index Fund US Treasury Bond 15/5/50 $(93,300) $(84,833)

1111
Notes to the Financial Statements
Collateral pledged by the Funds as at 31 December 2020: (continued)
Fund Collateral NamePrincipal Pledged as at
31 December 2020
Market Value Pledged as at 31 December
2020Global Bond Index Fund US Treasury Note 15/10/23 $(103,000) $(102,947)Global Bond Index Fund US Treasury Note 31/10/25 $(121,300) $(120,820)Global Bond Index Fund US Treasury Note 30/9/22 $(143,000) $(143,046)Global Bond Index Fund US Treasury Note 31/8/22 $(156,000) $(161,503)Global Bond Index Fund US Treasury Note 30/9/22 $(234,600) $(234,675)Global Bond Index Fund US Treasury Note 15/8/23 $(419,000) $(448,751)Global Bond Index Fund US Treasury Note 15/10/22 $(527,000) $(540,246)Global Bond Index Fund US Treasury Note 30/9/22 $(550,800) $(550,976)Global Bond Index Fund US Treasury Note 30/9/22 $(643,000) $(643,205)Global Bond Index Fund US Treasury Bond 15/8/25 $(655,000) $(867,793)Global Bond Index Fund US Treasury Bond 15/11/22 $(1,100,000) $(1,264,031)Global Bond Index Fund US Treasury Note 15/2/22 $(1,267,000) $(1,312,620)Global Bond Index Fund US Treasury Note 31/10/23 $(1,399,200) $(1,513,217)Global Bond Index Fund US Treasury Note 31/7/25 $(1,368,100) $(1,543,602)Global Bond Index Fund US Treasury Note 28/2/25 $(1,736,700) $(1,804,394)Global Bond Index Fund US Treasury Note 30/9/26 $(2,130,000) $(2,279,291)Global Bond Index Fund US Treasury Note 15/9/23 $(2,328,900) $(2,327,950)Global Bond Index Fund US Treasury Note 15/5/23 $(2,398,300) $(2,397,941)Global Bond Index Fund US Treasury Note 15/11/30 $(2,448,200) $(2,442,567)Global Bond Index Fund US Treasury Note 15/2/30 $(2,436,000) $(2,591,394)Global Bond Index Fund US Treasury Note 30/9/22 $(3,349,000) $(3,350,070)Global Bond Index Fund US Treasury Note 15/8/28 $(3,060,700) $(3,588,433)Global Bond Index Fund US Treasury Bond 15/11/45 $(3,268,900) $(4,267,412)Global Bond Index Fund US Treasury Note 15/5/23 $(4,312,000) $(4,311,354)Global Bond Index Fund US Treasury Note 15/8/29 $(4,104,700) $(4,415,943)Global Bond Index Fund US Treasury Note 31/5/22 $(4,684,000) $(4,685,245)Global Bond Index Fund US Treasury Bond 15/2/36 $(3,307,000) $(4,908,201)Global Bond Index Fund US Treasury Note 30/6/25 $(5,255,000) $(5,241,079)Global Bond Index Fund US Treasury Note 31/3/25 $(5,196,000) $(5,249,729)Global Bond Index Fund US Treasury Note 15/8/28 $(4,542,000) $(5,325,142)Global Bond Index Fund US Treasury Note 15/5/23 $(5,603,000) $(5,602,161)Global Bond Index Fund US Treasury Note 15/5/22 $(7,021,000) $(7,231,258)Global Bond Index Fund US Treasury Bond 15/11/42 $(6,438,000) $(7,995,040)Global Bond Index Fund US Treasury Bond 15/2/49 $(6,652,700) $(8,852,791)Global Bond Index Fund US Treasury Note 15/5/30 $(9,192,000) $(8,995,516)Global Bond Index Fund US Treasury Bond 15/8/49 $(7,960,500) $(9,182,426)Global Bond Index Fund US Treasury Bond 15/11/40 $(10,251,300) $(10,159,082)Global Bond Index Fund US Treasury Note 31/10/27 $(11,476,000) $(11,392,585)Global Bond Index Fund US Treasury Note 30/11/27 $(11,429,000) $(11,433,497)Global Bond Index Fund US Treasury Note 30/11/25 $(13,391,000) $(13,414,242)Global Bond Index Fund US Treasury Note 15/10/22 $(16,474,300) $(16,888,372)Global Bond Index Fund US Treasury Note 28/2/25 $(16,375,000) $(17,013,273)Global Bond Index Fund US Treasury Note 30/11/22 $(32,322,000) $(32,325,552)Global Bond Index Fund US Treasury Note 30/9/22 $(34,754,200) $(34,765,299)Global Corporate Bond Index Fund Truist Financial Corp. 1/8/24 $(25,000) $(26,876)Global Corporate Bond Index Fund AstraZeneca plc 16/11/25 $(40,000) $(45,135)Global Corporate Bond Index Fund Verizon Communications, Inc. 15/8/26 $(51,000) $(56,345)Global Corporate Bond Index Fund Verizon Communications, Inc. 15/2/25 $(51,000) $(57,264)Global Corporate Bond Index Fund Coca-Cola Co. 1/4/23 $(92,000) $(97,278)Global Corporate Bond Index Fund Bristol-Myers Squibb Co. 1/11/23 $(90,000) $(97,914)Global Corporate Bond Index Fund ConocoPhillips 15/10/32 $(91,000) $(124,836)Global Corporate Bond Index Fund Apple, Inc. 11/9/22 $(122,000) $(125,654)Global Corporate Bond Index Fund Eli Lilly & Co. 15/5/22 €(100,000) $(126,239)Global Corporate Bond Index Fund Honeywell International, Inc. 1/12/23 $(117,000) $(127,751)Global Corporate Bond Index Fund Toyota Motor Corp. 10/1/22 €(108,000) $(133,163)Global Corporate Bond Index Fund Wells Fargo & Co. 22/7/22 $(140,000) $(146,525)Global Corporate Bond Index Fund Schlumberger Holdings Corp. 21/12/25 $(134,000) $(152,480)Global Corporate Bond Index Fund Bristol-Myers Squibb Co. 16/5/22 $(150,000) $(154,797)Global Corporate Bond Index Fund Adobe, Inc. 1/2/23 $(150,000) $(155,362)Global Corporate Bond Index Fund US Treasury Note 30/11/25 $(186,000) $(186,323)Global Corporate Bond Index Fund Gilead Sciences, Inc. 1/4/24 $(172,000) $(189,477)Global Corporate Bond Index Fund Deere & Co. 16/10/29 $(150,000) $(200,783)Global Corporate Bond Index Fund TWDC Enterprises 18 Corp. 4/3/22 $(195,000) $(201,322)Global Corporate Bond Index Fund Cargill, Inc. 1/3/23 $(195,000) $(209,030)Global Corporate Bond Index Fund Coca-Cola Co. 6/9/24 $(200,000) $(210,379)Global Corporate Bond Index Fund Coca-Cola Co. 1/11/23 $(200,000) $(217,583)Global Corporate Bond Index Fund Toyota Motor Corp. 2/7/22 $(215,000) $(223,229)Global Corporate Bond Index Fund Coca-Cola Co. 1/6/30 $(220,000) $(225,797)

1112
Notes to the Financial Statements
Collateral pledged by the Funds as at 31 December 2020: (continued)
Fund Collateral NamePrincipal Pledged as at
31 December 2020
Market Value Pledged as at 31 December
2020Global Corporate Bond Index Fund Deere & Co. 3/3/31 $(180,000) $(268,491)Global Corporate Bond Index Fund Bristol-Myers Squibb Co. 27/2/27 $(250,000) $(286,021)Global Corporate Bond Index Fund Starbucks Corp. 7/5/22 $(294,000) $(298,167)Global Corporate Bond Index Fund Cisco Systems, Inc. 4/3/24 $(272,000) $(301,736)Global Corporate Bond Index Fund Coca-Cola Co. 15/3/33 €(250,000) $(308,628)Global Corporate Bond Index Fund Reckitt Benckiser Treasury Services plc 26/6/24 $(295,000) $(314,166)Global Corporate Bond Index Fund Volkswagen Group of America Finance LLC 13/5/22 $(315,000) $(326,141)Global Corporate Bond Index Fund Coca-Cola Co. 1/6/27 $(325,000) $(334,673)Global Corporate Bond Index Fund Biogen, Inc. 15/9/22 $(325,000) $(346,346)Global Corporate Bond Index Fund DVB Bank SE 25/4/22 €(290,000) $(361,017)Global Corporate Bond Index Fund Cisco Systems, Inc. 28/2/23 $(350,000) $(370,517)Global Corporate Bond Index Fund Exxon Mobil Corp. 15/4/23 $(365,000) $(373,068)Global Corporate Bond Index Fund Unilever Capital Corp. 28/7/26 $(350,000) $(376,570)Global Corporate Bond Index Fund Colgate-Palmolive Co. 15/11/22 $(380,000) $(395,221)Global Corporate Bond Index Fund KeyBank NA 1/6/25 $(366,000) $(407,800)Global Corporate Bond Index Fund Brookfield Finance, Inc. 20/9/47 $(330,000) $(422,307)Global Corporate Bond Index Fund Target Corp. 1/7/24 $(407,000) $(457,665)Global Corporate Bond Index Fund General Electric Co. 15/3/32 $(335,000) $(477,289)Global Corporate Bond Index Fund Unilever Capital Corp. 14/9/23 $(500,000) $(503,119)Global Corporate Bond Index Fund Apple, Inc. 13/5/25 $(450,000) $(503,937)Global Corporate Bond Index Fund Procter & Gamble Co. 6/2/22 $(500,000) $(515,620)Global Corporate Bond Index Fund Intel Corp. 15/12/22 $(500,000) $(524,179)Global Corporate Bond Index Fund Orange SA 1/3/31 $(325,000) $(541,614)Global Corporate Bond Index Fund Hyundai Capital America 6/4/23 $(500,000) $(560,850)Global Corporate Bond Index Fund Daimler AG 8/2/24 €(490,000) $(598,526)Global Corporate Bond Index Fund Oracle Corp. 15/10/22 $(575,000) $(600,697)Global Corporate Bond Index Fund Apple, Inc. 4/5/43 $(476,000) $(607,357)Global Corporate Bond Index Fund International Business Machines Corp. 12/2/24 $(550,000) $(607,790)Global Corporate Bond Index Fund Verizon Communications, Inc. 15/8/26 $(559,000) $(617,585)Global Corporate Bond Index Fund Daimler AG 8/2/30 €(490,000) $(620,716)Global Corporate Bond Index Fund AbbVie, Inc. 6/11/22 $(605,000) $(635,272)Global Corporate Bond Index Fund NextEra Energy Capital Holdings, Inc. 1/9/22 $(617,000) $(636,908)Global Corporate Bond Index Fund Daimler AG 7/4/25 €(490,000) $(675,187)Global Corporate Bond Index Fund Apple, Inc. 9/2/25 $(627,000) $(683,527)Global Corporate Bond Index Fund Cooperatieve Rabobank UA 9/11/22 $(1,000,000) $(1,067,584)Global Corporate Bond Index Fund Credit Suisse Group AG 14/4/22 €(900,000) $(1,131,040)Global Corporate Bond Index Fund Cooperatieve Rabobank UA 21/7/26 $(1,000,000) $(1,145,114)Global Corporate Bond Index Fund Verizon Communications, Inc. 21/9/28 $(953,000) $(1,156,304)Global Credit Bond Fund US Treasury Note 15/10/23 $(20,600) $(20,589)Global Credit Bond Fund Boeing Co. 1/5/22 $(30,000) $(30,870)Global Credit Bond Fund Sky Group Finance Ltd. 15/10/35 $(46,000) $(69,380)Global Credit Bond Fund US Treasury Note 15/10/23 $(73,400) $(73,362)Global Credit Bond Fund BP Capital Markets plc 17/3/25 $(67,000) $(75,389)Global Credit Bond Fund International Business Machines Corp. 15/5/26 $(90,000) $(101,968)Global Credit Bond Fund DTE Energy Co. 15/6/22 $(181,000) $(186,760)Global Credit Bond Fund Nissan Motor Co., Ltd. 15/9/23 $(208,000) $(219,371)Global Credit Bond Fund AP Moller-Maersk A/S 4/4/25 £(180,000) $(282,414)Global Credit Bond Fund Nissan Motor Co., Ltd. 15/9/23 $(272,000) $(286,870)Global Credit Bond Fund US Treasury Note 30/6/22 $(310,000) $(310,025)Global Credit Bond Fund US Treasury Note 30/6/22 $(329,700) $(329,726)Global Credit Bond Fund US Treasury Note 30/6/22 $(399,300) $(399,331)Global Credit Bond Fund US Treasury Note 15/10/23 $(940,000) $(939,518)Global Short-Term Bond Index Fund US Treasury Note 31/8/22 $(17,700) $(18,234)Global Short-Term Bond Index Fund US Treasury Note 31/3/25 $(42,300) $(42,737)Global Short-Term Bond Index Fund US Treasury Note 30/6/25 $(63,600) $(63,431)Global Short-Term Bond Index Fund US Treasury Note 15/11/23 $(112,000) $(112,351)Global Short-Term Bond Index Fund US Treasury Note 30/9/22 $(205,000) $(212,196)Global Short-Term Bond Index Fund US Treasury Note 15/10/22 $(418,100) $(428,609)Global Short-Term Bond Index Fund US Treasury Note 31/3/22 $(634,000) $(636,589)Global Short-Term Bond Index Fund US Treasury Note 30/11/25 $(957,500) $(959,162)Global Short-Term Bond Index Fund US Treasury Note 30/11/25 $(960,000) $(961,666)Global Short-Term Bond Index Fund US Treasury Note 15/11/22 $(990,000) $(1,019,624)Global Short-Term Bond Index Fund US Treasury Note 15/12/23 $(1,062,400) $(1,061,134)Global Short-Term Bond Index Fund US Treasury Note 15/8/24 $(1,023,000) $(1,111,460)Global Short-Term Bond Index Fund US Treasury Note 31/7/25 $(1,163,700) $(1,161,462)Global Short-Term Bond Index Fund US Treasury Note 31/8/22 $(1,218,000) $(1,254,795)Global Short-Term Bond Index Fund US Treasury Note 31/3/25 $(1,452,200) $(1,467,216)Global Short-Term Bond Index Fund US Treasury Note 31/12/23 $(1,377,400) $(1,478,437)

1113
Notes to the Financial Statements
Collateral pledged by the Funds as at 31 December 2020: (continued)
Fund Collateral NamePrincipal Pledged as at
31 December 2020
Market Value Pledged as at 31 December
2020Global Short-Term Bond Index Fund US Treasury Note 30/11/25 $(1,482,600) $(1,485,173)Global Short-Term Bond Index Fund US Treasury Note 31/3/22 $(1,796,000) $(1,803,333)Global Short-Term Bond Index Fund US Treasury Note 15/11/23 $(2,259,000) $(2,266,088)Global Short-Term Bond Index Fund US Treasury Note 31/10/22 $(2,351,000) $(2,439,135)Global Short-Term Bond Index Fund US Treasury Note 31/3/25 $(4,584,000) $(4,631,401)Global Short-Term Corporate Bond Index Fund International Business Machines Corp. 1/8/23 $(52,000) $(56,826)Global Short-Term Corporate Bond Index Fund Phillips 66 1/4/22 $(60,000) $(63,486)Global Short-Term Corporate Bond Index Fund Oracle Corp. 15/9/23 $(85,000) $(89,907)Global Short-Term Corporate Bond Index Fund McDonald's Corp. 29/1/24 $(100,000) $(102,806)Global Short-Term Corporate Bond Index Fund NextEra Energy Capital Holdings, Inc. 1/4/22 $(110,000) $(114,167)Global Short-Term Corporate Bond Index Fund Apple, Inc. 3/5/23 $(109,000) $(114,715)Global Short-Term Corporate Bond Index Fund Target Corp. 1/7/24 $(125,000) $(140,560)Global Short-Term Corporate Bond Index Fund Apple, Inc. 6/5/24 $(136,000) $(150,424)Global Short-Term Corporate Bond Index Fund NextEra Energy Capital Holdings, Inc. 1/9/22 $(150,000) $(154,840)Global Short-Term Corporate Bond Index Fund US Treasury Note 30/11/25 $(155,000) $(155,269)Global Short-Term Corporate Bond Index Fund 3M Co. 15/5/23 $(150,000) $(155,385)Global Short-Term Corporate Bond Index Fund Target Corp. 15/1/22 $(150,000) $(156,143)Global Short-Term Corporate Bond Index Fund Total Capital Canada Ltd. 18/3/22 €(131,000) $(164,566)Global Short-Term Corporate Bond Index Fund John Deere Capital Corp. 12/6/24 €(150,000) $(201,499)Global Short-Term Corporate Bond Index Fund Oracle Corp. 15/10/22 $(200,000) $(208,938)Global Short-Term Corporate Bond Index Fund Oracle Corp. 15/9/23 $(202,000) $(213,662)Global Short-Term Corporate Bond Index Fund Unilever Capital Corp. 12/8/23 €(175,000) $(218,786)Global Short-Term Corporate Bond Index Fund Societe General 27/5/22 €(200,000) $(245,691)Global Short-Term Corporate Bond Index Fund PepsiCo, Inc. 1/3/23 $(235,000) $(249,914)Global Short-Term Corporate Bond Index Fund QUALCOMM, Inc. 20/5/22 $(280,000) $(291,058)Global Short-Term Corporate Bond Index Fund International Business Machines Corp. 13/5/22 $(282,000) $(293,086)Global Short-Term Corporate Bond Index Fund PepsiCo, Inc. 5/3/22 $(289,000) $(300,052)Global Short-Term Corporate Bond Index Fund Bank of Nova Scotia 1/5/23 $(304,000) $(313,225)Global Short-Term Corporate Bond Index Fund Comcast Corp. 1/3/24 $(300,000) $(332,805)Global Short-Term Corporate Bond Index Fund Apple, Inc. 3/5/23 $(321,000) $(337,830)Global Short-Term Corporate Bond Index Fund Cisco Systems, Inc. 15/6/22 $(325,000) $(338,244)Global Short-Term Corporate Bond Index Fund Pfizer, Inc. 15/12/21 €(300,000) $(373,953)Global Short-Term Corporate Bond Index Fund Procter & Gamble Co. 2/11/23 €(300,000) $(382,199)Global Short-Term Corporate Bond Index Fund Apple, Inc. 3/5/23 $(380,000) $(399,923)Global Short-Term Corporate Bond Index Fund McDonald's Corp. 15/1/22 $(390,000) $(404,047)Global Short-Term Corporate Bond Index Fund Phillips 66 6/4/23 $(375,000) $(404,881)Global Short-Term Corporate Bond Index Fund Apple, Inc. 12/9/22 $(400,000) $(414,400)Global Short-Term Corporate Bond Index Fund Procter & Gamble Co. 16/8/22 $(400,000) $(417,913)Global Short-Term Corporate Bond Index Fund Intel Corp. 11/5/24 $(427,000) $(461,375)Global Short-Term Corporate Bond Index Fund Unilever Capital Corp. 3/2/22 €(390,000) $(481,484)Global Short-Term Corporate Bond Index Fund AstraZeneca plc 16/11/25 €(400,000) $(552,252)Global Short-Term Corporate Bond Index Fund Apple, Inc. 17/1/24 €(464,000) $(603,868)Global Short-Term Corporate Bond Index Fund HSBC Holdings plc 13/3/23 $(606,000) $(631,347)Global Short-Term Corporate Bond Index Fund Oracle Corp. 15/10/22 $(672,000) $(702,032)Global Short-Term Corporate Bond Index Fund Intel Corp. 15/12/22 $(710,000) $(744,333)Global Short-Term Corporate Bond Index Fund Biogen, Inc. 15/9/22 $(700,000) $(745,976)Global Short-Term Corporate Bond Index Fund Volkswagen Group of America Finance LLC 13/5/22 $(800,000) $(828,295)Global Short-Term Corporate Bond Index Fund McDonald's Corp. 15/11/25 €(800,000) $(1,012,715)Global Short-Term Corporate Bond Index Fund Apple, Inc. 11/9/22 $(1,000,000) $(1,029,954)Global Short-Term Corporate Bond Index Fund Verizon Communications, Inc. 15/9/23 $(1,500,000) $(1,711,153)U.K. Investment Grade Bond Index Fund Export Development Canada 8/12/23 £(50,000) £(51,839)U.K. Investment Grade Bond Index Fund Caisse des Depots et Consignations 21/7/23 £(700,000) £(707,142)U.K. Investment Grade Bond Index Fund Bpifrance Financement SA 22/7/22 £(800,000) £(809,471)U.K. Short-Term Investment Grade Bond Index Fund European Investment Bank 15/12/23 £(620,000) £(635,006)U.S. Government Bond Index Fund US Treasury Note 31/8/24 $(79,200) $(82,482)U.S. Government Bond Index Fund US Treasury Bond 15/8/29 $(78,300) $(115,175)U.S. Investment Grade Credit Index Fund US Treasury Note 30/11/25 $(288,000) $(288,500)U.S. Investment Grade Credit Index Fund Wells Fargo & Co. 30/10/25 $(350,000) $(370,986)
12. Related Party Transactions.
Manager. Vanguard Group (Ireland) Limited is the Funds’ Manager and acts as a principal in respect of all transactions of shares in the Funds. For its services, the Manager receives a fixed single fee per share class (the “Management Fees”) calculated on a daily basis and expressed as a percentage by dividing the total net assets of each share class by the number of shares in issue and paid monthly. Out of the fees received, the Manager pays for any sub-advisers, as well as the costs of administration including audit, depositary, legal, registration and regulatory fees associated with the Funds. As a result, the Manager anticipates that the ongoing charges figure (“OCF”) of each share class will closely track the Management Fees. In the event that the costs and expenses of the Company or any Fund exceed the OCF, the Manager will be responsible
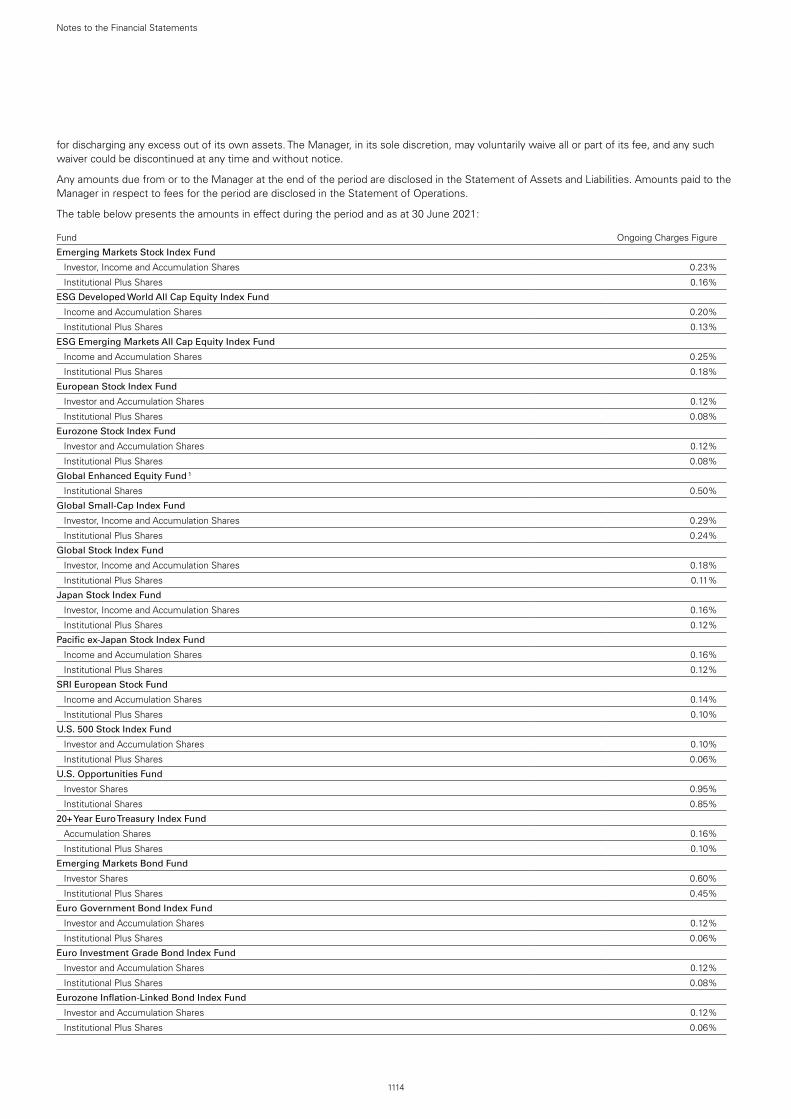
1114
Notes to the Financial Statements
for discharging any excess out of its own assets. The Manager, in its sole discretion, may voluntarily waive all or part of its fee, and any such waiver could be discontinued at any time and without notice.
Any amounts due from or to the Manager at the end of the period are disclosed in the Statement of Assets and Liabilities. Amounts paid to the Manager in respect to fees for the period are disclosed in the Statement of Operations.
The table below presents the amounts in effect during the period and as at 30 June 2021:
Fund Ongoing Charges Figure
Emerging Markets Stock Index Fund
Investor, Income and Accumulation Shares 0.23%
Institutional Plus Shares 0.16%
ESG Developed World All Cap Equity Index Fund
Income and Accumulation Shares 0.20%
Institutional Plus Shares 0.13%
ESG Emerging Markets All Cap Equity Index Fund
Income and Accumulation Shares 0.25%
Institutional Plus Shares 0.18%
European Stock Index Fund
Investor and Accumulation Shares 0.12%
Institutional Plus Shares 0.08%
Eurozone Stock Index Fund
Investor and Accumulation Shares 0.12%
Institutional Plus Shares 0.08%
Global Enhanced Equity Fund 1
Institutional Shares 0.50%
Global Small-Cap Index Fund
Investor, Income and Accumulation Shares 0.29%
Institutional Plus Shares 0.24%
Global Stock Index Fund
Investor, Income and Accumulation Shares 0.18%
Institutional Plus Shares 0.11%
Japan Stock Index Fund
Investor, Income and Accumulation Shares 0.16%
Institutional Plus Shares 0.12%
Pacific ex-Japan Stock Index Fund
Income and Accumulation Shares 0.16%
Institutional Plus Shares 0.12%
SRI European Stock Fund
Income and Accumulation Shares 0.14%
Institutional Plus Shares 0.10%
U.S. 500 Stock Index Fund
Investor and Accumulation Shares 0.10%
Institutional Plus Shares 0.06%
U.S. Opportunities Fund
Investor Shares 0.95%
Institutional Shares 0.85%
20+ Year Euro Treasury Index Fund
Accumulation Shares 0.16%
Institutional Plus Shares 0.10%
Emerging Markets Bond Fund
Investor Shares 0.60%
Institutional Plus Shares 0.45%
Euro Government Bond Index Fund
Investor and Accumulation Shares 0.12%
Institutional Plus Shares 0.06%
Euro Investment Grade Bond Index Fund
Investor and Accumulation Shares 0.12%
Institutional Plus Shares 0.08%
Eurozone Inflation-Linked Bond Index Fund
Investor and Accumulation Shares 0.12%
Institutional Plus Shares 0.06%
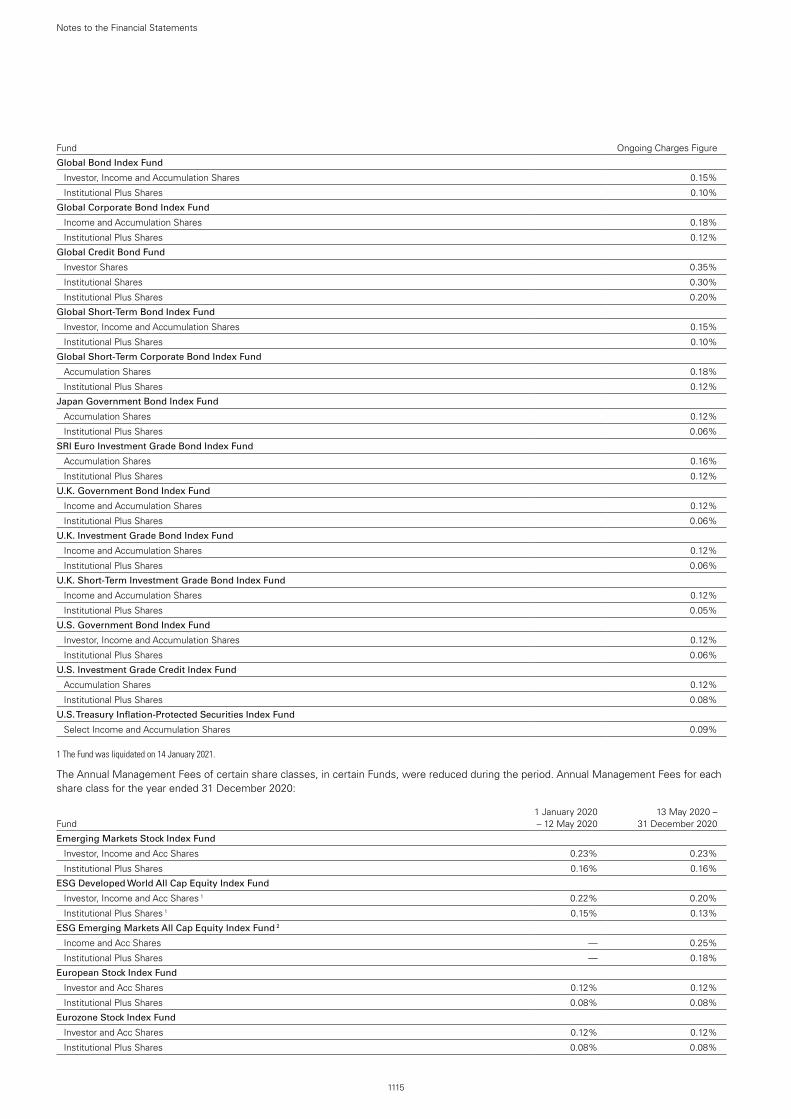
1115
Notes to the Financial Statements
Fund Ongoing Charges Figure
Global Bond Index Fund
Investor, Income and Accumulation Shares 0.15%
Institutional Plus Shares 0.10%
Global Corporate Bond Index Fund
Income and Accumulation Shares 0.18%
Institutional Plus Shares 0.12%
Global Credit Bond Fund
Investor Shares 0.35%
Institutional Shares 0.30%
Institutional Plus Shares 0.20%
Global Short-Term Bond Index Fund
Investor, Income and Accumulation Shares 0.15%
Institutional Plus Shares 0.10%
Global Short-Term Corporate Bond Index Fund
Accumulation Shares 0.18%
Institutional Plus Shares 0.12%
Japan Government Bond Index Fund
Accumulation Shares 0.12%
Institutional Plus Shares 0.06%
SRI Euro Investment Grade Bond Index Fund
Accumulation Shares 0.16%
Institutional Plus Shares 0.12%
U.K. Government Bond Index Fund
Income and Accumulation Shares 0.12%
Institutional Plus Shares 0.06%
U.K. Investment Grade Bond Index Fund
Income and Accumulation Shares 0.12%
Institutional Plus Shares 0.06%
U.K. Short-Term Investment Grade Bond Index Fund
Income and Accumulation Shares 0.12%
Institutional Plus Shares 0.05%
U.S. Government Bond Index Fund
Investor, Income and Accumulation Shares 0.12%
Institutional Plus Shares 0.06%
U.S. Investment Grade Credit Index Fund
Accumulation Shares 0.12%
Institutional Plus Shares 0.08%
U.S. Treasury Inflation-Protected Securities Index Fund
Select Income and Accumulation Shares 0.09%
1 The Fund was liquidated on 14 January 2021.
The Annual Management Fees of certain share classes, in certain Funds, were reduced during the period. Annual Management Fees for each share class for the year ended 31 December 2020:
Fund
1 January 2020 – 12 May 2020
13 May 2020 – 31 December 2020
Emerging Markets Stock Index Fund
Investor, Income and Acc Shares 0.23% 0.23%
Institutional Plus Shares 0.16% 0.16%
ESG Developed World All Cap Equity Index Fund
Investor, Income and Acc Shares 1 0.22% 0.20%
Institutional Plus Shares 1 0.15% 0.13%
ESG Emerging Markets All Cap Equity Index Fund 2
Income and Acc Shares — 0.25%
Institutional Plus Shares — 0.18%
European Stock Index Fund
Investor and Acc Shares 0.12% 0.12%
Institutional Plus Shares 0.08% 0.08%
Eurozone Stock Index Fund
Investor and Acc Shares 0.12% 0.12%
Institutional Plus Shares 0.08% 0.08%

1116
Notes to the Financial Statements
Fund
1 January 2020 – 12 May 2020
13 May 2020 – 31 December 2020
Global Enhanced Equity Fund
Institutional Shares 0.50% 0.50%
Global Small-Cap Index Fund
Investor, Income and Acc Shares 0.29% 0.29%
Institutional Plus Shares 0.24% 0.24%
Global Stock Index Fund
Investor, Income and Acc Shares 0.18% 0.18%
Institutional Plus Shares 0.11% 0.11%
Japan Stock Index Fund
Investor, Income and Acc Shares 0.16% 0.16%
Institutional Plus Shares 0.12% 0.12%
Pacific ex-Japan Stock Index Fund
Investor, Income and Acc Shares 0.16% 0.16%
Institutional Plus Shares 0.12% 0.12%
SRI European Stock Fund
Investor, Income and Acc Shares 1 0.16% 0.14%
Institutional Plus Shares 1 0.12% 0.10%
U.S. 500 Stock Index Fund
Investor and Acc Shares 0.10% 0.10%
Institutional Plus Shares 0.06% 0.06%
U.S. Fundamental Value Fund 3
Investor Shares 0.95% 0.95%
U.S. Opportunities Fund
Investor Shares 0.95% 0.95%
Institutional Shares 0.85% 0.85%
20+ Year Euro Treasury Index Fund
Acc Shares 0.16% 0.16%
Institutional Plus Shares 0.10% 0.10%
Emerging Markets Bond Fund
Investor Shares 0.60% 0.60%
Institutional Plus Shares 0.45% 0.45%
Euro Government Bond Index Fund
Investor and Acc Shares 0.12% 0.12%
Institutional Plus Shares 0.06% 0.06%
Euro Investment Grade Bond Index Fund
Investor and Acc Shares 0.12% 0.12%
Institutional Plus Shares 0.08% 0.08%
Eurozone Inflation-Linked Bond Index Fund
Investor and Acc Shares 0.12% 0.12%
Institutional Plus Shares 0.06% 0.06%
Global Bond Index Fund
Investor, Income, and Acc Shares 0.15% 0.15%
Institutional Plus Shares 0.10% 0.10%
Global Corporate Bond Index Fund
Acc Shares 0.18% 0.18%
Institutional Plus Shares 0.12% 0.12%
Global Credit Bond Fund
Investor Shares 0.35% 0.35%
Institutional Shares 0.30% 0.30%
Institutional Plus Shares 0.20% 0.20%
Global Short-Term Bond Index Fund
Investor, Income and Acc Shares 0.15% 0.15%
Institutional Plus Shares 0.10% 0.10%
Global Short-Term Corporate Bond Index Fund
Acc Shares 0.18% 0.18%
Institutional Plus Shares 0.12% 0.12%
Japan Government Bond Index Fund
Acc Shares 0.12% 0.12%
Institutional Plus Shares 0.06% 0.06%

1117
Notes to the Financial Statements
Fund
1 January 2020 – 12 May 2020
13 May 2020 – 31 December 2020
SRI Euro Investment Grade Bond Index Fund
Acc Shares 0.16% 0.16%
Institutional Plus Shares 0.12% 0.12%
U.K. Government Bond Index Fund
Income and Acc Shares 0.12% 0.12%
Institutional Plus Shares 0.06% 0.06%
U.K. Investment Grade Bond Index Fund
Income and Acc Shares 0.12% 0.12%
Institutional Plus Shares 0.06% 0.06%
U.K. Short-Term Investment Grade Bond Index Fund
Income and Acc Shares 0.12% 0.12%
Institutional Plus Shares 0.05% 0.05%
U.S. Government Bond Index Fund
Investor, Income and Acc Shares 0.12% 0.12%
Institutional Plus Shares 0.06% 0.06%
U.S. Investment Grade Credit Index Fund
Investor and Acc Shares 0.12% 0.12%
Institutional Plus Shares 0.08% 0.08%
U.S. Treasury Inflation-Protected Securities Index Fund
Select Income and Acc Shares 0.09% 0.09%
1 The Management Fee was reduced during the year. 2 The Fund was launched on 9 June 2020. 3 The Fund was liquidated on 8 October 2020.
Directors’ Fees. Aggregate director fees paid by the Manager out of the management fees on behalf of the Funds and other funds managed by the Manager for the period ended 30 June 2021 were US$189,609 (30 June 2020: US$218,828), of which US$0 (30 June 2020: US$0) was outstanding at the period-end.
The Company had seven Directors as at 30 June 2021, three of whom were independent. The interests of the Directors in related parties are as follows:
Mr Sean P. Hagerty is Managing Director of Vanguard Asset Management, Limited; Mr Michael S. Miller retired as a Managing Director of The Vanguard Group, Inc., in 2015; Ms Robyn Laidlaw is Head of Distribution, Europe; Ms Tara Doyle is a partner in the legal advisory firm acting as the Manager’s Secretary and serving the activities of the Manager. Mr. Richard Wane, Managing Director, Ireland, resigned as a Director with effect from 31 March 2021 and Ann Stock, Managing Director, Ireland, was appointed as a Director with effect from 1 April 2021.
Investment Manager. Vanguard Global Advisers, LLC, is the Investment Manager of the Company and is compensated by the Manager. PRIMECAP Management Company sub-manages Vanguard U.S. Opportunities Fund. Pzena Investment Management, LLC, sub-manages Vanguard U.S. Fundamental Value Fund.
The Investment Manager or the Manager, at their discretion, may appoint other companies from within the Vanguard Group of Companies to provide investment management and advisory services with respect to the Funds.

1118
Notes to the Financial Statements
Inter-Fund Trading. The table below details the inter-fund trades between the Company and other funds also managed by the Investment Manager or its affiliates during the period ended 30 June 2021.
Fund Bought Sold
ESG Developed World All Cap Equity Index Fund $979,173 $432,044
Global Small-Cap Index Fund $6,054,087 $26,410,133
Global Stock Index Fund $26,663,963 $4,140,642
U.S. 500 Stock Index Fund $26,779,603 $12,135,094
20+ Year Euro Treasury Index Fund €2,459,522 €8,301,416
Euro Government Bond Index Fund €8,301,416 €2,459,522
Euro Investment Grade Bond Index Fund €203,318 €4,893,940
Global Bond Index Fund $133,195,662 $3,417,106
Global Corporate Bond Index Fund $43,666,054 $34,916,793
Global Credit Bond Fund $9,525,227 $28,882,935
Global Short-Term Bond Index Fund $52,545,123 $3,385,387
Global Short-Term Corporate Bond Index Fund $51,299,693 $20,347,711
Japan Government Bond Index Fund ¥261,010,430 ¥774,862,640
SRI Euro Investment Grade Bond Index Fund €1,662,652 €102,147
U.K. Investment Grade Bond Index Fund £1,797,594 £3,417,805
U.K. Short-Term Investment Grade Bond Index Fund £1,711,464 £5,153,530
U.S. Government Bond Index Fund $2,320,740 —
U.S. Investment Grade Credit Index Fund $18,658,030 $155,670,197
Inter-Fund trades for the year ended 31 December 2020 are shown below:
Fund Bought Sold
ESG Developed World All Cap Equity Index Fund $3,538,749 $4,319,534
Global Small-Cap Index Fund $36,160,594 $50,025,782
Global Stock Index Fund $29,796,719 $26,463,737
U.S. 500 Stock Index Fund $39,824,386 $17,097,479
Euro Government Bond Index Fund €1,245,468 €39,289,724
Euro Investment Grade Bond Index Fund €35,763,049 €27,505,439
Global Bond Index Fund $271,180,712 $56,898,810
Global Corporate Bond Index Fund $46,905,973 $65,648,120
Global Credit Bond Fund $12,080,889 $73,987,369
Global Short-Term Bond Index Fund $101,550,259 $7,571,970
Global Short-Term Corporate Bond Index Fund $78,864,930 $83,882,104
Japan Government Bond Index Fund ¥202,373,232 ¥3,435,001,683
SRI Euro Investment Grade Bond Index Fund €1,798,084 €2,234,162
U.K. Government Bond Index Fund £7,593,802 —
U.K. Investment Grade Bond Index Fund £2,917,915 £79,355,276
U.K. Short-Term Investment Grade Bond Index Fund £34,321,152 £8,526,173
U.S. Government Bond Index Fund — $909,119
U.S. Investment Grade Credit Index Fund $261,278,299 $493,461,519
U.S. Treasury Inflation-Protected Securities Index Fund $219,752,791 $442,928,956

1119
Notes to the Financial Statements
The following amounts were held by affiliates of the Manager expressed as a percentage of total net assets:
Fund 30 June 2021 31 December 2020
Emerging Markets Stock Index Fund 17.49% 15.21%
ESG Developed World All Cap Equity Index Fund 0.01% 0.00%
ESG Emerging Markets All Cap Equity Index Fund¹ 0.05% 29.05%
European Stock Index Fund 0.00% 0.00%
Eurozone Stock Index Fund 0.00% 0.00%
Global Enhanced Equity2 — 69.63%
Global Small-Cap Index Fund 0.00% 0.00%
Global Stock Index Fund 0.00% 0.00%
Japan Stock Index Fund 17.10% 16.35%
Pacific ex-Japan Stock Index Fund 9.98% 8.90%
SRI European Stock Fund 0.00% 0.00%
Emerging Markets Bond Fund 0.03% 7.60%
Euro Government Bond Index Fund 13.66% 12.50%
Euro Investment Grade Bond Index Fund 14.28% 13.07%
Global Bond Index Fund 33.54% 22.39%
Global Corporate Bond Index Fund 0.01% 0.00%
Global Short-Term Bond Index Fund 0.00% 0.00%
Global Short-Term Corporate Bond Index Fund 0.04% 0.04%
Japan Government Bond Index Fund 55.26% 55.88%
SRI Euro Investment Grade Bond Index Fund 0.00% 0.00%
U.K. Government Bond Index Fund 40.42% 37.78%
U.K. Investment Grade Bond Index Fund 28.09% 27.05%
U.S. Government Bond Index Fund 17.94% 17.88%
U.S. Investment Grade Credit Index Fund 54.32% 47.54%
1 The Fund was launched on 9 June 2020. 2 The Fund was liquidated on 14 January 2021.
13. Soft Commission Arrangements. Neither the Investment Manager nor PRIMECAP Management Company, the sub-manager for Vanguard U.S. Opportunities Fund, has a commission arrangement on behalf of the Company.

1120
Notes to the Financial Statements
14. Exchange Rates. The principal exchange rates to one US dollar used in the preparation of the financial statements at 30 June 2021 were:
Currency Rate Currency Rate
AED United Arab Emirates Dirham 3.6732 KWD Kuwaiti Dinar 0.3013
AUD Australian Dollar 1.3320 KZT Kazakhstani Tenge 427.2450
BRL Brazilian Real 5.0179 MXN Mexican Peso 19.9105
CAD Canadian Dollar 1.2383 MYR Malaysian Ringgit 4.1515
CHF Swiss Franc 0.9244 NOK Norwegian Krone 8.6052
CLP Chilean Peso 728.1100 NZD New Zealand Dollar 1.4311
CNH Yuan Renminbi China Offshore 6.4609 PEN Peruvian Sol 3.8325
CNY Yuan Renminbi China 6.4615 PHP Philippine Peso 48.8150
COP Colombian Peso 3,734.0000 PKR Pakistan Rupee 157.6000
CZK Czech Koruna 21.5086 PLN Polish Zloty 3.8070
DKK Danish Krone 6.2706 QAR Qatari Rial 3.6410
EGP Egyptian Pound 15.6950 RON Romanian Leu 4.1526
EUR Euro 0.8432 RUB Russian Ruble 73.0538
GBP British Pound 0.7239 SAR Saudi Riyal 3.7504
HKD Hong Kong Dollar 7.7659 SEK Swedish Krona 8.5522
HUF Hungarian Forint 296.0031 SGD Singapore Dollar 1.3442
IDR Indonesian Rupiah 14,500.0000 THB Thai Baht 32.0500
ILS Israeli Shekel 3.2585 TRY Turkish Lira 8.6875
INR Indian Rupee 74.3300 TWD Taiwanese Dollar 27.8625
JPY Japanese Yen 110.9900 ZAR South African Rand 14.2788
KRW South Korean Won 1,126.1500
The principal exchange rates to one euro used in the preparation of the financial statements statements at 30 June 2021 were:
Currency Rate Currency Rate
AUD Australian Dollar 1.5796 NOK Norwegian Krone 10.2049
CAD Canadian Dollar 1.4685 NZD New Zealand Dollar 1.6972
CHF Swiss Franc 1.0962 PLN Polish Zloty 4.5147
DKK Danish Krone 7.4362 SEK Swedish Krona 10.1420
GBP British Pound 0.8584 SGD Singapore Dollar 1.5941
HKD Hong Kong Dollar 9.2095 USD US Dollar 1.1859
JPY Japanese Yen 131.6230
The principal exchange rates to one Japanese yen used in the preparation of the financial statements at 30 June 2021 were:
Currency Rate Currency Rate
GBP British Pound 0.0065 USD US Dollar 0.0090
The principal exchange rates to one British pound used in the preparation of the financial statements at 30 June 2021 were:
Currency Rate
USD US Dollar 1.3815

1121
Notes to the Financial Statements
The principal exchange rates to one US dollar used in the preparation of the financial statements at 31 December 2020 were:
Currency Rate Currency Rate
AED United Arab Emirates Dirham 3.6732 KRW South Korean Won 1,086.3000
AUD Australian Dollar 1.2959 KWD Kuwaiti Dinar 0.3042
BRL Brazilian Real 5.1942 MXN Mexican Peso 19.9255
CAD Canadian Dollar 1.2740 MYR Malaysian Ringgit 4.0225
CHF Swiss Franc 0.8840 NOK Norwegian Krone 8.5620
CLP Chilean Peso 710.5000 NZD New Zealand Dollar 1.3889
CNH Yuan Renminbi China Offshore 6.4967 PEN Peruvian Sol 3.6173
CNY Yuan Renminbi China 6.5398 PHP Philippine Peso 48.0235
COP Colombian Peso 3,420.5000 PKR Pakistan Rupee 159.8000
CZK Czech Koruna 21.4638 PLN Polish Zloty 3.7260
DKK Danish Krone 6.0835 QAR Qatari Rial 3.6410
EGP Egyptian Pound 15.7300 RUB Russian Ruble 73.9644
EUR Euro 0.8173 SAR Saudi Riyal 3.7516
GBP British Pound 0.7316 SEK Swedish Krona 8.2126
HKD Hong Kong Dollar 7.7539 SGD Singapore Dollar 1.3217
HUF Hungarian Forint 296.4203 THB Thai Baht 29.9600
IDR Indonesian Rupiah 14,050.0000 TRY Turkish Lira 7.4325
ILS Israeli Shekel 3.2108 TWD Taiwanese Dollar 28.0980
INR Indian Rupee 73.0675 ZAR South African Rand 14.6888
JPY Japanese Yen 103.2450
The principal exchange rates to one euro used in the preparation of the financial statements at 31 December 2020 were:
Currency Rate Currency Rate
AUD Australian Dollar 1.5856 NOK Norwegian Krone 10.4760
CAD Canadian Dollar 1.5588 NZD New Zealand Dollar 1.6994
CHF Swiss Franc 1.0816 PLN Polish Zloty 4.5589
DKK Danish Krone 7.4435 SEK Swedish Krona 10.0485
GBP British Pound 0.8951 SGD Singapore Dollar 1.6171
HKD Hong Kong Dollar 9.4872 USD US Dollar 1.2236
JPY Japanese Yen 126.3254
The principal exchange rates to one Japanese yen used in the preparation of the financial statements at 31 December 2020 were:
Currency Rate Currency Rate
EUR Euro 0.0079 USD US Dollar 0.0097
GBP British Pound 0.0071
The principal exchange rates to one British pound used in the preparation of the financial statements at 31 December 2020 were:
Currency Rate
USD US Dollar 1.3670
15. Contingent Liabilities. There were no contingent liabilities as at 30 June 2021 and 31 December 2020.
16. Segregated Liabilities. Each Fund is treated as bearing its own liabilities.
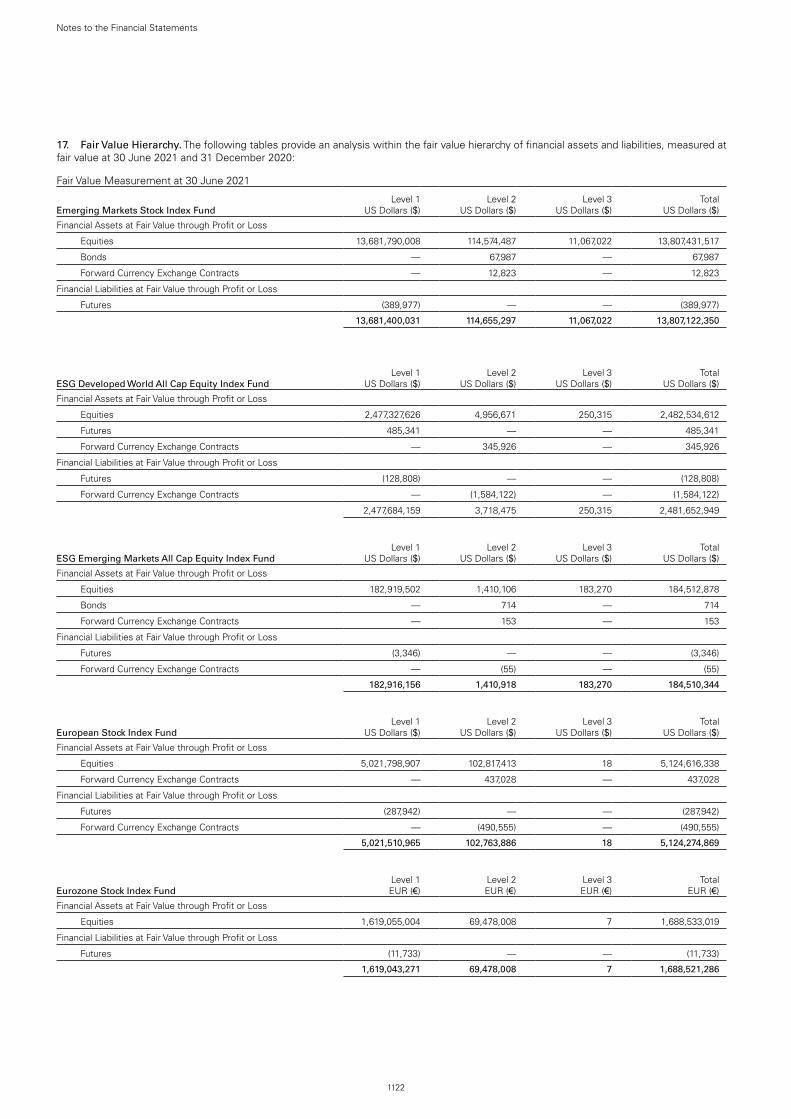
1122
Notes to the Financial Statements
17. Fair Value Hierarchy. The following tables provide an analysis within the fair value hierarchy of financial assets and liabilities, measured at fair value at 30 June 2021 and 31 December 2020:
Fair Value Measurement at 30 June 2021
Emerging Markets Stock Index FundLevel 1
US Dollars ($)Level 2
US Dollars ($)Level 3
US Dollars ($)Total
US Dollars ($)
Financial Assets at Fair Value through Profit or Loss
Equities 13,681,790,008 114,574,487 11,067,022 13,807,431,517
Bonds — 67,987 — 67,987
Forward Currency Exchange Contracts — 12,823 — 12,823
Financial Liabilities at Fair Value through Profit or Loss
Futures (389,977) — — (389,977)
13,681,400,031 114,655,297 11,067,022 13,807,122,350
ESG Developed World All Cap Equity Index FundLevel 1
US Dollars ($)Level 2
US Dollars ($)Level 3
US Dollars ($)Total
US Dollars ($)
Financial Assets at Fair Value through Profit or Loss
Equities 2,477,327,626 4,956,671 250,315 2,482,534,612
Futures 485,341 — — 485,341
Forward Currency Exchange Contracts — 345,926 — 345,926
Financial Liabilities at Fair Value through Profit or Loss
Futures (128,808) — — (128,808)
Forward Currency Exchange Contracts — (1,584,122) — (1,584,122)
2,477,684,159 3,718,475 250,315 2,481,652,949
ESG Emerging Markets All Cap Equity Index FundLevel 1
US Dollars ($)Level 2
US Dollars ($)Level 3
US Dollars ($)Total
US Dollars ($)
Financial Assets at Fair Value through Profit or Loss
Equities 182,919,502 1,410,106 183,270 184,512,878
Bonds — 714 — 714
Forward Currency Exchange Contracts — 153 — 153
Financial Liabilities at Fair Value through Profit or Loss
Futures (3,346) — — (3,346)
Forward Currency Exchange Contracts — (55) — (55)
182,916,156 1,410,918 183,270 184,510,344
European Stock Index FundLevel 1
US Dollars ($)Level 2
US Dollars ($)Level 3
US Dollars ($)Total
US Dollars ($)
Financial Assets at Fair Value through Profit or Loss
Equities 5,021,798,907 102,817,413 18 5,124,616,338
Forward Currency Exchange Contracts — 437,028 — 437,028
Financial Liabilities at Fair Value through Profit or Loss
Futures (287,942) — — (287,942)
Forward Currency Exchange Contracts — (490,555) — (490,555)
5,021,510,965 102,763,886 18 5,124,274,869
Eurozone Stock Index FundLevel 1 EUR (€)
Level 2 EUR (€)
Level 3 EUR (€)
Total EUR (€)
Financial Assets at Fair Value through Profit or Loss
Equities 1,619,055,004 69,478,008 7 1,688,533,019
Financial Liabilities at Fair Value through Profit or Loss
Futures (11,733) — — (11,733)
1,619,043,271 69,478,008 7 1,688,521,286

1123
Notes to the Financial Statements
Global Small-Cap Index FundLevel 1
US Dollars ($)Level 2
US Dollars ($)Level 3
US Dollars ($)Total
US Dollars ($)
Financial Assets at Fair Value through Profit or Loss
Equities 3,453,782,666 1,866,766 1,131,793 3,456,781,225
Futures 1,852 — — 1,852
Forward Currency Exchange Contracts — 1,925,733 — 1,925,733
Financial Liabilities at Fair Value through Profit or Loss
Futures (99,152) — — (99,152)
Forward Currency Exchange Contracts — (1,923,337) — (1,923,337)
3,453,685,366 1,869,162 1,131,793 3,456,686,321
Global Stock Index FundLevel 1
US Dollars ($)Level 2
US Dollars ($)Level 3
US Dollars ($)Total
US Dollars ($)
Financial Assets at Fair Value through Profit or Loss
Equities 13,256,832,536 57,969,522 3,800 13,314,805,858
Forward Currency Exchange Contracts — 897,434 — 897,434
Financial Liabilities at Fair Value through Profit or Loss
Futures (7,403) — — (7,403)
Forward Currency Exchange Contracts — (31,064,287) — (31,064,287)
13,256,825,133 27,802,669 3,800 13,284,631,602
Japan Stock Index FundLevel 1 EUR (€)
Level 2 EUR (€)
Level 3 EUR (€)
Total EUR (€)
Financial Assets at Fair Value through Profit or Loss
Equities 3,928,971,649 — — 3,928,971,649
Forward Currency Exchange Contracts — 3,905,835 — 3,905,835
Financial Liabilities at Fair Value through Profit or Loss
Futures (379,410) — — (379,410)
Forward Currency Exchange Contracts — (4,867,826) — (4,867,826)
3,928,592,239 (961,991) — 3,927,630,248
Pacific ex-Japan Stock Index FundLevel 1 EUR (€)
Level 2 EUR (€)
Level 3 EUR (€)
Total EUR (€)
Financial Assets at Fair Value through Profit or Loss
Equities 3,452,727,755 — 10,228 3,452,737,983
Futures 37,547 — — 37,547
Forward Currency Exchange Contracts — 3,750,664 — 3,750,664
Financial Liabilities at Fair Value through Profit or Loss
Futures (527,369) — — (527,369)
Forward Currency Exchange Contracts — (3,853,465) — (3,853,465)
3,452,237,933 (102,801) 10,228 3,452,145,360
SRI European Stock FundLevel 1 EUR (€)
Level 2 EUR (€)
Level 3 EUR (€)
Total EUR (€)
Financial Assets at Fair Value through Profit or Loss
Equities 357,943,451 4,733,400 4 362,676,855
Futures 1,937 — — 1,937
Forward Currency Exchange Contracts — 5,144 — 5,144
Financial Liabilities at Fair Value through Profit or Loss
Futures (107,531) — — (107,531)
Forward Currency Exchange Contracts — (13,443) — (13,443)
357,837,857 4,725,101 4 362,562,962
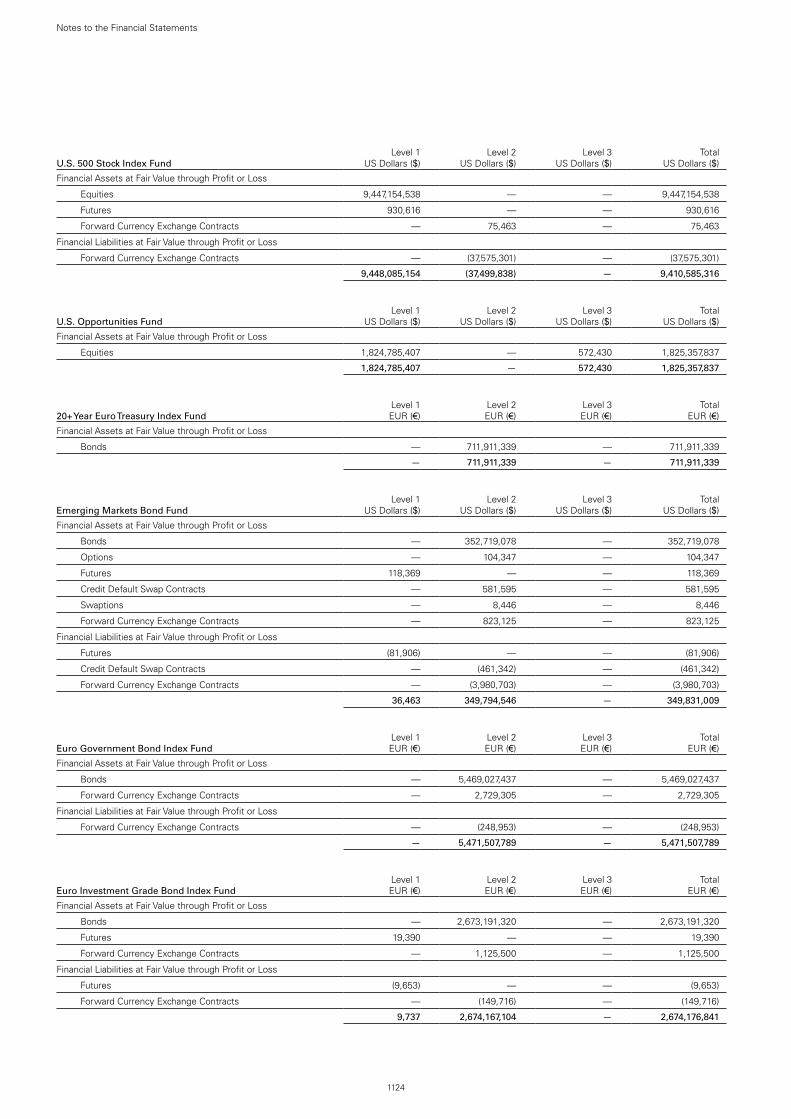
1124
Notes to the Financial Statements
U.S. 500 Stock Index FundLevel 1
US Dollars ($)Level 2
US Dollars ($)Level 3
US Dollars ($)Total
US Dollars ($)
Financial Assets at Fair Value through Profit or Loss
Equities 9,447,154,538 — — 9,447,154,538
Futures 930,616 — — 930,616
Forward Currency Exchange Contracts — 75,463 — 75,463
Financial Liabilities at Fair Value through Profit or Loss
Forward Currency Exchange Contracts — (37,575,301) — (37,575,301)
9,448,085,154 (37,499,838) — 9,410,585,316
U.S. Opportunities FundLevel 1
US Dollars ($)Level 2
US Dollars ($)Level 3
US Dollars ($)Total
US Dollars ($)
Financial Assets at Fair Value through Profit or Loss
Equities 1,824,785,407 — 572,430 1,825,357,837
1,824,785,407 — 572,430 1,825,357,837
20+ Year Euro Treasury Index FundLevel 1 EUR (€)
Level 2 EUR (€)
Level 3 EUR (€)
Total EUR (€)
Financial Assets at Fair Value through Profit or Loss
Bonds — 711,911,339 — 711,911,339
— 711,911,339 — 711,911,339
Emerging Markets Bond FundLevel 1
US Dollars ($)Level 2
US Dollars ($)Level 3
US Dollars ($)Total
US Dollars ($)
Financial Assets at Fair Value through Profit or Loss
Bonds — 352,719,078 — 352,719,078
Options — 104,347 — 104,347
Futures 118,369 — — 118,369
Credit Default Swap Contracts — 581,595 — 581,595
Swaptions — 8,446 — 8,446
Forward Currency Exchange Contracts — 823,125 — 823,125
Financial Liabilities at Fair Value through Profit or Loss
Futures (81,906) — — (81,906)
Credit Default Swap Contracts — (461,342) — (461,342)
Forward Currency Exchange Contracts — (3,980,703) — (3,980,703)
36,463 349,794,546 — 349,831,009
Euro Government Bond Index FundLevel 1 EUR (€)
Level 2 EUR (€)
Level 3 EUR (€)
Total EUR (€)
Financial Assets at Fair Value through Profit or Loss
Bonds — 5,469,027,437 — 5,469,027,437
Forward Currency Exchange Contracts — 2,729,305 — 2,729,305
Financial Liabilities at Fair Value through Profit or Loss
Forward Currency Exchange Contracts — (248,953) — (248,953)
— 5,471,507,789 — 5,471,507,789
Euro Investment Grade Bond Index FundLevel 1 EUR (€)
Level 2 EUR (€)
Level 3 EUR (€)
Total EUR (€)
Financial Assets at Fair Value through Profit or Loss
Bonds — 2,673,191,320 — 2,673,191,320
Futures 19,390 — — 19,390
Forward Currency Exchange Contracts — 1,125,500 — 1,125,500
Financial Liabilities at Fair Value through Profit or Loss
Futures (9,653) — — (9,653)
Forward Currency Exchange Contracts — (149,716) — (149,716)
9,737 2,674,167,104 — 2,674,176,841

1125
Notes to the Financial Statements
Eurozone Inflation-Linked Bond Index FundLevel 1 EUR (€)
Level 2 EUR (€)
Level 3 EUR (€)
Total EUR (€)
Financial Assets at Fair Value through Profit or Loss
Bonds — 1,267,753,348 — 1,267,753,348
— 1,267,753,348 — 1,267,753,348
Global Bond Index FundLevel 1
US Dollars ($)Level 2
US Dollars ($)Level 3
US Dollars ($)Total
US Dollars ($)
Financial Assets at Fair Value through Profit or Loss
Bonds — 21,801,078,395 — 21,801,078,395
Forward Currency Exchange Contracts — 277,064,142 — 277,064,142
Financial Liabilities at Fair Value through Profit or Loss
Futures (225,748) — — (225,748)
Forward Currency Exchange Contracts — (532,353,210) — (532,353,210)
(225,748) 21,545,789,327 — 21,545,563,579
Global Corporate Bond Index FundLevel 1
US Dollars ($)Level 2
US Dollars ($)Level 3
US Dollars ($)Total
US Dollars ($)
Financial Assets at Fair Value through Profit or Loss
Bonds — 2,869,692,351 — 2,869,692,351
Futures 345,545 — — 345,545
Forward Currency Exchange Contracts — 26,559,697 — 26,559,697
Financial Liabilities at Fair Value through Profit or Loss
Futures (333,726) — — (333,726)
Forward Currency Exchange Contracts — (76,104,132) — (76,104,132)
11,819 2,820,147,916 — 2,820,159,735
Global Credit Bond FundLevel 1
US Dollars ($)Level 2
US Dollars ($)Level 3
US Dollars ($)Total
US Dollars ($)
Financial Assets at Fair Value through Profit or Loss
Bonds — 468,544,562 — 468,544,562
Futures 130,768 — — 130,768
Credit Default Swap Contracts — 261,595 — 261,595
Swaptions — 20,637 — 20,637
Forward Currency Exchange Contracts — 1,403,964 — 1,403,964
Financial Liabilities at Fair Value through Profit or Loss
Futures (170,326) — — (170,326)
Credit Default Swap Contracts — (436,999) — (436,999)
Swaptions — (1,975) — (1,975)
Forward Currency Exchange Contracts — (11,044,631) — (11,044,631)
(39,558) 458,747,153 — 458,707,595
Global Short-Term Bond Index FundLevel 1
US Dollars ($)Level 2
US Dollars ($)Level 3
US Dollars ($)Total
US Dollars ($)
Financial Assets at Fair Value through Profit or Loss
Bonds — 3,177,225,299 — 3,177,225,299
Futures 3,084 — — 3,084
Forward Currency Exchange Contracts — 40,206,010 — 40,206,010
Financial Liabilities at Fair Value through Profit or Loss
Futures (58,238) — — (58,238)
Forward Currency Exchange Contracts — (77,630,057) — (77,630,057)
(55,154) 3,139,801,252 — 3,139,746,098

1126
Notes to the Financial Statements
Global Short-Term Corporate Bond Index FundLevel 1
US Dollars ($)Level 2
US Dollars ($)Level 3
US Dollars ($)Total
US Dollars ($)
Financial Assets at Fair Value through Profit or Loss
Bonds — 1,562,029,737 — 1,562,029,737
Futures 8,948 — — 8,948
Forward Currency Exchange Contracts — 17,846,688 — 17,846,688
Financial Liabilities at Fair Value through Profit or Loss
Futures (15,629) — — (15,629)
Forward Currency Exchange Contracts — (42,113,891) — (42,113,891)
(6,681) 1,537,762,534 — 1,537,755,853
Japan Government Bond Index FundLevel 1
Japanese Yen (¥)Level 2
Japanese Yen (¥)Level 3
Japanese Yen (¥)Total
Japanese Yen (¥)
Financial Assets at Fair Value through Profit or Loss
Bonds — 78,961,866,271 — 78,961,866,271
Futures 10,000 — — 10,000
Forward Currency Exchange Contracts — 39,827,707 — 39,827,707
Financial Liabilities at Fair Value through Profit or Loss
Forward Currency Exchange Contracts — (668,578,930) — (668,578,930)
10,000 78,333,115,048 — 78,333,125,048
SRI Euro Investment Grade Bond Index Fund Level 1 EUR (€)
Level 2 EUR (€)
Level 3 EUR (€)
Total EUR (€)
Financial Assets at Fair Value through Profit or Loss
Bonds — 437,994,222 — 437,994,222
Financial Liabilities at Fair Value through Profit or Loss
Futures (8,038) — — (8,038)
(8,038) 437,994,222 — 437,986,184
U.K. Government Bond Index FundLevel 1 GBP (£)
Level 2 GBP (£)
Level 3 GBP (£)
Total GBP (£)
Financial Assets at Fair Value through Profit or Loss
Bonds — 4,467,641,490 — 4,467,641,490
Forward Currency Exchange Contracts — 1 — 1
Financial Liabilities at Fair Value through Profit or Loss
Forward Currency Exchange Contracts — (56) — (56)
— 4,467,641,435 — 4,467,641,435
U.K. Investment Grade Bond Index FundLevel 1 GBP (£)
Level 2 GBP (£)
Level 3 GBP (£)
Total GBP (£)
Financial Assets at Fair Value through Profit or Loss
Bonds — 3,971,028,983 — 3,971,028,983
Financial Liabilities at Fair Value through Profit or Loss
Futures (24,236) — — (24,236)
(24,236) 3,971,028,983 — 3,971,004,747
U.K. Short-Term Investment Grade Bond Index FundLevel 1 GBP (£)
Level 2 GBP (£)
Level 3 GBP (£)
Total GBP (£)
Financial Assets at Fair Value through Profit or Loss
Bonds — 2,387,976,783 — 2,387,976,783
Financial Liabilities at Fair Value through Profit or Loss
Futures (23,210) — — (23,210)
(23,210) 2,387,976,783 — 2,387,953,573

1127
Notes to the Financial Statements
U.S. Government Bond Index FundLevel 1
US Dollars ($)Level 2
US Dollars ($)Level 3
US Dollars ($)Total
US Dollars ($)
Financial Assets at Fair Value through Profit or Loss
Bonds — 4,532,566,070 — 4,532,566,070
Forward Currency Exchange Contracts — 1,540,247 — 1,540,247
Financial Liabilities at Fair Value through Profit or Loss
Forward Currency Exchange Contracts — (75,739,916) — (75,739,916)
— 4,458,366,401 — 4,458,366,401
U.S. Investment Grade Credit Index FundLevel 1
US Dollars ($)Level 2
US Dollars ($)Level 3
US Dollars ($)Total
US Dollars ($)
Financial Assets at Fair Value through Profit or Loss
Bonds — 1,536,384,169 — 1,536,384,169
Futures 102,497 — — 102,497
Forward Currency Exchange Contracts — 301,303 — 301,303
Financial Liabilities at Fair Value through Profit or Loss
Futures (54,112) — — (54,112)
Forward Currency Exchange Contracts — (27,409,718) — (27,409,718)
48,385 1,509,275,754 — 1,509,324,139
U.S. Treasury Inflation-Protected Securities Index FundLevel 1
US Dollars ($)Level 2
US Dollars ($)Level 3
US Dollars ($)Total
US Dollars ($)
Financial Assets at Fair Value through Profit or Loss
Bonds — 2,146,862,666 — 2,146,862,666
Forward Currency Exchange Contracts — 136,988 — 136,988
Financial Liabilities at Fair Value through Profit or Loss
Forward Currency Exchange Contracts — (35,138,519) — (35,138,519)
— 2,111,861,135 — 2,111,861,135
Fair Value Measurement at 31 December 2020
Emerging Markets Stock Index FundLevel 1
US Dollars ($)Level 2
US Dollars ($)Level 3
US Dollars ($)Total
US Dollars ($)
Financial Assets at Fair Value through Profit or Loss
Equities 12,905,549,537 82,096,037 5,643,196 12,993,288,770
Futures 6,778,031 — — 6,778,031
Financial Liabilities at Fair Value through Profit or Loss
Forward Currency Exchange Contracts — (506) — (506)
12,912,327,568 82,095,531 5,643,196 13,000,066,295
ESG Developed World All Cap Equity Index FundLevel 1
US Dollars ($)Level 2
US Dollars ($)Level 3
US Dollars ($)Total
US Dollars ($)
Financial Assets at Fair Value through Profit or Loss
Equities 1,541,791,078 2,508,682 27,977 1,544,327,737
Futures 570,385 — — 570,385
Forward Currency Exchange Contracts — 1,479,946 — 1,479,946
Financial Liabilities at Fair Value through Profit or Loss
Forward Currency Exchange Contracts — (1,378,732) — (1,378,732)
1,542,361,463 2,609,896 27,977 1,544,999,336
ESG Emerging Markets All Cap Equity Index FundLevel 1
US Dollars ($)Level 2
US Dollars ($)Level 3
US Dollars ($)Total
US Dollars ($)
Financial Assets at Fair Value through Profit or Loss
Equities 42,750,625 154,466 2,656 42,907,747
Futures 17,894 — — 17,894
Financial Liabilities at Fair Value through Profit or Loss
Forward Currency Exchange Contracts — (1) — (1)
42,768,519 154,465 2,656 42,925,640

1128
Notes to the Financial Statements
European Stock Index FundLevel 1
US Dollars ($)Level 2
US Dollars ($)Level 3
US Dollars ($)Total
US Dollars ($)
Financial Assets at Fair Value through Profit or Loss
Equities 4,926,968,504 92,784,867 19 5,019,753,390
Futures 518,537 — — 518,537
Forward Currency Exchange Contracts — 1,699,418 — 1,699,418
Financial Liabilities at Fair Value through Profit or Loss
Futures (70,379) — — (70,379)
Forward Currency Exchange Contracts — (1,666,215) — (1,666,215)
4,927,416,662 92,818,070 19 5,020,234,751
Eurozone Stock Index FundLevel 1 EUR (€)
Level 2 EUR (€)
Level 3 EUR (€)
Total EUR (€)
Financial Assets at Fair Value through Profit or Loss
Equities 1,786,533,409 62,845,804 7 1,849,379,220
Futures 185,988 — — 185,988
1,786,719,397 62,845,804 7 1,849,565,208
Global Enhanced Equity FundLevel 1
US Dollars ($)Level 2
US Dollars ($)Level 3
US Dollars ($)Total
US Dollars ($)
Financial Assets at Fair Value through Profit or Loss
Equities 7,167,261 — — 7,167,261
Futures 6,125 — — 6,125
7,173,386 — — 7,173,386
Global Small-Cap Index FundLevel 1
US Dollars ($)Level 2
US Dollars ($)Level 3
US Dollars ($)Total
US Dollars ($)
Financial Assets at Fair Value through Profit or Loss
Equities 3,041,009,466 688,565 519,791 3,042,217,822
Futures 501,963 — — 501,963
Forward Currency Exchange Contracts — 1,519,001 — 1,519,001
Financial Liabilities at Fair Value through Profit or Loss
Futures (74,317) — — (74,317)
Forward Currency Exchange Contracts — (992,759) — (992,759)
3,041,437,112 1,214,807 519,791 3,043,171,710
Global Stock Index FundLevel 1
US Dollars ($)Level 2
US Dollars ($)Level 3
US Dollars ($)Total
US Dollars ($)
Financial Assets at Fair Value through Profit or Loss
Equities 10,906,124,014 48,307,464 30,034 10,954,461,512
Futures 3,985,096 — — 3,985,096
Forward Currency Exchange Contracts — 29,415,413 — 29,415,413
Financial Liabilities at Fair Value through Profit or Loss
Futures (46,520) — — (46,520)
Forward Currency Exchange Contracts — (5,621,011) — (5,621,011)
10,910,062,590 72,101,866 30,034 10,982,194,490
Japan Stock Index FundLevel 1 EUR (€)
Level 2 EUR (€)
Level 3 EUR (€)
Total EUR (€)
Financial Assets at Fair Value through Profit or Loss
Equities 3,409,671,266 — — 3,409,671,266
Futures 922,749 — — 922,749
Forward Currency Exchange Contracts — 2,012,316 — 2,012,316
Financial Liabilities at Fair Value through Profit or Loss
Futures (15,089) — — (15,089)
Forward Currency Exchange Contracts — (1,483,930) — (1,483,930)
3,410,578,926 528,386 — 3,411,107,312

1129
Notes to the Financial Statements
Pacific ex-Japan Stock Index FundLevel 1 EUR (€)
Level 2 EUR (€)
Level 3 EUR (€)
Total EUR (€)
Financial Assets at Fair Value through Profit or Loss
Equities 3,010,789,156 — 20 3,010,789,176
Treasury Bonds — 552,445 — 552,445
Futures 203,432 — — 203,432
Forward Currency Exchange Contracts — 4,283,545 — 4,283,545
Financial Liabilities at Fair Value through Profit or Loss
Futures (130,460) — — (130,460)
Forward Currency Exchange Contracts — (3,693,728) — (3,693,728)
3,010,862,128 1,142,262 20 3,012,004,410
SRI European Stock FundLevel 1 EUR (€)
Level 2 EUR (€)
Level 3 EUR (€)
Total EUR (€)
Financial Assets at Fair Value through Profit or Loss
Equities 331,413,803 6,316,701 4 337,730,508
Futures 52,515 — — 52,515
Forward Currency Exchange Contracts — 80,376 — 80,376
Financial Liabilities at Fair Value through Profit or Loss
Futures (2,267) — — (2,267)
Forward Currency Exchange Contracts — (56,281) — (56,281)
331,464,051 6,340,796 4 337,804,851
U.S. 500 Stock Index FundLevel 1
US Dollars ($)Level 2
US Dollars ($)Level 3
US Dollars ($)Total
US Dollars ($)
Financial Assets at Fair Value through Profit or Loss
Equities 9,120,233,738 — — 9,120,233,738
Treasury Bonds — 2,043,848 — 2,043,848
Futures 1,273,397 — — 1,273,397
Forward Currency Exchange Contracts — 22,703,895 — 22,703,895
9,121,507,135 24,747,743 — 9,146,254,878
U.S. Opportunities FundLevel 1
US Dollars ($)Level 2
US Dollars ($)Level 3
US Dollars ($)Total
US Dollars ($)
Financial Assets at Fair Value through Profit or Loss
Equities 1,717,649,929 — 572,414 1,718,222,343
1,717,649,929 — 572,414 1,718,222,343
20+ Year Euro Treasury Index FundLevel 1 EUR (€)
Level 2 EUR (€)
Level 3 EUR (€)
Total EUR (€)
Financial Assets at Fair Value through Profit or Loss
Bonds — 783,795,540 — 783,795,540
— 783,795,540 — 783,795,540
Emerging Markets Bond FundLevel 1
US Dollars ($)Level 2
US Dollars ($)Level 3
US Dollars ($)Total
US Dollars ($)
Financial Assets at Fair Value through Profit or Loss
Bonds — 211,989,225 — 211,989,225
Options — 17,686 — 17,686
Futures 67,821 — — 67,821
Forward Currency Exchange Contracts — 886,293 — 886,293
Credit Default Swap Contracts — 233,555 — 233,555
Financial Liabilities at Fair Value through Profit or Loss
Futures (63,775) — — (63,775)
Forward Currency Exchange Contracts — (119,225) — (119,225)
Credit Default Swap Contracts — (497,889) — (497,889)
4,046 212,509,645 — 212,513,691
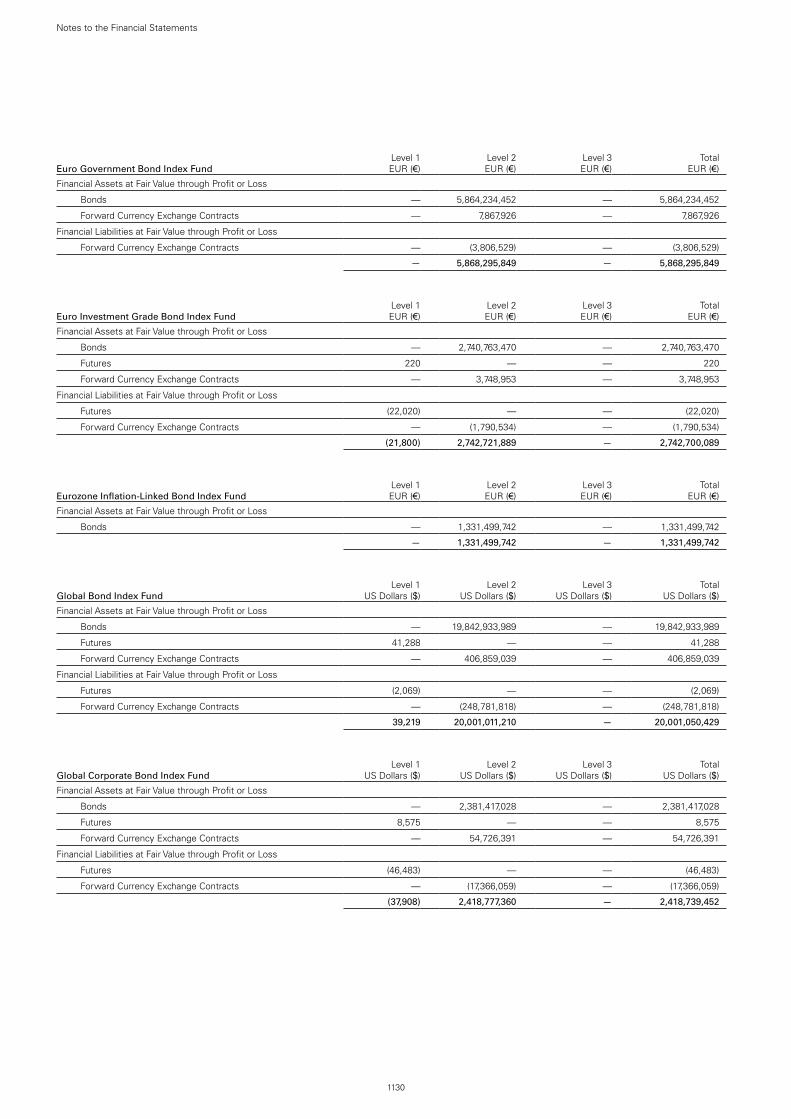
1130
Notes to the Financial Statements
Euro Government Bond Index FundLevel 1 EUR (€)
Level 2 EUR (€)
Level 3 EUR (€)
Total EUR (€)
Financial Assets at Fair Value through Profit or Loss
Bonds — 5,864,234,452 — 5,864,234,452
Forward Currency Exchange Contracts — 7,867,926 — 7,867,926
Financial Liabilities at Fair Value through Profit or Loss
Forward Currency Exchange Contracts — (3,806,529) — (3,806,529)
— 5,868,295,849 — 5,868,295,849
Euro Investment Grade Bond Index FundLevel 1 EUR (€)
Level 2 EUR (€)
Level 3 EUR (€)
Total EUR (€)
Financial Assets at Fair Value through Profit or Loss
Bonds — 2,740,763,470 — 2,740,763,470
Futures 220 — — 220
Forward Currency Exchange Contracts — 3,748,953 — 3,748,953
Financial Liabilities at Fair Value through Profit or Loss
Futures (22,020) — — (22,020)
Forward Currency Exchange Contracts — (1,790,534) — (1,790,534)
(21,800) 2,742,721,889 — 2,742,700,089
Eurozone Inflation-Linked Bond Index FundLevel 1 EUR (€)
Level 2 EUR (€)
Level 3 EUR (€)
Total EUR (€)
Financial Assets at Fair Value through Profit or Loss
Bonds — 1,331,499,742 — 1,331,499,742
— 1,331,499,742 — 1,331,499,742
Global Bond Index FundLevel 1
US Dollars ($)Level 2
US Dollars ($)Level 3
US Dollars ($)Total
US Dollars ($)
Financial Assets at Fair Value through Profit or Loss
Bonds — 19,842,933,989 — 19,842,933,989
Futures 41,288 — — 41,288
Forward Currency Exchange Contracts — 406,859,039 — 406,859,039
Financial Liabilities at Fair Value through Profit or Loss
Futures (2,069) — — (2,069)
Forward Currency Exchange Contracts — (248,781,818) — (248,781,818)
39,219 20,001,011,210 — 20,001,050,429
Global Corporate Bond Index FundLevel 1
US Dollars ($)Level 2
US Dollars ($)Level 3
US Dollars ($)Total
US Dollars ($)
Financial Assets at Fair Value through Profit or Loss
Bonds — 2,381,417,028 — 2,381,417,028
Futures 8,575 — — 8,575
Forward Currency Exchange Contracts — 54,726,391 — 54,726,391
Financial Liabilities at Fair Value through Profit or Loss
Futures (46,483) — — (46,483)
Forward Currency Exchange Contracts — (17,366,059) — (17,366,059)
(37,908) 2,418,777,360 — 2,418,739,452

1131
Notes to the Financial Statements
Global Credit Bond FundLevel 1
US Dollars ($)Level 2
US Dollars ($)Level 3
US Dollars ($)Total
US Dollars ($)
Financial Assets at Fair Value through Profit or Loss
Bonds — 308,260,727 — 308,260,727
Futures 59,033 — — 59,033
Forward Currency Exchange Contracts — 5,820,669 — 5,820,669
Credit Default Swap Contracts — 464,168 — 464,168
Swaptions — 16,202 — 16,202
Financial Liabilities at Fair Value through Profit or Loss
Futures (38,482) — — (38,482)
Forward Currency Exchange Contracts — (1,763,051) — (1,763,051)
Credit Default Swap Contracts — (67,847) — (67,847)
Swaptions — (14,323) — (14,323)
20,551 312,716,545 — 312,737,096
Global Short-Term Bond Index FundLevel 1
US Dollars ($)Level 2
US Dollars ($)Level 3
US Dollars ($)Total
US Dollars ($)
Financial Assets at Fair Value through Profit or Loss
Bonds — 2,723,484,008 — 2,723,484,008
Futures 11,324 — — 11,324
Forward Currency Exchange Contracts — 55,129,968 — 55,129,968
Financial Liabilities at Fair Value through Profit or Loss
Forward Currency Exchange Contracts — (29,288,133) — (29,288,133)
11,324 2,749,325,843 — 2,749,337,167
Global Short-Term Corporate Bond Index FundLevel 1
US Dollars ($)Level 2
US Dollars ($)Level 3
US Dollars ($)Total
US Dollars ($)
Financial Assets at Fair Value through Profit or Loss
Bonds — 1,395,624,150 — 1,395,624,150
Futures 362 — — 362
Forward Currency Exchange Contracts — 31,805,210 — 31,805,210
Financial Liabilities at Fair Value through Profit or Loss
Futures (671) — — (671)
Forward Currency Exchange Contracts — (12,172,988) — (12,172,988)
(309) 1,415,256,372 — 1,415,256,063
Japan Government Bond Index FundLevel 1
Japanese Yen (¥)Level 2
Japanese Yen (¥)Level 3
Japanese Yen (¥)Total
Japanese Yen (¥)
Financial Assets at Fair Value through Profit or Loss
Bonds — 75,898,037,867 — 75,898,037,867
Forward Currency Exchange Contracts — 687,109,398 — 687,109,398
Financial Liabilities at Fair Value through Profit or Loss
Futures (485,013) — — (485,013)
Forward Currency Exchange Contracts — (108,680,084) — (108,680,084)
(485,013) 76,476,467,181 — 76,475,982,168
SRI Euro Investment Grade Bond Index Fund Level 1 EUR (€)
Level 2 EUR (€)
Level 3 EUR (€)
Total EUR (€)
Financial Assets at Fair Value through Profit or Loss
Bonds — 357,202,082 — 357,202,082
Futures 2,240 — — 2,240
Financial Liabilities at Fair Value through Profit or Loss
Futures (4,850) — — (4,850)
(2,610) 357,202,082 — 357,199,472

1132
Notes to the Financial Statements
U.K. Government Bond Index FundLevel 1 GBP (£)
Level 2 GBP (£)
Level 3 GBP (£)
Total GBP (£)
Financial Assets at Fair Value through Profit or Loss
Bonds — 4,305,709,043 — 4,305,709,043
— 4,305,709,043 — 4,305,709,043
U.K. Investment Grade Bond Index FundLevel 1 GBP (£)
Level 2 GBP (£)
Level 3 GBP (£)
Total GBP (£)
Financial Assets at Fair Value through Profit or Loss
Bonds — 3,629,413,939 — 3,629,413,939
Futures 33,278 — — 33,278
33,278 3,629,413,939 — 3,629,447,217
U.K. Short-Term Investment Grade Bond Index FundLevel 1 GBP (£)
Level 2 GBP (£)
Level 3 GBP (£)
Total GBP (£)
Financial Assets at Fair Value through Profit or Loss
Bonds — 2,255,589,108 — 2,255,589,108
Futures 25,979 — — 25,979
25,979 2,255,589,108 — 2,255,615,087
U.S. Government Bond Index FundLevel 1
US Dollars ($)Level 2
US Dollars ($)Level 3
US Dollars ($)Total
US Dollars ($)
Financial Assets at Fair Value through Profit or Loss
Bonds — 4,429,376,722 — 4,429,376,722
Forward Currency Exchange Contracts — 60,286,313 — 60,286,313
Financial Liabilities at Fair Value through Profit or Loss
Forward Currency Exchange Contracts — (575,410) — (575,410)
— 4,489,087,625 — 4,489,087,625
U.S. Investment Grade Credit Index FundLevel 1
US Dollars ($)Level 2
US Dollars ($)Level 3
US Dollars ($)Total
US Dollars ($)
Financial Assets at Fair Value through Profit or Loss
Bonds — 2,021,014,461 — 2,021,014,461
Futures 11,916 — — 11,916
Forward Currency Exchange Contracts — 30,166,022 — 30,166,022
Financial Liabilities at Fair Value through Profit or Loss
Forward Currency Exchange Contracts — (644,303) — (644,303)
11,916 2,050,536,180 — 2,050,548,096
U.S. Treasury Inflation-Protected Securities Index FundLevel 1
US Dollars ($)Level 2
US Dollars ($)Level 3
US Dollars ($)Total
US Dollars ($)
Financial Assets at Fair Value through Profit or Loss
Bonds — 1,736,060,082 — 1,736,060,082
Forward Currency Exchange Contracts — 22,613,837 — 22,613,837
Financial Liabilities at Fair Value through Profit or Loss
Forward Currency Exchange Contracts — (147,896) — (147,896)
— 1,758,526,023 — 1,758,526,023
18. Events During the Period.
The Global Enhanced Equity Fund was liquidated on 14 January 2021.
Richard Wane resigned as a Director with effect from 31 March 2021 and Ann Stock was appointed as a Director with effect from 1 April 2021.
19. Events Since the Statement of Assets and Liabilities Date.
Karin A. Risi was appointed as Director on 22 July 2021.
20. Approval of Financial Statements. The Financial Statements were approved by the Directors on 26 August 2021.

Additional Information From the Directors
1133
Connected Persons DisclosureTransactions carried out with the Company by the Investment Manager, Manager, Depositary, Investment Adviser and/or associated or group companies of these (“Connected Persons”) during the period ended 30 June 2021 were carried out as if negotiated at arm’s length and were in the best interests of the Company’s Shareholders. The Directors of the Company are satisfied that there are arrangements (evidenced by written procedures) in place to ensure that all transactions entered into by the Company with Connected Persons are carried out as if negotiated at arm’s length and in the best interests of the Company’s Shareholders.
Potential Implications of BrexitThe United Kingdom is no longer a member state of the European Union. Despite the negotiation of the UK-EU Trade and Cooperation Agreement in December 2020, the future economic and political relationship between the United Kingdom and the European Union (and between the United Kingdom and other countries) remains uncertain and subject to further negotiation in many respects, and a period of economic and political uncertainty may therefore continue in the United Kingdom and the European Union. Political and economic uncertainty may lead to speculation and subsequent market volatility, particularly for assets denominated in British pounds. Vanguard continues to encourage investors to follow its core investing principles, including maintaining long-term discipline.
The implications of Brexit extend beyond the UK economy and financial markets, affecting multinational organisations globally. The relevant regulatory authorities in the United Kingdom may in the future make changes to their rules which deviate from the standards applicable in the European Union. This could result in changes being made to the rules applicable in the European Union.
The nature and extent of the impact of these factors on the Funds are uncertain, but may be adverse. Vanguard remains committed to safeguarding our investors' assets and their long-term interests and has devoted significant resources to developing plans to manage the impact of Brexit.
Coronavirus (COVID-19)Market disruptions associated with the COVID-19 pandemic have had a global impact, and uncertainty exists as to the long-term implications. Such disruptions can adversely affect assets of the Funds and thus performance of the Funds. Vanguard continues to encourage investors to follow its core investment principles, including maintaining long-term discipline. Vanguard is committed to safeguarding the assets of investors and their long-term interests.
Securities Financing Transactions Regulation (“SFTR”)A Securities Financing Transaction (SFT) is defined as per Article 3(11) of the SFTR as:
• A repurchase/reverse repurchase agreement.
• Securities or commodities lending and securities or commodities borrowing.
• A buy-sell back transaction or sell-buy back transaction.
• A margin lending transaction.
As at 30 June 2021, the Company had a securities lending programme as a type of SFT under the scope of the SFTR.

1134
Additional Information From the Directors
Global DataThe amounts of securities on loan as at 30 June 2021 are as follows:
Fund Loan AmountProportion
of NAV (%)Proportion of
Lendable Assets (%)Emerging Markets Stock Index Fund $73,104,711 0.52 0.88ESG Developed World All Cap Equity Index Fund $8,954,019 0.35 0.45ESG Emerging Markets All Cap Equity Index Fund $585,525 0.32 1.18European Stock Index Fund $20,235,592 0.39 0.41Eurozone Stock Index Fund €12,221,687 0.72 0.70Global Small-Cap Index Fund $116,458,054 3.35 3.41Global Stock Index Fund $78,532,511 0.59 0.64Japan Stock Index Fund €274,508,048 6.88 7.21SRI European Stock Fund €2,256,146 0.61 0.69U.S. 500 Stock Index Fund $1,287,963 0.01 0.01U.S. Opportunities Fund $23,521,956 1.26 1.30
Data on Re-Use of CollateralVanguard Investment Series Plc did not re-use any collateral received during the period ended 30 June 2021.
Concentration Data The split of issuers of collateral securities received across all SFTs as at 30 June 2021 is as follows:
Fund Collateral Issuer Collateral AmountEmerging Markets Stock Index Fund DE Government $19,273,613Emerging Markets Stock Index Fund FR Government $12,288,040Emerging Markets Stock Index Fund NL Government $215,427Emerging Markets Stock Index Fund UK Government $14,005,479Emerging Markets Stock Index Fund US Government $32,727,087ESG Developed World All Cap Equity Index Fund DE Government $2,282,793ESG Developed World All Cap Equity Index Fund FR Government $3,390,176ESG Developed World All Cap Equity Index Fund NL Government $44,366ESG Developed World All Cap Equity Index Fund UK Government $1,163,887ESG Developed World All Cap Equity Index Fund US Government $2,729,432ESG Emerging Markets All Cap Equity Index Fund DE Government $146,749ESG Emerging Markets All Cap Equity Index Fund FR Government $164,206ESG Emerging Markets All Cap Equity Index Fund NL Government $2,189ESG Emerging Markets All Cap Equity Index Fund UK Government $206,288ESG Emerging Markets All Cap Equity Index Fund US Government $109,414European Stock Index Fund DE Government $8,637,676European Stock Index Fund FR Government $3,205,204European Stock Index Fund US Government $10,126,310Eurozone Stock Index Fund DE Government €6,570,637Eurozone Stock Index Fund FR Government €2,635,630Eurozone Stock Index Fund UK Government €3,689Eurozone Stock Index Fund US Government €4,131,867Global Small-Cap Index Fund DE Government $21,849,039Global Small-Cap Index Fund FR Government $36,031,607Global Small-Cap Index Fund NL Government $4,502,543Global Small-Cap Index Fund UK Government $13,834,406Global Small-Cap Index Fund US Government $48,257,083Global Stock Index Fund DE Government $10,517,923Global Stock Index Fund FR Government $24,176,425Global Stock Index Fund NL Government $78,380Global Stock Index Fund UK Government $25,867,801Global Stock Index Fund US Government $22,999,070Japan Stock Index Fund DE Government €15,998,090Japan Stock Index Fund FR Government €81,784,762Japan Stock Index Fund UK Government €54,330,761Japan Stock Index Fund US Government €138,829,530SRI European Stock Fund DE Government €404,155SRI European Stock Fund FR Government €1,484,397SRI European Stock Fund UK Government €329SRI European Stock Fund US Government €524,423U.S. 500 Stock Index Fund DE Government $7,631U.S. 500 Stock Index Fund FR Government $17,575U.S. 500 Stock Index Fund UK Government $275U.S. 500 Stock Index Fund US Government $1,341,430U.S. Opportunities Fund DE Government $870,878U.S. Opportunities Fund FR Government $2,269,666

1135
Additional Information From the Directors
Fund Collateral Issuer Collateral AmountU.S. Opportunities Fund UK Government $416,551U.S. Opportunities Fund US Government $21,412,776
The split of counterparties of the securities lending programme as at 30 June 2021 is as follows:
Fund CounterpartySecurities on Loan Amount
Emerging Markets Stock Index Fund Morgan Stanley $21,384,962Emerging Markets Stock Index Fund Goldman Sachs $18,926,894Emerging Markets Stock Index Fund Citigroup $18,422,512Emerging Markets Stock Index Fund UBS AG $12,553,785Emerging Markets Stock Index Fund JP Morgan $1,154,718Emerging Markets Stock Index Fund Credit Suisse Group $661,840ESG Developed World All Cap Equity Index Fund Morgan Stanley $2,603,759ESG Developed World All Cap Equity Index Fund Citigroup $1,500,519ESG Developed World All Cap Equity Index Fund Merrill Lynch $1,439,377ESG Developed World All Cap Equity Index Fund UBS AG $1,233,722ESG Developed World All Cap Equity Index Fund Goldman Sachs $1,040,648ESG Developed World All Cap Equity Index Fund JP Morgan $626,445ESG Developed World All Cap Equity Index Fund HSBC Bank $373,305ESG Developed World All Cap Equity Index Fund Credit Suisse Group $136,244ESG Emerging Markets All Cap Equity Index Fund Goldman Sachs $280,034ESG Emerging Markets All Cap Equity Index Fund Morgan Stanley $177,747ESG Emerging Markets All Cap Equity Index Fund JP Morgan $96,714ESG Emerging Markets All Cap Equity Index Fund Citigroup $17,847ESG Emerging Markets All Cap Equity Index Fund Credit Suisse Group $6,725ESG Emerging Markets All Cap Equity Index Fund UBS AG $6,458European Stock Index Fund Morgan Stanley $10,693,420European Stock Index Fund UBS AG $9,542,172Eurozone Stock Index Fund Morgan Stanley €8,007,905Eurozone Stock Index Fund UBS AG €3,204,469Eurozone Stock Index Fund Citigroup €1,009,313Global Small-Cap Index Fund UBS AG $28,678,708Global Small-Cap Index Fund Morgan Stanley $22,443,492Global Small-Cap Index Fund Citigroup $18,275,621Global Small-Cap Index Fund Goldman Sachs $14,316,623Global Small-Cap Index Fund Merrill Lynch $12,119,480Global Small-Cap Index Fund Credit Suisse Group $10,612,575Global Small-Cap Index Fund JP Morgan $6,939,826Global Small-Cap Index Fund HSBC Bank $3,070,391Global Small-Cap Index Fund Barclays $1,338Global Stock Index Fund Goldman Sachs $32,975,648Global Stock Index Fund Merrill Lynch $18,109,755Global Stock Index Fund Morgan Stanley $12,288,272Global Stock Index Fund UBS AG $8,064,885Global Stock Index Fund Citigroup $5,363,676Global Stock Index Fund HSBC Bank $1,489,476Global Stock Index Fund Credit Suisse Group $240,799Japan Stock Index Fund Citigroup €157,992,530Japan Stock Index Fund Goldman Sachs €72,992,723Japan Stock Index Fund Merrill Lynch €42,577,313Japan Stock Index Fund UBS AG €945,482SRI European Stock Fund Merrill Lynch €954,946SRI European Stock Fund Morgan Stanley €489,057SRI European Stock Fund UBS AG €432,711SRI European Stock Fund JP Morgan €289,405SRI European Stock Fund Citigroup €90,027U.S. 500 Stock Index Fund UBS AG $1,212,599U.S. 500 Stock Index Fund Citigroup $75,364U.S. Opportunities Fund UBS AG $14,148,318U.S. Opportunities Fund Citigroup $8,600,540U.S. Opportunities Fund Goldman Sachs $522,958U.S. Opportunities Fund Merrill Lynch $250,140

1136
Additional Information From the Directors
Safekeeping of Collateral ReceivedAll securities lending collateral received is held by BNY Mellon as tri-party agent in the name of Brown Brothers Harriman as at 30 June 2021.
Aggregate Transaction DataThe aggregate transaction data for collateral positions received in respect of the securities lending programme as at 30 June 2021 are as follows:
FundType of
CollateralCollateral Amount
Fitch Rating
Maturity Tenor of Collateral
Currency of Collateral
Country of Counterparty
EstablishmentSettlement
and ClearingEmerging Markets Stock Index Fund Bond $539 NR 1 week to 1 month EUR United Kingdom Tri PartyEmerging Markets Stock Index Fund Bond $30,564 NR 3 months to 1 year EUR United Kingdom Tri PartyEmerging Markets Stock Index Fund Bond $184,863 NR > 1 year EUR United Kingdom Tri PartyEmerging Markets Stock Index Fund Bond $5,604,446 NR 3 months to 1 year USD United Kingdom Tri PartyEmerging Markets Stock Index Fund Bond $14,005,479 AA- > 1 year GBP United Kingdom Tri PartyEmerging Markets Stock Index Fund Bond $4,326,152 AA 3 months to 1 year EUR United Kingdom Tri PartyEmerging Markets Stock Index Fund Bond $7,961,347 AA > 1 year EUR United Kingdom Tri PartyEmerging Markets Stock Index Fund Bond $1,217,921 AAA 3 months to 1 year EUR United Kingdom Tri PartyEmerging Markets Stock Index Fund Bond $18,055,694 AAA > 1 year EUR United Kingdom Tri PartyEmerging Markets Stock Index Fund Bond $1,230,969 AAA 3 months to 1 year USD United Kingdom Tri PartyEmerging Markets Stock Index Fund Bond $19,422,279 AAA > 1 year USD United Kingdom Tri PartyEmerging Markets Stock Index Fund Bond $6,469,393 F1+ 1 month to 3 months USD United Kingdom Tri PartyESG Developed World All Cap Equity Index Fund Bond $293 NR 1 week to 1 month EUR United Kingdom Tri PartyESG Developed World All Cap Equity Index Fund Bond $6,291 NR 3 months to 1 year EUR United Kingdom Tri PartyESG Developed World All Cap Equity Index Fund Bond $38,048 NR > 1 year EUR United Kingdom Tri PartyESG Developed World All Cap Equity Index Fund Bond $308,147 NR 3 months to 1 year USD United Kingdom Tri PartyESG Developed World All Cap Equity Index Fund Bond $1,163,887 AA- > 1 year GBP United Kingdom Tri PartyESG Developed World All Cap Equity Index Fund Bond $366,214 AA 3 months to 1 year EUR United Kingdom Tri PartyESG Developed World All Cap Equity Index Fund Bond $3,023,669 AA > 1 year EUR United Kingdom Tri PartyESG Developed World All Cap Equity Index Fund Bond $99,199 AAA 3 months to 1 year EUR United Kingdom Tri PartyESG Developed World All Cap Equity Index Fund Bond $2,183,621 AAA > 1 year EUR United Kingdom Tri PartyESG Developed World All Cap Equity Index Fund Bond $88,259 AAA 3 months to 1 year USD United Kingdom Tri PartyESG Developed World All Cap Equity Index Fund Bond $1,697,247 AAA > 1 year USD United Kingdom Tri PartyESG Developed World All Cap Equity Index Fund Bond $635,779 F1+ 1 month to 3 months USD United Kingdom Tri PartyESG Emerging Markets All Cap Equity Index Fund Bond $45 NR 1 week to 1 month EUR United Kingdom Tri PartyESG Emerging Markets All Cap Equity Index Fund Bond $311 NR 3 months to 1 year EUR United Kingdom Tri PartyESG Emerging Markets All Cap Equity Index Fund Bond $1,878 NR > 1 year EUR United Kingdom Tri PartyESG Emerging Markets All Cap Equity Index Fund Bond $82,921 NR 3 months to 1 year USD United Kingdom Tri PartyESG Emerging Markets All Cap Equity Index Fund Bond $206,288 AA- > 1 year GBP United Kingdom Tri PartyESG Emerging Markets All Cap Equity Index Fund Bond $6,678 AA 3 months to 1 year EUR United Kingdom Tri PartyESG Emerging Markets All Cap Equity Index Fund Bond $157,484 AA > 1 year EUR United Kingdom Tri PartyESG Emerging Markets All Cap Equity Index Fund Bond $1,180 AAA 3 months to 1 year EUR United Kingdom Tri PartyESG Emerging Markets All Cap Equity Index Fund Bond $145,568 AAA > 1 year EUR United Kingdom Tri PartyESG Emerging Markets All Cap Equity Index Fund Bond $7,463 AAA 3 months to 1 year USD United Kingdom Tri PartyESG Emerging Markets All Cap Equity Index Fund Bond $15,702 AAA > 1 year USD United Kingdom Tri PartyESG Emerging Markets All Cap Equity Index Fund Bond $3,328 F1+ 1 month to 3 months USD United Kingdom Tri PartyEuropean Stock Index Fund Bond $3,205,204 AA > 1 year EUR United Kingdom Tri PartyEuropean Stock Index Fund Bond $8,637,676 AAA > 1 year EUR United Kingdom Tri Party

1137
Additional Information From the Directors
FundType of
CollateralCollateral Amount
Fitch Rating
Maturity Tenor of Collateral
Currency of Collateral
Country of Counterparty
EstablishmentSettlement
and ClearingEuropean Stock Index Fund Bond $5,208,904 AAA > 1 year USD United Kingdom Tri PartyEuropean Stock Index Fund Bond $4,917,406 F1+ 1 month to 3 months USD United Kingdom Tri PartyEurozone Stock Index Fund Bond €3,689 AA- > 1 year GBP United Kingdom Tri PartyEurozone Stock Index Fund Bond €235,371 AA 3 months to 1 year EUR United Kingdom Tri PartyEurozone Stock Index Fund Bond €2,400,259 AA > 1 year EUR United Kingdom Tri PartyEurozone Stock Index Fund Bond €66,726 AAA 3 months to 1 year EUR United Kingdom Tri PartyEurozone Stock Index Fund Bond €6,503,911 AAA > 1 year EUR United Kingdom Tri PartyEurozone Stock Index Fund Bond €42,594 AAA 3 months to 1 year USD United Kingdom Tri PartyEurozone Stock Index Fund Bond €2,437,901 AAA > 1 year USD United Kingdom Tri PartyEurozone Stock Index Fund Bond €1,651,372 F1+ 1 month to 3 months USD United Kingdom Tri PartyGlobal Small-Cap Index Fund Bond $3,241 NR 1 week to 1 month EUR United Kingdom Tri PartyGlobal Small-Cap Index Fund Bond $423,300 NR 3 months to 1 year EUR United Kingdom Tri PartyGlobal Small-Cap Index Fund Bond $2,560,290 NR > 1 year EUR United Kingdom Tri PartyGlobal Small-Cap Index Fund Bond $4,239,298 NR 3 months to 1 year USD United Kingdom Tri PartyGlobal Small-Cap Index Fund Bond $13,834,406 AA- > 1 year GBP United Kingdom Tri PartyGlobal Small-Cap Index Fund Bond $4,442,381 AA 3 months to 1 year EUR United Kingdom Tri PartyGlobal Small-Cap Index Fund Bond $31,585,986 AA > 1 year EUR United Kingdom Tri PartyGlobal Small-Cap Index Fund Bond $1,208,210 AAA 3 months to 1 year EUR United Kingdom Tri PartyGlobal Small-Cap Index Fund Bond $22,159,781 AAA > 1 year EUR United Kingdom Tri PartyGlobal Small-Cap Index Fund Bond $1,114,301 AAA 3 months to 1 year USD United Kingdom Tri PartyGlobal Small-Cap Index Fund Bond $28,124,370 AAA > 1 year USD United Kingdom Tri PartyGlobal Small-Cap Index Fund Bond $14,779,114 F1+ 1 month to 3 months USD United Kingdom Tri PartyGlobal Stock Index Fund Bond $11,120 NR 3 months to 1 year EUR United Kingdom Tri PartyGlobal Stock Index Fund Bond $67,259 NR > 1 year EUR United Kingdom Tri PartyGlobal Stock Index Fund Bond $9,764,425 NR 3 months to 1 year USD United Kingdom Tri PartyGlobal Stock Index Fund Bond $25,867,801 AA- > 1 year GBP United Kingdom Tri PartyGlobal Stock Index Fund Bond $1,250,805 AA 3 months to 1 year EUR United Kingdom Tri PartyGlobal Stock Index Fund Bond $22,925,621 AA > 1 year EUR United Kingdom Tri PartyGlobal Stock Index Fund Bond $354,595 AAA 3 months to 1 year EUR United Kingdom Tri PartyGlobal Stock Index Fund Bond $10,163,328 AAA > 1 year EUR United Kingdom Tri PartyGlobal Stock Index Fund Bond $1,016,505 AAA 3 months to 1 year USD United Kingdom Tri PartyGlobal Stock Index Fund Bond $8,062,030 AAA > 1 year USD United Kingdom Tri PartyGlobal Stock Index Fund Bond $4,156,110 F1+ 1 month to 3 months USD United Kingdom Tri PartyJapan Stock Index Fund Bond €21,613,887 NR 3 months to 1 year USD United Kingdom Tri PartyJapan Stock Index Fund Bond €54,330,761 AA- > 1 year GBP United Kingdom Tri PartyJapan Stock Index Fund Bond €36,843,746 AA 3 months to 1 year EUR United Kingdom Tri PartyJapan Stock Index Fund Bond €44,941,016 AA > 1 year EUR United Kingdom Tri PartyJapan Stock Index Fund Bond €10,444,956 AAA 3 months to 1 year EUR United Kingdom Tri PartyJapan Stock Index Fund Bond €5,553,134 AAA > 1 year EUR United Kingdom Tri PartyJapan Stock Index Fund Bond €8,416,481 AAA 3 months to 1 year USD United Kingdom Tri PartyJapan Stock Index Fund Bond €108,311,923 AAA > 1 year USD United Kingdom Tri PartyJapan Stock Index Fund Bond €487,239 F1+ 1 month to 3 months USD United Kingdom Tri PartySRI European Stock Fund Bond €135 NR 1 week to 1 month EUR United Kingdom Tri PartySRI European Stock Fund Bond €329 AA- > 1 year GBP United Kingdom Tri PartySRI European Stock Fund Bond €28,522 AA 3 months to 1 year EUR United Kingdom Tri PartySRI European Stock Fund Bond €1,455,740 AA > 1 year EUR United Kingdom Tri PartySRI European Stock Fund Bond €5,952 AAA 3 months to 1 year EUR United Kingdom Tri PartySRI European Stock Fund Bond €398,203 AAA > 1 year EUR United Kingdom Tri PartySRI European Stock Fund Bond €3,799 AAA 3 months to 1 year USD United Kingdom Tri PartySRI European Stock Fund Bond €297,634 AAA > 1 year USD United Kingdom Tri PartySRI European Stock Fund Bond €222,990 F1+ 1 month to 3 months USD United Kingdom Tri PartyU.S. 500 Stock Index Fund Bond $275 AA- > 1 year GBP United Kingdom Tri PartyU.S. 500 Stock Index Fund Bond $17,575 AA 3 months to 1 year EUR United Kingdom Tri PartyU.S. 500 Stock Index Fund Bond $4,982 AAA 3 months to 1 year EUR United Kingdom Tri PartyU.S. 500 Stock Index Fund Bond $2,649 AAA > 1 year EUR United Kingdom Tri PartyU.S. 500 Stock Index Fund Bond $3,180 AAA 3 months to 1 year USD United Kingdom Tri PartyU.S. 500 Stock Index Fund Bond $713,357 AAA > 1 year USD United Kingdom Tri PartyU.S. 500 Stock Index Fund Bond $624,893 F1+ 1 month to 3 months USD United Kingdom Tri PartyU.S. Opportunities Fund Bond $154,853 NR 3 months to 1 year USD United Kingdom Tri PartyU.S. Opportunities Fund Bond $416,551 AA- > 1 year GBP United Kingdom Tri PartyU.S. Opportunities Fund Bond $2,005,640 AA 3 months to 1 year EUR United Kingdom Tri PartyU.S. Opportunities Fund Bond $264,027 AA > 1 year EUR United Kingdom Tri PartyU.S. Opportunities Fund Bond $568,585 AAA 3 months to 1 year EUR United Kingdom Tri PartyU.S. Opportunities Fund Bond $302,292 AAA > 1 year EUR United Kingdom Tri PartyU.S. Opportunities Fund Bond $375,483 AAA 3 months to 1 year USD United Kingdom Tri PartyU.S. Opportunities Fund Bond $13,591,330 AAA > 1 year USD United Kingdom Tri PartyU.S. Opportunities Fund Bond $7,291,110 F1+ 1 month to 3 months USD United Kingdom Tri Party

1138
Additional Information From the Directors
Return/CostsThe securities lending agent appointed is Brown Brothers Harriman & Co. All securities lending revenue, with the exception of a lending agent fee, is received directly into the Funds.
All operational costs in supporting the lending programme are borne by the lending agent and paid directly out of the agent lender fee received.
The current securities lending income split between the relevant Fund and the securities lending agent for the period ended 30 June 2021 is as follows:
Fund Returns Amount% Overall
ReturnsEmerging Markets Stock Index Fund To Fund: $532,385 91Emerging Markets Stock Index Fund To Lending Agent: $54,090 9ESG Developed World All Cap Equity Index Fund To Fund: $105,232 90ESG Developed World All Cap Equity Index Fund To Lending Agent: $11,105 10ESG Emerging Markets All Cap Equity Index Fund To Fund: $1,190 90ESG Emerging Markets All Cap Equity Index Fund To Lending Agent: $129 10European Stock Index Fund To Fund: $622,975 90European Stock Index Fund To Lending Agent: $67,667 10Eurozone Stock Index Fund To Fund: €111,710 90Eurozone Stock Index Fund To Lending Agent: €12,016 10Global Small-Cap Index Fund To Fund: $1,185,238 91Global Small-Cap Index Fund To Lending Agent: $118,799 9Global Stock Index Fund To Fund: $719,542 90Global Stock Index Fund To Lending Agent: $77,598 10Japan Stock Index Fund To Fund: €191,170 91Japan Stock Index Fund To Lending Agent: €18,837 9Pacific ex-Japan Stock Index Fund To Fund: €18,083 90Pacific ex-Japan Stock Index Fund To Lending Agent: €2,009 10SRI European Stock Fund To Fund: €43,871 90SRI European Stock Fund To Lending Agent: €4,637 10U.S. 500 Stock Index Fund To Fund: $37,646 91U.S. 500 Stock Index Fund To Lending Agent: $3,636 9U.S. Opportunities Fund To Fund: $134,260 91U.S. Opportunities Fund To Lending Agent: $12,604 9

Additional Information for Investors in the Federal Republic of Germany
1139
Additional Information for Investors in the Federal Republic of Germany
J.P. Morgan AG, Junghofstrasse 14, D-60311 Frankfurt am Main has undertaken the function of Paying and Information Agent for the Company in the Federal Republic of Germany (the “German Paying and Information Agent”).
Applications for the redemptions and conversion of Shares may be sent to the German Paying and Information Agent. All payments to investors, including redemption proceeds and potential distributions, may, upon request, be paid through the German Paying and Information Agent.
The Prospectus together with its supplements, the key investor information documents, the Memorandum and Articles of Association of the Company and the annual and semi-annual reports may be obtained, free of charge, in hard-copy form at the office of the German Paying and Information Agent during normal opening hours. The statement of changes in the composition of the investment portfolio is also free of charge upon request at the office of the German Paying and Information Agent.
Issue, redemption and conversion prices of Shares, and any other information to the shareholders, are also available, free of charge, from the German Paying and Information Agent.
The issue, redemption and conversion prices will be published on the following website: www.fundinfo.com.
Any other information to the shareholders will be published in Germany by way of investor letter.
1140
London Stock Exchange Group companies include FTSE International Limited (“FTSE”), Frank Russell Company (“Russell”), MTS Next Limited (“MTS”), and FTSE TMX Global Debt Capital Markets Inc. (“FTSE TMX”). All rights reserved. “FTSE®”, “Russell®”, “MTS®”, “FTSE TMX®” and “FTSE Russell” and other service marks and trademarks related to the FTSE or Russell indexes are trademarks of the London Stock Exchange Group companies and are used by FTSE, MTS, FTSE TMX and Russell under license. All information is provided for information purposes only. Every effort is made to ensure that all information given in this publication is accurate, but no responsibility or liability can be accepted by the London Stock Exchange Group companies nor its licensors for any errors or for any loss from use of this publication. Neither the London Stock Exchange Group companies nor any of their licensors make any claim, prediction, warranty or representation whatsoever, expressly or impliedly, either as to the results to be obtained from the use of the Indices or the fitness or suitability of the Indices for any particular purpose to which they might be put. The London Stock Exchange Group companies do not provide investment advice and nothing in this document should be taken as constituting financial or investment advice. The London Stock Exchange Group companies make no representation regarding the advisability of investing in any asset. A decision to invest in any such asset should not be made in reliance on any information herein. Indexes cannot be invested in directly. Inclusion of an asset in an index is not a recommendation to buy, sell or hold that asset. The general information contained in this publication should not be acted upon without obtaining specific legal, tax, and investment advice from a licensed professional. No part of this information may be reproduced, stored in a retrieval system or transmitted in any form or by any means, electronic, mechanical, photocopying, recording or otherwise, without prior written permission of the London Stock Exchange Group companies. Distribution of the London Stock Exchange Group companies' index values and the use of their indexes to create financial products require a license with FTSE, FTSE TMX, MTS and/or Russell and/or its licensors.
The Industry Classification Benchmark (“ICB”) is owned by FTSE. FTSE does not accept any liability to any person for any loss or damage arising out of any error or omission in the ICB.
Information has been obtained from sources believed to be reliable but J.P. Morgan does not warrant its completeness or accuracy. The Index referenced herein is used with permission. The Index may not be copied, used, or distributed without J.P. Morgan’s prior written approval. Copyright 2016, J.P. Morgan Chase & Co. All rights reserved.
THIS FUND IS NOT SPONSORED, ENDORSED, SOLD OR PROMOTED BY MSCI INC. (“MSCI”), ANY OF ITS AFFILIATES, ANY OF ITS DIRECT OR INDIRECT INFORMATION PROVIDERS OR ANY OTHER THIRD PARTY INVOLVED IN, OR RELATED TO, COMPILING, COMPUTING OR CREATING ANY MSCI INDEX (COLLECTIVELY, THE “MSCI PARTIES”). THE MSCI INDEXES ARE THE EXCLUSIVE PROPERTY OF MSCI. MSCI AND THE MSCI INDEX NAMES ARE SERVICE MARK(S) OF MSCI OR ITS AFFILIATES AND HAVE BEEN LICENSED FOR USE FOR CERTAIN PURPOSES BY VANGUARD. NONE OF THE MSCI PARTIES MAKES ANY REPRESENTATION OR WARRANTY, EXPRESS OR IMPLIED, TO THE OWNERS OF THIS FUND OR ANY MEMBER OF THE PUBLIC REGARDING THE ADVISABILITY OF INVESTING IN FUNDS GENERALLY OR IN THIS FUND PARTICULARLY OR THE ABILITY OF ANY MSCI INDEX TO TRACK CORRESPONDING STOCK MARKET PERFORMANCE. MSCI OR ITS AFFILIATES ARE THE LICENSORS OF CERTAIN TRADEMARKS, SERVICE MARKS AND TRADE NAMES AND OF THE MSCI INDEXES WHICH ARE DETERMINED, COMPOSED AND CALCULATED BY MSCI WITHOUT REGARD TO THIS FUND OR THE ISSUER OR OWNER OF THIS FUND. NONE OF THE MSCI PARTIES HAS ANY OBLIGATION TO TAKE THE NEEDS OF THE ISSUERS OR OWNERS OF THIS FUND INTO CONSIDERATION IN DETERMINING, COMPOSING OR CALCULATING THE MSCI INDEXES. NONE OF THE MSCI PARTIES IS RESPONSIBLE FOR OR HAS PARTICIPATED IN THE DETERMINATION OF THE TIMING OF, PRICES AT, OR QUANTITIES OF THIS FUND TO BE ISSUED OR IN THE DETERMINATION OR CALCULATION OF THE CONSIDERATION INTO WHICH THIS FUND IS REDEEMABLE. NONE OF THE MSCI PARTIES HAS ANY OBLIGATION OR LIABILITY TO THE OWNERS OF THIS FUND IN CONNECTION WITH THE ADMINISTRATION, MARKETING OR OFFERING OF THIS FUND.
ALTHOUGH MSCI SHALL OBTAIN INFORMATION FOR INCLUSION IN OR FOR USE IN THE CALCULATION OF THE MSCI INDEXES FROM SOURCES WHICH MSCI CONSIDERS RELIABLE, NONE OF THE MSCI PARTIES WARRANTS OR GUARANTEES THE ORIGINALITY, ACCURACY AND/OR THE COMPLETENESS OF ANY MSCI INDEX OR ANY DATA INCLUDED THEREIN. NONE OF THE MSCI PARTIES MAKES ANY WARRANTY, EXPRESS OR IMPLIED, AS TO RESULTS TO BE OBTAINED BY LICENSEE, LICENSEE’S CUSTOMERS OR COUNTERPARTIES, ISSUERS OF THE FUNDS, OWNERS OF THE FUNDS, OR ANY OTHER PERSON OR ENTITY, FROM THE USE OF ANY MSCI INDEX OR ANY DATA INCLUDED THEREIN IN CONNECTION WITH THE RIGHTS LICENSED HEREUNDER OR FOR ANY OTHER USE. NONE OF THE MSCI PARTIES SHALL HAVE ANY LIABILITY FOR ANY ERRORS, OMISSIONS OR INTERRUPTIONS OF OR IN CONNECTION WITH ANY MSCI INDEX OR ANY DATA INCLUDED THEREIN. FURTHER, NONE OF THE MSCI PARTIES MAKES ANY EXPRESS OR IMPLIED WARRANTIES OF ANY KIND, AND THE MSCI PARTIES HEREBY EXPRESSLY DISCLAIM ALL WARRANTIES OF MERCHANTABILITY OR FITNESS FOR A PARTICULAR PURPOSE, WITH RESPECT TO ANY MSCI INDEX AND ANY DATA INCLUDED THEREIN. WITHOUT LIMITING ANY OF THE FOREGOING, IN NO EVENT SHALL ANY OF THE MSCI PARTIES HAVE ANY LIABILITY FOR ANY DIRECT, INDIRECT, SPECIAL, PUNITIVE, CONSEQUENTIAL OR ANY OTHER DAMAGES (INCLUDING WITHOUT LIMITATION LOST PROFITS) EVEN IF NOTIFIED OF THE POSSIBILITY OF SUCH DAMAGES.
The S&P 500 Index is a product of S&P Dow Jones Indices LLC, a division of S&P Global, or its affiliates (“SPDJI”), and has been licensed for use by Vanguard. Standard & Poor’s®, and S&P® are registered trademarks of Standard & Poor’s Financial Services LLC, a division of S&P Global (“S&P”) and Dow Jones® is a registered trademark of Dow Jones Trademark Holdings LLC (“Dow Jones”). The trademarks have been licensed to SPDJI and have been sublicensed for use for certain purposes by Vanguard. Vanguard U.S. 500 Stock Index Fund is not sponsored, endorsed, sold or promoted by SPDJI, Dow Jones, S&P, any of their respective affiliates (collectively, “S&P Dow Jones Indices”). S&P Dow Jones Indices make no representation or warranty, express or implied, to the owners of Vanguard U.S. 500 Stock Index Fund or any member of the public regarding the advisability of investing in securities generally or in Vanguard U.S. 500 Stock Index Fund particularly or the ability of the S&P 500 Index to track general market performance. S&P Dow Jones Indices’ only relationship to Vanguard with respect to the S&P 500 Index is the licensing of the Index and certain trademarks, service marks and/or trade names of S&P Dow Jones Indices and/or its licensors. The S&P 500 Index is determined, composed and calculated by S&P Dow Jones Indices without regard to Vanguard or Vanguard U.S. 500 Stock Index Fund. S&P Dow Jones Indices have no obligation to take the needs of Vanguard or the owners of Vanguard U.S. 500 Stock Index Fund into consideration in determining, composing or calculating the S&P 500 Index. S&P Dow Jones Indices are not responsible for and have not participated in the determination of the prices, and amount of Vanguard U.S. 500 Stock Index Fund or the timing of the issuance or sale of Vanguard U.S. 500 Stock Index Fund or in the determination or calculation of the equation by which Vanguard U.S. 500 Stock Index Fund is to be converted into cash, surrendered or redeemed, as the case may be. S&P Dow Jones Indices have no obligation or liability in connection with the administration, marketing or trading of Vanguard U.S. 500 Stock Index Fund. There is no assurance that investment products based on the S&P 500 Index will accurately track index performance or provide positive investment returns. S&P Dow Jones Indices LLC is not an investment advisor. Inclusion of a security within an index is not a recommendation by S&P Dow Jones Indices to buy, sell, or hold such security, nor is it considered to be investment advice.
S&P DOW JONES INDICES DOES NOT GUARANTEE THE ADEQUACY, ACCURACY, TIMELINESS AND/OR THE COMPLETENESS OF THE S&P 500 INDEX OR ANY DATA RELATED THERETO OR ANY COMMUNICATION, INCLUDING BUT NOT LIMITED TO, ORAL OR WRITTEN COMMUNICATION (INCLUDING ELECTRONIC COMMUNICATIONS) WITH RESPECT THERETO. S&P DOW JONES INDICES SHALL NOT BE SUBJECT TO ANY DAMAGES OR LIABILITY FOR ANY ERRORS, OMISSIONS, OR DELAYS THEREIN. S&P DOW JONES INDICES MAKE NO EXPRESS OR IMPLIED WARRANTIES, AND EXPRESSLY DISCLAIMS ALL WARRANTIES, OF MERCHANTABILITY OR FITNESS FOR A PARTICULAR PURPOSE OR USE OR AS TO RESULTS TO BE OBTAINED BY VANGUARD, OWNERS OF VANGUARD U.S. 500 STOCK INDEX FUND, OR ANY OTHER PERSON OR ENTITY FROM THE USE OF THE S&P 500 INDEX OR WITH RESPECT TO ANY DATA RELATED THERETO. WITHOUT LIMITING ANY OF THE FOREGOING, IN NO EVENT WHATSOEVER SHALL S&P DOW JONES INDICES BE LIABLE FOR ANY INDIRECT, SPECIAL, INCIDENTAL, PUNITIVE, OR CONSEQUENTIAL DAMAGES INCLUDING BUT NOT LIMITED TO, LOSS OF PROFITS, TRADING LOSSES, LOST TIME OR GOODWILL, EVEN IF THEY HAVE BEEN ADVISED OF THE POSSIBILITY OF SUCH DAMAGES, WHETHER IN CONTRACT, TORT, STRICT LIABILITY, OR OTHERWISE. THERE ARE NO THIRD PARTY BENEFICIARIES OF ANY AGREEMENTS OR ARRANGEMENTS BETWEEN S&P DOW JONES INDICES AND VANGUARD, OTHER THAN THE LICENSORS OF S&P DOW JONES INDICES.

1141
BLOOMBERG is a trademark and service mark of Bloomberg Finance L.P. BARCLAYS is a trademark and service mark of Barclays Bank Plc, used under license. Bloomberg Finance L.P. and its affiliates, including Bloomberg Index Services Limited (BISL) (collectively, Bloomberg), or Bloomberg’s licensors, own all proprietary rights in the Bloomberg Barclays Euro Treasury 20+ Year Bond Index, Bloomberg Barclays Euro Government Float Adjusted Bond Index, Bloomberg Barclays EUR Non-Government Float Adjusted Bond Index, Bloomberg Barclays Global Inflation-Linked: Eurozone – Euro CPI Index, Bloomberg Barclays Global Aggregate Float Adjusted Bond Index, Bloomberg Barclays Global Aggregate Float Adjusted Corporate Index Hedged, Bloomberg Barclays Global Aggregate Credit Index Hedged, Bloomberg Barclays Global Aggregate Ex US MBS 1–5 Year Float Adjusted Bond Index, Bloomberg Barclays Global Aggregate Corporate 1–5 Year Float Adjusted Index, Bloomberg Barclays Japan Government Float Adjusted Bond Index, Bloomberg Barclays U.K. Government Float Adjusted Bond Index, Bloomberg Barclays GBP Non-Government Float Adjusted Bond Index, Bloomberg Barclays GBP Non-Government 1–5 Year 200MM Float Adjusted Bond Index, Bloomberg Barclays U.S. Government Float Adjusted Bond Index, Bloomberg Barclays Global Aggregate USD Credit Float Adjusted Bond Index, and Bloomberg Barclays U.S. Government Inflation-Linked 1–10 Year Index (the Indices or Bloomberg Barclays Indices).
Neither Barclays Bank Plc, Barclays Capital Inc., or any affiliate (collectively Barclays) or Bloomberg is the issuer or producer of the Vanguard Funds and neither Bloomberg nor Barclays has any responsibilities, obligations or duties to investors in the Vanguard Funds. The Indices are licensed for use by The Vanguard Group, Inc. (Vanguard) as the sponsor of the Vanguard Funds. Bloomberg and Barclays’ only relationship with Vanguard in respect of the Indices is the licensing of the Indices, which are determined, composed and calculated by BISL, or any successor thereto, without regard to the Issuer or the Vanguard Funds or the owners of the Vanguard Funds.
Additionally, Vanguard may for itself execute transaction(s) with Barclays in or relating to the Indices in connection with the Vanguard Funds. Investors acquire the Vanguard Funds from Vanguard and investors neither acquire any interest in the Indices nor enter into any relationship of any kind whatsoever with Bloomberg or Barclays upon making an investment in the Vanguard Funds. The Vanguard Funds are not sponsored, endorsed, sold or promoted by Bloomberg or Barclays. Neither Bloomberg nor Barclays makes any representation or warranty, express or implied regarding the advisability of investing in the Vanguard Funds or the advisability of investing in securities generally or the ability of the Indices to track corresponding or relative market performance. Neither Bloomberg nor Barclays has passed on the legality or suitability of the Vanguard Funds with respect to any person or entity. Neither Bloomberg nor Barclays is responsible for and has not participated in the determination of the timing of, prices at, or quantities of the Vanguard Funds to be issued. Neither Bloomberg nor Barclays has any obligation to take the needs of the Issuer or the owners of the Vanguard Funds or any other third party into consideration in determining, composing or calculating the Indices. Neither Bloomberg nor Barclays has any obligation or liability in connection with administration, marketing or trading of the Vanguard Funds.
The licensing agreement between Bloomberg and Barclays is solely for the benefit of Bloomberg and Barclays and not for the benefit of the owners of the Vanguard Funds, investors or other third parties. In addition, the licensing agreement between Vanguard and Bloomberg is solely for the benefit of Vanguard and Bloomberg and not for the benefit of the owners of the Vanguard Funds, investors or other third parties.
NEITHER BLOOMBERG NOR BARCLAYS SHALL HAVE ANY LIABILITY TO THE ISSUER, INVESTORS OR TO OTHER THIRD PARTIES FOR THE QUALITY, ACCURACY AND/OR COMPLETENESS OF THE BLOOMBERG BARCLAYS INDICES OR ANY DATA INCLUDED THEREIN OR FOR INTERRUPTIONS IN THE DELIVERY OF THE BLOOMBERG BARCLAYS INDICES. NEITHER BLOOMBERG NOR BARCLAYS MAKES ANY WARRANTY, EXPRESS OR IMPLIED, AS TO RESULTS TO BE OBTAINED BY THE ISSUER, THE INVESTORS OR ANY OTHER PERSON OR ENTITY FROM THE USE OF THE BLOOMBERG BARCLAYS INDICES OR ANY DATA INCLUDED THEREIN. NEITHER BLOOMBERG NOR BARCLAYS MAKES ANY EXPRESS OR IMPLIED WARRANTIES, AND EACH HEREBY EXPRESSLY DISCLAIMS ALL WARRANTIES OF MERCHANTABILITY OR FITNESS FOR A PARTICULAR PURPOSE OR USE WITH RESPECT TO THE BLOOMBERG BARCLAYS INDICES OR ANY DATA INCLUDED THEREIN. BLOOMBERG RESERVES THE RIGHT TO CHANGE THE METHODS OF CALCULATION OR PUBLICATION, OR TO CEASE THE CALCULATION OR PUBLICATION OF THE BLOOMBERG BARCLAYS INDICES, AND NEITHER BLOOMBERG NOR BARCLAYS SHALL BE LIABLE FOR ANY MISCALCULATION OF OR ANY INCORRECT, DELAYED OR INTERRUPTED PUBLICATION WITH RESPECT TO THE BLOOMBERG BARCLAYS INDICES. NEITHER BLOOMBERG NOR BARCLAYS SHALL BE LIABLE FOR ANY DAMAGES, INCLUDING, WITHOUT LIMITATION, ANY SPECIAL, INDIRECT OR CONSEQUENTIAL DAMAGES, OR ANY LOST PROFITS AND EVEN IF ADVISED OF THE POSSIBILITY OF SUCH, RESULTING FROM THE USE OF THE BLOOMBERG BARCLAYS INDICES OR ANY DATA INCLUDED THEREIN OR WITH RESPECT TO THE VANGUARD FUNDS.
None of the information supplied by Bloomberg or Barclays and used in this publication may be reproduced in any manner without the prior written permission of both Bloomberg and Barclays Capital, the investment banking division of Barclays Bank Plc. Barclays Bank Plc is registered in England No. 1026167. Registered office 1 Churchill Place London E14 5HP.
© 2021 Bloomberg. Used with Permission.
Source: Bloomberg Index Services Limited. Copyright 2021, Bloomberg. All rights reserved.

Board of Directors1
Peter Blessing2 (Irish)William Slattery2 (Irish)Michael S. Miller (American)Sean P. Hagerty (American)Tara Doyle2 (Irish)Ann Stock3 (British)Karin A. Risi4 (American)Robyn Laidlaw (New Zealand)
ManagerVanguard Group (Ireland) Limited70 Sir John Rogerson’s QuayDublin 2Ireland
Investment Manager Vanguard Global Advisers, LLC100 Vanguard BoulevardMalvem, PA 19355USA
Sponsoring Euronext Dublin BrokerJ & E DavyDavy House49 Dawson StreetDublin 2Ireland
DepositaryBrown Brothers Harriman Trustee Services (Ireland) Limited30 Herbert StreetDublin 2 Ireland
Administrator, Registrar and Transfer Agent Brown Brothers Harriman Fund Administration Services (Ireland) Limited30 Herbert StreetDublin 2 Ireland
Secretary for the Company and ManagerMatsack Trust Limited 70 Sir John Rogerson’s QuayDublin 2Ireland
Legal Advisors as to Matters of Irish LawWilliam Fry2 Grand Canal SquareDublin 2Ireland
Independent AuditorsPricewaterhouseCoopersOne Spencer DockNorth Wall QuayDublin 1Ireland
1 Richard Wane resigned as a Director of the Company on 31 March 2021.2 Served in an independent, non-executive capacity during the year.3 Ann Stock was appointed as Director on 1 April 2021.4 Karin A. Risi was appointed as Director on 22 July 2021.

Connect with Vanguard® > vanguard.com
Brown Brothers Harriman Fund Administration Services (Ireland) Limited 30 Herbert StreetDublin 2Ireland
Investor Information and Services (Ireland)Fax: 353-1-612-3067Phone: 353-1-612-3226
World Wide Webhttp://global.vanguard.com
© 2021 Vanguard Group (Ireland) Limited.All rights reserved.
QVIL0 082021
This report is intended for the Funds’ shareholders. It may not be distributed to prospective investors unless it is preceded or accompanied by the Company’s current prospectus.
All comparative mutual fund data are from Lipper, a Thomson Reuters Company, or Morningstar, Inc., unless otherwise noted.