Vanguard Investments Funds ICVC
128
Vanguard Investments Funds ICVC Annual Report and Financial Statements | 31 October 2015 (An open-ended investment company incorporated with limited liability and registered in England and Wales under registered number IC000758)
-
Upload
khangminh22 -
Category
Documents
-
view
2 -
download
0
Transcript of Vanguard Investments Funds ICVC
Vanguard Investments Funds ICVC
Annual Report and Financial Statements | 31 October 2015
(An open-ended investment company incorporated with limited liability and registered in England and Wales under registered number IC000758)
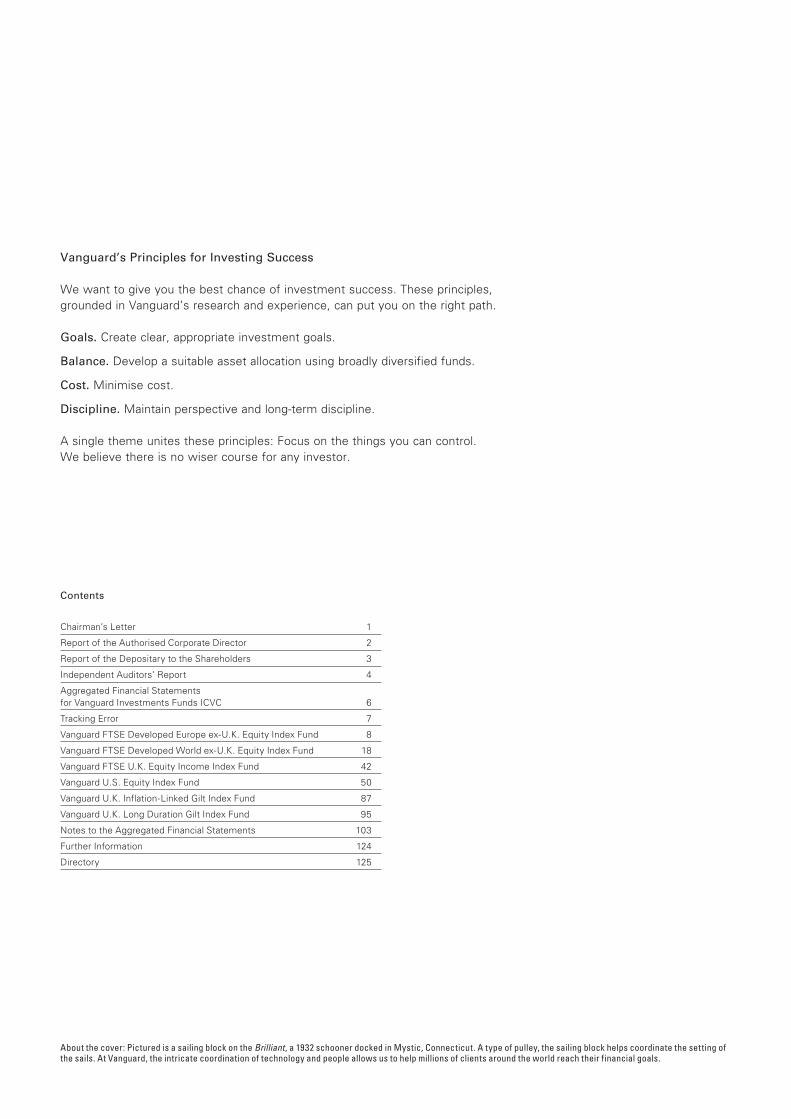
Contents
Chairman’s Letter 1
Report of the Authorised Corporate Director 2
Report of the Depositary to the Shareholders 3
Independent Auditors’ Report 4
Aggregated Financial Statements for Vanguard Investments Funds ICVC 6
Tracking Error 7
Vanguard FTSE Developed Europe ex-U.K. Equity Index Fund 8
Vanguard FTSE Developed World ex-U.K. Equity Index Fund 18
Vanguard FTSE U.K. Equity Income Index Fund 42
Vanguard U.S. Equity Index Fund 50
Vanguard U.K. Inflation-Linked Gilt Index Fund 87
Vanguard U.K. Long Duration Gilt Index Fund 95
Notes to the Aggregated Financial Statements 103
Further Information 124
Directory 125
Vanguard’s Principles for Investing Success
We want to give you the best chance of investment success. These principles, grounded in Vanguard’s research and experience, can put you on the right path.
Goals. Create clear, appropriate investment goals.
Balance. Develop a suitable asset allocation using broadly diversified funds.
Cost. Minimise cost.
Discipline. Maintain perspective and long-term discipline.
A single theme unites these principles: Focus on the things you can control. We believe there is no wiser course for any investor.
About the cover: Pictured is a sailing block on the Brilliant, a 1932 schooner docked in Mystic, Connecticut. A type of pulley, the sailing block helps coordinate the setting of the sails. At Vanguard, the intricate coordination of technology and people allows us to help millions of clients around the world reach their financial goals.

1
Dear Shareholder,
The fiscal year ended 31 October 2015 was a volatile one for the world’s equity markets. Domestic and international markets struggled late in the period. Although results varied dramatically among countries, stocks of developed economies generally held up better than those of emerging-market economies.
Uncertainty about when the US Federal Reserve might begin raising interest rates weighed on sentiment at times, but a host of other factors also contributed to the bumpy ride. They included twists and turns in Greek debt negotiations, mounting signs of a marked slowdown in China and disinflationary pressures from the drop in the price of oil and other commodities.
Despite the concerns, further monetary easing by many central banks helped push stock indices in a number of countries to all-time highs by spring. But volatility followed, leaving UK and US stocks little changed in the final six months of the period. The end result was modest gains for both markets.
The fundamentals of the British economy remained healthy overall, with output expanding, unemployment edging lower and wages rising. However, the prospect of a weaker global economy dampened enthusiasm for stocks toward the end of the period, and the drop in commodities prices hurt energy and mining stocks in particular.
The economic picture in Europe was mixed. After initially posting gains, European stocks retreated in the second half of the period, with weakness in the automobile segment contributing to the industrial sector’s placing among the laggards, alongside energy and materials. Europe as a whole ended the period in positive territory, but results among countries varied widely. Ireland notched the best result, while Greece lost the most. The largest markets – Germany, France and Switzerland – registered gains that were reduced modestly by the weakened euro.
In the United States, the economy accelerated modestly after almost grinding to a halt at the beginning of 2015, and the unemployment rate fell to a seven-year low in August. Inflation, however, remained well below the Fed’s 2% target, and stock valuations concerned investors at times. After skidding in August and September, US stocks staged a robust rally in October as the Fed kept its short-term interest rates at historical lows. (In mid-December, weeks after the close of the reporting period, the Fed raised its target for those rates to 0.25%–0.5%.) Corporate earnings, although lower than in recent years, mostly exceeded expectations.
Notably, the strength of the US dollar helped results for UK investors when US returns were translated back into pounds.
In the Pacific region, the drop in commodities, triggered by weakened demand from China and the strong US dollar, hindered results for some countries. Australia, a big exporter of commodities, declined substantially. However, strong returns in Japan, the world’s third-largest economy, more than offset these losses.
Declining commodities prices also weighed heavily on emerging-market countries. In China, weaker-than-expected manufacturing data, a surprising devaluation of the country’s currency and a sharp correction in the stock market sparked concern about policymakers’ ability to engineer a soft landing for the economy. Knock-on effects were felt across the globe but especially among China’s biggest trading partners and commodity-oriented emerging markets.
Several of the other bigger emerging economies, including Taiwan, India and South Korea, posted losses. Brazil, which relies heavily on commodity exports to China, was hit particularly hard, with its market declining nearly 50%.
Global bond market returns were generally positive when calculated in local currencies as investors favored safe-haven assets during periods of stock market volatility. Bond prices were also supported by continued aggressive monetary stimulus by several key central banks.
In the United Kingdom, gilt yields, which fell in the first six months of the period, recovered a bit but still ended lower. The same was true for inflation-linked gilts as inflation remained dormant. The European Central Bank’s decision to step up quantitative easing in the euro zone further stimulated demand from income-hungry investors.
As always, thank you for your confidence in Vanguard Investments UK, Limited.
Yours faithfully,
F. William McNabb III Chairman The Vanguard Group, Inc. 29 February 2016
Chairman’s Letter
Vanguard Investments Funds ICVC Report of the Authorised Corporate DirectorYear ended 31 October 2015
The Authorised Corporate Director (“ACD”) of Vanguard Investments Funds ICVC (the “Company”) is Vanguard Investments UK., Limited. The ACD is the sole director of the Company. The Depositary is State Street Trustees Limited and the Independent Auditors are PricewaterhouseCoopers LLP. The Company is an authorised open-ended investment company with variable capital under Regulation 12 (Authorisation) of the Open Ended Investment Companies Regulations 2001 (as amended) and the shareholders are not liable for the debts of the Company.
The Company is structured as an umbrella company with each underlying sub-fund (“Fund”) having the investment powers equivalent to those of a securities company. In the future, there may be other Funds within the Company. The investment objective of each Fund, the Company’s policy for pursuing that objective and a review of each Fund’s investment activities for the relevant period are set out in the individual fund reviews contained in this Annual Report and Financial Statements.
These financial statements have been prepared by the ACD in accordance with the Statement of Recommended Practice for Authorised Funds (SORP) issued by the Investment Management Association (now the Investment Association) in October 2010 and the rules contained in the Financial Conduct Authority’s Collective Investment Schemes sourcebook (together the “Regulations”) and give a true and fair view of the net revenue/expenses and gains/losses of the scheme property of the Company and the Fund and the financial position of the Company and the Fund at the end of the accounting year.
The ACD is responsible for keeping proper accounting records, which disclose with reasonable accuracy at any time the financial position of the Company and enable the ACD to ensure that the financial statements comply with the Regulations. In preparing this report, the ACD has:
• prepared the financial statements on a going-concern basis;
• selected suitable accounting policies and applied them consistently;
• made judgements and estimates that are reasonable and prudent;
• followed applicable accounting standards; and
• prepared financial statements in accordance with the SORP.
The ACD confirms that it has complied with the above requirements in preparing the financial statements. The ACD is responsible for the management of the Company in accordance with the Company’s Instrument of Incorporation, Prospectus and the Regulations. The ACD is responsible for taking reasonable steps for the prevention and detection of fraud and other irregularities.
John James, Chief Executive Officer Vanguard Investments UK, Limited as Authorised Corporate Director of Vanguard Investments Funds ICVC
29 February 2016
2
Vanguard Investments Funds ICVC Report of the Depositary to the Shareholders
The Depositary is responsible for the safekeeping of all the property of the Company (other than tangible moveable property) which is entrusted to it. It is the duty of the Depositary to take reasonable care to ensure that the Company is managed in accordance with the rules set out in the Financial Conduct Authority’s Collective Investment Schemes sourcebook (“COLL”), the Open-Ended Investment Companies Regulations 2001 (SI 2001/1228) (the “OEIC Regulations”), and the Company’s Instrument of Incorporation, in relation to the pricing of, and dealings in, shares in the Company; the application of income of the Company; and the investment and borrowing powers of the Company.
Having carried out such procedures as we consider necessary to discharge our responsibilities as Depositary of the Company, it is our opinion, based on the information available to us and the explanations provided, that in all material respects the Company, acting through the Authorised Corporate Director:
• has carried out the issue, sale, redemption and cancellation, and calculation of the price of the Company’s shares and the application of the Company’s income in accordance with the COLL and, where applicable, the OEIC Regulations and the Instrument of Incorporation of the Company; and
• has observed the investment and borrowing powers and restrictions applicable to the Company.
State Street Trustees Limited Edinburgh
29 February 2016
3
Independent Auditors’ Report to the Shareholders of Vanguard Investments Funds ICVC (the “Company”)
Report on the Financial Statements
Our Opinion
In our opinion the financial statements, defined below:
• give a true and fair view of the financial position of the Company and each of the sub-funds as at 31 October 2015 and of the net revenue and the net capital gains/(losses) of the scheme property of the Company and each of the sub-funds for the year then ended; and
• have been properly prepared in accordance with United Kingdom Generally Accepted Accounting Practice, the Statement of Recommended Practice for Authorised Funds, the Collective Investment Schemes sourcebook and the Instrument of Incorporation.
This opinion is to be read in the context of what we say in the remainder of this report.
What We Have Audited
The financial statements of Vanguard Investments Funds ICVC (the “Company”), which are prepared by Vanguard Investments UK, Limited (the “Authorised Corporate Director”), comprise:
• the aggregated balance sheet of the Company as at 31 October 2015;
• the aggregated statement of total return of the Company for the year then ended;
• the aggregated statement of change in net assets attributable to shareholders of the Company for the year then ended;
• the balance sheets as at 31 October 2015 together with the statements of total return and statements of change in net assets attributable to shareholders of each of the Company’s sub-funds;
• the notes to the Company’s financial statements and each of the Company’s sub-funds, which include a summary of significant accounting policies and other explanatory information; and
• the distribution tables
The financial reporting framework that has been applied in their preparation is applicable law and United Kingdom Accounting Standards (United Kingdom Generally Accepted Accounting Practice), the Statement of Recommended Practice “Financial Statements of Authorised Funds” issued by the Investment Management Association (the “Statement of Recommended Practice for Authorised Funds”), the Collective Investment Schemes sourcebook and the Instrument of Incorporation.
In applying the financial reporting framework, the Authorised Corporate Director has made a number of subjective judgements, for example in respect of significant accounting estimates. In making such estimates, they have made assumptions and considered future events.
What an Audit of Financial Statements Involves
We conducted our audit in accordance with International Standards on Auditing (UK and Ireland) (“ISAs (UK & Ireland)”). An audit involves obtaining evidence about the amounts and disclosures in the financial statements sufficient to give reasonable assurance that the financial statements are free from material misstatement, whether caused by fraud or error. This includes an assessment of:
• whether the accounting policies are appropriate to the Company’s and each of the Company’s sub-funds’ circumstances and have been consistently applied and adequately disclosed;
• the reasonableness of significant accounting estimates made by the Authorised Corporate Director; and
• the overall presentation of the financial statements.
In addition, we read all the financial and non-financial information in the Annual Report to identify material inconsistencies with the audited financial statements and to identify any information that is apparently materially incorrect based on, or materially inconsistent with, the knowledge acquired by us in the course of performing the audit. If we become aware of any apparent material misstatements or inconsistencies we consider the implications for our report.
Opinions on Matters Prescribed by the Collective Investment Schemes Sourcebook
In our opinion:
• we have obtained all the information and explanations we consider necessary for the purposes of the audit; and
• the information given in the Authorised Corporate Director’s Report for the financial year for which the financial statements are prepared is consistent with the financial statements.
4
Other Matters on Which We Are Required to Report by Exception
Propriety of Accounting Records and Information and Explanations Received
Under the Collective Investment Schemes sourcebook we are required to report to you if, in our opinion:
• proper accounting records have not been kept; or
• the financial statements are not in agreement with the accounting records and returns.
We have no exceptions to report arising from this responsibility.
Responsibilities for the Financial Statements and the Audit
Our Responsibilities and Those of the Authorised Corporate Director
As explained more fully in the Authorised Corporate Director’s Responsibilities Statement set out on page 2, the Authorised Corporate Director is responsible for the preparation of the financial statements and for being satisfied that they give a true and fair view.
Our responsibility is to audit and express an opinion on the financial statements in accordance with applicable law and ISAs (UK & Ireland). Those standards require us to comply with the Auditing Practices Board’s Ethical Standards for Auditors.
This report, including the opinions, has been prepared for and only for the Company’s members as a body in accordance with paragraph 4.5.12 of the Collective Investment Schemes sourcebook as required by paragraph 67(2) of the Open-Ended Investment Companies Regulations 2001 and for no other purpose.
We do not, in giving these opinions, accept or assume responsibility for any other purpose or to any other person to whom this report is shown or into whose hands it may come save where expressly agreed by our prior consent in writing.
PricewaterhouseCoopers LLP Chartered Accountants and Statutory Auditors London
29 February 2016
The maintenance and integrity of the Vanguard Investments UK, Limited website is the responsibility of the directors; the work carried out by the auditors does not involve consideration of these matters and, accordingly, the auditors accept no responsibility for any changes that may have occurred to the financial statements since they were initially presented on the website.Legislation in the United Kingdom governing the preparation and dissemination of financial statements may differ from legislation in other jurisdictions.
5
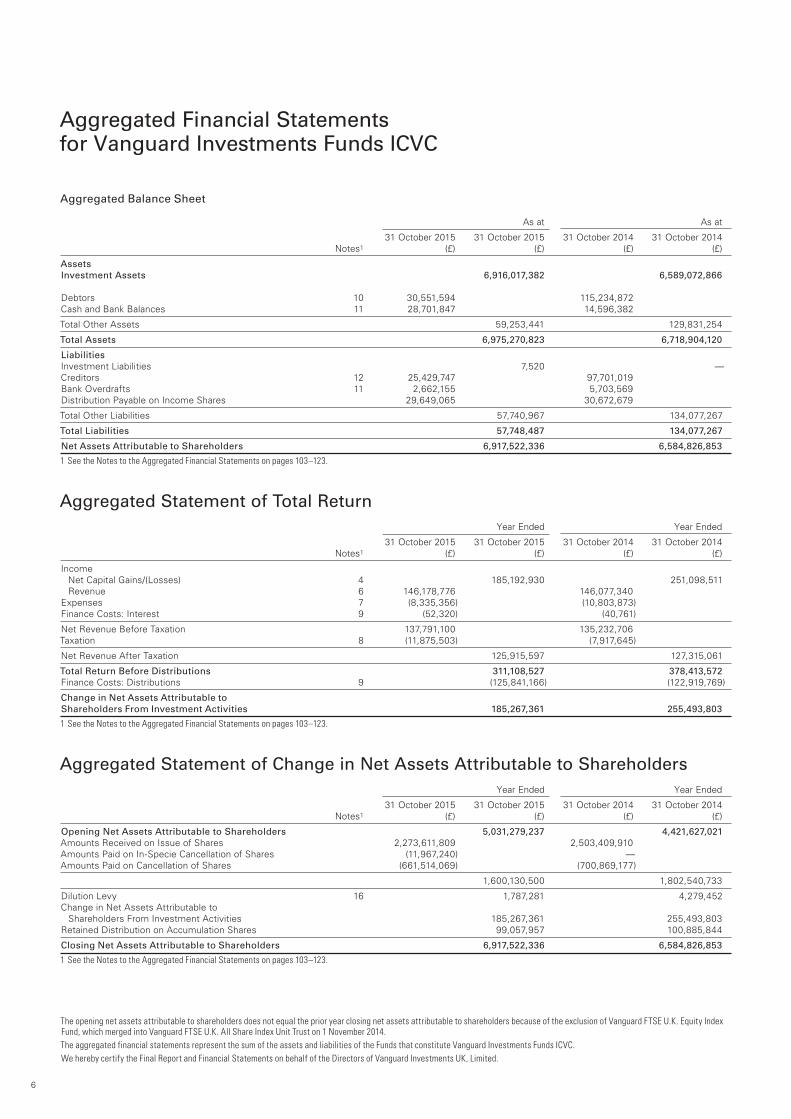
Aggregated Financial Statements for Vanguard Investments Funds ICVC
Aggregated Balance Sheet As at As at
31 October 2015 31 October 2015 31 October 2014 31 October 2014 Notes1 (£) (£) (£) (£)
AssetsInvestment Assets 6,916,017,382 6,589,072,866
Debtors 10 30,551,594 115,234,872 Cash and Bank Balances 11 28,701,847 14,596,382
Total Other Assets 59,253,441 129,831,254
Total Assets 6,975,270,823 6,718,904,120
LiabilitiesInvestment Liabilities 7,520 —Creditors 12 25,429,747 97,701,019 Bank Overdrafts 11 2,662,155 5,703,569 Distribution Payable on Income Shares 29,649,065 30,672,679
Total Other Liabilities 57,740,967 134,077,267
Total Liabilities 57,748,487 134,077,267
Net Assets Attributable to Shareholders 6,917,522,336 6,584,826,853
1 See the Notes to the Aggregated Financial Statements on pages 103–123.
Aggregated Statement of Total Return Year Ended Year Ended
31 October 2015 31 October 2015 31 October 2014 31 October 2014 Notes1 (£) (£) (£) (£)
Income Net Capital Gains/(Losses) 4 185,192,930 251,098,511 Revenue 6 146,178,776 146,077,340 Expenses 7 (8,335,356) (10,803,873)Finance Costs: Interest 9 (52,320) (40,761)
Net Revenue Before Taxation 137,791,100 135,232,706Taxation 8 (11,875,503) (7,917,645)
Net Revenue After Taxation 125,915,597 127,315,061
Total Return Before Distributions 311,108,527 378,413,572 Finance Costs: Distributions 9 (125,841,166) (122,919,769)
Change in Net Assets Attributable to Shareholders From Investment Activities 185,267,361 255,493,803
1 See the Notes to the Aggregated Financial Statements on pages 103–123.
Aggregated Statement of Change in Net Assets Attributable to Shareholders Year Ended Year Ended
31 October 2015 31 October 2015 31 October 2014 31 October 2014 Notes1 (£) (£) (£) (£)
Opening Net Assets Attributable to Shareholders 5,031,279,237 4,421,627,021 Amounts Received on Issue of Shares 2,273,611,809 2,503,409,910 Amounts Paid on In-Specie Cancellation of Shares (11,967,240) —Amounts Paid on Cancellation of Shares (661,514,069) (700,869,177)
1,600,130,500 1,802,540,733
Dilution Levy 16 1,787,281 4,279,452Change in Net Assets Attributable to Shareholders From Investment Activities 185,267,361 255,493,803 Retained Distribution on Accumulation Shares 99,057,957 100,885,844
Closing Net Assets Attributable to Shareholders 6,917,522,336 6,584,826,853
1 See the Notes to the Aggregated Financial Statements on pages 103–123.
The opening net assets attributable to shareholders does not equal the prior year closing net assets attributable to shareholders because of the exclusion of Vanguard FTSE U.K. Equity Index Fund, which merged into Vanguard FTSE U.K. All Share Index Unit Trust on 1 November 2014.The aggregated financial statements represent the sum of the assets and liabilities of the Funds that constitute Vanguard Investments Funds ICVC.We hereby certify the Final Report and Financial Statements on behalf of the Directors of Vanguard Investments UK, Limited.
6
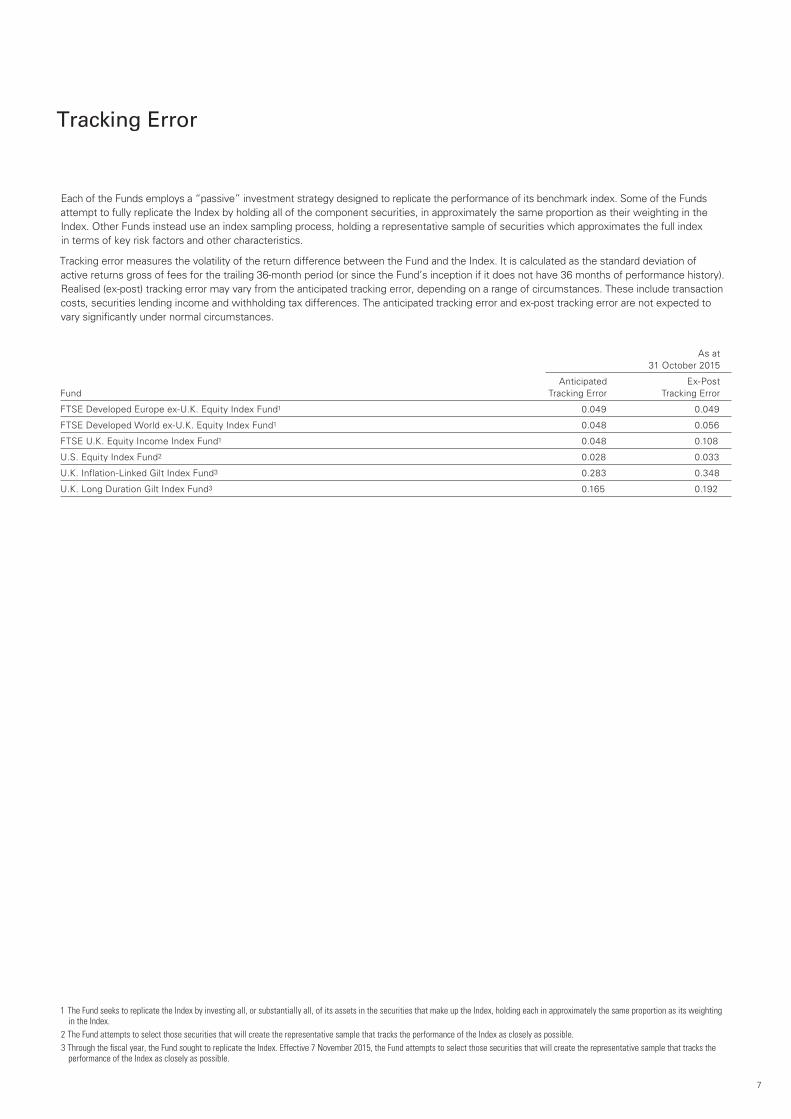
Tracking Error
Each of the Funds employs a “passive” investment strategy designed to replicate the performance of its benchmark index. Some of the Funds attempt to fully replicate the Index by holding all of the component securities, in approximately the same proportion as their weighting in the Index. Other Funds instead use an index sampling process, holding a representative sample of securities which approximates the full index in terms of key risk factors and other characteristics.
Tracking error measures the volatility of the return difference between the Fund and the Index. It is calculated as the standard deviation of active returns gross of fees for the trailing 36-month period (or since the Fund’s inception if it does not have 36 months of performance history). Realised (ex-post) tracking error may vary from the anticipated tracking error, depending on a range of circumstances. These include transaction costs, securities lending income and withholding tax differences. The anticipated tracking error and ex-post tracking error are not expected to vary significantly under normal circumstances.
1 The Fund seeks to replicate the Index by investing all, or substantially all, of its assets in the securities that make up the Index, holding each in approximately the same proportion as its weighting in the Index.
2 The Fund attempts to select those securities that will create the representative sample that tracks the performance of the Index as closely as possible.3 Through the fiscal year, the Fund sought to replicate the Index. Effective 7 November 2015, the Fund attempts to select those securities that will create the representative sample that tracks the
performance of the Index as closely as possible.
7
As at 31 October 2015
Anticipated Ex-Post Fund Tracking Error Tracking Error
FTSE Developed Europe ex-U.K. Equity Index Fund1 0.049 0.049
FTSE Developed World ex-U.K. Equity Index Fund1 0.048 0.056
FTSE U.K. Equity Income Index Fund1 0.048 0.108
U.S. Equity Index Fund2 0.028 0.033
U.K. Inflation-Linked Gilt Index Fund3 0.283 0.348
U.K. Long Duration Gilt Index Fund3 0.165 0.192
FTSE Developed Europe ex-U.K. Equity Index Fund
Fund Profile As at 31 October 2015
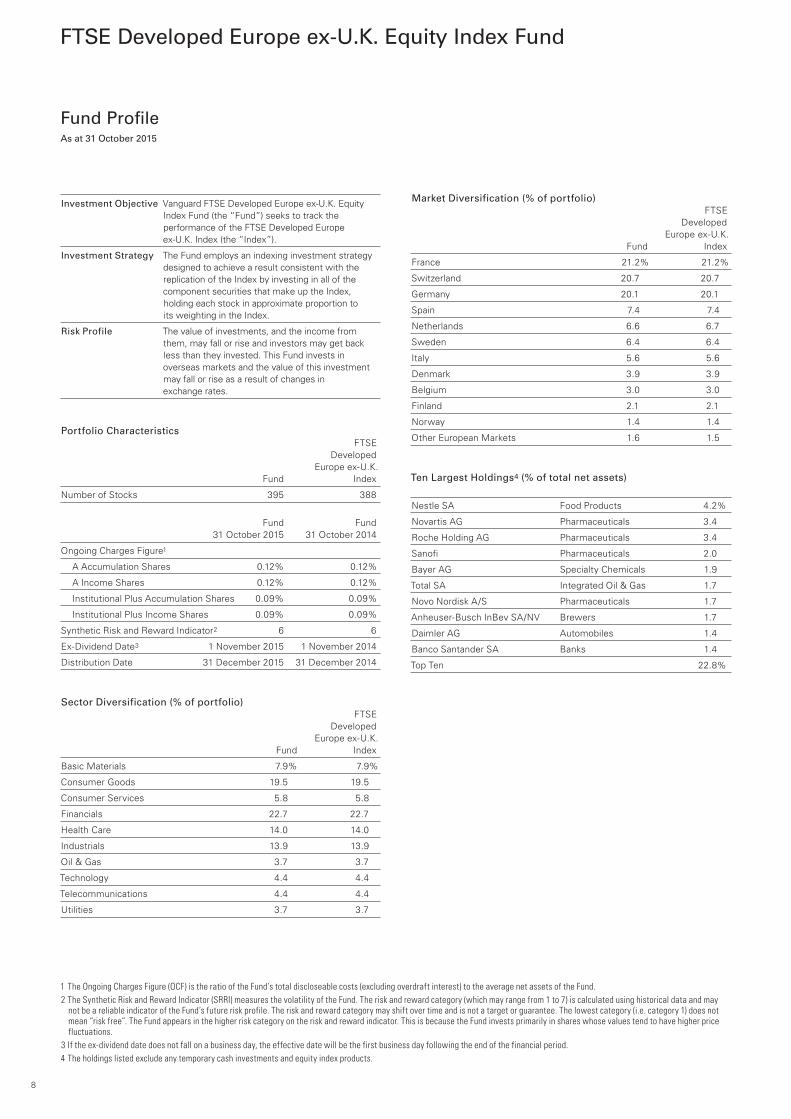
Investment Objective Vanguard FTSE Developed Europe ex-U.K. Equity Index Fund (the “Fund”) seeks to track the performance of the FTSE Developed Europe ex-U.K. Index (the “Index”).
Investment Strategy The Fund employs an indexing investment strategy designed to achieve a result consistent with the replication of the Index by investing in all of the component securities that make up the Index, holding each stock in approximate proportion to its weighting in the Index.
Risk Profile The value of investments, and the income from them, may fall or rise and investors may get back less than they invested. This Fund invests in overseas markets and the value of this investment may fall or rise as a result of changes in exchange rates.
Portfolio Characteristics FTSE Developed Europe ex-U.K. Fund Index
Number of Stocks 395 388
Fund Fund 31 October 2015 31 October 2014
Ongoing Charges Figure1
A Accumulation Shares 0.12% 0.12%
A Income Shares 0.12% 0.12%
Institutional Plus Accumulation Shares 0.09% 0.09%
Institutional Plus Income Shares 0.09% 0.09%
Synthetic Risk and Reward Indicator2 6 6
Ex-Dividend Date3 1 November 2015 1 November 2014
Distribution Date 31 December 2015 31 December 2014
Sector Diversification (% of portfolio) FTSE Developed Europe ex-U.K. Fund Index
Basic Materials 7.9% 7.9%
Consumer Goods 19.5 19.5
Consumer Services 5.8 5.8
Financials 22.7 22.7
Health Care 14.0 14.0
Industrials 13.9 13.9
Oil & Gas 3.7 3.7
Technology 4.4 4.4
Telecommunications 4.4 4.4
Utilities 3.7 3.7
Market Diversification (% of portfolio) FTSE Developed Europe ex-U.K. Fund Index
France 21.2% 21.2%
Switzerland 20.7 20.7
Germany 20.1 20.1
Spain 7.4 7.4
Netherlands 6.6 6.7
Sweden 6.4 6.4
Italy 5.6 5.6
Denmark 3.9 3.9
Belgium 3.0 3.0
Finland 2.1 2.1
Norway 1.4 1.4
Other European Markets 1.6 1.5
Ten Largest Holdings4 (% of total net assets)
Nestle SA Food Products 4.2%
Novartis AG Pharmaceuticals 3.4
Roche Holding AG Pharmaceuticals 3.4
Sanofi Pharmaceuticals 2.0
Bayer AG Specialty Chemicals 1.9
Total SA Integrated Oil & Gas 1.7
Novo Nordisk A/S Pharmaceuticals 1.7
Anheuser-Busch InBev SA/NV Brewers 1.7
Daimler AG Automobiles 1.4
Banco Santander SA Banks 1.4
Top Ten 22.8%
1 The Ongoing Charges Figure (OCF) is the ratio of the Fund’s total discloseable costs (excluding overdraft interest) to the average net assets of the Fund.2 The Synthetic Risk and Reward Indicator (SRRI) measures the volatility of the Fund. The risk and reward category (which may range from 1 to 7) is calculated using historical data and may
not be a reliable indicator of the Fund’s future risk profile. The risk and reward category may shift over time and is not a target or guarantee. The lowest category (i.e. category 1) does not mean “risk free”. The Fund appears in the higher risk category on the risk and reward indicator. This is because the Fund invests primarily in shares whose values tend to have higher price fluctuations.
3 If the ex-dividend date does not fall on a business day, the effective date will be the first business day following the end of the financial period.4 The holdings listed exclude any temporary cash investments and equity index products.
8
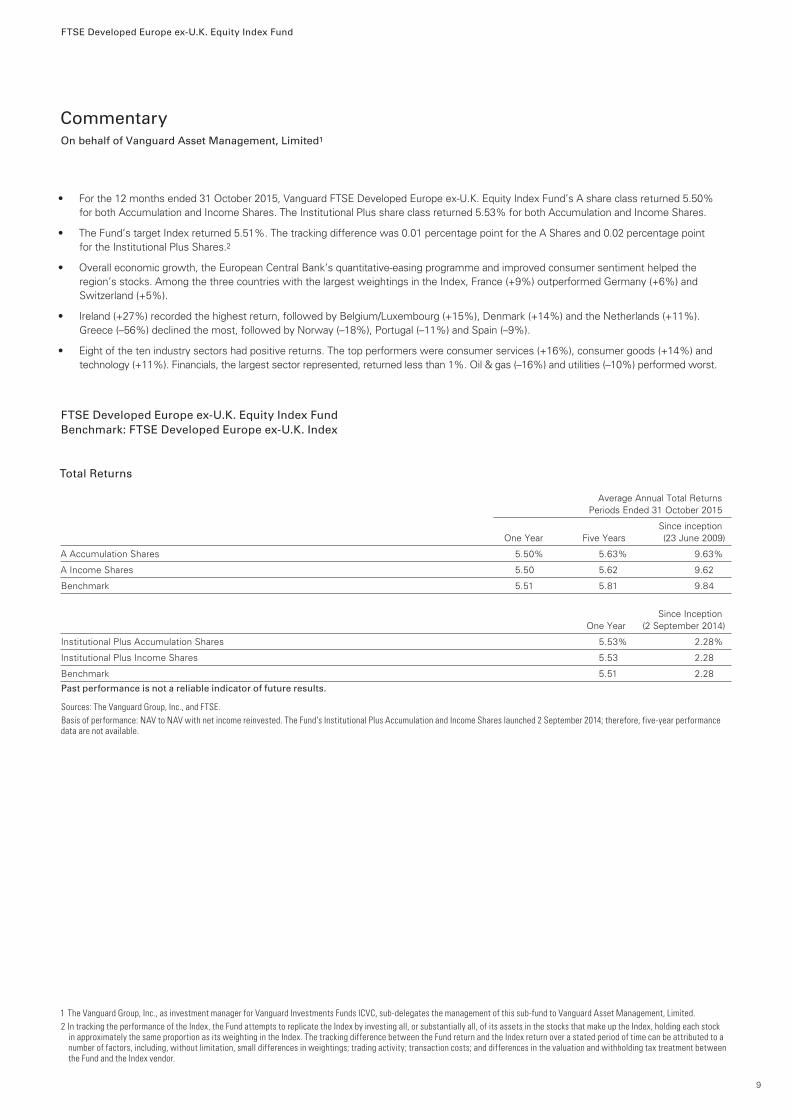
FTSE Developed Europe ex-U.K. Equity Index Fund
Commentary On behalf of Vanguard Asset Management, Limited1
• For the 12 months ended 31 October 2015, Vanguard FTSE Developed Europe ex-U.K. Equity Index Fund’s A share class returned 5.50% for both Accumulation and Income Shares. The Institutional Plus share class returned 5.53% for both Accumulation and Income Shares.
• The Fund’s target Index returned 5.51%. The tracking difference was 0.01 percentage point for the A Shares and 0.02 percentage point for the Institutional Plus Shares.2
• Overall economic growth, the European Central Bank’s quantitative-easing programme and improved consumer sentiment helped the region’s stocks. Among the three countries with the largest weightings in the Index, France (+9%) outperformed Germany (+6%) and Switzerland (+5%).
• Ireland (+27%) recorded the highest return, followed by Belgium/Luxembourg (+15%), Denmark (+14%) and the Netherlands (+11%). Greece (–56%) declined the most, followed by Norway (–18%), Portugal (–11%) and Spain (–9%).
• Eight of the ten industry sectors had positive returns. The top performers were consumer services (+16%), consumer goods (+14%) and technology (+11%). Financials, the largest sector represented, returned less than 1%. Oil & gas (–16%) and utilities (–10%) performed worst.
FTSE Developed Europe ex-U.K. Equity Index Fund Benchmark: FTSE Developed Europe ex-U.K. Index
Total Returns Average Annual Total Returns Periods Ended 31 October 2015
Since inception One Year Five Years (23 June 2009)
A Accumulation Shares 5.50% 5.63% 9.63%
A Income Shares 5.50 5.62 9.62
Benchmark 5.51 5.81 9.84
Since Inception One Year (2 September 2014)
Institutional Plus Accumulation Shares 5.53% 2.28%
Institutional Plus Income Shares 5.53 2.28
Benchmark 5.51 2.28
Past performance is not a reliable indicator of future results.
Sources: The Vanguard Group, Inc., and FTSE.Basis of performance: NAV to NAV with net income reinvested. The Fund’s Institutional Plus Accumulation and Income Shares launched 2 September 2014; therefore, five-year performance data are not available.
1 The Vanguard Group, Inc., as investment manager for Vanguard Investments Funds ICVC, sub-delegates the management of this sub-fund to Vanguard Asset Management, Limited.2 In tracking the performance of the Index, the Fund attempts to replicate the Index by investing all, or substantially all, of its assets in the stocks that make up the Index, holding each stock
in approximately the same proportion as its weighting in the Index. The tracking difference between the Fund return and the Index return over a stated period of time can be attributed to a number of factors, including, without limitation, small differences in weightings; trading activity; transaction costs; and differences in the valuation and withholding tax treatment between the Fund and the Index vendor.
9
FTSE Developed Europe ex-U.K. Equity Index Fund
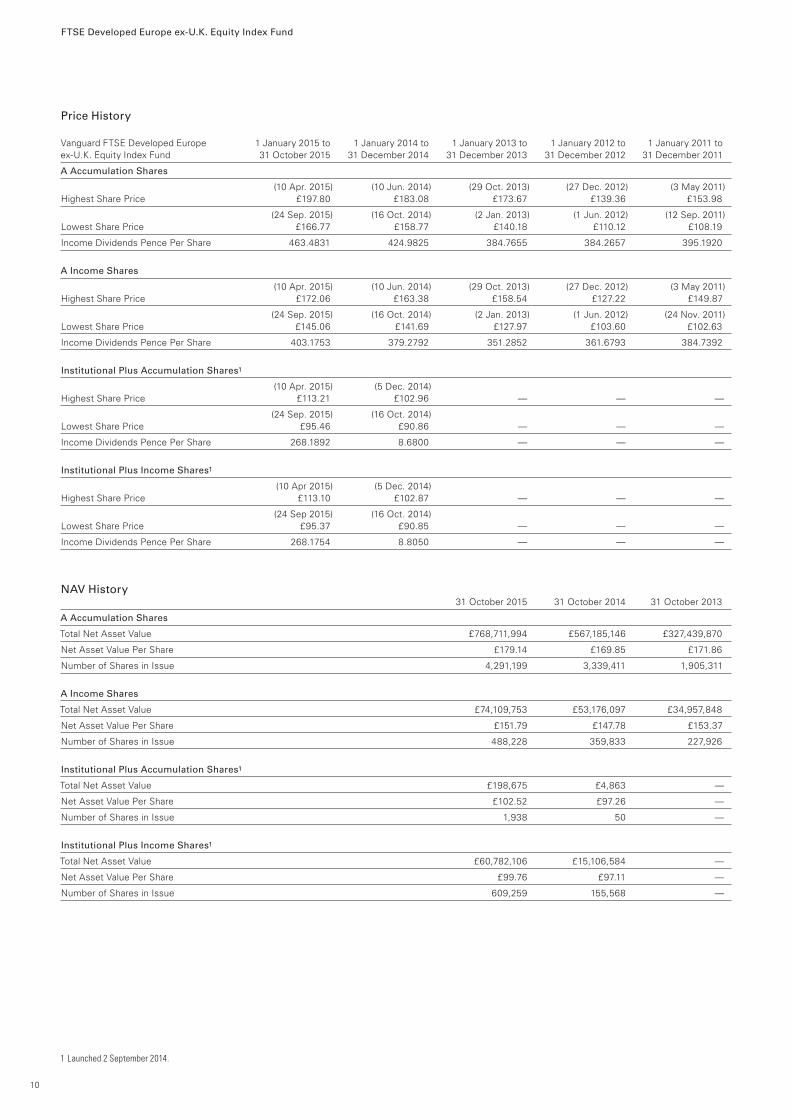
Price History
Vanguard FTSE Developed Europe 1 January 2015 to 1 January 2014 to 1 January 2013 to 1 January 2012 to 1 January 2011 to ex-U.K. Equity Index Fund 31 October 2015 31 December 2014 31 December 2013 31 December 2012 31 December 2011
A Accumulation Shares
(10 Apr. 2015) (10 Jun. 2014) (29 Oct. 2013) (27 Dec. 2012) (3 May 2011)Highest Share Price £197.80 £183.08 £173.67 £139.36 £153.98
(24 Sep. 2015) (16 Oct. 2014) (2 Jan. 2013) (1 Jun. 2012) (12 Sep. 2011)Lowest Share Price £166.77 £158.77 £140.18 £110.12 £108.19
Income Dividends Pence Per Share 463.4831 424.9825 384.7655 384.2657 395.1920
A Income Shares
(10 Apr. 2015) (10 Jun. 2014) (29 Oct. 2013) (27 Dec. 2012) (3 May 2011)Highest Share Price £172.06 £163.38 £158.54 £127.22 £149.87
(24 Sep. 2015) (16 Oct. 2014) (2 Jan. 2013) (1 Jun. 2012) (24 Nov. 2011)Lowest Share Price £145.06 £141.69 £127.97 £103.60 £102.63
Income Dividends Pence Per Share 403.1753 379.2792 351.2852 361.6793 384.7392
Institutional Plus Accumulation Shares1
(10 Apr. 2015) (5 Dec. 2014)Highest Share Price £113.21 £102.96 — — —
(24 Sep. 2015) (16 Oct. 2014)Lowest Share Price £95.46 £90.86 — — —
Income Dividends Pence Per Share 268.1892 8.6800 — — —
Institutional Plus Income Shares1
(10 Apr 2015) (5 Dec. 2014)Highest Share Price £113.10 £102.87 — — —
(24 Sep 2015) (16 Oct. 2014)Lowest Share Price £95.37 £90.85 — — —
Income Dividends Pence Per Share 268.1754 8.8050 — — —
NAV History 31 October 2015 31 October 2014 31 October 2013
A Accumulation Shares
Total Net Asset Value £768,711,994 £567,185,146 £327,439,870
Net Asset Value Per Share £179.14 £169.85 £171.86
Number of Shares in Issue 4,291,199 3,339,411 1,905,311
A Income Shares
Total Net Asset Value £74,109,753 £53,176,097 £34,957,848
Net Asset Value Per Share £151.79 £147.78 £153.37
Number of Shares in Issue 488,228 359,833 227,926
Institutional Plus Accumulation Shares1
Total Net Asset Value £198,675 £4,863 —
Net Asset Value Per Share £102.52 £97.26 —
Number of Shares in Issue 1,938 50 —
Institutional Plus Income Shares1
Total Net Asset Value £60,782,106 £15,106,584 —
Net Asset Value Per Share £99.76 £97.11 —
Number of Shares in Issue 609,259 155,568 —
1 Launched 2 September 2014.
10
FTSE Developed Europe ex-U.K. Equity Index Fund
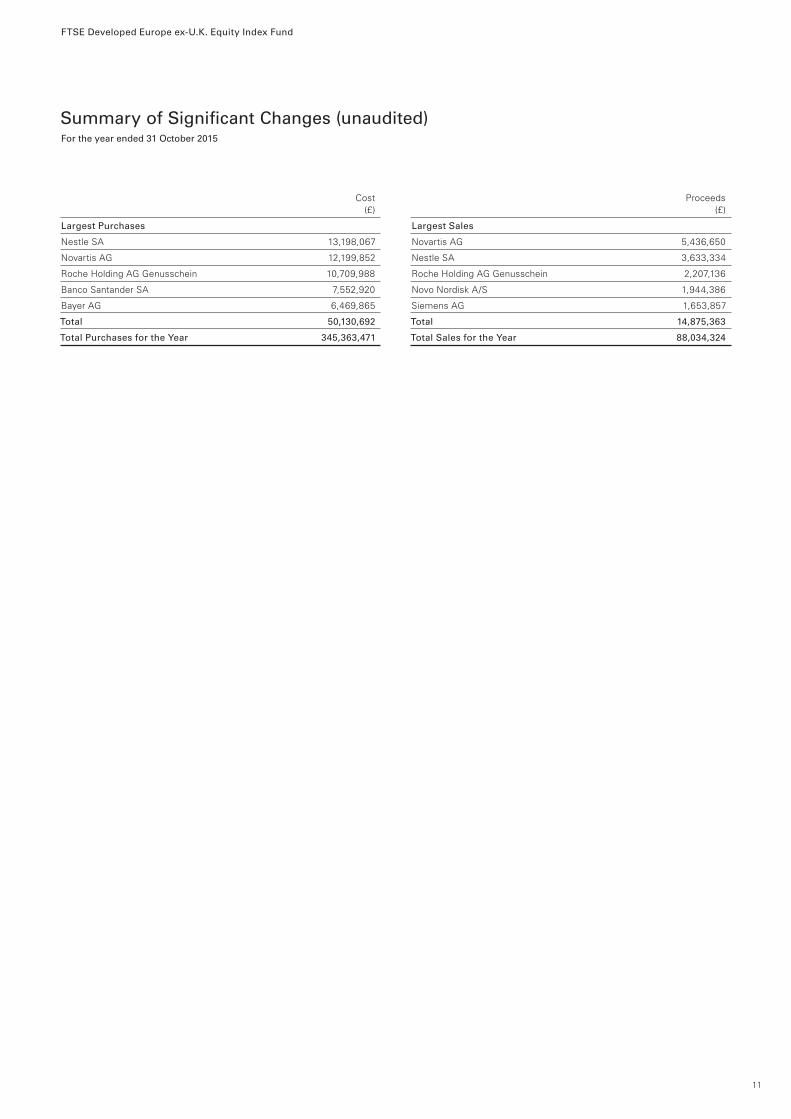
Summary of Significant Changes (unaudited)For the year ended 31 October 2015
Cost (£)
Largest Purchases
Nestle SA 13,198,067
Novartis AG 12,199,852
Roche Holding AG Genusschein 10,709,988
Banco Santander SA 7,552,920
Bayer AG 6,469,865
Total 50,130,692
Total Purchases for the Year 345,363,471
Proceeds (£)
Largest Sales
Novartis AG 5,436,650
Nestle SA 3,633,334
Roche Holding AG Genusschein 2,207,136
Novo Nordisk A/S 1,944,386
Siemens AG 1,653,857
Total 14,875,363
Total Sales for the Year 88,034,324
11
FTSE Developed Europe ex-U.K. Equity Index Fund
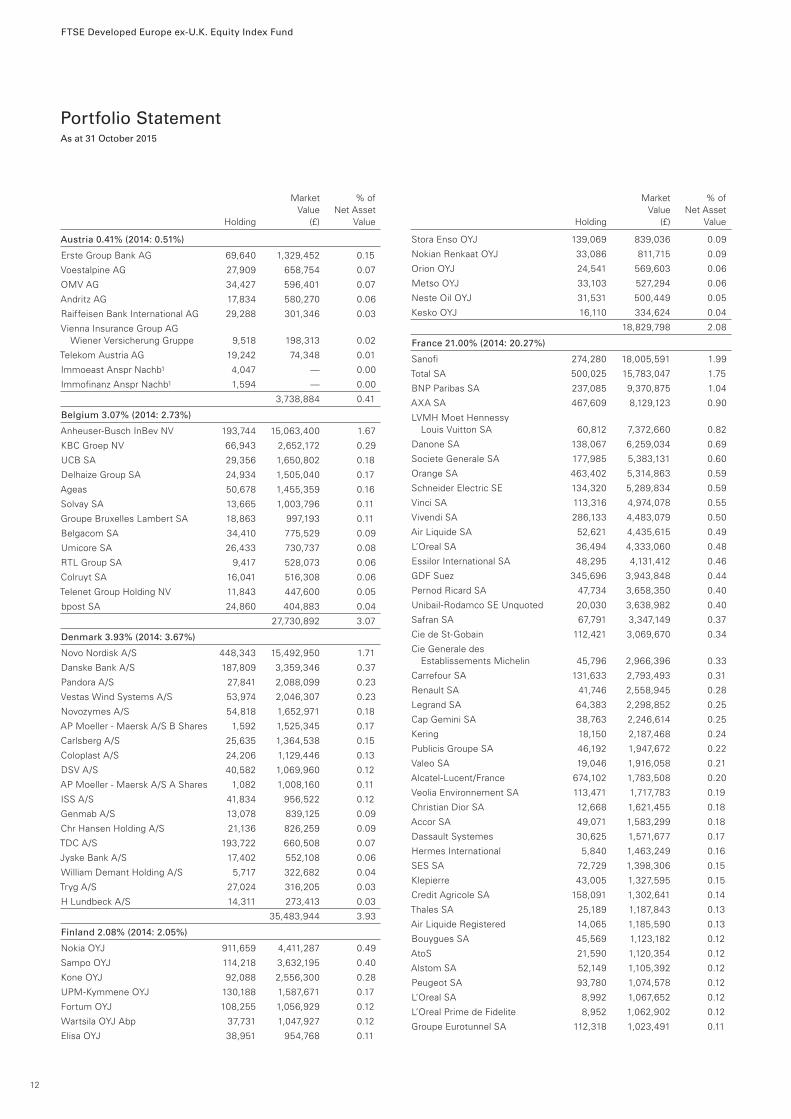
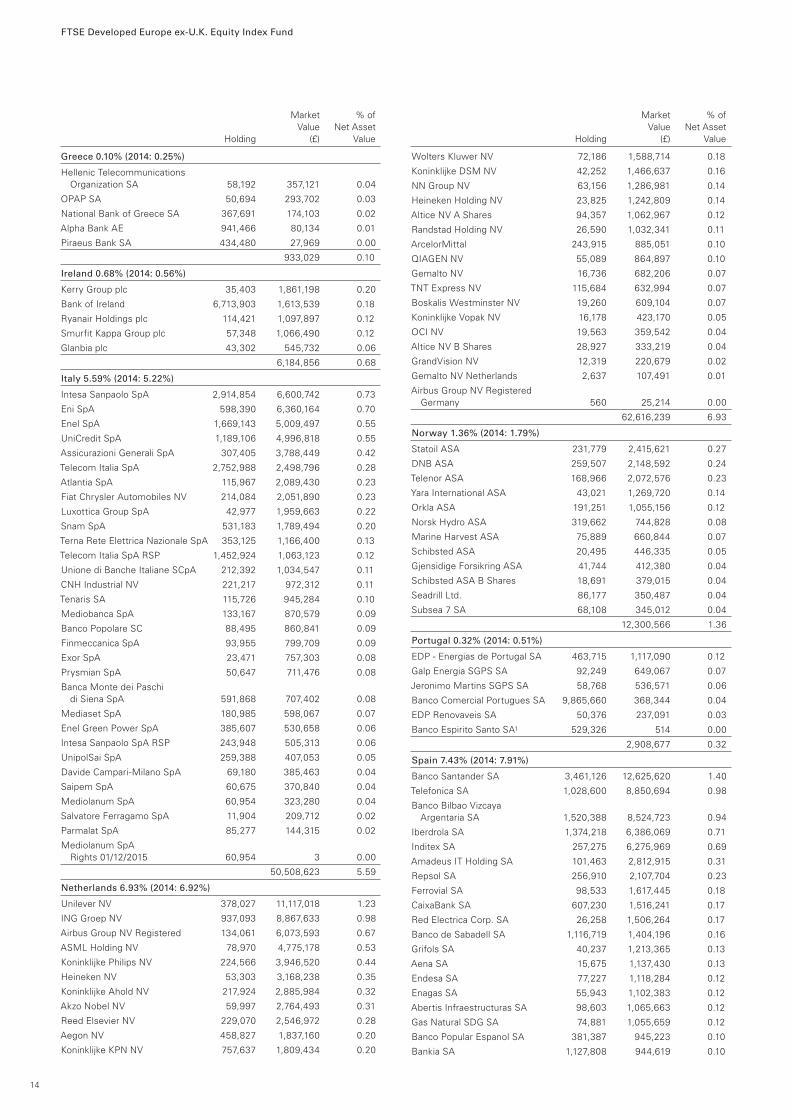
Portfolio StatementAs at 31 October 2015
Austria 0.41% (2014: 0.51%)
Erste Group Bank AG 69,640 1,329,452 0.15
Voestalpine AG 27,909 658,754 0.07
OMV AG 34,427 596,401 0.07
Andritz AG 17,834 580,270 0.06
Raiffeisen Bank International AG 29,288 301,346 0.03
Vienna Insurance Group AG Wiener Versicherung Gruppe 9,518 198,313 0.02
Telekom Austria AG 19,242 74,348 0.01
Immoeast Anspr Nachb1 4,047 — 0.00
Immofinanz Anspr Nachb1 1,594 — 0.00
3,738,884 0.41
Belgium 3.07% (2014: 2.73%)
Anheuser-Busch InBev NV 193,744 15,063,400 1.67
KBC Groep NV 66,943 2,652,172 0.29
UCB SA 29,356 1,650,802 0.18
Delhaize Group SA 24,934 1,505,040 0.17
Ageas 50,678 1,455,359 0.16
Solvay SA 13,665 1,003,796 0.11
Groupe Bruxelles Lambert SA 18,863 997,193 0.11
Belgacom SA 34,410 775,529 0.09
Umicore SA 26,433 730,737 0.08
RTL Group SA 9,417 528,073 0.06
Colruyt SA 16,041 516,308 0.06
Telenet Group Holding NV 11,843 447,600 0.05
bpost SA 24,860 404,883 0.04
27,730,892 3.07
Denmark 3.93% (2014: 3.67%)
Novo Nordisk A/S 448,343 15,492,950 1.71
Danske Bank A/S 187,809 3,359,346 0.37
Pandora A/S 27,841 2,088,099 0.23
Vestas Wind Systems A/S 53,974 2,046,307 0.23
Novozymes A/S 54,818 1,652,971 0.18
AP Moeller - Maersk A/S B Shares 1,592 1,525,345 0.17
Carlsberg A/S 25,635 1,364,538 0.15
Coloplast A/S 24,206 1,129,446 0.13
DSV A/S 40,582 1,069,960 0.12
AP Moeller - Maersk A/S A Shares 1,082 1,008,160 0.11
ISS A/S 41,834 956,522 0.12
Genmab A/S 13,078 839,125 0.09
Chr Hansen Holding A/S 21,136 826,259 0.09
TDC A/S 193,722 660,508 0.07
Jyske Bank A/S 17,402 552,108 0.06
William Demant Holding A/S 5,717 322,682 0.04
Tryg A/S 27,024 316,205 0.03
H Lundbeck A/S 14,311 273,413 0.03
35,483,944 3.93
Finland 2.08% (2014: 2.05%)
Nokia OYJ 911,659 4,411,287 0.49
Sampo OYJ 114,218 3,632,195 0.40
Kone OYJ 92,088 2,556,300 0.28
UPM-Kymmene OYJ 130,188 1,587,671 0.17
Fortum OYJ 108,255 1,056,929 0.12
Wartsila OYJ Abp 37,731 1,047,927 0.12
Elisa OYJ 38,951 954,768 0.11
Stora Enso OYJ 139,069 839,036 0.09
Nokian Renkaat OYJ 33,086 811,715 0.09
Orion OYJ 24,541 569,603 0.06
Metso OYJ 33,103 527,294 0.06
Neste Oil OYJ 31,531 500,449 0.05
Kesko OYJ 16,110 334,624 0.04
18,829,798 2.08
France 21.00% (2014: 20.27%)
Sanofi 274,280 18,005,591 1.99
Total SA 500,025 15,783,047 1.75
BNP Paribas SA 237,085 9,370,875 1.04
AXA SA 467,609 8,129,123 0.90
LVMH Moet Hennessy Louis Vuitton SA 60,812 7,372,660 0.82
Danone SA 138,067 6,259,034 0.69
Societe Generale SA 177,985 5,383,131 0.60
Orange SA 463,402 5,314,863 0.59
Schneider Electric SE 134,320 5,289,834 0.59
Vinci SA 113,316 4,974,078 0.55
Vivendi SA 286,133 4,483,079 0.50
Air Liquide SA 52,621 4,435,615 0.49
L’Oreal SA 36,494 4,333,060 0.48
Essilor International SA 48,295 4,131,412 0.46
GDF Suez 345,696 3,943,848 0.44
Pernod Ricard SA 47,734 3,658,350 0.40
Unibail-Rodamco SE Unquoted 20,030 3,638,982 0.40
Safran SA 67,791 3,347,149 0.37
Cie de St-Gobain 112,421 3,069,670 0.34
Cie Generale des Establissements Michelin 45,796 2,966,396 0.33
Carrefour SA 131,633 2,793,493 0.31
Renault SA 41,746 2,558,945 0.28
Legrand SA 64,383 2,298,852 0.25
Cap Gemini SA 38,763 2,246,614 0.25
Kering 18,150 2,187,468 0.24
Publicis Groupe SA 46,192 1,947,672 0.22
Valeo SA 19,046 1,916,058 0.21
Alcatel-Lucent/France 674,102 1,783,508 0.20
Veolia Environnement SA 113,471 1,717,783 0.19
Christian Dior SA 12,668 1,621,455 0.18
Accor SA 49,071 1,583,299 0.18
Dassault Systemes 30,625 1,571,677 0.17
Hermes International 5,840 1,463,249 0.16
SES SA 72,729 1,398,306 0.15
Klepierre 43,005 1,327,595 0.15
Credit Agricole SA 158,091 1,302,641 0.14
Thales SA 25,189 1,187,843 0.13
Air Liquide Registered 14,065 1,185,590 0.13
Bouygues SA 45,569 1,123,182 0.12
AtoS 21,590 1,120,354 0.12
Alstom SA 52,149 1,105,392 0.12
Peugeot SA 93,780 1,074,578 0.12
L’Oreal SA 8,992 1,067,652 0.12
L’Oreal Prime de Fidelite 8,952 1,062,902 0.12
Groupe Eurotunnel SA 112,318 1,023,491 0.11
12
Market % of Value Net Asset Holding (£) Value
Market % of Value Net Asset Holding (£) Value
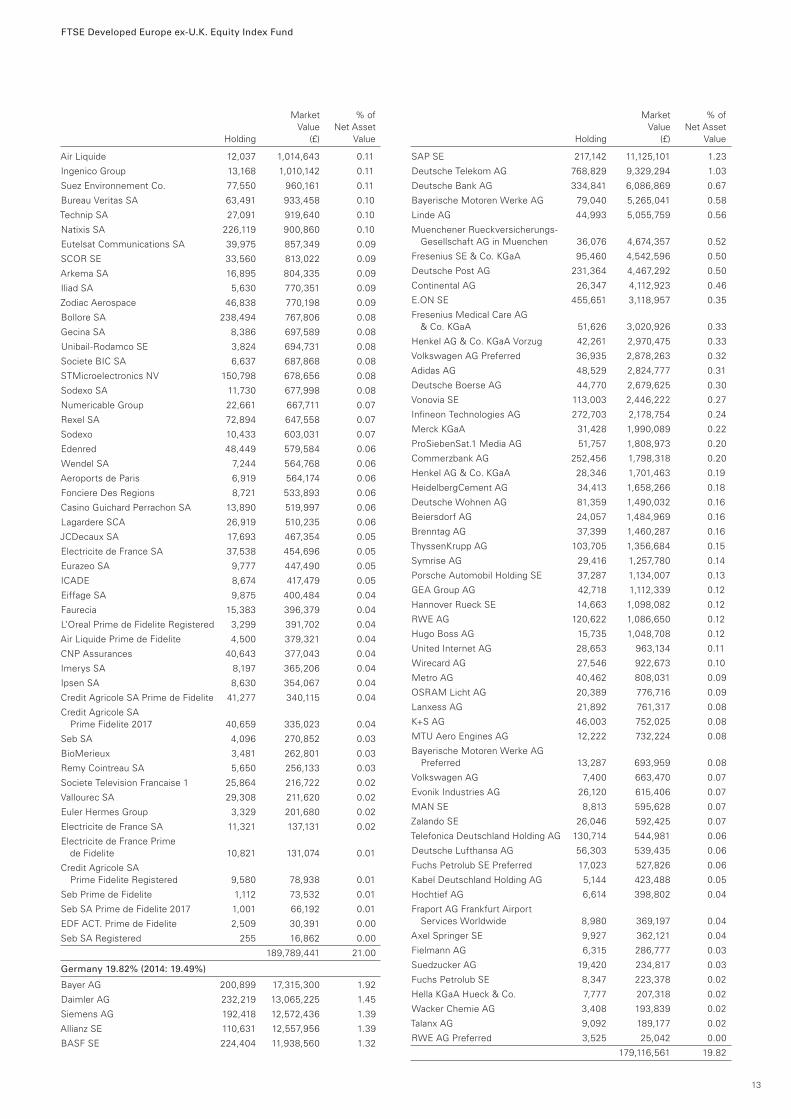
FTSE Developed Europe ex-U.K. Equity Index Fund
Air Liquide 12,037 1,014,643 0.11
Ingenico Group 13,168 1,010,142 0.11
Suez Environnement Co. 77,550 960,161 0.11
Bureau Veritas SA 63,491 933,458 0.10
Technip SA 27,091 919,640 0.10
Natixis SA 226,119 900,860 0.10
Eutelsat Communications SA 39,975 857,349 0.09
SCOR SE 33,560 813,022 0.09
Arkema SA 16,895 804,335 0.09
Iliad SA 5,630 770,351 0.09
Zodiac Aerospace 46,838 770,198 0.09
Bollore SA 238,494 767,806 0.08
Gecina SA 8,386 697,589 0.08
Unibail-Rodamco SE 3,824 694,731 0.08
Societe BIC SA 6,637 687,868 0.08
STMicroelectronics NV 150,798 678,656 0.08
Sodexo SA 11,730 677,998 0.08
Numericable Group 22,661 667,711 0.07
Rexel SA 72,894 647,558 0.07
Sodexo 10,433 603,031 0.07
Edenred 48,449 579,584 0.06
Wendel SA 7,244 564,768 0.06
Aeroports de Paris 6,919 564,174 0.06
Fonciere Des Regions 8,721 533,893 0.06
Casino Guichard Perrachon SA 13,890 519,997 0.06
Lagardere SCA 26,919 510,235 0.06
JCDecaux SA 17,693 467,354 0.05
Electricite de France SA 37,538 454,696 0.05
Eurazeo SA 9,777 447,490 0.05
ICADE 8,674 417,479 0.05
Eiffage SA 9,875 400,484 0.04
Faurecia 15,383 396,379 0.04
L’Oreal Prime de Fidelite Registered 3,299 391,702 0.04
Air Liquide Prime de Fidelite 4,500 379,321 0.04
CNP Assurances 40,643 377,043 0.04
Imerys SA 8,197 365,206 0.04
Ipsen SA 8,630 354,067 0.04
Credit Agricole SA Prime de Fidelite 41,277 340,115 0.04
Credit Agricole SA Prime Fidelite 2017 40,659 335,023 0.04
Seb SA 4,096 270,852 0.03
BioMerieux 3,481 262,801 0.03
Remy Cointreau SA 5,650 256,133 0.03
Societe Television Francaise 1 25,864 216,722 0.02
Vallourec SA 29,308 211,620 0.02
Euler Hermes Group 3,329 201,680 0.02
Electricite de France SA 11,321 137,131 0.02
Electricite de France Prime de Fidelite 10,821 131,074 0.01
Credit Agricole SA Prime Fidelite Registered 9,580 78,938 0.01
Seb Prime de Fidelite 1,112 73,532 0.01
Seb SA Prime de Fidelite 2017 1,001 66,192 0.01
EDF ACT. Prime de Fidelite 2,509 30,391 0.00
Seb SA Registered 255 16,862 0.00
189,789,441 21.00
Germany 19.82% (2014: 19.49%)
Bayer AG 200,899 17,315,300 1.92
Daimler AG 232,219 13,065,225 1.45
Siemens AG 192,418 12,572,436 1.39
Allianz SE 110,631 12,557,956 1.39
BASF SE 224,404 11,938,560 1.32
SAP SE 217,142 11,125,101 1.23
Deutsche Telekom AG 768,829 9,329,294 1.03
Deutsche Bank AG 334,841 6,086,869 0.67
Bayerische Motoren Werke AG 79,040 5,265,041 0.58
Linde AG 44,993 5,055,759 0.56
Muenchener Rueckversicherungs- Gesellschaft AG in Muenchen 36,076 4,674,357 0.52
Fresenius SE & Co. KGaA 95,460 4,542,596 0.50
Deutsche Post AG 231,364 4,467,292 0.50
Continental AG 26,347 4,112,923 0.46
E.ON SE 455,651 3,118,957 0.35
Fresenius Medical Care AG & Co. KGaA 51,626 3,020,926 0.33
Henkel AG & Co. KGaA Vorzug 42,261 2,970,475 0.33
Volkswagen AG Preferred 36,935 2,878,263 0.32
Adidas AG 48,529 2,824,777 0.31
Deutsche Boerse AG 44,770 2,679,625 0.30
Vonovia SE 113,003 2,446,222 0.27
Infineon Technologies AG 272,703 2,178,754 0.24
Merck KGaA 31,428 1,990,089 0.22
ProSiebenSat.1 Media AG 51,757 1,808,973 0.20
Commerzbank AG 252,456 1,798,318 0.20
Henkel AG & Co. KGaA 28,346 1,701,463 0.19
HeidelbergCement AG 34,413 1,658,266 0.18
Deutsche Wohnen AG 81,359 1,490,032 0.16
Beiersdorf AG 24,057 1,484,969 0.16
Brenntag AG 37,399 1,460,287 0.16
ThyssenKrupp AG 103,705 1,356,684 0.15
Symrise AG 29,416 1,257,780 0.14
Porsche Automobil Holding SE 37,287 1,134,007 0.13
GEA Group AG 42,718 1,112,339 0.12
Hannover Rueck SE 14,663 1,098,082 0.12
RWE AG 120,622 1,086,650 0.12
Hugo Boss AG 15,735 1,048,708 0.12
United Internet AG 28,653 963,134 0.11
Wirecard AG 27,546 922,673 0.10
Metro AG 40,462 808,031 0.09
OSRAM Licht AG 20,389 776,716 0.09
Lanxess AG 21,892 761,317 0.08
K+S AG 46,003 752,025 0.08
MTU Aero Engines AG 12,222 732,224 0.08
Bayerische Motoren Werke AG Preferred 13,287 693,959 0.08
Volkswagen AG 7,400 663,470 0.07
Evonik Industries AG 26,120 615,406 0.07
MAN SE 8,813 595,628 0.07
Zalando SE 26,046 592,425 0.07
Telefonica Deutschland Holding AG 130,714 544,981 0.06
Deutsche Lufthansa AG 56,303 539,435 0.06
Fuchs Petrolub SE Preferred 17,023 527,826 0.06
Kabel Deutschland Holding AG 5,144 423,488 0.05
Hochtief AG 6,614 398,802 0.04
Fraport AG Frankfurt Airport Services Worldwide 8,980 369,197 0.04
Axel Springer SE 9,927 362,121 0.04
Fielmann AG 6,315 286,777 0.03
Suedzucker AG 19,420 234,817 0.03
Fuchs Petrolub SE 8,347 223,378 0.02
Hella KGaA Hueck & Co. 7,777 207,318 0.02
Wacker Chemie AG 3,408 193,839 0.02
Talanx AG 9,092 189,177 0.02
RWE AG Preferred 3,525 25,042 0.00
179,116,561 19.82
13
Market % of Value Net Asset Holding (£) Value
Market % of Value Net Asset Holding (£) Value
FTSE Developed Europe ex-U.K. Equity Index Fund
14
Market % of Value Net Asset Holding (£) Value
Market % of Value Net Asset Holding (£) Value
Greece 0.10% (2014: 0.25%)
Hellenic Telecommunications Organization SA 58,192 357,121 0.04
OPAP SA 50,694 293,702 0.03
National Bank of Greece SA 367,691 174,103 0.02
Alpha Bank AE 941,466 80,134 0.01
Piraeus Bank SA 434,480 27,969 0.00
933,029 0.10
Ireland 0.68% (2014: 0.56%)
Kerry Group plc 35,403 1,861,198 0.20
Bank of Ireland 6,713,903 1,613,539 0.18
Ryanair Holdings plc 114,421 1,097,897 0.12
Smurfit Kappa Group plc 57,348 1,066,490 0.12
Glanbia plc 43,302 545,732 0.06
6,184,856 0.68
Italy 5.59% (2014: 5.22%)
Intesa Sanpaolo SpA 2,914,854 6,600,742 0.73
Eni SpA 598,390 6,360,164 0.70
Enel SpA 1,669,143 5,009,497 0.55
UniCredit SpA 1,189,106 4,996,818 0.55
Assicurazioni Generali SpA 307,405 3,788,449 0.42
Telecom Italia SpA 2,752,988 2,498,796 0.28
Atlantia SpA 115,967 2,089,430 0.23
Fiat Chrysler Automobiles NV 214,084 2,051,890 0.23
Luxottica Group SpA 42,977 1,959,663 0.22
Snam SpA 531,183 1,789,494 0.20
Terna Rete Elettrica Nazionale SpA 353,125 1,166,400 0.13
Telecom Italia SpA RSP 1,452,924 1,063,123 0.12
Unione di Banche Italiane SCpA 212,392 1,034,547 0.11
CNH Industrial NV 221,217 972,312 0.11
Tenaris SA 115,726 945,284 0.10
Mediobanca SpA 133,167 870,579 0.09
Banco Popolare SC 88,495 860,841 0.09
Finmeccanica SpA 93,955 799,709 0.09
Exor SpA 23,471 757,303 0.08
Prysmian SpA 50,647 711,476 0.08
Banca Monte dei Paschi di Siena SpA 591,868 707,402 0.08
Mediaset SpA 180,985 598,067 0.07
Enel Green Power SpA 385,607 530,658 0.06
Intesa Sanpaolo SpA RSP 243,948 505,313 0.06
UnipolSai SpA 259,388 407,053 0.05
Davide Campari-Milano SpA 69,180 385,463 0.04
Saipem SpA 60,675 370,840 0.04
Mediolanum SpA 60,954 323,280 0.04
Salvatore Ferragamo SpA 11,904 209,712 0.02
Parmalat SpA 85,277 144,315 0.02
Mediolanum SpA Rights 01/12/2015 60,954 3 0.00
50,508,623 5.59
Netherlands 6.93% (2014: 6.92%)
Unilever NV 378,027 11,117,018 1.23
ING Groep NV 937,093 8,867,633 0.98
Airbus Group NV Registered 134,061 6,073,593 0.67
ASML Holding NV 78,970 4,775,178 0.53
Koninklijke Philips NV 224,566 3,946,520 0.44
Heineken NV 53,303 3,168,238 0.35
Koninklijke Ahold NV 217,924 2,885,984 0.32
Akzo Nobel NV 59,997 2,764,493 0.31
Reed Elsevier NV 229,070 2,546,972 0.28
Aegon NV 458,827 1,837,160 0.20
Koninklijke KPN NV 757,637 1,809,434 0.20
Wolters Kluwer NV 72,186 1,588,714 0.18
Koninklijke DSM NV 42,252 1,466,637 0.16
NN Group NV 63,156 1,286,981 0.14
Heineken Holding NV 23,825 1,242,809 0.14
Altice NV A Shares 94,357 1,062,967 0.12
Randstad Holding NV 26,590 1,032,341 0.11
ArcelorMittal 243,915 885,051 0.10
QIAGEN NV 55,089 864,897 0.10
Gemalto NV 16,736 682,206 0.07
TNT Express NV 115,684 632,994 0.07
Boskalis Westminster NV 19,260 609,104 0.07
Koninklijke Vopak NV 16,178 423,170 0.05
OCI NV 19,563 359,542 0.04
Altice NV B Shares 28,927 333,219 0.04
GrandVision NV 12,319 220,679 0.02
Gemalto NV Netherlands 2,637 107,491 0.01
Airbus Group NV Registered Germany 560 25,214 0.00
62,616,239 6.93
Norway 1.36% (2014: 1.79%)
Statoil ASA 231,779 2,415,621 0.27
DNB ASA 259,507 2,148,592 0.24
Telenor ASA 168,966 2,072,576 0.23
Yara International ASA 43,021 1,269,720 0.14
Orkla ASA 191,251 1,055,156 0.12
Norsk Hydro ASA 319,662 744,828 0.08
Marine Harvest ASA 75,889 660,844 0.07
Schibsted ASA 20,495 446,335 0.05
Gjensidige Forsikring ASA 41,744 412,380 0.04
Schibsted ASA B Shares 18,691 379,015 0.04
Seadrill Ltd. 86,177 350,487 0.04
Subsea 7 SA 68,108 345,012 0.04
12,300,566 1.36
Portugal 0.32% (2014: 0.51%)
EDP - Energias de Portugal SA 463,715 1,117,090 0.12
Galp Energia SGPS SA 92,249 649,067 0.07
Jeronimo Martins SGPS SA 58,768 536,571 0.06
Banco Comercial Portugues SA 9,865,660 368,344 0.04
EDP Renovaveis SA 50,376 237,091 0.03
Banco Espirito Santo SA1 529,326 514 0.00
2,908,677 0.32
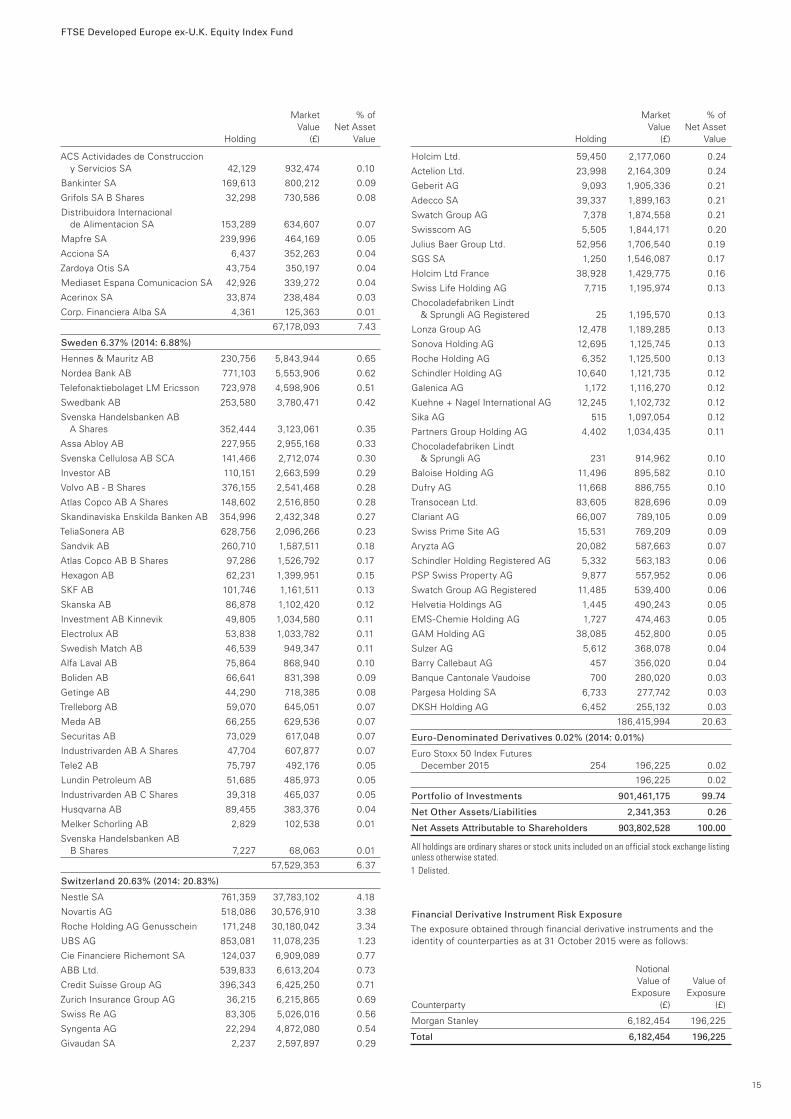
Spain 7.43% (2014: 7.91%)
Banco Santander SA 3,461,126 12,625,620 1.40
Telefonica SA 1,028,600 8,850,694 0.98
Banco Bilbao Vizcaya Argentaria SA 1,520,388 8,524,723 0.94
Iberdrola SA 1,374,218 6,386,069 0.71
Inditex SA 257,275 6,275,969 0.69
Amadeus IT Holding SA 101,463 2,812,915 0.31
Repsol SA 256,910 2,107,704 0.23
Ferrovial SA 98,533 1,617,445 0.18
CaixaBank SA 607,230 1,516,241 0.17
Red Electrica Corp. SA 26,258 1,506,264 0.17
Banco de Sabadell SA 1,116,719 1,404,196 0.16
Grifols SA 40,237 1,213,365 0.13
Aena SA 15,675 1,137,430 0.13
Endesa SA 77,227 1,118,284 0.12
Enagas SA 55,943 1,102,383 0.12
Abertis Infraestructuras SA 98,603 1,065,663 0.12
Gas Natural SDG SA 74,881 1,055,659 0.12
Banco Popular Espanol SA 381,387 945,223 0.10
Bankia SA 1,127,808 944,619 0.10
FTSE Developed Europe ex-U.K. Equity Index Fund
15
Market % of Value Net Asset Holding (£) Value
Market % of Value Net Asset Holding (£) Value
ACS Actividades de Construccion y Servicios SA 42,129 932,474 0.10
Bankinter SA 169,613 800,212 0.09
Grifols SA B Shares 32,298 730,586 0.08
Distribuidora Internacional de Alimentacion SA 153,289 634,607 0.07
Mapfre SA 239,996 464,169 0.05
Acciona SA 6,437 352,263 0.04
Zardoya Otis SA 43,754 350,197 0.04
Mediaset Espana Comunicacion SA 42,926 339,272 0.04
Acerinox SA 33,874 238,484 0.03
Corp. Financiera Alba SA 4,361 125,363 0.01
67,178,093 7.43
Sweden 6.37% (2014: 6.88%)
Hennes & Mauritz AB 230,756 5,843,944 0.65
Nordea Bank AB 771,103 5,553,906 0.62
Telefonaktiebolaget LM Ericsson 723,978 4,598,906 0.51
Swedbank AB 253,580 3,780,471 0.42
Svenska Handelsbanken AB A Shares 352,444 3,123,061 0.35
Assa Abloy AB 227,955 2,955,168 0.33
Svenska Cellulosa AB SCA 141,466 2,712,074 0.30
Investor AB 110,151 2,663,599 0.29
Volvo AB - B Shares 376,155 2,541,468 0.28
Atlas Copco AB A Shares 148,602 2,516,850 0.28
Skandinaviska Enskilda Banken AB 354,996 2,432,348 0.27
TeliaSonera AB 628,756 2,096,266 0.23
Sandvik AB 260,710 1,587,511 0.18
Atlas Copco AB B Shares 97,286 1,526,792 0.17
Hexagon AB 62,231 1,399,951 0.15
SKF AB 101,746 1,161,511 0.13
Skanska AB 86,878 1,102,420 0.12
Investment AB Kinnevik 49,805 1,034,580 0.11
Electrolux AB 53,838 1,033,782 0.11
Swedish Match AB 46,539 949,347 0.11
Alfa Laval AB 75,864 868,940 0.10
Boliden AB 66,641 831,398 0.09
Getinge AB 44,290 718,385 0.08
Trelleborg AB 59,070 645,051 0.07
Meda AB 66,255 629,536 0.07
Securitas AB 73,029 617,048 0.07
Industrivarden AB A Shares 47,704 607,877 0.07
Tele2 AB 75,797 492,176 0.05
Lundin Petroleum AB 51,685 485,973 0.05
Industrivarden AB C Shares 39,318 465,037 0.05
Husqvarna AB 89,455 383,376 0.04
Melker Schorling AB 2,829 102,538 0.01
Svenska Handelsbanken AB B Shares 7,227 68,063 0.01
57,529,353 6.37
Switzerland 20.63% (2014: 20.83%)
Nestle SA 761,359 37,783,102 4.18
Novartis AG 518,086 30,576,910 3.38
Roche Holding AG Genusschein 171,248 30,180,042 3.34
UBS AG 853,081 11,078,235 1.23
Cie Financiere Richemont SA 124,037 6,909,089 0.77
ABB Ltd. 539,833 6,613,204 0.73
Credit Suisse Group AG 396,343 6,425,250 0.71
Zurich Insurance Group AG 36,215 6,215,865 0.69
Swiss Re AG 83,305 5,026,016 0.56
Syngenta AG 22,294 4,872,080 0.54
Givaudan SA 2,237 2,597,897 0.29
Holcim Ltd. 59,450 2,177,060 0.24
Actelion Ltd. 23,998 2,164,309 0.24
Geberit AG 9,093 1,905,336 0.21
Adecco SA 39,337 1,899,163 0.21
Swatch Group AG 7,378 1,874,558 0.21
Swisscom AG 5,505 1,844,171 0.20
Julius Baer Group Ltd. 52,956 1,706,540 0.19
SGS SA 1,250 1,546,087 0.17
Holcim Ltd France 38,928 1,429,775 0.16
Swiss Life Holding AG 7,715 1,195,974 0.13
Chocoladefabriken Lindt & Sprungli AG Registered 25 1,195,570 0.13
Lonza Group AG 12,478 1,189,285 0.13
Sonova Holding AG 12,695 1,125,745 0.13
Roche Holding AG 6,352 1,125,500 0.13
Schindler Holding AG 10,640 1,121,735 0.12
Galenica AG 1,172 1,116,270 0.12
Kuehne + Nagel International AG 12,245 1,102,732 0.12
Sika AG 515 1,097,054 0.12
Partners Group Holding AG 4,402 1,034,435 0.11
Chocoladefabriken Lindt & Sprungli AG 231 914,962 0.10
Baloise Holding AG 11,496 895,582 0.10
Dufry AG 11,668 886,755 0.10
Transocean Ltd. 83,605 828,696 0.09
Clariant AG 66,007 789,105 0.09
Swiss Prime Site AG 15,531 769,209 0.09
Aryzta AG 20,082 587,663 0.07
Schindler Holding Registered AG 5,332 563,183 0.06
PSP Swiss Property AG 9,877 557,952 0.06
Swatch Group AG Registered 11,485 539,400 0.06
Helvetia Holdings AG 1,445 490,243 0.05
EMS-Chemie Holding AG 1,727 474,463 0.05
GAM Holding AG 38,085 452,800 0.05
Sulzer AG 5,612 368,078 0.04
Barry Callebaut AG 457 356,020 0.04
Banque Cantonale Vaudoise 700 280,020 0.03
Pargesa Holding SA 6,733 277,742 0.03
DKSH Holding AG 6,452 255,132 0.03
186,415,994 20.63
Euro-Denominated Derivatives 0.02% (2014: 0.01%)
Euro Stoxx 50 Index Futures December 2015 254 196,225 0.02
196,225 0.02
Portfolio of Investments 901,461,175 99.74
Net Other Assets/Liabilities 2,341,353 0.26
Net Assets Attributable to Shareholders 903,802,528 100.00
All holdings are ordinary shares or stock units included on an official stock exchange listing unless otherwise stated.1 Delisted.
Financial Derivative Instrument Risk Exposure
The exposure obtained through financial derivative instruments and the identity of counterparties as at 31 October 2015 were as follows:
Notional Value of Value of Exposure Exposure Counterparty (£) (£)
Morgan Stanley 6,182,454 196,225
Total 6,182,454 196,225
FTSE Developed Europe ex-U.K. Equity Index Fund
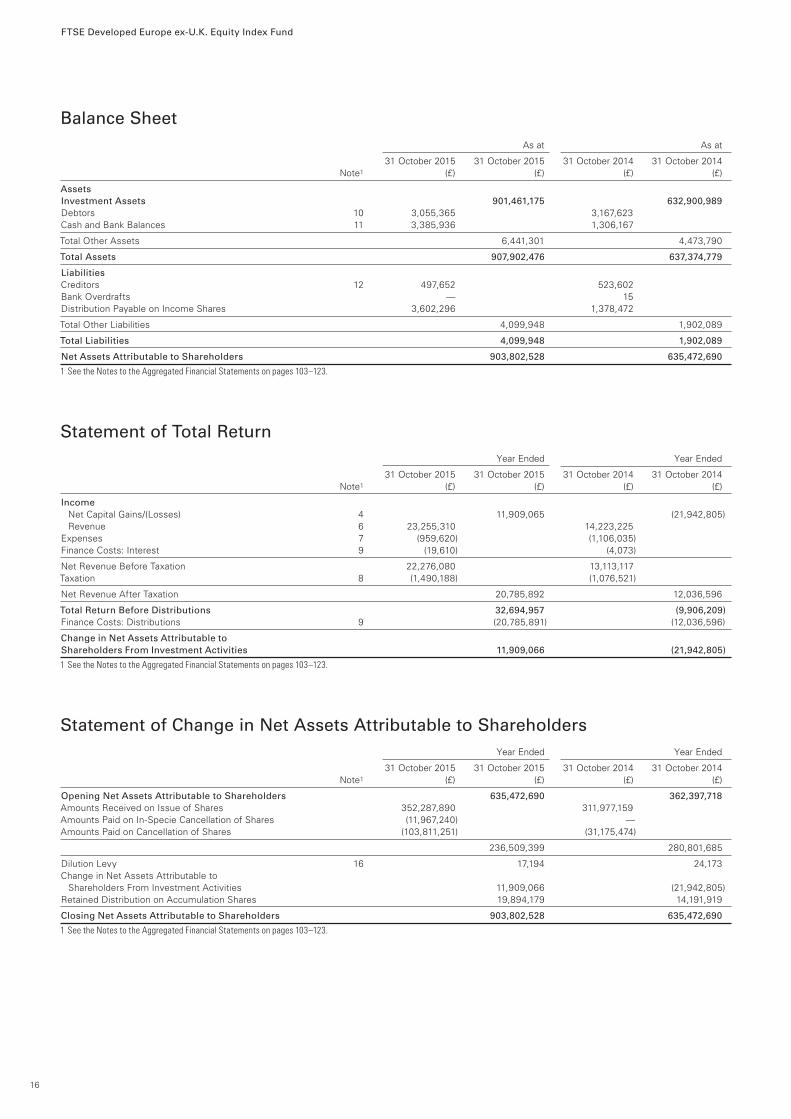
Balance Sheet As at As at
31 October 2015 31 October 2015 31 October 2014 31 October 2014 Note1 (£) (£) (£) (£)
AssetsInvestment Assets 901,461,175 632,900,989 Debtors 10 3,055,365 3,167,623 Cash and Bank Balances 11 3,385,936 1,306,167
Total Other Assets 6,441,301 4,473,790
Total Assets 907,902,476 637,374,779
LiabilitiesCreditors 12 497,652 523,602Bank Overdrafts — 15Distribution Payable on Income Shares 3,602,296 1,378,472
Total Other Liabilities 4,099,948 1,902,089
Total Liabilities 4,099,948 1,902,089
Net Assets Attributable to Shareholders 903,802,528 635,472,690
1 See the Notes to the Aggregated Financial Statements on pages 103–123.
Statement of Total Return Year Ended Year Ended
31 October 2015 31 October 2015 31 October 2014 31 October 2014 Note1 (£) (£) (£) (£)
Income Net Capital Gains/(Losses) 4 11,909,065 (21,942,805) Revenue 6 23,255,310 14,223,225 Expenses 7 (959,620) (1,106,035)Finance Costs: Interest 9 (19,610) (4,073)
Net Revenue Before Taxation 22,276,080 13,113,117 Taxation 8 (1,490,188) (1,076,521)
Net Revenue After Taxation 20,785,892 12,036,596
Total Return Before Distributions 32,694,957 (9,906,209)Finance Costs: Distributions 9 (20,785,891) (12,036,596)
Change in Net Assets Attributable to Shareholders From Investment Activities 11,909,066 (21,942,805)
1 See the Notes to the Aggregated Financial Statements on pages 103–123.
Statement of Change in Net Assets Attributable to Shareholders Year Ended Year Ended
31 October 2015 31 October 2015 31 October 2014 31 October 2014 Note1 (£) (£) (£) (£)
Opening Net Assets Attributable to Shareholders 635,472,690 362,397,718 Amounts Received on Issue of Shares 352,287,890 311,977,159 Amounts Paid on In-Specie Cancellation of Shares (11,967,240) —Amounts Paid on Cancellation of Shares (103,811,251) (31,175,474)
236,509,399 280,801,685
Dilution Levy 16 17,194 24,173 Change in Net Assets Attributable to Shareholders From Investment Activities 11,909,066 (21,942,805)Retained Distribution on Accumulation Shares 19,894,179 14,191,919
Closing Net Assets Attributable to Shareholders 903,802,528 635,472,690
1 See the Notes to the Aggregated Financial Statements on pages 103–123.
16

FTSE Developed Europe ex-U.K. Equity Index Fund
Distribution TableFor the year ended 31 October 2015
Final distribution payable 31 December 2015
Distribution Distribution Net Paid Paid Income Equalisation 31 December 2015 31 December 2014 Pence Per Share Pence Per Share Pence Per Share Pence Per Share
A Accumulation Shares
Group 1 463.4831 — 463.4831 424.9825
Group 2 263.7890 199.6941 463.4831 424.9825
A Income Shares
Group 1 403.1753 — 403.1753 379.2792
Group 2 194.5676 208.6077 403.1753 379.2792
Institutional Plus Accumulation Shares
Group 1 268.1892 — 268.1892 8.6800
Group 2 3.0908 265.0984 268.1892 8.6800
Institutional Plus Income Shares
Group 1 268.1754 — 268.1754 8.8050
Group 2 91.7860 176.3894 268.1754 8.8050
Group 1—shares purchased before 1 November 2014.Group 2—shares purchased between 1 November 2014 and 31 October 2015.Note: Equalisation applies only to shares purchased during the distribution period (Group 2 shares). It is the average amount of income included in the purchase price of all Group 2 shares and is refunded to holders of these shares as a return of capital. Being capital, it is not liable to income tax but must be deducted from the cost of shares for capital gains tax purposes.
17
FTSE Developed World ex-U.K. Equity Index Fund
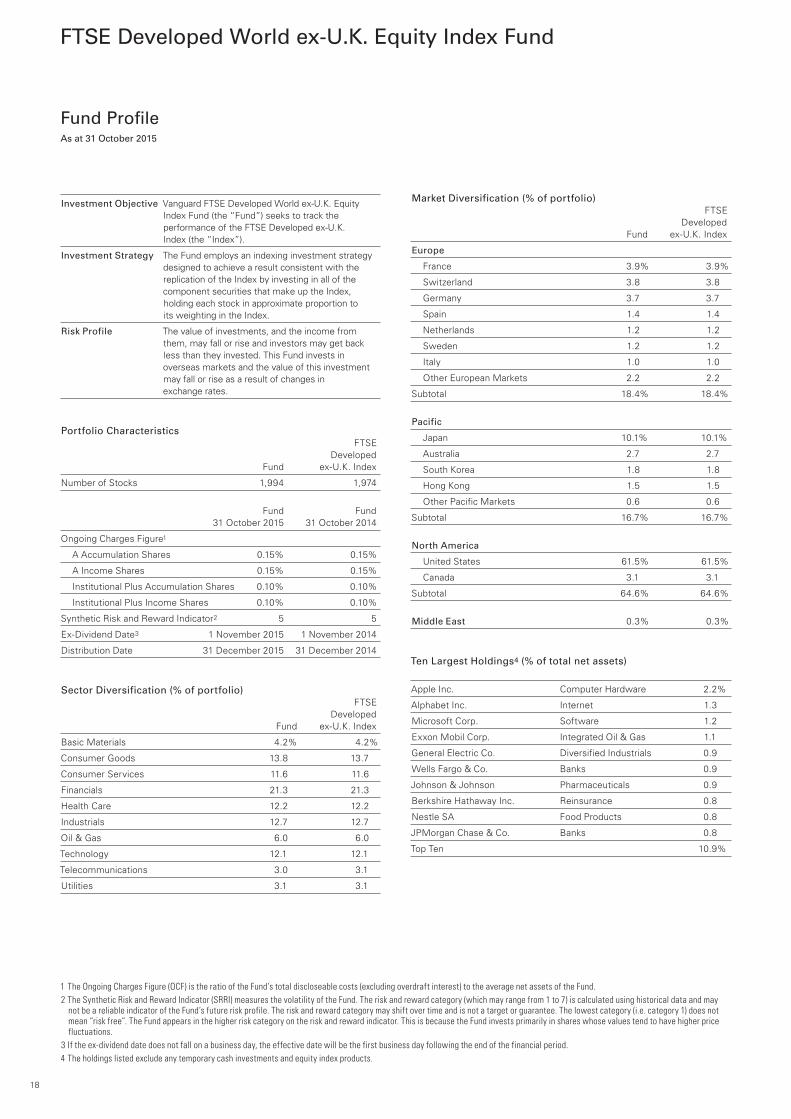
Fund Profile As at 31 October 2015
Investment Objective Vanguard FTSE Developed World ex-U.K. Equity Index Fund (the “Fund”) seeks to track the performance of the FTSE Developed ex-U.K. Index (the “Index”).
Investment Strategy The Fund employs an indexing investment strategy designed to achieve a result consistent with the replication of the Index by investing in all of the component securities that make up the Index, holding each stock in approximate proportion to its weighting in the Index.
Risk Profile The value of investments, and the income from them, may fall or rise and investors may get back less than they invested. This Fund invests in overseas markets and the value of this investment may fall or rise as a result of changes in exchange rates.
Portfolio Characteristics FTSE Developed Fund ex-U.K. Index
Number of Stocks 1,994 1,974
Fund Fund 31 October 2015 31 October 2014
Ongoing Charges Figure1
A Accumulation Shares 0.15% 0.15%
A Income Shares 0.15% 0.15%
Institutional Plus Accumulation Shares 0.10% 0.10%
Institutional Plus Income Shares 0.10% 0.10%
Synthetic Risk and Reward Indicator2 5 5
Ex-Dividend Date3 1 November 2015 1 November 2014
Distribution Date 31 December 2015 31 December 2014
Sector Diversification (% of portfolio) FTSE Developed Fund ex-U.K. Index
Basic Materials 4.2% 4.2%
Consumer Goods 13.8 13.7
Consumer Services 11.6 11.6
Financials 21.3 21.3
Health Care 12.2 12.2
Industrials 12.7 12.7
Oil & Gas 6.0 6.0
Technology 12.1 12.1
Telecommunications 3.0 3.1
Utilities 3.1 3.1
Market Diversification (% of portfolio) FTSE Developed Fund ex-U.K. Index
Europe
France 3.9% 3.9%
Switzerland 3.8 3.8
Germany 3.7 3.7
Spain 1.4 1.4
Netherlands 1.2 1.2
Sweden 1.2 1.2
Italy 1.0 1.0
Other European Markets 2.2 2.2
Subtotal 18.4% 18.4%
Pacific
Japan 10.1% 10.1%
Australia 2.7 2.7
South Korea 1.8 1.8
Hong Kong 1.5 1.5
Other Pacific Markets 0.6 0.6
Subtotal 16.7% 16.7%
North America
United States 61.5% 61.5%
Canada 3.1 3.1
Subtotal 64.6% 64.6%
Middle East 0.3% 0.3%
Ten Largest Holdings4 (% of total net assets)
Apple Inc. Computer Hardware 2.2%
Alphabet Inc. Internet 1.3
Microsoft Corp. Software 1.2
Exxon Mobil Corp. Integrated Oil & Gas 1.1
General Electric Co. Diversified Industrials 0.9
Wells Fargo & Co. Banks 0.9
Johnson & Johnson Pharmaceuticals 0.9
Berkshire Hathaway Inc. Reinsurance 0.8
Nestle SA Food Products 0.8
JPMorgan Chase & Co. Banks 0.8
Top Ten 10.9%
1 The Ongoing Charges Figure (OCF) is the ratio of the Fund’s total discloseable costs (excluding overdraft interest) to the average net assets of the Fund.2 The Synthetic Risk and Reward Indicator (SRRI) measures the volatility of the Fund. The risk and reward category (which may range from 1 to 7) is calculated using historical data and may
not be a reliable indicator of the Fund’s future risk profile. The risk and reward category may shift over time and is not a target or guarantee. The lowest category (i.e. category 1) does not mean “risk free”. The Fund appears in the higher risk category on the risk and reward indicator. This is because the Fund invests primarily in shares whose values tend to have higher price fluctuations.
3 If the ex-dividend date does not fall on a business day, the effective date will be the first business day following the end of the financial period.4 The holdings listed exclude any temporary cash investments and equity index products.
18
FTSE Developed World ex-U.K. Equity Index Fund
Commentary On behalf of Vanguard Asset Management, Limited1
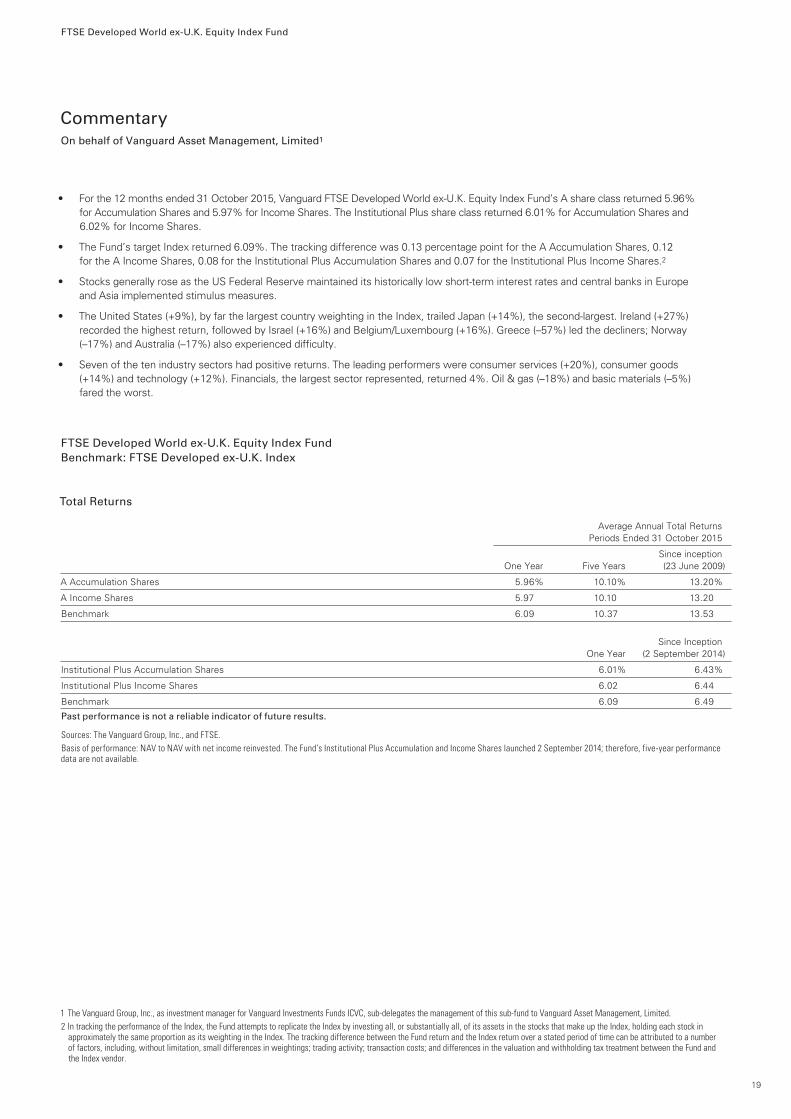
• For the 12 months ended 31 October 2015, Vanguard FTSE Developed World ex-U.K. Equity Index Fund’s A share class returned 5.96% for Accumulation Shares and 5.97% for Income Shares. The Institutional Plus share class returned 6.01% for Accumulation Shares and 6.02% for Income Shares.
• The Fund’s target Index returned 6.09%. The tracking difference was 0.13 percentage point for the A Accumulation Shares, 0.12 for the A Income Shares, 0.08 for the Institutional Plus Accumulation Shares and 0.07 for the Institutional Plus Income Shares.2
• Stocks generally rose as the US Federal Reserve maintained its historically low short-term interest rates and central banks in Europe and Asia implemented stimulus measures.
• The United States (+9%), by far the largest country weighting in the Index, trailed Japan (+14%), the second-largest. Ireland (+27%) recorded the highest return, followed by Israel (+16%) and Belgium/Luxembourg (+16%). Greece (–57%) led the decliners; Norway (–17%) and Australia (–17%) also experienced difficulty.
• Seven of the ten industry sectors had positive returns. The leading performers were consumer services (+20%), consumer goods (+14%) and technology (+12%). Financials, the largest sector represented, returned 4%. Oil & gas (–18%) and basic materials (–5%) fared the worst.
FTSE Developed World ex-U.K. Equity Index Fund Benchmark: FTSE Developed ex-U.K. Index
Total Returns Average Annual Total Returns Periods Ended 31 October 2015
Since inception One Year Five Years (23 June 2009)
A Accumulation Shares 5.96% 10.10% 13.20%
A Income Shares 5.97 10.10 13.20
Benchmark 6.09 10.37 13.53
Since Inception One Year (2 September 2014)
Institutional Plus Accumulation Shares 6.01% 6.43%
Institutional Plus Income Shares 6.02 6.44
Benchmark 6.09 6.49
Past performance is not a reliable indicator of future results.
Sources: The Vanguard Group, Inc., and FTSE.Basis of performance: NAV to NAV with net income reinvested. The Fund’s Institutional Plus Accumulation and Income Shares launched 2 September 2014; therefore, five-year performance data are not available.
1 The Vanguard Group, Inc., as investment manager for Vanguard Investments Funds ICVC, sub-delegates the management of this sub-fund to Vanguard Asset Management, Limited.2 In tracking the performance of the Index, the Fund attempts to replicate the Index by investing all, or substantially all, of its assets in the stocks that make up the Index, holding each stock in
approximately the same proportion as its weighting in the Index. The tracking difference between the Fund return and the Index return over a stated period of time can be attributed to a number of factors, including, without limitation, small differences in weightings; trading activity; transaction costs; and differences in the valuation and withholding tax treatment between the Fund and the Index vendor.
19

FTSE Developed World ex-U.K. Equity Index Fund
Price History
Vanguard FTSE Developed World 1 January 2015 to 1 January 2014 to 1 January 2013 to 1 January 2012 to 1 January 2011 to ex-U.K. Equity Index Fund 31 October 2015 31 December 2014 31 December 2013 31 December 2012 31 December 2011
A Accumulation Shares
(10 Apr. 2015) (29 Dec. 2014) (15 Nov. 2013) (20 Dec. 2012) (7 Jul. 2011)Highest Share Price £238.97 £217.57 £191.77 £154.90 £153.42
(25 Aug. 2015) (3 Feb. 2014) (2 Jan. 2013) (18 May 2012) (19 Aug. 2011)Lowest Share Price £199.25 £183.13 £156.67 £137.12 £123.15
Income Dividends Pence Per Share 417.2454 343.9735 330.4819 300.2432 275.6703
A Income Shares
(10 Apr. 2015) (29 Dec. 2014) (29 Oct. 2013) (18 Oct. 2012) (7 Jul. 2011)Highest Share Price £216.80 £197.39 £179.27 £147.52 £150.06
(25 Aug. 2015) (3 Feb. 2014) (2 Jan. 2013) (18 May 2012) (19 Aug. 2011)Lowest Share Price £180.76 £168.96 £147.09 £131.35 £120.45
Income Dividends Pence Per Share 378.5353 317.3083 310.2667 287.4159 269.7352
Institutional Plus Accumulation Shares1
(10 Apr. 2015) (29 Dec. 2014) Highest Share Price £116.84 £106.35 — — —
(25 Aug. 2015) (16 Oct. 2014) Lowest Share Price £97.41 £94.38 — — —
Income Dividends Pence Per Share 209.7434 24.8400 — — —
Institutional Plus Income Shares1
(10 Apr. 2015) (29 Dec. 2014) Highest Share Price £116.54 £106.09 — — —
(25 Aug. 2015) (16 Oct. 2014) Lowest Share Price £97.18 £94.37 — — —
Income Dividends Pence Per Share 208.8467 24.6438 — — —
NAV History 31 October 2015 31 October 2014 31 October 2013
A Accumulation Shares
Total Net Asset Value £1,777,299,547 £1,265,218,622 £937,042,147
Net Asset Value Per Share £219.77 £207.34 £189.59
Number of Shares in Issue 8,087,090 6,102,176 4,942,346
A Income Shares
Total Net Asset Value £360,916,943 £275,025,962 £225,131,588
Net Asset Value Per Share £195.61 £188.11 £174.92
Number of Shares in Issue 1,845,083 1,462,024 1,287,068
Institutional Plus Accumulation Shares1
Total Net Asset Value £29,216 £5,067 —
Net Asset Value Per Share £107.41 £101.34 —
Number of Shares in Issue 272 50 —
Institutional Plus Income Shares1
Total Net Asset Value £11,658,940 £10,147,681 —
Net Asset Value Per Share £105.12 £101.09 —
Number of Shares in Issue 110,911 100,379 —
1 Launched 2 September 2014.
20

FTSE Developed World ex-U.K. Equity Index Fund
Summary of Significant Changes (unaudited)For the year ended 31 October 2015
Cost (£)
Largest Purchases
Apple Inc. 11,759,120
Exxon Mobil Corp. 6,064,520
Microsoft Corp. 5,605,886
Wells Fargo & Co. 4,735,049
Johnson & Johnson 4,687,274
Total 32,851,849
Total Purchases for the Year 615,533,343
Proceeds (£)
Largest Sales
Covidien plc 2,693,144
Lorillard Inc. 2,088,499
Apple Inc. 1,808,955
Pharmacyclics Inc. 1,461,194
Novartis AG 1,236,477
Total 9,288,269
Total Sales for the Year 77,259,140
21
FTSE Developed World ex-U.K. Equity Index Fund
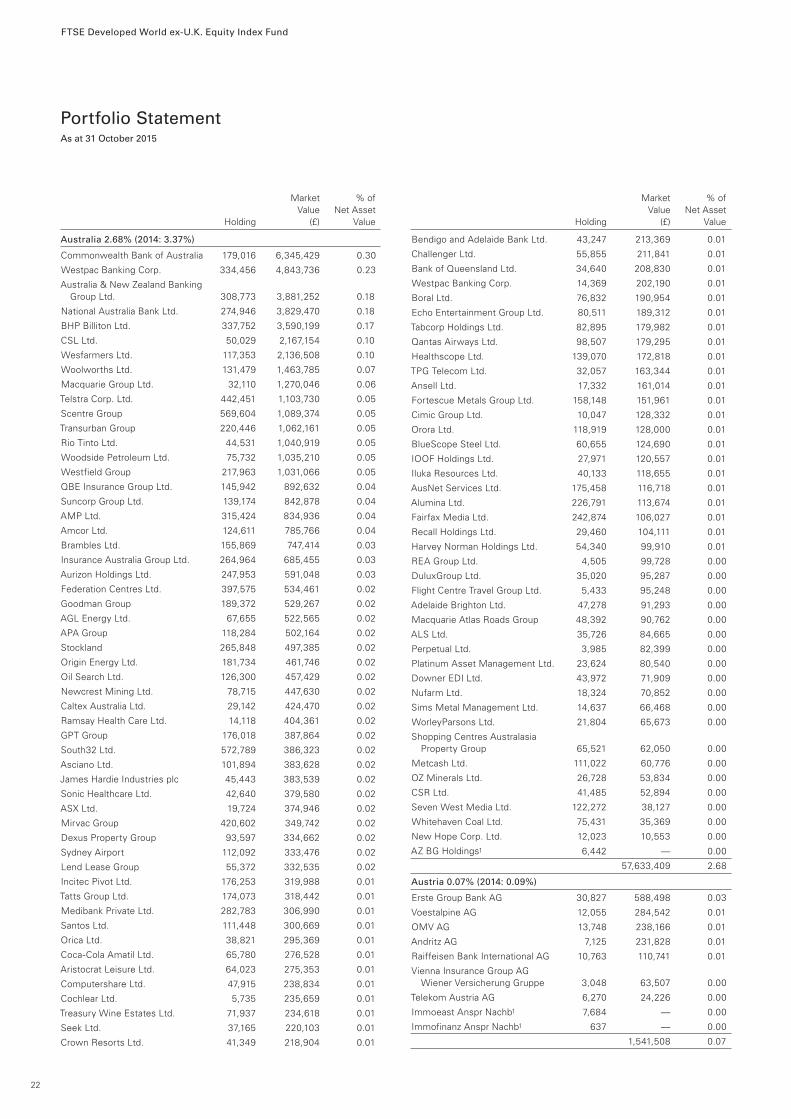
Portfolio StatementAs at 31 October 2015
Australia 2.68% (2014: 3.37%)
Commonwealth Bank of Australia 179,016 6,345,429 0.30
Westpac Banking Corp. 334,456 4,843,736 0.23
Australia & New Zealand Banking Group Ltd. 308,773 3,881,252 0.18
National Australia Bank Ltd. 274,946 3,829,470 0.18
BHP Billiton Ltd. 337,752 3,590,199 0.17
CSL Ltd. 50,029 2,167,154 0.10
Wesfarmers Ltd. 117,353 2,136,508 0.10
Woolworths Ltd. 131,479 1,463,785 0.07
Macquarie Group Ltd. 32,110 1,270,046 0.06
Telstra Corp. Ltd. 442,451 1,103,730 0.05
Scentre Group 569,604 1,089,374 0.05
Transurban Group 220,446 1,062,161 0.05
Rio Tinto Ltd. 44,531 1,040,919 0.05
Woodside Petroleum Ltd. 75,732 1,035,210 0.05
Westfield Group 217,963 1,031,066 0.05
QBE Insurance Group Ltd. 145,942 892,632 0.04
Suncorp Group Ltd. 139,174 842,878 0.04
AMP Ltd. 315,424 834,936 0.04
Amcor Ltd. 124,611 785,766 0.04
Brambles Ltd. 155,869 747,414 0.03
Insurance Australia Group Ltd. 264,964 685,455 0.03
Aurizon Holdings Ltd. 247,953 591,048 0.03
Federation Centres Ltd. 397,575 534,461 0.02
Goodman Group 189,372 529,267 0.02
AGL Energy Ltd. 67,655 522,565 0.02
APA Group 118,284 502,164 0.02
Stockland 265,848 497,385 0.02
Origin Energy Ltd. 181,734 461,746 0.02
Oil Search Ltd. 126,300 457,429 0.02
Newcrest Mining Ltd. 78,715 447,630 0.02
Caltex Australia Ltd. 29,142 424,470 0.02
Ramsay Health Care Ltd. 14,118 404,361 0.02
GPT Group 176,018 387,864 0.02
South32 Ltd. 572,789 386,323 0.02
Asciano Ltd. 101,894 383,628 0.02
James Hardie Industries plc 45,443 383,539 0.02
Sonic Healthcare Ltd. 42,640 379,580 0.02
ASX Ltd. 19,724 374,946 0.02
Mirvac Group 420,602 349,742 0.02
Dexus Property Group 93,597 334,662 0.02
Sydney Airport 112,092 333,476 0.02
Lend Lease Group 55,372 332,535 0.02
Incitec Pivot Ltd. 176,253 319,988 0.01
Tatts Group Ltd. 174,073 318,442 0.01
Medibank Private Ltd. 282,783 306,990 0.01
Santos Ltd. 111,448 300,669 0.01
Orica Ltd. 38,821 295,369 0.01
Coca-Cola Amatil Ltd. 65,780 276,528 0.01
Aristocrat Leisure Ltd. 64,023 275,353 0.01
Computershare Ltd. 47,915 238,834 0.01
Cochlear Ltd. 5,735 235,659 0.01
Treasury Wine Estates Ltd. 71,937 234,618 0.01
Seek Ltd. 37,165 220,103 0.01
Crown Resorts Ltd. 41,349 218,904 0.01
Bendigo and Adelaide Bank Ltd. 43,247 213,369 0.01
Challenger Ltd. 55,855 211,841 0.01
Bank of Queensland Ltd. 34,640 208,830 0.01
Westpac Banking Corp. 14,369 202,190 0.01
Boral Ltd. 76,832 190,954 0.01
Echo Entertainment Group Ltd. 80,511 189,312 0.01
Tabcorp Holdings Ltd. 82,895 179,982 0.01
Qantas Airways Ltd. 98,507 179,295 0.01
Healthscope Ltd. 139,070 172,818 0.01
TPG Telecom Ltd. 32,057 163,344 0.01
Ansell Ltd. 17,332 161,014 0.01
Fortescue Metals Group Ltd. 158,148 151,961 0.01
Cimic Group Ltd. 10,047 128,332 0.01
Orora Ltd. 118,919 128,000 0.01
BlueScope Steel Ltd. 60,655 124,690 0.01
IOOF Holdings Ltd. 27,971 120,557 0.01
Iluka Resources Ltd. 40,133 118,655 0.01
AusNet Services Ltd. 175,458 116,718 0.01
Alumina Ltd. 226,791 113,674 0.01
Fairfax Media Ltd. 242,874 106,027 0.01
Recall Holdings Ltd. 29,460 104,111 0.01
Harvey Norman Holdings Ltd. 54,340 99,910 0.01
REA Group Ltd. 4,505 99,728 0.00
DuluxGroup Ltd. 35,020 95,287 0.00
Flight Centre Travel Group Ltd. 5,433 95,248 0.00
Adelaide Brighton Ltd. 47,278 91,293 0.00
Macquarie Atlas Roads Group 48,392 90,762 0.00
ALS Ltd. 35,726 84,665 0.00
Perpetual Ltd. 3,985 82,399 0.00
Platinum Asset Management Ltd. 23,624 80,540 0.00
Downer EDI Ltd. 43,972 71,909 0.00
Nufarm Ltd. 18,324 70,852 0.00
Sims Metal Management Ltd. 14,637 66,468 0.00
WorleyParsons Ltd. 21,804 65,673 0.00
Shopping Centres Australasia Property Group 65,521 62,050 0.00
Metcash Ltd. 111,022 60,776 0.00
OZ Minerals Ltd. 26,728 53,834 0.00
CSR Ltd. 41,485 52,894 0.00
Seven West Media Ltd. 122,272 38,127 0.00
Whitehaven Coal Ltd. 75,431 35,369 0.00
New Hope Corp. Ltd. 12,023 10,553 0.00
AZ BG Holdings1 6,442 — 0.00
57,633,409 2.68
Austria 0.07% (2014: 0.09%)
Erste Group Bank AG 30,827 588,498 0.03
Voestalpine AG 12,055 284,542 0.01
OMV AG 13,748 238,166 0.01
Andritz AG 7,125 231,828 0.01
Raiffeisen Bank International AG 10,763 110,741 0.01
Vienna Insurance Group AG Wiener Versicherung Gruppe 3,048 63,507 0.00
Telekom Austria AG 6,270 24,226 0.00
Immoeast Anspr Nachb1 7,684 — 0.00
Immofinanz Anspr Nachb1 637 — 0.00
1,541,508 0.07
22
Market % of Value Net Asset Holding (£) Value
Market % of Value Net Asset Holding (£) Value
FTSE Developed World ex-U.K. Equity Index Fund
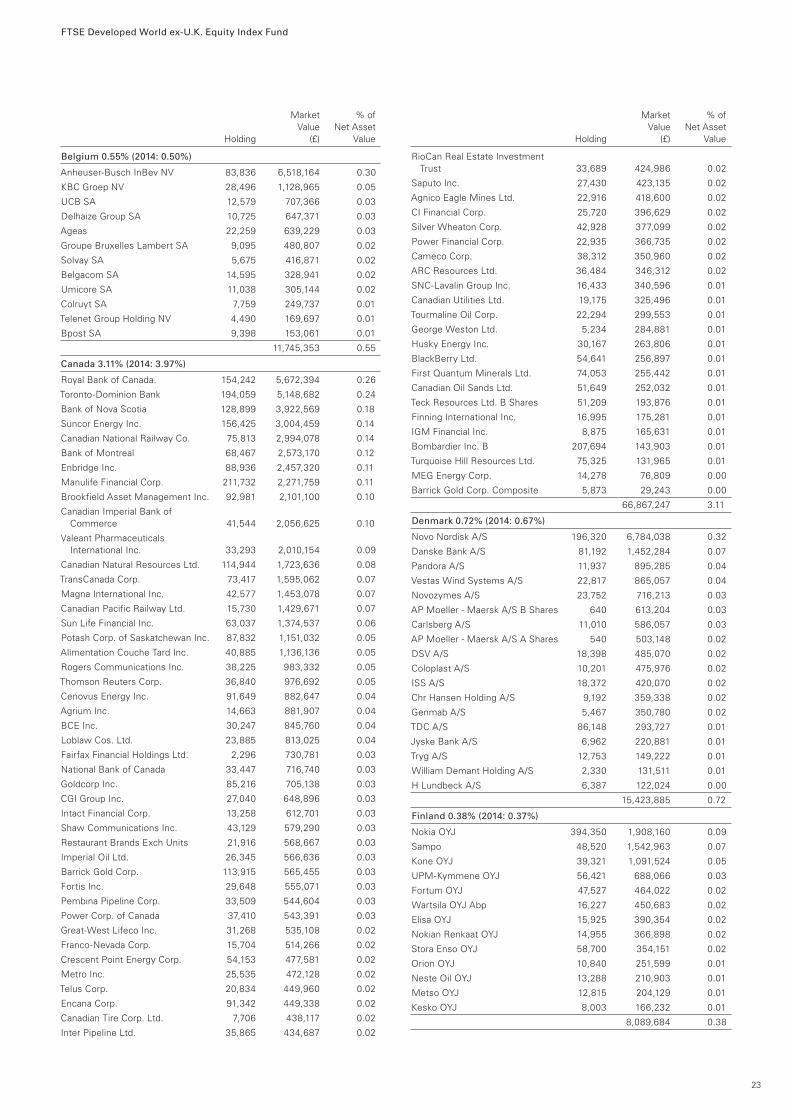
Belgium 0.55% (2014: 0.50%)
Anheuser-Busch InBev NV 83,836 6,518,164 0.30
KBC Groep NV 28,496 1,128,965 0.05
UCB SA 12,579 707,366 0.03
Delhaize Group SA 10,725 647,371 0.03
Ageas 22,259 639,229 0.03
Groupe Bruxelles Lambert SA 9,095 480,807 0.02
Solvay SA 5,675 416,871 0.02
Belgacom SA 14,595 328,941 0.02
Umicore SA 11,038 305,144 0.02
Colruyt SA 7,759 249,737 0.01
Telenet Group Holding NV 4,490 169,697 0.01
Bpost SA 9,398 153,061 0.01
11,745,353 0.55
Canada 3.11% (2014: 3.97%)
Royal Bank of Canada. 154,242 5,672,394 0.26
Toronto-Dominion Bank 194,059 5,148,682 0.24
Bank of Nova Scotia 128,899 3,922,569 0.18
Suncor Energy Inc. 156,425 3,004,459 0.14
Canadian National Railway Co. 75,813 2,994,078 0.14
Bank of Montreal 68,467 2,573,170 0.12
Enbridge Inc. 88,936 2,457,320 0.11
Manulife Financial Corp. 211,732 2,271,759 0.11
Brookfield Asset Management Inc. 92,981 2,101,100 0.10
Canadian Imperial Bank of Commerce 41,544 2,056,625 0.10
Valeant Pharmaceuticals International Inc. 33,293 2,010,154 0.09
Canadian Natural Resources Ltd. 114,944 1,723,636 0.08
TransCanada Corp. 73,417 1,595,062 0.07
Magna International Inc. 42,577 1,453,078 0.07
Canadian Pacific Railway Ltd. 15,730 1,429,671 0.07
Sun Life Financial Inc. 63,037 1,374,537 0.06
Potash Corp. of Saskatchewan Inc. 87,832 1,151,032 0.05
Alimentation Couche Tard Inc. 40,885 1,136,136 0.05
Rogers Communications Inc. 38,225 983,332 0.05
Thomson Reuters Corp. 36,840 976,692 0.05
Cenovus Energy Inc. 91,649 882,647 0.04
Agrium Inc. 14,663 881,907 0.04
BCE Inc. 30,247 845,760 0.04
Loblaw Cos. Ltd. 23,885 813,025 0.04
Fairfax Financial Holdings Ltd. 2,296 730,781 0.03
National Bank of Canada 33,447 716,740 0.03
Goldcorp Inc. 85,216 705,138 0.03
CGI Group Inc. 27,040 648,896 0.03
Intact Financial Corp. 13,258 612,701 0.03
Shaw Communications Inc. 43,129 579,290 0.03
Restaurant Brands Exch Units 21,916 568,667 0.03
Imperial Oil Ltd. 26,345 566,636 0.03
Barrick Gold Corp. 113,915 565,455 0.03
Fortis Inc. 29,648 555,071 0.03
Pembina Pipeline Corp. 33,509 544,604 0.03
Power Corp. of Canada 37,410 543,391 0.03
Great-West Lifeco Inc. 31,268 535,108 0.02
Franco-Nevada Corp. 15,704 514,266 0.02
Crescent Point Energy Corp. 54,153 477,581 0.02
Metro Inc. 25,535 472,128 0.02
Telus Corp. 20,834 449,960 0.02
Encana Corp. 91,342 449,338 0.02
Canadian Tire Corp. Ltd. 7,706 438,117 0.02
Inter Pipeline Ltd. 35,865 434,687 0.02
RioCan Real Estate Investment Trust 33,689 424,986 0.02
Saputo Inc. 27,430 423,135 0.02
Agnico Eagle Mines Ltd. 22,916 418,600 0.02
CI Financial Corp. 25,720 396,629 0.02
Silver Wheaton Corp. 42,928 377,099 0.02
Power Financial Corp. 22,935 366,735 0.02
Cameco Corp. 38,312 350,960 0.02
ARC Resources Ltd. 36,484 346,312 0.02
SNC-Lavalin Group Inc. 16,433 340,596 0.01
Canadian Utilities Ltd. 19,175 325,496 0.01
Tourmaline Oil Corp. 22,294 299,553 0.01
George Weston Ltd. 5,234 284,881 0.01
Husky Energy Inc. 30,167 263,806 0.01
BlackBerry Ltd. 54,641 256,897 0.01
First Quantum Minerals Ltd. 74,053 255,442 0.01
Canadian Oil Sands Ltd. 51,649 252,032 0.01
Teck Resources Ltd. B Shares 51,209 193,876 0.01
Finning International Inc. 16,995 175,281 0.01
IGM Financial Inc. 8,875 165,631 0.01
Bombardier Inc. B 207,694 143,903 0.01
Turquoise Hill Resources Ltd. 75,325 131,965 0.01
MEG Energy Corp. 14,278 76,809 0.00
Barrick Gold Corp. Composite 5,873 29,243 0.00
66,867,247 3.11
Denmark 0.72% (2014: 0.67%)
Novo Nordisk A/S 196,320 6,784,038 0.32
Danske Bank A/S 81,192 1,452,284 0.07
Pandora A/S 11,937 895,285 0.04
Vestas Wind Systems A/S 22,817 865,057 0.04
Novozymes A/S 23,752 716,213 0.03
AP Moeller - Maersk A/S B Shares 640 613,204 0.03
Carlsberg A/S 11,010 586,057 0.03
AP Moeller - Maersk A/S A Shares 540 503,148 0.02
DSV A/S 18,398 485,070 0.02
Coloplast A/S 10,201 475,976 0.02
ISS A/S 18,372 420,070 0.02
Chr Hansen Holding A/S 9,192 359,338 0.02
Genmab A/S 5,467 350,780 0.02
TDC A/S 86,148 293,727 0.01
Jyske Bank A/S 6,962 220,881 0.01
Tryg A/S 12,753 149,222 0.01
William Demant Holding A/S 2,330 131,511 0.01
H Lundbeck A/S 6,387 122,024 0.00
15,423,885 0.72
Finland 0.38% (2014: 0.37%)
Nokia OYJ 394,350 1,908,160 0.09
Sampo 48,520 1,542,963 0.07
Kone OYJ 39,321 1,091,524 0.05
UPM-Kymmene OYJ 56,421 688,066 0.03
Fortum OYJ 47,527 464,022 0.02
Wartsila OYJ Abp 16,227 450,683 0.02
Elisa OYJ 15,925 390,354 0.02
Nokian Renkaat OYJ 14,955 366,898 0.02
Stora Enso OYJ 58,700 354,151 0.02
Orion OYJ 10,840 251,599 0.01
Neste Oil OYJ 13,288 210,903 0.01
Metso OYJ 12,815 204,129 0.01
Kesko OYJ 8,003 166,232 0.01
8,089,684 0.38
23
Market % of Value Net Asset Holding (£) Value
Market % of Value Net Asset Holding (£) Value
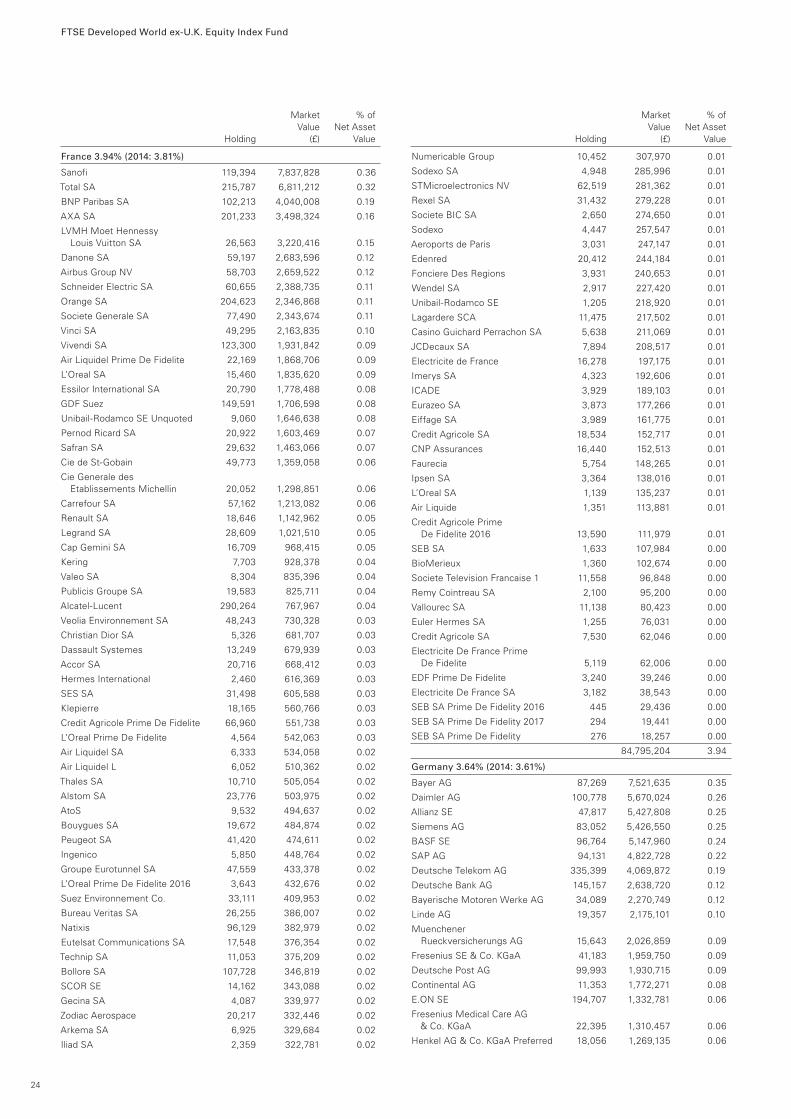
FTSE Developed World ex-U.K. Equity Index Fund
France 3.94% (2014: 3.81%)
Sanofi 119,394 7,837,828 0.36
Total SA 215,787 6,811,212 0.32
BNP Paribas SA 102,213 4,040,008 0.19
AXA SA 201,233 3,498,324 0.16
LVMH Moet Hennessy Louis Vuitton SA 26,563 3,220,416 0.15
Danone SA 59,197 2,683,596 0.12
Airbus Group NV 58,703 2,659,522 0.12
Schneider Electric SA 60,655 2,388,735 0.11
Orange SA 204,623 2,346,868 0.11
Societe Generale SA 77,490 2,343,674 0.11
Vinci SA 49,295 2,163,835 0.10
Vivendi SA 123,300 1,931,842 0.09
Air Liquidel Prime De Fidelite 22,169 1,868,706 0.09
L’Oreal SA 15,460 1,835,620 0.09
Essilor International SA 20,790 1,778,488 0.08
GDF Suez 149,591 1,706,598 0.08
Unibail-Rodamco SE Unquoted 9,060 1,646,638 0.08
Pernod Ricard SA 20,922 1,603,469 0.07
Safran SA 29,632 1,463,066 0.07
Cie de St-Gobain 49,773 1,359,058 0.06
Cie Generale des Etablissements Michellin 20,052 1,298,851 0.06
Carrefour SA 57,162 1,213,082 0.06
Renault SA 18,646 1,142,962 0.05
Legrand SA 28,609 1,021,510 0.05
Cap Gemini SA 16,709 968,415 0.05
Kering 7,703 928,378 0.04
Valeo SA 8,304 835,396 0.04
Publicis Groupe SA 19,583 825,711 0.04
Alcatel-Lucent 290,264 767,967 0.04
Veolia Environnement SA 48,243 730,328 0.03
Christian Dior SA 5,326 681,707 0.03
Dassault Systemes 13,249 679,939 0.03
Accor SA 20,716 668,412 0.03
Hermes International 2,460 616,369 0.03
SES SA 31,498 605,588 0.03
Klepierre 18,165 560,766 0.03
Credit Agricole Prime De Fidelite 66,960 551,738 0.03
L’Oreal Prime De Fidelite 4,564 542,063 0.03
Air Liquidel SA 6,333 534,058 0.02
Air Liquidel L 6,052 510,362 0.02
Thales SA 10,710 505,054 0.02
Alstom SA 23,776 503,975 0.02
AtoS 9,532 494,637 0.02
Bouygues SA 19,672 484,874 0.02
Peugeot SA 41,420 474,611 0.02
Ingenico 5,850 448,764 0.02
Groupe Eurotunnel SA 47,559 433,378 0.02
L’Oreal Prime De Fidelite 2016 3,643 432,676 0.02
Suez Environnement Co. 33,111 409,953 0.02
Bureau Veritas SA 26,255 386,007 0.02
Natixis 96,129 382,979 0.02
Eutelsat Communications SA 17,548 376,354 0.02
Technip SA 11,053 375,209 0.02
Bollore SA 107,728 346,819 0.02
SCOR SE 14,162 343,088 0.02
Gecina SA 4,087 339,977 0.02
Zodiac Aerospace 20,217 332,446 0.02
Arkema SA 6,925 329,684 0.02
Iliad SA 2,359 322,781 0.02
Numericable Group 10,452 307,970 0.01
Sodexo SA 4,948 285,996 0.01
STMicroelectronics NV 62,519 281,362 0.01
Rexel SA 31,432 279,228 0.01
Societe BIC SA 2,650 274,650 0.01
Sodexo 4,447 257,547 0.01
Aeroports de Paris 3,031 247,147 0.01
Edenred 20,412 244,184 0.01
Fonciere Des Regions 3,931 240,653 0.01
Wendel SA 2,917 227,420 0.01
Unibail-Rodamco SE 1,205 218,920 0.01
Lagardere SCA 11,475 217,502 0.01
Casino Guichard Perrachon SA 5,638 211,069 0.01
JCDecaux SA 7,894 208,517 0.01
Electricite de France 16,278 197,175 0.01
Imerys SA 4,323 192,606 0.01
ICADE 3,929 189,103 0.01
Eurazeo SA 3,873 177,266 0.01
Eiffage SA 3,989 161,775 0.01
Credit Agricole SA 18,534 152,717 0.01
CNP Assurances 16,440 152,513 0.01
Faurecia 5,754 148,265 0.01
Ipsen SA 3,364 138,016 0.01
L’Oreal SA 1,139 135,237 0.01
Air Liquide 1,351 113,881 0.01
Credit Agricole Prime De Fidelite 2016 13,590 111,979 0.01
SEB SA 1,633 107,984 0.00
BioMerieux 1,360 102,674 0.00
Societe Television Francaise 1 11,558 96,848 0.00
Remy Cointreau SA 2,100 95,200 0.00
Vallourec SA 11,138 80,423 0.00
Euler Hermes SA 1,255 76,031 0.00
Credit Agricole SA 7,530 62,046 0.00
Electricite De France Prime De Fidelite 5,119 62,006 0.00
EDF Prime De Fidelite 3,240 39,246 0.00
Electricite De France SA 3,182 38,543 0.00
SEB SA Prime De Fidelity 2016 445 29,436 0.00
SEB SA Prime De Fidelity 2017 294 19,441 0.00
SEB SA Prime De Fidelity 276 18,257 0.00
84,795,204 3.94
Germany 3.64% (2014: 3.61%)
Bayer AG 87,269 7,521,635 0.35
Daimler AG 100,778 5,670,024 0.26
Allianz SE 47,817 5,427,808 0.25
Siemens AG 83,052 5,426,550 0.25
BASF SE 96,764 5,147,960 0.24
SAP AG 94,131 4,822,728 0.22
Deutsche Telekom AG 335,399 4,069,872 0.19
Deutsche Bank AG 145,157 2,638,720 0.12
Bayerische Motoren Werke AG 34,089 2,270,749 0.12
Linde AG 19,357 2,175,101 0.10
Muenchener Rueckversicherungs AG 15,643 2,026,859 0.09
Fresenius SE & Co. KGaA 41,183 1,959,750 0.09
Deutsche Post AG 99,993 1,930,715 0.09
Continental AG 11,353 1,772,271 0.08
E.ON SE 194,707 1,332,781 0.06
Fresenius Medical Care AG & Co. KGaA 22,395 1,310,457 0.06
Henkel AG & Co. KGaA Preferred 18,056 1,269,135 0.06
24
Market % of Value Net Asset Holding (£) Value
Market % of Value Net Asset Holding (£) Value
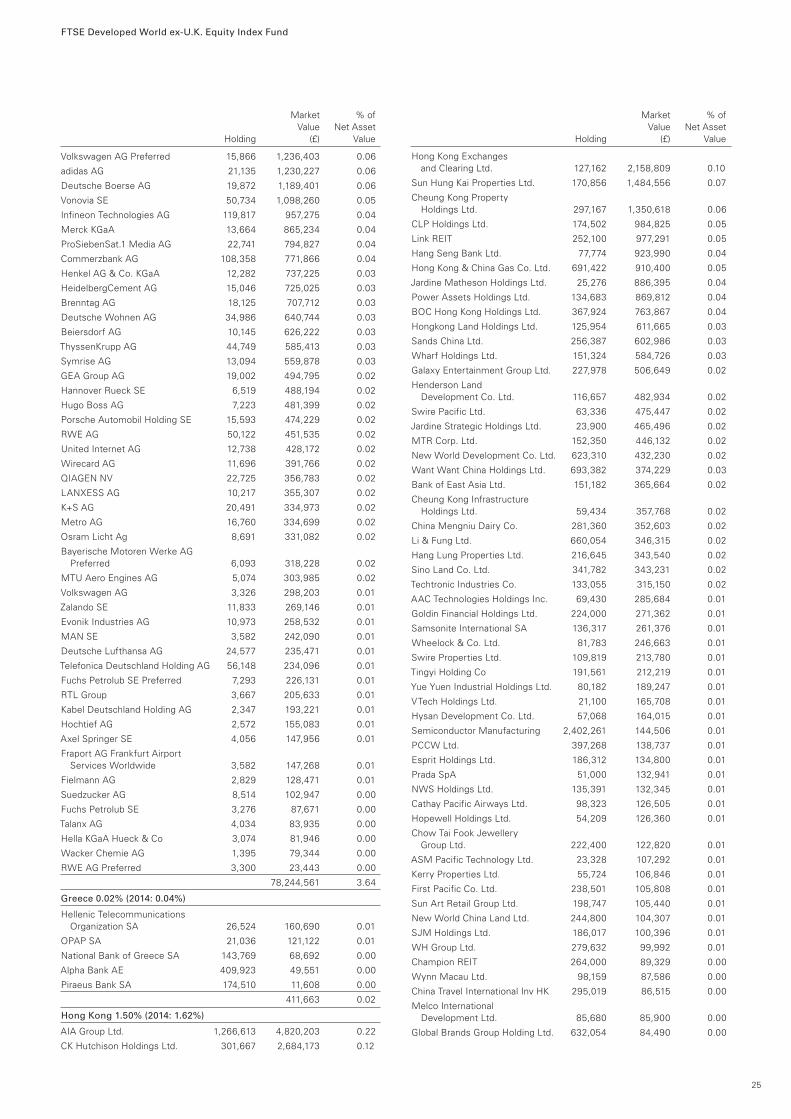
FTSE Developed World ex-U.K. Equity Index Fund
Volkswagen AG Preferred 15,866 1,236,403 0.06
adidas AG 21,135 1,230,227 0.06
Deutsche Boerse AG 19,872 1,189,401 0.06
Vonovia SE 50,734 1,098,260 0.05
Infineon Technologies AG 119,817 957,275 0.04
Merck KGaA 13,664 865,234 0.04
ProSiebenSat.1 Media AG 22,741 794,827 0.04
Commerzbank AG 108,358 771,866 0.04
Henkel AG & Co. KGaA 12,282 737,225 0.03
HeidelbergCement AG 15,046 725,025 0.03
Brenntag AG 18,125 707,712 0.03
Deutsche Wohnen AG 34,986 640,744 0.03
Beiersdorf AG 10,145 626,222 0.03
ThyssenKrupp AG 44,749 585,413 0.03
Symrise AG 13,094 559,878 0.03
GEA Group AG 19,002 494,795 0.02
Hannover Rueck SE 6,519 488,194 0.02
Hugo Boss AG 7,223 481,399 0.02
Porsche Automobil Holding SE 15,593 474,229 0.02
RWE AG 50,122 451,535 0.02
United Internet AG 12,738 428,172 0.02
Wirecard AG 11,696 391,766 0.02
QIAGEN NV 22,725 356,783 0.02
LANXESS AG 10,217 355,307 0.02
K+S AG 20,491 334,973 0.02
Metro AG 16,760 334,699 0.02
Osram Licht Ag 8,691 331,082 0.02
Bayerische Motoren Werke AG Preferred 6,093 318,228 0.02
MTU Aero Engines AG 5,074 303,985 0.02
Volkswagen AG 3,326 298,203 0.01
Zalando SE 11,833 269,146 0.01
Evonik Industries AG 10,973 258,532 0.01
MAN SE 3,582 242,090 0.01
Deutsche Lufthansa AG 24,577 235,471 0.01
Telefonica Deutschland Holding AG 56,148 234,096 0.01
Fuchs Petrolub SE Preferred 7,293 226,131 0.01
RTL Group 3,667 205,633 0.01
Kabel Deutschland Holding AG 2,347 193,221 0.01
Hochtief AG 2,572 155,083 0.01
Axel Springer SE 4,056 147,956 0.01
Fraport AG Frankfurt Airport Services Worldwide 3,582 147,268 0.01
Fielmann AG 2,829 128,471 0.01
Suedzucker AG 8,514 102,947 0.00
Fuchs Petrolub SE 3,276 87,671 0.00
Talanx AG 4,034 83,935 0.00
Hella KGaA Hueck & Co 3,074 81,946 0.00
Wacker Chemie AG 1,395 79,344 0.00
RWE AG Preferred 3,300 23,443 0.00
78,244,561 3.64
Greece 0.02% (2014: 0.04%)
Hellenic Telecommunications Organization SA 26,524 160,690 0.01
OPAP SA 21,036 121,122 0.01
National Bank of Greece SA 143,769 68,692 0.00
Alpha Bank AE 409,923 49,551 0.00
Piraeus Bank SA 174,510 11,608 0.00
411,663 0.02
Hong Kong 1.50% (2014: 1.62%)
AIA Group Ltd. 1,266,613 4,820,203 0.22
CK Hutchison Holdings Ltd. 301,667 2,684,173 0.12
Hong Kong Exchanges and Clearing Ltd. 127,162 2,158,809 0.10
Sun Hung Kai Properties Ltd. 170,856 1,484,556 0.07
Cheung Kong Property Holdings Ltd. 297,167 1,350,618 0.06
CLP Holdings Ltd. 174,502 984,825 0.05
Link REIT 252,100 977,291 0.05
Hang Seng Bank Ltd. 77,774 923,990 0.04
Hong Kong & China Gas Co. Ltd. 691,422 910,400 0.05
Jardine Matheson Holdings Ltd. 25,276 886,395 0.04
Power Assets Holdings Ltd. 134,683 869,812 0.04
BOC Hong Kong Holdings Ltd. 367,924 763,867 0.04
Hongkong Land Holdings Ltd. 125,954 611,665 0.03
Sands China Ltd. 256,387 602,986 0.03
Wharf Holdings Ltd. 151,324 584,726 0.03
Galaxy Entertainment Group Ltd. 227,978 506,649 0.02
Henderson Land Development Co. Ltd. 116,657 482,934 0.02
Swire Pacific Ltd. 63,336 475,447 0.02
Jardine Strategic Holdings Ltd. 23,900 465,496 0.02
MTR Corp. Ltd. 152,350 446,132 0.02
New World Development Co. Ltd. 623,310 432,230 0.02
Want Want China Holdings Ltd. 693,382 374,229 0.03
Bank of East Asia Ltd. 151,182 365,664 0.02
Cheung Kong Infrastructure Holdings Ltd. 59,434 357,768 0.02
China Mengniu Dairy Co. 281,360 352,603 0.02
Li & Fung Ltd. 660,054 346,315 0.02
Hang Lung Properties Ltd. 216,645 343,540 0.02
Sino Land Co. Ltd. 341,782 343,231 0.02
Techtronic Industries Co. 133,055 315,150 0.02
AAC Technologies Holdings Inc. 69,430 285,684 0.01
Goldin Financial Holdings Ltd. 224,000 271,362 0.01
Samsonite International SA 136,317 261,376 0.01
Wheelock & Co. Ltd. 81,783 246,663 0.01
Swire Properties Ltd. 109,819 213,780 0.01
Tingyi Holding Co 191,561 212,219 0.01
Yue Yuen Industrial Holdings Ltd. 80,182 189,247 0.01
VTech Holdings Ltd. 21,100 165,708 0.01
Hysan Development Co. Ltd. 57,068 164,015 0.01
Semiconductor Manufacturing 2,402,261 144,506 0.01
PCCW Ltd. 397,268 138,737 0.01
Esprit Holdings Ltd. 186,312 134,800 0.01
Prada SpA 51,000 132,941 0.01
NWS Holdings Ltd. 135,391 132,345 0.01
Cathay Pacific Airways Ltd. 98,323 126,505 0.01
Hopewell Holdings Ltd. 54,209 126,360 0.01
Chow Tai Fook Jewellery Group Ltd. 222,400 122,820 0.01
ASM Pacific Technology Ltd. 23,328 107,292 0.01
Kerry Properties Ltd. 55,724 106,846 0.01
First Pacific Co. Ltd. 238,501 105,808 0.01
Sun Art Retail Group Ltd. 198,747 105,440 0.01
New World China Land Ltd. 244,800 104,307 0.01
SJM Holdings Ltd. 186,017 100,396 0.01
WH Group Ltd. 279,632 99,992 0.01
Champion REIT 264,000 89,329 0.00
Wynn Macau Ltd. 98,159 87,586 0.00
China Travel International Inv HK 295,019 86,515 0.00
Melco International Development Ltd. 85,680 85,900 0.00
Global Brands Group Holding Ltd. 632,054 84,490 0.00
25
Market % of Value Net Asset Holding (£) Value
Market % of Value Net Asset Holding (£) Value

FTSE Developed World ex-U.K. Equity Index Fund
Haitong International Securities Group Ltd. 226,000 81,191 0.00
Johnson Electric Holdings Ltd. 34,206 80,591 0.00
Imperial Pacific International Holdings Ltd. 4,860,000 79,174 0.00
MGM China Holdings Ltd. 81,200 77,067 0.00
Goldin Properties Holdings Ltd. 136,049 75,701 0.00
Uni President China Holdings 142,200 75,322 0.00
Cafe de Coral Holdings Ltd. 34,398 75,152 0.00
Brightoil Petroleum Holdings Ltd. 321,000 73,751 0.00
Xinyi Glass Holdings Ltd. 212,021 71,209 0.00
Xinyi Solar Holdings Ltd. 252,021 65,062 0.00
L Occitane International SA 49,500 64,598 0.00
FIH Mobile Ltd. 201,286 62,223 0.00
China Jicheng Holdings Ltd. 390,000 61,909 0.00
Guotai Junan International Holdings Ltd. 254,000 61,541 0.00
Television Broadcasts Ltd. 24,057 56,780 0.00
Dah Sing Financial Holdings Ltd. 14,963 54,443 0.00
Kerry Logistics Network Ltd. 55,362 53,284 0.00
Shangri-La Asia Ltd. 89,575 53,135 0.00
Great Eagle Holdings Ltd. 24,590 51,977 0.00
Huabao International Holdings Ltd. 183,040 49,395 0.00
Lifestyle International Holdings Ltd. 52,000 48,658 0.00
Shun Tak Holdings Ltd. 182,750 47,179 0.00
Orient Overseas International Ltd. 15,172 46,901 0.00
Shui On Land Ltd. 244,666 43,744 0.00
United Co. Rusal plc 158,000 39,865 0.00
Good Resources Holdings Ltd. 250,000 39,685 0.00
China Oceanwide Holdings Ltd. 407,761 36,111 0.00
Texwinca Holdings Ltd. 52,000 32,627 0.00
Shougang Fushan Resources Group Ltd. 356,982 30,719 0.00
Dah Sing Banking Group Ltd. 24,622 30,281 0.00
Kowloon Development Co. Ltd. 35,201 25,822 0.00
Hutchison Telecommunications Hong Kong Holdings Ltd. 102,000 24,287 0.00
Hopewell Highway Infrastructure Ltd. 79,235 23,567 0.00
Towngas China Co. Ltd. 53,000 23,203 0.00
China Huarong Energy Co. Ltd. 657,000 17,290 0.00
Sa Sa International Holdings Ltd. 74,000 15,271 0.00
Macau Legend Development Ltd. 127,000 11,778 0.00
32,315,166 1.50
Ireland 0.16% (2014: 0.63%)
Kerry Group plc 15,035 790,416 0.04
Bank of Ireland 2,839,453 682,400 0.03
Alkermes plc 13,725 638,794 0.03
Ryanair Holdings plc 54,048 518,604 0.03
Smurfit Kappa Group plc 25,406 472,471 0.02
Glanbia plc 18,628 234,767 0.01
3,337,452 0.16
Israel 0.30% (2014: 0.31%)
Teva Pharmaceutical Industries Ltd. 101,648 3,931,291 0.18
Bank Hapoalim BM 120,028 409,080 0.02
Bank Leumi Le-Israel BM 121,687 303,554 0.01
Bezeq The Israeli Telecommunication Corp. Ltd. 205,005 291,990 0.01
NICE-Systems Ltd. 6,221 248,318 0.01
Israel Chemicals Ltd. 43,904 155,596 0.01
Israel Discount Bank Ltd. 110,355 132,462 0.01
Elbit Systems Ltd. 2,528 129,981 0.01
Frutarom Industries Ltd. 3,412 95,982 0.01
Mizrahi Tefahot Bank Ltd. 11,797 93,407 0.01
Azrieli Group 3,338 84,835 0.01
Delek Group Ltd. 493 79,814 0.01
Tower Semiconductor Ltd. 8,928 77,531 0.00
Gazit-Globe Ltd. 8,519 60,140 0.00
Melisron Ltd. 1,935 43,014 0.00
Osem Investments Ltd. 2,948 37,313 0.00
Oil Refineries Ltd. 154,462 36,563 0.00
Strauss Group Ltd. 3,492 32,619 0.00
Israel Corp. Ltd. 193 32,352 0.00
First International Bank of Israel Ltd. 3,651 29,808 0.00
Paz Oil Co. Ltd. 298 28,851 0.00
Delek Automotive Systems Ltd. 4,282 26,625 0.00
Shikun & Binui Ltd. 22,209 25,947 0.00
Harel Insurance Investments & Financial Services Ltd. 6,180 17,053 0.00
Clal Insurance Enterprises Holdings Ltd. 481 4,794 0.00
Migdal Insurance & Financial Holding Ltd. 3,054 1,801 0.00
Africa Israel Investments Ltd. 1 — 0.00
Isramco Negev 2 LP1 1 — 0.00
6,410,721 0.30
Italy 1.01% (2014: 1.02%)
Intesa Sanpaolo SpA 1,303,103 2,950,902 0.14
Eni SpA 258,102 2,743,313 0.13
UniCredit SpA 525,795 2,209,477 0.10
Enel SpA 733,085 2,200,163 0.10
Assicurazioni Generali SpA 134,167 1,653,469 0.08
Telecom Italia RSP 1,035,290 939,699 0.04
Atlantia SpA 49,765 896,638 0.04
Fiat Chrysler Automobiles NV 91,106 873,206 0.04
Luxottica Group SpA 18,015 821,447 0.04
Snam SpA 231,481 779,833 0.04
Telecom Italia SpA 802,041 586,864 0.03
Terna Rete Elettrica Nazionale SpA 148,444 490,322 0.02
Unione di Banche Italiane SCpA 88,373 430,459 0.02
CNH Industrial NV 92,611 407,052 0.02
Tenaris SA 47,863 390,959 0.02
Banco Popolare SC 38,835 377,770 0.02
Mediobanca SpA 55,655 363,844 0.02
Finmeccanica SpA 40,527 344,950 0.02
EXOR SpA 9,579 309,071 0.01
Prysmian SpA 20,869 293,162 0.01
Banca Monte dei Paschi di Siena SpA 240,203 287,091 0.01
Mediaset SpA 72,924 240,978 0.01
Enel Green Power SpA 150,571 207,210 0.01
UnipolSai SpA 123,855 194,364 0.01
Saipem SpA 28,049 171,433 0.01
Davide Campari-Milano SpA 27,433 152,854 0.01
Mediolanum SpA 27,063 143,533 0.01
Intesa Sanpaolo SpA Preferred 63,795 132,145 0.00
Salvatore Ferragamo SpA 4,330 76,281 0.00
Parmalat SpA 37,385 63,267 0.00
Pirelli & C. SpA 2,557 26,812 0.00
Mediolanum SpA Rights 01/12/2015 27,063 1 0.00
21,758,569 1.01
26
Market % of Value Net Asset Holding (£) Value
Market % of Value Net Asset Holding (£) Value
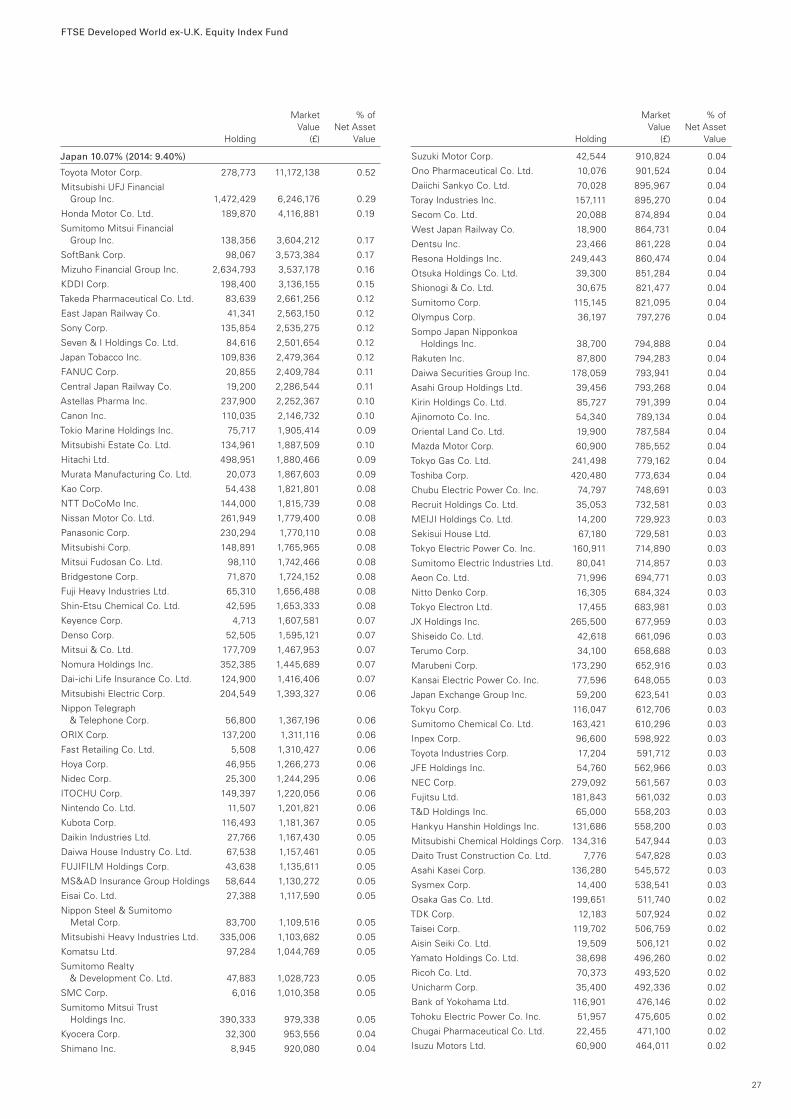
FTSE Developed World ex-U.K. Equity Index Fund
Japan 10.07% (2014: 9.40%)
Toyota Motor Corp. 278,773 11,172,138 0.52
Mitsubishi UFJ Financial Group Inc. 1,472,429 6,246,176 0.29
Honda Motor Co. Ltd. 189,870 4,116,881 0.19
Sumitomo Mitsui Financial Group Inc. 138,356 3,604,212 0.17
SoftBank Corp. 98,067 3,573,384 0.17
Mizuho Financial Group Inc. 2,634,793 3,537,178 0.16
KDDI Corp. 198,400 3,136,155 0.15
Takeda Pharmaceutical Co. Ltd. 83,639 2,661,256 0.12
East Japan Railway Co. 41,341 2,563,150 0.12
Sony Corp. 135,854 2,535,275 0.12
Seven & I Holdings Co. Ltd. 84,616 2,501,654 0.12
Japan Tobacco Inc. 109,836 2,479,364 0.12
FANUC Corp. 20,855 2,409,784 0.11
Central Japan Railway Co. 19,200 2,286,544 0.11
Astellas Pharma Inc. 237,900 2,252,367 0.10
Canon Inc. 110,035 2,146,732 0.10
Tokio Marine Holdings Inc. 75,717 1,905,414 0.09
Mitsubishi Estate Co. Ltd. 134,961 1,887,509 0.10
Hitachi Ltd. 498,951 1,880,466 0.09
Murata Manufacturing Co. Ltd. 20,073 1,867,603 0.09
Kao Corp. 54,438 1,821,801 0.08
NTT DoCoMo Inc. 144,000 1,815,739 0.08
Nissan Motor Co. Ltd. 261,949 1,779,400 0.08
Panasonic Corp. 230,294 1,770,110 0.08
Mitsubishi Corp. 148,891 1,765,965 0.08
Mitsui Fudosan Co. Ltd. 98,110 1,742,466 0.08
Bridgestone Corp. 71,870 1,724,152 0.08
Fuji Heavy Industries Ltd. 65,310 1,656,488 0.08
Shin-Etsu Chemical Co. Ltd. 42,595 1,653,333 0.08
Keyence Corp. 4,713 1,607,581 0.07
Denso Corp. 52,505 1,595,121 0.07
Mitsui & Co. Ltd. 177,709 1,467,953 0.07
Nomura Holdings Inc. 352,385 1,445,689 0.07
Dai-ichi Life Insurance Co. Ltd. 124,900 1,416,406 0.07
Mitsubishi Electric Corp. 204,549 1,393,327 0.06
Nippon Telegraph & Telephone Corp. 56,800 1,367,196 0.06
ORIX Corp. 137,200 1,311,116 0.06
Fast Retailing Co. Ltd. 5,508 1,310,427 0.06
Hoya Corp. 46,955 1,266,273 0.06
Nidec Corp. 25,300 1,244,295 0.06
ITOCHU Corp. 149,397 1,220,056 0.06
Nintendo Co. Ltd. 11,507 1,201,821 0.06
Kubota Corp. 116,493 1,181,367 0.05
Daikin Industries Ltd. 27,766 1,167,430 0.05
Daiwa House Industry Co. Ltd. 67,538 1,157,461 0.05
FUJIFILM Holdings Corp. 43,638 1,135,611 0.05
MS&AD Insurance Group Holdings 58,644 1,130,272 0.05
Eisai Co. Ltd. 27,388 1,117,590 0.05
Nippon Steel & Sumitomo Metal Corp. 83,700 1,109,516 0.05
Mitsubishi Heavy Industries Ltd. 335,006 1,103,682 0.05
Komatsu Ltd. 97,284 1,044,769 0.05
Sumitomo Realty & Development Co. Ltd. 47,883 1,028,723 0.05
SMC Corp. 6,016 1,010,358 0.05
Sumitomo Mitsui Trust Holdings Inc. 390,333 979,338 0.05
Kyocera Corp. 32,300 953,556 0.04
Shimano Inc. 8,945 920,080 0.04
Suzuki Motor Corp. 42,544 910,824 0.04
Ono Pharmaceutical Co. Ltd. 10,076 901,524 0.04
Daiichi Sankyo Co. Ltd. 70,028 895,967 0.04
Toray Industries Inc. 157,111 895,270 0.04
Secom Co. Ltd. 20,088 874,894 0.04
West Japan Railway Co. 18,900 864,731 0.04
Dentsu Inc. 23,466 861,228 0.04
Resona Holdings Inc. 249,443 860,474 0.04
Otsuka Holdings Co. Ltd. 39,300 851,284 0.04
Shionogi & Co. Ltd. 30,675 821,477 0.04
Sumitomo Corp. 115,145 821,095 0.04
Olympus Corp. 36,197 797,276 0.04
Sompo Japan Nipponkoa Holdings Inc. 38,700 794,888 0.04
Rakuten Inc. 87,800 794,283 0.04
Daiwa Securities Group Inc. 178,059 793,941 0.04
Asahi Group Holdings Ltd. 39,456 793,268 0.04
Kirin Holdings Co. Ltd. 85,727 791,399 0.04
Ajinomoto Co. Inc. 54,340 789,134 0.04
Oriental Land Co. Ltd. 19,900 787,584 0.04
Mazda Motor Corp. 60,900 785,552 0.04
Tokyo Gas Co. Ltd. 241,498 779,162 0.04
Toshiba Corp. 420,480 773,634 0.04
Chubu Electric Power Co. Inc. 74,797 748,691 0.03
Recruit Holdings Co. Ltd. 35,053 732,581 0.03
MEIJI Holdings Co. Ltd. 14,200 729,923 0.03
Sekisui House Ltd. 67,180 729,581 0.03
Tokyo Electric Power Co. Inc. 160,911 714,890 0.03
Sumitomo Electric Industries Ltd. 80,041 714,857 0.03
Aeon Co. Ltd. 71,996 694,771 0.03
Nitto Denko Corp. 16,305 684,324 0.03
Tokyo Electron Ltd. 17,455 683,981 0.03
JX Holdings Inc. 265,500 677,959 0.03
Shiseido Co. Ltd. 42,618 661,096 0.03
Terumo Corp. 34,100 658,688 0.03
Marubeni Corp. 173,290 652,916 0.03
Kansai Electric Power Co. Inc. 77,596 648,055 0.03
Japan Exchange Group Inc. 59,200 623,541 0.03
Tokyu Corp. 116,047 612,706 0.03
Sumitomo Chemical Co. Ltd. 163,421 610,296 0.03
Inpex Corp. 96,600 598,922 0.03
Toyota Industries Corp. 17,204 591,712 0.03
JFE Holdings Inc. 54,760 562,966 0.03
NEC Corp. 279,092 561,567 0.03
Fujitsu Ltd. 181,843 561,032 0.03
T&D Holdings Inc. 65,000 558,203 0.03
Hankyu Hanshin Holdings Inc. 131,686 558,200 0.03
Mitsubishi Chemical Holdings Corp. 134,316 547,944 0.03
Daito Trust Construction Co. Ltd. 7,776 547,828 0.03
Asahi Kasei Corp. 136,280 545,572 0.03
Sysmex Corp. 14,400 538,541 0.03
Osaka Gas Co. Ltd. 199,651 511,740 0.02
TDK Corp. 12,183 507,924 0.02
Taisei Corp. 119,702 506,759 0.02
Aisin Seiki Co. Ltd. 19,509 506,121 0.02
Yamato Holdings Co. Ltd. 38,698 496,260 0.02
Ricoh Co. Ltd. 70,373 493,520 0.02
Unicharm Corp. 35,400 492,336 0.02
Bank of Yokohama Ltd. 116,901 476,146 0.02
Tohoku Electric Power Co. Inc. 51,957 475,605 0.02
Chugai Pharmaceutical Co. Ltd. 22,455 471,100 0.02
Isuzu Motors Ltd. 60,900 464,011 0.02
27
Market % of Value Net Asset Holding (£) Value
Market % of Value Net Asset Holding (£) Value
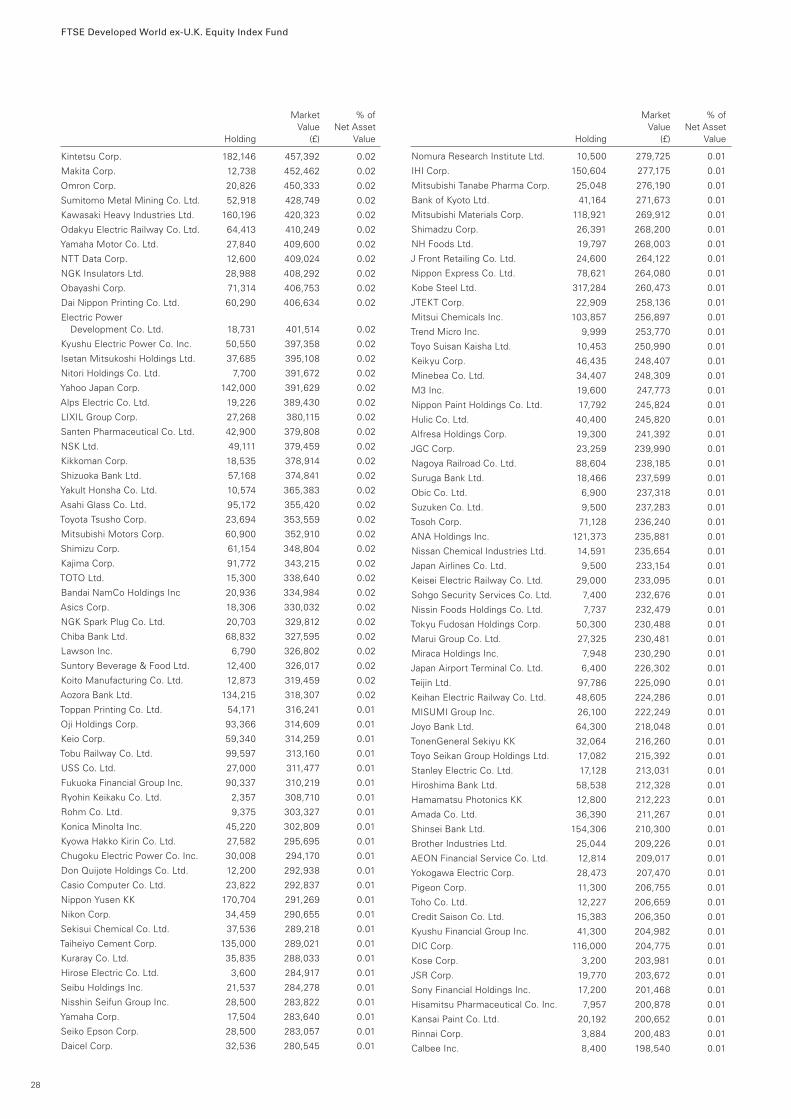
FTSE Developed World ex-U.K. Equity Index Fund
Kintetsu Corp. 182,146 457,392 0.02
Makita Corp. 12,738 452,462 0.02
Omron Corp. 20,826 450,333 0.02
Sumitomo Metal Mining Co. Ltd. 52,918 428,749 0.02
Kawasaki Heavy Industries Ltd. 160,196 420,323 0.02
Odakyu Electric Railway Co. Ltd. 64,413 410,249 0.02
Yamaha Motor Co. Ltd. 27,840 409,600 0.02
NTT Data Corp. 12,600 409,024 0.02
NGK Insulators Ltd. 28,988 408,292 0.02
Obayashi Corp. 71,314 406,753 0.02
Dai Nippon Printing Co. Ltd. 60,290 406,634 0.02
Electric Power Development Co. Ltd. 18,731 401,514 0.02
Kyushu Electric Power Co. Inc. 50,550 397,358 0.02
Isetan Mitsukoshi Holdings Ltd. 37,685 395,108 0.02
Nitori Holdings Co. Ltd. 7,700 391,672 0.02
Yahoo Japan Corp. 142,000 391,629 0.02
Alps Electric Co. Ltd. 19,226 389,430 0.02
LIXIL Group Corp. 27,268 380,115 0.02
Santen Pharmaceutical Co. Ltd. 42,900 379,808 0.02
NSK Ltd. 49,111 379,459 0.02
Kikkoman Corp. 18,535 378,914 0.02
Shizuoka Bank Ltd. 57,168 374,841 0.02
Yakult Honsha Co. Ltd. 10,574 365,383 0.02
Asahi Glass Co. Ltd. 95,172 355,420 0.02
Toyota Tsusho Corp. 23,694 353,559 0.02
Mitsubishi Motors Corp. 60,900 352,910 0.02
Shimizu Corp. 61,154 348,804 0.02
Kajima Corp. 91,772 343,215 0.02
TOTO Ltd. 15,300 338,640 0.02
Bandai NamCo Holdings Inc 20,936 334,984 0.02
Asics Corp. 18,306 330,032 0.02
NGK Spark Plug Co. Ltd. 20,703 329,812 0.02
Chiba Bank Ltd. 68,832 327,595 0.02
Lawson Inc. 6,790 326,802 0.02
Suntory Beverage & Food Ltd. 12,400 326,017 0.02
Koito Manufacturing Co. Ltd. 12,873 319,459 0.02
Aozora Bank Ltd. 134,215 318,307 0.02
Toppan Printing Co. Ltd. 54,171 316,241 0.01
Oji Holdings Corp. 93,366 314,609 0.01
Keio Corp. 59,340 314,259 0.01
Tobu Railway Co. Ltd. 99,597 313,160 0.01
USS Co. Ltd. 27,000 311,477 0.01
Fukuoka Financial Group Inc. 90,337 310,219 0.01
Ryohin Keikaku Co. Ltd. 2,357 308,710 0.01
Rohm Co. Ltd. 9,375 303,327 0.01
Konica Minolta Inc. 45,220 302,809 0.01
Kyowa Hakko Kirin Co. Ltd. 27,582 295,695 0.01
Chugoku Electric Power Co. Inc. 30,008 294,170 0.01
Don Quijote Holdings Co. Ltd. 12,200 292,938 0.01
Casio Computer Co. Ltd. 23,822 292,837 0.01
Nippon Yusen KK 170,704 291,269 0.01
Nikon Corp. 34,459 290,655 0.01
Sekisui Chemical Co. Ltd. 37,536 289,218 0.01
Taiheiyo Cement Corp. 135,000 289,021 0.01
Kuraray Co. Ltd. 35,835 288,033 0.01
Hirose Electric Co. Ltd. 3,600 284,917 0.01
Seibu Holdings Inc. 21,537 284,278 0.01
Nisshin Seifun Group Inc. 28,500 283,822 0.01
Yamaha Corp. 17,504 283,640 0.01
Seiko Epson Corp. 28,500 283,057 0.01
Daicel Corp. 32,536 280,545 0.01
Nomura Research Institute Ltd. 10,500 279,725 0.01
IHI Corp. 150,604 277,175 0.01
Mitsubishi Tanabe Pharma Corp. 25,048 276,190 0.01
Bank of Kyoto Ltd. 41,164 271,673 0.01
Mitsubishi Materials Corp. 118,921 269,912 0.01
Shimadzu Corp. 26,391 268,200 0.01
NH Foods Ltd. 19,797 268,003 0.01
J Front Retailing Co. Ltd. 24,600 264,122 0.01
Nippon Express Co. Ltd. 78,621 264,080 0.01
Kobe Steel Ltd. 317,284 260,473 0.01
JTEKT Corp. 22,909 258,136 0.01
Mitsui Chemicals Inc. 103,857 256,897 0.01
Trend Micro Inc. 9,999 253,770 0.01
Toyo Suisan Kaisha Ltd. 10,453 250,990 0.01
Keikyu Corp. 46,435 248,407 0.01
Minebea Co. Ltd. 34,407 248,309 0.01
M3 Inc. 19,600 247,773 0.01
Nippon Paint Holdings Co. Ltd. 17,792 245,824 0.01
Hulic Co. Ltd. 40,400 245,820 0.01
Alfresa Holdings Corp. 19,300 241,392 0.01
JGC Corp. 23,259 239,990 0.01
Nagoya Railroad Co. Ltd. 88,604 238,185 0.01
Suruga Bank Ltd. 18,466 237,599 0.01
Obic Co. Ltd. 6,900 237,318 0.01
Suzuken Co. Ltd. 9,500 237,283 0.01
Tosoh Corp. 71,128 236,240 0.01
ANA Holdings Inc. 121,373 235,881 0.01
Nissan Chemical Industries Ltd. 14,591 235,654 0.01
Japan Airlines Co. Ltd. 9,500 233,154 0.01
Keisei Electric Railway Co. Ltd. 29,000 233,095 0.01
Sohgo Security Services Co. Ltd. 7,400 232,676 0.01
Nissin Foods Holdings Co. Ltd. 7,737 232,479 0.01
Tokyu Fudosan Holdings Corp. 50,300 230,488 0.01
Marui Group Co. Ltd. 27,325 230,481 0.01
Miraca Holdings Inc. 7,948 230,290 0.01
Japan Airport Terminal Co. Ltd. 6,400 226,302 0.01
Teijin Ltd. 97,786 225,090 0.01
Keihan Electric Railway Co. Ltd. 48,605 224,286 0.01
MISUMI Group Inc. 26,100 222,249 0.01
Joyo Bank Ltd. 64,300 218,048 0.01
TonenGeneral Sekiyu KK 32,064 216,260 0.01
Toyo Seikan Group Holdings Ltd. 17,082 215,392 0.01
Stanley Electric Co. Ltd. 17,128 213,031 0.01
Hiroshima Bank Ltd. 58,538 212,328 0.01
Hamamatsu Photonics KK 12,800 212,223 0.01
Amada Co. Ltd. 36,390 211,267 0.01
Shinsei Bank Ltd. 154,306 210,300 0.01
Brother Industries Ltd. 25,044 209,226 0.01
AEON Financial Service Co. Ltd. 12,814 209,017 0.01
Yokogawa Electric Corp. 28,473 207,470 0.01
Pigeon Corp. 11,300 206,755 0.01
Toho Co. Ltd. 12,227 206,659 0.01
Credit Saison Co. Ltd. 15,383 206,350 0.01
Kyushu Financial Group Inc. 41,300 204,982 0.01
DIC Corp. 116,000 204,775 0.01
Kose Corp. 3,200 203,981 0.01
JSR Corp. 19,770 203,672 0.01
Sony Financial Holdings Inc. 17,200 201,468 0.01
Hisamitsu Pharmaceutical Co. Inc. 7,957 200,878 0.01
Kansai Paint Co. Ltd. 20,192 200,652 0.01
Rinnai Corp. 3,884 200,483 0.01
Calbee Inc. 8,400 198,540 0.01
28
Market % of Value Net Asset Holding (£) Value
Market % of Value Net Asset Holding (£) Value

FTSE Developed World ex-U.K. Equity Index Fund
Kaneka Corp. 34,000 196,480 0.01
Shimamura Co. Ltd. 2,664 195,401 0.01
Seven Bank Ltd. 65,300 194,109 0.01
Sojitz Corp. 134,893 193,252 0.01
Toho Gas Co. Ltd. 48,409 192,991 0.01
Sumitomo Heavy Industries Ltd. 65,254 192,222 0.01
Yamada Denki Co. Ltd. 65,600 191,833 0.01
Tokyo Tatemono Co. .Ltd. 23,700 191,767 0.01
Taisho Pharmaceutical Holdings Co. Ltd. 4,700 191,157 0.01
Tsuruha Holdings Inc. 3,700 190,985 0.01
Hino Motors Ltd. 25,475 190,136 0.01
Hyakugo Bank Ltd. 57,000 189,928 0.01
Haseko Corp. 28,500 189,469 0.01
Nankai Electric Railway Co. Ltd. 57,000 189,317 0.01
Mitsui OSK Lines Ltd. 108,520 188,659 0.01
Yaskawa Electric Corp. 24,182 187,752 0.01
Iyo Bank Ltd. 26,718 187,514 0.01
Iida Group Holdings Co. Ltd. 15,100 184,648 0.01
Hoshizaki Electric Co. Ltd. 3,900 184,149 0.01
NTN Corp. 56,196 182,726 0.01
Nabtesco Corp. 13,793 180,581 0.01
Hakuhodo DY Holdings Inc. 26,100 179,116 0.01
Hokuhoku Financial Group Inc. 123,447 178,841 0.01
Yamaguchi Financial Group Inc. 22,220 178,003 0.01
Takashimaya Co. Ltd. 30,516 177,820 0.01
Gunma Bank Ltd. 43,275 177,632 0.01
Yamazaki Baking Co. Ltd. 14,111 177,248 0.01
Air Water Inc. 16,544 176,296 0.01
Kurita Water Industries Ltd. 11,945 175,807 0.01
Sumitomo Rubber Industries Ltd. 18,100 175,784 0.01
Hachijuni Bank Ltd. 39,504 175,719 0.01
Chugoku Bank Ltd. 18,910 175,026 0.01
Disco Corp. 2,915 173,614 0.01
Medipal Holdings Corp. 15,155 172,635 0.01
Kakaku.com Inc. 14,100 171,890 0.01
Nomura Real Estate Holdings Inc. 12,316 171,553 0.01
Hokuriku Electric Power Co. 17,504 170,090 0.01
Zenkoku Hosho Co. Ltd. 7,700 169,807 0.01
Mabuchi Motor Co. Ltd. 5,200 168,246 0.01
Square Enix Holdings Co. Ltd. 9,462 166,525 0.01
Daihatsu Motor Co. Ltd. 20,767 165,917 0.01
Sotetsu Holdings Inc. 44,803 165,874 0.01
Kobayashi Pharmaceutical Co. Ltd. 3,272 165,382 0.01
Shikoku Electric Power Co. Inc. 14,744 163,207 0.01
NOK Corp. 10,590 163,080 0.01
Lion Corp. 25,739 161,585 0.01
Ezaki Glico Co. Ltd. 5,100 158,443 0.01
Kewpie Corp. 10,630 158,106 0.01
Kaken Pharmaceutical Co. Ltd. 3,500 157,750 0.01
Mitsubishi UFJ Lease & Finance Co. Ltd. 45,820 156,855 0.01
Fuji Electric Co. Ltd. 53,518 155,928 0.01
Sawai Pharmaceutical Co. Ltd. 3,700 154,257 0.01
Otsuka Corp. 4,900 153,807 0.01
Nippon Shokubai Co. Ltd. 3,000 153,082 0.01
Nippon Shinyaku Co. Ltd. 6,000 152,921 0.01
Acom Co. Ltd. 42,700 152,361 0.01
Temp Holdings Co. Ltd. 15,600 151,840 0.01
Aeon Mall Co. Ltd. 13,900 151,477 0.01
Konami Corp. 10,230 151,224 0.01
FamilyMart Co. Ltd. 5,676 150,907 0.01
Mitsubishi Gas Chemical Co. Inc. 41,258 150,093 0.01
Citizen Holdings Co. Ltd. 30,059 148,545 0.01
Denki Kagaku Kogyo KK 48,562 147,220 0.01
Sugi Holdings Co. Ltd. 4,600 145,624 0.01
Mitsubishi Logistics Corp. 15,388 144,079 0.01
Dowa Holdings Co. Ltd. 25,292 143,851 0.01
Ube Industries Ltd. 103,792 141,456 0.01
SBI Holdings Inc. 19,004 140,819 0.01
THK Co. Ltd. 11,418 140,603 0.01
Cyberagent Inc 5,200 139,228 0.01
Benesse Holdings Inc. 7,957 138,971 0.01
Asahi Intecc Co. Ltd. 5,475 138,072 0.01
Hitachi Metals Ltd. 18,621 137,781 0.01
Nisshinbo Holdings Inc. 15,523 137,097 0.01
Nippon Electric Glass Co. Ltd. 42,834 136,980 0.01
Park24 Co. Ltd. 10,000 136,502 0.01
Nishi-Nippon City Bank Ltd. 71,117 135,464 0.01
Kawasaki Kisen Kaisha Ltd. 92,706 135,301 0.01
Nishi-Nippon Railroad Co. Ltd. 39,330 132,317 0.01
Kinden Corp. 15,553 131,604 0.01
Toyo Tire & Rubber Co. Ltd. 9,400 129,422 0.01
Hokkaido Electric Power Co. Inc. 18,482 128,423 0.01
Sanwa Holdings Corp. 24,000 126,200 0.01
NHK Spring Co. Ltd. 18,971 126,120 0.01
Yokohama Rubber Co. Ltd. 10,000 125,503 0.01
Kamigumi Co. Ltd. 22,366 125,169 0.01
Nippon Kayaku Co. Ltd. 18,419 125,119 0.01
Nexon Co. Ltd. 13,800 124,916 0.01
77 Bank Ltd. 34,603 124,583 0.01
Showa Denko KK 152,570 124,433 0.01
Seino Holdings Co. Ltd. 15,900 123,023 0.01
Nippon Paper Industries Co. Ltd. 10,176 122,743 0.01
Dena Co. Ltd. 11,600 121,496 0.01
Maruichi Steel Tube Ltd. 7,239 120,799 0.01
OSG Corp. 9,800 120,416 0.01
Sundrug Co. Ltd. 3,500 120,191 0.01
Sankyo Co. Ltd. 4,653 116,718 0.01
Aoyama Trading Co. Ltd. 4,900 116,341 0.01
Nifco Inc 4,600 115,759 0.01
Start Today Co. Ltd. 5,300 115,743 0.01
SCSK Corp. 4,600 114,771 0.01
Sanrio Co. Ltd. 6,600 114,031 0.01
Juroku Bank Ltd. 39,000 113,210 0.01
Hitachi High-Technologies Corp. 6,400 112,121 0.01
Fujikura Ltd. 33,267 111,562 0.01
Sharp Corp. 154,758 110,440 0.01
Ebara Corp. 39,117 110,401 0.01
Nichirei Corp. 26,000 110,350 0.01
Showa Shell Sekiyu KK 19,200 110,026 0.01
Toyoda Gosei Co. Ltd. 7,283 109,262 0.01
Sega Sammy Holdings Inc. 15,926 109,210 0.01
Sumco Corp. 16,554 109,075 0.01
Hikari Tsushin Inc. 2,200 109,073 0.01
Tsumura & Co. 6,913 108,459 0.01
Resorttrust Inc. 6,400 106,970 0.01
Century Tokyo Leasing Corp. 4,800 106,240 0.01
Daishi Bank Ltd. 36,000 105,854 0.01
Rohto Pharmaceutical Co. Ltd. 9,800 105,325 0.01
Sapporo Holdings Ltd. 39,256 105,107 0.01
Azbil Corp. 6,381 104,940 0.01
Izumi Co. Ltd. 4,300 104,172 0.01
Nihon Kohden Corp. 8,200 104,100 0.01
Matsumotokiyoshi Holdings Co. Ltd. 3,716 103,682 0.01
29
Market % of Value Net Asset Holding (£) Value
Market % of Value Net Asset Holding (£) Value
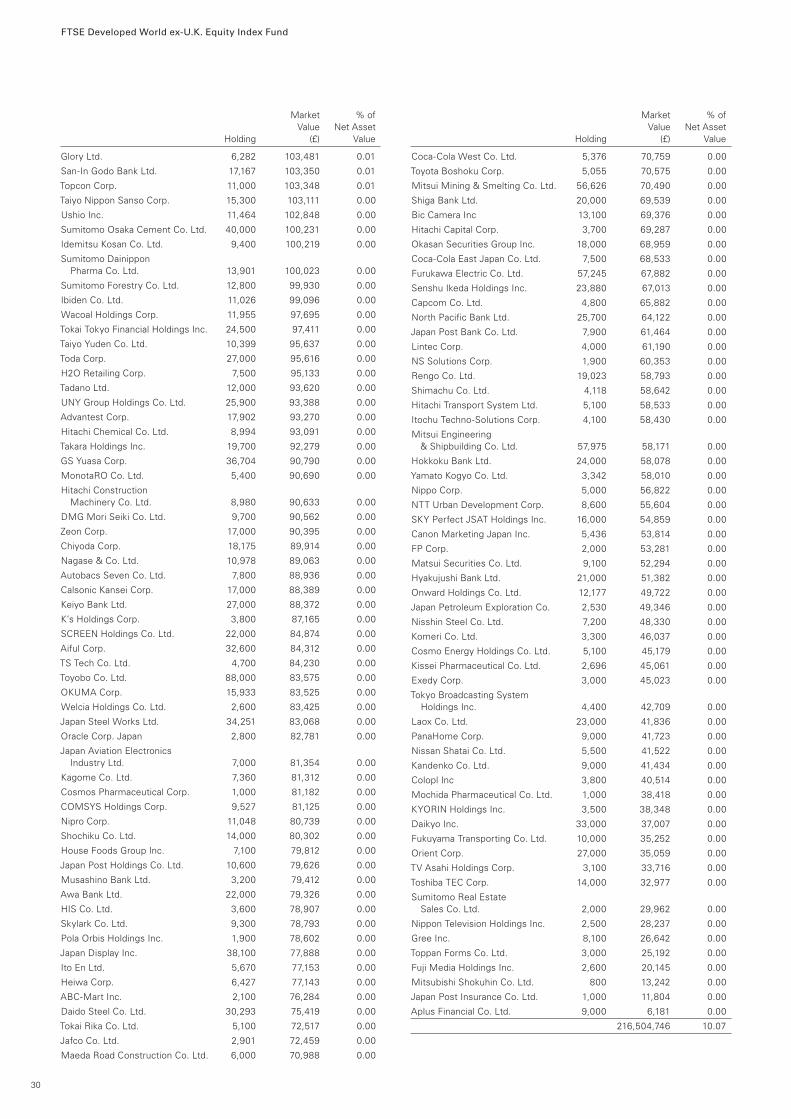
FTSE Developed World ex-U.K. Equity Index Fund
Glory Ltd. 6,282 103,481 0.01
San-In Godo Bank Ltd. 17,167 103,350 0.01
Topcon Corp. 11,000 103,348 0.01
Taiyo Nippon Sanso Corp. 15,300 103,111 0.00
Ushio Inc. 11,464 102,848 0.00
Sumitomo Osaka Cement Co. Ltd. 40,000 100,231 0.00
Idemitsu Kosan Co. Ltd. 9,400 100,219 0.00
Sumitomo Dainippon Pharma Co. Ltd. 13,901 100,023 0.00
Sumitomo Forestry Co. Ltd. 12,800 99,930 0.00
Ibiden Co. Ltd. 11,026 99,096 0.00
Wacoal Holdings Corp. 11,955 97,695 0.00
Tokai Tokyo Financial Holdings Inc. 24,500 97,411 0.00
Taiyo Yuden Co. Ltd. 10,399 95,637 0.00
Toda Corp. 27,000 95,616 0.00
H2O Retailing Corp. 7,500 95,133 0.00
Tadano Ltd. 12,000 93,620 0.00
UNY Group Holdings Co. Ltd. 25,900 93,388 0.00
Advantest Corp. 17,902 93,270 0.00
Hitachi Chemical Co. Ltd. 8,994 93,091 0.00
Takara Holdings Inc. 19,700 92,279 0.00
GS Yuasa Corp. 36,704 90,790 0.00
MonotaRO Co. Ltd. 5,400 90,690 0.00
Hitachi Construction Machinery Co. Ltd. 8,980 90,633 0.00
DMG Mori Seiki Co. Ltd. 9,700 90,562 0.00
Zeon Corp. 17,000 90,395 0.00
Chiyoda Corp. 18,175 89,914 0.00
Nagase & Co. Ltd. 10,978 89,063 0.00
Autobacs Seven Co. Ltd. 7,800 88,936 0.00
Calsonic Kansei Corp. 17,000 88,389 0.00
Keiyo Bank Ltd. 27,000 88,372 0.00
K’s Holdings Corp. 3,800 87,165 0.00
SCREEN Holdings Co. Ltd. 22,000 84,874 0.00
Aiful Corp. 32,600 84,312 0.00
TS Tech Co. Ltd. 4,700 84,230 0.00
Toyobo Co. Ltd. 88,000 83,575 0.00
OKUMA Corp. 15,933 83,525 0.00
Welcia Holdings Co. Ltd. 2,600 83,425 0.00
Japan Steel Works Ltd. 34,251 83,068 0.00
Oracle Corp. Japan 2,800 82,781 0.00
Japan Aviation Electronics Industry Ltd. 7,000 81,354 0.00
Kagome Co. Ltd. 7,360 81,312 0.00
Cosmos Pharmaceutical Corp. 1,000 81,182 0.00
COMSYS Holdings Corp. 9,527 81,125 0.00
Nipro Corp. 11,048 80,739 0.00
Shochiku Co. Ltd. 14,000 80,302 0.00
House Foods Group Inc. 7,100 79,812 0.00
Japan Post Holdings Co. Ltd. 10,600 79,626 0.00
Musashino Bank Ltd. 3,200 79,412 0.00
Awa Bank Ltd. 22,000 79,326 0.00
HIS Co. Ltd. 3,600 78,907 0.00
Skylark Co. Ltd. 9,300 78,793 0.00
Pola Orbis Holdings Inc. 1,900 78,602 0.00
Japan Display Inc. 38,100 77,888 0.00
Ito En Ltd. 5,670 77,153 0.00
Heiwa Corp. 6,427 77,143 0.00
ABC-Mart Inc. 2,100 76,284 0.00
Daido Steel Co. Ltd. 30,293 75,419 0.00
Tokai Rika Co. Ltd. 5,100 72,517 0.00
Jafco Co. Ltd. 2,901 72,459 0.00
Maeda Road Construction Co. Ltd. 6,000 70,988 0.00
Coca-Cola West Co. Ltd. 5,376 70,759 0.00
Toyota Boshoku Corp. 5,055 70,575 0.00
Mitsui Mining & Smelting Co. Ltd. 56,626 70,490 0.00
Shiga Bank Ltd. 20,000 69,539 0.00
Bic Camera Inc 13,100 69,376 0.00
Hitachi Capital Corp. 3,700 69,287 0.00
Okasan Securities Group Inc. 18,000 68,959 0.00
Coca-Cola East Japan Co. Ltd. 7,500 68,533 0.00
Furukawa Electric Co. Ltd. 57,245 67,882 0.00
Senshu Ikeda Holdings Inc. 23,880 67,013 0.00
Capcom Co. Ltd. 4,800 65,882 0.00
North Pacific Bank Ltd. 25,700 64,122 0.00
Japan Post Bank Co. Ltd. 7,900 61,464 0.00
Lintec Corp. 4,000 61,190 0.00
NS Solutions Corp. 1,900 60,353 0.00
Rengo Co. Ltd. 19,023 58,793 0.00
Shimachu Co. Ltd. 4,118 58,642 0.00
Hitachi Transport System Ltd. 5,100 58,533 0.00
Itochu Techno-Solutions Corp. 4,100 58,430 0.00
Mitsui Engineering & Shipbuilding Co. Ltd. 57,975 58,171 0.00
Hokkoku Bank Ltd. 24,000 58,078 0.00
Yamato Kogyo Co. Ltd. 3,342 58,010 0.00
Nippo Corp. 5,000 56,822 0.00
NTT Urban Development Corp. 8,600 55,604 0.00
SKY Perfect JSAT Holdings Inc. 16,000 54,859 0.00
Canon Marketing Japan Inc. 5,436 53,814 0.00
FP Corp. 2,000 53,281 0.00
Matsui Securities Co. Ltd. 9,100 52,294 0.00
Hyakujushi Bank Ltd. 21,000 51,382 0.00
Onward Holdings Co. Ltd. 12,177 49,722 0.00
Japan Petroleum Exploration Co. 2,530 49,346 0.00
Nisshin Steel Co. Ltd. 7,200 48,330 0.00
Komeri Co. Ltd. 3,300 46,037 0.00
Cosmo Energy Holdings Co. Ltd. 5,100 45,179 0.00
Kissei Pharmaceutical Co. Ltd. 2,696 45,061 0.00
Exedy Corp. 3,000 45,023 0.00
Tokyo Broadcasting System Holdings Inc. 4,400 42,709 0.00
Laox Co. Ltd. 23,000 41,836 0.00
PanaHome Corp. 9,000 41,723 0.00
Nissan Shatai Co. Ltd. 5,500 41,522 0.00
Kandenko Co. Ltd. 9,000 41,434 0.00
Colopl Inc 3,800 40,514 0.00
Mochida Pharmaceutical Co. Ltd. 1,000 38,418 0.00
KYORIN Holdings Inc. 3,500 38,348 0.00
Daikyo Inc. 33,000 37,007 0.00
Fukuyama Transporting Co. Ltd. 10,000 35,252 0.00
Orient Corp. 27,000 35,059 0.00
TV Asahi Holdings Corp. 3,100 33,716 0.00
Toshiba TEC Corp. 14,000 32,977 0.00
Sumitomo Real Estate Sales Co. Ltd. 2,000 29,962 0.00
Nippon Television Holdings Inc. 2,500 28,237 0.00
Gree Inc. 8,100 26,642 0.00
Toppan Forms Co. Ltd. 3,000 25,192 0.00
Fuji Media Holdings Inc. 2,600 20,145 0.00
Mitsubishi Shokuhin Co. Ltd. 800 13,242 0.00
Japan Post Insurance Co. Ltd. 1,000 11,804 0.00
Aplus Financial Co. Ltd. 9,000 6,181 0.00
216,504,746 10.07
30
Market % of Value Net Asset Holding (£) Value
Market % of Value Net Asset Holding (£) Value
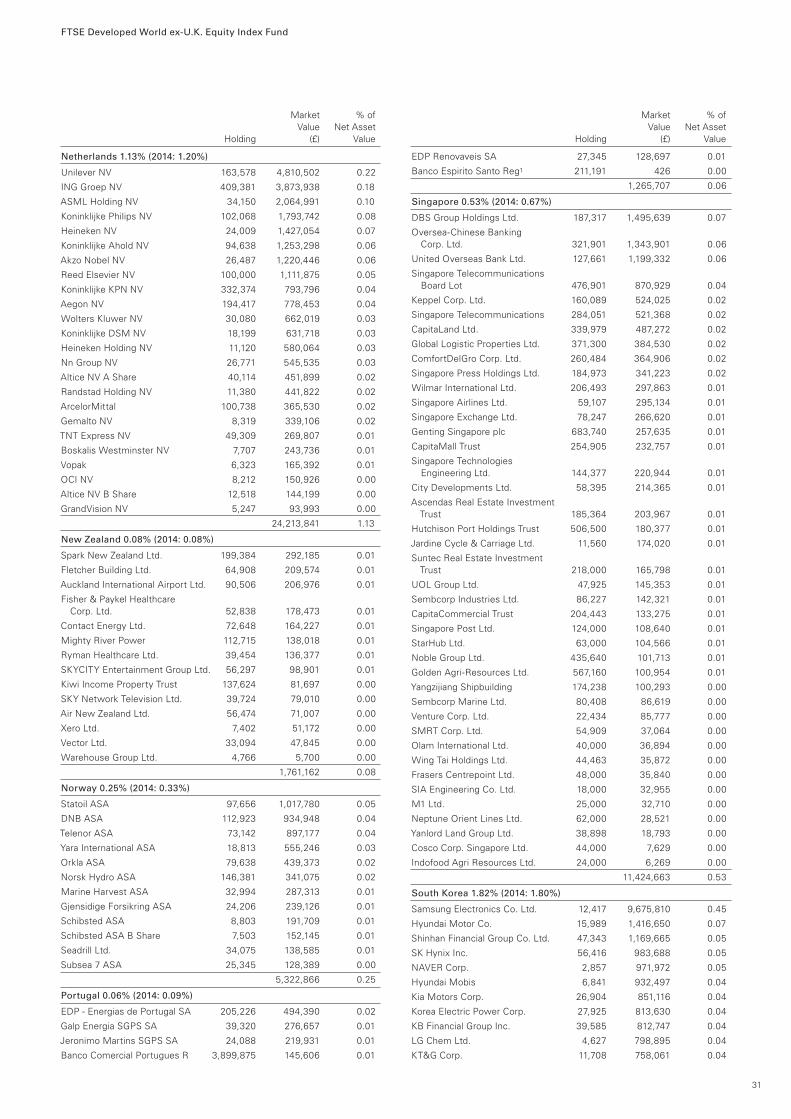
FTSE Developed World ex-U.K. Equity Index Fund
Netherlands 1.13% (2014: 1.20%)
Unilever NV 163,578 4,810,502 0.22
ING Groep NV 409,381 3,873,938 0.18
ASML Holding NV 34,150 2,064,991 0.10
Koninklijke Philips NV 102,068 1,793,742 0.08
Heineken NV 24,009 1,427,054 0.07
Koninklijke Ahold NV 94,638 1,253,298 0.06
Akzo Nobel NV 26,487 1,220,446 0.06
Reed Elsevier NV 100,000 1,111,875 0.05
Koninklijke KPN NV 332,374 793,796 0.04
Aegon NV 194,417 778,453 0.04
Wolters Kluwer NV 30,080 662,019 0.03
Koninklijke DSM NV 18,199 631,718 0.03
Heineken Holding NV 11,120 580,064 0.03
Nn Group NV 26,771 545,535 0.03
Altice NV A Share 40,114 451,899 0.02
Randstad Holding NV 11,380 441,822 0.02
ArcelorMittal 100,738 365,530 0.02
Gemalto NV 8,319 339,106 0.02
TNT Express NV 49,309 269,807 0.01
Boskalis Westminster NV 7,707 243,736 0.01
Vopak 6,323 165,392 0.01
OCI NV 8,212 150,926 0.00
Altice NV B Share 12,518 144,199 0.00
GrandVision NV 5,247 93,993 0.00
24,213,841 1.13
New Zealand 0.08% (2014: 0.08%)
Spark New Zealand Ltd. 199,384 292,185 0.01
Fletcher Building Ltd. 64,908 209,574 0.01
Auckland International Airport Ltd. 90,506 206,976 0.01
Fisher & Paykel Healthcare Corp. Ltd. 52,838 178,473 0.01
Contact Energy Ltd. 72,648 164,227 0.01
Mighty River Power 112,715 138,018 0.01
Ryman Healthcare Ltd. 39,454 136,377 0.01
SKYCITY Entertainment Group Ltd. 56,297 98,901 0.01
Kiwi Income Property Trust 137,624 81,697 0.00
SKY Network Television Ltd. 39,724 79,010 0.00
Air New Zealand Ltd. 56,474 71,007 0.00
Xero Ltd. 7,402 51,172 0.00
Vector Ltd. 33,094 47,845 0.00
Warehouse Group Ltd. 4,766 5,700 0.00
1,761,162 0.08
Norway 0.25% (2014: 0.33%)
Statoil ASA 97,656 1,017,780 0.05
DNB ASA 112,923 934,948 0.04
Telenor ASA 73,142 897,177 0.04
Yara International ASA 18,813 555,246 0.03
Orkla ASA 79,638 439,373 0.02
Norsk Hydro ASA 146,381 341,075 0.02
Marine Harvest ASA 32,994 287,313 0.01
Gjensidige Forsikring ASA 24,206 239,126 0.01
Schibsted ASA 8,803 191,709 0.01
Schibsted ASA B Share 7,503 152,145 0.01
Seadrill Ltd. 34,075 138,585 0.01
Subsea 7 ASA 25,345 128,389 0.00
5,322,866 0.25
Portugal 0.06% (2014: 0.09%)
EDP - Energias de Portugal SA 205,226 494,390 0.02
Galp Energia SGPS SA 39,320 276,657 0.01
Jeronimo Martins SGPS SA 24,088 219,931 0.01
Banco Comercial Portugues R 3,899,875 145,606 0.01
EDP Renovaveis SA 27,345 128,697 0.01
Banco Espirito Santo Reg1 211,191 426 0.00
1,265,707 0.06
Singapore 0.53% (2014: 0.67%)
DBS Group Holdings Ltd. 187,317 1,495,639 0.07
Oversea-Chinese Banking Corp. Ltd. 321,901 1,343,901 0.06
United Overseas Bank Ltd. 127,661 1,199,332 0.06
Singapore Telecommunications Board Lot 476,901 870,929 0.04
Keppel Corp. Ltd. 160,089 524,025 0.02
Singapore Telecommunications 284,051 521,368 0.02
CapitaLand Ltd. 339,979 487,272 0.02
Global Logistic Properties Ltd. 371,300 384,530 0.02
ComfortDelGro Corp. Ltd. 260,484 364,906 0.02
Singapore Press Holdings Ltd. 184,973 341,223 0.02
Wilmar International Ltd. 206,493 297,863 0.01
Singapore Airlines Ltd. 59,107 295,134 0.01
Singapore Exchange Ltd. 78,247 266,620 0.01
Genting Singapore plc 683,740 257,635 0.01
CapitaMall Trust 254,905 232,757 0.01
Singapore Technologies Engineering Ltd. 144,377 220,944 0.01
City Developments Ltd. 58,395 214,365 0.01
Ascendas Real Estate Investment Trust 185,364 203,967 0.01
Hutchison Port Holdings Trust 506,500 180,377 0.01
Jardine Cycle & Carriage Ltd. 11,560 174,020 0.01
Suntec Real Estate Investment Trust 218,000 165,798 0.01
UOL Group Ltd. 47,925 145,353 0.01
Sembcorp Industries Ltd. 86,227 142,321 0.01
CapitaCommercial Trust 204,443 133,275 0.01
Singapore Post Ltd. 124,000 108,640 0.01
StarHub Ltd. 63,000 104,566 0.01
Noble Group Ltd. 435,640 101,713 0.01
Golden Agri-Resources Ltd. 567,160 100,954 0.01
Yangzijiang Shipbuilding 174,238 100,293 0.00
Sembcorp Marine Ltd. 80,408 86,619 0.00
Venture Corp. Ltd. 22,434 85,777 0.00
SMRT Corp. Ltd. 54,909 37,064 0.00
Olam International Ltd. 40,000 36,894 0.00
Wing Tai Holdings Ltd. 44,463 35,872 0.00
Frasers Centrepoint Ltd. 48,000 35,840 0.00
SIA Engineering Co. Ltd. 18,000 32,955 0.00
M1 Ltd. 25,000 32,710 0.00
Neptune Orient Lines Ltd. 62,000 28,521 0.00
Yanlord Land Group Ltd. 38,898 18,793 0.00
Cosco Corp. Singapore Ltd. 44,000 7,629 0.00
Indofood Agri Resources Ltd. 24,000 6,269 0.00
11,424,663 0.53
South Korea 1.82% (2014: 1.80%)
Samsung Electronics Co. Ltd. 12,417 9,675,810 0.45
Hyundai Motor Co. 15,989 1,416,650 0.07
Shinhan Financial Group Co. Ltd. 47,343 1,169,665 0.05
SK Hynix Inc. 56,416 983,688 0.05
NAVER Corp. 2,857 971,972 0.05
Hyundai Mobis 6,841 932,497 0.04
Kia Motors Corp. 26,904 851,116 0.04
Korea Electric Power Corp. 27,925 813,630 0.04
KB Financial Group Inc. 39,585 812,747 0.04
LG Chem Ltd. 4,627 798,895 0.04
KT&G Corp. 11,708 758,061 0.04
31
Market % of Value Net Asset Holding (£) Value
Market % of Value Net Asset Holding (£) Value
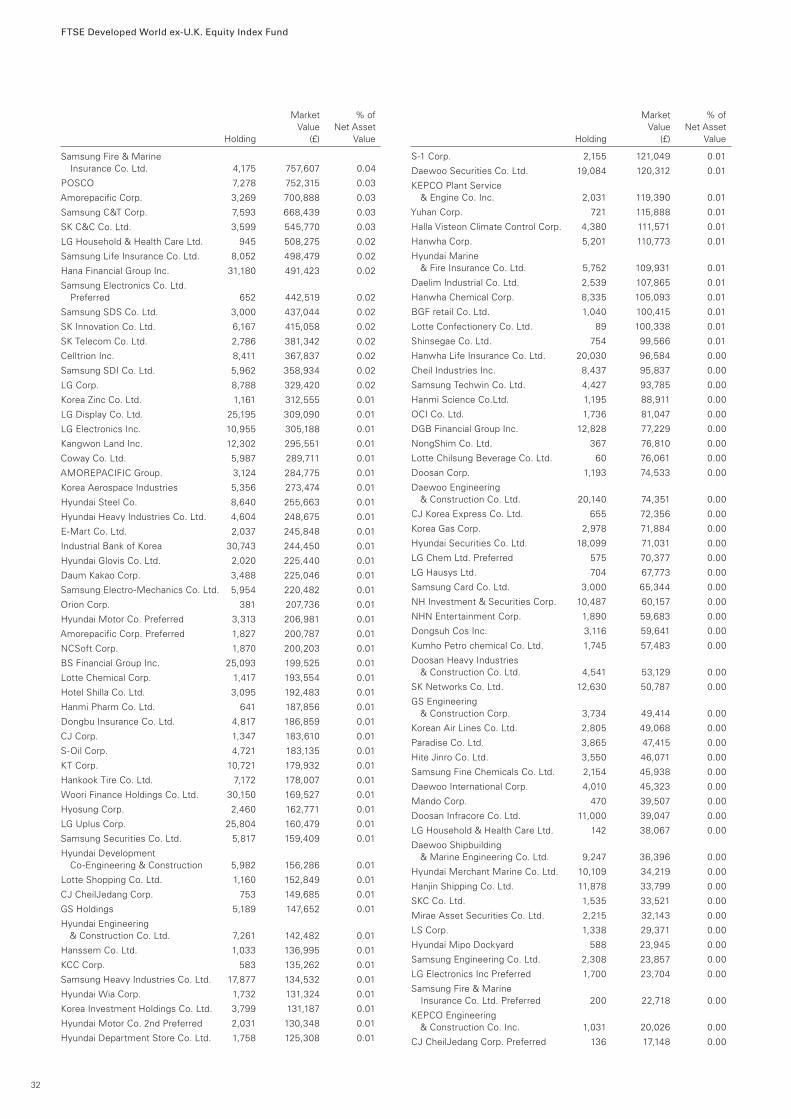
FTSE Developed World ex-U.K. Equity Index Fund
Samsung Fire & Marine Insurance Co. Ltd. 4,175 757,607 0.04
POSCO 7,278 752,315 0.03
Amorepacific Corp. 3,269 700,888 0.03
Samsung C&T Corp. 7,593 668,439 0.03
SK C&C Co. Ltd. 3,599 545,770 0.03
LG Household & Health Care Ltd. 945 508,275 0.02
Samsung Life Insurance Co. Ltd. 8,052 498,479 0.02
Hana Financial Group Inc. 31,180 491,423 0.02
Samsung Electronics Co. Ltd. Preferred 652 442,519 0.02
Samsung SDS Co. Ltd. 3,000 437,044 0.02
SK Innovation Co. Ltd. 6,167 415,058 0.02
SK Telecom Co. Ltd. 2,786 381,342 0.02
Celltrion Inc. 8,411 367,837 0.02
Samsung SDI Co. Ltd. 5,962 358,934 0.02
LG Corp. 8,788 329,420 0.02
Korea Zinc Co. Ltd. 1,161 312,555 0.01
LG Display Co. Ltd. 25,195 309,090 0.01
LG Electronics Inc. 10,955 305,188 0.01
Kangwon Land Inc. 12,302 295,551 0.01
Coway Co. Ltd. 5,987 289,711 0.01
AMOREPACIFIC Group. 3,124 284,775 0.01
Korea Aerospace Industries 5,356 273,474 0.01
Hyundai Steel Co. 8,640 255,663 0.01
Hyundai Heavy Industries Co. Ltd. 4,604 248,675 0.01
E-Mart Co. Ltd. 2,037 245,848 0.01
Industrial Bank of Korea 30,743 244,450 0.01
Hyundai Glovis Co. Ltd. 2,020 225,440 0.01
Daum Kakao Corp. 3,488 225,046 0.01
Samsung Electro-Mechanics Co. Ltd. 5,954 220,482 0.01
Orion Corp. 381 207,736 0.01
Hyundai Motor Co. Preferred 3,313 206,981 0.01
Amorepacific Corp. Preferred 1,827 200,787 0.01
NCSoft Corp. 1,870 200,203 0.01
BS Financial Group Inc. 25,093 199,525 0.01
Lotte Chemical Corp. 1,417 193,554 0.01
Hotel Shilla Co. Ltd. 3,095 192,483 0.01
Hanmi Pharm Co. Ltd. 641 187,856 0.01
Dongbu Insurance Co. Ltd. 4,817 186,859 0.01
CJ Corp. 1,347 183,610 0.01
S-Oil Corp. 4,721 183,135 0.01
KT Corp. 10,721 179,932 0.01
Hankook Tire Co. Ltd. 7,172 178,007 0.01
Woori Finance Holdings Co. Ltd. 30,150 169,527 0.01
Hyosung Corp. 2,460 162,771 0.01
LG Uplus Corp. 25,804 160,479 0.01
Samsung Securities Co. Ltd. 5,817 159,409 0.01
Hyundai Development Co-Engineering & Construction 5,982 156,286 0.01
Lotte Shopping Co. Ltd. 1,160 152,849 0.01
CJ CheilJedang Corp. 753 149,685 0.01
GS Holdings 5,189 147,652 0.01
Hyundai Engineering & Construction Co. Ltd. 7,261 142,482 0.01
Hanssem Co. Ltd. 1,033 136,995 0.01
KCC Corp. 583 135,262 0.01
Samsung Heavy Industries Co. Ltd. 17,877 134,532 0.01
Hyundai Wia Corp. 1,732 131,324 0.01
Korea Investment Holdings Co. Ltd. 3,799 131,187 0.01
Hyundai Motor Co. 2nd Preferred 2,031 130,348 0.01
Hyundai Department Store Co. Ltd. 1,758 125,308 0.01
S-1 Corp. 2,155 121,049 0.01
Daewoo Securities Co. Ltd. 19,084 120,312 0.01
KEPCO Plant Service & Engine Co. Inc. 2,031 119,390 0.01
Yuhan Corp. 721 115,888 0.01
Halla Visteon Climate Control Corp. 4,380 111,571 0.01
Hanwha Corp. 5,201 110,773 0.01
Hyundai Marine & Fire Insurance Co. Ltd. 5,752 109,931 0.01
Daelim Industrial Co. Ltd. 2,539 107,865 0.01
Hanwha Chemical Corp. 8,335 105,093 0.01
BGF retail Co. Ltd. 1,040 100,415 0.01
Lotte Confectionery Co. Ltd. 89 100,338 0.01
Shinsegae Co. Ltd. 754 99,566 0.01
Hanwha Life Insurance Co. Ltd. 20,030 96,584 0.00
Cheil Industries Inc. 8,437 95,837 0.00
Samsung Techwin Co. Ltd. 4,427 93,785 0.00
Hanmi Science Co.Ltd. 1,195 88,911 0.00
OCI Co. Ltd. 1,736 81,047 0.00
DGB Financial Group Inc. 12,828 77,229 0.00
NongShim Co. Ltd. 367 76,810 0.00
Lotte Chilsung Beverage Co. Ltd. 60 76,061 0.00
Doosan Corp. 1,193 74,533 0.00
Daewoo Engineering & Construction Co. Ltd. 20,140 74,351 0.00
CJ Korea Express Co. Ltd. 655 72,356 0.00
Korea Gas Corp. 2,978 71,884 0.00
Hyundai Securities Co. Ltd. 18,099 71,031 0.00
LG Chem Ltd. Preferred 575 70,377 0.00
LG Hausys Ltd. 704 67,773 0.00
Samsung Card Co. Ltd. 3,000 65,344 0.00
NH Investment & Securities Corp. 10,487 60,157 0.00
NHN Entertainment Corp. 1,890 59,683 0.00
Dongsuh Cos Inc. 3,116 59,641 0.00
Kumho Petro chemical Co. Ltd. 1,745 57,483 0.00
Doosan Heavy Industries & Construction Co. Ltd. 4,541 53,129 0.00
SK Networks Co. Ltd. 12,630 50,787 0.00
GS Engineering & Construction Corp. 3,734 49,414 0.00
Korean Air Lines Co. Ltd. 2,805 49,068 0.00
Paradise Co. Ltd. 3,865 47,415 0.00
Hite Jinro Co. Ltd. 3,550 46,071 0.00
Samsung Fine Chemicals Co. Ltd. 2,154 45,938 0.00
Daewoo International Corp. 4,010 45,323 0.00
Mando Corp. 470 39,507 0.00
Doosan Infracore Co. Ltd. 11,000 39,047 0.00
LG Household & Health Care Ltd. 142 38,067 0.00
Daewoo Shipbuilding & Marine Engineering Co. Ltd. 9,247 36,396 0.00
Hyundai Merchant Marine Co. Ltd. 10,109 34,219 0.00
Hanjin Shipping Co. Ltd. 11,878 33,799 0.00
SKC Co. Ltd. 1,535 33,521 0.00
Mirae Asset Securities Co. Ltd. 2,215 32,143 0.00
LS Corp. 1,338 29,371 0.00
Hyundai Mipo Dockyard 588 23,945 0.00
Samsung Engineering Co. Ltd. 2,308 23,857 0.00
LG Electronics Inc Preferred 1,700 23,704 0.00
Samsung Fire & Marine Insurance Co. Ltd. Preferred 200 22,718 0.00
KEPCO Engineering & Construction Co. Inc. 1,031 20,026 0.00
CJ CheilJedang Corp. Preferred 136 17,148 0.00
32
Market % of Value Net Asset Holding (£) Value
Market % of Value Net Asset Holding (£) Value
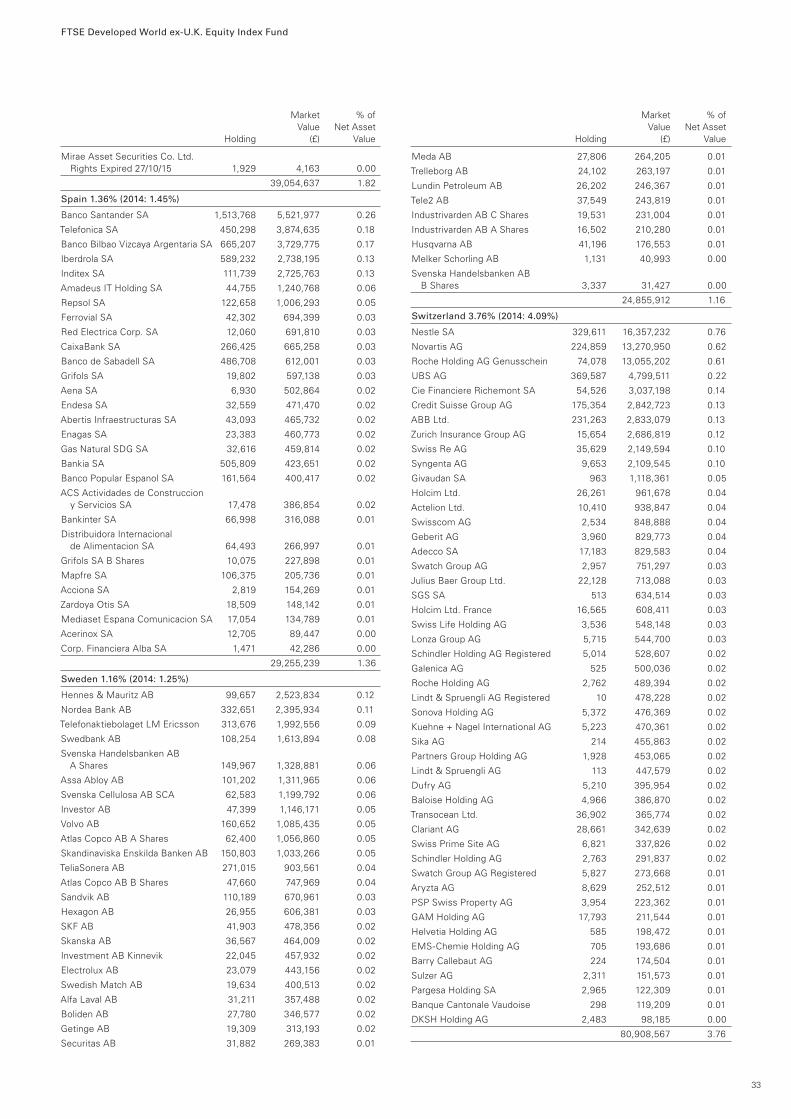
FTSE Developed World ex-U.K. Equity Index Fund
Mirae Asset Securities Co. Ltd. Rights Expired 27/10/15 1,929 4,163 0.00
39,054,637 1.82
Spain 1.36% (2014: 1.45%)
Banco Santander SA 1,513,768 5,521,977 0.26
Telefonica SA 450,298 3,874,635 0.18
Banco Bilbao Vizcaya Argentaria SA 665,207 3,729,775 0.17
Iberdrola SA 589,232 2,738,195 0.13
Inditex SA 111,739 2,725,763 0.13
Amadeus IT Holding SA 44,755 1,240,768 0.06
Repsol SA 122,658 1,006,293 0.05
Ferrovial SA 42,302 694,399 0.03
Red Electrica Corp. SA 12,060 691,810 0.03
CaixaBank SA 266,425 665,258 0.03
Banco de Sabadell SA 486,708 612,001 0.03
Grifols SA 19,802 597,138 0.03
Aena SA 6,930 502,864 0.02
Endesa SA 32,559 471,470 0.02
Abertis Infraestructuras SA 43,093 465,732 0.02
Enagas SA 23,383 460,773 0.02
Gas Natural SDG SA 32,616 459,814 0.02
Bankia SA 505,809 423,651 0.02
Banco Popular Espanol SA 161,564 400,417 0.02
ACS Actividades de Construccion y Servicios SA 17,478 386,854 0.02
Bankinter SA 66,998 316,088 0.01
Distribuidora Internacional de Alimentacion SA 64,493 266,997 0.01
Grifols SA B Shares 10,075 227,898 0.01
Mapfre SA 106,375 205,736 0.01
Acciona SA 2,819 154,269 0.01
Zardoya Otis SA 18,509 148,142 0.01
Mediaset Espana Comunicacion SA 17,054 134,789 0.01
Acerinox SA 12,705 89,447 0.00
Corp. Financiera Alba SA 1,471 42,286 0.00
29,255,239 1.36
Sweden 1.16% (2014: 1.25%)
Hennes & Mauritz AB 99,657 2,523,834 0.12
Nordea Bank AB 332,651 2,395,934 0.11
Telefonaktiebolaget LM Ericsson 313,676 1,992,556 0.09
Swedbank AB 108,254 1,613,894 0.08
Svenska Handelsbanken AB A Shares 149,967 1,328,881 0.06
Assa Abloy AB 101,202 1,311,965 0.06
Svenska Cellulosa AB SCA 62,583 1,199,792 0.06
Investor AB 47,399 1,146,171 0.05
Volvo AB 160,652 1,085,435 0.05
Atlas Copco AB A Shares 62,400 1,056,860 0.05
Skandinaviska Enskilda Banken AB 150,803 1,033,266 0.05
TeliaSonera AB 271,015 903,561 0.04
Atlas Copco AB B Shares 47,660 747,969 0.04
Sandvik AB 110,189 670,961 0.03
Hexagon AB 26,955 606,381 0.03
SKF AB 41,903 478,356 0.02
Skanska AB 36,567 464,009 0.02
Investment AB Kinnevik 22,045 457,932 0.02
Electrolux AB 23,079 443,156 0.02
Swedish Match AB 19,634 400,513 0.02
Alfa Laval AB 31,211 357,488 0.02
Boliden AB 27,780 346,577 0.02
Getinge AB 19,309 313,193 0.02
Securitas AB 31,882 269,383 0.01
Meda AB 27,806 264,205 0.01
Trelleborg AB 24,102 263,197 0.01
Lundin Petroleum AB 26,202 246,367 0.01
Tele2 AB 37,549 243,819 0.01
Industrivarden AB C Shares 19,531 231,004 0.01
Industrivarden AB A Shares 16,502 210,280 0.01
Husqvarna AB 41,196 176,553 0.01
Melker Schorling AB 1,131 40,993 0.00
Svenska Handelsbanken AB B Shares 3,337 31,427 0.00
24,855,912 1.16
Switzerland 3.76% (2014: 4.09%)
Nestle SA 329,611 16,357,232 0.76
Novartis AG 224,859 13,270,950 0.62
Roche Holding AG Genusschein 74,078 13,055,202 0.61
UBS AG 369,587 4,799,511 0.22
Cie Financiere Richemont SA 54,526 3,037,198 0.14
Credit Suisse Group AG 175,354 2,842,723 0.13
ABB Ltd. 231,263 2,833,079 0.13
Zurich Insurance Group AG 15,654 2,686,819 0.12
Swiss Re AG 35,629 2,149,594 0.10
Syngenta AG 9,653 2,109,545 0.10
Givaudan SA 963 1,118,361 0.05
Holcim Ltd. 26,261 961,678 0.04
Actelion Ltd. 10,410 938,847 0.04
Swisscom AG 2,534 848,888 0.04
Geberit AG 3,960 829,773 0.04
Adecco SA 17,183 829,583 0.04
Swatch Group AG 2,957 751,297 0.03
Julius Baer Group Ltd. 22,128 713,088 0.03
SGS SA 513 634,514 0.03
Holcim Ltd. France 16,565 608,411 0.03
Swiss Life Holding AG 3,536 548,148 0.03
Lonza Group AG 5,715 544,700 0.03
Schindler Holding AG Registered 5,014 528,607 0.02
Galenica AG 525 500,036 0.02
Roche Holding AG 2,762 489,394 0.02
Lindt & Spruengli AG Registered 10 478,228 0.02
Sonova Holding AG 5,372 476,369 0.02
Kuehne + Nagel International AG 5,223 470,361 0.02
Sika AG 214 455,863 0.02
Partners Group Holding AG 1,928 453,065 0.02
Lindt & Spruengli AG 113 447,579 0.02
Dufry AG 5,210 395,954 0.02
Baloise Holding AG 4,966 386,870 0.02
Transocean Ltd. 36,902 365,774 0.02
Clariant AG 28,661 342,639 0.02
Swiss Prime Site AG 6,821 337,826 0.02
Schindler Holding AG 2,763 291,837 0.02
Swatch Group AG Registered 5,827 273,668 0.01
Aryzta AG 8,629 252,512 0.01
PSP Swiss Property AG 3,954 223,362 0.01
GAM Holding AG 17,793 211,544 0.01
Helvetia Holding AG 585 198,472 0.01
EMS-Chemie Holding AG 705 193,686 0.01
Barry Callebaut AG 224 174,504 0.01
Sulzer AG 2,311 151,573 0.01
Pargesa Holding SA 2,965 122,309 0.01
Banque Cantonale Vaudoise 298 119,209 0.01
DKSH Holding AG 2,483 98,185 0.00
80,908,567 3.76
33
Market % of Value Net Asset Holding (£) Value
Market % of Value Net Asset Holding (£) Value
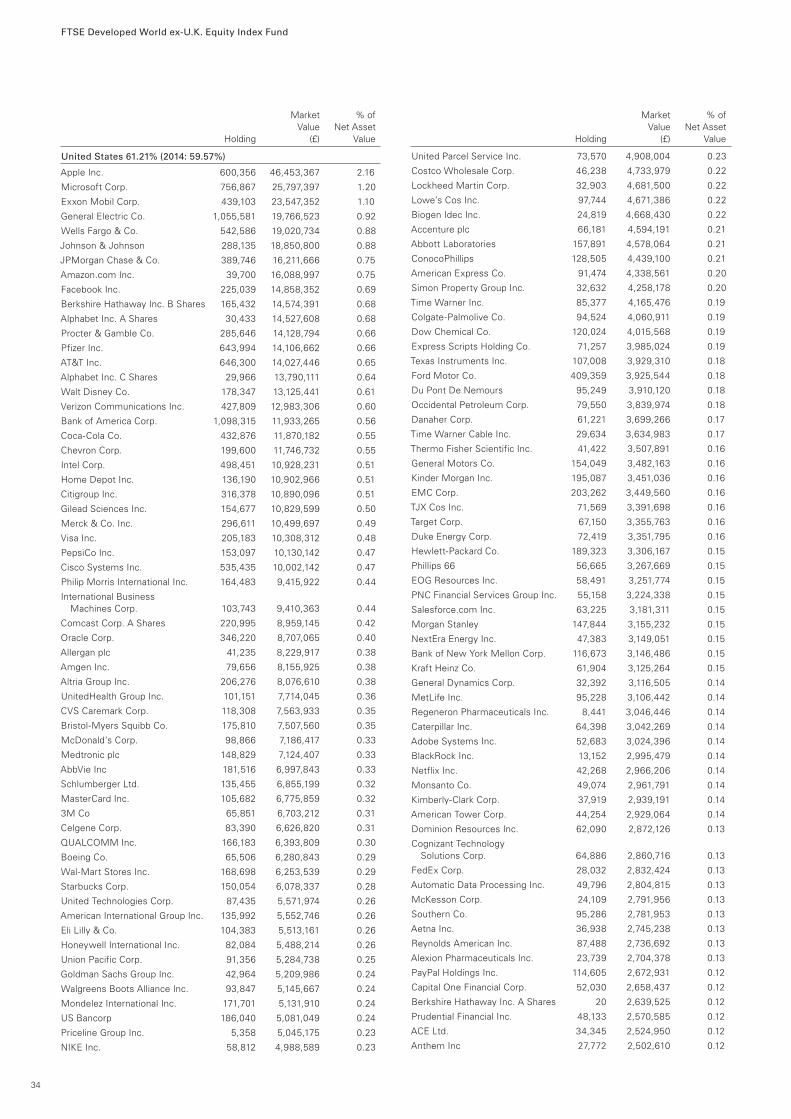
FTSE Developed World ex-U.K. Equity Index Fund
United States 61.21% (2014: 59.57%)
Apple Inc. 600,356 46,453,367 2.16
Microsoft Corp. 756,867 25,797,397 1.20
Exxon Mobil Corp. 439,103 23,547,352 1.10
General Electric Co. 1,055,581 19,766,523 0.92
Wells Fargo & Co. 542,586 19,020,734 0.88
Johnson & Johnson 288,135 18,850,800 0.88
JPMorgan Chase & Co. 389,746 16,211,666 0.75
Amazon.com Inc. 39,700 16,088,997 0.75
Facebook Inc. 225,039 14,858,352 0.69
Berkshire Hathaway Inc. B Shares 165,432 14,574,391 0.68
Alphabet Inc. A Shares 30,433 14,527,608 0.68
Procter & Gamble Co. 285,646 14,128,794 0.66
Pfizer Inc. 643,994 14,106,662 0.66
AT&T Inc. 646,300 14,027,446 0.65
Alphabet Inc. C Shares 29,966 13,790,111 0.64
Walt Disney Co. 178,347 13,125,441 0.61
Verizon Communications Inc. 427,809 12,983,306 0.60
Bank of America Corp. 1,098,315 11,933,265 0.56
Coca-Cola Co. 432,876 11,870,182 0.55
Chevron Corp. 199,600 11,746,732 0.55
Intel Corp. 498,451 10,928,231 0.51
Home Depot Inc. 136,190 10,902,966 0.51
Citigroup Inc. 316,378 10,890,096 0.51
Gilead Sciences Inc. 154,677 10,829,599 0.50
Merck & Co. Inc. 296,611 10,499,697 0.49
Visa Inc. 205,183 10,308,312 0.48
PepsiCo Inc. 153,097 10,130,142 0.47
Cisco Systems Inc. 535,435 10,002,142 0.47
Philip Morris International Inc. 164,483 9,415,922 0.44
International Business Machines Corp. 103,743 9,410,363 0.44
Comcast Corp. A Shares 220,995 8,959,145 0.42
Oracle Corp. 346,220 8,707,065 0.40
Allergan plc 41,235 8,229,917 0.38
Amgen Inc. 79,656 8,155,925 0.38
Altria Group Inc. 206,276 8,076,610 0.38
UnitedHealth Group Inc. 101,151 7,714,045 0.36
CVS Caremark Corp. 118,308 7,563,933 0.35
Bristol-Myers Squibb Co. 175,810 7,507,560 0.35
McDonald’s Corp. 98,866 7,186,417 0.33
Medtronic plc 148,829 7,124,407 0.33
AbbVie Inc 181,516 6,997,843 0.33
Schlumberger Ltd. 135,455 6,855,199 0.32
MasterCard Inc. 105,682 6,775,859 0.32
3M Co 65,851 6,703,212 0.31
Celgene Corp. 83,390 6,626,820 0.31
QUALCOMM Inc. 166,183 6,393,809 0.30
Boeing Co. 65,506 6,280,843 0.29
Wal-Mart Stores Inc. 168,698 6,253,539 0.29
Starbucks Corp. 150,054 6,078,337 0.28
United Technologies Corp. 87,435 5,571,974 0.26
American International Group Inc. 135,992 5,552,746 0.26
Eli Lilly & Co. 104,383 5,513,161 0.26
Honeywell International Inc. 82,084 5,488,214 0.26
Union Pacific Corp. 91,356 5,284,738 0.25
Goldman Sachs Group Inc. 42,964 5,209,986 0.24
Walgreens Boots Alliance Inc. 93,847 5,145,667 0.24
Mondelez International Inc. 171,701 5,131,910 0.24
US Bancorp 186,040 5,081,049 0.24
Priceline Group Inc. 5,358 5,045,175 0.23
NIKE Inc. 58,812 4,988,589 0.23
United Parcel Service Inc. 73,570 4,908,004 0.23
Costco Wholesale Corp. 46,238 4,733,979 0.22
Lockheed Martin Corp. 32,903 4,681,500 0.22
Lowe’s Cos Inc. 97,744 4,671,386 0.22
Biogen Idec Inc. 24,819 4,668,430 0.22
Accenture plc 66,181 4,594,191 0.21
Abbott Laboratories 157,891 4,578,064 0.21
ConocoPhillips 128,505 4,439,100 0.21
American Express Co. 91,474 4,338,561 0.20
Simon Property Group Inc. 32,632 4,258,178 0.20
Time Warner Inc. 85,377 4,165,476 0.19
Colgate-Palmolive Co. 94,524 4,060,911 0.19
Dow Chemical Co. 120,024 4,015,568 0.19
Express Scripts Holding Co. 71,257 3,985,024 0.19
Texas Instruments Inc. 107,008 3,929,310 0.18
Ford Motor Co. 409,359 3,925,544 0.18
Du Pont De Nemours 95,249 3,910,120 0.18
Occidental Petroleum Corp. 79,550 3,839,974 0.18
Danaher Corp. 61,221 3,699,266 0.17
Time Warner Cable Inc. 29,634 3,634,983 0.17
Thermo Fisher Scientific Inc. 41,422 3,507,891 0.16
General Motors Co. 154,049 3,482,163 0.16
Kinder Morgan Inc. 195,087 3,451,036 0.16
EMC Corp. 203,262 3,449,560 0.16
TJX Cos Inc. 71,569 3,391,698 0.16
Target Corp. 67,150 3,355,763 0.16
Duke Energy Corp. 72,419 3,351,795 0.16
Hewlett-Packard Co. 189,323 3,306,167 0.15
Phillips 66 56,665 3,267,669 0.15
EOG Resources Inc. 58,491 3,251,774 0.15
PNC Financial Services Group Inc. 55,158 3,224,338 0.15
Salesforce.com Inc. 63,225 3,181,311 0.15
Morgan Stanley 147,844 3,155,232 0.15
NextEra Energy Inc. 47,383 3,149,051 0.15
Bank of New York Mellon Corp. 116,673 3,146,486 0.15
Kraft Heinz Co. 61,904 3,125,264 0.15
General Dynamics Corp. 32,392 3,116,505 0.14
MetLife Inc. 95,228 3,106,442 0.14
Regeneron Pharmaceuticals Inc. 8,441 3,046,446 0.14
Caterpillar Inc. 64,398 3,042,269 0.14
Adobe Systems Inc. 52,683 3,024,396 0.14
BlackRock Inc. 13,152 2,995,479 0.14
Netflix Inc. 42,268 2,966,206 0.14
Monsanto Co. 49,074 2,961,791 0.14
Kimberly-Clark Corp. 37,919 2,939,191 0.14
American Tower Corp. 44,254 2,929,064 0.14
Dominion Resources Inc. 62,090 2,872,126 0.13
Cognizant Technology Solutions Corp. 64,886 2,860,716 0.13
FedEx Corp. 28,032 2,832,424 0.13
Automatic Data Processing Inc. 49,796 2,804,815 0.13
McKesson Corp. 24,109 2,791,956 0.13
Southern Co. 95,286 2,781,953 0.13
Aetna Inc. 36,938 2,745,238 0.13
Reynolds American Inc. 87,488 2,736,692 0.13
Alexion Pharmaceuticals Inc. 23,739 2,704,378 0.13
PayPal Holdings Inc. 114,605 2,672,931 0.12
Capital One Financial Corp. 52,030 2,658,437 0.12
Berkshire Hathaway Inc. A Shares 20 2,639,525 0.12
Prudential Financial Inc. 48,133 2,570,585 0.12
ACE Ltd. 34,345 2,524,950 0.12
Anthem Inc 27,772 2,502,610 0.12
34
Market % of Value Net Asset Holding (£) Value
Market % of Value Net Asset Holding (£) Value

FTSE Developed World ex-U.K. Equity Index Fund
LyondellBasell Industries NV 41,453 2,494,321 0.12
Twenty-First Century Fox Inc. A Shares 123,339 2,450,170 0.11
General Mills Inc. 64,719 2,435,135 0.11
Raytheon Co. 31,791 2,417,056 0.11
Northrop Grumman Corp. 19,835 2,411,308 0.11
Kroger Co. 97,190 2,379,407 0.11
Travelers Cos Inc. 32,492 2,375,048 0.11
Anadarko Petroleum Corp. 54,704 2,369,658 0.11
Cigna Corp. 27,181 2,358,187 0.11
Charles Schwab Corp. 118,324 2,337,521 0.11
Halliburton Co. 91,405 2,271,514 0.11
Public Storage 15,260 2,266,176 0.11
Valero Energy Corp. 51,898 2,214,840 0.10
Ecolab Inc. 28,228 2,199,716 0.10
Avago Technologies Ltd. 27,316 2,177,640 0.10
Yahoo! Inc. 94,100 2,169,102 0.10
Praxair Inc. 30,130 2,166,497 0.10
Precision Castparts Corp. 14,487 2,164,984 0.10
Emerson Electric Co. 70,312 2,149,789 0.10
Yum! Brands Inc. 45,436 2,086,456 0.10
eBay Inc. 114,763 2,072,482 0.10
CME Group Inc. 33,790 2,066,915 0.10
Vertex Pharmaceuticals Inc. 25,598 2,065,874 0.10
Becton Dickinson and Co. 22,340 2,061,576 0.10
Illinois Tool Works Inc. 34,345 2,044,823 0.10
Air Products & Chemicals Inc. 22,618 2,035,973 0.09
Johnson Controls Inc. 69,342 2,028,537 0.09
Marsh & McLennan Cos Inc. 55,659 2,009,189 0.09
Williams Cos Inc. 78,613 2,008,593 0.09
Chubb Corp. 23,950 2,005,914 0.09
State Street Corp. 44,777 2,000,817 0.09
BB&T Corp. 82,721 1,989,826 0.09
Broadcom Corp. 58,648 1,951,896 0.09
Crown Castle International Corp. 35,037 1,938,334 0.09
PPG Industries Inc. 28,675 1,935,991 0.09
IntercontinentalExchange Group Inc. 11,799 1,928,684 0.09
LinkedIn Corp. 12,291 1,916,948 0.09
Equity Residential 37,834 1,893,906 0.09
American Electric Power Co. Inc. 51,574 1,891,448 0.09
Marathon Petroleum Corp. 56,269 1,887,293 0.09
Archer-Daniels-Midland Co. 63,794 1,886,476 0.09
Cardinal Health Inc. 34,900 1,856,860 0.09
O’Reilly Automotive Inc. 10,346 1,849,807 0.09
Eaton Corp. plc 50,472 1,827,176 0.08
Stryker Corp. 29,334 1,815,997 0.08
Humana Inc. 15,686 1,814,698 0.08
CSX Corp. 103,703 1,812,319 0.08
Aflac Inc. 43,896 1,811,947 0.08
Aon Corp. 29,417 1,777,135 0.08
PG&E Corp. 51,395 1,776,729 0.08
TE Connectivity Ltd. 42,277 1,764,006 0.08
McGraw Hill Financial Inc. 29,218 1,752,816 0.08
Discover Financial Services 47,852 1,741,933 0.08
Deere & Co. 34,115 1,723,423 0.08
Liberty Global plc Series 62,305 1,719,803 0.08
Sempra Energy. 25,872 1,715,420 0.08
Allstate Corp. 42,435 1,699,984 0.08
Intuit Inc. 26,893 1,696,398 0.08
AutoZone Inc. 3,280 1,666,102 0.08
Waste Management Inc. 47,774 1,662,996 0.08
Sysco Corp. 61,961 1,654,942 0.08
Boston Scientific Corp. 139,780 1,654,481 0.08
Comcast Corp. Special A Shares 40,617 1,649,245 0.08
Exelon Corp. 90,238 1,631,343 0.08
Delphi Automotive plc 30,256 1,629,562 0.08
Norfolk Southern Corp. 31,344 1,624,028 0.08
Activision Blizzard Inc. 71,198 1,601,080 0.07
AvalonBay Communities Inc. 13,769 1,557,260 0.07
Fiserv Inc. 24,864 1,553,759 0.07
Carnival Corp. 44,176 1,546,619 0.07
PPL Corp. 69,052 1,537,620 0.07
Corning Inc. 127,088 1,530,587 0.07
Welltower Inc. 36,436 1,529,256 0.07
VF Corp. 34,936 1,527,603 0.07
Prologis Inc. 55,191 1,525,937 0.07
Baker Hughes Inc. 44,648 1,522,381 0.07
Constellation Brands Inc. 17,218 1,502,395 0.07
HCA Holdings Inc. 33,570 1,494,609 0.07
Electronic Arts Inc. 31,854 1,486,480 0.07
AmerisourceBergen Corp. 23,721 1,482,179 0.07
Zoetis Inc. 52,879 1,472,286 0.07
Fidelity National Information Services Inc 31,090 1,468,140 0.07
Ameriprise Financial Inc. 19,451 1,452,780 0.07
Perrigo Co. plc 14,117 1,442,414 0.07
SunTrust Banks Inc. 53,423 1,436,237 0.07
Public Service Enterprise Group Inc. 53,323 1,425,607 0.07
CBS Corp. 47,229 1,422,620 0.07
Monster Beverage Corp. 16,018 1,413,866 0.07
L Brands Inc. 22,753 1,413,445 0.07
Illumina Inc. 15,199 1,410,071 0.07
Sherwin-Williams Co. 8,119 1,401,690 0.07
Ross Stores Inc. 42,773 1,400,841 0.07
T Rowe Price Group Inc. 28,200 1,380,238 0.06
Chipotle Mexican Grill Inc. 3,327 1,378,819 0.06
Pioneer Natural Resources Co. 15,503 1,376,640 0.06
Baxter International Inc. 56,304 1,363,852 0.06
Las Vegas Sands Corp. 42,167 1,351,507 0.06
Applied Materials Inc. 124,092 1,346,661 0.06
Edison International 34,323 1,344,785 0.06
Cerner Corp. 30,902 1,325,801 0.06
Boston Properties Inc. 16,178 1,317,580 0.06
Tesla Motors Inc. 9,815 1,315,086 0.06
NXP Semiconductor NV 25,888 1,313,007 0.06
Analog Devices Inc. 33,628 1,308,627 0.06
Roper Industries Inc. 10,808 1,303,833 0.06
Spectra Energy Corp. 70,463 1,303,502 0.06
Consolidated Edison Inc. 30,571 1,300,713 0.06
Moody’s Corp. 20,866 1,299,194 0.06
Hartford Financial Services Group Inc. 43,313 1,297,371 0.06
Omnicom Group Inc. 26,693 1,294,898 0.06
St Jude Medical Inc. 30,690 1,268,020 0.06
Devon Energy Corp. 46,253 1,255,756 0.06
Baxalta Inc. 56,249 1,255,077 0.06
Dollar General Corp. 28,587 1,253,875 0.06
PACCAR Inc. 36,680 1,250,218 0.06
International Paper Co. 44,792 1,237,552 0.06
BioMarin Pharmaceutical Inc. 16,327 1,237,212 0.06
Cummins Inc. 18,435 1,235,446 0.06
Ventas Inc. 35,519 1,235,254 0.06
Alliance Data Systems Corp. 6,411 1,234,172 0.06
M&T Bank Corp. 15,856 1,233,964 0.06
Intuitive Surgical Inc. 3,835 1,232,495 0.06
35
Market % of Value Net Asset Holding (£) Value
Market % of Value Net Asset Holding (£) Value
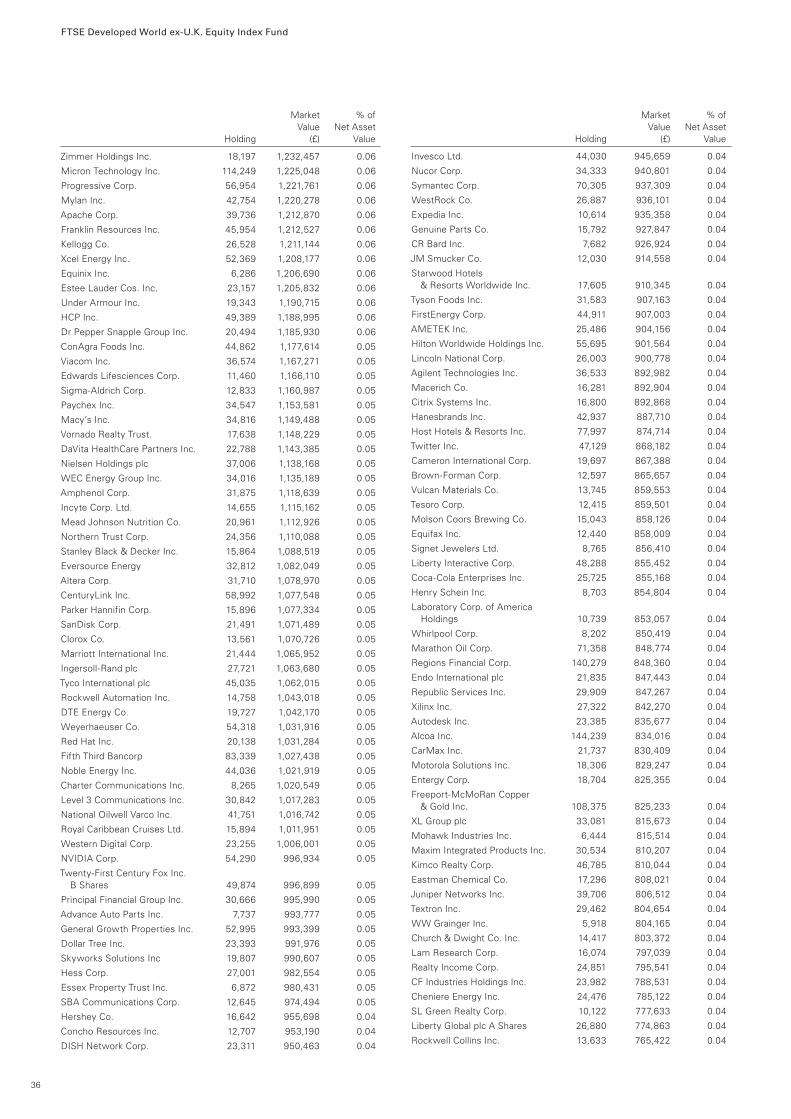
FTSE Developed World ex-U.K. Equity Index Fund
Zimmer Holdings Inc. 18,197 1,232,457 0.06
Micron Technology Inc. 114,249 1,225,048 0.06
Progressive Corp. 56,954 1,221,761 0.06
Mylan Inc. 42,754 1,220,278 0.06
Apache Corp. 39,736 1,212,870 0.06
Franklin Resources Inc. 45,954 1,212,527 0.06
Kellogg Co. 26,528 1,211,144 0.06
Xcel Energy Inc. 52,369 1,208,177 0.06
Equinix Inc. 6,286 1,206,690 0.06
Estee Lauder Cos. Inc. 23,157 1,205,832 0.06
Under Armour Inc. 19,343 1,190,715 0.06
HCP Inc. 49,389 1,188,995 0.06
Dr Pepper Snapple Group Inc. 20,494 1,185,930 0.06
ConAgra Foods Inc. 44,862 1,177,614 0.05
Viacom Inc. 36,574 1,167,271 0.05
Edwards Lifesciences Corp. 11,460 1,166,110 0.05
Sigma-Aldrich Corp. 12,833 1,160,987 0.05
Paychex Inc. 34,547 1,153,581 0.05
Macy’s Inc. 34,816 1,149,488 0.05
Vornado Realty Trust. 17,638 1,148,229 0.05
DaVita HealthCare Partners Inc. 22,788 1,143,385 0.05
Nielsen Holdings plc 37,006 1,138,168 0.05
WEC Energy Group Inc. 34,016 1,135,189 0.05
Amphenol Corp. 31,875 1,118,639 0.05
Incyte Corp. Ltd. 14,655 1,115,162 0.05
Mead Johnson Nutrition Co. 20,961 1,112,926 0.05
Northern Trust Corp. 24,356 1,110,088 0.05
Stanley Black & Decker Inc. 15,864 1,088,519 0.05
Eversource Energy 32,812 1,082,049 0.05
Altera Corp. 31,710 1,078,970 0.05
CenturyLink Inc. 58,992 1,077,548 0.05
Parker Hannifin Corp. 15,896 1,077,334 0.05
SanDisk Corp. 21,491 1,071,489 0.05
Clorox Co. 13,561 1,070,726 0.05
Marriott International Inc. 21,444 1,065,952 0.05
Ingersoll-Rand plc 27,721 1,063,680 0.05
Tyco International plc 45,035 1,062,015 0.05
Rockwell Automation Inc. 14,758 1,043,018 0.05
DTE Energy Co. 19,727 1,042,170 0.05
Weyerhaeuser Co. 54,318 1,031,916 0.05
Red Hat Inc. 20,138 1,031,284 0.05
Fifth Third Bancorp 83,339 1,027,438 0.05
Noble Energy Inc. 44,036 1,021,919 0.05
Charter Communications Inc. 8,265 1,020,549 0.05
Level 3 Communications Inc. 30,842 1,017,283 0.05
National Oilwell Varco Inc. 41,751 1,016,742 0.05
Royal Caribbean Cruises Ltd. 15,894 1,011,951 0.05
Western Digital Corp. 23,255 1,006,001 0.05
NVIDIA Corp. 54,290 996,934 0.05
Twenty-First Century Fox Inc. B Shares 49,874 996,899 0.05
Principal Financial Group Inc. 30,666 995,990 0.05
Advance Auto Parts Inc. 7,737 993,777 0.05
General Growth Properties Inc. 52,995 993,399 0.05
Dollar Tree Inc. 23,393 991,976 0.05
Skyworks Solutions Inc 19,807 990,607 0.05
Hess Corp. 27,001 982,554 0.05
Essex Property Trust Inc. 6,872 980,431 0.05
SBA Communications Corp. 12,645 974,494 0.05
Hershey Co. 16,642 955,698 0.04
Concho Resources Inc. 12,707 953,190 0.04
DISH Network Corp. 23,311 950,463 0.04
Invesco Ltd. 44,030 945,659 0.04
Nucor Corp. 34,333 940,801 0.04
Symantec Corp. 70,305 937,309 0.04
WestRock Co. 26,887 936,101 0.04
Expedia Inc. 10,614 935,358 0.04
Genuine Parts Co. 15,792 927,847 0.04
CR Bard Inc. 7,682 926,924 0.04
JM Smucker Co. 12,030 914,558 0.04
Starwood Hotels & Resorts Worldwide Inc. 17,605 910,345 0.04
Tyson Foods Inc. 31,583 907,163 0.04
FirstEnergy Corp. 44,911 907,003 0.04
AMETEK Inc. 25,486 904,156 0.04
Hilton Worldwide Holdings Inc. 55,695 901,564 0.04
Lincoln National Corp. 26,003 900,778 0.04
Agilent Technologies Inc. 36,533 892,982 0.04
Macerich Co. 16,281 892,904 0.04
Citrix Systems Inc. 16,800 892,868 0.04
Hanesbrands Inc. 42,937 887,710 0.04
Host Hotels & Resorts Inc. 77,997 874,714 0.04
Twitter Inc. 47,129 868,182 0.04
Cameron International Corp. 19,697 867,388 0.04
Brown-Forman Corp. 12,597 865,657 0.04
Vulcan Materials Co. 13,745 859,553 0.04
Tesoro Corp. 12,415 859,501 0.04
Molson Coors Brewing Co. 15,043 858,126 0.04
Equifax Inc. 12,440 858,009 0.04
Signet Jewelers Ltd. 8,765 856,410 0.04
Liberty Interactive Corp. 48,288 855,452 0.04
Coca-Cola Enterprises Inc. 25,725 855,168 0.04
Henry Schein Inc. 8,703 854,804 0.04
Laboratory Corp. of America Holdings 10,739 853,057 0.04
Whirlpool Corp. 8,202 850,419 0.04
Marathon Oil Corp. 71,358 848,774 0.04
Regions Financial Corp. 140,279 848,360 0.04
Endo International plc 21,835 847,443 0.04
Republic Services Inc. 29,909 847,267 0.04
Xilinx Inc. 27,322 842,270 0.04
Autodesk Inc. 23,385 835,677 0.04
Alcoa Inc. 144,239 834,016 0.04
CarMax Inc. 21,737 830,409 0.04
Motorola Solutions Inc. 18,306 829,247 0.04
Entergy Corp. 18,704 825,355 0.04
Freeport-McMoRan Copper & Gold Inc. 108,375 825,233 0.04
XL Group plc 33,081 815,673 0.04
Mohawk Industries Inc. 6,444 815,514 0.04
Maxim Integrated Products Inc. 30,534 810,207 0.04
Kimco Realty Corp. 46,785 810,044 0.04
Eastman Chemical Co. 17,296 808,021 0.04
Juniper Networks Inc. 39,706 806,512 0.04
Textron Inc. 29,462 804,654 0.04
WW Grainger Inc. 5,918 804,165 0.04
Church & Dwight Co. Inc. 14,417 803,372 0.04
Lam Research Corp. 16,074 797,039 0.04
Realty Income Corp. 24,851 795,541 0.04
CF Industries Holdings Inc. 23,982 788,531 0.04
Cheniere Energy Inc. 24,476 785,122 0.04
SL Green Realty Corp. 10,122 777,633 0.04
Liberty Global plc A Shares 26,880 774,863 0.04
Rockwell Collins Inc. 13,633 765,422 0.04
36
Market % of Value Net Asset Holding (£) Value
Market % of Value Net Asset Holding (£) Value
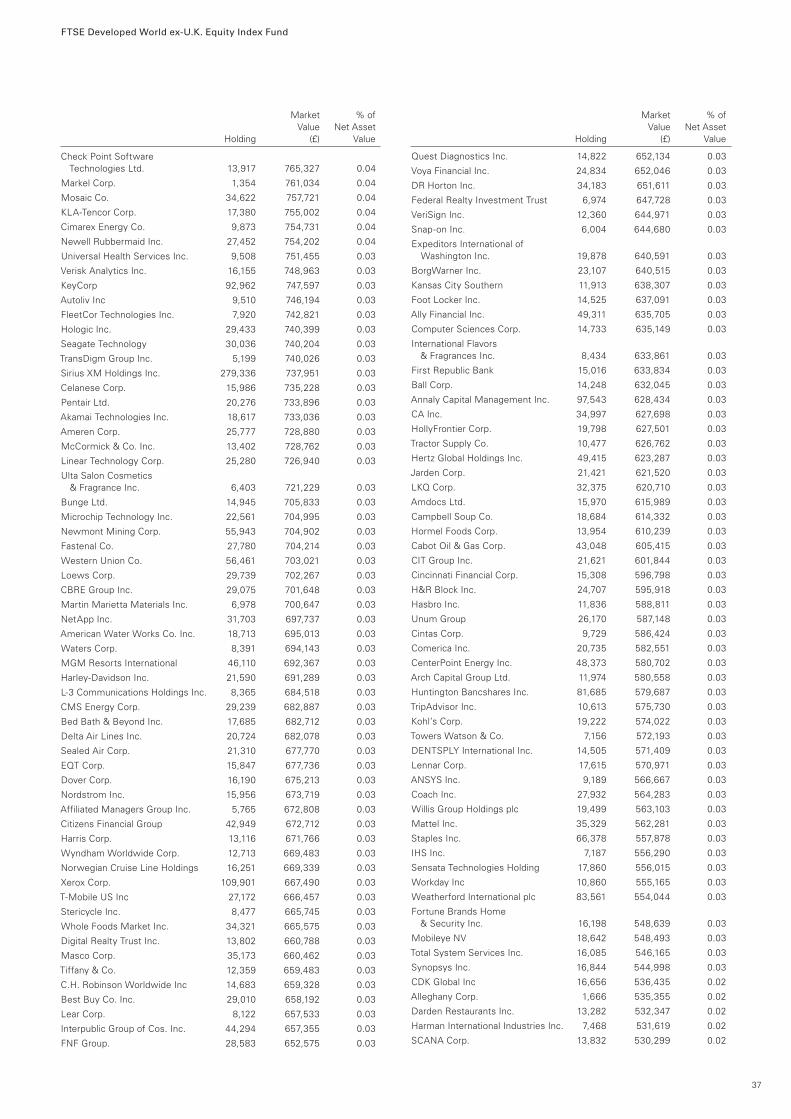
FTSE Developed World ex-U.K. Equity Index Fund
Check Point Software Technologies Ltd. 13,917 765,327 0.04
Markel Corp. 1,354 761,034 0.04
Mosaic Co. 34,622 757,721 0.04
KLA-Tencor Corp. 17,380 755,002 0.04
Cimarex Energy Co. 9,873 754,731 0.04
Newell Rubbermaid Inc. 27,452 754,202 0.04
Universal Health Services Inc. 9,508 751,455 0.03
Verisk Analytics Inc. 16,155 748,963 0.03
KeyCorp 92,962 747,597 0.03
Autoliv Inc 9,510 746,194 0.03
FleetCor Technologies Inc. 7,920 742,821 0.03
Hologic Inc. 29,433 740,399 0.03
Seagate Technology 30,036 740,204 0.03
TransDigm Group Inc. 5,199 740,026 0.03
Sirius XM Holdings Inc. 279,336 737,951 0.03
Celanese Corp. 15,986 735,228 0.03
Pentair Ltd. 20,276 733,896 0.03
Akamai Technologies Inc. 18,617 733,036 0.03
Ameren Corp. 25,777 728,880 0.03
McCormick & Co. Inc. 13,402 728,762 0.03
Linear Technology Corp. 25,280 726,940 0.03
Ulta Salon Cosmetics & Fragrance Inc. 6,403 721,229 0.03
Bunge Ltd. 14,945 705,833 0.03
Microchip Technology Inc. 22,561 704,995 0.03
Newmont Mining Corp. 55,943 704,902 0.03
Fastenal Co. 27,780 704,214 0.03
Western Union Co. 56,461 703,021 0.03
Loews Corp. 29,739 702,267 0.03
CBRE Group Inc. 29,075 701,648 0.03
Martin Marietta Materials Inc. 6,978 700,647 0.03
NetApp Inc. 31,703 697,737 0.03
American Water Works Co. Inc. 18,713 695,013 0.03
Waters Corp. 8,391 694,143 0.03
MGM Resorts International 46,110 692,367 0.03
Harley-Davidson Inc. 21,590 691,289 0.03
L-3 Communications Holdings Inc. 8,365 684,518 0.03
CMS Energy Corp. 29,239 682,887 0.03
Bed Bath & Beyond Inc. 17,685 682,712 0.03
Delta Air Lines Inc. 20,724 682,078 0.03
Sealed Air Corp. 21,310 677,770 0.03
EQT Corp. 15,847 677,736 0.03
Dover Corp. 16,190 675,213 0.03
Nordstrom Inc. 15,956 673,719 0.03
Affiliated Managers Group Inc. 5,765 672,808 0.03
Citizens Financial Group 42,949 672,712 0.03
Harris Corp. 13,116 671,766 0.03
Wyndham Worldwide Corp. 12,713 669,483 0.03
Norwegian Cruise Line Holdings 16,251 669,339 0.03
Xerox Corp. 109,901 667,490 0.03
T-Mobile US Inc 27,172 666,457 0.03
Stericycle Inc. 8,477 665,745 0.03
Whole Foods Market Inc. 34,321 665,575 0.03
Digital Realty Trust Inc. 13,802 660,788 0.03
Masco Corp. 35,173 660,462 0.03
Tiffany & Co. 12,359 659,483 0.03
C.H. Robinson Worldwide Inc 14,683 659,328 0.03
Best Buy Co. Inc. 29,010 658,192 0.03
Lear Corp. 8,122 657,533 0.03
Interpublic Group of Cos. Inc. 44,294 657,355 0.03
FNF Group. 28,583 652,575 0.03
Quest Diagnostics Inc. 14,822 652,134 0.03
Voya Financial Inc. 24,834 652,046 0.03
DR Horton Inc. 34,183 651,611 0.03
Federal Realty Investment Trust 6,974 647,728 0.03
VeriSign Inc. 12,360 644,971 0.03
Snap-on Inc. 6,004 644,680 0.03
Expeditors International of Washington Inc. 19,878 640,591 0.03
BorgWarner Inc. 23,107 640,515 0.03
Kansas City Southern 11,913 638,307 0.03
Foot Locker Inc. 14,525 637,091 0.03
Ally Financial Inc. 49,311 635,705 0.03
Computer Sciences Corp. 14,733 635,149 0.03
International Flavors & Fragrances Inc. 8,434 633,861 0.03
First Republic Bank 15,016 633,834 0.03
Ball Corp. 14,248 632,045 0.03
Annaly Capital Management Inc. 97,543 628,434 0.03
CA Inc. 34,997 627,698 0.03
HollyFrontier Corp. 19,798 627,501 0.03
Tractor Supply Co. 10,477 626,762 0.03
Hertz Global Holdings Inc. 49,415 623,287 0.03
Jarden Corp. 21,421 621,520 0.03
LKQ Corp. 32,375 620,710 0.03
Amdocs Ltd. 15,970 615,989 0.03
Campbell Soup Co. 18,684 614,332 0.03
Hormel Foods Corp. 13,954 610,239 0.03
Cabot Oil & Gas Corp. 43,048 605,415 0.03
CIT Group Inc. 21,621 601,844 0.03
Cincinnati Financial Corp. 15,308 596,798 0.03
H&R Block Inc. 24,707 595,918 0.03
Hasbro Inc. 11,836 588,811 0.03
Unum Group 26,170 587,148 0.03
Cintas Corp. 9,729 586,424 0.03
Comerica Inc. 20,735 582,551 0.03
CenterPoint Energy Inc. 48,373 580,702 0.03
Arch Capital Group Ltd. 11,974 580,558 0.03
Huntington Bancshares Inc. 81,685 579,687 0.03
TripAdvisor Inc. 10,613 575,730 0.03
Kohl’s Corp. 19,222 574,022 0.03
Towers Watson & Co. 7,156 572,193 0.03
DENTSPLY International Inc. 14,505 571,409 0.03
Lennar Corp. 17,615 570,971 0.03
ANSYS Inc. 9,189 566,667 0.03
Coach Inc. 27,932 564,283 0.03
Willis Group Holdings plc 19,499 563,103 0.03
Mattel Inc. 35,329 562,281 0.03
Staples Inc. 66,378 557,878 0.03
IHS Inc. 7,187 556,290 0.03
Sensata Technologies Holding 17,860 556,015 0.03
Workday Inc 10,860 555,165 0.03
Weatherford International plc 83,561 554,044 0.03
Fortune Brands Home & Security Inc. 16,198 548,639 0.03
Mobileye NV 18,642 548,493 0.03
Total System Services Inc. 16,085 546,165 0.03
Synopsys Inc. 16,844 544,998 0.03
CDK Global Inc 16,656 536,435 0.02
Alleghany Corp. 1,666 535,355 0.02
Darden Restaurants Inc. 13,282 532,347 0.02
Harman International Industries Inc. 7,468 531,619 0.02
SCANA Corp. 13,832 530,299 0.02
37
Market % of Value Net Asset Holding (£) Value
Market % of Value Net Asset Holding (£) Value

FTSE Developed World ex-U.K. Equity Index Fund
Mettler-Toledo International Inc. 2,613 525,612 0.02
Everest Re Group Ltd. 4,518 520,255 0.02
VEREIT Inc. 96,334 515,853 0.02
F5 Networks Inc. 7,219 515,062 0.02
Mallinckrodt plc 12,079 513,303 0.02
Robert Half International Inc. 15,009 511,671 0.02
Arthur J Gallagher & Co. 18,023 510,208 0.02
American Airlines Group Inc. 17,019 509,226 0.02
TD Ameritrade Holding Corp. 22,780 508,288 0.02
FMC Technologies Inc. 23,186 507,888 0.02
Jazz Pharmaceuticals plc 5,696 506,311 0.02
Varian Medical Systems Inc. 9,944 505,699 0.02
Ashland Inc. 7,120 505,509 0.02
PVH Corp. 8,570 504,745 0.02
Southwest Airlines Co. 16,803 503,525 0.02
AES Corp. 70,867 502,915 0.02
Torchmark Corp. 13,310 499,858 0.02
Plum Creek Timber Co. Inc. 18,873 497,977 0.02
Alliant Energy Corp. 12,888 492,438 0.02
Allegion plc 11,635 490,744 0.02
ONEOK Inc. 22,224 487,967 0.02
New York Community Bancorp Inc. 45,631 486,329 0.02
Michael Kors Holdings Ltd. 19,295 482,875 0.02
Duke Realty Corp. 35,955 482,147 0.02
Broadridge Financial Solutions Inc. 12,492 481,837 0.02
Fluor Corp. 15,369 475,778 0.02
JB Hunt Transport Services Inc. 9,557 472,343 0.02
Pinnacle West Capital Corp. 11,471 471,571 0.02
Liberty Media Corp. C. 18,536 469,881 0.02
Manpowergroup Inc. 7,854 466,490 0.02
AerCap Holdings NV 17,252 463,584 0.02
XL Group plc 19,582 461,783 0.02
Polaris Industries Inc. 6,321 459,709 0.02
Leggett & Platt Inc. 15,681 457,414 0.02
PartnerRe Ltd. 5,071 456,403 0.02
Centene Corp. 11,716 451,071 0.02
Newfield Exploration Co. 17,323 450,798 0.02
Discovery Communications Inc. C Shares 25,302 450,698 0.02
Pepco Holdings Inc. 26,090 449,700 0.02
Regency Centers Corp. 10,191 448,314 0.02
Wabtec Corp. 8,307 445,740 0.02
Palo Alto Networks Inc. 4,233 441,280 0.02
Cablevision Systems Corp. 20,875 440,370 0.02
Columbia Pipeline Group Inc. 32,764 440,205 0.02
Gap Inc. 24,971 439,952 0.02
Ralph Lauren Corp. 6,094 436,887 0.02
United Rentals Inc. 8,984 435,472 0.02
Medivation Inc. 15,820 430,635 0.02
Flowserve Corp. 14,276 428,447 0.02
Leucadia National Corp. 33,074 428,095 0.02
Avnet Inc. 14,520 426,932 0.02
NVR Inc. 403 425,989 0.02
TECO Energy Inc. 24,299 424,651 0.02
Qorvo Inc. 14,888 423,389 0.02
Keurig Green Mountain Inc. 12,885 423,326 0.02
Flextronics International Ltd. 57,097 421,092 0.02
SEI Investments Co. 12,527 420,244 0.02
TEGNA Inc. 23,849 417,250 0.02
NiSource Inc. 33,555 415,853 0.02
Trimble Navigation Ltd. 27,870 410,543 0.02
Zions Bancorporation 22,045 410,525 0.02
Helmerich & Payne Inc. 11,232 409,237 0.02
American Capital Agency Corp. 35,369 408,333 0.02
Alnylam Pharmaceuticals Inc. 7,280 405,152 0.02
ADT Corp. 18,923 404,705 0.02
Keysight Technologies Inc. 18,638 399,093 0.02
Frontier Communications Corp. 120,030 398,701 0.02
Liberty Ventures 14,047 396,289 0.02
Wynn Resorts Ltd. 8,715 394,726 0.02
Avery Dennison Corp. 9,361 393,982 0.02
Toll Brothers Inc. 16,913 393,914 0.02
WR Berkley Corp. 10,784 389,911 0.02
Assurant Inc. 7,379 389,495 0.02
Quintiles Transnational Holdings Inc. 9,406 387,532 0.02
United Continental Holdings Inc. 9,781 381,956 0.02
FMC Corp. 14,289 376,655 0.02
Iron Mountain Inc. 18,694 370,757 0.02
Arrow Electronics Inc. 10,415 370,568 0.02
Airgas Inc. 5,832 363,046 0.02
PulteGroup Inc. 30,240 358,714 0.02
Southern Copper Corp. 19,747 354,945 0.02
Range Resources Corp. 17,776 350,364 0.02
B/E Aerospace Inc 11,495 349,376 0.02
Edgewell Personal Care Co. 6,368 349,284 0.02
Herbalife Ltd. 9,425 341,995 0.02
Core Laboratories NV 4,537 341,832 0.02
Axis Capital Holdings Ltd. 9,720 339,860 0.02
GameStop Corp. 11,388 339,561 0.02
Liberty Property Trust 15,281 336,808 0.02
People’s United Financial Inc. 32,467 335,308 0.02
Navient Corp. 39,190 334,704 0.02
News Corp. A Shares 33,221 331,049 0.02
Discovery Communications Inc. A Shares 17,270 329,096 0.02
Gentex Corp. 30,963 328,396 0.02
Chesapeake Energy Corp. 70,584 325,407 0.02
lululemon athletica Inc. 10,220 325,182 0.02
RenaissanceRe Holdings Ltd. 4,543 322,487 0.02
Jacobs Engineering Group Inc. 12,376 321,501 0.01
Dun & Bradstreet Corp. 4,359 321,196 0.01
Commerce Bancshares Inc. 10,788 318,178 0.01
IAC/InterActiveCorp. 7,281 315,727 0.01
NCR Corp. 18,254 314,398 0.01
Murphy Oil Corp. 16,818 309,593 0.01
AutoNation Inc. 7,521 307,677 0.01
Chicago Bridge & Iron Co. NV 10,549 306,484 0.01
Calpine Corp. 30,383 304,932 0.01
Old Republic International Corp. 25,981 303,145 0.01
Legg Mason Inc. 10,443 302,728 0.01
Nuance Communications Inc. 27,401 300,907 0.01
Teradata Corp. 16,445 299,213 0.01
Jabil Circuit Inc. 19,931 296,436 0.01
City National Corp. 5,037 292,358 0.01
Southwestern Energy Co. 40,767 291,155 0.01
IMS Health Holdings Inc. 16,505 290,793 0.01
NRG Energy Inc. 34,297 285,808 0.01
Bemis Co. Inc. 9,618 285,165 0.01
Splunk Inc. 7,788 283,150 0.01
VMware Inc. 7,143 278,107 0.01
Brown & Brown Inc. 13,216 275,975 0.01
Yandex NV 26,295 274,119 0.01
Ensco plc 25,252 271,749 0.01
Synchrony Financial 13,447 267,739 0.01
38
Market % of Value Net Asset Holding (£) Value
Market % of Value Net Asset Holding (£) Value
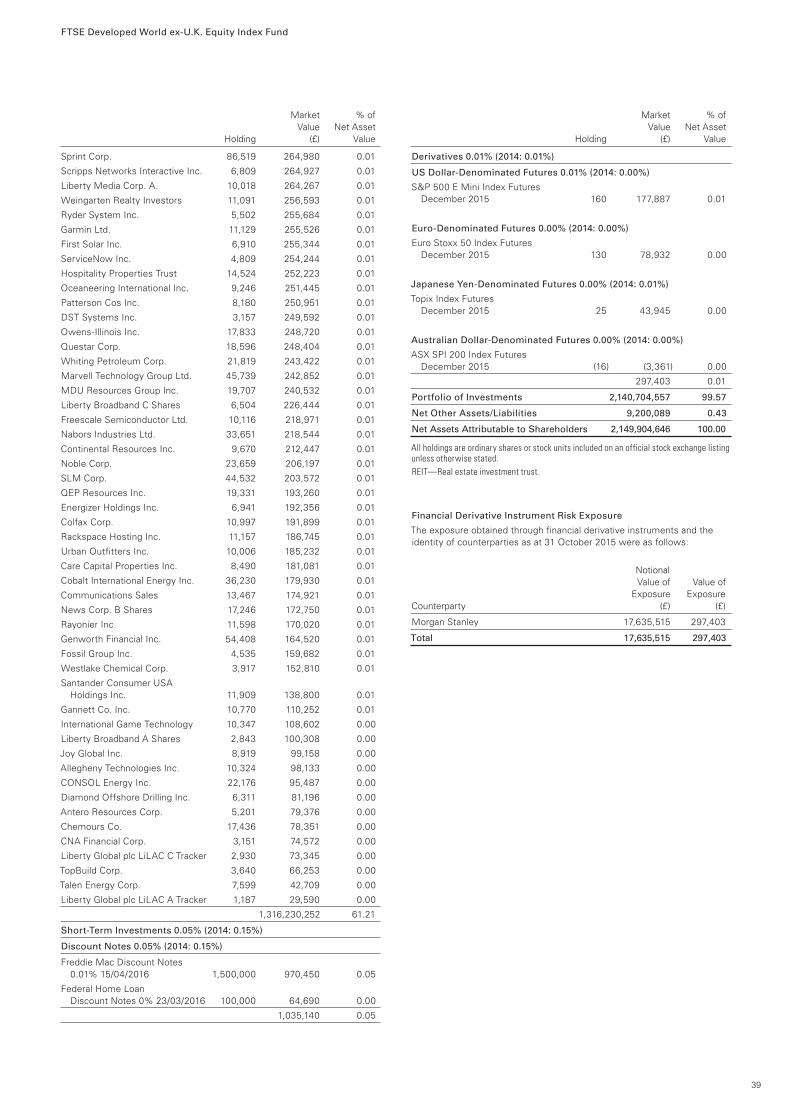
FTSE Developed World ex-U.K. Equity Index Fund
Sprint Corp. 86,519 264,980 0.01
Scripps Networks Interactive Inc. 6,809 264,927 0.01
Liberty Media Corp. A. 10,018 264,267 0.01
Weingarten Realty Investors 11,091 256,593 0.01
Ryder System Inc. 5,502 255,684 0.01
Garmin Ltd. 11,129 255,526 0.01
First Solar Inc. 6,910 255,344 0.01
ServiceNow Inc. 4,809 254,244 0.01
Hospitality Properties Trust 14,524 252,223 0.01
Oceaneering International Inc. 9,246 251,445 0.01
Patterson Cos Inc. 8,180 250,951 0.01
DST Systems Inc. 3,157 249,592 0.01
Owens-Illinois Inc. 17,833 248,720 0.01
Questar Corp. 18,596 248,404 0.01
Whiting Petroleum Corp. 21,819 243,422 0.01
Marvell Technology Group Ltd. 45,739 242,852 0.01
MDU Resources Group Inc. 19,707 240,532 0.01
Liberty Broadband C Shares 6,504 226,444 0.01
Freescale Semiconductor Ltd. 10,116 218,971 0.01
Nabors Industries Ltd. 33,651 218,544 0.01
Continental Resources Inc. 9,670 212,447 0.01
Noble Corp. 23,659 206,197 0.01
SLM Corp. 44,532 203,572 0.01
QEP Resources Inc. 19,331 193,260 0.01
Energizer Holdings Inc. 6,941 192,356 0.01
Colfax Corp. 10,997 191,899 0.01
Rackspace Hosting Inc. 11,157 186,745 0.01
Urban Outfitters Inc. 10,006 185,232 0.01
Care Capital Properties Inc. 8,490 181,081 0.01
Cobalt International Energy Inc. 36,230 179,930 0.01
Communications Sales 13,467 174,921 0.01
News Corp. B Shares 17,246 172,750 0.01
Rayonier Inc. 11,598 170,020 0.01
Genworth Financial Inc. 54,408 164,520 0.01
Fossil Group Inc. 4,535 159,682 0.01
Westlake Chemical Corp. 3,917 152,810 0.01
Santander Consumer USA Holdings Inc. 11,909 138,800 0.01
Gannett Co. Inc. 10,770 110,252 0.01
International Game Technology 10,347 108,602 0.00
Liberty Broadband A Shares 2,843 100,308 0.00
Joy Global Inc. 8,919 99,158 0.00
Allegheny Technologies Inc. 10,324 98,133 0.00
CONSOL Energy Inc. 22,176 95,487 0.00
Diamond Offshore Drilling Inc. 6,311 81,196 0.00
Antero Resources Corp. 5,201 79,376 0.00
Chemours Co. 17,436 78,351 0.00
CNA Financial Corp. 3,151 74,572 0.00
Liberty Global plc LiLAC C Tracker 2,930 73,345 0.00
TopBuild Corp. 3,640 66,253 0.00
Talen Energy Corp. 7,599 42,709 0.00
Liberty Global plc LiLAC A Tracker 1,187 29,590 0.00
1,316,230,252 61.21
Short-Term Investments 0.05% (2014: 0.15%)
Discount Notes 0.05% (2014: 0.15%)
Freddie Mac Discount Notes 0.01% 15/04/2016 1,500,000 970,450 0.05
Federal Home Loan Discount Notes 0% 23/03/2016 100,000 64,690 0.00
1,035,140 0.05
Derivatives 0.01% (2014: 0.01%)
US Dollar-Denominated Futures 0.01% (2014: 0.00%)
S&P 500 E Mini Index Futures December 2015 160 177,887 0.01
Euro-Denominated Futures 0.00% (2014: 0.00%)
Euro Stoxx 50 Index Futures December 2015 130 78,932 0.00
Japanese Yen-Denominated Futures 0.00% (2014: 0.01%)
Topix Index Futures December 2015 25 43,945 0.00
Australian Dollar-Denominated Futures 0.00% (2014: 0.00%)
ASX SPI 200 Index Futures December 2015 (16) (3,361) 0.00
297,403 0.01
Portfolio of Investments 2,140,704,557 99.57
Net Other Assets/Liabilities 9,200,089 0.43
Net Assets Attributable to Shareholders 2,149,904,646 100.00
All holdings are ordinary shares or stock units included on an official stock exchange listing unless otherwise stated.REIT—Real estate investment trust.
Financial Derivative Instrument Risk Exposure
The exposure obtained through financial derivative instruments and the identity of counterparties as at 31 October 2015 were as follows:
Notional Value of Value of Exposure Exposure Counterparty (£) (£)
Morgan Stanley 17,635,515 297,403
Total 17,635,515 297,403
39
Market % of Value Net Asset Holding (£) Value
Market % of Value Net Asset Holding (£) Value
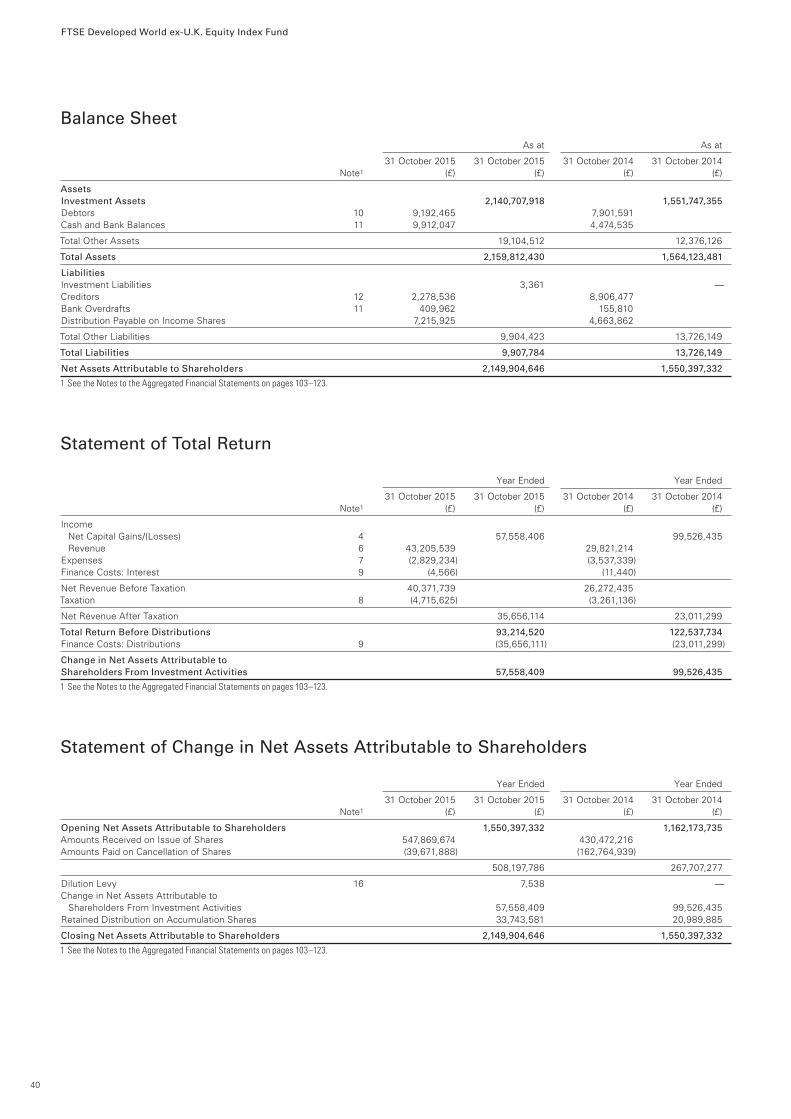
FTSE Developed World ex-U.K. Equity Index Fund
Balance Sheet As at As at
31 October 2015 31 October 2015 31 October 2014 31 October 2014 Note1 (£) (£) (£) (£)
AssetsInvestment Assets 2,140,707,918 1,551,747,355 Debtors 10 9,192,465 7,901,591Cash and Bank Balances 11 9,912,047 4,474,535
Total Other Assets 19,104,512 12,376,126
Total Assets 2,159,812,430 1,564,123,481
LiabilitiesInvestment Liabilities 3,361 —Creditors 12 2,278,536 8,906,477Bank Overdrafts 11 409,962 155,810Distribution Payable on Income Shares 7,215,925 4,663,862
Total Other Liabilities 9,904,423 13,726,149
Total Liabilities 9,907,784 13,726,149
Net Assets Attributable to Shareholders 2,149,904,646 1,550,397,332
1 See the Notes to the Aggregated Financial Statements on pages 103–123.
Statement of Total Return Year Ended Year Ended
31 October 2015 31 October 2015 31 October 2014 31 October 2014 Note1 (£) (£) (£) (£)
Income Net Capital Gains/(Losses) 4 57,558,406 99,526,435 Revenue 6 43,205,539 29,821,214 Expenses 7 (2,829,234) (3,537,339)Finance Costs: Interest 9 (4,566) (11,440)
Net Revenue Before Taxation 40,371,739 26,272,435 Taxation 8 (4,715,625) (3,261,136)
Net Revenue After Taxation 35,656,114 23,011,299
Total Return Before Distributions 93,214,520 122,537,734 Finance Costs: Distributions 9 (35,656,111) (23,011,299)
Change in Net Assets Attributable to Shareholders From Investment Activities 57,558,409 99,526,435
1 See the Notes to the Aggregated Financial Statements on pages 103–123.
Statement of Change in Net Assets Attributable to Shareholders Year Ended Year Ended
31 October 2015 31 October 2015 31 October 2014 31 October 2014 Note1 (£) (£) (£) (£)
Opening Net Assets Attributable to Shareholders 1,550,397,332 1,162,173,735 Amounts Received on Issue of Shares 547,869,674 430,472,216 Amounts Paid on Cancellation of Shares (39,671,888) (162,764,939)
508,197,786 267,707,277
Dilution Levy 16 7,538 —Change in Net Assets Attributable to Shareholders From Investment Activities 57,558,409 99,526,435 Retained Distribution on Accumulation Shares 33,743,581 20,989,885
Closing Net Assets Attributable to Shareholders 2,149,904,646 1,550,397,332
1 See the Notes to the Aggregated Financial Statements on pages 103–123.
40
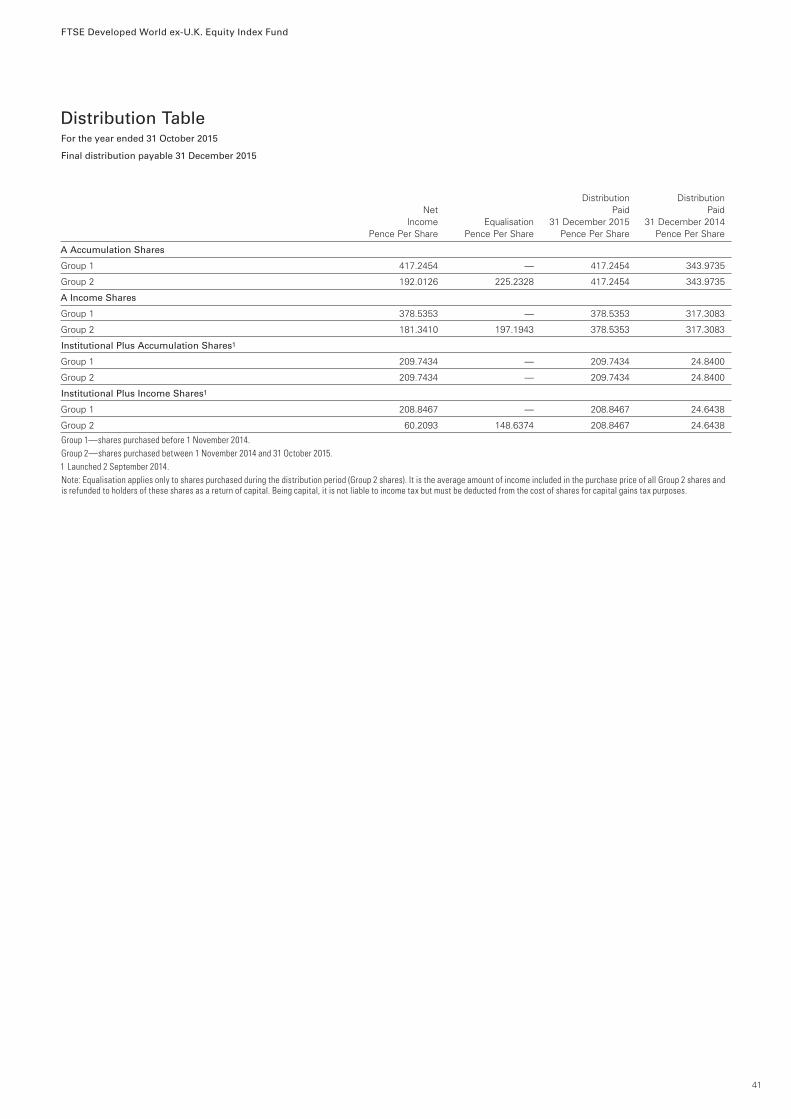
FTSE Developed World ex-U.K. Equity Index Fund
Distribution TableFor the year ended 31 October 2015
Final distribution payable 31 December 2015
Distribution Distribution Net Paid Paid Income Equalisation 31 December 2015 31 December 2014 Pence Per Share Pence Per Share Pence Per Share Pence Per Share
A Accumulation Shares
Group 1 417.2454 — 417.2454 343.9735
Group 2 192.0126 225.2328 417.2454 343.9735
A Income Shares
Group 1 378.5353 — 378.5353 317.3083
Group 2 181.3410 197.1943 378.5353 317.3083
Institutional Plus Accumulation Shares1
Group 1 209.7434 — 209.7434 24.8400
Group 2 209.7434 — 209.7434 24.8400
Institutional Plus Income Shares1
Group 1 208.8467 — 208.8467 24.6438
Group 2 60.2093 148.6374 208.8467 24.6438
Group 1—shares purchased before 1 November 2014.Group 2—shares purchased between 1 November 2014 and 31 October 2015.1 Launched 2 September 2014.Note: Equalisation applies only to shares purchased during the distribution period (Group 2 shares). It is the average amount of income included in the purchase price of all Group 2 shares and is refunded to holders of these shares as a return of capital. Being capital, it is not liable to income tax but must be deducted from the cost of shares for capital gains tax purposes.
41

FTSE U.K. Equity Income Index Fund
Fund Profile As at 31 October 2015
Investment Objective Vanguard FTSE U.K. Equity Income Index Fund (the “Fund”) seeks to track the performance of the FTSE U.K. Equity Income Index (the “Index”).
Investment Strategy The Fund employs an indexing investment strategy designed to achieve a result consistent with the replication of the Index by investing in all of the component securities that make up the Index, holding each stock in approximate proportion to its weighting in the Index.
Risk Profile The value of investments, and the income from them, may fall or rise and investors may get back less than they invested. Charges are deducted from capital (not income). Whilst this may increase the level of income paid, it will result in capital erosion and will constrain growth.
Portfolio Characteristics FTSE U.K. Equity Income Fund Index
Number of Stocks 135 135
Fund Fund 31 October 2015 31 October 2014
Ongoing Charges Figure1
A Accumulation Shares 0.22% 0.22%
A Income Shares 0.22% 0.22%
Institutional Plus Accumulation Shares 0.15% 0.15%
Institutional Plus Income Shares 0.15% 0.15%
Synthetic Risk and Reward Indicator2 5 5
Ex-Dividend Date3 1 May 2015 1 May 2014
1 November 2015 1 November 2014
Distribution Date 30 June 2015 30 June 2014
31 December 2015 31 December 2014
Sector Diversification (% of portfolio) FTSE U.K. Equity Income Fund Index
Basic Materials 7.1% 7.1%
Consumer Goods 15.1 15.1
Consumer Services 11.0 11.0
Financials 24.4 24.4
Health Care 9.7 9.7
Industrials 5.4 5.4
Oil & Gas 10.7 10.7
Technology 0.4 0.4
Telecommunications 8.9 8.9
Utilities 7.3 7.3
Ten Largest Holdings4 (% of total net assets)
BP plc Integrated Oil & Gas 5.3%
British American Tobacco plc Tobacco 5.2
GlaxoSmithKline plc Pharmaceuticals 5.0
Royal Dutch Shell plc Integrated Oil & Gas 4.9
HSBC Holdings plc Banks 4.5
AstraZeneca plc Pharmaceuticals 4.5
Vodafone Group plc Mobile Telecommunications 4.4
Lloyds Banking Group plc Banks 4.1
BT Group plc Fixed Line Telecommunications 3.7
Barclays plc Banks 3.5
Top Ten 45.1%
1 The Ongoing Charges Figure (OCF) is the ratio of the Fund’s total discloseable costs (excluding overdraft interest) to the average net assets of the Fund.2 The Synthetic Risk and Reward Indicator (SRRI) measures the volatility of the Fund. The risk and reward category (which may range from 1 to 7) is calculated using historical data and may
not be a reliable indicator of the Fund’s future risk profile. The risk and reward category may shift over time and is not a target or guarantee. The lowest category (i.e. category 1) does not mean “risk free”. The Fund appears in the higher risk category on the risk and reward indicator. This is because the Fund invests primarily in shares whose values tend to have higher price fluctuations.
3 If the ex-dividend date does not fall on a business day, the effective date will be the first business day following the end of the financial period.4 The holdings listed exclude any temporary cash investments and equity index products.
42
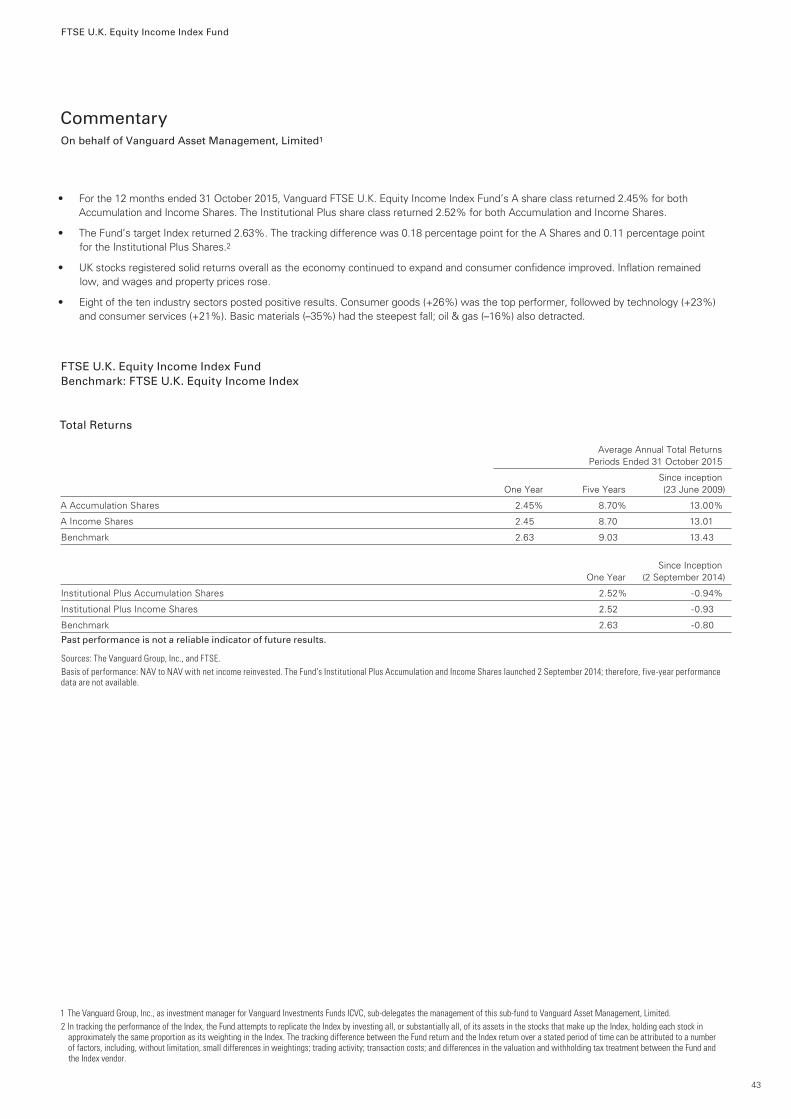
FTSE U.K. Equity Income Index Fund
Commentary On behalf of Vanguard Asset Management, Limited1
• For the 12 months ended 31 October 2015, Vanguard FTSE U.K. Equity Income Index Fund’s A share class returned 2.45% for both Accumulation and Income Shares. The Institutional Plus share class returned 2.52% for both Accumulation and Income Shares.
• The Fund’s target Index returned 2.63%. The tracking difference was 0.18 percentage point for the A Shares and 0.11 percentage point for the Institutional Plus Shares.2
• UK stocks registered solid returns overall as the economy continued to expand and consumer confidence improved. Inflation remained low, and wages and property prices rose.
• Eight of the ten industry sectors posted positive results. Consumer goods (+26%) was the top performer, followed by technology (+23%) and consumer services (+21%). Basic materials (–35%) had the steepest fall; oil & gas (–16%) also detracted.
FTSE U.K. Equity Income Index Fund Benchmark: FTSE U.K. Equity Income Index
Total Returns Average Annual Total Returns Periods Ended 31 October 2015
Since inception One Year Five Years (23 June 2009)
A Accumulation Shares 2.45% 8.70% 13.00%
A Income Shares 2.45 8.70 13.01
Benchmark 2.63 9.03 13.43
Since Inception One Year (2 September 2014)
Institutional Plus Accumulation Shares 2.52% -0.94%
Institutional Plus Income Shares 2.52 -0.93
Benchmark 2.63 -0.80
Past performance is not a reliable indicator of future results.
Sources: The Vanguard Group, Inc., and FTSE.Basis of performance: NAV to NAV with net income reinvested. The Fund’s Institutional Plus Accumulation and Income Shares launched 2 September 2014; therefore, five-year performance data are not available.
1 The Vanguard Group, Inc., as investment manager for Vanguard Investments Funds ICVC, sub-delegates the management of this sub-fund to Vanguard Asset Management, Limited.2 In tracking the performance of the Index, the Fund attempts to replicate the Index by investing all, or substantially all, of its assets in the stocks that make up the Index, holding each stock in
approximately the same proportion as its weighting in the Index. The tracking difference between the Fund return and the Index return over a stated period of time can be attributed to a number of factors, including, without limitation, small differences in weightings; trading activity; transaction costs; and differences in the valuation and withholding tax treatment between the Fund and the Index vendor.
43
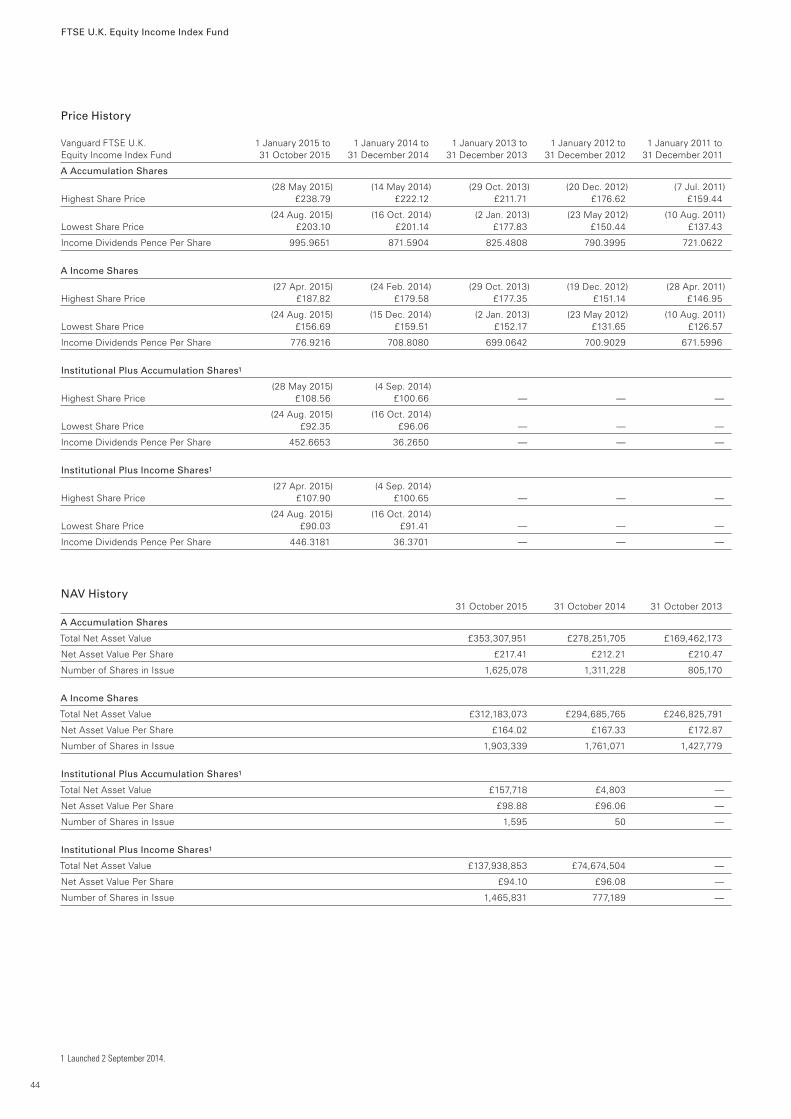
FTSE U.K. Equity Income Index Fund
Price History
Vanguard FTSE U.K. 1 January 2015 to 1 January 2014 to 1 January 2013 to 1 January 2012 to 1 January 2011 to Equity Income Index Fund 31 October 2015 31 December 2014 31 December 2013 31 December 2012 31 December 2011
A Accumulation Shares
(28 May 2015) (14 May 2014) (29 Oct. 2013) (20 Dec. 2012) (7 Jul. 2011)Highest Share Price £238.79 £222.12 £211.71 £176.62 £159.44
(24 Aug. 2015) (16 Oct. 2014) (2 Jan. 2013) (23 May 2012) (10 Aug. 2011)Lowest Share Price £203.10 £201.14 £177.83 £150.44 £137.43
Income Dividends Pence Per Share 995.9651 871.5904 825.4808 790.3995 721.0622
A Income Shares
(27 Apr. 2015) (24 Feb. 2014) (29 Oct. 2013) (19 Dec. 2012) (28 Apr. 2011)Highest Share Price £187.82 £179.58 £177.35 £151.14 £146.95
(24 Aug. 2015) (15 Dec. 2014) (2 Jan. 2013) (23 May 2012) (10 Aug. 2011)Lowest Share Price £156.69 £159.51 £152.17 £131.65 £126.57
Income Dividends Pence Per Share 776.9216 708.8080 699.0642 700.9029 671.5996
Institutional Plus Accumulation Shares1
(28 May 2015) (4 Sep. 2014)Highest Share Price £108.56 £100.66 — — —
(24 Aug. 2015) (16 Oct. 2014) Lowest Share Price £92.35 £96.06 — — —
Income Dividends Pence Per Share 452.6653 36.2650 — — —
Institutional Plus Income Shares1
(27 Apr. 2015) (4 Sep. 2014) Highest Share Price £107.90 £100.65 — — —
(24 Aug. 2015) (16 Oct. 2014) Lowest Share Price £90.03 £91.41 — — —
Income Dividends Pence Per Share 446.3181 36.3701 — — —
NAV History 31 October 2015 31 October 2014 31 October 2013
A Accumulation Shares
Total Net Asset Value £353,307,951 £278,251,705 £169,462,173
Net Asset Value Per Share £217.41 £212.21 £210.47
Number of Shares in Issue 1,625,078 1,311,228 805,170
A Income Shares
Total Net Asset Value £312,183,073 £294,685,765 £246,825,791
Net Asset Value Per Share £164.02 £167.33 £172.87
Number of Shares in Issue 1,903,339 1,761,071 1,427,779
Institutional Plus Accumulation Shares1
Total Net Asset Value £157,718 £4,803 —
Net Asset Value Per Share £98.88 £96.06 —
Number of Shares in Issue 1,595 50 —
Institutional Plus Income Shares1
Total Net Asset Value £137,938,853 £74,674,504 —
Net Asset Value Per Share £94.10 £96.08 —
Number of Shares in Issue 1,465,831 777,189 —
1 Launched 2 September 2014.
44

FTSE U.K. Equity Income Index Fund
Summary of Significant Changes (unaudited)For the year ended 31 October 2015
Cost (£)
Largest Purchases
Lloyds Banking Group plc 39,009,060
Glencore plc 27,097,158
BP plc 20,911,441
HSBC Holdings plc 18,007,462
WPP plc 14,134,709
Total 119,159,830
Total Purchases for the Year 365,086,942
Proceeds (£)
Largest Sales
Reckitt Benckiser Group plc 27,702,078
Tesco plc 14,316,087
CRH plc 10,795,083
RELX plc 9,703,050
Vodafone Group plc 9,416,163
Total 71,932,461
Total Sales for the Year 181,539,418
45

FTSE U.K. Equity Income Index Fund
Portfolio StatementAs at 31 October 2015
Basic Materials 7.15% (2014: 9.39%)
Rio Tinto plc 952,470 22,464,005 2.80
Bhp Billiton plc 1,636,817 17,031,081 2.12
Glencore plc 9,028,546 10,143,571 1.26
Anglo American plc 1,013,873 5,541,830 0.69
Elementis plc 353,462 829,222 0.10
Synthomer plc 206,436 683,097 0.09
Vedanta Resources plc 82,297 406,959 0.05
Evraz plc 369,954 313,536 0.04
57,413,301 7.15
Consumer Goods 15.18% (2014: 16.21%)
British American Tobacco plc 1,098,784 42,402,075 5.28
Unilever plc 934,970 27,048,682 3.36
Imperial Tobacco Group plc 746,643 26,095,173 3.25
Taylor Wimpey plc 2,507,107 4,959,058 0.62
Persimmon plc 237,355 4,730,485 0.59
Barratt Developments plc 772,732 4,729,120 0.59
Berkeley Group Holdings plc 97,687 3,240,278 0.40
Bellway plc 94,822 2,461,579 0.31
Tate & Lyle plc 361,774 2,159,791 0.27
Britvic plc 195,551 1,365,924 0.17
Bovis Homes Group plc 103,769 1,063,632 0.13
Crest Nicholson Holdings plc 187,479 1,018,948 0.13
Dairy Crest Group plc 105,588 679,987 0.08
121,954,732 15.18
Consumer Services 11.08% (2014: 9.87%)
WPP plc 1,004,323 14,643,029 1.82
Next plc 114,284 9,119,863 1.13
Sky plc 811,876 8,890,042 1.11
Marks & Spencer Group plc 1,276,961 6,544,425 0.81
Kingfisher plc 1,810,281 6,390,292 0.80
Pearson plc 630,923 5,435,402 0.68
TUI AG 365,678 4,417,390 0.55
Easyjet plc 192,716 3,368,676 0.42
J Sainsbury plc 1,095,810 2,904,992 0.36
Informa plc 504,058 2,860,529 0.36
WM Morrison Supermarkets plc 1,679,501 2,829,959 0.35
Booker Group plc 1,274,755 2,372,319 0.30
William Hill plc 684,699 2,171,181 0.27
Greene King plc 239,507 1,923,241 0.24
UBM plc 339,959 1,738,890 0.22
WH Smith plc 85,957 1,464,707 0.18
Thomas Cook Group plc 1,187,805 1,458,625 0.18
Moneysupermarket.com Group plc 340,667 1,138,168 0.14
Stagecoach Group plc 329,046 1,137,841 0.14
National Express Group plc 325,702 975,152 0.12
Saga plc 470,343 973,140 0.12
Debenhams plc 944,708 844,569 0.11
Cineworld Group plc 150,548 831,025 0.10
Ladbrokes plc 783,624 826,723 0.10
Go-Ahead Group plc 32,839 795,689 0.10
Marston’s plc 439,504 708,480 0.09
Halfords Group plc 152,836 664,684 0.08
Bwin.Party Digital Entertainment plc 536,063 599,855 0.07
Wizz Air Holdings plc 31,083 588,712 0.07
Brown (N) Group plc 121,202 454,265 0.06
89,071,865 11.08
Financials 24.64% (2014: 21.25%)
HSBC Holdings plc 7,235,104 36,718,153 4.57
Lloyds Banking Group plc 45,008,177 33,148,522 4.13
Barclays plc 12,323,203 28,583,669 3.56
Aviva plc 2,976,411 14,459,405 1.80
Legal & General Group plc 4,367,413 11,416,418 1.42
Standard Chartered plc 1,535,208 11,074,991 1.38
Old Mutual plc 3,591,148 7,620,416 0.95
Standard Life plc 1,441,266 6,066,289 0.75
Direct Line Insurance Group plc 1,013,992 3,997,156 0.50
Provident Financial plc 107,725 3,736,980 0.47
St James’s Place plc 381,941 3,680,002 0.46
RSA Insurance Group plc 748,309 3,148,884 0.39
Aberdeen Asset Management plc 728,173 2,524,576 0.31
Amlin plc 368,580 2,427,099 0.30
Admiral Group plc 146,048 2,355,754 0.29
Hargreaves Lansdown plc 160,739 2,321,071 0.29
Henderson Group plc 777,467 2,232,108 0.28
Investec plc 375,048 2,030,885 0.25
Hiscox Ltd. 209,323 2,023,107 0.25
IG Group Holdings plc 267,621 2,020,539 0.25
Man Group plc 1,128,131 1,885,107 0.23
ICAP plc 394,498 1,735,397 0.22
Close Brothers Group plc 109,530 1,603,519 0.20
Phoenix Group Holdings 164,775 1,408,826 0.18
Jupiter Fund Management plc 306,972 1,383,830 0.17
Beazley plc 380,054 1,381,876 0.17
Intermediate Capital Group plc 239,925 1,356,776 0.17
Lancashire Holdings Ltd. 145,002 1,032,414 0.13
Jardine Lloyd Thompson Group plc 89,540 848,392 0.11
Ashmore Group plc 285,299 770,307 0.10
International Personal Finance plc 169,647 627,185 0.08
Tullett Prebon plc 169,407 595,804 0.07
Brewin Dolphin Holdings plc 201,042 542,813 0.07
Bank of Georgia Holdings plc 24,525 489,764 0.06
esure Group plc 181,403 479,992 0.06
John Laing Group plc 103,897 198,443 0.02
197,926,469 24.64
Health Care 9.77% (2014: 9.84%)
GlaxoSmithKline plc 2,916,075 40,970,854 5.10
AstraZeneca plc 880,822 36,549,709 4.55
Indivior plc 495,899 1,018,081 0.12
78,538,644 9.77
Industrials 5.62% (2014: 6.97%)
BAE Systems plc 2,450,262 10,786,053 1.34
Royal Mail plc 713,502 3,177,224 0.39
Rexam plc 544,739 2,938,867 0.37
Smiths Group plc 304,256 2,923,900 0.36
46
Market % of Value Net Asset Holding (£) Value
Market % of Value Net Asset Holding (£) Value
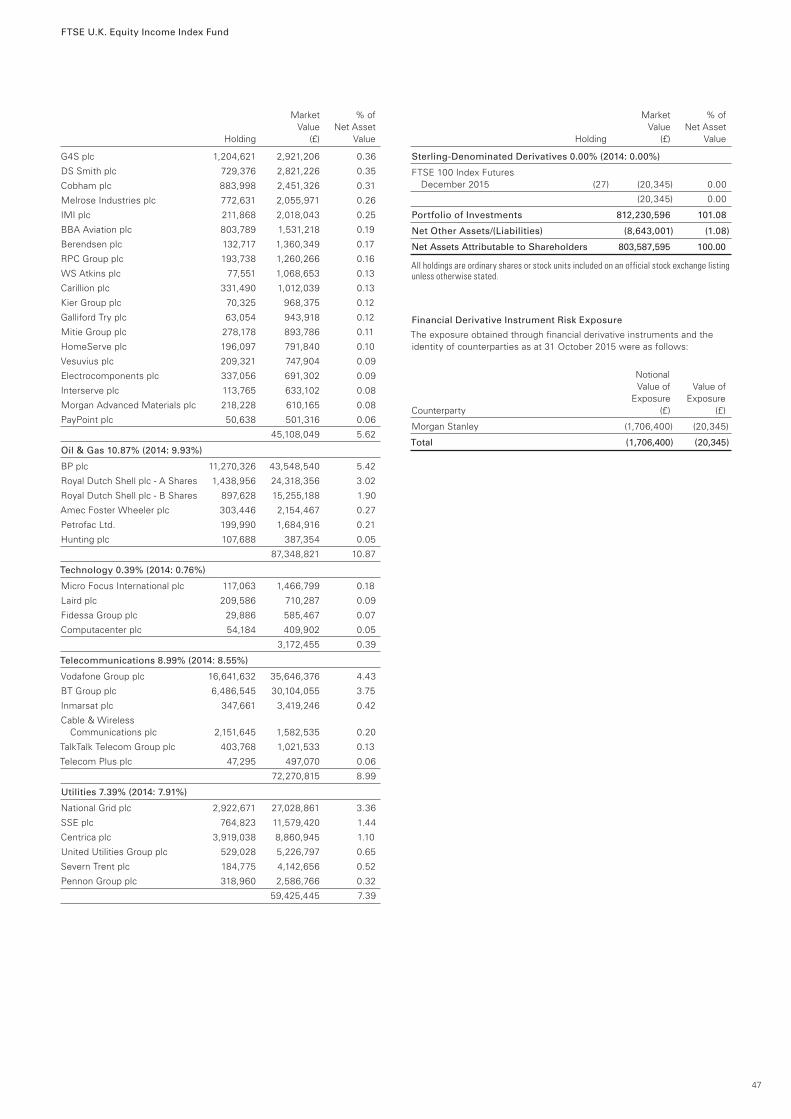
FTSE U.K. Equity Income Index Fund
G4S plc 1,204,621 2,921,206 0.36
DS Smith plc 729,376 2,821,226 0.35
Cobham plc 883,998 2,451,326 0.31
Melrose Industries plc 772,631 2,055,971 0.26
IMI plc 211,868 2,018,043 0.25
BBA Aviation plc 803,789 1,531,218 0.19
Berendsen plc 132,717 1,360,349 0.17
RPC Group plc 193,738 1,260,266 0.16
WS Atkins plc 77,551 1,068,653 0.13
Carillion plc 331,490 1,012,039 0.13
Kier Group plc 70,325 968,375 0.12
Galliford Try plc 63,054 943,918 0.12
Mitie Group plc 278,178 893,786 0.11
HomeServe plc 196,097 791,840 0.10
Vesuvius plc 209,321 747,904 0.09
Electrocomponents plc 337,056 691,302 0.09
Interserve plc 113,765 633,102 0.08
Morgan Advanced Materials plc 218,228 610,165 0.08
PayPoint plc 50,638 501,316 0.06
45,108,049 5.62
Oil & Gas 10.87% (2014: 9.93%)
BP plc 11,270,326 43,548,540 5.42
Royal Dutch Shell plc - A Shares 1,438,956 24,318,356 3.02
Royal Dutch Shell plc - B Shares 897,628 15,255,188 1.90
Amec Foster Wheeler plc 303,446 2,154,467 0.27
Petrofac Ltd. 199,990 1,684,916 0.21
Hunting plc 107,688 387,354 0.05
87,348,821 10.87
Technology 0.39% (2014: 0.76%)
Micro Focus International plc 117,063 1,466,799 0.18
Laird plc 209,586 710,287 0.09
Fidessa Group plc 29,886 585,467 0.07
Computacenter plc 54,184 409,902 0.05
3,172,455 0.39
Telecommunications 8.99% (2014: 8.55%)
Vodafone Group plc 16,641,632 35,646,376 4.43
BT Group plc 6,486,545 30,104,055 3.75
Inmarsat plc 347,661 3,419,246 0.42
Cable & Wireless Communications plc 2,151,645 1,582,535 0.20
TalkTalk Telecom Group plc 403,768 1,021,533 0.13
Telecom Plus plc 47,295 497,070 0.06
72,270,815 8.99
Utilities 7.39% (2014: 7.91%)
National Grid plc 2,922,671 27,028,861 3.36
SSE plc 764,823 11,579,420 1.44
Centrica plc 3,919,038 8,860,945 1.10
United Utilities Group plc 529,028 5,226,797 0.65
Severn Trent plc 184,775 4,142,656 0.52
Pennon Group plc 318,960 2,586,766 0.32
59,425,445 7.39
Sterling-Denominated Derivatives 0.00% (2014: 0.00%)
FTSE 100 Index Futures December 2015 (27) (20,345) 0.00
(20,345) 0.00
Portfolio of Investments 812,230,596 101.08
Net Other Assets/(Liabilities) (8,643,001) (1.08)
Net Assets Attributable to Shareholders 803,587,595 100.00
All holdings are ordinary shares or stock units included on an official stock exchange listing unless otherwise stated.
Financial Derivative Instrument Risk Exposure
The exposure obtained through financial derivative instruments and the identity of counterparties as at 31 October 2015 were as follows:
Notional Value of Value of Exposure Exposure Counterparty (£) (£)
Morgan Stanley (1,706,400) (20,345)
Total (1,706,400) (20,345)
47
Market % of Value Net Asset Holding (£) Value
Market % of Value Net Asset Holding (£) Value
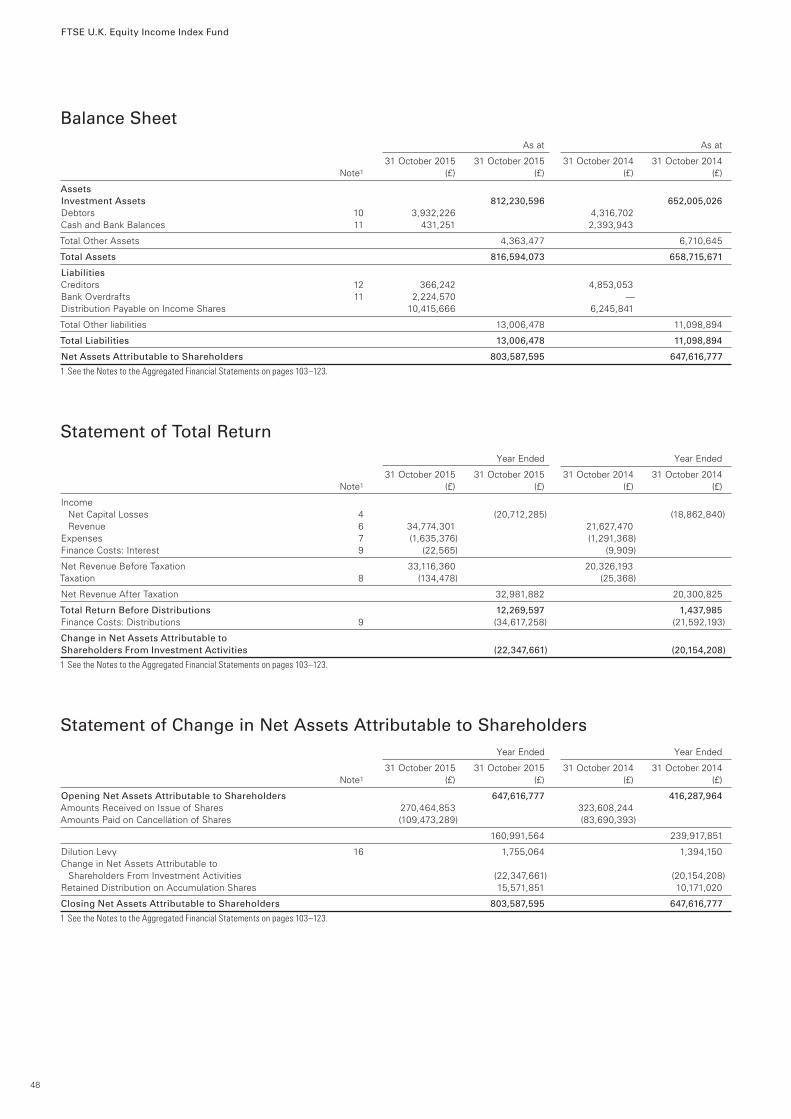
FTSE U.K. Equity Income Index Fund
Balance Sheet As at As at
31 October 2015 31 October 2015 31 October 2014 31 October 2014 Note1 (£) (£) (£) (£)
AssetsInvestment Assets 812,230,596 652,005,026Debtors 10 3,932,226 4,316,702Cash and Bank Balances 11 431,251 2,393,943
Total Other Assets 4,363,477 6,710,645
Total Assets 816,594,073 658,715,671
LiabilitiesCreditors 12 366,242 4,853,053Bank Overdrafts 11 2,224,570 —Distribution Payable on Income Shares 10,415,666 6,245,841
Total Other liabilities 13,006,478 11,098,894
Total Liabilities 13,006,478 11,098,894
Net Assets Attributable to Shareholders 803,587,595 647,616,777
1 See the Notes to the Aggregated Financial Statements on pages 103–123.
Statement of Total Return Year Ended Year Ended
31 October 2015 31 October 2015 31 October 2014 31 October 2014 Note1 (£) (£) (£) (£)
Income Net Capital Losses 4 (20,712,285) (18,862,840) Revenue 6 34,774,301 21,627,470Expenses 7 (1,635,376) (1,291,368)Finance Costs: Interest 9 (22,565) (9,909)
Net Revenue Before Taxation 33,116,360 20,326,193Taxation 8 (134,478) (25,368)
Net Revenue After Taxation 32,981,882 20,300,825
Total Return Before Distributions 12,269,597 1,437,985 Finance Costs: Distributions 9 (34,617,258) (21,592,193)
Change in Net Assets Attributable to Shareholders From Investment Activities (22,347,661) (20,154,208)
1 See the Notes to the Aggregated Financial Statements on pages 103–123.
Statement of Change in Net Assets Attributable to Shareholders Year Ended Year Ended
31 October 2015 31 October 2015 31 October 2014 31 October 2014 Note1 (£) (£) (£) (£)
Opening Net Assets Attributable to Shareholders 647,616,777 416,287,964Amounts Received on Issue of Shares 270,464,853 323,608,244Amounts Paid on Cancellation of Shares (109,473,289) (83,690,393)
160,991,564 239,917,851
Dilution Levy 16 1,755,064 1,394,150Change in Net Assets Attributable to Shareholders From Investment Activities (22,347,661) (20,154,208)Retained Distribution on Accumulation Shares 15,571,851 10,171,020
Closing Net Assets Attributable to Shareholders 803,587,595 647,616,777
1 See the Notes to the Aggregated Financial Statements on pages 103–123.
48
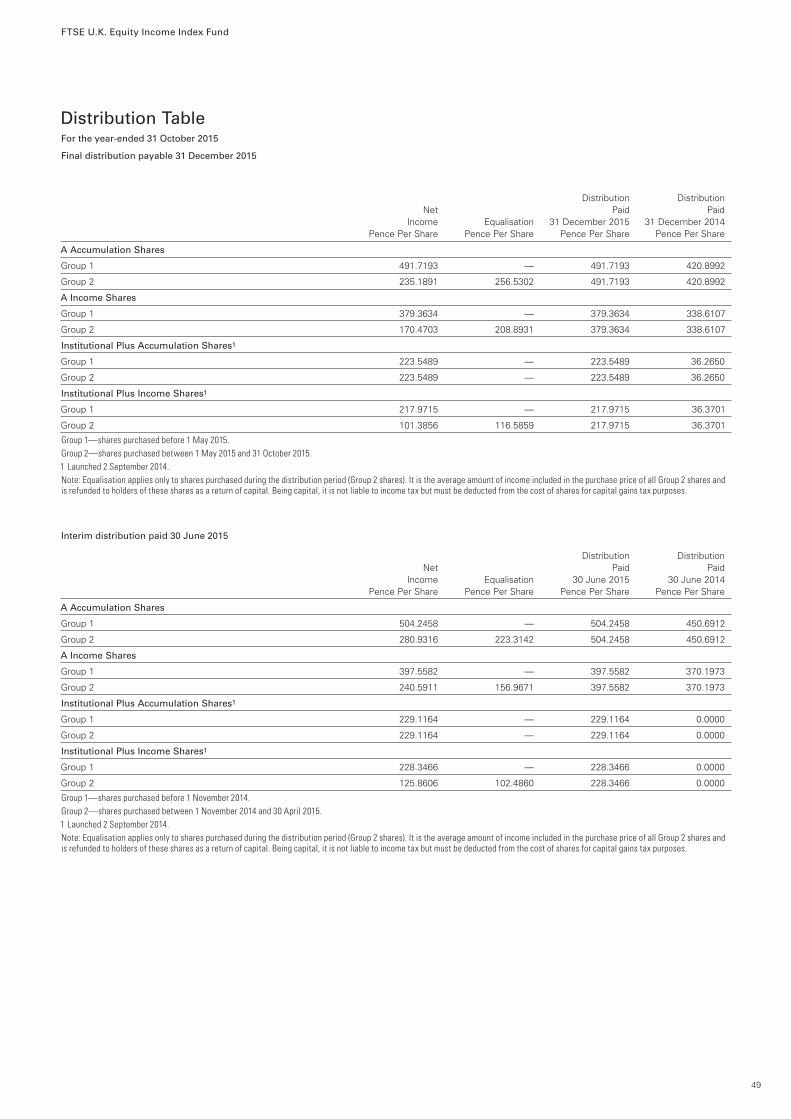
FTSE U.K. Equity Income Index Fund
Distribution TableFor the year-ended 31 October 2015
Final distribution payable 31 December 2015
Distribution Distribution Net Paid Paid Income Equalisation 31 December 2015 31 December 2014 Pence Per Share Pence Per Share Pence Per Share Pence Per Share
A Accumulation Shares
Group 1 491.7193 — 491.7193 420.8992
Group 2 235.1891 256.5302 491.7193 420.8992
A Income Shares
Group 1 379.3634 — 379.3634 338.6107
Group 2 170.4703 208.8931 379.3634 338.6107
Institutional Plus Accumulation Shares1
Group 1 223.5489 — 223.5489 36.2650
Group 2 223.5489 — 223.5489 36.2650
Institutional Plus Income Shares1
Group 1 217.9715 — 217.9715 36.3701
Group 2 101.3856 116.5859 217.9715 36.3701
Group 1—shares purchased before 1 May 2015.Group 2—shares purchased between 1 May 2015 and 31 October 2015.1 Launched 2 September 2014. Note: Equalisation applies only to shares purchased during the distribution period (Group 2 shares). It is the average amount of income included in the purchase price of all Group 2 shares and is refunded to holders of these shares as a return of capital. Being capital, it is not liable to income tax but must be deducted from the cost of shares for capital gains tax purposes.
Interim distribution paid 30 June 2015
Distribution Distribution Net Paid Paid Income Equalisation 30 June 2015 30 June 2014 Pence Per Share Pence Per Share Pence Per Share Pence Per Share
A Accumulation Shares
Group 1 504.2458 — 504.2458 450.6912
Group 2 280.9316 223.3142 504.2458 450.6912
A Income Shares
Group 1 397.5582 — 397.5582 370.1973
Group 2 240.5911 156.9671 397.5582 370.1973
Institutional Plus Accumulation Shares1
Group 1 229.1164 — 229.1164 0.0000
Group 2 229.1164 — 229.1164 0.0000
Institutional Plus Income Shares1
Group 1 228.3466 — 228.3466 0.0000
Group 2 125.8606 102.4860 228.3466 0.0000
Group 1—shares purchased before 1 November 2014.Group 2—shares purchased between 1 November 2014 and 30 April 2015.1 Launched 2 September 2014.Note: Equalisation applies only to shares purchased during the distribution period (Group 2 shares). It is the average amount of income included in the purchase price of all Group 2 shares and is refunded to holders of these shares as a return of capital. Being capital, it is not liable to income tax but must be deducted from the cost of shares for capital gains tax purposes.
49
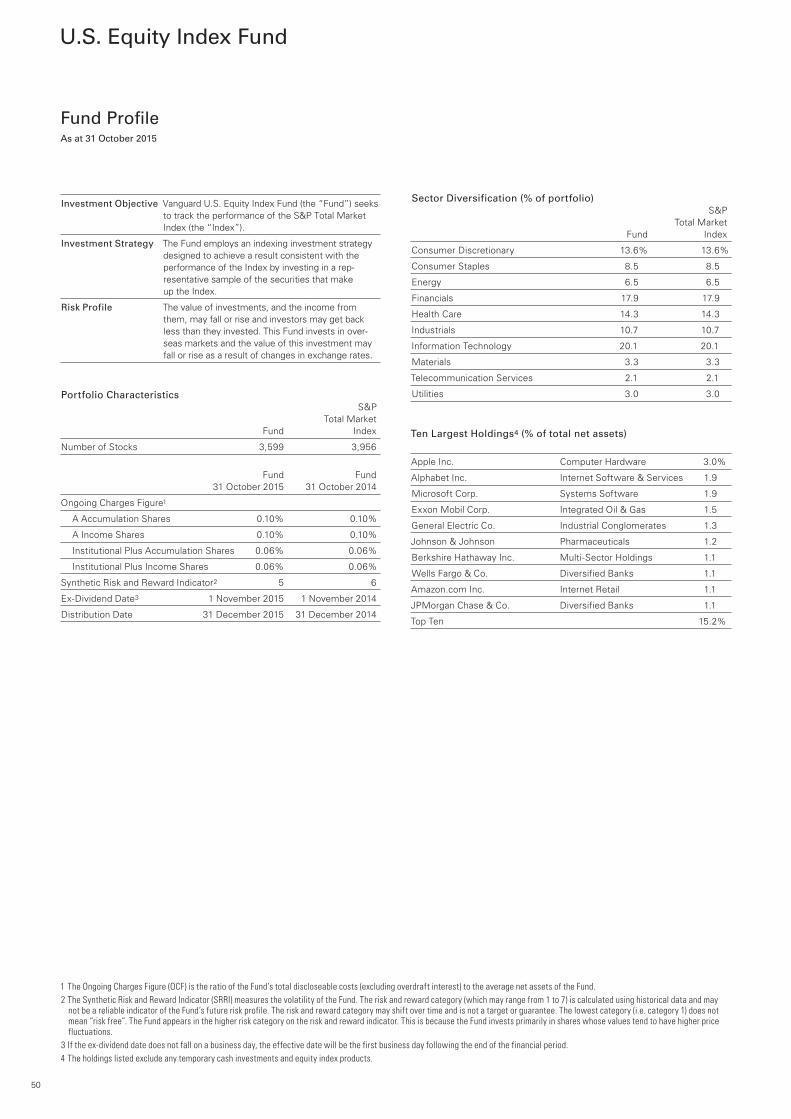
U.S. Equity Index Fund
Fund Profile As at 31 October 2015
Investment Objective Vanguard U.S. Equity Index Fund (the “Fund”) seeks to track the performance of the S&P Total Market Index (the “Index”).
Investment Strategy The Fund employs an indexing investment strategy designed to achieve a result consistent with the performance of the Index by investing in a rep-resentative sample of the securities that make up the Index.
Risk Profile The value of investments, and the income from them, may fall or rise and investors may get back less than they invested. This Fund invests in over-seas markets and the value of this investment may fall or rise as a result of changes in exchange rates.
Portfolio Characteristics S&P Total Market Fund Index
Number of Stocks 3,599 3,956
Fund Fund 31 October 2015 31 October 2014
Ongoing Charges Figure1
A Accumulation Shares 0.10% 0.10%
A Income Shares 0.10% 0.10%
Institutional Plus Accumulation Shares 0.06% 0.06%
Institutional Plus Income Shares 0.06% 0.06%
Synthetic Risk and Reward Indicator2 5 6
Ex-Dividend Date3 1 November 2015 1 November 2014
Distribution Date 31 December 2015 31 December 2014
Sector Diversification (% of portfolio) S&P Total Market Fund Index
Consumer Discretionary 13.6% 13.6%
Consumer Staples 8.5 8.5
Energy 6.5 6.5
Financials 17.9 17.9
Health Care 14.3 14.3
Industrials 10.7 10.7
Information Technology 20.1 20.1
Materials 3.3 3.3
Telecommunication Services 2.1 2.1
Utilities 3.0 3.0
Ten Largest Holdings4 (% of total net assets)
Apple Inc. Computer Hardware 3.0%
Alphabet Inc. Internet Software & Services 1.9
Microsoft Corp. Systems Software 1.9
Exxon Mobil Corp. Integrated Oil & Gas 1.5
General Electric Co. Industrial Conglomerates 1.3
Johnson & Johnson Pharmaceuticals 1.2
Berkshire Hathaway Inc. Multi-Sector Holdings 1.1
Wells Fargo & Co. Diversified Banks 1.1
Amazon.com Inc. Internet Retail 1.1
JPMorgan Chase & Co. Diversified Banks 1.1
Top Ten 15.2%
1 The Ongoing Charges Figure (OCF) is the ratio of the Fund’s total discloseable costs (excluding overdraft interest) to the average net assets of the Fund.2 The Synthetic Risk and Reward Indicator (SRRI) measures the volatility of the Fund. The risk and reward category (which may range from 1 to 7) is calculated using historical data and may
not be a reliable indicator of the Fund’s future risk profile. The risk and reward category may shift over time and is not a target or guarantee. The lowest category (i.e. category 1) does not mean “risk free”. The Fund appears in the higher risk category on the risk and reward indicator. This is because the Fund invests primarily in shares whose values tend to have higher price fluctuations.
3 If the ex-dividend date does not fall on a business day, the effective date will be the first business day following the end of the financial period.4 The holdings listed exclude any temporary cash investments and equity index products.
50
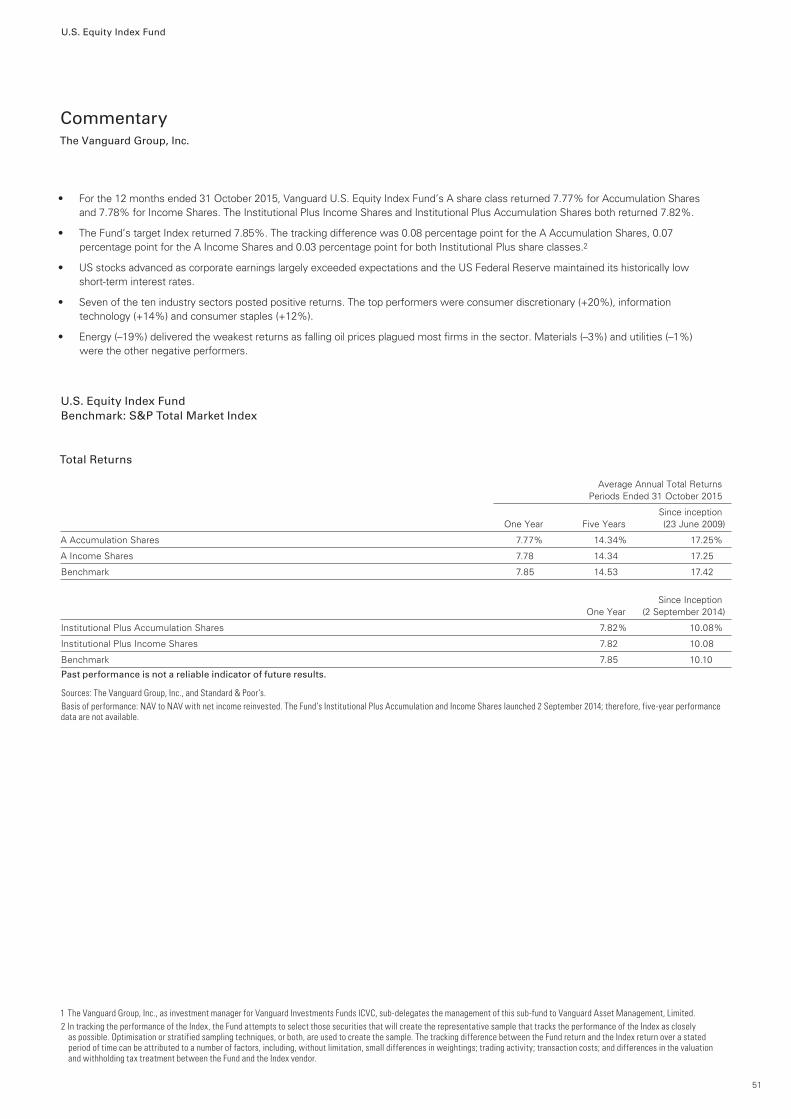
U.S. Equity Index Fund
Commentary The Vanguard Group, Inc.
• For the 12 months ended 31 October 2015, Vanguard U.S. Equity Index Fund’s A share class returned 7.77% for Accumulation Shares and 7.78% for Income Shares. The Institutional Plus Income Shares and Institutional Plus Accumulation Shares both returned 7.82%.
• The Fund’s target Index returned 7.85%. The tracking difference was 0.08 percentage point for the A Accumulation Shares, 0.07 percentage point for the A Income Shares and 0.03 percentage point for both Institutional Plus share classes.2
• US stocks advanced as corporate earnings largely exceeded expectations and the US Federal Reserve maintained its historically low short-term interest rates.
• Seven of the ten industry sectors posted positive returns. The top performers were consumer discretionary (+20%), information technology (+14%) and consumer staples (+12%).
• Energy (–19%) delivered the weakest returns as falling oil prices plagued most firms in the sector. Materials (–3%) and utilities (–1%) were the other negative performers.
U.S. Equity Index Fund Benchmark: S&P Total Market Index
Total Returns Average Annual Total Returns Periods Ended 31 October 2015
Since inception One Year Five Years (23 June 2009)
A Accumulation Shares 7.77% 14.34% 17.25%
A Income Shares 7.78 14.34 17.25
Benchmark 7.85 14.53 17.42
Since Inception One Year (2 September 2014)
Institutional Plus Accumulation Shares 7.82% 10.08%
Institutional Plus Income Shares 7.82 10.08
Benchmark 7.85 10.10
Past performance is not a reliable indicator of future results.
Sources: The Vanguard Group, Inc., and Standard & Poor’s.Basis of performance: NAV to NAV with net income reinvested. The Fund’s Institutional Plus Accumulation and Income Shares launched 2 September 2014; therefore, five-year performance data are not available.
1 The Vanguard Group, Inc., as investment manager for Vanguard Investments Funds ICVC, sub-delegates the management of this sub-fund to Vanguard Asset Management, Limited.2 In tracking the performance of the Index, the Fund attempts to select those securities that will create the representative sample that tracks the performance of the Index as closely
as possible. Optimisation or stratified sampling techniques, or both, are used to create the sample. The tracking difference between the Fund return and the Index return over a stated period of time can be attributed to a number of factors, including, without limitation, small differences in weightings; trading activity; transaction costs; and differences in the valuation and withholding tax treatment between the Fund and the Index vendor.
51
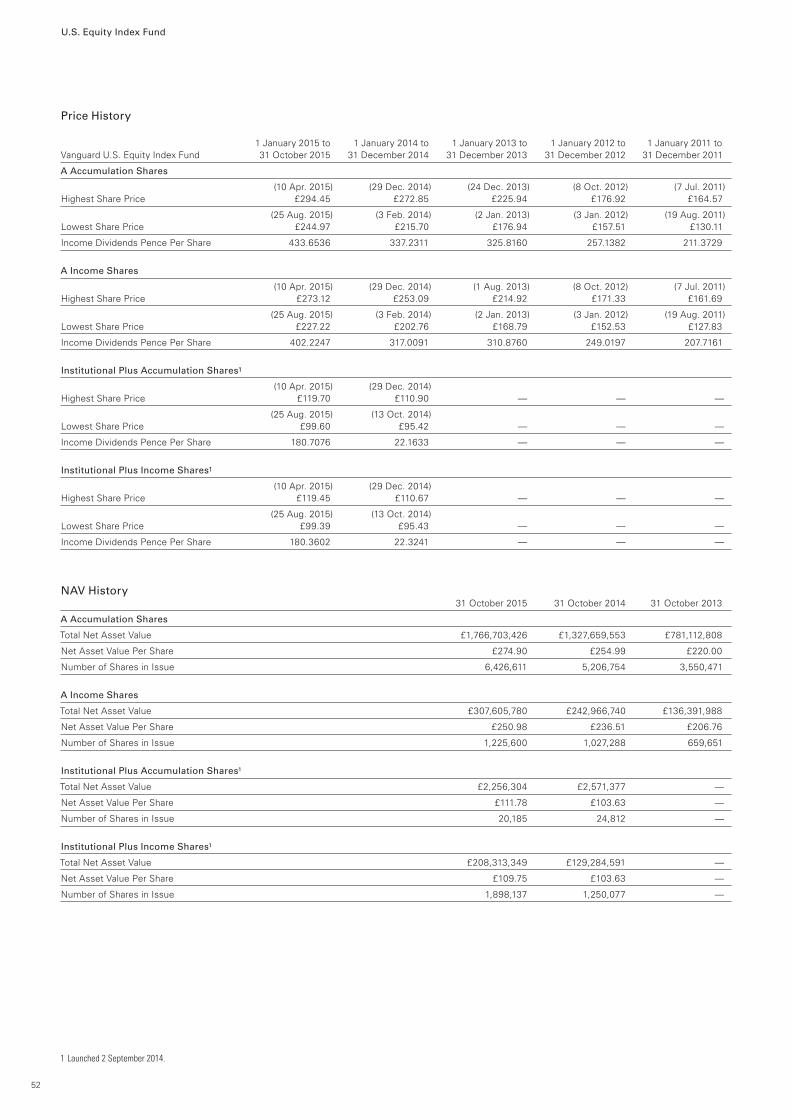
U.S. Equity Index Fund
Price History
1 January 2015 to 1 January 2014 to 1 January 2013 to 1 January 2012 to 1 January 2011 to Vanguard U.S. Equity Index Fund 31 October 2015 31 December 2014 31 December 2013 31 December 2012 31 December 2011
A Accumulation Shares
(10 Apr. 2015) (29 Dec. 2014) (24 Dec. 2013) (8 Oct. 2012) (7 Jul. 2011)Highest Share Price £294.45 £272.85 £225.94 £176.92 £164.57
(25 Aug. 2015) (3 Feb. 2014) (2 Jan. 2013) (3 Jan. 2012) (19 Aug. 2011)Lowest Share Price £244.97 £215.70 £176.94 £157.51 £130.11
Income Dividends Pence Per Share 433.6536 337.2311 325.8160 257.1382 211.3729
A Income Shares
(10 Apr. 2015) (29 Dec. 2014) (1 Aug. 2013) (8 Oct. 2012) (7 Jul. 2011)Highest Share Price £273.12 £253.09 £214.92 £171.33 £161.69
(25 Aug. 2015) (3 Feb. 2014) (2 Jan. 2013) (3 Jan. 2012) (19 Aug. 2011)Lowest Share Price £227.22 £202.76 £168.79 £152.53 £127.83
Income Dividends Pence Per Share 402.2247 317.0091 310.8760 249.0197 207.7161
Institutional Plus Accumulation Shares1
(10 Apr. 2015) (29 Dec. 2014) Highest Share Price £119.70 £110.90 — — —
(25 Aug. 2015) (13 Oct. 2014) Lowest Share Price £99.60 £95.42 — — —
Income Dividends Pence Per Share 180.7076 22.1633 — — —
Institutional Plus Income Shares1
(10 Apr. 2015) (29 Dec. 2014) Highest Share Price £119.45 £110.67 — — —
(25 Aug. 2015) (13 Oct. 2014) Lowest Share Price £99.39 £95.43 — — —
Income Dividends Pence Per Share 180.3602 22.3241 — — —
NAV History 31 October 2015 31 October 2014 31 October 2013
A Accumulation Shares
Total Net Asset Value £1,766,703,426 £1,327,659,553 £781,112,808
Net Asset Value Per Share £274.90 £254.99 £220.00
Number of Shares in Issue 6,426,611 5,206,754 3,550,471
A Income Shares
Total Net Asset Value £307,605,780 £242,966,740 £136,391,988
Net Asset Value Per Share £250.98 £236.51 £206.76
Number of Shares in Issue 1,225,600 1,027,288 659,651
Institutional Plus Accumulation Shares¹
Total Net Asset Value £2,256,304 £2,571,377 —
Net Asset Value Per Share £111.78 £103.63 —
Number of Shares in Issue 20,185 24,812 —
Institutional Plus Income Shares¹
Total Net Asset Value £208,313,349 £129,284,591 —
Net Asset Value Per Share £109.75 £103.63 —
Number of Shares in Issue 1,898,137 1,250,077 —
1 Launched 2 September 2014.
52
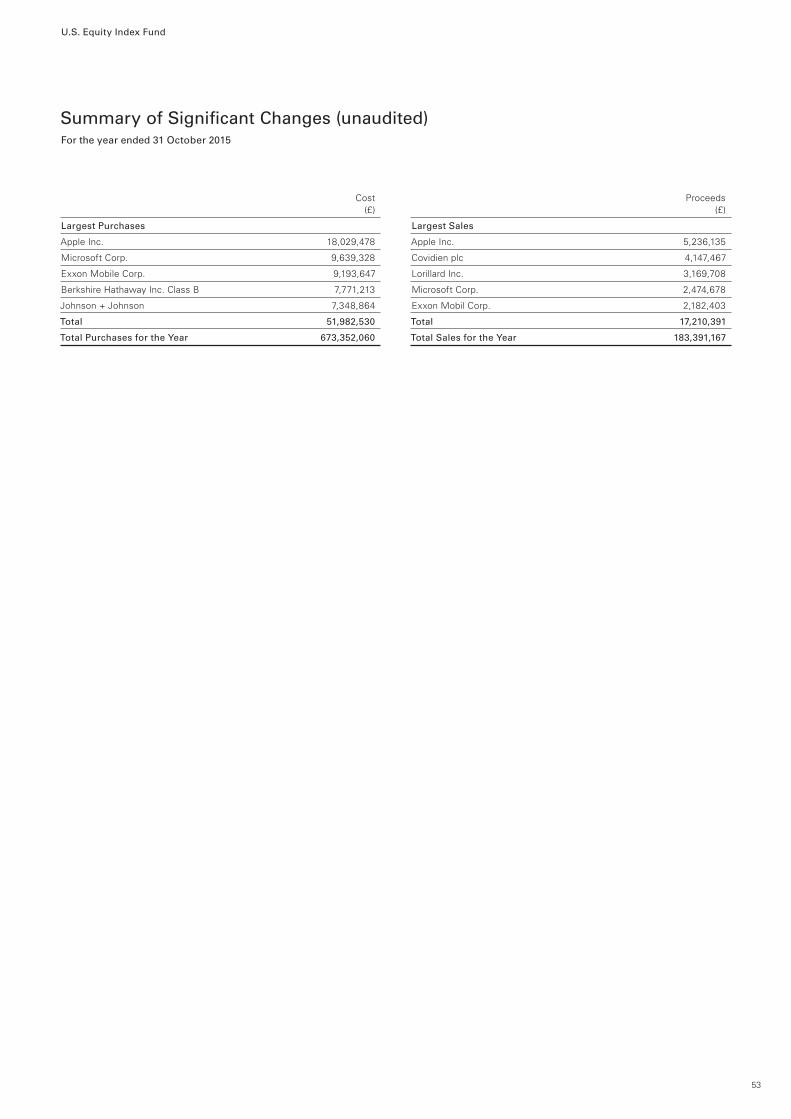
U.S. Equity Index Fund
Summary of Significant Changes (unaudited)For the year ended 31 October 2015
Cost (£)
Largest Purchases
Apple Inc. 18,029,478
Microsoft Corp. 9,639,328
Exxon Mobile Corp. 9,193,647
Berkshire Hathaway Inc. Class B 7,771,213
Johnson + Johnson 7,348,864
Total 51,982,530
Total Purchases for the Year 673,352,060
Proceeds (£)
Largest Sales
Apple Inc. 5,236,135
Covidien plc 4,147,467
Lorillard Inc. 3,169,708
Microsoft Corp. 2,474,678
Exxon Mobil Corp. 2,182,403
Total 17,210,391
Total Sales for the Year 183,391,167
53
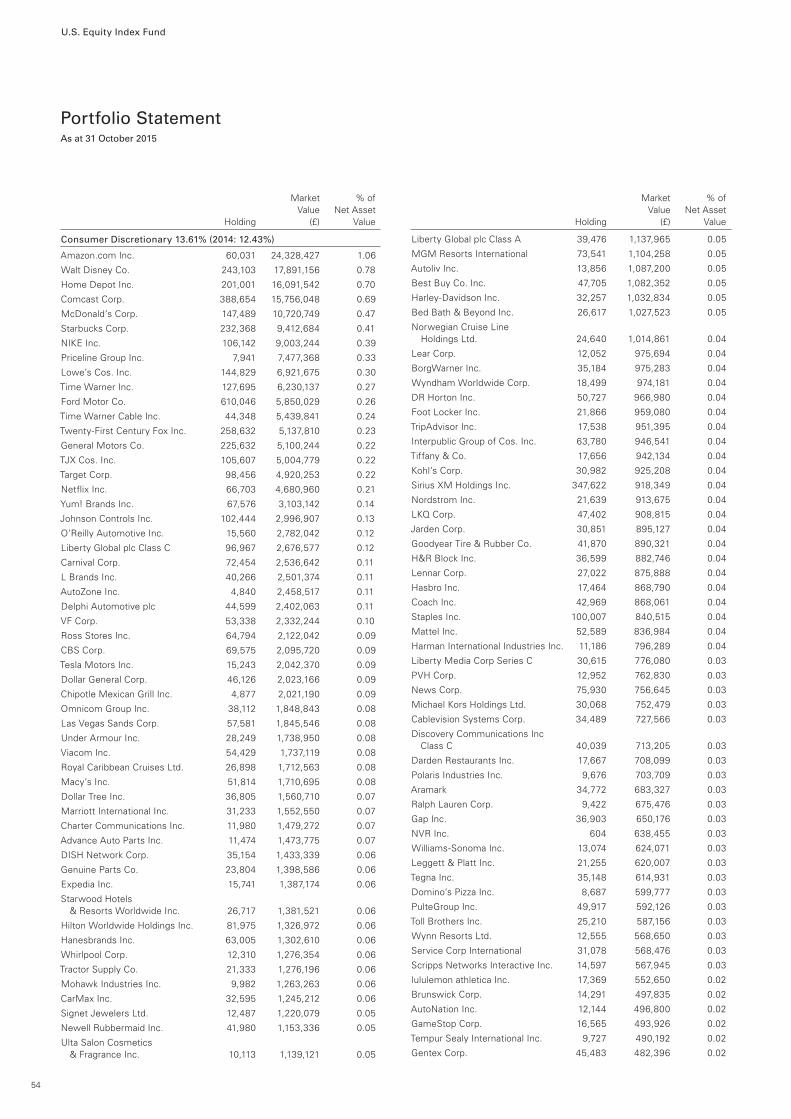
U.S. Equity Index Fund
Portfolio StatementAs at 31 October 2015
Consumer Discretionary 13.61% (2014: 12.43%)
Amazon.com Inc. 60,031 24,328,427 1.06
Walt Disney Co. 243,103 17,891,156 0.78
Home Depot Inc. 201,001 16,091,542 0.70
Comcast Corp. 388,654 15,756,048 0.69
McDonald’s Corp. 147,489 10,720,749 0.47
Starbucks Corp. 232,368 9,412,684 0.41
NIKE Inc. 106,142 9,003,244 0.39
Priceline Group Inc. 7,941 7,477,368 0.33
Lowe’s Cos. Inc. 144,829 6,921,675 0.30
Time Warner Inc. 127,695 6,230,137 0.27
Ford Motor Co. 610,046 5,850,029 0.26
Time Warner Cable Inc. 44,348 5,439,841 0.24
Twenty-First Century Fox Inc. 258,632 5,137,810 0.23
General Motors Co. 225,632 5,100,244 0.22
TJX Cos. Inc. 105,607 5,004,779 0.22
Target Corp. 98,456 4,920,253 0.22
Netflix Inc. 66,703 4,680,960 0.21
Yum! Brands Inc. 67,576 3,103,142 0.14
Johnson Controls Inc. 102,444 2,996,907 0.13
O’Reilly Automotive Inc. 15,560 2,782,042 0.12
Liberty Global plc Class C 96,967 2,676,577 0.12
Carnival Corp. 72,454 2,536,642 0.11
L Brands Inc. 40,266 2,501,374 0.11
AutoZone Inc. 4,840 2,458,517 0.11
Delphi Automotive plc 44,599 2,402,063 0.11
VF Corp. 53,338 2,332,244 0.10
Ross Stores Inc. 64,794 2,122,042 0.09
CBS Corp. 69,575 2,095,720 0.09
Tesla Motors Inc. 15,243 2,042,370 0.09
Dollar General Corp. 46,126 2,023,166 0.09
Chipotle Mexican Grill Inc. 4,877 2,021,190 0.09
Omnicom Group Inc. 38,112 1,848,843 0.08
Las Vegas Sands Corp. 57,581 1,845,546 0.08
Under Armour Inc. 28,249 1,738,950 0.08
Viacom Inc. 54,429 1,737,119 0.08
Royal Caribbean Cruises Ltd. 26,898 1,712,563 0.08
Macy’s Inc. 51,814 1,710,695 0.08
Dollar Tree Inc. 36,805 1,560,710 0.07
Marriott International Inc. 31,233 1,552,550 0.07
Charter Communications Inc. 11,980 1,479,272 0.07
Advance Auto Parts Inc. 11,474 1,473,775 0.07
DISH Network Corp. 35,154 1,433,339 0.06
Genuine Parts Co. 23,804 1,398,586 0.06
Expedia Inc. 15,741 1,387,174 0.06
Starwood Hotels & Resorts Worldwide Inc. 26,717 1,381,521 0.06
Hilton Worldwide Holdings Inc. 81,975 1,326,972 0.06
Hanesbrands Inc. 63,005 1,302,610 0.06
Whirlpool Corp. 12,310 1,276,354 0.06
Tractor Supply Co. 21,333 1,276,196 0.06
Mohawk Industries Inc. 9,982 1,263,263 0.06
CarMax Inc. 32,595 1,245,212 0.06
Signet Jewelers Ltd. 12,487 1,220,079 0.05
Newell Rubbermaid Inc. 41,980 1,153,336 0.05
Ulta Salon Cosmetics & Fragrance Inc. 10,113 1,139,121 0.05
Liberty Global plc Class A 39,476 1,137,965 0.05
MGM Resorts International 73,541 1,104,258 0.05
Autoliv Inc. 13,856 1,087,200 0.05
Best Buy Co. Inc. 47,705 1,082,352 0.05
Harley-Davidson Inc. 32,257 1,032,834 0.05
Bed Bath & Beyond Inc. 26,617 1,027,523 0.05
Norwegian Cruise Line Holdings Ltd. 24,640 1,014,861 0.04
Lear Corp. 12,052 975,694 0.04
BorgWarner Inc. 35,184 975,283 0.04
Wyndham Worldwide Corp. 18,499 974,181 0.04
DR Horton Inc. 50,727 966,980 0.04
Foot Locker Inc. 21,866 959,080 0.04
TripAdvisor Inc. 17,538 951,395 0.04
Interpublic Group of Cos. Inc. 63,780 946,541 0.04
Tiffany & Co. 17,656 942,134 0.04
Kohl’s Corp. 30,982 925,208 0.04
Sirius XM Holdings Inc. 347,622 918,349 0.04
Nordstrom Inc. 21,639 913,675 0.04
LKQ Corp. 47,402 908,815 0.04
Jarden Corp. 30,851 895,127 0.04
Goodyear Tire & Rubber Co. 41,870 890,321 0.04
H&R Block Inc. 36,599 882,746 0.04
Lennar Corp. 27,022 875,888 0.04
Hasbro Inc. 17,464 868,790 0.04
Coach Inc. 42,969 868,061 0.04
Staples Inc. 100,007 840,515 0.04
Mattel Inc. 52,589 836,984 0.04
Harman International Industries Inc. 11,186 796,289 0.04
Liberty Media Corp Series C 30,615 776,080 0.03
PVH Corp. 12,952 762,830 0.03
News Corp. 75,930 756,645 0.03
Michael Kors Holdings Ltd. 30,068 752,479 0.03
Cablevision Systems Corp. 34,489 727,566 0.03
Discovery Communications Inc Class C 40,039 713,205 0.03
Darden Restaurants Inc. 17,667 708,099 0.03
Polaris Industries Inc. 9,676 703,709 0.03
Aramark 34,772 683,327 0.03
Ralph Lauren Corp. 9,422 675,476 0.03
Gap Inc. 36,903 650,176 0.03
NVR Inc. 604 638,455 0.03
Williams-Sonoma Inc. 13,074 624,071 0.03
Leggett & Platt Inc. 21,255 620,007 0.03
Tegna Inc. 35,148 614,931 0.03
Domino’s Pizza Inc. 8,687 599,777 0.03
PulteGroup Inc. 49,917 592,126 0.03
Toll Brothers Inc. 25,210 587,156 0.03
Wynn Resorts Ltd. 12,555 568,650 0.03
Service Corp International 31,078 568,476 0.03
Scripps Networks Interactive Inc. 14,597 567,945 0.03
lululemon athletica Inc. 17,369 552,650 0.02
Brunswick Corp. 14,291 497,835 0.02
AutoNation Inc. 12,144 496,800 0.02
GameStop Corp. 16,565 493,926 0.02
Tempur Sealy International Inc. 9,727 490,192 0.02
Gentex Corp. 45,483 482,396 0.02
54
Market % of Value Net Asset Holding (£) Value
Market % of Value Net Asset Holding (£) Value
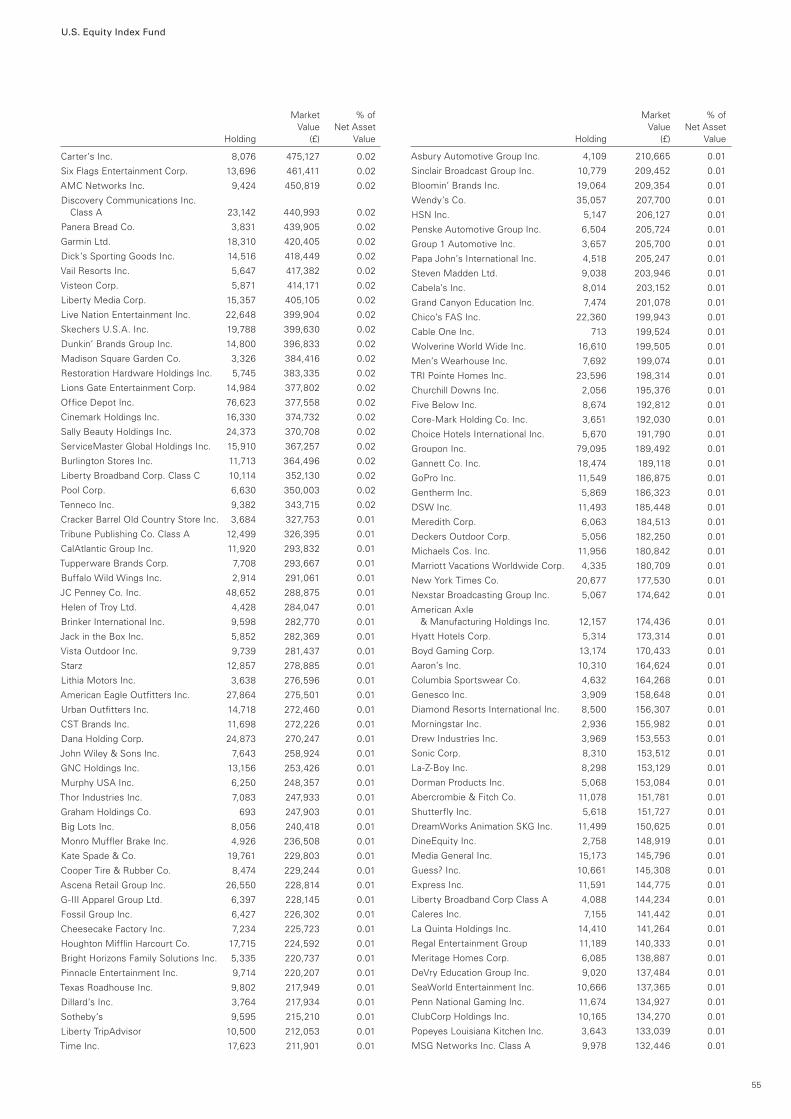
U.S. Equity Index Fund
Carter’s Inc. 8,076 475,127 0.02
Six Flags Entertainment Corp. 13,696 461,411 0.02
AMC Networks Inc. 9,424 450,819 0.02
Discovery Communications Inc. Class A 23,142 440,993 0.02
Panera Bread Co. 3,831 439,905 0.02
Garmin Ltd. 18,310 420,405 0.02
Dick’s Sporting Goods Inc. 14,516 418,449 0.02
Vail Resorts Inc. 5,647 417,382 0.02
Visteon Corp. 5,871 414,171 0.02
Liberty Media Corp. 15,357 405,105 0.02
Live Nation Entertainment Inc. 22,648 399,904 0.02
Skechers U.S.A. Inc. 19,788 399,630 0.02
Dunkin’ Brands Group Inc. 14,800 396,833 0.02
Madison Square Garden Co. 3,326 384,416 0.02
Restoration Hardware Holdings Inc. 5,745 383,335 0.02
Lions Gate Entertainment Corp. 14,984 377,802 0.02
Office Depot Inc. 76,623 377,558 0.02
Cinemark Holdings Inc. 16,330 374,732 0.02
Sally Beauty Holdings Inc. 24,373 370,708 0.02
ServiceMaster Global Holdings Inc. 15,910 367,257 0.02
Burlington Stores Inc. 11,713 364,496 0.02
Liberty Broadband Corp. Class C 10,114 352,130 0.02
Pool Corp. 6,630 350,003 0.02
Tenneco Inc. 9,382 343,715 0.02
Cracker Barrel Old Country Store Inc. 3,684 327,753 0.01
Tribune Publishing Co. Class A 12,499 326,395 0.01
CalAtlantic Group Inc. 11,920 293,832 0.01
Tupperware Brands Corp. 7,708 293,667 0.01
Buffalo Wild Wings Inc. 2,914 291,061 0.01
JC Penney Co. Inc. 48,652 288,875 0.01
Helen of Troy Ltd. 4,428 284,047 0.01
Brinker International Inc. 9,598 282,770 0.01
Jack in the Box Inc. 5,852 282,369 0.01
Vista Outdoor Inc. 9,739 281,437 0.01
Starz 12,857 278,885 0.01
Lithia Motors Inc. 3,638 276,596 0.01
American Eagle Outfitters Inc. 27,864 275,501 0.01
Urban Outfitters Inc. 14,718 272,460 0.01
CST Brands Inc. 11,698 272,226 0.01
Dana Holding Corp. 24,873 270,247 0.01
John Wiley & Sons Inc. 7,643 258,924 0.01
GNC Holdings Inc. 13,156 253,426 0.01
Murphy USA Inc. 6,250 248,357 0.01
Thor Industries Inc. 7,083 247,933 0.01
Graham Holdings Co. 693 247,903 0.01
Big Lots Inc. 8,056 240,418 0.01
Monro Muffler Brake Inc. 4,926 236,508 0.01
Kate Spade & Co. 19,761 229,803 0.01
Cooper Tire & Rubber Co. 8,474 229,244 0.01
Ascena Retail Group Inc. 26,550 228,814 0.01
G-III Apparel Group Ltd. 6,397 228,145 0.01
Fossil Group Inc. 6,427 226,302 0.01
Cheesecake Factory Inc. 7,234 225,723 0.01
Houghton Mifflin Harcourt Co. 17,715 224,592 0.01
Bright Horizons Family Solutions Inc. 5,335 220,737 0.01
Pinnacle Entertainment Inc. 9,714 220,207 0.01
Texas Roadhouse Inc. 9,802 217,949 0.01
Dillard’s Inc. 3,764 217,934 0.01
Sotheby’s 9,595 215,210 0.01
Liberty TripAdvisor 10,500 212,053 0.01
Time Inc. 17,623 211,901 0.01
Asbury Automotive Group Inc. 4,109 210,665 0.01
Sinclair Broadcast Group Inc. 10,779 209,452 0.01
Bloomin’ Brands Inc. 19,064 209,354 0.01
Wendy’s Co. 35,057 207,700 0.01
HSN Inc. 5,147 206,127 0.01
Penske Automotive Group Inc. 6,504 205,724 0.01
Group 1 Automotive Inc. 3,657 205,700 0.01
Papa John’s International Inc. 4,518 205,247 0.01
Steven Madden Ltd. 9,038 203,946 0.01
Cabela’s Inc. 8,014 203,152 0.01
Grand Canyon Education Inc. 7,474 201,078 0.01
Chico’s FAS Inc. 22,360 199,943 0.01
Cable One Inc. 713 199,524 0.01
Wolverine World Wide Inc. 16,610 199,505 0.01
Men’s Wearhouse Inc. 7,692 199,074 0.01
TRI Pointe Homes Inc. 23,596 198,314 0.01
Churchill Downs Inc. 2,056 195,376 0.01
Five Below Inc. 8,674 192,812 0.01
Core-Mark Holding Co. Inc. 3,651 192,030 0.01
Choice Hotels International Inc. 5,670 191,790 0.01
Groupon Inc. 79,095 189,492 0.01
Gannett Co. Inc. 18,474 189,118 0.01
GoPro Inc. 11,549 186,875 0.01
Gentherm Inc. 5,869 186,323 0.01
DSW Inc. 11,493 185,448 0.01
Meredith Corp. 6,063 184,513 0.01
Deckers Outdoor Corp. 5,056 182,250 0.01
Michaels Cos. Inc. 11,956 180,842 0.01
Marriott Vacations Worldwide Corp. 4,335 180,709 0.01
New York Times Co. 20,677 177,530 0.01
Nexstar Broadcasting Group Inc. 5,067 174,642 0.01
American Axle & Manufacturing Holdings Inc. 12,157 174,436 0.01
Hyatt Hotels Corp. 5,314 173,314 0.01
Boyd Gaming Corp. 13,174 170,433 0.01
Aaron’s Inc. 10,310 164,624 0.01
Columbia Sportswear Co. 4,632 164,268 0.01
Genesco Inc. 3,909 158,648 0.01
Diamond Resorts International Inc. 8,500 156,307 0.01
Morningstar Inc. 2,936 155,982 0.01
Drew Industries Inc. 3,969 153,553 0.01
Sonic Corp. 8,310 153,512 0.01
La-Z-Boy Inc. 8,298 153,129 0.01
Dorman Products Inc. 5,068 153,084 0.01
Abercrombie & Fitch Co. 11,078 151,781 0.01
Shutterfly Inc. 5,618 151,727 0.01
DreamWorks Animation SKG Inc. 11,499 150,625 0.01
DineEquity Inc. 2,758 148,919 0.01
Media General Inc. 15,173 145,796 0.01
Guess? Inc. 10,661 145,308 0.01
Express Inc. 11,591 144,775 0.01
Liberty Broadband Corp Class A 4,088 144,234 0.01
Caleres Inc. 7,155 141,442 0.01
La Quinta Holdings Inc. 14,410 141,264 0.01
Regal Entertainment Group 11,189 140,333 0.01
Meritage Homes Corp. 6,085 138,887 0.01
DeVry Education Group Inc. 9,020 137,484 0.01
SeaWorld Entertainment Inc. 10,666 137,365 0.01
Penn National Gaming Inc. 11,674 134,927 0.01
ClubCorp Holdings Inc. 10,165 134,270 0.01
Popeyes Louisiana Kitchen Inc. 3,643 133,039 0.01
MSG Networks Inc. Class A 9,978 132,446 0.01
55
Market % of Value Net Asset Holding (£) Value
Market % of Value Net Asset Holding (£) Value
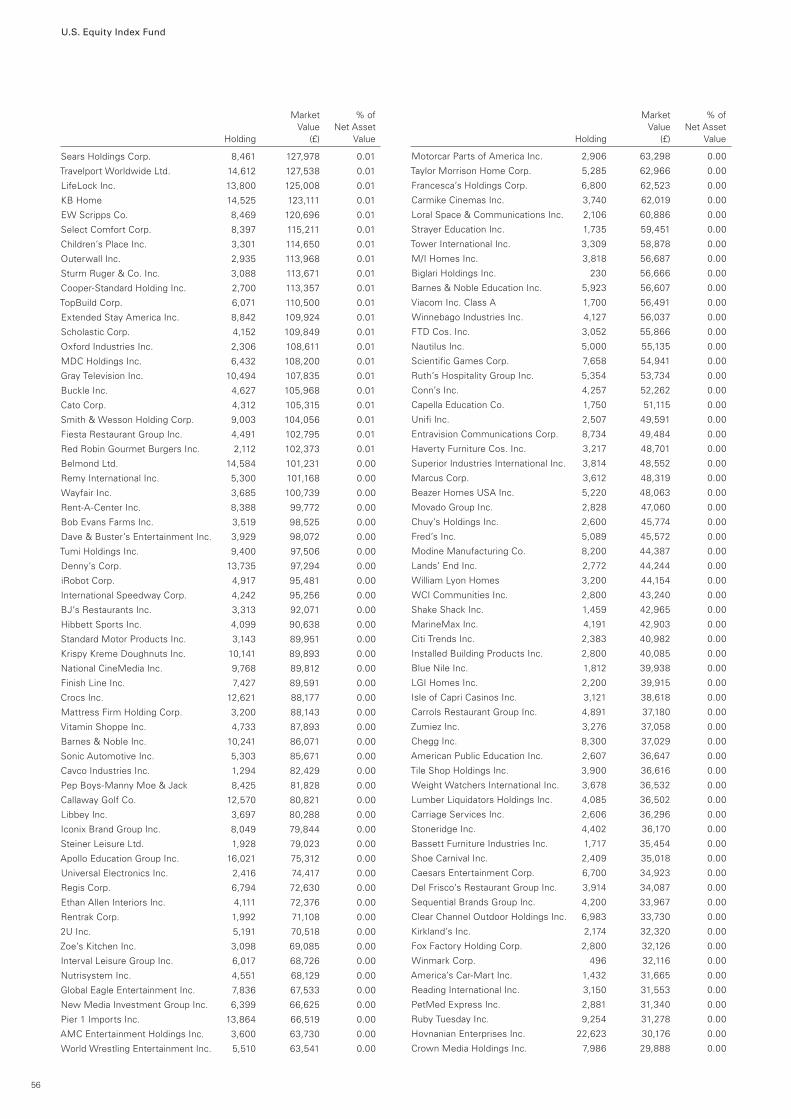
U.S. Equity Index Fund
Sears Holdings Corp. 8,461 127,978 0.01
Travelport Worldwide Ltd. 14,612 127,538 0.01
LifeLock Inc. 13,800 125,008 0.01
KB Home 14,525 123,111 0.01
EW Scripps Co. 8,469 120,696 0.01
Select Comfort Corp. 8,397 115,211 0.01
Children’s Place Inc. 3,301 114,650 0.01
Outerwall Inc. 2,935 113,968 0.01
Sturm Ruger & Co. Inc. 3,088 113,671 0.01
Cooper-Standard Holding Inc. 2,700 113,357 0.01
TopBuild Corp. 6,071 110,500 0.01
Extended Stay America Inc. 8,842 109,924 0.01
Scholastic Corp. 4,152 109,849 0.01
Oxford Industries Inc. 2,306 108,611 0.01
MDC Holdings Inc. 6,432 108,200 0.01
Gray Television Inc. 10,494 107,835 0.01
Buckle Inc. 4,627 105,968 0.01
Cato Corp. 4,312 105,315 0.01
Smith & Wesson Holding Corp. 9,003 104,056 0.01
Fiesta Restaurant Group Inc. 4,491 102,795 0.01
Red Robin Gourmet Burgers Inc. 2,112 102,373 0.01
Belmond Ltd. 14,584 101,231 0.00
Remy International Inc. 5,300 101,168 0.00
Wayfair Inc. 3,685 100,739 0.00
Rent-A-Center Inc. 8,388 99,772 0.00
Bob Evans Farms Inc. 3,519 98,525 0.00
Dave & Buster’s Entertainment Inc. 3,929 98,072 0.00
Tumi Holdings Inc. 9,400 97,506 0.00
Denny’s Corp. 13,735 97,294 0.00
iRobot Corp. 4,917 95,481 0.00
International Speedway Corp. 4,242 95,256 0.00
BJ’s Restaurants Inc. 3,313 92,071 0.00
Hibbett Sports Inc. 4,099 90,638 0.00
Standard Motor Products Inc. 3,143 89,951 0.00
Krispy Kreme Doughnuts Inc. 10,141 89,893 0.00
National CineMedia Inc. 9,768 89,812 0.00
Finish Line Inc. 7,427 89,591 0.00
Crocs Inc. 12,621 88,177 0.00
Mattress Firm Holding Corp. 3,200 88,143 0.00
Vitamin Shoppe Inc. 4,733 87,893 0.00
Barnes & Noble Inc. 10,241 86,071 0.00
Sonic Automotive Inc. 5,303 85,671 0.00
Cavco Industries Inc. 1,294 82,429 0.00
Pep Boys-Manny Moe & Jack 8,425 81,828 0.00
Callaway Golf Co. 12,570 80,821 0.00
Libbey Inc. 3,697 80,288 0.00
Iconix Brand Group Inc. 8,049 79,844 0.00
Steiner Leisure Ltd. 1,928 79,023 0.00
Apollo Education Group Inc. 16,021 75,312 0.00
Universal Electronics Inc. 2,416 74,417 0.00
Regis Corp. 6,794 72,630 0.00
Ethan Allen Interiors Inc. 4,111 72,376 0.00
Rentrak Corp. 1,992 71,108 0.00
2U Inc. 5,191 70,518 0.00
Zoe’s Kitchen Inc. 3,098 69,085 0.00
Interval Leisure Group Inc. 6,017 68,726 0.00
Nutrisystem Inc. 4,551 68,129 0.00
Global Eagle Entertainment Inc. 7,836 67,533 0.00
New Media Investment Group Inc. 6,399 66,625 0.00
Pier 1 Imports Inc. 13,864 66,519 0.00
AMC Entertainment Holdings Inc. 3,600 63,730 0.00
World Wrestling Entertainment Inc. 5,510 63,541 0.00
Motorcar Parts of America Inc. 2,906 63,298 0.00
Taylor Morrison Home Corp. 5,285 62,966 0.00
Francesca’s Holdings Corp. 6,800 62,523 0.00
Carmike Cinemas Inc. 3,740 62,019 0.00
Loral Space & Communications Inc. 2,106 60,886 0.00
Strayer Education Inc. 1,735 59,451 0.00
Tower International Inc. 3,309 58,878 0.00
M/I Homes Inc. 3,818 56,687 0.00
Biglari Holdings Inc. 230 56,666 0.00
Barnes & Noble Education Inc. 5,923 56,607 0.00
Viacom Inc. Class A 1,700 56,491 0.00
Winnebago Industries Inc. 4,127 56,037 0.00
FTD Cos. Inc. 3,052 55,866 0.00
Nautilus Inc. 5,000 55,135 0.00
Scientific Games Corp. 7,658 54,941 0.00
Ruth’s Hospitality Group Inc. 5,354 53,734 0.00
Conn’s Inc. 4,257 52,262 0.00
Capella Education Co. 1,750 51,115 0.00
Unifi Inc. 2,507 49,591 0.00
Entravision Communications Corp. 8,734 49,484 0.00
Haverty Furniture Cos. Inc. 3,217 48,701 0.00
Superior Industries International Inc. 3,814 48,552 0.00
Marcus Corp. 3,612 48,319 0.00
Beazer Homes USA Inc. 5,220 48,063 0.00
Movado Group Inc. 2,828 47,060 0.00
Chuy’s Holdings Inc. 2,600 45,774 0.00
Fred’s Inc. 5,089 45,572 0.00
Modine Manufacturing Co. 8,200 44,387 0.00
Lands’ End Inc. 2,772 44,244 0.00
William Lyon Homes 3,200 44,154 0.00
WCI Communities Inc. 2,800 43,240 0.00
Shake Shack Inc. 1,459 42,965 0.00
MarineMax Inc. 4,191 42,903 0.00
Citi Trends Inc. 2,383 40,982 0.00
Installed Building Products Inc. 2,800 40,085 0.00
Blue Nile Inc. 1,812 39,938 0.00
LGI Homes Inc. 2,200 39,915 0.00
Isle of Capri Casinos Inc. 3,121 38,618 0.00
Carrols Restaurant Group Inc. 4,891 37,180 0.00
Zumiez Inc. 3,276 37,058 0.00
Chegg Inc. 8,300 37,029 0.00
American Public Education Inc. 2,607 36,647 0.00
Tile Shop Holdings Inc. 3,900 36,616 0.00
Weight Watchers International Inc. 3,678 36,532 0.00
Lumber Liquidators Holdings Inc. 4,085 36,502 0.00
Carriage Services Inc. 2,606 36,296 0.00
Stoneridge Inc. 4,402 36,170 0.00
Bassett Furniture Industries Inc. 1,717 35,454 0.00
Shoe Carnival Inc. 2,409 35,018 0.00
Caesars Entertainment Corp. 6,700 34,923 0.00
Del Frisco’s Restaurant Group Inc. 3,914 34,087 0.00
Sequential Brands Group Inc. 4,200 33,967 0.00
Clear Channel Outdoor Holdings Inc. 6,983 33,730 0.00
Kirkland’s Inc. 2,174 32,320 0.00
Fox Factory Holding Corp. 2,800 32,126 0.00
Winmark Corp. 496 32,116 0.00
America’s Car-Mart Inc. 1,432 31,665 0.00
Reading International Inc. 3,150 31,553 0.00
PetMed Express Inc. 2,881 31,340 0.00
Ruby Tuesday Inc. 9,254 31,278 0.00
Hovnanian Enterprises Inc. 22,623 30,176 0.00
Crown Media Holdings Inc. 7,986 29,888 0.00
56
Market % of Value Net Asset Holding (£) Value
Market % of Value Net Asset Holding (£) Value
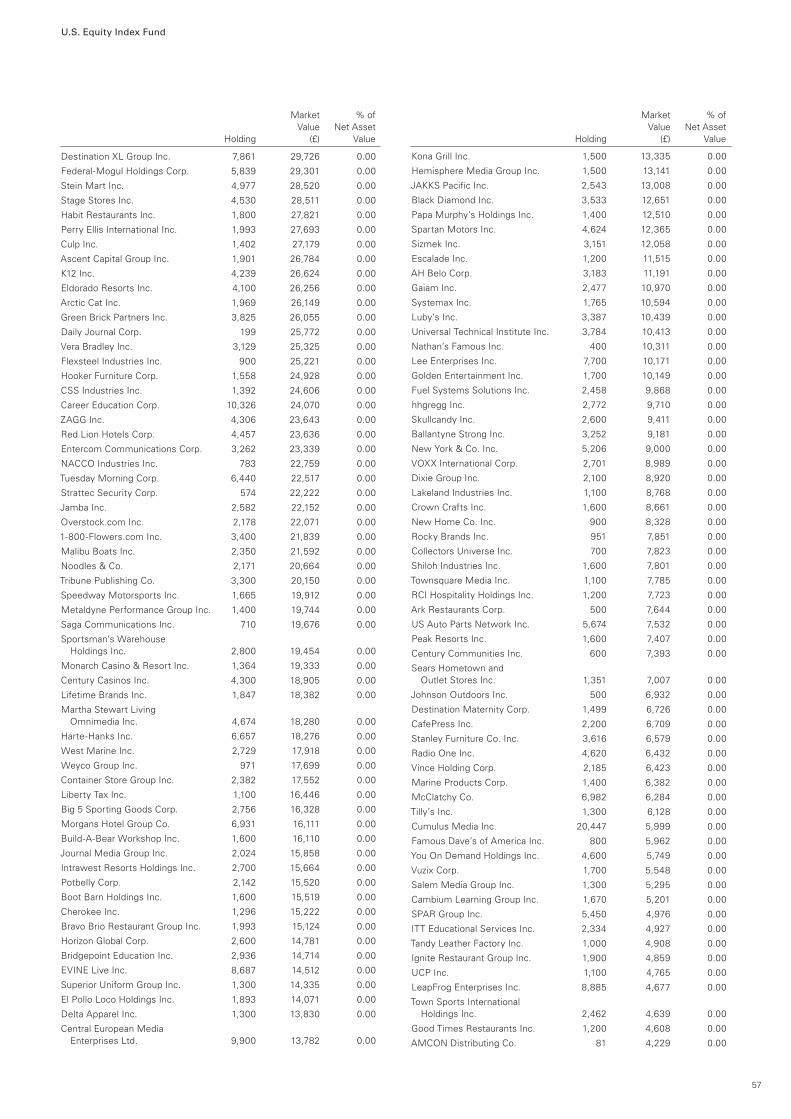
U.S. Equity Index Fund
Destination XL Group Inc. 7,861 29,726 0.00
Federal-Mogul Holdings Corp. 5,839 29,301 0.00
Stein Mart Inc. 4,977 28,520 0.00
Stage Stores Inc. 4,530 28,511 0.00
Habit Restaurants Inc. 1,800 27,821 0.00
Perry Ellis International Inc. 1,993 27,693 0.00
Culp Inc. 1,402 27,179 0.00
Ascent Capital Group Inc. 1,901 26,784 0.00
K12 Inc. 4,239 26,624 0.00
Eldorado Resorts Inc. 4,100 26,256 0.00
Arctic Cat Inc. 1,969 26,149 0.00
Green Brick Partners Inc. 3,825 26,055 0.00
Daily Journal Corp. 199 25,772 0.00
Vera Bradley Inc. 3,129 25,325 0.00
Flexsteel Industries Inc. 900 25,221 0.00
Hooker Furniture Corp. 1,558 24,928 0.00
CSS Industries Inc. 1,392 24,606 0.00
Career Education Corp. 10,326 24,070 0.00
ZAGG Inc. 4,306 23,643 0.00
Red Lion Hotels Corp. 4,457 23,636 0.00
Entercom Communications Corp. 3,262 23,339 0.00
NACCO Industries Inc. 783 22,759 0.00
Tuesday Morning Corp. 6,440 22,517 0.00
Strattec Security Corp. 574 22,222 0.00
Jamba Inc. 2,582 22,152 0.00
Overstock.com Inc. 2,178 22,071 0.00
1-800-Flowers.com Inc. 3,400 21,839 0.00
Malibu Boats Inc. 2,350 21,592 0.00
Noodles & Co. 2,171 20,664 0.00
Tribune Publishing Co. 3,300 20,150 0.00
Speedway Motorsports Inc. 1,665 19,912 0.00
Metaldyne Performance Group Inc. 1,400 19,744 0.00
Saga Communications Inc. 710 19,676 0.00
Sportsman’s Warehouse Holdings Inc. 2,800 19,454 0.00
Monarch Casino & Resort Inc. 1,364 19,333 0.00
Century Casinos Inc. 4,300 18,905 0.00
Lifetime Brands Inc. 1,847 18,382 0.00
Martha Stewart Living Omnimedia Inc. 4,674 18,280 0.00
Harte-Hanks Inc. 6,657 18,276 0.00
West Marine Inc. 2,729 17,918 0.00
Weyco Group Inc. 971 17,699 0.00
Container Store Group Inc. 2,382 17,552 0.00
Liberty Tax Inc. 1,100 16,446 0.00
Big 5 Sporting Goods Corp. 2,756 16,328 0.00
Morgans Hotel Group Co. 6,931 16,111 0.00
Build-A-Bear Workshop Inc. 1,600 16,110 0.00
Journal Media Group Inc. 2,024 15,858 0.00
Intrawest Resorts Holdings Inc. 2,700 15,664 0.00
Potbelly Corp. 2,142 15,520 0.00
Boot Barn Holdings Inc. 1,600 15,519 0.00
Cherokee Inc. 1,296 15,222 0.00
Bravo Brio Restaurant Group Inc. 1,993 15,124 0.00
Horizon Global Corp. 2,600 14,781 0.00
Bridgepoint Education Inc. 2,936 14,714 0.00
EVINE Live Inc. 8,687 14,512 0.00
Superior Uniform Group Inc. 1,300 14,335 0.00
El Pollo Loco Holdings Inc. 1,893 14,071 0.00
Delta Apparel Inc. 1,300 13,830 0.00
Central European Media Enterprises Ltd. 9,900 13,782 0.00
Kona Grill Inc. 1,500 13,335 0.00
Hemisphere Media Group Inc. 1,500 13,141 0.00
JAKKS Pacific Inc. 2,543 13,008 0.00
Black Diamond Inc. 3,533 12,651 0.00
Papa Murphy’s Holdings Inc. 1,400 12,510 0.00
Spartan Motors Inc. 4,624 12,365 0.00
Sizmek Inc. 3,151 12,058 0.00
Escalade Inc. 1,200 11,515 0.00
AH Belo Corp. 3,183 11,191 0.00
Gaiam Inc. 2,477 10,970 0.00
Systemax Inc. 1,765 10,594 0.00
Luby’s Inc. 3,387 10,439 0.00
Universal Technical Institute Inc. 3,784 10,413 0.00
Nathan’s Famous Inc. 400 10,311 0.00
Lee Enterprises Inc. 7,700 10,171 0.00
Golden Entertainment Inc. 1,700 10,149 0.00
Fuel Systems Solutions Inc. 2,458 9,868 0.00
hhgregg Inc. 2,772 9,710 0.00
Skullcandy Inc. 2,600 9,411 0.00
Ballantyne Strong Inc. 3,252 9,181 0.00
New York & Co. Inc. 5,206 9,000 0.00
VOXX International Corp. 2,701 8,989 0.00
Dixie Group Inc. 2,100 8,920 0.00
Lakeland Industries Inc. 1,100 8,768 0.00
Crown Crafts Inc. 1,600 8,661 0.00
New Home Co. Inc. 900 8,328 0.00
Rocky Brands Inc. 951 7,851 0.00
Collectors Universe Inc. 700 7,823 0.00
Shiloh Industries Inc. 1,600 7,801 0.00
Townsquare Media Inc. 1,100 7,785 0.00
RCI Hospitality Holdings Inc. 1,200 7,723 0.00
Ark Restaurants Corp. 500 7,644 0.00
US Auto Parts Network Inc. 5,674 7,532 0.00
Peak Resorts Inc. 1,600 7,407 0.00
Century Communities Inc. 600 7,393 0.00
Sears Hometown and Outlet Stores Inc. 1,351 7,007 0.00
Johnson Outdoors Inc. 500 6,932 0.00
Destination Maternity Corp. 1,499 6,726 0.00
CafePress Inc. 2,200 6,709 0.00
Stanley Furniture Co. Inc. 3,616 6,579 0.00
Radio One Inc. 4,620 6,432 0.00
Vince Holding Corp. 2,185 6,423 0.00
Marine Products Corp. 1,400 6,382 0.00
McClatchy Co. 6,982 6,284 0.00
Tilly’s Inc. 1,300 6,128 0.00
Cumulus Media Inc. 20,447 5,999 0.00
Famous Dave’s of America Inc. 800 5,962 0.00
You On Demand Holdings Inc. 4,600 5,749 0.00
Vuzix Corp. 1,700 5,548 0.00
Salem Media Group Inc. 1,300 5,295 0.00
Cambium Learning Group Inc. 1,670 5,201 0.00
SPAR Group Inc. 5,450 4,976 0.00
ITT Educational Services Inc. 2,334 4,927 0.00
Tandy Leather Factory Inc. 1,000 4,908 0.00
Ignite Restaurant Group Inc. 1,900 4,859 0.00
UCP Inc. 1,100 4,765 0.00
LeapFrog Enterprises Inc. 8,885 4,677 0.00
Town Sports International Holdings Inc. 2,462 4,639 0.00
Good Times Restaurants Inc. 1,200 4,608 0.00
AMCON Distributing Co. 81 4,229 0.00
57
Market % of Value Net Asset Holding (£) Value
Market % of Value Net Asset Holding (£) Value
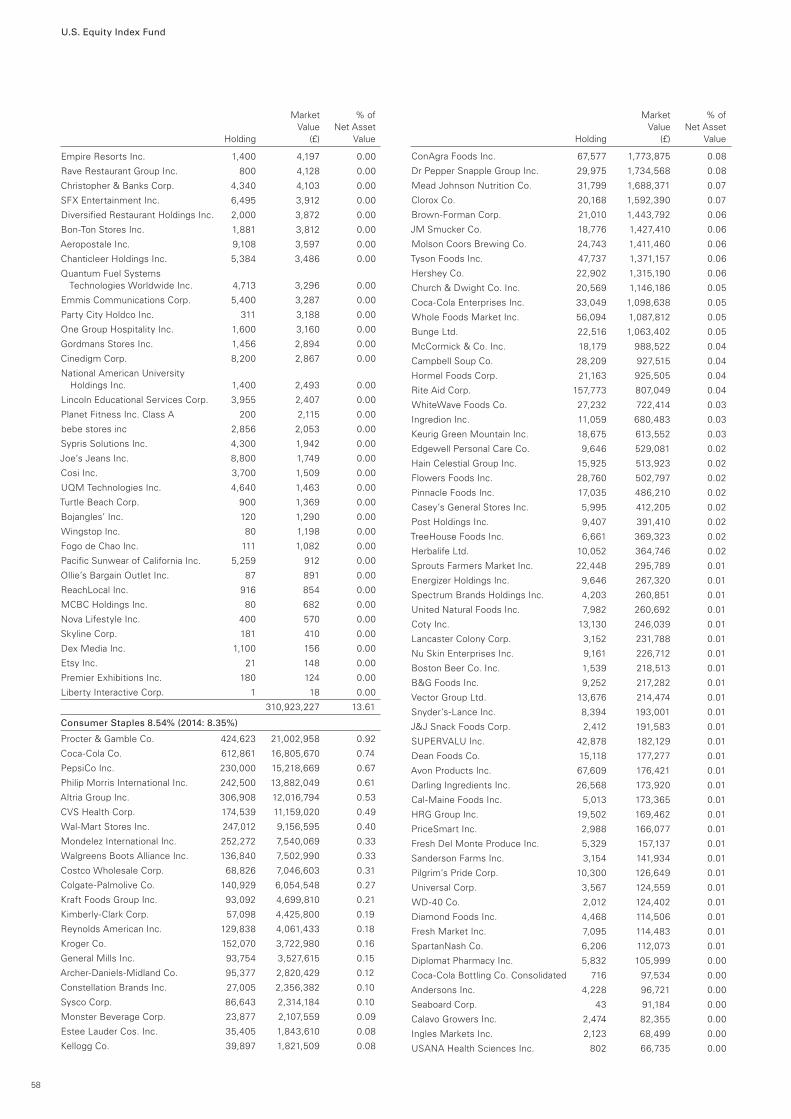
U.S. Equity Index Fund
Empire Resorts Inc. 1,400 4,197 0.00
Rave Restaurant Group Inc. 800 4,128 0.00
Christopher & Banks Corp. 4,340 4,103 0.00
SFX Entertainment Inc. 6,495 3,912 0.00
Diversified Restaurant Holdings Inc. 2,000 3,872 0.00
Bon-Ton Stores Inc. 1,881 3,812 0.00
Aeropostale Inc. 9,108 3,597 0.00
Chanticleer Holdings Inc. 5,384 3,486 0.00
Quantum Fuel Systems Technologies Worldwide Inc. 4,713 3,296 0.00
Emmis Communications Corp. 5,400 3,287 0.00
Party City Holdco Inc. 311 3,188 0.00
One Group Hospitality Inc. 1,600 3,160 0.00
Gordmans Stores Inc. 1,456 2,894 0.00
Cinedigm Corp. 8,200 2,867 0.00
National American University Holdings Inc. 1,400 2,493 0.00
Lincoln Educational Services Corp. 3,955 2,407 0.00
Planet Fitness Inc. Class A 200 2,115 0.00
bebe stores inc 2,856 2,053 0.00
Sypris Solutions Inc. 4,300 1,942 0.00
Joe’s Jeans Inc. 8,800 1,749 0.00
Cosi Inc. 3,700 1,509 0.00
UQM Technologies Inc. 4,640 1,463 0.00
Turtle Beach Corp. 900 1,369 0.00
Bojangles’ Inc. 120 1,290 0.00
Wingstop Inc. 80 1,198 0.00
Fogo de Chao Inc. 111 1,082 0.00
Pacific Sunwear of California Inc. 5,259 912 0.00
Ollie’s Bargain Outlet Inc. 87 891 0.00
ReachLocal Inc. 916 854 0.00
MCBC Holdings Inc. 80 682 0.00
Nova Lifestyle Inc. 400 570 0.00
Skyline Corp. 181 410 0.00
Dex Media Inc. 1,100 156 0.00
Etsy Inc. 21 148 0.00
Premier Exhibitions Inc. 180 124 0.00
Liberty Interactive Corp. 1 18 0.00
310,923,227 13.61
Consumer Staples 8.54% (2014: 8.35%)
Procter & Gamble Co. 424,623 21,002,958 0.92
Coca-Cola Co. 612,861 16,805,670 0.74
PepsiCo Inc. 230,000 15,218,669 0.67
Philip Morris International Inc. 242,500 13,882,049 0.61
Altria Group Inc. 306,908 12,016,794 0.53
CVS Health Corp. 174,539 11,159,020 0.49
Wal-Mart Stores Inc. 247,012 9,156,595 0.40
Mondelez International Inc. 252,272 7,540,069 0.33
Walgreens Boots Alliance Inc. 136,840 7,502,990 0.33
Costco Wholesale Corp. 68,826 7,046,603 0.31
Colgate-Palmolive Co. 140,929 6,054,548 0.27
Kraft Foods Group Inc. 93,092 4,699,810 0.21
Kimberly-Clark Corp. 57,098 4,425,800 0.19
Reynolds American Inc. 129,838 4,061,433 0.18
Kroger Co. 152,070 3,722,980 0.16
General Mills Inc. 93,754 3,527,615 0.15
Archer-Daniels-Midland Co. 95,377 2,820,429 0.12
Constellation Brands Inc. 27,005 2,356,382 0.10
Sysco Corp. 86,643 2,314,184 0.10
Monster Beverage Corp. 23,877 2,107,559 0.09
Estee Lauder Cos. Inc. 35,405 1,843,610 0.08
Kellogg Co. 39,897 1,821,509 0.08
ConAgra Foods Inc. 67,577 1,773,875 0.08
Dr Pepper Snapple Group Inc. 29,975 1,734,568 0.08
Mead Johnson Nutrition Co. 31,799 1,688,371 0.07
Clorox Co. 20,168 1,592,390 0.07
Brown-Forman Corp. 21,010 1,443,792 0.06
JM Smucker Co. 18,776 1,427,410 0.06
Molson Coors Brewing Co. 24,743 1,411,460 0.06
Tyson Foods Inc. 47,737 1,371,157 0.06
Hershey Co. 22,902 1,315,190 0.06
Church & Dwight Co. Inc. 20,569 1,146,186 0.05
Coca-Cola Enterprises Inc. 33,049 1,098,638 0.05
Whole Foods Market Inc. 56,094 1,087,812 0.05
Bunge Ltd. 22,516 1,063,402 0.05
McCormick & Co. Inc. 18,179 988,522 0.04
Campbell Soup Co. 28,209 927,515 0.04
Hormel Foods Corp. 21,163 925,505 0.04
Rite Aid Corp. 157,773 807,049 0.04
WhiteWave Foods Co. 27,232 722,414 0.03
Ingredion Inc. 11,059 680,483 0.03
Keurig Green Mountain Inc. 18,675 613,552 0.03
Edgewell Personal Care Co. 9,646 529,081 0.02
Hain Celestial Group Inc. 15,925 513,923 0.02
Flowers Foods Inc. 28,760 502,797 0.02
Pinnacle Foods Inc. 17,035 486,210 0.02
Casey’s General Stores Inc. 5,995 412,205 0.02
Post Holdings Inc. 9,407 391,410 0.02
TreeHouse Foods Inc. 6,661 369,323 0.02
Herbalife Ltd. 10,052 364,746 0.02
Sprouts Farmers Market Inc. 22,448 295,789 0.01
Energizer Holdings Inc. 9,646 267,320 0.01
Spectrum Brands Holdings Inc. 4,203 260,851 0.01
United Natural Foods Inc. 7,982 260,692 0.01
Coty Inc. 13,130 246,039 0.01
Lancaster Colony Corp. 3,152 231,788 0.01
Nu Skin Enterprises Inc. 9,161 226,712 0.01
Boston Beer Co. Inc. 1,539 218,513 0.01
B&G Foods Inc. 9,252 217,282 0.01
Vector Group Ltd. 13,676 214,474 0.01
Snyder’s-Lance Inc. 8,394 193,001 0.01
J&J Snack Foods Corp. 2,412 191,583 0.01
SUPERVALU Inc. 42,878 182,129 0.01
Dean Foods Co. 15,118 177,277 0.01
Avon Products Inc. 67,609 176,421 0.01
Darling Ingredients Inc. 26,568 173,920 0.01
Cal-Maine Foods Inc. 5,013 173,365 0.01
HRG Group Inc. 19,502 169,462 0.01
PriceSmart Inc. 2,988 166,077 0.01
Fresh Del Monte Produce Inc. 5,329 157,137 0.01
Sanderson Farms Inc. 3,154 141,934 0.01
Pilgrim’s Pride Corp. 10,300 126,649 0.01
Universal Corp. 3,567 124,559 0.01
WD-40 Co. 2,012 124,402 0.01
Diamond Foods Inc. 4,468 114,506 0.01
Fresh Market Inc. 7,095 114,483 0.01
SpartanNash Co. 6,206 112,073 0.01
Diplomat Pharmacy Inc. 5,832 105,999 0.00
Coca-Cola Bottling Co. Consolidated 716 97,534 0.00
Andersons Inc. 4,228 96,721 0.00
Seaboard Corp. 43 91,184 0.00
Calavo Growers Inc. 2,474 82,355 0.00
Ingles Markets Inc. 2,123 68,499 0.00
USANA Health Sciences Inc. 802 66,735 0.00
58
Market % of Value Net Asset Holding (£) Value
Market % of Value Net Asset Holding (£) Value
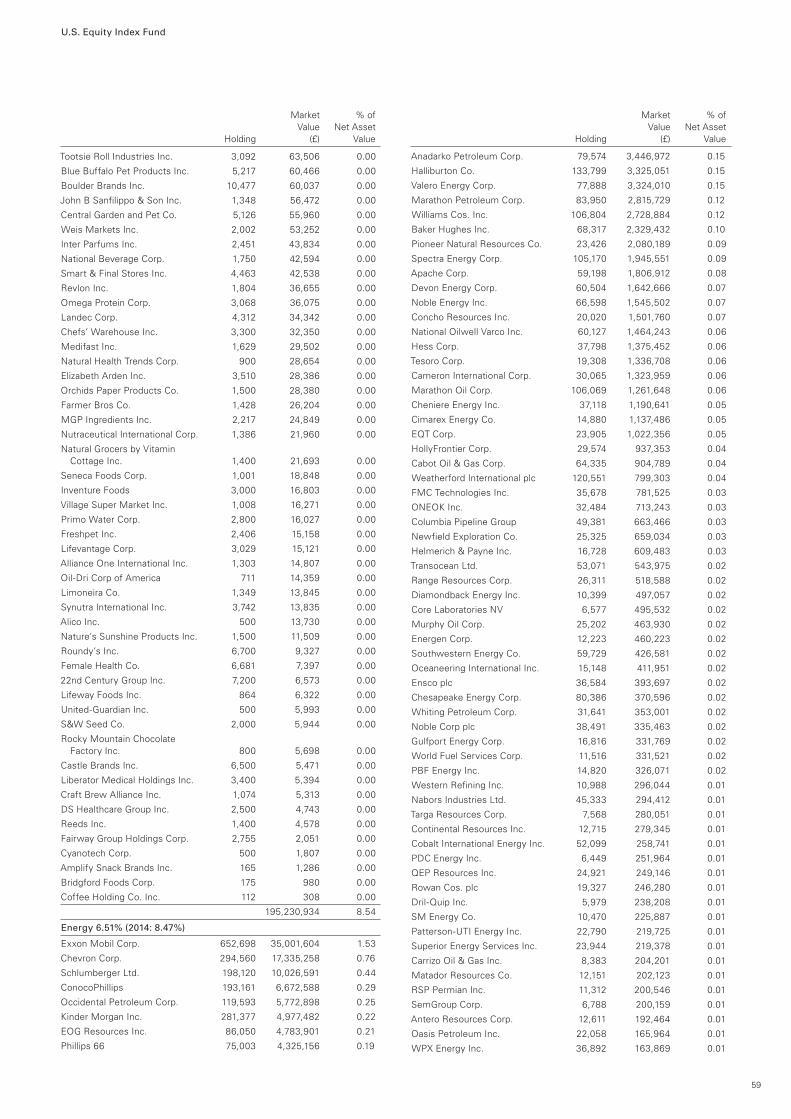
U.S. Equity Index Fund
Tootsie Roll Industries Inc. 3,092 63,506 0.00
Blue Buffalo Pet Products Inc. 5,217 60,466 0.00
Boulder Brands Inc. 10,477 60,037 0.00
John B Sanfilippo & Son Inc. 1,348 56,472 0.00
Central Garden and Pet Co. 5,126 55,960 0.00
Weis Markets Inc. 2,002 53,252 0.00
Inter Parfums Inc. 2,451 43,834 0.00
National Beverage Corp. 1,750 42,594 0.00
Smart & Final Stores Inc. 4,463 42,538 0.00
Revlon Inc. 1,804 36,655 0.00
Omega Protein Corp. 3,068 36,075 0.00
Landec Corp. 4,312 34,342 0.00
Chefs’ Warehouse Inc. 3,300 32,350 0.00
Medifast Inc. 1,629 29,502 0.00
Natural Health Trends Corp. 900 28,654 0.00
Elizabeth Arden Inc. 3,510 28,386 0.00
Orchids Paper Products Co. 1,500 28,380 0.00
Farmer Bros Co. 1,428 26,204 0.00
MGP Ingredients Inc. 2,217 24,849 0.00
Nutraceutical International Corp. 1,386 21,960 0.00
Natural Grocers by Vitamin Cottage Inc. 1,400 21,693 0.00
Seneca Foods Corp. 1,001 18,848 0.00
Inventure Foods 3,000 16,803 0.00
Village Super Market Inc. 1,008 16,271 0.00
Primo Water Corp. 2,800 16,027 0.00
Freshpet Inc. 2,406 15,158 0.00
Lifevantage Corp. 3,029 15,121 0.00
Alliance One International Inc. 1,303 14,807 0.00
Oil-Dri Corp of America 711 14,359 0.00
Limoneira Co. 1,349 13,845 0.00
Synutra International Inc. 3,742 13,835 0.00
Alico Inc. 500 13,730 0.00
Nature’s Sunshine Products Inc. 1,500 11,509 0.00
Roundy’s Inc. 6,700 9,327 0.00
Female Health Co. 6,681 7,397 0.00
22nd Century Group Inc. 7,200 6,573 0.00
Lifeway Foods Inc. 864 6,322 0.00
United-Guardian Inc. 500 5,993 0.00
S&W Seed Co. 2,000 5,944 0.00
Rocky Mountain Chocolate Factory Inc. 800 5,698 0.00
Castle Brands Inc. 6,500 5,471 0.00
Liberator Medical Holdings Inc. 3,400 5,394 0.00
Craft Brew Alliance Inc. 1,074 5,313 0.00
DS Healthcare Group Inc. 2,500 4,743 0.00
Reeds Inc. 1,400 4,578 0.00
Fairway Group Holdings Corp. 2,755 2,051 0.00
Cyanotech Corp. 500 1,807 0.00
Amplify Snack Brands Inc. 165 1,286 0.00
Bridgford Foods Corp. 175 980 0.00
Coffee Holding Co. Inc. 112 308 0.00
195,230,934 8.54
Energy 6.51% (2014: 8.47%)
Exxon Mobil Corp. 652,698 35,001,604 1.53
Chevron Corp. 294,560 17,335,258 0.76
Schlumberger Ltd. 198,120 10,026,591 0.44
ConocoPhillips 193,161 6,672,588 0.29
Occidental Petroleum Corp. 119,593 5,772,898 0.25
Kinder Morgan Inc. 281,377 4,977,482 0.22
EOG Resources Inc. 86,050 4,783,901 0.21
Phillips 66 75,003 4,325,156 0.19
Anadarko Petroleum Corp. 79,574 3,446,972 0.15
Halliburton Co. 133,799 3,325,051 0.15
Valero Energy Corp. 77,888 3,324,010 0.15
Marathon Petroleum Corp. 83,950 2,815,729 0.12
Williams Cos. Inc. 106,804 2,728,884 0.12
Baker Hughes Inc. 68,317 2,329,432 0.10
Pioneer Natural Resources Co. 23,426 2,080,189 0.09
Spectra Energy Corp. 105,170 1,945,551 0.09
Apache Corp. 59,198 1,806,912 0.08
Devon Energy Corp. 60,504 1,642,666 0.07
Noble Energy Inc. 66,598 1,545,502 0.07
Concho Resources Inc. 20,020 1,501,760 0.07
National Oilwell Varco Inc. 60,127 1,464,243 0.06
Hess Corp. 37,798 1,375,452 0.06
Tesoro Corp. 19,308 1,336,708 0.06
Cameron International Corp. 30,065 1,323,959 0.06
Marathon Oil Corp. 106,069 1,261,648 0.06
Cheniere Energy Inc. 37,118 1,190,641 0.05
Cimarex Energy Co. 14,880 1,137,486 0.05
EQT Corp. 23,905 1,022,356 0.05
HollyFrontier Corp. 29,574 937,353 0.04
Cabot Oil & Gas Corp. 64,335 904,789 0.04
Weatherford International plc 120,551 799,303 0.04
FMC Technologies Inc. 35,678 781,525 0.03
ONEOK Inc. 32,484 713,243 0.03
Columbia Pipeline Group 49,381 663,466 0.03
Newfield Exploration Co. 25,325 659,034 0.03
Helmerich & Payne Inc. 16,728 609,483 0.03
Transocean Ltd. 53,071 543,975 0.02
Range Resources Corp. 26,311 518,588 0.02
Diamondback Energy Inc. 10,399 497,057 0.02
Core Laboratories NV 6,577 495,532 0.02
Murphy Oil Corp. 25,202 463,930 0.02
Energen Corp. 12,223 460,223 0.02
Southwestern Energy Co. 59,729 426,581 0.02
Oceaneering International Inc. 15,148 411,951 0.02
Ensco plc 36,584 393,697 0.02
Chesapeake Energy Corp. 80,386 370,596 0.02
Whiting Petroleum Corp. 31,641 353,001 0.02
Noble Corp plc 38,491 335,463 0.02
Gulfport Energy Corp. 16,816 331,769 0.02
World Fuel Services Corp. 11,516 331,521 0.02
PBF Energy Inc. 14,820 326,071 0.02
Western Refining Inc. 10,988 296,044 0.01
Nabors Industries Ltd. 45,333 294,412 0.01
Targa Resources Corp. 7,568 280,051 0.01
Continental Resources Inc. 12,715 279,345 0.01
Cobalt International Energy Inc. 52,099 258,741 0.01
PDC Energy Inc. 6,449 251,964 0.01
QEP Resources Inc. 24,921 249,146 0.01
Rowan Cos. plc 19,327 246,280 0.01
Dril-Quip Inc. 5,979 238,208 0.01
SM Energy Co. 10,470 225,887 0.01
Patterson-UTI Energy Inc. 22,790 219,725 0.01
Superior Energy Services Inc. 23,944 219,378 0.01
Carrizo Oil & Gas Inc. 8,383 204,201 0.01
Matador Resources Co. 12,151 202,123 0.01
RSP Permian Inc. 11,312 200,546 0.01
SemGroup Corp. 6,788 200,159 0.01
Antero Resources Corp. 12,611 192,464 0.01
Oasis Petroleum Inc. 22,058 165,964 0.01
WPX Energy Inc. 36,892 163,869 0.01
59
Market % of Value Net Asset Holding (£) Value
Market % of Value Net Asset Holding (£) Value
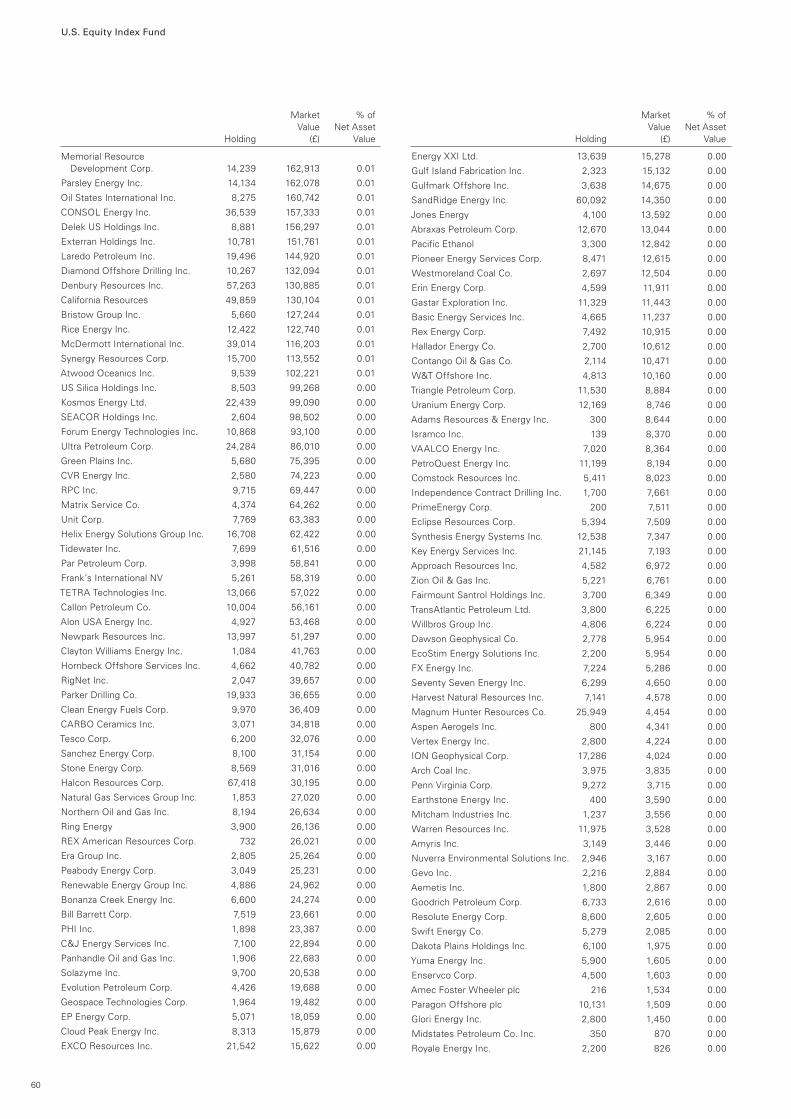
U.S. Equity Index Fund
Memorial Resource Development Corp. 14,239 162,913 0.01
Parsley Energy Inc. 14,134 162,078 0.01
Oil States International Inc. 8,275 160,742 0.01
CONSOL Energy Inc. 36,539 157,333 0.01
Delek US Holdings Inc. 8,881 156,297 0.01
Exterran Holdings Inc. 10,781 151,761 0.01
Laredo Petroleum Inc. 19,496 144,920 0.01
Diamond Offshore Drilling Inc. 10,267 132,094 0.01
Denbury Resources Inc. 57,263 130,885 0.01
California Resources 49,859 130,104 0.01
Bristow Group Inc. 5,660 127,244 0.01
Rice Energy Inc. 12,422 122,740 0.01
McDermott International Inc. 39,014 116,203 0.01
Synergy Resources Corp. 15,700 113,552 0.01
Atwood Oceanics Inc. 9,539 102,221 0.01
US Silica Holdings Inc. 8,503 99,268 0.00
Kosmos Energy Ltd. 22,439 99,090 0.00
SEACOR Holdings Inc. 2,604 98,502 0.00
Forum Energy Technologies Inc. 10,868 93,100 0.00
Ultra Petroleum Corp. 24,284 86,010 0.00
Green Plains Inc. 5,680 75,395 0.00
CVR Energy Inc. 2,580 74,223 0.00
RPC Inc. 9,715 69,447 0.00
Matrix Service Co. 4,374 64,262 0.00
Unit Corp. 7,769 63,383 0.00
Helix Energy Solutions Group Inc. 16,708 62,422 0.00
Tidewater Inc. 7,699 61,516 0.00
Par Petroleum Corp. 3,998 58,841 0.00
Frank’s International NV 5,261 58,319 0.00
TETRA Technologies Inc. 13,066 57,022 0.00
Callon Petroleum Co. 10,004 56,161 0.00
Alon USA Energy Inc. 4,927 53,468 0.00
Newpark Resources Inc. 13,997 51,297 0.00
Clayton Williams Energy Inc. 1,084 41,763 0.00
Hornbeck Offshore Services Inc. 4,662 40,782 0.00
RigNet Inc. 2,047 39,657 0.00
Parker Drilling Co. 19,933 36,655 0.00
Clean Energy Fuels Corp. 9,970 36,409 0.00
CARBO Ceramics Inc. 3,071 34,818 0.00
Tesco Corp. 6,200 32,076 0.00
Sanchez Energy Corp. 8,100 31,154 0.00
Stone Energy Corp. 8,569 31,016 0.00
Halcon Resources Corp. 67,418 30,195 0.00
Natural Gas Services Group Inc. 1,853 27,020 0.00
Northern Oil and Gas Inc. 8,194 26,634 0.00
Ring Energy 3,900 26,136 0.00
REX American Resources Corp. 732 26,021 0.00
Era Group Inc. 2,805 25,264 0.00
Peabody Energy Corp. 3,049 25,231 0.00
Renewable Energy Group Inc. 4,886 24,962 0.00
Bonanza Creek Energy Inc. 6,600 24,274 0.00
Bill Barrett Corp. 7,519 23,661 0.00
PHI Inc. 1,898 23,387 0.00
C&J Energy Services Inc. 7,100 22,894 0.00
Panhandle Oil and Gas Inc. 1,906 22,683 0.00
Solazyme Inc. 9,700 20,538 0.00
Evolution Petroleum Corp. 4,426 19,688 0.00
Geospace Technologies Corp. 1,964 19,482 0.00
EP Energy Corp. 5,071 18,059 0.00
Cloud Peak Energy Inc. 8,313 15,879 0.00
EXCO Resources Inc. 21,542 15,622 0.00
Energy XXI Ltd. 13,639 15,278 0.00
Gulf Island Fabrication Inc. 2,323 15,132 0.00
Gulfmark Offshore Inc. 3,638 14,675 0.00
SandRidge Energy Inc. 60,092 14,350 0.00
Jones Energy 4,100 13,592 0.00
Abraxas Petroleum Corp. 12,670 13,044 0.00
Pacific Ethanol 3,300 12,842 0.00
Pioneer Energy Services Corp. 8,471 12,615 0.00
Westmoreland Coal Co. 2,697 12,504 0.00
Erin Energy Corp. 4,599 11,911 0.00
Gastar Exploration Inc. 11,329 11,443 0.00
Basic Energy Services Inc. 4,665 11,237 0.00
Rex Energy Corp. 7,492 10,915 0.00
Hallador Energy Co. 2,700 10,612 0.00
Contango Oil & Gas Co. 2,114 10,471 0.00
W&T Offshore Inc. 4,813 10,160 0.00
Triangle Petroleum Corp. 11,530 8,884 0.00
Uranium Energy Corp. 12,169 8,746 0.00
Adams Resources & Energy Inc. 300 8,644 0.00
Isramco Inc. 139 8,370 0.00
VAALCO Energy Inc. 7,020 8,364 0.00
PetroQuest Energy Inc. 11,199 8,194 0.00
Comstock Resources Inc. 5,411 8,023 0.00
Independence Contract Drilling Inc. 1,700 7,661 0.00
PrimeEnergy Corp. 200 7,511 0.00
Eclipse Resources Corp. 5,394 7,509 0.00
Synthesis Energy Systems Inc. 12,538 7,347 0.00
Key Energy Services Inc. 21,145 7,193 0.00
Approach Resources Inc. 4,582 6,972 0.00
Zion Oil & Gas Inc. 5,221 6,761 0.00
Fairmount Santrol Holdings Inc. 3,700 6,349 0.00
TransAtlantic Petroleum Ltd. 3,800 6,225 0.00
Willbros Group Inc. 4,806 6,224 0.00
Dawson Geophysical Co. 2,778 5,954 0.00
EcoStim Energy Solutions Inc. 2,200 5,954 0.00
FX Energy Inc. 7,224 5,286 0.00
Seventy Seven Energy Inc. 6,299 4,650 0.00
Harvest Natural Resources Inc. 7,141 4,578 0.00
Magnum Hunter Resources Co. 25,949 4,454 0.00
Aspen Aerogels Inc. 800 4,341 0.00
Vertex Energy Inc. 2,800 4,224 0.00
ION Geophysical Corp. 17,286 4,024 0.00
Arch Coal Inc. 3,975 3,835 0.00
Penn Virginia Corp. 9,272 3,715 0.00
Earthstone Energy Inc. 400 3,590 0.00
Mitcham Industries Inc. 1,237 3,556 0.00
Warren Resources Inc. 11,975 3,528 0.00
Amyris Inc. 3,149 3,446 0.00
Nuverra Environmental Solutions Inc. 2,946 3,167 0.00
Gevo Inc. 2,216 2,884 0.00
Aemetis Inc. 1,800 2,867 0.00
Goodrich Petroleum Corp. 6,733 2,616 0.00
Resolute Energy Corp. 8,600 2,605 0.00
Swift Energy Co. 5,279 2,085 0.00
Dakota Plains Holdings Inc. 6,100 1,975 0.00
Yuma Energy Inc. 5,900 1,605 0.00
Enservco Corp. 4,500 1,603 0.00
Amec Foster Wheeler plc 216 1,534 0.00
Paragon Offshore plc 10,131 1,509 0.00
Glori Energy Inc. 2,800 1,450 0.00
Midstates Petroleum Co. Inc. 350 870 0.00
Royale Energy Inc. 2,200 826 0.00
60
Market % of Value Net Asset Holding (£) Value
Market % of Value Net Asset Holding (£) Value
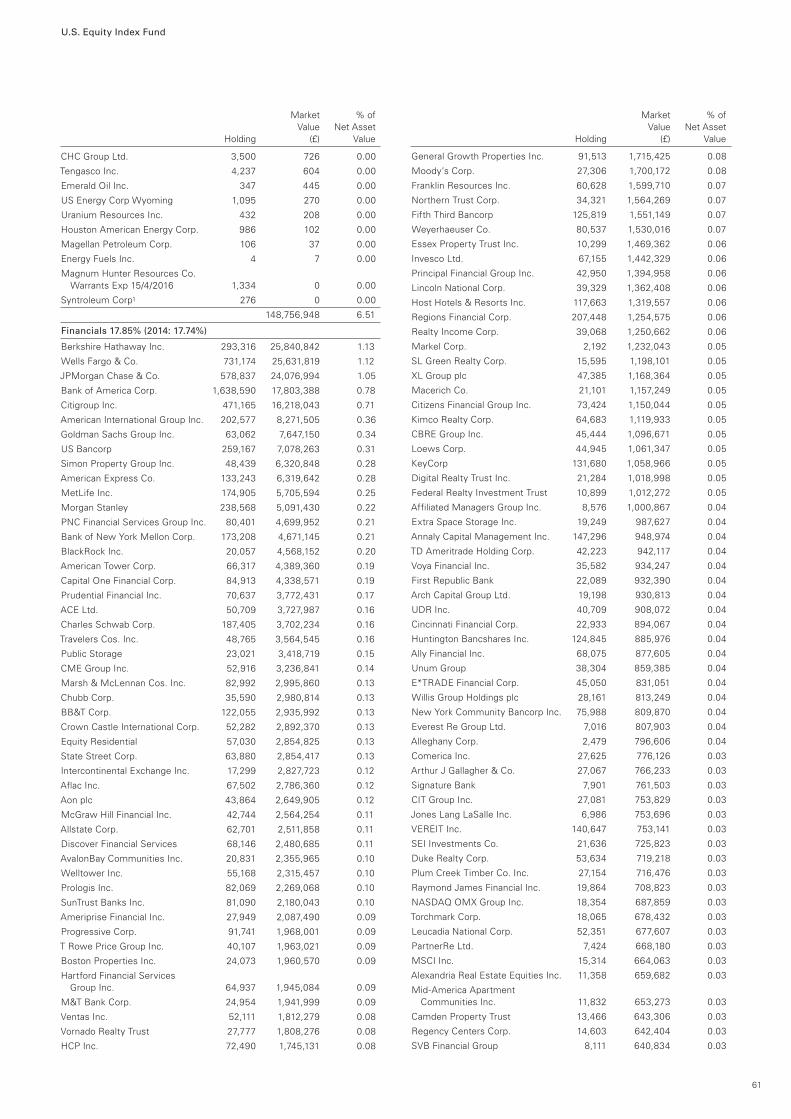
U.S. Equity Index Fund
CHC Group Ltd. 3,500 726 0.00
Tengasco Inc. 4,237 604 0.00
Emerald Oil Inc. 347 445 0.00
US Energy Corp Wyoming 1,095 270 0.00
Uranium Resources Inc. 432 208 0.00
Houston American Energy Corp. 986 102 0.00
Magellan Petroleum Corp. 106 37 0.00
Energy Fuels Inc. 4 7 0.00
Magnum Hunter Resources Co. Warrants Exp 15/4/2016 1,334 0 0.00
Syntroleum Corp1 276 0 0.00
148,756,948 6.51
Financials 17.85% (2014: 17.74%)
Berkshire Hathaway Inc. 293,316 25,840,842 1.13
Wells Fargo & Co. 731,174 25,631,819 1.12
JPMorgan Chase & Co. 578,837 24,076,994 1.05
Bank of America Corp. 1,638,590 17,803,388 0.78
Citigroup Inc. 471,165 16,218,043 0.71
American International Group Inc. 202,577 8,271,505 0.36
Goldman Sachs Group Inc. 63,062 7,647,150 0.34
US Bancorp 259,167 7,078,263 0.31
Simon Property Group Inc. 48,439 6,320,848 0.28
American Express Co. 133,243 6,319,642 0.28
MetLife Inc. 174,905 5,705,594 0.25
Morgan Stanley 238,568 5,091,430 0.22
PNC Financial Services Group Inc. 80,401 4,699,952 0.21
Bank of New York Mellon Corp. 173,208 4,671,145 0.21
BlackRock Inc. 20,057 4,568,152 0.20
American Tower Corp. 66,317 4,389,360 0.19
Capital One Financial Corp. 84,913 4,338,571 0.19
Prudential Financial Inc. 70,637 3,772,431 0.17
ACE Ltd. 50,709 3,727,987 0.16
Charles Schwab Corp. 187,405 3,702,234 0.16
Travelers Cos. Inc. 48,765 3,564,545 0.16
Public Storage 23,021 3,418,719 0.15
CME Group Inc. 52,916 3,236,841 0.14
Marsh & McLennan Cos. Inc. 82,992 2,995,860 0.13
Chubb Corp. 35,590 2,980,814 0.13
BB&T Corp. 122,055 2,935,992 0.13
Crown Castle International Corp. 52,282 2,892,370 0.13
Equity Residential 57,030 2,854,825 0.13
State Street Corp. 63,880 2,854,417 0.13
Intercontinental Exchange Inc. 17,299 2,827,723 0.12
Aflac Inc. 67,502 2,786,360 0.12
Aon plc 43,864 2,649,905 0.12
McGraw Hill Financial Inc. 42,744 2,564,254 0.11
Allstate Corp. 62,701 2,511,858 0.11
Discover Financial Services 68,146 2,480,685 0.11
AvalonBay Communities Inc. 20,831 2,355,965 0.10
Welltower Inc. 55,168 2,315,457 0.10
Prologis Inc. 82,069 2,269,068 0.10
SunTrust Banks Inc. 81,090 2,180,043 0.10
Ameriprise Financial Inc. 27,949 2,087,490 0.09
Progressive Corp. 91,741 1,968,001 0.09
T Rowe Price Group Inc. 40,107 1,963,021 0.09
Boston Properties Inc. 24,073 1,960,570 0.09
Hartford Financial Services Group Inc. 64,937 1,945,084 0.09
M&T Bank Corp. 24,954 1,941,999 0.09
Ventas Inc. 52,111 1,812,279 0.08
Vornado Realty Trust 27,777 1,808,276 0.08
HCP Inc. 72,490 1,745,131 0.08
General Growth Properties Inc. 91,513 1,715,425 0.08
Moody’s Corp. 27,306 1,700,172 0.08
Franklin Resources Inc. 60,628 1,599,710 0.07
Northern Trust Corp. 34,321 1,564,269 0.07
Fifth Third Bancorp 125,819 1,551,149 0.07
Weyerhaeuser Co. 80,537 1,530,016 0.07
Essex Property Trust Inc. 10,299 1,469,362 0.06
Invesco Ltd. 67,155 1,442,329 0.06
Principal Financial Group Inc. 42,950 1,394,958 0.06
Lincoln National Corp. 39,329 1,362,408 0.06
Host Hotels & Resorts Inc. 117,663 1,319,557 0.06
Regions Financial Corp. 207,448 1,254,575 0.06
Realty Income Corp. 39,068 1,250,662 0.06
Markel Corp. 2,192 1,232,043 0.05
SL Green Realty Corp. 15,595 1,198,101 0.05
XL Group plc 47,385 1,168,364 0.05
Macerich Co. 21,101 1,157,249 0.05
Citizens Financial Group Inc. 73,424 1,150,044 0.05
Kimco Realty Corp. 64,683 1,119,933 0.05
CBRE Group Inc. 45,444 1,096,671 0.05
Loews Corp. 44,945 1,061,347 0.05
KeyCorp 131,680 1,058,966 0.05
Digital Realty Trust Inc. 21,284 1,018,998 0.05
Federal Realty Investment Trust 10,899 1,012,272 0.05
Affiliated Managers Group Inc. 8,576 1,000,867 0.04
Extra Space Storage Inc. 19,249 987,627 0.04
Annaly Capital Management Inc. 147,296 948,974 0.04
TD Ameritrade Holding Corp. 42,223 942,117 0.04
Voya Financial Inc. 35,582 934,247 0.04
First Republic Bank 22,089 932,390 0.04
Arch Capital Group Ltd. 19,198 930,813 0.04
UDR Inc. 40,709 908,072 0.04
Cincinnati Financial Corp. 22,933 894,067 0.04
Huntington Bancshares Inc. 124,845 885,976 0.04
Ally Financial Inc. 68,075 877,605 0.04
Unum Group 38,304 859,385 0.04
E*TRADE Financial Corp. 45,050 831,051 0.04
Willis Group Holdings plc 28,161 813,249 0.04
New York Community Bancorp Inc. 75,988 809,870 0.04
Everest Re Group Ltd. 7,016 807,903 0.04
Alleghany Corp. 2,479 796,606 0.04
Comerica Inc. 27,625 776,126 0.03
Arthur J Gallagher & Co. 27,067 766,233 0.03
Signature Bank 7,901 761,503 0.03
CIT Group Inc. 27,081 753,829 0.03
Jones Lang LaSalle Inc. 6,986 753,696 0.03
VEREIT Inc. 140,647 753,141 0.03
SEI Investments Co. 21,636 725,823 0.03
Duke Realty Corp. 53,634 719,218 0.03
Plum Creek Timber Co. Inc. 27,154 716,476 0.03
Raymond James Financial Inc. 19,864 708,823 0.03
NASDAQ OMX Group Inc. 18,354 687,859 0.03
Torchmark Corp. 18,065 678,432 0.03
Leucadia National Corp. 52,351 677,607 0.03
PartnerRe Ltd. 7,424 668,180 0.03
MSCI Inc. 15,314 664,063 0.03
Alexandria Real Estate Equities Inc. 11,358 659,682 0.03
Mid-America Apartment Communities Inc. 11,832 653,273 0.03
Camden Property Trust 13,466 643,306 0.03
Regency Centers Corp. 14,603 642,404 0.03
SVB Financial Group 8,111 640,834 0.03
61
Market % of Value Net Asset Holding (£) Value
Market % of Value Net Asset Holding (£) Value
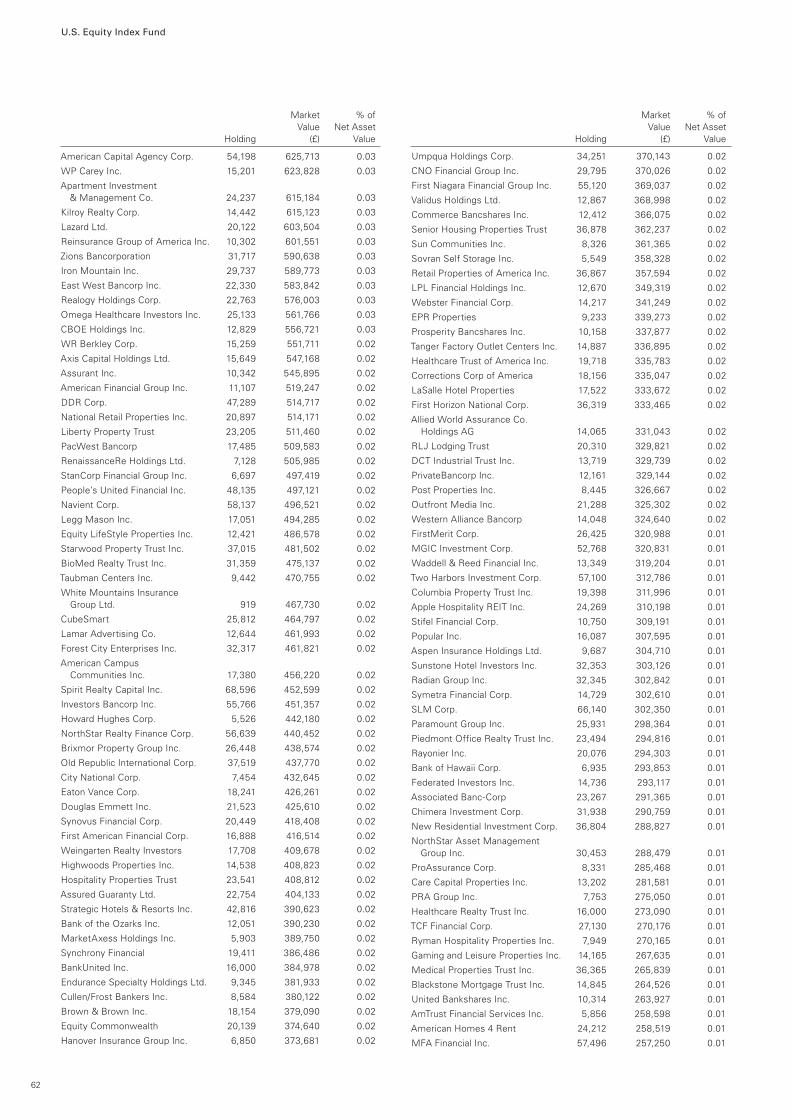
U.S. Equity Index Fund
American Capital Agency Corp. 54,198 625,713 0.03
WP Carey Inc. 15,201 623,828 0.03
Apartment Investment & Management Co. 24,237 615,184 0.03
Kilroy Realty Corp. 14,442 615,123 0.03
Lazard Ltd. 20,122 603,504 0.03
Reinsurance Group of America Inc. 10,302 601,551 0.03
Zions Bancorporation 31,717 590,638 0.03
Iron Mountain Inc. 29,737 589,773 0.03
East West Bancorp Inc. 22,330 583,842 0.03
Realogy Holdings Corp. 22,763 576,003 0.03
Omega Healthcare Investors Inc. 25,133 561,766 0.03
CBOE Holdings Inc. 12,829 556,721 0.03
WR Berkley Corp. 15,259 551,711 0.02
Axis Capital Holdings Ltd. 15,649 547,168 0.02
Assurant Inc. 10,342 545,895 0.02
American Financial Group Inc. 11,107 519,247 0.02
DDR Corp. 47,289 514,717 0.02
National Retail Properties Inc. 20,897 514,171 0.02
Liberty Property Trust 23,205 511,460 0.02
PacWest Bancorp 17,485 509,583 0.02
RenaissanceRe Holdings Ltd. 7,128 505,985 0.02
StanCorp Financial Group Inc. 6,697 497,419 0.02
People’s United Financial Inc. 48,135 497,121 0.02
Navient Corp. 58,137 496,521 0.02
Legg Mason Inc. 17,051 494,285 0.02
Equity LifeStyle Properties Inc. 12,421 486,578 0.02
Starwood Property Trust Inc. 37,015 481,502 0.02
BioMed Realty Trust Inc. 31,359 475,137 0.02
Taubman Centers Inc. 9,442 470,755 0.02
White Mountains Insurance Group Ltd. 919 467,730 0.02
CubeSmart 25,812 464,797 0.02
Lamar Advertising Co. 12,644 461,993 0.02
Forest City Enterprises Inc. 32,317 461,821 0.02
American Campus Communities Inc. 17,380 456,220 0.02
Spirit Realty Capital Inc. 68,596 452,599 0.02
Investors Bancorp Inc. 55,766 451,357 0.02
Howard Hughes Corp. 5,526 442,180 0.02
NorthStar Realty Finance Corp. 56,639 440,452 0.02
Brixmor Property Group Inc. 26,448 438,574 0.02
Old Republic International Corp. 37,519 437,770 0.02
City National Corp. 7,454 432,645 0.02
Eaton Vance Corp. 18,241 426,261 0.02
Douglas Emmett Inc. 21,523 425,610 0.02
Synovus Financial Corp. 20,449 418,408 0.02
First American Financial Corp. 16,888 416,514 0.02
Weingarten Realty Investors 17,708 409,678 0.02
Highwoods Properties Inc. 14,538 408,823 0.02
Hospitality Properties Trust 23,541 408,812 0.02
Assured Guaranty Ltd. 22,754 404,133 0.02
Strategic Hotels & Resorts Inc. 42,816 390,623 0.02
Bank of the Ozarks Inc. 12,051 390,230 0.02
MarketAxess Holdings Inc. 5,903 389,750 0.02
Synchrony Financial 19,411 386,486 0.02
BankUnited Inc. 16,000 384,978 0.02
Endurance Specialty Holdings Ltd. 9,345 381,933 0.02
Cullen/Frost Bankers Inc. 8,584 380,122 0.02
Brown & Brown Inc. 18,154 379,090 0.02
Equity Commonwealth 20,139 374,640 0.02
Hanover Insurance Group Inc. 6,850 373,681 0.02
Umpqua Holdings Corp. 34,251 370,143 0.02
CNO Financial Group Inc. 29,795 370,026 0.02
First Niagara Financial Group Inc. 55,120 369,037 0.02
Validus Holdings Ltd. 12,867 368,998 0.02
Commerce Bancshares Inc. 12,412 366,075 0.02
Senior Housing Properties Trust 36,878 362,237 0.02
Sun Communities Inc. 8,326 361,365 0.02
Sovran Self Storage Inc. 5,549 358,328 0.02
Retail Properties of America Inc. 36,867 357,594 0.02
LPL Financial Holdings Inc. 12,670 349,319 0.02
Webster Financial Corp. 14,217 341,249 0.02
EPR Properties 9,233 339,273 0.02
Prosperity Bancshares Inc. 10,158 337,877 0.02
Tanger Factory Outlet Centers Inc. 14,887 336,895 0.02
Healthcare Trust of America Inc. 19,718 335,783 0.02
Corrections Corp of America 18,156 335,047 0.02
LaSalle Hotel Properties 17,522 333,672 0.02
First Horizon National Corp. 36,319 333,465 0.02
Allied World Assurance Co. Holdings AG 14,065 331,043 0.02
RLJ Lodging Trust 20,310 329,821 0.02
DCT Industrial Trust Inc. 13,719 329,739 0.02
PrivateBancorp Inc. 12,161 329,144 0.02
Post Properties Inc. 8,445 326,667 0.02
Outfront Media Inc. 21,288 325,302 0.02
Western Alliance Bancorp 14,048 324,640 0.02
FirstMerit Corp. 26,425 320,988 0.01
MGIC Investment Corp. 52,768 320,831 0.01
Waddell & Reed Financial Inc. 13,349 319,204 0.01
Two Harbors Investment Corp. 57,100 312,786 0.01
Columbia Property Trust Inc. 19,398 311,996 0.01
Apple Hospitality REIT Inc. 24,269 310,198 0.01
Stifel Financial Corp. 10,750 309,191 0.01
Popular Inc. 16,087 307,595 0.01
Aspen Insurance Holdings Ltd. 9,687 304,710 0.01
Sunstone Hotel Investors Inc. 32,353 303,126 0.01
Radian Group Inc. 32,345 302,842 0.01
Symetra Financial Corp. 14,729 302,610 0.01
SLM Corp. 66,140 302,350 0.01
Paramount Group Inc. 25,931 298,364 0.01
Piedmont Office Realty Trust Inc. 23,494 294,816 0.01
Rayonier Inc. 20,076 294,303 0.01
Bank of Hawaii Corp. 6,935 293,853 0.01
Federated Investors Inc. 14,736 293,117 0.01
Associated Banc-Corp 23,267 291,365 0.01
Chimera Investment Corp. 31,938 290,759 0.01
New Residential Investment Corp. 36,804 288,827 0.01
NorthStar Asset Management Group Inc. 30,453 288,479 0.01
ProAssurance Corp. 8,331 285,468 0.01
Care Capital Properties Inc. 13,202 281,581 0.01
PRA Group Inc. 7,753 275,050 0.01
Healthcare Realty Trust Inc. 16,000 273,090 0.01
TCF Financial Corp. 27,130 270,176 0.01
Ryman Hospitality Properties Inc. 7,949 270,165 0.01
Gaming and Leisure Properties Inc. 14,165 267,635 0.01
Medical Properties Trust Inc. 36,365 265,839 0.01
Blackstone Mortgage Trust Inc. 14,845 264,526 0.01
United Bankshares Inc. 10,314 263,927 0.01
AmTrust Financial Services Inc. 5,856 258,598 0.01
American Homes 4 Rent 24,212 258,519 0.01
MFA Financial Inc. 57,496 257,250 0.01
62
Market % of Value Net Asset Holding (£) Value
Market % of Value Net Asset Holding (£) Value
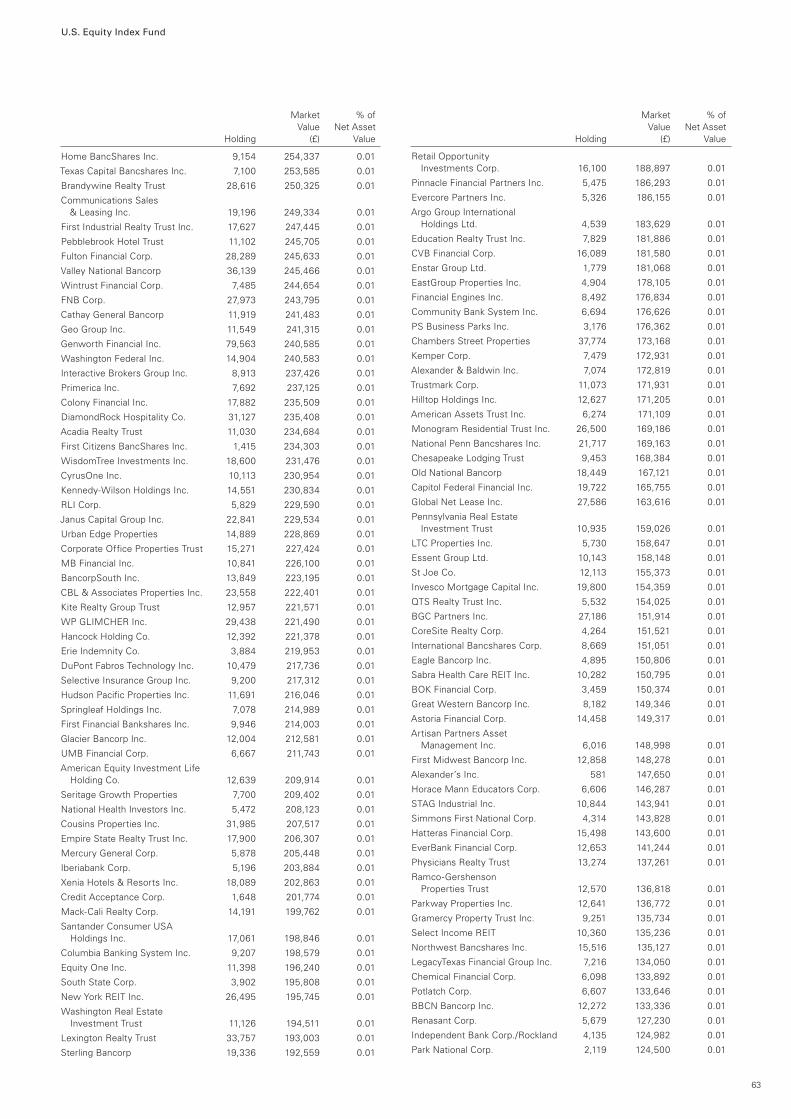
U.S. Equity Index Fund
Home BancShares Inc. 9,154 254,337 0.01
Texas Capital Bancshares Inc. 7,100 253,585 0.01
Brandywine Realty Trust 28,616 250,325 0.01
Communications Sales & Leasing Inc. 19,196 249,334 0.01
First Industrial Realty Trust Inc. 17,627 247,445 0.01
Pebblebrook Hotel Trust 11,102 245,705 0.01
Fulton Financial Corp. 28,289 245,633 0.01
Valley National Bancorp 36,139 245,466 0.01
Wintrust Financial Corp. 7,485 244,654 0.01
FNB Corp. 27,973 243,795 0.01
Cathay General Bancorp 11,919 241,483 0.01
Geo Group Inc. 11,549 241,315 0.01
Genworth Financial Inc. 79,563 240,585 0.01
Washington Federal Inc. 14,904 240,583 0.01
Interactive Brokers Group Inc. 8,913 237,426 0.01
Primerica Inc. 7,692 237,125 0.01
Colony Financial Inc. 17,882 235,509 0.01
DiamondRock Hospitality Co. 31,127 235,408 0.01
Acadia Realty Trust 11,030 234,684 0.01
First Citizens BancShares Inc. 1,415 234,303 0.01
WisdomTree Investments Inc. 18,600 231,476 0.01
CyrusOne Inc. 10,113 230,954 0.01
Kennedy-Wilson Holdings Inc. 14,551 230,834 0.01
RLI Corp. 5,829 229,590 0.01
Janus Capital Group Inc. 22,841 229,534 0.01
Urban Edge Properties 14,889 228,869 0.01
Corporate Office Properties Trust 15,271 227,424 0.01
MB Financial Inc. 10,841 226,100 0.01
BancorpSouth Inc. 13,849 223,195 0.01
CBL & Associates Properties Inc. 23,558 222,401 0.01
Kite Realty Group Trust 12,957 221,571 0.01
WP GLIMCHER Inc. 29,438 221,490 0.01
Hancock Holding Co. 12,392 221,378 0.01
Erie Indemnity Co. 3,884 219,953 0.01
DuPont Fabros Technology Inc. 10,479 217,736 0.01
Selective Insurance Group Inc. 9,200 217,312 0.01
Hudson Pacific Properties Inc. 11,691 216,046 0.01
Springleaf Holdings Inc. 7,078 214,989 0.01
First Financial Bankshares Inc. 9,946 214,003 0.01
Glacier Bancorp Inc. 12,004 212,581 0.01
UMB Financial Corp. 6,667 211,743 0.01
American Equity Investment Life Holding Co. 12,639 209,914 0.01
Seritage Growth Properties 7,700 209,402 0.01
National Health Investors Inc. 5,472 208,123 0.01
Cousins Properties Inc. 31,985 207,517 0.01
Empire State Realty Trust Inc. 17,900 206,307 0.01
Mercury General Corp. 5,878 205,448 0.01
Iberiabank Corp. 5,196 203,884 0.01
Xenia Hotels & Resorts Inc. 18,089 202,863 0.01
Credit Acceptance Corp. 1,648 201,774 0.01
Mack-Cali Realty Corp. 14,191 199,762 0.01
Santander Consumer USA Holdings Inc. 17,061 198,846 0.01
Columbia Banking System Inc. 9,207 198,579 0.01
Equity One Inc. 11,398 196,240 0.01
South State Corp. 3,902 195,808 0.01
New York REIT Inc. 26,495 195,745 0.01
Washington Real Estate Investment Trust 11,126 194,511 0.01
Lexington Realty Trust 33,757 193,003 0.01
Sterling Bancorp 19,336 192,559 0.01
Retail Opportunity Investments Corp. 16,100 188,897 0.01
Pinnacle Financial Partners Inc. 5,475 186,293 0.01
Evercore Partners Inc. 5,326 186,155 0.01
Argo Group International Holdings Ltd. 4,539 183,629 0.01
Education Realty Trust Inc. 7,829 181,886 0.01
CVB Financial Corp. 16,089 181,580 0.01
Enstar Group Ltd. 1,779 181,068 0.01
EastGroup Properties Inc. 4,904 178,105 0.01
Financial Engines Inc. 8,492 176,834 0.01
Community Bank System Inc. 6,694 176,626 0.01
PS Business Parks Inc. 3,176 176,362 0.01
Chambers Street Properties 37,774 173,168 0.01
Kemper Corp. 7,479 172,931 0.01
Alexander & Baldwin Inc. 7,074 172,819 0.01
Trustmark Corp. 11,073 171,931 0.01
Hilltop Holdings Inc. 12,627 171,205 0.01
American Assets Trust Inc. 6,274 171,109 0.01
Monogram Residential Trust Inc. 26,500 169,186 0.01
National Penn Bancshares Inc. 21,717 169,163 0.01
Chesapeake Lodging Trust 9,453 168,384 0.01
Old National Bancorp 18,449 167,121 0.01
Capitol Federal Financial Inc. 19,722 165,755 0.01
Global Net Lease Inc. 27,586 163,616 0.01
Pennsylvania Real Estate Investment Trust 10,935 159,026 0.01
LTC Properties Inc. 5,730 158,647 0.01
Essent Group Ltd. 10,143 158,148 0.01
St Joe Co. 12,113 155,373 0.01
Invesco Mortgage Capital Inc. 19,800 154,359 0.01
QTS Realty Trust Inc. 5,532 154,025 0.01
BGC Partners Inc. 27,186 151,914 0.01
CoreSite Realty Corp. 4,264 151,521 0.01
International Bancshares Corp. 8,669 151,051 0.01
Eagle Bancorp Inc. 4,895 150,806 0.01
Sabra Health Care REIT Inc. 10,282 150,795 0.01
BOK Financial Corp. 3,459 150,374 0.01
Great Western Bancorp Inc. 8,182 149,346 0.01
Astoria Financial Corp. 14,458 149,317 0.01
Artisan Partners Asset Management Inc. 6,016 148,998 0.01
First Midwest Bancorp Inc. 12,858 148,278 0.01
Alexander’s Inc. 581 147,650 0.01
Horace Mann Educators Corp. 6,606 146,287 0.01
STAG Industrial Inc. 10,844 143,941 0.01
Simmons First National Corp. 4,314 143,828 0.01
Hatteras Financial Corp. 15,498 143,600 0.01
EverBank Financial Corp. 12,653 141,244 0.01
Physicians Realty Trust 13,274 137,261 0.01
Ramco-Gershenson Properties Trust 12,570 136,818 0.01
Parkway Properties Inc. 12,641 136,772 0.01
Gramercy Property Trust Inc. 9,251 135,734 0.01
Select Income REIT 10,360 135,236 0.01
Northwest Bancshares Inc. 15,516 135,127 0.01
LegacyTexas Financial Group Inc. 7,216 134,050 0.01
Chemical Financial Corp. 6,098 133,892 0.01
Potlatch Corp. 6,607 133,646 0.01
BBCN Bancorp Inc. 12,272 133,336 0.01
Renasant Corp. 5,679 127,230 0.01
Independent Bank Corp./Rockland 4,135 124,982 0.01
Park National Corp. 2,119 124,500 0.01
63
Market % of Value Net Asset Holding (£) Value
Market % of Value Net Asset Holding (£) Value

U.S. Equity Index Fund
HFF Inc. 5,538 123,569 0.01
Hersha Hospitality Trust 7,932 123,315 0.01
CYS Investments Inc. 24,700 123,308 0.01
Beneficial Bancorp Inc. 13,723 123,155 0.01
Provident Financial Services Inc. 9,366 123,109 0.01
Westamerica Bancorporation 4,281 122,354 0.01
First Financial Bancorp 9,801 122,290 0.01
NBT Bancorp Inc. 6,719 122,120 0.01
United Community Banks Inc. 9,213 120,203 0.01
STORE Capital Corp. 8,189 120,046 0.01
WesBanco Inc. 5,673 119,932 0.01
Government Properties Income Trust 11,325 119,454 0.01
National General Holdings Corp. 9,367 119,423 0.01
TFS Financial Corp. 10,462 118,886 0.01
Summit Hotel Properties Inc. 13,900 117,633 0.01
Union Bankshares Corp. 7,235 117,257 0.01
Redwood Trust Inc. 13,496 115,962 0.01
S&T Bancorp Inc. 5,618 115,823 0.01
PennyMac Mortgage Investment Trust 12,060 114,009 0.01
iStar Financial Inc. 13,593 113,979 0.01
TowneBank 8,171 113,486 0.01
AMERISAFE Inc. 3,173 112,382 0.01
First Cash Financial Services Inc. 4,528 111,705 0.01
BofI Holding Inc. 2,130 110,196 0.01
Universal Insurance Holdings Inc. 5,330 108,850 0.01
Talmer Bancorp Inc. 9,994 108,780 0.01
FelCor Lodging Trust Inc. 20,773 108,277 0.01
MBIA Inc. 22,250 108,196 0.01
Banner Corp. 3,393 107,652 0.01
CNA Financial Corp. 4,465 105,669 0.01
Investors Real Estate Trust 19,951 104,767 0.01
Terreno Realty Corp. 7,221 104,547 0.01
First Merchants Corp. 6,064 102,912 0.01
Navigators Group Inc. 1,861 102,835 0.01
Cash America International Inc. 4,486 100,444 0.01
ServisFirst Bancshares Inc. 3,636 99,705 0.01
Capstead Mortgage Corp. 15,900 99,246 0.01
Boston Private Financial Holdings Inc. 13,291 98,280 0.01
Apollo Commercial Real Estate Finance Inc. 9,137 98,268 0.01
Stewart Information Services Corp. 3,742 97,184 0.01
Encore Capital Group Inc. 3,663 96,461 0.01
Infinity Property & Casualty Corp. 1,829 95,133 0.01
Franklin Street Properties Corp. 13,976 94,386 0.00
Starwood Waypoint Residential Trust 5,918 94,227 0.00
Maiden Holdings Ltd. 9,347 94,051 0.00
Chatham Lodging Trust 6,282 93,107 0.00
ARMOUR Residential REIT Inc. 7,012 93,030 0.00
Capital Bank Financial Corp. 4,380 91,576 0.00
Green Dot Corp. 7,512 90,033 0.00
New Senior Investment Group Inc. 13,793 89,220 0.00
WSFS Financial Corp. 4,338 89,125 0.00
Rexford Industrial Realty Inc. 9,098 89,071 0.00
American National Insurance Co. 1,321 88,204 0.00
Employers Holdings Inc. 5,098 87,310 0.00
Safety Insurance Group Inc. 2,319 86,850 0.00
LendingTree Inc. 1,100 86,389 0.00
Altisource Residential Corp. 9,221 85,798 0.00
Ameris Bancorp 4,200 85,664 0.00
Berkshire Hills Bancorp Inc. 4,624 85,600 0.00
Hanmi Financial Corp. 5,137 84,685 0.00
United Fire Group Inc. 3,507 84,360 0.00
First Commonwealth Financial Corp. 13,937 82,752 0.00
BNC Bancorp 5,654 82,042 0.00
Virtus Investment Partners Inc. 1,078 81,632 0.00
State Bank Financial Corp. 5,858 81,058 0.00
Brookline Bancorp Inc. 11,005 80,806 0.00
Inland Real Estate Corp. 14,068 80,524 0.00
National Bank Holdings Corp. 5,582 79,660 0.00
PHH Corp. 8,315 79,037 0.00
Cardinal Financial Corp. 5,336 78,499 0.00
Walker & Dunlop Inc. 4,181 78,455 0.00
Ambac Financial Group Inc. 7,500 78,283 0.00
Ocwen Financial Corp. 17,291 78,260 0.00
Third Point Reinsurance Ltd. 8,764 77,573 0.00
City Holding Co. 2,490 76,970 0.00
American Capital Mortgage Investment Corp. 8,170 76,759 0.00
Lakeland Financial Corp. 2,624 76,338 0.00
Wilshire Bancorp Inc. 11,021 76,214 0.00
Northfield Bancorp Inc. 7,522 74,567 0.00
Central Pacific Financial Corp. 5,150 74,429 0.00
Greenhill & Co. Inc. 4,415 73,955 0.00
Nelnet Inc. 3,196 73,940 0.00
TIER REIT Inc. 7,801 73,393 0.00
Greenlight Capital Re Ltd. 5,120 72,769 0.00
Customers Bancorp Inc. 4,067 72,286 0.00
Meridian Bancorp Inc. 7,867 71,416 0.00
Tompkins Financial Corp. 2,020 70,760 0.00
Sandy Spring Bancorp Inc. 3,891 69,209 0.00
First Potomac Realty Trust 9,046 69,057 0.00
Centerstate Banks Inc. 7,270 68,539 0.00
Rouse Properties Inc. 5,938 67,670 0.00
1st Source Corp. 3,282 67,451 0.00
FBL Financial Group Inc. 1,611 65,477 0.00
Monmouth Real Estate Investment Corp. 9,681 65,255 0.00
Southside Bancshares Inc. 3,753 65,247 0.00
Saul Centers Inc. 1,789 64,950 0.00
Marcus & Millichap Inc. 2,300 64,768 0.00
Diamond Hill Investment Group Inc. 501 64,724 0.00
United Financial Bancorp Inc. 7,699 64,607 0.00
KCG Holdings Inc. 7,942 64,126 0.00
Hannon Armstrong Sustainable Infrastructure Capital Inc. 5,500 64,031 0.00
New York Mortgage Trust Inc. 17,400 63,994 0.00
Heartland Financial USA Inc. 2,659 63,307 0.00
Getty Realty Corp. 5,800 63,280 0.00
Oritani Financial Corp. 6,122 63,067 0.00
TrustCo Bank Corp NY 15,542 62,695 0.00
First NBC Bank Holding Co. 2,600 62,492 0.00
Yadkin Financial Corp. 4,093 62,254 0.00
Enterprise Financial Services Corp. 3,331 61,060 0.00
Ladder Capital Corp. 6,600 60,812 0.00
Ashford Hospitality Trust Inc. 13,609 60,537 0.00
Universal Health Realty Income Trust 1,878 60,326 0.00
Silver Bay Realty Trust Corp. 5,642 59,255 0.00
Cohen & Steers Inc. 2,969 58,749 0.00
InfraREIT Inc. 3,775 58,370 0.00
Washington Trust Bancorp Inc. 2,305 57,849 0.00
64
Market % of Value Net Asset Holding (£) Value
Market % of Value Net Asset Holding (£) Value
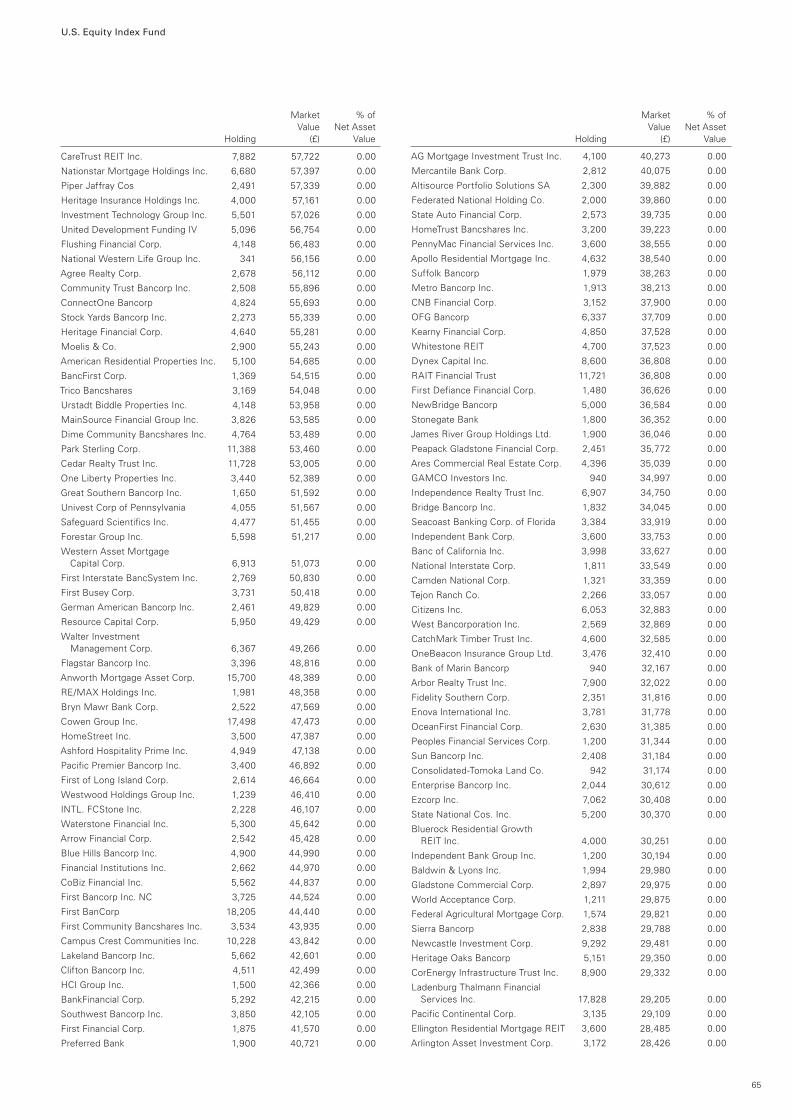
U.S. Equity Index Fund
CareTrust REIT Inc. 7,882 57,722 0.00
Nationstar Mortgage Holdings Inc. 6,680 57,397 0.00
Piper Jaffray Cos 2,491 57,339 0.00
Heritage Insurance Holdings Inc. 4,000 57,161 0.00
Investment Technology Group Inc. 5,501 57,026 0.00
United Development Funding IV 5,096 56,754 0.00
Flushing Financial Corp. 4,148 56,483 0.00
National Western Life Group Inc. 341 56,156 0.00
Agree Realty Corp. 2,678 56,112 0.00
Community Trust Bancorp Inc. 2,508 55,896 0.00
ConnectOne Bancorp 4,824 55,693 0.00
Stock Yards Bancorp Inc. 2,273 55,339 0.00
Heritage Financial Corp. 4,640 55,281 0.00
Moelis & Co. 2,900 55,243 0.00
American Residential Properties Inc. 5,100 54,685 0.00
BancFirst Corp. 1,369 54,515 0.00
Trico Bancshares 3,169 54,048 0.00
Urstadt Biddle Properties Inc. 4,148 53,958 0.00
MainSource Financial Group Inc. 3,826 53,585 0.00
Dime Community Bancshares Inc. 4,764 53,489 0.00
Park Sterling Corp. 11,388 53,460 0.00
Cedar Realty Trust Inc. 11,728 53,005 0.00
One Liberty Properties Inc. 3,440 52,389 0.00
Great Southern Bancorp Inc. 1,650 51,592 0.00
Univest Corp of Pennsylvania 4,055 51,567 0.00
Safeguard Scientifics Inc. 4,477 51,455 0.00
Forestar Group Inc. 5,598 51,217 0.00
Western Asset Mortgage Capital Corp. 6,913 51,073 0.00
First Interstate BancSystem Inc. 2,769 50,830 0.00
First Busey Corp. 3,731 50,418 0.00
German American Bancorp Inc. 2,461 49,829 0.00
Resource Capital Corp. 5,950 49,429 0.00
Walter Investment Management Corp. 6,367 49,266 0.00
Flagstar Bancorp Inc. 3,396 48,816 0.00
Anworth Mortgage Asset Corp. 15,700 48,389 0.00
RE/MAX Holdings Inc. 1,981 48,358 0.00
Bryn Mawr Bank Corp. 2,522 47,569 0.00
Cowen Group Inc. 17,498 47,473 0.00
HomeStreet Inc. 3,500 47,387 0.00
Ashford Hospitality Prime Inc. 4,949 47,138 0.00
Pacific Premier Bancorp Inc. 3,400 46,892 0.00
First of Long Island Corp. 2,614 46,664 0.00
Westwood Holdings Group Inc. 1,239 46,410 0.00
INTL. FCStone Inc. 2,228 46,107 0.00
Waterstone Financial Inc. 5,300 45,642 0.00
Arrow Financial Corp. 2,542 45,428 0.00
Blue Hills Bancorp Inc. 4,900 44,990 0.00
Financial Institutions Inc. 2,662 44,970 0.00
CoBiz Financial Inc. 5,562 44,837 0.00
First Bancorp Inc. NC 3,725 44,524 0.00
First BanCorp 18,205 44,440 0.00
First Community Bancshares Inc. 3,534 43,935 0.00
Campus Crest Communities Inc. 10,228 43,842 0.00
Lakeland Bancorp Inc. 5,662 42,601 0.00
Clifton Bancorp Inc. 4,511 42,499 0.00
HCI Group Inc. 1,500 42,366 0.00
BankFinancial Corp. 5,292 42,215 0.00
Southwest Bancorp Inc. 3,850 42,105 0.00
First Financial Corp. 1,875 41,570 0.00
Preferred Bank 1,900 40,721 0.00
AG Mortgage Investment Trust Inc. 4,100 40,273 0.00
Mercantile Bank Corp. 2,812 40,075 0.00
Altisource Portfolio Solutions SA 2,300 39,882 0.00
Federated National Holding Co. 2,000 39,860 0.00
State Auto Financial Corp. 2,573 39,735 0.00
HomeTrust Bancshares Inc. 3,200 39,223 0.00
PennyMac Financial Services Inc. 3,600 38,555 0.00
Apollo Residential Mortgage Inc. 4,632 38,540 0.00
Suffolk Bancorp 1,979 38,263 0.00
Metro Bancorp Inc. 1,913 38,213 0.00
CNB Financial Corp. 3,152 37,900 0.00
OFG Bancorp 6,337 37,709 0.00
Kearny Financial Corp. 4,850 37,528 0.00
Whitestone REIT 4,700 37,523 0.00
Dynex Capital Inc. 8,600 36,808 0.00
RAIT Financial Trust 11,721 36,808 0.00
First Defiance Financial Corp. 1,480 36,626 0.00
NewBridge Bancorp 5,000 36,584 0.00
Stonegate Bank 1,800 36,352 0.00
James River Group Holdings Ltd. 1,900 36,046 0.00
Peapack Gladstone Financial Corp. 2,451 35,772 0.00
Ares Commercial Real Estate Corp. 4,396 35,039 0.00
GAMCO Investors Inc. 940 34,997 0.00
Independence Realty Trust Inc. 6,907 34,750 0.00
Bridge Bancorp Inc. 1,832 34,045 0.00
Seacoast Banking Corp. of Florida 3,384 33,919 0.00
Independent Bank Corp. 3,600 33,753 0.00
Banc of California Inc. 3,998 33,627 0.00
National Interstate Corp. 1,811 33,549 0.00
Camden National Corp. 1,321 33,359 0.00
Tejon Ranch Co. 2,266 33,057 0.00
Citizens Inc. 6,053 32,883 0.00
West Bancorporation Inc. 2,569 32,869 0.00
CatchMark Timber Trust Inc. 4,600 32,585 0.00
OneBeacon Insurance Group Ltd. 3,476 32,410 0.00
Bank of Marin Bancorp 940 32,167 0.00
Arbor Realty Trust Inc. 7,900 32,022 0.00
Fidelity Southern Corp. 2,351 31,816 0.00
Enova International Inc. 3,781 31,778 0.00
OceanFirst Financial Corp. 2,630 31,385 0.00
Peoples Financial Services Corp. 1,200 31,344 0.00
Sun Bancorp Inc. 2,408 31,184 0.00
Consolidated-Tomoka Land Co. 942 31,174 0.00
Enterprise Bancorp Inc. 2,044 30,612 0.00
Ezcorp Inc. 7,062 30,408 0.00
State National Cos. Inc. 5,200 30,370 0.00
Bluerock Residential Growth REIT Inc. 4,000 30,251 0.00
Independent Bank Group Inc. 1,200 30,194 0.00
Baldwin & Lyons Inc. 1,994 29,980 0.00
Gladstone Commercial Corp. 2,897 29,975 0.00
World Acceptance Corp. 1,211 29,875 0.00
Federal Agricultural Mortgage Corp. 1,574 29,821 0.00
Sierra Bancorp 2,838 29,788 0.00
Newcastle Investment Corp. 9,292 29,481 0.00
Heritage Oaks Bancorp 5,151 29,350 0.00
CorEnergy Infrastructure Trust Inc. 8,900 29,332 0.00
Ladenburg Thalmann Financial Services Inc. 17,828 29,205 0.00
Pacific Continental Corp. 3,135 29,109 0.00
Ellington Residential Mortgage REIT 3,600 28,485 0.00
Arlington Asset Investment Corp. 3,172 28,426 0.00
65
Market % of Value Net Asset Holding (£) Value
Market % of Value Net Asset Holding (£) Value
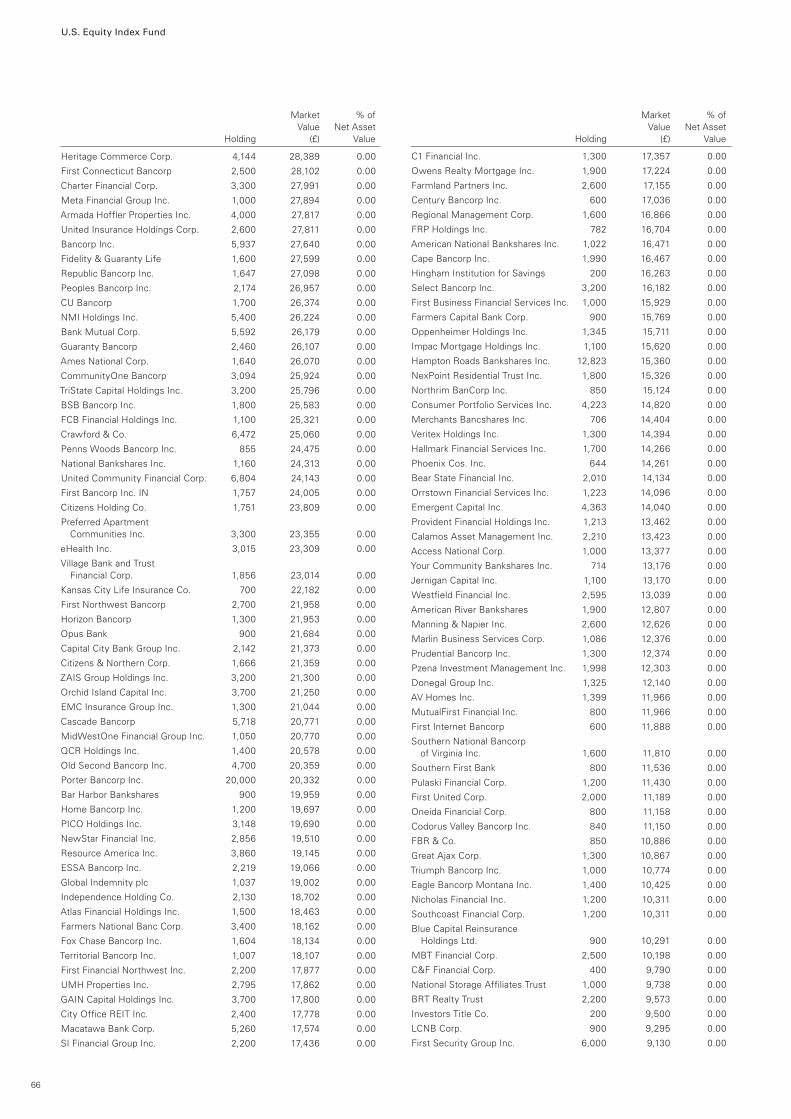
U.S. Equity Index Fund
Heritage Commerce Corp. 4,144 28,389 0.00
First Connecticut Bancorp 2,500 28,102 0.00
Charter Financial Corp. 3,300 27,991 0.00
Meta Financial Group Inc. 1,000 27,894 0.00
Armada Hoffler Properties Inc. 4,000 27,817 0.00
United Insurance Holdings Corp. 2,600 27,811 0.00
Bancorp Inc. 5,937 27,640 0.00
Fidelity & Guaranty Life 1,600 27,599 0.00
Republic Bancorp Inc. 1,647 27,098 0.00
Peoples Bancorp Inc. 2,174 26,957 0.00
CU Bancorp 1,700 26,374 0.00
NMI Holdings Inc. 5,400 26,224 0.00
Bank Mutual Corp. 5,592 26,179 0.00
Guaranty Bancorp 2,460 26,107 0.00
Ames National Corp. 1,640 26,070 0.00
CommunityOne Bancorp 3,094 25,924 0.00
TriState Capital Holdings Inc. 3,200 25,796 0.00
BSB Bancorp Inc. 1,800 25,583 0.00
FCB Financial Holdings Inc. 1,100 25,321 0.00
Crawford & Co. 6,472 25,060 0.00
Penns Woods Bancorp Inc. 855 24,475 0.00
National Bankshares Inc. 1,160 24,313 0.00
United Community Financial Corp. 6,804 24,143 0.00
First Bancorp Inc. IN 1,757 24,005 0.00
Citizens Holding Co. 1,751 23,809 0.00
Preferred Apartment Communities Inc. 3,300 23,355 0.00
eHealth Inc. 3,015 23,309 0.00
Village Bank and Trust Financial Corp. 1,856 23,014 0.00
Kansas City Life Insurance Co. 700 22,182 0.00
First Northwest Bancorp 2,700 21,958 0.00
Horizon Bancorp 1,300 21,953 0.00
Opus Bank 900 21,684 0.00
Capital City Bank Group Inc. 2,142 21,373 0.00
Citizens & Northern Corp. 1,666 21,359 0.00
ZAIS Group Holdings Inc. 3,200 21,300 0.00
Orchid Island Capital Inc. 3,700 21,250 0.00
EMC Insurance Group Inc. 1,300 21,044 0.00
Cascade Bancorp 5,718 20,771 0.00
MidWestOne Financial Group Inc. 1,050 20,770 0.00
QCR Holdings Inc. 1,400 20,578 0.00
Old Second Bancorp Inc. 4,700 20,359 0.00
Porter Bancorp Inc. 20,000 20,332 0.00
Bar Harbor Bankshares 900 19,959 0.00
Home Bancorp Inc. 1,200 19,697 0.00
PICO Holdings Inc. 3,148 19,690 0.00
NewStar Financial Inc. 2,856 19,510 0.00
Resource America Inc. 3,860 19,145 0.00
ESSA Bancorp Inc. 2,219 19,066 0.00
Global Indemnity plc 1,037 19,002 0.00
Independence Holding Co. 2,130 18,702 0.00
Atlas Financial Holdings Inc. 1,500 18,463 0.00
Farmers National Banc Corp. 3,400 18,162 0.00
Fox Chase Bancorp Inc. 1,604 18,134 0.00
Territorial Bancorp Inc. 1,007 18,107 0.00
First Financial Northwest Inc. 2,200 17,877 0.00
UMH Properties Inc. 2,795 17,862 0.00
GAIN Capital Holdings Inc. 3,700 17,800 0.00
City Office REIT Inc. 2,400 17,778 0.00
Macatawa Bank Corp. 5,260 17,574 0.00
SI Financial Group Inc. 2,200 17,436 0.00
C1 Financial Inc. 1,300 17,357 0.00
Owens Realty Mortgage Inc. 1,900 17,224 0.00
Farmland Partners Inc. 2,600 17,155 0.00
Century Bancorp Inc. 600 17,036 0.00
Regional Management Corp. 1,600 16,866 0.00
FRP Holdings Inc. 782 16,704 0.00
American National Bankshares Inc. 1,022 16,471 0.00
Cape Bancorp Inc. 1,990 16,467 0.00
Hingham Institution for Savings 200 16,263 0.00
Select Bancorp Inc. 3,200 16,182 0.00
First Business Financial Services Inc. 1,000 15,929 0.00
Farmers Capital Bank Corp. 900 15,769 0.00
Oppenheimer Holdings Inc. 1,345 15,711 0.00
Impac Mortgage Holdings Inc. 1,100 15,620 0.00
Hampton Roads Bankshares Inc. 12,823 15,360 0.00
NexPoint Residential Trust Inc. 1,800 15,326 0.00
Northrim BanCorp Inc. 850 15,124 0.00
Consumer Portfolio Services Inc. 4,223 14,820 0.00
Merchants Bancshares Inc. 706 14,404 0.00
Veritex Holdings Inc. 1,300 14,394 0.00
Hallmark Financial Services Inc. 1,700 14,266 0.00
Phoenix Cos. Inc. 644 14,261 0.00
Bear State Financial Inc. 2,010 14,134 0.00
Orrstown Financial Services Inc. 1,223 14,096 0.00
Emergent Capital Inc. 4,363 14,040 0.00
Provident Financial Holdings Inc. 1,213 13,462 0.00
Calamos Asset Management Inc. 2,210 13,423 0.00
Access National Corp. 1,000 13,377 0.00
Your Community Bankshares Inc. 714 13,176 0.00
Jernigan Capital Inc. 1,100 13,170 0.00
Westfield Financial Inc. 2,595 13,039 0.00
American River Bankshares 1,900 12,807 0.00
Manning & Napier Inc. 2,600 12,626 0.00
Marlin Business Services Corp. 1,086 12,376 0.00
Prudential Bancorp Inc. 1,300 12,374 0.00
Pzena Investment Management Inc. 1,998 12,303 0.00
Donegal Group Inc. 1,325 12,140 0.00
AV Homes Inc. 1,399 11,966 0.00
MutualFirst Financial Inc. 800 11,966 0.00
First Internet Bancorp 600 11,888 0.00
Southern National Bancorp of Virginia Inc. 1,600 11,810 0.00
Southern First Bank 800 11,536 0.00
Pulaski Financial Corp. 1,200 11,430 0.00
First United Corp. 2,000 11,189 0.00
Oneida Financial Corp. 800 11,158 0.00
Codorus Valley Bancorp Inc. 840 11,150 0.00
FBR & Co. 850 10,886 0.00
Great Ajax Corp. 1,300 10,867 0.00
Triumph Bancorp Inc. 1,000 10,774 0.00
Eagle Bancorp Montana Inc. 1,400 10,425 0.00
Nicholas Financial Inc. 1,200 10,311 0.00
Southcoast Financial Corp. 1,200 10,311 0.00
Blue Capital Reinsurance Holdings Ltd. 900 10,291 0.00
MBT Financial Corp. 2,500 10,198 0.00
C&F Financial Corp. 400 9,790 0.00
National Storage Affiliates Trust 1,000 9,738 0.00
BRT Realty Trust 2,200 9,573 0.00
Investors Title Co. 200 9,500 0.00
LCNB Corp. 900 9,295 0.00
First Security Group Inc. 6,000 9,130 0.00
66
Market % of Value Net Asset Holding (£) Value
Market % of Value Net Asset Holding (£) Value
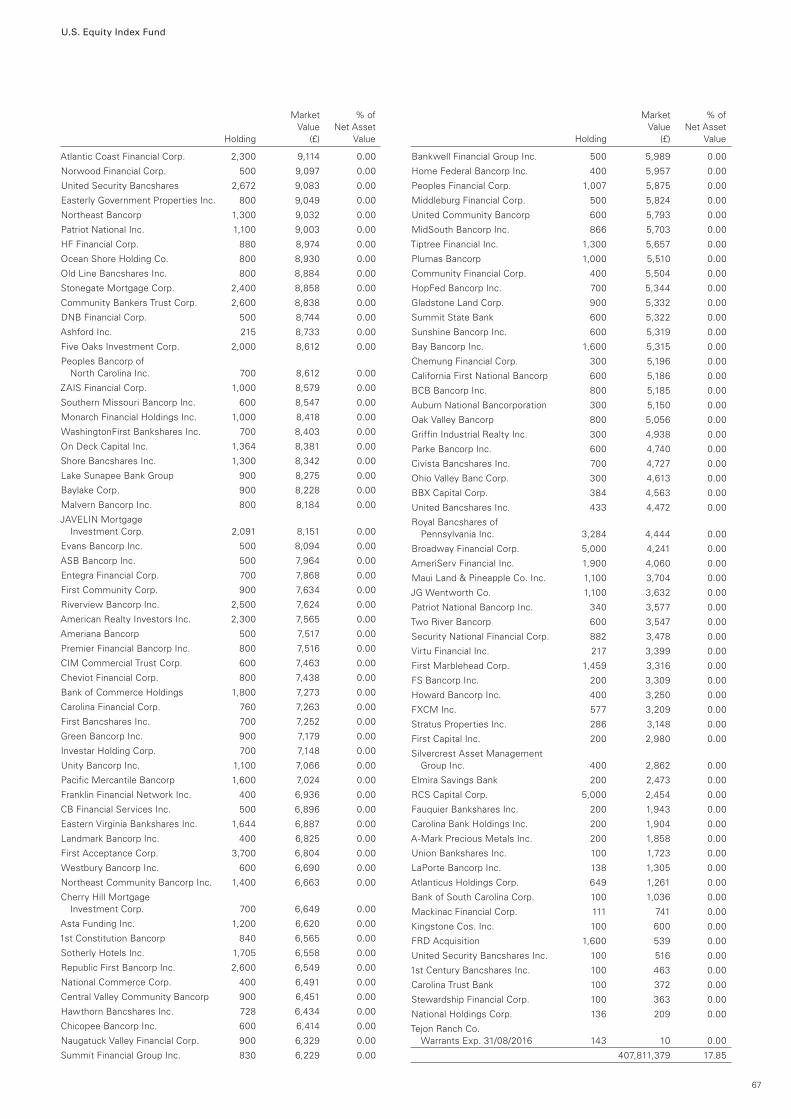
U.S. Equity Index Fund
Atlantic Coast Financial Corp. 2,300 9,114 0.00
Norwood Financial Corp. 500 9,097 0.00
United Security Bancshares 2,672 9,083 0.00
Easterly Government Properties Inc. 800 9,049 0.00
Northeast Bancorp 1,300 9,032 0.00
Patriot National Inc. 1,100 9,003 0.00
HF Financial Corp. 880 8,974 0.00
Ocean Shore Holding Co. 800 8,930 0.00
Old Line Bancshares Inc. 800 8,884 0.00
Stonegate Mortgage Corp. 2,400 8,858 0.00
Community Bankers Trust Corp. 2,600 8,838 0.00
DNB Financial Corp. 500 8,744 0.00
Ashford Inc. 215 8,733 0.00
Five Oaks Investment Corp. 2,000 8,612 0.00
Peoples Bancorp of North Carolina Inc. 700 8,612 0.00
ZAIS Financial Corp. 1,000 8,579 0.00
Southern Missouri Bancorp Inc. 600 8,547 0.00
Monarch Financial Holdings Inc. 1,000 8,418 0.00
WashingtonFirst Bankshares Inc. 700 8,403 0.00
On Deck Capital Inc. 1,364 8,381 0.00
Shore Bancshares Inc. 1,300 8,342 0.00
Lake Sunapee Bank Group 900 8,275 0.00
Baylake Corp. 900 8,228 0.00
Malvern Bancorp Inc. 800 8,184 0.00
JAVELIN Mortgage Investment Corp. 2,091 8,151 0.00
Evans Bancorp Inc. 500 8,094 0.00
ASB Bancorp Inc. 500 7,964 0.00
Entegra Financial Corp. 700 7,868 0.00
First Community Corp. 900 7,634 0.00
Riverview Bancorp Inc. 2,500 7,624 0.00
American Realty Investors Inc. 2,300 7,565 0.00
Ameriana Bancorp 500 7,517 0.00
Premier Financial Bancorp Inc. 800 7,516 0.00
CIM Commercial Trust Corp. 600 7,463 0.00
Cheviot Financial Corp. 800 7,438 0.00
Bank of Commerce Holdings 1,800 7,273 0.00
Carolina Financial Corp. 760 7,263 0.00
First Bancshares Inc. 700 7,252 0.00
Green Bancorp Inc. 900 7,179 0.00
Investar Holding Corp. 700 7,148 0.00
Unity Bancorp Inc. 1,100 7,066 0.00
Pacific Mercantile Bancorp 1,600 7,024 0.00
Franklin Financial Network Inc. 400 6,936 0.00
CB Financial Services Inc. 500 6,896 0.00
Eastern Virginia Bankshares Inc. 1,644 6,887 0.00
Landmark Bancorp Inc. 400 6,825 0.00
First Acceptance Corp. 3,700 6,804 0.00
Westbury Bancorp Inc. 600 6,690 0.00
Northeast Community Bancorp Inc. 1,400 6,663 0.00
Cherry Hill Mortgage Investment Corp. 700 6,649 0.00
Asta Funding Inc. 1,200 6,620 0.00
1st Constitution Bancorp 840 6,565 0.00
Sotherly Hotels Inc. 1,705 6,558 0.00
Republic First Bancorp Inc. 2,600 6,549 0.00
National Commerce Corp. 400 6,491 0.00
Central Valley Community Bancorp 900 6,451 0.00
Hawthorn Bancshares Inc. 728 6,434 0.00
Chicopee Bancorp Inc. 600 6,414 0.00
Naugatuck Valley Financial Corp. 900 6,329 0.00
Summit Financial Group Inc. 830 6,229 0.00
Bankwell Financial Group Inc. 500 5,989 0.00
Home Federal Bancorp Inc. 400 5,957 0.00
Peoples Financial Corp. 1,007 5,875 0.00
Middleburg Financial Corp. 500 5,824 0.00
United Community Bancorp 600 5,793 0.00
MidSouth Bancorp Inc. 866 5,703 0.00
Tiptree Financial Inc. 1,300 5,657 0.00
Plumas Bancorp 1,000 5,510 0.00
Community Financial Corp. 400 5,504 0.00
HopFed Bancorp Inc. 700 5,344 0.00
Gladstone Land Corp. 900 5,332 0.00
Summit State Bank 600 5,322 0.00
Sunshine Bancorp Inc. 600 5,319 0.00
Bay Bancorp Inc. 1,600 5,315 0.00
Chemung Financial Corp. 300 5,196 0.00
California First National Bancorp 600 5,186 0.00
BCB Bancorp Inc. 800 5,185 0.00
Auburn National Bancorporation 300 5,150 0.00
Oak Valley Bancorp 800 5,056 0.00
Griffin Industrial Realty Inc. 300 4,938 0.00
Parke Bancorp Inc. 600 4,740 0.00
Civista Bancshares Inc. 700 4,727 0.00
Ohio Valley Banc Corp. 300 4,613 0.00
BBX Capital Corp. 384 4,563 0.00
United Bancshares Inc. 433 4,472 0.00
Royal Bancshares of Pennsylvania Inc. 3,284 4,444 0.00
Broadway Financial Corp. 5,000 4,241 0.00
AmeriServ Financial Inc. 1,900 4,060 0.00
Maui Land & Pineapple Co. Inc. 1,100 3,704 0.00
JG Wentworth Co. 1,100 3,632 0.00
Patriot National Bancorp Inc. 340 3,577 0.00
Two River Bancorp 600 3,547 0.00
Security National Financial Corp. 882 3,478 0.00
Virtu Financial Inc. 217 3,399 0.00
First Marblehead Corp. 1,459 3,316 0.00
FS Bancorp Inc. 200 3,309 0.00
Howard Bancorp Inc. 400 3,250 0.00
FXCM Inc. 577 3,209 0.00
Stratus Properties Inc. 286 3,148 0.00
First Capital Inc. 200 2,980 0.00
Silvercrest Asset Management Group Inc. 400 2,862 0.00
Elmira Savings Bank 200 2,473 0.00
RCS Capital Corp. 5,000 2,454 0.00
Fauquier Bankshares Inc. 200 1,943 0.00
Carolina Bank Holdings Inc. 200 1,904 0.00
A-Mark Precious Metals Inc. 200 1,858 0.00
Union Bankshares Inc. 100 1,723 0.00
LaPorte Bancorp Inc. 138 1,305 0.00
Atlanticus Holdings Corp. 649 1,261 0.00
Bank of South Carolina Corp. 100 1,036 0.00
Mackinac Financial Corp. 111 741 0.00
Kingstone Cos. Inc. 100 600 0.00
FRD Acquisition 1,600 539 0.00
United Security Bancshares Inc. 100 516 0.00
1st Century Bancshares Inc. 100 463 0.00
Carolina Trust Bank 100 372 0.00
Stewardship Financial Corp. 100 363 0.00
National Holdings Corp. 136 209 0.00
Tejon Ranch Co. Warrants Exp. 31/08/2016 143 10 0.00
407,811,379 17.85
67
Market % of Value Net Asset Holding (£) Value
Market % of Value Net Asset Holding (£) Value
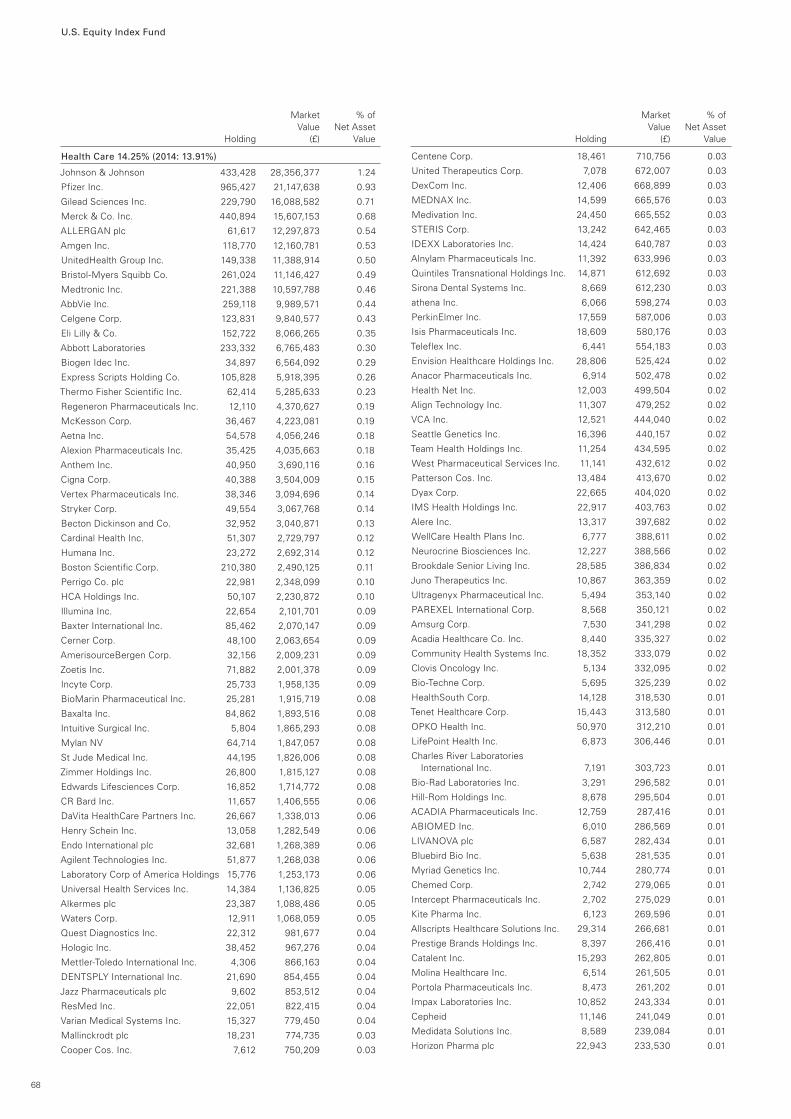
U.S. Equity Index Fund
Health Care 14.25% (2014: 13.91%)
Johnson & Johnson 433,428 28,356,377 1.24
Pfizer Inc. 965,427 21,147,638 0.93
Gilead Sciences Inc. 229,790 16,088,582 0.71
Merck & Co. Inc. 440,894 15,607,153 0.68
ALLERGAN plc 61,617 12,297,873 0.54
Amgen Inc. 118,770 12,160,781 0.53
UnitedHealth Group Inc. 149,338 11,388,914 0.50
Bristol-Myers Squibb Co. 261,024 11,146,427 0.49
Medtronic Inc. 221,388 10,597,788 0.46
AbbVie Inc. 259,118 9,989,571 0.44
Celgene Corp. 123,831 9,840,577 0.43
Eli Lilly & Co. 152,722 8,066,265 0.35
Abbott Laboratories 233,332 6,765,483 0.30
Biogen Idec Inc. 34,897 6,564,092 0.29
Express Scripts Holding Co. 105,828 5,918,395 0.26
Thermo Fisher Scientific Inc. 62,414 5,285,633 0.23
Regeneron Pharmaceuticals Inc. 12,110 4,370,627 0.19
McKesson Corp. 36,467 4,223,081 0.19
Aetna Inc. 54,578 4,056,246 0.18
Alexion Pharmaceuticals Inc. 35,425 4,035,663 0.18
Anthem Inc. 40,950 3,690,116 0.16
Cigna Corp. 40,388 3,504,009 0.15
Vertex Pharmaceuticals Inc. 38,346 3,094,696 0.14
Stryker Corp. 49,554 3,067,768 0.14
Becton Dickinson and Co. 32,952 3,040,871 0.13
Cardinal Health Inc. 51,307 2,729,797 0.12
Humana Inc. 23,272 2,692,314 0.12
Boston Scientific Corp. 210,380 2,490,125 0.11
Perrigo Co. plc 22,981 2,348,099 0.10
HCA Holdings Inc. 50,107 2,230,872 0.10
Illumina Inc. 22,654 2,101,701 0.09
Baxter International Inc. 85,462 2,070,147 0.09
Cerner Corp. 48,100 2,063,654 0.09
AmerisourceBergen Corp. 32,156 2,009,231 0.09
Zoetis Inc. 71,882 2,001,378 0.09
Incyte Corp. 25,733 1,958,135 0.09
BioMarin Pharmaceutical Inc. 25,281 1,915,719 0.08
Baxalta Inc. 84,862 1,893,516 0.08
Intuitive Surgical Inc. 5,804 1,865,293 0.08
Mylan NV 64,714 1,847,057 0.08
St Jude Medical Inc. 44,195 1,826,006 0.08
Zimmer Holdings Inc. 26,800 1,815,127 0.08
Edwards Lifesciences Corp. 16,852 1,714,772 0.08
CR Bard Inc. 11,657 1,406,555 0.06
DaVita HealthCare Partners Inc. 26,667 1,338,013 0.06
Henry Schein Inc. 13,058 1,282,549 0.06
Endo International plc 32,681 1,268,389 0.06
Agilent Technologies Inc. 51,877 1,268,038 0.06
Laboratory Corp of America Holdings 15,776 1,253,173 0.06
Universal Health Services Inc. 14,384 1,136,825 0.05
Alkermes plc 23,387 1,088,486 0.05
Waters Corp. 12,911 1,068,059 0.05
Quest Diagnostics Inc. 22,312 981,677 0.04
Hologic Inc. 38,452 967,276 0.04
Mettler-Toledo International Inc. 4,306 866,163 0.04
DENTSPLY International Inc. 21,690 854,455 0.04
Jazz Pharmaceuticals plc 9,602 853,512 0.04
ResMed Inc. 22,051 822,415 0.04
Varian Medical Systems Inc. 15,327 779,450 0.04
Mallinckrodt plc 18,231 774,735 0.03
Cooper Cos. Inc. 7,612 750,209 0.03
Centene Corp. 18,461 710,756 0.03
United Therapeutics Corp. 7,078 672,007 0.03
DexCom Inc. 12,406 668,899 0.03
MEDNAX Inc. 14,599 665,576 0.03
Medivation Inc. 24,450 665,552 0.03
STERIS Corp. 13,242 642,465 0.03
IDEXX Laboratories Inc. 14,424 640,787 0.03
Alnylam Pharmaceuticals Inc. 11,392 633,996 0.03
Quintiles Transnational Holdings Inc. 14,871 612,692 0.03
Sirona Dental Systems Inc. 8,669 612,230 0.03
athena Inc. 6,066 598,274 0.03
PerkinElmer Inc. 17,559 587,006 0.03
Isis Pharmaceuticals Inc. 18,609 580,176 0.03
Teleflex Inc. 6,441 554,183 0.03
Envision Healthcare Holdings Inc. 28,806 525,424 0.02
Anacor Pharmaceuticals Inc. 6,914 502,478 0.02
Health Net Inc. 12,003 499,504 0.02
Align Technology Inc. 11,307 479,252 0.02
VCA Inc. 12,521 444,040 0.02
Seattle Genetics Inc. 16,396 440,157 0.02
Team Health Holdings Inc. 11,254 434,595 0.02
West Pharmaceutical Services Inc. 11,141 432,612 0.02
Patterson Cos. Inc. 13,484 413,670 0.02
Dyax Corp. 22,665 404,020 0.02
IMS Health Holdings Inc. 22,917 403,763 0.02
Alere Inc. 13,317 397,682 0.02
WellCare Health Plans Inc. 6,777 388,611 0.02
Neurocrine Biosciences Inc. 12,227 388,566 0.02
Brookdale Senior Living Inc. 28,585 386,834 0.02
Juno Therapeutics Inc. 10,867 363,359 0.02
Ultragenyx Pharmaceutical Inc. 5,494 353,140 0.02
PAREXEL International Corp. 8,568 350,121 0.02
Amsurg Corp. 7,530 341,298 0.02
Acadia Healthcare Co. Inc. 8,440 335,327 0.02
Community Health Systems Inc. 18,352 333,079 0.02
Clovis Oncology Inc. 5,134 332,095 0.02
Bio-Techne Corp. 5,695 325,239 0.02
HealthSouth Corp. 14,128 318,530 0.01
Tenet Healthcare Corp. 15,443 313,580 0.01
OPKO Health Inc. 50,970 312,210 0.01
LifePoint Health Inc. 6,873 306,446 0.01
Charles River Laboratories International Inc. 7,191 303,723 0.01
Bio-Rad Laboratories Inc. 3,291 296,582 0.01
Hill-Rom Holdings Inc. 8,678 295,504 0.01
ACADIA Pharmaceuticals Inc. 12,759 287,416 0.01
ABIOMED Inc. 6,010 286,569 0.01
LIVANOVA plc 6,587 282,434 0.01
Bluebird Bio Inc. 5,638 281,535 0.01
Myriad Genetics Inc. 10,744 280,774 0.01
Chemed Corp. 2,742 279,065 0.01
Intercept Pharmaceuticals Inc. 2,702 275,029 0.01
Kite Pharma Inc. 6,123 269,596 0.01
Allscripts Healthcare Solutions Inc. 29,314 266,681 0.01
Prestige Brands Holdings Inc. 8,397 266,416 0.01
Catalent Inc. 15,293 262,805 0.01
Molina Healthcare Inc. 6,514 261,505 0.01
Portola Pharmaceuticals Inc. 8,473 261,202 0.01
Impax Laboratories Inc. 10,852 243,334 0.01
Cepheid 11,146 241,049 0.01
Medidata Solutions Inc. 8,589 239,084 0.01
Horizon Pharma plc 22,943 233,530 0.01
68
Market % of Value Net Asset Holding (£) Value
Market % of Value Net Asset Holding (£) Value
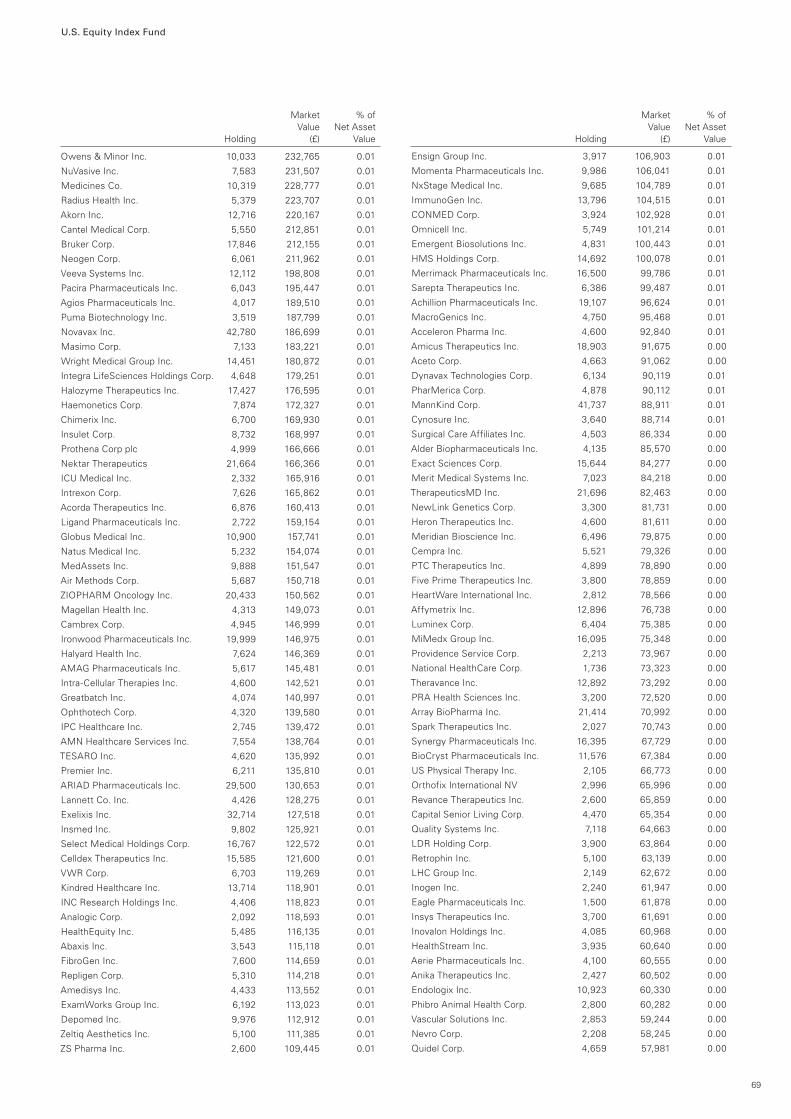
U.S. Equity Index Fund
Owens & Minor Inc. 10,033 232,765 0.01
NuVasive Inc. 7,583 231,507 0.01
Medicines Co. 10,319 228,777 0.01
Radius Health Inc. 5,379 223,707 0.01
Akorn Inc. 12,716 220,167 0.01
Cantel Medical Corp. 5,550 212,851 0.01
Bruker Corp. 17,846 212,155 0.01
Neogen Corp. 6,061 211,962 0.01
Veeva Systems Inc. 12,112 198,808 0.01
Pacira Pharmaceuticals Inc. 6,043 195,447 0.01
Agios Pharmaceuticals Inc. 4,017 189,510 0.01
Puma Biotechnology Inc. 3,519 187,799 0.01
Novavax Inc. 42,780 186,699 0.01
Masimo Corp. 7,133 183,221 0.01
Wright Medical Group Inc. 14,451 180,872 0.01
Integra LifeSciences Holdings Corp. 4,648 179,251 0.01
Halozyme Therapeutics Inc. 17,427 176,595 0.01
Haemonetics Corp. 7,874 172,327 0.01
Chimerix Inc. 6,700 169,930 0.01
Insulet Corp. 8,732 168,997 0.01
Prothena Corp plc 4,999 166,666 0.01
Nektar Therapeutics 21,664 166,366 0.01
ICU Medical Inc. 2,332 165,916 0.01
Intrexon Corp. 7,626 165,862 0.01
Acorda Therapeutics Inc. 6,876 160,413 0.01
Ligand Pharmaceuticals Inc. 2,722 159,154 0.01
Globus Medical Inc. 10,900 157,741 0.01
Natus Medical Inc. 5,232 154,074 0.01
MedAssets Inc. 9,888 151,547 0.01
Air Methods Corp. 5,687 150,718 0.01
ZIOPHARM Oncology Inc. 20,433 150,562 0.01
Magellan Health Inc. 4,313 149,073 0.01
Cambrex Corp. 4,945 146,999 0.01
Ironwood Pharmaceuticals Inc. 19,999 146,975 0.01
Halyard Health Inc. 7,624 146,369 0.01
AMAG Pharmaceuticals Inc. 5,617 145,481 0.01
Intra-Cellular Therapies Inc. 4,600 142,521 0.01
Greatbatch Inc. 4,074 140,997 0.01
Ophthotech Corp. 4,320 139,580 0.01
IPC Healthcare Inc. 2,745 139,472 0.01
AMN Healthcare Services Inc. 7,554 138,764 0.01
TESARO Inc. 4,620 135,992 0.01
Premier Inc. 6,211 135,810 0.01
ARIAD Pharmaceuticals Inc. 29,500 130,653 0.01
Lannett Co. Inc. 4,426 128,275 0.01
Exelixis Inc. 32,714 127,518 0.01
Insmed Inc. 9,802 125,921 0.01
Select Medical Holdings Corp. 16,767 122,572 0.01
Celldex Therapeutics Inc. 15,585 121,600 0.01
VWR Corp. 6,703 119,269 0.01
Kindred Healthcare Inc. 13,714 118,901 0.01
INC Research Holdings Inc. 4,406 118,823 0.01
Analogic Corp. 2,092 118,593 0.01
HealthEquity Inc. 5,485 116,135 0.01
Abaxis Inc. 3,543 115,118 0.01
FibroGen Inc. 7,600 114,659 0.01
Repligen Corp. 5,310 114,218 0.01
Amedisys Inc. 4,433 113,552 0.01
ExamWorks Group Inc. 6,192 113,023 0.01
Depomed Inc. 9,976 112,912 0.01
Zeltiq Aesthetics Inc. 5,100 111,385 0.01
ZS Pharma Inc. 2,600 109,445 0.01
Ensign Group Inc. 3,917 106,903 0.01
Momenta Pharmaceuticals Inc. 9,986 106,041 0.01
NxStage Medical Inc. 9,685 104,789 0.01
ImmunoGen Inc. 13,796 104,515 0.01
CONMED Corp. 3,924 102,928 0.01
Omnicell Inc. 5,749 101,214 0.01
Emergent Biosolutions Inc. 4,831 100,443 0.01
HMS Holdings Corp. 14,692 100,078 0.01
Merrimack Pharmaceuticals Inc. 16,500 99,786 0.01
Sarepta Therapeutics Inc. 6,386 99,487 0.01
Achillion Pharmaceuticals Inc. 19,107 96,624 0.01
MacroGenics Inc. 4,750 95,468 0.01
Acceleron Pharma Inc. 4,600 92,840 0.01
Amicus Therapeutics Inc. 18,903 91,675 0.00
Aceto Corp. 4,663 91,062 0.00
Dynavax Technologies Corp. 6,134 90,119 0.01
PharMerica Corp. 4,878 90,112 0.01
MannKind Corp. 41,737 88,911 0.01
Cynosure Inc. 3,640 88,714 0.01
Surgical Care Affiliates Inc. 4,503 86,334 0.00
Alder Biopharmaceuticals Inc. 4,135 85,570 0.00
Exact Sciences Corp. 15,644 84,277 0.00
Merit Medical Systems Inc. 7,023 84,218 0.00
TherapeuticsMD Inc. 21,696 82,463 0.00
NewLink Genetics Corp. 3,300 81,731 0.00
Heron Therapeutics Inc. 4,600 81,611 0.00
Meridian Bioscience Inc. 6,496 79,875 0.00
Cempra Inc. 5,521 79,326 0.00
PTC Therapeutics Inc. 4,899 78,890 0.00
Five Prime Therapeutics Inc. 3,800 78,859 0.00
HeartWare International Inc. 2,812 78,566 0.00
Affymetrix Inc. 12,896 76,738 0.00
Luminex Corp. 6,404 75,385 0.00
MiMedx Group Inc. 16,095 75,348 0.00
Providence Service Corp. 2,213 73,967 0.00
National HealthCare Corp. 1,736 73,323 0.00
Theravance Inc. 12,892 73,292 0.00
PRA Health Sciences Inc. 3,200 72,520 0.00
Array BioPharma Inc. 21,414 70,992 0.00
Spark Therapeutics Inc. 2,027 70,743 0.00
Synergy Pharmaceuticals Inc. 16,395 67,729 0.00
BioCryst Pharmaceuticals Inc. 11,576 67,384 0.00
US Physical Therapy Inc. 2,105 66,773 0.00
Orthofix International NV 2,996 65,996 0.00
Revance Therapeutics Inc. 2,600 65,859 0.00
Capital Senior Living Corp. 4,470 65,354 0.00
Quality Systems Inc. 7,118 64,663 0.00
LDR Holding Corp. 3,900 63,864 0.00
Retrophin Inc. 5,100 63,139 0.00
LHC Group Inc. 2,149 62,672 0.00
Inogen Inc. 2,240 61,947 0.00
Eagle Pharmaceuticals Inc. 1,500 61,878 0.00
Insys Therapeutics Inc. 3,700 61,691 0.00
Inovalon Holdings Inc. 4,085 60,968 0.00
HealthStream Inc. 3,935 60,640 0.00
Aerie Pharmaceuticals Inc. 4,100 60,555 0.00
Anika Therapeutics Inc. 2,427 60,502 0.00
Endologix Inc. 10,923 60,330 0.00
Phibro Animal Health Corp. 2,800 60,282 0.00
Vascular Solutions Inc. 2,853 59,244 0.00
Nevro Corp. 2,208 58,245 0.00
Quidel Corp. 4,659 57,981 0.00
69
Market % of Value Net Asset Holding (£) Value
Market % of Value Net Asset Holding (£) Value
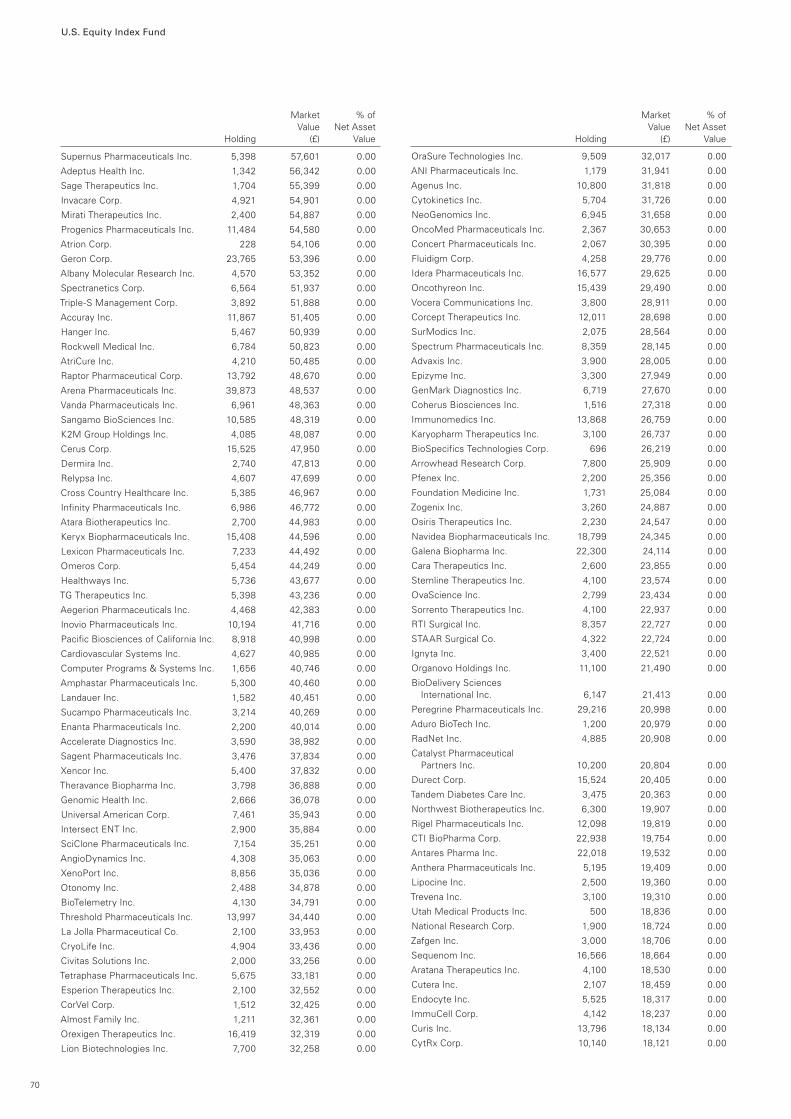
U.S. Equity Index Fund
Supernus Pharmaceuticals Inc. 5,398 57,601 0.00
Adeptus Health Inc. 1,342 56,342 0.00
Sage Therapeutics Inc. 1,704 55,399 0.00
Invacare Corp. 4,921 54,901 0.00
Mirati Therapeutics Inc. 2,400 54,887 0.00
Progenics Pharmaceuticals Inc. 11,484 54,580 0.00
Atrion Corp. 228 54,106 0.00
Geron Corp. 23,765 53,396 0.00
Albany Molecular Research Inc. 4,570 53,352 0.00
Spectranetics Corp. 6,564 51,937 0.00
Triple-S Management Corp. 3,892 51,888 0.00
Accuray Inc. 11,867 51,405 0.00
Hanger Inc. 5,467 50,939 0.00
Rockwell Medical Inc. 6,784 50,823 0.00
AtriCure Inc. 4,210 50,485 0.00
Raptor Pharmaceutical Corp. 13,792 48,670 0.00
Arena Pharmaceuticals Inc. 39,873 48,537 0.00
Vanda Pharmaceuticals Inc. 6,961 48,363 0.00
Sangamo BioSciences Inc. 10,585 48,319 0.00
K2M Group Holdings Inc. 4,085 48,087 0.00
Cerus Corp. 15,525 47,950 0.00
Dermira Inc. 2,740 47,813 0.00
Relypsa Inc. 4,607 47,699 0.00
Cross Country Healthcare Inc. 5,385 46,967 0.00
Infinity Pharmaceuticals Inc. 6,986 46,772 0.00
Atara Biotherapeutics Inc. 2,700 44,983 0.00
Keryx Biopharmaceuticals Inc. 15,408 44,596 0.00
Lexicon Pharmaceuticals Inc. 7,233 44,492 0.00
Omeros Corp. 5,454 44,249 0.00
Healthways Inc. 5,736 43,677 0.00
TG Therapeutics Inc. 5,398 43,236 0.00
Aegerion Pharmaceuticals Inc. 4,468 42,383 0.00
Inovio Pharmaceuticals Inc. 10,194 41,716 0.00
Pacific Biosciences of California Inc. 8,918 40,998 0.00
Cardiovascular Systems Inc. 4,627 40,985 0.00
Computer Programs & Systems Inc. 1,656 40,746 0.00
Amphastar Pharmaceuticals Inc. 5,300 40,460 0.00
Landauer Inc. 1,582 40,451 0.00
Sucampo Pharmaceuticals Inc. 3,214 40,269 0.00
Enanta Pharmaceuticals Inc. 2,200 40,014 0.00
Accelerate Diagnostics Inc. 3,590 38,982 0.00
Sagent Pharmaceuticals Inc. 3,476 37,834 0.00
Xencor Inc. 5,400 37,832 0.00
Theravance Biopharma Inc. 3,798 36,888 0.00
Genomic Health Inc. 2,666 36,078 0.00
Universal American Corp. 7,461 35,943 0.00
Intersect ENT Inc. 2,900 35,884 0.00
SciClone Pharmaceuticals Inc. 7,154 35,251 0.00
AngioDynamics Inc. 4,308 35,063 0.00
XenoPort Inc. 8,856 35,036 0.00
Otonomy Inc. 2,488 34,878 0.00
BioTelemetry Inc. 4,130 34,791 0.00
Threshold Pharmaceuticals Inc. 13,997 34,440 0.00
La Jolla Pharmaceutical Co. 2,100 33,953 0.00
CryoLife Inc. 4,904 33,436 0.00
Civitas Solutions Inc. 2,000 33,256 0.00
Tetraphase Pharmaceuticals Inc. 5,675 33,181 0.00
Esperion Therapeutics Inc. 2,100 32,552 0.00
CorVel Corp. 1,512 32,425 0.00
Almost Family Inc. 1,211 32,361 0.00
Orexigen Therapeutics Inc. 16,419 32,319 0.00
Lion Biotechnologies Inc. 7,700 32,258 0.00
OraSure Technologies Inc. 9,509 32,017 0.00
ANI Pharmaceuticals Inc. 1,179 31,941 0.00
Agenus Inc. 10,800 31,818 0.00
Cytokinetics Inc. 5,704 31,726 0.00
NeoGenomics Inc. 6,945 31,658 0.00
OncoMed Pharmaceuticals Inc. 2,367 30,653 0.00
Concert Pharmaceuticals Inc. 2,067 30,395 0.00
Fluidigm Corp. 4,258 29,776 0.00
Idera Pharmaceuticals Inc. 16,577 29,625 0.00
Oncothyreon Inc. 15,439 29,490 0.00
Vocera Communications Inc. 3,800 28,911 0.00
Corcept Therapeutics Inc. 12,011 28,698 0.00
SurModics Inc. 2,075 28,564 0.00
Spectrum Pharmaceuticals Inc. 8,359 28,145 0.00
Advaxis Inc. 3,900 28,005 0.00
Epizyme Inc. 3,300 27,949 0.00
GenMark Diagnostics Inc. 6,719 27,670 0.00
Coherus Biosciences Inc. 1,516 27,318 0.00
Immunomedics Inc. 13,868 26,759 0.00
Karyopharm Therapeutics Inc. 3,100 26,737 0.00
BioSpecifics Technologies Corp. 696 26,219 0.00
Arrowhead Research Corp. 7,800 25,909 0.00
Pfenex Inc. 2,200 25,356 0.00
Foundation Medicine Inc. 1,731 25,084 0.00
Zogenix Inc. 3,260 24,887 0.00
Osiris Therapeutics Inc. 2,230 24,547 0.00
Navidea Biopharmaceuticals Inc. 18,799 24,345 0.00
Galena Biopharma Inc. 22,300 24,114 0.00
Cara Therapeutics Inc. 2,600 23,855 0.00
Stemline Therapeutics Inc. 4,100 23,574 0.00
OvaScience Inc. 2,799 23,434 0.00
Sorrento Therapeutics Inc. 4,100 22,937 0.00
RTI Surgical Inc. 8,357 22,727 0.00
STAAR Surgical Co. 4,322 22,724 0.00
Ignyta Inc. 3,400 22,521 0.00
Organovo Holdings Inc. 11,100 21,490 0.00
BioDelivery Sciences International Inc. 6,147 21,413 0.00
Peregrine Pharmaceuticals Inc. 29,216 20,998 0.00
Aduro BioTech Inc. 1,200 20,979 0.00
RadNet Inc. 4,885 20,908 0.00
Catalyst Pharmaceutical Partners Inc. 10,200 20,804 0.00
Durect Corp. 15,524 20,405 0.00
Tandem Diabetes Care Inc. 3,475 20,363 0.00
Northwest Biotherapeutics Inc. 6,300 19,907 0.00
Rigel Pharmaceuticals Inc. 12,098 19,819 0.00
CTI BioPharma Corp. 22,938 19,754 0.00
Antares Pharma Inc. 22,018 19,532 0.00
Anthera Pharmaceuticals Inc. 5,195 19,409 0.00
Lipocine Inc. 2,500 19,360 0.00
Trevena Inc. 3,100 19,310 0.00
Utah Medical Products Inc. 500 18,836 0.00
National Research Corp. 1,900 18,724 0.00
Zafgen Inc. 3,000 18,706 0.00
Sequenom Inc. 16,566 18,664 0.00
Aratana Therapeutics Inc. 4,100 18,530 0.00
Cutera Inc. 2,107 18,459 0.00
Endocyte Inc. 5,525 18,317 0.00
ImmuCell Corp. 4,142 18,237 0.00
Curis Inc. 13,796 18,134 0.00
CytRx Corp. 10,140 18,121 0.00
70
Market % of Value Net Asset Holding (£) Value
Market % of Value Net Asset Holding (£) Value
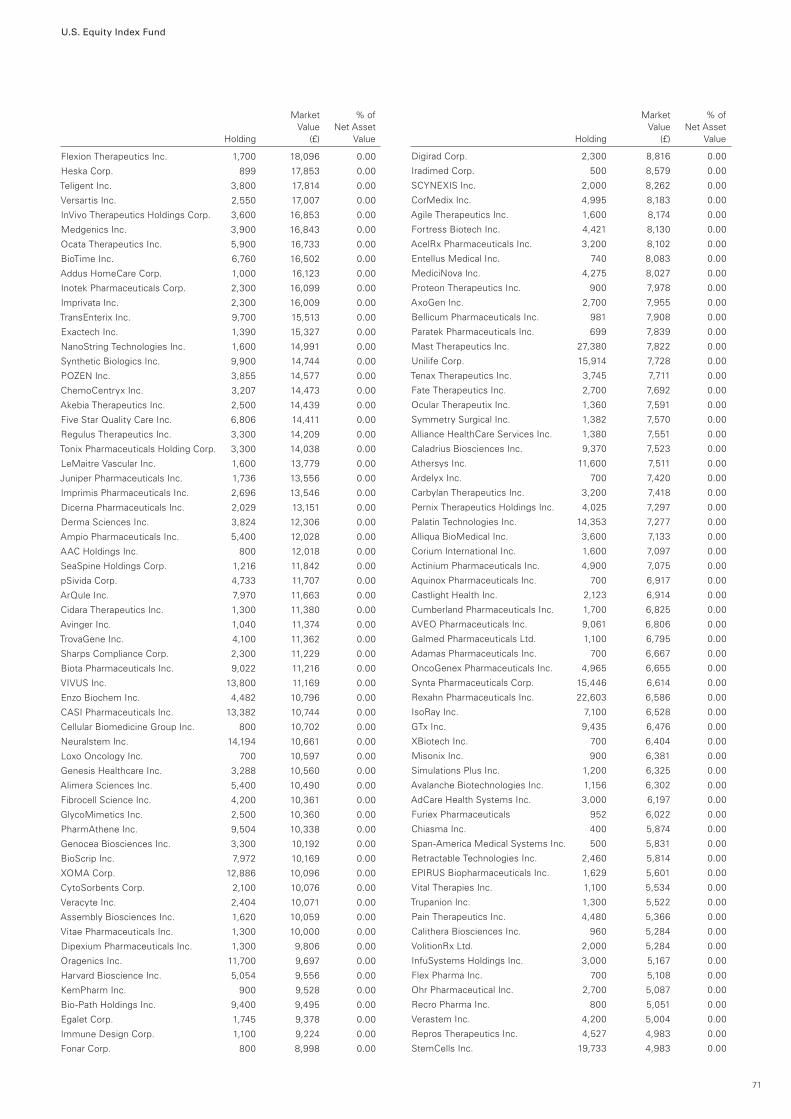
U.S. Equity Index Fund
Flexion Therapeutics Inc. 1,700 18,096 0.00
Heska Corp. 899 17,853 0.00
Teligent Inc. 3,800 17,814 0.00
Versartis Inc. 2,550 17,007 0.00
InVivo Therapeutics Holdings Corp. 3,600 16,853 0.00
Medgenics Inc. 3,900 16,843 0.00
Ocata Therapeutics Inc. 5,900 16,733 0.00
BioTime Inc. 6,760 16,502 0.00
Addus HomeCare Corp. 1,000 16,123 0.00
Inotek Pharmaceuticals Corp. 2,300 16,099 0.00
Imprivata Inc. 2,300 16,009 0.00
TransEnterix Inc. 9,700 15,513 0.00
Exactech Inc. 1,390 15,327 0.00
NanoString Technologies Inc. 1,600 14,991 0.00
Synthetic Biologics Inc. 9,900 14,744 0.00
POZEN Inc. 3,855 14,577 0.00
ChemoCentryx Inc. 3,207 14,473 0.00
Akebia Therapeutics Inc. 2,500 14,439 0.00
Five Star Quality Care Inc. 6,806 14,411 0.00
Regulus Therapeutics Inc. 3,300 14,209 0.00
Tonix Pharmaceuticals Holding Corp. 3,300 14,038 0.00
LeMaitre Vascular Inc. 1,600 13,779 0.00
Juniper Pharmaceuticals Inc. 1,736 13,556 0.00
Imprimis Pharmaceuticals Inc. 2,696 13,546 0.00
Dicerna Pharmaceuticals Inc. 2,029 13,151 0.00
Derma Sciences Inc. 3,824 12,306 0.00
Ampio Pharmaceuticals Inc. 5,400 12,028 0.00
AAC Holdings Inc. 800 12,018 0.00
SeaSpine Holdings Corp. 1,216 11,842 0.00
pSivida Corp. 4,733 11,707 0.00
ArQule Inc. 7,970 11,663 0.00
Cidara Therapeutics Inc. 1,300 11,380 0.00
Avinger Inc. 1,040 11,374 0.00
TrovaGene Inc. 4,100 11,362 0.00
Sharps Compliance Corp. 2,300 11,229 0.00
Biota Pharmaceuticals Inc. 9,022 11,216 0.00
VIVUS Inc. 13,800 11,169 0.00
Enzo Biochem Inc. 4,482 10,796 0.00
CASI Pharmaceuticals Inc. 13,382 10,744 0.00
Cellular Biomedicine Group Inc. 800 10,702 0.00
Neuralstem Inc. 14,194 10,661 0.00
Loxo Oncology Inc. 700 10,597 0.00
Genesis Healthcare Inc. 3,288 10,560 0.00
Alimera Sciences Inc. 5,400 10,490 0.00
Fibrocell Science Inc. 4,200 10,361 0.00
GlycoMimetics Inc. 2,500 10,360 0.00
PharmAthene Inc. 9,504 10,338 0.00
Genocea Biosciences Inc. 3,300 10,192 0.00
BioScrip Inc. 7,972 10,169 0.00
XOMA Corp. 12,886 10,096 0.00
CytoSorbents Corp. 2,100 10,076 0.00
Veracyte Inc. 2,404 10,071 0.00
Assembly Biosciences Inc. 1,620 10,059 0.00
Vitae Pharmaceuticals Inc. 1,300 10,000 0.00
Dipexium Pharmaceuticals Inc. 1,300 9,806 0.00
Oragenics Inc. 11,700 9,697 0.00
Harvard Bioscience Inc. 5,054 9,556 0.00
KemPharm Inc. 900 9,528 0.00
Bio-Path Holdings Inc. 9,400 9,495 0.00
Egalet Corp. 1,745 9,378 0.00
Immune Design Corp. 1,100 9,224 0.00
Fonar Corp. 800 8,998 0.00
Digirad Corp. 2,300 8,816 0.00
Iradimed Corp. 500 8,579 0.00
SCYNEXIS Inc. 2,000 8,262 0.00
CorMedix Inc. 4,995 8,183 0.00
Agile Therapeutics Inc. 1,600 8,174 0.00
Fortress Biotech Inc. 4,421 8,130 0.00
AcelRx Pharmaceuticals Inc. 3,200 8,102 0.00
Entellus Medical Inc. 740 8,083 0.00
MediciNova Inc. 4,275 8,027 0.00
Proteon Therapeutics Inc. 900 7,978 0.00
AxoGen Inc. 2,700 7,955 0.00
Bellicum Pharmaceuticals Inc. 981 7,908 0.00
Paratek Pharmaceuticals Inc. 699 7,839 0.00
Mast Therapeutics Inc. 27,380 7,822 0.00
Unilife Corp. 15,914 7,728 0.00
Tenax Therapeutics Inc. 3,745 7,711 0.00
Fate Therapeutics Inc. 2,700 7,692 0.00
Ocular Therapeutix Inc. 1,360 7,591 0.00
Symmetry Surgical Inc. 1,382 7,570 0.00
Alliance HealthCare Services Inc. 1,380 7,551 0.00
Caladrius Biosciences Inc. 9,370 7,523 0.00
Athersys Inc. 11,600 7,511 0.00
Ardelyx Inc. 700 7,420 0.00
Carbylan Therapeutics Inc. 3,200 7,418 0.00
Pernix Therapeutics Holdings Inc. 4,025 7,297 0.00
Palatin Technologies Inc. 14,353 7,277 0.00
Alliqua BioMedical Inc. 3,600 7,133 0.00
Corium International Inc. 1,600 7,097 0.00
Actinium Pharmaceuticals Inc. 4,900 7,075 0.00
Aquinox Pharmaceuticals Inc. 700 6,917 0.00
Castlight Health Inc. 2,123 6,914 0.00
Cumberland Pharmaceuticals Inc. 1,700 6,825 0.00
AVEO Pharmaceuticals Inc. 9,061 6,806 0.00
Galmed Pharmaceuticals Ltd. 1,100 6,795 0.00
Adamas Pharmaceuticals Inc. 700 6,667 0.00
OncoGenex Pharmaceuticals Inc. 4,965 6,655 0.00
Synta Pharmaceuticals Corp. 15,446 6,614 0.00
Rexahn Pharmaceuticals Inc. 22,603 6,586 0.00
IsoRay Inc. 7,100 6,528 0.00
GTx Inc. 9,435 6,476 0.00
XBiotech Inc. 700 6,404 0.00
Misonix Inc. 900 6,381 0.00
Simulations Plus Inc. 1,200 6,325 0.00
Avalanche Biotechnologies Inc. 1,156 6,302 0.00
AdCare Health Systems Inc. 3,000 6,197 0.00
Furiex Pharmaceuticals 952 6,022 0.00
Chiasma Inc. 400 5,874 0.00
Span-America Medical Systems Inc. 500 5,831 0.00
Retractable Technologies Inc. 2,460 5,814 0.00
EPIRUS Biopharmaceuticals Inc. 1,629 5,601 0.00
Vital Therapies Inc. 1,100 5,534 0.00
Trupanion Inc. 1,300 5,522 0.00
Pain Therapeutics Inc. 4,480 5,366 0.00
Calithera Biosciences Inc. 960 5,284 0.00
VolitionRx Ltd. 2,000 5,284 0.00
InfuSystems Holdings Inc. 3,000 5,167 0.00
Flex Pharma Inc. 700 5,108 0.00
Ohr Pharmaceutical Inc. 2,700 5,087 0.00
Recro Pharma Inc. 800 5,051 0.00
Verastem Inc. 4,200 5,004 0.00
Repros Therapeutics Inc. 4,527 4,983 0.00
StemCells Inc. 19,733 4,983 0.00
71
Market % of Value Net Asset Holding (£) Value
Market % of Value Net Asset Holding (£) Value
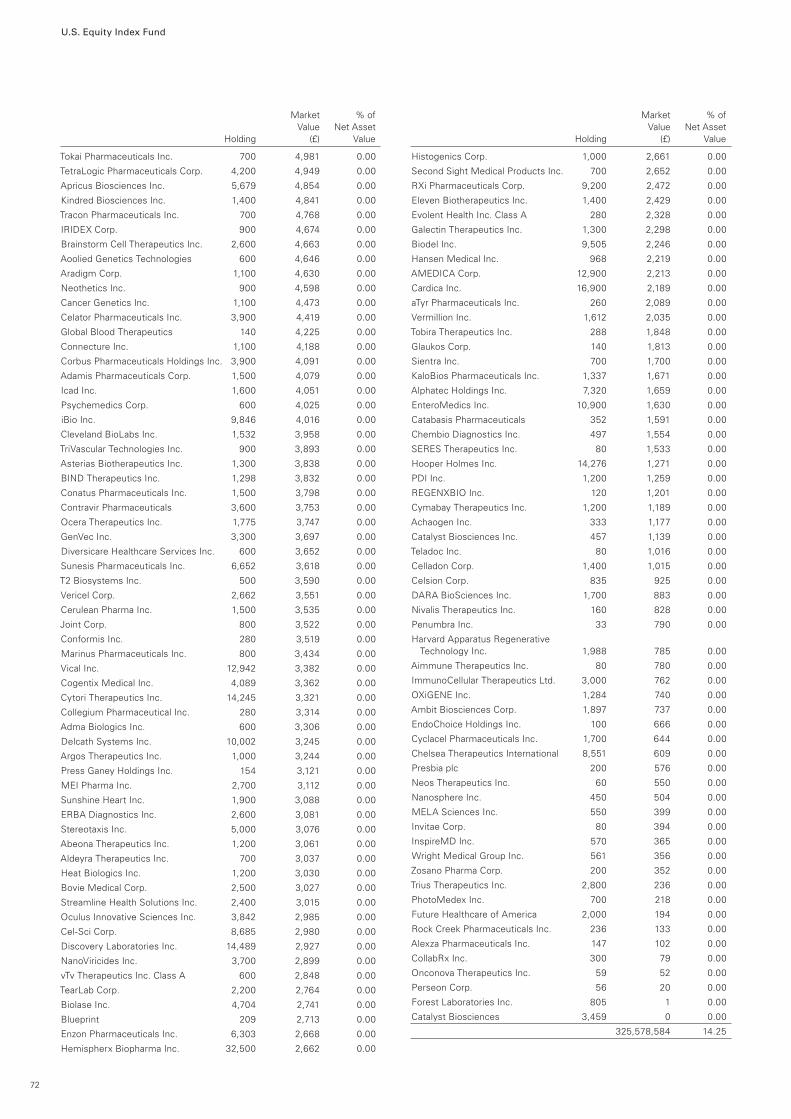
U.S. Equity Index Fund
Tokai Pharmaceuticals Inc. 700 4,981 0.00
TetraLogic Pharmaceuticals Corp. 4,200 4,949 0.00
Apricus Biosciences Inc. 5,679 4,854 0.00
Kindred Biosciences Inc. 1,400 4,841 0.00
Tracon Pharmaceuticals Inc. 700 4,768 0.00
IRIDEX Corp. 900 4,674 0.00
Brainstorm Cell Therapeutics Inc. 2,600 4,663 0.00
Aoolied Genetics Technologies 600 4,646 0.00
Aradigm Corp. 1,100 4,630 0.00
Neothetics Inc. 900 4,598 0.00
Cancer Genetics Inc. 1,100 4,473 0.00
Celator Pharmaceuticals Inc. 3,900 4,419 0.00
Global Blood Therapeutics 140 4,225 0.00
Connecture Inc. 1,100 4,188 0.00
Corbus Pharmaceuticals Holdings Inc. 3,900 4,091 0.00
Adamis Pharmaceuticals Corp. 1,500 4,079 0.00
Icad Inc. 1,600 4,051 0.00
Psychemedics Corp. 600 4,025 0.00
iBio Inc. 9,846 4,016 0.00
Cleveland BioLabs Inc. 1,532 3,958 0.00
TriVascular Technologies Inc. 900 3,893 0.00
Asterias Biotherapeutics Inc. 1,300 3,838 0.00
BIND Therapeutics Inc. 1,298 3,832 0.00
Conatus Pharmaceuticals Inc. 1,500 3,798 0.00
Contravir Pharmaceuticals 3,600 3,753 0.00
Ocera Therapeutics Inc. 1,775 3,747 0.00
GenVec Inc. 3,300 3,697 0.00
Diversicare Healthcare Services Inc. 600 3,652 0.00
Sunesis Pharmaceuticals Inc. 6,652 3,618 0.00
T2 Biosystems Inc. 500 3,590 0.00
Vericel Corp. 2,662 3,551 0.00
Cerulean Pharma Inc. 1,500 3,535 0.00
Joint Corp. 800 3,522 0.00
Conformis Inc. 280 3,519 0.00
Marinus Pharmaceuticals Inc. 800 3,434 0.00
Vical Inc. 12,942 3,382 0.00
Cogentix Medical Inc. 4,089 3,362 0.00
Cytori Therapeutics Inc. 14,245 3,321 0.00
Collegium Pharmaceutical Inc. 280 3,314 0.00
Adma Biologics Inc. 600 3,306 0.00
Delcath Systems Inc. 10,002 3,245 0.00
Argos Therapeutics Inc. 1,000 3,244 0.00
Press Ganey Holdings Inc. 154 3,121 0.00
MEI Pharma Inc. 2,700 3,112 0.00
Sunshine Heart Inc. 1,900 3,088 0.00
ERBA Diagnostics Inc. 2,600 3,081 0.00
Stereotaxis Inc. 5,000 3,076 0.00
Abeona Therapeutics Inc. 1,200 3,061 0.00
Aldeyra Therapeutics Inc. 700 3,037 0.00
Heat Biologics Inc. 1,200 3,030 0.00
Bovie Medical Corp. 2,500 3,027 0.00
Streamline Health Solutions Inc. 2,400 3,015 0.00
Oculus Innovative Sciences Inc. 3,842 2,985 0.00
Cel-Sci Corp. 8,685 2,980 0.00
Discovery Laboratories Inc. 14,489 2,927 0.00
NanoViricides Inc. 3,700 2,899 0.00
vTv Therapeutics Inc. Class A 600 2,848 0.00
TearLab Corp. 2,200 2,764 0.00
Biolase Inc. 4,704 2,741 0.00
Blueprint 209 2,713 0.00
Enzon Pharmaceuticals Inc. 6,303 2,668 0.00
Hemispherx Biopharma Inc. 32,500 2,662 0.00
Histogenics Corp. 1,000 2,661 0.00
Second Sight Medical Products Inc. 700 2,652 0.00
RXi Pharmaceuticals Corp. 9,200 2,472 0.00
Eleven Biotherapeutics Inc. 1,400 2,429 0.00
Evolent Health Inc. Class A 280 2,328 0.00
Galectin Therapeutics Inc. 1,300 2,298 0.00
Biodel Inc. 9,505 2,246 0.00
Hansen Medical Inc. 968 2,219 0.00
AMEDICA Corp. 12,900 2,213 0.00
Cardica Inc. 16,900 2,189 0.00
aTyr Pharmaceuticals Inc. 260 2,089 0.00
Vermillion Inc. 1,612 2,035 0.00
Tobira Therapeutics Inc. 288 1,848 0.00
Glaukos Corp. 140 1,813 0.00
Sientra Inc. 700 1,700 0.00
KaloBios Pharmaceuticals Inc. 1,337 1,671 0.00
Alphatec Holdings Inc. 7,320 1,659 0.00
EnteroMedics Inc. 10,900 1,630 0.00
Catabasis Pharmaceuticals 352 1,591 0.00
Chembio Diagnostics Inc. 497 1,554 0.00
SERES Therapeutics Inc. 80 1,533 0.00
Hooper Holmes Inc. 14,276 1,271 0.00
PDI Inc. 1,200 1,259 0.00
REGENXBIO Inc. 120 1,201 0.00
Cymabay Therapeutics Inc. 1,200 1,189 0.00
Achaogen Inc. 333 1,177 0.00
Catalyst Biosciences Inc. 457 1,139 0.00
Teladoc Inc. 80 1,016 0.00
Celladon Corp. 1,400 1,015 0.00
Celsion Corp. 835 925 0.00
DARA BioSciences Inc. 1,700 883 0.00
Nivalis Therapeutics Inc. 160 828 0.00
Penumbra Inc. 33 790 0.00
Harvard Apparatus Regenerative Technology Inc. 1,988 785 0.00
Aimmune Therapeutics Inc. 80 780 0.00
ImmunoCellular Therapeutics Ltd. 3,000 762 0.00
OXiGENE Inc. 1,284 740 0.00
Ambit Biosciences Corp. 1,897 737 0.00
EndoChoice Holdings Inc. 100 666 0.00
Cyclacel Pharmaceuticals Inc. 1,700 644 0.00
Chelsea Therapeutics International 8,551 609 0.00
Presbia plc 200 576 0.00
Neos Therapeutics Inc. 60 550 0.00
Nanosphere Inc. 450 504 0.00
MELA Sciences Inc. 550 399 0.00
Invitae Corp. 80 394 0.00
InspireMD Inc. 570 365 0.00
Wright Medical Group Inc. 561 356 0.00
Zosano Pharma Corp. 200 352 0.00
Trius Therapeutics Inc. 2,800 236 0.00
PhotoMedex Inc. 700 218 0.00
Future Healthcare of America 2,000 194 0.00
Rock Creek Pharmaceuticals Inc. 236 133 0.00
Alexza Pharmaceuticals Inc. 147 102 0.00
CollabRx Inc. 300 79 0.00
Onconova Therapeutics Inc. 59 52 0.00
Perseon Corp. 56 20 0.00
Forest Laboratories Inc. 805 1 0.00
Catalyst Biosciences 3,459 0 0.00
325,578,584 14.25
72
Market % of Value Net Asset Holding (£) Value
Market % of Value Net Asset Holding (£) Value
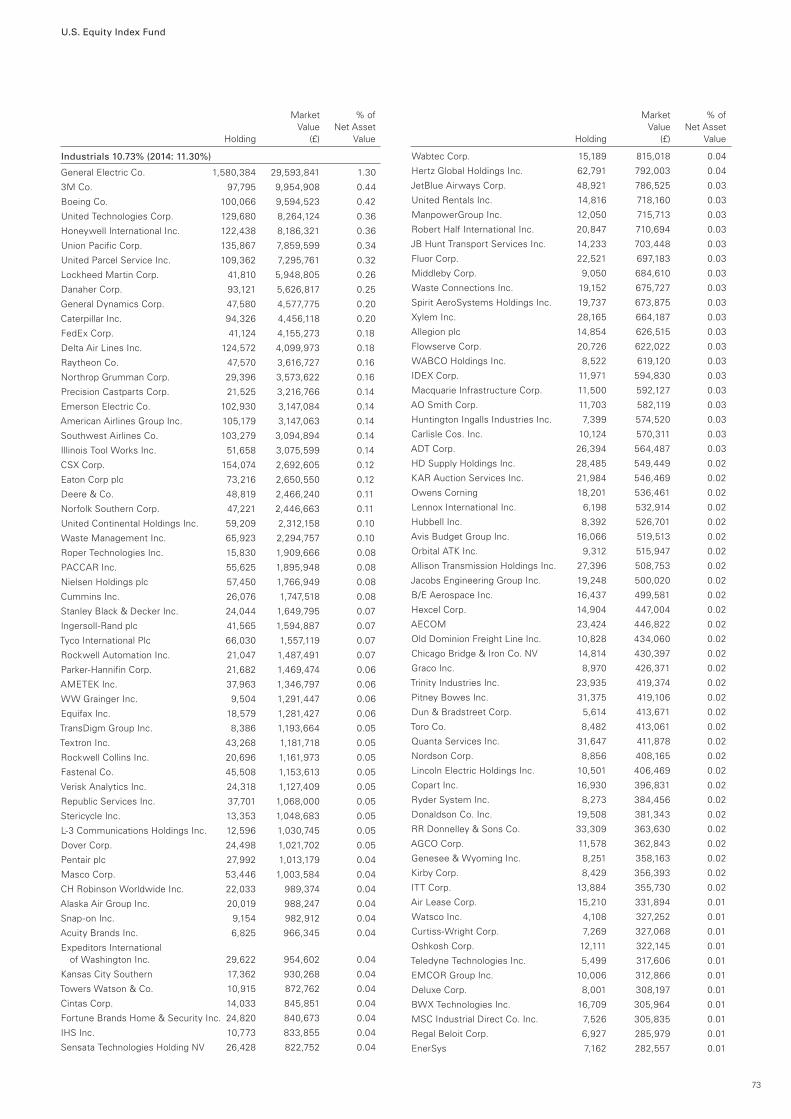
U.S. Equity Index Fund
Industrials 10.73% (2014: 11.30%)
General Electric Co. 1,580,384 29,593,841 1.30
3M Co. 97,795 9,954,908 0.44
Boeing Co. 100,066 9,594,523 0.42
United Technologies Corp. 129,680 8,264,124 0.36
Honeywell International Inc. 122,438 8,186,321 0.36
Union Pacific Corp. 135,867 7,859,599 0.34
United Parcel Service Inc. 109,362 7,295,761 0.32
Lockheed Martin Corp. 41,810 5,948,805 0.26
Danaher Corp. 93,121 5,626,817 0.25
General Dynamics Corp. 47,580 4,577,775 0.20
Caterpillar Inc. 94,326 4,456,118 0.20
FedEx Corp. 41,124 4,155,273 0.18
Delta Air Lines Inc. 124,572 4,099,973 0.18
Raytheon Co. 47,570 3,616,727 0.16
Northrop Grumman Corp. 29,396 3,573,622 0.16
Precision Castparts Corp. 21,525 3,216,766 0.14
Emerson Electric Co. 102,930 3,147,084 0.14
American Airlines Group Inc. 105,179 3,147,063 0.14
Southwest Airlines Co. 103,279 3,094,894 0.14
Illinois Tool Works Inc. 51,658 3,075,599 0.14
CSX Corp. 154,074 2,692,605 0.12
Eaton Corp plc 73,216 2,650,550 0.12
Deere & Co. 48,819 2,466,240 0.11
Norfolk Southern Corp. 47,221 2,446,663 0.11
United Continental Holdings Inc. 59,209 2,312,158 0.10
Waste Management Inc. 65,923 2,294,757 0.10
Roper Technologies Inc. 15,830 1,909,666 0.08
PACCAR Inc. 55,625 1,895,948 0.08
Nielsen Holdings plc 57,450 1,766,949 0.08
Cummins Inc. 26,076 1,747,518 0.08
Stanley Black & Decker Inc. 24,044 1,649,795 0.07
Ingersoll-Rand plc 41,565 1,594,887 0.07
Tyco International Plc 66,030 1,557,119 0.07
Rockwell Automation Inc. 21,047 1,487,491 0.07
Parker-Hannifin Corp. 21,682 1,469,474 0.06
AMETEK Inc. 37,963 1,346,797 0.06
WW Grainger Inc. 9,504 1,291,447 0.06
Equifax Inc. 18,579 1,281,427 0.06
TransDigm Group Inc. 8,386 1,193,664 0.05
Textron Inc. 43,268 1,181,718 0.05
Rockwell Collins Inc. 20,696 1,161,973 0.05
Fastenal Co. 45,508 1,153,613 0.05
Verisk Analytics Inc. 24,318 1,127,409 0.05
Republic Services Inc. 37,701 1,068,000 0.05
Stericycle Inc. 13,353 1,048,683 0.05
L-3 Communications Holdings Inc. 12,596 1,030,745 0.05
Dover Corp. 24,498 1,021,702 0.05
Pentair plc 27,992 1,013,179 0.04
Masco Corp. 53,446 1,003,584 0.04
CH Robinson Worldwide Inc. 22,033 989,374 0.04
Alaska Air Group Inc. 20,019 988,247 0.04
Snap-on Inc. 9,154 982,912 0.04
Acuity Brands Inc. 6,825 966,345 0.04
Expeditors International of Washington Inc. 29,622 954,602 0.04
Kansas City Southern 17,362 930,268 0.04
Towers Watson & Co. 10,915 872,762 0.04
Cintas Corp. 14,033 845,851 0.04
Fortune Brands Home & Security Inc. 24,820 840,673 0.04
IHS Inc. 10,773 833,855 0.04
Sensata Technologies Holding NV 26,428 822,752 0.04
Wabtec Corp. 15,189 815,018 0.04
Hertz Global Holdings Inc. 62,791 792,003 0.04
JetBlue Airways Corp. 48,921 786,525 0.03
United Rentals Inc. 14,816 718,160 0.03
ManpowerGroup Inc. 12,050 715,713 0.03
Robert Half International Inc. 20,847 710,694 0.03
JB Hunt Transport Services Inc. 14,233 703,448 0.03
Fluor Corp. 22,521 697,183 0.03
Middleby Corp. 9,050 684,610 0.03
Waste Connections Inc. 19,152 675,727 0.03
Spirit AeroSystems Holdings Inc. 19,737 673,875 0.03
Xylem Inc. 28,165 664,187 0.03
Allegion plc 14,854 626,515 0.03
Flowserve Corp. 20,726 622,022 0.03
WABCO Holdings Inc. 8,522 619,120 0.03
IDEX Corp. 11,971 594,830 0.03
Macquarie Infrastructure Corp. 11,500 592,127 0.03
AO Smith Corp. 11,703 582,119 0.03
Huntington Ingalls Industries Inc. 7,399 574,520 0.03
Carlisle Cos. Inc. 10,124 570,311 0.03
ADT Corp. 26,394 564,487 0.03
HD Supply Holdings Inc. 28,485 549,449 0.02
KAR Auction Services Inc. 21,984 546,469 0.02
Owens Corning 18,201 536,461 0.02
Lennox International Inc. 6,198 532,914 0.02
Hubbell Inc. 8,392 526,701 0.02
Avis Budget Group Inc. 16,066 519,513 0.02
Orbital ATK Inc. 9,312 515,947 0.02
Allison Transmission Holdings Inc. 27,396 508,753 0.02
Jacobs Engineering Group Inc. 19,248 500,020 0.02
B/E Aerospace Inc. 16,437 499,581 0.02
Hexcel Corp. 14,904 447,004 0.02
AECOM 23,424 446,822 0.02
Old Dominion Freight Line Inc. 10,828 434,060 0.02
Chicago Bridge & Iron Co. NV 14,814 430,397 0.02
Graco Inc. 8,970 426,371 0.02
Trinity Industries Inc. 23,935 419,374 0.02
Pitney Bowes Inc. 31,375 419,106 0.02
Dun & Bradstreet Corp. 5,614 413,671 0.02
Toro Co. 8,482 413,061 0.02
Quanta Services Inc. 31,647 411,878 0.02
Nordson Corp. 8,856 408,165 0.02
Lincoln Electric Holdings Inc. 10,501 406,469 0.02
Copart Inc. 16,930 396,831 0.02
Ryder System Inc. 8,273 384,456 0.02
Donaldson Co. Inc. 19,508 381,343 0.02
RR Donnelley & Sons Co. 33,309 363,630 0.02
AGCO Corp. 11,578 362,843 0.02
Genesee & Wyoming Inc. 8,251 358,163 0.02
Kirby Corp. 8,429 356,393 0.02
ITT Corp. 13,884 355,730 0.02
Air Lease Corp. 15,210 331,894 0.01
Watsco Inc. 4,108 327,252 0.01
Curtiss-Wright Corp. 7,269 327,068 0.01
Oshkosh Corp. 12,111 322,145 0.01
Teledyne Technologies Inc. 5,499 317,606 0.01
EMCOR Group Inc. 10,006 312,866 0.01
Deluxe Corp. 8,001 308,197 0.01
BWX Technologies Inc. 16,709 305,964 0.01
MSC Industrial Direct Co. Inc. 7,526 305,835 0.01
Regal Beloit Corp. 6,927 285,979 0.01
EnerSys 7,162 282,557 0.01
73
Market % of Value Net Asset Holding (£) Value
Market % of Value Net Asset Holding (£) Value
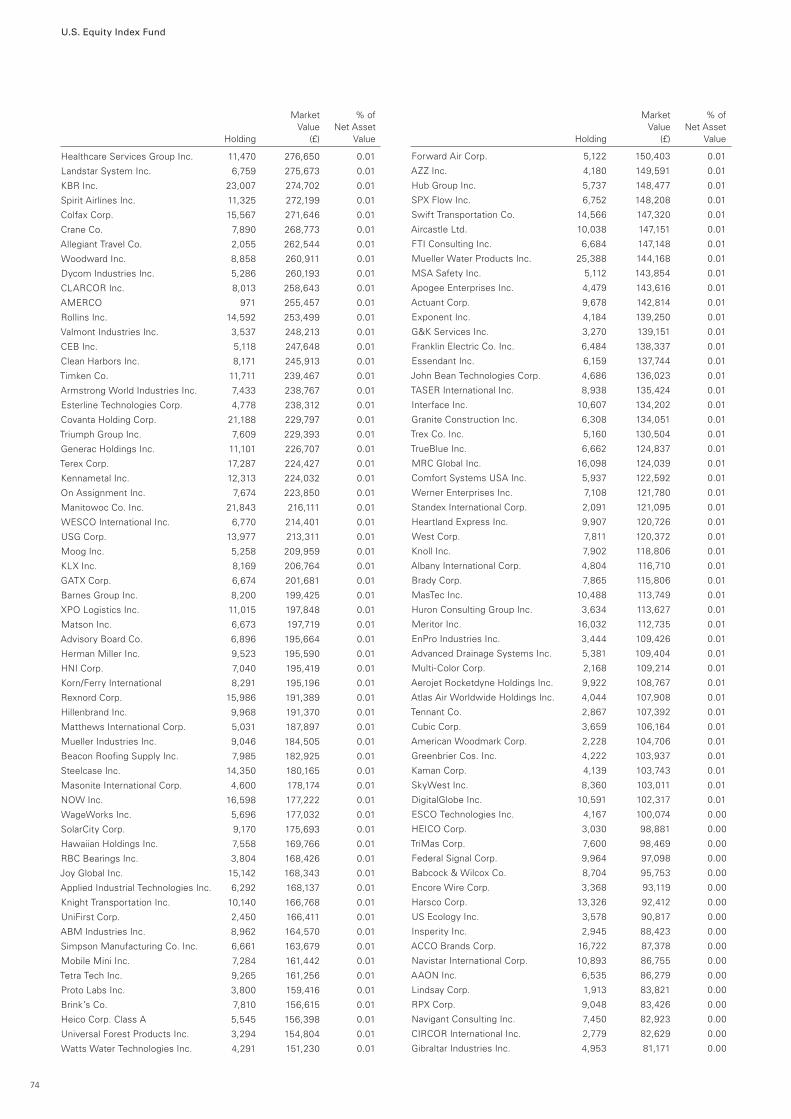
U.S. Equity Index Fund
Healthcare Services Group Inc. 11,470 276,650 0.01
Landstar System Inc. 6,759 275,673 0.01
KBR Inc. 23,007 274,702 0.01
Spirit Airlines Inc. 11,325 272,199 0.01
Colfax Corp. 15,567 271,646 0.01
Crane Co. 7,890 268,773 0.01
Allegiant Travel Co. 2,055 262,544 0.01
Woodward Inc. 8,858 260,911 0.01
Dycom Industries Inc. 5,286 260,193 0.01
CLARCOR Inc. 8,013 258,643 0.01
AMERCO 971 255,457 0.01
Rollins Inc. 14,592 253,499 0.01
Valmont Industries Inc. 3,537 248,213 0.01
CEB Inc. 5,118 247,648 0.01
Clean Harbors Inc. 8,171 245,913 0.01
Timken Co. 11,711 239,467 0.01
Armstrong World Industries Inc. 7,433 238,767 0.01
Esterline Technologies Corp. 4,778 238,312 0.01
Covanta Holding Corp. 21,188 229,797 0.01
Triumph Group Inc. 7,609 229,393 0.01
Generac Holdings Inc. 11,101 226,707 0.01
Terex Corp. 17,287 224,427 0.01
Kennametal Inc. 12,313 224,032 0.01
On Assignment Inc. 7,674 223,850 0.01
Manitowoc Co. Inc. 21,843 216,111 0.01
WESCO International Inc. 6,770 214,401 0.01
USG Corp. 13,977 213,311 0.01
Moog Inc. 5,258 209,959 0.01
KLX Inc. 8,169 206,764 0.01
GATX Corp. 6,674 201,681 0.01
Barnes Group Inc. 8,200 199,425 0.01
XPO Logistics Inc. 11,015 197,848 0.01
Matson Inc. 6,673 197,719 0.01
Advisory Board Co. 6,896 195,664 0.01
Herman Miller Inc. 9,523 195,590 0.01
HNI Corp. 7,040 195,419 0.01
Korn/Ferry International 8,291 195,196 0.01
Rexnord Corp. 15,986 191,389 0.01
Hillenbrand Inc. 9,968 191,370 0.01
Matthews International Corp. 5,031 187,897 0.01
Mueller Industries Inc. 9,046 184,505 0.01
Beacon Roofing Supply Inc. 7,985 182,925 0.01
Steelcase Inc. 14,350 180,165 0.01
Masonite International Corp. 4,600 178,174 0.01
NOW Inc. 16,598 177,222 0.01
WageWorks Inc. 5,696 177,032 0.01
SolarCity Corp. 9,170 175,693 0.01
Hawaiian Holdings Inc. 7,558 169,766 0.01
RBC Bearings Inc. 3,804 168,426 0.01
Joy Global Inc. 15,142 168,343 0.01
Applied Industrial Technologies Inc. 6,292 168,137 0.01
Knight Transportation Inc. 10,140 166,768 0.01
UniFirst Corp. 2,450 166,411 0.01
ABM Industries Inc. 8,962 164,570 0.01
Simpson Manufacturing Co. Inc. 6,661 163,679 0.01
Mobile Mini Inc. 7,284 161,442 0.01
Tetra Tech Inc. 9,265 161,256 0.01
Proto Labs Inc. 3,800 159,416 0.01
Brink’s Co. 7,810 156,615 0.01
Heico Corp. Class A 5,545 156,398 0.01
Universal Forest Products Inc. 3,294 154,804 0.01
Watts Water Technologies Inc. 4,291 151,230 0.01
Forward Air Corp. 5,122 150,403 0.01
AZZ Inc. 4,180 149,591 0.01
Hub Group Inc. 5,737 148,477 0.01
SPX Flow Inc. 6,752 148,208 0.01
Swift Transportation Co. 14,566 147,320 0.01
Aircastle Ltd. 10,038 147,151 0.01
FTI Consulting Inc. 6,684 147,148 0.01
Mueller Water Products Inc. 25,388 144,168 0.01
MSA Safety Inc. 5,112 143,854 0.01
Apogee Enterprises Inc. 4,479 143,616 0.01
Actuant Corp. 9,678 142,814 0.01
Exponent Inc. 4,184 139,250 0.01
G&K Services Inc. 3,270 139,151 0.01
Franklin Electric Co. Inc. 6,484 138,337 0.01
Essendant Inc. 6,159 137,744 0.01
John Bean Technologies Corp. 4,686 136,023 0.01
TASER International Inc. 8,938 135,424 0.01
Interface Inc. 10,607 134,202 0.01
Granite Construction Inc. 6,308 134,051 0.01
Trex Co. Inc. 5,160 130,504 0.01
TrueBlue Inc. 6,662 124,837 0.01
MRC Global Inc. 16,098 124,039 0.01
Comfort Systems USA Inc. 5,937 122,592 0.01
Werner Enterprises Inc. 7,108 121,780 0.01
Standex International Corp. 2,091 121,095 0.01
Heartland Express Inc. 9,907 120,726 0.01
West Corp. 7,811 120,372 0.01
Knoll Inc. 7,902 118,806 0.01
Albany International Corp. 4,804 116,710 0.01
Brady Corp. 7,865 115,806 0.01
MasTec Inc. 10,488 113,749 0.01
Huron Consulting Group Inc. 3,634 113,627 0.01
Meritor Inc. 16,032 112,735 0.01
EnPro Industries Inc. 3,444 109,426 0.01
Advanced Drainage Systems Inc. 5,381 109,404 0.01
Multi-Color Corp. 2,168 109,214 0.01
Aerojet Rocketdyne Holdings Inc. 9,922 108,767 0.01
Atlas Air Worldwide Holdings Inc. 4,044 107,908 0.01
Tennant Co. 2,867 107,392 0.01
Cubic Corp. 3,659 106,164 0.01
American Woodmark Corp. 2,228 104,706 0.01
Greenbrier Cos. Inc. 4,222 103,937 0.01
Kaman Corp. 4,139 103,743 0.01
SkyWest Inc. 8,360 103,011 0.01
DigitalGlobe Inc. 10,591 102,317 0.01
ESCO Technologies Inc. 4,167 100,074 0.00
HEICO Corp. 3,030 98,881 0.00
TriMas Corp. 7,600 98,469 0.00
Federal Signal Corp. 9,964 97,098 0.00
Babcock & Wilcox Co. 8,704 95,753 0.00
Encore Wire Corp. 3,368 93,119 0.00
Harsco Corp. 13,326 92,412 0.00
US Ecology Inc. 3,578 90,817 0.00
Insperity Inc. 2,945 88,423 0.00
ACCO Brands Corp. 16,722 87,378 0.00
Navistar International Corp. 10,893 86,755 0.00
AAON Inc. 6,535 86,279 0.00
Lindsay Corp. 1,913 83,821 0.00
RPX Corp. 9,048 83,426 0.00
Navigant Consulting Inc. 7,450 82,923 0.00
CIRCOR International Inc. 2,779 82,629 0.00
Gibraltar Industries Inc. 4,953 81,171 0.00
74
Market % of Value Net Asset Holding (£) Value
Market % of Value Net Asset Holding (£) Value
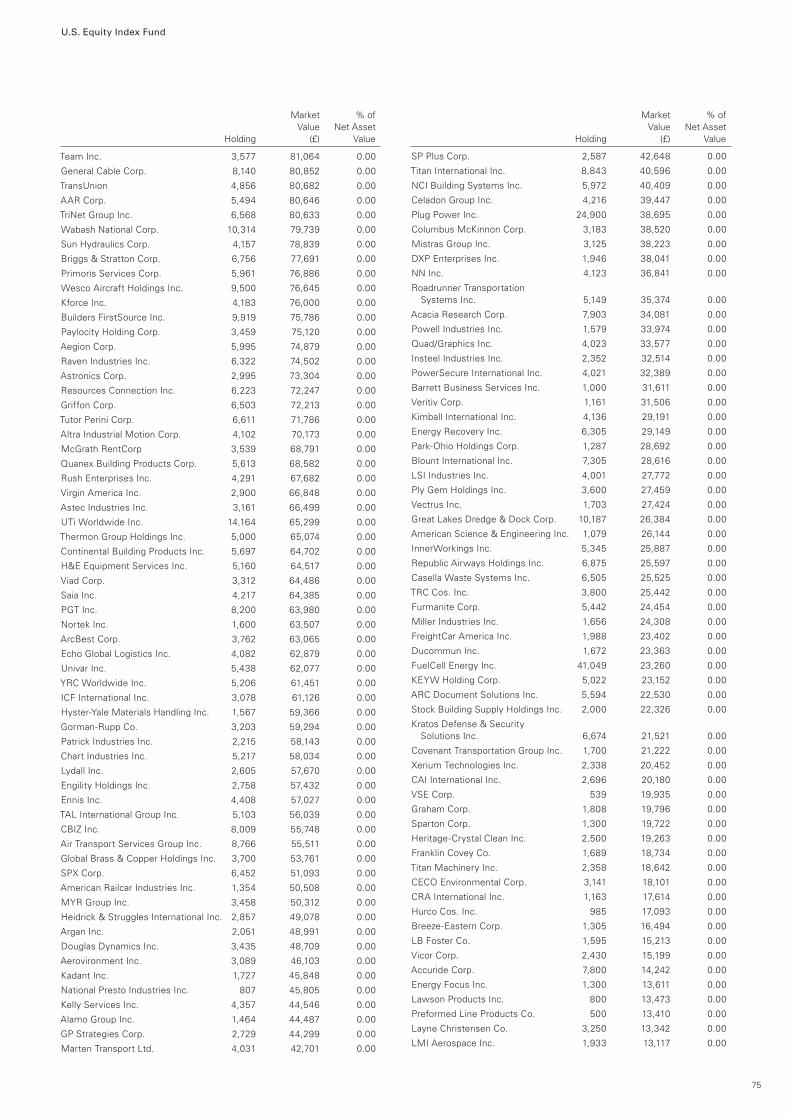
U.S. Equity Index Fund
Team Inc. 3,577 81,064 0.00
General Cable Corp. 8,140 80,852 0.00
TransUnion 4,856 80,682 0.00
AAR Corp. 5,494 80,646 0.00
TriNet Group Inc. 6,568 80,633 0.00
Wabash National Corp. 10,314 79,739 0.00
Sun Hydraulics Corp. 4,157 78,839 0.00
Briggs & Stratton Corp. 6,756 77,691 0.00
Primoris Services Corp. 5,961 76,886 0.00
Wesco Aircraft Holdings Inc. 9,500 76,645 0.00
Kforce Inc. 4,183 76,000 0.00
Builders FirstSource Inc. 9,919 75,786 0.00
Paylocity Holding Corp. 3,459 75,120 0.00
Aegion Corp. 5,995 74,879 0.00
Raven Industries Inc. 6,322 74,502 0.00
Astronics Corp. 2,995 73,304 0.00
Resources Connection Inc. 6,223 72,247 0.00
Griffon Corp. 6,503 72,213 0.00
Tutor Perini Corp. 6,611 71,786 0.00
Altra Industrial Motion Corp. 4,102 70,173 0.00
McGrath RentCorp 3,539 68,791 0.00
Quanex Building Products Corp. 5,613 68,582 0.00
Rush Enterprises Inc. 4,291 67,682 0.00
Virgin America Inc. 2,900 66,848 0.00
Astec Industries Inc. 3,161 66,499 0.00
UTi Worldwide Inc. 14,164 65,299 0.00
Thermon Group Holdings Inc. 5,000 65,074 0.00
Continental Building Products Inc. 5,697 64,702 0.00
H&E Equipment Services Inc. 5,160 64,517 0.00
Viad Corp. 3,312 64,486 0.00
Saia Inc. 4,217 64,385 0.00
PGT Inc. 8,200 63,980 0.00
Nortek Inc. 1,600 63,507 0.00
ArcBest Corp. 3,762 63,065 0.00
Echo Global Logistics Inc. 4,082 62,879 0.00
Univar Inc. 5,438 62,077 0.00
YRC Worldwide Inc. 5,206 61,451 0.00
ICF International Inc. 3,078 61,126 0.00
Hyster-Yale Materials Handling Inc. 1,567 59,366 0.00
Gorman-Rupp Co. 3,203 59,294 0.00
Patrick Industries Inc. 2,215 58,143 0.00
Chart Industries Inc. 5,217 58,034 0.00
Lydall Inc. 2,605 57,670 0.00
Engility Holdings Inc. 2,758 57,432 0.00
Ennis Inc. 4,408 57,027 0.00
TAL International Group Inc. 5,103 56,039 0.00
CBIZ Inc. 8,009 55,748 0.00
Air Transport Services Group Inc. 8,766 55,511 0.00
Global Brass & Copper Holdings Inc. 3,700 53,761 0.00
SPX Corp. 6,452 51,093 0.00
American Railcar Industries Inc. 1,354 50,508 0.00
MYR Group Inc. 3,458 50,312 0.00
Heidrick & Struggles International Inc. 2,857 49,078 0.00
Argan Inc. 2,051 48,991 0.00
Douglas Dynamics Inc. 3,435 48,709 0.00
Aerovironment Inc. 3,089 46,103 0.00
Kadant Inc. 1,727 45,848 0.00
National Presto Industries Inc. 807 45,805 0.00
Kelly Services Inc. 4,357 44,546 0.00
Alamo Group Inc. 1,464 44,487 0.00
GP Strategies Corp. 2,729 44,299 0.00
Marten Transport Ltd. 4,031 42,701 0.00
SP Plus Corp. 2,587 42,648 0.00
Titan International Inc. 8,843 40,596 0.00
NCI Building Systems Inc. 5,972 40,409 0.00
Celadon Group Inc. 4,216 39,447 0.00
Plug Power Inc. 24,900 38,695 0.00
Columbus McKinnon Corp. 3,183 38,520 0.00
Mistras Group Inc. 3,125 38,223 0.00
DXP Enterprises Inc. 1,946 38,041 0.00
NN Inc. 4,123 36,841 0.00
Roadrunner Transportation Systems Inc. 5,149 35,374 0.00
Acacia Research Corp. 7,903 34,081 0.00
Powell Industries Inc. 1,579 33,974 0.00
Quad/Graphics Inc. 4,023 33,577 0.00
Insteel Industries Inc. 2,352 32,514 0.00
PowerSecure International Inc. 4,021 32,389 0.00
Barrett Business Services Inc. 1,000 31,611 0.00
Veritiv Corp. 1,161 31,506 0.00
Kimball International Inc. 4,136 29,191 0.00
Energy Recovery Inc. 6,305 29,149 0.00
Park-Ohio Holdings Corp. 1,287 28,692 0.00
Blount International Inc. 7,305 28,616 0.00
LSI Industries Inc. 4,001 27,772 0.00
Ply Gem Holdings Inc. 3,600 27,459 0.00
Vectrus Inc. 1,703 27,424 0.00
Great Lakes Dredge & Dock Corp. 10,187 26,384 0.00
American Science & Engineering Inc. 1,079 26,144 0.00
InnerWorkings Inc. 5,345 25,887 0.00
Republic Airways Holdings Inc. 6,875 25,597 0.00
Casella Waste Systems Inc. 6,505 25,525 0.00
TRC Cos. Inc. 3,800 25,442 0.00
Furmanite Corp. 5,442 24,454 0.00
Miller Industries Inc. 1,656 24,308 0.00
FreightCar America Inc. 1,988 23,402 0.00
Ducommun Inc. 1,672 23,363 0.00
FuelCell Energy Inc. 41,049 23,260 0.00
KEYW Holding Corp. 5,022 23,152 0.00
ARC Document Solutions Inc. 5,594 22,530 0.00
Stock Building Supply Holdings Inc. 2,000 22,326 0.00
Kratos Defense & Security Solutions Inc. 6,674 21,521 0.00
Covenant Transportation Group Inc. 1,700 21,222 0.00
Xerium Technologies Inc. 2,338 20,452 0.00
CAI International Inc. 2,696 20,180 0.00
VSE Corp. 539 19,935 0.00
Graham Corp. 1,808 19,796 0.00
Sparton Corp. 1,300 19,722 0.00
Heritage-Crystal Clean Inc. 2,500 19,263 0.00
Franklin Covey Co. 1,689 18,734 0.00
Titan Machinery Inc. 2,358 18,642 0.00
CECO Environmental Corp. 3,141 18,101 0.00
CRA International Inc. 1,163 17,614 0.00
Hurco Cos. Inc. 985 17,093 0.00
Breeze-Eastern Corp. 1,305 16,494 0.00
LB Foster Co. 1,595 15,213 0.00
Vicor Corp. 2,430 15,199 0.00
Accuride Corp. 7,800 14,242 0.00
Energy Focus Inc. 1,300 13,611 0.00
Lawson Products Inc. 800 13,473 0.00
Preformed Line Products Co. 500 13,410 0.00
Layne Christensen Co. 3,250 13,342 0.00
LMI Aerospace Inc. 1,933 13,117 0.00
75
Market % of Value Net Asset Holding (£) Value
Market % of Value Net Asset Holding (£) Value
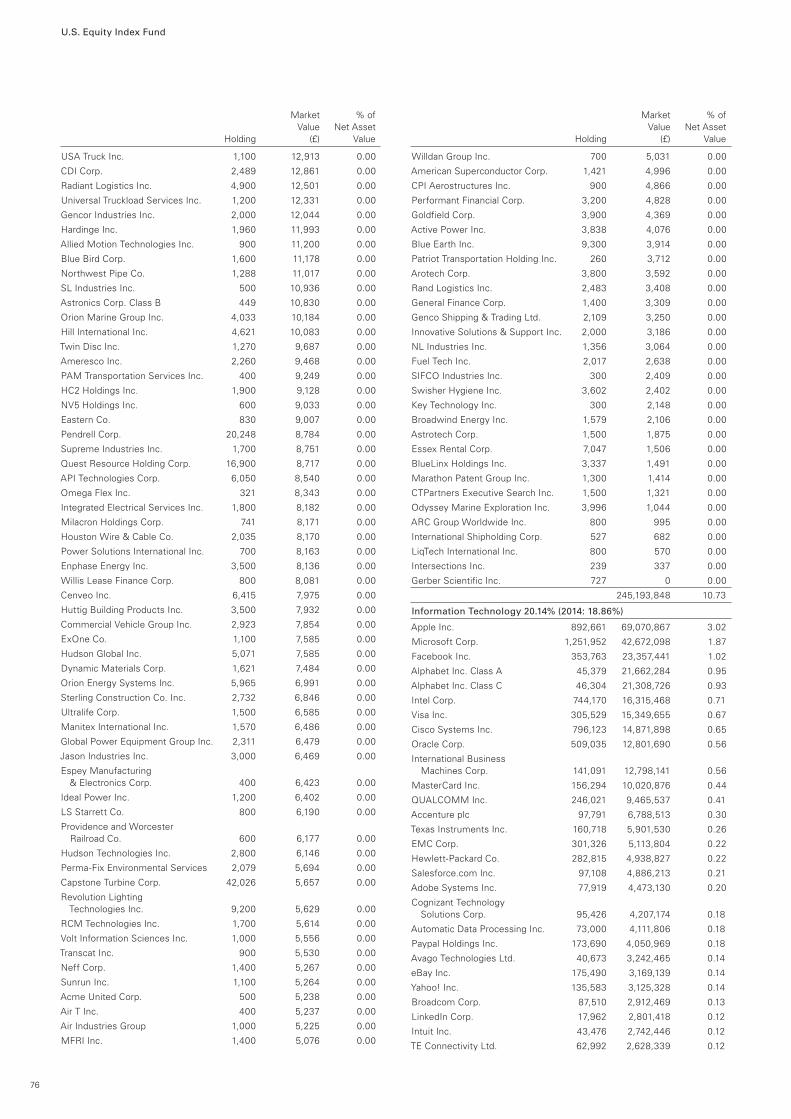
U.S. Equity Index Fund
USA Truck Inc. 1,100 12,913 0.00
CDI Corp. 2,489 12,861 0.00
Radiant Logistics Inc. 4,900 12,501 0.00
Universal Truckload Services Inc. 1,200 12,331 0.00
Gencor Industries Inc. 2,000 12,044 0.00
Hardinge Inc. 1,960 11,993 0.00
Allied Motion Technologies Inc. 900 11,200 0.00
Blue Bird Corp. 1,600 11,178 0.00
Northwest Pipe Co. 1,288 11,017 0.00
SL Industries Inc. 500 10,936 0.00
Astronics Corp. Class B 449 10,830 0.00
Orion Marine Group Inc. 4,033 10,184 0.00
Hill International Inc. 4,621 10,083 0.00
Twin Disc Inc. 1,270 9,687 0.00
Ameresco Inc. 2,260 9,468 0.00
PAM Transportation Services Inc. 400 9,249 0.00
HC2 Holdings Inc. 1,900 9,128 0.00
NV5 Holdings Inc. 600 9,033 0.00
Eastern Co. 830 9,007 0.00
Pendrell Corp. 20,248 8,784 0.00
Supreme Industries Inc. 1,700 8,751 0.00
Quest Resource Holding Corp. 16,900 8,717 0.00
API Technologies Corp. 6,050 8,540 0.00
Omega Flex Inc. 321 8,343 0.00
Integrated Electrical Services Inc. 1,800 8,182 0.00
Milacron Holdings Corp. 741 8,171 0.00
Houston Wire & Cable Co. 2,035 8,170 0.00
Power Solutions International Inc. 700 8,163 0.00
Enphase Energy Inc. 3,500 8,136 0.00
Willis Lease Finance Corp. 800 8,081 0.00
Cenveo Inc. 6,415 7,975 0.00
Huttig Building Products Inc. 3,500 7,932 0.00
Commercial Vehicle Group Inc. 2,923 7,854 0.00
ExOne Co. 1,100 7,585 0.00
Hudson Global Inc. 5,071 7,585 0.00
Dynamic Materials Corp. 1,621 7,484 0.00
Orion Energy Systems Inc. 5,965 6,991 0.00
Sterling Construction Co. Inc. 2,732 6,846 0.00
Ultralife Corp. 1,500 6,585 0.00
Manitex International Inc. 1,570 6,486 0.00
Global Power Equipment Group Inc. 2,311 6,479 0.00
Jason Industries Inc. 3,000 6,469 0.00
Espey Manufacturing & Electronics Corp. 400 6,423 0.00
Ideal Power Inc. 1,200 6,402 0.00
LS Starrett Co. 800 6,190 0.00
Providence and Worcester Railroad Co. 600 6,177 0.00
Hudson Technologies Inc. 2,800 6,146 0.00
Perma-Fix Environmental Services 2,079 5,694 0.00
Capstone Turbine Corp. 42,026 5,657 0.00
Revolution Lighting Technologies Inc. 9,200 5,629 0.00
RCM Technologies Inc. 1,700 5,614 0.00
Volt Information Sciences Inc. 1,000 5,556 0.00
Transcat Inc. 900 5,530 0.00
Neff Corp. 1,400 5,267 0.00
Sunrun Inc. 1,100 5,264 0.00
Acme United Corp. 500 5,238 0.00
Air T Inc. 400 5,237 0.00
Air Industries Group 1,000 5,225 0.00
MFRI Inc. 1,400 5,076 0.00
Willdan Group Inc. 700 5,031 0.00
American Superconductor Corp. 1,421 4,996 0.00
CPI Aerostructures Inc. 900 4,866 0.00
Performant Financial Corp. 3,200 4,828 0.00
Goldfield Corp. 3,900 4,369 0.00
Active Power Inc. 3,838 4,076 0.00
Blue Earth Inc. 9,300 3,914 0.00
Patriot Transportation Holding Inc. 260 3,712 0.00
Arotech Corp. 3,800 3,592 0.00
Rand Logistics Inc. 2,483 3,408 0.00
General Finance Corp. 1,400 3,309 0.00
Genco Shipping & Trading Ltd. 2,109 3,250 0.00
Innovative Solutions & Support Inc. 2,000 3,186 0.00
NL Industries Inc. 1,356 3,064 0.00
Fuel Tech Inc. 2,017 2,638 0.00
SIFCO Industries Inc. 300 2,409 0.00
Swisher Hygiene Inc. 3,602 2,402 0.00
Key Technology Inc. 300 2,148 0.00
Broadwind Energy Inc. 1,579 2,106 0.00
Astrotech Corp. 1,500 1,875 0.00
Essex Rental Corp. 7,047 1,506 0.00
BlueLinx Holdings Inc. 3,337 1,491 0.00
Marathon Patent Group Inc. 1,300 1,414 0.00
CTPartners Executive Search Inc. 1,500 1,321 0.00
Odyssey Marine Exploration Inc. 3,996 1,044 0.00
ARC Group Worldwide Inc. 800 995 0.00
International Shipholding Corp. 527 682 0.00
LiqTech International Inc. 800 570 0.00
Intersections Inc. 239 337 0.00
Gerber Scientific Inc. 727 0 0.00
245,193,848 10.73
Information Technology 20.14% (2014: 18.86%)
Apple Inc. 892,661 69,070,867 3.02
Microsoft Corp. 1,251,952 42,672,098 1.87
Facebook Inc. 353,763 23,357,441 1.02
Alphabet Inc. Class A 45,379 21,662,284 0.95
Alphabet Inc. Class C 46,304 21,308,726 0.93
Intel Corp. 744,170 16,315,468 0.71
Visa Inc. 305,529 15,349,655 0.67
Cisco Systems Inc. 796,123 14,871,898 0.65
Oracle Corp. 509,035 12,801,690 0.56
International Business Machines Corp. 141,091 12,798,141 0.56
MasterCard Inc. 156,294 10,020,876 0.44
QUALCOMM Inc. 246,021 9,465,537 0.41
Accenture plc 97,791 6,788,513 0.30
Texas Instruments Inc. 160,718 5,901,530 0.26
EMC Corp. 301,326 5,113,804 0.22
Hewlett-Packard Co. 282,815 4,938,827 0.22
Salesforce.com Inc. 97,108 4,886,213 0.21
Adobe Systems Inc. 77,919 4,473,130 0.20
Cognizant Technology Solutions Corp. 95,426 4,207,174 0.18
Automatic Data Processing Inc. 73,000 4,111,806 0.18
Paypal Holdings Inc. 173,690 4,050,969 0.18
Avago Technologies Ltd. 40,673 3,242,465 0.14
eBay Inc. 175,490 3,169,139 0.14
Yahoo! Inc. 135,583 3,125,328 0.14
Broadcom Corp. 87,510 2,912,469 0.13
LinkedIn Corp. 17,962 2,801,418 0.12
Intuit Inc. 43,476 2,742,446 0.12
TE Connectivity Ltd. 62,992 2,628,339 0.12
76
Market % of Value Net Asset Holding (£) Value
Market % of Value Net Asset Holding (£) Value

U.S. Equity Index Fund
Corning Inc. 191,961 2,311,886 0.10
Fiserv Inc. 36,762 2,297,269 0.10
Electronic Arts Inc. 48,830 2,278,671 0.10
Fidelity National Information Services Inc. 44,101 2,082,548 0.09
Applied Materials Inc. 187,982 2,040,002 0.09
Analog Devices Inc. 49,126 1,911,729 0.08
Alliance Data Systems Corp. 9,621 1,852,124 0.08
Micron Technology Inc. 168,525 1,807,029 0.08
Activision Blizzard Inc. 78,819 1,772,459 0.08
Equinix Inc. 9,173 1,760,891 0.08
Amphenol Corp. 48,474 1,701,173 0.08
Paychex Inc. 50,324 1,680,400 0.07
Twitter Inc. 89,190 1,643,005 0.07
Altera Corp. 47,367 1,611,718 0.07
SanDisk Corp. 32,098 1,600,329 0.07
Western Digital Corp. 36,077 1,560,674 0.07
Skyworks Solutions Inc. 29,927 1,496,738 0.07
Red Hat Inc. 28,773 1,473,490 0.07
NVIDIA Corp. 80,151 1,471,823 0.07
Symantec Corp. 107,091 1,427,742 0.06
Citrix Systems Inc. 25,216 1,340,152 0.06
Autodesk Inc. 35,473 1,267,648 0.06
Xilinx Inc. 40,535 1,249,594 0.06
Lam Research Corp. 24,783 1,228,881 0.05
ServiceNow Inc. 22,999 1,215,922 0.05
Maxim Integrated Products Inc. 44,296 1,175,376 0.05
Seagate Technology plc 47,301 1,165,681 0.05
Palo Alto Networks Inc. 11,165 1,163,925 0.05
Motorola Solutions Inc. 25,223 1,142,581 0.05
FleetCor Technologies Inc. 12,143 1,138,898 0.05
Juniper Networks Inc. 55,447 1,126,245 0.05
Akamai Technologies Inc. 28,014 1,103,038 0.05
Linear Technology Corp. 37,625 1,081,926 0.05
KLA-Tencor Corp. 24,666 1,071,512 0.05
NetApp Inc. 47,010 1,034,622 0.05
Microchip Technology Inc. 33,042 1,032,510 0.05
Harris Corp. 19,421 994,692 0.04
Western Union Co. 79,520 990,139 0.04
Xerox Corp. 156,158 948,435 0.04
Computer Sciences Corp. 21,717 936,233 0.04
Global Payments Inc. 10,193 899,907 0.04
Total System Services Inc. 26,304 893,151 0.04
CA Inc. 48,686 873,221 0.04
ANSYS Inc. 14,010 863,969 0.04
Workday Inc. 16,784 858,001 0.04
VeriSign Inc. 15,511 809,397 0.04
CDK Global Inc. 24,866 800,852 0.04
F5 Networks Inc. 11,182 797,815 0.04
Synopsys Inc. 24,479 792,033 0.04
Gartner Inc. 12,874 755,568 0.03
FactSet Research Systems Inc. 6,506 737,886 0.03
Vantiv Inc. 22,715 737,605 0.03
Splunk Inc. 19,527 709,947 0.03
Broadridge Financial Solutions Inc. 18,322 706,709 0.03
CoStar Group Inc. 5,170 679,793 0.03
Qorvo Inc. 23,183 659,284 0.03
Cadence Design Systems Inc. 45,269 651,013 0.03
CDW Corp. 21,798 630,624 0.03
Jack Henry & Associates Inc. 12,564 629,177 0.03
Avnet Inc. 20,866 613,523 0.03
Ultimate Software Group Inc. 4,480 592,779 0.03
Trimble Navigation Ltd. 39,895 587,679 0.03
Tyler Technologies Inc. 5,324 586,971 0.03
SS&C Technologies Holdings Inc. 12,121 581,406 0.03
Keysight Technologies Inc. 26,237 561,809 0.03
Manhattan Associates Inc. 11,523 543,470 0.02
Arrow Electronics Inc. 14,641 520,929 0.02
IAC/InterActiveCorp 11,896 515,848 0.02
Fortinet Inc. 22,591 502,461 0.02
VMware Inc. 12,127 472,155 0.02
Ingram Micro Inc. 24,227 467,002 0.02
ON Semiconductor Corp. 64,176 457,510 0.02
MAXIMUS Inc. 10,223 451,311 0.02
Jabil Circuit Inc. 30,133 448,171 0.02
Brocade Communications Systems Inc. 64,503 435,199 0.02
First Solar Inc. 11,753 434,307 0.02
Nuance Communications Inc. 38,999 428,272 0.02
DST Systems Inc. 5,361 423,840 0.02
NCR Corp. 24,462 421,322 0.02
Tableau Software Inc. 7,719 419,237 0.02
Teradyne Inc. 32,776 414,051 0.02
Guidewire Software Inc. 10,925 411,845 0.02
CommScope Holding Co. Inc. 19,460 408,252 0.02
PTC Inc. 17,736 406,996 0.02
Euronet Worldwide Inc. 7,726 401,158 0.02
Zebra Technologies Corp. 8,049 400,730 0.02
Teradata Corp. 21,960 399,557 0.02
SolarWinds Inc. 10,610 398,597 0.02
Genpact Ltd. 24,770 397,276 0.02
Cavium Inc. 8,626 396,224 0.02
Sabre Corp. 20,828 395,279 0.02
Marvell Technology Group Ltd. 73,145 388,364 0.02
ARRIS Group Inc. 20,896 382,363 0.02
Integrated Device Technology Inc. 23,028 380,222 0.02
FLIR Systems Inc. 21,753 375,508 0.02
Freescale Semiconductor Ltd. 17,327 375,060 0.02
FireEye Inc. 22,031 372,890 0.02
Solera Holdings Inc. 10,334 365,611 0.02
NetScout Systems Inc. 15,648 363,337 0.02
j2 Global Inc. 7,151 359,032 0.02
Aspen Technology Inc. 13,271 355,664 0.02
Cypress Semiconductor Corp. 52,046 355,196 0.02
WEX Inc. 5,992 348,680 0.02
CoreLogic Inc. 13,803 348,293 0.02
VeriFone Systems Inc. 17,742 346,017 0.02
Microsemi Corp. 14,757 343,986 0.02
Cognex Corp. 13,902 338,009 0.02
Leidos Holdings Inc. 9,897 336,821 0.02
Atmel Corp. 65,016 319,944 0.01
EPAM Systems Inc. 6,300 315,327 0.01
NetSuite Inc. 5,707 314,395 0.01
Rackspace Hosting Inc. 18,735 313,585 0.01
National Instruments Corp. 15,826 312,032 0.01
Synaptics Inc. 5,594 308,206 0.01
Ciena Corp. 19,616 306,484 0.01
HomeAway Inc. 14,919 304,775 0.01
Fair Isaac Corp. 4,990 298,386 0.01
FEI Co. 6,375 297,946 0.01
IPG Photonics Corp. 5,561 297,458 0.01
Blackbaud Inc. 7,263 294,630 0.01
LendingClub Corp. 32,081 294,346 0.01
ViaSat Inc. 6,868 293,060 0.01
77
Market % of Value Net Asset Holding (£) Value
Market % of Value Net Asset Holding (£) Value
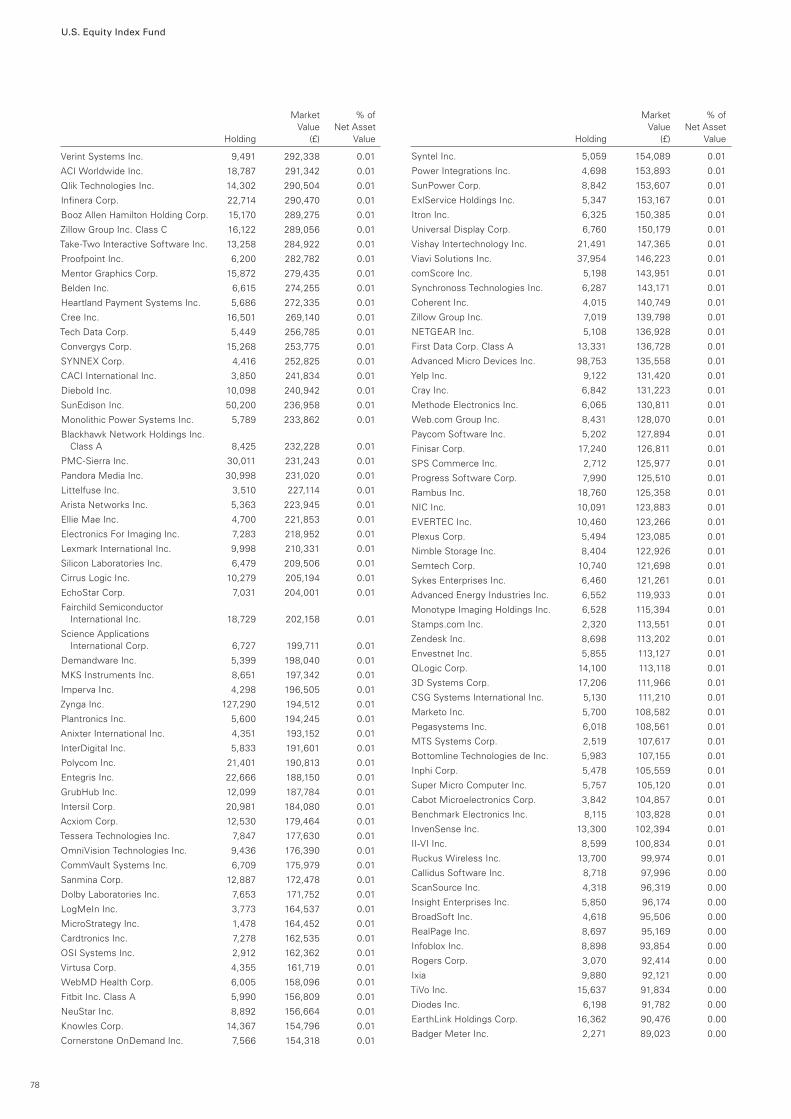
U.S. Equity Index Fund
Verint Systems Inc. 9,491 292,338 0.01
ACI Worldwide Inc. 18,787 291,342 0.01
Qlik Technologies Inc. 14,302 290,504 0.01
Infinera Corp. 22,714 290,470 0.01
Booz Allen Hamilton Holding Corp. 15,170 289,275 0.01
Zillow Group Inc. Class C 16,122 289,056 0.01
Take-Two Interactive Software Inc. 13,258 284,922 0.01
Proofpoint Inc. 6,200 282,782 0.01
Mentor Graphics Corp. 15,872 279,435 0.01
Belden Inc. 6,615 274,255 0.01
Heartland Payment Systems Inc. 5,686 272,335 0.01
Cree Inc. 16,501 269,140 0.01
Tech Data Corp. 5,449 256,785 0.01
Convergys Corp. 15,268 253,775 0.01
SYNNEX Corp. 4,416 252,825 0.01
CACI International Inc. 3,850 241,834 0.01
Diebold Inc. 10,098 240,942 0.01
SunEdison Inc. 50,200 236,958 0.01
Monolithic Power Systems Inc. 5,789 233,862 0.01
Blackhawk Network Holdings Inc. Class A 8,425 232,228 0.01
PMC-Sierra Inc. 30,011 231,243 0.01
Pandora Media Inc. 30,998 231,020 0.01
Littelfuse Inc. 3,510 227,114 0.01
Arista Networks Inc. 5,363 223,945 0.01
Ellie Mae Inc. 4,700 221,853 0.01
Electronics For Imaging Inc. 7,283 218,952 0.01
Lexmark International Inc. 9,998 210,331 0.01
Silicon Laboratories Inc. 6,479 209,506 0.01
Cirrus Logic Inc. 10,279 205,194 0.01
EchoStar Corp. 7,031 204,001 0.01
Fairchild Semiconductor International Inc. 18,729 202,158 0.01
Science Applications International Corp. 6,727 199,711 0.01
Demandware Inc. 5,399 198,040 0.01
MKS Instruments Inc. 8,651 197,342 0.01
Imperva Inc. 4,298 196,505 0.01
Zynga Inc. 127,290 194,512 0.01
Plantronics Inc. 5,600 194,245 0.01
Anixter International Inc. 4,351 193,152 0.01
InterDigital Inc. 5,833 191,601 0.01
Polycom Inc. 21,401 190,813 0.01
Entegris Inc. 22,666 188,150 0.01
GrubHub Inc. 12,099 187,784 0.01
Intersil Corp. 20,981 184,080 0.01
Acxiom Corp. 12,530 179,464 0.01
Tessera Technologies Inc. 7,847 177,630 0.01
OmniVision Technologies Inc. 9,436 176,390 0.01
CommVault Systems Inc. 6,709 175,979 0.01
Sanmina Corp. 12,887 172,478 0.01
Dolby Laboratories Inc. 7,653 171,752 0.01
LogMeIn Inc. 3,773 164,537 0.01
MicroStrategy Inc. 1,478 164,452 0.01
Cardtronics Inc. 7,278 162,535 0.01
OSI Systems Inc. 2,912 162,362 0.01
Virtusa Corp. 4,355 161,719 0.01
WebMD Health Corp. 6,005 158,096 0.01
Fitbit Inc. Class A 5,990 156,809 0.01
NeuStar Inc. 8,892 156,664 0.01
Knowles Corp. 14,367 154,796 0.01
Cornerstone OnDemand Inc. 7,566 154,318 0.01
Syntel Inc. 5,059 154,089 0.01
Power Integrations Inc. 4,698 153,893 0.01
SunPower Corp. 8,842 153,607 0.01
ExlService Holdings Inc. 5,347 153,167 0.01
Itron Inc. 6,325 150,385 0.01
Universal Display Corp. 6,760 150,179 0.01
Vishay Intertechnology Inc. 21,491 147,365 0.01
Viavi Solutions Inc. 37,954 146,223 0.01
comScore Inc. 5,198 143,951 0.01
Synchronoss Technologies Inc. 6,287 143,171 0.01
Coherent Inc. 4,015 140,749 0.01
Zillow Group Inc. 7,019 139,798 0.01
NETGEAR Inc. 5,108 136,928 0.01
First Data Corp. Class A 13,331 136,728 0.01
Advanced Micro Devices Inc. 98,753 135,558 0.01
Yelp Inc. 9,122 131,420 0.01
Cray Inc. 6,842 131,223 0.01
Methode Electronics Inc. 6,065 130,811 0.01
Web.com Group Inc. 8,431 128,070 0.01
Paycom Software Inc. 5,202 127,894 0.01
Finisar Corp. 17,240 126,811 0.01
SPS Commerce Inc. 2,712 125,977 0.01
Progress Software Corp. 7,990 125,510 0.01
Rambus Inc. 18,760 125,358 0.01
NIC Inc. 10,091 123,883 0.01
EVERTEC Inc. 10,460 123,266 0.01
Plexus Corp. 5,494 123,085 0.01
Nimble Storage Inc. 8,404 122,926 0.01
Semtech Corp. 10,740 121,698 0.01
Sykes Enterprises Inc. 6,460 121,261 0.01
Advanced Energy Industries Inc. 6,552 119,933 0.01
Monotype Imaging Holdings Inc. 6,528 115,394 0.01
Stamps.com Inc. 2,320 113,551 0.01
Zendesk Inc. 8,698 113,202 0.01
Envestnet Inc. 5,855 113,127 0.01
QLogic Corp. 14,100 113,118 0.01
3D Systems Corp. 17,206 111,966 0.01
CSG Systems International Inc. 5,130 111,210 0.01
Marketo Inc. 5,700 108,582 0.01
Pegasystems Inc. 6,018 108,561 0.01
MTS Systems Corp. 2,519 107,617 0.01
Bottomline Technologies de Inc. 5,983 107,155 0.01
Inphi Corp. 5,478 105,559 0.01
Super Micro Computer Inc. 5,757 105,120 0.01
Cabot Microelectronics Corp. 3,842 104,857 0.01
Benchmark Electronics Inc. 8,115 103,828 0.01
InvenSense Inc. 13,300 102,394 0.01
II-VI Inc. 8,599 100,834 0.01
Ruckus Wireless Inc. 13,700 99,974 0.01
Callidus Software Inc. 8,718 97,996 0.00
ScanSource Inc. 4,318 96,319 0.00
Insight Enterprises Inc. 5,850 96,174 0.00
BroadSoft Inc. 4,618 95,506 0.00
RealPage Inc. 8,697 95,169 0.00
Infoblox Inc. 8,898 93,854 0.00
Rogers Corp. 3,070 92,414 0.00
Ixia 9,880 92,121 0.00
TiVo Inc. 15,637 91,834 0.00
Diodes Inc. 6,198 91,782 0.00
EarthLink Holdings Corp. 16,362 90,476 0.00
Badger Meter Inc. 2,271 89,023 0.00
78
Market % of Value Net Asset Holding (£) Value
Market % of Value Net Asset Holding (£) Value
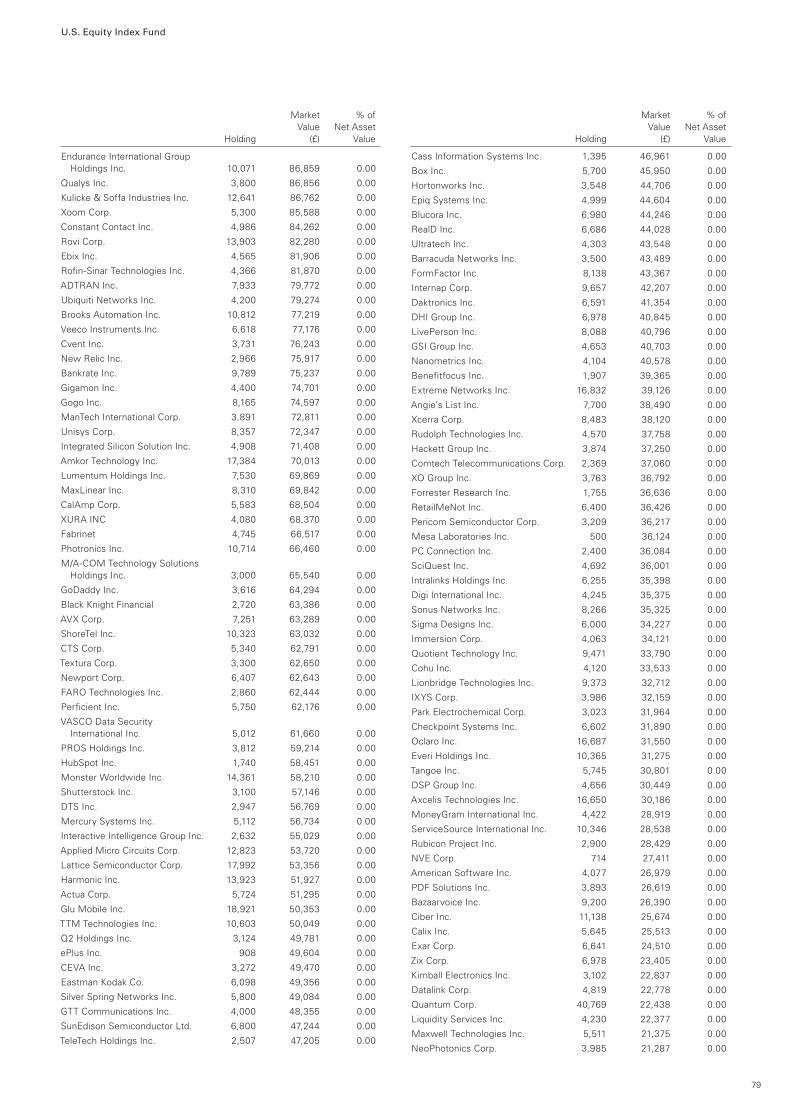
U.S. Equity Index Fund
Endurance International Group Holdings Inc. 10,071 86,859 0.00
Qualys Inc. 3,800 86,856 0.00
Kulicke & Soffa Industries Inc. 12,641 86,762 0.00
Xoom Corp. 5,300 85,588 0.00
Constant Contact Inc. 4,986 84,262 0.00
Rovi Corp. 13,903 82,280 0.00
Ebix Inc. 4,565 81,906 0.00
Rofin-Sinar Technologies Inc. 4,366 81,870 0.00
ADTRAN Inc. 7,933 79,772 0.00
Ubiquiti Networks Inc. 4,200 79,274 0.00
Brooks Automation Inc. 10,812 77,219 0.00
Veeco Instruments Inc. 6,618 77,176 0.00
Cvent Inc. 3,731 76,243 0.00
New Relic Inc. 2,966 75,917 0.00
Bankrate Inc. 9,789 75,237 0.00
Gigamon Inc. 4,400 74,701 0.00
Gogo Inc. 8,165 74,597 0.00
ManTech International Corp. 3,891 72,811 0.00
Unisys Corp. 8,357 72,347 0.00
Integrated Silicon Solution Inc. 4,908 71,408 0.00
Amkor Technology Inc. 17,384 70,013 0.00
Lumentum Holdings Inc. 7,530 69,869 0.00
MaxLinear Inc. 8,310 69,842 0.00
CalAmp Corp. 5,583 68,504 0.00
XURA INC 4,080 68,370 0.00
Fabrinet 4,745 66,517 0.00
Photronics Inc. 10,714 66,460 0.00
M/A-COM Technology Solutions Holdings Inc. 3,000 65,540 0.00
GoDaddy Inc. 3,616 64,294 0.00
Black Knight Financial 2,720 63,386 0.00
AVX Corp. 7,251 63,289 0.00
ShoreTel Inc. 10,323 63,032 0.00
CTS Corp. 5,340 62,791 0.00
Textura Corp. 3,300 62,650 0.00
Newport Corp. 6,407 62,643 0.00
FARO Technologies Inc. 2,860 62,444 0.00
Perficient Inc. 5,750 62,176 0.00
VASCO Data Security International Inc. 5,012 61,660 0.00
PROS Holdings Inc. 3,812 59,214 0.00
HubSpot Inc. 1,740 58,451 0.00
Monster Worldwide Inc. 14,361 58,210 0.00
Shutterstock Inc. 3,100 57,146 0.00
DTS Inc. 2,947 56,769 0.00
Mercury Systems Inc. 5,112 56,734 0.00
Interactive Intelligence Group Inc. 2,632 55,029 0.00
Applied Micro Circuits Corp. 12,823 53,720 0.00
Lattice Semiconductor Corp. 17,992 53,356 0.00
Harmonic Inc. 13,923 51,927 0.00
Actua Corp. 5,724 51,295 0.00
Glu Mobile Inc. 18,921 50,353 0.00
TTM Technologies Inc. 10,603 50,049 0.00
Q2 Holdings Inc. 3,124 49,781 0.00
ePlus Inc. 908 49,604 0.00
CEVA Inc. 3,272 49,470 0.00
Eastman Kodak Co. 6,098 49,356 0.00
Silver Spring Networks Inc. 5,800 49,084 0.00
GTT Communications Inc. 4,000 48,355 0.00
SunEdison Semiconductor Ltd. 6,800 47,244 0.00
TeleTech Holdings Inc. 2,507 47,205 0.00
Cass Information Systems Inc. 1,395 46,961 0.00
Box Inc. 5,700 45,950 0.00
Hortonworks Inc. 3,548 44,706 0.00
Epiq Systems Inc. 4,999 44,604 0.00
Blucora Inc. 6,980 44,246 0.00
RealD Inc. 6,686 44,028 0.00
Ultratech Inc. 4,303 43,548 0.00
Barracuda Networks Inc. 3,500 43,489 0.00
FormFactor Inc. 8,138 43,367 0.00
Internap Corp. 9,657 42,207 0.00
Daktronics Inc. 6,591 41,354 0.00
DHI Group Inc. 6,978 40,845 0.00
LivePerson Inc. 8,088 40,796 0.00
GSI Group Inc. 4,653 40,703 0.00
Nanometrics Inc. 4,104 40,578 0.00
Benefitfocus Inc. 1,907 39,365 0.00
Extreme Networks Inc. 16,832 39,126 0.00
Angie’s List Inc. 7,700 38,490 0.00
Xcerra Corp. 8,483 38,120 0.00
Rudolph Technologies Inc. 4,570 37,758 0.00
Hackett Group Inc. 3,874 37,250 0.00
Comtech Telecommunications Corp. 2,369 37,060 0.00
XO Group Inc. 3,763 36,792 0.00
Forrester Research Inc. 1,755 36,636 0.00
RetailMeNot Inc. 6,400 36,426 0.00
Pericom Semiconductor Corp. 3,209 36,217 0.00
Mesa Laboratories Inc. 500 36,124 0.00
PC Connection Inc. 2,400 36,084 0.00
SciQuest Inc. 4,692 36,001 0.00
Intralinks Holdings Inc. 6,255 35,398 0.00
Digi International Inc. 4,245 35,375 0.00
Sonus Networks Inc. 8,266 35,325 0.00
Sigma Designs Inc. 6,000 34,227 0.00
Immersion Corp. 4,063 34,121 0.00
Quotient Technology Inc. 9,471 33,790 0.00
Cohu Inc. 4,120 33,533 0.00
Lionbridge Technologies Inc. 9,373 32,712 0.00
IXYS Corp. 3,986 32,159 0.00
Park Electrochemical Corp. 3,023 31,964 0.00
Checkpoint Systems Inc. 6,602 31,890 0.00
Oclaro Inc. 16,687 31,550 0.00
Everi Holdings Inc. 10,365 31,275 0.00
Tangoe Inc. 5,745 30,801 0.00
DSP Group Inc. 4,656 30,449 0.00
Axcelis Technologies Inc. 16,650 30,186 0.00
MoneyGram International Inc. 4,422 28,919 0.00
ServiceSource International Inc. 10,346 28,538 0.00
Rubicon Project Inc. 2,900 28,429 0.00
NVE Corp. 714 27,411 0.00
American Software Inc. 4,077 26,979 0.00
PDF Solutions Inc. 3,893 26,619 0.00
Bazaarvoice Inc. 9,200 26,390 0.00
Ciber Inc. 11,138 25,674 0.00
Calix Inc. 5,645 25,513 0.00
Exar Corp. 6,641 24,510 0.00
Zix Corp. 6,978 23,405 0.00
Kimball Electronics Inc. 3,102 22,837 0.00
Datalink Corp. 4,819 22,778 0.00
Quantum Corp. 40,769 22,438 0.00
Liquidity Services Inc. 4,230 22,377 0.00
Maxwell Technologies Inc. 5,511 21,375 0.00
NeoPhotonics Corp. 3,985 21,287 0.00
79
Market % of Value Net Asset Holding (£) Value
Market % of Value Net Asset Holding (£) Value
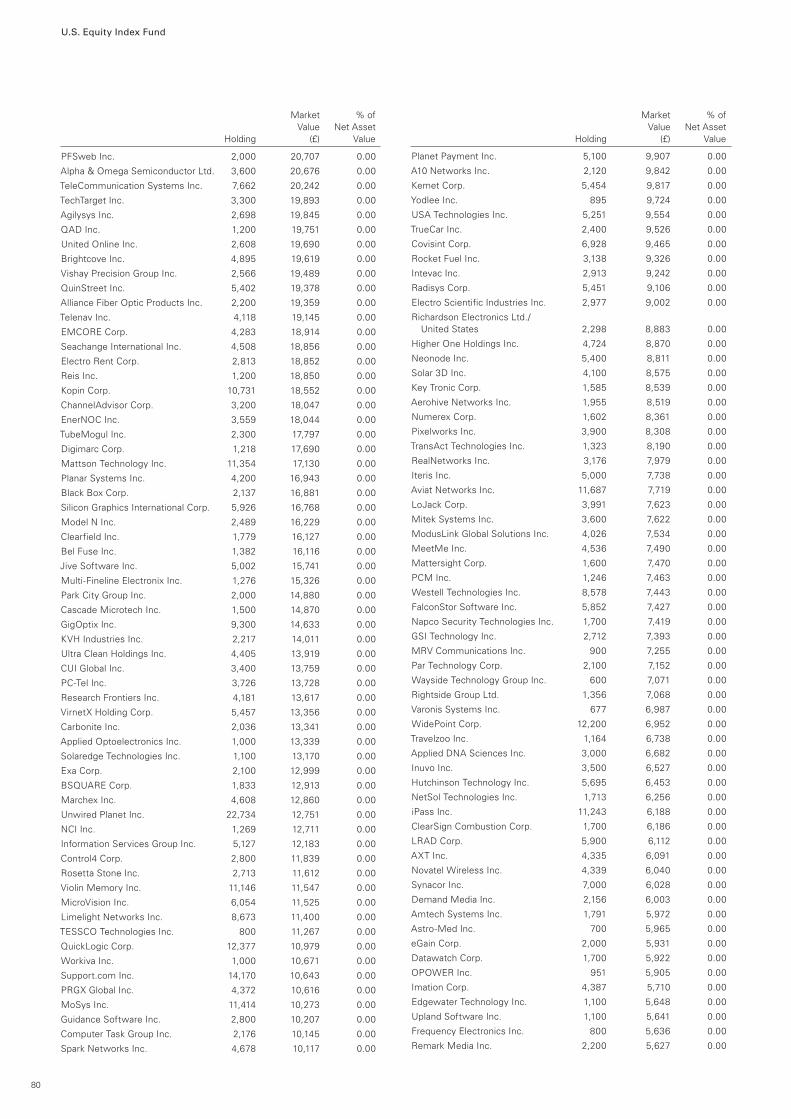
U.S. Equity Index Fund
PFSweb Inc. 2,000 20,707 0.00
Alpha & Omega Semiconductor Ltd. 3,600 20,676 0.00
TeleCommunication Systems Inc. 7,662 20,242 0.00
TechTarget Inc. 3,300 19,893 0.00
Agilysys Inc. 2,698 19,845 0.00
QAD Inc. 1,200 19,751 0.00
United Online Inc. 2,608 19,690 0.00
Brightcove Inc. 4,895 19,619 0.00
Vishay Precision Group Inc. 2,566 19,489 0.00
QuinStreet Inc. 5,402 19,378 0.00
Alliance Fiber Optic Products Inc. 2,200 19,359 0.00
Telenav Inc. 4,118 19,145 0.00
EMCORE Corp. 4,283 18,914 0.00
Seachange International Inc. 4,508 18,856 0.00
Electro Rent Corp. 2,813 18,852 0.00
Reis Inc. 1,200 18,850 0.00
Kopin Corp. 10,731 18,552 0.00
ChannelAdvisor Corp. 3,200 18,047 0.00
EnerNOC Inc. 3,559 18,044 0.00
TubeMogul Inc. 2,300 17,797 0.00
Digimarc Corp. 1,218 17,690 0.00
Mattson Technology Inc. 11,354 17,130 0.00
Planar Systems Inc. 4,200 16,943 0.00
Black Box Corp. 2,137 16,881 0.00
Silicon Graphics International Corp. 5,926 16,768 0.00
Model N Inc. 2,489 16,229 0.00
Clearfield Inc. 1,779 16,127 0.00
Bel Fuse Inc. 1,382 16,116 0.00
Jive Software Inc. 5,002 15,741 0.00
Multi-Fineline Electronix Inc. 1,276 15,326 0.00
Park City Group Inc. 2,000 14,880 0.00
Cascade Microtech Inc. 1,500 14,870 0.00
GigOptix Inc. 9,300 14,633 0.00
KVH Industries Inc. 2,217 14,011 0.00
Ultra Clean Holdings Inc. 4,405 13,919 0.00
CUI Global Inc. 3,400 13,759 0.00
PC-Tel Inc. 3,726 13,728 0.00
Research Frontiers Inc. 4,181 13,617 0.00
VirnetX Holding Corp. 5,457 13,356 0.00
Carbonite Inc. 2,036 13,341 0.00
Applied Optoelectronics Inc. 1,000 13,339 0.00
Solaredge Technologies Inc. 1,100 13,170 0.00
Exa Corp. 2,100 12,999 0.00
BSQUARE Corp. 1,833 12,913 0.00
Marchex Inc. 4,608 12,860 0.00
Unwired Planet Inc. 22,734 12,751 0.00
NCI Inc. 1,269 12,711 0.00
Information Services Group Inc. 5,127 12,183 0.00
Control4 Corp. 2,800 11,839 0.00
Rosetta Stone Inc. 2,713 11,612 0.00
Violin Memory Inc. 11,146 11,547 0.00
MicroVision Inc. 6,054 11,525 0.00
Limelight Networks Inc. 8,673 11,400 0.00
TESSCO Technologies Inc. 800 11,267 0.00
QuickLogic Corp. 12,377 10,979 0.00
Workiva Inc. 1,000 10,671 0.00
Support.com Inc. 14,170 10,643 0.00
PRGX Global Inc. 4,372 10,616 0.00
MoSys Inc. 11,414 10,273 0.00
Guidance Software Inc. 2,800 10,207 0.00
Computer Task Group Inc. 2,176 10,145 0.00
Spark Networks Inc. 4,678 10,117 0.00
Planet Payment Inc. 5,100 9,907 0.00
A10 Networks Inc. 2,120 9,842 0.00
Kemet Corp. 5,454 9,817 0.00
Yodlee Inc. 895 9,724 0.00
USA Technologies Inc. 5,251 9,554 0.00
TrueCar Inc. 2,400 9,526 0.00
Covisint Corp. 6,928 9,465 0.00
Rocket Fuel Inc. 3,138 9,326 0.00
Intevac Inc. 2,913 9,242 0.00
Radisys Corp. 5,451 9,106 0.00
Electro Scientific Industries Inc. 2,977 9,002 0.00
Richardson Electronics Ltd./ United States 2,298 8,883 0.00
Higher One Holdings Inc. 4,724 8,870 0.00
Neonode Inc. 5,400 8,811 0.00
Solar 3D Inc. 4,100 8,575 0.00
Key Tronic Corp. 1,585 8,539 0.00
Aerohive Networks Inc. 1,955 8,519 0.00
Numerex Corp. 1,602 8,361 0.00
Pixelworks Inc. 3,900 8,308 0.00
TransAct Technologies Inc. 1,323 8,190 0.00
RealNetworks Inc. 3,176 7,979 0.00
Iteris Inc. 5,000 7,738 0.00
Aviat Networks Inc. 11,687 7,719 0.00
LoJack Corp. 3,991 7,623 0.00
Mitek Systems Inc. 3,600 7,622 0.00
ModusLink Global Solutions Inc. 4,026 7,534 0.00
MeetMe Inc. 4,536 7,490 0.00
Mattersight Corp. 1,600 7,470 0.00
PCM Inc. 1,246 7,463 0.00
Westell Technologies Inc. 8,578 7,443 0.00
FalconStor Software Inc. 5,852 7,427 0.00
Napco Security Technologies Inc. 1,700 7,419 0.00
GSI Technology Inc. 2,712 7,393 0.00
MRV Communications Inc. 900 7,255 0.00
Par Technology Corp. 2,100 7,152 0.00
Wayside Technology Group Inc. 600 7,071 0.00
Rightside Group Ltd. 1,356 7,068 0.00
Varonis Systems Inc. 677 6,987 0.00
WidePoint Corp. 12,200 6,952 0.00
Travelzoo Inc. 1,164 6,738 0.00
Applied DNA Sciences Inc. 3,000 6,682 0.00
Inuvo Inc. 3,500 6,527 0.00
Hutchinson Technology Inc. 5,695 6,453 0.00
NetSol Technologies Inc. 1,713 6,256 0.00
iPass Inc. 11,243 6,188 0.00
ClearSign Combustion Corp. 1,700 6,186 0.00
LRAD Corp. 5,900 6,112 0.00
AXT Inc. 4,335 6,091 0.00
Novatel Wireless Inc. 4,339 6,040 0.00
Synacor Inc. 7,000 6,028 0.00
Demand Media Inc. 2,156 6,003 0.00
Amtech Systems Inc. 1,791 5,972 0.00
Astro-Med Inc. 700 5,965 0.00
eGain Corp. 2,000 5,931 0.00
Datawatch Corp. 1,700 5,922 0.00
OPOWER Inc. 951 5,905 0.00
Imation Corp. 4,387 5,710 0.00
Edgewater Technology Inc. 1,100 5,648 0.00
Upland Software Inc. 1,100 5,641 0.00
Frequency Electronics Inc. 800 5,636 0.00
Remark Media Inc. 2,200 5,627 0.00
80
Market % of Value Net Asset Holding (£) Value
Market % of Value Net Asset Holding (£) Value
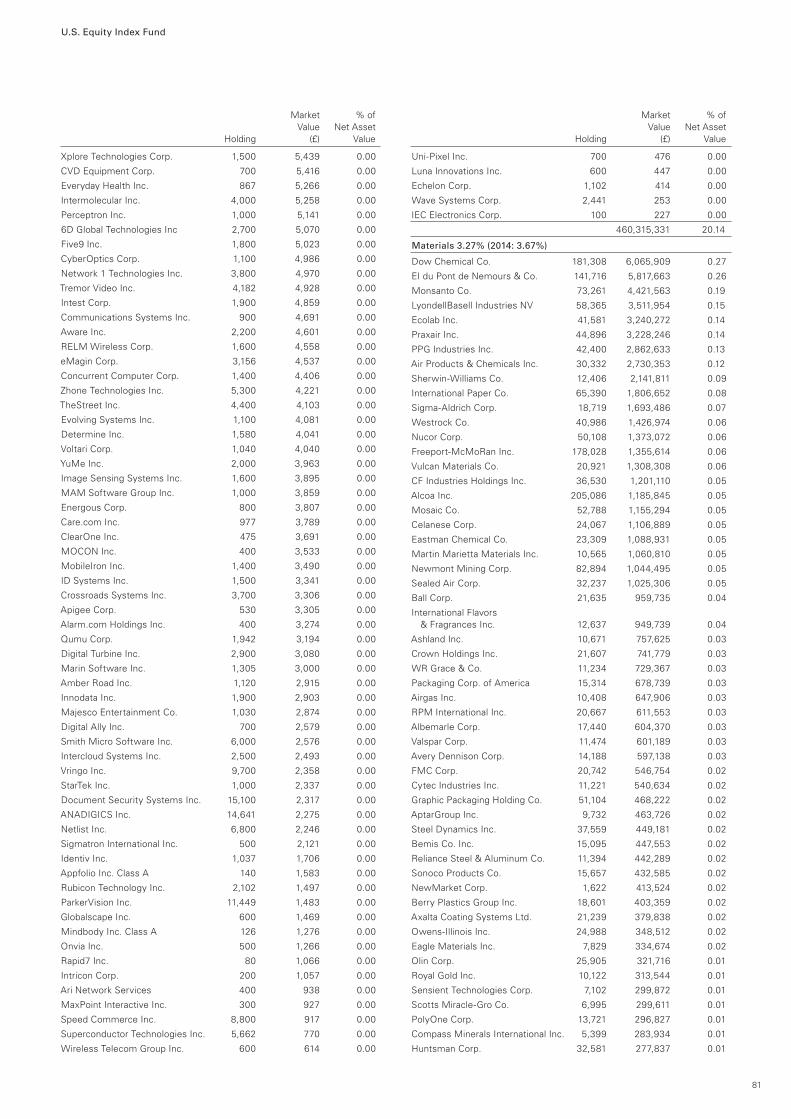
U.S. Equity Index Fund
Xplore Technologies Corp. 1,500 5,439 0.00
CVD Equipment Corp. 700 5,416 0.00
Everyday Health Inc. 867 5,266 0.00
Intermolecular Inc. 4,000 5,258 0.00
Perceptron Inc. 1,000 5,141 0.00
6D Global Technologies Inc 2,700 5,070 0.00
Five9 Inc. 1,800 5,023 0.00
CyberOptics Corp. 1,100 4,986 0.00
Network 1 Technologies Inc. 3,800 4,970 0.00
Tremor Video Inc. 4,182 4,928 0.00
Intest Corp. 1,900 4,859 0.00
Communications Systems Inc. 900 4,691 0.00
Aware Inc. 2,200 4,601 0.00
RELM Wireless Corp. 1,600 4,558 0.00
eMagin Corp. 3,156 4,537 0.00
Concurrent Computer Corp. 1,400 4,406 0.00
Zhone Technologies Inc. 5,300 4,221 0.00
TheStreet Inc. 4,400 4,103 0.00
Evolving Systems Inc. 1,100 4,081 0.00
Determine Inc. 1,580 4,041 0.00
Voltari Corp. 1,040 4,040 0.00
YuMe Inc. 2,000 3,963 0.00
Image Sensing Systems Inc. 1,600 3,895 0.00
MAM Software Group Inc. 1,000 3,859 0.00
Energous Corp. 800 3,807 0.00
Care.com Inc. 977 3,789 0.00
ClearOne Inc. 475 3,691 0.00
MOCON Inc. 400 3,533 0.00
MobileIron Inc. 1,400 3,490 0.00
ID Systems Inc. 1,500 3,341 0.00
Crossroads Systems Inc. 3,700 3,306 0.00
Apigee Corp. 530 3,305 0.00
Alarm.com Holdings Inc. 400 3,274 0.00
Qumu Corp. 1,942 3,194 0.00
Digital Turbine Inc. 2,900 3,080 0.00
Marin Software Inc. 1,305 3,000 0.00
Amber Road Inc. 1,120 2,915 0.00
Innodata Inc. 1,900 2,903 0.00
Majesco Entertainment Co. 1,030 2,874 0.00
Digital Ally Inc. 700 2,579 0.00
Smith Micro Software Inc. 6,000 2,576 0.00
Intercloud Systems Inc. 2,500 2,493 0.00
Vringo Inc. 9,700 2,358 0.00
StarTek Inc. 1,000 2,337 0.00
Document Security Systems Inc. 15,100 2,317 0.00
ANADIGICS Inc. 14,641 2,275 0.00
Netlist Inc. 6,800 2,246 0.00
Sigmatron International Inc. 500 2,121 0.00
Identiv Inc. 1,037 1,706 0.00
Appfolio Inc. Class A 140 1,583 0.00
Rubicon Technology Inc. 2,102 1,497 0.00
ParkerVision Inc. 11,449 1,483 0.00
Globalscape Inc. 600 1,469 0.00
Mindbody Inc. Class A 126 1,276 0.00
Onvia Inc. 500 1,266 0.00
Rapid7 Inc. 80 1,066 0.00
Intricon Corp. 200 1,057 0.00
Ari Network Services 400 938 0.00
MaxPoint Interactive Inc. 300 927 0.00
Speed Commerce Inc. 8,800 917 0.00
Superconductor Technologies Inc. 5,662 770 0.00
Wireless Telecom Group Inc. 600 614 0.00
Uni-Pixel Inc. 700 476 0.00
Luna Innovations Inc. 600 447 0.00
Echelon Corp. 1,102 414 0.00
Wave Systems Corp. 2,441 253 0.00
IEC Electronics Corp. 100 227 0.00
460,315,331 20.14
Materials 3.27% (2014: 3.67%)
Dow Chemical Co. 181,308 6,065,909 0.27
EI du Pont de Nemours & Co. 141,716 5,817,663 0.26
Monsanto Co. 73,261 4,421,563 0.19
LyondellBasell Industries NV 58,365 3,511,954 0.15
Ecolab Inc. 41,581 3,240,272 0.14
Praxair Inc. 44,896 3,228,246 0.14
PPG Industries Inc. 42,400 2,862,633 0.13
Air Products & Chemicals Inc. 30,332 2,730,353 0.12
Sherwin-Williams Co. 12,406 2,141,811 0.09
International Paper Co. 65,390 1,806,652 0.08
Sigma-Aldrich Corp. 18,719 1,693,486 0.07
Westrock Co. 40,986 1,426,974 0.06
Nucor Corp. 50,108 1,373,072 0.06
Freeport-McMoRan Inc. 178,028 1,355,614 0.06
Vulcan Materials Co. 20,921 1,308,308 0.06
CF Industries Holdings Inc. 36,530 1,201,110 0.05
Alcoa Inc. 205,086 1,185,845 0.05
Mosaic Co. 52,788 1,155,294 0.05
Celanese Corp. 24,067 1,106,889 0.05
Eastman Chemical Co. 23,309 1,088,931 0.05
Martin Marietta Materials Inc. 10,565 1,060,810 0.05
Newmont Mining Corp. 82,894 1,044,495 0.05
Sealed Air Corp. 32,237 1,025,306 0.05
Ball Corp. 21,635 959,735 0.04
International Flavors & Fragrances Inc. 12,637 949,739 0.04
Ashland Inc. 10,671 757,625 0.03
Crown Holdings Inc. 21,607 741,779 0.03
WR Grace & Co. 11,234 729,367 0.03
Packaging Corp. of America 15,314 678,739 0.03
Airgas Inc. 10,408 647,906 0.03
RPM International Inc. 20,667 611,553 0.03
Albemarle Corp. 17,440 604,370 0.03
Valspar Corp. 11,474 601,189 0.03
Avery Dennison Corp. 14,188 597,138 0.03
FMC Corp. 20,742 546,754 0.02
Cytec Industries Inc. 11,221 540,634 0.02
Graphic Packaging Holding Co. 51,104 468,222 0.02
AptarGroup Inc. 9,732 463,726 0.02
Steel Dynamics Inc. 37,559 449,181 0.02
Bemis Co. Inc. 15,095 447,553 0.02
Reliance Steel & Aluminum Co. 11,394 442,289 0.02
Sonoco Products Co. 15,657 432,585 0.02
NewMarket Corp. 1,622 413,524 0.02
Berry Plastics Group Inc. 18,601 403,359 0.02
Axalta Coating Systems Ltd. 21,239 379,838 0.02
Owens-Illinois Inc. 24,988 348,512 0.02
Eagle Materials Inc. 7,829 334,674 0.02
Olin Corp. 25,905 321,716 0.01
Royal Gold Inc. 10,122 313,544 0.01
Sensient Technologies Corp. 7,102 299,872 0.01
Scotts Miracle-Gro Co. 6,995 299,611 0.01
PolyOne Corp. 13,721 296,827 0.01
Compass Minerals International Inc. 5,399 283,934 0.01
Huntsman Corp. 32,581 277,837 0.01
81
Market % of Value Net Asset Holding (£) Value
Market % of Value Net Asset Holding (£) Value
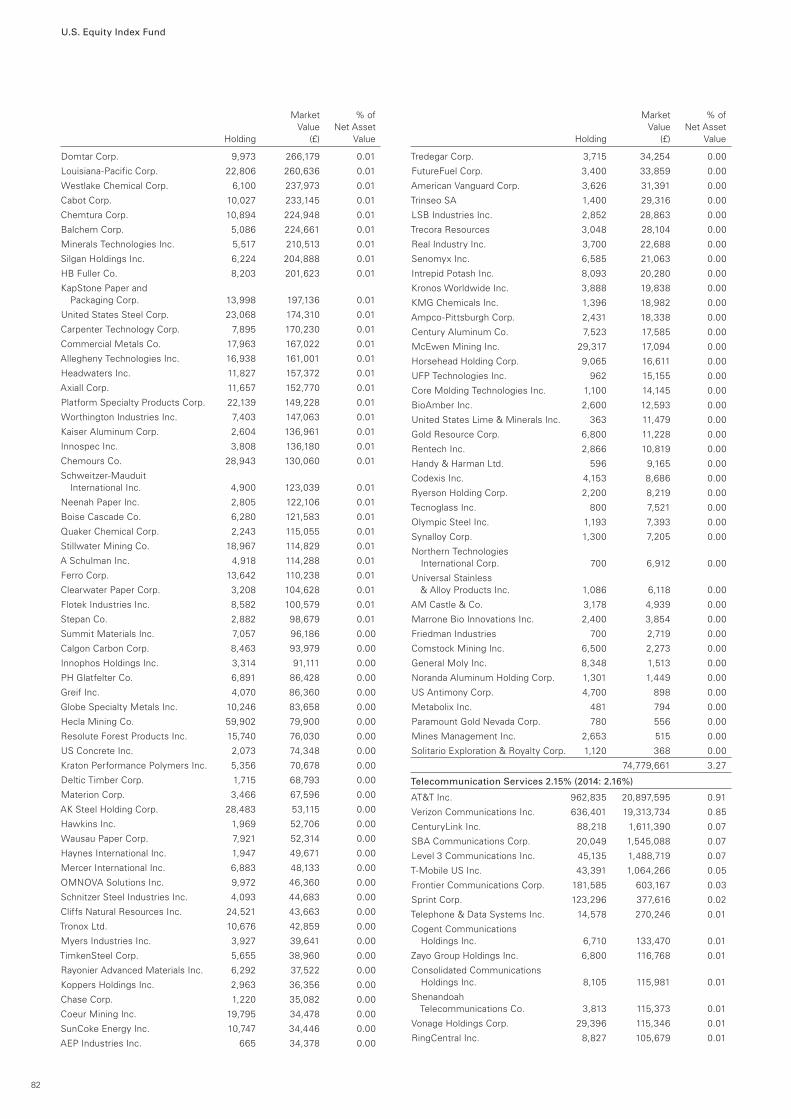
U.S. Equity Index Fund
Domtar Corp. 9,973 266,179 0.01
Louisiana-Pacific Corp. 22,806 260,636 0.01
Westlake Chemical Corp. 6,100 237,973 0.01
Cabot Corp. 10,027 233,145 0.01
Chemtura Corp. 10,894 224,948 0.01
Balchem Corp. 5,086 224,661 0.01
Minerals Technologies Inc. 5,517 210,513 0.01
Silgan Holdings Inc. 6,224 204,888 0.01
HB Fuller Co. 8,203 201,623 0.01
KapStone Paper and Packaging Corp. 13,998 197,136 0.01
United States Steel Corp. 23,068 174,310 0.01
Carpenter Technology Corp. 7,895 170,230 0.01
Commercial Metals Co. 17,963 167,022 0.01
Allegheny Technologies Inc. 16,938 161,001 0.01
Headwaters Inc. 11,827 157,372 0.01
Axiall Corp. 11,657 152,770 0.01
Platform Specialty Products Corp. 22,139 149,228 0.01
Worthington Industries Inc. 7,403 147,063 0.01
Kaiser Aluminum Corp. 2,604 136,961 0.01
Innospec Inc. 3,808 136,180 0.01
Chemours Co. 28,943 130,060 0.01
Schweitzer-Mauduit International Inc. 4,900 123,039 0.01
Neenah Paper Inc. 2,805 122,106 0.01
Boise Cascade Co. 6,280 121,583 0.01
Quaker Chemical Corp. 2,243 115,055 0.01
Stillwater Mining Co. 18,967 114,829 0.01
A Schulman Inc. 4,918 114,288 0.01
Ferro Corp. 13,642 110,238 0.01
Clearwater Paper Corp. 3,208 104,628 0.01
Flotek Industries Inc. 8,582 100,579 0.01
Stepan Co. 2,882 98,679 0.01
Summit Materials Inc. 7,057 96,186 0.00
Calgon Carbon Corp. 8,463 93,979 0.00
Innophos Holdings Inc. 3,314 91,111 0.00
PH Glatfelter Co. 6,891 86,428 0.00
Greif Inc. 4,070 86,360 0.00
Globe Specialty Metals Inc. 10,246 83,658 0.00
Hecla Mining Co. 59,902 79,900 0.00
Resolute Forest Products Inc. 15,740 76,030 0.00
US Concrete Inc. 2,073 74,348 0.00
Kraton Performance Polymers Inc. 5,356 70,678 0.00
Deltic Timber Corp. 1,715 68,793 0.00
Materion Corp. 3,466 67,596 0.00
AK Steel Holding Corp. 28,483 53,115 0.00
Hawkins Inc. 1,969 52,706 0.00
Wausau Paper Corp. 7,921 52,314 0.00
Haynes International Inc. 1,947 49,671 0.00
Mercer International Inc. 6,883 48,133 0.00
OMNOVA Solutions Inc. 9,972 46,360 0.00
Schnitzer Steel Industries Inc. 4,093 44,683 0.00
Cliffs Natural Resources Inc. 24,521 43,663 0.00
Tronox Ltd. 10,676 42,859 0.00
Myers Industries Inc. 3,927 39,641 0.00
TimkenSteel Corp. 5,655 38,960 0.00
Rayonier Advanced Materials Inc. 6,292 37,522 0.00
Koppers Holdings Inc. 2,963 36,356 0.00
Chase Corp. 1,220 35,082 0.00
Coeur Mining Inc. 19,795 34,478 0.00
SunCoke Energy Inc. 10,747 34,446 0.00
AEP Industries Inc. 665 34,378 0.00
Tredegar Corp. 3,715 34,254 0.00
FutureFuel Corp. 3,400 33,859 0.00
American Vanguard Corp. 3,626 31,391 0.00
Trinseo SA 1,400 29,316 0.00
LSB Industries Inc. 2,852 28,863 0.00
Trecora Resources 3,048 28,104 0.00
Real Industry Inc. 3,700 22,688 0.00
Senomyx Inc. 6,585 21,063 0.00
Intrepid Potash Inc. 8,093 20,280 0.00
Kronos Worldwide Inc. 3,888 19,838 0.00
KMG Chemicals Inc. 1,396 18,982 0.00
Ampco-Pittsburgh Corp. 2,431 18,338 0.00
Century Aluminum Co. 7,523 17,585 0.00
McEwen Mining Inc. 29,317 17,094 0.00
Horsehead Holding Corp. 9,065 16,611 0.00
UFP Technologies Inc. 962 15,155 0.00
Core Molding Technologies Inc. 1,100 14,145 0.00
BioAmber Inc. 2,600 12,593 0.00
United States Lime & Minerals Inc. 363 11,479 0.00
Gold Resource Corp. 6,800 11,228 0.00
Rentech Inc. 2,866 10,819 0.00
Handy & Harman Ltd. 596 9,165 0.00
Codexis Inc. 4,153 8,686 0.00
Ryerson Holding Corp. 2,200 8,219 0.00
Tecnoglass Inc. 800 7,521 0.00
Olympic Steel Inc. 1,193 7,393 0.00
Synalloy Corp. 1,300 7,205 0.00
Northern Technologies International Corp. 700 6,912 0.00
Universal Stainless & Alloy Products Inc. 1,086 6,118 0.00
AM Castle & Co. 3,178 4,939 0.00
Marrone Bio Innovations Inc. 2,400 3,854 0.00
Friedman Industries 700 2,719 0.00
Comstock Mining Inc. 6,500 2,273 0.00
General Moly Inc. 8,348 1,513 0.00
Noranda Aluminum Holding Corp. 1,301 1,449 0.00
US Antimony Corp. 4,700 898 0.00
Metabolix Inc. 481 794 0.00
Paramount Gold Nevada Corp. 780 556 0.00
Mines Management Inc. 2,653 515 0.00
Solitario Exploration & Royalty Corp. 1,120 368 0.00
74,779,661 3.27
Telecommunication Services 2.15% (2014: 2.16%)
AT&T Inc. 962,835 20,897,595 0.91
Verizon Communications Inc. 636,401 19,313,734 0.85
CenturyLink Inc. 88,218 1,611,390 0.07
SBA Communications Corp. 20,049 1,545,088 0.07
Level 3 Communications Inc. 45,135 1,488,719 0.07
T-Mobile US Inc. 43,391 1,064,266 0.05
Frontier Communications Corp. 181,585 603,167 0.03
Sprint Corp. 123,296 377,616 0.02
Telephone & Data Systems Inc. 14,578 270,246 0.01
Cogent Communications Holdings Inc. 6,710 133,470 0.01
Zayo Group Holdings Inc. 6,800 116,768 0.01
Consolidated Communications Holdings Inc. 8,105 115,981 0.01
Shenandoah Telecommunications Co. 3,813 115,373 0.01
Vonage Holdings Corp. 29,396 115,346 0.01
RingCentral Inc. 8,827 105,679 0.01
82
Market % of Value Net Asset Holding (£) Value
Market % of Value Net Asset Holding (£) Value
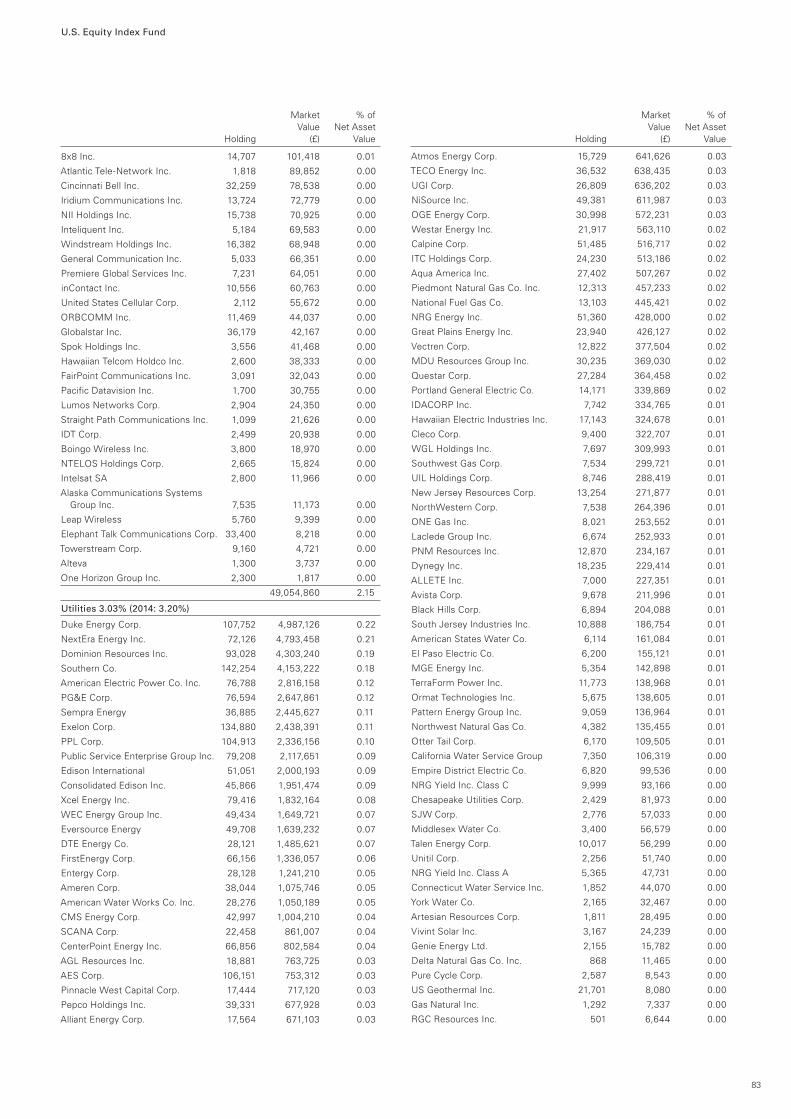
U.S. Equity Index Fund
8x8 Inc. 14,707 101,418 0.01
Atlantic Tele-Network Inc. 1,818 89,852 0.00
Cincinnati Bell Inc. 32,259 78,538 0.00
Iridium Communications Inc. 13,724 72,779 0.00
NII Holdings Inc. 15,738 70,925 0.00
Inteliquent Inc. 5,184 69,583 0.00
Windstream Holdings Inc. 16,382 68,948 0.00
General Communication Inc. 5,033 66,351 0.00
Premiere Global Services Inc. 7,231 64,051 0.00
inContact Inc. 10,556 60,763 0.00
United States Cellular Corp. 2,112 55,672 0.00
ORBCOMM Inc. 11,469 44,037 0.00
Globalstar Inc. 36,179 42,167 0.00
Spok Holdings Inc. 3,556 41,468 0.00
Hawaiian Telcom Holdco Inc. 2,600 38,333 0.00
FairPoint Communications Inc. 3,091 32,043 0.00
Pacific Datavision Inc. 1,700 30,755 0.00
Lumos Networks Corp. 2,904 24,350 0.00
Straight Path Communications Inc. 1,099 21,626 0.00
IDT Corp. 2,499 20,938 0.00
Boingo Wireless Inc. 3,800 18,970 0.00
NTELOS Holdings Corp. 2,665 15,824 0.00
Intelsat SA 2,800 11,966 0.00
Alaska Communications Systems Group Inc. 7,535 11,173 0.00
Leap Wireless 5,760 9,399 0.00
Elephant Talk Communications Corp. 33,400 8,218 0.00
Towerstream Corp. 9,160 4,721 0.00
Alteva 1,300 3,737 0.00
One Horizon Group Inc. 2,300 1,817 0.00
49,054,860 2.15
Utilities 3.03% (2014: 3.20%)
Duke Energy Corp. 107,752 4,987,126 0.22
NextEra Energy Inc. 72,126 4,793,458 0.21
Dominion Resources Inc. 93,028 4,303,240 0.19
Southern Co. 142,254 4,153,222 0.18
American Electric Power Co. Inc. 76,788 2,816,158 0.12
PG&E Corp. 76,594 2,647,861 0.12
Sempra Energy 36,885 2,445,627 0.11
Exelon Corp. 134,880 2,438,391 0.11
PPL Corp. 104,913 2,336,156 0.10
Public Service Enterprise Group Inc. 79,208 2,117,651 0.09
Edison International 51,051 2,000,193 0.09
Consolidated Edison Inc. 45,866 1,951,474 0.09
Xcel Energy Inc. 79,416 1,832,164 0.08
WEC Energy Group Inc. 49,434 1,649,721 0.07
Eversource Energy 49,708 1,639,232 0.07
DTE Energy Co. 28,121 1,485,621 0.07
FirstEnergy Corp. 66,156 1,336,057 0.06
Entergy Corp. 28,128 1,241,210 0.05
Ameren Corp. 38,044 1,075,746 0.05
American Water Works Co. Inc. 28,276 1,050,189 0.05
CMS Energy Corp. 42,997 1,004,210 0.04
SCANA Corp. 22,458 861,007 0.04
CenterPoint Energy Inc. 66,856 802,584 0.04
AGL Resources Inc. 18,881 763,725 0.03
AES Corp. 106,151 753,312 0.03
Pinnacle West Capital Corp. 17,444 717,120 0.03
Pepco Holdings Inc. 39,331 677,928 0.03
Alliant Energy Corp. 17,564 671,103 0.03
Atmos Energy Corp. 15,729 641,626 0.03
TECO Energy Inc. 36,532 638,435 0.03
UGI Corp. 26,809 636,202 0.03
NiSource Inc. 49,381 611,987 0.03
OGE Energy Corp. 30,998 572,231 0.03
Westar Energy Inc. 21,917 563,110 0.02
Calpine Corp. 51,485 516,717 0.02
ITC Holdings Corp. 24,230 513,186 0.02
Aqua America Inc. 27,402 507,267 0.02
Piedmont Natural Gas Co. Inc. 12,313 457,233 0.02
National Fuel Gas Co. 13,103 445,421 0.02
NRG Energy Inc. 51,360 428,000 0.02
Great Plains Energy Inc. 23,940 426,127 0.02
Vectren Corp. 12,822 377,504 0.02
MDU Resources Group Inc. 30,235 369,030 0.02
Questar Corp. 27,284 364,458 0.02
Portland General Electric Co. 14,171 339,869 0.02
IDACORP Inc. 7,742 334,765 0.01
Hawaiian Electric Industries Inc. 17,143 324,678 0.01
Cleco Corp. 9,400 322,707 0.01
WGL Holdings Inc. 7,697 309,993 0.01
Southwest Gas Corp. 7,534 299,721 0.01
UIL Holdings Corp. 8,746 288,419 0.01
New Jersey Resources Corp. 13,254 271,877 0.01
NorthWestern Corp. 7,538 264,396 0.01
ONE Gas Inc. 8,021 253,552 0.01
Laclede Group Inc. 6,674 252,933 0.01
PNM Resources Inc. 12,870 234,167 0.01
Dynegy Inc. 18,235 229,414 0.01
ALLETE Inc. 7,000 227,351 0.01
Avista Corp. 9,678 211,996 0.01
Black Hills Corp. 6,894 204,088 0.01
South Jersey Industries Inc. 10,888 186,754 0.01
American States Water Co. 6,114 161,084 0.01
El Paso Electric Co. 6,200 155,121 0.01
MGE Energy Inc. 5,354 142,898 0.01
TerraForm Power Inc. 11,773 138,968 0.01
Ormat Technologies Inc. 5,675 138,605 0.01
Pattern Energy Group Inc. 9,059 136,964 0.01
Northwest Natural Gas Co. 4,382 135,455 0.01
Otter Tail Corp. 6,170 109,505 0.01
California Water Service Group 7,350 106,319 0.00
Empire District Electric Co. 6,820 99,536 0.00
NRG Yield Inc. Class C 9,999 93,166 0.00
Chesapeake Utilities Corp. 2,429 81,973 0.00
SJW Corp. 2,776 57,033 0.00
Middlesex Water Co. 3,400 56,579 0.00
Talen Energy Corp. 10,017 56,299 0.00
Unitil Corp. 2,256 51,740 0.00
NRG Yield Inc. Class A 5,365 47,731 0.00
Connecticut Water Service Inc. 1,852 44,070 0.00
York Water Co. 2,165 32,467 0.00
Artesian Resources Corp. 1,811 28,495 0.00
Vivint Solar Inc. 3,167 24,239 0.00
Genie Energy Ltd. 2,155 15,782 0.00
Delta Natural Gas Co. Inc. 868 11,465 0.00
Pure Cycle Corp. 2,587 8,543 0.00
US Geothermal Inc. 21,701 8,080 0.00
Gas Natural Inc. 1,292 7,337 0.00
RGC Resources Inc. 501 6,644 0.00
83
Market % of Value Net Asset Holding (£) Value
Market % of Value Net Asset Holding (£) Value
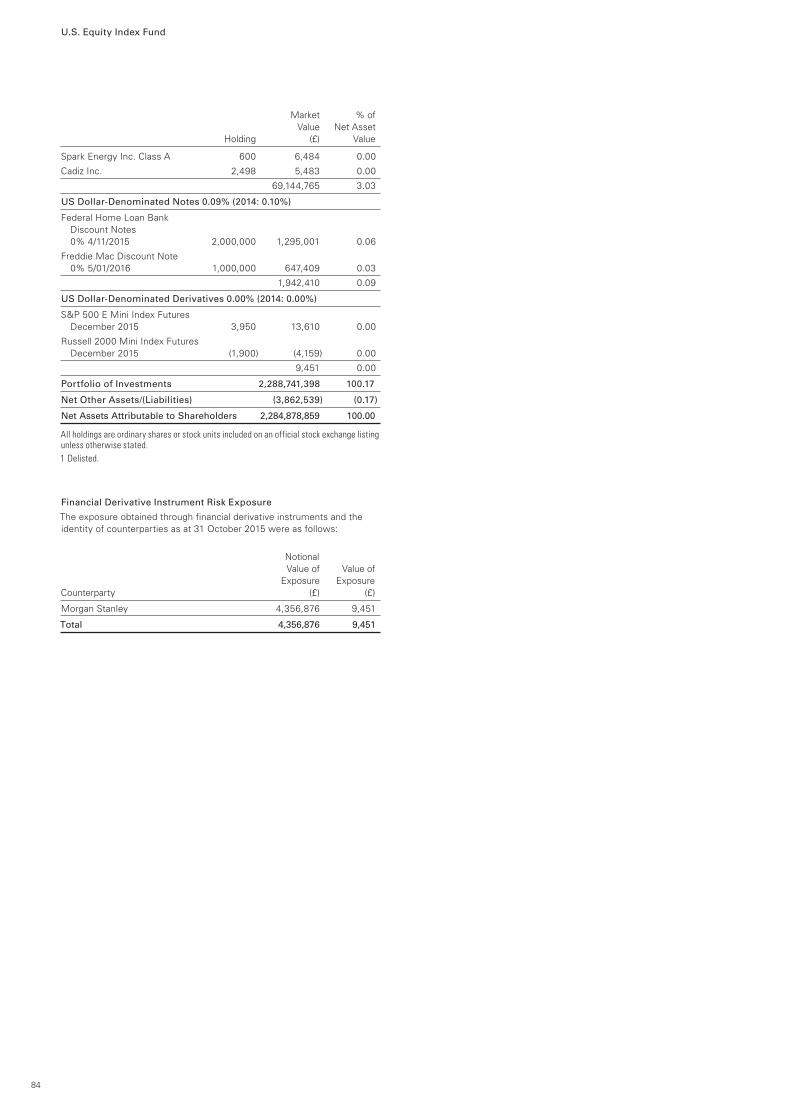
U.S. Equity Index Fund
Spark Energy Inc. Class A 600 6,484 0.00
Cadiz Inc. 2,498 5,483 0.00
69,144,765 3.03
US Dollar-Denominated Notes 0.09% (2014: 0.10%)
Federal Home Loan Bank Discount Notes 0% 4/11/2015 2,000,000 1,295,001 0.06
Freddie Mac Discount Note 0% 5/01/2016 1,000,000 647,409 0.03
1,942,410 0.09
US Dollar-Denominated Derivatives 0.00% (2014: 0.00%)
S&P 500 E Mini Index Futures December 2015 3,950 13,610 0.00
Russell 2000 Mini Index Futures December 2015 (1,900) (4,159) 0.00
9,451 0.00
Portfolio of Investments 2,288,741,398 100.17
Net Other Assets/(Liabilities) (3,862,539) (0.17)
Net Assets Attributable to Shareholders 2,284,878,859 100.00
All holdings are ordinary shares or stock units included on an official stock exchange listing unless otherwise stated.1 Delisted.
Financial Derivative Instrument Risk Exposure
The exposure obtained through financial derivative instruments and the identity of counterparties as at 31 October 2015 were as follows:
Notional Value of Value of Exposure Exposure Counterparty (£) (£)
Morgan Stanley 4,356,876 9,451
Total 4,356,876 9,451
84
Market % of Value Net Asset Holding (£) Value
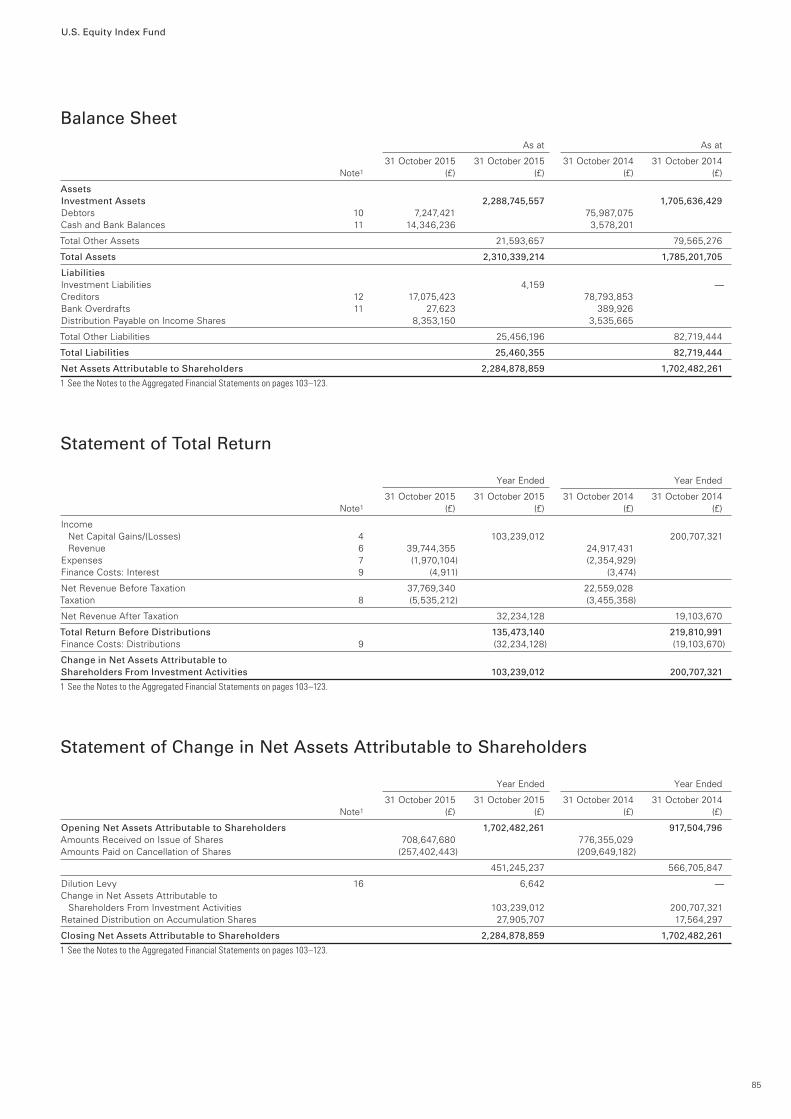
U.S. Equity Index Fund
Balance Sheet As at As at
31 October 2015 31 October 2015 31 October 2014 31 October 2014 Note1 (£) (£) (£) (£)
AssetsInvestment Assets 2,288,745,557 1,705,636,429 Debtors 10 7,247,421 75,987,075Cash and Bank Balances 11 14,346,236 3,578,201
Total Other Assets 21,593,657 79,565,276
Total Assets 2,310,339,214 1,785,201,705
LiabilitiesInvestment Liabilities 4,159 —Creditors 12 17,075,423 78,793,853 Bank Overdrafts 11 27,623 389,926 Distribution Payable on Income Shares 8,353,150 3,535,665
Total Other Liabilities 25,456,196 82,719,444
Total Liabilities 25,460,355 82,719,444
Net Assets Attributable to Shareholders 2,284,878,859 1,702,482,261
1 See the Notes to the Aggregated Financial Statements on pages 103–123.
Statement of Total Return Year Ended Year Ended
31 October 2015 31 October 2015 31 October 2014 31 October 2014 Note1 (£) (£) (£) (£)
Income Net Capital Gains/(Losses) 4 103,239,012 200,707,321 Revenue 6 39,744,355 24,917,431Expenses 7 (1,970,104) (2,354,929)Finance Costs: Interest 9 (4,911) (3,474)
Net Revenue Before Taxation 37,769,340 22,559,028Taxation 8 (5,535,212) (3,455,358)
Net Revenue After Taxation 32,234,128 19,103,670
Total Return Before Distributions 135,473,140 219,810,991Finance Costs: Distributions 9 (32,234,128) (19,103,670)
Change in Net Assets Attributable to Shareholders From Investment Activities 103,239,012 200,707,321
1 See the Notes to the Aggregated Financial Statements on pages 103–123.
Statement of Change in Net Assets Attributable to Shareholders Year Ended Year Ended
31 October 2015 31 October 2015 31 October 2014 31 October 2014 Note1 (£) (£) (£) (£)
Opening Net Assets Attributable to Shareholders 1,702,482,261 917,504,796 Amounts Received on Issue of Shares 708,647,680 776,355,029Amounts Paid on Cancellation of Shares (257,402,443) (209,649,182)
451,245,237 566,705,847
Dilution Levy 16 6,642 —Change in Net Assets Attributable to Shareholders From Investment Activities 103,239,012 200,707,321Retained Distribution on Accumulation Shares 27,905,707 17,564,297
Closing Net Assets Attributable to Shareholders 2,284,878,859 1,702,482,261
1 See the Notes to the Aggregated Financial Statements on pages 103–123.
85

U.S. Equity Index Fund
Distribution TableFor the year-ended 31 October 2015
Final distribution payable 31 December 2015
Distribution Distribution Net Paid Paid Income Equalisation 31 December 2015 31 December 2014 Pence Per Share Pence Per Share Pence Per Share Pence Per Share
A Accumulation Shares
Group 1 433.6536 — 433.6536 337.2311
Group 2 186.2357 247.4179 433.6536 337.2311
A Income Shares
Group 1 402.2247 — 402.2247 317.0091
Group 2 195.0854 207.1393 402.2247 317.0091
Institutional Plus Accumulation Shares1
Group 1 180.7076 — 180.7076 22.1633
Group 2 23.3414 157.3662 180.7076 22.1633
Institutional Plus Income Shares1
Group 1 180.3602 — 180.3602 22.3241
Group 2 75.7482 104.6120 180.3602 22.3241
Group 1—shares purchased before 1 November 2014. Group 2—shares purchased between 1 November 2014 and 31 October 2015.1 Launched 2 September 2014.Note: Equalisation applies only to shares purchased during the distribution period (Group 2 shares). It is the average amount of income included in the purchase price of all Group 2 shares and is refunded to holders of these shares as a return of capital. Being capital, it is not liable to income tax but must be deducted from the cost of shares for capital gains tax purposes.
86
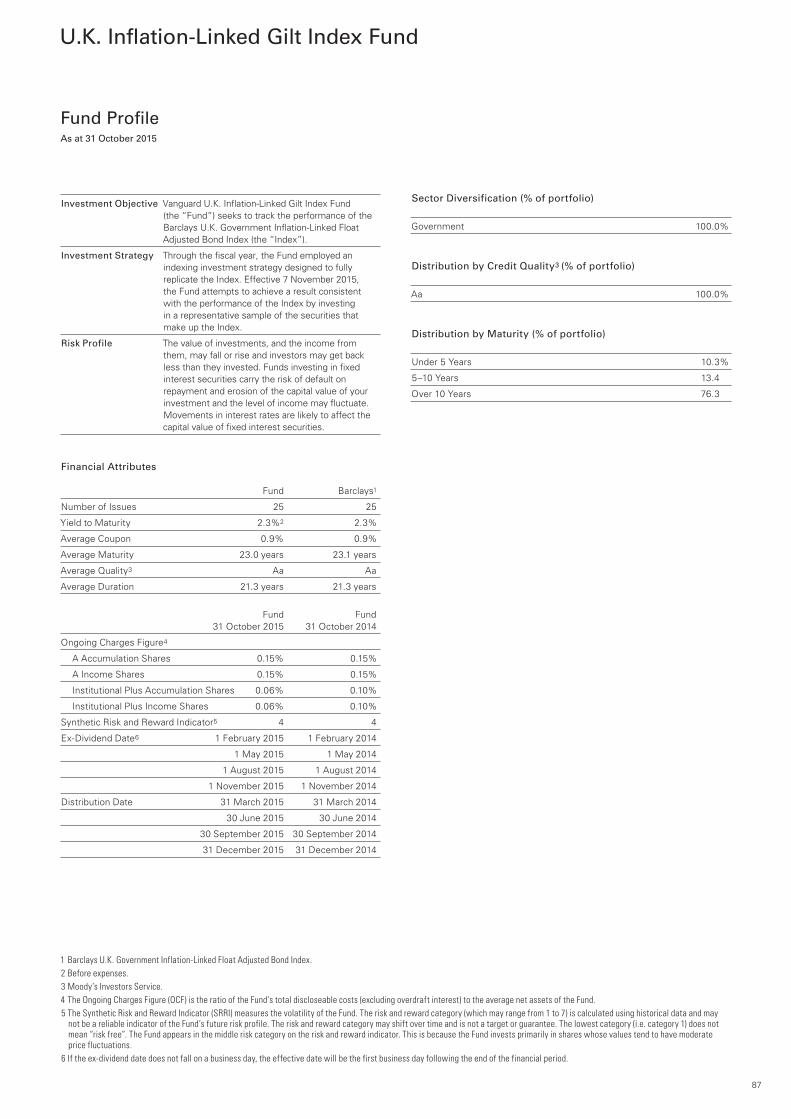
U.K. Inflation-Linked Gilt Index Fund
Fund Profile As at 31 October 2015
Investment Objective Vanguard U.K. Inflation-Linked Gilt Index Fund (the “Fund”) seeks to track the performance of the Barclays U.K. Government Inflation-Linked Float Adjusted Bond Index (the “Index”).
Investment Strategy Through the fiscal year, the Fund employed an indexing investment strategy designed to fully replicate the Index. Effective 7 November 2015, the Fund attempts to achieve a result consistent with the performance of the Index by investing in a representative sample of the securities that make up the Index.
Risk Profile The value of investments, and the income from them, may fall or rise and investors may get back less than they invested. Funds investing in fixed interest securities carry the risk of default on repayment and erosion of the capital value of your investment and the level of income may fluctuate.Movements in interest rates are likely to affect the capital value of fixed interest securities.
Financial Attributes Fund Barclays1
Number of Issues 25 25
Yield to Maturity 2.3%2 2.3%
Average Coupon 0.9% 0.9%
Average Maturity 23.0 years 23.1 years
Average Quality3 Aa Aa
Average Duration 21.3 years 21.3 years
Fund Fund 31 October 2015 31 October 2014
Ongoing Charges Figure4
A Accumulation Shares 0.15% 0.15%
A Income Shares 0.15% 0.15%
Institutional Plus Accumulation Shares 0.06% 0.10%
Institutional Plus Income Shares 0.06% 0.10%
Synthetic Risk and Reward Indicator5 4 4
Ex-Dividend Date6 1 February 2015 1 February 2014
1 May 2015 1 May 2014
1 August 2015 1 August 2014
1 November 2015 1 November 2014
Distribution Date 31 March 2015 31 March 2014
30 June 2015 30 June 2014
30 September 2015 30 September 2014
31 December 2015 31 December 2014
Sector Diversification (% of portfolio)
Government 100.0%
Distribution by Credit Quality3 (% of portfolio)
Aa 100.0%
Distribution by Maturity (% of portfolio)
Under 5 Years 10.3%
5–10 Years 13.4
Over 10 Years 76.3
1 Barclays U.K. Government Inflation-Linked Float Adjusted Bond Index.2 Before expenses.3 Moody’s Investors Service.4 The Ongoing Charges Figure (OCF) is the ratio of the Fund’s total discloseable costs (excluding overdraft interest) to the average net assets of the Fund.5 The Synthetic Risk and Reward Indicator (SRRI) measures the volatility of the Fund. The risk and reward category (which may range from 1 to 7) is calculated using historical data and may
not be a reliable indicator of the Fund’s future risk profile. The risk and reward category may shift over time and is not a target or guarantee. The lowest category (i.e. category 1) does not mean “risk free”. The Fund appears in the middle risk category on the risk and reward indicator. This is because the Fund invests primarily in shares whose values tend to have moderate price fluctuations.
6 If the ex-dividend date does not fall on a business day, the effective date will be the first business day following the end of the financial period.
87
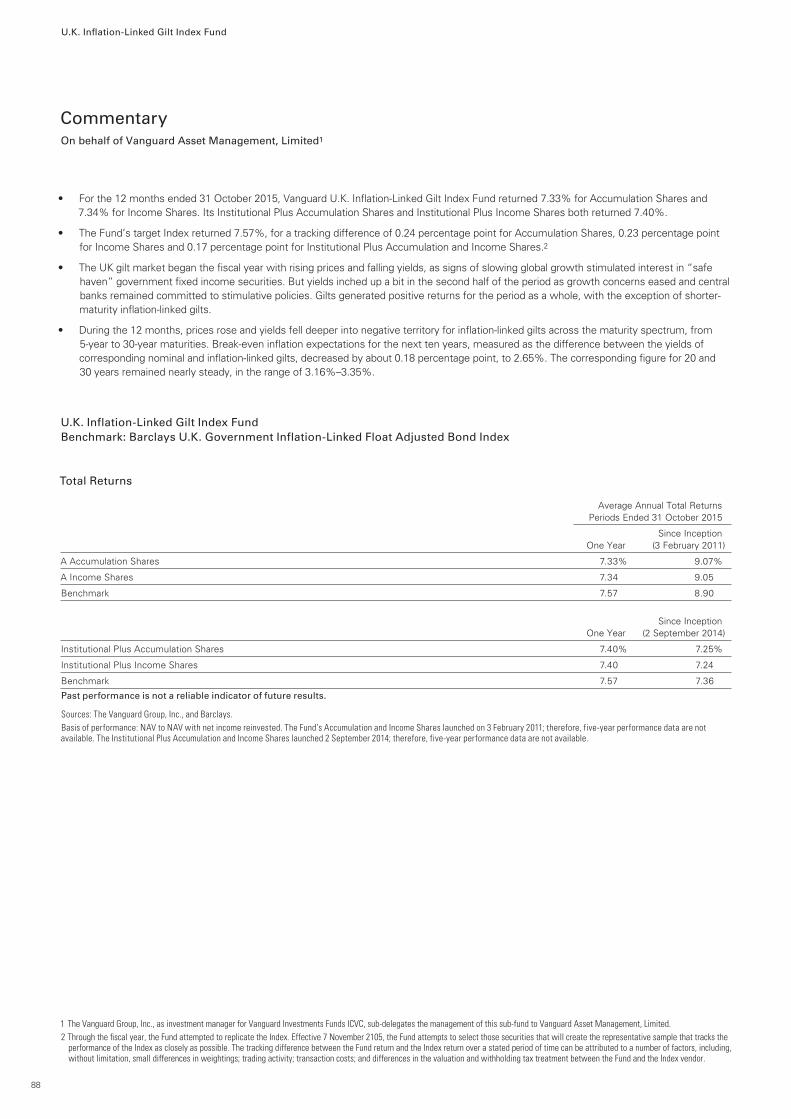
U.K. Inflation-Linked Gilt Index Fund
Commentary On behalf of Vanguard Asset Management, Limited1
• For the 12 months ended 31 October 2015, Vanguard U.K. Inflation-Linked Gilt Index Fund returned 7.33% for Accumulation Shares and 7.34% for Income Shares. Its Institutional Plus Accumulation Shares and Institutional Plus Income Shares both returned 7.40%.
• The Fund’s target Index returned 7.57%, for a tracking difference of 0.24 percentage point for Accumulation Shares, 0.23 percentage point for Income Shares and 0.17 percentage point for Institutional Plus Accumulation and Income Shares.2
• The UK gilt market began the fiscal year with rising prices and falling yields, as signs of slowing global growth stimulated interest in “safe haven” government fixed income securities. But yields inched up a bit in the second half of the period as growth concerns eased and central banks remained committed to stimulative policies. Gilts generated positive returns for the period as a whole, with the exception of shorter-maturity inflation-linked gilts.
• During the 12 months, prices rose and yields fell deeper into negative territory for inflation-linked gilts across the maturity spectrum, from 5-year to 30-year maturities. Break-even inflation expectations for the next ten years, measured as the difference between the yields of corresponding nominal and inflation-linked gilts, decreased by about 0.18 percentage point, to 2.65%. The corresponding figure for 20 and 30 years remained nearly steady, in the range of 3.16%–3.35%.
U.K. Inflation-Linked Gilt Index Fund Benchmark: Barclays U.K. Government Inflation-Linked Float Adjusted Bond Index
Total Returns Average Annual Total Returns Periods Ended 31 October 2015
Since Inception One Year (3 February 2011)
A Accumulation Shares 7.33% 9.07%
A Income Shares 7.34 9.05
Benchmark 7.57 8.90
Since Inception One Year (2 September 2014)
Institutional Plus Accumulation Shares 7.40% 7.25%
Institutional Plus Income Shares 7.40 7.24
Benchmark 7.57 7.36
Past performance is not a reliable indicator of future results.
Sources: The Vanguard Group, Inc., and Barclays.Basis of performance: NAV to NAV with net income reinvested. The Fund’s Accumulation and Income Shares launched on 3 February 2011; therefore, five-year performance data are not available. The Institutional Plus Accumulation and Income Shares launched 2 September 2014; therefore, five-year performance data are not available.
1 The Vanguard Group, Inc., as investment manager for Vanguard Investments Funds ICVC, sub-delegates the management of this sub-fund to Vanguard Asset Management, Limited.2 Through the fiscal year, the Fund attempted to replicate the Index. Effective 7 November 2105, the Fund attempts to select those securities that will create the representative sample that tracks the
performance of the Index as closely as possible. The tracking difference between the Fund return and the Index return over a stated period of time can be attributed to a number of factors, including, without limitation, small differences in weightings; trading activity; transaction costs; and differences in the valuation and withholding tax treatment between the Fund and the Index vendor.
88

U.K. Inflation-Linked Gilt Index Fund
Price History
Vanguard U.K. Inflation-Linked 1 January 2015 to 1 January 2014 to 1 January 2013 to 1 January 2012 to 3 February 2011 to Gilt Index Fund 31 October 2015 31 December 2014 31 December 2013 31 December 2012 31 December 2011
A Accumulation Shares
(21 Jan. 2015) (12 Dec. 2014) (8 Apr. 2013) (31 May 2012) (29 Dec. 2011)Highest Share Price £157.72 £151.61 £139.61 £126.47 £124.89
(9 Mar. 2015) (6 Jan. 2014) (7 Jan. 2013) (16 Mar. 2012) (9 Feb. 2011)Lowest Share Price £142.31 £125.22 £121.59 £118.89 £99.19
Income Dividends Pence Per Share 0.0000 0.0000 11.8588 9.4159 31.0399
A Income Shares
(21 Jan. 2015) (12 Dec. 2014) (8 Apr. 2013) (31 May 2012) (29 Dec. 2011)Highest Share Price £157.02 £150.93 £138.99 £126.04 £124.52
(9 Mar. 2015) (6 Jan. 2014) (7 Jan. 2013) (16 Mar. 2012) (9 Feb. 2011)Lowest Share Price £141.67 £124.65 £121.15 £118.50 £99.19
Income Dividends Pence Per Share 0.0000 0.0000 11.7079 8.2984 29.8770
Institutional Plus Accumulation Shares1
(21 Jan. 2015) (12 Dec. 2014) Highest Share Price £113.32 £108.92 — — —
(9 Mar. 2015) (18 Sep. 2014) Lowest Share Price £102.25 £96.47 — — —
Income Dividends Pence Per Share 0.0000 0.0000 — — —
Institutional Plus Income Shares1
(21 Jan. 2015) (12 Dec. 2014)Highest Share Price £113.32 £108.91 — — —
(9 Mar. 2015) (18 Sep. 2014)Lowest Share Price £102.25 £96.47 — — —
Income Dividends Pence Per Share 0.0000 0.0000 — — —
NAV History 31 October 2015 31 October 2014 31 October 2013
A Accumulation Shares
Total Net Asset Value £477,871,583 £354,525,398 £289,481,780
Net Asset Value Per Share £150.72 £140.48 £128.81
Number of Shares in Issue 3,170,630 2,523,598 2,247,314
A Income Shares
Total Net Asset Value £166,194,518 £62,849,863 £40,759,736
Net Asset Value Per Share £150.05 £139.85 £128.16
Number of Shares in Issue 1,107,568 449,396 318,028
Institutional Plus Accumulation Shares¹
Total Net Asset Value £5,417 £5,046 —
Net Asset Value Per Share £108.34 £100.92 —
Number of Shares in Issue 50 50 —
Institutional Plus Income Shares¹
Total Net Asset Value £6,431,903 £2,773,440 —
Net Asset Value Per Share £108.34 £100.91 —
Number of Shares in Issue 59,367 27,483 —
1 Launched 2 September 2014.
89
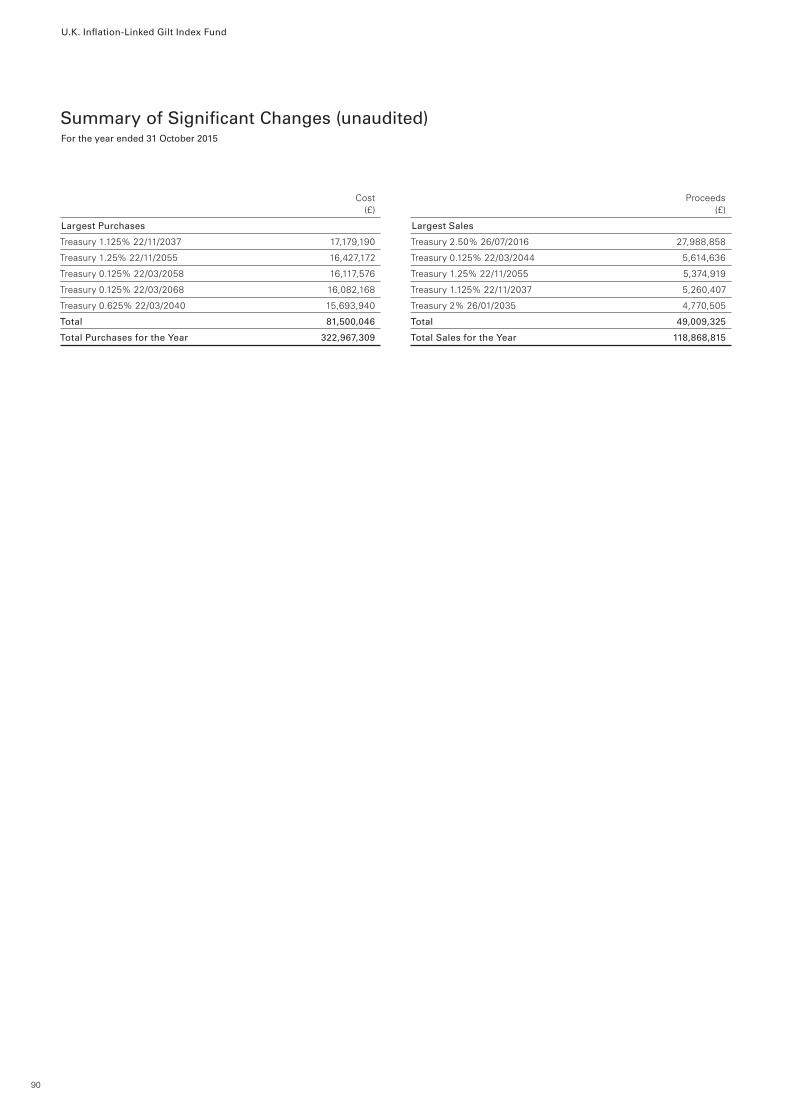
U.K. Inflation-Linked Gilt Index Fund
Summary of Significant Changes (unaudited)For the year ended 31 October 2015
Cost (£)
Largest Purchases
Treasury 1.125% 22/11/2037 17,179,190
Treasury 1.25% 22/11/2055 16,427,172
Treasury 0.125% 22/03/2058 16,117,576
Treasury 0.125% 22/03/2068 16,082,168
Treasury 0.625% 22/03/2040 15,693,940
Total 81,500,046
Total Purchases for the Year 322,967,309
Proceeds (£)
Largest Sales
Treasury 2.50% 26/07/2016 27,988,858
Treasury 0.125% 22/03/2044 5,614,636
Treasury 1.25% 22/11/2055 5,374,919
Treasury 1.125% 22/11/2037 5,260,407
Treasury 2% 26/01/2035 4,770,505
Total 49,009,325
Total Sales for the Year 118,868,815
90
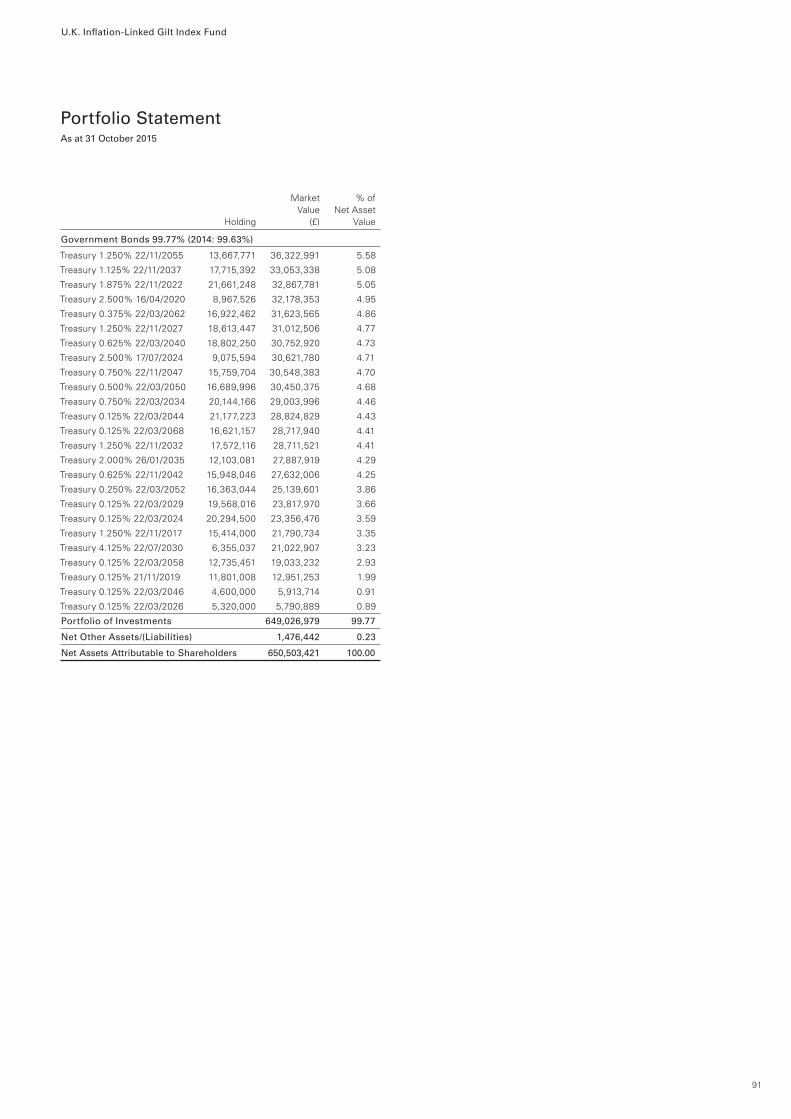
U.K. Inflation-Linked Gilt Index Fund
Portfolio StatementAs at 31 October 2015
Government Bonds 99.77% (2014: 99.63%)
Treasury 1.250% 22/11/2055 13,667,771 36,322,991 5.58
Treasury 1.125% 22/11/2037 17,715,392 33,053,338 5.08
Treasury 1.875% 22/11/2022 21,661,248 32,867,781 5.05
Treasury 2.500% 16/04/2020 8,967,526 32,178,353 4.95
Treasury 0.375% 22/03/2062 16,922,462 31,623,565 4.86
Treasury 1.250% 22/11/2027 18,613,447 31,012,506 4.77
Treasury 0.625% 22/03/2040 18,802,250 30,752,920 4.73
Treasury 2.500% 17/07/2024 9,075,594 30,621,780 4.71
Treasury 0.750% 22/11/2047 15,759,704 30,548,383 4.70
Treasury 0.500% 22/03/2050 16,689,996 30,450,375 4.68
Treasury 0.750% 22/03/2034 20,144,166 29,003,996 4.46
Treasury 0.125% 22/03/2044 21,177,223 28,824,829 4.43
Treasury 0.125% 22/03/2068 16,621,157 28,717,940 4.41
Treasury 1.250% 22/11/2032 17,572,116 28,711,521 4.41
Treasury 2.000% 26/01/2035 12,103,081 27,887,919 4.29
Treasury 0.625% 22/11/2042 15,948,046 27,632,006 4.25
Treasury 0.250% 22/03/2052 16,363,044 25,139,601 3.86
Treasury 0.125% 22/03/2029 19,568,016 23,817,970 3.66
Treasury 0.125% 22/03/2024 20,294,500 23,356,476 3.59
Treasury 1.250% 22/11/2017 15,414,000 21,790,734 3.35
Treasury 4.125% 22/07/2030 6,355,037 21,022,907 3.23
Treasury 0.125% 22/03/2058 12,735,451 19,033,232 2.93
Treasury 0.125% 21/11/2019 11,801,008 12,951,253 1.99
Treasury 0.125% 22/03/2046 4,600,000 5,913,714 0.91
Treasury 0.125% 22/03/2026 5,320,000 5,790,889 0.89
Portfolio of Investments 649,026,979 99.77
Net Other Assets/(Liabilities) 1,476,442 0.23
Net Assets Attributable to Shareholders 650,503,421 100.00
91
Market % of Value Net Asset Holding (£) Value
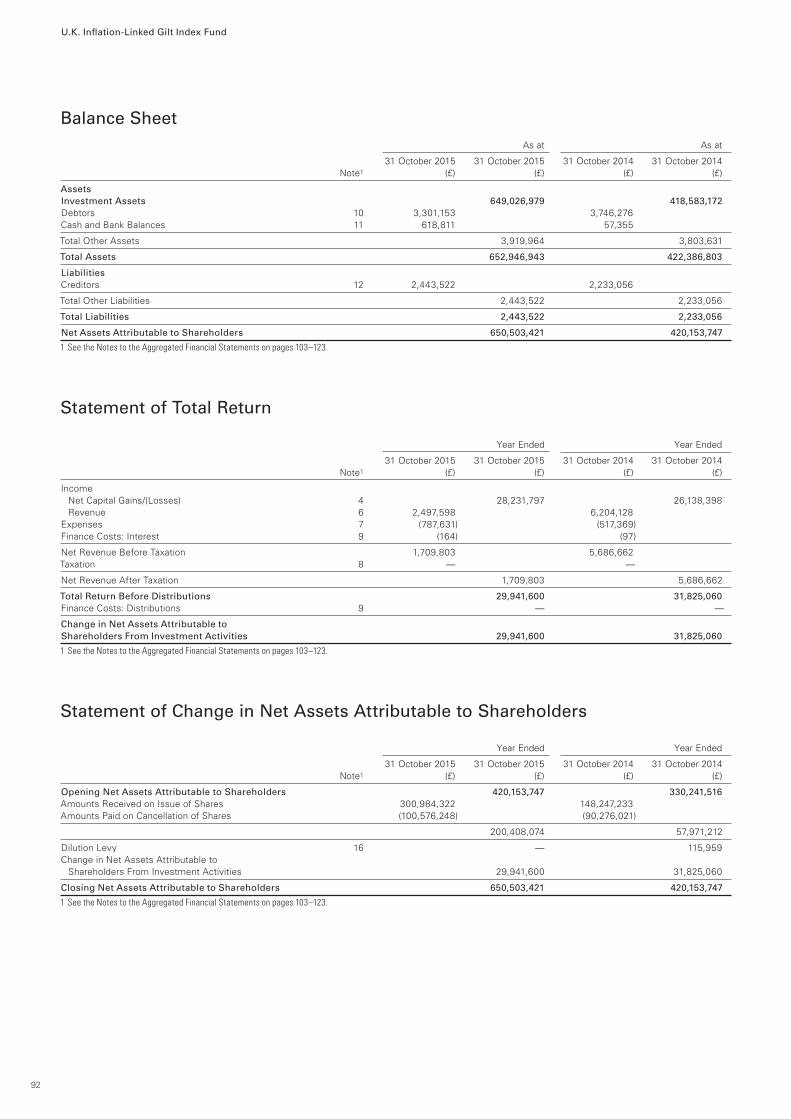
U.K. Inflation-Linked Gilt Index Fund
Balance Sheet As at As at
31 October 2015 31 October 2015 31 October 2014 31 October 2014 Note1 (£) (£) (£) (£)
AssetsInvestment Assets 649,026,979 418,583,172 Debtors 10 3,301,153 3,746,276 Cash and Bank Balances 11 618,811 57,355
Total Other Assets 3,919,964 3,803,631
Total Assets 652,946,943 422,386,803
LiabilitiesCreditors 12 2,443,522 2,233,056
Total Other Liabilities 2,443,522 2,233,056
Total Liabilities 2,443,522 2,233,056
Net Assets Attributable to Shareholders 650,503,421 420,153,747
1 See the Notes to the Aggregated Financial Statements on pages 103–123.
Statement of Total Return Year Ended Year Ended
31 October 2015 31 October 2015 31 October 2014 31 October 2014 Note1 (£) (£) (£) (£)
Income Net Capital Gains/(Losses) 4 28,231,797 26,138,398 Revenue 6 2,497,598 6,204,128 Expenses 7 (787,631) (517,369)Finance Costs: Interest 9 (164) (97)
Net Revenue Before Taxation 1,709,803 5,686,662Taxation 8 — —
Net Revenue After Taxation 1,709,803 5,686,662
Total Return Before Distributions 29,941,600 31,825,060 Finance Costs: Distributions 9 — —
Change in Net Assets Attributable to Shareholders From Investment Activities 29,941,600 31,825,060
1 See the Notes to the Aggregated Financial Statements on pages 103–123.
Statement of Change in Net Assets Attributable to Shareholders Year Ended Year Ended
31 October 2015 31 October 2015 31 October 2014 31 October 2014 Note1 (£) (£) (£) (£)
Opening Net Assets Attributable to Shareholders 420,153,747 330,241,516 Amounts Received on Issue of Shares 300,984,322 148,247,233 Amounts Paid on Cancellation of Shares (100,576,248) (90,276,021)
200,408,074 57,971,212
Dilution Levy 16 — 115,959Change in Net Assets Attributable to Shareholders From Investment Activities 29,941,600 31,825,060
Closing Net Assets Attributable to Shareholders 650,503,421 420,153,747
1 See the Notes to the Aggregated Financial Statements on pages 103–123.
92
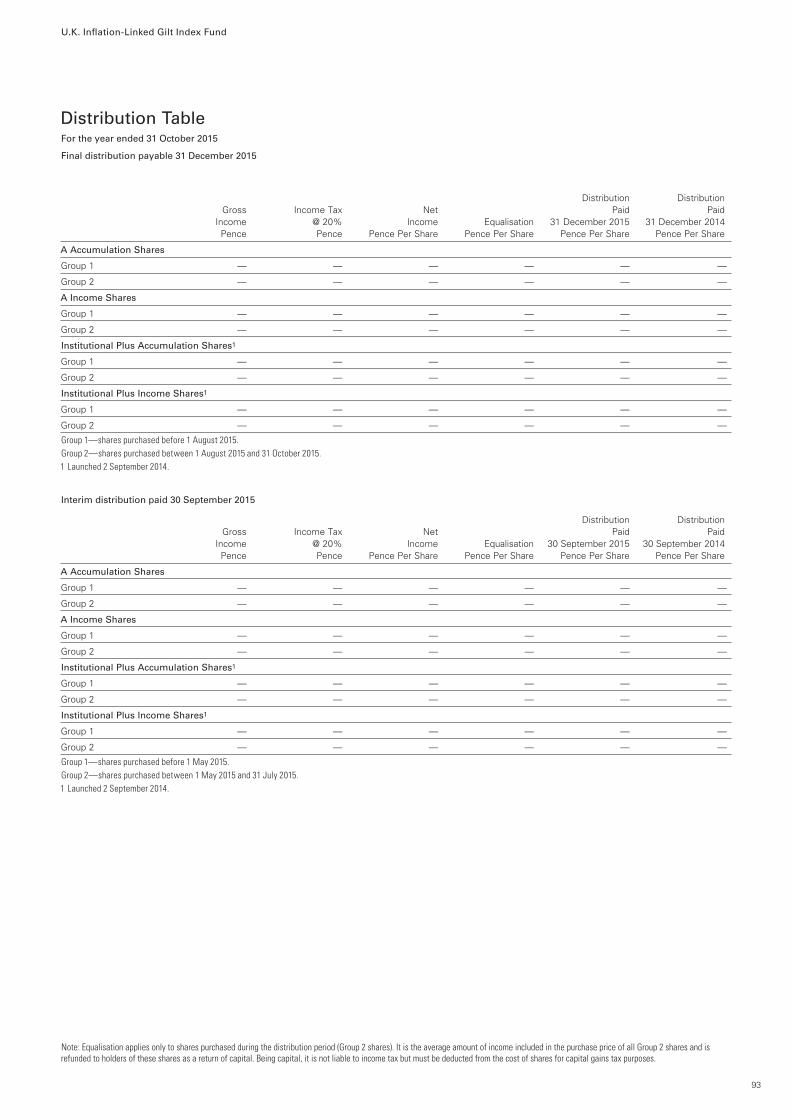
Note: Equalisation applies only to shares purchased during the distribution period (Group 2 shares). It is the average amount of income included in the purchase price of all Group 2 shares and is refunded to holders of these shares as a return of capital. Being capital, it is not liable to income tax but must be deducted from the cost of shares for capital gains tax purposes.
U.K. Inflation-Linked Gilt Index Fund
Distribution TableFor the year ended 31 October 2015
Final distribution payable 31 December 2015
Distribution Distribution Gross Income Tax Net Paid Paid Income @ 20% Income Equalisation 31 December 2015 31 December 2014 Pence Pence Pence Per Share Pence Per Share Pence Per Share Pence Per Share
A Accumulation Shares
Group 1 — — — — — —
Group 2 — — — — — —
A Income Shares
Group 1 — — — — — —
Group 2 — — — — — —
Institutional Plus Accumulation Shares1
Group 1 — — — — — —
Group 2 — — — — — —
Institutional Plus Income Shares1
Group 1 — — — — — —
Group 2 — — — — — —
Group 1—shares purchased before 1 August 2015.Group 2—shares purchased between 1 August 2015 and 31 October 2015.1 Launched 2 September 2014.
Interim distribution paid 30 September 2015
Distribution Distribution Gross Income Tax Net Paid Paid Income @ 20% Income Equalisation 30 September 2015 30 September 2014 Pence Pence Pence Per Share Pence Per Share Pence Per Share Pence Per Share
A Accumulation Shares
Group 1 — — — — — —
Group 2 — — — — — —
A Income Shares
Group 1 — — — — — —
Group 2 — — — — — —
Institutional Plus Accumulation Shares1
Group 1 — — — — — —
Group 2 — — — — — —
Institutional Plus Income Shares1
Group 1 — — — — — —
Group 2 — — — — — —
Group 1—shares purchased before 1 May 2015.Group 2—shares purchased between 1 May 2015 and 31 July 2015.1 Launched 2 September 2014.
93
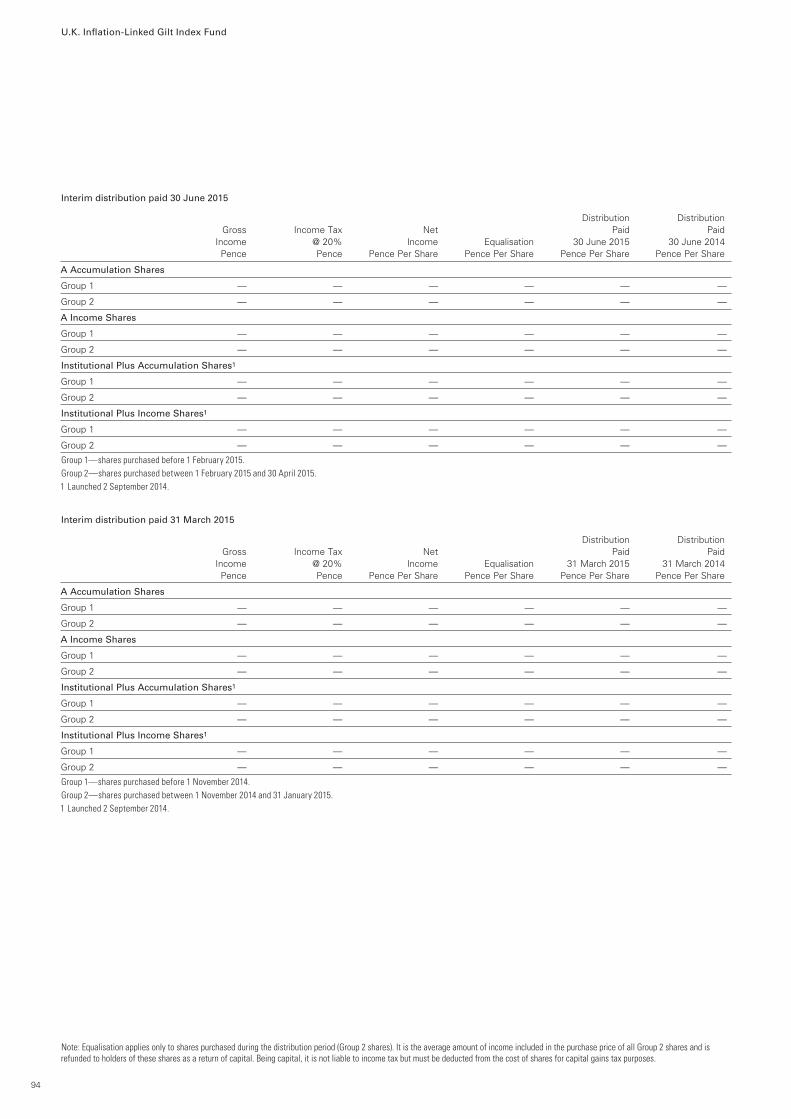
U.K. Inflation-Linked Gilt Index Fund
Interim distribution paid 30 June 2015
Distribution Distribution Gross Income Tax Net Paid Paid Income @ 20% Income Equalisation 30 June 2015 30 June 2014 Pence Pence Pence Per Share Pence Per Share Pence Per Share Pence Per Share
A Accumulation Shares
Group 1 — — — — — —
Group 2 — — — — — —
A Income Shares
Group 1 — — — — — —
Group 2 — — — — — —
Institutional Plus Accumulation Shares1
Group 1 — — — — — —
Group 2 — — — — — —
Institutional Plus Income Shares1
Group 1 — — — — — —
Group 2 — — — — — —
Group 1—shares purchased before 1 February 2015.Group 2—shares purchased between 1 February 2015 and 30 April 2015.1 Launched 2 September 2014.
Interim distribution paid 31 March 2015
Distribution Distribution Gross Income Tax Net Paid Paid Income @ 20% Income Equalisation 31 March 2015 31 March 2014 Pence Pence Pence Per Share Pence Per Share Pence Per Share Pence Per Share
A Accumulation Shares
Group 1 — — — — — —
Group 2 — — — — — —
A Income Shares
Group 1 — — — — — —
Group 2 — — — — — —
Institutional Plus Accumulation Shares1
Group 1 — — — — — —
Group 2 — — — — — —
Institutional Plus Income Shares1
Group 1 — — — — — —
Group 2 — — — — — —
Group 1—shares purchased before 1 November 2014.Group 2—shares purchased between 1 November 2014 and 31 January 2015.1 Launched 2 September 2014.
Note: Equalisation applies only to shares purchased during the distribution period (Group 2 shares). It is the average amount of income included in the purchase price of all Group 2 shares and is refunded to holders of these shares as a return of capital. Being capital, it is not liable to income tax but must be deducted from the cost of shares for capital gains tax purposes.
94
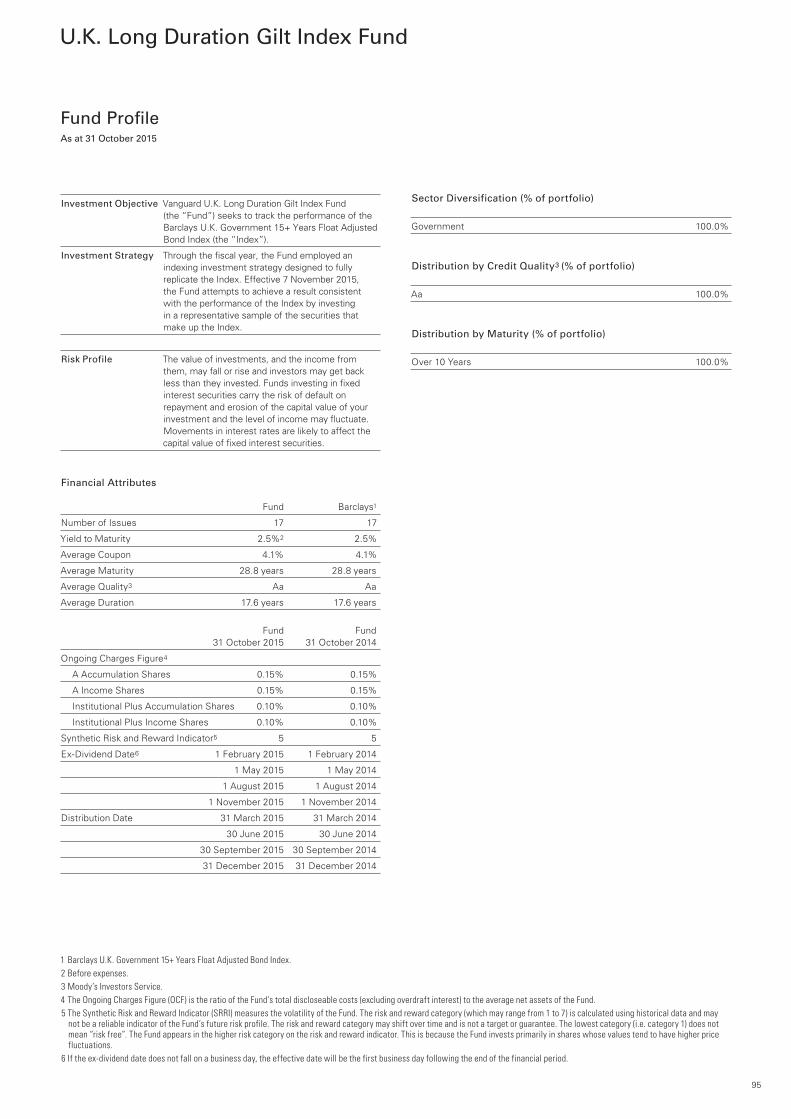
U.K. Long Duration Gilt Index Fund
Fund Profile As at 31 October 2015
Investment Objective Vanguard U.K. Long Duration Gilt Index Fund (the “Fund”) seeks to track the performance of the Barclays U.K. Government 15+ Years Float Adjusted Bond Index (the “Index”).
Investment Strategy Through the fiscal year, the Fund employed an indexing investment strategy designed to fully replicate the Index. Effective 7 November 2015, the Fund attempts to achieve a result consistent with the performance of the Index by investing in a representative sample of the securities that make up the Index.
Risk Profile The value of investments, and the income from them, may fall or rise and investors may get back less than they invested. Funds investing in fixed interest securities carry the risk of default on repayment and erosion of the capital value of your investment and the level of income may fluctuate.Movements in interest rates are likely to affect the capital value of fixed interest securities.
Financial Attributes Fund Barclays1
Number of Issues 17 17
Yield to Maturity 2.5%2 2.5%
Average Coupon 4.1% 4.1%
Average Maturity 28.8 years 28.8 years
Average Quality3 Aa Aa
Average Duration 17.6 years 17.6 years
Fund Fund 31 October 2015 31 October 2014
Ongoing Charges Figure4
A Accumulation Shares 0.15% 0.15%
A Income Shares 0.15% 0.15%
Institutional Plus Accumulation Shares 0.10% 0.10%
Institutional Plus Income Shares 0.10% 0.10%
Synthetic Risk and Reward Indicator5 5 5
Ex-Dividend Date6 1 February 2015 1 February 2014
1 May 2015 1 May 2014
1 August 2015 1 August 2014
1 November 2015 1 November 2014
Distribution Date 31 March 2015 31 March 2014
30 June 2015 30 June 2014
30 September 2015 30 September 2014
31 December 2015 31 December 2014
Sector Diversification (% of portfolio)
Government 100.0%
Distribution by Credit Quality3 (% of portfolio)
Aa 100.0%
Distribution by Maturity (% of portfolio)
Over 10 Years 100.0%
1 Barclays U.K. Government 15+ Years Float Adjusted Bond Index.2 Before expenses.3 Moody’s Investors Service.4 The Ongoing Charges Figure (OCF) is the ratio of the Fund’s total discloseable costs (excluding overdraft interest) to the average net assets of the Fund.5 The Synthetic Risk and Reward Indicator (SRRI) measures the volatility of the Fund. The risk and reward category (which may range from 1 to 7) is calculated using historical data and may
not be a reliable indicator of the Fund’s future risk profile. The risk and reward category may shift over time and is not a target or guarantee. The lowest category (i.e. category 1) does not mean “risk free”. The Fund appears in the higher risk category on the risk and reward indicator. This is because the Fund invests primarily in shares whose values tend to have higher price fluctuations.
6 If the ex-dividend date does not fall on a business day, the effective date will be the first business day following the end of the financial period.
95
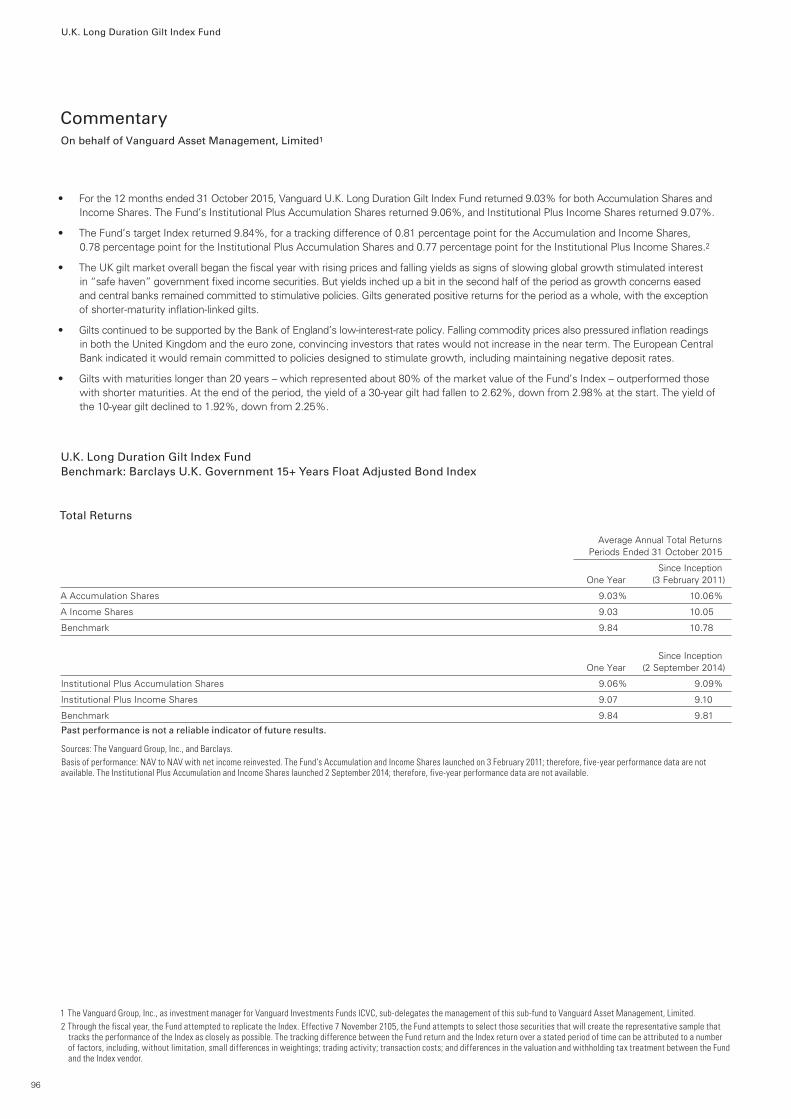
U.K. Long Duration Gilt Index Fund
Commentary On behalf of Vanguard Asset Management, Limited1
• For the 12 months ended 31 October 2015, Vanguard U.K. Long Duration Gilt Index Fund returned 9.03% for both Accumulation Shares and Income Shares. The Fund’s Institutional Plus Accumulation Shares returned 9.06%, and Institutional Plus Income Shares returned 9.07%.
• The Fund’s target Index returned 9.84%, for a tracking difference of 0.81 percentage point for the Accumulation and Income Shares, 0.78 percentage point for the Institutional Plus Accumulation Shares and 0.77 percentage point for the Institutional Plus Income Shares.2
• The UK gilt market overall began the fiscal year with rising prices and falling yields as signs of slowing global growth stimulated interest in “safe haven” government fixed income securities. But yields inched up a bit in the second half of the period as growth concerns eased and central banks remained committed to stimulative policies. Gilts generated positive returns for the period as a whole, with the exception of shorter-maturity inflation-linked gilts.
• Gilts continued to be supported by the Bank of England’s low-interest-rate policy. Falling commodity prices also pressured inflation readings in both the United Kingdom and the euro zone, convincing investors that rates would not increase in the near term. The European Central Bank indicated it would remain committed to policies designed to stimulate growth, including maintaining negative deposit rates.
• Gilts with maturities longer than 20 years – which represented about 80% of the market value of the Fund’s Index – outperformed those with shorter maturities. At the end of the period, the yield of a 30-year gilt had fallen to 2.62%, down from 2.98% at the start. The yield of the 10-year gilt declined to 1.92%, down from 2.25%.
U.K. Long Duration Gilt Index Fund Benchmark: Barclays U.K. Government 15+ Years Float Adjusted Bond Index
Total Returns Average Annual Total Returns Periods Ended 31 October 2015
Since Inception One Year (3 February 2011)
A Accumulation Shares 9.03% 10.06%
A Income Shares 9.03 10.05
Benchmark 9.84 10.78
Since Inception One Year (2 September 2014)
Institutional Plus Accumulation Shares 9.06% 9.09%
Institutional Plus Income Shares 9.07 9.10
Benchmark 9.84 9.81
Past performance is not a reliable indicator of future results.
Sources: The Vanguard Group, Inc., and Barclays.Basis of performance: NAV to NAV with net income reinvested. The Fund’s Accumulation and Income Shares launched on 3 February 2011; therefore, five-year performance data are not available. The Institutional Plus Accumulation and Income Shares launched 2 September 2014; therefore, five-year performance data are not available.
1 The Vanguard Group, Inc., as investment manager for Vanguard Investments Funds ICVC, sub-delegates the management of this sub-fund to Vanguard Asset Management, Limited.2 Through the fiscal year, the Fund attempted to replicate the Index. Effective 7 November 2105, the Fund attempts to select those securities that will create the representative sample that
tracks the performance of the Index as closely as possible. The tracking difference between the Fund return and the Index return over a stated period of time can be attributed to a number of factors, including, without limitation, small differences in weightings; trading activity; transaction costs; and differences in the valuation and withholding tax treatment between the Fund and the Index vendor.
96

U.K. Long Duration Gilt Index Fund
Price History
Vanguard U.K. Long 1 January 2015 to 1 January 2014 to 1 January 2013 to 1 January 2012 to 3 February 2011 to Duration Gilt Index Fund 31 October 2015 31 December 2014 31 December 2013 31 December 2012 31 December 2011
A Accumulation Shares
(30 Jan. 2015) (31 Dec. 2014) (2 May 2013) (18 Jul. 2012) (29 Dec. 2011)Highest Share Price £172.20 £157.89 £139.67 £138.44 £132.53
(10 Jun. 2015) (2 Jan. 2014) (10 Sep. 2013) (16 Mar. 2012) (9 Feb. 2011)Lowest Share Price £150.06 £125.56 £123.35 £123.04 £98.91
Income Dividends Pence Per Share 315.0704 332.5406 240.8687 323.6632 247.7250
A Income Shares
(30 Jan. 2015) (31 Dec. 2014) (5 Apr. 2013) (18 Jul. 2012) (29 Dec. 2011)Highest Share Price £156.51 £143.53 £132.25 £133.77 £129.70
(10 Jun. 2015) (2 Jan. 2014) (10 Sep. 2013) (16 Mar. 2012) (9 Feb. 2011)Lowest Share Price £135.10 £116.96 £115.66 £119.65 £98.91
Income Dividends Pence Per Share 283.1697 303.5977 227.7326 313.7881 245.4335
Institutional Plus Accumulation Shares¹
(30 Jan. 2015) (31 Dec. 2014) Highest Share Price £120.92 £110.87 — — —
(10 Jun. 2015) (18 Sep. 2014) Lowest Share Price £105.39 £96.98 — — —
Income Dividends Pence Per Share 225.2200 38.3200 — — —
Institutional Plus Income Shares¹
(30 Jan. 2015) (31 Dec. 2014) Highest Share Price £120.46 £110.45 — — —
(10 Jun. 2015) (18 Sep. 2014) Lowest Share Price £103.97 £96.98 — — —
Income Dividends Pence Per Share 222.9800 38.4400 — — —
NAV History 31 October 2015 31 October 2014 31 October 2013
A Accumulation Shares
Total Net Asset Value £111,735,209 £63,677,365 £35,012,195
Net Asset Value Per Share £157.44 £144.43 £129.66
Number of Shares in Issue 709,702 440,890 270,041
A Income Shares
Total Net Asset Value £13,099,149 £11,468,943 £1,341,090
Net Asset Value Per Share £140.33 £131.29 £120.76
Number of Shares in Issue 93,344 87,359 11,105
Institutional Plus Accumulation Shares1
Total Net Asset Value £5,529 £5,071 —
Net Asset Value Per Share £110.58 £101.42 —
Number of Shares in Issue 50 50 —
Institutional Plus Income Shares1
Total Net Asset Value £5,400 £5,051 —
Net Asset Value Per Share £108.00 £101.02 —
Number of Shares in Issue 50 50 —
1 Launched 2 September 2014.
97
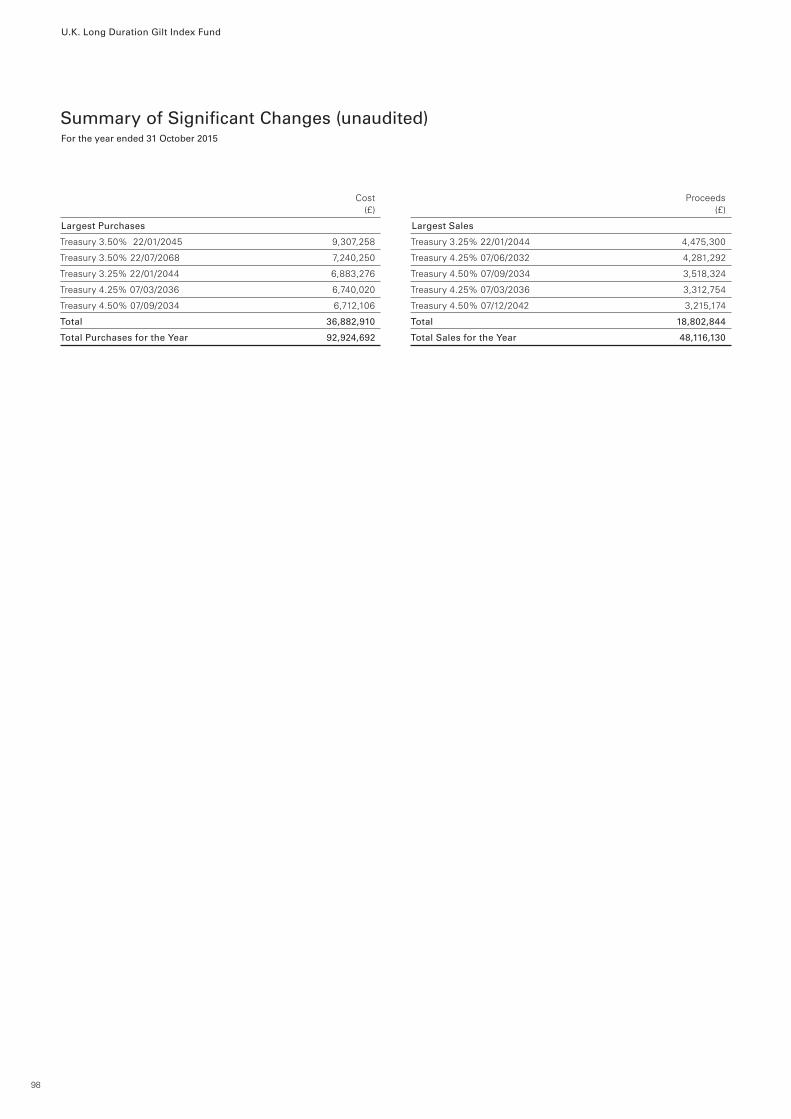
U.K. Long Duration Gilt Index Fund
Summary of Significant Changes (unaudited)For the year ended 31 October 2015
Cost (£)
Largest Purchases
Treasury 3.50% 22/01/2045 9,307,258
Treasury 3.50% 22/07/2068 7,240,250
Treasury 3.25% 22/01/2044 6,883,276
Treasury 4.25% 07/03/2036 6,740,020
Treasury 4.50% 07/09/2034 6,712,106
Total 36,882,910
Total Purchases for the Year 92,924,692
Proceeds (£)
Largest Sales
Treasury 3.25% 22/01/2044 4,475,300
Treasury 4.25% 07/06/2032 4,281,292
Treasury 4.50% 07/09/2034 3,518,324
Treasury 4.25% 07/03/2036 3,312,754
Treasury 4.50% 07/12/2042 3,215,174
Total 18,802,844
Total Sales for the Year 48,116,130
98

U.K. Long Duration Gilt Index Fund
Portfolio StatementAs at 31 October 2015
Government Bonds 99.20% (2014: 99.16%)
Treasury 4.25% 07/03/2036 7,334,161 9,350,102 7.49
Treasury 4.50% 07/09/2034 6,973,535 9,120,868 7.31
Treasury 3.25% 22/01/2044 8,030,453 9,044,798 7.25
Treasury 4.75% 07/12/2030 6,688,569 8,836,491 7.08
Treasury 4.50% 07/12/2042 6,187,742 8,479,341 6.79
Treasury 3.50% 22/01/2045 6,995,000 8,252,278 6.61
Treasury 4.25% 07/06/2032 6,523,395 8,228,969 6.59
Treasury 3.50% 22/07/2068 6,160,913 7,924,741 6.35
Treasury 4.25% 07/12/2055 5,304,791 7,632,634 6.11
Treasury 4.75% 07/12/2038 5,496,364 7,592,980 6.08
Treasury 4.25% 07/12/2046 5,196,814 7,027,825 5.63
Treasury 4.25% 07/12/2040 5,343,510 6,965,452 5.58
Treasury 4.25% 07/12/2049 4,627,574 6,409,806 5.13
Treasury 4.00% 22/01/2060 4,441,532 6,203,162 4.97
Treasury 3.75% 22/07/2052 4,690,876 6,030,591 4.83
Treasury 4.25% 07/09/2039 4,136,093 5,359,609 4.29
Treasury 2.50% 22/07/2065 1,390,000 1,385,510 1.11
Portfolio of Investments 123,845,157 99.20
Net Other Assets/(Liabilities) 1,000,130 0.80
Net Assets Attributable to Shareholders 124,845,287 100.00
99
Market % of Value Net Asset Holding (£) Value

U.K. Long Duration Gilt Index Fund
Balance Sheet As at As at
31 October 2015 31 October 2015 31 October 2014 31 October 2014 Note1 (£) (£) (£) (£)
AssetsInvestment Assets 123,845,157 74,521,553 Debtors 10 3,822,964 2,818,561Cash and Bank Balances 11 7,566 9,950
Total Other Assets 3,830,530 2,828,511
Total Assets 127,675,687 77,350,064
LiabilitiesCreditors 12 2,768,372 2,126,394Distribution Payable on Income Shares 62,028 67,240
Total Other Liabilities 2,830,400 2,193,634
Total Liabilities 2,830,400 2,193,634
Net Assets Attributable to Shareholders 124,845,287 75,156,430
1 See the Notes to the Aggregated Financial Statements on pages 103–123.
Statement of Total Return Year Ended Year Ended
31 October 2015 31 October 2015 31 October 2014 31 October 2014 Note1 (£) (£) (£) (£)
Income Net Capital Gains/(Losses) 4 4,966,935 4,638,511 Revenue 6 2,701,673 1,607,119Expenses 7 (153,391) (73,923)Finance Costs: Interest 9 (504) (117)
Net Revenue Before Taxation 2,547,778 1,533,079 Taxation 8 — —
Net Revenue After Taxation 2,547,778 1,533,079
Total Return Before Distributions 7,514,713 6,171,590 Finance Costs: Distributions 9 (2,547,778) (1,533,079)
Change in Net Assets Attributable to Shareholders From Investment Activities 4,966,935 4,638,511
1 See the Notes to the Aggregated Financial Statements on pages 103–123.
Statement of Change in Net Assets Attributable to Shareholders Year Ended Year Ended
31 October 2015 31 October 2015 31 October 2014 31 October 2014 Note1 (£) (£) (£) (£)
Opening Net Assets Attributable to Shareholders 75,156,430 36,353,285 Amounts Received on Issue of Shares 93,357,390 38,560,368 Amounts Paid on Cancellation of Shares (50,578,950) (5,606,616)
42,778,440 32,953,752
Dilution Levy 16 843 17,784 Change in Net Assets Attributable to Shareholders From Investment Activities 4,966,935 4,638,511 Retained Distribution on Accumulation Shares 1,942,639 1,193,098
Closing Net Assets Attributable to Shareholders 124,845,287 75,156,430
1 See the Notes to the Aggregated Financial Statements on pages 103–123.
100
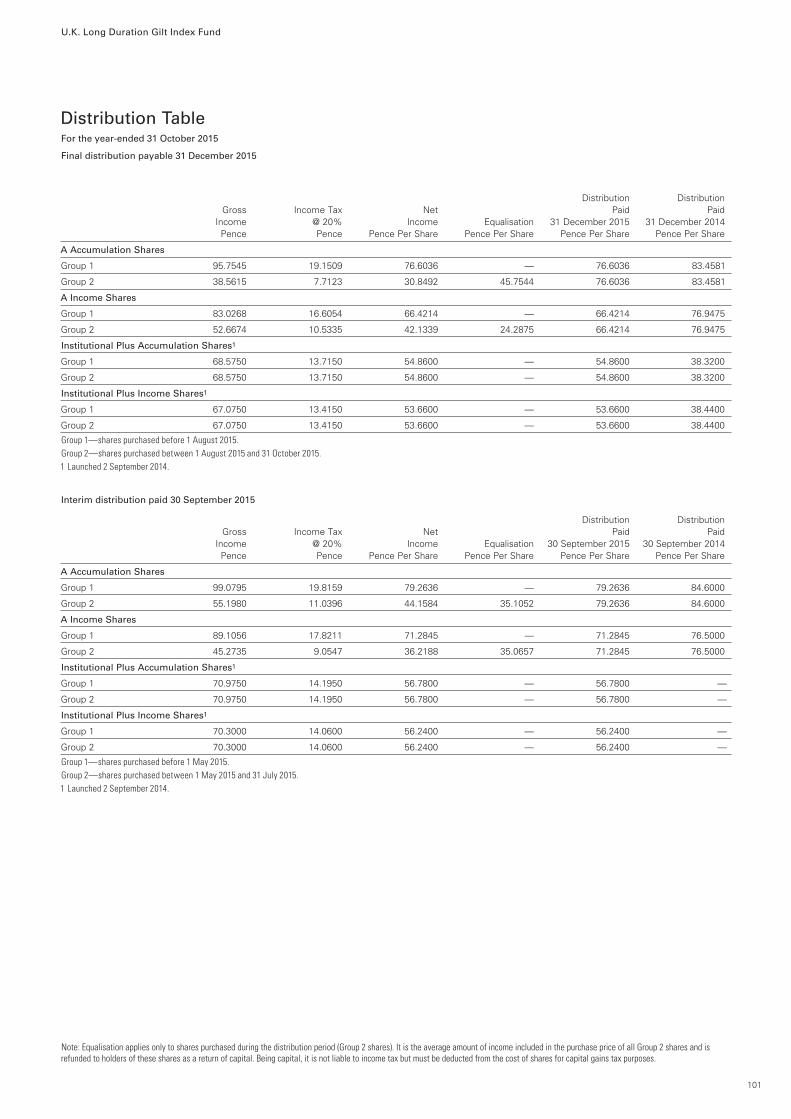
U.K. Long Duration Gilt Index Fund
Distribution TableFor the year-ended 31 October 2015
Final distribution payable 31 December 2015
Distribution Distribution Gross Income Tax Net Paid Paid Income @ 20% Income Equalisation 31 December 2015 31 December 2014 Pence Pence Pence Per Share Pence Per Share Pence Per Share Pence Per Share
A Accumulation Shares
Group 1 95.7545 19.1509 76.6036 — 76.6036 83.4581
Group 2 38.5615 7.7123 30.8492 45.7544 76.6036 83.4581
A Income Shares
Group 1 83.0268 16.6054 66.4214 — 66.4214 76.9475
Group 2 52.6674 10.5335 42.1339 24.2875 66.4214 76.9475
Institutional Plus Accumulation Shares1
Group 1 68.5750 13.7150 54.8600 — 54.8600 38.3200
Group 2 68.5750 13.7150 54.8600 — 54.8600 38.3200
Institutional Plus Income Shares1
Group 1 67.0750 13.4150 53.6600 — 53.6600 38.4400
Group 2 67.0750 13.4150 53.6600 — 53.6600 38.4400
Group 1—shares purchased before 1 August 2015.Group 2—shares purchased between 1 August 2015 and 31 October 2015.1 Launched 2 September 2014.
Interim distribution paid 30 September 2015
Distribution Distribution Gross Income Tax Net Paid Paid Income @ 20% Income Equalisation 30 September 2015 30 September 2014 Pence Pence Pence Per Share Pence Per Share Pence Per Share Pence Per Share
A Accumulation Shares
Group 1 99.0795 19.8159 79.2636 — 79.2636 84.6000
Group 2 55.1980 11.0396 44.1584 35.1052 79.2636 84.6000
A Income Shares
Group 1 89.1056 17.8211 71.2845 — 71.2845 76.5000
Group 2 45.2735 9.0547 36.2188 35.0657 71.2845 76.5000
Institutional Plus Accumulation Shares1
Group 1 70.9750 14.1950 56.7800 — 56.7800 —
Group 2 70.9750 14.1950 56.7800 — 56.7800 —
Institutional Plus Income Shares1
Group 1 70.3000 14.0600 56.2400 — 56.2400 —
Group 2 70.3000 14.0600 56.2400 — 56.2400 —
Group 1—shares purchased before 1 May 2015.Group 2—shares purchased between 1 May 2015 and 31 July 2015.1 Launched 2 September 2014.
Note: Equalisation applies only to shares purchased during the distribution period (Group 2 shares). It is the average amount of income included in the purchase price of all Group 2 shares and is refunded to holders of these shares as a return of capital. Being capital, it is not liable to income tax but must be deducted from the cost of shares for capital gains tax purposes.
101
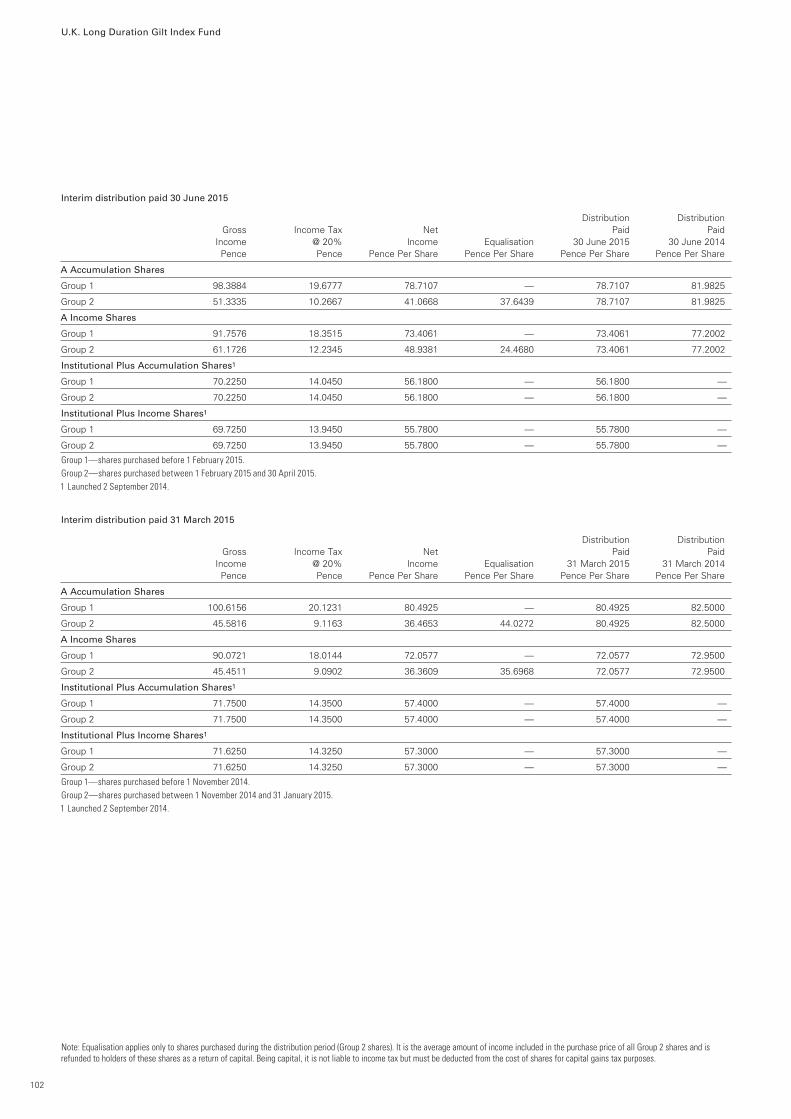
U.K. Long Duration Gilt Index Fund
Interim distribution paid 30 June 2015
Distribution Distribution Gross Income Tax Net Paid Paid Income @ 20% Income Equalisation 30 June 2015 30 June 2014 Pence Pence Pence Per Share Pence Per Share Pence Per Share Pence Per Share
A Accumulation Shares
Group 1 98.3884 19.6777 78.7107 — 78.7107 81.9825
Group 2 51.3335 10.2667 41.0668 37.6439 78.7107 81.9825
A Income Shares
Group 1 91.7576 18.3515 73.4061 — 73.4061 77.2002
Group 2 61.1726 12.2345 48.9381 24.4680 73.4061 77.2002
Institutional Plus Accumulation Shares1
Group 1 70.2250 14.0450 56.1800 — 56.1800 —
Group 2 70.2250 14.0450 56.1800 — 56.1800 —
Institutional Plus Income Shares1
Group 1 69.7250 13.9450 55.7800 — 55.7800 —
Group 2 69.7250 13.9450 55.7800 — 55.7800 —
Group 1—shares purchased before 1 February 2015.Group 2—shares purchased between 1 February 2015 and 30 April 2015.1 Launched 2 September 2014.
Interim distribution paid 31 March 2015
Distribution Distribution Gross Income Tax Net Paid Paid Income @ 20% Income Equalisation 31 March 2015 31 March 2014 Pence Pence Pence Per Share Pence Per Share Pence Per Share Pence Per Share
A Accumulation Shares
Group 1 100.6156 20.1231 80.4925 — 80.4925 82.5000
Group 2 45.5816 9.1163 36.4653 44.0272 80.4925 82.5000
A Income Shares
Group 1 90.0721 18.0144 72.0577 — 72.0577 72.9500
Group 2 45.4511 9.0902 36.3609 35.6968 72.0577 72.9500
Institutional Plus Accumulation Shares1
Group 1 71.7500 14.3500 57.4000 — 57.4000 —
Group 2 71.7500 14.3500 57.4000 — 57.4000 —
Institutional Plus Income Shares1
Group 1 71.6250 14.3250 57.3000 — 57.3000 —
Group 2 71.6250 14.3250 57.3000 — 57.3000 —
Group 1—shares purchased before 1 November 2014.Group 2—shares purchased between 1 November 2014 and 31 January 2015.1 Launched 2 September 2014.
Note: Equalisation applies only to shares purchased during the distribution period (Group 2 shares). It is the average amount of income included in the purchase price of all Group 2 shares and is refunded to holders of these shares as a return of capital. Being capital, it is not liable to income tax but must be deducted from the cost of shares for capital gains tax purposes.
102
Notes to the Aggregated Financial StatementsFor the year ended 31 October 2015
1. Accounting Policies
(a) Basis of Accounting
The financial statements have been prepared under the historical cost basis, as modified by the revaluation of investments, and in accordance with the revised Statement of Recommended Practice (SORP) for Authorised Funds issued by the Investment Management Association (now the Investment Association) in October 2010 and UK Generally Accepted Accounting Practice. These policies have remained unchanged and have been consistently applied to all the years presented, unless otherwise stated. The financial statements have been prepared on a going concern basis.
The Funds have complied with the European Securities and Markets Authority (ESMA) disclosure guidelines.
(b) Aggregation
The aggregated financial statements represent the sum of the individual Funds within the umbrella company. Further analysis of the distribution and net asset position can be found within the financial statements of the individual Funds.
(c) Recognition of Revenue
Dividends on quoted equities and preference stock are recognised when the securities are quoted ex-dividend.
Dividends, interest and other revenue receivable include any withholding taxes but exclude any other taxes such as attributable tax credits.
Special dividends are treated as either capital or revenue depending on the facts of each particular case.
The ordinary element of stock dividends, received in lieu of cash dividends, is treated as revenue on the basis of the market value of shares at the date they are quoted ex-dividend, and forms part of the distribution. In the case of an enhanced stock dividend, the value of the enhancement is treated as capital and does not form part of the distribution.
Interest on debt securities and bank and short-term deposits is recognised on an accrual basis.
In the case of debt securities any difference between acquisition cost and maturity value is recognised as revenue over the life of the security using the effective yield basis of calculating amortisation.
Stock-lending revenue is accounted for on a receipt basis.
(d) Treatment of Expenses
Each of the Funds currently has two share classes: “A” and “Institutional Plus”, and Income and Accumulation Shares are available in each class. The shares within each share class are subject to the same Authorised Corporate Director (ACD) fee. Income and expenses are allocated when earned or incurred in the proportion of the net asset value of each share class to the total net asset value of the Funds at that time. All expenses, other than those relating to the purchase and sale of investments, are included in expenses, in the Statement of Total Return.
Stamp Duty Reserve Tax, where payable, is deducted as an expense from the capital of the Funds. The ACD’s annual fee is charged to the income property of the respective Funds. The expenses of Vanguard FTSE U.K. Equity Income Index Fund are transferred to capital for the purpose of calculating the distribution.
The ACD has chosen to pay all other expenses of the Funds in order to reduce the impact that such fees may have on the performance of the Funds. The ACD may also waive part or all of its fees. This waiver is entirely voluntary and may be discontinued at any time without notice at the sole discretion of the ACD.
(e) Taxation
The charge for taxation is based on the net income for the period. UK dividend income is disclosed net of any related tax credit. Overseas dividends are disclosed gross of any foreign tax suffered, the tax element being separately disclosed in the taxation note. Deferred tax liabilities are recognised to the extent that it is possible that an actual liability will crystallise, and deferred tax assets are recognised where it is more likely that an asset is recoverable. Deferred tax assets and liabilities are discounted to reflect the time value of money.
(f) Valuation of Investments
The listed investments of the Funds have been valued at the closing bid-market prices ruling on the principal markets on which the stocks are quoted, on the last business day of the accounting period. Market value is defined by the SORP as fair value, which generally is the bid value of each security. To comply with this, quoted investments have been valued at the closing bid-market price on the last business day of the period, net of any accrued interest, which is included in the Balance Sheet as income receivable. For investments in other funds, the fair value is the bid value for that security.
Where applicable, unlisted and suspended securities are based on the ACD’s assessment of their net realisable value or the last traded price. All Funds are valued daily based on quoted last-traded prices from recognised exchanges or from broker-dealers for non-exchange trade-purposes.
103
Notes to the Aggregated Financial Statements for the year ended 31 October 2015 (continued)
(g) Exchange Rates
All transactions in foreign currencies are translated into sterling at the exchange rates ruling on the date of such transactions. Foreign currency assets and liabilities at the end of the accounting period are translated at the exchange rates on the last day of the accounting period. Gains or losses arising on the translation are reported as part of the return for the period.
(h) Derivatives
Derivative transactions are accounted for on a trade-date basis. Where such transactions are used to protect or enhance revenue, the revenue and expenses derived therefrom are included in “Revenue” or “Finance costs” in the Statement of Total Return on an accruals basis. Where such transactions are used to protect or enhance capital, the gains and losses derived therefrom are included in “Net capital gains/(losses)” in the Statement of Total Return. Any positions open at the year-end are reflected in the Balance Sheet at their market value, using either available market prices or the ACD’s assessment of the fair value based on counterparty valuations and appropriate pricing models. Cash held at futures brokers as margin is reflected separately within cash and bank balances.
2. Distribution Policy
(a) Basis of Distribution
Where the revenue from investment exceeds the expenses for any share class, a distribution will be made to that share class. Should expenses exceed revenue, there will be no distribution and a shortfall will be transferred to capital. Revenue attributable to Accumulation shareholders is retained at the end of each distribution period and represents a reinvestment of revenue. All remaining revenue is distributed in accordance with the Collective Investment Schemes sourcebook.
The allocation of income and non-class-specific expenses is based upon the proportion of the Funds’ assets attributable to each share class, on the day the income is earned or expense is suffered. Income equalisation and the annual management charge are specific to each share class. Where distributions are unclaimed for a period of six years, these are brought back into the relevant Fund as capital.
The indexation adjustment from inflation-linked securities is recognised in revenue but transferred to capital for the purpose of calculating the distribution.
(b) Interest From Debt Securities
As previously noted in Note 1c above, revenue from fixed interest securities is accounted for on an effective yield basis of calculating amortisation; distributions are also calculated using revenue accounted for on an effective yield basis.
Vanguard U.K. Inflation-Linked Gilt Index Fund retains the indexation adjustment based on changes in the Retail Price Index when calculating the distribution.
(c) Authorised Corporate Director’s Fees and Charges
The ACD’s annual fee is charged to the income property of the respective Funds. Vanguard FTSE U.K. Equity Income Index Fund transfers its expenses to capital for the purpose of calculating the distribution.
(d) Equalisation
Equalisation takes account of the revenue received on the creation of shares and revenue paid on the cancellation of shares and is allocated to the distribution account.
(e) Apportionment to Multiple Share Classes
The allocation of income and non-class-specific expenses is based upon the proportion of the Funds’ assets attributable to each share class, on the day the income is earned or the expense is suffered. Equalisation and annual management charges are specific to each share class.
3. Risk Management Policies
Any investment in stock market funds involves risk. Some of these risks are general, which means that they apply to all funds. Others are specific, which means that they apply to individual funds only. In this section we explain both types. The ACD’s policies for managing these risks are summarised below and have been applied throughout the year. In order to fully understand the risk factors, please refer to the relevant Full Prospectus, where you will find further information.
104
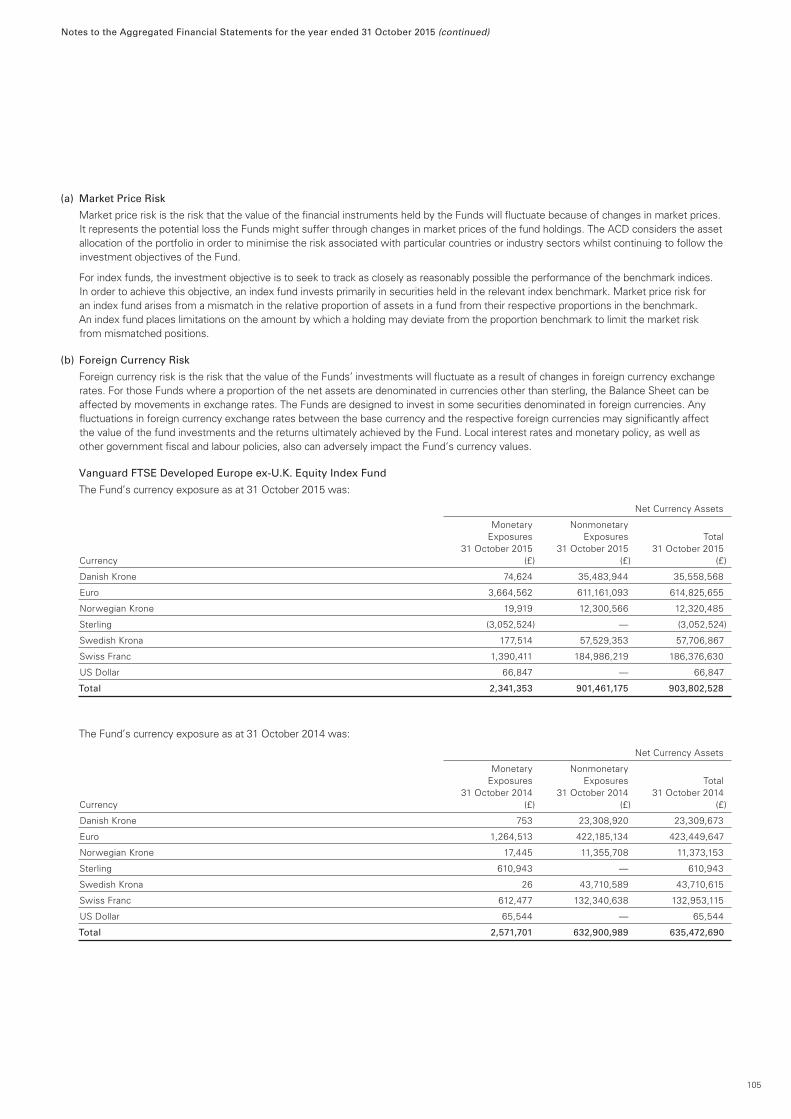
Notes to the Aggregated Financial Statements for the year ended 31 October 2015 (continued)
(a) Market Price Risk
Market price risk is the risk that the value of the financial instruments held by the Funds will fluctuate because of changes in market prices. It represents the potential loss the Funds might suffer through changes in market prices of the fund holdings. The ACD considers the asset allocation of the portfolio in order to minimise the risk associated with particular countries or industry sectors whilst continuing to follow the investment objectives of the Fund.
For index funds, the investment objective is to seek to track as closely as reasonably possible the performance of the benchmark indices. In order to achieve this objective, an index fund invests primarily in securities held in the relevant index benchmark. Market price risk for an index fund arises from a mismatch in the relative proportion of assets in a fund from their respective proportions in the benchmark. An index fund places limitations on the amount by which a holding may deviate from the proportion benchmark to limit the market risk from mismatched positions.
(b) Foreign Currency Risk
Foreign currency risk is the risk that the value of the Funds’ investments will fluctuate as a result of changes in foreign currency exchange rates. For those Funds where a proportion of the net assets are denominated in currencies other than sterling, the Balance Sheet can be affected by movements in exchange rates. The Funds are designed to invest in some securities denominated in foreign currencies. Any fluctuations in foreign currency exchange rates between the base currency and the respective foreign currencies may significantly affect the value of the fund investments and the returns ultimately achieved by the Fund. Local interest rates and monetary policy, as well as other government fiscal and labour policies, also can adversely impact the Fund’s currency values.
Vanguard FTSE Developed Europe ex-U.K. Equity Index Fund
The Fund’s currency exposure as at 31 October 2015 was:
Net Currency Assets
Monetary Nonmonetary Exposures Exposures Total 31 October 2015 31 October 2015 31 October 2015 Currency (£) (£) (£)
Danish Krone 74,624 35,483,944 35,558,568
Euro 3,664,562 611,161,093 614,825,655
Norwegian Krone 19,919 12,300,566 12,320,485
Sterling (3,052,524) — (3,052,524)
Swedish Krona 177,514 57,529,353 57,706,867
Swiss Franc 1,390,411 184,986,219 186,376,630
US Dollar 66,847 — 66,847
Total 2,341,353 901,461,175 903,802,528
The Fund’s currency exposure as at 31 October 2014 was:
Net Currency Assets
Monetary Nonmonetary Exposures Exposures Total 31 October 2014 31 October 2014 31 October 2014 Currency (£) (£) (£)
Danish Krone 753 23,308,920 23,309,673
Euro 1,264,513 422,185,134 423,449,647
Norwegian Krone 17,445 11,355,708 11,373,153
Sterling 610,943 — 610,943
Swedish Krona 26 43,710,589 43,710,615
Swiss Franc 612,477 132,340,638 132,953,115
US Dollar 65,544 — 65,544
Total 2,571,701 632,900,989 635,472,690
105
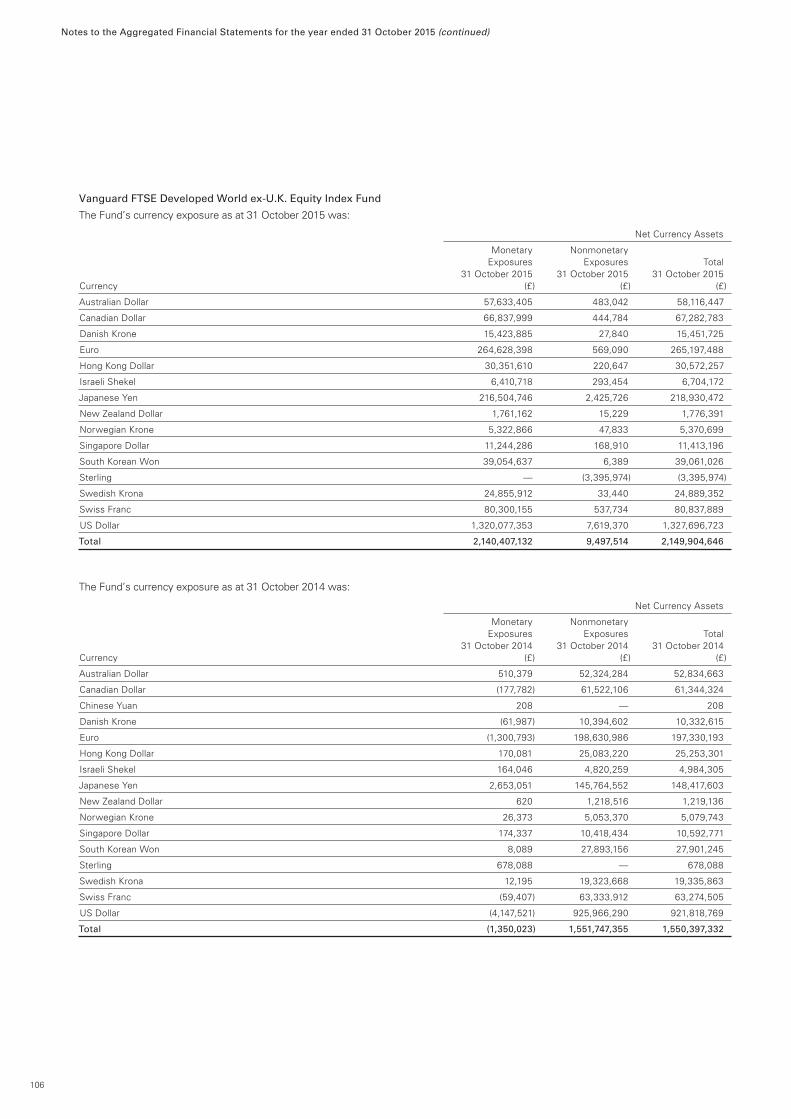
Notes to the Aggregated Financial Statements for the year ended 31 October 2015 (continued)
Vanguard FTSE Developed World ex-U.K. Equity Index Fund
The Fund’s currency exposure as at 31 October 2015 was:
Net Currency Assets
Monetary Nonmonetary Exposures Exposures Total 31 October 2015 31 October 2015 31 October 2015 Currency (£) (£) (£)
Australian Dollar 57,633,405 483,042 58,116,447
Canadian Dollar 66,837,999 444,784 67,282,783
Danish Krone 15,423,885 27,840 15,451,725
Euro 264,628,398 569,090 265,197,488
Hong Kong Dollar 30,351,610 220,647 30,572,257
Israeli Shekel 6,410,718 293,454 6,704,172
Japanese Yen 216,504,746 2,425,726 218,930,472
New Zealand Dollar 1,761,162 15,229 1,776,391
Norwegian Krone 5,322,866 47,833 5,370,699
Singapore Dollar 11,244,286 168,910 11,413,196
South Korean Won 39,054,637 6,389 39,061,026
Sterling — (3,395,974) (3,395,974)
Swedish Krona 24,855,912 33,440 24,889,352
Swiss Franc 80,300,155 537,734 80,837,889
US Dollar 1,320,077,353 7,619,370 1,327,696,723
Total 2,140,407,132 9,497,514 2,149,904,646
The Fund’s currency exposure as at 31 October 2014 was:
Net Currency Assets
Monetary Nonmonetary Exposures Exposures Total 31 October 2014 31 October 2014 31 October 2014 Currency (£) (£) (£)
Australian Dollar 510,379 52,324,284 52,834,663
Canadian Dollar (177,782) 61,522,106 61,344,324
Chinese Yuan 208 — 208
Danish Krone (61,987) 10,394,602 10,332,615
Euro (1,300,793) 198,630,986 197,330,193
Hong Kong Dollar 170,081 25,083,220 25,253,301
Israeli Shekel 164,046 4,820,259 4,984,305
Japanese Yen 2,653,051 145,764,552 148,417,603
New Zealand Dollar 620 1,218,516 1,219,136
Norwegian Krone 26,373 5,053,370 5,079,743
Singapore Dollar 174,337 10,418,434 10,592,771
South Korean Won 8,089 27,893,156 27,901,245
Sterling 678,088 — 678,088
Swedish Krona 12,195 19,323,668 19,335,863
Swiss Franc (59,407) 63,333,912 63,274,505
US Dollar (4,147,521) 925,966,290 921,818,769
Total (1,350,023) 1,551,747,355 1,550,397,332
106

Notes to the Aggregated Financial Statements for the year ended 31 October 2015 (continued)
Vanguard FTSE U.K. Equity Income Index Fund
The Fund’s currency exposure as at 31 October 2015 was:
Net Currency Assets
Monetary Nonmonetary Exposures Exposures Total 31 October 2015 31 October 2015 31 October 2015 Currency (£) (£) (£)
Euro 34,675 — 34,675
Sterling (9,573,888) 812,230,596 802,656,708
US Dollar 896,212 — 896,212
Total (8,643,001) 812,230,596 803,587,595
The Fund’s currency exposure as at 31 October 2014 was:
Net Currency Assets
Monetary Nonmonetary Exposures Exposures Total 31 October 2014 31 October 2014 31 October 2014 Currency (£) (£) (£)
Euro 17,761 — 17,761
Sterling (5,101,161) 652,005,026 646,903,865
US Dollar 695,151 — 695,151
Total (4,388,249) 652,005,026 647,616,777
Vanguard U.S. Equity Index Fund
The Fund’s currency exposure as at 31 October 2015 was:
Net Currency Assets
Monetary Nonmonetary Exposures Exposures Total 31 October 2015 31 October 2015 31 October 2015 Currency (£) (£) (£)
Canadian Dollar 4,948 7 4,955
Sterling (5,364,305) 1,534 (5,362,771)
US Dollar 1,506,269 2,288,730,406 2,290,236,675
Total (3,853,088) 2,288,731,947 2,284,878,859
The Fund’s currency exposure as at 31 October 2014 was:
Net Currency Assets
Monetary Nonmonetary Exposures Exposures Total 31 October 2014 31 October 2014 31 October 2014 Currency (£) (£) (£)
Sterling 5,768,566 — 5,768,566
US Dollar (8,922,734) 1,705,636,429 1,696,713,695
Total (3,154,168) 1,705,636,429 1,702,482,261
107
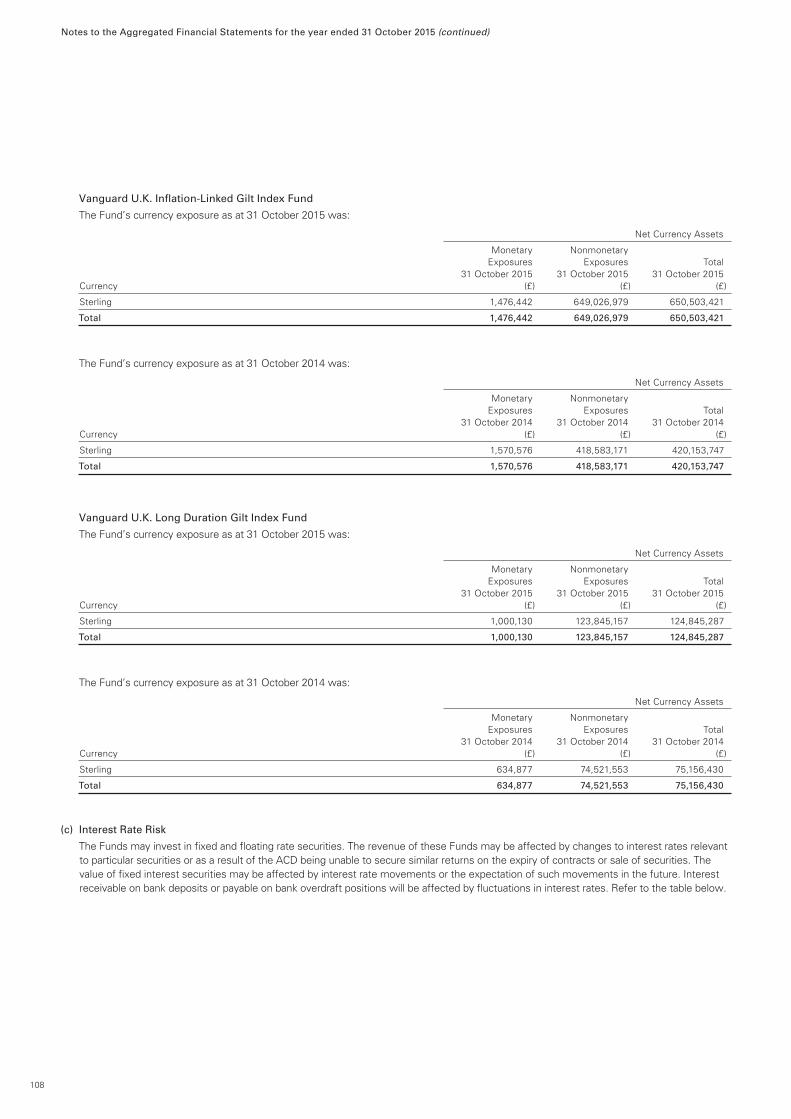
Notes to the Aggregated Financial Statements for the year ended 31 October 2015 (continued)
Vanguard U.K. Inflation-Linked Gilt Index Fund
The Fund’s currency exposure as at 31 October 2015 was:
Net Currency Assets
Monetary Nonmonetary Exposures Exposures Total 31 October 2015 31 October 2015 31 October 2015 Currency (£) (£) (£)
Sterling 1,476,442 649,026,979 650,503,421
Total 1,476,442 649,026,979 650,503,421
The Fund’s currency exposure as at 31 October 2014 was:
Net Currency Assets
Monetary Nonmonetary Exposures Exposures Total 31 October 2014 31 October 2014 31 October 2014 Currency (£) (£) (£)
Sterling 1,570,576 418,583,171 420,153,747
Total 1,570,576 418,583,171 420,153,747
Vanguard U.K. Long Duration Gilt Index Fund
The Fund’s currency exposure as at 31 October 2015 was:
Net Currency Assets
Monetary Nonmonetary Exposures Exposures Total 31 October 2015 31 October 2015 31 October 2015 Currency (£) (£) (£)
Sterling 1,000,130 123,845,157 124,845,287
Total 1,000,130 123,845,157 124,845,287
The Fund’s currency exposure as at 31 October 2014 was:
Net Currency Assets
Monetary Nonmonetary Exposures Exposures Total 31 October 2014 31 October 2014 31 October 2014 Currency (£) (£) (£)
Sterling 634,877 74,521,553 75,156,430
Total 634,877 74,521,553 75,156,430
(c) Interest Rate Risk
The Funds may invest in fixed and floating rate securities. The revenue of these Funds may be affected by changes to interest rates relevant to particular securities or as a result of the ACD being unable to secure similar returns on the expiry of contracts or sale of securities. The value of fixed interest securities may be affected by interest rate movements or the expectation of such movements in the future. Interest receivable on bank deposits or payable on bank overdraft positions will be affected by fluctuations in interest rates. Refer to the table below.
108
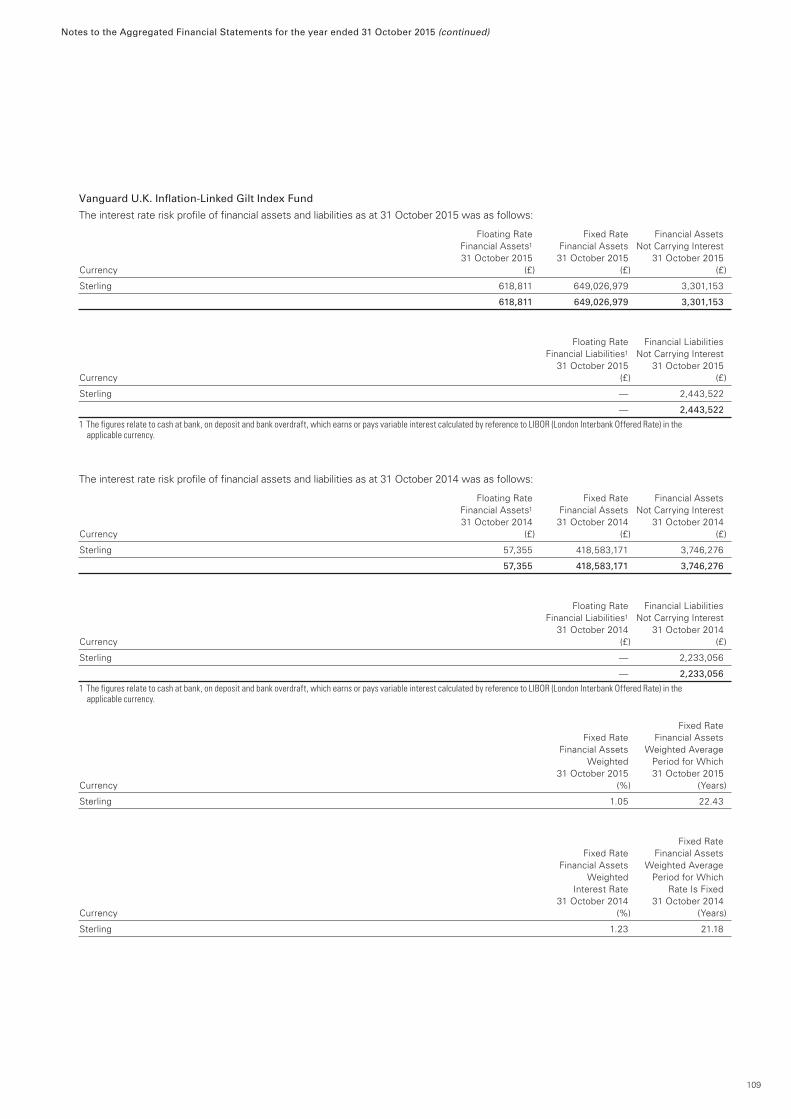
Notes to the Aggregated Financial Statements for the year ended 31 October 2015 (continued)
Vanguard U.K. Inflation-Linked Gilt Index Fund
The interest rate risk profile of financial assets and liabilities as at 31 October 2015 was as follows:
Floating Rate Fixed Rate Financial Assets Financial Assets1 Financial Assets Not Carrying Interest 31 October 2015 31 October 2015 31 October 2015 Currency (£) (£) (£)
Sterling 618,811 649,026,979 3,301,153
618,811 649,026,979 3,301,153
Floating Rate Financial Liabilities Financial Liabilities1 Not Carrying Interest 31 October 2015 31 October 2015 Currency (£) (£)
Sterling — 2,443,522
— 2,443,522
1 The figures relate to cash at bank, on deposit and bank overdraft, which earns or pays variable interest calculated by reference to LIBOR (London Interbank Offered Rate) in the applicable currency.
The interest rate risk profile of financial assets and liabilities as at 31 October 2014 was as follows:
Floating Rate Fixed Rate Financial Assets Financial Assets1 Financial Assets Not Carrying Interest 31 October 2014 31 October 2014 31 October 2014 Currency (£) (£) (£)
Sterling 57,355 418,583,171 3,746,276
57,355 418,583,171 3,746,276
Floating Rate Financial Liabilities Financial Liabilities1 Not Carrying Interest 31 October 2014 31 October 2014 Currency (£) (£)
Sterling — 2,233,056
— 2,233,056
1 The figures relate to cash at bank, on deposit and bank overdraft, which earns or pays variable interest calculated by reference to LIBOR (London Interbank Offered Rate) in the applicable currency.
Fixed Rate Fixed Rate Financial Assets Financial Assets Weighted Average Weighted Period for Which 31 October 2015 31 October 2015 Currency (%) (Years)
Sterling 1.05 22.43
Fixed Rate Fixed Rate Financial Assets Financial Assets Weighted Average Weighted Period for Which Interest Rate Rate Is Fixed 31 October 2014 31 October 2014 Currency (%) (Years)
Sterling 1.23 21.18
109
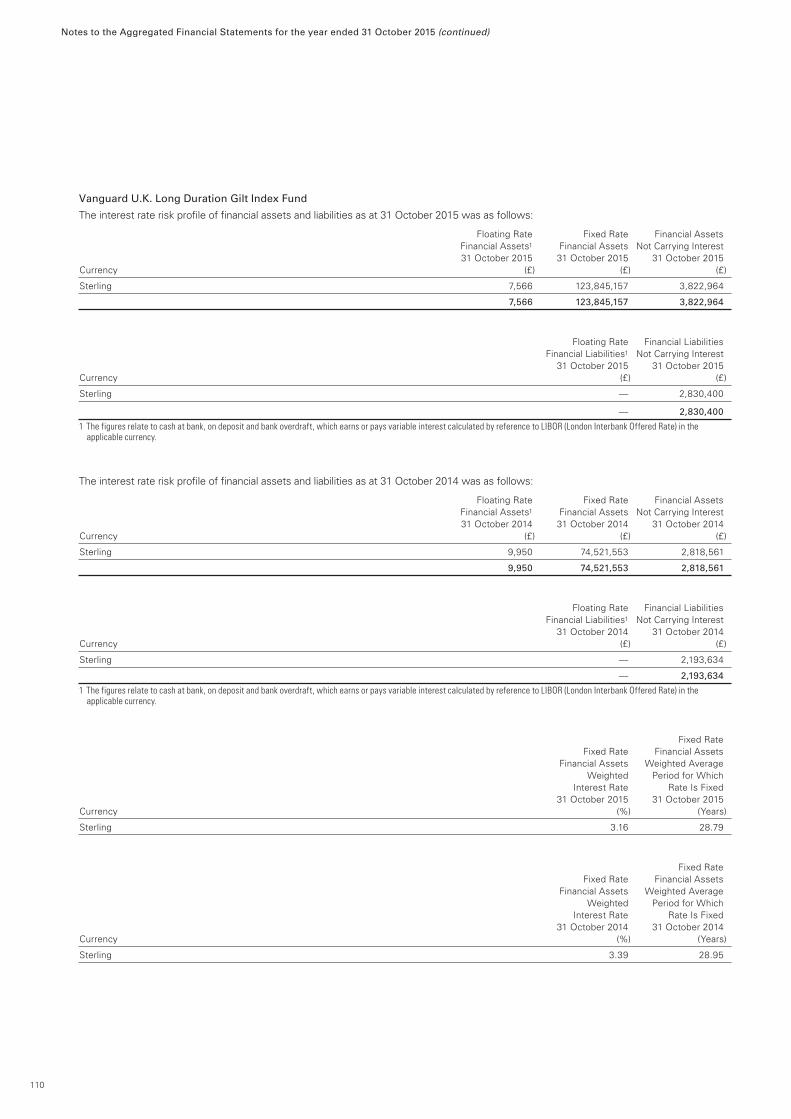
Notes to the Aggregated Financial Statements for the year ended 31 October 2015 (continued)
Vanguard U.K. Long Duration Gilt Index Fund
The interest rate risk profile of financial assets and liabilities as at 31 October 2015 was as follows:
Floating Rate Fixed Rate Financial Assets Financial Assets1 Financial Assets Not Carrying Interest 31 October 2015 31 October 2015 31 October 2015 Currency (£) (£) (£)
Sterling 7,566 123,845,157 3,822,964
7,566 123,845,157 3,822,964
Floating Rate Financial Liabilities Financial Liabilities1 Not Carrying Interest 31 October 2015 31 October 2015 Currency (£) (£)
Sterling — 2,830,400
— 2,830,400
1 The figures relate to cash at bank, on deposit and bank overdraft, which earns or pays variable interest calculated by reference to LIBOR (London Interbank Offered Rate) in the applicable currency.
The interest rate risk profile of financial assets and liabilities as at 31 October 2014 was as follows:
Floating Rate Fixed Rate Financial Assets Financial Assets1 Financial Assets Not Carrying Interest 31 October 2014 31 October 2014 31 October 2014 Currency (£) (£) (£)
Sterling 9,950 74,521,553 2,818,561
9,950 74,521,553 2,818,561
Floating Rate Financial Liabilities Financial Liabilities1 Not Carrying Interest 31 October 2014 31 October 2014 Currency (£) (£)
Sterling — 2,193,634
— 2,193,634
1 The figures relate to cash at bank, on deposit and bank overdraft, which earns or pays variable interest calculated by reference to LIBOR (London Interbank Offered Rate) in the applicable currency.
Fixed Rate Fixed Rate Financial Assets Financial Assets Weighted Average Weighted Period for Which Interest Rate Rate Is Fixed 31 October 2015 31 October 2015 Currency (%) (Years)
Sterling 3.16 28.79
Fixed Rate Fixed Rate Financial Assets Financial Assets Weighted Average Weighted Period for Which Interest Rate Rate Is Fixed 31 October 2014 31 October 2014 Currency (%) (Years)
Sterling 3.39 28.95
110
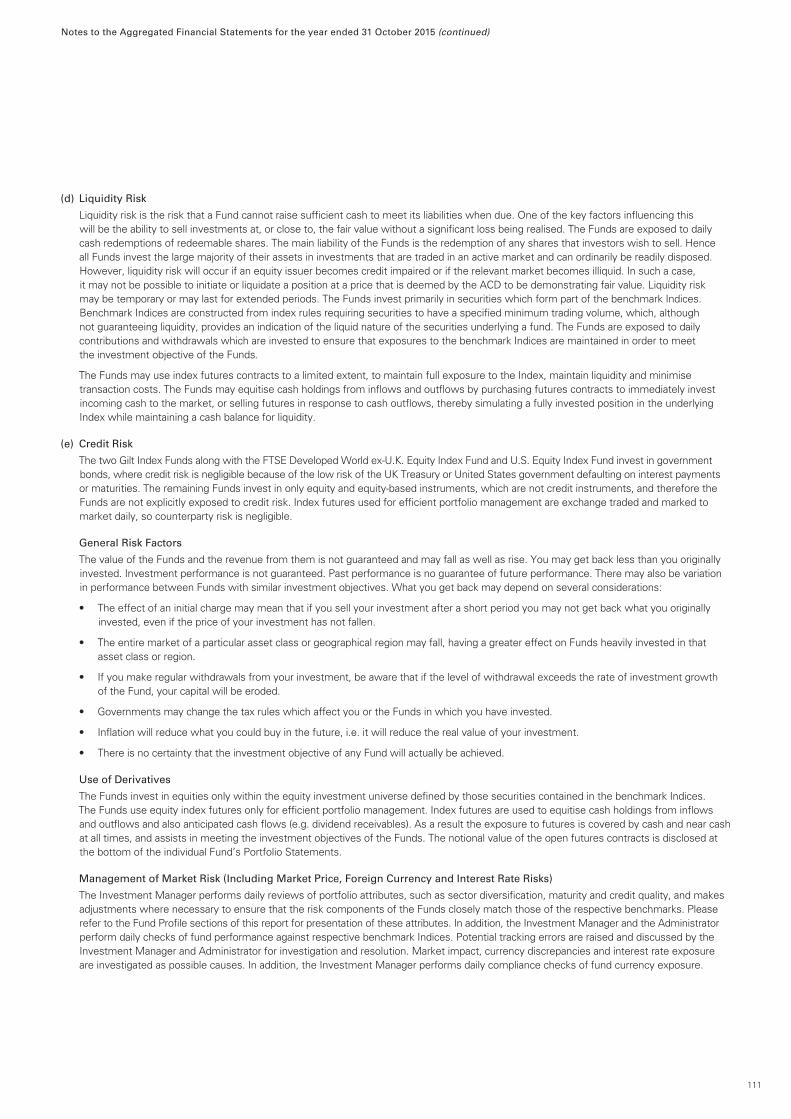
Notes to the Aggregated Financial Statements for the year ended 31 October 2015 (continued)
(d) Liquidity Risk
Liquidity risk is the risk that a Fund cannot raise sufficient cash to meet its liabilities when due. One of the key factors influencing this will be the ability to sell investments at, or close to, the fair value without a significant loss being realised. The Funds are exposed to daily cash redemptions of redeemable shares. The main liability of the Funds is the redemption of any shares that investors wish to sell. Hence all Funds invest the large majority of their assets in investments that are traded in an active market and can ordinarily be readily disposed. However, liquidity risk will occur if an equity issuer becomes credit impaired or if the relevant market becomes illiquid. In such a case, it may not be possible to initiate or liquidate a position at a price that is deemed by the ACD to be demonstrating fair value. Liquidity risk may be temporary or may last for extended periods. The Funds invest primarily in securities which form part of the benchmark Indices. Benchmark Indices are constructed from index rules requiring securities to have a specified minimum trading volume, which, although not guaranteeing liquidity, provides an indication of the liquid nature of the securities underlying a fund. The Funds are exposed to daily contributions and withdrawals which are invested to ensure that exposures to the benchmark Indices are maintained in order to meet the investment objective of the Funds.
The Funds may use index futures contracts to a limited extent, to maintain full exposure to the Index, maintain liquidity and minimise transaction costs. The Funds may equitise cash holdings from inflows and outflows by purchasing futures contracts to immediately invest incoming cash to the market, or selling futures in response to cash outflows, thereby simulating a fully invested position in the underlying Index while maintaining a cash balance for liquidity.
(e) Credit Risk
The two Gilt Index Funds along with the FTSE Developed World ex-U.K. Equity Index Fund and U.S. Equity Index Fund invest in government bonds, where credit risk is negligible because of the low risk of the UK Treasury or United States government defaulting on interest payments or maturities. The remaining Funds invest in only equity and equity-based instruments, which are not credit instruments, and therefore the Funds are not explicitly exposed to credit risk. Index futures used for efficient portfolio management are exchange traded and marked to market daily, so counterparty risk is negligible.
General Risk Factors
The value of the Funds and the revenue from them is not guaranteed and may fall as well as rise. You may get back less than you originally invested. Investment performance is not guaranteed. Past performance is no guarantee of future performance. There may also be variation in performance between Funds with similar investment objectives. What you get back may depend on several considerations:
• The effect of an initial charge may mean that if you sell your investment after a short period you may not get back what you originally invested, even if the price of your investment has not fallen.
• The entire market of a particular asset class or geographical region may fall, having a greater effect on Funds heavily invested in that asset class or region.
• If you make regular withdrawals from your investment, be aware that if the level of withdrawal exceeds the rate of investment growth of the Fund, your capital will be eroded.
• Governments may change the tax rules which affect you or the Funds in which you have invested.
• Inflation will reduce what you could buy in the future, i.e. it will reduce the real value of your investment.
• There is no certainty that the investment objective of any Fund will actually be achieved.
Use of Derivatives
The Funds invest in equities only within the equity investment universe defined by those securities contained in the benchmark Indices. The Funds use equity index futures only for efficient portfolio management. Index futures are used to equitise cash holdings from inflows and outflows and also anticipated cash flows (e.g. dividend receivables). As a result the exposure to futures is covered by cash and near cash at all times, and assists in meeting the investment objectives of the Funds. The notional value of the open futures contracts is disclosed at the bottom of the individual Fund’s Portfolio Statements.
Management of Market Risk (Including Market Price, Foreign Currency and Interest Rate Risks)
The Investment Manager performs daily reviews of portfolio attributes, such as sector diversification, maturity and credit quality, and makes adjustments where necessary to ensure that the risk components of the Funds closely match those of the respective benchmarks. Please refer to the Fund Profile sections of this report for presentation of these attributes. In addition, the Investment Manager and the Administrator perform daily checks of fund performance against respective benchmark Indices. Potential tracking errors are raised and discussed by the Investment Manager and Administrator for investigation and resolution. Market impact, currency discrepancies and interest rate exposure are investigated as possible causes. In addition, the Investment Manager performs daily compliance checks of fund currency exposure.
111
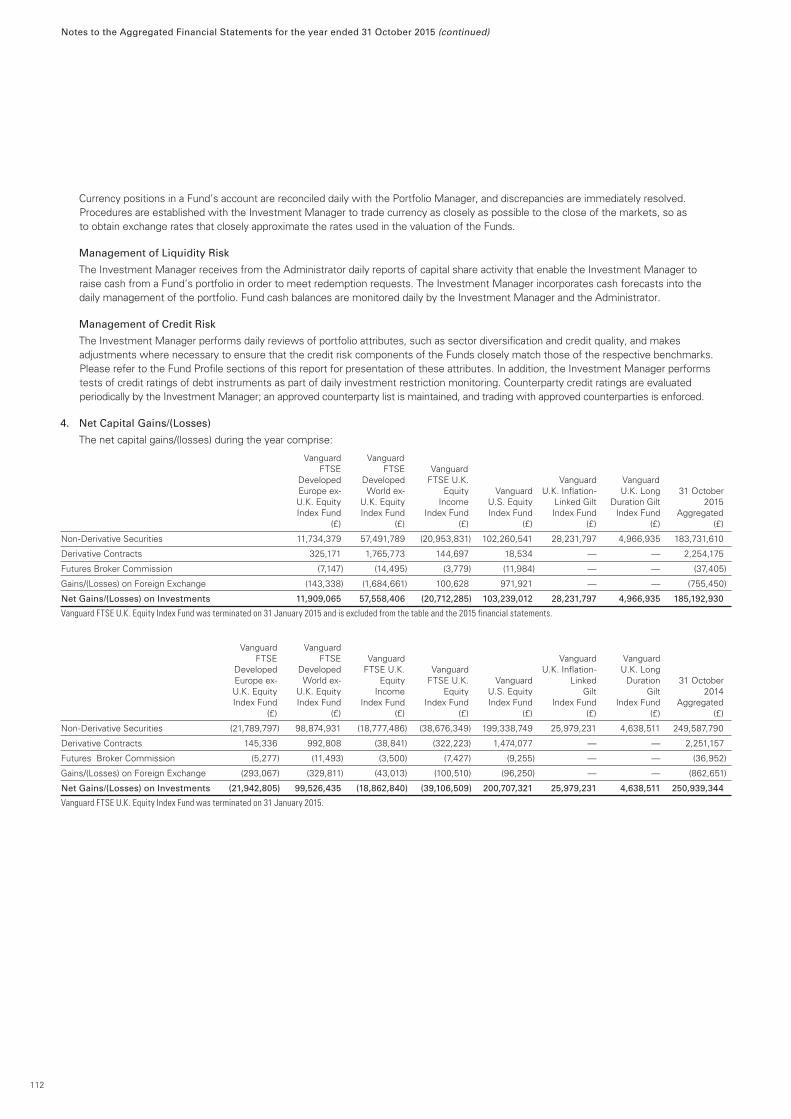
Notes to the Aggregated Financial Statements for the year ended 31 October 2015 (continued)
Currency positions in a Fund’s account are reconciled daily with the Portfolio Manager, and discrepancies are immediately resolved. Procedures are established with the Investment Manager to trade currency as closely as possible to the close of the markets, so as to obtain exchange rates that closely approximate the rates used in the valuation of the Funds.
Management of Liquidity Risk
The Investment Manager receives from the Administrator daily reports of capital share activity that enable the Investment Manager to raise cash from a Fund’s portfolio in order to meet redemption requests. The Investment Manager incorporates cash forecasts into the daily management of the portfolio. Fund cash balances are monitored daily by the Investment Manager and the Administrator.
Management of Credit Risk
The Investment Manager performs daily reviews of portfolio attributes, such as sector diversification and credit quality, and makes adjustments where necessary to ensure that the credit risk components of the Funds closely match those of the respective benchmarks. Please refer to the Fund Profile sections of this report for presentation of these attributes. In addition, the Investment Manager performs tests of credit ratings of debt instruments as part of daily investment restriction monitoring. Counterparty credit ratings are evaluated periodically by the Investment Manager; an approved counterparty list is maintained, and trading with approved counterparties is enforced.
4. Net Capital Gains/(Losses)
The net capital gains/(losses) during the year comprise:
Vanguard Vanguard FTSE FTSE Vanguard Developed Developed FTSE U.K. Vanguard Vanguard Europe ex- World ex- Equity Vanguard U.K. Inflation- U.K. Long 31 October U.K. Equity U.K. Equity Income U.S. Equity Linked Gilt Duration Gilt 2015 Index Fund Index Fund Index Fund Index Fund Index Fund Index Fund Aggregated (£) (£) (£) (£) (£) (£) (£)
Non-Derivative Securities 11,734,379 57,491,789 (20,953,831) 102,260,541 28,231,797 4,966,935 183,731,610
Derivative Contracts 325,171 1,765,773 144,697 18,534 — — 2,254,175
Futures Broker Commission (7,147) (14,495) (3,779) (11,984) — — (37,405)
Gains/(Losses) on Foreign Exchange (143,338) (1,684,661) 100,628 971,921 — — (755,450)
Net Gains/(Losses) on Investments 11,909,065 57,558,406 (20,712,285) 103,239,012 28,231,797 4,966,935 185,192,930
Vanguard FTSE U.K. Equity Index Fund was terminated on 31 January 2015 and is excluded from the table and the 2015 financial statements.
Vanguard Vanguard FTSE FTSE Vanguard Vanguard Vanguard Developed Developed FTSE U.K. Vanguard U.K. Inflation- U.K. Long Europe ex- World ex- Equity FTSE U.K. Vanguard Linked Duration 31 October U.K. Equity U.K. Equity Income Equity U.S. Equity Gilt Gilt 2014 Index Fund Index Fund Index Fund Index Fund Index Fund Index Fund Index Fund Aggregated (£) (£) (£) (£) (£) (£) (£) (£)
Non-Derivative Securities (21,789,797) 98,874,931 (18,777,486) (38,676,349) 199,338,749 25,979,231 4,638,511 249,587,790
Derivative Contracts 145,336 992,808 (38,841) (322,223) 1,474,077 — — 2,251,157
Futures Broker Commission (5,277) (11,493) (3,500) (7,427) (9,255) — — (36,952)
Gains/(Losses) on Foreign Exchange (293,067) (329,811) (43,013) (100,510) (96,250) — — (862,651)
Net Gains/(Losses) on Investments (21,942,805) 99,526,435 (18,862,840) (39,106,509) 200,707,321 25,979,231 4,638,511 250,939,344
Vanguard FTSE U.K. Equity Index Fund was terminated on 31 January 2015.
112
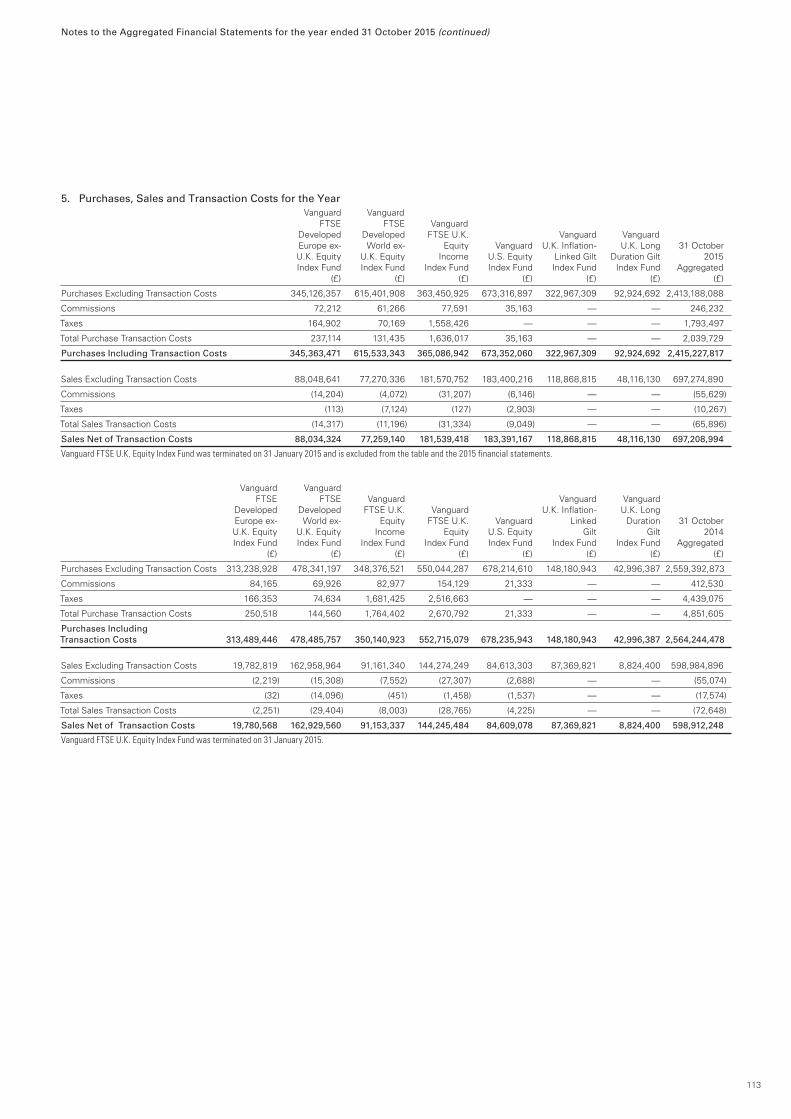
Notes to the Aggregated Financial Statements for the year ended 31 October 2015 (continued)
5. Purchases, Sales and Transaction Costs for the Year Vanguard Vanguard FTSE FTSE Vanguard Developed Developed FTSE U.K. Vanguard Vanguard Europe ex- World ex- Equity Vanguard U.K. Inflation- U.K. Long 31 October U.K. Equity U.K. Equity Income U.S. Equity Linked Gilt Duration Gilt 2015 Index Fund Index Fund Index Fund Index Fund Index Fund Index Fund Aggregated (£) (£) (£) (£) (£) (£) (£)
Purchases Excluding Transaction Costs 345,126,357 615,401,908 363,450,925 673,316,897 322,967,309 92,924,692 2,413,188,088
Commissions 72,212 61,266 77,591 35,163 — — 246,232
Taxes 164,902 70,169 1,558,426 — — — 1,793,497
Total Purchase Transaction Costs 237,114 131,435 1,636,017 35,163 — — 2,039,729
Purchases Including Transaction Costs 345,363,471 615,533,343 365,086,942 673,352,060 322,967,309 92,924,692 2,415,227,817
Sales Excluding Transaction Costs 88,048,641 77,270,336 181,570,752 183,400,216 118,868,815 48,116,130 697,274,890
Commissions (14,204) (4,072) (31,207) (6,146) — — (55,629)
Taxes (113) (7,124) (127) (2,903) — — (10,267)
Total Sales Transaction Costs (14,317) (11,196) (31,334) (9,049) — — (65,896)
Sales Net of Transaction Costs 88,034,324 77,259,140 181,539,418 183,391,167 118,868,815 48,116,130 697,208,994
Vanguard FTSE U.K. Equity Index Fund was terminated on 31 January 2015 and is excluded from the table and the 2015 financial statements.
Vanguard Vanguard FTSE FTSE Vanguard Vanguard Vanguard Developed Developed FTSE U.K. Vanguard U.K. Inflation- U.K. Long Europe ex- World ex- Equity FTSE U.K. Vanguard Linked Duration 31 October U.K. Equity U.K. Equity Income Equity U.S. Equity Gilt Gilt 2014 Index Fund Index Fund Index Fund Index Fund Index Fund Index Fund Index Fund Aggregated (£) (£) (£) (£) (£) (£) (£) (£)
Purchases Excluding Transaction Costs 313,238,928 478,341,197 348,376,521 550,044,287 678,214,610 148,180,943 42,996,387 2,559,392,873
Commissions 84,165 69,926 82,977 154,129 21,333 — — 412,530
Taxes 166,353 74,634 1,681,425 2,516,663 — — — 4,439,075
Total Purchase Transaction Costs 250,518 144,560 1,764,402 2,670,792 21,333 — — 4,851,605
Purchases Including Transaction Costs 313,489,446 478,485,757 350,140,923 552,715,079 678,235,943 148,180,943 42,996,387 2,564,244,478
Sales Excluding Transaction Costs 19,782,819 162,958,964 91,161,340 144,274,249 84,613,303 87,369,821 8,824,400 598,984,896
Commissions (2,219) (15,308) (7,552) (27,307) (2,688) — — (55,074)
Taxes (32) (14,096) (451) (1,458) (1,537) — — (17,574)
Total Sales Transaction Costs (2,251) (29,404) (8,003) (28,765) (4,225) — — (72,648)
Sales Net of Transaction Costs 19,780,568 162,929,560 91,153,337 144,245,484 84,609,078 87,369,821 8,824,400 598,912,248
Vanguard FTSE U.K. Equity Index Fund was terminated on 31 January 2015.
113
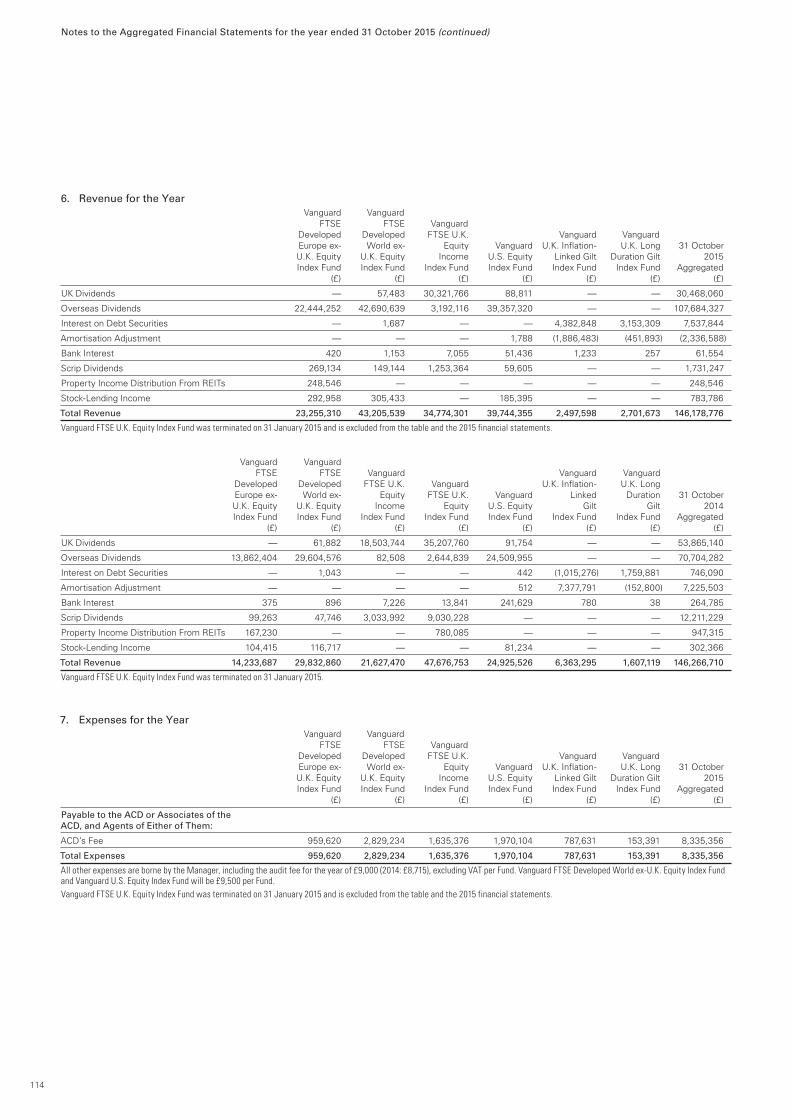
Notes to the Aggregated Financial Statements for the year ended 31 October 2015 (continued)
6. Revenue for the Year Vanguard Vanguard FTSE FTSE Vanguard Developed Developed FTSE U.K. Vanguard Vanguard Europe ex- World ex- Equity Vanguard U.K. Inflation- U.K. Long 31 October U.K. Equity U.K. Equity Income U.S. Equity Linked Gilt Duration Gilt 2015 Index Fund Index Fund Index Fund Index Fund Index Fund Index Fund Aggregated (£) (£) (£) (£) (£) (£) (£)
UK Dividends — 57,483 30,321,766 88,811 — — 30,468,060
Overseas Dividends 22,444,252 42,690,639 3,192,116 39,357,320 — — 107,684,327
Interest on Debt Securities — 1,687 — — 4,382,848 3,153,309 7,537,844
Amortisation Adjustment — — — 1,788 (1,886,483) (451,893) (2,336,588)
Bank Interest 420 1,153 7,055 51,436 1,233 257 61,554
Scrip Dividends 269,134 149,144 1,253,364 59,605 — — 1,731,247
Property Income Distribution From REITs 248,546 — — — — — 248,546
Stock-Lending Income 292,958 305,433 — 185,395 — — 783,786
Total Revenue 23,255,310 43,205,539 34,774,301 39,744,355 2,497,598 2,701,673 146,178,776
Vanguard FTSE U.K. Equity Index Fund was terminated on 31 January 2015 and is excluded from the table and the 2015 financial statements.
Vanguard Vanguard FTSE FTSE Vanguard Vanguard Vanguard Developed Developed FTSE U.K. Vanguard U.K. Inflation- U.K. Long Europe ex- World ex- Equity FTSE U.K. Vanguard Linked Duration 31 October U.K. Equity U.K. Equity Income Equity U.S. Equity Gilt Gilt 2014 Index Fund Index Fund Index Fund Index Fund Index Fund Index Fund Index Fund Aggregated (£) (£) (£) (£) (£) (£) (£) (£)
UK Dividends — 61,882 18,503,744 35,207,760 91,754 — — 53,865,140
Overseas Dividends 13,862,404 29,604,576 82,508 2,644,839 24,509,955 — — 70,704,282
Interest on Debt Securities — 1,043 — — 442 (1,015,276) 1,759,881 746,090
Amortisation Adjustment — — — — 512 7,377,791 (152,800) 7,225,503
Bank Interest 375 896 7,226 13,841 241,629 780 38 264,785
Scrip Dividends 99,263 47,746 3,033,992 9,030,228 — — — 12,211,229
Property Income Distribution From REITs 167,230 — — 780,085 — — — 947,315
Stock-Lending Income 104,415 116,717 — — 81,234 — — 302,366
Total Revenue 14,233,687 29,832,860 21,627,470 47,676,753 24,925,526 6,363,295 1,607,119 146,266,710
Vanguard FTSE U.K. Equity Index Fund was terminated on 31 January 2015.
7. Expenses for the Year Vanguard Vanguard FTSE FTSE Vanguard Developed Developed FTSE U.K. Vanguard Vanguard Europe ex- World ex- Equity Vanguard U.K. Inflation- U.K. Long 31 October U.K. Equity U.K. Equity Income U.S. Equity Linked Gilt Duration Gilt 2015 Index Fund Index Fund Index Fund Index Fund Index Fund Index Fund Aggregated (£) (£) (£) (£) (£) (£) (£)
Payable to the ACD or Associates of the ACD, and Agents of Either of Them:
ACD’s Fee 959,620 2,829,234 1,635,376 1,970,104 787,631 153,391 8,335,356
Total Expenses 959,620 2,829,234 1,635,376 1,970,104 787,631 153,391 8,335,356
All other expenses are borne by the Manager, including the audit fee for the year of £9,000 (2014: £8,715), excluding VAT per Fund. Vanguard FTSE Developed World ex-U.K. Equity Index Fund and Vanguard U.S. Equity Index Fund will be £9,500 per Fund.Vanguard FTSE U.K. Equity Index Fund was terminated on 31 January 2015 and is excluded from the table and the 2015 financial statements.
114
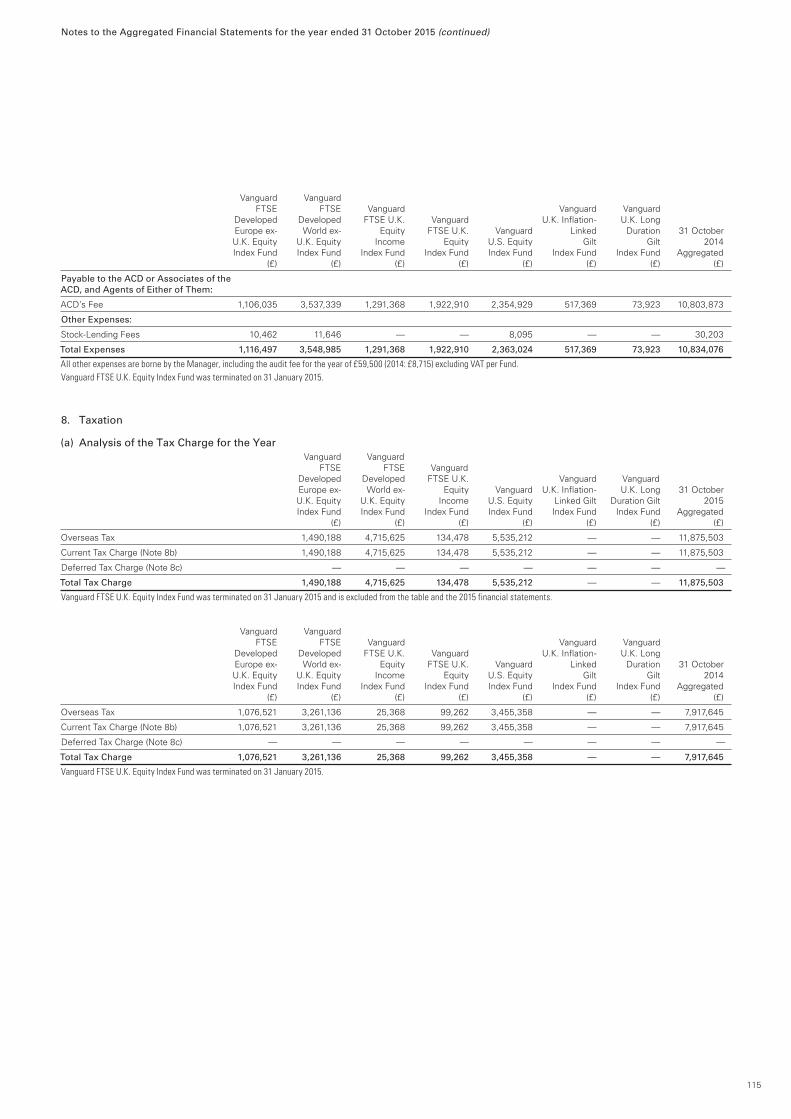
Notes to the Aggregated Financial Statements for the year ended 31 October 2015 (continued)
Vanguard Vanguard FTSE FTSE Vanguard Vanguard Vanguard Developed Developed FTSE U.K. Vanguard U.K. Inflation- U.K. Long Europe ex- World ex- Equity FTSE U.K. Vanguard Linked Duration 31 October U.K. Equity U.K. Equity Income Equity U.S. Equity Gilt Gilt 2014 Index Fund Index Fund Index Fund Index Fund Index Fund Index Fund Index Fund Aggregated (£) (£) (£) (£) (£) (£) (£) (£)
Payable to the ACD or Associates of the ACD, and Agents of Either of Them:
ACD’s Fee 1,106,035 3,537,339 1,291,368 1,922,910 2,354,929 517,369 73,923 10,803,873
Other Expenses:
Stock-Lending Fees 10,462 11,646 — — 8,095 — — 30,203
Total Expenses 1,116,497 3,548,985 1,291,368 1,922,910 2,363,024 517,369 73,923 10,834,076
All other expenses are borne by the Manager, including the audit fee for the year of £59,500 (2014: £8,715) excluding VAT per Fund.Vanguard FTSE U.K. Equity Index Fund was terminated on 31 January 2015.
8. Taxation
(a) Analysis of the Tax Charge for the Year Vanguard Vanguard FTSE FTSE Vanguard Developed Developed FTSE U.K. Vanguard Vanguard Europe ex- World ex- Equity Vanguard U.K. Inflation- U.K. Long 31 October U.K. Equity U.K. Equity Income U.S. Equity Linked Gilt Duration Gilt 2015 Index Fund Index Fund Index Fund Index Fund Index Fund Index Fund Aggregated (£) (£) (£) (£) (£) (£) (£)
Overseas Tax 1,490,188 4,715,625 134,478 5,535,212 — — 11,875,503
Current Tax Charge (Note 8b) 1,490,188 4,715,625 134,478 5,535,212 — — 11,875,503
Deferred Tax Charge (Note 8c) — — — — — — —
Total Tax Charge 1,490,188 4,715,625 134,478 5,535,212 — — 11,875,503
Vanguard FTSE U.K. Equity Index Fund was terminated on 31 January 2015 and is excluded from the table and the 2015 financial statements.
Vanguard Vanguard FTSE FTSE Vanguard Vanguard Vanguard Developed Developed FTSE U.K. Vanguard U.K. Inflation- U.K. Long Europe ex- World ex- Equity FTSE U.K. Vanguard Linked Duration 31 October U.K. Equity U.K. Equity Income Equity U.S. Equity Gilt Gilt 2014 Index Fund Index Fund Index Fund Index Fund Index Fund Index Fund Index Fund Aggregated (£) (£) (£) (£) (£) (£) (£) (£)
Overseas Tax 1,076,521 3,261,136 25,368 99,262 3,455,358 — — 7,917,645
Current Tax Charge (Note 8b) 1,076,521 3,261,136 25,368 99,262 3,455,358 — — 7,917,645
Deferred Tax Charge (Note 8c) — — — — — — — —
Total Tax Charge 1,076,521 3,261,136 25,368 99,262 3,455,358 — — 7,917,645
Vanguard FTSE U.K. Equity Index Fund was terminated on 31 January 2015.
115
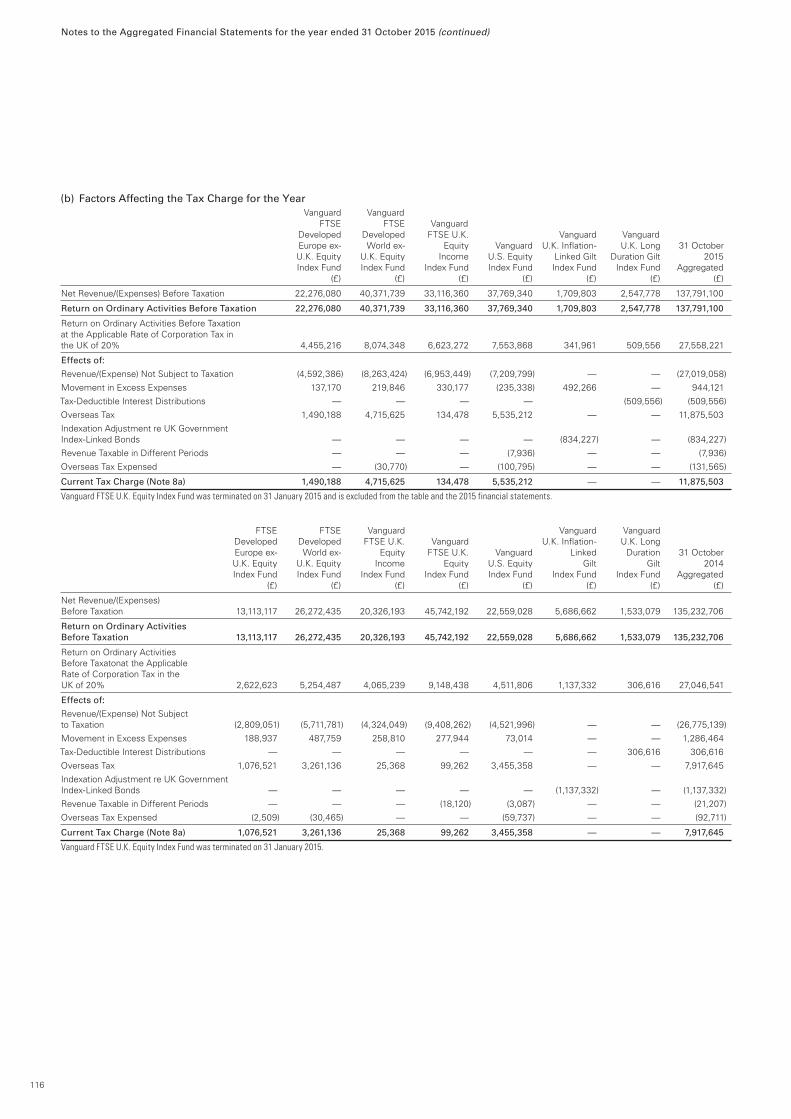
Notes to the Aggregated Financial Statements for the year ended 31 October 2015 (continued)
(b) Factors Affecting the Tax Charge for the Year Vanguard Vanguard FTSE FTSE Vanguard Developed Developed FTSE U.K. Vanguard Vanguard Europe ex- World ex- Equity Vanguard U.K. Inflation- U.K. Long 31 October U.K. Equity U.K. Equity Income U.S. Equity Linked Gilt Duration Gilt 2015 Index Fund Index Fund Index Fund Index Fund Index Fund Index Fund Aggregated (£) (£) (£) (£) (£) (£) (£)
Net Revenue/(Expenses) Before Taxation 22,276,080 40,371,739 33,116,360 37,769,340 1,709,803 2,547,778 137,791,100
Return on Ordinary Activities Before Taxation 22,276,080 40,371,739 33,116,360 37,769,340 1,709,803 2,547,778 137,791,100
Return on Ordinary Activities Before Taxation at the Applicable Rate of Corporation Tax in the UK of 20% 4,455,216 8,074,348 6,623,272 7,553,868 341,961 509,556 27,558,221
Effects of:
Revenue/(Expense) Not Subject to Taxation (4,592,386) (8,263,424) (6,953,449) (7,209,799) — — (27,019,058)
Movement in Excess Expenses 137,170 219,846 330,177 (235,338) 492,266 — 944,121
Tax-Deductible Interest Distributions — — — — (509,556) (509,556)
Overseas Tax 1,490,188 4,715,625 134,478 5,535,212 — — 11,875,503
Indexation Adjustment re UK Government Index-Linked Bonds — — — — (834,227) — (834,227)
Revenue Taxable in Different Periods — — — (7,936) — — (7,936)
Overseas Tax Expensed — (30,770) — (100,795) — — (131,565)
Current Tax Charge (Note 8a) 1,490,188 4,715,625 134,478 5,535,212 — — 11,875,503
Vanguard FTSE U.K. Equity Index Fund was terminated on 31 January 2015 and is excluded from the table and the 2015 financial statements.
FTSE FTSE Vanguard Vanguard Vanguard Developed Developed FTSE U.K. Vanguard U.K. Inflation- U.K. Long Europe ex- World ex- Equity FTSE U.K. Vanguard Linked Duration 31 October U.K. Equity U.K. Equity Income Equity U.S. Equity Gilt Gilt 2014 Index Fund Index Fund Index Fund Index Fund Index Fund Index Fund Index Fund Aggregated (£) (£) (£) (£) (£) (£) (£) (£)
Net Revenue/(Expenses) Before Taxation 13,113,117 26,272,435 20,326,193 45,742,192 22,559,028 5,686,662 1,533,079 135,232,706
Return on Ordinary Activities Before Taxation 13,113,117 26,272,435 20,326,193 45,742,192 22,559,028 5,686,662 1,533,079 135,232,706
Return on Ordinary Activities Before Taxatonat the Applicable Rate of Corporation Tax in the UK of 20% 2,622,623 5,254,487 4,065,239 9,148,438 4,511,806 1,137,332 306,616 27,046,541
Effects of:
Revenue/(Expense) Not Subject to Taxation (2,809,051) (5,711,781) (4,324,049) (9,408,262) (4,521,996) — — (26,775,139)
Movement in Excess Expenses 188,937 487,759 258,810 277,944 73,014 — — 1,286,464
Tax-Deductible Interest Distributions — — — — — — 306,616 306,616
Overseas Tax 1,076,521 3,261,136 25,368 99,262 3,455,358 — — 7,917,645
Indexation Adjustment re UK Government Index-Linked Bonds — — — — — (1,137,332) — (1,137,332)
Revenue Taxable in Different Periods — — — (18,120) (3,087) — — (21,207)
Overseas Tax Expensed (2,509) (30,465) — — (59,737) — — (92,711)
Current Tax Charge (Note 8a) 1,076,521 3,261,136 25,368 99,262 3,455,358 — — 7,917,645
Vanguard FTSE U.K. Equity Index Fund was terminated on 31 January 2015.
116
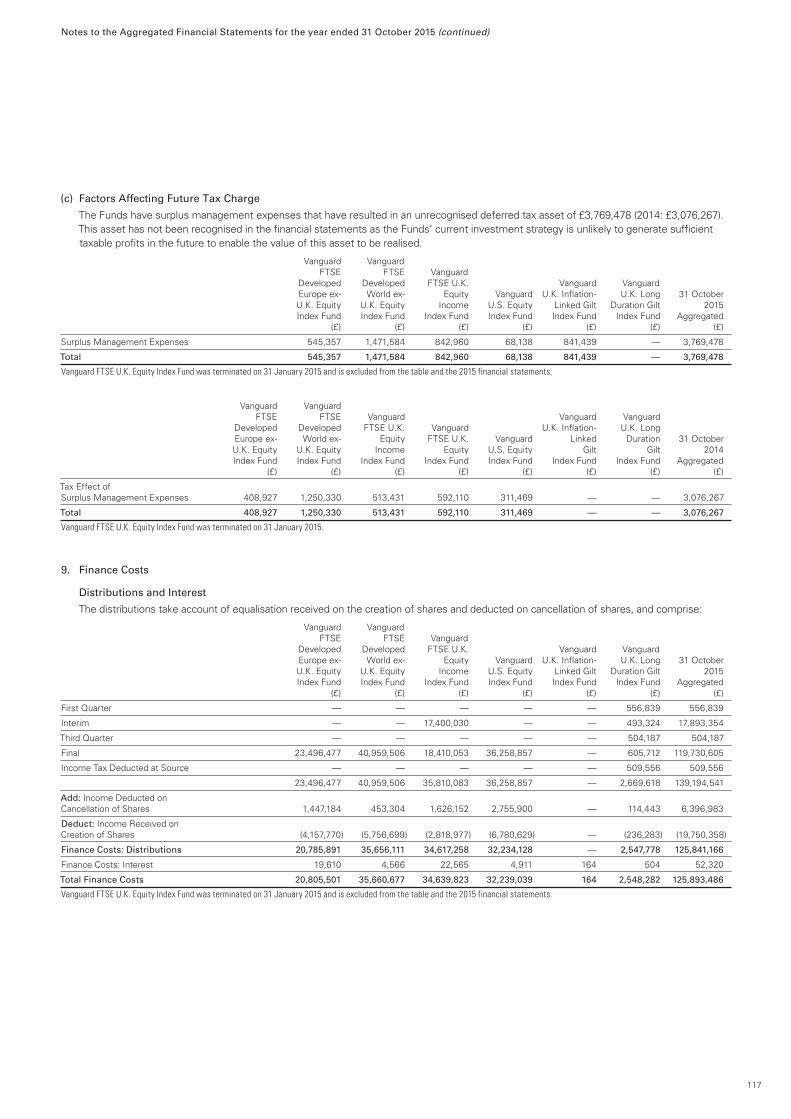
Notes to the Aggregated Financial Statements for the year ended 31 October 2015 (continued)
(c) Factors Affecting Future Tax Charge
The Funds have surplus management expenses that have resulted in an unrecognised deferred tax asset of £3,769,478 (2014: £3,076,267). This asset has not been recognised in the financial statements as the Funds’ current investment strategy is unlikely to generate sufficient taxable profits in the future to enable the value of this asset to be realised.
Vanguard Vanguard FTSE FTSE Vanguard Developed Developed FTSE U.K. Vanguard Vanguard Europe ex- World ex- Equity Vanguard U.K. Inflation- U.K. Long 31 October U.K. Equity U.K. Equity Income U.S. Equity Linked Gilt Duration Gilt 2015 Index Fund Index Fund Index Fund Index Fund Index Fund Index Fund Aggregated (£) (£) (£) (£) (£) (£) (£)
Surplus Management Expenses 545,357 1,471,584 842,960 68,138 841,439 — 3,769,478
Total 545,357 1,471,584 842,960 68,138 841,439 — 3,769,478
Vanguard FTSE U.K. Equity Index Fund was terminated on 31 January 2015 and is excluded from the table and the 2015 financial statements.
Vanguard Vanguard FTSE FTSE Vanguard Vanguard Vanguard Developed Developed FTSE U.K. Vanguard U.K. Inflation- U.K. Long Europe ex- World ex- Equity FTSE U.K. Vanguard Linked Duration 31 October U.K. Equity U.K. Equity Income Equity U.S. Equity Gilt Gilt 2014 Index Fund Index Fund Index Fund Index Fund Index Fund Index Fund Index Fund Aggregated (£) (£) (£) (£) (£) (£) (£) (£)
Tax Effect of Surplus Management Expenses 408,927 1,250,330 513,431 592,110 311,469 — — 3,076,267
Total 408,927 1,250,330 513,431 592,110 311,469 — — 3,076,267
Vanguard FTSE U.K. Equity Index Fund was terminated on 31 January 2015.
9. Finance Costs
Distributions and Interest
The distributions take account of equalisation received on the creation of shares and deducted on cancellation of shares, and comprise:
Vanguard Vanguard FTSE FTSE Vanguard Developed Developed FTSE U.K. Vanguard Vanguard Europe ex- World ex- Equity Vanguard U.K. Inflation- U.K. Long 31 October U.K. Equity U.K. Equity Income U.S. Equity Linked Gilt Duration Gilt 2015 Index Fund Index Fund Index Fund Index Fund Index Fund Index Fund Aggregated (£) (£) (£) (£) (£) (£) (£)
First Quarter — — — — — 556,839 556,839
Interim — — 17,400,030 — — 493,324 17,893,354
Third Quarter — — — — — 504,187 504,187
Final 23,496,477 40,959,506 18,410,053 36,258,857 — 605,712 119,730,605
Income Tax Deducted at Source — — — — — 509,556 509,556
23,496,477 40,959,506 35,810,083 36,258,857 — 2,669,618 139,194,541
Add: Income Deducted on Cancellation of Shares 1,447,184 453,304 1,626,152 2,755,900 — 114,443 6,396,983
Deduct: Income Received on Creation of Shares (4,157,770) (5,756,699) (2,818,977) (6,780,629) — (236,283) (19,750,358)
Finance Costs: Distributions 20,785,891 35,656,111 34,617,258 32,234,128 — 2,547,778 125,841,166
Finance Costs: Interest 19,610 4,566 22,565 4,911 164 504 52,320
Total Finance Costs 20,805,501 35,660,677 34,639,823 32,239,039 164 2,548,282 125,893,486
Vanguard FTSE U.K. Equity Index Fund was terminated on 31 January 2015 and is excluded from the table and the 2015 financial statements.
117
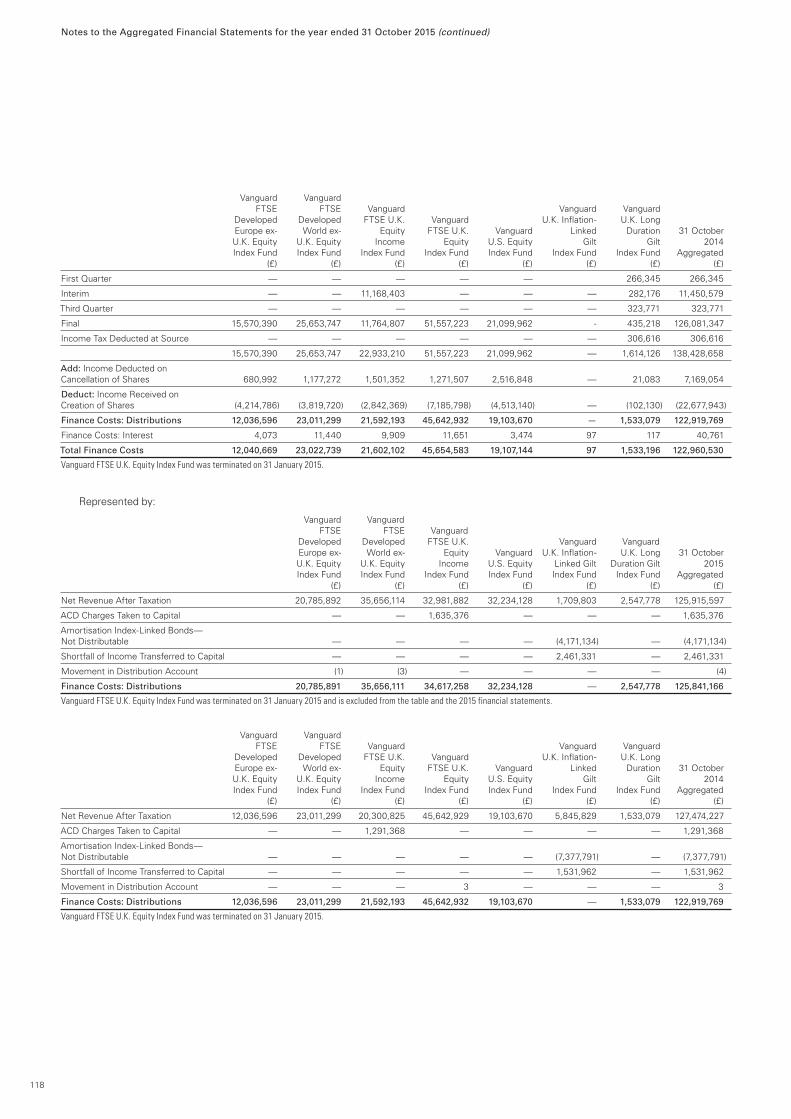
Notes to the Aggregated Financial Statements for the year ended 31 October 2015 (continued)
Vanguard Vanguard FTSE FTSE Vanguard Vanguard Vanguard Developed Developed FTSE U.K. Vanguard U.K. Inflation- U.K. Long Europe ex- World ex- Equity FTSE U.K. Vanguard Linked Duration 31 October U.K. Equity U.K. Equity Income Equity U.S. Equity Gilt Gilt 2014 Index Fund Index Fund Index Fund Index Fund Index Fund Index Fund Index Fund Aggregated (£) (£) (£) (£) (£) (£) (£) (£)
First Quarter — — — — — 266,345 266,345
Interim — — 11,168,403 — — — 282,176 11,450,579
Third Quarter — — — — — — 323,771 323,771
Final 15,570,390 25,653,747 11,764,807 51,557,223 21,099,962 - 435,218 126,081,347
Income Tax Deducted at Source — — — — — — 306,616 306,616
15,570,390 25,653,747 22,933,210 51,557,223 21,099,962 — 1,614,126 138,428,658
Add: Income Deducted on Cancellation of Shares 680,992 1,177,272 1,501,352 1,271,507 2,516,848 — 21,083 7,169,054
Deduct: Income Received on Creation of Shares (4,214,786) (3,819,720) (2,842,369) (7,185,798) (4,513,140) — (102,130) (22,677,943)
Finance Costs: Distributions 12,036,596 23,011,299 21,592,193 45,642,932 19,103,670 — 1,533,079 122,919,769
Finance Costs: Interest 4,073 11,440 9,909 11,651 3,474 97 117 40,761
Total Finance Costs 12,040,669 23,022,739 21,602,102 45,654,583 19,107,144 97 1,533,196 122,960,530
Vanguard FTSE U.K. Equity Index Fund was terminated on 31 January 2015.
Represented by:
Vanguard Vanguard FTSE FTSE Vanguard Developed Developed FTSE U.K. Vanguard Vanguard Europe ex- World ex- Equity Vanguard U.K. Inflation- U.K. Long 31 October U.K. Equity U.K. Equity Income U.S. Equity Linked Gilt Duration Gilt 2015 Index Fund Index Fund Index Fund Index Fund Index Fund Index Fund Aggregated (£) (£) (£) (£) (£) (£) (£)
Net Revenue After Taxation 20,785,892 35,656,114 32,981,882 32,234,128 1,709,803 2,547,778 125,915,597
ACD Charges Taken to Capital — — 1,635,376 — — — 1,635,376
Amortisation Index-Linked Bonds— Not Distributable — — — — (4,171,134) — (4,171,134)
Shortfall of Income Transferred to Capital — — — — 2,461,331 — 2,461,331
Movement in Distribution Account (1) (3) — — — — (4)
Finance Costs: Distributions 20,785,891 35,656,111 34,617,258 32,234,128 — 2,547,778 125,841,166
Vanguard FTSE U.K. Equity Index Fund was terminated on 31 January 2015 and is excluded from the table and the 2015 financial statements.
Vanguard Vanguard FTSE FTSE Vanguard Vanguard Vanguard Developed Developed FTSE U.K. Vanguard U.K. Inflation- U.K. Long Europe ex- World ex- Equity FTSE U.K. Vanguard Linked Duration 31 October U.K. Equity U.K. Equity Income Equity U.S. Equity Gilt Gilt 2014 Index Fund Index Fund Index Fund Index Fund Index Fund Index Fund Index Fund Aggregated (£) (£) (£) (£) (£) (£) (£) (£)
Net Revenue After Taxation 12,036,596 23,011,299 20,300,825 45,642,929 19,103,670 5,845,829 1,533,079 127,474,227
ACD Charges Taken to Capital — — 1,291,368 — — — — 1,291,368
Amortisation Index-Linked Bonds— Not Distributable — — — — — (7,377,791) — (7,377,791)
Shortfall of Income Transferred to Capital — — — — — 1,531,962 — 1,531,962
Movement in Distribution Account — — — 3 — — — 3
Finance Costs: Distributions 12,036,596 23,011,299 21,592,193 45,642,932 19,103,670 — 1,533,079 122,919,769
Vanguard FTSE U.K. Equity Index Fund was terminated on 31 January 2015.
118
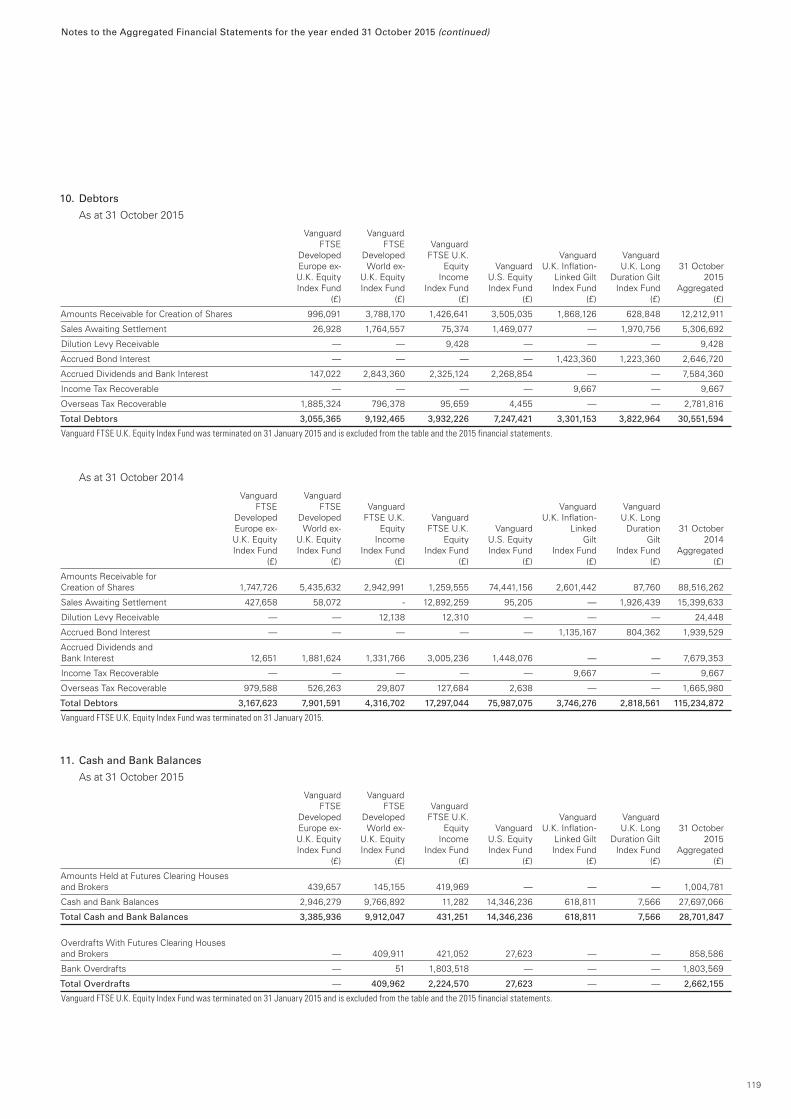
Notes to the Aggregated Financial Statements for the year ended 31 October 2015 (continued)
10. Debtors
As at 31 October 2015
Vanguard Vanguard FTSE FTSE Vanguard Developed Developed FTSE U.K. Vanguard Vanguard Europe ex- World ex- Equity Vanguard U.K. Inflation- U.K. Long 31 October U.K. Equity U.K. Equity Income U.S. Equity Linked Gilt Duration Gilt 2015 Index Fund Index Fund Index Fund Index Fund Index Fund Index Fund Aggregated (£) (£) (£) (£) (£) (£) (£)
Amounts Receivable for Creation of Shares 996,091 3,788,170 1,426,641 3,505,035 1,868,126 628,848 12,212,911
Sales Awaiting Settlement 26,928 1,764,557 75,374 1,469,077 — 1,970,756 5,306,692
Dilution Levy Receivable — — 9,428 — — — 9,428
Accrued Bond Interest — — — — 1,423,360 1,223,360 2,646,720
Accrued Dividends and Bank Interest 147,022 2,843,360 2,325,124 2,268,854 — — 7,584,360
Income Tax Recoverable — — — — 9,667 — 9,667
Overseas Tax Recoverable 1,885,324 796,378 95,659 4,455 — — 2,781,816
Total Debtors 3,055,365 9,192,465 3,932,226 7,247,421 3,301,153 3,822,964 30,551,594
Vanguard FTSE U.K. Equity Index Fund was terminated on 31 January 2015 and is excluded from the table and the 2015 financial statements.
As at 31 October 2014
Vanguard Vanguard FTSE FTSE Vanguard Vanguard Vanguard Developed Developed FTSE U.K. Vanguard U.K. Inflation- U.K. Long Europe ex- World ex- Equity FTSE U.K. Vanguard Linked Duration 31 October U.K. Equity U.K. Equity Income Equity U.S. Equity Gilt Gilt 2014 Index Fund Index Fund Index Fund Index Fund Index Fund Index Fund Index Fund Aggregated (£) (£) (£) (£) (£) (£) (£) (£)
Amounts Receivable for Creation of Shares 1,747,726 5,435,632 2,942,991 1,259,555 74,441,156 2,601,442 87,760 88,516,262
Sales Awaiting Settlement 427,658 58,072 - 12,892,259 95,205 — 1,926,439 15,399,633
Dilution Levy Receivable — — 12,138 12,310 — — — 24,448
Accrued Bond Interest — — — — — 1,135,167 804,362 1,939,529
Accrued Dividends and Bank Interest 12,651 1,881,624 1,331,766 3,005,236 1,448,076 — — 7,679,353
Income Tax Recoverable — — — — — 9,667 — 9,667
Overseas Tax Recoverable 979,588 526,263 29,807 127,684 2,638 — — 1,665,980
Total Debtors 3,167,623 7,901,591 4,316,702 17,297,044 75,987,075 3,746,276 2,818,561 115,234,872
Vanguard FTSE U.K. Equity Index Fund was terminated on 31 January 2015.
11. Cash and Bank Balances
As at 31 October 2015
Vanguard Vanguard FTSE FTSE Vanguard Developed Developed FTSE U.K. Vanguard Vanguard Europe ex- World ex- Equity Vanguard U.K. Inflation- U.K. Long 31 October U.K. Equity U.K. Equity Income U.S. Equity Linked Gilt Duration Gilt 2015 Index Fund Index Fund Index Fund Index Fund Index Fund Index Fund Aggregated (£) (£) (£) (£) (£) (£) (£)
Amounts Held at Futures Clearing Houses and Brokers 439,657 145,155 419,969 — — — 1,004,781
Cash and Bank Balances 2,946,279 9,766,892 11,282 14,346,236 618,811 7,566 27,697,066
Total Cash and Bank Balances 3,385,936 9,912,047 431,251 14,346,236 618,811 7,566 28,701,847
Overdrafts With Futures Clearing Houses and Brokers — 409,911 421,052 27,623 — — 858,586
Bank Overdrafts — 51 1,803,518 — — — 1,803,569
Total Overdrafts — 409,962 2,224,570 27,623 — — 2,662,155
Vanguard FTSE U.K. Equity Index Fund was terminated on 31 January 2015 and is excluded from the table and the 2015 financial statements.
119
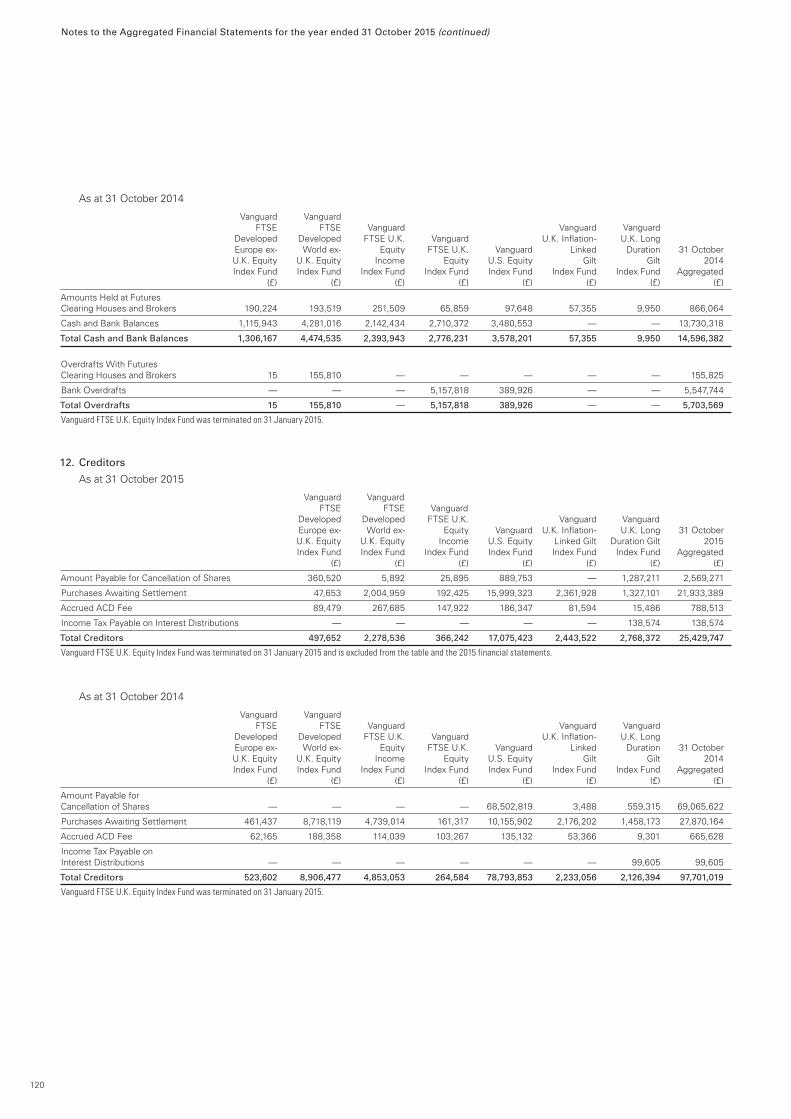
Notes to the Aggregated Financial Statements for the year ended 31 October 2015 (continued)
As at 31 October 2014
Vanguard Vanguard FTSE FTSE Vanguard Vanguard Vanguard Developed Developed FTSE U.K. Vanguard U.K. Inflation- U.K. Long Europe ex- World ex- Equity FTSE U.K. Vanguard Linked Duration 31 October U.K. Equity U.K. Equity Income Equity U.S. Equity Gilt Gilt 2014 Index Fund Index Fund Index Fund Index Fund Index Fund Index Fund Index Fund Aggregated (£) (£) (£) (£) (£) (£) (£) (£)
Amounts Held at Futures Clearing Houses and Brokers 190,224 193,519 251,509 65,859 97,648 57,355 9,950 866,064
Cash and Bank Balances 1,115,943 4,281,016 2,142,434 2,710,372 3,480,553 — — 13,730,318
Total Cash and Bank Balances 1,306,167 4,474,535 2,393,943 2,776,231 3,578,201 57,355 9,950 14,596,382
Overdrafts With Futures Clearing Houses and Brokers 15 155,810 — — — — — 155,825
Bank Overdrafts — — — 5,157,818 389,926 — — 5,547,744
Total Overdrafts 15 155,810 — 5,157,818 389,926 — — 5,703,569
Vanguard FTSE U.K. Equity Index Fund was terminated on 31 January 2015.
12. Creditors
As at 31 October 2015
Vanguard Vanguard FTSE FTSE Vanguard Developed Developed FTSE U.K. Vanguard Vanguard Europe ex- World ex- Equity Vanguard U.K. Inflation- U.K. Long 31 October U.K. Equity U.K. Equity Income U.S. Equity Linked Gilt Duration Gilt 2015 Index Fund Index Fund Index Fund Index Fund Index Fund Index Fund Aggregated (£) (£) (£) (£) (£) (£) (£)
Amount Payable for Cancellation of Shares 360,520 5,892 25,895 889,753 — 1,287,211 2,569,271
Purchases Awaiting Settlement 47,653 2,004,959 192,425 15,999,323 2,361,928 1,327,101 21,933,389
Accrued ACD Fee 89,479 267,685 147,922 186,347 81,594 15,486 788,513
Income Tax Payable on Interest Distributions — — — — — 138,574 138,574
Total Creditors 497,652 2,278,536 366,242 17,075,423 2,443,522 2,768,372 25,429,747
Vanguard FTSE U.K. Equity Index Fund was terminated on 31 January 2015 and is excluded from the table and the 2015 financial statements.
As at 31 October 2014
Vanguard Vanguard FTSE FTSE Vanguard Vanguard Vanguard Developed Developed FTSE U.K. Vanguard U.K. Inflation- U.K. Long Europe ex- World ex- Equity FTSE U.K. Vanguard Linked Duration 31 October U.K. Equity U.K. Equity Income Equity U.S. Equity Gilt Gilt 2014 Index Fund Index Fund Index Fund Index Fund Index Fund Index Fund Index Fund Aggregated (£) (£) (£) (£) (£) (£) (£) (£)
Amount Payable for Cancellation of Shares — — — — 68,502,819 3,488 559,315 69,065,622
Purchases Awaiting Settlement 461,437 8,718,119 4,739,014 161,317 10,155,902 2,176,202 1,458,173 27,870,164
Accrued ACD Fee 62,165 188,358 114,039 103,267 135,132 53,366 9,301 665,628
Income Tax Payable on Interest Distributions — — — — — — 99,605 99,605
Total Creditors 523,602 8,906,477 4,853,053 264,584 78,793,853 2,233,056 2,126,394 97,701,019
Vanguard FTSE U.K. Equity Index Fund was terminated on 31 January 2015.
120

Notes to the Aggregated Financial Statements for the year ended 31 October 2015 (continued)
13. Capital Commitments and Contingent Liabilities
The Funds had no capital commitments at the year-end date. The Funds had no contingent liabilities (2014: nil) at the year-end date.
14. Efficient Portfolio Management
The Company may employ investment techniques and use financial derivative instruments (such as futures contracts, forward foreign currency contracts, options and swaps) for efficient portfolio management of the assets of any Fund including hedging against market movements, currency exchange or interest rate risks subject to the conditions and within the limits stipulated under the COLL sourcebook and the Prospectus. The efficient portfolio management purposes for which the Company intends to employ financial derivative instruments and such investment techniques are the reduction of risk, reduction of cost and generation of additional capital or income for the relevant Fund with an appropriate level of risk, taking into account the risk profile of the Fund and the risk diversification rules under the COLL sourcebook. Any such investment technique or use of financial derivative instruments must be one which is reasonably believed by the Investment Manager to be economically appropriate in that it is realised in a cost-effective way.
Disclosure is required under ESMA guidelines for UCITS Funds which have engaged in efficient portfolio management techniques. UCITS Funds are required to disclose the revenues arising from efficient portfolio management techniques for the entire reporting period together with the direct and indirect operational costs and fees incurred.
The gains and losses including costs incurred for futures contracts held for efficient portfolio management purposes during the year ended 31 October 2015 are disclosed in the table in Note 4, Net Capital Gains/(Losses).
Collateral
The table below lists the collateral posted for futures contracts. Cash collateral is disclosed under Amounts Held at Futures Clearing Houses and Brokers in Note 11, Cash and Bank Balances.
Market Value Amount as of Held/(Pledged) 31 October 2015 2015 Fund Collateral Name (£) (£)
FTSE Developed World ex-U.K. Equity Index Fund Federal Home Loan Mortgage Corporation 15/4/2016 (1,500,000) (970,450)
Total (970,450)
U.S. Equity Index Fund Federal Home Loan Mortgage Corporation 5/1/2016 (600,000) (388,445)
Total (388,445)
Market Value Amount as of Held/(Pledged) 31 October 2014 2014 Fund Collateral Name (£) (£)
FTSE Developed World ex-U.K. Equity Index Fund Federal Home Loan Bank 3/12/2014 (238,000) (148,762)
FTSE Developed World ex-U.K. Equity Index Fund Federal Home Loan Mortgage Corporation 3/2/2015 (700,000) (437,508)
Total (556,270)
U.S. Equity Index Fund Federal National Mortgage Association 6/1/2015 (600,000) (375,022)
Total (375,022)
121

Notes to the Aggregated Financial Statements for the year ended 31 October 2015 (continued)
Stock Lending
The exposure obtained through efficient portfolio management techniques and identity of counterparties as at 31 October 2015 was as follows:
Value of Collateral Stock on Loan Held Fund Counterparty (£) (£)
FTSE Developed Europe ex-U.K. Equity Index Fund JP Morgan Chase Bank N.A. 1,405,572 1,478,477
FTSE Developed World ex-U.K. Equity Index Fund JP Morgan Chase Bank N.A. 12,937,386 13,352,806
U.S. Equity Index Fund JP Morgan Chase Bank N.A. 2,558,999 2,637,982
Total 16,901,957 17,469,265
The gross stock-lending revenue and fees for the year ended 31 October 2015 were as follows:
Stock Stock Lending Revenue Lending Fees Fund Counterparty (£) (£)
FTSE Developed Europe ex-U.K. Equity Index Fund JP Morgan Chase Bank N.A. 326,007 33,049
FTSE Developed World ex-U.K. Equity Index Fund JP Morgan Chase Bank N.A. 340,944 35,511
U.S. Equity Index Fund JP Morgan Chase Bank N.A. 206,400 21,005
Total 873,351 89,565
The exposure obtained through efficient portfolio management techniques and identity of counterparties as at 31 October 2014 was as follows:
Value of Collateral Stock on Loan Held Fund Counterparty (£) (£)
FTSE Developed Europe ex-U.K. Equity Index Fund JP Morgan Chase Bank N.A. 2,999,062 3,131,274
FTSE Developed World ex-U.K. Equity Index Fund JP Morgan Chase Bank N.A. 12,332,180 12,908,644
U.S. Equity Index Fund JP Morgan Chase Bank N.A. 4,012,357 4,158,638
Total 19,343,599 20,198,556
The gross stock-lending revenue and fees for the year ended 31 October 2014 were as follows:
Stock Stock Lending Revenue Lending Fees Fund Counterparty (£) (£)
FTSE Developed Europe ex-U.K. Equity Index Fund JP Morgan Chase Bank N.A. 104,415 10,462
FTSE Developed World ex-U.K. Equity Index Fund JP Morgan Chase Bank N.A. 116,717 11,646
U.S. Equity Index Fund JP Morgan Chase Bank N.A. 81,234 8,095
Total 302,366 30,203
15. Related Party Transactions
Vanguard Investments UK, Limited, as the ACD, is a related party, and acts as a principal in respect of all transactions of shares in the Company. The aggregate monies received through issues and paid on cancellation of shares are disclosed in the Statement of Change in Net Assets Attributable to Shareholders. Any amounts due from or to the ACD at the end of the accounting period are disclosed in Notes 10 and 12. Amounts paid to the ACD in respect to Manager’s Fees for the year are disclosed in Note 7.
Intra-Fund Trading
The Company undertook intra-fund trading with other Funds in The Vanguard Group during the accounting year amounting to £20,982,022 in purchases and £6,325,290 in sales (2014: Purchases £7,582,874, Sales £3,220,357).
Investment Adviser
The Vanguard Group, Inc., which is registered with the US Securities and Exchange Commission, is the Investment Adviser to the Funds. The Investment Adviser currently provides investment management and advisory services to collective investment schemes domiciled in the United States and Ireland as well as corporate management and administrative services to collective investment schemes domiciled in the United States.
122
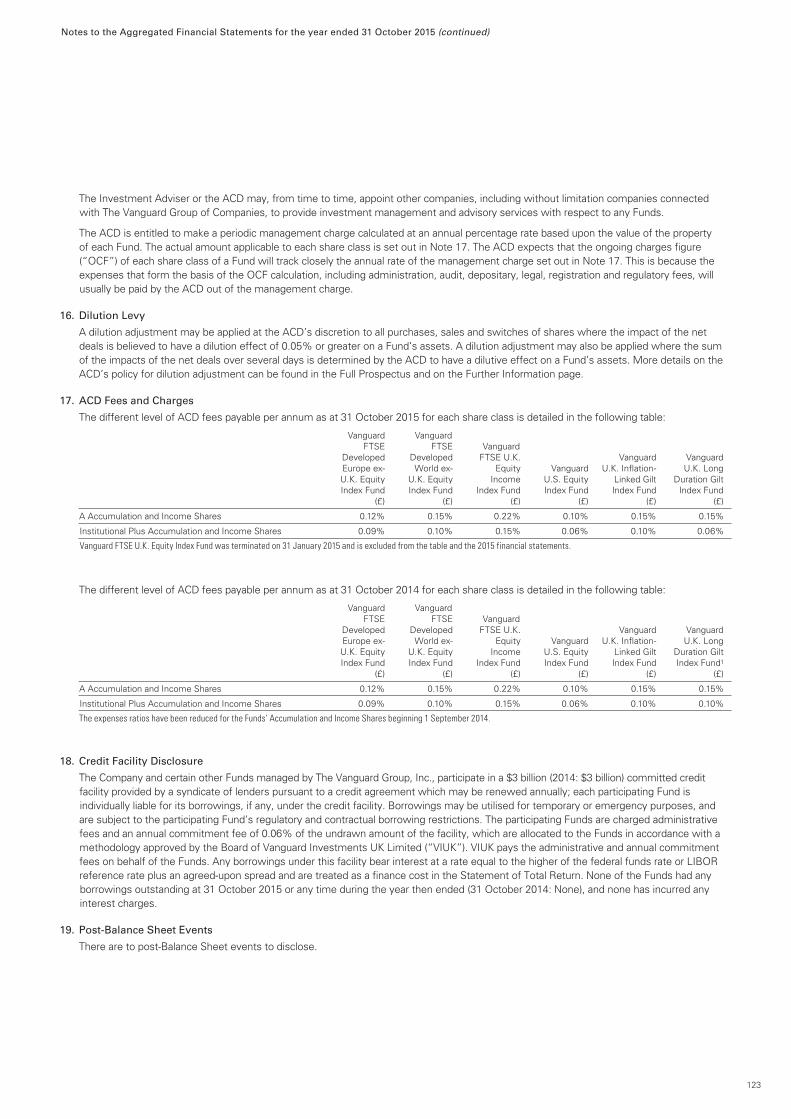
Notes to the Aggregated Financial Statements for the year ended 31 October 2015 (continued)
The Investment Adviser or the ACD may, from time to time, appoint other companies, including without limitation companies connected with The Vanguard Group of Companies, to provide investment management and advisory services with respect to any Funds.
The ACD is entitled to make a periodic management charge calculated at an annual percentage rate based upon the value of the property of each Fund. The actual amount applicable to each share class is set out in Note 17. The ACD expects that the ongoing charges figure (“OCF”) of each share class of a Fund will track closely the annual rate of the management charge set out in Note 17. This is because the expenses that form the basis of the OCF calculation, including administration, audit, depositary, legal, registration and regulatory fees, will usually be paid by the ACD out of the management charge.
16. Dilution Levy
A dilution adjustment may be applied at the ACD’s discretion to all purchases, sales and switches of shares where the impact of the net deals is believed to have a dilution effect of 0.05% or greater on a Fund’s assets. A dilution adjustment may also be applied where the sum of the impacts of the net deals over several days is determined by the ACD to have a dilutive effect on a Fund’s assets. More details on the ACD’s policy for dilution adjustment can be found in the Full Prospectus and on the Further Information page.
17. ACD Fees and Charges
The different level of ACD fees payable per annum as at 31 October 2015 for each share class is detailed in the following table:
Vanguard Vanguard FTSE FTSE Vanguard Developed Developed FTSE U.K. Vanguard Vanguard Europe ex- World ex- Equity Vanguard U.K. Inflation- U.K. Long U.K. Equity U.K. Equity Income U.S. Equity Linked Gilt Duration Gilt Index Fund Index Fund Index Fund Index Fund Index Fund Index Fund (£) (£) (£) (£) (£) (£)
A Accumulation and Income Shares 0.12% 0.15% 0.22% 0.10% 0.15% 0.15%
Institutional Plus Accumulation and Income Shares 0.09% 0.10% 0.15% 0.06% 0.10% 0.06%
Vanguard FTSE U.K. Equity Index Fund was terminated on 31 January 2015 and is excluded from the table and the 2015 financial statements.
The different level of ACD fees payable per annum as at 31 October 2014 for each share class is detailed in the following table:
Vanguard Vanguard FTSE FTSE Vanguard Developed Developed FTSE U.K. Vanguard Vanguard Europe ex- World ex- Equity Vanguard U.K. Inflation- U.K. Long U.K. Equity U.K. Equity Income U.S. Equity Linked Gilt Duration Gilt Index Fund Index Fund Index Fund Index Fund Index Fund Index Fund1 (£) (£) (£) (£) (£) (£)
A Accumulation and Income Shares 0.12% 0.15% 0.22% 0.10% 0.15% 0.15%
Institutional Plus Accumulation and Income Shares 0.09% 0.10% 0.15% 0.06% 0.10% 0.10%
The expenses ratios have been reduced for the Funds’ Accumulation and Income Shares beginning 1 September 2014.
18. Credit Facility Disclosure
The Company and certain other Funds managed by The Vanguard Group, Inc., participate in a $3 billion (2014: $3 billion) committed credit facility provided by a syndicate of lenders pursuant to a credit agreement which may be renewed annually; each participating Fund is individually liable for its borrowings, if any, under the credit facility. Borrowings may be utilised for temporary or emergency purposes, and are subject to the participating Fund’s regulatory and contractual borrowing restrictions. The participating Funds are charged administrative fees and an annual commitment fee of 0.06% of the undrawn amount of the facility, which are allocated to the Funds in accordance with a methodology approved by the Board of Vanguard Investments UK Limited (“VIUK”). VIUK pays the administrative and annual commitment fees on behalf of the Funds. Any borrowings under this facility bear interest at a rate equal to the higher of the federal funds rate or LIBOR reference rate plus an agreed-upon spread and are treated as a finance cost in the Statement of Total Return. None of the Funds had any borrowings outstanding at 31 October 2015 or any time during the year then ended (31 October 2014: None), and none has incurred any interest charges.
19. Post-Balance Sheet Events
There are to post-Balance Sheet events to disclose.
123
Further Information
Reports and Financial Statements
Each year, annual and interim reports will be prepared. They will describe investment activity during the period and provide management commentary.
Prospectus
The Fund Prospectus, an important document describing each Fund in detail, is available from the ACD, which is responsible for the management and administration of the Funds.
The ACD for Vanguard Investments Funds ICVC is Vanguard Investments UK, Limited, located at 4th Floor, The Walbrook Building, 25 Walbrook, London EC4N 8AF.
Types of Shares Available
During the period, each of the Funds offered two classes of shares: “A” and “Institutional Plus,” and Accumulation and Income Shares were available in each class.
Switching
Investors may sell their shares and transfer the proceeds into any of the other Funds by calling our dealing desk on 0800 408 2065.
Distributions
Vanguard U.K. Inflation-Linked Gilt Index Fund and Vanguard U.K. Long Duration Gilt Index Fund allocate revenue to shareholders quarterly, on 31 January, 30 April, 31 July and 31 October. Vanguard FTSE U.K. Equity Income Index Fund allocates revenue to shareholders twice a year, on 30 April and 31 October. Vanguard FTSE Developed Europe ex-U.K. Equity Index Fund, FTSE Developed World ex-U.K. Equity Index Fund and U.S. Equity Index Fund allocate revenue annually, on 31 October. If the ex-dividend date does not fall on a business day, the effective date will be the first business day following the fiscal year-end.
Publication of Prices
The most recent share prices will be published daily on vanguard.co.uk.
Dilution Levy
The transaction costs associated with Fund investments may vary from the mid-market value used in calculating a Fund’s share price. This may sometimes have an adverse effect on the shareholders’ interest in the Fund, called ‘dilution’. To prevent this effect, the ACD may apply a dilution levy to share purchases or redemptions. This charge is paid into and becomes part of the relevant Fund. For the Fund, a dilution adjustment may be applied to investments where:
• over a dealing period, a Fund has experienced a large level of net issues or redemptions relative to its size. For these purposes, a large level of net dealing is defined as 3% or more of the net asset value of the Fund in question (as calculated at the last valuation point);
• over a dealing period, there have been net issues or redemptions which could lead to dilution of a Fund, regardless of whether this is below 3% of the net asset value of the Fund; or
• the Manager considers it necessary to protect the interests of the Company.
Recipients of this document should not treat the contents as advice relating to legal, taxation or investment matters and should consult their own professional advisers concerning the acquisition, holding or disposing of investments in the Funds.
Past performance is not necessarily indicative of future performance, and the value of the shares and income from them may fall as well as rise. On redemption of shares, investors may receive back an amount less than the original amount of their investment. The assets of the Funds will be in a variety of currencies, and therefore movements in the value of currencies may affect the value of an investor’s holdings and the income from the holdings may fluctuate in value in money terms.
Issued by Vanguard Investments UK, Limited 4th Floor, The Walbrook Building, 25 Walbrook, London, EC4N 8AF
124
Directory
Company’s Head Office and Registered Office4th Floor, The Walbrook Building, 25 Walbrook London EC4N 8AF United Kingdom
Authorised Corporate DirectorVanguard Investments UK, Limited 4th Floor, The Walbrook Building, 25 Walbrook London EC4N 8AF United Kingdom
Administrator and RegistrarInternational Financial Data Services (UK) Limited IFDS House St. Nicholas Lane Basildon Essex SS15 5FS United Kingdom
Investment AdviserThe Vanguard Group, Inc. P.O. Box 2600 Valley Forge, PA 19482 USA
The DepositaryState Street Trustees Limited 525 Ferry Road Edinburgh EH5 2AW United Kingdom
Independent AuditorsPricewaterhouseCoopers LLP 7 More London Riverside London SE1 2RT United Kingdom
125
Vanguard Investments UK, Limited4th Floor, The Walbrook Building25 WalbrookLondonEC4N 8AFUnited Kingdom
Connect with Vanguard® > vanguard.co.uk
© 2016 Vanguard Investments UK, Limited. All rights reserved. QICVC 022016
or any member of the public regarding the advisability of investing in securities generally or in the Funds particularly or the ability of the Barclays Indices to track general bond market performance. Barclays has not passed on the legality or suitability of the Funds with respect to any person or entity. Barclays’ only relationship to Vanguard and the Funds is the licensing of the Barclays Indices, which are determined, composed, and calculated by Barclays without regard to Vanguard or the Funds or any owners or purchasers of the Funds. Barclays has no obligation to take the needs of Vanguard, the Funds, or the owners of the Funds into consideration in determining, composing, or calculating the Barclays Indices. Barclays is not responsible for and has not participated in the determination of the timing of, prices at, or quantities of the Funds to be issued. Barclays has no obligation or liability in connection with the administration, marketing, or trading of the Funds.
Barclays shall have no liability to third parties for the quality, accuracy, and/or completeness of the Indices or any data included therein or for interruptions in the delivery of the Indices. Barclays makes no warranty, express or implied, as to results to be obtained by owners of the Funds or any other person or entity from the use of the Indices or any data included therein in connection with the rights licensed hereunder or for any other use. Barclays reserves the right to change the methods of calculation or publication, or to cease the calculation or publication of the Barclays U.K. Government Inflation-Linked Float Adjusted Bond Index and Barclays U.K. Government 15+ Years Float Adjusted Bond Index, and Barclays shall not be liable for any miscalculation of or any incorrect, delayed, or interrupted publication with respect to any of the Barclays Indices. Barclays makes no express or implied warranties, and hereby expressly disclaims all warranties of merchantability or fitness for a particular purpose or use with respect to the Indices or any data included therein. Barclays shall not be liable for any damages, including, without limitation, any indirect or consequential damages resulting from the use of the Indices or any data included therein.
Vanguard Investments UK, Limited, only gives information on products and services and does not give investment advice based on individual circumstances. The Key Investor Information Document (“KIID”) and the Prospectus for these Funds are available in local languages from Vanguard Investments UK, Limited, via our website vanguard.co.uk.
Issued by Vanguard Investments UK, Limited, which is authorised and regulated in the UK by the Financial Conduct Authority.
Client Services 0800 408 2065
Monday to Friday 09.00–17.00
This report is intended for the Funds’ shareholders. It may not be distributed to prospective investors unless it is preceded or accompanied by the current Fund Prospectus.
All comparative mutual fund data are from Lipper, a Thomson Reuters Company, or Morningstar, Inc., unless otherwise noted.
London Stock Exchange Group companies include FTSE International Limited (“FTSE”), Frank Russell Company (“Russell”), MTS Next Limited (“MTS”), and FTSE TMX Global Debt Capital Markets Inc. (“FTSE TMX”). All rights reserved. “FTSE®”, “Russell®”, “MTS®”, “FTSE TMX®” and “FTSE Russell” and other service marks and trademarks related to the FTSE or Russell indexes are trademarks of the London Stock Exchange Group companies and are used by FTSE, MTS, FTSE TMX and Russell under licence. All information is provided for information purposes only. No responsibility or liability can be accepted by the London Stock Exchange Group companies nor its licensors for any errors or for any loss from use of this publication. Neither the London Stock Exchange Group companies nor any of its licensors make any claim, prediction, warranty or representation whatsoever, expressly or impliedly, either as to the results to be obtained from the use of the FTSE Indexes or the fitness or suitability of the Indexes for any particular purpose to which they might be put.
The S&P Total Market Index is a product of S&P Dow Jones Indices LLC (“SPDJI”), and has been licensed for use by Vanguard. Standard & Poor’s® and S&P® are registered trademarks of Standard & Poor’s Financial Services LLC (“S&P”); Dow Jones® is a registered trademark of Dow Jones Trademark Holdings LLC (“Dow Jones”); S&P® and S&P 500® are trademarks of S&P; and these trademarks have been licensed for use by SPDJI and sublicensed for certain purposes by Vanguard. Vanguard’s product is not sponsored, endorsed, sold or promoted by SPDJI, Dow Jones, S&P, or their respective affiliates and none of such parties make any representation regarding the advisability of investing in such product(s) nor do they have any liability for any errors, omissions, or interruptions of the S&P Total Market Index.
The Vanguard Funds are not sponsored, endorsed, issued, sold, or promoted by Barclays Capital Inc. or any of its affiliates (“Barclays”). Barclays makes no representation or warranty, express or implied, to the owners or purchasers of the Funds