Exchange-traded funds: Clarity amid the clutter - Vanguard ...
Upload
khangminh22Category
view
0download
0
Annual Report | October 31, 2021
Vanguard Total World Stock Index Fund

Contents
Your Fund’s Performance at a Glance . . . . . . . . . . . . . . . . .1
About Your Fund’s Expenses . . . . . . . . . . . . . . . . . . . . . . . . . .2
Performance Summary . . . . . . . . . . . . . . . . . . . . . . . . . . . . . . .4
Financial Statements . . . . . . . . . . . . . . . . . . . . . . . . . . . . . . . . .7
Please note: The opinions expressed in this report are just that—informed opinions. They should not be considered promisesor advice. Also, please keep in mind that the information and opinions cover the period through the date on the front of thisreport. Of course, the risks of investing in your fund are spelled out in the prospectus.

• For the 12 months ended October 31, 2021, Vanguard Total World Stock Index Fundreturned 37.99% for ETF Shares (based on net asset value), 37.98% for Admiral Shares,and 37.97% for Institutional Shares. Its benchmark index, the FTSE Global All Cap Index,returned 38.26%.
• The global economy continued to recover from the sharp pandemic-inducedcontraction in the spring of 2020. Countries that were more successful in containingthe virus, whether through vaccinations, lockdowns, or both, generally fared bettereconomically. Swift and extensive fiscal and monetary support from policymakers wasalso key to the rebound.
• U.S. stocks, which make up more than half the index’s assets, contributed nearly aquarter of its return. Europe had a solid showing, led by the U.K. and France. AmongPacific region stocks, Japan contributed most. In emerging markets, China, one of thefew with a negative return for the period, detracted.
• All sectors contributed positively to the index return. Technology, the largest sector inthe index at more than 20%, industrials, and financials contributed most. Utilities,telecommunications, and consumer staples brought up the rear.
Market Barometer
Average Annual Total ReturnsPeriods Ended October 31, 2021
One Year Three Years Five Years
Stocks
Russell 1000 Index (Large-caps) 43.51% 22.01% 19.16%
Russell 2000 Index (Small-caps) 50.80 16.47 15.52
Russell 3000 Index (Broad U.S. market) 43.90 21.62 18.91
FTSE All-World ex US Index (International) 30.23 12.42 10.05
Bonds
Bloomberg U.S. Aggregate Bond Index(Broad taxable market) -0.48% 5.63% 3.10%
Bloomberg Municipal Bond Index(Broad tax-exempt market) 2.64 5.17 3.41
FTSE Three-Month U.S. Treasury Bill Index 0.05 1.08 1.12
CPI
Consumer Price Index 6.22% 3.03% 2.73%
Your Fund’s Performance at a Glance
1
As a shareholder of the fund, you incur ongoing costs, which include costs for portfolio
management, administrative services, and shareholder reports (like this one), among others.
Operating expenses, which are deducted from a fund’s gross income, directly reduce the
investment return of the fund.
A fund’s expenses are expressed as a percentage of its average net assets. This figure is known
as the expense ratio. The following examples are intended to help you understand the ongoing
costs (in dollars) of investing in your fund and to compare these costs with those of other mutual
funds. The examples are based on an investment of $1,000 made at the beginning of the period
shown and held for the entire period.
The accompanying table illustrates your fund’s costs in two ways:
• Based on actual fund return. This section helps you to estimate the actual expenses that you
paid over the period. The ”Ending Account Value“ shown is derived from the fund‘s actual return,
and the third column shows the dollar amount that would have been paid by an investor who
started with $1,000 in the fund. You may use the information here, together with the amount you
invested, to estimate the expenses that you paid over the period.
To do so, simply divide your account value by $1,000 (for example, an $8,600 account value
divided by $1,000 = 8.6), then multiply the result by the number given for your fund under the
heading ”Expenses Paid During Period.“
• Based on hypothetical 5% yearly return. This section is intended to help you compare your
fund‘s costs with those of other mutual funds. It assumes that the fund had a yearly return of 5%
before expenses, but that the expense ratio is unchanged. In this case—because the return used
is not the fund’s actual return—the results do not apply to your investment. The example is useful
in making comparisons because the Securities and Exchange Commission requires all mutual
funds to calculate expenses based on a 5% return. You can assess your fund’s costs by comparing
this hypothetical example with the hypothetical examples that appear in shareholder reports of
other funds.
Note that the expenses shown in the table are meant to highlight and help you compare ongoingcosts only and do not reflect transaction costs incurred by the fund for buying and selling
securities. Further, the expenses do not include any purchase, redemption, or account service fees
described in the fund prospectus. If such fees were applied to your account, your costs would be
higher. Your fund does not carry a “sales load.”
The calculations assume no shares were bought or sold during the period. Your actual costs may
have been higher or lower, depending on the amount of your investment and the timing of any
purchases or redemptions.
You can find more information about the fund’s expenses, including annual expense ratios, in the
Financial Statements section of this report. For additional information on operating expenses and
other shareholder costs, please refer to your fund’s current prospectus.
About Your Fund’s Expenses
2

Six Months Ended October 31, 2021Beginning
Account Value4/30/2021
EndingAccount Value
10/31/2021
ExpensesPaid During
Period
Based on Actual Fund Return
Total World Stock Index Fund
ETF Shares $1,000.00 $1,066.20 $0.31
Admiral™ Shares 1,000.00 1,066.20 0.52
Institutional Shares 1,000.00 1,066.10 0.42
Based on Hypothetical 5% Yearly Return
Total World Stock Index Fund
ETF Shares $1,000.00 $1,024.90 $0.31
Admiral Shares 1,000.00 1,024.70 0.51
Institutional Shares 1,000.00 1,024.80 0.41
The calculations are based on expenses incurred in the most recent six-month period. The fund’s annualized six-month expense ratios forthat period are 0.06% for ETF Shares, 0.10% for Admiral Shares, and 0.08% for Institutional Shares. The dollar amounts shown as“Expenses Paid” are equal to the annualized expense ratio multiplied by the average account value over the period, multiplied by thenumber of days in the most recent six-month period, then divided by the number of days in the most recent 12-month period (184/365).
3

All of the returns in this report represent past performance, which is not a guarantee of
future results that may be achieved by the fund. (Current performance may be lower or
higher than the performance data cited. For performance data current to the most recent
month-end, visit our website at vanguard.com/performance.) Note, too, that both
investment returns and principal value can fluctuate widely, so an investor’s shares, when
sold, could be worth more or less than their original cost. The returns shown do not reflect
taxes that a shareholder would pay on fund distributions or on the sale of fund shares.
Cumulative Performance: October 31, 2011, Through October 31, 2021Initial Investment of $10,000
$33,000
6,000
30,187
2021202020192018201720162015201420132012
Average Annual Total ReturnsPeriods Ended October 31, 2021
OneYear
FiveYears
TenYears
Final Valueof a $10,000Investment
Total World Stock Index Fund
ETF Shares Net Asset Value 37.99% 14.88% 11.68% $30,187
Total World Stock Index FundETF Shares Market Price 37.95 14.89 11.68 30,187
Spliced Total World Stock Index 38.26 14.93 11.67 30,162
Spliced Total World Stock Index: FTSE All-World Index through December 18, 2011, and FTSE Global All Cap Index thereafter. Benchmarkreturns are adjusted for withholding taxes.
OneYear
SinceInception(2/7/2019)
Final Valueof a $10,000Investment
Total World Stock Index FundAdmiral Shares 37.98% 18.84% $16,015
Spliced Total World Stock Index 38.26 18.86 16,025
“Since Inception” performance is calculated from the Admiral Shares’ inception date for both the fund and its comparative standard(s).
Total World Stock Index Fund
Performance Summary
See Financial Highlights for dividend and capital gains information.
4

Average Annual Total ReturnsPeriods Ended October 31, 2021
OneYear
FiveYears
TenYears
Final Valueof a $5,000,000
Investment
Total World Stock Index FundInstitutional Shares 37.97% 14.88% 11.69% $15,100,407
Spliced Total World Stock Index 38.26 14.93 11.67 15,081,078
Cumulative Returns of ETF Shares: October 31, 2011, Through October 31, 2021
OneYear
FiveYears
TenYears
Total World Stock Index Fund ETF Shares Market Price 37.95% 100.20% 201.87%
Total World Stock Index Fund ETF Shares Net Asset Value 37.99 100.09 201.87
Spliced Total World Stock Index 38.26 100.54 201.62
For the ETF Shares, the market price is determined by the midpoint of the bid-offer spread as of the closing time of the New York StockExchange (generally 4 p.m., Eastern time). The net asset value is also determined as of the NYSE closing time. For more information abouthow the ETF Shares’ market prices have compared with their net asset value, visit vanguard.com, select your ETF, and then select thePrice and Performance tab. The ETF premium/discount analysis there shows the percentages of days on which the ETF Shares’ marketprice was above or below the NAV.
Total World Stock Index Fund
5

United States 59.3%
Japan 6.3
United Kingdom 3.9
China 3.7
Canada 2.9
France 2.5
Switzerland 2.3
Germany 2.2
Australia 2.0
Taiwan 1.9
India 1.5
South Korea 1.5
Netherlands 1.2
Sweden 1.1
Other 7.7
The table reflects the fund’s investments, except for short-terminvestments and derivatives.
The fund may invest in derivatives (such as futures and swapcontracts) for various reasons, including, but not limited to,attempting to remain fully invested and tracking its target index asclosely as possible.
Total World Stock Index Fund
Fund AllocationAs of October 31, 2021
6

The fund files its complete schedule of portfolio holdings with the Securities and Exchange
Commission (SEC) for the first and third quarters of each fiscal year as an exhibit to its reports on
Form N-PORT. The fund’s Form N-PORT reports are available on the SEC’s website at
www.sec.gov.
Shares
MarketValue•
($000)
Common Stocks (99.6%)
Argentina (0.1%)* MercadoLibre Inc. 19,950 29,546
Australia (2.0%) Commonwealth
Bank of Australia 743,633 58,942 CSL Ltd. 198,652 45,201 BHP Group Ltd. 1,291,553 35,475 National Australia
Bank Ltd. 1,436,221 31,226 Westpac Banking
Corp. 1,596,165 31,054 Australia & New
Zealand BankingGroup Ltd. 1,238,430 26,354
1 Macquarie GroupLtd. 146,130 21,573
Wesfarmers Ltd. 495,218 21,426 Woolworths Group
Ltd. 521,990 15,036 Transurban Group
(XASX) 1,333,889 13,591 Goodman Group 796,657 13,190 Rio Tinto Ltd. 164,814 11,292 Aristocrat Leisure
Ltd. 294,345 10,439* Afterpay Ltd. 97,472 9,030 James Hardie
Industries plcGDR 195,261 7,671
Amcor plc GDR 616,478 7,461 Woodside
Petroleum Ltd. 424,799 7,426 Fortescue Metals
Group Ltd. 705,572 7,352 Coles Group Ltd. 561,253 7,273 Newcrest Mining
Ltd. 360,653 6,757 Sonic Healthcare
Ltd. 212,156 6,438* Xero Ltd. 55,449 6,322 QBE Insurance
Group Ltd. 651,107 5,830 South32 Ltd. 2,105,487 5,680 ASX Ltd. 86,713 5,453 Scentre Group 2,305,749 5,259 Telstra Corp. Ltd. 1,794,042 5,186 Suncorp Group Ltd. 569,247 5,037 Brambles Ltd. 644,383 4,889
Shares
MarketValue•
($000)
Cochlear Ltd. 28,836 4,823 Santos Ltd. 792,202 4,160 Ramsay Health Care
Ltd. 76,349 4,081 Dexus Industria
REIT (XASX) 492,630 4,041 Insurance Australia
Group Ltd. 1,096,802 3,974 SEEK Ltd. 154,291 3,835 Stockland 1,083,626 3,735 Mirvac Group 1,694,883 3,617* Sydney Airport 559,754 3,471 BlueScope Steel
Ltd. 216,750 3,387 Computershare Ltd.
(XASX) 237,547 3,380 Tabcorp Holdings
Ltd. 895,469 3,372 Northern Star
Resources Ltd. 479,859 3,322 GPT Group 825,661 3,223 APA Group 499,697 3,100 Medibank Pvt Ltd. 1,189,065 2,988 Oil Search Ltd. 920,514 2,982 Origin Energy Ltd. 776,728 2,975 Endeavour Group
Ltd. 546,885 2,810 REA Group Ltd. 22,291 2,705 OZ Minerals Ltd. 139,746 2,658 Domino's Pizza
Enterprises Ltd. 25,781 2,645 Treasury Wine
Estates Ltd. 301,339 2,629 Charter Hall Group 197,787 2,595 Lendlease Corp.
Ltd. 295,818 2,344 Ampol Ltd. 97,212 2,249 carsales.com Ltd. 119,852 2,243 IDP Education Ltd. 78,080 2,209 Orica Ltd. 190,871 2,191* Lynas Rare Earths
Ltd. 376,236 2,099 Vicinity Centres 1,529,058 1,997 ALS Ltd. 194,346 1,949 Atlas Arteria Ltd. 412,378 1,938 Aurizon Holdings
Ltd. 748,612 1,909 IGO Ltd. 259,904 1,903* Pilbara Minerals Ltd. 1,134,829 1,903
Total World Stock Index Fund
Financial Statements
Schedule of InvestmentsAs of October 31, 2021
7

Shares
MarketValue•
($000)
Evolution MiningLtd. 696,093 1,890
Bank of QueenslandLtd. 276,477 1,841
Incitec Pivot Ltd. 805,575 1,823 Reece Ltd. 120,197 1,823* NEXTDC Ltd. 197,602 1,764 Mineral Resources
Ltd. 59,949 1,762 JB Hi-Fi Ltd. 46,042 1,758 Qube Holdings Ltd. 701,277 1,694 Magellan Financial
Group Ltd. 63,679 1,675* Orocobre Ltd. 246,823 1,667 Alumina Ltd. 1,085,401 1,640 Bendigo & Adelaide
Bank Ltd. 216,950 1,520 Challenger Ltd. 286,194 1,503 Reliance Worldwide
Corp. Ltd. 340,729 1,498 AusNet Services
Ltd. 804,413 1,496 WiseTech Global
Ltd. 36,654 1,429 Metcash Ltd. 459,054 1,415 Downer EDI Ltd. 282,253 1,349 Steadfast Group
Ltd. 372,228 1,310 Altium Ltd. 46,309 1,290* Qantas Airways Ltd. 316,007 1,280 Worley Ltd. 154,268 1,268 Breville Group Ltd. 56,460 1,257 Ansell Ltd. 52,288 1,252 Nine Entertainment
Co. Holdings Ltd. 583,917 1,223 Iluka Resources Ltd. 166,896 1,191 AGL Energy Ltd. 270,059 1,165* AMP Ltd. 1,407,066 1,151 Bapcor Ltd. 182,563 1,101* Crown Resorts Ltd. 144,921 1,092 Cleanaway Waste
Management Ltd. 536,684 1,091 Eagers Automotive
Ltd. 96,272 1,082 ARB Corp. Ltd. 27,604 1,017* Star Entertainment
Grp Ltd. 355,799 989 Harvey Norman
Holdings Ltd. 257,527 966* Uniti Group Ltd. 313,036 965 Washington H Soul
Pattinson & Co.Ltd. 39,134 964
*,2 Flight Centre TravelGroup Ltd. 62,838 951
nib holdings Ltd. 188,364 948 CSR Ltd. 209,804 942* Zip Co. Ltd. 190,478 941* Boral Ltd. 190,362 918 Seven Group
Holdings Ltd. 56,072 916 Orora Ltd. 363,449 909 National Storage
REIT 492,135 891 Premier
Investments Ltd. 37,922 880
Shares
MarketValue•
($000)
Shopping CentresAustralasiaProperty Group 414,143 870
Charter Hall LongWale REIT 231,263 848
Pendal Group Ltd. 164,721 833 IOOF Holdings Ltd. 266,536 825* Imugene Ltd. 2,147,192 808 Healius Ltd. 218,206 799*,2 Webjet Ltd. 165,898 794* Whitehaven Coal
Ltd. 387,232 766* Corporate Travel
Management Ltd. 40,888 758 Amcor plc 62,832 758 Lifestyle
Communities Ltd. 45,419 750* Chalice Mining Ltd. 148,710 750* Liontown Resources
Ltd. 519,977 750* Perseus Mining Ltd. 627,347 744 Pro Medicus Ltd. 18,192 735 Link Administration
Holdings Ltd. 220,381 726 Centuria Capital
Group 298,615 726 Ingenia
CommunitiesGroup 144,484 714
Perpetual Ltd. 24,597 703 Waypoint REIT 340,272 702 Sims Ltd. 64,418 701 Beach Energy Ltd. 664,200 698* Megaport Ltd. 51,207 693 Super Retail Group
Ltd. 70,173 688 TPG Telecom Ltd. 132,802 678* PointsBet Holdings
Ltd. 105,113 660 IRESS Ltd. 70,695 644* Paladin Energy Ltd. 941,119 625 BWP Trust 194,745 624 AUB Group Ltd. 37,702 621 Arena REIT 182,201 620 Charter Hall Social
InfrastructureREIT 213,949 616
3 Viva Energy GroupLtd. 338,136 596
Abacus PropertyGroup 210,172 568
Charter Hall RetailREIT 182,119 565
* Champion Iron Ltd. 168,071 561 Deterra Royalties
Ltd. 189,302 557 Centuria Industrial
REIT 201,668 556 Technology One Ltd. 59,623 554 Elders Ltd. 60,037 545 Sandfire Resources
Ltd. (XASX) 127,922 539 InvoCare Ltd. 61,718 529 Rural Funds Group 248,430 522 CIMIC Group Ltd. 34,447 519 Blackmores Ltd. 7,151 510* Nufarm Ltd. 154,478 509
Total World Stock Index Fund
8

Shares
MarketValue•
($000)
Credit Corp. GroupLtd. 21,268 506
Bega Cheese Ltd. 122,457 502 Clinuvel
PharmaceuticalsLtd. 16,708 490
* EVENT HospitalityandEntertainmentLtd. 39,152 485
*,3 Life360 Inc. GDR 58,318 4832 HUB24 Ltd. 19,929 479 Collins Foods Ltd. 49,137 477 Brickworks Ltd. 26,328 472 Lovisa Holdings Ltd. 28,117 463* Telix
PharmaceuticalsLtd. 99,039 452
Pinnacle InvestmentManagementGroup Ltd. 34,594 450
* Australian StrategicMaterials Ltd. 55,606 447
Ramelius ResourcesLtd. 372,219 444
Australian EthicalInvestment Ltd. 42,777 442
GrainCorp Ltd.Class A 91,043 433
* De Grey Mining Ltd. 517,915 431* Temple & Webster
Group Ltd. 44,749 431* ioneer Ltd. 808,000 418 Netwealth Group
Ltd. 31,459 413 Aventus Group 159,073 410 Dexus Industria
REIT 159,732 406* Nanosonics Ltd. 89,279 401 Domain Holdings
Australia Ltd. 91,179 396 Western Areas Ltd. 164,101 393* Silver Lake
Resources Ltd. 310,618 393 Adbri Ltd. 172,872 389 Codan Ltd. 50,891 388 Nickel Mines Ltd. 487,238 386 Regis Resources
Ltd. 249,274 374* Karoon Energy Ltd. 268,395 369* Capricorn Metals
Ltd. 190,001 367 MyState Ltd. 93,253 366 Hansen
Technologies Ltd. 76,538 365 GDI Property Group 410,674 362 Centuria Office REIT 196,798 357 Hotel Property
Investments 130,574 353 IPH Ltd. 54,206 352 Home Consortium
Ltd. 58,853 352*,2 Vulcan Energy
Resources Ltd. 36,886 352* West African
Resources Ltd. 358,465 348 Cromwell Property
Group 567,566 347 GUD Holdings Ltd. 37,380 346
Shares
MarketValue•
($000)
Costa GroupHoldings Ltd.(XASX) 156,496 346
* Tyro Payments Ltd. 112,690 344 Platinum Asset
Management Ltd. 145,485 336 Imdex Ltd. 153,718 332 Appen Ltd. 40,273 328* Eclipx Group Ltd. 172,186 325 SeaLink Travel Group
Ltd. 57,576 319 Senex Energy Ltd. 95,075 318*,2 Mesoblast Ltd. 262,914 316 Genworth Mortgage
InsuranceAustralia Ltd. 179,466 312
Gold RoadResources Ltd. 290,876 302
* G8 Education Ltd. 359,410 299* PolyNovo Ltd. 214,784 297 Growthpoint
PropertiesAustralia Ltd. 92,600 291
United Malt Grp Ltd. 94,310 289* Superloop Ltd. 293,545 286 Johns Lyng Group
Ltd. 57,196 280 St. Barbara Ltd. 253,880 279* Betmakers
Technology GroupLtd. 296,392 275
*,3 Coronado GlobalResources Inc.GDR 261,832 270
Accent Group Ltd. 144,190 270* Dubber Corp. Ltd. 114,926 265* City Chic Collective
Ltd. 56,501 264* Starpharma
Holdings Ltd.Class A 320,543 254
Data#3 Ltd. 58,914 252 Inghams Group Ltd. 88,279 248* Audinate Group Ltd. 38,055 244 Select Harvests Ltd. 43,244 242 NRW Holdings Ltd. 174,335 242* EML Payments Ltd. 105,956 238* Australian
Agricultural Co.Ltd. 198,343 236
* Redbubble Ltd. 74,363 234 Monadelphous
Group Ltd. 29,944 228* oOh!media Ltd. 165,108 227 GWA Group Ltd. 108,684 223* Myer Holdings Ltd. 545,572 223 Omni Bridgeway
Ltd. 94,211 221 Dicker Data Ltd. 19,419 220 Estia Health Ltd. 138,781 219 Baby Bunting Group
Ltd. 48,163 215* nearmap Ltd. 127,771 2142 HomeCo Daily
Needs REIT 195,388 212 SmartGroup Corp.
Ltd. 34,915 211 Tassal Group Ltd. 77,455 207
Total World Stock Index Fund
9

Shares
MarketValue•
($000)* Bellevue Gold Ltd. 321,745 207 Jumbo Interactive
Ltd. 16,258 2052 Emeco Holdings
Ltd. 242,499 202 Money3 Corp. Ltd. 78,326 197* Fineos Corp. Ltd.
GDR 64,697 195 Westgold
Resources Ltd. 130,456 191 Vita Group Ltd. 304,606 190* PPK Group Ltd. 19,014 187 BWX Ltd. 50,991 179* Nuix Ltd. 76,126 178 Perenti Global Ltd. 228,452 177 Australian
PharmaceuticalIndustries Ltd. 154,238 175
2 Kogan.com Ltd. 22,722 171 Integral Diagnostics
Ltd. 45,882 162* Seven West Media
Ltd. 466,784 161 McMillan
Shakespeare Ltd. 15,440 160 Bravura Solutions
Ltd. 75,685 159 Australian Finance
Group Ltd. 79,434 158 Austal Ltd. 109,789 156 Pact Group Holdings
Ltd. 65,730 154 Infomedia Ltd. 145,778 152* Mayne Pharma
Group Ltd. 564,865 145* Syrah Resources
Ltd. 148,491 142 Sigma Healthcare
Ltd. 325,671 140 Southern Cross
Media Group Ltd. 76,125 134* Cooper Energy Ltd. 597,256 131* Resolute Mining
Ltd. 410,631 129 OFX Group Ltd. 100,137 120*,2 Carnarvon
Petroleum Ltd. 469,345 120 Service Stream Ltd. 177,883 118* Aurelia Metals Ltd. 391,770 111*,2 Andromeda Metals
Ltd. 811,258 108 New Hope Corp.
Ltd. 68,583 104*,2 Paradigm
BiopharmaceuticalsLtd. 65,623 102
* Alkane ResourcesLtd. 147,212 99
Macmahon HoldingsLtd. 608,142 94
*,2 Electro OpticSystems HoldingsLtd. 38,619 93
Mount Gibson IronLtd. 286,220 91
* Marley Spoon AGGDR 117,806 91
* Opthea Ltd. 93,159 90
Shares
MarketValue•
($000)
Cedar WoodsProperties Ltd. 18,566 84
Virtus Health Ltd. 20,063 84*,2 AMA Group Ltd. 215,269 79 Jupiter Mines Ltd. 422,476 75*,1 Japara Healthcare
Ltd. 64,092 68*,2 Bubs Australia Ltd. 168,022 66* Humm Group Ltd. 96,019 64* New Century
Resources Ltd. 530,714 62 SG Fleet Group Ltd. 31,301 60 Navigator Global
Investments Ltd. 36,584 52 Regis Healthcare
Ltd. 27,703 41 MACA Ltd. 54,308 31* Dacian Gold Ltd. 165,962 29*,2 Minerals 260 Ltd. 43,531 15* Juno Minerals Ltd. 20,991 2*,1 Bgp Holdings plc 197,753 1
669,393Austria (0.1%) Erste Group Bank
AG 127,640 5,474 OMV AG 61,289 3,711 Verbund AG 28,369 2,957 voestalpine AG 49,572 1,8833 BAWAG Group AG 28,457 1,790 Wienerberger AG 48,193 1,706 Raiffeisen Bank
International AG 56,949 1,664 ANDRITZ AG 28,995 1,647 IMMOFINANZ AG 37,173 890 CA Immobilien
Anlagen AG(XWBO) 17,365 745
Mayr MelnhofKarton AG 3,719 732
* Lenzing AG 5,276 636 Telekom Austria AG
Class A 63,074 545 Oesterreichische
Post AG 12,820 541 Vienna Insurance
Group AG WienerVersicherungGruppe 18,064 526
S IMMO AG 22,083 524 EVN AG 17,858 504 UNIQA Insurance
Group AG 42,174 393 AT&S Austria
Technologie &Systemtechnik AG 9,422 361
* DO & CO AG 2,752 249* Schoeller-
BleckmannOilfieldEquipment AG 5,345 218
Strabag SE (Bearer) 5,036 216*,2 Porr AG 10,423 150 Palfinger AG 2,713 120* Flughafen Wien AG 3,428 113 Agrana Beteiligungs
AG 3,459 73* Porr AG Rights
Exp.11/3/2021 10,423 2
Total World Stock Index Fund
10

Shares
MarketValue•
($000)*,1 CA Immobilien
Anlagen AG 30,705 —
28,370Bahrain (0.0%) Ahli United Bank
BSC 2,769,761 2,694
Belgium (0.3%) Anheuser-Busch
InBev SA 365,899 22,381 KBC Group NV 120,208 11,194* Argenx SE 22,558 6,791 UCB SA 53,476 6,392 Groupe Bruxelles
Lambert SA 45,464 5,275 Umicore SA 90,607 5,195 Ageas SA 79,705 3,878 Solvay SA 29,953 3,561 Sofina SA 6,595 2,918 Warehouses De
Pauw CVA 60,812 2,769 Cofinimmo SA 13,043 2,104* Aedifica SA 15,511 2,068 Elia Group SA 15,222 1,776 D'ieteren Group 9,735 1,679 Ackermans & van
Haaren NV 9,624 1,655 Etablissements
Franz Colruyt NV 24,063 1,182 Proximus SADP 55,968 1,054 Melexis NV 8,228 949 Euronav NV 80,811 860 Montea NV 4,852 720 Barco NV 31,493 710 VGP NV 2,681 693 KBC Ancora 13,214 689 Bekaert SA 15,212 666 Telenet Group
Holding NV 16,754 602* Xior Student
Housing NV 9,561 566 Gimv NV 8,579 554 Shurgard Self
Storage SA 8,733 535* Kinepolis Group NV 8,060 508 Retail Estates NV 5,739 460 Befimmo SA 10,888 445 Fagron 24,337 422* Tessenderlo Group
SA 9,918 362* bpost SA 38,427 329* AGFA-Gevaert NV 66,622 290 Cie
d'Entreprises CFE 2,720 278* Ontex Group NV 29,502 278*,2 Mithra
PharmaceuticalsSA 11,731 258
Econocom GroupSA NV 56,008 237
Orange Belgium SA 9,315 211 Wereldhave Belgium
Comm VA 1,657 93 Van de Velde NV 1,942 67
93,654
Shares
MarketValue•
($000)
Brazil (0.5%) Vale SA 1,288,297 16,346* Petroleo Brasileiro
SA PreferenceShares 1,965,092 9,488
* Petroleo BrasileiroSA 1,438,863 7,054
Itau UnibancoHolding SAPreference Shares 1,454,883 6,009
B3 SA - Brasil BolsaBalcao 2,657,191 5,607
Vale SA Class BADR 428,024 5,449
* XP Inc. Class A 146,688 4,813* Banco Bradesco SA
Preference Shares 1,222,231 4,310 Weg SA 637,436 4,179 Ambev SA 1,294,763 3,898 Itausa SA
Preference Shares 1,984,689 3,605* StoneCo. Ltd.
Class A 100,410 3,400* Banco Bradesco SA
ADR 890,358 3,116* Natura & Co.
Holding SA 433,723 2,989 Itau Unibanco
Holding SA ADR 705,875 2,873 JBS SA 406,498 2,813* Suzano SA 310,315 2,707 Notre Dame
IntermedicaParticipacoes SA 218,206 2,481
Magazine Luiza SA 1,283,868 2,4593 Rede D'Or Sao Luiz
SA 204,571 2,139 Lojas Renner SA 366,631 2,094 Localiza Rent a Car
SA 249,557 2,003 Raia Drogasil SA 473,200 1,949 Petroleo Brasileiro
SA ADR 195,307 1,877 Vibra Energia SA 498,248 1,852 Cosan SA 512,852 1,798 Banco Do Brasil SA 347,820 1,756 Ambev SA ADR 588,786 1,743* Banco Bradesco SA 561,885 1,692 Equatorial Energia
SA 395,876 1,605 Gerdau SA
Preference Shares 329,700 1,571 Banco BTG Pactual
SA (BVMF) 387,724 1,549 Centrais Eletricas
Brasileiras SA 256,482 1,537* Rumo SA 538,016 1,524* BRF SA 364,424 1,500* Klabin SA 356,900 1,451 Telefonica Brasil SA 177,164 1,429 Petroleo Brasileiro
SA ADR (XNYS) 129,754 1,2743 Hapvida
Participacoes eInvestimentos SA 609,412 1,246
* Embraer SA 317,100 1,232 Totvs SA 200,484 1,164* Petro Rio SA 278,575 1,158* Eneva SA 451,568 1,152
Total World Stock Index Fund
11

Shares
MarketValue•
($000)
Itau UnibancoHolding SA 292,934 1,092
BB SeguridadeParticipacoes SA 267,539 1,047
* Banco SantanderBrasil SA 157,800 962
CCR SA 473,344 959* Bradespar SA
Preference Shares 109,560 945 Cia Energetica de
Minas GeraisPreference Shares 413,101 943
* Americanas SA 177,596 935 Cia de Saneamento
Basico do Estadode Sao Paulo 149,500 932
Sendas DistribuidoraSA 315,605 855
Hypera SA 171,212 851 Marfrig Global
Foods SA 176,391 828 Energisa SA 113,415 796* Braskem SA
Preference Shares 79,580 768 Ultrapar
Participacoes SA 331,796 767 Sul America SA 161,190 742 Gerdau SA ADR 156,698 741 Centrais Eletricas
Brasileiras SAPreference Shares 122,300 733
Engie Brasil EnergiaSA 100,692 694
Cia SiderurgicaNacional SA 170,600 689
* Via SA 620,989 677 Transmissora
Alianca de EnergiaEletrica SA 96,527 627
Cia Paranaense deEnergiaPreference Shares 576,000 604
3 Locaweb Servicosde Internet SA 185,437 601
Metalurgica GerdauSA PreferenceShares 270,100 599
3 Banco Inter SAPreference Shares 273,753 593
TIM SA 288,300 573* Alpargatas SA
Preference Shares 83,161 569 Cia Energetica de
Sao PauloPreference Shares 123,385 557
* Azul SA PreferenceShares 109,636 483
YDUQS Part 128,600 475 Cia de Locacao das
Americas 135,937 475 Sao Martinho SA 67,100 455 Cia Energetica de
Minas Gerais 153,347 452* GRUPO DE MODA
SOMA SA 191,618 445 EDP - Energias do
Brasil SA 127,367 442
Shares
MarketValue•
($000)
Usinas SiderurgicasDe Minas GeraisSAUsiminasPreference Shares 179,571 422
CSHG Logistica FIImobiliario 14,107 417
MultiplanEmpreendimentosImobiliarios SA 125,121 411
* Omega Geracao SA 69,315 402 Fleury SA 117,600 392 Banco Inter SA 189,494 389* BR Malls
Participacoes SA 295,118 375 M Dias Branco SA 67,300 369 Cia Siderurgica
Nacional SA ADR 89,670 366 Neoenergia SA 128,800 354 Pet Center
Comercio EParticipacoes SA 104,100 346
CPFL Energia SA 72,900 340 Kinea Indice de
Precos FII 18,318 333* Cia de Transmissao
de EnergiaEletrica PaulistaPreference Shares 76,808 331
* IRB BrasilResseguros SA 393,981 327
Kinea RendimentosImobiliarios FII 17,781 307
Atacadao SA 102,671 303 Unipar Carbocloro
SA PreferenceShares 22,570 299
* Cogna Educacao 658,273 289* Afya Ltd. Class A 16,530 288 Lojas Americanas
SA PreferenceShares (BVMF) 336,853 288
Cia Brasileira deDistribuicao 63,121 286
* Santos BrasilParticipacoes SA 312,523 285
Arezzo Industria eComercio SA 21,500 282
* Porto Seguro SA 67,744 280 TIM SA ADR 28,251 279 Dexco SA 99,885 275 Qualicorp
Consultoria eCorretora deSeguros SA 89,700 272
Odontoprev SA 114,585 272 Cyrela Brazil Realty
SAEmpreendimentose Participacoes 108,098 270
Grendene SA 177,800 270 Kinea Renda
Imobiliaria FII 10,840 261 Light SA 151,500 260 Alupar Investimento
SA 61,658 259* CVC Brasil
Operadora eAgencia deViagens SA 89,583 254
Total World Stock Index Fund
12

Shares
MarketValue•
($000)
Banco Pan SAPreference Shares 106,700 251
Banco Inter SA(BVMF) 39,573 249
Cia de Saneamentode MinasGerais-COPASA 99,867 241
SLC Agricola SA 30,800 238 Cia de Saneamento
do Parana 71,580 231 Banco do Estado do
Rio Grande do SulSA Class BPreference Shares 115,998 224
JHSF ParticipacoesSA 253,747 224
Cia Paranaense deEnergia 231,000 220
CSN Mineracao SA 227,200 212 MRV Engenharia e
Participacoes SA 116,700 210* Gol Linhas Aereas
Inteligentes SAPreference Shares 75,974 204
* Grupo Mateus SA 156,400 198* Grupo SBF SA 51,109 190 Camil Alimentos SA 106,200 182 Aliansce Sonae
Shopping CentersSA 50,598 172
Iguatemi Empresade ShoppingCenters SA 31,500 167
Usinas Siderurgicasde Minas GeraisSA Usiminas 70,700 161
Minerva SA 91,760 158* Anima Holding SA 132,984 156 AES Brasil Energia
SA 79,497 154 Vivara Participacoes
SA 33,200 153 Raizen SA
Preference Shares 126,503 152 SIMPAR SA 83,272 151* Vamos Locacao de
CaminhoesMaquinas eEquipamentos SA 75,081 151
Cielo SA 383,088 149 Cia Ferro Ligas da
Bahia - FERBASAPreference Shares 17,400 146
Lojas AmericanasSA (BVMF) 159,865 140
MovidaParticipacoes SA 52,800 139
* Intelbras SAIndustria deTelecomunicacaoEletronicaBrasileira 28,700 134
RandonSAImplementos EParticipacoesPreference Shares 71,064 128
Boa Vista ServicosSA 76,100 123
Shares
MarketValue•
($000)
LOG CommercialProperties eParticipacoes SA 29,615 123
* EcoRodoviasInfraestrutura eLogistica SA 81,353 118
BR Properties SA 89,835 115* Iochpe Maxion SA 37,596 112 Lojas Quero Quero
SA 54,300 111 Ez Tec
Empreendimentose ParticipacoesSA 33,961 110
Marcopolo SAPreference Shares 231,609 106
AmbiparParticipacoes eEmpreendimentosSA 15,900 104
* Aeris Industria EComercio DeEquipamentosPara Geracao DeEnergia SA 71,900 100
Cia de Saneamentodo ParanaPreference Shares 139,400 92
MPM Corporeos SA 51,200 89 Tupy SA 23,300 86 Construtora Tenda
SA 27,118 823 Meliuz SA 138,942 82* BK Brasil Operacao
e Assessoria aRestaurantes SA 65,544 80
* Hidrovias do BrasilSA 151,300 80
Mahle-Metal LeveSA 12,100 73
* Sequoia Logistica ETransportes SA 27,700 64
JereissatiParticipacoes SA 12,761 60
GuararapesConfeccoes SA 29,000 56
EnautaParticipacoes SA 23,045 52
DirecionalEngenharia SA 28,542 48
Instituto HermesPardini SA 12,400 48
Wiz Solucoes eCorretagem deSeguros SA 25,310 43
3 Ser Educacional SA 23,047 43 Even Construtora e
Incorporadora SA 35,991 40* C&a Modas Ltda 35,000 38* Getnet Adquirencia
e Servicos paraMeios dePagamento SA 39,450 30
* EmpreendimentosPague Menos S/A 4,601 8
Cosan SA ADR 4 —
Total World Stock Index Fund
13

Shares
MarketValue•
($000)* Ultrapar
ParticipacoesRightsExp.11/3/2021 23,781 —
175,751Canada (2.9%) Royal Bank of
Canada 614,280 63,940 Toronto-Dominion
Bank 788,702 57,254* Shopify Inc. Class A
(XTSE) 28,906 42,397 Enbridge Inc. 880,686 36,890 Brookfield Asset
Management Inc.Class A 580,292 35,035
2 Bank of Nova Scotia 524,327 34,376 Canadian National
Railway Co. 257,990 34,2872 Bank of Montreal 281,195 30,530* Shopify Inc. Class A 20,090 29,333 TC Energy Corp. 429,922 23,257 Canadian Imperial
Bank ofCommerce 187,205 22,715
Canadian PacificRailway Ltd. 290,964 22,521
Canadian NaturalResources Ltd. 509,860 21,670
Nutrien Ltd. 250,271 17,492 Suncor Energy Inc. 653,963 17,200 Manulife Financial
Corp. 851,921 16,596 Waste Connections
Inc. 116,543 15,858 Constellation
Software Inc. 8,391 14,747 Sun Life Financial
Inc. 254,615 14,510 Alimentation
Couche-Tard Inc.Class B 346,295 12,989
National Bank ofCanada 147,118 12,180
Franco-Nevada Corp. 83,287 11,884 Barrick Gold Corp.
(XLON) 568,287 10,428 Magna International
Inc. 123,777 10,068 Fortis Inc. (XTSE) 209,382 9,320 Thomson Reuters
Corp. 73,787 8,876* CGI Inc. 96,145 8,589 Intact Financial
Corp. 62,192 8,337 Pembina Pipeline
Corp. 242,620 8,032 Wheaton Precious
Metals Corp. 198,068 7,996 Power Corp. of
Canada 237,960 7,926 Restaurant Brands
International Inc.(XTSE) 132,859 7,522
RogersCommunicationsInc. Class B 153,230 7,127
WSP Global Inc. 51,498 6,982 BCE Inc. 132,768 6,835
Shares
MarketValue•
($000)
Cenovus Energy Inc. 556,195 6,651 Open Text Corp. 122,466 6,169 First Quantum
Minerals Ltd. 244,743 5,794 Dollarama Inc. 127,926 5,782* Teck Resources Ltd.
Class B 203,949 5,692 Agnico Eagle Mines
Ltd. 107,073 5,683 Shaw
CommunicationsInc. Class B 193,789 5,581
Metro Inc. 110,000 5,535* Lightspeed
Commerce Inc. 56,427 5,500 Loblaw Cos. Ltd. 68,840 5,1772 Emera Inc. 110,528 5,142 Kirkland Lake Gold
Ltd. 117,826 4,967 Tourmaline Oil Corp. 123,461 4,462 TELUS Corp. 194,189 4,455 TFI International Inc. 40,155 4,453 Fairfax Financial
Holdings Ltd. 10,818 4,381 Cameco Corp. 172,763 4,198 Barrick Gold Corp. 214,008 3,939 Algonquin Power &
Utilities Corp. 273,085 3,937* Bausch Health Cos.
Inc. 138,031 3,869* CAE Inc. 126,615 3,840 West Fraser Timber
Co. Ltd. 47,685 3,8182 Canadian Tire Corp.
Ltd. Class A 25,243 3,585 Canadian Apartment
Properties REIT 73,373 3,583 CCL Industries Inc.
Class B 63,834 3,489 Great-West Lifeco
Inc. 116,386 3,424 George Weston Ltd. 31,607 3,415 Kinross Gold Corp. 556,658 3,346 FirstService Corp. 16,651 3,321 Northland Power
Inc. 102,680 3,301 Ritchie Bros
Auctioneers Inc. 47,639 3,2563 Hydro One Ltd. 135,779 3,244*,3 Nuvei Corp. 26,739 3,214 Gildan Activewear
Inc. 84,562 3,106 Toromont Industries
Ltd. 34,196 3,042 Imperial Oil Ltd. 88,773 3,005* Descartes Systems
Group Inc. 35,779 2,922 ARC Resources Ltd. 297,612 2,854 Brookfield
InfrastructureCorp. Class A 45,752 2,773
RioCan REIT 151,744 2,733 iA Financial Corp.
Inc. 45,999 2,721 Saputo Inc. 109,166 2,607 TMX Group Ltd. 23,898 2,587 Stantec Inc. 45,155 2,4962 AltaGas Ltd. 117,447 2,431
Total World Stock Index Fund
14

Shares
MarketValue•
($000)
Onex Corp. 32,499 2,4222 Keyera Corp. 94,247 2,416* BlackBerry Ltd. 217,979 2,355 Lundin Mining Corp. 268,866 2,340 Pan American Silver
Corp. 89,052 2,279 Empire Co. Ltd.
Class A 76,049 2,274 Finning International
Inc. 76,088 2,253 Granite REIT 26,377 2,138 Quebecor Inc.
Class B 78,319 1,996* Ballard Power
Systems Inc. 107,860 1,955 Allied Properties
REIT 55,872 1,931 SNC-Lavalin Group
Inc. 71,410 1,921 GFL Environmental
Inc. 46,228 1,901 Element Fleet
ManagementCorp. 174,768 1,899
Colliers InternationalGroup Inc. 12,767 1,852
* Ivanhoe Mines Ltd.Class A 223,523 1,754
Parkland Corp. 60,197 1,752* Kinaxis Inc. 11,152 1,731 B2Gold Corp. 413,099 1,706 Boyd Group
Services Inc. 8,781 1,704 Premium Brands
Holdings Corp.Class A 15,536 1,679
CI Financial Corp. 71,976 1,641 Capital Power Corp. 49,759 1,634 Yamana Gold Inc. 400,095 1,571 H&R REIT 110,674 1,521*,2 Bombardier Inc.
Class B 940,082 1,512 Canadian Utilities
Ltd. Class A 51,896 1,503 Brookfield
Renewable Corp.Class A 35,688 1,478
* Aritzia Inc. 37,485 1,476 SSR Mining Inc. 91,905 1,450 BRP Inc. 16,366 1,439 IGM Financial Inc. 34,571 1,373* Air Canada Class A 75,075 1,346*,2 Canopy Growth
Corp. 105,594 1,335 SmartCentres REIT 52,716 1,329 Choice Properties
REIT 108,928 1,311 Enerplus Corp. 137,181 1,299 Methanex Corp. 28,925 1,296 Alamos Gold Inc.
Class A 170,423 1,264 First Capital REIT 86,150 1,231 PrairieSky Royalty
Ltd. 98,450 1,212 Boralex Inc. Class A 38,408 1,189 Gibson Energy Inc. 58,072 1,170 TransAlta Corp. 104,337 1,170
Shares
MarketValue•
($000)
Crescent PointEnergy Corp. 228,595 1,149
Canadian WesternBank 35,855 1,147
* MEG Energy Corp. 126,331 1,1322 First Majestic Silver
Corp. 87,130 1,104* Pretium Resources
Inc. 90,435 1,094 Atco Ltd. Class I 32,002 1,086* ATS Automation
Tooling SystemsInc. 31,706 1,079
Cargojet Inc. 6,687 1,065 Linamar Corp. 18,476 1,016 Primo Water Corp. 63,183 1,006 Stella-Jones Inc. 27,699 994 Innergex Renewable
Energy Inc. 58,303 970* Canada Goose
Holdings Inc. 25,589 949 Parex Resources
Inc. 48,843 948* Equinox Gold Corp. 126,611 939 Osisko Gold
Royalties Ltd. 70,185 886 Laurentian Bank of
Canada 26,221 883 Brookfield
Renewable Corp.Class A (XTSE) 21,325 883
* Eldorado Gold Corp. 96,121 860 ECN Capital Corp. 98,373 855 Chartwell
RetirementResidences 86,155 831
Enghouse SystemsLtd. 18,594 806
Maple Leaf FoodsInc. 34,402 750
Centerra Gold Inc. 95,574 717*,2 Aurora Cannabis Inc. 105,705 701 Russel Metals Inc. 26,125 689 Whitecap
Resources Inc. 114,598 688* Vermilion Energy
Inc. 62,870 682 Superior Plus Corp. 61,160 680 Stelco Holdings Inc. 19,417 674* Home Capital Group
Inc. Class B 20,552 667* Novagold Resources
Inc. 90,139 658* OceanaGold Corp. 345,291 645 Cominar REIT 66,759 6232 Boardwalk REIT 14,268 616 North West Co. Inc. 21,943 596 Hudbay Minerals
Inc. 79,265 553 TransAlta
Renewables Inc. 37,359 553 NFI Group Inc. 27,128 550 Cascades Inc. 44,345 514* IAMGOLD Corp. 177,175 488* Canfor Corp. 23,459 486* Turquoise Hill
Resources Ltd. 37,125 470 Aecon Group Inc. 30,083 449
Total World Stock Index Fund
15

Shares
MarketValue•
($000)
Dye & Durham Ltd. 13,925 426 Winpak Ltd. 13,570 425 Artis REIT 43,300 410 Transcontinental Inc.
Class A 25,901 410* Celestica Inc. 40,101 395* Torex Gold
Resources Inc. 33,404 388* Cronos Group Inc. 70,696 367 Mullen Group Ltd. 32,690 338 Cogeco
CommunicationsInc. 3,793 326
WestshoreTerminalsInvestment Corp. 14,700 318
Dream Office REIT 15,117 285 Martinrea
International Inc. 29,300 272 First National
Financial Corp. 7,029 237 Brookfield Asset
ManagementReinsurancePartners Ltd.Class A 3,727 230
Canadian ImperialBank ofCommerce (XTSE) 1,229 149
GFL EnvironmentalInc. (XTSE) 1,460 60
* Bombardier Inc.Class A 7,478 13
989,367Chile (0.0%) Sociedad Quimica y
Minera de ChileSA Class BPreference Shares 51,068 2,773
Banco De Chile 18,709,814 1,624* Empresas COPEC
SA 197,654 1,555 Empresas CMPC SA 511,771 944 Enel Americas SA 7,732,643 879 Falabella SA 315,774 873 Banco Santander
Chile SA 19,589,525 857 Cencosud SA 568,969 832 Banco de Credito e
Inversiones SA 20,824 701 Sociedad Quimica y
Minera de ChileSA ADR 10,910 599
Enel Chile SA 12,468,240 511 Cia Sud Americana
de Vapores SA 7,515,641 488 Cia Cervecerias
Unidas SA 55,525 465 CAP SA 38,966 386* Parque Arauco SA 360,481 356 Banco Santander
Chile ADR 18,759 332 Embotelladora
Andina SAPreference Shares 149,068 308
Cencosud ShoppingSA 263,796 255
Colbun SA 3,109,604 215
Shares
MarketValue•
($000)* Latam Airlines
Group SA 130,499 191 Aguas Andinas SA
Class A 974,615 186 Empresa Nacional
deTelecomunicacionesSA 52,751 181
Vina Concha y ToroSA 117,757 171
* Inversiones AguasMetropolitanasSA 349,036 164
Enel Chile SA ADR 65,984 143* Plaza SA 137,445 137* Itau CorpBanca
Chile SA 61,154,961 136 AES Andes SA 1,218,430 125 SMU SA 1,180,463 118 Engie Energia Chile
SA 169,857 99* Ripley Corp. SA 580,437 98 Salfacorp SA 196,211 67 SONDA SA 157,659 53 Inversiones La
Construccion SA 9,475 34 Enel Americas SA
ADR 303 2*,1 Itau CorpBanca
Chile SA RightsExp. 11/2/21 55,032,904 —
16,858China (3.7%) Tencent Holdings
Ltd. 2,608,102 158,650* Alibaba Group
Holding Ltd. 6,197,220 127,431*,3 Meituan Class B 1,693,957 57,643 China Construction
Bank Corp.Class H 40,591,026 27,625
* NIO Inc. ADR 567,609 22,369*,3 Wuxi Biologics
Cayman Inc. 1,430,240 21,664* JD.com Inc. Class A 549,424 21,508* Baidu Inc. ADR 120,381 19,531 Industrial &
Commercial Bankof China Ltd.Class H 32,886,245 18,027
*,3 Xiaomi Corp.Class B 5,846,000 15,980
Ping An InsuranceGroup Co. ofChina Ltd. Class H 2,187,966 15,672
* Pinduoduo Inc. ADR 162,538 14,453 China Merchants
Bank Co. Ltd.Class H 1,504,398 12,607
NetEase Inc. 639,355 12,402 BYD Co. Ltd.
Class H 298,460 11,415 Bank of China Ltd.
Class H 31,994,410 11,323 Kweichow Moutai
Co. Ltd. Class A 38,530 10,995 Li Ning Co. Ltd. 965,750 10,657* XPeng Inc. Class A
ADR 207,451 9,673
Total World Stock Index Fund
16

Shares
MarketValue•
($000)*,3 Kuaishou Technology 679,800 8,893 China Mengniu
Dairy Co. Ltd. 1,366,236 8,693*,2 Bilibili Inc. ADR 110,702 8,114 Geely Automobile
Holdings Ltd. 2,320,200 8,053 ANTA Sports
Products Ltd. 498,000 7,716 Sunny Optical
Technology GroupCo. Ltd. 286,400 7,685
ShenzhouInternationalGroup HoldingsLtd. 333,466 7,184
China MerchantsBank Co. Ltd.Class A 805,949 6,789
* Trip.com Group Ltd.ADR 237,138 6,773
Ping An InsuranceGroup Co. ofChina Ltd. Class A 771,217 5,957
Country GardenServices HoldingsCo. Ltd. 773,141 5,952
China ResourcesBeer Holdings Co.Ltd. 716,681 5,918
* ENN EnergyHoldings Ltd. 334,918 5,770
* Li Auto Inc. ADR 174,598 5,697 Great Wall Motor
Co. Ltd. Class H 1,232,058 5,544*,3 Innovent Biologics
Inc. 581,441 5,204 China Petroleum
and ChemicalCorp. (Sinopec)Class H 9,873,337 4,811
China Life InsuranceCo. Ltd. Class H 2,761,271 4,797
China ResourcesLand Ltd. 1,227,909 4,771
Agricultural Bank ofChina Class H 13,608,500 4,624
BYD Co. Ltd.Class A 94,248 4,606
PetroChina Co. Ltd.Class H 9,222,000 4,446
* Huazhu Group Ltd.ADR 93,853 4,351
Haier Smart HomeCo. Ltd. Class H 1,165,800 4,341
3 Longfor GroupHoldings Ltd. 871,600 4,217
Wuliangye Yibin Co.Ltd. Class A 124,200 4,197
CSPCPharmaceuticalGroup Ltd. 3,740,000 3,903
China OverseasLand &Investment Ltd. 1,725,980 3,807
Xinyi Solar HoldingsLtd. 1,828,200 3,798
* KingdeeInternationalSoftware GroupCo. Ltd. 1,146,000 3,771
Shares
MarketValue•
($000)3 Smoore
InternationalHoldings Ltd. 775,000 3,685
China Conch VentureHoldings Ltd. 753,498 3,662
China LongyuanPower GroupCorp. Ltd. Class H 1,498,000 3,504
SinoBiopharmaceuticalLtd. 4,550,250 3,355
*,2 COSCO SHIPPINGHoldings Co. Ltd.Class H 2,158,049 3,343
China Gas HoldingsLtd. 1,335,674 3,334
Country GardenHoldings Co. 3,470,230 3,266
Zijin Mining GroupCo. Ltd. Class H 2,327,301 3,236
China PacificInsurance GroupCo. Ltd. Class H 1,024,400 3,132
* GDS Holdings Ltd.ADR 50,523 3,001
3 WuXi AppTec Co.Ltd. Class H 140,256 2,995
3 Postal Savings Bankof China Co. Ltd.Class H 3,974,000 2,888
PICC Property &Casualty Co. Ltd.Class H 3,082,330 2,869
* Zai Lab Ltd. ADR 27,400 2,861 China Shenhua
Energy Co. Ltd.Class H 1,325,500 2,850
*,3 JD HealthInternational Inc. 315,411 2,769
* Alibaba HealthInformationTechnology Ltd. 2,112,000 2,645
3 China Tower Corp.Ltd. Class H 20,396,576 2,643
Industrial &Commercial Bankof China Ltd.Class A 3,592,185 2,623
Zhongsheng GroupHoldings Ltd. 285,500 2,574
ContemporaryAmperexTechnology Co.Ltd. Class A 24,940 2,498
LONGi GreenEnergyTechnology Co.Ltd. Class A 160,984 2,455
Sunac ChinaHoldings Ltd. 1,115,400 2,385
China Tourism GroupDuty Free Corp.Ltd. Class A 55,788 2,337
Anhui ConchCement Co. Ltd.Class H 457,000 2,260
China NationalBuilding MaterialCo. Ltd. Class H 1,780,750 2,232
Total World Stock Index Fund
17

Shares
MarketValue•
($000)
China ResourcesPower HoldingsCo. Ltd. 851,400 2,204
* Vipshop HoldingsLtd. ADR 195,505 2,182
China ResourcesGas Group Ltd. 402,000 2,158
CITIC Securities Co.Ltd. Class H 837,000 2,125
Citic Pacific Ltd. 2,113,000 2,1173 China Feihe Ltd. 1,185,000 1,967* Tencent Music
EntertainmentGroup ADR 250,060 1,965
* Daqo New EnergyCorp. ADR 24,403 1,898
Industrial Bank Co.Ltd. Class A 636,600 1,853
* KE Holdings Inc.ADR 100,933 1,839
*,1 GCL-Poly EnergyHoldings Ltd. 7,206,604 1,834
* Genscript BiotechCorp. 414,000 1,832
3 China InternationalCapital Corp. Ltd.Class H 728,000 1,802
CITIC Securities Co.Ltd. Class A 445,217 1,800
Weichai Power Co.Ltd. Class H 1,002,400 1,794
Agricultural Bank ofChina Ltd. Class A 3,884,435 1,784
3 Ganfeng Lithium Co.Ltd. Class H 95,200 1,784
Ping An Bank Co.Ltd. Class A 571,500 1,741
Shanxi XinghuacunFen Wine FactoryCo. Ltd. Class A 36,924 1,739
Bank ofCommunicationsLtd. Class H 2,908,058 1,730
Kingsoft Corp. Ltd. 401,200 1,712 China CITIC Bank
Corp. Ltd. Class H 3,890,525 1,707 ZTO Express
Cayman Inc. ADR 58,119 1,705 Great Wall Motor
Co. Ltd. Class A 157,031 1,675 GF Securities Co.
Ltd. Class H 986,800 1,674 China Vanke Co. Ltd.
Class H 714,089 1,668 Haitong Securities
Co. Ltd. Class H 1,872,739 1,666 Chinasoft
International Ltd. 994,000 1,660 East Money
Information Co.Ltd. Class A 320,812 1,650
Shandong WeigaoGroup MedicalPolymer Co. Ltd.Class H 964,000 1,642
Tsingtao BreweryCo. Ltd. Class H 188,322 1,639
Luzhou Laojiao Co.Ltd. Class A 45,600 1,627
Shares
MarketValue•
($000)
Shenzhen MindrayBio-MedicalElectronics Co.Ltd. Class A 27,488 1,611
GuangdongInvestment Ltd. 1,266,000 1,592
Wanhua ChemicalGroup Co. Ltd.Class A 95,400 1,576
HenganInternationalGroup Co. Ltd. 300,230 1,569
3 Fuyao GlassIndustry GroupCo. Ltd. Class H 272,000 1,566
Bank of China Ltd.Class A 3,238,700 1,543
*,2 RLX Technology Inc.ADR 313,915 1,526
* Lufax Holding Ltd.ADR 241,046 1,521
Jiangsu HengruiMedicine Co. Ltd.Class A 192,316 1,477
Kunlun Energy Co.Ltd. 1,596,000 1,454
China Yangtze PowerCo. Ltd. Class A 435,594 1,448
Inner Mongolia YiliIndustrial GroupCo. Ltd. Class A 212,700 1,426
Kingboard HoldingsLtd. 322,340 1,405
China Life InsuranceCo. Ltd. Class A 299,672 1,390
Muyuan Foods Co.Ltd. Class A 155,348 1,389
Zijin Mining GroupCo. Ltd. Class A 846,712 1,382
* New OrientalEducation &Technology GroupInc. ADR 667,446 1,368
Shanghai FosunPharmaceuticalGroup Co. Ltd.Class H 287,639 1,354
China PacificInsurance GroupCo. Ltd. Class A 311,988 1,333
Luxshare PrecisionIndustry Co. Ltd.Class A 218,869 1,324
Tongwei Co. Ltd.Class A 148,100 1,322
3 China ResourcesMixc LifestyleServices Ltd. 251,400 1,322
Jiangsu YangheBreweryJoint-Stock Co.Ltd. Class A 45,295 1,314
*,3 Weimob Inc. 848,000 1,295 Sinopharm Group
Co. Ltd. Class H 545,000 1,294 China Petroleum &
Chemical Corp.Class A 1,943,380 1,291
*,3 China Literature Ltd. 183,600 1,274
Total World Stock Index Fund
18

Shares
MarketValue•
($000)
ZhangzhouPientzehuangPharmaceuticalCo. Ltd. Class A 19,398 1,247
Aier Eye HospitalGroup Co. Ltd.Class A 164,012 1,240
2 Dongyue Group Ltd. 522,000 1,2142 Yihai International
Holding Ltd. 207,000 1,213* 360 DigiTech Inc.
ADR 58,775 1,2003 Hangzhou Tigermed
Consulting Co.Ltd. Class H 61,000 1,190
China MinshengBanking Corp.Ltd. Class H 2,973,512 1,179
JOYY Inc. ADR 23,346 1,176 Guangzhou
Automobile GroupCo. Ltd. Class H 1,237,399 1,168
Dongfeng MotorGroup Co. Ltd.Class H 1,246,000 1,160
2,3 Pop MartInternationalGroup Ltd. 194,600 1,148
Shanghai PudongDevelopmentBank Co. Ltd.Class A 804,486 1,124
*,2,3 Akeso Inc. 201,000 1,121*,3 Hua Hong
SemiconductorLtd. 222,084 1,114
3 Hygeia HealthcareHoldings Co. Ltd. 125,532 1,102
2,3 HaidilaoInternationalHolding Ltd. 394,000 1,099
Bank ofCommunicationsCo. Ltd. Class A 1,547,100 1,092
Zhuzhou CRRCTimes Electric Co.Ltd. 226,209 1,081
Yunnan Energy NewMaterial Co. Ltd.Class A 23,600 1,076
Shanghai BaosightSoftware Co. Ltd.Class B 268,544 1,074
3 China MerchantsSecurities Co. Ltd.Class H 678,160 1,071
ZTE Corp. Class H 355,614 1,067 Fosun International
Ltd. 910,464 1,067 China Vanke Co. Ltd.
Class A 374,500 1,065 People's Insurance
Co. Group ofChina Ltd. Class H 3,410,000 1,064
New China LifeInsurance Co. Ltd.Class H 368,834 1,064
BYD ElectronicInternational Co.Ltd. 358,500 1,064
Shares
MarketValue•
($000)
Eve Energy Co. Ltd.Class A 59,605 1,057
China Meidong AutoHoldings Ltd. 204,000 1,054
China GalaxySecurities Co. Ltd.Class H 1,878,000 1,046
Sungrow PowerSupply Co. Ltd.Class A 40,700 1,046
Autohome Inc. ADR 26,443 1,041*,2 Didi Global Inc. ADR 127,625 1,0303 CGN Power Co. Ltd.
Class H 3,806,832 1,0253 Hansoh
PharmaceuticalGroup Co. Ltd. 460,000 1,023
NARI TechnologyCo. Ltd. Class A 166,480 1,014
China MolybdenumCo. Ltd. Class H 1,638,000 1,013
Sany Heavy IndustryCo. Ltd. Class A 281,946 1,011
2 Huaneng PowerInternational Inc.Class H 1,952,000 1,010
* iQIYI Inc. ADR 120,072 994 China Everbright
International Ltd. 1,445,777 993 Anhui Conch
Cement Co. Ltd.Class A 167,300 992
China MedicalSystem HoldingsLtd. 585,000 991
China InsuranceInternationalHoldings Co. Ltd. 650,059 989
* Kingsoft CloudHoldings Ltd.ADR 42,517 977
3 Pharmaron BeijingCo. Ltd. Class H 45,100 976
Foshan HaitianFlavouring & FoodCo. Ltd. Class A 52,728 966
* Weibo Corp. ADR 21,480 966 Yangzijiang
ShipbuildingHoldings Ltd. 914,336 965
China HongqiaoGroup Ltd. 861,000 957
3 Huatai SecuritiesCo. Ltd. Class H 638,564 950
BosidengInternationalHoldings Ltd. 1,212,000 939
China MerchantsPort Holdings Co.Ltd. 562,000 937
China Northern RareEarth GroupHigh-Tech Co. Ltd.Class A 117,900 935
Bank of Ningbo Co.Ltd. Class A 156,500 933
*,2,3 Evergrande PropertyServices GroupLtd. 1,823,000 929
Total World Stock Index Fund
19

Shares
MarketValue•
($000)2 Flat Glass Group Co.
Ltd. Class H 173,000 927* Aluminum Corp. of
China Ltd. Class H 1,537,331 925 NAURA Technology
Group Co. Ltd.Class A 15,900 922
* Canadian Solar Inc. 22,142 920 Hello Group Inc.
ADR 73,822 919* Tongcheng-Elong
Holdings Ltd. 411,200 916 China Power
InternationalDevelopment Ltd. 1,801,851 905
* JinkoSolar HoldingCo. Ltd. ADR 15,089 903
Nine Dragons PaperHoldings Ltd. 716,000 900
China ShenhuaEnergy Co. Ltd.Class A 288,500 898
WuXi AppTec Co.Ltd. Class A 41,584 896
Chongqing ZhifeiBiologicalProducts Co. Ltd.Class A 37,500 882
Shimao GroupHoldings Ltd. 560,500 879
SAIC Motor Corp.Ltd. Class A 276,099 876
CIFI Holdings GroupCo. Ltd. 1,572,000 873
CRRC Corp. Ltd.Class H 1,917,000 866
Xinjiang GoldwindScience &Technology Co.Ltd. Class H 387,365 866
* Vnet Group Inc.ADR 55,178 865
3 TopsportsInternationalHoldings Ltd. 711,000 864
Far East HorizonLtd. 897,000 855
2 Ming Yuan CloudGroup HoldingsLtd. 263,000 855
Poly Developmentsand HoldingsGroup Co. Ltd.Class A 432,799 849
AECC AviationPower Co. Ltd.Class A 91,800 848
Tianjin ZhonghuanSemiconductorCo. Ltd. Class A 101,961 836
3 Yadea GroupHoldings Ltd. 486,000 835
*,3 Jinxin Fertility GroupLtd. 582,000 821
Haitian InternationalHoldings Ltd. 281,000 819
Shenzhen InovanceTechnology Co.Ltd. Class A 80,000 815
Shares
MarketValue•
($000)*,2,3 Ping An Healthcare
and TechnologyCo. Ltd. 167,627 810
Jiangxi Copper Co.Ltd. Class H 461,000 805
China Railway GroupLtd. Class H 1,645,000 804
Beijing EnterprisesWater Group Ltd. 2,101,015 803
*,2,3 CanSino BiologicsInc. Class H 31,400 803
Beijing EnterprisesHoldings Ltd. 208,500 801
China StateConstructionInternationalHoldings Ltd. 779,750 799
Huatai SecuritiesCo. Ltd. Class A 320,900 795
2 Yanzhou CoalMining Co. Ltd.Class H 534,000 792
China JinmaoHoldings GroupLtd. 2,712,000 792
HopsonDevelopmentHoldings Ltd. 289,080 784
Guangzhou TinciMaterialsTechnology Co.Ltd. Class A 30,430 783
GoerTek Inc. Class A 114,500 778* TAL Education
Group ADR 189,791 776 Cosco Shipping
Ports Ltd. 908,000 756 China State
ConstructionEngineering Corp.Ltd. Class A 1,039,800 756
* Noah Holdings Ltd.ADR 17,496 744
China ResourcesCement HoldingsLtd. 882,000 742
Ganfeng Lithium Co.Ltd. Class A 27,900 730
AviChina Industry &Technology Co.Ltd. Class H 1,138,000 724
KingboardLaminatesHoldings Ltd. 458,858 719
*,3 InnoCare PharmaLtd. 298,000 715
China YongdaAutomobilesServices HoldingsLtd. 442,000 703
3 JiumaojiuInternationalHoldings Ltd. 281,000 703
JA Solar TechnologyCo. Ltd. Class A 49,300 703
SF Holding Co. Ltd.Class A 69,598 702
China Lesso GroupHoldings Ltd. 453,000 700
Total World Stock Index Fund
20

Shares
MarketValue•
($000)* Air China Ltd.
Class H 986,000 694*,2 Gome Electrical
AppliancesHoldings Ltd. 6,833,720 693
Seazen Group Ltd. 876,038 693* I-Mab ADR 11,215 6932,3 Shandong Gold
Mining Co. Ltd.Class H 376,050 680
ShanghaiPharmaceuticalsHolding Co. Ltd.Class H 369,700 677
Anhui GujingDistillery Co. Ltd.Class B 52,300 674
Zhejiang HuayouCobalt Co. Ltd.Class A 38,800 673
China GrandPharmaceuticaland HealthcareHoldings Ltd.Class A 823,080 659
ZTE Corp. Class A 129,398 659 Sanan
OptoelectronicsCo. Ltd. Class A 125,100 657
China Suntien GreenEnergy Corp. Ltd.Class H 824,000 655
* China SouthernAirlines Co. Ltd.Class H 1,076,000 654
BOE TechnologyGroup Co. Ltd.Class A 850,900 654
Beijing KingsoftOffice SoftwareInc. Class A 14,047 651
TravelSkyTechnology Ltd.Class H 347,000 648
2 Xtep InternationalHoldings Ltd. 492,000 643
Fu Shou YuanInternationalGroup Ltd. 744,000 639
* Beijing CapitalInternationalAirport Co. Ltd.Class H 980,000 637
China Cinda AssetManagement Co.Ltd. Class H 3,785,000 632
*,2,3 ZhongAn OnlineP&C InsuranceCo. Ltd. Class H 173,556 631
Tsingtao BreweryCo. Ltd. Class A 38,600 629
CRRC Corp. Ltd.Class A 677,700 629
China MinshengBanking Corp.Ltd. Class A 1,032,100 627
* 51job Inc. ADR 10,508 626 Baoshan Iron &
Steel Co. Ltd.Class A 562,400 626
Shares
MarketValue•
($000)
Will SemiconductorCo. Ltd. ShanghaiClass A 14,900 619
Chongqing ChanganAutomobile Co.Ltd. Class A 199,220 609
China EverbrightBank Co. Ltd.Class A 1,124,800 605
Bank of Nanjing Co.Ltd. Class A 398,300 604
3 A-Living Smart CityServices Co. Ltd. 178,500 593
*,1,3 China HuarongAssetManagement Co.Ltd. Class H 4,482,000 588
GigadeviceSemiconductorBeijing Inc.Class A 22,151 587
Shenzhen TranssionHoldings Co. Ltd.Class A 23,860 587
3 Shimao ServicesHoldings Ltd. 305,000 575
Bank of ShanghaiCo. Ltd. Class A 503,837 574
WingtechTechnology Co.Ltd. Class A 33,400 573
*,3 3SBio Inc. 626,500 5733 Guotai Junan
Securities Co. Ltd.Class H 418,600 571
Unigroup GuoxinMicroelectronicsCo. Ltd. Class A 18,000 570
Yanzhou CoalMining Co. Ltd.Class A 160,200 569
* Inner MongoliaBaoTou SteelUnion Co. Ltd.Class A 1,282,300 564
TBEA Co. Ltd.Class A 130,500 552
Greentown ChinaHoldings Ltd. 399,879 551
New China LifeInsurance Co. Ltd.Class A 89,100 544
*,3 Alphamab Oncology 264,000 542* XD Inc. 95,600 541* Alibaba Pictures
Group Ltd. 5,090,000 541 Shanghai Putailai
New EnergyTechnology Co.Ltd. Class A 19,400 539
*,2,3 Yidu Tech Inc. 168,200 537 Zhejiang
Expressway Co.Ltd. Class H 596,000 529
China Coal EnergyCo. Ltd. Class H 859,000 524
3 Dali Foods GroupCo. Ltd. 939,000 523
Total World Stock Index Fund
21

Shares
MarketValue•
($000)
China OilfieldServices Ltd.Class H 542,000 518
* Dada Nexus Ltd.ADR 25,489 518
China OverseasProperty HoldingsLtd. 572,493 514
China EducationGroup HoldingsLtd. 300,000 513
*,2,3 KintorPharmaceuticalLtd. 102,000 509
Shenwan HongyuanGroup Co. Ltd.Class A 629,900 505
*,2,3 Venus MedTechHangzhou Inc.Class H 109,000 504
Ecovacs RoboticsCo. Ltd. Class A 18,800 504
* Aluminum Corp. ofChina Ltd. Class A 520,700 501
Zoomlion HeavyIndustry Scienceand TechnologyCo. Ltd. Class H 692,380 499
China Railway GroupLtd. Class A 608,200 499
Hangzhou TigermedConsulting Co.Ltd. Class A 18,650 496
CIFI Ever SunshineServices GroupLtd. 278,000 496
* Lifetech ScientificCorp. 1,059,998 492
WalvaxBiotechnology Co.Ltd. Class A 56,800 491
Guotai JunanSecurities Co. Ltd.Class A 178,800 490
ChinaCommunicationsServices Corp.Ltd. Class H 886,000 490
COFCO MeatHoldings Ltd. 1,261,000 488
Imeik TechnologyDevelopment Co.Ltd. Class A 5,000 487
ShenzhenInternationalHoldings Ltd. 402,000 484
3 Legend HoldingsCorp. Class H 275,100 484
Iflytek Co. Ltd.Class A 54,600 482
* China UnitedNetworkCommunicationsLtd. Class A 756,300 482
MaxscendMicroelectronicsCo. Ltd. Class A 9,920 480
CGN New EnergyHoldings Co. Ltd. 510,000 477
Shares
MarketValue•
($000)
Wuxi LeadIntelligentEquipment Co.Ltd. Class A 37,440 477
Shanghai ElectricGroup Co. Ltd.Class H 1,690,000 476
* Hollysys AutomationTechnologies Ltd. 23,767 474
Jiangsu EasternShenghong Co.Ltd. Class A 108,900 463
Anhui GujingDistillery Co. Ltd.Class A 13,000 462
Hubei XingfaChemicals GroupCo. Ltd. Class A 59,300 461
Orient SecuritiesCo. Ltd. Class A 213,600 460
China TraditionalChinese MedicineHoldings Co. Ltd. 962,000 458
* Zhejiang YongtaiTechnology Co.Ltd. Class A 40,800 457
Angang Steel Co.Ltd. Class H 842,800 453
Logan Group Co.Ltd. 452,000 453
Hangzhou SilanMicroelectronicsCo. Ltd. Class A 46,900 452
* AdvancedMicro-FabricationEquipment Inc.Class A 18,483 452
Agile GroupHoldings Ltd. 575,500 451
Metallurgical Corp.of China Ltd.Class H 1,618,000 449
2 Dongfang ElectricCorp. Ltd. Class H 280,600 448
Ming Yang SmartEnergy Group Ltd.Class A 92,300 447
China EverbrightBank Co. Ltd.Class H 1,262,000 444
Lens Technology Co.Ltd. Class A 133,400 444
Yuexiu Property Co.Ltd. 505,441 444
China CSSCHoldings Ltd.Class A 124,900 439
* Canaan Inc. ADR 51,187 439 China Water Affairs
Group Ltd. 424,000 436 Sihuan
PharmaceuticalHoldings GroupLtd. 2,071,000 435
2 Poly PropertyServices Co. Ltd. 78,000 435
* Niu TechnologiesADR 16,570 434
Pharmaron BeijingCo. Ltd. Class A 14,442 431
Total World Stock Index Fund
22

Shares
MarketValue•
($000)3 BAIC Motor Corp.
Ltd. Class H 1,296,900 4302 China International
Marine ContainersGroup Co. Ltd.Class H 217,000 430
Changchun High &New TechnologyIndustry GroupInc. Class A 10,046 428
2 Guangzhou R&FProperties Co.Ltd. Class H 678,600 425
BOE TechnologyGroup Co. Ltd.Class B 989,400 424
China Datang CorpRenewable PowerCo. Ltd. Class H 1,003,000 424
*,3 Remegen Co. Ltd.Class H 34,000 423
*,3 China LogisticsProperty HoldingsCo. Ltd. 785,000 422
Kwg Group HoldingsLtd. 481,500 420
2,3 Blue Moon GroupHoldings Ltd. 466,000 420
Chongqing RuralCommercial BankCo. Ltd. Class H 1,162,000 418
Focus MediaInformationTechnology Co.Ltd. Class A 363,700 417
Inner Mongolia YitaiCoal Co. Ltd.Class B 479,704 416
MINISO GroupHolding Ltd. ADR 27,686 416
Shanghai RAASBlood ProductsCo. Ltd. Class A 403,000 415
3 China Railway Signal& CommunicationCorp. Ltd. Class H 1,180,500 414
2 Tianneng PowerInternational Ltd. 360,000 411
FinVolution GroupADR 66,835 409
3 Hope EducationGroup Co. Ltd. 2,278,000 406
Sany HeavyEquipmentInternationalHoldings Co. Ltd. 356,000 405
3 Sunac ServicesHoldings Ltd. 200,455 405
Greentown ServiceGroup Co. Ltd. 408,000 404
Hoshine SiliconIndustry Co. Ltd.Class A 15,700 404
*,2,3 Shanghai JunshiBiosciences Co.Ltd. Class H 80,400 404
Sinotrans Ltd.Class H 1,224,000 402
Shares
MarketValue•
($000)
Yonyou NetworkTechnology Co.Ltd. Class A 80,667 400
Guangdong HaidGroup Co. Ltd.Class A 39,077 400
Yunnan BaiyaoGroup Co. Ltd.Class A 28,500 399
Fuyao GlassIndustry GroupCo. Ltd. Class A 51,300 396
2 ShenzhenInvestment Ltd. 1,603,953 393
* ShanghaiInternationalAirport Co. Ltd.Class A 47,541 393
*,2,3 Luye Pharma GroupLtd. 825,000 393
CIMC EnricHoldings Ltd. 302,000 388
* Skyworth GroupLtd. 695,340 387
SG Micro Corp.Class A 7,650 387
*,3 Peijia Medical Ltd. 158,000 385* Baozun Inc. Class A 66,536 384 China Oriental
Group Co. Ltd. 1,352,000 381 Shaanxi Coal
Industry Co. Ltd.Class A 193,300 379
Sinopec ShanghaiPetrochemical Co.Ltd. Class H 1,620,000 378
China Jushi Co. Ltd.Class A 125,730 376
Zhejiang JingshengMechanical &Electrical Co. Ltd.Class A 31,200 373
NetDragon WebsoftHoldings Ltd. 170,000 372
China EverbrightLtd. 330,000 371
3 China New HigherEducation GroupLtd. 738,000 370
Jiangsu HengliHydraulic Co. Ltd.Class A 28,672 368
Hangzhou FirstApplied MaterialCo. Ltd. Class A 16,368 367
China NationalNuclear PowerCo. Ltd. Class A 341,500 366
Citic Pacific SpecialSteel Group Co.Ltd. Class A 122,910 366
2 TiangongInternational Co.Ltd. 604,000 363
Shenzhen CapchemTechnology Co.Ltd. Class A 16,200 363
Total World Stock Index Fund
23

Shares
MarketValue•
($000)
Henan ShuanghuiInvestment &Development Co.Ltd. Class A 78,478 362
Bank of Beijing Co.Ltd. Class A 521,200 361
Shougang FushanResources GroupLtd. 1,361,524 360
* Hainan MeilanInternationalAirport Co. Ltd.Class H 89,000 360
2 Jinke SmartServices GroupCo. Ltd. Class H 66,600 360
2,3 CSC Financial Co.Ltd. Class H 340,000 359
* XPeng Inc. Class A 15,444 358 Hundsun
Technologies Inc.Class A 36,246 356
China Risun GroupLtd. 584,000 356
COSCO SHIPPINGDevelopment Co.Ltd. Class A 652,900 354
* Guoyuan SecuritiesCo. Ltd. Class A 304,220 352
China MerchantsSecurities Co. Ltd.Class A 130,987 352
JiuGui Liquor Co.Ltd. Class A 10,500 351
Sinotruk Hong KongLtd. 252,000 348
ChaozhouThree-CircleGroup Co. Ltd.Class A 55,600 348
GuangzhouAutomobile GroupCo. Ltd. Class A 128,600 348
Jiangsu ExpresswayCo. Ltd. Class A 261,600 347
TCL TechnologyGroup Corp.Class A 363,800 345
China BlueChemicalLtd. Class H 1,028,000 344
Xinyi EnergyHoldings Ltd. 582,000 343
Power ConstructionCorp. of ChinaLtd. Class A 266,200 343
Shanghai LujiazuiFinance & TradeZoneDevelopment Co.Ltd. Class B 380,411 338
Yihai Kerry ArawanaHoldings Co. Ltd.Class A 35,500 337
Weichai Power Co.Ltd. Class A 142,300 336
Huaxia Bank Co.Ltd. Class A 379,500 334
Sun Art Retail GroupLtd. 568,500 333
Shares
MarketValue•
($000)
Shenzhen KangtaiBiologicalProducts Co. Ltd.Class A 18,607 333
Zhejiang ChintElectrics Co. Ltd.Class A 35,100 331
Zhejiang SanhuaIntelligentControls Co. Ltd.Class A 89,010 330
Times ChinaHoldings Ltd. 480,000 327
Huayu AutomotiveSystems Co. Ltd.Class A 78,000 327
Concord NewEnergy Group Ltd. 3,100,000 327
2,3 China ResourcesPharmaceuticalGroup Ltd. 676,000 325
2 Zhongyu GasHoldings Ltd. 338,000 324
Bank of HangzhouCo. Ltd. Class A 145,400 324
* HUYA Inc. ADR 39,330 323 China CITIC Bank
Corp. Ltd. Class A 454,900 323* EHang Holdings Ltd.
ADR 13,376 323 Shandong Gold
Mining Co. Ltd.Class A 103,577 321
* Shanghai FudanMicroelectronicsGroup Co. Ltd.Class H 116,000 318
China MolybdenumCo. Ltd. Class A 338,200 318
Sunwoda ElectronicCo. Ltd. Class A 41,100 317
2,3 Zhou Hei YaInternationalHoldings Co. Ltd. 351,000 316
2 Differ Group HoldingCo. Ltd. 1,312,000 316
Lao Feng Xiang Co.Ltd. Class A 41,900 314
Health & HappinessH&H InternationalHoldings Ltd. 133,236 312
Montage TechnologyCo. Ltd. Class A 30,642 312
Jiangsu ExpresswayCo. Ltd. Class H 328,000 311
Ausnutria DairyCorp. Ltd. 249,000 311
Yuexiu TransportInfrastructure Ltd. 476,000 305
2 Fire Rock HoldingsLtd. 968,000 305
China AutomotiveEngineeringResearch InstituteCo. Ltd. Class A 114,100 305
GinlongTechnologies Co.Ltd. Class A 6,970 304
Fufeng Group Ltd. 875,000 303
Total World Stock Index Fund
24

Shares
MarketValue•
($000)
Zoomlion HeavyIndustry Scienceand TechnologyCo. Ltd. Class A 266,700 303
Shenzhen SeniorTechnologyMaterial Co. Ltd.Class A 36,276 303
ShenzhenExpressway Co.Ltd. Class H 318,000 300
Wuxi ShangjiAutomation Co.Ltd. Class A 6,400 300
Seazen Holdings Co.Ltd. Class A 55,900 299
Datang InternationalPower GenerationCo. Ltd. Class H 1,648,000 298
China MerchantsShekou IndustrialZone Holdings Co.Ltd. Class A 181,800 297
* Topchoice MedicalCorp. Class A 7,995 297
Satellite ChemicalCo. Ltd. Class A 48,440 295
Jiangxi Copper Co.Ltd. Class A 80,700 294
2,3 China EastEducationHoldings Ltd. 306,500 291
Chongqing ChanganAutomobile Co.Ltd. Class B 448,087 290
Shanghai IndustrialHoldings Ltd. 194,000 289
* Brilliance ChinaAutomotiveHoldings Ltd. 527,000 288
GuangzhouBaiyunshanPharmaceuticalHoldings Co. Ltd.Class H 114,000 288
Yuexiu REIT 658,940 287 Maanshan Iron &
Steel Co. Ltd.Class H 674,000 287
2 Zhaojin MiningIndustry Co. Ltd.Class H 402,500 287
CECEP Wind-PowerCorp. Class A 248,900 287
* Roshow TechnologyCo. Ltd. Class A 108,900 287
* Gotion High-techCo. Ltd. Class A 31,000 285
* Genetron HoldingsLtd. ADR 20,640 284
IngenicSemiconductorCo. Ltd. Class A 13,200 284
Sealand SecuritiesCo. Ltd. Class A 469,570 283
China OilfieldServices Ltd.Class A 122,225 283
Shares
MarketValue•
($000)
C&D InternationalInvestment GroupLtd. 151,000 281
Sinopec EngineeringGroup Co. Ltd.Class H 532,135 280
AsymchemLaboratoriesTianjin Co. Ltd.Class A 4,500 280
Suzhou MaxwellTechnologies Co.Ltd. Class A 2,340 280
China ConstructionBank Corp.Class A 301,800 280
SDIC PowerHoldings Co. Ltd.Class A 169,500 279
* Sinopec OilfieldService Corp.Class A 787,700 278
Beijing Bei Mo GaoKe FrictionMaterial Co. Ltd.Class A 15,800 273
Haitong SecuritiesCo. Ltd. Class A 141,000 272
*,3 Ascentage PharmaGroupInternational 73,100 271
Mango ExcellentMedia Co. Ltd.Class A 44,026 270
Suzhou TA&A UltraClean TechnologyCo. Ltd. Class A 16,200 270
StarPowerSemiconductorLtd. Class A 4,300 270
*,2 Li Auto Inc. Class A 15,983 270 Zhejiang NHU Co.
Ltd. Class A 63,480 269 Xiamen Faratronic
Co. Ltd. Class A 8,900 2693 Joinn Laboratories
China Co. Ltd.Class H 20,900 269
LB Group Co. Ltd.Class A 60,100 267
HengliPetrochemical Co.Ltd. Class A 77,500 267
Shandong HualuHengshengChemical Co. Ltd.Class A 54,990 267
Shanghai FosunPharmaceuticalGroup Co. Ltd.Class A 34,000 266
COSCO SHIPPINGEnergyTransportation Co.Ltd. Class H 600,000 265
* LexinFintechHoldings Ltd.ADR 49,470 264
2 Tian Lun GasHoldings Ltd. 285,500 264
Total World Stock Index Fund
25

Shares
MarketValue•
($000)2 China Evergrande
Group 890,000 2643 Genertec Universal
Medical GroupCo. Ltd. 349,000 263
GEM Co. Ltd.Class A 153,900 262
Fangda Carbon NewMaterial Co. Ltd.Class A 156,135 262
China SCE GroupHoldings Ltd. 837,000 261
Founder SecuritiesCo. Ltd. Class A 204,400 261
* Chongqing BreweryCo. Ltd. Class A 11,100 260
Flat Glass Group Co.Ltd. Class A 30,200 260
China MinmetalsRare Earth Co.Ltd. Class A 43,500 258
Yantai ChangyuPioneer Wine Co.Ltd. Class B 143,033 257
CNNC Hua YuanTitanium DioxideCo. Ltd. Class A 119,200 257
Lonking HoldingsLtd. 877,000 256
3 China RenaissanceHoldings Ltd. 105,800 256
SSY Group Ltd. 534,336 254 Zhejiang Dahua
Technology Co.Ltd. Class A 74,600 254
* China EasternAirlines Corp. Ltd.Class A 333,500 252
Glarun TechnologyCo. Ltd. Class A 109,000 252
* SichuanDevelopmentLomon Co. Ltd.Class A 89,400 252
*,3 CStonePharmaceuticals 204,000 251
GD PowerDevelopment Co.Ltd. Class A 576,899 251
Cangzhou MingzhuPlastic Co. Ltd.Class A 162,933 251
* SOHO China Ltd. 983,000 250 Livzon
PharmaceuticalGroup Inc.Class H 75,806 250
2,3 Viva BiotechHoldings 330,000 249
Beijing EaspringMaterialTechnology Co.Ltd. Class A 17,900 248
Huadong MedicineCo. Ltd. Class A 43,130 246
Beijing RoborockTechnology Co.Ltd. Class A 1,740 246
Shares
MarketValue•
($000)* Xian International
MedicalInvestment Co.Ltd. Class A 131,600 245
3 Orient SecuritiesCo. Ltd. Class H 296,000 243
China NationalChemicalEngineering Co.Ltd. Class A 148,500 243
Digital ChinaHoldings Ltd. 449,499 242
Guosen SecuritiesCo. Ltd. Class A 136,055 242
LuoyangXinqianglianSlewing BearingCo. Ltd. Class A 6,800 242
Sinoma Science &Technology Co.Ltd. Class A 40,800 241
3 Shenwan HongyuanGroup Co. Ltd.Class H 952,800 241
Sichuan SwellfunCo. Ltd. Class A 12,100 239
Changzhou XingyuAutomotiveLighting SystemsCo. Ltd. Class A 6,700 239
Tofflon Science &Technology GroupCo. Ltd. Class A 36,500 238
Shandong NanshanAluminum Co.Ltd. Class A 350,000 237
* Sichuan HebangBiotechnology Co.Ltd. Class A 425,700 237
Hithink RoyalFlushInformationNetwork Co. Ltd.Class A 13,353 235
Poly Property GroupCo. Ltd. 952,000 235
Yealink NetworkTechnology Corp.Ltd. Class A 19,930 235
COSCO SHIPPINGEnergyTransportation Co.Ltd. Class A 253,800 235
Hualan BiologicalEngineering Inc.Class A 50,375 234
* New Hope LiuheCo. Ltd. Class A 104,100 234
ShanghaiInternational PortGroup Co. Ltd.Class A 265,200 234
Industrial SecuritiesCo. Ltd. Class A 163,500 233
West China CementLtd. 1,334,000 233
* Yunnan AluminiumCo. Ltd. Class A 125,400 233
Fujian Funeng Co.Ltd. Class A 82,865 232
Total World Stock Index Fund
26

Shares
MarketValue•
($000)
Metallurgical Corp.of China Ltd.Class A 367,400 232
Sichuan Road &Bridge Co. Ltd.Class A 123,500 232
* Kuang-ChiTechnologies Co.Ltd. Class A 72,100 231
Jiangxi ZhengbangTechnology Co.Ltd. Class A 147,700 231
Jiangsu King's LuckBrewery JSC Ltd.Class A 30,027 231
China ReinsuranceGroup Corp.Class H 2,218,000 231
CMGE TechnologyGroup Ltd. 590,000 230
Huaxin Cement Co.Ltd. Class B 128,100 228
ShenzhenChanghongTechnology Co.Ltd. Class A 40,600 226
Shenzhen TopbandCo. Ltd. Class A 97,600 226
CSG Holding Co.Ltd. Class B 516,606 225
Xianhe Co. Ltd.Class A 39,900 225
* National SiliconIndustry GroupCo. Ltd. Class A 50,798 225
BBMG Corp.Class H 1,331,000 224
Ovctek China Inc.Class A 20,997 224
Red Avenue NewMaterials GroupCo. Ltd. Class A 25,900 222
China OverseasGrand OceansGroup Ltd. 462,500 222
Sichuan ChuantouEnergy Co. Ltd.Class A 107,400 220
CECEP Solar EnergyCo. Ltd. Class A 125,590 219
WestoneInformationIndustry Inc.Class A 26,500 217
Jinko PowerTechnology Co.Ltd. Class A 142,500 216
Hisense HomeAppliances GroupCo. Ltd. Class A 118,200 215
Hongfa TechnologyCo. Ltd. Class A 18,500 214
Lao Feng Xiang Co.Ltd. Class B 60,294 213
Shan Xi Hua YangGroup NewEnergy Co. Ltd.Class A 128,400 213
Shanghai MedicilonInc. Class A 1,861 213
Shares
MarketValue•
($000)2 Jiayuan International
Group Ltd. 548,000 212 JCET Group Co. Ltd.
Class A 43,900 212 Gemdale Properties
& InvestmentCorp. Ltd. 2,166,000 211
Shanxi Coking CoalEnergy Group Co.Ltd. Class A 145,470 211
* Zhejiang CenturyHuatong GroupCo. Ltd. Class A 182,300 211
Q Technology GroupCo. Ltd. 144,000 210
* Sohu.com Ltd. ADR 10,354 210 Hangzhou Chang
Chuan TechnologyCo. Ltd. Class A 28,400 210
KWG Living GroupHoldings Ltd. 310,750 209
China Baoan GroupCo. Ltd. Class A 63,600 209
Beijing WantaiBiologicalPharmacyEnterprise Co.Ltd. Class A 6,020 208
China ZhenhuaGroup Science &Technology Co.Ltd. Class A 12,800 207
Do-Fluoride NewMaterials Co. Ltd.Class A 21,300 207
China GreatwallTechnology GroupCo. Ltd. Class A 98,400 207
2,3 SimcerePharmaceuticalGroup Ltd. 198,000 206
Titan Wind EnergySuzhou Co. Ltd.Class A 61,500 205
Huizhou Desay SvAutomotive Co.Ltd. Class A 12,200 204
*,3 OcumensionTherapeutics 94,000 204
3 Midea Real EstateHolding Ltd. 117,800 203
GokeMicroelectronicsCo. Ltd. Class A 7,700 203
Shoucheng HoldingsLtd. 947,600 201
Shanghai JinjiangInternationalHotels Co. Ltd.Class A 23,900 201
Sino-Ocean GroupHolding Ltd. 922,500 200
Thunder SoftwareTechnology Co.Ltd. Class A 9,400 200
Han's LaserTechnologyIndustry GroupCo. Ltd. Class A 29,697 199
Total World Stock Index Fund
27

Shares
MarketValue•
($000)
Haier Smart HomeCo. Ltd. Class A 46,799 199
Tianjin CapitalEnvironmentalProtection GroupCo. Ltd. Class H 400,000 198
Shenzhen OverseasChinese Town Co.Ltd. Class A 201,900 198
Jiangsu LinyangEnergy Co. Ltd.Class A 111,300 197
YongXing SpecialMaterialsTechnology Co.Ltd. Class A 11,700 196
Shengyi TechnologyCo. Ltd. Class A 56,300 196
* Jiangsu AkcomeScience &Technology Co.Ltd. Class A 243,600 196
* China EasternAirlines Corp. Ltd.Class H 496,000 195
Xingda InternationalHoldings Ltd. 858,000 195
Beijing JingnengClean Energy Co.Ltd. Class H 646,000 195
Shanghai YuyuanTourist MartGroup Co. Ltd.Class A 127,300 195
Hangcha Group Co.Ltd. Class A 75,200 195
Jiangsu GuotaiInternationalGroup Co. Ltd.Class A 94,300 194
*,2,3 Mobvista Inc. 200,000 194* Beijing Jingyuntong
Technology Co.Ltd. Class A 108,400 194
Shanxi TaigangStainless SteelCo. Ltd. Class A 160,200 193
Fu Jian Anjoy FoodsCo. Ltd. Class A 6,100 193
*,2 Yeahka Ltd. 63,600 192 Wuhan Guide
Infrared Co. Ltd.Class A 56,168 191
ApeloaPharmaceuticalCo. Ltd. Class A 35,000 190
Wuhan DR LaserTechnology Corp.Ltd. Class A 8,800 190
* Chengxin LithiumGroup Co. Ltd.Class A 21,000 190
Joinn LaboratoriesChina Co. Ltd.Class A 7,560 189
2 Huadian PowerInternational Corp.Ltd. Class H 510,000 188
Shares
MarketValue•
($000)
ShanghaiPharmaceuticalsHolding Co. Ltd.Class A 64,600 188
China Harmony NewEnergy AutoHolding Ltd. 365,000 187
* DouYu InternationalHoldings Ltd.ADR 59,347 187
Zhejiang Juhua Co.Ltd. Class A 76,900 187
XCMG ConstructionMachinery Co.Ltd. Class A 194,600 186
Beijing New BuildingMaterials plcClass A 42,100 186
Vats Liquor ChainStoreManagement JSCLtd. 30,100 185
Jiangsu Azure Corp.Class A 54,700 185
Tong Ren TangTechnologies Co.Ltd. Class H 259,000 184
Sieyuan Electric Co.Ltd. Class A 28,400 184
AVICElectromechanicalSystems Co. Ltd.Class A 77,600 184
* Zhihu Inc. ADR 22,277 184 Wuhu Sanqi
InteractiveEntertainmentNetworkTechnology GroupCo. Ltd. Class A 48,800 182
* Jilin Electric PowerCo. Ltd. Class A 153,700 182
Huaneng PowerInternational Inc.Class A 150,400 181
Tongkun Group Co.Ltd. Class A 58,000 181
* Spring Airlines Co.Ltd. Class A 19,800 181
* HainanDevelopmentHoldings NanhaiCo. Ltd. Class A 85,000 181
RongshengPetrochemical Co.Ltd. Class A 66,900 180
* Shanxi MeijinEnergy Co. Ltd.Class A 102,000 180
Hangzhou SteamTurbine Co. Ltd.Class B 87,657 179
Shanghai IndustrialUrbanDevelopmentGroup Ltd. 2,083,200 179
Inspur ElectronicInformationIndustry Co. Ltd.Class A 36,912 179
Total World Stock Index Fund
28

Shares
MarketValue•
($000)
Lepu MedicalTechnologyBeijing Co. Ltd.Class A 53,900 179
China MerchantsLand Ltd. 1,598,000 179
Ningbo Tuopu GroupCo. Ltd. Class A 21,800 178
Zhejiang JiuzhouPharmaceuticalCo. Ltd. Class A 21,700 178
Gemdale Corp.Class A 111,700 177
Angel Yeast Co. Ltd.Class A 20,300 177
Chengdu LeejunIndustrial Co. Ltd.Class A 98,500 177
* Lingyi iTechGuangdong Co.Class A 169,000 176
Greatview AsepticPackaging Co.Ltd. 426,000 175
Jizhong EnergyResources Co.Ltd. Class A 179,100 175
CTS InternationalLogistics Corp.Ltd. Class A 90,900 175
2 ShandongChenming PaperHoldings Ltd.Class H 360,750 174
Shanghai BairunInvestmentHolding Group Co.Ltd. Class A 17,500 174
* Guanghui EnergyCo. Ltd. Class A 168,300 174
2 China Aoyuan GroupLtd. 437,000 173
ENN Natural GasCo. Ltd. Class A 60,100 173
EverbrightSecurities Co. Ltd.Class A 72,700 173
* Burning RockBiotech Ltd. ADR 12,310 173
* Tianshan AluminumGroup Co. Ltd.Class A 131,700 173
DawningInformationIndustry Co. Ltd.Class A 40,400 173
Shanghai BailianGroup Co. Ltd.Class B 193,500 172
GuangzhouKingmedDiagnostics GroupCo. Ltd. Class A 9,600 172
Shanghai ElectricGroup Co. Ltd.Class A 232,100 172
Tianjin ZhongXinPharmaceuticalGroup Corp. Ltd.Class A 41,100 172
Shares
MarketValue•
($000)
GuangdongDowstoneTechnology Co.Ltd. Class A 37,900 171
TellingTelecommunicationHolding Co. Ltd.Class A 45,600 170
Shanxi Lu'anEnvironmentalEnergyDevelopment Co.Ltd. Class A 83,800 170
2,3 China YuhuaEducation Corp.Ltd. 376,000 170
Jiangsu ShuangxingColor Plastic NewMaterials Co. Ltd.Class A 45,700 169
* Sichuan NewEnergy Power Co.Ltd. 38,000 169
Jafron BiomedicalCo. Ltd. Class A 20,770 168
Pingdingshan TiananCoal Mining Co.Ltd. Class A 125,900 168
Kehua Data Co. Ltd.Class A 27,500 168
Zhuguang HoldingsGroup Co. Ltd. 762,000 167
Zhuzhou KibingGroup Co. Ltd.Class A 67,200 167
LivzonPharmaceuticalGroup Inc.Class A 30,300 166
China MerchantsEnergy ShippingCo. Ltd. Class A 232,560 166
Bank of ChongqingCo. Ltd. Class H 295,500 166
TCL ElectronicsHoldings Ltd. 304,333 165
Xiamen TungstenCo. Ltd. Class A 46,600 165
China DongxiangGroup Co. Ltd. 1,565,000 164
* Gaotu Techedu Inc.ADR 55,673 164
Xinjiang GoldwindScience &Technology Co.Ltd. Class A 56,800 164
LongshineTechnology GroupCo. Ltd. Class A 32,400 164
Sinomine ResourceGroup Co. Ltd.Class A 17,100 164
Jiangsu YuyueMedicalEquipment &Supply Co. Ltd.Class A 29,600 163
Shenzhen KedaliIndustry Co. Ltd.Class A 6,000 163
Total World Stock Index Fund
29

Shares
MarketValue•
($000)
Yonghui SuperstoresCo. Ltd. Class A 264,300 163
Beijing GeoEnvironEngineering &Technology Inc.Class A 64,090 163
Shanghai FriendessElectronicTechnology Corp.Ltd. Class A 2,736 163
Zhejiang OrientGene Biotech Co.Ltd. Class A 7,305 163
Yanlord Land GroupLtd. 194,600 162
* Inner MongoliaXingye Mining Co.Ltd. Class A 141,000 162
Qingdao TGOODElectric Co. Ltd.Class A 39,200 161
Yantai Jereh OilfieldServices GroupCo. Ltd. Class A 24,500 161
Huadian PowerInternational Corp.Ltd. Class A 234,000 161
AVICOPTER plcClass A 16,400 161
* Suning.com Co. Ltd.Class A 229,700 160
CGN Power Co. Ltd.Class A 349,900 160
Beijing-ShanghaiHigh SpeedRailway Co. Ltd.Class A 222,700 160
* Chengdu CORPROTechnology Co.Ltd. Class A 41,800 159
QuakeSafeTechnologies Co.Ltd. Class A 10,300 159
Shenghe ResourcesHolding Co. Ltd.Class A 49,000 156
Zhongjin Gold Corp.Ltd. Class A 120,700 156
Sunresin NewMaterials Co. Ltd.Class A 12,700 156
Bethel AutomotiveSafety SystemsCo. Ltd. Class A 16,400 155
Beijing UnitedInformationTechnology Co.Ltd. 8,845 155
1 PAX GlobalTechnology Ltd. 222,000 154
* OneConnectFinancialTechnology Co.Ltd. ADR 48,695 154
Dongxing SecuritiesCo. Ltd. Class A 89,900 154
COSCO SHIPPINGDevelopment Co.Ltd. Class H 793,000 154
Shares
MarketValue•
($000)
Luxi ChemicalGroup Co. Ltd.Class A 60,000 154
Shenzhen TellusHolding Co. Ltd.Class A 70,125 154
Datang InternationalPower GenerationCo. Ltd. Class A 361,800 154
Zhejiang LongshengGroup Co. Ltd.Class A 79,000 154
Zhejiang HangKeTechnology Inc.Co. Class A 9,491 154
Central ChinaManagement Co.Ltd. 1,000,000 154
ChangjiangSecurities Co. Ltd.Class A 135,520 153
*,2 Kaisa GroupHoldings Ltd. 990,262 152
Sichuan YahuaIndustrial GroupCo. Ltd. Class A 29,700 152
Wuchan ZhongdaGroup Co. Ltd.Class A 154,600 152
Hisense HomeAppliances GroupCo. Ltd. Class H 141,000 151
Huafon ChemicalCo. Ltd. Class A 81,100 151
Hangzhou RobamAppliances Co.Ltd. Class A 30,600 150
Nanjing King-FriendBiochemicalPharmaceuticalCo. Ltd. Class A 25,857 150
Beijing YuanliuHongyuanElectronicTechnology Co.Ltd. Class A 5,900 150
WesternSuperconductingTechnologies Co.Ltd. Class A 12,345 150
Gongniu Group Co.Ltd. Class A 6,100 150
Sichuan ShuangmaCement Co. Ltd.Class A 47,700 149
YTO Express GroupCo. Ltd. Class A 65,400 149
Beijing TiantanBiologicalProducts Corp.Ltd. Class A 32,739 148
Tongling NonferrousMetals Group Co.Ltd. Class A 254,100 147
Unisplendour Corp.Ltd. Class A 33,740 146
Zhefu HoldingGroup Co. Ltd.Class A 130,600 146
Total World Stock Index Fund
30

Shares
MarketValue•
($000)
By-health Co. Ltd.Class A 36,600 146
Ningxia BaofengEnergy Group Co.Ltd. Class A 63,700 146
Shandong LinglongTyre Co. Ltd.Class A 26,400 146
* Youdao Inc. ADR 11,928 146 Tibet Rhodiola
PharmaceuticalHolding Co.Class A 19,500 146
*,2 Comba TelecomSystems HoldingsLtd. 522,039 145
ShandongChenming PaperHoldings Ltd.Class B 320,300 145
SDIC Capital Co.Ltd. Class A 112,936 145
China ShinewayPharmaceuticalGroup Ltd. 150,000 144
GRG BankingEquipment Co.Ltd. Class A 88,897 144
SooChow SecuritiesCo. Ltd. Class A 108,160 143
Bank of Jiangsu Co.Ltd. Class A 145,800 143
* Pangang GroupVanadiumTitanium &Resources Co.Ltd. Class A 228,000 142
SangforTechnologies Inc.Class A 4,500 142
Inner MongoliaJunzheng Energy& ChemicalIndustry GroupCo. Ltd. Class A 176,900 142
Sailun Group Co.Ltd. Class A 68,100 142
Raytron TechnologyCo. Ltd. Class A 12,578 142
*,2,3 JD Logistics Inc. 36,127 142 Shanghai Fullhan
MicroelectronicsCo. Ltd. Class A 5,800 142
LianChuangElectronicTechnology Co.Ltd. Class A 44,500 141
SongchengPerformanceDevelopment Co.Ltd. Class A 64,640 141
Proya CosmeticsCo. Ltd. Class A 4,500 141
* Guangzhou GRGMetrology & TestCo. Ltd. Class A 34,965 141
Xiamen Xiangyu Co.Ltd. Class A 116,103 141
Shares
MarketValue•
($000)
Jiangsu YangnongChemical Co. Ltd.Class A 7,600 140
China ExpressAirlines Co. Ltd.Class A 81,473 140
Inner MongoliaEerduosiResources Co.Ltd. Class A 30,200 140
Nanjing SecuritiesCo. Ltd. Class A 91,700 139
Shenzhen H&TIntelligent ControlCo. Ltd. Class A 38,100 138
Foxconn IndustrialInternet Co. Ltd.Class A 77,900 138
Winall Hi-Tech SeedCo. Ltd. Class A 31,700 138
Kangji MedicalHoldings Ltd. 120,500 137
Wuhan Raycus FiberLaserTechnologies Co.Ltd. Class A 14,352 137
Tianshui HuatianTechnology Co.Ltd. Class A 68,000 137
TianmaMicroelectronicsCo. Ltd. Class A 71,200 137
Sichuan KelunPharmaceuticalCo. Ltd. Class A 49,500 137
Beijing ShijiInformationTechnology Co.Ltd. Class A 36,960 137
CSC Financial Co.Ltd. Class A 31,100 137
* Huazhu Group Ltd. 29,610 137* Yuan Longping
High-techAgriculture Co.Ltd. Class A 41,400 136
Jiangsu YokeTechnology Co.Ltd. Class A 11,400 136
China Coal EnergyCo. Ltd. Class A 124,100 136
* Youngy Co. Ltd.Class A 7,800 136
Shanghai JinqiaoExport ProcessingZoneDevelopment Co.Ltd. Class B 148,714 134
* Tuya Inc. ADR 20,616 134 Huolinhe Opencut
Coal IndustryCorp. Ltd. of InnerMongolia Class A 67,100 133
Shenzhen EnergyGroup Co. Ltd.Class A 104,400 133
Avary HoldingShenzhen Co. Ltd.Class A 24,400 133
Total World Stock Index Fund
31
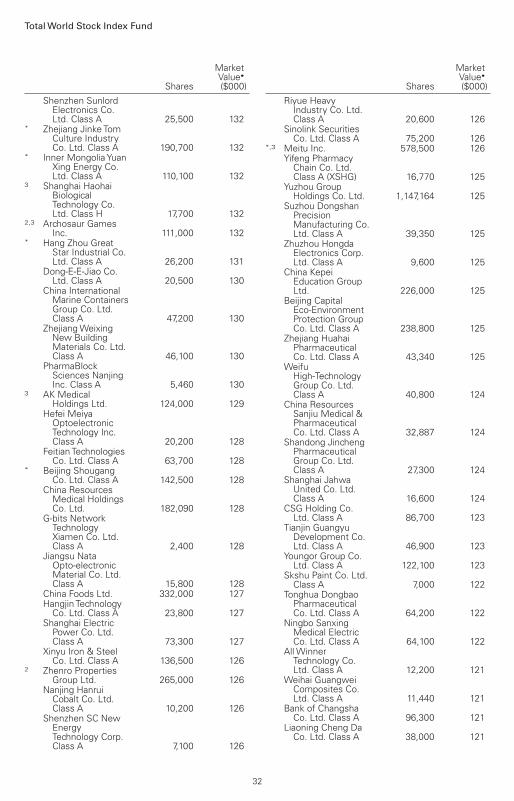
Shares
MarketValue•
($000)
Shenzhen SunlordElectronics Co.Ltd. Class A 25,500 132
* Zhejiang Jinke TomCulture IndustryCo. Ltd. Class A 190,700 132
* Inner Mongolia YuanXing Energy Co.Ltd. Class A 110,100 132
3 Shanghai HaohaiBiologicalTechnology Co.Ltd. Class H 17,700 132
2,3 Archosaur GamesInc. 111,000 132
* Hang Zhou GreatStar Industrial Co.Ltd. Class A 26,200 131
Dong-E-E-Jiao Co.Ltd. Class A 20,500 130
China InternationalMarine ContainersGroup Co. Ltd.Class A 47,200 130
Zhejiang WeixingNew BuildingMaterials Co. Ltd.Class A 46,100 130
PharmaBlockSciences NanjingInc. Class A 5,460 130
3 AK MedicalHoldings Ltd. 124,000 129
Hefei MeiyaOptoelectronicTechnology Inc.Class A 20,200 128
Feitian TechnologiesCo. Ltd. Class A 63,700 128
* Beijing ShougangCo. Ltd. Class A 142,500 128
China ResourcesMedical HoldingsCo. Ltd. 182,090 128
G-bits NetworkTechnologyXiamen Co. Ltd.Class A 2,400 128
Jiangsu NataOpto-electronicMaterial Co. Ltd.Class A 15,800 128
China Foods Ltd. 332,000 127 Hangjin Technology
Co. Ltd. Class A 23,800 127 Shanghai Electric
Power Co. Ltd.Class A 73,300 127
Xinyu Iron & SteelCo. Ltd. Class A 136,500 126
2 Zhenro PropertiesGroup Ltd. 265,000 126
Nanjing HanruiCobalt Co. Ltd.Class A 10,200 126
Shenzhen SC NewEnergyTechnology Corp.Class A 7,100 126
Shares
MarketValue•
($000)
Riyue HeavyIndustry Co. Ltd.Class A 20,600 126
Sinolink SecuritiesCo. Ltd. Class A 75,200 126
*,3 Meitu Inc. 578,500 126 Yifeng Pharmacy
Chain Co. Ltd.Class A (XSHG) 16,770 125
Yuzhou GroupHoldings Co. Ltd. 1,147,164 125
Suzhou DongshanPrecisionManufacturing Co.Ltd. Class A 39,350 125
Zhuzhou HongdaElectronics Corp.Ltd. Class A 9,600 125
China KepeiEducation GroupLtd. 226,000 125
Beijing CapitalEco-EnvironmentProtection GroupCo. Ltd. Class A 238,800 125
Zhejiang HuahaiPharmaceuticalCo. Ltd. Class A 43,340 125
WeifuHigh-TechnologyGroup Co. Ltd.Class A 40,800 124
China ResourcesSanjiu Medical &PharmaceuticalCo. Ltd. Class A 32,887 124
Shandong JinchengPharmaceuticalGroup Co. Ltd.Class A 27,300 124
Shanghai JahwaUnited Co. Ltd.Class A 16,600 124
CSG Holding Co.Ltd. Class A 86,700 123
Tianjin GuangyuDevelopment Co.Ltd. Class A 46,900 123
Youngor Group Co.Ltd. Class A 122,100 123
Skshu Paint Co. Ltd.Class A 7,000 122
Tonghua DongbaoPharmaceuticalCo. Ltd. Class A 64,200 122
Ningbo SanxingMedical ElectricCo. Ltd. Class A 64,100 122
All WinnerTechnology Co.Ltd. Class A 12,200 121
Weihai GuangweiComposites Co.Ltd. Class A 11,440 121
Bank of ChangshaCo. Ltd. Class A 96,300 121
Liaoning Cheng DaCo. Ltd. Class A 38,000 121
Total World Stock Index Fund
32

Shares
MarketValue•
($000)
Guizhou PanjiangRefined Coal Co.Ltd. Class A 100,400 121
Sichuan ExpresswayCo. Ltd. Class A 215,200 121
China Lilang Ltd. 210,000 120 Heilongjiang
Agriculture Co.Ltd. Class A 55,600 120
Wolong ElectricGroup Co. Ltd.Class A 52,100 120
JointownPharmaceuticalGroup Co. Ltd.Class A 56,200 119
Fangda SpecialSteel TechnologyCo. Ltd. Class A 102,800 119
Shanghai WanyeEnterprises Co.Ltd. Class A 24,500 119
Ningbo JoysonElectronic Corp.Class A 42,800 119
Hunan Valin SteelCo. Ltd. Class A 141,000 118
2 China Modern DairyHoldings Ltd. 626,500 118
Addsino Co. Ltd.Class A 49,300 118
2,3 EverbrightSecurities Co. Ltd.Class H 150,600 118
Intco MedicalTechnology Co.Ltd. Class A 14,625 118
* Guangdong HECTechnologyHolding Co. Ltd.Class A 71,200 118
Anhui HengyuanCoal Industry andElectricity PowerCo. Ltd. Class A 107,600 118
Sinopec KantonsHoldings Ltd. 308,000 117
* China High SpeedTransmissionEquipment GroupCo. Ltd. 151,000 117
Jiangsu JiejieMicroelectronicsCo. Ltd. Class A 24,450 117
Yantai EddiePrecisionMachinery Co.Ltd. Class A 20,860 117
SouthwestSecurities Co. Ltd.Class A 155,100 117
Jiangsu ZhongtianTechnology Co.Ltd. Class A 74,300 117
Zhejiang DingliMachinery Co.Ltd. Class A 10,934 117
Shares
MarketValue•
($000)
Shandong DongyueOrganosiliconMaterial Co. Ltd.Class A 34,600 117
* Hunan Gold Corp.Ltd. Class A 68,600 116
Shandong HimileMechanicalScience &Technology Co.Ltd. Class A 29,600 116
Perfect World Co.Ltd. Class A 42,950 116
Bafang ElectricSuzhou Co. Ltd.Class A 3,100 116
Jonjee Hi-TechIndustrial AndCommercialHolding Co. Ltd.Class A 20,400 116
* CanSino BiologicsInc. Class A 2,713 116
Oppein HomeGroup Inc.Class A 5,800 115
Kingfa Sci & TechCo. Ltd. Class A 62,900 115
Greenland HoldingsCorp. Ltd. Class A 178,815 115
Kaishan Group Co.Ltd. Class A 40,700 115
* GCL SystemIntegrationTechnology Co.Ltd. Class A 181,900 115
* BEST Inc. ADR 70,614 114 Shanghai Jinjiang
InternationalHotels Co. Ltd.Class B 59,100 114
Chongqing FulingZhacai Group Co.Ltd. Class A 21,000 114
BOC InternationalChina Co. Ltd.Class A 54,800 114
Zhejiang XinanChemicalIndustrial GroupCo. Ltd. Class A 26,100 113
Huaibei MiningHoldings Co. Ltd.Class A 57,100 113
* INKON LifeTechnology Co.Ltd. Class A 49,900 113
AdvancedTechnology &Materials Co. Ltd.Class A 83,800 112
Huagong Tech Co.Ltd. Class A 24,900 112
An Hui Wenergy Co.Ltd. Class A 162,200 111
Shenzhen ZhongjinLingnanNonfemet Co.Ltd. Class A 142,900 111
Total World Stock Index Fund
33
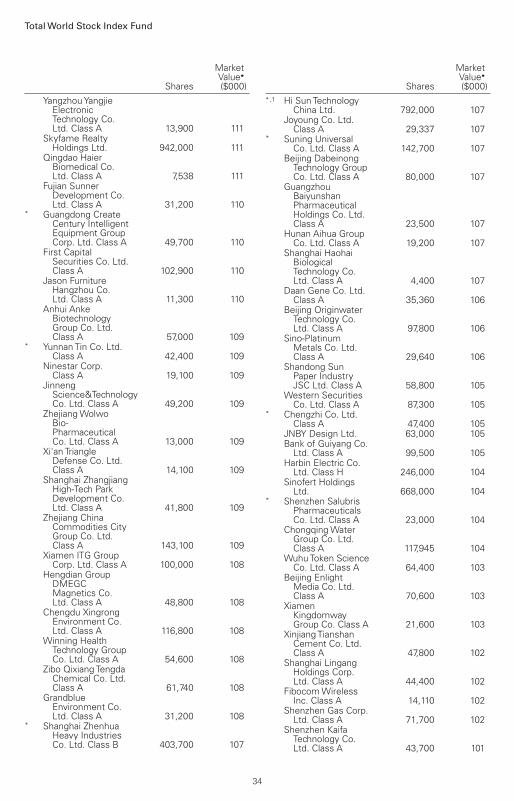
Shares
MarketValue•
($000)
Yangzhou YangjieElectronicTechnology Co.Ltd. Class A 13,900 111
Skyfame RealtyHoldings Ltd. 942,000 111
Qingdao HaierBiomedical Co.Ltd. Class A 7,538 111
Fujian SunnerDevelopment Co.Ltd. Class A 31,200 110
* Guangdong CreateCentury IntelligentEquipment GroupCorp. Ltd. Class A 49,700 110
First CapitalSecurities Co. Ltd.Class A 102,900 110
Jason FurnitureHangzhou Co.Ltd. Class A 11,300 110
Anhui AnkeBiotechnologyGroup Co. Ltd.Class A 57,000 109
* Yunnan Tin Co. Ltd.Class A 42,400 109
Ninestar Corp.Class A 19,100 109
JinnengScience&TechnologyCo. Ltd. Class A 49,200 109
Zhejiang WolwoBio-PharmaceuticalCo. Ltd. Class A 13,000 109
Xi'an TriangleDefense Co. Ltd.Class A 14,100 109
Shanghai ZhangjiangHigh-Tech ParkDevelopment Co.Ltd. Class A 41,800 109
Zhejiang ChinaCommodities CityGroup Co. Ltd.Class A 143,100 109
Xiamen ITG GroupCorp. Ltd. Class A 100,000 108
Hengdian GroupDMEGCMagnetics Co.Ltd. Class A 48,800 108
Chengdu XingrongEnvironment Co.Ltd. Class A 116,800 108
Winning HealthTechnology GroupCo. Ltd. Class A 54,600 108
Zibo Qixiang TengdaChemical Co. Ltd.Class A 61,740 108
GrandblueEnvironment Co.Ltd. Class A 31,200 108
* Shanghai ZhenhuaHeavy IndustriesCo. Ltd. Class B 403,700 107
Shares
MarketValue•
($000)*,1 Hi Sun Technology
China Ltd. 792,000 107 Joyoung Co. Ltd.
Class A 29,337 107* Suning Universal
Co. Ltd. Class A 142,700 107 Beijing Dabeinong
Technology GroupCo. Ltd. Class A 80,000 107
GuangzhouBaiyunshanPharmaceuticalHoldings Co. Ltd.Class A 23,500 107
Hunan Aihua GroupCo. Ltd. Class A 19,200 107
Shanghai HaohaiBiologicalTechnology Co.Ltd. Class A 4,400 107
Daan Gene Co. Ltd.Class A 35,360 106
Beijing OriginwaterTechnology Co.Ltd. Class A 97,800 106
Sino-PlatinumMetals Co. Ltd.Class A 29,640 106
Shandong SunPaper IndustryJSC Ltd. Class A 58,800 105
Western SecuritiesCo. Ltd. Class A 87,300 105
* Chengzhi Co. Ltd.Class A 47,400 105
JNBY Design Ltd. 63,000 105 Bank of Guiyang Co.
Ltd. Class A 99,500 105 Harbin Electric Co.
Ltd. Class H 246,000 104 Sinofert Holdings
Ltd. 668,000 104* Shenzhen Salubris
PharmaceuticalsCo. Ltd. Class A 23,000 104
Chongqing WaterGroup Co. Ltd.Class A 117,945 104
Wuhu Token ScienceCo. Ltd. Class A 64,400 103
Beijing EnlightMedia Co. Ltd.Class A 70,600 103
XiamenKingdomwayGroup Co. Class A 21,600 103
Xinjiang TianshanCement Co. Ltd.Class A 47,800 102
Shanghai LingangHoldings Corp.Ltd. Class A 44,400 102
Fibocom WirelessInc. Class A 14,110 102
Shenzhen Gas Corp.Ltd. Class A 71,700 102
Shenzhen KaifaTechnology Co.Ltd. Class A 43,700 101
Total World Stock Index Fund
34

Shares
MarketValue•
($000)
Hesteel Co. Ltd.Class A 263,800 101
Chacha Food Co.Ltd. Class A 11,200 100
Beijing ShunxinAgriculture Co.Ltd. Class A 19,699 100
Victory GiantTechnologyHuizhou Co. Ltd.Class A 24,200 100
CNOOC EnergyTechnology &Services Ltd.Class A 221,900 100
Yutong Bus Co. Ltd.Class A 56,700 100
Haohua ChemicalScience &Technology Co.Ltd. Class A 19,700 100
Zhongtai SecuritiesCo. Ltd. Class A 69,100 100
* Montnets CloudTechnology GroupCo. Ltd. Class A 31,300 99
* NavInfo Co. Ltd.Class A 54,100 99
Wanxiang QianchaoCo. Ltd. Class A 105,400 99
HengyiPetrochemical Co.Ltd. Class A 58,000 99
MLS Co. Ltd.Class A 45,400 99
Shanxi Blue FlameHolding Co. Ltd.Class A 69,300 99
SinofibersTechnology Co.Ltd. Class A 11,200 99
*,3 Red Star MacallineGroup Corp. Ltd.Class H 176,455 99
Hubei Energy GroupCo. Ltd. Class A 126,000 98
Eternal Asia SupplyChainManagement Ltd.Class A 108,900 98
SGIS Songshan Co.Ltd. Class A 141,400 98
Shanghai WeaverNetwork Co. Ltd.Class A 9,720 98
JinduichengMolybdenum Co.Ltd. Class A 86,200 98
ZhejiangCrystal-OptechCo. Ltd. Class A 39,500 97
Yunda Holding Co.Ltd. Class A 33,146 97
ShanghaiEnvironmentGroup Co. Ltd.Class A 53,500 97
China ZheshangBank Co. Ltd.Class A 179,900 97
Shares
MarketValue•
($000)
Dongfang ElectricCorp. Ltd. Class A 34,300 97
*,1 China ZhongwangHoldings Ltd. 442,800 96
* China NonferrousMetal Industry'sForeignEngineering andConstruction Co.Ltd. Class A 119,700 96
* Zhongtian FinancialGroup Co. Ltd.Class A 245,300 96
* Guosheng FinancialHolding Inc.Class A 65,600 96
3 Shenzhen HepalinkPharmaceuticalGroup Co. Ltd.Class H 87,500 96
Quectel WirelessSolutions Co. Ltd.Class A 3,380 95
* Beijing BDStarNavigation Co.Ltd. Class A 15,400 95
DHC Software Co.Ltd. Class A 87,269 95
Guangdong KinlongHardwareProducts Co. Ltd.Class A 4,600 95
Tianfeng SecuritiesCo. Ltd. Class A 154,294 95
HumanwellHealthcare GroupCo. Ltd. Class A 29,000 95
Shenzhen HuaqiangIndustry Co. Ltd.Class A 41,200 94
* Siasun Robot &Automation Co.Ltd. Class A 64,400 94
* BTG Hotels GroupCo. Ltd. Class A 24,600 94
Guangdong TapaiGroup Co. Ltd.Class A 59,300 93
First Tractor Co. Ltd.Class H 184,000 93
Xinjiang ZhongtaiChemical Co. Ltd.Class A 56,300 93
LeyardOptoelectronicCo. Ltd. Class A 63,400 93
Anhui JinheIndustrial Co. Ltd.Class A 12,400 93
Anhui Xinhua MediaCo. Ltd. Class A 127,000 93
China NationalSoftware &Service Co. Ltd.Class A 11,600 93
Chengtun MiningGroup Co. Ltd.Class A 57,900 93
Total World Stock Index Fund
35

Shares
MarketValue•
($000)
Zhejiang CfmotoPower Co. Ltd.Class A 3,700 93
Jinke PropertiesGroup Co. Ltd.Class A 132,700 92
Shanghai Chlor-AlkaliChemical Co. Ltd.Class B 138,200 92
Xinhua WinsharePublishing andMedia Co. Ltd.Class H 126,000 92
* Beijing E-HualuInformationTechnology Co.Ltd. Class A 20,228 92
XinyangfengAgriculturalTechnology Co.Ltd. Class A 32,200 92
DongjiangEnvironmental Co.Ltd. Class A 86,300 92
* Meinian OnehealthHealthcareHoldings Co. Ltd.Class A 81,640 92
AVICIndustry-FinanceHoldings Co. Ltd.Class A 151,600 92
Wangfujing GroupCo. Ltd. Class A 19,200 92
GuangdongProvincialExpresswayDevelopment Co.Ltd. Class B 129,300 91
* Jiangsu HoperunSoftware Co. Ltd.Class A 22,200 91
FAW Jiefang GroupCo. Ltd. Class A 55,600 91
*,3 MaoyanEntertainment 75,600 91
Shenzhen GoodixTechnology Co.Ltd. Class A 5,642 90
ShaanxiInternational TrustCo. Ltd. Class A 185,400 90
Beijing Zhong KeSan HuanHigh-Tech Co. Ltd.Class A 51,400 90
Zhongshan PublicUtilities Group Co.Ltd. Class A 66,700 90
BoyaBio-pharmaceuticalGroup Co. Ltd.Class A 14,600 90
East Group Co. Ltd.Class A 55,600 90
Topsec TechnologiesGroup Inc.Class A 31,400 90
Shares
MarketValue•
($000)
ShandongPharmaceuticalGlass Co. Ltd.Class A 17,000 90
Inner MongoliaMengDianHuaNeng ThermalPower Corp. Ltd.Class A 160,200 90
Xiamen Meiya PicoInformation Co.Ltd. Class A 37,200 89
Chongqing RuralCommercial BankCo. Ltd. Class A 149,400 89
China NationalMedicines Corp.Ltd. Class A 18,600 89
Shanghai Belling Co.Ltd. Class A 18,900 89
* Offcn EducationTechnology Co.Ltd. Class A 53,900 88
Shenzhen SunwayCommunicationCo. Ltd. Class A 23,700 88
Yunnan Copper Co.Ltd. Class A 42,400 88
Xiamen C & D Inc.Class A 70,200 88
Shenzhen LaibaoHi-tech Co. Ltd.Class A 53,800 87
Zhejiang HisoarPharmaceuticalCo. Ltd. Class A 71,400 87
Jointo EnergyInvestment Co.Ltd. HebeiClass A 108,700 87
Zhejiang JiecangLinear MotionTechnology Co.Ltd. Class A 12,040 87
ShanghaiConstructionGroup Co. Ltd.Class A 170,500 87
Sinoma InternationalEngineering Co.Class A 53,400 87
* Shenzhen MTC Co.Ltd. Class A 111,700 86
* China CAMCEngineering Co.Ltd. Class A 84,700 86
* Pengdu Agriculture& AnimalHusbandry Co.Ltd. Class A 158,300 86
Shanxi SecuritiesCo. Ltd. Class A 87,770 86
* SPIC Dongfang NewEnergy Corp.Class A 117,800 86
C&S Paper Co. Ltd.Class A 32,400 86
Total World Stock Index Fund
36

Shares
MarketValue•
($000)
China SouthPublishing &Media Group Co.Ltd. Class A 66,900 86
Shenergy Co. Ltd.Class A 88,900 86
JoincarePharmaceuticalGroup IndustryCo. Ltd. Class A 48,000 86
3 Cathay Media AndEducation GroupInc. 210,000 86
Nanjing Iron & SteelCo. Ltd. Class A 154,100 85
Sansteel MinguangCo. Ltd. FujianClass A 79,600 85
*,2 China Maple LeafEducationalSystems Ltd. 528,000 85
Guangzhou HaigeCommunicationsGroup Inc. CoClass A 57,400 85
China MerchantsPropertyOperation &Service Co. Ltd.Class A 40,430 85
Sanquan Food Co.Ltd. Class A 28,160 85
Ningbo ZhoushanPort Co. Ltd.Class A 144,600 85
China World TradeCenter Co. Ltd.Class A 39,900 85
Jiangxi LianchuangOptoelectronicScience &Technology Co.Ltd. Class A 19,700 85
Shanghai Jin JiangCapital Co. Ltd.Class H 372,000 84
IKD Co. Ltd. Class A 39,200 84 Shenzhen Yinghe
Technology Co.Ltd. Class A 17,100 84
Anhui ExpresswayCo. Ltd. Class A 92,100 84
Guangdong BaolihuaNew EnergyStock Co. Ltd.Class A 92,800 83
Kunlun Tech Co. Ltd.Class A 28,400 83
Risen Energy Co.Ltd. Class A 22,300 83
Beijing Cisri-GaonaMaterials &Technology Co.Ltd. Class A 12,700 83
* China Tianying Inc.Class A 112,100 83
Guizhou Gas GroupCorp. Ltd. Class A 53,700 83
Zhongliang HoldingsGroup Co. Ltd. 179,500 83
Shares
MarketValue•
($000)
Beijing North StarCo. Ltd. Class A 238,800 83
Amoy DiagnosticsCo. Ltd. Class A 6,500 82
* Aerospace Hi-TechHoldings GroupLtd. Class A 62,157 82
Anhui ZhongdingSealing Parts Co.Ltd. Class A 30,600 82
Shenzhen YUTOPackagingTechnology Co.Ltd. Class A 16,100 82
ChemPartnerPharmaTech Co.Ltd. Class A 36,000 82
Hainan Poly PharmCo. Ltd. Class A 10,725 82
Offshore OilEngineering Co.Ltd. Class A 112,800 82
Yintai Gold Co. Ltd.Class A 58,660 81
* Holitech TechnologyCo. Ltd. Class A 160,300 81
Hangzhou BinjiangReal Estate GroupCo. Ltd. Class A 126,500 81
* Guangdong GoldenDragonDevelopment Inc.Class A 32,500 81
Jiangxi WannianqingCement Co. Ltd.Class A 45,300 81
Central ChinaSecurities Co. Ltd.Class A 113,100 81
TimesNeighborhoodHoldings Ltd. 170,615 80
Tibet Tianlu Co. Ltd.Class A 80,700 80
HyteraCommunicationsCorp. Ltd. Class A 90,200 80
TongFuMicroelectronicsCo. Ltd. Class A 25,700 80
Shennan CircuitsCo. Ltd. Class A 5,740 80
COFCO CapitalHoldings Co. Ltd.Class A 62,300 80
Guolian SecuritiesCo. Ltd. Class A 42,200 80
* Pacific Securities CoLtd./The/ChinaClass A 164,900 80
EasternCommunicationsCo. Ltd. Class B 175,800 79
ShanghaiMechanical andElectrical IndustryCo. Ltd. Class B 61,773 79
Newland DigitalTechnology Co.Ltd. Class A 33,399 79
Total World Stock Index Fund
37

Shares
MarketValue•
($000)
Northeast SecuritiesCo. Ltd. Class A 58,700 79
Sino WealthElectronic Ltd.Class A 8,250 79
Zhongji Innolight Co.Ltd. Class A 15,300 79
ZhongyuanEnvironment-Protection Co.Ltd. Class A 83,600 79
China Great WallSecurities Co. Ltd.Class A 44,200 79
Anhui Honglu SteelConstructionGroup Co. Ltd.Class A 11,900 79
* BeijingChunlizhengdaMedicalInstruments Co.Ltd. Class H 33,250 78
Shenzhen TagenGroup Co. Ltd.Class A 99,100 78
COFCOBiotechnology Co.Ltd. Class A 46,600 78
YifanPharmaceuticalCo. Ltd. Class A 30,300 78
Xuji Electric Co. Ltd.Class A 25,200 78
Guangzhou ShiyuanElectronicTechnology Co.Ltd. Class A 6,597 78
Huaan SecuritiesCo. Ltd. Class A 97,760 78
Estun AutomationCo. Ltd. Class A(XSEC) 18,600 77
* Sinopec OilfieldService Corp.Class H 806,000 77
Wuxi BotonTechnology Co.Ltd. Class A 21,400 77
Wuhan JingceElectronic GroupCo. Ltd. Class A 9,400 77
Milkyway ChemicalSupply ChainService Co. Ltd.Class A 4,500 77
Zhejiang MedicineCo. Ltd. Class A 31,000 77
Huafa Industrial Co.Ltd. ZhuhaiClass A 93,200 77
3 Yangtze OpticalFibre and CableJoint Stock Ltd.Co Class H 46,000 77
* Beijing EnterprisesClean EnergyGroup Ltd. 5,760,000 77
Shares
MarketValue•
($000)* Southern Shuanglin
Bio-pharmacy Co.Ltd. Class A 15,600 77
ConsunPharmaceuticalGroup Ltd. 178,000 76
* Chongqing Iron &Steel Co. Ltd.Class H 378,000 76
* DazhongTransportationGroup Co. Ltd.Class B 264,350 76
* Yatsen Holding Ltd.ADR 26,980 76
Shenzhen DesayBatteryTechnology Co.Class A 11,455 76
Shenzhen InfogemTechnologies Co.Ltd. Class A 36,900 76
Infore EnvironmentTechnology GroupCo. Ltd. Class A 78,200 76
Shanghai LiangxinElectrical Co. Ltd.Class A 29,770 76
Guangdong ElectricPowerDevelopment Co.Ltd. Class B 239,743 75
Shenzhen EverwinPrecisionTechnology Co.Ltd. Class A 34,080 75
Financial StreetHoldings Co. Ltd.Class A 81,700 75
China WestConstructionGroup Co. Ltd.Class A 67,200 75
Guangdong HongdaBlasting Co. Ltd.Class A 17,500 75
Keshun WaterproofTechnologies Co.Ltd. Class A 36,180 75
Hangzhou DptechTechnologies Co.Ltd. Class A 11,600 75
Hongta SecuritiesCo. Ltd. Class A 42,900 75
Hebei HengshuiLaobaigan LiquorCo. Ltd. Class A 22,300 75
* LVGEM China RealEstate InvestmentCo. Ltd. 332,000 75
Shanghai M&GStationery Inc.Class A 7,600 75
NanJi E-CommerceCo. Ltd. Class A 66,500 74
Jiangsu NhwaPharmaceuticalCo. Ltd. Class A 32,000 74
Total World Stock Index Fund
38

Shares
MarketValue•
($000)
Xinhua WinsharePublishing andMedia Co. Ltd.Class A 56,600 74
* Red Star MacallineGroup Corp. Ltd.Class A 52,250 74
Tianli EducationInternationalHoldings Ltd. 358,000 74
Shanghai LujiazuiFinance & TradeZoneDevelopment Co.Ltd. Class A 43,500 74
Tangshan SanyouChemicalIndustries Co. Ltd.Class A 51,300 74
Guangxi GuiguanElectric Power Co.Ltd. Class A 81,800 74
Ronshine ChinaHoldings Ltd. 182,500 74
3 Redco PropertiesGroup Ltd. 238,000 73
Shandong DenghaiSeeds Co. Ltd.Class A 21,800 73
Sinocare Inc.Class A 19,800 73
Shenzhen FastprintCircuit Tech Co.Ltd. Class A 37,100 73
Hubei Dinglong Co.Ltd. Class A 23,400 73
Sai MicroElectronics Inc.Class A 19,900 73
Hubei FeilihuaQuartz Glass Co.Ltd. Class A 8,400 73
ZheJiang DaliTechnology Co.Ltd. Class A 24,720 73
Chinese UniversePublishing andMedia Group Co.Ltd. Class A 44,900 73
ShanghaiMechanical andElectrical IndustryCo. Ltd. Class A 32,100 73
Greattown HoldingsLtd. Class A 131,500 73
* Chifeng Jilong GoldMining Co. Ltd.Class A 28,900 73
Shanghai HaixinGroup Co. Class B 210,800 72
Shenzhen HepalinkPharmaceuticalGroup Co. Ltd.Class A 30,000 72
Zhejiang Huace Film& Television Co.Ltd. Class A 81,100 72
Valiant Co. Ltd.Class A 22,500 72
Shares
MarketValue•
($000)
Tibet SummitResources Co.Ltd. Class A 15,000 72
Shandong Hi-speedCo. Ltd. Class A 85,500 72
Hexing Electrical Co.Ltd. Class A 39,100 72
Guangzhou WondfoBiotech Co. Ltd.Class A 13,130 71
Chaowei PowerHoldings Ltd. 240,000 71
Beijing YanjingBrewery Co. Ltd.Class A 68,900 71
Shenyang XingqiPharmaceuticalCo. Ltd. Class A 3,600 71
LaobaixingPharmacy ChainJSC Class A 10,220 70
Fujian Star-netCommunicationCo. Ltd. Class A 20,600 70
Jiangsu ZhongnanConstructionGroup Co. Ltd.Class A 116,700 70
OFILM Group Co.Ltd. Class A 59,800 70
Henan ShenhuoCoal & Power Co.Ltd. Class A 47,400 70
Guangdong XinbaoElectricalAppliancesHoldings Co. Ltd.Class A 19,900 70
Shanxi Coking Co.Ltd. Class A 65,390 70
Anhui ExpresswayCo. Ltd. Class H 116,000 69
Lianhe ChemicalTechnology Co.Ltd. Class A 22,800 69
Yotrio Group Co.Ltd. Class A 127,800 69
* Beijing UltrapowerSoftware Co. Ltd.Class A 77,900 69
Huaxin Cement Co.Ltd. Class A 26,100 68
* Sichuan HaiteHigh-tech Co. Ltd.Class A 36,800 68
YGSOFT Inc.Class A 63,960 68
Tianjin Chase SunPharmaceuticalCo. Ltd. Class A 107,100 68
Zhejiang YashaDecoration Co.Ltd. Class A 58,400 68
YixintangPharmaceuticalGroup Co. Ltd.Class A 13,700 68
EoptolinkTechnology Inc.Ltd Class A 15,262 68
Total World Stock Index Fund
39

Shares
MarketValue•
($000)
Juewei Food Co.Ltd. Class A 6,600 68
* Bank of ZhengzhouCo. Ltd. Class A 128,150 68
LuoxinPharmaceuticalsGroup Stock Co.Ltd. Class A 46,318 68
Shanghai AJ GroupCo. Ltd. Class A 67,600 68
* Tongda GroupHoldings Ltd. 2,100,439 67
Beijing SLPharmaceuticalCo. Ltd. Class A 46,500 67
Jilin AodongPharmaceuticalGroup Co. Ltd.Class A 27,200 67
Shenzhen SuntakCircuit TechnologyCo. Ltd. Class A 31,000 67
FiberhomeTelecommunicationTechnologies Co.Ltd. Class A 24,800 67
* Cinda Real EstateCo. Ltd. Class A 133,900 67
Wens FoodstuffsGroup Co. Ltd.Class A 25,560 66
WeifuHigh-TechnologyGroup Co. Ltd.Class B 34,600 66
* So-YoungInternational Inc.ADR 16,711 66
* Beijing JetsenTechnology Co.Ltd. Class A 102,600 66
Shanghai PretComposites Co.Ltd. Class A 38,400 66
Konka Group Co.Ltd. Class A 75,700 66
Huaxi Securities Co.Ltd. Class A 47,000 66
Bright Dairy & FoodCo. Ltd. Class A 30,100 66
State GridInformation &CommunicationCo. Ltd. Class A 27,900 66
Tianjin 712Communication &Broadcasting Co.Ltd. Class A 11,000 65
Vatti Corp. Ltd.Class A 69,700 64
B-Soft Co. Ltd.Class A 50,960 64
Bank of ChengduCo. Ltd. Class A 32,000 64
Qianhe Condimentand Food Co. Ltd.Class A 16,680 64
Sinopec ShanghaiPetrochemical Co.Ltd. Class A 105,100 64
Shares
MarketValue•
($000)
Shanghai TunnelEngineering Co.Ltd. Class A 79,800 64
Chongqing DimaIndustry Co. Ltd.Class A 177,600 64
Henan ZhongyuanExpressway Co.Ltd. Class A 130,439 64
Zhejiang Supor Co.Ltd. Class A 7,595 63
Dian DiagnosticsGroup Co. Ltd.Class A 12,600 63
* Bohai Leasing Co.Ltd. Class A 154,100 63
Jiangsu HengshunVinegar IndustryCo. Ltd. Class A 24,900 63
1 Fantasia HoldingsGroup Co. Ltd. 861,000 62
Shenzhen JinjiaGroup Co. Ltd.Class A 36,400 62
ORG Technology Co.Ltd. Class A 59,500 62
HaiscoPharmaceuticalGroup Co. Ltd.Class A 23,700 62
Suzhou Gold MantisConstructionDecoration Co.Ltd. Class A 66,600 62
* Alpha Group Class A 79,000 62 Dare Power Dekor
Home Co. Ltd.Class A 33,800 62
Guangzhou ZhujiangBrewery Co. Ltd.Class A 40,100 62
* Zheshang SecuritiesCo. Ltd. Class A 32,100 62
Shenzhen KinwongElectronic Co. Ltd.Class A 15,300 62
Zhejiang WanfengAuto Wheel Co.Ltd. Class A 74,500 61
* GenimousTechnology Co.Ltd. Class A 64,200 61
BettaPharmaceuticalsCo. Ltd. Class A 4,900 61
Hangzhou OxygenPlant Group Co.Ltd. Class A 15,100 61
* TangShan PortGroup Co. Ltd.Class A 145,900 61
ShanyingInternationalHolding Co. Ltd.Class A 119,600 61
Autobio DiagnosticsCo. Ltd. Class A 7,020 60
Total World Stock Index Fund
40

Shares
MarketValue•
($000)
Shanghai Jin JiangOnline NetworkService Co. Ltd.Class B 91,264 60
Shijiazhuang YilingPharmaceuticalCo. Ltd. Class A 23,800 60
Beibuwan Port Co.Ltd. Class A 51,700 60
Shenzhen MegmeetElectrical Co. Ltd.Class A 12,500 60
2 Perennial EnergyHoldings Ltd. 295,000 60
* Guangshen RailwayCo. Ltd. Class H 336,000 59
AccelinkTechnologies Co.Ltd. Class A 17,300 59
Xinxing Ductile IronPipes Co. Ltd.Class A 102,100 59
ShandongChenming PaperHoldings Ltd.Class A 53,600 59
Zhejiang HailiangCo. Ltd. Class A 36,000 59
* Guangshen RailwayCo. Ltd. Class A 177,800 59
Zhengzhou CoalMining MachineryGroup Co. Ltd.Class A 37,100 59
* Baidu Inc. Class A 2,888 59 Gan & Lee
PharmaceuticalsCo. Ltd. Class A 5,611 59
China South CityHoldings Ltd. 778,000 58
WUS Printed CircuitKunshan Co. Ltd.Class A 36,080 58
Shanghai KehuaBio-EngineeringCo. Ltd. Class A 27,200 58
Leo Group Co. Ltd.Class A 162,800 58
* STO Express Co.Ltd. Class A 48,400 58
Greenland HongKong HoldingsLtd. 275,000 58
*,3 Ascletis Pharma Inc. 167,000 58 China Merchants
ExpresswayNetwork &TechnologyHoldings Co. Ltd.Class A 52,800 58
Zhejiang TianyuPharmaceuticalCo. Ltd. Class A 9,720 58
Universal ScientificIndustrialShanghai Co. Ltd.Class A 26,800 58
* Shenzhen AirportCo. Ltd. Class A 48,400 57
Shares
MarketValue•
($000)
Taiji Computer Corp.Ltd. Class A 13,019 57
Bluefocus IntelligentCommunicationsGroup Co. Ltd.Class A 73,500 57
* Huafu Fashion Co.Ltd. Class A 82,600 57
5I5J Holding GroupCo. Ltd. Class A 123,300 57
People.cn Co. Ltd.Class A 27,700 57
Luenmei QuantumCo. Ltd. Class A 43,800 57
Anhui KouziDistillery Co. Ltd.Class A 5,900 56
* Beijing SanjuEnvironmentalProtection andNew Material Co.Ltd. Class A 58,600 56
Jiangxi Bank Co.Ltd. Class H 126,500 56
BGI Genomics Co.Ltd. Class A 4,000 56
Shanghai ZijiangEnterprise GroupCo. Ltd. Class A 36,800 56
* Grandjoy HoldingsGroup Co. Ltd.Class A 107,100 55
Shanghai SinyangSemiconductorMaterials Co. Ltd.Class A 8,900 55
Zhongfu InformationInc. Class A 9,900 55
Camel Group Co.Ltd. Class A 26,910 55
* Markor InternationalHome FurnishingsCo. Ltd. Class A 104,000 55
* Autohome Inc.Class A 5,444 55
MaccuraBiotechnology Co.Ltd. Class A 12,500 54
3 Qingdao PortInternational Co.Ltd. Class H 108,000 54
* Huangshan TourismDevelopment Co.Ltd. Class B 77,426 54
Guangzhou YuexiuFinancial HoldingsGroup Co. Ltd.Class A 45,090 54
Beijing SinnetTechnology Co.Ltd. Class A 26,100 54
* CITIC GuoanInformationIndustry Co. Ltd.Class A 153,300 54
CNHTC Jinan TruckCo. Ltd. Class A 25,900 54
Beijing AosaikangPharmaceuticalCo. Ltd. Class A 29,500 54
Total World Stock Index Fund
41
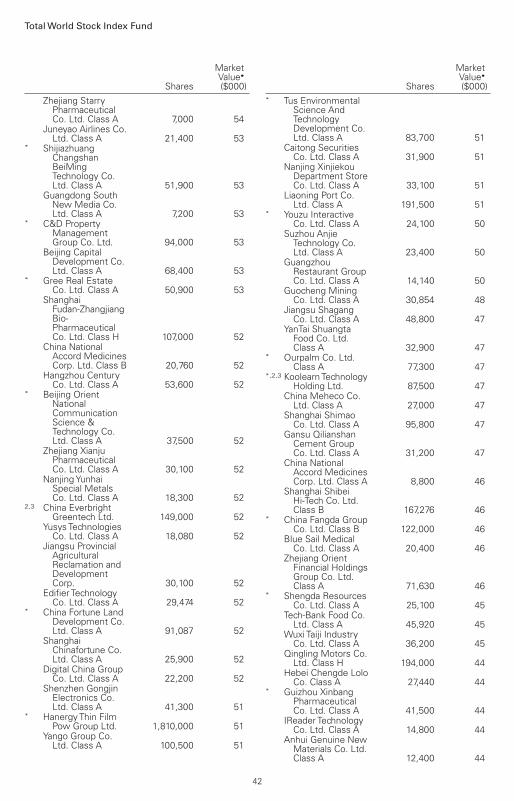
Shares
MarketValue•
($000)
Zhejiang StarryPharmaceuticalCo. Ltd. Class A 7,000 54
Juneyao Airlines Co.Ltd. Class A 21,400 53
* ShijiazhuangChangshanBeiMingTechnology Co.Ltd. Class A 51,900 53
Guangdong SouthNew Media Co.Ltd. Class A 7,200 53
* C&D PropertyManagementGroup Co. Ltd. 94,000 53
Beijing CapitalDevelopment Co.Ltd. Class A 68,400 53
* Gree Real EstateCo. Ltd. Class A 50,900 53
ShanghaiFudan-ZhangjiangBio-PharmaceuticalCo. Ltd. Class H 107,000 52
China NationalAccord MedicinesCorp. Ltd. Class B 20,760 52
Hangzhou CenturyCo. Ltd. Class A 53,600 52
* Beijing OrientNationalCommunicationScience &Technology Co.Ltd. Class A 37,500 52
Zhejiang XianjuPharmaceuticalCo. Ltd. Class A 30,100 52
Nanjing YunhaiSpecial MetalsCo. Ltd. Class A 18,300 52
2,3 China EverbrightGreentech Ltd. 149,000 52
Yusys TechnologiesCo. Ltd. Class A 18,080 52
Jiangsu ProvincialAgriculturalReclamation andDevelopmentCorp. 30,100 52
Edifier TechnologyCo. Ltd. Class A 29,474 52
* China Fortune LandDevelopment Co.Ltd. Class A 91,087 52
ShanghaiChinafortune Co.Ltd. Class A 25,900 52
Digital China GroupCo. Ltd. Class A 22,200 52
Shenzhen GongjinElectronics Co.Ltd. Class A 41,300 51
* Hanergy Thin FilmPow Group Ltd. 1,810,000 51
Yango Group Co.Ltd. Class A 100,500 51
Shares
MarketValue•
($000)* Tus Environmental
Science AndTechnologyDevelopment Co.Ltd. Class A 83,700 51
Caitong SecuritiesCo. Ltd. Class A 31,900 51
Nanjing XinjiekouDepartment StoreCo. Ltd. Class A 33,100 51
Liaoning Port Co.Ltd. Class A 191,500 51
* Youzu InteractiveCo. Ltd. Class A 24,100 50
Suzhou AnjieTechnology Co.Ltd. Class A 23,400 50
GuangzhouRestaurant GroupCo. Ltd. Class A 14,140 50
Guocheng MiningCo. Ltd. Class A 30,854 48
Jiangsu ShagangCo. Ltd. Class A 48,800 47
YanTai ShuangtaFood Co. Ltd.Class A 32,900 47
* Ourpalm Co. Ltd.Class A 77,300 47
*,2,3 Koolearn TechnologyHolding Ltd. 87,500 47
China Meheco Co.Ltd. Class A 27,000 47
Shanghai ShimaoCo. Ltd. Class A 95,800 47
Gansu QilianshanCement GroupCo. Ltd. Class A 31,200 47
China NationalAccord MedicinesCorp. Ltd. Class A 8,800 46
Shanghai ShibeiHi-Tech Co. Ltd.Class B 167,276 46
* China Fangda GroupCo. Ltd. Class B 122,000 46
Blue Sail MedicalCo. Ltd. Class A 20,400 46
Zhejiang OrientFinancial HoldingsGroup Co. Ltd.Class A 71,630 46
* Shengda ResourcesCo. Ltd. Class A 25,100 45
Tech-Bank Food Co.Ltd. Class A 45,920 45
Wuxi Taiji IndustryCo. Ltd. Class A 36,200 45
Qingling Motors Co.Ltd. Class H 194,000 44
Hebei Chengde LoloCo. Class A 27,440 44
* Guizhou XinbangPharmaceuticalCo. Ltd. Class A 41,500 44
IReader TechnologyCo. Ltd. Class A 14,800 44
Anhui Genuine NewMaterials Co. Ltd.Class A 12,400 44
Total World Stock Index Fund
42

Shares
MarketValue•
($000)* Tongdao Liepin
Group 30,600 44*,2,3 YiChang HEC
ChangJiangPharmaceuticalCo. Ltd. Class H 92,800 43
INESA IntelligentTech Inc. Class B 98,400 43
Zhejiang JIULIHi-tech MetalsCo. Ltd. Class A 21,700 43
Yantai DongchengPharmaceuticalCo. Ltd. Class A 19,800 43
Shanghai YaojiTechnology Co.Ltd. Class A 16,400 43
Shenzhen KingdomSci-Tech Co. Ltd.Class A 21,498 43
Shanghai HuayiGroup Co. Ltd.Class B 63,200 42
* Beijing WatertekInformationTechnology Co.Ltd. Class A 80,700 42
Shanghai AtHub Co.Ltd. Class A 8,540 42
Jiajiayue Group Co.Ltd. Class A 18,300 42
Shenzhen LeaguerCo. Ltd. Class A 30,200 42
* Orient Group Inc.Class A 92,500 42
CPMC Holdings Ltd. 83,000 41 Shandong Humon
Smelting Co. Ltd.Class A 23,000 41
Hebei ConstructionGroup Corp. Ltd.Class H 160,500 41
2 Colour Life ServicesGroup Co. Ltd. 235,000 41
Hubei BiocausePharmaceuticalCo. Ltd. Class A 79,700 40
* Huafon MicrofibreShanghaiTechnology Co.Ltd. Class T 57,300 40
Double MedicalTechnology Inc.Class A 5,500 40
Suofeiya HomeCollection Co. Ltd.Class A 14,600 39
* Aotecar New EnergyTechnology Co.Ltd. Class A 78,200 39
Shandong DawnPolymer Co. Ltd.Class A 17,200 39
Sichuan ExpresswayCo. Ltd. Class H 166,000 38
Shenzhen WoerHeat-ShrinkableMaterial Co. Ltd.Class A 32,800 38
Shares
MarketValue•
($000)
RiseSun Real EstateDevelopment Co.Ltd. Class A 56,200 38
Wisdom EducationInternationalHoldings Co. Ltd. 224,000 38
DaShenLinPharmaceuticalGroup Co. Ltd.Class A 6,960 38
Central China RealEstate Ltd. 248,000 37
GoldenmaxInternationalTechnology Ltd.Class A 17,800 37
* 360 SecurityTechnology Inc.Class A 19,798 37
2 E-House ChinaEnterpriseHoldings Ltd. 195,900 37
Monalisa Group Co.Ltd. Class A 12,415 37
Tian Di Science &Technology Co.Ltd. Class A 56,611 37
Bear ElectricAppliance Co. Ltd.Class A 4,000 36
* OceanwideHoldings Co. Ltd.Class A 125,400 35
Shenzhen SunlineTech Co. Ltd.Class A 17,900 35
Chengdu FusenNoble-HouseIndustrial Co. Ltd.Class A 17,930 35
Shenzhen SinovatioTechnology Co.Ltd. Class A 7,520 35
Tangshan JidongCement Co. Ltd.Class A 18,500 34
Beijing Global SafetyTechnology Co.Ltd. Class A 10,500 34
Shenzhen AncheTechnologies Co.Ltd. Class A 11,500 34
Shanghai KineticMedical Co. Ltd.Class A 20,900 33
* YaGuang TechnologyGroup Co. Ltd.Class A 24,900 33
* Sichuan LanguangDevelopment Co.Ltd. Class A 120,200 32
* Tahoe Group Co.Ltd. Class A 104,500 32
Unilumin Group Co.Ltd. Class A 24,800 32
ShanghaiWaigaoqiao FreeTrade Zone GroupCo. Ltd. Class A 15,600 31
Total World Stock Index Fund
43

Shares
MarketValue•
($000)* Gds Holdings Ltd.
Class A 3,931 30 Beijing Thunisoft
Corp. Ltd. Class A 18,200 30 Chongqing
Zongshen PowerMachinery Co.Ltd. Class A 29,000 30
Shenzhen WorldUnion Group Inc.Class A 50,700 30
Yangtze OpticalFibre and CableJoint Stock Ltd.Co Class A 6,300 30
GuangzhouShangpin HomeCollection Co. Ltd.Class A 4,400 30
Sichuan Teway FoodGroup Co. Ltd.Class A 7,800 30
* ShaanxiConstructionMachinery Co.Ltd. Class A 22,200 30
Jiangsu JiangyinRural CommercialBank Co. Ltd.Class A 47,800 29
China TransInfoTechnology Co.Ltd. Class A 13,400 28
Changchun FawayAutomobileComponents Co.Ltd. Class A 17,310 28
PCI TechnologyGroup Co. Ltd.Class A 23,100 27
China Publishing &Media Co. Ltd.Class A 32,300 27
* Berry Genomics Co.Ltd. Class A 8,600 26
China ResourcesDouble CranePharmaceuticalCo. Ltd. Class A 14,500 26
Dashang Co. Ltd.Class A 8,500 26
GuomaiTechnologies Inc.Class A 27,800 25
NSFOCUSTechnologiesGroup Co. Ltd.Class A 10,497 25
* Shanghai 2345Network HoldingGroup Co. Ltd.Class A 80,900 25
ShanghaiWaigaoqiao FreeTrade Zone GroupCo. Ltd. Class B 26,900 24
Chengdu KanghongPharmaceuticalGroup Co. Ltd.Class A 8,500 24
Shares
MarketValue•
($000)
Central ChinaSecurities Co. Ltd.Class H 129,988 24
Western RegionGold Co. Ltd.Class A 13,400 24
* New OrientalEducation &Technology GroupInc. 11,770 24
Wangsu Science &Technology Co.Ltd. Class A 26,600 23
* Visionox TechnologyInc. Class A 17,998 23
Henan Yuguang Gold& Lead Co. Ltd.Class A 27,900 23
Sinosoft Co. Ltd.Class A 5,880 23
Skyworth Digital Co.Ltd. Class A 18,500 21
Beijing North StarCo. Ltd. Class H 118,000 19
* Kunshan KersenScience &Technology Co.Ltd. Class A 12,100 19
Guangxi WuzhouCommunicationsCo. Ltd. Class A 31,300 18
BBMG Corp.Class A 38,700 17
Yantai ChangyuPioneer Wine Co.Ltd. Class A 3,230 16
* Myhome RealEstateDevelopmentGroup Co. Ltd.Class A 61,300 15
Rongan PropertyCo. Ltd. Class A 40,800 15
* Doushen BeijingEducation &Technology Inc.Class A 24,700 14
JiangsuZhangjiagangRural CommercialBank Co. Ltd.Class A 14,500 14
DongjiangEnvironmental Co.Ltd. Class H 27,100 12
Fujian Cement Inc.Class A 11,300 12
*,1 China Lumena NewMaterials Corp. 11,900 8
ShandongPublishing &Media Co. Ltd.Class A 5,700 5
*,1 Tianhe ChemicalsGroup Ltd. 383,088 —
*,1,2 Midas Holdings Ltd. 223,900 —*,1 China Animal
Healthcare Ltd. 84,000 —
1,256,929
Total World Stock Index Fund
44

Shares
MarketValue•
($000)
Colombia (0.0%) Bancolombia SA
ADR 48,141 1,730 Interconexion
Electrica SA ESP 193,870 1,164 Bancolombia SA 111,855 1,000 Ecopetrol SA ADR 56,019 849 Ecopetrol SA 971,880 735 Grupo Argos SA 164,203 514 Grupo de
InversionesSuramericana SA 75,133 438
Grupo Aval Accionesy Valores SAPreference Shares 1,430,144 437
* Banco DaviviendaSA PreferenceShares 38,989 351
Cementos Argos SA 164,401 277 Grupo De
InversionesSuramericana SAPreference Shares 46,730 234
Bancolombia SAPreference Shares 14,574 131
7,860Czech Republic (0.0%) CEZ A/S 68,713 2,269* Komercni banka A/S 32,601 1,264*,3 Moneta Money
Bank A/S 180,939 709 O2 Czech Republic
A/S 19,144 220 Philip Morris CR A/S 235 167
4,629Denmark (0.6%) Novo Nordisk A/S
Class B 691,126 75,785 DSV A/S 86,526 20,110 Vestas Wind
Systems A/S 440,133 19,027* Genmab A/S 25,983 11,6733 Orsted A/S 82,271 11,620 Coloplast A/S
Class B 58,360 9,531 Carlsberg A/S
Class B 43,093 7,115 AP Moller - Maersk
A/S Class B 2,253 6,529 Novozymes A/S
Class B 86,715 6,379 Pandora A/S 42,913 6,005 AP Moller - Maersk
A/S Class A 2,110 5,793 Danske Bank A/S 289,867 4,905 GN Store Nord A/S 57,461 3,492 Chr Hansen Holding
A/S 43,477 3,461 Tryg A/S 131,992 3,133 Royal Unibrew A/S 21,994 2,732 SimCorp A/S 18,394 2,227* Demant A/S 43,236 2,096 Ambu A/S Class B 71,896 2,047 Ringkjoebing
Landbobank A/S 13,032 1,6563 Netcompany Group
A/S 14,419 1,642* ISS A/S 76,608 1,529
Shares
MarketValue•
($000)*,2 Bavarian Nordic A/S 28,382 1,362* ALK-Abello A/S 2,944 1,276 ROCKWOOL
International A/SClass B 2,578 1,179
* Jyske Bank A/S(Registered) 23,235 1,134
* NKT A/S 20,344 980 Sydbank A/S 24,931 857 FLSmidth & Co. A/S 22,499 855 Topdanmark A/S 16,024 850* Dfds A/S 15,232 7893 Scandinavian
Tobacco GroupA/S Class A 28,791 647
H Lundbeck A/S 21,958 611* Zealand Pharma A/S 17,222 553 Chemometec A/S 3,554 539 Spar Nord Bank A/S 40,007 516* NTG Nordic
Transport GroupA/S Class A 5,879 481
* Nilfisk Holding A/S 12,898 450 Schouw & Co. A/S 4,587 4462 Alm Brand A/S 34,676 268* Drilling Co. of 1972
A/S 7,206 258 D/S Norden A/S 9,456 228
222,766Egypt (0.0%)* Commercial
International BankEgypt SAE 676,494 2,202
* Egyptian FinancialGroup-HermesHolding Co. 587,834 466
* Egypt KuwaitHolding Co. SAE(XCAI) 294,616 408
Eastern Co. SAE 372,204 275 Six of October
Development &Investment 224,901 263
* Fawry for Banking &PaymentTechnologyServices SAE 264,594 253
ElSewedy ElectricCo. 296,180 163
* Egypt KuwaitHolding Co. SAE 103,346 141
Talaat MoustafaGroup 292,136 138
Oriental Weavers 227,675 120 Telecom Egypt Co. 127,965 110 Palm Hills
DevelopmentsSAE 548,521 67
* Pioneers Properties 243,648 46 Medinet Nasr
Housing 166,743 25* Gadwa for Industrial
Development 243,648 18* Aspire Capital
Holding forFinancialInvestments 243,648 5
4,700
Total World Stock Index Fund
45

Shares
MarketValue•
($000)
Finland (0.3%)* Nokia OYJ 2,468,166 14,166 Sampo OYJ Class A 221,969 11,800 Kone OYJ Class B 170,690 11,641 Nordea Bank Abp 927,204 11,355 Neste OYJ 182,008 10,133 Nordea Bank Abp
(XHEL) 679,251 8,311 UPM-Kymmene OYJ 234,435 8,273 Fortum OYJ 185,426 5,515 Stora Enso OYJ
Class R 255,805 4,257 Elisa OYJ 61,594 3,717 Kesko OYJ Class B 113,814 3,704 Wartsila OYJ Abp 206,169 2,859 Metso Outotec OYJ 261,984 2,632 Valmet OYJ 57,072 2,317 Nokian Renkaat OYJ 58,259 2,188 Orion OYJ Class B 43,312 1,876 Kojamo OYJ 78,220 1,753 Huhtamaki OYJ 40,042 1,746* QT Group OYJ 8,425 1,363 Konecranes OYJ
Class A 31,095 1,293 TietoEVRY OYJ
(XHEL) 38,050 1,167 Cargotec OYJ
Class B 19,818 1,026* Outokumpu OYJ 149,336 930 Revenio Group OYJ 11,637 768 Neles OYJ 47,183 707 Metsa Board OYJ 67,444 624 Sanoma OYJ 33,466 521 Uponor OYJ 20,557 502 Tokmanni Group
Corp. 21,018 478 Kemira OYJ 30,367 466 YIT OYJ 75,612 446 Citycon OYJ 38,860 320 Raisio OYJ Class V 73,906 2993 Terveystalo OYJ 22,517 293 F-Secure OYJ 41,897 236*,2 Finnair OYJ 288,850 221 TietoEVRY OYJ 5,682 176 Oriola OYJ Class B 39,257 90*,1,2 Ahlstrom-Munksjo
OYJ Rights 4,033 83
120,252France (2.5%) LVMH Moet
Hennessy LouisVuitton SE 108,543 85,111
TotalEnergies SE 1,055,973 52,878 Sanofi 473,571 47,567 Schneider Electric
SE 229,802 39,622 BNP Paribas SA 471,297 31,547* Airbus SE 242,884 31,158 EssilorLuxottica SA 127,912 26,465* L'Oreal SA Loyalty
Shares 55,237 25,268 AXA SA 835,189 24,298 Kering SA 32,041 24,048 Vinci SA 218,467 23,356 Hermes
International 13,460 21,373 Pernod Ricard SA 91,126 20,965
Shares
MarketValue•
($000)
Safran SA 152,472 20,521 L'Oreal SA (XPAR) 44,854 20,519* Air Liquide SA
Loyalty Shares 106,413 17,767 Danone SA 264,265 17,226 Dassault Systemes
SE 289,009 16,877 Capgemini SE 68,473 15,965 Cie de Saint-Gobain 209,564 14,463 Air Liquide SA
(XPAR) 86,186 14,389 STMicroelectronics
NV 276,677 13,136 Legrand SA 117,133 12,778 Cie Generale des
EtablissementsMichelin SCA 76,191 11,979
Societe Generale SA 339,264 11,333 Teleperformance 25,488 10,647 Orange SA 845,814 9,2242 Veolia
EnvironnementSA 273,017 8,916
Credit Agricole SA 539,382 8,138 Publicis Groupe SA 102,062 6,852 Eurofins Scientific
SE 53,204 6,279*,3 Worldline SA 106,434 6,207 Edenred 110,464 5,977 Sartorius Stedim
Biotech 10,530 5,804* Engie SA Loyalty
Shares 389,176 5,536 Carrefour SA 289,254 5,237 Alstom SA 131,696 4,693 Engie SA (XPAR) 310,533 4,417 Thales SA 45,686 4,216 Vivendi SE 326,566 4,2073 Euronext NV 35,230 3,964 Arkema SA 28,814 3,942 Bouygues SA 94,668 3,836 Bureau Veritas SA 118,279 3,760 Suez SA 163,281 3,717 Eiffage SA 32,937 3,390 Getlink SE 205,404 3,161 Valeo 106,809 3,138 Gecina SA 21,749 3,044* Accor SA 82,501 2,952* Renault SA 81,482 2,936 Rexel SA 127,976 2,544* SOITEC 9,237 2,459 Bollore SA 421,910 2,452 BioMerieux 18,549 2,363 Faurecia SE (XPAR) 44,800 2,3403 Amundi SA 26,260 2,340 Orpea SA 21,724 2,269 SCOR SE 67,169 2,261 Atos SE 41,035 2,141* Ubisoft
Entertainment SA 39,948 2,092 Remy Cointreau SA 10,102 2,041 Alten SA 12,488 2,012* L'Oreal SA Loyalty
Shares 2023 4,349 1,9893 La Francaise des
Jeux SAEM 37,042 1,923* Elis SA (XPAR) 98,753 1,875 Covivio 21,414 1,855
Total World Stock Index Fund
46

Shares
MarketValue•
($000)
Klepierre SA 73,274 1,744* TechnipFMC plc
(XNYS) 220,434 1,640* EDF 110,051 1,622 CNP Assurances 63,926 1,602* Aeroports de Paris 11,687 1,559* Air Liquide 9,106 1,520 Wendel SE 11,358 1,513 Ipsen SA 13,927 1,441 SES SA Class A
GDR 159,766 1,435* Sodexo SA ACT
Loyalty Shares 14,556 1,416 Rubis SCA 41,376 1,326* Sodexo SA (XPAR) 13,618 1,325 Nexans SA 13,180 1,322 Electricite de France
SA (XPAR) 87,210 1,285 Sopra Steria Group
SACA 6,476 1,273 SPIE SA 50,909 1,238 ICADE 13,923 1,092 Eutelsat
CommunicationsSA 75,447 1,072
Dassault Aviation SA 10,070 1,052* SEB SA Loyalty
Shares 6,405 1,004 Korian SA 28,707 956* Eurazeo SA 9,906 929 Virbac SA 1,817 9213 Verallia SA 24,356 902 SEB SA (XPAR) 5,574 873 Gaztransport Et
Technigaz SA 10,258 848 Eurazeo SE 8,696 815* Technip Energies NV 52,915 814 Nexity SA 17,709 810* JCDecaux SA 27,563 7193 ALD SA 47,706 711 IPSOS 14,752 691 Societe BIC SA 11,740 682 Imerys SA 13,791 598 Trigano SA 3,101 582* Albioma SA Loyalty
Shares 14,535 572 Cie Plastic Omnium
SA 20,423 567 Coface SA 39,115 559 Somfy SA 2,781 546*,2 Air France-KLM 115,805 545*,2,3 Neoen SA (XPAR) 11,575 533* Sodexo SA Loyalty
Shares 2023 5,394 525 Metropole Television
SA 22,757 502*,2 Vallourec SA 62,764 502 Interparfums SA 6,172 499*,2 Casino Guichard
Perrachon SA 19,708 4913 Maisons du Monde
SA 19,767 448 Mersen SA 11,600 435 Mercialys SA 36,851 400 Fnac Darty SA 6,138 399 Rothschild & Co. 9,000 397* Derichebourg SA 34,724 395
Shares
MarketValue•
($000)
Television Francaise1 36,880 395
* ID Logistics Group 1,017 374* Akka Technologies 6,236 345* Engie SA 24,111 343* Beneteau SA 20,566 314 Altarea SCA 1,428 305*,3 Elior Group SA 38,533 305 Robertet SA 277 304 Quadient SA 12,082 289*,2 Solutions 30 SE 31,284 283* Voltalia SA
(Registered) 10,775 281* Sodexo SA 2,851 277* Lagardere SA 9,970 264 PEUGEOT
Investment 1,670 233 Faurecia SE 4,469 231* Eramet SA 2,680 224 Cie de L'Odet SE 135 204 Vicat SA 4,456 190* CGG SA 251,140 182 Vilmorin & Cie SA 2,836 180 Carmila SA 11,845 180* Electricite de France
SA (EuronextParis) 12,229 180
*,3 X-Fab SiliconFoundries SE 14,653 146
PharmagestInteractive 1,284 141
Manitou BF SA 3,706 126 Guerbet 2,723 120* Sodexo SA Loyalty
Shares 2025 1,212 118 Bonduelle SCA 4,520 116* Lisi SA 4,123 115 Jacquet Metals
SACA 4,253 104 Boiron SA 2,097 102* SEB SA Loyalty
Shares 2022 580 91* SEB SA Loyalty
Shares 2023 565 89* GL Events 3,863 82* Tarkett SA 3,330 77* Electricite de France
SA 4,511 67*,3 SMCP SA 7,781 64* Rallye SA 7,866 51 Lisi (XPAR) 1,767 49 AKWEL 1,885 48* Etablissements
Maurel et PromSA 6,895 20
*,1 Bourbon Corp. 44 —* Bourbon Corp. SA 100 —* CGG SA Warrants
Exp. 2/21/23 17,186 —* CGG SA Warrants
Exp. 2/21/22 5,291 —
865,011Germany (2.2%) SAP SE 481,600 69,741 Siemens AG
(Registered) 327,335 53,219 Allianz SE
(Registered) 178,400 41,426
Total World Stock Index Fund
47

Shares
MarketValue•
($000)
Daimler AG(Registered) 365,442 36,275
BASF SE 397,413 28,603 adidas AG 83,730 27,405 Infineon
Technologies AG 568,776 26,6372 Deutsche Post AG
(Registered) 427,138 26,443 Deutsche Telekom
AG (Registered) 1,413,133 26,280 Bayer AG
(Registered) 426,457 24,034 Muenchener
Rueckversicherungs-Gesellschaft AG inMuenchen(Registered) 60,707 17,975
Volkswagen AGPreference Shares 78,207 17,552
Vonovia SE 249,882 15,159 Bayerische Motoren
Werke AG 143,998 14,549 Merck KGaA 56,486 13,349 Deutsche Boerse
AG 80,137 13,303 E.ON SE 950,219 12,049* Deutsche Bank AG
(Registered) 901,544 11,581 RWE AG 275,699 10,612*,3 Delivery Hero SE 82,267 10,261*,3 Zalando SE 95,432 9,016 Fresenius SE & Co.
KGaA 179,286 8,1493 Siemens
Healthineers AG 118,438 7,877 Symrise AG Class A 55,199 7,635 Sartorius AG
Preference Shares 11,433 7,406 Henkel AG & Co.
KGaA PreferenceShares 82,513 7,392
Porsche AutomobilHolding SEPreference Shares 67,427 7,018
Brenntag SE 68,555 6,522 Fresenius Medical
Care AG & Co.KGaA 89,960 5,976
* HelloFresh SE 71,663 5,808* Continental AG 48,444 5,696 Puma SE 44,092 5,470* QIAGEN NV 96,515 5,318* Siemens Energy AG 184,403 5,292 MTU Aero Engines
AG 23,715 5,2823 Covestro AG 79,592 5,097 HeidelbergCement
AG 65,784 4,954 Hannover Rueck SE 26,736 4,882 Volkswagen AG 14,939 4,857 Beiersdorf AG 44,561 4,738 LEG Immobilien SE
(XETR) 31,358 4,664 KION Group AG 33,679 3,679 GEA Group AG 71,308 3,512 Aroundtown SA 498,408 3,464 Knorr-Bremse AG 30,390 3,207* Commerzbank AG 438,040 3,199
Shares
MarketValue•
($000)
Carl Zeiss MeditecAG (Bearer) 15,787 3,179
Henkel AG & Co.KGaA 37,530 3,134
* Evotec SE 60,548 2,935 Nemetschek SE 24,120 2,7693 Scout24 SE 39,101 2,723 Evonik Industries AG 82,588 2,676 Bechtle AG 35,360 2,652 LANXESS AG 39,033 2,630* thyssenkrupp AG 188,406 1,961 United Internet AG
(Registered) 50,634 1,868* CTS Eventim AG &
Co. KGaA 25,191 1,832 Bayerische Motoren
Werke AGPreference Shares 20,036 1,708
Rheinmetall AG 17,165 1,665*,2 Deutsche Lufthansa
AG (Registered) 241,806 1,598 Freenet AG 61,974 1,5962 Siltronic AG (XETR) 10,210 1,593 alstria office REIT-AG 83,782 1,566*,3 Auto1 Group SE 39,538 1,556 Uniper SE 34,845 1,540 TAG Immobilien AG 50,525 1,535*,2 zooplus AG 2,672 1,478* K+S AG (Registered) 83,745 1,443 Rational AG 1,447 1,4362 HUGO BOSS AG 21,065 1,3192 Hella GmbH & Co.
KGaA 18,966 1,3153 Befesa SA 17,180 1,278 Deutsche Wohnen
SE 24,717 1,266 Aurubis AG 14,497 1,2492 Gerresheimer AG 13,517 1,240 Wacker Chemie AG 6,454 1,166*,3 TeamViewer AG 77,512 1,157 ProSiebenSat.1
Media SE 67,005 1,122* Talanx AG 23,118 1,112* Fraport AG Frankfurt
Airport ServicesWorldwide 15,233 1,090
AIXTRON SE 45,538 1,082* Hypoport SE 1,737 1,069 Jungheinrich AG
Preference Shares 20,494 1,039 Vantage Towers AG 29,664 1,020 Duerr AG 21,874 991* Sixt SE 5,614 968 FUCHS PETROLUB
SE PreferenceShares 19,974 958
2 Varta AG 6,189 954 Grand City
Properties SA 37,098 950 CANCOM SE 13,655 9442 Encavis AG 44,646 936* RTL Group SA 16,084 929 Software AG 22,409 922 FUCHS PETROLUB
SE 24,902 917
Total World Stock Index Fund
48
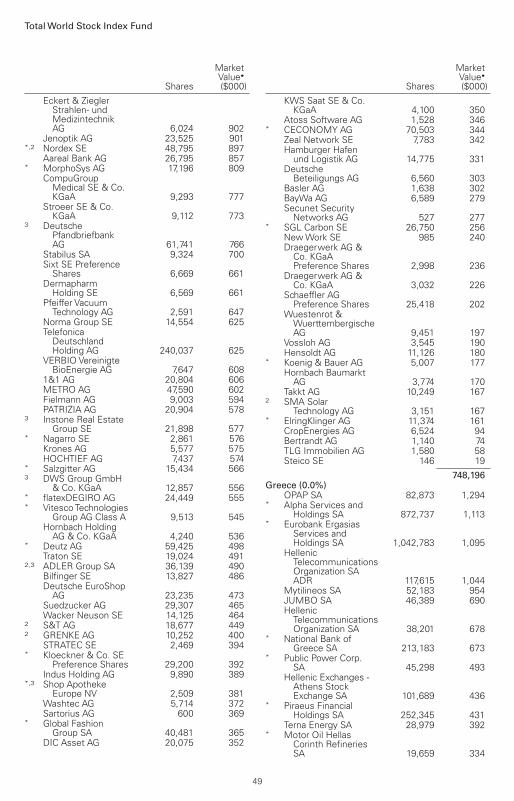
Shares
MarketValue•
($000)
Eckert & ZieglerStrahlen- undMedizintechnikAG 6,024 902
Jenoptik AG 23,525 901*,2 Nordex SE 48,795 897 Aareal Bank AG 26,795 857* MorphoSys AG 17,196 809 CompuGroup
Medical SE & Co.KGaA 9,293 777
Stroeer SE & Co.KGaA 9,112 773
3 DeutschePfandbriefbankAG 61,741 766
Stabilus SA 9,324 700 Sixt SE Preference
Shares 6,669 661 Dermapharm
Holding SE 6,569 661 Pfeiffer Vacuum
Technology AG 2,591 647 Norma Group SE 14,554 625 Telefonica
DeutschlandHolding AG 240,037 625
VERBIO VereinigteBioEnergie AG 7,647 608
1&1 AG 20,804 606 METRO AG 47,590 602 Fielmann AG 9,003 594 PATRIZIA AG 20,904 5783 Instone Real Estate
Group SE 21,898 577* Nagarro SE 2,861 576 Krones AG 5,577 575 HOCHTIEF AG 7,437 574* Salzgitter AG 15,434 5663 DWS Group GmbH
& Co. KGaA 12,857 556* flatexDEGIRO AG 24,449 555* Vitesco Technologies
Group AG Class A 9,513 545 Hornbach Holding
AG & Co. KGaA 4,240 536* Deutz AG 59,425 498 Traton SE 19,024 4912,3 ADLER Group SA 36,139 490 Bilfinger SE 13,827 486 Deutsche EuroShop
AG 23,235 473 Suedzucker AG 29,307 465 Wacker Neuson SE 14,125 4642 S&T AG 18,677 4492 GRENKE AG 10,252 400 STRATEC SE 2,469 394* Kloeckner & Co. SE
Preference Shares 29,200 392 Indus Holding AG 9,890 389*,3 Shop Apotheke
Europe NV 2,509 381 Washtec AG 5,714 372 Sartorius AG 600 369* Global Fashion
Group SA 40,481 365 DIC Asset AG 20,075 352
Shares
MarketValue•
($000)
KWS Saat SE & Co.KGaA 4,100 350
Atoss Software AG 1,528 346* CECONOMY AG 70,503 344 Zeal Network SE 7,783 342 Hamburger Hafen
und Logistik AG 14,775 331 Deutsche
Beteiligungs AG 6,560 303 Basler AG 1,638 302 BayWa AG 6,589 279 Secunet Security
Networks AG 527 277* SGL Carbon SE 26,750 256 New Work SE 985 240 Draegerwerk AG &
Co. KGaAPreference Shares 2,998 236
Draegerwerk AG &Co. KGaA 3,032 226
Schaeffler AGPreference Shares 25,418 202
Wuestenrot &WuerttembergischeAG 9,451 197
Vossloh AG 3,545 190 Hensoldt AG 11,126 180* Koenig & Bauer AG 5,007 177 Hornbach Baumarkt
AG 3,774 170 Takkt AG 10,249 1672 SMA Solar
Technology AG 3,151 167* ElringKlinger AG 11,374 161 CropEnergies AG 6,524 94 Bertrandt AG 1,140 74 TLG Immobilien AG 1,580 58 Steico SE 146 19
748,196Greece (0.0%) OPAP SA 82,873 1,294* Alpha Services and
Holdings SA 872,737 1,113* Eurobank Ergasias
Services andHoldings SA 1,042,783 1,095
HellenicTelecommunicationsOrganization SAADR 117,615 1,044
Mytilineos SA 52,183 954 JUMBO SA 46,389 690 Hellenic
TelecommunicationsOrganization SA 38,201 678
* National Bank ofGreece SA 213,183 673
* Public Power Corp.SA 45,298 493
Hellenic Exchanges -Athens StockExchange SA 101,689 436
* Piraeus FinancialHoldings SA 252,345 431
Terna Energy SA 28,979 392* Motor Oil Hellas
Corinth RefineriesSA 19,659 334
Total World Stock Index Fund
49

Shares
MarketValue•
($000)
Holding Co. ADMIEIPTO SA 98,417 290
* LAMDADevelopment SA 22,404 185
Viohalco SA 35,271 179* GEK Terna Holding
Real EstateConstruction SA 15,796 177
Hellenic PetroleumSA 23,436 162
Athens WaterSupply & SewageCo. SA 17,663 155
* Ellaktor SA 76,010 121 Sarantis SA 9,960 100* Aegean Airlines SA 12,797 77* Fourlis Holdings SA 16,670 74*,1 FF Group 12,862 71
11,218Hong Kong (0.8%) AIA Group Ltd. 5,272,782 59,092 Hong Kong
Exchanges &Clearing Ltd. 555,324 33,454
Techtronic IndustriesCo. Ltd. 547,000 11,238
Sun Hung KaiProperties Ltd. 636,982 8,445
Link REIT 922,690 8,174 CK Hutchison
Holdings Ltd. 1,188,391 7,967* BeiGene Ltd. 263,700 7,292 Hong Kong & China
Gas Co. Ltd. 4,608,365 7,159 CLP Holdings Ltd. 726,580 7,114 Hang Seng Bank
Ltd. 325,951 6,194 CK Asset Holdings
Ltd. 878,250 5,425 Jardine Matheson
Holdings Ltd. 92,362 5,365* Galaxy
EntertainmentGroup Ltd. 954,000 5,133
BOC Hong KongHoldings Ltd. 1,551,700 4,917
Wharf Real EstateInvestment Co.Ltd. 724,600 4,093
Lenovo Group Ltd. 3,336,000 3,623 Power Assets
Holdings Ltd. 590,500 3,609 MTR Corp. Ltd. 621,326 3,389 Hongkong Land
Holdings Ltd. 498,500 2,753 New World
Development Co.Ltd. 613,306 2,660
*,3 ESR Cayman Ltd. 799,389 2,587 Xinyi Glass Holdings
Ltd. 846,000 2,384* Sands China Ltd. 1,033,200 2,355 Henderson Land
Development Co.Ltd. 559,896 2,344
3 WH Group Ltd. 3,055,258 2,142 Hang Lung
Properties Ltd. 899,000 2,086
Shares
MarketValue•
($000)
Wharf Holdings Ltd. 587,600 2,0433 Budweiser Brewing
Co. APAC Ltd. 728,800 1,9992 Sino Land Co. Ltd. 1,394,279 1,833 Want Want China
Holdings Ltd. 2,297,467 1,782 SITC International
Holdings Co. Ltd. 501,000 1,693 CK Infrastructure
Holdings Ltd. 268,500 1,619 Chow Tai Fook
Jewellery GroupLtd. 771,800 1,574
PRADA SpA 237,700 1,498 Tingyi Cayman
Islands HoldingCorp. 794,000 1,482
ASM PacificTechnology Ltd. 132,622 1,435
AAC TechnologiesHoldings Inc. 317,000 1,370
Minth Group Ltd. 306,000 1,216 Swire Pacific Ltd.
Class A 190,642 1,198*,3 Samsonite
International SA 550,496 1,184 Swire Properties
Ltd. 422,180 1,132 Hysan Development
Co. Ltd. 279,000 969 Microport Scientific
Corp. 200,852 945 Man Wah Holdings
Ltd. 607,200 940 PCCW Ltd. 1,820,112 937 Pacific Basin
Shipping Ltd. 1,988,000 917 Bank of East Asia
Ltd. 514,072 8442 Vitasoy International
Holdings Ltd. 336,332 811 Huabao International
Holdings Ltd. 407,000 761 Hang Lung Group
Ltd. 322,000 754 Kerry Properties Ltd. 257,000 7263 BOC Aviation Ltd. 79,100 692 NagaCorp Ltd. 706,000 648 L'Occitane
International SA 169,500 606*,2 SJM Holdings Ltd. 804,000 598 Fortune REIT 569,923 591* Yue Yuen Industrial
Holdings Ltd. 271,000 575*,2 Wynn Macau Ltd. 642,000 574* MMG Ltd. 1,214,117 5613 Js Global Lifestyle
Co. Ltd. 301,000 557* Vobile Group Ltd. 626,000 551 NWS Holdings Ltd. 538,500 535 Swire Pacific Ltd.
Class B 507,500 533 Kerry Logistics
Network Ltd. 220,000 533 VTech Holdings Ltd. 63,200 487 Powerlong Real
Estate HoldingsLtd. 660,000 452
Total World Stock Index Fund
50

Shares
MarketValue•
($000)
Towngas China Co.Ltd. 628,000 431
Champion REIT 790,332 415 Lee & Man Paper
ManufacturingLtd. 549,000 413
Uni-President ChinaHoldings Ltd. 468,800 400
Jinchuan GroupInternationalResources Co.Ltd. 2,457,000 396
2 LK TechnologyHoldings Ltd. 156,502 390
Dairy FarmInternationalHoldings Ltd. 107,700 385
Nexteer AutomotiveGroup Ltd. 312,000 385
CP Pokphand Co.Ltd. 2,668,000 378
*,1,3 Razer Inc. 1,489,000 374*,3 Jacobio
PharmaceuticalsGroup Co. Ltd. 164,400 374
* Melco InternationalDevelopment Ltd. 278,000 361
First Pacific Co. Ltd. 901,200 360 HKBN Ltd. 291,689 349* Shangri-La Asia Ltd. 427,519 348* Cathay Pacific
Airways Ltd. 373,090 344 Luk Fook Holdings
International Ltd. 126,000 343 Cafe de Coral
Holdings Ltd. 186,000 339 Prosperity REIT 844,000 332 United Energy
Group Ltd. 3,706,000 328 Stella International
Holdings Ltd. 272,000 325* China Travel
InternationalInvestment HongKong Ltd. 2,224,000 323
*,2 HengTen NetworksGroup Ltd. 885,200 302
Hong KongTechnologyVenture Co. Ltd. 196,000 295
* Shun Tak HoldingsLtd. 1,074,000 294
Johnson ElectricHoldings Ltd. 132,250 293
Vinda InternationalHoldings Ltd. 102,599 283
IGG Inc. 288,000 268* Realord Group
Holdings Ltd. 166,000 258 VSTECS Holdings
Ltd. 272,000 2573 IMAX China Holding
Inc. 173,500 254 Truly International
Holdings Ltd. 760,000 248 Sunlight REIT 410,000 237* GCL New Energy
Holdings Ltd. 4,970,000 233 Vesync Co. Ltd. 165,000 232
Shares
MarketValue•
($000)
CITIC TelecomInternationalHoldings Ltd. 649,500 230
HaitongInternationalSecurities GroupLtd. 988,038 227
*,3 Everest MedicinesLtd. 39,500 227
Great EagleHoldings Ltd. 82,000 226
EC Healthcare 157,000 226* MGM China
Holdings Ltd. 288,800 212* OCI International
Holdings Ltd. 417,200 212 SUNeVision
Holdings Ltd. 228,000 2093 Asiainfo
Technologies Ltd. 124,800 206*,3 Hua Medicine 381,000 202 K Wah International
Holdings Ltd. 490,000 196 Chow Sang Sang
HoldingsInternational Ltd. 135,000 192
* Glory Sun FinancialGroup Ltd. 5,420,000 188
*,3 Antengene Corp.Ltd. 134,500 178
Dah Sing FinancialHoldings Ltd. 55,744 173
CanvestEnvironmentalProtection GroupCo. Ltd. 291,000 167
Shui On Land Ltd. 1,104,500 164 Value Partners
Group Ltd. 313,000 160* FIH Mobile Ltd. 1,002,000 156 Powerlong
CommercialManagementHoldings Ltd. 68,000 152
*,2,3 JW CaymanTherapeutics Co.Ltd. (XHKG) 76,500 140
China TobaccoInternational HKCo. Ltd. 58,000 133
Far East ConsortiumInternational Ltd. 401,000 132
Pacific TextilesHoldings Ltd. 254,000 127
*,2 Apollo FutureMobility GroupLtd. 1,824,000 126
Guotai JunanInternationalHoldings Ltd. 860,000 125
3 Xiabuxiabu CateringManagementChina HoldingsCo. Ltd. 171,000 125
Road KingInfrastructure Ltd. 120,000 122
*,1 SMI Holdings GroupLtd. 402,400 121
Texhong TextileGroup Ltd. 79,500 119
Total World Stock Index Fund
51

Shares
MarketValue•
($000)* Esprit Holdings Ltd.
(XHKG) 1,350,519 117*,1,2 Superb Summit
International 620,000 116* Macau Legend
Development Ltd. 1,119,000 114 United Laboratories
InternationalHoldings Ltd. 178,000 113
* Pou ShengInternationalHoldings Ltd. 672,000 113
Beijing Tong RenTang ChineseMedicine Co. Ltd. 86,000 110
Dah Sing BankingGroup Ltd. 113,537 109
Asia Cement ChinaHoldings Corp. 142,500 109
*,3 Frontage HoldingsCorp. 186,000 108
C-Mer Eye CareHoldings Ltd. 108,000 105
*,1 Huiyuan Juice 398,000 103* Sa Sa International
Holdings Ltd. 455,995 100 SmarTone
TelecommunicationsHoldings Ltd. 172,000 100
*,2 CosmopolitanInternationalHoldings Ltd. 732,000 98
* LifestyleInternationalHoldings Ltd. 179,000 94
HutchisonTelecommunicationsHong KongHoldings Ltd. 570,000 91
*,2,3 FIT Hon Teng Ltd. 441,000 883 Crystal International
Group Ltd. 275,500 88* CITIC Resources
Holdings Ltd. 1,238,000 87 Sun Hung Kai & Co.
Ltd. 165,000 86* Television
Broadcasts Ltd. 98,900 77 Chinese Estates
Holdings Ltd. 147,000 71 Giordano
International Ltd. 354,000 69 Lee's
PharmaceuticalHoldings Ltd. 147,500 69
Dynam JapanHoldings Co. Ltd. 72,400 67
*,1 Convoy 3,102,000 67 Singamas Container
Holdings Ltd. 548,000 64 CMBC Capital
Holdings Ltd. 5,250,000 64 Texwinca Holdings
Ltd. 292,000 60* Digital Domain
Holdings Ltd. 641,000 542,3 VPower Group
InternationalHoldings Ltd. 259,000 51
Shares
MarketValue•
($000)* China LNG Group
Ltd. 870,000 45*,1 National Agricultural
Holdings 246,000 38* Suncity Group
Holdings Ltd. 670,000 25*,1 Long Well
InternationalHoldings Ltd. 1,348,000 20
*,1 MH DevelopmentNPV 130,000 19
*,1 CTEG 424,000 18*,1 Brightoil 426,340 11*,1 Real Nutrition 143,000 4* NewOcean Energy
Holdings Ltd. 41,985 1*,1 Agritrade Resources
Ltd. 735,000 —*,1 Anxin China
Holdings Ltd. 312,000 —*,1 C Fiber Optic 348,000 —*,1 Hua Han Health
Industry HoldingsLtd. 214,708 —
*,1,2 Huishan Dairy 822,401 —*,1 Tech Pro Tech Dev 833,600 —
270,812Hungary (0.0%)* OTP Bank Nyrt 96,660 5,808 Richter Gedeon Nyrt 57,339 1,607 MOL Hungarian Oil
& Gas plc 146,911 1,256 Magyar Telekom
Telecommunicationsplc 209,897 289
* Opus Global Nyrt 85,838 65
9,025India (1.5%) Housing
DevelopmentFinance Corp. Ltd. 761,070 29,017
Reliance IndustriesLtd. 852,709 28,937
Infosys Ltd. 1,029,788 23,045 Tata Consultancy
Services Ltd. 448,800 20,4003 Reliance Industries
Ltd. GDR 278,182 18,931 Hindustan Unilever
Ltd. 386,857 12,382 Infosys Ltd. ADR 541,746 12,070 Bajaj Finance Ltd. 103,790 10,293* Axis Bank Ltd. 994,495 9,896* Bharti Airtel Ltd
(XNSE) 990,105 9,083 Asian Paints Ltd. 194,085 8,044 ICICI Bank Ltd. 678,754 7,308 Larsen & Toubro Ltd. 305,528 7,237 HCL Technologies
Ltd. 472,248 7,231 Tata Steel Ltd. 343,651 6,059 Titan Co. Ltd. 181,730 5,799 Maruti Suzuki India
Ltd. 57,003 5,708 Tech Mahindra Ltd. 259,523 5,137 UltraTech Cement
Ltd. 50,270 5,134
Total World Stock Index Fund
52

Shares
MarketValue•
($000)
Sun PharmaceuticalIndustries Ltd. 475,959 5,061
Mahindra &Mahindra Ltd. 395,626 4,687
State Bank of IndiaGDR (Registered) 68,723 4,645
JSW Steel Ltd. 445,670 3,992*,3 Avenue Supermarts
Ltd. 64,023 3,971 Nestle India Ltd. 15,514 3,942 ITC Ltd. 1,295,995 3,870 Grasim Industries
Ltd. 167,670 3,863 Bajaj Finserv Ltd. 16,172 3,861 Hindalco Industries
Ltd. 617,986 3,808 Divi's Laboratories
Ltd. 53,454 3,6783 HDFC Life Insurance
Co. Ltd. 398,847 3,627* Tata Motors Ltd. 527,240 3,392 Power Grid Corp. of
India Ltd. 1,360,638 3,370 NTPC Ltd. 1,879,035 3,336 Dr. Reddy's
Laboratories Ltd. 51,943 3,231 Adani Ports &
Special EconomicZone Ltd. 342,996 3,182
Wipro Ltd. ADR 340,800 3,054 Tata Consumer
Products Ltd. 263,669 2,8573 SBI Life Insurance
Co. Ltd. 186,128 2,852 Cipla Ltd. 226,716 2,744 Info Edge India Ltd. 32,823 2,671 Tata Power Co. Ltd. 886,275 2,543* Adani Green Energy
Ltd. 165,280 2,541* Adani Transmission
Ltd. 107,268 2,527 Oil & Natural Gas
Corp. Ltd. 1,260,180 2,508 Britannia Industries
Ltd. 50,483 2,483 Apollo Hospitals
Enterprise Ltd. 43,410 2,476 Bharat Petroleum
Corp. Ltd. 442,866 2,476 UPL Ltd. 238,373 2,363 Adani Total Gas Ltd. 120,906 2,330 Shree Cement Ltd. 5,812 2,225* Tata Motors Ltd.
Class A 670,649 2,217 Vedanta Ltd. 528,613 2,151* Godrej Consumer
Products Ltd. 164,109 2,101 Adani Enterprises
Ltd. 109,693 2,088 Piramal Enterprises
Ltd. 58,918 2,054 Indus Towers Ltd. 558,926 2,032 Hero MotoCorp Ltd. 56,435 2,006 Indian Oil Corp. Ltd. 1,170,897 2,005 Pidilite Industries
Ltd. 63,584 1,968 Eicher Motors Ltd. 57,837 1,925 Coal India Ltd. 843,652 1,857
Shares
MarketValue•
($000)3 ICICI Lombard
General InsuranceCo. Ltd. 92,011 1,823
Wipro Ltd. 203,506 1,762 Havells India Ltd. 101,459 1,715* Marico Ltd. 225,610 1,715 Dabur India Ltd. 217,800 1,706 Cholamandalam
Investment andFinance Co. Ltd. 205,748 1,694
* United Spirits Ltd. 132,091 1,677* Shriram Transport
Finance Co. Ltd. 85,438 1,646 Mphasis Ltd. 37,676 1,634 SRF Ltd. 57,425 1,6263 Larsen & Toubro
Infotech Ltd. 18,057 1,615* SBI Cards &
Payment ServicesLtd. 112,928 1,595
Jubilant FoodworksLtd. 31,906 1,577
Voltas Ltd. 97,126 1,566 Ambuja Cements
Ltd. 288,415 1,563 Gail India Ltd. 776,271 1,545 DLF Ltd. 277,271 1,481 Zee Entertainment
Enterprises Ltd. 362,692 1,462 Bajaj Auto Ltd. 29,183 1,447 Motherson Sumi
Systems Ltd. 480,717 1,441 Hindustan
Petroleum Corp.Ltd. 330,006 1,370
Bharat ElectronicsLtd. 475,885 1,317
* Page Industries Ltd. 2,559 1,289* Max Financial
Services Ltd. 98,478 1,282 Lupin Ltd. 103,265 1,277 Indian Railway
Catering &Tourism Corp. Ltd. 112,705 1,277
*,3 InterGlobe AviationLtd. 43,820 1,274
* Godrej PropertiesLtd. 42,574 1,272
3 Bandhan Bank Ltd. 323,250 1,263 PI Industries Ltd. 30,931 1,2413 ICICI Prudential Life
Insurance Co. Ltd. 146,354 1,211 Crompton Greaves
ConsumerElectricals Ltd. 193,194 1,203
Tata Elxsi Ltd. 14,742 1,158 Aurobindo Pharma
Ltd. 124,615 1,1493 Laurus Labs Ltd. 165,006 1,140 Persistent Systems
Ltd. 21,646 1,137 Astral Ltd. (XNSE) 38,723 1,132 Federal Bank Ltd. 866,051 1,131 Ashok Leyland Ltd. 588,995 1,1243 HDFC Asset
Management Co.Ltd. 31,598 1,119
Trent Ltd. 83,313 1,118 Mindtree Ltd. 18,571 1,117
Total World Stock Index Fund
53

Shares
MarketValue•
($000)
MRF Ltd. 1,076 1,113 Balkrishna
Industries Ltd. 33,225 1,094 Colgate-Palmolive
India Ltd. 52,969 1,093*,3 AU Small Finance
Bank Ltd. 66,544 1,083* Biocon Ltd. 228,435 1,073 Siemens Ltd. 36,516 1,068 ACC Ltd. 33,921 1,059 Indraprastha Gas
Ltd. 164,037 1,040 Bharat Forge Ltd. 100,139 1,030 Berger Paints India
Ltd. 103,505 1,027 Petronet LNG Ltd. 333,805 1,025 Dixon Technologies
India Ltd. 14,883 994 Embassy Office
Parks REIT 209,902 981 Container Corp. of
India Ltd. 109,330 959* Jindal Steel & Power
Ltd. 170,628 954* Dalmia Bharat Ltd. 35,344 952 Cadila Healthcare
Ltd. 140,857 948 Supreme Industries
Ltd. 30,162 940 Indian Hotels Co.
Ltd. 355,092 937 Aarti Industries Ltd. 71,108 918 Deepak Nitrite Ltd. 29,568 882 Tata Chemicals Ltd. 72,907 881 Sundaram Finance
Ltd. 26,962 863* IDFC First Bank Ltd. 1,293,641 858 Atul Ltd. 6,991 854 LIC Housing Finance
Ltd. 151,725 827 Power Finance Corp.
Ltd. 458,639 817 Torrent
PharmaceuticalsLtd. 21,215 811
JSW Energy Ltd. 173,029 806 Bata India Ltd. 29,358 778* Ipca Laboratories
Ltd. 27,057 776 REC Ltd. 389,611 775 TVS Motor Co. Ltd. 87,336 775 Escorts Ltd. 36,828 774 Tata
CommunicationsLtd. 43,997 769
Gujarat Gas Ltd. 91,074 758* APL Apollo Tubes
Ltd. 70,434 755 Ramco Cements
Ltd. 52,530 750 Muthoot Finance
Ltd. 37,739 741*,3 RBL Bank Ltd. 291,379 706 United Breweries
Ltd. 31,665 702 Tube Investments of
India Ltd. 37,326 698 Cummins India Ltd. 58,266 698
Shares
MarketValue•
($000)3 Indian Energy
Exchange Ltd. 73,469 696 Bosch Ltd. 3,046 691 Navin Fluorine
International Ltd. 15,367 686 NMDC Ltd. 352,458 676* Max Healthcare
Institute Ltd. 151,588 6723 L&T Technology
Services Ltd. 10,273 650* Oberoi Realty Ltd. 53,475 647 Emami Ltd. 90,155 641 Manappuram
Finance Ltd. 228,561 636 National Aluminium
Co. Ltd. 487,109 633* Steel Authority of
India Ltd. 409,945 631* Fortis Healthcare
Ltd. 192,818 631* Kajaria Ceramics
Ltd. 38,260 625 Bajaj Holdings &
Investment Ltd. 9,560 6183 Dr Lal PathLabs Ltd. 13,127 617 Relaxo Footwears
Ltd. 34,486 614 Varun Beverages
Ltd. 53,733 610* GMR Infrastructure
Ltd. 1,118,695 607* Adani Power Ltd. 436,532 586 City Union Bank Ltd. 259,238 584 JK Cement Ltd. 13,051 579 Torrent Power Ltd. 85,552 572* Vodafone Idea Ltd. 4,450,243 570 ABB India Ltd. 19,787 561 Rajesh Exports Ltd. 65,522 559 Amara Raja
Batteries Ltd. 61,361 559* Aditya Birla Fashion
and Retail Ltd. 158,219 557 Mahindra &
MahindraFinancial ServicesLtd. 229,981 553
State Bank of India 81,983 552 Oracle Financial
Services SoftwareLtd. 9,311 551
Sanofi India Ltd. 4,933 550 Indiabulls Housing
Finance Ltd. 186,383 542 Exide Industries Ltd. 232,558 538* PVR Ltd. 23,839 537 Glenmark
PharmaceuticalsLtd. 79,307 534
Gujarat StatePetronet Ltd. 129,583 530
CarborundumUniversal Ltd. 47,096 529
Cyient Ltd. 36,852 527* Canara Bank 182,128 524* Bharat Heavy
Electricals Ltd. 563,559 515 Pfizer Ltd. 7,572 511 Oil India Ltd. 166,655 501* Bank of Baroda 377,709 493
Total World Stock Index Fund
54

Shares
MarketValue•
($000)
Minda IndustriesLtd. 47,006 492
CoromandelInternational Ltd. 46,489 489
Sundram FastenersLtd. 43,147 482
Castrol India Ltd. 256,622 474 Blue Star Ltd. 36,688 472 Apollo Tyres Ltd. 164,607 470 NHPC Ltd. 1,145,792 470 Honeywell
Automation IndiaLtd. 836 469
Can Fin Homes Ltd. 55,345 465 CESC Ltd. 394,390 460 Kansai Nerolac
Paints Ltd. 62,764 458 IIFL Finance Ltd. 104,223 452 Radico Khaitan Ltd. 30,055 451* CG Power &
IndustrialSolutions Ltd. 227,523 446
Brigade EnterprisesLtd. 71,580 444
* Aavas FinanciersLtd. 11,752 441
SKF India Ltd. 9,811 437* IDFC Ltd. 585,218 431* Happiest Minds
Technologies Ltd. 25,214 430 Hatsun Agro
Product Ltd. 23,950 429* Amber Enterprises
India Ltd. 9,641 426*,3 Nippon Life India
AssetManagement Ltd. 75,895 425
Alkem LaboratoriesLtd. 8,685 419
Rain Industries Ltd. 136,140 416* 3M India Ltd. 1,196 407 Redington India Ltd. 210,294 404* NIIT Technologies
Ltd. 6,173 403 Century Textiles &
Industries Ltd. 38,230 400 India Cements Ltd. 143,258 395 Cholamandalam
Financial HoldingsLtd. 41,281 387
3 Brookfield India RealEstate Trust 99,994 384
* Hindustan Zinc Ltd. 90,431 377 Ratnamani Metals &
Tubes Ltd. 12,867 368 Finolex Industries
Ltd. 125,114 368 Natco Pharma Ltd. 33,078 366 AIA Engineering Ltd. 14,135 363* Gujarat
FluorochemicalsLtd. 14,930 363
DCM Shriram Ltd. 26,845 355 Jubilant Pharmova
Ltd. Class A(XNSE) 44,430 355
Gillette India Ltd. 4,702 354 Tanla Platforms Ltd. 21,579 353* Affle India Ltd. 24,865 351
Shares
MarketValue•
($000)* L&T Finance
Holdings Ltd. 316,441 3483 Endurance
Technologies Ltd. 14,247 3473 Metropolis
Healthcare Ltd. 8,691 345 Thermax Ltd. 18,593 343 Strides Pharma
Science Ltd. 46,763 335* EIH Ltd. 178,526 332* Dhani Services Ltd. 139,298 3323 Mindspace
Business ParksREIT 75,400 329
Whirlpool of IndiaLtd. 10,912 323
Computer AgeManagementServices Ltd. 8,022 323
Mahanagar Gas Ltd. 23,984 322 Prestige Estates
Projects Ltd. 55,794 319* Indiabulls Real
Estate Ltd. 155,530 316 Central Depository
Services IndiaLtd. 17,379 315
Bayer CropScienceLtd. 4,697 313
Phoenix Mills Ltd. 24,155 312 Welspun India Ltd. 168,228 310 Solar Industries
India Ltd. 9,275 308 GlaxoSmithKline
PharmaceuticalsLtd. 15,254 306
Birlasoft Ltd. 56,225 306 Firstsource
Solutions Ltd. 114,958 305 KPIT Technologies
Ltd. 73,593 305*,3 Syngene
International Ltd. 41,990 304 Sonata Software
Ltd. 27,133 304 Jubilant Ingrevia Ltd. 33,633 301 CRISIL Ltd. 7,981 2993 IndiaMart InterMesh
Ltd. 3,126 299 Balaji Amines Ltd. 6,454 299* Intellect Design
Arena Ltd. 33,944 298 HFCL Ltd. 311,698 298* V-Mart Retail Ltd. 5,403 294 Chambal Fertilizers
and ChemicalsLtd. 59,328 293
* Shriram City UnionFinance Ltd. 9,940 288
Schaeffler India Ltd. 2,867 283 KEI Industries Ltd. 22,836 279*,3 Aster DM
Healthcare Ltd. 110,767 278 Ceat Ltd. 16,571 277 Ajanta Pharma Ltd. 9,775 277 V-Guard Industries
Ltd. 80,619 277 Linde India Ltd. 8,872 274
Total World Stock Index Fund
55

Shares
MarketValue•
($000)
Alkyl AminesChemicals Ltd. 5,678 274
3 Quess Corp. Ltd. 23,431 272 JB Chemicals &
PharmaceuticalsLtd. 12,092 271
* Godrej IndustriesLtd. 34,381 267
* Bajaj Electricals Ltd. 18,062 267 Sobha Ltd. 25,879 266 Bombay Burmah
Trading Co. 18,422 266 JK Lakshmi Cement
Ltd. 32,258 266 Rallis India Ltd. 74,494 265 Suven
PharmaceuticalsLtd. 38,922 265
Engineers India Ltd. 271,348 264 KEC International
Ltd. 41,153 263 NBCC India Ltd. 437,665 262 Sterlite Technologies
Ltd. 70,464 259 Zensar Technologies
Ltd. 41,885 259 Timken India Ltd. 10,739 258 Lakshmi Machine
Works Ltd. 2,182 255 Polycab India Ltd. 8,364 253 Great Eastern
Shipping Co. Ltd. 58,258 251* TeamLease Services
Ltd. 4,127 247 Orient Electric Ltd. 53,418 247* EID Parry India Ltd. 40,323 2463 Eris Lifesciences
Ltd. 22,202 244 Finolex Cables Ltd. 38,898 243 Gateway Distriparks
Ltd. 64,049 239* Suzlon Energy Ltd. 2,636,868 238 Praj Industries Ltd. 52,825 236 Sun TV Network Ltd. 31,281 2353 ICICI Securities Ltd. 23,274 230 NCC Ltd. 239,084 228*,3 Indian Railway
Finance Corp. Ltd. 698,889 226 Procter & Gamble
Health Ltd. 3,042 220 Hindustan
Aeronautics Ltd. 12,570 220 Avanti Feeds Ltd. 29,194 218* Aditya Birla Capital
Ltd. 166,880 216 Poly Medicure Ltd. 17,306 214 Edelweiss Financial
Services Ltd. 205,827 213 TTK Prestige Ltd. 1,449 212 PNC Infratech Ltd. 48,109 209 Infibeam Avenues
Ltd. (XNSE) 339,476 206 Balrampur Chini
Mills Ltd. 46,302 203 Graphite India Ltd. 28,273 203* Mahindra CIE
Automotive Ltd. 56,317 201 Granules India Ltd. 48,122 200
Shares
MarketValue•
($000)
Zydus Wellness Ltd. 7,296 2003 Godrej Agrovet Ltd. 25,053 199* Reliance Power Ltd. 1,053,346 199 Vinati Organics Ltd. 7,740 198 Vaibhav Global Ltd. 25,010 193*,3 New India
Assurance Co.Ltd. 94,543 193
AlembicPharmaceuticalsLtd. 18,294 190
*,3 PNB HousingFinance Ltd. 28,982 187
* Punjab NationalBank 329,505 186
* Bank of India 217,534 174 JM Financial Ltd. 148,001 174 Sumitomo Chemical
India Ltd. 34,549 174 Motilal Oswal
Financial ServicesLtd. 14,216 174
Bajaj ConsumerCare Ltd. 55,712 173
* NarayanaHrudayalaya Ltd. 24,758 173
* Union Bank of India 270,719 167* Westlife
Development Ltd. 21,378 166*,3 General Insurance
Corp. of India 92,423 165 EPL Ltd. 56,156 162 Gujarat Pipavav Port
Ltd. 102,320 153* IRB Infrastructure
Developers Ltd. 48,800 148 Indian Bank 63,128 146 eClerx Services Ltd. 4,918 144* IFCI Ltd. 842,125 138 Equitas Holdings
Ltd. 78,491 136* Alok Industries Ltd. 457,474 135 PTC India Ltd. 76,646 130 Karnataka Bank Ltd. 140,736 128 Aegis Logistics Ltd. 45,022 128 HEG Ltd. 4,603 127* CreditAccess
Grameen Ltd. 15,061 127 Vakrangee Ltd. 236,119 116 AstraZeneca
Pharma India Ltd. 2,814 113* Sun Pharma
AdvancedResearch Co. Ltd. 32,065 113
Karur Vysya BankLtd. 167,704 110
Akzo Nobel IndiaLtd. 3,822 107
KRBL Ltd. 28,058 106* South Indian Bank
Ltd. 829,833 104* Symphony Ltd. 7,065 98 Jindal Saw Ltd. 61,019 95* Wockhardt Ltd. 15,956 91* Yes Bank Ltd. 509,982 87 Kaveri Seed Co. Ltd. 11,057 77* TV18 Broadcast Ltd. 137,341 77 Care Ratings Ltd. 8,295 76
Total World Stock Index Fund
56

Shares
MarketValue•
($000)3 Dilip Buildcon Ltd. 9,318 75* DCB Bank Ltd. 60,028 73 Welspun Corp. Ltd. 36,272 65 Multi Commodity
Exchange of IndiaLtd. 2,593 59
GE Power India Ltd. 13,473 52* Raymond Ltd. 8,316 51* Future Retail Ltd. 65,433 42* Hindustan
Construction Co.Ltd. 283,967 36
* Mangalore Refinery& PetrochemicalsLtd. 45,416 30
* Just Dial Ltd. 2,560 27* Future Consumer
Ltd. 197,528 18*,1 Amtek Auto Ltd. 7,896 —
528,208Indonesia (0.2%) Bank Central Asia
Tbk PT 21,371,520 11,301 Bank Rakyat
Indonesia PerseroTbk PT 28,512,043 8,559
Telkom IndonesiaPersero Tbk PT 20,749,040 5,546
Bank MandiriPersero Tbk PT 7,954,232 4,021
Astra InternationalTbk PT 8,707,330 3,709
Bank NegaraIndonesia PerseroTbk PT 3,211,630 1,588
Charoen PokphandIndonesia Tbk PT 2,979,900 1,307
United Tractors TbkPT 737,460 1,227
Kalbe Farma Tbk PT 8,758,300 989 Indofood Sukses
Makmur Tbk PT 2,164,100 971 Tower Bersama
Infrastructure TbkPT 4,382,300 910
Sarana MenaraNusantara Tbk PT 11,055,100 906
Indah Kiat Pulp &Paper Corp. TbkPT 1,352,100 809
Unilever IndonesiaTbk PT 2,527,200 789
Adaro Energy Tbk PT 6,340,400 751 Semen Indonesia
Persero Tbk PT 1,111,700 714 Barito Pacific Tbk PT 9,730,200 644 Indofood CBP
Sukses MakmurTbk PT 991,800 616
Aneka Tambang Tbk 3,142,000 520 Bukit Asam Tbk PT 2,554,900 484 Gudang Garam Tbk
PT 185,500 439 Japfa Comfeed
Indonesia Tbk PT 3,336,200 408 Indocement Tunggal
Prakarsa Tbk PT 467,900 391* Smartfren Telecom
Tbk PT 51,136,100 390
Shares
MarketValue•
($000)
CiputraDevelopment TbkPT 5,047,430 383
* Perusahaan GasNegara PerseroTbk PT 3,567,300 380
* Pakuwon Jati Tbk PT 9,245,100 327 Mitra Keluarga
Karyasehat Tbk PT 1,955,700 315* Surya Citra Media
Tbk PT 10,248,500 304* Summarecon Agung
Tbk PT 4,629,266 300* Bumi Serpong
Damai Tbk PT 3,763,400 295 Bank Pembangunan
Daerah JawaBarat Dan BantenTbk PT 2,827,600 285
* Jasa Marga PerseroTbk PT 928,317 276
* Surya SemestaInternusa Tbk PT 7,697,500 271
* Bank RakyatIndonesiaAgroniaga Tbk PT 1,767,900 263
XL Axiata Tbk PT 1,192,400 260 Ace Hardware
Indonesia Tbk PT 2,595,300 259 Pabrik Kertas Tjiwi
Kimia Tbk PT 430,000 253 BFI Finance
Indonesia Tbk PT 3,321,200 246 Vale Indonesia Tbk
PT 710,300 243 Mayora Indah Tbk
PT 1,335,900 221 Hanjaya Mandala
Sampoerna TbkPT 2,999,700 220
Indo TambangrayaMegah Tbk PT 142,300 217
* Indosat Tbk PT 429,300 210* Lippo Karawaci Tbk
PT 19,524,292 204* Matahari
Department StoreTbk PT 925,000 199
Bank BTPN SyariahTbk PT 728,600 196
AKR Corporindo TbkPT 616,900 186
* LEG Immobilien SE 1,229,514 183* Bank Tabungan
Negara PerseroTbk PT 1,289,700 162
* Medco EnergiInternasional TbkPT 3,935,581 158
* Mitra AdiperkasaTbk PT 2,405,000 150
* Bank Bukopin TbkPT (XIDX) 4,919,600 149
* Timah Tbk PT 1,216,300 137 Astra Agro Lestari
Tbk PT 170,855 130 Media Nusantara
Citra Tbk PT 1,784,200 113
Total World Stock Index Fund
57

Shares
MarketValue•
($000)* Wijaya Karya
Persero Tbk PT 1,149,145 101* Panin Financial Tbk
PT 7,071,800 91* Waskita Karya
Persero Tbk PT 1,299,774 85* Bank Pan Indonesia
Tbk PT 1,448,500 81 Perusahaan
PerkebunanLondon SumatraIndonesia Tbk PT 725,400 71
Ramayana LestariSentosa Tbk PT 1,190,900 62
* Krakatau SteelPersero Tbk PT 1,444,300 54
* Adhi Karya PerseroTbk PT 620,300 46
* PP Persero Tbk PT 528,300 45* Alam Sutera Realty
Tbk PT 2,990,900 38 Bank Danamon
Indonesia Tbk PT 189,500 36*,1 Trada Alam Minera
Tbk PT 10,114,628 36* Kresna Graha
Investama Tbk PT 4,091,300 31* Global Mediacom
Tbk PT 1,211,000 23* Totalindo Eka
Persada Tbk PT 782,320 3
56,287Ireland (0.1%) Kerry Group plc
Class A 67,141 9,009 Kingspan Group plc 67,695 7,793* Bank of Ireland
Group plc 388,428 2,314 Glanbia plc (XDUB) 82,126 1,341* AIB Group plc 304,704 825 Hibernia REIT plc 265,010 387* Dalata Hotel Group
plc 78,590 336* Irish Continental
Group plc 63,570 313* Cairn Homes plc 205,327 266* Cairn Homes plc
(XDUB) 45,485 59*,1 Irish Bank
Resolution Corp. 14,385 —
22,643Israel (0.2%)* Nice Ltd. 28,010 7,918 Bank Leumi
Le-Israel BM 619,433 5,918 Bank Hapoalim BM 497,656 4,901* Teva Pharmaceutical
Industries Ltd. 437,925 3,862* Israel Discount Bank
Ltd. Class A 510,272 3,083 ICL Group Ltd. 283,974 2,434 Mizrahi Tefahot Bank
Ltd. 56,907 2,071 Elbit Systems Ltd. 9,892 1,559* Tower
SemiconductorLtd. 46,173 1,512
Azrieli Group Ltd. 14,655 1,371
Shares
MarketValue•
($000)* Nova Ltd. 12,056 1,287* Bezeq The Israeli
TelecommunicationCorp. Ltd. 907,508 1,138
Mivne Real EstateKD Ltd. 254,909 929
* Enlight RenewableEnergy Ltd. 358,435 884
First InternationalBank of Israel Ltd. 20,731 831
* Shikun & Binui Ltd. 129,175 768 Big Shopping
Centers Ltd. 4,548 682 Alony Hetz
Properties &Investments Ltd. 40,612 665
Harel InsuranceInvestments &Financial ServicesLtd. 57,896 647
* Israel Corp. Ltd. 1,723 636 REIT 1 Ltd. 101,213 633* Paz Oil Co. Ltd. 4,895 624* Melisron Ltd. 7,323 620 Phoenix Holdings
Ltd. 47,581 602* Clal Insurance
EnterprisesHoldings Ltd. 24,123 596
Strauss Group Ltd. 18,651 548* Airport City Ltd. 27,424 524 Maytronics Ltd. 22,147 524 Ashtrom Group Ltd. 20,230 473 Hilan Ltd. 8,521 472 Sella Capital Real
Estate Ltd. 141,777 468 Electra Ltd. 695 458* Camtek Ltd. 11,381 457 Amot Investments
Ltd. 59,040 451 Gav-Yam Lands
Corp. Ltd. 33,924 404 FIBI Holdings Ltd. 9,088 400 Energix-Renewable
Energies Ltd. 82,368 388 Shufersal Ltd. 46,489 385 Danel Adir Yeoshua
Ltd. 1,767 374* Delek Group Ltd. 4,481 373 Isracard Ltd. 92,515 372 Sapiens
International Corp.NV 10,659 369
Fox Wizel Ltd. 2,575 355* Perion Network Ltd. 12,610 352 Shapir Engineering
and Industry Ltd. 42,926 351 Matrix IT Ltd. 12,675 344 Mega Or Holdings
Ltd. 8,209 325 AudioCodes Ltd. 9,082 316 Formula Systems
1985 Ltd. 2,809 303* OPC Energy Ltd. 28,762 301* AFI Properties Ltd. 5,687 295* Summit Real Estate
Holdings Ltd. 15,005 273 Delek Automotive
Systems Ltd. 20,634 270
Total World Stock Index Fund
58

Shares
MarketValue•
($000)
Kenon Holdings Ltd. 6,499 261 Gazit-Globe Ltd. 29,496 239* Fattal Holdings 1998
Ltd. 2,178 234* Compugen Ltd. 36,694 233 Menora Mivtachim
Holdings Ltd. 9,950 230 Rami Levy Chain
Stores HashikmaMarketing 2006Ltd. 2,924 220
Migdal Insurance &Financial HoldingsLtd. 122,731 209
* PartnerCommunicationsCo. Ltd. 39,795 201
* Equital Ltd. 5,802 178 Delta Galil Industries
Ltd. 3,081 158* Allot Ltd. 10,427 154* Oil Refineries Ltd. 498,716 135* Cellcom Israel Ltd. 32,887 125* Kamada Ltd. 17,290 99 IDI Insurance Co.
Ltd. 2,463 99 Gilat Satellite
Networks Ltd. 10,809 90* Brack Capital
Properties NV 559 65* Naphtha Israel
Petroleum Corp.Ltd. 9,312 58
* Tera Light Ltd. 9,950 25
60,109Italy (0.7%) Enel SpA 3,391,988 28,397 Intesa Sanpaolo SpA 7,232,885 20,557 Stellantis NV 883,337 17,635 Eni SpA 1,097,079 15,724 UniCredit SpA 958,798 12,675 Ferrari NV 52,981 12,572 Assicurazioni
Generali SpA 554,541 12,075 CNH Industrial NV 433,653 7,470 Moncler SpA 94,738 6,818 Snam SpA (MTAA) 960,814 5,442* FinecoBank Banca
Fineco SpA 270,240 5,161 Terna - Rete Elettrica
Nazionale 638,699 4,759*,3 Nexi SpA 260,158 4,523 Prysmian SpA 117,918 4,458 EXOR NV 44,479 4,196* Atlantia SpA 206,318 3,988* Mediobanca Banca
di CreditoFinanziario SpA 311,849 3,721
DavideCampari-MilanoNV 206,958 2,940
Amplifon SpA 56,377 2,8693 Poste Italiane SpA 196,500 2,806 Recordati Industria
Chimica eFarmaceutica SpA 41,786 2,618
Interpump GroupSpA 34,569 2,546
Shares
MarketValue•
($000)
DiaSorin SpA 9,279 2,098 Reply SpA 10,585 2,055 Banco BPM SpA 650,243 2,022 Telecom Italia SpA 5,212,824 1,860 Tenaris SA 143,956 1,6033 Infrastrutture
Wireless ItalianeSpA 139,855 1,545
Azimut Holding SpA 52,787 1,5203 Pirelli & C SpA 228,210 1,404 Italgas SpA 216,074 1,373 A2A SpA 612,818 1,290 Hera SpA 311,381 1,274* Leonardo SpA 169,792 1,246 Unipol Gruppo SpA 207,594 1,192 De' Longhi SpA 30,317 1,186 ERG SpA 32,477 1,173 Banca Mediolanum
SpA 114,118 1,150 BPER Banca 486,672 1,067* Banca Generali SpA 21,790 1,025 Telecom Italia SpA
Savings Shares 2,481,528 943 Buzzi Unicem SpA 36,901 861* Brunello Cucinelli
SpA 14,078 854 Banca Popolare di
Sondrio SCPA 193,474 841 Brembo SpA 62,622 822 Iren SpA 227,725 7083 Technogym SpA 63,727 6703 BFF Bank SpA 73,170 655 Tenaris SA ADR 28,752 641 Sesa SpA 3,135 615* Autogrill SpA 74,611 5863 Anima Holding SpA 108,107 574* Salvatore Ferragamo
SpA 24,532 522 UnipolSai
Assicurazioni SpA 175,849 509 Danieli & C Officine
Meccaniche SpA 14,064 4733 Carel Industries SpA 15,923 459*,2 Saipem SpA 195,818 429 Gruppo MutuiOnline
SpA 8,773 428 Falck Renewables
SpA 42,216 426* Societa Cattolica Di
AssicurazioneSpA 50,964 387
*,3 Enav SpA 86,759 381 Maire Tecnimont
SpA 87,046 3753 GVS SpA 24,877 370 Tamburi Investment
Partners SpA 31,859 3602 Webuild SpA
(MTAA) 139,245 345 Tinexta SpA 7,571 336 MARR SpA 13,886 327 ACEA SpA 14,415 313 SOL SpA 12,905 296 Mediaset NV 104,006 292 Zignago Vetro SpA 13,478 272* Tod's SpA 4,506 248
Total World Stock Index Fund
59

Shares
MarketValue•
($000)
Danieli & C OfficineMeccaniche SpASavings Shares 11,415 247
*,2 Banca Monte deiPaschi di SienaSpA 183,756 220
3 doValue SpA 22,034 211 Cementir Holding
NV 19,613 2063 RAI Way SpA 33,424 202 Piaggio & C SpA 59,240 199* Cerved Group SpA 16,403 197* CIR SpA-Compagnie
Industriali 356,743 197 Credito Emiliano
SpA 23,562 179 Italmobiliare SpA 4,572 160 Datalogic SpA 8,753 159* Saras SpA 179,414 133* Immobiliare Grande
Distribuzione SIIQSpA 29,470 129
* Arnoldo MondadoriEditore SpA 55,412 128
* Biesse SpA 4,125 128*,2 Juventus Football
Club SpA 149,272 121 Banca IFIS SpA 6,213 115*,2 Fincantieri SpA 123,712 97 DeA Capital SpA 57,909 89 Rizzoli Corriere Della
Sera MediagroupSpA 37,870 31
* Webuild SpA 12,600 15
229,514Japan (6.3%) Toyota Motor Corp. 5,350,640 94,408 Sony Group Corp. 539,300 62,449 Keyence Corp. 78,632 47,463 Recruit Holdings Co.
Ltd. 582,027 38,716 SoftBank Group
Corp. 583,640 31,597 Shin-Etsu Chemical
Co. Ltd. 172,556 30,772 Tokyo Electron Ltd. 63,400 29,546 Mitsubishi UFJ
Financial GroupInc. 5,371,360 29,454
Daikin IndustriesLtd. 115,863 25,376
Hitachi Ltd. 403,552 23,255 Hoya Corp. 155,751 22,928 KDDI Corp. 735,500 22,492 Nidec Corp. 202,996 22,483 Honda Motor Co.
Ltd. 744,241 22,013 Daiichi Sankyo Co.
Ltd. 819,500 20,678 Nintendo Co. Ltd. 45,906 20,275 Takeda
PharmaceuticalCo. Ltd. 668,739 18,769
MurataManufacturing Co.Ltd. 248,874 18,461
Shares
MarketValue•
($000)
Sumitomo MitsuiFinancial GroupInc. 567,548 18,417
Mitsubishi Corp. 526,700 16,748 FANUC Corp. 84,491 16,697 ITOCHU Corp. 584,528 16,671 Softbank Corp. 1,182,533 16,141 Mitsui & Co. Ltd. 696,100 15,930 Fast Retailing Co.
Ltd. 22,600 15,002 Tokio Marine
Holdings Inc. 281,452 14,824 Nippon Telegraph &
Telephone Corp. 527,300 14,774 SMC Corp. 24,500 14,621 Mizuho Financial
Group Inc. 1,100,410 14,523 Denso Corp. 199,400 14,456 Fujitsu Ltd. 82,740 14,300 Seven & i Holdings
Co. Ltd. 336,600 14,132 Astellas Pharma Inc. 813,200 13,710 Oriental Land Co.
Ltd. 82,500 13,030 Terumo Corp. 288,728 12,737 FUJIFILM Holdings
Corp. 153,700 11,878 Central Japan
Railway Co. 78,819 11,692 Panasonic Corp. 939,159 11,614 Mitsubishi Electric
Corp. 864,340 11,608 Kao Corp. 202,848 11,475 Shiseido Co. Ltd. 170,700 11,390 Bridgestone Corp. 252,504 11,171 M3 Inc. 184,938 10,898 ORIX Corp. 538,560 10,705 Chugai
PharmaceuticalCo. Ltd. 285,400 10,671
Komatsu Ltd. 401,350 10,512 Kubota Corp. 487,500 10,385 Sysmex Corp. 83,434 10,345 Japan Tobacco Inc. 518,882 10,186 Olympus Corp. 463,800 10,047 Canon Inc. 435,000 9,892 East Japan Railway
Co. 157,205 9,792 Dai-ichi Life
Holdings Inc. 456,400 9,602 Shimano Inc. 33,600 9,375 Daiwa House
Industry Co. Ltd. 281,000 9,270 Mitsui Fudosan Co.
Ltd. 403,600 9,228 Suzuki Motor Corp. 198,371 8,847 Asahi Group
Holdings Ltd. 186,652 8,470 Toshiba Corp. 190,100 8,199 Eisai Co. Ltd. 115,400 8,177 Kyocera Corp. 136,000 7,962 Shionogi & Co. Ltd. 120,800 7,876 Omron Corp. 81,800 7,823 Mitsubishi Estate
Co. Ltd. 502,891 7,642 Japan Post Holdings
Co. Ltd. 984,852 7,568
Total World Stock Index Fund
60

Shares
MarketValue•
($000)
Otsuka Holdings Co.Ltd. 186,100 7,360
Lasertec Corp. 33,400 7,245 Aeon Co. Ltd. 310,000 7,131 Advantest Corp. 86,489 7,091 Z Holdings Corp. 1,138,700 7,069 Sumitomo Corp. 495,000 7,054 Unicharm Corp. 171,600 6,940 MS&AD Insurance
Group HoldingsInc. 207,856 6,715
Kikkoman Corp. 80,350 6,572 Bandai Namco
Holdings Inc. 85,800 6,557 Ajinomoto Co. Inc. 217,800 6,521 Nomura Holdings
Inc. 1,340,700 6,385 Sompo Holdings
Inc. 145,375 6,304 Nippon Steel Corp. 358,558 6,287 Sumitomo Realty &
Development Co.Ltd. 173,846 6,283
Nitori Holdings Co.Ltd. 33,700 6,191
Toyota IndustriesCorp. 70,700 6,010
NEC Corp. 117,000 5,991 Kirin Holdings Co.
Ltd. 340,000 5,918 Marubeni Corp. 691,528 5,868 Secom Co. Ltd. 85,287 5,814 Asahi Kasei Corp. 550,800 5,786 TDK Corp. 159,160 5,786 NTT Data Corp. 282,500 5,667 Japan Exchange
Group Inc. 233,400 5,526 Obic Co. Ltd. 29,200 5,400 ENEOS Holdings
Inc. 1,322,607 5,333 Subaru Corp. 270,100 5,298 Sumitomo Mitsui
Trust Holdings Inc. 161,046 5,297 Sekisui House Ltd. 254,800 5,297* Renesas Electronics
Corp. 429,923 5,289 Nippon Yusen KK 71,000 5,116 Nitto Denko Corp. 64,900 5,071 Yaskawa Electric
Corp. 114,663 4,966 Makita Corp. 106,700 4,952 MISUMI Group Inc. 118,400 4,952 West Japan Railway
Co. 100,432 4,741 SG Holdings Co.
Ltd. 188,600 4,736 Mitsubishi Chemical
Holdings Corp. 570,184 4,720 Shimadzu Corp. 115,500 4,692 MINEBEA MITSUMI
Inc. 180,584 4,572 Sumitomo Electric
Industries Ltd. 338,700 4,496 Yamaha Corp. 71,100 4,492* Nissan Motor Co.
Ltd. 847,701 4,315 Nomura Research
Institute Ltd. 106,869 4,278
Shares
MarketValue•
($000)
Toyota Tsusho Corp. 97,600 4,234 Toray Industries Inc. 677,900 4,224 Nippon Building
Fund Inc. 632 4,106 Sumitomo Metal
Mining Co. Ltd. 105,600 4,096 Ono Pharmaceutical
Co. Ltd. 191,700 4,022 Pan Pacific
InternationalHoldings Corp. 188,900 3,966
AGC Inc. 79,300 3,949 Rakuten Group Inc. 355,300 3,890 Daiwa Securities
Group Inc. 673,900 3,786 Daifuku Co. Ltd. 40,000 3,682 Yamato Holdings
Co. Ltd. 149,400 3,673 Nippon Paint
Holdings Co. Ltd. 341,200 3,651 Resona Holdings
Inc. 966,689 3,631 MEIJI Holdings Co.
Ltd. 56,734 3,580 Yamaha Motor Co.
Ltd. 128,400 3,579 Dentsu Group Inc. 96,749 3,536 Nihon M&A Center
Holdings Inc. 112,300 3,448 Kyowa Kirin Co. Ltd. 103,100 3,391 Daito Trust
Construction Co.Ltd. 26,952 3,342
Japan Real EstateInvestment Corp. 540 3,310
JFE Holdings Inc. 215,400 3,291 Hamamatsu
Photonics KK 54,800 3,253 Inpex Corp. 384,700 3,208 Sumitomo Chemical
Co. Ltd. 648,292 3,194 Nissan Chemical
Corp. 57,200 3,184 Mitsubishi Heavy
Industries Ltd. 123,087 3,148 Rohm Co. Ltd. 34,300 3,136 Nomura Real Estate
Master Fund Inc. 2,089 3,128 Disco Corp. 11,600 3,127 Chubu Electric
Power Co. Inc. 301,470 3,121 Nippon Prologis
REIT Inc. 932 3,113 Tokyo Gas Co. Ltd. 177,700 3,084 Nexon Co. Ltd. 179,724 3,059 Isuzu Motors Ltd. 221,420 2,979 GLP J-REIT 1,825 2,977 T&D Holdings Inc. 231,100 2,964 TOTO Ltd. 60,800 2,938 Tokyu Corp. 208,100 2,934 Mitsui OSK Lines
Ltd. 46,139 2,909 Lixil Corp. 112,900 2,900 Koito Manufacturing
Co. Ltd. 51,000 2,894 Trend Micro Inc. 51,100 2,888 Hankyu Hanshin
Holdings Inc. 91,100 2,825 JSR Corp. 77,700 2,818
Total World Stock Index Fund
61

Shares
MarketValue•
($000)
Odakyu ElectricRailway Co. Ltd. 129,800 2,814
Yakult Honsha Co.Ltd. 55,388 2,799
Ricoh Co. Ltd. 285,700 2,782 Dai Nippon Printing
Co. Ltd. 111,200 2,755 Idemitsu Kosan Co.
Ltd. 100,614 2,748 Kansai Electric
Power Co. Inc. 297,700 2,741 Aisin Corp. 74,300 2,719 Osaka Gas Co. Ltd. 167,600 2,701 CyberAgent Inc. 160,968 2,697 Taiyo Yuden Co. Ltd. 53,200 2,697 TIS Inc. 98,900 2,694 Ibiden Co. Ltd. 44,200 2,656 Japan Metropolitan
Fund Investment 2,890 2,655 SBI Holdings Inc. 101,540 2,632 Daiwa House REIT
Investment Corp. 912 2,617 Obayashi Corp. 306,900 2,591 Fuji Electric Co. Ltd. 52,477 2,566 Sekisui Chemical
Co. Ltd. 156,100 2,565 BayCurrent
Consulting Inc. 5,857 2,431 Keio Corp. 48,100 2,428 Asahi Intecc Co.
Ltd. 91,400 2,409 Azbil Corp. 55,000 2,345 Kajima Corp. 188,900 2,326 SUMCO Corp. 121,326 2,318 Kurita Water
Industries Ltd. 46,500 2,297 Hirose Electric Co.
Ltd. 13,721 2,295* Kintetsu Group
Holdings Co. Ltd. 72,800 2,292 MonotaRO Co. Ltd. 99,844 2,276 Suntory Beverage &
Food Ltd. 57,800 2,243 Konami Holdings
Corp. 40,600 2,234 Taisei Corp. 70,199 2,203 Mitsui Chemicals
Inc. 73,300 2,179 Ebara Corp. 39,800 2,172 Otsuka Corp. 44,000 2,167 Keisei Electric
Railway Co. Ltd. 67,200 2,163 Nissin Foods
Holdings Co. Ltd. 28,200 2,156 GMO Payment
Gateway Inc. 17,006 2,155 Toho Co. Ltd. (XTKS) 45,200 2,124 MatsukiyoCocokara
& Co. 47,880 2,123 Mazda Motor Corp. 233,900 2,104 Kobayashi
PharmaceuticalCo. Ltd. 26,200 2,098
Tobu Railway Co.Ltd. 84,000 2,091
Seiko Epson Corp. 115,900 2,064 Yokogawa Electric
Corp. 102,800 2,054
Shares
MarketValue•
($000)
SantenPharmaceuticalCo. Ltd. 144,800 2,041
Capcom Co. Ltd. 74,600 2,008 Asics Corp. 79,600 1,984 Persol Holdings Co.
Ltd. 73,100 1,965 Tosoh Corp. 116,390 1,960 Open House Co.
Ltd. 30,500 1,945 Concordia Financial
Group Ltd. 487,179 1,936 TOPPAN Inc. 119,900 1,935 Ryohin Keikaku Co.
Ltd. 97,370 1,919 Showa Denko KK 75,988 1,906 Nippon Express Co.
Ltd. 30,100 1,884 Orix JREIT Inc. 1,132 1,878 Brother Industries
Ltd. 95,900 1,854 Sojitz Corp. 111,860 1,846 Hoshizaki Corp. 21,782 1,832 Advance Residence
Investment Corp. 557 1,831 Tsuruha Holdings
Inc. 14,800 1,826 Kansai Paint Co. Ltd. 78,200 1,811 Food & Life Cos.
Ltd. 41,700 1,807* Tokyo Electric Power
Co. Holdings Inc. 648,800 1,797 Kakaku.com Inc. 53,868 1,788 NGK Insulators Ltd. 105,700 1,760 Oji Holdings Corp. 353,300 1,751 Square Enix
Holdings Co. Ltd. 31,900 1,747* ANA Holdings Inc. 74,930 1,746 Nisshin Seifun
Group Inc. 110,320 1,742 Hulic Co. Ltd. 179,071 1,722 Nippon Shinyaku Co.
Ltd. 21,400 1,714 Lion Corp. 102,100 1,700* Kawasaki Kisen
Kaisha Ltd. 35,199 1,697 Marui Group Co.
Ltd. 85,200 1,672 Hakuhodo DY
Holdings Inc. 101,600 1,656 Chiba Bank Ltd. 262,200 1,625 Miura Co. Ltd. 41,700 1,604 Shimizu Corp. 218,700 1,602 United Urban
Investment Corp. 1,284 1,601 Ito En Ltd. 24,000 1,599 Shizuoka Bank Ltd. 198,400 1,598 Hikari Tsushin Inc. 10,300 1,588 Welcia Holdings Co.
Ltd. 42,100 1,572 Rinnai Corp. 15,200 1,561 Mitsubishi Gas
Chemical Co. Inc. 77,000 1,550 TechnoPro Holdings
Inc. 48,500 1,550 NH Foods Ltd. 43,900 1,544* Hitachi Metals Ltd. 81,400 1,541 ZOZO Inc. 47,900 1,538
Total World Stock Index Fund
62

Shares
MarketValue•
($000)
Toyo Suisan KaishaLtd. 35,500 1,530
Nabtesco Corp. 47,000 1,525 Industrial &
InfrastructureFund InvestmentCorp. 829 1,520
Tokyo Century Corp. 26,320 1,507 Stanley Electric Co.
Ltd. 59,700 1,505 Iida Group Holdings
Co. Ltd. 60,697 1,496 Bank of Kyoto Ltd. 33,000 1,484 Koei Tecmo Holdings
Co. Ltd. 31,512 1,467 USS Co. Ltd. 90,100 1,452 Nikon Corp. 131,200 1,447 Hitachi Construction
Machinery Co.Ltd. 45,300 1,445
Haseko Corp. 110,400 1,438 NOF Corp. 28,600 1,435 SCREEN Holdings
Co. Ltd. 15,400 1,431 Japan Prime Realty
Investment Corp. 390 1,430 Kyushu Railway Co. 63,124 1,413 Tokyu Fudosan
Holdings Corp. 241,886 1,402 Jeol Ltd. 18,400 1,395 Nippon Sanso
Holdings Corp. 59,100 1,395 Japan Post
Insurance Co. Ltd. 84,678 1,374 Japan Post Bank Co.
Ltd. 175,535 1,370 Toho Gas Co. Ltd. 45,700 1,354 Kuraray Co. Ltd. 148,900 1,347 Kose Corp. 11,500 1,335 Rohto
PharmaceuticalCo. Ltd. 43,700 1,335
Aozora Bank Ltd. 57,990 1,327 Nagoya Railroad Co.
Ltd. 79,800 1,319 Amada Co. Ltd. 133,300 1,317 Fukuoka Financial
Group Inc. 73,264 1,316 Iwatani Corp. 22,200 1,311* Japan Airlines Co.
Ltd. 60,845 1,309 Itochu
Techno-SolutionsCorp. 41,400 1,308
Oracle Corp. Japan 13,800 1,306 Tohoku Electric
Power Co. Inc. 201,000 1,304 Rakus Co. Ltd 41,100 1,303 Kyushu Electric
Power Co. Inc. 183,900 1,295 Mitsubishi HC
Capital Inc. (XTKS) 258,150 1,294 NGK Spark Plug Co.
Ltd. 81,000 1,294 Casio Computer Co.
Ltd. 91,000 1,288 Benefit One Inc. 25,300 1,277 Activia Properties
Inc. 310 1,271
Shares
MarketValue•
($000)
Shinsei Bank Ltd. 76,803 1,268 NSK Ltd. 186,800 1,255 IHI Corp. 53,600 1,252 Sumitomo Heavy
Industries Ltd. 48,400 1,246 Sohgo Security
Services Co. Ltd. 28,900 1,236 Tokyo Tatemono Co.
Ltd. 83,200 1,223 Japan Hotel REIT
Investment Corp. 2,023 1,2222 Sega Sammy
Holdings Inc. 85,800 1,220 Sekisui House REIT
Inc. 1,597 1,207 Yamada Denki Co.
Ltd. 312,672 1,195 NET One Systems
Co. Ltd. 36,200 1,187 Nifco Inc. 37,202 1,187 Denka Co. Ltd. 36,000 1,179* Skylark Holdings Co.
Ltd. 87,047 1,179 LaSalle Logiport
REIT 708 1,177 Keikyu Corp. 103,900 1,173 Nomura Real Estate
Holdings Inc. 48,100 1,173 Japan Logistics
Fund Inc. 390 1,167 Nippon
AccommodationsFund Inc. 209 1,166
HisamitsuPharmaceuticalCo. Inc. 34,100 1,163
Air Water Inc. 76,000 1,163 Ulvac Inc. 20,600 1,156 Kawasaki Heavy
Industries Ltd. 56,900 1,155 Cosmos
PharmaceuticalCorp. 7,500 1,146
Horiba Ltd. 17,300 1,134 DIC Corp. 42,600 1,128* Japan Airport
Terminal Co. Ltd. 22,600 1,121 Sumitomo Forestry
Co. Ltd. 58,700 1,121 Nichirei Corp. 46,000 1,120 THK Co. Ltd. 52,000 1,118 Alfresa Holdings
Corp. 78,700 1,109 Sugi Holdings Co.
Ltd. 15,400 1,103 Teijin Ltd. 81,800 1,098 Tokai Carbon Co.
Ltd. 83,900 1,097 Hino Motors Ltd. 115,200 1,090 Kenedix Office
Investment Corp. 171 1,083 Pigeon Corp. 46,660 1,080 Chugoku Electric
Power Co. Inc. 129,600 1,075 Ship Healthcare
Holdings Inc. 40,700 1,069 Mitsui Fudosan
Logistics Park Inc. 200 1,063
Total World Stock Index Fund
63

Shares
MarketValue•
($000)
COMSYS HoldingsCorp. 42,698 1,057
Mitsubishi MaterialsCorp. 53,934 1,047
Kinden Corp. 63,700 1,045 Keihan Holdings Co.
Ltd. 39,700 1,044 Zenkoku Hosho Co.
Ltd. 21,600 1,044 Morinaga Milk
Industry Co. Ltd. 17,700 1,037 Taisho
PharmaceuticalHoldings Co. Ltd. 19,300 1,036
Taiheiyo CementCorp. 48,600 1,033
Kewpie Corp. 47,100 1,033 Takara Holdings Inc. 75,000 1,026 Tokyo Ohka Kogyo
Co. Ltd. 16,100 1,024 Sanwa Holdings
Corp. 86,000 1,003 Medipal Holdings
Corp. 55,400 1,002 Lawson Inc. 20,700 1,001 Kaneka Corp. 26,000 997 Shinko Electric
Industries Co. Ltd. 24,700 995 Relo Group Inc. 47,553 989 Electric Power
Development Co.Ltd. 74,700 988
2 Anritsu Corp. 59,500 987* Sansan Inc. 8,398 976 Nippon Electric
Glass Co. Ltd. 38,000 970* SHIFT Inc. 4,200 969 SCSK Corp. 47,700 965 Sumitomo
Dainippon PharmaCo. Ltd. 68,200 964
Isetan MitsukoshiHoldings Ltd. 131,100 958
Frontier Real EstateInvestment Corp. 215 951
Sumitomo RubberIndustries Ltd. 77,072 950
Mebuki FinancialGroup Inc. 463,350 949
EXEO Group Inc. 41,000 948 Seibu Holdings Inc. 86,788 948 Kadokawa Corp. 17,736 936 Daiseki Co. Ltd. 19,920 930 Kamigumi Co. Ltd. 45,800 922 JGC Holdings Corp. 98,000 921 Sharp Corp. 78,029 920 Tsumura & Co. 29,200 910* PeptiDream Inc. 37,500 906 Ushio Inc. 50,400 902 Sawai Group
Holdings Co. Ltd. 20,400 900 House Foods Group
Inc. 31,200 895 Nihon Kohden Corp. 28,100 894 Sankyu Inc. 19,800 894 Kenedix Residential
Next InvestmentCorp. 460 885
Outsourcing Inc. 45,900 881
Shares
MarketValue•
($000)
Daicel Corp. 117,100 877 JTEKT Corp. 99,100 877 ADEKA Corp. 39,300 874 J Front Retailing Co.
Ltd. 93,800 869 Suzuken Co. Ltd. 30,660 854 Mori Hills REIT
Investment Corp. 627 850 Alps Alpine Co. Ltd. 86,567 846 Topcon Corp. 47,200 842 Kobe Steel Ltd. 142,600 838 Fuji Corp. 35,900 837 Konica Minolta Inc. 169,200 837 AEON REIT
Investment Corp. 619 837 Coca-Cola Bottlers
Japan HoldingsInc. 60,575 834
SMS Co. Ltd. 21,400 830 Zensho Holdings
Co. Ltd. 35,500 820 Fujitec Co. Ltd. 36,100 820 DeNA Co. Ltd. 44,300 818* RENOVA Inc. 18,600 818 NIPPON REIT
Investment Corp. 210 807 Nankai Electric
Railway Co. Ltd. 40,600 806* Park24 Co. Ltd. 52,300 801 Goldwin Inc. 13,200 799 GS Yuasa Corp. 36,600 797 Shimamura Co. Ltd. 9,400 796 Comforia Residential
REIT Inc. 273 796 Benesse Holdings
Inc. 34,700 794 Fancl Corp. 26,100 791 Nishi-Nippon
Railroad Co. Ltd. 32,100 791 Nagase & Co. Ltd. 46,500 787 Daiwa Securities
LivingInvestments Corp. 774 782
SHO-BONDHoldings Co. Ltd. 18,600 779
Justsystems Corp. 15,000 775 Toyo Seikan Group
Holdings Ltd. 65,200 774* Mitsubishi Motors
Corp. 240,000 768 OKUMA Corp. 16,100 767 Invincible
Investment Corp. 1,939 767 DMG Mori Co. Ltd. 44,100 759 Kagome Co. Ltd. 29,700 754 Penta-Ocean
Construction Co.Ltd. 108,800 750
Infomart Corp. 76,700 748 Nihon Unisys Ltd. 26,500 745 Ube Industries Ltd. 40,000 745 Aeon Mall Co. Ltd. 50,072 734 Rengo Co. Ltd. 96,800 734 Hulic REIT Inc. 483 732 Internet Initiative
Japan Inc. 20,900 731 Kenedix Retail REIT
Corp. 286 730
Total World Stock Index Fund
64

Shares
MarketValue•
($000)
Ain Holdings Inc. 12,300 726 Yamazaki Baking Co.
Ltd. 47,600 723 Hoshino Resorts
REIT Inc. 110 718 Sundrug Co. Ltd. 24,300 711 Japan Elevator
Service HoldingsCo. Ltd. 32,800 711
Dowa Holdings Co.Ltd. 17,000 710
Nippo Corp. 20,000 708 Menicon Co. Ltd. 18,800 706 Credit Saison Co.
Ltd. 57,400 704 Calbee Inc. 27,200 701 Japan Steel Works
Ltd. 23,800 699 Daiwa Office
Investment Corp. 108 697 Ezaki Glico Co. Ltd. 19,000 6902 NTT UD REIT
Investment Corp. 518 688 Katitas Co. Ltd. 18,800 686 Jafco Co. Ltd. 10,800 684* Fujikura Ltd. 126,600 683 Descente Ltd. 17,900 679 Nippon Suisan
Kaisha Ltd. 119,000 676 Yokohama Rubber
Co. Ltd. 39,600 670 Tokyu REIT Inc. 397 666 Mitsubishi Logistics
Corp. 23,800 665 Daiichikosho Co.
Ltd. 18,200 661 Mitsubishi Estate
Logistics REITInvestment Corp. 150 649
INFRONEERHoldings Inc. 77,752 644
Sumitomo BakeliteCo. Ltd. 14,300 643
Toyo Tire Corp. 38,600 642 Hachijuni Bank Ltd. 191,700 641 Zeon Corp. 53,700 637 TS Tech Co. Ltd. 47,600 637 Hitachi Zosen Corp. 81,000 635 Seino Holdings Co.
Ltd. 52,300 634 Pilot Corp. 17,200 631* Nishimatsu
Construction Co.Ltd. 21,800 629
Mitsui High-Tec Inc. 8,100 626 Toagosei Co. Ltd. 55,900 625 Bic Camera Inc. 72,500 625 Daido Steel Co. Ltd. 16,300 624 Mabuchi Motor Co.
Ltd. 18,100 624 Nippon Shokubai
Co. Ltd. 11,900 622 Acom Co. Ltd. 186,200 621 K's Holdings Corp 59,968 619 As One Corp. 4,500 617 Kyoritsu
Maintenance Co.Ltd. 16,372 613
Shares
MarketValue•
($000)
Mirait HoldingsCorp. 31,800 612
Amano Corp. 24,700 611 Nippon Kayaku Co.
Ltd. 57,900 610 Toyobo Co. Ltd. 50,700 609 FP Corp. 17,900 608 Japan Excellent Inc. 501 605 JCR
PharmaceuticalsCo. Ltd. 24,500 601
Daiwabo HoldingsCo. Ltd. 34,000 599
NHK Spring Co. Ltd. 79,200 597 Hirogin Holdings
Inc. 107,900 594 GMO internet Inc. 21,400 591 Fujitsu General Ltd. 24,100 591 Hitachi Transport
System Ltd. 15,000 591 CKD Corp. 29,700 589 Aica Kogyo Co. Ltd. 19,200 588 Tadano Ltd. 53,700 586 Mori Trust Sogo
REIT Inc. 448 579 Meitec Corp. 9,600 577 Kyudenko Corp. 18,100 574 Wacoal Holdings
Corp. 28,300 567 Inaba Denki Sangyo
Co. Ltd. 23,600 566 Tokyo Seimitsu Co.
Ltd. 13,900 566 Mitsui Mining &
Smelting Co. Ltd. 19,600 562 Fujimi Inc. 8,900 560 Yamaguchi Financial
Group Inc. 100,100 559 Pola Orbis Holdings
Inc. 26,200 559 Digital Garage Inc. 11,900 556 Iyo Bank Ltd. 113,600 556 Glory Ltd. 25,400 547*,2 HIS Co. Ltd. 24,200 5442 Kobe Bussan Co.
Ltd. 15,800 544 Sapporo Holdings
Ltd. 24,700 536 Toyoda Gosei Co.
Ltd. 26,100 534 Hankyu Hanshin
REIT Inc. 361 532 Sotetsu Holdings
Inc. 27,300 528 Toshiba TEC Corp. 13,400 528 Heiwa Real Estate
REIT Inc. 378 528 Daio Paper Corp. 29,900 526 Fukuoka REIT Corp. 354 525 Kokuyo Co. Ltd. 34,400 524 Cosmo Energy
Holdings Co. Ltd. 25,600 523 Kyushu Financial
Group Inc. 154,670 521 AEON Financial
Service Co. Ltd. 40,900 520 OBIC Business
Consultants Co.Ltd. 10,489 518
Total World Stock Index Fund
65

Shares
MarketValue•
($000)
Takara Bio Inc. 19,800 517 Maruichi Steel Tube
Ltd. 22,700 516 NSD Co. Ltd. 26,780 510 Global One Real
Estate InvestmentCorp. 492 507
* Toda Corp. 80,400 506 NOK Corp. 43,300 503 Heiwa Real Estate
Co. Ltd. 15,900 502 OSG Corp. 30,200 502 SOSiLA Logistics
REIT Inc. 334 502* Shochiku Co. Ltd. 4,600 501 Nippon Gas Co. Ltd. 40,200 499 Fukuyama
Transporting Co.Ltd. 12,500 498
Furukawa ElectricCo. Ltd. 22,700 497
Kotobuki Spirits Co.Ltd. 7,400 495
Nichias Corp. 20,200 495 Takashimaya Co.
Ltd. 53,500 495 JCU Corp. 12,300 494 PALTAC Corp. 11,100 492 Ichigo Office REIT
Investment Corp. 649 492 Tomy Co. Ltd. 51,500 489 Seven Bank Ltd. 229,600 485* Raksul Inc. 8,800 484 Sakata Seed Corp. 16,000 483 Shikoku Electric
Power Co. Inc. 73,800 481 Gunma Bank Ltd. 155,000 479 Nikkon Holdings Co.
Ltd. 24,500 479 Kaken
PharmaceuticalCo. Ltd. 12,100 477
ABC-Mart Inc. 9,900 476 Monex Group Inc. 73,100 476 Itochu Advance
LogisticsInvestment Corp. 334 476
Morinaga & Co. Ltd. 13,400 474 Tokai Tokyo Financial
Holdings Inc. 136,700 474 Dexerials Corp. 23,400 473 Toei Co. Ltd. 2,400 471 Citizen Watch Co.
Ltd. 106,600 465 Okumura Corp. 18,000 465* Oisix ra daichi Inc. 11,100 465 Tsubakimoto Chain
Co. 15,700 464 Nippon Light Metal
Holdings Co. Ltd. 27,830 462 Asahi Holdings Inc. 25,800 460 Yaoko Co. Ltd. 7,700 458 Round One Corp. 38,000 457 Hokuetsu Corp. 68,900 455 Toyota Boshoku
Corp. 23,600 454 H.U. Group Holdings
Inc. 18,300 451
Shares
MarketValue•
($000)
Yoshinoya HoldingsCo. Ltd. 23,100 450
Izumi Co. Ltd. 14,800 449 Sanrio Co. Ltd. 19,892 446 Senko Group
Holdings Co. Ltd. 50,000 445 Shoei Co. Ltd. 10,000 445 Systena Corp. 24,000 444 eRex Co. Ltd. 19,400 444 Yamato Kogyo Co.
Ltd. 13,200 443 Chugoku Bank Ltd. 60,900 442 Earth Corp. 7,200 442 Hokuhoku Financial
Group Inc. 61,700 441 Mizuho Leasing Co.
Ltd. 14,100 436 Kureha Corp. 6,700 435 TOKAI Holdings
Corp. 57,300 435 Macnica Fuji
ElectronicsHoldings Inc. 18,500 435
NS Solutions Corp. 12,900 434 Hazama Ando Corp. 63,800 432 Nipro Corp. 42,400 431 Sanken Electric Co.
Ltd. 8,200 431 en japan Inc. 10,700 425 Resorttrust Inc. 23,800 422 Hokuriku Electric
Power Co. 88,700 422 Okamura Corp. 31,900 421 Wacom Co. Ltd. 64,900 420 Mirai Corp. 910 420 Milbon Co. Ltd. 7,000 419 Toridoll Holdings
Corp. 17,400 419 Fuyo General Lease
Co. Ltd. 6,400 416 Tokuyama Corp. 24,100 413 Ariake Japan Co.
Ltd. 6,300 410 Central Glass Co.
Ltd. 21,900 408 Kiyo Bank Ltd. 30,807 405 Fuji Soft Inc. 7,900 402 Hanwa Co. Ltd. 13,200 397 Nichicon Corp. 41,600 394 Kusuri no Aoki
Holdings Co. Ltd. 5,900 393 San-A Co. Ltd. 10,800 389 Nagawa Co. Ltd. 4,100 388 Nisshinbo Holdings
Inc. 50,100 387 Sankyo Co. Ltd. 15,900 386 CRE Logistics REIT
Inc. 198 385 DCM Holdings Co.
Ltd. 39,200 382 Oki Electric Industry
Co. Ltd. 46,400 381 Takasago Thermal
Engineering Co.Ltd. 20,800 381
*,2 giftee Inc. 11,127 376 Mani Inc. 22,000 375 Fuji Oil Holdings Inc. 16,000 375
Total World Stock Index Fund
66

Shares
MarketValue•
($000)
Rorze Corp. 3,900 374 Kohnan Shoji Co.
Ltd. 11,900 372 Lintec Corp. 16,600 371 Oiles Corp. 24,960 371 SAMTY Co. Ltd. 16,700 371 Nippon Signal Co.
Ltd. 42,800 370 Aida Engineering
Ltd. 40,500 368 Toyo Ink SC
Holdings Co. Ltd. 20,900 368 JINS Holdings Inc. 5,800 367 Nojima Corp. 16,700 366 Takuma Co. Ltd. 27,800 364 Hokkaido Electric
Power Co. Inc. 87,000 362 NEC Networks &
SystemIntegration Corp. 22,500 362
Iriso Electronics Co.Ltd. 7,700 354
Japan SecuritiesFinance Co. Ltd. 46,400 354
SumitomoWarehouse Co.Ltd. 22,000 354
Nihon ParkerizingCo. Ltd. 35,200 351
Fuji Kyuko Co. Ltd. 8,700 350 Elecom Co. Ltd. 22,800 349 Nitto Boseki Co. Ltd. 10,800 346* NTN Corp. 159,100 345 Sumitomo Osaka
Cement Co. Ltd. 12,300 345 Toho Holdings Co.
Ltd. 21,300 345 Tokyo Steel
Manufacturing Co.Ltd. 30,900 344
Star AsiaInvestment Corp. 649 344
Mixi Inc. 15,024 344 Central Sports Co.
Ltd. 16,050 342 Token Corp. 4,200 342 Kanematsu Corp. 29,400 341 Nippon Paper
Industries Co. Ltd. 33,100 339 Daito
PharmaceuticalCo. Ltd. 12,000 338
Duskin Co. Ltd. 14,000 337 Riso Kagaku Corp. 15,900 336 Daishi Hokuetsu
Financial GroupInc. 14,950 335
Asahi DiamondIndustrial Co. Ltd. 54,300 334
77 Bank Ltd. 32,700 334 KH Neochem Co.
Ltd. 12,900 332 Musashi Seimitsu
Industry Co. Ltd. 17,600 331 Mars Group
Holdings Corp. 22,700 330 BeNext-Yumeshin
Group Co. 25,300 330
Shares
MarketValue•
($000)
Kumagai Gumi Co.Ltd. 13,300 329
Fuji SealInternational Inc. 14,900 328
Showa Sangyo Co.Ltd. 13,200 328
Hirata Corp. 5,380 328 Fuso Chemical Co.
Ltd. 7,100 327* Royal Holdings Co.
Ltd. 18,000 327 Osaka Organic
Chemical IndustryLtd. 10,900 327
Meidensha Corp. 15,500 326 Trusco Nakayama
Corp. 13,500 326 Heiwa Corp. 18,200 325 Nichiha Corp. 11,300 325 Sodick Co. Ltd. 42,200 325 Nishi-Nippon
Financial HoldingsInc. 55,500 324
Joyful Honda Co.Ltd. 23,488 323
2 Colowide Co. Ltd. 22,300 322 Maxell Ltd. 26,800 322 Pacific Industrial Co.
Ltd. 31,500 321 Okinawa Electric
Power Co. Inc. 26,012 319 Nippon Beet Sugar
Manufacturing Co.Ltd. 21,900 318
Raito Kogyo Co. Ltd. 17,900 318 Maruha Nichiro
Corp. 14,100 318 Japan Material Co.
Ltd. 22,900 318 Eizo Corp. 8,300 317 Hibiya Engineering
Ltd. 18,700 314 Maruwa Co. Ltd. 2,800 314 Ichiyoshi Securities
Co. Ltd. 54,700 312 Hyakugo Bank Ltd. 107,800 312 Ringer Hut Co. Ltd. 16,100 312 DTS Corp. 14,000 311 Ogaki Kyoritsu Bank
Ltd. 18,700 311 Nippon Koei Co. Ltd. 10,200 310 Okabe Co. Ltd. 51,600 310 MCJ Co. Ltd. 27,500 310 Aiful Corp. 92,800 309 Shiga Bank Ltd. 19,100 3092 Midac Holdings Co.
Ltd. 6,500 309 Takeuchi
Manufacturing Co.Ltd. 12,000 308
gremz Inc. 13,400 308 Atom Corp. 45,349 306 UT Group Co. Ltd. 9,500 304 Noevir Holdings Co.
Ltd. 6,200 303 Musashino Bank
Ltd. 19,200 302 Nanto Bank Ltd. 17,500 302
Total World Stock Index Fund
67

Shares
MarketValue•
($000)
Anicom HoldingsInc. 38,700 302
Takara Leben RealEstate InvestmentCorp. 309 301
Nippon Soda Co.Ltd. 10,000 300
Yokowo Co. Ltd. 13,495 300 Sangetsu Corp. 21,700 299 Taiyo Holdings Co.
Ltd. 11,200 299 Canon Marketing
Japan Inc. 14,900 295 San-In Godo Bank
Ltd. 60,300 295 Information Services
International-Dentsu Ltd. 8,400 294
TKC Corp. 9,600 2942 Yamashin-Filter
Corp. 48,551 294 Bunka Shutter Co.
Ltd. 29,900 291 Dip Corp. 8,100 291 Okinawa Financial
Group Inc. 13,180 290 JP-Holdings Inc. 129,900 289 Seiren Co. Ltd. 14,200 287 Daido Metal Co. Ltd. 53,300 286 Taikisha Ltd. 10,000 286 LIFULL Co. Ltd. 91,000 286 IR Japan Holdings
Ltd. 3,100 286 Mitani Sekisan Co.
Ltd. 4,500 286 San-Ai Oil Co. Ltd. 21,900 285 Japan Lifeline Co.
Ltd. 26,400 284 Kandenko Co. Ltd. 36,700 284 Tocalo Co. Ltd. 23,200 284 Nippon Ceramic Co.
Ltd. 10,900 283 Financial Products
Group Co. Ltd. 48,900 283 Nomura Co. Ltd. 28,600 282 Star Micronics Co.
Ltd. 21,500 282 One REIT Inc. 105 282 Itoham Yonekyu
Holdings Inc. 46,072 281 North Pacific Bank
Ltd. 135,700 281 Nachi-Fujikoshi
Corp. 7,400 280 Kintetsu World
Express Inc. 11,600 279 V Technology Co.
Ltd. 7,400 279 Monogatari Corp. 4,472 279 Kumiai Chemical
Industry Co. Ltd. 37,263 278 Mochida
PharmaceuticalCo. Ltd. 9,542 278
Nippon ThompsonCo. Ltd. 54,100 278
Nihon Chouzai Co.Ltd. 19,300 278
Shares
MarketValue•
($000)
Osaki Electric Co.Ltd. 56,100 277
Cosel Co. Ltd. 33,800 275 Tokyo Individualized
EducationalInstitute Inc. 43,400 274
* Fujita Kanko Inc. 12,800 271 Funai Soken
Holdings Inc. 9,750 271 Noritake Co. Ltd. 6,200 271 Valor Holdings Co.
Ltd. 12,800 271 Nissha Co. Ltd. 16,500 270 MEC Co. Ltd. 9,783 269 Ministop Co. Ltd. 22,000 268 Takasago
International Corp. 10,300 268 Intage Holdings Inc. 15,800 267 Daihen Corp. 6,400 267 Megmilk Snow
Brand Co. Ltd. 13,800 267 Mori Trust Hotel
REIT Inc. 215 267 Stella Chemifa Corp. 10,600 2662 Kura Sushi Inc. 8,200 265 Hioki EE Corp. 3,800 265 Japan Aviation
ElectronicsIndustry Ltd. 16,000 265
EDION Corp. 27,900 265 Transcosmos Inc. 8,800 265 eGuarantee Inc. 11,900 2652 Starts Proceed
Investment Corp. 126 265 Chiyoda Integre Co.
Ltd. 13,800 264 Keiyo Bank Ltd. 67,600 263 GLOBERIDE Inc. 7,200 261 Digital Arts Inc. 3,200 261 Paramount Bed
Holdings Co. Ltd. 14,000 261 MOS Food Services
Inc. 9,300 259 Ai Holdings Corp. 13,700 259 Senshu Ikeda
Holdings Inc. 184,500 259 Zuken Inc. 6,700 258 Aomori Bank Ltd. 14,900 257 Konishi Co. Ltd. 16,500 257 Oyo Corp. 16,800 257 Autobacs Seven Co.
Ltd. 19,800 256 Giken Ltd. 6,700 256 Usen-Next Holdings
Co. Ltd. 8,681 256 Daibiru Corp. 18,300 255 Tamura Corp. 37,000 254 TOMONY Holdings
Inc. 95,000 254 Meisei Industrial Co.
Ltd. 42,400 253 Future Corp. 8,600 252 Aeon Fantasy Co.
Ltd. 15,200 252 Hyakujushi Bank
Ltd. 19,500 252 BML Inc. 7,100 250
Total World Stock Index Fund
68

Shares
MarketValue•
($000)
Fuso PharmaceuticalIndustries Ltd. 11,200 250
Inabata & Co. Ltd. 16,900 250 Key Coffee Inc. 12,800 250 Tri Chemical
Laboratories Inc. 8,368 250 Yamazen Corp. 26,800 248* M&A Capital
Partners Co. Ltd. 4,400 248 Ichibanya Co. Ltd. 6,100 247 PC Depot Corp. 61,420 247 Kyokuyo Co. Ltd. 9,200 247* ARTERIA Networks
Corp. 17,500 247 Nichireki Co. Ltd. 20,800 247 Samty Residential
Investment Corp. 233 246 Kato Sangyo Co.
Ltd. 8,700 245 Orient Corp. 178,500 245* Right On Co. Ltd. 38,900 245 GungHo Online
EntertainmentInc. 13,070 245
Gree Inc. 29,100 245 Hosiden Corp. 23,100 244 Nissin Corp. 17,200 244 Fujimori Kogyo Co.
Ltd. 5,900 243 CAC Holdings Corp. 17,100 242 Roland DG Corp. 9,200 242 Nagatanien Holdings
Co. Ltd. 13,200 242 S-Pool Inc. 21,565 241 Prima Meat Packers
Ltd. 10,200 240 Rokko Butter Co.
Ltd. 16,400 240 Starts Corp. Inc. 9,900 238 Maeda Kosen Co.
Ltd. 8,200 238 Fukui Bank Ltd. 18,300 237 Shizuoka Gas Co.
Ltd. 22,500 237 Makino Milling
Machine Co. Ltd. 6,600 237 Sanyo Electric
Railway Co. Ltd. 13,481 237 Nippon Pillar
Packing Co. Ltd. 9,700 237 Nichiban Co. Ltd. 14,500 236 Shimizu Bank Ltd. 17,400 236 Qol Holdings Co.
Ltd. 15,800 235 Fujiya Co. Ltd. 11,300 234 Arcs Co. Ltd. 12,200 234 T Hasegawa Co.
Ltd. 9,600 234 Kenko Mayonnaise
Co. Ltd. 17,400 233 Komeri Co. Ltd. 10,100 233 Zenrin Co. Ltd. 25,250 233 DKS Co. Ltd. 7,700 233* SRE Holdings Corp. 3,360 233 Nippn Corp. 16,200 232 Sanki Engineering
Co. Ltd. 18,400 232
Shares
MarketValue•
($000)
Tokyo KiraboshiFinancial GroupInc. 17,949 232
Yamanashi ChuoBank Ltd. 32,000 231
Aichi Corp. 32,400 230 Nippon Parking
Development Co.Ltd. 181,900 230
Jaccs Co. Ltd. 8,600 229 Marudai Food Co.
Ltd. 15,400 229 Noritz Corp. 14,300 229 San ju San Financial
Group Inc. 18,680 229 KYORIN Holdings
Inc. 14,900 229 Nextage Co. Ltd. 12,500 229 Matsui Securities
Co. Ltd. 31,800 228*,2 Sagami Holdings
Corp. 25,400 228 Awa Bank Ltd. 12,200 227 ZERIA
PharmaceuticalCo. Ltd. 12,700 227
UACJ Corp. 9,800 227 Daisyo Corp. 25,400 226 Taisei Lamick Co.
Ltd. 9,400 226 Oita Bank Ltd. 14,100 225 Pacific Metals Co.
Ltd. 12,400 225 Osaka Steel Co. Ltd. 21,900 224 Takihyo Co. Ltd. 14,300 224 Shima Seiki
ManufacturingLtd. 11,600 223
Furukawa BatteryCo. Ltd. 15,950 223
Raiznext Corp. 20,500 222 Bank of the Ryukyus
Ltd. 33,200 221 Tonami Holdings Co.
Ltd. 5,600 221 Create SD Holdings
Co. Ltd. 7,200 221 H2O Retailing Corp. 27,300 218 Okamoto Industries
Inc. 6,200 218 Sanyo Denki Co.
Ltd. 3,800 218 Sinanen Holdings
Co. Ltd. 7,100 218 Tokai Rika Co. Ltd. 15,600 218 Nissin Sugar Co.
Ltd. 14,600 218 Solasto Corp. 18,000 218 Max Co. Ltd. 13,600 217 Shibuya Corp. 8,200 217 S Foods Inc. 7,500 217 Aeon Hokkaido
Corp. 18,800 217 Gunze Ltd. 5,600 216 Fukushima Galilei
Co. Ltd. 5,400 215 Nippon Denko Co.
Ltd. 66,600 215 Suruga Bank Ltd. 58,500 215
Total World Stock Index Fund
69

Shares
MarketValue•
($000)
Akita Bank Ltd. 16,800 214 CMK Corp. 56,900 214 Cybozu Inc. 9,000 214 Mitsuuroko Group
Holdings Co. Ltd. 17,900 214 TOC Co. Ltd. 38,200 214 Maruwa Unyu Kikan
Co. Ltd. 15,264 214 Saizeriya Co. Ltd. 7,900 213 Futaba Corp. 31,400 213 Morita Holdings
Corp. 16,900 213 Furuno Electric Co.
Ltd. 19,800 212 Idec Corp. 10,000 212* Toho Co. Ltd. 15,800 212 Comture Corp. 7,800 212 Takara Leben Co.
Ltd. 77,300 211 CTS Co. Ltd. 30,179 211 Japan Petroleum
Exploration Co.Ltd. 11,600 211
United SuperMarkets HoldingsInc. 23,160 211
ZIGExN Co. Ltd. 59,200 211 Bank of Iwate Ltd. 14,600 210 Kyosan Electric
Manufacturing Co.Ltd. 49,900 210
* Sun FrontierFudousan Co. Ltd. 22,300 209
FANCommunicationsInc. 52,800 209
Sumitomo MitsuiConstruction Co.Ltd. 49,120 208
Nippon Steel TradingCorp. 4,600 208
Tekken Corp. 13,000 208 Towa
PharmaceuticalCo. Ltd. 8,100 208
Dai Nippon ToryoCo. Ltd. 27,200 207
Life Corp. 6,300 207 Takara Standard Co.
Ltd. 15,600 207 Juroku Financial
Group Inc. 11,400 207 Megachips Corp. 6,500 206 Prestige
International Inc. 30,000 206 Kaga Electronics Co.
Ltd. 7,500 206 Kanto Denka Kogyo
Co. Ltd. 22,400 206 Nihon Tokushu Toryo
Co. Ltd. 23,400 206 Tsugami Corp. 15,000 2062 Pharma Foods
International Co.Ltd. 9,100 206
Yokogawa BridgeHoldings Corp. 10,100 204
St. Marc HoldingsCo. Ltd. 15,200 204
Shares
MarketValue•
($000)
Melco Holdings Inc. 4,900 203 YAKUODO Holdings
Co. Ltd. 9,600 203* Curves Holdings Co.
Ltd. 26,104 203 KeePer Technical
Laboratory Co.Ltd. 7,029 203
Canon ElectronicsInc. 14,700 202
Daiho Corp. 6,000 202 Warabeya Nichiyo
Holdings Co. Ltd. 10,300 202*,2 Change Inc. 11,200 202 Zojirushi Corp. 14,500 201 Aisan Industry Co.
Ltd. 27,100 2002 V-Cube Inc. 13,239 200 Yodogawa Steel
Works Ltd. 9,100 199 Avex Inc. 14,500 198* Kourakuen Holdings
Corp. 15,200 197 Adastria Co. Ltd. 10,640 197 Kissei
PharmaceuticalCo. Ltd. 9,848 197
Tokyu ConstructionCo. Ltd. 27,800 197
Sekisui Jushi Corp. 10,600 1972 Create Restaurants
Holdings Inc. 28,600 197 BRONCO BILLY Co.
Ltd. 9,300 197 Tsubaki Nakashima
Co. Ltd. 14,100 197 Roland Corp. 4,800 197 Nisshin Oillio Group
Ltd. 7,400 196 Seika Corp. 13,600 196 Totetsu Kogyo Co.
Ltd. 9,000 196 Daiichi Jitsugyo Co.
Ltd. 4,200 195 Kitz Corp. 29,200 195 Koatsu Gas Kogyo
Co. Ltd. 28,900 195 Mitsubishi Logisnext
Co. Ltd. 21,200 195 Towa Corp. 8,951 1952 Nishimatsuya Chain
Co. Ltd. 15,200 194 Ohsho Food Service
Corp. 3,700 194 Amuse Inc. 9,900 193 Tatsuta Electric Wire
and Cable Co. Ltd. 42,800 193 Tochigi Bank Ltd. 124,000 193 Topy Industries Ltd. 18,400 193 Chiyoda Co. Ltd. 28,600 192 FCC Co. Ltd. 13,900 192 Hogy Medical Co.
Ltd. 7,000 192 KOMEDA Holdings
Co. Ltd. 10,600 192 Kanamoto Co. Ltd. 8,900 191 Feed One Co. Ltd. 29,080 191 Airtrip Corp. 5,625 191 Ichigo Inc. 63,600 190
Total World Stock Index Fund
70

Shares
MarketValue•
($000)
Nissin Electric Co.Ltd. 15,300 190
Ryosan Co. Ltd. 9,200 190 Sekisui Kasei Co.
Ltd. 38,100 190 Shoei Foods Corp. 5,500 190 Tokyotokeiba Co.
Ltd. 4,800 190 ValueCommerce Co.
Ltd. 4,800 189 FULLCAST Holdings
Co. Ltd. 8,066 188 Hokkaido Gas Co.
Ltd. 14,000 188 Tokyo Electron
Device Ltd. 3,100 188 Nihon Trim Co. Ltd. 6,100 187 Fuji Pharma Co. Ltd. 19,400 187 Pasona Group Inc. 6,700 187 Mizuno Corp. 8,000 186 Nitta Corp. 8,100 186 ST Corp. 13,100 186 Ubicom Holdings
Inc. 7,300 186 ASKUL Corp. 13,600 185 SWCC Showa
Holdings Co. Ltd. 9,500 185 Nikkiso Co. Ltd. 20,700 183* Nippon Sheet Glass
Co. Ltd. 32,774 183 Riken Keiki Co. Ltd. 6,600 183 CONEXIO Corp. 14,300 183 Towa Bank Ltd. 40,900 182 Moriroku Holdings
Co. Ltd. 10,600 182* MedPeer Inc. 6,011 181 Saibu Gas Holdings
Co. Ltd. 8,800 180 Okasan Securities
Group Inc. 52,400 179 Aeon Delight Co.
Ltd. 5,800 178 Shikoku Bank Ltd. 27,000 178 Carta Holdings Inc. 8,300 178 Eiken Chemical Co.
Ltd. 10,500 177 Nippon Densetsu
Kogyo Co. Ltd. 11,500 177 Gakken Holdings
Co. Ltd. 18,000 176 DyDo Group
Holdings Inc. 3,700 176 Argo Graphics Inc. 6,300 175 Sato Holdings Corp. 7,600 175 Trancom Co. Ltd. 2,500 175 Sac's Bar Holdings
Inc. 36,100 175 Exedy Corp. 11,700 174 Kameda Seika Co.
Ltd. 4,449 174 Tenma Corp. 7,300 174 Belc Co. Ltd. 3,500 173 Nippon Seiki Co.
Ltd. 17,200 173 Nitto Kogyo Corp. 11,600 173 Noritsu Koki Co. Ltd. 8,300 173 Optex Group Co.
Ltd. 13,600 173
Shares
MarketValue•
($000)
Sakata INX Corp. 17,900 173 Shibaura Machine
Co. Ltd. 7,400 173 Mandom Corp. 11,800 172 Nippon Kanzai Co.
Ltd. 7,100 172 Shinmaywa
Industries Ltd. 21,100 172*,2 euglena Co. Ltd. 24,300 172 Nagaileben Co. Ltd. 8,300 171 Yellow Hat Ltd. 10,500 171 SKY Perfect JSAT
Holdings Inc. 45,600 171* CHIMNEY Co. Ltd. 13,200 171 Kanematsu
Electronics Ltd. 5,200 170 Keihanshin Building
Co. Ltd. 13,600 170 Koa Corp. 12,600 170 Nissan Shatai Co.
Ltd. 24,000 170 Mitsubishi Pencil
Co. Ltd. 14,100 169 Torii Pharmaceutical
Co. Ltd. 6,500 169 Hokkan Holdings
Ltd. 12,600 168 Sanyo Chemical
Industries Ltd. 3,400 168 Toyo Construction
Co. Ltd. 33,600 168 Strike Co. Ltd. 4,443 168 KFC Holdings Japan
Ltd. 6,600 167 Hokkoku Financial
Holdings Inc. 9,600 167* Chiyoda Corp. 45,400 166 Heiwado Co. Ltd. 9,600 166 Nippon Road Co.
Ltd. 2,300 166 Takamatsu
ConstructionGroup Co. Ltd. 9,400 165
Axial Retailing Inc. 5,199 165 Shinnihon Corp. 22,500 165 Inaba Seisakusho
Co. Ltd. 14,000 164 Chudenko Corp. 8,400 164 Link And Motivation
Inc. 15,500 164 Foster Electric Co.
Ltd. 22,900 163 Yuasa Trading Co.
Ltd. 6,100 163 Toyo Tanso Co. Ltd. 6,000 163 LITALICO Inc. 5,400 163* Leopalace21 Corp. 75,300 162 Nippon Carbon Co.
Ltd. 4,200 162 NS United Kaiun
Kaisha Ltd. 5,100 161* KNT-CT Holdings Co.
Ltd. 10,900 160 Genky DrugStores
Co. Ltd. 3,300 159 Chugoku Marine
Paints Ltd. 20,400 158 KYB Corp. 5,900 158 Kisoji Co. Ltd. 8,400 158
Total World Stock Index Fund
71

Shares
MarketValue•
($000)2 Aruhi Corp. 13,656 158 SBS Holdings Inc. 4,400 157 Tamron Co. Ltd. 6,700 157 Seiko Holdings
Corp. 7,400 156 Arata Corp. 4,400 156 Nohmi Bosai Ltd. 8,500 156 Tokushu Tokai Paper
Co. Ltd. 4,000 156 Katakura Industries
Co. Ltd. 10,200 155 WingArc1st Inc. 8,000 154 Riso Kyoiku Co. Ltd. 36,600 153 Maruzen Showa
Unyu Co. Ltd. 5,000 153 Toho Bank Ltd. 85,400 153 United Arrows Ltd. 7,600 152 ESPEC Corp. 7,500 152 Union Tool Co. 4,500 152 Alpen Co. Ltd. 6,200 151 Alconix Corp. 10,019 151 Arcland Sakamoto
Co. Ltd. 10,000 150 Dainichiseika Color
& ChemicalsManufacturing Co.Ltd. 6,500 150
Nittetsu Mining Co.Ltd. 2,600 150
Topre Corp. 13,000 150 HI-LEX Corp. 9,400 150 VT Holdings Co. Ltd. 33,400 149 Japan Pulp & Paper
Co. Ltd. 4,400 148 Yamagata Bank Ltd. 20,800 148 Hamakyorex Co.
Ltd. 5,300 147 Osaka Soda Co. Ltd. 5,800 147 Sumitomo Riko Co.
Ltd. 22,600 147 TBS Holdings Inc. 9,300 147 Daikyonishikawa
Corp. 24,500 147 Ryoyo Electro Corp. 7,000 146 Japan Wool Textile
Co. Ltd. 18,200 145 Shin-Etsu Polymer
Co. Ltd. 16,100 145 Hosokawa Micron
Corp. 5,200 144 Pressance Corp. 8,700 144 T-Gaia Corp. 8,000 143 Infocom Corp. 7,459 143 Aichi Bank Ltd. 4,700 142 Teikoku Sen-I Co.
Ltd. 7,900 142 Plenus Co. Ltd. 8,300 141 Bell System24
Holdings Inc. 11,000 141 Relia Inc. 13,700 140 Ricoh Leasing Co.
Ltd. 4,400 140 Tachi-S Co. Ltd. 11,500 139 Airport Facilities Co.
Ltd. 27,041 138 Daiwa Industries
Ltd. 12,400 138
Shares
MarketValue•
($000)
Ishihara SangyoKaisha Ltd. 12,500 138
Direct MarketingMiX Inc. 3,600 138
Proto Corp. 11,100 137 Mitsui-Soko
Holdings Co. Ltd. 6,800 136 Shikoku Chemicals
Corp. 11,100 136 Tsukishima Kikai Co.
Ltd. 13,300 136 Tsurumi
Manufacturing Co.Ltd. 8,800 136
* Macromill Inc. 19,300 136 Akatsuki Inc. 4,989 136 Itochu Enex Co. Ltd. 15,300 135 Fujio Food Group
Inc. 11,300 135 Aiphone Co. Ltd. 6,500 134 Fujibo Holdings Inc. 3,700 134 Retail Partners Co.
Ltd. 12,800 134 Modec Inc. 7,800 134 Belluna Co. Ltd. 18,900 133 Doshisha Co. Ltd. 8,500 133 Hiday Hidaka Corp. 9,236 132 Doutor Nichires
Holdings Co. Ltd. 9,200 132 Vector Inc. 11,600 132 Micronics Japan Co.
Ltd. 9,900 131 Daikokutenbussan
Co. Ltd. 2,300 131 Uchida Yoko Co. Ltd. 3,100 131 Base Co. Ltd. 3,100 131 Kyokuto Kaihatsu
Kogyo Co. Ltd. 9,500 130 Yonex Co. Ltd. 19,800 130* Optim Corp. 8,298 130 Fuji Media Holdings
Inc. 12,400 129 Siix Corp. 11,600 129 Joshin Denki Co.
Ltd. 6,200 129 Nishio Rent All Co.
Ltd. 5,200 129 Nichi-iko
PharmaceuticalCo. Ltd. 16,950 129
Mitsubishi ShokuhinCo. Ltd. 5,000 129
Restar HoldingsCorp. 7,700 129
Hokuto Corp. 7,400 128 Iino Kaiun Kaisha
Ltd. 26,500 128 Matsuda Sangyo
Co. Ltd. 4,300 128* Matsuya Co. Ltd. 13,300 127 Tanseisha Co. Ltd. 15,500 127 Broadleaf Co. Ltd. 26,400 127 Toppan Forms Co.
Ltd. 13,100 126 Toho Zinc Co. Ltd. 4,600 126 COLOPL Inc. 17,400 126 Piolax Inc. 8,700 125
Total World Stock Index Fund
72

Shares
MarketValue•
($000)
Taihei DengyoKaisha Ltd. 5,300 125
* Vision Inc. 9,300 125 Ehime Bank Ltd. 18,400 124 Weathernews Inc. 1,700 124 Fujicco Co. Ltd. 7,400 124 Sakai Moving
Service Co. Ltd. 3,000 124 Bank of Nagoya Ltd. 5,800 123 Sanshin Electronics
Co. Ltd. 8,600 123* BrainPad Inc. 2,570 123 Matsuyafoods
Holdings Co. Ltd. 3,802 122 PAL GROUP
Holdings Co. Ltd. 8,400 121 TPR Co. Ltd. 9,500 121 Toa Corp. 5,500 121 Wakita & Co. Ltd. 13,400 1212 YA-MAN Ltd. 11,400 121 Yondoshi Holdings
Inc. 7,900 120* Mitsui E&S Holdings
Co. Ltd. 23,300 119 Tokai Corp. 6,200 119 Konoike Transport
Co. Ltd. 10,900 119 Chilled & Frozen
Logistics HoldingsCo. Ltd. 8,000 119
2 Rock Field Co. Ltd. 8,000 118 WDB Holdings Co.
Ltd. 3,740 118 Furukawa Co. Ltd. 10,600 117 Valqua Ltd. 5,800 117 Mitsuboshi Belting
Ltd. 6,500 116* W-Scope Corp. 14,500 116* Istyle Inc. 33,400 116 Fuji Co. Ltd. 6,500 115* Kappa Create Co.
Ltd. 9,500 115 Yokohama Reito Co.
Ltd. 15,100 115 Organo Corp. 1,800 114 Okuwa Co. Ltd. 11,800 113 Sanei Architecture
Planning Co. Ltd. 7,200 113 YAMABIKO Corp. 10,400 113 Vital KSK Holdings
Inc. 16,900 113 Obara Group Inc. 3,500 112 Sanyo Special Steel
Co. Ltd. 6,800 112 Sinko Industries Ltd. 6,159 112 Insource Co. Ltd. 5,600 112 Chubu Shiryo Co.
Ltd. 11,600 111 Nissei ASB Machine
Co. Ltd. 3,400 111 France Bed Holdings
Co. Ltd. 14,000 111 Japan Best Rescue
System Co. Ltd. 10,955 111 Press Kogyo Co.
Ltd. 37,600 110
Shares
MarketValue•
($000)
Rheon AutomaticMachinery Co.Ltd. 9,280 110
Shin Nippon AirTechnologies Co.Ltd. 5,100 110
SRA Holdings 4,300 110 Elan Corp. 10,200 110 Anest Iwata Corp. 13,700 109 Seikagaku Corp. 12,300 109 Unipres Corp. 13,300 109 RS Technologies Co.
Ltd. 2,000 109 Ines Corp. 7,400 108 Toyo Corp. 11,400 108 METAWATER Co.
Ltd. 6,400 108 Goldcrest Co. Ltd. 7,500 107 J Trust Co. Ltd. 20,500 1072 Kansai Super
Market Ltd. 6,600 107 Nippon Yakin Kogyo
Co. Ltd. 4,449 107* Atrae Inc. 5,000 107 Eagle Industry Co.
Ltd. 9,900 106 Sinfonia Technology
Co. Ltd. 9,200 106 Toenec Corp. 3,600 106*,2 Open Door Inc. 4,800 106 Shinwa Co. Ltd. 5,400 105 Miyazaki Bank Ltd. 5,800 105 Kurabo Industries
Ltd. 6,300 105 Sintokogio Ltd. 15,900 104 Shinko Shoji Co.
Ltd. 13,000 104 Sumitomo Densetsu
Co. Ltd. 5,400 104 Keiyo Co. Ltd. 14,200 103 Halows Co. Ltd. 4,200 103 Miroku Jyoho
Service Co. Ltd. 6,500 103* Nippon Chemi-Con
Corp. 5,500 103 Starzen Co. Ltd. 5,400 102 Bando Chemical
Industries Ltd. 13,100 101 Onward Holdings
Co. Ltd. 34,000 101 TechMatrix Corp. 6,400 101 Tama Home Co. Ltd. 4,900 101 TV Asahi Holdings
Corp. 6,500 99 Geo Holdings Corp. 9,300 99 SB Technology Corp. 3,600 99* Aoyama Trading Co.
Ltd. 14,200 98 Tosei Corp. 10,200 98 DKK Co. Ltd. 4,400 97 Yurtec Corp. 16,500 97 Yorozu Corp. 9,300 97 Bank of Saga Ltd. 7,600 96 Chofu Seisakusho
Co. Ltd. 5,300 96 Hisaka Works Ltd. 12,900 96 Pack Corp. 3,600 96 IDOM Inc. 13,800 95
Total World Stock Index Fund
73

Shares
MarketValue•
($000)
Alpha Systems Inc. 2,500 95 Dai-Dan Co. Ltd. 4,500 95 Arcland Service
Holdings Co. Ltd. 4,800 95 G-7 Holdings Inc. 5,200 95 Hakuto Co. Ltd. 5,492 94 Inageya Co. Ltd. 7,747 94 G-Tekt Corp. 7,500 94 Mimasu
SemiconductorIndustry Co. Ltd. 4,300 94
Riken Vitamin Co.Ltd. 5,700 94
Poletowin PitcrewHoldings Inc. 10,300 93
Sparx Group Co.Ltd. 35,700 93
Itochu-Shokuhin Co.Ltd. 2,000 92
Nippon TelevisionHoldings Inc. 8,500 92
World Holdings Co.Ltd. 3,700 92
JAC RecruitmentCo. Ltd. 4,700 92
GMO GlobalSignHoldings KK 2,222 92
Yukiguni MaitakeCo. Ltd. 7,300 92
HitoCommunicationsHoldings Inc. 4,700 91
FIDEA Holdings Co.Ltd. 8,790 91
Kyodo Printing Co.Ltd. 3,900 90
J-Oil Mills Inc. 5,600 90 Hodogaya Chemical
Co. Ltd. 2,100 89 Kojima Co. Ltd. 17,300 89* Kintetsu
Department StoreCo. Ltd. 4,000 89
Mitsui DM SugarHoldings Co. Ltd. 5,000 89
Shimojima Co. Ltd. 9,000 89 Taki Chemical Co.
Ltd. 1,600 89 I'll Inc. 6,000 89 Computer
Engineering &Consulting Ltd. 7,426 88
Denyo Co. Ltd. 5,100 88* PIA Corp. 2,500 87 Nichiden Corp. 4,300 87 Tayca Corp. 7,561 87 Komatsu Matere
Co. Ltd. 10,700 86 Ryobi Ltd. 8,200 86 TSI Holdings Co.
Ltd. 28,200 86 Enplas Corp. 3,200 85 Marusan Securities
Co. Ltd. 16,100 85 Sumitomo Seika
Chemicals Co.Ltd. 3,000 85
Shares
MarketValue•
($000)
Shindengen ElectricManufacturing Co.Ltd. 2,400 85
Sumida Corp. 7,334 85 Koshidaka Holdings
Co. Ltd. 13,904 85 Ichikoh Industries
Ltd. 17,000 84* Jamco Corp. 9,600 83 Hoosiers Holdings 13,500 83 K&O Energy Group
Inc. 5,800 83 Kitanotatsujin Corp. 22,900 83 Optorun Co. Ltd. 4,100 83 Enigmo Inc. 8,700 83 Shin Nippon
BiomedicalLaboratories Ltd. 6,500 82
Sakai ChemicalIndustry Co. Ltd. 4,400 82
LEC Inc. 9,000 82 Tachibana Eletech
Co. Ltd. 6,100 82 Mitsubishi Research
Institute Inc. 2,200 82 Maxvalu Tokai Co.
Ltd. 3,600 82 Arakawa Chemical
Industries Ltd. 7,400 81 Ryoden Corp. 5,100 81 Japan Transcity
Corp. 15,200 81 Nihon Nohyaku Co.
Ltd. 17,100 80 Komori Corp. 12,200 80 Maezawa Kyuso
Industries Co. Ltd. 8,600 80 Daiken Corp. 3,600 79 Fukui Computer
Holdings Inc. 2,200 79 Krosaki Harima
Corp. 1,900 79 Toyo Kanetsu KK 3,600 79 Chukyo Bank Ltd. 6,700 78 Cawachi Ltd. 4,000 78 Aichi Steel Corp. 3,300 77 ES-Con Japan Ltd. 10,700 77 Toho Titanium Co.
Ltd. 7,300 77 Kamei Corp. 7,500 762 Sanoh Industrial Co.
Ltd. 8,600 76 Toa Corp. (XTKS) 10,600 76 Japan Medical
DynamicMarketing Inc. 3,957 76
Teikoku ElectricManufacturing Co.Ltd. 5,900 75
Nitto Kohki Co. Ltd. 4,500 75 Digital Holdings Inc. 4,895 75 Riken Corp. 3,200 75* Oriental Shiraishi
Corp. 31,300 74 Riken Technos Corp. 15,200 73 JVCKenwood Corp. 42,200 73 EM Systems Co.
Ltd. 11,000 73 Kyoei Steel Ltd. 5,800 72
Total World Stock Index Fund
74

Shares
MarketValue•
($000)
JM Holdings Co.Ltd. 4,400 72
Nippon Rietec Co.Ltd. 5,200 72
Pronexus Inc. 7,600 71 Onoken Co. Ltd. 4,800 71 Tokyo Rakutenchi
Co. Ltd. 2,000 71 Zuiko Corp. 9,200 71 Ohara Inc. 5,800 71 Medical Data Vision
Co. Ltd. 5,500 71 Kanamic Network
Co. Ltd. 13,400 71 Advan Group Co.
Ltd. 8,200 70 Fudo Tetra Corp. 4,400 70 Mitsuba Corp. 12,400 69 Xebio Holdings Co.
Ltd. 7,400 69 Mie Kotsu Group
Holdings Inc. 15,900 69 Media Do Co. Ltd. 1,830 69 World Co. Ltd. 5,500 68 Futaba Industrial Co.
Ltd. 16,800 66 Godo Steel Ltd. 5,000 66 Icom Inc. 3,100 66 Corona Corp.
Class A 8,100 65 Taiko
PharmaceuticalCo. Ltd. 9,157 65
* Iseki & Co. Ltd. 4,400 64 Nippon Sharyo Ltd. 3,483 64 Shibusawa
Warehouse Co.Ltd. 3,300 64
JDC Corp. 12,200 64 Grace Technology
Inc. 7,038 64 ASKA
PharmaceuticalHoldings Co. Ltd. 7,400 64
Chuetsu Pulp &Paper Co. Ltd. 6,000 62
Elematec Corp. 6,200 62 Neturen Co. Ltd. 11,600 62 Takaoka Toko Co.
Ltd. 4,800 62*,2 Heroz Inc. 3,700 622 Kanagawa Chuo
Kotsu Co. Ltd. 2,000 61* KLab Inc. 10,800 60 Happinet Corp. 4,500 59 Achilles Corp. 5,100 59*,2 Japan Display Inc. 196,500 59 Honeys Holdings
Co. Ltd. 6,260 58 Sankyo Seiko Co.
Ltd. 11,500 58 Tokyo Energy &
Systems Inc. 6,000 58 Takamiya Co. Ltd. 14,800 58 Tosho Co. Ltd. 3,300 57 Kurimoto Ltd. 3,900 56 Hochiki Corp. 5,000 55 Kanaden Corp. 6,100 55
Shares
MarketValue•
($000)
Yahagi ConstructionCo. Ltd. 8,200 55
AOKI Holdings Inc. 8,800 54 Sankyo Tateyama
Inc. 8,200 54 ASAHI YUKIZAI
Corp. 4,400 53 Studio Alice Co. Ltd. 2,800 53 CI Takiron Corp. 10,000 53 Torishima Pump
Manufacturing Co.Ltd. 6,900 53
* Unitika Ltd. 16,400 52 Kawada
Technologies Inc. 1,500 52 Central Security
Patrols Co. Ltd. 2,119 51 Chuo Spring Co.
Ltd. 5,600 49 Fukuda Corp. 1,200 49 Marvelous Inc. 7,600 48 NEC Capital
Solutions Ltd. 2,600 47 Ebase Co. Ltd. 7,100 47 MTI Ltd. 7,000 45 Toa Oil Co. Ltd. 1,800 45 Kyokuto Securities
Co. Ltd. 6,700 45 Artnature Inc. 7,000 45 Fixstars Corp. 6,600 45* Akebono Brake
Industry Co. Ltd. 21,900 44* FDK Corp. 4,900 44 Sourcenext Corp. 24,700 44 Okura Industrial Co.
Ltd. 2,400 44 Asahi Co. Ltd. 3,800 44 Tsutsumi Jewelry
Co. Ltd. 2,300 43 Yushin Precision
Equipment Co.Ltd. 6,400 43
CMIC Holdings Co.Ltd. 3,100 40
Tomoku Co. Ltd. 2,400 40*,2 Laox Co. Ltd. 23,300 38 Nippon Coke &
Engineering Co.Ltd. 28,400 38
Oro Co. Ltd. 1,142 382 Raccoon Holdings
Inc. 2,681 38 Wowow Inc. 1,800 37* WATAMI Co. Ltd. 4,300 37 Tv Tokyo Holdings
Corp. 1,900 36*,2 RPA Holdings Inc. 8,948 34 Taiho Kogyo Co. Ltd. 4,500 32 I-PEX Inc. 1,800 32 JSP Corp. 2,300 31 Fibergate Inc. 2,603 31 Chori Co. Ltd. 1,900 30 Kamakura Shinsho
Ltd. 3,700 30* OSAKA Titanium
Technologies Co.Ltd. 4,100 28
* TerraSky Co. Ltd. 1,312 25
Total World Stock Index Fund
75

Shares
MarketValue•
($000)
Cleanup Corp. 5,000 24 Gecoss Corp. 3,200 24 Nakayama Steel
Works Ltd. 5,000 19 Linical Co. Ltd. 1,300 9* Gunosy Inc. 1,500 9 Nisso Corp. 1,000 6
2,142,422Jersey (0.0%)* Petrofac Ltd. 21,555 4
Kuwait (0.1%) National Bank of
Kuwait SAKP 2,957,531 9,725 Kuwait Finance
House KSCP 1,897,680 5,245 Agility Public
Warehousing Co.KSC 534,870 1,778
MobileTelecommunicationsCo. KSCP 894,692 1,772
* Boubyan Bank KSCP 382,395 993 Mabanee Co. KPSC 256,418 670 Boubyan
PetrochemicalsCo. KSCP 185,530 566
Gulf Bank KSCP 596,345 487* Warba Bank KSCP 495,142 463 Humansoft Holding
Co. KSC 36,030 400* National Industries
Group HoldingSAK 397,622 361
QurainPetrochemicalIndustries Co. 225,597 284
* Alimtiaz InvestmentGroup KSC 502,896 225
Burgan Bank SAK 232,374 184 Kuwait Projects Co.
Holding KSCP 352,864 172* Kuwait International
Bank KSCP 214,350 159* Integrated Holding
Co. KCSC 74,047 92* Kuwait Projects Co
Holding KSCPRights Exp.11/2/21 115,386 3
23,579Malaysia (0.2%) Public Bank Bhd. 6,709,930 6,760 Malayan Banking
Bhd. 2,701,081 5,254 Tenaga Nasional
Bhd. 1,718,074 4,008 CIMB Group
Holdings Bhd. 3,006,852 3,794 Petronas Chemicals
Group Bhd. 1,219,189 2,560 Ihh Healthcare Bhd. 1,440,220 2,274 Press Metal
AluminiumHoldings Bhd. 1,602,460 2,154
Axiata Group Bhd. 1,841,451 1,760 DiGi.Com Bhd. 1,631,600 1,670
Shares
MarketValue•
($000)
Sime DarbyPlantation Bhd. 1,679,975 1,629
Top Glove Corp.Bhd. 2,369,800 1,556
PPB Group Bhd. 326,340 1,433 Dialog Group Bhd. 1,974,248 1,350 MISC Bhd. 765,321 1,309 Maxis Bhd. 1,093,900 1,235 IOI Corp. Bhd. 1,282,540 1,217 Hong Leong Bank
Bhd. 252,100 1,146 Genting Bhd. 862,800 1,080 Kuala Lumpur
Kepong Bhd. 191,600 1,001* Gamuda Bhd. 1,183,000 926 RHB Bank Bhd. 683,350 922 Inari Amertron Bhd. 980,975 919 Petronas Gas 217,800 881 Hartalega Holdings
Bhd. 603,200 855 Genting Malaysia
Bhd. 1,032,900 791 Nestle Malaysia
Bhd. 24,100 783 Sime Darby Bhd. 1,313,775 721 AMMB Holdings
Bhd. 882,900 716 HAP Seng
Consolidated Bhd. 351,700 666 Petronas Dagangan
Bhd. 133,200 655* Malaysia Airports
Holdings Bhd. 407,700 638 IJM Corp. Bhd. 1,339,420 600 QL Resources Bhd. 473,590 578 Telekom Malaysia
Bhd. 401,900 562 Frontken Corp. Bhd. 533,400 492 Westports Holdings
Bhd. 410,900 444 Hong Leong
Financial GroupBhd. 95,942 425
Alliance BankMalaysia Bhd. 622,400 413
VS Industry Bhd. 1,044,000 399 Sunway REIT 1,119,900 396 TIME dotCom Bhd. 361,200 394 Axis REIT 812,000 375 Mega First Corp.
Bhd. 428,700 373 My EG Services
Bhd. 1,484,500 373 Bursa Malaysia Bhd. 201,650 365 Malaysian Pacific
Industries Bhd. 31,000 3583 MR DIY Group M
Bhd 390,900 356 Scientex Bhd. 313,200 353 British American
Tobacco MalaysiaBhd. 94,900 346
AEON CreditService M Bhd. 101,300 343
D&O GreenTechnologies Bhd. 233,800 319
IGB REIT 764,600 310 Magnum Bhd. 565,249 295
Total World Stock Index Fund
76
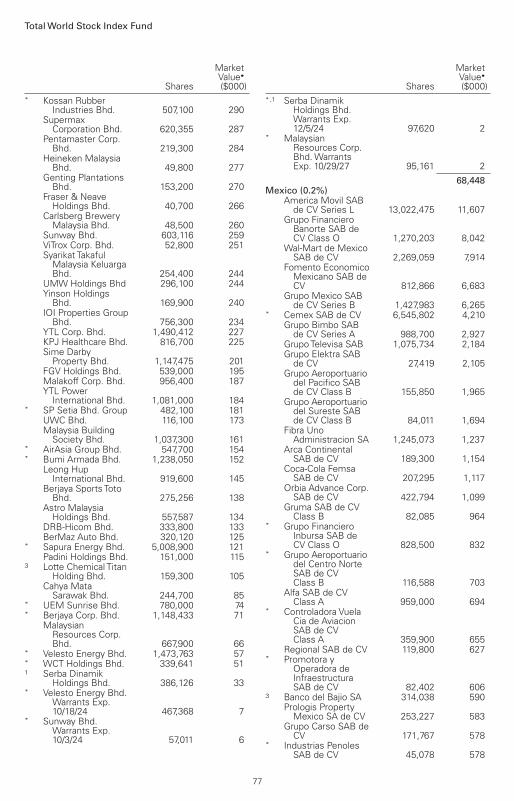
Shares
MarketValue•
($000)* Kossan Rubber
Industries Bhd. 507,100 290 Supermax
Corporation Bhd. 620,355 287 Pentamaster Corp.
Bhd. 219,300 284 Heineken Malaysia
Bhd. 49,800 277 Genting Plantations
Bhd. 153,200 270 Fraser & Neave
Holdings Bhd. 40,700 266 Carlsberg Brewery
Malaysia Bhd. 48,500 260 Sunway Bhd. 603,116 259 ViTrox Corp. Bhd. 52,800 251 Syarikat Takaful
Malaysia KeluargaBhd. 254,400 244
UMW Holdings Bhd 296,100 244 Yinson Holdings
Bhd. 169,900 240 IOI Properties Group
Bhd. 756,300 234 YTL Corp. Bhd. 1,490,412 227 KPJ Healthcare Bhd. 816,700 225 Sime Darby
Property Bhd. 1,147,475 201 FGV Holdings Bhd. 539,000 195 Malakoff Corp. Bhd. 956,400 187 YTL Power
International Bhd. 1,081,000 184* SP Setia Bhd. Group 482,100 181 UWC Bhd. 116,100 173 Malaysia Building
Society Bhd. 1,037,300 161* AirAsia Group Bhd. 547,700 154* Bumi Armada Bhd. 1,238,050 152 Leong Hup
International Bhd. 919,600 145 Berjaya Sports Toto
Bhd. 275,256 138 Astro Malaysia
Holdings Bhd. 557,587 134 DRB-Hicom Bhd. 333,800 133 BerMaz Auto Bhd. 320,120 125* Sapura Energy Bhd. 5,008,900 121 Padini Holdings Bhd. 151,000 1153 Lotte Chemical Titan
Holding Bhd. 159,300 105 Cahya Mata
Sarawak Bhd. 244,700 85* UEM Sunrise Bhd. 780,000 74* Berjaya Corp. Bhd. 1,148,433 71 Malaysian
Resources Corp.Bhd. 667,900 66
* Velesto Energy Bhd. 1,473,763 57* WCT Holdings Bhd. 339,641 511 Serba Dinamik
Holdings Bhd. 386,126 33* Velesto Energy Bhd.
Warrants Exp.10/18/24 467,368 7
* Sunway Bhd.Warrants Exp.10/3/24 57,011 6
Shares
MarketValue•
($000)*,1 Serba Dinamik
Holdings Bhd.Warrants Exp.12/5/24 97,620 2
* MalaysianResources Corp.Bhd. WarrantsExp. 10/29/27 95,161 2
68,448Mexico (0.2%) America Movil SAB
de CV Series L 13,022,475 11,607 Grupo Financiero
Banorte SAB deCV Class O 1,270,203 8,042
Wal-Mart de MexicoSAB de CV 2,269,059 7,914
Fomento EconomicoMexicano SAB deCV 812,866 6,683
Grupo Mexico SABde CV Series B 1,427,983 6,265
* Cemex SAB de CV 6,545,802 4,210 Grupo Bimbo SAB
de CV Series A 988,700 2,927 Grupo Televisa SAB 1,075,734 2,184 Grupo Elektra SAB
de CV 27,419 2,105 Grupo Aeroportuario
del Pacifico SABde CV Class B 155,850 1,965
Grupo Aeroportuariodel Sureste SABde CV Class B 84,011 1,694
Fibra UnoAdministracion SA 1,245,073 1,237
Arca ContinentalSAB de CV 189,300 1,154
Coca-Cola FemsaSAB de CV 207,295 1,117
Orbia Advance Corp.SAB de CV 422,794 1,099
Gruma SAB de CVClass B 82,085 964
* Grupo FinancieroInbursa SAB deCV Class O 828,500 832
* Grupo Aeroportuariodel Centro NorteSAB de CVClass B 116,588 703
Alfa SAB de CVClass A 959,000 694
* Controladora VuelaCia de AviacionSAB de CVClass A 359,900 655
Regional SAB de CV 119,800 627* Promotora y
Operadora deInfraestructuraSAB de CV 82,402 606
3 Banco del Bajio SA 314,038 590 Prologis Property
Mexico SA de CV 253,227 583 Grupo Carso SAB de
CV 171,767 578* Industrias Penoles
SAB de CV 45,078 578
Total World Stock Index Fund
77

Shares
MarketValue•
($000)* Alsea SAB de CV 262,700 551 GCC SAB de CV 73,200 545 Kimberly-Clark de
Mexico SAB deCV Class A 313,800 496
3 Macquarie MexicoReal EstateManagement SAde CV 414,800 495
Becle SAB de CV 209,000 478 Telesites SAB de CV 498,765 455 Corp. Inmobiliaria
Vesta SAB de CV 259,201 451 PLA Administradora
Industrial S de RLde CV 317,386 445
Megacable HoldingsSAB de CV 146,462 432
* Genomma LabInternacional SABde CV Class B 388,063 371
Bolsa Mexicana deValores SAB deCV 178,300 342
La Comer SAB deCV 187,574 338
Grupo ComercialChedraui SA deCV 171,300 338
QualitasControladora SABde CV 68,064 315
El Puerto deLiverpool SAB deCV Class C1 70,400 311
Concentradora FibraDanhos SA de CV 250,008 302
*,3 Grupo Traxion SABde CV 159,535 276
Banco SantanderMexico SAInstitucion deBanca MultipleGrupo FinancieroSantand 208,700 266
* Gentera SAB de CV 391,800 234 Industrias Bachoco
SAB de CVClass B 56,689 201
Grupo Herdez SABde CV 103,100 190
*,3 Nemak SAB de CV 752,599 174* Axtel SAB de CV 542,336 123* Alpek SAB de CV 100,700 110* Credito Real SAB de
CV SOFOM ER 219,342 110* Unifin Financiera
SAB de CV 68,455 105 Grupo Rotoplas SAB
de CV 65,251 90
76,157Netherlands (1.2%) ASML Holding NV 172,311 140,072*,3 Adyen NV 12,624 38,090 Prosus NV 384,296 33,850 ING Groep NV 1,704,922 25,862 Koninklijke Philips
NV 392,903 18,535 Koninklijke DSM NV 72,223 15,779
Shares
MarketValue•
($000)
Koninklijke AholdDelhaize NV 425,559 13,844
Wolters Kluwer NV 115,731 12,119 Heineken NV 103,550 11,462 Akzo Nobel NV 84,083 9,663 ASM International
NV 21,080 9,540 ArcelorMittal SA 279,383 9,449 Universal Music
Group NV 320,865 9,316 NN Group NV 134,409 7,185 IMCD NV 25,159 5,586*,3 Just Eat
Takeaway.com NV 63,078 4,531* Unibail-Rodamco-
Westfield 61,883 4,419 Koninklijke KPN NV 1,471,936 4,398 Heineken Holding
NV 45,275 4,196 Aegon NV 780,673 3,960 Randstad NV 46,003 3,305 BE Semiconductor
Industries NV 30,907 2,824 ASR Nederland NV 57,064 2,6673 Signify NV 54,643 2,6483 ABN AMRO Bank
NV GDR 168,203 2,474 Aalberts NV 41,312 2,287 Arcadis NV 31,262 1,524* OCI NV 49,183 1,394* InPost SA 86,930 1,241 Corbion NV 23,673 1,124 APERAM SA 18,693 1,115* Galapagos NV 20,777 1,102 SBM Offshore NV 69,203 1,093 JDE Peet's NV 36,980 1,077* Just Eat
Takeaway.com NVADR 73,832 1,055
Koninklijke Vopak NV 26,367 1,049 TKH Group NV GDR 17,380 990 Boskalis
Westminster 30,845 920 PostNL NV 207,848 902*,3 Basic-Fit NV 17,995 874*,3 GrandVision NV 22,711 745*,3 Intertrust NV 38,330 5803 CTP NV 26,060 553*,3 Alfen Beheer BV 4,423 498 AMG Advanced
MetallurgicalGroup NV 15,733 464
EurocommercialProperties NV 19,147 447
3 Flow Traders 12,164 413* Accell Group NV 9,543 393* Sligro Food Group
NV 12,587 337 NSI NV 7,906 317 Vastned Retail NV 10,192 290* Fugro NV 32,885 279 Wereldhave NV 16,890 262* Koninklijke BAM
Groep NV 90,114 262* TomTom NV 21,048 181*,3 Just Eat
Takeaway.com NV(XLON) 1,405 101
Total World Stock Index Fund
78

Shares
MarketValue•
($000)
ForFarmers NV 20,499 983 B&S Group Sarl 7,543 68 Brunel International
NV 4,071 56
419,865New Zealand (0.1%) Fisher & Paykel
Healthcare Corp.Ltd. 250,784 5,618
* AucklandInternationalAirport Ltd. 514,332 2,948
Spark New ZealandLtd. 802,180 2,626
Mainfreight Ltd. 34,612 2,230 Contact Energy Ltd. 347,972 2,042 Meridian Energy
Ltd. 503,358 1,803 Fletcher Building
Ltd. 345,241 1,776 Ryman Healthcare
Ltd. 167,185 1,730*,2 a2 Milk Co. Ltd. 337,819 1,591 Infratil Ltd. 228,604 1,356 Mercury NZ Ltd. 280,714 1,235 Summerset Group
Holdings Ltd. 105,618 1,099 Chorus Ltd. 209,654 957 EBOS Group Ltd. 35,516 923 Goodman Property
Trust 437,157 780 Freightways Ltd. 74,322 690 SKYCITY
EntertainmentGroup Ltd. 284,372 652
Precinct PropertiesNew Zealand Ltd. 530,460 635
Kiwi Property GroupLtd. 715,522 600
Z Energy Ltd. 225,894 583 Genesis Energy Ltd. 231,807 542 Argosy Property Ltd. 433,607 485 Arvida Group Ltd. 334,695 479* Pushpay Holdings
Ltd. 257,432 351 Scales Corp. Ltd. 90,087 346*,2 Air New Zealand
Ltd. 276,741 331 Oceania Healthcare
Ltd. 327,119 328 Stride Property
Group 180,969 309 Skellerup Holdings
Ltd. 65,641 293 Vital Healthcare
Property Trust 137,358 289 Heartland Group
Holdings Ltd. 168,409 284 Kathmandu
Holdings Ltd. 240,079 274* Vista Group
International Ltd. 149,431 271 Vector Ltd. 77,157 226* Serko Ltd. 40,373 226* Pacific Edge Ltd. 182,119 192*,2 Synlait Milk Ltd. 35,408 91* Tourism Holdings
Ltd. 38,634 76
Shares
MarketValue•
($000)* SKY Network
Television Ltd. 55,880 76* Restaurant Brands
New Zealand Ltd. 6,016 67* Arvida Group Ltd.
RightsExp.11/08/2021 50,942 6
37,416Norway (0.2%) Equinor ASA 420,426 10,653 DNB Bank ASA 446,915 10,635 Mowi ASA 196,798 5,707 Norsk Hydro ASA 599,384 4,403 Telenor ASA 273,124 4,316 Yara International
ASA 72,331 3,780 TOMRA Systems
ASA 50,426 3,259 Orkla ASA 327,961 3,190 Schibsted ASA
Class B 46,454 2,107 Bakkafrost P/F 22,338 2,066 Storebrand ASA 185,361 1,988* Nordic
SemiconductorASA 63,777 1,895
* Adevinta ASA 113,821 1,880 Gjensidige
Forsikring ASA 71,843 1,789 Salmar ASA 23,383 1,784 Aker BP ASA 46,449 1,782 Schibsted ASA
Class A 30,712 1,587* NEL ASA 612,335 1,296 SpareBank 1
SR-Bank ASA 76,489 1,173 Borregaard ASA 44,130 1,072 SpareBank 1 SMN 61,573 1,0263 Scatec ASA 49,411 975 Leroy Seafood
Group ASA 105,642 9603 Entra ASA 38,340 957 Aker ASA Class A 10,319 951 Kongsberg Gruppen
ASA 28,481 935 Subsea 7 SA 97,603 876*,3 Crayon Group
Holding ASA 35,256 823* Kahoot! ASA 126,187 757* Bank Norwegian
ASA 59,949 743 Atea ASA 32,090 600 Veidekke ASA 40,757 587 Austevoll Seafood
ASA 43,237 585 TGS ASA 60,760 5603 Elkem ASA 125,425 4993 Sbanken ASA 39,235 460 BW Offshore Ltd. 106,189 346* Wallenius
Wilhelmsen ASA 69,324 318* MPC Container
Ships A/S 132,278 313 Frontline Ltd. 34,474 306 Bonheur ASA 7,179 284* DNO ASA 188,320 275 Sparebank 1
Oestlandet 14,697 242
Total World Stock Index Fund
79

Shares
MarketValue•
($000)* Grieg Seafood ASA 19,835 221* Hexagon
Composites ASA 43,276 174 Norway Royal
Salmon ASA 7,755 163* BW Energy Ltd. 44,486 146 Ocean Yield ASA 29,459 1433 BW LPG Ltd. 23,866 128 Stolt-Nielsen Ltd. 7,735 119
81,834Pakistan (0.0%)* Lucky Cement Ltd. 69,998 316 Engro Corp. Ltd. 173,226 287 Fauji Fertilizer Co.
Ltd. 469,991 282 Bank Alfalah Ltd. 1,284,017 273 Pakistan State Oil
Co. Ltd. 171,596 191 TRG Pakistan 249,819 175 MCB Bank Ltd. 180,931 173 Hub Power Co. Ltd. 384,498 171 Habib Bank Ltd. 213,200 157 Pakistan Oilfields
Ltd. 53,810 120 Pakistan Petroleum
Ltd. 260,712 115 Oil & Gas
Development Co.Ltd. 177,400 88
Millat Tractors Ltd. 15,513 81 Engro Fertilizers Ltd. 189,840 79 United Bank Ltd. 95,600 78 Searle Co. Ltd. 63,272 66* SUI Southern Gas
Co. Ltd. 1,070,500 65 Nishat Mills Ltd. 116,000 61* Fauji Cement Co.
Ltd. 448,621 53 DG Khan Cement
Co. Ltd. 90,500 47 Kot Addu Power Co.
Ltd. 217,493 36 SUI Northern Gas
Pipeline 129,900 30* National Bank of
Pakistan 129,500 26
2,970Philippines (0.1%) SM Investments
Corp. 222,908 4,269 SM Prime Holdings
Inc. 3,811,550 2,507 Ayala Land Inc. 3,523,200 2,454 Ayala Corp. 141,365 2,422 Bdo Unibank Inc. 793,074 1,952 International
Container TerminalServices Inc. 450,370 1,608
JG Summit HoldingsInc. 1,296,763 1,549
PLDT Inc. 40,800 1,333 Bank of The
Philippine Islands 724,950 1,251 Jollibee Foods Corp. 207,330 968 Universal Robina
Corp. 344,140 944 Globe Telecom Inc. 12,750 757
Shares
MarketValue•
($000)
Metropolitan Bank &Trust Co. 687,669 650
AC Energy Corp. 2,586,100 630 Manila Electric Co. 100,695 574 GT Capital Holdings
Inc. 48,085 540 Security Bank Corp. 215,650 517 Wilcon Depot Inc. 747,100 462 San Miguel Corp. 198,800 460 Aboitiz Power Corp. 700,320 447* Converge
Information andCommunicationsTechnologySolutions Inc. 661,100 418
San Miguel Foodand Beverage Inc. 271,770 409
Metro PacificInvestments Corp. 5,426,300 404
Puregold Price ClubInc. 360,980 302
Alliance GlobalGroup Inc. 1,458,100 301
Megaworld Corp. 4,417,900 269 Robinsons Retail
Holdings Inc. 211,970 262 Robinson's Land
Corp. 753,861 255 LT Group Inc. 1,264,300 252 DMCI Holdings Inc. 1,475,900 233 Filinvest Land Inc. 9,974,000 228* Manila Water Co.
Inc. 427,700 225 Century Pacific Food
Inc. 394,200 221 Semirara Mining &
Power Corp.Class A 367,836 190
Vista Land &Lifescapes Inc. 2,503,800 188
* Bloomberry ResortsCorp. 1,343,300 181
First Gen Corp. 286,238 171 Nickel Asia Corp. 1,574,100 171 D&L Industries Inc. 751,700 126* Cebu Air Inc. 45,640 40*,3 CEMEX Holdings
Philippines Inc. 1,282,312 32
31,172Poland (0.1%)* Powszechna Kasa
OszczednosciBank Polski SA 366,546 4,488
Polski KoncernNaftowy ORLENSA 133,349 2,876
Powszechny ZakladUbezpieczen SA 241,507 2,416
KGHM Polska MiedzSA 61,510 2,365
Bank Polska KasaOpieki SA 62,283 2,058
LPP SA 531 1,910*,3 Allegro.eu SA 166,398 1,884*,3 Dino Polska SA 20,520 1,8342 CD Projekt SA 26,707 1,166
Total World Stock Index Fund
80
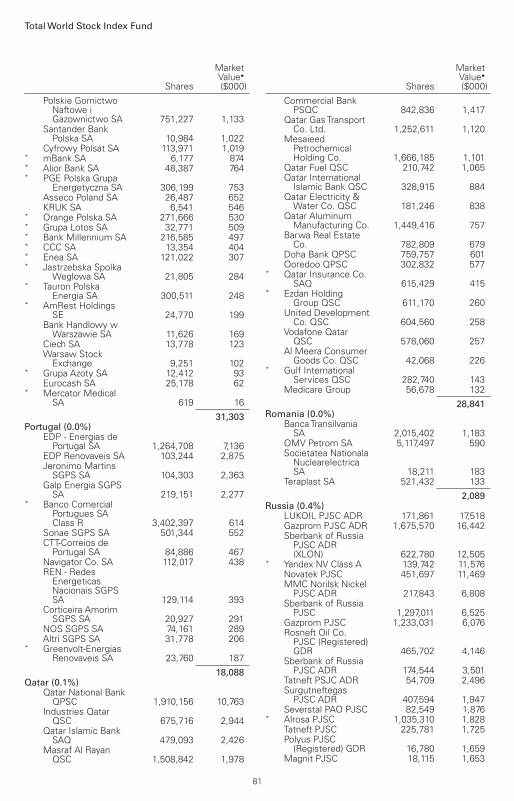
Shares
MarketValue•
($000)
Polskie GornictwoNaftowe iGazownictwo SA 751,227 1,133
Santander BankPolska SA 10,984 1,022
Cyfrowy Polsat SA 113,971 1,019* mBank SA 6,177 874* Alior Bank SA 48,387 764* PGE Polska Grupa
Energetyczna SA 306,199 753 Asseco Poland SA 26,487 652 KRUK SA 6,541 546* Orange Polska SA 271,666 530* Grupa Lotos SA 32,771 509* Bank Millennium SA 216,585 497* CCC SA 13,354 404* Enea SA 121,022 307* Jastrzebska Spolka
Weglowa SA 21,805 284* Tauron Polska
Energia SA 300,511 248* AmRest Holdings
SE 24,770 199 Bank Handlowy w
Warszawie SA 11,626 169 Ciech SA 13,778 123 Warsaw Stock
Exchange 9,251 102* Grupa Azoty SA 12,412 93 Eurocash SA 25,178 62* Mercator Medical
SA 619 16
31,303Portugal (0.0%) EDP - Energias de
Portugal SA 1,264,708 7,136 EDP Renovaveis SA 103,244 2,875 Jeronimo Martins
SGPS SA 104,303 2,363 Galp Energia SGPS
SA 219,151 2,277* Banco Comercial
Portugues SAClass R 3,402,397 614
Sonae SGPS SA 501,344 552 CTT-Correios de
Portugal SA 84,886 467 Navigator Co. SA 112,017 438 REN - Redes
EnergeticasNacionais SGPSSA 129,114 393
Corticeira AmorimSGPS SA 20,927 291
NOS SGPS SA 74,161 289 Altri SGPS SA 31,778 206* Greenvolt-Energias
Renovaveis SA 23,760 187
18,088Qatar (0.1%) Qatar National Bank
QPSC 1,910,156 10,763 Industries Qatar
QSC 675,716 2,944 Qatar Islamic Bank
SAQ 479,093 2,426 Masraf Al Rayan
QSC 1,508,842 1,978
Shares
MarketValue•
($000)
Commercial BankPSQC 842,836 1,417
Qatar Gas TransportCo. Ltd. 1,252,611 1,120
MesaieedPetrochemicalHolding Co. 1,666,185 1,101
Qatar Fuel QSC 210,742 1,065 Qatar International
Islamic Bank QSC 328,915 884 Qatar Electricity &
Water Co. QSC 181,246 838 Qatar Aluminum
Manufacturing Co. 1,449,416 757 Barwa Real Estate
Co. 782,809 679 Doha Bank QPSC 759,757 601 Ooredoo QPSC 302,832 577* Qatar Insurance Co.
SAQ 615,429 415* Ezdan Holding
Group QSC 611,170 260 United Development
Co. QSC 604,560 258 Vodafone Qatar
QSC 578,060 257 Al Meera Consumer
Goods Co. QSC 42,068 226* Gulf International
Services QSC 282,740 143 Medicare Group 56,678 132
28,841Romania (0.0%) Banca Transilvania
SA 2,015,402 1,183 OMV Petrom SA 5,117,497 590 Societatea Nationala
NuclearelectricaSA 18,211 183
Teraplast SA 521,432 133
2,089Russia (0.4%) LUKOIL PJSC ADR 171,861 17,518 Gazprom PJSC ADR 1,675,570 16,442 Sberbank of Russia
PJSC ADR(XLON) 622,780 12,505
* Yandex NV Class A 139,742 11,576 Novatek PJSC 451,697 11,469 MMC Norilsk Nickel
PJSC ADR 217,843 6,808 Sberbank of Russia
PJSC 1,297,011 6,525 Gazprom PJSC 1,233,031 6,076 Rosneft Oil Co.
PJSC (Registered)GDR 465,702 4,146
Sberbank of RussiaPJSC ADR 174,544 3,501
Tatneft PSJC ADR 54,709 2,496 Surgutneftegas
PJSC ADR 407,594 1,947 Severstal PAO PJSC 82,549 1,876* Alrosa PJSC 1,035,310 1,828 Tatneft PJSC 225,781 1,725 Polyus PJSC
(Registered) GDR 16,780 1,659 Magnit PJSC 18,115 1,653
Total World Stock Index Fund
81

Shares
MarketValue•
($000)
SurgutneftegasPJSC PreferenceShares 3,000,000 1,634
* NovolipetskiyMetallurgicheskiyKombinat PJSC 493,984 1,559
Mobile TeleSystemsPJSC 325,942 1,428
Transneft PJSCPreference Shares 665 1,427
* Moscow ExchangeMICEX-RTS PJSC 554,605 1,361
* Tatneft PJSCPreference Shares 197,444 1,359
Magnit PJSC GDR(Registered) 55,799 1,034
* United Co. RusalInternational 1,001,888 1,018
* Inter Rao Ues PJSC 13,477,172 914 PhosAgro PJSC
GDR (Registered) 33,457 800 VTB Bank PJSC
GDR (Registered) 544,162 791* Magnitogorsk Iron &
Steel Works PJSC 837,541 783 VTB Bank PJSC 1,007,092,403 752* Polyus PJSC 3,037 602* RusHydro PJSC 48,994,242 562 Rostelecom PJSC 423,403 557* Credit Bank of
Moscow PJSC 5,047,800 5093 Detsky Mir PJSC 260,150 503* Aeroflot PJSC 460,151 446 Sistema PJSFC 969,800 369 Sistema PJSFC
GDR (Registered) 38,526 292 Raspadskaya OJSC 42,160 257* Federal Grid Co. 97,070,000 254 Novorossiysk
Commercial SeaPort PJSC 2,266,500 248
Samolet Group 3,481 241* Mechel PJSC 111,128 229 ROSSETI PJSC 10,882,193 214 PhosAgro PJSC 2,689 213 Sovcomflot PJSC 170,280 205 Mechel PJSC
Preference Shares 45,248 189 Unipro PJSC 4,599,900 177 TGC-1 PJSC 1,082,800,000 170 Rosseti Lenenergo
PJSC PreferenceShares 65,770 163
IDGC of Centre andVolga RegionPJSC 41,250,000 155
* OGK-2 PJSC 12,702,000 126* ENEL RUSSIA PJSC 10,241,000 124 Novatek PJSC GDR
(Registered) 441 112 Bank St. Petersburg
PJSC 83,530 107* M Video PJSC 12,400 103* Mosenergo PJSC 3,183,467 101 LSR Group PJSC
Class A 8,952 94 Bashneft PJSC
Preference Shares 5,732 93
Shares
MarketValue•
($000)
Mobile TeleSystemsPJSC ADR 8,900 82
SurgutneftegasPJSC ADR(XLON) 8,300 40
Rosneft Oil Co.PJSC 3,288 30
132,177Saudi Arabia (0.4%) Al Rajhi Bank 536,930 19,863 Saudi National Bank 959,594 16,8453 Saudi Arabian Oil
Co. 1,086,692 10,940 Saudi Basic
Industries Corp. 291,771 10,056 Saudi Telecom Co. 207,711 6,489 Riyad Bank 522,322 4,112* Saudi Arabian
Mining Co. 180,460 3,935 SABIC
Agri-Nutrients Co. 79,945 3,508 Saudi British Bank 378,353 3,344 Alinma Bank 446,737 2,999 Banque Saudi Fransi 254,965 2,870 Saudi Electricity Co. 336,962 2,563* Bank AlBilad 179,209 2,019 Sahara International
Petrochemical Co. 160,814 1,888 Yanbu National
Petrochemical Co. 92,054 1,870* Saudi Kayan
Petrochemical Co. 313,774 1,708 Arab National Bank 276,082 1,696 Dr Sulaiman Al
Habib MedicalServices GroupCo. 37,275 1,649
Almarai Co. JSC 108,153 1,525 Jarir Marketing Co. 25,253 1,366 Etihad Etisalat Co. 163,627 1,319 Savola Group 111,497 1,088* National
IndustrializationCo. 157,180 1,046
Saudi IndustrialInvestment Group 98,557 996
Bupa Arabia forCooperativeInsurance Co. 25,333 978
Bank Al-Jazira 176,581 905 Mouwasat Medical
Services Co. 18,693 899 Advanced
Petrochemical Co. 44,920 893* Rabigh Refining &
Petrochemical Co. 101,861 777* Emaar Economic
City 207,358 701 National
Petrochemical Co. 54,527 701 Co. for Cooperative
Insurance 30,507 700* Dar Al Arkan Real
EstateDevelopment Co. 265,100 700
* International Co. ForWater & PowerProjects 31,841 606
Total World Stock Index Fund
82

Shares
MarketValue•
($000)
Abdullah Al OthaimMarkets Co. 19,519 602
* Saudi Research &Media Group 12,762 575
* MobileTelecommunicationsCo. Saudi Arabia 155,229 562
Saudi Cement Co. 32,253 510 Leejam Sports Co.
JSC 16,538 501* Arabian Internet &
CommunicationsServices Co. 9,355 497
Southern ProvinceCement Co. 25,833 493
Qassim Cement Co. 20,322 442 United Electronics
Co. 11,629 437* Saudi Ground
Services Co. 43,312 430* Methanol Chemicals
Co. 43,219 410 Arabian Centres Co.
Ltd. 57,433 391 Dallah Healthcare
Co. 18,853 365* Saudi Airlines
Catering Co. 14,408 365* Seera Group
Holding 52,491 324 BinDawood Holding
Co. 11,626 323 Jadwa REIT Saudi
Fund 82,391 321 Yanbu Cement Co. 28,786 294 Saudia Dairy &
Foodstuff Co. 6,214 272* Yamama Cement
Co. 36,625 271 Saudi
PharmaceuticalIndustries &MedicalAppliances Corp. 23,425 268
Aldrees Petroleumand TransportServices Co. 13,242 261
United InternationalTransportation Co. 18,517 248
ArriyadhDevelopment Co. 34,439 244
Al Hammadi Co. forDevelopment andInvestment 21,585 244
* Saudi Real EstateCo. 40,611 242
Arabian Cement Co. 23,203 241* National Agriculture
Development Co. 24,421 231 National Gas &
IndustrializationCo. 13,286 209
Saudi Ceramic Co. 12,356 179 Eastern Province
Cement Co. 13,957 178* Aseer Trading
Tourism &Manufacturing Co. 28,158 171
Shares
MarketValue•
($000)* Zamil Industrial
Investment Co. 17,264 163 Astra Industrial
Group 13,957 161 Saudi Chemical Co.
Holding 14,736 149* Saudi Public
Transport Co. 22,688 146 Najran Cement Co. 28,468 143* Middle East
Healthcare Co. 13,925 138 City Cement Co. 21,222 137* Fawaz Abdulaziz Al
Hokair & Co. 25,790 132* Dur Hospitality Co. 13,720 131 National Medical
Care Co. 7,877 128 Herfy Food Services
Co. 7,093 124 Hail Cement Co. 29,572 117* Mediterranean &
Gulf Insurance &Reinsurance Co. 17,756 110
* Al Jouf Cement Co. 34,234 110 Northern Region
Cement Co. 26,787 106 Bawan Co. 9,330 99* Tabuk Cement Co. 19,317 98* Abdul Mohsen
Al-Hokair Tourismand DevelopmentCo. 11,319 67
126,914Singapore (0.3%) DBS Group Holdings
Ltd. 787,878 18,411 Oversea-Chinese
Banking Corp.Ltd. 1,536,838 13,435
United OverseasBank Ltd. 571,500 11,360
SingaporeTelecommunicationsLtd. 3,397,500 6,303
Ascendas REIT 1,623,313 3,718 CapitaLand
IntegratedCommercial Trust 2,048,517 3,262
* CapitalandInvestment Ltd. 1,206,200 3,077
Wilmar InternationalLtd. 911,437 2,914
Singapore ExchangeLtd. 354,610 2,545
Keppel Corp. Ltd. 617,613 2,465* Singapore Airlines
Ltd. 548,636 2,113 Singapore
TechnologiesEngineering Ltd. 658,100 1,869
Mapletree LogisticsTrust 1,188,347 1,782
Venture Corp. Ltd. 113,700 1,588 Mapletree Industrial
Trust 739,892 1,510 Mapletree
Commercial Trust 931,759 1,507 Genting Singapore
Ltd. 2,502,000 1,447
Total World Stock Index Fund
83

Shares
MarketValue•
($000)
Frasers Logistics &Commercial Trust 1,219,776 1,374
UOL Group Ltd. 214,355 1,150 City Developments
Ltd. 192,000 1,0421 Singapore Press
Holdings Ltd. 677,400 1,003 NetLink NBN Trust 1,286,100 972 Suntec REIT 868,500 962 Keppel DC REIT 539,088 955 ComfortDelGro
Corp. Ltd. 771,700 894 Frasers Centrepoint
Trust 487,852 872 Keppel REIT 910,388 762* SATS Ltd. 242,700 755 Mapletree North
Asia CommercialTrust 984,300 746
Parkway Life REIT 194,186 672 Keppel
InfrastructureTrust 1,605,235 631
SembcorpIndustries Ltd. 421,231 629
* GoldenAgri-ResourcesLtd. 3,153,719 619
Jardine Cycle &Carriage Ltd. 34,888 583
Manulife US REIT 783,584 558 Ascott Residence
Trust 717,763 549 CapitaLand China
Trust 599,068 543* Sembcorp Marine
Ltd. 9,222,742 541 ARA LOGOS
Logistics Trust 783,072 523 Cromwell European
REIT 166,820 509 Haw Par Corp. Ltd. 51,000 477 ESR-REIT 1,268,372 452 CDL Hospitality
Trusts 483,688 430 Hutchison Port
Holdings TrustClass U 1,973,600 425
iFAST Corp. Ltd. 64,500 415 Lendlease Global
Commercial REIT 636,600 413 OUE Commercial
REIT 1,210,175 403 AIMS APAC REIT 370,400 396 Keppel Pacific Oak
US REIT 462,700 368 Ascendas India Trust 349,600 361 StarHub Ltd. 384,200 353 Raffles Medical
Group Ltd. 343,000 349 Wing Tai Holdings
Ltd. 236,700 341 Prime US REIT 383,400 331 Olam International
Ltd. 248,000 313 Starhill Global REIT 647,200 3101 SPH REIT 411,500 298 First Resources Ltd. 192,400 254 Singapore Post Ltd. 499,000 243
Shares
MarketValue•
($000)
Frasers HospitalityTrust 675,900 241
Far East HospitalityTrust 472,400 226
AEM Holdings Ltd. 69,700 217 Nanofilm
TechnologiesInternational Ltd. 74,400 209
Asian Pay TelevisionTrust 2,082,700 208
First REIT 1,043,136 205* Thomson Medical
Group Ltd. 3,104,800 196 Sabana Industrial
REIT 589,600 190 Sheng Siong Group
Ltd. 168,000 177* SIA Engineering Co.
Ltd. 98,500 159 Riverstone Holdings
Ltd. 211,900 135*,1 Best World
International Ltd. 90,400 87 Lippo Malls
Indonesia RetailTrust 2,006,940 83
* COSCO ShippingInternationalSingapore Co.Ltd. 379,700 77
Bumitama Agri Ltd. 133,200 54 Silverlake Axis Ltd. 177,499 42*,1 Eagle Hospitality
Trust 242,300 33* Yoma Strategic
Holdings Ltd. 310,430 32*,1,2 Hyflux Ltd. 54,000 8*,1,2 Ezra Holdings Ltd. 344,056 3*,2 Ezion Holdings Ltd.
Warrants Exp.4/16/23 267,303 —
106,664South Africa (0.4%) Naspers Ltd.
Class N 92,757 15,709 FirstRand Ltd. 2,165,634 8,227* MTN Group Ltd. 792,434 7,106 Standard Bank
Group Ltd. 568,894 5,041 Impala Platinum
Holdings Ltd. 359,392 4,651 Sibanye Stillwater
Ltd. 1,277,981 4,473* Sasol Ltd. 239,148 4,017 Capitec Bank
Holdings Ltd. 35,680 3,986 Gold Fields Ltd. 376,841 3,502 Anglogold Ltd. 182,596 3,369 Bid Corp. Ltd. 155,905 3,342 Sanlam Ltd. 735,447 3,021 Absa Group Ltd. 297,336 2,720 Anglo American
Platinum Ltd. 25,974 2,632 Aspen Pharmacare
Holdings Ltd. 161,049 2,559 Shoprite Holdings
Ltd. 199,196 2,364 Vodacom Group Ltd. 246,942 2,187
Total World Stock Index Fund
84

Shares
MarketValue•
($000)* Northam Platinum
Holdings Ltd. 142,320 2,131 Clicks Group Ltd. 106,079 1,940 Remgro Ltd. 214,451 1,8912 Bidvest Group Ltd. 135,508 1,6972 Nedbank Group Ltd. 144,067 1,642* Discovery Ltd. 171,979 1,578 Multichoice Group 182,255 1,449 Old Mutual Ltd. 1,455,121 1,433 Mr Price Group Ltd. 109,200 1,425 Woolworths
Holdings Ltd. 365,356 1,286*,3 Pepkor Holdings
Ltd. 732,019 1,154 Exxaro Resources
Ltd. 103,952 1,140 Growthpoint
Properties Ltd. 1,347,441 1,140* Foschini Group Ltd. 133,350 1,131 Reinet Investments
SCA 57,967 1,048 SPAR Group Ltd. 81,505 1,041* Life Healthcare
Group HoldingsLtd. 593,021 939
2 Rand MerchantInvestmentHoldings Ltd. 338,927 907
Tiger Brands Ltd. 70,711 895 Harmony Gold
Mining Co. Ltd. 240,653 8642 AVI Ltd. 162,265 841 Kumba Iron Ore Ltd. 24,844 756* Sappi Ltd. 241,481 742 Barloworld Ltd. 84,217 707 Transaction Capital
Ltd. 242,799 700* Netcare Ltd. 614,660 680 Investec Ltd. 141,786 653* Redefine Properties
Ltd. 2,117,381 624 African Rainbow
Minerals Ltd. 45,583 609 Royal Bafokeng
Platinum Ltd. 82,003 587 Resilient REIT Ltd. 157,411 576 Truworths
International Ltd. 159,305 562 Momentum
MetropolitanHoldings 418,340 537
Old Mutual Ltd.(XZIM) 523,563 535
Pick n Pay StoresLtd. 129,465 504
Motus Holdings Ltd. 74,778 499 Ninety One plc 130,807 464 Super Group Ltd. 216,350 453 PSG Group Ltd. 81,823 410* Distell Group
Holdings Ltd. 33,656 403 Equites Property
Fund Ltd. 298,746 398* Telkom SA SOC Ltd. 117,167 390 Fortress REIT Ltd.
Class A 432,641 377 KAP Industrial
Holdings Ltd. 1,215,044 374
Shares
MarketValue•
($000)
Hyprop InvestmentsLtd. 188,081 365
Ninety One Ltd. 98,139 339 AECI Ltd. 45,345 337 Advtech Ltd. 263,200 331 Coronation Fund
Managers Ltd. 98,576 3283 Dis-chem
Pharmacies Ltd. 145,496 304 Omnia Holdings Ltd. 66,723 276 Irongate Group 225,316 275 Imperial Logistics
Ltd. 64,353 263* Steinhoff
InternationalHoldings NV 1,654,648 261
Santam Ltd. 14,925 248 Cashbuild Ltd. 13,879 242 Vukile Property Fund
Ltd. 300,173 239* Liberty Holdings
Ltd. 40,336 238* Thungela Resources
Ltd. 49,847 237 JSE Ltd. 33,129 232* Tsogo Sun Gaming
Ltd. 262,465 212 Reunert Ltd. 59,789 197 MAS Real Estate
Inc. 167,179 197* Curro Holdings Ltd. 243,183 196*,2 Bytes Technology
Group plc 26,808 195 SA Corporate Real
Estate Ltd. 1,346,692 188* DataTec Ltd. 67,595 184 Astral Foods Ltd. 15,486 179* Famous Brands Ltd. 36,851 178* Blue Label Telecoms
Ltd. 432,314 157 Wilson Bayly
Holmes-OvconLtd. 22,336 155
* EPP NV 168,559 132 Investec Property
Fund Ltd. 188,893 131* Massmart Holdings
Ltd. 31,813 130 DRDGOLD Ltd. 138,281 123* Attacq Ltd. 287,506 123* Sun International
Ltd. 57,248 120 Raubex Group Ltd. 55,550 119*,2 Brait plc 387,075 108* Long4Life Ltd. 272,592 107 Hudaco Industries
Ltd. 11,423 1032 Adcock Ingram
Holdings Ltd. 28,993 93* Hosken
ConsolidatedInvestments Ltd. 19,068 90
Emira Property FundLtd. 143,141 88
Zeder InvestmentsLtd. 396,625 82
* Fortress REIT Ltd.Class B 440,214 71
Altron Ltd. Class A 71,488 51
Total World Stock Index Fund
85

Shares
MarketValue•
($000)
Alexander ForbesGroup HoldingsLtd. 171,753 49
* SteinhoffInternationalHoldings NV(XETR) 19,964 3
127,294South Korea (1.5%) Samsung
Electronics Co.Ltd. 1,106,581 66,254
SamsungElectronics Co.Ltd. GDR(Registered) 35,714 53,476
SamsungElectronics Co.Ltd. PreferenceShares 422,123 23,190
NAVER Corp. 58,142 20,215 SK Hynix Inc. 227,442 20,049 Samsung SDI Co.
Ltd. 23,251 14,670 LG Chem Ltd. 19,255 13,817 Kakao Corp. 116,909 12,578 Hyundai Motor Co. 53,387 9,549 Kia Corp. 109,292 7,975* Celltrion Inc. 45,293 7,798 POSCO 27,942 7,087 Shinhan Financial
Group Co. Ltd. 205,629 6,713 KB Financial Group
Inc. 122,699 5,939 Hyundai Mobis Co.
Ltd. 27,274 5,896* SK Innovation Co.
Ltd. 23,667 4,936 Hana Financial
Group Inc. 123,274 4,753 LG Electronics Inc. 44,336 4,587*,3 Samsung Biologics
Co. Ltd. 5,627 4,192 NCSoft Corp. 7,332 3,940 Samsung C&T Corp. 35,747 3,500*,2 HMM Co. Ltd. 149,832 3,428 LG Household &
Health Care Ltd. 3,292 3,295 Samsung
Electro-MechanicsCo. Ltd. 23,853 3,248
KT&G Corp. 46,535 3,232 Samsung Fire &
Marine InsuranceCo. Ltd. 14,615 2,897
SK Inc. 13,560 2,830 LG Corp. 35,301 2,760* Doosan Heavy
Industries &Construction Co.Ltd. 129,595 2,711
Woori FinancialGroup Inc. 221,806 2,522
Hyundai Motor Co.Preference Shares(XKRS) 28,230 2,372
* HYBE Co. Ltd. 7,763 2,230 Korea Electric Power
Corp. 112,986 2,189
Shares
MarketValue•
($000)
KB Financial GroupInc. ADR 44,662 2,147
* Celltrion HealthcareCo. Ltd. 30,461 2,118
* Korean Air Lines Co.Ltd. 78,029 2,034
Amorepacific Corp. 12,098 1,883 Korea Zinc Co. Ltd. 3,988 1,8361 SK Telecom Co. Ltd. 6,894 1,825 LG Chem Ltd.
Preference Shares 5,158 1,694 Samsung SDS Co.
Ltd. 12,876 1,692* SK Bioscience Co.
Ltd. 8,526 1,674 Coway Co. Ltd. 22,820 1,547* Korea Shipbuilding
& OffshoreEngineering Co.Ltd. 17,483 1,546
L&F Co. Ltd. 9,750 1,544 Korea Investment
Holdings Co. Ltd. 20,272 1,516 Samsung Life
Insurance Co. Ltd. 26,035 1,506*,2 LG Display Co. Ltd. 88,734 1,500 S-Oil Corp. 16,953 1,483* Samsung
Engineering Co.Ltd. 69,484 1,478
POSCO ChemicalCo. Ltd. 11,472 1,431
* HLB Inc. 39,141 1,410* Hanwha Solutions
Corp. 39,566 1,388* Samsung Heavy
Industries Co. Ltd. 250,017 1,366 Ecopro BM Co. Ltd. 3,777 1,328 E-MART Inc. 9,011 1,297*,2 Pearl Abyss Corp. 14,167 1,261 Lotte Chemical
Corp. 6,537 1,257 Hyundai Steel Co. 32,123 1,228 Hyundai Engineering
& ConstructionCo. Ltd. 28,152 1,217
2 Wemade Co. Ltd. 7,558 1,183 Hyundai Heavy
IndustriesHoldings Co. Ltd. 21,658 1,174
SKC Co. Ltd. 7,573 1,164 Hyundai Motor Co.
Preference Shares 13,794 1,154 Hyundai Glovis Co.
Ltd. 7,893 1,137 Samsung Securities
Co. Ltd. 27,844 1,132 BNK Financial Group
Inc. 143,194 1,080 LG Uplus Corp. 87,571 1,078 DB Insurance Co.
Ltd. 20,948 1,065* F&F Co. Ltd. 1,421 1,061 Orion Corp.Republic
of Korea 10,485 1,060 Hansol Chemical
Co. Ltd. 3,728 1,052
Total World Stock Index Fund
86

Shares
MarketValue•
($000)
KumhoPetrochemical Co.Ltd. 7,048 1,037
LG Innotek Co. Ltd. 5,762 1,036 Mirae Asset
Securities Co. Ltd. 137,024 1,022 Hankook Tire &
Technology Co.Ltd. 28,708 1,017
SK Chemicals Co.Ltd. 6,442 995
CJ CheilJedangCorp. 3,058 994
Industrial Bank ofKorea 104,598 990
Hotel Shilla Co. Ltd. 13,169 986 LG Household &
Health Care Ltd.Preference Shares 1,891 971
* Kangwon Land Inc. 40,256 958 Yuhan Corp. 18,341 941* OCI Co. Ltd. 8,245 913 GS Holdings Corp. 24,674 894*,2 Kakao Games Corp. 12,630 863* SK
BiopharmaceuticalsCo. Ltd. 10,396 842
GS Engineering &ConstructionCorp. 23,655 839
* Alteogen Inc. 13,858 830 Hanmi Pharm Co.
Ltd. 3,528 7972 Fila Holdings Corp. 23,974 764* Hyosung Advanced
Materials Corp. 1,234 754* Mando Corp. 13,900 746 Hanon Systems 59,869 742* Celltrion Pharm Inc. 7,542 735 DGB Financial
Group Inc. 82,047 727 Korea Aerospace
Industries Ltd. 27,174 714 DB HiTek Co. Ltd. 14,391 711* DL E&C Co. Ltd. 6,049 700 CJ ENM Co. Ltd. 4,558 689 LOTTE Fine
Chemical Co. Ltd. 9,334 6813 Netmarble Corp. 6,365 674 Kolon Industries Inc. 8,682 664 SK Telecom Co. Ltd.
ADR 22,202 644 LG Electronics Inc.
Preference Shares 11,659 6422 Hyosung TNC Corp. 1,231 633 Meritz Fire & Marine
Insurance Co. Ltd. 26,368 6272 Seegene Inc. 13,628 623 Green Cross Corp. 2,623 617 Shin Poong
PharmaceuticalCo. Ltd. 13,856 617
S-1 Corp. 8,589 612* SM Entertainment
Co. Ltd. 9,086 612 JB Financial Group
Co. Ltd. 80,396 611 Iljin Materials Co.
Ltd. 6,986 604
Shares
MarketValue•
($000)
NH Investment &Securities Co. Ltd. 52,609 594
AfreecaTV Co. Ltd. 3,587 594 Hanwha Aerospace
Co. Ltd. 15,336 5922 Shinsegae Inc. 2,676 569 SK Materials Co.
Ltd. 1,729 566* Eubiologics Co. Ltd. 13,248 543* NHN Corp. 7,912 542* CJ Logistics Corp. 4,399 535* Hyundai Rotem Co.
Ltd. 27,399 531 KIWOOM Securities
Co. Ltd. 5,821 525 Cheil Worldwide Inc. 25,636 524 AMOREPACIFIC
Group 12,187 519 Amorepacific Corp.
Preference Shares 8,349 514 Hanwha Corp. 17,659 508* Hyundai Mipo
Dockyard Co. Ltd. 7,746 504 LEENO Industrial
Inc. 3,432 503 Douzone Bizon Co.
Ltd. 7,122 4972 Ecopro Co. Ltd. 5,750 494* YG Entertainment
Inc. 8,173 493* Doosan Fuel Cell
Co. Ltd. 10,909 490 JYP Entertainment
Corp. 10,605 477 Samsung Card Co.
Ltd. 16,192 475 Hyundai Marine &
Fire Insurance Co.Ltd. 20,905 470
KCC Corp. 1,634 467 Daishin Securities
Co. Ltd. 26,048 4652 WONIK IPS Co. Ltd. 13,396 4652 CS Wind Corp. 7,652 457 Daejoo Electronic
Materials Co. Ltd. 5,071 456 Youngone Corp. 11,886 455 Meritz Securities
Co. Ltd. 113,662 454 GS Retail Co. Ltd. 16,224 448 Posco International
Corp. 23,993 447 Innocean Worldwide
Inc. 8,753 441 Hyundai
Department StoreCo. Ltd. 6,181 439
* Ecopro HN Co. Ltd. 4,704 438 Hyundai Wia Corp. 5,852 423 Osstem Implant Co.
Ltd. 3,945 418 Hyundai Elevator
Co. Ltd. 10,016 416 Shinhan Financial
Group Co. Ltd.ADR 12,816 414
* Naturecell Co. Ltd. 23,800 404* CosmoAM&T Co.
Ltd. 11,149 403
Total World Stock Index Fund
87
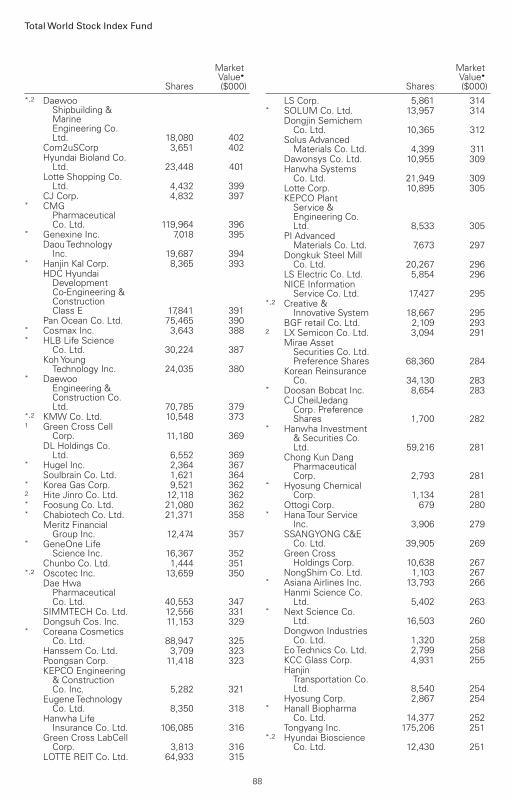
Shares
MarketValue•
($000)*,2 Daewoo
Shipbuilding &MarineEngineering Co.Ltd. 18,080 402
Com2uSCorp 3,651 402 Hyundai Bioland Co.
Ltd. 23,448 401 Lotte Shopping Co.
Ltd. 4,432 399 CJ Corp. 4,832 397* CMG
PharmaceuticalCo. Ltd. 119,964 396
* Genexine Inc. 7,018 395 Daou Technology
Inc. 19,687 394* Hanjin Kal Corp. 8,365 393 HDC Hyundai
DevelopmentCo-Engineering &ConstructionClass E 17,841 391
Pan Ocean Co. Ltd. 75,465 390* Cosmax Inc. 3,643 388* HLB Life Science
Co. Ltd. 30,224 387 Koh Young
Technology Inc. 24,035 380* Daewoo
Engineering &Construction Co.Ltd. 70,785 379
*,2 KMW Co. Ltd. 10,548 3731 Green Cross Cell
Corp. 11,180 369 DL Holdings Co.
Ltd. 6,552 369* Hugel Inc. 2,364 367 Soulbrain Co. Ltd. 1,621 364* Korea Gas Corp. 9,521 3622 Hite Jinro Co. Ltd. 12,118 362* Foosung Co. Ltd. 21,080 362* Chabiotech Co. Ltd. 21,371 358 Meritz Financial
Group Inc. 12,474 357* GeneOne Life
Science Inc. 16,367 352 Chunbo Co. Ltd. 1,444 351*,2 Oscotec Inc. 13,659 350 Dae Hwa
PharmaceuticalCo. Ltd. 40,553 347
SIMMTECH Co. Ltd. 12,556 331 Dongsuh Cos. Inc. 11,153 329* Coreana Cosmetics
Co. Ltd. 88,947 325 Hanssem Co. Ltd. 3,709 323 Poongsan Corp. 11,418 323 KEPCO Engineering
& ConstructionCo. Inc. 5,282 321
Eugene TechnologyCo. Ltd. 8,350 318
Hanwha LifeInsurance Co. Ltd. 106,085 316
Green Cross LabCellCorp. 3,813 316
LOTTE REIT Co. Ltd. 64,933 315
Shares
MarketValue•
($000)
LS Corp. 5,861 314* SOLUM Co. Ltd. 13,957 314 Dongjin Semichem
Co. Ltd. 10,365 312 Solus Advanced
Materials Co. Ltd. 4,399 311 Dawonsys Co. Ltd. 10,955 309 Hanwha Systems
Co. Ltd. 21,949 309 Lotte Corp. 10,895 305 KEPCO Plant
Service &Engineering Co.Ltd. 8,533 305
PI AdvancedMaterials Co. Ltd. 7,673 297
Dongkuk Steel MillCo. Ltd. 20,267 296
LS Electric Co. Ltd. 5,854 296 NICE Information
Service Co. Ltd. 17,427 295*,2 Creative &
Innovative System 18,667 295 BGF retail Co. Ltd. 2,109 2932 LX Semicon Co. Ltd. 3,094 291 Mirae Asset
Securities Co. Ltd.Preference Shares 68,360 284
Korean ReinsuranceCo. 34,130 283
* Doosan Bobcat Inc. 8,654 283 CJ CheilJedang
Corp. PreferenceShares 1,700 282
* Hanwha Investment& Securities Co.Ltd. 59,216 281
Chong Kun DangPharmaceuticalCorp. 2,793 281
* Hyosung ChemicalCorp. 1,134 281
Ottogi Corp. 679 280* Hana Tour Service
Inc. 3,906 279 SSANGYONG C&E
Co. Ltd. 39,905 269 Green Cross
Holdings Corp. 10,638 267 NongShim Co. Ltd. 1,103 267* Asiana Airlines Inc. 13,793 266 Hanmi Science Co.
Ltd. 5,402 263* Next Science Co.
Ltd. 16,503 260 Dongwon Industries
Co. Ltd. 1,320 258 Eo Technics Co. Ltd. 2,799 258 KCC Glass Corp. 4,931 255 Hanjin
Transportation Co.Ltd. 8,540 254
Hyosung Corp. 2,867 254* Hanall Biopharma
Co. Ltd. 14,377 252 Tongyang Inc. 175,206 251*,2 Hyundai Bioscience
Co. Ltd. 12,430 251
Total World Stock Index Fund
88

Shares
MarketValue•
($000)* Dongsung
PharmaceuticalCo. Ltd. 32,372 247
* KomipharmInternational Co.Ltd. 31,541 243
* Hanjin HeavyIndustries &Construction Co.Ltd. 29,691 243
* Humasis Co. Ltd. 17,514 242*,2 NKMax Co. Ltd. 10,750 241* Mezzion Pharma Co.
Ltd. 1,770 238*,2 Paradise Co. Ltd. 15,864 237* CrystalGenomics
Inc. 40,355 237 Hanmi
SemiconductorCo. Ltd. 8,606 237
* Insun ENT Co. Ltd. 22,663 235* ST Pharm Co. Ltd. 3,130 235*,2 Enzychem
Lifesciences Corp. 4,087 233 Kolmar Korea Co.
Ltd. 5,995 229* Kumho Tire Co. Inc. 50,020 229 Korea United Pharm
Inc. 5,473 229* CJ CGV Co. Ltd. 8,305 227*,2 LegoChem
Biosciences Inc. 5,864 226* Amicogen Inc. 8,149 226* DIO Corp. 6,970 225*,2 Telcon RF
PharmaceuticalInc. 76,974 224
* Helixmith Co. Ltd. 10,861 222 Seoul
SemiconductorCo. Ltd. 17,246 221
* NHN KCP Corp. 4,503 221* SFA Semicon Co.
Ltd. 40,560 220* Pharmicell Co. Ltd. 20,513 220 IS Dongseo Co. Ltd. 5,641 219 LIG Nex1 Co. Ltd. 5,464 219 SK Networks Co.
Ltd. 49,736 217 Daewoong
PharmaceuticalCo. Ltd. 1,793 215
Sebang GlobalBattery Co. Ltd. 3,049 214
SFA EngineeringCorp. 7,090 214
* MedPacto Inc. 4,422 214 MegaStudyEdu Co.
Ltd. 3,258 214 Samsung SDI Co.
Ltd. PreferenceShares 661 214
*,2 Taihan Electric WireCo. Ltd. 110,571 212
JR REIT XXVII 44,528 212* Gamevil Inc. 3,293 210* Vaxcell-Bio
Therapeutics Co.Ltd. 3,812 210
Shares
MarketValue•
($000)
Daewoong Co. Ltd. 7,674 208 PharmaResearch
Co. Ltd. 2,587 204 Korea Electric
Terminal Co. Ltd. 3,118 202 Zinus Inc. 3,009 202* Duk San Neolux Co.
Ltd. 4,300 200 ENF Technology Co.
Ltd. 8,056 200 Nature Holdings Co.
Ltd. 7,057 199*,2 Sam Chun Dang
Pharm Co. Ltd. 4,904 198* Medytox Inc. 1,544 198 Mcnex Co. Ltd. 5,314 198 Samyang Holdings
Corp. 2,219 196 GOLFZON Co. Ltd. 1,620 196* Solid Inc. 33,987 194 LX International
Corp. 8,296 193 Lotte Chilsung
Beverage Co. Ltd. 1,540 192 DoubleUGames Co.
Ltd. 3,487 192 Daeduck Electronics
Co. Ltd. 13,041 192* Cellivery
Therapeutics Inc. 4,476 192* iNtRON
Biotechnology Inc. 11,424 189 Handsome Co. Ltd. 5,208 188 SL Corp. 6,678 188* Seojin System Co.
Ltd. 6,324 187 Tokai Carbon Korea
Co. Ltd. 1,729 185 Hansol Holdings Co.
Ltd. 56,593 184 Korea Petrochemical
Ind Co. Ltd. 1,153 183* NEPES Corp. 6,078 183*,2 GemVax & Kael Co.
Ltd. 11,309 181 TES Co. Ltd. 7,554 173* Cellid Co. Ltd. 2,819 173 Daesang Corp. 8,390 172 Huchems Fine
Chemical Corp. 7,579 172 Taekwang Industrial
Co. Ltd. 199 170 ESR Kendall Square
REIT Co. Ltd. 28,902 169 Samwha Capacitor
Co. Ltd. 3,429 167* Lotte Tour
Development Co.Ltd. 9,679 167
* TY Holdings Co. Ltd. 7,169 167 Park Systems Corp. 1,631 166*,2 Hyundai Doosan
Infracore Co. Ltd. 18,387 165*,2 Ananti Inc. 14,330 163* Inscobee Inc. 57,676 162 Hyundai Autoever
Corp. 1,619 162
Total World Stock Index Fund
89

Shares
MarketValue•
($000)
DongKookPharmaceuticalCo. Ltd. 8,385 161
SK Discovery Co.Ltd. 3,913 160
* Korea Line Corp. 65,526 159* Innox Advanced
Materials Co. Ltd. 4,344 1582 BH Co. Ltd. 9,805 158 Hanwha Corp.
Preference Shares 10,942 154 RFHIC Corp. 5,703 154* UniTest Inc. 6,076 1542 Tesna Inc. 3,945 154* Eyegene Inc. 7,709 154* Eoflow Co. Ltd. 3,351 153* Hancom Inc. 8,867 152 Partron Co. Ltd. 18,924 152* Studio Dragon Corp. 2,043 151 Hankook & Co. Co.
Ltd. 10,472 150 Bukwang
PharmaceuticalCo. Ltd. 13,344 149
Yuanta SecuritiesKorea Co. Ltd. 38,496 149
* HyundaiConstructionEquipment Co.Ltd. 4,299 149
Hansae Co. Ltd. 7,440 148* Webzen Inc. 6,293 146* Hyundai Electric &
Energy SystemCo. Ltd. 7,710 146
BoryungPharmaceuticalCo. Ltd. 11,701 145
Ahnlab Inc. 2,032 143 Binggrae Co. Ltd. 2,977 142 Samsung Fire &
Marine InsuranceCo. Ltd.Preference Shares 936 142
* ABLBio Inc. 7,730 142 Korea Real Estate
Investment &Trust Co. Ltd. 69,006 138
Doosan Co. Ltd. 1,562 138 Hanil Cement Co.
Ltd. 8,300 137 Interpark Corp. 23,623 136 Hyundai Home
ShoppingNetwork Corp. 2,274 136
* KH Feelux Co. Ltd. 52,132 135* Yungjin
PharmaceuticalCo. Ltd. 33,594 135
iMarketKorea Inc. 14,356 135*,2 KH Vatec Co. Ltd. 6,489 134 SK Securities Co.
Ltd. 159,590 134 S&S Tech Corp. 4,240 134* Hyosung Heavy
Industries Corp. 2,279 132 SNT Motiv Co. Ltd. 3,039 131 Hyundai Greenfood
Co. Ltd. 15,539 129
Shares
MarketValue•
($000)
Young Poong Corp. 219 129 Dentium Co. Ltd. 2,128 126 Seobu T&D 16,847 126 i-SENS Inc. 4,404 126 Eusu Holdings Co.
Ltd. 24,450 125 LOTTE Himart Co.
Ltd. 5,257 125* Modetour Network
Inc. 5,632 125* Ace Technologies
Corp. 10,046 124 Daea TI Co. Ltd. 21,668 123*,2 Krafton Inc. 306 123*,2 G-treeBNT Co. Ltd. 8,690 122* LX Holdings Corp. 16,031 122 Mirae Asset Life
Insurance Co. Ltd. 33,189 121* Shinsung E&G Co.
Ltd. 59,891 121* Binex Co. Ltd. 8,291 118 HDC Holdings Co.
Ltd. 13,059 118 Ilyang
PharmaceuticalCo. Ltd. 4,628 118
* Vidente Co. Ltd. 9,421 117 LX Hausys Ltd. 1,962 117 Korea Asset In Trust
Co. Ltd. 31,050 117* OliX
PharmaceuticalsInc. 3,549 117
Hankook Shell OilCo. Ltd. 484 116
Posco ICT Co. Ltd. 20,195 116 Tongyang Life
Insurance Co. Ltd. 19,837 116 Orion Holdings
Corp. 8,252 113* Grand Korea Leisure
Co. Ltd. 8,051 113 Muhak Co. Ltd. 13,269 111 JW Pharmaceutical
Corp. 5,382 108 Dongwon F&B Co.
Ltd. 596 105 Halla Holdings Corp. 2,411 105 NICE Holdings Co.
Ltd. 7,180 104* Hanwha General
Insurance Co. Ltd. 26,925 104 Jeil Pharmaceutical
Co. Ltd. 3,563 104* Samsung
PharmaceuticalCo. Ltd. 20,527 103
2 ShinsegaeInternational Inc. 713 103
* Jusung EngineeringCo. Ltd. 10,459 101
Namhae ChemicalCorp. 8,782 101
Vieworks Co. Ltd. 2,977 101 Youngone Holdings
Co. Ltd. 2,479 100* Sangsangin Co. Ltd. 12,992 100 KTB Investment &
Securities Co. Ltd. 17,627 100
Total World Stock Index Fund
90

Shares
MarketValue•
($000)
Huons Co. Ltd. 2,303 100*,2 Kuk-il Paper
Manufacturing Co.Ltd. 26,987 99
L&C Bio Co. Ltd. 3,390 99 Dong-A Socio
Holdings Co. Ltd. 1,084 98* S-MAC Co. Ltd. 98,155 98 ITM Semiconductor
Co. Ltd. 2,429 97* Sambu Engineering
& ConstructionCo. Ltd. 54,342 97
* AprogenpharmaceuticalsInc. 108,181 95
Dong-A ST Co. Ltd. 1,528 95 Cuckoo Homesys
Co. Ltd. 2,535 95* Neowiz 4,212 95 Kolon Corp. 3,096 94* Medipost Co. Ltd. 4,816 94* Anterogen Co. Ltd. 1,829 92* Lutronic Corp. 5,622 91 SNT Dynamics Co.
Ltd. 11,365 90 Kwang Dong
PharmaceuticalCo. Ltd. 13,372 89
Samchully Co. Ltd. 1,099 89 Hansol Paper Co.
Ltd. 7,240 89 Taeyoung
Engineering &Construction Co.Ltd. 9,408 89
Huons Global Co.Ltd. 2,052 87
Aekyung IndustrialCo. Ltd. 4,557 87
KUMHOE&C Co.Ltd. 8,282 86
Samyang Corp. 1,434 84 Youlchon Chemical
Co. Ltd. 4,378 83* Cafe24 Corp. 3,358 83 HS Industries Co.
Ltd. 14,294 82 INTOPS Co. Ltd. 4,080 81 Advanced Process
Systems Corp. 3,991 81* Wonik Holdings Co.
Ltd. 17,538 78 Sungwoo Hitech Co.
Ltd. 15,099 78 Chongkundang
Holdings Corp. 1,116 78 LF Corp. 4,969 78 Kolmar Korea
Holdings Co. Ltd. 3,886 77 BGF Co. Ltd. 16,233 77 NS Shopping Co.
Ltd. 6,400 76* Hansol Technics Co.
Ltd. 12,925 75 LG HelloVision Co.
Ltd. 12,615 75 Harim Holdings Co.
Ltd. 8,995 75
Shares
MarketValue•
($000)
SK Gas Ltd. 627 74 Maeil Dairies Co.
Ltd. 1,225 74 KISWIRE Ltd. 3,035 72 OptoElectronics
Solutions Co. Ltd. 2,511 72 Dae Han Flour Mills
Co. Ltd. 505 71 Namyang Dairy
Products Co. Ltd. 180 71 Songwon Industrial
Co. Ltd. 4,340 67* AbClon Inc. 4,694 65 Hyundai Engineering
& ConstructionCo. Ltd.Preference Shares 478 65
* Eutilex Co. Ltd. 2,960 64 Seah Besteel Corp. 3,350 62 Nexen Tire Corp. 9,585 62*,2 Soulbrain Holdings
Co. Ltd. 1,658 62* SCM Lifescience
Co. Ltd. 3,386 58 Sung Kwang Bend
Co. Ltd. 7,218 57* CJ Freshway Corp. 2,037 57 Eugene Investment
& Securities Co.Ltd. 17,472 57
KISCO Corp. 7,103 55* STCUBE 7,603 54 Lotte Food Co. Ltd. 162 53 KC Tech Co. Ltd. 2,755 53 TK Corp. 5,206 52 DB Financial
Investment Co.Ltd. 8,526 52
Toptec Co. Ltd. 6,950 52 AK Holdings Inc. 2,228 51* Namsun Aluminum
Co. Ltd. 20,329 51 InBody Co. Ltd. 2,162 50 SPC Samlip Co. Ltd. 758 50* Able C&C Co. Ltd. 7,592 50 Cuckoo Holdings
Co. Ltd. 2,530 492 F&F Holdings Co.
Ltd. 1,435 48*,1,2 SillaJen Inc. 17,385 48 Sam Young
Electronics Co.Ltd. 4,528 47
Daeduck Co. Ltd. 7,545 47* CUROCOM Co. Ltd. 39,320 47 Byucksan Corp. 14,569 46* Lock&Lock Co. Ltd. 5,144 46 ICD Co. Ltd. 4,187 45 E1 Corp. 906 41 Kyobo Securities Co.
Ltd. 5,429 41 Daekyo Co. Ltd. 11,162 41 KC Co. Ltd. 2,009 39 Woongjin Thinkbig
Co. Ltd. 13,570 39* Peptron Inc. 3,982 38 Lotte Confectionery
Co. Ltd. 340 37
Total World Stock Index Fund
91

Shares
MarketValue•
($000)* Interflex Co. Ltd. 3,142 35 POSCO ADR 528 33 Cell Biotech Co. Ltd. 1,908 29* Sindoh Co. Ltd. 1,039 29 KT Skylife Co. Ltd. 3,297 29 Humedix Co. Ltd. 1,152 27 Hanil Holdings Co.
Ltd. 2,130 25* SBS Media Holdings
Co. Ltd. 14,389 25* KakaoBank Corp. 426 23* Homecast Co. Ltd. 8,376 22 Hyundai Livart
Furniture Co. Ltd. 1,541 21* Enzychem
LifesciencesRightsExp.12/17/2021 2,486 21
Hyundai Corp. 941 15*,1 Y2 Solution Co. Ltd. 14,731 15* GeneOne Life
Science Inc.Rights Exp.11/25/2021 2,093 7
*,1 Cnk InternationalCo. Ltd. 78 —
501,096Spain (0.6%) Iberdrola SA
(XMAD) 2,564,165 30,306 Banco Santander SA 7,326,638 27,791 Banco Bilbao Vizcaya
Argentaria SA 2,929,782 20,503 Industria de Diseno
Textil SA 458,972 16,6263 Cellnex Telecom SA 267,141 16,429* Amadeus IT Group
SA 186,390 12,469 Telefonica SA 2,174,937 9,447 Repsol SA 575,030 7,365 Ferrovial SA 210,220 6,636 CaixaBank SA 1,950,004 5,606*,3 Aena SME SA 31,141 5,115 Red Electrica Corp.
SA 185,684 3,8662 Naturgy Energy
Group SA 128,253 3,372 Grifols SA 144,655 3,313 Endesa SA 135,615 3,128 ACS Actividades de
Construccion yServicios SA 105,461 2,764
* Siemens GamesaRenewableEnergy SA 100,862 2,737
Enagas SA 103,645 2,326* Banco de Sabadell
SA 2,470,158 1,988* Fluidra SA 50,202 1,917 Acciona SA 9,178 1,763 Inmobiliaria Colonial
Socimi SA 167,984 1,633 Bankinter SA 284,153 1,565 Merlin Properties
Socimi SA 134,298 1,454 Acerinox SA 91,745 1,277 Viscofan SA 16,714 1,143 Mapfre SA 375,765 796
Shares
MarketValue•
($000)
Ebro Foods SA 36,858 731 Zardoya Otis SA 89,714 721 Grupo Catalana
Occidente SA 19,046 676 Laboratorios
FarmaceuticosRovi SA 9,529 669
* Solaria Energia yMedio AmbienteSA 29,172 584
Linea DirectaAseguradora SACia de Seguros yReaseguros 284,153 570
CIE Automotive SA 19,980 544 Cia de Distribucion
Integral LogistaHoldings SA 25,478 543
Banco Santander SAADR 137,759 522
* Indra Sistemas SA 42,840 518 Applus Services SA 55,185 5003 Unicaja Banco SA 457,926 490 Faes Farma SA 109,984 448 Almirall SA 28,861 429 Sacyr SA (XMAD) 136,966 390 Pharma Mar SA 4,999 3893 Neinor Homes SA 26,333 3403 Aedas Homes SA 11,224 323 Construcciones y
Auxiliar deFerrocarriles SA 7,051 311
* Melia HotelsInternational SA 37,871 280
Prosegur Cia deSeguridad SA 98,413 279
* Mediaset EspanaComunicacion SA 52,714 275
3 Global DominionAccess SA 47,418 254
*,3 GestampAutomocion SA 52,799 236
Fomento deConstrucciones yContratas SA 17,730 226
Grifols SAPreference Shares 15,452 203
* Atresmedia Corp. deMedios deComunicacion SA 33,387 136
* Lar Espana RealEstate Socimi SA 21,012 128
*,3 Metrovacesa SA 14,260 125* Ence Energia y
Celulosa SA 44,717 115*,2 Distribuidora
Internacional deAlimentacion SA 6,028,697 110
* Tecnicas ReunidasSA 10,072 91
3 Prosegur Cash SA 110,532 76* NH Hotel Group SA
(XMAD) 7,857 29*,1 Let S Gowex SA 3,921 —
205,596
Total World Stock Index Fund
92

Shares
MarketValue•
($000)
Sweden (1.1%)2 Atlas Copco AB
Class A 281,091 18,102 Investor AB Class B 712,108 16,431 Volvo AB Class B 641,772 14,966 Telefonaktiebolaget
LM EricssonClass B 1,310,650 14,306
Hexagon AB Class B 765,914 12,326 Sandvik AB 470,638 11,935 Assa Abloy AB
Class B 403,130 11,8293 Evolution AB 70,542 11,452 Skandinaviska
Enskilda BankenAB Class A 634,398 9,921
2 Swedbank ABClass A 438,700 9,515
Essity AB Class B 269,135 8,7182 Atlas Copco AB
Class B 156,750 8,495 Nibe Industrier AB
Class B 525,246 7,8122 Svenska
HandelsbankenAB Class A 650,965 7,462
Investor AB Class A 317,586 7,3472 H & M Hennes &
Mauritz ABClass B 385,510 7,253
EQT AB 121,369 6,411 Alfa Laval AB 148,022 6,349 Epiroc AB Class A 250,601 6,235 Swedish Match AB 664,004 5,8552 Telia Co. AB 1,143,039 4,502*,3 Sinch AB 227,236 4,325 Boliden AB 122,459 4,317 Getinge AB Class B 95,361 4,268* Kinnevik AB Class B 107,681 4,227 Epiroc AB Class B 193,463 4,110 SKF AB Class B 169,878 3,945 Skanska AB Class B 154,276 3,923 Indutrade AB 125,100 3,6472 Industrivarden AB
Class A 105,083 3,466 Svenska Cellulosa
AB SCA Class B 218,322 3,411 Lundin Energy AB 81,049 3,201* Fastighets AB
Balder Class B 43,172 3,130 Tele2 AB Class B 213,174 3,013 Lifco AB Class B 97,361 2,839 Sagax AB Class B 71,268 2,789 Samhallsbyggnadsbolaget
i Norden AB 411,519 2,759 Volvo AB Class A 111,354 2,6333 Thule Group AB 45,170 2,610 Trelleborg AB
Class B 112,025 2,5642 Husqvarna AB
Class B 171,971 2,4512 Electrolux AB
Class B 104,062 2,368 Castellum AB 88,324 2,354 Investment AB
Latour Class B 61,528 2,235 Industrivarden AB
Class C 66,282 2,156
Shares
MarketValue•
($000)
Securitas ABClass B 128,038 2,121
* Swedish OrphanBiovitrum AB 75,779 2,059
Avanza BankHolding AB 51,753 2,057
3 Dometic Group AB 139,520 2,035 Beijer Ref AB
Class B 98,970 2,031 Vitrolife AB 29,807 1,940* Nordic
EntertainmentGroup AB Class B 33,295 1,931
Elekta AB Class B 164,621 1,917 L E
LundbergforetagenAB Class B 31,698 1,827
AddTech AB Class B 81,006 1,812 AddLife AB Class B 43,403 1,773 Fabege AB 103,274 1,748 ICA Gruppen AB 33,369 1,727 Holmen AB Class B 38,596 1,713 Sweco AB Class B 98,063 1,561 BillerudKorsnas AB 72,611 1,521 AAK AB 68,778 1,504 Nordnet AB publ 73,475 1,408 Sectra AB Class B 55,270 1,345* SSAB AB Class B 266,187 1,3303 Bravida Holding AB 87,121 1,310 Wihlborgs
Fastigheter AB 54,151 1,284 AFRY AB 41,940 1,248 Nyfosa AB 72,725 1,227 Mips AB 10,110 1,224 JM AB 29,862 1,210 Arjo AB Class B 86,418 1,178 Wallenstam AB
Class B 66,298 1,164 Hexpol AB 98,341 1,151 Saab AB Class B 39,921 1,113 Axfood AB 45,156 1,107 Instalco AB 20,441 1,087 Bure Equity AB 23,367 1,0852 Kungsleden AB 76,608 1,054 Biotage AB 32,349 1,047 Nolato AB Class B 78,505 1,038 Peab AB Class B 81,007 1,018 Corem Property
Group AB Class B 280,948 932 Loomis AB Class B 34,372 928 Svenska Cellulosa
AB SCA Class A 57,595 909 Lindab International
AB 27,144 889 Intrum AB 30,958 879* Electrolux
Professional ABClass B 100,736 778
Mycronic AB 30,685 712 NCC AB Class B 40,700 705 HMS Networks AB 12,153 694 Catena AB 11,190 682* SSAB AB Class A 118,306 674 Medicover AB
Class B 21,610 655 Sagax AB Class D 164,036 626 Hufvudstaden AB
Class A 37,568 601
Total World Stock Index Fund
93

Shares
MarketValue•
($000)* Pandox AB Class B 33,515 591* Modern Times
Group MTG ABClass B 46,685 535
Concentric AB 18,183 535 Bilia AB Class A 29,824 530* BICO Group AB
Class B 10,571 530 Troax Group AB 12,645 518 Vitec Software
Group AB Class B 8,415 497 Dios Fastigheter AB 42,250 492* Cint Group AB 32,557 492* Karo Pharma AB 65,449 431 Platzer Fastigheter
Holding ABClass B 26,316 429
Granges AB 39,279 428*,2,3 Boozt AB 25,213 425* Betsson AB Class B 60,095 419 Atrium Ljungberg
AB Class B 18,027 414* VNV Global AB 28,210 414*,3 Resurs Holding AB 76,489 412 Ratos AB Class B 70,826 408 Cloetta AB Class B 124,219 395 INVISIO AB 21,344 386 Investment AB
Oresund 22,015 383 Nobia AB 59,879 369*,2 SAS AB 2,003,749 349* BHG Group AB 29,885 345 SkiStar AB 15,371 3213 Munters Group AB 41,835 310 Clas Ohlson AB
Class B 27,837 300 Systemair AB 29,856 288 Fagerhult AB 35,407 284*,2,3 Scandic Hotels
Group AB 58,544 283* Mekonomen AB 13,668 282 Bonava AB Class B 24,050 2382 Svenska
HandelsbankenAB Class B 18,027 228
TelefonaktiebolagetLM EricssonClass A 19,844 217
BONAVA AB 20,064 207 Samhallsbyggnadsbolaget
i Norden ABClass D 54,795 199
* Collector AB 39,722 196 Husqvarna AB
Class A 13,494 194*,2 Hansa Biopharma
AB 15,806 1802 Corem Property
Group ABPreference Shares 4,687 179
* Kinnevik AB Class A 4,257 172*,3 Attendo AB 38,500 165* Camurus AB 7,385 139 Skandinaviska
Enskilda BankenAB Class C 3,402 54
NCC AB Class A 1,486 26*,2,3 Oncopeptides AB 17,118 8
Shares
MarketValue•
($000)*,1 Ow Bunker A/S 3,210 —
364,729Switzerland (2.3%) Nestle SA
(Registered) 1,223,593 161,401 Roche Holding AG 266,272 103,152 Novartis AG
(Registered) 921,338 76,206 Zurich Insurance
Group AG 64,528 28,600 Cie Financiere
Richemont SAClass A(Registered) 222,962 27,592
Lonza Group AG(Registered) 32,446 26,664
UBS Group AG(Registered) 1,416,154 25,778
ABB Ltd.(Registered) 735,005 24,316
Sika AG (Registered) 61,722 20,910 Givaudan SA
(Registered) 4,026 18,970 Roche Holding AG
(Bearer) 43,123 18,548 Partners Group
Holding AG 9,830 17,173 Alcon Inc. 202,188 16,765 Swiss Re AG 124,225 12,034 Geberit AG
(Registered) 14,919 11,651 Credit Suisse Group
AG (Registered) 1,056,072 10,985 Holcim Ltd. 205,308 10,241 Sonova Holding AG
(Registered) 23,285 9,649 Straumann Holding
AG (Registered) 4,293 8,937 SGS SA (Registered) 2,585 7,653 Swiss Life Holding
AG (Registered) 13,882 7,615 Kuehne + Nagel
International AG(Registered) 22,380 7,049
Julius Baer GroupLtd. 94,776 6,855
ChocoladefabrikenLindt & SpruengliAG Ptg. Ctf. 522 6,155
Swisscom AG(Registered) 10,947 5,961
LogitechInternational SA(Registered) 64,857 5,425
3 VAT Group AG 11,036 5,276 Schindler Holding
AG Ptg. Ctf. 18,932 4,930 Chocoladefabriken
Lindt & SpruengliAG (Registered) 39 4,685
Temenos AG(Registered) 26,682 4,085
Swatch Group AG(Bearer) 14,275 3,929
SIG CombiblocGroup AG 143,779 3,760
Barry Callebaut AG(Registered) 1,534 3,553
Total World Stock Index Fund
94

Shares
MarketValue•
($000)
Adecco Group AG(Registered) 68,093 3,431
Tecan Group AG(Registered) 5,451 3,340
Swiss Prime Site AG(Registered) 31,480 3,200
Baloise Holding AG(Registered) 19,334 3,081
Georg Fischer AG(Registered) 1,932 2,923
EMS-ChemieHolding AG(Registered) 2,915 2,891
Vifor Pharma AG 22,222 2,869 Belimo Holding AG
(Registered) 4,540 2,639 Clariant AG
(Registered) 105,493 2,221 PSP Swiss Property
AG (Registered) 17,462 2,183 Bachem Holding AG
(Registered)Class B 2,699 2,173
* ams AG 102,992 2,039 Helvetia Holding AG
(Registered) 16,502 1,964 Schindler Holding
AG (Registered) 7,014 1,801 Holcim Ltd. (XSWX) 34,256 1,717 Daetwyler Holding
AG (Bearer) 4,034 1,569 Siegfried Holding
AG (Registered) 1,609 1,5483 Galenica AG 20,550 1,505* Dufry AG
(Registered) 26,709 1,414* Flughafen Zurich AG
(Registered) 7,779 1,405 DKSH Holding AG 17,066 1,368 Bucher Industries
AG (Registered) 2,606 1,315 Allreal Holding AG
(Registered) 5,667 1,199 Comet Holding AG
(Registered) 3,187 1,186 Interroll Holding AG
(Registered) 238 1,155* Zur Rose Group AG 3,209 1,141 Vontobel Holding AG
(Registered) 11,802 1,093* Idorsia Ltd. 52,762 1,086 Inficon Holding AG
(Registered) 830 1,065 Banque Cantonale
Vaudoise(Registered) 13,100 1,055
SoftwareoneHolding AG 43,289 1,003
dormakaba HoldingAG 1,320 978
OC Oerlikon Corp.AG (Registered) 91,501 932
2 Stadler Rail AG 21,125 928 Emmi AG
(Registered) 864 902 SFS Group AG 6,565 884 Mobimo Holding AG
(Registered) 2,592 874 BKW AG 6,556 869
Shares
MarketValue•
($000)
Valiant Holding AG(Registered) 8,710 862
Cembra MoneyBank AG 12,697 848
Kardex Holding AG(Registered) 2,707 835
Forbo Holding AG(Registered) 422 821
Landis+Gyr GroupAG 11,412 785
Sulzer AG(Registered) 7,450 732
Bystronic AG 520 715 Huber + Suhner AG
(Registered) 7,880 701* Dottikon Es Holding
AG (Registered) 1,904 699 Swissquote Group
Holding SA(Registered) 3,158 641
*,3 Sensirion HoldingAG 4,421 637
Swatch Group AG(Registered) 11,868 631
St. GallerKantonalbank AG(Registered) 1,296 597
* Meyer BurgerTechnology AG 1,179,686 563
VZ Holding AG 5,300 538* Aryzta AG 409,694 536 Schweiter
Technologies AG(Bearer) 370 531
Bossard Holding AG(Registered)Class A 1,395 512
BurckhardtCompressionHolding AG 1,205 508
* Komax Holding AG(Registered) 1,979 504
LEM Holding SA(Registered) 187 453
Leonteq AG 6,314 418 Zehnder Group AG 3,781 407* Valora Holding AG
(Registered) 2,104 400 Intershop Holding
AG 583 365*,3 Medmix AG 7,450 356*,3 Medacta Group SA 2,055 344 Arbonia AG 15,299 333*,2 Basilea
Pharmaceutica AG(Registered) 6,878 322
ALSO Holding AG(Registered) 1,028 305
* Autoneum HoldingAG 1,863 292
Vetropack HoldingAG Class A(Registered) 4,376 269
* Implenia AG(Registered) 12,856 262
Bell Food Group AG(Registered) 785 252
* Ascom Holding AG(Registered) 16,022 249
Total World Stock Index Fund
95

Shares
MarketValue•
($000)
Hiag ImmobilienHolding AG 2,215 235
* Bobst Group SA(Registered) 2,817 229
* Rieter Holding AG(Registered) 1,063 221
*,2 COSMOPharmaceuticalsNV 2,814 214
Ypsomed HoldingAG (Registered) 1,264 209
EFG InternationalAG 26,628 187
* u-blox Holding AG 2,049 150 VP Bank AG Class A 742 84* APG SGA SA 321 73* Swiss Steel Holding
AG 161,037 62* Transocean Ltd. 8,480 30
791,366Taiwan (1.9%) Taiwan
SemiconductorManufacturing Co.Ltd. 7,908,413 167,819
TaiwanSemiconductorManufacturing Co.Ltd. ADR 518,821 58,990
MediaTek Inc. 640,558 21,082 Hon Hai Precision
Industry Co. Ltd. 5,211,848 20,119 United
MicroelectronicsCorp. 4,688,780 9,734
Fubon FinancialHolding Co. Ltd. 3,648,678 9,645
Formosa PlasticsCorp. 2,181,873 8,451
Delta ElectronicsInc. 949,311 8,380
Nan Ya PlasticsCorp. 2,458,423 7,545
Cathay FinancialHolding Co. Ltd. 3,592,895 7,489
CTBC FinancialHolding Co. Ltd. 7,906,715 6,603
China Steel Corp. 5,364,390 6,468 Mega Financial
Holding Co. Ltd. 4,713,769 5,665 Chailease Holding
Co. Ltd. 570,830 5,467 ASE Technology
Holding Co. Ltd. 1,487,636 5,321 E.Sun Financial
Holding Co. Ltd. 5,455,396 5,213 Uni-President
Enterprises Corp. 2,100,992 5,040 Yuanta Financial
Holding Co. Ltd. 5,223,903 4,643 Silergy Corp. 27,000 4,461 Formosa Chemicals
& Fibre Corp. 1,505,259 4,368 Evergreen Marine
Corp. Taiwan Ltd. 1,148,956 4,135 Asustek Computer
Inc. 319,169 4,058 Taiwan Cement
Corp. 2,299,921 3,991
Shares
MarketValue•
($000)
Chunghwa TelecomCo. Ltd. ADR 97,033 3,833
UnimicronTechnology Corp. 558,000 3,825
NovatekMicroelectronicsCorp. 250,025 3,750
RealtekSemiconductorCorp. 205,420 3,695
First FinancialHolding Co. Ltd. 4,395,826 3,619
Taiwan CooperativeFinancial HoldingCo. Ltd. 4,209,157 3,422
Largan Precision Co.Ltd. 45,020 3,355
Quanta ComputerInc. 1,166,450 3,277
Yageo Corp. 197,473 3,091 China Development
Financial HoldingCorp. 5,974,580 3,054
Chunghwa TelecomCo. Ltd. 765,000 3,036
Hotai Motor Co. Ltd. 137,288 3,023 Hua Nan Financial
Holdings Co. Ltd. 4,038,602 2,957 Taishin Financial
Holding Co. Ltd. 4,490,315 2,948 eMemory
Technology Inc. 31,000 2,575* Yang Ming Marine
Transport Corp. 714,030 2,493 President Chain
Store Corp. 245,137 2,478 Taiwan Mobile Co.
Ltd. 690,800 2,437 Globalwafers Co.
Ltd. 87,000 2,387 Advantech Co. Ltd. 176,674 2,311 Win
SemiconductorsCorp. 176,151 2,273
Sinopac HoldingsCo. 4,414,756 2,248
ShanghaiCommercial &Savings Bank Ltd. 1,409,000 2,231
Innolux Corp. 3,692,885 2,221 Vanguard
InternationalSemiconductorCorp. 419,000 2,183
Pegatron Corp. 872,954 2,137 Formosa
PetrochemicalCorp. 586,140 2,110
Accton TechnologyCorp. 237,000 2,072
Wan Hai Lines Ltd. 348,700 2,012 Lite-On Technology
Corp. 909,988 2,008 Airtac International
Group 65,804 1,969 Pou Chen Corp. 1,549,524 1,900 Parade Technologies
Ltd. 29,000 1,868 Eclat Textile Co. Ltd. 85,166 1,861
Total World Stock Index Fund
96

Shares
MarketValue•
($000)
Shin Kong FinancialHoldings Co. Ltd. 5,138,851 1,811
Far Eastern NewCentury Corp. 1,682,279 1,762
Catcher TechnologyCo. Ltd. 302,310 1,753
momo.com Inc. 26,700 1,721 Ruentex
Development Co.Ltd. 668,763 1,707
Chang Hwa Bank 2,841,348 1,678 Compal Electronics
Inc. 1,846,323 1,625 Feng TAY Enterprise
Co. Ltd. 207,509 1,615 Sino-American
Silicon ProductsInc. 234,000 1,603
Nan Ya PrintedCircuit BoardCorp. 87,000 1,539
ASPEED TechnologyInc. 15,000 1,505
Micro-StarInternational Co.Ltd. 294,000 1,484
Asia Cement Corp. 931,264 1,483 Giant Manufacturing
Co. Ltd. 123,881 1,439 Hiwin Technologies
Corp. 125,363 1,396 AU Optronics Corp. 2,028,000 1,394 Far EasTone
TelecommunicationsCo. Ltd. 629,000 1,384
Voltronic PowerTechnology Corp. 23,322 1,366
Wistron Corp. 1,277,152 1,342 AU Optronics Corp.
ADR 191,821 1,310 Taiwan High Speed
Rail Corp. 1,250,000 1,306 Walsin Lihwa Corp. 1,388,000 1,297 Inventec Corp. 1,285,554 1,230 Taiwan Business
Bank 3,514,597 1,196* Oneness Biotech
Co. Ltd. 126,000 1,189 Winbond Electronics
Corp. 1,236,726 1,173 Foxconn Technology
Co. Ltd. 472,514 1,173 Chroma ATE Inc. 179,000 1,169 E Ink Holdings Inc. 349,000 1,157 Walsin Technology
Corp. 209,968 1,143 AP Memory
Technology Corp. 58,700 1,142 Merida Industry Co.
Ltd. 106,400 1,108 Synnex Technology
International Corp. 554,498 1,074 TA Chen Stainless
Pipe 677,072 1,071 WPG Holdings Ltd. 571,440 1,068 Wiwynn Corp. 32,000 1,025 Acer Inc. 1,094,551 1,024 Kinsus Interconnect
Technology Corp. 116,000 1,021
Shares
MarketValue•
($000)
Elite Material Co.Ltd. 116,000 1,005
Alchip TechnologiesLtd. 26,882 999
ASMedia TechnologyInc. 17,000 996
* Phison ElectronicsCorp. 70,000 987
China Life InsuranceCo. Ltd. 937,632 980
PowertechTechnology Inc. 277,000 972
MacronixInternational Co.Ltd. 678,903 961
Ruentex IndustriesLtd. 243,048 948
Gigabyte TechnologyCo. Ltd. 233,000 946
Cheng Shin RubberIndustry Co. Ltd. 767,379 942
Tripod TechnologyCorp. 220,000 932
UnitedMicroelectronicsCorp. ADR 87,418 898
ITEQ Corp. 191,244 885 Chicony Electronics
Co. Ltd. 302,231 864 Teco Electric and
Machinery Co.Ltd. 766,000 832
Zhen DingTechnologyHolding Ltd. 238,700 827
* ENNOSTAR Inc. 304,278 801 Lien Hwa Industrial
Holdings Corp. 396,753 797 Nien Made
Enterprise Co.Ltd. 55,000 756
* China Airlines Ltd. 1,195,000 740 Nanya Technology
Corp. 306,324 734 Global Unichip Corp. 34,000 734 Simplo Technology
Co. Ltd. 66,640 718* China Petrochemical
DevelopmentCorp. 1,633,567 712
Taiwan Fertilizer Co.Ltd. 287,000 702
ElanMicroelectronicsCorp. 116,400 701
FLEXiumInterconnect Inc. 202,154 700
* HTC Corp. 294,491 696 YFY Inc. 599,000 691* Eva Airways Corp. 1,008,817 685 King's Town Bank
Co. Ltd. 458,000 684 Genius Electronic
Optical Co. Ltd. 43,911 677 Sinbon Electronics
Co. Ltd. 81,499 674 Makalot Industrial
Co. Ltd. 76,985 672 Lotes Co. Ltd. 31,800 663
Total World Stock Index Fund
97

Shares
MarketValue•
($000)
Bizlink Holding Inc. 71,616 662 Tung Ho Steel
Enterprise Corp. 433,000 629 Taiwan Glass
Industry Corp. 636,842 628 Qisda Corp. 556,000 621 Compeq
Manufacturing Co.Ltd. 420,000 611
IBF FinancialHoldings Co. Ltd. 1,064,524 609
* Episil TechnologiesInc. 110,666 609
HighwealthConstructionCorp. 373,394 603
RadiantOpto-ElectronicsCorp. 171,314 600
Wafer Works Corp. 257,601 598 Tong Hsing
ElectronicIndustries Ltd. 62,130 592
TXC Corp. 158,000 584 King Yuan
Electronics Co.Ltd. 394,000 565
Faraday TechnologyCorp. 76,800 557
Wisdom MarineLines Co. Ltd. 231,196 544
Everlight ElectronicsCo. Ltd. 304,000 543
TaichungCommercial BankCo. Ltd. 1,233,918 530
Mitac HoldingsCorp. 511,589 529
ChipbondTechnology Corp. 227,000 527
Pan Jit InternationalInc. 127,800 518
Chung Hung SteelCorp. 409,000 516
SDI Corp. 85,000 508 Eternal Materials
Co. Ltd. 380,919 505* Medigen Vaccine
Biologics Corp. 57,591 496 Elite Semiconductor
MicroelectronicsTechnology Inc. 96,000 494
International GamesSystem Co. Ltd. 19,000 489
Poya InternationalCo. Ltd. 27,243 488
Nantex Industry Co.Ltd. 164,000 482
Clevo Co. 383,628 476 Feng Hsin Steel Co.
Ltd. 169,000 475 HannStar Display
Corp. 931,265 474* Yieh Phui Enterprise
Co. Ltd. 523,136 467 Taiwan Surface
MountingTechnology Corp. 115,250 465
TCI Co. Ltd. 56,022 455
Shares
MarketValue•
($000)
Taiwan Secom Co.Ltd. 125,675 454
* Oriental UnionChemical Corp. 528,000 454
United IntegratedServices Co. Ltd. 68,200 451
Advanced EnergySolution HoldingCo. Ltd. 10,000 441
Great WallEnterprise Co.Ltd. 228,146 440
Cheng Loong Corp. 356,000 436 Grand Pacific
Petrochemical 447,000 435 Solar Applied
MaterialsTechnology Corp. 240,571 434
Asia VitalComponents Co.Ltd. 145,000 433
Goldsun BuildingMaterials Co. Ltd. 462,137 428
TA-I Technology Co.Ltd. 186,750 427
Fitipower IntegratedTechnology Inc. 55,603 427
Tainan Spinning Co.Ltd. 519,543 425
Tong Yang IndustryCo. Ltd. 349,000 424
Yulon Finance Corp. 69,575 422 FocalTech Systems
Co. Ltd. 72,655 419 King Slide Works
Co. Ltd. 27,000 415 TSRC Corp. 357,925 413 Sitronix Technology
Corp. 42,000 403 Hota Industrial
Manufacturing Co.Ltd. 116,940 396
USI Corp. 316,645 392 Ardentec Corp. 181,903 390 China Steel
Chemical Corp. 87,000 387 Nan Kang Rubber
Tire Co. Ltd. 268,493 386 Shinkong Synthetic
Fibers Corp. 567,000 385 CTCI Corp. 293,000 384 Gold Circuit
Electronics Ltd. 159,000 381 Formosa Taffeta Co.
Ltd. 352,000 380* United Renewable
Energy Co. Ltd. 441,502 380 Sigurd
MicroelectronicsCorp. 178,781 378
Kinpo Electronics 806,000 377 Jentech Precision
Industrial Co. Ltd. 28,000 372 ChipMOS
Technologies Inc. 221,682 369 Capital Securities
Corp. 667,220 364 Getac Holdings
Corp. 192,000 362
Total World Stock Index Fund
98

Shares
MarketValue•
($000)
Chin-Poon IndustrialCo. Ltd. 326,000 351
Kinik Co. 129,000 351 Far Eastern
International Bank 926,316 348 Coretronic Corp. 165,400 342 Primax Electronics
Ltd. 184,000 341 China Electric
ManufacturingCorp. 810,360 337
Ichia TechnologiesInc. 573,000 335
Topco Scientific Co.Ltd. 67,047 333
Visual PhotonicsEpitaxy Co. Ltd. 65,250 331
U-Ming MarineTransport Corp. 174,000 330
* Microbio Co. Ltd. 144,962 329 Far Eastern
DepartmentStores Ltd. 405,115 322
Yulon Motor Co. Ltd. 217,430 322 Greatek Electronics
Inc. 112,000 321 Machvision Inc. 37,404 316 Standard Foods
Taiwan Ltd. 168,400 314 WT
MicroelectronicsCo. Ltd. 138,986 314
Fusheng PrecisionCo. Ltd. 46,000 312
Chung-Hsin Electric& MachineryManufacturingCorp. 208,000 309
Via Technologies Inc. 135,000 302 Taiwan Mask Corp. 105,158 302 Charoen Pokphand
Enterprise 104,000 299 Taiwan Union
Technology Corp. 86,000 297 Taiwan Sakura Corp. 117,994 297 Run Long
Construction Co.Ltd. 137,376 296
* Ambassador Hotel 271,000 295 Longchen Paper &
Packaging Co.Ltd. 338,689 294
Pegavision Corp. 15,000 294 Transcend
Information Inc. 120,000 292 L&K Engineering
Co. Ltd. 278,000 292 Huaku Development
Co. Ltd. 89,000 291 Wei Chuan Foods
Corp. 354,000 291 RichWave
Technology Corp. 28,000 291* RDC Semiconductor
Co. Ltd. 20,000 287 UPC Technology
Corp. 344,265 286 Systex Corp. 91,000 283
Shares
MarketValue•
($000)
International CSRCInvestmentHoldings Co. 323,447 280
Mercuries &AssociatesHolding Ltd. 335,321 279
Advanced WirelessSemiconductorCo. 48,437 279
Global Mixed ModeTechnology Inc. 34,000 276
ADATA TechnologyCo. Ltd. 92,190 276
President SecuritiesCorp. 334,670 273
* EirGenix Inc. 70,000 273 Farglory Land
Development Co.Ltd. 110,000 266
Topkey Corp. 57,000 266 Center Laboratories
Inc. 110,775 265 Sunny Friend
EnvironmentalTechnology Co.Ltd. 37,000 265
China Motor Corp. 104,800 261 XinTec Inc. 53,000 259 Wistron NeWeb
Corp. 92,400 258* Phihong Technology
Co. Ltd. 193,000 256 Asia Optical Co. Inc. 80,000 255 Ta Ya Electric Wire &
Cable 282,844 252 Grape King Bio Ltd. 43,000 251 CMC Magnetics
Corp. 787,080 250 Taiwan Hon Chuan
Enterprise Co.Ltd. 105,772 248
China GeneralPlastics Corp. 184,895 247
Bank of KaohsiungCo. Ltd. 604,629 245
* Shihlin Paper Corp. 99,000 244 Ability Enterprise
Co. Ltd. 346,000 243 Cheng Uei Precision
Industry Co. Ltd. 173,000 241 Taiwan Paiho Ltd. 77,000 240 Depo Auto Parts Ind
Co. Ltd. 118,000 239 Kenda Rubber
Industrial Co. Ltd. 217,000 239 O-Bank Co. Ltd. 845,000 237 Basso Industry
Corp. 152,200 236* PharmaEssentia
Corp. 67,648 236 China Chemical &
PharmaceuticalCo. Ltd. 294,000 234
Chilisin ElectronicsCorp. 75,325 234
* CSBC Corp. Taiwan 297,615 234 Iron Force Industrial
Co. Ltd. 92,000 233
Total World Stock Index Fund
99

Shares
MarketValue•
($000)
Chong HongConstruction Co.Ltd. 87,152 231
Sunplus TechnologyCo. Ltd. 171,000 228
* AmTRANTechnology Co.Ltd. 359,000 228
TaiwanSemiconductorCo. Ltd. 77,000 226
Jih Sun FinancialHoldings Co. Ltd. 481,000 225
Cathay Real EstateDevelopment Co.Ltd. 319,200 224
HoltekSemiconductorInc. 60,000 223
KindomDevelopment Co.Ltd. 161,700 223
SupremeElectronics Co.Ltd. 138,210 223
Advanced Ceramic XCorp. 18,000 223
Ennoconn Corp. 33,664 223 Pixart Imaging Inc. 39,000 222 Foxsemicon
IntegratedTechnology Inc. 29,900 221
SportonInternational Inc. 27,092 220
General InterfaceSolution HoldingLtd. 63,000 220
AURAS TechnologyCo. Ltd. 38,000 218
Andes TechnologyCorp. 12,000 218
Merry ElectronicsCo. Ltd. 72,309 214
Taiwan FamilyMartCo. Ltd. 23,000 214
TaiwanCogenerationCorp. 155,000 213
Sinyi Realty Inc. 177,358 212 Dimerco Express
Corp. 68,466 212 Sanyang Motor Co.
Ltd. 214,000 209 Sensortek
Technology Corp. 10,000 209 Cleanaway Co. Ltd. 27,000 208 Pan-International
Industrial Corp. 142,000 208 Century Iron & Steel
Industrial Co. Ltd. 51,000 208 TYC Brother
Industrial Co. Ltd. 288,000 207 TTY Biopharm Co.
Ltd. 83,541 207 Co-Tech
DevelopmentCorp. 76,000 205
* KMC Kuei MengInternational Inc. 28,000 204
Shares
MarketValue•
($000)
T3EX GlobalHoldings Corp. 44,000 204
ArcadyanTechnology Corp. 53,099 201
Chunghwa PrecisionTest Tech Co. Ltd. 7,000 200
Chun Yuan SteelIndustry Co. Ltd. 244,000 199
Wah Lee IndustrialCorp. 64,260 197
Prince Housing &DevelopmentCorp. 412,050 197
Rich DevelopmentCo. Ltd. 594,000 196
Flytech TechnologyCo. Ltd. 74,853 196
* Lealea EnterpriseCo. Ltd. 470,000 195
Universal VisionBiotechnology Co.Ltd. 17,000 195
First Steamship Co.Ltd. 419,936 194
FormosaInternationalHotels Corp. 36,058 193
Chlitina Holding Ltd. 22,400 192 Aten International
Co. Ltd. 63,000 191 Cub Elecparts Inc. 31,044 191 China Man-Made
Fiber Corp. 516,602 189 Tung Thih Electronic
Co. Ltd. 26,000 189 Holy Stone
Enterprise Co.Ltd. 44,200 188
* TSEC Corp. 156,000 187 Yeong Guan Energy
Technology GroupCo. Ltd. 80,639 186
Asia Polymer Corp. 131,556 185 Thinking Electronic
Industrial Co. Ltd. 30,000 184 Tyntek Corp. 194,000 183 Jess-Link Products
Co. Ltd. 144,750 183 Apex International
Co. Ltd. 65,000 183 Innodisk Corp. 26,340 182 Ton Yi Industrial
Corp. 389,000 182 Adimmune Corp. 115,485 182 Hotai Finance Co.
Ltd. 57,000 181 Continental
Holdings Corp. 200,000 181 TPK Holding Co.
Ltd. 117,958 180 BES Engineering
Corp. 560,000 177 Chang Wah
ElectromaterialsInc. 144,000 175
Sercomm Corp. 76,000 174 Silicon Integrated
Systems Corp. 198,245 171
Total World Stock Index Fund
100

Shares
MarketValue•
($000)
Zeng HsingIndustrial Co. Ltd. 31,000 170
Nan Pao ResinsChemical Co. Ltd. 34,000 170
Ginko InternationalCo. Ltd. 23,100 168
* TaiMed BiologicsInc. 69,000 166
* Federal Corp. 170,612 165 Hsin Kuang Steel
Co. Ltd. 78,000 163 Soft-World
International Corp. 50,000 162* Etron Technology
Inc. 74,467 160 Fulgent Sun
InternationalHolding Co. Ltd. 43,029 160
Globe UnionIndustrial Corp. 288,000 159
Chicony PowerTechnology Co.Ltd. 63,000 158
Hung ShengConstruction Ltd. 181,912 158
AcBel Polytech Inc. 126,000 157* OBI Pharma Inc. 41,014 157 Evergreen
InternationalStorage &Transport Corp. 160,000 156
IEI Integration Corp. 96,605 154 Shin Zu Shing Co.
Ltd. 42,691 153 Sonix Technology
Co. Ltd. 49,000 152 Darfon Electronics
Corp. 101,000 152 Gudeng Precision
Industrial Co. Ltd. 17,201 151* Asia Pacific Telecom
Co. Ltd. 507,508 150 Dynapack
InternationalTechnology Corp. 43,000 149
St. Shine Optical Co.Ltd. 14,000 149
Formosa SumcoTechnology Corp. 26,000 148
* Mercuries LifeInsurance Co. Ltd. 449,981 148
Adlink TechnologyInc. 59,584 144
Kaimei ElectronicCorp. 46,000 144
Shin FoongSpecialty &Applied MaterialsCo. Ltd. 22,000 144
WeltrendSemiconductor 48,599 142
Speed Tech Corp. 46,000 141 OptoTech Corp. 91,312 141 Taiwan PCB
Techvest Co. Ltd. 83,000 140 ITE Technology Inc. 37,000 139 LandMark
OptoelectronicsCorp. 21,600 139
Shares
MarketValue•
($000)
Huang HsiangConstructionCorp. 105,000 138
Posiflex TechnologyInc. 42,169 138
* Unitech PrintedCircuit BoardCorp. 210,120 137
Test Research Inc. 68,000 137 D-Link Corp. 184,212 136 Elite Advanced
Laser Corp. 67,412 135 Hannstar Board
Corp. 89,059 134 Radium Life Tech
Co. Ltd. 352,440 133 Firich Enterprises
Co. Ltd. 115,127 133 Gourmet Master Co.
Ltd. 28,245 133 Acter Group Corp.
Ltd. 19,788 132 Lotus
PharmaceuticalCo. Ltd. 39,000 132
YC INOX Co. Ltd. 115,692 131 Senao International
Co. Ltd. 114,000 131 Advanced
InternationalMultitech Co. Ltd. 46,000 131
* Taiwan TEA Corp. 174,000 131 Sampo Corp. 121,600 130 Gamania Digital
Entertainment Co.Ltd. 62,000 129
Egis Technology Inc. 27,000 129 YungShin Global
Holding Corp. 81,400 127 Unizyx Holding
Corp. 112,000 126 Motech Industries
Inc. 108,133 125 Taiwan Styrene
Monomer 190,450 124 Syncmold
Enterprise Corp. 48,750 124 Nichidenbo Corp. 68,000 123 FSP Technology Inc. 84,000 123 Chief Telecom Inc. 12,000 123* Chung Hwa Pulp
Corp. 152,421 122 Everlight Chemical
Industrial Corp. 131,240 121 Career Technology
MFG. Co. Ltd. 134,522 121 TaiDoc Technology
Corp. 19,000 120 Taiyen Biotech Co.
Ltd. 100,000 119 ScinoPharm Taiwan
Ltd. 133,245 119 PChome Online Inc. 22,587 118 China Metal
Products 101,000 116 Chia Hsin Cement
Corp. 159,000 116* Lingsen Precision
Industries Ltd. 125,000 114
Total World Stock Index Fund
101

Shares
MarketValue•
($000)
Hu Lane AssociateInc. 23,575 114
Wowprime Corp. 21,665 112 Fittech Co. Ltd. 14,781 112 Namchow Holdings
Co. Ltd. 64,000 111 Hong Pu Real Estate
Development Co.Ltd. 140,000 110
Lung Yen LifeService Corp. 67,000 108
* OrientSemiconductorElectronics Ltd. 120,605 108
Xxentria TechnologyMaterials Corp. 44,000 107
Alpha Networks Inc. 107,772 105 CyberTAN
Technology Inc. 109,000 104 Rexon Industrial
Corp. Ltd. 43,000 104 Johnson Health Tech
Co. Ltd. 49,105 103 Gemtek Technology
Corp. 102,000 101* Gigastorage Corp. 111,064 100* Kuo Yang
Construction Co.Ltd. 116,000 100
Kuo ToongInternational Co.Ltd. 127,374 98
Test RiteInternational Co.Ltd. 113,000 98
Kung Long BatteriesIndustrial Co. Ltd. 19,000 96
SunonwealthElectric MachineIndustry Co. Ltd. 69,000 96
* MedigenBiotechnologyCorp. 49,000 96
Sincere NavigationCorp. 95,790 96
Gloria MaterialTechnology Corp. 125,000 95
* Shining BuildingBusiness Co. Ltd. 237,915 95
Ho Tung ChemicalCorp. 251,141 94
Taiflex Scientific Co.Ltd. 54,800 94
Yulon Nissan MotorCo. Ltd. 10,000 91
* Li Peng EnterpriseCo. Ltd. 240,600 90
Bioteque Corp. 22,000 87 HannsTouch
Solution Inc. 200,133 86 Dyaco International
Inc. 36,000 84 Altek Corp. 61,600 83 Quanta Storage Inc. 59,000 82 Formosan Rubber
Group Inc. 99,890 81 Rechi Precision Co.
Ltd. 120,000 81
Shares
MarketValue•
($000)
Global BrandsManufacture Ltd. 61,640 79
Swancor HoldingCo. Ltd. 22,000 78
NidecChaun-ChoungTechnology Corp. 13,000 78
KEE TAI PropertiesCo. Ltd. 156,000 74
Dynamic ElectronicsCo. Ltd. 94,760 72
* Ritek Corp. 202,257 71 Nan Liu Enterprise
Co. Ltd. 16,000 71* ALI Corp. 66,811 68 Sheng Yu Steel Co.
Ltd. 56,000 67 Vivotek Inc. 25,000 67 Infortrend
Technology Inc. 127,000 66 Elitegroup
ComputerSystems Co. Ltd. 73,000 62
Savior Lifetec Corp. 81,096 60* Darwin Precisions
Corp. 142,000 57*,1 Unity Opto
Technology Co.Ltd. 378,000 56
Toung Loong TextileManufacturing 44,000 56
* AGV Products Corp. 149,440 55 WUS Printed Circuit
Co. Ltd. 53,457 55* Roo Hsing Co. Ltd. 168,000 51* Newmax Technology
Co. Ltd. 33,000 49 Gigasolar Materials
Corp. 6,400 47 Concraft Holding Co.
Ltd. 22,512 46* Taigen
BiopharmaceuticalsHoldings Ltd. 77,872 45
* Tong-Tai Machine &Tool Co. Ltd. 74,560 43
CHC HealthcareGroup 31,268 41
Cyberlink Corp. 11,000 36 PharmaEngine Inc. 17,038 36 GeneReach
BiotechnologyCorp. 11,324 32
* Zinwell Corp. 43,000 31* Brogent
Technologies Inc. 5,529 25*,1 Pharmally
InternationalHolding Co. Ltd. 10,673 22
* Li Cheng EnterpriseCo. Ltd. 28,407 20
*,1 Pihsiang MachineryManufacturing Co.Ltd. 38,000 —
*,1 Xpec EntertainmentInc. 21,468 —
636,437
Total World Stock Index Fund
102

Shares
MarketValue•
($000)
Thailand (0.3%) PTT PCL 6,080,880 6,962 CP ALL PCL 2,443,500 4,721 Siam Commercial
Bank PCL 965,000 3,669 Airports of Thailand
PCL 1,825,350 3,557 Advanced Info
Service PCL 523,000 2,983 Kasikornbank PCL 681,966 2,907 Bangkok Dusit
Medical ServicesPCL Class F 3,967,800 2,814
Gulf EnergyDevelopment PCL 1,815,480 2,370
Central Pattana PCL 1,299,800 2,326 Siam Cement PCL
(Registered) 195,306 2,325 PTT Exploration &
Production PCL 578,081 2,045 Siam Cement PCL
NDVR 162,800 1,938 PTT Global Chemical
PCL 969,515 1,835 Intouch Holdings
PCL Class F 721,031 1,636 Delta Electronics
Thailand PCL 129,100 1,621* Minor International
PCL 1,630,530 1,610 Energy Absolute
PCL 623,400 1,233 Central Retail Corp.
PCL 1,106,700 1,161 Bangkok Bank PCL
(Registered) 300,848 1,113 Charoen Pokphand
Foods PCL 1,419,700 1,0812 Banpu PCL
(Registered) 3,122,704 1,072 Home Product
Center PCL 2,375,898 1,047 Indorama Ventures
PCL 823,100 1,045 SCG Packaging PCL 502,100 973 BTS Group Holdings
PCL 3,266,611 941 Tisco Financial
Group PCL 330,200 919 Bangkok
Expressway &Metro PCL 3,340,157 907
PTT Oil & RetailBusiness PCL 1,090,900 905
TMBThanachartBank PCL 24,144,669 846
DigitalTelecommunicationsInfrastructureFund Class F 2,080,417 840
2 KCE Electronics PCL 311,700 8182 Krungthai Card PCL 464,100 809 Thai Union Group
PCL Class F 1,236,080 779 Hana
MicroelectronicsPCL 292,700 707
Thai Oil PCL 403,700 677 Krung Thai Bank PCL 1,865,775 648
Shares
MarketValue•
($000)
ElectricityGenerating PCL 113,000 609
2 Global PowerSynergy PCLClass F 258,993 609
Kiatnakin Bank PCL 331,900 601 Com7 PCL Class F 273,800 593 Muangthai Capital
PCL 321,700 588 True Corp. PCL 4,725,554 578 Bumrungrad
Hospital PCL 130,600 574 Osotspa PCL 562,700 556 Jasmine Broadband
InternetInfrastructureFund Class F 1,805,600 555
CPN Retail GrowthLeasehold REIT 852,800 551
2 Carabao Group PCLClass F 140,500 526
Land & Houses PCL(Registered) 2,022,600 516
VGI PCL 2,407,941 484 Siam Global House
PCL 775,590 478 IRPC PCL 3,602,700 467 Srisawad Corp. PCL 235,805 456 Supalai PCL 616,000 435* Asset World Corp.
PCL 3,135,100 432 Siam Commercial
Bank PCL NVDR 111,400 424 Gunkul Engineering
PCL 2,487,599 4062 Berli Jucker PCL 384,984 392 Total Access
CommunicationPCL 336,900 388
Land & Houses PCLNVDR 1,482,900 378
2 CH Karnchang PCL 575,000 3782 Ratch Group PCL 269,924 370 Thonburi Healthcare
Group PCL 353,600 360 CK Power PCL 2,330,445 3562 Sri Trang Gloves
Thailand PCL 385,000 354 Bangkok Chain
Hospital PCL 566,200 347 Bangkok
Commercial AssetManagement PCL(XBKK) 602,800 346
JMT NetworkServices PCLClass F 230,347 339
Jay Mart PCL 263,000 330 Sri Trang
Agro-Industry PCL 331,096 325 Thailand Future Fund 1,367,400 322* Central Plaza Hotel
PCL 290,900 316 Bangchak Corp. PCL 377,100 312 TTW PCL 870,200 307 IMPACT Growth
REIT 513,000 3062 B Grimm Power PCL 235,500 302 Sansiri PCL 7,649,500 292
Total World Stock Index Fund
103

Shares
MarketValue•
($000)
WHA PremiumGrowth Freehold& Leasehold REITClass F 732,620 291
2 Chularat HospitalPCL Class F 2,340,180 269
Thanachart CapitalPCL 247,100 263
MK RestaurantsGroup PCL 157,200 260
Thoresen ThaiAgencies PCL 707,352 248
WHA Corp. PCL 2,428,602 248 AP Thailand PCL 921,500 246 Amata Corp. PCL 383,249 2362 Siam Makro PCL 160,100 232 Dohome PCL 317,800 229 Krung Thai Bank PCL
NDVR 633,000 220 TPI Polene PCL 4,173,300 2152 Kerry Express
Thailand PCL 186,000 213 Mega Lifesciences
PCL 146,600 206 AEON Thana Sinsap
Thailand PCL 36,100 204 TQM Corp. PCL 61,800 196* STARK Corp. PCL 1,480,800 196 Thai Vegetable Oil
PCL 206,400 194 LPN Development
PCL 1,259,200 189 Quality Houses PCL 2,442,183 169 TOA Paint Thailand
PCL 164,400 164* Bangkok Airways
PCL 457,000 1602 Sino-Thai
Engineering &Construction PCL 376,100 157
North BangkokPower Plant Block1 InfrastructureFund - EGATClass F 425,900 157
* Star PetroleumRefining PCL 484,700 153
Plan B Media PclClass F 786,800 152
Bangkok Land PCL 4,444,600 147* BEC World PCL 397,300 146 Tipco Asphalt PCL 257,200 142 Bangkok Life
Assurance PCLNVDR 157,940 142
2 Siam City CementPCL 27,700 141
Origin Property PCLClass F 389,400 133
* Major CineplexGroup PCL 203,500 131
BTS Rail MassTransit GrowthInfrastructureFund Class F 846,100 117
Banpu Power PCL 215,100 114 Super Energy Corp.
PCL 3,838,700 112
Shares
MarketValue•
($000)* Italian-Thai
Development PCL 1,562,400 1102 Jasmine
International PCL 1,256,900 109 Precious Shipping
PCL 188,100 103 Thaicom PCL 303,900 1002 PTG Energy PCL 190,400 90 TPI Polene Power
PCL 688,700 88* Esso Thailand PCL 357,200 86 Thaifoods Group
PCL Class F 649,700 862 BCPG PCL 215,213 85 Ratchthani Leasing
PCL 670,500 83* U City PCL Class F 1,520,425 82* MBK PCL 192,712 81 Pruksa Holding PCL 195,300 81* Banpu PCL Warrants
Exp. 10/1/22 503,899 78* Unique Engineering
& ConstructionPCL 382,500 77
WorkpointEntertainmentPCL 106,900 73
* Pruksa Real EstatePCL 210,700 66
SPCG PCL 120,600 65 BTS Group Holdings
PCL NDVR 222,000 64 GFPT PCL 164,000 57 Kasikornbank PCL
NVDR 11,959 51* Banpu PCL Warrants
Exp. 10/1/23 486,630 50 Thanachart Capital
PCL NDVR 38,600 41* Samart Corp. PCL 211,300 40 Univentures PCL 246,900 30*,1 Thai Airways
International PCL 300,774 302 Taokaenoi Food &
Marketing PCLClass F 123,500 25
Bangkok LifeAssurance PCL 16,500 15
Ratch Group PCLNDVR 9,776 13
* BTS Group HoldingsPCL WarrantsExp. 9/5/22 163,330 7
* MBK PCL WarrantsExp. 11/15/23 7,412 3
* Mbk W3 WarrantsExp. 10/22/27 7,709 3
* Vibhavadi MedicalCenter PCLWarrants Exp.6/14/22 79,130 1
* BCPG PCL WarrantsExp. 11/13/23 1 —
* Minor InternationalPCL WarrantsExp. 2/5/24 1 —
* BTS Group HoldingsPCL WarrantsExp. 11/7/24 348,861 —
Total World Stock Index Fund
104

Shares
MarketValue•
($000)* BTS Group Holdings
PCL WarrantsExp. 11/20/26 697,722 —
89,863Turkey (0.0%) BIM Birlesik
Magazalar A/S 190,649 1,233 Eregli Demir ve
Celik FabrikalariTAS 564,208 1,178
Turkiye GarantiBankasi A/S 899,989 922
KOC Holding A/S 364,023 888 Turkcell Iletisim
Hizmetleri A/S 530,684 847 Akbank TAS 1,381,329 836* Turkiye Petrol
Rafinerileri A/S 47,130 678 Aselsan Elektronik
Sanayi Ve TicaretA/S 298,070 509
Turkiye Sise ve CamFabrikalari A/S 547,298 492
Ford OtomotivSanayi A/S 22,288 429
Haci Omer SabanciHolding A/S 333,446 388
* Cimsa CimentoSanayi VE TicaretA/S 100,880 328
Enka Insaat veSanayi A/S 283,192 327
Anadolu EfesBiracilik Ve MaltSanayii A/S 135,847 313
* Turk Hava Yollari AO 203,001 309* Aksa Enerji Uretim
A/S Class B 386,236 305 Turkiye Is Bankasi
A/S Class C 495,971 291* Petkim Petrokimya
Holding A/S 410,397 279 Tat Gida Sanayi A/S 272,198 272* Gubre Fabrikalari
TAS 36,375 262* Kardemir Karabuk
Demir CelikSanayi ve TicaretA/S Class D 325,697 254
Coca-Cola IcecekA/S 26,410 233
* Sasa PolyesterSanayi A/S 70,941 229
Tofas Turk OtomobilFabrikasi A/S 37,311 228
Yatas Yatak veYorgan Sanayi veTicaret A/S 161,829 225
* Koza AltinIsletmeleri A/S 19,560 217
Arcelik A/S 59,514 209* Oyak Cimento
Fabrikalari A/S 281,629 203*,3 MLP Saglik
Hizmetleri A/S 69,471 196* TAV Havalimanlari
Holding A/S 68,404 189 Kervan Gida Sanayi
Ve Ticaret A/S 130,593 158
Shares
MarketValue•
($000)* Is Gayrimenkul
Yatirim OrtakligiA/S 756,498 151
Emlak KonutGayrimenkulYatirim OrtakligiA/S 733,255 151
AG Anadolu GrubuHolding A/S 51,361 147
Yapi ve KrediBankasi A/S 514,749 146
3 Enerjisa Enerji A/S 116,815 143* Migros Ticaret A/S 38,712 142* Hektas Ticaret TAS 148,851 1373 Mavi Giyim Sanayi
Ve Ticaret A/SClass B 18,167 136
Ulker Biskuvi SanayiA/S 62,695 132
Otokar Otomotiv VeSavunma SanayiA/S 3,623 128
SarkuysanElektrolitik BakirSanayi ve TicaretA/S 66,510 128
TurkTelekomunikasyonA/S 160,573 126
Tekfen Holding A/S 74,320 117* Turkiye Halk Bankasi
A/S 242,994 112 Borusan Yatirim ve
Pazarlama A/S 3,077 112 Dogan Sirketler
Grubu Holding A/S 389,279 109 Iskenderun Demir
ve Celik A/S 77,436 109* Bera Holding A/S 109,865 109* Koza Anadolu Metal
MadencilikIsletmeleri A/S 59,315 103
* Pegasus HavaTasimaciligi A/S 11,507 96
Sok MarketlerTicaret A/S 80,871 94
Logo Yazilim SanayiVe Ticaret A/S 19,952 89
Turk Traktor ve ZiraatMakineleri A/S 4,701 81
* Turkiye VakiflarBankasi TAOClass D 218,437 78
Polisan Holding A/S 271,018 78 Turkiye Sinai
Kalkinma BankasiA/S 560,984 76
* Zorlu Enerji ElektrikUretim A/S 410,334 70
Nuh Cimento SanayiA/S 14,263 65
* Kardemir KarabukDemir CelikSanayi ve TicaretA/S Class A 81,746 55
Brisa BridgestoneSabanci Sanayi veTicaret A/S 21,814 53
Total World Stock Index Fund
105

Shares
MarketValue•
($000)* Vestel Elektronik
Sanayi ve TicaretA/S 20,037 53
EGE Endustri VETicaret A/S 387 52
Aksa Akrilik KimyaSanayii A/S 20,723 51
* Ipek Dogal EnerjiKaynaklariArastirma VeUretim A/S 35,502 50
Is Yatirim MenkulDegerler A/S 29,494 49
Aksigorta A/S 61,914 45* Konya Cimento
Sanayii A/S 506 44* NET Holding A/S 95,198 42 Alarko Holding A/S 41,515 41 EIS Eczacibasi Ilac
ve Sinai veFinansal YatirimlarSanayi ve TicaretA/S 60,942 38
* Kordsa Teknik TekstilA/S 12,974 37
* Is Finansal KiralamaA/S 111,340 36
* Sekerbank Turk A/S 330,447 35 Dogus Otomotiv
Servis ve TicaretA/S 7,386 28
Aygaz A/S 12,065 23 Kartonsan Karton
Sanayi ve TicaretA/S 3,436 19
* TorunlarGayrimenkulYatirim OrtakligiA/S 26,089 10
* Albaraka Turk KatilimBankasi A/S 48,631 9
*,1 Asya Katilim BankasiA/S 147,465 —
17,362United Arab Emirates (0.1%) First Abu Dhabi
Bank PJSC 1,893,168 9,189 Emirates
TelecommunicationsGroup Co. PJSC 750,139 5,232
Emirates NBD BankPJSC 1,089,163 4,144
Abu DhabiCommercial BankPJSC 1,195,029 2,703
Aldar PropertiesPJSC 1,679,068 1,847
Dubai Islamic BankPJSC 1,251,822 1,745
Emaar PropertiesPJSC 1,512,953 1,656
Abu Dhabi NationalOil Co. forDistribution PJSC 1,077,713 1,257
Abu Dhabi IslamicBank PJSC 605,976 965
* ADNOC Drilling Co.PJSC 655,512 532
Dana Gas PJSC 1,726,644 486
Shares
MarketValue•
($000)
Dubai InvestmentsPJSC 992,931 461
* Air Arabia PJSC 1,163,146 441* Emaar Malls PJSC 749,716 409 GFH Financial Group
BSC 1,371,936 316* Emaar Development
PJSC 270,876 289* DAMAC Properties
Dubai Co. PJSC 667,912 228* Dubai Financial
Market PJSC 659,693 183 Aramex PJSC 132,235 158* RAK Properties
PJSC 603,454 121* Union Properties
PJSC 1,323,013 95*,1 Arabtec Holding
PJSC 245,437 35*,1 Drake & Scull
International PJSC 114,862 12
32,504United Kingdom (3.9%) AstraZeneca plc 673,994 84,318 Unilever plc (XLON) 1,122,154 60,082 HSBC Holdings plc 8,870,190 53,444 Diageo plc 996,713 49,588 GlaxoSmithKline plc 2,150,538 44,647 BP plc 8,679,984 41,585 Royal Dutch Shell
plc Class A 1,807,700 41,412 Royal Dutch Shell
plc Class B 1,593,266 36,563 British American
Tobacco plc 988,053 34,369 Rio Tinto plc 473,429 29,519 Glencore plc 5,787,678 28,942 RELX plc 808,438 25,068 Prudential plc
(XLON) 1,195,903 24,406 BHP Group plc 906,243 23,935 Reckitt Benckiser
Group plc 277,742 22,548 Lloyds Banking
Group plc 30,810,456 21,086 Anglo American plc 537,296 20,440 Barclays plc 7,384,511 20,377 National Grid plc 1,543,816 19,766 Experian plc 398,953 18,292 Vodafone Group plc 12,062,073 17,778* Compass Group plc 782,564 16,606 Ashtead Group plc 196,220 16,445 CRH plc (XDUB) 337,028 16,123 London Stock
Exchange Groupplc 157,382 15,320
Ferguson plc 96,948 14,587* Flutter
Entertainment plc(XDUB) 72,671 13,714
Tesco plc 3,343,218 12,344 BAE Systems plc 1,390,666 10,486 SSE plc 458,228 10,319 Legal & General
Group plc 2,608,610 10,288 Segro plc 529,336 9,356 Aviva plc 1,719,002 9,276 Imperial Brands plc 415,880 8,776
Total World Stock Index Fund
106

Shares
MarketValue•
($000)
3i Group plc 417,465 7,796 Croda International
plc 59,200 7,662 Standard Chartered
plc 1,126,092 7,616 WPP plc 516,056 7,459* Entain plc 254,762 7,139 Spirax-Sarco
Engineering plc 32,240 6,882 Smith & Nephew
plc 395,431 6,829 Natwest Group plc 2,259,300 6,812 Halma plc 166,734 6,762* Rolls-Royce
Holdings plc 3,676,173 6,635 Rentokil Initial plc 821,724 6,614* BT Group plc 3,298,485 6,267 Next plc 56,273 6,133 Smurfit Kappa
Group plc 113,627 5,959* InterContinental
Hotels Group plc 81,609 5,716 Bunzl plc 147,278 5,443* Ocado Group plc 213,474 5,269 Persimmon plc 140,881 5,249 St. James's Place
plc 225,963 4,881 Intertek Group plc 71,143 4,764* Informa plc 661,462 4,706 Burberry Group plc 177,478 4,691 Sage Group plc 469,439 4,566 Mondi plc (XLON) 181,650 4,536 United Utilities
Group plc 306,977 4,363 Kingfisher plc 932,947 4,282 Barratt
Developments plc 455,212 4,132 Melrose Industries
plc 1,914,925 4,132 Severn Trent plc 107,884 4,040* Whitbread plc 90,225 4,036 Admiral Group plc 95,499 3,751 Rightmove plc 392,296 3,708 Associated British
Foods plc 147,598 3,6103 Auto Trader Group
plc 428,219 3,550 DCC plc 42,404 3,538 Intermediate Capital
Group plc 117,511 3,525 Hargreaves
Lansdown plc 166,201 3,497* Meggitt plc 336,693 3,457 Taylor Wimpey plc 1,629,526 3,448 Smiths Group plc 181,329 3,367 Abrdn plc 961,934 3,344 DS Smith plc 635,971 3,336 Dechra
Pharmaceuticalsplc 47,415 3,315
B&M EuropeanValue Retail SA 377,625 3,272
Johnson Mattheyplc 85,203 3,184
Electrocomponentsplc 202,241 3,112
Howden JoineryGroup plc 245,526 3,091
Shares
MarketValue•
($000)
JD Sports Fashionplc 206,270 3,074
J Sainsbury plc 738,263 3,024 Antofagasta plc 152,216 2,969 M&G plc 1,076,813 2,942 Polymetal
International plc 158,778 2,935 Coca-Cola HBC AG 83,911 2,908 Land Securities
Group plc 306,461 2,879 Pearson plc 335,431 2,760 British Land Co. plc 398,998 2,694 Weir Group plc 112,692 2,673 Phoenix Group
Holdings plc 285,887 2,567 Berkeley Group
Holdings plc 42,900 2,559 AVEVA Group plc 52,384 2,551 Spectris plc 48,820 2,512 Royal Mail plc 435,743 2,512 IMI plc 110,066 2,458 Bellway plc 53,134 2,411* ITV plc 1,633,736 2,405 Hikma
Pharmaceuticalsplc 72,761 2,398
Tritax Big Box REITplc 774,570 2,384
Schroders plc 48,085 2,382 Direct Line
Insurance Groupplc 584,512 2,336
Evraz plc 272,365 2,313 Future plc 47,756 2,304 Genus plc 29,888 2,266* S4 Capital plc 223,781 2,222 Diploma plc 52,293 2,149* Centrica plc 2,557,963 2,112 Endeavour Mining
plc 81,695 2,068* Marks & Spencer
Group plc 816,218 2,052 Travis Perkins plc 96,996 2,051 UNITE Group plc 136,918 2,0443 ConvaTec Group plc 696,649 2,039 Derwent London plc 41,732 1,930 Man Group plc 602,045 1,912 Games Workshop
Group plc 14,201 1,876 Pennon Group plc 115,444 1,8413 Avast plc 240,042 1,837 Inchcape plc 159,524 1,800 Tate & Lyle plc 196,011 1,737 Rotork plc 354,321 1,713 Greggs plc 40,815 1,706 Grafton Group plc 90,134 1,656 Hiscox Ltd. 144,337 1,642*,3 Watches of
Switzerland Groupplc 103,313 1,604
IG Group Holdingsplc 147,724 1,603
3 Quilter plc 726,486 1,547 Vistry Group plc 91,594 1,534* Virgin Money UK plc 551,698 1,533 Big Yellow Group plc 72,739 1,471 Hays plc 649,216 1,471
Total World Stock Index Fund
107

Shares
MarketValue•
($000)*,3 Countryside
Properties plc 222,113 1,430* Beazley plc 266,712 1,419 Softcat plc 52,980 1,408* easyJet plc 164,717 1,404 Safestore Holdings
plc 84,248 1,385* Carnival plc 66,750 1,347* IWG plc 316,623 1,343 Pets at Home Group
plc 200,641 1,324* THG plc 446,430 1,323 HomeServe plc 112,181 1,310 Investec plc 287,905 1,304* SSP Group plc 367,526 1,295 Ultra Electronics
Holdings plc 29,155 1,292 Britvic plc 105,580 1,282 LondonMetric
Property plc 354,570 1,268*,2 TUI AG 377,831 1,265* Playtech plc 132,268 1,258 Savills plc 64,523 1,255 Grainger plc 296,423 1,247 Assura plc 1,227,370 1,224 Pagegroup plc 133,743 1,214*,3 Wizz Air Holdings
plc 19,034 1,204 Close Brothers
Group plc 61,081 1,203* WH Smith plc 55,162 1,181 OSB Group plc 170,035 1,173* Indivior plc 350,231 1,169 NEPI Rockcastle plc 171,962 1,150 Primary Health
Properties plc 545,449 1,146 Computacenter plc 31,121 1,144 Drax Group plc 155,931 1,134 Shaftesbury plc 130,797 1,116 Balfour Beatty plc 313,400 1,090* Dr. Martens plc 213,546 1,079* Ascential plc 194,524 1,074 Victrex plc 34,316 1,073 Great Portland
Estates plc 107,092 1,071 Fresnillo plc 89,975 1,059 Domino's Pizza
Group plc 193,552 1,025 IP Group plc 618,682 1,021 Renishaw plc 14,726 1,013 Cranswick plc 20,903 988* International
ConsolidatedAirlines Group SA 424,805 951
SpirentCommunicationsplc 235,750 926
Serco Group plc 522,804 903*,3 Trainline plc 204,156 887 Synthomer plc 127,561 884*,3 Network
InternationalHoldings plc 200,230 883
Genuit Group plc 96,632 877 QinetiQ Group plc 234,654 866 Dunelm Group plc 49,183 862 Capital & Counties
Properties plc 380,002 857
Shares
MarketValue•
($000)
Bodycote plc 78,066 855* John Wood Group
plc 284,282 829 Marshalls plc 85,531 8282 Hammerson plc 1,843,916 810 Paragon Banking
Group plc 107,879 809 Ashmore Group plc 172,551 797 Sirius Real Estate
Ltd. 431,025 796 Hill & Smith
Holdings plc 31,660 795 IntegraFin Holdings
plc 101,662 795 Sanne Group plc 63,220 782 Mondi plc 30,941 771 Redrow plc 86,450 761 Oxford Instruments
plc 23,958 754 Liontrust Asset
Management plc 25,212 752* National Express
Group plc 239,196 748* Firstgroup plc 534,615 735* Frasers Group plc 82,705 729 AJ Bell plc 126,788 711 TP ICAP Group plc 330,303 701* Helios Towers plc 331,314 700 Lancashire Holdings
Ltd. 100,797 696 Rathbone Brothers
plc 25,811 694* Mediclinic
International plc 150,351 688 Plus500 Ltd. 37,933 683*,3 Aston Martin
Lagonda GlobalHoldings plc 28,948 676
EuromoneyInstitutionalInvestor plc 47,168 675
Currys plc 398,061 662 Workspace Group
plc 57,989 652* Energean plc 52,887 650 Centamin plc 496,741 635* Auction Technology
Group plc 32,400 628 888 Holdings plc 119,822 627 Essentra plc 156,794 624* Just Group plc 494,999 619 Redde Northgate plc 112,792 614 Cairn Energy plc 239,345 598 Jupiter Fund
Management plc 173,949 596 Kainos Group plc 21,998 596* Mitie Group plc 656,581 590 Ferrexpo plc 135,795 579 Telecom Plus plc 33,610 574 Morgan Advanced
Materials plc 117,909 5573 Airtel Africa plc 370,714 556 Brewin Dolphin
Holdings plc 107,283 553 Chemring Group plc 138,188 551* Oxford Biomedica
plc 26,565 551
Total World Stock Index Fund
108

Shares
MarketValue•
($000)
Moneysupermarket.comGroup plc 189,375 550
Morgan SindallGroup plc 17,418 540
* Elementis plc 281,773 537 Clarkson plc 9,662 5293 Ibstock plc 192,672 526*,3 Biffa plc 95,913 524* Provident Financial
plc 103,065 521* Babcock
InternationalGroup plc 119,058 520
Vesuvius plc 80,313 518* C&C Group plc 146,342 518 Rhi Magnesita NV 11,261 517 Crest Nicholson
Holdings plc 104,048 508 Hilton Food Group
plc 30,853 493 FDM Group
Holdings plc 29,864 491 Coats Group plc 539,113 476* J D Wetherspoon
plc 33,815 475*,2 Petropavlovsk plc 1,458,327 473* Senior plc 213,364 468* Bytes Technology
Group plc (XLON) 63,791 467* Marston's plc 423,751 461* Capita plc 707,976 459 Premier Foods plc 294,034 441 BMO Commercial
Property Trust Ltd. 313,967 439 Bank of Georgia
Group plc 20,589 427* Harbour Energy plc 88,908 426 NCC Group plc 121,239 412* Greencore Group
plc 232,499 411*,3 Equiniti Group plc 168,093 410 XP Power Ltd. 5,694 4093 TI Fluid Systems plc
Class B 111,025 402* Mitchells & Butlers
plc 112,927 392* Tullow Oil plc 619,593 389 TBC Bank Group plc 17,851 383 Micro Focus
International plc 76,023 373*,3 Spire Healthcare
Group plc 113,405 366 UK Commercial
Property REIT Ltd. 349,353 363 Devro plc 121,917 360* Restaurant Group
plc 290,865 351 Helical plc 55,409 349*,2 Cineworld Group plc 400,731 336 AG Barr plc 48,232 327 Keller Group plc 25,893 326 PZ Cussons plc 110,790 325 Hochschild Mining
plc 158,826 3103 ContourGlobal plc 105,751 288*,3 Trustpilot Group plc 65,510 283* PureTech Health plc 58,134 280 Wickes Group plc 93,436 275
Shares
MarketValue•
($000)
Halfords Group plc 74,716 272 Avon Protection plc 9,861 262* Moonpig Group plc 56,409 258 Micro Focus
International plcADR 52,251 257
Picton PropertyIncome Ltd. 183,531 244
3 Vivo Energy plc 162,330 235 CLS Holdings plc 71,863 220*,2 TUI AG (XETR) 64,158 213* AO World plc 101,244 203* SIG plc 283,997 202* Go-Ahead Group plc 17,800 192* Stagecoach Group
plc 168,866 1843 CMC Markets plc 46,417 159*,2 Petrofac Ltd. (XLON) 86,220 153* Rank Group plc 60,828 137 Hunting plc 50,312 116 CRH plc 2,038 98*,3 Funding Circle
Holdings plc 42,016 903 Bakkavor Group plc 46,001 793 Alfa Financial
Software Holdingsplc 18,397 48
*,1,3 Finablr plc 58,416 9*,1,2 Intu Properties plc 184,897 —*,1 NMC Health plc 26,225 —*,1 Carillion plc 88,745 —
1,337,890United States (59.1%) Microsoft Corp. 3,277,002 1,086,719 Apple Inc. 6,829,774 1,023,100* Amazon.com Inc. 188,898 637,045* Tesla Inc. 347,018 386,578* Alphabet Inc.
Class A 128,895 381,648* Alphabet Inc.
Class C 124,249 368,449* Meta Platforms Inc.
Class A 1,042,553 337,339 NVIDIA Corp. 1,041,148 266,190 JPMorgan Chase &
Co. 1,290,804 219,295 UnitedHealth Group
Inc. 408,550 188,125 Johnson & Johnson 1,144,389 186,398* Berkshire Hathaway
Inc. Class B 644,709 185,038 Home Depot Inc. 461,644 171,612 Visa Inc. Class A 737,201 156,117 Bank of America
Corp. 3,215,226 153,624 Procter & Gamble
Co. 1,056,864 151,121* Adobe Inc. 207,422 134,899* Walt Disney Co. 789,734 133,520* Netflix Inc. 187,949 129,743 Mastercard Inc.
Class A 380,225 127,573* salesforce.com Inc. 401,601 120,356* PayPal Holdings Inc. 511,292 118,921 Exxon Mobil Corp. 1,840,299 118,644 Thermo Fisher
Scientific Inc. 170,881 108,180 Pfizer Inc. 2,429,388 106,261
Total World Stock Index Fund
109

Shares
MarketValue•
($000)
Cisco Systems Inc. 1,836,859 102,809 Comcast Corp.
Class A 1,982,697 101,970 Accenture plc
Class A 275,841 98,969 Abbott Laboratories 755,112 97,326 Merck & Co. Inc. 1,101,866 97,019 PepsiCo Inc. 598,780 96,763 Chevron Corp. 839,553 96,120 Verizon
CommunicationsInc. 1,795,244 95,130
Coca-Cola Co. 1,682,800 94,859 Costco Wholesale
Corp. 192,003 94,377 Eli Lilly & Co. 368,892 93,979 Walmart Inc. 622,729 93,048 Broadcom Inc. 173,766 92,386 Wells Fargo & Co. 1,799,928 92,084 NIKE Inc. Class B 537,843 89,976 AbbVie Inc. 768,875 88,167 Intel Corp. 1,757,027 86,094 Danaher Corp. 275,717 85,960 McDonald's Corp. 323,863 79,525 AT&T Inc. 3,103,438 78,393 Texas Instruments
Inc. 402,512 75,463 NextEra Energy Inc. 852,332 72,729 Lowe's Cos. Inc. 307,811 71,972 Linde plc 224,081 71,527 Oracle Corp. 731,903 70,219 Medtronic plc 584,108 70,011 Intuit Inc. 110,832 69,380 Union Pacific Corp. 282,873 68,286 United Parcel
Service Inc.Class B 314,794 67,199
HoneywellInternational Inc. 301,504 65,915
QUALCOMM Inc. 490,396 65,242 Philip Morris
International Inc. 676,297 63,937* Advanced Micro
Devices Inc. 526,895 63,349 Citigroup Inc. 880,000 60,861 Morgan Stanley 592,083 60,854* ServiceNow Inc. 85,718 59,811 Goldman Sachs
Group Inc. 143,917 59,488 BlackRock Inc. 62,111 58,599 Raytheon
TechnologiesCorp. 654,857 58,191
Bristol-MyersSquibb Co. 971,387 56,729
Target Corp. 216,432 56,190* Intuitive Surgical Inc. 154,634 55,843 American Tower
Corp. 195,956 55,254 Applied Materials
Inc. 398,599 54,469 Starbucks Corp. 511,936 54,301 Charles Schwab
Corp. 654,755 53,710 Amgen Inc. 247,197 51,162 CVS Health Corp. 572,304 51,095* Moderna Inc. 147,274 50,840 General Electric Co. 475,989 49,917
Shares
MarketValue•
($000)
S&P Global Inc. 104,804 49,694 Caterpillar Inc. 238,970 48,752 American Express
Co. 280,370 48,723 International
BusinessMachines Corp. 388,136 48,556
* Boeing Co. 233,348 48,310* Berkshire Hathaway
Inc. Class A 111 48,052 Anthem Inc. 106,787 46,466 Prologis Inc. 319,105 46,257 3M Co. 250,902 44,831 Zoetis Inc. 206,390 44,622* Square Inc. Class A 172,458 43,891 ConocoPhillips 588,132 43,810* Booking Holdings
Inc. 17,812 43,119 Deere & Co. 122,746 42,017 Automatic Data
Processing Inc. 184,924 41,514 Blackstone Inc. 296,374 41,024 Analog Devices Inc. 234,911 40,755 Stryker Corp. 151,537 40,319 PNC Financial
Services GroupInc. 184,021 38,834
* CharterCommunicationsInc. Class A 55,671 37,572
Chubb Ltd. 189,594 37,043 Truist Financial Corp. 582,332 36,961 Marsh & McLennan
Cos. Inc. 220,348 36,754 Mondelez
International Inc.Class A 604,896 36,741
CSX Corp. 985,042 35,629 Altria Group Inc. 805,817 35,545 Gilead Sciences Inc. 546,893 35,482 Lockheed Martin
Corp. 106,659 35,445 US Bancorp 583,662 35,236 Lam Research Corp. 62,047 34,968 TJX Cos. Inc. 526,390 34,473 CME Group Inc. 155,773 34,356 Duke Energy Corp. 332,772 33,946 Micron Technology
Inc. 490,972 33,926 Crown Castle
International Corp. 187,944 33,886 Sherwin-Williams
Co. 105,769 33,488 Intercontinental
Exchange Inc. 240,820 33,344 Equinix Inc. 39,110 32,738* General Motors Co. 598,494 32,576 Estee Lauder Cos.
Inc. Class A 99,700 32,336* Edwards
Lifesciences Corp. 269,334 32,272 Norfolk Southern
Corp. 107,166 31,405 Aon plc Class A
(XNYS) 97,088 31,060 Cigna Corp. 145,301 31,038 Illinois Tool Works
Inc. 135,806 30,946
Total World Stock Index Fund
110

Shares
MarketValue•
($000)* Uber Technologies
Inc. 702,786 30,796* Autodesk Inc. 95,882 30,453* Snowflake Inc.
Class A 85,185 30,142 Fidelity National
InformationServices Inc. 270,328 29,936
Becton Dickinsonand Co. 124,072 29,726
* T-Mobile US Inc. 256,754 29,534* Ford Motor Co. 1,710,812 29,221 Waste Management
Inc. 182,265 29,204 Capital One
Financial Corp. 192,846 29,126 Air Products and
Chemicals Inc. 95,740 28,704 Southern Co. 458,347 28,564 Eaton Corp. plc 173,112 28,522 Moody's Corp. 69,960 28,274* Regeneron
PharmaceuticalsInc. 43,956 28,129
Colgate-PalmoliveCo. 362,182 27,595
HCA Healthcare Inc. 109,713 27,479* Atlassian Corp. plc
Class A 59,379 27,203* Boston Scientific
Corp. 619,032 26,699* Illumina Inc. 63,897 26,521 Dominion Energy
Inc. 348,962 26,497 Activision Blizzard
Inc. 337,628 26,399* DexCom Inc. 41,992 26,170 Humana Inc. 56,126 25,995* Fiserv Inc. 259,779 25,586* Zoom Video
CommunicationsInc. Class A 93,025 25,549
FedEx Corp. 107,100 25,225 Emerson Electric
Co. 259,543 25,178 KLA Corp. 67,062 24,998* IDEXX Laboratories
Inc. 37,151 24,748 Marvell Technology
Inc. 354,000 24,249* Crowdstrike
Holdings Inc.Class A 85,974 24,227
Freeport-McMoRanInc. 639,055 24,105
Ecolab Inc. 108,262 24,058 Progressive Corp. 253,438 24,046* Workday Inc.
Class A 81,968 23,769 EOG Resources Inc. 254,653 23,545 Northrop Grumman
Corp. 65,189 23,287 MSCI Inc. Class A 34,943 23,233 NXP
SemiconductorsNV 115,549 23,209
* DocuSign Inc.Class A 83,322 23,188
Shares
MarketValue•
($000)* Lululemon Athletica
Inc. 49,671 23,147 Johnson Controls
International plc 311,375 22,846 Dollar General Corp. 102,558 22,719 Exelon Corp. 422,531 22,474 Roper Technologies
Inc. 45,399 22,149 American
InternationalGroup Inc. 374,271 22,116
* Synopsys Inc. 66,174 22,048* Cloudflare Inc.
Class A 112,072 21,823 Public Storage 65,656 21,810* Chipotle Mexican
Grill Inc. Class A 12,256 21,804 General Dynamics
Corp. 107,243 21,744 eBay Inc. 283,046 21,715* IQVIA Holdings Inc. 82,805 21,647* Align Technology
Inc. 34,510 21,547 IHS Markit Ltd. 163,479 21,370 T Rowe Price Group
Inc. 98,051 21,265* Palo Alto Networks
Inc. 41,533 21,144* Twilio Inc. Class A 72,491 21,121 Simon Property
Group Inc. 142,507 20,889 Agilent Technologies
Inc. 132,337 20,842 TE Connectivity Ltd. 142,755 20,842* Cadence Design
Systems Inc. 120,293 20,824* Vertex
PharmaceuticalsInc. 112,494 20,804
Bank of New YorkMellon Corp. 344,600 20,400
* Aptiv plc 117,338 20,287 L3Harris
Technologies Inc. 87,114 20,083 Carrier Global Corp. 379,637 19,828 Schlumberger NV 612,466 19,758 MetLife Inc. 314,157 19,729* Fortinet Inc. 58,521 19,683 Amphenol Corp.
Class A 253,248 19,442 Digital Realty Trust
Inc. 122,471 19,327 Xilinx Inc. 107,136 19,284 KKR & Co. Inc. 241,022 19,202* Marriott
International Inc.Class A 118,520 18,966
* Veeva Systems Inc.Class A 59,824 18,965
Kimberly-Clark Corp. 146,305 18,945 Trane Technologies
plc 103,917 18,802* O'Reilly Automotive
Inc. 29,740 18,508 Marathon Petroleum
Corp. 279,640 18,437 American Electric
Power Co. Inc. 217,300 18,407
Total World Stock Index Fund
111

Shares
MarketValue•
($000)
Global PaymentsInc. 128,307 18,347
* Palantir TechnologiesInc. Class A 708,697 18,341
Motorola SolutionsInc. 73,473 18,265
* Twitter Inc. 340,840 18,249 Dow Inc. 324,977 18,189 Prudential Financial
Inc. 164,570 18,111* Match Group Inc. 119,571 18,029* Centene Corp. 252,330 17,976 Cognizant
TechnologySolutions Corp.Class A 227,818 17,790
* SVB Financial Group 24,696 17,717 Pioneer Natural
Resources Co. 94,443 17,659 Travelers Cos. Inc. 108,836 17,510 Ross Stores Inc. 153,944 17,426 Microchip
Technology Inc. 234,620 17,383 Electronic Arts Inc. 123,939 17,382 Paychex Inc. 140,379 17,306* Spotify Technology
SA 59,794 17,304 Baxter International
Inc. 218,967 17,290* Biogen Inc. 64,562 17,217* Hilton Worldwide
Holdings Inc. 119,527 17,206 Sempra Energy
(XNYS) 132,708 16,938* Datadog Inc.
Class A 100,594 16,804 First Republic Bank 77,519 16,770* AutoZone Inc. 9,393 16,765 Parker-Hannifin
Corp. 55,974 16,601 PPG Industries Inc. 103,193 16,570 ResMed Inc. 62,623 16,464 General Mills Inc. 265,822 16,428 Sysco Corp. 212,853 16,368 Cintas Corp. 37,745 16,347 SBA
CommunicationsCorp. Class A 47,305 16,336
Yum! Brands Inc. 129,297 16,154 Rockwell
Automation Inc. 50,516 16,135* EPAM Systems Inc. 23,739 15,982 International Flavors
& Fragrances Inc. 107,819 15,898 HP Inc. 523,967 15,892 DuPont de Nemours
Inc. 227,905 15,862 Allstate Corp. 127,779 15,802* HubSpot Inc. 19,446 15,756 Archer-Daniels-
Midland Co. 244,867 15,730 State Street Corp. 158,972 15,667* Roku Inc. 50,498 15,397 Aflac Inc. 284,682 15,279* CBRE Group Inc.
Class A 146,154 15,212 Old Dominion
Freight Line Inc. 44,503 15,191
Shares
MarketValue•
($000)
Constellation BrandsInc. Class A 70,057 15,189
Cummins Inc. 62,889 15,083 Xcel Energy Inc. 233,359 15,073 Ameriprise Financial
Inc. 49,709 15,019 Arthur J Gallagher &
Co. 89,262 14,967 Otis Worldwide
Corp. 185,986 14,937 Williams Cos. Inc. 530,662 14,906* Mettler-Toledo
International Inc. 10,025 14,846 Discover Financial
Services 130,621 14,802 Welltower Inc. 183,991 14,793 Equifax Inc. 53,308 14,789* Keysight
Technologies Inc. 81,688 14,705* CoStar Group Inc. 170,312 14,655 Walgreens Boots
Alliance Inc. 311,192 14,632 Verisk Analytics Inc.
Class A 68,817 14,470* ANSYS Inc. 38,001 14,424 AvalonBay
Communities Inc. 60,822 14,395 Nucor Corp. 128,070 14,299 Phillips 66 191,168 14,296 Kinder Morgan Inc. 849,983 14,237* Copart Inc. 91,288 14,176 Fastenal Co. 248,072 14,160* TransDigm Group
Inc. 22,614 14,107* MongoDB Inc.
Class A 26,985 14,067 McKesson Corp. 67,523 14,037* Trade Desk Inc.
Class A 186,709 13,986 Valero Energy Corp. 180,106 13,928 Equity Residential 160,983 13,909* Etsy Inc. 55,419 13,893 Corteva Inc. 321,185 13,859 Public Service
Enterprise GroupInc. 216,983 13,844
WestPharmaceuticalServices Inc. 32,081 13,791
American WaterWorks Co. Inc. 79,109 13,779
* Monster BeverageCorp. 161,590 13,735
Alexandria RealEstate EquitiesInc. 67,179 13,714
Willis TowersWatson plc 55,724 13,501
* Enphase Energy Inc. 58,263 13,495 Best Buy Co. Inc. 110,204 13,471 Newmont Corp. 249,076 13,450* Okta Inc. 54,108 13,374* Generac Holdings
Inc. 26,820 13,371 PACCAR Inc. 147,847 13,250 AMETEK Inc. 100,007 13,241 Kroger Co. 329,249 13,177 DR Horton Inc. 147,187 13,139
Total World Stock Index Fund
112

Shares
MarketValue•
($000)
Fifth Third Bancorp 301,013 13,103* Dell Technologies
Class C 118,105 12,990 Zimmer Biomet
Holdings Inc. 90,407 12,939 Ball Corp. 139,072 12,722 Albemarle Corp. 50,762 12,714 Eversource Energy 149,669 12,707 Stanley Black &
Decker Inc. 70,160 12,610* Zebra Technologies
Corp. Class A 23,446 12,519 ONEOK Inc. 195,734 12,453 Occidental
Petroleum Corp. 369,910 12,403 WEC Energy Group
Inc. 137,189 12,355 Kansas City
Southern 39,784 12,343 Republic Services
Inc. Class A 91,653 12,337* Laboratory Corp. of
America Holdings 42,764 12,274* DoorDash Inc.
Class A 62,760 12,226* United Rentals Inc. 32,112 12,174* Paycom Software
Inc. 22,211 12,168 Lennar Corp.
Class A 121,090 12,101 Realty Income Corp. 168,770 12,055 Skyworks Solutions
Inc. 71,793 11,999 Devon Energy Corp. 295,148 11,830* Splunk Inc. 71,697 11,817* Gartner Inc. 35,493 11,780 Corning Inc. 328,493 11,685 Weyerhaeuser Co. 327,050 11,682 Synchrony Financial 248,463 11,541* Horizon
Therapeutics plc 96,065 11,519 Consolidated Edison
Inc. 152,414 11,492 Hershey Co. 65,006 11,399 Extra Space Storage
Inc. 57,640 11,376 Northern Trust Corp. 91,179 11,219 CDW Corp. 59,867 11,174 Vulcan Materials Co. 58,418 11,106 Hartford Financial
Services GroupInc. 151,446 11,045
* Dollar Tree Inc. 102,224 11,016 Tractor Supply Co. 50,332 10,931 Keurig Dr Pepper
Inc. 301,571 10,884* Arista Networks Inc. 26,463 10,842 Martin Marietta
Materials Inc. 27,592 10,839* Zscaler Inc. 33,933 10,820* Cheniere Energy
Inc. 104,068 10,761 Fortive Corp. 141,701 10,728* Pinterest Inc.
Class A 239,834 10,706 LyondellBasell
Industries NVClass A 115,334 10,705
Shares
MarketValue•
($000)* Liberty Broadband
Corp. Class C 65,883 10,703 Dover Corp. 62,929 10,640 Nasdaq Inc. 50,679 10,636* Peloton Interactive
Inc. Class A 116,237 10,629 Yum China Holdings
Inc. 185,308 10,577 Invitation Homes
Inc. 253,806 10,470 VF Corp. 142,781 10,406 Mid-America
ApartmentCommunities Inc. 50,809 10,376
Edison International 164,628 10,360 Xylem Inc. 79,272 10,352 Teradyne Inc. 74,780 10,338* Expedia Group Inc. 62,795 10,324 Monolithic Power
Systems Inc. 19,630 10,315* Seagen Inc. 58,496 10,315 Kraft Heinz Co. 287,170 10,307* Avantor Inc. 254,459 10,275* Carvana Co. Class A 33,689 10,214* Bill.Com Holdings
Inc. 34,405 10,126 Hess Corp. 122,523 10,117 Sun Communities
Inc. 51,505 10,094 Huntington
Bancshares Inc. 641,178 10,092 Tyson Foods Inc.
Class A 125,282 10,019 Regions Financial
Corp. 422,118 9,996* Teladoc Health Inc. 66,265 9,913* ICON plc 34,516 9,898* Waters Corp. 26,787 9,846* Charles River
LaboratoriesInternational Inc. 21,919 9,835
Halliburton Co. 393,505 9,834* Catalent Inc. 71,150 9,809* Caesars
EntertainmentInc. 89,609 9,809
* CarMax Inc. 71,577 9,800 PPL Corp. 339,372 9,774* Unity Software Inc. 64,513 9,761 KeyCorp. 418,332 9,735 Essex Property Trust
Inc. 28,503 9,689 Cerner Corp. 129,956 9,654 TransUnion 83,705 9,650* VeriSign Inc. 43,333 9,649* Trimble Inc. 109,535 9,570* Tyler Technologies
Inc. 17,608 9,565 Ameren Corp. 113,182 9,540* Ingersoll Rand Inc. 176,857 9,508 Garmin Ltd. 65,677 9,431 Church & Dwight
Co. Inc. 107,823 9,419 DTE Energy Co. 83,092 9,418 WW Grainger Inc. 20,287 9,395 Duke Realty Corp. 164,871 9,272 ViacomCBS Inc.
Class B 255,172 9,242
Total World Stock Index Fund
113

Shares
MarketValue•
($000)
FirstEnergy Corp. 239,219 9,217 Ventas Inc. 171,951 9,177 Expeditors
International ofWashington Inc. 73,870 9,105
Broadridge FinancialSolutions Inc. 50,902 9,081
* TeledyneTechnologies Inc. 20,153 9,053
* Take-Two InteractiveSoftware Inc. 50,009 9,052
Entergy Corp. 87,763 9,041* Insulet Corp. 29,152 9,038 Bio-Techne Corp. 17,069 8,938* FleetCor
Technologies Inc. 35,981 8,902* ON Semiconductor
Corp. 185,144 8,900 PerkinElmer Inc. 50,141 8,869 Citizens Financial
Group Inc. 186,953 8,858 Cooper Cos. Inc. 21,214 8,845 McCormick & Co.
Inc. 110,218 8,843 Pool Corp. 17,124 8,822 STERIS plc 37,709 8,814 Clorox Co. 53,813 8,772 NetApp Inc. 97,406 8,698* RingCentral Inc.
Class A 35,559 8,669* Ulta Beauty Inc. 23,380 8,589 International Paper
Co. 171,449 8,516 Diamondback
Energy Inc. 79,385 8,509* Plug Power Inc. 221,393 8,473 Healthpeak
Properties Inc. 236,927 8,413* Carnival Corp. 377,514 8,366 Entegris Inc. 59,086 8,318 Hewlett Packard
Enterprise Co. 567,441 8,313 MGM Resorts
International 176,274 8,313* Alnylam
PharmaceuticalsInc. 51,895 8,280
M&T Bank Corp. 56,257 8,277* Royal Caribbean
Cruises Ltd. 98,035 8,277* Burlington Stores
Inc. 29,761 8,223 Darden Restaurants
Inc. 56,932 8,206*,2 Wayfair Inc. Class A 32,911 8,198* Qorvo Inc. 48,530 8,164 Baker Hughes Co.
Class A 323,460 8,112 Genuine Parts Co. 61,680 8,087* SolarEdge
Technologies Inc. 22,737 8,064 AmerisourceBergen
Corp. Class A 66,066 8,061* Hologic Inc. 109,493 8,027 Raymond James
Financial Inc. 81,417 8,027 Jacobs Engineering
Group Inc. 56,738 7,967
Shares
MarketValue•
($000)
Cincinnati FinancialCorp. 65,550 7,960
Avery DennisonCorp. 36,414 7,928
*,2 AMC EntertainmentHoldings Inc.Class A 223,070 7,890
Celanese Corp.Class A 48,802 7,882
VICI Properties Inc. 267,085 7,839 Quest Diagnostics
Inc. 53,382 7,835 Principal Financial
Group Inc. 116,770 7,834 Domino's Pizza Inc. 16,019 7,833 Boston Properties
Inc. 68,914 7,831* Zillow Group Inc.
Class C 75,145 7,787 Signature Bank 26,112 7,777* Markel Corp. 5,907 7,757* PG&E Corp. 664,527 7,709 SS&C Technologies
Holdings Inc. 96,748 7,689 CMS Energy Corp. 126,198 7,616 Seagate Technology
Holdings plc 85,417 7,608 IDEX Corp. 34,066 7,582 Ally Financial Inc. 158,503 7,567* Akamai Technologies
Inc. 71,314 7,521* Molina Healthcare
Inc. 25,352 7,497* Bio-Rad
Laboratories Inc.Class A 9,427 7,491
Textron Inc. 100,125 7,394 Bath & Body Works
Inc. 106,889 7,385 FactSet Research
Systems Inc. 16,621 7,378 Quanta Services
Inc. 60,662 7,357 AES Corp. 292,630 7,354 Coterra Energy Inc. 343,875 7,331 Teleflex Inc. 20,515 7,323* Coupa Software Inc. 32,133 7,317 UDR Inc. 131,552 7,305 JB Hunt Transport
Services Inc. 36,995 7,295 Westinghouse Air
BrakeTechnologiesCorp. 79,419 7,206
* Ceridian HCMHolding Inc. 57,255 7,171
* Exact SciencesCorp. 75,079 7,149
Masco Corp. 108,077 7,084 Viatris Inc. 529,271 7,066 Camden Property
Trust 43,253 7,055* Western Digital
Corp. 134,462 7,031* Repligen Corp. 23,990 6,969* Arch Capital Group
Ltd. 166,482 6,962* NVR Inc. 1,407 6,887
Total World Stock Index Fund
114

Shares
MarketValue•
($000)
CenterPoint EnergyInc. 261,857 6,819
MarketAxessHoldings Inc. 16,670 6,813
Kellogg Co. 110,409 6,768* Avalara Inc. 37,409 6,720 Conagra Brands Inc. 207,266 6,674* Dynatrace Inc. 88,086 6,606* Nuance
CommunicationsInc. 119,979 6,605
* LKQ Corp. 119,516 6,583 Cognex Corp. 75,025 6,571 Equity LifeStyle
Properties Inc. 77,606 6,558 Advance Auto Parts
Inc. 28,955 6,530 Brown & Brown Inc. 103,284 6,518* ABIOMED Inc. 19,456 6,460 Nordson Corp. 25,308 6,434 Evergy Inc. 100,874 6,431* Elanco Animal
Health Inc. (XNYS) 194,986 6,411 Omnicom Group
Inc. 93,703 6,379* BioMarin
PharmaceuticalInc. 80,223 6,356
* Upstart HoldingsInc. 19,652 6,329
Mosaic Co. 152,022 6,320 Interpublic Group of
Cos. Inc. 172,774 6,318 Leidos Holdings Inc. 62,450 6,244 Williams-Sonoma
Inc. 33,600 6,241 Cboe Global
Markets Inc. 47,286 6,239 Alliant Energy Corp. 110,228 6,236* Masimo Corp. 21,989 6,235* Wolfspeed Inc. 51,858 6,229 Eastman Chemical
Co. 59,837 6,225 Fortune Brands
Home & SecurityInc. 60,982 6,184
* DraftKings Inc.Class A 132,640 6,180
NortonLifeLock Inc. 242,676 6,176* Floor & Decor
Holdings Inc.Class A 44,756 6,083
Cardinal Health Inc. 126,931 6,069 Vail Resorts Inc. 17,592 6,064 WP Carey Inc. 78,486 6,052* Darling Ingredients
Inc. 70,947 5,996 Apollo Global
Management Inc.Class A 77,885 5,993
* Live NationEntertainmentInc. 58,918 5,960
* PTC Inc. 46,667 5,943 Lincoln National
Corp. 82,309 5,939* 10X Genomics Inc.
Class A 36,438 5,876
Shares
MarketValue•
($000)
Lumen TechnologiesInc. 492,283 5,838
* Lyft Inc. Class A 126,530 5,804* First Solar Inc. 48,429 5,792 LPL Financial
Holdings Inc. 35,244 5,781 Iron Mountain Inc. 126,485 5,773 Crown Holdings Inc. 55,506 5,772 Fidelity National
Financial Inc. 119,694 5,735 Graco Inc. 76,117 5,722 J M Smucker Co. 46,219 5,678 Marathon Oil Corp. 347,771 5,676 Whirlpool Corp. 26,892 5,670 CH Robinson
Worldwide Inc. 58,413 5,665* Globant SA 17,722 5,657 DENTSPLY SIRONA
Inc. 98,806 5,653 Royalty Pharma plc
Class A 142,827 5,646* Jones Lang LaSalle
Inc. 21,837 5,639 Bunge Ltd. 60,827 5,635* Las Vegas Sands
Corp. 145,180 5,634 Steel Dynamics Inc. 85,157 5,627 Westrock Co. 116,952 5,625* F5 Networks Inc. 26,615 5,620 Kimco Realty Corp. 248,675 5,620 Medical Properties
Trust Inc. 263,104 5,612* Check Point
SoftwareTechnologies Ltd. 46,332 5,541
Brown-FormanCorp. Class B 81,569 5,538
Packaging Corp. ofAmerica 40,277 5,533
Equitable HoldingsInc. 163,740 5,485
PulteGroup Inc. 113,336 5,449 Targa Resources
Corp. 99,677 5,449* Incyte Corp. 81,196 5,439* Farfetch Ltd. Class A 138,011 5,411 CF Industries
Holdings Inc. 95,240 5,410* Trex Co. Inc. 50,846 5,410 Hasbro Inc. 56,486 5,409 Jack Henry &
Associates Inc. 32,442 5,401 Pentair plc 72,713 5,379* Zendesk Inc. 52,481 5,343 Robert Half
International Inc. 47,174 5,334 FMC Corp. 58,428 5,318 Newmont Corp.
(XNYS) 98,329 5,309 Atmos Energy Corp. 57,470 5,294 Hormel Foods Corp. 125,044 5,292* Host Hotels &
Resorts Inc. 313,871 5,282* Builders FirstSource
Inc. 90,359 5,265 Annaly Capital
Management Inc. 618,184 5,230* Elastic NV 30,058 5,215
Total World Stock Index Fund
115
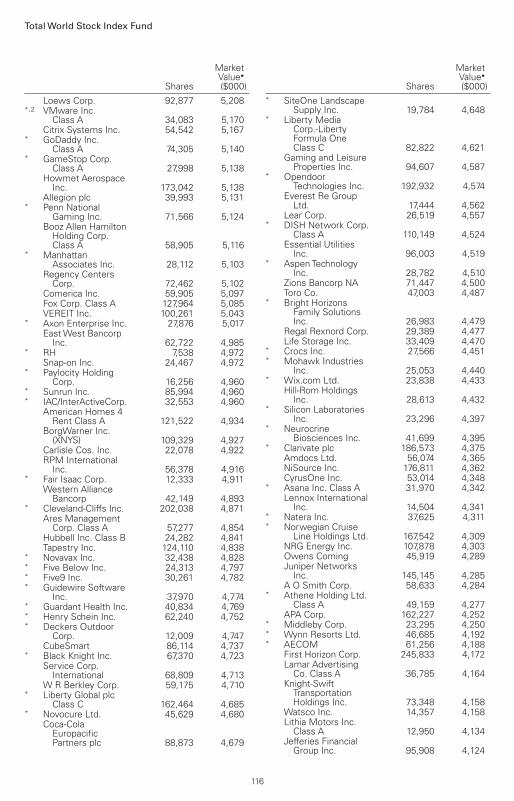
Shares
MarketValue•
($000)
Loews Corp. 92,877 5,208*,2 VMware Inc.
Class A 34,083 5,170 Citrix Systems Inc. 54,542 5,167* GoDaddy Inc.
Class A 74,305 5,140* GameStop Corp.
Class A 27,998 5,138 Howmet Aerospace
Inc. 173,042 5,138 Allegion plc 39,993 5,131* Penn National
Gaming Inc. 71,566 5,124 Booz Allen Hamilton
Holding Corp.Class A 58,905 5,116
* ManhattanAssociates Inc. 28,112 5,103
Regency CentersCorp. 72,462 5,102
Comerica Inc. 59,905 5,097 Fox Corp. Class A 127,964 5,085 VEREIT Inc. 100,261 5,043* Axon Enterprise Inc. 27,876 5,017 East West Bancorp
Inc. 62,722 4,985* RH 7,538 4,972 Snap-on Inc. 24,467 4,972* Paylocity Holding
Corp. 16,256 4,960* Sunrun Inc. 85,994 4,960* IAC/InterActiveCorp. 32,553 4,960 American Homes 4
Rent Class A 121,522 4,934 BorgWarner Inc.
(XNYS) 109,329 4,927 Carlisle Cos. Inc. 22,078 4,922 RPM International
Inc. 56,378 4,916* Fair Isaac Corp. 12,333 4,911 Western Alliance
Bancorp 42,149 4,893* Cleveland-Cliffs Inc. 202,038 4,871 Ares Management
Corp. Class A 57,277 4,854 Hubbell Inc. Class B 24,282 4,841 Tapestry Inc. 124,110 4,838* Novavax Inc. 32,438 4,828* Five Below Inc. 24,313 4,797* Five9 Inc. 30,261 4,782* Guidewire Software
Inc. 37,970 4,774* Guardant Health Inc. 40,834 4,769* Henry Schein Inc. 62,240 4,752* Deckers Outdoor
Corp. 12,009 4,747 CubeSmart 86,114 4,737* Black Knight Inc. 67,370 4,723 Service Corp.
International 68,809 4,713 W R Berkley Corp. 59,175 4,710* Liberty Global plc
Class C 162,464 4,685* Novocure Ltd. 45,629 4,680 Coca-Cola
EuropacificPartners plc 88,873 4,679
Shares
MarketValue•
($000)* SiteOne Landscape
Supply Inc. 19,784 4,648* Liberty Media
Corp.-LibertyFormula OneClass C 82,822 4,621
Gaming and LeisureProperties Inc. 94,607 4,587
* OpendoorTechnologies Inc. 192,932 4,574
Everest Re GroupLtd. 17,444 4,562
Lear Corp. 26,519 4,557* DISH Network Corp.
Class A 110,149 4,524 Essential Utilities
Inc. 96,003 4,519* Aspen Technology
Inc. 28,782 4,510 Zions Bancorp NA 71,447 4,500 Toro Co. 47,003 4,487* Bright Horizons
Family SolutionsInc. 26,983 4,479
Regal Rexnord Corp. 29,389 4,477 Life Storage Inc. 33,409 4,470* Crocs Inc. 27,566 4,451* Mohawk Industries
Inc. 25,053 4,440* Wix.com Ltd. 23,838 4,433 Hill-Rom Holdings
Inc. 28,613 4,432* Silicon Laboratories
Inc. 23,296 4,397* Neurocrine
Biosciences Inc. 41,699 4,395* Clarivate plc 186,573 4,375 Amdocs Ltd. 56,074 4,365 NiSource Inc. 176,811 4,362 CyrusOne Inc. 53,014 4,348* Asana Inc. Class A 31,970 4,342 Lennox International
Inc. 14,504 4,341* Natera Inc. 37,625 4,311* Norwegian Cruise
Line Holdings Ltd. 167,542 4,309 NRG Energy Inc. 107,878 4,303 Owens Corning 45,919 4,289 Juniper Networks
Inc. 145,145 4,285 A O Smith Corp. 58,633 4,284* Athene Holding Ltd.
Class A 49,159 4,277 APA Corp. 162,227 4,252* Middleby Corp. 23,295 4,250* Wynn Resorts Ltd. 46,685 4,192* AECOM 61,256 4,188 First Horizon Corp. 245,833 4,172 Lamar Advertising
Co. Class A 36,785 4,164 Knight-Swift
TransportationHoldings Inc. 73,348 4,158
Watsco Inc. 14,357 4,158 Lithia Motors Inc.
Class A 12,950 4,134 Jefferies Financial
Group Inc. 95,908 4,124
Total World Stock Index Fund
116

Shares
MarketValue•
($000)
Reliance Steel &Aluminum Co. 28,111 4,109
News Corp. Class A 179,233 4,104 Tradeweb Markets
Inc. Class A 45,931 4,092 Cable One Inc. 2,389 4,088 Universal Health
Services Inc.Class B 32,718 4,060
* Syneos Health Inc. 43,464 4,057 Vistra Corp. 206,669 4,049* Acceleron Pharma
Inc. 23,224 4,045 Assurant Inc. 25,013 4,035 Tetra Tech Inc. 22,964 4,034 Genpact Ltd. 81,578 4,026* Intellia Therapeutics
Inc. 30,088 4,001 Organon & Co. 108,814 3,999* Lattice
SemiconductorCorp. 57,444 3,989
Federal RealtyInvestment Trust 33,127 3,987
Rexford IndustrialRealty Inc. 59,098 3,971
Credicorp Ltd. 30,580 3,965* Penumbra Inc. 14,248 3,940* Dropbox Inc.
Class A 128,696 3,924 Carlyle Group Inc. 69,651 3,911 MKS Instruments
Inc. 26,043 3,908 Globe Life Inc. 43,866 3,905 Alcoa Corp. 84,739 3,894* XPO Logistics Inc. 45,390 3,894 Jabil Inc. 64,670 3,878* GXO Logistics Inc. 43,608 3,872* Anaplan Inc. 59,303 3,867 Sealed Air Corp. 65,138 3,864 UGI Corp. 88,925 3,860 Newell Brands Inc. 168,331 3,853* Sensata
TechnologiesHolding plc 69,893 3,851
STORE Capital Corp. 111,928 3,842 New York Times Co.
Class A 70,038 3,823 Franklin Resources
Inc. 121,370 3,822 American Financial
Group Inc. 28,028 3,813 Autoliv Inc. 39,161 3,793 Churchill Downs Inc. 16,476 3,789* Alleghany Corp. 5,799 3,777 Invesco Ltd. 148,562 3,775* Discovery Inc.
Class C 167,188 3,772 Aramark 103,255 3,767* Chegg Inc. 63,286 3,762 Tempur Sealy
International Inc. 84,526 3,759* Avis Budget Group
Inc. 21,675 3,757 Gentex Corp. 106,086 3,754* Ciena Corp. 69,024 3,747* United Therapeutics
Corp. 19,500 3,720
Shares
MarketValue•
($000)* Arrow Electronics
Inc. 32,110 3,717* Berry Global Group
Inc. 56,292 3,689 Huntington Ingalls
Industries Inc. 18,196 3,689 HEICO Corp. 26,436 3,685 Lamb Weston
Holdings Inc. 64,616 3,648* Flex Ltd. 215,831 3,648 Brooks Automation
Inc. 31,262 3,640 ITT Inc. 38,690 3,640 Universal Display
Corp. 19,809 3,629 EastGroup
Properties Inc. 18,254 3,610 AGNC Investment
Corp. 225,804 3,595* YETI Holdings Inc. 36,350 3,574* Saia Inc. 11,390 3,561 Olin Corp. 62,433 3,557* Tandem Diabetes
Care Inc. 26,065 3,553 Apartment Income
REIT Corp. 66,258 3,552 Wyndham Hotels &
Resorts Inc. 41,939 3,543* Smartsheet Inc.
Class A 51,134 3,529 Bruker Corp. 43,865 3,522* TopBuild Corp. 13,652 3,508 Lincoln Electric
Holdings Inc. 24,604 3,504* Omnicell Inc. 19,621 3,495* Jazz
Pharmaceuticalsplc 26,267 3,495
First IndustrialRealty Trust Inc. 59,920 3,489
Macy's Inc. 131,372 3,477 Reinsurance Group
of America Inc. 29,346 3,465* DXC Technology Co. 106,303 3,462 HEICO Corp.
Class A 27,543 3,462* Capri Holdings Ltd. 64,776 3,449 American Campus
Communities Inc. 64,108 3,444 AptarGroup Inc. 28,459 3,437 Janus Henderson
Group plc 73,324 3,410 National Retail
Properties Inc. 74,908 3,398 Rollins Inc. 96,383 3,396* IAA Inc. 56,892 3,394 Molson Coors
Beverage Co.Class B 76,806 3,386
Voya Financial Inc. 48,537 3,386* Zynga Inc. Class A 457,875 3,379* BJ's Wholesale Club
Holdings Inc. 57,568 3,364 Kilroy Realty Corp. 49,842 3,358 Commerce
Bancshares Inc. 47,569 3,354 Campbell Soup Co. 83,941 3,353* Digital Turbine Inc. 38,912 3,349
Total World Stock Index Fund
117
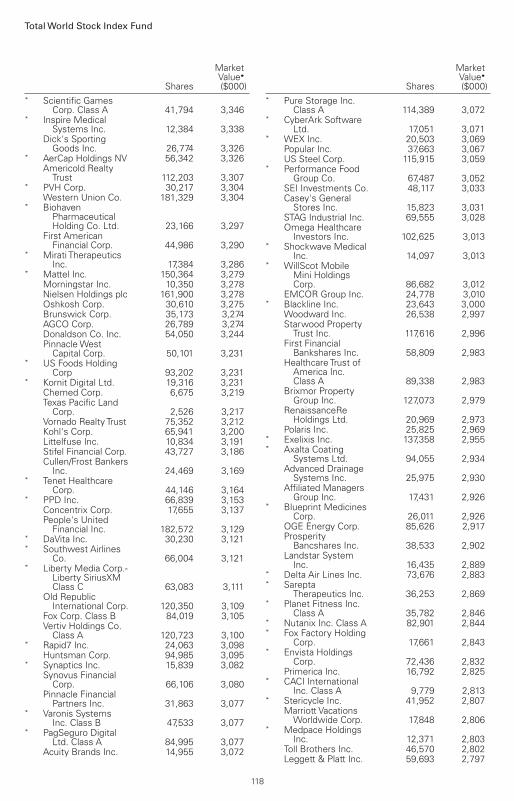
Shares
MarketValue•
($000)* Scientific Games
Corp. Class A 41,794 3,346* Inspire Medical
Systems Inc. 12,384 3,338 Dick's Sporting
Goods Inc. 26,774 3,326* AerCap Holdings NV 56,342 3,326 Americold Realty
Trust 112,203 3,307* PVH Corp. 30,217 3,304 Western Union Co. 181,329 3,304* Biohaven
PharmaceuticalHolding Co. Ltd. 23,166 3,297
First AmericanFinancial Corp. 44,986 3,290
* Mirati TherapeuticsInc. 17,384 3,286
* Mattel Inc. 150,364 3,279 Morningstar Inc. 10,350 3,278 Nielsen Holdings plc 161,900 3,278 Oshkosh Corp. 30,610 3,275 Brunswick Corp. 35,173 3,274 AGCO Corp. 26,789 3,274 Donaldson Co. Inc. 54,050 3,244 Pinnacle West
Capital Corp. 50,101 3,231* US Foods Holding
Corp 93,202 3,231* Kornit Digital Ltd. 19,316 3,231 Chemed Corp. 6,675 3,219 Texas Pacific Land
Corp. 2,526 3,217 Vornado Realty Trust 75,352 3,212 Kohl's Corp. 65,941 3,200 Littelfuse Inc. 10,834 3,191 Stifel Financial Corp. 43,727 3,186 Cullen/Frost Bankers
Inc. 24,469 3,169* Tenet Healthcare
Corp. 44,146 3,164* PPD Inc. 66,839 3,153 Concentrix Corp. 17,655 3,137 People's United
Financial Inc. 182,572 3,129* DaVita Inc. 30,230 3,121* Southwest Airlines
Co. 66,004 3,121* Liberty Media Corp.-
Liberty SiriusXMClass C 63,083 3,111
Old RepublicInternational Corp. 120,350 3,109
Fox Corp. Class B 84,019 3,105 Vertiv Holdings Co.
Class A 120,723 3,100* Rapid7 Inc. 24,063 3,098 Huntsman Corp. 94,985 3,095* Synaptics Inc. 15,839 3,082 Synovus Financial
Corp. 66,106 3,080 Pinnacle Financial
Partners Inc. 31,863 3,077* Varonis Systems
Inc. Class B 47,533 3,077* PagSeguro Digital
Ltd. Class A 84,995 3,077 Acuity Brands Inc. 14,955 3,072
Shares
MarketValue•
($000)* Pure Storage Inc.
Class A 114,389 3,072* CyberArk Software
Ltd. 17,051 3,071* WEX Inc. 20,503 3,069 Popular Inc. 37,663 3,067 US Steel Corp. 115,915 3,059* Performance Food
Group Co. 67,487 3,052 SEI Investments Co. 48,117 3,033 Casey's General
Stores Inc. 15,823 3,031 STAG Industrial Inc. 69,555 3,028 Omega Healthcare
Investors Inc. 102,625 3,013* Shockwave Medical
Inc. 14,097 3,013* WillScot Mobile
Mini HoldingsCorp. 86,682 3,012
EMCOR Group Inc. 24,778 3,010* Blackline Inc. 23,643 3,000 Woodward Inc. 26,538 2,997 Starwood Property
Trust Inc. 117,616 2,996 First Financial
Bankshares Inc. 58,809 2,983 Healthcare Trust of
America Inc.Class A 89,338 2,983
Brixmor PropertyGroup Inc. 127,073 2,979
RenaissanceReHoldings Ltd. 20,969 2,973
Polaris Inc. 25,825 2,969* Exelixis Inc. 137,358 2,955* Axalta Coating
Systems Ltd. 94,055 2,934 Advanced Drainage
Systems Inc. 25,975 2,930 Affiliated Managers
Group Inc. 17,431 2,926* Blueprint Medicines
Corp. 26,011 2,926 OGE Energy Corp. 85,626 2,917 Prosperity
Bancshares Inc. 38,533 2,902 Landstar System
Inc. 16,435 2,889* Delta Air Lines Inc. 73,676 2,883* Sarepta
Therapeutics Inc. 36,253 2,869* Planet Fitness Inc.
Class A 35,782 2,846* Nutanix Inc. Class A 82,901 2,844* Fox Factory Holding
Corp. 17,661 2,843* Envista Holdings
Corp. 72,436 2,832 Primerica Inc. 16,792 2,825* CACI International
Inc. Class A 9,779 2,813* Stericycle Inc. 41,952 2,807 Marriott Vacations
Worldwide Corp. 17,848 2,806* Medpace Holdings
Inc. 12,371 2,803 Toll Brothers Inc. 46,570 2,802 Leggett & Platt Inc. 59,693 2,797
Total World Stock Index Fund
118

Shares
MarketValue•
($000)
AMERCO 3,790 2,793* Chart Industries Inc. 15,733 2,793* RBC Bearings Inc. 11,923 2,789 Royal Gold Inc. 28,168 2,789* Freshpet Inc. 17,823 2,779 Perrigo Co. plc 61,532 2,778* Arrowhead
PharmaceuticalsInc. 43,505 2,776
* Workiva Inc. Class A 18,510 2,768 Texas Roadhouse
Inc. Class A 31,126 2,764 Eagle Materials Inc. 18,499 2,745 Ingredion Inc. 28,787 2,741* Colfax Corp. 52,870 2,729* Everbridge Inc. 16,999 2,708* II-VI Inc. 44,675 2,703 Chesapeake Energy
Corp. 42,189 2,689* Teradata Corp. 47,375 2,680 CoreSite Realty
Corp. 18,781 2,676* Coherent Inc. 10,507 2,673* ASGN Inc. 22,315 2,670* Ambarella Inc. 14,342 2,665* Lumentum Holdings
Inc. 32,160 2,656 Valvoline Inc. 77,903 2,646 Ovintiv Inc. 70,469 2,644* Skechers USA Inc.
Class A 57,172 2,642 MDU Resources
Group Inc. 85,371 2,623* CRISPR
Therapeutics AG 28,725 2,623* EQT Corp. 131,427 2,617 Glacier Bancorp Inc. 47,286 2,614 Power Integrations
Inc. 25,209 2,602* Novanta Inc. 15,047 2,597 Nexstar Media
Group Inc.Class A 17,306 2,595
Ralph Lauren Corp.Class A 20,342 2,587
Encompass HealthCorp. 40,557 2,578
Scotts Miracle-GroCo. 17,363 2,578
* AutoNation Inc. 21,279 2,577 MSA Safety Inc. 16,831 2,576* NOV Inc. 183,476 2,572 KBR Inc. 60,440 2,565* Goodyear Tire &
Rubber Co. 133,830 2,559* Globus Medical Inc.
Class A 33,143 2,558* QuantumScape
Corp. Class A 88,369 2,557 Innovative Industrial
Properties Inc. 9,665 2,543 nVent Electric plc 71,430 2,532 BWX Technologies
Inc. 44,369 2,518 Cousins Properties
Inc. 63,579 2,518 Dolby Laboratories
Inc. Class A 28,337 2,504
Shares
MarketValue•
($000)* Zillow Group Inc.
Class A 23,645 2,500 Houlihan Lokey Inc.
Class A 22,276 2,497 Exponent Inc. 21,727 2,494 Spirit Realty Capital
Inc. 50,963 2,494 Hanesbrands Inc. 145,880 2,486 MGIC Investment
Corp. 152,307 2,461 Vontier Corp. 72,748 2,461* WESCO
International Inc. 18,990 2,460* Semtech Corp. 28,900 2,457* Sprout Social Inc.
Class A 19,184 2,449* Clean Harbors Inc. 21,752 2,448* MicroStrategy Inc.
Class A 3,424 2,448 Interactive Brokers
Group Inc.Class A 34,456 2,441
* Range ResourcesCorp. 104,572 2,439
* Post Holdings Inc. 24,011 2,437 Curtiss-Wright Corp. 19,082 2,436* Ziff Davis Inc. 18,979 2,434* IPG Photonics Corp. 15,280 2,430* Antero Resources
Corp. 122,191 2,428* Euronet Worldwide
Inc. 21,592 2,422 National
Instruments Corp. 56,952 2,419 Graphic Packaging
Holding Co. 121,271 2,417* STAAR Surgical Co. 20,401 2,417 Valley National
Bancorp 182,157 2,415 Evercore Inc.
Class A 15,885 2,412* Amedisys Inc. 14,222 2,408 New York
CommunityBancorp Inc. 193,516 2,405
*,2 Beyond Meat Inc. 24,244 2,400* Bridgebio Pharma
Inc. 48,511 2,395 Louisiana-Pacific
Corp. 40,496 2,386 Essent Group Ltd. 49,660 2,384* Upwork Inc. 50,189 2,365 Thor Industries Inc. 23,179 2,363* Twist Bioscience
Corp. 19,870 2,361 Harley-Davidson Inc. 64,632 2,358 PacWest Bancorp 49,667 2,358* Cadence Bank 81,181 2,356* Acadia Healthcare
Co. Inc. 37,978 2,355* HealthEquity Inc. 35,577 2,354* Terminix Global
Holdings Inc. 58,152 2,354 Bank OZK 52,664 2,353 Sonoco Products
Co. 40,510 2,348 SLM Corp. 127,877 2,347 CDK Global Inc. 53,861 2,344
Total World Stock Index Fund
119

Shares
MarketValue•
($000)* Helen of Troy Ltd. 10,407 2,3412 Sirius XM Holdings
Inc. 382,519 2,330* Invitae Corp. 87,679 2,323 OneMain Holdings
Inc. 43,816 2,314* Ultragenyx
PharmaceuticalInc. 27,476 2,306
* Change HealthcareInc. 106,966 2,303
* SPS Commerce Inc. 15,004 2,292* Halozyme
Therapeutics Inc. 60,154 2,290* ICU Medical Inc. 9,775 2,289* Fastly Inc. Class A 45,111 2,283* ChampionX Corp. 86,612 2,272* Redfin Corp. 44,178 2,268* Credit Acceptance
Corp. 3,776 2,259 UFP Industries Inc. 27,593 2,258 Element Solutions
Inc. 99,321 2,256 ManpowerGroup
Inc. 23,342 2,256 Sterling Bancorp 88,360 2,249 Science Applications
International Corp. 25,034 2,248* Boyd Gaming Corp. 35,213 2,246 Armstrong World
Industries Inc. 21,197 2,239 Ashland Global
Holdings Inc. 23,302 2,237 Douglas Emmett
Inc. 68,437 2,237* Fiverr International
Ltd. 13,133 2,237 Unum Group 87,585 2,231 Lazard Ltd. Class A 45,428 2,226 Watts Water
Technologies Inc.Class A 11,705 2,224
* NeoGenomics Inc. 48,318 2,223* Celsius Holdings
Inc. 23,006 2,221 Southern Copper
Corp. 36,743 2,204 SouthState Corp. 28,084 2,193* NCR Corp. 55,385 2,190 Crane Co. 21,130 2,182 Rayonier Inc. 58,395 2,180 PDC Energy Inc. 41,646 2,179 Webster Financial
Corp. 38,666 2,164 Terreno Realty Corp. 29,553 2,161* MasTec Inc. 24,197 2,157* Pacific Biosciences
of California Inc. 81,334 2,154 Simpson
Manufacturing Co.Inc. 20,287 2,152
* Herbalife NutritionLtd. 46,379 2,152
Wintrust FinancialCorp. 24,254 2,146
Valmont IndustriesInc. 8,964 2,142
Shares
MarketValue•
($000)* Liberty Media Corp.-
Liberty SiriusXMClass A 42,874 2,134
* Marathon DigitalHoldings Inc. 40,811 2,132
Pegasystems Inc. 17,933 2,129 RLI Corp. 19,634 2,127 Umpqua Holdings
Corp. 104,025 2,127* Quidel Corp. 16,002 2,125 CIT Group Inc. 42,888 2,124 First Citizens
BancShares Inc.Class A 2,589 2,107
IDACORP Inc. 20,194 2,107 Maximus Inc. 24,762 2,094* Tenable Holdings
Inc. 39,309 2,093* Iridium
CommunicationsInc. 51,502 2,088
Wingstop Inc. 11,975 2,065 Albertsons Cos. Inc.
Class A 66,654 2,063 Agree Realty Corp. 29,012 2,062* Integra LifeSciences
Holdings Corp. 30,999 2,060 Healthcare Realty
Trust Inc. 62,233 2,057* National Vision
Holdings Inc. 33,335 2,055* Oak Street Health
Inc. 43,464 2,053 Travel + Leisure Co. 37,692 2,048* Vimeo Inc. 60,576 2,043* MaxLinear Inc. 32,401 2,041 UMB Financial Corp. 20,653 2,041* Hexcel Corp. 35,960 2,040 Balchem Corp. 13,320 2,039 National Storage
Affiliates Trust 32,625 2,038 HollyFrontier Corp. 60,202 2,035 Hannon Armstrong
SustainableInfrastructureCapital Inc. 33,627 2,031
New ResidentialInvestment Corp. 178,512 2,028
Premier Inc. Class A 52,005 2,026 Flowers Foods Inc. 81,285 2,012 National Fuel Gas
Co. 35,013 2,011* Cirrus Logic Inc. 24,815 2,005* Univar Solutions Inc. 78,307 2,003* Evoqua Water
TechnologiesCorp. 47,828 2,001
Radian Group Inc. 83,735 1,999* Liberty Global plc
Class A 69,296 1,992* Envestnet Inc. 23,754 1,983* Neogen Corp. 46,868 1,983* Nomad Foods Ltd. 72,840 1,983 Black Hills Corp. 29,819 1,979 Selective Insurance
Group Inc. 25,235 1,978* Alkermes plc 65,299 1,978 Highwoods
Properties Inc. 44,065 1,976
Total World Stock Index Fund
120

Shares
MarketValue•
($000)* FTI Consulting Inc. 13,719 1,974 Avient Corp. 36,563 1,970 Gap Inc. 86,530 1,963* Q2 Holdings Inc. 24,994 1,961* Ollie's Bargain
Outlet HoldingsInc. 28,911 1,956
* AMN HealthcareServices Inc. 19,806 1,955
Chemours Co. 69,745 1,954 Ryder System Inc. 22,992 1,953 Matador Resources
Co. 46,588 1,950* Boston Beer Co. Inc.
Class A 3,952 1,946* Livent Corp. 68,886 1,944 Choice Hotels
International Inc. 13,783 1,938* New Relic Inc. 23,718 1,925 Signet Jewelers Ltd. 21,515 1,919* Denali Therapeutics
Inc. 39,673 1,918* Ionis
PharmaceuticalsInc. 60,194 1,918
* Mandiant Inc. 109,582 1,911* Inmode Ltd. 20,102 1,904 Kite Realty Group
Trust 93,641 1,901 SL Green Realty
Corp. 27,122 1,900 Portland General
Electric Co. 38,358 1,891* Under Armour Inc.
Class C 99,855 1,885 Zurn Water
Solutions Corp. 51,814 1,880* Alteryx Inc. Class A 25,671 1,879 Flowserve Corp. 55,893 1,879 United Bankshares
Inc. 50,761 1,878 John Bean
TechnologiesCorp. 12,702 1,877
* MaravaiLifeSciencesHoldings Inc.Class A 44,354 1,876
Ensign Group Inc. 24,017 1,874 Blackstone
Mortgage TrustInc. Class A 56,900 1,872
* Park Hotels &Resorts Inc. 100,911 1,870
* API Group Corp. 85,828 1,869 Franklin Electric Co.
Inc. 21,630 1,868 Spirit AeroSystems
Holdings Inc.Class A 45,210 1,867
* Atkore Inc. 19,692 1,861 Kinsale Capital
Group Inc. 9,911 1,855* DTE Midstream LLC 38,545 1,849 Kemper Corp. 29,029 1,843 Hanover Insurance
Group Inc. 14,611 1,841 Foot Locker Inc. 38,586 1,839 Herc Holdings Inc. 10,086 1,836
Shares
MarketValue•
($000)* Mimecast Ltd. 24,327 1,835* Qualys Inc. 14,732 1,834 Hawaiian Electric
Industries Inc. 45,193 1,833* Progyny Inc. 29,826 1,832*,2 Tilray Inc. Class 2 177,627 1,830 Macerich Co. 101,112 1,829 FNB Corp. 156,674 1,825 Alliance Data
Systems Corp. 21,390 1,824 Chimera Investment
Corp. 116,765 1,823 Hancock Whitney
Corp. 36,822 1,822* LHC Group Inc. 13,503 1,817* Fate Therapeutics
Inc. 33,676 1,812* Ryman Hospitality
Properties Inc. 21,186 1,812* Beam Therapeutics
Inc. 20,397 1,811 Insperity Inc. 14,477 1,810 Timken Co. 25,508 1,810 Korn Ferry 23,411 1,808* Sailpoint
TechnologiesHoldings Inc. 37,632 1,806
EquitransMidstream Corp. 174,478 1,799
TEGNA Inc. 91,514 1,799 SYNNEX Corp. 17,104 1,796 Air Lease Corp.
Class A 44,684 1,790* ViaSat Inc. 29,874 1,783 Spectrum Brands
Holdings Inc. 19,005 1,782* nCino Inc. 24,314 1,767* TriNet Group Inc. 17,412 1,763 SM Energy Co. 51,271 1,760* Alarm.com Holdings
Inc. 20,867 1,758* Meritage Homes
Corp. 16,146 1,755 Broadstone Net
Lease Inc. 66,008 1,755 Moelis & Co.
Class A 24,119 1,754* Overstock.com Inc. 18,370 1,749* Option Care Health
Inc. 63,859 1,745 Wendy's Co. 77,787 1,735 Carter's Inc. 17,584 1,732* Hyatt Hotels Corp.
Class A 20,317 1,731 Murphy USA Inc. 10,605 1,728* LivaNova plc 22,525 1,728* Perficient Inc. 13,933 1,722* Nevro Corp. 15,113 1,719* Luminar
Technologies Inc.Class A 104,902 1,719
* Diodes Inc. 17,869 1,717* Vonage Holdings
Corp. 106,451 1,716* Bloom Energy Corp.
Class A 54,860 1,715 HB Fuller Co. 24,319 1,715
Total World Stock Index Fund
121

Shares
MarketValue•
($000)* Southwest Gas
Holdings Inc. 24,727 1,712 PNM Resources Inc. 34,388 1,711 ServisFirst
Bancshares Inc. 21,238 1,706* Trupanion Inc. 16,656 1,706* Bumble Inc. Class A 32,484 1,706 Murphy Oil Corp. 61,218 1,704* Appian Corp.
Class A 17,099 1,700* Hilton Grand
Vacations Inc. 33,753 1,697* Brighthouse
Financial Inc. 33,749 1,695* TG Therapeutics Inc. 54,225 1,693* Casella Waste
Systems Inc.Class A 19,481 1,689
* AZEK Co. Inc.Class A 45,960 1,686
* Asbury AutomotiveGroup Inc. 8,608 1,685
* ExlService HoldingsInc. 13,697 1,680
* Victoria's Secret &Co. 33,262 1,679
Papa John'sInternational Inc. 13,521 1,678
* Summit MaterialsInc. Class A 47,066 1,678
CONMED Corp. 11,447 1,674* LiveRamp Holdings
Inc. 31,163 1,668* Sonos Inc. 50,917 1,661 H&R Block Inc. 71,757 1,655 CMC Materials Inc. 12,886 1,654 Ovintiv Inc. (XNYS) 44,017 1,652 Axis Capital
Holdings Ltd. 31,641 1,648 Columbia
Sportswear Co. 15,841 1,645* fuboTV Inc. 55,197 1,645* Onto Innovation Inc. 20,737 1,643 Assured Guaranty
Ltd. 29,511 1,640 Hudson Pacific
Properties Inc. 63,496 1,635* Silvergate Capital
Corp. Class A 10,438 1,635 Triton International
Ltd. 26,262 1,633* Arvinas Inc. 18,854 1,632 Qurate Retail Inc.
Series A 156,135 1,630* Fabrinet 16,944 1,627 Community Bank
System Inc. 22,667 1,625 EPR Properties 32,331 1,623* Cerence Inc. 15,394 1,618 Physicians Realty
Trust 84,950 1,615 Sensient
TechnologiesCorp. 16,891 1,615
* Hain Celestial GroupInc. 35,969 1,614
MSC IndustrialDirect Co. Inc.Class A 19,161 1,611
Shares
MarketValue•
($000)* ACI Worldwide Inc. 52,482 1,610 American States
Water Co. 17,686 1,607* Adaptive
BiotechnologiesCorp. 48,004 1,604
* Adient plc 38,458 1,601* Verint Systems Inc. 34,319 1,599* Veoneer Inc. 45,440 1,599* Focus Financial
Partners Inc.Class A 25,424 1,598
AssociatedBanc-Corp. 71,630 1,596
Penske AutomotiveGroup Inc. 15,010 1,592
* Kodiak Sciences Inc. 13,543 1,586 Steven Madden Ltd. 35,016 1,579* Under Armour Inc.
Class A 71,817 1,577 Lexington Realty
Trust 108,197 1,576* Arena
PharmaceuticalsInc. 27,258 1,564
Commercial MetalsCo. 48,590 1,564
Sanderson FarmsInc. 8,228 1,559
* ResideoTechnologies Inc. 63,071 1,555
Pacific PremierBancorp Inc. 36,901 1,549
* Grand CanyonEducation Inc. 19,309 1,539
First Hawaiian Inc. 55,635 1,535 Select Medical
Holdings Corp. 46,216 1,535* Blackbaud Inc. 21,563 1,531* Haemonetics Corp. 22,266 1,530 New Jersey
Resources Corp. 40,400 1,528 Applied Industrial
Technologies Inc. 15,607 1,521* Arconic Corp. 51,536 1,516 BankUnited Inc. 37,337 1,514* Iovance
BiotherapeuticsInc. 62,241 1,513
KB Home 37,613 1,510* Sunnova Energy
International Inc. 33,893 1,510* Altice USA Inc.
Class A 92,366 1,506 CNO Financial
Group Inc. 62,365 1,505 PS Business Parks
Inc. 8,468 1,505* Rogers Corp. 7,476 1,504 Avnet Inc. 39,387 1,501* Box Inc. Class A 58,053 1,500 Allison Transmission
Holdings Inc. 44,937 1,499* Magnite Inc. 55,397 1,497* Open Lending Corp.
Class A 47,490 1,497 Kulicke & Soffa
Industries Inc. 26,265 1,497
Total World Stock Index Fund
122

Shares
MarketValue•
($000)
Walker & DunlopInc. 11,502 1,496
* SeaWorldEntertainmentInc. 23,429 1,488
* Altair EngineeringInc. Class A 19,104 1,486
* United AirlinesHoldings Inc. 32,170 1,484
* Insmed Inc. 49,023 1,478* Calix Inc. 23,565 1,475* Phreesia Inc. 20,794 1,467 Hillenbrand Inc. 32,216 1,465* Southwestern
Energy Co. 299,032 1,459* LivePerson Inc. 28,184 1,452 Outfront Media Inc. 58,353 1,452* Simply Good Foods
Co. 36,482 1,447*,2 Virgin Galactic
Holdings Inc. 76,799 1,440 Bank of Hawaii
Corp. 17,030 1,439 Apple Hospitality
REIT Inc. 91,474 1,437 Advanced Energy
Industries Inc. 15,628 1,435* Madison Square
Garden SportsCorp. 7,570 1,435
ONE Gas Inc. 21,322 1,435* Axonics Inc. 19,531 1,433* Howard Hughes
Corp. 16,447 1,433* Ingevity Corp. 18,391 1,433 Home BancShares
Inc. 60,209 1,431* Inari Medical Inc. 15,779 1,428 California Water
Service Group 23,438 1,427 Continental
Resources Inc. 29,241 1,427* Taylor Morrison
Home Corp.Class A 46,724 1,426
American EagleOutfitters Inc. 60,023 1,425
* Momentive GlobalInc. 62,185 1,425
eXp World HoldingsInc. 27,499 1,419
*,2 Skillz Inc. Class A 126,921 1,419 Brink's Co. 20,581 1,418* Skyline Champion
Corp. 22,396 1,418* Academy Sports &
Outdoors Inc. 33,130 1,417 Kennametal Inc. 35,615 1,416* Itron Inc. 18,174 1,413 JBG SMITH
Properties 48,928 1,412 Antero Midstream
Corp. 132,570 1,411 Encore Wire Corp. 10,526 1,411 LCI Industries 10,100 1,410* CryoPort Inc. 17,273 1,408 Investors Bancorp
Inc. 92,040 1,408* 3D Systems Corp. 49,997 1,408
Shares
MarketValue•
($000)
Eastern BanksharesInc. 67,708 1,406
PotlatchDeltic Corp. 26,883 1,405 Aerojet Rocketdyne
Holdings Inc. 31,828 1,401 Hamilton Lane Inc.
Class A 13,376 1,398 Old National
Bancorp 81,856 1,398* Veracyte Inc. 29,135 1,395* Certara Inc. 33,697 1,392* MACOM Technology
SolutionsHoldings Inc.Class H 19,923 1,391
* Viavi Solutions Inc. 90,333 1,391 SPX FLOW Inc. 18,602 1,390 Silgan Holdings Inc. 34,557 1,389* Allakos Inc. 13,783 1,386* Digitalbridge Group
Inc. 206,746 1,385 Westlake Chemical
Corp. 14,223 1,384 Federated Hermes
Inc. 41,520 1,383 Rent-A-Center Inc. 25,969 1,383* Red Rock Resorts
Inc. Class A 25,354 1,380 Independent Bank
Corp. (XNGS) 16,307 1,378* AtriCure Inc. 18,287 1,373 Ameris Bancorp 26,181 1,372 Essential Properties
Realty Trust Inc. 46,046 1,372 FirstCash Inc. 15,497 1,371* Integer Holdings
Corp. 15,230 1,371 Cabot Corp. 25,687 1,370 Navient Corp. 69,370 1,367* Six Flags
EntertainmentCorp. 33,182 1,365
Altra IndustrialMotion Corp. 26,131 1,363
* Shoals TechnologiesGroup Inc.Class A 43,869 1,360
Simmons FirstNational Corp.Class A 45,439 1,358
EnerSys 16,897 1,352 Quaker Chemical
Corp. 5,494 1,351 Cracker Barrel Old
Country Store Inc. 10,120 1,348* Sabre Corp. 129,911 1,348 Spire Inc. 21,464 1,347* Dun & Bradstreet
Holdings Inc. 71,435 1,346 GATX Corp. 14,165 1,344* International Game
Technology plc 45,425 1,340 Group 1 Automotive
Inc. 7,444 1,338* Merit Medical
Systems Inc. 19,848 1,335* TripAdvisor Inc. 40,481 1,335* Liberty Broadband
Corp. Class A 8,298 1,334
Total World Stock Index Fund
123

Shares
MarketValue•
($000)* LGI Homes Inc. 8,931 1,333 Sabra Health Care
REIT Inc. 94,193 1,333 White Mountains
Insurance GroupLtd. 1,262 1,331
Dana Inc. 59,926 1,330* Cargurus Inc. 39,611 1,329* PagerDuty Inc. 31,803 1,328 Lancaster Colony
Corp. 7,799 1,326* Cannae Holdings
Inc. 38,628 1,317 Mueller Water
Products Inc.Class A 80,249 1,317
* Inovalon HoldingsInc. Class A 32,260 1,316
* Yelp Inc. Class A 33,982 1,313* FormFactor Inc. 32,990 1,312* Masonite
International Corp. 10,891 1,307* Insight Enterprises
Inc. 13,794 1,306* Nordstrom Inc. 45,468 1,306* Visteon Corp. 11,524 1,304 Ormat Technologies
Inc. (XNYS) 18,012 1,303 ALLETE Inc. 21,147 1,301* Welbilt Inc. 54,946 1,300* frontdoor Inc. 34,844 1,299 Werner Enterprises
Inc. 28,591 1,296 Helmerich & Payne
Inc. 41,533 1,289 Cogent
CommunicationsHoldings Inc. 16,821 1,288
* Playtika HoldingCorp. 45,303 1,281
* Kirby Corp. 24,425 1,280* Coty Inc. Class A 150,870 1,279 Cathay General
Bancorp 30,093 1,270 Comfort Systems
USA Inc. 13,846 1,267 ABM Industries Inc. 28,751 1,265* Vicor Corp. 8,306 1,259* Texas Capital
Bancshares Inc. 20,689 1,254 NorthWestern Corp. 21,961 1,249* American Airlines
Group Inc. 65,022 1,248 Pebblebrook Hotel
Trust 55,451 1,245* Prestige Consumer
Healthcare Inc. 20,753 1,245 Switch Inc. Class A 49,219 1,244* Mr Cooper Group
Inc. 28,308 1,241* CommVault
Systems Inc. 20,141 1,239 WSFS Financial
Corp. 23,909 1,239 Herman Miller Inc. 31,753 1,236* Enstar Group Ltd. 5,352 1,235* Callaway Golf Co. 45,635 1,234 Washington Federal
Inc. 34,892 1,234
Shares
MarketValue•
($000)
Magnolia Oil & GasCorp. Class A 58,799 1,228
* Karuna TherapeuticsInc. 8,751 1,228
AAON Inc. 17,118 1,227 CVB Financial Corp. 61,254 1,226* Renewable Energy
Group Inc. 19,148 1,225 BOK Financial Corp. 12,065 1,221 Gray Television Inc. 51,943 1,218 Avangrid Inc. 23,030 1,214 Badger Meter Inc. 11,871 1,214 MGE Energy Inc. 15,992 1,214 WD-40 Co. 5,348 1,214 Atlantic Union
Bankshares Corp. 33,818 1,213 Terex Corp. 27,024 1,211 UniFirst Corp. 6,112 1,210 Corporate Office
Properties Trust 44,563 1,209* Mercury Systems
Inc. 23,414 1,207 Hecla Mining Co. 208,560 1,205 World Wrestling
EntertainmentInc. Class A 19,717 1,205
* CNX ResourcesCorp. 82,225 1,201
* EquityCommonwealth 46,322 1,201
* Intra-CellularTherapies Inc. 27,808 1,198
Live OakBancshares Inc. 13,424 1,197
Piper Sandler Cos. 7,265 1,196 United Community
Banks Inc. 34,214 1,192 Artisan Partners
AssetManagement Inc.Class A 24,035 1,191
* Domtar Corp. 21,820 1,191 Mueller Industries
Inc. 22,627 1,191* Axos Financial Inc. 22,446 1,190 MDC Holdings Inc. 24,290 1,190 Installed Building
Products Inc. 9,348 1,188 News Corp. Class B 52,508 1,185 Patterson Cos. Inc. 37,888 1,184 EVERTEC Inc. 26,118 1,181* NuVasive Inc. 22,133 1,181* Amicus Therapeutics
Inc. 112,221 1,178 Shutterstock Inc. 9,651 1,169 Helios Technologies
Inc. 12,818 1,167* Shift4 Payments Inc.
Class A 18,490 1,167 Wolverine World
Wide Inc. 35,104 1,164* Beacon Roofing
Supply Inc. 21,977 1,162* R1 RCM Inc. 53,238 1,155* SunPower Corp. 34,310 1,155* Dorman Products
Inc. 11,037 1,152
Total World Stock Index Fund
124

Shares
MarketValue•
($000)
American EquityInvestment LifeHolding Co. 35,944 1,146
Columbia BankingSystem Inc. 33,571 1,146
Tronox Holdings plcClass A 49,107 1,145
* Appfolio Inc. Class A 8,656 1,140* 1Life Healthcare Inc. 52,648 1,140 Towne Bank 36,142 1,139 Moog Inc. Class A 15,062 1,138 First BanCorp
(XNYS) 83,156 1,135* BioCryst
PharmaceuticalsInc. 75,987 1,134
* Kratos Defense &Security SolutionsInc. 53,032 1,134
*,2 Nikola Corp. 95,952 1,132* Tri Pointe Homes
Inc. 46,676 1,129 PROG Holdings Inc. 27,901 1,129 NewMarket Corp. 3,315 1,127 New Fortress
Energy Inc.Class A 37,529 1,126
* ReataPharmaceuticalsInc. Class A 11,720 1,125
* Discovery Inc.Class A 47,888 1,123
* PTC TherapeuticsInc. 29,611 1,123
* CareDx Inc. 21,950 1,119* Fluor Corp. 57,336 1,115* ChargePoint
Holdings Inc. 45,003 1,115 Owens & Minor Inc. 30,941 1,110* Jamf Holding Corp. 23,281 1,109 Xerox Holdings
Corp. 62,127 1,106* Hub Group Inc.
Class A 14,058 1,105 ESCO Technologies
Inc. 13,060 1,104 Arcosa Inc. 21,260 1,100* Leslie's Inc. 53,197 1,100 Stepan Co. 9,155 1,099 Belden Inc. 18,228 1,098* Editas Medicine Inc.
Class A 29,912 1,098 Vishay
IntertechnologyInc. 57,101 1,097
* Green Dot Corp.Class A 25,861 1,095
* Fisker Inc. 68,137 1,094* Agios
PharmaceuticalsInc. 23,112 1,086
SITE Centers Corp. 68,353 1,086* SPX Corp. 18,644 1,083* Amyris Inc. 72,942 1,081* Nektar Therapeutics
Class A 71,305 1,081 Clearway Energy
Inc. Class C 30,396 1,078
Shares
MarketValue•
($000)* Sunstone Hotel
Investors Inc. 87,184 1,076 Winnebago
Industries Inc. 15,851 1,073* Array Technologies
Inc. 50,226 1,072 Compass Minerals
International Inc. 16,311 1,070 Otter Tail Corp. 17,253 1,070* Xencor Inc. 27,031 1,069 Covanta Holding
Corp. 52,902 1,068 Forward Air Corp. 10,621 1,068 Independent Bank
Group Inc. 14,772 1,068 Avista Corp. 26,767 1,066* Gentherm Inc. 14,361 1,057* MP Materials Corp. 31,155 1,055 Energizer Holdings
Inc. 28,889 1,054* Sotera Health Co. 42,646 1,053* FuelCell Energy Inc. 131,440 1,050 Progress Software
Corp. 20,360 1,047* Sprouts Farmers
Market Inc. 47,300 1,047* Plexus Corp. 11,951 1,044 Monro Inc. 16,837 1,040* Ortho Clinical
DiagnosticsHoldings plcClass H 52,331 1,035
Kontoor Brands Inc. 19,514 1,034* Sanmina Corp. 27,380 1,034* Vista Outdoor Inc. 24,718 1,034 Kennedy-Wilson
Holdings Inc. 46,138 1,032 Uniti Group Inc. 72,009 1,030* Emergent
BioSolutions Inc. 21,553 1,027* Hostess Brands Inc.
Class A 54,258 1,026 WesBanco Inc. 29,512 1,026* Cardlytics Inc. 13,022 1,024 Atlantica
SustainableInfrastructure plc 26,032 1,024
* Shake Shack Inc.Class A 14,758 1,021
* NetScout SystemsInc. 37,582 1,017
* Abercrombie & FitchCo. Class A 25,701 1,016
ManTechInternational Corp.Class A 11,756 1,014
Virtus InvestmentPartners Inc. 3,148 1,007
National HealthInvestors Inc. 18,674 1,004
Bank of NTButterfield & SonLtd. 27,726 995
* Myriad Genetics Inc. 32,303 994* 8x8 Inc. 43,665 989* JELD-WEN Holding
Inc. 36,013 987* Riot Blockchain Inc. 36,105 983
Total World Stock Index Fund
125

Shares
MarketValue•
($000)* Duck Creek
Technologies Inc. 31,210 983* iRobot Corp. 11,723 978* PRA Group Inc. 22,715 974* Schrodinger Inc. 17,849 974 Brady Corp. Class A 18,565 967 Brandywine Realty
Trust 72,897 966* Vroom Inc. 50,496 966 Flagstar Bancorp
Inc. 20,430 964 Graham Holdings
Co. Class B 1,641 961 Santander
Consumer USAHoldings Inc. 22,966 958
First MidwestBancorp Inc. 49,533 954
Boise Cascade Co. 16,796 951 Federal Signal Corp. 22,217 951 Fulton Financial
Corp. 58,875 948* Cushman &
Wakefield plc 51,564 948 Hilltop Holdings Inc. 26,607 943* Pacira BioSciences
Inc. 18,032 943 Albany International
Corp. Class A 11,680 942 Coca-Cola
Consolidated Inc. 2,347 942* Rambus Inc. 40,461 942* Lemonade Inc. 15,159 942* Gibraltar Industries
Inc. 14,424 940* Palomar Holdings
Inc. 10,273 939* Magellan Health Inc. 9,890 938 Piedmont Office
Realty Trust Inc.Class A 52,600 934
* CureVac NV 23,294 933 South Jersey
Industries Inc. 40,969 932 Trinseo plc 16,629 932 Medifast Inc. 4,742 931* Constellium SE
Class A 50,551 931 GrafTech
International Ltd. 86,954 930* NanoString
Technologies Inc. 19,248 930* iHeartMedia Inc.
Class A 47,750 925* Alaska Air Group
Inc. 17,469 922 Jack in the Box Inc. 9,299 920 TTEC Holdings Inc. 9,745 920 Virtu Financial Inc.
Class A 36,935 919* Dycom Industries
Inc. 11,482 912 Amkor Technology
Inc. 41,567 911 Horace Mann
Educators Corp. 23,238 910* MEDNAX Inc. 33,425 910 Rush Enterprises
Inc. Class A 17,465 910
Shares
MarketValue•
($000)
Newmark GroupInc. Class A 61,076 909
* Raven IndustriesInc. 15,678 907
* Meredith Corp. 15,536 905* Stitch Fix Inc.
Class A 26,158 905 RLJ Lodging Trust 62,664 904 Four Corners
Property Trust Inc. 31,087 902 Retail Opportunity
Investments Corp. 50,699 901 Trustmark Corp. 28,229 898 International
Bancshares Corp. 21,142 896* Vir Biotechnology
Inc. 23,695 894* Evolent Health Inc.
Class A 30,515 893 Renasant Corp. 23,837 892 SJW Group 13,475 888* Sleep Number Corp. 10,053 888* Verra Mobility Corp.
Class A 59,685 888 Minerals
Technologies Inc. 12,500 887 Washington REIT 34,963 886* Bottomline
Technologies DEInc. 19,124 885
* AeroVironment Inc. 9,921 884 First Merchants
Corp. 21,248 883* Callon Petroleum
Co. 17,062 883* O-I Glass Inc. 67,567 882* 2U Inc. 29,764 879 John Wiley & Sons
Inc. Class A 16,219 879* ChemoCentryx Inc. 25,187 877 Innospec Inc. 9,666 876 McGrath RentCorp. 12,125 875* Realogy Holdings
Corp. 50,541 875 Trinity Industries Inc. 31,137 873* CommScope
Holding Co. Inc. 81,297 871* Covetrus Inc. 43,046 869 McAfee
Corp.Class A 40,458 865 First Financial
Bancorp 36,185 860* Sage Therapeutics
Inc. 21,274 859* Accolade Inc. 21,427 853* Alexander &
Baldwin Inc. 34,669 850 MFA Financial Inc. 188,396 850 Cohen & Steers Inc. 8,947 849* NMI Holdings Inc.
Class A 34,888 847 Sandy Spring
Bancorp Inc. 17,780 844* Ligand
PharmaceuticalsInc. 5,779 843
Telephone and DataSystems Inc. 44,774 839
Total World Stock Index Fund
126

Shares
MarketValue•
($000)*,2 ContextLogic Inc.
Class A 164,267 838* Corcept
Therapeutics Inc. 46,527 837* iRhythm
Technologies Inc. 11,914 836 Xperi Holding Corp. 46,655 836* Genworth Financial
Inc. Class A 202,328 832* AdaptHealth Corp.
Class A 30,495 831* ODP Corp. 19,172 830* Glaukos Corp. 18,131 829* Allscripts Healthcare
Solutions Inc. 60,100 828 InterDigital Inc. 12,367 828* Liberty Media Corp.-
Liberty FormulaOne Class A 15,869 828
PennyMac FinancialServices Inc. 13,324 827
J & J Snack FoodsCorp. 5,591 825
* Urban Outfitters Inc. 25,781 823* TreeHouse Foods
Inc. 22,733 822* BigCommerce
Holdings Inc.Series 1 17,730 819
* SorrentoTherapeutics Inc. 118,757 815
* Cavco IndustriesInc. 3,387 814
Maxar TechnologiesInc. 30,641 814
Columbia PropertyTrust Inc. 42,435 813
Capitol FederalFinancial Inc. 66,793 810
* ACADIAPharmaceuticalsInc. 44,892 806
* DiamondRockHospitality Co. 89,030 805
* Transocean Ltd.(XNYS) 227,978 805
* KAR AuctionServices Inc. 54,712 803
* Global BloodTherapeutics Inc. 21,885 799
* Liberty LatinAmerica Ltd.Class C 66,233 797
* Brinker InternationalInc. 18,946 795
Ubiquiti Inc. 2,600 794 Heartland Financial
USA Inc. 15,767 790* Meritor Inc. 32,455 790* Apellis
PharmaceuticalsInc. 25,609 787
Barnes Group Inc. 18,735 786 Urban Edge
Properties 44,774 785* LendingTree Inc. 4,819 778 Apollo Commercial
Real EstateFinance Inc. 51,269 776
Shares
MarketValue•
($000)
Provident FinancialServices Inc. 31,359 776
* Xenia Hotels &Resorts Inc. 43,576 776
Patrick IndustriesInc. 9,890 771
* SpringWorksTherapeutics Inc. 11,498 771
* Grocery OutletHolding Corp. 34,625 768
* Bandwidth Inc.Class A 8,996 767
* Cinemark HoldingsInc. 40,773 767
* Relay TherapeuticsInc. 23,030 766
* Selectquote Inc. 57,250 761* Ironwood
PharmaceuticalsInc. Class A 59,389 758
* Coeur Mining Inc. 119,410 756 Nu Skin Enterprises
Inc. Class A 18,810 755* Jackson Financial
Inc. Class A 27,875 755* Allegheny
Technologies Inc. 46,804 754* Turning Point
Therapeutics Inc. 18,118 753 Two Harbors
Investment Corp. 117,174 752* Stratasys Ltd. 23,849 752* Driven Brands
Holdings Inc. 23,117 751* JFrog Ltd. 22,926 749 Great Western
Bancorp Inc. 21,847 744 CareTrust REIT Inc. 35,656 740 Banner Corp. 12,752 737 Service Properties
Trust 68,173 734* Cheesecake Factory
Inc. 18,028 733* Fulgent Genetics
Inc. 8,816 731* Petco Health &
Wellness Co. Inc.Class A 29,540 731
World Fuel ServicesCorp. 23,791 726
* CBIZ Inc. 19,634 721 Strategic Education
Inc. 10,501 716 Edgewell Personal
Care Co. 20,370 713 Tanger Factory
Outlet CentersInc. 42,399 712
Vector Group Ltd. 53,546 710* CorVel Corp. 3,860 707 PennyMac
MortgageInvestment Trust 35,054 706
*,2 Cassava SciencesInc. 16,325 704
* Avanos Medical Inc. 22,265 702* Bloomin' Brands
Inc. 32,422 701
Total World Stock Index Fund
127

Shares
MarketValue•
($000)
Mack-Cali RealtyCorp. 38,511 701
WorthingtonIndustries Inc. 12,874 699
* Cimpress plc 7,821 6992 B&G Foods Inc. 23,601 695 PriceSmart Inc. 9,643 694* Proto Labs Inc. 11,574 692* Central Garden &
Pet Co. Class A 14,953 691* American Well Corp.
Class A 76,708 690 Northwest
Bancshares Inc. 49,899 689* REVOLUTION
Medicines Inc. 23,385 688 iStar Inc. 27,160 686* Ferro Corp. 32,447 682 ProAssurance Corp. 29,710 681* Avaya Holdings
Corp. 36,466 679* Madison Square
GardenEntertainmentCorp. 9,629 679
* Laureate EducationInc. Class A 39,147 678
* Adtalem GlobalEducation Inc. 18,282 675
NBT Bancorp Inc. 18,378 674 Patterson-UTI
Energy Inc. 78,713 674* Allegro
MicroSystemsInc. 20,164 673
* Gates IndustrialCorp. plc 40,889 672
* C3.ai Inc. Class A 14,891 672 American Assets
Trust Inc. 17,694 669 American National
Group Inc. 3,502 664 Argo Group
InternationalHoldings Ltd. 12,034 663
Acadia Realty Trust 30,956 662* Sally Beauty
Holdings Inc. 43,100 658 HNI Corp. 17,473 653 Sempra Energy 5,137 653* Enanta
PharmaceuticalsInc. 7,585 651
* Knowles Corp. 31,232 651 BGC Partners Inc.
Class A 121,014 650* OSI Systems Inc. 6,955 648 EnPro Industries
Inc. 7,200 646* Encore Capital
Group Inc. 11,915 644 Acushnet Holdings
Corp. 12,584 641 Inter Parfums Inc. 6,908 638 Methode
Electronics Inc. 15,170 638 Healthcare Services
Group Inc. 33,136 636 Big Lots Inc. 14,278 632
Shares
MarketValue•
($000)
Eagle Bancorp Inc. 11,100 628 Deluxe Corp. 17,541 626* Yext Inc. 49,502 623* Dicerna
PharmaceuticalsInc. 29,777 620
* TTM TechnologiesInc. 46,855 620
Tennant Co. 7,808 620 Carpenter
Technology Corp. 20,015 618 Stock Yards Bancorp
Inc. 10,072 617 Brightsphere
Investment GroupInc. 20,577 617
* UniQure N.V. 20,206 616* Golar LNG Ltd. 47,306 616* Bed Bath & Beyond
Inc. 43,275 608* Dine Brands Global
Inc. 7,146 604* Dave & Buster's
EntertainmentInc. 16,229 603
Global Net LeaseInc. 37,640 603
Granite ConstructionInc. 16,155 600
* RocketPharmaceuticalsInc. 20,197 600
St. Joe Co. 12,698 597 Dillard's Inc. Class A 2,579 596 Hope Bancorp Inc. 40,854 596 Reynolds Consumer
Products Inc. 22,084 596 Northwest Natural
Holding Co. 13,032 588 Greif Inc. Class A 9,000 582* Oceaneering
International Inc. 42,470 578* FARO Technologies
Inc. 7,831 576* Harsco Corp. 33,641 575 H&E Equipment
Services Inc. 12,733 574* PBF Energy Inc.
Class A 39,302 574 Kaiser Aluminum
Corp. 5,894 573 Lindsay Corp. 3,923 571 Oxford Industries
Inc. 6,147 570* MakeMyTrip Ltd. 17,997 570 Primoris Services
Corp. 21,057 567 Kaman Corp. 15,779 565 Ladder Capital Corp.
Class A 47,112 565* Bluebird Bio Inc. 24,073 564 Paramount Group
Inc. 66,468 564 Berkshire Hills
Bancorp Inc. 20,730 563* Alector Inc. 25,740 560* TriMas Corp. 16,700 557 ADT Inc. 66,414 555
Total World Stock Index Fund
128

Shares
MarketValue•
($000)
CSG SystemsInternational Inc. 11,066 554
* Surgery PartnersInc. 13,476 554
* Kosmos Energy Ltd. 153,446 552 Getty Realty Corp. 17,159 551 Mercury General
Corp. 10,101 550*,2 Inovio
PharmaceuticalsInc. 76,930 549
La-Z-Boy Inc. 16,433 546* Orion Engineered
Carbons SA 28,976 545 Schneider National
Inc. Class B 21,826 544 Clearway Energy
Inc. Class A 16,425 542 Washington Trust
Bancorp Inc. 9,877 540* Marcus & Millichap
Inc. 11,387 536 Materion Corp. 7,432 536* Kraton Corp. 11,698 534* MicroVision Inc. 70,167 534 Standex
International Corp. 4,802 534 Sturm Ruger & Co.
Inc. 6,775 534* USANA Health
Sciences Inc. 5,489 533 Westamerica
BanCorp. 9,567 533* OPKO Health Inc. 140,140 531 Diversified
Healthcare Trust 144,899 527 Redwood Trust Inc. 38,700 525 Sinclair Broadcast
Group Inc.Class A 20,097 525
Centerspace 5,175 524* Parsons Corp. 15,086 523 Safehold Inc. 6,982 522 Nelnet Inc. Class A 6,311 521* Pilgrim's Pride Corp. 18,506 521 First
CommonwealthFinancial Corp. 33,977 520
* REGENXBIO Inc. 14,409 511 Shenandoah
TelecommunicationsCo. 18,461 510
* Varex Imaging Corp. 18,948 509* Supernus
PharmaceuticalsInc. 17,000 507
* PROS Holdings Inc. 16,860 506 Cal-Maine Foods
Inc. 13,865 500 Enerpac Tool Group
Corp. Class A 23,877 499 Empire State Realty
Trust Inc. Class A 50,986 494 Greenbrier Cos. Inc. 12,050 494 RPT Realty 37,104 493 Fresh Del Monte
Produce Inc. 14,697 492 National Beverage
Corp. 8,696 490
Shares
MarketValue•
($000)* AMC Networks Inc.
Class A 12,292 489 LTC Properties Inc. 15,330 488* GrowGeneration
Corp. 23,092 487* Plantronics Inc. 18,036 483* Cognyte Software
Ltd. 24,134 481* G-III Apparel Group
Ltd. 16,670 478 Archrock Inc. 58,248 477 Community Trust
Bancorp Inc. 10,916 477* Lions Gate
EntertainmentCorp. Class B 42,090 476
* Brookdale SeniorLiving Inc. 72,091 469
AZZ Inc. 8,800 468* Heron Therapeutics
Inc. 42,474 468 City Holding Co. 5,856 466 BancFirst Corp. 7,139 464* Allogene
Therapeutics Inc. 26,816 462* eHealth Inc. 10,387 461 Kelly Services Inc.
Class A 25,376 458* American
Woodmark Corp. 6,654 457 S&T Bancorp Inc. 14,759 451 Buckle Inc. 10,800 450* CoreCivic Inc. 52,311 450* Desktop Metal Inc.
Class A 64,362 450 Employers Holdings
Inc. 11,517 445* Columbia Financial
Inc. 23,841 444* Sylvamo Corp. 15,727 443 Brookline Bancorp
Inc. 27,418 440 Griffon Corp. 16,625 440* Berkeley Lights Inc. 18,869 439 Astec Industries Inc. 8,192 437 Delek US Holdings
Inc. 22,478 437* Deciphera
PharmaceuticalsInc. 13,068 436
Core LaboratoriesNV 16,736 435
CTS Corp. 12,100 431* Huron Consulting
Group Inc. 8,567 430 Safety Insurance
Group Inc. 5,484 430* AAR Corp. 12,010 425 Universal Corp. 9,018 424 Office Properties
Income Trust 16,401 420* Multiplan Corp. 96,617 416* Children's Place Inc. 5,000 414 EW Scripps Co.
Class A 22,243 414* Atara
BiotherapeuticsInc. 26,691 413
* FibroGen Inc. 36,683 408
Total World Stock Index Fund
129

Shares
MarketValue•
($000)
Lennar Corp.Class B 4,965 408
MatthewsInternational Corp.Class A 11,719 403
* Tivity Health Inc. 16,116 403 Weis Markets Inc. 7,154 403* Consensus Cloud
Solutions Inc. 6,326 401 Apartment
Investment andManagement Co.Class A 52,743 400
Heartland ExpressInc. 24,180 395
* American Axle &ManufacturingHoldings Inc. 43,342 394
Scholastic Corp. 10,900 394* Axsome
Therapeutics Inc. 10,124 390 CNA Financial Corp. 8,700 390* JetBlue Airways
Corp. 27,524 3862 ARMOUR
Residential REITInc. 36,562 385
* EchoStar Corp.Class A 16,414 385
* GCP AppliedTechnologies Inc. 16,995 384
* Dril-Quip Inc. 16,257 383* Lions Gate
EntertainmentCorp. Class A 29,135 377
Schweitzer-MauduitInternational Inc. 10,778 376
* Summit HotelProperties Inc. 37,496 375
Kearny FinancialCorp. 27,587 370
* WW InternationalInc. 21,142 367
* SiriusPoint Ltd. 38,928 366 Steelcase Inc.
Class A 30,400 362 Apogee Enterprises
Inc. 8,600 361* Century Aluminum
Co. 27,189 359* Radius Health Inc. 16,611 359 Guess? Inc. 17,200 356* Myovant Sciences
Ltd. 16,279 356 WisdomTree
Investments Inc. 55,362 354* Imax Corp. 18,800 354* Vivint Smart Home
Inc. 38,845 352* TrueBlue Inc. 12,600 351* US Ecology Inc. 10,864 350* Madrigal
PharmaceuticalsInc. 4,472 348
* Innoviva Inc. 19,900 347 Republic Bancorp
Inc. Class A 6,430 347* Endo International
plc 80,789 343
Shares
MarketValue•
($000)* NextGen Healthcare
Inc. 20,722 341 TFS Financial Corp. 17,420 339 Ebix Inc. 10,260 337 State Auto Financial
Corp. 6,500 334* Workhorse Group
Inc. 48,713 328* Liberty Media Corp.-
Liberty BravesClass C 11,018 327
* NETGEAR Inc. 11,352 327 Atlas Corp. 23,268 326 GEO Group Inc. 39,698 325 Scorpio Tankers Inc. 19,766 317 Benchmark
Electronics Inc. 13,300 310 Matson Inc. 3,700 308 SFL Corp. Ltd. 38,345 303* ScanSource Inc. 8,411 301 Neenah Inc. 5,900 298* Zogenix Inc. 19,398 297 Universal Health
Realty IncomeTrust 5,094 290
* Inogen Inc. 7,201 286* Allegiant Travel Co. 1,626 285 1st Source Corp. 5,811 281 Aaron's Co. Inc. 12,027 281* Natus Medical Inc. 11,196 280* Blucora Inc. 16,400 271*,2 Maxeon Solar
Technologies Ltd. 12,000 270* Amneal
PharmaceuticalsInc. 48,745 268
* Liberty LatinAmerica Ltd.Class A 22,191 267
* NOW Inc. 36,496 264 ACCO Brands Corp. 31,661 262* Pennant Group Inc. 9,938 254 Brightspire Capital
Inc. Class A 25,568 251 Calavo Growers Inc. 6,226 250 Saul Centers Inc. 5,132 238* Orthofix Medical
Inc. 6,600 237* Forrester Research
Inc. 4,285 228 Alexander's Inc. 800 223 SolarWinds Corp. 13,823 223* Copa Holdings SA
Class A 2,965 219* Taro Pharmaceutical
Industries Ltd. 3,800 211* Precigen Inc. 43,240 209* Spirit Airlines Inc. 8,709 190 Ormat Technologies
Inc. 2,610 190 CVR Energy Inc. 9,664 185* N-Able Inc. 13,823 184 Tootsie Roll
Industries Inc. 5,741 182* Liberty Media Corp.-
Liberty BravesClass A 5,866 179
* SkyWest Inc. 4,085 176
Total World Stock Index Fund
130

Shares
MarketValue•
($000)* Tutor Perini Corp. 12,200 166 ATN International
Inc. 4,035 165* Epizyme Inc. 33,673 141* US Cellular Corp. 4,600 141* Theravance
Biopharma Inc. 16,757 130* Immunovant Inc. 14,259 115*,1 Alder
BiopharmaceuticalsInc. CVR Exp.12/31/21 8,266 7
*,1 Media General Inc.CVR 21,051 1
* Piedmont LithiumInc. GDR 1,851 1
*,1 Ferroglobe Unit 10,400 —
20,196,030
Total Common Stocks(Cost $23,060,320) 34,053,902
Temporary Cash Investments (0.8%)
Money Market Fund (0.8%)4,5 Vanguard Market
Liquidity Fund,0.070%(Cost $281,376) 2,813,871 281,387
Total Investments (100.4%)(Cost $23,341,696) 34,335,289
Other Assets andLiabilities—Net (-0.4%) (137,085)
Net Assets (100%) 34,198,204
Cost is in $000. • See Note A in Notes to Financial Statements.* Non-income-producing security.1 Security value determined using significant unobservable
inputs.2 Includes partial security positions on loan to broker-dealers. The
total value of securities on loan is $206,300,000.3 Security exempt from registration under Rule 144A of the
Securities Act of 1933. Such securities may be sold intransactions exempt from registration, normally to qualifiedinstitutional buyers. At October 31, 2021, the aggregate valuewas $490,362,000, representing 1.4% of net assets.
4 Affiliated money market fund available only to Vanguard fundsand certain trusts and accounts managed by Vanguard. Rateshown is the 7-day yield.
5 Collateral of $223,521,000 was received for securities on loan,of which $218,790,000 is held in Vanguard Market LiquidityFund and $4,731,000 is held in cash.ADR—American Depositary Receipt.CVR—Contingent Value Rights.GDR—Global Depositary Receipt.NVDR—Non-Voting Depository Receipt.Ptg. Ctf.—Participating Certificates.REIT—Real Estate Investment Trust.
Total World Stock Index Fund
131

Derivative Financial Instruments Outstanding as of Period End
Futures Contracts
($000)
Expiration
Number ofLong (Short)
ContractsNotionalAmount
Value andUnrealized
Appreciation(Depreciation)
Long Futures Contracts
E-mini Russell 2000 Index December 2021 109 12,510 436
E-mini S&P 500 Index December 2021 305 70,104 3,377
Euro Stoxx 50 Index December 2021 286 14,008 323
FTSE 100 Index December 2021 60 5,932 178
MSCI Emerging Markets Index December 2021 286 18,047 (97)
S&P ASX 200 Index December 2021 29 3,970 (36)
S&P TSX 60 Index December 2021 19 3,870 123
Topix Index December 2021 50 8,741 (317)
3,987
Forward Currency Contracts
ContractSettlement
Date
Contract Amount (000)Unrealized
Appreciation($000)
UnrealizedDepreciation
($000)Counterparty Receive Deliver
Bank of Montreal 12/15/21 AUD 1,932 USD 1,425 28 —
Royal Bank of Canada 12/15/21 AUD 362 USD 267 5 —
Toronto-Dominion Bank 12/15/21 CAD 4,574 USD 3,632 64 —
Goldman Sachs International 12/15/21 CAD 4,260 USD 3,357 86 —
Royal Bank of Canada 12/15/21 CAD 2,253 USD 1,796 24 —
Morgan Stanley Capital ServicesInc. 12/15/21 EUR 12,014 USD 14,219 — (316)
Bank of Montreal 12/15/21 EUR 6,156 USD 7,299 — (175)
BNP Paribas 12/15/21 EUR 3,370 USD 4,010 — (110)
Royal Bank of Canada 12/15/21 EUR 889 USD 1,032 — (3)
Royal Bank of Canada 12/15/21 GBP 2,163 USD 2,977 — (15)
Bank of Montreal 12/15/21 GBP 928 USD 1,282 — (12)
Royal Bank of Canada 12/15/21 GBP 355 USD 485 1 —
Morgan Stanley Capital ServicesInc. 12/15/21 GBP 213 USD 290 2 —
Morgan Stanley Capital ServicesInc. 12/15/21 INR 498,612 USD 6,728 — (104)
Morgan Stanley Capital ServicesInc. 12/15/21 JPY 1,257,091 USD 11,474 — (437)
Royal Bank of Canada 12/15/21 JPY 556,534 USD 5,045 — (159)
UBS AG 12/15/21 JPY 275,732 USD 2,510 — (90)
Morgan Stanley Capital ServicesInc. 12/15/21 USD 3,442 AUD 4,733 — (119)
JPMorgan Chase Bank, N.A. 12/15/21 USD 5,443 CAD 6,888 — (124)
Morgan Stanley Capital ServicesInc. 12/15/21 USD 3,130 CAD 3,992 — (96)
JPMorgan Chase Bank, N.A. 12/15/21 USD 10,339 CHF 9,459 — (6)
Barclays Bank plc 12/15/21 USD 673 DKK 4,237 14 —
JPMorgan Chase Bank, N.A. 12/15/21 USD 11,410 EUR 9,723 157 —
Total World Stock Index Fund
132

Forward Currency Contracts (continued)
ContractSettlement
Date
Contract Amount (000)Unrealized
Appreciation($000)
UnrealizedDepreciation
($000)Counterparty Receive Deliver
State Street Bank & Trust Co. 12/15/21 USD 5,753 EUR 4,896 87 —
JPMorgan Chase Bank, N.A. 12/15/21 USD 6,773 GBP 4,953 — (8)
JPMorgan Chase Bank, N.A. 12/15/21 USD 3,201 HKD 24,902 — —
BNP Paribas 12/15/21 USD 11,865 JPY 1,321,511 263 —
Royal Bank of Canada 12/15/21 USD 6,638 JPY 734,827 188 —
Deutsche Bank AG 12/15/21 USD 5,570 JPY 612,036 197 —
Morgan Stanley Capital ServicesInc. 12/15/21 USD 2,264 KRW 2,645,559 3 —
1,119 (1,774)
AUD—Australian dollar.CAD—Canadian dollar.CHF—Swiss franc.DKK—Danish krone.EUR—euro.GBP—British pound.HKD—Hong Kong dollar.INR—Indian rupee.JPY—Japanese yen.KRW—Korean won.USD—U.S. dollar.
At October 31, 2021, the counterparties had deposited in segregated accounts cash of $31,000 in
connection with open forward currency contracts.
See accompanying Notes, which are an integral part of the Financial Statements.
Total World Stock Index Fund
133

($000s, except shares and per-share amounts) Amount
Assets
Investments in Securities, at Value
Unaffiliated Issuers (Cost $23,060,320) 34,053,902
Affiliated Issuers (Cost $281,376) 281,387
Total Investments in Securities 34,335,289
Investment in Vanguard 1,101
Cash 14,140
Cash Collateral Pledged—Futures Contracts 7,687
Cash Collateral Pledged—Forward Currency Contracts 550
Foreign Currency, at Value (Cost $30,827) 30,644
Receivables for Investment Securities Sold 9,023
Receivables for Accrued Income 52,660
Receivables for Capital Shares Issued 6,003
Unrealized Appreciation—Forward Currency Contracts 1,119
Total Assets 34,458,216
Liabilities
Payables for Investment Securities Purchased 14,883
Collateral for Securities on Loan 223,521
Payables for Capital Shares Redeemed 2,565
Payables to Vanguard 909
Variation Margin Payable—Futures Contracts 128
Unrealized Depreciation—Forward Currency Contracts 1,774
Deferred Foreign Capital Gains Taxes 16,232
Total Liabilities 260,012
Net Assets 34,198,204
Total World Stock Index Fund
Statement of Assets and LiabilitiesAs of October 31, 2021
134

Statement of Assets and Liabilities (continued)
At October 31, 2021, net assets consisted of:
($000s, except shares and per-share amounts) Amount
Paid-in Capital 23,771,730
Total Distributable Earnings (Loss) 10,426,474
Net Assets 34,198,204
ETF Shares—Net Assets
Applicable to 235,322,399 outstanding $.001 par value shares ofbeneficial interest (unlimited authorization) 25,166,040
Net Asset Value Per Share—ETF Shares $106.94
Admiral Shares—Net Assets
Applicable to 135,916,799 outstanding $.001 par value shares ofbeneficial interest (unlimited authorization) 5,149,267
Net Asset Value Per Share—Admiral Shares $37.89
Institutional Shares—Net Assets
Applicable to 17,779,235 outstanding $.001 par value shares ofbeneficial interest (unlimited authorization) 3,882,897
Net Asset Value Per Share—Institutional Shares $218.40
See accompanying Notes, which are an integral part of the Financial Statements.
Total World Stock Index Fund
135

Year EndedOctober 31, 2021
($000)
Investment Income
Income
Dividends1 541,537
Interest2 99
Securities Lending—Net 4,452
Total Income 546,088
Expenses
The Vanguard Group—Note B
Investment Advisory Services 2,548
Management and Administrative—ETF Shares 10,648
Management and Administrative—Admiral Shares 3,538
Management and Administrative—Institutional Shares 2,416
Marketing and Distribution—ETF Shares 541
Marketing and Distribution—Admiral Shares 153
Marketing and Distribution—Institutional Shares 99
Custodian Fees 1,184
Auditing Fees 43
Shareholders’ Reports—ETF Shares 241
Shareholders’ Reports—Admiral Shares 35
Shareholders’ Reports—Institutional Shares 5
Trustees’ Fees and Expenses 8
Total Expenses 21,459
Net Investment Income 524,629
Realized Net Gain (Loss)
Investment Securities Sold2,3 (107,360)
Futures Contracts 41,750
Swap Contracts 13
Forward Currency Contracts (553)
Foreign Currencies (1,151)
Realized Net Gain (Loss) (67,301)
Total World Stock Index Fund
Statement of Operations
136

Statement of Operations (continued)
Year EndedOctober 31, 2021
($000)
Change in Unrealized Appreciation (Depreciation)
Investment Securities2,4 7,624,193
Futures Contracts 7,822
Swap Contracts (3)
Forward Currency Contracts (66)
Foreign Currencies (921)
Change in Unrealized Appreciation (Depreciation) 7,631,025
Net Increase (Decrease) in Net Assets Resulting from Operations 8,088,353
1 Dividends are net of foreign withholding taxes of $35,514,000.2 Interest income, realized net gain (loss), and change in unrealized appreciation (depreciation) from an affiliated company of the fund
were $96,000, less than $1,000, and less than $1,000, respectively. Purchases and sales are for temporary cash investment purposes.3 Realized gain (loss) is net of foreign capital gain taxes of $56,000.4 The change in unrealized appreciation (depreciation) is net of the change in deferred foreign capital gains taxes of $16,224,000.
See accompanying Notes, which are an integral part of the Financial Statements.
Total World Stock Index Fund
137

Year Ended October 31,
2021($000)
2020($000)
Increase (Decrease) in Net Assets
Operations
Net Investment Income 524,629 382,588
Realized Net Gain (Loss) (67,301) 55,647
Change in Unrealized Appreciation (Depreciation) 7,631,025 627,154
Net Increase (Decrease) in Net Assets Resulting from Operations 8,088,353 1,065,389
Distributions
ETF Shares (351,277) (275,179)
Admiral Shares (72,781) (51,356)
Institutional Shares (65,774) (64,101)
Total Distributions (489,832) (390,636)
Capital Share Transactions
Investor Shares — (3,594)
ETF Shares 5,703,441 1,493,356
Admiral Shares 1,187,620 530,126
Institutional Shares (310,062) 94,517
Net Increase (Decrease) from Capital Share Transactions 6,580,999 2,114,405
Total Increase (Decrease) 14,179,520 2,789,158
Net Assets
Beginning of Period 20,018,684 17,229,526
End of Period 34,198,204 20,018,684
See accompanying Notes, which are an integral part of the Financial Statements.
Total World Stock Index Fund
Statement of Changes in Net Assets
138

ETF Shares
For a Share OutstandingThroughout Each Period
Year Ended October 31,
2021 2020 2019 2018 2017
Net Asset Value, Beginning of Period $78.87 $76.83 $69.96 $72.13 $59.62
Investment Operations
Net Investment Income1 1.838 1.556 1.801 1.732 1.512
Net Realized and Unrealized Gain (Loss) onInvestments 27.954 2.078 6.825 (2.241) 12.528
Total from Investment Operations 29.792 3.634 8.626 (.509) 14.040
Distributions
Dividends from Net Investment Income (1.722) (1.594) (1.756) (1.661) (1.530)
Distributions from Realized Capital Gains — — — — —
Total Distributions (1.722) (1.594) (1.756) (1.661) (1.530)
Net Asset Value, End of Period $106.94 $78.87 $76.83 $69.96 $72.13
Total Return 37.99% 4.87% 12.60% -0.82% 23.82%
Ratios/Supplemental Data
Net Assets, End of Period (Millions) $25,166 $14,070 $12,122 $11,372 $9,755
Ratio of Total Expenses to Average Net Assets 0.07% 0.08% 0.08% 0.09% 0.10%
Ratio of Net Investment Income toAverage Net Assets 1.84% 2.03% 2.48% 2.32% 2.28%
Portfolio Turnover Rate2 6% 6% 7% 9% 10%
1 Calculated based on average shares outstanding.2 Excludes the value of portfolio securities received or delivered as a result of in-kind purchases or redemptions of the fund’s capital
shares, including ETF Creation Units.
See accompanying Notes, which are an integral part of the Financial Statements.
Total World Stock Index Fund
Financial Highlights
139

Admiral Shares
For a Share OutstandingThroughout Each Period
Year Ended October 31,
February 7,20191 to
October 31,20192021 2020
Net Asset Value, Beginning of Period $27.94 $27.22 $25.00
Investment Operations
Net Investment Income2 .644 .547 .488
Net Realized and Unrealized Gain (Loss) on Investments 9.908 .732 2.173
Total from Investment Operations 10.552 1.279 2.661
Distributions
Dividends from Net Investment Income (.602) (.559) (.441)
Distributions from Realized Capital Gains — — —
Total Distributions (.602) (.559) (.441)
Net Asset Value, End of Period $37.89 $27.94 $27.22
Total Return3 37.98% 4.83% 10.73%
Ratios/Supplemental Data
Net Assets, End of Period (Millions) $5,149 $2,842 $2,181
Ratio of Total Expenses to Average Net Assets 0.10% 0.10% 0.10%4
Ratio of Net Investment Income to Average Net Assets 1.82% 2.02% 2.53%4
Portfolio Turnover Rate5 6% 6% 7%6
1 Inception.2 Calculated based on average shares outstanding.3 Total returns do not include account service fees that may have applied in the periods shown. Fund prospectuses provide information
about any applicable account service fees.4 Annualized.5 Excludes the value of portfolio securities received or delivered as a result of in-kind purchases or redemptions of the fund’s capital
shares, including ETF Creation Units.6 Reflects the fund’s portfolio turnover for the fiscal year ended October 31, 2019.
See accompanying Notes, which are an integral part of the Financial Statements.
Total World Stock Index Fund
Financial Highlights
140

Institutional Shares
For a Share OutstandingThroughout Each Period
Year Ended October 31,
2021 2020 2019 2018 2017
Net Asset Value, Beginning of Period $161.08 $156.89 $142.87 $147.32 $121.75
Investment Operations
Net Investment Income1 3.694 3.176 3.702 3.531 3.112
Net Realized and Unrealized Gain (Loss) onInvestments 57.129 4.265 13.907 (4.578) 25.594
Total from Investment Operations 60.823 7.441 17.609 (1.047) 28.706
Distributions
Dividends from Net Investment Income (3.503) (3.251) (3.589) (3.403) (3.136)
Distributions from Realized Capital Gains — — — — —
Total Distributions (3.503) (3.251) (3.589) (3.403) (3.136)
Net Asset Value, End of Period $218.40 $161.08 $156.89 $142.87 $147.32
Total Return 37.97% 4.87% 12.57% -0.82% 23.86%
Ratios/Supplemental Data
Net Assets, End of Period (Millions) $3,883 $3,107 $2,924 $2,570 $2,529
Ratio of Total Expenses toAverage Net Assets 0.08% 0.08% 0.08% 0.08% 0.09%
Ratio of Net Investment Income toAverage Net Assets 1.83% 2.03% 2.49% 2.33% 2.29%
Portfolio Turnover Rate2 6% 6% 7% 9% 10%
1 Calculated based on average shares outstanding.2 Excludes the value of portfolio securities received or delivered as a result of in-kind purchases or redemptions of the fund’s capital
shares, including ETF Creation Units.
See accompanying Notes, which are an integral part of the Financial Statements.
Total World Stock Index Fund
Financial Highlights
141

Vanguard Total World Stock Index Fund is registered under the Investment Company Act of 1940as an open-end investment company, or mutual fund. The fund offers three classes of shares: ETFShares, Admiral Shares, and Institutional Shares. Each of the share classes has different eligibilityand minimum purchase requirements, and is designed for different types of investors. ETF Sharesare listed for trading on NYSE Arca; they can be purchased and sold through a broker. Prior toNovember 7, 2019, the fund offered Investor Shares. Effective at the close of business onNovember 7, 2019, the remaining Investor Shares were converted to Admiral Shares.
The fund invests in securities of foreign issuers, which may subject it to investment risks notnormally associated with investing in securities of U.S. corporations. Market disruptions associatedwith the COVID-19 pandemic have had a global impact, and uncertainty exists as to the long-termimplications. Such disruptions can adversely affect assets of the fund and thus fund performance.
A. The following significant accounting policies conform to generally accepted accountingprinciples for U.S. investment companies. The fund consistently follows such policies in preparingits financial statements.
1. Security Valuation: Securities are valued as of the close of trading on the New York StockExchange (generally 4 p.m., Eastern time) on the valuation date. Equity securities are valued at thelatest quoted sales prices or official closing prices taken from the primary market in which eachsecurity trades; such securities not traded on the valuation date are valued at the mean of thelatest quoted bid and asked prices. Securities for which market quotations are not readily available,or whose values have been affected by events occurring before the fund’s pricing time but afterthe close of the securities’ primary markets, are valued at their fair values calculated according toprocedures adopted by the board of trustees. These procedures include obtaining quotations froman independent pricing service, monitoring news to identify significant market- or security-specificevents, and evaluating changes in the values of foreign market proxies (for example, ADRs, futurescontracts, or exchange-traded funds), between the time the foreign markets close and the fund’spricing time. When fair-value pricing is employed, the prices of securities used by a fund tocalculate its net asset value may differ from quoted or published prices for the same securities.Investments in Vanguard Market Liquidity Fund are valued at that fund's net asset value.Temporary cash investments are valued using the latest bid prices or using valuations based on amatrix system (which considers such factors as security prices, yields, maturities, and ratings),both as furnished by independent pricing services.
2. Foreign Currency: Securities and other assets and liabilities denominated in foreign currenciesare translated into U.S. dollars using exchange rates obtained from an independent third party asof the fund’s pricing time on the valuation date. Realized gains (losses) and unrealized appreciation(depreciation) on investment securities include the effects of changes in exchange rates since thesecurities were purchased, combined with the effects of changes in security prices. Fluctuations inthe value of other assets and liabilities resulting from changes in exchange rates are recorded asunrealized foreign currency gains (losses) until the assets or liabilities are settled in cash, at whichtime they are recorded as realized foreign currency gains (losses).
3. Futures Contracts: The fund uses index futures contracts to a limited extent, with the objectivesof maintaining full exposure to the stock market, maintaining liquidity, and minimizing transactioncosts. The fund may purchase futures contracts to immediately invest incoming cash in themarket, or sell futures in response to cash outflows, thereby simulating a fully invested position inthe underlying index while maintaining a cash balance for liquidity. The primary risks associatedwith the use of futures contracts are imperfect correlation between changes in market values of
Total World Stock Index Fund
Notes to Financial Statements
142

stocks held by the fund and the prices of futures contracts, and the possibility of an illiquid market.Counterparty risk involving futures is mitigated because a regulated clearinghouse is thecounterparty instead of the clearing broker. To further mitigate counterparty risk, the fund tradesfutures contracts on an exchange, monitors the financial strength of its clearing brokers andclearinghouse, and has entered into clearing agreements with its clearing brokers. Theclearinghouse imposes initial margin requirements to secure the fund’s performance and requiresdaily settlement of variation margin representing changes in the market value of each contract. Anysecurities pledged as initial margin for open contracts are noted in the Schedule of Investments.
Futures contracts are valued at their quoted daily settlement prices. The notional amounts of thecontracts are not recorded in the Statement of Assets and Liabilities. Fluctuations in the value ofthe contracts are recorded in the Statement of Assets and Liabilities as an asset (liability) and inthe Statement of Operations as unrealized appreciation (depreciation) until the contracts areclosed, when they are recorded as realized gains (losses) on futures contracts.
During the year ended October 31, 2021, the fund’s average investments in long and short futurescontracts represented 1% and 0% of net assets, respectively, based on the average of thenotional amounts at each quarter-end during the period.
4. Forward Currency Contracts: The fund enters into forward currency contracts to protect thevalue of securities and related receivables and payables against changes in future foreign exchangerates. The fund’s risks in using these contracts include movement in the values of the foreigncurrencies relative to the U.S. dollar and the ability of the counterparties to fulfill their obligationsunder the contracts. The fund mitigates its counterparty risk by entering into forward currencycontracts only with a diverse group of prequalified counterparties, monitoring their financialstrength, entering into master netting arrangements with its counterparties, and requiring itscounterparties to transfer collateral as security for their performance. In the absence of a default,the collateral pledged or received by the fund cannot be repledged, resold, or rehypothecated. Themaster netting arrangements provide that, in the event of a counterparty’s default (includingbankruptcy), the fund may terminate the forward currency contracts, determine the net amountowed by either party in accordance with its master netting arrangements, and sell or retain anycollateral held up to the net amount owed to the fund under the master netting arrangements. Theforward currency contracts contain provisions whereby a counterparty may terminate opencontracts if the fund’s net assets decline below a certain level, triggering a payment by the fund ifthe fund is in a net liability position at the time of the termination. The payment amount would bereduced by any collateral the fund has pledged. Any securities pledged as collateral for opencontracts are noted in the Schedule of Investments. The value of collateral received or pledged iscompared daily to the value of the forward currency contracts exposure with each counterparty,and any difference, if in excess of a specified minimum transfer amount, is adjusted and settledwithin two business days.
Forward currency contracts are valued at their quoted daily prices obtained from an independentthird party, adjusted for currency risk based on the expiration date of each contract. The notionalamounts of the contracts are not recorded in the Statement of Assets and Liabilities. Fluctuationsin the value of the contracts are recorded in the Statement of Assets and Liabilities as an asset(liability) and in the Statement of Operations as unrealized appreciation (depreciation) until thecontracts are closed, when they are recorded as realized gains (losses) on forward currencycontracts.
Total World Stock Index Fund
143

During the year ended October 31, 2021, the fund’s average investment in forward currencycontracts represented less than 1% of net assets, based on the average of the notional amountsat each quarter-end during the period.
5. Swap Contracts: The fund has entered into equity swap contracts to earn the total return onselected reference stocks in the fund’s target index. Under the terms of the swaps, the fundreceives the total return on the referenced stock (i.e., receiving the increase or paying thedecrease in value of the selected reference stock and receiving the equivalent of any dividends inrespect of the selected referenced stock) over a specified period of time, applied to a notionalamount that represents the value of a designated number of shares of the selected referencestock at the beginning of the equity swap contract. The fund also pays a floating rate that is basedon short-term interest rates, applied to the notional amount. At the same time, the fund generallyinvests an amount approximating the notional amount of the swap in high-quality temporary cashinvestments.
A risk associated with all types of swaps is the possibility that a counterparty may default on itsobligation to pay net amounts due to the fund. The fund’s maximum amount subject tocounterparty risk is the unrealized appreciation on the swap contract. The fund mitigates itscounterparty risk by entering into swaps only with a diverse group of prequalified counterparties,monitoring their financial strength, entering into master netting arrangements with itscounterparties, and requiring its counterparties to transfer collateral as security for theirperformance. In the absence of a default, the collateral pledged or received by the fund cannot berepledged, resold, or rehypothecated. In the event of a counterparty’s default (includingbankruptcy), the fund may terminate any swap contracts with that counterparty, determine the netamount owed by either party in accordance with its master netting arrangements, and sell orretain any collateral held up to the net amount owed to the fund under the master nettingarrangements. The swap contracts contain provisions whereby a counterparty may terminate opencontracts if the fund’s net assets decline below a certain level, triggering a payment by the fund ifthe fund is in a net liability position at the time of the termination. The payment amount would bereduced by any collateral the fund has pledged. Any securities pledged as collateral for opencontracts are noted in the Schedule of Investments. The value of collateral received or pledged iscompared daily to the value of the swap contracts exposure with each counterparty, and anydifference, if in excess of a specified minimum transfer amount, is adjusted and settled within twobusiness days.
The notional amounts of swap contracts are not recorded in the Statement of Assets andLiabilities. Swaps are valued daily based on market quotations received from independent pricingservices or recognized dealers and the change in value is recorded in the Statement of Assets andLiabilities as an asset (liability) and in the Statement of Operations as unrealized appreciation(depreciation) until periodic payments are made or the termination of the swap, at which timerealized gain (loss) is recorded.
During the year ended October 31, 2021, the fund’s average amounts of investments in totalreturn swaps represented less than 1% of net assets, based on the average of notional amountsat each quarter-end during the period. The fund had no open swap contracts at October 31, 2021.
6. Federal Income Taxes: The fund intends to continue to qualify as a regulated investmentcompany and distribute all of its taxable income. The fund’s tax returns are open to examination bythe relevant tax authorities until expiration of the applicable statute of limitations, which is
Total World Stock Index Fund
144

generally three years after the filing of the tax return. Management has analyzed the fund’s taxpositions taken for all open federal and state income tax years, and has concluded that noprovision for income tax is required in the fund’s financial statements.
7. Distributions: Distributions to shareholders are recorded on the ex-dividend date. Distributionsare determined on a tax basis at the fiscal year-end and may differ from net investment incomeand realized capital gains for financial reporting purposes.
8. Securities Lending: To earn additional income, the fund lends its securities to qualifiedinstitutional borrowers. Security loans are subject to termination by the fund at any time, and arerequired to be secured at all times by collateral in an amount at least equal to the market value ofsecurities loaned. Daily market fluctuations could cause the value of loaned securities to be moreor less than the value of the collateral received. When this occurs, the collateral is adjusted andsettled before the opening of the market on the next business day. The fund further mitigates itscounterparty risk by entering into securities lending transactions only with a diverse group ofprequalified counterparties, monitoring their financial strength, and entering into master securitieslending agreements with its counterparties. The master securities lending agreements providethat, in the event of a counterparty’s default (including bankruptcy), the fund may terminate anyloans with that borrower, determine the net amount owed, and sell or retain the collateral up tothe net amount owed to the fund; however, such actions may be subject to legal proceedings.While collateral mitigates counterparty risk, in the event of a default, the fund may experiencedelays and costs in recovering the securities loaned. The fund invests cash collateral received inVanguard Market Liquidity Fund, and records a liability in the Statement of Assets and Liabilitiesfor the return of the collateral, during the period the securities are on loan. Collateral investmentsin Vanguard Market Liquidity Fund are subject to market appreciation or depreciation. Securitieslending income represents fees charged to borrowers plus income earned on invested cashcollateral, less expenses associated with the loan. During the term of the loan, the fund is entitledto all distributions made on or in respect of the loaned securities.
9. Credit Facilities and Interfund Lending Program: The fund and certain other funds managed byThe Vanguard Group ("Vanguard") participate in a $4.3 billion committed credit facility provided by asyndicate of lenders pursuant to a credit agreement and an uncommitted credit facility provided byVanguard. Both facilities may be renewed annually. Each fund is individually liable for itsborrowings, if any, under the credit facilities. Borrowings may be utilized for temporary oremergency purposes, subject to the fund’s regulatory and contractual borrowing restrictions. Withrespect to the committed credit facility, the participating funds are charged administrative fees andan annual commitment fee of 0.10% of the undrawn committed amount of the facility; these feesare allocated to the funds based on a method approved by the fund’s board of trustees andincluded in Management and Administrative expenses on the fund’s Statement of Operations. Anyborrowings under either facility bear interest at a rate based upon the higher of the one-monthLondon Interbank Offered Rate (or an acceptable alternate rate, if necessary), federal fundseffective rate, or overnight bank funding rate plus an agreed-upon spread, except that borrowingsunder the uncommitted credit facility may bear interest based upon an alternate rate agreed to bythe fund and Vanguard.
In accordance with an exemptive order (the “Order”) from the SEC, the fund may participate in ajoint lending and borrowing program that allows registered open-end Vanguard funds to borrowmoney from and lend money to each other for temporary or emergency purposes (the “InterfundLending Program”), subject to compliance with the terms and conditions of the Order, and to theextent permitted by the fund’s investment objective and investment policies. Interfund loans and
Total World Stock Index Fund
145

borrowings normally extend overnight, but can have a maximum duration of seven days. Loansmay be called on one business day’s notice. The interest rate to be charged is governed by theconditions of the Order and internal procedures adopted by the board of trustees. The board oftrustees is responsible for overseeing the Interfund Lending Program.
For the year ended October 31, 2021, the fund did not utilize the credit facilities or the InterfundLending Program.
10. Other: Dividend income is recorded on the ex-dividend date. Non-cash dividends included inincome, if any, are recorded at the fair value of the securities received. Interest income includesincome distributions received from Vanguard Market Liquidity Fund and is accrued daily. Premiumsand discounts on debt securities are amortized and accreted, respectively, to interest income overthe lives of the respective securities, except for premiums on certain callable debt securities thatare amortized to the earliest call date. Security transactions are accounted for on the datesecurities are bought or sold. Costs used to determine realized gains (losses) on the sale ofinvestment securities are those of the specific securities sold.
Taxes on foreign dividends and capital gains have been provided for in accordance with the fund'sunderstanding of the applicable countries' tax rules and rates. Deferred foreign capital gains tax, ifany, is accrued daily based upon net unrealized gains. The fund has filed tax reclaims for previouslywithheld taxes on dividends earned in certain European Union countries. These filings are subjectto various administrative and judicial proceedings within these countries. Such tax reclaimsreceived during the year, if any, are included in dividend income. No other amounts for additionaltax reclaims are reflected in the financial statements due to the uncertainty as to the ultimateresolution of proceedings, the likelihood of receipt of these reclaims, and the potential timing ofpayment.
Each class of shares has equal rights as to assets and earnings, except that each class separatelybears certain class-specific expenses related to maintenance of shareholder accounts (included inManagement and Administrative expenses) and shareholder reporting. Marketing and distributionexpenses are allocated to each class of shares based on a method approved by the board oftrustees. Income, other non-class-specific expenses, and gains and losses on investments areallocated to each class of shares based on its relative net assets.
B. In accordance with the terms of a Funds' Service Agreement (the “FSA”) between Vanguardand the fund, Vanguard furnishes to the fund investment advisory, corporate management,administrative, marketing, and distribution services at Vanguard’s cost of operations (as defined bythe FSA). These costs of operations are allocated to the fund based on methods and guidelinesapproved by the board of trustees and are generally settled twice a month.
Upon the request of Vanguard, the fund may invest up to 0.40% of its net assets as capital inVanguard. At October 31, 2021, the fund had contributed to Vanguard capital in the amount of$1,101,000, representing less than 0.01% of the fund’s net assets and 0.44% of Vanguard’s capitalreceived pursuant to the FSA. The fund’s trustees and officers are also directors and employees,respectively, of Vanguard.
C. Various inputs may be used to determine the value of the fund’s investments and derivatives.These inputs are summarized in three broad levels for financial statement purposes. The inputs ormethodologies used to value securities are not necessarily an indication of the risk associated withinvesting in those securities.
Total World Stock Index Fund
146

Level 1—Quoted prices in active markets for identical securities.
Level 2—Other significant observable inputs (including quoted prices for similar securities, interestrates, prepayment speeds, credit risk, etc.).
Level 3—Significant unobservable inputs (including the fund’s own assumptions used todetermine the fair value of investments). Any investments and derivatives valued with significantunobservable inputs are noted on the Schedule of Investments.
The following table summarizes the market value of the fund’s investments and derivatives as ofOctober 31, 2021, based on the inputs used to value them:
Level 1($000)
Level 2($000)
Level 3($000)
Total($000)
Investments
Assets
Common Stocks—North and SouthAmerica 21,487,431 4,130 8 21,491,569
Common Stocks—Other 247,108 12,285,765 29,460 12,562,333
Temporary Cash Investments 281,387 — — 281,387
Total 22,015,926 12,289,895 29,468 34,335,289 Derivative Financial Instruments
Assets
Futures Contracts1 4,437 — — 4,437
Forward Currency Contracts — 1,119 — 1,119
Total 4,437 1,119 — 5,556
Liabilities
Futures Contracts1 450 — — 450
Forward Currency Contracts — 1,774 — 1,774
Total 450 1,774 — 2,224 1 Includes cumulative appreciation (depreciation) on futures contracts and centrally cleared swaps, if any, as reported in the Schedule of
Investments. Only current day’s variation margin is reported within the Statement of Assets and Liabilities.
Total World Stock Index Fund
147

D. At October 31, 2021, the fair values of derivatives were reflected in the Statement of Assetsand Liabilities as follows:
Statement of Assets and Liabilities
EquityContracts
($000)
ForeignExchangeContracts
($000)Total
($000)
Unrealized Appreciation—Futures Contracts1 4,437 — 4,437
Unrealized Appreciation—Forward Currency Contracts — 1,119 1,119
Total Assets 4,437 1,119 5,556
Unrealized Depreciation—Futures Contracts1 450 — 450
Unrealized Depreciation—Forward Currency Contracts — 1,774 1,774
Total Liabilities 450 1,774 2,224
1 Includes cumulative appreciation (depreciation) on futures contracts and centrally cleared swaps, if any, as reported in the Schedule ofInvestments. Only current day’s variation margin is reported within the Statement of Assets and Liabilities.
Realized net gain (loss) and the change in unrealized appreciation (depreciation) on derivatives forthe year ended October 31, 2021, were:
Realized Net Gain (Loss) on Derivatives
EquityContracts
($000)
ForeignExchangeContracts
($000)Total
($000)
Futures Contracts 41,750 — 41,750
Swap Contracts 13 — 13
Forward Currency Contracts — (553) (553)
Realized Net Gain (Loss) on Derivatives 41,763 (553) 41,210
Change in Unrealized Appreciation (Depreciation) on Derivatives
Futures Contracts 7,822 — 7,822
Swap Contracts (3) — (3)
Forward Currency Contracts — (66) (66)
Change in Unrealized Appreciation (Depreciation) on Derivatives 7,819 (66) 7,753
E. Permanent differences between book-basis and tax-basis components of net assets arereclassified among capital accounts in the financial statements to reflect their tax character. Thesereclassifications have no effect on net assets or net asset value per share. As of period end,permanent differences primarily attributable to the accounting for foreign currency transactions,passive foreign investment companies, swap agreements, and tax expense on capital gains werereclassified between the following accounts:
Amount($000)
Paid-in Capital 12
Total Distributable Earnings (Loss) (12)
Temporary differences between book-basis and tax-basis components of total distributableearnings (loss) arise when certain items of income, gain, or loss are recognized in different periods
Total World Stock Index Fund
148

for financial statement and tax purposes; these differences will reverse at some time in the future.The differences are primarily related to the deferral of losses from wash sales; the recognition ofunrealized gains or losses from certain derivative contracts; the recognition of unrealized gainsfrom passive foreign investment companies; and the classification of securities for tax purposes.As of period end, the tax-basis components of total distributable earnings (loss) are detailed in thetable as follows:
Amount($000)
Undistributed Ordinary Income 164,174
Undistributed Long-Term Gains —
Capital Loss Carryforwards (622,416)
Qualified Late-Year Losses —
Net Unrealized Gains (Losses) 10,884,716
The tax character of distributions paid was as follows:
Year Ended October 31,
2021Amount
($000)
2020Amount
($000)
Ordinary Income* 489,832 390,636
Long-Term Capital Gains — —
Total 489,832 390,636 * Includes short-term capital gains, if any.
As of October 31, 2021, gross unrealized appreciation and depreciation for investments andderivatives based on cost for U.S. federal income tax purposes were as follows:
Amount($000)
Tax Cost 23,433,969
Gross Unrealized Appreciation 12,505,587
Gross Unrealized Depreciation (1,604,485)
Net Unrealized Appreciation (Depreciation) 10,901,102
F. During the year ended October 31, 2021, the fund purchased $8,410,109,000 of investmentsecurities and sold $1,761,943,000 of investment securities, other than temporary cashinvestments. Purchases and sales include $4,894,243,000 and $0, respectively, in connection within-kind purchases and redemptions of the fund's capital shares.
The fund purchased securities from and sold securities to other Vanguard funds or accountsmanaged by Vanguard or its affiliates, in accordance with procedures adopted by the board oftrustees in compliance with Rule 17a-7 of the Investment Company Act of 1940. For the yearended October 31, 2021, such purchases were $262,386,000 and sales were $157,694,000,resulting in net realized loss of $13,033,000; these amounts, other than temporary cashinvestments, are included in the purchases and sales of investment securities noted above.
Total World Stock Index Fund
149

G. Capital share transactions for each class of shares were:
Year Ended October 31,
2021 2020
Amount($000)
Shares(000)
Amount($000)
Shares(000)
Investor Shares
Issued — — 70 2
Issued in Lieu of Cash Distributions — — — —
Redeemed1 — — (3,664) (115)
Net Increase (Decrease)—Investor Shares — — (3,594) (113)
ETF Shares
Issued 5,703,441 56,936 2,214,590 30,406
Issued in Lieu of Cash Distributions — — — —
Redeemed — — (721,234) (9,800)
Net Increase (Decrease)—ETF Shares 5,703,441 56,936 1,493,356 20,606
Admiral Shares
Issued1 1,998,565 57,315 1,409,764 55,845
Issued in Lieu of Cash Distributions 63,440 1,817 45,953 1,739
Redeemed (874,385) (24,928) (925,591) (35,995)
Net Increase (Decrease)—Admiral Shares 1,187,620 34,204 530,126 21,589
Institutional Shares
Issued 822,546 4,037 964,601 6,259
Issued in Lieu of Cash Distributions 62,725 314 61,520 403
Redeemed (1,195,333) (5,858) (931,604) (6,011)
Net Increase (Decrease)—Institutional Shares (310,062) (1,507) 94,517 651 1 In November 2018, the fund announced changes to the availability and minimum investment criteria of the Investor and Admiral share
classes. As a result, all of the outstanding Investor Shares automatically converted to Admiral Shares beginning in April 2019, with theexception of those held by Vanguard funds and certain other institutional investors. Investor Shares—Redeemed and AdmiralShares—Issued include 73,932 and 85,057 shares, respectively, in the amount of $2,357,000 from the conversion during the year ended2020.
H. Management has determined that no events or transactions occurred subsequent toOctober 31, 2021, that would require recognition or disclosure in these financial statements.
Total World Stock Index Fund
150

To the Board of Trustees of Vanguard International Equity Index Funds and Shareholders ofVanguard Total World Stock Index Fund
Opinion on the Financial StatementsWe have audited the accompanying statement of assets and liabilities, including the schedule ofinvestments, of Vanguard Total World Stock Index Fund (one of the funds constituting VanguardInternational Equity Index Funds, referred to hereafter as the "Fund") as of October 31, 2021, therelated statement of operations for the year ended October 31, 2021, the statement of changes innet assets for each of the two years in the period ended October 31, 2021, including the relatednotes, and the financial highlights for each of the periods indicated therein (collectively referred toas the "financial statements"). In our opinion, the financial statements present fairly, in all materialrespects, the financial position of the Fund as of October 31, 2021, the results of its operations forthe year then ended, the changes in its net assets for each of the two years in the period endedOctober 31, 2021 and the financial highlights for each of the periods indicated therein inconformity with accounting principles generally accepted in the United States of America.
Basis for OpinionThese financial statements are the responsibility of the Fund’s management. Our responsibility isto express an opinion on the Fund’s financial statements based on our audits. We are a publicaccounting firm registered with the Public Company Accounting Oversight Board (United States)(PCAOB) and are required to be independent with respect to the Fund in accordance with the U.S.federal securities laws and the applicable rules and regulations of the Securities and ExchangeCommission and the PCAOB.
We conducted our audits of these financial statements in accordance with the standards of thePCAOB. Those standards require that we plan and perform the audit to obtain reasonableassurance about whether the financial statements are free of material misstatement, whether dueto error or fraud.
Our audits included performing procedures to assess the risks of material misstatement of thefinancial statements, whether due to error or fraud, and performing procedures that respond tothose risks. Such procedures included examining, on a test basis, evidence regarding the amountsand disclosures in the financial statements. Our audits also included evaluating the accountingprinciples used and significant estimates made by management, as well as evaluating the overallpresentation of the financial statements. Our procedures included confirmation of securitiesowned as of October 31, 2021 by correspondence with the custodian, transfer agent and brokers;when replies were not received from the transfer agent or brokers, we performed other auditingprocedures. We believe that our audits provide a reasonable basis for our opinion.
/s/PricewaterhouseCoopers LLPPhiladelphia, PennsylvaniaDecember 17, 2021
We have served as the auditor of one or more investment companies in The Vanguard Group ofFunds since 1975.
Report of Independent RegisteredPublic Accounting Firm
151

Special 2021 tax information (unaudited) for Vanguard Total World Stock Index Fund
This information for the fiscal year ended October 31, 2021, is included pursuant to provisions ofthe Internal Revenue Code.
The fund distributed $441,312,000 of qualified dividend income to shareholders during the fiscalyear.
The fund distributed $11,391,000 of qualified business income to shareholders during the fiscalyear.
For corporate shareholders, 32.7% of investment income (dividend income plus short-term gains,if any) qualifies for the dividends-received deduction.
The fund designates to shareholders foreign source income of $367,125,000 and foreign taxes paidof $32,300,000. Shareholders will receive more detailed information with their Form 1099-DIV inJanuary 2022 to determine the calendar-year amounts to be included on their 2021 tax returns.
152

London Stock Exchange Group companies include FTSE International Limited (“FTSE”), Frank Russell Company(“Russell”), MTS Next Limited (“MTS”), and FTSE TMX Global Debt Capital Markets Inc. (“FTSE TMX”). All rightsreserved. “FTSE®”, “Russell®”, “MTS®”, “FTSE TMX®” and “FTSE Russell” and other service marks and trademarksrelated to the FTSE or Russell indexes are trademarks of the London Stock Exchange Group companies and are used byFTSE, MTS, FTSE TMX and Russell under license. All information is provided for information purposes only. Every effort ismade to ensure that all information given in this publication is accurate, but no responsibility or liability can be acceptedby the London Stock Exchange Group companies nor its licensors for any errors or for any loss from use of thispublication. Neither the London Stock Exchange Group companies nor any of their licensors make any claim, prediction,warranty or representation whatsoever, expressly or impliedly, either as to the results to be obtained from the use of theIndices or the fitness or suitability of the Indices for any particular purpose to which they might be put. The London StockExchange Group companies do not provide investment advice and nothing in this document should be taken asconstituting financial or investment advice. The London Stock Exchange Group companies make no representationregarding the advisability of investing in any asset. A decision to invest in any such asset should not be made in relianceon any information herein. Indexes cannot be invested in directly. Inclusion of an asset in an index is not arecommendation to buy, sell or hold that asset. The general information contained in this publication should not be actedupon without obtaining specific legal, tax, and investment advice from a licensed professional. No part of thisinformation may be reproduced, stored in a retrieval system or transmitted in any form or by any means, electronic,mechanical, photocopying, recording or otherwise, without prior written permission of the London Stock Exchange Groupcompanies. Distribution of the London Stock Exchange Group companies’ index values and the use of their indexes tocreate financial products require a license with FTSE, FTSE TMX, MTS and/or Russell and/or its licensors.
153

This page intentionally left blank.

The trustees of your mutual fund are there to see that the fund is operated and managed in yourbest interests since, as a shareholder, you are a part owner of the fund. Your fund’s trustees alsoserve on the board of directors of The Vanguard Group, Inc., which is owned by the Vanguard fundsand provides services to them.
A majority of Vanguard’s board members are independent, meaning that they have no affiliationwith Vanguard or the funds they oversee, apart from the sizable personal investments they havemade as private individuals. The independent board members have distinguished backgrounds inbusiness, academia, and public service. Each of the trustees and executive officers oversees 214Vanguard funds.
Information for each trustee and executive officer of the fund appears below. That information, aswell as the Vanguard fund count, is as of the date on the cover of this fund report. The mailingaddress of the trustees and officers is P.O. Box 876, Valley Forge, PA 19482. More informationabout the trustees is in the Statement of Additional Information, which can be obtained, withoutcharge, by contacting Vanguard at 800-662-7447, or online at vanguard.com.
Interested Trustee1
Mortimer J. BuckleyBorn in 1969. Trustee since January 2018. Principaloccupation(s) during the past five years and otherexperience: chairman of the board (2019–present) ofVanguard and of each of the investment companiesserved by Vanguard; chief executive officer(2018–present) of Vanguard; chief executive officer,president, and trustee (2018–present) of each of theinvestment companies served by Vanguard; presidentand director (2017–present) of Vanguard; andpresident (2018–present) of Vanguard MarketingCorporation. Chief investment officer (2013–2017),managing director (2002–2017), head of the RetailInvestor Group (2006–2012), and chief informationofficer (2001–2006) of Vanguard. Chairman of theboard (2011–2017) and trustee (2009–2017) of theChildren’s Hospital of Philadelphia; and trustee(2018–present) and vice chair (2019–present) of TheShipley School.
Independent Trustees
Emerson U. FullwoodBorn in 1948. Trustee since January 2008. Principaloccupation(s) during the past five years and otherexperience: executive chief staff and marketingofficer for North America and corporate vice president(retired 2008) of Xerox Corporation (documentmanagement products and services). Formerpresident of the Worldwide Channels Group, Latin
America, and Worldwide Customer Service andexecutive chief staff officer of Developing Markets ofXerox. Executive in residence and 2009–2010Distinguished Minett Professor at the RochesterInstitute of Technology. Director of SPX FLOW, Inc.(multi-industry manufacturing). Director of theUniversity of Rochester Medical Center, the MonroeCommunity College Foundation, the United Way ofRochester, North Carolina A&T University, andRoberts Wesleyan College. Trustee of the Universityof Rochester.
Amy GutmannBorn in 1949. Trustee since June 2006. Principaloccupation(s) during the past five years and otherexperience: president (2004–present) of theUniversity of Pennsylvania. Christopher H. BrowneDistinguished Professor of Political Science, School ofArts and Sciences, and professor of communication,Annenberg School for Communication, withsecondary faculty appointments in the Department ofPhilosophy, School of Arts and Sciences, and at theGraduate School of Education, University ofPennsylvania.
F. Joseph LoughreyBorn in 1949. Trustee since October 2009. Principaloccupation(s) during the past five years and otherexperience: president and chief operating officer(retired 2009) and vice chairman of the board(2008–2009) of Cummins Inc. (industrial machinery).Chairman of the board of Hillenbrand, Inc. (specializedconsumer services). Director of the V Foundation.
1 Mr. Buckley is considered an “interested person,” as defined in the Investment Company Act of 1940, because he is an officer of the
Vanguard funds.
The People Who Govern Your Fund

Member of the advisory council for the College ofArts and Letters and chair of the advisory board to theKellogg Institute for International Studies, both at theUniversity of Notre Dame. Chairman of the board ofSaint Anselm College.
Mark LoughridgeBorn in 1953. Trustee since March 2012. Principaloccupation(s) during the past five years and otherexperience: senior vice president and chief financialofficer (retired 2013) of IBM (information technologyservices). Fiduciary member of IBM’s RetirementPlan Committee (2004–2013), senior vice presidentand general manager (2002–2004) of IBM GlobalFinancing, vice president and controller (1998–2002)of IBM, and a variety of other prior management rolesat IBM. Member of the Council on Chicago Booth.
Scott C. MalpassBorn in 1962. Trustee since March 2012. Principaloccupation(s) during the past five years and otherexperience: chief investment officer (retired June2020) and vice president (retired June 2020) of theUniversity of Notre Dame. Assistant professor (retiredJune 2020) of finance at the Mendoza College ofBusiness, University of Notre Dame, and member ofthe Notre Dame 403(b) Investment Committee.Member of the board of Catholic InvestmentServices, Inc. (investment advisors) and the board ofsuperintendence of the Institute for the Works ofReligion.
Deanna MulliganBorn in 1963. Trustee since January 2018. Principaloccupation(s) during the past five years and otherexperience: board chair (2020), chief executive officer(2011–2020), and president (2010–2019) of TheGuardian Life Insurance Company of America. Chiefoperating officer (2010–2011) and executive vicepresident (2008–2010) of Individual Life and Disabilityof the Guardian Life Insurance Company of America.Member of the board of the Economic Club of NewYork. Trustee of the Partnership for New York City(business leadership), Chief Executives for CorporatePurpose, NewYork-Presbyterian Hospital, and theBruce Museum (arts and science). Member of theAdvisory Council for the Stanford Graduate School ofBusiness.
André F. PeroldBorn in 1952. Trustee since December 2004. Principaloccupation(s) during the past five years and otherexperience: George Gund Professor of Finance andBanking, Emeritus at the Harvard Business School(retired 2011). Chief investment officer andco-managing partner of HighVista Strategies (privateinvestment firm). Member of the board
(2018–present) of RIT Capital Partners (investmentfirm). Member of the investment committee ofPartners Health Care System.
Sarah Bloom RaskinBorn in 1961. Trustee since January 2018. Principaloccupation(s) during the past five years and otherexperience: deputy secretary (2014–2017) of theUnited States Department of the Treasury. Governor(2010–2014) of the Federal Reserve Board.Commissioner (2007–2010) of financial regulation forthe State of Maryland. Professor (2020–present),Distinguished Fellow of the Global Financial MarketsCenter (2020–present), and Rubenstein Fellow(2017–2020) at Duke University. Trustee(2017–present) of Amherst College and member ofAmherst College Investment Committee(2019–present). Member of the Regenerative CrisisResponse Committee (2020–present).
David A. ThomasBorn in 1956. Trustee since July 2021. Principaloccupation(s) during the past five years and otherexperience: president of Morehouse College(2018–present). Professor of business administration,emeritus at Harvard University (2017–2018). Dean(2011–2016) and professor of management(2016–2017) at the Georgetown UniversityMcDonough School of Business. Director of DTEEnergy Company (2013–present). Trustee of CommonFund (2019–present).
Peter F. VolanakisBorn in 1955. Trustee since July 2009. Principaloccupation(s) during the past five years and otherexperience: president and chief operating officer(retired 2010) of Corning Incorporated(communications equipment) and director of CorningIncorporated (2000–2010) and Dow Corning(2001–2010). Director (2012) of SPX Corporation(multi-industry manufacturing). Overseer of the AmosTuck School of Business Administration, DartmouthCollege (2001–2013). Chairman of the board oftrustees of Colby-Sawyer College. Member of theBMW Group Mobility Council.

Executive Officers
Christine M. BuchananBorn in 1970. Principal occupation(s) during the pastfive years and other experience: principal ofVanguard. Chief financial officer (2021–present) andtreasurer (2017–present) of each of the investmentcompanies served by Vanguard. Partner (2005–2017)at KPMG (audit, tax, and advisory services).
David CermakBorn in 1960. Principal occupation(s) during the pastfive years and other experience: principal ofVanguard. Finance director (2019–present) of each ofthe investment companies served by Vanguard.Managing director and head (2017–present) ofVanguard Investments Singapore. Managing directorand head (2017–2019) of Vanguard Investments HongKong. Representative director and head (2014–2017)of Vanguard Investments Japan.
John GallowayBorn in 1973. Principal occupation(s) during the pastfive years and other experience: principal ofVanguard. Investment stewardship officer (September2020–present) of each of the investment companiesserved by Vanguard. Head of Investor Advocacy(February 2020–present) and head of MarketingStrategy and Planning (2017–2020) at Vanguard.Deputy assistant to the President of theUnited States (2015).
Peter MahoneyBorn in 1974. Principal occupation(s) during the pastfive years and other experience: principal ofVanguard. Controller (2015–present) of each of theinvestment companies served by Vanguard. Head ofInternational Fund Services (2008–2014) at Vanguard.
Anne E. RobinsonBorn in 1970. Principal occupation(s) during the pastfive years and other experience: general counsel(2016–present) of Vanguard. Secretary (2016–present)of Vanguard and of each of the investmentcompanies served by Vanguard. Managing director(2016–present) of Vanguard. Managing director andgeneral counsel of Global Cards and ConsumerServices (2014–2016) at Citigroup. Counsel(2003–2014) at American Express.
Michael RollingsBorn in 1963. Principal occupation(s) during the pastfive years and other experience: finance director(2017–present) and treasurer (2017) of each of theinvestment companies served by Vanguard.Managing director (2016–present) of Vanguard. Chieffinancial officer (2016–present) of Vanguard. Director(2016–present) of Vanguard Marketing Corporation.Executive vice president and chief financial officer(2006–2016) of MassMutual Financial Group.
John E. SchadlBorn in 1972. Principal occupation(s) during the pastfive years and other experience: principal ofVanguard. Chief compliance officer (2019–present) ofVanguard and of each of the investment companiesserved by Vanguard. Assistant vice president(2019–present) of Vanguard Marketing Corporation.
Vanguard Senior Management Team Matthew Benchener Thomas M. RampullaJoseph Brennan Karin A. RisiMortimer J. Buckley Anne E. RobinsonGregory Davis Michael RollingsJohn James Nitin TandonJohn T. Marcante Lauren ValenteChris D. Mclsaac

Connect with Vanguard® > vanguard.com
Fund Information > 800-662-7447
Direct Investor Account Services > 800-662-2739
Institutional Investor Services > 800-523-1036
Text Telephone for People Who Are Deaf or Hardof Hearing > 800-749-7273
This material may be used in conjunctionwith the offering of shares of any Vanguardfund only if preceded or accompanied bythe fund’s current prospectus.
All comparative mutual fund data are from Morningstar,Inc., unless otherwise noted.
You can obtain a free copy of Vanguard’s proxy votingguidelines by visiting vanguard.com/proxyreporting or bycalling Vanguard at 800-662-2739. The guidelines arealso available from the SEC’s website, www.sec.gov. Inaddition, you may obtain a free report on how your fundvoted the proxies for securities it owned during the 12months ended June 30. To get the report, visit eithervanguard.com/proxyreporting or www.sec.gov.
You can review information about your fund on the SEC’swebsite, and you can receive copies of this information,for a fee, by sending a request via email addressed [email protected].
Source for Bloomberg indexes: Bloomberg IndexServices Limited. Copyright 2021, Bloomberg. All rightsreserved.
© 2021 The Vanguard Group, Inc.All rights reserved.U.S. Patent Nos. 6,879,964 and 7,720,749.Vanguard Marketing Corporation, Distributor.
Q6280 122021
Copyright © 2022 FDOKUMEN