Legal & General UCITS ETF Plc - Fund Communication Solutions
Upload
khangminh22Category
view
1download
0
Vanguard ETF Series
Annual ReportFor the year ended 31 December 2017
Vanguard Sub-Funds covered in this annualreport
Vanguard FTSE Asia ex Japan Index ETF SEHK Stock code: 2805
Vanguard FTSE Asia ex Japan High Dividend Yield Index ETF SEHK Stock code: 3085
Vanguard FTSE Developed Europe Index ETF SEHK Stock code: 3101
Vanguard FTSE Japan Index ETF SEHK Stock code: 3126
Vanguard S&P 500 Index ETF SEHK Stock code: 3140
Vanguard ETF SeriesFor the year ended 31 December 2017
ContentsPage
Report of the manager to the unitholders 1
Report of the trustee to the unitholders 2
Statement of responsibilities of the manager and the trustee 3
Independent auditor’s report 4
Statement of financial position 8
Statement of comprehensive income 11
Statement of changes in net assets attributable to unitholders 14
Statement of cash flows 17
Notes to the financial statements 20
Vanguard FTSE Asia ex Japan Index ETF
Investment portfolio (Unaudited) 58
Statement of movements in investment portfolio (Unaudited) 83
Performance record (Unaudited) 106
Vanguard FTSE Asia ex Japan High Dividend Yield Index ETF
Investment portfolio (Unaudited) 107
Statement of movements in investment portfolio (Unaudited) 118
Performance record (Unaudited) 129
Vanguard FTSE Developed Europe Index ETF
Investment portfolio (Unaudited) 130
Statement of movements in investment portfolio (Unaudited) 148
Performance record (Unaudited) 163
Vanguard FTSE Japan Index ETF
Investment portfolio (Unaudited) 164
Statement of movements in investment portfolio (Unaudited) 179
Performance record (Unaudited) 193
Vanguard S&P 500 Index ETF
Investment portfolio (Unaudited) 194
Statement of movements in investment portfolio (Unaudited) 209
Performance record (Unaudited) 223
Administration and management 224
Report of the manager to the unitholders
The Vanguard ETF Series (the “Trust”) is an umbrella unit trust authorised under the Securities and Futures Ordinance (Cap.571) of Hong Kong. The Manager of the Trust is Vanguard Investments Hong Kong Limited (the “Manager”). The Trustee isState Street Trust (HK) Limited (the “Trustee”). The Trustee and the Manager may issue different sub-funds representingseparate portfolios of assets. The assets of each sub-fund will be invested in accordance with the investment objective andpolicies applicable to the sub-fund.
Vanguard FTSE Asia ex Japan Index ETF
The Vanguard FTSE Asia ex Japan Index ETF (the “Sub-Fund”) was launched on 10 May 2013 and commenced trading in HKDunder stock code 2805 on The Stock Exchange of Hong Kong Limited (the “SEHK”) on 15 May 2013. The Sub-Fund isbenchmarked against the FTSE Asia Pacific ex Japan, Australia and New Zealand Index* and adopts a representative samplingstrategy.
Vanguard FTSE Asia ex Japan High Dividend Yield Index ETF
The Vanguard FTSE Asia ex Japan High Dividend Yield Index ETF (the “Sub-Fund”) was launched on 10 June 2014 andcommenced trading in HKD under stock code 3085 on the SEHK on 13 June 2014. The Sub-Fund is benchmarked against theFTSE Asia Pacific ex Japan, Australia and New Zealand High Dividend Yield Index* and adopts a representative samplingstrategy.
Vanguard FTSE Developed Europe Index ETF
The Vanguard FTSE Developed Europe Index ETF (the “Sub-Fund”) was launched on 10 June 2014 and commenced tradingin HKD under stock code 3101 on the SEHK on 13 June 2014. The Sub-Fund is benchmarked against the FTSE DevelopedEurope Index* and adopts a representative sampling strategy.
Vanguard FTSE Japan Index ETF
The Vanguard FTSE Japan Index ETF (the “Sub-Fund”) was launched on 10 June 2014 and commenced trading in HKD understock code 3126 on the SEHK on 13 June 2014. The Sub-Fund is benchmarked against the FTSE Japan Index* and adopts arepresentative sampling strategy.
Vanguard S&P 500 Index ETF
The Vanguard S&P 500 Index ETF (the “Sub-Fund”) was launched on 18 May 2015 and commenced trading in HKD under stockcode 3140 on the SEHK on 21 May 2015. The Sub-Fund is benchmarked against the S&P 500 Index* and adopts arepresentative sampling strategy.
*The above-mentioned indices are compiled and published by FTSE International Limited, except for S&P 500 Index which iscompiled and published by Standard & Poor’s Financial Services LLC. Each index operates under clearly defined rulespublished by the index provider and is a tradable index.
For and on behalf ofVanguard Investments Hong Kong Limited,as the Manager
24 April 2018
Vanguard ETF SeriesAnnual Report 2017
-1-
Report of the trustee to the unitholders
We hereby confirm that, in our opinion, the Manager of the Vanguard FTSE Asia ex Japan Index ETF, Vanguard FTSE Asia exJapan High Dividend Yield Index ETF, Vanguard FTSE Developed Europe Index ETF, Vanguard FTSE Japan Index ETF andVanguard S&P 500 Index ETF (the “Sub-Funds”) has, in all material respects, managed the Sub-Funds in accordance with theprovisions of the Trust Deed dated 18 March 2013, as amended by five supplemental deeds dated 25 April 2014, 23 June 2014,19 March 2015, 22 April 2015 and 25 April 2017 respectively (collectively the “Trust Deed”), for the year ended 31 December2017.
For and on behalf ofState Street Trust (HK) Limited,as the Trustee
24 April 2018
Vanguard ETF SeriesAnnual Report 2017
-2-
Statement of responsibilities of the manager and the trustee
MANAGER’S RESPONSIBILITIES
The Manager of the Sub-Funds is required by the Code on Unit Trusts and Mutual Funds issued by the Securities & FuturesCommission of Hong Kong and the Trust Deed dated 18 March 2013, as amended (the “Trust Deed”), to prepare financialstatements for each annual accounting year which give a true and fair view of the financial position of the Sub-Funds at the endof that year and of the transactions for the year then ended. In preparing these financial statements the Manager is requiredto:
• select suitable accounting policies and then apply them consistently;
• make judgements and estimates that are prudent and reasonable; and
• prepare the financial statements with the assistance of the Trustee on the basis that the Sub-Funds will continue inoperation unless it is inappropriate to presume this.
The Manager is also required to manage the Sub-Funds in accordance with the Trust Deed and take reasonable steps for theprevention and detection of fraud and other irregularities.
The Trust is an umbrella unit trust governed by its Trust Deed. As at 31 December 2017, the Trust has established the followingSub-Funds:
• Vanguard FTSE Asia ex Japan Index ETF
• Vanguard FTSE Asia ex Japan High Dividend Yield Index ETF
• Vanguard FTSE Developed Europe Index ETF
• Vanguard FTSE Japan Index ETF
• Vanguard S&P 500 Index ETF
TRUSTEE’S RESPONSIBILITIES
The Trustee of the Sub-Funds is required to:
• take reasonable care to ensure that the Sub-Funds are managed by the Manager in accordance with the Trust Deed andthat the investment and borrowing powers are complied with;
• satisfy itself that accounting and other related records have been maintained;
• safeguard the property of the Sub-Funds and rights attaching thereto;
• report to the Unitholders for each annual accounting year on the conduct of the Manager in the management of theSub-Funds; and
• take reasonable care to ensure that the methods adopted by the Manager in calculating the value of units are adequateto ensure that the unit prices are calculated in accordance with the provisions of the constitutive documents.
Vanguard ETF SeriesAnnual Report 2017
-3-
Independent Auditor’s ReportTo the Unitholders of the Vanguard ETF Series (the “Trust”)
Report on the Audit of the Financial Statements
Opinion
What we have audited
The financial statements of Vanguard FTSE Asia ex Japan Index ETF, Vanguard FTSE Asia ex Japan High Dividend Yield IndexETF, Vanguard FTSE Developed Europe Index ETF, Vanguard FTSE Japan Index ETF and Vanguard S&P 500 Index ETF (eacha separate sub-fund of the Trust and referred to individually or collectively as the “Sub-Funds”) set out on pages 8 to 57, whichcomprise:
• the statements of financial position as at 31 December 2017;
• the statements of comprehensive income for the year then ended;
• the statements of changes in net assets attributable to unitholders for the year then ended;
• the statements of cash flows for the year then ended; and
• the notes to the financial statements, which include a summary of significant accounting policies.
Our opinion
In our opinion, the financial statements give a true and fair view of the financial position of each of the Sub-Funds as at31 December 2017, and of their financial transactions and their cash flows for the year then ended in accordance withInternational Financial Reporting Standards (“IFRSs”).
Basis for Opinion
We conducted our audit in accordance with International Standards on Auditing (“ISAs”). Our responsibilities under thosestandards are further described in the Auditor’s Responsibilities for the Audit of the Financial Statements section of our report.
We believe that the audit evidence we have obtained is sufficient and appropriate to provide a basis for our opinion.
Independence
We are independent of the Sub-Funds in accordance with the International Ethics Standards Board for Accountants’ Code ofEthics for Professional Accountants (“IESBA Code”), and we have fulfilled our other ethical responsibilities in accordance withthe IESBA Code.
Key Audit Matters
Key audit matters are those matters that, in our professional judgment, were of most significance in our audit of the financialstatements of the current period. These matters were addressed in the context of our audit of the financial statements as awhole, and in forming our opinion thereon, and we do not provide a separate opinion on these matters.
-4-
Independent Auditor’s Report
To the Unitholders of the Vanguard ETF Series (the “Trust”) (Continued)
Key Audit Matters (Continued)
Key audit matters identified in our audit are summarised as follows:
• Existence and valuation of investments
Key Audit Matter How our audit addressed the Key Audit MatterExistence and valuation of investments
The investments held by each of the Sub-Funds namelyVanguard FTSE Asia ex Japan Index ETF, VanguardFTSE Asia ex Japan High Dividend Yield Index ETF,Vanguard FTSE Developed Europe Index ETF, VanguardFTSE Japan Index ETF and Vanguard S&P 500 Index ETFas at 31 December 2017 mainly comprised of listedequities valued at HK$205,316,095, HK$286,142,586,HK$208,961,426, HK$103,872,529 and HK$282,272,903in their respective financial statements.
We focused on the existence and valuation of theinvestments because the investments represented theprincipal element of the respective Sub-Funds’ net assetvalue.
Refer to note 9(b) to the financial statements.
We tested the existence of investments by obtaining directconfirmations from the Sub-Funds’ custodian andagreeing the Sub-Funds’ holdings of investments to thoseconfirmations. No material exceptions were identified fromour testing.
We agreed the valuation of each of the Sub-Funds’investments by comparing the pricing used by theSub-Funds to external pricing sources on a sample basisas at 31 December 2017. We found no materialexceptions from our testing.
Other Information
The Manager (the “Management”) of the Sub-Funds is responsible for the other information. The other information comprisesall of the information included in the annual report other than the financial statements and our auditor’s report theron.
Our opinion on the financial statements does not cover the other information and we do not express any form of assuranceconclusion thereon.
In connection with our audit of the financial statements, our responsibility is to read the other information and, in doing so,consider whether the other information is materially inconsistent with the financial statements or our knowledge obtained in theaudit or otherwise appears to be materially misstated.
If, based on the work we have performed, we conclude that there is a material misstatement of this other information, we arerequired to report that fact. We have nothing to report in this regard.
Responsibilities of Management for the Financial Statements
The Management of the Sub-Funds is responsible for the preparation of the financial statements that give a true and fair viewin accordance with IFRSs, and for such internal control as the Management determines is necessary to enable the preparationof financial statements that are free from material misstatement, whether due to fraud or error.
In preparing the financial statements, the Management of the Sub-Funds is responsible for assessing the Sub-Funds’ abilityto continue as a going concern, disclosing, as applicable, matters related to going concern and using the going concern basisof accounting unless the Management either intends to liquidate the Sub-Funds or to cease operations, or have no realisticalternative but to do so.
In addition, the Management of the Sub-Funds is required to ensure that the financial statements have been properly preparedin accordance with the relevant disclosure provisions of the Trust Deed dated 18 March 2013, as amended (“Trust Deed”) andAppendix E of the Code on Unit Trusts and Mutual Funds issued by the Hong Kong Securities and Futures Commission (the“SFC Code”).
-5-
Independent Auditor’s ReportTo the Unitholders of the Vanguard ETF Series (the “Trust”) (Continued)
Auditor’s Responsibilities for the Audit of the Financial Statements
Our objectives are to obtain reasonable assurance about whether the financial statements as a whole are free from materialmisstatement, whether due to fraud or error, and to issue an auditor’s report that includes our opinion. We report our opinionsolely to you, as a body, and for no other purpose. We do not assume responsibility towards or accept liability to any other personfor the contents of this report. Reasonable assurance is a high level of assurance, but is not a guarantee that an audit conductedin accordance with ISAs will always detect a material misstatement when it exists. Misstatements can arise from fraud or errorand are considered material if, individually or in the aggregate, they could reasonably be expected to influence the economicdecisions of users taken on the basis of these financial statements. In addition, we are required to assess whether the financialstatements of the Sub-Funds have been properly prepared, in all material respects, in accordance with the relevant disclosureprovisions of the Trust Deed and Appendix E of the SFC Code.
As part of an audit in accordance with ISAs, we exercise professional judgment and maintain professional scepticismthroughout the audit. We also:
• Identify and assess the risks of material misstatement of the financial statements, whether due to fraud or error,design and perform audit procedures responsive to those risks, and obtain audit evidence that is sufficient andappropriate to provide a basis for our opinion. The risk of not detecting a material misstatement resulting from fraudis higher than for one resulting from error, as fraud may involve collusion, forgery, intentional omissions,misrepresentations, or the override of internal control.
• Obtain an understanding of internal control relevant to the audit in order to design audit procedures that areappropriate in the circumstances, but not for the purpose of expressing an opinion on the effectiveness of theSub-Funds’ internal control.
• Evaluate the appropriateness of accounting policies used and the reasonableness of accounting estimates andrelated disclosures made by the Management.
• Conclude on the appropriateness of the Management’s use of the going concern basis of accounting and, basedon the audit evidence obtained, whether a material uncertainty exists related to events or conditions that may castsignificant doubt on the Sub-Funds’ ability to continue as a going concern. If we conclude that a materialuncertainty exists, we are required to draw attention in our auditor’s report to the related disclosures in the financialstatements or, if such disclosures are inadequate, to modify our opinion. Our conclusions are based on the auditevidence obtained up to the date of our auditor’s report. However, future events or conditions may cause theSub-Funds to cease to continue as a going concern.
• Evaluate the overall presentation, structure and content of the financial statements, including the disclosures, andwhether the financial statements represent the underlying transactions and events in a manner that achieves fairpresentation.
We communicate with the Management regarding, among other matters, the planned scope and timing of the audit andsignificant audit findings, including any significant deficiencies in internal control that we identify during our audit.
We also provide the Management with a statement that we have complied with relevant ethical requirements regardingindependence, and to communicate with them all relationships and other matters that may reasonably be thought to bear onour independence, and where applicable, related safeguards.
From the matters communicated with the Management, we determine those matters that were of most significance in the auditof the financial statements of the current period and are therefore the key audit matters. We describe these matters in ourauditor’s report unless law or regulation precludes public disclosure about the matter or when, in extremely rare circumstances,we determine that a matter should not be communicated in our report because the adverse consequences of doing so wouldreasonably be expected to outweigh the public interest benefits of such communication.
-6-
Independent Auditor’s ReportTo the Unitholders of the Vanguard ETF Series (the “Trust”) (Continued)
Report on Matters under the Relevant Disclosure Provisions of the Trust Deed and Appendix E of the SFC Code
In our opinion, the financial statements have been properly prepared, in all material respects, in accordance with the relevantdisclosure provisions of the Trust Deed and Appendix E of the SFC Code.
The engagement partner on the audit resulting in this independent auditor’s report is Tsui, Maria Yuk Hung.
PricewaterhouseCoopersCertified Public Accountants
Hong Kong, 24 April 2018
-7-

Statement of financial positionAs at 31 December 2017
Vanguard FTSE Asia ex JapanIndex ETF
Vanguard FTSE Asia ex JapanHigh Dividend Yield Index ETF
31 December2017
31 December2016
31 December2017
31 December2016
Notes HK$ HK$ HK$ HK$
Current Assets
Cash and cash equivalents 1,935,397 545,091 1,710,004 919,312
Margin deposits 59,628 50,430 412,185 132,227
Dividends receivable 289,650 271,243 494,265 246,700
Financial assets at fair value through profit or loss 9(b), 10 205,349,861 119,421,841 286,204,449 207,967,265
Total Assets 207,634,536 120,288,605 288,820,903 209,265,504
Current Liabilities
Amounts due to brokers 537,145 - - -
Management fee payable 6(a) 33,855 20,490 83,788 61,887
Financial liabilities at fair value through profit or loss 9(b), 10 257 376 493 192
Total Liabilities 571,257 20,866 84,281 62,079
Equity
Net assets attributable to unitholders 4 207,063,279 120,267,739 288,736,622 209,203,425
The financial statements on pages 8 to 57 were approved by the Trustee and the Manager on 24 April 2018 and weresigned on their behalf.
For and on behalf of For and on behalf ofVanguard Investments Hong Kong Limited, State Street Trust (HK) Limited,as the Manager as the Trustee
The notes on pages 20 to 57 form part of these financial statements.
Vanguard ETF SeriesAnnual Report 2017
-8-
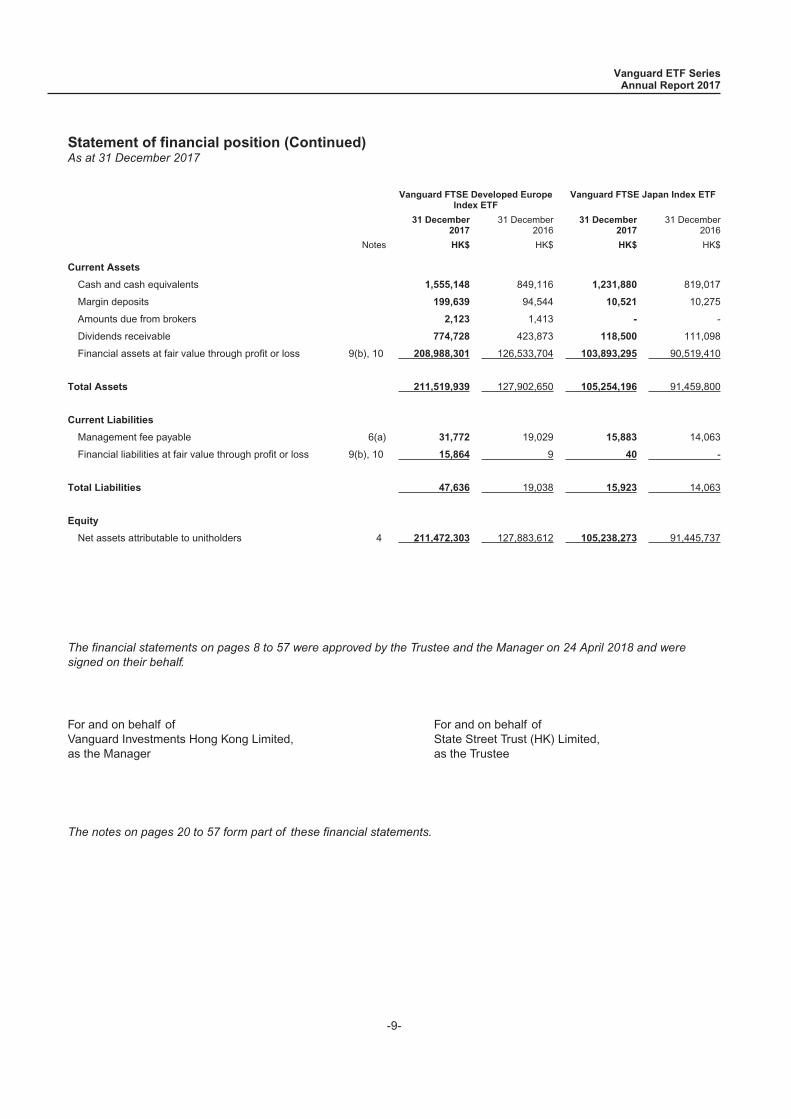
Statement of financial position (Continued)As at 31 December 2017
Vanguard FTSE Developed EuropeIndex ETF
Vanguard FTSE Japan Index ETF
31 December2017
31 December2016
31 December2017
31 December2016
Notes HK$ HK$ HK$ HK$
Current Assets
Cash and cash equivalents 1,555,148 849,116 1,231,880 819,017
Margin deposits 199,639 94,544 10,521 10,275
Amounts due from brokers 2,123 1,413 - -
Dividends receivable 774,728 423,873 118,500 111,098
Financial assets at fair value through profit or loss 9(b), 10 208,988,301 126,533,704 103,893,295 90,519,410
Total Assets 211,519,939 127,902,650 105,254,196 91,459,800
Current Liabilities
Management fee payable 6(a) 31,772 19,029 15,883 14,063
Financial liabilities at fair value through profit or loss 9(b), 10 15,864 9 40 -
Total Liabilities 47,636 19,038 15,923 14,063
Equity
Net assets attributable to unitholders 4 211,472,303 127,883,612 105,238,273 91,445,737
The financial statements on pages 8 to 57 were approved by the Trustee and the Manager on 24 April 2018 and weresigned on their behalf.
For and on behalf of For and on behalf ofVanguard Investments Hong Kong Limited, State Street Trust (HK) Limited,as the Manager as the Trustee
The notes on pages 20 to 57 form part of these financial statements.
Vanguard ETF SeriesAnnual Report 2017
-9-

Statement of financial position (Continued)As at 31 December 2017
Vanguard S&P 500 Index ETF
31 December2017
31 December2016
Notes HK$ HK$
Current Assets
Cash and cash equivalents 1,727,923 980,913
Margin deposits 92,357 43,492
Amounts due from brokers 405,467 349,777
Dividends receivable 261,142 137,240
Other receivables 89,549 46,483
Financial assets at fair value through profit or loss 9(b), 10 282,281,550 152,257,695
Total Assets 284,857,988 153,815,600
Current Liabilities
Amounts due to brokers 206,797 -
Management fee payable 6(a) 42,000 22,272
Financial liabilities at fair value through profit or loss 9(b), 10 4 7,136
Total Liabilities 248,801 29,408
Equity
Net assets attributable to unitholders 4 284,609,187 153,786,192
The financial statements on pages 8 to 57 were approved by the Trustee and the Manager on 24 April 2018 and weresigned on their behalf.
For and on behalf of For and on behalf ofVanguard Investments Hong Kong Limited, State Street Trust (HK) Limited,as the Manager as the Trustee
The notes on pages 20 to 57 form part of these financial statements.
Vanguard ETF SeriesAnnual Report 2017
-10-
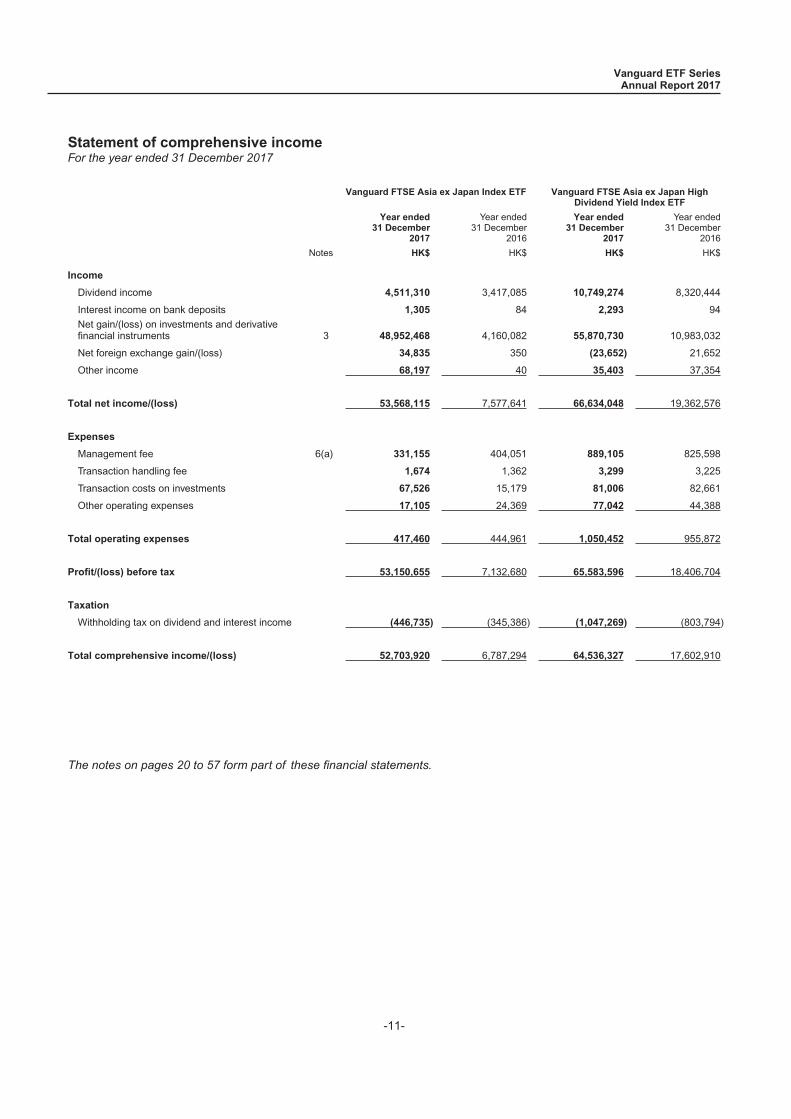
Statement of comprehensive incomeFor the year ended 31 December 2017
Vanguard FTSE Asia ex Japan Index ETF Vanguard FTSE Asia ex Japan HighDividend Yield Index ETF
Year ended31 December
2017
Year ended31 December
2016
Year ended31 December
2017
Year ended31 December
2016
Notes HK$ HK$ HK$ HK$
Income
Dividend income 4,511,310 3,417,085 10,749,274 8,320,444
Interest income on bank deposits 1,305 84 2,293 94
Net gain/(loss) on investments and derivativefinancial instruments 3 48,952,468 4,160,082 55,870,730 10,983,032
Net foreign exchange gain/(loss) 34,835 350 (23,652) 21,652
Other income 68,197 40 35,403 37,354
Total net income/(loss) 53,568,115 7,577,641 66,634,048 19,362,576
Expenses
Management fee 6(a) 331,155 404,051 889,105 825,598
Transaction handling fee 1,674 1,362 3,299 3,225
Transaction costs on investments 67,526 15,179 81,006 82,661
Other operating expenses 17,105 24,369 77,042 44,388
Total operating expenses 417,460 444,961 1,050,452 955,872
Profit/(loss) before tax 53,150,655 7,132,680 65,583,596 18,406,704
Taxation
Withholding tax on dividend and interest income (446,735) (345,386) (1,047,269) (803,794)
Total comprehensive income/(loss) 52,703,920 6,787,294 64,536,327 17,602,910
The notes on pages 20 to 57 form part of these financial statements.
Vanguard ETF SeriesAnnual Report 2017
-11-
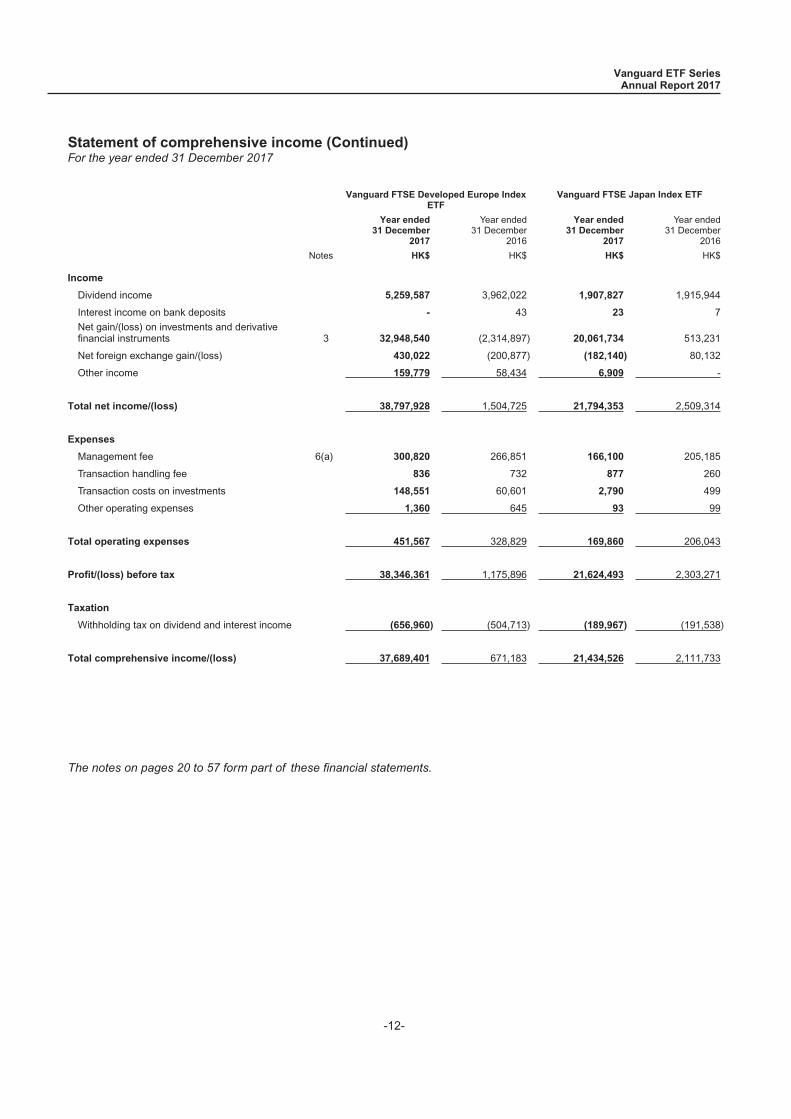
Statement of comprehensive income (Continued)For the year ended 31 December 2017
Vanguard FTSE Developed Europe IndexETF
Vanguard FTSE Japan Index ETF
Year ended31 December
2017
Year ended31 December
2016
Year ended31 December
2017
Year ended31 December
2016
Notes HK$ HK$ HK$ HK$
Income
Dividend income 5,259,587 3,962,022 1,907,827 1,915,944
Interest income on bank deposits - 43 23 7
Net gain/(loss) on investments and derivativefinancial instruments 3 32,948,540 (2,314,897) 20,061,734 513,231
Net foreign exchange gain/(loss) 430,022 (200,877) (182,140) 80,132
Other income 159,779 58,434 6,909 -
Total net income/(loss) 38,797,928 1,504,725 21,794,353 2,509,314
Expenses
Management fee 6(a) 300,820 266,851 166,100 205,185
Transaction handling fee 836 732 877 260
Transaction costs on investments 148,551 60,601 2,790 499
Other operating expenses 1,360 645 93 99
Total operating expenses 451,567 328,829 169,860 206,043
Profit/(loss) before tax 38,346,361 1,175,896 21,624,493 2,303,271
Taxation
Withholding tax on dividend and interest income (656,960) (504,713) (189,967) (191,538)
Total comprehensive income/(loss) 37,689,401 671,183 21,434,526 2,111,733
The notes on pages 20 to 57 form part of these financial statements.
Vanguard ETF SeriesAnnual Report 2017
-12-
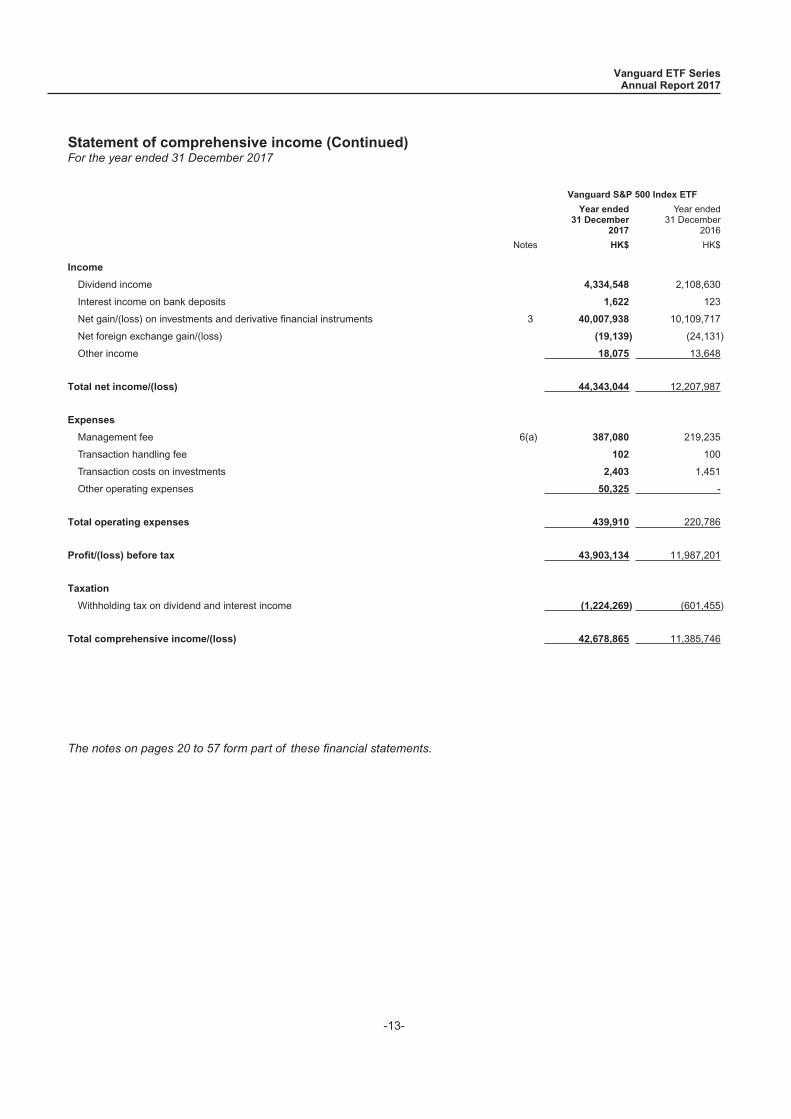
Statement of comprehensive income (Continued)For the year ended 31 December 2017
Vanguard S&P 500 Index ETF
Year ended31 December
2017
Year ended31 December
2016
Notes HK$ HK$
Income
Dividend income 4,334,548 2,108,630
Interest income on bank deposits 1,622 123
Net gain/(loss) on investments and derivative financial instruments 3 40,007,938 10,109,717
Net foreign exchange gain/(loss) (19,139) (24,131)
Other income 18,075 13,648
Total net income/(loss) 44,343,044 12,207,987
Expenses
Management fee 6(a) 387,080 219,235
Transaction handling fee 102 100
Transaction costs on investments 2,403 1,451
Other operating expenses 50,325 -
Total operating expenses 439,910 220,786
Profit/(loss) before tax 43,903,134 11,987,201
Taxation
Withholding tax on dividend and interest income (1,224,269) (601,455)
Total comprehensive income/(loss) 42,678,865 11,385,746
The notes on pages 20 to 57 form part of these financial statements.
Vanguard ETF SeriesAnnual Report 2017
-13-
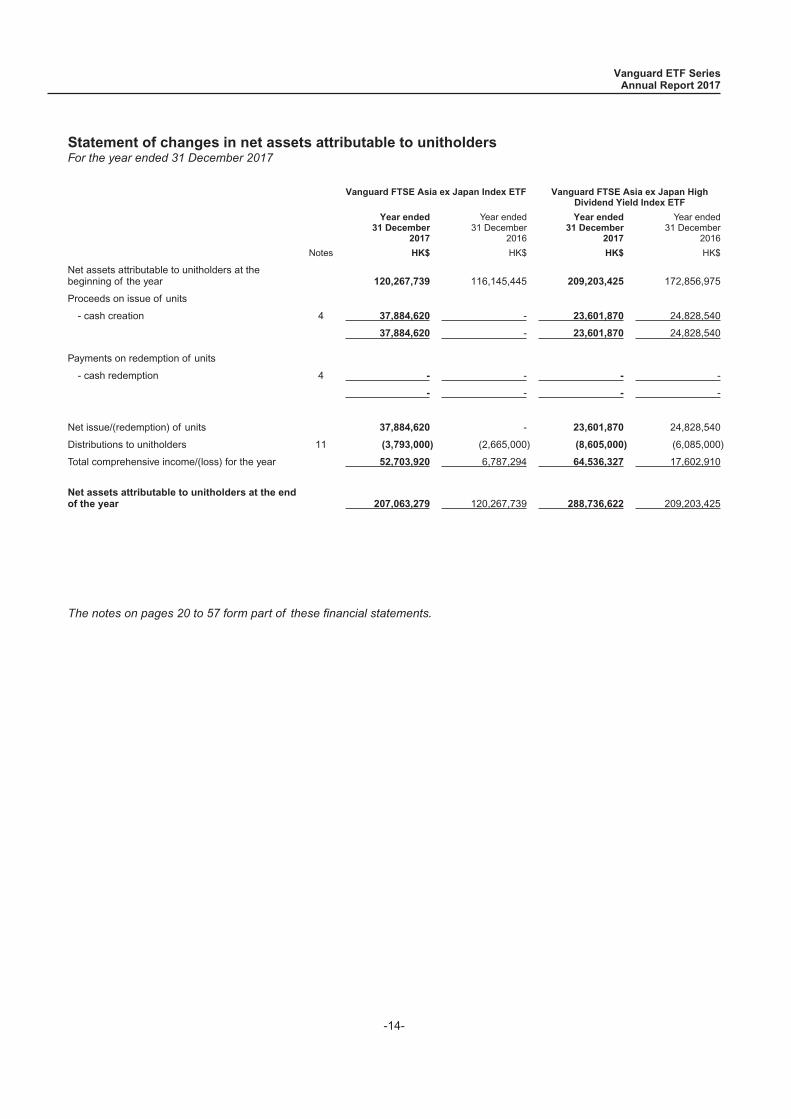
Statement of changes in net assets attributable to unitholdersFor the year ended 31 December 2017
Vanguard FTSE Asia ex Japan Index ETF Vanguard FTSE Asia ex Japan HighDividend Yield Index ETF
Year ended31 December
2017
Year ended31 December
2016
Year ended31 December
2017
Year ended31 December
2016
Notes HK$ HK$ HK$ HK$
Net assets attributable to unitholders at thebeginning of the year 120,267,739 116,145,445 209,203,425 172,856,975
Proceeds on issue of units
- cash creation 4 37,884,620 - 23,601,870 24,828,540
37,884,620 - 23,601,870 24,828,540
Payments on redemption of units
- cash redemption 4 - - - -
- - - -
Net issue/(redemption) of units 37,884,620 - 23,601,870 24,828,540
Distributions to unitholders 11 (3,793,000) (2,665,000) (8,605,000) (6,085,000)
Total comprehensive income/(loss) for the year 52,703,920 6,787,294 64,536,327 17,602,910
Net assets attributable to unitholders at the endof the year 207,063,279 120,267,739 288,736,622 209,203,425
The notes on pages 20 to 57 form part of these financial statements.
Vanguard ETF SeriesAnnual Report 2017
-14-

Statement of changes in net assets attributable to unitholders (Continued)For the year ended 31 December 2017
Vanguard FTSE Developed Europe IndexETF
Vanguard FTSE Japan Index ETF
Year ended31 December
2017
Year ended31 December
2016
Year ended31 December
2017
Year ended31 December
2016
Notes HK$ HK$ HK$ HK$
Net assets attributable to unitholders at thebeginning of the year 127,883,612 105,105,059 91,445,737 90,720,004
Proceeds on issue of units
- cash creation 4 65,375,570 25,090,370 2,652,570 -
65,375,570 25,090,370 2,652,570 -
Payments on redemption of units
- cash redemption 4 (15,027,280) - (8,862,560) -
(15,027,280) - (8,862,560) -
Net issue/(redemption) of units 50,348,290 25,090,370 (6,209,990) -
Distributions to unitholders 11 (4,449,000) (2,983,000) (1,432,000) (1,386,000)
Total comprehensive income/(loss) for the year 37,689,401 671,183 21,434,526 2,111,733
Net assets attributable to unitholders at the endof the year 211,472,303 127,883,612 105,238,273 91,445,737
The notes on pages 20 to 57 form part of these financial statements.
Vanguard ETF SeriesAnnual Report 2017
-15-
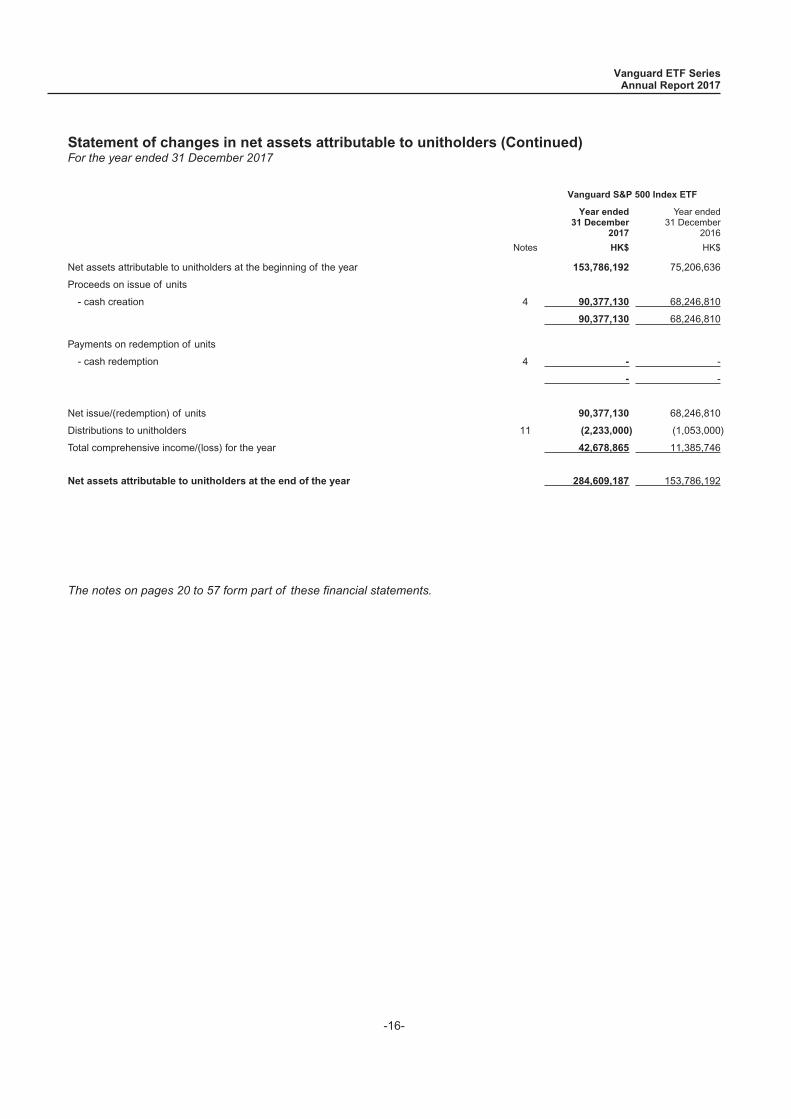
Statement of changes in net assets attributable to unitholders (Continued)For the year ended 31 December 2017
Vanguard S&P 500 Index ETF
Year ended31 December
2017
Year ended31 December
2016
Notes HK$ HK$
Net assets attributable to unitholders at the beginning of the year 153,786,192 75,206,636
Proceeds on issue of units
- cash creation 4 90,377,130 68,246,810
90,377,130 68,246,810
Payments on redemption of units
- cash redemption 4 - -
- -
Net issue/(redemption) of units 90,377,130 68,246,810
Distributions to unitholders 11 (2,233,000) (1,053,000)
Total comprehensive income/(loss) for the year 42,678,865 11,385,746
Net assets attributable to unitholders at the end of the year 284,609,187 153,786,192
The notes on pages 20 to 57 form part of these financial statements.
Vanguard ETF SeriesAnnual Report 2017
-16-
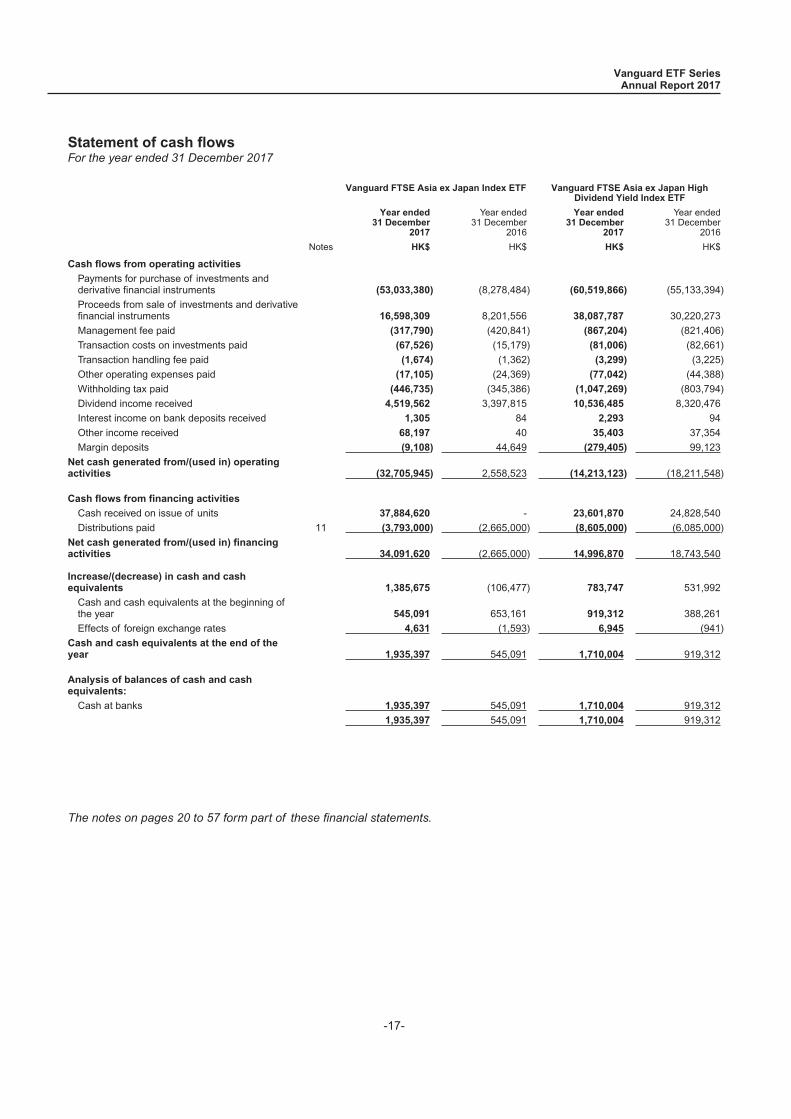
Statement of cash flowsFor the year ended 31 December 2017
Vanguard FTSE Asia ex Japan Index ETF Vanguard FTSE Asia ex Japan HighDividend Yield Index ETF
Year ended31 December
2017
Year ended31 December
2016
Year ended31 December
2017
Year ended31 December
2016
Notes HK$ HK$ HK$ HK$
Cash flows from operating activities
Payments for purchase of investments andderivative financial instruments (53,033,380) (8,278,484) (60,519,866) (55,133,394)
Proceeds from sale of investments and derivativefinancial instruments 16,598,309 8,201,556 38,087,787 30,220,273
Management fee paid (317,790) (420,841) (867,204) (821,406)
Transaction costs on investments paid (67,526) (15,179) (81,006) (82,661)
Transaction handling fee paid (1,674) (1,362) (3,299) (3,225)
Other operating expenses paid (17,105) (24,369) (77,042) (44,388)
Withholding tax paid (446,735) (345,386) (1,047,269) (803,794)
Dividend income received 4,519,562 3,397,815 10,536,485 8,320,476
Interest income on bank deposits received 1,305 84 2,293 94
Other income received 68,197 40 35,403 37,354
Margin deposits (9,108) 44,649 (279,405) 99,123
Net cash generated from/(used in) operatingactivities (32,705,945) 2,558,523 (14,213,123) (18,211,548)
Cash flows from financing activities
Cash received on issue of units 37,884,620 - 23,601,870 24,828,540
Distributions paid 11 (3,793,000) (2,665,000) (8,605,000) (6,085,000)
Net cash generated from/(used in) financingactivities 34,091,620 (2,665,000) 14,996,870 18,743,540
Increase/(decrease) in cash and cashequivalents 1,385,675 (106,477) 783,747 531,992
Cash and cash equivalents at the beginning ofthe year 545,091 653,161 919,312 388,261
Effects of foreign exchange rates 4,631 (1,593) 6,945 (941)
Cash and cash equivalents at the end of theyear 1,935,397 545,091 1,710,004 919,312
Analysis of balances of cash and cashequivalents:
Cash at banks 1,935,397 545,091 1,710,004 919,312
1,935,397 545,091 1,710,004 919,312
The notes on pages 20 to 57 form part of these financial statements.
Vanguard ETF SeriesAnnual Report 2017
-17-
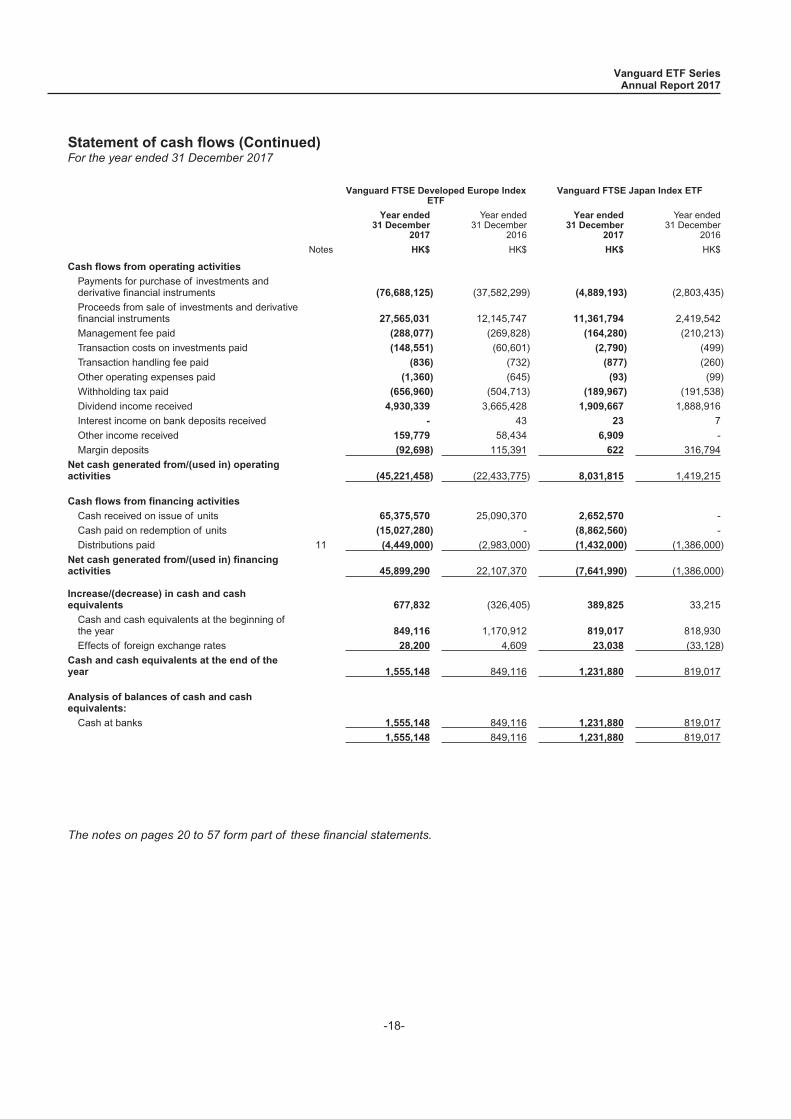
Statement of cash flows (Continued)For the year ended 31 December 2017
Vanguard FTSE Developed Europe IndexETF
Vanguard FTSE Japan Index ETF
Year ended31 December
2017
Year ended31 December
2016
Year ended31 December
2017
Year ended31 December
2016
Notes HK$ HK$ HK$ HK$
Cash flows from operating activities
Payments for purchase of investments andderivative financial instruments (76,688,125) (37,582,299) (4,889,193) (2,803,435)
Proceeds from sale of investments and derivativefinancial instruments 27,565,031 12,145,747 11,361,794 2,419,542
Management fee paid (288,077) (269,828) (164,280) (210,213)
Transaction costs on investments paid (148,551) (60,601) (2,790) (499)
Transaction handling fee paid (836) (732) (877) (260)
Other operating expenses paid (1,360) (645) (93) (99)
Withholding tax paid (656,960) (504,713) (189,967) (191,538)
Dividend income received 4,930,339 3,665,428 1,909,667 1,888,916
Interest income on bank deposits received - 43 23 7
Other income received 159,779 58,434 6,909 -
Margin deposits (92,698) 115,391 622 316,794
Net cash generated from/(used in) operatingactivities (45,221,458) (22,433,775) 8,031,815 1,419,215
Cash flows from financing activities
Cash received on issue of units 65,375,570 25,090,370 2,652,570 -
Cash paid on redemption of units (15,027,280) - (8,862,560) -
Distributions paid 11 (4,449,000) (2,983,000) (1,432,000) (1,386,000)
Net cash generated from/(used in) financingactivities 45,899,290 22,107,370 (7,641,990) (1,386,000)
Increase/(decrease) in cash and cashequivalents 677,832 (326,405) 389,825 33,215
Cash and cash equivalents at the beginning ofthe year 849,116 1,170,912 819,017 818,930
Effects of foreign exchange rates 28,200 4,609 23,038 (33,128)
Cash and cash equivalents at the end of theyear 1,555,148 849,116 1,231,880 819,017
Analysis of balances of cash and cashequivalents:
Cash at banks 1,555,148 849,116 1,231,880 819,017
1,555,148 849,116 1,231,880 819,017
The notes on pages 20 to 57 form part of these financial statements.
Vanguard ETF SeriesAnnual Report 2017
-18-
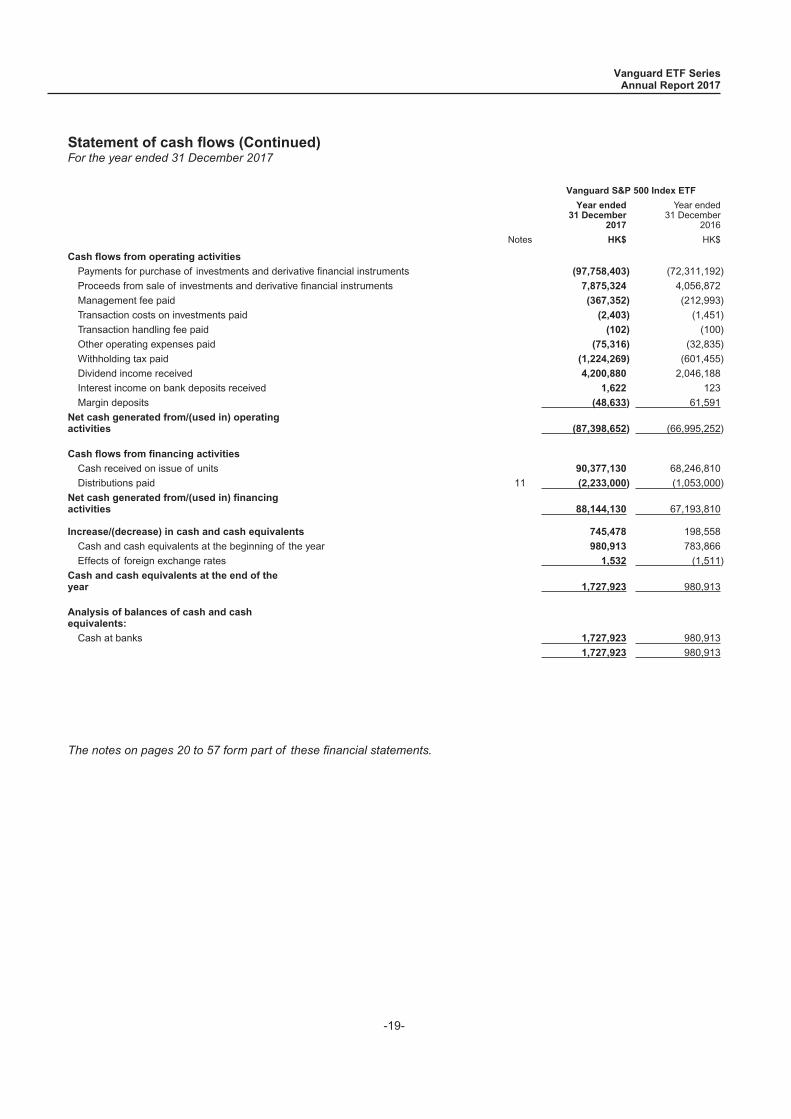
Statement of cash flows (Continued)For the year ended 31 December 2017
Vanguard S&P 500 Index ETF
Year ended31 December
2017
Year ended31 December
2016
Notes HK$ HK$
Cash flows from operating activities
Payments for purchase of investments and derivative financial instruments (97,758,403) (72,311,192)
Proceeds from sale of investments and derivative financial instruments 7,875,324 4,056,872
Management fee paid (367,352) (212,993)
Transaction costs on investments paid (2,403) (1,451)
Transaction handling fee paid (102) (100)
Other operating expenses paid (75,316) (32,835)
Withholding tax paid (1,224,269) (601,455)
Dividend income received 4,200,880 2,046,188
Interest income on bank deposits received 1,622 123
Margin deposits (48,633) 61,591
Net cash generated from/(used in) operatingactivities (87,398,652) (66,995,252)
Cash flows from financing activities
Cash received on issue of units 90,377,130 68,246,810
Distributions paid 11 (2,233,000) (1,053,000)
Net cash generated from/(used in) financingactivities 88,144,130 67,193,810
Increase/(decrease) in cash and cash equivalents 745,478 198,558
Cash and cash equivalents at the beginning of the year 980,913 783,866
Effects of foreign exchange rates 1,532 (1,511)
Cash and cash equivalents at the end of theyear 1,727,923 980,913
Analysis of balances of cash and cashequivalents:
Cash at banks 1,727,923 980,913
1,727,923 980,913
The notes on pages 20 to 57 form part of these financial statements.
Vanguard ETF SeriesAnnual Report 2017
-19-
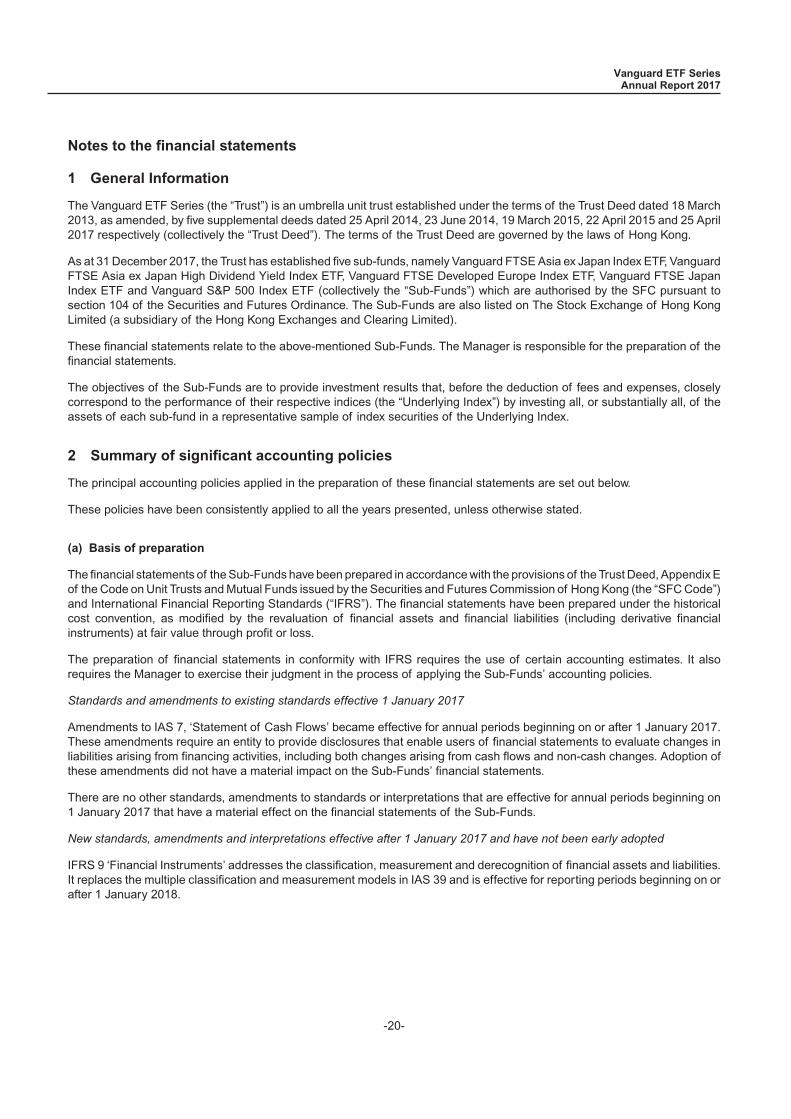
1 General Information
The Vanguard ETF Series (the “Trust”) is an umbrella unit trust established under the terms of the Trust Deed dated 18 March2013, as amended, by five supplemental deeds dated 25 April 2014, 23 June 2014, 19 March 2015, 22 April 2015 and 25 April2017 respectively (collectively the “Trust Deed”). The terms of the Trust Deed are governed by the laws of Hong Kong.
As at 31 December 2017, the Trust has established five sub-funds, namely Vanguard FTSE Asia ex Japan Index ETF, VanguardFTSE Asia ex Japan High Dividend Yield Index ETF, Vanguard FTSE Developed Europe Index ETF, Vanguard FTSE JapanIndex ETF and Vanguard S&P 500 Index ETF (collectively the “Sub-Funds”) which are authorised by the SFC pursuant tosection 104 of the Securities and Futures Ordinance. The Sub-Funds are also listed on The Stock Exchange of Hong KongLimited (a subsidiary of the Hong Kong Exchanges and Clearing Limited).
These financial statements relate to the above-mentioned Sub-Funds. The Manager is responsible for the preparation of thefinancial statements.
The objectives of the Sub-Funds are to provide investment results that, before the deduction of fees and expenses, closelycorrespond to the performance of their respective indices (the “Underlying Index”) by investing all, or substantially all, of theassets of each sub-fund in a representative sample of index securities of the Underlying Index.
2 Summary of significant accounting policies
The principal accounting policies applied in the preparation of these financial statements are set out below.
These policies have been consistently applied to all the years presented, unless otherwise stated.
(a) Basis of preparation
The financial statements of the Sub-Funds have been prepared in accordance with the provisions of the Trust Deed, Appendix Eof the Code on Unit Trusts and Mutual Funds issued by the Securities and Futures Commission of Hong Kong (the “SFC Code”)and International Financial Reporting Standards (“IFRS”). The financial statements have been prepared under the historicalcost convention, as modified by the revaluation of financial assets and financial liabilities (including derivative financialinstruments) at fair value through profit or loss.
The preparation of financial statements in conformity with IFRS requires the use of certain accounting estimates. It alsorequires the Manager to exercise their judgment in the process of applying the Sub-Funds’ accounting policies.
Standards and amendments to existing standards effective 1 January 2017
Amendments to IAS 7, ‘Statement of Cash Flows’ became effective for annual periods beginning on or after 1 January 2017.These amendments require an entity to provide disclosures that enable users of financial statements to evaluate changes inliabilities arising from financing activities, including both changes arising from cash flows and non-cash changes. Adoption ofthese amendments did not have a material impact on the Sub-Funds’ financial statements.
There are no other standards, amendments to standards or interpretations that are effective for annual periods beginning on1 January 2017 that have a material effect on the financial statements of the Sub-Funds.
New standards, amendments and interpretations effective after 1 January 2017 and have not been early adopted
IFRS 9 ‘Financial Instruments’ addresses the classification, measurement and derecognition of financial assets and liabilities.It replaces the multiple classification and measurement models in IAS 39 and is effective for reporting periods beginning on orafter 1 January 2018.
Vanguard ETF SeriesAnnual Report 2017
Notes to the financial statements
-20-

2 Summary of significant accounting policies (Continued)
(a) Basis of preparation (Continued)
New standards, amendments and interpretations effective after 1 January 2017 and have not been early adopted (Continued)
Classification and measurement of debt assets will be driven by the entity’s business model for managing the financial assetsand the contractual cash flow characteristics of the financial assets. A debt instrument is measured at amortised cost if theobjective of the business model is to hold the financial asset for the collection of the contractual cash flows and the contractualcash flows under the instrument solely represent payments of principal and interest (“SPPI”). A debt instrument is measuredat fair value through other comprehensive income if the objective of the business model is to hold the financial asset both tocollect contractual cash flows from SPPI and to sell. All other debt instruments must be recognised at fair value through profitor loss. An entity may however, at initial recognition, irrevocably designate a financial asset as measured at fair value throughprofit or loss if doing so eliminates or significantly reduces a measurement or recognition inconsistency. Derivative and equityinstruments are measured at fair value through profit or loss unless, for equity instruments not held for trading, an irrevocableoption is taken to measure at fair value through other comprehensive income. IFRS 9 also introduces a new expected credit loss(“ECL”) impairment model.
On adoption of IFRS 9 the Sub-Funds’ investment portfolio will continue to be classified as fair value through profit or loss. Otherfinancial assets which are held for collection will continue to be measured at amortised cost with no material impact expectedfrom application of the new impairment model. As a result, the adoption of IFRS 9 is not expected to have a material impact onthe Sub-Funds’ financial statements.
In addition to the above, a number of new standards, amendments to standards and interpretations are effective for annualperiods beginning after 1 January 2017, and have not been applied in preparing these financial statements. None of these areexpected to have a material effect on the financial statements of the Sub-Funds.
(b) Investments
(i) Classification
The Sub-Funds classify their investments as financial assets at fair value through profit or loss. These financial assets aredesignated by the Manager at fair value through profit or loss at inception. Financial assets designated at fair value throughprofit or loss at inception are those that are managed and their performance evaluated on a fair value basis in accordance withthe Sub-Funds’ documented investment strategies. The Sub-Funds’ policies require the Manager to evaluate the informationabout these financial assets on a fair value basis together with other related financial information.
(ii) Recognition/derecognition
Purchases and sales of investments are accounted for on the trade date basis. Investments are derecognised when the rightsto receive cash flows from the investments have expired or the Sub-Funds have transferred substantially all risks and rewardsof ownership.
(iii) Measurement
Investments are initially recognised at fair value. Transaction costs are expensed as incurred in the Statement ofcomprehensive income. Subsequent to initial recognition, all investments are measured at fair value. Realised and unrealisedgains and losses on investments are recognised in the Statement of comprehensive income in the year in which they arise.
(iv) Fair value estimation
Fair value is the price that would be received to sell an asset or paid to transfer a liability in an orderly transaction between marketparticipants at the measurement date. The fair value of investments that are listed or traded on an exchange is based on quotedmarket prices at the close of trading on the reporting date. The quoted market price used for investments held by the Sub-Fundsis the last traded price.
Vanguard ETF SeriesAnnual Report 2017
Notes to the financial statements (Continued)
-21-
2 Summary of significant accounting policies (Continued)
(b) Investments (Continued)
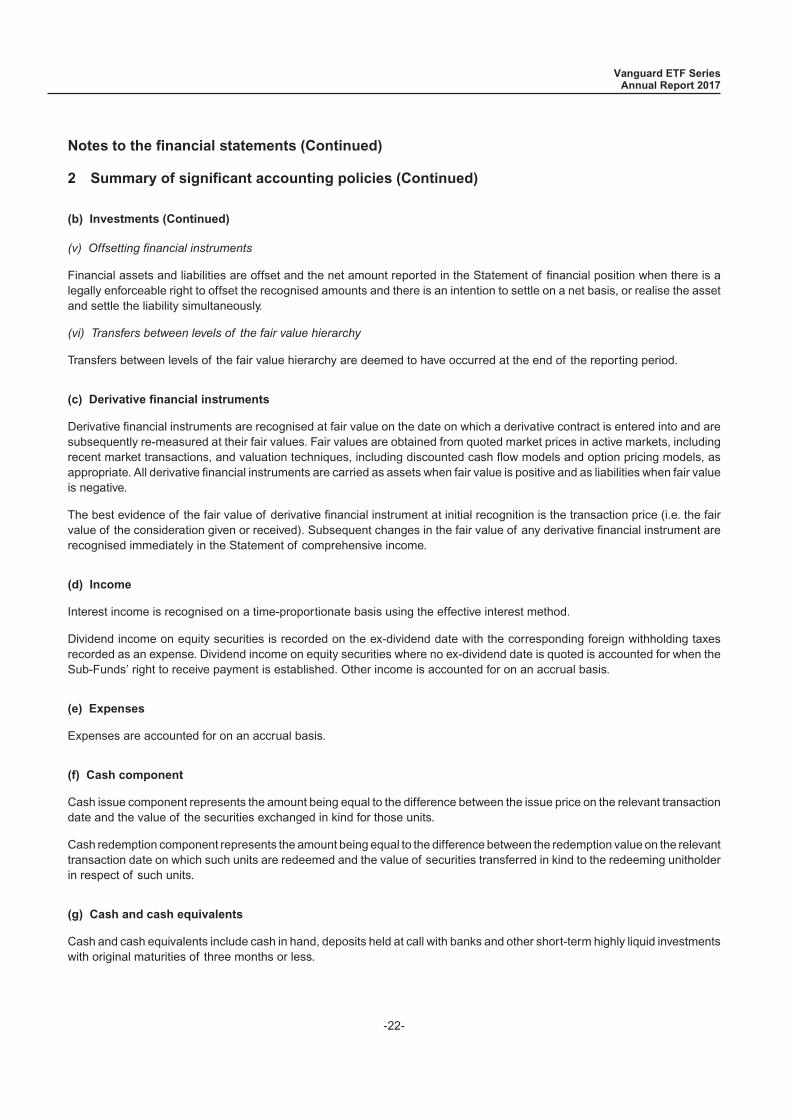
(v) Offsetting financial instruments
Financial assets and liabilities are offset and the net amount reported in the Statement of financial position when there is alegally enforceable right to offset the recognised amounts and there is an intention to settle on a net basis, or realise the assetand settle the liability simultaneously.
(vi) Transfers between levels of the fair value hierarchy
Transfers between levels of the fair value hierarchy are deemed to have occurred at the end of the reporting period.
(c) Derivative financial instruments
Derivative financial instruments are recognised at fair value on the date on which a derivative contract is entered into and aresubsequently re-measured at their fair values. Fair values are obtained from quoted market prices in active markets, includingrecent market transactions, and valuation techniques, including discounted cash flow models and option pricing models, asappropriate. All derivative financial instruments are carried as assets when fair value is positive and as liabilities when fair valueis negative.
The best evidence of the fair value of derivative financial instrument at initial recognition is the transaction price (i.e. the fairvalue of the consideration given or received). Subsequent changes in the fair value of any derivative financial instrument arerecognised immediately in the Statement of comprehensive income.
(d) Income
Interest income is recognised on a time-proportionate basis using the effective interest method.
Dividend income on equity securities is recorded on the ex-dividend date with the corresponding foreign withholding taxesrecorded as an expense. Dividend income on equity securities where no ex-dividend date is quoted is accounted for when theSub-Funds’ right to receive payment is established. Other income is accounted for on an accrual basis.
(e) Expenses
Expenses are accounted for on an accrual basis.
(f) Cash component
Cash issue component represents the amount being equal to the difference between the issue price on the relevant transactiondate and the value of the securities exchanged in kind for those units.
Cash redemption component represents the amount being equal to the difference between the redemption value on the relevanttransaction date on which such units are redeemed and the value of securities transferred in kind to the redeeming unitholderin respect of such units.
(g) Cash and cash equivalents
Cash and cash equivalents include cash in hand, deposits held at call with banks and other short-term highly liquid investmentswith original maturities of three months or less.
Vanguard ETF SeriesAnnual Report 2017
Notes to the financial statements (Continued)
-22-
2 Summary of significant accounting policies (Continued)
(h) Translation of foreign currencies
Functional and presentation currency
Items included in the financial statements are measured using the currency of the primary economic environment in which theSub-Funds operate (the “functional currency”). The performance of each Sub-Fund is measured and reported to theunitholders in Hong Kong dollars. The Manager considers the Hong Kong dollar as the currency that most faithfully representsthe economic effects of the underlying transactions, events and conditions. The financial statements are presented in HongKong dollars, which is each Sub-Fund’s functional and presentation currency.
Transactions and balances
Foreign currency transactions are translated into the functional currency using the exchange rates prevailing at the dates of thetransactions. Foreign currency assets and liabilities are translated into the functional currency using the exchange rateprevailing at the year end date.
Foreign exchange gains and losses arising from translation are included in the Statement of comprehensive income.
Foreign exchange gains and losses relating to cash and cash equivalents are presented in the Statement of comprehensiveincome within ‘net foreign exchange gain/(loss)’.
Foreign exchange gains and losses relating to the financial assets and liabilities carried at fair value through profit or loss arepresented in the Statement of comprehensive income within ‘net gain/(loss) on investments and derivative financialinstruments’.
(i) Units
The Sub-Funds issue units, which are redeemable at the holder’s option and are classified as equity. Units can be redeemedin-kind and/or in cash equal to a proportionate share of the respective Sub-Fund’s net asset value. The Sub-Funds’ net assetvalue per unit is calculated by dividing the net assets attributable to the unitholders with the total number of outstanding units.Units are created or redeemed in multiples of 100,000 units.
(j) Taxation
The Sub-Funds currently incur withholding taxes imposed by certain countries on investment income. Such income is recordedgross of withholding taxes in the Statement of comprehensive income. Withholding taxes are included as taxation in theStatement of comprehensive income.
(k) Segmental reporting
Operating segments are reported in a manner consistent with the internal reporting used by the chief operating decision-maker.The Manager, who is responsible for allocating resources and assessing performance of the operating segments, has beenidentified as the chief operating decision-maker that makes strategic decisions.
(l) Amounts due from and due to brokers
Amounts due from and to brokers represent receivables for investments sold and payables for investments purchased that havebeen contracted for but not yet settled or delivered on the Statement of financial position date respectively.
(m) Distributions
Proposed distributions to unitholders are recognised in the Statement of changes in net assets attributable to unitholders whenthey are appropriately authorised and no longer at the discretion of the Manager.
Vanguard ETF SeriesAnnual Report 2017
Notes to the financial statements (Continued)
-23-
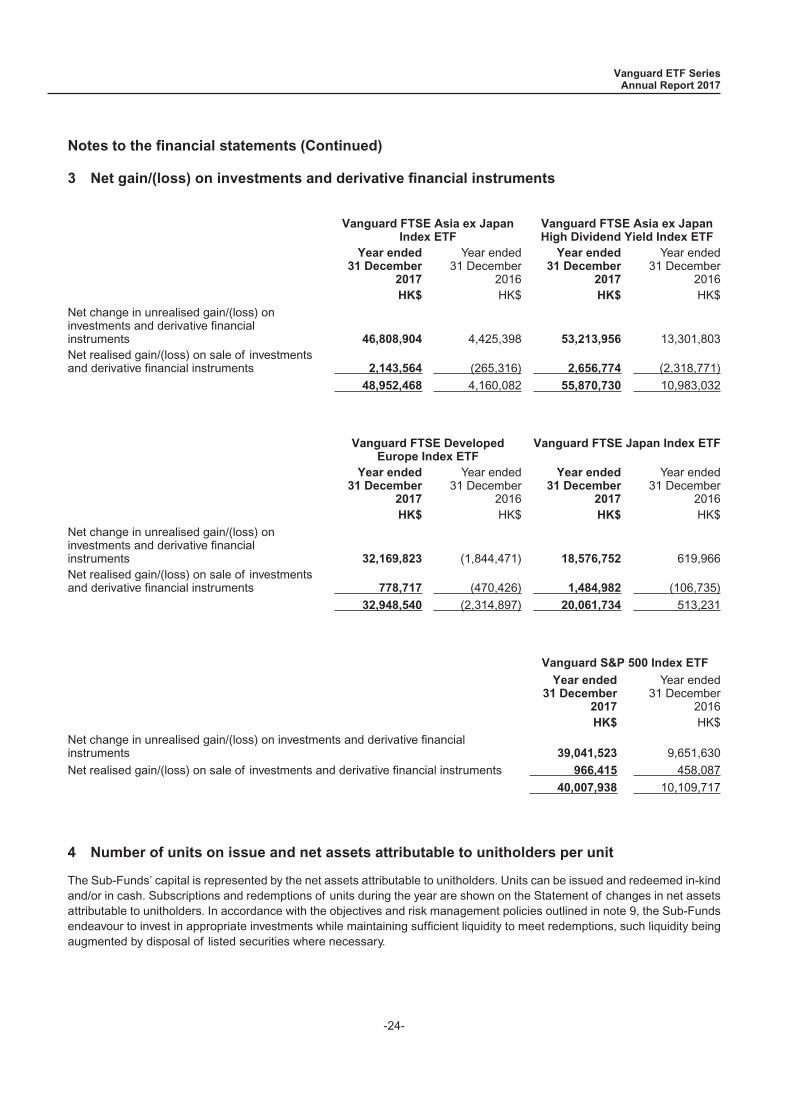
3 Net gain/(loss) on investments and derivative financial instruments
Vanguard FTSE Asia ex JapanIndex ETF
Vanguard FTSE Asia ex JapanHigh Dividend Yield Index ETF
Year ended31 December
2017
Year ended31 December
2016
Year ended31 December
2017
Year ended31 December
2016HK$ HK$ HK$ HK$
Net change in unrealised gain/(loss) oninvestments and derivative financialinstruments 46,808,904 4,425,398 53,213,956 13,301,803Net realised gain/(loss) on sale of investmentsand derivative financial instruments 2,143,564 (265,316) 2,656,774 (2,318,771)
48,952,468 4,160,082 55,870,730 10,983,032
Vanguard FTSE DevelopedEurope Index ETF
Vanguard FTSE Japan Index ETF
Year ended31 December
2017
Year ended31 December
2016
Year ended31 December
2017
Year ended31 December
2016HK$ HK$ HK$ HK$
Net change in unrealised gain/(loss) oninvestments and derivative financialinstruments 32,169,823 (1,844,471) 18,576,752 619,966Net realised gain/(loss) on sale of investmentsand derivative financial instruments 778,717 (470,426) 1,484,982 (106,735)
32,948,540 (2,314,897) 20,061,734 513,231
Vanguard S&P 500 Index ETF
Year ended31 December
2017
Year ended31 December
2016HK$ HK$
Net change in unrealised gain/(loss) on investments and derivative financialinstruments 39,041,523 9,651,630
Net realised gain/(loss) on sale of investments and derivative financial instruments 966,415 458,087
40,007,938 10,109,717
4 Number of units on issue and net assets attributable to unitholders per unit
The Sub-Funds’ capital is represented by the net assets attributable to unitholders. Units can be issued and redeemed in-kindand/or in cash. Subscriptions and redemptions of units during the year are shown on the Statement of changes in net assetsattributable to unitholders. In accordance with the objectives and risk management policies outlined in note 9, the Sub-Fundsendeavour to invest in appropriate investments while maintaining sufficient liquidity to meet redemptions, such liquidity beingaugmented by disposal of listed securities where necessary.
Vanguard ETF SeriesAnnual Report 2017
Notes to the financial statements (Continued)
-24-
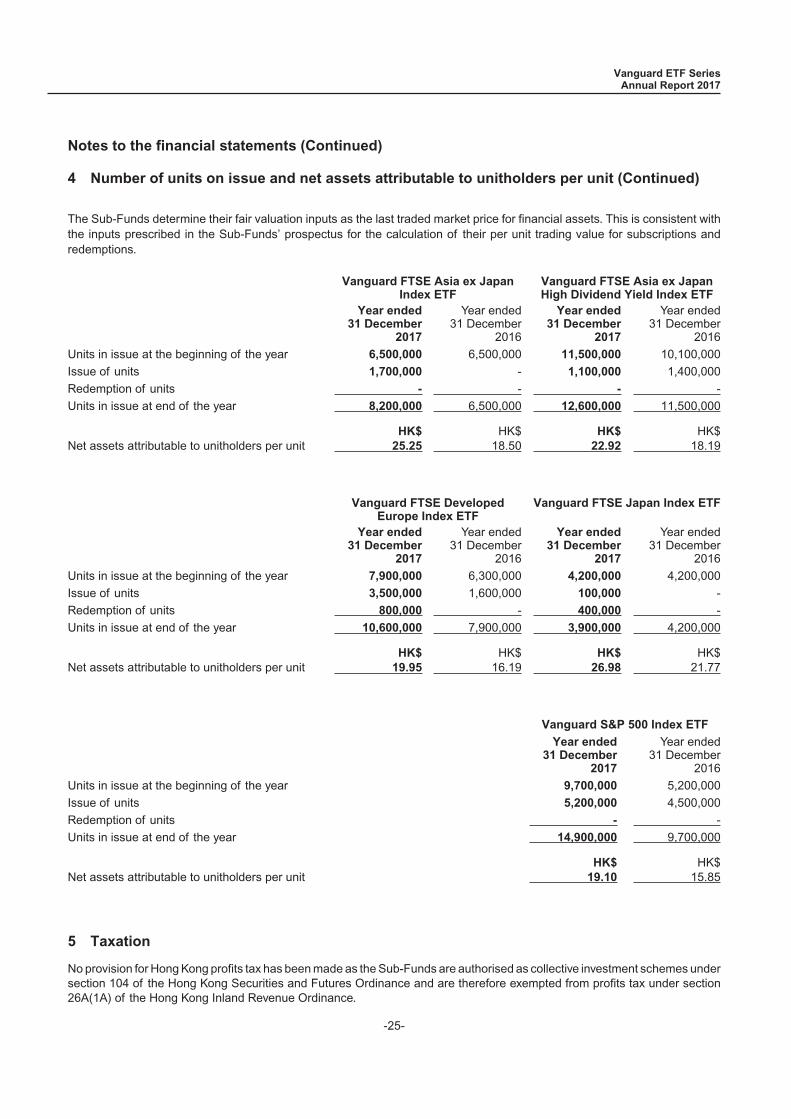
4 Number of units on issue and net assets attributable to unitholders per unit (Continued)
The Sub-Funds determine their fair valuation inputs as the last traded market price for financial assets. This is consistent withthe inputs prescribed in the Sub-Funds’ prospectus for the calculation of their per unit trading value for subscriptions andredemptions.
Vanguard FTSE Asia ex JapanIndex ETF
Vanguard FTSE Asia ex JapanHigh Dividend Yield Index ETF
Year ended31 December
2017
Year ended31 December
2016
Year ended31 December
2017
Year ended31 December
2016
Units in issue at the beginning of the year 6,500,000 6,500,000 11,500,000 10,100,000
Issue of units 1,700,000 - 1,100,000 1,400,000
Redemption of units - - - -
Units in issue at end of the year 8,200,000 6,500,000 12,600,000 11,500,000
Net assets attributable to unitholders per unitHK$
25.25HK$
18.50HK$
22.92HK$
18.19
Vanguard FTSE DevelopedEurope Index ETF
Vanguard FTSE Japan Index ETF
Year ended31 December
2017
Year ended31 December
2016
Year ended31 December
2017
Year ended31 December
2016
Units in issue at the beginning of the year 7,900,000 6,300,000 4,200,000 4,200,000
Issue of units 3,500,000 1,600,000 100,000 -
Redemption of units 800,000 - 400,000 -
Units in issue at end of the year 10,600,000 7,900,000 3,900,000 4,200,000
Net assets attributable to unitholders per unitHK$
19.95HK$
16.19HK$
26.98HK$
21.77
Vanguard S&P 500 Index ETF
Year ended31 December
2017
Year ended31 December
2016
Units in issue at the beginning of the year 9,700,000 5,200,000
Issue of units 5,200,000 4,500,000
Redemption of units - -
Units in issue at end of the year 14,900,000 9,700,000
Net assets attributable to unitholders per unitHK$
19.10HK$
15.85
5 Taxation
No provision for Hong Kong profits tax has been made as the Sub-Funds are authorised as collective investment schemes undersection 104 of the Hong Kong Securities and Futures Ordinance and are therefore exempted from profits tax under section26A(1A) of the Hong Kong Inland Revenue Ordinance.
Vanguard ETF SeriesAnnual Report 2017
Notes to the financial statements (Continued)
-25-

5 Taxation (Continued)
Vanguard FTSE Asia ex Japan Index ETF and Vanguard FTSE Asia ex Japan High Dividend Yield Index ETF invest in H-sharesof the People’s Republic of China (“PRC”) securities listed on the Hong Kong Stock Exchange and B-shares of PRC securitieslisted on the Shanghai Stock Exchange and the Shenzhen Stock Exchange. Under the PRC Corporate Income Tax Law, theSub-Funds may be liable to pay PRC tax on the capital gains realised in the trading of these securities. However, no provisionwas made for taxation on such gains in the financial statements as the Manager believes that the Sub-Funds can sustain aposition for not filing a tax return based on the existing tax regulations and that the enforcement of PRC tax on capital gains isnot probable.
6 Transactions with related parties / Trustee, Manager and its Connected Persons
Parties are considered to be related if one party has the ability to control the other party or exercise significant influence overthe other party in making financial or operational decisions. Related parties of the Sub-Funds include the Trustee, the Managerand its Connected Persons. Connected Persons of the Manager are those as defined in the SFC Code. All transactions enteredinto during the year between the Sub-Funds and their related parties were carried out in the normal course of business and onnormal commercial terms. To the best of the Trustee’s and the Manager’s knowledge, the Sub-Funds did not have any othertransactions with their related parties except for those disclosed below.
(a) Management fee
Management fee is accrued daily and paid as soon as practicable after the last dealing day in each month. The table below setsout the management fee that is currently charged per annum as a percentage of the net asset value of each of the Sub-Funds.The Manager is entitled to receive a management fee of up to 4% per annum of the net asset value of the respective Sub-Fund.The Sub-Funds have a single fee structure whereby a single fixed rate of fee (i.e. management fee) is paid to the Manager tocover the fees, costs and expenses of the Sub-Funds (including, but not limited to, the Manager’s fee, the Trustee’s fee, theregistrar’s fee, fees and expenses of the service agent, auditor, legal counsel and other service providers, ordinaryout-of-pocket fees, charges and expenses incurred by the Trustee or the Manager, and the costs, fees and expenses relatingto index-related services).
2017% per annum
Prior to17 October
2016% per annum
Vanguard FTSE Asia ex Japan Index ETF 0.20 0.38
Vanguard FTSE Asia ex Japan High Dividend Yield Index ETF 0.35 0.45
Vanguard FTSE Developed Europe Index ETF 0.18 0.25
Vanguard FTSE Japan Index ETF 0.18 0.25
Vanguard S&P 500 Index ETF 0.18 0.25
(b) Establishment costs
The costs and expenses, such as the costs of establishing the Trust and the Sub-Funds and the preparation of the prospectus,inception fees, the costs of seeking and obtaining the listing and authorisation by the SFC and all initial legal and printing costs(collectively, “establishment costs”), incurred by The Vanguard Group, Inc in establishing the Trust and the Sub-Funds, areborne by The Vanguard Group, Inc.
Vanguard ETF SeriesAnnual Report 2017
Notes to the financial statements (Continued)
-26-
6 Transactions with related parties / Trustee, Manager and its Connected Persons(Continued)
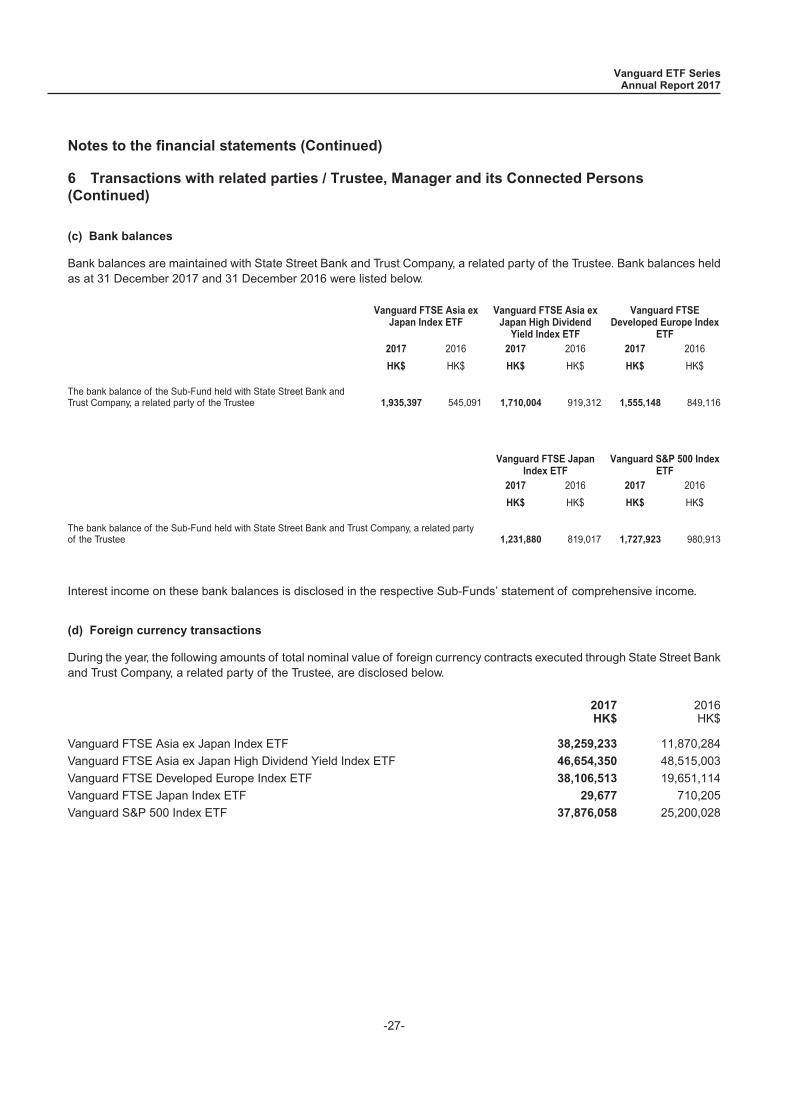
(c) Bank balances
Bank balances are maintained with State Street Bank and Trust Company, a related party of the Trustee. Bank balances heldas at 31 December 2017 and 31 December 2016 were listed below.
Vanguard FTSE Asia exJapan Index ETF
Vanguard FTSE Asia exJapan High Dividend
Yield Index ETF
Vanguard FTSEDeveloped Europe Index
ETF2017 2016 2017 2016 2017 2016
HK$ HK$ HK$ HK$ HK$ HK$
The bank balance of the Sub-Fund held with State Street Bank andTrust Company, a related party of the Trustee 1,935,397 545,091 1,710,004 919,312 1,555,148 849,116
Vanguard FTSE JapanIndex ETF
Vanguard S&P 500 IndexETF
2017 2016 2017 2016
HK$ HK$ HK$ HK$
The bank balance of the Sub-Fund held with State Street Bank and Trust Company, a related partyof the Trustee 1,231,880 819,017 1,727,923 980,913
Interest income on these bank balances is disclosed in the respective Sub-Funds’ statement of comprehensive income.
(d) Foreign currency transactions
During the year, the following amounts of total nominal value of foreign currency contracts executed through State Street Bankand Trust Company, a related party of the Trustee, are disclosed below.
2017HK$
2016HK$
Vanguard FTSE Asia ex Japan Index ETF 38,259,233 11,870,284
Vanguard FTSE Asia ex Japan High Dividend Yield Index ETF 46,654,350 48,515,003
Vanguard FTSE Developed Europe Index ETF 38,106,513 19,651,114
Vanguard FTSE Japan Index ETF 29,677 710,205
Vanguard S&P 500 Index ETF 37,876,058 25,200,028
Vanguard ETF SeriesAnnual Report 2017
Notes to the financial statements (Continued)
-27-
6 Transactions with related parties / Trustee, Manager and its Connected Persons(Continued)
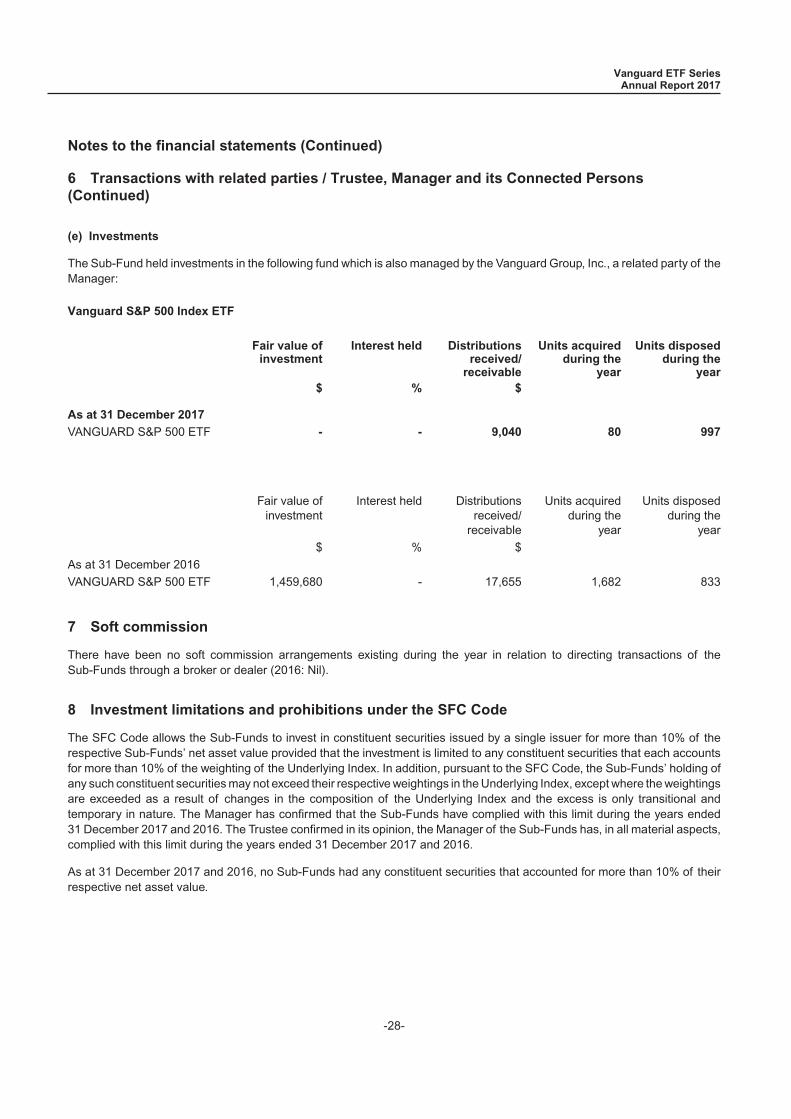
(e) Investments
The Sub-Fund held investments in the following fund which is also managed by the Vanguard Group, Inc., a related party of theManager:
Vanguard S&P 500 Index ETF
Fair value ofinvestment
Interest held Distributionsreceived/
receivable
Units acquiredduring the
year
Units disposedduring the
year$ % $
As at 31 December 2017
VANGUARD S&P 500 ETF - - 9,040 80 997
Fair value ofinvestment
Interest held Distributionsreceived/
receivable
Units acquiredduring the
year
Units disposedduring the
year
$ % $
As at 31 December 2016
VANGUARD S&P 500 ETF 1,459,680 - 17,655 1,682 833
7 Soft commission
There have been no soft commission arrangements existing during the year in relation to directing transactions of theSub-Funds through a broker or dealer (2016: Nil).
8 Investment limitations and prohibitions under the SFC Code
The SFC Code allows the Sub-Funds to invest in constituent securities issued by a single issuer for more than 10% of therespective Sub-Funds’ net asset value provided that the investment is limited to any constituent securities that each accountsfor more than 10% of the weighting of the Underlying Index. In addition, pursuant to the SFC Code, the Sub-Funds’ holding ofany such constituent securities may not exceed their respective weightings in the Underlying Index, except where the weightingsare exceeded as a result of changes in the composition of the Underlying Index and the excess is only transitional andtemporary in nature. The Manager has confirmed that the Sub-Funds have complied with this limit during the years ended31 December 2017 and 2016. The Trustee confirmed in its opinion, the Manager of the Sub-Funds has, in all material aspects,complied with this limit during the years ended 31 December 2017 and 2016.
As at 31 December 2017 and 2016, no Sub-Funds had any constituent securities that accounted for more than 10% of theirrespective net asset value.
Vanguard ETF SeriesAnnual Report 2017
Notes to the financial statements (Continued)
-28-
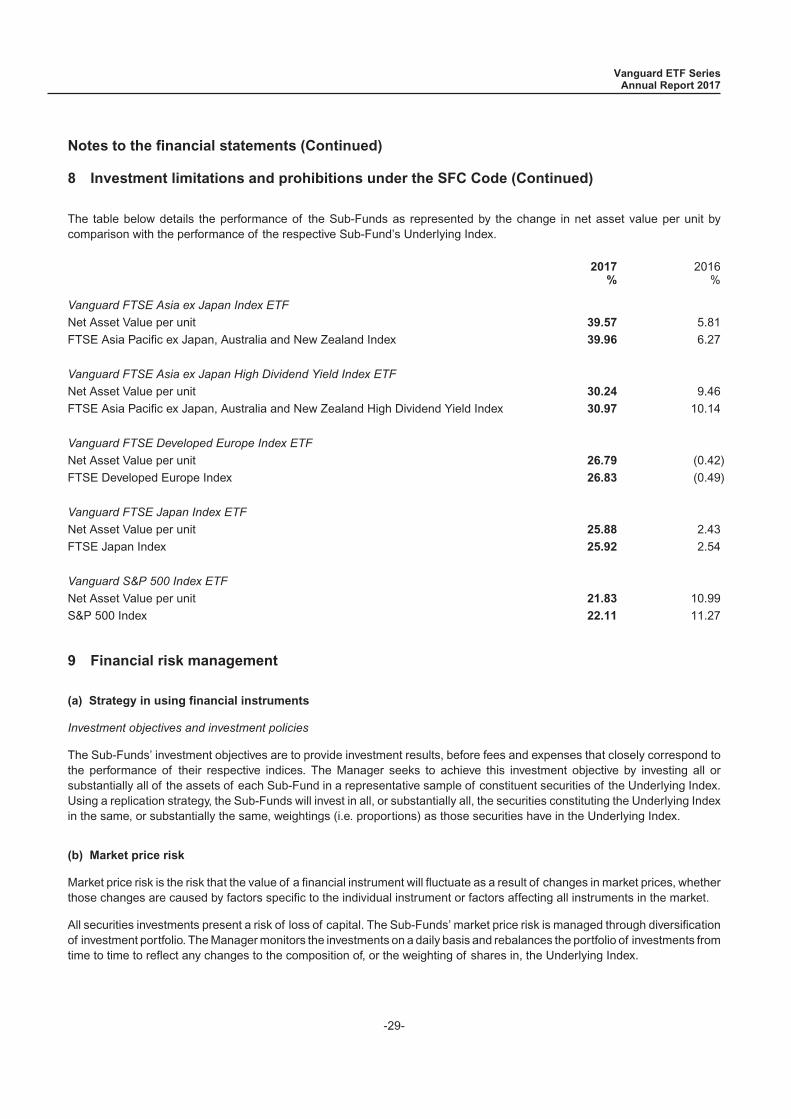
8 Investment limitations and prohibitions under the SFC Code (Continued)
The table below details the performance of the Sub-Funds as represented by the change in net asset value per unit bycomparison with the performance of the respective Sub-Fund’s Underlying Index.
2017%
2016%
Vanguard FTSE Asia ex Japan Index ETF
Net Asset Value per unit 39.57 5.81
FTSE Asia Pacific ex Japan, Australia and New Zealand Index 39.96 6.27
Vanguard FTSE Asia ex Japan High Dividend Yield Index ETF
Net Asset Value per unit 30.24 9.46
FTSE Asia Pacific ex Japan, Australia and New Zealand High Dividend Yield Index 30.97 10.14
Vanguard FTSE Developed Europe Index ETF
Net Asset Value per unit 26.79 (0.42)
FTSE Developed Europe Index 26.83 (0.49)
Vanguard FTSE Japan Index ETF
Net Asset Value per unit 25.88 2.43
FTSE Japan Index 25.92 2.54
Vanguard S&P 500 Index ETF
Net Asset Value per unit 21.83 10.99
S&P 500 Index 22.11 11.27
9 Financial risk management
(a) Strategy in using financial instruments
Investment objectives and investment policies
The Sub-Funds’ investment objectives are to provide investment results, before fees and expenses that closely correspond tothe performance of their respective indices. The Manager seeks to achieve this investment objective by investing all orsubstantially all of the assets of each Sub-Fund in a representative sample of constituent securities of the Underlying Index.Using a replication strategy, the Sub-Funds will invest in all, or substantially all, the securities constituting the Underlying Indexin the same, or substantially the same, weightings (i.e. proportions) as those securities have in the Underlying Index.
(b) Market price risk
Market price risk is the risk that the value of a financial instrument will fluctuate as a result of changes in market prices, whetherthose changes are caused by factors specific to the individual instrument or factors affecting all instruments in the market.
All securities investments present a risk of loss of capital. The Sub-Funds’ market price risk is managed through diversificationof investment portfolio. The Manager monitors the investments on a daily basis and rebalances the portfolio of investments fromtime to time to reflect any changes to the composition of, or the weighting of shares in, the Underlying Index.
Vanguard ETF SeriesAnnual Report 2017
Notes to the financial statements (Continued)
-29-

9 Financial risk management (Continued)
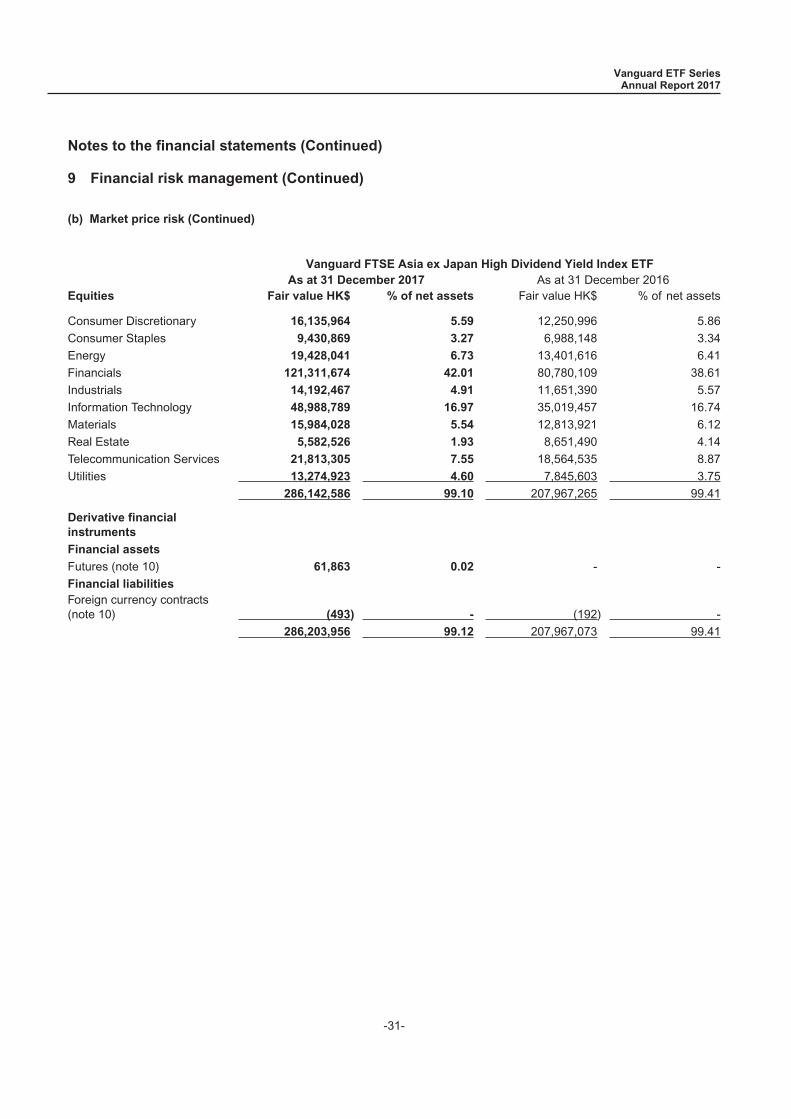
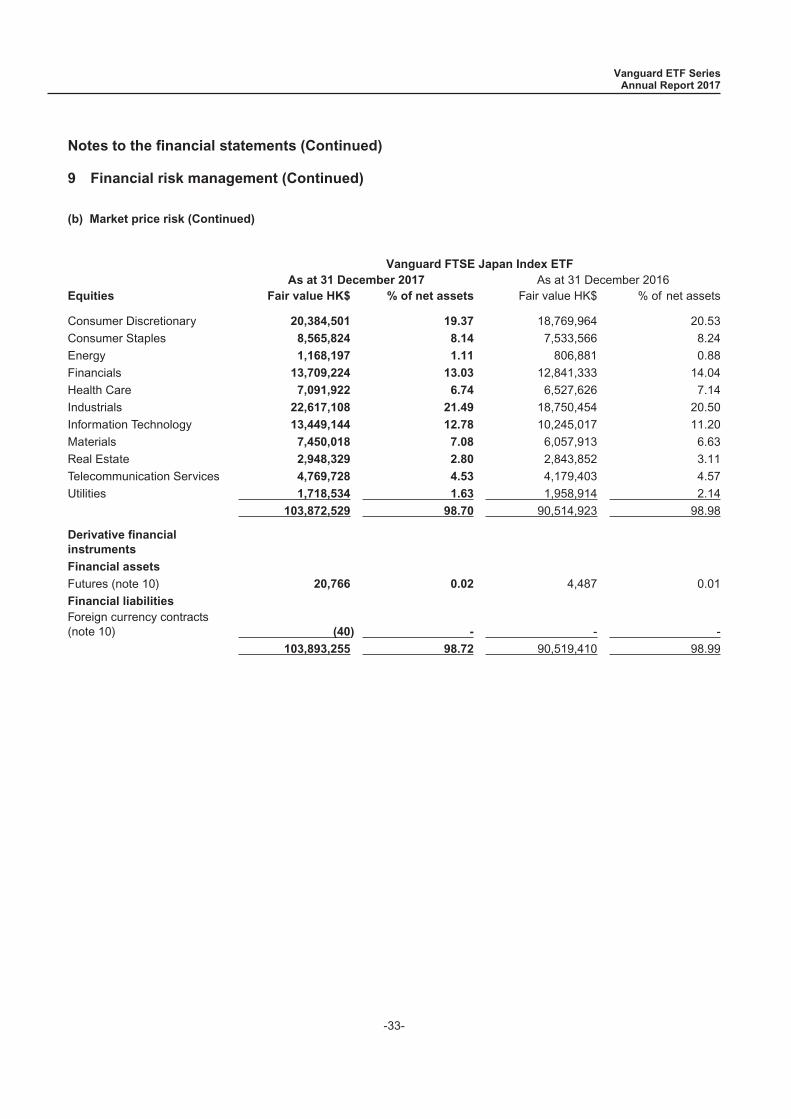
(b) Market price risk (Continued)
As at 31 December 2017 and 2016, the Sub-Funds’ investments were concentrated in the following industries:
Vanguard FTSE Asia ex Japan Index ETFAs at 31 December 2017 As at 31 December 2016
Equities Fair value HK$ % of net assets Fair value HK$ % of net assets
Consumer Discretionary 22,354,222 10.80 9,992,080 8.31
Consumer Staples 10,299,836 4.97 6,436,867 5.35
Energy 7,831,351 3.78 5,464,166 4.54
Financials 60,909,992 29.42 36,371,935 30.24
Health Care 5,507,052 2.66 3,056,517 2.54
Industrials 12,924,319 6.24 9,019,419 7.50
Information Technology 49,766,686 24.03 26,538,728 22.07
Materials 14,428,604 6.97 8,119,728 6.75
Real Estate 4,403,472 2.13 3,565,245 2.97
Telecommunication Services 10,627,287 5.13 6,410,018 5.33
Utilities 6,263,274 3.03 4,447,138 3.70
205,316,095 99.16 119,421,841 99.30
Derivative financialinstruments
Financial assets
Futures (note 10) 33,350 0.01 - -Foreign currency contracts(note 10) 416 - - -
Financial liabilities
Futures (note 10) - - (349) -Foreign currency contracts(note 10) (257) - (27) -
205,349,604 99.17 119,421,465 99.30
Vanguard ETF SeriesAnnual Report 2017
Notes to the financial statements (Continued)
-30-
9 Financial risk management (Continued)
(b) Market price risk (Continued)
Vanguard FTSE Asia ex Japan High Dividend Yield Index ETFAs at 31 December 2017 As at 31 December 2016
Equities Fair value HK$ % of net assets Fair value HK$ % of net assets
Consumer Discretionary 16,135,964 5.59 12,250,996 5.86
Consumer Staples 9,430,869 3.27 6,988,148 3.34
Energy 19,428,041 6.73 13,401,616 6.41
Financials 121,311,674 42.01 80,780,109 38.61
Industrials 14,192,467 4.91 11,651,390 5.57
Information Technology 48,988,789 16.97 35,019,457 16.74
Materials 15,984,028 5.54 12,813,921 6.12
Real Estate 5,582,526 1.93 8,651,490 4.14
Telecommunication Services 21,813,305 7.55 18,564,535 8.87
Utilities 13,274,923 4.60 7,845,603 3.75
286,142,586 99.10 207,967,265 99.41
Derivative financialinstruments
Financial assets
Futures (note 10) 61,863 0.02 - -
Financial liabilitiesForeign currency contracts(note 10) (493) - (192) -
286,203,956 99.12 207,967,073 99.41
Vanguard ETF SeriesAnnual Report 2017
Notes to the financial statements (Continued)
-31-

9 Financial risk management (Continued)
(b) Market price risk (Continued)
Vanguard FTSE Developed Europe Index ETFAs at 31 December 2017 As at 31 December 2016
Equities Fair value HK$ % of net assets Fair value HK$ % of net assets
Consumer Discretionary 24,132,387 11.41 14,757,071 11.54
Consumer Staples 27,874,972 13.18 16,656,805 13.02
Energy 15,070,136 7.13 9,586,455 7.50
Financials 46,009,554 21.76 26,102,017 20.41
Health Care 24,531,907 11.60 16,481,223 12.89
Industrials 27,547,974 13.03 15,581,853 12.18
Information Technology 8,892,369 4.21 4,468,991 3.49
Materials 17,540,192 8.29 10,897,036 8.52
Real Estate 1,617,377 0.76 1,791,017 1.40
Telecommunication Services 7,958,800 3.76 5,480,278 4.29
Utilities 7,785,758 3.68 4,725,785 3.70
208,961,426 98.81 126,528,531 98.94
Derivative financialinstruments
Financial assets
Futures (note 10) 26,875 0.01 5,173 -
Financial liabilities
Futures (note 10) (15,810) - - -Foreign currency contracts(note 10) (54) - (9) -
208,972,437 98.82 126,533,695 98.94
Vanguard ETF SeriesAnnual Report 2017
Notes to the financial statements (Continued)
-32-
9 Financial risk management (Continued)
(b) Market price risk (Continued)
Vanguard FTSE Japan Index ETFAs at 31 December 2017 As at 31 December 2016
Equities Fair value HK$ % of net assets Fair value HK$ % of net assets
Consumer Discretionary 20,384,501 19.37 18,769,964 20.53
Consumer Staples 8,565,824 8.14 7,533,566 8.24
Energy 1,168,197 1.11 806,881 0.88
Financials 13,709,224 13.03 12,841,333 14.04
Health Care 7,091,922 6.74 6,527,626 7.14
Industrials 22,617,108 21.49 18,750,454 20.50
Information Technology 13,449,144 12.78 10,245,017 11.20
Materials 7,450,018 7.08 6,057,913 6.63
Real Estate 2,948,329 2.80 2,843,852 3.11
Telecommunication Services 4,769,728 4.53 4,179,403 4.57
Utilities 1,718,534 1.63 1,958,914 2.14
103,872,529 98.70 90,514,923 98.98
Derivative financialinstruments
Financial assets
Futures (note 10) 20,766 0.02 4,487 0.01
Financial liabilitiesForeign currency contracts(note 10) (40) - - -
103,893,255 98.72 90,519,410 98.99
Vanguard ETF SeriesAnnual Report 2017
Notes to the financial statements (Continued)
-33-

9 Financial risk management (Continued)
(b) Market price risk (Continued)
Vanguard S&P 500 Index ETFAs at 31 December 2017 As at 31 December 2016
Equities Fair value HK$ % of net assets Fair value HK$ % of net assets
Consumer Discretionary 28,855,835 10.14 14,716,443 9.57
Consumer Staples 24,207,336 8.51 14,726,988 9.58
Energy 17,125,223 6.02 11,408,612 7.42
Financials 51,434,095 18.07 25,135,010 16.34
Health Care 38,607,850 13.56 20,437,739 13.29
Industrials 24,737,970 8.69 13,172,111 8.56
Information Technology 48,098,702 16.90 22,335,222 14.52
Materials 9,874,191 3.47 4,873,695 3.17
Real Estate 3,604,857 1.27 4,150,089 2.70
Telecommunication Services 27,416,131 9.63 15,019,930 9.77
Utilities 8,310,713 2.92 4,822,176 3.14
Other - - 1,459,680 0.95
282,272,903 99.18 152,257,695 99.01
Derivative financialinstruments
Financial assets
Futures (note 10) 8,647 - - -
Financial liabilities
Futures (note 10) - - (7,136) (0.01)Foreign currency contracts(note 10) (4) - - -
282,281,546 99.18 152,250,559 99.00
Vanguard ETF SeriesAnnual Report 2017
Notes to the financial statements (Continued)
-34-
9 Financial risk management (Continued)
(b) Market price risk (Continued)
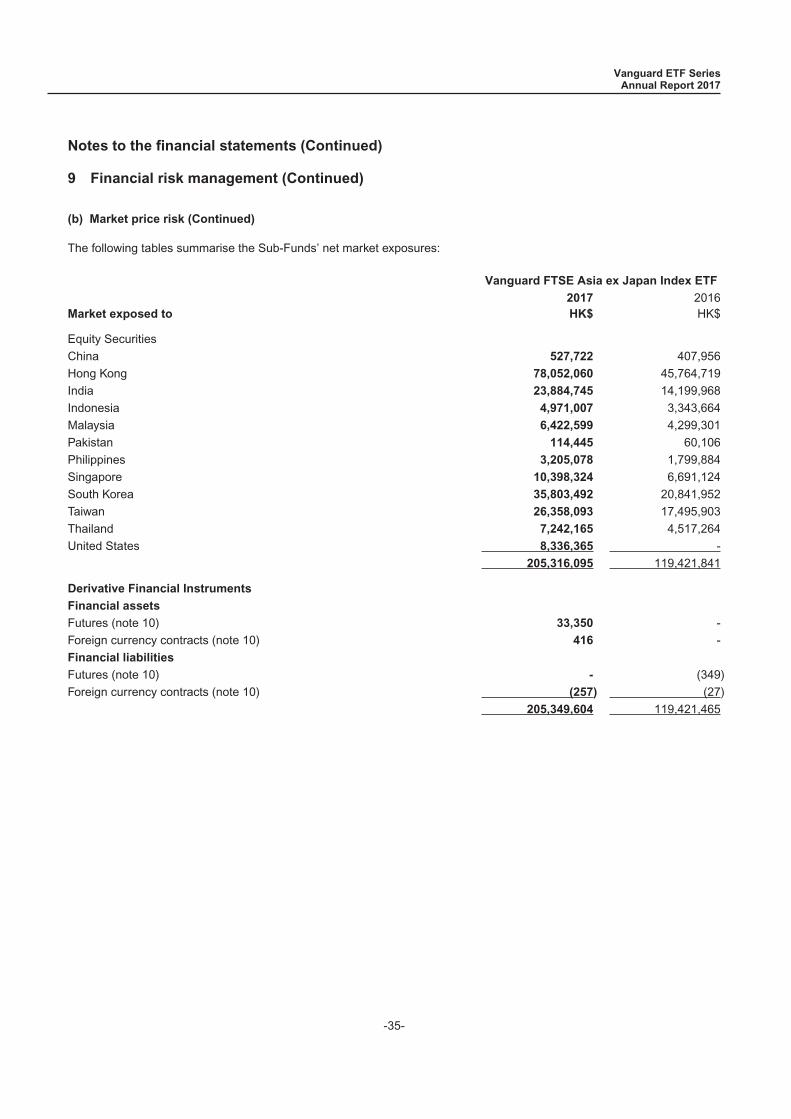
The following tables summarise the Sub-Funds’ net market exposures:
Vanguard FTSE Asia ex Japan Index ETF
2017 2016Market exposed to HK$ HK$
Equity Securities
China 527,722 407,956
Hong Kong 78,052,060 45,764,719
India 23,884,745 14,199,968
Indonesia 4,971,007 3,343,664
Malaysia 6,422,599 4,299,301
Pakistan 114,445 60,106
Philippines 3,205,078 1,799,884
Singapore 10,398,324 6,691,124
South Korea 35,803,492 20,841,952
Taiwan 26,358,093 17,495,903
Thailand 7,242,165 4,517,264
United States 8,336,365 -
205,316,095 119,421,841
Derivative Financial Instruments
Financial assets
Futures (note 10) 33,350 -
Foreign currency contracts (note 10) 416 -
Financial liabilities
Futures (note 10) - (349)
Foreign currency contracts (note 10) (257) (27)
205,349,604 119,421,465
Vanguard ETF SeriesAnnual Report 2017
Notes to the financial statements (Continued)
-35-
9 Financial risk management (Continued)
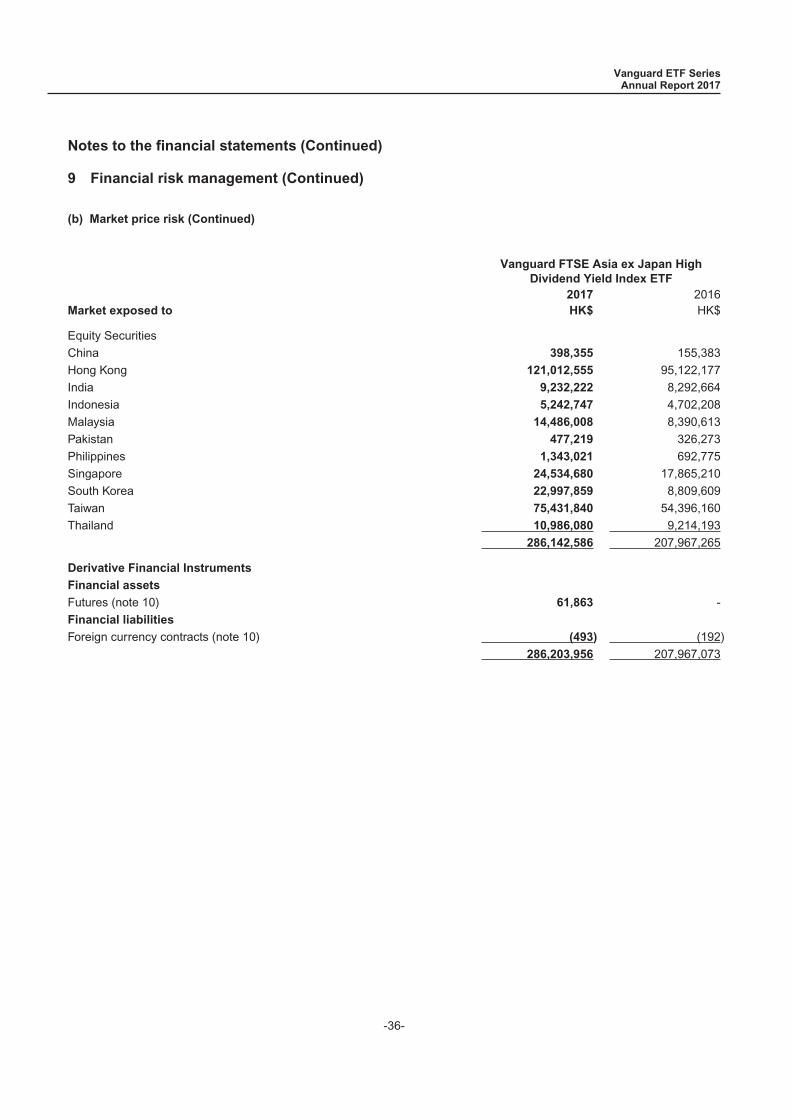
(b) Market price risk (Continued)
Vanguard FTSE Asia ex Japan HighDividend Yield Index ETF
2017 2016Market exposed to HK$ HK$
Equity Securities
China 398,355 155,383
Hong Kong 121,012,555 95,122,177
India 9,232,222 8,292,664
Indonesia 5,242,747 4,702,208
Malaysia 14,486,008 8,390,613
Pakistan 477,219 326,273
Philippines 1,343,021 692,775
Singapore 24,534,680 17,865,210
South Korea 22,997,859 8,809,609
Taiwan 75,431,840 54,396,160
Thailand 10,986,080 9,214,193
286,142,586 207,967,265
Derivative Financial Instruments
Financial assets
Futures (note 10) 61,863 -
Financial liabilities
Foreign currency contracts (note 10) (493) (192)
286,203,956 207,967,073
Vanguard ETF SeriesAnnual Report 2017
Notes to the financial statements (Continued)
-36-
9 Financial risk management (Continued)
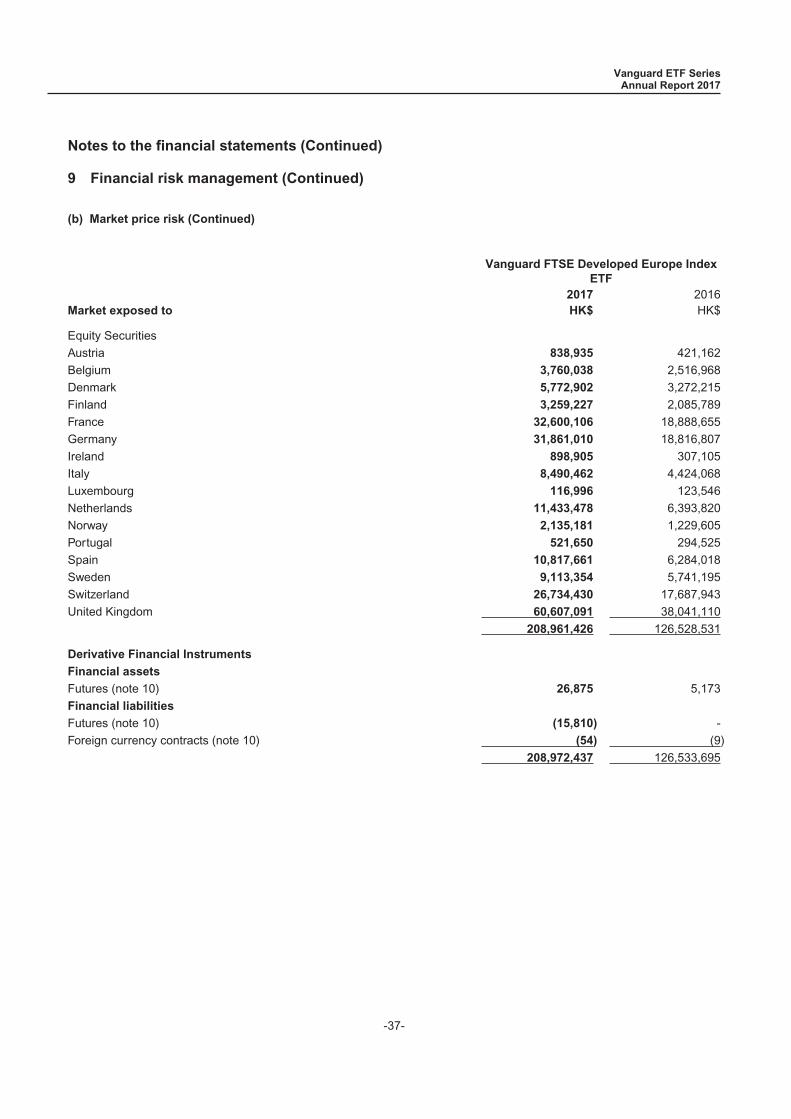
(b) Market price risk (Continued)
Vanguard FTSE Developed Europe IndexETF
2017 2016Market exposed to HK$ HK$
Equity Securities
Austria 838,935 421,162
Belgium 3,760,038 2,516,968
Denmark 5,772,902 3,272,215
Finland 3,259,227 2,085,789
France 32,600,106 18,888,655
Germany 31,861,010 18,816,807
Ireland 898,905 307,105
Italy 8,490,462 4,424,068
Luxembourg 116,996 123,546
Netherlands 11,433,478 6,393,820
Norway 2,135,181 1,229,605
Portugal 521,650 294,525
Spain 10,817,661 6,284,018
Sweden 9,113,354 5,741,195
Switzerland 26,734,430 17,687,943
United Kingdom 60,607,091 38,041,110
208,961,426 126,528,531
Derivative Financial Instruments
Financial assets
Futures (note 10) 26,875 5,173
Financial liabilities
Futures (note 10) (15,810) -
Foreign currency contracts (note 10) (54) (9)
208,972,437 126,533,695
Vanguard ETF SeriesAnnual Report 2017
Notes to the financial statements (Continued)
-37-
9 Financial risk management (Continued)
(b) Market price risk (Continued)
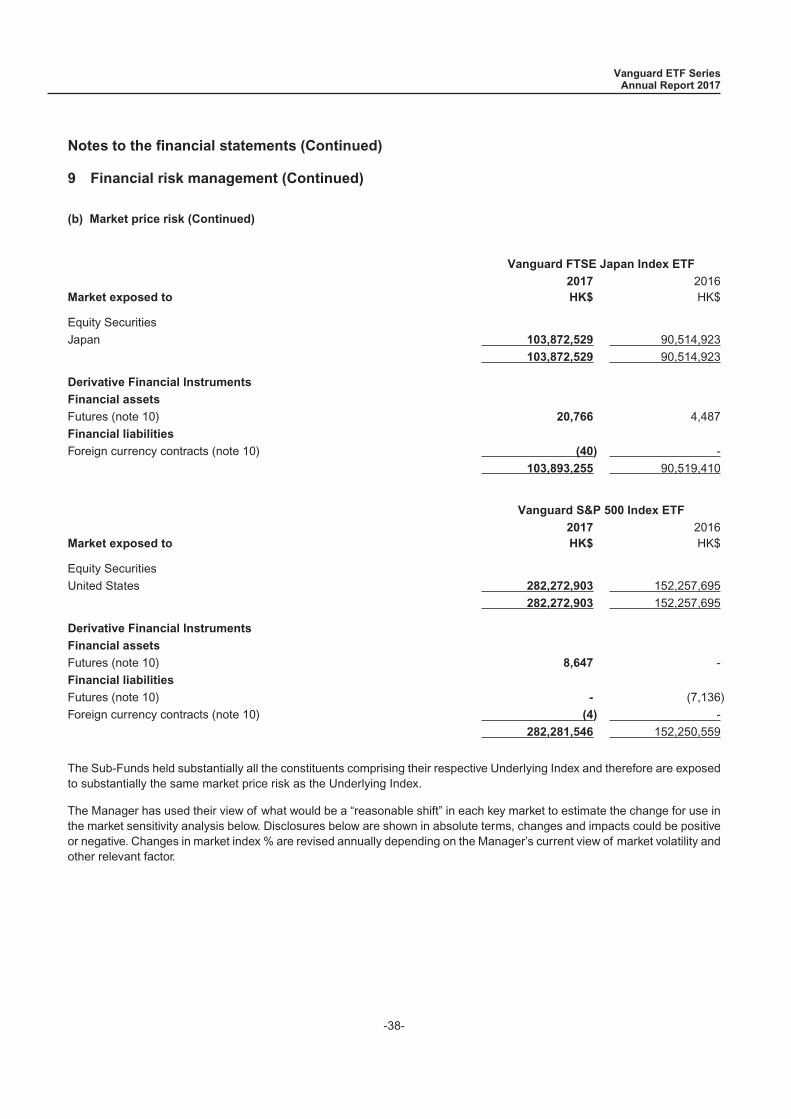
Vanguard FTSE Japan Index ETF
2017 2016Market exposed to HK$ HK$
Equity Securities
Japan 103,872,529 90,514,923
103,872,529 90,514,923
Derivative Financial Instruments
Financial assets
Futures (note 10) 20,766 4,487
Financial liabilities
Foreign currency contracts (note 10) (40) -
103,893,255 90,519,410
Vanguard S&P 500 Index ETF
2017 2016Market exposed to HK$ HK$
Equity Securities
United States 282,272,903 152,257,695
282,272,903 152,257,695
Derivative Financial Instruments
Financial assets
Futures (note 10) 8,647 -
Financial liabilities
Futures (note 10) - (7,136)
Foreign currency contracts (note 10) (4) -
282,281,546 152,250,559
The Sub-Funds held substantially all the constituents comprising their respective Underlying Index and therefore are exposedto substantially the same market price risk as the Underlying Index.
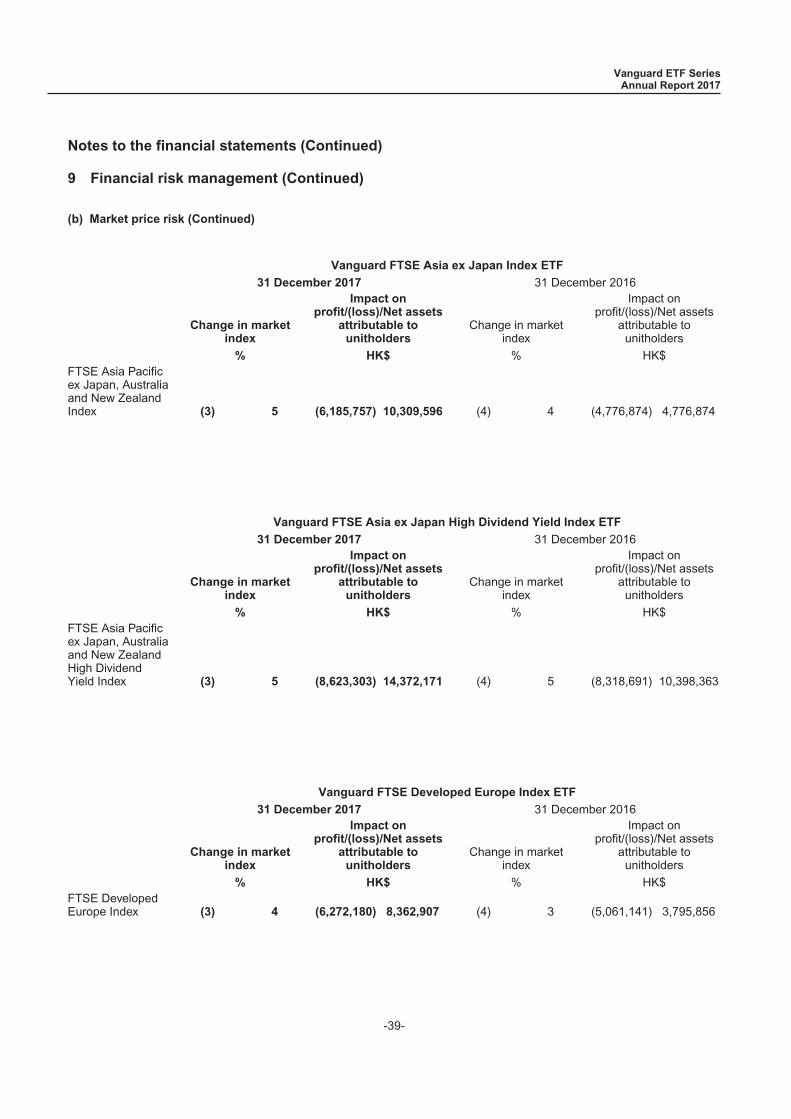
The Manager has used their view of what would be a “reasonable shift” in each key market to estimate the change for use inthe market sensitivity analysis below. Disclosures below are shown in absolute terms, changes and impacts could be positiveor negative. Changes in market index % are revised annually depending on the Manager’s current view of market volatility andother relevant factor.
Vanguard ETF SeriesAnnual Report 2017
Notes to the financial statements (Continued)
-38-
9 Financial risk management (Continued)
(b) Market price risk (Continued)
Vanguard FTSE Asia ex Japan Index ETF
31 December 2017 31 December 2016
Change in marketindex
Impact onprofit/(loss)/Net assets
attributable tounitholders
Change in marketindex
Impact onprofit/(loss)/Net assets
attributable tounitholders
% HK$ % HK$FTSE Asia Pacificex Japan, Australiaand New ZealandIndex (3) 5 (6,185,757) 10,309,596 (4) 4 (4,776,874) 4,776,874
Vanguard FTSE Asia ex Japan High Dividend Yield Index ETF
31 December 2017 31 December 2016
Change in marketindex
Impact onprofit/(loss)/Net assets
attributable tounitholders
Change in marketindex
Impact onprofit/(loss)/Net assets
attributable tounitholders
% HK$ % HK$FTSE Asia Pacificex Japan, Australiaand New ZealandHigh DividendYield Index (3) 5 (8,623,303) 14,372,171 (4) 5 (8,318,691) 10,398,363
Vanguard FTSE Developed Europe Index ETF
31 December 2017 31 December 2016
Change in marketindex
Impact onprofit/(loss)/Net assets
attributable tounitholders
Change in marketindex
Impact onprofit/(loss)/Net assets
attributable tounitholders
% HK$ % HK$FTSE DevelopedEurope Index (3) 4 (6,272,180) 8,362,907 (4) 3 (5,061,141) 3,795,856
Vanguard ETF SeriesAnnual Report 2017
Notes to the financial statements (Continued)
-39-
9 Financial risk management (Continued)
(b) Market price risk (Continued)
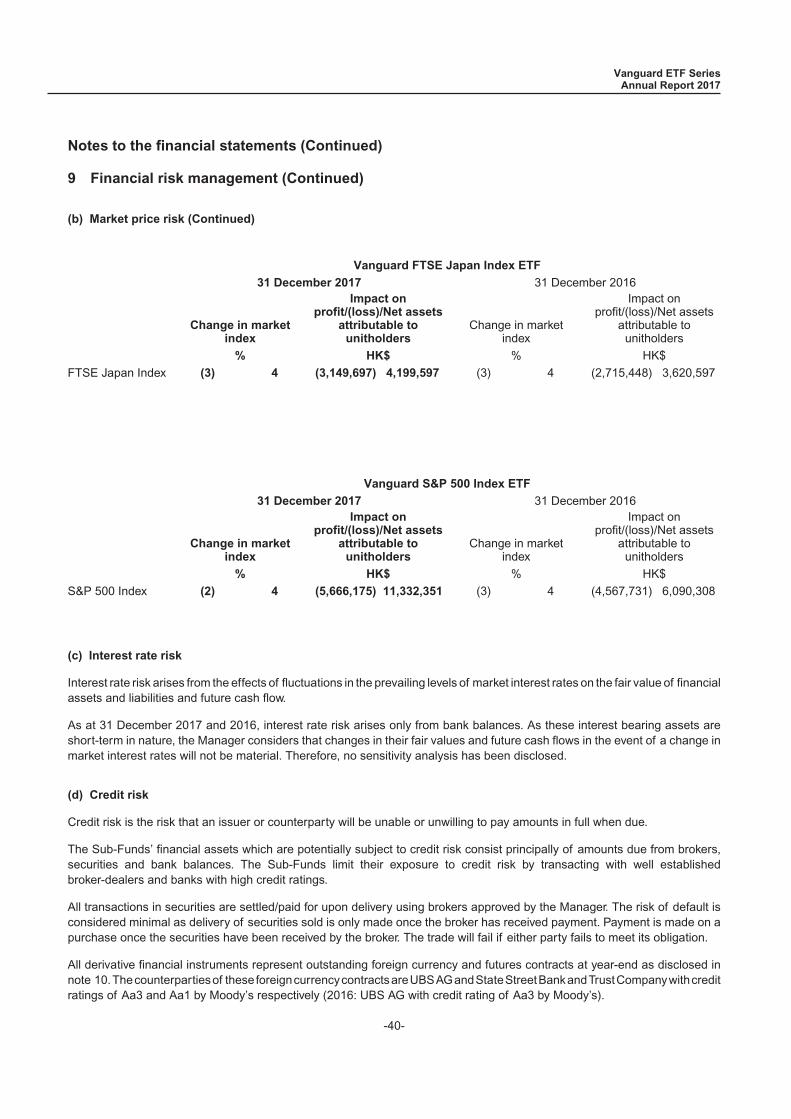
Vanguard FTSE Japan Index ETF
31 December 2017 31 December 2016
Change in marketindex
Impact onprofit/(loss)/Net assets
attributable tounitholders
Change in marketindex
Impact onprofit/(loss)/Net assets
attributable tounitholders
% HK$ % HK$
FTSE Japan Index (3) 4 (3,149,697) 4,199,597 (3) 4 (2,715,448) 3,620,597
Vanguard S&P 500 Index ETF
31 December 2017 31 December 2016
Change in marketindex
Impact onprofit/(loss)/Net assets
attributable tounitholders
Change in marketindex
Impact onprofit/(loss)/Net assets
attributable tounitholders
% HK$ % HK$
S&P 500 Index (2) 4 (5,666,175) 11,332,351 (3) 4 (4,567,731) 6,090,308
(c) Interest rate risk
Interest rate risk arises from the effects of fluctuations in the prevailing levels of market interest rates on the fair value of financialassets and liabilities and future cash flow.
As at 31 December 2017 and 2016, interest rate risk arises only from bank balances. As these interest bearing assets areshort-term in nature, the Manager considers that changes in their fair values and future cash flows in the event of a change inmarket interest rates will not be material. Therefore, no sensitivity analysis has been disclosed.
(d) Credit risk
Credit risk is the risk that an issuer or counterparty will be unable or unwilling to pay amounts in full when due.
The Sub-Funds’ financial assets which are potentially subject to credit risk consist principally of amounts due from brokers,securities and bank balances. The Sub-Funds limit their exposure to credit risk by transacting with well establishedbroker-dealers and banks with high credit ratings.
All transactions in securities are settled/paid for upon delivery using brokers approved by the Manager. The risk of default isconsidered minimal as delivery of securities sold is only made once the broker has received payment. Payment is made on apurchase once the securities have been received by the broker. The trade will fail if either party fails to meet its obligation.
All derivative financial instruments represent outstanding foreign currency and futures contracts at year-end as disclosed innote 10.Thecounterpartiesof these foreigncurrencycontractsareUBSAGandStateStreetBankandTrustCompanywithcreditratings of Aa3 and Aa1 by Moody’s respectively (2016: UBS AG with credit rating of Aa3 by Moody’s).
Vanguard ETF SeriesAnnual Report 2017
Notes to the financial statements (Continued)
-40-

9 Financial risk management (Continued)
(d) Credit risk (Continued)
As at 31 December 2017 and 2016, bank balances and investments of the Sub-Funds were held with the custodian andsub-custodians of the Sub-Funds. The credit ratings issued by Moody’s were as follows:
Credit Rating
31 December 2017 31 December 2016
Custodian
State Street Bank and Trust Company Aa1 Aa1
Sub-Custodians
Deutsche Bank AG, India A3 A3
Deutsche Bank AG, Taiwan A3 A3
The Hongkong and Shanghai Banking Corporation, Seoul Aa3 Aa2
Accordingly, the Sub-Funds have no significant credit risk.
The maximum exposure to credit risk at year end is the carrying amount of the financial assets as shown on the Statement offinancial position.
As at 31 December 2017 and 2016, none of the assets are impaired nor past due but not impaired.
State Street Bank and Trust Company acts as custodian for the Sub-Funds. It is expected that all investments deposited witha custodian will be clearly identified, and segregated, as being assets of the Sub-Funds; the Sub-Funds should not thereforebe exposed to credit risk with a custodian. However, it may not always be possible to achieve this segregation, so the Sub-Funds’investments may experience increased exposure to credit risk associated with the applicable custodian.
(e) Liquidity risk
Liquidity risk is the risk that an entity will encounter difficulty in settling a liability, including a redemption request.
The Sub-Funds invest the majority of their assets in investments that are traded in active markets and can be readily disposedof. The Sub-Funds’ securities are considered readily realisable, as they are listed on prescribed Stock Exchanges. It is the intentof the Manager to monitor the Sub-Funds’ liquidity positions on a daily basis.
Vanguard ETF SeriesAnnual Report 2017
Notes to the financial statements (Continued)
-41-
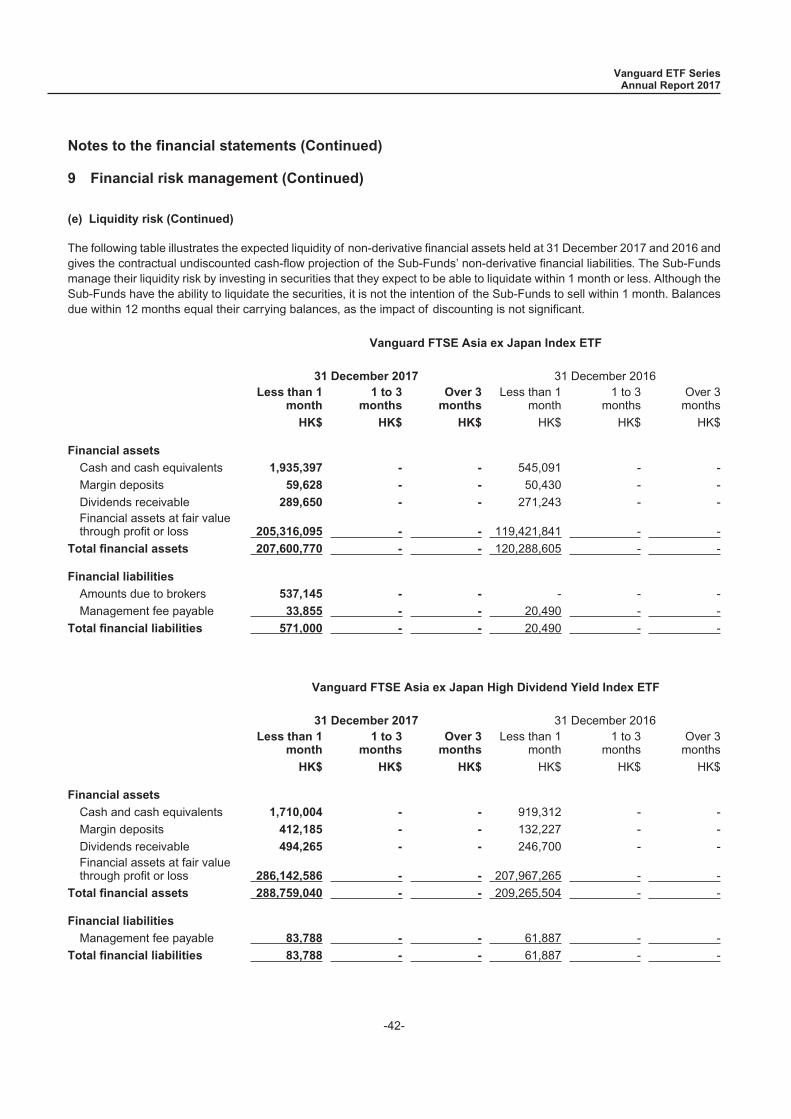
9 Financial risk management (Continued)
(e) Liquidity risk (Continued)
The following table illustrates the expected liquidity of non-derivative financial assets held at 31 December 2017 and 2016 andgives the contractual undiscounted cash-flow projection of the Sub-Funds’ non-derivative financial liabilities. The Sub-Fundsmanage their liquidity risk by investing in securities that they expect to be able to liquidate within 1 month or less. Although theSub-Funds have the ability to liquidate the securities, it is not the intention of the Sub-Funds to sell within 1 month. Balancesdue within 12 months equal their carrying balances, as the impact of discounting is not significant.
Vanguard FTSE Asia ex Japan Index ETF
31 December 2017 31 December 2016Less than 1
month1 to 3
monthsOver 3
monthsLess than 1
month1 to 3
monthsOver 3
months
HK$ HK$ HK$ HK$ HK$ HK$
Financial assets
Cash and cash equivalents 1,935,397 - - 545,091 - -
Margin deposits 59,628 - - 50,430 - -
Dividends receivable 289,650 - - 271,243 - -Financial assets at fair valuethrough profit or loss 205,316,095 - - 119,421,841 - -
Total financial assets 207,600,770 - - 120,288,605 - -
Financial liabilities
Amounts due to brokers 537,145 - - - - -
Management fee payable 33,855 - - 20,490 - -
Total financial liabilities 571,000 - - 20,490 - -
Vanguard FTSE Asia ex Japan High Dividend Yield Index ETF
31 December 2017 31 December 2016Less than 1
month1 to 3
monthsOver 3
monthsLess than 1
month1 to 3
monthsOver 3
months
HK$ HK$ HK$ HK$ HK$ HK$
Financial assets
Cash and cash equivalents 1,710,004 - - 919,312 - -
Margin deposits 412,185 - - 132,227 - -
Dividends receivable 494,265 - - 246,700 - -Financial assets at fair valuethrough profit or loss 286,142,586 - - 207,967,265 - -
Total financial assets 288,759,040 - - 209,265,504 - -
Financial liabilities
Management fee payable 83,788 - - 61,887 - -
Total financial liabilities 83,788 - - 61,887 - -
Vanguard ETF SeriesAnnual Report 2017
Notes to the financial statements (Continued)
-42-
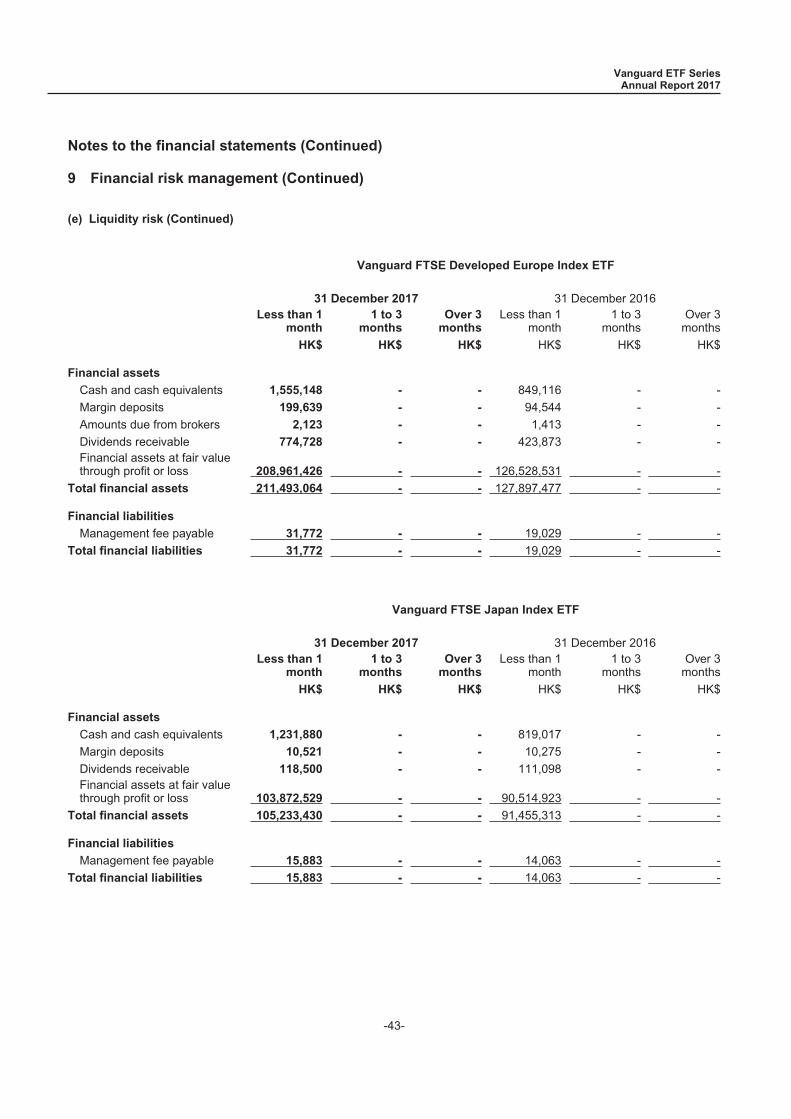
9 Financial risk management (Continued)
(e) Liquidity risk (Continued)
Vanguard FTSE Developed Europe Index ETF
31 December 2017 31 December 2016Less than 1
month1 to 3
monthsOver 3
monthsLess than 1
month1 to 3
monthsOver 3
months
HK$ HK$ HK$ HK$ HK$ HK$
Financial assets
Cash and cash equivalents 1,555,148 - - 849,116 - -
Margin deposits 199,639 - - 94,544 - -
Amounts due from brokers 2,123 - - 1,413 - -
Dividends receivable 774,728 - - 423,873 - -Financial assets at fair valuethrough profit or loss 208,961,426 - - 126,528,531 - -
Total financial assets 211,493,064 - - 127,897,477 - -
Financial liabilities
Management fee payable 31,772 - - 19,029 - -
Total financial liabilities 31,772 - - 19,029 - -
Vanguard FTSE Japan Index ETF
31 December 2017 31 December 2016Less than 1
month1 to 3
monthsOver 3
monthsLess than 1
month1 to 3
monthsOver 3
months
HK$ HK$ HK$ HK$ HK$ HK$
Financial assets
Cash and cash equivalents 1,231,880 - - 819,017 - -
Margin deposits 10,521 - - 10,275 - -
Dividends receivable 118,500 - - 111,098 - -Financial assets at fair valuethrough profit or loss 103,872,529 - - 90,514,923 - -
Total financial assets 105,233,430 - - 91,455,313 - -
Financial liabilities
Management fee payable 15,883 - - 14,063 - -
Total financial liabilities 15,883 - - 14,063 - -
Vanguard ETF SeriesAnnual Report 2017
Notes to the financial statements (Continued)
-43-
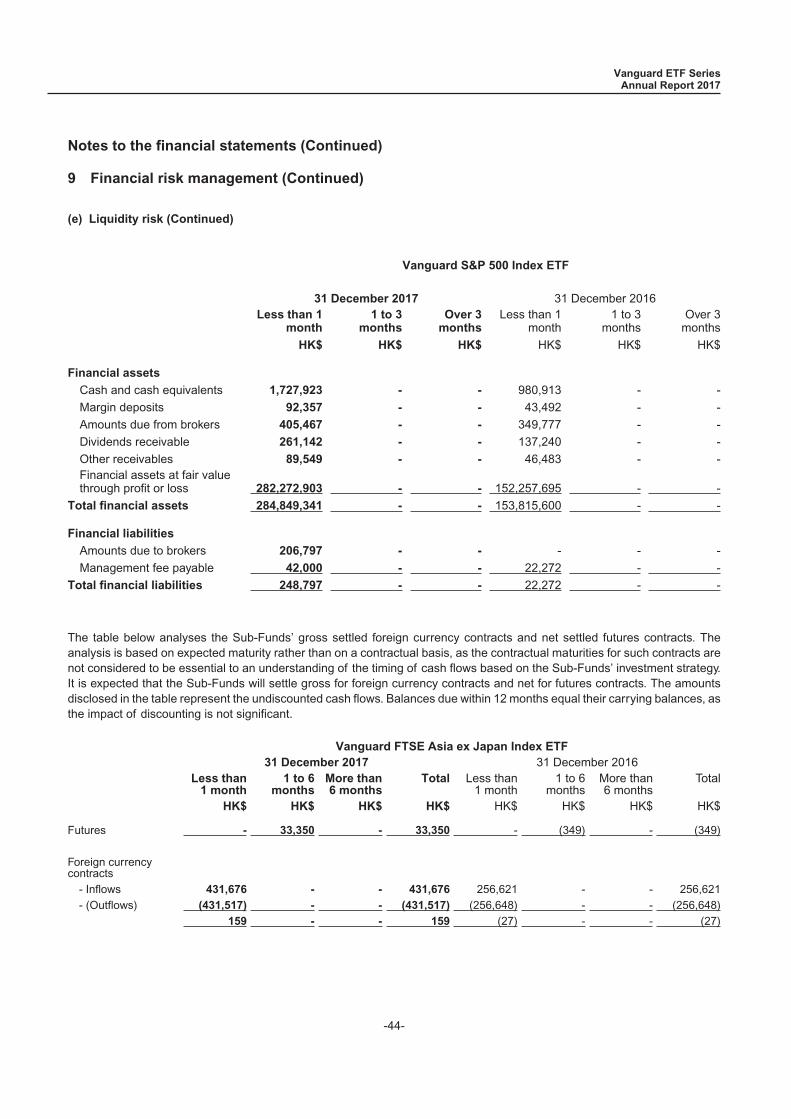
9 Financial risk management (Continued)
(e) Liquidity risk (Continued)
Vanguard S&P 500 Index ETF
31 December 2017 31 December 2016Less than 1
month1 to 3
monthsOver 3
monthsLess than 1
month1 to 3
monthsOver 3
months
HK$ HK$ HK$ HK$ HK$ HK$
Financial assets
Cash and cash equivalents 1,727,923 - - 980,913 - -
Margin deposits 92,357 - - 43,492 - -
Amounts due from brokers 405,467 - - 349,777 - -
Dividends receivable 261,142 - - 137,240 - -
Other receivables 89,549 - - 46,483 - -Financial assets at fair valuethrough profit or loss 282,272,903 - - 152,257,695 - -
Total financial assets 284,849,341 - - 153,815,600 - -
Financial liabilities
Amounts due to brokers 206,797 - - - - -
Management fee payable 42,000 - - 22,272 - -
Total financial liabilities 248,797 - - 22,272 - -
The table below analyses the Sub-Funds’ gross settled foreign currency contracts and net settled futures contracts. Theanalysis is based on expected maturity rather than on a contractual basis, as the contractual maturities for such contracts arenot considered to be essential to an understanding of the timing of cash flows based on the Sub-Funds’ investment strategy.It is expected that the Sub-Funds will settle gross for foreign currency contracts and net for futures contracts. The amountsdisclosed in the table represent the undiscounted cash flows. Balances due within 12 months equal their carrying balances, asthe impact of discounting is not significant.
Vanguard FTSE Asia ex Japan Index ETF31 December 2017 31 December 2016
Less than1 month
1 to 6months
More than6 months
Total Less than1 month
1 to 6months
More than6 months
Total
HK$ HK$ HK$ HK$ HK$ HK$ HK$ HK$
Futures - 33,350 - 33,350 - (349) - (349)
Foreign currencycontracts
- Inflows 431,676 - - 431,676 256,621 - - 256,621- (Outflows) (431,517) - - (431,517) (256,648) - - (256,648)
159 - - 159 (27) - - (27)
Vanguard ETF SeriesAnnual Report 2017
Notes to the financial statements (Continued)
-44-

9 Financial risk management (Continued)
(e) Liquidity risk (Continued)
Vanguard FTSE Asia ex Japan High Dividend Yield Index ETF31 December 2017 31 December 2016
Less than1 month
1 to 6months
More than6 months
Total Less than1 month
1 to 6months
More than6 months
Total
HK$ HK$ HK$ HK$ HK$ HK$ HK$ HK$
Futures - 61,863 - 61,863 - - - -
Foreign currencycontracts
- Inflows 852,793 - - 852,793 744,172 - - 744,172- (Outflows) (853,286) - - (853,286) (744,364) - - (744,364)
(493) - - (493) (192) - - (192)
Vanguard FTSE Developed Europe Index ETF31 December 2017 31 December 2016
Less than1 month
1 to 6months
More than6 months
Total Less than1 month
1 to 6months
More than6 months
Total
HK$ HK$ HK$ HK$ HK$ HK$ HK$ HK$
Futures - 11,065 - 11,065 - 5,173 - 5,173
Foreign currencycontracts
- Inflows 596,872 - - 596,872 383,198 - - 383,198- (Outflows) (596,926) - - (596,926) (383,207) - - (383,207)
(54) - - (54) (9) - - (9)
Vanguard FTSE Japan Index ETF31 December 2017 31 December 2016
Less than1 month
1 to 6months
More than6 months
Total Less than1 month
1 to 6months
More than6 months
Total
HK$ HK$ HK$ HK$ HK$ HK$ HK$ HK$
Futures - 20,766 - 20,766 - 4,487 - 4,487
Foreign currencycontracts
- Inflows 625,000 - - 625,000 - - - -- (Outflows) (625,040) - - (625,040) - - - -
(40) - - (40) - - - -
Vanguard ETF SeriesAnnual Report 2017
Notes to the financial statements (Continued)
-45-

9 Financial risk management (Continued)
(e) Liquidity risk (Continued)
Vanguard S&P 500 Index ETF31 December 2017 31 December 2016
Less than1 month
1 to 6months
More than6 months
Total Less than1 month
1 to 6months
More than6 months
Total
HK$ HK$ HK$ HK$ HK$ HK$ HK$ HK$
Futures - 8,647 - 8,647 - (7,136) - (7,136)
Foreign currencycontracts
- Inflows 100,000 - - 100,000 350,000 - - 350,000- (Outflows) (100,004) - - (100,004) (350,000) - - (350,000)
(4) - - (4) - - - -
Units in the Sub-Funds are redeemed at the unitholders’ option.
As at 31 December 2017, 3 unitholders (2016: 3 unitholders) held 53% (2016: 58%) of the Vanguard FTSE Asia ex Japan IndexETF’s total net assets.
As at 31 December 2017, 1 unitholder (2016: 1 unitholder) held 54% (2016: 59%) of the Vanguard FTSE Asia ex Japan HighDividend Yield Index ETF’s total net assets.
As at 31 December 2017, 3 unitholders (2016: 3 unitholders) held 56% (2016: 58%) of the Vanguard FTSE Developed EuropeIndex ETF’s total net assets.
As at 31 December 2017, 2 unitholders (2016: 2 unitholders) held 58% (2016: 60%) of the Vanguard FTSE Japan Index ETF’stotal net assets.
As at 31 December 2017, 4 unitholders (2016: 4 unitholders) held 57% (2016: 57%) of the Vanguard S&P 500 Index ETF’s totalnet assets.
(f) Currency risk
Currency risk is the risk that the value of financial instruments will fluctuate due to changes in foreign exchange rates.
The Sub-Funds’ foreign exchange exposure on international equity securities is embedded in the price risk as presented innote 9(b). Other than the Sub-Funds’ exposure to foreign exchange on international equity securities the Sub-Funds have nosignificant currency risk as substantially all other assets and liabilities are denominated in Hong Kong dollars, the Sub-Funds’functional and presentation currency.
(g) Capital risk management
The Sub-Funds’ objectives are to provide investment results that closely correspond to the performance of their respectiveUnderlying Indices. The Manager may:
• Redeem and issue new units in accordance with the constitutive documents of the Sub-Funds, which include the abilityto amend the creation unit and redemption unit size upon giving prior notice to the Trustee;
• Suspend the creation and redemption of units under certain circumstances stipulated in the Trust Deed.
Vanguard ETF SeriesAnnual Report 2017
Notes to the financial statements (Continued)
-46-
9 Financial risk management (Continued)
(h) Fair value estimation
The fair value of financial assets and liabilities traded in active markets (such as publicly traded derivatives and tradingsecurities) are based on quoted market prices at the close of trading on the year end date. The Sub-Funds use last tradedmarket price as their fair valuation inputs for their investments.
An active market is a market in which transactions for the asset or liability take place with sufficient frequency and volume toprovide pricing information on an ongoing basis.
A financial instrument is regarded as quoted in an active market if quoted prices are readily and regularly available from anexchange, dealer, broker, industry group, pricing service, or regulatory agency, and those prices represent actual and regularlyoccurring market transactions on an arm’s length basis.
The carrying value less impairment provision of other receivables and payables are assumed to approximate their fair values.The fair value of financial liabilities for disclosure purposes is estimated by discounting the future contractual cash flows at thecurrent market interest rate that is available to the Sub-Funds for similar financial instruments.
IFRS 13 requires the Sub-Funds to classify fair value measurements using a fair value hierarchy that reflects the significanceof the inputs used in making the measurements. The fair value hierarchy has the following levels:
• Quoted prices (unadjusted) in active markets for identical assets or liabilities that the entity can access at themeasurement date (level 1).
• Inputs other than quoted prices included within level 1 that are observable for the asset or liability, either directly orindirectly (level 2).
• Inputs for the asset or liability that are unobservable inputs (level 3).
The level in the fair value hierarchy within which the fair value measurement is categorised in its entirety is determined on thebasis of the lowest level input that is significant to the fair value measurement in its entirety. For this purpose, the significanceof an input is assessed against the fair value measurement in its entirety. If a fair value measurement uses observable inputsthat require significant adjustment based on unobservable inputs, that measurement is a level 3 measurement. Assessing thesignificance of a particular input to the fair value measurement in its entirety requires judgment, considering factors specific tothe asset or liability.
The determination of what constitutes ‘observable’ requires significant judgment by the Sub-Funds. The Sub-Funds considerobservable data to be that market data that is readily available, regularly distributed or updated, reliable and verifiable, notproprietary, and provided by independent sources that are actively involved in the relevant market.
Vanguard ETF SeriesAnnual Report 2017
Notes to the financial statements (Continued)
-47-
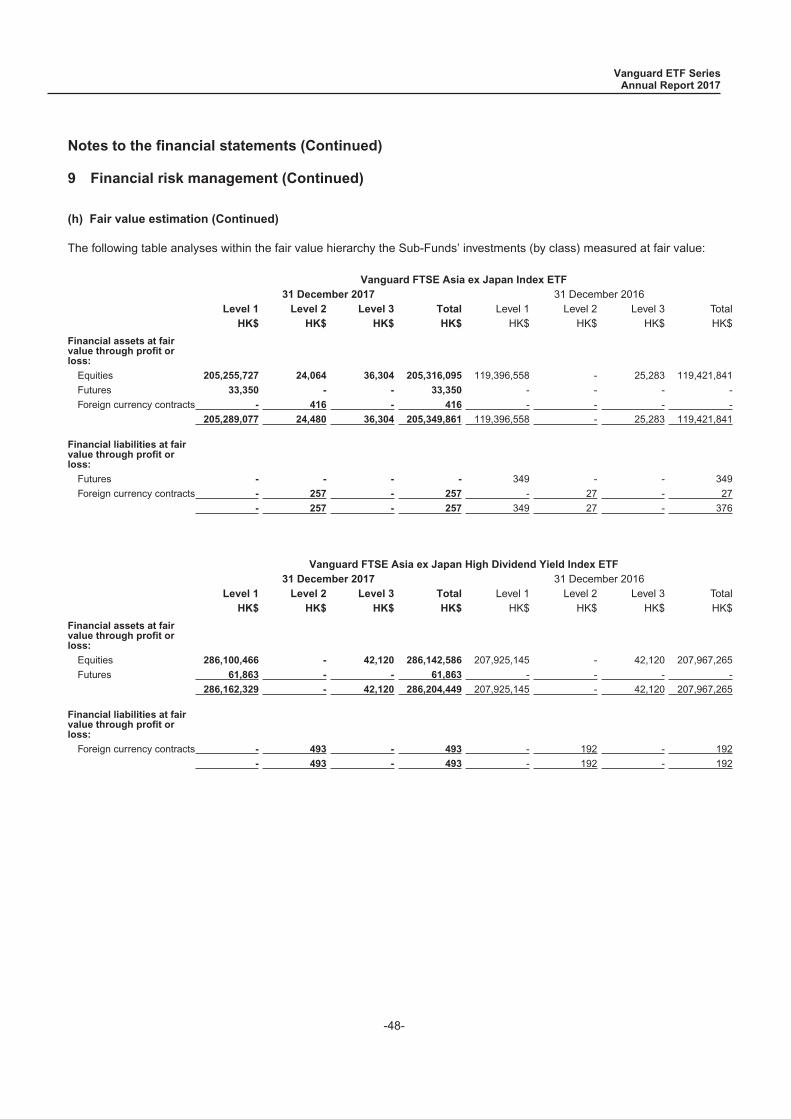
9 Financial risk management (Continued)
(h) Fair value estimation (Continued)
The following table analyses within the fair value hierarchy the Sub-Funds’ investments (by class) measured at fair value:
Vanguard FTSE Asia ex Japan Index ETF31 December 2017 31 December 2016
Level 1 Level 2 Level 3 Total Level 1 Level 2 Level 3 TotalHK$ HK$ HK$ HK$ HK$ HK$ HK$ HK$
Financial assets at fairvalue through profit orloss:
Equities 205,255,727 24,064 36,304 205,316,095 119,396,558 - 25,283 119,421,841
Futures 33,350 - - 33,350 - - - -
Foreign currency contracts - 416 - 416 - - - -
205,289,077 24,480 36,304 205,349,861 119,396,558 - 25,283 119,421,841
Financial liabilities at fairvalue through profit orloss:
Futures - - - - 349 - - 349
Foreign currency contracts - 257 - 257 - 27 - 27
- 257 - 257 349 27 - 376
Vanguard FTSE Asia ex Japan High Dividend Yield Index ETF31 December 2017 31 December 2016
Level 1 Level 2 Level 3 Total Level 1 Level 2 Level 3 TotalHK$ HK$ HK$ HK$ HK$ HK$ HK$ HK$
Financial assets at fairvalue through profit orloss:
Equities 286,100,466 - 42,120 286,142,586 207,925,145 - 42,120 207,967,265
Futures 61,863 - - 61,863 - - - -
286,162,329 - 42,120 286,204,449 207,925,145 - 42,120 207,967,265
Financial liabilities at fairvalue through profit orloss:
Foreign currency contracts - 493 - 493 - 192 - 192
- 493 - 493 - 192 - 192
Vanguard ETF SeriesAnnual Report 2017
Notes to the financial statements (Continued)
-48-
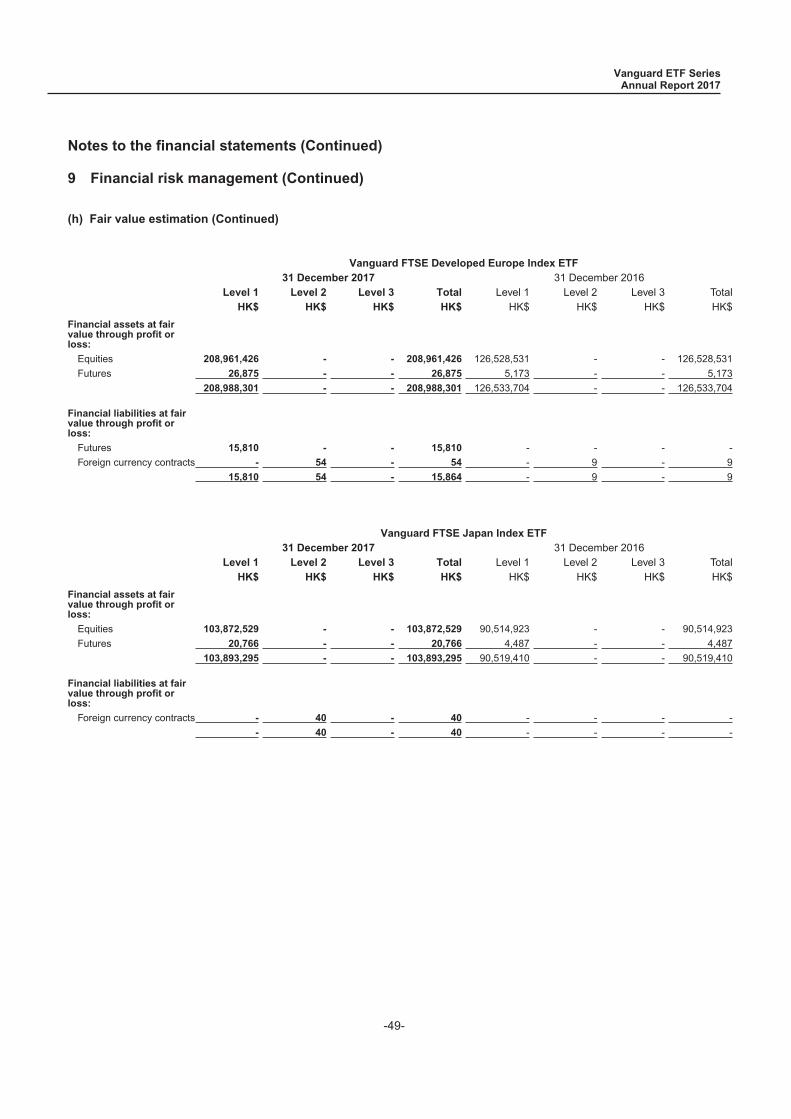
9 Financial risk management (Continued)
(h) Fair value estimation (Continued)
Vanguard FTSE Developed Europe Index ETF31 December 2017 31 December 2016
Level 1 Level 2 Level 3 Total Level 1 Level 2 Level 3 TotalHK$ HK$ HK$ HK$ HK$ HK$ HK$ HK$
Financial assets at fairvalue through profit orloss:
Equities 208,961,426 - - 208,961,426 126,528,531 - - 126,528,531
Futures 26,875 - - 26,875 5,173 - - 5,173
208,988,301 - - 208,988,301 126,533,704 - - 126,533,704
Financial liabilities at fairvalue through profit orloss:
Futures 15,810 - - 15,810 - - - -
Foreign currency contracts - 54 - 54 - 9 - 9
15,810 54 - 15,864 - 9 - 9
Vanguard FTSE Japan Index ETF31 December 2017 31 December 2016
Level 1 Level 2 Level 3 Total Level 1 Level 2 Level 3 TotalHK$ HK$ HK$ HK$ HK$ HK$ HK$ HK$
Financial assets at fairvalue through profit orloss:
Equities 103,872,529 - - 103,872,529 90,514,923 - - 90,514,923
Futures 20,766 - - 20,766 4,487 - - 4,487
103,893,295 - - 103,893,295 90,519,410 - - 90,519,410
Financial liabilities at fairvalue through profit orloss:
Foreign currency contracts - 40 - 40 - - - -
- 40 - 40 - - - -
Vanguard ETF SeriesAnnual Report 2017
Notes to the financial statements (Continued)
-49-
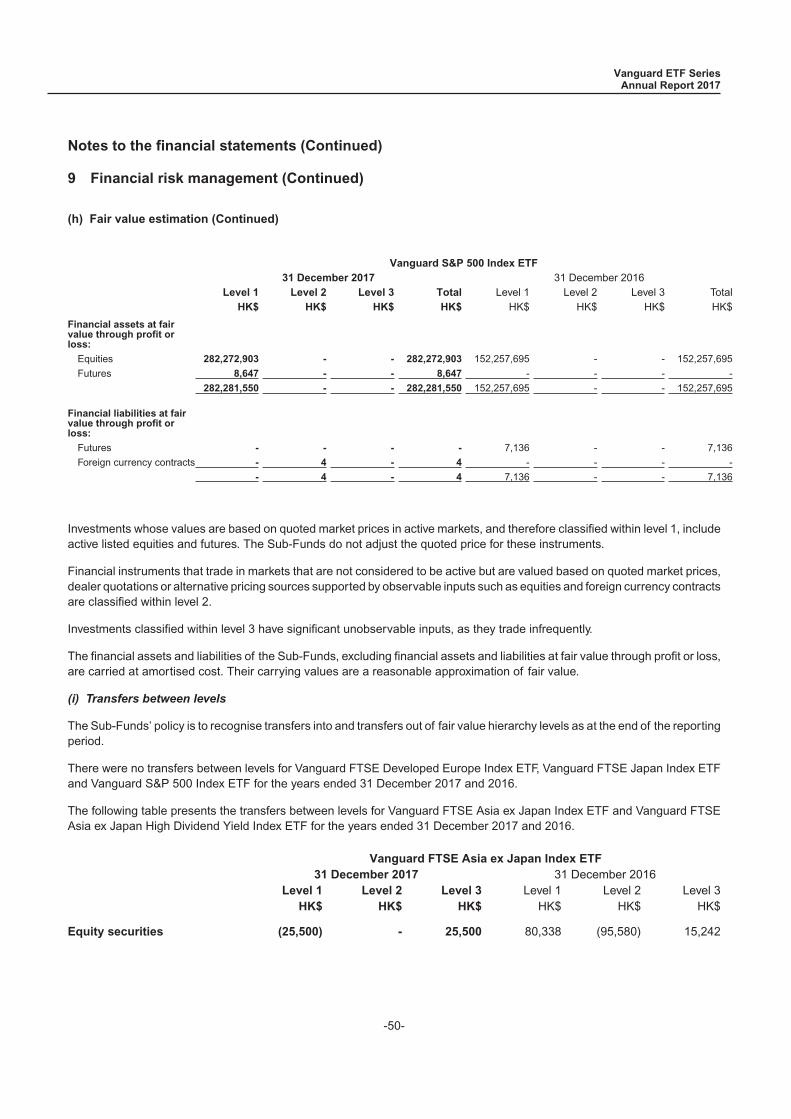
9 Financial risk management (Continued)
(h) Fair value estimation (Continued)
Vanguard S&P 500 Index ETF31 December 2017 31 December 2016
Level 1 Level 2 Level 3 Total Level 1 Level 2 Level 3 TotalHK$ HK$ HK$ HK$ HK$ HK$ HK$ HK$
Financial assets at fairvalue through profit orloss:
Equities 282,272,903 - - 282,272,903 152,257,695 - - 152,257,695
Futures 8,647 - - 8,647 - - - -
282,281,550 - - 282,281,550 152,257,695 - - 152,257,695
Financial liabilities at fairvalue through profit orloss:
Futures - - - - 7,136 - - 7,136
Foreign currency contracts - 4 - 4 - - - -
- 4 - 4 7,136 - - 7,136
Investments whose values are based on quoted market prices in active markets, and therefore classified within level 1, includeactive listed equities and futures. The Sub-Funds do not adjust the quoted price for these instruments.
Financial instruments that trade in markets that are not considered to be active but are valued based on quoted market prices,dealer quotations or alternative pricing sources supported by observable inputs such as equities and foreign currency contractsare classified within level 2.
Investments classified within level 3 have significant unobservable inputs, as they trade infrequently.
The financial assets and liabilities of the Sub-Funds, excluding financial assets and liabilities at fair value through profit or loss,are carried at amortised cost. Their carrying values are a reasonable approximation of fair value.
(i) Transfers between levels
The Sub-Funds’ policy is to recognise transfers into and transfers out of fair value hierarchy levels as at the end of the reportingperiod.
There were no transfers between levels for Vanguard FTSE Developed Europe Index ETF, Vanguard FTSE Japan Index ETFand Vanguard S&P 500 Index ETF for the years ended 31 December 2017 and 2016.
The following table presents the transfers between levels for Vanguard FTSE Asia ex Japan Index ETF and Vanguard FTSEAsia ex Japan High Dividend Yield Index ETF for the years ended 31 December 2017 and 2016.
Vanguard FTSE Asia ex Japan Index ETF31 December 2017 31 December 2016
Level 1 Level 2 Level 3 Level 1 Level 2 Level 3HK$ HK$ HK$ HK$ HK$ HK$
Equity securities (25,500) - 25,500 80,338 (95,580) 15,242
Vanguard ETF SeriesAnnual Report 2017
Notes to the financial statements (Continued)
-50-
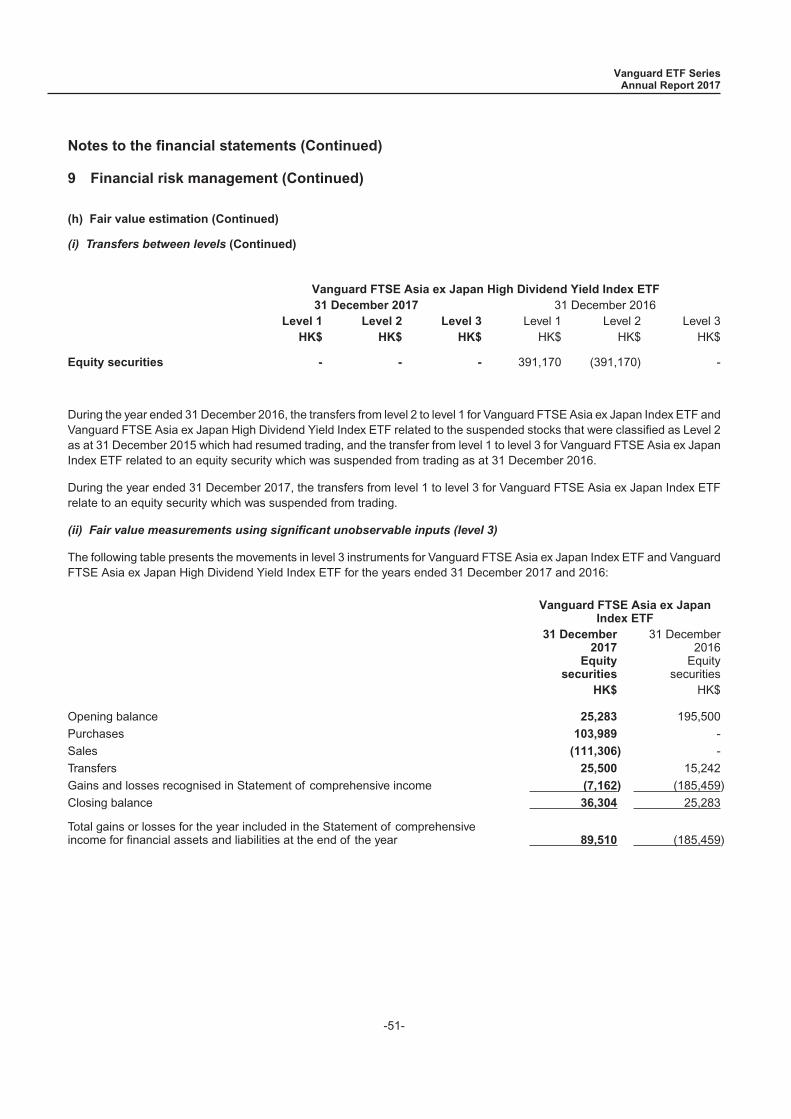
9 Financial risk management (Continued)
(h) Fair value estimation (Continued)
(i) Transfers between levels (Continued)
Vanguard FTSE Asia ex Japan High Dividend Yield Index ETF31 December 2017 31 December 2016
Level 1 Level 2 Level 3 Level 1 Level 2 Level 3HK$ HK$ HK$ HK$ HK$ HK$
Equity securities - - - 391,170 (391,170) -
During the year ended 31 December 2016, the transfers from level 2 to level 1 for Vanguard FTSE Asia ex Japan Index ETF andVanguard FTSE Asia ex Japan High Dividend Yield Index ETF related to the suspended stocks that were classified as Level 2as at 31 December 2015 which had resumed trading, and the transfer from level 1 to level 3 for Vanguard FTSE Asia ex JapanIndex ETF related to an equity security which was suspended from trading as at 31 December 2016.
During the year ended 31 December 2017, the transfers from level 1 to level 3 for Vanguard FTSE Asia ex Japan Index ETFrelate to an equity security which was suspended from trading.
(ii) Fair value measurements using significant unobservable inputs (level 3)
The following table presents the movements in level 3 instruments for Vanguard FTSE Asia ex Japan Index ETF and VanguardFTSE Asia ex Japan High Dividend Yield Index ETF for the years ended 31 December 2017 and 2016:
Vanguard FTSE Asia ex JapanIndex ETF
31 December2017
Equitysecurities
31 December2016
Equitysecurities
HK$ HK$
Opening balance 25,283 195,500
Purchases 103,989 -
Sales (111,306) -
Transfers 25,500 15,242
Gains and losses recognised in Statement of comprehensive income (7,162) (185,459)
Closing balance 36,304 25,283
Total gains or losses for the year included in the Statement of comprehensiveincome for financial assets and liabilities at the end of the year 89,510 (185,459)
Vanguard ETF SeriesAnnual Report 2017
Notes to the financial statements (Continued)
-51-
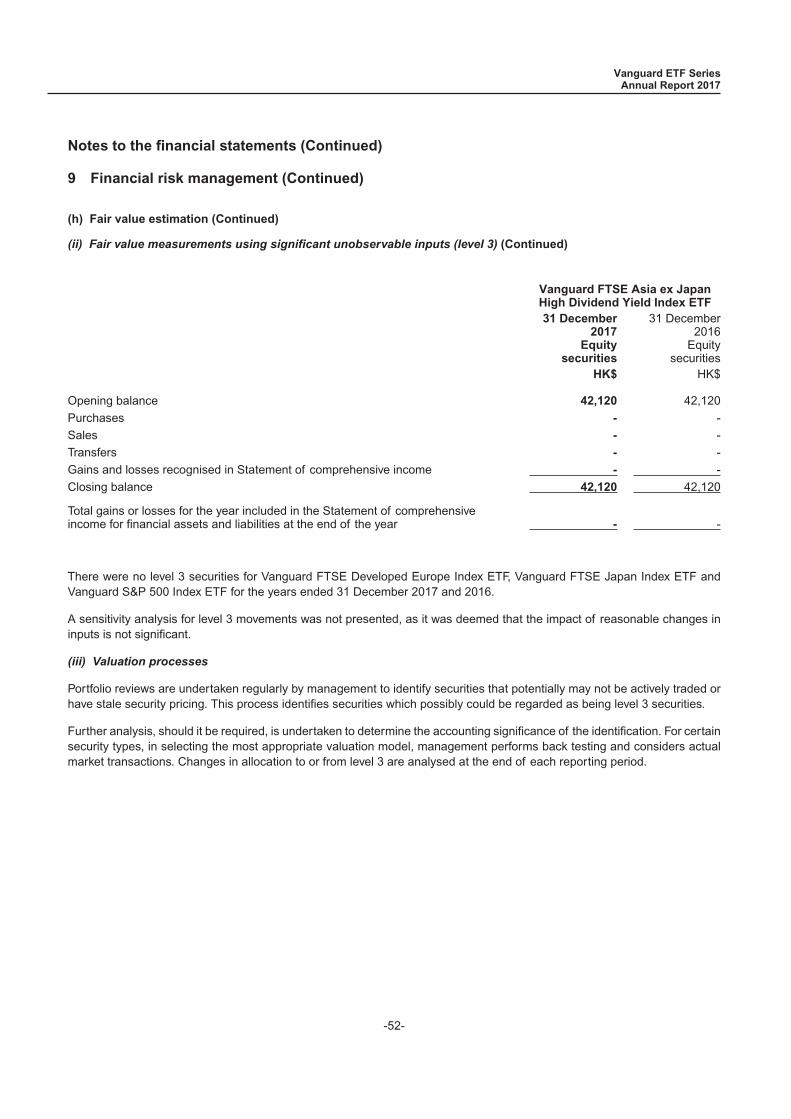
9 Financial risk management (Continued)
(h) Fair value estimation (Continued)
(ii) Fair value measurements using significant unobservable inputs (level 3) (Continued)
Vanguard FTSE Asia ex JapanHigh Dividend Yield Index ETF31 December
2017Equity
securities
31 December2016
Equitysecurities
HK$ HK$
Opening balance 42,120 42,120
Purchases - -
Sales - -
Transfers - -
Gains and losses recognised in Statement of comprehensive income - -
Closing balance 42,120 42,120
Total gains or losses for the year included in the Statement of comprehensiveincome for financial assets and liabilities at the end of the year - -
There were no level 3 securities for Vanguard FTSE Developed Europe Index ETF, Vanguard FTSE Japan Index ETF andVanguard S&P 500 Index ETF for the years ended 31 December 2017 and 2016.
A sensitivity analysis for level 3 movements was not presented, as it was deemed that the impact of reasonable changes ininputs is not significant.
(iii) Valuation processes
Portfolio reviews are undertaken regularly by management to identify securities that potentially may not be actively traded orhave stale security pricing. This process identifies securities which possibly could be regarded as being level 3 securities.
Further analysis, should it be required, is undertaken to determine the accounting significance of the identification. For certainsecurity types, in selecting the most appropriate valuation model, management performs back testing and considers actualmarket transactions. Changes in allocation to or from level 3 are analysed at the end of each reporting period.
Vanguard ETF SeriesAnnual Report 2017
Notes to the financial statements (Continued)
-52-

10 Derivative financial instruments
As at 31 December 2017 and 2016, the Sub-Funds had the following outstanding derivatives.
Vanguard FTSE Asia ex Japan Index ETF31 December 2017 31 December 2016
Contract/Notional Fair value Contract/Notional Fair valueHK$ HK$ HK$ HK$
Financial Assets
Futures 875,820 33,350 - -
Foreign currency contracts 124,110 416 - -
Financial Liabilities
Futures - - 333,393 (349)
Foreign currency contracts 307,566 (257) 256,621 (27)
1,307,496 33,509 590,014 (376)
Vanguard FTSE Asia ex Japan High Dividend Yield Index ETF31 December 2017 31 December 2016
Contract/Notional Fair value Contract/Notional Fair valueHK$ HK$ HK$ HK$
Financial Assets
Futures 1,300,834 61,863 - -
Financial Liabilities
Foreign currency contracts 852,793 (493) 744,172 (192)
2,153,627 61,370 744,172 (192)
Vanguard FTSE Developed Europe Index ETF31 December 2017 31 December 2016
Contract/Notional Fair value Contract/Notional Fair valueHK$ HK$ HK$ HK$
Financial Assets
Futures 770,035 26,875 533,238 5,173
Financial Liabilities
Futures 658,787 (15,810) - -
Foreign currency contracts 596,872 (54) 383,198 (9)
2,025,694 11,011 916,436 5,164
Vanguard ETF SeriesAnnual Report 2017
Notes to the financial statements (Continued)
-53-

10 Derivative financial instruments (Continued)
Vanguard FTSE Japan Index ETF31 December 2017 31 December 2016
Contract/Notional Fair value Contract/Notional Fair valueHK$ HK$ HK$ HK$
Financial Assets
Futures 1,117,384 20,766 125,401 4,487
Financial Liabilities
Foreign currency contracts 625,000 (40) - -
1,742,384 20,726 125,401 4,487
Vanguard S&P 500 Index ETF31 December 2017 31 December 2016
Contract/Notional Fair value Contract/Notional Fair valueHK$ HK$ HK$ HK$
Financial Assets
Futures 1,035,868 8,647 - -
Foreign currency contracts - - 350,000 -
Financial Liabilities
Futures - - 874,632 (7,136)
Foreign currency contracts 100,000 (4) - -
1,135,868 8,643 1,224,632 (7,136)
Vanguard ETF SeriesAnnual Report 2017
Notes to the financial statements (Continued)
-54-
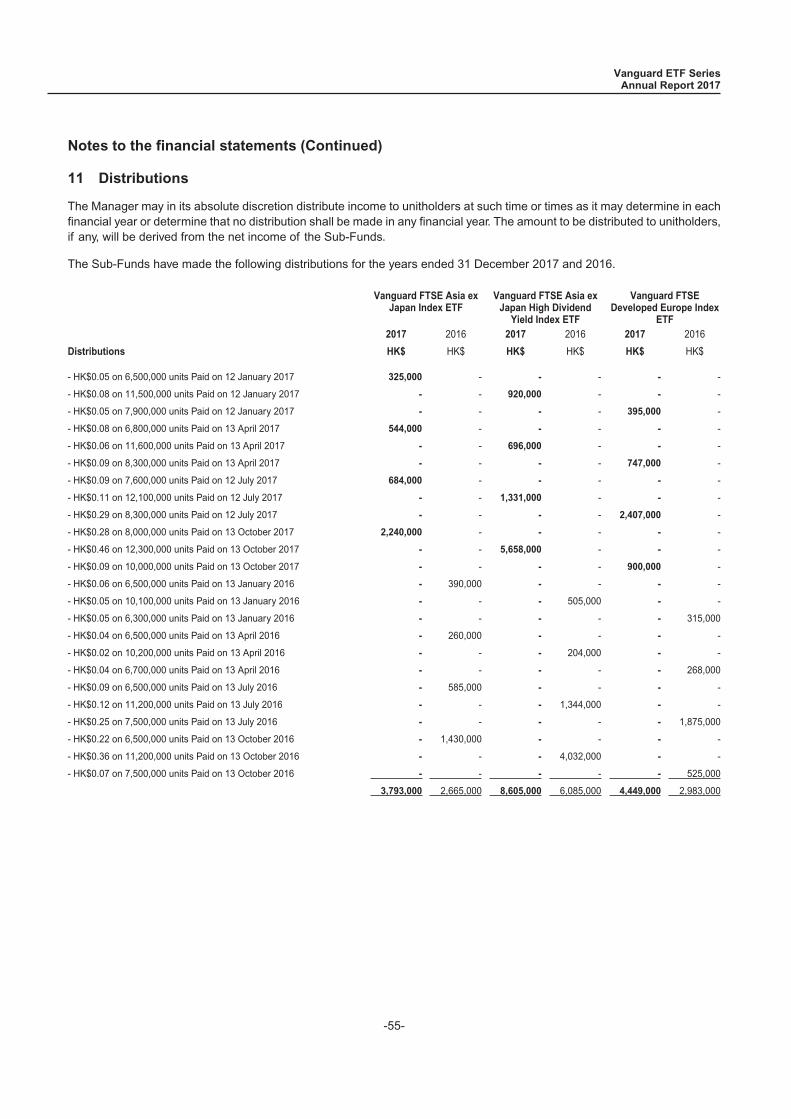
11 Distributions
The Manager may in its absolute discretion distribute income to unitholders at such time or times as it may determine in eachfinancial year or determine that no distribution shall be made in any financial year. The amount to be distributed to unitholders,if any, will be derived from the net income of the Sub-Funds.
The Sub-Funds have made the following distributions for the years ended 31 December 2017 and 2016.
Vanguard FTSE Asia exJapan Index ETF
Vanguard FTSE Asia exJapan High Dividend
Yield Index ETF
Vanguard FTSEDeveloped Europe Index
ETF2017 2016 2017 2016 2017 2016
Distributions HK$ HK$ HK$ HK$ HK$ HK$
- HK$0.05 on 6,500,000 units Paid on 12 January 2017 325,000 - - - - -
- HK$0.08 on 11,500,000 units Paid on 12 January 2017 - - 920,000 - - -
- HK$0.05 on 7,900,000 units Paid on 12 January 2017 - - - - 395,000 -
- HK$0.08 on 6,800,000 units Paid on 13 April 2017 544,000 - - - - -
- HK$0.06 on 11,600,000 units Paid on 13 April 2017 - - 696,000 - - -
- HK$0.09 on 8,300,000 units Paid on 13 April 2017 - - - - 747,000 -
- HK$0.09 on 7,600,000 units Paid on 12 July 2017 684,000 - - - - -
- HK$0.11 on 12,100,000 units Paid on 12 July 2017 - - 1,331,000 - - -
- HK$0.29 on 8,300,000 units Paid on 12 July 2017 - - - - 2,407,000 -
- HK$0.28 on 8,000,000 units Paid on 13 October 2017 2,240,000 - - - - -
- HK$0.46 on 12,300,000 units Paid on 13 October 2017 - - 5,658,000 - - -
- HK$0.09 on 10,000,000 units Paid on 13 October 2017 - - - - 900,000 -
- HK$0.06 on 6,500,000 units Paid on 13 January 2016 - 390,000 - - - -
- HK$0.05 on 10,100,000 units Paid on 13 January 2016 - - - 505,000 - -
- HK$0.05 on 6,300,000 units Paid on 13 January 2016 - - - - - 315,000
- HK$0.04 on 6,500,000 units Paid on 13 April 2016 - 260,000 - - - -
- HK$0.02 on 10,200,000 units Paid on 13 April 2016 - - - 204,000 - -
- HK$0.04 on 6,700,000 units Paid on 13 April 2016 - - - - - 268,000
- HK$0.09 on 6,500,000 units Paid on 13 July 2016 - 585,000 - - - -
- HK$0.12 on 11,200,000 units Paid on 13 July 2016 - - - 1,344,000 - -
- HK$0.25 on 7,500,000 units Paid on 13 July 2016 - - - - - 1,875,000
- HK$0.22 on 6,500,000 units Paid on 13 October 2016 - 1,430,000 - - - -
- HK$0.36 on 11,200,000 units Paid on 13 October 2016 - - - 4,032,000 - -
- HK$0.07 on 7,500,000 units Paid on 13 October 2016 - - - - - 525,000
3,793,000 2,665,000 8,605,000 6,085,000 4,449,000 2,983,000
Vanguard ETF SeriesAnnual Report 2017
Notes to the financial statements (Continued)
-55-
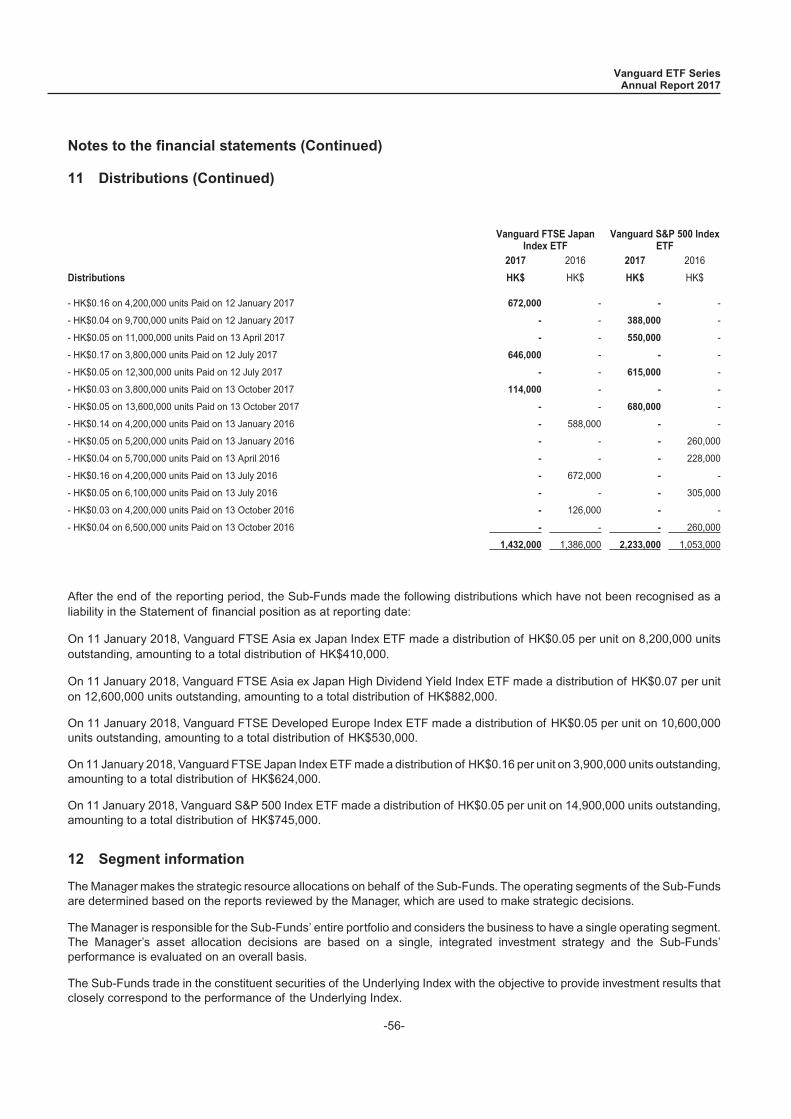
11 Distributions (Continued)
Vanguard FTSE JapanIndex ETF
Vanguard S&P 500 IndexETF
2017 2016 2017 2016
Distributions HK$ HK$ HK$ HK$
- HK$0.16 on 4,200,000 units Paid on 12 January 2017 672,000 - - -
- HK$0.04 on 9,700,000 units Paid on 12 January 2017 - - 388,000 -
- HK$0.05 on 11,000,000 units Paid on 13 April 2017 - - 550,000 -
- HK$0.17 on 3,800,000 units Paid on 12 July 2017 646,000 - - -
- HK$0.05 on 12,300,000 units Paid on 12 July 2017 - - 615,000 -
- HK$0.03 on 3,800,000 units Paid on 13 October 2017 114,000 - - -
- HK$0.05 on 13,600,000 units Paid on 13 October 2017 - - 680,000 -
- HK$0.14 on 4,200,000 units Paid on 13 January 2016 - 588,000 - -
- HK$0.05 on 5,200,000 units Paid on 13 January 2016 - - - 260,000
- HK$0.04 on 5,700,000 units Paid on 13 April 2016 - - - 228,000
- HK$0.16 on 4,200,000 units Paid on 13 July 2016 - 672,000 - -
- HK$0.05 on 6,100,000 units Paid on 13 July 2016 - - - 305,000
- HK$0.03 on 4,200,000 units Paid on 13 October 2016 - 126,000 - -
- HK$0.04 on 6,500,000 units Paid on 13 October 2016 - - - 260,000
1,432,000 1,386,000 2,233,000 1,053,000
After the end of the reporting period, the Sub-Funds made the following distributions which have not been recognised as aliability in the Statement of financial position as at reporting date:
On 11 January 2018, Vanguard FTSE Asia ex Japan Index ETF made a distribution of HK$0.05 per unit on 8,200,000 unitsoutstanding, amounting to a total distribution of HK$410,000.
On 11 January 2018, Vanguard FTSE Asia ex Japan High Dividend Yield Index ETF made a distribution of HK$0.07 per uniton 12,600,000 units outstanding, amounting to a total distribution of HK$882,000.
On 11 January 2018, Vanguard FTSE Developed Europe Index ETF made a distribution of HK$0.05 per unit on 10,600,000units outstanding, amounting to a total distribution of HK$530,000.
On 11 January 2018, Vanguard FTSE Japan Index ETF made a distribution of HK$0.16 per unit on 3,900,000 units outstanding,amounting to a total distribution of HK$624,000.
On 11 January 2018, Vanguard S&P 500 Index ETF made a distribution of HK$0.05 per unit on 14,900,000 units outstanding,amounting to a total distribution of HK$745,000.
12 Segment information
The Manager makes the strategic resource allocations on behalf of the Sub-Funds. The operating segments of the Sub-Fundsare determined based on the reports reviewed by the Manager, which are used to make strategic decisions.
The Manager is responsible for the Sub-Funds’ entire portfolio and considers the business to have a single operating segment.The Manager’s asset allocation decisions are based on a single, integrated investment strategy and the Sub-Funds’performance is evaluated on an overall basis.
The Sub-Funds trade in the constituent securities of the Underlying Index with the objective to provide investment results thatclosely correspond to the performance of the Underlying Index.
Vanguard ETF SeriesAnnual Report 2017
Notes to the financial statements (Continued)
-56-
12 Segment information (Continued)
The internal reporting provided to the Manager for the Sub-Funds’ assets, liabilities and performance is prepared on aconsistent basis with the measurement and recognition principles of IFRS.
There were no changes in the reportable segment during the years ended 31 December 2017 and 2016.
The Sub-Funds are domiciled in Hong Kong. The majority of the Sub-Funds’ income is derived from investments in constituentsecurities of the Underlying Index.
The Sub-Funds have no assets classified as non-current assets. The Sub-Funds have a diversified portfolio of investments.During the years ended 31 December 2017 and 2016, there was no investment which accounted for more than 10% of theSub-Funds’ income. As at 31 December 2017 and 2016, there was no investment which accounted for more than 10% of theSub-Funds’ net assets.
13 Approval of financial statements
The financial statements were approved by the Trustee and the Manager on 24 April 2018.
Vanguard ETF SeriesAnnual Report 2017
Notes to the financial statements (Continued)
-57-
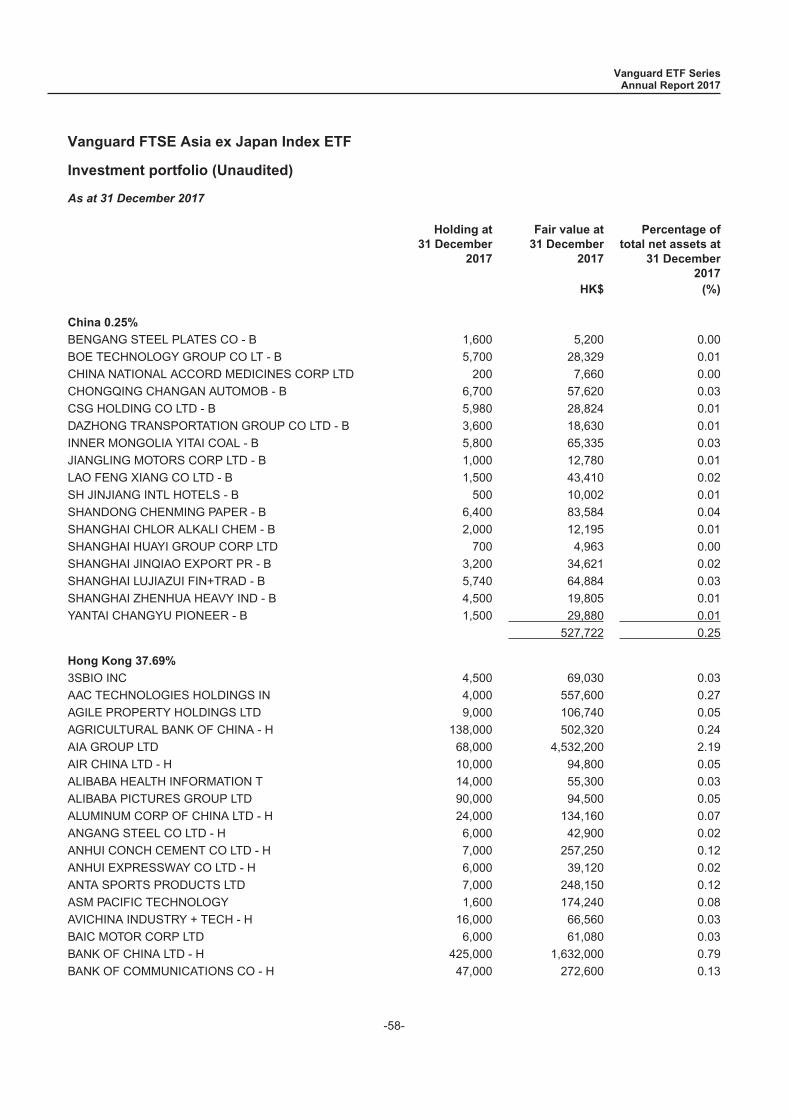
Investment portfolio (Unaudited)
As at 31 December 2017
Holding at31 December
2017
Fair value at31 December
2017
Percentage oftotal net assets at
31 December2017
HK$ (%)
China 0.25%
BENGANG STEEL PLATES CO - B 1,600 5,200 0.00
BOE TECHNOLOGY GROUP CO LT - B 5,700 28,329 0.01
CHINA NATIONAL ACCORD MEDICINES CORP LTD 200 7,660 0.00
CHONGQING CHANGAN AUTOMOB - B 6,700 57,620 0.03
CSG HOLDING CO LTD - B 5,980 28,824 0.01
DAZHONG TRANSPORTATION GROUP CO LTD - B 3,600 18,630 0.01
INNER MONGOLIA YITAI COAL - B 5,800 65,335 0.03
JIANGLING MOTORS CORP LTD - B 1,000 12,780 0.01
LAO FENG XIANG CO LTD - B 1,500 43,410 0.02
SH JINJIANG INTL HOTELS - B 500 10,002 0.01
SHANDONG CHENMING PAPER - B 6,400 83,584 0.04
SHANGHAI CHLOR ALKALI CHEM - B 2,000 12,195 0.01
SHANGHAI HUAYI GROUP CORP LTD 700 4,963 0.00
SHANGHAI JINQIAO EXPORT PR - B 3,200 34,621 0.02
SHANGHAI LUJIAZUI FIN+TRAD - B 5,740 64,884 0.03
SHANGHAI ZHENHUA HEAVY IND - B 4,500 19,805 0.01
YANTAI CHANGYU PIONEER - B 1,500 29,880 0.01
527,722 0.25
Hong Kong 37.69%
3SBIO INC 4,500 69,030 0.03
AAC TECHNOLOGIES HOLDINGS IN 4,000 557,600 0.27
AGILE PROPERTY HOLDINGS LTD 9,000 106,740 0.05
AGRICULTURAL BANK OF CHINA - H 138,000 502,320 0.24
AIA GROUP LTD 68,000 4,532,200 2.19
AIR CHINA LTD - H 10,000 94,800 0.05
ALIBABA HEALTH INFORMATION T 14,000 55,300 0.03
ALIBABA PICTURES GROUP LTD 90,000 94,500 0.05
ALUMINUM CORP OF CHINA LTD - H 24,000 134,160 0.07
ANGANG STEEL CO LTD - H 6,000 42,900 0.02
ANHUI CONCH CEMENT CO LTD - H 7,000 257,250 0.12
ANHUI EXPRESSWAY CO LTD - H 6,000 39,120 0.02
ANTA SPORTS PRODUCTS LTD 7,000 248,150 0.12
ASM PACIFIC TECHNOLOGY 1,600 174,240 0.08
AVICHINA INDUSTRY + TECH - H 16,000 66,560 0.03
BAIC MOTOR CORP LTD 6,000 61,080 0.03
BANK OF CHINA LTD - H 425,000 1,632,000 0.79
BANK OF COMMUNICATIONS CO - H 47,000 272,600 0.13
Vanguard ETF SeriesAnnual Report 2017
Vanguard FTSE Asia ex Japan Index ETF
-58-
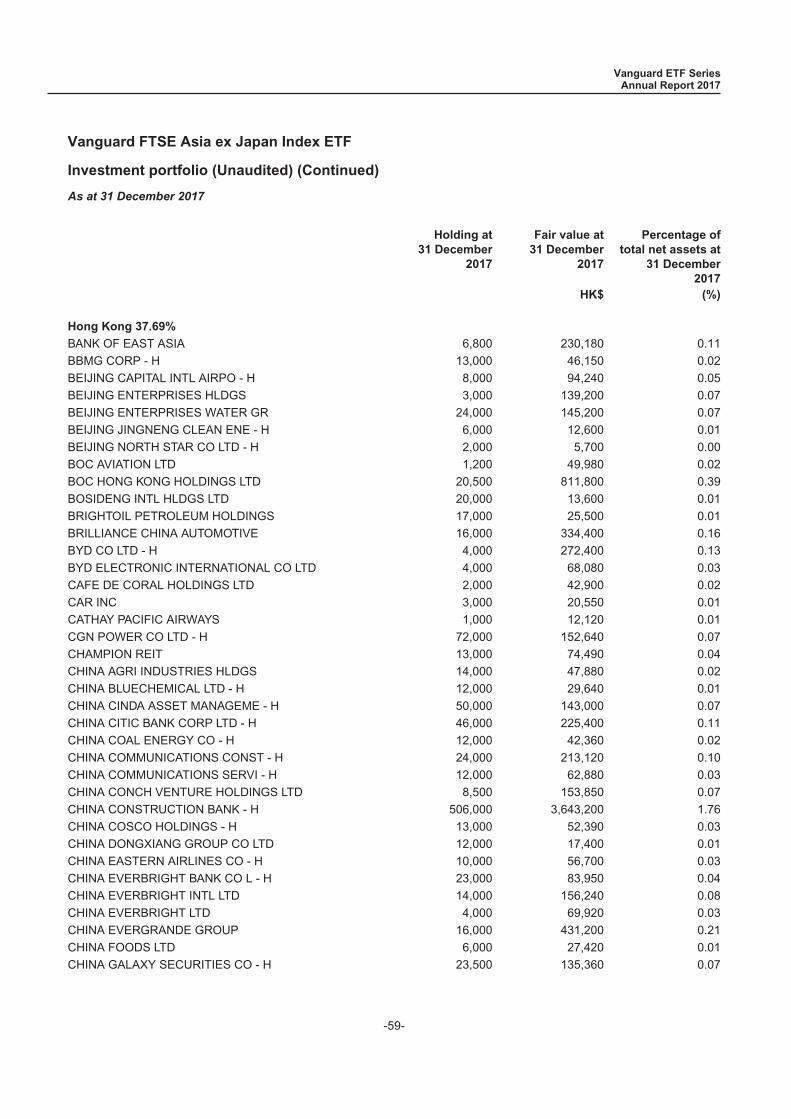
Investment portfolio (Unaudited) (Continued)
As at 31 December 2017
Holding at31 December
2017
Fair value at31 December
2017
Percentage oftotal net assets at
31 December2017
HK$ (%)
Hong Kong 37.69%
BANK OF EAST ASIA 6,800 230,180 0.11
BBMG CORP - H 13,000 46,150 0.02
BEIJING CAPITAL INTL AIRPO - H 8,000 94,240 0.05
BEIJING ENTERPRISES HLDGS 3,000 139,200 0.07
BEIJING ENTERPRISES WATER GR 24,000 145,200 0.07
BEIJING JINGNENG CLEAN ENE - H 6,000 12,600 0.01
BEIJING NORTH STAR CO LTD - H 2,000 5,700 0.00
BOC AVIATION LTD 1,200 49,980 0.02
BOC HONG KONG HOLDINGS LTD 20,500 811,800 0.39
BOSIDENG INTL HLDGS LTD 20,000 13,600 0.01
BRIGHTOIL PETROLEUM HOLDINGS 17,000 25,500 0.01
BRILLIANCE CHINA AUTOMOTIVE 16,000 334,400 0.16
BYD CO LTD - H 4,000 272,400 0.13
BYD ELECTRONIC INTERNATIONAL CO LTD 4,000 68,080 0.03
CAFE DE CORAL HOLDINGS LTD 2,000 42,900 0.02
CAR INC 3,000 20,550 0.01
CATHAY PACIFIC AIRWAYS 1,000 12,120 0.01
CGN POWER CO LTD - H 72,000 152,640 0.07
CHAMPION REIT 13,000 74,490 0.04
CHINA AGRI INDUSTRIES HLDGS 14,000 47,880 0.02
CHINA BLUECHEMICAL LTD - H 12,000 29,640 0.01
CHINA CINDA ASSET MANAGEME - H 50,000 143,000 0.07
CHINA CITIC BANK CORP LTD - H 46,000 225,400 0.11
CHINA COAL ENERGY CO - H 12,000 42,360 0.02
CHINA COMMUNICATIONS CONST - H 24,000 213,120 0.10
CHINA COMMUNICATIONS SERVI - H 12,000 62,880 0.03
CHINA CONCH VENTURE HOLDINGS LTD 8,500 153,850 0.07
CHINA CONSTRUCTION BANK - H 506,000 3,643,200 1.76
CHINA COSCO HOLDINGS - H 13,000 52,390 0.03
CHINA DONGXIANG GROUP CO LTD 12,000 17,400 0.01
CHINA EASTERN AIRLINES CO - H 10,000 56,700 0.03
CHINA EVERBRIGHT BANK CO L - H 23,000 83,950 0.04
CHINA EVERBRIGHT INTL LTD 14,000 156,240 0.08
CHINA EVERBRIGHT LTD 4,000 69,920 0.03
CHINA EVERGRANDE GROUP 16,000 431,200 0.21
CHINA FOODS LTD 6,000 27,420 0.01
CHINA GALAXY SECURITIES CO - H 23,500 135,360 0.07
Vanguard ETF SeriesAnnual Report 2017
Vanguard FTSE Asia ex Japan Index ETF
-59-
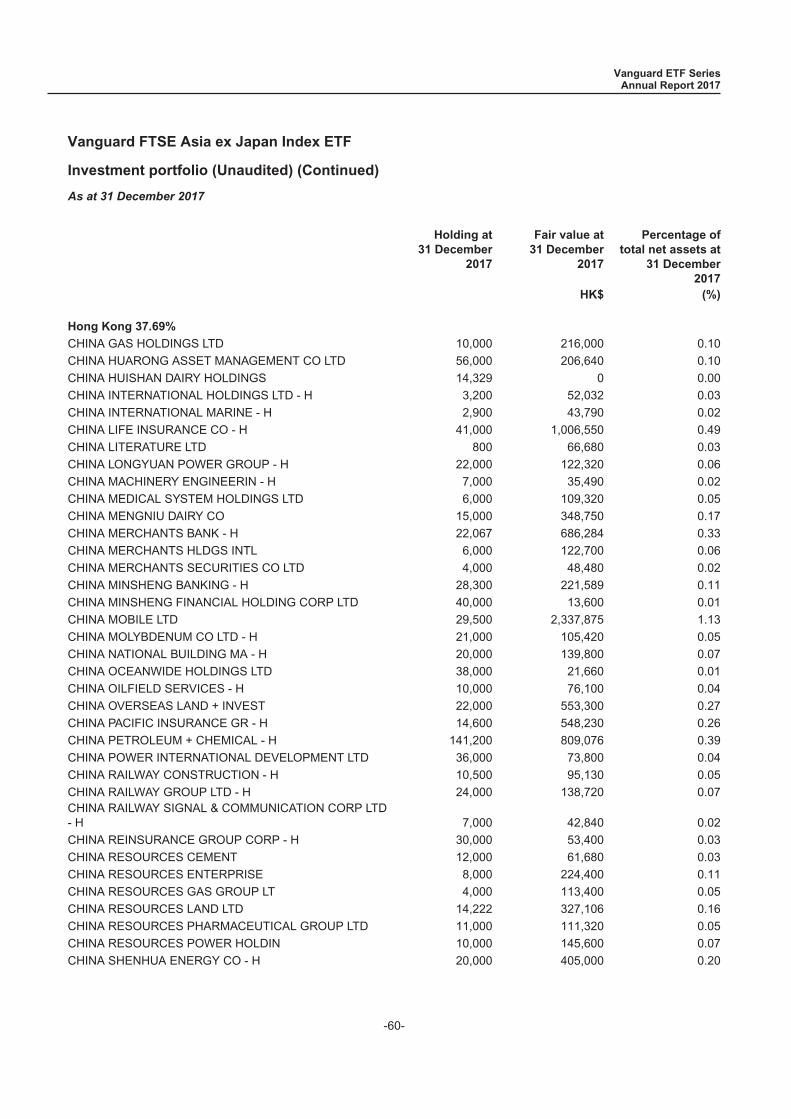
Investment portfolio (Unaudited) (Continued)
As at 31 December 2017
Holding at31 December
2017
Fair value at31 December
2017
Percentage oftotal net assets at
31 December2017
HK$ (%)
Hong Kong 37.69%
CHINA GAS HOLDINGS LTD 10,000 216,000 0.10
CHINA HUARONG ASSET MANAGEMENT CO LTD 56,000 206,640 0.10
CHINA HUISHAN DAIRY HOLDINGS 14,329 0 0.00
CHINA INTERNATIONAL HOLDINGS LTD - H 3,200 52,032 0.03
CHINA INTERNATIONAL MARINE - H 2,900 43,790 0.02
CHINA LIFE INSURANCE CO - H 41,000 1,006,550 0.49
CHINA LITERATURE LTD 800 66,680 0.03
CHINA LONGYUAN POWER GROUP - H 22,000 122,320 0.06
CHINA MACHINERY ENGINEERIN - H 7,000 35,490 0.02
CHINA MEDICAL SYSTEM HOLDINGS LTD 6,000 109,320 0.05
CHINA MENGNIU DAIRY CO 15,000 348,750 0.17
CHINA MERCHANTS BANK - H 22,067 686,284 0.33
CHINA MERCHANTS HLDGS INTL 6,000 122,700 0.06
CHINA MERCHANTS SECURITIES CO LTD 4,000 48,480 0.02
CHINA MINSHENG BANKING - H 28,300 221,589 0.11
CHINA MINSHENG FINANCIAL HOLDING CORP LTD 40,000 13,600 0.01
CHINA MOBILE LTD 29,500 2,337,875 1.13
CHINA MOLYBDENUM CO LTD - H 21,000 105,420 0.05
CHINA NATIONAL BUILDING MA - H 20,000 139,800 0.07
CHINA OCEANWIDE HOLDINGS LTD 38,000 21,660 0.01
CHINA OILFIELD SERVICES - H 10,000 76,100 0.04
CHINA OVERSEAS LAND + INVEST 22,000 553,300 0.27
CHINA PACIFIC INSURANCE GR - H 14,600 548,230 0.26
CHINA PETROLEUM + CHEMICAL - H 141,200 809,076 0.39
CHINA POWER INTERNATIONAL DEVELOPMENT LTD 36,000 73,800 0.04
CHINA RAILWAY CONSTRUCTION - H 10,500 95,130 0.05
CHINA RAILWAY GROUP LTD - H 24,000 138,720 0.07CHINA RAILWAY SIGNAL & COMMUNICATION CORP LTD- H 7,000 42,840 0.02
CHINA REINSURANCE GROUP CORP - H 30,000 53,400 0.03
CHINA RESOURCES CEMENT 12,000 61,680 0.03
CHINA RESOURCES ENTERPRISE 8,000 224,400 0.11
CHINA RESOURCES GAS GROUP LT 4,000 113,400 0.05
CHINA RESOURCES LAND LTD 14,222 327,106 0.16
CHINA RESOURCES PHARMACEUTICAL GROUP LTD 11,000 111,320 0.05
CHINA RESOURCES POWER HOLDIN 10,000 145,600 0.07
CHINA SHENHUA ENERGY CO - H 20,000 405,000 0.20
Vanguard ETF SeriesAnnual Report 2017
Vanguard FTSE Asia ex Japan Index ETF
-60-
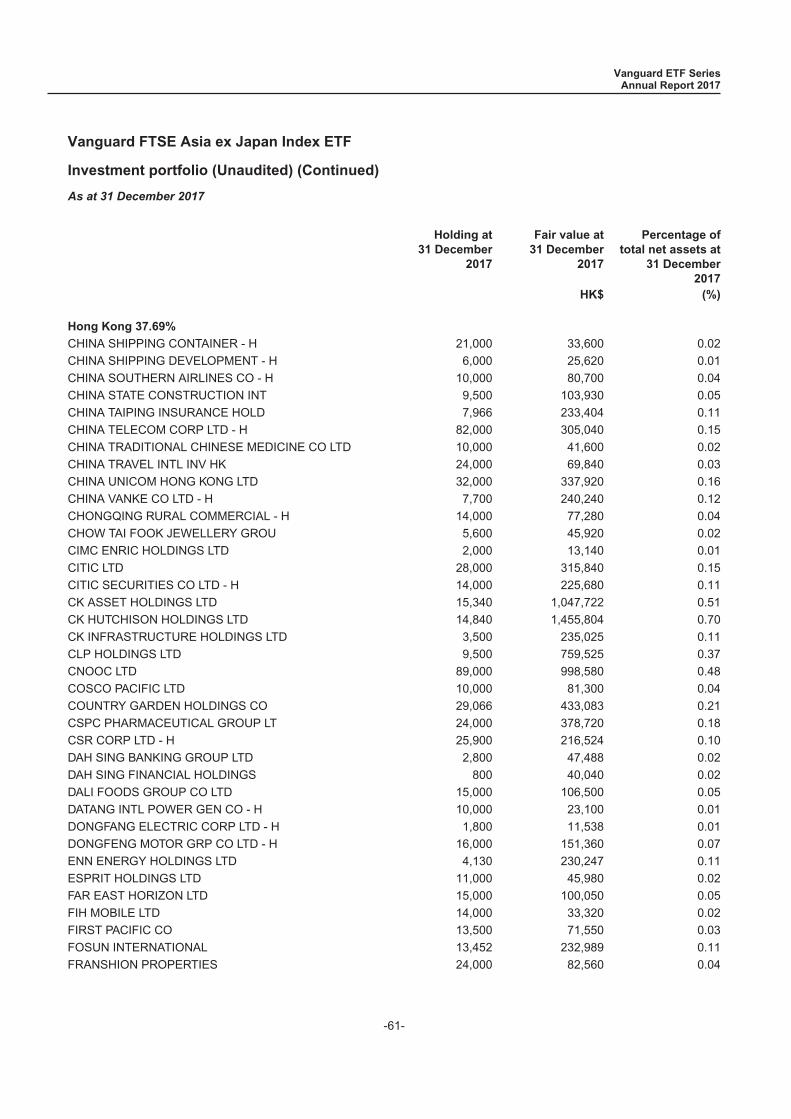
Investment portfolio (Unaudited) (Continued)
As at 31 December 2017
Holding at31 December
2017
Fair value at31 December
2017
Percentage oftotal net assets at
31 December2017
HK$ (%)
Hong Kong 37.69%
CHINA SHIPPING CONTAINER - H 21,000 33,600 0.02
CHINA SHIPPING DEVELOPMENT - H 6,000 25,620 0.01
CHINA SOUTHERN AIRLINES CO - H 10,000 80,700 0.04
CHINA STATE CONSTRUCTION INT 9,500 103,930 0.05
CHINA TAIPING INSURANCE HOLD 7,966 233,404 0.11
CHINA TELECOM CORP LTD - H 82,000 305,040 0.15
CHINA TRADITIONAL CHINESE MEDICINE CO LTD 10,000 41,600 0.02
CHINA TRAVEL INTL INV HK 24,000 69,840 0.03
CHINA UNICOM HONG KONG LTD 32,000 337,920 0.16
CHINA VANKE CO LTD - H 7,700 240,240 0.12
CHONGQING RURAL COMMERCIAL - H 14,000 77,280 0.04
CHOW TAI FOOK JEWELLERY GROU 5,600 45,920 0.02
CIMC ENRIC HOLDINGS LTD 2,000 13,140 0.01
CITIC LTD 28,000 315,840 0.15
CITIC SECURITIES CO LTD - H 14,000 225,680 0.11
CK ASSET HOLDINGS LTD 15,340 1,047,722 0.51
CK HUTCHISON HOLDINGS LTD 14,840 1,455,804 0.70
CK INFRASTRUCTURE HOLDINGS LTD 3,500 235,025 0.11
CLP HOLDINGS LTD 9,500 759,525 0.37
CNOOC LTD 89,000 998,580 0.48
COSCO PACIFIC LTD 10,000 81,300 0.04
COUNTRY GARDEN HOLDINGS CO 29,066 433,083 0.21
CSPC PHARMACEUTICAL GROUP LT 24,000 378,720 0.18
CSR CORP LTD - H 25,900 216,524 0.10
DAH SING BANKING GROUP LTD 2,800 47,488 0.02
DAH SING FINANCIAL HOLDINGS 800 40,040 0.02
DALI FOODS GROUP CO LTD 15,000 106,500 0.05
DATANG INTL POWER GEN CO - H 10,000 23,100 0.01
DONGFANG ELECTRIC CORP LTD - H 1,800 11,538 0.01
DONGFENG MOTOR GRP CO LTD - H 16,000 151,360 0.07
ENN ENERGY HOLDINGS LTD 4,130 230,247 0.11
ESPRIT HOLDINGS LTD 11,000 45,980 0.02
FAR EAST HORIZON LTD 15,000 100,050 0.05
FIH MOBILE LTD 14,000 33,320 0.02
FIRST PACIFIC CO 13,500 71,550 0.03
FOSUN INTERNATIONAL 13,452 232,989 0.11
FRANSHION PROPERTIES 24,000 82,560 0.04
Vanguard ETF SeriesAnnual Report 2017
Vanguard FTSE Asia ex Japan Index ETF
-61-
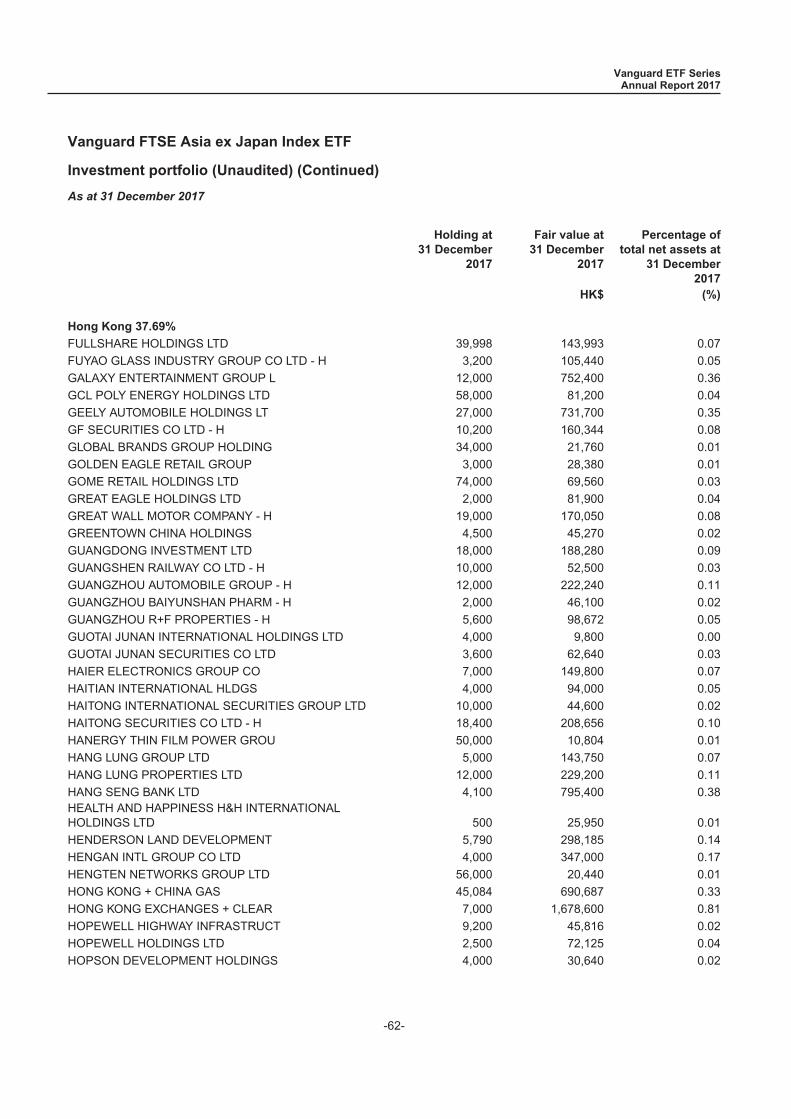
Investment portfolio (Unaudited) (Continued)
As at 31 December 2017
Holding at31 December
2017
Fair value at31 December
2017
Percentage oftotal net assets at
31 December2017
HK$ (%)
Hong Kong 37.69%
FULLSHARE HOLDINGS LTD 39,998 143,993 0.07
FUYAO GLASS INDUSTRY GROUP CO LTD - H 3,200 105,440 0.05
GALAXY ENTERTAINMENT GROUP L 12,000 752,400 0.36
GCL POLY ENERGY HOLDINGS LTD 58,000 81,200 0.04
GEELY AUTOMOBILE HOLDINGS LT 27,000 731,700 0.35
GF SECURITIES CO LTD - H 10,200 160,344 0.08
GLOBAL BRANDS GROUP HOLDING 34,000 21,760 0.01
GOLDEN EAGLE RETAIL GROUP 3,000 28,380 0.01
GOME RETAIL HOLDINGS LTD 74,000 69,560 0.03
GREAT EAGLE HOLDINGS LTD 2,000 81,900 0.04
GREAT WALL MOTOR COMPANY - H 19,000 170,050 0.08
GREENTOWN CHINA HOLDINGS 4,500 45,270 0.02
GUANGDONG INVESTMENT LTD 18,000 188,280 0.09
GUANGSHEN RAILWAY CO LTD - H 10,000 52,500 0.03
GUANGZHOU AUTOMOBILE GROUP - H 12,000 222,240 0.11
GUANGZHOU BAIYUNSHAN PHARM - H 2,000 46,100 0.02
GUANGZHOU R+F PROPERTIES - H 5,600 98,672 0.05
GUOTAI JUNAN INTERNATIONAL HOLDINGS LTD 4,000 9,800 0.00
GUOTAI JUNAN SECURITIES CO LTD 3,600 62,640 0.03
HAIER ELECTRONICS GROUP CO 7,000 149,800 0.07
HAITIAN INTERNATIONAL HLDGS 4,000 94,000 0.05
HAITONG INTERNATIONAL SECURITIES GROUP LTD 10,000 44,600 0.02
HAITONG SECURITIES CO LTD - H 18,400 208,656 0.10
HANERGY THIN FILM POWER GROU 50,000 10,804 0.01
HANG LUNG GROUP LTD 5,000 143,750 0.07
HANG LUNG PROPERTIES LTD 12,000 229,200 0.11
HANG SENG BANK LTD 4,100 795,400 0.38HEALTH AND HAPPINESS H&H INTERNATIONALHOLDINGS LTD 500 25,950 0.01
HENDERSON LAND DEVELOPMENT 5,790 298,185 0.14
HENGAN INTL GROUP CO LTD 4,000 347,000 0.17
HENGTEN NETWORKS GROUP LTD 56,000 20,440 0.01
HONG KONG + CHINA GAS 45,084 690,687 0.33
HONG KONG EXCHANGES + CLEAR 7,000 1,678,600 0.81
HOPEWELL HIGHWAY INFRASTRUCT 9,200 45,816 0.02
HOPEWELL HOLDINGS LTD 2,500 72,125 0.04
HOPSON DEVELOPMENT HOLDINGS 4,000 30,640 0.02
Vanguard ETF SeriesAnnual Report 2017
Vanguard FTSE Asia ex Japan Index ETF
-62-
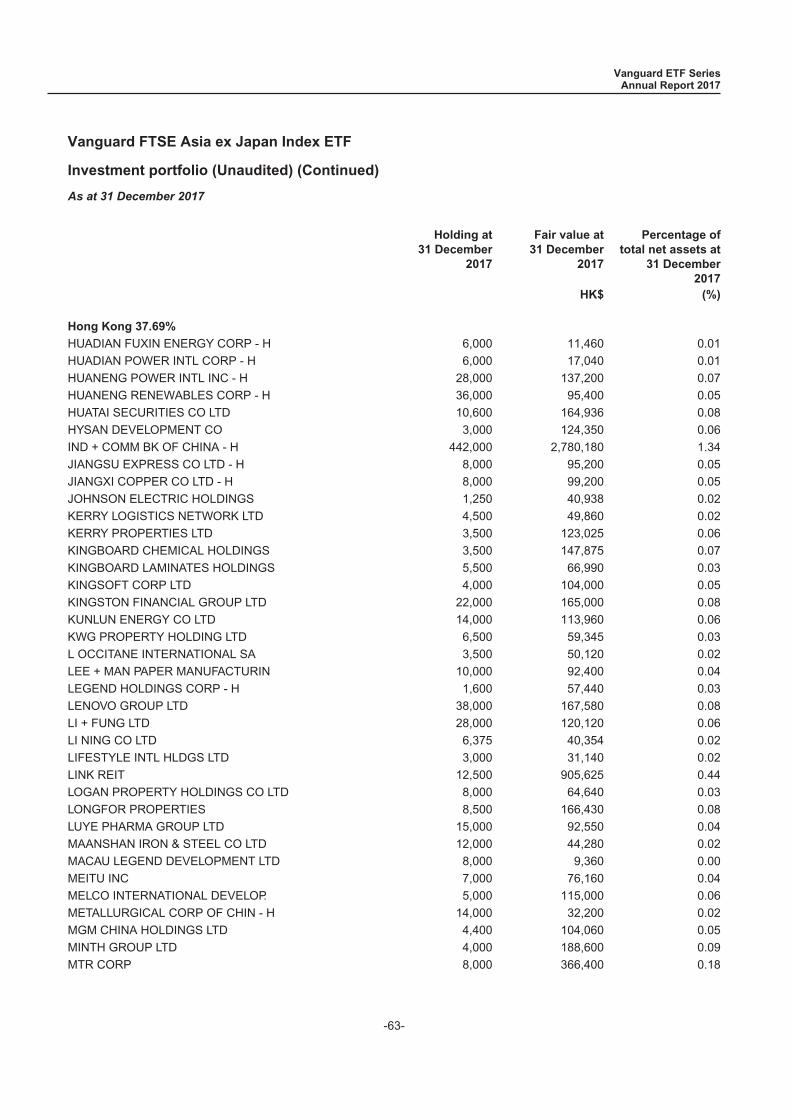
Investment portfolio (Unaudited) (Continued)
As at 31 December 2017
Holding at31 December
2017
Fair value at31 December
2017
Percentage oftotal net assets at
31 December2017
HK$ (%)
Hong Kong 37.69%
HUADIAN FUXIN ENERGY CORP - H 6,000 11,460 0.01
HUADIAN POWER INTL CORP - H 6,000 17,040 0.01
HUANENG POWER INTL INC - H 28,000 137,200 0.07
HUANENG RENEWABLES CORP - H 36,000 95,400 0.05
HUATAI SECURITIES CO LTD 10,600 164,936 0.08
HYSAN DEVELOPMENT CO 3,000 124,350 0.06
IND + COMM BK OF CHINA - H 442,000 2,780,180 1.34
JIANGSU EXPRESS CO LTD - H 8,000 95,200 0.05
JIANGXI COPPER CO LTD - H 8,000 99,200 0.05
JOHNSON ELECTRIC HOLDINGS 1,250 40,938 0.02
KERRY LOGISTICS NETWORK LTD 4,500 49,860 0.02
KERRY PROPERTIES LTD 3,500 123,025 0.06
KINGBOARD CHEMICAL HOLDINGS 3,500 147,875 0.07
KINGBOARD LAMINATES HOLDINGS 5,500 66,990 0.03
KINGSOFT CORP LTD 4,000 104,000 0.05
KINGSTON FINANCIAL GROUP LTD 22,000 165,000 0.08
KUNLUN ENERGY CO LTD 14,000 113,960 0.06
KWG PROPERTY HOLDING LTD 6,500 59,345 0.03
L OCCITANE INTERNATIONAL SA 3,500 50,120 0.02
LEE + MAN PAPER MANUFACTURIN 10,000 92,400 0.04
LEGEND HOLDINGS CORP - H 1,600 57,440 0.03
LENOVO GROUP LTD 38,000 167,580 0.08
LI + FUNG LTD 28,000 120,120 0.06
LI NING CO LTD 6,375 40,354 0.02
LIFESTYLE INTL HLDGS LTD 3,000 31,140 0.02
LINK REIT 12,500 905,625 0.44
LOGAN PROPERTY HOLDINGS CO LTD 8,000 64,640 0.03
LONGFOR PROPERTIES 8,500 166,430 0.08
LUYE PHARMA GROUP LTD 15,000 92,550 0.04
MAANSHAN IRON & STEEL CO LTD 12,000 44,280 0.02
MACAU LEGEND DEVELOPMENT LTD 8,000 9,360 0.00
MEITU INC 7,000 76,160 0.04
MELCO INTERNATIONAL DEVELOP. 5,000 115,000 0.06
METALLURGICAL CORP OF CHIN - H 14,000 32,200 0.02
MGM CHINA HOLDINGS LTD 4,400 104,060 0.05
MINTH GROUP LTD 4,000 188,600 0.09
MTR CORP 8,000 366,400 0.18
Vanguard ETF SeriesAnnual Report 2017
Vanguard FTSE Asia ex Japan Index ETF
-63-
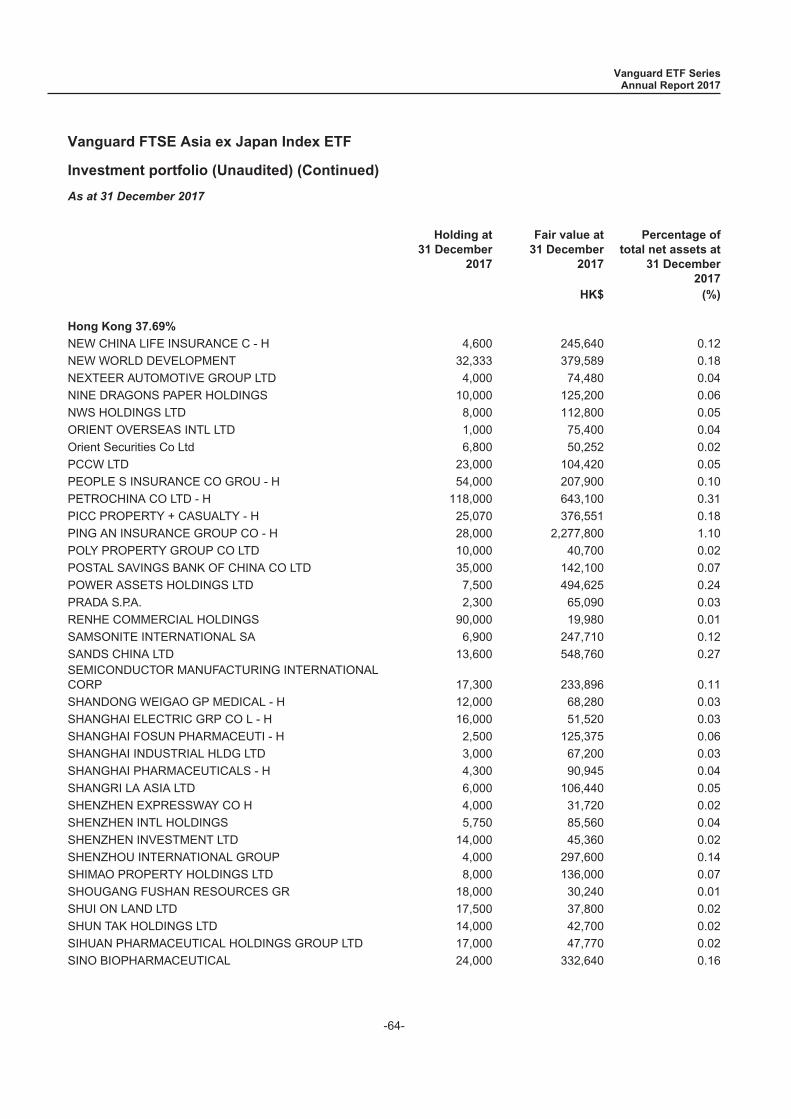
Investment portfolio (Unaudited) (Continued)
As at 31 December 2017
Holding at31 December
2017
Fair value at31 December
2017
Percentage oftotal net assets at
31 December2017
HK$ (%)
Hong Kong 37.69%
NEW CHINA LIFE INSURANCE C - H 4,600 245,640 0.12
NEW WORLD DEVELOPMENT 32,333 379,589 0.18
NEXTEER AUTOMOTIVE GROUP LTD 4,000 74,480 0.04
NINE DRAGONS PAPER HOLDINGS 10,000 125,200 0.06
NWS HOLDINGS LTD 8,000 112,800 0.05
ORIENT OVERSEAS INTL LTD 1,000 75,400 0.04
Orient Securities Co Ltd 6,800 50,252 0.02
PCCW LTD 23,000 104,420 0.05
PEOPLE S INSURANCE CO GROU - H 54,000 207,900 0.10
PETROCHINA CO LTD - H 118,000 643,100 0.31
PICC PROPERTY + CASUALTY - H 25,070 376,551 0.18
PING AN INSURANCE GROUP CO - H 28,000 2,277,800 1.10
POLY PROPERTY GROUP CO LTD 10,000 40,700 0.02
POSTAL SAVINGS BANK OF CHINA CO LTD 35,000 142,100 0.07
POWER ASSETS HOLDINGS LTD 7,500 494,625 0.24
PRADA S.P.A. 2,300 65,090 0.03
RENHE COMMERCIAL HOLDINGS 90,000 19,980 0.01
SAMSONITE INTERNATIONAL SA 6,900 247,710 0.12
SANDS CHINA LTD 13,600 548,760 0.27SEMICONDUCTOR MANUFACTURING INTERNATIONALCORP 17,300 233,896 0.11
SHANDONG WEIGAO GP MEDICAL - H 12,000 68,280 0.03
SHANGHAI ELECTRIC GRP CO L - H 16,000 51,520 0.03
SHANGHAI FOSUN PHARMACEUTI - H 2,500 125,375 0.06
SHANGHAI INDUSTRIAL HLDG LTD 3,000 67,200 0.03
SHANGHAI PHARMACEUTICALS - H 4,300 90,945 0.04
SHANGRI LA ASIA LTD 6,000 106,440 0.05
SHENZHEN EXPRESSWAY CO H 4,000 31,720 0.02
SHENZHEN INTL HOLDINGS 5,750 85,560 0.04
SHENZHEN INVESTMENT LTD 14,000 45,360 0.02
SHENZHOU INTERNATIONAL GROUP 4,000 297,600 0.14
SHIMAO PROPERTY HOLDINGS LTD 8,000 136,000 0.07
SHOUGANG FUSHAN RESOURCES GR 18,000 30,240 0.01
SHUI ON LAND LTD 17,500 37,800 0.02
SHUN TAK HOLDINGS LTD 14,000 42,700 0.02
SIHUAN PHARMACEUTICAL HOLDINGS GROUP LTD 17,000 47,770 0.02
SINO BIOPHARMACEUTICAL 24,000 332,640 0.16
Vanguard ETF SeriesAnnual Report 2017
Vanguard FTSE Asia ex Japan Index ETF
-64-

Investment portfolio (Unaudited) (Continued)
As at 31 December 2017
Holding at31 December
2017
Fair value at31 December
2017
Percentage oftotal net assets at
31 December2017
HK$ (%)
Hong Kong 37.69%
SINO LAND CO 16,000 221,440 0.11
SINO OCEAN LAND HOLDINGS 18,000 97,020 0.05
SINOFERT HOLDINGS LTD 14,000 18,200 0.01
SINOPEC ENGINEERING GROUP - H 10,500 77,700 0.04
SINOPEC SHANGHAI PETROCHEM - H 24,000 106,800 0.05
SINOPHARM GROUP CO - H 6,000 202,800 0.10
SINOTRANS LIMITED - H 7,000 26,810 0.01
SJM HOLDINGS LTD 12,000 84,000 0.04
SOHO CHINA LTD 11,000 50,270 0.02
SUN ART RETAIL GROUP LTD 13,000 107,380 0.05
SUN HUNG KAI PROPERTIES 7,932 1,034,333 0.50
SUNAC CHINA HOLDINGS LTD 12,000 388,200 0.19
SUNNY OPTICAL TECHNOLOGY GROUP CO LTD 3,690 368,631 0.18
SWIRE PACIFIC LTD 2,500 30,400 0.01
SWIRE PACIFIC LTD A 3,000 217,050 0.11
SWIRE PROPERTIES LTD 6,600 166,320 0.08
TECHTRONIC INDUSTRIES CO LTD 7,000 356,650 0.17
TELEVISION BROADCASTS LTD 2,200 61,820 0.03
TENCENT HOLDINGS LTD 29,900 12,139,400 5.86
TEXWINCA HOLDINGS LTD 4,000 17,200 0.01
TINGYI (CAYMAN ISLN) HLDG CO 12,000 182,400 0.09
TOWNGAS CHINA CO LTD 4,000 25,120 0.01
TRAVELSKY TECHNOLOGY LTD - H 6,000 140,700 0.07
TSINGTAO BREWERY CO LTD - H 2,000 80,600 0.04
UNI PRESIDENT CHINA HOLDINGS 7,800 51,012 0.02
UNITED CO RUSAL PLC 10,000 54,800 0.03
VTECH HOLDINGS LTD 900 92,160 0.04
WANT WANT CHINA HOLDINGS LTD 32,000 209,600 0.10
WEICHAI POWER CO LTD - H 12,000 102,720 0.05
WH GROUP LTD 48,000 423,360 0.20
WHARF HOLDINGS LTD 7,000 189,000 0.09
WHARF REAL ESTATE INVESTMENT CO LTD 7,000 364,000 0.18
WHEELOCK + CO LTD 4,000 223,200 0.11
WUXI BIOLOGICS CAYMAN INC 1,500 65,550 0.03
WYNN MACAU LTD 8,800 217,800 0.11XINJIANG GOLDWIND SCIENCE & TECHNOLOGY COLTD 2,180 28,950 0.01
Vanguard ETF SeriesAnnual Report 2017
Vanguard FTSE Asia ex Japan Index ETF
-65-
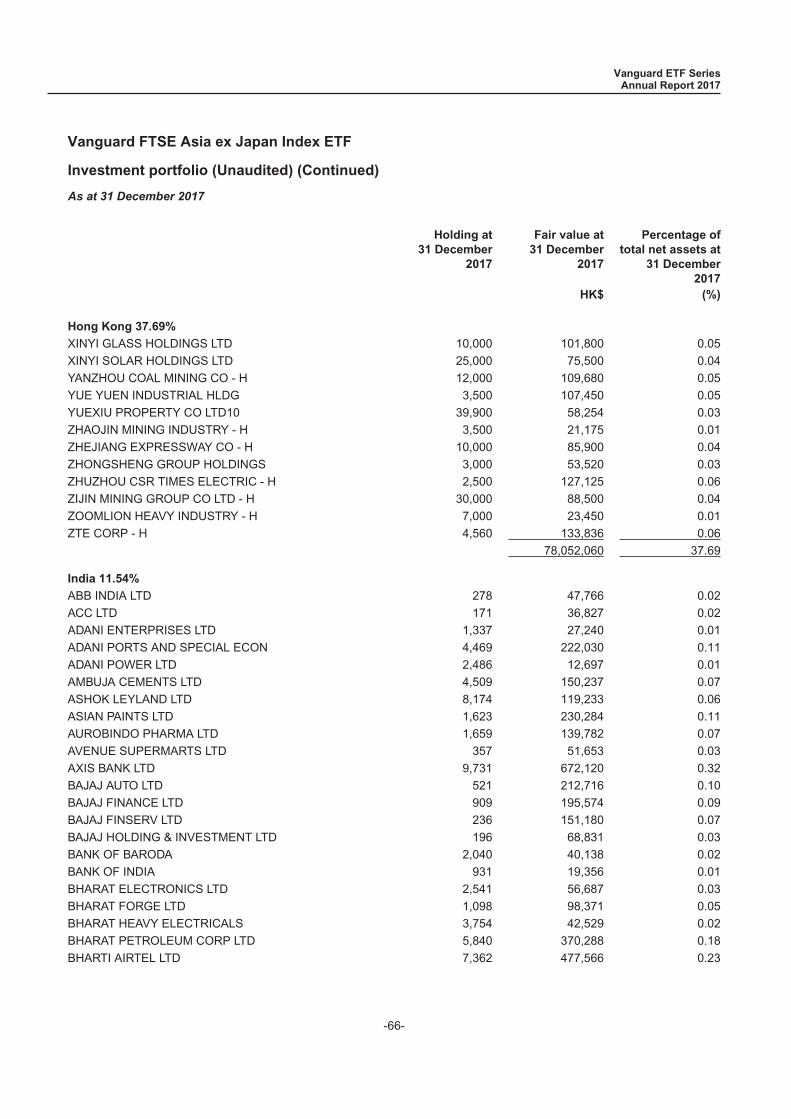
Investment portfolio (Unaudited) (Continued)
As at 31 December 2017
Holding at31 December
2017
Fair value at31 December
2017
Percentage oftotal net assets at
31 December2017
HK$ (%)
Hong Kong 37.69%
XINYI GLASS HOLDINGS LTD 10,000 101,800 0.05
XINYI SOLAR HOLDINGS LTD 25,000 75,500 0.04
YANZHOU COAL MINING CO - H 12,000 109,680 0.05
YUE YUEN INDUSTRIAL HLDG 3,500 107,450 0.05
YUEXIU PROPERTY CO LTD10 39,900 58,254 0.03
ZHAOJIN MINING INDUSTRY - H 3,500 21,175 0.01
ZHEJIANG EXPRESSWAY CO - H 10,000 85,900 0.04
ZHONGSHENG GROUP HOLDINGS 3,000 53,520 0.03
ZHUZHOU CSR TIMES ELECTRIC - H 2,500 127,125 0.06
ZIJIN MINING GROUP CO LTD - H 30,000 88,500 0.04
ZOOMLION HEAVY INDUSTRY - H 7,000 23,450 0.01
ZTE CORP - H 4,560 133,836 0.06
78,052,060 37.69
India 11.54%
ABB INDIA LTD 278 47,766 0.02
ACC LTD 171 36,827 0.02
ADANI ENTERPRISES LTD 1,337 27,240 0.01
ADANI PORTS AND SPECIAL ECON 4,469 222,030 0.11
ADANI POWER LTD 2,486 12,697 0.01
AMBUJA CEMENTS LTD 4,509 150,237 0.07
ASHOK LEYLAND LTD 8,174 119,233 0.06
ASIAN PAINTS LTD 1,623 230,284 0.11
AUROBINDO PHARMA LTD 1,659 139,782 0.07
AVENUE SUPERMARTS LTD 357 51,653 0.03
AXIS BANK LTD 9,731 672,120 0.32
BAJAJ AUTO LTD 521 212,716 0.10
BAJAJ FINANCE LTD 909 195,574 0.09
BAJAJ FINSERV LTD 236 151,180 0.07
BAJAJ HOLDING & INVESTMENT LTD 196 68,831 0.03
BANK OF BARODA 2,040 40,138 0.02
BANK OF INDIA 931 19,356 0.01
BHARAT ELECTRONICS LTD 2,541 56,687 0.03
BHARAT FORGE LTD 1,098 98,371 0.05
BHARAT HEAVY ELECTRICALS 3,754 42,529 0.02
BHARAT PETROLEUM CORP LTD 5,840 370,288 0.18
BHARTI AIRTEL LTD 7,362 477,566 0.23
Vanguard ETF SeriesAnnual Report 2017
Vanguard FTSE Asia ex Japan Index ETF
-66-

Investment portfolio (Unaudited) (Continued)
As at 31 December 2017
Holding at31 December
2017
Fair value at31 December
2017
Percentage oftotal net assets at
31 December2017
HK$ (%)
India 11.54%
BHARTI INFRATEL LTD 4,799 222,614 0.11
BOSCH LTD 38 93,852 0.05
BRITANNIA INDUSTRIES LTD 196 113,046 0.05
CADILA HEALTHCARE LTD 1,130 59,995 0.03
CANARA BANK 763 33,679 0.02
CASTROL INDIA LTD 1,017 24,064 0.01
CASTROL INDIA LTD 1,017 24,064 0.01
CIPLA LTD 2,109 157,176 0.08
COAL INDIA LTD 7,401 238,349 0.12
COLGATE-PALMOLIVE INDIA LTD 233 31,390 0.02
CONTAINER CORP OF INDIA LTD 590 99,672 0.05
CROMPTON GREAVES LTD 1,632 18,549 0.01
CUMMINS INDIA LTD 317 35,016 0.02
DABUR INDIA LTD 2,565 109,858 0.05
DIVI S LABORATORIES LTD 312 41,970 0.02
DLF LTD 3,168 100,628 0.05
DR. REDDY S LABORATORIES 406 120,046 0.06
EICHER MOTORS LTD 77 286,133 0.14
EMAMI LTD 274 44,639 0.02
EXIDE INDUSTRIES LTD 1,801 49,266 0.02
GAIL INDIA LTD 2,053 125,633 0.06
GLAXOSMITHKLINE CONSUMER HEA 51 40,838 0.02
GLENMARK PHARMACEUTICALS LTD 639 46,546 0.02
GMR INFRASTRUCTURE LTD 12,216 33,589 0.02
GODREJ CONSUMER PRODUCTS LTD 1,428 174,799 0.08
GODREJ INDUSTRIES LTD 639 47,462 0.02
GRASIM INDUSTRIES LTD 1,859 265,420 0.13
HAVELLS INDIA LTD 1,107 76,257 0.04
HCL TECHNOLOGIES LTD 3,016 328,938 0.16
HERO MOTOCORP LTD 564 261,464 0.13
HINDALCO INDUSTRIES LTD 4,716 158,001 0.08
HINDUSTAN PETROLEUM CORP 3,738 191,641 0.09
HINDUSTAN UNILEVER LTD 3,998 669,777 0.32
HINDUSTAN ZINC LTD 1,460 55,227 0.03
HOUSING DEVELOPMENT FINANCE 8,986 1,882,405 0.91
ICICI BANK LTD 4,925 189,402 0.09
ICICI PRUDENTIAL LIFE INSURANCE CO LTD/INDIA 1,118 52,525 0.03
Vanguard ETF SeriesAnnual Report 2017
Vanguard FTSE Asia ex Japan Index ETF
-67-
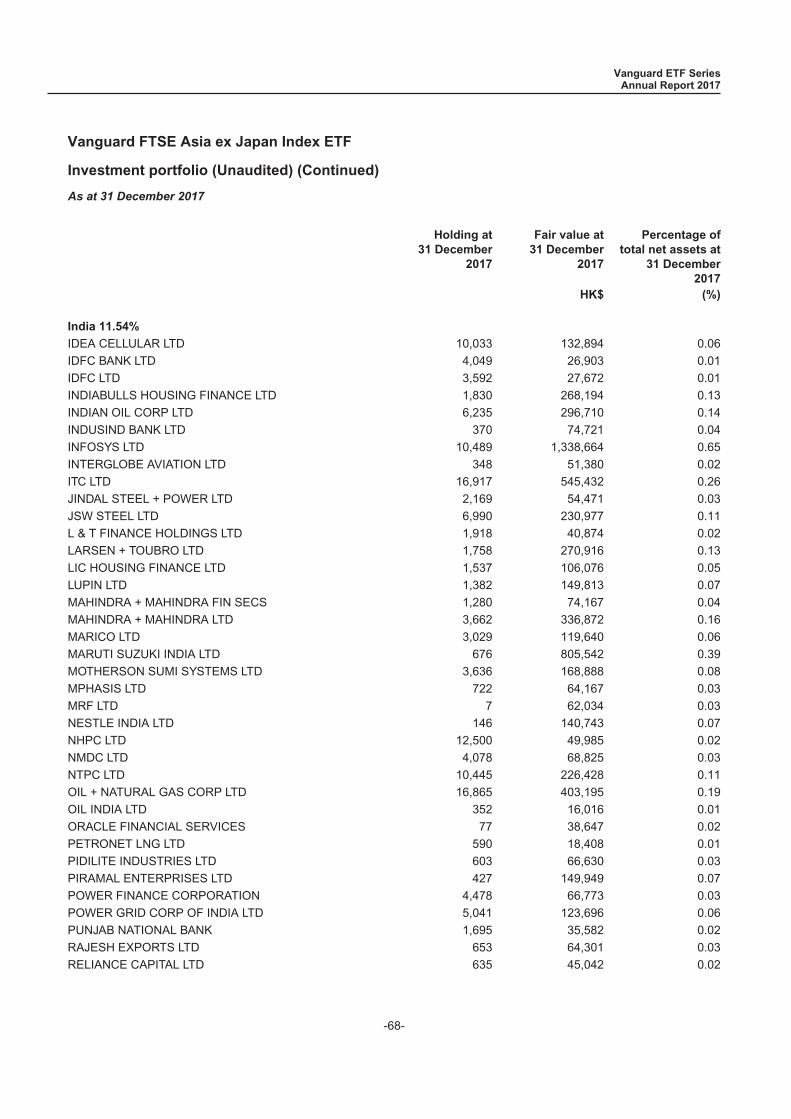
Investment portfolio (Unaudited) (Continued)
As at 31 December 2017
Holding at31 December
2017
Fair value at31 December
2017
Percentage oftotal net assets at
31 December2017
HK$ (%)
India 11.54%
IDEA CELLULAR LTD 10,033 132,894 0.06
IDFC BANK LTD 4,049 26,903 0.01
IDFC LTD 3,592 27,672 0.01
INDIABULLS HOUSING FINANCE LTD 1,830 268,194 0.13
INDIAN OIL CORP LTD 6,235 296,710 0.14
INDUSIND BANK LTD 370 74,721 0.04
INFOSYS LTD 10,489 1,338,664 0.65
INTERGLOBE AVIATION LTD 348 51,380 0.02
ITC LTD 16,917 545,432 0.26
JINDAL STEEL + POWER LTD 2,169 54,471 0.03
JSW STEEL LTD 6,990 230,977 0.11
L & T FINANCE HOLDINGS LTD 1,918 40,874 0.02
LARSEN + TOUBRO LTD 1,758 270,916 0.13
LIC HOUSING FINANCE LTD 1,537 106,076 0.05
LUPIN LTD 1,382 149,813 0.07
MAHINDRA + MAHINDRA FIN SECS 1,280 74,167 0.04
MAHINDRA + MAHINDRA LTD 3,662 336,872 0.16
MARICO LTD 3,029 119,640 0.06
MARUTI SUZUKI INDIA LTD 676 805,542 0.39
MOTHERSON SUMI SYSTEMS LTD 3,636 168,888 0.08
MPHASIS LTD 722 64,167 0.03
MRF LTD 7 62,034 0.03
NESTLE INDIA LTD 146 140,743 0.07
NHPC LTD 12,500 49,985 0.02
NMDC LTD 4,078 68,825 0.03
NTPC LTD 10,445 226,428 0.11
OIL + NATURAL GAS CORP LTD 16,865 403,195 0.19
OIL INDIA LTD 352 16,016 0.01
ORACLE FINANCIAL SERVICES 77 38,647 0.02
PETRONET LNG LTD 590 18,408 0.01
PIDILITE INDUSTRIES LTD 603 66,630 0.03
PIRAMAL ENTERPRISES LTD 427 149,949 0.07
POWER FINANCE CORPORATION 4,478 66,773 0.03
POWER GRID CORP OF INDIA LTD 5,041 123,696 0.06
PUNJAB NATIONAL BANK 1,695 35,582 0.02
RAJESH EXPORTS LTD 653 64,301 0.03
RELIANCE CAPITAL LTD 635 45,042 0.02
Vanguard ETF SeriesAnnual Report 2017
Vanguard FTSE Asia ex Japan Index ETF
-68-
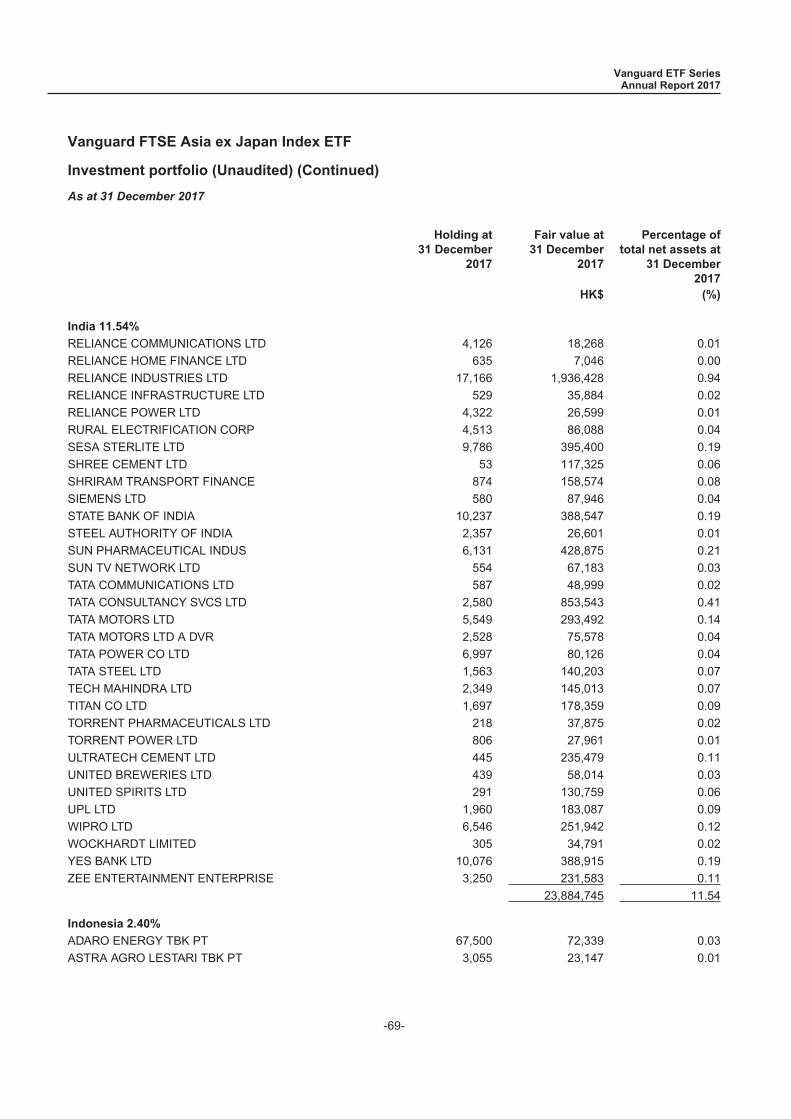
Investment portfolio (Unaudited) (Continued)
As at 31 December 2017
Holding at31 December
2017
Fair value at31 December
2017
Percentage oftotal net assets at
31 December2017
HK$ (%)
India 11.54%
RELIANCE COMMUNICATIONS LTD 4,126 18,268 0.01
RELIANCE HOME FINANCE LTD 635 7,046 0.00
RELIANCE INDUSTRIES LTD 17,166 1,936,428 0.94
RELIANCE INFRASTRUCTURE LTD 529 35,884 0.02
RELIANCE POWER LTD 4,322 26,599 0.01
RURAL ELECTRIFICATION CORP 4,513 86,088 0.04
SESA STERLITE LTD 9,786 395,400 0.19
SHREE CEMENT LTD 53 117,325 0.06
SHRIRAM TRANSPORT FINANCE 874 158,574 0.08
SIEMENS LTD 580 87,946 0.04
STATE BANK OF INDIA 10,237 388,547 0.19
STEEL AUTHORITY OF INDIA 2,357 26,601 0.01
SUN PHARMACEUTICAL INDUS 6,131 428,875 0.21
SUN TV NETWORK LTD 554 67,183 0.03
TATA COMMUNICATIONS LTD 587 48,999 0.02
TATA CONSULTANCY SVCS LTD 2,580 853,543 0.41
TATA MOTORS LTD 5,549 293,492 0.14
TATA MOTORS LTD A DVR 2,528 75,578 0.04
TATA POWER CO LTD 6,997 80,126 0.04
TATA STEEL LTD 1,563 140,203 0.07
TECH MAHINDRA LTD 2,349 145,013 0.07
TITAN CO LTD 1,697 178,359 0.09
TORRENT PHARMACEUTICALS LTD 218 37,875 0.02
TORRENT POWER LTD 806 27,961 0.01
ULTRATECH CEMENT LTD 445 235,479 0.11
UNITED BREWERIES LTD 439 58,014 0.03
UNITED SPIRITS LTD 291 130,759 0.06
UPL LTD 1,960 183,087 0.09
WIPRO LTD 6,546 251,942 0.12
WOCKHARDT LIMITED 305 34,791 0.02
YES BANK LTD 10,076 388,915 0.19
ZEE ENTERTAINMENT ENTERPRISE 3,250 231,583 0.11
23,884,745 11.54
Indonesia 2.40%
ADARO ENERGY TBK PT 67,500 72,339 0.03
ASTRA AGRO LESTARI TBK PT 3,055 23,147 0.01
Vanguard ETF SeriesAnnual Report 2017
Vanguard FTSE Asia ex Japan Index ETF
-69-

Investment portfolio (Unaudited) (Continued)
As at 31 December 2017
Holding at31 December
2017
Fair value at31 December
2017
Percentage oftotal net assets at
31 December2017
HK$ (%)
Indonesia 2.40%
ASTRA INTERNATIONAL TBK PT 110,600 528,920 0.25
BANK CENTRAL ASIA TBK PT 54,000 681,389 0.33
BANK DANAMON INDONESIA TBK 16,000 64,071 0.03
BANK MANDIRI PERSERO TBK PT 106,800 492,287 0.24
BANK NEGARA INDONESIA PERSER 46,500 265,244 0.13
BANK RAKYAT INDONESIA PERSER 286,800 601,503 0.29
BUKIT ASAM PERSERO TBK PT 50,800 72,004 0.03
BUMI SERPONG DAMAI TBK PT 33,300 32,617 0.02
CHAROEN POKPHAND INDONESI PT 32,700 56,523 0.03
GUDANG GARAM TBK PT 2,600 125,538 0.06
HANJAYA MANDALA SAMPOERNA TBK PT 43,000 117,189 0.06
INDOCEMENT TUNGGAL PRAKARSA 8,000 101,177 0.05
INDOFOOD CBP SUKSES MAKMUR T 10,000 51,280 0.02
INDOFOOD SUKSES MAKMUR TBK P 27,500 120,817 0.06
JASA MARGA (PERSERO) TBK PT 13,875 51,165 0.02
KALBE FARMA TBK PT 124,900 121,620 0.06
MATAHARI DEPARTMENT STORE TBK PT 11,100 63,956 0.03
MEDIA NUSANTARA CITRA TBK PT 20,500 15,178 0.01
PERUSAHAAN GAS NEGARA PERSER 53,700 54,146 0.03
SEMEN INDONESIA PERSERO TBK 17,400 99,252 0.05
SURYA CITRA MEDIA PT TBK 23,800 34,008 0.02
TELEKOMUNIKASI INDONESIA PER 266,500 681,769 0.33
TOWER BERSAMA INFRASTRUCTURE TBK PT 8,700 32,207 0.01
UNILEVER INDONESIA TBK PT 6,800 219,017 0.11
UNITED TRACTORS TBK PT 8,500 173,372 0.08
XL AXIATA TBK PT 11,300 19,272 0.01
4,971,007 2.40
Malaysia 3.10%
AIRASIA BHD 5,800 37,532 0.02
ALLIANCE BANK MALAYSIA BHD 9,200 72,506 0.03
AMMB HOLDINGS BHD 9,200 78,370 0.04
ASTRO MALAYSIA HOLDINGS BHD 7,600 38,903 0.02
AXIATA GROUP BERHAD 22,300 236,483 0.11
BRITISH AMERICAN TOBACCO BHD 1,000 77,265 0.04
BUMI ARMADA BHD 24,400 36,056 0.02
CIMB GROUP HOLDINGS BHD 37,700 476,258 0.23
Vanguard ETF SeriesAnnual Report 2017
Vanguard FTSE Asia ex Japan Index ETF
-70-

Investment portfolio (Unaudited) (Continued)
As at 31 December 2017
Holding at31 December
2017
Fair value at31 December
2017
Percentage oftotal net assets at
31 December2017
HK$ (%)
Malaysia 3.10%
DIGI.COM BHD 19,100 188,160 0.09
FELDA GLOBAL VENTURES 12,600 41,132 0.02
GAMUDA BHD 11,500 110,180 0.05
GENTING BHD 12,500 222,137 0.11
GENTING MALAYSIA BHD 17,000 184,876 0.09
HAP SENG CONSOLIDATED BHD 5,000 92,235 0.04
HONG LEONG BANK BERHAD 3,472 114,012 0.06
HONG LEONG FINANCIAL GROUP 1,962 67,763 0.03
IHH HEALTHCARE BHD 17,300 195,825 0.09
IJM CORP BHD 15,800 93,085 0.04
IOI CORP BHD 20,300 178,023 0.09
IOI PROPERTIES GROUP BHD 9,672 34,563 0.02
KLCCP STAPLED GROUP 3,300 55,075 0.03
KUALA LUMPUR KEPONG BHD 2,500 120,727 0.06
MALAYAN BANKING BHD 32,500 615,224 0.30
MALAYSIA AIRPORTS HLDGS BHD 5,720 97,120 0.05
MAXIS BHD 14,800 171,815 0.08
MISC BHD 6,800 97,462 0.05
MMC CORP BHD 4,100 16,235 0.01
PETRONAS CHEMICALS GROUP BHD 16,900 251,363 0.12
PETRONAS DAGANGAN BHD 1,400 65,606 0.03
PETRONAS GAS BHD 4,000 135,059 0.07
PPB GROUP BERHAD 3,300 109,894 0.05
PUBLIC BANK BERHAD 16,620 667,114 0.32
RHB CAPITAL BHD 7,042 68,013 0.03
SAPURAKENCANA PETROLEUM BHD 22,000 30,172 0.01
SIME DARBY BERHAD 19,700 84,097 0.04
SIME DARBY BHD 19,700 228,318 0.11
SIME DARBY PROPERTY BHD 19,700 67,735 0.03
TELEKOM MALAYSIA BHD 8,100 98,571 0.05
TENAGA NASIONAL BHD 23,300 686,806 0.33
UEM SUNRISE BHD 7,200 14,464 0.01
UMW HOLDINGS BHD 3,900 39,173 0.02
WESTPORTS HOLDINGS BHD 5,200 37,165 0.02
YTL CORP BHD 22,644 59,924 0.03
YTL POWER INTERNATIONAL BHD 12,081 30,103 0.01
6,422,599 3.10
Vanguard ETF SeriesAnnual Report 2017
Vanguard FTSE Asia ex Japan Index ETF
-71-
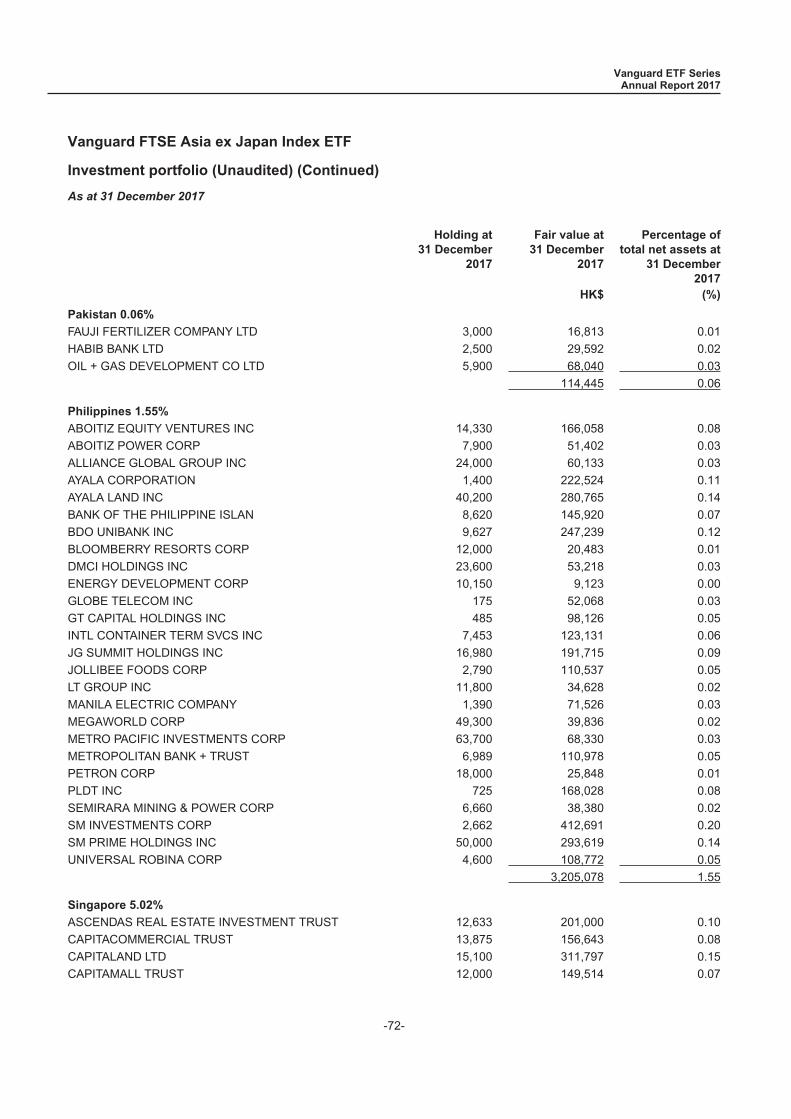
Investment portfolio (Unaudited) (Continued)
As at 31 December 2017
Holding at31 December
2017
Fair value at31 December
2017
Percentage oftotal net assets at
31 December2017
HK$ (%)
Pakistan 0.06%
FAUJI FERTILIZER COMPANY LTD 3,000 16,813 0.01
HABIB BANK LTD 2,500 29,592 0.02
OIL + GAS DEVELOPMENT CO LTD 5,900 68,040 0.03
114,445 0.06
Philippines 1.55%
ABOITIZ EQUITY VENTURES INC 14,330 166,058 0.08
ABOITIZ POWER CORP 7,900 51,402 0.03
ALLIANCE GLOBAL GROUP INC 24,000 60,133 0.03
AYALA CORPORATION 1,400 222,524 0.11
AYALA LAND INC 40,200 280,765 0.14
BANK OF THE PHILIPPINE ISLAN 8,620 145,920 0.07
BDO UNIBANK INC 9,627 247,239 0.12
BLOOMBERRY RESORTS CORP 12,000 20,483 0.01
DMCI HOLDINGS INC 23,600 53,218 0.03
ENERGY DEVELOPMENT CORP 10,150 9,123 0.00
GLOBE TELECOM INC 175 52,068 0.03
GT CAPITAL HOLDINGS INC 485 98,126 0.05
INTL CONTAINER TERM SVCS INC 7,453 123,131 0.06
JG SUMMIT HOLDINGS INC 16,980 191,715 0.09
JOLLIBEE FOODS CORP 2,790 110,537 0.05
LT GROUP INC 11,800 34,628 0.02
MANILA ELECTRIC COMPANY 1,390 71,526 0.03
MEGAWORLD CORP 49,300 39,836 0.02
METRO PACIFIC INVESTMENTS CORP 63,700 68,330 0.03
METROPOLITAN BANK + TRUST 6,989 110,978 0.05
PETRON CORP 18,000 25,848 0.01
PLDT INC 725 168,028 0.08
SEMIRARA MINING & POWER CORP 6,660 38,380 0.02
SM INVESTMENTS CORP 2,662 412,691 0.20
SM PRIME HOLDINGS INC 50,000 293,619 0.14
UNIVERSAL ROBINA CORP 4,600 108,772 0.05
3,205,078 1.55
Singapore 5.02%
ASCENDAS REAL ESTATE INVESTMENT TRUST 12,633 201,000 0.10
CAPITACOMMERCIAL TRUST 13,875 156,643 0.08
CAPITALAND LTD 15,100 311,797 0.15
CAPITAMALL TRUST 12,000 149,514 0.07
Vanguard ETF SeriesAnnual Report 2017
Vanguard FTSE Asia ex Japan Index ETF
-72-
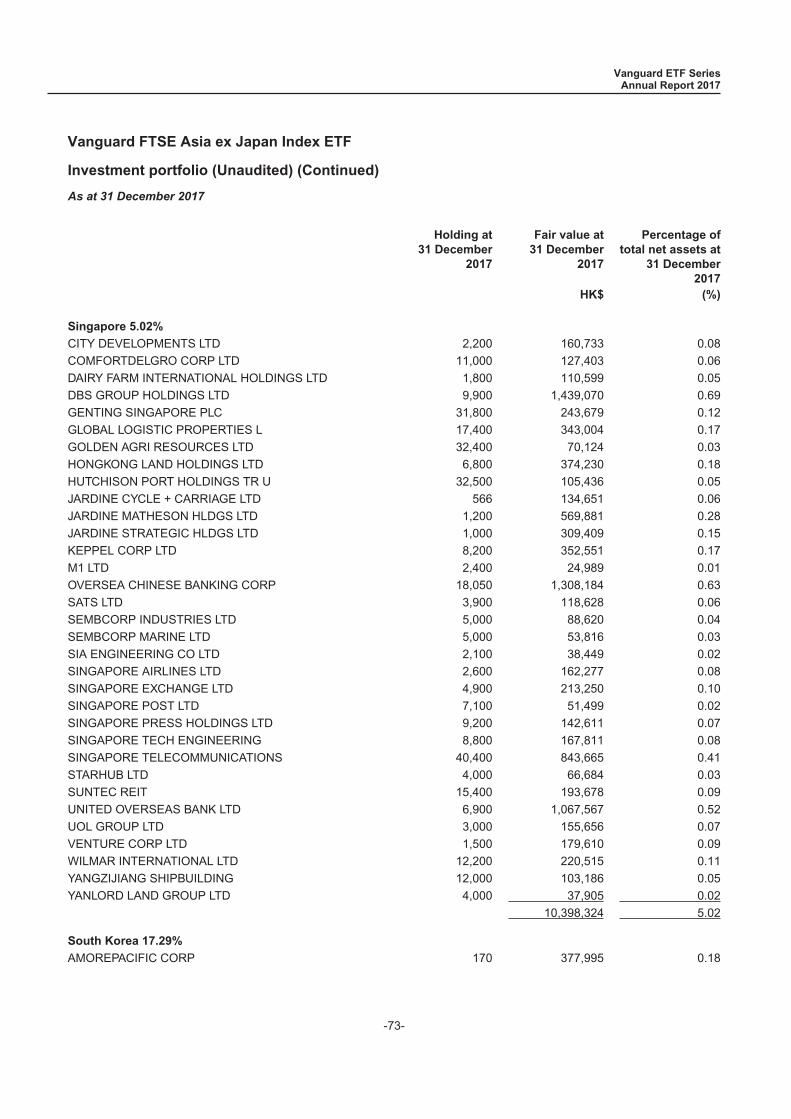
Investment portfolio (Unaudited) (Continued)
As at 31 December 2017
Holding at31 December
2017
Fair value at31 December
2017
Percentage oftotal net assets at
31 December2017
HK$ (%)
Singapore 5.02%
CITY DEVELOPMENTS LTD 2,200 160,733 0.08
COMFORTDELGRO CORP LTD 11,000 127,403 0.06
DAIRY FARM INTERNATIONAL HOLDINGS LTD 1,800 110,599 0.05
DBS GROUP HOLDINGS LTD 9,900 1,439,070 0.69
GENTING SINGAPORE PLC 31,800 243,679 0.12
GLOBAL LOGISTIC PROPERTIES L 17,400 343,004 0.17
GOLDEN AGRI RESOURCES LTD 32,400 70,124 0.03
HONGKONG LAND HOLDINGS LTD 6,800 374,230 0.18
HUTCHISON PORT HOLDINGS TR U 32,500 105,436 0.05
JARDINE CYCLE + CARRIAGE LTD 566 134,651 0.06
JARDINE MATHESON HLDGS LTD 1,200 569,881 0.28
JARDINE STRATEGIC HLDGS LTD 1,000 309,409 0.15
KEPPEL CORP LTD 8,200 352,551 0.17
M1 LTD 2,400 24,989 0.01
OVERSEA CHINESE BANKING CORP 18,050 1,308,184 0.63
SATS LTD 3,900 118,628 0.06
SEMBCORP INDUSTRIES LTD 5,000 88,620 0.04
SEMBCORP MARINE LTD 5,000 53,816 0.03
SIA ENGINEERING CO LTD 2,100 38,449 0.02
SINGAPORE AIRLINES LTD 2,600 162,277 0.08
SINGAPORE EXCHANGE LTD 4,900 213,250 0.10
SINGAPORE POST LTD 7,100 51,499 0.02
SINGAPORE PRESS HOLDINGS LTD 9,200 142,611 0.07
SINGAPORE TECH ENGINEERING 8,800 167,811 0.08
SINGAPORE TELECOMMUNICATIONS 40,400 843,665 0.41
STARHUB LTD 4,000 66,684 0.03
SUNTEC REIT 15,400 193,678 0.09
UNITED OVERSEAS BANK LTD 6,900 1,067,567 0.52
UOL GROUP LTD 3,000 155,656 0.07
VENTURE CORP LTD 1,500 179,610 0.09
WILMAR INTERNATIONAL LTD 12,200 220,515 0.11
YANGZIJIANG SHIPBUILDING 12,000 103,186 0.05
YANLORD LAND GROUP LTD 4,000 37,905 0.02
10,398,324 5.02
South Korea 17.29%
AMOREPACIFIC CORP 170 377,995 0.18
Vanguard ETF SeriesAnnual Report 2017
Vanguard FTSE Asia ex Japan Index ETF
-73-
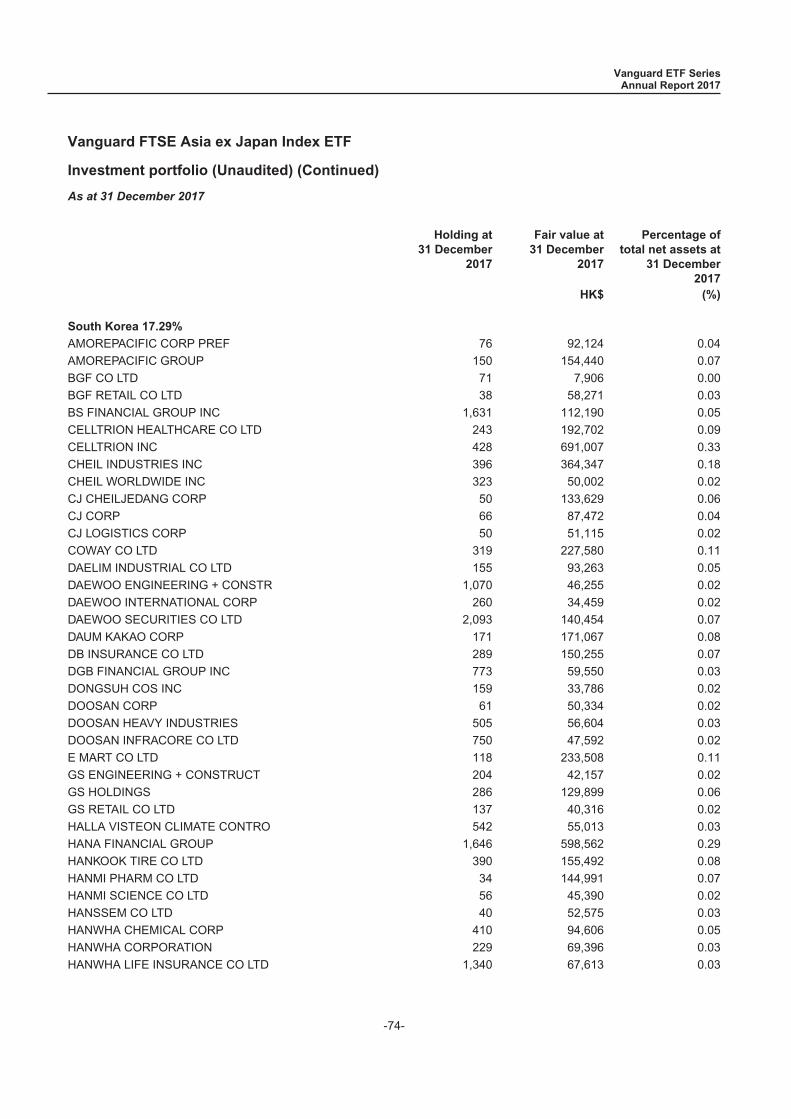
Investment portfolio (Unaudited) (Continued)
As at 31 December 2017
Holding at31 December
2017
Fair value at31 December
2017
Percentage oftotal net assets at
31 December2017
HK$ (%)
South Korea 17.29%
AMOREPACIFIC CORP PREF 76 92,124 0.04
AMOREPACIFIC GROUP 150 154,440 0.07
BGF CO LTD 71 7,906 0.00
BGF RETAIL CO LTD 38 58,271 0.03
BS FINANCIAL GROUP INC 1,631 112,190 0.05
CELLTRION HEALTHCARE CO LTD 243 192,702 0.09
CELLTRION INC 428 691,007 0.33
CHEIL INDUSTRIES INC 396 364,347 0.18
CHEIL WORLDWIDE INC 323 50,002 0.02
CJ CHEILJEDANG CORP 50 133,629 0.06
CJ CORP 66 87,472 0.04
CJ LOGISTICS CORP 50 51,115 0.02
COWAY CO LTD 319 227,580 0.11
DAELIM INDUSTRIAL CO LTD 155 93,263 0.05
DAEWOO ENGINEERING + CONSTR 1,070 46,255 0.02
DAEWOO INTERNATIONAL CORP 260 34,459 0.02
DAEWOO SECURITIES CO LTD 2,093 140,454 0.07
DAUM KAKAO CORP 171 171,067 0.08
DB INSURANCE CO LTD 289 150,255 0.07
DGB FINANCIAL GROUP INC 773 59,550 0.03
DONGSUH COS INC 159 33,786 0.02
DOOSAN CORP 61 50,334 0.02
DOOSAN HEAVY INDUSTRIES 505 56,604 0.03
DOOSAN INFRACORE CO LTD 750 47,592 0.02
E MART CO LTD 118 233,508 0.11
GS ENGINEERING + CONSTRUCT 204 42,157 0.02
GS HOLDINGS 286 129,899 0.06
GS RETAIL CO LTD 137 40,316 0.02
HALLA VISTEON CLIMATE CONTRO 542 55,013 0.03
HANA FINANCIAL GROUP 1,646 598,562 0.29
HANKOOK TIRE CO LTD 390 155,492 0.08
HANMI PHARM CO LTD 34 144,991 0.07
HANMI SCIENCE CO LTD 56 45,390 0.02
HANSSEM CO LTD 40 52,575 0.03
HANWHA CHEMICAL CORP 410 94,606 0.05
HANWHA CORPORATION 229 69,396 0.03
HANWHA LIFE INSURANCE CO LTD 1,340 67,613 0.03
Vanguard ETF SeriesAnnual Report 2017
Vanguard FTSE Asia ex Japan Index ETF
-74-
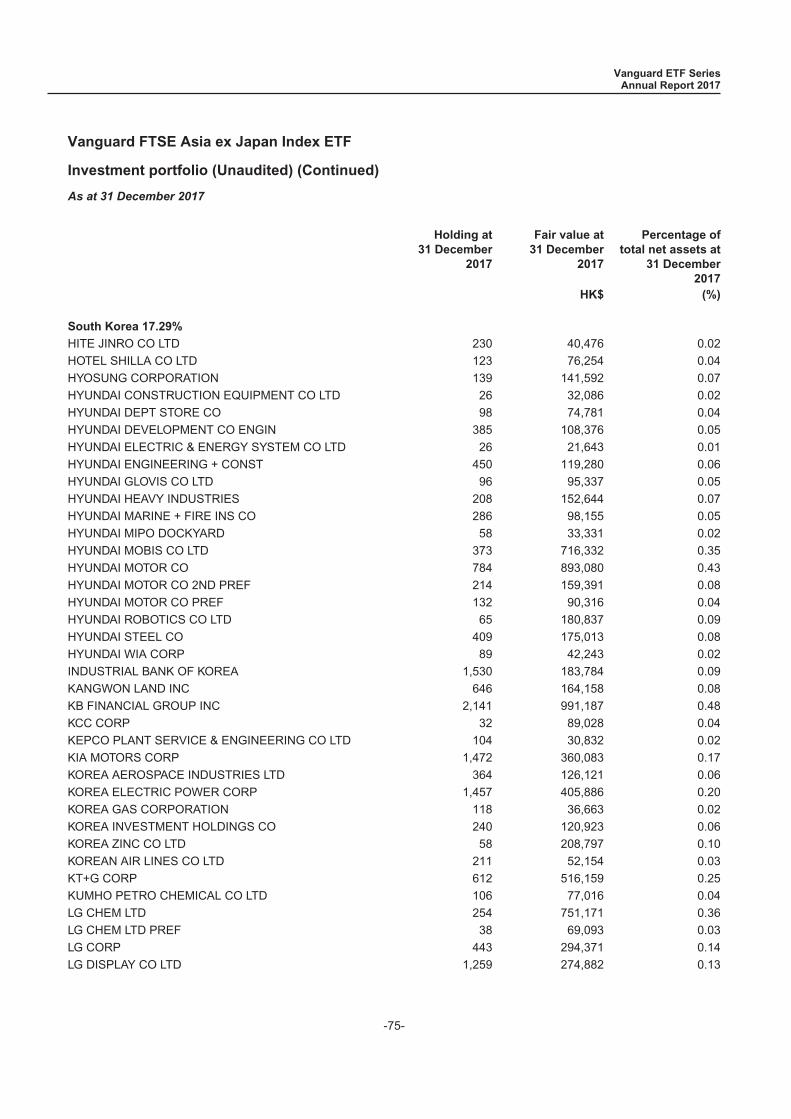
Investment portfolio (Unaudited) (Continued)
As at 31 December 2017
Holding at31 December
2017
Fair value at31 December
2017
Percentage oftotal net assets at
31 December2017
HK$ (%)
South Korea 17.29%
HITE JINRO CO LTD 230 40,476 0.02
HOTEL SHILLA CO LTD 123 76,254 0.04
HYOSUNG CORPORATION 139 141,592 0.07
HYUNDAI CONSTRUCTION EQUIPMENT CO LTD 26 32,086 0.02
HYUNDAI DEPT STORE CO 98 74,781 0.04
HYUNDAI DEVELOPMENT CO ENGIN 385 108,376 0.05
HYUNDAI ELECTRIC & ENERGY SYSTEM CO LTD 26 21,643 0.01
HYUNDAI ENGINEERING + CONST 450 119,280 0.06
HYUNDAI GLOVIS CO LTD 96 95,337 0.05
HYUNDAI HEAVY INDUSTRIES 208 152,644 0.07
HYUNDAI MARINE + FIRE INS CO 286 98,155 0.05
HYUNDAI MIPO DOCKYARD 58 33,331 0.02
HYUNDAI MOBIS CO LTD 373 716,332 0.35
HYUNDAI MOTOR CO 784 893,080 0.43
HYUNDAI MOTOR CO 2ND PREF 214 159,391 0.08
HYUNDAI MOTOR CO PREF 132 90,316 0.04
HYUNDAI ROBOTICS CO LTD 65 180,837 0.09
HYUNDAI STEEL CO 409 175,013 0.08
HYUNDAI WIA CORP 89 42,243 0.02
INDUSTRIAL BANK OF KOREA 1,530 183,784 0.09
KANGWON LAND INC 646 164,158 0.08
KB FINANCIAL GROUP INC 2,141 991,187 0.48
KCC CORP 32 89,028 0.04
KEPCO PLANT SERVICE & ENGINEERING CO LTD 104 30,832 0.02
KIA MOTORS CORP 1,472 360,083 0.17
KOREA AEROSPACE INDUSTRIES LTD 364 126,121 0.06
KOREA ELECTRIC POWER CORP 1,457 405,886 0.20
KOREA GAS CORPORATION 118 36,663 0.02
KOREA INVESTMENT HOLDINGS CO 240 120,923 0.06
KOREA ZINC CO LTD 58 208,797 0.10
KOREAN AIR LINES CO LTD 211 52,154 0.03
KT+G CORP 612 516,159 0.25
KUMHO PETRO CHEMICAL CO LTD 106 77,016 0.04
LG CHEM LTD 254 751,171 0.36
LG CHEM LTD PREF 38 69,093 0.03
LG CORP 443 294,371 0.14
LG DISPLAY CO LTD 1,259 274,882 0.13
Vanguard ETF SeriesAnnual Report 2017
Vanguard FTSE Asia ex Japan Index ETF
-75-
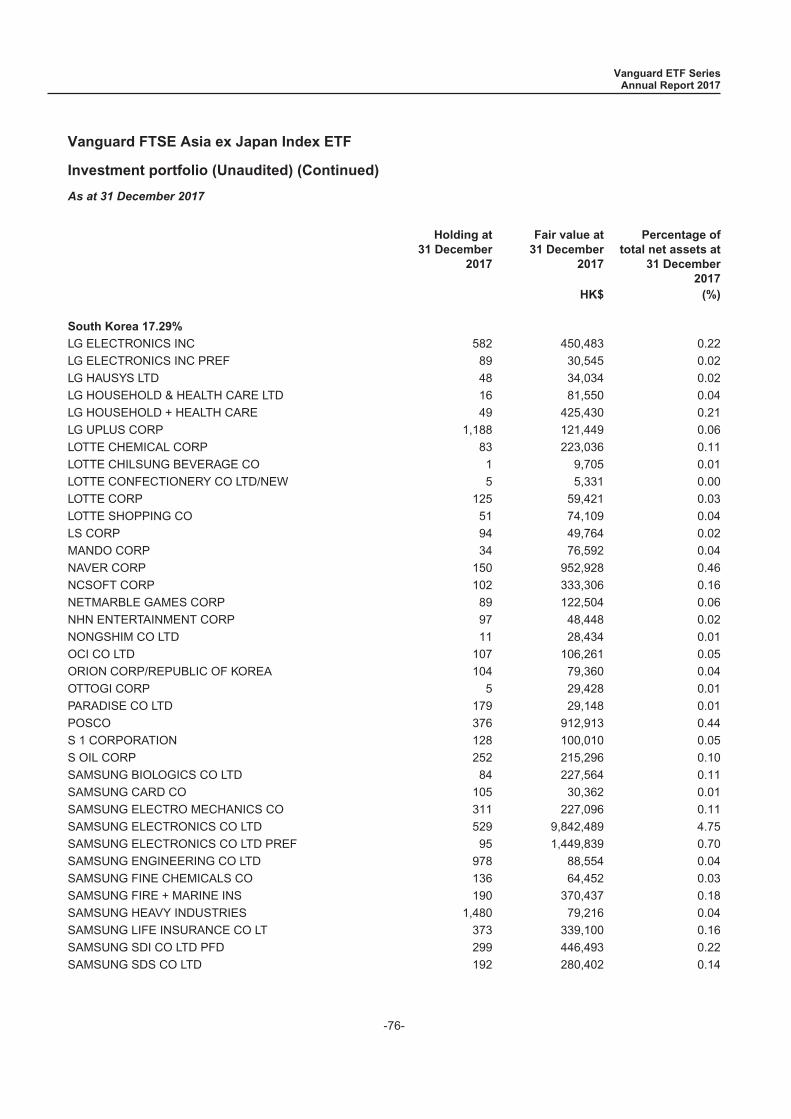
Investment portfolio (Unaudited) (Continued)
As at 31 December 2017
Holding at31 December
2017
Fair value at31 December
2017
Percentage oftotal net assets at
31 December2017
HK$ (%)
South Korea 17.29%
LG ELECTRONICS INC 582 450,483 0.22
LG ELECTRONICS INC PREF 89 30,545 0.02
LG HAUSYS LTD 48 34,034 0.02
LG HOUSEHOLD & HEALTH CARE LTD 16 81,550 0.04
LG HOUSEHOLD + HEALTH CARE 49 425,430 0.21
LG UPLUS CORP 1,188 121,449 0.06
LOTTE CHEMICAL CORP 83 223,036 0.11
LOTTE CHILSUNG BEVERAGE CO 1 9,705 0.01
LOTTE CONFECTIONERY CO LTD/NEW 5 5,331 0.00
LOTTE CORP 125 59,421 0.03
LOTTE SHOPPING CO 51 74,109 0.04
LS CORP 94 49,764 0.02
MANDO CORP 34 76,592 0.04
NAVER CORP 150 952,928 0.46
NCSOFT CORP 102 333,306 0.16
NETMARBLE GAMES CORP 89 122,504 0.06
NHN ENTERTAINMENT CORP 97 48,448 0.02
NONGSHIM CO LTD 11 28,434 0.01
OCI CO LTD 107 106,261 0.05
ORION CORP/REPUBLIC OF KOREA 104 79,360 0.04
OTTOGI CORP 5 29,428 0.01
PARADISE CO LTD 179 29,148 0.01
POSCO 376 912,913 0.44
S 1 CORPORATION 128 100,010 0.05
S OIL CORP 252 215,296 0.10
SAMSUNG BIOLOGICS CO LTD 84 227,564 0.11
SAMSUNG CARD CO 105 30,362 0.01
SAMSUNG ELECTRO MECHANICS CO 311 227,096 0.11
SAMSUNG ELECTRONICS CO LTD 529 9,842,489 4.75
SAMSUNG ELECTRONICS CO LTD PREF 95 1,449,839 0.70
SAMSUNG ENGINEERING CO LTD 978 88,554 0.04
SAMSUNG FINE CHEMICALS CO 136 64,452 0.03
SAMSUNG FIRE + MARINE INS 190 370,437 0.18
SAMSUNG HEAVY INDUSTRIES 1,480 79,216 0.04
SAMSUNG LIFE INSURANCE CO LT 373 339,100 0.16
SAMSUNG SDI CO LTD PFD 299 446,493 0.22
SAMSUNG SDS CO LTD 192 280,402 0.14
Vanguard ETF SeriesAnnual Report 2017
Vanguard FTSE Asia ex Japan Index ETF
-76-

Investment portfolio (Unaudited) (Continued)
As at 31 December 2017
Holding at31 December
2017
Fair value at31 December
2017
Percentage oftotal net assets at
31 December2017
HK$ (%)
South Korea 17.29%
SAMSUNG SECURITIES CO LTD 367 98,084 0.05
SAMSUNG TECHWIN CO LTD 284 73,724 0.04
SHINHAN FINANCIAL GROUP LTD 2,469 890,631 0.43
SHINSEGAE CO LTD 42 92,007 0.04
SK C+C CO LTD 184 380,237 0.18
SK HYNIX INC 2,998 1,674,723 0.81
SK INNOVATION CO LTD 345 515,184 0.25
SK NETWORKS CO LTD 840 40,790 0.02
SK TELECOM 134 261,256 0.13
SKC CO LTD 120 41,184 0.02
WOORI BANK 2,780 319,724 0.15
WOORI INVESTMENT + SECURITIE 610 61,915 0.03
YUHAN CORP 57 91,152 0.04
35,803,492 17.29
Taiwan 12.73%
ACER INC 17,376 110,233 0.05
ADVANCED SEMICONDUCTOR ENGR 35,937 360,149 0.17
ADVANTECH CO LTD 1,724 95,331 0.05
ASIA CEMENT CORP 15,606 115,608 0.06
ASUSTEK COMPUTER INC 4,000 293,689 0.14
AU OPTRONICS CORP 47,000 153,096 0.07
CAPITAL SECURITIES CORP 19,000 57,897 0.03
CATCHER TECHNOLOGY CO LTD 4,500 387,732 0.19
CATHAY FINANCIAL HOLDING CO 44,032 618,825 0.30
CHANG HWA COMMERCIAL BANK 31,544 137,139 0.07
CHENG SHIN RUBBER IND CO LTD 10,350 142,740 0.07
CHENG UEI PRECISION INDUSTRY 3,000 39,404 0.02
CHICONY ELECTRONICS CO LTD 3,115 61,371 0.03
CHINA AIRLINES LTD 12,000 36,724 0.02
CHINA DEVELOPMENT FINANCIAL 82,000 218,638 0.11
CHINA LIFE INSURANCE CO LTD 9,440 74,270 0.04
CHINA MOTOR CORP 7,000 47,810 0.02
CHINA STEEL CORP 68,204 443,436 0.21
CHUNGHWA TELECOM CO LTD 21,000 584,751 0.28
COMPAL ELECTRONICS 20,000 111,906 0.05
CTBC FINANCIAL HOLDING CO LT 103,373 556,681 0.27
Vanguard ETF SeriesAnnual Report 2017
Vanguard FTSE Asia ex Japan Index ETF
-77-

Investment portfolio (Unaudited) (Continued)
As at 31 December 2017
Holding at31 December
2017
Fair value at31 December
2017
Percentage oftotal net assets at
31 December2017
HK$ (%)
Taiwan 12.73%
DELTA ELECTRONICS INC 12,525 472,145 0.23
E.SUN FINANCIAL HOLDING CO 59,787 296,834 0.14
ECLAT TEXTILE CO LTD 1,042 81,433 0.04
EPISTAR CORP 5,000 59,303 0.03
ETERNAL MATERIALS CO LTD 4,673 37,809 0.02
EVA AIRWAYS CORP 11,166 46,491 0.02
EVERGREEN MARINE CORP LTD 11,250 48,319 0.02
FAR EASTERN INTERNATIONAL BANK 1,460 3,659 0.00
FAR EASTERN NEW CENTURY CORP 22,284 156,882 0.08
FAR EASTONE TELECOMM CO LTD 8,000 154,462 0.07
FEN TAY ENTERPRISE CO LTD 2,120 75,461 0.04
FIRST FINANCIAL HOLDING CO 56,005 287,620 0.14
FORMOSA CHEMICALS + FIBRE 17,750 480,265 0.23
FORMOSA PETROCHEMICAL CORP 8,000 242,727 0.12
FORMOSA PLASTICS CORP 26,120 677,230 0.33
FORMOSA TAFFETA CO. 7,000 57,556 0.03
FOXCONN TECHNOLOGY CO LTD 6,727 150,559 0.07
FUBON FINANCIAL HOLDING CO 42,000 559,375 0.27
GIANT MANUFACTURING 2,000 85,900 0.04
HON HAI PRECISION INDUSTRY 83,286 2,082,834 1.01
HOTAI MOTOR COMPANY LTD 2,405 223,648 0.11
HTC CORP 5,000 96,014 0.05
HUA NAN FINANCIAL HOLDINGS C 41,298 181,714 0.09
INNOLUX CORP 49,681 161,830 0.08
INVENTEC CO LTD 18,000 112,301 0.05
LARGAN PRECISION CO LTD 567 598,763 0.29
LITE ON TECHNOLOGY CORP 12,219 130,319 0.06
MEDIATEK INC 8,464 653,685 0.32
MEGA FINANCIAL HOLDING CO LT 60,607 382,898 0.18
NAN YA PLASTICS CORP 32,380 662,613 0.32
NANYA TECHNOLOGY CORP 4,000 80,068 0.04
NOVATEK MICROELECTRONICS COR 3,000 89,446 0.04
OBI PHARMA INC 500 19,768 0.01
ORIENTAL UNION CHEMICAL 7,000 58,199 0.03
PEGATRON CORP 11,000 208,052 0.10
POU CHEN 13,000 131,648 0.06
PRESIDENT CHAIN STORE CORP 3,000 223,813 0.11
Vanguard ETF SeriesAnnual Report 2017
Vanguard FTSE Asia ex Japan Index ETF
-78-

Investment portfolio (Unaudited) (Continued)
As at 31 December 2017
Holding at31 December
2017
Fair value at31 December
2017
Percentage oftotal net assets at
31 December2017
HK$ (%)
Taiwan 12.73%
QUANTA COMPUTER INC 16,000 260,169 0.13
REALTEK SEMICONDUCTOR CORP 3,030 86,759 0.04
SHIN KONG FINANCIAL HOLDING 46,594 128,518 0.06
SILICONWARE PRECISION INDS 13,629 180,085 0.09
SINOPAC FINANCIAL HOLDINGS 64,547 163,964 0.08
SYNNEX TECHNOLOGY INTL CORP 8,400 89,478 0.04
TAISHIN FINANCIAL HOLDING 56,895 207,000 0.10
TAIWAN BUSINESS BANK 21,630 47,672 0.02
TAIWAN CEMENT 20,000 191,502 0.09
TAIWAN COOPERATIVE FINANCIAL 44,166 192,594 0.09
TAIWAN FERTILIZER CO LTD 6,000 60,445 0.03
TAIWAN GLASS IND CORP 9,020 52,958 0.03
TAIWAN HIGH SPEED RAIL CORP 15,000 92,599 0.04
TAIWAN MOBILE CO LTD 8,000 225,915 0.11
TAIWAN SECOM CO LTD 2,000 48,125 0.02
TAIWAN SEMICONDUCTOR MANUFAC 134,000 8,078,547 3.90
TECO ELECTRIC + MACHINERY 12,000 89,840 0.04
TON YI INDUSTRIAL CORP 7,000 25,652 0.01
TPK HOLDING CO LTD 1,000 21,961 0.01
TRANSCEND INFORMATION INC 1,000 21,725 0.01
U MING MARINE TRANSPORT CORP 1,000 9,588 0.00
UNI PRESIDENT ENTERPRISES CO 26,181 453,916 0.22
UNIMICRON TECHNOLOGY CORP 9,000 38,537 0.02
UNITED MICROELECTRONICS CORP 70,000 261,115 0.13
VANGUARD INTERNATIONAL SEMI 6,000 104,026 0.05
WALSIN LIHWA CORP 19,000 87,844 0.04
WAN HAI LINES LTD 7,000 35,398 0.02
WISTRON CORP 17,417 109,578 0.05
YUANTA FINANCIAL HOLDING CO 66,698 241,790 0.12
YULON MOTOR COMPANY 5,000 31,720 0.02
26,358,093 12.73
Thailand 3.50%
ADVANCED INFO SERVICE FOR RG 6,000 274,889 0.13
AIRPORTS OF THAILAND PCL 21,100 344,163 0.17
BANGKOK BANK PCL FOREIGN REG 2,900 152,340 0.07
BANGKOK DUSIT MED SERVICE F 51,500 258,182 0.13
Vanguard ETF SeriesAnnual Report 2017
Vanguard FTSE Asia ex Japan Index ETF
-79-
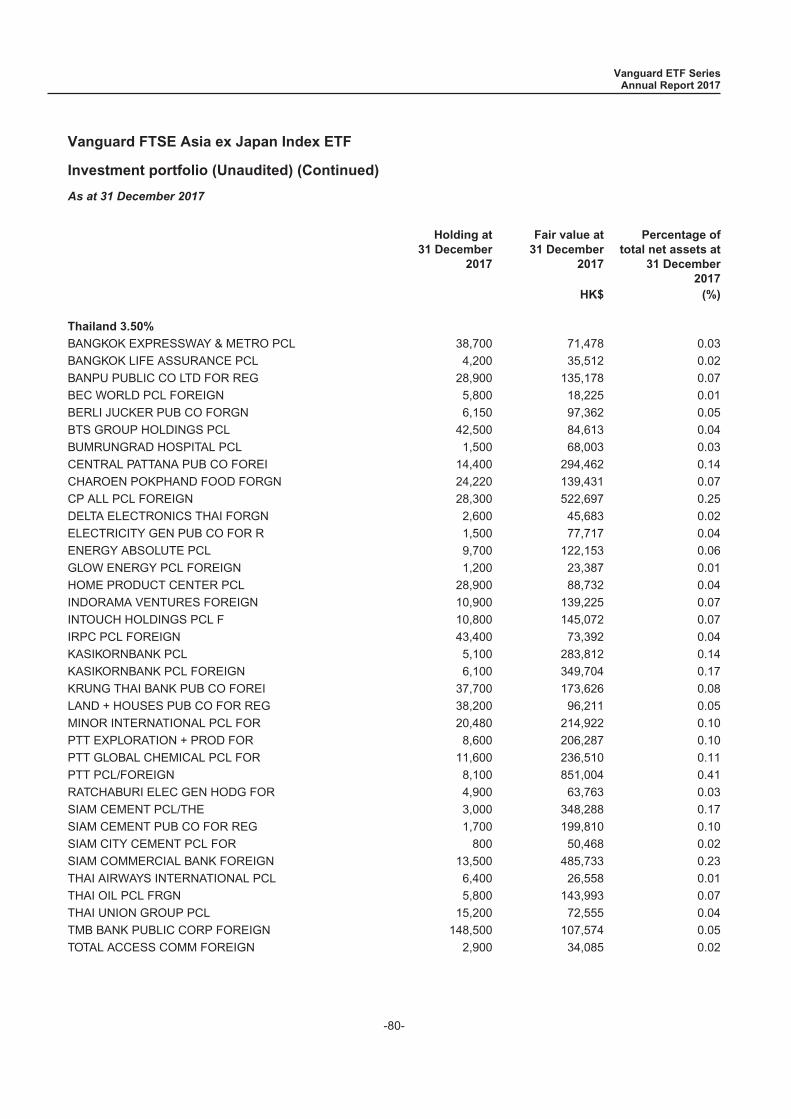
Investment portfolio (Unaudited) (Continued)
As at 31 December 2017
Holding at31 December
2017
Fair value at31 December
2017
Percentage oftotal net assets at
31 December2017
HK$ (%)
Thailand 3.50%
BANGKOK EXPRESSWAY & METRO PCL 38,700 71,478 0.03
BANGKOK LIFE ASSURANCE PCL 4,200 35,512 0.02
BANPU PUBLIC CO LTD FOR REG 28,900 135,178 0.07
BEC WORLD PCL FOREIGN 5,800 18,225 0.01
BERLI JUCKER PUB CO FORGN 6,150 97,362 0.05
BTS GROUP HOLDINGS PCL 42,500 84,613 0.04
BUMRUNGRAD HOSPITAL PCL 1,500 68,003 0.03
CENTRAL PATTANA PUB CO FOREI 14,400 294,462 0.14
CHAROEN POKPHAND FOOD FORGN 24,220 139,431 0.07
CP ALL PCL FOREIGN 28,300 522,697 0.25
DELTA ELECTRONICS THAI FORGN 2,600 45,683 0.02
ELECTRICITY GEN PUB CO FOR R 1,500 77,717 0.04
ENERGY ABSOLUTE PCL 9,700 122,153 0.06
GLOW ENERGY PCL FOREIGN 1,200 23,387 0.01
HOME PRODUCT CENTER PCL 28,900 88,732 0.04
INDORAMA VENTURES FOREIGN 10,900 139,225 0.07
INTOUCH HOLDINGS PCL F 10,800 145,072 0.07
IRPC PCL FOREIGN 43,400 73,392 0.04
KASIKORNBANK PCL 5,100 283,812 0.14
KASIKORNBANK PCL FOREIGN 6,100 349,704 0.17
KRUNG THAI BANK PUB CO FOREI 37,700 173,626 0.08
LAND + HOUSES PUB CO FOR REG 38,200 96,211 0.05
MINOR INTERNATIONAL PCL FOR 20,480 214,922 0.10
PTT EXPLORATION + PROD FOR 8,600 206,287 0.10
PTT GLOBAL CHEMICAL PCL FOR 11,600 236,510 0.11
PTT PCL/FOREIGN 8,100 851,004 0.41
RATCHABURI ELEC GEN HODG FOR 4,900 63,763 0.03
SIAM CEMENT PCL/THE 3,000 348,288 0.17
SIAM CEMENT PUB CO FOR REG 1,700 199,810 0.10
SIAM CITY CEMENT PCL FOR 800 50,468 0.02
SIAM COMMERCIAL BANK FOREIGN 13,500 485,733 0.23
THAI AIRWAYS INTERNATIONAL PCL 6,400 26,558 0.01
THAI OIL PCL FRGN 5,800 143,993 0.07
THAI UNION GROUP PCL 15,200 72,555 0.04
TMB BANK PUBLIC CORP FOREIGN 148,500 107,574 0.05
TOTAL ACCESS COMM FOREIGN 2,900 34,085 0.02
Vanguard ETF SeriesAnnual Report 2017
Vanguard FTSE Asia ex Japan Index ETF
-80-
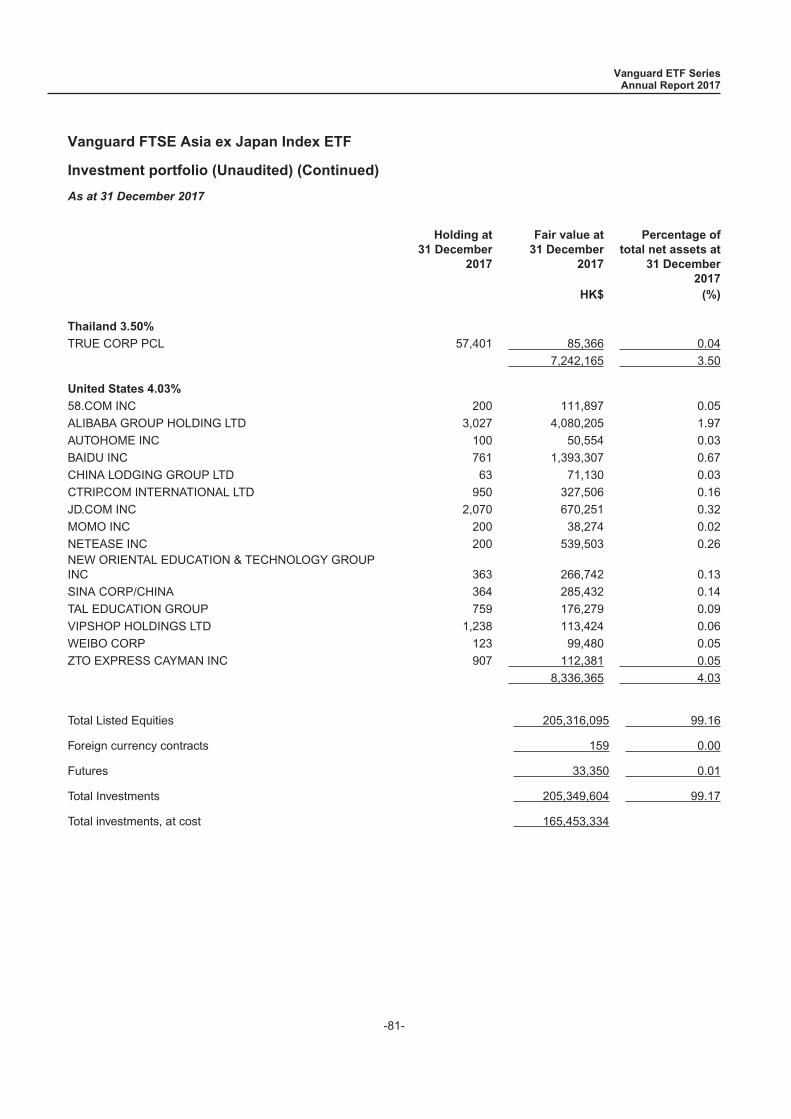
Investment portfolio (Unaudited) (Continued)
As at 31 December 2017
Holding at31 December
2017
Fair value at31 December
2017
Percentage oftotal net assets at
31 December2017
HK$ (%)
Thailand 3.50%
TRUE CORP PCL 57,401 85,366 0.04
7,242,165 3.50
United States 4.03%
58.COM INC 200 111,897 0.05
ALIBABA GROUP HOLDING LTD 3,027 4,080,205 1.97
AUTOHOME INC 100 50,554 0.03
BAIDU INC 761 1,393,307 0.67
CHINA LODGING GROUP LTD 63 71,130 0.03
CTRIP.COM INTERNATIONAL LTD 950 327,506 0.16
JD.COM INC 2,070 670,251 0.32
MOMO INC 200 38,274 0.02
NETEASE INC 200 539,503 0.26NEW ORIENTAL EDUCATION & TECHNOLOGY GROUPINC 363 266,742 0.13
SINA CORP/CHINA 364 285,432 0.14
TAL EDUCATION GROUP 759 176,279 0.09
VIPSHOP HOLDINGS LTD 1,238 113,424 0.06
WEIBO CORP 123 99,480 0.05
ZTO EXPRESS CAYMAN INC 907 112,381 0.05
8,336,365 4.03
Total Listed Equities 205,316,095 99.16
Foreign currency contracts 159 0.00
Futures 33,350 0.01
Total Investments 205,349,604 99.17
Total investments, at cost 165,453,334
Vanguard ETF SeriesAnnual Report 2017
Vanguard FTSE Asia ex Japan Index ETF
-81-
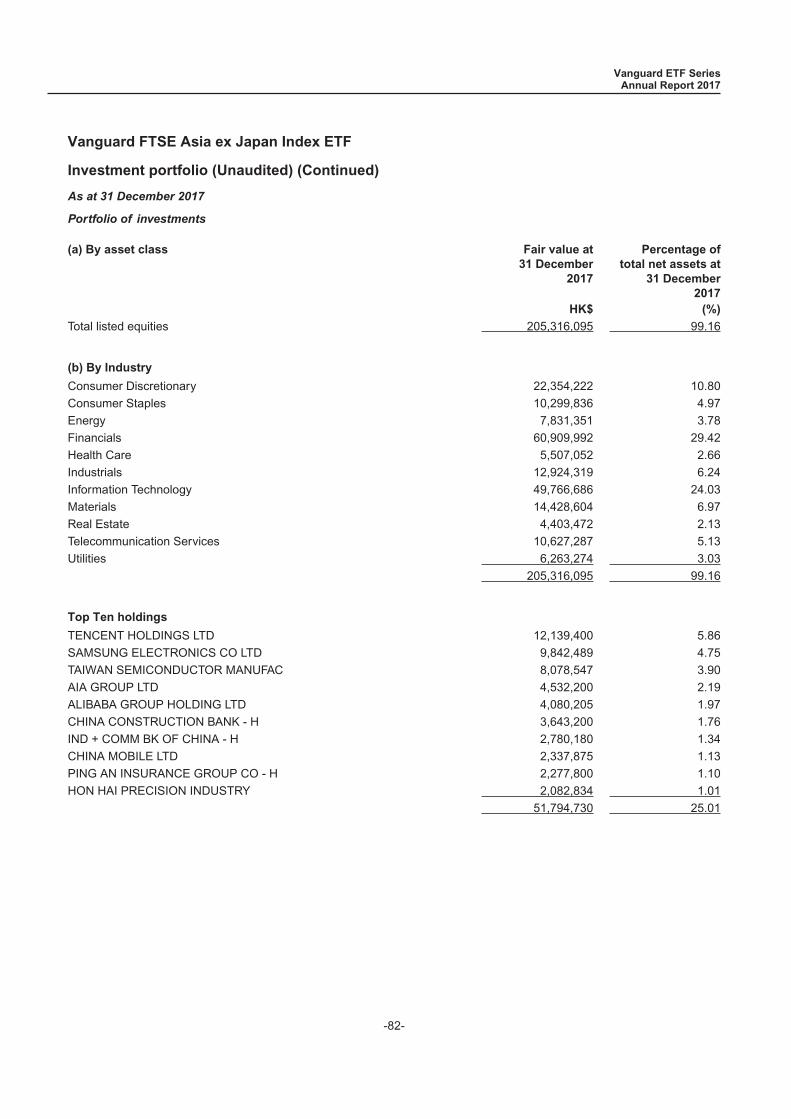
Investment portfolio (Unaudited) (Continued)
As at 31 December 2017
Portfolio of investments
(a) By asset class Fair value at31 December
2017
Percentage oftotal net assets at
31 December2017
HK$ (%)
Total listed equities 205,316,095 99.16
(b) By Industry
Consumer Discretionary 22,354,222 10.80
Consumer Staples 10,299,836 4.97
Energy 7,831,351 3.78
Financials 60,909,992 29.42
Health Care 5,507,052 2.66
Industrials 12,924,319 6.24
Information Technology 49,766,686 24.03
Materials 14,428,604 6.97
Real Estate 4,403,472 2.13
Telecommunication Services 10,627,287 5.13
Utilities 6,263,274 3.03
205,316,095 99.16
Top Ten holdings
TENCENT HOLDINGS LTD 12,139,400 5.86
SAMSUNG ELECTRONICS CO LTD 9,842,489 4.75
TAIWAN SEMICONDUCTOR MANUFAC 8,078,547 3.90
AIA GROUP LTD 4,532,200 2.19
ALIBABA GROUP HOLDING LTD 4,080,205 1.97
CHINA CONSTRUCTION BANK - H 3,643,200 1.76
IND + COMM BK OF CHINA - H 2,780,180 1.34
CHINA MOBILE LTD 2,337,875 1.13
PING AN INSURANCE GROUP CO - H 2,277,800 1.10
HON HAI PRECISION INDUSTRY 2,082,834 1.01
51,794,730 25.01
Vanguard ETF SeriesAnnual Report 2017
Vanguard FTSE Asia ex Japan Index ETF
-82-
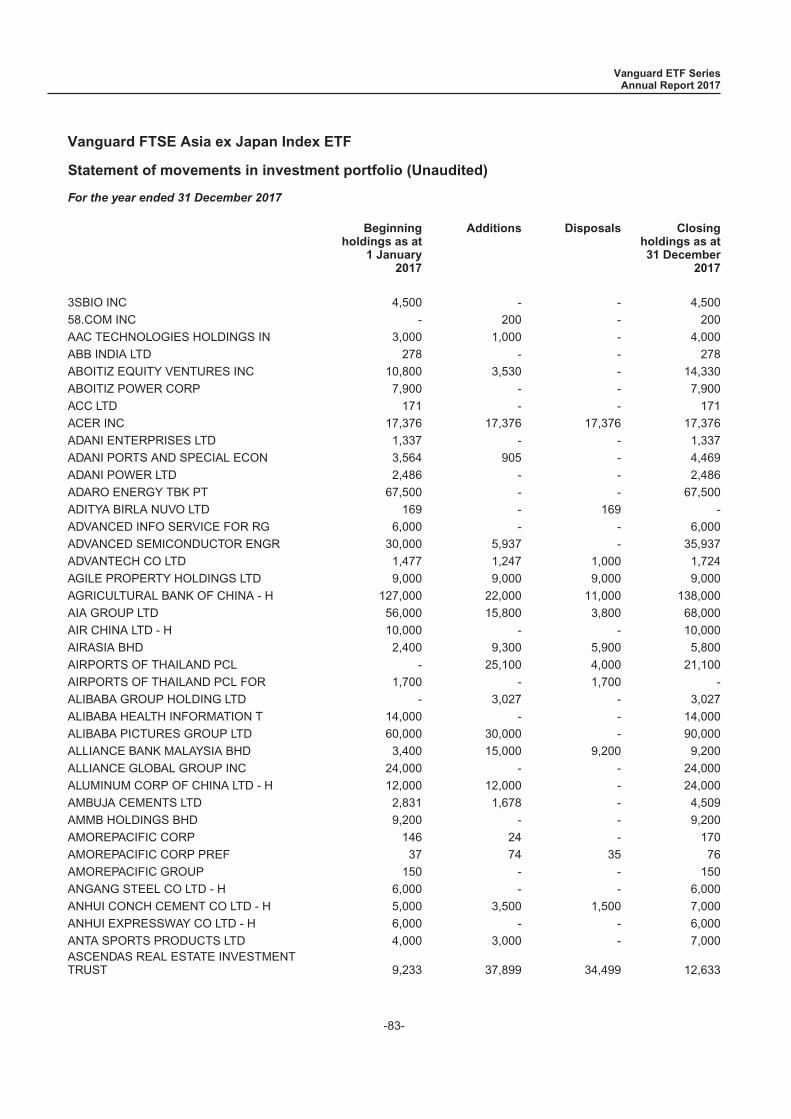
Statement of movements in investment portfolio (Unaudited)
For the year ended 31 December 2017
Beginningholdings as at
1 January2017
Additions Disposals Closingholdings as at31 December
2017
3SBIO INC 4,500 - - 4,500
58.COM INC - 200 - 200
AAC TECHNOLOGIES HOLDINGS IN 3,000 1,000 - 4,000
ABB INDIA LTD 278 - - 278
ABOITIZ EQUITY VENTURES INC 10,800 3,530 - 14,330
ABOITIZ POWER CORP 7,900 - - 7,900
ACC LTD 171 - - 171
ACER INC 17,376 17,376 17,376 17,376
ADANI ENTERPRISES LTD 1,337 - - 1,337
ADANI PORTS AND SPECIAL ECON 3,564 905 - 4,469
ADANI POWER LTD 2,486 - - 2,486
ADARO ENERGY TBK PT 67,500 - - 67,500
ADITYA BIRLA NUVO LTD 169 - 169 -
ADVANCED INFO SERVICE FOR RG 6,000 - - 6,000
ADVANCED SEMICONDUCTOR ENGR 30,000 5,937 - 35,937
ADVANTECH CO LTD 1,477 1,247 1,000 1,724
AGILE PROPERTY HOLDINGS LTD 9,000 9,000 9,000 9,000
AGRICULTURAL BANK OF CHINA - H 127,000 22,000 11,000 138,000
AIA GROUP LTD 56,000 15,800 3,800 68,000
AIR CHINA LTD - H 10,000 - - 10,000
AIRASIA BHD 2,400 9,300 5,900 5,800
AIRPORTS OF THAILAND PCL - 25,100 4,000 21,100
AIRPORTS OF THAILAND PCL FOR 1,700 - 1,700 -
ALIBABA GROUP HOLDING LTD - 3,027 - 3,027
ALIBABA HEALTH INFORMATION T 14,000 - - 14,000
ALIBABA PICTURES GROUP LTD 60,000 30,000 - 90,000
ALLIANCE BANK MALAYSIA BHD 3,400 15,000 9,200 9,200
ALLIANCE GLOBAL GROUP INC 24,000 - - 24,000
ALUMINUM CORP OF CHINA LTD - H 12,000 12,000 - 24,000
AMBUJA CEMENTS LTD 2,831 1,678 - 4,509
AMMB HOLDINGS BHD 9,200 - - 9,200
AMOREPACIFIC CORP 146 24 - 170
AMOREPACIFIC CORP PREF 37 74 35 76
AMOREPACIFIC GROUP 150 - - 150
ANGANG STEEL CO LTD - H 6,000 - - 6,000
ANHUI CONCH CEMENT CO LTD - H 5,000 3,500 1,500 7,000
ANHUI EXPRESSWAY CO LTD - H 6,000 - - 6,000
ANTA SPORTS PRODUCTS LTD 4,000 3,000 - 7,000ASCENDAS REAL ESTATE INVESTMENTTRUST 9,233 37,899 34,499 12,633
Vanguard ETF SeriesAnnual Report 2017
Vanguard FTSE Asia ex Japan Index ETF
-83-

Statement of movements in investment portfolio (Unaudited) (Continued)
For the year ended 31 December 2017
Beginningholdings as at
1 January2017
Additions Disposals Closingholdings as at31 December
2017
ASHOK LEYLAND LTD 4,483 3,691 - 8,174
ASIA CEMENT CORP 9,606 6,000 - 15,606
ASIAN PAINTS LTD 1,324 299 - 1,623
ASM PACIFIC TECHNOLOGY 1,400 200 - 1,600
ASTRA AGRO LESTARI TBK PT 3,055 - - 3,055
ASTRA INTERNATIONAL TBK PT 95,400 25,400 10,200 110,600
ASTRO MALAYSIA HOLDINGS BHD 7,600 - - 7,600
ASUSTEK COMPUTER INC 3,000 2,000 1,000 4,000
AU OPTRONICS CORP 47,000 - - 47,000
AUROBINDO PHARMA LTD 1,040 619 - 1,659
AUTOHOME INC - 100 - 100
AVENUE SUPERMARTS LTD - 357 - 357
AVICHINA INDUSTRY + TECH - H 8,000 8,000 - 16,000
AXIATA GROUP BERHAD 22,600 4,700 5,000 22,300
AXIS BANK LTD 6,425 3,306 - 9,731
AYALA CORPORATION 1,100 300 - 1,400
AYALA LAND INC 17,800 31,000 8,600 40,200
BAIC MOTOR CORP LTD 6,000 - - 6,000
BAIDU INC - 781 20 761
BAJAJ AUTO LTD 371 150 - 521
BAJAJ FINANCE LTD 670 239 - 909
BAJAJ FINSERV LTD 156 80 - 236
BAJAJ HOLDING & INVESTMENT LTD - 196 - 196
BANGKOK BANK PCL FOREIGN REG 2,000 900 - 2,900
BANGKOK DUSIT MED SERVICE F 41,900 9,600 - 51,500
BANGKOK EXPRESSWAY & METRO PCL 38,700 - - 38,700
BANGKOK LIFE ASSURANCE PCL - 4,200 - 4,200
BANK CENTRAL ASIA TBK PT 55,800 9,700 11,500 54,000
BANK DANAMON INDONESIA TBK 16,000 - - 16,000
BANK MANDIRI PERSERO TBK PT 43,400 63,400 - 106,800
BANK NEGARA INDONESIA PERSER 37,000 9,500 - 46,500
BANK OF BARODA 2,040 - - 2,040
BANK OF CHINA LTD - H 354,000 83,000 12,000 425,000
BANK OF COMMUNICATIONS CO - H 40,000 7,000 - 47,000
BANK OF EAST ASIA 5,600 1,200 - 6,800
BANK OF INDIA 931 - - 931
BANK OF THE PHILIPPINE ISLAN 8,620 - - 8,620
BANK RAKYAT INDONESIA PERSER 52,900 268,000 34,100 286,800
BANPU PUBLIC CO LTD FOR REG 19,700 9,200 - 28,900
Vanguard ETF SeriesAnnual Report 2017
Vanguard FTSE Asia ex Japan Index ETF
-84-
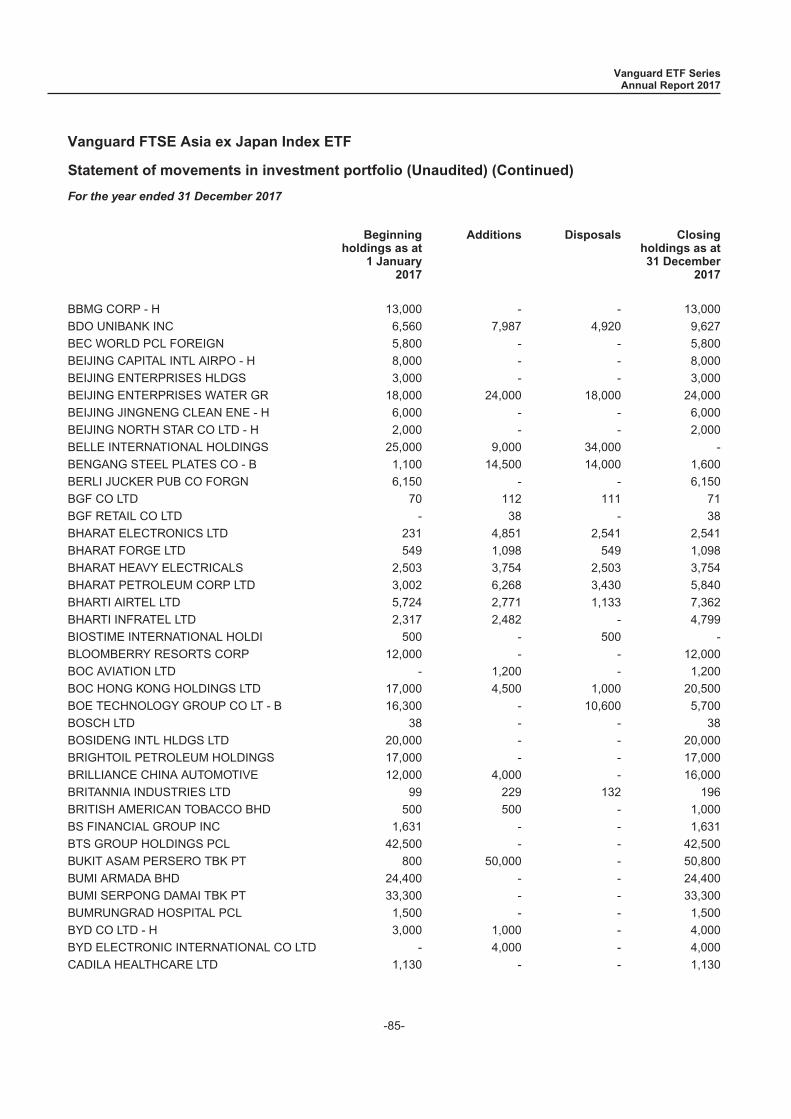
Statement of movements in investment portfolio (Unaudited) (Continued)
For the year ended 31 December 2017
Beginningholdings as at
1 January2017
Additions Disposals Closingholdings as at31 December
2017
BBMG CORP - H 13,000 - - 13,000
BDO UNIBANK INC 6,560 7,987 4,920 9,627
BEC WORLD PCL FOREIGN 5,800 - - 5,800
BEIJING CAPITAL INTL AIRPO - H 8,000 - - 8,000
BEIJING ENTERPRISES HLDGS 3,000 - - 3,000
BEIJING ENTERPRISES WATER GR 18,000 24,000 18,000 24,000
BEIJING JINGNENG CLEAN ENE - H 6,000 - - 6,000
BEIJING NORTH STAR CO LTD - H 2,000 - - 2,000
BELLE INTERNATIONAL HOLDINGS 25,000 9,000 34,000 -
BENGANG STEEL PLATES CO - B 1,100 14,500 14,000 1,600
BERLI JUCKER PUB CO FORGN 6,150 - - 6,150
BGF CO LTD 70 112 111 71
BGF RETAIL CO LTD - 38 - 38
BHARAT ELECTRONICS LTD 231 4,851 2,541 2,541
BHARAT FORGE LTD 549 1,098 549 1,098
BHARAT HEAVY ELECTRICALS 2,503 3,754 2,503 3,754
BHARAT PETROLEUM CORP LTD 3,002 6,268 3,430 5,840
BHARTI AIRTEL LTD 5,724 2,771 1,133 7,362
BHARTI INFRATEL LTD 2,317 2,482 - 4,799
BIOSTIME INTERNATIONAL HOLDI 500 - 500 -
BLOOMBERRY RESORTS CORP 12,000 - - 12,000
BOC AVIATION LTD - 1,200 - 1,200
BOC HONG KONG HOLDINGS LTD 17,000 4,500 1,000 20,500
BOE TECHNOLOGY GROUP CO LT - B 16,300 - 10,600 5,700
BOSCH LTD 38 - - 38
BOSIDENG INTL HLDGS LTD 20,000 - - 20,000
BRIGHTOIL PETROLEUM HOLDINGS 17,000 - - 17,000
BRILLIANCE CHINA AUTOMOTIVE 12,000 4,000 - 16,000
BRITANNIA INDUSTRIES LTD 99 229 132 196
BRITISH AMERICAN TOBACCO BHD 500 500 - 1,000
BS FINANCIAL GROUP INC 1,631 - - 1,631
BTS GROUP HOLDINGS PCL 42,500 - - 42,500
BUKIT ASAM PERSERO TBK PT 800 50,000 - 50,800
BUMI ARMADA BHD 24,400 - - 24,400
BUMI SERPONG DAMAI TBK PT 33,300 - - 33,300
BUMRUNGRAD HOSPITAL PCL 1,500 - - 1,500
BYD CO LTD - H 3,000 1,000 - 4,000
BYD ELECTRONIC INTERNATIONAL CO LTD - 4,000 - 4,000
CADILA HEALTHCARE LTD 1,130 - - 1,130
Vanguard ETF SeriesAnnual Report 2017
Vanguard FTSE Asia ex Japan Index ETF
-85-
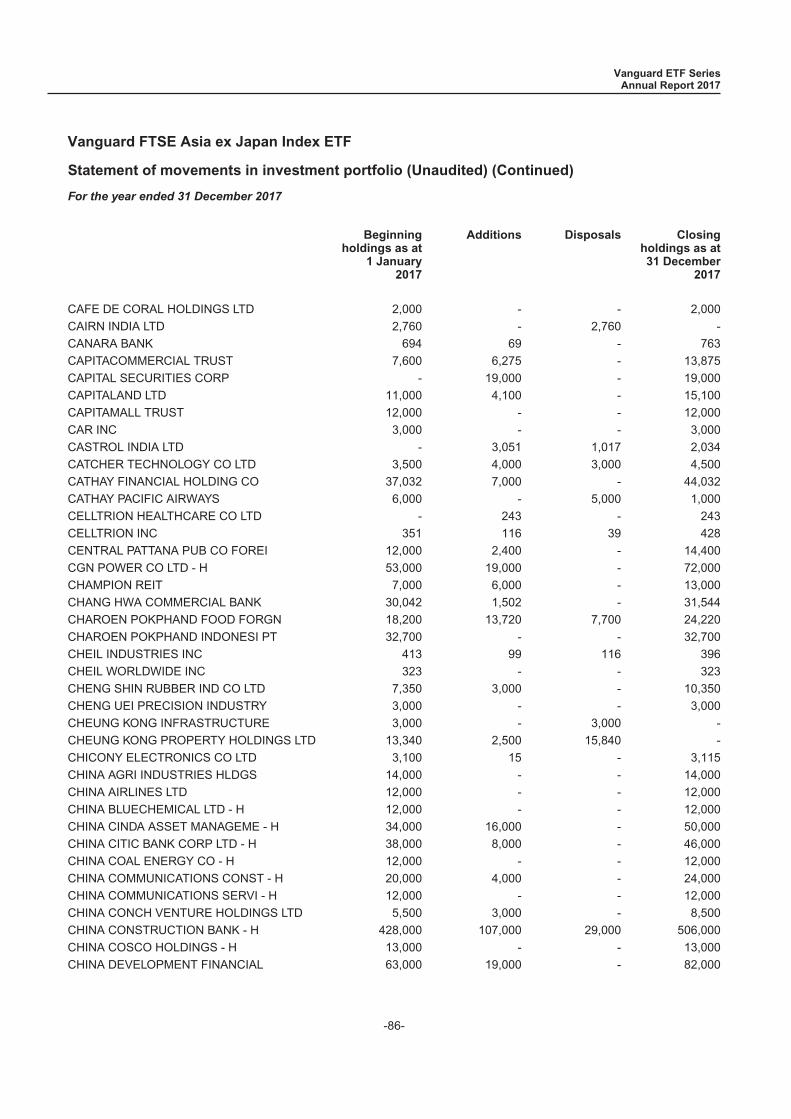
Statement of movements in investment portfolio (Unaudited) (Continued)
For the year ended 31 December 2017
Beginningholdings as at
1 January2017
Additions Disposals Closingholdings as at31 December
2017
CAFE DE CORAL HOLDINGS LTD 2,000 - - 2,000
CAIRN INDIA LTD 2,760 - 2,760 -
CANARA BANK 694 69 - 763
CAPITACOMMERCIAL TRUST 7,600 6,275 - 13,875
CAPITAL SECURITIES CORP - 19,000 - 19,000
CAPITALAND LTD 11,000 4,100 - 15,100
CAPITAMALL TRUST 12,000 - - 12,000
CAR INC 3,000 - - 3,000
CASTROL INDIA LTD - 3,051 1,017 2,034
CATCHER TECHNOLOGY CO LTD 3,500 4,000 3,000 4,500
CATHAY FINANCIAL HOLDING CO 37,032 7,000 - 44,032
CATHAY PACIFIC AIRWAYS 6,000 - 5,000 1,000
CELLTRION HEALTHCARE CO LTD - 243 - 243
CELLTRION INC 351 116 39 428
CENTRAL PATTANA PUB CO FOREI 12,000 2,400 - 14,400
CGN POWER CO LTD - H 53,000 19,000 - 72,000
CHAMPION REIT 7,000 6,000 - 13,000
CHANG HWA COMMERCIAL BANK 30,042 1,502 - 31,544
CHAROEN POKPHAND FOOD FORGN 18,200 13,720 7,700 24,220
CHAROEN POKPHAND INDONESI PT 32,700 - - 32,700
CHEIL INDUSTRIES INC 413 99 116 396
CHEIL WORLDWIDE INC 323 - - 323
CHENG SHIN RUBBER IND CO LTD 7,350 3,000 - 10,350
CHENG UEI PRECISION INDUSTRY 3,000 - - 3,000
CHEUNG KONG INFRASTRUCTURE 3,000 - 3,000 -
CHEUNG KONG PROPERTY HOLDINGS LTD 13,340 2,500 15,840 -
CHICONY ELECTRONICS CO LTD 3,100 15 - 3,115
CHINA AGRI INDUSTRIES HLDGS 14,000 - - 14,000
CHINA AIRLINES LTD 12,000 - - 12,000
CHINA BLUECHEMICAL LTD - H 12,000 - - 12,000
CHINA CINDA ASSET MANAGEME - H 34,000 16,000 - 50,000
CHINA CITIC BANK CORP LTD - H 38,000 8,000 - 46,000
CHINA COAL ENERGY CO - H 12,000 - - 12,000
CHINA COMMUNICATIONS CONST - H 20,000 4,000 - 24,000
CHINA COMMUNICATIONS SERVI - H 12,000 - - 12,000
CHINA CONCH VENTURE HOLDINGS LTD 5,500 3,000 - 8,500
CHINA CONSTRUCTION BANK - H 428,000 107,000 29,000 506,000
CHINA COSCO HOLDINGS - H 13,000 - - 13,000
CHINA DEVELOPMENT FINANCIAL 63,000 19,000 - 82,000
Vanguard ETF SeriesAnnual Report 2017
Vanguard FTSE Asia ex Japan Index ETF
-86-
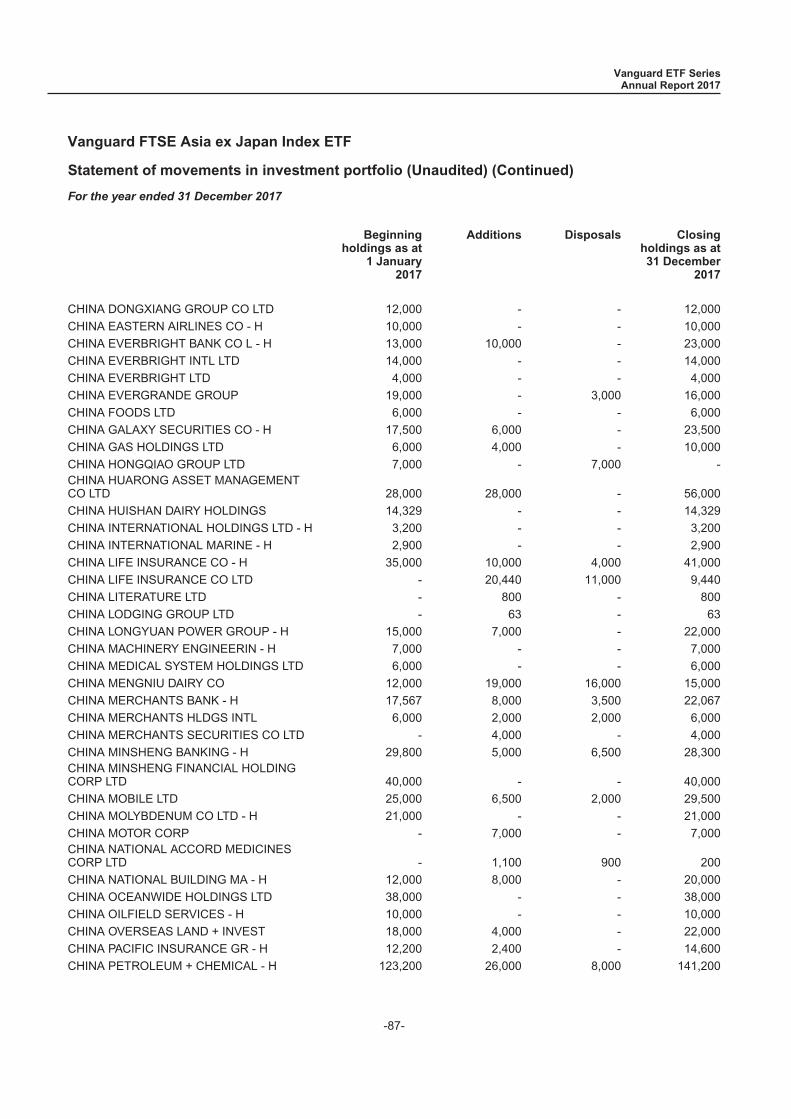
Statement of movements in investment portfolio (Unaudited) (Continued)
For the year ended 31 December 2017
Beginningholdings as at
1 January2017
Additions Disposals Closingholdings as at31 December
2017
CHINA DONGXIANG GROUP CO LTD 12,000 - - 12,000
CHINA EASTERN AIRLINES CO - H 10,000 - - 10,000
CHINA EVERBRIGHT BANK CO L - H 13,000 10,000 - 23,000
CHINA EVERBRIGHT INTL LTD 14,000 - - 14,000
CHINA EVERBRIGHT LTD 4,000 - - 4,000
CHINA EVERGRANDE GROUP 19,000 - 3,000 16,000
CHINA FOODS LTD 6,000 - - 6,000
CHINA GALAXY SECURITIES CO - H 17,500 6,000 - 23,500
CHINA GAS HOLDINGS LTD 6,000 4,000 - 10,000
CHINA HONGQIAO GROUP LTD 7,000 - 7,000 -CHINA HUARONG ASSET MANAGEMENTCO LTD 28,000 28,000 - 56,000
CHINA HUISHAN DAIRY HOLDINGS 14,329 - - 14,329
CHINA INTERNATIONAL HOLDINGS LTD - H 3,200 - - 3,200
CHINA INTERNATIONAL MARINE - H 2,900 - - 2,900
CHINA LIFE INSURANCE CO - H 35,000 10,000 4,000 41,000
CHINA LIFE INSURANCE CO LTD - 20,440 11,000 9,440
CHINA LITERATURE LTD - 800 - 800
CHINA LODGING GROUP LTD - 63 - 63
CHINA LONGYUAN POWER GROUP - H 15,000 7,000 - 22,000
CHINA MACHINERY ENGINEERIN - H 7,000 - - 7,000
CHINA MEDICAL SYSTEM HOLDINGS LTD 6,000 - - 6,000
CHINA MENGNIU DAIRY CO 12,000 19,000 16,000 15,000
CHINA MERCHANTS BANK - H 17,567 8,000 3,500 22,067
CHINA MERCHANTS HLDGS INTL 6,000 2,000 2,000 6,000
CHINA MERCHANTS SECURITIES CO LTD - 4,000 - 4,000
CHINA MINSHENG BANKING - H 29,800 5,000 6,500 28,300CHINA MINSHENG FINANCIAL HOLDINGCORP LTD 40,000 - - 40,000
CHINA MOBILE LTD 25,000 6,500 2,000 29,500
CHINA MOLYBDENUM CO LTD - H 21,000 - - 21,000
CHINA MOTOR CORP - 7,000 - 7,000CHINA NATIONAL ACCORD MEDICINESCORP LTD - 1,100 900 200
CHINA NATIONAL BUILDING MA - H 12,000 8,000 - 20,000
CHINA OCEANWIDE HOLDINGS LTD 38,000 - - 38,000
CHINA OILFIELD SERVICES - H 10,000 - - 10,000
CHINA OVERSEAS LAND + INVEST 18,000 4,000 - 22,000
CHINA PACIFIC INSURANCE GR - H 12,200 2,400 - 14,600
CHINA PETROLEUM + CHEMICAL - H 123,200 26,000 8,000 141,200
Vanguard ETF SeriesAnnual Report 2017
Vanguard FTSE Asia ex Japan Index ETF
-87-

Statement of movements in investment portfolio (Unaudited) (Continued)
For the year ended 31 December 2017
Beginningholdings as at
1 January2017
Additions Disposals Closingholdings as at31 December
2017
CHINA POWER INTERNATIONALDEVELOPMENT LTD 12,000 24,000 - 36,000
CHINA RAILWAY CONSTRUCTION - H 10,500 - - 10,500
CHINA RAILWAY GROUP LTD - H 17,000 7,000 - 24,000CHINA RAILWAY SIGNAL &COMMUNICATION CORP LTD - H 7,000 - - 7,000
CHINA REINSURANCE GROUP CORP - H 30,000 - - 30,000
CHINA RESOURCES CEMENT 12,000 - - 12,000
CHINA RESOURCES ENTERPRISE 8,000 2,000 2,000 8,000
CHINA RESOURCES GAS GROUP LT 4,000 2,000 2,000 4,000
CHINA RESOURCES LAND LTD 12,222 4,000 2,000 14,222CHINA RESOURCES PHARMACEUTICALGROUP LTD - 11,000 - 11,000
CHINA RESOURCES POWER HOLDIN 10,000 - - 10,000
CHINA SHENHUA ENERGY CO - H 16,000 4,000 - 20,000
CHINA SHIPPING CONTAINER - H 21,000 - - 21,000
CHINA SHIPPING DEVELOPMENT - H 6,000 - - 6,000
CHINA SOUTHERN AIRLINES CO - H 10,000 - - 10,000
CHINA STATE CONSTRUCTION INT 8,000 5,500 4,000 9,500
CHINA STEEL CORP 55,204 20,000 7,000 68,204
CHINA TAIPING INSURANCE HOLD 7,966 - - 7,966
CHINA TELECOM CORP LTD - H 70,000 12,000 - 82,000CHINA TRADITIONAL CHINESE MEDICINECO LTD 6,000 12,000 8,000 10,000
CHINA TRAVEL INTL INV HK 6,000 18,000 - 24,000
CHINA UNICOM HONG KONG LTD 28,000 4,000 - 32,000
CHINA VANKE CO LTD - H 5,400 2,300 - 7,700
CHONGQING CHANGAN AUTOMOB - B 2,300 9,000 4,600 6,700
CHONGQING RURAL COMMERCIAL - H 14,000 - - 14,000
CHOW TAI FOOK JEWELLERY GROU 5,600 - - 5,600
CHUNGHWA TELECOM CO LTD 18,000 3,000 - 21,000
CIMB GROUP HOLDINGS BHD 25,500 12,200 - 37,700
CIMC ENRIC HOLDINGS LTD 2,000 - - 2,000
CIPLA LTD 1,584 525 - 2,109
CITIC LTD 25,000 3,000 - 28,000
CITIC SECURITIES CO LTD - H 11,500 2,500 - 14,000
CITY DEVELOPMENTS LTD 3,000 - 800 2,200
CJ CHEILJEDANG CORP 32 18 - 50
CJ CORP 66 - - 66
CJ LOGISTICS CORP 21 29 - 50
CK ASSET HOLDINGS LTD - 16,340 1,000 15,340
Vanguard ETF SeriesAnnual Report 2017
Vanguard FTSE Asia ex Japan Index ETF
-88-
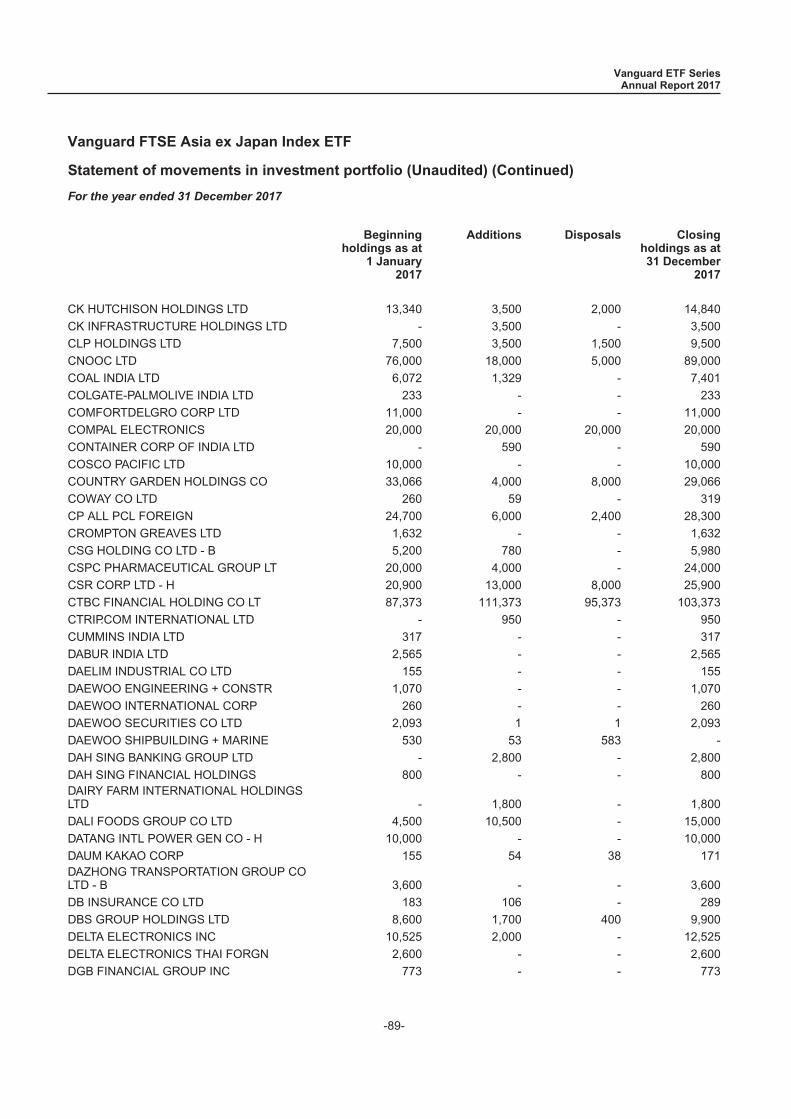
Statement of movements in investment portfolio (Unaudited) (Continued)
For the year ended 31 December 2017
Beginningholdings as at
1 January2017
Additions Disposals Closingholdings as at31 December
2017
CK HUTCHISON HOLDINGS LTD 13,340 3,500 2,000 14,840
CK INFRASTRUCTURE HOLDINGS LTD - 3,500 - 3,500
CLP HOLDINGS LTD 7,500 3,500 1,500 9,500
CNOOC LTD 76,000 18,000 5,000 89,000
COAL INDIA LTD 6,072 1,329 - 7,401
COLGATE-PALMOLIVE INDIA LTD 233 - - 233
COMFORTDELGRO CORP LTD 11,000 - - 11,000
COMPAL ELECTRONICS 20,000 20,000 20,000 20,000
CONTAINER CORP OF INDIA LTD - 590 - 590
COSCO PACIFIC LTD 10,000 - - 10,000
COUNTRY GARDEN HOLDINGS CO 33,066 4,000 8,000 29,066
COWAY CO LTD 260 59 - 319
CP ALL PCL FOREIGN 24,700 6,000 2,400 28,300
CROMPTON GREAVES LTD 1,632 - - 1,632
CSG HOLDING CO LTD - B 5,200 780 - 5,980
CSPC PHARMACEUTICAL GROUP LT 20,000 4,000 - 24,000
CSR CORP LTD - H 20,900 13,000 8,000 25,900
CTBC FINANCIAL HOLDING CO LT 87,373 111,373 95,373 103,373
CTRIP.COM INTERNATIONAL LTD - 950 - 950
CUMMINS INDIA LTD 317 - - 317
DABUR INDIA LTD 2,565 - - 2,565
DAELIM INDUSTRIAL CO LTD 155 - - 155
DAEWOO ENGINEERING + CONSTR 1,070 - - 1,070
DAEWOO INTERNATIONAL CORP 260 - - 260
DAEWOO SECURITIES CO LTD 2,093 1 1 2,093
DAEWOO SHIPBUILDING + MARINE 530 53 583 -
DAH SING BANKING GROUP LTD - 2,800 - 2,800
DAH SING FINANCIAL HOLDINGS 800 - - 800DAIRY FARM INTERNATIONAL HOLDINGSLTD - 1,800 - 1,800
DALI FOODS GROUP CO LTD 4,500 10,500 - 15,000
DATANG INTL POWER GEN CO - H 10,000 - - 10,000
DAUM KAKAO CORP 155 54 38 171DAZHONG TRANSPORTATION GROUP COLTD - B 3,600 - - 3,600
DB INSURANCE CO LTD 183 106 - 289
DBS GROUP HOLDINGS LTD 8,600 1,700 400 9,900
DELTA ELECTRONICS INC 10,525 2,000 - 12,525
DELTA ELECTRONICS THAI FORGN 2,600 - - 2,600
DGB FINANCIAL GROUP INC 773 - - 773
Vanguard ETF SeriesAnnual Report 2017
Vanguard FTSE Asia ex Japan Index ETF
-89-

Statement of movements in investment portfolio (Unaudited) (Continued)
For the year ended 31 December 2017
Beginningholdings as at
1 January2017
Additions Disposals Closingholdings as at31 December
2017
DIGI.COM BHD 19,100 - - 19,100
DIVI S LABORATORIES LTD 312 - - 312
DLF LTD 3,168 - - 3,168
DMCI HOLDINGS INC 23,600 - - 23,600
DONGFANG ELECTRIC CORP LTD - H 1,800 - - 1,800
DONGFENG MOTOR GRP CO LTD - H 16,000 - - 16,000
DONGSUH COS INC 159 - - 159
DOOSAN CORP 61 - - 61
DOOSAN HEAVY INDUSTRIES 230 275 - 505
DOOSAN INFRACORE CO LTD 750 - - 750
DR. REDDY S LABORATORIES 406 - - 406
E MART CO LTD 87 31 - 118
E.SUN FINANCIAL HOLDING CO 43,214 26,573 10,000 59,787
ECLAT TEXTILE CO LTD 1,022 20 - 1,042
EICHER MOTORS LTD 63 14 - 77
ELECTRICITY GEN PUB CO FOR R 1,500 - - 1,500
EMAMI LTD 274 - - 274
ENERGY ABSOLUTE PCL - 9,700 - 9,700
ENERGY DEVELOPMENT CORP 24,800 42,800 57,450 10,150
ENN ENERGY HOLDINGS LTD 3,013 1,117 - 4,130
EPISTAR CORP 5,000 - - 5,000
ESPRIT HOLDINGS LTD 11,000 - - 11,000
ETERNAL MATERIALS CO LTD 2,451 6,222 4,000 4,673
EVA AIRWAYS CORP 10,841 325 - 11,166
EVERGREEN MARINE CORP LTD 10,100 1,150 - 11,250
EXIDE INDUSTRIES LTD - 1,801 - 1,801
FAR EAST HORIZON LTD 9,000 6,000 - 15,000
FAR EASTERN INTERNATIONAL BANK - 20,460 19,000 1,460
FAR EASTERN NEW CENTURY CORP 22,284 - - 22,284
FAR EASTONE TELECOMM CO LTD 8,000 8,000 8,000 8,000
FAUJI FERTILIZER COMPANY LTD 3,000 - - 3,000
FELDA GLOBAL VENTURES 12,600 - - 12,600
FEN TAY ENTERPRISE CO LTD 1,120 1,000 - 2,120
FIH MOBILE LTD 14,000 - - 14,000
FIRST FINANCIAL HOLDING CO 48,045 7,960 - 56,005
FIRST PACIFIC CO 13,500 - - 13,500
FORMOSA CHEMICALS + FIBRE 20,750 2,000 5,000 17,750
FORMOSA PETROCHEMICAL CORP 7,000 1,000 - 8,000
FORMOSA PLASTICS CORP 22,120 8,000 4,000 26,120
Vanguard ETF SeriesAnnual Report 2017
Vanguard FTSE Asia ex Japan Index ETF
-90-

Statement of movements in investment portfolio (Unaudited) (Continued)
For the year ended 31 December 2017
Beginningholdings as at
1 January2017
Additions Disposals Closingholdings as at31 December
2017
FORMOSA TAFFETA CO. 7,000 - - 7,000
FOSUN INTERNATIONAL 9,452 4,000 - 13,452
FOXCONN TECHNOLOGY CO LTD 4,727 2,000 - 6,727
FRANSHION PROPERTIES 24,000 - - 24,000
FUBON FINANCIAL HOLDING CO 35,000 7,000 - 42,000
FULLSHARE HOLDINGS LTD 37,498 49,998 47,498 39,998FUYAO GLASS INDUSTRY GROUP CO LTD -H 2,000 1,200 - 3,200
GAIL INDIA LTD 1,540 2,053 1,540 2,053
GALAXY ENTERTAINMENT GROUP L 10,000 2,000 - 12,000
GAMUDA BHD 11,500 - - 11,500
GCL POLY ENERGY HOLDINGS LTD 58,000 - - 58,000
GEELY AUTOMOBILE HOLDINGS LT 25,000 2,000 - 27,000
GENTING BHD 9,600 2,900 - 12,500
GENTING MALAYSIA BHD 13,500 3,500 - 17,000
GENTING SINGAPORE PLC 26,000 5,800 - 31,800
GF SECURITIES CO LTD - H 7,800 2,400 - 10,200
GIANT MANUFACTURING 1,000 1,000 - 2,000
GLAXOSMITHKLINE CONSUMER HEA 51 - - 51
GLENMARK PHARMACEUTICALS LTD 639 - - 639
GLOBAL BRANDS GROUP HOLDING 34,000 - - 34,000
GLOBAL LOGISTIC PROPERTIES L 13,000 4,400 - 17,400
GLOBAL MEDIACOM TBK PT 29,000 - 29,000 -
GLOBE TELECOM INC 55 120 - 175
GLOW ENERGY PCL FOREIGN 3,500 - 2,300 1,200
GMR INFRASTRUCTURE LTD 12,216 - - 12,216
GODREJ CONSUMER PRODUCTS LTD 541 1,601 714 1,428
GODREJ INDUSTRIES LTD - 639 - 639
GOLDEN AGRI RESOURCES LTD 32,400 - - 32,400
GOLDEN EAGLE RETAIL GROUP 3,000 - - 3,000
GOME RETAIL HOLDINGS LTD 28,000 46,000 - 74,000
GRASIM INDUSTRIES LTD - 2,112 253 1,859
GREAT EAGLE HOLDINGS LTD 2,000 - - 2,000
GREAT WALL MOTOR COMPANY - H 15,000 4,000 - 19,000
GREENTOWN CHINA HOLDINGS 4,500 - - 4,500
GS ENGINEERING + CONSTRUCT 204 - - 204
GS HOLDINGS 286 - - 286
GS RETAIL CO LTD - 137 - 137
GT CAPITAL HOLDINGS INC 280 205 - 485
GUANGDONG INVESTMENT LTD 14,000 4,000 - 18,000
Vanguard ETF SeriesAnnual Report 2017
Vanguard FTSE Asia ex Japan Index ETF
-91-
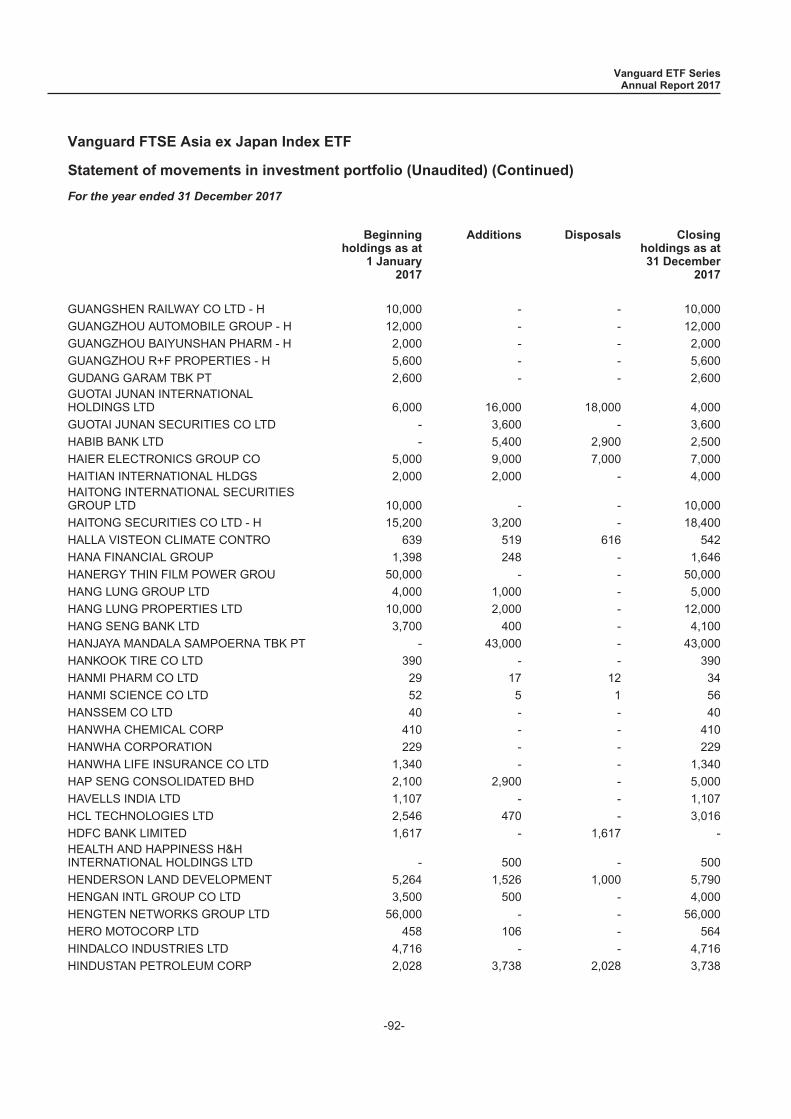
Statement of movements in investment portfolio (Unaudited) (Continued)
For the year ended 31 December 2017
Beginningholdings as at
1 January2017
Additions Disposals Closingholdings as at31 December
2017
GUANGSHEN RAILWAY CO LTD - H 10,000 - - 10,000
GUANGZHOU AUTOMOBILE GROUP - H 12,000 - - 12,000
GUANGZHOU BAIYUNSHAN PHARM - H 2,000 - - 2,000
GUANGZHOU R+F PROPERTIES - H 5,600 - - 5,600
GUDANG GARAM TBK PT 2,600 - - 2,600GUOTAI JUNAN INTERNATIONALHOLDINGS LTD 6,000 16,000 18,000 4,000
GUOTAI JUNAN SECURITIES CO LTD - 3,600 - 3,600
HABIB BANK LTD - 5,400 2,900 2,500
HAIER ELECTRONICS GROUP CO 5,000 9,000 7,000 7,000
HAITIAN INTERNATIONAL HLDGS 2,000 2,000 - 4,000HAITONG INTERNATIONAL SECURITIESGROUP LTD 10,000 - - 10,000
HAITONG SECURITIES CO LTD - H 15,200 3,200 - 18,400
HALLA VISTEON CLIMATE CONTRO 639 519 616 542
HANA FINANCIAL GROUP 1,398 248 - 1,646
HANERGY THIN FILM POWER GROU 50,000 - - 50,000
HANG LUNG GROUP LTD 4,000 1,000 - 5,000
HANG LUNG PROPERTIES LTD 10,000 2,000 - 12,000
HANG SENG BANK LTD 3,700 400 - 4,100
HANJAYA MANDALA SAMPOERNA TBK PT - 43,000 - 43,000
HANKOOK TIRE CO LTD 390 - - 390
HANMI PHARM CO LTD 29 17 12 34
HANMI SCIENCE CO LTD 52 5 1 56
HANSSEM CO LTD 40 - - 40
HANWHA CHEMICAL CORP 410 - - 410
HANWHA CORPORATION 229 - - 229
HANWHA LIFE INSURANCE CO LTD 1,340 - - 1,340
HAP SENG CONSOLIDATED BHD 2,100 2,900 - 5,000
HAVELLS INDIA LTD 1,107 - - 1,107
HCL TECHNOLOGIES LTD 2,546 470 - 3,016
HDFC BANK LIMITED 1,617 - 1,617 -HEALTH AND HAPPINESS H&HINTERNATIONAL HOLDINGS LTD - 500 - 500
HENDERSON LAND DEVELOPMENT 5,264 1,526 1,000 5,790
HENGAN INTL GROUP CO LTD 3,500 500 - 4,000
HENGTEN NETWORKS GROUP LTD 56,000 - - 56,000
HERO MOTOCORP LTD 458 106 - 564
HINDALCO INDUSTRIES LTD 4,716 - - 4,716
HINDUSTAN PETROLEUM CORP 2,028 3,738 2,028 3,738
Vanguard ETF SeriesAnnual Report 2017
Vanguard FTSE Asia ex Japan Index ETF
-92-
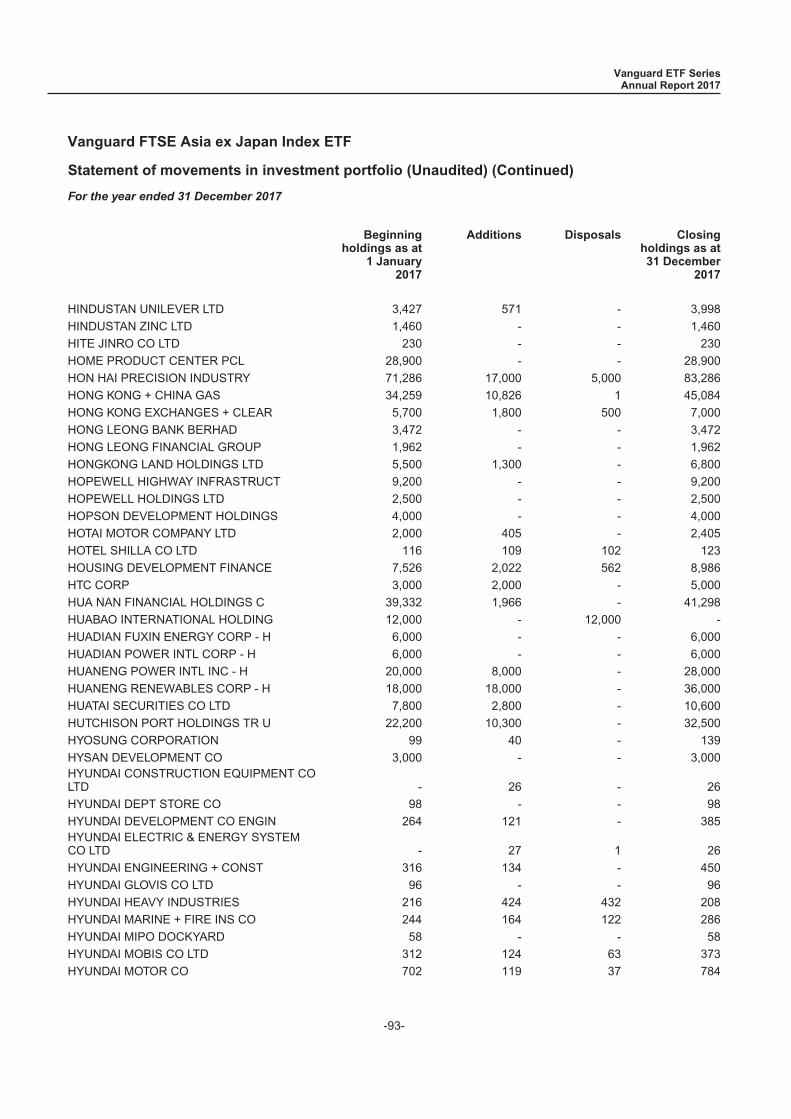
Statement of movements in investment portfolio (Unaudited) (Continued)
For the year ended 31 December 2017
Beginningholdings as at
1 January2017
Additions Disposals Closingholdings as at31 December
2017
HINDUSTAN UNILEVER LTD 3,427 571 - 3,998
HINDUSTAN ZINC LTD 1,460 - - 1,460
HITE JINRO CO LTD 230 - - 230
HOME PRODUCT CENTER PCL 28,900 - - 28,900
HON HAI PRECISION INDUSTRY 71,286 17,000 5,000 83,286
HONG KONG + CHINA GAS 34,259 10,826 1 45,084
HONG KONG EXCHANGES + CLEAR 5,700 1,800 500 7,000
HONG LEONG BANK BERHAD 3,472 - - 3,472
HONG LEONG FINANCIAL GROUP 1,962 - - 1,962
HONGKONG LAND HOLDINGS LTD 5,500 1,300 - 6,800
HOPEWELL HIGHWAY INFRASTRUCT 9,200 - - 9,200
HOPEWELL HOLDINGS LTD 2,500 - - 2,500
HOPSON DEVELOPMENT HOLDINGS 4,000 - - 4,000
HOTAI MOTOR COMPANY LTD 2,000 405 - 2,405
HOTEL SHILLA CO LTD 116 109 102 123
HOUSING DEVELOPMENT FINANCE 7,526 2,022 562 8,986
HTC CORP 3,000 2,000 - 5,000
HUA NAN FINANCIAL HOLDINGS C 39,332 1,966 - 41,298
HUABAO INTERNATIONAL HOLDING 12,000 - 12,000 -
HUADIAN FUXIN ENERGY CORP - H 6,000 - - 6,000
HUADIAN POWER INTL CORP - H 6,000 - - 6,000
HUANENG POWER INTL INC - H 20,000 8,000 - 28,000
HUANENG RENEWABLES CORP - H 18,000 18,000 - 36,000
HUATAI SECURITIES CO LTD 7,800 2,800 - 10,600
HUTCHISON PORT HOLDINGS TR U 22,200 10,300 - 32,500
HYOSUNG CORPORATION 99 40 - 139
HYSAN DEVELOPMENT CO 3,000 - - 3,000HYUNDAI CONSTRUCTION EQUIPMENT COLTD - 26 - 26
HYUNDAI DEPT STORE CO 98 - - 98
HYUNDAI DEVELOPMENT CO ENGIN 264 121 - 385HYUNDAI ELECTRIC & ENERGY SYSTEMCO LTD - 27 1 26
HYUNDAI ENGINEERING + CONST 316 134 - 450
HYUNDAI GLOVIS CO LTD 96 - - 96
HYUNDAI HEAVY INDUSTRIES 216 424 432 208
HYUNDAI MARINE + FIRE INS CO 244 164 122 286
HYUNDAI MIPO DOCKYARD 58 - - 58
HYUNDAI MOBIS CO LTD 312 124 63 373
HYUNDAI MOTOR CO 702 119 37 784
Vanguard ETF SeriesAnnual Report 2017
Vanguard FTSE Asia ex Japan Index ETF
-93-
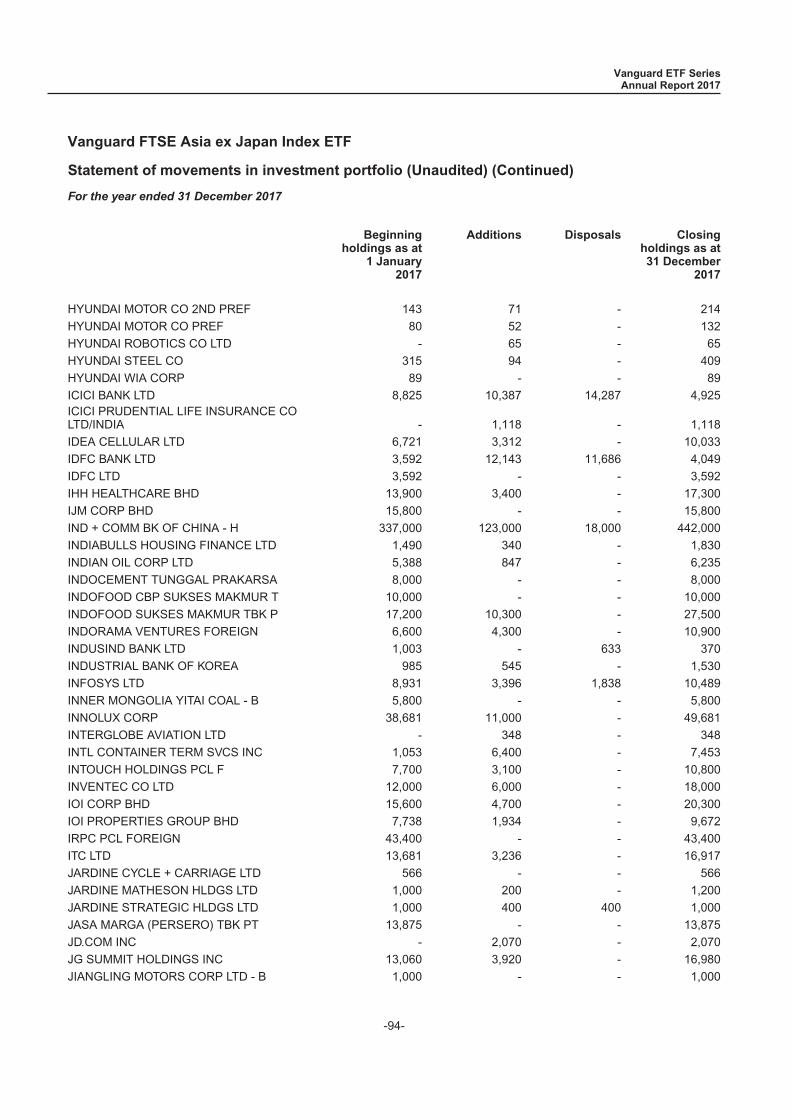
Statement of movements in investment portfolio (Unaudited) (Continued)
For the year ended 31 December 2017
Beginningholdings as at
1 January2017
Additions Disposals Closingholdings as at31 December
2017
HYUNDAI MOTOR CO 2ND PREF 143 71 - 214
HYUNDAI MOTOR CO PREF 80 52 - 132
HYUNDAI ROBOTICS CO LTD - 65 - 65
HYUNDAI STEEL CO 315 94 - 409
HYUNDAI WIA CORP 89 - - 89
ICICI BANK LTD 8,825 10,387 14,287 4,925ICICI PRUDENTIAL LIFE INSURANCE COLTD/INDIA - 1,118 - 1,118
IDEA CELLULAR LTD 6,721 3,312 - 10,033
IDFC BANK LTD 3,592 12,143 11,686 4,049
IDFC LTD 3,592 - - 3,592
IHH HEALTHCARE BHD 13,900 3,400 - 17,300
IJM CORP BHD 15,800 - - 15,800
IND + COMM BK OF CHINA - H 337,000 123,000 18,000 442,000
INDIABULLS HOUSING FINANCE LTD 1,490 340 - 1,830
INDIAN OIL CORP LTD 5,388 847 - 6,235
INDOCEMENT TUNGGAL PRAKARSA 8,000 - - 8,000
INDOFOOD CBP SUKSES MAKMUR T 10,000 - - 10,000
INDOFOOD SUKSES MAKMUR TBK P 17,200 10,300 - 27,500
INDORAMA VENTURES FOREIGN 6,600 4,300 - 10,900
INDUSIND BANK LTD 1,003 - 633 370
INDUSTRIAL BANK OF KOREA 985 545 - 1,530
INFOSYS LTD 8,931 3,396 1,838 10,489
INNER MONGOLIA YITAI COAL - B 5,800 - - 5,800
INNOLUX CORP 38,681 11,000 - 49,681
INTERGLOBE AVIATION LTD - 348 - 348
INTL CONTAINER TERM SVCS INC 1,053 6,400 - 7,453
INTOUCH HOLDINGS PCL F 7,700 3,100 - 10,800
INVENTEC CO LTD 12,000 6,000 - 18,000
IOI CORP BHD 15,600 4,700 - 20,300
IOI PROPERTIES GROUP BHD 7,738 1,934 - 9,672
IRPC PCL FOREIGN 43,400 - - 43,400
ITC LTD 13,681 3,236 - 16,917
JARDINE CYCLE + CARRIAGE LTD 566 - - 566
JARDINE MATHESON HLDGS LTD 1,000 200 - 1,200
JARDINE STRATEGIC HLDGS LTD 1,000 400 400 1,000
JASA MARGA (PERSERO) TBK PT 13,875 - - 13,875
JD.COM INC - 2,070 - 2,070
JG SUMMIT HOLDINGS INC 13,060 3,920 - 16,980
JIANGLING MOTORS CORP LTD - B 1,000 - - 1,000
Vanguard ETF SeriesAnnual Report 2017
Vanguard FTSE Asia ex Japan Index ETF
-94-
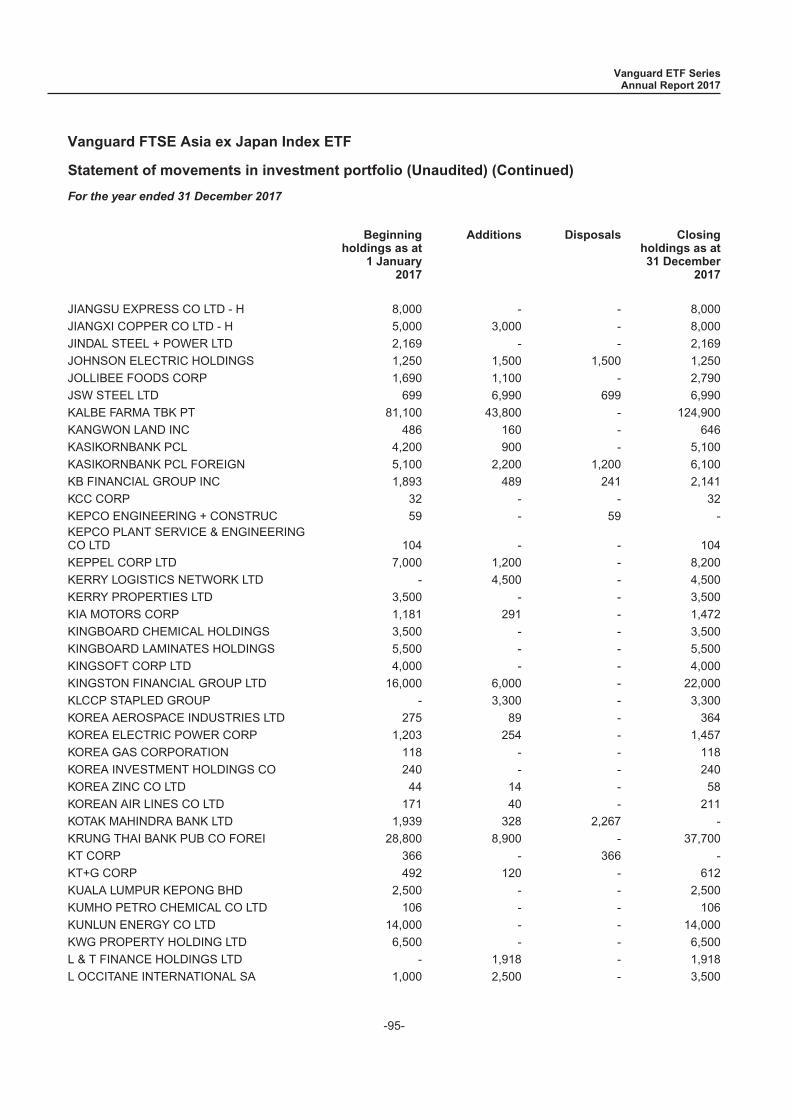
Statement of movements in investment portfolio (Unaudited) (Continued)
For the year ended 31 December 2017
Beginningholdings as at
1 January2017
Additions Disposals Closingholdings as at31 December
2017
JIANGSU EXPRESS CO LTD - H 8,000 - - 8,000
JIANGXI COPPER CO LTD - H 5,000 3,000 - 8,000
JINDAL STEEL + POWER LTD 2,169 - - 2,169
JOHNSON ELECTRIC HOLDINGS 1,250 1,500 1,500 1,250
JOLLIBEE FOODS CORP 1,690 1,100 - 2,790
JSW STEEL LTD 699 6,990 699 6,990
KALBE FARMA TBK PT 81,100 43,800 - 124,900
KANGWON LAND INC 486 160 - 646
KASIKORNBANK PCL 4,200 900 - 5,100
KASIKORNBANK PCL FOREIGN 5,100 2,200 1,200 6,100
KB FINANCIAL GROUP INC 1,893 489 241 2,141
KCC CORP 32 - - 32
KEPCO ENGINEERING + CONSTRUC 59 - 59 -KEPCO PLANT SERVICE & ENGINEERINGCO LTD 104 - - 104
KEPPEL CORP LTD 7,000 1,200 - 8,200
KERRY LOGISTICS NETWORK LTD - 4,500 - 4,500
KERRY PROPERTIES LTD 3,500 - - 3,500
KIA MOTORS CORP 1,181 291 - 1,472
KINGBOARD CHEMICAL HOLDINGS 3,500 - - 3,500
KINGBOARD LAMINATES HOLDINGS 5,500 - - 5,500
KINGSOFT CORP LTD 4,000 - - 4,000
KINGSTON FINANCIAL GROUP LTD 16,000 6,000 - 22,000
KLCCP STAPLED GROUP - 3,300 - 3,300
KOREA AEROSPACE INDUSTRIES LTD 275 89 - 364
KOREA ELECTRIC POWER CORP 1,203 254 - 1,457
KOREA GAS CORPORATION 118 - - 118
KOREA INVESTMENT HOLDINGS CO 240 - - 240
KOREA ZINC CO LTD 44 14 - 58
KOREAN AIR LINES CO LTD 171 40 - 211
KOTAK MAHINDRA BANK LTD 1,939 328 2,267 -
KRUNG THAI BANK PUB CO FOREI 28,800 8,900 - 37,700
KT CORP 366 - 366 -
KT+G CORP 492 120 - 612
KUALA LUMPUR KEPONG BHD 2,500 - - 2,500
KUMHO PETRO CHEMICAL CO LTD 106 - - 106
KUNLUN ENERGY CO LTD 14,000 - - 14,000
KWG PROPERTY HOLDING LTD 6,500 - - 6,500
L & T FINANCE HOLDINGS LTD - 1,918 - 1,918
L OCCITANE INTERNATIONAL SA 1,000 2,500 - 3,500
Vanguard ETF SeriesAnnual Report 2017
Vanguard FTSE Asia ex Japan Index ETF
-95-

Statement of movements in investment portfolio (Unaudited) (Continued)
For the year ended 31 December 2017
Beginningholdings as at
1 January2017
Additions Disposals Closingholdings as at31 December
2017
LAFARGE MALAYSIA BHD 1,400 - 1,400 -
LAND + HOUSES PUB CO FOR REG 17,000 21,200 - 38,200
LAO FENG XIANG CO LTD - B 1,500 - - 1,500
LARGAN PRECISION CO LTD 460 107 - 567
LARSEN + TOUBRO LTD 1,210 2,074 1,526 1,758
LEE + MAN PAPER MANUFACTURIN 10,000 - - 10,000
LEGEND HOLDINGS CORP - H 1,600 - - 1,600
LENOVO GROUP LTD 30,000 8,000 - 38,000
LG CHEM LTD 213 59 18 254
LG CHEM LTD PREF 38 - - 38
LG CORP 395 144 96 443
LG DISPLAY CO LTD 1,100 159 - 1,259
LG ELECTRONICS INC 507 75 - 582
LG ELECTRONICS INC PREF - 251 162 89
LG HAUSYS LTD 48 - - 48
LG HOUSEHOLD & HEALTH CARE LTD 8 20 12 16
LG HOUSEHOLD + HEALTH CARE 40 9 - 49
LG UPLUS CORP 836 352 - 1,188
LI + FUNG LTD 26,000 14,000 12,000 28,000
LI NING CO LTD 6,375 - - 6,375
LIC HOUSING FINANCE LTD 819 718 - 1,537
LIFESTYLE INTL HLDGS LTD 3,000 - - 3,000
LINK REIT 11,000 1,500 - 12,500
LITE ON TECHNOLOGY CORP 8,219 4,000 - 12,219
LOGAN PROPERTY HOLDINGS CO LTD - 8,000 - 8,000
LONGFOR PROPERTIES 6,000 2,500 - 8,500
LOTTE CHEMICAL CORP 65 18 - 83
LOTTE CHILSUNG BEVERAGE CO 3 2 4 1
LOTTE CONFECTIONERY CO LTD/NEW - 6 1 5
LOTTE CORP 20 126 21 125
LOTTE SHOPPING CO 39 71 59 51
LS CORP 94 - - 94
LT GROUP INC 11,800 - - 11,800
LUPIN LTD 1,066 316 - 1,382
LUYE PHARMA GROUP LTD 6,000 9,000 - 15,000
M1 LTD 2,400 - - 2,400
MAANSHAN IRON & STEEL CO LTD - 12,000 - 12,000
MACAU LEGEND DEVELOPMENT LTD 8,000 - - 8,000
MAHINDRA + MAHINDRA FIN SECS 1,280 - - 1,280
Vanguard ETF SeriesAnnual Report 2017
Vanguard FTSE Asia ex Japan Index ETF
-96-
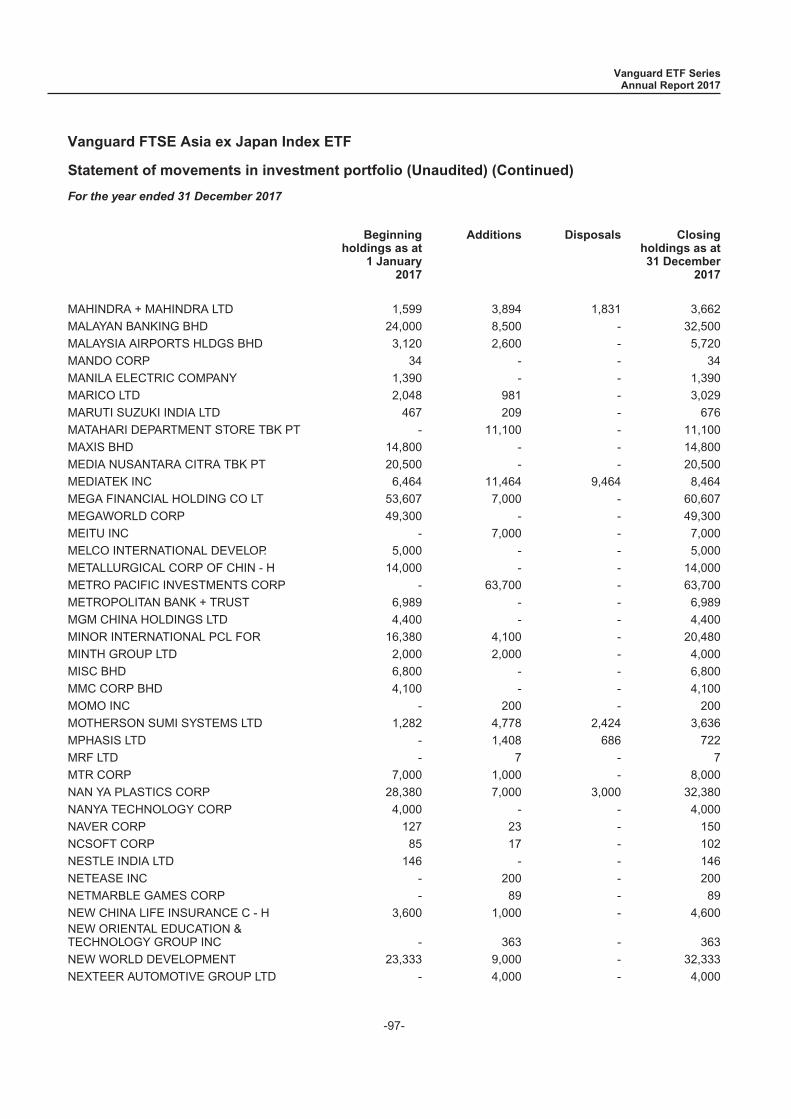
Statement of movements in investment portfolio (Unaudited) (Continued)
For the year ended 31 December 2017
Beginningholdings as at
1 January2017
Additions Disposals Closingholdings as at31 December
2017
MAHINDRA + MAHINDRA LTD 1,599 3,894 1,831 3,662
MALAYAN BANKING BHD 24,000 8,500 - 32,500
MALAYSIA AIRPORTS HLDGS BHD 3,120 2,600 - 5,720
MANDO CORP 34 - - 34
MANILA ELECTRIC COMPANY 1,390 - - 1,390
MARICO LTD 2,048 981 - 3,029
MARUTI SUZUKI INDIA LTD 467 209 - 676
MATAHARI DEPARTMENT STORE TBK PT - 11,100 - 11,100
MAXIS BHD 14,800 - - 14,800
MEDIA NUSANTARA CITRA TBK PT 20,500 - - 20,500
MEDIATEK INC 6,464 11,464 9,464 8,464
MEGA FINANCIAL HOLDING CO LT 53,607 7,000 - 60,607
MEGAWORLD CORP 49,300 - - 49,300
MEITU INC - 7,000 - 7,000
MELCO INTERNATIONAL DEVELOP. 5,000 - - 5,000
METALLURGICAL CORP OF CHIN - H 14,000 - - 14,000
METRO PACIFIC INVESTMENTS CORP - 63,700 - 63,700
METROPOLITAN BANK + TRUST 6,989 - - 6,989
MGM CHINA HOLDINGS LTD 4,400 - - 4,400
MINOR INTERNATIONAL PCL FOR 16,380 4,100 - 20,480
MINTH GROUP LTD 2,000 2,000 - 4,000
MISC BHD 6,800 - - 6,800
MMC CORP BHD 4,100 - - 4,100
MOMO INC - 200 - 200
MOTHERSON SUMI SYSTEMS LTD 1,282 4,778 2,424 3,636
MPHASIS LTD - 1,408 686 722
MRF LTD - 7 - 7
MTR CORP 7,000 1,000 - 8,000
NAN YA PLASTICS CORP 28,380 7,000 3,000 32,380
NANYA TECHNOLOGY CORP 4,000 - - 4,000
NAVER CORP 127 23 - 150
NCSOFT CORP 85 17 - 102
NESTLE INDIA LTD 146 - - 146
NETEASE INC - 200 - 200
NETMARBLE GAMES CORP - 89 - 89
NEW CHINA LIFE INSURANCE C - H 3,600 1,000 - 4,600NEW ORIENTAL EDUCATION &TECHNOLOGY GROUP INC - 363 - 363
NEW WORLD DEVELOPMENT 23,333 9,000 - 32,333
NEXTEER AUTOMOTIVE GROUP LTD - 4,000 - 4,000
Vanguard ETF SeriesAnnual Report 2017
Vanguard FTSE Asia ex Japan Index ETF
-97-

Statement of movements in investment portfolio (Unaudited) (Continued)
For the year ended 31 December 2017
Beginningholdings as at
1 January2017
Additions Disposals Closingholdings as at31 December
2017
NHN ENTERTAINMENT CORP 97 - - 97
NHPC LTD 12,500 - - 12,500
NINE DRAGONS PAPER HOLDINGS 10,000 - - 10,000
NMDC LTD 4,078 - - 4,078
NOBLE GROUP LTD 42,000 - 42,000 -
NONGSHIM CO LTD 11 - - 11
NOVATEK MICROELECTRONICS COR 3,000 - - 3,000
NTPC LTD 10,445 - - 10,445
NWS HOLDINGS LTD 5,000 3,000 - 8,000
OBI PHARMA INC 500 - - 500
OCI CO LTD 107 - - 107
OIL + GAS DEVELOPMENT CO LTD 3,000 2,900 - 5,900
OIL + NATURAL GAS CORP LTD 14,749 3,925 1,809 16,865
OIL INDIA LTD 451 1,724 1,823 352
OLAM INTERNATIONAL LTD 2,100 - 2,100 -
ORACLE FINANCIAL SERVICES 77 - - 77
ORIENT OVERSEAS INTL LTD 1,000 - - 1,000
Orient Securities Co Ltd - 6,800 - 6,800
ORIENTAL UNION CHEMICAL - 22,000 15,000 7,000
ORION CORP 17 158 175 -
ORION CORP/REPUBLIC OF KOREA - 179 75 104
OTTOGI CORP 5 - - 5
OVERSEA CHINESE BANKING CORP 15,250 3,600 800 18,050
PARADISE CO LTD 179 - - 179
PCCW LTD 23,000 - - 23,000
PEGATRON CORP 9,000 2,000 - 11,000
PEOPLE S INSURANCE CO GROU - H 30,000 24,000 - 54,000
PERUSAHAAN GAS NEGARA PERSER 53,700 - - 53,700
PETROCHINA CO LTD - H 102,000 16,000 - 118,000
PETRON CORP 18,000 - - 18,000
PETRONAS CHEMICALS GROUP BHD 13,000 3,900 - 16,900
PETRONAS DAGANGAN BHD 1,400 - - 1,400
PETRONAS GAS BHD 4,000 - - 4,000
PETRONET LNG LTD 943 1,886 2,239 590
PICC PROPERTY + CASUALTY - H 21,070 4,000 - 25,070
PIDILITE INDUSTRIES LTD 603 - - 603
PING AN INSURANCE GROUP CO - H 23,500 6,500 2,000 28,000
PIRAMAL ENTERPRISES LTD 427 - - 427
PLDT INC 120 605 - 725
Vanguard ETF SeriesAnnual Report 2017
Vanguard FTSE Asia ex Japan Index ETF
-98-
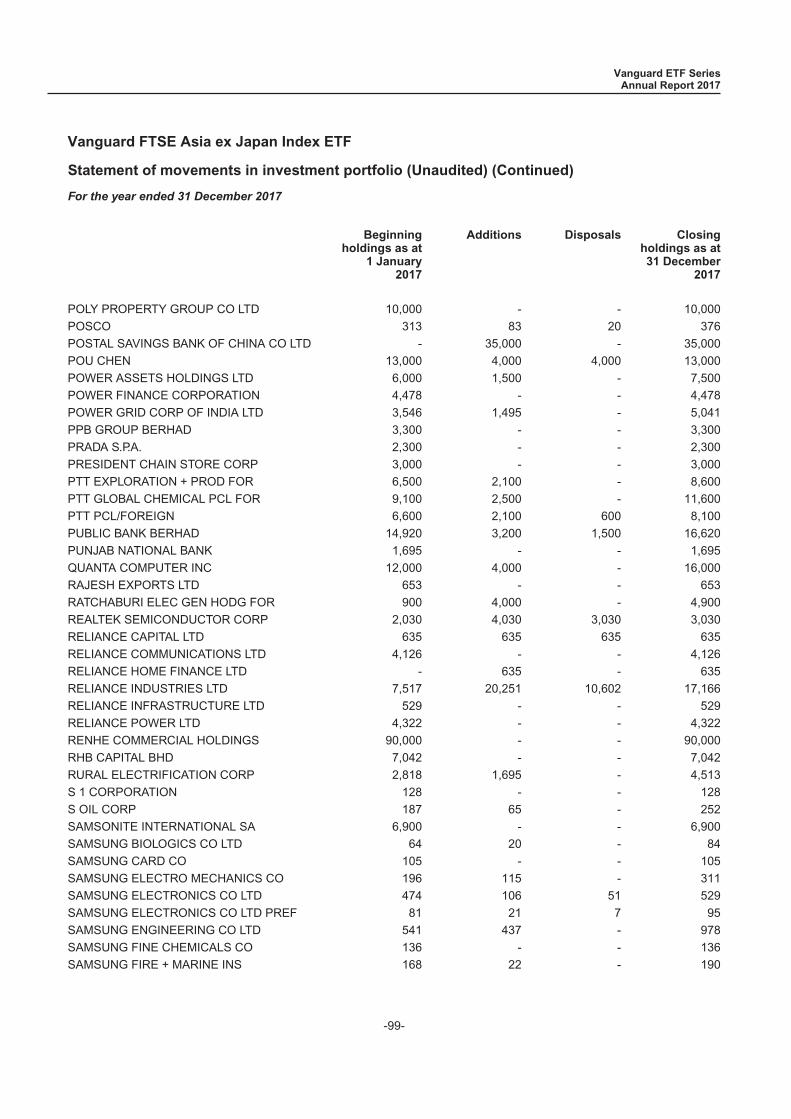
Statement of movements in investment portfolio (Unaudited) (Continued)
For the year ended 31 December 2017
Beginningholdings as at
1 January2017
Additions Disposals Closingholdings as at31 December
2017
POLY PROPERTY GROUP CO LTD 10,000 - - 10,000
POSCO 313 83 20 376
POSTAL SAVINGS BANK OF CHINA CO LTD - 35,000 - 35,000
POU CHEN 13,000 4,000 4,000 13,000
POWER ASSETS HOLDINGS LTD 6,000 1,500 - 7,500
POWER FINANCE CORPORATION 4,478 - - 4,478
POWER GRID CORP OF INDIA LTD 3,546 1,495 - 5,041
PPB GROUP BERHAD 3,300 - - 3,300
PRADA S.P.A. 2,300 - - 2,300
PRESIDENT CHAIN STORE CORP 3,000 - - 3,000
PTT EXPLORATION + PROD FOR 6,500 2,100 - 8,600
PTT GLOBAL CHEMICAL PCL FOR 9,100 2,500 - 11,600
PTT PCL/FOREIGN 6,600 2,100 600 8,100
PUBLIC BANK BERHAD 14,920 3,200 1,500 16,620
PUNJAB NATIONAL BANK 1,695 - - 1,695
QUANTA COMPUTER INC 12,000 4,000 - 16,000
RAJESH EXPORTS LTD 653 - - 653
RATCHABURI ELEC GEN HODG FOR 900 4,000 - 4,900
REALTEK SEMICONDUCTOR CORP 2,030 4,030 3,030 3,030
RELIANCE CAPITAL LTD 635 635 635 635
RELIANCE COMMUNICATIONS LTD 4,126 - - 4,126
RELIANCE HOME FINANCE LTD - 635 - 635
RELIANCE INDUSTRIES LTD 7,517 20,251 10,602 17,166
RELIANCE INFRASTRUCTURE LTD 529 - - 529
RELIANCE POWER LTD 4,322 - - 4,322
RENHE COMMERCIAL HOLDINGS 90,000 - - 90,000
RHB CAPITAL BHD 7,042 - - 7,042
RURAL ELECTRIFICATION CORP 2,818 1,695 - 4,513
S 1 CORPORATION 128 - - 128
S OIL CORP 187 65 - 252
SAMSONITE INTERNATIONAL SA 6,900 - - 6,900
SAMSUNG BIOLOGICS CO LTD 64 20 - 84
SAMSUNG CARD CO 105 - - 105
SAMSUNG ELECTRO MECHANICS CO 196 115 - 311
SAMSUNG ELECTRONICS CO LTD 474 106 51 529
SAMSUNG ELECTRONICS CO LTD PREF 81 21 7 95
SAMSUNG ENGINEERING CO LTD 541 437 - 978
SAMSUNG FINE CHEMICALS CO 136 - - 136
SAMSUNG FIRE + MARINE INS 168 22 - 190
Vanguard ETF SeriesAnnual Report 2017
Vanguard FTSE Asia ex Japan Index ETF
-99-
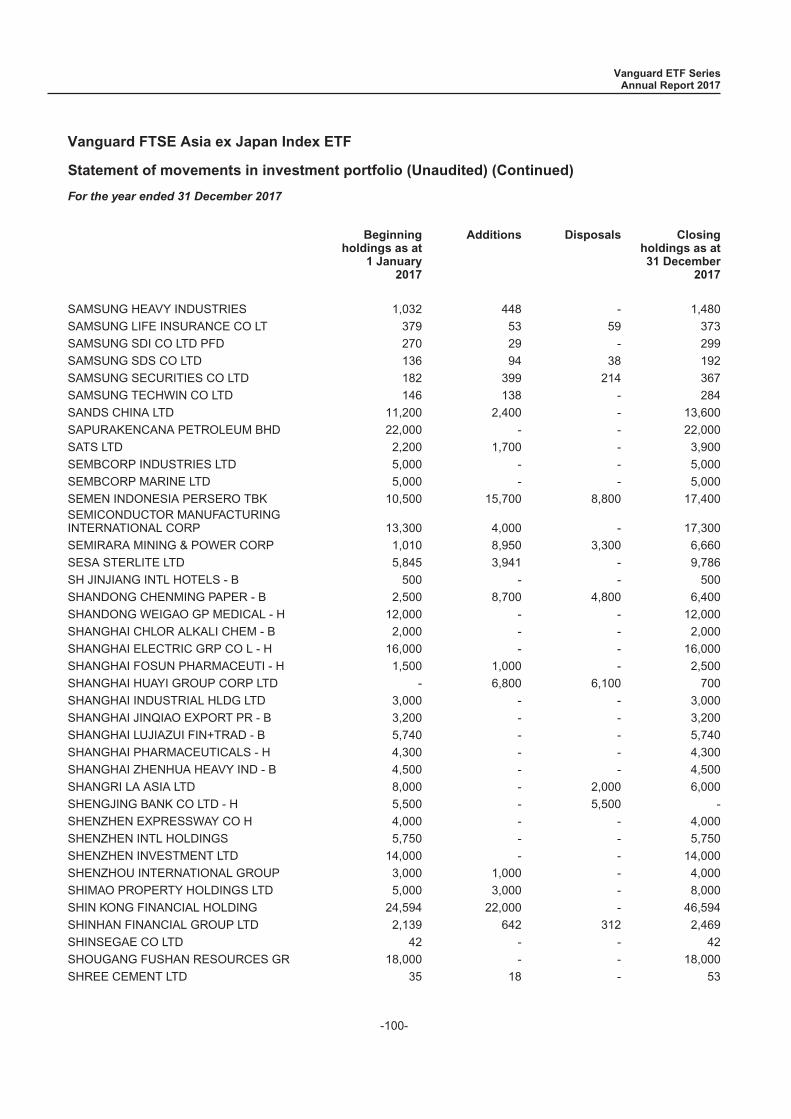
Statement of movements in investment portfolio (Unaudited) (Continued)
For the year ended 31 December 2017
Beginningholdings as at
1 January2017
Additions Disposals Closingholdings as at31 December
2017
SAMSUNG HEAVY INDUSTRIES 1,032 448 - 1,480
SAMSUNG LIFE INSURANCE CO LT 379 53 59 373
SAMSUNG SDI CO LTD PFD 270 29 - 299
SAMSUNG SDS CO LTD 136 94 38 192
SAMSUNG SECURITIES CO LTD 182 399 214 367
SAMSUNG TECHWIN CO LTD 146 138 - 284
SANDS CHINA LTD 11,200 2,400 - 13,600
SAPURAKENCANA PETROLEUM BHD 22,000 - - 22,000
SATS LTD 2,200 1,700 - 3,900
SEMBCORP INDUSTRIES LTD 5,000 - - 5,000
SEMBCORP MARINE LTD 5,000 - - 5,000
SEMEN INDONESIA PERSERO TBK 10,500 15,700 8,800 17,400SEMICONDUCTOR MANUFACTURINGINTERNATIONAL CORP 13,300 4,000 - 17,300
SEMIRARA MINING & POWER CORP 1,010 8,950 3,300 6,660
SESA STERLITE LTD 5,845 3,941 - 9,786
SH JINJIANG INTL HOTELS - B 500 - - 500
SHANDONG CHENMING PAPER - B 2,500 8,700 4,800 6,400
SHANDONG WEIGAO GP MEDICAL - H 12,000 - - 12,000
SHANGHAI CHLOR ALKALI CHEM - B 2,000 - - 2,000
SHANGHAI ELECTRIC GRP CO L - H 16,000 - - 16,000
SHANGHAI FOSUN PHARMACEUTI - H 1,500 1,000 - 2,500
SHANGHAI HUAYI GROUP CORP LTD - 6,800 6,100 700
SHANGHAI INDUSTRIAL HLDG LTD 3,000 - - 3,000
SHANGHAI JINQIAO EXPORT PR - B 3,200 - - 3,200
SHANGHAI LUJIAZUI FIN+TRAD - B 5,740 - - 5,740
SHANGHAI PHARMACEUTICALS - H 4,300 - - 4,300
SHANGHAI ZHENHUA HEAVY IND - B 4,500 - - 4,500
SHANGRI LA ASIA LTD 8,000 - 2,000 6,000
SHENGJING BANK CO LTD - H 5,500 - 5,500 -
SHENZHEN EXPRESSWAY CO H 4,000 - - 4,000
SHENZHEN INTL HOLDINGS 5,750 - - 5,750
SHENZHEN INVESTMENT LTD 14,000 - - 14,000
SHENZHOU INTERNATIONAL GROUP 3,000 1,000 - 4,000
SHIMAO PROPERTY HOLDINGS LTD 5,000 3,000 - 8,000
SHIN KONG FINANCIAL HOLDING 24,594 22,000 - 46,594
SHINHAN FINANCIAL GROUP LTD 2,139 642 312 2,469
SHINSEGAE CO LTD 42 - - 42
SHOUGANG FUSHAN RESOURCES GR 18,000 - - 18,000
SHREE CEMENT LTD 35 18 - 53
Vanguard ETF SeriesAnnual Report 2017
Vanguard FTSE Asia ex Japan Index ETF
-100-
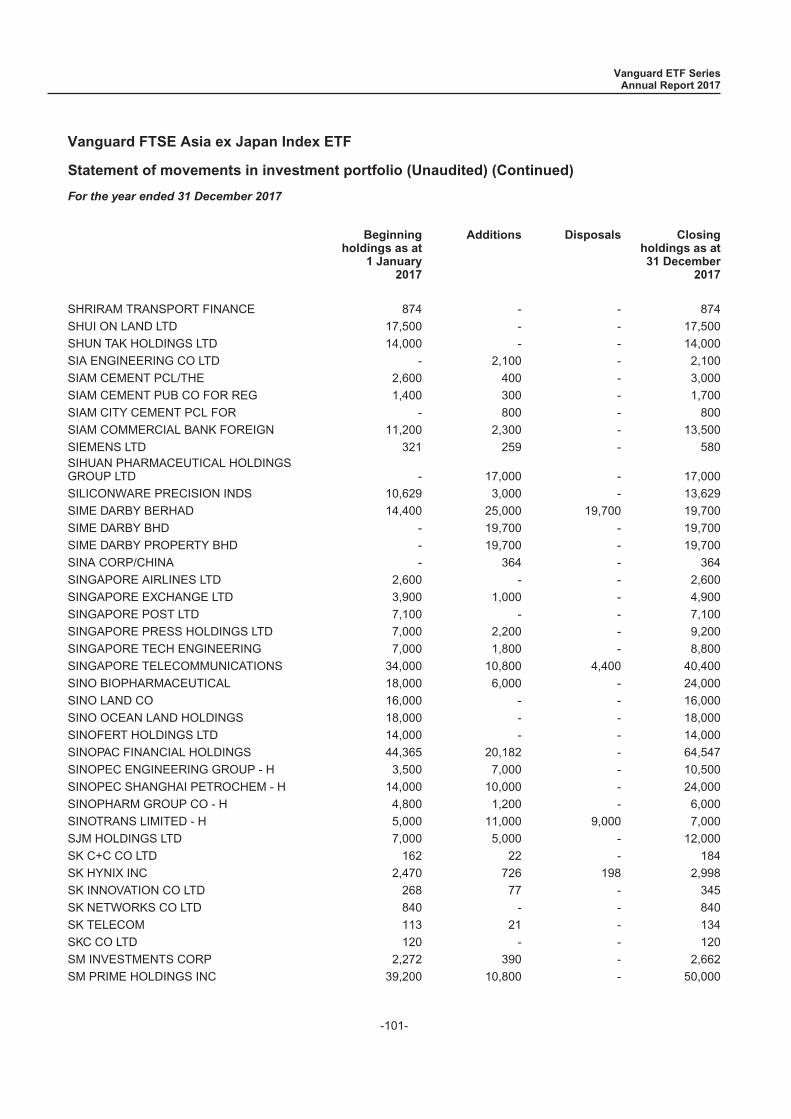
Statement of movements in investment portfolio (Unaudited) (Continued)
For the year ended 31 December 2017
Beginningholdings as at
1 January2017
Additions Disposals Closingholdings as at31 December
2017
SHRIRAM TRANSPORT FINANCE 874 - - 874
SHUI ON LAND LTD 17,500 - - 17,500
SHUN TAK HOLDINGS LTD 14,000 - - 14,000
SIA ENGINEERING CO LTD - 2,100 - 2,100
SIAM CEMENT PCL/THE 2,600 400 - 3,000
SIAM CEMENT PUB CO FOR REG 1,400 300 - 1,700
SIAM CITY CEMENT PCL FOR - 800 - 800
SIAM COMMERCIAL BANK FOREIGN 11,200 2,300 - 13,500
SIEMENS LTD 321 259 - 580SIHUAN PHARMACEUTICAL HOLDINGSGROUP LTD - 17,000 - 17,000
SILICONWARE PRECISION INDS 10,629 3,000 - 13,629
SIME DARBY BERHAD 14,400 25,000 19,700 19,700
SIME DARBY BHD - 19,700 - 19,700
SIME DARBY PROPERTY BHD - 19,700 - 19,700
SINA CORP/CHINA - 364 - 364
SINGAPORE AIRLINES LTD 2,600 - - 2,600
SINGAPORE EXCHANGE LTD 3,900 1,000 - 4,900
SINGAPORE POST LTD 7,100 - - 7,100
SINGAPORE PRESS HOLDINGS LTD 7,000 2,200 - 9,200
SINGAPORE TECH ENGINEERING 7,000 1,800 - 8,800
SINGAPORE TELECOMMUNICATIONS 34,000 10,800 4,400 40,400
SINO BIOPHARMACEUTICAL 18,000 6,000 - 24,000
SINO LAND CO 16,000 - - 16,000
SINO OCEAN LAND HOLDINGS 18,000 - - 18,000
SINOFERT HOLDINGS LTD 14,000 - - 14,000
SINOPAC FINANCIAL HOLDINGS 44,365 20,182 - 64,547
SINOPEC ENGINEERING GROUP - H 3,500 7,000 - 10,500
SINOPEC SHANGHAI PETROCHEM - H 14,000 10,000 - 24,000
SINOPHARM GROUP CO - H 4,800 1,200 - 6,000
SINOTRANS LIMITED - H 5,000 11,000 9,000 7,000
SJM HOLDINGS LTD 7,000 5,000 - 12,000
SK C+C CO LTD 162 22 - 184
SK HYNIX INC 2,470 726 198 2,998
SK INNOVATION CO LTD 268 77 - 345
SK NETWORKS CO LTD 840 - - 840
SK TELECOM 113 21 - 134
SKC CO LTD 120 - - 120
SM INVESTMENTS CORP 2,272 390 - 2,662
SM PRIME HOLDINGS INC 39,200 10,800 - 50,000
Vanguard ETF SeriesAnnual Report 2017
Vanguard FTSE Asia ex Japan Index ETF
-101-
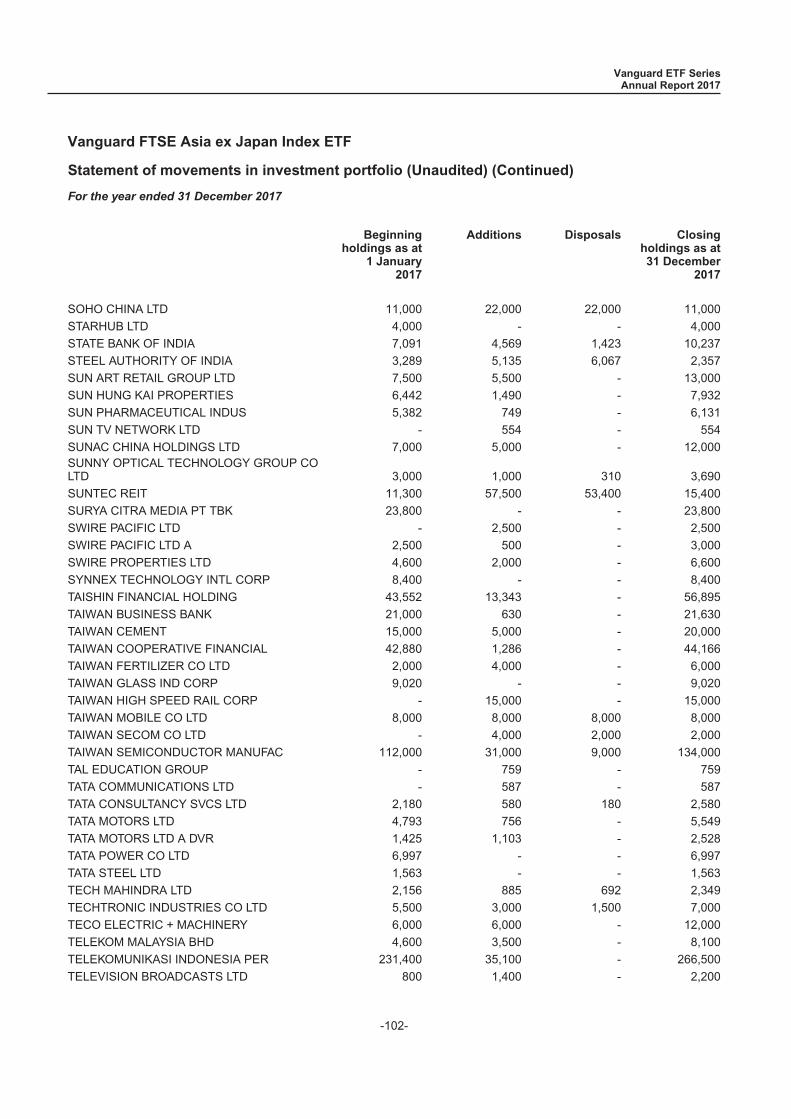
Statement of movements in investment portfolio (Unaudited) (Continued)
For the year ended 31 December 2017
Beginningholdings as at
1 January2017
Additions Disposals Closingholdings as at31 December
2017
SOHO CHINA LTD 11,000 22,000 22,000 11,000
STARHUB LTD 4,000 - - 4,000
STATE BANK OF INDIA 7,091 4,569 1,423 10,237
STEEL AUTHORITY OF INDIA 3,289 5,135 6,067 2,357
SUN ART RETAIL GROUP LTD 7,500 5,500 - 13,000
SUN HUNG KAI PROPERTIES 6,442 1,490 - 7,932
SUN PHARMACEUTICAL INDUS 5,382 749 - 6,131
SUN TV NETWORK LTD - 554 - 554
SUNAC CHINA HOLDINGS LTD 7,000 5,000 - 12,000SUNNY OPTICAL TECHNOLOGY GROUP COLTD 3,000 1,000 310 3,690
SUNTEC REIT 11,300 57,500 53,400 15,400
SURYA CITRA MEDIA PT TBK 23,800 - - 23,800
SWIRE PACIFIC LTD - 2,500 - 2,500
SWIRE PACIFIC LTD A 2,500 500 - 3,000
SWIRE PROPERTIES LTD 4,600 2,000 - 6,600
SYNNEX TECHNOLOGY INTL CORP 8,400 - - 8,400
TAISHIN FINANCIAL HOLDING 43,552 13,343 - 56,895
TAIWAN BUSINESS BANK 21,000 630 - 21,630
TAIWAN CEMENT 15,000 5,000 - 20,000
TAIWAN COOPERATIVE FINANCIAL 42,880 1,286 - 44,166
TAIWAN FERTILIZER CO LTD 2,000 4,000 - 6,000
TAIWAN GLASS IND CORP 9,020 - - 9,020
TAIWAN HIGH SPEED RAIL CORP - 15,000 - 15,000
TAIWAN MOBILE CO LTD 8,000 8,000 8,000 8,000
TAIWAN SECOM CO LTD - 4,000 2,000 2,000
TAIWAN SEMICONDUCTOR MANUFAC 112,000 31,000 9,000 134,000
TAL EDUCATION GROUP - 759 - 759
TATA COMMUNICATIONS LTD - 587 - 587
TATA CONSULTANCY SVCS LTD 2,180 580 180 2,580
TATA MOTORS LTD 4,793 756 - 5,549
TATA MOTORS LTD A DVR 1,425 1,103 - 2,528
TATA POWER CO LTD 6,997 - - 6,997
TATA STEEL LTD 1,563 - - 1,563
TECH MAHINDRA LTD 2,156 885 692 2,349
TECHTRONIC INDUSTRIES CO LTD 5,500 3,000 1,500 7,000
TECO ELECTRIC + MACHINERY 6,000 6,000 - 12,000
TELEKOM MALAYSIA BHD 4,600 3,500 - 8,100
TELEKOMUNIKASI INDONESIA PER 231,400 35,100 - 266,500
TELEVISION BROADCASTS LTD 800 1,400 - 2,200
Vanguard ETF SeriesAnnual Report 2017
Vanguard FTSE Asia ex Japan Index ETF
-102-
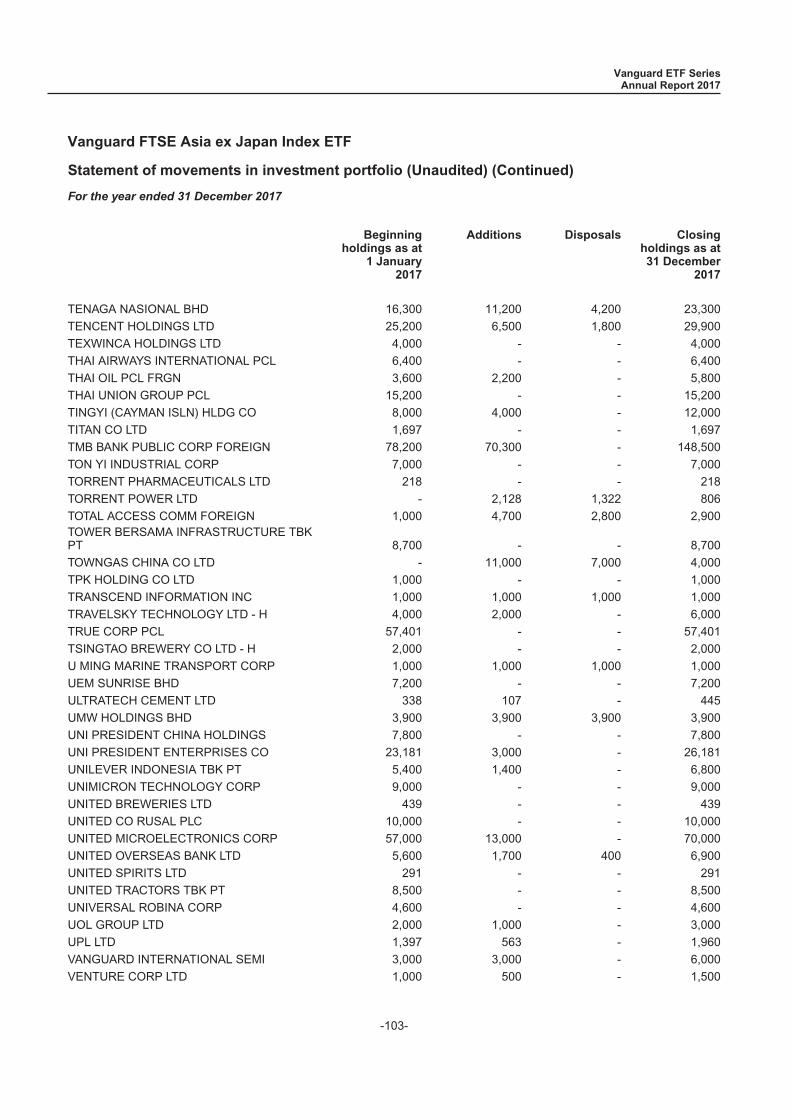
Statement of movements in investment portfolio (Unaudited) (Continued)
For the year ended 31 December 2017
Beginningholdings as at
1 January2017
Additions Disposals Closingholdings as at31 December
2017
TENAGA NASIONAL BHD 16,300 11,200 4,200 23,300
TENCENT HOLDINGS LTD 25,200 6,500 1,800 29,900
TEXWINCA HOLDINGS LTD 4,000 - - 4,000
THAI AIRWAYS INTERNATIONAL PCL 6,400 - - 6,400
THAI OIL PCL FRGN 3,600 2,200 - 5,800
THAI UNION GROUP PCL 15,200 - - 15,200
TINGYI (CAYMAN ISLN) HLDG CO 8,000 4,000 - 12,000
TITAN CO LTD 1,697 - - 1,697
TMB BANK PUBLIC CORP FOREIGN 78,200 70,300 - 148,500
TON YI INDUSTRIAL CORP 7,000 - - 7,000
TORRENT PHARMACEUTICALS LTD 218 - - 218
TORRENT POWER LTD - 2,128 1,322 806
TOTAL ACCESS COMM FOREIGN 1,000 4,700 2,800 2,900TOWER BERSAMA INFRASTRUCTURE TBKPT 8,700 - - 8,700
TOWNGAS CHINA CO LTD - 11,000 7,000 4,000
TPK HOLDING CO LTD 1,000 - - 1,000
TRANSCEND INFORMATION INC 1,000 1,000 1,000 1,000
TRAVELSKY TECHNOLOGY LTD - H 4,000 2,000 - 6,000
TRUE CORP PCL 57,401 - - 57,401
TSINGTAO BREWERY CO LTD - H 2,000 - - 2,000
U MING MARINE TRANSPORT CORP 1,000 1,000 1,000 1,000
UEM SUNRISE BHD 7,200 - - 7,200
ULTRATECH CEMENT LTD 338 107 - 445
UMW HOLDINGS BHD 3,900 3,900 3,900 3,900
UNI PRESIDENT CHINA HOLDINGS 7,800 - - 7,800
UNI PRESIDENT ENTERPRISES CO 23,181 3,000 - 26,181
UNILEVER INDONESIA TBK PT 5,400 1,400 - 6,800
UNIMICRON TECHNOLOGY CORP 9,000 - - 9,000
UNITED BREWERIES LTD 439 - - 439
UNITED CO RUSAL PLC 10,000 - - 10,000
UNITED MICROELECTRONICS CORP 57,000 13,000 - 70,000
UNITED OVERSEAS BANK LTD 5,600 1,700 400 6,900
UNITED SPIRITS LTD 291 - - 291
UNITED TRACTORS TBK PT 8,500 - - 8,500
UNIVERSAL ROBINA CORP 4,600 - - 4,600
UOL GROUP LTD 2,000 1,000 - 3,000
UPL LTD 1,397 563 - 1,960
VANGUARD INTERNATIONAL SEMI 3,000 3,000 - 6,000
VENTURE CORP LTD 1,000 500 - 1,500
Vanguard ETF SeriesAnnual Report 2017
Vanguard FTSE Asia ex Japan Index ETF
-103-
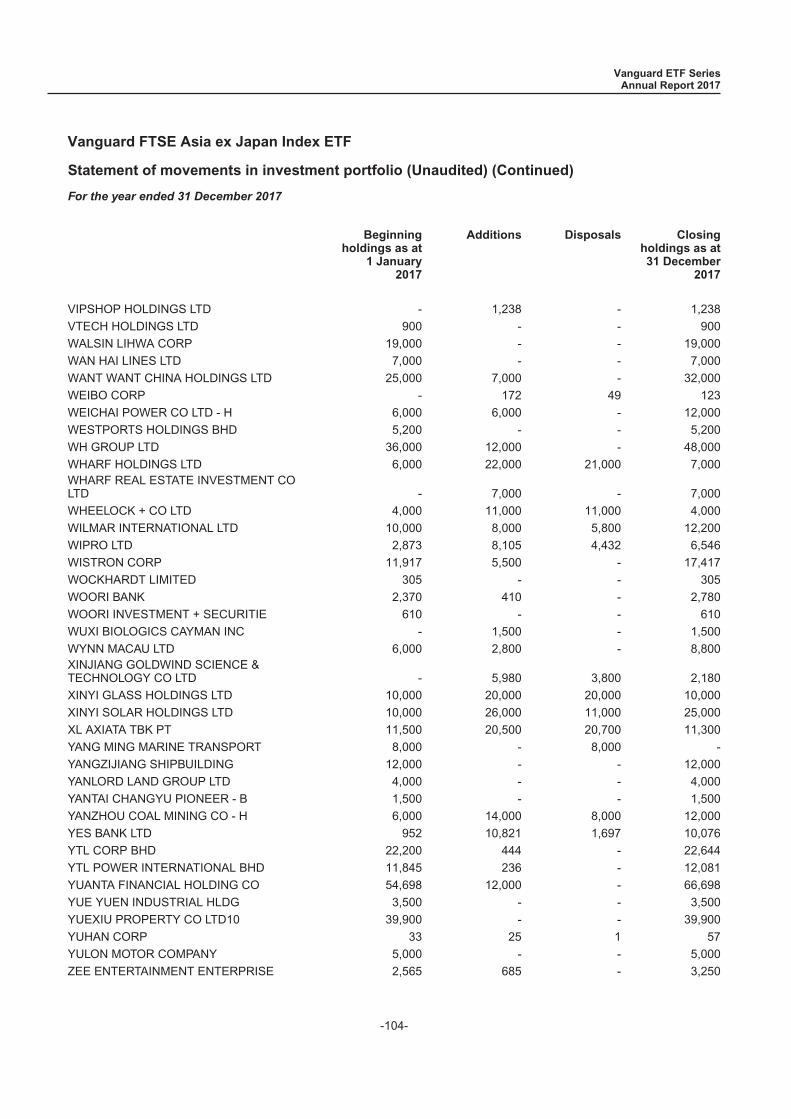
Statement of movements in investment portfolio (Unaudited) (Continued)
For the year ended 31 December 2017
Beginningholdings as at
1 January2017
Additions Disposals Closingholdings as at31 December
2017
VIPSHOP HOLDINGS LTD - 1,238 - 1,238
VTECH HOLDINGS LTD 900 - - 900
WALSIN LIHWA CORP 19,000 - - 19,000
WAN HAI LINES LTD 7,000 - - 7,000
WANT WANT CHINA HOLDINGS LTD 25,000 7,000 - 32,000
WEIBO CORP - 172 49 123
WEICHAI POWER CO LTD - H 6,000 6,000 - 12,000
WESTPORTS HOLDINGS BHD 5,200 - - 5,200
WH GROUP LTD 36,000 12,000 - 48,000
WHARF HOLDINGS LTD 6,000 22,000 21,000 7,000WHARF REAL ESTATE INVESTMENT COLTD - 7,000 - 7,000
WHEELOCK + CO LTD 4,000 11,000 11,000 4,000
WILMAR INTERNATIONAL LTD 10,000 8,000 5,800 12,200
WIPRO LTD 2,873 8,105 4,432 6,546
WISTRON CORP 11,917 5,500 - 17,417
WOCKHARDT LIMITED 305 - - 305
WOORI BANK 2,370 410 - 2,780
WOORI INVESTMENT + SECURITIE 610 - - 610
WUXI BIOLOGICS CAYMAN INC - 1,500 - 1,500
WYNN MACAU LTD 6,000 2,800 - 8,800XINJIANG GOLDWIND SCIENCE &TECHNOLOGY CO LTD - 5,980 3,800 2,180
XINYI GLASS HOLDINGS LTD 10,000 20,000 20,000 10,000
XINYI SOLAR HOLDINGS LTD 10,000 26,000 11,000 25,000
XL AXIATA TBK PT 11,500 20,500 20,700 11,300
YANG MING MARINE TRANSPORT 8,000 - 8,000 -
YANGZIJIANG SHIPBUILDING 12,000 - - 12,000
YANLORD LAND GROUP LTD 4,000 - - 4,000
YANTAI CHANGYU PIONEER - B 1,500 - - 1,500
YANZHOU COAL MINING CO - H 6,000 14,000 8,000 12,000
YES BANK LTD 952 10,821 1,697 10,076
YTL CORP BHD 22,200 444 - 22,644
YTL POWER INTERNATIONAL BHD 11,845 236 - 12,081
YUANTA FINANCIAL HOLDING CO 54,698 12,000 - 66,698
YUE YUEN INDUSTRIAL HLDG 3,500 - - 3,500
YUEXIU PROPERTY CO LTD10 39,900 - - 39,900
YUHAN CORP 33 25 1 57
YULON MOTOR COMPANY 5,000 - - 5,000
ZEE ENTERTAINMENT ENTERPRISE 2,565 685 - 3,250
Vanguard ETF SeriesAnnual Report 2017
Vanguard FTSE Asia ex Japan Index ETF
-104-
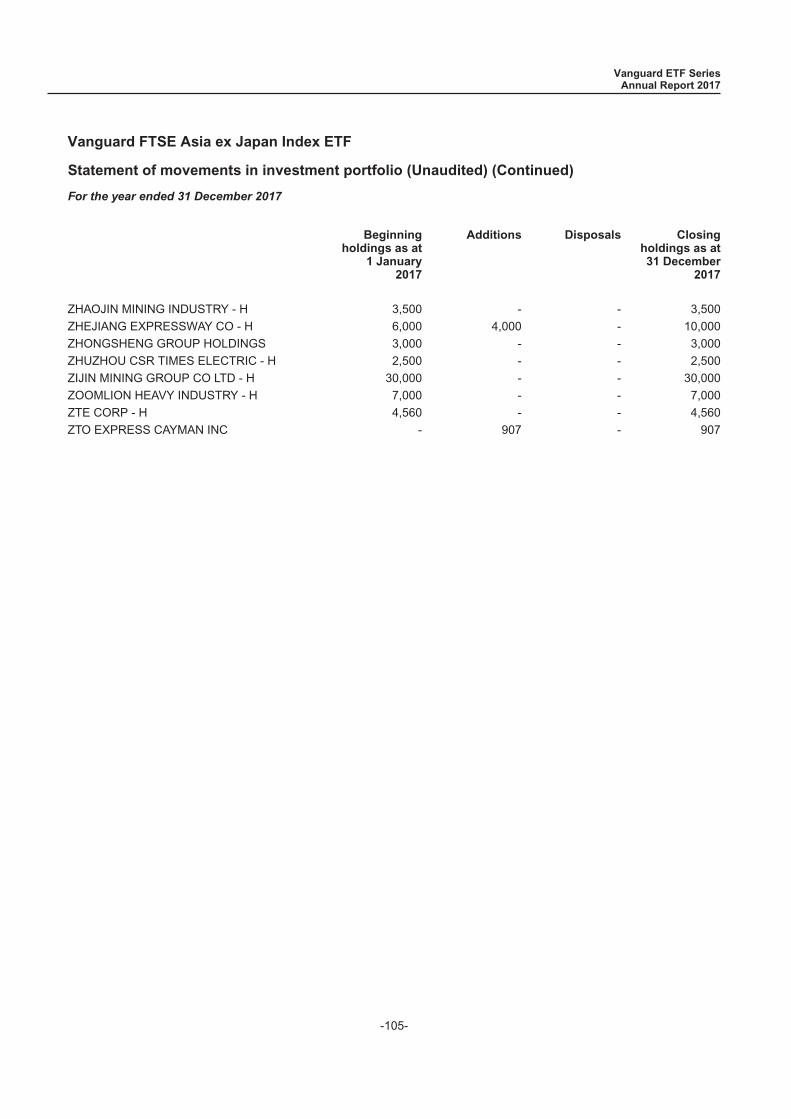
Statement of movements in investment portfolio (Unaudited) (Continued)
For the year ended 31 December 2017
Beginningholdings as at
1 January2017
Additions Disposals Closingholdings as at31 December
2017
ZHAOJIN MINING INDUSTRY - H 3,500 - - 3,500
ZHEJIANG EXPRESSWAY CO - H 6,000 4,000 - 10,000
ZHONGSHENG GROUP HOLDINGS 3,000 - - 3,000
ZHUZHOU CSR TIMES ELECTRIC - H 2,500 - - 2,500
ZIJIN MINING GROUP CO LTD - H 30,000 - - 30,000
ZOOMLION HEAVY INDUSTRY - H 7,000 - - 7,000
ZTE CORP - H 4,560 - - 4,560
ZTO EXPRESS CAYMAN INC - 907 - 907
Vanguard ETF SeriesAnnual Report 2017
Vanguard FTSE Asia ex Japan Index ETF
-105-
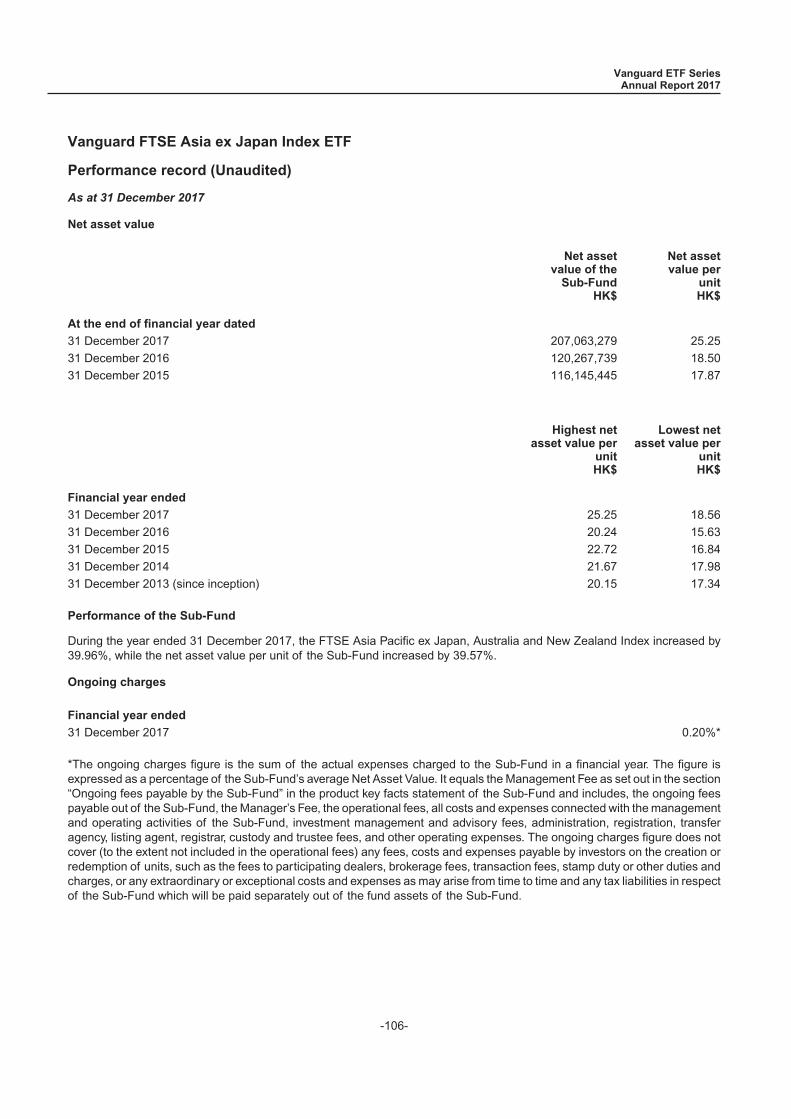
Performance record (Unaudited)
As at 31 December 2017
Net asset value
Net assetvalue of the
Sub-FundHK$
Net assetvalue per
unitHK$
At the end of financial year dated
31 December 2017 207,063,279 25.25
31 December 2016 120,267,739 18.50
31 December 2015 116,145,445 17.87
Highest netasset value per
unitHK$
Lowest netasset value per
unitHK$
Financial year ended
31 December 2017 25.25 18.56
31 December 2016 20.24 15.63
31 December 2015 22.72 16.84
31 December 2014 21.67 17.98
31 December 2013 (since inception) 20.15 17.34
Performance of the Sub-Fund
During the year ended 31 December 2017, the FTSE Asia Pacific ex Japan, Australia and New Zealand Index increased by39.96%, while the net asset value per unit of the Sub-Fund increased by 39.57%.
Ongoing charges
Financial year ended
31 December 2017 0.20%*
*The ongoing charges figure is the sum of the actual expenses charged to the Sub-Fund in a financial year. The figure isexpressed as a percentage of the Sub-Fund’s average Net Asset Value. It equals the Management Fee as set out in the section“Ongoing fees payable by the Sub-Fund” in the product key facts statement of the Sub-Fund and includes, the ongoing feespayable out of the Sub-Fund, the Manager’s Fee, the operational fees, all costs and expenses connected with the managementand operating activities of the Sub-Fund, investment management and advisory fees, administration, registration, transferagency, listing agent, registrar, custody and trustee fees, and other operating expenses. The ongoing charges figure does notcover (to the extent not included in the operational fees) any fees, costs and expenses payable by investors on the creation orredemption of units, such as the fees to participating dealers, brokerage fees, transaction fees, stamp duty or other duties andcharges, or any extraordinary or exceptional costs and expenses as may arise from time to time and any tax liabilities in respectof the Sub-Fund which will be paid separately out of the fund assets of the Sub-Fund.
Vanguard ETF SeriesAnnual Report 2017
Vanguard FTSE Asia ex Japan Index ETF
-106-

Investment portfolio (Unaudited)
As at 31 December 2017
Holding at31 December
2017
Fair value at31 December
2017
Percentage oftotal net assets at
31 December2017
HK$ (%)
China 0.14%
CHONGQING CHANGAN AUTOMOB - B 13,100 112,660 0.04
JIANGLING MOTORS CORP LTD - B 1,300 16,614 0.01
LAO FENG XIANG CO LTD - B 3,200 92,607 0.03
SH JINJIANG INTL HOTELS - B 4,000 80,018 0.03
WEIFU HIGH-TECHNOLOGY GROUP CO LTD -B 1,600 26,736 0.01
YANTAI CHANGYU PIONEER - B 3,500 69,720 0.02
398,355 0.14
Hong Kong 41.91%
AGILE PROPERTY HOLDINGS LTD 25,500 302,430 0.10
AGRICULTURAL BANK OF CHINA - H 472,000 1,718,080 0.60
ANHUI EXPRESSWAY CO LTD - H 6,000 39,120 0.01
ANTA SPORTS PRODUCTS LTD 21,000 744,450 0.26
BAIC MOTOR CORP LTD 25,768 262,318 0.09
BANK OF CHINA LTD - H 1,383,000 5,310,720 1.84
BANK OF COMMUNICATIONS CO - H 144,000 835,200 0.29
BEIJING ENTERPRISES HLDGS 9,000 417,600 0.14
BEIJING JINGNENG CLEAN ENE - H 48,000 100,800 0.03
BOC AVIATION LTD 4,200 174,930 0.06
BOC HONG KONG HOLDINGS LTD 65,000 2,574,000 0.89
CAFE DE CORAL HOLDINGS LTD 6,000 128,700 0.04
CHAMPION REIT 35,000 200,550 0.07
CHINA CINDA ASSET MANAGEME - H 174,000 497,640 0.17
CHINA CITIC BANK CORP LTD - H 149,000 730,100 0.25
CHINA COMMUNICATIONS CONST - H 79,000 701,520 0.24
CHINA COMMUNICATIONS SERVI - H 46,000 241,040 0.08
CHINA CONSTRUCTION BANK - H 1,609,000 11,584,800 4.01
CHINA DONGXIANG GROUP CO LTD 42,000 60,900 0.02
CHINA EVERBRIGHT BANK CO L - H 52,000 189,800 0.07
CHINA EVERBRIGHT LTD 14,000 244,720 0.08
CHINA EVERGRANDE GROUP 52,000 1,401,400 0.49
CHINA HUARONG ASSET MANAGEMENT CO LTD 179,000 660,510 0.23
CHINA MACHINERY ENGINEERIN - H 18,000 91,260 0.03
CHINA MERCHANTS BANK - H 68,500 2,130,350 0.74
CHINA MERCHANTS HLDGS INTL 22,000 449,900 0.16
CHINA MINSHENG BANKING - H 97,773 765,562 0.27
CHINA MOBILE LTD 95,000 7,528,750 2.61
CHINA OVERSEAS LAND + INVEST 70,000 1,760,500 0.61
Vanguard ETF SeriesAnnual Report 2017
Vanguard FTSE Asia ex Japan High Dividend Yield Index ETF
-107-
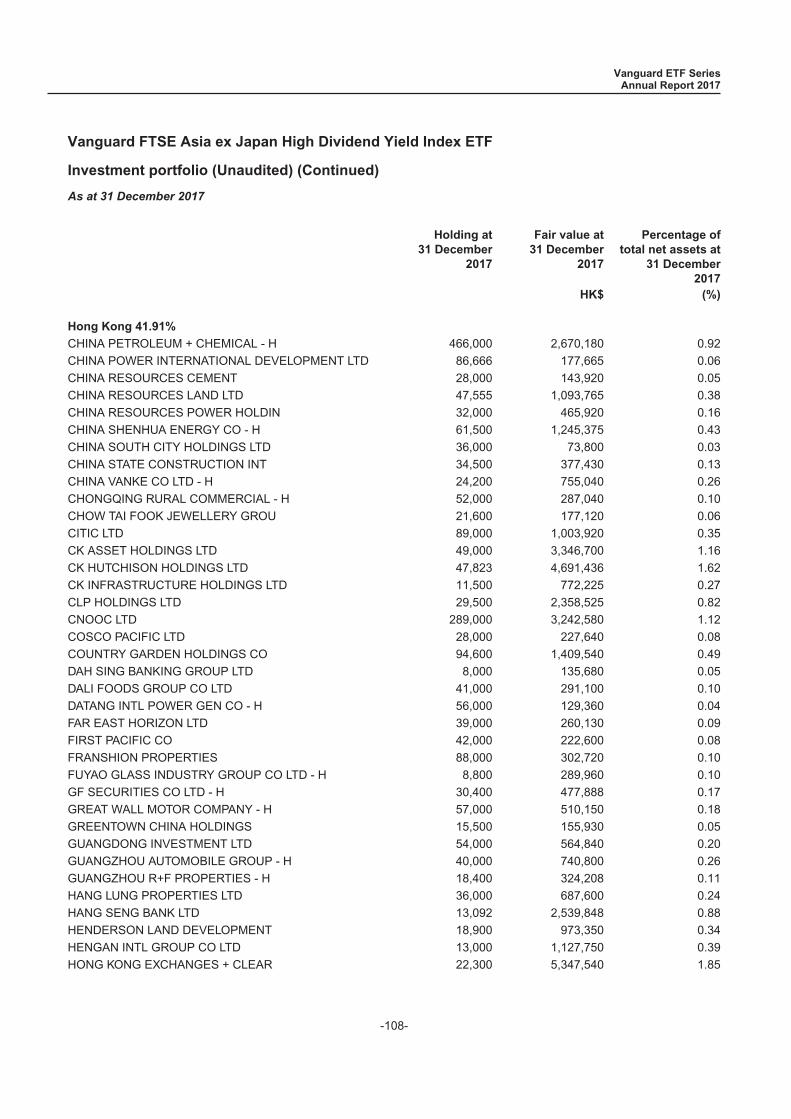
Investment portfolio (Unaudited) (Continued)
As at 31 December 2017
Holding at31 December
2017
Fair value at31 December
2017
Percentage oftotal net assets at
31 December2017
HK$ (%)
Hong Kong 41.91%
CHINA PETROLEUM + CHEMICAL - H 466,000 2,670,180 0.92
CHINA POWER INTERNATIONAL DEVELOPMENT LTD 86,666 177,665 0.06
CHINA RESOURCES CEMENT 28,000 143,920 0.05
CHINA RESOURCES LAND LTD 47,555 1,093,765 0.38
CHINA RESOURCES POWER HOLDIN 32,000 465,920 0.16
CHINA SHENHUA ENERGY CO - H 61,500 1,245,375 0.43
CHINA SOUTH CITY HOLDINGS LTD 36,000 73,800 0.03
CHINA STATE CONSTRUCTION INT 34,500 377,430 0.13
CHINA VANKE CO LTD - H 24,200 755,040 0.26
CHONGQING RURAL COMMERCIAL - H 52,000 287,040 0.10
CHOW TAI FOOK JEWELLERY GROU 21,600 177,120 0.06
CITIC LTD 89,000 1,003,920 0.35
CK ASSET HOLDINGS LTD 49,000 3,346,700 1.16
CK HUTCHISON HOLDINGS LTD 47,823 4,691,436 1.62
CK INFRASTRUCTURE HOLDINGS LTD 11,500 772,225 0.27
CLP HOLDINGS LTD 29,500 2,358,525 0.82
CNOOC LTD 289,000 3,242,580 1.12
COSCO PACIFIC LTD 28,000 227,640 0.08
COUNTRY GARDEN HOLDINGS CO 94,600 1,409,540 0.49
DAH SING BANKING GROUP LTD 8,000 135,680 0.05
DALI FOODS GROUP CO LTD 41,000 291,100 0.10
DATANG INTL POWER GEN CO - H 56,000 129,360 0.04
FAR EAST HORIZON LTD 39,000 260,130 0.09
FIRST PACIFIC CO 42,000 222,600 0.08
FRANSHION PROPERTIES 88,000 302,720 0.10
FUYAO GLASS INDUSTRY GROUP CO LTD - H 8,800 289,960 0.10
GF SECURITIES CO LTD - H 30,400 477,888 0.17
GREAT WALL MOTOR COMPANY - H 57,000 510,150 0.18
GREENTOWN CHINA HOLDINGS 15,500 155,930 0.05
GUANGDONG INVESTMENT LTD 54,000 564,840 0.20
GUANGZHOU AUTOMOBILE GROUP - H 40,000 740,800 0.26
GUANGZHOU R+F PROPERTIES - H 18,400 324,208 0.11
HANG LUNG PROPERTIES LTD 36,000 687,600 0.24
HANG SENG BANK LTD 13,092 2,539,848 0.88
HENDERSON LAND DEVELOPMENT 18,900 973,350 0.34
HENGAN INTL GROUP CO LTD 13,000 1,127,750 0.39
HONG KONG EXCHANGES + CLEAR 22,300 5,347,540 1.85
Vanguard ETF SeriesAnnual Report 2017
Vanguard FTSE Asia ex Japan High Dividend Yield Index ETF
-108-
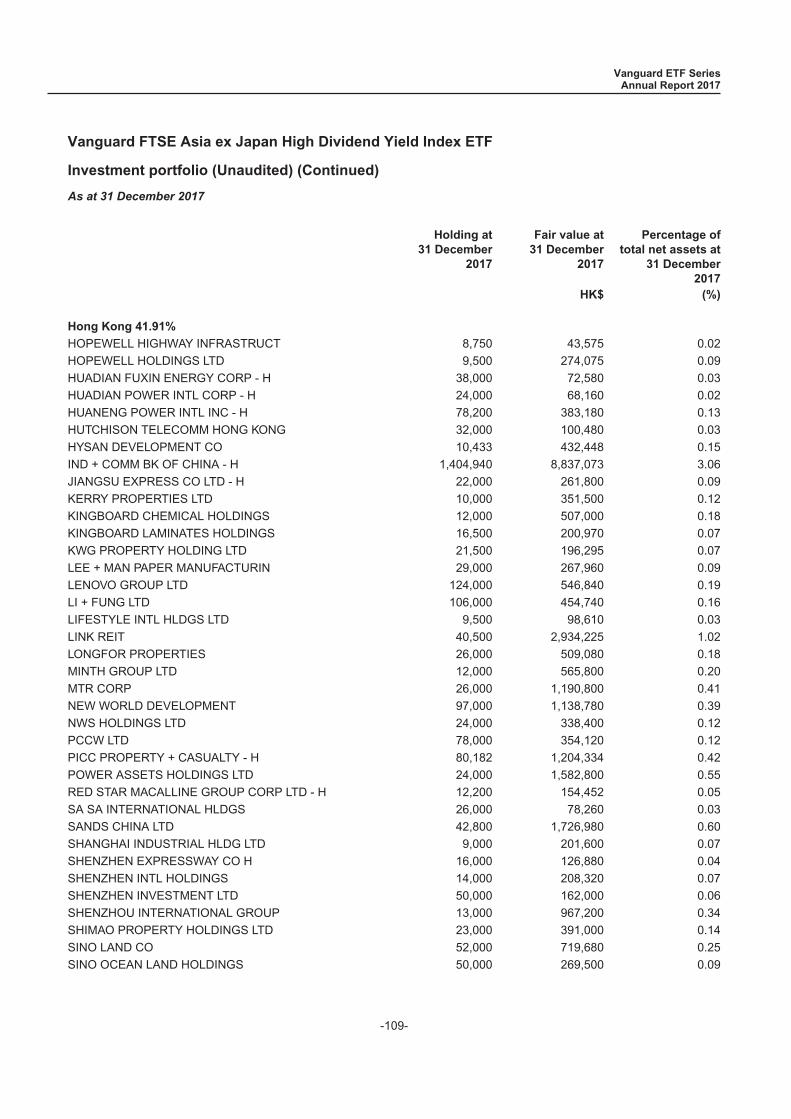
Investment portfolio (Unaudited) (Continued)
As at 31 December 2017
Holding at31 December
2017
Fair value at31 December
2017
Percentage oftotal net assets at
31 December2017
HK$ (%)
Hong Kong 41.91%
HOPEWELL HIGHWAY INFRASTRUCT 8,750 43,575 0.02
HOPEWELL HOLDINGS LTD 9,500 274,075 0.09
HUADIAN FUXIN ENERGY CORP - H 38,000 72,580 0.03
HUADIAN POWER INTL CORP - H 24,000 68,160 0.02
HUANENG POWER INTL INC - H 78,200 383,180 0.13
HUTCHISON TELECOMM HONG KONG 32,000 100,480 0.03
HYSAN DEVELOPMENT CO 10,433 432,448 0.15
IND + COMM BK OF CHINA - H 1,404,940 8,837,073 3.06
JIANGSU EXPRESS CO LTD - H 22,000 261,800 0.09
KERRY PROPERTIES LTD 10,000 351,500 0.12
KINGBOARD CHEMICAL HOLDINGS 12,000 507,000 0.18
KINGBOARD LAMINATES HOLDINGS 16,500 200,970 0.07
KWG PROPERTY HOLDING LTD 21,500 196,295 0.07
LEE + MAN PAPER MANUFACTURIN 29,000 267,960 0.09
LENOVO GROUP LTD 124,000 546,840 0.19
LI + FUNG LTD 106,000 454,740 0.16
LIFESTYLE INTL HLDGS LTD 9,500 98,610 0.03
LINK REIT 40,500 2,934,225 1.02
LONGFOR PROPERTIES 26,000 509,080 0.18
MINTH GROUP LTD 12,000 565,800 0.20
MTR CORP 26,000 1,190,800 0.41
NEW WORLD DEVELOPMENT 97,000 1,138,780 0.39
NWS HOLDINGS LTD 24,000 338,400 0.12
PCCW LTD 78,000 354,120 0.12
PICC PROPERTY + CASUALTY - H 80,182 1,204,334 0.42
POWER ASSETS HOLDINGS LTD 24,000 1,582,800 0.55
RED STAR MACALLINE GROUP CORP LTD - H 12,200 154,452 0.05
SA SA INTERNATIONAL HLDGS 26,000 78,260 0.03
SANDS CHINA LTD 42,800 1,726,980 0.60
SHANGHAI INDUSTRIAL HLDG LTD 9,000 201,600 0.07
SHENZHEN EXPRESSWAY CO H 16,000 126,880 0.04
SHENZHEN INTL HOLDINGS 14,000 208,320 0.07
SHENZHEN INVESTMENT LTD 50,000 162,000 0.06
SHENZHOU INTERNATIONAL GROUP 13,000 967,200 0.34
SHIMAO PROPERTY HOLDINGS LTD 23,000 391,000 0.14
SINO LAND CO 52,000 719,680 0.25
SINO OCEAN LAND HOLDINGS 50,000 269,500 0.09
Vanguard ETF SeriesAnnual Report 2017
Vanguard FTSE Asia ex Japan High Dividend Yield Index ETF
-109-

Investment portfolio (Unaudited) (Continued)
As at 31 December 2017
Holding at31 December
2017
Fair value at31 December
2017
Percentage oftotal net assets at
31 December2017
HK$ (%)
Hong Kong 41.91%
SINOPEC ENGINEERING GROUP - H 29,000 214,600 0.07
SINOPEC SHANGHAI PETROCHEM - H 60,000 267,000 0.09
SINOTRANS LIMITED - H 47,000 180,010 0.06
SOHO CHINA LTD 36,500 166,805 0.06
SUN HUNG KAI PROPERTIES 25,697 3,350,889 1.16
SWIRE PACIFIC LTD A 9,000 651,150 0.23
SWIRE PROPERTIES LTD 18,600 468,720 0.16
TELEVISION BROADCASTS LTD 4,400 123,640 0.04
TEXWINCA HOLDINGS LTD 18,000 77,400 0.03
TIANHE CHEMICALS GROUP LTD 36,000 42,120 0.01
VTECH HOLDINGS LTD 2,900 296,960 0.10
WANT WANT CHINA HOLDINGS LTD 95,000 622,250 0.22
WH GROUP LTD 151,500 1,336,230 0.46
WHARF HOLDINGS LTD 21,982 593,514 0.21
WHARF REAL ESTATE INVESTMENT CO LTD 21,982 1,143,064 0.40
WYNN MACAU LTD 26,400 653,400 0.23XINJIANG GOLDWIND SCIENCE & TECHNOLOGY COLTD 7,540 100,131 0.03
XINYI GLASS HOLDINGS LTD 38,000 386,840 0.13
XINYI SOLAR HOLDINGS LTD 66,200 199,924 0.07
YUE YUEN INDUSTRIAL HLDG 12,500 383,750 0.13
YUEXIU PROPERTY CO LTD10 109,860 160,396 0.06
ZHEJIANG EXPRESSWAY CO - H 26,000 223,340 0.08
121,012,555 41.91
India 3.20%
BHARAT PETROLEUM CORP LTD 18,303 1,160,512 0.40
BHARTI INFRATEL LTD 15,451 716,734 0.25
COAL INDIA LTD 23,426 754,432 0.26
GREAT EASTERN SHIPPING CO 623 30,471 0.01
HERO MOTOCORP LTD 1,768 819,623 0.28
HINDUSTAN PETROLEUM CORP 10,936 560,669 0.19
INDIABULLS HOUSING FINANCE LTD 5,848 857,048 0.30
INDIAN OIL CORP LTD 19,630 934,149 0.32
INTERGLOBE AVIATION LTD 914 134,947 0.05
JSW ENERGY LTD 11,320 128,106 0.05
MPHASIS LTD 1,199 106,560 0.04
NHPC LTD 38,478 153,867 0.05
Vanguard ETF SeriesAnnual Report 2017
Vanguard FTSE Asia ex Japan High Dividend Yield Index ETF
-110-

Investment portfolio (Unaudited) (Continued)
As at 31 December 2017
Holding at31 December
2017
Fair value at31 December
2017
Percentage oftotal net assets at
31 December2017
HK$ (%)
India 3.20%
NMDC LTD 13,955 235,520 0.08
NTPC LTD 35,331 765,911 0.27
OIL + NATURAL GAS CORP LTD 54,968 1,314,131 0.46
OIL INDIA LTD 3,373 153,470 0.05
POWER FINANCE CORPORATION 11,500 171,481 0.06
RURAL ELECTRIFICATION CORP 12,298 234,591 0.08
9,232,222 3.20
Indonesia 1.82%
ASTRA INTERNATIONAL TBK PT 362,500 1,733,577 0.60
BUKIT ASAM PERSERO TBK PT 142,300 201,696 0.07
INDOCEMENT TUNGGAL PRAKARSA 27,200 344,001 0.12
MATAHARI DEPARTMENT STORE TBK PT 38,000 218,948 0.08
MEDIA NUSANTARA CITRA TBK PT 81,800 60,564 0.02
PERUSAHAAN GAS NEGARA PERSER 173,300 174,740 0.06
SEMEN INDONESIA PERSERO TBK 55,900 318,863 0.11
TELEKOMUNIKASI INDONESIA PER 856,200 2,190,358 0.76
5,242,747 1.82
Malaysia 5.02%
ALLIANCE BANK MALAYSIA BHD 20,300 159,985 0.05
AMMB HOLDINGS BHD 35,100 298,999 0.10
ASTRO MALAYSIA HOLDINGS BHD 33,700 172,504 0.06
AXIATA GROUP BERHAD 80,300 851,553 0.29
BERJAYA SPORTS TOTO BHD 15,253 65,997 0.02
BRITISH AMERICAN TOBACCO BHD 2,500 193,163 0.07
CIMB GROUP HOLDINGS BHD 113,900 1,438,881 0.50
DIGI.COM BHD 61,000 600,930 0.21
HONG LEONG BANK BERHAD 11,400 374,350 0.13
IOI PROPERTIES GROUP BHD 41,128 146,971 0.05
KLCCP STAPLED GROUP 8,200 136,852 0.05
MALAYAN BANKING BHD 107,000 2,025,505 0.70
MAXIS BHD 49,200 571,167 0.20
MISC BHD 27,500 394,149 0.14
PETRONAS GAS BHD 14,400 486,214 0.17
PUBLIC BANK BERHAD 56,320 2,260,642 0.78
RHB CAPITAL BHD 17,446 168,496 0.06
SIME DARBY BERHAD 64,700 276,198 0.10
Vanguard ETF SeriesAnnual Report 2017
Vanguard FTSE Asia ex Japan High Dividend Yield Index ETF
-111-
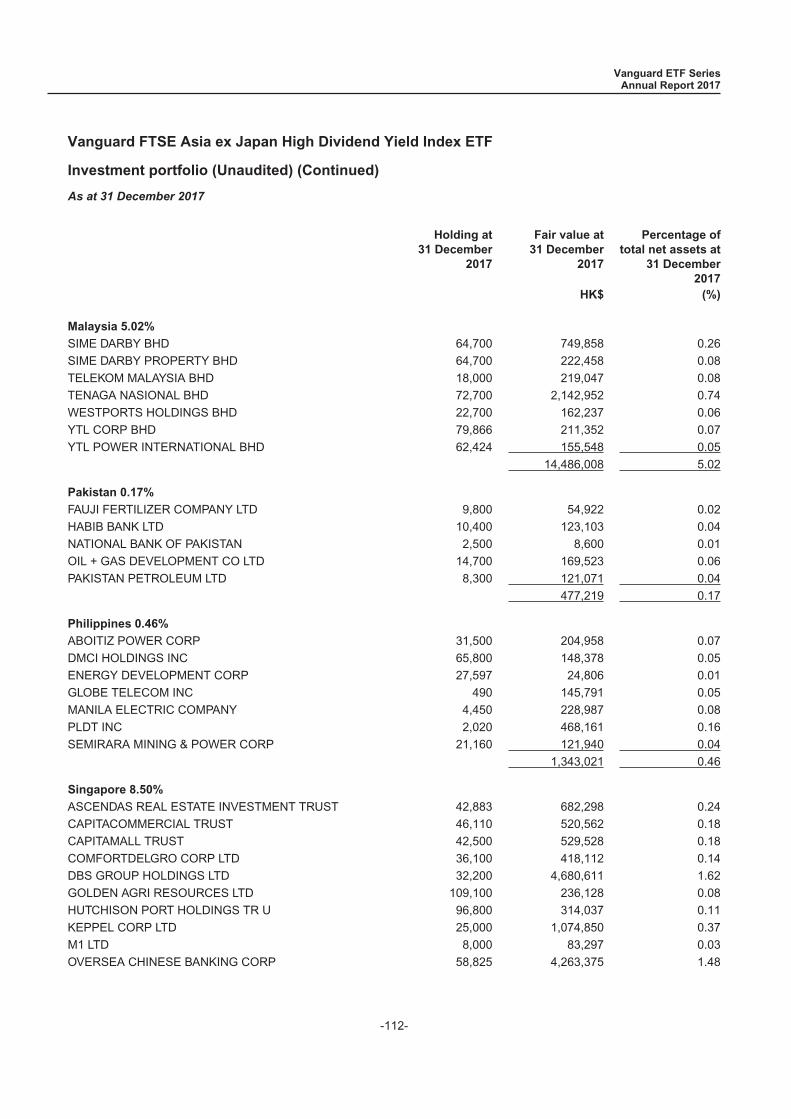
Investment portfolio (Unaudited) (Continued)
As at 31 December 2017
Holding at31 December
2017
Fair value at31 December
2017
Percentage oftotal net assets at
31 December2017
HK$ (%)
Malaysia 5.02%
SIME DARBY BHD 64,700 749,858 0.26
SIME DARBY PROPERTY BHD 64,700 222,458 0.08
TELEKOM MALAYSIA BHD 18,000 219,047 0.08
TENAGA NASIONAL BHD 72,700 2,142,952 0.74
WESTPORTS HOLDINGS BHD 22,700 162,237 0.06
YTL CORP BHD 79,866 211,352 0.07
YTL POWER INTERNATIONAL BHD 62,424 155,548 0.05
14,486,008 5.02
Pakistan 0.17%
FAUJI FERTILIZER COMPANY LTD 9,800 54,922 0.02
HABIB BANK LTD 10,400 123,103 0.04
NATIONAL BANK OF PAKISTAN 2,500 8,600 0.01
OIL + GAS DEVELOPMENT CO LTD 14,700 169,523 0.06
PAKISTAN PETROLEUM LTD 8,300 121,071 0.04
477,219 0.17
Philippines 0.46%
ABOITIZ POWER CORP 31,500 204,958 0.07
DMCI HOLDINGS INC 65,800 148,378 0.05
ENERGY DEVELOPMENT CORP 27,597 24,806 0.01
GLOBE TELECOM INC 490 145,791 0.05
MANILA ELECTRIC COMPANY 4,450 228,987 0.08
PLDT INC 2,020 468,161 0.16
SEMIRARA MINING & POWER CORP 21,160 121,940 0.04
1,343,021 0.46
Singapore 8.50%
ASCENDAS REAL ESTATE INVESTMENT TRUST 42,883 682,298 0.24
CAPITACOMMERCIAL TRUST 46,110 520,562 0.18
CAPITAMALL TRUST 42,500 529,528 0.18
COMFORTDELGRO CORP LTD 36,100 418,112 0.14
DBS GROUP HOLDINGS LTD 32,200 4,680,611 1.62
GOLDEN AGRI RESOURCES LTD 109,100 236,128 0.08
HUTCHISON PORT HOLDINGS TR U 96,800 314,037 0.11
KEPPEL CORP LTD 25,000 1,074,850 0.37
M1 LTD 8,000 83,297 0.03
OVERSEA CHINESE BANKING CORP 58,825 4,263,375 1.48
Vanguard ETF SeriesAnnual Report 2017
Vanguard FTSE Asia ex Japan High Dividend Yield Index ETF
-112-
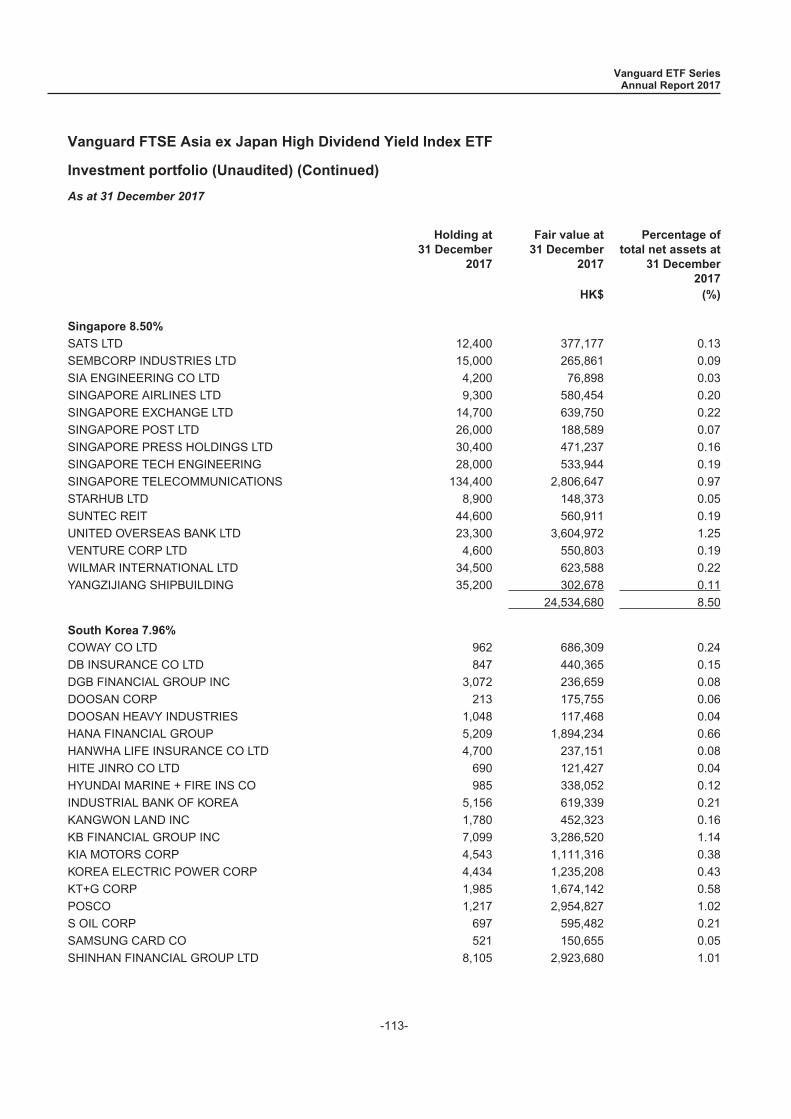
Investment portfolio (Unaudited) (Continued)
As at 31 December 2017
Holding at31 December
2017
Fair value at31 December
2017
Percentage oftotal net assets at
31 December2017
HK$ (%)
Singapore 8.50%
SATS LTD 12,400 377,177 0.13
SEMBCORP INDUSTRIES LTD 15,000 265,861 0.09
SIA ENGINEERING CO LTD 4,200 76,898 0.03
SINGAPORE AIRLINES LTD 9,300 580,454 0.20
SINGAPORE EXCHANGE LTD 14,700 639,750 0.22
SINGAPORE POST LTD 26,000 188,589 0.07
SINGAPORE PRESS HOLDINGS LTD 30,400 471,237 0.16
SINGAPORE TECH ENGINEERING 28,000 533,944 0.19
SINGAPORE TELECOMMUNICATIONS 134,400 2,806,647 0.97
STARHUB LTD 8,900 148,373 0.05
SUNTEC REIT 44,600 560,911 0.19
UNITED OVERSEAS BANK LTD 23,300 3,604,972 1.25
VENTURE CORP LTD 4,600 550,803 0.19
WILMAR INTERNATIONAL LTD 34,500 623,588 0.22
YANGZIJIANG SHIPBUILDING 35,200 302,678 0.11
24,534,680 8.50
South Korea 7.96%
COWAY CO LTD 962 686,309 0.24
DB INSURANCE CO LTD 847 440,365 0.15
DGB FINANCIAL GROUP INC 3,072 236,659 0.08
DOOSAN CORP 213 175,755 0.06
DOOSAN HEAVY INDUSTRIES 1,048 117,468 0.04
HANA FINANCIAL GROUP 5,209 1,894,234 0.66
HANWHA LIFE INSURANCE CO LTD 4,700 237,151 0.08
HITE JINRO CO LTD 690 121,427 0.04
HYUNDAI MARINE + FIRE INS CO 985 338,052 0.12
INDUSTRIAL BANK OF KOREA 5,156 619,339 0.21
KANGWON LAND INC 1,780 452,323 0.16
KB FINANCIAL GROUP INC 7,099 3,286,520 1.14
KIA MOTORS CORP 4,543 1,111,316 0.38
KOREA ELECTRIC POWER CORP 4,434 1,235,208 0.43
KT+G CORP 1,985 1,674,142 0.58
POSCO 1,217 2,954,827 1.02
S OIL CORP 697 595,482 0.21
SAMSUNG CARD CO 521 150,655 0.05
SHINHAN FINANCIAL GROUP LTD 8,105 2,923,680 1.01
Vanguard ETF SeriesAnnual Report 2017
Vanguard FTSE Asia ex Japan High Dividend Yield Index ETF
-113-
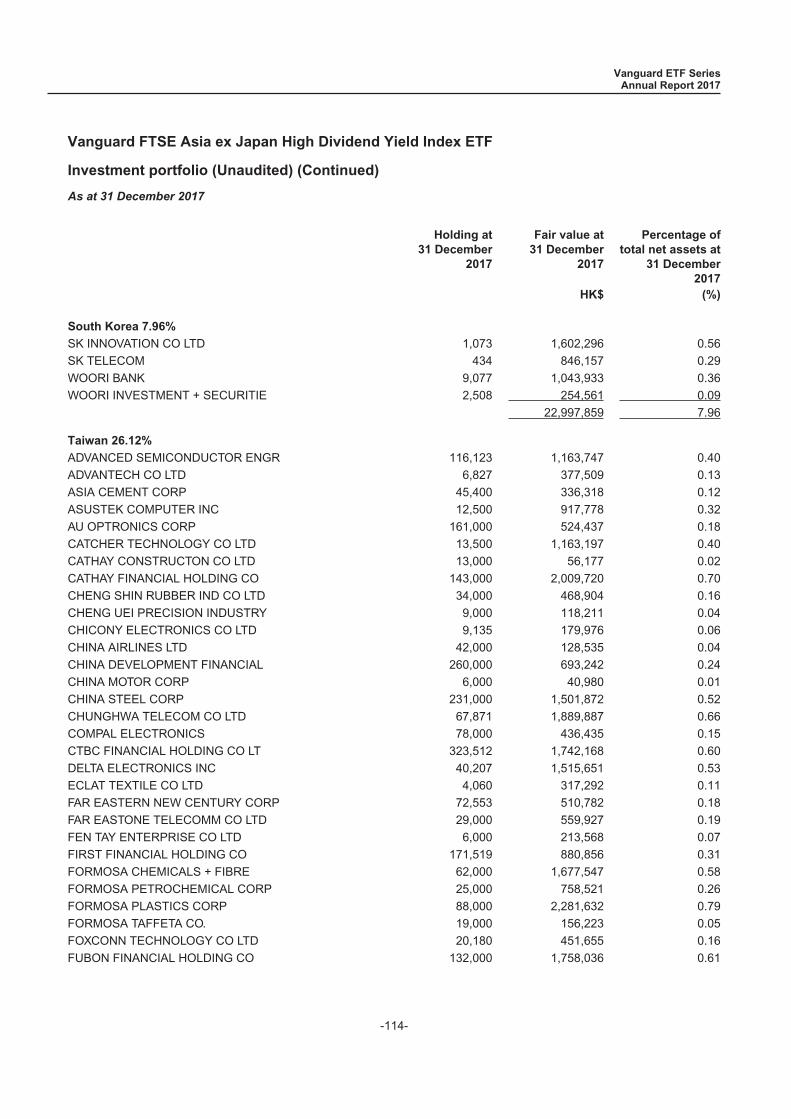
Investment portfolio (Unaudited) (Continued)
As at 31 December 2017
Holding at31 December
2017
Fair value at31 December
2017
Percentage oftotal net assets at
31 December2017
HK$ (%)
South Korea 7.96%
SK INNOVATION CO LTD 1,073 1,602,296 0.56
SK TELECOM 434 846,157 0.29
WOORI BANK 9,077 1,043,933 0.36
WOORI INVESTMENT + SECURITIE 2,508 254,561 0.09
22,997,859 7.96
Taiwan 26.12%
ADVANCED SEMICONDUCTOR ENGR 116,123 1,163,747 0.40
ADVANTECH CO LTD 6,827 377,509 0.13
ASIA CEMENT CORP 45,400 336,318 0.12
ASUSTEK COMPUTER INC 12,500 917,778 0.32
AU OPTRONICS CORP 161,000 524,437 0.18
CATCHER TECHNOLOGY CO LTD 13,500 1,163,197 0.40
CATHAY CONSTRUCTON CO LTD 13,000 56,177 0.02
CATHAY FINANCIAL HOLDING CO 143,000 2,009,720 0.70
CHENG SHIN RUBBER IND CO LTD 34,000 468,904 0.16
CHENG UEI PRECISION INDUSTRY 9,000 118,211 0.04
CHICONY ELECTRONICS CO LTD 9,135 179,976 0.06
CHINA AIRLINES LTD 42,000 128,535 0.04
CHINA DEVELOPMENT FINANCIAL 260,000 693,242 0.24
CHINA MOTOR CORP 6,000 40,980 0.01
CHINA STEEL CORP 231,000 1,501,872 0.52
CHUNGHWA TELECOM CO LTD 67,871 1,889,887 0.66
COMPAL ELECTRONICS 78,000 436,435 0.15
CTBC FINANCIAL HOLDING CO LT 323,512 1,742,168 0.60
DELTA ELECTRONICS INC 40,207 1,515,651 0.53
ECLAT TEXTILE CO LTD 4,060 317,292 0.11
FAR EASTERN NEW CENTURY CORP 72,553 510,782 0.18
FAR EASTONE TELECOMM CO LTD 29,000 559,927 0.19
FEN TAY ENTERPRISE CO LTD 6,000 213,568 0.07
FIRST FINANCIAL HOLDING CO 171,519 880,856 0.31
FORMOSA CHEMICALS + FIBRE 62,000 1,677,547 0.58
FORMOSA PETROCHEMICAL CORP 25,000 758,521 0.26
FORMOSA PLASTICS CORP 88,000 2,281,632 0.79
FORMOSA TAFFETA CO. 19,000 156,223 0.05
FOXCONN TECHNOLOGY CO LTD 20,180 451,655 0.16
FUBON FINANCIAL HOLDING CO 132,000 1,758,036 0.61
Vanguard ETF SeriesAnnual Report 2017
Vanguard FTSE Asia ex Japan High Dividend Yield Index ETF
-114-
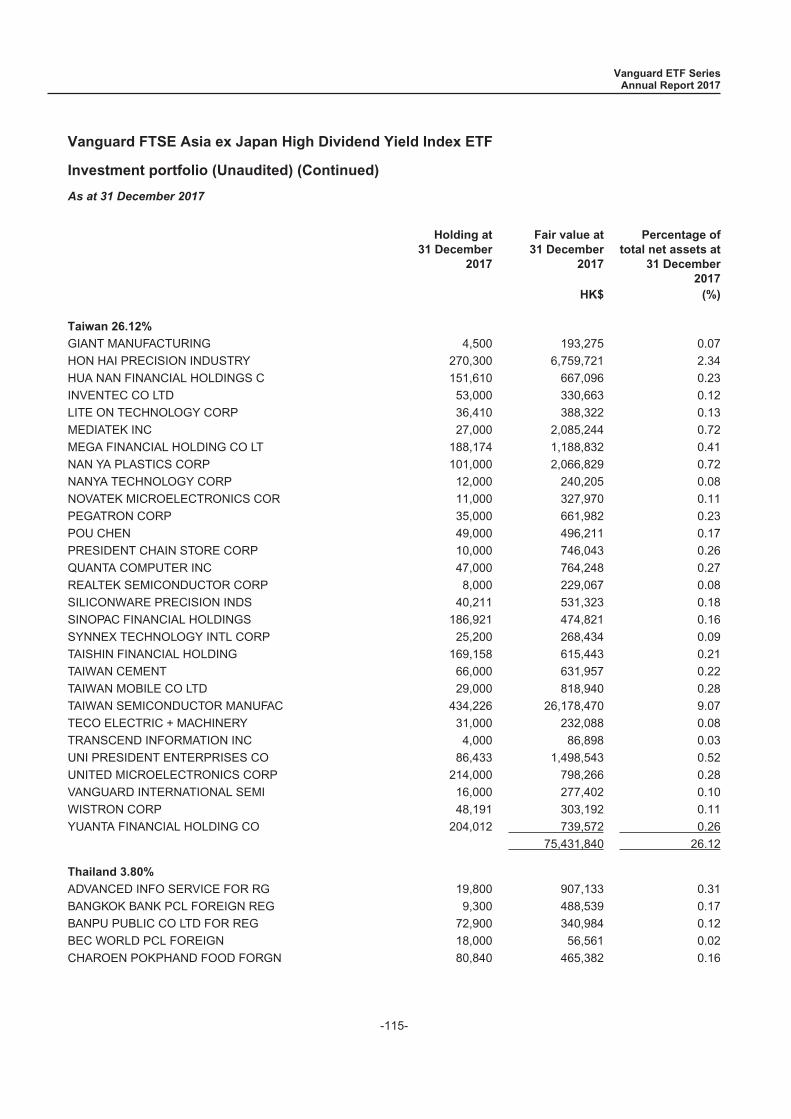
Investment portfolio (Unaudited) (Continued)
As at 31 December 2017
Holding at31 December
2017
Fair value at31 December
2017
Percentage oftotal net assets at
31 December2017
HK$ (%)
Taiwan 26.12%
GIANT MANUFACTURING 4,500 193,275 0.07
HON HAI PRECISION INDUSTRY 270,300 6,759,721 2.34
HUA NAN FINANCIAL HOLDINGS C 151,610 667,096 0.23
INVENTEC CO LTD 53,000 330,663 0.12
LITE ON TECHNOLOGY CORP 36,410 388,322 0.13
MEDIATEK INC 27,000 2,085,244 0.72
MEGA FINANCIAL HOLDING CO LT 188,174 1,188,832 0.41
NAN YA PLASTICS CORP 101,000 2,066,829 0.72
NANYA TECHNOLOGY CORP 12,000 240,205 0.08
NOVATEK MICROELECTRONICS COR 11,000 327,970 0.11
PEGATRON CORP 35,000 661,982 0.23
POU CHEN 49,000 496,211 0.17
PRESIDENT CHAIN STORE CORP 10,000 746,043 0.26
QUANTA COMPUTER INC 47,000 764,248 0.27
REALTEK SEMICONDUCTOR CORP 8,000 229,067 0.08
SILICONWARE PRECISION INDS 40,211 531,323 0.18
SINOPAC FINANCIAL HOLDINGS 186,921 474,821 0.16
SYNNEX TECHNOLOGY INTL CORP 25,200 268,434 0.09
TAISHIN FINANCIAL HOLDING 169,158 615,443 0.21
TAIWAN CEMENT 66,000 631,957 0.22
TAIWAN MOBILE CO LTD 29,000 818,940 0.28
TAIWAN SEMICONDUCTOR MANUFAC 434,226 26,178,470 9.07
TECO ELECTRIC + MACHINERY 31,000 232,088 0.08
TRANSCEND INFORMATION INC 4,000 86,898 0.03
UNI PRESIDENT ENTERPRISES CO 86,433 1,498,543 0.52
UNITED MICROELECTRONICS CORP 214,000 798,266 0.28
VANGUARD INTERNATIONAL SEMI 16,000 277,402 0.10
WISTRON CORP 48,191 303,192 0.11
YUANTA FINANCIAL HOLDING CO 204,012 739,572 0.26
75,431,840 26.12
Thailand 3.80%
ADVANCED INFO SERVICE FOR RG 19,800 907,133 0.31
BANGKOK BANK PCL FOREIGN REG 9,300 488,539 0.17
BANPU PUBLIC CO LTD FOR REG 72,900 340,984 0.12
BEC WORLD PCL FOREIGN 18,000 56,561 0.02
CHAROEN POKPHAND FOOD FORGN 80,840 465,382 0.16
Vanguard ETF SeriesAnnual Report 2017
Vanguard FTSE Asia ex Japan High Dividend Yield Index ETF
-115-

Investment portfolio (Unaudited) (Continued)
As at 31 December 2017
Holding at31 December
2017
Fair value at31 December
2017
Percentage oftotal net assets at
31 December2017
HK$ (%)
Thailand 3.80%
DELTA ELECTRONICS THAI FORGN 8,300 145,834 0.05
ELECTRICITY GEN PUB CO FOR R 4,500 233,152 0.08
GLOW ENERGY PCL FOREIGN 7,600 148,119 0.05
INTOUCH HOLDINGS PCL 11,000 148,418 0.05
INTOUCH HOLDINGS PCL F 24,800 333,129 0.12
IRPC PCL FOREIGN 168,700 285,283 0.10
KRUNG THAI BANK PUB CO FOREI 114,500 527,326 0.18
LAND & HOUSES PCL 37,400 94,196 0.03
LAND + HOUSES PUB CO FOR REG 61,600 155,147 0.05
PTT GLOBAL CHEMICAL PCL FOR 36,500 744,191 0.26
PTT PCL/FOREIGN 26,000 2,731,617 0.95
RATCHABURI ELEC GEN HODG FOR 14,100 183,481 0.06
SIAM CEMENT PUB CO FOR REG 5,250 617,061 0.21
SIAM CITY CEMENT PCL FOR 2,073 130,776 0.04
SIAM COMMERCIAL BANK FOREIGN 43,100 1,550,747 0.54
THAI OIL PCL FRGN 18,100 449,357 0.16
THAI UNION GROUP PCL 52,300 249,647 0.09
10,986,080 3.80
Total Listed Equities 286,142,586 99.10
Foreign currency contracts (493) (0.00)
Futures 61,863 0.02
Total Investments 286,203,956 99.12
Total investments, at cost 244,419,022
Vanguard ETF SeriesAnnual Report 2017
Vanguard FTSE Asia ex Japan High Dividend Yield Index ETF
-116-
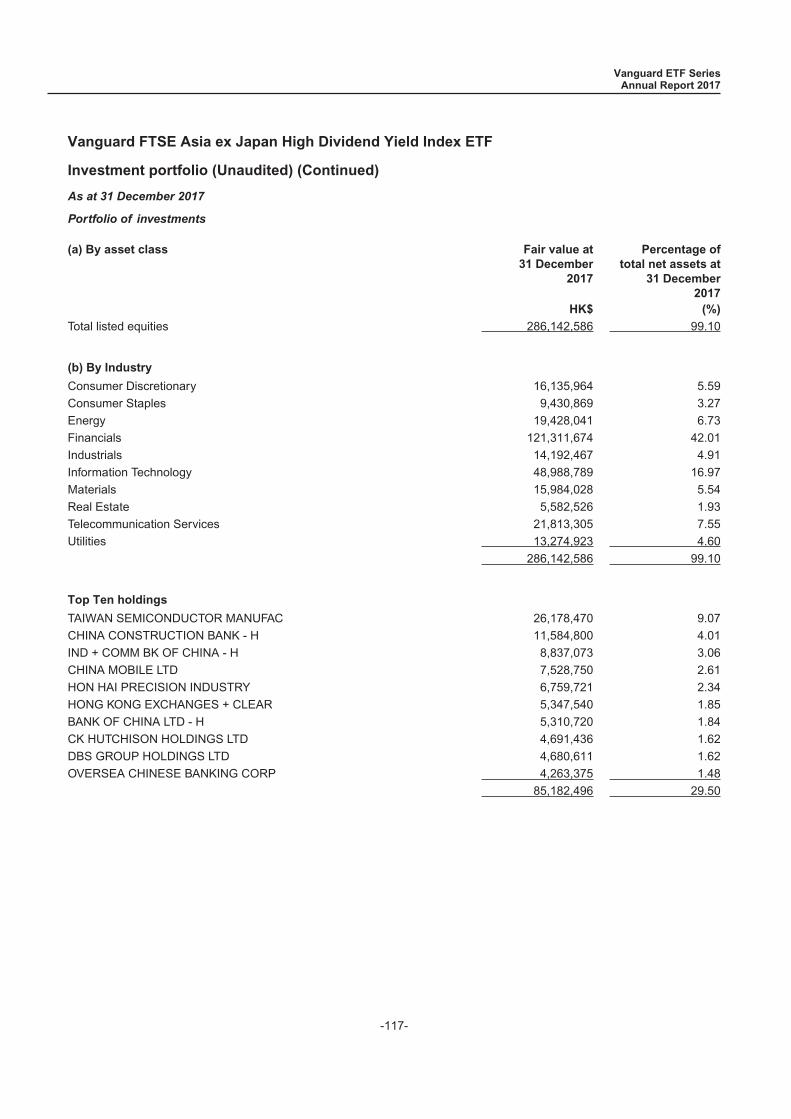
Investment portfolio (Unaudited) (Continued)
As at 31 December 2017
Portfolio of investments
(a) By asset class Fair value at31 December
2017
Percentage oftotal net assets at
31 December2017
HK$ (%)
Total listed equities 286,142,586 99.10
(b) By Industry
Consumer Discretionary 16,135,964 5.59
Consumer Staples 9,430,869 3.27
Energy 19,428,041 6.73
Financials 121,311,674 42.01
Industrials 14,192,467 4.91
Information Technology 48,988,789 16.97
Materials 15,984,028 5.54
Real Estate 5,582,526 1.93
Telecommunication Services 21,813,305 7.55
Utilities 13,274,923 4.60
286,142,586 99.10
Top Ten holdings
TAIWAN SEMICONDUCTOR MANUFAC 26,178,470 9.07
CHINA CONSTRUCTION BANK - H 11,584,800 4.01
IND + COMM BK OF CHINA - H 8,837,073 3.06
CHINA MOBILE LTD 7,528,750 2.61
HON HAI PRECISION INDUSTRY 6,759,721 2.34
HONG KONG EXCHANGES + CLEAR 5,347,540 1.85
BANK OF CHINA LTD - H 5,310,720 1.84
CK HUTCHISON HOLDINGS LTD 4,691,436 1.62
DBS GROUP HOLDINGS LTD 4,680,611 1.62
OVERSEA CHINESE BANKING CORP 4,263,375 1.48
85,182,496 29.50
Vanguard ETF SeriesAnnual Report 2017
Vanguard FTSE Asia ex Japan High Dividend Yield Index ETF
-117-
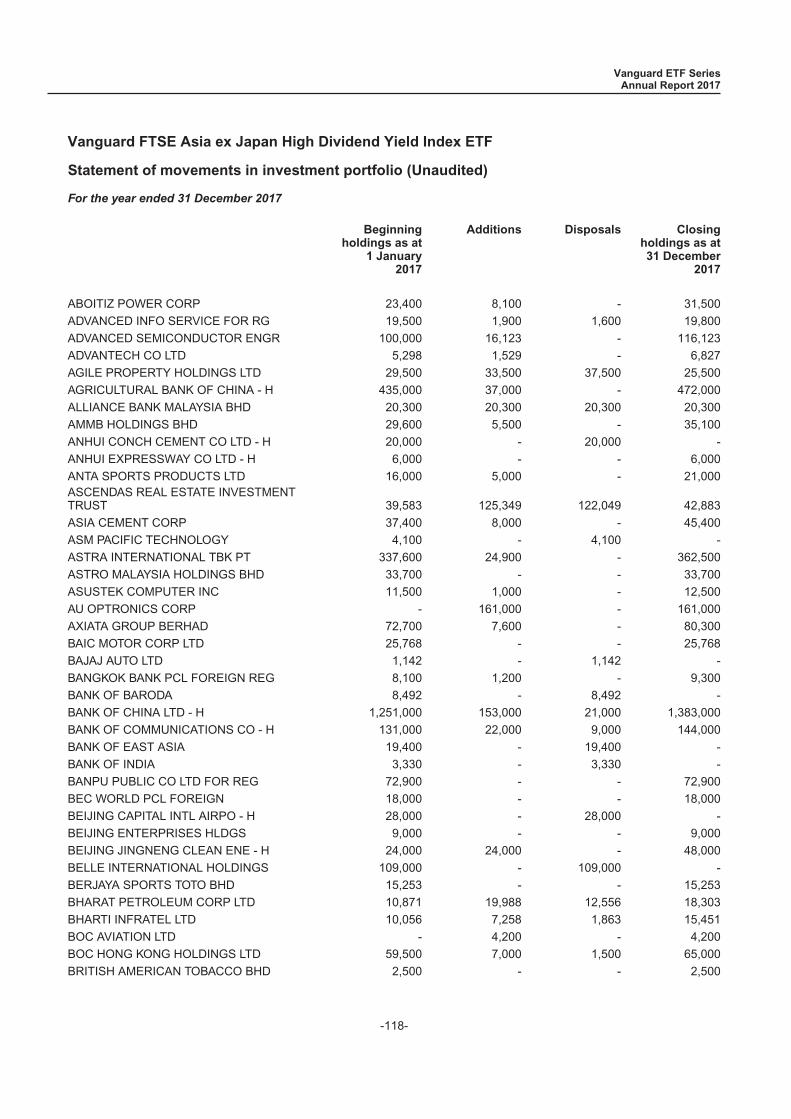
Statement of movements in investment portfolio (Unaudited)
For the year ended 31 December 2017
Beginningholdings as at
1 January2017
Additions Disposals Closingholdings as at31 December
2017
ABOITIZ POWER CORP 23,400 8,100 - 31,500
ADVANCED INFO SERVICE FOR RG 19,500 1,900 1,600 19,800
ADVANCED SEMICONDUCTOR ENGR 100,000 16,123 - 116,123
ADVANTECH CO LTD 5,298 1,529 - 6,827
AGILE PROPERTY HOLDINGS LTD 29,500 33,500 37,500 25,500
AGRICULTURAL BANK OF CHINA - H 435,000 37,000 - 472,000
ALLIANCE BANK MALAYSIA BHD 20,300 20,300 20,300 20,300
AMMB HOLDINGS BHD 29,600 5,500 - 35,100
ANHUI CONCH CEMENT CO LTD - H 20,000 - 20,000 -
ANHUI EXPRESSWAY CO LTD - H 6,000 - - 6,000
ANTA SPORTS PRODUCTS LTD 16,000 5,000 - 21,000ASCENDAS REAL ESTATE INVESTMENTTRUST 39,583 125,349 122,049 42,883
ASIA CEMENT CORP 37,400 8,000 - 45,400
ASM PACIFIC TECHNOLOGY 4,100 - 4,100 -
ASTRA INTERNATIONAL TBK PT 337,600 24,900 - 362,500
ASTRO MALAYSIA HOLDINGS BHD 33,700 - - 33,700
ASUSTEK COMPUTER INC 11,500 1,000 - 12,500
AU OPTRONICS CORP - 161,000 - 161,000
AXIATA GROUP BERHAD 72,700 7,600 - 80,300
BAIC MOTOR CORP LTD 25,768 - - 25,768
BAJAJ AUTO LTD 1,142 - 1,142 -
BANGKOK BANK PCL FOREIGN REG 8,100 1,200 - 9,300
BANK OF BARODA 8,492 - 8,492 -
BANK OF CHINA LTD - H 1,251,000 153,000 21,000 1,383,000
BANK OF COMMUNICATIONS CO - H 131,000 22,000 9,000 144,000
BANK OF EAST ASIA 19,400 - 19,400 -
BANK OF INDIA 3,330 - 3,330 -
BANPU PUBLIC CO LTD FOR REG 72,900 - - 72,900
BEC WORLD PCL FOREIGN 18,000 - - 18,000
BEIJING CAPITAL INTL AIRPO - H 28,000 - 28,000 -
BEIJING ENTERPRISES HLDGS 9,000 - - 9,000
BEIJING JINGNENG CLEAN ENE - H 24,000 24,000 - 48,000
BELLE INTERNATIONAL HOLDINGS 109,000 - 109,000 -
BERJAYA SPORTS TOTO BHD 15,253 - - 15,253
BHARAT PETROLEUM CORP LTD 10,871 19,988 12,556 18,303
BHARTI INFRATEL LTD 10,056 7,258 1,863 15,451
BOC AVIATION LTD - 4,200 - 4,200
BOC HONG KONG HOLDINGS LTD 59,500 7,000 1,500 65,000
BRITISH AMERICAN TOBACCO BHD 2,500 - - 2,500
Vanguard ETF SeriesAnnual Report 2017
Vanguard FTSE Asia ex Japan High Dividend Yield Index ETF
-118-

Statement of movements in investment portfolio (Unaudited) (Continued)
For the year ended 31 December 2017
Beginningholdings as at
1 January2017
Additions Disposals Closingholdings as at31 December
2017
BUKIT ASAM PERSERO TBK PT 10,700 131,600 - 142,300
CAFE DE CORAL HOLDINGS LTD 6,000 - - 6,000
CAIRN INDIA LTD 7,220 - 7,220 -
CANARA BANK 1,892 189 2,081 -
CAPITACOMMERCIAL TRUST 33,800 12,310 - 46,110
CAPITAMALL TRUST 42,500 - - 42,500
CATCHER TECHNOLOGY CO LTD 12,500 2,000 1,000 13,500
CATHAY CONSTRUCTON - 13,000 - 13,000
CATHAY FINANCIAL HOLDING CO 133,000 15,000 5,000 143,000
CATHAY PACIFIC AIRWAYS 16,000 - 16,000 -
CHAMPION REIT 35,000 - - 35,000
CHAROEN POKPHAND FOOD FORGN 69,200 22,940 11,300 80,840
CHENG SHIN RUBBER IND CO LTD 31,000 3,000 - 34,000
CHENG UEI PRECISION INDUSTRY 9,000 - - 9,000
CHEUNG KONG INFRASTRUCTURE 10,500 - 10,500 -
CHEUNG KONG PROPERTY HOLDINGS LTD 47,000 3,500 50,500 -
CHICONY ELECTRONICS CO LTD 8,090 8,045 7,000 9,135
CHINA AIRLINES LTD - 42,000 - 42,000
CHINA BLUECHEMICAL LTD - H 16,000 - 16,000 -
CHINA CINDA ASSET MANAGEME - H 153,000 21,000 - 174,000
CHINA CITIC BANK CORP LTD - H 139,000 10,000 - 149,000
CHINA COMMUNICATIONS CONST - H 72,000 7,000 - 79,000
CHINA COMMUNICATIONS SERVI - H 46,000 - - 46,000
CHINA CONSTRUCTION BANK - H 1,513,000 159,000 63,000 1,609,000
CHINA DEVELOPMENT FINANCIAL 237,000 45,000 22,000 260,000
CHINA DONGXIANG GROUP CO LTD 34,000 47,000 39,000 42,000
CHINA EVERBRIGHT BANK CO L - H 52,000 - - 52,000
CHINA EVERBRIGHT LTD 14,000 - - 14,000
CHINA EVERGRANDE GROUP 56,000 4,000 8,000 52,000
CHINA GALAXY SECURITIES CO - H 63,000 - 63,000 -
CHINA HONGQIAO GROUP LTD 15,500 - 15,500 -CHINA HUARONG ASSET MANAGEMENTCO LTD 99,000 109,000 29,000 179,000
CHINA INTERNATIONAL MARINE - H 7,400 - 7,400 -
CHINA LIFE INSURANCE CO - H 124,000 - 124,000 -
CHINA MACHINERY ENGINEERIN - H 18,000 - - 18,000
CHINA MERCHANTS BANK - H 63,500 7,000 2,000 68,500
CHINA MERCHANTS HLDGS INTL 20,000 2,000 - 22,000
CHINA MINSHENG BANKING - H 105,100 28,173 35,500 97,773
CHINA MOBILE LTD 88,000 9,500 2,500 95,000
Vanguard ETF SeriesAnnual Report 2017
Vanguard FTSE Asia ex Japan High Dividend Yield Index ETF
-119-
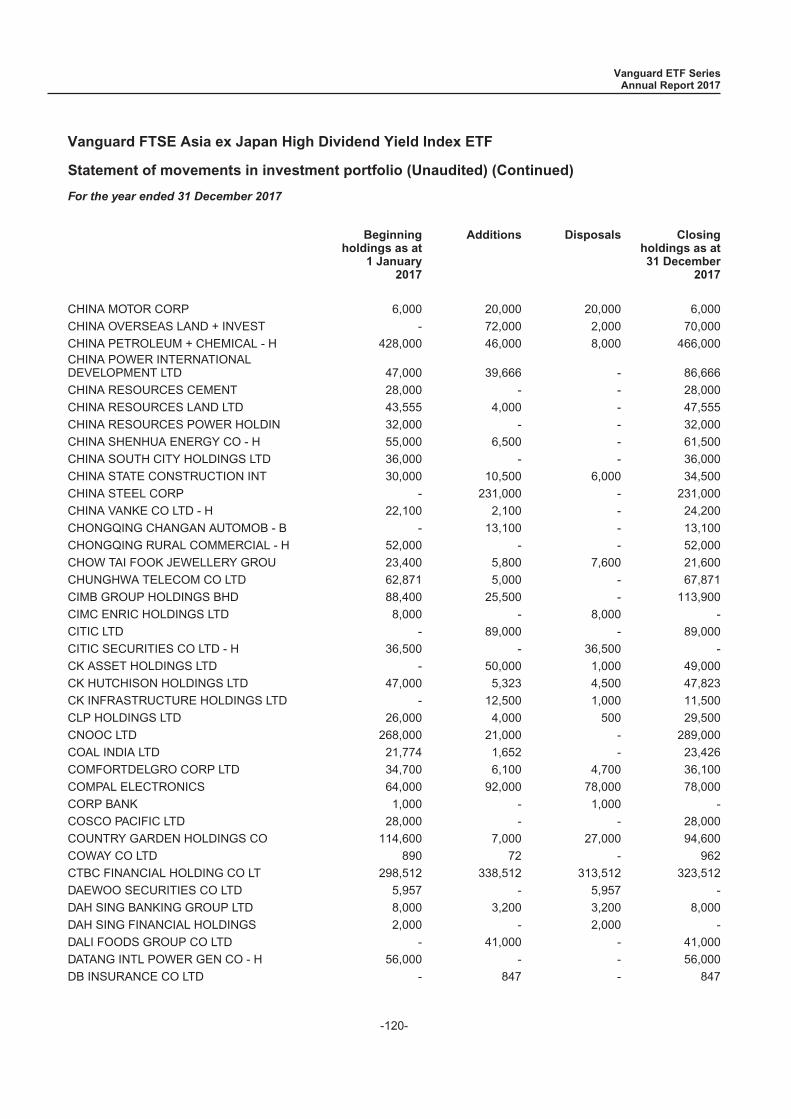
Statement of movements in investment portfolio (Unaudited) (Continued)
For the year ended 31 December 2017
Beginningholdings as at
1 January2017
Additions Disposals Closingholdings as at31 December
2017
CHINA MOTOR CORP 6,000 20,000 20,000 6,000
CHINA OVERSEAS LAND + INVEST - 72,000 2,000 70,000
CHINA PETROLEUM + CHEMICAL - H 428,000 46,000 8,000 466,000CHINA POWER INTERNATIONALDEVELOPMENT LTD 47,000 39,666 - 86,666
CHINA RESOURCES CEMENT 28,000 - - 28,000
CHINA RESOURCES LAND LTD 43,555 4,000 - 47,555
CHINA RESOURCES POWER HOLDIN 32,000 - - 32,000
CHINA SHENHUA ENERGY CO - H 55,000 6,500 - 61,500
CHINA SOUTH CITY HOLDINGS LTD 36,000 - - 36,000
CHINA STATE CONSTRUCTION INT 30,000 10,500 6,000 34,500
CHINA STEEL CORP - 231,000 - 231,000
CHINA VANKE CO LTD - H 22,100 2,100 - 24,200
CHONGQING CHANGAN AUTOMOB - B - 13,100 - 13,100
CHONGQING RURAL COMMERCIAL - H 52,000 - - 52,000
CHOW TAI FOOK JEWELLERY GROU 23,400 5,800 7,600 21,600
CHUNGHWA TELECOM CO LTD 62,871 5,000 - 67,871
CIMB GROUP HOLDINGS BHD 88,400 25,500 - 113,900
CIMC ENRIC HOLDINGS LTD 8,000 - 8,000 -
CITIC LTD - 89,000 - 89,000
CITIC SECURITIES CO LTD - H 36,500 - 36,500 -
CK ASSET HOLDINGS LTD - 50,000 1,000 49,000
CK HUTCHISON HOLDINGS LTD 47,000 5,323 4,500 47,823
CK INFRASTRUCTURE HOLDINGS LTD - 12,500 1,000 11,500
CLP HOLDINGS LTD 26,000 4,000 500 29,500
CNOOC LTD 268,000 21,000 - 289,000
COAL INDIA LTD 21,774 1,652 - 23,426
COMFORTDELGRO CORP LTD 34,700 6,100 4,700 36,100
COMPAL ELECTRONICS 64,000 92,000 78,000 78,000
CORP BANK 1,000 - 1,000 -
COSCO PACIFIC LTD 28,000 - - 28,000
COUNTRY GARDEN HOLDINGS CO 114,600 7,000 27,000 94,600
COWAY CO LTD 890 72 - 962
CTBC FINANCIAL HOLDING CO LT 298,512 338,512 313,512 323,512
DAEWOO SECURITIES CO LTD 5,957 - 5,957 -
DAH SING BANKING GROUP LTD 8,000 3,200 3,200 8,000
DAH SING FINANCIAL HOLDINGS 2,000 - 2,000 -
DALI FOODS GROUP CO LTD - 41,000 - 41,000
DATANG INTL POWER GEN CO - H 56,000 - - 56,000
DB INSURANCE CO LTD - 847 - 847
Vanguard ETF SeriesAnnual Report 2017
Vanguard FTSE Asia ex Japan High Dividend Yield Index ETF
-120-

Statement of movements in investment portfolio (Unaudited) (Continued)
For the year ended 31 December 2017
Beginningholdings as at
1 January2017
Additions Disposals Closingholdings as at31 December
2017
DBS GROUP HOLDINGS LTD 29,700 2,900 400 32,200
DELTA ELECTRONICS INC 37,207 4,000 1,000 40,207
DELTA ELECTRONICS THAI FORGN 8,300 - - 8,300
DGB FINANCIAL GROUP INC 2,057 1,015 - 3,072
DIGI.COM BHD 62,200 19,700 20,900 61,000
DMCI HOLDINGS INC 54,600 33,800 22,600 65,800
DOOSAN CORP 151 62 - 213
DOOSAN HEAVY INDUSTRIES 1,048 - - 1,048
ECLAT TEXTILE CO LTD - 7,060 3,000 4,060
ELECTRICITY GEN PUB CO FOR R 3,900 1,600 1,000 4,500
ENERGY DEVELOPMENT CORP - 183,800 156,203 27,597
FAR EAST HORIZON LTD 39,000 - - 39,000
FAR EASTERN NEW CENTURY CORP 60,553 12,000 - 72,553
FAR EASTONE TELECOMM CO LTD 26,000 29,000 26,000 29,000
FAUJI FERTILIZER COMPANY LTD 9,800 - - 9,800
FEN TAY ENTERPRISE CO LTD - 7,000 1,000 6,000
FIRST FINANCIAL HOLDING CO 158,156 13,363 - 171,519
FIRST PACIFIC CO 34,000 8,000 - 42,000
FORMOSA CHEMICALS + FIBRE 74,000 5,000 17,000 62,000
FORMOSA PETROCHEMICAL CORP 23,000 2,000 - 25,000
FORMOSA PLASTICS CORP 80,000 10,000 2,000 88,000
FORMOSA TAFFETA CO. 19,000 - - 19,000
FOXCONN TECHNOLOGY CO LTD 18,180 2,000 - 20,180
FRANSHION PROPERTIES 74,000 14,000 - 88,000
FUBON FINANCIAL HOLDING CO 123,000 9,000 - 132,000FUYAO GLASS INDUSTRY GROUP CO LTD -H 8,800 - - 8,800
GF SECURITIES CO LTD - H 25,800 7,600 3,000 30,400
GIANT MANUFACTURING 4,500 - - 4,500
GLOBE TELECOM INC 190 300 - 490
GLOW ENERGY PCL FOREIGN 7,600 - - 7,600
GOLDEN AGRI RESOURCES LTD 109,100 - - 109,100
GOME ELECTRICAL APPLIANCES 182,000 - 182,000 -
GREAT EASTERN SHIPPING CO 623 - - 623
GREAT WALL MOTOR COMPANY - H 52,000 5,000 - 57,000
GREENTOWN CHINA HOLDINGS 15,500 - - 15,500
GUANGDONG INVESTMENT LTD 50,000 4,000 - 54,000
GUANGZHOU AUTOMOBILE GROUP - H 38,000 4,000 2,000 40,000
GUANGZHOU R+F PROPERTIES - H 16,000 5,600 3,200 18,400
Vanguard ETF SeriesAnnual Report 2017
Vanguard FTSE Asia ex Japan High Dividend Yield Index ETF
-121-
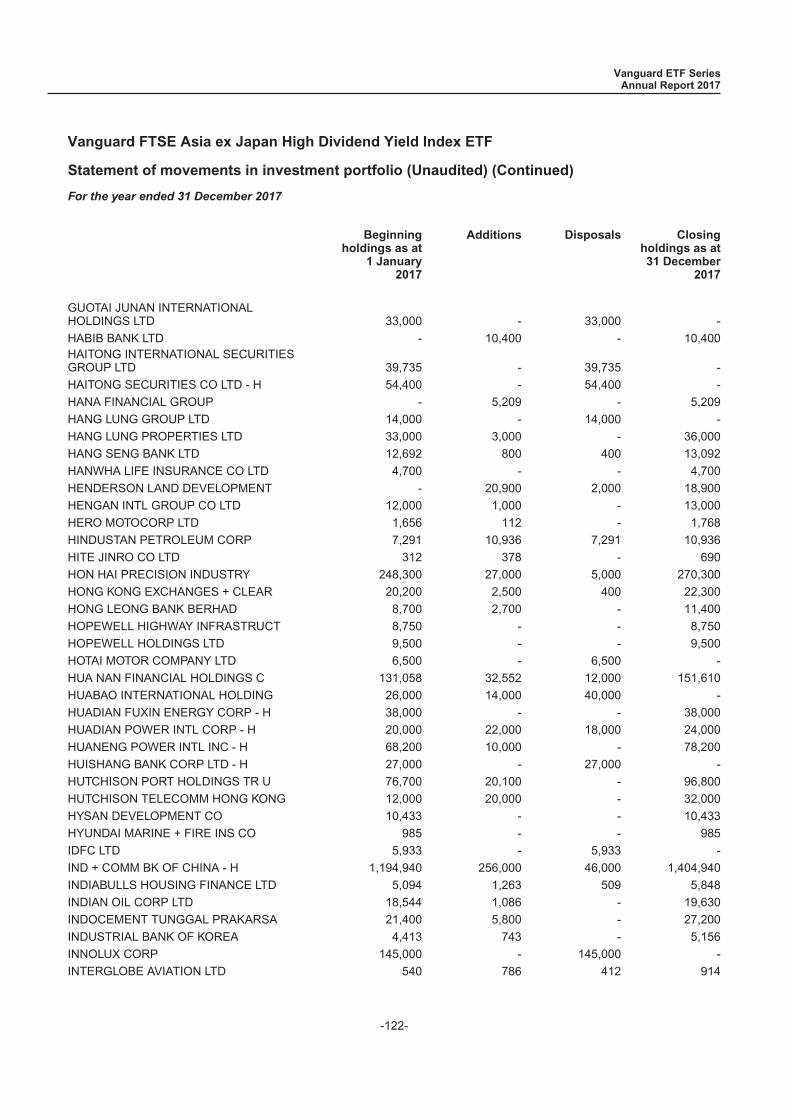
Statement of movements in investment portfolio (Unaudited) (Continued)
For the year ended 31 December 2017
Beginningholdings as at
1 January2017
Additions Disposals Closingholdings as at31 December
2017
GUOTAI JUNAN INTERNATIONALHOLDINGS LTD 33,000 - 33,000 -
HABIB BANK LTD - 10,400 - 10,400HAITONG INTERNATIONAL SECURITIESGROUP LTD 39,735 - 39,735 -
HAITONG SECURITIES CO LTD - H 54,400 - 54,400 -
HANA FINANCIAL GROUP - 5,209 - 5,209
HANG LUNG GROUP LTD 14,000 - 14,000 -
HANG LUNG PROPERTIES LTD 33,000 3,000 - 36,000
HANG SENG BANK LTD 12,692 800 400 13,092
HANWHA LIFE INSURANCE CO LTD 4,700 - - 4,700
HENDERSON LAND DEVELOPMENT - 20,900 2,000 18,900
HENGAN INTL GROUP CO LTD 12,000 1,000 - 13,000
HERO MOTOCORP LTD 1,656 112 - 1,768
HINDUSTAN PETROLEUM CORP 7,291 10,936 7,291 10,936
HITE JINRO CO LTD 312 378 - 690
HON HAI PRECISION INDUSTRY 248,300 27,000 5,000 270,300
HONG KONG EXCHANGES + CLEAR 20,200 2,500 400 22,300
HONG LEONG BANK BERHAD 8,700 2,700 - 11,400
HOPEWELL HIGHWAY INFRASTRUCT 8,750 - - 8,750
HOPEWELL HOLDINGS LTD 9,500 - - 9,500
HOTAI MOTOR COMPANY LTD 6,500 - 6,500 -
HUA NAN FINANCIAL HOLDINGS C 131,058 32,552 12,000 151,610
HUABAO INTERNATIONAL HOLDING 26,000 14,000 40,000 -
HUADIAN FUXIN ENERGY CORP - H 38,000 - - 38,000
HUADIAN POWER INTL CORP - H 20,000 22,000 18,000 24,000
HUANENG POWER INTL INC - H 68,200 10,000 - 78,200
HUISHANG BANK CORP LTD - H 27,000 - 27,000 -
HUTCHISON PORT HOLDINGS TR U 76,700 20,100 - 96,800
HUTCHISON TELECOMM HONG KONG 12,000 20,000 - 32,000
HYSAN DEVELOPMENT CO 10,433 - - 10,433
HYUNDAI MARINE + FIRE INS CO 985 - - 985
IDFC LTD 5,933 - 5,933 -
IND + COMM BK OF CHINA - H 1,194,940 256,000 46,000 1,404,940
INDIABULLS HOUSING FINANCE LTD 5,094 1,263 509 5,848
INDIAN OIL CORP LTD 18,544 1,086 - 19,630
INDOCEMENT TUNGGAL PRAKARSA 21,400 5,800 - 27,200
INDUSTRIAL BANK OF KOREA 4,413 743 - 5,156
INNOLUX CORP 145,000 - 145,000 -
INTERGLOBE AVIATION LTD 540 786 412 914
Vanguard ETF SeriesAnnual Report 2017
Vanguard FTSE Asia ex Japan High Dividend Yield Index ETF
-122-

Statement of movements in investment portfolio (Unaudited) (Continued)
For the year ended 31 December 2017
Beginningholdings as at
1 January2017
Additions Disposals Closingholdings as at31 December
2017
INTOUCH HOLDINGS PCL 6,000 5,000 - 11,000
INTOUCH HOLDINGS PCL F 24,800 - - 24,800
INVENTEC CO LTD 53,000 - - 53,000
IOI PROPERTIES GROUP BHD 34,983 37,445 31,300 41,128
IRPC PCL FOREIGN 168,700 - - 168,700
JARDINE CYCLE + CARRIAGE LTD 1,700 - 1,700 -
JIANGLING MOTORS CORP LTD - B 1,300 - - 1,300
JIANGSU EXPRESS CO LTD - H 22,000 - - 22,000
JSW ENERGY LTD 4,310 7,010 - 11,320
KANGWON LAND INC 1,780 - - 1,780
KB FINANCIAL GROUP INC 6,891 705 497 7,099
KEPPEL CORP LTD 23,200 3,700 1,900 25,000
KERRY PROPERTIES LTD 11,500 - 1,500 10,000
KIA MOTORS CORP - 4,543 - 4,543
KINGBOARD CHEMICAL HOLDINGS 12,000 - - 12,000
KINGBOARD LAMINATES HOLDINGS 21,500 - 5,000 16,500
KLCCP STAPLED GROUP 8,200 - - 8,200
KOREA ELECTRIC POWER CORP - 4,739 305 4,434
KRUNG THAI BANK PUB CO FOREI 101,900 12,600 - 114,500
KT+G CORP 1,789 283 87 1,985
KWG PROPERTY HOLDING LTD 21,500 - - 21,500
LAFARGE MALAYSIA BHD 7,900 - 7,900 -
LAND & HOUSES PCL 37,400 - - 37,400
LAND + HOUSES PUB CO FOR REG 66,300 28,600 33,300 61,600
LAO FENG XIANG CO LTD - B 2,400 2,600 1,800 3,200
LEE + MAN PAPER MANUFACTURIN 18,000 11,000 - 29,000
LENOVO GROUP LTD 112,000 12,000 - 124,000
LI + FUNG LTD 86,000 36,000 16,000 106,000
LIFESTYLE INTL HLDGS LTD 9,500 - - 9,500
LINK REIT 38,000 4,000 1,500 40,500
LITE ON TECHNOLOGY CORP 36,410 - - 36,410
LONGFOR PROPERTIES 23,500 2,500 - 26,000
M1 LTD 3,000 5,000 - 8,000
MALAYAN BANKING BHD 93,800 13,200 - 107,000
MANILA ELECTRIC COMPANY 4,450 - - 4,450
MATAHARI DEPARTMENT STORE TBK PT - 38,000 - 38,000
MAXIS BHD 44,100 5,100 - 49,200
MEDIA NUSANTARA CITRA TBK PT - 81,800 - 81,800
MEDIATEK INC 24,000 31,000 28,000 27,000
Vanguard ETF SeriesAnnual Report 2017
Vanguard FTSE Asia ex Japan High Dividend Yield Index ETF
-123-
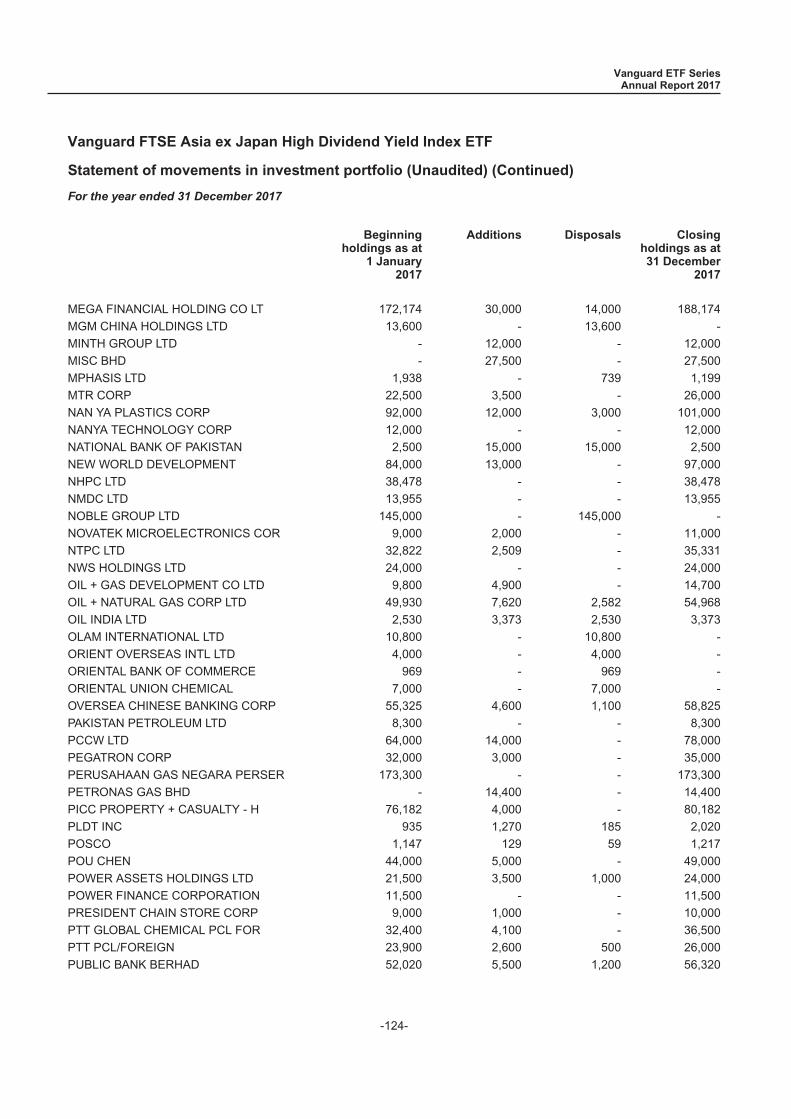
Statement of movements in investment portfolio (Unaudited) (Continued)
For the year ended 31 December 2017
Beginningholdings as at
1 January2017
Additions Disposals Closingholdings as at31 December
2017
MEGA FINANCIAL HOLDING CO LT 172,174 30,000 14,000 188,174
MGM CHINA HOLDINGS LTD 13,600 - 13,600 -
MINTH GROUP LTD - 12,000 - 12,000
MISC BHD - 27,500 - 27,500
MPHASIS LTD 1,938 - 739 1,199
MTR CORP 22,500 3,500 - 26,000
NAN YA PLASTICS CORP 92,000 12,000 3,000 101,000
NANYA TECHNOLOGY CORP 12,000 - - 12,000
NATIONAL BANK OF PAKISTAN 2,500 15,000 15,000 2,500
NEW WORLD DEVELOPMENT 84,000 13,000 - 97,000
NHPC LTD 38,478 - - 38,478
NMDC LTD 13,955 - - 13,955
NOBLE GROUP LTD 145,000 - 145,000 -
NOVATEK MICROELECTRONICS COR 9,000 2,000 - 11,000
NTPC LTD 32,822 2,509 - 35,331
NWS HOLDINGS LTD 24,000 - - 24,000
OIL + GAS DEVELOPMENT CO LTD 9,800 4,900 - 14,700
OIL + NATURAL GAS CORP LTD 49,930 7,620 2,582 54,968
OIL INDIA LTD 2,530 3,373 2,530 3,373
OLAM INTERNATIONAL LTD 10,800 - 10,800 -
ORIENT OVERSEAS INTL LTD 4,000 - 4,000 -
ORIENTAL BANK OF COMMERCE 969 - 969 -
ORIENTAL UNION CHEMICAL 7,000 - 7,000 -
OVERSEA CHINESE BANKING CORP 55,325 4,600 1,100 58,825
PAKISTAN PETROLEUM LTD 8,300 - - 8,300
PCCW LTD 64,000 14,000 - 78,000
PEGATRON CORP 32,000 3,000 - 35,000
PERUSAHAAN GAS NEGARA PERSER 173,300 - - 173,300
PETRONAS GAS BHD - 14,400 - 14,400
PICC PROPERTY + CASUALTY - H 76,182 4,000 - 80,182
PLDT INC 935 1,270 185 2,020
POSCO 1,147 129 59 1,217
POU CHEN 44,000 5,000 - 49,000
POWER ASSETS HOLDINGS LTD 21,500 3,500 1,000 24,000
POWER FINANCE CORPORATION 11,500 - - 11,500
PRESIDENT CHAIN STORE CORP 9,000 1,000 - 10,000
PTT GLOBAL CHEMICAL PCL FOR 32,400 4,100 - 36,500
PTT PCL/FOREIGN 23,900 2,600 500 26,000
PUBLIC BANK BERHAD 52,020 5,500 1,200 56,320
Vanguard ETF SeriesAnnual Report 2017
Vanguard FTSE Asia ex Japan High Dividend Yield Index ETF
-124-
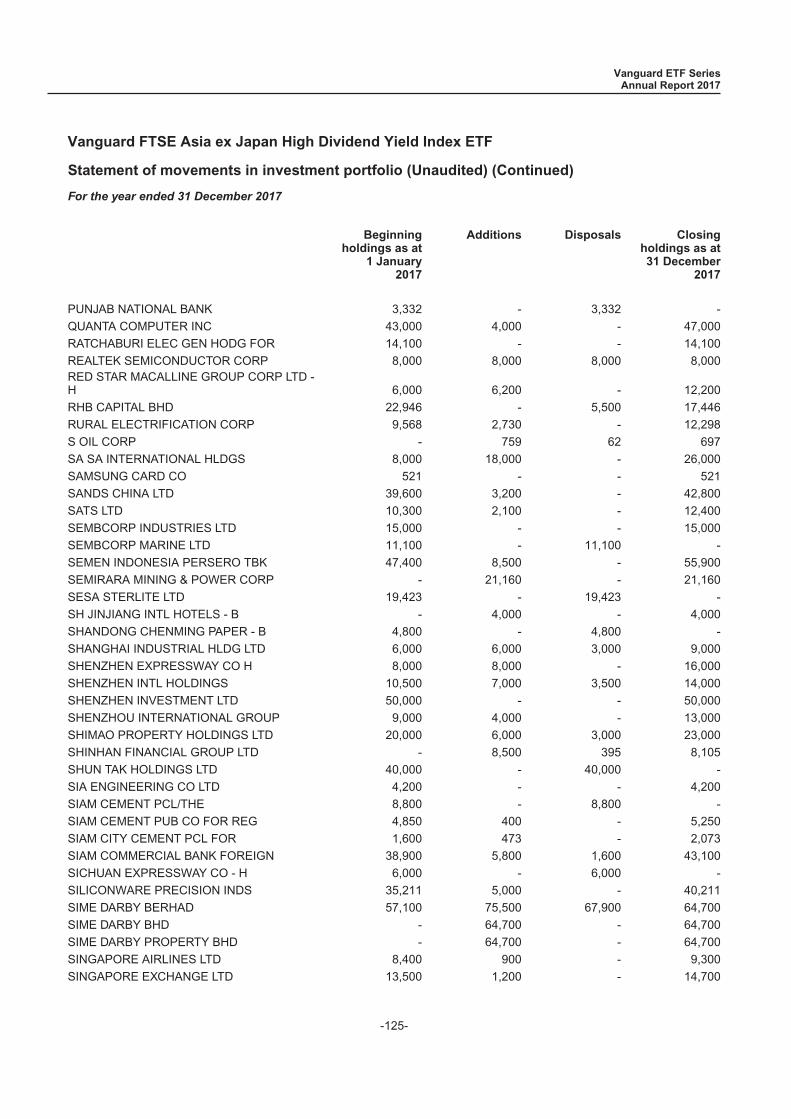
Statement of movements in investment portfolio (Unaudited) (Continued)
For the year ended 31 December 2017
Beginningholdings as at
1 January2017
Additions Disposals Closingholdings as at31 December
2017
PUNJAB NATIONAL BANK 3,332 - 3,332 -
QUANTA COMPUTER INC 43,000 4,000 - 47,000
RATCHABURI ELEC GEN HODG FOR 14,100 - - 14,100
REALTEK SEMICONDUCTOR CORP 8,000 8,000 8,000 8,000RED STAR MACALLINE GROUP CORP LTD -H 6,000 6,200 - 12,200
RHB CAPITAL BHD 22,946 - 5,500 17,446
RURAL ELECTRIFICATION CORP 9,568 2,730 - 12,298
S OIL CORP - 759 62 697
SA SA INTERNATIONAL HLDGS 8,000 18,000 - 26,000
SAMSUNG CARD CO 521 - - 521
SANDS CHINA LTD 39,600 3,200 - 42,800
SATS LTD 10,300 2,100 - 12,400
SEMBCORP INDUSTRIES LTD 15,000 - - 15,000
SEMBCORP MARINE LTD 11,100 - 11,100 -
SEMEN INDONESIA PERSERO TBK 47,400 8,500 - 55,900
SEMIRARA MINING & POWER CORP - 21,160 - 21,160
SESA STERLITE LTD 19,423 - 19,423 -
SH JINJIANG INTL HOTELS - B - 4,000 - 4,000
SHANDONG CHENMING PAPER - B 4,800 - 4,800 -
SHANGHAI INDUSTRIAL HLDG LTD 6,000 6,000 3,000 9,000
SHENZHEN EXPRESSWAY CO H 8,000 8,000 - 16,000
SHENZHEN INTL HOLDINGS 10,500 7,000 3,500 14,000
SHENZHEN INVESTMENT LTD 50,000 - - 50,000
SHENZHOU INTERNATIONAL GROUP 9,000 4,000 - 13,000
SHIMAO PROPERTY HOLDINGS LTD 20,000 6,000 3,000 23,000
SHINHAN FINANCIAL GROUP LTD - 8,500 395 8,105
SHUN TAK HOLDINGS LTD 40,000 - 40,000 -
SIA ENGINEERING CO LTD 4,200 - - 4,200
SIAM CEMENT PCL/THE 8,800 - 8,800 -
SIAM CEMENT PUB CO FOR REG 4,850 400 - 5,250
SIAM CITY CEMENT PCL FOR 1,600 473 - 2,073
SIAM COMMERCIAL BANK FOREIGN 38,900 5,800 1,600 43,100
SICHUAN EXPRESSWAY CO - H 6,000 - 6,000 -
SILICONWARE PRECISION INDS 35,211 5,000 - 40,211
SIME DARBY BERHAD 57,100 75,500 67,900 64,700
SIME DARBY BHD - 64,700 - 64,700
SIME DARBY PROPERTY BHD - 64,700 - 64,700
SINGAPORE AIRLINES LTD 8,400 900 - 9,300
SINGAPORE EXCHANGE LTD 13,500 1,200 - 14,700
Vanguard ETF SeriesAnnual Report 2017
Vanguard FTSE Asia ex Japan High Dividend Yield Index ETF
-125-
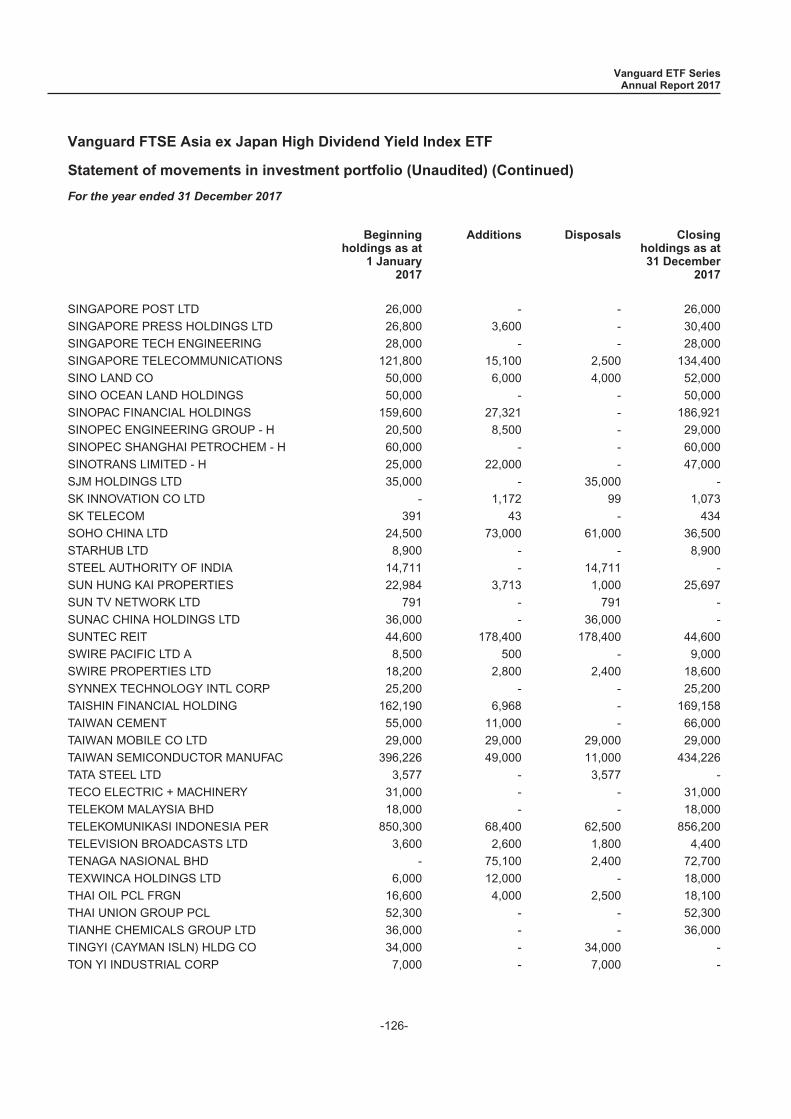
Statement of movements in investment portfolio (Unaudited) (Continued)
For the year ended 31 December 2017
Beginningholdings as at
1 January2017
Additions Disposals Closingholdings as at31 December
2017
SINGAPORE POST LTD 26,000 - - 26,000
SINGAPORE PRESS HOLDINGS LTD 26,800 3,600 - 30,400
SINGAPORE TECH ENGINEERING 28,000 - - 28,000
SINGAPORE TELECOMMUNICATIONS 121,800 15,100 2,500 134,400
SINO LAND CO 50,000 6,000 4,000 52,000
SINO OCEAN LAND HOLDINGS 50,000 - - 50,000
SINOPAC FINANCIAL HOLDINGS 159,600 27,321 - 186,921
SINOPEC ENGINEERING GROUP - H 20,500 8,500 - 29,000
SINOPEC SHANGHAI PETROCHEM - H 60,000 - - 60,000
SINOTRANS LIMITED - H 25,000 22,000 - 47,000
SJM HOLDINGS LTD 35,000 - 35,000 -
SK INNOVATION CO LTD - 1,172 99 1,073
SK TELECOM 391 43 - 434
SOHO CHINA LTD 24,500 73,000 61,000 36,500
STARHUB LTD 8,900 - - 8,900
STEEL AUTHORITY OF INDIA 14,711 - 14,711 -
SUN HUNG KAI PROPERTIES 22,984 3,713 1,000 25,697
SUN TV NETWORK LTD 791 - 791 -
SUNAC CHINA HOLDINGS LTD 36,000 - 36,000 -
SUNTEC REIT 44,600 178,400 178,400 44,600
SWIRE PACIFIC LTD A 8,500 500 - 9,000
SWIRE PROPERTIES LTD 18,200 2,800 2,400 18,600
SYNNEX TECHNOLOGY INTL CORP 25,200 - - 25,200
TAISHIN FINANCIAL HOLDING 162,190 6,968 - 169,158
TAIWAN CEMENT 55,000 11,000 - 66,000
TAIWAN MOBILE CO LTD 29,000 29,000 29,000 29,000
TAIWAN SEMICONDUCTOR MANUFAC 396,226 49,000 11,000 434,226
TATA STEEL LTD 3,577 - 3,577 -
TECO ELECTRIC + MACHINERY 31,000 - - 31,000
TELEKOM MALAYSIA BHD 18,000 - - 18,000
TELEKOMUNIKASI INDONESIA PER 850,300 68,400 62,500 856,200
TELEVISION BROADCASTS LTD 3,600 2,600 1,800 4,400
TENAGA NASIONAL BHD - 75,100 2,400 72,700
TEXWINCA HOLDINGS LTD 6,000 12,000 - 18,000
THAI OIL PCL FRGN 16,600 4,000 2,500 18,100
THAI UNION GROUP PCL 52,300 - - 52,300
TIANHE CHEMICALS GROUP LTD 36,000 - - 36,000
TINGYI (CAYMAN ISLN) HLDG CO 34,000 - 34,000 -
TON YI INDUSTRIAL CORP 7,000 - 7,000 -
Vanguard ETF SeriesAnnual Report 2017
Vanguard FTSE Asia ex Japan High Dividend Yield Index ETF
-126-
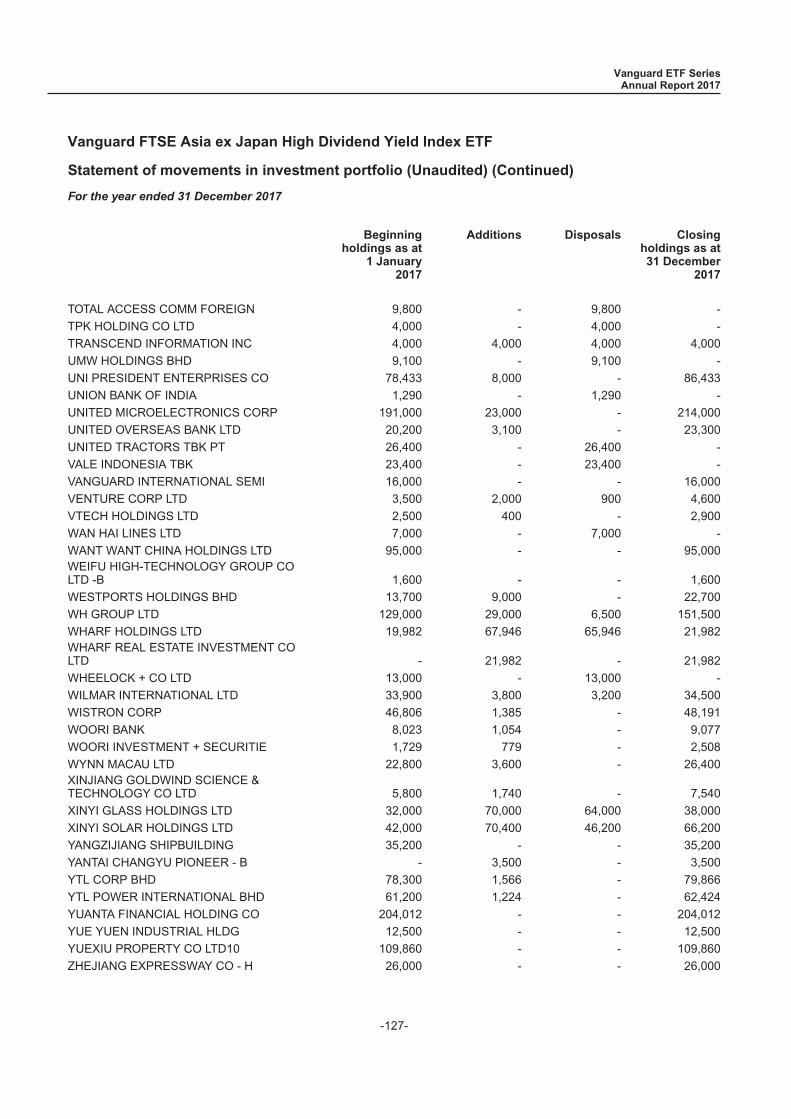
Statement of movements in investment portfolio (Unaudited) (Continued)
For the year ended 31 December 2017
Beginningholdings as at
1 January2017
Additions Disposals Closingholdings as at31 December
2017
TOTAL ACCESS COMM FOREIGN 9,800 - 9,800 -
TPK HOLDING CO LTD 4,000 - 4,000 -
TRANSCEND INFORMATION INC 4,000 4,000 4,000 4,000
UMW HOLDINGS BHD 9,100 - 9,100 -
UNI PRESIDENT ENTERPRISES CO 78,433 8,000 - 86,433
UNION BANK OF INDIA 1,290 - 1,290 -
UNITED MICROELECTRONICS CORP 191,000 23,000 - 214,000
UNITED OVERSEAS BANK LTD 20,200 3,100 - 23,300
UNITED TRACTORS TBK PT 26,400 - 26,400 -
VALE INDONESIA TBK 23,400 - 23,400 -
VANGUARD INTERNATIONAL SEMI 16,000 - - 16,000
VENTURE CORP LTD 3,500 2,000 900 4,600
VTECH HOLDINGS LTD 2,500 400 - 2,900
WAN HAI LINES LTD 7,000 - 7,000 -
WANT WANT CHINA HOLDINGS LTD 95,000 - - 95,000WEIFU HIGH-TECHNOLOGY GROUP COLTD -B 1,600 - - 1,600
WESTPORTS HOLDINGS BHD 13,700 9,000 - 22,700
WH GROUP LTD 129,000 29,000 6,500 151,500
WHARF HOLDINGS LTD 19,982 67,946 65,946 21,982WHARF REAL ESTATE INVESTMENT COLTD - 21,982 - 21,982
WHEELOCK + CO LTD 13,000 - 13,000 -
WILMAR INTERNATIONAL LTD 33,900 3,800 3,200 34,500
WISTRON CORP 46,806 1,385 - 48,191
WOORI BANK 8,023 1,054 - 9,077
WOORI INVESTMENT + SECURITIE 1,729 779 - 2,508
WYNN MACAU LTD 22,800 3,600 - 26,400XINJIANG GOLDWIND SCIENCE &TECHNOLOGY CO LTD 5,800 1,740 - 7,540
XINYI GLASS HOLDINGS LTD 32,000 70,000 64,000 38,000
XINYI SOLAR HOLDINGS LTD 42,000 70,400 46,200 66,200
YANGZIJIANG SHIPBUILDING 35,200 - - 35,200
YANTAI CHANGYU PIONEER - B - 3,500 - 3,500
YTL CORP BHD 78,300 1,566 - 79,866
YTL POWER INTERNATIONAL BHD 61,200 1,224 - 62,424
YUANTA FINANCIAL HOLDING CO 204,012 - - 204,012
YUE YUEN INDUSTRIAL HLDG 12,500 - - 12,500
YUEXIU PROPERTY CO LTD10 109,860 - - 109,860
ZHEJIANG EXPRESSWAY CO - H 26,000 - - 26,000
Vanguard ETF SeriesAnnual Report 2017
Vanguard FTSE Asia ex Japan High Dividend Yield Index ETF
-127-

Statement of movements in investment portfolio (Unaudited) (Continued)
For the year ended 31 December 2017
Beginningholdings as at
1 January2017
Additions Disposals Closingholdings as at31 December
2017
ZIJIN MINING GROUP CO LTD - H 90,000 - 90,000 -
Vanguard ETF SeriesAnnual Report 2017
Vanguard FTSE Asia ex Japan High Dividend Yield Index ETF
-128-
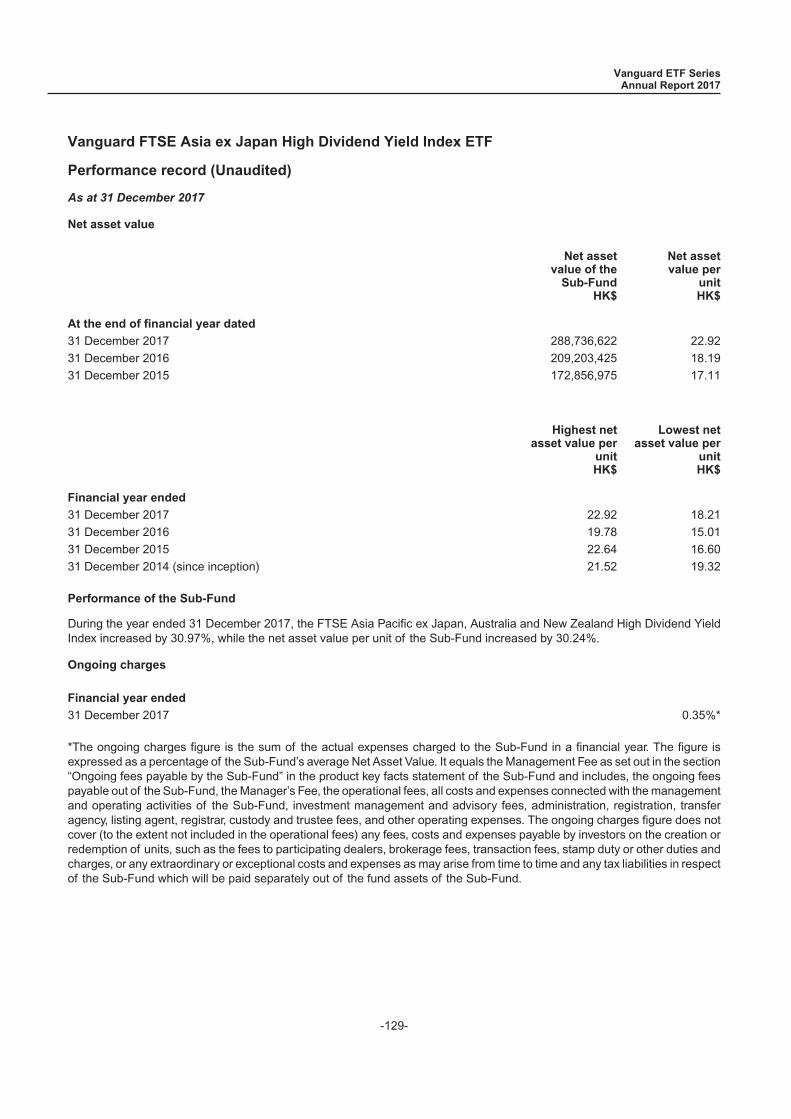
Performance record (Unaudited)
As at 31 December 2017
Net asset value
Net assetvalue of the
Sub-FundHK$
Net assetvalue per
unitHK$
At the end of financial year dated
31 December 2017 288,736,622 22.92
31 December 2016 209,203,425 18.19
31 December 2015 172,856,975 17.11
Highest netasset value per
unitHK$
Lowest netasset value per
unitHK$
Financial year ended
31 December 2017 22.92 18.21
31 December 2016 19.78 15.01
31 December 2015 22.64 16.60
31 December 2014 (since inception) 21.52 19.32
Performance of the Sub-Fund
During the year ended 31 December 2017, the FTSE Asia Pacific ex Japan, Australia and New Zealand High Dividend YieldIndex increased by 30.97%, while the net asset value per unit of the Sub-Fund increased by 30.24%.
Ongoing charges
Financial year ended
31 December 2017 0.35%*
*The ongoing charges figure is the sum of the actual expenses charged to the Sub-Fund in a financial year. The figure isexpressed as a percentage of the Sub-Fund’s average Net Asset Value. It equals the Management Fee as set out in the section“Ongoing fees payable by the Sub-Fund” in the product key facts statement of the Sub-Fund and includes, the ongoing feespayable out of the Sub-Fund, the Manager’s Fee, the operational fees, all costs and expenses connected with the managementand operating activities of the Sub-Fund, investment management and advisory fees, administration, registration, transferagency, listing agent, registrar, custody and trustee fees, and other operating expenses. The ongoing charges figure does notcover (to the extent not included in the operational fees) any fees, costs and expenses payable by investors on the creation orredemption of units, such as the fees to participating dealers, brokerage fees, transaction fees, stamp duty or other duties andcharges, or any extraordinary or exceptional costs and expenses as may arise from time to time and any tax liabilities in respectof the Sub-Fund which will be paid separately out of the fund assets of the Sub-Fund.
Vanguard ETF SeriesAnnual Report 2017
Vanguard FTSE Asia ex Japan High Dividend Yield Index ETF
-129-

Investment portfolio (Unaudited)
As at 31 December 2017
Holding at31 December
2017
Fair value at31 December
2017
Percentage oftotal net assets at
31 December2017
HK$ (%)
Austria 0.40%
ANDRITZ AG 204 90,166 0.04
ERSTE GROUP BANK AG 796 269,779 0.13
OMV AG 377 186,960 0.09
RAIFFEISEN BANK INTERNATIONA 397 112,545 0.05
TELEKOM AUSTRIA AG 220 15,962 0.01
VIENNA INSURANCE GROUP AG 88 21,283 0.01
VOESTALPINE AG 304 142,240 0.07
838,935 0.40
Belgium 1.78%
ACKERMANS & VAN HAAREN NV 52 70,851 0.03
AGEAS 579 221,289 0.10
ANHEUSER-BUSCH INBEV SA/NV 2,090 1,827,105 0.86
BELGACOM SA 373 95,762 0.05
BPOST SA 338 80,542 0.04
COLRUYT SA 191 77,741 0.04
GROUPE BRUXELLES LAMBERT SA 191 161,345 0.08
KBC GROEP NV 694 463,253 0.22
SOFINA SA 51 62,787 0.03
SOLVAY SA 197 214,327 0.10
TELENET GROUP HOLDING NV 176 95,971 0.05
UCB SA 358 222,401 0.10
UMICORE SA 450 166,664 0.08
3,760,038 1.78
Denmark 2.73%
AP MOELLER MAERSK A/S A 10 130,616 0.06
AP MOELLER MAERSK A/S B 19 259,669 0.12
CARLSBERG AS B 275 258,301 0.12
CHR HANSEN HOLDING A/S 300 220,131 0.11
COLOPLAST B 349 217,145 0.10
DANSKE BANK A/S 1,825 555,900 0.26
DSV A/S 485 298,767 0.14
GENMAB A/S 147 190,709 0.09
H LUNDBECK A/S 177 70,295 0.03
ISS A/S 496 150,270 0.07
JYSKE BANK REG 194 86,389 0.04
NOVO NORDISK A/S B 4,876 2,056,349 0.97
Vanguard ETF SeriesAnnual Report 2017
Vanguard FTSE Developed Europe Index ETF
-130-
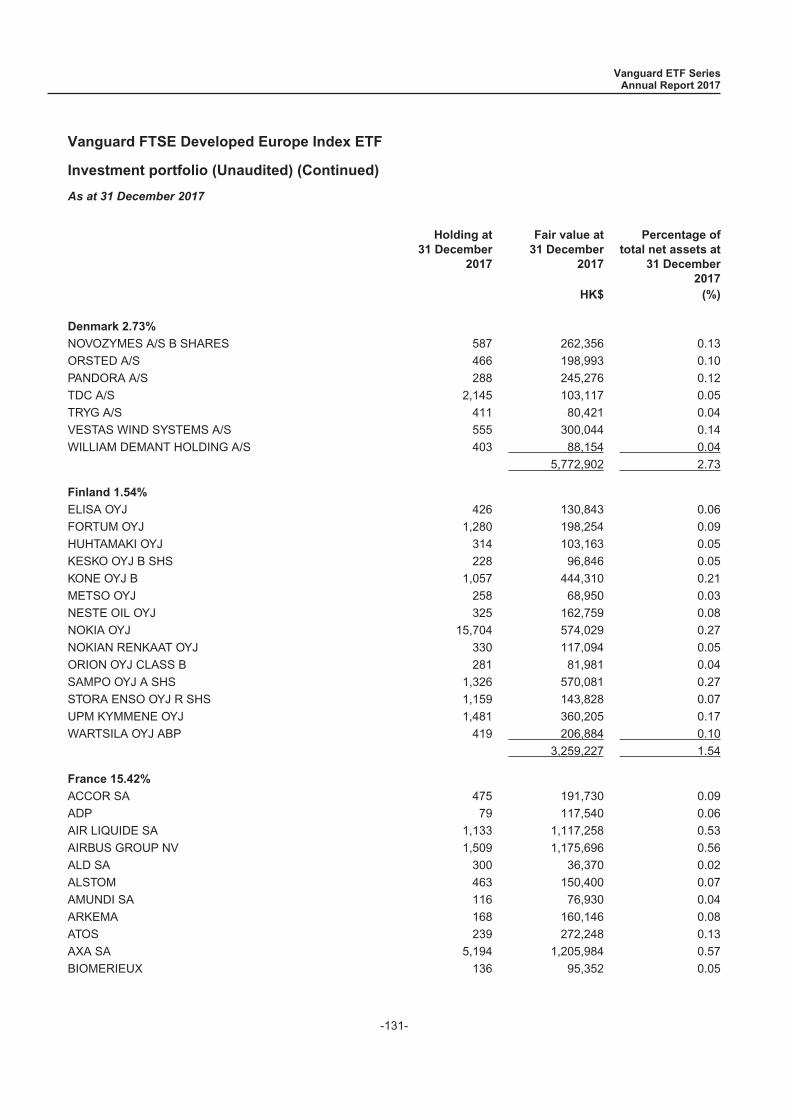
Investment portfolio (Unaudited) (Continued)
As at 31 December 2017
Holding at31 December
2017
Fair value at31 December
2017
Percentage oftotal net assets at
31 December2017
HK$ (%)
Denmark 2.73%
NOVOZYMES A/S B SHARES 587 262,356 0.13
ORSTED A/S 466 198,993 0.10
PANDORA A/S 288 245,276 0.12
TDC A/S 2,145 103,117 0.05
TRYG A/S 411 80,421 0.04
VESTAS WIND SYSTEMS A/S 555 300,044 0.14
WILLIAM DEMANT HOLDING A/S 403 88,154 0.04
5,772,902 2.73
Finland 1.54%
ELISA OYJ 426 130,843 0.06
FORTUM OYJ 1,280 198,254 0.09
HUHTAMAKI OYJ 314 103,163 0.05
KESKO OYJ B SHS 228 96,846 0.05
KONE OYJ B 1,057 444,310 0.21
METSO OYJ 258 68,950 0.03
NESTE OIL OYJ 325 162,759 0.08
NOKIA OYJ 15,704 574,029 0.27
NOKIAN RENKAAT OYJ 330 117,094 0.05
ORION OYJ CLASS B 281 81,981 0.04
SAMPO OYJ A SHS 1,326 570,081 0.27
STORA ENSO OYJ R SHS 1,159 143,828 0.07
UPM KYMMENE OYJ 1,481 360,205 0.17
WARTSILA OYJ ABP 419 206,884 0.10
3,259,227 1.54
France 15.42%
ACCOR SA 475 191,730 0.09
ADP 79 117,540 0.06
AIR LIQUIDE SA 1,133 1,117,258 0.53
AIRBUS GROUP NV 1,509 1,175,696 0.56
ALD SA 300 36,370 0.02
ALSTOM 463 150,400 0.07
AMUNDI SA 116 76,930 0.04
ARKEMA 168 160,146 0.08
ATOS 239 272,248 0.13
AXA SA 5,194 1,205,984 0.57
BIOMERIEUX 136 95,352 0.05
Vanguard ETF SeriesAnnual Report 2017
Vanguard FTSE Developed Europe Index ETF
-131-
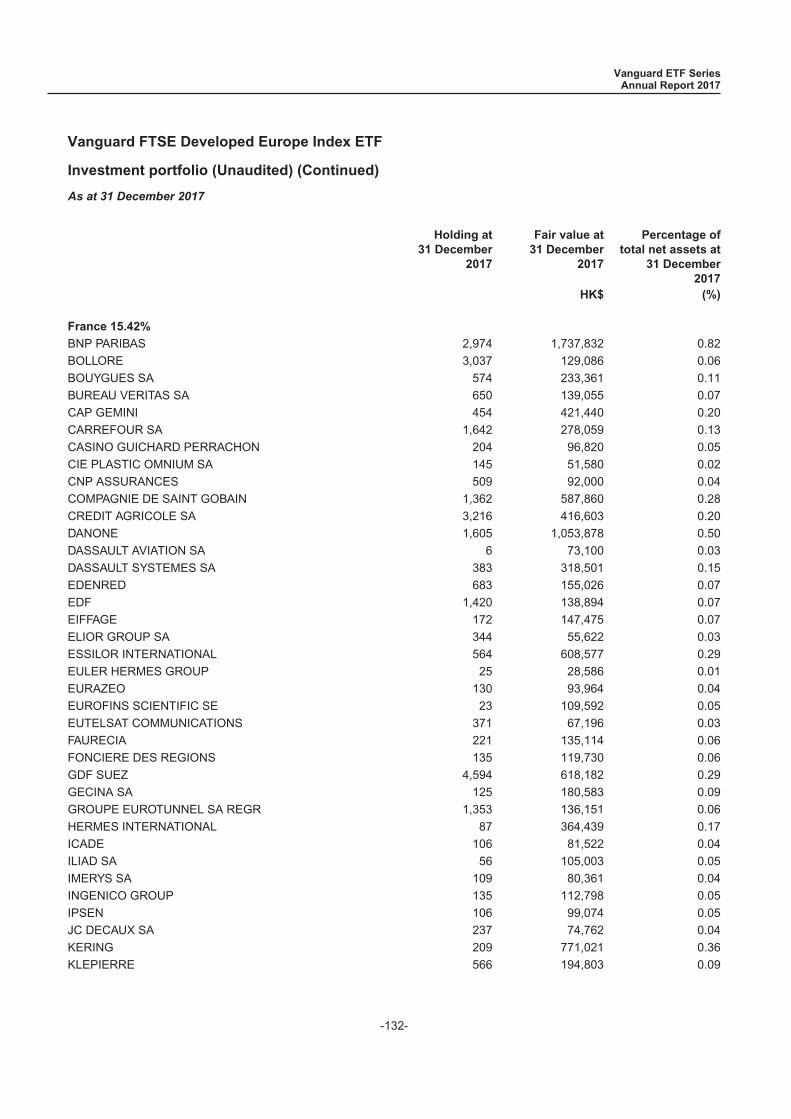
Investment portfolio (Unaudited) (Continued)
As at 31 December 2017
Holding at31 December
2017
Fair value at31 December
2017
Percentage oftotal net assets at
31 December2017
HK$ (%)
France 15.42%
BNP PARIBAS 2,974 1,737,832 0.82
BOLLORE 3,037 129,086 0.06
BOUYGUES SA 574 233,361 0.11
BUREAU VERITAS SA 650 139,055 0.07
CAP GEMINI 454 421,440 0.20
CARREFOUR SA 1,642 278,059 0.13
CASINO GUICHARD PERRACHON 204 96,820 0.05
CIE PLASTIC OMNIUM SA 145 51,580 0.02
CNP ASSURANCES 509 92,000 0.04
COMPAGNIE DE SAINT GOBAIN 1,362 587,860 0.28
CREDIT AGRICOLE SA 3,216 416,603 0.20
DANONE 1,605 1,053,878 0.50
DASSAULT AVIATION SA 6 73,100 0.03
DASSAULT SYSTEMES SA 383 318,501 0.15
EDENRED 683 155,026 0.07
EDF 1,420 138,894 0.07
EIFFAGE 172 147,475 0.07
ELIOR GROUP SA 344 55,622 0.03
ESSILOR INTERNATIONAL 564 608,577 0.29
EULER HERMES GROUP 25 28,586 0.01
EURAZEO 130 93,964 0.04
EUROFINS SCIENTIFIC SE 23 109,592 0.05
EUTELSAT COMMUNICATIONS 371 67,196 0.03
FAURECIA 221 135,114 0.06
FONCIERE DES REGIONS 135 119,730 0.06
GDF SUEZ 4,594 618,182 0.29
GECINA SA 125 180,583 0.09
GROUPE EUROTUNNEL SA REGR 1,353 136,151 0.06
HERMES INTERNATIONAL 87 364,439 0.17
ICADE 106 81,522 0.04
ILIAD SA 56 105,003 0.05
IMERYS SA 109 80,361 0.04
INGENICO GROUP 135 112,798 0.05
IPSEN 106 99,074 0.05
JC DECAUX SA 237 74,762 0.04
KERING 209 771,021 0.36
KLEPIERRE 566 194,803 0.09
Vanguard ETF SeriesAnnual Report 2017
Vanguard FTSE Developed Europe Index ETF
-132-
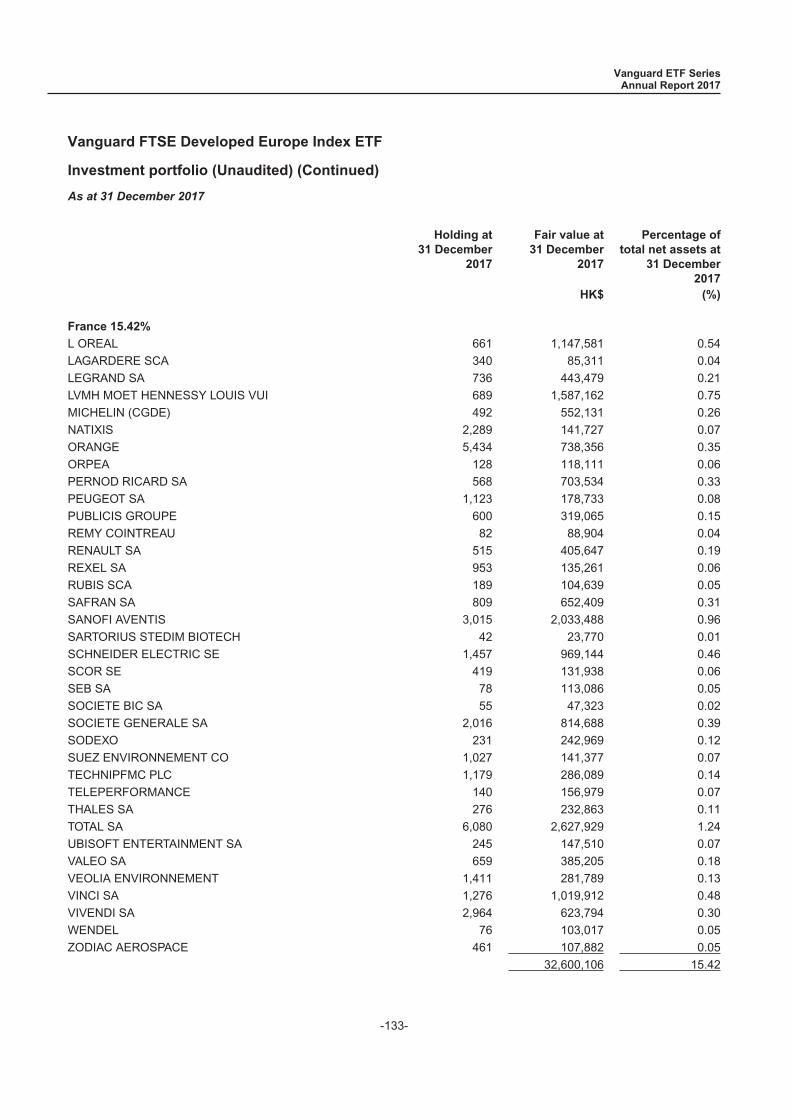
Investment portfolio (Unaudited) (Continued)
As at 31 December 2017
Holding at31 December
2017
Fair value at31 December
2017
Percentage oftotal net assets at
31 December2017
HK$ (%)
France 15.42%
L OREAL 661 1,147,581 0.54
LAGARDERE SCA 340 85,311 0.04
LEGRAND SA 736 443,479 0.21
LVMH MOET HENNESSY LOUIS VUI 689 1,587,162 0.75
MICHELIN (CGDE) 492 552,131 0.26
NATIXIS 2,289 141,727 0.07
ORANGE 5,434 738,356 0.35
ORPEA 128 118,111 0.06
PERNOD RICARD SA 568 703,534 0.33
PEUGEOT SA 1,123 178,733 0.08
PUBLICIS GROUPE 600 319,065 0.15
REMY COINTREAU 82 88,904 0.04
RENAULT SA 515 405,647 0.19
REXEL SA 953 135,261 0.06
RUBIS SCA 189 104,639 0.05
SAFRAN SA 809 652,409 0.31
SANOFI AVENTIS 3,015 2,033,488 0.96
SARTORIUS STEDIM BIOTECH 42 23,770 0.01
SCHNEIDER ELECTRIC SE 1,457 969,144 0.46
SCOR SE 419 131,938 0.06
SEB SA 78 113,086 0.05
SOCIETE BIC SA 55 47,323 0.02
SOCIETE GENERALE SA 2,016 814,688 0.39
SODEXO 231 242,969 0.12
SUEZ ENVIRONNEMENT CO 1,027 141,377 0.07
TECHNIPFMC PLC 1,179 286,089 0.14
TELEPERFORMANCE 140 156,979 0.07
THALES SA 276 232,863 0.11
TOTAL SA 6,080 2,627,929 1.24
UBISOFT ENTERTAINMENT SA 245 147,510 0.07
VALEO SA 659 385,205 0.18
VEOLIA ENVIRONNEMENT 1,411 281,789 0.13
VINCI SA 1,276 1,019,912 0.48
VIVENDI SA 2,964 623,794 0.30
WENDEL 76 103,017 0.05
ZODIAC AEROSPACE 461 107,882 0.05
32,600,106 15.42
Vanguard ETF SeriesAnnual Report 2017
Vanguard FTSE Developed Europe Index ETF
-133-

Investment portfolio (Unaudited) (Continued)
As at 31 December 2017
Holding at31 December
2017
Fair value at31 December
2017
Percentage oftotal net assets at
31 December2017
HK$ (%)
Germany 15.07%
ADIDAS AG 545 855,127 0.40
ALLIANZ SE REG 1,220 2,193,088 1.04
AXEL SPRINGER SE 92 56,247 0.03
BASF SE 2,554 2,199,415 1.04
BAYER AG REG 2,279 2,224,873 1.05
BAYERISCHE MOTOREN WERKE AG 882 718,896 0.34
BAYERISCHE MOTOREN WERKE AG PREF 166 116,307 0.05
BEIERSDORF AG 266 244,451 0.12
BRENNTAG AG 450 222,909 0.11
CECONOMY AG 304 35,970 0.02
COMMERZBANK AG 2,706 317,643 0.15
CONTINENTAL AG 311 657,002 0.31
COVESTRO AG 354 285,878 0.14
DAIMLER AG REGISTERED SHARES 2,634 1,750,558 0.83
DELIVERY HERO AG 100 30,977 0.01
DEUTSCHE BANK AG REGISTERED 5,199 774,749 0.37
DEUTSCHE BOERSE AG 494 448,880 0.21
DEUTSCHE LUFTHANSA REG 576 166,101 0.08
DEUTSCHE POST AG REG 2,607 972,760 0.46
DEUTSCHE TELEKOM AG REG 8,836 1,227,152 0.58
DEUTSCHE WOHNEN SE 969 331,641 0.16
E.ON SE 5,401 459,386 0.22
EVONIK INDUSTRIES AG 371 109,249 0.05
FIELMANN AG 46 31,746 0.01
FRAPORT AG FRANKFURT AIRPORT 109 93,990 0.04
FRESENIUS MEDICAL CARE AG + 564 464,732 0.22
FRESENIUS SE + CO KGAA 1,081 660,289 0.31
FUCHS PETROLUB SE 80 30,316 0.01
FUCHS PETROLUB SE PREF 195 80,998 0.04
GEA GROUP AG 424 159,244 0.08
HANNOVER RUECK SE 146 143,766 0.07
HEIDELBERGCEMENT AG 392 332,094 0.16
HELLA GMBH + CO KGAA 156 75,518 0.04
HENKEL AG + CO KGAA 313 293,814 0.14
HENKEL AG + CO KGAA VORZUG 491 508,606 0.24
HOCHTIEF AG 60 83,131 0.04
HUGO BOSS AG ORD 166 110,542 0.05
INFINEON TECHNOLOGIES AG 3,101 664,707 0.31
Vanguard ETF SeriesAnnual Report 2017
Vanguard FTSE Developed Europe Index ETF
-134-

Investment portfolio (Unaudited) (Continued)
As at 31 December 2017
Holding at31 December
2017
Fair value at31 December
2017
Percentage oftotal net assets at
31 December2017
HK$ (%)
Germany 15.07%
INNOGY SE 379 116,247 0.05
K S AG REG 485 94,491 0.04
KION GROUP AG 178 120,271 0.06
LANXESS AG 230 143,121 0.07
LEG IMMOBILIEN AG 162 144,907 0.07
LINDE AG 523 955,616 0.45
MAN SE 75 67,164 0.03
MERCK KGAA 395 332,781 0.16
METRO AG 548 85,649 0.04
MTU AERO ENGINES AG 166 232,802 0.11
MUENCHENER RUECKVER AG REG 387 656,624 0.31
OSRAM LICHT AG 285 200,460 0.09
PORSCHE AUTOMOBIL HLDG PRF 433 283,626 0.13
PROSIEBEN SAT.1 MEDIA AG REG 556 149,817 0.07
QIAGEN NV 541 133,003 0.06
RATIONAL AG 7 35,299 0.02
RTL GROUP 123 77,439 0.04
RWE AG 1,294 206,496 0.10
RWE AG PREF 147 19,774 0.01
SAP SE 2,499 2,192,164 1.04
SARTORIUS AG 102 76,158 0.04
SIEMENS AG REG 2,087 2,275,460 1.08
SUEDZUCKER AG 151 25,627 0.01
SYMRISE AG 382 256,818 0.12
TALANX AG 58 18,549 0.01
TELEFONICA DEUTSCHLAND HOLDI 1,846 72,537 0.03
THYSSENKRUPP AG 1,469 333,913 0.16
TUI AG 1,117 181,906 0.09
UNIPER SE 583 142,288 0.07
UNITED INTERNET AG REG SHARE 327 176,008 0.08
VOLKSWAGEN AG 92 145,690 0.07
VOLKSWAGEN AG PREF 480 749,985 0.35
VONOVIA SE 1,424 553,265 0.26
WACKER CHEMIE AG 32 48,722 0.02
WIRECARD AG 327 285,683 0.13
ZALANDO SE 333 137,898 0.07
31,861,010 15.07
Vanguard ETF SeriesAnnual Report 2017
Vanguard FTSE Developed Europe Index ETF
-135-
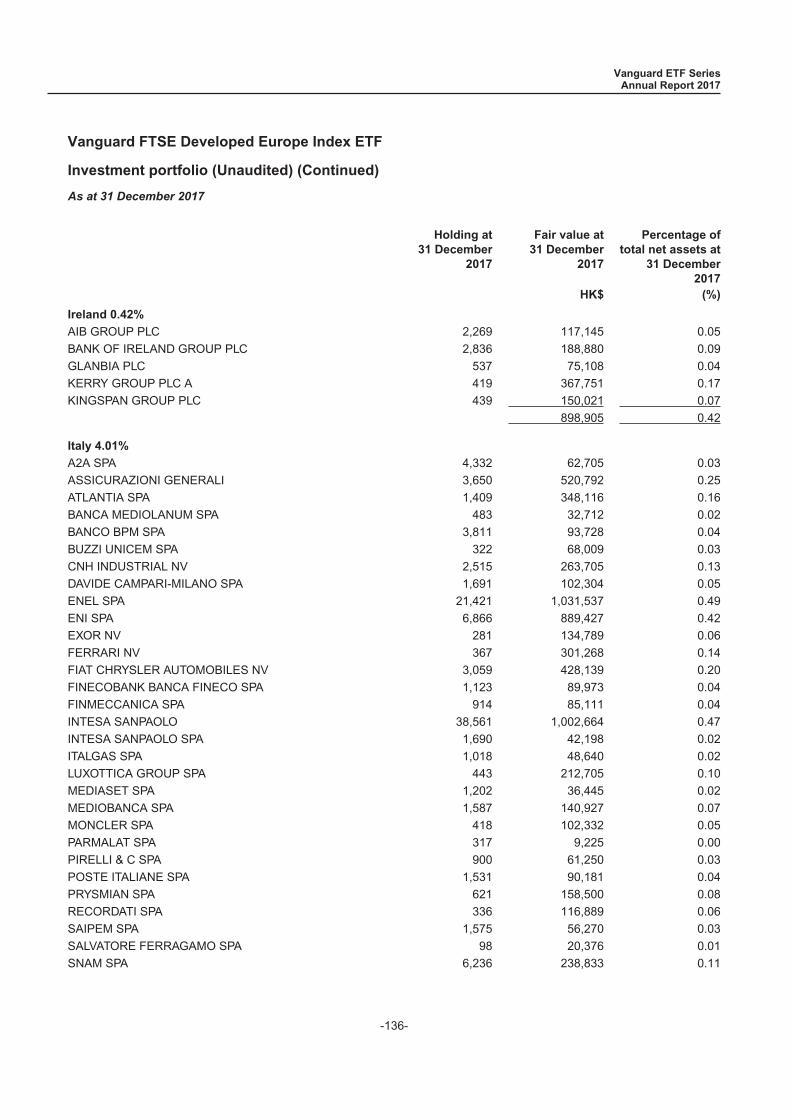
Investment portfolio (Unaudited) (Continued)
As at 31 December 2017
Holding at31 December
2017
Fair value at31 December
2017
Percentage oftotal net assets at
31 December2017
HK$ (%)
Ireland 0.42%
AIB GROUP PLC 2,269 117,145 0.05
BANK OF IRELAND GROUP PLC 2,836 188,880 0.09
GLANBIA PLC 537 75,108 0.04
KERRY GROUP PLC A 419 367,751 0.17
KINGSPAN GROUP PLC 439 150,021 0.07
898,905 0.42
Italy 4.01%
A2A SPA 4,332 62,705 0.03
ASSICURAZIONI GENERALI 3,650 520,792 0.25
ATLANTIA SPA 1,409 348,116 0.16
BANCA MEDIOLANUM SPA 483 32,712 0.02
BANCO BPM SPA 3,811 93,728 0.04
BUZZI UNICEM SPA 322 68,009 0.03
CNH INDUSTRIAL NV 2,515 263,705 0.13
DAVIDE CAMPARI-MILANO SPA 1,691 102,304 0.05
ENEL SPA 21,421 1,031,537 0.49
ENI SPA 6,866 889,427 0.42
EXOR NV 281 134,789 0.06
FERRARI NV 367 301,268 0.14
FIAT CHRYSLER AUTOMOBILES NV 3,059 428,139 0.20
FINECOBANK BANCA FINECO SPA 1,123 89,973 0.04
FINMECCANICA SPA 914 85,111 0.04
INTESA SANPAOLO 38,561 1,002,664 0.47
INTESA SANPAOLO SPA 1,690 42,198 0.02
ITALGAS SPA 1,018 48,640 0.02
LUXOTTICA GROUP SPA 443 212,705 0.10
MEDIASET SPA 1,202 36,445 0.02
MEDIOBANCA SPA 1,587 140,927 0.07
MONCLER SPA 418 102,332 0.05
PARMALAT SPA 317 9,225 0.00
PIRELLI & C SPA 900 61,250 0.03
POSTE ITALIANE SPA 1,531 90,181 0.04
PRYSMIAN SPA 621 158,500 0.08
RECORDATI SPA 336 116,889 0.06
SAIPEM SPA 1,575 56,270 0.03
SALVATORE FERRAGAMO SPA 98 20,376 0.01
SNAM SPA 6,236 238,833 0.11
Vanguard ETF SeriesAnnual Report 2017
Vanguard FTSE Developed Europe Index ETF
-136-
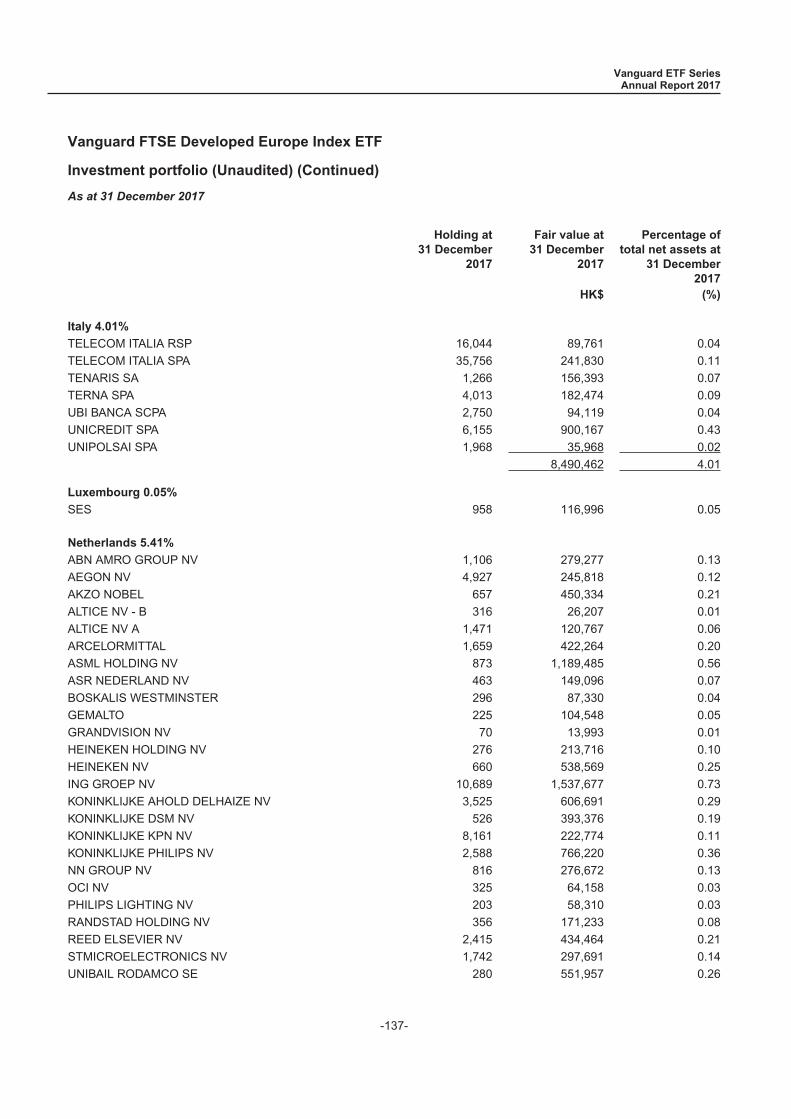
Investment portfolio (Unaudited) (Continued)
As at 31 December 2017
Holding at31 December
2017
Fair value at31 December
2017
Percentage oftotal net assets at
31 December2017
HK$ (%)
Italy 4.01%
TELECOM ITALIA RSP 16,044 89,761 0.04
TELECOM ITALIA SPA 35,756 241,830 0.11
TENARIS SA 1,266 156,393 0.07
TERNA SPA 4,013 182,474 0.09
UBI BANCA SCPA 2,750 94,119 0.04
UNICREDIT SPA 6,155 900,167 0.43
UNIPOLSAI SPA 1,968 35,968 0.02
8,490,462 4.01
Luxembourg 0.05%
SES 958 116,996 0.05
Netherlands 5.41%
ABN AMRO GROUP NV 1,106 279,277 0.13
AEGON NV 4,927 245,818 0.12
AKZO NOBEL 657 450,334 0.21
ALTICE NV - B 316 26,207 0.01
ALTICE NV A 1,471 120,767 0.06
ARCELORMITTAL 1,659 422,264 0.20
ASML HOLDING NV 873 1,189,485 0.56
ASR NEDERLAND NV 463 149,096 0.07
BOSKALIS WESTMINSTER 296 87,330 0.04
GEMALTO 225 104,548 0.05
GRANDVISION NV 70 13,993 0.01
HEINEKEN HOLDING NV 276 213,716 0.10
HEINEKEN NV 660 538,569 0.25
ING GROEP NV 10,689 1,537,677 0.73
KONINKLIJKE AHOLD DELHAIZE NV 3,525 606,691 0.29
KONINKLIJKE DSM NV 526 393,376 0.19
KONINKLIJKE KPN NV 8,161 222,774 0.11
KONINKLIJKE PHILIPS NV 2,588 766,220 0.36
NN GROUP NV 816 276,672 0.13
OCI NV 325 64,158 0.03
PHILIPS LIGHTING NV 203 58,310 0.03
RANDSTAD HOLDING NV 356 171,233 0.08
REED ELSEVIER NV 2,415 434,464 0.21
STMICROELECTRONICS NV 1,742 297,691 0.14
UNIBAIL RODAMCO SE 280 551,957 0.26
Vanguard ETF SeriesAnnual Report 2017
Vanguard FTSE Developed Europe Index ETF
-137-

Investment portfolio (Unaudited) (Continued)
As at 31 December 2017
Holding at31 December
2017
Fair value at31 December
2017
Percentage oftotal net assets at
31 December2017
HK$ (%)
Netherlands 5.41%
UNILEVER NV CVA 4,231 1,864,887 0.88
VOPAK 191 65,567 0.03
WOLTERS KLUWER 687 280,397 0.13
11,433,478 5.41
Norway 1.01%
AKER BP ASA 210 40,522 0.02
DNB ASA 2,842 413,134 0.20
GJENSIDIGE FORSIKRING ASA 544 80,536 0.04
MARINE HARVEST 1,190 158,088 0.07
NORSK HYDRO ASA 3,998 238,241 0.11
ORKLA ASA 2,155 179,289 0.08
SCHIBSTED ASA B SHS COMMON STOCK NOK.5 159 33,128 0.02
SCHIBSTED ASA CL A COMMON STOCK NOK.5 341 76,458 0.04
STATOIL ASA 2,739 458,632 0.22
TELENOR ASA 1,807 303,782 0.14
YARA INTERNATIONAL ASA 426 153,371 0.07
2,135,181 1.01
Portugal 0.25%
BANCO ESPIRITO SANTO REG 2,999 - 0.00
EDP ENERGIAS DE PORTUGAL SA 6,859 185,753 0.09
EDP RENOVAVEIS SA 696 45,518 0.02
GALP ENERGIA SGPS SA 1,450 208,591 0.10
JERONIMO MARTINS 538 81,788 0.04
521,650 0.25
Spain 5.11%
ABERTIS INFRAESTRUCTURAS SA 1,854 322,836 0.15
ACCIONA SA 48 30,657 0.01
ACERINOX SA 291 32,547 0.02
ACS ACTIVIDADES CONS Y SERV 747 228,735 0.11
AENA SME SA 173 274,448 0.13
AMADEUS IT HOLDING SA A SHS 1,196 674,847 0.32
BANCO BILBAO VIZCAYA ARGENTA 18,455 1,232,064 0.58
BANCO DE SABADELL SA COMMON STOCK EUR.125 16,156 251,143 0.12
BANCO SANTANDER SA 44,021 2,264,064 1.07
BANKIA SA 3,045 113,962 0.05
Vanguard ETF SeriesAnnual Report 2017
Vanguard FTSE Developed Europe Index ETF
-138-
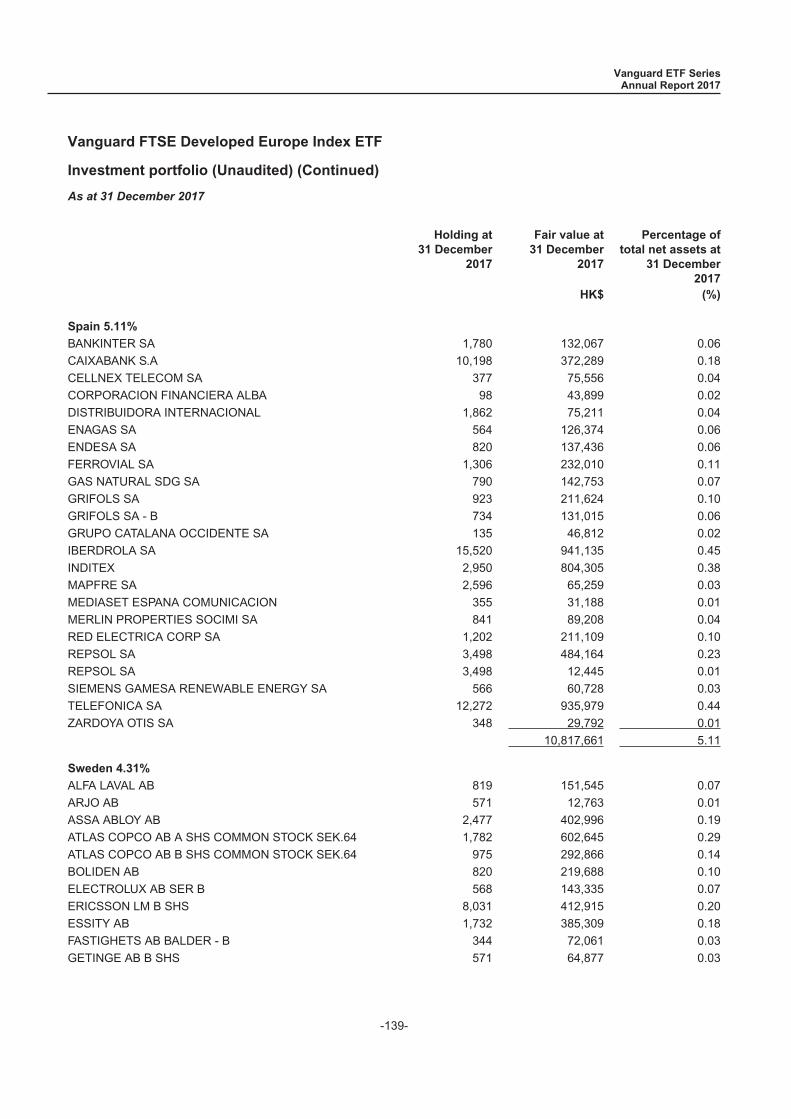
Investment portfolio (Unaudited) (Continued)
As at 31 December 2017
Holding at31 December
2017
Fair value at31 December
2017
Percentage oftotal net assets at
31 December2017
HK$ (%)
Spain 5.11%
BANKINTER SA 1,780 132,067 0.06
CAIXABANK S.A 10,198 372,289 0.18
CELLNEX TELECOM SA 377 75,556 0.04
CORPORACION FINANCIERA ALBA 98 43,899 0.02
DISTRIBUIDORA INTERNACIONAL 1,862 75,211 0.04
ENAGAS SA 564 126,374 0.06
ENDESA SA 820 137,436 0.06
FERROVIAL SA 1,306 232,010 0.11
GAS NATURAL SDG SA 790 142,753 0.07
GRIFOLS SA 923 211,624 0.10
GRIFOLS SA - B 734 131,015 0.06
GRUPO CATALANA OCCIDENTE SA 135 46,812 0.02
IBERDROLA SA 15,520 941,135 0.45
INDITEX 2,950 804,305 0.38
MAPFRE SA 2,596 65,259 0.03
MEDIASET ESPANA COMUNICACION 355 31,188 0.01
MERLIN PROPERTIES SOCIMI SA 841 89,208 0.04
RED ELECTRICA CORP SA 1,202 211,109 0.10
REPSOL SA 3,498 484,164 0.23
REPSOL SA 3,498 12,445 0.01
SIEMENS GAMESA RENEWABLE ENERGY SA 566 60,728 0.03
TELEFONICA SA 12,272 935,979 0.44
ZARDOYA OTIS SA 348 29,792 0.01
10,817,661 5.11
Sweden 4.31%
ALFA LAVAL AB 819 151,545 0.07
ARJO AB 571 12,763 0.01
ASSA ABLOY AB 2,477 402,996 0.19
ATLAS COPCO AB A SHS COMMON STOCK SEK.64 1,782 602,645 0.29
ATLAS COPCO AB B SHS COMMON STOCK SEK.64 975 292,866 0.14
BOLIDEN AB 820 219,688 0.10
ELECTROLUX AB SER B 568 143,335 0.07
ERICSSON LM B SHS 8,031 412,915 0.20
ESSITY AB 1,732 385,309 0.18
FASTIGHETS AB BALDER - B 344 72,061 0.03
GETINGE AB B SHS 571 64,877 0.03
Vanguard ETF SeriesAnnual Report 2017
Vanguard FTSE Developed Europe Index ETF
-139-
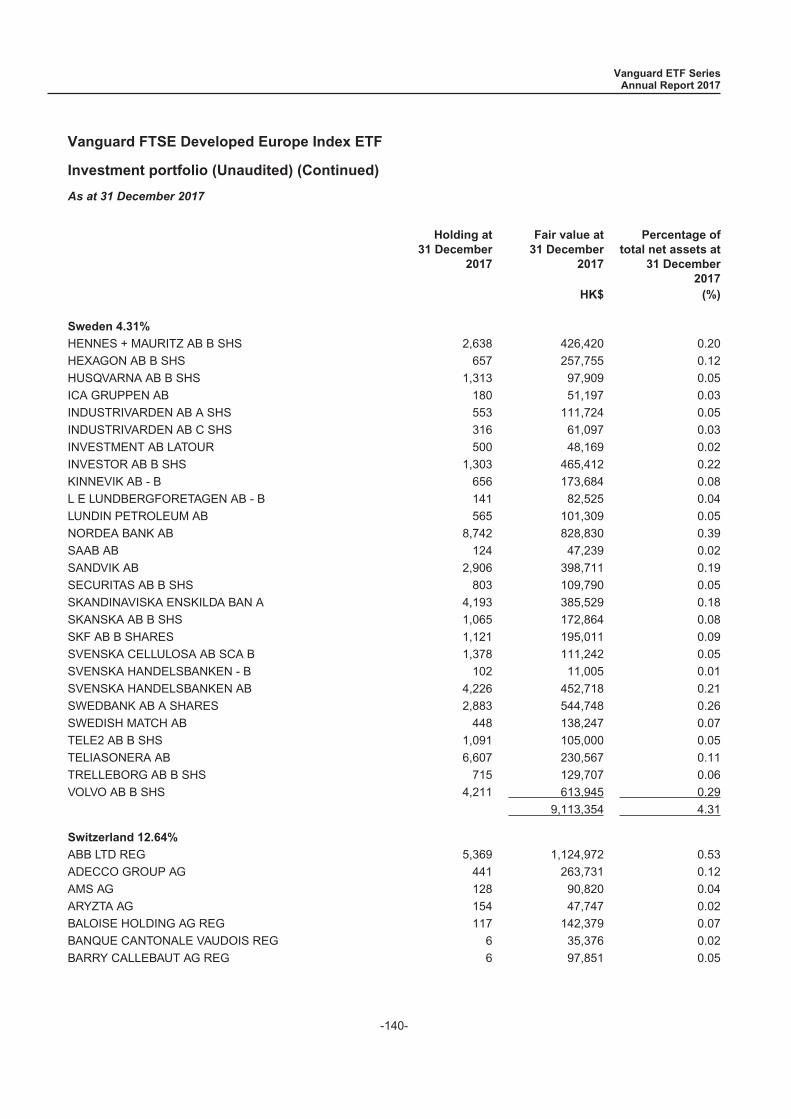
Investment portfolio (Unaudited) (Continued)
As at 31 December 2017
Holding at31 December
2017
Fair value at31 December
2017
Percentage oftotal net assets at
31 December2017
HK$ (%)
Sweden 4.31%
HENNES + MAURITZ AB B SHS 2,638 426,420 0.20
HEXAGON AB B SHS 657 257,755 0.12
HUSQVARNA AB B SHS 1,313 97,909 0.05
ICA GRUPPEN AB 180 51,197 0.03
INDUSTRIVARDEN AB A SHS 553 111,724 0.05
INDUSTRIVARDEN AB C SHS 316 61,097 0.03
INVESTMENT AB LATOUR 500 48,169 0.02
INVESTOR AB B SHS 1,303 465,412 0.22
KINNEVIK AB - B 656 173,684 0.08
L E LUNDBERGFORETAGEN AB - B 141 82,525 0.04
LUNDIN PETROLEUM AB 565 101,309 0.05
NORDEA BANK AB 8,742 828,830 0.39
SAAB AB 124 47,239 0.02
SANDVIK AB 2,906 398,711 0.19
SECURITAS AB B SHS 803 109,790 0.05
SKANDINAVISKA ENSKILDA BAN A 4,193 385,529 0.18
SKANSKA AB B SHS 1,065 172,864 0.08
SKF AB B SHARES 1,121 195,011 0.09
SVENSKA CELLULOSA AB SCA B 1,378 111,242 0.05
SVENSKA HANDELSBANKEN - B 102 11,005 0.01
SVENSKA HANDELSBANKEN AB 4,226 452,718 0.21
SWEDBANK AB A SHARES 2,883 544,748 0.26
SWEDISH MATCH AB 448 138,247 0.07
TELE2 AB B SHS 1,091 105,000 0.05
TELIASONERA AB 6,607 230,567 0.11
TRELLEBORG AB B SHS 715 129,707 0.06
VOLVO AB B SHS 4,211 613,945 0.29
9,113,354 4.31
Switzerland 12.64%
ABB LTD REG 5,369 1,124,972 0.53
ADECCO GROUP AG 441 263,731 0.12
AMS AG 128 90,820 0.04
ARYZTA AG 154 47,747 0.02
BALOISE HOLDING AG REG 117 142,379 0.07
BANQUE CANTONALE VAUDOIS REG 6 35,376 0.02
BARRY CALLEBAUT AG REG 6 97,851 0.05
Vanguard ETF SeriesAnnual Report 2017
Vanguard FTSE Developed Europe Index ETF
-140-
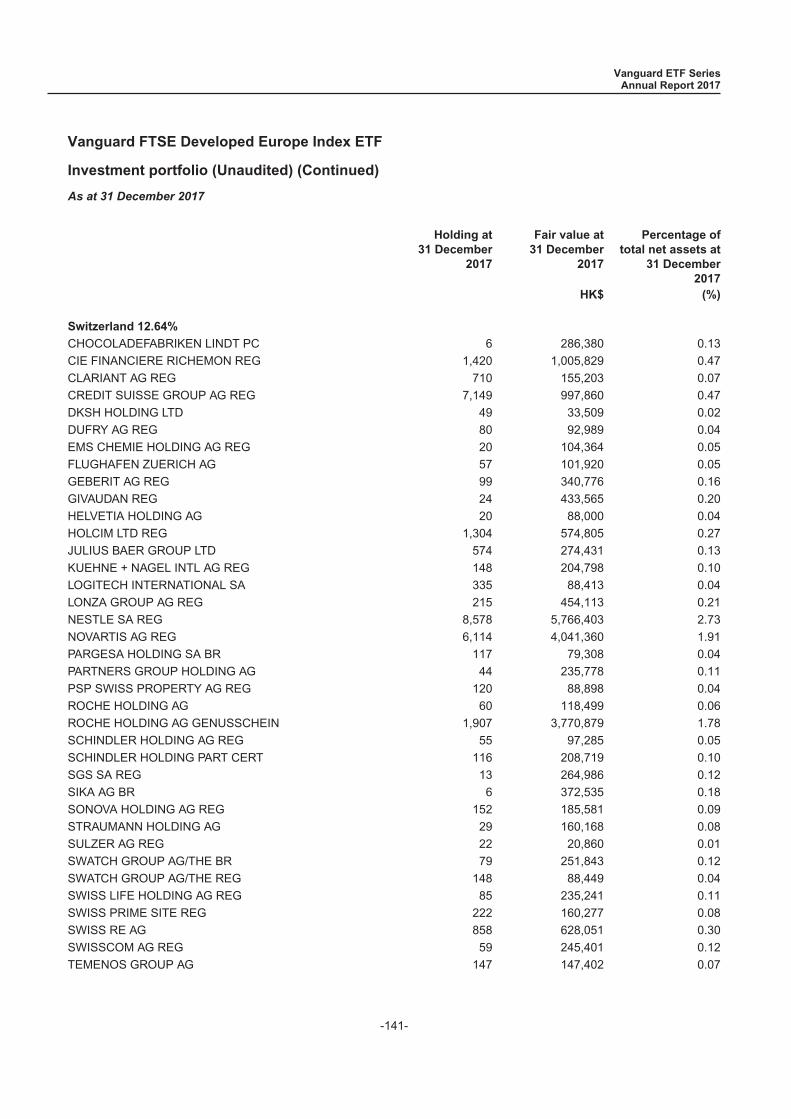
Investment portfolio (Unaudited) (Continued)
As at 31 December 2017
Holding at31 December
2017
Fair value at31 December
2017
Percentage oftotal net assets at
31 December2017
HK$ (%)
Switzerland 12.64%
CHOCOLADEFABRIKEN LINDT PC 6 286,380 0.13
CIE FINANCIERE RICHEMON REG 1,420 1,005,829 0.47
CLARIANT AG REG 710 155,203 0.07
CREDIT SUISSE GROUP AG REG 7,149 997,860 0.47
DKSH HOLDING LTD 49 33,509 0.02
DUFRY AG REG 80 92,989 0.04
EMS CHEMIE HOLDING AG REG 20 104,364 0.05
FLUGHAFEN ZUERICH AG 57 101,920 0.05
GEBERIT AG REG 99 340,776 0.16
GIVAUDAN REG 24 433,565 0.20
HELVETIA HOLDING AG 20 88,000 0.04
HOLCIM LTD REG 1,304 574,805 0.27
JULIUS BAER GROUP LTD 574 274,431 0.13
KUEHNE + NAGEL INTL AG REG 148 204,798 0.10
LOGITECH INTERNATIONAL SA 335 88,413 0.04
LONZA GROUP AG REG 215 454,113 0.21
NESTLE SA REG 8,578 5,766,403 2.73
NOVARTIS AG REG 6,114 4,041,360 1.91
PARGESA HOLDING SA BR 117 79,308 0.04
PARTNERS GROUP HOLDING AG 44 235,778 0.11
PSP SWISS PROPERTY AG REG 120 88,898 0.04
ROCHE HOLDING AG 60 118,499 0.06
ROCHE HOLDING AG GENUSSCHEIN 1,907 3,770,879 1.78
SCHINDLER HOLDING AG REG 55 97,285 0.05
SCHINDLER HOLDING PART CERT 116 208,719 0.10
SGS SA REG 13 264,986 0.12
SIKA AG BR 6 372,535 0.18
SONOVA HOLDING AG REG 152 185,581 0.09
STRAUMANN HOLDING AG 29 160,168 0.08
SULZER AG REG 22 20,860 0.01
SWATCH GROUP AG/THE BR 79 251,843 0.12
SWATCH GROUP AG/THE REG 148 88,449 0.04
SWISS LIFE HOLDING AG REG 85 235,241 0.11
SWISS PRIME SITE REG 222 160,277 0.08
SWISS RE AG 858 628,051 0.30
SWISSCOM AG REG 59 245,401 0.12
TEMENOS GROUP AG 147 147,402 0.07
Vanguard ETF SeriesAnnual Report 2017
Vanguard FTSE Developed Europe Index ETF
-141-
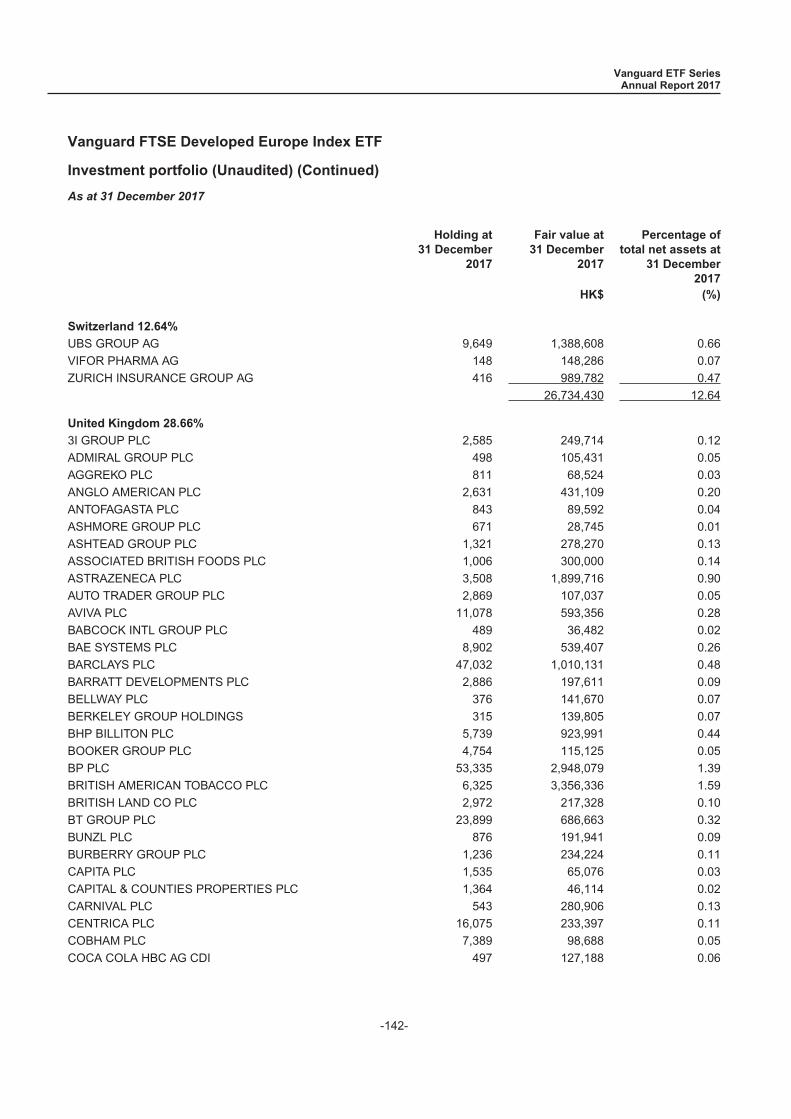
Investment portfolio (Unaudited) (Continued)
As at 31 December 2017
Holding at31 December
2017
Fair value at31 December
2017
Percentage oftotal net assets at
31 December2017
HK$ (%)
Switzerland 12.64%
UBS GROUP AG 9,649 1,388,608 0.66
VIFOR PHARMA AG 148 148,286 0.07
ZURICH INSURANCE GROUP AG 416 989,782 0.47
26,734,430 12.64
United Kingdom 28.66%
3I GROUP PLC 2,585 249,714 0.12
ADMIRAL GROUP PLC 498 105,431 0.05
AGGREKO PLC 811 68,524 0.03
ANGLO AMERICAN PLC 2,631 431,109 0.20
ANTOFAGASTA PLC 843 89,592 0.04
ASHMORE GROUP PLC 671 28,745 0.01
ASHTEAD GROUP PLC 1,321 278,270 0.13
ASSOCIATED BRITISH FOODS PLC 1,006 300,000 0.14
ASTRAZENECA PLC 3,508 1,899,716 0.90
AUTO TRADER GROUP PLC 2,869 107,037 0.05
AVIVA PLC 11,078 593,356 0.28
BABCOCK INTL GROUP PLC 489 36,482 0.02
BAE SYSTEMS PLC 8,902 539,407 0.26
BARCLAYS PLC 47,032 1,010,131 0.48
BARRATT DEVELOPMENTS PLC 2,886 197,611 0.09
BELLWAY PLC 376 141,670 0.07
BERKELEY GROUP HOLDINGS 315 139,805 0.07
BHP BILLITON PLC 5,739 923,991 0.44
BOOKER GROUP PLC 4,754 115,125 0.05
BP PLC 53,335 2,948,079 1.39
BRITISH AMERICAN TOBACCO PLC 6,325 3,356,336 1.59
BRITISH LAND CO PLC 2,972 217,328 0.10
BT GROUP PLC 23,899 686,663 0.32
BUNZL PLC 876 191,941 0.09
BURBERRY GROUP PLC 1,236 234,224 0.11
CAPITA PLC 1,535 65,076 0.03
CAPITAL & COUNTIES PROPERTIES PLC 1,364 46,114 0.02
CARNIVAL PLC 543 280,906 0.13
CENTRICA PLC 16,075 233,397 0.11
COBHAM PLC 7,389 98,688 0.05
COCA COLA HBC AG CDI 497 127,188 0.06
Vanguard ETF SeriesAnnual Report 2017
Vanguard FTSE Developed Europe Index ETF
-142-
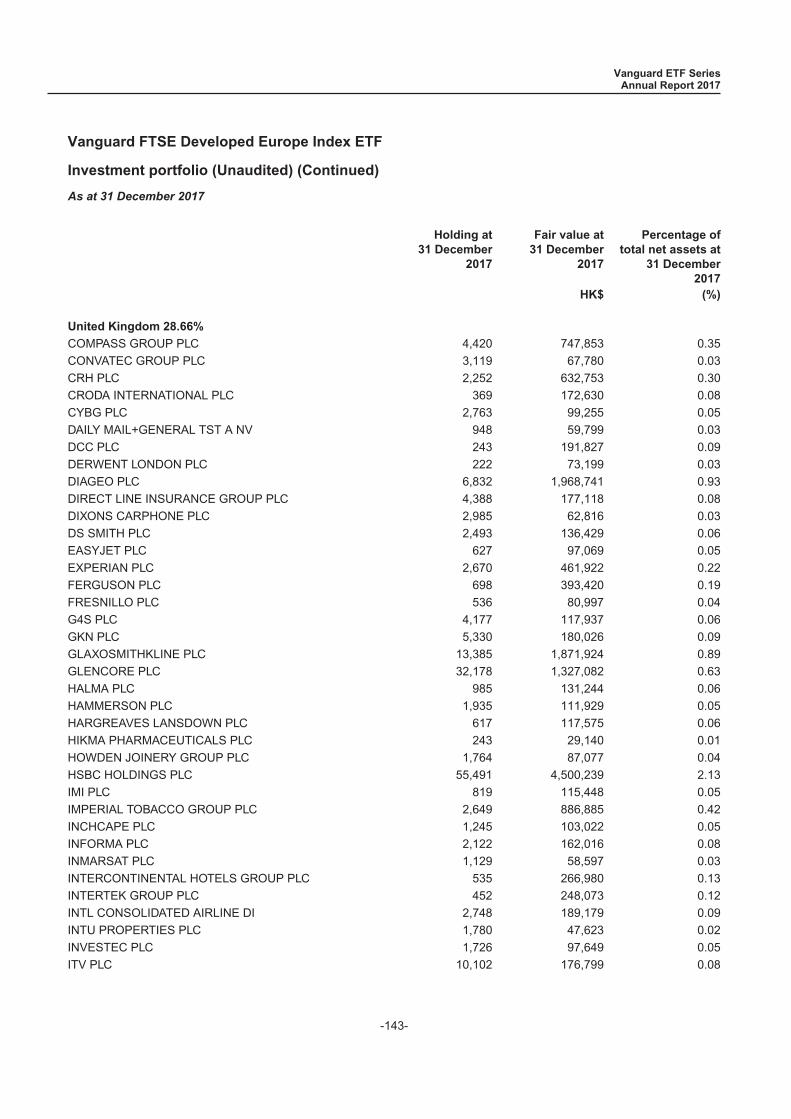
Investment portfolio (Unaudited) (Continued)
As at 31 December 2017
Holding at31 December
2017
Fair value at31 December
2017
Percentage oftotal net assets at
31 December2017
HK$ (%)
United Kingdom 28.66%
COMPASS GROUP PLC 4,420 747,853 0.35
CONVATEC GROUP PLC 3,119 67,780 0.03
CRH PLC 2,252 632,753 0.30
CRODA INTERNATIONAL PLC 369 172,630 0.08
CYBG PLC 2,763 99,255 0.05
DAILY MAIL+GENERAL TST A NV 948 59,799 0.03
DCC PLC 243 191,827 0.09
DERWENT LONDON PLC 222 73,199 0.03
DIAGEO PLC 6,832 1,968,741 0.93
DIRECT LINE INSURANCE GROUP PLC 4,388 177,118 0.08
DIXONS CARPHONE PLC 2,985 62,816 0.03
DS SMITH PLC 2,493 136,429 0.06
EASYJET PLC 627 97,069 0.05
EXPERIAN PLC 2,670 461,922 0.22
FERGUSON PLC 698 393,420 0.19
FRESNILLO PLC 536 80,997 0.04
G4S PLC 4,177 117,937 0.06
GKN PLC 5,330 180,026 0.09
GLAXOSMITHKLINE PLC 13,385 1,871,924 0.89
GLENCORE PLC 32,178 1,327,082 0.63
HALMA PLC 985 131,244 0.06
HAMMERSON PLC 1,935 111,929 0.05
HARGREAVES LANSDOWN PLC 617 117,575 0.06
HIKMA PHARMACEUTICALS PLC 243 29,140 0.01
HOWDEN JOINERY GROUP PLC 1,764 87,077 0.04
HSBC HOLDINGS PLC 55,491 4,500,239 2.13
IMI PLC 819 115,448 0.05
IMPERIAL TOBACCO GROUP PLC 2,649 886,885 0.42
INCHCAPE PLC 1,245 103,022 0.05
INFORMA PLC 2,122 162,016 0.08
INMARSAT PLC 1,129 58,597 0.03
INTERCONTINENTAL HOTELS GROUP PLC 535 266,980 0.13
INTERTEK GROUP PLC 452 248,073 0.12
INTL CONSOLIDATED AIRLINE DI 2,748 189,179 0.09
INTU PROPERTIES PLC 1,780 47,623 0.02
INVESTEC PLC 1,726 97,649 0.05
ITV PLC 10,102 176,799 0.08
Vanguard ETF SeriesAnnual Report 2017
Vanguard FTSE Developed Europe Index ETF
-143-

Investment portfolio (Unaudited) (Continued)
As at 31 December 2017
Holding at31 December
2017
Fair value at31 December
2017
Percentage oftotal net assets at
31 December2017
HK$ (%)
United Kingdom 28.66%
JOHNSON MATTHEY PLC 453 147,305 0.07
JUST EAT PLC 1,412 116,616 0.06
KINGFISHER PLC 6,016 214,839 0.10
LAND SECURITIES GROUP PLC 1,901 202,636 0.10
LEGAL + GENERAL GROUP PLC 16,015 462,851 0.22
LLOYDS BANKING GROUP PLC 197,244 1,419,613 0.67
LONDON STOCK EXCHANGE GROUP 878 352,169 0.17
MARKS + SPENCER GROUP PLC 5,098 169,710 0.08
MEDICLINIC INTERNATIONAL PLC 498 34,204 0.02
MEGGITT PLC 2,335 119,066 0.06
MELROSE INDUSTRIES PLC 4,933 110,696 0.05
MERLIN ENTERTAINME 2,481 95,211 0.04
MICRO FOCUS INTERNATIONAL PLC 1,179 314,561 0.15
MONDI PLC 909 185,618 0.09
NATIONAL GRID PLC 8,862 820,094 0.39
NEXT PLC 390 186,620 0.09
NMC HEALTH PLC 189 57,661 0.03
OLD MUTUAL PLC 14,134 346,310 0.16
PADDY POWER BETFAIR PLC 226 210,910 0.10
PEARSON PLC 2,438 189,752 0.09
PENNON GROUP PLC 1,372 113,603 0.05
PERSIMMON PLC 820 237,422 0.11
POLYMETAL INTERNATIONAL PLC 917 89,262 0.04
PROVIDENT FINANCIAL PLC 368 34,946 0.02
PRUDENTIAL PLC 7,162 1,443,170 0.68
RANDGOLD RESOURCES LTD 224 175,526 0.08
RECKITT BENCKISER GROUP PLC 1,726 1,262,869 0.60
REED ELSEVIER PLC 3,014 554,265 0.26
RENTOKIL INITIAL PLC 5,715 192,184 0.09
RIGHTMOVE PLC 224 106,594 0.05
RIO TINTO PLC 3,274 1,364,802 0.65
ROLLS ROYCE HOLDINGS PLC 4,364 390,879 0.18
ROYAL BANK OF SCOTLAND GROUP 8,997 264,495 0.13
ROYAL DUTCH SHELL PLC A SHS 12,616 3,308,626 1.56
ROYAL DUTCH SHELL PLC B SHS 10,402 2,759,340 1.30
ROYAL MAIL PLC 2,775 132,787 0.06
RPC GROUP PLC 1,044 97,319 0.05
Vanguard ETF SeriesAnnual Report 2017
Vanguard FTSE Developed Europe Index ETF
-144-

Investment portfolio (Unaudited) (Continued)
As at 31 December 2017
Holding at31 December
2017
Fair value at31 December
2017
Percentage oftotal net assets at
31 December2017
HK$ (%)
United Kingdom 28.66%
RSA INSURANCE GROUP PLC 3,073 205,540 0.10
SAGE GROUP PLC/THE 2,958 249,618 0.12
SAINSBURY (J) PLC 3,765 96,112 0.05
SCHRODERS PLC 319 118,608 0.06
SEGRO PLC 2,445 151,772 0.07
SEVERN TRENT PLC 729 166,670 0.08
SHIRE PLC 2,468 1,017,851 0.48
SKY PLC 2,734 292,586 0.14
SMITH + NEPHEW PLC 2,396 326,345 0.15
SMITHS GROUP PLC 1,204 189,709 0.09
SMURFIT KAPPA GROUP PLC 739 195,917 0.09
SPIRAX - SARCO ENGINEERING PLC 190 112,918 0.05
SSE PLC 2,705 377,586 0.18
ST JAMES S PLACE PLC 1,550 200,954 0.10
STANDARD CHARTERED PLC 7,360 607,159 0.29
STANDARD LIFE ABERDEEN PLC 7,214 333,069 0.16
TATE + LYLE PLC 1,374 102,145 0.05
TAYLOR WIMPEY PLC 8,674 189,323 0.09
TESCO PLC 21,801 482,410 0.23
TRAVIS PERKINS PLC 573 94,951 0.04
UNILEVER PLC 3,126 1,363,766 0.64
UNITED UTILITIES GROUP PLC 1,913 167,805 0.08
VODAFONE GROUP PLC 74,016 1,839,364 0.87
WEIR GROUP PLC/THE 671 150,642 0.07
WHITBREAD PLC 512 216,573 0.10
WILLIAM HILL PLC 3,102 105,626 0.05
WM MORRISON SUPERMARKETS 5,334 124,037 0.06
WOOD GROUP (JOHN) PLC 1,982 136,236 0.06
WORLDPAY GROUP PLC 4,920 221,640 0.10
WPP PLC 3,483 493,920 0.23
60,607,091 28.66
Vanguard ETF SeriesAnnual Report 2017
Vanguard FTSE Developed Europe Index ETF
-145-
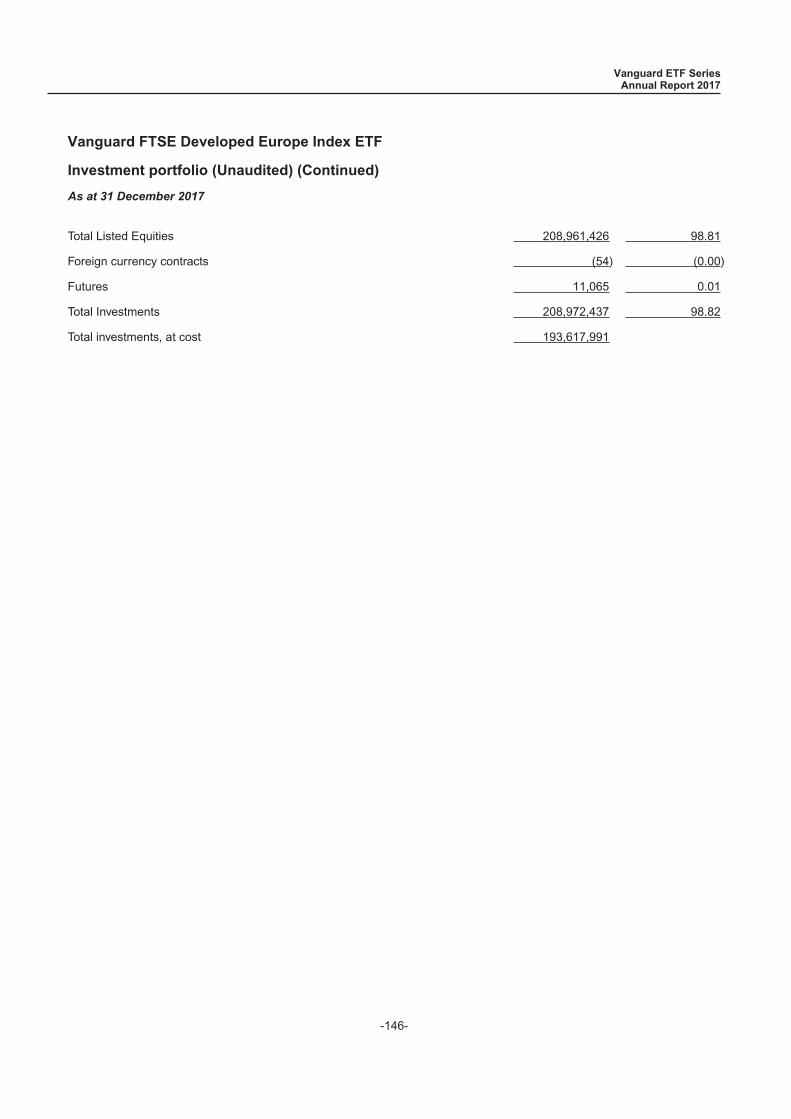
Investment portfolio (Unaudited) (Continued)
As at 31 December 2017
Total Listed Equities 208,961,426 98.81
Foreign currency contracts (54) (0.00)
Futures 11,065 0.01
Total Investments 208,972,437 98.82
Total investments, at cost 193,617,991
Vanguard ETF SeriesAnnual Report 2017
Vanguard FTSE Developed Europe Index ETF
-146-
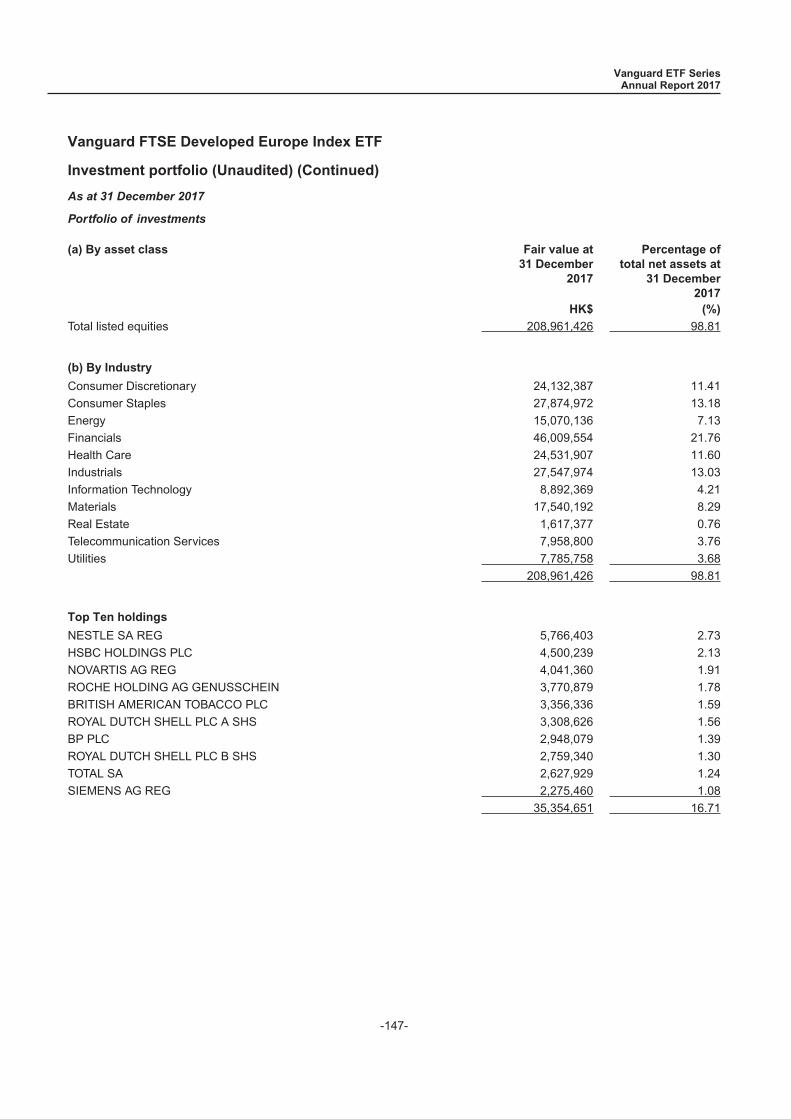
Investment portfolio (Unaudited) (Continued)
As at 31 December 2017
Portfolio of investments
(a) By asset class Fair value at31 December
2017
Percentage oftotal net assets at
31 December2017
HK$ (%)
Total listed equities 208,961,426 98.81
(b) By Industry
Consumer Discretionary 24,132,387 11.41
Consumer Staples 27,874,972 13.18
Energy 15,070,136 7.13
Financials 46,009,554 21.76
Health Care 24,531,907 11.60
Industrials 27,547,974 13.03
Information Technology 8,892,369 4.21
Materials 17,540,192 8.29
Real Estate 1,617,377 0.76
Telecommunication Services 7,958,800 3.76
Utilities 7,785,758 3.68
208,961,426 98.81
Top Ten holdings
NESTLE SA REG 5,766,403 2.73
HSBC HOLDINGS PLC 4,500,239 2.13
NOVARTIS AG REG 4,041,360 1.91
ROCHE HOLDING AG GENUSSCHEIN 3,770,879 1.78
BRITISH AMERICAN TOBACCO PLC 3,356,336 1.59
ROYAL DUTCH SHELL PLC A SHS 3,308,626 1.56
BP PLC 2,948,079 1.39
ROYAL DUTCH SHELL PLC B SHS 2,759,340 1.30
TOTAL SA 2,627,929 1.24
SIEMENS AG REG 2,275,460 1.08
35,354,651 16.71
Vanguard ETF SeriesAnnual Report 2017
Vanguard FTSE Developed Europe Index ETF
-147-
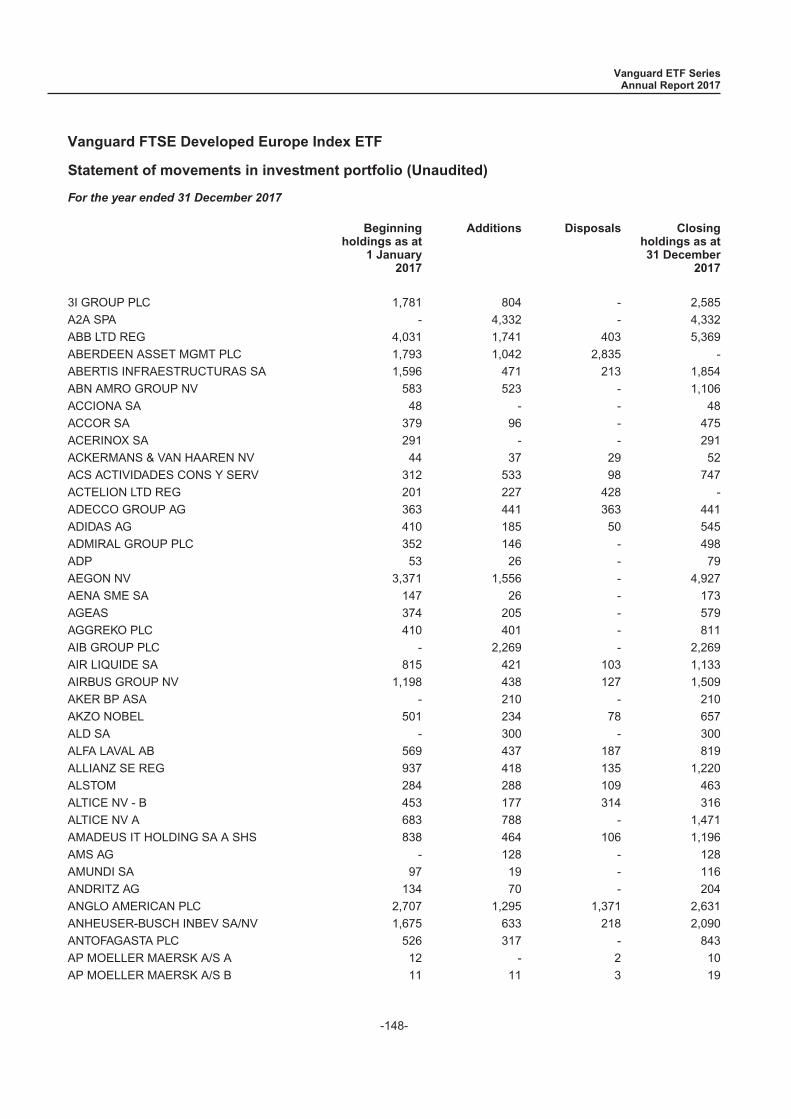
Statement of movements in investment portfolio (Unaudited)
For the year ended 31 December 2017
Beginningholdings as at
1 January2017
Additions Disposals Closingholdings as at31 December
2017
3I GROUP PLC 1,781 804 - 2,585
A2A SPA - 4,332 - 4,332
ABB LTD REG 4,031 1,741 403 5,369
ABERDEEN ASSET MGMT PLC 1,793 1,042 2,835 -
ABERTIS INFRAESTRUCTURAS SA 1,596 471 213 1,854
ABN AMRO GROUP NV 583 523 - 1,106
ACCIONA SA 48 - - 48
ACCOR SA 379 96 - 475
ACERINOX SA 291 - - 291
ACKERMANS & VAN HAAREN NV 44 37 29 52
ACS ACTIVIDADES CONS Y SERV 312 533 98 747
ACTELION LTD REG 201 227 428 -
ADECCO GROUP AG 363 441 363 441
ADIDAS AG 410 185 50 545
ADMIRAL GROUP PLC 352 146 - 498
ADP 53 26 - 79
AEGON NV 3,371 1,556 - 4,927
AENA SME SA 147 26 - 173
AGEAS 374 205 - 579
AGGREKO PLC 410 401 - 811
AIB GROUP PLC - 2,269 - 2,269
AIR LIQUIDE SA 815 421 103 1,133
AIRBUS GROUP NV 1,198 438 127 1,509
AKER BP ASA - 210 - 210
AKZO NOBEL 501 234 78 657
ALD SA - 300 - 300
ALFA LAVAL AB 569 437 187 819
ALLIANZ SE REG 937 418 135 1,220
ALSTOM 284 288 109 463
ALTICE NV - B 453 177 314 316
ALTICE NV A 683 788 - 1,471
AMADEUS IT HOLDING SA A SHS 838 464 106 1,196
AMS AG - 128 - 128
AMUNDI SA 97 19 - 116
ANDRITZ AG 134 70 - 204
ANGLO AMERICAN PLC 2,707 1,295 1,371 2,631
ANHEUSER-BUSCH INBEV SA/NV 1,675 633 218 2,090
ANTOFAGASTA PLC 526 317 - 843
AP MOELLER MAERSK A/S A 12 - 2 10
AP MOELLER MAERSK A/S B 11 11 3 19
Vanguard ETF SeriesAnnual Report 2017
Vanguard FTSE Developed Europe Index ETF
-148-

Statement of movements in investment portfolio (Unaudited) (Continued)
For the year ended 31 December 2017
Beginningholdings as at
1 January2017
Additions Disposals Closingholdings as at31 December
2017
ARCELORMITTAL 3,945 1,892 4,178 1,659
ARJO AB - 571 - 571
ARKEMA 168 - - 168
ARYZTA AG 154 154 154 154
ASHMORE GROUP PLC 671 - - 671
ASHTEAD GROUP PLC 1,107 214 - 1,321
ASML HOLDING NV 658 286 71 873
ASR NEDERLAND NV - 463 - 463
ASSA ABLOY AB 1,862 887 272 2,477
ASSICURAZIONI GENERALI 2,771 1,121 242 3,650
ASSOCIATED BRITISH FOODS PLC 739 372 105 1,006
ASTRAZENECA PLC 2,686 1,111 289 3,508
ATLANTIA SPA 1,067 480 138 1,409ATLAS COPCO AB A SHS COMMON STOCKSEK.64 1,264 660 142 1,782ATLAS COPCO AB B SHS COMMON STOCKSEK.64 827 259 111 975
ATOS 209 30 - 239
AUTO TRADER GROUP PLC 1,701 1,958 790 2,869
AVIVA PLC 8,588 3,546 1,056 11,078
AXA SA 3,960 1,626 392 5,194
AXEL SPRINGER SE 92 - - 92
BABCOCK INTL GROUP PLC 416 412 339 489
BAE SYSTEMS PLC 6,312 3,248 658 8,902
BALOISE HOLDING AG REG 117 - - 117
BANCA MEDIOLANUM SPA 483 - - 483
BANCO BILBAO VIZCAYA ARGENTA 14,044 5,912 1,501 18,455
BANCO BPM SPA - 3,811 - 3,811BANCO DE SABADELL SA COMMON STOCKEUR.125 12,913 7,329 4,086 16,156
BANCO ESPIRITO SANTO REG 2,999 - - 2,999
BANCO POPULAR ESPANOL 5,842 - 5,842 -
BANCO SANTANDER SA 29,605 17,616 3,200 44,021
BANK OF IRELAND 49,961 14,308 64,269 -
BANK OF IRELAND GROUP PLC - 2,836 - 2,836
BANKIA SA 8,744 3,045 8,744 3,045
BANKINTER SA 1,780 - - 1,780
BANQUE CANTONALE VAUDOIS REG 6 6 6 6
BARCLAYS PLC 34,704 15,184 2,856 47,032
BARRATT DEVELOPMENTS PLC 2,283 603 - 2,886
Vanguard ETF SeriesAnnual Report 2017
Vanguard FTSE Developed Europe Index ETF
-149-
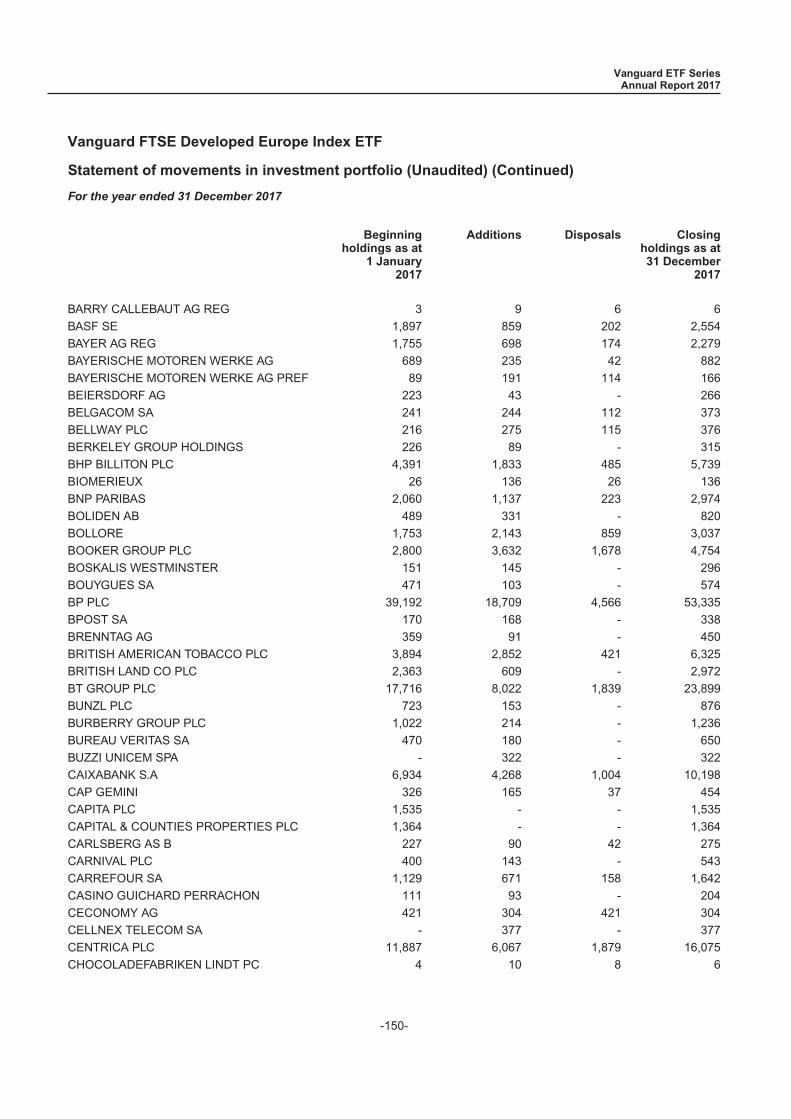
Statement of movements in investment portfolio (Unaudited) (Continued)
For the year ended 31 December 2017
Beginningholdings as at
1 January2017
Additions Disposals Closingholdings as at31 December
2017
BARRY CALLEBAUT AG REG 3 9 6 6
BASF SE 1,897 859 202 2,554
BAYER AG REG 1,755 698 174 2,279
BAYERISCHE MOTOREN WERKE AG 689 235 42 882
BAYERISCHE MOTOREN WERKE AG PREF 89 191 114 166
BEIERSDORF AG 223 43 - 266
BELGACOM SA 241 244 112 373
BELLWAY PLC 216 275 115 376
BERKELEY GROUP HOLDINGS 226 89 - 315
BHP BILLITON PLC 4,391 1,833 485 5,739
BIOMERIEUX 26 136 26 136
BNP PARIBAS 2,060 1,137 223 2,974
BOLIDEN AB 489 331 - 820
BOLLORE 1,753 2,143 859 3,037
BOOKER GROUP PLC 2,800 3,632 1,678 4,754
BOSKALIS WESTMINSTER 151 145 - 296
BOUYGUES SA 471 103 - 574
BP PLC 39,192 18,709 4,566 53,335
BPOST SA 170 168 - 338
BRENNTAG AG 359 91 - 450
BRITISH AMERICAN TOBACCO PLC 3,894 2,852 421 6,325
BRITISH LAND CO PLC 2,363 609 - 2,972
BT GROUP PLC 17,716 8,022 1,839 23,899
BUNZL PLC 723 153 - 876
BURBERRY GROUP PLC 1,022 214 - 1,236
BUREAU VERITAS SA 470 180 - 650
BUZZI UNICEM SPA - 322 - 322
CAIXABANK S.A 6,934 4,268 1,004 10,198
CAP GEMINI 326 165 37 454
CAPITA PLC 1,535 - - 1,535
CAPITAL & COUNTIES PROPERTIES PLC 1,364 - - 1,364
CARLSBERG AS B 227 90 42 275
CARNIVAL PLC 400 143 - 543
CARREFOUR SA 1,129 671 158 1,642
CASINO GUICHARD PERRACHON 111 93 - 204
CECONOMY AG 421 304 421 304
CELLNEX TELECOM SA - 377 - 377
CENTRICA PLC 11,887 6,067 1,879 16,075
CHOCOLADEFABRIKEN LINDT PC 4 10 8 6
Vanguard ETF SeriesAnnual Report 2017
Vanguard FTSE Developed Europe Index ETF
-150-
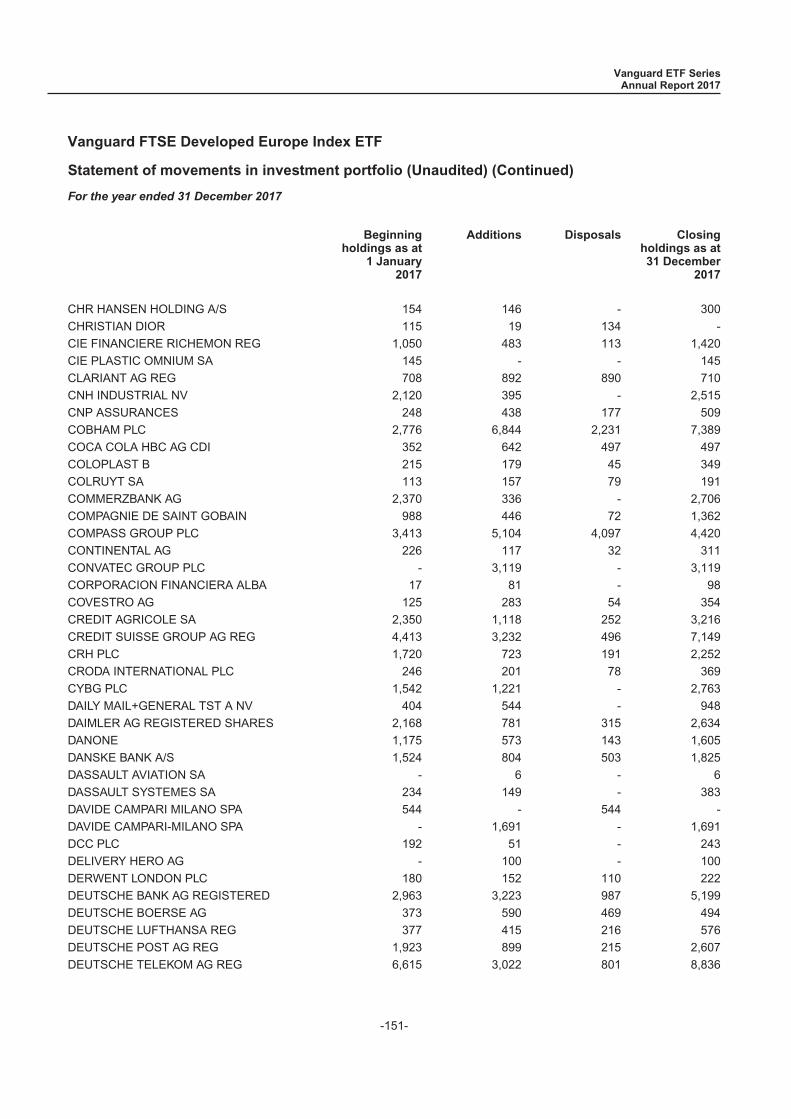
Statement of movements in investment portfolio (Unaudited) (Continued)
For the year ended 31 December 2017
Beginningholdings as at
1 January2017
Additions Disposals Closingholdings as at31 December
2017
CHR HANSEN HOLDING A/S 154 146 - 300
CHRISTIAN DIOR 115 19 134 -
CIE FINANCIERE RICHEMON REG 1,050 483 113 1,420
CIE PLASTIC OMNIUM SA 145 - - 145
CLARIANT AG REG 708 892 890 710
CNH INDUSTRIAL NV 2,120 395 - 2,515
CNP ASSURANCES 248 438 177 509
COBHAM PLC 2,776 6,844 2,231 7,389
COCA COLA HBC AG CDI 352 642 497 497
COLOPLAST B 215 179 45 349
COLRUYT SA 113 157 79 191
COMMERZBANK AG 2,370 336 - 2,706
COMPAGNIE DE SAINT GOBAIN 988 446 72 1,362
COMPASS GROUP PLC 3,413 5,104 4,097 4,420
CONTINENTAL AG 226 117 32 311
CONVATEC GROUP PLC - 3,119 - 3,119
CORPORACION FINANCIERA ALBA 17 81 - 98
COVESTRO AG 125 283 54 354
CREDIT AGRICOLE SA 2,350 1,118 252 3,216
CREDIT SUISSE GROUP AG REG 4,413 3,232 496 7,149
CRH PLC 1,720 723 191 2,252
CRODA INTERNATIONAL PLC 246 201 78 369
CYBG PLC 1,542 1,221 - 2,763
DAILY MAIL+GENERAL TST A NV 404 544 - 948
DAIMLER AG REGISTERED SHARES 2,168 781 315 2,634
DANONE 1,175 573 143 1,605
DANSKE BANK A/S 1,524 804 503 1,825
DASSAULT AVIATION SA - 6 - 6
DASSAULT SYSTEMES SA 234 149 - 383
DAVIDE CAMPARI MILANO SPA 544 - 544 -
DAVIDE CAMPARI-MILANO SPA - 1,691 - 1,691
DCC PLC 192 51 - 243
DELIVERY HERO AG - 100 - 100
DERWENT LONDON PLC 180 152 110 222
DEUTSCHE BANK AG REGISTERED 2,963 3,223 987 5,199
DEUTSCHE BOERSE AG 373 590 469 494
DEUTSCHE LUFTHANSA REG 377 415 216 576
DEUTSCHE POST AG REG 1,923 899 215 2,607
DEUTSCHE TELEKOM AG REG 6,615 3,022 801 8,836
Vanguard ETF SeriesAnnual Report 2017
Vanguard FTSE Developed Europe Index ETF
-151-
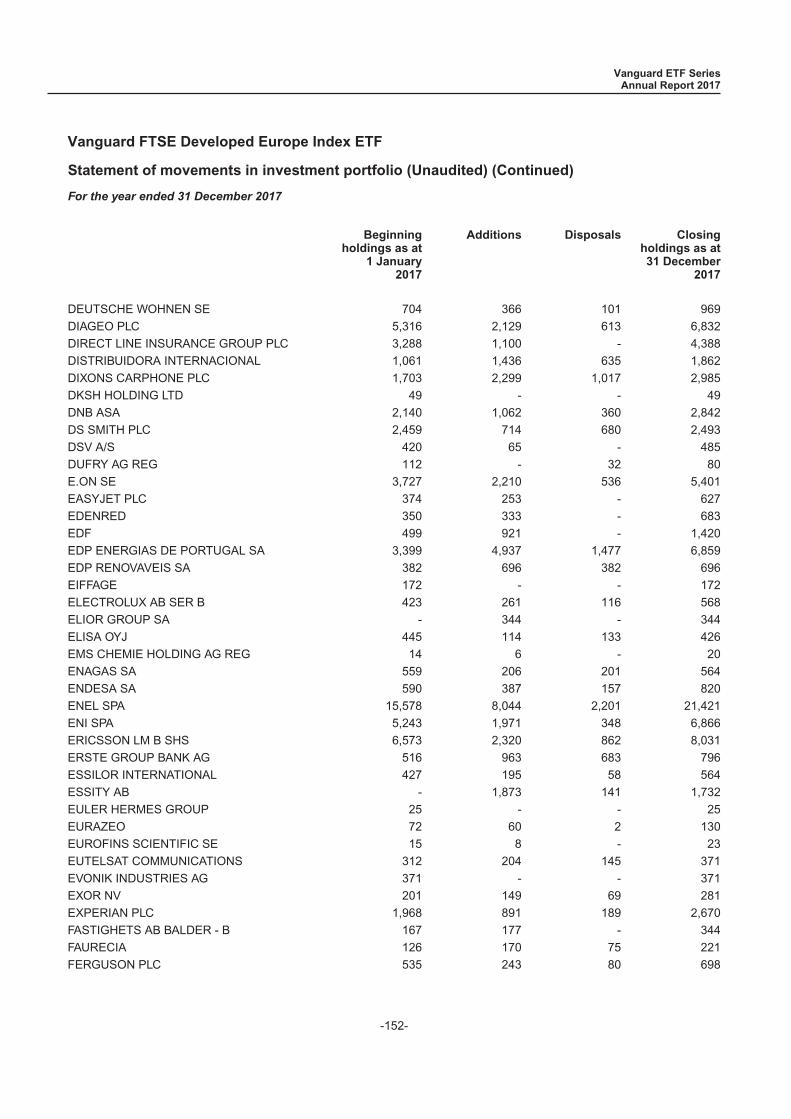
Statement of movements in investment portfolio (Unaudited) (Continued)
For the year ended 31 December 2017
Beginningholdings as at
1 January2017
Additions Disposals Closingholdings as at31 December
2017
DEUTSCHE WOHNEN SE 704 366 101 969
DIAGEO PLC 5,316 2,129 613 6,832
DIRECT LINE INSURANCE GROUP PLC 3,288 1,100 - 4,388
DISTRIBUIDORA INTERNACIONAL 1,061 1,436 635 1,862
DIXONS CARPHONE PLC 1,703 2,299 1,017 2,985
DKSH HOLDING LTD 49 - - 49
DNB ASA 2,140 1,062 360 2,842
DS SMITH PLC 2,459 714 680 2,493
DSV A/S 420 65 - 485
DUFRY AG REG 112 - 32 80
E.ON SE 3,727 2,210 536 5,401
EASYJET PLC 374 253 - 627
EDENRED 350 333 - 683
EDF 499 921 - 1,420
EDP ENERGIAS DE PORTUGAL SA 3,399 4,937 1,477 6,859
EDP RENOVAVEIS SA 382 696 382 696
EIFFAGE 172 - - 172
ELECTROLUX AB SER B 423 261 116 568
ELIOR GROUP SA - 344 - 344
ELISA OYJ 445 114 133 426
EMS CHEMIE HOLDING AG REG 14 6 - 20
ENAGAS SA 559 206 201 564
ENDESA SA 590 387 157 820
ENEL SPA 15,578 8,044 2,201 21,421
ENI SPA 5,243 1,971 348 6,866
ERICSSON LM B SHS 6,573 2,320 862 8,031
ERSTE GROUP BANK AG 516 963 683 796
ESSILOR INTERNATIONAL 427 195 58 564
ESSITY AB - 1,873 141 1,732
EULER HERMES GROUP 25 - - 25
EURAZEO 72 60 2 130
EUROFINS SCIENTIFIC SE 15 8 - 23
EUTELSAT COMMUNICATIONS 312 204 145 371
EVONIK INDUSTRIES AG 371 - - 371
EXOR NV 201 149 69 281
EXPERIAN PLC 1,968 891 189 2,670
FASTIGHETS AB BALDER - B 167 177 - 344
FAURECIA 126 170 75 221
FERGUSON PLC 535 243 80 698
Vanguard ETF SeriesAnnual Report 2017
Vanguard FTSE Developed Europe Index ETF
-152-
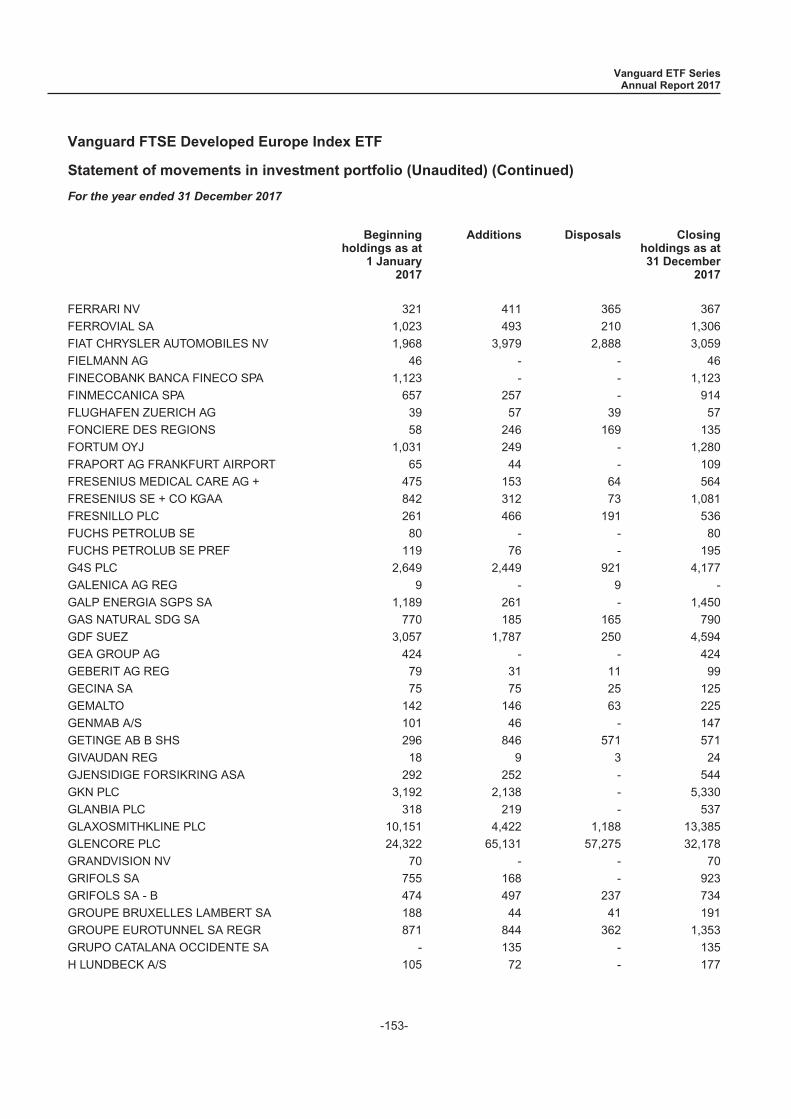
Statement of movements in investment portfolio (Unaudited) (Continued)
For the year ended 31 December 2017
Beginningholdings as at
1 January2017
Additions Disposals Closingholdings as at31 December
2017
FERRARI NV 321 411 365 367
FERROVIAL SA 1,023 493 210 1,306
FIAT CHRYSLER AUTOMOBILES NV 1,968 3,979 2,888 3,059
FIELMANN AG 46 - - 46
FINECOBANK BANCA FINECO SPA 1,123 - - 1,123
FINMECCANICA SPA 657 257 - 914
FLUGHAFEN ZUERICH AG 39 57 39 57
FONCIERE DES REGIONS 58 246 169 135
FORTUM OYJ 1,031 249 - 1,280
FRAPORT AG FRANKFURT AIRPORT 65 44 - 109
FRESENIUS MEDICAL CARE AG + 475 153 64 564
FRESENIUS SE + CO KGAA 842 312 73 1,081
FRESNILLO PLC 261 466 191 536
FUCHS PETROLUB SE 80 - - 80
FUCHS PETROLUB SE PREF 119 76 - 195
G4S PLC 2,649 2,449 921 4,177
GALENICA AG REG 9 - 9 -
GALP ENERGIA SGPS SA 1,189 261 - 1,450
GAS NATURAL SDG SA 770 185 165 790
GDF SUEZ 3,057 1,787 250 4,594
GEA GROUP AG 424 - - 424
GEBERIT AG REG 79 31 11 99
GECINA SA 75 75 25 125
GEMALTO 142 146 63 225
GENMAB A/S 101 46 - 147
GETINGE AB B SHS 296 846 571 571
GIVAUDAN REG 18 9 3 24
GJENSIDIGE FORSIKRING ASA 292 252 - 544
GKN PLC 3,192 2,138 - 5,330
GLANBIA PLC 318 219 - 537
GLAXOSMITHKLINE PLC 10,151 4,422 1,188 13,385
GLENCORE PLC 24,322 65,131 57,275 32,178
GRANDVISION NV 70 - - 70
GRIFOLS SA 755 168 - 923
GRIFOLS SA - B 474 497 237 734
GROUPE BRUXELLES LAMBERT SA 188 44 41 191
GROUPE EUROTUNNEL SA REGR 871 844 362 1,353
GRUPO CATALANA OCCIDENTE SA - 135 - 135
H LUNDBECK A/S 105 72 - 177
Vanguard ETF SeriesAnnual Report 2017
Vanguard FTSE Developed Europe Index ETF
-153-
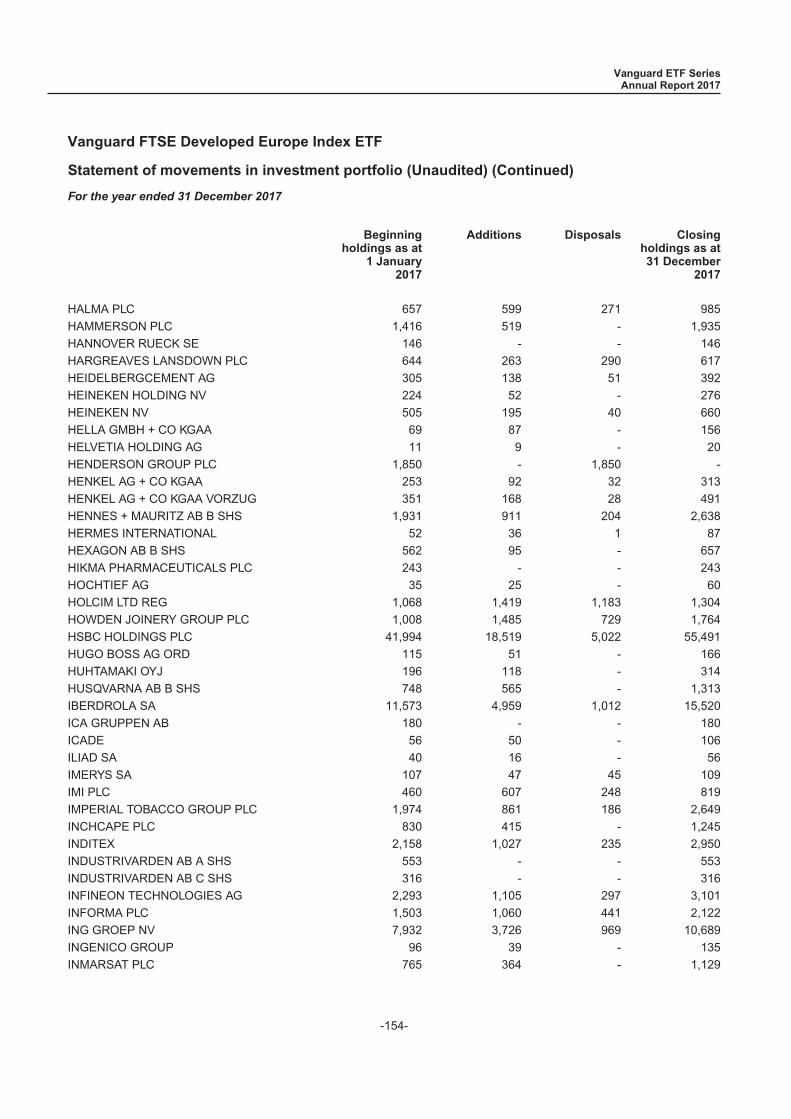
Statement of movements in investment portfolio (Unaudited) (Continued)
For the year ended 31 December 2017
Beginningholdings as at
1 January2017
Additions Disposals Closingholdings as at31 December
2017
HALMA PLC 657 599 271 985
HAMMERSON PLC 1,416 519 - 1,935
HANNOVER RUECK SE 146 - - 146
HARGREAVES LANSDOWN PLC 644 263 290 617
HEIDELBERGCEMENT AG 305 138 51 392
HEINEKEN HOLDING NV 224 52 - 276
HEINEKEN NV 505 195 40 660
HELLA GMBH + CO KGAA 69 87 - 156
HELVETIA HOLDING AG 11 9 - 20
HENDERSON GROUP PLC 1,850 - 1,850 -
HENKEL AG + CO KGAA 253 92 32 313
HENKEL AG + CO KGAA VORZUG 351 168 28 491
HENNES + MAURITZ AB B SHS 1,931 911 204 2,638
HERMES INTERNATIONAL 52 36 1 87
HEXAGON AB B SHS 562 95 - 657
HIKMA PHARMACEUTICALS PLC 243 - - 243
HOCHTIEF AG 35 25 - 60
HOLCIM LTD REG 1,068 1,419 1,183 1,304
HOWDEN JOINERY GROUP PLC 1,008 1,485 729 1,764
HSBC HOLDINGS PLC 41,994 18,519 5,022 55,491
HUGO BOSS AG ORD 115 51 - 166
HUHTAMAKI OYJ 196 118 - 314
HUSQVARNA AB B SHS 748 565 - 1,313
IBERDROLA SA 11,573 4,959 1,012 15,520
ICA GRUPPEN AB 180 - - 180
ICADE 56 50 - 106
ILIAD SA 40 16 - 56
IMERYS SA 107 47 45 109
IMI PLC 460 607 248 819
IMPERIAL TOBACCO GROUP PLC 1,974 861 186 2,649
INCHCAPE PLC 830 415 - 1,245
INDITEX 2,158 1,027 235 2,950
INDUSTRIVARDEN AB A SHS 553 - - 553
INDUSTRIVARDEN AB C SHS 316 - - 316
INFINEON TECHNOLOGIES AG 2,293 1,105 297 3,101
INFORMA PLC 1,503 1,060 441 2,122
ING GROEP NV 7,932 3,726 969 10,689
INGENICO GROUP 96 39 - 135
INMARSAT PLC 765 364 - 1,129
Vanguard ETF SeriesAnnual Report 2017
Vanguard FTSE Developed Europe Index ETF
-154-
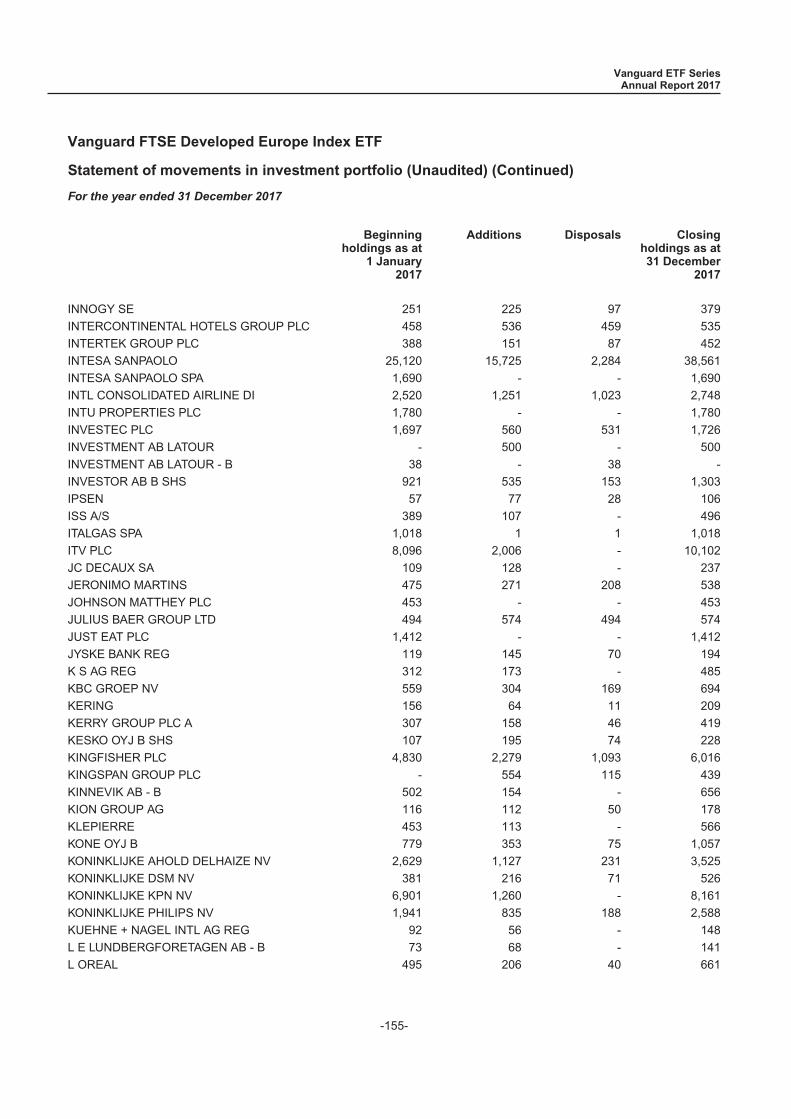
Statement of movements in investment portfolio (Unaudited) (Continued)
For the year ended 31 December 2017
Beginningholdings as at
1 January2017
Additions Disposals Closingholdings as at31 December
2017
INNOGY SE 251 225 97 379
INTERCONTINENTAL HOTELS GROUP PLC 458 536 459 535
INTERTEK GROUP PLC 388 151 87 452
INTESA SANPAOLO 25,120 15,725 2,284 38,561
INTESA SANPAOLO SPA 1,690 - - 1,690
INTL CONSOLIDATED AIRLINE DI 2,520 1,251 1,023 2,748
INTU PROPERTIES PLC 1,780 - - 1,780
INVESTEC PLC 1,697 560 531 1,726
INVESTMENT AB LATOUR - 500 - 500
INVESTMENT AB LATOUR - B 38 - 38 -
INVESTOR AB B SHS 921 535 153 1,303
IPSEN 57 77 28 106
ISS A/S 389 107 - 496
ITALGAS SPA 1,018 1 1 1,018
ITV PLC 8,096 2,006 - 10,102
JC DECAUX SA 109 128 - 237
JERONIMO MARTINS 475 271 208 538
JOHNSON MATTHEY PLC 453 - - 453
JULIUS BAER GROUP LTD 494 574 494 574
JUST EAT PLC 1,412 - - 1,412
JYSKE BANK REG 119 145 70 194
K S AG REG 312 173 - 485
KBC GROEP NV 559 304 169 694
KERING 156 64 11 209
KERRY GROUP PLC A 307 158 46 419
KESKO OYJ B SHS 107 195 74 228
KINGFISHER PLC 4,830 2,279 1,093 6,016
KINGSPAN GROUP PLC - 554 115 439
KINNEVIK AB - B 502 154 - 656
KION GROUP AG 116 112 50 178
KLEPIERRE 453 113 - 566
KONE OYJ B 779 353 75 1,057
KONINKLIJKE AHOLD DELHAIZE NV 2,629 1,127 231 3,525
KONINKLIJKE DSM NV 381 216 71 526
KONINKLIJKE KPN NV 6,901 1,260 - 8,161
KONINKLIJKE PHILIPS NV 1,941 835 188 2,588
KUEHNE + NAGEL INTL AG REG 92 56 - 148
L E LUNDBERGFORETAGEN AB - B 73 68 - 141
L OREAL 495 206 40 661
Vanguard ETF SeriesAnnual Report 2017
Vanguard FTSE Developed Europe Index ETF
-155-
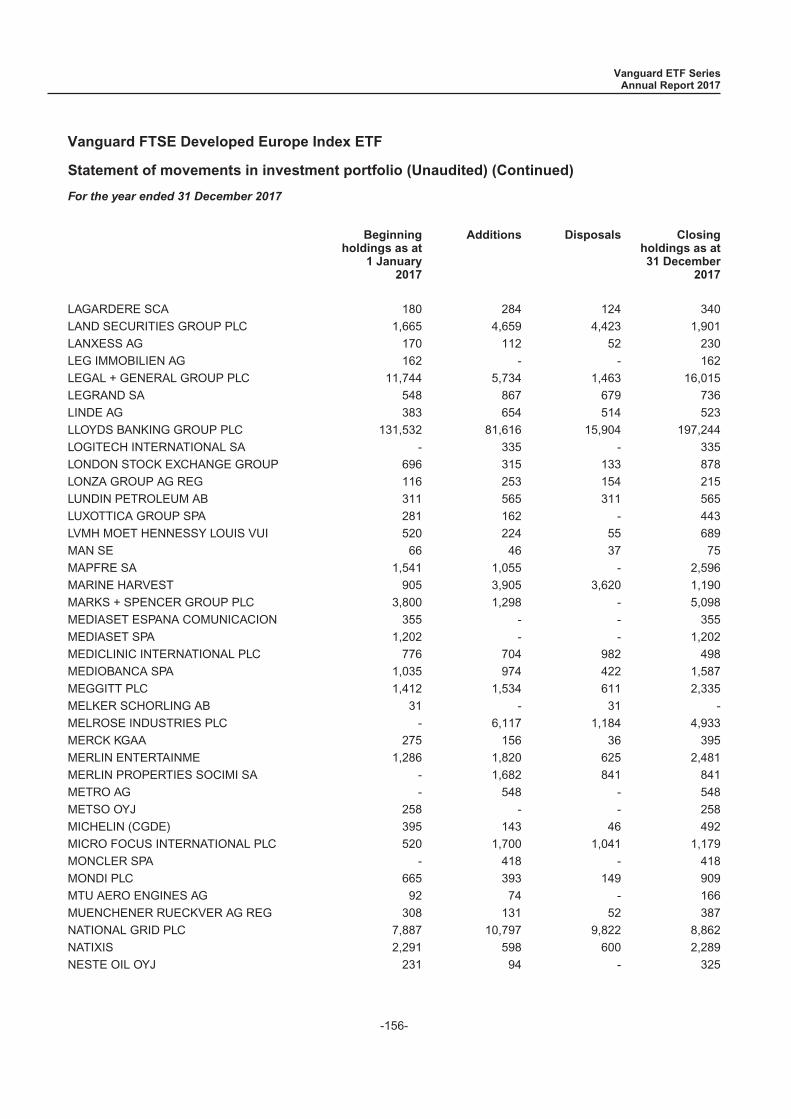
Statement of movements in investment portfolio (Unaudited) (Continued)
For the year ended 31 December 2017
Beginningholdings as at
1 January2017
Additions Disposals Closingholdings as at31 December
2017
LAGARDERE SCA 180 284 124 340
LAND SECURITIES GROUP PLC 1,665 4,659 4,423 1,901
LANXESS AG 170 112 52 230
LEG IMMOBILIEN AG 162 - - 162
LEGAL + GENERAL GROUP PLC 11,744 5,734 1,463 16,015
LEGRAND SA 548 867 679 736
LINDE AG 383 654 514 523
LLOYDS BANKING GROUP PLC 131,532 81,616 15,904 197,244
LOGITECH INTERNATIONAL SA - 335 - 335
LONDON STOCK EXCHANGE GROUP 696 315 133 878
LONZA GROUP AG REG 116 253 154 215
LUNDIN PETROLEUM AB 311 565 311 565
LUXOTTICA GROUP SPA 281 162 - 443
LVMH MOET HENNESSY LOUIS VUI 520 224 55 689
MAN SE 66 46 37 75
MAPFRE SA 1,541 1,055 - 2,596
MARINE HARVEST 905 3,905 3,620 1,190
MARKS + SPENCER GROUP PLC 3,800 1,298 - 5,098
MEDIASET ESPANA COMUNICACION 355 - - 355
MEDIASET SPA 1,202 - - 1,202
MEDICLINIC INTERNATIONAL PLC 776 704 982 498
MEDIOBANCA SPA 1,035 974 422 1,587
MEGGITT PLC 1,412 1,534 611 2,335
MELKER SCHORLING AB 31 - 31 -
MELROSE INDUSTRIES PLC - 6,117 1,184 4,933
MERCK KGAA 275 156 36 395
MERLIN ENTERTAINME 1,286 1,820 625 2,481
MERLIN PROPERTIES SOCIMI SA - 1,682 841 841
METRO AG - 548 - 548
METSO OYJ 258 - - 258
MICHELIN (CGDE) 395 143 46 492
MICRO FOCUS INTERNATIONAL PLC 520 1,700 1,041 1,179
MONCLER SPA - 418 - 418
MONDI PLC 665 393 149 909
MTU AERO ENGINES AG 92 74 - 166
MUENCHENER RUECKVER AG REG 308 131 52 387
NATIONAL GRID PLC 7,887 10,797 9,822 8,862
NATIXIS 2,291 598 600 2,289
NESTE OIL OYJ 231 94 - 325
Vanguard ETF SeriesAnnual Report 2017
Vanguard FTSE Developed Europe Index ETF
-156-
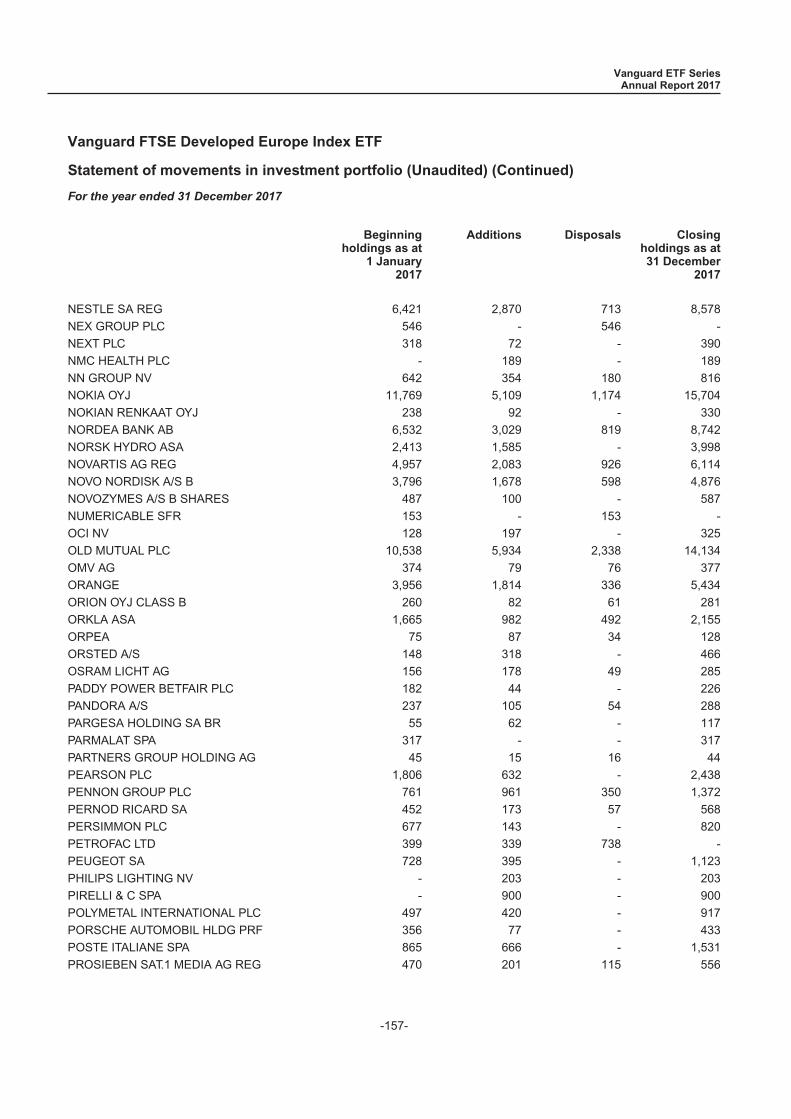
Statement of movements in investment portfolio (Unaudited) (Continued)
For the year ended 31 December 2017
Beginningholdings as at
1 January2017
Additions Disposals Closingholdings as at31 December
2017
NESTLE SA REG 6,421 2,870 713 8,578
NEX GROUP PLC 546 - 546 -
NEXT PLC 318 72 - 390
NMC HEALTH PLC - 189 - 189
NN GROUP NV 642 354 180 816
NOKIA OYJ 11,769 5,109 1,174 15,704
NOKIAN RENKAAT OYJ 238 92 - 330
NORDEA BANK AB 6,532 3,029 819 8,742
NORSK HYDRO ASA 2,413 1,585 - 3,998
NOVARTIS AG REG 4,957 2,083 926 6,114
NOVO NORDISK A/S B 3,796 1,678 598 4,876
NOVOZYMES A/S B SHARES 487 100 - 587
NUMERICABLE SFR 153 - 153 -
OCI NV 128 197 - 325
OLD MUTUAL PLC 10,538 5,934 2,338 14,134
OMV AG 374 79 76 377
ORANGE 3,956 1,814 336 5,434
ORION OYJ CLASS B 260 82 61 281
ORKLA ASA 1,665 982 492 2,155
ORPEA 75 87 34 128
ORSTED A/S 148 318 - 466
OSRAM LICHT AG 156 178 49 285
PADDY POWER BETFAIR PLC 182 44 - 226
PANDORA A/S 237 105 54 288
PARGESA HOLDING SA BR 55 62 - 117
PARMALAT SPA 317 - - 317
PARTNERS GROUP HOLDING AG 45 15 16 44
PEARSON PLC 1,806 632 - 2,438
PENNON GROUP PLC 761 961 350 1,372
PERNOD RICARD SA 452 173 57 568
PERSIMMON PLC 677 143 - 820
PETROFAC LTD 399 339 738 -
PEUGEOT SA 728 395 - 1,123
PHILIPS LIGHTING NV - 203 - 203
PIRELLI & C SPA - 900 - 900
POLYMETAL INTERNATIONAL PLC 497 420 - 917
PORSCHE AUTOMOBIL HLDG PRF 356 77 - 433
POSTE ITALIANE SPA 865 666 - 1,531
PROSIEBEN SAT.1 MEDIA AG REG 470 201 115 556
Vanguard ETF SeriesAnnual Report 2017
Vanguard FTSE Developed Europe Index ETF
-157-
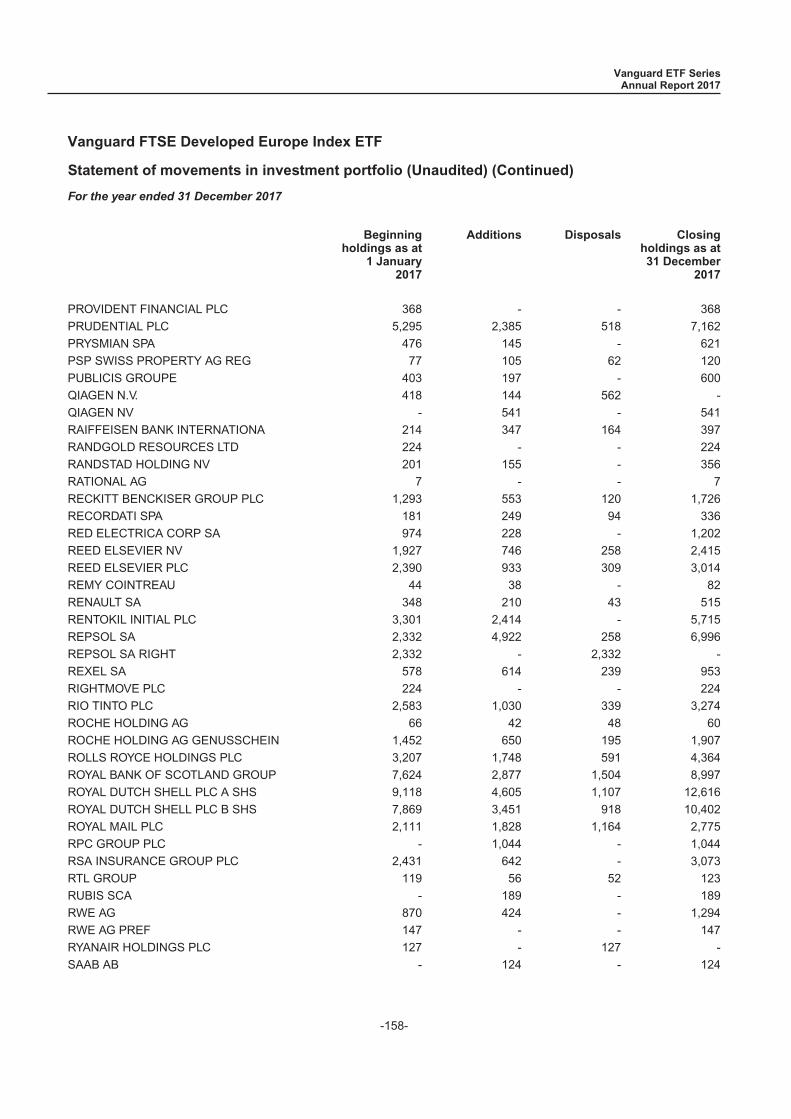
Statement of movements in investment portfolio (Unaudited) (Continued)
For the year ended 31 December 2017
Beginningholdings as at
1 January2017
Additions Disposals Closingholdings as at31 December
2017
PROVIDENT FINANCIAL PLC 368 - - 368
PRUDENTIAL PLC 5,295 2,385 518 7,162
PRYSMIAN SPA 476 145 - 621
PSP SWISS PROPERTY AG REG 77 105 62 120
PUBLICIS GROUPE 403 197 - 600
QIAGEN N.V. 418 144 562 -
QIAGEN NV - 541 - 541
RAIFFEISEN BANK INTERNATIONA 214 347 164 397
RANDGOLD RESOURCES LTD 224 - - 224
RANDSTAD HOLDING NV 201 155 - 356
RATIONAL AG 7 - - 7
RECKITT BENCKISER GROUP PLC 1,293 553 120 1,726
RECORDATI SPA 181 249 94 336
RED ELECTRICA CORP SA 974 228 - 1,202
REED ELSEVIER NV 1,927 746 258 2,415
REED ELSEVIER PLC 2,390 933 309 3,014
REMY COINTREAU 44 38 - 82
RENAULT SA 348 210 43 515
RENTOKIL INITIAL PLC 3,301 2,414 - 5,715
REPSOL SA 2,332 4,922 258 6,996
REPSOL SA RIGHT 2,332 - 2,332 -
REXEL SA 578 614 239 953
RIGHTMOVE PLC 224 - - 224
RIO TINTO PLC 2,583 1,030 339 3,274
ROCHE HOLDING AG 66 42 48 60
ROCHE HOLDING AG GENUSSCHEIN 1,452 650 195 1,907
ROLLS ROYCE HOLDINGS PLC 3,207 1,748 591 4,364
ROYAL BANK OF SCOTLAND GROUP 7,624 2,877 1,504 8,997
ROYAL DUTCH SHELL PLC A SHS 9,118 4,605 1,107 12,616
ROYAL DUTCH SHELL PLC B SHS 7,869 3,451 918 10,402
ROYAL MAIL PLC 2,111 1,828 1,164 2,775
RPC GROUP PLC - 1,044 - 1,044
RSA INSURANCE GROUP PLC 2,431 642 - 3,073
RTL GROUP 119 56 52 123
RUBIS SCA - 189 - 189
RWE AG 870 424 - 1,294
RWE AG PREF 147 - - 147
RYANAIR HOLDINGS PLC 127 - 127 -
SAAB AB - 124 - 124
Vanguard ETF SeriesAnnual Report 2017
Vanguard FTSE Developed Europe Index ETF
-158-
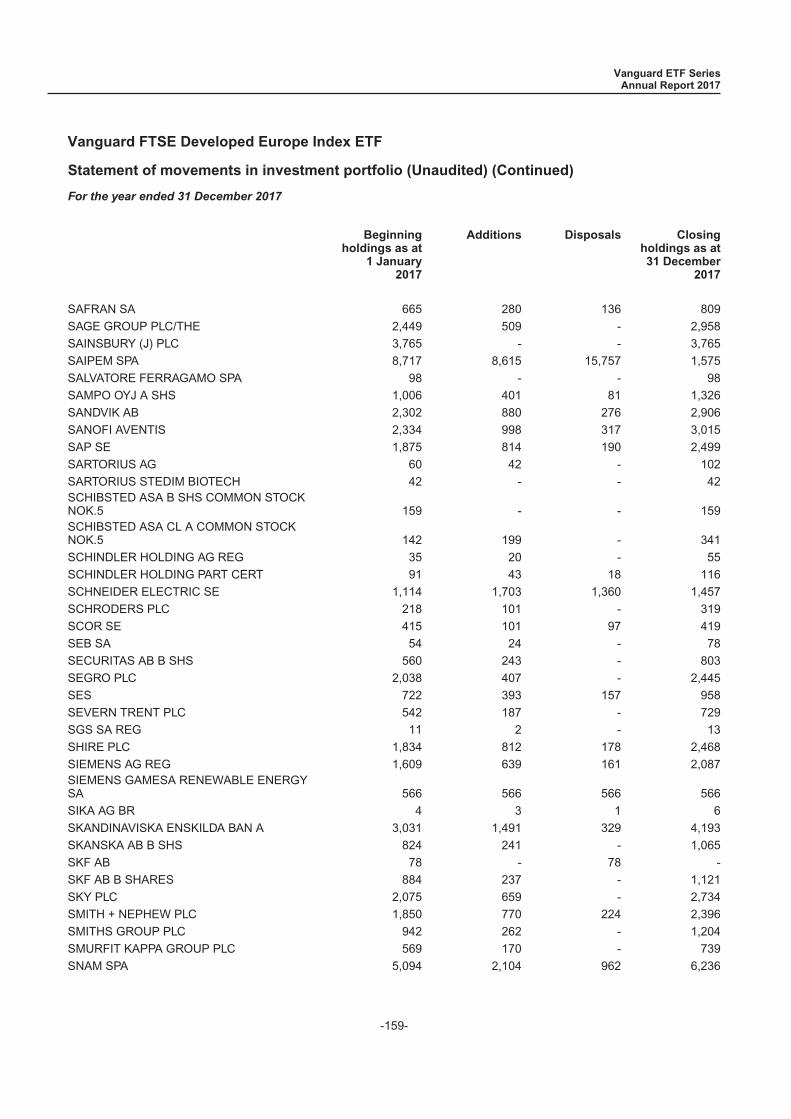
Statement of movements in investment portfolio (Unaudited) (Continued)
For the year ended 31 December 2017
Beginningholdings as at
1 January2017
Additions Disposals Closingholdings as at31 December
2017
SAFRAN SA 665 280 136 809
SAGE GROUP PLC/THE 2,449 509 - 2,958
SAINSBURY (J) PLC 3,765 - - 3,765
SAIPEM SPA 8,717 8,615 15,757 1,575
SALVATORE FERRAGAMO SPA 98 - - 98
SAMPO OYJ A SHS 1,006 401 81 1,326
SANDVIK AB 2,302 880 276 2,906
SANOFI AVENTIS 2,334 998 317 3,015
SAP SE 1,875 814 190 2,499
SARTORIUS AG 60 42 - 102
SARTORIUS STEDIM BIOTECH 42 - - 42SCHIBSTED ASA B SHS COMMON STOCKNOK.5 159 - - 159SCHIBSTED ASA CL A COMMON STOCKNOK.5 142 199 - 341
SCHINDLER HOLDING AG REG 35 20 - 55
SCHINDLER HOLDING PART CERT 91 43 18 116
SCHNEIDER ELECTRIC SE 1,114 1,703 1,360 1,457
SCHRODERS PLC 218 101 - 319
SCOR SE 415 101 97 419
SEB SA 54 24 - 78
SECURITAS AB B SHS 560 243 - 803
SEGRO PLC 2,038 407 - 2,445
SES 722 393 157 958
SEVERN TRENT PLC 542 187 - 729
SGS SA REG 11 2 - 13
SHIRE PLC 1,834 812 178 2,468
SIEMENS AG REG 1,609 639 161 2,087SIEMENS GAMESA RENEWABLE ENERGYSA 566 566 566 566
SIKA AG BR 4 3 1 6
SKANDINAVISKA ENSKILDA BAN A 3,031 1,491 329 4,193
SKANSKA AB B SHS 824 241 - 1,065
SKF AB 78 - 78 -
SKF AB B SHARES 884 237 - 1,121
SKY PLC 2,075 659 - 2,734
SMITH + NEPHEW PLC 1,850 770 224 2,396
SMITHS GROUP PLC 942 262 - 1,204
SMURFIT KAPPA GROUP PLC 569 170 - 739
SNAM SPA 5,094 2,104 962 6,236
Vanguard ETF SeriesAnnual Report 2017
Vanguard FTSE Developed Europe Index ETF
-159-
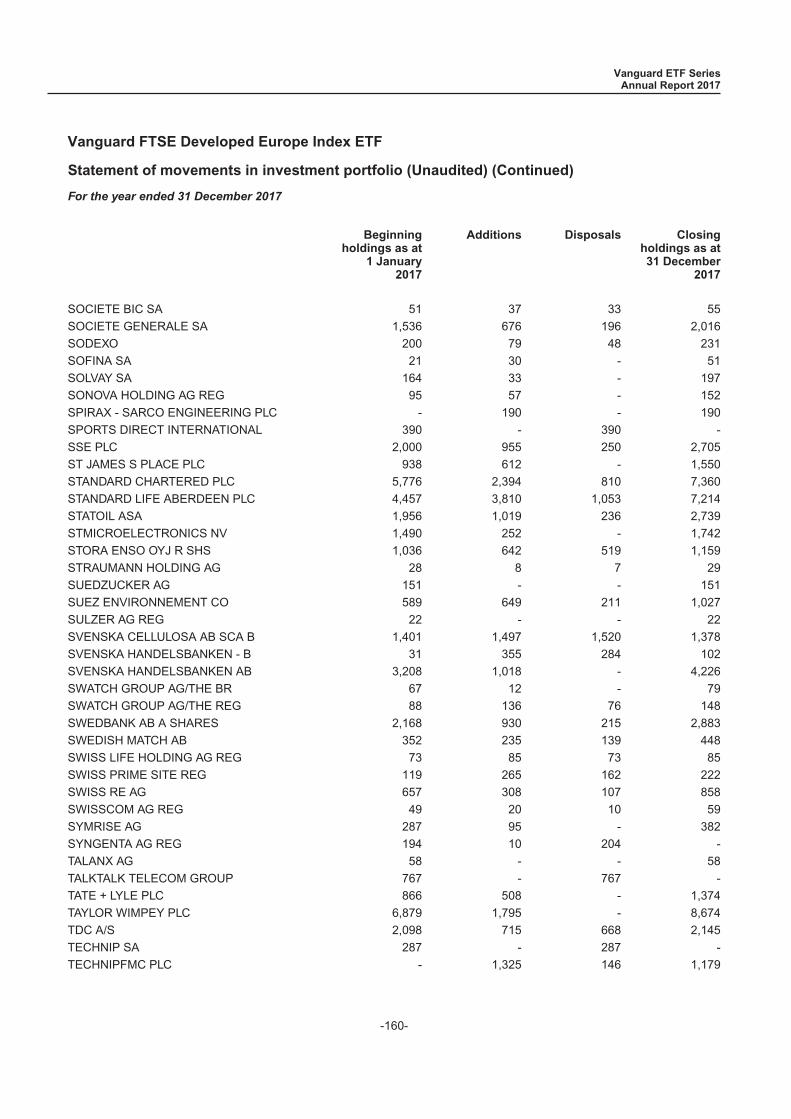
Statement of movements in investment portfolio (Unaudited) (Continued)
For the year ended 31 December 2017
Beginningholdings as at
1 January2017
Additions Disposals Closingholdings as at31 December
2017
SOCIETE BIC SA 51 37 33 55
SOCIETE GENERALE SA 1,536 676 196 2,016
SODEXO 200 79 48 231
SOFINA SA 21 30 - 51
SOLVAY SA 164 33 - 197
SONOVA HOLDING AG REG 95 57 - 152
SPIRAX - SARCO ENGINEERING PLC - 190 - 190
SPORTS DIRECT INTERNATIONAL 390 - 390 -
SSE PLC 2,000 955 250 2,705
ST JAMES S PLACE PLC 938 612 - 1,550
STANDARD CHARTERED PLC 5,776 2,394 810 7,360
STANDARD LIFE ABERDEEN PLC 4,457 3,810 1,053 7,214
STATOIL ASA 1,956 1,019 236 2,739
STMICROELECTRONICS NV 1,490 252 - 1,742
STORA ENSO OYJ R SHS 1,036 642 519 1,159
STRAUMANN HOLDING AG 28 8 7 29
SUEDZUCKER AG 151 - - 151
SUEZ ENVIRONNEMENT CO 589 649 211 1,027
SULZER AG REG 22 - - 22
SVENSKA CELLULOSA AB SCA B 1,401 1,497 1,520 1,378
SVENSKA HANDELSBANKEN - B 31 355 284 102
SVENSKA HANDELSBANKEN AB 3,208 1,018 - 4,226
SWATCH GROUP AG/THE BR 67 12 - 79
SWATCH GROUP AG/THE REG 88 136 76 148
SWEDBANK AB A SHARES 2,168 930 215 2,883
SWEDISH MATCH AB 352 235 139 448
SWISS LIFE HOLDING AG REG 73 85 73 85
SWISS PRIME SITE REG 119 265 162 222
SWISS RE AG 657 308 107 858
SWISSCOM AG REG 49 20 10 59
SYMRISE AG 287 95 - 382
SYNGENTA AG REG 194 10 204 -
TALANX AG 58 - - 58
TALKTALK TELECOM GROUP 767 - 767 -
TATE + LYLE PLC 866 508 - 1,374
TAYLOR WIMPEY PLC 6,879 1,795 - 8,674
TDC A/S 2,098 715 668 2,145
TECHNIP SA 287 - 287 -
TECHNIPFMC PLC - 1,325 146 1,179
Vanguard ETF SeriesAnnual Report 2017
Vanguard FTSE Developed Europe Index ETF
-160-

Statement of movements in investment portfolio (Unaudited) (Continued)
For the year ended 31 December 2017
Beginningholdings as at
1 January2017
Additions Disposals Closingholdings as at31 December
2017
TELE2 AB B SHS 699 392 - 1,091
TELECOM ITALIA RSP 15,947 6,644 6,547 16,044
TELECOM ITALIA SPA 20,502 15,254 - 35,756
TELEFONICA DEUTSCHLAND HOLDI 1,104 742 - 1,846
TELEFONICA SA 8,547 4,812 1,087 12,272
TELEKOM AUSTRIA AG 220 220 220 220
TELENET GROUP HOLDING NV 101 75 - 176
TELENOR ASA 1,574 233 - 1,807
TELEPERFORMANCE 100 40 - 140
TELIASONERA AB 5,669 2,092 1,154 6,607
TEMENOS GROUP AG - 294 147 147
TENARIS SA 1,188 339 261 1,266
TERNA SPA 3,210 803 - 4,013
TESCO PLC 16,186 7,686 2,071 21,801
THALES SA 236 85 45 276
THYSSENKRUPP AG 928 541 - 1,469
TOTAL SA 4,495 2,029 444 6,080
TP ICAP PLC 446 - 446 -
TRAVIS PERKINS PLC 573 - - 573
TRELLEBORG AB B SHS 464 418 167 715
TRYG A/S 200 211 - 411
TUI AG 821 567 271 1,117
UBI BANCA SCPA 1,525 1,225 - 2,750
UBISOFT ENTERTAINMENT SA - 245 - 245
UBS GROUP AG 7,191 11,256 8,798 9,649
UCB SA 287 71 - 358
UMICORE 225 - 225 -
UMICORE SA - 450 - 450
UNIBAIL RODAMCO SE 208 98 26 280
UNICREDIT SPA 11,833 6,656 12,334 6,155
UNILEVER NV CVA 3,278 1,443 490 4,231
UNILEVER PLC 2,468 1,096 438 3,126
UNIPER SE 372 211 - 583
UNIPOLSAI SPA 1,968 - - 1,968
UNITED INTERNET AG REG SHARE 222 192 87 327
UNITED UTILITIES GROUP PLC 1,528 385 - 1,913
UPM KYMMENE OYJ 1,147 497 163 1,481
VALEO SA 508 221 70 659
VEOLIA ENVIRONNEMENT 988 606 183 1,411
Vanguard ETF SeriesAnnual Report 2017
Vanguard FTSE Developed Europe Index ETF
-161-
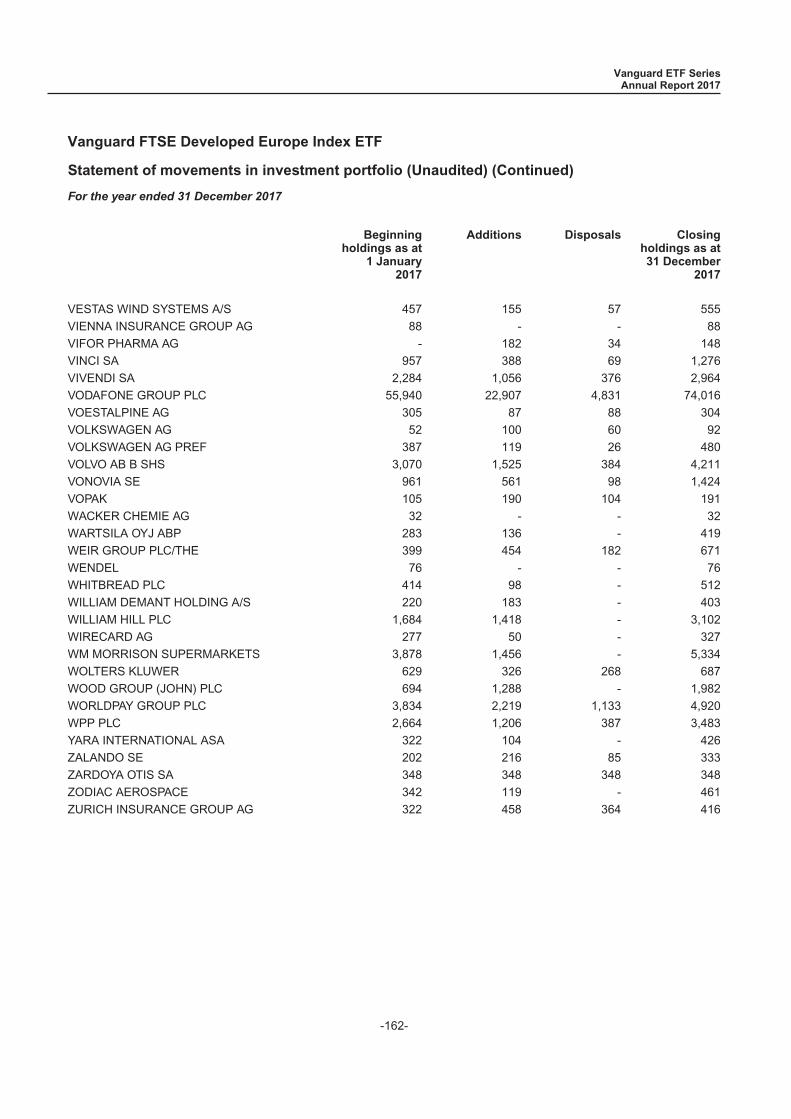
Statement of movements in investment portfolio (Unaudited) (Continued)
For the year ended 31 December 2017
Beginningholdings as at
1 January2017
Additions Disposals Closingholdings as at31 December
2017
VESTAS WIND SYSTEMS A/S 457 155 57 555
VIENNA INSURANCE GROUP AG 88 - - 88
VIFOR PHARMA AG - 182 34 148
VINCI SA 957 388 69 1,276
VIVENDI SA 2,284 1,056 376 2,964
VODAFONE GROUP PLC 55,940 22,907 4,831 74,016
VOESTALPINE AG 305 87 88 304
VOLKSWAGEN AG 52 100 60 92
VOLKSWAGEN AG PREF 387 119 26 480
VOLVO AB B SHS 3,070 1,525 384 4,211
VONOVIA SE 961 561 98 1,424
VOPAK 105 190 104 191
WACKER CHEMIE AG 32 - - 32
WARTSILA OYJ ABP 283 136 - 419
WEIR GROUP PLC/THE 399 454 182 671
WENDEL 76 - - 76
WHITBREAD PLC 414 98 - 512
WILLIAM DEMANT HOLDING A/S 220 183 - 403
WILLIAM HILL PLC 1,684 1,418 - 3,102
WIRECARD AG 277 50 - 327
WM MORRISON SUPERMARKETS 3,878 1,456 - 5,334
WOLTERS KLUWER 629 326 268 687
WOOD GROUP (JOHN) PLC 694 1,288 - 1,982
WORLDPAY GROUP PLC 3,834 2,219 1,133 4,920
WPP PLC 2,664 1,206 387 3,483
YARA INTERNATIONAL ASA 322 104 - 426
ZALANDO SE 202 216 85 333
ZARDOYA OTIS SA 348 348 348 348
ZODIAC AEROSPACE 342 119 - 461
ZURICH INSURANCE GROUP AG 322 458 364 416
Vanguard ETF SeriesAnnual Report 2017
Vanguard FTSE Developed Europe Index ETF
-162-

Performance record (Unaudited)
As at 31 December 2017
Net asset value
Net assetvalue of the
Sub-FundHK$
Net assetvalue per
unitHK$
At the end of financial year dated
31 December 2017 211,472,303 19.95
31 December 2016 127,883,612 16.19
31 December 2015 105,105,059 16.68
Highest netasset value per
unitHK$
Lowest netasset value per
unitHK$
Financial year ended
31 December 2017 19.95 16.08
31 December 2016 16.86 14.54
31 December 2015 19.35 16.03
31 December 2014 (since inception) 20.10 16.80
Performance of the Sub-Fund
During the year ended 31 December 2017, the FTSE Developed Europe Index increased by 26.83%, while the net asset valueper unit of the Sub-Fund increased by 26.79%.
Ongoing charges
Financial year ended
31 December 2017 0.18%*
*The ongoing charges figure is the sum of the actual expenses charged to the Sub-Fund in a financial year. The figure isexpressed as a percentage of the Sub-Fund’s average Net Asset Value. It equals the Management Fee as set out in the section“Ongoing fees payable by the Sub-Fund” in the product key facts statement of the Sub-Fund and includes, the ongoing feespayable out of the Sub-Fund, the Manager’s Fee, the operational fees, all costs and expenses connected with the managementand operating activities of the Sub-Fund, investment management and advisory fees, administration, registration, transferagency, listing agent, registrar, custody and trustee fees, and other operating expenses. The ongoing charges figure does notcover (to the extent not included in the operational fees) any fees, costs and expenses payable by investors on the creation orredemption of units, such as the fees to participating dealers, brokerage fees, transaction fees, stamp duty or other duties andcharges, or any extraordinary or exceptional costs and expenses as may arise from time to time and any tax liabilities in respectof the Sub-Fund which will be paid separately out of the fund assets of the Sub-Fund.
Vanguard ETF SeriesAnnual Report 2017
Vanguard FTSE Developed Europe Index ETF
-163-

Investment portfolio (Unaudited)
As at 31 December 2017
Holding at31 December
2017
Fair value at31 December
2017
Percentage oftotal net assets at
31 December2017
HK$ (%)
Japan 98.70%
77 BANK LTD 246 48,584 0.05
ABC MART INC 76 34,123 0.03
ACOM CO LTD 1,337 44,071 0.04
ADASTRIA CO LTD 100 15,815 0.01
ADVANTEST CORP 567 82,274 0.08
AEON CO LTD 2,291 302,465 0.29
AEON FINANCIAL SERVICE CO LT 370 67,374 0.06
AEON MALL CO LTD 431 65,920 0.06
AICA KOGYO CO LTD 157 45,595 0.04
AIFUL CORP 958 25,728 0.02
AIN PHARMACIEZ INC 124 57,911 0.05
AIR WATER INC 541 89,276 0.08
AISIN SEIKI CO LTD 588 258,289 0.25
AJINOMOTO CO INC 1,674 246,389 0.23
ALFRESA HOLDINGS CORP 545 100,110 0.10
ALPS ELECTRIC CO LTD 658 147,030 0.14
AMADA CO LTD 1,107 117,842 0.11
ANA HOLDINGS INC 391 127,689 0.12
AOYAMA TRADING CO LTD 181 52,879 0.05
AOZORA BANK LTD 379 115,328 0.11
APLUS FINANCIAL CO LTD 2,000 15,267 0.01
ARIAKE JAPAN CO LTD 51 34,046 0.03
ASAHI GLASS CO LTD 679 229,940 0.22
ASAHI GROUP HOLDINGS LTD 1,312 508,945 0.48
ASAHI INTECC CO LTD 352 94,776 0.09
ASAHI KASEI CORP 4,158 419,397 0.40
ASICS CORP 622 77,522 0.07
ASKUL CORP 100 22,172 0.02
ASTELLAS PHARMA INC 6,757 673,808 0.64
AUTOBACS SEVEN CO LTD 177 26,556 0.03
AWA BANK LTD 754 37,621 0.04
AZBIL CORP 235 79,745 0.08
BANDAI NAMCO HOLDINGS INC 647 165,450 0.16
BANK OF KYOTO LTD 243 98,985 0.09
BENESSE HOLDINGS INC 263 72,547 0.07
BIC CAMERA INC 598 67,434 0.06
BRIDGESTONE CORP 2,121 770,960 0.73
Vanguard ETF SeriesAnnual Report 2017
Vanguard FTSE Japan Index ETF
-164-

Investment portfolio (Unaudited) (Continued)
As at 31 December 2017
Holding at31 December
2017
Fair value at31 December
2017
Percentage oftotal net assets at
31 December2017
HK$ (%)
Japan 98.70%
BROTHER INDUSTRIES LTD 790 152,404 0.14
CALBEE INC 247 62,820 0.06
CANON INC 3,473 1,012,231 0.96
CANON MARKETING JAPAN INC 177 37,401 0.04
CAPCOM CO LTD 170 42,175 0.04
CASIO COMPUTER CO LTD 668 75,142 0.07
CENTRAL JAPAN RAILWAY CO 613 858,435 0.82
CENTURY TOKYO LEASING CORP 158 59,975 0.06
CHIBA BANK LTD 2,115 137,670 0.13
CHIYODA CORP 582 33,522 0.03
CHUBU ELECTRIC POWER CO INC 2,360 229,362 0.22
CHUGAI PHARMACEUTICAL CO LTD 719 287,892 0.27
CHUGOKU BANK LTD 536 56,054 0.05
CHUGOKU ELECTRIC POWER CO 921 77,398 0.07
CITIZEN HOLDINGS CO LTD 748 42,927 0.04
COCA-COLA BOTTLERS JAPAN HOLDINGS INC 409 116,794 0.11
COLOPL INC 200 16,988 0.02
COMSYS HOLDINGS CORP 389 88,137 0.08
CONCORDIA FINANCIAL GROUP LTD 3,925 185,214 0.18
COSMO ENERGY HOLDINGS CO LTD 218 64,370 0.06
COSMOS PHARMACEUTICAL CORP 29 47,353 0.04
CREDIT SAISON CO LTD 492 69,991 0.07
CYBERAGENT INC 299 91,296 0.09
DAI ICHI LIFE INSURANCE 3,873 624,610 0.59
DAI NIPPON PRINTING CO LTD 1,039 181,190 0.17
DAICEL CORP 924 82,203 0.08
DAIDO STEEL CO LTD 118 56,829 0.05
DAIFUKU CO LTD 327 139,329 0.13
DAIICHI SANKYO CO LTD 2,247 457,965 0.44
DAIICHIKOSHO CO LTD 136 53,040 0.05
DAIKIN INDUSTRIES LTD 907 839,317 0.80
DAIKYO INC 68 10,306 0.01
DAISHI BANK LTD 115 40,939 0.04
DAITO TRUST CONSTRUCT CO LTD 241 384,236 0.37
DAIWA HOUSE INDUSTRY CO LTD 2,206 662,396 0.63
DAIWA SECURITIES GROUP INC 5,623 275,836 0.26
DENA CO LTD 368 59,323 0.06
Vanguard ETF SeriesAnnual Report 2017
Vanguard FTSE Japan Index ETF
-165-

Investment portfolio (Unaudited) (Continued)
As at 31 December 2017
Holding at31 December
2017
Fair value at31 December
2017
Percentage oftotal net assets at
31 December2017
HK$ (%)
Japan 98.70%
DENKI KAGAKU KOGYO K K 307 96,188 0.09
DENSO CORP 1,650 774,371 0.74
DENTSU INC 735 243,549 0.23
DIC CORP 264 78,044 0.07
DISCO CORP 97 168,753 0.16
DMG MORI SEIKI CO LTD 392 63,409 0.06
DON QUIJOTE HOLDINGS CO LTD 400 163,494 0.16
DOWA HOLDINGS CO LTD 159 50,755 0.05
EAST JAPAN RAILWAY CO 1,257 959,083 0.91
EBARA CORP 369 109,980 0.10
EISAI CO LTD 879 391,362 0.37
ELECTRIC POWER DEVELOPMENT C 581 122,366 0.12
EXEDY CORP 99 23,942 0.02
EZAKI GLICO CO LTD 186 72,540 0.07
FAMILYMART CO LTD 269 147,470 0.14
FANUC CORP 656 1,231,848 1.17
FAST RETAILING CO LTD 176 548,506 0.52
FP CORP 83 34,846 0.03
FUJI ELECTRIC CO LTD 1,996 117,596 0.11
FUJI HEAVY INDUSTRIES LTD 2,033 505,487 0.48
FUJI MEDIA HOLDINGS INC 207 25,454 0.02
FUJI OIL HOLDINGS INC 138 31,554 0.03
FUJIFILM HOLDINGS CORP 1,307 417,668 0.40
FUJIKURA LTD 826 56,976 0.05
FUJITSU GENERAL LTD 213 36,568 0.03
FUJITSU LTD 6,435 358,449 0.34
FUKUOKA FINANCIAL GROUP INC 2,297 100,900 0.10
FUKUYAMA TRANSPORTING CO LTD 119 35,179 0.03
FURUKAWA ELECTRIC CO LTD 184 70,993 0.07
GLORY LTD 197 58,169 0.06
GMO PAYMENT GATEWAY INC 44 28,457 0.03
GREE INC 310 15,231 0.01
GS YUASA CORP 1,299 50,571 0.05
GUNGHO ONLINE ENTERTAINMENT INC 1,400 30,117 0.03
GUNMA BANK LTD 1,568 74,209 0.07
H I S CO LTD 122 34,584 0.03
H2O RETAILING CORP 300 49,111 0.05
Vanguard ETF SeriesAnnual Report 2017
Vanguard FTSE Japan Index ETF
-166-

Investment portfolio (Unaudited) (Continued)
As at 31 December 2017
Holding at31 December
2017
Fair value at31 December
2017
Percentage oftotal net assets at
31 December2017
HK$ (%)
Japan 98.70%
HACHIJUNI BANK LTD 1,196 53,698 0.05
HAKUHODO DY HOLDINGS INC 724 73,504 0.07
HAMAMATSU PHOTONICS KK 406 106,780 0.10
HANKYU HANSHIN HOLDINGS INC 799 251,172 0.24
HASEKO CORP 979 118,958 0.11
HEIWA CORP 124 18,208 0.02
HIKARI TSUSHIN INC 76 85,439 0.08
HINO MOTORS LTD 977 98,986 0.09
HIROSE ELECTRIC CO LTD 99 113,150 0.11
HIROSHIMA BANK LTD 978 66,578 0.06
HISAMITSU PHARMACEUTICAL CO 224 106,168 0.10
HITACHI CAPITAL CORP 155 30,494 0.03
HITACHI CHEMICAL CO LTD 348 69,888 0.07
HITACHI CONSTRUCTION MACHINE 336 95,481 0.09
HITACHI HIGH TECHNOLOGIES CO 216 71,199 0.07
HITACHI KOKUSAI ELECTRIC INC 100 21,582 0.02
HITACHI LTD 15,619 951,533 0.90
HITACHI METALS LTD 640 71,859 0.07
HITACHI TRANSPORT SYSTEM LTD 145 29,553 0.03
HOKKAIDO ELECTRIC POWER CO 620 31,924 0.03
HOKUHOKU FINANCIAL GROUP INC 451 55,145 0.05
HOKURIKU ELECTRIC POWER CO 480 30,212 0.03
HONDA MOTOR CO LTD 6,028 1,615,515 1.54
HORIBA LTD 137 64,553 0.06
HOSHIZAKI ELECTRIC CO LTD 166 115,080 0.11
HOUSE FOODS GROUP INC 257 66,701 0.06
HOYA CORP 1,239 483,895 0.46
HULIC CO LTD 1,228 107,884 0.10
IBIDEN CO LTD 388 45,423 0.04
ICHIGO INC 800 23,705 0.02
IDEMITSU KOSAN CO LTD 510 160,145 0.15
IHI CORP 412 107,215 0.10
IIDA GROUP HOLDINGS CO LTD 412 60,755 0.06
INPEX CORP 3,030 296,264 0.28
ISETAN MITSUKOSHI HOLDINGS L 1,088 105,475 0.10
ISUZU MOTORS LTD 1,907 249,717 0.24
IT HOLDINGS CORP 300 81,920 0.08
Vanguard ETF SeriesAnnual Report 2017
Vanguard FTSE Japan Index ETF
-167-
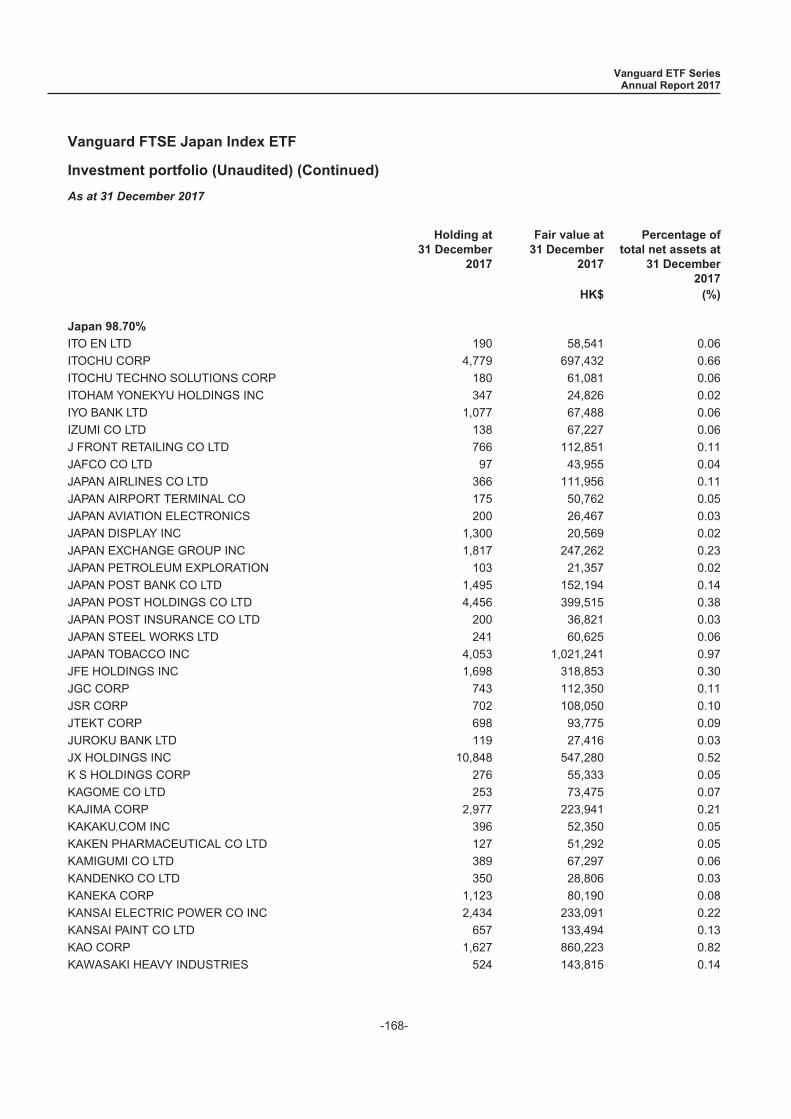
Investment portfolio (Unaudited) (Continued)
As at 31 December 2017
Holding at31 December
2017
Fair value at31 December
2017
Percentage oftotal net assets at
31 December2017
HK$ (%)
Japan 98.70%
ITO EN LTD 190 58,541 0.06
ITOCHU CORP 4,779 697,432 0.66
ITOCHU TECHNO SOLUTIONS CORP 180 61,081 0.06
ITOHAM YONEKYU HOLDINGS INC 347 24,826 0.02
IYO BANK LTD 1,077 67,488 0.06
IZUMI CO LTD 138 67,227 0.06
J FRONT RETAILING CO LTD 766 112,851 0.11
JAFCO CO LTD 97 43,955 0.04
JAPAN AIRLINES CO LTD 366 111,956 0.11
JAPAN AIRPORT TERMINAL CO 175 50,762 0.05
JAPAN AVIATION ELECTRONICS 200 26,467 0.03
JAPAN DISPLAY INC 1,300 20,569 0.02
JAPAN EXCHANGE GROUP INC 1,817 247,262 0.23
JAPAN PETROLEUM EXPLORATION 103 21,357 0.02
JAPAN POST BANK CO LTD 1,495 152,194 0.14
JAPAN POST HOLDINGS CO LTD 4,456 399,515 0.38
JAPAN POST INSURANCE CO LTD 200 36,821 0.03
JAPAN STEEL WORKS LTD 241 60,625 0.06
JAPAN TOBACCO INC 4,053 1,021,241 0.97
JFE HOLDINGS INC 1,698 318,853 0.30
JGC CORP 743 112,350 0.11
JSR CORP 702 108,050 0.10
JTEKT CORP 698 93,775 0.09
JUROKU BANK LTD 119 27,416 0.03
JX HOLDINGS INC 10,848 547,280 0.52
K S HOLDINGS CORP 276 55,333 0.05
KAGOME CO LTD 253 73,475 0.07
KAJIMA CORP 2,977 223,941 0.21
KAKAKU.COM INC 396 52,350 0.05
KAKEN PHARMACEUTICAL CO LTD 127 51,292 0.05
KAMIGUMI CO LTD 389 67,297 0.06
KANDENKO CO LTD 350 28,806 0.03
KANEKA CORP 1,123 80,190 0.08
KANSAI ELECTRIC POWER CO INC 2,434 233,091 0.22
KANSAI PAINT CO LTD 657 133,494 0.13
KAO CORP 1,627 860,223 0.82
KAWASAKI HEAVY INDUSTRIES 524 143,815 0.14
Vanguard ETF SeriesAnnual Report 2017
Vanguard FTSE Japan Index ETF
-168-
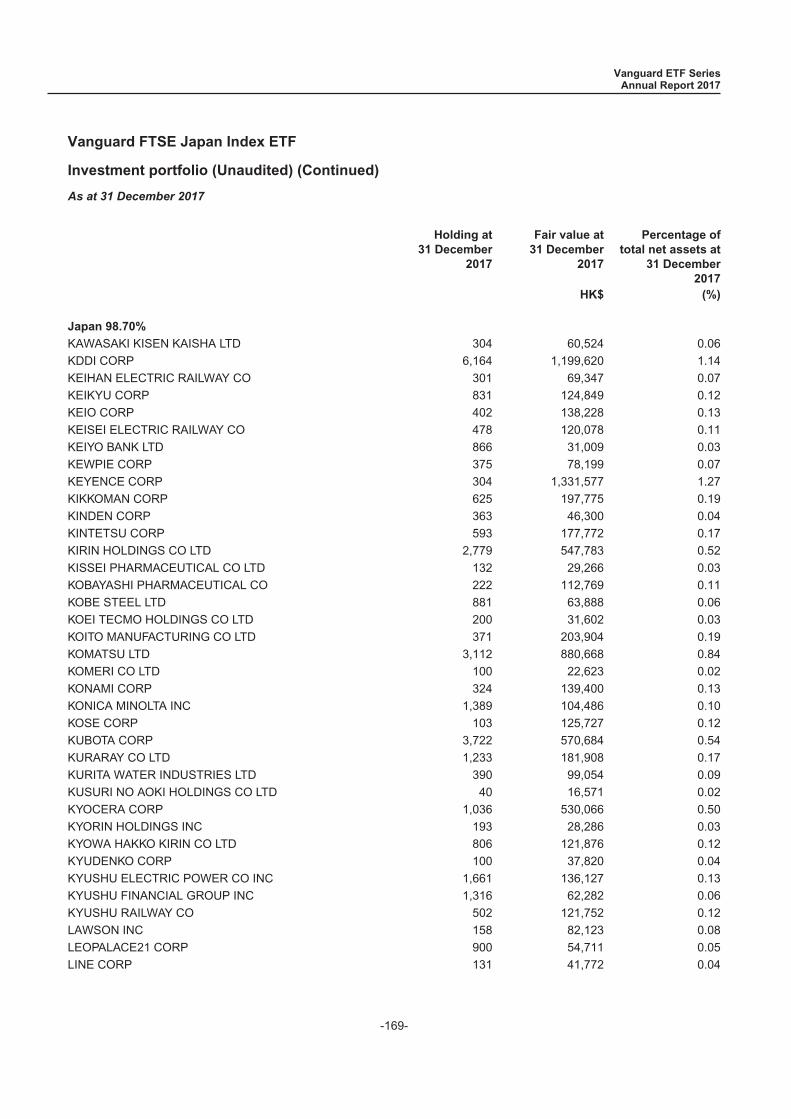
Investment portfolio (Unaudited) (Continued)
As at 31 December 2017
Holding at31 December
2017
Fair value at31 December
2017
Percentage oftotal net assets at
31 December2017
HK$ (%)
Japan 98.70%
KAWASAKI KISEN KAISHA LTD 304 60,524 0.06
KDDI CORP 6,164 1,199,620 1.14
KEIHAN ELECTRIC RAILWAY CO 301 69,347 0.07
KEIKYU CORP 831 124,849 0.12
KEIO CORP 402 138,228 0.13
KEISEI ELECTRIC RAILWAY CO 478 120,078 0.11
KEIYO BANK LTD 866 31,009 0.03
KEWPIE CORP 375 78,199 0.07
KEYENCE CORP 304 1,331,577 1.27
KIKKOMAN CORP 625 197,775 0.19
KINDEN CORP 363 46,300 0.04
KINTETSU CORP 593 177,772 0.17
KIRIN HOLDINGS CO LTD 2,779 547,783 0.52
KISSEI PHARMACEUTICAL CO LTD 132 29,266 0.03
KOBAYASHI PHARMACEUTICAL CO 222 112,769 0.11
KOBE STEEL LTD 881 63,888 0.06
KOEI TECMO HOLDINGS CO LTD 200 31,602 0.03
KOITO MANUFACTURING CO LTD 371 203,904 0.19
KOMATSU LTD 3,112 880,668 0.84
KOMERI CO LTD 100 22,623 0.02
KONAMI CORP 324 139,400 0.13
KONICA MINOLTA INC 1,389 104,486 0.10
KOSE CORP 103 125,727 0.12
KUBOTA CORP 3,722 570,684 0.54
KURARAY CO LTD 1,233 181,908 0.17
KURITA WATER INDUSTRIES LTD 390 99,054 0.09
KUSURI NO AOKI HOLDINGS CO LTD 40 16,571 0.02
KYOCERA CORP 1,036 530,066 0.50
KYORIN HOLDINGS INC 193 28,286 0.03
KYOWA HAKKO KIRIN CO LTD 806 121,876 0.12
KYUDENKO CORP 100 37,820 0.04
KYUSHU ELECTRIC POWER CO INC 1,661 136,127 0.13
KYUSHU FINANCIAL GROUP INC 1,316 62,282 0.06
KYUSHU RAILWAY CO 502 121,752 0.12
LAWSON INC 158 82,123 0.08
LEOPALACE21 CORP 900 54,711 0.05
LINE CORP 131 41,772 0.04
Vanguard ETF SeriesAnnual Report 2017
Vanguard FTSE Japan Index ETF
-169-

Investment portfolio (Unaudited) (Continued)
As at 31 December 2017
Holding at31 December
2017
Fair value at31 December
2017
Percentage oftotal net assets at
31 December2017
HK$ (%)
Japan 98.70%
LINTEC CORP 177 38,630 0.04
LION CORP 871 129,045 0.12
LIXIL GROUP CORP 841 178,001 0.17
M3 INC 681 187,377 0.18
MABUCHI MOTOR CO LTD 150 63,600 0.06
MAEDA CORP 426 45,939 0.04
MAEDA ROAD CONSTRUCTION CO 210 37,671 0.04
MAKITA CORP 810 266,153 0.25
MARUBENI CORP 5,171 292,849 0.28
MARUI GROUP CO LTD 710 101,644 0.10
MARUICHI STEEL TUBE LTD 223 51,067 0.05
MATSUI SECURITIES CO LTD 361 23,824 0.02
MATSUMOTOKIYOSHI HOLDINGS CO 266 85,650 0.08
MAZDA MOTOR CORP 1,873 196,459 0.19
MEBUKI FINANCIAL GROUP INC 3,500 115,854 0.11
MEDIPAL HOLDINGS CORP 504 77,190 0.07
MEGMILK SNOW BRAND CO LTD 105 24,300 0.02
MEIJI HOLDINGS CO LTD 454 302,134 0.29
MINEBEA CO LTD 1,456 238,754 0.23
MIRACA HOLDINGS INC 195 65,292 0.06
MISUMI GROUP INC 953 216,916 0.21
MITSUBISHI CHEMICAL HOLDINGS 4,354 373,601 0.35
MITSUBISHI CORP 4,364 942,735 0.90
MITSUBISHI ELECTRIC CORP 6,708 871,181 0.83
MITSUBISHI ESTATE CO LTD 4,051 550,990 0.52
MITSUBISHI GAS CHEMICAL CO 656 147,266 0.14
MITSUBISHI HEAVY INDUSTRIES 961 280,757 0.27
MITSUBISHI LOGISTICS CORP 247 50,136 0.05
MITSUBISHI MATERIALS CORP 410 114,092 0.11
MITSUBISHI MOTORS CORP 2,289 129,299 0.12
MITSUBISHI SHOKUHIN CO LTD 49 11,238 0.01
MITSUBISHI TANABE PHARMA 719 116,354 0.11
MITSUBISHI UFJ FINANCIAL GRO 43,439 2,491,126 2.37
MITSUBISHI UFJ LEASE + FINAN 1,389 64,677 0.06
MITSUI + CO LTD 5,679 721,976 0.69
MITSUI CHEMICALS INC 622 156,467 0.15
MITSUI ENGINEER + SHIPBUILD 253 29,636 0.03
Vanguard ETF SeriesAnnual Report 2017
Vanguard FTSE Japan Index ETF
-170-

Investment portfolio (Unaudited) (Continued)
As at 31 December 2017
Holding at31 December
2017
Fair value at31 December
2017
Percentage oftotal net assets at
31 December2017
HK$ (%)
Japan 98.70%
MITSUI FUDOSAN CO LTD 3,134 549,144 0.52
MITSUI MINING & SMELTING CO LTD 176 80,487 0.08
MITSUI OSK LINES LTD 374 97,585 0.09
MIURA CO LTD 284 59,715 0.06
MIZUHO FINANCIAL GROUP INC 85,892 1,219,506 1.16
MOCHIDA PHARMACEUTICAL CO 52 31,142 0.03
MONOTARO CO LTD 200 49,964 0.05
MORINAGA & CO LTD/JAPAN 136 53,889 0.05
MS+AD INSURANCE GROUP HOLDIN 1,691 447,559 0.43
MURATA MANUFACTURING CO LTD 648 679,912 0.65
NABTESCO CORP 400 119,914 0.11
NAGASE + CO LTD 407 57,391 0.05
NAGOYA RAILROAD CO LTD 595 117,139 0.11
NANKAI ELECTRIC RAILWAY CO 412 79,825 0.08
NEC CORP 865 182,480 0.17
NEXON CO LTD 648 147,494 0.14
NGK INSULATORS LTD 952 140,583 0.13
NGK SPARK PLUG CO LTD 611 116,134 0.11
NH FOODS LTD 638 121,664 0.12
NHK SPRING CO LTD 449 38,636 0.04
NICHIREI CORP 369 79,765 0.08
NIDEC CORP 801 878,800 0.84
NIFCO INC/JAPAN 145 77,378 0.07
NIHON KOHDEN CORP 303 54,984 0.05
NIHON M&A CENTER INC 200 74,530 0.07
NIKON CORP 1,115 175,641 0.17
NINTENDO CO LTD 363 1,037,586 0.99
NIPPO CORP 171 31,292 0.03
NIPPON ELECTRIC GLASS CO LTD 276 82,358 0.08
NIPPON EXPRESS CO LTD 245 127,343 0.12
NIPPON KAYAKU CO LTD 592 68,688 0.07
NIPPON PAINT HOLDINGS CO LTD 507 125,428 0.12
NIPPON PAPER INDUSTRIES CO L 354 52,620 0.05
NIPPON SHINYAKU CO LTD 167 97,463 0.09
NIPPON SHOKUBAI CO LTD 108 57,034 0.05
NIPPON STEEL + SUMITOMO META 2,596 520,809 0.49
NIPPON TELEGRAPH + TELEPHONE 2,285 840,562 0.80
Vanguard ETF SeriesAnnual Report 2017
Vanguard FTSE Japan Index ETF
-171-
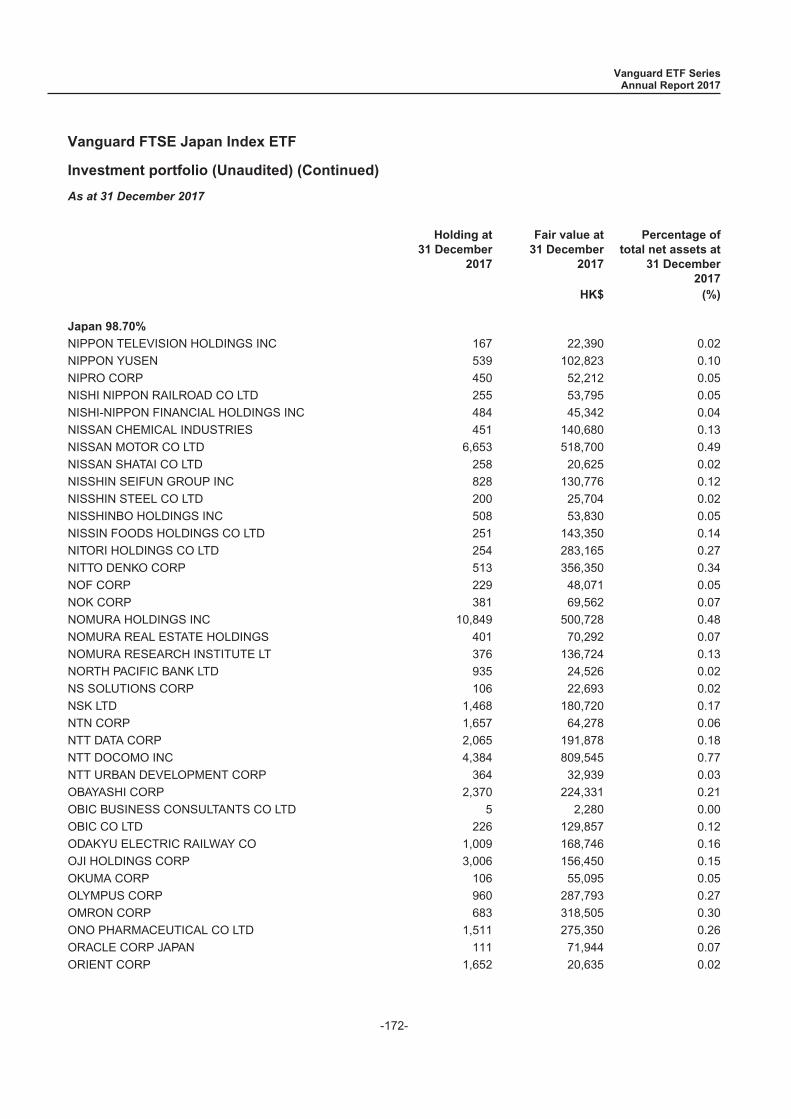
Investment portfolio (Unaudited) (Continued)
As at 31 December 2017
Holding at31 December
2017
Fair value at31 December
2017
Percentage oftotal net assets at
31 December2017
HK$ (%)
Japan 98.70%
NIPPON TELEVISION HOLDINGS INC 167 22,390 0.02
NIPPON YUSEN 539 102,823 0.10
NIPRO CORP 450 52,212 0.05
NISHI NIPPON RAILROAD CO LTD 255 53,795 0.05
NISHI-NIPPON FINANCIAL HOLDINGS INC 484 45,342 0.04
NISSAN CHEMICAL INDUSTRIES 451 140,680 0.13
NISSAN MOTOR CO LTD 6,653 518,700 0.49
NISSAN SHATAI CO LTD 258 20,625 0.02
NISSHIN SEIFUN GROUP INC 828 130,776 0.12
NISSHIN STEEL CO LTD 200 25,704 0.02
NISSHINBO HOLDINGS INC 508 53,830 0.05
NISSIN FOODS HOLDINGS CO LTD 251 143,350 0.14
NITORI HOLDINGS CO LTD 254 283,165 0.27
NITTO DENKO CORP 513 356,350 0.34
NOF CORP 229 48,071 0.05
NOK CORP 381 69,562 0.07
NOMURA HOLDINGS INC 10,849 500,728 0.48
NOMURA REAL ESTATE HOLDINGS 401 70,292 0.07
NOMURA RESEARCH INSTITUTE LT 376 136,724 0.13
NORTH PACIFIC BANK LTD 935 24,526 0.02
NS SOLUTIONS CORP 106 22,693 0.02
NSK LTD 1,468 180,720 0.17
NTN CORP 1,657 64,278 0.06
NTT DATA CORP 2,065 191,878 0.18
NTT DOCOMO INC 4,384 809,545 0.77
NTT URBAN DEVELOPMENT CORP 364 32,939 0.03
OBAYASHI CORP 2,370 224,331 0.21
OBIC BUSINESS CONSULTANTS CO LTD 5 2,280 0.00
OBIC CO LTD 226 129,857 0.12
ODAKYU ELECTRIC RAILWAY CO 1,009 168,746 0.16
OJI HOLDINGS CORP 3,006 156,450 0.15
OKUMA CORP 106 55,095 0.05
OLYMPUS CORP 960 287,793 0.27
OMRON CORP 683 318,505 0.30
ONO PHARMACEUTICAL CO LTD 1,511 275,350 0.26
ORACLE CORP JAPAN 111 71,944 0.07
ORIENT CORP 1,652 20,635 0.02
Vanguard ETF SeriesAnnual Report 2017
Vanguard FTSE Japan Index ETF
-172-
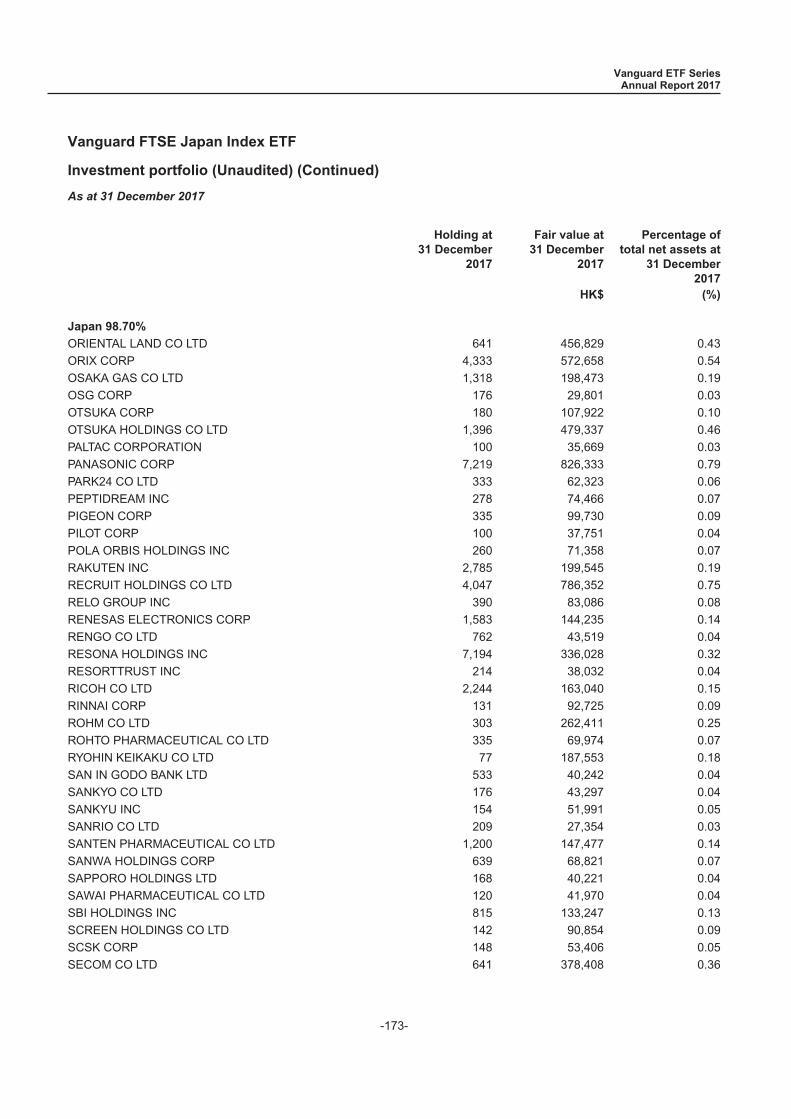
Investment portfolio (Unaudited) (Continued)
As at 31 December 2017
Holding at31 December
2017
Fair value at31 December
2017
Percentage oftotal net assets at
31 December2017
HK$ (%)
Japan 98.70%
ORIENTAL LAND CO LTD 641 456,829 0.43
ORIX CORP 4,333 572,658 0.54
OSAKA GAS CO LTD 1,318 198,473 0.19
OSG CORP 176 29,801 0.03
OTSUKA CORP 180 107,922 0.10
OTSUKA HOLDINGS CO LTD 1,396 479,337 0.46
PALTAC CORPORATION 100 35,669 0.03
PANASONIC CORP 7,219 826,333 0.79
PARK24 CO LTD 333 62,323 0.06
PEPTIDREAM INC 278 74,466 0.07
PIGEON CORP 335 99,730 0.09
PILOT CORP 100 37,751 0.04
POLA ORBIS HOLDINGS INC 260 71,358 0.07
RAKUTEN INC 2,785 199,545 0.19
RECRUIT HOLDINGS CO LTD 4,047 786,352 0.75
RELO GROUP INC 390 83,086 0.08
RENESAS ELECTRONICS CORP 1,583 144,235 0.14
RENGO CO LTD 762 43,519 0.04
RESONA HOLDINGS INC 7,194 336,028 0.32
RESORTTRUST INC 214 38,032 0.04
RICOH CO LTD 2,244 163,040 0.15
RINNAI CORP 131 92,725 0.09
ROHM CO LTD 303 262,411 0.25
ROHTO PHARMACEUTICAL CO LTD 335 69,974 0.07
RYOHIN KEIKAKU CO LTD 77 187,553 0.18
SAN IN GODO BANK LTD 533 40,242 0.04
SANKYO CO LTD 176 43,297 0.04
SANKYU INC 154 51,991 0.05
SANRIO CO LTD 209 27,354 0.03
SANTEN PHARMACEUTICAL CO LTD 1,200 147,477 0.14
SANWA HOLDINGS CORP 639 68,821 0.07
SAPPORO HOLDINGS LTD 168 40,221 0.04
SAWAI PHARMACEUTICAL CO LTD 120 41,970 0.04
SBI HOLDINGS INC 815 133,247 0.13
SCREEN HOLDINGS CO LTD 142 90,854 0.09
SCSK CORP 148 53,406 0.05
SECOM CO LTD 641 378,408 0.36
Vanguard ETF SeriesAnnual Report 2017
Vanguard FTSE Japan Index ETF
-173-

Investment portfolio (Unaudited) (Continued)
As at 31 December 2017
Holding at31 December
2017
Fair value at31 December
2017
Percentage oftotal net assets at
31 December2017
HK$ (%)
Japan 98.70%
SEGA SAMMY HOLDINGS INC 668 64,805 0.06
SEIBU HOLDINGS INC 685 101,298 0.10
SEIKO EPSON CORP 973 179,538 0.17
SEINO HOLDINGS CO LTD 521 64,717 0.06
SEKISUI CHEMICAL CO LTD 1,229 192,917 0.18
SEKISUI HOUSE LTD 1,917 270,781 0.26
SENSHU IKEDA HOLDINGS INC 1,065 30,745 0.03
SEVEN + I HOLDINGS CO LTD 2,605 846,559 0.80
SEVEN BANK LTD 1,836 49,180 0.05
SG HOLDINGS CO LTD 300 47,674 0.05
SHARP CORP 479 128,639 0.12
SHIGA BANK LTD 862 34,515 0.03
SHIKOKU ELECTRIC POWER CO 584 49,766 0.05
SHIMACHU CO LTD 172 38,732 0.04
SHIMADZU CORP 941 167,299 0.16
SHIMAMURA CO LTD 70 60,235 0.06
SHIMANO INC 261 287,075 0.27
SHIMIZU CORP 1,880 151,858 0.14
SHIN ETSU CHEMICAL CO LTD 1,378 1,094,915 1.04
SHINSEI BANK LTD 598 80,880 0.08
SHIONOGI + CO LTD 983 415,906 0.40
SHISEIDO CO LTD 1,291 487,898 0.46
SHIZUOKA BANK LTD 1,717 138,691 0.13
SHOCHIKU CO LTD 38 50,709 0.05
SHOWA DENKO K K 400 133,654 0.13
SHOWA SHELL SEKIYU KK 742 78,781 0.07
SKY PERFECT JSAT HOLDINGS 491 17,582 0.02
SKYLARK CO LTD 481 53,506 0.05
SMC CORP 194 624,393 0.59
SOFTBANK CORP 2,877 1,780,862 1.69
SOHGO SECURITY SERVICES CO 227 96,563 0.09
SOJITZ CORP 4,569 109,704 0.10
SOMPO JAPAN NIPPONKOA HOLDIN 1,227 371,582 0.35
SONY CORP 4,263 1,503,699 1.43
SONY FINANCIAL HOLDINGS INC 517 71,610 0.07
SOTETSU HOLDINGS INC 301 61,849 0.06
SQUARE ENIX HOLDINGS CO LTD 250 92,989 0.09
Vanguard ETF SeriesAnnual Report 2017
Vanguard FTSE Japan Index ETF
-174-

Investment portfolio (Unaudited) (Continued)
As at 31 December 2017
Holding at31 December
2017
Fair value at31 December
2017
Percentage oftotal net assets at
31 December2017
HK$ (%)
Japan 98.70%
STANLEY ELECTRIC CO LTD 515 163,502 0.16
START TODAY CO LTD 593 140,942 0.13
SUGI HOLDINGS CO LTD 143 57,060 0.05
SUMCO CORP 786 157,524 0.15
SUMITOMO CHEMICAL CO LTD 5,044 283,521 0.27
SUMITOMO CORP 3,718 494,087 0.47
SUMITOMO DAINIPPON PHARMA CO 532 61,801 0.06
SUMITOMO ELECTRIC INDUSTRIES 2,505 331,153 0.31
SUMITOMO FORESTRY CO LTD 442 61,836 0.06
SUMITOMO HEAVY INDUSTRIES 377 124,792 0.12
SUMITOMO METAL MINING CO LTD 782 280,992 0.27
SUMITOMO MITSUI FINANCIAL GR 4,516 1,525,563 1.45
SUMITOMO MITSUI TRUST HOLDIN 1,247 387,071 0.37
SUMITOMO OSAKA CEMENT CO LTD 1,312 49,438 0.05
SUMITOMO REALTY + DEVELOPMEN 1,426 366,437 0.35
SUMITOMO RUBBER INDUSTRIES 537 78,107 0.07
SUNDRUG CO LTD 230 83,634 0.08
SUNTORY BEVERAGE + FOOD LTD 411 142,891 0.14
SURUGA BANK LTD 530 88,895 0.08
SUZUKEN CO LTD 285 91,669 0.09
SUZUKI MOTOR CORP 1,409 638,875 0.61
SYSMEX CORP 469 288,684 0.27
T+D HOLDINGS INC 2,044 273,331 0.26
TADANO LTD 448 58,167 0.06
TAIHEIYO CEMENT CORP 409 138,080 0.13
TAISEI CORP 709 276,016 0.26
TAISHO PHARMACEUTICAL HOLDIN 157 98,055 0.09
TAIYO NIPPON SANSO CORP 445 48,699 0.05
TAIYO YUDEN CO LTD 378 46,062 0.04
TAKARA HOLDINGS INC 641 58,538 0.06
TAKASHIMAYA CO LTD 940 77,364 0.07
TAKEDA PHARMACEUTICAL CO LTD 2,568 1,140,692 1.08
TDK CORP 399 248,919 0.24
TEIJIN LTD 645 112,346 0.11
TEMP HOLDINGS CO LTD 593 116,210 0.11
TERUMO CORP 1,043 386,501 0.37
THK CO LTD 400 117,416 0.11
Vanguard ETF SeriesAnnual Report 2017
Vanguard FTSE Japan Index ETF
-175-

Investment portfolio (Unaudited) (Continued)
As at 31 December 2017
Holding at31 December
2017
Fair value at31 December
2017
Percentage oftotal net assets at
31 December2017
HK$ (%)
Japan 98.70%
TOBU RAILWAY CO LTD 701 177,070 0.17
TODA CORP 810 50,813 0.05
TOHO CO LTD 398 107,852 0.10
TOHO GAS CO LTD 279 59,826 0.06
TOHOKU ELECTRIC POWER CO INC 1,490 148,996 0.14
TOKAI RIKA CO LTD 170 27,983 0.03
TOKAI TOKYO FINANCIAL HOLDIN 817 41,218 0.04
TOKIO MARINE HOLDINGS INC 2,363 843,018 0.80
TOKYO BROADCASTING SYSTEM 128 24,995 0.02
TOKYO ELECTRIC POWER CO INC 5,053 156,390 0.15
TOKYO ELECTRON LTD 520 736,138 0.70
TOKYO GAS CO LTD 1,367 244,603 0.23
TOKYO TATEMONO CO LTD 700 73,933 0.07
TOKYU CORP 1,647 205,499 0.20
TOKYU FUDOSAN HOLDINGS CORP 1,723 97,447 0.09
TOPCON CORP 337 56,992 0.05
TOPPAN FORMS CO LTD 139 12,308 0.01
TOPPAN PRINTING CO LTD 1,705 120,566 0.11
TORAY INDUSTRIES INC 5,039 371,534 0.35
TOSHIBA CORP 12,647 278,210 0.26
TOSOH CORP 930 164,827 0.16
TOTO LTD 464 214,124 0.20
TOYO SEIKAN GROUP HOLDINGS L 573 71,971 0.07
TOYO SUISAN KAISHA LTD 330 110,265 0.10
TOYO TIRE + RUBBER CO LTD 300 48,465 0.05
TOYOBO CO LTD 297 42,189 0.04
TOYODA GOSEI CO LTD 248 49,341 0.05
TOYOTA BOSHOKU CORP 208 34,050 0.03
TOYOTA INDUSTRIES CORP 542 272,310 0.26
TOYOTA MOTOR CORP 8,736 4,372,745 4.16
TOYOTA TSUSHO CORP 745 234,455 0.22
TREND MICRO INC 380 168,504 0.16
TS TECH CO LTD 155 49,855 0.05
TSUMURA + CO 227 58,993 0.06
TSURUHA HOLDINGS INC 118 125,449 0.12
TV ASAHI HOLDINGS CORP 67 10,536 0.01
UBE INDUSTRIES LTD 354 81,435 0.08
Vanguard ETF SeriesAnnual Report 2017
Vanguard FTSE Japan Index ETF
-176-
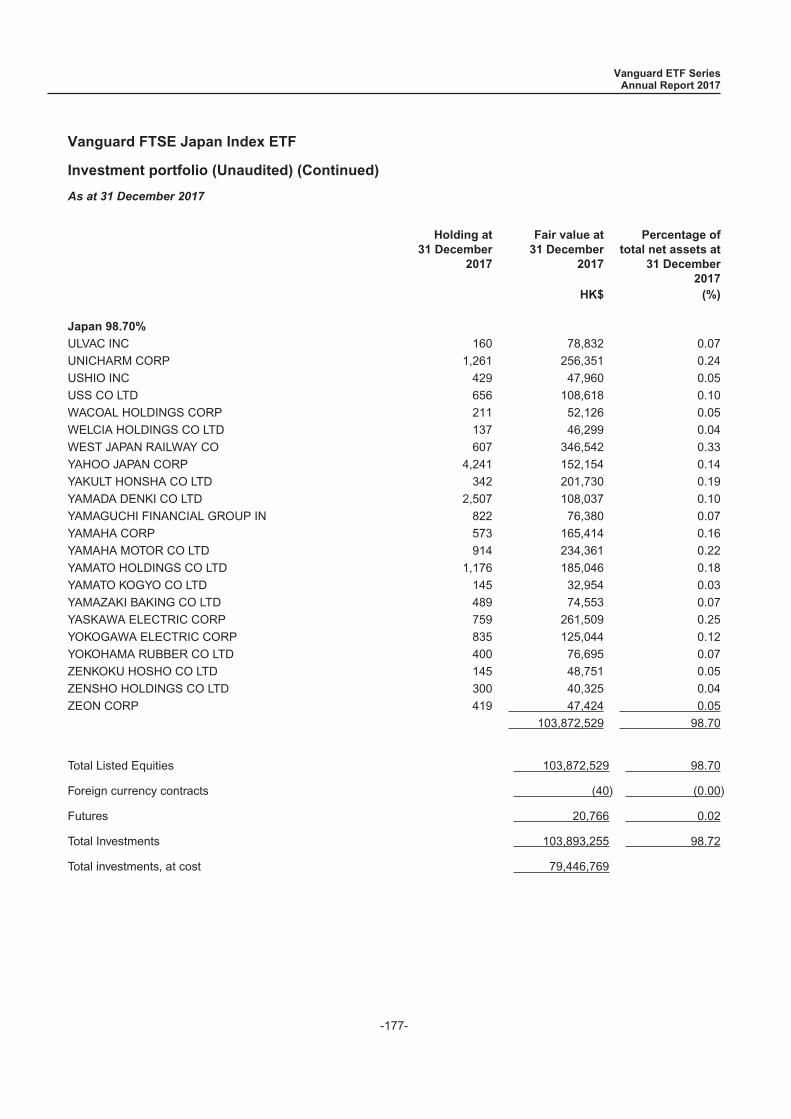
Investment portfolio (Unaudited) (Continued)
As at 31 December 2017
Holding at31 December
2017
Fair value at31 December
2017
Percentage oftotal net assets at
31 December2017
HK$ (%)
Japan 98.70%
ULVAC INC 160 78,832 0.07
UNICHARM CORP 1,261 256,351 0.24
USHIO INC 429 47,960 0.05
USS CO LTD 656 108,618 0.10
WACOAL HOLDINGS CORP 211 52,126 0.05
WELCIA HOLDINGS CO LTD 137 46,299 0.04
WEST JAPAN RAILWAY CO 607 346,542 0.33
YAHOO JAPAN CORP 4,241 152,154 0.14
YAKULT HONSHA CO LTD 342 201,730 0.19
YAMADA DENKI CO LTD 2,507 108,037 0.10
YAMAGUCHI FINANCIAL GROUP IN 822 76,380 0.07
YAMAHA CORP 573 165,414 0.16
YAMAHA MOTOR CO LTD 914 234,361 0.22
YAMATO HOLDINGS CO LTD 1,176 185,046 0.18
YAMATO KOGYO CO LTD 145 32,954 0.03
YAMAZAKI BAKING CO LTD 489 74,553 0.07
YASKAWA ELECTRIC CORP 759 261,509 0.25
YOKOGAWA ELECTRIC CORP 835 125,044 0.12
YOKOHAMA RUBBER CO LTD 400 76,695 0.07
ZENKOKU HOSHO CO LTD 145 48,751 0.05
ZENSHO HOLDINGS CO LTD 300 40,325 0.04
ZEON CORP 419 47,424 0.05
103,872,529 98.70
Total Listed Equities 103,872,529 98.70
Foreign currency contracts (40) (0.00)
Futures 20,766 0.02
Total Investments 103,893,255 98.72
Total investments, at cost 79,446,769
Vanguard ETF SeriesAnnual Report 2017
Vanguard FTSE Japan Index ETF
-177-
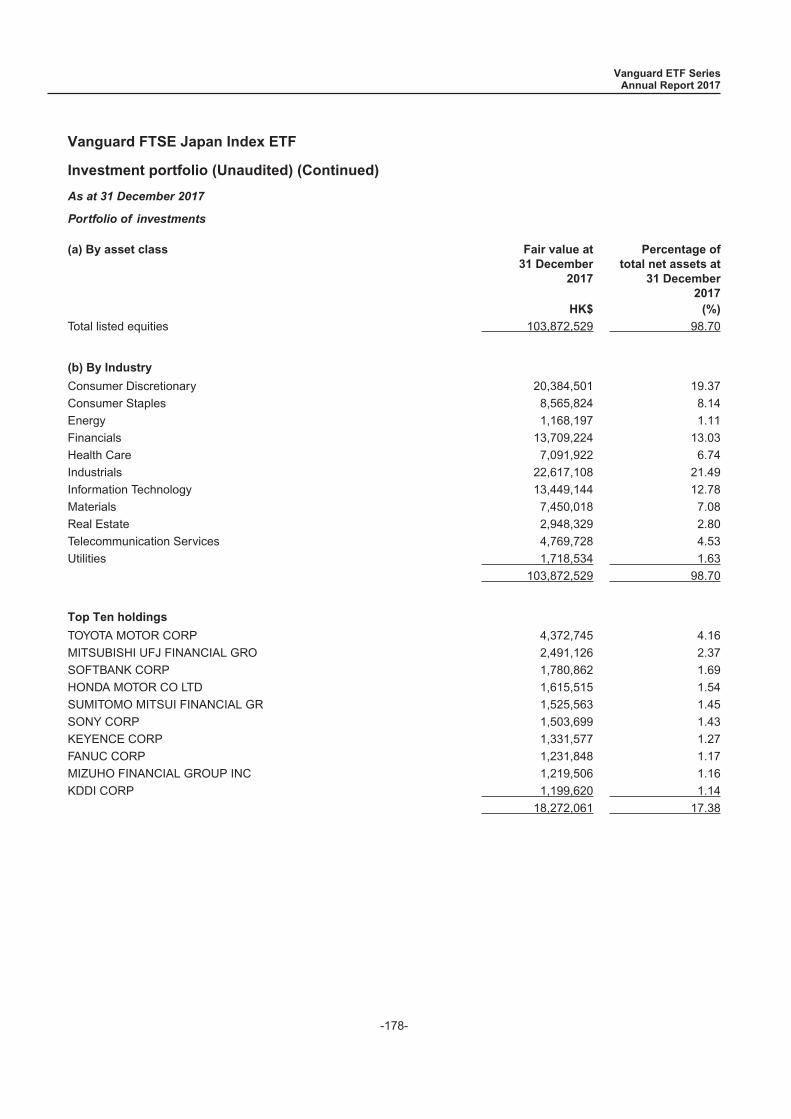
Investment portfolio (Unaudited) (Continued)
As at 31 December 2017
Portfolio of investments
(a) By asset class Fair value at31 December
2017
Percentage oftotal net assets at
31 December2017
HK$ (%)
Total listed equities 103,872,529 98.70
(b) By Industry
Consumer Discretionary 20,384,501 19.37
Consumer Staples 8,565,824 8.14
Energy 1,168,197 1.11
Financials 13,709,224 13.03
Health Care 7,091,922 6.74
Industrials 22,617,108 21.49
Information Technology 13,449,144 12.78
Materials 7,450,018 7.08
Real Estate 2,948,329 2.80
Telecommunication Services 4,769,728 4.53
Utilities 1,718,534 1.63
103,872,529 98.70
Top Ten holdings
TOYOTA MOTOR CORP 4,372,745 4.16
MITSUBISHI UFJ FINANCIAL GRO 2,491,126 2.37
SOFTBANK CORP 1,780,862 1.69
HONDA MOTOR CO LTD 1,615,515 1.54
SUMITOMO MITSUI FINANCIAL GR 1,525,563 1.45
SONY CORP 1,503,699 1.43
KEYENCE CORP 1,331,577 1.27
FANUC CORP 1,231,848 1.17
MIZUHO FINANCIAL GROUP INC 1,219,506 1.16
KDDI CORP 1,199,620 1.14
18,272,061 17.38
Vanguard ETF SeriesAnnual Report 2017
Vanguard FTSE Japan Index ETF
-178-
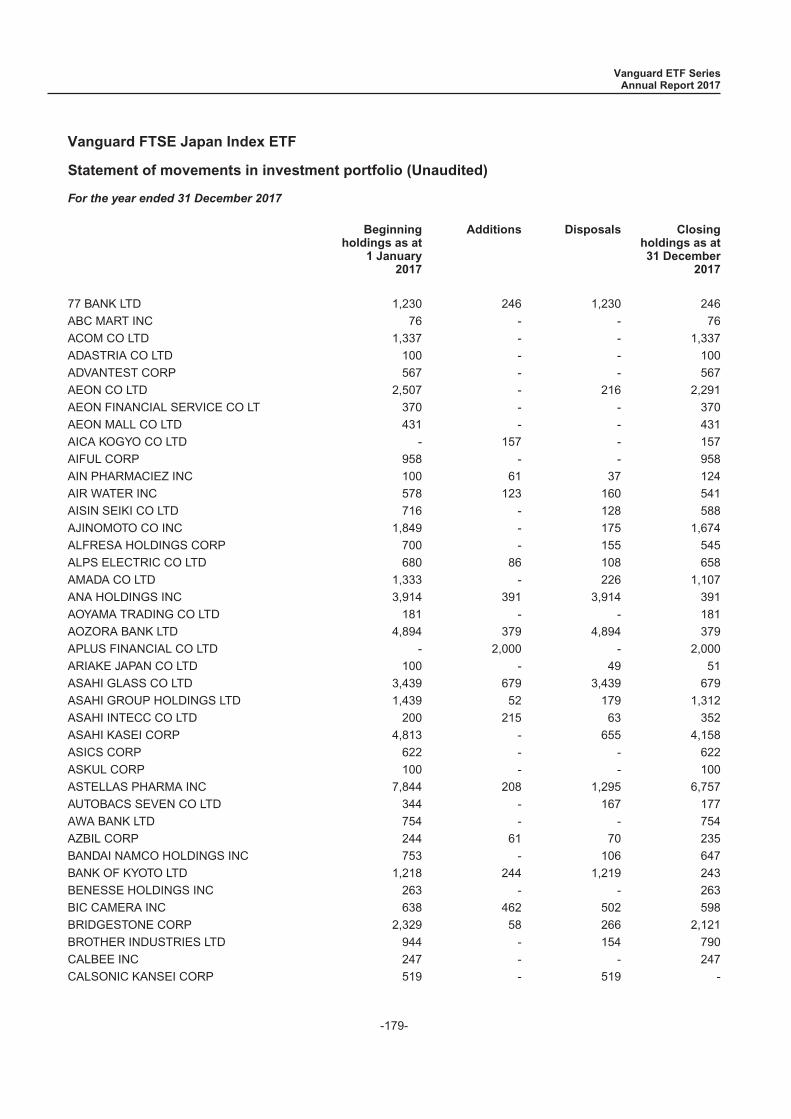
Statement of movements in investment portfolio (Unaudited)
For the year ended 31 December 2017
Beginningholdings as at
1 January2017
Additions Disposals Closingholdings as at31 December
2017
77 BANK LTD 1,230 246 1,230 246
ABC MART INC 76 - - 76
ACOM CO LTD 1,337 - - 1,337
ADASTRIA CO LTD 100 - - 100
ADVANTEST CORP 567 - - 567
AEON CO LTD 2,507 - 216 2,291
AEON FINANCIAL SERVICE CO LT 370 - - 370
AEON MALL CO LTD 431 - - 431
AICA KOGYO CO LTD - 157 - 157
AIFUL CORP 958 - - 958
AIN PHARMACIEZ INC 100 61 37 124
AIR WATER INC 578 123 160 541
AISIN SEIKI CO LTD 716 - 128 588
AJINOMOTO CO INC 1,849 - 175 1,674
ALFRESA HOLDINGS CORP 700 - 155 545
ALPS ELECTRIC CO LTD 680 86 108 658
AMADA CO LTD 1,333 - 226 1,107
ANA HOLDINGS INC 3,914 391 3,914 391
AOYAMA TRADING CO LTD 181 - - 181
AOZORA BANK LTD 4,894 379 4,894 379
APLUS FINANCIAL CO LTD - 2,000 - 2,000
ARIAKE JAPAN CO LTD 100 - 49 51
ASAHI GLASS CO LTD 3,439 679 3,439 679
ASAHI GROUP HOLDINGS LTD 1,439 52 179 1,312
ASAHI INTECC CO LTD 200 215 63 352
ASAHI KASEI CORP 4,813 - 655 4,158
ASICS CORP 622 - - 622
ASKUL CORP 100 - - 100
ASTELLAS PHARMA INC 7,844 208 1,295 6,757
AUTOBACS SEVEN CO LTD 344 - 167 177
AWA BANK LTD 754 - - 754
AZBIL CORP 244 61 70 235
BANDAI NAMCO HOLDINGS INC 753 - 106 647
BANK OF KYOTO LTD 1,218 244 1,219 243
BENESSE HOLDINGS INC 263 - - 263
BIC CAMERA INC 638 462 502 598
BRIDGESTONE CORP 2,329 58 266 2,121
BROTHER INDUSTRIES LTD 944 - 154 790
CALBEE INC 247 - - 247
CALSONIC KANSEI CORP 519 - 519 -
Vanguard ETF SeriesAnnual Report 2017
Vanguard FTSE Japan Index ETF
-179-

Statement of movements in investment portfolio (Unaudited) (Continued)
For the year ended 31 December 2017
Beginningholdings as at
1 January2017
Additions Disposals Closingholdings as at31 December
2017
CANON INC 3,883 80 490 3,473
CANON MARKETING JAPAN INC 177 - - 177
CAPCOM CO LTD 170 - - 170
CASIO COMPUTER CO LTD 821 - 153 668
CENTRAL JAPAN RAILWAY CO 656 14 57 613
CENTURY TOKYO LEASING CORP 158 - - 158
CHIBA BANK LTD 2,531 - 416 2,115
CHIYODA CORP 582 - - 582
CHUBU ELECTRIC POWER CO INC 2,573 - 213 2,360
CHUGAI PHARMACEUTICAL CO LTD 815 - 96 719
CHUGOKU BANK LTD 714 - 178 536
CHUGOKU ELECTRIC POWER CO 1,143 - 222 921
CITIZEN HOLDINGS CO LTD 1,089 - 341 748
COCA COLA EAST JAPAN CO LTD 259 - 259 -COCA-COLA BOTTLERS JAPAN HOLDINGSINC 215 194 - 409
COLOPL INC 200 - - 200
COMSYS HOLDINGS CORP 419 97 127 389
CONCORDIA FINANCIAL GROUP LTD 4,448 - 523 3,925
COOKPAD INC 200 - 200 -
COSMO ENERGY HOLDINGS CO LTD 218 - - 218
COSMOS PHARMACEUTICAL CORP 29 - - 29
CREDIT SAISON CO LTD 634 - 142 492
CYBERAGENT INC 400 - 101 299
DAI ICHI LIFE INSURANCE 4,110 129 366 3,873
DAI NIPPON PRINTING CO LTD 2,085 1,039 2,085 1,039
DAICEL CORP 1,157 - 233 924
DAIDO STEEL CO LTD 1,187 119 1,188 118
DAIFUKU CO LTD 400 49 122 327
DAIICHI SANKYO CO LTD 2,423 100 276 2,247
DAIICHIKOSHO CO LTD 200 - 64 136
DAIKIN INDUSTRIES LTD 972 23 88 907
DAIKYO INC 684 68 684 68
DAISHI BANK LTD 1,151 115 1,151 115
DAITO TRUST CONSTRUCT CO LTD 281 - 40 241
DAIWA HOUSE INDUSTRY CO LTD 2,326 72 192 2,206
DAIWA SECURITIES GROUP INC 6,153 426 956 5,623
DENA CO LTD 368 - - 368
DENKI KAGAKU KOGYO K K 1,539 308 1,540 307
DENSO CORP 1,864 62 276 1,650
Vanguard ETF SeriesAnnual Report 2017
Vanguard FTSE Japan Index ETF
-180-
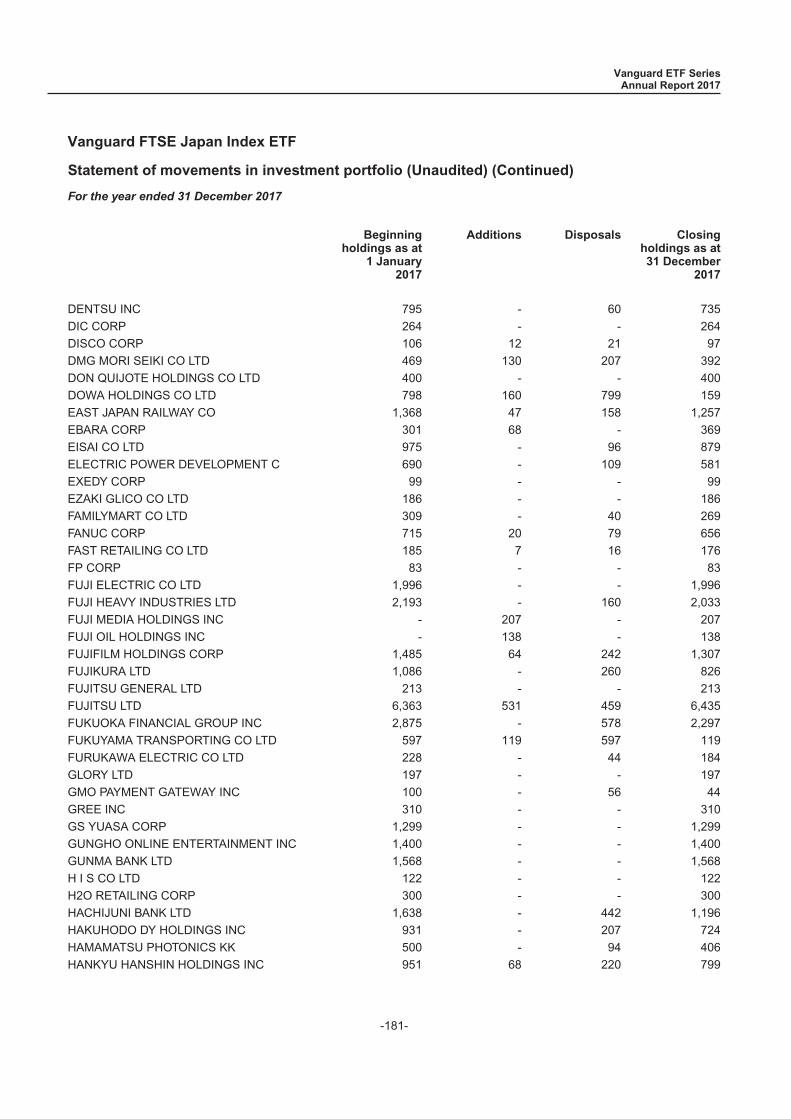
Statement of movements in investment portfolio (Unaudited) (Continued)
For the year ended 31 December 2017
Beginningholdings as at
1 January2017
Additions Disposals Closingholdings as at31 December
2017
DENTSU INC 795 - 60 735
DIC CORP 264 - - 264
DISCO CORP 106 12 21 97
DMG MORI SEIKI CO LTD 469 130 207 392
DON QUIJOTE HOLDINGS CO LTD 400 - - 400
DOWA HOLDINGS CO LTD 798 160 799 159
EAST JAPAN RAILWAY CO 1,368 47 158 1,257
EBARA CORP 301 68 - 369
EISAI CO LTD 975 - 96 879
ELECTRIC POWER DEVELOPMENT C 690 - 109 581
EXEDY CORP 99 - - 99
EZAKI GLICO CO LTD 186 - - 186
FAMILYMART CO LTD 309 - 40 269
FANUC CORP 715 20 79 656
FAST RETAILING CO LTD 185 7 16 176
FP CORP 83 - - 83
FUJI ELECTRIC CO LTD 1,996 - - 1,996
FUJI HEAVY INDUSTRIES LTD 2,193 - 160 2,033
FUJI MEDIA HOLDINGS INC - 207 - 207
FUJI OIL HOLDINGS INC - 138 - 138
FUJIFILM HOLDINGS CORP 1,485 64 242 1,307
FUJIKURA LTD 1,086 - 260 826
FUJITSU GENERAL LTD 213 - - 213
FUJITSU LTD 6,363 531 459 6,435
FUKUOKA FINANCIAL GROUP INC 2,875 - 578 2,297
FUKUYAMA TRANSPORTING CO LTD 597 119 597 119
FURUKAWA ELECTRIC CO LTD 228 - 44 184
GLORY LTD 197 - - 197
GMO PAYMENT GATEWAY INC 100 - 56 44
GREE INC 310 - - 310
GS YUASA CORP 1,299 - - 1,299
GUNGHO ONLINE ENTERTAINMENT INC 1,400 - - 1,400
GUNMA BANK LTD 1,568 - - 1,568
H I S CO LTD 122 - - 122
H2O RETAILING CORP 300 - - 300
HACHIJUNI BANK LTD 1,638 - 442 1,196
HAKUHODO DY HOLDINGS INC 931 - 207 724
HAMAMATSU PHOTONICS KK 500 - 94 406
HANKYU HANSHIN HOLDINGS INC 951 68 220 799
Vanguard ETF SeriesAnnual Report 2017
Vanguard FTSE Japan Index ETF
-181-
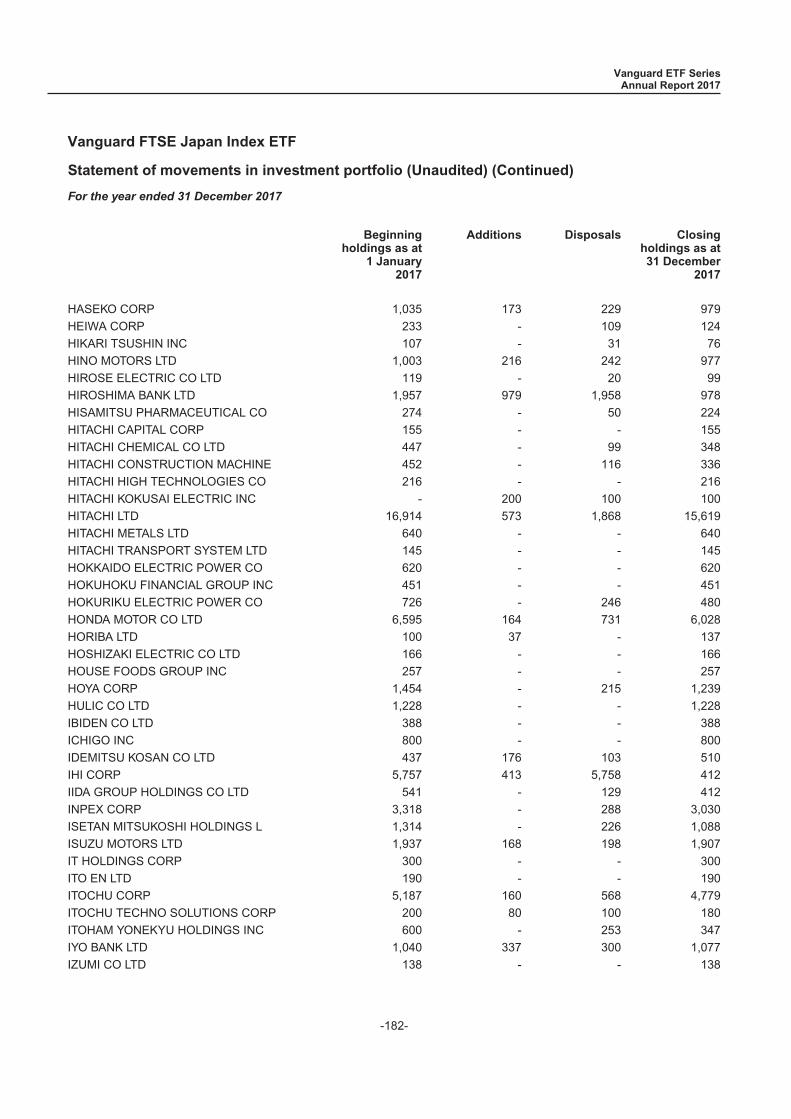
Statement of movements in investment portfolio (Unaudited) (Continued)
For the year ended 31 December 2017
Beginningholdings as at
1 January2017
Additions Disposals Closingholdings as at31 December
2017
HASEKO CORP 1,035 173 229 979
HEIWA CORP 233 - 109 124
HIKARI TSUSHIN INC 107 - 31 76
HINO MOTORS LTD 1,003 216 242 977
HIROSE ELECTRIC CO LTD 119 - 20 99
HIROSHIMA BANK LTD 1,957 979 1,958 978
HISAMITSU PHARMACEUTICAL CO 274 - 50 224
HITACHI CAPITAL CORP 155 - - 155
HITACHI CHEMICAL CO LTD 447 - 99 348
HITACHI CONSTRUCTION MACHINE 452 - 116 336
HITACHI HIGH TECHNOLOGIES CO 216 - - 216
HITACHI KOKUSAI ELECTRIC INC - 200 100 100
HITACHI LTD 16,914 573 1,868 15,619
HITACHI METALS LTD 640 - - 640
HITACHI TRANSPORT SYSTEM LTD 145 - - 145
HOKKAIDO ELECTRIC POWER CO 620 - - 620
HOKUHOKU FINANCIAL GROUP INC 451 - - 451
HOKURIKU ELECTRIC POWER CO 726 - 246 480
HONDA MOTOR CO LTD 6,595 164 731 6,028
HORIBA LTD 100 37 - 137
HOSHIZAKI ELECTRIC CO LTD 166 - - 166
HOUSE FOODS GROUP INC 257 - - 257
HOYA CORP 1,454 - 215 1,239
HULIC CO LTD 1,228 - - 1,228
IBIDEN CO LTD 388 - - 388
ICHIGO INC 800 - - 800
IDEMITSU KOSAN CO LTD 437 176 103 510
IHI CORP 5,757 413 5,758 412
IIDA GROUP HOLDINGS CO LTD 541 - 129 412
INPEX CORP 3,318 - 288 3,030
ISETAN MITSUKOSHI HOLDINGS L 1,314 - 226 1,088
ISUZU MOTORS LTD 1,937 168 198 1,907
IT HOLDINGS CORP 300 - - 300
ITO EN LTD 190 - - 190
ITOCHU CORP 5,187 160 568 4,779
ITOCHU TECHNO SOLUTIONS CORP 200 80 100 180
ITOHAM YONEKYU HOLDINGS INC 600 - 253 347
IYO BANK LTD 1,040 337 300 1,077
IZUMI CO LTD 138 - - 138
Vanguard ETF SeriesAnnual Report 2017
Vanguard FTSE Japan Index ETF
-182-

Statement of movements in investment portfolio (Unaudited) (Continued)
For the year ended 31 December 2017
Beginningholdings as at
1 January2017
Additions Disposals Closingholdings as at31 December
2017
J FRONT RETAILING CO LTD 943 - 177 766
JAFCO CO LTD 97 - - 97
JAPAN AIRLINES CO LTD 200 249 83 366
JAPAN AIRPORT TERMINAL CO 175 - - 175
JAPAN AVIATION ELECTRONICS 200 - - 200
JAPAN DISPLAY INC 1,300 - - 1,300
JAPAN EXCHANGE GROUP INC 2,036 - 219 1,817
JAPAN PETROLEUM EXPLORATION 103 - - 103
JAPAN POST BANK CO LTD 1,500 207 212 1,495
JAPAN POST HOLDINGS CO LTD 1,659 3,000 203 4,456
JAPAN POST INSURANCE CO LTD 200 - - 200
JAPAN STEEL WORKS LTD 241 - - 241
JAPAN TOBACCO INC 4,384 79 410 4,053
JFE HOLDINGS INC 1,878 - 180 1,698
JGC CORP 743 - - 743
JSR CORP 719 136 153 702
JTEKT CORP 855 - 157 698
JUROKU BANK LTD 1,194 119 1,194 119
JX HOLDINGS INC 8,691 2,868 711 10,848
K S HOLDINGS CORP 276 - - 276
KAGOME CO LTD 253 - - 253
KAJIMA CORP 3,343 - 366 2,977
KAKAKU.COM INC 547 - 151 396
KAKEN PHARMACEUTICAL CO LTD 127 - - 127
KAMIGUMI CO LTD 779 390 780 389
KANDENKO CO LTD 350 - - 350
KANEKA CORP 1,135 297 309 1,123
KANSAI ELECTRIC POWER CO INC 2,695 - 261 2,434
KANSAI PAINT CO LTD 657 - - 657
KAO CORP 1,836 50 259 1,627
KAWASAKI HEAVY INDUSTRIES 5,160 524 5,160 524
KAWASAKI KISEN KAISHA LTD 3,043 304 3,043 304
KDDI CORP 6,800 193 829 6,164
KEIHAN ELECTRIC RAILWAY CO 1,895 302 1,896 301
KEIKYU CORP 1,662 831 1,662 831
KEIO CORP 2,026 403 2,027 402
KEISEI ELECTRIC RAILWAY CO 478 - - 478
KEIYO BANK LTD 866 - - 866
KEWPIE CORP 375 - - 375
Vanguard ETF SeriesAnnual Report 2017
Vanguard FTSE Japan Index ETF
-183-
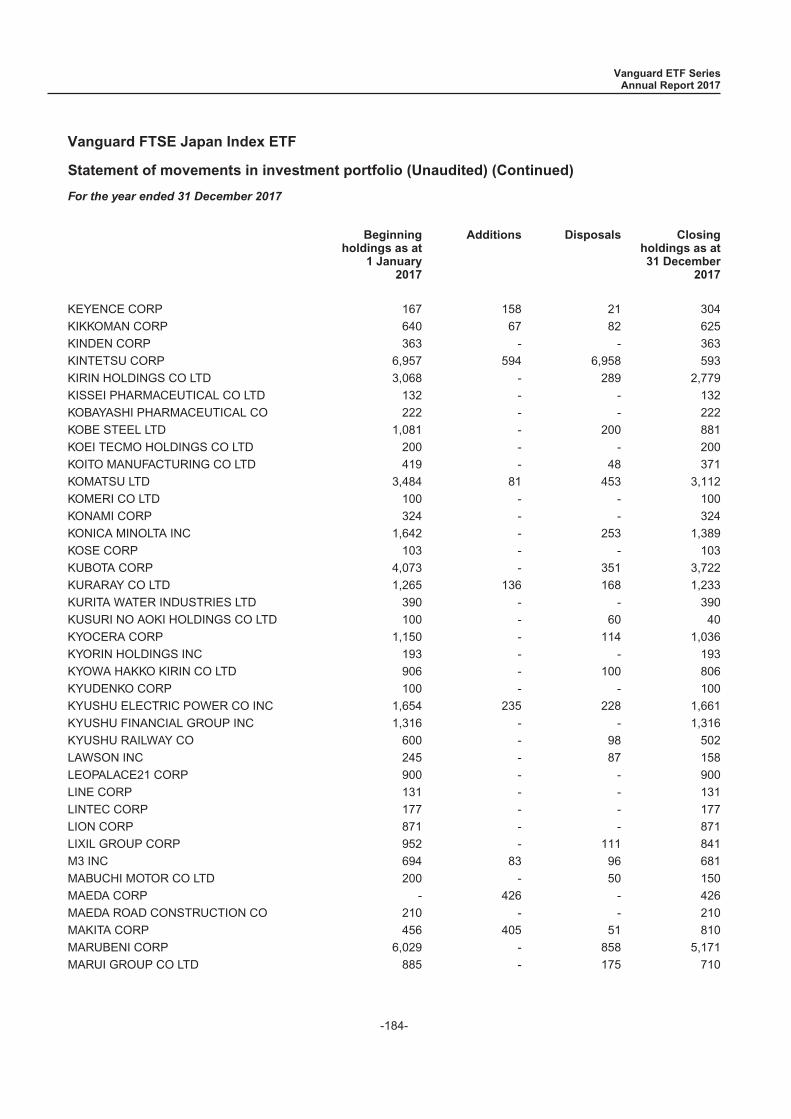
Statement of movements in investment portfolio (Unaudited) (Continued)
For the year ended 31 December 2017
Beginningholdings as at
1 January2017
Additions Disposals Closingholdings as at31 December
2017
KEYENCE CORP 167 158 21 304
KIKKOMAN CORP 640 67 82 625
KINDEN CORP 363 - - 363
KINTETSU CORP 6,957 594 6,958 593
KIRIN HOLDINGS CO LTD 3,068 - 289 2,779
KISSEI PHARMACEUTICAL CO LTD 132 - - 132
KOBAYASHI PHARMACEUTICAL CO 222 - - 222
KOBE STEEL LTD 1,081 - 200 881
KOEI TECMO HOLDINGS CO LTD 200 - - 200
KOITO MANUFACTURING CO LTD 419 - 48 371
KOMATSU LTD 3,484 81 453 3,112
KOMERI CO LTD 100 - - 100
KONAMI CORP 324 - - 324
KONICA MINOLTA INC 1,642 - 253 1,389
KOSE CORP 103 - - 103
KUBOTA CORP 4,073 - 351 3,722
KURARAY CO LTD 1,265 136 168 1,233
KURITA WATER INDUSTRIES LTD 390 - - 390
KUSURI NO AOKI HOLDINGS CO LTD 100 - 60 40
KYOCERA CORP 1,150 - 114 1,036
KYORIN HOLDINGS INC 193 - - 193
KYOWA HAKKO KIRIN CO LTD 906 - 100 806
KYUDENKO CORP 100 - - 100
KYUSHU ELECTRIC POWER CO INC 1,654 235 228 1,661
KYUSHU FINANCIAL GROUP INC 1,316 - - 1,316
KYUSHU RAILWAY CO 600 - 98 502
LAWSON INC 245 - 87 158
LEOPALACE21 CORP 900 - - 900
LINE CORP 131 - - 131
LINTEC CORP 177 - - 177
LION CORP 871 - - 871
LIXIL GROUP CORP 952 - 111 841
M3 INC 694 83 96 681
MABUCHI MOTOR CO LTD 200 - 50 150
MAEDA CORP - 426 - 426
MAEDA ROAD CONSTRUCTION CO 210 - - 210
MAKITA CORP 456 405 51 810
MARUBENI CORP 6,029 - 858 5,171
MARUI GROUP CO LTD 885 - 175 710
Vanguard ETF SeriesAnnual Report 2017
Vanguard FTSE Japan Index ETF
-184-
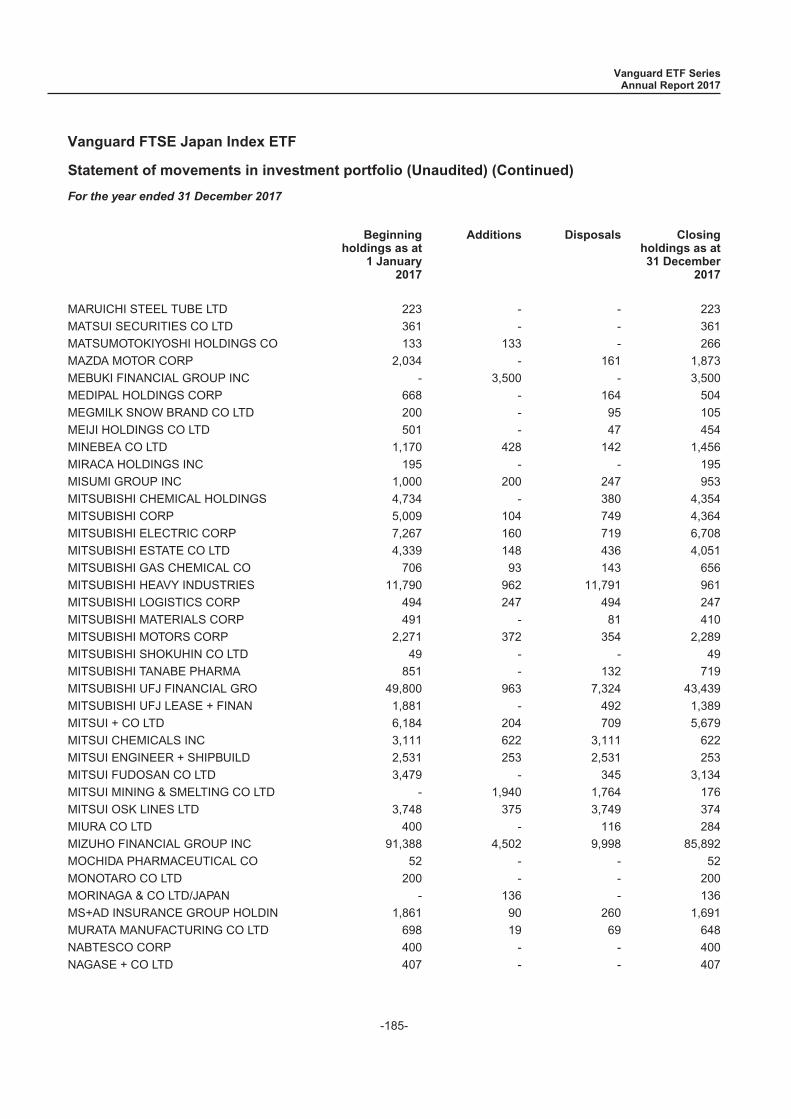
Statement of movements in investment portfolio (Unaudited) (Continued)
For the year ended 31 December 2017
Beginningholdings as at
1 January2017
Additions Disposals Closingholdings as at31 December
2017
MARUICHI STEEL TUBE LTD 223 - - 223
MATSUI SECURITIES CO LTD 361 - - 361
MATSUMOTOKIYOSHI HOLDINGS CO 133 133 - 266
MAZDA MOTOR CORP 2,034 - 161 1,873
MEBUKI FINANCIAL GROUP INC - 3,500 - 3,500
MEDIPAL HOLDINGS CORP 668 - 164 504
MEGMILK SNOW BRAND CO LTD 200 - 95 105
MEIJI HOLDINGS CO LTD 501 - 47 454
MINEBEA CO LTD 1,170 428 142 1,456
MIRACA HOLDINGS INC 195 - - 195
MISUMI GROUP INC 1,000 200 247 953
MITSUBISHI CHEMICAL HOLDINGS 4,734 - 380 4,354
MITSUBISHI CORP 5,009 104 749 4,364
MITSUBISHI ELECTRIC CORP 7,267 160 719 6,708
MITSUBISHI ESTATE CO LTD 4,339 148 436 4,051
MITSUBISHI GAS CHEMICAL CO 706 93 143 656
MITSUBISHI HEAVY INDUSTRIES 11,790 962 11,791 961
MITSUBISHI LOGISTICS CORP 494 247 494 247
MITSUBISHI MATERIALS CORP 491 - 81 410
MITSUBISHI MOTORS CORP 2,271 372 354 2,289
MITSUBISHI SHOKUHIN CO LTD 49 - - 49
MITSUBISHI TANABE PHARMA 851 - 132 719
MITSUBISHI UFJ FINANCIAL GRO 49,800 963 7,324 43,439
MITSUBISHI UFJ LEASE + FINAN 1,881 - 492 1,389
MITSUI + CO LTD 6,184 204 709 5,679
MITSUI CHEMICALS INC 3,111 622 3,111 622
MITSUI ENGINEER + SHIPBUILD 2,531 253 2,531 253
MITSUI FUDOSAN CO LTD 3,479 - 345 3,134
MITSUI MINING & SMELTING CO LTD - 1,940 1,764 176
MITSUI OSK LINES LTD 3,748 375 3,749 374
MIURA CO LTD 400 - 116 284
MIZUHO FINANCIAL GROUP INC 91,388 4,502 9,998 85,892
MOCHIDA PHARMACEUTICAL CO 52 - - 52
MONOTARO CO LTD 200 - - 200
MORINAGA & CO LTD/JAPAN - 136 - 136
MS+AD INSURANCE GROUP HOLDIN 1,861 90 260 1,691
MURATA MANUFACTURING CO LTD 698 19 69 648
NABTESCO CORP 400 - - 400
NAGASE + CO LTD 407 - - 407
Vanguard ETF SeriesAnnual Report 2017
Vanguard FTSE Japan Index ETF
-185-
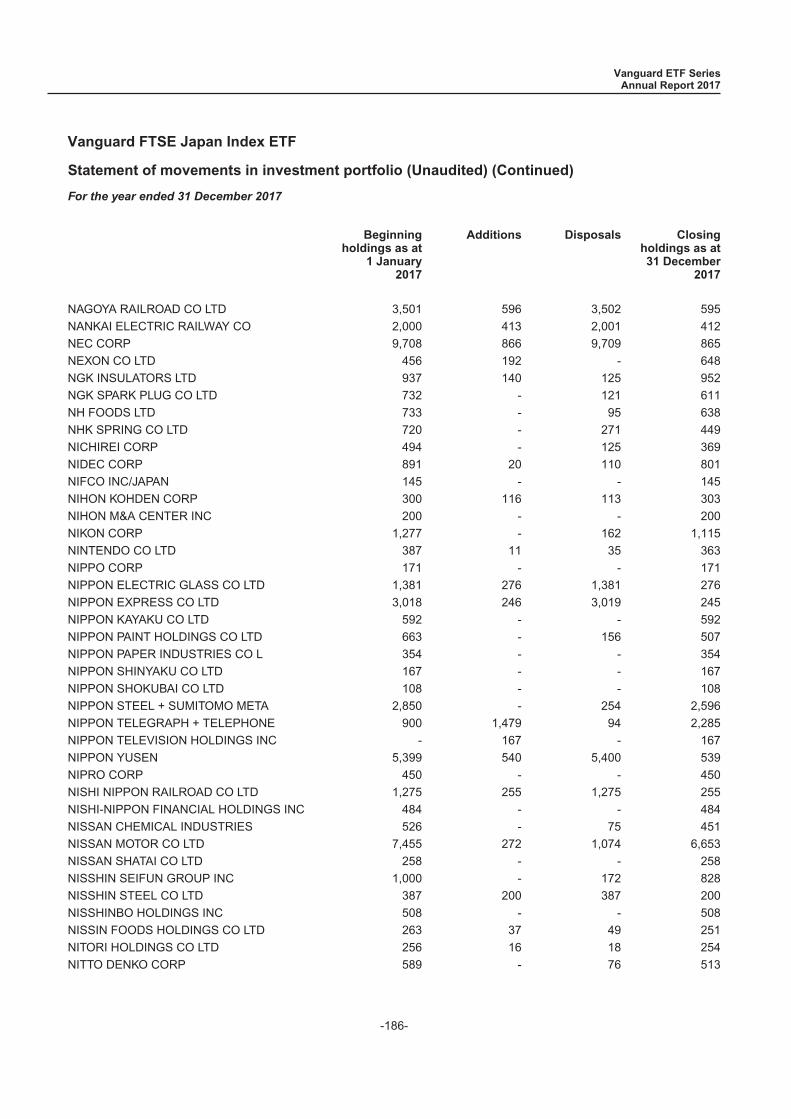
Statement of movements in investment portfolio (Unaudited) (Continued)
For the year ended 31 December 2017
Beginningholdings as at
1 January2017
Additions Disposals Closingholdings as at31 December
2017
NAGOYA RAILROAD CO LTD 3,501 596 3,502 595
NANKAI ELECTRIC RAILWAY CO 2,000 413 2,001 412
NEC CORP 9,708 866 9,709 865
NEXON CO LTD 456 192 - 648
NGK INSULATORS LTD 937 140 125 952
NGK SPARK PLUG CO LTD 732 - 121 611
NH FOODS LTD 733 - 95 638
NHK SPRING CO LTD 720 - 271 449
NICHIREI CORP 494 - 125 369
NIDEC CORP 891 20 110 801
NIFCO INC/JAPAN 145 - - 145
NIHON KOHDEN CORP 300 116 113 303
NIHON M&A CENTER INC 200 - - 200
NIKON CORP 1,277 - 162 1,115
NINTENDO CO LTD 387 11 35 363
NIPPO CORP 171 - - 171
NIPPON ELECTRIC GLASS CO LTD 1,381 276 1,381 276
NIPPON EXPRESS CO LTD 3,018 246 3,019 245
NIPPON KAYAKU CO LTD 592 - - 592
NIPPON PAINT HOLDINGS CO LTD 663 - 156 507
NIPPON PAPER INDUSTRIES CO L 354 - - 354
NIPPON SHINYAKU CO LTD 167 - - 167
NIPPON SHOKUBAI CO LTD 108 - - 108
NIPPON STEEL + SUMITOMO META 2,850 - 254 2,596
NIPPON TELEGRAPH + TELEPHONE 900 1,479 94 2,285
NIPPON TELEVISION HOLDINGS INC - 167 - 167
NIPPON YUSEN 5,399 540 5,400 539
NIPRO CORP 450 - - 450
NISHI NIPPON RAILROAD CO LTD 1,275 255 1,275 255
NISHI-NIPPON FINANCIAL HOLDINGS INC 484 - - 484
NISSAN CHEMICAL INDUSTRIES 526 - 75 451
NISSAN MOTOR CO LTD 7,455 272 1,074 6,653
NISSAN SHATAI CO LTD 258 - - 258
NISSHIN SEIFUN GROUP INC 1,000 - 172 828
NISSHIN STEEL CO LTD 387 200 387 200
NISSHINBO HOLDINGS INC 508 - - 508
NISSIN FOODS HOLDINGS CO LTD 263 37 49 251
NITORI HOLDINGS CO LTD 256 16 18 254
NITTO DENKO CORP 589 - 76 513
Vanguard ETF SeriesAnnual Report 2017
Vanguard FTSE Japan Index ETF
-186-
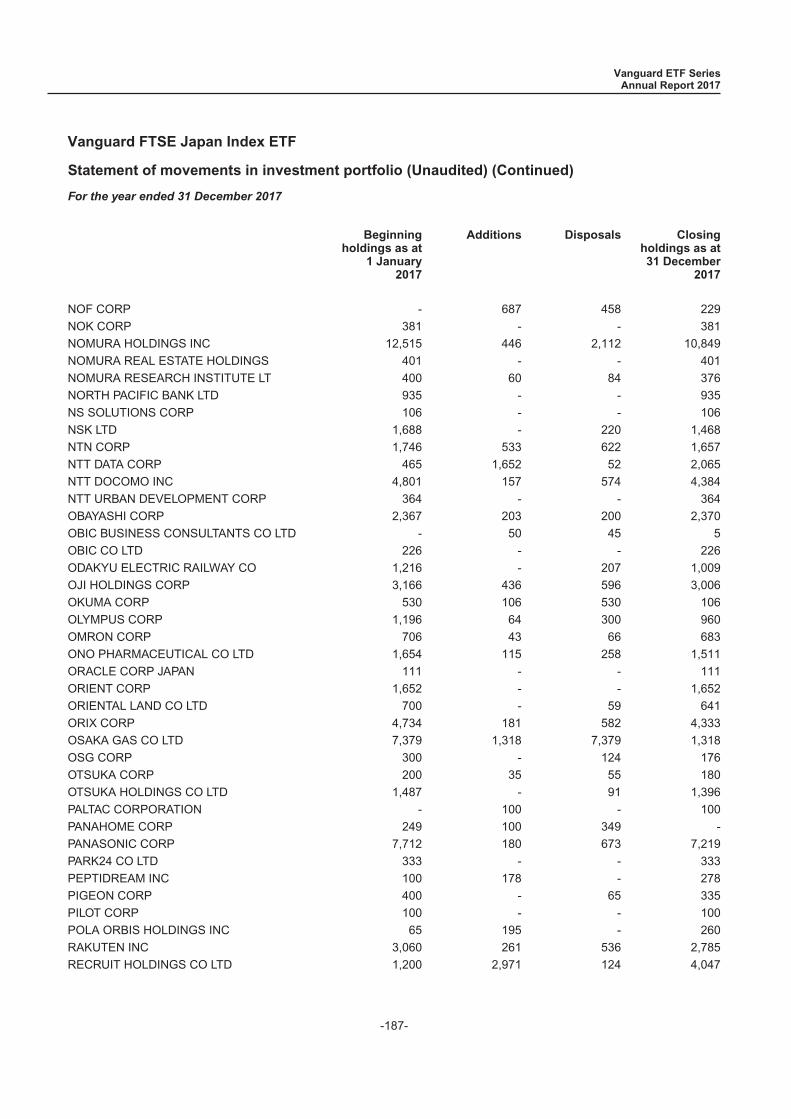
Statement of movements in investment portfolio (Unaudited) (Continued)
For the year ended 31 December 2017
Beginningholdings as at
1 January2017
Additions Disposals Closingholdings as at31 December
2017
NOF CORP - 687 458 229
NOK CORP 381 - - 381
NOMURA HOLDINGS INC 12,515 446 2,112 10,849
NOMURA REAL ESTATE HOLDINGS 401 - - 401
NOMURA RESEARCH INSTITUTE LT 400 60 84 376
NORTH PACIFIC BANK LTD 935 - - 935
NS SOLUTIONS CORP 106 - - 106
NSK LTD 1,688 - 220 1,468
NTN CORP 1,746 533 622 1,657
NTT DATA CORP 465 1,652 52 2,065
NTT DOCOMO INC 4,801 157 574 4,384
NTT URBAN DEVELOPMENT CORP 364 - - 364
OBAYASHI CORP 2,367 203 200 2,370
OBIC BUSINESS CONSULTANTS CO LTD - 50 45 5
OBIC CO LTD 226 - - 226
ODAKYU ELECTRIC RAILWAY CO 1,216 - 207 1,009
OJI HOLDINGS CORP 3,166 436 596 3,006
OKUMA CORP 530 106 530 106
OLYMPUS CORP 1,196 64 300 960
OMRON CORP 706 43 66 683
ONO PHARMACEUTICAL CO LTD 1,654 115 258 1,511
ORACLE CORP JAPAN 111 - - 111
ORIENT CORP 1,652 - - 1,652
ORIENTAL LAND CO LTD 700 - 59 641
ORIX CORP 4,734 181 582 4,333
OSAKA GAS CO LTD 7,379 1,318 7,379 1,318
OSG CORP 300 - 124 176
OTSUKA CORP 200 35 55 180
OTSUKA HOLDINGS CO LTD 1,487 - 91 1,396
PALTAC CORPORATION - 100 - 100
PANAHOME CORP 249 100 349 -
PANASONIC CORP 7,712 180 673 7,219
PARK24 CO LTD 333 - - 333
PEPTIDREAM INC 100 178 - 278
PIGEON CORP 400 - 65 335
PILOT CORP 100 - - 100
POLA ORBIS HOLDINGS INC 65 195 - 260
RAKUTEN INC 3,060 261 536 2,785
RECRUIT HOLDINGS CO LTD 1,200 2,971 124 4,047
Vanguard ETF SeriesAnnual Report 2017
Vanguard FTSE Japan Index ETF
-187-

Statement of movements in investment portfolio (Unaudited) (Continued)
For the year ended 31 December 2017
Beginningholdings as at
1 January2017
Additions Disposals Closingholdings as at31 December
2017
RELO GROUP INC 39 351 - 390
RENESAS ELECTRONICS CORP - 1,583 - 1,583
RENGO CO LTD 762 - - 762
RESONA HOLDINGS INC 7,703 - 509 7,194
RESORTTRUST INC 214 - - 214
RICOH CO LTD 2,541 - 297 2,244
RINNAI CORP 131 - - 131
ROHM CO LTD 318 26 41 303
ROHTO PHARMACEUTICAL CO LTD 335 - - 335
RYOHIN KEIKAKU CO LTD 90 - 13 77
SAN IN GODO BANK LTD 533 - - 533
SANKYO CO LTD 176 - - 176
SANKYU INC - 925 771 154
SANRIO CO LTD 209 - - 209
SANTEN PHARMACEUTICAL CO LTD 1,400 - 200 1,200
SANWA HOLDINGS CORP 900 - 261 639
SAPPORO HOLDINGS LTD 253 - 85 168
SAWAI PHARMACEUTICAL CO LTD 120 - - 120
SBI HOLDINGS INC 809 200 194 815
SCREEN HOLDINGS CO LTD 142 - - 142
SCSK CORP 148 - - 148
SECOM CO LTD 693 - 52 641
SEGA SAMMY HOLDINGS INC 668 - - 668
SEIBU HOLDINGS INC 785 - 100 685
SEIKO EPSON CORP 1,000 100 127 973
SEINO HOLDINGS CO LTD 521 - - 521
SEKISUI CHEMICAL CO LTD 1,430 - 201 1,229
SEKISUI HOUSE LTD 2,100 - 183 1,917
SENSHU IKEDA HOLDINGS INC 1,065 - - 1,065
SEVEN + I HOLDINGS CO LTD 2,887 81 363 2,605
SEVEN BANK LTD 2,490 - 654 1,836
SG HOLDINGS CO LTD - 300 - 300
SHARP CORP 5,985 479 5,985 479
SHIGA BANK LTD 862 - - 862
SHIKOKU ELECTRIC POWER CO 617 198 231 584
SHIMACHU CO LTD 172 - - 172
SHIMADZU CORP 990 112 161 941
SHIMAMURA CO LTD 90 - 20 70
SHIMANO INC 292 - 31 261
Vanguard ETF SeriesAnnual Report 2017
Vanguard FTSE Japan Index ETF
-188-

Statement of movements in investment portfolio (Unaudited) (Continued)
For the year ended 31 December 2017
Beginningholdings as at
1 January2017
Additions Disposals Closingholdings as at31 December
2017
SHIMIZU CORP 2,188 - 308 1,880
SHIN ETSU CHEMICAL CO LTD 1,526 42 190 1,378
SHINSEI BANK LTD 5,980 598 5,980 598
SHIONOGI + CO LTD 1,068 47 132 983
SHISEIDO CO LTD 1,410 - 119 1,291
SHIZUOKA BANK LTD 2,113 - 396 1,717
SHOCHIKU CO LTD 384 38 384 38
SHOWA DENKO K K 400 - - 400
SHOWA SHELL SEKIYU KK 742 - - 742
SKY PERFECT JSAT HOLDINGS 491 - - 491
SKYLARK CO LTD 300 181 - 481
SMC CORP 219 - 25 194
SOFTBANK CORP 3,113 68 304 2,877
SOHGO SECURITY SERVICES CO 227 - - 227
SOJITZ CORP 4,678 909 1,018 4,569
SOMPO JAPAN NIPPONKOA HOLDIN 1,392 - 165 1,227
SONY CORP 4,564 104 405 4,263
SONY FINANCIAL HOLDINGS INC 682 - 165 517
SOTETSU HOLDINGS INC 1,481 301 1,481 301
SQUARE ENIX HOLDINGS CO LTD 250 - - 250
STANLEY ELECTRIC CO LTD 515 - - 515
START TODAY CO LTD 795 - 202 593
SUGI HOLDINGS CO LTD 150 50 57 143
SUMCO CORP 645 141 - 786
SUMITOMO CHEMICAL CO LTD 5,624 - 580 5,044
SUMITOMO CORP 4,062 - 344 3,718
SUMITOMO DAINIPPON PHARMA CO 532 - - 532
SUMITOMO ELECTRIC INDUSTRIES 2,760 - 255 2,505
SUMITOMO FORESTRY CO LTD 442 - - 442
SUMITOMO HEAVY INDUSTRIES 1,889 378 1,890 377
SUMITOMO METAL MINING CO LTD 1,780 782 1,780 782
SUMITOMO MITSUI FINANCIAL GR 4,739 219 442 4,516
SUMITOMO MITSUI TRUST HOLDIN 1,353 - 106 1,247
SUMITOMO OSAKA CEMENT CO LTD 1,312 - - 1,312
SUMITOMO REAL ESTATE SALES 50 - 50 -
SUMITOMO REALTY + DEVELOPMEN 1,537 - 111 1,426
SUMITOMO RUBBER INDUSTRIES 698 - 161 537
SUNDRUG CO LTD 115 115 - 230
SUNTORY BEVERAGE + FOOD LTD 473 - 62 411
Vanguard ETF SeriesAnnual Report 2017
Vanguard FTSE Japan Index ETF
-189-
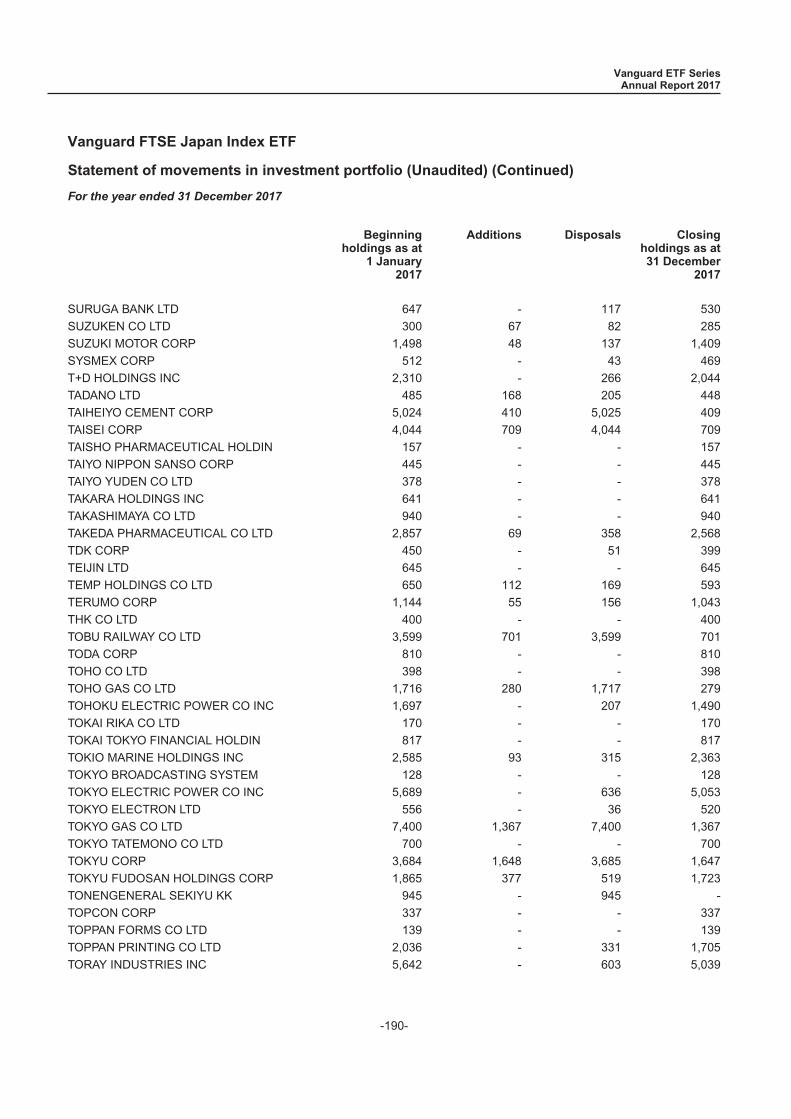
Statement of movements in investment portfolio (Unaudited) (Continued)
For the year ended 31 December 2017
Beginningholdings as at
1 January2017
Additions Disposals Closingholdings as at31 December
2017
SURUGA BANK LTD 647 - 117 530
SUZUKEN CO LTD 300 67 82 285
SUZUKI MOTOR CORP 1,498 48 137 1,409
SYSMEX CORP 512 - 43 469
T+D HOLDINGS INC 2,310 - 266 2,044
TADANO LTD 485 168 205 448
TAIHEIYO CEMENT CORP 5,024 410 5,025 409
TAISEI CORP 4,044 709 4,044 709
TAISHO PHARMACEUTICAL HOLDIN 157 - - 157
TAIYO NIPPON SANSO CORP 445 - - 445
TAIYO YUDEN CO LTD 378 - - 378
TAKARA HOLDINGS INC 641 - - 641
TAKASHIMAYA CO LTD 940 - - 940
TAKEDA PHARMACEUTICAL CO LTD 2,857 69 358 2,568
TDK CORP 450 - 51 399
TEIJIN LTD 645 - - 645
TEMP HOLDINGS CO LTD 650 112 169 593
TERUMO CORP 1,144 55 156 1,043
THK CO LTD 400 - - 400
TOBU RAILWAY CO LTD 3,599 701 3,599 701
TODA CORP 810 - - 810
TOHO CO LTD 398 - - 398
TOHO GAS CO LTD 1,716 280 1,717 279
TOHOKU ELECTRIC POWER CO INC 1,697 - 207 1,490
TOKAI RIKA CO LTD 170 - - 170
TOKAI TOKYO FINANCIAL HOLDIN 817 - - 817
TOKIO MARINE HOLDINGS INC 2,585 93 315 2,363
TOKYO BROADCASTING SYSTEM 128 - - 128
TOKYO ELECTRIC POWER CO INC 5,689 - 636 5,053
TOKYO ELECTRON LTD 556 - 36 520
TOKYO GAS CO LTD 7,400 1,367 7,400 1,367
TOKYO TATEMONO CO LTD 700 - - 700
TOKYU CORP 3,684 1,648 3,685 1,647
TOKYU FUDOSAN HOLDINGS CORP 1,865 377 519 1,723
TONENGENERAL SEKIYU KK 945 - 945 -
TOPCON CORP 337 - - 337
TOPPAN FORMS CO LTD 139 - - 139
TOPPAN PRINTING CO LTD 2,036 - 331 1,705
TORAY INDUSTRIES INC 5,642 - 603 5,039
Vanguard ETF SeriesAnnual Report 2017
Vanguard FTSE Japan Index ETF
-190-
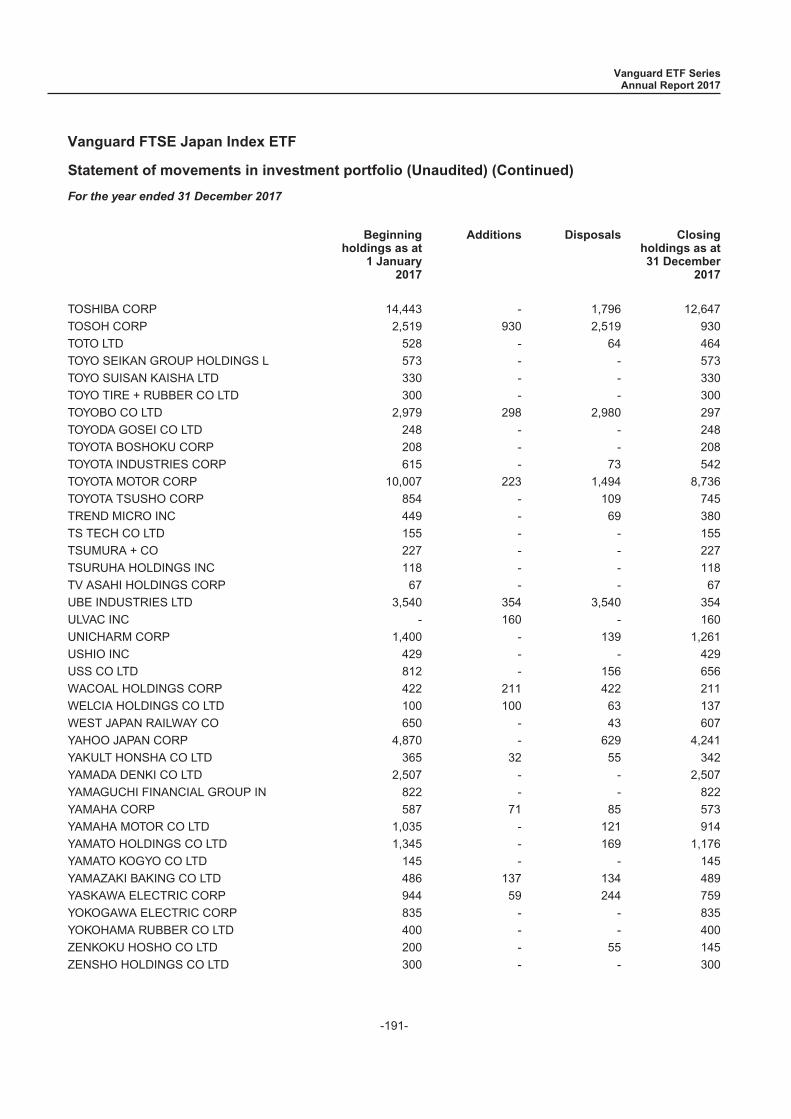
Statement of movements in investment portfolio (Unaudited) (Continued)
For the year ended 31 December 2017
Beginningholdings as at
1 January2017
Additions Disposals Closingholdings as at31 December
2017
TOSHIBA CORP 14,443 - 1,796 12,647
TOSOH CORP 2,519 930 2,519 930
TOTO LTD 528 - 64 464
TOYO SEIKAN GROUP HOLDINGS L 573 - - 573
TOYO SUISAN KAISHA LTD 330 - - 330
TOYO TIRE + RUBBER CO LTD 300 - - 300
TOYOBO CO LTD 2,979 298 2,980 297
TOYODA GOSEI CO LTD 248 - - 248
TOYOTA BOSHOKU CORP 208 - - 208
TOYOTA INDUSTRIES CORP 615 - 73 542
TOYOTA MOTOR CORP 10,007 223 1,494 8,736
TOYOTA TSUSHO CORP 854 - 109 745
TREND MICRO INC 449 - 69 380
TS TECH CO LTD 155 - - 155
TSUMURA + CO 227 - - 227
TSURUHA HOLDINGS INC 118 - - 118
TV ASAHI HOLDINGS CORP 67 - - 67
UBE INDUSTRIES LTD 3,540 354 3,540 354
ULVAC INC - 160 - 160
UNICHARM CORP 1,400 - 139 1,261
USHIO INC 429 - - 429
USS CO LTD 812 - 156 656
WACOAL HOLDINGS CORP 422 211 422 211
WELCIA HOLDINGS CO LTD 100 100 63 137
WEST JAPAN RAILWAY CO 650 - 43 607
YAHOO JAPAN CORP 4,870 - 629 4,241
YAKULT HONSHA CO LTD 365 32 55 342
YAMADA DENKI CO LTD 2,507 - - 2,507
YAMAGUCHI FINANCIAL GROUP IN 822 - - 822
YAMAHA CORP 587 71 85 573
YAMAHA MOTOR CO LTD 1,035 - 121 914
YAMATO HOLDINGS CO LTD 1,345 - 169 1,176
YAMATO KOGYO CO LTD 145 - - 145
YAMAZAKI BAKING CO LTD 486 137 134 489
YASKAWA ELECTRIC CORP 944 59 244 759
YOKOGAWA ELECTRIC CORP 835 - - 835
YOKOHAMA RUBBER CO LTD 400 - - 400
ZENKOKU HOSHO CO LTD 200 - 55 145
ZENSHO HOLDINGS CO LTD 300 - - 300
Vanguard ETF SeriesAnnual Report 2017
Vanguard FTSE Japan Index ETF
-191-

Statement of movements in investment portfolio (Unaudited) (Continued)
For the year ended 31 December 2017
Beginningholdings as at
1 January2017
Additions Disposals Closingholdings as at31 December
2017
ZEON CORP 672 - 253 419
Vanguard ETF SeriesAnnual Report 2017
Vanguard FTSE Japan Index ETF
-192-

Performance record (Unaudited)
As at 31 December 2017
Net asset value
Net assetvalue of the
Sub-FundHK$
Net assetvalue per
unitHK$
At the end of financial year dated
31 December 2017 105,238,273 26.98
31 December 2016 91,445,737 21.77
31 December 2015 90,720,004 21.60
Highest netasset value per
unitHK$
Lowest netasset value per
unitHK$
Financial year ended
31 December 2017 27.06 21.37
31 December 2016 22.38 17.72
31 December 2015 23.13 19.05
31 December 2014 (since inception) 21.01 18.50
Performance of the Sub-Fund
During the year ended 31 December 2017, the FTSE Japan Index increased by 25.92%, while the net asset value per unit ofthe Sub-Fund increased by 25.88%.
Ongoing charges
Financial year ended
31 December 2017 0.18%*
*The ongoing charges figure is the sum of the actual expenses charged to the Sub-Fund in a financial year. The figure isexpressed as a percentage of the Sub-Fund’s average Net Asset Value. It equals the Management Fee as set out in the section“Ongoing fees payable by the Sub-Fund” in the product key facts statement of the Sub-Fund and includes, the ongoing feespayable out of the Sub-Fund, the Manager’s Fee, the operational fees, all costs and expenses connected with the managementand operating activities of the Sub-Fund, investment management and advisory fees, administration, registration, transferagency, listing agent, registrar, custody and trustee fees, and other operating expenses. The ongoing charges figure does notcover (to the extent not included in the operational fees) any fees, costs and expenses payable by investors on the creation orredemption of units, such as the fees to participating dealers, brokerage fees, transaction fees, stamp duty or other duties andcharges, or any extraordinary or exceptional costs and expenses as may arise from time to time and any tax liabilities in respectof the Sub-Fund which will be paid separately out of the fund assets of the Sub-Fund.
Vanguard ETF SeriesAnnual Report 2017
Vanguard FTSE Japan Index ETF
-193-
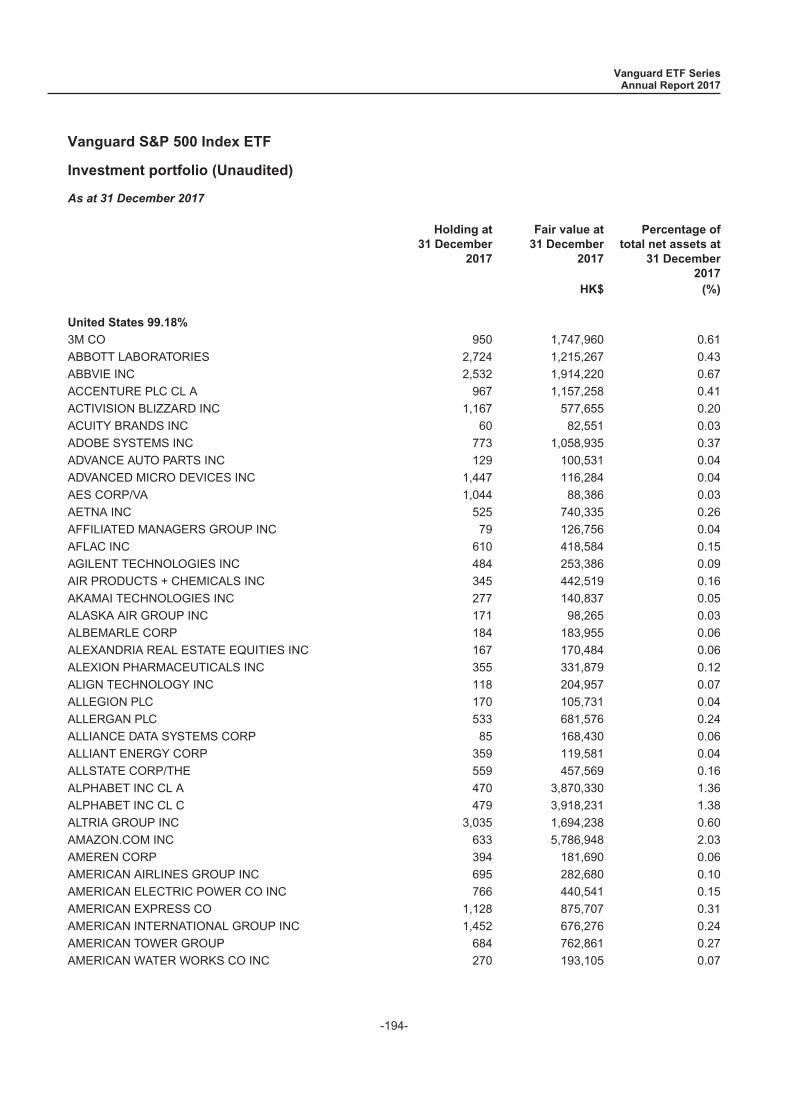
Investment portfolio (Unaudited)
As at 31 December 2017
Holding at31 December
2017
Fair value at31 December
2017
Percentage oftotal net assets at
31 December2017
HK$ (%)
United States 99.18%
3M CO 950 1,747,960 0.61
ABBOTT LABORATORIES 2,724 1,215,267 0.43
ABBVIE INC 2,532 1,914,220 0.67
ACCENTURE PLC CL A 967 1,157,258 0.41
ACTIVISION BLIZZARD INC 1,167 577,655 0.20
ACUITY BRANDS INC 60 82,551 0.03
ADOBE SYSTEMS INC 773 1,058,935 0.37
ADVANCE AUTO PARTS INC 129 100,531 0.04
ADVANCED MICRO DEVICES INC 1,447 116,284 0.04
AES CORP/VA 1,044 88,386 0.03
AETNA INC 525 740,335 0.26
AFFILIATED MANAGERS GROUP INC 79 126,756 0.04
AFLAC INC 610 418,584 0.15
AGILENT TECHNOLOGIES INC 484 253,386 0.09
AIR PRODUCTS + CHEMICALS INC 345 442,519 0.16
AKAMAI TECHNOLOGIES INC 277 140,837 0.05
ALASKA AIR GROUP INC 171 98,265 0.03
ALBEMARLE CORP 184 183,955 0.06
ALEXANDRIA REAL ESTATE EQUITIES INC 167 170,484 0.06
ALEXION PHARMACEUTICALS INC 355 331,879 0.12
ALIGN TECHNOLOGY INC 118 204,957 0.07
ALLEGION PLC 170 105,731 0.04
ALLERGAN PLC 533 681,576 0.24
ALLIANCE DATA SYSTEMS CORP 85 168,430 0.06
ALLIANT ENERGY CORP 359 119,581 0.04
ALLSTATE CORP/THE 559 457,569 0.16
ALPHABET INC CL A 470 3,870,330 1.36
ALPHABET INC CL C 479 3,918,231 1.38
ALTRIA GROUP INC 3,035 1,694,238 0.60
AMAZON.COM INC 633 5,786,948 2.03
AMEREN CORP 394 181,690 0.06
AMERICAN AIRLINES GROUP INC 695 282,680 0.10
AMERICAN ELECTRIC POWER CO INC 766 440,541 0.15
AMERICAN EXPRESS CO 1,128 875,707 0.31
AMERICAN INTERNATIONAL GROUP INC 1,452 676,276 0.24
AMERICAN TOWER GROUP 684 762,861 0.27
AMERICAN WATER WORKS CO INC 270 193,105 0.07
Vanguard ETF SeriesAnnual Report 2017
Vanguard S&P 500 Index ETF
-194-
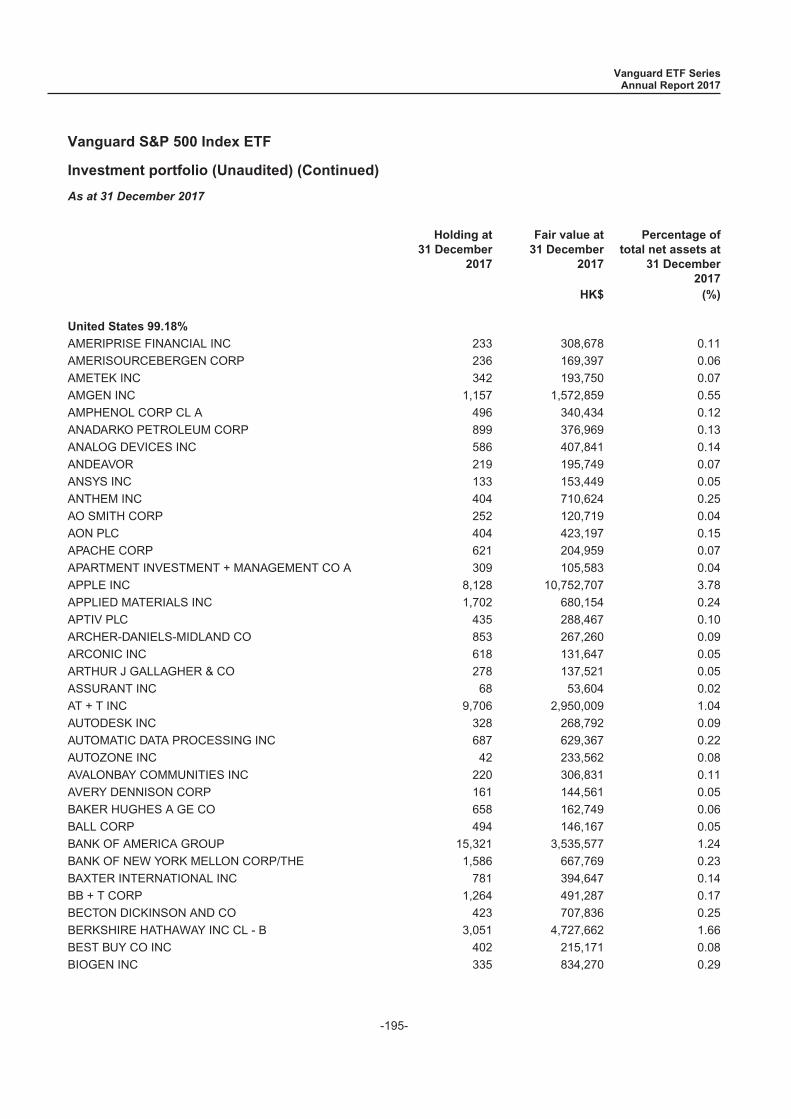
Investment portfolio (Unaudited) (Continued)
As at 31 December 2017
Holding at31 December
2017
Fair value at31 December
2017
Percentage oftotal net assets at
31 December2017
HK$ (%)
United States 99.18%
AMERIPRISE FINANCIAL INC 233 308,678 0.11
AMERISOURCEBERGEN CORP 236 169,397 0.06
AMETEK INC 342 193,750 0.07
AMGEN INC 1,157 1,572,859 0.55
AMPHENOL CORP CL A 496 340,434 0.12
ANADARKO PETROLEUM CORP 899 376,969 0.13
ANALOG DEVICES INC 586 407,841 0.14
ANDEAVOR 219 195,749 0.07
ANSYS INC 133 153,449 0.05
ANTHEM INC 404 710,624 0.25
AO SMITH CORP 252 120,719 0.04
AON PLC 404 423,197 0.15
APACHE CORP 621 204,959 0.07
APARTMENT INVESTMENT + MANAGEMENT CO A 309 105,583 0.04
APPLE INC 8,128 10,752,707 3.78
APPLIED MATERIALS INC 1,702 680,154 0.24
APTIV PLC 435 288,467 0.10
ARCHER-DANIELS-MIDLAND CO 853 267,260 0.09
ARCONIC INC 618 131,647 0.05
ARTHUR J GALLAGHER & CO 278 137,521 0.05
ASSURANT INC 68 53,604 0.02
AT + T INC 9,706 2,950,009 1.04
AUTODESK INC 328 268,792 0.09
AUTOMATIC DATA PROCESSING INC 687 629,367 0.22
AUTOZONE INC 42 233,562 0.08
AVALONBAY COMMUNITIES INC 220 306,831 0.11
AVERY DENNISON CORP 161 144,561 0.05
BAKER HUGHES A GE CO 658 162,749 0.06
BALL CORP 494 146,167 0.05
BANK OF AMERICA GROUP 15,321 3,535,577 1.24
BANK OF NEW YORK MELLON CORP/THE 1,586 667,769 0.23
BAXTER INTERNATIONAL INC 781 394,647 0.14
BB + T CORP 1,264 491,287 0.17
BECTON DICKINSON AND CO 423 707,836 0.25
BERKSHIRE HATHAWAY INC CL - B 3,051 4,727,662 1.66
BEST BUY CO INC 402 215,171 0.08
BIOGEN INC 335 834,270 0.29
Vanguard ETF SeriesAnnual Report 2017
Vanguard S&P 500 Index ETF
-195-
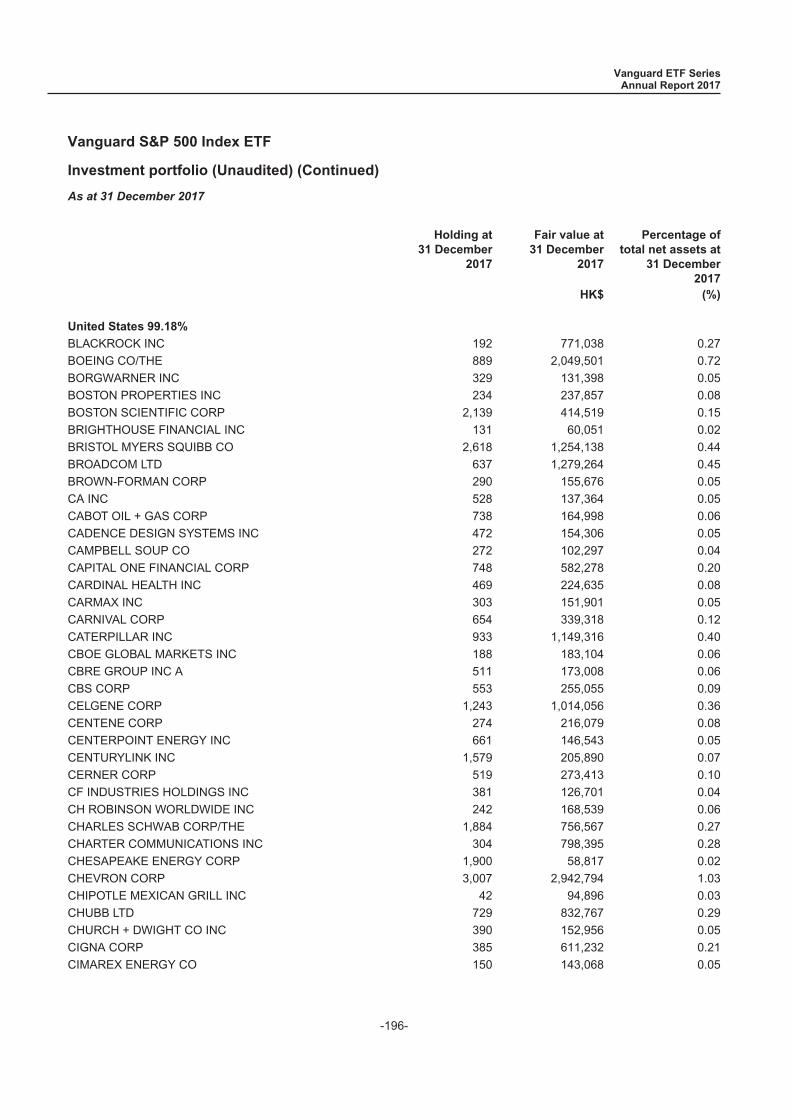
Investment portfolio (Unaudited) (Continued)
As at 31 December 2017
Holding at31 December
2017
Fair value at31 December
2017
Percentage oftotal net assets at
31 December2017
HK$ (%)
United States 99.18%
BLACKROCK INC 192 771,038 0.27
BOEING CO/THE 889 2,049,501 0.72
BORGWARNER INC 329 131,398 0.05
BOSTON PROPERTIES INC 234 237,857 0.08
BOSTON SCIENTIFIC CORP 2,139 414,519 0.15
BRIGHTHOUSE FINANCIAL INC 131 60,051 0.02
BRISTOL MYERS SQUIBB CO 2,618 1,254,138 0.44
BROADCOM LTD 637 1,279,264 0.45
BROWN-FORMAN CORP 290 155,676 0.05
CA INC 528 137,364 0.05
CABOT OIL + GAS CORP 738 164,998 0.06
CADENCE DESIGN SYSTEMS INC 472 154,306 0.05
CAMPBELL SOUP CO 272 102,297 0.04
CAPITAL ONE FINANCIAL CORP 748 582,278 0.20
CARDINAL HEALTH INC 469 224,635 0.08
CARMAX INC 303 151,901 0.05
CARNIVAL CORP 654 339,318 0.12
CATERPILLAR INC 933 1,149,316 0.40
CBOE GLOBAL MARKETS INC 188 183,104 0.06
CBRE GROUP INC A 511 173,008 0.06
CBS CORP 553 255,055 0.09
CELGENE CORP 1,243 1,014,056 0.36
CENTENE CORP 274 216,079 0.08
CENTERPOINT ENERGY INC 661 146,543 0.05
CENTURYLINK INC 1,579 205,890 0.07
CERNER CORP 519 273,413 0.10
CF INDUSTRIES HOLDINGS INC 381 126,701 0.04
CH ROBINSON WORLDWIDE INC 242 168,539 0.06
CHARLES SCHWAB CORP/THE 1,884 756,567 0.27
CHARTER COMMUNICATIONS INC 304 798,395 0.28
CHESAPEAKE ENERGY CORP 1,900 58,817 0.02
CHEVRON CORP 3,007 2,942,794 1.03
CHIPOTLE MEXICAN GRILL INC 42 94,896 0.03
CHUBB LTD 729 832,767 0.29
CHURCH + DWIGHT CO INC 390 152,956 0.05
CIGNA CORP 385 611,232 0.21
CIMAREX ENERGY CO 150 143,068 0.05
Vanguard ETF SeriesAnnual Report 2017
Vanguard S&P 500 Index ETF
-196-
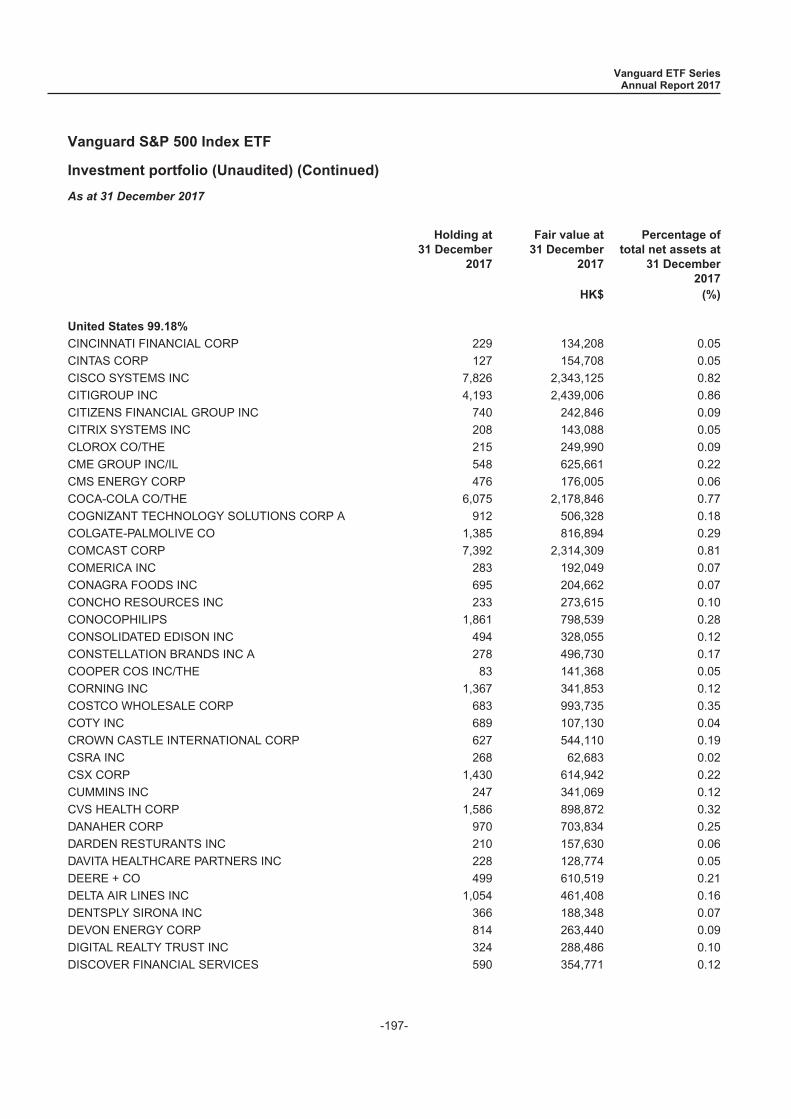
Investment portfolio (Unaudited) (Continued)
As at 31 December 2017
Holding at31 December
2017
Fair value at31 December
2017
Percentage oftotal net assets at
31 December2017
HK$ (%)
United States 99.18%
CINCINNATI FINANCIAL CORP 229 134,208 0.05
CINTAS CORP 127 154,708 0.05
CISCO SYSTEMS INC 7,826 2,343,125 0.82
CITIGROUP INC 4,193 2,439,006 0.86
CITIZENS FINANCIAL GROUP INC 740 242,846 0.09
CITRIX SYSTEMS INC 208 143,088 0.05
CLOROX CO/THE 215 249,990 0.09
CME GROUP INC/IL 548 625,661 0.22
CMS ENERGY CORP 476 176,005 0.06
COCA-COLA CO/THE 6,075 2,178,846 0.77
COGNIZANT TECHNOLOGY SOLUTIONS CORP A 912 506,328 0.18
COLGATE-PALMOLIVE CO 1,385 816,894 0.29
COMCAST CORP 7,392 2,314,309 0.81
COMERICA INC 283 192,049 0.07
CONAGRA FOODS INC 695 204,662 0.07
CONCHO RESOURCES INC 233 273,615 0.10
CONOCOPHILIPS 1,861 798,539 0.28
CONSOLIDATED EDISON INC 494 328,055 0.12
CONSTELLATION BRANDS INC A 278 496,730 0.17
COOPER COS INC/THE 83 141,368 0.05
CORNING INC 1,367 341,853 0.12
COSTCO WHOLESALE CORP 683 993,735 0.35
COTY INC 689 107,130 0.04
CROWN CASTLE INTERNATIONAL CORP 627 544,110 0.19
CSRA INC 268 62,683 0.02
CSX CORP 1,430 614,942 0.22
CUMMINS INC 247 341,069 0.12
CVS HEALTH CORP 1,586 898,872 0.32
DANAHER CORP 970 703,834 0.25
DARDEN RESTURANTS INC 210 157,630 0.06
DAVITA HEALTHCARE PARTNERS INC 228 128,774 0.05
DEERE + CO 499 610,519 0.21
DELTA AIR LINES INC 1,054 461,408 0.16
DENTSPLY SIRONA INC 366 188,348 0.07
DEVON ENERGY CORP 814 263,440 0.09
DIGITAL REALTY TRUST INC 324 288,486 0.10
DISCOVER FINANCIAL SERVICES 590 354,771 0.12
Vanguard ETF SeriesAnnual Report 2017
Vanguard S&P 500 Index ETF
-197-

Investment portfolio (Unaudited) (Continued)
As at 31 December 2017
Holding at31 December
2017
Fair value at31 December
2017
Percentage oftotal net assets at
31 December2017
HK$ (%)
United States 99.18%
DISCOVERY COMMUNICATIONS INC A 189 33,066 0.01
DISCOVERY COMMUNICATIONS INC C 347 57,426 0.02
DISH NETWORK CORP 368 137,366 0.05
DOLLAR GENERAL CORP 423 307,558 0.11
DOLLAR TREE INC 380 318,772 0.11
DOMINION RESOURCES INC/VA 1,025 649,512 0.23
DOVER CORP 230 181,578 0.06
DOWDUPONT INC 3,712 2,066,649 0.73
DR HORTON INC 534 213,189 0.07
DR PEPPER SNAPPLE GROUP INC 286 217,002 0.08
DTE ENERGY CO 268 229,323 0.08
DUKE ENERGY CORP 1,101 723,922 0.25
DUKE REALTY CORP 643 136,772 0.05
DXC TECHNOLOGY CO 467 346,449 0.12
E TRADE FINANCIAL CORP 400 155,001 0.05
EASTMAN CHEMICAL CO 220 159,323 0.06
EATON CORP PLC 706 436,057 0.15
EBAY INC 1,570 463,189 0.16
ECOLAB INC 401 420,619 0.15
EDISON INTERNATIONAL 530 262,014 0.09
EDWARDS LIFESCIENCES CORP 339 298,689 0.11
ELECTRONIC ARTS INC 482 395,860 0.14
ELI LILLY + CO 1,553 1,025,367 0.36
EMERSON ELECTRIC CO 1,038 565,490 0.20
ENTERGY CORP 267 169,879 0.06
ENVISION HEALTHCARE CORP 150 40,525 0.01
EOG RESOURCE INC 914 771,018 0.27
EQT CORP 380 169,085 0.06
EQUIFAX INC 197 181,598 0.06
EQUINIX INC 122 432,241 0.15
EQUITY RESIDENTIAL 590 294,120 0.10
ESSEX PROPERTY TRUST INC 102 192,460 0.07
ESTEE LAUDER COS INC/THE 358 356,093 0.13
EVEREST RE GROUP LTD 64 110,698 0.04
EVERSOURCE ENERGY 519 256,333 0.09
EXELON CORP 1,482 456,574 0.16
EXPEDIA INC 180 168,530 0.06
Vanguard ETF SeriesAnnual Report 2017
Vanguard S&P 500 Index ETF
-198-
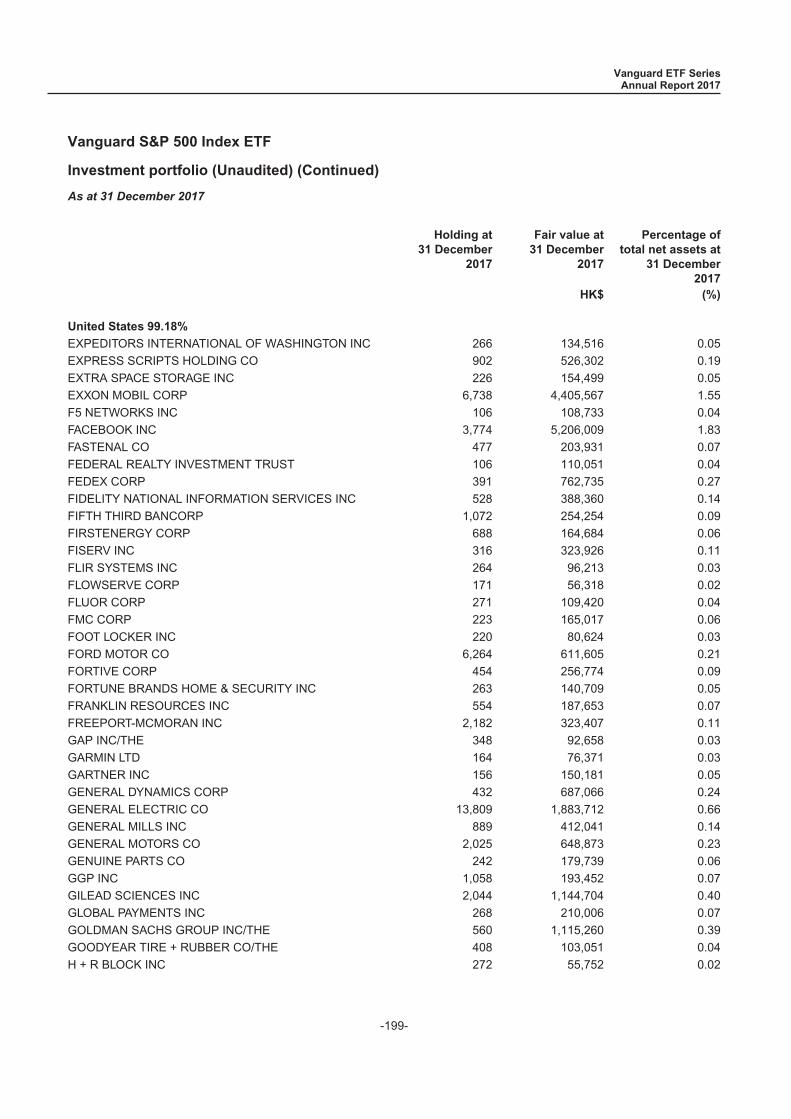
Investment portfolio (Unaudited) (Continued)
As at 31 December 2017
Holding at31 December
2017
Fair value at31 December
2017
Percentage oftotal net assets at
31 December2017
HK$ (%)
United States 99.18%
EXPEDITORS INTERNATIONAL OF WASHINGTON INC 266 134,516 0.05
EXPRESS SCRIPTS HOLDING CO 902 526,302 0.19
EXTRA SPACE STORAGE INC 226 154,499 0.05
EXXON MOBIL CORP 6,738 4,405,567 1.55
F5 NETWORKS INC 106 108,733 0.04
FACEBOOK INC 3,774 5,206,009 1.83
FASTENAL CO 477 203,931 0.07
FEDERAL REALTY INVESTMENT TRUST 106 110,051 0.04
FEDEX CORP 391 762,735 0.27
FIDELITY NATIONAL INFORMATION SERVICES INC 528 388,360 0.14
FIFTH THIRD BANCORP 1,072 254,254 0.09
FIRSTENERGY CORP 688 164,684 0.06
FISERV INC 316 323,926 0.11
FLIR SYSTEMS INC 264 96,213 0.03
FLOWSERVE CORP 171 56,318 0.02
FLUOR CORP 271 109,420 0.04
FMC CORP 223 165,017 0.06
FOOT LOCKER INC 220 80,624 0.03
FORD MOTOR CO 6,264 611,605 0.21
FORTIVE CORP 454 256,774 0.09
FORTUNE BRANDS HOME & SECURITY INC 263 140,709 0.05
FRANKLIN RESOURCES INC 554 187,653 0.07
FREEPORT-MCMORAN INC 2,182 323,407 0.11
GAP INC/THE 348 92,658 0.03
GARMIN LTD 164 76,371 0.03
GARTNER INC 156 150,181 0.05
GENERAL DYNAMICS CORP 432 687,066 0.24
GENERAL ELECTRIC CO 13,809 1,883,712 0.66
GENERAL MILLS INC 889 412,041 0.14
GENERAL MOTORS CO 2,025 648,873 0.23
GENUINE PARTS CO 242 179,739 0.06
GGP INC 1,058 193,452 0.07
GILEAD SCIENCES INC 2,044 1,144,704 0.40
GLOBAL PAYMENTS INC 268 210,006 0.07
GOLDMAN SACHS GROUP INC/THE 560 1,115,260 0.39
GOODYEAR TIRE + RUBBER CO/THE 408 103,051 0.04
H + R BLOCK INC 272 55,752 0.02
Vanguard ETF SeriesAnnual Report 2017
Vanguard S&P 500 Index ETF
-199-
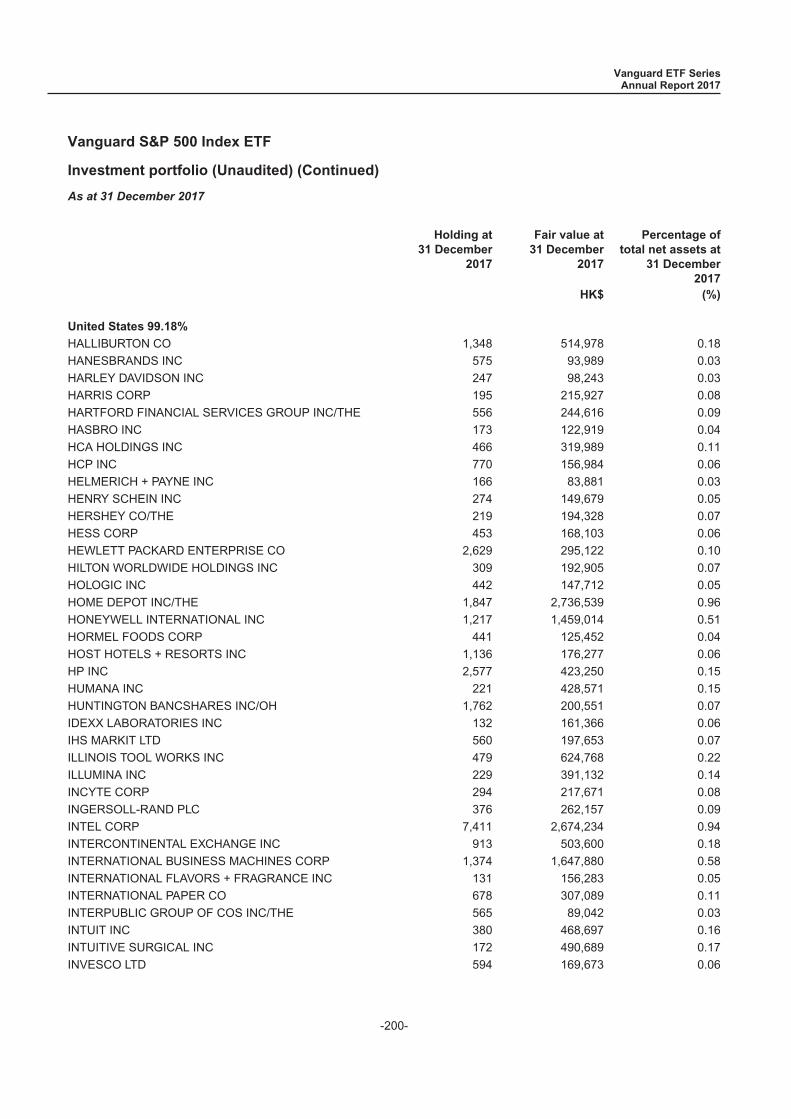
Investment portfolio (Unaudited) (Continued)
As at 31 December 2017
Holding at31 December
2017
Fair value at31 December
2017
Percentage oftotal net assets at
31 December2017
HK$ (%)
United States 99.18%
HALLIBURTON CO 1,348 514,978 0.18
HANESBRANDS INC 575 93,989 0.03
HARLEY DAVIDSON INC 247 98,243 0.03
HARRIS CORP 195 215,927 0.08
HARTFORD FINANCIAL SERVICES GROUP INC/THE 556 244,616 0.09
HASBRO INC 173 122,919 0.04
HCA HOLDINGS INC 466 319,989 0.11
HCP INC 770 156,984 0.06
HELMERICH + PAYNE INC 166 83,881 0.03
HENRY SCHEIN INC 274 149,679 0.05
HERSHEY CO/THE 219 194,328 0.07
HESS CORP 453 168,103 0.06
HEWLETT PACKARD ENTERPRISE CO 2,629 295,122 0.10
HILTON WORLDWIDE HOLDINGS INC 309 192,905 0.07
HOLOGIC INC 442 147,712 0.05
HOME DEPOT INC/THE 1,847 2,736,539 0.96
HONEYWELL INTERNATIONAL INC 1,217 1,459,014 0.51
HORMEL FOODS CORP 441 125,452 0.04
HOST HOTELS + RESORTS INC 1,136 176,277 0.06
HP INC 2,577 423,250 0.15
HUMANA INC 221 428,571 0.15
HUNTINGTON BANCSHARES INC/OH 1,762 200,551 0.07
IDEXX LABORATORIES INC 132 161,366 0.06
IHS MARKIT LTD 560 197,653 0.07
ILLINOIS TOOL WORKS INC 479 624,768 0.22
ILLUMINA INC 229 391,132 0.14
INCYTE CORP 294 217,671 0.08
INGERSOLL-RAND PLC 376 262,157 0.09
INTEL CORP 7,411 2,674,234 0.94
INTERCONTINENTAL EXCHANGE INC 913 503,600 0.18
INTERNATIONAL BUSINESS MACHINES CORP 1,374 1,647,880 0.58
INTERNATIONAL FLAVORS + FRAGRANCE INC 131 156,283 0.05
INTERNATIONAL PAPER CO 678 307,089 0.11
INTERPUBLIC GROUP OF COS INC/THE 565 89,042 0.03
INTUIT INC 380 468,697 0.16
INTUITIVE SURGICAL INC 172 490,689 0.17
INVESCO LTD 594 169,673 0.06
Vanguard ETF SeriesAnnual Report 2017
Vanguard S&P 500 Index ETF
-200-
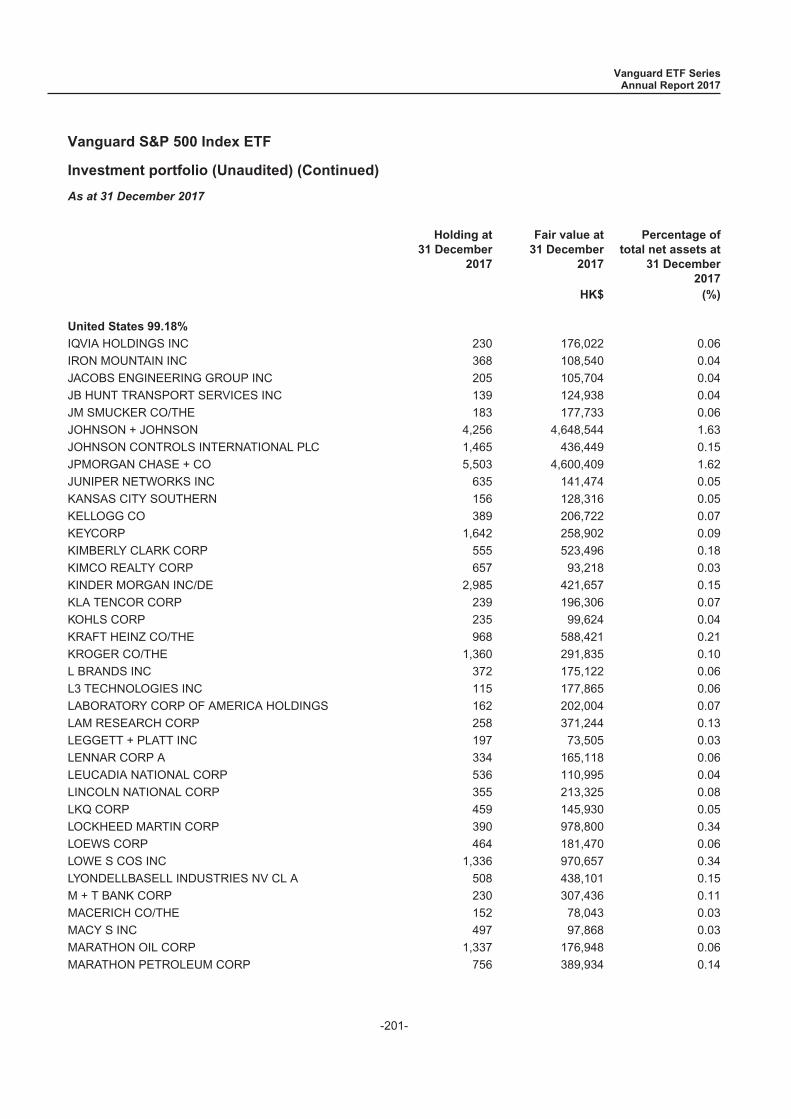
Investment portfolio (Unaudited) (Continued)
As at 31 December 2017
Holding at31 December
2017
Fair value at31 December
2017
Percentage oftotal net assets at
31 December2017
HK$ (%)
United States 99.18%
IQVIA HOLDINGS INC 230 176,022 0.06
IRON MOUNTAIN INC 368 108,540 0.04
JACOBS ENGINEERING GROUP INC 205 105,704 0.04
JB HUNT TRANSPORT SERVICES INC 139 124,938 0.04
JM SMUCKER CO/THE 183 177,733 0.06
JOHNSON + JOHNSON 4,256 4,648,544 1.63
JOHNSON CONTROLS INTERNATIONAL PLC 1,465 436,449 0.15
JPMORGAN CHASE + CO 5,503 4,600,409 1.62
JUNIPER NETWORKS INC 635 141,474 0.05
KANSAS CITY SOUTHERN 156 128,316 0.05
KELLOGG CO 389 206,722 0.07
KEYCORP 1,642 258,902 0.09
KIMBERLY CLARK CORP 555 523,496 0.18
KIMCO REALTY CORP 657 93,218 0.03
KINDER MORGAN INC/DE 2,985 421,657 0.15
KLA TENCOR CORP 239 196,306 0.07
KOHLS CORP 235 99,624 0.04
KRAFT HEINZ CO/THE 968 588,421 0.21
KROGER CO/THE 1,360 291,835 0.10
L BRANDS INC 372 175,122 0.06
L3 TECHNOLOGIES INC 115 177,865 0.06
LABORATORY CORP OF AMERICA HOLDINGS 162 202,004 0.07
LAM RESEARCH CORP 258 371,244 0.13
LEGGETT + PLATT INC 197 73,505 0.03
LENNAR CORP A 334 165,118 0.06
LEUCADIA NATIONAL CORP 536 110,995 0.04
LINCOLN NATIONAL CORP 355 213,325 0.08
LKQ CORP 459 145,930 0.05
LOCKHEED MARTIN CORP 390 978,800 0.34
LOEWS CORP 464 181,470 0.06
LOWE S COS INC 1,336 970,657 0.34
LYONDELLBASELL INDUSTRIES NV CL A 508 438,101 0.15
M + T BANK CORP 230 307,436 0.11
MACERICH CO/THE 152 78,043 0.03
MACY S INC 497 97,868 0.03
MARATHON OIL CORP 1,337 176,948 0.06
MARATHON PETROLEUM CORP 756 389,934 0.14
Vanguard ETF SeriesAnnual Report 2017
Vanguard S&P 500 Index ETF
-201-
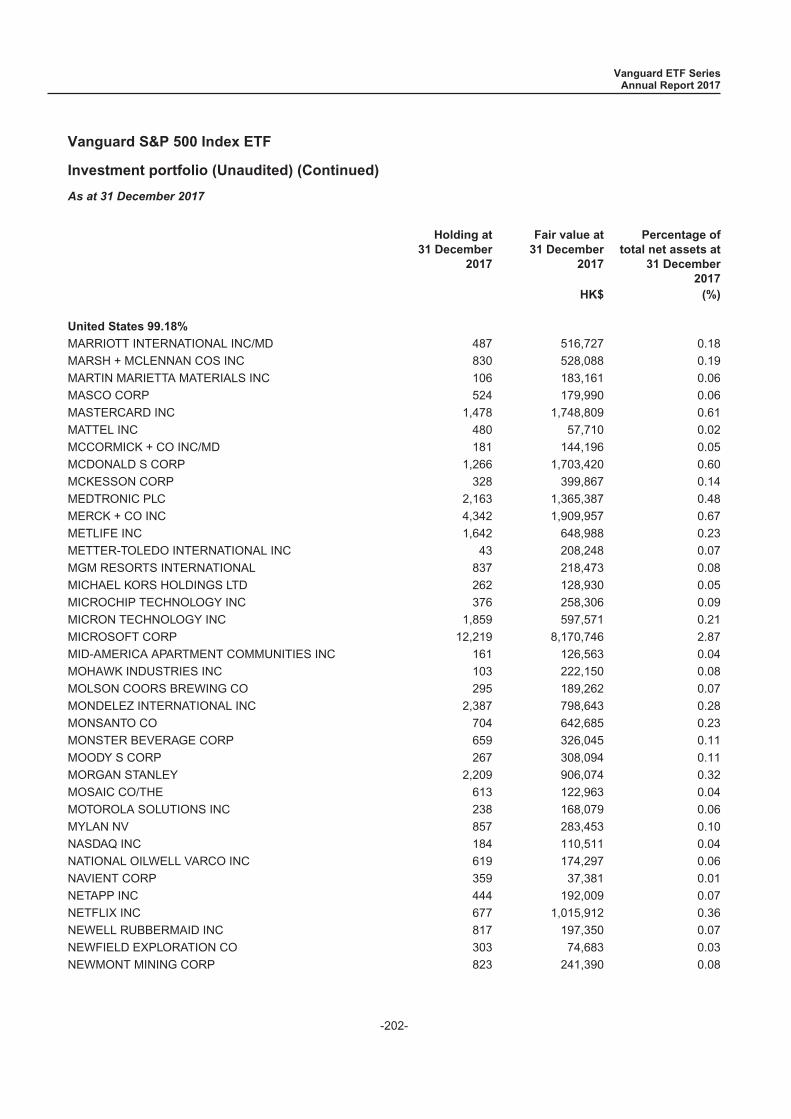
Investment portfolio (Unaudited) (Continued)
As at 31 December 2017
Holding at31 December
2017
Fair value at31 December
2017
Percentage oftotal net assets at
31 December2017
HK$ (%)
United States 99.18%
MARRIOTT INTERNATIONAL INC/MD 487 516,727 0.18
MARSH + MCLENNAN COS INC 830 528,088 0.19
MARTIN MARIETTA MATERIALS INC 106 183,161 0.06
MASCO CORP 524 179,990 0.06
MASTERCARD INC 1,478 1,748,809 0.61
MATTEL INC 480 57,710 0.02
MCCORMICK + CO INC/MD 181 144,196 0.05
MCDONALD S CORP 1,266 1,703,420 0.60
MCKESSON CORP 328 399,867 0.14
MEDTRONIC PLC 2,163 1,365,387 0.48
MERCK + CO INC 4,342 1,909,957 0.67
METLIFE INC 1,642 648,988 0.23
METTER-TOLEDO INTERNATIONAL INC 43 208,248 0.07
MGM RESORTS INTERNATIONAL 837 218,473 0.08
MICHAEL KORS HOLDINGS LTD 262 128,930 0.05
MICROCHIP TECHNOLOGY INC 376 258,306 0.09
MICRON TECHNOLOGY INC 1,859 597,571 0.21
MICROSOFT CORP 12,219 8,170,746 2.87
MID-AMERICA APARTMENT COMMUNITIES INC 161 126,563 0.04
MOHAWK INDUSTRIES INC 103 222,150 0.08
MOLSON COORS BREWING CO 295 189,262 0.07
MONDELEZ INTERNATIONAL INC 2,387 798,643 0.28
MONSANTO CO 704 642,685 0.23
MONSTER BEVERAGE CORP 659 326,045 0.11
MOODY S CORP 267 308,094 0.11
MORGAN STANLEY 2,209 906,074 0.32
MOSAIC CO/THE 613 122,963 0.04
MOTOROLA SOLUTIONS INC 238 168,079 0.06
MYLAN NV 857 283,453 0.10
NASDAQ INC 184 110,511 0.04
NATIONAL OILWELL VARCO INC 619 174,297 0.06
NAVIENT CORP 359 37,381 0.01
NETAPP INC 444 192,009 0.07
NETFLIX INC 677 1,015,912 0.36
NEWELL RUBBERMAID INC 817 197,350 0.07
NEWFIELD EXPLORATION CO 303 74,683 0.03
NEWMONT MINING CORP 823 241,390 0.08
Vanguard ETF SeriesAnnual Report 2017
Vanguard S&P 500 Index ETF
-202-
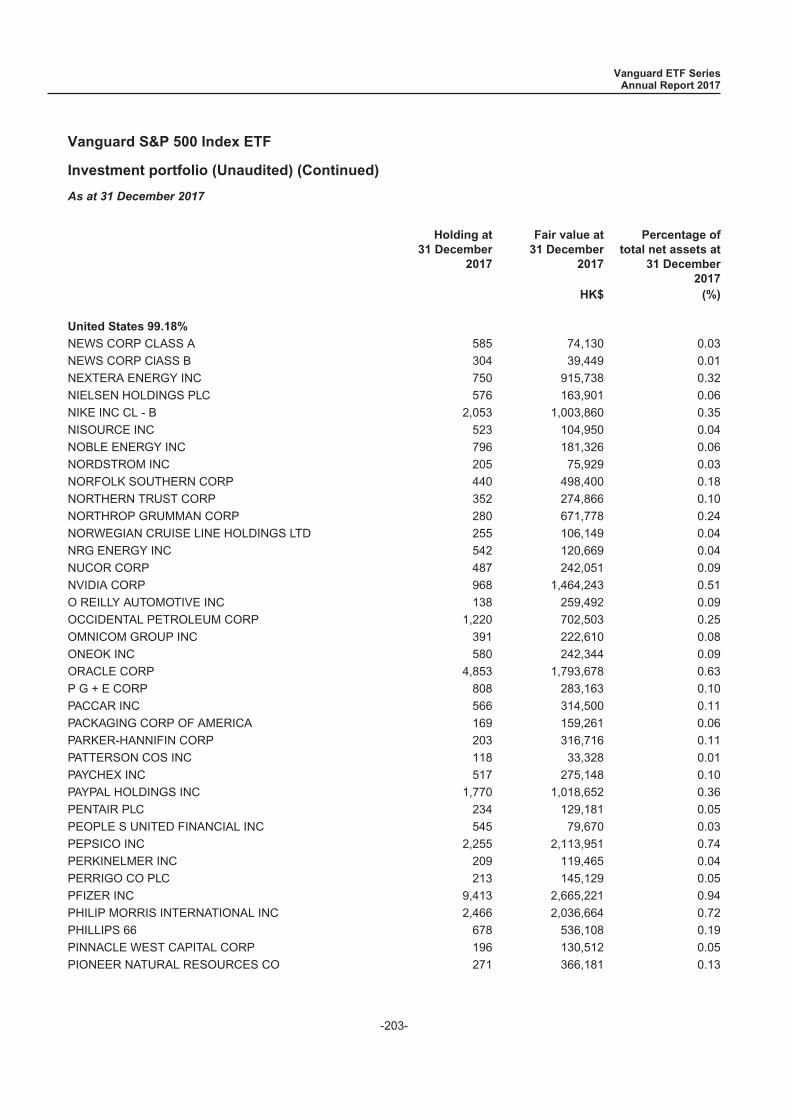
Investment portfolio (Unaudited) (Continued)
As at 31 December 2017
Holding at31 December
2017
Fair value at31 December
2017
Percentage oftotal net assets at
31 December2017
HK$ (%)
United States 99.18%
NEWS CORP CLASS A 585 74,130 0.03
NEWS CORP ClASS B 304 39,449 0.01
NEXTERA ENERGY INC 750 915,738 0.32
NIELSEN HOLDINGS PLC 576 163,901 0.06
NIKE INC CL - B 2,053 1,003,860 0.35
NISOURCE INC 523 104,950 0.04
NOBLE ENERGY INC 796 181,326 0.06
NORDSTROM INC 205 75,929 0.03
NORFOLK SOUTHERN CORP 440 498,400 0.18
NORTHERN TRUST CORP 352 274,866 0.10
NORTHROP GRUMMAN CORP 280 671,778 0.24
NORWEGIAN CRUISE LINE HOLDINGS LTD 255 106,149 0.04
NRG ENERGY INC 542 120,669 0.04
NUCOR CORP 487 242,051 0.09
NVIDIA CORP 968 1,464,243 0.51
O REILLY AUTOMOTIVE INC 138 259,492 0.09
OCCIDENTAL PETROLEUM CORP 1,220 702,503 0.25
OMNICOM GROUP INC 391 222,610 0.08
ONEOK INC 580 242,344 0.09
ORACLE CORP 4,853 1,793,678 0.63
P G + E CORP 808 283,163 0.10
PACCAR INC 566 314,500 0.11
PACKAGING CORP OF AMERICA 169 159,261 0.06
PARKER-HANNIFIN CORP 203 316,716 0.11
PATTERSON COS INC 118 33,328 0.01
PAYCHEX INC 517 275,148 0.10
PAYPAL HOLDINGS INC 1,770 1,018,652 0.36
PENTAIR PLC 234 129,181 0.05
PEOPLE S UNITED FINANCIAL INC 545 79,670 0.03
PEPSICO INC 2,255 2,113,951 0.74
PERKINELMER INC 209 119,465 0.04
PERRIGO CO PLC 213 145,129 0.05
PFIZER INC 9,413 2,665,221 0.94
PHILIP MORRIS INTERNATIONAL INC 2,466 2,036,664 0.72
PHILLIPS 66 678 536,108 0.19
PINNACLE WEST CAPITAL CORP 196 130,512 0.05
PIONEER NATURAL RESOURCES CO 271 366,181 0.13
Vanguard ETF SeriesAnnual Report 2017
Vanguard S&P 500 Index ETF
-203-
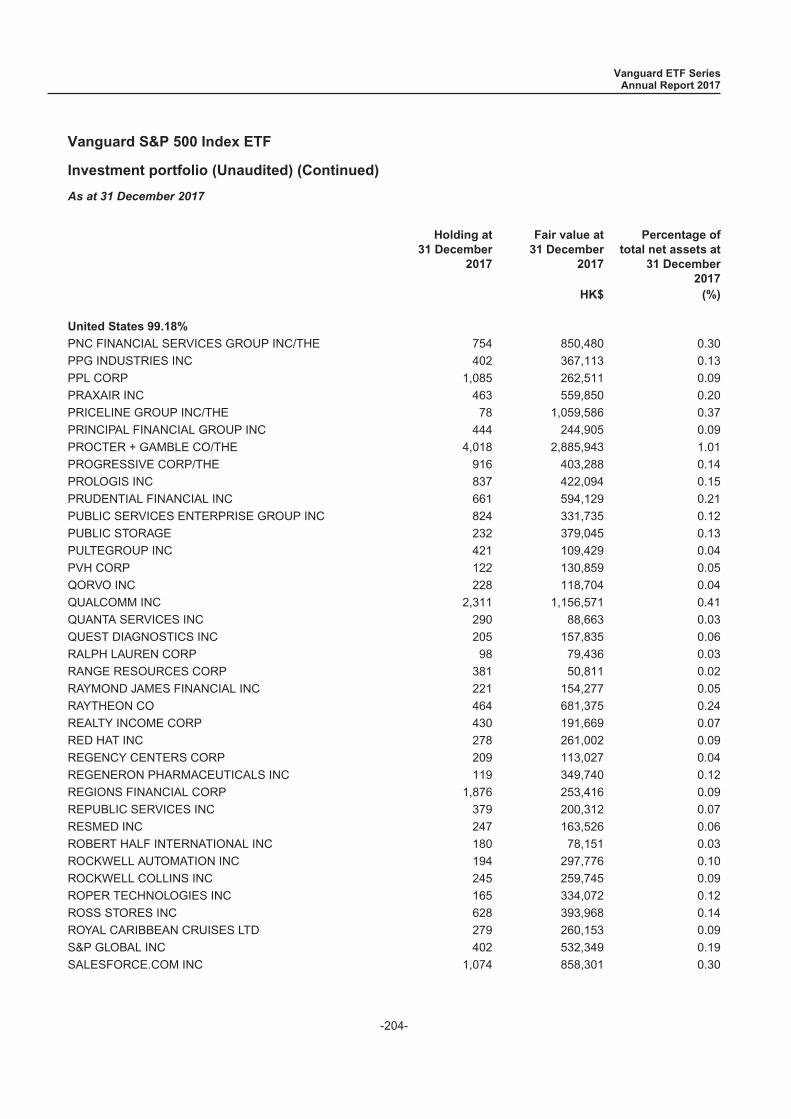
Investment portfolio (Unaudited) (Continued)
As at 31 December 2017
Holding at31 December
2017
Fair value at31 December
2017
Percentage oftotal net assets at
31 December2017
HK$ (%)
United States 99.18%
PNC FINANCIAL SERVICES GROUP INC/THE 754 850,480 0.30
PPG INDUSTRIES INC 402 367,113 0.13
PPL CORP 1,085 262,511 0.09
PRAXAIR INC 463 559,850 0.20
PRICELINE GROUP INC/THE 78 1,059,586 0.37
PRINCIPAL FINANCIAL GROUP INC 444 244,905 0.09
PROCTER + GAMBLE CO/THE 4,018 2,885,943 1.01
PROGRESSIVE CORP/THE 916 403,288 0.14
PROLOGIS INC 837 422,094 0.15
PRUDENTIAL FINANCIAL INC 661 594,129 0.21
PUBLIC SERVICES ENTERPRISE GROUP INC 824 331,735 0.12
PUBLIC STORAGE 232 379,045 0.13
PULTEGROUP INC 421 109,429 0.04
PVH CORP 122 130,859 0.05
QORVO INC 228 118,704 0.04
QUALCOMM INC 2,311 1,156,571 0.41
QUANTA SERVICES INC 290 88,663 0.03
QUEST DIAGNOSTICS INC 205 157,835 0.06
RALPH LAUREN CORP 98 79,436 0.03
RANGE RESOURCES CORP 381 50,811 0.02
RAYMOND JAMES FINANCIAL INC 221 154,277 0.05
RAYTHEON CO 464 681,375 0.24
REALTY INCOME CORP 430 191,669 0.07
RED HAT INC 278 261,002 0.09
REGENCY CENTERS CORP 209 113,027 0.04
REGENERON PHARMACEUTICALS INC 119 349,740 0.12
REGIONS FINANCIAL CORP 1,876 253,416 0.09
REPUBLIC SERVICES INC 379 200,312 0.07
RESMED INC 247 163,526 0.06
ROBERT HALF INTERNATIONAL INC 180 78,151 0.03
ROCKWELL AUTOMATION INC 194 297,776 0.10
ROCKWELL COLLINS INC 245 259,745 0.09
ROPER TECHNOLOGIES INC 165 334,072 0.12
ROSS STORES INC 628 393,968 0.14
ROYAL CARIBBEAN CRUISES LTD 279 260,153 0.09
S&P GLOBAL INC 402 532,349 0.19
SALESFORCE.COM INC 1,074 858,301 0.30
Vanguard ETF SeriesAnnual Report 2017
Vanguard S&P 500 Index ETF
-204-

Investment portfolio (Unaudited) (Continued)
As at 31 December 2017
Holding at31 December
2017
Fair value at31 December
2017
Percentage oftotal net assets at
31 December2017
HK$ (%)
United States 99.18%
SBA COMMUNICATIONS CORP 174 222,204 0.08
SCANA CORP 230 71,524 0.03
SCHLUMBERGER LTD 2,187 1,152,129 0.40
SCRIPPS NETWORKS INTERACTIVE INC CL A 163 108,793 0.04
SEAGATE TECHNOLOGY PLC 437 142,932 0.05
SEALED AIR CORP 289 111,379 0.04
SEMPRA ENERGY 403 336,838 0.12
SHERWIN-WILLIAMS CO/THE 131 419,908 0.15
SIGNET JEWELERS LTD 114 50,396 0.02
SIMON PROPERTY GROUP INC 482 647,106 0.23
SKYWORKS SOLUTIONS INC 277 205,604 0.07
SL GREEN REALTY CORP 161 127,029 0.04
SNAP ON INC 83 113,092 0.04
SOUTHERN CO/THE 1,592 598,487 0.21
SOUTHWEST AIRLINES CO 874 447,175 0.16
STANLEY BLACK + DECKER INC 231 306,426 0.11
STARBUCKS CORP 2,238 1,004,745 0.35
STATE STREET CORP 577 440,278 0.15
STERICYCLE INC 146 77,599 0.03
STRYKER CORP 499 604,005 0.21
SUNTRUST BANKS INC 749 378,185 0.13
SYMANTEC CORP 914 200,489 0.07
SYNCHRONY FINANCIAL 1,191 359,475 0.13
SYNOPSYS INC 250 166,587 0.06
SYSCO CORP 774 367,452 0.13
T ROWE PRICE GROUP INC 396 324,827 0.11
TAPESTRY INC 471 162,853 0.06
TARGET CORP 847 432,037 0.15
TE CONNECTIVITY LTD 547 406,397 0.14
TECHNIPFMC PLC 646 158,115 0.06
TEXAS INSTRUMENTS INC 1,543 1,259,765 0.44
TEXTRON INC 441 195,090 0.07
THERMO FISHER SCIENTIFIC INC 626 929,202 0.33
TIFFANY + CO 157 127,579 0.04
TIME WARNER INC 1,217 870,214 0.31
TJX COS INC/THE 996 595,320 0.21
TORCHMARK CORP 154 109,203 0.04
Vanguard ETF SeriesAnnual Report 2017
Vanguard S&P 500 Index ETF
-205-
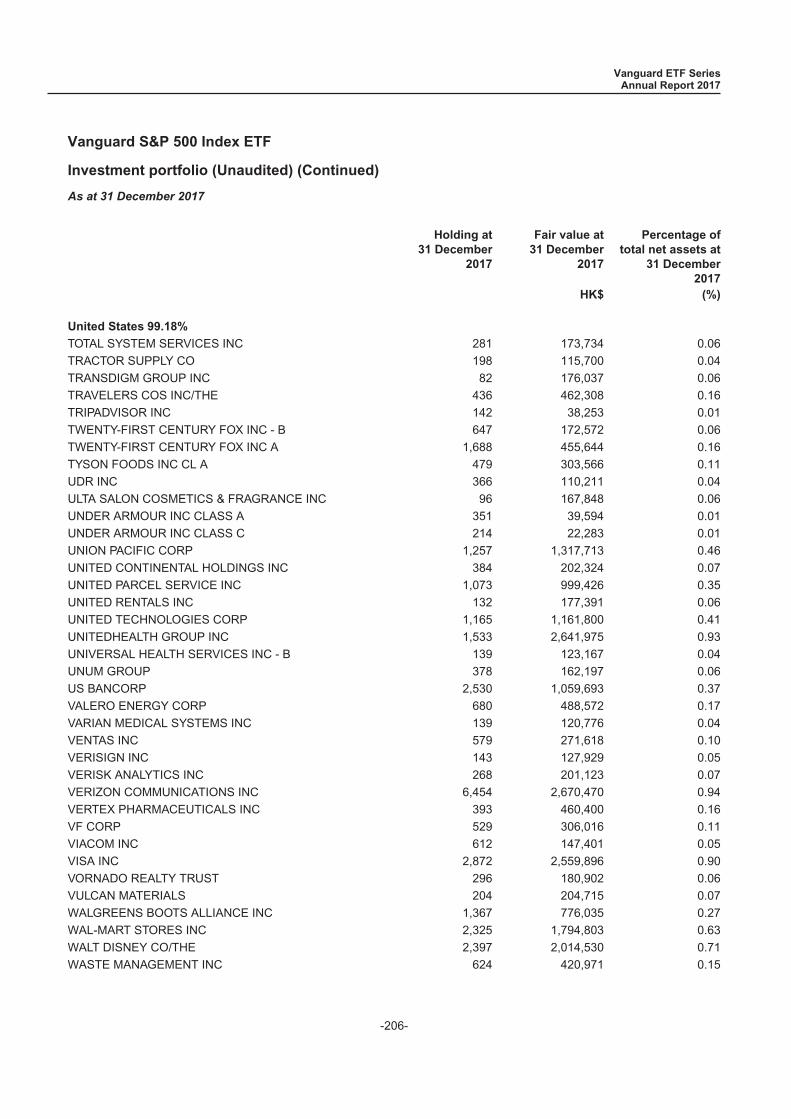
Investment portfolio (Unaudited) (Continued)
As at 31 December 2017
Holding at31 December
2017
Fair value at31 December
2017
Percentage oftotal net assets at
31 December2017
HK$ (%)
United States 99.18%
TOTAL SYSTEM SERVICES INC 281 173,734 0.06
TRACTOR SUPPLY CO 198 115,700 0.04
TRANSDIGM GROUP INC 82 176,037 0.06
TRAVELERS COS INC/THE 436 462,308 0.16
TRIPADVISOR INC 142 38,253 0.01
TWENTY-FIRST CENTURY FOX INC - B 647 172,572 0.06
TWENTY-FIRST CENTURY FOX INC A 1,688 455,644 0.16
TYSON FOODS INC CL A 479 303,566 0.11
UDR INC 366 110,211 0.04
ULTA SALON COSMETICS & FRAGRANCE INC 96 167,848 0.06
UNDER ARMOUR INC CLASS A 351 39,594 0.01
UNDER ARMOUR INC CLASS C 214 22,283 0.01
UNION PACIFIC CORP 1,257 1,317,713 0.46
UNITED CONTINENTAL HOLDINGS INC 384 202,324 0.07
UNITED PARCEL SERVICE INC 1,073 999,426 0.35
UNITED RENTALS INC 132 177,391 0.06
UNITED TECHNOLOGIES CORP 1,165 1,161,800 0.41
UNITEDHEALTH GROUP INC 1,533 2,641,975 0.93
UNIVERSAL HEALTH SERVICES INC - B 139 123,167 0.04
UNUM GROUP 378 162,197 0.06
US BANCORP 2,530 1,059,693 0.37
VALERO ENERGY CORP 680 488,572 0.17
VARIAN MEDICAL SYSTEMS INC 139 120,776 0.04
VENTAS INC 579 271,618 0.10
VERISIGN INC 143 127,929 0.05
VERISK ANALYTICS INC 268 201,123 0.07
VERIZON COMMUNICATIONS INC 6,454 2,670,470 0.94
VERTEX PHARMACEUTICALS INC 393 460,400 0.16
VF CORP 529 306,016 0.11
VIACOM INC 612 147,401 0.05
VISA INC 2,872 2,559,896 0.90
VORNADO REALTY TRUST 296 180,902 0.06
VULCAN MATERIALS 204 204,715 0.07
WALGREENS BOOTS ALLIANCE INC 1,367 776,035 0.27
WAL-MART STORES INC 2,325 1,794,803 0.63
WALT DISNEY CO/THE 2,397 2,014,530 0.71
WASTE MANAGEMENT INC 624 420,971 0.15
Vanguard ETF SeriesAnnual Report 2017
Vanguard S&P 500 Index ETF
-206-
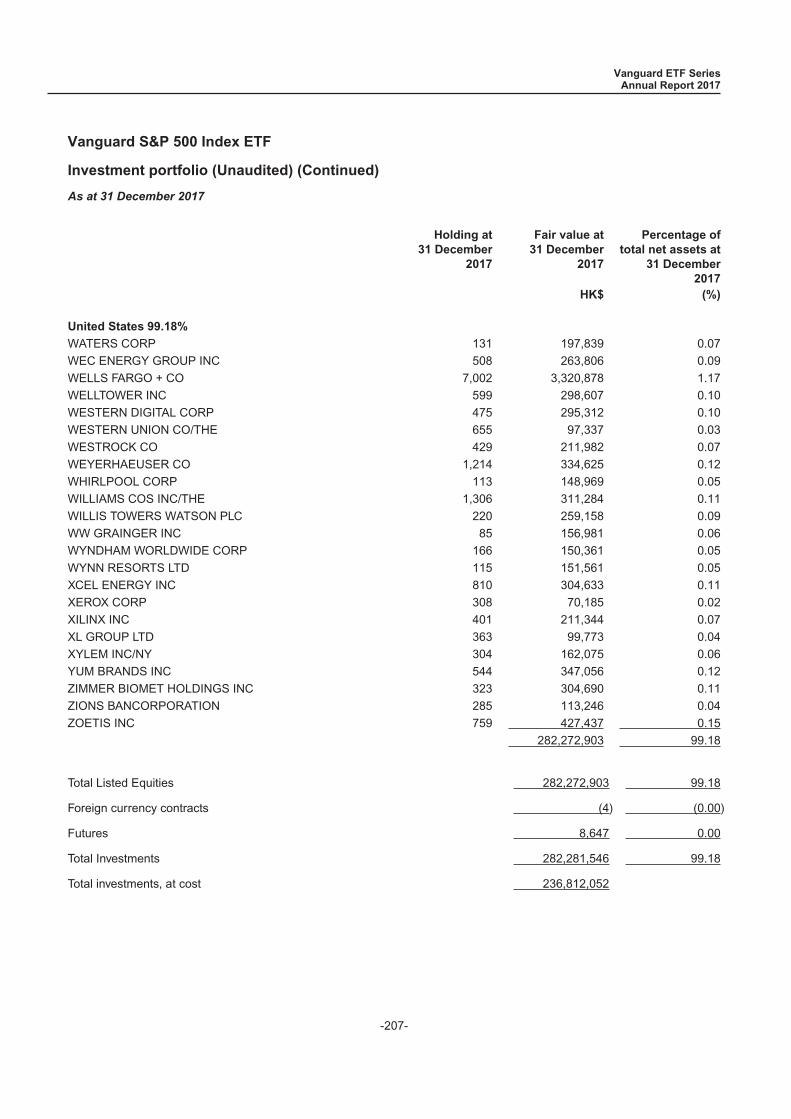
Investment portfolio (Unaudited) (Continued)
As at 31 December 2017
Holding at31 December
2017
Fair value at31 December
2017
Percentage oftotal net assets at
31 December2017
HK$ (%)
United States 99.18%
WATERS CORP 131 197,839 0.07
WEC ENERGY GROUP INC 508 263,806 0.09
WELLS FARGO + CO 7,002 3,320,878 1.17
WELLTOWER INC 599 298,607 0.10
WESTERN DIGITAL CORP 475 295,312 0.10
WESTERN UNION CO/THE 655 97,337 0.03
WESTROCK CO 429 211,982 0.07
WEYERHAEUSER CO 1,214 334,625 0.12
WHIRLPOOL CORP 113 148,969 0.05
WILLIAMS COS INC/THE 1,306 311,284 0.11
WILLIS TOWERS WATSON PLC 220 259,158 0.09
WW GRAINGER INC 85 156,981 0.06
WYNDHAM WORLDWIDE CORP 166 150,361 0.05
WYNN RESORTS LTD 115 151,561 0.05
XCEL ENERGY INC 810 304,633 0.11
XEROX CORP 308 70,185 0.02
XILINX INC 401 211,344 0.07
XL GROUP LTD 363 99,773 0.04
XYLEM INC/NY 304 162,075 0.06
YUM BRANDS INC 544 347,056 0.12
ZIMMER BIOMET HOLDINGS INC 323 304,690 0.11
ZIONS BANCORPORATION 285 113,246 0.04
ZOETIS INC 759 427,437 0.15
282,272,903 99.18
Total Listed Equities 282,272,903 99.18
Foreign currency contracts (4) (0.00)
Futures 8,647 0.00
Total Investments 282,281,546 99.18
Total investments, at cost 236,812,052
Vanguard ETF SeriesAnnual Report 2017
Vanguard S&P 500 Index ETF
-207-
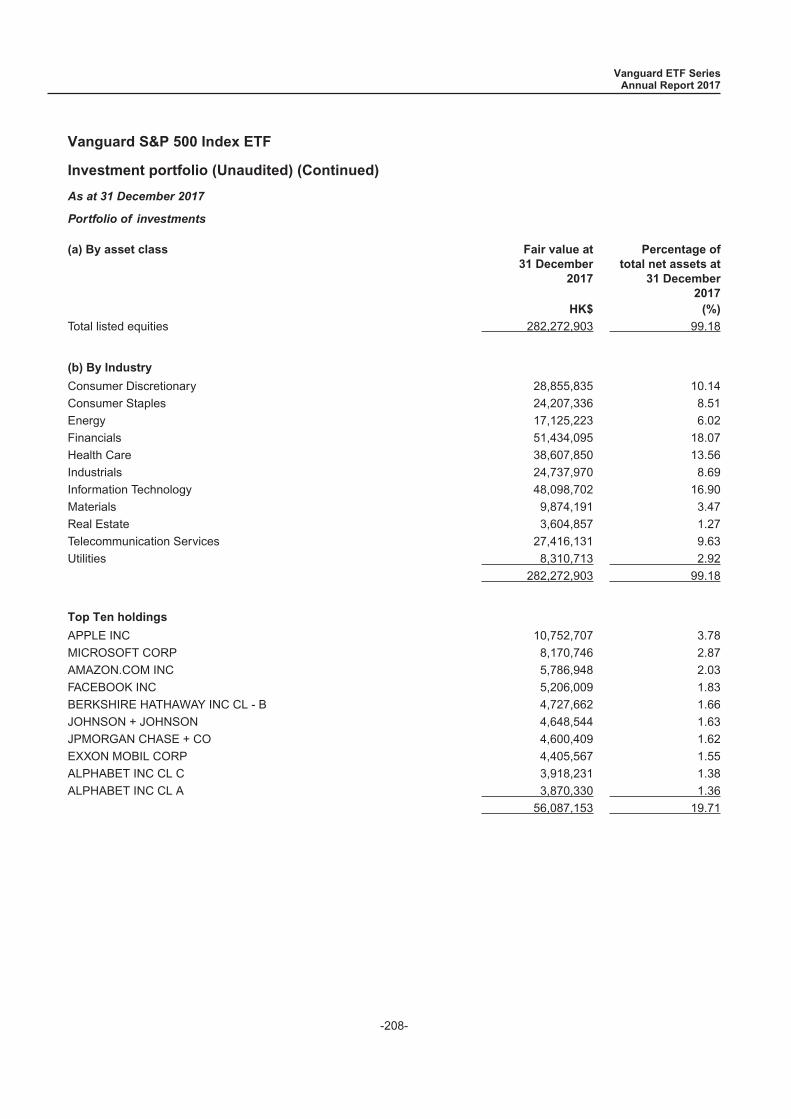
Investment portfolio (Unaudited) (Continued)
As at 31 December 2017
Portfolio of investments
(a) By asset class Fair value at31 December
2017
Percentage oftotal net assets at
31 December2017
HK$ (%)
Total listed equities 282,272,903 99.18
(b) By Industry
Consumer Discretionary 28,855,835 10.14
Consumer Staples 24,207,336 8.51
Energy 17,125,223 6.02
Financials 51,434,095 18.07
Health Care 38,607,850 13.56
Industrials 24,737,970 8.69
Information Technology 48,098,702 16.90
Materials 9,874,191 3.47
Real Estate 3,604,857 1.27
Telecommunication Services 27,416,131 9.63
Utilities 8,310,713 2.92
282,272,903 99.18
Top Ten holdings
APPLE INC 10,752,707 3.78
MICROSOFT CORP 8,170,746 2.87
AMAZON.COM INC 5,786,948 2.03
FACEBOOK INC 5,206,009 1.83
BERKSHIRE HATHAWAY INC CL - B 4,727,662 1.66
JOHNSON + JOHNSON 4,648,544 1.63
JPMORGAN CHASE + CO 4,600,409 1.62
EXXON MOBIL CORP 4,405,567 1.55
ALPHABET INC CL C 3,918,231 1.38
ALPHABET INC CL A 3,870,330 1.36
56,087,153 19.71
Vanguard ETF SeriesAnnual Report 2017
Vanguard S&P 500 Index ETF
-208-

Statement of movements in investment portfolio (Unaudited)
For the year ended 31 December 2017
Beginningholdings as at
1 January2017
Additions Disposals Closingholdings as at31 December
2017
3M CO 607 343 - 950
ABBOTT LABORATORIES 1,484 1,240 - 2,724
ABBVIE INC 1,640 892 - 2,532
ACCENTURE PLC CL A 624 343 - 967
ACTIVISION BLIZZARD INC 705 462 - 1,167
ACUITY BRANDS INC 43 17 - 60
ADOBE SYSTEMS INC 500 273 - 773
ADVANCE AUTO PARTS INC 75 54 - 129
ADVANCED MICRO DEVICES INC - 1,447 - 1,447
AES CORP/VA 723 321 - 1,044
AETNA INC 353 172 - 525
AFFILIATED MANAGERS GROUP INC 62 17 - 79
AFLAC INC 409 201 - 610
AGILENT TECHNOLOGIES INC 309 175 - 484
AIR PRODUCTS + CHEMICALS INC 218 127 - 345
AKAMAI TECHNOLOGIES INC 170 107 - 277
ALASKA AIR GROUP INC 109 62 - 171
ALBEMARLE CORP 100 84 - 184
ALEXANDRIA REAL ESTATE EQUITIES INC - 167 - 167
ALEXION PHARMACEUTICALS INC 229 126 - 355
ALIGN TECHNOLOGY INC - 118 - 118
ALLEGION PLC 82 88 - 170
ALLERGAN PLC 378 195 40 533
ALLIANCE DATA SYSTEMS CORP 55 51 21 85
ALLIANT ENERGY CORP 207 152 - 359
ALLSTATE CORP/THE 373 186 - 559
ALPHABET INC CL A 298 172 - 470
ALPHABET INC CL C 302 177 - 479
ALTRIA GROUP INC 1,963 1,072 - 3,035
AMAZON.COM INC 397 236 - 633
AMEREN CORP 235 159 - 394
AMERICAN AIRLINES GROUP INC 541 264 110 695
AMERICAN ELECTRIC POWER CO INC 497 269 - 766
AMERICAN EXPRESS CO 774 354 - 1,128
AMERICAN INTERNATIONAL GROUP INC 981 530 59 1,452
AMERICAN TOWER GROUP 428 256 - 684
AMERICAN WATER WORKS CO INC 180 90 - 270
AMERIPRISE FINANCIAL INC 171 80 18 233
AMERISOURCEBERGEN CORP 172 64 - 236
AMETEK INC 228 114 - 342
Vanguard ETF SeriesAnnual Report 2017
Vanguard S&P 500 Index ETF
-209-
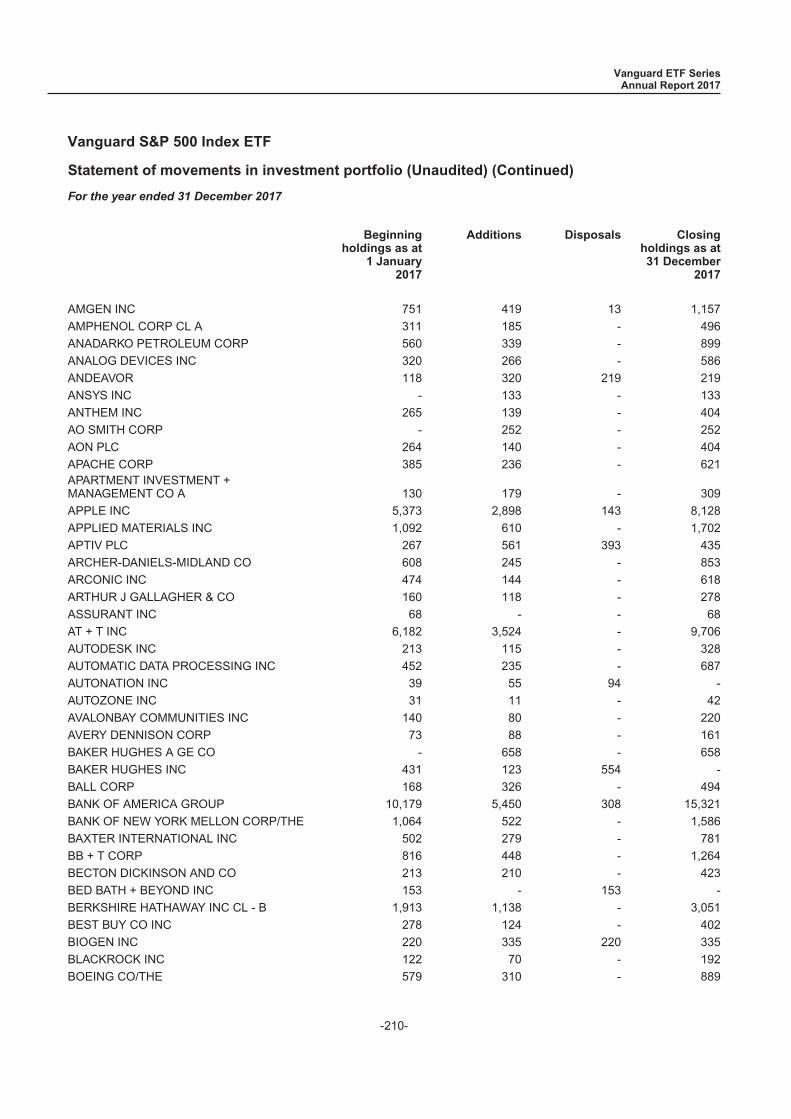
Statement of movements in investment portfolio (Unaudited) (Continued)
For the year ended 31 December 2017
Beginningholdings as at
1 January2017
Additions Disposals Closingholdings as at31 December
2017
AMGEN INC 751 419 13 1,157
AMPHENOL CORP CL A 311 185 - 496
ANADARKO PETROLEUM CORP 560 339 - 899
ANALOG DEVICES INC 320 266 - 586
ANDEAVOR 118 320 219 219
ANSYS INC - 133 - 133
ANTHEM INC 265 139 - 404
AO SMITH CORP - 252 - 252
AON PLC 264 140 - 404
APACHE CORP 385 236 - 621APARTMENT INVESTMENT +MANAGEMENT CO A 130 179 - 309
APPLE INC 5,373 2,898 143 8,128
APPLIED MATERIALS INC 1,092 610 - 1,702
APTIV PLC 267 561 393 435
ARCHER-DANIELS-MIDLAND CO 608 245 - 853
ARCONIC INC 474 144 - 618
ARTHUR J GALLAGHER & CO 160 118 - 278
ASSURANT INC 68 - - 68
AT + T INC 6,182 3,524 - 9,706
AUTODESK INC 213 115 - 328
AUTOMATIC DATA PROCESSING INC 452 235 - 687
AUTONATION INC 39 55 94 -
AUTOZONE INC 31 11 - 42
AVALONBAY COMMUNITIES INC 140 80 - 220
AVERY DENNISON CORP 73 88 - 161
BAKER HUGHES A GE CO - 658 - 658
BAKER HUGHES INC 431 123 554 -
BALL CORP 168 326 - 494
BANK OF AMERICA GROUP 10,179 5,450 308 15,321
BANK OF NEW YORK MELLON CORP/THE 1,064 522 - 1,586
BAXTER INTERNATIONAL INC 502 279 - 781
BB + T CORP 816 448 - 1,264
BECTON DICKINSON AND CO 213 210 - 423
BED BATH + BEYOND INC 153 - 153 -
BERKSHIRE HATHAWAY INC CL - B 1,913 1,138 - 3,051
BEST BUY CO INC 278 124 - 402
BIOGEN INC 220 335 220 335
BLACKROCK INC 122 70 - 192
BOEING CO/THE 579 310 - 889
Vanguard ETF SeriesAnnual Report 2017
Vanguard S&P 500 Index ETF
-210-
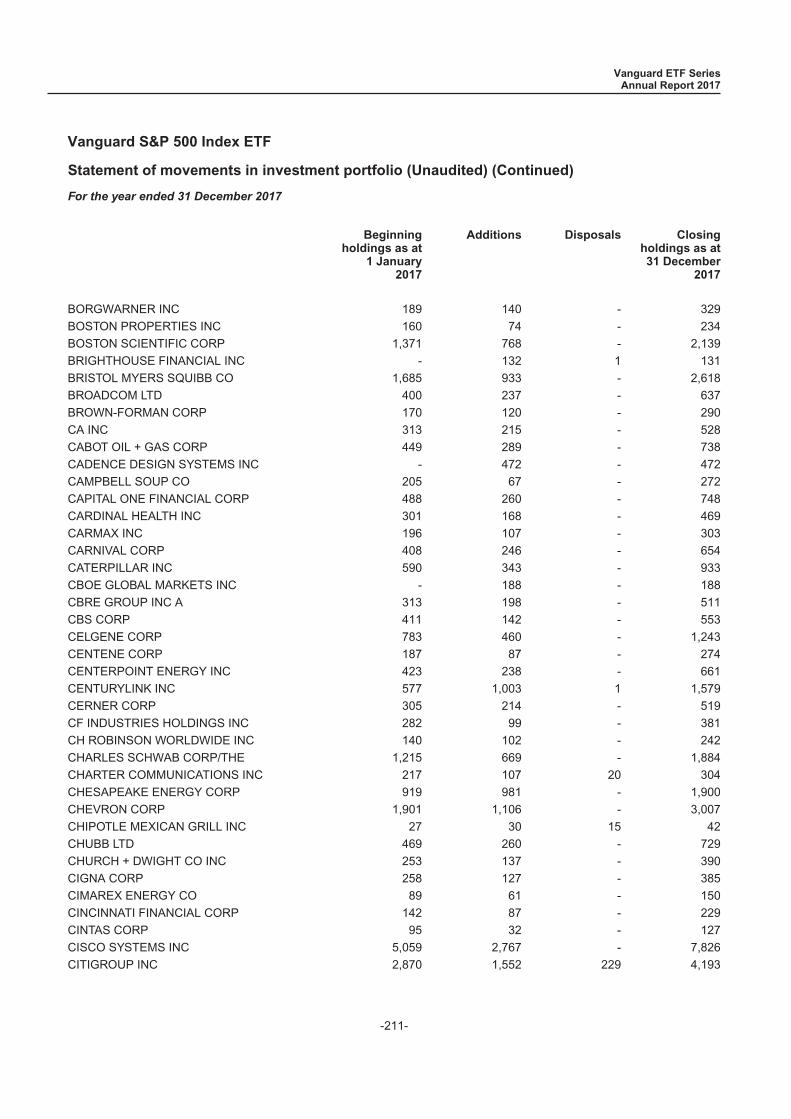
Statement of movements in investment portfolio (Unaudited) (Continued)
For the year ended 31 December 2017
Beginningholdings as at
1 January2017
Additions Disposals Closingholdings as at31 December
2017
BORGWARNER INC 189 140 - 329
BOSTON PROPERTIES INC 160 74 - 234
BOSTON SCIENTIFIC CORP 1,371 768 - 2,139
BRIGHTHOUSE FINANCIAL INC - 132 1 131
BRISTOL MYERS SQUIBB CO 1,685 933 - 2,618
BROADCOM LTD 400 237 - 637
BROWN-FORMAN CORP 170 120 - 290
CA INC 313 215 - 528
CABOT OIL + GAS CORP 449 289 - 738
CADENCE DESIGN SYSTEMS INC - 472 - 472
CAMPBELL SOUP CO 205 67 - 272
CAPITAL ONE FINANCIAL CORP 488 260 - 748
CARDINAL HEALTH INC 301 168 - 469
CARMAX INC 196 107 - 303
CARNIVAL CORP 408 246 - 654
CATERPILLAR INC 590 343 - 933
CBOE GLOBAL MARKETS INC - 188 - 188
CBRE GROUP INC A 313 198 - 511
CBS CORP 411 142 - 553
CELGENE CORP 783 460 - 1,243
CENTENE CORP 187 87 - 274
CENTERPOINT ENERGY INC 423 238 - 661
CENTURYLINK INC 577 1,003 1 1,579
CERNER CORP 305 214 - 519
CF INDUSTRIES HOLDINGS INC 282 99 - 381
CH ROBINSON WORLDWIDE INC 140 102 - 242
CHARLES SCHWAB CORP/THE 1,215 669 - 1,884
CHARTER COMMUNICATIONS INC 217 107 20 304
CHESAPEAKE ENERGY CORP 919 981 - 1,900
CHEVRON CORP 1,901 1,106 - 3,007
CHIPOTLE MEXICAN GRILL INC 27 30 15 42
CHUBB LTD 469 260 - 729
CHURCH + DWIGHT CO INC 253 137 - 390
CIGNA CORP 258 127 - 385
CIMAREX ENERGY CO 89 61 - 150
CINCINNATI FINANCIAL CORP 142 87 - 229
CINTAS CORP 95 32 - 127
CISCO SYSTEMS INC 5,059 2,767 - 7,826
CITIGROUP INC 2,870 1,552 229 4,193
Vanguard ETF SeriesAnnual Report 2017
Vanguard S&P 500 Index ETF
-211-
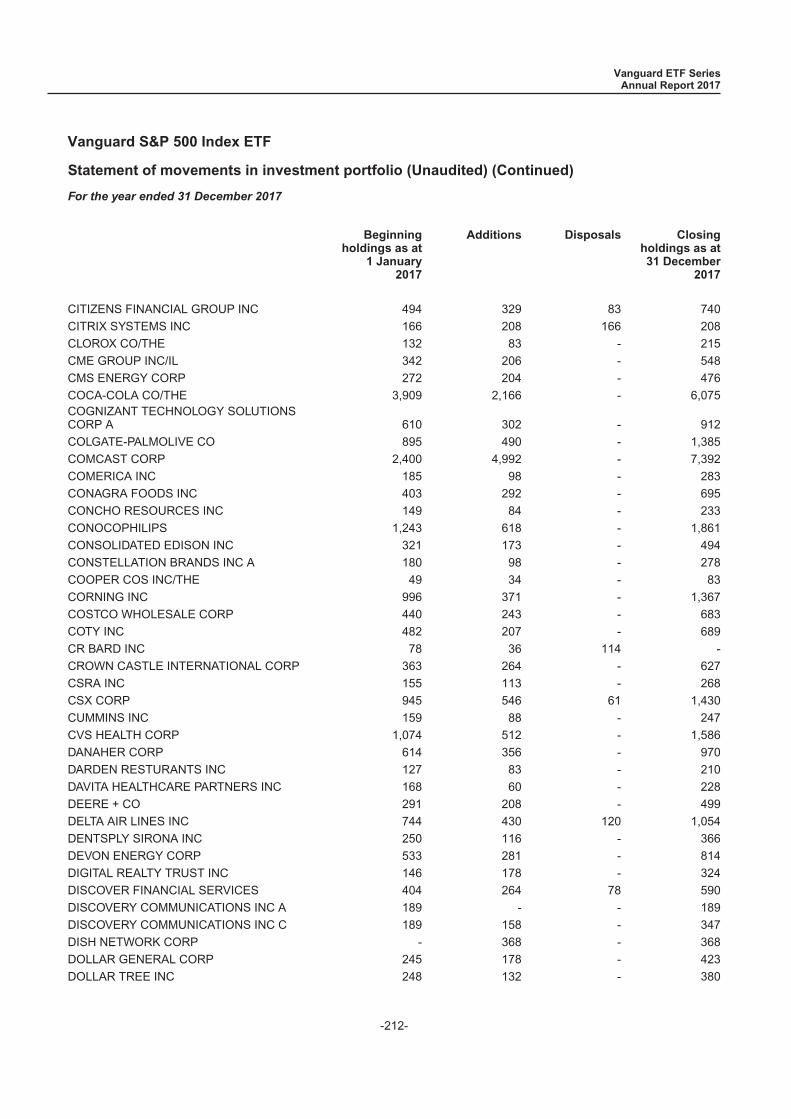
Statement of movements in investment portfolio (Unaudited) (Continued)
For the year ended 31 December 2017
Beginningholdings as at
1 January2017
Additions Disposals Closingholdings as at31 December
2017
CITIZENS FINANCIAL GROUP INC 494 329 83 740
CITRIX SYSTEMS INC 166 208 166 208
CLOROX CO/THE 132 83 - 215
CME GROUP INC/IL 342 206 - 548
CMS ENERGY CORP 272 204 - 476
COCA-COLA CO/THE 3,909 2,166 - 6,075COGNIZANT TECHNOLOGY SOLUTIONSCORP A 610 302 - 912
COLGATE-PALMOLIVE CO 895 490 - 1,385
COMCAST CORP 2,400 4,992 - 7,392
COMERICA INC 185 98 - 283
CONAGRA FOODS INC 403 292 - 695
CONCHO RESOURCES INC 149 84 - 233
CONOCOPHILIPS 1,243 618 - 1,861
CONSOLIDATED EDISON INC 321 173 - 494
CONSTELLATION BRANDS INC A 180 98 - 278
COOPER COS INC/THE 49 34 - 83
CORNING INC 996 371 - 1,367
COSTCO WHOLESALE CORP 440 243 - 683
COTY INC 482 207 - 689
CR BARD INC 78 36 114 -
CROWN CASTLE INTERNATIONAL CORP 363 264 - 627
CSRA INC 155 113 - 268
CSX CORP 945 546 61 1,430
CUMMINS INC 159 88 - 247
CVS HEALTH CORP 1,074 512 - 1,586
DANAHER CORP 614 356 - 970
DARDEN RESTURANTS INC 127 83 - 210
DAVITA HEALTHCARE PARTNERS INC 168 60 - 228
DEERE + CO 291 208 - 499
DELTA AIR LINES INC 744 430 120 1,054
DENTSPLY SIRONA INC 250 116 - 366
DEVON ENERGY CORP 533 281 - 814
DIGITAL REALTY TRUST INC 146 178 - 324
DISCOVER FINANCIAL SERVICES 404 264 78 590
DISCOVERY COMMUNICATIONS INC A 189 - - 189
DISCOVERY COMMUNICATIONS INC C 189 158 - 347
DISH NETWORK CORP - 368 - 368
DOLLAR GENERAL CORP 245 178 - 423
DOLLAR TREE INC 248 132 - 380
Vanguard ETF SeriesAnnual Report 2017
Vanguard S&P 500 Index ETF
-212-
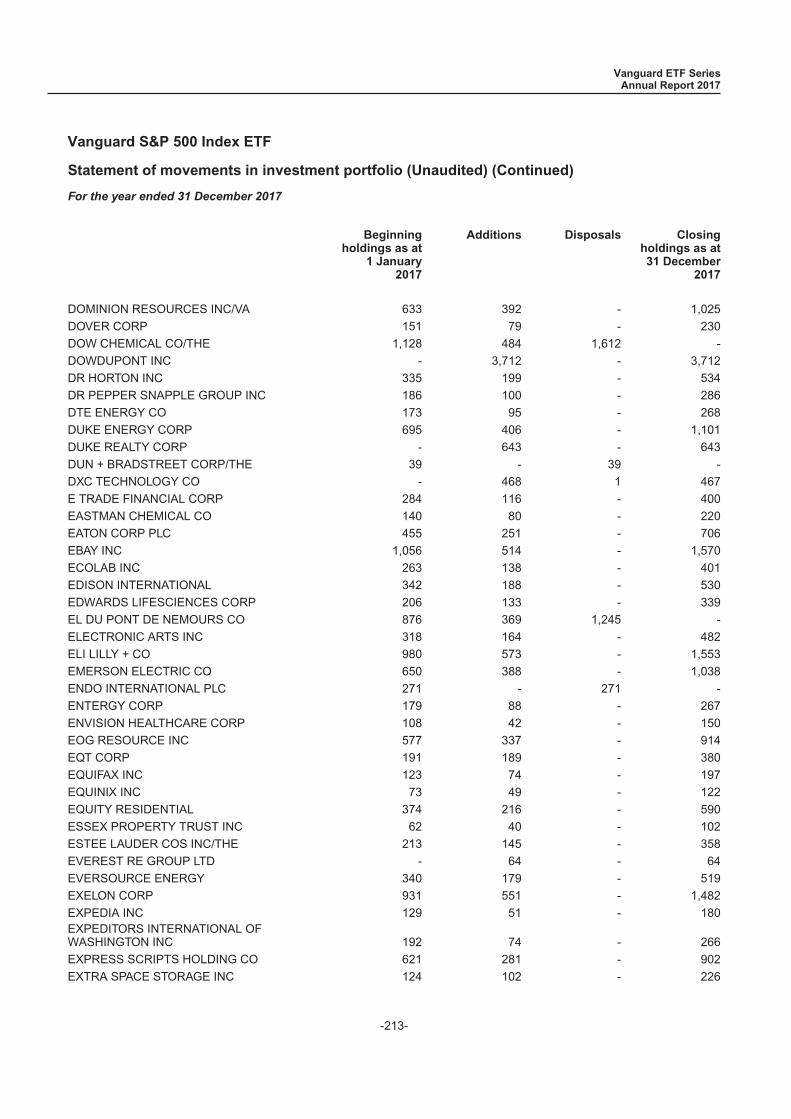
Statement of movements in investment portfolio (Unaudited) (Continued)
For the year ended 31 December 2017
Beginningholdings as at
1 January2017
Additions Disposals Closingholdings as at31 December
2017
DOMINION RESOURCES INC/VA 633 392 - 1,025
DOVER CORP 151 79 - 230
DOW CHEMICAL CO/THE 1,128 484 1,612 -
DOWDUPONT INC - 3,712 - 3,712
DR HORTON INC 335 199 - 534
DR PEPPER SNAPPLE GROUP INC 186 100 - 286
DTE ENERGY CO 173 95 - 268
DUKE ENERGY CORP 695 406 - 1,101
DUKE REALTY CORP - 643 - 643
DUN + BRADSTREET CORP/THE 39 - 39 -
DXC TECHNOLOGY CO - 468 1 467
E TRADE FINANCIAL CORP 284 116 - 400
EASTMAN CHEMICAL CO 140 80 - 220
EATON CORP PLC 455 251 - 706
EBAY INC 1,056 514 - 1,570
ECOLAB INC 263 138 - 401
EDISON INTERNATIONAL 342 188 - 530
EDWARDS LIFESCIENCES CORP 206 133 - 339
EL DU PONT DE NEMOURS CO 876 369 1,245 -
ELECTRONIC ARTS INC 318 164 - 482
ELI LILLY + CO 980 573 - 1,553
EMERSON ELECTRIC CO 650 388 - 1,038
ENDO INTERNATIONAL PLC 271 - 271 -
ENTERGY CORP 179 88 - 267
ENVISION HEALTHCARE CORP 108 42 - 150
EOG RESOURCE INC 577 337 - 914
EQT CORP 191 189 - 380
EQUIFAX INC 123 74 - 197
EQUINIX INC 73 49 - 122
EQUITY RESIDENTIAL 374 216 - 590
ESSEX PROPERTY TRUST INC 62 40 - 102
ESTEE LAUDER COS INC/THE 213 145 - 358
EVEREST RE GROUP LTD - 64 - 64
EVERSOURCE ENERGY 340 179 - 519
EXELON CORP 931 551 - 1,482
EXPEDIA INC 129 51 - 180EXPEDITORS INTERNATIONAL OFWASHINGTON INC 192 74 - 266
EXPRESS SCRIPTS HOLDING CO 621 281 - 902
EXTRA SPACE STORAGE INC 124 102 - 226
Vanguard ETF SeriesAnnual Report 2017
Vanguard S&P 500 Index ETF
-213-

Statement of movements in investment portfolio (Unaudited) (Continued)
For the year ended 31 December 2017
Beginningholdings as at
1 January2017
Additions Disposals Closingholdings as at31 December
2017
EXXON MOBIL CORP 4,178 2,560 - 6,738
F5 NETWORKS INC 75 31 - 106
FACEBOOK INC 2,359 1,415 - 3,774
FASTENAL CO 286 191 - 477
FEDERAL REALTY INVESTMENT TRUST 74 32 - 106
FEDEX CORP 246 145 - 391FIDELITY NATIONAL INFORMATIONSERVICES INC 334 194 - 528
FIFTH THIRD BANCORP 814 433 175 1,072
FIRST SOLAR INC 39 91 130 -
FIRSTENERGY CORP 462 226 - 688
FISERV INC 225 91 - 316
FLIR SYSTEMS INC 158 106 - 264
FLOWSERVE CORP 112 59 - 171
FLUOR CORP 116 155 - 271
FMC CORP 149 74 - 223
FMC TECHNOLOGIES INC 186 - 186 -
FOOT LOCKER INC 147 73 - 220
FORD MOTOR CO 3,927 2,337 - 6,264
FORTIVE CORP 314 140 - 454
FORTUNE BRANDS HOME & SECURITY INC 148 115 - 263
FRANKLIN RESOURCES INC 338 216 - 554
FREEPORT-MCMORAN INC 1,173 1,009 - 2,182
FRONTIER COMMUNICATIONS CORP 1,584 - 1,584 -
GAP INC/THE 240 272 164 348
GARMIN LTD 113 51 - 164
GARTNER INC - 156 - 156
GENERAL DYNAMICS CORP 289 143 - 432
GENERAL ELECTRIC CO 8,918 4,891 - 13,809
GENERAL MILLS INC 593 296 - 889
GENERAL MOTORS CO 1,395 751 121 2,025
GENUINE PARTS CO 160 82 - 242
GGP INC 598 1,058 598 1,058
GILEAD SCIENCES INC 1,329 715 - 2,044
GLOBAL PAYMENTS INC 156 112 - 268
GOLDMAN SACHS GROUP INC/THE 372 188 - 560
GOODYEAR TIRE + RUBBER CO/THE 292 116 - 408
H + R BLOCK INC 272 - - 272
HALLIBURTON CO 870 478 - 1,348
HANESBRANDS INC 427 148 - 575
Vanguard ETF SeriesAnnual Report 2017
Vanguard S&P 500 Index ETF
-214-
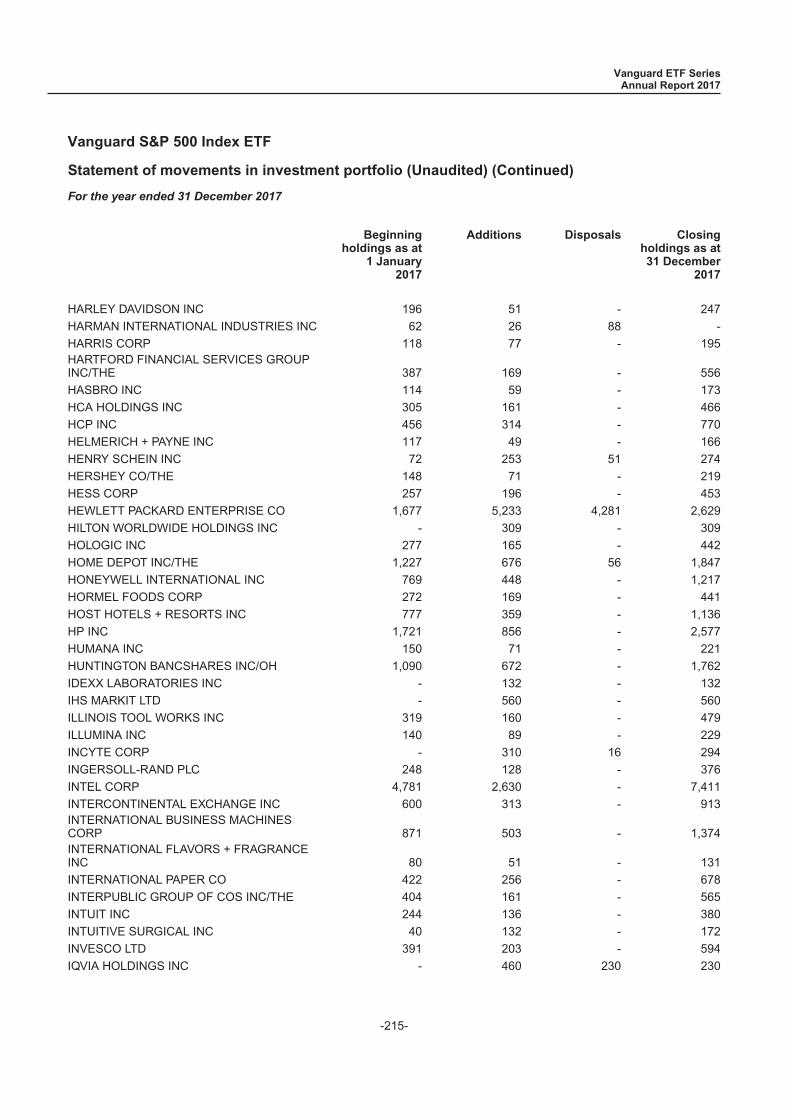
Statement of movements in investment portfolio (Unaudited) (Continued)
For the year ended 31 December 2017
Beginningholdings as at
1 January2017
Additions Disposals Closingholdings as at31 December
2017
HARLEY DAVIDSON INC 196 51 - 247
HARMAN INTERNATIONAL INDUSTRIES INC 62 26 88 -
HARRIS CORP 118 77 - 195HARTFORD FINANCIAL SERVICES GROUPINC/THE 387 169 - 556
HASBRO INC 114 59 - 173
HCA HOLDINGS INC 305 161 - 466
HCP INC 456 314 - 770
HELMERICH + PAYNE INC 117 49 - 166
HENRY SCHEIN INC 72 253 51 274
HERSHEY CO/THE 148 71 - 219
HESS CORP 257 196 - 453
HEWLETT PACKARD ENTERPRISE CO 1,677 5,233 4,281 2,629
HILTON WORLDWIDE HOLDINGS INC - 309 - 309
HOLOGIC INC 277 165 - 442
HOME DEPOT INC/THE 1,227 676 56 1,847
HONEYWELL INTERNATIONAL INC 769 448 - 1,217
HORMEL FOODS CORP 272 169 - 441
HOST HOTELS + RESORTS INC 777 359 - 1,136
HP INC 1,721 856 - 2,577
HUMANA INC 150 71 - 221
HUNTINGTON BANCSHARES INC/OH 1,090 672 - 1,762
IDEXX LABORATORIES INC - 132 - 132
IHS MARKIT LTD - 560 - 560
ILLINOIS TOOL WORKS INC 319 160 - 479
ILLUMINA INC 140 89 - 229
INCYTE CORP - 310 16 294
INGERSOLL-RAND PLC 248 128 - 376
INTEL CORP 4,781 2,630 - 7,411
INTERCONTINENTAL EXCHANGE INC 600 313 - 913INTERNATIONAL BUSINESS MACHINESCORP 871 503 - 1,374INTERNATIONAL FLAVORS + FRAGRANCEINC 80 51 - 131
INTERNATIONAL PAPER CO 422 256 - 678
INTERPUBLIC GROUP OF COS INC/THE 404 161 - 565
INTUIT INC 244 136 - 380
INTUITIVE SURGICAL INC 40 132 - 172
INVESCO LTD 391 203 - 594
IQVIA HOLDINGS INC - 460 230 230
Vanguard ETF SeriesAnnual Report 2017
Vanguard S&P 500 Index ETF
-215-
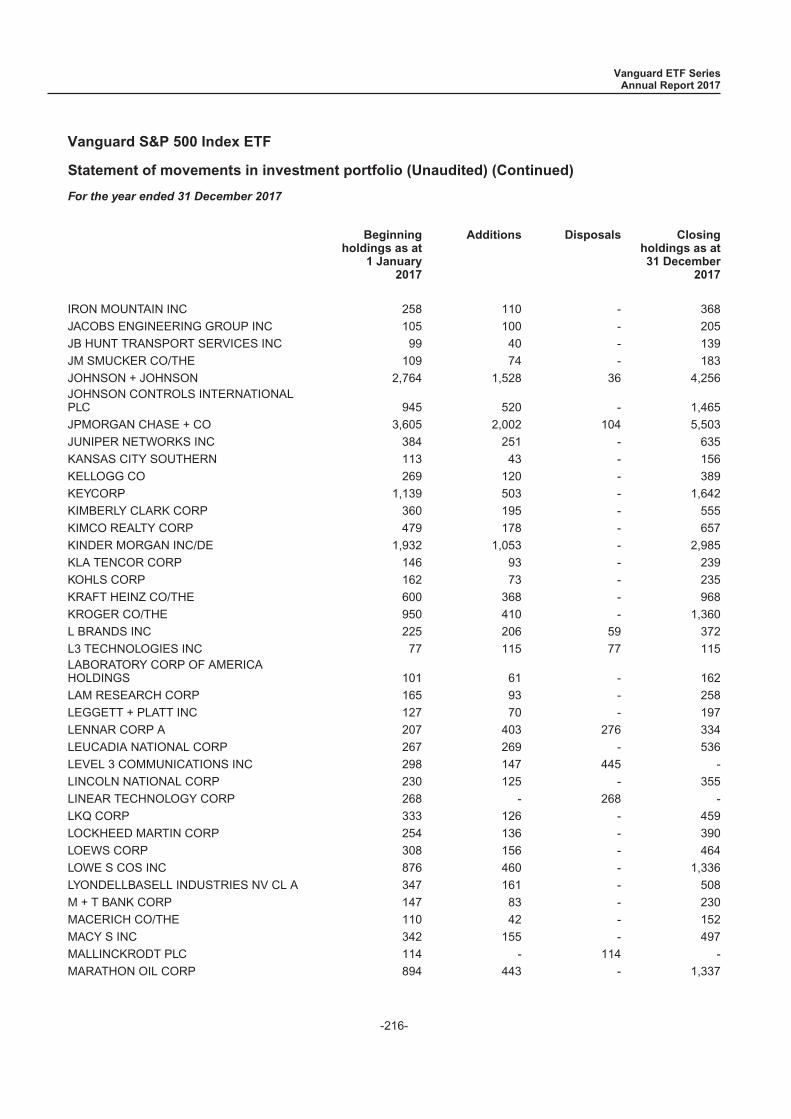
Statement of movements in investment portfolio (Unaudited) (Continued)
For the year ended 31 December 2017
Beginningholdings as at
1 January2017
Additions Disposals Closingholdings as at31 December
2017
IRON MOUNTAIN INC 258 110 - 368
JACOBS ENGINEERING GROUP INC 105 100 - 205
JB HUNT TRANSPORT SERVICES INC 99 40 - 139
JM SMUCKER CO/THE 109 74 - 183
JOHNSON + JOHNSON 2,764 1,528 36 4,256JOHNSON CONTROLS INTERNATIONALPLC 945 520 - 1,465
JPMORGAN CHASE + CO 3,605 2,002 104 5,503
JUNIPER NETWORKS INC 384 251 - 635
KANSAS CITY SOUTHERN 113 43 - 156
KELLOGG CO 269 120 - 389
KEYCORP 1,139 503 - 1,642
KIMBERLY CLARK CORP 360 195 - 555
KIMCO REALTY CORP 479 178 - 657
KINDER MORGAN INC/DE 1,932 1,053 - 2,985
KLA TENCOR CORP 146 93 - 239
KOHLS CORP 162 73 - 235
KRAFT HEINZ CO/THE 600 368 - 968
KROGER CO/THE 950 410 - 1,360
L BRANDS INC 225 206 59 372
L3 TECHNOLOGIES INC 77 115 77 115LABORATORY CORP OF AMERICAHOLDINGS 101 61 - 162
LAM RESEARCH CORP 165 93 - 258
LEGGETT + PLATT INC 127 70 - 197
LENNAR CORP A 207 403 276 334
LEUCADIA NATIONAL CORP 267 269 - 536
LEVEL 3 COMMUNICATIONS INC 298 147 445 -
LINCOLN NATIONAL CORP 230 125 - 355
LINEAR TECHNOLOGY CORP 268 - 268 -
LKQ CORP 333 126 - 459
LOCKHEED MARTIN CORP 254 136 - 390
LOEWS CORP 308 156 - 464
LOWE S COS INC 876 460 - 1,336
LYONDELLBASELL INDUSTRIES NV CL A 347 161 - 508
M + T BANK CORP 147 83 - 230
MACERICH CO/THE 110 42 - 152
MACY S INC 342 155 - 497
MALLINCKRODT PLC 114 - 114 -
MARATHON OIL CORP 894 443 - 1,337
Vanguard ETF SeriesAnnual Report 2017
Vanguard S&P 500 Index ETF
-216-
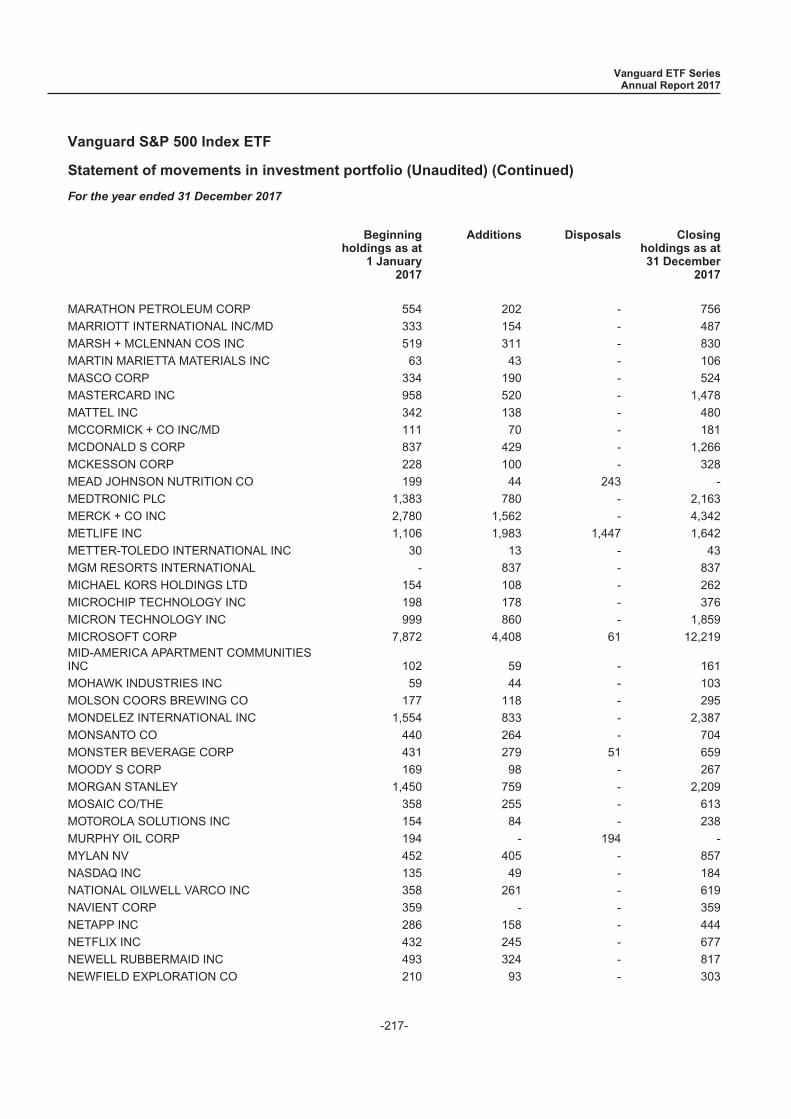
Statement of movements in investment portfolio (Unaudited) (Continued)
For the year ended 31 December 2017
Beginningholdings as at
1 January2017
Additions Disposals Closingholdings as at31 December
2017
MARATHON PETROLEUM CORP 554 202 - 756
MARRIOTT INTERNATIONAL INC/MD 333 154 - 487
MARSH + MCLENNAN COS INC 519 311 - 830
MARTIN MARIETTA MATERIALS INC 63 43 - 106
MASCO CORP 334 190 - 524
MASTERCARD INC 958 520 - 1,478
MATTEL INC 342 138 - 480
MCCORMICK + CO INC/MD 111 70 - 181
MCDONALD S CORP 837 429 - 1,266
MCKESSON CORP 228 100 - 328
MEAD JOHNSON NUTRITION CO 199 44 243 -
MEDTRONIC PLC 1,383 780 - 2,163
MERCK + CO INC 2,780 1,562 - 4,342
METLIFE INC 1,106 1,983 1,447 1,642
METTER-TOLEDO INTERNATIONAL INC 30 13 - 43
MGM RESORTS INTERNATIONAL - 837 - 837
MICHAEL KORS HOLDINGS LTD 154 108 - 262
MICROCHIP TECHNOLOGY INC 198 178 - 376
MICRON TECHNOLOGY INC 999 860 - 1,859
MICROSOFT CORP 7,872 4,408 61 12,219MID-AMERICA APARTMENT COMMUNITIESINC 102 59 - 161
MOHAWK INDUSTRIES INC 59 44 - 103
MOLSON COORS BREWING CO 177 118 - 295
MONDELEZ INTERNATIONAL INC 1,554 833 - 2,387
MONSANTO CO 440 264 - 704
MONSTER BEVERAGE CORP 431 279 51 659
MOODY S CORP 169 98 - 267
MORGAN STANLEY 1,450 759 - 2,209
MOSAIC CO/THE 358 255 - 613
MOTOROLA SOLUTIONS INC 154 84 - 238
MURPHY OIL CORP 194 - 194 -
MYLAN NV 452 405 - 857
NASDAQ INC 135 49 - 184
NATIONAL OILWELL VARCO INC 358 261 - 619
NAVIENT CORP 359 - - 359
NETAPP INC 286 158 - 444
NETFLIX INC 432 245 - 677
NEWELL RUBBERMAID INC 493 324 - 817
NEWFIELD EXPLORATION CO 210 93 - 303
Vanguard ETF SeriesAnnual Report 2017
Vanguard S&P 500 Index ETF
-217-
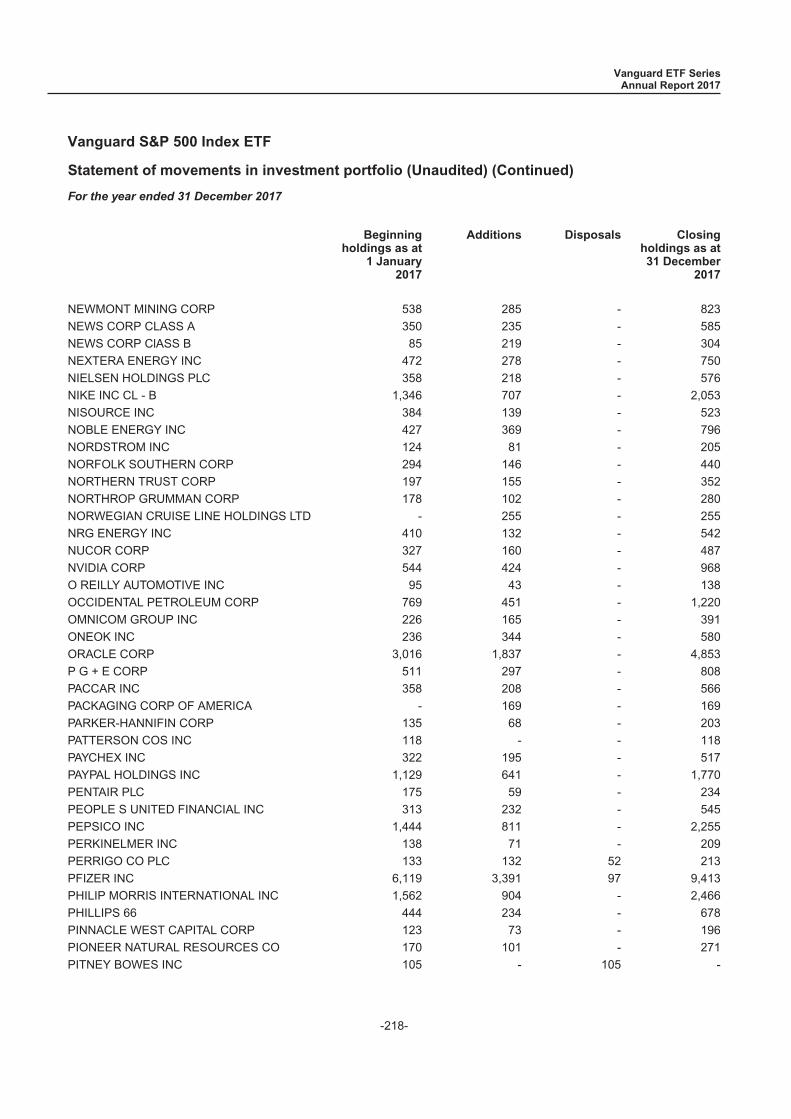
Statement of movements in investment portfolio (Unaudited) (Continued)
For the year ended 31 December 2017
Beginningholdings as at
1 January2017
Additions Disposals Closingholdings as at31 December
2017
NEWMONT MINING CORP 538 285 - 823
NEWS CORP CLASS A 350 235 - 585
NEWS CORP ClASS B 85 219 - 304
NEXTERA ENERGY INC 472 278 - 750
NIELSEN HOLDINGS PLC 358 218 - 576
NIKE INC CL - B 1,346 707 - 2,053
NISOURCE INC 384 139 - 523
NOBLE ENERGY INC 427 369 - 796
NORDSTROM INC 124 81 - 205
NORFOLK SOUTHERN CORP 294 146 - 440
NORTHERN TRUST CORP 197 155 - 352
NORTHROP GRUMMAN CORP 178 102 - 280
NORWEGIAN CRUISE LINE HOLDINGS LTD - 255 - 255
NRG ENERGY INC 410 132 - 542
NUCOR CORP 327 160 - 487
NVIDIA CORP 544 424 - 968
O REILLY AUTOMOTIVE INC 95 43 - 138
OCCIDENTAL PETROLEUM CORP 769 451 - 1,220
OMNICOM GROUP INC 226 165 - 391
ONEOK INC 236 344 - 580
ORACLE CORP 3,016 1,837 - 4,853
P G + E CORP 511 297 - 808
PACCAR INC 358 208 - 566
PACKAGING CORP OF AMERICA - 169 - 169
PARKER-HANNIFIN CORP 135 68 - 203
PATTERSON COS INC 118 - - 118
PAYCHEX INC 322 195 - 517
PAYPAL HOLDINGS INC 1,129 641 - 1,770
PENTAIR PLC 175 59 - 234
PEOPLE S UNITED FINANCIAL INC 313 232 - 545
PEPSICO INC 1,444 811 - 2,255
PERKINELMER INC 138 71 - 209
PERRIGO CO PLC 133 132 52 213
PFIZER INC 6,119 3,391 97 9,413
PHILIP MORRIS INTERNATIONAL INC 1,562 904 - 2,466
PHILLIPS 66 444 234 - 678
PINNACLE WEST CAPITAL CORP 123 73 - 196
PIONEER NATURAL RESOURCES CO 170 101 - 271
PITNEY BOWES INC 105 - 105 -
Vanguard ETF SeriesAnnual Report 2017
Vanguard S&P 500 Index ETF
-218-
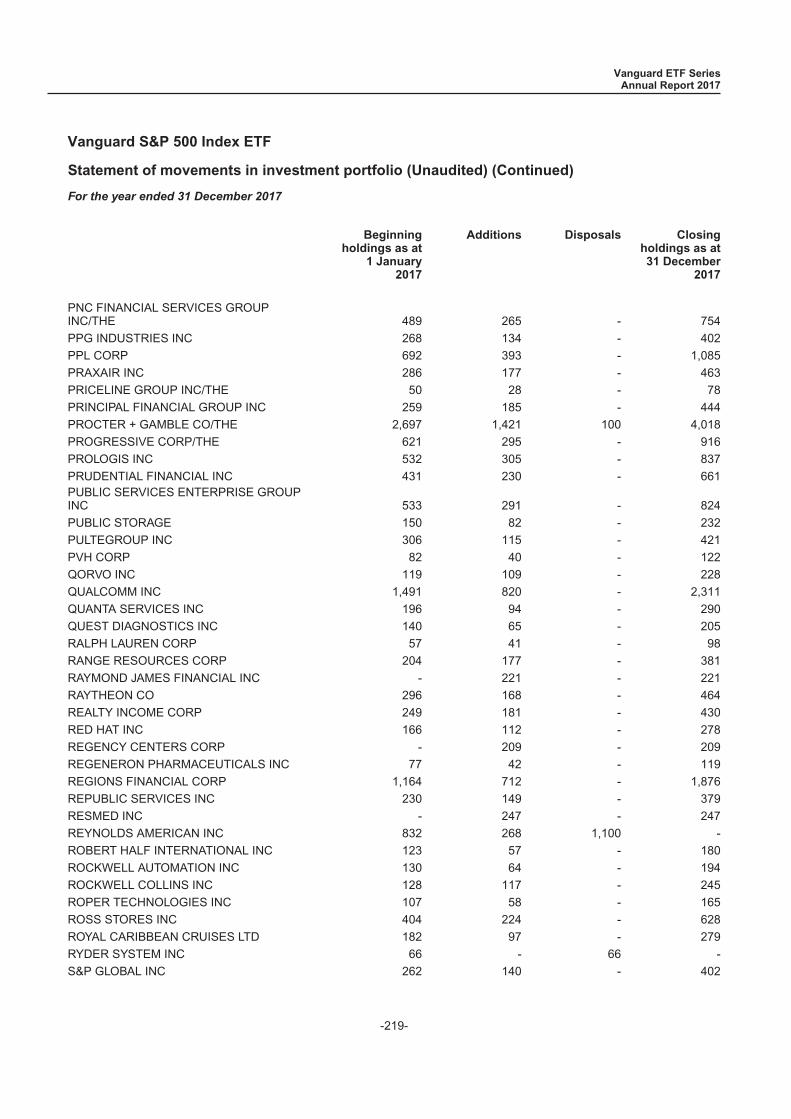
Statement of movements in investment portfolio (Unaudited) (Continued)
For the year ended 31 December 2017
Beginningholdings as at
1 January2017
Additions Disposals Closingholdings as at31 December
2017
PNC FINANCIAL SERVICES GROUPINC/THE 489 265 - 754
PPG INDUSTRIES INC 268 134 - 402
PPL CORP 692 393 - 1,085
PRAXAIR INC 286 177 - 463
PRICELINE GROUP INC/THE 50 28 - 78
PRINCIPAL FINANCIAL GROUP INC 259 185 - 444
PROCTER + GAMBLE CO/THE 2,697 1,421 100 4,018
PROGRESSIVE CORP/THE 621 295 - 916
PROLOGIS INC 532 305 - 837
PRUDENTIAL FINANCIAL INC 431 230 - 661PUBLIC SERVICES ENTERPRISE GROUPINC 533 291 - 824
PUBLIC STORAGE 150 82 - 232
PULTEGROUP INC 306 115 - 421
PVH CORP 82 40 - 122
QORVO INC 119 109 - 228
QUALCOMM INC 1,491 820 - 2,311
QUANTA SERVICES INC 196 94 - 290
QUEST DIAGNOSTICS INC 140 65 - 205
RALPH LAUREN CORP 57 41 - 98
RANGE RESOURCES CORP 204 177 - 381
RAYMOND JAMES FINANCIAL INC - 221 - 221
RAYTHEON CO 296 168 - 464
REALTY INCOME CORP 249 181 - 430
RED HAT INC 166 112 - 278
REGENCY CENTERS CORP - 209 - 209
REGENERON PHARMACEUTICALS INC 77 42 - 119
REGIONS FINANCIAL CORP 1,164 712 - 1,876
REPUBLIC SERVICES INC 230 149 - 379
RESMED INC - 247 - 247
REYNOLDS AMERICAN INC 832 268 1,100 -
ROBERT HALF INTERNATIONAL INC 123 57 - 180
ROCKWELL AUTOMATION INC 130 64 - 194
ROCKWELL COLLINS INC 128 117 - 245
ROPER TECHNOLOGIES INC 107 58 - 165
ROSS STORES INC 404 224 - 628
ROYAL CARIBBEAN CRUISES LTD 182 97 - 279
RYDER SYSTEM INC 66 - 66 -
S&P GLOBAL INC 262 140 - 402
Vanguard ETF SeriesAnnual Report 2017
Vanguard S&P 500 Index ETF
-219-
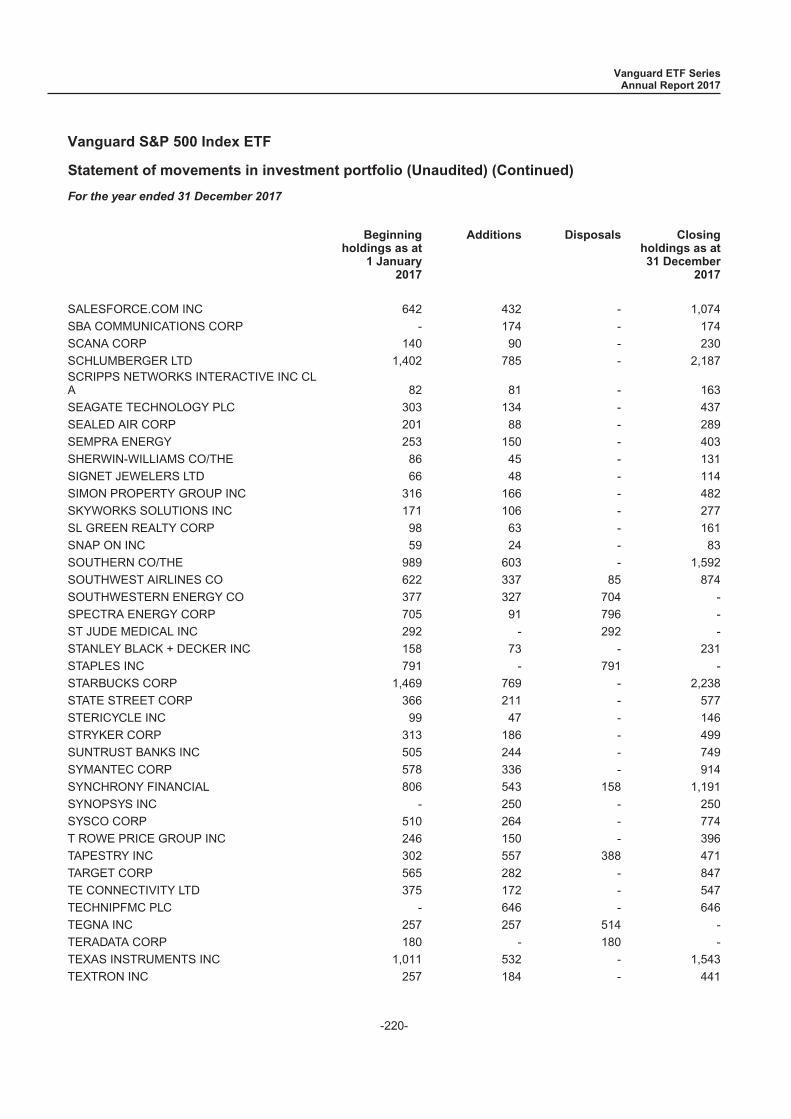
Statement of movements in investment portfolio (Unaudited) (Continued)
For the year ended 31 December 2017
Beginningholdings as at
1 January2017
Additions Disposals Closingholdings as at31 December
2017
SALESFORCE.COM INC 642 432 - 1,074
SBA COMMUNICATIONS CORP - 174 - 174
SCANA CORP 140 90 - 230
SCHLUMBERGER LTD 1,402 785 - 2,187SCRIPPS NETWORKS INTERACTIVE INC CLA 82 81 - 163
SEAGATE TECHNOLOGY PLC 303 134 - 437
SEALED AIR CORP 201 88 - 289
SEMPRA ENERGY 253 150 - 403
SHERWIN-WILLIAMS CO/THE 86 45 - 131
SIGNET JEWELERS LTD 66 48 - 114
SIMON PROPERTY GROUP INC 316 166 - 482
SKYWORKS SOLUTIONS INC 171 106 - 277
SL GREEN REALTY CORP 98 63 - 161
SNAP ON INC 59 24 - 83
SOUTHERN CO/THE 989 603 - 1,592
SOUTHWEST AIRLINES CO 622 337 85 874
SOUTHWESTERN ENERGY CO 377 327 704 -
SPECTRA ENERGY CORP 705 91 796 -
ST JUDE MEDICAL INC 292 - 292 -
STANLEY BLACK + DECKER INC 158 73 - 231
STAPLES INC 791 - 791 -
STARBUCKS CORP 1,469 769 - 2,238
STATE STREET CORP 366 211 - 577
STERICYCLE INC 99 47 - 146
STRYKER CORP 313 186 - 499
SUNTRUST BANKS INC 505 244 - 749
SYMANTEC CORP 578 336 - 914
SYNCHRONY FINANCIAL 806 543 158 1,191
SYNOPSYS INC - 250 - 250
SYSCO CORP 510 264 - 774
T ROWE PRICE GROUP INC 246 150 - 396
TAPESTRY INC 302 557 388 471
TARGET CORP 565 282 - 847
TE CONNECTIVITY LTD 375 172 - 547
TECHNIPFMC PLC - 646 - 646
TEGNA INC 257 257 514 -
TERADATA CORP 180 - 180 -
TEXAS INSTRUMENTS INC 1,011 532 - 1,543
TEXTRON INC 257 184 - 441
Vanguard ETF SeriesAnnual Report 2017
Vanguard S&P 500 Index ETF
-220-

Statement of movements in investment portfolio (Unaudited) (Continued)
For the year ended 31 December 2017
Beginningholdings as at
1 January2017
Additions Disposals Closingholdings as at31 December
2017
THERMO FISHER SCIENTIFIC INC 398 228 - 626
TIFFANY + CO 114 43 - 157
TIME WARNER INC 776 441 - 1,217
TJX COS INC/THE 658 338 - 996
TORCHMARK CORP 109 45 - 154
TOTAL SYSTEM SERVICES INC 169 112 - 281
TRACTOR SUPPLY CO 131 67 - 198
TRANSDIGM GROUP INC 53 29 - 82
TRANSOCEAN LTD 415 - 415 -
TRAVELERS COS INC/THE 285 151 - 436
TRIPADVISOR INC 85 57 - 142
TWENTY-FIRST CENTURY FOX INC - B 435 212 - 647
TWENTY-FIRST CENTURY FOX INC A 1,115 573 - 1,688
TYSON FOODS INC CL A 313 166 - 479
UDR INC 299 67 - 366ULTA SALON COSMETICS & FRAGRANCEINC 55 41 - 96
UNDER ARMOUR INC CLASS A 147 204 - 351
UNDER ARMOUR INC CLASS C 214 - - 214
UNION PACIFIC CORP 831 426 - 1,257
UNITED CONTINENTAL HOLDINGS INC 292 92 - 384
UNITED PARCEL SERVICE INC 696 377 - 1,073
UNITED RENTALS INC 79 53 - 132
UNITED TECHNOLOGIES CORP 773 392 - 1,165
UNITEDHEALTH GROUP INC 959 574 - 1,533
UNIVERSAL HEALTH SERVICES INC - B 80 59 - 139
UNUM GROUP 240 138 - 378
URBAN OUTFITTERS INC 52 83 135 -
US BANCORP 1,610 920 - 2,530
VALERO ENERGY CORP 457 223 - 680
VANGUARD S+P 500 ETF 917 80 997 -
VARIAN MEDICAL SYSTEMS INC 98 139 98 139
VENTAS INC 361 218 - 579
VERISIGN INC 85 58 - 143
VERISK ANALYTICS INC 145 123 - 268
VERIZON COMMUNICATIONS INC 4,103 2,351 - 6,454
VERTEX PHARMACEUTICALS INC 234 159 - 393
VF CORP 356 173 - 529
VIACOM INC 383 229 - 612
VISA INC 1,880 992 - 2,872
Vanguard ETF SeriesAnnual Report 2017
Vanguard S&P 500 Index ETF
-221-
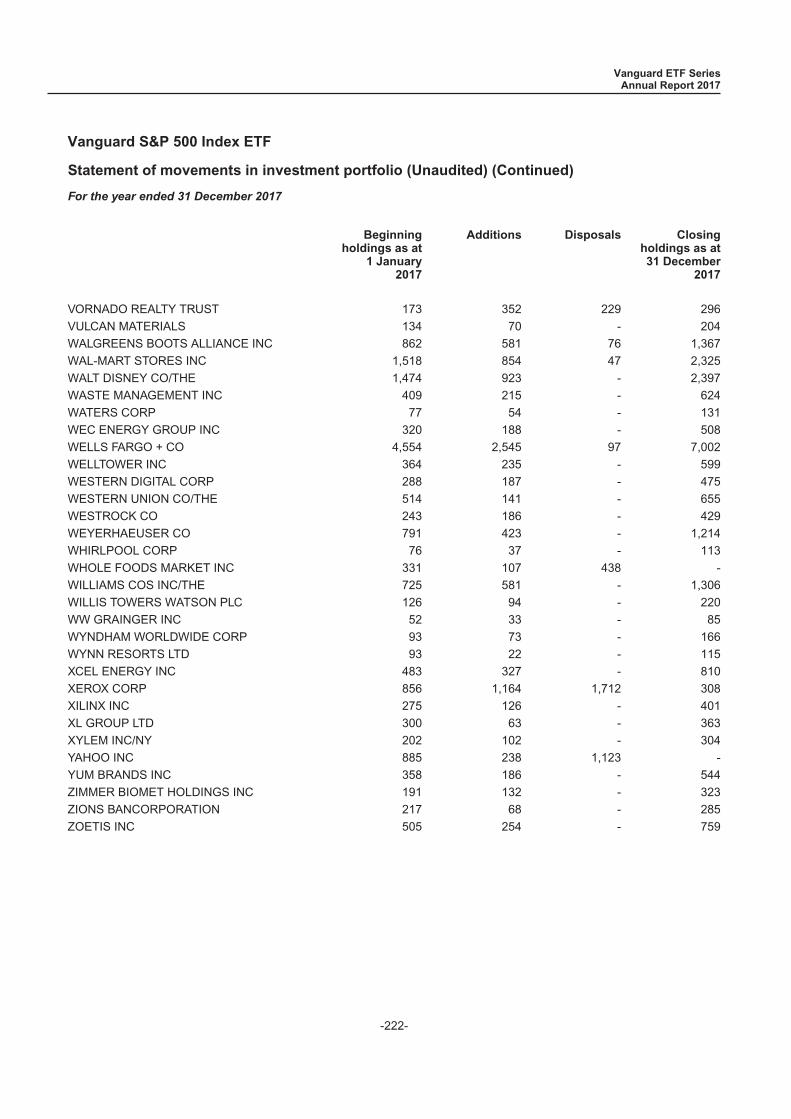
Statement of movements in investment portfolio (Unaudited) (Continued)
For the year ended 31 December 2017
Beginningholdings as at
1 January2017
Additions Disposals Closingholdings as at31 December
2017
VORNADO REALTY TRUST 173 352 229 296
VULCAN MATERIALS 134 70 - 204
WALGREENS BOOTS ALLIANCE INC 862 581 76 1,367
WAL-MART STORES INC 1,518 854 47 2,325
WALT DISNEY CO/THE 1,474 923 - 2,397
WASTE MANAGEMENT INC 409 215 - 624
WATERS CORP 77 54 - 131
WEC ENERGY GROUP INC 320 188 - 508
WELLS FARGO + CO 4,554 2,545 97 7,002
WELLTOWER INC 364 235 - 599
WESTERN DIGITAL CORP 288 187 - 475
WESTERN UNION CO/THE 514 141 - 655
WESTROCK CO 243 186 - 429
WEYERHAEUSER CO 791 423 - 1,214
WHIRLPOOL CORP 76 37 - 113
WHOLE FOODS MARKET INC 331 107 438 -
WILLIAMS COS INC/THE 725 581 - 1,306
WILLIS TOWERS WATSON PLC 126 94 - 220
WW GRAINGER INC 52 33 - 85
WYNDHAM WORLDWIDE CORP 93 73 - 166
WYNN RESORTS LTD 93 22 - 115
XCEL ENERGY INC 483 327 - 810
XEROX CORP 856 1,164 1,712 308
XILINX INC 275 126 - 401
XL GROUP LTD 300 63 - 363
XYLEM INC/NY 202 102 - 304
YAHOO INC 885 238 1,123 -
YUM BRANDS INC 358 186 - 544
ZIMMER BIOMET HOLDINGS INC 191 132 - 323
ZIONS BANCORPORATION 217 68 - 285
ZOETIS INC 505 254 - 759
Vanguard ETF SeriesAnnual Report 2017
Vanguard S&P 500 Index ETF
-222-
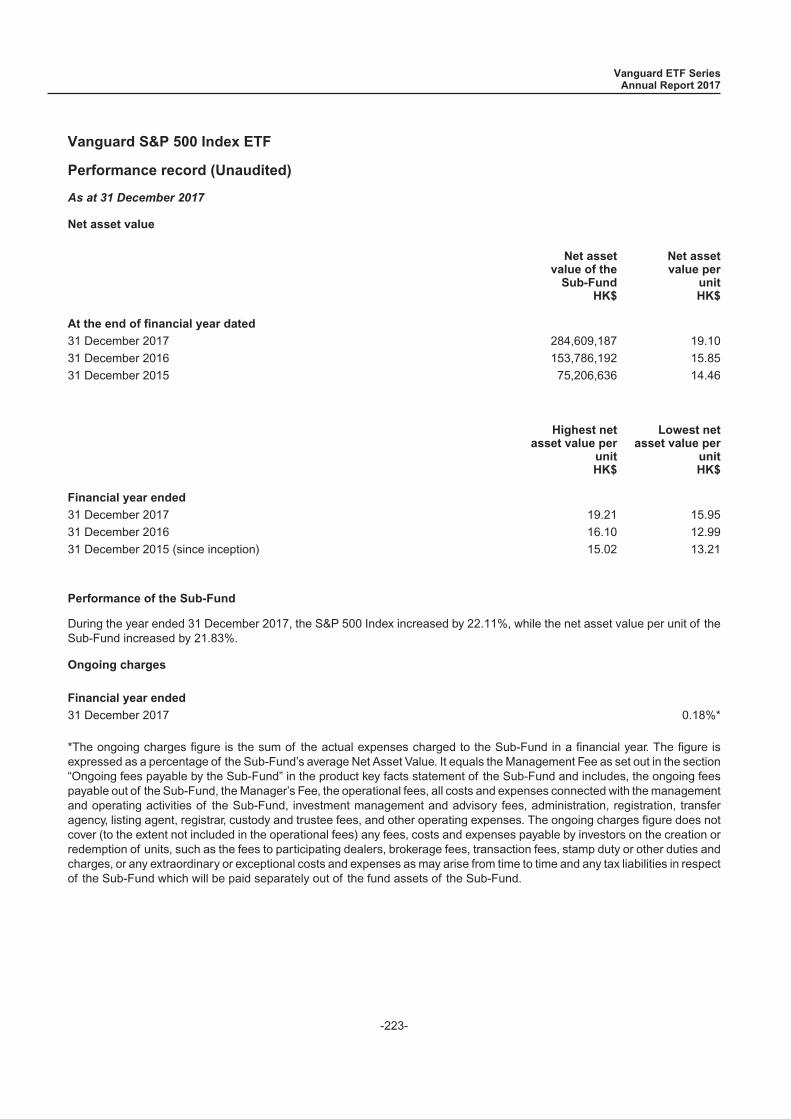
Performance record (Unaudited)
As at 31 December 2017
Net asset value
Net assetvalue of the
Sub-FundHK$
Net assetvalue per
unitHK$
At the end of financial year dated
31 December 2017 284,609,187 19.10
31 December 2016 153,786,192 15.85
31 December 2015 75,206,636 14.46
Highest netasset value per
unitHK$
Lowest netasset value per
unitHK$
Financial year ended
31 December 2017 19.21 15.95
31 December 2016 16.10 12.99
31 December 2015 (since inception) 15.02 13.21
Performance of the Sub-Fund
During the year ended 31 December 2017, the S&P 500 Index increased by 22.11%, while the net asset value per unit of theSub-Fund increased by 21.83%.
Ongoing charges
Financial year ended
31 December 2017 0.18%*
*The ongoing charges figure is the sum of the actual expenses charged to the Sub-Fund in a financial year. The figure isexpressed as a percentage of the Sub-Fund’s average Net Asset Value. It equals the Management Fee as set out in the section“Ongoing fees payable by the Sub-Fund” in the product key facts statement of the Sub-Fund and includes, the ongoing feespayable out of the Sub-Fund, the Manager’s Fee, the operational fees, all costs and expenses connected with the managementand operating activities of the Sub-Fund, investment management and advisory fees, administration, registration, transferagency, listing agent, registrar, custody and trustee fees, and other operating expenses. The ongoing charges figure does notcover (to the extent not included in the operational fees) any fees, costs and expenses payable by investors on the creation orredemption of units, such as the fees to participating dealers, brokerage fees, transaction fees, stamp duty or other duties andcharges, or any extraordinary or exceptional costs and expenses as may arise from time to time and any tax liabilities in respectof the Sub-Fund which will be paid separately out of the fund assets of the Sub-Fund.
Vanguard ETF SeriesAnnual Report 2017
Vanguard S&P 500 Index ETF
-223-
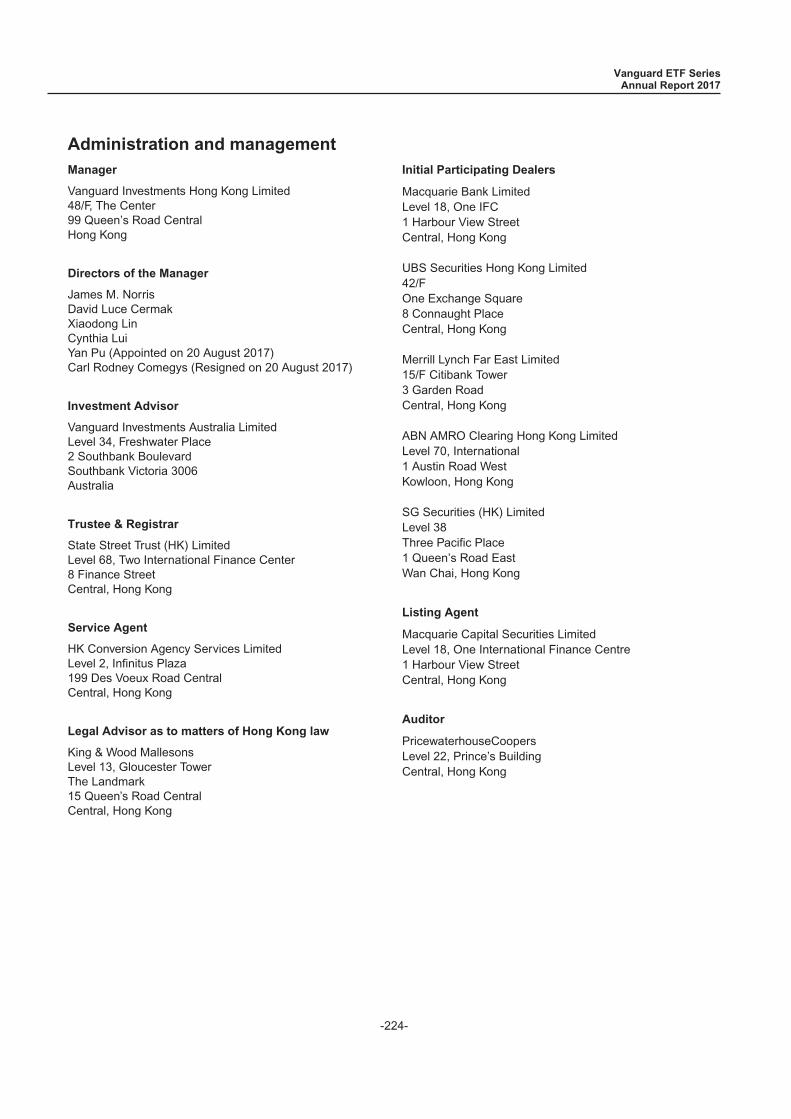
Administration and managementManager
Vanguard Investments Hong Kong Limited48/F, The Center99 Queen’s Road CentralHong Kong
Directors of the Manager
James M. NorrisDavid Luce CermakXiaodong LinCynthia LuiYan Pu (Appointed on 20 August 2017)Carl Rodney Comegys (Resigned on 20 August 2017)
Investment Advisor
Vanguard Investments Australia LimitedLevel 34, Freshwater Place2 Southbank BoulevardSouthbank Victoria 3006Australia
Trustee & Registrar
State Street Trust (HK) LimitedLevel 68, Two International Finance Center8 Finance StreetCentral, Hong Kong
Service Agent
HK Conversion Agency Services LimitedLevel 2, Infinitus Plaza199 Des Voeux Road CentralCentral, Hong Kong
Legal Advisor as to matters of Hong Kong law
King & Wood MallesonsLevel 13, Gloucester TowerThe Landmark15 Queen’s Road CentralCentral, Hong Kong
Initial Participating Dealers
Macquarie Bank LimitedLevel 18, One IFC1 Harbour View StreetCentral, Hong Kong
UBS Securities Hong Kong Limited42/FOne Exchange Square8 Connaught PlaceCentral, Hong Kong
Merrill Lynch Far East Limited15/F Citibank Tower3 Garden RoadCentral, Hong Kong
ABN AMRO Clearing Hong Kong LimitedLevel 70, International1 Austin Road WestKowloon, Hong Kong
SG Securities (HK) LimitedLevel 38Three Pacific Place1 Queen’s Road EastWan Chai, Hong Kong
Listing Agent
Macquarie Capital Securities LimitedLevel 18, One International Finance Centre1 Harbour View StreetCentral, Hong Kong
Auditor
PricewaterhouseCoopersLevel 22, Prince’s BuildingCentral, Hong Kong
Vanguard ETF SeriesAnnual Report 2017
-224-
Copyright © 2022 FDOKUMEN