Vanguard Emerging Markets Stock Index Fund
168
Annual Report | October 31, 2021 Vanguard Emerging Markets Stock Index Fund
-
Upload
khangminh22 -
Category
Documents
-
view
0 -
download
0
Transcript of Vanguard Emerging Markets Stock Index Fund

Annual Report | October 31, 2021
Vanguard Emerging Markets Stock IndexFund

Contents
Your Fund’s Performance at a Glance . . . . . . . . . . . . . . . . .1
About Your Fund’s Expenses . . . . . . . . . . . . . . . . . . . . . . . . . .2
Performance Summary . . . . . . . . . . . . . . . . . . . . . . . . . . . . . . .4
Financial Statements . . . . . . . . . . . . . . . . . . . . . . . . . . . . . . . . .7
Please note: The opinions expressed in this report are just that—informed opinions. They should not be considered promisesor advice. Also, please keep in mind that the information and opinions cover the period through the date on the front of thisreport. Of course, the risks of investing in your fund are spelled out in the prospectus.

• For the 12 months ended October 31, 2021, returns for Vanguard Emerging MarketsStock Index Fund ranged from 17.23% for Investor Shares to 17.51% for ETF Shares(based on net asset value). The fund trailed its benchmark index, which returned18.48%, in part because of differences in the prices of securities used by the fund tocalculate its net asset value and the quoted or published prices for the samesecurities.1
• The global economy continued to recover from the sharp pandemic-inducedcontraction in the spring of 2020. Countries that were more successful in containingthe virus, whether through vaccinations, lockdowns, or both, generally fared bettereconomically. Swift and extensive fiscal and monetary support from policymakers wasalso key to the rebound. Even amid concerns toward the end of the fiscal year aboutinflation and the prospect of less accommodative monetary policy, stock returns for theperiod were excellent.
• At the sector level, financial and technology stocks, the two largest weightings in theindex at the end of the period, powered the broad advance of emerging markets.Financials returned about 33%. Consumer discretionary stocks lagged, returning about–12%.
• Among markets, Taiwan (43%) and India (55%) led the way amid widespreadpositive returns, outweighing China, which was a detractor at –7%.
Market Barometer
Average Annual Total ReturnsPeriods Ended October 31, 2021
One Year Three Years Five Years
Stocks
Russell 1000 Index (Large-caps) 43.51% 22.01% 19.16%
Russell 2000 Index (Small-caps) 50.80 16.47 15.52
Russell 3000 Index (Broad U.S. market) 43.90 21.62 18.91
FTSE All-World ex US Index (International) 30.23 12.42 10.05
Bonds
Bloomberg U.S. Aggregate Bond Index(Broad taxable market) -0.48% 5.63% 3.10%
Bloomberg Municipal Bond Index(Broad tax-exempt market) 2.64 5.17 3.41
FTSE Three-Month U.S. Treasury Bill Index 0.05 1.08 1.12
CPI
Consumer Price Index 6.22% 3.03% 2.73%
Your Fund’s Performance at a Glance
1 See Note A-1, “Security Valuation,” in the Notes to Financial Statements.
1

As a shareholder of the fund, you incur ongoing costs, which include costs for portfolio
management, administrative services, and shareholder reports (like this one), among others.
Operating expenses, which are deducted from a fund’s gross income, directly reduce the
investment return of the fund.
A fund‘s expenses are expressed as a percentage of its average net assets. This figure is known
as the expense ratio. The following examples are intended to help you understand the ongoing
costs (in dollars) of investing in your fund and to compare these costs with those of other mutual
funds. The examples are based on an investment of $1,000 made at the beginning of the period
shown and held for the entire period.
The accompanying table illustrates your fund’s costs in two ways:
• Based on actual fund return.This section helps you to estimate the actual expenses that you
paid over the period. The ”Ending Account Value“ shown is derived from the fund’s actual return,
and the third column shows the dollar amount that would have been paid by an investor who
started with $1,000 in the fund. You may use the information here, together with the amount you
invested, to estimate the expenses that you paid over the period.
To do so, simply divide your account value by $1,000 (for example, an $8,600 account value
divided by $1,000 = 8.6), then multiply the result by the number given for your fund under the
heading ”Expenses Paid During Period.“
• Based on hypothetical 5% yearly return.This section is intended to help you compare your
fund‘s costs with those of other mutual funds. It assumes that the fund had a yearly return of 5%
before expenses, but that the expense ratio is unchanged. In this case—because the return used
is not the fund’s actual return—the results do not apply to your investment. The example is useful
in making comparisons because the Securities and Exchange Commission requires all mutual
funds to calculate expenses based on a 5% return. You can assess your fund’s costs by comparing
this hypothetical example with the hypothetical examples that appear in shareholder reports of
other funds.
Note that the expenses shown in the table are meant to highlight and help you compare ongoingcosts only and do not reflect transaction costs incurred by the fund for buying and selling
securities. Further, the expenses do not include any purchase, redemption, or account service fees
described in the fund prospectus. If such fees were applied to your account, your costs would be
higher. Your fund does not carry a “sales load.”
The calculations assume no shares were bought or sold during the period. Your actual costs may
have been higher or lower, depending on the amount of your investment and the timing of any
purchases or redemptions.
You can find more information about the fund’s expenses, including annual expense ratios, in the
Financial Statements section of this report. For additional information on operating expenses and
other shareholder costs, please refer to your fund’s current prospectus.
About Your Fund’s Expenses
2

Six Months Ended October 31, 2021Beginning
Account Value4/30/2021
EndingAccount Value
10/31/2021
ExpensesPaid During
Period
Based on Actual Fund Return
Emerging Markets Stock Index Fund
Investor Shares $1,000.00 $ 969.90 $1.44
FTSE Emerging Markets ETF Shares 1,000.00 971.40 0.30
Admiral™ Shares 1,000.00 970.90 0.70
Institutional Shares 1,000.00 970.80 0.50
Institutional Plus Shares 1,000.00 971.10 0.40
Based on Hypothetical 5% Yearly Return
Emerging Markets Stock Index Fund
Investor Shares $1,000.00 $1,023.74 $1.48
FTSE Emerging Markets ETF Shares 1,000.00 1,024.90 0.31
Admiral Shares 1,000.00 1,024.50 0.71
Institutional Shares 1,000.00 1,024.70 0.51
Institutional Plus Shares 1,000.00 1,024.80 0.41
The calculations are based on expenses incurred in the most recent six-month period. The fund’s annualized six-month expense ratios forthat period are: 0.29% for Investor Shares, 0.06% for FTSE Emerging Markets ETF Shares, 0.14% for Admiral Shares, 0.10% forInstitutional Shares, and 0.08% for Institutional Plus Shares. The dollar amounts shown as “Expenses Paid” are equal to the annualizedexpense ratio multiplied by the average account value over the period, multiplied by the number of days in the most recent six-monthperiod, then divided by the number of days in the most recent 12-month period (184/365).
3

All of the returns in this report represent past performance, which is not a guarantee of
future results that may be achieved by the fund. (Current performance may be lower or
higher than the performance data cited. For performance data current to the most recent
month-end, visit our website at vanguard.com/performance.) Note, too, that both
investment returns and principal value can fluctuate widely, so an investor’s shares, when
sold, could be worth more or less than their original cost.The returns shown do not reflect
taxes that a shareholder would pay on fund distributions or on the sale of fund shares.
Cumulative Performance: October 31, 2011,Through October 31, 2021Initial Investment of $10,000
$22,000
6,000
15,724
2021202020192018201720162015201420132012
Average Annual Total ReturnsPeriods Ended October 31, 2021
OneYear
FiveYears
TenYears
Final Valueof a $10,000Investment
Emerging Markets Stock Index Fund InvestorShares 17.23% 8.59% 4.63% $15,724
Spliced Emerging Markets Index 18.48 8.94 4.81 16,002
FTSE Global All Cap ex US Index 30.96 10.06 7.09 19,836
Spliced Emerging Markets Index: Select Emerging Markets Index through August 23, 2006; MSCI Emerging Markets Index throughJanuary 9, 2013; FTSE Emerging Transition Index through June 27, 2013; FTSE Emerging Index through November 1, 2015; FTSE EmergingMarkets All Cap China A Transition Index through September 18, 2016; and FTSE Emerging Markets All Cap China A Inclusion Indexthereafter. Benchmark returns are adjusted for withholding taxes.
OneYear
FiveYears
TenYears
Final Valueof a $10,000Investment
FTSE Emerging MarketsETF Shares Net Asset Value 17.51% 8.81% 4.83% $16,028
FTSE Emerging MarketsETF Shares Market Price 18.24 8.83 4.91 16,150
Spliced Emerging Markets Index 18.48 8.94 4.81 16,002
FTSE Global All Cap ex US Index 30.96 10.06 7.09 19,836
Emerging Markets Stock Index Fund
Performance Summary
See Financial Highlights for dividend and capital gains information.
4

Average Annual Total ReturnsPeriods Ended October 31, 2021
OneYear
FiveYears
TenYears
Final Valueof a $10,000Investment
Emerging Markets Stock Index Fund Admiral Shares 17.44% 8.77% 4.81% $15,989
Spliced Emerging Markets Index 18.48 8.94 4.81 16,002
FTSE Global All Cap ex US Index 30.96 10.06 7.09 19,836
OneYear
FiveYears
TenYears
Final Valueof a $5,000,000
Investment
Emerging Markets Stock Index Fund InstitutionalShares 17.45% 8.81% 4.84% $8,021,444
Spliced Emerging Markets Index 18.48 8.94 4.81 8,000,837
FTSE Global All Cap ex US Index 30.96 10.06 7.09 9,918,026
OneYear
FiveYears
TenYears
Final Valueof a $100,000,000
Investment
Emerging Markets Stock Index Fund InstitutionalPlus Shares 17.49% 8.83% 4.86% $160,805,640
Spliced Emerging Markets Index 18.48 8.94 4.81 160,016,730
FTSE Global All Cap ex US Index 30.96 10.06 7.09 198,360,510
Cumulative Returns of ETF Shares: October 31, 2011, Through October 31, 2021
OneYear
FiveYears
TenYears
FTSE Emerging Markets ETF Shares Market Price 18.24% 52.65% 61.50%
FTSE Emerging MarketsETF Shares Net Asset Value 17.51 52.51 60.28
Spliced Emerging Markets Index 18.48 53.44 60.02
For the ETF Shares, the market price is determined by the midpoint of the bid-offer spread as of the closing time of the New York StockExchange (generally 4 p.m., Eastern time). The net asset value is also determined as of the NYSE closing time. For more information abouthow the ETF Shares’ market prices have compared with their net asset value, visit vanguard.com, select your ETF, and then select thePrice and Performance tab. The ETF premium/discount analysis there shows the percentages of days on which the ETF Shares’ marketprice was above or below the NAV.
Emerging Markets Stock Index Fund
5

China 36.8%
Taiwan 18.2
India 15.2
Brazil 4.8
South Africa 3.7
Saudi Arabia 3.6
Russia 3.5
Thailand 2.6
Mexico 2.2
Malaysia 2.0
Indonesia 1.6
Other 5.8
The table reflects the fund’s investments, except for short-terminvestments and derivatives.
The fund may invest in derivatives (such as futures and swapcontracts) for various reasons, including, but not limited to,attempting to remain fully invested and tracking its target index asclosely as possible.
Emerging Markets Stock Index Fund
Fund AllocationAs of October 31, 2021
6

The fund files its complete schedule of portfolio holdings with the Securities and ExchangeCommission (SEC) for the first and third quarters of each fiscal year as an exhibit to its reports onForm N-PORT. The fund’s Form N-PORT reports are available on the SEC’s website atwww.sec.gov.
Shares
MarketValue•
($000)
Common Stocks (98.9%)
Brazil (4.8%)Vale SA 48,708,281 618,023Petroleo BrasileiroSA 61,073,171 299,425
Petroleo BrasileiroSA PreferenceShares 54,686,550 264,043
Itau UnibancoHolding SAPreference Shares 49,097,105 202,781
* Banco Bradesco SAPreference Shares 50,876,878 179,392
Ambev SA 59,027,138 177,694B3 SA - Brasil BolsaBalcao 84,182,210 177,648
WEG SA 20,837,974 136,611Itausa SAPreference Shares 62,071,096 112,731
JBS SA 12,977,303 89,791* Natura & Co.
Holding SA 12,946,365 89,233* Suzano SA 9,934,149 86,654
Notre DameIntermedicaParticipacoes SA 7,166,557 81,496
Itau UnibancoHolding SA ADR 19,349,345 78,752
* Magazine Luiza SA 40,830,118 78,205Vale SA Class BADR 5,364,050 68,284
Lojas Renner SA 11,714,955 66,9011 Rede D'Or Sao Luiz
SA 6,280,940 65,661Localiza Rent a CarSA 8,086,347 64,905
* Banco Bradesco SA 20,901,387 62,958* Raia Drogasil SA 15,230,678 62,744
Banco do Brasil SA 11,886,522 60,024Vibra Energia SA 16,062,179 59,709Gerdau SAPreference Shares 12,200,567 58,151
Cosan SA 16,287,216 57,111
Shares
MarketValue•
($000)
Petroleo BrasileiroSA ADR 5,639,547 54,196
* Banco BTG PactualSA 13,311,692 53,187
* Rumo SA 18,198,605 51,560Equatorial EnergiaSA 12,697,716 51,477
Centrais EletricasBrasileiras SA 8,503,359 50,971
Telefonica Brasil SA 5,974,554 48,188* BRF SA 10,851,254 44,664* Klabin SA 10,930,807 44,430
TOTVS SA 7,588,128 44,046* Banco Bradesco SA
ADR 12,319,151 43,117BB SeguridadeParticipacoes SA 9,722,499 38,054
* Petro Rio SA 8,858,522 36,8391 Hapvida
Participacoes eInvestimentos SA 16,253,389 33,234
Cia Energetica deMinas GeraisPreference Shares 14,326,515 32,695
* Eneva SA 12,466,808 31,809Bradespar SAPreference Shares 3,616,116 31,178
CCR SA 15,258,818 30,903* Americanas SA 5,835,071 30,707* Embraer SA 7,551,359 29,342* Hypera SA 5,894,085 29,304
UltraparParticipacoes SA 11,780,143 27,239
Sul America SA 5,207,364 23,962Marfrig GlobalFoods SA 5,034,722 23,640
* Banco Inter SA 3,731,858 23,474SendasDistribuidora SA 8,644,865 23,420
Energisa SA 3,280,964 23,033* Via SA 20,784,572 22,6492 Banco Santander
Brasil SA ADR 3,544,365 21,656
Emerging Markets Stock Index Fund
Financial Statements
Schedule of InvestmentsAs of October 31, 2021
7

Shares
MarketValue•
($000)
Cia SiderurgicaNacional SA 5,299,579 21,391
TransmissoraAlianca de EnergiaEletrica SA 3,247,428 21,094
Metalurgica GerdauSA PreferenceShares 9,373,796 20,778
1,2 Shimao ServicesHoldings Ltd. 10,330,000 19,470
*,1 Locaweb Servicosde Internet SA 5,609,814 18,190
*,1 Banco Inter SAPreference Shares 8,332,991 18,057
* TIM SA 9,047,765 17,987* Cia de Saneamento
Basico do Estadode Sao Paulo 2,800,253 17,465
Engie BrasilEnergia SA 2,522,192 17,389
* Cia de Locacao dasAmericas 4,916,727 17,188
* Azul SA PreferenceShares 3,886,813 17,128
Centrais EletricasBrasileiras SAPreference Shares 2,796,401 16,767
* Braskem SAPreference SharesClass A 1,685,879 16,268
Sao Martinho SA 2,389,840 16,218* Alpargatas SA
Preference Shares 2,333,154 15,970YDUQSParticipacoes SA 4,172,630 15,422
Usinas Siderurgicasde Minas GeraisSA UsiminasPreference SharesClass A 6,529,643 15,330
Cia SiderurgicaNacional SA ADR 3,627,002 14,798
* BR MallsParticipacoes SA 11,503,147 14,614
EDP - Energias doBrasil SA 4,136,860 14,367
* Grupo De ModaSoma SA 6,107,577 14,198
Itau UnibancoHolding SA 3,800,912 14,163
* IRB BrasilResseguros SA 15,844,722 13,167
* MultiplanEmpreendimentosImobiliarios SA 3,905,377 12,815
Cia Energetica deSao PauloPreference SharesClass B 2,787,531 12,595
Shares
MarketValue•
($000)
Cia Paranaense deEnergia ADR 2,423,128 12,382
CPFL Energia SA 2,630,847 12,264Gerdau SA ADR 2,588,905 12,246
* Cogna Educacao 27,263,273 11,980Atacadao SA 4,061,475 11,975Fleury SA 3,477,601 11,603
* Embraer SA ADR 735,313 11,419* Cia de Saneamento
do Parana 3,524,130 11,396Pet CenterComercio eParticipacoes SA 3,340,750 11,111
CSHG Logistica FIImobiliario 375,063 11,098
Porto Seguro SA 2,622,996 10,847*,2 Cia de Saneamento
Basico do Estadode Sao Paulo ADR 1,687,033 10,595
Cyrela Brazil RealtySAEmpreendimentose Participacoes 4,224,548 10,547
* Lojas AmericanasSA PreferenceShares 12,285,984 10,514
Dexco SA 3,743,363 10,287Banco SantanderBrasil SA 1,663,220 10,138
Cia deTransmissaode EnergiaEletrica PaulistaPreference Shares 2,331,606 10,047
Kinea Indice dePrecos FII 535,687 9,737
Banco Pan SAPreference Shares 4,087,263 9,625
SLC Agricola SA 1,234,608 9,533Arezzo Industria eComercio SA 705,392 9,236
Neoenergia SA 3,345,859 9,189* Braskem SA ADR 473,534 9,172
Light SA 5,108,194 8,761Odontoprev SA 3,668,519 8,717
* Omega Geracao SA 1,438,893 8,345QualicorpConsultoria eCorretora deSeguros SA 2,740,984 8,310
Cia Brasileira deDistribuicao 1,817,883 8,223
Unipar CarbocloroSA PreferenceShares Class B 616,836 8,161
* Santos BrasilParticipacoes SA 8,751,186 7,986
MRV Engenharia eParticipacoes SA 4,439,838 7,985
Emerging Markets Stock Index Fund
8

Shares
MarketValue•
($000)
* Gol Linhas AereasInteligentes SAPreference Shares 2,893,077 7,781
* CVC BrasilOperadora eAgencia deViagens SA 2,749,577 7,780
2 SendasDistribuidora SAADR 554,044 7,474
Cia Paranaense deEnergiaPreference Shares 7,073,762 7,420
* M Dias Branco SA 1,346,925 7,386Iguatemi Empresade ShoppingCenters SA 1,236,069 6,557
Cia de Saneamentode MinasGerais-COPASA 2,692,170 6,492
Minerva SA 3,655,457 6,309AluparInvestimento SA 1,472,167 6,193
Aliansce SonaeShopping CentersSA 1,788,722 6,079
Cielo SA 15,663,086 6,078SIMPAR SA 3,298,500 5,991Grendene SA 3,852,509 5,857VivaraParticipacoes SA 1,270,700 5,840
CSN Mineracao SA 6,201,814 5,791* Iochpe Maxion SA 1,870,049 5,560
Cia Energetica deMinas Gerais ADR 2,375,711 5,345
* Anima Holding SA 4,484,975 5,245Kinea RendimentosImobiliarios FII 300,000 5,177
* Vamos Locacao deCaminhoesMaquinas eEquipamentos SA 2,545,916 5,111
* MovidaParticipacoes SA 1,886,350 4,963
Kinea RendaImobiliaria FII 200,000 4,808
* Raizen SAPreference Shares 3,997,977 4,803
Randon SAImplementos eParticipacoesPreference Shares 2,629,234 4,733
Banco do Estadodo Rio Grande doSul SA PreferenceShares Class B 2,299,442 4,437
Shares
MarketValue•
($000)
Ez TecEmpreendimentose ParticipacoesSA 1,355,878 4,384
* Cia Ferro Ligas daBahia - FERBASAPreference Shares 515,272 4,328
AES Brasil EnergiaSA 2,224,294 4,296
* TIM SA ADR 435,188 4,291Lojas Quero QueroSA 2,087,874 4,284
* Grupo Mateus SA 3,291,300 4,158* EcoRodovias
Infraestrutura eLogistica SA 2,764,571 4,012
AmbiparParticipacoes eEmpreendimentosSA 608,948 3,987
Intelbras SAIndustria deTelecomunicacaoEletronicaBrasileira 845,500 3,943
* Grupo SBF SA 1,038,168 3,852* Marcopolo SA
Preference Shares 7,929,831 3,639BR Properties SA 2,816,674 3,598Boa Vista ServicosSA 2,199,660 3,558
* BK Brasil Operacaoe Assessoria aRestaurantes SA 2,777,611 3,381
* Tupy SA 909,992 3,368Construtora TendaSA 1,110,987 3,358
2 Centrais EletricasBrasileiras SAADR 542,798 3,300
Usinas Siderurgicasde Minas GeraisSA Usiminas 1,436,600 3,279
* Lojas AmericanasSA 3,737,943 3,265
Mahle-Metal LeveSA 525,673 3,174
* Camil AlimentosSA 1,831,100 3,141
JHSF ParticipacoesSA 3,365,000 2,975
* Hidrovias do BrasilSA 5,523,700 2,917
1 Meliuz SA 4,901,198 2,875* Aeris Industria E
Comercio DeEquipamentosPara Geracao DeEnergia SA 2,008,764 2,805
Emerging Markets Stock Index Fund
9

Shares
MarketValue•
($000)
LOG CommercialProperties eParticipacoes SA 666,218 2,766
EnautaParticipacoes SA 1,115,630 2,526
2 Cia Brasileira deDistribuicao ADR 554,044 2,526
* Instituto HermesPardini SA 625,360 2,433
* Banco Inter SAOrdinary Shares 1,116,790 2,291
* GuararapesConfeccoes SA 1,179,860 2,289
JereissatiParticipacoes SA 487,600 2,279
Cia Energetica deMinas Gerais 773,231 2,277
Cia Paranaense deEnergia 2,165,400 2,064
Wiz Solucoes eCorretagem deSeguros SA 1,191,824 2,038
MPM CorporeosSA 1,130,302 1,957
2 Centrais EletricasBrasileiras SAADR (XNYS) 313,592 1,891
Ambev SA ADR 622,682 1,843DirecionalEngenharia SA 1,079,543 1,825
Even Construtora eIncorporadora SA 1,539,310 1,696
1 Ser Educacional SA 760,628 1,407* Sequoia Logistica e
Transportes SA 510,000 1,175* C&A Modas Ltda 796,600 855
Telefonica Brasil SAADR 95,766 769
*,2 Getnet Adquirenciae Servicos paraMeios dePagamento SAADR 443,046 709
* Getnet Adquirenciae Servicos paraMeios dePagamento SA 415,805 321
* EmpreendimentosPague Menos SA 152,209 255
* Oi SA ADR 1 —* Ultrapar
Participacoes SARights Exp.11/3/21 818,243 —
* XP Inc. BDR 1 —
5,301,729
Shares
MarketValue•
($000)
Chile (0.5%)Sociedad Quimicay Minera de ChileSA PreferenceShares Class B 1,559,630 84,701
Empresas COPECSA 6,699,857 52,709
Banco de Chile 580,323,550 50,364Falabella SA 11,222,705 31,035Empresas CMPCSA 16,016,194 29,552
Cencosud SA 19,001,995 27,796Enel Americas SA 225,917,642 25,688Banco de Credito eInversiones SA 677,086 22,800
Banco SantanderChile 520,077,349 22,759
Cia Sud Americanade Vapores SA 241,207,209 15,670
Cia CerveceriasUnidas SA 1,815,693 15,212
Sociedad Quimicay Minera de ChileSA ADR 263,141 14,444
Banco SantanderChile ADR 752,638 13,337
Enel Chile SA 318,539,959 13,051CAP SA 1,020,097 10,097
* Itau CorpBancaChile SA 3,995,568,417 8,865
* Parque Arauco SA 8,833,511 8,720Aguas Andinas SAClass A 39,065,718 7,443
Colbun SA 106,778,071 7,364CencosudShopping SA 7,029,998 6,804
EmbotelladoraAndina SAPreference SharesClass B 3,053,443 6,306
Empresa NacionaldeTelecomunicacionesSA 1,778,047 6,096
2 Enel Americas SAADR 953,809 5,399
AES Andes SA 48,752,457 5,010* Latam Airlines
Group SA 3,024,840 4,415Vina Concha yToroSA 2,982,592 4,337
Engie Energia ChileSA 6,943,752 4,037
Plaza SA 4,033,928 4,026SMU SA 39,524,631 3,935Inversiones AguasMetropolitanasSA 6,741,307 3,168
Emerging Markets Stock Index Fund
10

Shares
MarketValue•
($000)
* Ripley Corp. SA 14,356,234 2,428SONDA SA 7,171,699 2,423Inversiones LaConstruccion SA 449,396 1,622
Salfacorp SA 4,524,748 1,5332 Enel Chile SA ADR 588,006 1,276
524,422China (36.4%)
Tencent HoldingsLtd. 82,225,744 5,001,774
* Alibaba GroupHolding Ltd. 195,120,828 4,012,203
*,1 Meituan Class B 53,341,582 1,815,142China ConstructionBank Corp.Class H 1,279,180,103 870,585
* NIO Inc. ADR 17,794,034 701,263*,1 Wuxi Biologics
Cayman Inc. 45,115,566 683,364* JD.com Inc.
Class A 17,191,196 672,984Industrial &Commercial Bankof China Ltd.Class H 1,097,969,614 601,866
* Baidu Inc. ADR 3,677,680 596,667Ping An InsuranceGroup Co. ofChina Ltd. Class H 82,016,813 587,465
*,1 Xiaomi Corp.Class B 182,062,600 497,678
China MerchantsBank Co. Ltd.Class H 58,358,295 489,051
* Pinduoduo Inc.ADR 5,097,479 453,268
BYD Co. Ltd.Class H 10,895,656 416,732
NetEase Inc. 20,311,811 394,002Bank of China Ltd.Class H 1,088,580,735 385,251
Li Ning Co. Ltd. 30,204,074 333,304*,2 XPeng Inc. Class A
ADR 6,498,456 303,023*,1 Kuaishou
Technology 21,314,200 278,820* China Mengniu
Dairy Co. Ltd. 42,483,920 270,307*,2 Bilibili Inc. ADR 3,459,595 253,588
Geely AutomobileHoldings Ltd. 72,984,743 253,304
ANTA SportsProducts Ltd. 15,574,405 241,306
Sunny OpticalTechnology GroupCo. Ltd. 8,976,475 240,870
GreatWall MotorCo. Ltd. Class H 49,708,875 223,667
Shares
MarketValue•
($000)
ShenzhouInternationalGroup HoldingsLtd. 10,367,541 223,360
* Trip.com GroupLtd. ADR 7,265,546 207,504
Kweichow MoutaiCo. Ltd. Class A(XSSC) 716,664 204,506
China LifeInsurance Co. Ltd.Class H 105,794,734 183,794
Country GardenServices HoldingsCo. Ltd. 23,767,331 182,972
ENN EnergyHoldings Ltd. 10,434,155 179,765
China ResourcesBeer Holdings Co.Ltd. 21,642,124 178,696
* Li Auto Inc. ADR 5,461,794 178,218China Petroleum &Chemical Corp.Class H 365,150,822 177,914
*,1 InnoventBiologics Inc. 18,341,320 164,161
China ResourcesLand Ltd. 38,312,325 148,861
Agricultural Bank ofChina Ltd. Class H 434,667,343 147,703
* Huazhu Group Ltd.ADR (XNGS) 2,941,201 136,354
PetroChina Co. Ltd.Class H 271,770,227 131,033
China PacificInsurance GroupCo. Ltd. Class H 41,425,992 126,675
Kweichow MoutaiCo. Ltd. Class A(XSHG) 435,276 124,210
1 Longfor GroupHoldings Ltd. 25,634,601 124,018
CSPCPharmaceuticalGroup Ltd. 116,550,529 121,620
Xinyi SolarHoldings Ltd. 58,188,000 120,872
* KingdeeInternationalSoftware GroupCo. Ltd. 36,105,284 118,800
Haier Smart HomeCo. Ltd. Class H 31,561,055 117,524
China OverseasLand &Investment Ltd. 53,051,841 117,009
1 SmooreInternationalHoldings Ltd. 24,062,000 114,419
Emerging Markets Stock Index Fund
11

Shares
MarketValue•
($000)
China ConchVenture HoldingsLtd. 22,767,018 110,633
China LongyuanPower GroupCorp. Ltd. Class H 46,726,493 109,295
Zijin Mining GroupCo. Ltd. Class H 77,457,097 107,716
China Gas HoldingsLtd. 41,407,693 103,354
China ShenhuaEnergy Co. Ltd.Class H 47,648,860 102,459
SinoBiopharmaceuticalLtd. 136,689,444 100,793
Country GardenHoldings Co. Ltd. 103,819,469 97,695
CITIC SecuritiesCo. Ltd. Class H 38,247,587 97,109
*,2 COSCO SHIPPINGHoldings Co. Ltd.Class H 61,334,105 95,001
1 Postal SavingsBank of China Co.Ltd. Class H 128,897,010 93,681
* GDS Holdings Ltd.ADR 1,517,926 90,165
*,1 JD HealthInternational Inc. 9,887,240 86,795
PICC Property &Casualty Co. Ltd.Class H 92,834,207 86,424
Anhui ConchCement Co. Ltd.Class H 17,114,135 84,628
* Zai Lab Ltd. ADR 810,614 84,6281 China Tower Corp.
Ltd. Class H 649,102,936 84,123WuliangyeYibin Co.Ltd. Class A(XSHE) 2,457,398 83,039
* Alibaba HealthInformationTechnology Ltd. 65,248,112 81,703
Zhongsheng GroupHoldings Ltd. 8,859,406 79,880
Ping An InsuranceGroup Co. ofChina Ltd. Class A 9,891,000 76,403
Sunac ChinaHoldings Ltd. 34,419,526 73,607
China TourismGroup Duty FreeCorp. Ltd. Class A(XSSC) 1,677,022 70,238
China ResourcesPower HoldingsCo. Ltd. 26,225,149 67,877
Shares
MarketValue•
($000)
China NationalBuilding MaterialCo. Ltd. Class H 54,129,473 67,840
* Vipshop HoldingsLtd. ADR 6,041,449 67,423
CITIC Ltd. 67,278,026 67,399China ResourcesGas Group Ltd. 12,312,405 66,085
China Vanke Co.Ltd. Class H 27,260,200 63,692
* Tencent MusicEntertainmentGroup ADR 7,958,701 62,555
Bank ofCommunicationsCo. Ltd. Class H 100,914,609 60,032
* Daqo New EnergyCorp. ADR 763,842 59,419
* KE Holdings Inc.ADR 3,214,609 58,570
* Genscript BiotechCorp. 13,134,320 58,118
1 China InternationalCapital Corp. Ltd.Class H 23,150,740 57,316
China MerchantsBank Co. Ltd.Class A (XSSC) 6,780,649 57,114
ContemporaryAmperexTechnology Co.Ltd. Class A(XSHE) 554,300 55,525
ShandongWeigaoGroup MedicalPolymer Co. Ltd.Class H 32,045,844 54,585
LONGi GreenEnergyTechnology Co.Ltd. Class A(XSSC) 3,565,601 54,365
1 WuXi AppTec Co.Ltd. Class H 2,507,519 53,538
Kingsoft Corp. Ltd. 12,209,078 52,097GF Securities Co.Ltd. Class A(XSHE) 16,533,155 52,031
HenganInternationalGroup Co. Ltd. 9,853,026 51,491
* ChinasoftInternational Ltd. 30,497,155 50,922
Haitong SecuritiesCo. Ltd. Class H 57,164,070 50,854
GuangdongInvestment Ltd. 40,060,021 50,370
Emerging Markets Stock Index Fund
12

Shares
MarketValue•
($000)
Wanhua ChemicalGroup Co. Ltd.Class A 2,949,967 48,746
China CITIC BankCorp. Ltd. Class H 110,544,476 48,490
*,2 RLXTechnology Inc.ADR 9,901,376 48,121
GuangzhouAutomobile GroupCo. Ltd. Class H 50,924,820 48,071
1 Ganfeng LithiumCo. Ltd. Class H 2,552,200 47,817
* Lufax Holding Ltd.ADR 7,530,733 47,519
WuXi AppTec Co.Ltd. Class A(XSSC) 2,175,564 46,884
Tsingtao BreweryCo. Ltd. 5,322,736 46,317
ZTO ExpressCayman Inc. ADR 1,576,362 46,235
Kingboard HoldingsLtd. 10,281,108 44,803
BYD Co. Ltd.Class A (XSEC) 899,969 43,987
2 China MinshengBanking Corp.Ltd. Class H 110,712,594 43,897
Kunlun Energy Co.Ltd. 47,386,541 43,159
1 CGN Power Co.Ltd. Class H 158,340,514 42,625
* New OrientalEducation &TechnologyGroup Inc. ADR 20,592,188 42,214
Weichai Power Co.Ltd. Class H 23,532,294 42,122
*,1,2 Weimob Inc. 27,194,000 41,535Fuyao GlassIndustry GroupCo. Ltd. Class A(XSHG) 5,370,232 41,483
China MerchantsBank Co. Ltd.Class A (XSHG) 4,874,029 41,055
Sinopharm GroupCo. Ltd. Class H 17,276,225 41,023
HangzhouTigermedConsulting Co.Ltd. Class A 1,533,834 40,832
1 China ResourcesMixc LifestyleServices Ltd. 7,687,600 40,440
Industrial Bank Co.Ltd. Class A(XSSC) 13,893,265 40,434
Shares
MarketValue•
($000)
Shanxi XinghuacunFenWine FactoryCo. Ltd. Class A(XSHG) 839,226 39,535
New China LifeInsurance Co. Ltd.Class H 13,548,712 39,087
Industrial &Commercial Bankof China Ltd.Class A (XSSC) 53,033,376 38,719
*,2 Yihai InternationalHolding Ltd. 6,534,648 38,277
2 Yanzhou CoalMining Co. Ltd.Class H 25,754,023 38,200
Ping An Bank Co.Ltd. Class A(XSHE) 12,522,304 38,143
*,1 China LiteratureLtd. 5,443,164 37,767
WuliangyeYibin Co.Ltd. Class A(XSEC) 1,107,662 37,429
* 360 DigiTech Inc.ADR 1,827,277 37,295
Dongfeng MotorGroup Co. Ltd.Class H 39,933,430 37,192
*,1 Akeso Inc. 6,665,000 37,156Aier Eye HospitalGroup Co. Ltd.Class A 4,803,043 36,324
1,2 HaidilaoInternationalHolding Ltd. 12,903,000 35,978
Fosun InternationalLtd. 30,544,125 35,786
*,2 DiDi Global Inc.ADR 4,403,047 35,533
BYD Co. Ltd.Class A (XSHE) 723,248 35,349
*,1,2 Pop MartInternationalGroup Ltd. 5,989,200 35,327
People's InsuranceCo. Group ofChina Ltd. Class H 112,833,422 35,195
1,2 Hygeia HealthcareHoldings Co. Ltd. 3,997,884 35,096
China EverbrightEnvironmentGroup Ltd. 50,782,203 34,885
*,1 Hua HongSemiconductorLtd. 6,930,606 34,780
Sungrow PowerSupply Co. Ltd.Class A 1,345,192 34,576
Emerging Markets Stock Index Fund
13
Shares
MarketValue•
($000)
2 Flat Glass GroupCo. Ltd. Class H 6,415,000 34,389
JOYY Inc. ADR 682,113 34,372* Aluminum Corp. of
China Ltd. Class H 56,593,237 34,057Shanghai FosunPharmaceuticalGroup Co. Ltd.Class H 7,233,109 34,048
2 Dongyue GroupLtd. 14,627,339 34,032
* Zhuzhou CRRCTimes Electric Co.Ltd. 7,037,379 33,628
Luxshare PrecisionIndustry Co. Ltd.Class A (XSHE) 5,495,583 33,234
China HongqiaoGroup Ltd. 29,775,500 33,082
East MoneyInformation Co.Ltd. Class A(XSEC) 6,409,603 32,961
Luzhou Laojiao Co.Ltd. Class A(XSHE) 912,999 32,570
* iQIYI Inc. ADR 3,927,419 32,519China MerchantsPort Holdings Co.Ltd. 19,422,671 32,381
ChinaYangtzePower Co. Ltd.Class A (XSHG) 9,739,991 32,369
China MolybdenumCo. Ltd. Class H 52,286,171 32,323
BYD ElectronicInternational Co.Ltd. 10,877,029 32,290
Jiangsu HengruiMedicine Co. Ltd.Class A (XSSC) 4,166,043 32,004
China GalaxySecurities Co. Ltd.Class H 57,402,875 31,961
China PowerInternationalDevelopment Ltd. 63,417,063 31,860
YangzijiangShipbuildingHoldings Ltd. 30,061,998 31,738
China TaipingInsuranceHoldings Co. Ltd. 20,855,800 31,736
Shanghai BaosightSoftware Co. Ltd.Class B 7,923,643 31,676
Jiangxi Copper Co.Ltd. Class H 18,132,722 31,666
ZTE Corp. Class H 10,417,039 31,270
Shares
MarketValue•
($000)
Muyuan Foods Co.Ltd. Class A(XSHE) 3,485,031 31,163
Shimao GroupHoldings Ltd. 19,749,423 30,981
China RailwayGroup Ltd.Class H 62,821,604 30,688
Eve Energy Co.Ltd. Class A 1,708,738 30,289
1 HansohPharmaceuticalGroup Co. Ltd. 13,607,000 30,250
Shanghai PudongDevelopmentBank Co. Ltd.Class A (XSSC) 21,643,831 30,230
* Weibo Corp. ADR 669,244 30,103China MeidongAuto HoldingsLtd. 5,800,521 29,965
China MedicalSystem HoldingsLtd. 17,646,584 29,880
*,2 JinkoSolar HoldingCo. Ltd. ADR 497,879 29,783
1 TopsportsInternationalHoldings Ltd. 24,462,000 29,718
Agricultural Bank ofChina Ltd. Class A(XSSC) 64,544,395 29,639
Beijing EnterprisesWater Group Ltd. 77,274,691 29,537
2 Huaneng PowerInternational Inc.Class H 56,798,822 29,397
Far East HorizonLtd. 30,831,130 29,396
JiangsuYangheBreweryJoint-Stock Co.Ltd. Class A(XSHE) 1,008,728 29,266
1 Huatai SecuritiesCo. Ltd. Class H 19,668,008 29,249
Tongwei Co. Ltd.Class A (XSSC) 3,247,185 28,994
*,2 Kingsoft CloudHoldings Ltd.ADR 1,261,510 28,977
*,1,2 EvergrandeProperty ServicesGroup Ltd. 56,861,000 28,969
BosidengInternationalHoldings Ltd. 37,241,764 28,857
Emerging Markets Stock Index Fund
14

Shares
MarketValue•
($000)
China OilfieldServices Ltd.Class H 29,940,348 28,634
Anhui GujingDistillery Co. Ltd.Class B 2,188,408 28,216
CIFI HoldingsGroup Co. Ltd. 50,800,897 28,198
*,1,2 Jinxin FertilityGroup Ltd. 19,959,500 28,151
*,1,2 CanSinoBiologics Inc.Class H 1,096,000 28,030
Inner Mongolia YiliIndustrial GroupCo. Ltd. Class A(XSSC) 4,179,492 28,020
*,3 GCL-Poly EnergyHoldings Ltd. 109,839,000 27,952
Chongqing ZhifeiBiologicalProducts Co. Ltd.Class A 1,187,871 27,926
Beijing EnterprisesHoldings Ltd. 7,175,267 27,581
* Canadian Solar Inc. 662,209 27,515Nine DragonsPaper HoldingsLtd. 21,552,910 27,103
1,2 China MerchantsSecurities Co. Ltd.Class H 17,139,856 27,080
TravelSkyTechnology Ltd.Class H 14,135,867 26,412
China ResourcesCement HoldingsLtd. 31,269,076 26,294
* Tongcheng-ElongHoldings Ltd. 11,797,600 26,293
China StateConstructionInternationalHoldings Ltd. 25,528,728 26,156
2 Xinjiang GoldwindScience &Technology Co.Ltd. Class H 11,686,690 26,135
China JinmaoHoldings GroupLtd. 88,927,771 25,980
* Vnet Group Inc.ADR 1,652,413 25,910
*,1,2 Ping An Healthcare&Technology Co.Ltd. 5,347,995 25,853
Autohome Inc.ADR 656,745 25,843
Shares
MarketValue•
($000)
*,2 MingYuan CloudGroup HoldingsLtd. 7,837,000 25,474
Shenzhen MindrayBio-MedicalElectronics Co.Ltd. Class A(XSHE) 434,287 25,448
HopsonDevelopmentHoldings Ltd. 9,347,727 25,366
CRRC Corp. Ltd.Class H 56,029,000 25,299
* TAL EducationGroup ADR 6,125,511 25,053
ZhangzhouPientzehuangPharmaceuticalCo. Ltd. Class A(XSSC) 389,306 25,027
Shenzhen MindrayBio-MedicalElectronics Co.Ltd. Class A(XSEC) 419,669 24,592
Ganfeng LithiumCo. Ltd. Class A(XSHE) 921,350 24,123
* 51job Inc. ADR 402,540 23,975Shenzhen InovanceTechnology Co.Ltd. Class A 2,352,928 23,974
Agricultural Bank ofChina Ltd. Class A(XSHG) 52,073,300 23,912
Yunnan EnergyNew Material Co.Ltd. (XSHE) 520,135 23,721
1 Yadea GroupHoldings Ltd. 13,736,000 23,601
HaitianInternationalHoldings Ltd. 8,070,180 23,521
Bank of Ningbo Co.Ltd. Class A(XSHE) 3,943,270 23,508
Pharmaron BeijingCo. Ltd. Class A(XSEC) 782,071 23,321
KingboardLaminatesHoldings Ltd. 14,816,799 23,227
LONGi GreenEnergyTechnology Co.Ltd. Class A(XSHG) 1,463,429 22,313
* Seazen Group Ltd. 28,162,824 22,279
Emerging Markets Stock Index Fund
15

Shares
MarketValue•
($000)
ContemporaryAmperexTechnology Co.Ltd. Class A(XSEC) 221,485 22,187
AviChina Industry&Technology Co.Ltd. Class H 34,760,476 22,116
COSCO SHIPPINGPorts Ltd. 26,519,359 22,074
1 JiumaojiuInternationalHoldings Ltd. 8,712,000 21,809
* I-Mab ADR 352,783 21,798ShanghaiPharmaceuticalsHolding Co. Ltd.Class H 11,899,426 21,779
CRRC Corp. Ltd.Class A 23,269,989 21,587
China Cinda AssetManagement Co.Ltd. Class H 128,980,276 21,533
Hello Group Inc.ADR 1,702,990 21,202
Haier Smart HomeCo. Ltd. Class A(XSSC) 4,972,807 21,130
*,1,3 China HuarongAssetManagement Co.Ltd. Class H 156,726,113 20,546
2 Xtep InternationalHoldings Ltd. 15,622,291 20,431
Shandong GoldMining Co. Ltd.Class A (XSSC) 6,572,346 20,395
* Noah Holdings Ltd.ADR 479,656 20,390
China Lesso GroupHoldings Ltd. 13,157,317 20,337
ChinaYongdaAutomobilesServices HoldingsLtd. 12,764,652 20,310
Bank ofCommunicationsCo. Ltd. Class A(XSSC) 28,614,739 20,204
ChinaCommunicationsServices Corp.Ltd. Class H 36,240,821 20,035
China NorthernRare Earth GroupHigh-Tech Co. Ltd.Class A (XSSC) 2,518,440 19,974
Shares
MarketValue•
($000)
China StateConstructionEngineering Corp.Ltd. Class A(XSSC) 27,089,170 19,708
*,1,2 InnoCare PharmaLtd. 8,212,000 19,693
Huatai SecuritiesCo. Ltd. Class A(XSSC) 7,927,031 19,637
NAURATechnologyGroup Co. Ltd.Class A (XSHE) 337,900 19,599
Zijin Mining GroupCo. Ltd. Class A(XSSC) 11,970,000 19,544
ShenzhenTranssionHoldings Co. Ltd.Class A 783,322 19,312
China SuntienGreen EnergyCorp. Ltd. Class H 24,240,823 19,266
SAIC Motor Corp.Ltd. Class A(XSSC) 6,056,213 19,219
China Coal EnergyCo. Ltd. Class H 31,471,653 19,200
ZhejiangExpressway Co.Ltd. Class H 21,621,477 19,182
JA Solar TechnologyCo. Ltd. Class A(XSHE) 1,334,700 19,043
Orient SecuritiesCo. Ltd. Class A(XSSC) 8,779,670 18,894
WingtechTechnology Co.Ltd. Class A 1,098,531 18,854
Beijing KingsoftOfficeSoftware Inc.Class A (XSHG) 403,640 18,673
SF Holding Co. Ltd.Class A (XSHE) 1,837,624 18,530
*,2 GOME RetailHoldings Ltd. 180,860,708 18,333
* Alibaba PicturesGroup Ltd. 171,879,250 18,259
Guotai JunanSecurities Co. Ltd.Class A (XSHG) 6,631,000 18,157
Will SemiconductorCo. Ltd. ShanghaiClass A (XSHG) 435,800 18,106
China LifeInsurance Co. Ltd.Class A 3,900,190 18,093
Emerging Markets Stock Index Fund
16

Shares
MarketValue•
($000)
* Air China Ltd.Class H 25,485,808 17,930
* Tianqi LithiumCorp. Class A(XSHE) 1,213,487 17,870
* China SouthernAirlines Co. Ltd.Class H 29,129,638 17,714
JiangsuExpressway Co.Ltd. Class H 18,574,976 17,613
* HollysysAutomationTechnologies Ltd. 881,169 17,579
2 China EducationGroup HoldingsLtd. 10,271,724 17,558
China TraditionalChinese MedicineHoldings Co. Ltd. 36,850,802 17,535
* Dada Nexus Ltd.ADR 861,660 17,500
China Vanke Co.Ltd. Class A(XSHE) 6,147,497 17,479
*,2 XD Inc. 3,081,400 17,443*,1,2 ZhongAn Online
P&C InsuranceCo. Ltd. Class H 4,785,993 17,409
* Beijing CapitalInternationalAirport Co. Ltd.Class H 26,572,447 17,279
*,1,2 Venus MedTechHangzhou Inc.Class H 3,698,000 17,114
*,1 3SBio Inc. 18,510,086 16,923Tsingtao BreweryCo. Ltd. Class A(XSHG) 1,033,151 16,839
CSC Financial Co.Ltd. Class A 3,805,410 16,807
China GrandPharmaceutical &HealthcareHoldings Ltd. 20,986,710 16,804
*,1,2 AlphamabOncology 8,177,000 16,777
1 A-Living Smart CityServices Co. Ltd. 5,047,663 16,756
China OverseasProperty HoldingsLtd. 18,362,311 16,497
East MoneyInformation Co.Ltd. Class A(XSHE) 3,195,969 16,435
Shares
MarketValue•
($000)
Poly Developments& Holdings GroupCo. Ltd. Class A(XSSC) 8,372,870 16,433
1 Dali Foods GroupCo. Ltd. 29,260,548 16,292
Luzhou Laojiao Co.Ltd. Class A(XSEC) 456,500 16,285
NARI TechnologyCo. Ltd. Class A(XSHG) 2,657,708 16,183
ShenzhenInternationalHoldings Ltd. 13,434,978 16,175
2 Greentown ChinaHoldings Ltd. 11,712,219 16,136
*,1,2 KintorPharmaceuticalLtd. 3,218,000 16,058
Ping An Bank Co.Ltd. Class A(XSEC) 5,245,600 15,978
Fuyao GlassIndustry GroupCo. Ltd. Class A(XSSC) 2,067,613 15,971
Shanghai LujiazuiFinance &TradeZoneDevelopment Co.Ltd. Class B 17,862,933 15,887
*,1,2 YiduTech Inc. 4,977,400 15,882NARI TechnologyCo. Ltd. Class A(XSSC) 2,603,968 15,855
Yuexiu Property Co.Ltd. 18,011,332 15,826
KWG GroupHoldings Ltd. 18,145,297 15,818
LensTechnologyCo. Ltd. Class A 4,752,454 15,813
GuangzhouTinciMaterialsTechnology Co.Ltd. Class A(XSHE) 614,129 15,804
Sany HeavyIndustry Co. Ltd.Class A (XSSC) 4,399,964 15,778
Bank of China Ltd.Class A (XSSC) 33,064,900 15,751
Zoomlion HeavyIndustry Science&Technology Co.Ltd. Class H 21,772,532 15,682
Agile GroupHoldings Ltd. 19,869,226 15,576
Emerging Markets Stock Index Fund
17

Shares
MarketValue•
($000)
Zhejiang HuayouCobalt Co. Ltd.Class A (XSHG) 891,337 15,459
SananOptoelectronicsCo. Ltd. Class A(XSSC) 2,937,042 15,431
2 China InternationalMarineContainers GroupCo. Ltd. Class H 7,775,578 15,406
Logan Group Co.Ltd. 15,273,165 15,299
China EverbrightBank Co. Ltd.Class H 43,454,956 15,281
China EverbrightBank Co. Ltd.Class A (XSSC) 28,214,294 15,167
Jiangsu HengruiMedicine Co. Ltd.Class A (XSHG) 1,969,099 15,127
WuXi AppTec Co.Ltd. Class A(XSHG) 696,246 15,004
Industrial Bank Co.Ltd. Class A(XSHG) 5,127,801 14,924
CIFI Ever SunshineServices GroupLtd. 8,360,000 14,918
*,1,2 Peijia Medical Ltd. 6,102,000 14,869Foshan HaitianFlavouring & FoodCo. Ltd. Class A(XSSC) 808,217 14,799
China UnitedNetworkCommunicationsLtd. Class A 23,134,444 14,731
Imeik TechnologyDevelopment Co.Ltd. Class A(XSHE) 150,560 14,682
GoerTek Inc.Class A (XSHE) 2,161,304 14,679
1 Sunac ServicesHoldings Ltd. 7,203,503 14,538
ChinaWater AffairsGroup Ltd. 14,142,149 14,535
Zhejiang JingshengMechanical &Electrical Co. Ltd.Class A 1,194,292 14,279
*,1 Remegen Co. Ltd.Class H 1,146,000 14,257
Shares
MarketValue•
($000)
ChongqingChanganAutomobile Co.Ltd. Class B 21,981,647 14,207
Jiangsu HengliHydraulic Co. Ltd.Class A 1,103,939 14,157
MaxscendMicroelectronicsCo. Ltd. Class A 292,448 14,136
*,1,2 Shanghai JunshiBiosciences Co.Ltd. Class H 2,805,800 14,102
Sany HeavyEquipmentInternationalHoldings Co. Ltd. 12,387,954 14,096
* Lifetech ScientificCorp. 30,289,059 14,067
MINISO GroupHolding Ltd. ADR 921,109 13,826
* Niu TechnologiesADR 526,360 13,780
*,2 Canaan Inc. ADR 1,599,032 13,7042 China Everbright
Ltd. 12,104,100 13,610China MerchantsSecurities Co. Ltd.Class A (XSSC) 5,051,753 13,560
* AdvancedMicro-FabricationEquipment Inc.China Class A 554,840 13,559
CGN New EnergyHoldings Co. Ltd. 14,404,000 13,482
ShenwanHongyuan GroupCo. Ltd. Class A(XSHE) 16,751,781 13,424
AECC AviationPower Co. Ltd.Class A (XSSC) 1,448,466 13,384
CITIC SecuritiesCo. Ltd. Class A(XSSC) 3,305,200 13,361
1 Pharmaron BeijingCo. Ltd. Class H 611,400 13,229
* Baozun Inc. Class A 2,290,733 13,222Shanxi XinghuacunFenWine FactoryCo. Ltd. Class A(XSSC) 280,320 13,205
Sany HeavyIndustry Co. Ltd.Class A (XSHG) 3,652,279 13,097
Xinyi EnergyHoldings Ltd. 22,088,000 13,024
Emerging Markets Stock Index Fund
18

Shares
MarketValue•
($000)
China Petroleum &Chemical Corp.Class A 19,536,901 12,981
China CITIC BankCorp. Ltd. Class A(XSSC) 18,288,166 12,972
Sinotruk HongKong Ltd. 9,385,467 12,955
Sinopec ShanghaiPetrochemical Co.Ltd. Class H 55,152,131 12,869
Greentown ServiceGroup Co. Ltd. 12,999,893 12,869
1 Legend HoldingsCorp. Class H 7,299,914 12,831
ChinaYangtzePower Co. Ltd.Class A (XSSC) 3,847,428 12,786
ZhangzhouPientzehuangPharmaceuticalCo. Ltd. Class A(XSHG) 197,875 12,721
Metallurgical Corp.of China Ltd.Class H 45,755,885 12,691
Inner Mongolia YitaiCoal Co. Ltd.Class B 14,618,896 12,677
* Baidu Inc. Class A 618,785 12,644Unigroup GuoxinMicroelectronicsCo. Ltd. Class A(XSHE) 398,093 12,603
China Datang Corp.Renewable PowerCo. Ltd. Class H 29,452,000 12,460
2 Chongqing RuralCommercial BankCo. Ltd. Class H 34,570,539 12,436
Citic Pacific SpecialSteel Group Co.Ltd. Class A(XSHE) 4,164,654 12,411
Zijin Mining GroupCo. Ltd. Class A(XSHG) 7,579,000 12,375
COSCO SHIPPINGDevelopment Co.Ltd. Class H 63,588,529 12,357
Trina Solar Co. Ltd.Class A 1,000,740 12,291
SihuanPharmaceuticalHoldings GroupLtd. 58,403,595 12,256
BOETechnologyGroup Co. Ltd.Class A (XSHE) 15,937,654 12,245
Shares
MarketValue•
($000)
2 Guangzhou R&FProperties Co.Ltd. Class H 19,567,536 12,241
Tianjin ZhonghuanSemiconductorCo. Ltd. Class A(XSHE) 1,483,100 12,165
Angang Steel Co.Ltd. Class H 22,522,652 12,107
WalvaxBiotechnology Co.Ltd. Class A 1,395,857 12,058
Inner Mongolia YiliIndustrial GroupCo. Ltd. Class A(XSHG) 1,798,162 12,055
1,2 China ResourcesPharmaceuticalGroup Ltd. 24,992,626 12,023
*,1,2 Luye PharmaGroup Ltd. 25,146,456 11,984
ZTE Corp. Class A(XSEC) 2,352,274 11,978
* Hainan MeilanInternationalAirport Co. Ltd. 2,954,000 11,953
Baoshan Iron &Steel Co. Ltd.Class A (XSHG) 10,736,494 11,950
* COFCO JoycomeFoods Ltd. 30,869,000 11,947
Fu ShouYuanInternationalGroup Ltd. 13,849,913 11,890
Shougang FushanResources GroupLtd. 44,824,000 11,840
SinopecEngineeringGroup Co. Ltd.Class H 22,297,064 11,752
BOETechnologyGroup Co. Ltd.Class B (XSHE) 27,240,209 11,662
*,2 Ausnutria DairyCorp. Ltd. 9,311,950 11,649
* XPeng Inc. Class A 499,031 11,579SunwodaElectronic Co. Ltd.Class A 1,502,280 11,572
*,1,2 Zhou Hei YaInternationalHoldings Co. Ltd. 12,872,904 11,572
*,1,2 China LogisticsProperty HoldingsCo. Ltd. 21,504,409 11,551
FinVolution GroupADR 1,882,568 11,521
Emerging Markets Stock Index Fund
19

Shares
MarketValue•
($000)
CIMC EnricHoldings Ltd. 8,905,019 11,451
* Inner MongoliaBaoTou SteelUnion Co. Ltd.Class A (XSSC) 26,036,625 11,444
2 Poly PropertyServices Co. Ltd. 2,048,800 11,437
1 China RailwaySignal &CommunicationCorp. Ltd. Class H 32,579,798 11,429
GigadeviceSemiconductorBeijing Inc.Class A (XSSC) 429,489 11,389
Yonyou NetworkTechnology Co.Ltd. Class A(XSSC) 2,255,185 11,194
Tianjin ZhonghuanSemiconductorCo. Ltd. Class A(XSEC) 1,364,400 11,191
Huaxia Bank Co.Ltd. Class A(XSSC) 12,698,440 11,168
Weichai Power Co.Ltd. Class A(XSHE) 4,727,878 11,162
SG Micro Corp.Class A 220,494 11,162
Bank of ShanghaiCo. Ltd. Class A(XSHG) 9,736,861 11,094
Changchun High &NewTechnologyIndustryGroup Inc.Class A (XSHE) 259,668 11,072
Shanghai PutailaiNew EnergyTechnology Co.Ltd. Class A(XSSC) 397,315 11,046
Focus MediaInformationTechnology Co.Ltd. Class A(XSHE) 9,589,431 10,989
Shanghai ElectricGroup Co. Ltd.Class H 38,897,315 10,959
Lao Feng Xiang Co.Ltd. Class B 3,098,352 10,929
* Brilliance ChinaAutomotiveHoldings Ltd. 19,850,559 10,854
Shares
MarketValue•
($000)
MontageTechnology Co.Ltd. Class A 1,063,994 10,842
Wuxi ShangjiAutomation Co.Ltd. Class A 231,400 10,836
1 HangzhouTigermedConsulting Co.Ltd. Class H 554,700 10,819
Foshan HaitianFlavouring & FoodCo. Ltd. Class A(XSHG) 588,617 10,778
JiangsuYangheBreweryJoint-Stock Co.Ltd. Class A(XSEC) 371,209 10,770
Henan ShuanghuiInvestment &Development Co.Ltd. Class A(XSHE) 2,333,476 10,753
COSCO SHIPPINGEnergyTransportation Co.Ltd. Class H 24,294,261 10,736
Suzhou MaxwellTechnologies Co.Ltd. Class A 89,560 10,731
Iflytek Co. Ltd.Class A (XSHE) 1,211,059 10,702
Muyuan Foods Co.Ltd. Class A(XSEC) 1,194,367 10,680
* China EasternAirlines Corp. Ltd.Class H 27,217,558 10,679
2 Tianneng PowerInternational Ltd. 9,346,156 10,672
HundsunTechnologies Inc.Class A (XSSC) 1,082,831 10,632
China ShenhuaEnergy Co. Ltd.Class A (XSSC) 3,404,148 10,597
Sinotrans Ltd.Class H 32,010,836 10,523
* Aluminum Corp. ofChina Ltd. Class A 10,938,600 10,519
Digital ChinaHoldings Ltd. 19,494,894 10,510
* Topchoice MedicalCorp. Class A 281,979 10,491
Guangdong HaidGroup Co. Ltd.Class A (XSHE) 1,023,667 10,488
Emerging Markets Stock Index Fund
20
Shares
MarketValue•
($000)
*,2 Shanghai FudanMicroelectronicsGroup Co. Ltd.Class H 3,822,000 10,468
Bank of NanjingCo. Ltd. Class A(XSSC) 6,894,868 10,451
Yunnan BaiyaoGroup Co. Ltd.Class A (XSHE) 745,692 10,439
ChaozhouThree-CircleGroup Co. Ltd.Class A 1,664,608 10,412
2 Jinke SmartServices GroupCo. Ltd. Class H 1,927,600 10,409
* Zhejiang CenturyHuatong GroupCo. Ltd. Class A 8,969,102 10,398
China ConstructionBank Corp.Class A (XSSC) 11,205,510 10,385
1 BAIC Motor Corp.Ltd. Class H 31,193,593 10,333
2 Zhaojin MiningIndustry Co. Ltd.Class H 14,450,167 10,288
* ChongqingBrewery Co. Ltd.Class A 434,451 10,192
Shanghai IndustrialHoldings Ltd. 6,826,289 10,186
Anhui ConchCement Co. Ltd.Class A (XSSC) 1,712,561 10,159
Iflytek Co. Ltd.Class A (XSEC) 1,143,650 10,106
*,2 EHang HoldingsLtd. ADR 415,430 10,024
2 TiangongInternational Co.Ltd. 16,633,224 10,007
Weichai Power Co.Ltd. Class A(XSEC) 4,204,300 9,926
Sun Art RetailGroup Ltd. 16,877,500 9,895
Sino-Ocean GroupHolding Ltd. 45,504,089 9,890
SAIC Motor Corp.Ltd. Class A(XSHG) 3,106,065 9,857
China ReinsuranceGroup Corp.Class H 94,101,940 9,786
China ResourcesMicroelectronicsLtd. Class A 1,012,886 9,777
Shares
MarketValue•
($000)
Yihai KerryArawana HoldingsCo. Ltd. Class A 1,021,160 9,698
2 SSY Group Ltd. 20,337,775 9,6611 Guotai Junan
Securities Co. Ltd.Class H 7,072,136 9,655
GinlongTechnologies Co.Ltd. Class A 220,850 9,638
China CSSCHoldings Ltd.Class A (XSSC) 2,742,329 9,636
Hangzhou FirstApplied MaterialCo. Ltd. Class A 429,134 9,616
Shaanxi CoalIndustry Co. Ltd.Class A (XSHG) 4,889,934 9,583
China Risun GroupLtd. 15,715,000 9,579
*,2 Differ GroupHolding Co. Ltd. 39,622,000 9,558
* ShanghaiInternationalAirport Co. Ltd.Class A (XSSC) 1,152,067 9,527
SuzhouTA&A UltraCleanTechnologyCo. Ltd. Class A 570,150 9,493
Daqin Railway Co.Ltd. Class A(XSSC) 9,556,460 9,482
China NationalNuclear PowerCo. Ltd. Class A(XSHG) 8,825,347 9,458
Bank of Ningbo Co.Ltd. Class A(XSEC) 1,581,700 9,429
ShenwanHongyuan GroupCo. Ltd. Class A(XSEC) 11,680,174 9,360
* Skyworth GroupLtd. 16,741,212 9,327
Power ConstructionCorp. of ChinaLtd. Class A(XSSC) 7,234,508 9,309
2 Fire Rock HoldingsLtd. 29,477,500 9,299
China OrientalGroup Co. Ltd. 33,037,736 9,298
* ShenzhenDynanonic Co.Ltd. Class A 94,100 9,262
CSG Holding Co.Ltd. Class B 21,266,997 9,261
Emerging Markets Stock Index Fund
21

Shares
MarketValue•
($000)
1,2 Blue Moon GroupHoldings Ltd. 10,257,500 9,246
AECC AviationPower Co. Ltd.Class A (XSHG) 998,613 9,227
2 Dongfang ElectricCorp. Ltd. Class H 5,711,013 9,113
Ecovacs RoboticsCo. Ltd. Class A(XSHG) 335,787 9,003
EverbrightSecurities Co. Ltd.Class A (XSSC) 3,781,910 8,994
China MerchantsShekou IndustrialZone Holdings Co.Ltd. Class A(XSHE) 5,482,430 8,942
ShenzhenExpressway Co.Ltd. Class H 9,431,170 8,889
TCLTechnologyGroup Corp.Class A (XSHE) 9,331,822 8,847
Pharmaron BeijingCo. Ltd. Class A(XSHE) 294,944 8,795
NetDragonWebsoft HoldingsLtd. 4,001,138 8,763
Yunnan EnergyNew Material Co.Ltd. (XSEC) 191,600 8,738
Lonking HoldingsLtd. 29,902,868 8,727
1 Genertec UniversalMedical GroupCo. Ltd. 11,527,168 8,696
Bank of Beijing Co.Ltd. Class A(XSSC) 12,557,073 8,691
BloomageBiotechnologyCorp. Ltd. Class A 334,408 8,680
BeijingWantaiBiologicalPharmacyEnterprise Co.Ltd. Class A 250,880 8,667
LB Group Co. Ltd.Class A (XSHE) 1,949,207 8,665
Shanghai FosunPharmaceuticalGroup Co. Ltd.Class A (XSSC) 1,103,599 8,642
China OverseasGrand OceansGroup Ltd. 18,006,142 8,633
Shares
MarketValue•
($000)
Huayu AutomotiveSystems Co. Ltd.Class A (XSSC) 2,059,116 8,630
Hangzhou SteamTurbine Co. Ltd.Class B 4,217,482 8,627
* LexinFintechHoldings Ltd.ADR 1,606,358 8,578
Huadong MedicineCo. Ltd. Class A(XSHE) 1,501,447 8,572
* Genetron HoldingsLtd. ADR 621,649 8,560
2 Huadian PowerInternational Corp.Ltd. Class H 23,137,909 8,546
StarPowerSemiconductorLtd. Class A 135,400 8,476
Zhongyu GasHoldings Ltd. 8,843,000 8,474
China Jushi Co.Ltd. Class A(XSSC) 2,826,619 8,444
Wuxi LeadIntelligentEquipment Co.Ltd. Class A(XSHE) 661,281 8,426
Shanghai PudongDevelopmentBank Co. Ltd.Class A (XSHG) 6,018,977 8,407
ChinaBlueChemical Ltd.Class H 25,064,568 8,381
HengliPetrochemical Co.Ltd. Class A(XSHG) 2,424,750 8,361
Yuexiu REIT 19,132,000 8,342ShenzhenCapchemTechnology Co.Ltd. Class A 371,900 8,339
Jiangsu EasternShenghong Co.Ltd. Class A(XSHE) 1,957,200 8,322
* National SiliconIndustry GroupCo. Ltd. Class A 1,875,919 8,283
Zhejiang SanhuaIntelligentControls Co. Ltd.Class A (XSEC) 2,231,114 8,270
2 C&D InternationalInvestment GroupLtd. 4,440,000 8,264
Emerging Markets Stock Index Fund
22

Shares
MarketValue•
($000)
* BAIC BlueParkNew EnergyTechnology Co.Ltd. Class A 3,717,812 8,236
Mango ExcellentMedia Co. Ltd.Class A (XSHE) 1,342,130 8,233
*,2 Li Auto Inc. Class A 486,845 8,210Joinn LaboratoriesChina Co. Ltd.Class A 328,552 8,198
China MinshengBanking Corp.Ltd. Class A(XSSC) 13,476,754 8,185
Ningbo RonbayNew EnergyTechnology Co.Ltd. Class A 455,407 8,182
China SCE GroupHoldings Ltd. 26,098,301 8,139
2 China EvergrandeGroup 27,090,057 8,039
Seazen HoldingsCo. Ltd. Class A(XSHG) 1,493,873 7,981
SDIC PowerHoldings Co. Ltd.Class A (XSSC) 4,812,507 7,931
Yealink NetworkTechnology Corp.Ltd. Class A(XSHE) 671,100 7,925
DatangInternationalPower GenerationCo. Ltd. Class H 43,690,046 7,896
Beijing RoborockTechnology Co.Ltd. Class A 55,998 7,877
* Fufeng Group Ltd. 22,606,495 7,826NAURATechnologyGroup Co. Ltd.Class A (XSEC) 134,700 7,813
1 Fuyao GlassIndustry GroupCo. Ltd. Class H 1,356,400 7,810
Shenzhen KangtaiBiologicalProducts Co. Ltd.Class A (XSHE) 434,900 7,776
Tsingtao BreweryCo. Ltd. Class A(XSSC) 476,086 7,760
Times ChinaHoldings Ltd. 11,352,884 7,725
CITIC SecuritiesCo. Ltd. Class A(XSHG) 1,908,000 7,713
Shares
MarketValue•
($000)
TBEA Co. Ltd.Class A (XSSC) 1,811,358 7,668
* Chongqing SokonIndustry GroupCo. Ltd. Class A 724,628 7,650
Hoshine SiliconIndustry Co. Ltd.Class A (XSSC) 296,900 7,638
Baoshan Iron &Steel Co. Ltd.Class A (XSSC) 6,846,784 7,621
2 QTechnologyGroup Co. Ltd. 5,201,424 7,594
* CMGETechnologyGroup Ltd. 19,380,000 7,559
JiuGui Liquor Co.Ltd. Class A(XSHE) 225,000 7,529
Yanlord Land GroupLtd. 9,048,560 7,522
Ovctek China Inc.Class A (XSHE) 705,542 7,511
1 Hope EducationGroup Co. Ltd. 42,060,000 7,501
IngenicSemiconductorCo. Ltd. Class A 348,916 7,495
2 Zhuguang HoldingsGroup Co. Ltd. 34,095,000 7,488
ZTE Corp. Class A(XSHE) 1,470,465 7,488
BOETechnologyGroup Co. Ltd.Class A (XSEC) 9,725,100 7,472
Poly PropertyGroup Co. Ltd. 30,197,038 7,449
3peak Inc. Class A 61,328 7,431Yantai ChangyuPioneerWine Co.Ltd. Class B 4,126,142 7,413
Hangzhou SilanMicroelectronicsCo. Ltd. Class A(XSSC) 767,600 7,402
2 ShenzhenInvestment Ltd. 30,039,262 7,368
2 China AoyuanGroup Ltd. 18,589,071 7,342
Anhui ConchCement Co. Ltd.Class A (XSHG) 1,237,657 7,342
ChongqingChanganAutomobile Co.Ltd. Class A(XSHE) 2,382,460 7,287
*,1,2 Ascentage PharmaGroupInternational 1,962,100 7,285
Emerging Markets Stock Index Fund
23

Shares
MarketValue•
($000)
1,2 Viva BiotechHoldings 9,658,500 7,282
Tongwei Co. Ltd.Class A (XSHG) 814,000 7,268
Guangdong JiaYuanTechnologyShares Co. Ltd.Class A 269,955 7,266
GuangzhouBaiyunshanPharmaceuticalHoldings Co. Ltd.Class H 2,865,825 7,245
*,2 Yeahka Ltd. 2,384,000 7,200GoerTek Inc.Class A (XSEC) 1,056,728 7,177
China NationalChemicalEngineering Co.Ltd. Class A 4,372,900 7,167
* YunnanYuntianhuaCo. Ltd. Class A 1,633,500 7,141
China StateConstructionEngineering Corp.Ltd. Class A(XSHG) 9,809,160 7,137
Ningbo ShanshanCo. Ltd. Class A(XSSC) 1,089,418 7,135
New China LifeInsurance Co. Ltd.Class A (XSSC) 1,168,286 7,130
2 ShouchengHoldings Ltd. 33,597,211 7,115
Shandong NanshanAluminum Co.Ltd. Class A 10,511,013 7,105
* Shanxi MeijinEnergy Co. Ltd.Class A 3,995,723 7,057
* Amlogic ShanghaiCo. Ltd. Class A 421,718 7,056
Guotai JunanSecurities Co. Ltd.Class A (XSSC) 2,573,068 7,046
Shanghai JinjiangInternationalHotels Co. Ltd.Class B 3,662,174 7,045
Founder SecuritiesCo. Ltd. Class A(XSSC) 5,520,913 7,040
* DouYu InternationalHoldings Ltd.ADR 2,231,162 7,028
Shares
MarketValue•
($000)
Shanghai FosunPharmaceuticalGroup Co. Ltd.Class A (XSHG) 897,500 7,028
KWG Living GroupHoldings Ltd. 10,424,047 7,022
China ZhenhuaGroup Science &Technology Co.Ltd. Class A(XSHE) 432,542 7,005
Luxshare PrecisionIndustry Co. Ltd.Class A (XSEC) 1,149,286 6,950
Changzhou XingyuAutomotiveLighting SystemsCo. Ltd. Class A(XSHG) 194,117 6,936
* Chengxin LithiumGroup Co. Ltd.Class A 764,774 6,907
Shanghai PutailaiNew EnergyTechnology Co.Ltd. Class A(XSHG) 248,045 6,896
*,1 China RenaissanceHoldings Ltd. 2,851,500 6,891
GemdaleProperties &Investment Corp.Ltd. 70,542,000 6,866
Concord NewEnergy Group Ltd. 64,754,071 6,828
ShanghaiMedicilon Inc.Class A 59,652 6,828
2 Zhenro PropertiesGroup Ltd. 14,329,508 6,811
Zhejiang ChintElectrics Co. Ltd.Class A (XSHG) 717,958 6,774
PetroChina Co. Ltd.Class A 7,897,590 6,759
Shandong ShidaShenghuaChemical GroupCo. Ltd. Class A 171,000 6,738
Industrial SecuritiesCo. Ltd. Class A(XSSC) 4,715,465 6,725
Wuhu SanqiInteractiveEntertainmentNetworkTechnology GroupCo. Ltd. Class A 1,804,467 6,718
Emerging Markets Stock Index Fund
24

Shares
MarketValue•
($000)
Shanghai BairunInvestmentHolding Group Co.Ltd. Class A 674,874 6,707
*,2 SOHO China Ltd. 26,396,030 6,704China NorthernRare Earth GroupHigh-Tech Co. Ltd.Class A (XSHG) 843,700 6,692
Hisense HomeAppliances GroupCo. Ltd. Class A(XSHE) 3,668,227 6,687
*,1 CStonePharmaceuticals 5,426,500 6,684
Shandong HualuHengshengChemical Co. Ltd.Class A (XSHG) 1,372,363 6,675
* Gotion High-techCo. Ltd. Class A(XSHE) 724,269 6,670
ShenzhenOverseas ChineseTown Co. Ltd.Class A (XSHE) 6,768,421 6,625
China ShenhuaEnergy Co. Ltd.Class A (XSHG) 2,123,830 6,611
Suzhou DongshanPrecisionManufacturing Co.Ltd. Class A 2,067,000 6,575
Beijing JingnengClean Energy Co.Ltd. Class H 21,745,531 6,573
Fu Jian AnjoyFoods Co. Ltd.Class A 206,298 6,518
Zhejiang DahuaTechnology Co.Ltd. Class A(XSHE) 1,908,592 6,502
SF Holding Co. Ltd.Class A (XSEC) 644,205 6,496
Huaxin Cement Co.Ltd. Class B 3,631,548 6,452
Bank of HangzhouCo. Ltd. Class A(XSSC) 2,885,351 6,436
ChongqingChanganAutomobile Co.Ltd. Class A(XSEC) 2,093,080 6,401
GuangzhouKingmedDiagnostics GroupCo. Ltd. Class A(XSHG) 356,490 6,398
Shares
MarketValue•
($000)
Guangdong HaidGroup Co. Ltd.Class A (XSEC) 622,059 6,373
Beijing-ShanghaiHigh SpeedRailway Co. Ltd.Class A 8,844,242 6,359
Sinoma Science &Technology Co.Ltd. Class A(XSHE) 1,072,739 6,338
Shanxi TaigangStainless SteelCo. Ltd. Class A 5,254,700 6,335
ShanghaiInternational PortGroup Co. Ltd.Class A (XSSC) 7,164,734 6,331
Huaneng PowerInternational Inc.Class A (XSSC) 5,246,597 6,329
* ZhejiangYongtaiTechnology Co.Ltd. Class A(XSHE) 563,626 6,318
Bank of ChongqingCo. Ltd. Class H 11,224,566 6,305
TitanWind EnergySuzhou Co. Ltd.Class A 1,882,872 6,266
LivzonPharmaceuticalGroup Inc.Class A (XSHE) 1,138,681 6,249
ApeloaPharmaceuticalCo. Ltd. Class A 1,149,021 6,237
Zhejiang NHU Co.Ltd. Class A(XSSC) 1,469,512 6,228
ShandongChenming PaperHoldings Ltd.Class B 13,756,746 6,213
Greatview AsepticPackaging Co.Ltd. 15,116,219 6,210
* Sohu.com Ltd.ADR 305,971 6,199
Yuexiu TransportInfrastructure Ltd. 9,658,501 6,187
GuangzhouTinciMaterialsTechnology Co.Ltd. Class A(XSEC) 240,210 6,182
Maanshan Iron &Steel Co. Ltd.Class A (XSSC) 9,305,792 6,178
Emerging Markets Stock Index Fund
25

Shares
MarketValue•
($000)
Ningbo OrientWires & CablesCo. Ltd. Class A 870,999 6,151
* Zangge Holding Co.Ltd. Class A 1,361,100 6,141
Unigroup GuoxinMicroelectronicsCo. Ltd. Class A(XSEC) 193,388 6,122
Inner MongoliaJunzheng Energy& ChemicalIndustry GroupCo. Ltd. Class A 7,637,500 6,118
Wuhan GuideInfrared Co. Ltd.Class A (XSHE) 1,792,611 6,089
*,1 Red Star MacallineGroup Corp. Ltd.Class H 10,813,570 6,066
Jiangsu CnanoTechnology Co.Ltd. Class A 240,093 6,051
1 SimcerePharmaceuticalGroup Ltd. 5,793,000 6,033
LuoyangXinqianglianSlewing BearingCo. Ltd. Class A 169,460 6,030
*,2 HUYA Inc. ADR 733,138 6,026Hongfa TechnologyCo. Ltd. Class A(XSHG) 520,834 6,026
1,2 ChinaYuhuaEducation Corp.Ltd. 13,293,676 6,025
*,1,2 China EastEducationHoldings Ltd. 6,346,500 6,021
AsymchemLaboratoriesTianjin Co. Ltd.Class A (XSHE) 96,376 5,993
Zhejiang JiuzhouPharmaceuticalCo. Ltd. Class A 731,570 5,989
Tong RenTangTechnologies Co.Ltd. Class H 8,420,132 5,975
WeifuHigh-TechnologyGroup Co. Ltd.Class B 3,140,849 5,966
DawningInformationIndustry Co. Ltd.Class A 1,386,935 5,952
Shares
MarketValue•
($000)
Anhui GujingDistillery Co. Ltd.Class A 167,440 5,951
* New Hope LiuheCo. Ltd. Class A(XSHE) 2,640,224 5,939
Health &Happiness H&HInternationalHoldings Ltd. 2,522,451 5,904
* China SouthernAirlines Co. Ltd.Class A 5,759,455 5,902
China ResourcesMedical HoldingsCo. Ltd. 8,342,289 5,853
SananOptoelectronicsCo. Ltd. Class A(XSHG) 1,113,900 5,852
* Air China Ltd.Class A (XSHG) 4,403,314 5,850
1,2 China New HigherEducation GroupLtd. 11,666,000 5,847
West ChinaCement Ltd. 33,436,438 5,843
Yifeng PharmacyChain Co. Ltd.Class A 777,860 5,805
*,2 China CommonRich RenewableEnergyInvestments Ltd. 206,154,000 5,799
Levima AdvancedMaterials Corp.Class A 639,500 5,797
China EverbrightBank Co. Ltd.Class A (XSHG) 10,706,200 5,755
3 PAX GlobalTechnology Ltd. 8,297,436 5,750
* Fushun SpecialSteel Co. Ltd.Class A 1,722,390 5,746
Beijing HuafengTest & ControlTechnology Co.Ltd. Class A 61,045 5,722
Shanghai FriendessElectronicTechnology Corp.Ltd. Class A 95,848 5,720
* OneConnectFinancialTechnology Co.Ltd. ADR 1,799,977 5,706
Emerging Markets Stock Index Fund
26

Shares
MarketValue•
($000)
WesternSuperconductingTechnologies Co.Ltd. Class A 466,439 5,671
BeijingYuanliuHongyuanElectronicTechnology Co.Ltd. Class A 222,900 5,659
TBEA Co. Ltd.Class A (XSHG) 1,336,069 5,656
BBMG Corp.Class H 33,654,781 5,655
Ningxia BaofengEnergy Group Co.Ltd. Class A 2,463,800 5,640
*,2 CombaTelecomSystems HoldingsLtd. 20,200,130 5,625
China Vanke Co.Ltd. Class A(XSEC) 1,977,298 5,622
Jiangsu King'sLuck BreweryJSC Ltd. Class A(XSSC) 728,415 5,604
Zhejiang SanhuaIntelligentControls Co. Ltd.Class A (XSHE) 1,509,449 5,595
Micro-Tech NanjingCo. Ltd. Class A 144,847 5,595
Haitong SecuritiesCo. Ltd. Class A(XSSC) 2,897,117 5,590
1 Joinn LaboratoriesChina Co. Ltd.Class H 431,500 5,553
Bank of Beijing Co.Ltd. Class A(XSHG) 7,990,662 5,531
*,2 Gaotu Techedu Inc.ADR 1,879,425 5,526
* Youdao Inc. ADR 449,765 5,523Bank of HangzhouCo. Ltd. Class A(XSHG) 2,468,928 5,507
GigadeviceSemiconductorBeijing Inc.Class A (XSHG) 207,690 5,507
SongchengPerformanceDevelopment Co.Ltd. Class A 2,512,551 5,499
* ShanghaiInternationalAirport Co. Ltd.Class A (XSHG) 662,526 5,479
Shares
MarketValue•
($000)
* Kuang-ChiTechnologies Co.Ltd. Class A(XSHE) 1,703,004 5,463
*,1 OcumensionTherapeutics 2,506,500 5,445
Shengyi TechnologyCo. Ltd. Class A(XSSC) 1,562,060 5,431
China GreatwallTechnology GroupCo. Ltd. Class A(XSHE) 2,581,088 5,428
Sichuan SwellfunCo. Ltd. Class A(XSHG) 274,775 5,422
Beijing EaspringMaterialTechnology Co.Ltd. Class A 391,500 5,419
* Lingyi iTechGuangdong Co.Class A (XSHE) 5,198,300 5,417
*,2 Zhihu Inc. ADR 654,403 5,4052 Tian Lun Gas
Holdings Ltd. 5,837,000 5,403ZTO ExpressCayman Inc. 181,793 5,392
Poly Developments& Holdings GroupCo. Ltd. Class A(XSHG) 2,745,552 5,388
Lepu MedicalTechnologyBeijing Co. Ltd.Class A 1,616,092 5,382
Yunnan BaiyaoGroup Co. Ltd.Class A (XSEC) 382,093 5,349
Tianshui HuatianTechnology Co.Ltd. Class A 2,661,019 5,349
RaytronTechnologyCo. Ltd. Class A 470,734 5,320
* Burning RockBiotech Ltd. ADR 376,458 5,304
Shenzhen KedaliIndustry Co. Ltd.Class A 195,400 5,296
China MolybdenumCo. Ltd. Class A(XSSC) 5,636,411 5,292
China MinmetalsRare Earth Co.Ltd. Class A 892,000 5,290
Bank ofCommunicationsCo. Ltd. Class A(XSHG) 7,470,900 5,275
Emerging Markets Stock Index Fund
27

Shares
MarketValue•
($000)
*,2 Kaisa GroupHoldings Ltd. 34,138,886 5,245
Huizhou Desay SvAutomotive Co.Ltd. Class A(XSHE) 312,900 5,235
* COSCO SHIPPINGHoldings Co. Ltd.Class A 2,025,538 5,228
Hualan BiologicalEngineering Inc.Class A (XSHE) 1,123,175 5,217
ShanghaiMechanical &Electrical IndustryCo. Ltd. Class B 4,046,069 5,202
China Baoan GroupCo. Ltd. Class A(XSHE) 1,584,916 5,199
JiangsuYokeTechnology Co.Ltd. Class A(XSHE) 434,400 5,173
Inspur ElectronicInformationIndustry Co. Ltd.Class A (XSHE) 1,065,310 5,171
YongXing SpecialMaterialsTechnology Co.Ltd. Class A 308,468 5,165
1,2 Midea Real EstateHolding Ltd. 2,991,600 5,163
Skshu Paint Co.Ltd. Class A 296,048 5,162
1,2 AK MedicalHoldings Ltd. 4,969,000 5,154
Shenzhen SeniorTechnologyMaterial Co. Ltd.Class A 614,410 5,138
Satellite ChemicalCo. Ltd. Class A(XSEC) 842,667 5,135
*,1,2 Mobvista Inc. 5,293,000 5,134China MerchantsSecurities Co. Ltd.Class A (XSHG) 1,911,960 5,132
Will SemiconductorCo. Ltd. ShanghaiClass A (XSSC) 123,500 5,131
Hithink RoyalFlushInformationNetwork Co. Ltd.Class A (XSEC) 291,059 5,129
Skyfame RealtyHoldings Ltd. 43,309,804 5,111
By-health Co. Ltd.Class A 1,281,506 5,101
Shares
MarketValue•
($000)
RongshengPetrochemical Co.Ltd. Class A(XSHE) 1,892,544 5,097
ShanghaiChlor-AlkaliChemical Co. Ltd.Class B 7,634,490 5,084
China KepeiEducation GroupLtd. 9,210,000 5,078
Metallurgical Corp.of China Ltd.Class A (XSSC) 8,007,833 5,062
Gongniu Group Co.Ltd. Class A 205,153 5,055
Zhejiang ChintElectrics Co. Ltd.Class A (XSSC) 532,088 5,021
SangforTechnologies Inc.Class A 158,382 5,010
Gemdale Corp.Class A (XSSC) 3,158,608 5,009
China DongxiangGroup Co. Ltd. 47,656,360 5,006
LivzonPharmaceuticalGroup Inc.Class H 1,518,153 5,001
Fangda CarbonNew Material Co.Ltd. Class A(XSSC) 2,963,392 4,980
Yonyou NetworkTechnology Co.Ltd. Class A(XSHG) 1,002,341 4,975
GuangzhouBaiyunshanPharmaceuticalHoldings Co. Ltd.Class A (XSSC) 1,092,991 4,968
Proya CosmeticsCo. Ltd. Class A 158,100 4,962
Jiangsu GoodWePower SupplyTechnology Co.Ltd. Class A 65,229 4,962
Guosen SecuritiesCo. Ltd. Class A(XSHE) 2,783,641 4,961
2 China ModernDairy HoldingsLtd. 26,225,299 4,947
1,2 ArchosaurGames Inc. 4,153,000 4,937
Emerging Markets Stock Index Fund
28
Shares
MarketValue•
($000)
Guangdong KinlongHardwareProducts Co. Ltd.Class A 237,150 4,922
2 JiayuanInternationalGroup Ltd. 12,727,853 4,921
Yunnan BotaneeBio-TechnologyGroup Co. Ltd.Class A 139,100 4,913
Shanghai JinqiaoExport ProcessingZoneDevelopment Co.Ltd. Class B 5,459,358 4,912
* Nuode InvestmentCo. Ltd. Class A 1,375,500 4,904
* Sichuan NewEnergy Power Co.Ltd. 1,095,478 4,885
Sichuan Road &Bridge Co. Ltd.Class A (XSSC) 2,601,695 4,884
AVICElectromechanicalSystems Co. Ltd.Class A (XSHE) 2,057,022 4,880
Riyue HeavyIndustry Co. Ltd.Class A 798,360 4,877
Changchun High &NewTechnologyIndustryGroup Inc.Class A (XSEC) 114,350 4,876
GD PowerDevelopment Co.Ltd. Class A(XSSC) 11,037,415 4,806
*,1,2 MaoyanEntertainment 3,976,800 4,803
China RailwayGroup Ltd.Class A (XSSC) 5,847,514 4,796
Tongkun Group Co.Ltd. Class A(XSSC) 1,535,799 4,792
China TourismGroup Duty FreeCorp. Ltd. Class A(XSHG) 114,300 4,787
Zhejiang NHU Co.Ltd. Class A(XSHE) 1,125,960 4,772
Ecovacs RoboticsCo. Ltd. Class A(XSSC) 177,900 4,770
Sieyuan ElectricCo. Ltd. Class A 733,100 4,753
Shares
MarketValue•
($000)
Porton PharmaSolutions Ltd.Class A (XSEC) 321,250 4,749
Hubei XingfaChemicals GroupCo. Ltd. Class A(XSSC) 610,750 4,748
HengyiPetrochemical Co.Ltd. Class A 2,762,100 4,727
Aisino Corp.Class A 2,638,819 4,723
GuangdongProvincialExpresswayDevelopment Co.Ltd. Class B 6,706,137 4,720
Shanghai RAASBlood ProductsCo. Ltd. Class A 4,555,299 4,695
* TCL ElectronicsHoldings Ltd. 8,647,329 4,689
China PacificInsurance GroupCo. Ltd. Class A(XSHG) 1,097,793 4,689
TonglingNonferrousMetals Group Co.Ltd. Class A(XSHE) 8,082,400 4,686
ZhejiangLongsheng GroupCo. Ltd. Class A(XSHG) 2,405,050 4,676
Zhejiang Juhua Co.Ltd. Class A(XSHG) 1,923,462 4,671
* Qi An XinTechnologyGroup Inc.Class A 326,133 4,660
* Shanghai ZhenhuaHeavy IndustriesCo. Ltd. Class B 17,644,195 4,655
LongshineTechnology GroupCo. Ltd. Class A(XSHE) 917,625 4,648
Dongfang ElectricCorp. Ltd. Class A(XSSC) 1,632,091 4,634
Beijing TongrentangCo. Ltd. Class A(XSSC) 923,994 4,630
Sichuan ChuantouEnergy Co. Ltd.Class A (XSSC) 2,259,661 4,622
Emerging Markets Stock Index Fund
29

Shares
MarketValue•
($000)
Yanzhou CoalMining Co. Ltd.Class A (XSSC) 1,301,300 4,618
2 Kangji MedicalHoldings Ltd. 4,062,500 4,609
Zhejiang HangKeTechnology Inc.Co. Class A 284,125 4,600
Bank of GuiyangCo. Ltd. Class A 4,356,227 4,596
ChangjiangSecurities Co. Ltd.Class A (XSHE) 4,061,524 4,594
Thunder SoftwareTechnology Co.Ltd. Class A(XSEC) 215,700 4,589
MingYang SmartEnergy Group Ltd.Class A (XSSC) 946,406 4,581
* Beijing JingyuntongTechnology Co.Ltd. Class A(XSHG) 2,560,903 4,576
Sichuan ChuantouEnergy Co. Ltd.Class A (XSHG) 2,230,216 4,561
PerfectWorld Co.Ltd. Class A 1,678,010 4,550
China NationalNuclear PowerCo. Ltd. Class A(XSSC) 4,236,800 4,541
Huayu AutomotiveSystems Co. Ltd.Class A (XSHG) 1,080,377 4,528
* GDS Holdings Ltd.Class A 601,424 4,517
Focus MediaInformationTechnology Co.Ltd. Class A(XSEC) 3,940,617 4,516
* Pangang GroupVanadiumTitanium &Resources Co.Ltd. Class A 7,221,500 4,508
Bank of JiangsuCo. Ltd. Class A 4,582,387 4,503
* Inner MongoliaBaoTou SteelUnion Co. Ltd.Class A (XSHG) 10,223,740 4,494
China MerchantsEnergy ShippingCo. Ltd. Class A(XSHG) 6,260,123 4,476
Shares
MarketValue•
($000)
Xiamen FaratronicCo. Ltd. Class A(XSSC) 148,115 4,475
* SichuanDevelopmentLomon Co. Ltd.Class A 1,584,100 4,474
Hithink RoyalFlushInformationNetwork Co. Ltd.Class A (XSHE) 253,728 4,471
Hangzhou SilanMicroelectronicsCo. Ltd. Class A(XSHG) 460,400 4,440
Beijing ShijiInformationTechnology Co.Ltd. Class A(XSHE) 1,194,490 4,421
Xinjiang GoldwindScience &Technology Co.Ltd. Class A(XSHE) 1,523,826 4,405
China CSSCHoldings Ltd.Class A (XSHG) 1,251,700 4,398
Shenzhen EnergyGroup Co. Ltd.Class A (XSHE) 3,449,070 4,396
JNBY Design Ltd. 2,616,500 4,377CECEPWind-Power Corp.Class A (XSSC) 3,785,316 4,363
Beijing UnitedInformationTechnology Co.Ltd. Class A 249,110 4,363
Shanghai ElectricGroup Co. Ltd.Class A (XSHG) 5,884,093 4,362
Anhui JinheIndustrial Co. Ltd.Class A 580,800 4,359
* Jiangsu AkcomeScience &Technology Co.Ltd. Class A 5,398,521 4,354
China PacificInsurance GroupCo. Ltd. Class A(XSSC) 1,018,927 4,352
Hoshine SiliconIndustry Co. Ltd.Class A (XSHG) 169,120 4,351
* Spring Airlines Co.Ltd. Class A(XSSC) 472,836 4,322
Emerging Markets Stock Index Fund
30

Shares
MarketValue•
($000)
China ShinewayPharmaceuticalGroup Ltd. 4,503,885 4,318
Zhuzhou HongdaElectronics Corp.Ltd. Class A(XSHE) 332,126 4,315
China ResourcesSanjiu Medical &PharmaceuticalCo. Ltd. Class A 1,141,579 4,304
Wens FoodstuffsGroup Co. Ltd.Class A 1,663,742 4,281
JCET Group Co.Ltd. Class A(XSHG) 885,051 4,280
* Guanghui EnergyCo. Ltd. Class A(XSSC) 4,127,812 4,260
Shenzhen SC NewEnergyTechnology Corp.Class A (XSHE) 239,070 4,259
ShanghaiPharmaceuticalsHolding Co. Ltd.Class A (XSHG) 1,461,585 4,258
CECEP SolarEnergy Co. Ltd.Class A (XSHE) 2,436,430 4,247
China NationalSoftware &Service Co. Ltd.Class A (XSSC) 529,634 4,246
Hangzhou ChangChuanTechnologyCo. Ltd. Class A 574,075 4,244
Chongqing FulingZhacai Group Co.Ltd. Class A 778,459 4,242
1,2 Shanghai HaohaiBiologicalTechnology Co.Ltd. Class H 566,000 4,236
Flat Glass GroupCo. Ltd. Class A 492,500 4,235
Jiangsu Lopal TechCo. Ltd. Class A 384,101 4,233
Zhejiang DailyDigital CultureGroup Co. Ltd.Class A (XSHG) 3,635,787 4,230
GokeMicroelectronicsCo. Ltd. Class A 160,649 4,225
Zhejiang DahuaTechnology Co.Ltd. Class A(XSEC) 1,239,421 4,222
Shares
MarketValue•
($000)
Bank of ChangshaCo. Ltd. Class A 3,355,488 4,218
Angel Yeast Co.Ltd. Class A(XSHG) 484,793 4,216
China MinshengBanking Corp.Ltd. Class A(XSHG) 6,935,960 4,213
Shanghai Jin JiangCapital Co. Ltd.Class H 18,561,780 4,207
Huaxin Cement Co.Ltd. Class A(XSSC) 1,613,004 4,207
AVICIndustry-FinanceHoldings Co. Ltd.Class A (XSSC) 6,912,445 4,206
Zoomlion HeavyIndustry Science&Technology Co.Ltd. Class A(XSHE) 3,682,391 4,182
ConsunPharmaceuticalGroup Ltd. 9,738,000 4,173
* Youngy Co. Ltd.Class A 239,500 4,164
Beijing NewBuilding Materialsplc Class A(XSEC) 944,497 4,162
* DazhongTransportationGroup Co. Ltd.Class B 14,483,176 4,158
State GridYingdaCo. Ltd. Class A(XSHG) 3,932,201 4,149
*,2,3 China ZhongwangHoldings Ltd. 19,211,219 4,148
China NationalAccord MedicinesCorp. Ltd. Class B 1,653,729 4,139
Foxconn IndustrialInternet Co. Ltd.Class A (XSHG) 2,330,600 4,135
NingboTuopuGroup Co. Ltd.Class A (XSSC) 507,518 4,132
* Suning.com Co.Ltd. Class A(XSHE) 5,912,122 4,129
Jafron BiomedicalCo. Ltd. Class A(XSHE) 510,690 4,120
Seazen HoldingsCo. Ltd. Class A(XSSC) 769,700 4,112
Emerging Markets Stock Index Fund
31

Shares
MarketValue•
($000)
Thunder SoftwareTechnology Co.Ltd. Class A(XSHE) 193,027 4,106
Inner MongoliaEerduosiResources Co.Ltd. Class A 884,900 4,102
Shandong LinglongTyre Co. Ltd.Class A 738,991 4,085
XCMGConstructionMachinery Co.Ltd. Class A(XSEC) 4,260,700 4,077
Zhongjin GoldCorp. Ltd. Class A(XSSC) 3,143,933 4,075
Hangzhou DptechTechnologies Co.Ltd. Class A 625,365 4,060
Zhuzhou KibingGroup Co. Ltd.Class A (XSSC) 1,635,114 4,058
Tofflon Science &Technology GroupCo. Ltd. Class A 622,854 4,058
YonghuiSuperstores Co.Ltd. Class A(XSSC) 6,583,940 4,048
Qingdao HaierBiomedical Co.Ltd. Class A 274,959 4,047
Youngor Group Co.Ltd. Class A(XSSC) 4,025,472 4,042
KunlunTech Co.Ltd. Class A(XSEC) 1,387,956 4,038
Shanghai LingangHoldings Corp.Ltd. Class A 1,753,021 4,023
* Xian InternationalMedicalInvestment Co.Ltd. Class A 2,156,006 4,019
China RailwayGroup Ltd.Class A (XSHG) 4,898,529 4,018
Arctech SolarHolding Co. Ltd.Class A 123,592 4,014
MingYang SmartEnergy Group Ltd.Class A (XSHG) 828,600 4,011
Bank of NanjingCo. Ltd. Class A(XSHG) 2,629,276 3,985
Shares
MarketValue•
($000)
Tianjin GuangyuDevelopment Co.Ltd. Class A 1,522,400 3,983
Yantai EddiePrecisionMachinery Co.Ltd. Class A(XSHG) 709,199 3,964
GuangdongFenghuaAdvancedTechnologyHolding Co. Ltd.Class A 878,495 3,958
China GreatWallSecurities Co. Ltd.Class A (XSHE) 2,214,000 3,955
PylonTechnologiesCo. Ltd. Class A 116,013 3,948
China ZheshangBank Co. Ltd.Class A 7,341,400 3,947
XiamenTungstenCo. Ltd. Class A(XSSC) 1,111,059 3,940
Daqin Railway Co.Ltd. Class A(XSHG) 3,964,820 3,934
* Tibet MineralDevelopment Co.Class A 483,500 3,930
Avary HoldingShenzhen Co. Ltd.Class A (XSHE) 718,384 3,930
Huaibei MiningHoldings Co. Ltd.Class A 1,987,600 3,927
Chacha Food Co.Ltd. Class A 440,621 3,925
Zhejiang HuayouCobalt Co. Ltd.Class A (XSSC) 226,170 3,923
Bank of ShanghaiCo. Ltd. Class A(XSSC) 3,424,875 3,902
QingdaoTGOODElectric Co. Ltd.Class A 947,216 3,901
Anhui ExpresswayCo. Ltd. Class H 6,572,097 3,896
* Chifeng Jilong GoldMining Co. Ltd.Class A 1,530,688 3,889
AVICOPTER plcClass A (XSSC) 395,502 3,888
Jiangxi Copper Co.Ltd. Class A 1,066,444 3,886
Emerging Markets Stock Index Fund
32

Shares
MarketValue•
($000)
Sinolink SecuritiesCo. Ltd. Class A(XSSC) 2,313,400 3,877
Do-Fluoride NewMaterials Co. Ltd.Class A (XSHE) 398,450 3,876
Yantai JerehOilfield ServicesGroup Co. Ltd.Class A (XSHE) 586,842 3,867
Intco MedicalTechnology Co.Ltd. Class A 480,525 3,865
*,2 BEST Inc. ADR 2,400,118 3,864AVICElectromechanicalSystems Co. Ltd.Class A (XSEC) 1,620,145 3,844
Harbin Electric Co.Ltd. Class H 9,081,875 3,842
Haohua ChemicalScience &Technology Co.Ltd. 757,270 3,837
Zhejiang Supor Co.Ltd. Class A 462,619 3,829
* 360 SecurityTechnology Inc.Class A (XSSC) 2,032,695 3,824
Han's LaserTechnologyIndustry GroupCo. Ltd. Class A(XSEC) 570,023 3,823
Winning HealthTechnology GroupCo. Ltd. Class A 1,933,768 3,821
Shanghai Aiko SolarEnergy Co. Ltd.Class A 1,249,200 3,797
Tianfeng SecuritiesCo. Ltd. Class A(XSHG) 6,154,760 3,789
Shandong HualuHengshengChemical Co. Ltd.Class A (XSSC) 776,700 3,777
HundsunTechnologies Inc.Class A (XSHG) 384,084 3,771
1,2 Yangtze OpticalFibre & CableJoint Stock Ltd.Co. Class H 2,223,659 3,745
Shenzhen SunlordElectronics Co.Ltd. Class A(XSHE) 725,578 3,744
Shares
MarketValue•
($000)
* Guangdong HECTechnologyHolding Co. Ltd.Class A (XSHG) 2,244,191 3,722
GRG BankingEquipment Co.Ltd. Class A 2,300,350 3,721
* Sinofert HoldingsLtd. 23,790,032 3,720
Huafon ChemicalCo. Ltd. Class A(XSHE) 1,999,101 3,719
Power ConstructionCorp. of ChinaLtd. Class A(XSHG) 2,885,702 3,713
Shandong GoldMining Co. Ltd.Class A (XSHG) 1,196,180 3,712
* IRICO DisplayDevices Co. Ltd.Class A 3,444,901 3,710
DBAPP SecurityLtd. Class A 81,099 3,710
GEM Co. Ltd.Class A (XSHE) 2,179,354 3,707
China MolybdenumCo. Ltd. Class A(XSHG) 3,941,600 3,701
TCLTechnologyGroup Corp.Class A (XSEC) 3,903,000 3,700
* Inner MongoliaYuan Xing EnergyCo. Ltd. Class A(XSHE) 3,088,732 3,692
Luxi ChemicalGroup Co. Ltd.Class A 1,437,608 3,689
Beijing DabeinongTechnology GroupCo. Ltd. Class A(XSHE) 2,750,387 3,688
DongxingSecurities Co. Ltd.Class A (XSHG) 2,151,801 3,685
Liaoning Cheng DaCo. Ltd. Class A(XSSC) 1,157,220 3,683
Beijing TiantanBiologicalProducts Corp.Ltd. Class A(XSSC) 815,911 3,683
ZhejiangWeixingNew BuildingMaterials Co. Ltd.Class A (XSEC) 1,310,729 3,683
1,2 Redco PropertiesGroup Ltd. 11,877,640 3,648
Emerging Markets Stock Index Fund
33

Shares
MarketValue•
($000)
Shenzhen KangtaiBiologicalProducts Co. Ltd.Class A (XSEC) 203,700 3,642
* Kingnet NetworkCo. Ltd. Class A 5,013,432 3,635
Kingfa Sci &TechCo. Ltd. Class A(XSHG) 1,977,100 3,627
Sailun Group Co.Ltd. Class A(XSHG) 1,737,560 3,626
PharmaBlockSciencesNanjing Inc.Class A (XSHE) 152,414 3,624
Zhejiang ZhenengElectric Power Co.Ltd. Class A(XSHG) 6,142,762 3,620
*,2 Beijing EnterprisesClean EnergyGroup Ltd. 268,597,198 3,610
* Shenzhen SalubrisPharmaceuticalsCo. Ltd. Class A 799,753 3,608
WestoneInformationIndustry Inc.Class A (XSHE) 441,179 3,607
Shanxi Coking CoalEnergy Group Co.Ltd. Class A(XSHE) 2,482,645 3,605
Hangzhou LionElectronics Co.Ltd. Class A 195,500 3,601
Jiangsu EasternShenghong Co.Ltd. Class A(XSEC) 846,816 3,600
* Neusoft Corp.Class A (XSHG) 2,408,466 3,589
* Beijing E-HualuInformationTechnology Co.Ltd. Class A 793,129 3,588
Hangzhou RobamAppliances Co.Ltd. Class A(XSHE) 731,804 3,580
Nanjing King-FriendBiochemicalPharmaceuticalCo. Ltd. Class A(XSHG) 617,120 3,574
Arcsoft Corp. Ltd.Class A 602,544 3,573
Shares
MarketValue•
($000)
* Sichuan HebangBiotechnology Co.Ltd. Class A(XSSC) 6,419,863 3,570
KBC Corp. Ltd.Class A 63,946 3,569
Xi'an TriangleDefense Co. Ltd.Class A 458,339 3,555
* Vantone NeoDevelopmentGroup Co. Ltd. 2,028,010 3,543
* Mianyang FulinPrecision Co. Ltd.(XSHE) 450,800 3,541
ZhejiangWolwoBio-PharmaceuticalCo. Ltd. Class A(XSHE) 421,687 3,530
New China LifeInsurance Co. Ltd.Class A (XSHG) 576,700 3,520
* China First HeavyIndustries Class A 6,516,775 3,519
* New Hope LiuheCo. Ltd. Class A(XSEC) 1,562,521 3,515
* China High SpeedTransmissionEquipment GroupCo. Ltd. 4,530,934 3,513
Zibo QixiangTengda ChemicalCo. Ltd. Class A 1,999,306 3,511
SDIC PowerHoldings Co. Ltd.Class A (XSHG) 2,129,000 3,509
*,2 China Maple LeafEducationalSystems Ltd. 21,870,538 3,503
* Ourpalm Co. Ltd.Class A 5,763,561 3,502
YangzhouYangjieElectronicTechnology Co.Ltd. Class A 437,547 3,483
* Great ChinasoftTechnology Co.Ltd. Class A 1,349,100 3,480
Henan Mingtai AlIndustrial Co. Ltd.Class A 678,054 3,477
Shaanxi CoalIndustry Co. Ltd.Class A (XSSC) 1,772,483 3,473
* Hang Zhou GreatStar Industrial Co.Ltd. Class A(XSHE) 692,700 3,469
Emerging Markets Stock Index Fund
34

Shares
MarketValue•
($000)
Shenzhen KingdomSci-Tech Co. Ltd.Class A (XSSC) 1,752,398 3,468
Guoyuan SecuritiesCo. Ltd. Class A(XSHE) 2,989,442 3,463
Zhejiang CfmotoPower Co. Ltd.Class A 136,700 3,447
* Sinopec OilfieldService Corp.Class A (XSHG) 9,698,700 3,424
Shenergy Co. Ltd.Class A (XSHG) 3,536,068 3,423
ShanghaiWanyeEnterprises Co.Ltd. Class A 706,456 3,418
Keda IndustrialGroup Co. Ltd.(XSHG) 1,088,600 3,413
1,2 Shandong GoldMining Co. Ltd.Class H 1,886,450 3,411
Shanghai BailianGroup Co. Ltd.Class B 3,845,856 3,410
2 ZhongliangHoldings GroupCo. Ltd. 7,356,500 3,410
ShanghaiWaigaoqiao FreeTrade Zone GroupCo. Ltd. Class B 3,750,086 3,389
Ningbo ZhoushanPort Co. Ltd.Class A (XSSC) 5,735,663 3,359
Sinopec KantonsHoldings Ltd. 8,816,976 3,357
China HainanRubber IndustryGroup Co. Ltd.Class A 4,107,000 3,357
HeilongjiangAgriculture Co.Ltd. Class A(XSHG) 1,560,371 3,355
*,3 Hi SunTechnologyChina Ltd. 24,876,186 3,352
* Guangshen RailwayCo. Ltd. Class H 19,019,093 3,348
JiangsuYangnongChemical Co. Ltd.Class A (XSSC) 182,100 3,348
China Foods Ltd. 8,761,153 3,347ShengheResourcesHolding Co. Ltd.Class A (XSHG) 1,051,830 3,344
Shares
MarketValue•
($000)
Huaxia Bank Co.Ltd. Class A(XSHG) 3,790,591 3,334
SDIC Capital Co.Ltd. Class A(XSSC) 2,601,024 3,333
JCET Group Co.Ltd. Class A(XSSC) 688,244 3,328
CNOOC EnergyTechnology &Services Ltd.Class A 7,369,200 3,327
*,1 Meitu Inc. 15,218,936 3,321* North Industries
Group Red ArrowCo. Ltd. Class A 796,743 3,314
Sichuan KelunPharmaceuticalCo. Ltd. Class A(XSHE) 1,194,312 3,303
Wuchan ZhongdaGroup Co. Ltd.Class A (XSSC) 3,360,100 3,298
* ShanghaiMilkground FoodTech Co. Ltd.Class A 422,543 3,298
Sichuan SwellfunCo. Ltd. Class A(XSSC) 167,033 3,296
Huadian PowerInternational Corp.Ltd. Class A(XSSC) 4,776,691 3,288
ENN Natural GasCo. Ltd. Class A(XSSC) 1,141,802 3,287
* Gotion High-techCo. Ltd. Class A(XSEC) 356,600 3,284
HengtongOptic-electric Co.Ltd. Class A(XSSC) 1,378,105 3,277
China HarmonyAuto Holding Ltd. 6,386,500 3,266
Tianli EducationInternationalHoldings Ltd. 15,654,000 3,255
Beijing OriginwaterTechnology Co.Ltd. Class A 2,987,418 3,252
Jiangsu AzureCorp. 956,450 3,242
Hualan BiologicalEngineering Inc.Class A (XSEC) 696,078 3,233
Emerging Markets Stock Index Fund
35

Shares
MarketValue•
($000)
* ZhejiangYongtaiTechnology Co.Ltd. Class A(XSEC) 288,087 3,230
Baoji TitaniumIndustry Co. Ltd.Class A 417,700 3,224
Zhejiang ChinaCommodities CityGroup Co. Ltd.Class A (XSSC) 4,221,531 3,221
East Group Co. Ltd.Class A 1,984,000 3,212
Shanghai HaohaiBiologicalTechnology Co.Ltd. Class A 131,582 3,211
Zhongtai SecuritiesCo. Ltd. Class A 2,215,700 3,207
Beijing NewBuilding Materialsplc Class A(XSHE) 727,200 3,205
* Guangdong CreateCentury IntelligentEquipment GroupCorp. Ltd. 1,448,300 3,194
Oppein HomeGroup Inc.Class A 160,397 3,191
2 Yuzhou GroupHoldings Co. Ltd. 29,214,577 3,185
Beijing Bei Mo GaoKe FrictionMaterial Co. Ltd.Class A 182,460 3,150
Huaneng PowerInternational Inc.Class A (XSHG) 2,599,994 3,136
Henan ShuanghuiInvestment &Development Co.Ltd. Class A(XSEC) 680,409 3,135
Jason FurnitureHangzhou Co.Ltd. Class A(XSHG) 322,318 3,134
* Jiangsu HoperunSoftware Co. Ltd.Class A 760,746 3,128
iRayTechnology Co.Ltd. Class A 43,955 3,122
*,2 LVGEM China RealEstate InvestmentCo. Ltd. 13,724,000 3,115
GD PowerDevelopment Co.Ltd. Class A(XSHG) 7,153,216 3,115
Shares
MarketValue•
($000)
Wuxi NCE PowerCo. Ltd. Class A 137,060 3,115
* Yunnan AluminiumCo. Ltd. Class A(XSEC) 1,669,852 3,109
BBMG Corp.Class A (XSSC) 7,076,779 3,105
Guangzhou BaiyunInternationalAirport Co. Ltd.Class A (XSHG) 1,671,947 3,093
Fujian Funeng Co.Ltd. Class A(XSHG) 1,105,261 3,090
* RoshowTechnologyCo. Ltd. Class A 1,171,700 3,090
ShandongPharmaceuticalGlass Co. Ltd.Class A 580,232 3,083
Zoomlion HeavyIndustry Science&Technology Co.Ltd. Class A(XSEC) 2,714,500 3,082
Beijing CapitalEco-EnvironmentProtection GroupCo. Ltd. Class A(XSSC) 5,866,055 3,082
Beijing EnlightMedia Co. Ltd.Class A 2,100,403 3,073
1,2 CSC Financial Co.Ltd. Class H 2,905,000 3,071
Shanghai Hiuv NewMaterials Co. Ltd.Class A 58,601 3,066
C&S Paper Co. Ltd.Class A (XSHE) 1,152,090 3,065
Anhui Honglu SteelConstructionGroup Co. Ltd.Class A 463,307 3,057
Shanxi Lu'anEnvironmentalEnergyDevelopment Co.Ltd. Class A(XSSC) 1,505,102 3,055
GEM Co. Ltd.Class A (XSEC) 1,791,386 3,047
Shanghai HaixinGroup Co. Class B 8,967,263 3,043
Beijing DahaoTechnology Corp.Ltd. Class A 709,387 3,040
Founder SecuritiesCo. Ltd. Class A(XSHG) 2,383,190 3,039
Emerging Markets Stock Index Fund
36

Shares
MarketValue•
($000)
Shandong HimileMechanicalScience &Technology Co.Ltd. Class A 775,957 3,030
CNGR AdvancedMaterial Co. Ltd.Class A 127,000 3,016
Xinhu ZhongbaoCo. Ltd. Class A(XSSC) 6,695,254 3,013
* China EasternAirlines Corp. Ltd.Class A (XSSC) 3,992,926 3,012
* Wanda FilmHolding Co. Ltd.Class A (XSEC) 1,373,150 3,008
*,2 BeijingChunlizhengdaMedicalInstruments Co.Ltd. Class H 1,281,750 3,005
Unisplendour Corp.Ltd. Class A(XSHE) 693,297 3,004
Chengtun MiningGroup Co. Ltd.Class A (XSSC) 1,874,962 2,997
Beijing TongtechCo. Ltd. Class A 664,380 2,996
*,2 Ronshine ChinaHoldings Ltd. 7,406,808 2,995
* Beiqi Foton MotorCo. Ltd. Class A(XSHG) 5,405,876 2,979
Industrial &Commercial Bankof China Ltd.Class A (XSHG) 4,078,600 2,978
Guolian SecuritiesCo. Ltd. Class A 1,561,900 2,977
Shanghai MicroPortEndovascularMedTech GroupCo. Ltd. Class A 82,115 2,976
* Tianqi LithiumCorp. Class A(XSEC) 201,353 2,965
Porton PharmaSolutions Ltd.Class A (XSHE) 200,500 2,964
Liaoning Port Co.Ltd. Class A 11,206,208 2,963
* Offcn EducationTechnology Co.Ltd. Class A 1,819,276 2,959
Red Avenue NewMaterials GroupCo. Ltd. Class A(XSHG) 345,100 2,953
Shares
MarketValue•
($000)
JiangsuYuyueMedicalEquipment &Supply Co. Ltd.Class A (XSHE) 535,915 2,952
SouthwestSecurities Co. Ltd.Class A (XSSC) 3,922,781 2,949
GuangdongHongda BlastingCo. Ltd. Class A 684,658 2,948
ShuangliangEco-EnergySystems Co. Ltd.Class A (XSSC) 1,412,260 2,946
Jilin AodongPharmaceuticalGroup Co. Ltd.Class A (XSHE) 1,190,046 2,938
Satellite ChemicalCo. Ltd. Class A(XSHE) 481,460 2,934
XCMGConstructionMachinery Co.Ltd. Class A(XSHE) 3,065,215 2,933
Hubei Dinglong Co.Ltd. Class A 930,908 2,922
China SouthernPower GridEnergyEfficiency&CleanEnergy Co. Ltd.Class A 2,258,900 2,918
Yunda Holding Co.Ltd. Class A(XSHE) 998,503 2,913
* GCL SystemIntegrationTechnology Co.Ltd. Class A 4,601,125 2,897
TimesNeighborhoodHoldings Ltd. 6,167,032 2,895
Oriental Energy Co.Ltd. Class A 1,603,721 2,893
Guangdong ElectricPowerDevelopment Co.Ltd. Class B 9,152,628 2,879
Eyebright MedicalTechnologyBeijing Co. Ltd.Class A 74,820 2,879
Beijing TongrentangCo. Ltd. Class A(XSHG) 574,200 2,877
Hongta SecuritiesCo. Ltd. Class A 1,638,780 2,874
Emerging Markets Stock Index Fund
37

Shares
MarketValue•
($000)
* Farasis Energy GanZhou Co. Ltd.Class A 549,615 2,868
XinyangfengAgriculturalTechnology Co.Ltd. Class A(XSHE) 1,008,156 2,865
China XD ElectricCo. Ltd. Class A(XSSC) 3,385,707 2,863
JiangsuShuangxing ColorPlastic NewMaterials Co. Ltd.Class A 773,385 2,861
Ninestar Corp.Class A (XSHE) 498,987 2,860
Sinodata Co. Ltd.Class A 1,857,635 2,857
Nanjing SecuritiesCo. Ltd. Class A(XSSC) 1,882,450 2,855
Hubei XingfaChemicals GroupCo. Ltd. Class A(XSHG) 367,200 2,855
CHN EnergyChangyuanElectric Power Co.Ltd. Class A 2,259,194 2,854
* China GrandAutomotiveServices GroupCo. Ltd. Class A(XSSC) 6,816,940 2,853
Hunan ZhongkeElectric Co. Ltd.Class A 475,400 2,848
CNSIG InnerMongoliaChemical IndustryCo. Ltd. 952,045 2,845
JointownPharmaceuticalGroup Co. Ltd.Class A (XSSC) 1,340,895 2,844
Shanghai HuayiGroup Co. Ltd.Class B 4,248,843 2,836
Jiangsu King'sLuck BreweryJSC Ltd. Class A(XSHG) 368,662 2,836
JoincarePharmaceuticalGroup IndustryCo. Ltd. Class A(XSSC) 1,571,541 2,830
Shares
MarketValue•
($000)
Dian DiagnosticsGroup Co. Ltd.Class A 561,937 2,827
SichuanExpressway Co.Ltd. Class A(XSSC) 5,008,410 2,822
Guangdong XinbaoElectricalAppliancesHoldings Co. Ltd.Class A 804,713 2,814
First CapitalSecurities Co. Ltd.Class A (XSEC) 2,632,100 2,809
Greenland HoldingsCorp. Ltd. Class A(XSHG) 4,372,495 2,809
Haitong SecuritiesCo. Ltd. Class A(XSHG) 1,455,300 2,808
Meihua HoldingsGroup Co. Ltd.Class A 2,937,500 2,793
Hubei FeilihuaQuartz Glass Co.Ltd. Class A 319,483 2,789
HangzhouElectronic SoulNetworkTechnology Co.Ltd. Class A 755,864 2,788
1,2 China EverbrightGreentech Ltd. 7,923,814 2,786
* Shanghai 2345Network HoldingGroup Co. Ltd.Class A (XSEC) 8,855,013 2,784
SichuanYahuaIndustrial GroupCo. Ltd. Class A(XSHE) 545,100 2,784
Western SecuritiesCo. Ltd. Class A(XSHE) 2,321,451 2,781
* Suning.com Co.Ltd. Class A(XSEC) 3,976,870 2,777
Chengdu XingrongEnvironment Co.Ltd. Class A(XSHE) 3,004,200 2,775
Infore EnvironmentTechnology GroupCo. Ltd. Class A(XSHE) 2,836,726 2,774
Shanghai YuyuanTourist MartGroup Co. Ltd.(XSHG) 1,806,254 2,773
Emerging Markets Stock Index Fund
38

Shares
MarketValue•
($000)
TianmaMicroelectronicsCo. Ltd. Class A(XSHE) 1,438,805 2,770
Hubei EnergyGroup Co. Ltd.Class A (XSHE) 3,564,555 2,767
WestoneInformationIndustry Inc.Class A (XSEC) 337,394 2,759
SooChowSecurities Co. Ltd.Class A (XSSC) 2,080,691 2,756
HumanwellHealthcare GroupCo. Ltd. Class A(XSHG) 839,200 2,756
Jonjee Hi-TechIndustrial &CommercialHolding Co. Ltd.Class A (XSSC) 482,625 2,753
TellingTelecommunicationHolding Co. Ltd.Class A (XSEC) 737,100 2,753
Foxconn IndustrialInternet Co. Ltd.Class A (XSSC) 1,550,700 2,751
Shenzhen FortuneTrendTechnologyCo. Ltd. Class A 122,057 2,739
Hengdian GroupDMEGCMagnetics Co.Ltd. Class A(XSHE) 1,241,400 2,738
China AutomotiveEngineeringResearch InstituteCo. Ltd. Class A 1,024,441 2,738
Beijing BalanceMedicalTechnology Co.Ltd. Class A 77,883 2,732
ZWSOFT Co. Ltd.GuangzhouClass A 58,604 2,728
*,2,3 Fantasia HoldingsGroup Co. Ltd. 37,861,520 2,725
Nantong JianghaiCapacitor Co. Ltd.Class A (XSHE) 770,148 2,725
Beijing ShijiInformationTechnology Co.Ltd. Class A(XSEC) 733,936 2,716
Shares
MarketValue•
($000)
Shanghai YuyuanTourist MartGroup Co. Ltd.(XSSC) 1,767,885 2,714
Hainan Poly PharmCo. Ltd. Class A(XSHE) 352,626 2,711
Jinko PowerTechnology Co.Ltd. Class A 1,789,200 2,708
* ShanghaiAerospaceAutomobileElectromechanicalCo. Ltd. Class A 1,444,129 2,706
Shandong Iron &Steel Co. Ltd.Class A 9,266,308 2,705
Shanghai FullhanMicroelectronicsCo. Ltd. Class A 110,712 2,705
ShenzhenChanghongTechnology Co.Ltd. Class A 485,400 2,699
* NavInfo Co. Ltd.Class A (XSHE) 1,474,200 2,697
Sichuan JiuyuanYinhai SoftwareCo. Ltd. Class A 899,270 2,694
Jiangsu JiejieMicroelectronicsCo. Ltd. Class A 560,250 2,691
1,2 Cathay Media &EducationGroup Inc. 6,538,000 2,688
Kehua Data Co.Ltd. Class A 440,300 2,687
AsymchemLaboratoriesTianjin Co. Ltd.Class A (XSEC) 43,128 2,682
Guosen SecuritiesCo. Ltd. Class A(XSEC) 1,502,321 2,678
China Jushi Co.Ltd. Class A(XSHG) 896,539 2,678
All WinnerTechnology Co.Ltd. Class A 269,700 2,675
Wuxi BotonTechnology Co.Ltd. Class A 741,804 2,669
ShanghaiInternational PortGroup Co. Ltd.Class A (XSHG) 3,013,800 2,663
Emerging Markets Stock Index Fund
39

Shares
MarketValue•
($000)
SinochemInternational Corp.Class A (XSSC) 1,871,806 2,656
HLA Group Corp.Ltd. (XSSC) 2,598,579 2,656
Ningbo JoysonElectronic Corp.Class A (XSHG) 955,826 2,654
China Lilang Ltd. 4,657,865 2,653Sanquan Food Co.Ltd. Class A 873,620 2,651
Wuhan RaycusFiber LaserTechnologies Co.Ltd. Class A(XSHE) 277,830 2,646
* China EasternAirlines Corp. Ltd.Class A (XSHG) 3,498,300 2,639
Weihai GuangweiComposites Co.Ltd. Class A(XSHE) 248,048 2,634
Vats Liquor ChainStoreManagement JSCLtd. Class A 428,658 2,634
Xiamen XiangyuCo. Ltd. Class A 2,173,328 2,631
Shanxi CoalInternationalEnergy Group Co.Ltd. Class A 1,901,600 2,626
Anhui AnkeBiotechnologyGroup Co. Ltd.Class A 1,365,949 2,617
WuhuTokenScience Co. Ltd.Class A (XSHE) 1,627,300 2,612
Guangdong ElectricPowerDevelopment Co.Ltd. Class A 3,812,800 2,603
Newland DigitalTechnology Co.Ltd. Class A(XSEC) 1,103,678 2,600
Bethel AutomotiveSafety SystemsCo. Ltd. Class A 274,420 2,595
Chengdu KanghuaBiologicalProducts Co. Ltd.Class A 104,100 2,593
BoyaBio-pharmaceuticalGroup Co. Ltd.Class A 421,500 2,589
Shares
MarketValue•
($000)
Bafang ElectricSuzhou Co. Ltd.Class A 69,289 2,584
Shenzhen H&TIntelligent ControlCo. Ltd. Class A(XSHE) 708,842 2,576
Lianhe ChemicalTechnology Co.Ltd. Class A 853,200 2,573
Risen Energy Co.Ltd. Class A 688,900 2,571
LeyardOptoelectronicCo. Ltd. Class A(XSEC) 1,748,173 2,570
* Suzhou ZelgenBiopharmaceuticalCo. Ltd. Class A 265,054 2,570
* YunnanTin Co. Ltd.Class A (XSEC) 1,002,399 2,567
China Coal EnergyCo. Ltd. Class A(XSSC) 2,344,794 2,566
Wangfujing GroupCo. Ltd. Class A(XSHG) 532,350 2,563
Victory GiantTechnologyHuizhou Co. Ltd.Class A 622,500 2,560
Xiamen C & D Inc.Class A (XSHG) 2,041,900 2,554
* Meinian OnehealthHealthcareHoldings Co. Ltd.Class A 2,270,886 2,554
Beijing ShunxinAgriculture Co.Ltd. Class A(XSHE) 499,354 2,543
Jinke PropertiesGroup Co. Ltd.Class A (XSHE) 3,657,625 2,538
State GridInformation &CommunicationCo. Ltd. 1,065,500 2,537
TopsecTechnologiesGroup Inc.Class A (XSHE) 879,332 2,533
Hesteel Co. Ltd.Class A (XSEC) 6,588,583 2,532
Yintai Gold Co. Ltd.Class A (XSHE) 1,843,853 2,532
Shanghai ElectricPower Co. Ltd.Class A (XSSC) 1,459,223 2,525
Emerging Markets Stock Index Fund
40
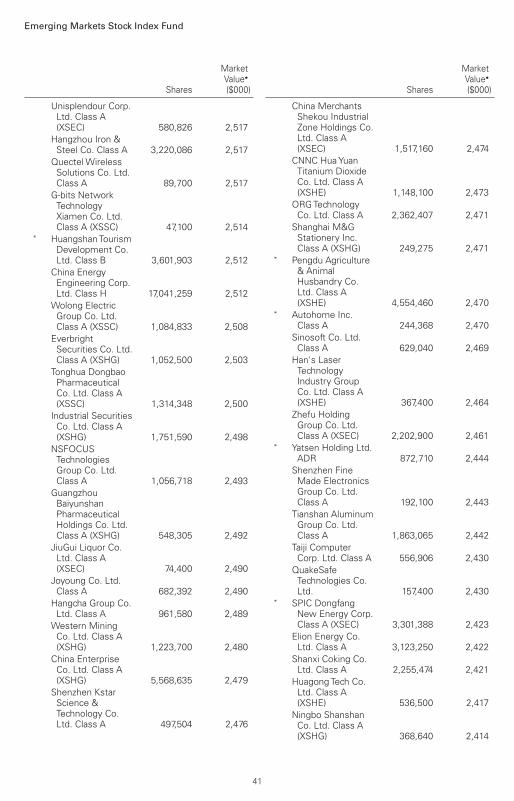
Shares
MarketValue•
($000)
Unisplendour Corp.Ltd. Class A(XSEC) 580,826 2,517
Hangzhou Iron &Steel Co. Class A 3,220,086 2,517
QuectelWirelessSolutions Co. Ltd.Class A 89,700 2,517
G-bits NetworkTechnologyXiamen Co. Ltd.Class A (XSSC) 47,100 2,514
* HuangshanTourismDevelopment Co.Ltd. Class B 3,601,903 2,512
China EnergyEngineering Corp.Ltd. Class H 17,041,259 2,512
Wolong ElectricGroup Co. Ltd.Class A (XSSC) 1,084,833 2,508
EverbrightSecurities Co. Ltd.Class A (XSHG) 1,052,500 2,503
Tonghua DongbaoPharmaceuticalCo. Ltd. Class A(XSSC) 1,314,348 2,500
Industrial SecuritiesCo. Ltd. Class A(XSHG) 1,751,590 2,498
NSFOCUSTechnologiesGroup Co. Ltd.Class A 1,056,718 2,493
GuangzhouBaiyunshanPharmaceuticalHoldings Co. Ltd.Class A (XSHG) 548,305 2,492
JiuGui Liquor Co.Ltd. Class A(XSEC) 74,400 2,490
Joyoung Co. Ltd.Class A 682,392 2,490
Hangcha Group Co.Ltd. Class A 961,580 2,489
Western MiningCo. Ltd. Class A(XSHG) 1,223,700 2,480
China EnterpriseCo. Ltd. Class A(XSHG) 5,568,635 2,479
Shenzhen KstarScience &Technology Co.Ltd. Class A 497,504 2,476
Shares
MarketValue•
($000)
China MerchantsShekou IndustrialZone Holdings Co.Ltd. Class A(XSEC) 1,517,160 2,474
CNNC HuaYuanTitanium DioxideCo. Ltd. Class A(XSHE) 1,148,100 2,473
ORGTechnologyCo. Ltd. Class A 2,362,407 2,471
Shanghai M&GStationery Inc.Class A (XSHG) 249,275 2,471
* Pengdu Agriculture& AnimalHusbandry Co.Ltd. Class A(XSHE) 4,554,460 2,470
* Autohome Inc.Class A 244,368 2,470
Sinosoft Co. Ltd.Class A 629,040 2,469
Han's LaserTechnologyIndustry GroupCo. Ltd. Class A(XSHE) 367,400 2,464
Zhefu HoldingGroup Co. Ltd.Class A (XSEC) 2,202,900 2,461
* Yatsen Holding Ltd.ADR 872,710 2,444
Shenzhen FineMade ElectronicsGroup Co. Ltd.Class A 192,100 2,443
Tianshan AluminumGroup Co. Ltd.Class A 1,863,065 2,442
Taiji ComputerCorp. Ltd. Class A 556,906 2,430
QuakeSafeTechnologies Co.Ltd. 157,400 2,430
* SPIC DongfangNew Energy Corp.Class A (XSEC) 3,301,388 2,423
Elion Energy Co.Ltd. Class A 3,123,250 2,422
Shanxi Coking Co.Ltd. Class A 2,255,474 2,421
HuagongTech Co.Ltd. Class A(XSHE) 536,500 2,417
Ningbo ShanshanCo. Ltd. Class A(XSHG) 368,640 2,414
Emerging Markets Stock Index Fund
41

Shares
MarketValue•
($000)
*,3 China HuiyuanJuice Group Ltd. 9,298,137 2,414
ShenzhenYingheTechnology Co.Ltd. Class A 492,360 2,406
Shandong DongyueOrganosiliconMaterial Co. Ltd.Class A (XSEC) 711,100 2,404
XingdaInternationalHoldings Ltd. 10,579,093 2,403
Hunan Valin SteelCo. Ltd. Class A(XSEC) 2,878,800 2,403
Sinomine ResourceGroup Co. Ltd.Class A 249,600 2,401
* Gansu Jiu SteelGroup HongxingIron & Steel Co.Ltd. Class A 6,449,000 2,396
Zhejiang XinanChemicalIndustrial GroupCo. Ltd. Class A(XSSC) 553,079 2,392
Yutong Bus Co.Ltd. Class A(XSSC) 1,347,414 2,387
Beijing SuperMapSoftware Co. Ltd.Class A 658,700 2,386
ZhejiangWanliyangCo. Ltd. Class A(XSEC) 1,126,200 2,379
* China FangdaGroup Co. Ltd.Class B 6,312,683 2,378
* Beijing SinohytecCo. Ltd. Class A 61,349 2,377
Hangzhou OxygenPlant Group Co.Ltd. 586,150 2,376
LianChuangElectronicTechnology Co.Ltd. Class A(XSHE) 747,661 2,373
Shanghai JahwaUnited Co. Ltd.Class A (XSSC) 317,125 2,372
China Baoan GroupCo. Ltd. Class A(XSEC) 722,020 2,368
SinofibersTechnology Co.Ltd. Class A 268,000 2,365
Shares
MarketValue•
($000)
RockchipElectronics Co.Ltd. 141,900 2,357
Kaishan Group Co.Ltd. Class A 830,608 2,356
Jiangsu ZhongtianTechnology Co.Ltd. Class A(XSHG) 1,490,700 2,356
China South CityHoldings Ltd. 31,585,258 2,354
SDIC Capital Co.Ltd. Class A(XSHG) 1,831,904 2,347
Electric ConnectorTechnology Co.Ltd. Class A 358,005 2,338
Shanghai BellingCo. Ltd. Class A(XSSC) 494,044 2,336
XinhuaWinsharePublishing &Media Co. Ltd.Class A (XSHG) 1,796,153 2,336
*,2 Tongda GroupHoldings Ltd. 72,707,878 2,333
Shengyi TechnologyCo. Ltd. Class A(XSHG) 671,118 2,333
China NationalMedicines Corp.Ltd. Class A(XSSC) 488,252 2,326
Huolinhe OpencutCoal IndustryCorp. Ltd. of InnerMongolia Class A 1,168,509 2,322
Shanxi LanhuaSci-Tech VentureCo. Ltd. Class A 1,360,200 2,320
Angang Steel Co.Ltd. Class A 3,513,012 2,315
Cangzhou MingzhuPlastic Co. Ltd.Class A 1,498,197 2,312
FiberhomeTelecommunicationTechnologies Co.Ltd. Class A(XSSC) 856,438 2,305
Beijing ThunisoftCorp. Ltd. Class A 1,376,720 2,304
* Shenzhen AirportCo. Ltd. Class A 1,947,184 2,303
Shanghai JinjiangInternationalHotels Co. Ltd.Class A 273,524 2,302
Emerging Markets Stock Index Fund
42

Shares
MarketValue•
($000)
HangzhouOnechanceTechCorp. Class A 262,325 2,300
ZhongfuInformation Inc.Class A 416,700 2,300
Huizhou Desay SvAutomotive Co.Ltd. Class A(XSEC) 137,400 2,299
HengliPetrochemical Co.Ltd. Class A(XSSC) 666,000 2,297
* Bohai Leasing Co.Ltd. Class A 5,586,400 2,295
Fujian SunnerDevelopment Co.Ltd. Class A(XSHE) 652,847 2,292
Shandong SunPaper IndustryJSC Ltd. Class A(XSHE) 1,277,100 2,291
* Pacific ShuanglinBio-pharmacy Co.Ltd. (XSHE) 465,203 2,288
JinduichengMolybdenum Co.Ltd. Class A(XSSC) 2,011,640 2,282
YTO Express GroupCo. Ltd. Class A(XSSC) 1,000,300 2,281
Nanjing Iron &Steel Co. Ltd.Class A (XSSC) 4,130,700 2,278
Shandong DenghaiSeeds Co. Ltd.Class A (XSHE) 683,618 2,275
Sailun Group Co.Ltd. Class A(XSSC) 1,085,915 2,266
XinjiangTianshanCement Co. Ltd.Class A 1,061,720 2,264
Hefei MeiyaOptoelectronicTechnology Inc.Class A (XSHE) 358,050 2,264
Shanghai BrightPowerSemiconductorCo. Ltd. Class A 46,870 2,264
Haier Smart HomeCo. Ltd. Class A(XSHG) 532,200 2,261
COFCO SugarHolding Co. Ltd.Class A 1,487,749 2,261
Shares
MarketValue•
($000)
Chaowei PowerHoldings Ltd. 7,664,924 2,258
DHC Software Co.Ltd. Class A(XSHE) 2,080,100 2,256
*,1,2 JD Logistics Inc. 573,746 2,255Yantai JerehOilfield ServicesGroup Co. Ltd.Class A (XSEC) 342,082 2,254
Hangjin TechnologyCo. Ltd. Class A(XSEC) 424,000 2,254
G-bits NetworkTechnologyXiamen Co. Ltd.Class A (XSHG) 42,200 2,253
Hebei HengshuiLaobaigan LiquorCo. Ltd. Class A 670,300 2,252
Sinoma Science &Technology Co.Ltd. Class A(XSEC) 380,500 2,248
Sunyard TechnologyCo. Ltd. (XSHG) 1,608,127 2,248
GreatWall MotorCo. Ltd. Class A 210,700 2,247
Greenland HongKong HoldingsLtd. 10,544,314 2,242
* HeiLongJiang ZBDPharmaceuticalCo. Ltd. Class A 915,000 2,240
CPMC HoldingsLtd. 4,573,319 2,235
ENN Natural GasCo. Ltd. Class A(XSHG) 776,269 2,235
Cathay Biotech Inc.Class A 91,250 2,234
Zhejiang DingliMachinery Co.Ltd. Class A(XSSC) 209,400 2,233
Zhefu HoldingGroup Co. Ltd.Class A (XSHE) 1,995,490 2,229
Chongqing RuralCommercial BankCo. Ltd. Class A 3,730,800 2,226
* Fujian KuncaiMaterialTechnology Co.Ltd. Class A 373,300 2,226
Emerging Markets Stock Index Fund
43

Shares
MarketValue•
($000)
ShanghaiZhangjiangHigh-Tech ParkDevelopment Co.Ltd. Class A(XSSC) 853,196 2,222
GuangzhouZhujiang BreweryCo. Ltd. Class A(XSHE) 1,435,600 2,221
Hunan Valin SteelCo. Ltd. Class A(XSHE) 2,658,600 2,219
Wuxi RuralCommercial BankCo. Ltd. Class A 2,385,000 2,219
Shan Xi HuaYangGroup NewEnergy Co. Ltd.Class A (XSSC) 1,335,200 2,217
Shenzhen KaifaTechnology Co.Ltd. Class A(XSHE) 958,400 2,217
* Guangdong GoldenDragonDevelopment Inc.Class A (XSHE) 892,900 2,215
Wuxi Taiji IndustryCo. Ltd. Class A(XSSC) 1,770,531 2,214
GuangzhouWondfoBiotech Co. Ltd.Class A 408,418 2,213
Shanghai IndustrialUrbanDevelopmentGroup Ltd. 25,690,162 2,212
Qingling MotorsCo. Ltd. Class H 9,812,072 2,209
North ChinaPharmaceuticalCo. Ltd. Class A 1,585,460 2,201
* Guanghui EnergyCo. Ltd. Class A(XSHG) 2,129,303 2,198
XiamenKingdomwayGroup Co. Class A(XSHE) 462,900 2,198
Yunnan ChihongZinc&GermaniumCo. Ltd. Class A(XSHG) 2,851,638 2,196
* Siasun Robot &Automation Co.Ltd. Class A 1,499,651 2,193
Shandong BohuiPaper IndustrialCo. Ltd. Class A 1,345,900 2,187
Shares
MarketValue•
($000)
* Rising NonferrousMetals Share Co.Ltd. Class A 290,620 2,184
Jiangsu GuotaiInternationalGroup Co. Ltd.(XSEC) 1,057,871 2,182
Daan Gene Co. Ltd.Class A (XSHE) 726,179 2,182
ZhejiangWeimingEnvironmentProtection Co.Ltd. Class A(XSSC) 508,599 2,181
ChengduWintrueHolding Co. Ltd.Class A 868,170 2,174
Beijing SinnetTechnology Co.Ltd. Class A 1,052,640 2,173
SichuanExpressway Co.Ltd. Class H 9,367,276 2,168
* Zhongtian FinancialGroup Co. Ltd.Class A 5,523,375 2,168
Shennan CircuitsCo. Ltd. Class A 155,817 2,166
Beijing Cisri-GaonaMaterials &Technology Co.Ltd. Class A(XSHE) 331,600 2,166
Shanxi Lu'anEnvironmentalEnergyDevelopment Co.Ltd. Class A(XSHG) 1,066,800 2,165
Jiangsu HengshunVinegar IndustryCo. Ltd. Class A 856,902 2,160
NortheastSecurities Co. Ltd.Class A (XSHE) 1,604,558 2,160
* C&D PropertyManagementGroup Co. Ltd. 3,819,000 2,160
BestechnicShanghai Co. Ltd.Class A 61,013 2,159
Sunresin NewMaterials Co. Ltd.Class A 176,200 2,158
WUS PrintedCircuit KunshanCo. Ltd. Class A(XSHE) 1,344,614 2,153
Emerging Markets Stock Index Fund
44

Shares
MarketValue•
($000)
* Pang DaAutomobile TradeCo. Ltd. Class A 8,188,100 2,152
Zhongshan PublicUtilities Group Co.Ltd. Class A(XSHE) 1,593,736 2,145
Offshore OilEngineering Co.Ltd. Class A(XSSC) 2,941,170 2,137
Western MiningCo. Ltd. Class A(XSSC) 1,053,500 2,135
* Montnets CloudTechnology GroupCo. Ltd. Class A(XSEC) 675,500 2,126
*,1,2 AscletisPharma Inc. 6,103,000 2,121
BOC InternationalChina Co. Ltd.Class A 1,019,327 2,115
JiangsuYangnongChemical Co. Ltd.Class A (XSHG) 114,900 2,113
* NationsTechnologies Inc.Class A 521,400 2,113
Angel Yeast Co.Ltd. Class A(XSSC) 242,888 2,112
EasternCommunicationsCo. Ltd. Class A(XSSC) 1,312,062 2,112
JiangsuYuyueMedicalEquipment &Supply Co. Ltd.Class A (XSEC) 382,600 2,107
* Beijing BDStarNavigation Co.Ltd. Class A(XSHE) 339,651 2,106
Yunnan Copper Co.Ltd. Class A(XSEC) 1,013,600 2,104
DongFengAutomobile Co.Ltd. Class A 1,936,312 2,104
Qianhe Condiment& Food Co. Ltd.Class A (XSHG) 546,672 2,102
Sinopec ShanghaiPetrochemical Co.Ltd. Class A 3,447,940 2,101
Shares
MarketValue•
($000)
Nanjing SciyonWisdomTechnology GroupCo. Ltd. Class A 1,043,246 2,101
* Sichuan MeifengChemical INDClass A 1,332,751 2,098
Chengdu XGimiTechnology Co.Ltd. Class A 26,159 2,094
China MerchantsExpresswayNetwork &TechnologyHoldings Co. Ltd.Class A 1,918,830 2,093
*,2,3 NationalAgriculturalHoldings Ltd. 13,680,292 2,092
* Shanghai DZH Ltd.Class A 1,945,300 2,090
LongshineTechnology GroupCo. Ltd. Class A(XSEC) 412,300 2,088
* VerisiliconMicroelectronicsShanghai Co. Ltd.Class A 202,337 2,088
Shanghai M&GStationery Inc.Class A (XSSC) 210,300 2,084
* Jolywood SuzhouSunwatt Co. Ltd.Class A 947,510 2,084
* Anhui Golden SeedWinery Co. Ltd.Class A 736,201 2,083
Beijing KingsoftOfficeSoftware Inc.Class A (XSSC) 44,953 2,082
First Tractor Co.Ltd. Class A(XSSC) 1,049,289 2,079
Shanghai HanbellPreciseMachinery Co.Ltd. Class A 560,880 2,078
YTO Express GroupCo. Ltd. Class A(XSHG) 911,106 2,077
Ningbo SanxingMedical ElectricCo. Ltd. Class A(XSSC) 1,089,936 2,073
YixintangPharmaceuticalGroup Co. Ltd.Class A 417,554 2,073
Emerging Markets Stock Index Fund
45

Shares
MarketValue•
($000)
Jiangsu ProvincialAgriculturalReclamation &DevelopmentCorp. 1,191,892 2,073
Jiangsu SuzhouRural CommercialBank Co. Ltd.Class A 2,423,900 2,072
Bluestar AdisseoCo. Class A 1,009,941 2,066
YGSOFT Inc.Class A (XSEC) 1,944,582 2,062
Fujian ApexSoftware Co. Ltd.Class A 395,500 2,061
* So-YoungInternational Inc.ADR 519,115 2,051
Anhui JianghuaiAutomobile GroupCorp. Ltd. Class A(XSSC) 810,628 2,050
* Yunnan AluminiumCo. Ltd. Class A(XSHE) 1,100,500 2,049
Jiangsu ZhongtianTechnology Co.Ltd. Class A(XSSC) 1,293,400 2,044
* Zhejiang JinkeTomCulture IndustryCo. Ltd. Class A 2,951,245 2,040
Shenzhen FastprintCircuit Tech Co.Ltd. Class A 1,025,700 2,031
DongjiangEnvironmental Co.Ltd. Class A(XSHE) 1,905,066 2,027
China RailwayHi-tech IndustryCo. Ltd. Class A 1,683,200 2,026
ShaanxiInternational TrustCo. Ltd. Class A(XSHE) 4,152,880 2,024
Anhui JianghuaiAutomobile GroupCorp. Ltd. Class A(XSHG) 798,301 2,019
ZhejiangCrystal-OptechCo. Ltd. Class A(XSHE) 819,994 2,018
TongFuMicroelectronicsCo. Ltd. Class A(XSHE) 644,588 2,017
Shares
MarketValue•
($000)
Yango Group Co.Ltd. Class A 4,010,183 2,016
Nanjing HanruiCobalt Co. Ltd.Class A (XSHE) 162,400 2,006
BrightGeneBio-MedicalTechnology Co.Ltd. Class A 414,069 2,006
Wuxi LeadIntelligentEquipment Co.Ltd. Class A(XSEC) 157,305 2,004
Gan & LeePharmaceuticalsCo. Ltd. Class A 191,000 2,004
Jiangxi ZhengbangTechnology Co.Ltd. Class A(XSHE) 1,279,608 2,002
IReader TechnologyCo. Ltd. Class A(XSSC) 676,494 2,001
Shandong JinjingScience &Technology Co.Ltd. Class A(XSSC) 1,271,196 2,001
JinyuBio-TechnologyCo. Ltd. Class A(XSSC) 803,254 1,999
Winner MedicalCo. Ltd. Class A 169,761 1,995
Xi'An ShaanguPower Co. Ltd.Class A (XSSC) 1,038,126 1,994
TDG Holdings Co.Ltd. Class A 940,100 1,992
Sinocare Inc.Class A 543,300 1,992
* Yuan LongpingHigh-techAgriculture Co.Ltd. Class A(XSEC) 606,800 1,991
2 Central ChinaSecurities Co. Ltd.Class H 10,847,000 1,990
* Inspur SoftwareCo. Ltd. Class A(XSHG) 1,051,998 1,988
Henan ShenhuoCoal & Power Co.Ltd. Class A(XSHE) 1,335,500 1,982
Shanxi SecuritiesCo. Ltd. Class A(XSHE) 2,026,110 1,981
Emerging Markets Stock Index Fund
46

Shares
MarketValue•
($000)
Wuhan DR LaserTechnology Corp.Ltd. Class A 91,680 1,979
Orient SecuritiesCo. Ltd. Class A(XSHG) 917,200 1,974
Wangfujing GroupCo. Ltd. Class A(XSSC) 409,042 1,969
FAW Jiefang GroupCo. Ltd. Class A 1,206,800 1,967
* Beijing JetsenTechnology Co.Ltd. Class A(XSEC) 3,068,123 1,966
SooChowSecurities Co. Ltd.Class A (XSHG) 1,483,170 1,964
SinoWealthElectronic Ltd.Class A (XSHE) 204,780 1,963
ShenzhenSunmoonMicroelectronicsCo. Ltd. Class A 59,237 1,963
NanJi E-CommerceCo. Ltd. Class A 1,754,443 1,962
OPT MachineVisionTech Co.Ltd. Class A 45,987 1,960
Do-Fluoride NewMaterials Co. Ltd.Class A (XSEC) 201,400 1,959
BeijingYanjingBrewery Co. Ltd.Class A 1,888,480 1,959
2 Perennial EnergyHoldings Ltd. 9,550,000 1,959
*,1,2 KoolearnTechnologyHolding Ltd. 3,617,500 1,958
ShenzhenTopbandCo. Ltd. Class A 845,600 1,957
Inner MongoliaMengDianHuaNengThermalPower Corp. Ltd.Class A (XSSC) 3,487,528 1,955
Sichuan Road &Bridge Co. Ltd.Class A (XSHG) 1,041,337 1,955
Jiangsu NhwaPharmaceuticalCo. Ltd. Class A(XSHE) 849,296 1,951
OFILM Group Co.Ltd. Class A(XSHE) 1,662,925 1,943
Shares
MarketValue•
($000)
Metallurgical Corp.of China Ltd.Class A (XSHG) 3,066,800 1,939
Huatai SecuritiesCo. Ltd. Class A(XSHG) 782,600 1,939
Lushang HealthIndustryDevelopment Co.Ltd. Class A 925,879 1,935
NanjingYunhaiSpecial MetalsCo. Ltd. Class A 676,934 1,930
CNHTC JinanTruckCo. Ltd. Class A 931,339 1,928
RiseSun RealEstateDevelopment Co.Ltd. Class A(XSHE) 2,871,785 1,926
FibocomWireless Inc.Class A 267,370 1,925
Harbin BoshiAutomation Co.Ltd. Class A 1,008,732 1,923
Shanghai ZijiangEnterprise GroupCo. Ltd. Class A(XSSC) 1,265,015 1,922
Sealand SecuritiesCo. Ltd. Class A(XSHE) 3,177,265 1,917
* Saturday Co. Ltd.Class A 608,400 1,914
* China Film Co. Ltd.Class A 1,041,800 1,914
* BTG Hotels GroupCo. Ltd. Class A(XSHG) 499,726 1,910
Huaxi SecuritiesCo. Ltd. Class A(XSHE) 1,351,200 1,910
Beijing JingnengPower Co. Ltd.Class A (XSSC) 4,196,303 1,909
Tibet SummitResources Co.Ltd. Class A(XSHG) 399,825 1,908
PengxinInternationalMining Co. Ltd.Class A 2,456,000 1,907
Shanghai ElectricGroup Co. Ltd.Class A (XSSC) 2,571,067 1,906
Emerging Markets Stock Index Fund
47

Shares
MarketValue•
($000)
Zhejiang HuahaiPharmaceuticalCo. Ltd. Class A(XSSC) 662,887 1,905
Anhui KouziDistillery Co. Ltd.Class A (XSSC) 201,427 1,904
Jiangsu ShagangCo. Ltd. Class A 1,960,385 1,902
TangShan PortGroup Co. Ltd.Class A (XSSC) 4,553,335 1,900
Sai MicroElectronics Inc.Class A 520,110 1,896
Maanshan Iron &Steel Co. Ltd.Class A (XSHG) 2,855,100 1,896
YifanPharmaceuticalCo. Ltd. Class A(XSHE) 740,302 1,896
* ShandongYulongGold Co. Ltd.Class A 717,600 1,893
* WondersInformation Co.Ltd. Class A 1,073,100 1,891
Shenzhen GasCorp. Ltd. Class A(XSSC) 1,333,087 1,890
NingboTuopuGroup Co. Ltd.Class A (XSHG) 231,855 1,888
ShanghaiConstructionGroup Co. Ltd.Class A (XSSC) 3,691,482 1,887
* Antong HoldingsCo. Ltd. Class A 3,140,131 1,886
Tangshan SanyouChemicalIndustries Co. Ltd.Class A (XSSC) 1,304,852 1,883
Yantai TayhoAdvancedMaterials Co. Ltd.Class A 668,261 1,879
Zhejiang HuahaiPharmaceuticalCo. Ltd. Class A(XSHG) 652,870 1,877
IKD Co. Ltd.Class A 876,400 1,876
* Guangzhou GRGMetrology &TestCo. Ltd. Class A 466,500 1,876
Lancy Co. Ltd.Class A 305,100 1,876
Shares
MarketValue•
($000)
*,1,2 YiChang HECChangJiangPharmaceuticalCo. Ltd. Class H 4,010,164 1,875
ShanghaiWeaverNetwork Co. Ltd.Class A (XSSC) 186,456 1,874
GCI Science &Technology Co.Ltd. Class A 562,600 1,868
Xianhe Co. Ltd.Class A 330,700 1,867
* Chengzhi Co. Ltd.Class A (XSEC) 842,000 1,865
* Aoyuan BeautyValley TechnologyCo. Ltd. Class A 751,700 1,864
Tianjin Chase SunPharmaceuticalCo. Ltd. Class A 2,920,805 1,863
* Pacific SecuritiesCo. Ltd. Class A(XSSC) 3,822,620 1,863
RongshengPetrochemical Co.Ltd. Class A(XSEC) 691,404 1,862
LuyangEnergy-SavingMaterials Co. Ltd. 445,340 1,861
COFCO CapitalHoldings Co. Ltd.Class A (XSHE) 1,446,657 1,861
* Xiangtan ElectricManufacturing Co.Ltd. Class A 867,153 1,859
ShanghaiWeaverNetwork Co. Ltd.Class A (XSHG) 184,916 1,858
Dong-E-E-Jiao Co.Ltd. Class A(XSHE) 293,067 1,857
Bank of ChengduCo. Ltd. Class A(XSHG) 930,600 1,856
Guangxi GuiguanElectric Power Co.Ltd. Class A(XSSC) 2,050,466 1,853
ShandongChenming PaperHoldings Ltd.Class A (XSHE) 1,677,550 1,853
ShanghaiZhangjiangHigh-Tech ParkDevelopment Co.Ltd. Class A(XSHG) 711,600 1,853
Emerging Markets Stock Index Fund
48
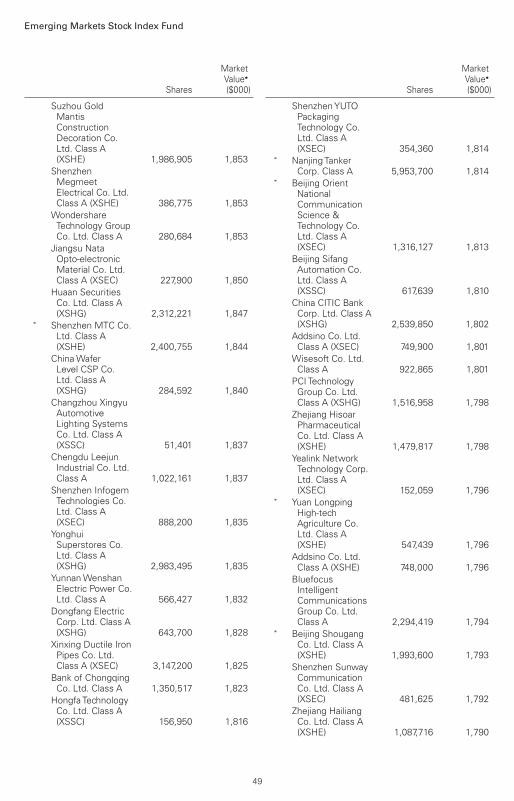
Shares
MarketValue•
($000)
Suzhou GoldMantisConstructionDecoration Co.Ltd. Class A(XSHE) 1,986,905 1,853
ShenzhenMegmeetElectrical Co. Ltd.Class A (XSHE) 386,775 1,853
WondershareTechnology GroupCo. Ltd. Class A 280,684 1,853
Jiangsu NataOpto-electronicMaterial Co. Ltd.Class A (XSEC) 227,900 1,850
Huaan SecuritiesCo. Ltd. Class A(XSHG) 2,312,221 1,847
* Shenzhen MTC Co.Ltd. Class A(XSHE) 2,400,755 1,844
ChinaWaferLevel CSP Co.Ltd. Class A(XSHG) 284,592 1,840
Changzhou XingyuAutomotiveLighting SystemsCo. Ltd. Class A(XSSC) 51,401 1,837
Chengdu LeejunIndustrial Co. Ltd.Class A 1,022,161 1,837
Shenzhen InfogemTechnologies Co.Ltd. Class A(XSEC) 888,200 1,835
YonghuiSuperstores Co.Ltd. Class A(XSHG) 2,983,495 1,835
YunnanWenshanElectric Power Co.Ltd. Class A 566,427 1,832
Dongfang ElectricCorp. Ltd. Class A(XSHG) 643,700 1,828
Xinxing Ductile IronPipes Co. Ltd.Class A (XSEC) 3,147,200 1,825
Bank of ChongqingCo. Ltd. Class A 1,350,517 1,823
Hongfa TechnologyCo. Ltd. Class A(XSSC) 156,950 1,816
Shares
MarketValue•
($000)
ShenzhenYUTOPackagingTechnology Co.Ltd. Class A(XSEC) 354,360 1,814
* Nanjing TankerCorp. Class A 5,953,700 1,814
* Beijing OrientNationalCommunicationScience &Technology Co.Ltd. Class A(XSEC) 1,316,127 1,813
Beijing SifangAutomation Co.Ltd. Class A(XSSC) 617,639 1,810
China CITIC BankCorp. Ltd. Class A(XSHG) 2,539,850 1,802
Addsino Co. Ltd.Class A (XSEC) 749,900 1,801
Wisesoft Co. Ltd.Class A 922,865 1,801
PCI TechnologyGroup Co. Ltd.Class A (XSHG) 1,516,958 1,798
Zhejiang HisoarPharmaceuticalCo. Ltd. Class A(XSHE) 1,479,817 1,798
Yealink NetworkTechnology Corp.Ltd. Class A(XSEC) 152,059 1,796
* Yuan LongpingHigh-techAgriculture Co.Ltd. Class A(XSHE) 547,439 1,796
Addsino Co. Ltd.Class A (XSHE) 748,000 1,796
BluefocusIntelligentCommunicationsGroup Co. Ltd.Class A 2,294,419 1,794
* Beijing ShougangCo. Ltd. Class A(XSHE) 1,993,600 1,793
Shenzhen SunwayCommunicationCo. Ltd. Class A(XSEC) 481,625 1,792
Zhejiang HailiangCo. Ltd. Class A(XSHE) 1,087,716 1,790
Emerging Markets Stock Index Fund
49

Shares
MarketValue•
($000)
Weihai GuangweiComposites Co.Ltd. Class A(XSEC) 168,500 1,789
Kailuan EnergyChemical Co. Ltd.Class A (XSHG) 1,477,669 1,785
* Chongqing Iron &Steel Co. Ltd.Class A (XSHG) 5,006,188 1,784
Lier Chemical Co.Ltd. Class A 504,444 1,783
Shenzhen GoodixTechnology Co.Ltd. Class A(XSHG) 111,347 1,781
ArchermindTechnologyNanjing Co. Ltd.Class A 150,070 1,781
XinhuaWinsharePublishing &Media Co. Ltd.Class A (XSSC) 1,368,770 1,780
* Gree Real EstateCo. Ltd. Class A(XSSC) 1,695,100 1,780
Guangxi LiugongMachinery Co.Ltd. Class A 1,530,461 1,778
Hebei ChengdeLolo Co. Class A(XSHE) 1,096,852 1,772
Guangzhou HaigeCommunicationsGroup Inc. Co.Class A (XSHE) 1,201,147 1,772
Jiangsu LinyangEnergy Co. Ltd.Class A (XSSC) 998,525 1,770
Zhejiang ZhenengElectric Power Co.Ltd. Class A(XSSC) 3,004,652 1,770
Shenzhen SunwayCommunicationCo. Ltd. Class A(XSHE) 475,324 1,768
Tianjin ZhongXinPharmaceuticalGroup Corp. Ltd.Class A (XSSC) 422,329 1,767
Shenzhen DesayBatteryTechnology Co.Class A (XSHE) 267,380 1,767
Xi'an Bright LaserTechnologies Co.Ltd. Class A 52,646 1,765
Shares
MarketValue•
($000)
Guizhou PanjiangRefined Coal Co.Ltd. Class A(XSHG) 1,466,300 1,763
Xiamen FaratronicCo. Ltd. Class A(XSHG) 58,248 1,760
Jiangsu BoqianNew MaterialsStock Co. Ltd.Class A 161,100 1,759
* HC SemiTek Corp.Class A 944,750 1,755
SinomaInternationalEngineering Co.Class A (XSSC) 1,078,722 1,753
* China MerchantsLand Ltd. 15,681,888 1,752
Tibet RhodiolaPharmaceuticalHolding Co.Class A 234,317 1,752
ShanyingInternationalHolding Co. Ltd.Class A (XSSC) 3,457,725 1,751
Dong-E-E-Jiao Co.Ltd. Class A(XSEC) 275,700 1,747
Gemdale Corp.Class A (XSHG) 1,101,700 1,747
ShanghaiFudan-ZhangjiangBio-PharmaceuticalCo. Ltd. Class H 3,561,772 1,746
Luolai LifestyleTechnology Co.Ltd. Class A(XSHE) 856,783 1,745
Xinjiang XintaiNatural Gas Co.Ltd. Class A 401,640 1,742
Shanghai JahwaUnited Co. Ltd.Class A (XSHG) 232,700 1,741
AccelinkTechnologies Co.Ltd. Class A(XSHE) 513,948 1,741
Shanghai HuayiGroup Co. Ltd.Class A (XSHG) 1,096,976 1,740
Keda IndustrialGroup Co. Ltd.(XSSC) 554,600 1,739
Emerging Markets Stock Index Fund
50

Shares
MarketValue•
($000)
ShengheResourcesHolding Co. Ltd.Class A (XSSC) 546,600 1,738
GuangdongDowstoneTechnology Co.Ltd. Class A(XSEC) 384,900 1,737
DongguanDevelopmentHoldings Co. Ltd.Class A 1,091,801 1,737
* 360 SecurityTechnology Inc.Class A (XSHG) 923,000 1,736
HuagongTech Co.Ltd. Class A(XSEC) 385,000 1,735
Amoy DiagnosticsCo. Ltd. Class A 137,300 1,735
Juewei Food Co.Ltd. Class A(XSHG) 168,760 1,734
ShanghaiEnvironmentGroup Co. Ltd.Class A 955,007 1,733
Anhui ZhongdingSealing Parts Co.Ltd. Class A(XSHE) 644,765 1,732
China Coal XinjiEnergy Co. Ltd.Class A 2,203,900 1,732
* Yibin TianyuanGroup Co. Ltd.Class A 860,429 1,730
Bright Dairy & FoodCo. Ltd. Class A(XSSC) 794,000 1,729
Xinyu Iron & SteelCo. Ltd. Class A(XSHG) 1,870,600 1,728
Central ChinaSecurities Co. Ltd.Class A (XSSC) 2,405,400 1,725
Anhui SierteFertilizer IndustryLtd. Co. Class A 798,125 1,722
* GuangYuYuanChinese HerbalMedicine Co. Ltd.Class A 378,240 1,721
Shanghai PretComposites Co.Ltd. Class A 1,003,062 1,721
* Jilin Electric PowerCo. Ltd. Class A(XSHE) 1,452,680 1,720
Shares
MarketValue•
($000)
* Guizhou XinbangPharmaceuticalCo. Ltd. Class A 1,609,931 1,713
Tianneng BatteryGroup Co. Ltd.Class A 268,678 1,712
Xinxiang ChemicalFiber Co. Ltd.Class A 1,663,349 1,700
Tianjin 712Communication &Broadcasting Co.Ltd. Class A(XSHG) 288,300 1,700
* Sinopec OilfieldService Corp.Class H 17,594,608 1,691
GuangzhouDevelopmentGroup Inc.Class A (XSHG) 1,503,400 1,687
Tibet UrbanDevelopment &Investment Co.Ltd. Class A(XSHG) 488,170 1,687
ZhejiangTianyuPharmaceuticalCo. Ltd. Class A 284,580 1,686
Beijing North StarCo. Ltd. Class A(XSSC) 4,822,415 1,683
Tian Di Science &Technology Co.Ltd. Class A(XSSC) 2,566,939 1,678
ChongqingThreeGorgesWaterConservancy &Electric Power Co.Ltd. Class A(XSHG) 1,120,400 1,675
JenkemTechnologyCo. Ltd. Class A 38,565 1,671
Jiangxi ZhengbangTechnology Co.Ltd. Class A(XSEC) 1,067,698 1,670
Zhejiang OrientGene Biotech Co.Ltd. Class A(XSHG) 74,710 1,670
Sichuan EMTechnology Co.Ltd. Class A(XSHG) 698,750 1,668
Shenzhen FuannaBedding &Furnishing Co.Ltd. Class A 1,313,540 1,666
Emerging Markets Stock Index Fund
51

Shares
MarketValue•
($000)
INESA IntelligentTech Inc. Class B 3,793,722 1,665
APT Medical Inc.Class A 35,548 1,665
* China Tianying Inc.Class A 2,242,000 1,663
Beijing GlobalSafety TechnologyCo. Ltd. Class A 519,083 1,663
Fujian SunnerDevelopment Co.Ltd. Class A(XSEC) 472,967 1,660
Fujian Funeng Co.Ltd. Class A(XSSC) 592,188 1,656
Zhengzhou CoalMining MachineryGroup Co. Ltd.Class A (XSSC) 1,043,125 1,656
* BTG Hotels GroupCo. Ltd. Class A(XSSC) 433,200 1,655
1 Qingdao PortInternational Co.Ltd. Class H 3,290,915 1,654
* YaGuangTechnology GroupCo. Ltd. 1,232,100 1,648
COSCO SHIPPINGSpecializedCarriers Co. Ltd.Class A (XSHG) 1,991,001 1,645
Valiant Co. Ltd.Class A (XSHE) 510,250 1,642
* Spring Airlines Co.Ltd. Class A(XSHG) 179,600 1,642
* Meinian OnehealthHealthcareHoldings Co. Ltd.Class A (XSEC) 1,459,514 1,641
* Shanghai ZhenhuaHeavy IndustriesCo. Ltd. Class A 2,989,140 1,641
Yunnan ChihongZinc&GermaniumCo. Ltd. Class A(XSSC) 2,126,424 1,637
* Beijing UltrapowerSoftware Co. Ltd.Class A 1,853,768 1,636
* Suning UniversalCo. Ltd. Class A(XSHE) 2,183,210 1,636
Hunan Aihua GroupCo. Ltd. Class A(XSHG) 293,306 1,635
Shares
MarketValue•
($000)
TsinghuaTongfangCo. Ltd. Class A(XSHG) 1,923,200 1,630
ZhejiangLongsheng GroupCo. Ltd. Class A(XSSC) 838,400 1,630
Yueyang Forest &Paper Co. Ltd.Class A (XSHG) 1,497,780 1,628
Mango ExcellentMedia Co. Ltd.Class A (XSEC) 265,199 1,627
ShanghaiChinafortune Co.Ltd. Class A(XSSC) 812,561 1,627
Jiangxi Bank Co.Ltd. Class H 3,698,529 1,624
Bank of Xi'an Co.Ltd. Class A 2,390,600 1,621
Tianjin CapitalEnvironmentalProtection GroupCo. Ltd. Class H 3,277,266 1,620
Suzhou Good-ArkElectronics Co.Ltd. Class A 719,200 1,620
Ningbo BowayAlloy Material Co.Ltd. Class A 623,270 1,620
Shanghai LiangxinElectrical Co. Ltd.Class A 635,872 1,619
Beijing DabeinongTechnology GroupCo. Ltd. Class A(XSEC) 1,206,300 1,618
LaobaixingPharmacy ChainJSC Class A(XSSC) 237,020 1,618
Zhejiang JiemeiElectronic &Technology Co.Ltd. Class A(XSEC) 372,934 1,608
Hebei YangyuanZhihui BeverageCo. Ltd. Class A 352,352 1,607
Digiwin SoftwareCo. Ltd. Class A 508,994 1,604
* Mianyang FulinPrecision Co. Ltd.(XSEC) 204,000 1,603
Xinjiang ZhongtaiChemical Co. Ltd.Class A (XSEC) 969,500 1,602
Emerging Markets Stock Index Fund
52

Shares
MarketValue•
($000)
* ZheshangSecurities Co. Ltd.Class A (XSHG) 832,600 1,602
* Grandjoy HoldingsGroup Co. Ltd.Class A (XSHE) 3,113,300 1,601
Huafon ChemicalCo. Ltd. Class A(XSEC) 859,600 1,599
Wuchan ZhongdaGroup Co. Ltd.Class A (XSHG) 1,626,115 1,596
ShenzhenWoerHeat-ShrinkableMaterial Co. Ltd.Class A 1,390,724 1,596
MaccuraBiotechnology Co.Ltd. Class A 366,530 1,595
* Sonoscape MedicalCorp. Class A 346,467 1,593
* ShandongSinobiowayBiomedicine Co.Ltd. Class A 631,460 1,589
Xinjiang ZhongtaiChemical Co. Ltd.Class A (XSHE) 961,315 1,588
Anhui TruchumAdvancedMaterials &Technology Co.Ltd. Class A 975,513 1,588
* Xinjiang BaYi Iron& Steel Co. Ltd.Class A 1,433,500 1,587
Yechiu MetalRecycling ChinaLtd. Class A 2,176,400 1,587
GrandblueEnvironment Co.Ltd. Class A(XSSC) 458,060 1,581
Moon EnvironmentTechnology Co.Ltd. Class A 795,284 1,581
ShenzhenYanTianPort Holding Co.Ltd. Class A 1,948,141 1,577
HaiscoPharmaceuticalGroup Co. Ltd.Class A 598,264 1,576
KeshunWaterproofTechnologies Co.Ltd. Class A 757,060 1,576
Camel Group Co.Ltd. Class A(XSSC) 770,071 1,575
Shares
MarketValue•
($000)
CMSTDevelopment Co.Ltd. Class A(XSSC) 1,645,731 1,573
* Jinneng HoldingShanxi ElectricPower Co. Ltd. 3,049,346 1,573
Qiming InformationTechnology Co.Ltd. Class A 1,066,374 1,573
China MerchantsPropertyOperation &Service Co. Ltd.Class A (XSHE) 744,416 1,569
Nanjing Gaoke Co.Ltd. Class A(XSSC) 1,141,108 1,565
* Blivex TechnologyCo. Ltd. Class A 4,172,796 1,564
ChangjiangSecurities Co. Ltd.Class A (XSEC) 1,377,986 1,559
Hefei MeiyaOptoelectronicTechnology Inc.Class A (XSEC) 246,158 1,557
SichuanChanghongElectric Co. Ltd.Class A (XSHG) 3,659,100 1,556
Shanghai TunnelEngineering Co.Ltd. Class A(XSSC) 1,945,380 1,554
Zhejiang NaradaPower Source Co.Ltd. Class A 879,962 1,553
Beijing TiantanBiologicalProducts Corp.Ltd. Class A(XSHG) 344,111 1,553
* Hang Zhou GreatStar Industrial Co.Ltd. Class A(XSEC) 310,000 1,552
ShenzhenTagenGroup Co. Ltd.Class A 1,970,094 1,551
Guangdong GreatRiver SmarterLogistics Co. Ltd.Class A 434,798 1,551
Zhejiang XianjuPharmaceuticalCo. Ltd. Class A 898,950 1,550
Shenergy Co. Ltd.Class A (XSSC) 1,600,491 1,549
Emerging Markets Stock Index Fund
53

Shares
MarketValue•
($000)
Beijing CapitalDevelopment Co.Ltd. Class A(XSSC) 2,014,531 1,548
Tangshan JidongCement Co. Ltd.Class A (XSHE) 851,877 1,547
Shanghai ShibeiHi-Tech Co. Ltd.Class B 5,596,869 1,546
EoptolinkTechnology Inc.Ltd. Class A(XSHE) 347,812 1,544
Ningbo PeacebirdFashion Co. Ltd.Class A (XSSC) 276,031 1,543
Oriental PearlGroup Co. Ltd.Class A (XSHG) 1,275,996 1,541
China GalaxySecurities Co. Ltd.Class A 995,320 1,537
Chongqing Road &Bridge Co. Ltd.Class A 3,813,200 1,537
Financial StreetHoldings Co. Ltd.Class A (XSHE) 1,676,851 1,537
Shandong HuataiPaper IndustryShareholding Co.Ltd. Class A 1,517,692 1,536
Beijing HaohuaEnergy ResourceCo. Ltd. Class A 975,900 1,530
* China Fortune LandDevelopment Co.Ltd. Class A(XSSC) 2,655,465 1,528
Zhongji InnolightCo. Ltd. Class A(XSHE) 295,537 1,528
Jiangxi GanyueExpressway Co.Ltd. Class A 2,901,500 1,527
* ShenzhenMicrogateTechnology Co.Ltd. Class A 683,000 1,525
Shenzhen ZhongjinLingnanNonfemet Co.Ltd. Class A(XSEC) 1,967,400 1,522
ChowTai SengJewellery Co. Ltd.Class A 515,325 1,521
Shares
MarketValue•
($000)
2 Hebei ConstructionGroup Corp. Ltd.Class H 6,015,500 1,521
Sansteel MinguangCo. Ltd. FujianClass A (XSHE) 1,418,556 1,520
Shenzhen HepalinkPharmaceuticalGroup Co. Ltd.Class A (XSEC) 632,221 1,517
Sichuan ShuangmaCement Co. Ltd.Class A (XSHE) 484,900 1,517
Chinalin SecuritiesCo. Ltd. Class A 924,427 1,514
Zhongji InnolightCo. Ltd. Class A(XSEC) 292,286 1,512
HLA Group Corp.Ltd. (XSHG) 1,475,631 1,508
JCHX MiningManagement Co.Ltd. Class A(XSHG) 439,296 1,508
* Jinneng HoldingShanxi CoalIndustry Co. Ltd.Class A (XSHG) 894,535 1,507
Inspur ElectronicInformationIndustry Co. Ltd.Class A (XSEC) 310,040 1,505
AnhuiWanweiUpdatedHigh-TechMaterial IndustryCo. Ltd. Class A(XSSC) 1,344,100 1,502
Zhejiang HuaceFilm &TelevisionCo. Ltd. Class A 1,700,924 1,500
Shandong SunPaper IndustryJSC Ltd. Class A(XSEC) 835,800 1,499
Hubei EnergyGroup Co. Ltd.Class A (XSEC) 1,930,290 1,499
* CSG SmartScience&TechnologyCo. Ltd. Class A 756,395 1,499
YanTai ShuangtaFood Co. Ltd.Class A (XSHE) 1,051,000 1,499
Citic Pacific SpecialSteel Group Co.Ltd. Class A(XSEC) 502,645 1,498
Emerging Markets Stock Index Fund
54

Shares
MarketValue•
($000)
COFCOBiotechnology Co.Ltd. Class A 899,900 1,498
Sino-PlatinumMetals Co. Ltd.Class A (XSSC) 419,357 1,497
Chengdu FusenNoble-HouseIndustrial Co. Ltd.Class A 762,003 1,492
Hisense VisualTechnology Co.Ltd. Class A(XSHG) 788,700 1,491
* Shenzhen Sea StarTechnology Co.Ltd. Class A 1,800,100 1,490
Caitong SecuritiesCo. Ltd. Class A(XSHG) 929,500 1,490
Henan ZhongyuanExpressway Co.Ltd. Class A 3,022,200 1,488
* Chengdu CORPROTechnology Co.Ltd. Class A(XSEC) 390,400 1,487
HumanwellHealthcare GroupCo. Ltd. Class A(XSSC) 452,907 1,487
JiangxiWannianqingCement Co. Ltd.Class A 828,724 1,485
Lao Feng Xiang Co.Ltd. Class A 197,800 1,484
Leader HarmoniousDrive SystemsCo. Ltd. Class A 70,904 1,484
Hainan StraitShipping Co. Ltd.Class A (XSHE) 1,677,780 1,481
Toly Bread Co. Ltd.Class A (XSHG) 301,409 1,480
GuangdongHybribio BiotechCo. Ltd. Class A 341,298 1,480
* Guosheng FinancialHolding Inc.Class A (XSHE) 1,012,873 1,479
Estun AutomationCo. Ltd. Class A(XSEC) 356,900 1,478
Daan Gene Co. Ltd.Class A (XSEC) 491,344 1,476
Edifier TechnologyCo. Ltd. Class A 835,300 1,475
Shares
MarketValue•
($000)
* GenimousTechnology Co.Ltd. Class A(XSEC) 1,558,100 1,473
Hubei ChutianSmartCommunicationCo. Ltd. Class A 3,163,800 1,472
* Inner MongoliaXingye Mining Co.Ltd. Class A(XSHE) 1,276,772 1,468
Anhui YingliuElectromechanicalCo. Ltd. Class A(XSHG) 472,360 1,468
Wuhan GuideInfrared Co. Ltd.Class A (XSEC) 431,831 1,467
Zhejiang MeidaIndustrial Co. Ltd.Class A (XSEC) 572,800 1,467
2 First Tractor Co.Ltd. Class H 2,905,706 1,465
* Hunan Corun NewEnergy Co. Ltd.Class A 1,484,230 1,465
Tianjin Port Co. Ltd.Class A (XSHG) 2,315,508 1,464
GuangdongTapaiGroup Co. Ltd.Class A (XSHE) 931,036 1,464
Zhejiang JiecangLinear MotionTechnology Co.Ltd. Class A 203,284 1,462
Red Avenue NewMaterials GroupCo. Ltd. Class A(XSSC) 170,500 1,459
* STO Express Co.Ltd. Class A(XSHE) 1,212,376 1,459
Shanxi Coking CoalEnergy Group Co.Ltd. Class A(XSEC) 1,004,120 1,458
Newland DigitalTechnology Co.Ltd. Class A(XSHE) 618,095 1,456
PingdingshanTianan CoalMining Co. Ltd.Class A (XSSC) 1,092,253 1,455
TaslyPharmaceuticalGroup Co. Ltd.Class A (XSSC) 686,014 1,453
Emerging Markets Stock Index Fund
55

Shares
MarketValue•
($000)
* Bank of ZhengzhouCo. Ltd. Class A(XSEC) 2,750,426 1,452
GuangzhouYuexiuFinancial HoldingsGroup Co. Ltd.Class A (XSHE) 1,202,040 1,451
* Sinopec OilfieldEquipment Corp.Class A 1,489,942 1,449
GuangdongGuanhaoHigh-Tech Co. Ltd.Class A 2,032,200 1,449
* Huazhu Group Ltd. 311,870 1,448Zhejiang OrientFinancial HoldingsGroup Co. Ltd.Class A (XSEC) 2,273,294 1,447
Shanghai ElectricPower Co. Ltd.Class A (XSHG) 836,400 1,447
* Beijing Join-CheerSoftware Co. Ltd.Class A 2,233,780 1,447
Hesteel Co. Ltd.Class A (XSHE) 3,757,200 1,444
Hangzhou BoilerGroup Co. Ltd.Class A 450,618 1,443
Central ChinaManagement Co.Ltd. 9,347,000 1,442
* Qingdao ZhongziZhongchengGroup Co. Ltd.Class A 808,606 1,440
Western SecuritiesCo. Ltd. Class A(XSEC) 1,201,468 1,439
Shanghai ShyndecPharmaceuticalCo. Ltd. Class A 986,738 1,439
ZhejiangShuanghuanDriveline Co. Ltd.Class A 350,280 1,439
Zhejiang DingliMachinery Co.Ltd. Class A(XSHG) 134,848 1,438
Espressif SystemsShanghai Co. Ltd.Class A 56,052 1,438
Suzhou ElectricalApparatusScience AcademyCo. Ltd. Class A 884,800 1,436
MLS Co. Ltd.Class A (XSEC) 658,500 1,433
Shares
MarketValue•
($000)
B-Soft Co. Ltd.Class A 1,147,766 1,433
Jafron BiomedicalCo. Ltd. Class A(XSEC) 177,470 1,432
Inner MongoliaMengDianHuaNengThermalPower Corp. Ltd.Class A (XSHG) 2,555,201 1,432
Zhejiang HailideNew Material Co.Ltd. Class A 1,186,917 1,432
Nanjing XinjiekouDepartment StoreCo. Ltd. Class A 936,500 1,430
Tongyu HeavyIndustry Co. Ltd.Class A 2,901,657 1,429
GuangzhouAutomobile GroupCo. Ltd. Class A(XSSC) 526,730 1,427
Biem.L.FdlkkGarment Co. Ltd.Class A 370,430 1,424
* Beijing ShougangCo. Ltd. Class A(XSEC) 1,581,061 1,422
CGN Power Co.Ltd. Class A 3,113,500 1,421
China ExpressAirlines Co. Ltd.Class A 827,400 1,421
Foran EnergyGroup Co. Ltd. 933,470 1,419
Sinotrans Ltd.Class A (XSHG) 2,009,995 1,418
FAWER AutomotiveParts Co. Ltd.Class A 1,597,545 1,414
Blue Sail MedicalCo. Ltd. Class A(XSHE) 625,000 1,412
* SumavisionTechnologies Co.Ltd. Class A(XSHE) 1,200,500 1,411
* Lingyi iTechGuangdong Co.Class A (XSEC) 1,352,100 1,409
Winall Hi-TechSeed Co. Ltd.Class A 323,700 1,408
* Zhejiang QianjiangMotorcycle Co.Ltd. Class A 646,849 1,408
Emerging Markets Stock Index Fund
56

Shares
MarketValue•
($000)
Huafa Industrial Co.Ltd. ZhuhaiClass A (XSSC) 1,712,126 1,407
* Infund Holding Co.Ltd. 1,027,334 1,407
GuangzhouShiyuan ElectronicTechnology Co.Ltd. Class A(XSHE) 118,600 1,407
Central China RealEstate Ltd. 9,347,000 1,405
Toyou FeijiElectronics Co.Ltd. Class A 1,001,635 1,404
AECC Aero-EngineControl Co. Ltd.Class A (XSEC) 335,600 1,400
* Hainan Mining Co.Ltd. Class A(XSHG) 586,500 1,400
TongFuMicroelectronicsCo. Ltd. Class A(XSEC) 446,991 1,399
Xi'An ShaanguPower Co. Ltd.Class A (XSHG) 728,545 1,399
CITIC HeavyIndustries Co. Ltd.Class A (XSHG) 2,056,652 1,396
Renhe PharmacyCo. Ltd. Class A(XSHE) 941,747 1,395
Befar Group Co.Ltd. Class A(XSHG) 1,058,542 1,389
Jiajiayue Group Co.Ltd. Class A 603,492 1,389
Shenzhen JinjiaGroup Co. Ltd.Class A (XSHE) 821,000 1,388
Kingfa Sci &TechCo. Ltd. Class A(XSSC) 755,423 1,386
Hangzhou HaoyuePersonal Care Co.Ltd. Class A 163,895 1,385
PingdingshanTianan CoalMining Co. Ltd.Class A (XSHG) 1,035,882 1,380
* ShenzhenTopraysolar Co.Ltd. Class A 1,218,258 1,379
Zhejiang StarryPharmaceuticalCo. Ltd. Class A 176,900 1,376
Shares
MarketValue•
($000)
* Montnets CloudTechnology GroupCo. Ltd. Class A(XSHE) 437,000 1,375
Xuji Electric Co.Ltd. Class A(XSHE) 443,400 1,373
2 E-House ChinaEnterpriseHoldings Ltd. 7,259,100 1,368
Fangda SpecialSteel TechnologyCo. Ltd. Class A(XSSC) 1,181,177 1,368
Guocheng MiningCo. Ltd. Class A 870,800 1,368
Xiamen ITG GroupCorp. Ltd. Class A(XSSC) 1,262,574 1,365
Tongkun Group Co.Ltd. Class A(XSHG) 437,100 1,364
Shenzhen SunlineTech Co. Ltd.Class A 692,152 1,360
Appotronics Corp.Ltd. Class A 262,714 1,360
Jiangsu FinancialLeasing Co. Ltd.Class A 1,645,707 1,355
ChinaWorld TradeCenter Co. Ltd.Class A (XSSC) 635,535 1,351
SunflowerPharmaceuticalGroup Co. Ltd.Class A 604,108 1,349
ChongqingDepartment StoreCo. Ltd. Class A 374,760 1,348
* Shanghai TopcareMedical ServicesCo. Ltd. (XSHG) 477,882 1,346
SichuanYahuaIndustrial GroupCo. Ltd. Class A(XSEC) 262,700 1,342
* ChongqingTaijiIndustry GroupCo. Ltd. Class A 574,700 1,341
* Datang HuayinElectric Power Co.Ltd. Class A 1,392,000 1,339
Jonjee Hi-TechIndustrial &CommercialHolding Co. Ltd.Class A (XSHG) 234,200 1,336
Emerging Markets Stock Index Fund
57
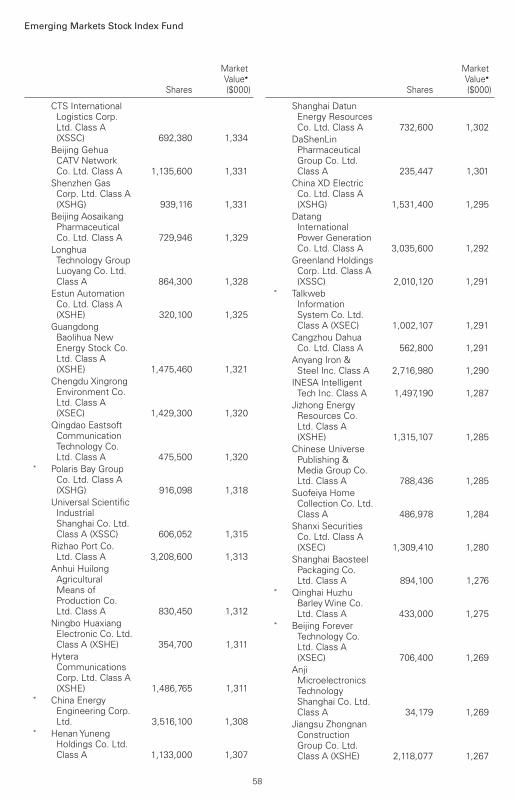
Shares
MarketValue•
($000)
CTS InternationalLogistics Corp.Ltd. Class A(XSSC) 692,380 1,334
Beijing GehuaCATV NetworkCo. Ltd. Class A 1,135,600 1,331
Shenzhen GasCorp. Ltd. Class A(XSHG) 939,116 1,331
Beijing AosaikangPharmaceuticalCo. Ltd. Class A 729,946 1,329
LonghuaTechnology GroupLuoyang Co. Ltd.Class A 864,300 1,328
Estun AutomationCo. Ltd. Class A(XSHE) 320,100 1,325
GuangdongBaolihua NewEnergy Stock Co.Ltd. Class A(XSHE) 1,475,460 1,321
Chengdu XingrongEnvironment Co.Ltd. Class A(XSEC) 1,429,300 1,320
Qingdao EastsoftCommunicationTechnology Co.Ltd. Class A 475,500 1,320
* Polaris Bay GroupCo. Ltd. Class A(XSHG) 916,098 1,318
Universal ScientificIndustrialShanghai Co. Ltd.Class A (XSSC) 606,052 1,315
Rizhao Port Co.Ltd. Class A 3,208,600 1,313
Anhui HuilongAgriculturalMeans ofProduction Co.Ltd. Class A 830,450 1,312
Ningbo HuaxiangElectronic Co. Ltd.Class A (XSHE) 354,700 1,311
HyteraCommunicationsCorp. Ltd. Class A(XSHE) 1,486,765 1,311
* China EnergyEngineering Corp.Ltd. 3,516,100 1,308
* HenanYunengHoldings Co. Ltd.Class A 1,133,000 1,307
Shares
MarketValue•
($000)
Shanghai DatunEnergy ResourcesCo. Ltd. Class A 732,600 1,302
DaShenLinPharmaceuticalGroup Co. Ltd.Class A 235,447 1,301
China XD ElectricCo. Ltd. Class A(XSHG) 1,531,400 1,295
DatangInternationalPower GenerationCo. Ltd. Class A 3,035,600 1,292
Greenland HoldingsCorp. Ltd. Class A(XSSC) 2,010,120 1,291
* TalkwebInformationSystem Co. Ltd.Class A (XSEC) 1,002,107 1,291
Cangzhou DahuaCo. Ltd. Class A 562,800 1,291
Anyang Iron &Steel Inc. Class A 2,716,980 1,290
INESA IntelligentTech Inc. Class A 1,497,190 1,287
Jizhong EnergyResources Co.Ltd. Class A(XSHE) 1,315,107 1,285
Chinese UniversePublishing &Media Group Co.Ltd. Class A 788,436 1,285
Suofeiya HomeCollection Co. Ltd.Class A 486,978 1,284
Shanxi SecuritiesCo. Ltd. Class A(XSEC) 1,309,410 1,280
Shanghai BaosteelPackaging Co.Ltd. Class A 894,100 1,276
* Qinghai HuzhuBarleyWine Co.Ltd. Class A 433,000 1,275
* Beijing ForeverTechnology Co.Ltd. Class A(XSEC) 706,400 1,269
AnjiMicroelectronicsTechnologyShanghai Co. Ltd.Class A 34,179 1,269
Jiangsu ZhongnanConstructionGroup Co. Ltd.Class A (XSHE) 2,118,077 1,267
Emerging Markets Stock Index Fund
58

Shares
MarketValue•
($000)
Fujian ExpresswayDevelopment Co.Ltd. Class A 3,044,400 1,266
* Chongqing Iron &Steel Co. Ltd.Class A (XSSC) 3,550,536 1,265
Fujian Star-netCommunicationCo. Ltd. Class A(XSHE) 369,581 1,265
YGSOFT Inc.Class A (XSHE) 1,192,715 1,264
TrukingTechnologyLtd. Class A 435,300 1,264
Shanghai BailianGroup Co. Ltd.Class A (XSHG) 582,700 1,254
JL Mag Rare-EarthCo. Ltd. Class A(XSHE) 204,800 1,253
Anhui ZhongdingSealing Parts Co.Ltd. Class A(XSEC) 465,300 1,250
An HuiWenergyCo. Ltd. Class A(XSHE) 1,824,144 1,250
Shinva MedicalInstrument Co.Ltd. Class A 366,248 1,247
Guoyuan SecuritiesCo. Ltd. Class A(XSEC) 1,075,657 1,246
* Guangshen RailwayCo. Ltd. Class A(XSSC) 3,727,334 1,245
ZhejiangYashaDecoration Co.Ltd. Class A(XSHE) 1,071,760 1,244
Jiangxi LianchuangOptoelectronicScience &Technology Co.Ltd. Class A(XSSC) 287,176 1,243
Sun CreateElectronics Co.Ltd. 180,400 1,243
YLZ InformationTechnology Co.Ltd. Class A 1,077,600 1,243
Jiangsu ChanghaiCompositeMaterials Co. Ltd.Class A 469,128 1,242
Jiangsu PhoenixPublishing &Media Corp. Ltd.Class A (XSSC) 1,130,306 1,242
Shares
MarketValue•
($000)
ShenzhenYUTOPackagingTechnology Co.Ltd. Class A(XSHE) 242,539 1,242
Shanghai TitanScientific Co. Ltd.Class A 38,603 1,241
ZhejiangWeixingIndustrialDevelopment Co.Ltd. Class A 843,040 1,239
China Coal EnergyCo. Ltd. Class A(XSHG) 1,130,000 1,237
China AnimalHusbandryIndustry Co. Ltd.Class A (XSHG) 748,498 1,235
Wanxiang QianchaoCo. Ltd. Class A(XSHE) 1,320,379 1,235
Shanghai GanglianE-CommerceHoldings Co. Ltd.Class A 206,924 1,235
Guangzhou HaigeCommunicationsGroup Inc. Co.Class A (XSEC) 835,700 1,233
Shenzhen SuntakCircuit TechnologyCo. Ltd. Class A(XSEC) 572,400 1,233
JilinSino-MicroelectronicsCo. Ltd. Class A 875,810 1,233
ShenzhenHuaqiang IndustryCo. Ltd. Class A 540,270 1,233
* Shenzhen MTC Co.Ltd. Class A(XSEC) 1,603,800 1,232
SouthwestSecurities Co. Ltd.Class A (XSHG) 1,636,906 1,231
Jiangsu JiangyinRural CommercialBank Co. Ltd.Class A 2,060,239 1,230
* MinmetalsDevelopment Co.Ltd. Class A(XSHG) 922,286 1,230
* VisionoxTechnology Inc.Class A (XSHE) 980,850 1,230
Emerging Markets Stock Index Fund
59

Shares
MarketValue•
($000)
JiaozuoWanfangAluminumManufacturing Co.Ltd. Class A 1,120,686 1,228
ShanghaiMechanical &Electrical IndustryCo. Ltd. Class A(XSHG) 541,700 1,228
JinnengScience&TechnologyCo. Ltd. Class A(XSHG) 553,455 1,224
Bank of Suzhou Co.Ltd. Class A 1,136,200 1,224
ShaanxiConstructionEngineeringGroup Corp. Ltd.Class A 1,889,590 1,222
Minmetals CapitalCo. Ltd. Class A 1,506,360 1,221
KuangdaTechnology GroupCo. Ltd. Class A 1,463,584 1,221
* YunnanTin Co. Ltd.Class A (XSHE) 476,300 1,220
Shandong JinchengPharmaceuticalGroup Co. Ltd.Class A 268,800 1,217
* CambriconTechnologiesCorp. Ltd. 101,642 1,216
Hisense HomeAppliances GroupCo. Ltd. Class A(XSEC) 666,334 1,215
Tech-Bank Food Co.Ltd. Class A(XSHE) 1,236,974 1,215
Jizhong EnergyResources Co.Ltd. Class A(XSEC) 1,241,100 1,213
* Huaihe EnergyGroup Co. Ltd.Class A 3,346,600 1,213
Shenma IndustryCo. Ltd. Class A 665,404 1,212
Shenzhen JinjiaGroup Co. Ltd.Class A (XSEC) 716,236 1,211
Shan Xi HuaYangGroup NewEnergy Co. Ltd.Class A (XSHG) 729,300 1,211
* Far East SmarterEnergy Co. Ltd.Class A (XSHG) 1,229,560 1,210
Shares
MarketValue•
($000)
ChongqingZaishengTechnology Corp.Ltd. Class A 694,240 1,209
Luenmei QuantumCo. Ltd. Class A(XSHG) 934,180 1,206
Beijing Zhong KeSan HuanHigh-Tech Co. Ltd.Class A (XSHE) 689,408 1,206
* BaodingTianweiBaobian ElectricCo. Ltd. Class A 1,751,501 1,203
* Henan HuangheWhirlwind Co.Ltd. Class A(XSHG) 764,600 1,202
SuzhouTFC OpticalCommunicationCo. Ltd. Class A(XSHE) 299,880 1,202
* ZhongManPetroleum &Natural Gas GroupCorp. Ltd. 551,800 1,202
* Shandong HeadCo. Ltd. Class A 156,500 1,202
Zhejiang Runtu Co.Ltd. Class A 868,351 1,200
Sino GeoPhysicalCo. Ltd. Class A 319,165 1,200
Tianjin CapitalEnvironmentalProtection GroupCo. Ltd. Class A(XSSC) 1,224,361 1,197
ShandongHi-Speed Road &Bridge Co. Ltd.Class A 1,162,500 1,197
Beyondsoft Corp.Class A 638,200 1,196
State GridYingdaCo. Ltd. Class A(XSSC) 1,131,046 1,193
LongYuanConstructionGroup Co. Ltd.Class A (XSSC) 1,061,024 1,191
* GuangdongChaohuaTechnology Co.Ltd. Class A 850,488 1,189
* GuangdongAdvertising GroupCo. Ltd. Class A 1,672,622 1,186
LuThai Textile Co.Ltd. Class B 2,415,793 1,184
Emerging Markets Stock Index Fund
60

Shares
MarketValue•
($000)
* China AluminumInternationalEngineering Corp.Ltd. Class A 1,830,300 1,182
* GosuncnTechnology GroupCo. Ltd. Class A 1,697,592 1,181
Zhejiang SemirGarment Co. Ltd.Class A 1,005,620 1,181
Visual China GroupCo. Ltd. Class A(XSEC) 570,719 1,179
Yintai Gold Co. Ltd.Class A (XSEC) 857,780 1,178
Wuhan DepartmentStore Group Co.Ltd. Class A 745,977 1,178
* Shandong XinchaoEnergy Corp. Ltd.Class A (XSHG) 3,400,300 1,176
HengtongOptic-electric Co.Ltd. Class A(XSHG) 494,260 1,175
Shenzhen HepalinkPharmaceuticalGroup Co. Ltd.Class A (XSHE) 489,180 1,174
GlarunTechnologyCo. Ltd. Class A(XSSC) 507,941 1,174
Jiangsu LinyangEnergy Co. Ltd.Class A (XSHG) 661,600 1,173
Shenzhen EverwinPrecisionTechnology Co.Ltd. Class A(XSEC) 534,933 1,172
Beijing UrbanConstructionInvestment &Development Co.Ltd. Class A(XSHG) 1,706,976 1,172
Huabao Flavours &Fragrances Co.Ltd. Class A(XSHE) 179,900 1,172
Inmyshow DigitalTechnology GroupCo. Ltd. (XSSC) 707,357 1,169
Beijing StrongBiotechnologies Inc.Class A 490,185 1,168
* China Tungsten &HightechMaterials Co. Ltd.Class A 562,960 1,167
Shares
MarketValue•
($000)
Beijing SanyuanFoods Co. Ltd.Class A 1,155,178 1,166
NingboYunshengCo. Ltd. Class A(XSSC) 708,831 1,165
* HunanTV &BroadcastIntermediary Co.Ltd. Class A 1,329,500 1,165
Wuxi HuaguangEnvironment &Energy Group Co.Ltd. Class A 714,870 1,164
GuangzhouShiyuan ElectronicTechnology Co.Ltd. Class A(XSEC) 98,084 1,163
Zhejiang Juhua Co.Ltd. Class A(XSSC) 478,140 1,161
ZhejiangWanfengAutoWheel Co.Ltd. Class A(XSEC) 1,411,966 1,161
2 Wisdom EducationInternationalHoldings Co. Ltd. 6,772,000 1,160
ShenzhenYsstechInfo-tech Co. Ltd.Class A (XSEC) 756,000 1,159
Wuhan RaycusFiber LaserTechnologies Co.Ltd. Class A(XSEC) 121,446 1,157
* Grand IndustrialHolding Group Co.Ltd. 311,800 1,157
Zhejiang MedicineCo. Ltd. Class A(XSEC) 463,550 1,156
ShijiazhuangYilingPharmaceuticalCo. Ltd. Class A(XSHE) 460,685 1,156
* Yunnan EnergyInvestment Co.Ltd. Class A 868,455 1,151
Jason FurnitureHangzhou Co.Ltd. Class A(XSSC) 118,200 1,149
MLS Co. Ltd.Class A (XSHE) 527,400 1,148
China MerchantsPort Group Co.Ltd. Class A 466,300 1,147
Emerging Markets Stock Index Fund
61

Shares
MarketValue•
($000)
ShenzhenAgriculturalProducts GroupCo. Ltd. Class A(XSHE) 1,056,629 1,146
Baiyin NonferrousGroup Co. Ltd.Class A 2,667,900 1,146
Jiangsu GuoxinCorp. Ltd. Class A 1,130,100 1,145
Xuji Electric Co.Ltd. Class A(XSEC) 369,300 1,144
* Guosheng FinancialHolding Inc.Class A (XSEC) 782,219 1,142
Bank of QingdaoCo. Ltd. Class A(XSHE) 1,551,800 1,142
KunlunTech Co.Ltd. Class A(XSHE) 392,631 1,142
Shanghai Jin JiangOnline NetworkService Co. Ltd. 1,742,110 1,141
Shenzhen FRDScience &Technology Co.Ltd. 384,462 1,141
Leo Group Co. Ltd.Class A (XSHE) 3,199,811 1,140
Nanjing SecuritiesCo. Ltd. Class A(XSHG) 751,560 1,140
AVICOPTER plcClass A (XSHG) 115,800 1,138
* ShandongYishengLivestock &Poultry BreedingCo. Ltd. Class A(XSHE) 684,944 1,138
* Xinjiang MachineryResearch InstituteCo. Ltd. Class A 1,411,536 1,137
Wuhan JingceElectronic GroupCo. Ltd. Class A(XSEC) 139,676 1,137
Client ServiceInternational Inc.Class A 432,967 1,137
Jiangsu GuotaiInternationalGroup Co. Ltd.(XSHE) 550,290 1,135
Beijing VRVSoftware Corp.Ltd. Class A(XSHE) 1,292,200 1,134
Shares
MarketValue•
($000)
Shenzhen LaibaoHi-tech Co. Ltd.Class A 702,487 1,133
Milkyway ChemicalSupply ChainService Co. Ltd.Class A 66,100 1,133
GuangzhouHengyunEnterprisesHoldings Ltd.Class A 967,676 1,132
CNNC HuaYuanTitanium DioxideCo. Ltd. Class A(XSEC) 524,900 1,131
* Luoniushan Co.Ltd. Class A(XSHE) 1,057,707 1,130
CTS InternationalLogistics Corp.Ltd. Class A(XSHG) 586,282 1,130
CGN NuclearTechnologyDevelopment Co.Ltd. Class A(XSHE) 809,829 1,128
Yutong Bus Co.Ltd. Class A(XSHG) 635,800 1,126
* Hunan Gold Corp.Ltd. Class A(XSHE) 665,040 1,126
* Shanghai Guijiu Co.Ltd. Class A 252,900 1,126
Beken Corp.Class A 122,587 1,125
Xinjiang JoinworldCo. Ltd. Class A(XSSC) 799,308 1,124
ZhongyuanEnvironment-Protection Co.Ltd. Class A 1,182,268 1,123
Shanghai HileBio-TechnologyCo. Ltd. Class A 539,541 1,123
Jiangxi GannengCo. Ltd. Class A 1,296,542 1,122
GuangdongZhongshengPharmaceuticalCo. Ltd. Class A 852,417 1,121
* Aotecar NewEnergyTechnology Co.Ltd. Class A 2,230,400 1,121
Emerging Markets Stock Index Fund
62

Shares
MarketValue•
($000)
GoldenmaxInternationalTechnology Ltd.Class A (XSHE) 538,100 1,120
Yangtze OpticalFibre & CableJoint Stock Ltd.Co. Class A 231,660 1,119
GuangzhouRestaurant GroupCo. Ltd. Class A(XSHG) 315,241 1,119
GuangzhouKingmedDiagnostics GroupCo. Ltd. Class A(XSSC) 62,100 1,115
Shanghai ShimaoCo. Ltd. Class A(XSSC) 2,254,512 1,114
Wangsu Science &Technology Co.Ltd. Class A(XSHE) 1,301,019 1,113
* Jihua Group Corp.Ltd. Class A 2,677,800 1,113
* Shenyang JinbeiAutomotive Co.Ltd. Class A 1,097,901 1,112
China ZhenhuaGroup Science &Technology Co.Ltd. Class A(XSEC) 68,600 1,111
Joeone Co. Ltd.Class A 502,277 1,111
Baotailong NewMaterials Co. Ltd.Class A 1,482,100 1,110
ShanghaiConstructionGroup Co. Ltd.Class A (XSHG) 2,169,991 1,109
Shanghai KineticMedical Co. Ltd.Class A 707,843 1,108
* ShaanxiConstructionMachinery Co.Ltd. Class A 820,700 1,104
Sealand SecuritiesCo. Ltd. Class A(XSEC) 1,828,130 1,103
Financial StreetHoldings Co. Ltd.Class A (XSEC) 1,203,460 1,103
* GuangdongGuanghuaSci-Tech Co. Ltd.Class A 315,542 1,101
Shares
MarketValue•
($000)
* Sichuan HongdaCo. Ltd. Class A 1,907,200 1,096
* Whirlpool ChinaCo. Ltd. Class A 738,250 1,096
* Pacific SecuritiesCo. Ltd. Class A(XSHG) 2,246,635 1,095
China ResourcesDouble CranePharmaceuticalCo. Ltd. Class A(XSHG) 613,542 1,094
GuangxiWuzhouCommunicationsCo. Ltd. Class A(XSSC) 1,921,390 1,093
Guodian NanjingAutomation Co.Ltd. Class A 687,800 1,092
* Vcanbio Cell &Gene EngineeringCorp. Ltd. Class A 341,400 1,092
GrandblueEnvironment Co.Ltd. Class A(XSHG) 316,000 1,091
Huadian PowerInternational Corp.Ltd. Class A(XSHG) 1,581,717 1,089
* TalkwebInformationSystem Co. Ltd.Class A (XSHE) 844,649 1,088
Henan HengxingScience &Technology Co.Ltd. Class A 1,425,295 1,087
China Meheco Co.Ltd. Class A(XSHG) 624,100 1,086
EIT EnvironmentalDevelopmentGroup Co. Ltd.Class A 239,932 1,086
* Cinda Real EstateCo. Ltd. Class A(XSSC) 2,163,113 1,085
Beibuwan Port Co.Ltd. Class A 931,400 1,085
Digital China GroupCo. Ltd. Class A 463,901 1,083
Shandong Hi-speedCo. Ltd. Class A(XSSC) 1,290,554 1,082
Juneyao AirlinesCo. Ltd. Class A(XSSC) 435,330 1,082
Emerging Markets Stock Index Fund
63

Shares
MarketValue•
($000)
* Beijing Urban-RuralCommercialGroup Co. Ltd.Class A 300,848 1,081
ADAMA Ltd.Class A 915,100 1,080
Beijing GeoEnvironEngineering &Technology Inc.Class A (XSHG) 424,320 1,077
Hangjin TechnologyCo. Ltd. Class A(XSHE) 202,350 1,076
Beijing SanlianHope Shin-GosenTechnical ServiceCo. Ltd. Class A 345,642 1,074
* TunghsuOptoelectronicTechnology Co.Ltd. Class A(XSHE) 3,465,608 1,073
Hunan Er-KangPharmaceuticalCo. Ltd. Class A(XSEC) 1,676,979 1,073
OFILM Group Co.Ltd. Class A(XSEC) 917,400 1,072
Jiangsu ChangshuRural CommercialBank Co. Ltd.Class A 944,900 1,072
* Henan AncaiHi-Tech Co. Ltd.Class A 1,024,750 1,070
* Tellhow Sci-TechCo. Ltd. Class A 983,884 1,070
Shanghai FlycoElectricalAppliance Co. Ltd.Class A 171,600 1,069
Guangzhou GreatPower Energy &Technology Co.Ltd. Class A(XSHE) 229,000 1,068
Beijing GeoEnvironEngineering &Technology Inc.Class A (XSSC) 420,332 1,067
* Beijing SanjuEnvironmentalProtection & NewMaterial Co. Ltd.Class A (XSEC) 1,120,179 1,066
China Meheco Co.Ltd. Class A(XSSC) 612,560 1,066
Shares
MarketValue•
($000)
Luxin VentureCapital Group Co.Ltd. Class A(XSHG) 532,800 1,066
Shenzhen NewIndustriesBiomedicalEngineering Co.Ltd. Class A(XSHE) 163,780 1,064
Shanghai JinfengWine Co. Ltd.Class A 986,045 1,063
Shanghai SinyangSemiconductorMaterials Co. Ltd.Class A (XSEC) 171,800 1,063
DeHuaTB NewDecorationMaterials Co. Ltd.Class A 760,550 1,061
AUCMA Co. Ltd.Class A 881,301 1,060
Qingdao HanheCable Co. Ltd.Class A 1,571,104 1,060
Grinm AdvancedMaterials Co. Ltd.Class A (XSSC) 528,800 1,057
Huaming PowerEquipment Co.Ltd. Class A 758,043 1,055
YusysTechnologiesCo. Ltd. Class A 365,280 1,055
DongxingSecurities Co. Ltd.Class A (XSSC) 615,613 1,054
* Xi'an Tian HeDefenseTechnology Co.Ltd. Class A 475,200 1,054
Contec MedicalSystems Co. Ltd.Class A 211,100 1,052
Ningxia Jiaze NewEnergy Co. Ltd.Class A 1,234,300 1,051
ShandongChenming PaperHoldings Ltd.Class A (XSEC) 948,941 1,048
Sansteel MinguangCo. Ltd. FujianClass A (XSEC) 978,600 1,048
Xinhuanet Co. Ltd.Class A 379,200 1,048
* Hongli ZhihuiGroup Co. Ltd.Class A 593,700 1,047
Emerging Markets Stock Index Fund
64

Shares
MarketValue•
($000)
Qingdao RuralCommercial BankCorp. Class A(XSHE) 1,751,800 1,046
* Henan HuangheWhirlwind Co.Ltd. Class A(XSSC) 664,380 1,044
Shenzhen EverwinPrecisionTechnology Co.Ltd. Class A(XSHE) 476,479 1,044
Jinyuan EP Co. Ltd.Class A 615,996 1,043
People.cn Co. Ltd.Class A (XSHG) 508,213 1,040
Xiangcai Co. Ltd.Class A 772,800 1,040
Top Energy Co. Ltd.Shanxi Class A 1,701,144 1,038
XiamenIntretech Inc.Class A 215,390 1,037
Shenzhen KinwongElectronic Co. Ltd.Class A (XSHG) 256,784 1,037
* GuangdongDongfangPrecision Science&Technology Co.Ltd. Class A(XSHE) 1,220,832 1,033
Shanghai BailianGroup Co. Ltd.Class A (XSSC) 479,788 1,033
Zhejiang HisunPharmaceuticalCo. Ltd. Class A(XSSC) 568,100 1,033
ZhejiangGuyuelongshanShaoxingWineCo. Ltd. Class A(XSHG) 609,690 1,031
Shanghai ShibeiHi-Tech Co. Ltd.Class A 1,294,230 1,030
Tonghua DongbaoPharmaceuticalCo. Ltd. Class A(XSHG) 541,421 1,030
Anhui ConstructionEngineeringGroup Co. Ltd.Class A 1,699,609 1,029
Dare Power DekorHome Co. Ltd.Class A 562,739 1,028
Shares
MarketValue•
($000)
* CanSinoBiologics Inc.Class A 24,130 1,028
Jinhui Liquor Co.Ltd. Class A 191,800 1,026
* Mesnac Co. Ltd.Class A 860,489 1,025
Yantai ZhenghaiMagnetic MaterialCo. Ltd. Class A(XSHE) 582,654 1,025
Shanghai YaojiTechnology Co.Ltd. Class A 386,659 1,025
Jiangsu Asia-PacificLight AlloyTechnology Co.Ltd. Class A 1,305,666 1,025
* Beijing BohuiInnovationBiotechnologyGroup Co. Ltd.Class A 865,369 1,025
* Anhui TatfookTechnology Co.Ltd. Class A 741,800 1,024
FocusTechnologyCo. Ltd. Class A 430,320 1,024
TaslyPharmaceuticalGroup Co. Ltd.Class A (XSHG) 482,342 1,022
CQ PharmaceuticalHolding Co. Ltd.Class A (XSHE) 1,366,500 1,021
Guangxi GuiguanElectric Power Co.Ltd. Class A(XSHG) 1,128,790 1,020
* Yunnan LincangXinyuanGermaniumIndustrial Co. Ltd.Class A 626,595 1,019
* Staidson BeijingBiopharmaceuticalsCo. Ltd. Class A 474,719 1,019
Liuzhou Iron &Steel Co. Ltd.Class A 1,201,700 1,019
*,2 Colour LifeServices GroupCo. Ltd. 5,812,570 1,018
Beijing CapitalEco-EnvironmentProtection GroupCo. Ltd. Class A(XSHG) 1,937,520 1,018
Shanghai TianchenCo. Ltd. Class A 728,338 1,014
Emerging Markets Stock Index Fund
65

Shares
MarketValue•
($000)
Guangzhou PortCo. Ltd. Class A 2,060,800 1,014
* ShijiazhuangChangshanBeiMingTechnology Co.Ltd. Class A(XSHE) 999,275 1,013
Zhongjin GoldCorp. Ltd. Class A(XSHG) 781,160 1,013
BGI Genomics Co.Ltd. Class A(XSHE) 72,800 1,013
* Beijing SanjuEnvironmentalProtection & NewMaterial Co. Ltd.Class A (XSHE) 1,062,828 1,012
Guangzhou GuangriStock Co. Ltd.Class A 961,200 1,011
Jin Tong LingTechnology GroupCo. Ltd. Class A 1,321,100 1,011
City DevelopmentEnvironment Co.Ltd. 654,680 1,010
* Youzu InteractiveCo. Ltd. Class A 485,916 1,007
Hubei BiocausePharmaceuticalCo. Ltd. Class A(XSEC) 1,977,200 1,004
Changying XinzhiTechnology Co.Ltd. Class A 382,400 1,003
JiangxiHuangshanghuangGroup Food Co.Ltd. Class A 462,301 1,001
Beijing CompassTechnologyDevelopment Co.Ltd. Class A 196,800 999
Jiangsu NataOpto-electronicMaterial Co. Ltd.Class A (XSHE) 123,000 999
Hangxiao SteelStructure Co. Ltd.Class A (XSHG) 1,786,435 997
Suzhou AnjieTechnology Co.Ltd. Class A(XSHE) 462,649 997
* Fujian QingshanPaper IndustryCo. Ltd. Class A 2,584,790 996
Shares
MarketValue•
($000)
Shanghai SMIHolding Co. Ltd.Class A (XSHG) 1,545,945 995
DBGTechnologyCo. Ltd. Class A 456,680 993
ShenzhenExpressway Co.Ltd. Class A(XSHG) 653,800 992
LeyardOptoelectronicCo. Ltd. Class A(XSHE) 674,766 992
Three Squirrels Inc.Class A 149,540 992
Nanjing HanruiCobalt Co. Ltd.Class A (XSEC) 80,200 991
* HiconicsEco-energyTechnology Co.Ltd. Class A 1,066,400 990
Leo Group Co. Ltd.Class A (XSEC) 2,776,300 989
* Shanghai ForeignService HoldingGroup Co. Ltd.(XSHG) 830,600 988
CECEP SolarEnergy Co. Ltd.Class A (XSEC) 565,900 986
* Huafu Fashion Co.Ltd. (XSHE) 1,425,310 986
Shandong HumonSmelting Co. Ltd.Class A (XSHE) 550,100 986
MedicalsystemBiotechnology Co.Ltd. Class A 346,583 986
* Kuang-ChiTechnologies Co.Ltd. Class A(XSEC) 306,600 984
Wanxiang QianchaoCo. Ltd. Class A(XSEC) 1,051,700 984
* Shenzhen InvtElectric Co. Ltd.Class A 844,252 983
Fujian Longking Co.Ltd. Class A(XSSC) 773,680 982
Ningbo PeacebirdFashion Co. Ltd.Class A (XSHG) 175,698 982
Huapont LifeSciences Co. Ltd.Class A (XSEC) 1,014,901 981
Emerging Markets Stock Index Fund
66

Shares
MarketValue•
($000)
Foshan Electrical &Lighting Co. Ltd.Class B 2,535,261 979
Shanghai AJ GroupCo. Ltd. Class A 966,398 979
* Taiyuan HeavyIndustry Co. Ltd.Class A (XSSC) 2,206,513 979
* Wuhan P&SInformationTechnology Co.Ltd. Class A(XSHE) 1,031,500 977
Fangda SpecialSteel TechnologyCo. Ltd. Class A(XSHG) 842,878 976
Shenzhen DasIntellitech Co. Ltd.Class A (XSHE) 1,832,196 974
China NationalMedicines Corp.Ltd. Class A(XSHG) 204,086 972
Chengdu HongqiChain Co. Ltd.Class A 1,222,800 970
Anhui HengyuanCoal Industry &Electricity PowerCo. Ltd. Class A(XSSC) 885,031 969
* Shandong XinchaoEnergy Corp. Ltd.Class A (XSSC) 2,802,816 969
InsigmaTechnologyCo. Ltd. Class A 1,008,500 969
* Nanjing QuanxinCable TechnologyCo. Ltd. Class A 295,630 969
* Zhejiang ConbaPharmaceuticalCo. Ltd. Class A(XSSC) 1,520,861 968
Zhejiang MedicineCo. Ltd. Class A(XSHG) 387,800 967
Xiamen C & D Inc.Class A (XSSC) 772,400 966
KunmingYunneiPower Co. Ltd.Class A 1,904,354 966
Jiangsu ChangbaoSteeltube Co. Ltd.Class A 1,550,700 965
Sinotrans Ltd.Class A (XSSC) 1,367,100 964
ChemPartnerPharmaTech Co.Ltd. Class A 422,377 964
Shares
MarketValue•
($000)
GuangzhouDevelopmentGroup Inc.Class A (XSSC) 858,971 964
FAW Jiefang GroupCo. Ltd. 589,943 962
KebodaTechnologyCo. Ltd. Class A 92,881 961
China TransInfoTechnology Co.Ltd. Class A(XSEC) 459,400 960
TellingTelecommunicationHolding Co. Ltd.Class A (XSHE) 257,000 960
Xiamen ComfortScience &Technology GroupCo. Ltd. Class A 564,300 959
Shenzhen LeaguerCo. Ltd. Class A 686,800 958
Chengdu KanghongPharmaceuticalGroup Co. Ltd.Class A 334,750 956
Anhui XinhuaMedia Co. Ltd.Class A 1,299,982 956
Shenzhen GoodixTechnology Co.Ltd. Class A(XSSC) 59,656 954
* Sinopec OilfieldService Corp.Class A (XSSC) 2,703,200 954
CachetPharmaceuticalCo. Ltd. Class A 496,043 953
Zhongshan BroadOcean Motor Co.Ltd. Class A(XSHE) 893,700 950
Jiang Su SuyanJingshen Co. Ltd.Class A 761,500 950
Shanghai AtHubCo. Ltd. Class A(XSHG) 194,320 948
* ShenzhenNeptunusBioengineeringCo. Ltd. Class A 1,950,950 945
Jiangsu ChangqingAgrochemical Co.Ltd. Class A 862,109 945
IReader TechnologyCo. Ltd. Class A(XSHG) 319,400 945
Emerging Markets Stock Index Fund
67

Shares
MarketValue•
($000)
Bank of ChengduCo. Ltd. Class A(XSSC) 472,700 943
Foshan NationstarOptoelectronicsCo. Ltd. Class A 589,283 943
Wangsu Science &Technology Co.Ltd. Class A(XSEC) 1,098,938 941
Valiant Co. Ltd.Class A (XSEC) 292,400 941
Huapont LifeSciences Co. Ltd.Class A (XSHE) 971,200 939
Shanghai RundaMedicalTechnology Co.Ltd. Class A 580,320 938
* Lander SportsDevelopment Co.Ltd. Class A 1,641,050 937
Weihai GuangtaiAirport EquipmentCo. Ltd. Class A 527,943 937
Guangxi YueguiGuangye HoldingCo. Ltd. Class A 887,856 935
GF Securities Co.Ltd. Class H 550,800 934
Fortune Ng FungFood Hebei Co.Ltd. Class A 930,674 932
Eternal Asia SupplyChainManagement Ltd.Class A (XSHE) 1,037,500 932
* Guangdong HECTechnologyHolding Co. Ltd.Class A (XSSC) 560,960 930
Jinke PropertiesGroup Co. Ltd.Class A (XSEC) 1,338,788 929
Baosheng Science&TechnologyInnovation Co.Ltd. Class A(XSSC) 1,225,155 929
Yunnan Copper Co.Ltd. Class A(XSHE) 447,200 928
ZheJiang DaliTechnology Co.Ltd. Class A 312,594 928
* ShenzhenChipscreenBiosciences Co.Ltd. Class A 161,154 928
Shares
MarketValue•
($000)
Henan PinggaoElectric Co. Ltd.Class A (XSSC) 672,114 927
* Trip.com GroupLtd. 32,191 925
Eternal Asia SupplyChainManagement Ltd.Class A (XSEC) 1,028,900 924
Yantai DongchengPharmaceuticalCo. Ltd. Class A(XSHE) 426,300 924
Tibet UrbanDevelopment &Investment Co.Ltd. Class A(XSSC) 267,344 924
BeijingWaterBusiness DoctorCo. Ltd. Class A(XSHE) 494,900 922
Stanley AgriculturalGroup Co. Ltd.Class A 1,085,928 922
Shenzhen KaifaTechnology Co.Ltd. Class A(XSEC) 398,300 921
Tibet Tianlu Co.Ltd. Class A 927,949 921
Zhejiang GardenBio-ChemicalHigh-tech Co. Ltd.Class A (XSHE) 440,350 919
Shandong LukangPharma Class A 867,190 918
GuangdongGoworld Co. Ltd.Class A 521,444 917
GuangzhouShangpin HomeCollection Co. Ltd.Class A (XSHE) 134,315 916
China Publishing &Media Co. Ltd.Class A 1,075,300 912
* Huludao ZincIndustry Co.Class A 1,526,300 910
* China NonferrousMetal Industry'sForeignEngineering &Construction Co.Ltd. Class A(XSHE) 1,132,500 909
Emerging Markets Stock Index Fund
68

Shares
MarketValue•
($000)
AVICIndustry-FinanceHoldings Co. Ltd.Class A (XSHG) 1,493,800 909
* MarkorInternationalHome FurnishingsCo. Ltd. Class A 1,715,635 909
China SportsIndustry GroupCo. Ltd. Class A 496,700 909
GreattownHoldings Ltd.Class A (XSHG) 1,641,600 908
QianjiangWaterResourcesDevelopment Co.Ltd. Class A 551,651 905
* KraussMaffei Co.Ltd. Class A 864,834 904
ZhejiangZhongchengPacking MaterialCo. Ltd. Class A 856,121 903
Anhui GenuineNew MaterialsCo. Ltd. Class A 252,600 903
ShenzhenHeungkongHolding Co. Ltd.Class A (XSSC) 3,067,468 901
* CITIC GuoanInformationIndustry Co. Ltd.Class A (XSHE) 2,563,300 900
Xiamen Meiya PicoInformation Co.Ltd. Class A(XSEC) 373,452 898
GuangdongVanward NewElectric Co. Ltd.Class A 841,940 897
WuhuTokenScience Co. Ltd.Class A (XSEC) 557,783 895
Black Peony GroupCo. Ltd. Class A(XSSC) 806,287 895
BGI Genomics Co.Ltd. Class A(XSEC) 64,249 894
Haining ChinaLeather MarketCo. Ltd. Class A 1,252,410 894
Tianjin Teda Co.Ltd. Class A 1,439,243 889
* Toread HoldingsGroup Co. Ltd.Class A 660,000 889
Shares
MarketValue•
($000)
China TransInfoTechnology Co.Ltd. Class A(XSHE) 425,300 889
Asian Star AnchorChain Co. Ltd.Jiangsu Class A 858,650 888
Zhuzhou KibingGroup Co. Ltd.Class A (XSHG) 357,700 888
AutobioDiagnostics Co.Ltd. Class A(XSSC) 103,610 887
China NationalSoftware &Service Co. Ltd.Class A (XSHG) 110,600 887
Tianjin CapitalEnvironmentalProtection GroupCo. Ltd. Class A(XSHG) 907,116 887
Zhejiang JIULIHi-tech MetalsCo. Ltd. Class A(XSSC) 449,450 887
SunstoneDevelopment Co.Ltd. Class A 286,400 887
* Far East SmarterEnergy Co. Ltd.Class A (XSSC) 901,200 887
ShandongWITDyne Health Co.Ltd. Class A 227,050 886
Shandong Hi-speedCo. Ltd. Class A(XSHG) 1,057,400 886
* HyUnion HoldingCo. Ltd. Class A(XSHE) 1,013,582 885
* Neusoft Corp.Class A (XSSC) 593,614 885
DHC Software Co.Ltd. Class A(XSEC) 813,800 883
Nanjing Iron &Steel Co. Ltd.Class A (XSHG) 1,601,500 883
ShenzhenProperties &ResourcesDevelopmentGroup Ltd.Class A 511,552 881
Hubei BiocausePharmaceuticalCo. Ltd. Class A(XSHE) 1,733,900 880
Emerging Markets Stock Index Fund
69

Shares
MarketValue•
($000)
Zhejiang JingxinPharmaceuticalCo. Ltd. Class A(XSEC) 698,539 880
* Shanxi GuoxinEnergy Corp. Ltd.Class A 1,249,726 879
Fangda CarbonNew Material Co.Ltd. Class A(XSHG) 522,917 879
New GuomaiDigital Culture Co.Ltd. Class A 559,900 878
Changchun FawayAutomobileComponents Co.Ltd. Class A 534,768 877
JA Solar TechnologyCo. Ltd. Class A(XSEC) 61,500 877
Shandong NewBeiyangInformationTechnology Co.Ltd. Class A 721,300 876
CITIC Press Corp.Class A 192,900 874
Anhui Korrun Co.Ltd. Class A 251,860 874
ZhejiangWanmaCo. Ltd. Class A(XSHG) 793,972 873
Henan ShenhuoCoal & Power Co.Ltd. Class A(XSEC) 587,000 871
YifanPharmaceuticalCo. Ltd. Class A(XSEC) 339,300 869
Huaan SecuritiesCo. Ltd. Class A(XSSC) 1,086,020 868
BettaPharmaceuticalsCo. Ltd. Class A(XSEC) 70,200 868
Hongbaoli GroupCorp. Ltd. Class A 714,859 868
* HolitechTechnologyCo. Ltd. Class A(XSHE) 1,706,396 868
* Beijing LierHigh-temperatureMaterials Co. Ltd.Class A 1,242,571 868
* Jiangmen KanhooIndustry Co. Ltd.Class A 311,117 868
Shares
MarketValue•
($000)
Shenzhen GuangjuEnergy Co. Ltd.Class A 659,888 866
Hanwei ElectronicsGroup Corp.Class A 274,002 866
Xinxiang RichfulLube Additive Co.Ltd. Class A 70,500 866
* Shang Gong GroupCo. Ltd. Class B 2,310,622 864
North Electro-OpticCo. Ltd. Class A 494,561 862
ZhejiangFuchunjiangEnvironmentalThermoelectricCo. Ltd. Class A 1,020,200 861
Yankershop FoodCo. Ltd. Class A 82,800 861
Beijing ShunxinAgriculture Co.Ltd. Class A(XSEC) 168,792 860
ShuangliangEco-EnergySystems Co. Ltd.Class A (XSHG) 412,005 860
Top ResourceConservation &EnvironmentCorp. Class A 518,300 858
Jilin Yatai Group Co.Ltd. Class A(XSSC) 1,597,167 857
GuangdongShaoneng GroupCo. Ltd. Class A 1,112,040 854
Hisense VisualTechnology Co.Ltd. Class A(XSSC) 450,162 851
Bright Dairy & FoodCo. Ltd. Class A(XSHG) 389,800 849
Baoxiniao HoldingCo. Ltd. Class A 1,203,300 849
SGIS Songshan Co.Ltd. Class A(XSEC) 1,225,100 848
JiangsuZhangjiagangRural CommercialBank Co. Ltd.Class A (XSEC) 875,700 848
Sunward IntelligentEquipment Co.Ltd. Class A(XSEC) 669,120 846
Emerging Markets Stock Index Fund
70

Shares
MarketValue•
($000)
Jointo EnergyInvestment Co.Ltd. HebeiClass A (XSHE) 1,058,144 846
Loncin Motor Co.Ltd. Class A(XSSC) 1,237,500 845
Offshore OilEngineering Co.Ltd. Class A(XSHG) 1,162,500 845
* Hainan Haiyao Co.Ltd. Class A 1,301,400 844
Shanghai DazhongPublic UtilitiesGroup Co. Ltd.Class A (XSHG) 1,437,500 843
Xiamen Meiya PicoInformation Co.Ltd. Class A(XSHE) 350,605 843
JSTI Group Class A 950,557 840PuyangRefractoriesGroup Co. Ltd.Class A 1,231,481 840
* Zhuhai OrbitaAerospaceScience &Technology Co.Ltd. Class A 620,408 839
* Jinneng HoldingShanxi CoalIndustry Co. Ltd.Class A (XSSC) 497,400 838
Shenzhen ZhongjinLingnanNonfemet Co.Ltd. Class A(XSHE) 1,082,550 838
Shanghai LujiazuiFinance &TradeZoneDevelopment Co.Ltd. Class A(XSHG) 494,864 837
Youngor Group Co.Ltd. Class A(XSHG) 832,608 836
Shanghai Jin JiangOnline NetworkService Co. Ltd.Class A (XSHG) 616,700 836
* JinJian CerealsIndustry Co. Ltd.Class A 650,200 834
Shandong SunwayChemical GroupCo. Ltd. Class A 880,300 834
Shares
MarketValue•
($000)
Dashang Co. Ltd.Class A 274,100 834
SinosteelEngineering &Technology Co.Ltd. Class A 732,700 834
Zhuhai Port Co.Ltd. Class A 853,300 833
Guangdong MeiyanJixiangHydropower Co.Ltd. Class A 1,901,400 832
* Sichuan HebangBiotechnology Co.Ltd. Class A(XSHG) 1,495,340 832
Xinfengming GroupCo. Ltd. Class A(XSHG) 362,796 832
Shanxi Blue FlameHolding Co. Ltd.Class A (XSEC) 577,896 828
* Nanfang ZhongjinEnvironment Co.Ltd. Class A 1,775,883 828
* Shunfa HengyeCorp. Class A(XSHE) 1,413,801 828
Shenyang ChemicalCo. Ltd. Class A 944,000 828
* KingsignalTechnology Co.Ltd. Class A 620,360 827
5I5J Holding GroupCo. Ltd. Class A 1,773,003 826
Jiangsu Zijin RuralCommercial BankCo. Ltd. Class A(XSHG) 1,646,800 826
* Jiangsu Zongyi Co.Ltd. Class A 983,700 824
Autel IntelligentTechnology Corp.Ltd. Class A 82,408 824
* Xinlun NewMaterials Co. Ltd. 1,033,500 823
GuizhouTyre Co.Ltd. Class A 1,044,976 822
China ResourcesDouble CranePharmaceuticalCo. Ltd. Class A(XSSC) 460,351 821
AECC Aero-EngineControl Co. Ltd.Class A (XSHE) 196,500 820
JiangsuYunyiElectric Co. Ltd.Class A 878,840 820
Emerging Markets Stock Index Fund
71
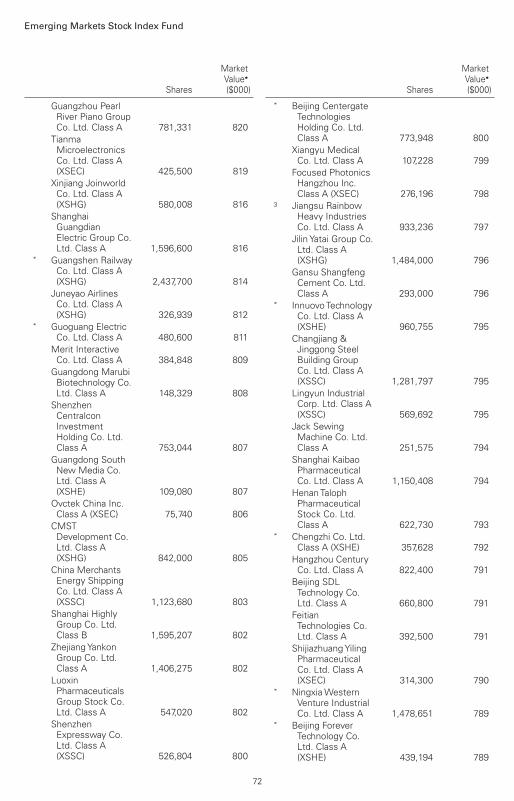
Shares
MarketValue•
($000)
Guangzhou PearlRiver Piano GroupCo. Ltd. Class A 781,331 820
TianmaMicroelectronicsCo. Ltd. Class A(XSEC) 425,500 819
Xinjiang JoinworldCo. Ltd. Class A(XSHG) 580,008 816
ShanghaiGuangdianElectric Group Co.Ltd. Class A 1,596,600 816
* Guangshen RailwayCo. Ltd. Class A(XSHG) 2,437,700 814
Juneyao AirlinesCo. Ltd. Class A(XSHG) 326,939 812
* Guoguang ElectricCo. Ltd. Class A 480,600 811
Merit InteractiveCo. Ltd. Class A 384,848 809
Guangdong MarubiBiotechnology Co.Ltd. Class A 148,329 808
ShenzhenCentralconInvestmentHolding Co. Ltd.Class A 753,044 807
Guangdong SouthNew Media Co.Ltd. Class A(XSHE) 109,080 807
Ovctek China Inc.Class A (XSEC) 75,740 806
CMSTDevelopment Co.Ltd. Class A(XSHG) 842,000 805
China MerchantsEnergy ShippingCo. Ltd. Class A(XSSC) 1,123,680 803
Shanghai HighlyGroup Co. Ltd.Class B 1,595,207 802
ZhejiangYankonGroup Co. Ltd.Class A 1,406,275 802
LuoxinPharmaceuticalsGroup Stock Co.Ltd. Class A 547,020 802
ShenzhenExpressway Co.Ltd. Class A(XSSC) 526,804 800
Shares
MarketValue•
($000)
* Beijing CentergateTechnologiesHolding Co. Ltd.Class A 773,948 800
Xiangyu MedicalCo. Ltd. Class A 107,228 799
Focused PhotonicsHangzhou Inc.Class A (XSEC) 276,196 798
3 Jiangsu RainbowHeavy IndustriesCo. Ltd. Class A 933,236 797
Jilin Yatai Group Co.Ltd. Class A(XSHG) 1,484,000 796
Gansu ShangfengCement Co. Ltd.Class A 293,000 796
* InnuovoTechnologyCo. Ltd. Class A(XSHE) 960,755 795
Changjiang &Jinggong SteelBuilding GroupCo. Ltd. Class A(XSSC) 1,281,797 795
Lingyun IndustrialCorp. Ltd. Class A(XSSC) 569,692 795
Jack SewingMachine Co. Ltd.Class A 251,575 794
Shanghai KaibaoPharmaceuticalCo. Ltd. Class A 1,150,408 794
HenanTalophPharmaceuticalStock Co. Ltd.Class A 622,730 793
* Chengzhi Co. Ltd.Class A (XSHE) 357,628 792
Hangzhou CenturyCo. Ltd. Class A 822,400 791
Beijing SDLTechnology Co.Ltd. Class A 660,800 791
FeitianTechnologies Co.Ltd. Class A 392,500 791
ShijiazhuangYilingPharmaceuticalCo. Ltd. Class A(XSEC) 314,300 790
* NingxiaWesternVenture IndustrialCo. Ltd. Class A 1,478,651 789
* Beijing ForeverTechnology Co.Ltd. Class A(XSHE) 439,194 789
Emerging Markets Stock Index Fund
72
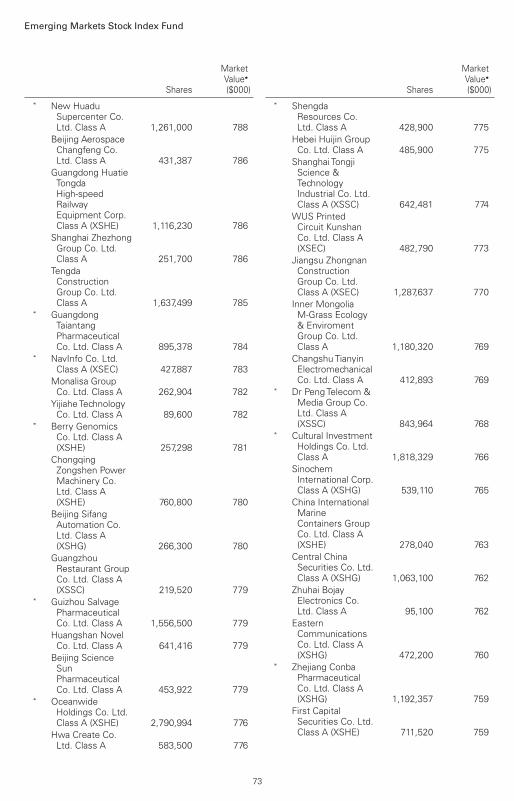
Shares
MarketValue•
($000)
* New HuaduSupercenter Co.Ltd. Class A 1,261,000 788
Beijing AerospaceChangfeng Co.Ltd. Class A 431,387 786
Guangdong HuatieTongdaHigh-speedRailwayEquipment Corp.Class A (XSHE) 1,116,230 786
Shanghai ZhezhongGroup Co. Ltd.Class A 251,700 786
TengdaConstructionGroup Co. Ltd.Class A 1,637,499 785
* GuangdongTaiantangPharmaceuticalCo. Ltd. Class A 895,378 784
* NavInfo Co. Ltd.Class A (XSEC) 427,887 783
Monalisa GroupCo. Ltd. Class A 262,904 782
YijiaheTechnologyCo. Ltd. Class A 89,600 782
* Berry GenomicsCo. Ltd. Class A(XSHE) 257,298 781
ChongqingZongshen PowerMachinery Co.Ltd. Class A(XSHE) 760,800 780
Beijing SifangAutomation Co.Ltd. Class A(XSHG) 266,300 780
GuangzhouRestaurant GroupCo. Ltd. Class A(XSSC) 219,520 779
* Guizhou SalvagePharmaceuticalCo. Ltd. Class A 1,556,500 779
Huangshan NovelCo. Ltd. Class A 641,416 779
Beijing ScienceSunPharmaceuticalCo. Ltd. Class A 453,922 779
* OceanwideHoldings Co. Ltd.Class A (XSHE) 2,790,994 776
Hwa Create Co.Ltd. Class A 583,500 776
Shares
MarketValue•
($000)
* ShengdaResources Co.Ltd. Class A 428,900 775
Hebei Huijin GroupCo. Ltd. Class A 485,900 775
Shanghai TongjiScience &TechnologyIndustrial Co. Ltd.Class A (XSSC) 642,481 774
WUS PrintedCircuit KunshanCo. Ltd. Class A(XSEC) 482,790 773
Jiangsu ZhongnanConstructionGroup Co. Ltd.Class A (XSEC) 1,287,637 770
Inner MongoliaM-Grass Ecology& EnviromentGroup Co. Ltd.Class A 1,180,320 769
ChangshuTianyinElectromechanicalCo. Ltd. Class A 412,893 769
* Dr PengTelecom &Media Group Co.Ltd. Class A(XSSC) 843,964 768
* Cultural InvestmentHoldings Co. Ltd.Class A 1,818,329 766
SinochemInternational Corp.Class A (XSHG) 539,110 765
China InternationalMarineContainers GroupCo. Ltd. Class A(XSHE) 278,040 763
Central ChinaSecurities Co. Ltd.Class A (XSHG) 1,063,100 762
Zhuhai BojayElectronics Co.Ltd. Class A 95,100 762
EasternCommunicationsCo. Ltd. Class A(XSHG) 472,200 760
* Zhejiang ConbaPharmaceuticalCo. Ltd. Class A(XSHG) 1,192,357 759
First CapitalSecurities Co. Ltd.Class A (XSHE) 711,520 759
Emerging Markets Stock Index Fund
73

Shares
MarketValue•
($000)
* INKON LifeTechnology Co.Ltd. Class A 335,700 759
Beijing TeamsunTechnology Co.Ltd. Class A(XSSC) 788,986 758
Shanghai KehuaBio-EngineeringCo. Ltd. Class A(XSHE) 352,700 758
* Shandong AirlinesCo. Ltd. Class B 1,489,541 756
ChongqingWaterGroup Co. Ltd.Class A (XSHG) 860,600 755
Beijing SLPharmaceuticalCo. Ltd. Class A(XSHE) 518,850 752
COSCO SHIPPINGDevelopment Co.Ltd. Class A(XSHG) 1,384,100 752
China HarzoneIndustry Corp.Ltd. Class A(XSEC) 593,522 750
Gansu QilianshanCement GroupCo. Ltd. Class A(XSSC) 497,350 750
CSSC Science &Technology Co.Ltd. Class A(XSHG) 375,000 750
Fujian AonongBiologicalTechnologyGroup Inc. Ltd.Class A (XSHG) 471,250 749
Three's Co. MediaGroup Co. Ltd.Class A 44,593 748
Wuhan FinguElectronicTechnology Co.Ltd. Class A 472,063 746
Zhejiang ChinaCommodities CityGroup Co. Ltd.Class A (XSHG) 976,000 745
Bank of China Ltd.Class A (XSHG) 1,564,597 745
ChangzhouQianhongBiopharma Co.Ltd. Class A(XSHE) 1,146,300 745
Shares
MarketValue•
($000)
Hangzhou CableCo. Ltd. Class A 652,000 745
* Shenzhen MinkaveTechnology Co.Ltd. Class A 602,150 745
* China ReformHealthManagement &Services GroupCo. Ltd. Class A(XSHE) 771,892 743
Changchun Gas Co.Ltd. Class A 741,500 742
BBMG Corp.Class A (XSHG) 1,692,214 742
* Gohigh DataNetworksTechnology Co.Ltd. Class A 856,940 741
* Jiangsu KanionPharmaceuticalCo. Ltd. Class A(XSHG) 505,566 741
Sinolink SecuritiesCo. Ltd. Class A(XSHG) 441,000 739
Zhejiang HangminCo. Ltd. Class A(XSHG) 870,745 739
Shenzhen ClickTechnology Co.Ltd. Class A 344,000 737
* Shenzhen SDGInformation Co.Ltd. Class A 784,994 736
BeijingWanjiTechnology Co.Ltd. Class A 201,160 736
Xinxing Ductile IronPipes Co. Ltd.Class A (XSHE) 1,266,700 735
* Beiqi Foton MotorCo. Ltd. Class A(XSSC) 1,333,709 735
Xiamen PortDevelopment Co.Ltd. Class A 739,716 733
Shandong BuchangPharmaceuticalsCo. Ltd. Class A 268,122 733
Beijing SLPharmaceuticalCo. Ltd. Class A(XSEC) 505,196 732
TsinghuaTongfangCo. Ltd. Class A(XSSC) 863,708 732
Emerging Markets Stock Index Fund
74

Shares
MarketValue•
($000)
Shenzhen CenterPower Tech Co.Ltd. Class A(XSHE) 281,850 732
* GuangdongZhengyeTechnology Co.Ltd. Class A 374,236 731
* China Oil HBPScience &Technology Co.Ltd. Class A 1,445,600 730
Motic XiamenElectric Group Co.Ltd. Class A 486,429 730
ChinaWestConstructionGroup Co. Ltd.Class A 649,000 729
Huaxin Cement Co.Ltd. Class A(XSHG) 279,360 729
* Hunan Gold Corp.Ltd. Class A(XSEC) 429,800 728
Lingyuan Iron &Steel Co. Ltd.Class A 1,715,370 727
* UTour Group Co.Ltd. Class A 929,925 725
* SPIC DongfangNew Energy Corp.Class A (XSHE) 986,256 724
* Hubei Broadcasting&TelevisionInformationNetwork Co. Ltd.Class A 1,403,600 724
Huizhou SpeedWirelessTechnology Co.Ltd. Class A 443,300 724
* China CIFCOInvestment Co.Ltd. Class A 560,600 721
EastcompeaceTechnology Co.Ltd. Class A 460,242 721
* Shanghai LonyerFuels Co. Ltd.Class A 690,800 721
* Nanjing KangniMechanical &Electrical Co. Ltd.Class A 926,835 717
Shenzhen SinovatioTechnology Co.Ltd. Class A 153,216 713
Shares
MarketValue•
($000)
* Beijing UniStrongScience &Technology Co.Ltd. Class A 758,400 713
* HarbinPharmaceuticalGroup Co. Ltd.Class A (XSSC) 1,447,577 712
NortheastSecurities Co. Ltd.Class A (XSEC) 528,100 711
FIYTA PrecisionTechnology Co.Ltd. Class A 420,085 709
First Tractor Co.Ltd. Class A(XSHG) 357,900 709
Jiangsu HongdouIndustrial Co. Ltd.Class A (XSHG) 1,515,822 708
Fujian SeptwolvesIndustry Co. Ltd.Class A 824,109 708
Vatti Corp. Ltd.Class A (XSHE) 768,748 708
Shenzhen AisidiCo. Ltd. Class A(XSHE) 422,520 708
* HeilongjiangInterchinaWaterTreatment Co.Ltd. Class A 1,993,124 707
Ningbo HuaxiangElectronic Co. Ltd.Class A (XSEC) 191,100 706
Better LifeCommercial ChainShare Co. Ltd.Class A (XSHE) 672,220 706
SinoWealthElectronic Ltd.Class A (XSEC) 73,609 706
Shanghai IndustrialDevelopment Co.Ltd. Class A(XSSC) 1,162,392 705
Western RegionGold Co. Ltd.Class A (XSSC) 388,800 705
ShantuiConstructionMachinery Co.Ltd. Class A 1,180,735 705
* Beijing OrientNationalCommunicationScience &Technology Co.Ltd. Class A(XSHE) 511,595 705
Emerging Markets Stock Index Fund
75

Shares
MarketValue•
($000)
Bengang SteelPlates Co. Ltd.Class B 2,055,311 704
2 ShandongChenming PaperHoldings Ltd.Class H 1,463,782 704
Zhongshan PublicUtilities Group Co.Ltd. Class A(XSEC) 523,000 704
MayinglongPharmaceuticalGroup Co. Ltd.Class A (XSHG) 179,100 704
Shanghai JinqiaoExport ProcessingZoneDevelopment Co.Ltd. Class A 398,657 703
GuangdongShirongzhaoyeCo. Ltd. Class A(XSHE) 916,961 698
Konfoong MaterialsInternational Co.Ltd. Class A(XSHE) 111,476 698
ShenzhenYsstechInfo-tech Co. Ltd.Class A (XSHE) 455,175 698
Konka Group Co.Ltd. Class A(XSEC) 793,800 697
Shandong LongdaMeat FoodstuffCo. Ltd. Class A 443,200 697
* Kunwu JiudingInvestmentHoldings Co. Ltd.Class A (XSHG) 319,099 696
Guangxi LiuzhouPharmaceuticalCo. Ltd. Class A(XSHG) 292,566 696
* Shaanxi FenghuoElectronics Co.Ltd. Class A 634,029 694
Der Future Science&TechnologyHolding Group Co.Ltd. Class A 609,840 693
Yonggao Co. Ltd.Class A 1,005,259 692
Wellhope FoodsCo. Ltd. Class A(XSSC) 482,801 691
Shares
MarketValue•
($000)
LaobaixingPharmacy ChainJSC Class A(XSHG) 100,970 689
AutobioDiagnostics Co.Ltd. Class A(XSHG) 80,470 689
Citic OffshoreHelicopter Co.Ltd. Class A 604,400 688
Henan PinggaoElectric Co. Ltd.Class A (XSHG) 498,800 688
GuangzhouKingTellerTechnology Co.Ltd. Class A 817,028 686
* Guangdong OrientZirconic Ind Sci &Tech Co. Ltd.Class A 553,600 685
* JiangsuYinheElectronics Co.Ltd. Class A 946,533 685
Jinzhou Port Co.Ltd. Class B 2,857,215 684
CSSC Science &Technology Co.Ltd. Class A(XSSC) 340,900 682
* AECC Aero Science&Technology Co.Ltd. Class A(XSHG) 221,200 681
* Xiwang FoodstuffsCo. Ltd. Class A(XSHE) 940,740 681
KPCPharmaceuticals Inc.Class A (XSSC) 523,308 680
* China CAMCEngineering Co.Ltd. Class A 673,800 680
263 NetworkCommunicationsCo. Ltd. Class A(XSHE) 1,156,660 679
Shanghai BellingCo. Ltd. Class A(XSHG) 143,000 676
SPICYuandaEnvironmental-Protection Co.Ltd. Class A 570,600 675
Shenzhen InfogemTechnologies Co.Ltd. Class A(XSHE) 326,680 675
Emerging Markets Stock Index Fund
76

Shares
MarketValue•
($000)
* Jiangsu XiuqiangGlasswork Co.Ltd. Class A 590,500 674
* Shenzhen DerenElectronic Co. Ltd.Class A 457,051 673
Anhui Sinonet &Xonglong Science&Technology Co.Ltd. Class A 671,702 673
Wuhan JingceElectronic GroupCo. Ltd. Class A(XSHE) 82,677 673
Guizhou Gas GroupCorp. Ltd. Class A(XSHG) 434,972 673
Anhui HuamaoTextile Co. Class A 1,074,064 672
Shanghai ShenTongMetro Co. Ltd.Class A 465,976 672
FiberhomeTelecommunicationTechnologies Co.Ltd. Class A(XSHG) 249,100 670
SanchuanWisdomTechnology Co.Ltd. Class A 967,300 670
* Air China Ltd.Class A (XSSC) 503,438 669
JinyuBio-TechnologyCo. Ltd. Class A(XSHG) 268,996 669
Visual China GroupCo. Ltd. Class A(XSHE) 323,812 669
AdvancedTechnology &Materials Co. Ltd.Class A (XSHE) 501,000 667
Haoxiangni HealthFood Co. Ltd.Class A 506,788 667
Hubei JiuzhiyangInfrared SystemCo. Ltd. Class A 151,237 667
JiangsuLianyungang PortCo. Ltd. Class A 1,211,925 666
* ShanghaiMetersbonweFashion &Accessories Co.Ltd. Class A 1,828,400 665
Shandong ShengliCo. Class A 973,577 664
Shares
MarketValue•
($000)
* Surfilter NetworkTechnology Co.Ltd. Class A 617,768 663
GuangzhouZhiguang ElectricCo. Ltd. Class A(XSEC) 377,400 663
* Chimin HealthManagement Co.Ltd. Class A 306,000 663
China SouthPublishing &Media Group Co.Ltd. Class A(XSSC) 517,249 662
* Zhejiang JingxingPaper JSC Ltd.Class A 1,126,300 662
Zhuhai HuajinCapital Co. Ltd.Class A 381,017 661
HongrunConstructionGroup Co. Ltd.Class A 1,089,346 661
TonglingNonferrousMetals Group Co.Ltd. Class A(XSEC) 1,138,900 660
HangzhouShunwangTechnology Co.Ltd. Class A 300,600 660
* Shanghai FudanForward S &T Co.Ltd. Class A(XSHG) 663,450 660
Canny Elevator Co.Ltd. Class A(XSHE) 578,496 660
* Huafon MicrofibreShanghaiTechnology Co.Ltd. (XSHE) 932,955 659
* Fujian SnowmanCo. Ltd. Class A 568,668 658
BettaPharmaceuticalsCo. Ltd. Class A(XSHE) 53,200 658
ENC DigitalTechnology Co.Ltd. Class A 482,090 657
Zhejiang HisunPharmaceuticalCo. Ltd. Class A(XSHG) 360,800 656
Emerging Markets Stock Index Fund
77

Shares
MarketValue•
($000)
Hangzhou SunriseTechnology Co.Ltd. Class A 524,066 655
Hainan ExpresswayCo. Ltd. Class A 1,056,400 654
GuangzhouZhiguang ElectricCo. Ltd. Class A(XSHE) 372,300 654
Tangrenshen GroupCo. Ltd. Class A(XSHE) 666,950 654
Jiangling MotorsCorp. Ltd. Class B 635,970 653
* GenimousTechnology Co.Ltd. Class A(XSHE) 691,035 653
* Myhome RealEstateDevelopmentGroup Co. Ltd.Class A 2,630,400 652
* Alpha GroupClass A (XSHE) 827,701 652
* Enjoyor TechnologyCo. Ltd. Class A(XSEC) 602,900 652
BeijingWaterBusiness DoctorCo. Ltd. Class A(XSEC) 349,774 651
Ningxia BuildingMaterials GroupCo. Ltd. Class A(XSSC) 388,388 650
Hunan Friendship &ApolloCommercial Co.Ltd. Class A 1,367,900 649
ShenzhenWorldUnion Group Inc.Class A (XSHE) 1,106,550 649
IntegratedElectronicSystems Lab Co.Ltd. Class A 550,069 649
* BluedonInformationSecurityTechnology Co.Ltd. Class A 1,245,056 647
* HybioPharmaceuticalCo. Ltd. Class A(XSEC) 815,691 646
GuangdongGuanghongHoldings Co. Ltd.Class A 720,203 645
Shares
MarketValue•
($000)
JointownPharmaceuticalGroup Co. Ltd.Class A (XSHG) 303,520 644
Anhui GuofengPlastic IndustryCo. Ltd. Class A 716,800 643
* Sichuan HaiteHigh-tech Co. Ltd.Class A (XSEC) 346,300 641
An HuiWenergyCo. Ltd. Class A(XSEC) 934,690 641
Ninestar Corp.Class A (XSEC) 111,600 640
ChinaWuyi Co. Ltd.Class A 1,611,511 640
Jiangsu HuaxicunCo. Ltd. Class A(XSHE) 704,200 640
Tungkong Inc.Class A 556,076 640
WeifuHigh-TechnologyGroup Co. Ltd.Class A 210,600 639
Bros Eastern Co.Ltd. Class A(XSHG) 778,810 639
* Jilin Electric PowerCo. Ltd. Class A(XSEC) 539,000 638
Wasu MediaHolding Co. Ltd.Class A 557,300 636
North HuajinChemicalIndustries Co. Ltd.Class A (XSHE) 687,903 634
Shandong MinheAnimal HusbandryCo. Ltd. Class A(XSHE) 254,283 634
Shenyang XingqiPharmaceuticalCo. Ltd. Class A 32,202 634
Shandong DongyueOrganosiliconMaterial Co. Ltd.Class A (XSHE) 187,500 634
* Bestway Marine &EnergyTechnology Co.Ltd. Class A 913,650 633
* Ningbo Cixing Co.Ltd. Class A 598,800 633
Huayuan PropertyCo. Ltd. Class A(XSSC) 2,201,505 633
Emerging Markets Stock Index Fund
78

Shares
MarketValue•
($000)
* Guizhou BailingGroupPharmaceuticalCo. Ltd. Class A(XSHE) 681,807 631
JCHX MiningManagement Co.Ltd. Class A(XSSC) 183,573 630
* Jiangsu Etern Co.Ltd. Class A(XSHG) 1,035,970 629
FSPG Hi-Tech Co.Ltd. Class A 885,500 629
Tangshan SanyouChemicalIndustries Co. Ltd.Class A (XSHG) 435,200 628
Anhui Heli Co. Ltd.Class A (XSSC) 382,675 628
Fujian LongmaEnvironmentalSanitationEquipment Co.Ltd. Class A(XSHG) 321,020 628
Suzhou JinhongGas Co. Ltd.Class A 185,431 628
ZhuzhouTimesNew MaterialTechnology Co.Ltd. Class A 394,800 627
* Bank of ZhengzhouCo. Ltd. Class A(XSHE) 1,186,790 627
Hand EnterpriseSolutions Co. Ltd.Class A (XSEC) 607,000 626
Tangshan JidongCement Co. Ltd.Class A (XSEC) 344,500 626
* Wutong HoldingGroup Co. Ltd.Class A 1,092,522 625
* Inner MongoliaYuan Xing EnergyCo. Ltd. Class A(XSEC) 521,700 624
Jiangnan Mould &Plastic TechnologyCo. Ltd. Class A 887,900 624
XiamenTungstenCo. Ltd. Class A(XSHG) 174,200 618
ZhongYeDa ElectricCo. Ltd. Class A 501,400 618
Zhongbai HoldingsGroup Co. Ltd.Class A 794,489 617
Shares
MarketValue•
($000)
* Wuxi HuadongHeavy MachineryCo. Ltd. Class A 1,022,158 617
Lakala Payment Co.Ltd. Class A 163,900 617
ShenzhenOverseas ChineseTown Co. Ltd.Class A (XSEC) 627,000 614
Maoye CommercialCo. Ltd. Class A(XSSC) 1,154,811 614
Hubei FuxingScience &Technology Co.Ltd. Class A 987,200 614
* Liaoning EnergyIndustry Co. Ltd. 1,025,900 613
East ChinaEngineeringScience &Technology Co.Ltd. Class A 319,200 613
Beijing eGOVA Co.Ltd. Class A(XSEC) 312,103 612
FuanPharmaceuticalGroup Co. Ltd.Class A (XSHE) 990,200 611
Guangzhou GreatPower Energy &Technology Co.Ltd. Class A(XSEC) 130,950 611
Ningbo ZhoushanPort Co. Ltd.Class A (XSHG) 1,042,200 610
Jiangsu SunshineCo. Ltd. Class A 1,785,755 609
Triumph Science &Technology Co.Ltd. Class A(XSHG) 465,200 609
GuomaiTechnologies Inc.Class A (XSHE) 680,179 609
Chongqing SanfengEnvironmentGroup Corp. Ltd.Class A 441,300 609
* Everbright JiabaoCo. Ltd. Class A 1,502,708 608
Shenzhen BatianEcotypicEngineering Co.Ltd. Class A(XSHE) 651,251 608
Emerging Markets Stock Index Fund
79

Shares
MarketValue•
($000)
Tibet CheezhengTibetan MedicineCo. Ltd. Class A 157,047 608
Xiamen King LongMotor Group Co.Ltd. Class A 676,646 607
Shenzhen SC NewEnergyTechnology Corp.Class A (XSEC) 34,000 606
Shandong HomeyAquaticDevelopment Co.Ltd. Class A 1,478,298 606
* BeijingWatertekInformationTechnology Co.Ltd. Class A 1,167,800 606
ChongqingThreeGorgesWaterConservancy &Electric Power Co.Ltd. Class A(XSSC) 404,858 605
ZYNP Corp. Class A 522,900 604Anhui YingliuElectromechanicalCo. Ltd. Class A(XSSC) 194,320 604
ChangzhouTronlyNew ElectronicMaterials Co. Ltd.Class A (XSEC) 325,700 603
Beijing ElectronicZone High-techGroup Co. Ltd.Class A 1,024,969 603
Shanghai ShimaoCo. Ltd. Class A(XSHG) 1,219,830 603
* Suzhou JinfuTechnology Co.Ltd. Class A 1,089,400 603
* Eastone CenturyTechnology Co.Ltd. Class A 843,315 603
Jangho Group Co.Ltd. Class A(XSSC) 616,507 603
* Rendong HoldingsCo. Ltd. 522,865 603
* Wanda FilmHolding Co. Ltd.Class A (XSHE) 274,800 602
PhiChem Corp.Class A 217,100 601
Goldcard SmartGroup Co. Ltd.(XSHE) 353,600 599
Shares
MarketValue•
($000)
ShenzhenTextileHoldings Co. Ltd.Class A 444,475 598
* Suning UniversalCo. Ltd. Class A(XSEC) 796,549 597
* BeijingWKWAutomotive PartsCo. Ltd. Class A 1,023,576 597
ShanyingInternationalHolding Co. Ltd.Class A (XSHG) 1,176,000 596
HenanYuguangGold & Lead Co.Ltd. Class A(XSHG) 710,800 596
ZhejiangCrystal-OptechCo. Ltd. Class A(XSEC) 241,898 595
Chengdu HuasunTechnologyGroup Inc. Ltd. 742,471 595
* Shanghai ShunhoNew MaterialsTechnology Co.Ltd. Class A 1,023,800 595
Jilin AodongPharmaceuticalGroup Co. Ltd.Class A (XSEC) 240,700 594
Tianjin ZhongXinPharmaceuticalGroup Corp. Ltd.Class A (XSHG) 141,500 592
TopsecTechnologiesGroup Inc.Class A (XSEC) 205,200 591
Zhejiang XinanChemicalIndustrial GroupCo. Ltd. Class A(XSHG) 136,600 591
* GI TechnologiesGroup Co. Ltd.Class A 1,351,260 590
* Global Infotech Co.Ltd. Class A 388,600 590
MayinglongPharmaceuticalGroup Co. Ltd.Class A (XSSC) 149,726 589
GuangdongHighsun GroupCo. Ltd. Class A 1,848,180 589
Emerging Markets Stock Index Fund
80

Shares
MarketValue•
($000)
SinomaInternationalEngineering Co.Class A (XSHG) 361,650 588
Hengbao Co. Ltd.Class A 671,300 588
YabaoPharmaceuticalGroup Co. Ltd.Class A (XSSC) 623,083 588
DuolunTechnologyCorp. Ltd. Class A 587,777 588
* Greatoo IntelligentEquipment Inc. 2,052,300 587
* Zhongfu StraitsPingtanDevelopment Co.Ltd. Class A 1,368,344 586
* Huayi BrothersMedia Corp.Class A (XSHE) 1,059,400 586
GuangdongEllingtonElectronicsTechnology Co.Ltd. Class A(XSSC) 562,164 585
* GansuYashengIndustrial GroupCo. Ltd. Class A 1,235,800 585
NortheastPharmaceuticalGroup Co. Ltd.Class A 712,670 583
Gem-Year IndustrialCo. Ltd. Class A(XSSC) 746,111 581
Xinhu ZhongbaoCo. Ltd. Class A(XSHG) 1,292,000 581
Ningbo LigongEnvironment &EnergyTechnology Co.Ltd. Class A 408,869 581
NewcapecElectronics Co.Ltd. Class A 488,335 581
Hubei JumpcanPharmaceuticalCo. Ltd. Class A(XSSC) 230,447 580
* Inner MongoliaXingye Mining Co.Ltd. Class A(XSEC) 503,000 578
Chongqing GangjiuCo. Ltd. Class A 1,045,300 578
Shares
MarketValue•
($000)
Befar Group Co.Ltd. Class A(XSSC) 439,492 577
XinjiangCommunicationsConstructionGroup Co. Ltd.Class A 348,800 577
1 Shenzhen HepalinkPharmaceuticalGroup Co. Ltd.Class H 524,500 577
Zhongshan BroadOcean Motor Co.Ltd. Class A(XSEC) 542,300 576
Hangzhou BinjiangReal Estate GroupCo. Ltd. Class A 903,400 576
Shandong XiantanCo. Ltd. Class A(XSHE) 520,942 576
* China CYTSToursHolding Co. Ltd.Class A (XSSC) 367,868 575
RiseSun RealEstateDevelopment Co.Ltd. Class A(XSEC) 855,744 574
Shanghai LujiazuiFinance &TradeZoneDevelopment Co.Ltd. Class A(XSSC) 339,094 574
ShenzhenWorldUnion Group Inc.Class A (XSEC) 978,805 574
China Bester GroupTelecom Co. Ltd.Class A (XSHG) 262,845 574
* China NonferrousMetal Industry'sForeignEngineering &Construction Co.Ltd. Class A(XSEC) 713,400 573
Create Technology& Science Co.Ltd. Class A 385,756 573
* Sunvim Group Co.Ltd. Class A 909,600 573
Bright Real EstateGroup Co. Ltd.Class A (XSSC) 1,679,474 572
* Ningbo ShuanglinAuto Parts Co.Ltd. Class A 406,900 572
Emerging Markets Stock Index Fund
81
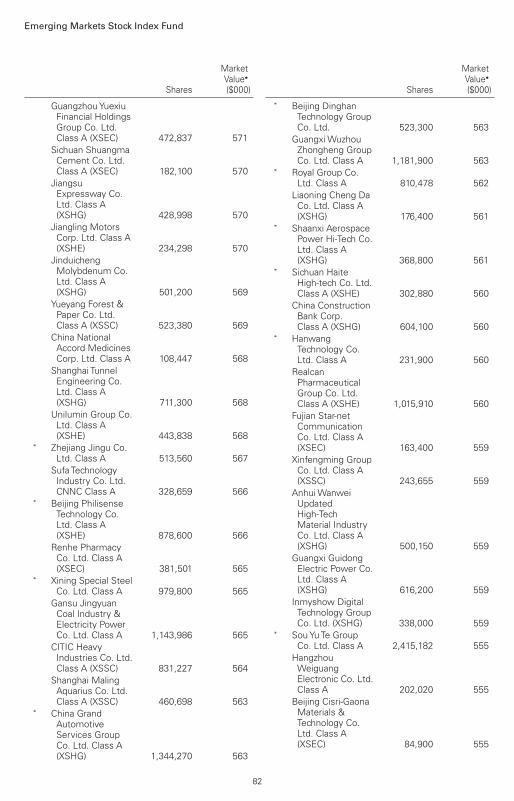
Shares
MarketValue•
($000)
GuangzhouYuexiuFinancial HoldingsGroup Co. Ltd.Class A (XSEC) 472,837 571
Sichuan ShuangmaCement Co. Ltd.Class A (XSEC) 182,100 570
JiangsuExpressway Co.Ltd. Class A(XSHG) 428,998 570
Jiangling MotorsCorp. Ltd. Class A(XSHE) 234,298 570
JinduichengMolybdenum Co.Ltd. Class A(XSHG) 501,200 569
Yueyang Forest &Paper Co. Ltd.Class A (XSSC) 523,380 569
China NationalAccord MedicinesCorp. Ltd. Class A 108,447 568
Shanghai TunnelEngineering Co.Ltd. Class A(XSHG) 711,300 568
Unilumin Group Co.Ltd. Class A(XSHE) 443,838 568
* Zhejiang Jingu Co.Ltd. Class A 513,560 567
Sufa TechnologyIndustry Co. Ltd.CNNC Class A 328,659 566
* Beijing PhilisenseTechnology Co.Ltd. Class A(XSHE) 878,600 566
Renhe PharmacyCo. Ltd. Class A(XSEC) 381,501 565
* Xining Special SteelCo. Ltd. Class A 979,800 565
Gansu JingyuanCoal Industry &Electricity PowerCo. Ltd. Class A 1,143,986 565
CITIC HeavyIndustries Co. Ltd.Class A (XSSC) 831,227 564
Shanghai MalingAquarius Co. Ltd.Class A (XSSC) 460,698 563
* China GrandAutomotiveServices GroupCo. Ltd. Class A(XSHG) 1,344,270 563
Shares
MarketValue•
($000)
* Beijing DinghanTechnology GroupCo. Ltd. 523,300 563
GuangxiWuzhouZhongheng GroupCo. Ltd. Class A 1,181,900 563
* Royal Group Co.Ltd. Class A 810,478 562
Liaoning Cheng DaCo. Ltd. Class A(XSHG) 176,400 561
* Shaanxi AerospacePower Hi-Tech Co.Ltd. Class A(XSHG) 368,800 561
* Sichuan HaiteHigh-tech Co. Ltd.Class A (XSHE) 302,880 560
China ConstructionBank Corp.Class A (XSHG) 604,100 560
* HanwangTechnology Co.Ltd. Class A 231,900 560
RealcanPharmaceuticalGroup Co. Ltd.Class A (XSHE) 1,015,910 560
Fujian Star-netCommunicationCo. Ltd. Class A(XSEC) 163,400 559
Xinfengming GroupCo. Ltd. Class A(XSSC) 243,655 559
AnhuiWanweiUpdatedHigh-TechMaterial IndustryCo. Ltd. Class A(XSHG) 500,150 559
Guangxi GuidongElectric Power Co.Ltd. Class A(XSHG) 616,200 559
Inmyshow DigitalTechnology GroupCo. Ltd. (XSHG) 338,000 559
* SouYuTe GroupCo. Ltd. Class A 2,415,182 555
HangzhouWeiguangElectronic Co. Ltd.Class A 202,020 555
Beijing Cisri-GaonaMaterials &Technology Co.Ltd. Class A(XSEC) 84,900 555
Emerging Markets Stock Index Fund
82

Shares
MarketValue•
($000)
Tianjin Port Co. Ltd.Class A (XSSC) 875,263 554
Solareast HoldingsCo. Ltd. Class A 775,159 554
Shanghai SMIHolding Co. Ltd.Class A (XSSC) 858,852 553
* ChangYuanTechnology GroupLtd. (XSHG) 607,060 552
Beijing JiaxunFeihong ElectricalCo. Ltd. Class A 611,600 551
Citychamp DartongCo. Ltd. Class A(XSSC) 925,633 551
VontronTechnologyCo. Ltd. Class A 423,300 550
SGIS Songshan Co.Ltd. Class A(XSHE) 794,400 550
ShandongWohuaPharmaceuticalCo. Ltd. Class A 568,140 550
* Sunsea AIoTTechnology Co.Ltd. Class A 337,045 550
* Zhuhai HokaiMedicalInstruments Co.Ltd. Class A 779,932 550
Fujian Green PineCo. Ltd. Class A 355,400 550
* Shenzhen GloryMedical Co. Ltd.Class A 766,022 549
Unilumin Group Co.Ltd. Class A(XSEC) 428,200 548
* ChangYuanTechnology GroupLtd. (XSSC) 602,283 548
* Langold RealEstate Co. Ltd.Class A 1,962,979 548
Shanghai SinyangSemiconductorMaterials Co. Ltd.Class A (XSHE) 88,500 548
Changshu FengfanPower EquipmentCo. Ltd. Class A(XSSC) 845,828 548
* TunghsuOptoelectronicTechnology Co.Ltd. Class A(XSEC) 1,767,600 547
Shares
MarketValue•
($000)
ChongqingWaterGroup Co. Ltd.Class A (XSSC) 623,550 547
Anhui Heli Co. Ltd.Class A (XSHG) 333,240 547
HuarenPharmaceuticalCo. Ltd. Class A(XSEC) 856,972 547
* Shenzhen InfinovaLtd. Class A 1,076,307 546
Tibet SummitResources Co.Ltd. Class A(XSSC) 114,132 545
* Jiangsu SihuanBioengineeringCo. Ltd. Class A 1,119,200 544
Sanjiang ShoppingClub Co. Ltd.Class A 448,200 544
Juewei Food Co.Ltd. Class A(XSSC) 52,860 543
Digital ChinaInformationService Co. Ltd.Class A (XSHE) 311,643 543
ShaanXi ProvincialNatural Gas Co.Ltd. Class A 479,500 543
* Chongyi ZhangyuanTungsten IndustryCo. Ltd. Class A 410,900 543
Xinjiang XuefengSci-Tech GroupCo. Ltd. Class A 649,200 543
Fujian RongjiSoftware Co. Ltd.Class A 609,300 542
Shandong HumonSmelting Co. Ltd.Class A (XSEC) 301,100 540
Hangzhou RobamAppliances Co.Ltd. Class A(XSEC) 110,300 540
Shenzhen EnergyGroup Co. Ltd.Class A (XSEC) 422,900 539
* China High SpeedRailwayTechnology Co.Ltd. Class A(XSEC) 1,584,100 539
Yotrio Group Co.Ltd. Class A(XSHE) 994,750 539
Emerging Markets Stock Index Fund
83

Shares
MarketValue•
($000)
Sunward IntelligentEquipment Co.Ltd. Class A(XSHE) 424,600 537
Beijing BeiluPharmaceuticalCo. Ltd. Class A 471,900 537
Yantai DongchengPharmaceuticalCo. Ltd. Class A(XSEC) 247,161 536
Hexing ElectricalCo. Ltd. Class A(XSSC) 291,668 536
* Tuya Inc. ADR 82,665 536Shanghai RongtaiHealth TechnologyCorp. Ltd. Class A 120,900 535
Shandong XinhuaPharmaceuticalCo. Ltd. Class A 457,342 535
Changhong MeilingCo. Ltd. Class A 1,078,628 534
Rainbow DigitalCommercial Co.Ltd. Class A 537,099 533
JoincarePharmaceuticalGroup IndustryCo. Ltd. Class A(XSHG) 294,624 531
* GuangdongShengluTelecommunicationTech Co. Ltd.Class A (XSHE) 649,037 531
Wellhope FoodsCo. Ltd. Class A(XSHG) 371,300 531
Zhuzhou HongdaElectronics Corp.Ltd. Class A(XSEC) 40,800 530
Shenzhen KingdomSci-Tech Co. Ltd.Class A (XSHG) 268,000 530
* Beijing BDStarNavigation Co.Ltd. Class A(XSEC) 85,400 529
* HolitechTechnologyCo. Ltd. Class A(XSEC) 1,039,700 529
Oriental PearlGroup Co. Ltd.Class A (XSSC) 438,393 529
Sino-PlatinumMetals Co. Ltd.Class A (XSHG) 148,298 529
Shares
MarketValue•
($000)
Bros Eastern Co.Ltd. Class A(XSSC) 644,479 529
Wuxi CommercialMansion GrandOrient Co. Ltd.Class A (XSHG) 558,122 527
Zhengzhou CoalMining MachineryGroup Co. Ltd.Class A (XSHG) 332,200 527
* TongdingInterconnectionInformation Co.Ltd. Class A(XSHE) 858,300 527
* Zhejiang FounderMotor Co. Ltd.Class A 418,986 525
Shenzhen JieshunScience &TechnologyIndustry Co. Ltd.Class A (XSHE) 386,900 525
AdvancedTechnology &Materials Co. Ltd.Class A (XSEC) 393,500 524
* Henan RebeccaHair Products Co.Ltd. Class A(XSHG) 1,267,320 524
* Shanghai 2345Network HoldingGroup Co. Ltd.Class A (XSHE) 1,658,514 521
JinlingPharmaceuticalCo. Ltd. Class A 508,831 519
XuchangYuandongDrive Shaft Co.Ltd. Class A 595,600 519
Guangdong AofeiData TechnologyCo. Ltd. Class A 156,580 519
* ShenzhenZhengtongElectronics Co.Ltd. Class A 479,100 518
Opple Lighting Co.Ltd. Class A 170,700 517
* Hunan JingfengPharmaceuticalCo. Ltd. Class A 892,853 517
Liaoning SGAutomotive GroupCo. Ltd. Class A 926,034 517
Zhejiang HangminCo. Ltd. Class A(XSSC) 607,439 516
Emerging Markets Stock Index Fund
84

Shares
MarketValue•
($000)
HeilongjiangAgriculture Co.Ltd. Class A(XSSC) 239,700 515
China InternationalMarineContainers GroupCo. Ltd. Class A(XSEC) 187,700 515
Triangle Tyre Co.Ltd. Class A 259,900 515
China GreatwallTechnology GroupCo. Ltd. Class A(XSEC) 243,700 513
Hengdian GroupDMEGCMagnetics Co.Ltd. Class A(XSEC) 232,500 513
* Tus EnvironmentalScience &TechnologyDevelopment Co.Ltd. Class A 845,482 512
Deluxe Family Co.Ltd. Class A(XSHG) 1,061,600 512
Beijing Zhong KeSan HuanHigh-Tech Co. Ltd.Class A (XSEC) 292,000 511
* Chang JiangShipping GroupPhoenix Co. Ltd.Class A 993,900 511
Nanjing Gaoke Co.Ltd. Class A(XSHG) 371,520 510
Fujian Cement Inc.Class A 472,320 509
* China QuanjudeGroup Co. Ltd.Class A 364,000 509
* Xuzhou HandlerSpecial VehicleCo. Ltd. Class A 1,041,757 508
* Inspur SoftwareCo. Ltd. Class A(XSSC) 267,926 506
* Pubang LandscapeArchitecture Co.Ltd. Class A 1,835,497 505
North HuajinChemicalIndustries Co. Ltd.Class A (XSEC) 546,600 504
Shares
MarketValue•
($000)
HPGCRenmintongtaiPharmaceuticalCorp. Class A(XSHG) 550,134 504
GuizhouYibaiPharmaceuticalCo. Ltd. Class A(XSHG) 569,700 504
ChangzhengEngineering Co.Ltd. Class A(XSSC) 223,016 504
ZhejiangCommunicationsTechnology Co.Ltd. (XSEC) 618,800 502
Guizhou GuihangAutomotiveComponents Co.Ltd. Class A 215,284 502
GlarunTechnologyCo. Ltd. Class A(XSHG) 217,058 502
ShenzhenAgriculturalProducts GroupCo. Ltd. Class A(XSEC) 461,800 501
NingXia QingLongPipes IndustryGroup Co. Ltd.Class A 430,090 501
Guangdong DelianGroup Co. Ltd.Class A 675,035 501
Qingdao RuralCommercial BankCorp. Class A(XSEC) 838,500 501
Hangzhou AdvanceGearbox GroupCo. Ltd. Class A 389,709 500
* Dr PengTelecom &Media Group Co.Ltd. Class A(XSHG) 548,100 499
* Xingmin IntelligentTransportationSystems GroupCo. Ltd. Class A 595,626 498
Nanjing XinlianElectronics Co.Ltd. Class A 855,041 497
* Vtron Group Co.Ltd. Class A 864,723 497
Guangdong SouthNew Media Co.Ltd. Class A(XSEC) 67,212 497
Emerging Markets Stock Index Fund
85

Shares
MarketValue•
($000)
* ZheshangSecurities Co. Ltd.Class A (XSSC) 257,100 495
Ningbo SanxingMedical ElectricCo. Ltd. Class A(XSHG) 258,500 492
* HainanDevelopmentHoldings NanhaiCo. Ltd. Class A 231,700 492
CASIN Real EstateDevelopmentGroup Co. Ltd.Class A 1,207,301 491
* Chengdu CORPROTechnology Co.Ltd. Class A(XSHE) 128,600 490
Xiamen JihongTechnology Co.Ltd. Class A 206,800 490
Hefei DepartmentStore Group Co.Ltd. Class A 754,417 489
Wolong Real EstateGroup Co. Ltd.Class A (XSSC) 662,901 489
* Orient Group Inc.Class A 1,069,700 488
WuhanYangtzeCommunicationsIndustry GroupCo. Ltd. Class A 201,960 487
Zhejiang ChinaLight &TextileIndustrial CityGroup Co. Ltd.Class A (XSHG) 1,055,320 486
Huaxi SecuritiesCo. Ltd. Class A(XSEC) 342,700 484
* Doushen BeijingEducation &Technology Inc.Class A 866,539 484
Grinm AdvancedMaterials Co. Ltd.Class A (XSHG) 241,500 483
Sanlux Co. Ltd.Class A 648,400 483
GuangzhouHangxin AviationTechnology Co.Ltd. Class A 226,400 483
Zhejiang RedDragonflyFootwear Co. Ltd.Class A 566,581 481
Shares
MarketValue•
($000)
COFCO CapitalHoldings Co. Ltd.Class A (XSEC) 372,900 480
Tianjin BenefoTejing Electric Co.Ltd. Class A(XSSC) 602,466 480
Suzhou NewDistrict Hi-TechIndustrial Co. Ltd.Class A (XSSC) 734,406 480
Skyworth DigitalCo. Ltd. Class A(XSHE) 423,200 479
Fujian LongxiBearing Group Co.Ltd. Class A 366,699 479
Anker InnovationsTechnology Co.Ltd. Class A(XSEC) 32,900 479
Jangho Group Co.Ltd. Class A(XSHG) 488,200 478
* Tunghsu AzureRenewableEnergy Co. Ltd.Class A (XSEC) 928,500 477
Shenzhen GongjinElectronics Co.Ltd. Class A(XSSC) 384,348 477
Zhende MedicalCo. Ltd. Class A 80,800 475
* China Fortune LandDevelopment Co.Ltd. Class A(XSHG) 824,578 474
* Huafu Fashion Co.Ltd. (XSEC) 683,600 473
* LigeanceAerospaceTechnology Co.Ltd. Class A(XSHE) 390,466 473
Tianjin 712Communication &Broadcasting Co.Ltd. Class A(XSSC) 80,000 472
Konka Group Co.Ltd. Class A(XSHE) 535,900 471
SichuanTianyiComheartTelecom Co. Ltd.Class A (XSHE) 185,900 471
Jiangsu HongdouIndustrial Co. Ltd.Class A (XSSC) 1,008,153 471
Emerging Markets Stock Index Fund
86

Shares
MarketValue•
($000)
Jiangsu SINOJITWind EnergyTechnology Co.Ltd. Class A(XSSC) 566,627 470
DongjiangEnvironmental Co.Ltd. Class A(XSEC) 440,600 469
Wenfeng GreatWorld ChainDevelopmentCorp. Class A(XSSC) 1,018,013 468
Sunyard TechnologyCo. Ltd. (XSSC) 334,854 468
Hunan MendaleHometextile Co.Ltd. Class A 762,754 467
* Guang DongTloongTechnology GroupCo. Ltd. Class A 723,970 467
Beijing UrbanConstructionInvestment &Development Co.Ltd. Class A(XSSC) 678,255 466
LongmasterInformation &Technology Co.Ltd. Class A(XSEC) 246,300 465
* China Dive Corp.Ltd. Class A(XSHE) 144,317 465
* Jiangxi FirstarPanel TechnologyCo. Ltd. Class A 946,000 464
Beijing CtrowellTechnology Corp.Ltd. Class A 312,700 464
* Sichuan LanguangDevelopment Co.Ltd. Class A(XSHG) 1,707,860 462
Gansu QilianshanCement GroupCo. Ltd. Class A(XSHG) 306,100 462
ZhejiangCommunicationsTechnology Co.Ltd. (XSHE) 568,700 462
China SouthPublishing &Media Group Co.Ltd. Class A(XSHG) 361,000 462
Shares
MarketValue•
($000)
* ZhejiangYongguiElectricEquipment Co.Ltd. Class A 330,670 460
Shenzhen SuntakCircuit TechnologyCo. Ltd. Class A(XSHE) 213,000 459
Zhejiang JIULIHi-tech MetalsCo. Ltd. Class A(XSHE) 232,200 458
Chengtun MiningGroup Co. Ltd.Class A (XSHG) 286,400 458
Yotrio Group Co.Ltd. Class A(XSEC) 844,600 457
Hangzhou JiebaiGroup Co. Ltd.Class A (XSSC) 490,657 457
* Tahoe Group Co.Ltd. Class A(XSHE) 1,471,400 456
* LingNanEco&Culture-Tourism Co. Ltd.Class A (XSHE) 1,091,911 456
* Beijing OrientLandscape &Environment Co.Ltd. Class A 1,025,055 455
Luenmei QuantumCo. Ltd. Class A(XSSC) 351,842 454
Nanjing King-FriendBiochemicalPharmaceuticalCo. Ltd. Class A(XSSC) 78,247 453
DongfengElectronicTechnology Co.Ltd. Class A(XSSC) 248,888 453
* ShenzhenGrandland GroupCo. Ltd. Class A 1,277,051 451
* Shenzhen MasonTechnologies Co.Ltd. Class A 848,500 450
* ShijiazhuangChangshanBeiMingTechnology Co.Ltd. Class A(XSEC) 442,000 448
Emerging Markets Stock Index Fund
87

Shares
MarketValue•
($000)
Shenzhen AncheTechnologies Co.Ltd. Class A(XSHE) 150,000 447
Rongan PropertyCo. Ltd. Class A(XSEC) 1,194,572 444
* Guizhou BailingGroupPharmaceuticalCo. Ltd. Class A(XSEC) 478,500 443
ChongqingYukaifaCo. Ltd. Class A 930,100 443
* Suzhou ChunxingPrecisionMechanical Co.Ltd. Class A(XSHE) 781,900 443
* Tianjin FutongInformationScience &Technology Co.Ltd. Class A 1,174,500 442
Poly UnionChemical HoldingGroup Co. Ltd.Class A 454,501 442
* Hongbo Co. Ltd.Class A 456,950 442
China RailwayTielong ContainerLogistics Co. Ltd.Class A (XSSC) 597,800 441
Yanzhou CoalMining Co. Ltd.Class A (XSHG) 123,865 440
COSCO SHIPPINGEnergyTransportation Co.Ltd. Class A(XSHG) 473,300 439
Harbin HatouInvestment Co.Ltd. Class A 498,900 439
* XiangxuePharmaceuticalCo. Ltd. Class A 460,600 438
* Strait InnovationInternet Co. Ltd.Class A 640,698 436
* Beijing JetsenTechnology Co.Ltd. Class A(XSHE) 680,212 436
* Red Star MacallineGroup Corp. Ltd.Class A 305,030 434
Shares
MarketValue•
($000)
* Aerospace Hi-TechHoldings Grp Ltd.Class A (XSEC) 330,130 433
Shandong JinjingScience &Technology Co.Ltd. Class A(XSHG) 275,100 433
* Qingdao KingkingAppliedChemistry Co.Ltd. Class A 680,270 433
HangzhouZhonghengElectric Co. Ltd.Class A (XSHE) 325,667 433
JinnengScience&TechnologyCo. Ltd. Class A(XSSC) 195,100 432
* JC Finance &TaxInterconnectHoldings Ltd.Class A (XSHE) 475,040 431
NanjingPharmaceuticalCo. Ltd. Class A 641,662 430
Shenzhen BauingConstructionHolding Group Co.Ltd. Class A(XSHE) 1,084,024 430
* Huatian HotelGroup Co. Ltd.Class A 893,800 429
Jiangsu JiangnanHigh PolymerFiber Co. Ltd.Class A (XSSC) 1,274,005 429
Ningbo JoysonElectronic Corp.Class A (XSSC) 154,040 428
* Aerospace Hi-TechHoldings Grp Ltd.Class A (XSHE) 326,020 428
Wenfeng GreatWorld ChainDevelopmentCorp. Class A(XSHG) 928,000 427
TongyuCommunication Inc.Class A (XSHE) 182,475 427
Konfoong MaterialsInternational Co.Ltd. Class A(XSEC) 68,000 426
Emerging Markets Stock Index Fund
88

Shares
MarketValue•
($000)
Digital ChinaInformationService Co. Ltd.Class A (XSEC) 243,900 425
Jiangxi LianchuangOptoelectronicScience &Technology Co.Ltd. Class A(XSHG) 98,300 425
Jiangsu LihuaAnimal HusbandryStock Co. Ltd.Class A 89,400 425
* CITIC GuoanInformationIndustry Co. Ltd.Class A (XSEC) 1,207,220 424
ZhejiangWolwoBio-PharmaceuticalCo. Ltd. Class A(XSEC) 50,700 424
Transfar Zhilian Co.Ltd. Class A 331,322 424
Hainan Ruize NewBuilding MaterialCo. Ltd. Class A(XSHE) 766,704 423
Hubei JumpcanPharmaceuticalCo. Ltd. Class A(XSHG) 167,500 422
Huadian HeavyIndustries Co. Ltd.Class A (XSSC) 604,909 422
* China CYTSToursHolding Co. Ltd.Class A (XSHG) 269,300 421
* Cinda Real EstateCo. Ltd. Class A(XSHG) 837,122 420
Nantong JianghaiCapacitor Co. Ltd.Class A (XSEC) 118,760 420
* Huafon MicrofibreShanghaiTechnology Co.Ltd. (XSEC) 593,346 419
* Inzone Group Co.Ltd. Class A(XSHG) 557,331 419
Wolong ElectricGroup Co. Ltd.Class A (XSHG) 180,200 417
Focused PhotonicsHangzhou Inc.Class A (XSHE) 143,400 414
Shares
MarketValue•
($000)
Zhejiang AokangShoes Co. Ltd.Class A 359,876 414
GuangdongTopstarTechnology Co.Ltd. Class A 176,500 414
Andon Health Co.Ltd. Class A 437,956 413
Dalian HuaruiHeavy IndustryGroup Co. Ltd.Class A (XSHE) 683,920 412
* GuizhouBroadcasting &TVInformationNetwork Co. Ltd.Class A 603,200 412
PharmaBlockSciencesNanjing Inc.Class A (XSEC) 17,291 411
* Saurer IntelligentTechnology Co.Ltd. Class A 925,900 411
Xinyu Iron & SteelCo. Ltd. Class A(XSSC) 443,400 410
* Shanghai JiaoYunCo. Ltd. Class A(XSSC) 643,190 408
* Liaoning ShenhuaHoldings Co. Ltd. 1,326,800 405
Triumph Science &Technology Co.Ltd. Class A(XSSC) 309,550 405
GuangdongBaolihua NewEnergy Stock Co.Ltd. Class A(XSEC) 451,000 404
* Chengdu XinzhuRoad&BridgeMachinery Co.Ltd. Class A 614,114 404
MYS Group Co.Ltd. Class A(XSHE) 789,767 403
Anker InnovationsTechnology Co.Ltd. Class A(XSHE) 27,600 401
Citychamp DartongCo. Ltd. Class A(XSHG) 668,700 398
XinyangfengAgriculturalTechnology Co.Ltd. Class A(XSEC) 139,800 397
Emerging Markets Stock Index Fund
89

Shares
MarketValue•
($000)
COSCO SHIPPINGDevelopment Co.Ltd. Class A(XSSC) 730,576 397
Shenzhen NewNanshan HoldingGroup Co. Ltd.Class A (XSHE) 898,744 397
ZhejiangWanfengAutoWheel Co.Ltd. Class A(XSHE) 481,800 396
Shanghai MalingAquarius Co. Ltd.Class A (XSHG) 323,200 395
ZhejiangWanliyangCo. Ltd. Class A(XSHE) 186,300 394
ShanghaiChinafortune Co.Ltd. Class A(XSHG) 196,700 394
Camel Group Co.Ltd. Class A(XSHG) 190,580 390
* EGing PhotovoltaicTechnology Co.Ltd. Class A(XSSC) 579,174 390
* Zhongtong Bus Co.Ltd. 528,900 389
Universal ScientificIndustrialShanghai Co. Ltd.Class A (XSHG) 178,938 388
Qinhuangdao PortCo. Ltd. Class A(XSSC) 931,800 386
* Qinghai SpringMedicinalResourcesTechnology Co.Ltd. Class A 388,781 386
* Shenzhen HongtaoGroup Co. Ltd.Class A 1,043,260 386
Zhejiang AusunPharmaceuticalCo. Ltd. Class A 99,240 386
Tianjin BenefoTejing Electric Co.Ltd. Class A(XSHG) 481,300 383
NingboYunshengCo. Ltd. Class A(XSHG) 232,740 382
Shanghai NewWorld Co. Ltd.Class A (XSHG) 317,000 382
Shares
MarketValue•
($000)
* Lanzhou LS HeavyEquipment Co.Ltd. Class A(XSSC) 489,203 382
Shanghai Jin JiangOnline NetworkService Co. Ltd.Class A (XSSC) 280,900 381
* KAISA JiaYunTechnology Inc.Class A 613,020 380
Shenzhen GongjinElectronics Co.Ltd. Class A(XSHG) 306,240 380
EdanInstruments Inc.Class A 225,200 380
Shanghai JinjiangInternational TravelCo. Ltd. Class B 268,749 379
* China CalxonGroup Co. Ltd.Class A (XSHE) 930,900 379
* JiangSuWuZhongPharmaceuticalDevelopment Co.Ltd. Class A(XSSC) 359,939 379
Shanghai NewWorld Co. Ltd.Class A (XSSC) 314,400 379
Caitong SecuritiesCo. Ltd. Class A(XSSC) 235,900 378
* VisionoxTechnology Inc.Class A (XSEC) 300,796 377
* JiangSuWuZhongPharmaceuticalDevelopment Co.Ltd. Class A(XSHG) 358,400 377
Neway ValveSuzhou Co. Ltd.Class A (XSHG) 251,288 377
SansureBiotech Inc.Class A 45,121 377
Xiamen ITG GroupCorp. Ltd. Class A(XSHG) 348,100 376
ShanghaiDragonNetTechnology Co.Ltd. Class A 300,901 376
Guangzhou HolikeCreative HomeCo. Ltd. Class A(XSHG) 220,658 370
Emerging Markets Stock Index Fund
90

Shares
MarketValue•
($000)
Shanghai NewHuang PuIndustrial GroupCo. Ltd. Class A(XSHG) 474,480 369
Shenzhen BatianEcotypicEngineering Co.Ltd. Class A(XSEC) 395,100 369
XiamenKingdomwayGroup Co. Class A(XSEC) 77,600 368
Beijing HualianDepartment StoreCo. Ltd. Class A(XSHE) 1,344,700 368
ChinaWorld TradeCenter Co. Ltd.Class A (XSHG) 172,500 367
* ZJBC InformationTechnology Co.Ltd. Class A 745,962 366
Changjiang &Jinggong SteelBuilding GroupCo. Ltd. Class A(XSHG) 590,400 366
Jiangsu SINOJITWind EnergyTechnology Co.Ltd. Class A(XSHG) 441,600 366
China MerchantsPropertyOperation &Service Co. Ltd.Class A (XSEC) 173,700 366
* Hainan Mining Co.Ltd. Class A(XSSC) 153,262 366
Orient InternationalEnterprise Ltd.Class A 307,800 365
KPCPharmaceuticals Inc.Class A (XSHG) 280,088 364
* HarbinPharmaceuticalGroup Co. Ltd.Class A (XSHG) 739,354 364
Guangdong HuatieTongdaHigh-speedRailwayEquipment Corp.Class A (XSEC) 515,756 363
Shares
MarketValue•
($000)
Guangzhou BaiyunInternationalAirport Co. Ltd.Class A (XSSC) 196,466 363
* Shenzhen RapooTechnology Co.Ltd. Class A 246,590 363
Hainan Poly PharmCo. Ltd. Class A(XSEC) 46,824 360
* Shaanxi AerospacePower Hi-Tech Co.Ltd. Class A(XSSC) 236,600 360
Zhejiang NetSunCo. Ltd. Class A(XSEC) 184,600 356
Yantai EddiePrecisionMachinery Co.Ltd. Class A(XSSC) 63,560 355
Shandong DawnPolymer Co. Ltd.Class A 155,700 355
Shanxi Blue FlameHolding Co. Ltd.Class A (XSHE) 246,440 353
* Henan RebeccaHair Products Co.Ltd. Class A(XSSC) 851,887 352
CSG Holding Co.Ltd. Class A 249,200 352
Western RegionGold Co. Ltd.Class A (XSHG) 194,400 352
* GuangdongDongfangPrecision Science&Technology Co.Ltd. Class A(XSEC) 414,800 351
ShenzhenTellusHolding Co. Ltd.Class A (XSHE) 159,510 351
* ShandongYishengLivestock &Poultry BreedingCo. Ltd. Class A(XSEC) 210,700 350
Shenzhen KinwongElectronic Co. Ltd.Class A (XSSC) 86,772 350
* Jilin ZixinPharmaceuticalIndustrial Co. Ltd.Class A (XSHE) 833,200 350
Emerging Markets Stock Index Fund
91

Shares
MarketValue•
($000)
ShenzhenNoposionAgrochemicalsCo. Ltd. Class A(XSHE) 383,200 350
Jiangsu PhoenixPublishing &Media Corp. Ltd.Class A (XSHG) 319,000 350
* Tongdao LiepinGroup 244,990 350
Suzhou NewDistrict Hi-TechIndustrial Co. Ltd.Class A (XSHG) 534,800 349
Shanghai KehuaBio-EngineeringCo. Ltd. Class A(XSEC) 160,900 346
Shenzhen H&TIntelligent ControlCo. Ltd. Class A(XSEC) 94,200 342
Jinxi Axle Co. Ltd.Class A (XSHG) 640,800 342
* ZhejiangAsia-PacificMechanical &Electronic Co. Ltd.Class A 325,300 342
Wuhan KeqianBiology Co. Ltd.Class A 87,319 342
ChangjiangRunfaHealth IndustryCo. Ltd. Class A 442,600 341
Shanghai AtHubCo. Ltd. Class A(XSSC) 69,580 339
* MCC Meili CloudComputingIndustryInvestment Co.Ltd. Class A 399,728 339
Shenzhen JieshunScience &TechnologyIndustry Co. Ltd.Class A (XSEC) 249,626 339
SichuanTewayFood Group Co.Ltd. Class A 87,350 339
Jiangsu GianTechnology Co.Ltd. Class A 45,840 339
Hand EnterpriseSolutions Co. Ltd.Class A (XSHE) 327,100 337
Shares
MarketValue•
($000)
SichuanChanghongElectric Co. Ltd.Class A (XSSC) 787,438 335
Bestsun EnergyCo. Ltd. Class A 436,100 333
Shandong MeichenEcology &Environment Co.Ltd. Class A 900,720 333
Ningbo DavidMedical DeviceCo. Ltd. Class A(XSEC) 182,500 333
China AnimalHusbandryIndustry Co. Ltd.Class A (XSSC) 201,768 333
China RailwayTielong ContainerLogistics Co. Ltd.Class A (XSHG) 450,150 332
Luxin VentureCapital Group Co.Ltd. Class A(XSSC) 165,708 332
Zhuzhou QianjinPharmaceuticalCo. Ltd. Class A(XSSC) 252,760 332
Shanghai ZijiangEnterprise GroupCo. Ltd. Class A(XSHG) 217,600 331
ZhejiangGuyuelongshanShaoxingWineCo. Ltd. Class A(XSSC) 195,598 331
* Shenzhen SilverBasis TechnologyCo. Ltd. Class A 355,546 330
Suzhou GoldMantisConstructionDecoration Co.Ltd. Class A(XSEC) 353,100 329
Beijing CapitalDevelopment Co.Ltd. Class A(XSHG) 428,652 329
HenanYuguangGold & Lead Co.Ltd. Class A(XSSC) 391,300 328
Lucky Film Co.Class A (XSHG) 309,500 328
Emerging Markets Stock Index Fund
92

Shares
MarketValue•
($000)
JiangsuBroadcastingCable InformationNetwork Corp.Ltd. Class A 712,550 327
Luolai LifestyleTechnology Co.Ltd. Class A(XSEC) 159,604 325
* Kunshan KersenScience &Technology Co.Ltd. Class A(XSSC) 203,500 325
Suzhou AnjieTechnology Co.Ltd. Class A(XSEC) 150,460 324
ChinaWaferLevel CSP Co.Ltd. Class A(XSSC) 50,108 324
Jiangsu PhoenixPropertyInvestment Co.Ltd. Class A(XSSC) 533,520 322
MYS Group Co.Ltd. Class A(XSEC) 628,125 320
Qianhe Condiment& Food Co. Ltd.Class A (XSSC) 82,920 319
* AECC Aero Science&Technology Co.Ltd. Class A(XSSC) 103,600 319
Bear ElectricAppliance Co. Ltd.Class A 35,700 319
GuangzhouShangpin HomeCollection Co. Ltd.Class A (XSEC) 46,662 318
* LigeanceAerospaceTechnology Co.Ltd. Class A(XSEC) 262,000 318
* Beijing PhilisenseTechnology Co.Ltd. Class A(XSEC) 492,033 317
Beijing HualianDepartment StoreCo. Ltd. Class A(XSEC) 1,155,081 316
Shenzhen AisidiCo. Ltd. Class A(XSEC) 188,800 316
Shares
MarketValue•
($000)
LongYuanConstructionGroup Co. Ltd.Class A (XSHG) 281,700 316
Maoye CommercialCo. Ltd. Class A(XSHG) 591,102 314
Chongqing DimaIndustry Co. Ltd.Class A (XSHG) 868,700 314
AccelinkTechnologies Co.Ltd. Class A(XSEC) 92,200 312
Shandong DenghaiSeeds Co. Ltd.Class A (XSEC) 93,900 312
Fujian Longking Co.Ltd. Class A(XSHG) 245,222 311
Tech-Bank Food Co.Ltd. Class A(XSEC) 315,280 310
ShenzhenNoposionAgrochemicalsCo. Ltd. Class A(XSEC) 338,500 309
* Tunghsu AzureRenewableEnergy Co. Ltd.Class A (XSHE) 597,100 307
Loncin Motor Co.Ltd. Class A(XSHG) 448,250 306
* Sichuan XunYouNetworkTechnology Co.Ltd. Class A(XSHE) 152,900 305
JiangsuExpressway Co.Ltd. Class A(XSSC) 228,800 304
Sichuan EMTechnology Co.Ltd. Class A(XSSC) 127,140 304
ChangzhouTronlyNew ElectronicMaterials Co. Ltd.Class A (XSHE) 164,114 304
Rongan PropertyCo. Ltd. Class A(XSHE) 814,200 303
* JiangsuYuedaInvestment Co.Ltd. Class A(XSSC) 486,700 303
Emerging Markets Stock Index Fund
93

Shares
MarketValue•
($000)
GreattownHoldings Ltd.Class A (XSSC) 546,421 302
Qinhuangdao PortCo. Ltd. Class A(XSHG) 729,500 302
Shanghai DazhongPublic UtilitiesGroup Co. Ltd.Class A (XSSC) 513,800 301
Sichuan KelunPharmaceuticalCo. Ltd. Class A(XSEC) 108,400 300
HangzhouZhonghengElectric Co. Ltd.Class A (XSEC) 225,600 300
Skyworth DigitalCo. Ltd. Class A(XSEC) 262,900 298
Tian Di Science &Technology Co.Ltd. Class A(XSHG) 456,100 298
* Yihua HealthcareCo. Ltd. Class A(XSHE) 495,958 297
* MacrolinkCulturaltainmentDevelopment Co.Ltd. Class A(XSHE) 1,056,632 297
* SinosunTechnologyCo. Ltd. Class A 271,600 295
Zhejiang HailiangCo. Ltd. Class A(XSEC) 178,300 293
Shanghai KelaiMechatronicsEngineering Co.Ltd. Class A 61,000 290
Huadian HeavyIndustries Co. Ltd.Class A (XSHG) 414,676 289
Easyhome NewRetail Group Co.Ltd. Class A 378,500 289
LianChuangElectronicTechnology Co.Ltd. Class A(XSEC) 90,700 288
Guizhou Gas GroupCorp. Ltd. Class A(XSSC) 184,400 286
* Gree Real EstateCo. Ltd. Class A(XSHG) 271,320 285
Shares
MarketValue•
($000)
* Guangdong GoldenDragonDevelopment Inc.Class A (XSEC) 114,600 284
Zhejiang ChinaLight &TextileIndustrial CityGroup Co. Ltd.Class A (XSSC) 615,704 284
* Kunshan KersenScience &Technology Co.Ltd. Class A(XSHG) 177,968 284
GuangdongAnjubao DigitalTechnology Co.Ltd. Class A 298,900 283
Chongqing DimaIndustry Co. Ltd.Class A (XSSC) 778,307 281
Zhejiang DailyDigital CultureGroup Co. Ltd.Class A (XSSC) 241,888 281
CCS Supply ChainManagement Co.Ltd. Class A 327,540 278
Huabao Flavours &Fragrances Co.Ltd. Class A(XSEC) 42,321 276
Wuxi CommercialMansion GrandOrient Co. Ltd.Class A (XSSC) 291,225 275
* Pacific ShuanglinBio-pharmacy Co.Ltd. (XSEC) 55,800 275
ZhejiangWeixingNew BuildingMaterials Co. Ltd.Class A (XSHE) 97,600 274
GuangzhouAutomobile GroupCo. Ltd. Class A(XSHG) 100,920 273
* Taiyuan HeavyIndustry Co. Ltd.Class A (XSHG) 613,100 272
* Yihua HealthcareCo. Ltd. Class A(XSEC) 452,475 271
* STO Express Co.Ltd. Class A(XSEC) 223,899 269
Emerging Markets Stock Index Fund
94
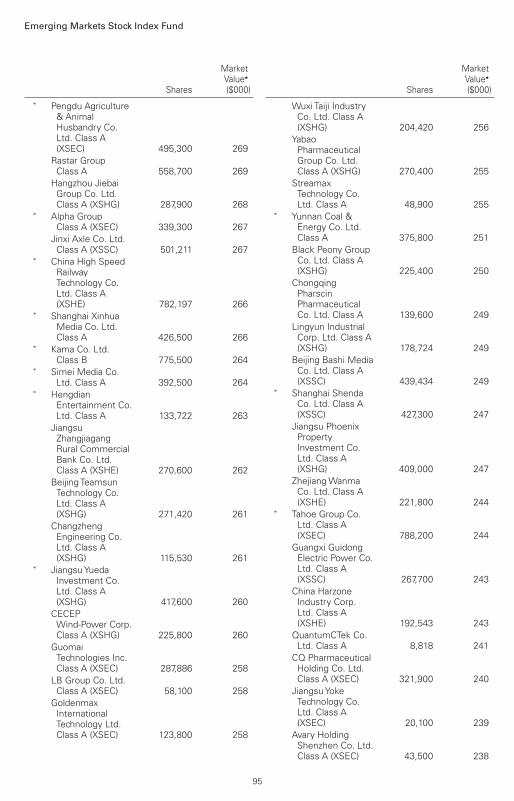
Shares
MarketValue•
($000)
* Pengdu Agriculture& AnimalHusbandry Co.Ltd. Class A(XSEC) 495,300 269
Rastar GroupClass A 558,700 269
Hangzhou JiebaiGroup Co. Ltd.Class A (XSHG) 287,900 268
* Alpha GroupClass A (XSEC) 339,300 267
Jinxi Axle Co. Ltd.Class A (XSSC) 501,211 267
* China High SpeedRailwayTechnology Co.Ltd. Class A(XSHE) 782,197 266
* Shanghai XinhuaMedia Co. Ltd.Class A 426,500 266
* Kama Co. Ltd.Class B 775,500 264
* Simei Media Co.Ltd. Class A 392,500 264
* HengdianEntertainment Co.Ltd. Class A 133,722 263
JiangsuZhangjiagangRural CommercialBank Co. Ltd.Class A (XSHE) 270,600 262
Beijing TeamsunTechnology Co.Ltd. Class A(XSHG) 271,420 261
ChangzhengEngineering Co.Ltd. Class A(XSHG) 115,530 261
* JiangsuYuedaInvestment Co.Ltd. Class A(XSHG) 417,600 260
CECEPWind-Power Corp.Class A (XSHG) 225,800 260
GuomaiTechnologies Inc.Class A (XSEC) 287,886 258
LB Group Co. Ltd.Class A (XSEC) 58,100 258
GoldenmaxInternationalTechnology Ltd.Class A (XSEC) 123,800 258
Shares
MarketValue•
($000)
Wuxi Taiji IndustryCo. Ltd. Class A(XSHG) 204,420 256
YabaoPharmaceuticalGroup Co. Ltd.Class A (XSHG) 270,400 255
StreamaxTechnology Co.Ltd. Class A 48,900 255
* Yunnan Coal &Energy Co. Ltd.Class A 375,800 251
Black Peony GroupCo. Ltd. Class A(XSHG) 225,400 250
ChongqingPharscinPharmaceuticalCo. Ltd. Class A 139,600 249
Lingyun IndustrialCorp. Ltd. Class A(XSHG) 178,724 249
Beijing Bashi MediaCo. Ltd. Class A(XSSC) 439,434 249
* Shanghai ShendaCo. Ltd. Class A(XSSC) 427,300 247
Jiangsu PhoenixPropertyInvestment Co.Ltd. Class A(XSHG) 409,000 247
ZhejiangWanmaCo. Ltd. Class A(XSHE) 221,800 244
* Tahoe Group Co.Ltd. Class A(XSEC) 788,200 244
Guangxi GuidongElectric Power Co.Ltd. Class A(XSSC) 267,700 243
China HarzoneIndustry Corp.Ltd. Class A(XSHE) 192,543 243
QuantumCTek Co.Ltd. Class A 8,818 241
CQ PharmaceuticalHolding Co. Ltd.Class A (XSEC) 321,900 240
JiangsuYokeTechnology Co.Ltd. Class A(XSEC) 20,100 239
Avary HoldingShenzhen Co. Ltd.Class A (XSEC) 43,500 238
Emerging Markets Stock Index Fund
95

Shares
MarketValue•
($000)
* Tangel Culture Co.Ltd. Class A 416,600 236
Hunan Aihua GroupCo. Ltd. Class A(XSSC) 42,200 235
RealcanPharmaceuticalGroup Co. Ltd.Class A (XSEC) 420,100 232
HuarenPharmaceuticalCo. Ltd. Class A(XSHE) 363,900 232
Lucky Film Co.Class A (XSSC) 219,191 232
* Kunwu JiudingInvestmentHoldings Co. Ltd.Class A (XSSC) 106,168 231
Shanghai NewHuang PuIndustrial GroupCo. Ltd. Class A(XSSC) 294,716 229
Huafa Industrial Co.Ltd. ZhuhaiClass A (XSHG) 276,840 228
* JC Finance &TaxInterconnectHoldings Ltd.Class A (XSEC) 250,100 227
Hanyu GroupJoint-Stock Co.Ltd. Class A 249,500 225
Hexing ElectricalCo. Ltd. Class A(XSHG) 120,021 221
Songz AutomobileAir ConditioningCo. Ltd. Class A 187,400 219
* LingNanEco&Culture-Tourism Co. Ltd.Class A (XSEC) 521,400 218
Shanghai IndustrialDevelopment Co.Ltd. Class A(XSHG) 357,890 217
Ningxia BuildingMaterials GroupCo. Ltd. Class A(XSHG) 129,000 216
* OceanwideHoldings Co. Ltd.Class A (XSEC) 767,000 213
XiamenInternationalAirport Co. Ltd.Class A 84,970 212
Shares
MarketValue•
($000)
Canny Elevator Co.Ltd. Class A(XSEC) 185,877 212
Deluxe Family Co.Ltd. Class A(XSSC) 437,436 211
GuizhouYibaiPharmaceuticalCo. Ltd. Class A(XSSC) 237,100 210
SuzhouTFC OpticalCommunicationCo. Ltd. Class A(XSEC) 52,200 209
China GreatWallSecurities Co. Ltd.Class A (XSEC) 115,600 207
Wolong Real EstateGroup Co. Ltd.Class A (XSHG) 280,100 207
Tianjin TianyaoPharmaceuticalCo. Ltd. Class A 325,200 207
Beijing Bashi MediaCo. Ltd. Class A(XSHG) 362,236 205
Shanghai PudongConstruction Co.Ltd. Class A(XSHG) 227,783 205
* MacrolinkCulturaltainmentDevelopment Co.Ltd. Class A(XSEC) 718,242 202
Zhuzhou QianjinPharmaceuticalCo. Ltd. Class A(XSHG) 153,960 202
Shaanxi Broadcast&TV NetworkIntermediaryGroup Co. Ltd.Class A 248,200 201
Dalian HuaruiHeavy IndustryGroup Co. Ltd.Class A (XSEC) 331,600 200
* Shanghai ForeignService HoldingGroup Co. Ltd.(XSSC) 168,000 200
Shenzhen SunlordElectronics Co.Ltd. Class A(XSEC) 38,500 199
* Berry GenomicsCo. Ltd. Class A(XSEC) 65,305 198
Emerging Markets Stock Index Fund
96

Shares
MarketValue•
($000)
Blue Sail MedicalCo. Ltd. Class A(XSEC) 87,564 198
NorincoInternationalCooperation Ltd.Class A 168,845 198
Zhejiang JingxinPharmaceuticalCo. Ltd. Class A(XSHE) 155,280 196
HyteraCommunicationsCorp. Ltd. Class A(XSEC) 219,500 194
C&S Paper Co. Ltd.Class A (XSEC) 72,800 194
* Sichuan XunYouNetworkTechnology Co.Ltd. Class A(XSEC) 97,194 194
Yantai ZhenghaiMagnetic MaterialCo. Ltd. Class A(XSEC) 109,800 193
ChongqingZongshen PowerMachinery Co.Ltd. Class A(XSEC) 187,500 192
* Shanghai JiaoYunCo. Ltd. Class A(XSHG) 293,500 186
Hunan Er-KangPharmaceuticalCo. Ltd. Class A(XSHE) 291,100 186
* Grandjoy HoldingsGroup Co. Ltd.Class A (XSEC) 359,500 185
Zhejiang OrientFinancial HoldingsGroup Co. Ltd.Class A (XSHG) 290,550 185
* EGing PhotovoltaicTechnology Co.Ltd. Class A(XSHG) 271,800 183
Hangxiao SteelStructure Co. Ltd.Class A (XSSC) 324,200 181
JL Mag Rare-EarthCo. Ltd. Class A(XSEC) 29,120 178
* Jiangsu KanionPharmaceuticalCo. Ltd. Class A(XSSC) 121,218 178
Shares
MarketValue•
($000)
GuangdongTapaiGroup Co. Ltd.Class A (XSEC) 110,900 174
Beijing eGOVA Co.Ltd. Class A(XSHE) 88,441 173
Ningbo DavidMedical DeviceCo. Ltd. Class A(XSHE) 94,800 173
* Beijing JingyuntongTechnology Co.Ltd. Class A(XSSC) 96,388 172
Baosheng Science&TechnologyInnovation Co.Ltd. Class A(XSHG) 226,569 172
People.cn Co. Ltd.Class A (XSSC) 83,981 172
Changshu FengfanPower EquipmentCo. Ltd. Class A(XSHG) 263,500 171
* Polaris Bay GroupCo. Ltd. Class A(XSSC) 118,400 170
ShenzhenMegmeetElectrical Co. Ltd.Class A (XSEC) 35,200 169
* Suzhou ChunxingPrecisionMechanical Co.Ltd. Class A(XSEC) 293,600 166
* Guangzhou PearlRiver IndustrialDevelopment Co.Ltd. Class A 342,120 166
GuangdongDowstoneTechnology Co.Ltd. Class A(XSHE) 36,700 166
* TongdingInterconnectionInformation Co.Ltd. Class A(XSEC) 268,000 165
* Jilin ZixinPharmaceuticalIndustrial Co. Ltd.Class A (XSEC) 393,700 165
TangShan PortGroup Co. Ltd.Class A (XSHG) 391,248 163
Emerging Markets Stock Index Fund
97
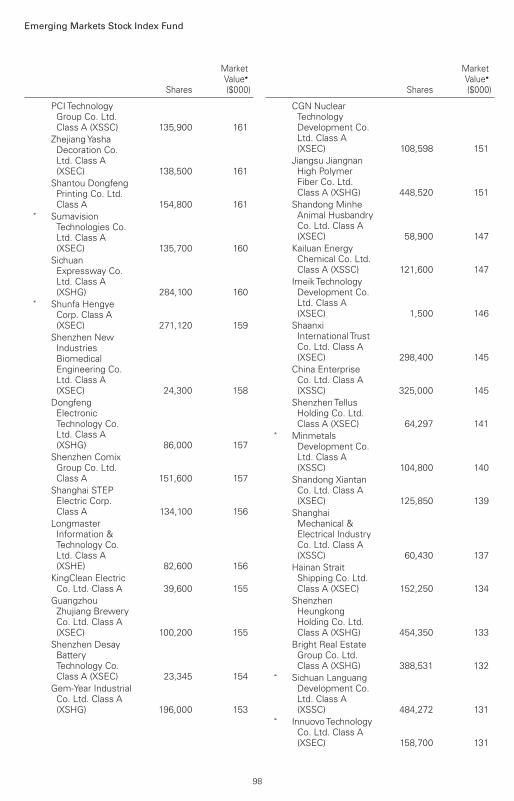
Shares
MarketValue•
($000)
PCI TechnologyGroup Co. Ltd.Class A (XSSC) 135,900 161
ZhejiangYashaDecoration Co.Ltd. Class A(XSEC) 138,500 161
Shantou DongfengPrinting Co. Ltd.Class A 154,800 161
* SumavisionTechnologies Co.Ltd. Class A(XSEC) 135,700 160
SichuanExpressway Co.Ltd. Class A(XSHG) 284,100 160
* Shunfa HengyeCorp. Class A(XSEC) 271,120 159
Shenzhen NewIndustriesBiomedicalEngineering Co.Ltd. Class A(XSEC) 24,300 158
DongfengElectronicTechnology Co.Ltd. Class A(XSHG) 86,000 157
Shenzhen ComixGroup Co. Ltd.Class A 151,600 157
Shanghai STEPElectric Corp.Class A 134,100 156
LongmasterInformation &Technology Co.Ltd. Class A(XSHE) 82,600 156
KingClean ElectricCo. Ltd. Class A 39,600 155
GuangzhouZhujiang BreweryCo. Ltd. Class A(XSEC) 100,200 155
Shenzhen DesayBatteryTechnology Co.Class A (XSEC) 23,345 154
Gem-Year IndustrialCo. Ltd. Class A(XSHG) 196,000 153
Shares
MarketValue•
($000)
CGN NuclearTechnologyDevelopment Co.Ltd. Class A(XSEC) 108,598 151
Jiangsu JiangnanHigh PolymerFiber Co. Ltd.Class A (XSHG) 448,520 151
Shandong MinheAnimal HusbandryCo. Ltd. Class A(XSEC) 58,900 147
Kailuan EnergyChemical Co. Ltd.Class A (XSSC) 121,600 147
Imeik TechnologyDevelopment Co.Ltd. Class A(XSEC) 1,500 146
ShaanxiInternational TrustCo. Ltd. Class A(XSEC) 298,400 145
China EnterpriseCo. Ltd. Class A(XSSC) 325,000 145
ShenzhenTellusHolding Co. Ltd.Class A (XSEC) 64,297 141
* MinmetalsDevelopment Co.Ltd. Class A(XSSC) 104,800 140
Shandong XiantanCo. Ltd. Class A(XSEC) 125,850 139
ShanghaiMechanical &Electrical IndustryCo. Ltd. Class A(XSSC) 60,430 137
Hainan StraitShipping Co. Ltd.Class A (XSEC) 152,250 134
ShenzhenHeungkongHolding Co. Ltd.Class A (XSHG) 454,350 133
Bright Real EstateGroup Co. Ltd.Class A (XSHG) 388,531 132
* Sichuan LanguangDevelopment Co.Ltd. Class A(XSSC) 484,272 131
* InnuovoTechnologyCo. Ltd. Class A(XSEC) 158,700 131
Emerging Markets Stock Index Fund
98

Shares
MarketValue•
($000)
EoptolinkTechnology Inc.Ltd. Class A(XSEC) 29,545 131
TongyuCommunication Inc.Class A (XSEC) 55,500 130
Tianfeng SecuritiesCo. Ltd. Class A(XSSC) 209,400 129
YanTai ShuangtaFood Co. Ltd.Class A (XSEC) 90,500 129
FuanPharmaceuticalGroup Co. Ltd.Class A (XSEC) 206,900 128
Huayuan PropertyCo. Ltd. Class A(XSHG) 440,570 127
SichuanTianyiComheartTelecom Co. Ltd.Class A (XSEC) 49,700 126
Toly Bread Co. Ltd.Class A (XSSC) 25,340 124
Hainan Ruize NewBuilding MaterialCo. Ltd. Class A(XSEC) 219,000 121
Tangrenshen GroupCo. Ltd. Class A(XSEC) 120,100 118
* Jiangsu Etern Co.Ltd. Class A(XSSC) 195,000 118
Jointo EnergyInvestment Co.Ltd. HebeiClass A (XSEC) 145,900 117
Shenzhen NewNanshan HoldingGroup Co. Ltd.Class A (XSEC) 259,700 115
Fujian AonongBiologicalTechnologyGroup Inc. Ltd.Class A (XSSC) 72,280 115
Beijing JingnengPower Co. Ltd.Class A (XSHG) 252,800 115
China Bester GroupTelecom Co. Ltd.Class A (XSSC) 52,000 114
263 NetworkCommunicationsCo. Ltd. Class A(XSEC) 194,200 114
Shares
MarketValue•
($000)
Shanghai TongjiScience &TechnologyIndustrial Co. Ltd.Class A (XSHG) 93,600 113
* Shanghai ShendaCo. Ltd. Class A(XSHG) 195,100 113
Guangxi LiuzhouPharmaceuticalCo. Ltd. Class A(XSSC) 46,620 111
ChangzhouQianhongBiopharma Co.Ltd. Class A(XSEC) 171,350 111
* Huayi BrothersMedia Corp.Class A (XSEC) 195,302 108
Zhejiang OrientGene Biotech Co.Ltd. Class A(XSSC) 4,800 107
Zhejiang HuatongMeat ProductsCo. Ltd. Class A 65,700 106
GuangdongEllingtonElectronicsTechnology Co.Ltd. Class A(XSHG) 101,000 105
Infore EnvironmentTechnology GroupCo. Ltd. Class A(XSEC) 105,300 103
* Lanzhou LS HeavyEquipment Co.Ltd. Class A(XSHG) 129,885 102
Huadong MedicineCo. Ltd. Class A(XSEC) 17,700 101
* Wuhan P&SInformationTechnology Co.Ltd. Class A(XSEC) 105,700 100
Better LifeCommercial ChainShare Co. Ltd.Class A (XSEC) 94,200 99
Anhui HengyuanCoal Industry &Electricity PowerCo. Ltd. Class A(XSHG) 89,440 98
Emerging Markets Stock Index Fund
99

Shares
MarketValue•
($000)
Anhui KouziDistillery Co. Ltd.Class A (XSHG) 10,400 98
GF Securities Co.Ltd. Class A(XSEC) 29,900 94
Dlg Exhibitions &Events Corp. Ltd.Class A 71,800 90
Shanghai PhoenixEnterprise GroupCo. Ltd. Class B 229,100 89
Zhejiang NetSunCo. Ltd. Class A(XSHE) 45,000 87
Jiangsu HuaxicunCo. Ltd. Class A(XSEC) 95,200 86
Beijing North StarCo. Ltd. Class A(XSHG) 247,700 86
* China Dive Corp.Ltd. Class A(XSEC) 26,600 86
Shenzhen BauingConstructionHolding Group Co.Ltd. Class A(XSEC) 207,400 82
Zhejiang HisoarPharmaceuticalCo. Ltd. Class A(XSEC) 67,400 82
* GuangdongShengluTelecommunicationTech Co. Ltd.Class A (XSEC) 98,000 80
Jiangling MotorsCorp. Ltd. Class A(XSEC) 31,900 78
* Shanghai TopcareMedical ServicesCo. Ltd. (XSSC) 27,800 78
* HyUnion HoldingCo. Ltd. Class A(XSEC) 87,800 77
* Xiwang FoodstuffsCo. Ltd. Class A(XSEC) 106,164 77
Neway ValveSuzhou Co. Ltd.Class A (XSSC) 48,721 73
Zhejiang GardenBio-ChemicalHigh-tech Co. Ltd.Class A (XSEC) 34,100 71
Changhong MeilingCo. Ltd. Class B 231,154 70
Shares
MarketValue•
($000)
* China ReformHealthManagement &Services GroupCo. Ltd. Class A(XSEC) 70,600 68
Vatti Corp. Ltd.Class A (XSEC) 73,700 68
Bank of QingdaoCo. Ltd. Class A(XSEC) 92,400 68
Jiangsu NhwaPharmaceuticalCo. Ltd. Class A(XSEC) 29,000 67
Fujian LongmaEnvironmentalSanitationEquipment Co.Ltd. Class A(XSSC) 34,300 67
Beijing VRVSoftware Corp.Ltd. Class A(XSEC) 73,500 64
* HybioPharmaceuticalCo. Ltd. Class A(XSHE) 80,700 64
HPGCRenmintongtaiPharmaceuticalCorp. Class A(XSSC) 69,000 63
Zhejiang MeidaIndustrial Co. Ltd.Class A (XSHE) 24,400 62
* Guangxi Radio &TelevisionInformationNetwork Corp.Ltd. Class A 152,800 62
* Enjoyor TechnologyCo. Ltd. Class A(XSHE) 56,200 61
Goldcard SmartGroup Co. Ltd.(XSEC) 35,510 60
* Inzone Group Co.Ltd. Class A(XSSC) 78,132 59
Hebei ChengdeLolo Co. Class A(XSEC) 36,020 58
COSCO SHIPPINGSpecializedCarriers Co. Ltd.Class A (XSSC) 67,400 56
Emerging Markets Stock Index Fund
100

Shares
MarketValue•
($000)
Shenzhen AncheTechnologies Co.Ltd. Class A(XSEC) 18,400 55
GuangdongShirongzhaoyeCo. Ltd. Class A(XSEC) 70,056 53
Shenzhen CenterPower Tech Co.Ltd. Class A(XSEC) 17,600 46
* China CalxonGroup Co. Ltd.Class A (XSEC) 109,448 45
ZhejiangWeimingEnvironmentProtection Co.Ltd. Class A(XSEC) 10,400 45
ShanghaiPharmaceuticalsHolding Co. Ltd.Class A (XSSC) 14,594 43
* Luoniushan Co.Ltd. Class A(XSEC) 40,200 43
Shanghai HaixinGroup Co. Class A 32,500 43
Yunda Holding Co.Ltd. Class A(XSEC) 14,427 42
Shenzhen DasIntellitech Co. Ltd.Class A (XSEC) 71,600 38
Jiangsu Zijin RuralCommercial BankCo. Ltd. Class A(XSSC) 71,500 36
XinhuaWinsharePublishing &Media Co. Ltd.Class H 48,524 35
* ShanghaiXinnanyang OnlyEducation &Technology Co.Ltd. Class A(XSSC) 19,087 33
LuThai Textile Co.Ltd. Class A 35,300 33
EasternCommunicationsCo. Ltd. Class B 63,500 28
GuangxiWuzhouCommunicationsCo. Ltd. Class A 47,100 27
Shares
MarketValue•
($000)
* ShanghaiXinnanyang OnlyEducation &Technology Co.Ltd. Class A(XSHG) 15,062 26
Guangzhou HolikeCreative HomeCo. Ltd. Class A(XSSC) 14,800 25
Shanghai PudongConstruction Co.Ltd. Class A(XSSC) 15,741 14
Guizhou PanjiangRefined Coal Co.Ltd. Class A(XSSC) 9,700 12
*,3 ShenwuEnvironmentalTechnology Co.Ltd. 616,265 12
* Shanghai FudanForward S &T Co.Ltd. Class A(XSSC) 10,910 11
*,2,3 Midas HoldingsLtd. 202,000 —
*,1,3 Tianhe ChemicalsGroup Ltd. 57,304,542 —
*,2,3 China HuishanDairy HoldingsCo. Ltd. 70,679,103 —
*,3 China Fiber OpticNetwork SystemGroup Ltd. 17,564,000 —
*,3 Hua Han HealthIndustry HoldingsLtd. 13,993,028 —
*,3 CT EnvironmentalGroup Ltd. 38,490,600 —
40,396,390Colombia (0.2%)
Bancolombia SAADR 1,635,908 58,778
InterconexionElectrica SA ESP 6,399,321 38,422
Ecopetrol SA 42,707,437 32,288Bancolombia SA 2,276,027 20,356
2 Ecopetrol SA ADR 1,062,121 16,091Grupo deInversionesSuramericana SA 2,596,353 15,134
Grupo AvalAcciones yValores SAPreference Shares 48,956,397 14,951
Grupo Argos SA 4,309,947 13,505
Emerging Markets Stock Index Fund
101

Shares
MarketValue•
($000)
* Banco DaviviendaSA PreferenceShares 1,482,616 13,351
Cementos ArgosSA 7,115,548 11,999
Bancolombia SAPreference Shares 1,201,548 10,785
Grupo deInversionesSuramericana SAPreference Shares 1,574,290 7,897
Grupo AvalAcciones yValores SA ADR 652,479 3,934
257,491Czech Republic (0.1%)
CEZ A/S 2,296,012 75,831* Komercni Banka
A/S 1,101,716 42,734*,1 Moneta Money
Bank A/S 4,015,732 15,7262 O2 Czech Republic
A/S 507,158 5,823Philip Morris CRA/S 6,097 4,333
144,447Egypt (0.1%)
* CommercialInternational BankEgypt SAE 23,522,358 76,575
* Egypt KuwaitHolding Co. SAE 12,233,365 16,676
Eastern Co. SAE 14,144,020 10,438* Egyptian Financial
Group-HermesHolding Co. 11,365,371 9,014
* Fawry for Banking& PaymentTechnologyServices SAE 7,882,214 7,542
Talaat MoustafaGroup 14,061,132 6,644
ElSewedy ElectricCo. 10,308,046 5,665
Telecom Egypt Co. 4,931,977 4,252Six of OctoberDevelopment &Investment 3,326,445 3,893
Palm HillsDevelopmentsSAE 20,332,470 2,489
Oriental Weavers 3,372,486 1,776Medinet NasrHousing 10,978,548 1,646
* Pioneers Properties 4,431,189 835
Shares
MarketValue•
($000)
* Gadwa forIndustrialDevelopment 4,431,189 330
* Aspire CapitalHolding forFinancialInvestments 4,431,189 85
147,860Greece (0.3%)
HellenicTelecommunicationsOrganization SA 3,306,712 58,707
OPAP SA 2,899,047 45,275* Alpha Services &
Holdings SA 29,064,796 37,054* Eurobank Ergasias
Services &Holdings SA 34,747,151 36,495
Mytilineos SA 1,529,406 27,949* National Bank of
Greece SA 7,575,640 23,922JUMBO SA 1,545,235 23,000
* Public Power Corp.SA 1,685,685 18,337
* Piraeus FinancialHoldings SA 8,074,425 13,799
* Motor Oil HellasCorinth RefineriesSA 788,339 13,381
* GEKTerna HoldingReal EstateConstruction SA 820,672 9,201
Terna Energy SA 589,333 7,968* LAMDA
Development SA 949,434 7,825Hellenic PetroleumSA 758,665 5,231
* Ellaktor SA 2,927,796 4,661Holding Co. ADMIEIPTO SA 1,577,580 4,657
AthensWaterSupply & SewageCo. SA 523,607 4,583
Sarantis SA 436,033 4,402Viohalco SA 787,919 3,989Hellenic Exchanges- Athens StockExchange SA 817,635 3,503
* Fourlis Holdings SA 595,885 2,649*,3 FF Group 397,542 2,206* Aegean Airlines SA 121,994 732
359,526Hong Kong (0.1%)
1 China Feihe Ltd. 36,123,000 59,975*,2 HengTen Networks
Group Ltd. 32,366,709 11,042
Emerging Markets Stock Index Fund
102
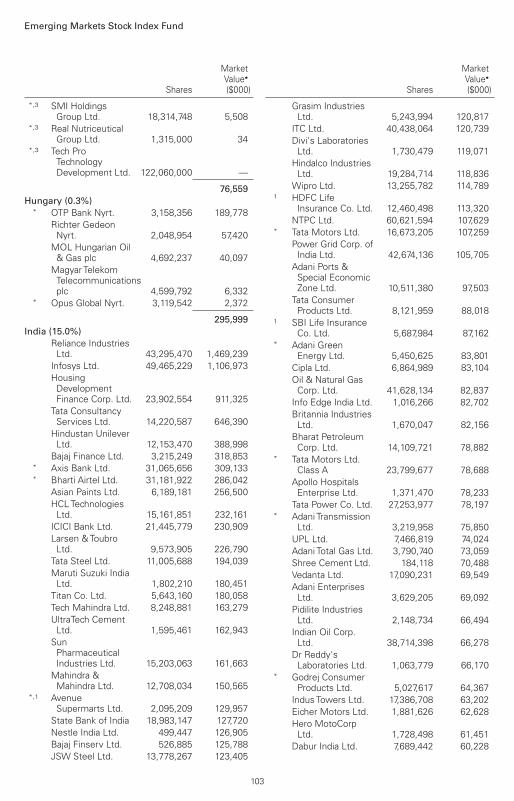
Shares
MarketValue•
($000)
*,3 SMI HoldingsGroup Ltd. 18,314,748 5,508
*,3 Real NutriceuticalGroup Ltd. 1,315,000 34
*,3 Tech ProTechnologyDevelopment Ltd. 122,060,000 —
76,559Hungary (0.3%)
* OTP Bank Nyrt. 3,158,356 189,778Richter GedeonNyrt. 2,048,954 57,420
MOL Hungarian Oil& Gas plc 4,692,237 40,097
Magyar TelekomTelecommunicationsplc 4,599,792 6,332
* Opus Global Nyrt. 3,119,542 2,372
295,999India (15.0%)
Reliance IndustriesLtd. 43,295,470 1,469,239
Infosys Ltd. 49,465,229 1,106,973HousingDevelopmentFinance Corp. Ltd. 23,902,554 911,325
Tata ConsultancyServices Ltd. 14,220,587 646,390
Hindustan UnileverLtd. 12,153,470 388,998
Bajaj Finance Ltd. 3,215,249 318,853* Axis Bank Ltd. 31,065,656 309,133* Bharti Airtel Ltd. 31,181,922 286,042
Asian Paints Ltd. 6,189,181 256,500HCLTechnologiesLtd. 15,161,851 232,161
ICICI Bank Ltd. 21,445,779 230,909Larsen &ToubroLtd. 9,573,905 226,790
Tata Steel Ltd. 11,005,688 194,039Maruti Suzuki IndiaLtd. 1,802,210 180,451
Titan Co. Ltd. 5,643,160 180,058Tech Mahindra Ltd. 8,248,881 163,279UltraTech CementLtd. 1,595,461 162,943
SunPharmaceuticalIndustries Ltd. 15,203,063 161,663
Mahindra &Mahindra Ltd. 12,708,034 150,565
*,1 AvenueSupermarts Ltd. 2,095,209 129,957
State Bank of India 18,983,147 127,720Nestle India Ltd. 499,447 126,905Bajaj Finserv Ltd. 526,885 125,788JSW Steel Ltd. 13,778,267 123,405
Shares
MarketValue•
($000)
Grasim IndustriesLtd. 5,243,994 120,817
ITC Ltd. 40,438,064 120,739Divi's LaboratoriesLtd. 1,730,479 119,071
Hindalco IndustriesLtd. 19,284,714 118,836
Wipro Ltd. 13,255,782 114,7891 HDFC Life
Insurance Co. Ltd. 12,460,498 113,320NTPC Ltd. 60,621,594 107,629
* Tata Motors Ltd. 16,673,205 107,259Power Grid Corp. ofIndia Ltd. 42,674,136 105,705
Adani Ports &Special EconomicZone Ltd. 10,511,380 97,503
Tata ConsumerProducts Ltd. 8,121,959 88,018
1 SBI Life InsuranceCo. Ltd. 5,687,984 87,162
* Adani GreenEnergy Ltd. 5,450,625 83,801
Cipla Ltd. 6,864,989 83,104Oil & Natural GasCorp. Ltd. 41,628,134 82,837
Info Edge India Ltd. 1,016,266 82,702Britannia IndustriesLtd. 1,670,047 82,156
Bharat PetroleumCorp. Ltd. 14,109,721 78,882
* Tata Motors Ltd.Class A 23,799,677 78,688
Apollo HospitalsEnterprise Ltd. 1,371,470 78,233
Tata Power Co. Ltd. 27,253,977 78,197* Adani Transmission
Ltd. 3,219,958 75,850UPL Ltd. 7,466,819 74,024Adani Total Gas Ltd. 3,790,740 73,059Shree Cement Ltd. 184,118 70,488Vedanta Ltd. 17,090,231 69,549Adani EnterprisesLtd. 3,629,205 69,092
Pidilite IndustriesLtd. 2,148,734 66,494
Indian Oil Corp.Ltd. 38,714,398 66,278
Dr Reddy'sLaboratories Ltd. 1,063,779 66,170
* Godrej ConsumerProducts Ltd. 5,027,617 64,367
IndusTowers Ltd. 17,386,708 63,202Eicher Motors Ltd. 1,881,626 62,628Hero MotoCorpLtd. 1,728,498 61,451
Dabur India Ltd. 7,689,442 60,228
Emerging Markets Stock Index Fund
103

Shares
MarketValue•
($000)
Piramal EnterprisesLtd. 1,670,176 58,218
Havells India Ltd. 3,427,885 57,934Coal India Ltd. 25,858,597 56,908
1 ICICI LombardGeneral InsuranceCo. Ltd. 2,805,113 55,585
SRF Ltd. 1,911,835 54,142Ambuja CementsLtd. 9,888,238 53,587
Mphasis Ltd. 1,222,533 53,024ShriramTransportFinance Co. Ltd. 2,713,197 52,262
1 Larsen &ToubroInfotech Ltd. 580,587 51,941
Marico Ltd. 6,817,775 51,840* United Spirits Ltd. 3,994,045 50,702
Voltas Ltd. 3,129,976 50,456Bajaj Auto Ltd. 1,009,099 50,037
* SBI Cards &Payment ServicesLtd. 3,527,197 49,808
Jubilant FoodworksLtd. 995,884 49,220
GAIL India Ltd. 24,468,756 48,688Motherson SumiSystems Ltd. 16,143,061 48,376
DLF Ltd. 8,526,441 45,538Zee EntertainmentEnterprises Ltd. 11,121,989 44,819
CholamandalamInvestment &Finance Co. Ltd. 5,433,261 44,736
Bharat ElectronicsLtd. 15,414,144 42,656
1 Bandhan Bank Ltd. 10,835,127 42,335Reliance IndustriesLtd. 1,628,240 41,501
HindustanPetroleum Corp.Ltd. 9,913,924 41,147
*,1 InterGlobe AviationLtd. 1,415,324 41,147
Indian RailwayCatering &Tourism Corp. Ltd. 3,628,460 41,107
* Max FinancialServices Ltd. 3,142,362 40,918
Crompton GreavesConsumerElectricals Ltd. 6,551,215 40,785
Wipro Ltd. ADR 4,551,838 40,784Lupin Ltd. 3,278,480 40,528
1 ICICI Prudential LifeInsurance Co. Ltd. 4,802,129 39,721
Colgate-PalmoliveIndia Ltd. 1,912,933 39,461
PI Industries Ltd. 978,165 39,242
Shares
MarketValue•
($000)
Tata Elxsi Ltd. 499,000 39,200State Bank of IndiaGDR 574,071 38,805
Mindtree Ltd. 643,613 38,725BalkrishnaIndustries Ltd. 1,158,671 38,168
Page IndustriesLtd. 74,090 37,333
1 HDFC AssetManagement Co.Ltd. 1,050,112 37,196
Astral Ltd. 1,233,142 36,051Siemens Ltd. 1,232,551 36,046MRF Ltd. 34,807 35,991Aurobindo PharmaLtd. 3,856,484 35,555
Ashok Leyland Ltd. 18,516,850 35,341Dr Reddy'sLaboratories Ltd.ADR 570,607 35,058
ACC Ltd. 1,116,074 34,849*,1 AU Small Finance
Bank Ltd. 2,128,248 34,642Aarti Industries Ltd. 2,676,354 34,555Bharat Forge Ltd. 3,323,245 34,168
* Godrej PropertiesLtd. 1,132,901 33,840
Trent Ltd. 2,507,420 33,661Berger Paints IndiaLtd. 3,391,094 33,634
1 Laurus Labs Ltd. 4,801,898 33,165Persistent SystemsLtd. 627,225 32,935
Container Corp. ofIndia Ltd. 3,735,301 32,759
DixonTechnologiesIndia Ltd. 487,264 32,545
Petronet LNG Ltd. 10,595,957 32,528Deepak Nitrite Ltd. 1,078,132 32,176
* Jindal Steel &Power Ltd. 5,636,738 31,512
Indraprastha GasLtd. 4,947,352 31,360
Embassy OfficeParks REIT 6,679,438 31,219
Dalmia Bharat Ltd. 1,118,966 30,146Power FinanceCorp. Ltd. 16,623,457 29,628
Atul Ltd. 237,816 29,037Federal Bank Ltd. 21,759,272 28,416Sundaram FinanceLtd. 887,057 28,389
* Biocon Ltd. 5,923,289 27,817TataCommunicationsLtd. 1,589,651 27,789
Tata Chemicals Ltd. 2,253,641 27,244
Emerging Markets Stock Index Fund
104
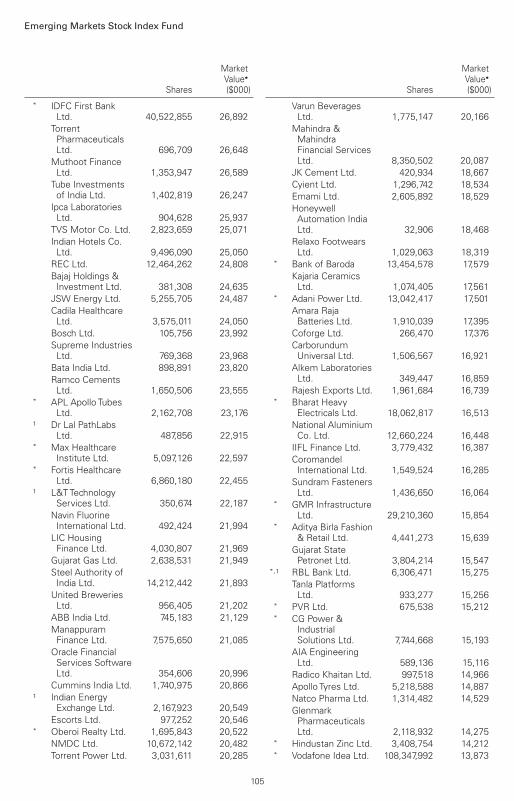
Shares
MarketValue•
($000)
* IDFC First BankLtd. 40,522,855 26,892
TorrentPharmaceuticalsLtd. 696,709 26,648
Muthoot FinanceLtd. 1,353,947 26,589
Tube Investmentsof India Ltd. 1,402,819 26,247
Ipca LaboratoriesLtd. 904,628 25,937
TVS Motor Co. Ltd. 2,823,659 25,071Indian Hotels Co.Ltd. 9,496,090 25,050
REC Ltd. 12,464,262 24,808Bajaj Holdings &Investment Ltd. 381,308 24,635
JSW Energy Ltd. 5,255,705 24,487Cadila HealthcareLtd. 3,575,011 24,050
Bosch Ltd. 105,756 23,992Supreme IndustriesLtd. 769,368 23,968
Bata India Ltd. 898,891 23,820Ramco CementsLtd. 1,650,506 23,555
* APL Apollo TubesLtd. 2,162,708 23,176
1 Dr Lal PathLabsLtd. 487,856 22,915
* Max HealthcareInstitute Ltd. 5,097,126 22,597
* Fortis HealthcareLtd. 6,860,180 22,455
1 L&TTechnologyServices Ltd. 350,674 22,187
Navin FluorineInternational Ltd. 492,424 21,994
LIC HousingFinance Ltd. 4,030,807 21,969
Gujarat Gas Ltd. 2,638,531 21,949Steel Authority ofIndia Ltd. 14,212,442 21,893
United BreweriesLtd. 956,405 21,202
ABB India Ltd. 745,183 21,129ManappuramFinance Ltd. 7,575,650 21,085
Oracle FinancialServices SoftwareLtd. 354,606 20,996
Cummins India Ltd. 1,740,975 20,8661 Indian Energy
Exchange Ltd. 2,167,923 20,549Escorts Ltd. 977,252 20,546
* Oberoi Realty Ltd. 1,695,843 20,522NMDC Ltd. 10,672,142 20,482Torrent Power Ltd. 3,031,611 20,285
Shares
MarketValue•
($000)
Varun BeveragesLtd. 1,775,147 20,166
Mahindra &MahindraFinancial ServicesLtd. 8,350,502 20,087
JK Cement Ltd. 420,934 18,667Cyient Ltd. 1,296,742 18,534Emami Ltd. 2,605,892 18,529HoneywellAutomation IndiaLtd. 32,906 18,468
Relaxo FootwearsLtd. 1,029,063 18,319
* Bank of Baroda 13,454,578 17,579Kajaria CeramicsLtd. 1,074,405 17,561
* Adani Power Ltd. 13,042,417 17,501Amara RajaBatteries Ltd. 1,910,039 17,395
Coforge Ltd. 266,470 17,376CarborundumUniversal Ltd. 1,506,567 16,921
Alkem LaboratoriesLtd. 349,447 16,859
Rajesh Exports Ltd. 1,961,684 16,739* Bharat Heavy
Electricals Ltd. 18,062,817 16,513National AluminiumCo. Ltd. 12,660,224 16,448
IIFL Finance Ltd. 3,779,432 16,387CoromandelInternational Ltd. 1,549,524 16,285
Sundram FastenersLtd. 1,436,650 16,064
* GMR InfrastructureLtd. 29,210,360 15,854
* Aditya Birla Fashion& Retail Ltd. 4,441,273 15,639
Gujarat StatePetronet Ltd. 3,804,214 15,547
*,1 RBL Bank Ltd. 6,306,471 15,275Tanla PlatformsLtd. 933,277 15,256
* PVR Ltd. 675,538 15,212* CG Power &
IndustrialSolutions Ltd. 7,744,668 15,193
AIA EngineeringLtd. 589,136 15,116
Radico Khaitan Ltd. 997,518 14,966Apollo Tyres Ltd. 5,218,588 14,887Natco Pharma Ltd. 1,314,482 14,529GlenmarkPharmaceuticalsLtd. 2,118,932 14,275
* Hindustan Zinc Ltd. 3,408,754 14,212* Vodafone Idea Ltd. 108,347,992 13,873
Emerging Markets Stock Index Fund
105

Shares
MarketValue•
($000)
Oil India Ltd. 4,572,161 13,745Pfizer Ltd. 203,626 13,736Kansai NerolacPaints Ltd. 1,875,448 13,687
Hatsun AgroProduct Ltd. 758,301 13,588
Birlasoft Ltd. 2,485,329 13,537Indiabulls HousingFinance Ltd. 4,648,061 13,509
NHPC Ltd. 32,871,073 13,490Castrol India Ltd. 7,209,012 13,328Happiest MindsTechnologies Ltd. 778,179 13,282
Redington IndiaLtd. 6,872,956 13,221
Whirlpool of IndiaLtd. 444,162 13,140
* Aavas FinanciersLtd. 347,966 13,046
* 3M India Ltd. 38,152 12,970Central DepositoryServices IndiaLtd. 711,593 12,893
1 MetropolisHealthcare Ltd. 324,130 12,853
*,1 SyngeneInternational Ltd. 1,738,022 12,569
Polycab India Ltd. 407,106 12,316* Canara Bank 4,260,590 12,250
Exide IndustriesLtd. 5,225,014 12,085
CholamandalamFinancial HoldingsLtd. 1,279,986 11,997
Chambal Fertilizers& Chemicals Ltd. 2,409,688 11,914
Schaeffler IndiaLtd. 120,469 11,907
* Amber EnterprisesIndia Ltd. 268,693 11,869
Sanofi India Ltd. 104,954 11,711Phoenix Mills Ltd. 904,871 11,682
1 Nippon Life IndiaAssetManagement Ltd. 2,070,254 11,584
1 EnduranceTechnologies Ltd. 475,675 11,576
* IDFC Ltd. 15,674,733 11,556City Union BankLtd. 5,099,370 11,482
JB Chemicals &PharmaceuticalsLtd. 511,713 11,476
* Intellect DesignArena Ltd. 1,306,144 11,459
Bayer CropScienceLtd. 169,840 11,328
Shares
MarketValue•
($000)
ZensarTechnologies Ltd. 1,802,817 11,152
* L&T FinanceHoldings Ltd. 10,138,931 11,151
GlaxoSmithKlinePharmaceuticalsLtd. 552,415 11,094
1 IndiaMartInterMesh Ltd. 115,285 11,029
SKF India Ltd. 244,190 10,865KPIT TechnologiesLtd. 2,605,068 10,789
* Dhani Services Ltd. 4,525,516 10,786Can Fin HomesLtd. 1,279,795 10,745
SuvenPharmaceuticalsLtd. 1,577,488 10,734
1 Eris LifesciencesLtd. 976,289 10,732
Sonata SoftwareLtd. 949,083 10,625
* GujaratFluorochemicalsLtd. 434,934 10,566
KEC InternationalLtd. 1,649,456 10,553
FirstsourceSolutions Ltd. 3,955,143 10,478
HindustanAeronautics Ltd. 598,431 10,458
CESC Ltd. 8,939,850 10,4241 Quess Corp. Ltd. 897,150 10,402
Blue Star Ltd. 796,042 10,231Computer AgeManagementServices Ltd. 253,544 10,224
Minda IndustriesLtd. 958,539 10,034
Mahanagar GasLtd. 739,559 9,918
Brigade EnterprisesLtd. 1,590,737 9,872
SterliteTechnologies Ltd. 2,687,200 9,860
Jubilant PharmovaLtd. Class A 1,233,446 9,852
JK LakshmiCement Ltd. 1,171,947 9,651
* Suzlon Energy Ltd. 106,084,880 9,5891 Mindspace
Business ParksREIT 2,166,060 9,456
Balaji Amines Ltd. 199,859 9,257Jubilant IngreviaLtd. 1,027,132 9,204
ZydusWellnes Ltd. 332,929 9,145
Emerging Markets Stock Index Fund
106

Shares
MarketValue•
($000)
1 ICICI SecuritiesLtd. 922,560 9,126
* EID Parry India Ltd. 1,465,134 8,953Linde India Ltd. 288,425 8,896Shriram City UnionFinance Ltd. 306,599 8,882
* Aditya Birla CapitalLtd. 6,833,209 8,849
CRISIL Ltd. 235,028 8,804Orient Electric Ltd. 1,898,504 8,797Prestige EstatesProjects Ltd. 1,538,734 8,784
HFCL Ltd. 9,181,798 8,777SunTV NetworkLtd. 1,144,188 8,596
Ajanta Pharma Ltd. 297,718 8,440Vinati Organics Ltd. 327,472 8,379
*,1 Aster DMHealthcare Ltd. 3,312,190 8,322
Solar IndustriesIndia Ltd. 250,091 8,316
* TeamLeaseServices Ltd. 138,036 8,269
DCM Shriram Ltd. 619,929 8,209Gillette India Ltd. 106,818 8,054India Cements Ltd. 2,915,434 8,043Granules India Ltd. 1,932,825 8,026
* Punjab NationalBank 14,175,800 7,993
Thermax Ltd. 432,538 7,976* Godrej Industries
Ltd. 1,025,254 7,953Lakshmi MachineWorks Ltd. 67,813 7,929
Welspun India Ltd. 4,268,646 7,864Alkyl AminesChemicals 161,398 7,777
* Bajaj ElectricalsLtd. 522,866 7,739
PNC Infratech Ltd. 1,767,969 7,677Finolex IndustriesLtd. 2,602,276 7,662
KEI Industries Ltd. 612,534 7,482Rain Industries Ltd. 2,433,581 7,428Ratnamani Metals&Tubes Ltd. 257,317 7,369
Balrampur ChiniMills Ltd. 1,678,182 7,353
* NarayanaHrudayalaya Ltd. 1,050,546 7,325
* Affle India Ltd. 516,810 7,290Edelweiss FinancialServices Ltd. 6,868,400 7,124
Great EasternShipping Co. Ltd. 1,608,191 6,933
TTK Prestige Ltd. 47,146 6,896Praj Industries Ltd. 1,535,361 6,866
Shares
MarketValue•
($000)
Vaibhav Global Ltd. 890,065 6,854* Indiabulls Real
Estate Ltd. 3,358,082 6,832eClerx ServicesLtd. 233,523 6,819
* WestlifeDevelopment Ltd. 871,989 6,775
Graphite India Ltd. 942,482 6,765SumitomoChemical IndiaLtd. 1,342,393 6,761
* EIH Ltd. 3,629,037 6,748Timken India Ltd. 280,807 6,745AlembicPharmaceuticalsLtd. 637,088 6,623
EPL Ltd. 2,301,513 6,623Century Textiles &Industries Ltd. 619,407 6,479
Motilal OswalFinancial ServicesLtd. 515,866 6,330
Infibeam AvenuesLtd. 10,335,474 6,263
* V-Mart Retail Ltd. 114,492 6,221* Just Dial Ltd. 577,448 6,175
Akzo Nobel IndiaLtd. 218,316 6,131
Indian Bank 2,649,695 6,111Sobha Ltd. 589,426 6,070V-Guard IndustriesLtd. 1,717,490 5,904
HEG Ltd. 212,635 5,860Bombay BurmahTrading Co. 399,774 5,772
NCC Ltd. 6,041,621 5,766Procter & GambleHealth Ltd. 79,145 5,734
Rallis India Ltd. 1,599,947 5,683* IRB Infrastructure
Developers Ltd. 1,849,471 5,6091 Indian Railway
Finance Corp. Ltd. 17,235,377 5,578Finolex Cables Ltd. 884,569 5,535
* Reliance PowerLtd. 29,207,037 5,531
*,1 PNB HousingFinance Ltd. 848,982 5,485
1 Godrej Agrovet Ltd. 687,193 5,460Aegis Logistics Ltd. 1,916,666 5,456Gujarat PipavavPort Ltd. 3,574,853 5,351
*,1 New IndiaAssurance Co.Ltd. 2,606,300 5,314
PTC India Ltd. 3,003,302 5,078KRBL Ltd. 1,307,115 4,949
Emerging Markets Stock Index Fund
107

Shares
MarketValue•
($000)
* Mahindra CIEAutomotive Ltd. 1,370,520 4,894
* Union Bank of India 7,749,795 4,794Strides PharmaScience Ltd. 668,159 4,787
* Alok Industries Ltd. 15,821,397 4,668NBCC India Ltd. 7,751,625 4,642Ceat Ltd. 271,842 4,536
* CreditAccessGrameen Ltd. 531,545 4,466
*,1 General InsuranceCorp. of India 2,498,870 4,456
JM Financial Ltd. 3,770,204 4,438Avanti Feeds Ltd. 592,609 4,419Bajaj ConsumerCare Ltd. 1,406,214 4,358
* Bank of India 5,234,255 4,199GatewayDistriparks Ltd. 1,025,928 3,823
Poly Medicure Ltd. 302,179 3,737* Sun Pharma
AdvancedResearch Co. Ltd. 1,060,355 3,726
Karur Vysya BankLtd. 5,618,887 3,683
* Yes Bank Ltd. 21,002,133 3,6031 Dilip Buildcon Ltd. 440,610 3,542
AstraZenecaPharma India Ltd. 86,982 3,496
Vakrangee Ltd. 7,065,244 3,482Welspun Corp. Ltd. 1,847,989 3,307Jindal Saw Ltd. 2,047,039 3,180Symphony Ltd. 223,751 3,103
* TV18 BroadcastLtd. 5,500,453 3,068
Care Ratings Ltd. 303,379 2,785* Wockhardt Ltd. 475,809 2,718
Equitas HoldingsLtd. 1,536,310 2,671
Karnataka BankLtd. 2,838,570 2,588
WABCO India Ltd. 25,902 2,575* DCB Bank Ltd. 2,053,949 2,501* Mangalore Refinery
& PetrochemicalsLtd. 3,787,344 2,489
Kaveri Seed Co.Ltd. 354,789 2,475
* Raymond Ltd. 387,920 2,377* Future Retail Ltd. 3,649,767 2,350
Multi CommodityExchange of IndiaLtd. 99,264 2,263
* South Indian BankLtd. 16,007,364 2,005
Engineers IndiaLtd. 1,814,572 1,763
Shares
MarketValue•
($000)
* IFCI Ltd. 10,283,312 1,682* Hindustan
Construction Co.Ltd. 9,420,683 1,192
* Future ConsumerLtd. 10,344,782 964
GE Power IndiaLtd. 196,440 761
1 Brookfield IndiaReal Estate Trust 62,713 241
*,3 Amtek Auto Ltd. 472,160 17
16,648,862Indonesia (1.6%)
Bank Central AsiaTbk. PT 663,490,750 350,839
Bank RakyatIndonesia PerseroTbk. PT 894,462,260 268,503
Telkom IndonesiaPersero Tbk. PT 643,628,052 172,033
Bank MandiriPersero Tbk. PT 253,180,575 128,001
Astra InternationalTbk. PT 281,948,081 120,085
Bank NegaraIndonesia PerseroTbk. PT 100,989,676 49,942
Charoen PokphandIndonesia Tbk. PT 102,709,123 45,038
UnitedTractors Tbk.PT 20,360,227 33,869
Kalbe FarmaTbk.PT 265,365,984 29,970
Sarana MenaraNusantara Tbk. PT 349,302,700 28,630
Tower BersamaInfrastructure Tbk.PT 137,414,885 28,543
Indofood SuksesMakmur Tbk. PT 60,935,708 27,352
Semen IndonesiaPersero Tbk. PT 41,484,910 26,657
Unilever IndonesiaTbk. PT 79,039,255 24,673
Barito Pacific Tbk.PT 349,415,650 23,120
Indah Kiat Pulp &Paper Tbk. PT 35,015,168 20,952
Adaro EnergyTbk.PT 170,752,979 20,226
AnekaTambangTbk. 119,416,810 19,762
Indofood CBPSukses MakmurTbk. PT 31,455,547 19,529
IndocementTunggal PrakarsaTbk. PT 19,748,601 16,486
Emerging Markets Stock Index Fund
108

Shares
MarketValue•
($000)
* Perusahaan GasNegara Tbk. PT 150,004,179 15,999
CiputraDevelopment Tbk.PT 196,250,850 14,906
Gudang GaramTbk.PT 6,135,830 14,536
* Pakuwon Jati Tbk.PT 352,471,867 12,475
* SummareconAgungTbk. PT 191,908,908 12,418
* Surya Citra MediaTbk. PT 412,946,655 12,250
Mitra KeluargaKaryasehat Tbk.PT 75,733,300 12,191
Japfa ComfeedIndonesia Tbk. PT 98,273,200 12,004
XL Axiata Tbk. PT 51,370,098 11,186* SmartfrenTelecom
Tbk. PT 1,297,016,500 9,904Bukit AsamTbk. PT 51,050,044 9,662Vale Indonesia Tbk.PT 27,185,247 9,317
Pabrik Kertas TjiwiKimia Tbk. PT 15,775,600 9,297
Ace HardwareIndonesia Tbk. PT 92,891,956 9,257
* Jasa MargaPersero Tbk. PT 30,445,604 9,037
* Bumi SerpongDamai Tbk. PT 114,845,401 9,015
Bank BTPN SyariahTbk. PT 32,837,600 8,831
* Lippo Karawaci Tbk.PT 825,285,488 8,632
Hanjaya MandalaSampoernaTbk.PT 110,141,974 8,059
* Bank RakyatIndonesiaAgroniaga Tbk. PT 52,484,200 7,818
IndoTambangrayaMegahTbk. PT 5,038,680 7,681
BFI FinanceIndonesia Tbk. PT 93,975,300 6,971
Mayora IndahTbk.PT 40,570,500 6,725
AKR CorporindoTbk. PT 22,157,425 6,685
* Indosat Tbk. PT 13,532,700 6,612* Matahari
Department StoreTbk. PT 30,406,367 6,549
* BankTabunganNegara PerseroTbk. PT 50,224,738 6,317
* Mitra AdiperkasaTbk. PT 98,246,126 6,109
Shares
MarketValue•
($000)
* Bank SyariahIndonesia Tbk. PT 40,014,287 5,961
* Bank Bukopin Tbk.PT 177,295,600 5,365
* Medco EnergiInternasional Tbk.PT 123,101,542 4,947
Media NusantaraCitra Tbk. PT 67,013,424 4,262
* TimahTbk. PT 35,634,874 4,006Astra Agro LestariTbk. PT 5,273,013 3,998
PerusahaanPerkebunanLondon SumatraIndonesia Tbk. PT 37,618,295 3,706
* Wijaya KaryaPersero Tbk. PT 41,029,470 3,614
* Waskita KaryaPersero Tbk. PT 55,410,398 3,602
BankPembangunanDaerah JawaBarat Dan BantenTbk. PT 33,538,499 3,375
* Bank Pan IndonesiaTbk. PT 50,780,400 2,830
* Panin Financial Tbk.PT 217,571,731 2,803
* PP Persero Tbk. PT 32,052,095 2,733* Alam Sutera Realty
Tbk. PT 164,634,154 2,118* Ramayana Lestari
Sentosa Tbk. PT 39,045,066 2,040* Krakatau Steel
Persero Tbk. PT 51,028,346 1,894* Surya Semesta
InternusaTbk. PT 51,470,798 1,812* Adhi Karya Persero
Tbk. PT 24,013,406 1,783*,3 Trada Alam Minera
Tbk. PT 487,603,966 1,721* Kresna Graha
InvestamaTbk. PT 181,775,948 1,362* Global Mediacom
Tbk. PT 59,516,703 1,133Bank DanamonIndonesia Tbk. PT 4,776,700 908
* Totalindo EkaPersadaTbk. PT 37,987,296 134
*,3 Sigmagold IntiPerkasa Tbk. PT 14,934,100 53
1,790,813Kuwait (0.8%)
National Bank ofKuwait SAKP 93,169,359 306,349
Kuwait FinanceHouse KSCP 60,802,171 168,043
Emerging Markets Stock Index Fund
109

Shares
MarketValue•
($000)
Ahli United BankBSC 83,472,446 81,196
MobileTelecommunicationsCo. KSCP 28,204,772 55,858
Agility PublicWarehousing Co.KSC 16,735,371 55,619
* Boubyan BankKSCP 13,635,460 35,399
Mabanee Co. KPSC 8,021,484 20,961Gulf Bank KSCP 22,314,068 18,242BoubyanPetrochemicalsCo. KSCP 5,460,427 16,664
Humansoft HoldingCo. KSC 1,333,717 14,793
* National IndustriesGroup HoldingSAK 14,807,998 13,464
* Warba Bank KSCP 12,139,443 11,365QurainPetrochemicalIndustries Co. 7,131,438 8,970
Burgan Bank SAK 9,431,457 7,455* Kuwait
International BankKSCP 7,862,041 5,843
* AlimtiazInvestment GroupKSC 10,182,693 4,562
Kuwait Projects Co.Holding KSCP 7,680,180 3,751
* Integrated HoldingCo. KCSC 2,276,334 2,826
Kuwait Projects Co.Holding KSCPRights 2,511,418 59
831,419Malaysia (2.0%)
Public Bank Bhd. 212,443,590 214,026Malayan BankingBhd. 82,166,612 159,828
Tenaga NasionalBhd. 53,201,451 124,111
CIMB GroupHoldings Bhd. 97,098,108 122,512
PetronasChemicals GroupBhd. 39,072,712 82,043
Press MetalAluminiumHoldings Bhd. 52,286,840 70,280
IHH HealthcareBhd. 41,793,655 65,977
Axiata Group Bhd. 60,887,249 58,180DiGi.Com Bhd. 50,234,133 51,409
Shares
MarketValue•
($000)
Sime DarbyPlantation Bhd. 50,389,179 48,859
Top Glove Corp.Bhd. 73,683,690 48,387
Dialog Group Bhd. 63,784,760 43,617IOI Corp. Bhd. 45,277,790 42,968Maxis Bhd. 37,708,660 42,562PPB Group Bhd. 9,239,260 40,557Genting Bhd. 31,684,024 39,658MISC Bhd. 23,133,296 39,571Hong Leong BankBhd. 8,640,172 39,278
Kuala LumpurKepong Bhd. 6,629,092 34,640
Petronas Gas Bhd. 7,373,863 29,834Inari Amertron Bhd. 31,816,800 29,806Hartalega HoldingsBhd. 20,766,310 29,438
RHB Bank Bhd. 21,197,000 28,601Sime Darby Bhd. 51,080,036 28,036Genting MalaysiaBhd. 34,896,437 26,738
Nestle MalaysiaBhd. 787,357 25,579
* Gamuda Bhd. 31,788,217 24,888Telekom MalaysiaBhd. 16,578,778 23,174
Petronas DaganganBhd. 4,602,907 22,633
* AMMB HoldingsBhd. 26,791,945 21,742
IJM Corp. Bhd. 46,437,134 20,792* Malaysia Airports
Holdings Bhd. 12,532,830 19,601HAP SengConsolidated Bhd. 9,229,200 17,485
QL Resources Bhd. 13,676,630 16,692WestportsHoldings Bhd. 15,254,501 16,472
My EG ServicesBhd. 62,282,900 15,669
TIME dotCom Bhd. 13,922,700 15,191Bursa MalaysiaBhd. 7,628,300 13,826
Frontken Corp.Bhd. 14,956,450 13,801
Hong LeongFinancial GroupBhd. 3,049,141 13,510
Malaysian PacificIndustries Bhd. 1,156,300 13,337
VS Industry Bhd. 34,854,900 13,3191 MR DIY Group M
Bhd. 13,568,100 12,367D&O GreenTechnologies Bhd. 8,708,500 11,885
Pentamaster Corp.Bhd. 8,762,050 11,356
Emerging Markets Stock Index Fund
110

Shares
MarketValue•
($000)
Carlsberg BreweryMalaysia Bhd. 2,045,200 10,956
Alliance BankMalaysia Bhd. 16,102,717 10,691
Heineken MalaysiaBhd. 1,890,200 10,501
Supermax Corp.Bhd. 22,647,512 10,495
Kossan RubberIndustries Bhd. 18,289,400 10,444
IGB REIT 24,630,470 9,991Sunway Bhd. 22,030,245 9,478Yinson HoldingsBhd. 6,667,900 9,427
KPJ HealthcareBhd. 32,898,600 9,048
YTL Corp. Bhd. 58,893,950 8,967Sunway REIT 24,876,900 8,786Scientex Bhd. 7,777,200 8,761Fraser & NeaveHoldings Bhd. 1,329,500 8,703
Sime DarbyProperty Bhd. 49,532,542 8,681
ViTrox Corp. Bhd. 1,791,604 8,511Genting PlantationsBhd. 4,579,200 8,075
IOI PropertiesGroup Bhd. 25,410,680 7,867
British AmericanTobacco MalaysiaBhd. 1,929,034 7,041
Axis REIT 15,251,500 7,037Malakoff Corp.Bhd. 34,285,300 6,705
* SP Setia Bhd.Group 17,561,845 6,611
Berjaya Sports TotoBhd. 11,568,943 5,812
UWC Bhd. 3,870,100 5,757* AirAsia Group Bhd. 20,384,358 5,722
Mega First Corp.Bhd. 6,492,100 5,649
* Bumi Armada Bhd. 45,234,728 5,552Magnum Bhd. 10,469,155 5,459Astro MalaysiaHoldings Bhd. 21,222,673 5,107
1 Lotte ChemicalTitan HoldingBhd. 7,770,147 5,107
DRB-Hicom Bhd. 12,096,400 4,820AEON CreditService M Bhd. 1,407,100 4,758
Malaysia BuildingSociety Bhd. 29,435,100 4,555
Padini HoldingsBhd. 4,938,237 3,746
* Sapura EnergyBhd. 144,428,622 3,497
Shares
MarketValue•
($000)
Bermaz Auto Bhd. 8,565,500 3,349Syarikat TakafulMalaysia KeluargaBhd. 3,375,300 3,237
MalaysianResources Corp.Bhd. 29,404,100 2,915
* Berjaya Corp. Bhd. 46,389,396 2,857Leong HupInternational Bhd. 16,617,600 2,626
Cahya MataSarawak Bhd. 7,274,600 2,517
FGV Holdings Bhd. 5,597,000 2,030* Velesto Energy
Bhd. 50,233,127 1,938UMW HoldingsBhd. 2,271,600 1,870
* WCT Holdings Bhd. 11,980,664 1,7983 Serba Dinamik
Holdings Bhd. 20,562,438 1,733* UEM Sunrise Bhd. 17,439,200 1,664
YTL PowerInternational Bhd. 5,983,067 1,019
* Sunway Bhd.Warrants Exp.10/3/24 3,473,743 373
* Velesto EnergyBhd.WarrantsExp. 10/18/24 20,487,189 322
*,3 Serba DinamikHoldings Bhd.Warrants Exp.12/5/24 4,443,960 75
* MalaysianResources Corp.Bhd.WarrantsExp. 10/29/27 3,624,441 74
2,166,949Mexico (2.2%)
America Movil SABde CV 407,822,035 363,490
Grupo FinancieroBanorte SAB deCV 39,651,898 251,050
Wal-Mart deMexico SAB deCV 71,279,137 248,618
FomentoEconomicoMexicano SAB deCV 25,073,710 206,138
Grupo Mexico SABde CV Class B 43,439,543 190,570
* Cemex SAB de CV 203,625,617 130,950Grupo Bimbo SABde CV Class A 30,927,742 91,545
GrupoTelevisa SAB 32,431,411 65,846
Emerging Markets Stock Index Fund
111

Shares
MarketValue•
($000)
Grupo Elektra SABde CV 810,897 62,269
* GrupoAeroportuario delPacifico SAB deCV Class B 4,939,158 62,263
GrupoAeroportuario delSureste SAB deCV Class B 2,779,616 56,055
Fibra UnoAdministracion SAde CV 41,386,202 41,129
Coca-Cola FemsaSAB de CV 7,217,659 38,896
Orbia AdvanceCorp. SAB de CV 14,404,875 37,440
Arca ContinentalSAB de CV 6,097,015 37,175
Gruma SAB de CVClass B 2,808,287 32,976
* Grupo FinancieroInbursa SAB deCV 28,024,161 28,136
* GrupoAeroportuario delCentro Norte SABde CV Class B 3,892,668 23,489
* Industrias PenolesSAB de CV 1,757,722 22,538
Grupo Carso SABde CV 6,632,942 22,311
Promotora yOperadora deInfraestructuraSAB de CV 3,010,884 22,141
* Controladora VuelaCia de AviacionSAB de CVClass A 11,023,204 20,051
Kimberly-Clark deMexico SAB deCV Class A 12,294,262 19,449
Alfa SAB de CVClass A 25,472,311 18,447
1 Banco del Bajio SA 9,812,018 18,420Becle SAB de CV 7,662,418 17,515GCC SAB de CV 2,343,407 17,432Regional SAB deCV 3,256,808 17,036
PLAAdministradoraIndustrial S de RLde CV 12,001,254 16,812
Telesites SAB deCV 18,024,867 16,442
Corp. InmobiliariaVesta SAB de CV 8,702,312 15,149
* Alsea SAB de CV 7,167,217 15,046
Shares
MarketValue•
($000)
Prologis PropertyMexico SA de CV 6,204,927 14,283
Grupo ComercialChedraui SA deCV 6,948,208 13,702
Bolsa Mexicana deValores SAB deCV 7,079,575 13,562
La Comer SAB deCV 7,440,831 13,423
1 Macquarie MexicoReal EstateManagement SAde CV 10,716,347 12,784
El Puerto deLiverpool SAB deCV 2,782,339 12,310
QualitasControladora SABde CV 2,520,252 11,675
*,1 GrupoTraxion SABde CV 6,451,523 11,159
* Genomma LabInternacional SABde CV Class B 11,533,851 11,036
MegacableHoldings SAB deCV 3,497,713 10,306
Banco SantanderMexico SAInstitucion deBanca MultipleGrupo FinancieroSantand 7,491,854 9,541
* Gentera SAB de CV 14,201,144 8,498Industrias BachocoSAB de CVClass B 2,266,241 8,038
*,1 Nemak SAB de CV 29,179,252 6,732Alpek SAB de CVClass A 5,055,420 5,535
Grupo Herdez SABde CV 2,994,827 5,507
* Unifin FinancieraSAB de CV 2,787,008 4,280
* Axtel SAB de CV 18,070,586 4,108ConcentradoraFibra Danhos SAde CV 3,159,946 3,819
* Grupo RotoplasSAB de CV 2,433,945 3,361
* Credito Real SABde CV SOFOM ER 3,237,767 1,631
*,3 Empresas ICA SABde CV 104,678 8
2,412,122Pakistan (0.1%)
* Lucky Cement Ltd. 2,661,202 12,029
Emerging Markets Stock Index Fund
112
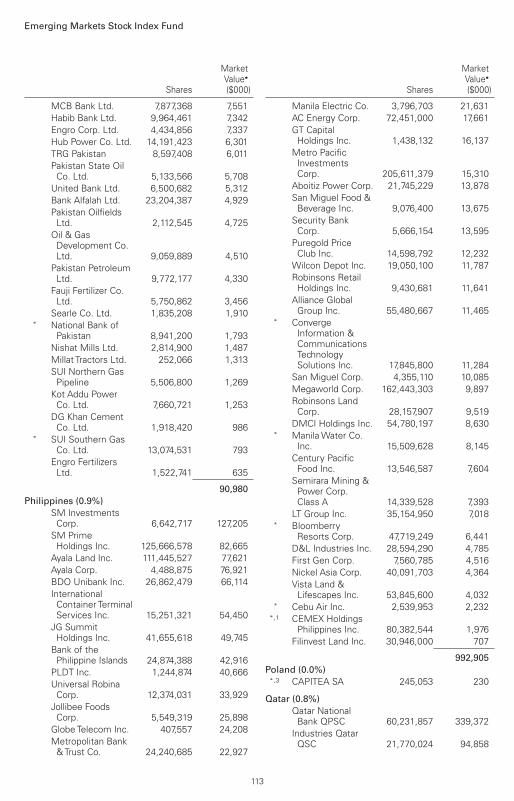
Shares
MarketValue•
($000)
MCB Bank Ltd. 7,877,368 7,551Habib Bank Ltd. 9,964,461 7,342Engro Corp. Ltd. 4,434,856 7,337Hub Power Co. Ltd. 14,191,423 6,301TRG Pakistan 8,597,408 6,011Pakistan State OilCo. Ltd. 5,133,566 5,708
United Bank Ltd. 6,500,682 5,312Bank Alfalah Ltd. 23,204,387 4,929Pakistan OilfieldsLtd. 2,112,545 4,725
Oil & GasDevelopment Co.Ltd. 9,059,889 4,510
Pakistan PetroleumLtd. 9,772,177 4,330
Fauji Fertilizer Co.Ltd. 5,750,862 3,456
Searle Co. Ltd. 1,835,208 1,910* National Bank of
Pakistan 8,941,200 1,793Nishat Mills Ltd. 2,814,900 1,487Millat Tractors Ltd. 252,066 1,313SUI Northern GasPipeline 5,506,800 1,269
Kot Addu PowerCo. Ltd. 7,660,721 1,253
DG Khan CementCo. Ltd. 1,918,420 986
* SUI Southern GasCo. Ltd. 13,074,531 793
Engro FertilizersLtd. 1,522,741 635
90,980Philippines (0.9%)
SM InvestmentsCorp. 6,642,717 127,205
SM PrimeHoldings Inc. 125,666,578 82,665
Ayala Land Inc. 111,445,527 77,621Ayala Corp. 4,488,875 76,921BDO Unibank Inc. 26,862,479 66,114InternationalContainer TerminalServices Inc. 15,251,321 54,450
JG SummitHoldings Inc. 41,655,618 49,745
Bank of thePhilippine Islands 24,874,388 42,916
PLDT Inc. 1,244,874 40,666Universal RobinaCorp. 12,374,031 33,929
Jollibee FoodsCorp. 5,549,319 25,898
GlobeTelecom Inc. 407,557 24,208Metropolitan Bank&Trust Co. 24,240,685 22,927
Shares
MarketValue•
($000)
Manila Electric Co. 3,796,703 21,631AC Energy Corp. 72,451,000 17,661GT CapitalHoldings Inc. 1,438,132 16,137
Metro PacificInvestmentsCorp. 205,611,379 15,310
Aboitiz Power Corp. 21,745,229 13,878San Miguel Food &Beverage Inc. 9,076,400 13,675
Security BankCorp. 5,666,154 13,595
Puregold PriceClub Inc. 14,598,792 12,232
Wilcon Depot Inc. 19,050,100 11,787Robinsons RetailHoldings Inc. 9,430,681 11,641
Alliance GlobalGroup Inc. 55,480,667 11,465
* ConvergeInformation &CommunicationsTechnologySolutions Inc. 17,845,800 11,284
San Miguel Corp. 4,355,110 10,085Megaworld Corp. 162,443,303 9,897Robinsons LandCorp. 28,157,907 9,519
DMCI Holdings Inc. 54,780,197 8,630* ManilaWater Co.
Inc. 15,509,628 8,145Century PacificFood Inc. 13,546,587 7,604
Semirara Mining &Power Corp.Class A 14,339,528 7,393
LT Group Inc. 35,154,950 7,018* Bloomberry
Resorts Corp. 47,719,249 6,441D&L Industries Inc. 28,594,290 4,785First Gen Corp. 7,560,785 4,516Nickel Asia Corp. 40,091,703 4,364Vista Land &Lifescapes Inc. 53,845,600 4,032
* Cebu Air Inc. 2,539,953 2,232*,1 CEMEX Holdings
Philippines Inc. 80,382,544 1,976Filinvest Land Inc. 30,946,000 707
992,905Poland (0.0%)*,3 CAPITEA SA 245,053 230
Qatar (0.8%)Qatar NationalBank QPSC 60,231,857 339,372
Industries QatarQSC 21,770,024 94,858
Emerging Markets Stock Index Fund
113

Shares
MarketValue•
($000)
Qatar Islamic BankSAQ 15,615,788 79,060
Masraf Al RayanQSC 50,421,570 66,104
Commercial BankPSQC 27,481,559 46,208
MesaieedPetrochemicalHolding Co. 60,212,962 39,781
Qatar GasTransportCo. Ltd. 37,242,771 33,307
Qatar Fuel QSC 6,514,976 32,912Qatar Electricity &Water Co. QSC 6,498,770 30,035
Qatar InternationalIslamic Bank QSC 10,221,004 27,477
Ooredoo QPSC 11,960,972 22,774Barwa Real EstateCo. 25,999,917 22,542
Qatar AluminumManufacturing Co. 37,884,977 19,784
Doha Bank QPSC 20,611,978 16,313* Qatar Insurance
Co. SAQ 23,058,085 15,563UnitedDevelopment Co.QSC 24,513,420 10,480
Vodafone QatarQSC 20,862,055 9,284
* Ezdan HoldingGroup QSC 21,378,331 9,092
Al MeeraConsumer GoodsCo. QSC 1,342,490 7,223
* Gulf InternationalServices QSC 13,399,528 6,779
Medicare Group 1,907,307 4,437
933,385Romania (0.1%)
BancaTransilvaniaSA 61,551,017 36,126
OMV Petrom SA 123,069,302 14,186SocietateaNationalaNuclearelectricaSA 535,004 5,392
Teraplast SA 10,497,795 2,673
58,377Russia (3.4%)
Gazprom PJSC 144,264,229 710,838Sberbank of RussiaPJSC 140,548,532 707,071
LUKOIL PJSC 5,244,044 535,165Novatek PJSC 10,258,967 260,490MMC NorilskNickel PJSC 380,327 118,726
Novatek PJSC GDR 439,304 111,526
Shares
MarketValue•
($000)
MMC NorilskNickel PJSC ADR 2,836,366 88,639
Tatneft PJSC ADR 1,881,548 86,045Tatneft PJSC 10,152,380 77,579Rosneft Oil Co.PJSC GDR 8,504,243 75,713
Rosneft Oil Co.PJSC 7,499,415 67,375
SurgutneftegasPJSC PreferenceShares 110,965,123 60,446
Alrosa PJSC 34,056,240 60,127Magnit PJSC GDR 3,182,533 58,964MobileTeleSystemsPJSC ADR 6,119,116 56,235
Severstal PAO 2,401,603 54,579Polyus PJSC GDR 523,471 51,751VTB Bank PJSC 68,488,233,072 51,159Moscow ExchangeMICEX-RTS PJSC 20,660,968 50,715
Transneft PJSCPreference Shares 21,982 47,173
Novolipetsk SteelPJSC GDR 1,189,254 37,584
* United Co. RUSALInternational PJSC 35,496,710 36,058
PhosAgro PJSCGDR 1,451,373 34,723
Inter RAO UESPJSC 497,967,170 33,758
Magnit PJSC 326,590 29,805Magnitogorsk Iron& SteelWorksPJSC 28,533,947 26,664
2 SurgutneftegasPJSC ADR 5,447,865 26,022
Polyus PJSC 117,468 23,279SurgutneftegasPJSC 41,925,149 20,173
RusHydro PJSC 1,657,671,418 19,025* Credit Bank of
Moscow PJSC 176,163,100 17,780Rostelecom PJSC 11,792,928 15,508
1 Detsky Mir PJSC 7,640,251 14,768Sistema PJSFCGDR 1,934,593 14,669
Novolipetsk SteelPJSC 4,261,817 13,454
* Aeroflot PJSC 13,666,219 13,259Federal Grid Co.Unified EnergySystem PJSC 4,151,604,717 10,867
ROSSETI PJSC 442,793,584 8,701Samolet Group 106,994 7,414Unipro PJSC 175,999,198 6,776
* Mechel PJSC 2,989,465 6,153
Emerging Markets Stock Index Fund
114

Shares
MarketValue•
($000)
Tatneft PJSCPreference Shares 855,515 5,890
Raspadskaya OJSC 910,080 5,541Severstal PAO GDR 206,805 4,728Bashneft PJSCPreference Shares 290,151 4,681
Mosenergo PJSC 135,072,554 4,276Rosseti LenenergoPJSC PreferenceShares 1,549,766 3,848
Sovcomflot PJSC 3,140,632 3,776Mechel PJSCPreference Shares 899,940 3,766
LSR Group PJSCClass A 322,692 3,392
M.Video PJSC 386,160 3,213OGK-2 PJSC 302,841,880 2,992TGC-1 PJSC 10,414,590,345 1,633
* ENEL RUSSIAPJSC 126,293,000 1,531
* Mechel PJSC ADR 164,675 692PhosAgro PJSC 4,808 380Bank St.Petersburg PJSC 248,146 318
NovorossiyskCommercial SeaPort PJSC 1,163,450 127
IDGC of Centre &Volga RegionPJSC 21,532,404 81
Cherkizovo GroupPJSC 729 36
3,797,657Saudi Arabia (3.6%)
Al Rajhi Bank 16,753,231 619,760Saudi NationalBank 30,019,060 526,976
1 Saudi Arabian OilCo. 34,731,464 349,652
Saudi BasicIndustries Corp. 9,261,759 319,220
Saudi Telecom Co. 6,545,486 204,472Riyad Bank 16,602,330 130,707
* Saudi ArabianMining Co. 5,545,486 120,905
SABICAgri-Nutrients Co. 2,578,748 113,150
Saudi British Bank 12,196,283 107,782Alinma Bank 13,622,321 91,462Banque SaudiFransi 8,012,464 90,187
Saudi ElectricityCo. 10,895,146 82,885
Yanbu NationalPetrochemical Co. 3,035,363 61,675
Shares
MarketValue•
($000)
SaharaInternationalPetrochemical Co. 5,064,161 59,469
* Saudi KayanPetrochemical Co. 10,566,590 57,521
* Bank AlBilad 5,052,010 56,904Dr Sulaiman AlHabib MedicalServices GroupCo. 1,181,392 52,264
Almarai Co. JSC 3,435,479 48,443Arab National Bank 7,593,226 46,653Jarir Marketing Co. 809,543 43,779Etihad Etisalat Co. 5,046,019 40,682Savola Group 3,511,964 34,259Saudi IndustrialInvestment Group 3,199,904 32,343
* NationalIndustrializationCo. 4,745,044 31,583
Bupa Arabia forCooperativeInsurance Co. 795,435 30,701
AdvancedPetrochemical Co. 1,527,134 30,347
Bank Al-Jazira 5,563,459 28,520Mouwasat MedicalServices Co. 576,770 27,727
* Rabigh Refining &Petrochemical Co. 2,993,301 22,826
NationalPetrochemical Co. 1,734,536 22,291
* MobileTelecommunicationsCo. Saudi Arabia 5,904,833 21,373
* Emaar EconomicCity 6,072,588 20,541
* Saudi Research &Media Group 437,649 19,724
* International Co.ForWater &Power Projects 1,002,983 19,092
Southern ProvinceCement Co. 983,741 18,767
Abdullah Al OthaimMarkets Co. 603,171 18,591
Co. for CooperativeInsurance 796,397 18,284
* Dar Al Arkan RealEstateDevelopment Co. 6,047,664 15,961
* Arabian Internet &CommunicationsServices Co. 296,228 15,748
Arabian CentresCo. Ltd. 2,298,088 15,645
United ElectronicsCo. 411,678 15,461
Emerging Markets Stock Index Fund
115

Shares
MarketValue•
($000)
Saudi Cement Co. 927,435 14,650* Saudi Airlines
Catering Co. 557,061 14,118Qassim CementCo. 602,483 13,093
* Saudi GroundServices Co. 1,212,772 12,052
* Seera GroupHolding 1,943,651 11,993
Yanbu Cement Co. 1,134,868 11,609* Yamama Cement
Co. 1,428,750 10,551BinDawoodHolding Co. 371,772 10,335
Aldrees Petroleum&TransportServices Co. 504,340 9,948
Saudia Dairy &Foodstuff Co. 218,489 9,567
Dallah HealthcareCo. 487,374 9,443
SaudiPharmaceuticalIndustries &MedicalAppliances Corp. 817,122 9,345
Al Hammadi Co. forDevelopment &Investment 820,416 9,263
Leejam Sports Co.JSC 302,826 9,165
Saudi Ceramic Co. 600,852 8,722Eastern ProvinceCement Co. 610,308 7,801
National Gas &IndustrializationCo. 465,005 7,320
Jadwa REIT SaudiFund 1,824,211 7,104
* Saudi Real EstateCo. 1,168,835 6,964
Arabian CementCo. 665,600 6,925
* National AgricultureDevelopment Co. 701,651 6,640
United InternationalTransportation Co. 476,695 6,393
City Cement Co. 989,247 6,388* Saudi Public
Transport Co. 911,818 5,873Najran Cement Co. 1,165,955 5,869ArriyadhDevelopment Co. 825,510 5,858
Astra IndustrialGroup 491,756 5,660
Northern RegionCement Co. 1,425,266 5,653
Shares
MarketValue•
($000)
Saudi Chemical Co.Holding 550,457 5,565
* Aseer TradingTourism &Manufacturing Co. 844,387 5,132
National MedicalCare Co. 303,331 4,923
Bawan Co. 445,710 4,713Herfy FoodServices Co. 266,997 4,664
* Fawaz Abdulaziz AlHokair & Co. 906,592 4,649
* Dur Hospitality Co. 458,183 4,367* Zamil Industrial
Investment Co. 459,729 4,346* Methanol
Chemicals Co. 424,890 4,031* Middle East
Healthcare Co. 386,483 3,832* Al Jouf Cement Co. 1,049,330 3,357* Tabuk Cement Co. 643,569 3,264* Mediterranean &
Gulf Insurance &Reinsurance Co. 439,347 2,731
* Abdul MohsenAl-Hokair Tourism& DevelopmentCo. 454,560 2,684
Hail Cement Co. 511,027 2,014
3,992,906South Africa (3.7%)
Naspers Ltd. 2,901,815 491,433FirstRand Ltd. 67,491,316 256,378
* MTN Group Ltd. 24,633,198 220,889Standard BankGroup Ltd. 17,522,931 155,278
Impala PlatinumHoldings Ltd. 11,090,043 143,531
2 Sibanye StillwaterLtd. 39,763,406 139,162
* Sasol Ltd. 7,640,973 128,338Capitec BankHoldings Ltd. 1,135,608 126,867
Gold Fields Ltd. 11,985,071 111,368AngloGold AshantiLtd. 5,742,605 105,944
2 Bid Corp. Ltd. 4,630,159 99,239Sanlam Ltd. 24,116,864 99,061Absa Group Ltd. 9,610,897 87,917Aspen PharmacareHoldings Ltd. 5,355,569 85,082
Anglo AmericanPlatinum Ltd. 816,791 82,757
Shoprite HoldingsLtd. 6,815,959 80,901
* Northam PlatinumHoldings Ltd. 4,772,937 71,477
Emerging Markets Stock Index Fund
116
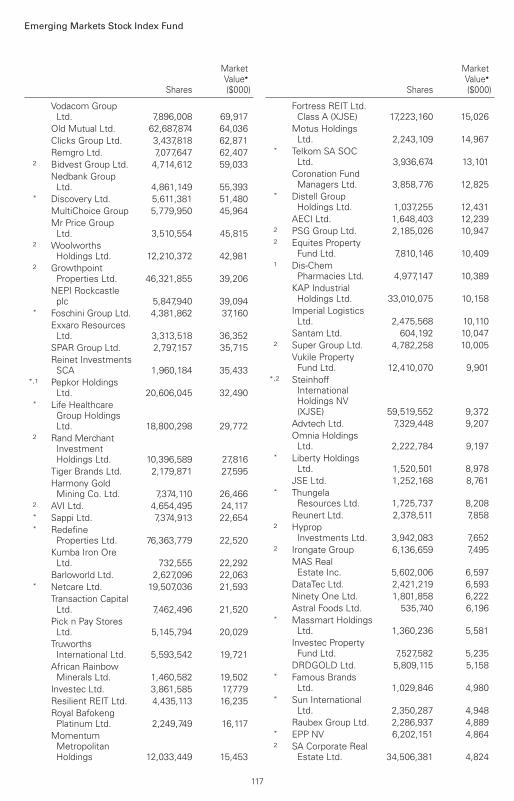
Shares
MarketValue•
($000)
Vodacom GroupLtd. 7,896,008 69,917
Old Mutual Ltd. 62,687,874 64,036Clicks Group Ltd. 3,437,818 62,871Remgro Ltd. 7,077,647 62,407
2 Bidvest Group Ltd. 4,714,612 59,033Nedbank GroupLtd. 4,861,149 55,393
* Discovery Ltd. 5,611,381 51,480MultiChoice Group 5,779,950 45,964Mr Price GroupLtd. 3,510,554 45,815
2 WoolworthsHoldings Ltd. 12,210,372 42,981
2 GrowthpointProperties Ltd. 46,321,855 39,206
NEPI Rockcastleplc 5,847,940 39,094
* Foschini Group Ltd. 4,381,862 37,160Exxaro ResourcesLtd. 3,313,518 36,352
SPAR Group Ltd. 2,797,157 35,715Reinet InvestmentsSCA 1,960,184 35,433
*,1 Pepkor HoldingsLtd. 20,606,045 32,490
* Life HealthcareGroup HoldingsLtd. 18,800,298 29,772
2 Rand MerchantInvestmentHoldings Ltd. 10,396,589 27,816
Tiger Brands Ltd. 2,179,871 27,595Harmony GoldMining Co. Ltd. 7,374,110 26,466
2 AVI Ltd. 4,654,495 24,117* Sappi Ltd. 7,374,913 22,654* Redefine
Properties Ltd. 76,363,779 22,520Kumba Iron OreLtd. 732,555 22,292
Barloworld Ltd. 2,627,096 22,063* Netcare Ltd. 19,507,036 21,593
Transaction CapitalLtd. 7,462,496 21,520
Pick n Pay StoresLtd. 5,145,794 20,029
TruworthsInternational Ltd. 5,593,542 19,721
African RainbowMinerals Ltd. 1,460,582 19,502
Investec Ltd. 3,861,585 17,779Resilient REIT Ltd. 4,435,113 16,235Royal BafokengPlatinum Ltd. 2,249,749 16,117
MomentumMetropolitanHoldings 12,033,449 15,453
Shares
MarketValue•
($000)
Fortress REIT Ltd.Class A (XJSE) 17,223,160 15,026
Motus HoldingsLtd. 2,243,109 14,967
* Telkom SA SOCLtd. 3,936,674 13,101
Coronation FundManagers Ltd. 3,858,776 12,825
* Distell GroupHoldings Ltd. 1,037,255 12,431
AECI Ltd. 1,648,403 12,2392 PSG Group Ltd. 2,185,026 10,9472 Equites Property
Fund Ltd. 7,810,146 10,4091 Dis-Chem
Pharmacies Ltd. 4,977,147 10,389KAP IndustrialHoldings Ltd. 33,010,075 10,158
Imperial LogisticsLtd. 2,475,568 10,110
Santam Ltd. 604,192 10,0472 Super Group Ltd. 4,782,258 10,005
Vukile PropertyFund Ltd. 12,410,070 9,901
*,2 SteinhoffInternationalHoldings NV(XJSE) 59,519,552 9,372
Advtech Ltd. 7,329,448 9,207Omnia HoldingsLtd. 2,222,784 9,197
* Liberty HoldingsLtd. 1,520,501 8,978
JSE Ltd. 1,252,168 8,761* Thungela
Resources Ltd. 1,725,737 8,208Reunert Ltd. 2,378,511 7,858
2 HypropInvestments Ltd. 3,942,083 7,652
2 Irongate Group 6,136,659 7,495MAS RealEstate Inc. 5,602,006 6,597
DataTec Ltd. 2,421,219 6,593Ninety One Ltd. 1,801,858 6,222Astral Foods Ltd. 535,740 6,196
* Massmart HoldingsLtd. 1,360,236 5,581
Investec PropertyFund Ltd. 7,527,582 5,235
DRDGOLD Ltd. 5,809,115 5,158* Famous Brands
Ltd. 1,029,846 4,980* Sun International
Ltd. 2,350,287 4,948Raubex Group Ltd. 2,286,937 4,889
* EPP NV 6,202,151 4,8642 SA Corporate Real
Estate Ltd. 34,506,381 4,824
Emerging Markets Stock Index Fund
117

Shares
MarketValue•
($000)
Cashbuild Ltd. 271,351 4,735* Tsogo Sun Gaming
Ltd. 5,730,043 4,624Wilson BaylyHolmes-OvconLtd. 615,686 4,280
* Attacq Ltd. 9,912,267 4,229* Long4Life Ltd. 10,499,295 4,120
Hudaco IndustriesLtd. 383,847 3,452
* Blue LabelTelecoms Ltd. 8,442,071 3,065
*,2 Brait plc 10,744,448 2,997* Hosken
ConsolidatedInvestments Ltd. 622,421 2,943
* Curro Holdings Ltd. 3,526,773 2,846Zeder InvestmentsLtd. 13,001,432 2,700
Altron Ltd. Class A 3,383,202 2,430Alexander ForbesGroup HoldingsLtd. 8,424,381 2,415
* Fortress REIT Ltd.Class B (XJSE) 12,883,024 2,067
Emira PropertyFund Ltd. 3,150,782 1,942
Adcock IngramHoldings Ltd. 125,714 402
* SteinhoffInternationalHoldings NV(XETR) 1,075,902 170
4,049,000Taiwan (18.0%)
TaiwanSemiconductorManufacturing Co.Ltd. 256,043,285 5,433,318
TaiwanSemiconductorManufacturing Co.Ltd. ADR 14,728,753 1,674,659
MediaTek Inc. 20,274,630 667,293Hon Hai PrecisionIndustry Co. Ltd. 163,687,761 631,890
Fubon FinancialHolding Co. Ltd. 114,569,033 302,855
DeltaElectronics Inc. 29,770,356 262,794
Formosa PlasticsCorp. 66,746,057 258,538
NanYa PlasticsCorp. 77,353,819 237,388
Cathay FinancialHolding Co. Ltd. 113,472,826 236,533
CTBC FinancialHolding Co. Ltd. 250,284,062 209,002
Shares
MarketValue•
($000)
UnitedMicroelectronicsCorp. 99,621,270 206,811
China Steel Corp. 168,765,308 203,473Mega FinancialHolding Co. Ltd. 149,319,503 179,443
Chailease HoldingCo. Ltd. 18,303,096 175,299
ASETechnologyHolding Co. Ltd. 47,121,723 168,555
E.Sun FinancialHolding Co. Ltd. 174,332,816 166,579
Uni-PresidentEnterprises Corp. 65,919,868 158,137
Yuanta FinancialHolding Co. Ltd. 160,423,210 142,597
Silergy Corp. 842,890 139,250Formosa Chemicals& Fibre Corp. 46,509,449 134,956
Taiwan CementCorp. 72,162,753 125,219
AsustekComputer Inc. 9,777,937 124,315
2 UnitedMicroelectronicsCorp. ADR 12,023,058 123,477
UnimicronTechnology Corp. 17,798,979 122,009
ChunghwaTelecomCo. Ltd. 30,498,663 121,026
RealtekSemiconductorCorp. 6,519,959 117,279
First FinancialHolding Co. Ltd. 139,850,513 115,141
Taiwan CooperativeFinancial HoldingCo. Ltd. 132,939,992 108,090
Largan PrecisionCo. Ltd. 1,404,076 104,631
QuantaComputer Inc. 36,445,200 102,393
Evergreen MarineCorp. Taiwan Ltd. 28,452,897 102,393
Yageo Corp. 6,384,169 99,923Hua Nan FinancialHoldings Co. Ltd. 134,360,790 98,384
Taishin FinancialHolding Co. Ltd. 148,791,135 97,681
China DevelopmentFinancial HoldingCorp. 190,353,653 97,295
Hotai Motor Co.Ltd. 4,341,154 95,593
NovatekMicroelectronicsCorp. 5,738,560 86,072
ChunghwaTelecomCo. Ltd. ADR 2,038,730 80,530
Emerging Markets Stock Index Fund
118

Shares
MarketValue•
($000)
Globalwafers Co.Ltd. 2,887,810 79,236
* Yang Ming MarineTransport Corp. 22,604,725 78,909
eMemoryTechnology Inc. 941,100 78,173
President ChainStore Corp. 7,666,449 77,485
Taiwan Mobile Co.Ltd. 21,659,941 76,399
Advantech Co. Ltd. 5,694,361 74,471SinoPac FinancialHoldings Co. Ltd. 144,161,618 73,420
Innolux Corp. 119,177,372 71,689WinSemiconductorsCorp. 5,552,519 71,663
ShanghaiCommercial &Savings Bank Ltd. 44,775,350 70,909
AU Optronics Corp. 101,720,549 69,905Pegatron Corp. 27,780,213 68,007FormosaPetrochemicalCorp. 18,675,977 67,239
Lite-OnTechnologyCorp. 29,489,084 65,076
AcctonTechnologyCorp. 7,332,610 64,108
VanguardInternationalSemiconductorCorp. 12,268,640 63,929
Wan Hai Lines Ltd. 10,999,606 63,458Airtac InternationalGroup 2,100,830 62,861
Shin Kong FinancialHolding Co. Ltd. 172,486,288 60,790
ParadeTechnologies Ltd. 943,290 60,766
Eclat Textile Co.Ltd. 2,712,209 59,270
Catcher TechnologyCo. Ltd. 9,932,956 57,595
Far Eastern NewCentury Corp. 53,979,963 56,536
RuentexDevelopment Co.Ltd. 21,848,778 55,761
momo.com Inc. 851,600 54,877Asia Cement Corp. 32,939,510 52,465Chang HwaCommercial BankLtd. 88,277,373 52,129
Sino-AmericanSiliconProducts Inc. 7,457,742 51,083
Shares
MarketValue•
($000)
CompalElectronics Inc. 57,669,900 50,753
NanYa PrintedCircuit BoardCorp. 2,849,521 50,420
GiantManufacturing Co.Ltd. 4,234,423 49,180
Micro-StarInternational Co.Ltd. 9,635,200 48,624
FengTAYEnterprise Co.Ltd. 6,044,132 47,030
ASPEEDTechnology Inc. 458,010 45,945
Far EasToneTelecommunicationsCo. Ltd. 20,746,035 45,650
Pou Chen Corp. 36,732,021 45,049Hiwin TechnologiesCorp. 3,759,313 41,863
E Ink Holdings Inc. 12,587,440 41,730Wistron Corp. 38,820,535 40,798Walsin Lihwa Corp. 43,625,405 40,753Voltronic PowerTechnology Corp. 694,325 40,663
Inventec Corp. 41,505,966 39,697WinbondElectronics Corp. 41,369,452 39,224
* Oneness BiotechCo. Ltd. 4,039,000 38,124
FoxconnTechnology Co.Ltd. 15,334,663 38,075
* Walsin TechnologyCorp. 6,987,521 38,040
Acer Inc. 40,339,897 37,757WPG Holdings Ltd. 19,983,720 37,332Wiwynn Corp. 1,137,280 36,433Chroma ATE Inc. 5,565,280 36,343Elite Material Co.Ltd. 4,185,156 36,245
SynnexTechnologyInternational Corp. 18,430,800 35,711
MacronixInternational Co.Ltd. 25,136,737 35,565
Merida IndustryCo. Ltd. 3,354,526 34,942
Alchip TechnologiesLtd. 923,463 34,302
KinsusInterconnectTechnology Corp. 3,803,530 33,473
* TA Chen StainlessPipe 20,519,775 32,470
Emerging Markets Stock Index Fund
119

Shares
MarketValue•
($000)
PowertechTechnology Inc. 9,054,550 31,771
Cheng Shin RubberIndustry Co. Ltd. 25,843,095 31,718
AP MemoryTechnology Corp. 1,600,120 31,128
ASMediaTechnology Inc. 528,857 30,998
Zhen DingTechnologyHolding Ltd. 8,867,710 30,709
Phison ElectronicsCorp. 2,150,080 30,317
Lien Hwa IndustrialHoldings Corp. 15,070,970 30,263
Ruentex IndustriesLtd. 7,724,068 30,141
Taiwan High SpeedRail Corp. 28,254,912 29,526
China LifeInsurance Co. Ltd. 28,026,063 29,295
TripodTechnologyCorp. 6,781,040 28,721
GigabyteTechnology Co.Ltd. 6,908,850 28,055
Teco Electric &Machinery Co.Ltd. 25,110,320 27,276
Taiwan FertilizerCo. Ltd. 10,662,186 26,074
Nien MadeEnterprise Co.Ltd. 1,873,560 25,748
NanyaTechnologyCorp. 10,598,878 25,413
ITEQ Corp. 5,483,357 25,381Simplo TechnologyCo. Ltd. 2,346,310 25,278
Global UnichipCorp. 1,168,960 25,228
Taiwan BusinessBank 73,596,414 25,037
Chicony ElectronicsCo. Ltd. 8,678,458 24,816
* HTC Corp. 10,393,301 24,561ElanMicroelectronicsCorp. 3,997,870 24,069
Makalot IndustrialCo. Ltd. 2,700,808 23,571
CompeqManufacturing Co.Ltd. 16,055,760 23,365
IBF FinancialHoldings Co. Ltd. 40,701,870 23,283
Sinbon ElectronicsCo. Ltd. 2,782,475 23,023
* China Airlines Ltd. 36,621,146 22,677
Shares
MarketValue•
($000)
Qisda Corp. 20,266,620 22,642* Episil
Technologies Inc. 4,098,149 22,545* Eva Airways Corp. 33,161,760 22,507
Taiwan GlassIndustry Corp. 22,427,290 22,105
HighwealthConstructionCorp. 13,475,321 21,759
KingYuanElectronics Co.Ltd. 14,876,280 21,346
ENNOSTAR Inc. 8,072,297 21,243YFY Inc. 17,616,703 20,309RadiantOpto-ElectronicsCorp. 5,759,751 20,180
FaradayTechnologyCorp. 2,733,000 19,836
Lotes Co. Ltd. 948,737 19,767Pan JitInternational Inc. 4,864,740 19,721
Tong HsingElectronicIndustries Ltd. 2,053,453 19,557
King's Town BankCo. Ltd. 13,001,184 19,413
Poya InternationalCo. Ltd. 1,048,779 18,785
GreatWallEnterprise Co.Ltd. 9,675,406 18,678
Eternal MaterialsCo. Ltd. 14,052,630 18,630
InternationalGames SystemCo. Ltd. 719,300 18,529
* ChinaPetrochemicalDevelopmentCorp. 42,320,730 18,441
ChipbondTechnology Corp. 7,806,630 18,121
EliteSemiconductorMicroelectronicsTechnology Inc. 3,483,000 17,909
Tung Ho SteelEnterprise Corp. 12,211,660 17,751
Genius ElectronicOptical Co. Ltd. 1,129,299 17,410
Taiwan SurfaceMountingTechnology Corp. 4,310,110 17,391
* Medigen VaccineBiologics Corp. 2,006,732 17,269
WaferWorks Corp. 7,234,103 16,780
Emerging Markets Stock Index Fund
120

Shares
MarketValue•
($000)
TaichungCommercial BankCo. Ltd. 38,351,568 16,488
* FLEXiumInterconnect Inc. 4,679,990 16,214
Cheng Loong Corp. 13,016,230 15,946HannStar DisplayCorp. 31,350,193 15,940
Visual PhotonicsEpitaxy Co. Ltd. 3,073,960 15,604
Capital SecuritiesCorp. 28,586,773 15,603
* Yieh PhuiEnterprise Co.Ltd. 17,387,928 15,535
Bizlink Holding Inc. 1,677,128 15,503FormosaTaffeta Co.Ltd. 14,328,632 15,469
Goldsun BuildingMaterials Co. Ltd. 16,656,415 15,423
USI Corp. 12,431,861 15,400FitipowerIntegratedTechnology Inc. 1,997,375 15,332
Wisdom MarineLines Co. Ltd. 6,496,155 15,291
Yulon FinanceCorp. 2,501,537 15,177
FocalTech SystemsCo. Ltd. 2,628,482 15,151
TXC Corp. 4,094,630 15,133* United Renewable
Energy Co. Ltd. 17,433,629 15,018Jentech PrecisionIndustrial Co. Ltd. 1,118,570 14,878
Ardentec Corp. 6,842,522 14,662Chung Hung SteelCorp. 11,616,000 14,656
Shinkong SyntheticFibers Corp. 21,376,400 14,502
Nan Kang RubberTire Co. Ltd. 10,057,390 14,468
Nantex IndustryCo. Ltd. 4,909,000 14,433
Mitac HoldingsCorp. 13,337,901 13,804
Taiwan Secom Co.Ltd. 3,811,876 13,785
United IntegratedServices Co. Ltd. 2,073,800 13,711
ChipMOSTechnologies Inc. 8,196,148 13,629
King SlideWorksCo. Ltd. 883,000 13,569
Advanced EnergySolution HoldingCo. Ltd. 300,000 13,229
CTCI Corp. 9,989,510 13,090
Shares
MarketValue•
($000)
Sitronix TechnologyCorp. 1,344,070 12,905
Tainan Spinning Co.Ltd. 15,521,000 12,705
* Microbio Co. Ltd. 5,571,183 12,658Feng Hsin SteelCo. Ltd. 4,458,200 12,538
SDI Corp. 2,095,236 12,530Far EasternDepartmentStores Ltd. 15,516,878 12,337
Taiwan UnionTechnology Corp. 3,575,052 12,327
Standard FoodsCorp. 6,586,603 12,278
Wistron NeWebCorp. 4,368,787 12,198
Yulon Motor Co.Ltd. 8,077,444 11,977
Grand PacificPetrochemical 12,133,304 11,808
TCI Co. Ltd. 1,450,549 11,789Gold CircuitElectronics Ltd. 4,918,090 11,782
Solar AppliedMaterialsTechnology Corp. 6,491,607 11,702
Coretronic Corp. 5,581,900 11,554U-Ming MarineTransport Corp. 6,064,108 11,500
CenterLaboratories Inc. 4,802,011 11,486
AU Optronics Corp.ADR 1,674,810 11,440
Run LongConstruction Co.Ltd. 5,268,412 11,350
TSRC Corp. 9,778,940 11,280Hota IndustrialManufacturing Co.Ltd. 3,307,178 11,188
Asia VitalComponents Co.Ltd. 3,741,890 11,182
PresidentSecurities Corp. 13,724,241 11,180
Fusheng PrecisionCo. Ltd. 1,641,920 11,146
RichWaveTechnology Corp. 1,066,800 11,093
WTMicroelectronicsCo. Ltd. 4,886,651 11,041
SigurdMicroelectronicsCorp. 5,209,546 11,011
AdvancedWirelessSemiconductorCo. 1,894,266 10,923
Emerging Markets Stock Index Fund
121

Shares
MarketValue•
($000)
* EirGenix Inc. 2,792,868 10,900* Asia Optical Co.
Inc. 3,398,260 10,850Taiwan Mask Corp. 3,757,272 10,798XinTec Inc. 2,182,225 10,660Taiwan Paiho Ltd. 3,411,140 10,623HuakuDevelopment Co.Ltd. 3,212,200 10,508
General InterfaceSolution HoldingLtd. 2,998,070 10,493
Getac HoldingsCorp. 5,501,420 10,362
Farglory LandDevelopment Co.Ltd. 4,280,550 10,345
Clevo Co. 8,329,000 10,325GreatekElectronics Inc. 3,577,000 10,249
ViaTechnologies Inc. 4,581,620 10,243
* RDCSemiconductorCo. Ltd. 714,000 10,235
UPCTechnologyCorp. 12,298,041 10,232
Far EasternInternational Bank 27,170,465 10,219
TranscendInformation Inc. 4,192,069 10,188
Longchen Paper &Packaging Co.Ltd. 11,677,606 10,121
EverlightElectronics Co.Ltd. 5,645,410 10,082
Pegavision Corp. 511,000 10,032Charoen PokphandEnterprise 3,449,676 9,924
SupremeElectronics Co.Ltd. 6,127,375 9,905
International CSRCInvestmentHoldings Co. 11,289,270 9,764
Kenda RubberIndustrial Co. Ltd. 8,700,000 9,582
TaiwanSemiconductorCo. Ltd. 3,261,290 9,581
* Oriental UnionChemical Corp. 11,053,582 9,507
* PharmaEssentiaCorp. 2,710,091 9,467
Taiwan Hon ChuanEnterprise Co.Ltd. 4,039,650 9,465
Shares
MarketValue•
($000)
Chilisin ElectronicsCorp. 3,036,851 9,421
ArcadyanTechnology Corp. 2,457,219 9,294
China SteelChemical Corp. 2,053,000 9,125
Primax ElectronicsLtd. 4,839,940 8,983
Holy StoneEnterprise Co.Ltd. 2,089,793 8,888
China Motor Corp. 3,556,844 8,861Cleanaway Co. Ltd. 1,146,000 8,823Century Iron &Steel IndustrialCo. Ltd. 2,163,000 8,812
Topco Scientific Co.Ltd. 1,755,342 8,724
Sanyang Motor Co.Ltd. 8,924,330 8,697
ADATATechnologyCo. Ltd. 2,841,000 8,513
Merry ElectronicsCo. Ltd. 2,874,999 8,505
Advanced CeramicX Corp. 683,105 8,462
Wah Lee IndustrialCorp. 2,753,194 8,434
Grape King Bio Ltd. 1,437,529 8,379Sercomm Corp. 3,634,600 8,332Cheng UeiPrecision IndustryCo. Ltd. 5,958,673 8,284
Apex InternationalCo. Ltd. 2,945,000 8,281
Pixart Imaging Inc. 1,451,680 8,250TongYang IndustryCo. Ltd. 6,625,350 8,055
Gudeng PrecisionIndustrial Co. Ltd. 909,517 7,969
AndesTechnologyCorp. 435,000 7,913
China GeneralPlastics Corp. 5,855,926 7,828
HoltekSemiconductor Inc. 2,105,483 7,825
Kinpo Electronics 16,670,670 7,799Universal VisionBiotechnology Co.Ltd. 668,000 7,653
TTY Biopharm Co.Ltd. 3,065,160 7,581
TaiwanCogenerationCorp. 5,401,850 7,432
Prince Housing &DevelopmentCorp. 15,547,270 7,418
Emerging Markets Stock Index Fund
122

Shares
MarketValue•
($000)
SportonInternational Inc. 906,631 7,366
Pan-InternationalIndustrial Corp. 5,036,000 7,360
FoxsemiconIntegratedTechnology Inc. 996,642 7,356
Hsin Kuang SteelCo. Ltd. 3,518,000 7,353
AcBel Polytech Inc. 5,891,000 7,342China Man-MadeFiber Corp. 20,023,016 7,325
Chung-Hsin Electric& MachineryManufacturingCorp. 4,893,000 7,257
Adimmune Corp. 4,581,825 7,240Co-TechDevelopmentCorp. 2,676,000 7,227
Chong HongConstruction Co.Ltd. 2,691,000 7,142
TPK Holding Co.Ltd. 4,633,288 7,087
SensortekTechnology Corp. 336,000 7,021
Sunplus TechnologyCo. Ltd. 5,218,000 6,961
Asia Polymer Corp. 4,913,340 6,920KindomDevelopment Co.Ltd. 5,000,600 6,903
ChunghwaPrecisionTestTech Co. Ltd. 240,153 6,875
DynapackInternationalTechnology Corp. 1,986,000 6,868
* OBI Pharma Inc. 1,779,917 6,825Hannstar BoardCorp. 4,527,685 6,800
Taiwan SakuraCorp. 2,695,000 6,787
* Shihlin Paper Corp. 2,724,433 6,728Shin Zu Shing Co.Ltd. 1,863,853 6,687
Global Mixed ModeTechnology Inc. 824,000 6,679
OptoTech Corp. 4,291,987 6,642Hotai Finance Co.Ltd. 2,074,000 6,588
St. Shine OpticalCo. Ltd. 620,000 6,586
Silicon IntegratedSystems Corp. 7,635,819 6,570
PChomeOnline Inc. 1,257,873 6,566
Shares
MarketValue•
($000)
* EtronTechnology Inc. 3,059,960 6,564
* TaiwanTEA Corp. 8,730,000 6,554Cub Elecparts Inc. 1,063,008 6,545TaYa ElectricWire& Cable 7,335,045 6,534
Nan Pao ResinsChemical Co. Ltd. 1,286,000 6,439
* AmTRANTechnology Co.Ltd. 10,137,000 6,433
Sunny FriendEnvironmentalTechnology Co.Ltd. 896,000 6,428
TungThihElectronic Co. Ltd. 871,000 6,324
Thinking ElectronicIndustrial Co. Ltd. 1,029,000 6,303
Systex Corp. 2,013,000 6,250* TaiMed
Biologics Inc. 2,576,090 6,203Taiwan PCBTechvest Co. Ltd. 3,656,000 6,175
Mercuries &AssociatesHolding Ltd. 7,372,824 6,145
BES EngineeringCorp. 19,381,000 6,131
T3EX GlobalHoldings Corp. 1,314,000 6,103
LandMarkOptoelectronicsCorp. 945,470 6,085
EvergreenInternationalStorage &Transport Corp. 6,222,000 6,076
* Mercuries LifeInsurance Co. Ltd. 18,253,494 6,020
YC INOX Co. Ltd. 5,299,800 6,011* Orient
SemiconductorElectronics Ltd. 6,664,792 5,963
KMC Kuei MengInternational Inc. 816,000 5,945
Chicony PowerTechnology Co.Ltd. 2,364,000 5,935
D-Link Corp. 8,020,000 5,915* TSEC Corp. 4,883,000 5,864
Taiwan FamilyMartCo. Ltd. 628,000 5,846
* Federal Corp. 5,954,040 5,759ITETechnology Inc. 1,519,000 5,697ChangWahElectromaterials Inc. 4,683,000 5,697
Emerging Markets Stock Index Fund
123

Shares
MarketValue•
($000)
Chlitina HoldingLtd. 661,000 5,674
Sonix TechnologyCo. Ltd. 1,824,000 5,643
Dimerco ExpressCorp. 1,817,199 5,639
Test Research Inc. 2,789,660 5,614WeltrendSemiconductor 1,901,567 5,557
* First Steamship Co.Ltd. 11,925,968 5,502
Fulgent SunInternationalHolding Co. Ltd. 1,455,893 5,399
Innodisk Corp. 775,200 5,357* Unitech Printed
Circuit BoardCorp. 8,173,880 5,331
* PhihongTechnologyCo. Ltd. 4,014,000 5,322
AURASTechnologyCo. Ltd. 919,000 5,284
Cathay Real EstateDevelopment Co.Ltd. 7,517,984 5,273
Hu LaneAssociate Inc. 1,078,300 5,221
TaiDocTechnologyCorp. 829,000 5,217
Fittech Co. Ltd. 688,491 5,211Everlight ChemicalIndustrial Corp. 5,648,200 5,207
Chin-PoonIndustrial Co. Ltd. 4,806,890 5,177
Darfon ElectronicsCorp. 3,410,000 5,128
* Asia PacificTelecom Co. Ltd. 17,233,352 5,095
ChunYuan SteelIndustry Co. Ltd. 6,190,000 5,058
* Career TechnologyMFG. Co. Ltd. 5,544,721 5,001
* CSBC Corp. Taiwan 6,349,119 4,984* Unizyx Holding
Corp. 4,418,000 4,962Aten InternationalCo. Ltd. 1,629,740 4,949
Topkey Corp. 1,059,000 4,935Wei Chuan FoodsCorp. 5,921,600 4,871
Sampo Corp. 4,557,800 4,854Kaimei ElectronicCorp. 1,544,000 4,837
Ennoconn Corp. 729,316 4,835LungYen LifeService Corp. 2,978,000 4,818
Nichidenbo Corp. 2,615,460 4,747
Shares
MarketValue•
($000)
HoTung ChemicalCorp. 12,634,459 4,733
Taiwan StyreneMonomer 7,236,050 4,726
Ginko InternationalCo. Ltd. 648,900 4,710
Soft-WorldInternational Corp. 1,457,653 4,709
* AdlinkTechnology Inc. 1,932,895 4,665
TonYi IndustrialCorp. 9,910,000 4,646
MotechIndustries Inc. 4,012,574 4,641
Gourmet MasterCo. Ltd. 981,469 4,632
Chia Hsin CementCorp. 6,370,000 4,629
FlytechTechnologyCo. Ltd. 1,757,650 4,605
Kinik Co. 1,670,000 4,541Hung ShengConstruction Ltd. 5,211,464 4,523
* Lealea EnterpriseCo. Ltd. 10,857,930 4,516
YungShin GlobalHolding Corp. 2,884,000 4,514
* CMC MagneticsCorp. 14,093,950 4,476
Xxentria TechnologyMaterials Corp. 1,840,000 4,473
EgisTechnology Inc. 934,100 4,449
GemtekTechnologyCorp. 4,455,000 4,390
Formosa SumcoTechnology Corp. 764,000 4,343
Wowprime Corp. 821,000 4,260CyberTANTechnology Inc. 4,414,000 4,210
* Chung Hwa PulpCorp. 5,252,000 4,204
Chief Telecom Inc. 408,000 4,188Namchow HoldingsCo. Ltd. 2,384,000 4,146
Radium Life TechCo. Ltd. 10,880,760 4,117
Gloria MaterialTechnology Corp. 5,366,640 4,099
* Jih Sun FinancialHoldings Co. Ltd. 8,732,000 4,086
China MetalProducts 3,517,000 4,050
Kung LongBatteriesIndustrial Co. Ltd. 797,000 4,044
Emerging Markets Stock Index Fund
124

Shares
MarketValue•
($000)
FormosaInternationalHotels Corp. 751,000 4,017
Rexon IndustrialCorp. Ltd. 1,658,525 3,995
LotusPharmaceuticalCo. Ltd. 1,176,000 3,975
Acter Group Corp.Ltd. 595,416 3,975
SunonwealthElectric MachineIndustry Co. Ltd. 2,865,000 3,973
Global BrandsManufacture Ltd. 3,108,680 3,966
Test RiteInternational Co.Ltd. 4,499,000 3,917
Altek Corp. 2,882,000 3,906SpeedTech Corp. 1,273,000 3,894Sinyi Realty Inc. 3,241,000 3,883
* Li Peng EnterpriseCo. Ltd. 9,936,000 3,712
Shin FoongSpecialty &Applied MaterialsCo. Ltd. 563,200 3,678
Sincere NavigationCorp. 3,656,240 3,652
Depo Auto PartsInd Co. Ltd. 1,799,000 3,639
Gamania DigitalEntertainment Co.Ltd. 1,744,916 3,628
SyncmoldEnterprise Corp. 1,417,500 3,601
* Shining BuildingBusiness Co. Ltd. 9,003,638 3,593
KuoYangConstruction Co.Ltd. 4,150,900 3,584
* Machvision Inc. 416,306 3,516* Ambassador Hotel 3,221,000 3,510* Firich Enterprises
Co. Ltd. 2,985,378 3,454Taiflex ScientificCo. Ltd. 1,971,920 3,386
Swancor HoldingCo. Ltd. 953,000 3,383
* Lingsen PrecisionIndustries Ltd. 3,717,000 3,378
Elite AdvancedLaser Corp. 1,666,349 3,348
ScinoPharmTaiwanLtd. 3,739,576 3,334
Formosan RubberGroup Inc. 4,084,135 3,314
Tyntek Corp. 3,436,000 3,243
Shares
MarketValue•
($000)
AdvancedInternationalMultitech Co. Ltd. 1,105,000 3,146
* Ritek Corp. 8,822,489 3,107TA-I Technology Co.Ltd. 1,349,750 3,089
* Roo Hsing Co. Ltd. 10,143,000 3,082Zeng HsingIndustrial Co. Ltd. 561,000 3,078
* BrogentTechnologies Inc. 665,792 3,031
Johnson HealthTech Co. Ltd. 1,439,000 3,022
HannsTouchSolution Inc. 7,036,115 3,013
Yulon Nissan MotorCo. Ltd. 322,188 2,942
NidecChaun-ChoungTechnology Corp. 488,000 2,941
Nan Liu EnterpriseCo. Ltd. 659,000 2,920
QuantaStorage Inc. 2,078,000 2,897
Rich DevelopmentCo. Ltd. 8,788,000 2,895
Bioteque Corp. 733,000 2,891* Medigen
BiotechnologyCorp. 1,470,000 2,883
Bank of KaohsiungCo. Ltd. 6,944,257 2,812
KEETAI PropertiesCo. Ltd. 5,952,000 2,810
ElitegroupComputerSystems Co. Ltd. 3,293,000 2,807
DynamicElectronics Co.Ltd. 3,705,533 2,804
China Chemical &PharmaceuticalCo. Ltd. 3,501,000 2,783
Cyberlink Corp. 841,674 2,742Huang HsiangConstructionCorp. 2,080,000 2,733
Yeong Guan EnergyTechnology GroupCo. Ltd. 1,182,180 2,727
* Gigastorage Corp. 3,024,953 2,726DyacoInternational Inc. 1,153,000 2,696
PosiflexTechnology Inc. 787,764 2,580
Rechi Precision Co.Ltd. 3,808,000 2,557
AlphaNetworks Inc. 2,610,772 2,536
Emerging Markets Stock Index Fund
125

Shares
MarketValue•
($000)
Hong Pu RealEstateDevelopment Co.Ltd. 3,153,000 2,468
IEI IntegrationCorp. 1,546,920 2,466
PharmaEngine Inc. 1,112,457 2,362* Darwin Precisions
Corp. 5,857,900 2,350* Taigen
BiopharmaceuticalsHoldings Ltd. 4,011,820 2,312
KuoToongInternational Co.Ltd. 2,995,514 2,311
FSPTechnology Inc. 1,548,120 2,258
Gigasolar MaterialsCorp. 298,000 2,177
IchiaTechnologies Inc. 3,652,000 2,134
* Savior Lifetec Corp. 2,857,325 2,101WUS PrintedCircuit Co. Ltd. 2,013,156 2,056
Basso IndustryCorp. 1,277,000 1,977
Globe UnionIndustrial Corp. 3,543,000 1,960
* NewmaxTechnology Co.Ltd. 1,301,000 1,929
Taiyen Biotech Co.Ltd. 1,596,000 1,892
* AGV ProductsCorp. 5,064,370 1,852
ShengYu Steel Co.Ltd. 1,532,000 1,839
* ALI Corp. 1,718,275 1,759TYC BrotherIndustrial Co. Ltd. 2,422,000 1,740
Concraft HoldingCo. Ltd. 848,492 1,731
* Tong-Tai Machine &Tool Co. Ltd. 2,993,000 1,725
Iron ForceIndustrial Co. Ltd. 680,000 1,719
* InfortrendTechnology Inc. 3,282,000 1,693
* Zinwell Corp. 2,356,000 1,671Jess-Link ProductsCo. Ltd. 1,279,750 1,620
China ElectricManufacturingCorp. 3,879,180 1,612
Toung LoongTextileManufacturing 1,156,000 1,476
GeneReachBiotechnologyCorp. 438,565 1,258
Shares
MarketValue•
($000)
*,3 PharmallyInternationalHolding Co. Ltd. 612,856 1,247
Senao InternationalCo. Ltd. 1,046,000 1,199
* Ability EnterpriseCo. Ltd. 1,695,491 1,193
Vivotek Inc. 351,349 935* Li Cheng
Enterprise Co.Ltd. 1,305,996 914
CHC HealthcareGroup 674,899 892
L&K EngineeringCo. Ltd. 845,000 889
*,3 Unity OptoTechnology Co.Ltd. 5,295,000 784
* Taiwan LandDevelopmentCorp. 3,593,970 439
ContinentalHoldings Corp. 412,000 374
O-Bank Co. Ltd. 480,000 135*,3 Pihsiang Machinery
Manufacturing Co.Ltd. 2,219,000 —
*,3 XPECEntertainment Inc. 988,965 —
*,3 E-Ton Solar TechCo. Ltd. 843,673 —
*,3 Green EnergyTechnology Inc. 2,819,000 —
*,3 Ya Hsin IndustrialCo. Ltd. 5,306,018 —
*,3 TaYa ElectricWire& Cable RightsExp. 11/10/21 267,965 —
19,982,224Thailand (2.5%)
PTT PCL (Foreign) 192,962,215 220,936CP ALL PCL(Foreign) 70,902,721 136,988
Siam CommercialBank PCL(Foreign) 34,550,990 131,369
Airports of ThailandPCL (Foreign) 59,863,744 116,663
Bangkok DusitMedical ServicesPCL (Foreign) 123,064,345 87,270
Advanced InfoService PCL(Foreign) 14,987,106 85,469
Siam Cement PCLNVDR 6,822,296 81,211
Kasikornbank PCL(Foreign) 17,495,635 74,586
Emerging Markets Stock Index Fund
126

Shares
MarketValue•
($000)
Gulf EnergyDevelopment PCL(Foreign) 55,446,215 72,370
PTT Exploration &Production PCL(Foreign) 19,013,384 67,257
Central PattanaPCL (Foreign) 35,677,424 63,844
Siam Cement PCL(Foreign) 4,832,388 57,524
PTT GlobalChemical PCL(Foreign) 30,083,379 56,933
* Minor InternationalPCL (Foreign) 57,089,920 56,388
Delta ElectronicsThailand PCL(Foreign) 4,124,500 51,778
Intouch HoldingsPCL (Foreign) 19,422,600 44,062
Energy AbsolutePCL (Foreign) 21,314,996 42,157
Central Retail Corp.PCL (Foreign) 37,332,200 39,158
Charoen PokphandFoods PCL(Foreign) 50,611,417 38,532
Home ProductCenter PCL(Foreign) 82,524,784 36,367
BTS GroupHoldings PCL(Foreign) 119,595,335 34,437
Indorama VenturesPCL (Foreign) 26,355,635 33,456
KCE ElectronicsPCL (Foreign) 12,518,114 32,866
BangkokExpressway &Metro PCL(Foreign) 116,696,222 31,674
2 SCG PackagingPCL (Foreign) 15,545,500 30,113
DigitalTelecommunicationsInfrastructureFund 74,343,613 30,032
PTT Oil & RetailBusiness PCL(Foreign) 35,107,200 29,135
Bangkok Bank PCLNVDR 7,849,800 29,050
2 Krungthai Card PCL(Foreign) 16,446,031 28,674
2 Banpu PCL(Foreign) 79,510,873 27,306
2 Global PowerSynergy PCL(Foreign) 10,357,140 24,372
Shares
MarketValue•
($000)
Thai Oil PCL(Foreign) 14,127,355 23,707
Land & HousesPCL NVDR 90,722,380 23,144
BumrungradHospital PCL(Foreign) 5,192,674 22,806
Thai Union GroupPCL (Foreign) 35,918,479 22,622
ElectricityGenerating PCL(Foreign) 3,974,011 21,417
KrungThai BankPCL (Foreign) 61,215,396 21,248
TMBThanachartBank PCL(Foreign) 581,249,600 20,371
2 IRPC PCL (Foreign) 152,323,114 19,734HanaMicroelectronicsPCL (Foreign) 7,946,783 19,197
2 Com7 PCL(Foreign) 8,233,200 17,839
Muangthai CapitalPCL (Foreign) 9,579,445 17,523
True Corp. PCL(Foreign) 140,794,988 17,234
Srisawad Corp.PCL (Foreign) 8,861,903 17,134
2 Osotspa PCL(Foreign) 16,981,300 16,781
JasmineBroadbandInternetInfrastructureFund 53,094,637 16,326
Tisco FinancialGroup PCL(Foreign) 5,720,968 15,919
2 Berli Jucker PCL(Foreign) 14,987,490 15,272
2 Carabao Group PCL(Foreign) 4,024,705 15,060
Ratch Group PCLNVDR 10,979,168 15,056
2 BangkokCommercial AssetManagement PCL(Foreign) 25,802,400 14,796
*,2 CPN Retail GrowthLeasehold REIT 22,706,600 14,668
Supalai PCL(Foreign) 20,458,085 14,431
2 Siam Global HousePCL (Foreign) 22,916,035 14,127
2 Kasikornbank PCLNVDR 3,163,075 13,485
* AssetWorld Corp.PCL (Foreign) 97,652,300 13,470
Emerging Markets Stock Index Fund
127

Shares
MarketValue•
($000)
2 B Grimm PowerPCL (Foreign) 10,219,947 13,103
Kiatnakin PhatraBank PCL(Foreign) 7,094,270 12,852
2 Bangchak Corp.PCL (Foreign) 15,064,666 12,482
Bangkok Bank PCL(Foreign) 3,257,641 12,056
2 Sri Trang GlovesThailand PCL(Foreign) 13,050,500 11,998
2 WHA Corp. PCL(Foreign) 114,087,306 11,644
2 VGI PCL (Foreign) 57,175,784 11,4922 Sri Trang
Agro-Industry PCL(Foreign) 11,576,461 11,347
2 Total AccessCommunicationPCL NVDR 9,083,845 10,475
Jay Mart PCL(Foreign) 8,145,900 10,211
Thanachart CapitalPCL (Foreign) 9,551,156 10,161
2 CH Karnchang PCL(Foreign) 14,388,263 9,469
2 Gunkul EngineeringPCL (Foreign) 55,721,566 9,086
2 Chularat HospitalPCL (Foreign) 78,979,346 9,072
Tisco FinancialGroup PCL NVDR 3,244,993 9,030
APThailand PCL(Foreign) 33,561,842 8,959
*,2 Central Plaza HotelPCL (Foreign) 8,156,313 8,864
Mega LifesciencesPCL (Foreign) 6,050,800 8,503
2 Dohome PCL(Foreign) 11,490,500 8,296
AEONThanaSinsapThailandPCL (Foreign) 1,446,800 8,180
2 Sino-ThaiEngineering &Construction PCL(Foreign) 18,629,263 7,766
2 CK Power PCL(Foreign) 50,749,372 7,750
JMT NetworkServices PCL(Foreign) 5,056,063 7,451
2 TOA Paint ThailandPCL (Foreign) 7,445,934 7,415
2 TQM Corp. PCL(Foreign) 2,331,400 7,381
Shares
MarketValue•
($000)
Bangkok ChainHospital PCL(Foreign) 11,922,945 7,311
2 ThonburiHealthcare GroupPCL (Foreign) 7,067,070 7,194
KrungThai BankPCL NVDR 19,542,000 6,783
2 ThoresenThaiAgencies PCL(Foreign) 19,162,387 6,715
WHA PremiumGrowth Freehold& Leasehold REIT 16,824,300 6,693
Thailand FutureFund 27,916,700 6,569
TTW PCL (Foreign) 18,606,234 6,5612 Sansiri PCL
(Foreign) 167,685,306 6,3902 Siam Makro PCL
(Foreign) 4,375,900 6,3392 Quality Houses
PCL (Foreign) 90,618,151 6,284Tipco Asphalt PCL(Foreign) 11,009,530 6,079
* Star PetroleumRefining PCL(Foreign) 19,042,868 6,020
2 Siam City CementPCL (Foreign) 1,154,106 5,896
2 Bangkok LifeAssurance PCL(Foreign) 6,428,814 5,773
2 Amata Corp. PCL(Foreign) 9,318,623 5,741
Bangkok Land PCL(Foreign) 170,463,378 5,656
* Major CineplexGroup PCL(Foreign) 8,632,997 5,550
* BTS Rail MassTransit GrowthInfrastructureFund 38,833,573 5,364
North BangkokPower Plant Block1 InfrastructureFund - EGAT 13,856,100 5,098
2 Thai Vegetable OilPCL (Foreign) 5,413,811 5,094
2 Super Energy Corp.PCL (Foreign) 173,390,819 5,071
Kerry ExpressThailand PCL(Foreign) 4,344,100 4,981
Intouch HoldingsPCL NVDR 2,153,100 4,884
TPI Polene PCL(Foreign) 94,560,561 4,876
Emerging Markets Stock Index Fund
128

Shares
MarketValue•
($000)
*,2 EssoThailand PCL(Foreign) 19,735,773 4,725
* BECWorld PCL(Foreign) 12,675,827 4,674
2 JasmineInternational PCL(Foreign) 52,586,055 4,540
2 Precious ShippingPCL (Foreign) 8,194,263 4,488
2 Banpu Power PCL(Foreign) 7,956,139 4,200
*,2 STARK Corp. PCL(Foreign) 30,226,700 4,011
*,2 Italian-ThaiDevelopment PCL(Foreign) 53,232,231 3,762
2 BCPG PCL(Foreign) 9,515,142 3,760
* Pruksa Real EstatePCL (Foreign) 11,775,000 3,673
TPI Polene PowerPCL (Foreign) 28,678,800 3,665
Pruksa Holding PCL(Foreign) 8,560,530 3,559
2 Plan B Media PCL(Foreign) 17,440,500 3,377
2 Ratchthani LeasingPCL (Foreign) 26,155,350 3,234
2 Thaifoods GroupPCL (Foreign) 24,111,275 3,183
2 MK RestaurantsGroup PCL(Foreign) 1,889,900 3,123
* Bangkok AirwaysPCL (Foreign) 8,886,424 3,111
*,2 U City PCL(Foreign) 57,031,569 3,080
Siam CommercialBank PCL NVDR 786,320 2,990
2 PTG Energy PCL(Foreign) 6,034,746 2,840
2 Thaicom PCL(Foreign) 8,311,185 2,732
SPCG PCL(Foreign) 4,865,704 2,609
Origin PropertyPCL (Foreign) 7,239,219 2,467
2 IMPACT GrowthREIT 4,086,000 2,436
2 GFPT PCL (Foreign) 6,838,096 2,394* MBK PCL (Foreign) 5,498,662 2,322
WorkpointEntertainmentPCL (Foreign) 3,113,234 2,123
* Banpu PCLWarrants Exp.9/30/22 12,251,813 1,901
2 LPN DevelopmentPCL (Foreign) 12,230,497 1,838
Shares
MarketValue•
($000)
*,2 Unique Engineering& ConstructionPCL (Foreign) 7,464,209 1,508
*,2,3 Thai AirwaysInternational PCL(Foreign) 14,720,268 1,473
Univentures PCL(Foreign) 11,781,451 1,447
2 Taokaenoi Food &Marketing PCL(Foreign) 7,187,081 1,433
* Banpu PCLWarrants Exp.9/30/23 11,833,218 1,205
* Samart Corp. PCL(Foreign) 6,186,920 1,174
Cal-CompElectronicsThailand PCL(Foreign) 12,849,822 1,016
2 Ratch Group PCL(Foreign) 704,104 966
Land & HousesPCL (Foreign) 3,759,100 959
* BTS GroupHoldings PCLWarrants Exp.9/5/22 5,914,697 255
2 Maybank Kim EngSecuritiesThailand PCL(Foreign) 563,800 209
* MBK PCLWarrantsExp. 10/25/22 219,946 73
*,3 WHA PremiumGrowth Freehold& Leasehold REITRights Exp.11/18/21 1,986,949 18
Bangkok LifeAssurance PCL 577 —
* Minor InternationalPCLWarrantsExp. 5/5/23 1 —
* BTS GroupHoldings PCLWarrants Exp.12/31/25 35,488,180 —
2,825,862Turkey (0.5%)
BIM BirlesikMagazalar A/S 6,237,367 40,353
Eregli Demir veCelik FabrikalariTAS 18,941,435 39,550
Turkiye GarantiBankasi A/S 28,897,509 29,593
KOC Holding A/S 11,292,451 27,533
Emerging Markets Stock Index Fund
129

Shares
MarketValue•
($000)
Turkcell IletisimHizmetleri A/S 15,419,788 24,599
* Turkiye PetrolRafinerileri A/S 1,701,623 24,488
AkbankTAS 36,155,267 21,886Turkiye Sise veCam FabrikalariA/S 18,743,984 16,861
Ford OtomotivSanayi A/S 873,836 16,826
Haci Omer SabanciHolding A/S 12,915,264 15,036
Aselsan ElektronikSanayi ve TicaretA/S 8,792,620 15,010
* Turk HavaYollari AO 8,661,782 13,201* Petkim Petrokimya
Holding A/S 18,771,877 12,762Turkiye Is BankasiA/S Class C 21,567,622 12,652
Enka Insaat veSanayi A/S 9,477,476 10,944
Tofas Turk OtomobilFabrikasi A/S 1,665,146 10,180
* Kardemir KarabukDemir CelikSanayi ve TicaretA/S 12,931,827 10,097
Arcelik A/S 2,617,884 9,184* Gubre Fabrikalari
TAS 1,184,585 8,534* Koza Altin
Isletmeleri A/S 699,760 7,778* Sasa Polyester
Sanayi A/S 2,361,556 7,617* TAV Havalimanlari
Holding A/S 2,575,456 7,105Coca-Cola IcecekA/S 799,942 7,067
TurkTelekomunikasyonA/S 7,575,026 5,940
Yapi ve KrediBankasi A/S 20,730,625 5,889
Emlak KonutGayrimenkulYatirim OrtakligiA/S 27,352,878 5,623
* Aksa Enerji UretimA/S Class B 6,673,650 5,272
Ulker BiskuviSanayi A/S 2,441,419 5,129
Anadolu EfesBiracilik ve MaltSanayii A/SClass B 2,204,380 5,073
* Turkiye VakiflarBankasi TAO 14,066,278 5,027
Shares
MarketValue•
($000)
AG Anadolu GrubuHolding A/S 1,743,478 4,992
* Turkiye HalkBankasi A/S 10,479,053 4,829
Tekfen Holding A/S 3,035,058 4,769* Koza Anadolu
Metal MadencilikIsletmeleri A/S 2,718,778 4,743
LogoYazilim Sanayive Ticaret A/S 1,059,000 4,702
Nuh CimentoSanayi A/S 1,020,958 4,626
* Bera Holding A/S 4,508,607 4,466Sok MarketlerTicaret A/S 3,697,717 4,284
* Hektas Ticaret TAS 4,437,203 4,095* Pegasus Hava
Tasimaciligi A/S 491,165 4,0841 Enerjisa Enerji A/S 3,242,255 3,979
Dogan SirketlerGrubu Holding A/S 13,114,112 3,658
SarkuysanElektrolitik BakirSanayi ve TicaretA/S 1,896,865 3,643
1 Mavi Giyim Sanayive Ticaret A/SClass B 482,709 3,618
Aksa Akrilik KimyaSanayii A/S 1,465,718 3,600
IsYatirim MenkulDegerler A/S 2,022,707 3,366
* Migros Ticaret A/S 868,681 3,188Otokar Otomotivve SavunmaSanayi A/S 87,272 3,079
Turk Traktor veZiraat MakineleriA/S 178,642 3,074
*,1 MLP SaglikHizmetleri A/SClass B 1,023,742 2,895
Iskenderun Demirve Celik A/S 1,986,681 2,806
BorusanYatirim vePazarlama A/S 75,951 2,753
Vestel ElektronikSanayi ve TicaretA/S 1,015,165 2,700
* Oyak CimentoFabrikalari A/S 3,371,400 2,424
EGE Endustri veTicaret A/S 16,393 2,200
Turkiye SinaiKalkinma BankasiA/S 15,918,812 2,153
* KordsaTeknikTekstil A/S 726,453 2,087
Emerging Markets Stock Index Fund
130
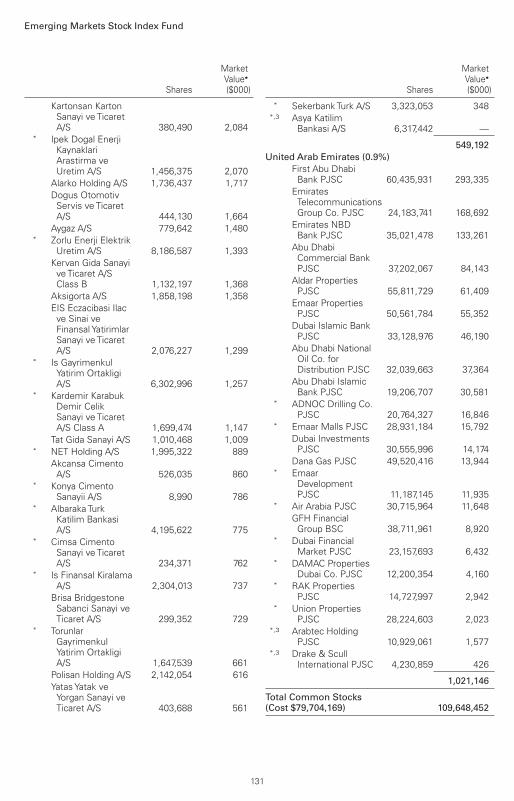
Shares
MarketValue•
($000)
Kartonsan KartonSanayi ve TicaretA/S 380,490 2,084
* Ipek Dogal EnerjiKaynaklariArastirma veUretim A/S 1,456,375 2,070
Alarko Holding A/S 1,736,437 1,717Dogus OtomotivServis veTicaretA/S 444,130 1,664
Aygaz A/S 779,642 1,480* Zorlu Enerji Elektrik
Uretim A/S 8,186,587 1,393Kervan Gida Sanayive Ticaret A/SClass B 1,132,197 1,368
Aksigorta A/S 1,858,198 1,358EIS Eczacibasi Ilacve Sinai veFinansal YatirimlarSanayi ve TicaretA/S 2,076,227 1,299
* Is GayrimenkulYatirim OrtakligiA/S 6,302,996 1,257
* Kardemir KarabukDemir CelikSanayi ve TicaretA/S Class A 1,699,474 1,147
Tat Gida Sanayi A/S 1,010,468 1,009* NET Holding A/S 1,995,322 889
Akcansa CimentoA/S 526,035 860
* Konya CimentoSanayii A/S 8,990 786
* Albaraka TurkKatilim BankasiA/S 4,195,622 775
* Cimsa CimentoSanayi ve TicaretA/S 234,371 762
* Is Finansal KiralamaA/S 2,304,013 737
Brisa BridgestoneSabanci Sanayi veTicaret A/S 299,352 729
* TorunlarGayrimenkulYatirim OrtakligiA/S 1,647,539 661
Polisan Holding A/S 2,142,054 616YatasYatak veYorgan Sanayi veTicaret A/S 403,688 561
Shares
MarketValue•
($000)
* SekerbankTurk A/S 3,323,053 348*,3 Asya Katilim
Bankasi A/S 6,317,442 —
549,192United Arab Emirates (0.9%)
First Abu DhabiBank PJSC 60,435,931 293,335
EmiratesTelecommunicationsGroup Co. PJSC 24,183,741 168,692
Emirates NBDBank PJSC 35,021,478 133,261
Abu DhabiCommercial BankPJSC 37,202,067 84,143
Aldar PropertiesPJSC 55,811,729 61,409
Emaar PropertiesPJSC 50,561,784 55,352
Dubai Islamic BankPJSC 33,128,976 46,190
Abu Dhabi NationalOil Co. forDistribution PJSC 32,039,663 37,364
Abu Dhabi IslamicBank PJSC 19,206,707 30,581
* ADNOC Drilling Co.PJSC 20,764,327 16,846
* Emaar Malls PJSC 28,931,184 15,792Dubai InvestmentsPJSC 30,555,996 14,174
Dana Gas PJSC 49,520,416 13,944* Emaar
DevelopmentPJSC 11,187,145 11,935
* Air Arabia PJSC 30,715,964 11,648GFH FinancialGroup BSC 38,711,961 8,920
* Dubai FinancialMarket PJSC 23,157,693 6,432
* DAMAC PropertiesDubai Co. PJSC 12,200,354 4,160
* RAK PropertiesPJSC 14,727,997 2,942
* Union PropertiesPJSC 28,224,603 2,023
*,3 Arabtec HoldingPJSC 10,929,061 1,577
*,3 Drake & ScullInternational PJSC 4,230,859 426
1,021,146
Total Common Stocks(Cost $79,704,169) 109,648,452
Emerging Markets Stock Index Fund
131

Shares
MarketValue•
($000)
Temporary Cash Investments (2.4%)
Money Market Fund (2.4%)4,5 Vanguard Market
Liquidity Fund,0.070%(Cost $2,652,866) 26,531,416 2,653,142
Total Investments(101.3%)(Cost $82,357,035) 112,301,594
Other Assets andLiabilities—Net (-1.3%) (1,436,426)
Net Assets (100%) 110,865,168
Cost is in $000.• See Note A in Notes to Financial Statements.* Non-income-producing security.1 Security exempt from registration under Rule 144A of theSecurities Act of 1933. Such securities may be sold intransactions exempt from registration, normally to qualifiedinstitutional buyers. At October 31, 2021, the aggregate valuewas $6,831,603,000, representing 6.2% of net assets.
2 Includes partial security positions on loan to broker-dealers. Thetotal value of securities on loan is $1,213,196,000.
3 Security value determined using significant unobservableinputs.
4 Affiliated money market fund available only to Vanguard fundsand certain trusts and accounts managed by Vanguard. Rateshown is the 7-day yield.
5 Collateral of $1,323,129,000 was received for securities onloan, of which $1,322,132,000 is held in Vanguard MarketLiquidity Fund and $997,000 is held in cash.ADR—American Depositary Receipt.BDR—Brazilian Depositary Receipt.GDR—Global Depositary Receipt.NVDR—Non-Voting Depositary Receipt.REIT—Real Estate Investment Trust.
Emerging Markets Stock Index Fund
132

Derivative Financial Instruments Outstanding as of Period End
Futures Contracts
($000)
Expiration
Number ofLong (Short)Contracts
NotionalAmount
Value andUnrealized
Appreciation(Depreciation)
Long Futures Contracts
E-mini S&P 500 Index December 2021 650 149,403 (44)
MSCI Emerging Market Index December 2021 11,504 725,902 (17,732)
(17,776)
Forward Currency Contracts
ContractSettlement
Date
Contract Amount (000)Unrealized
Appreciation($000)
Unrealized(Depreciation)
($000)Counterparty Receive Deliver
Citibank, N.A. 12/15/21 INR 18,908,200 USD 254,230 — (2,983)
BNP Paribas 12/15/21 INR 11,357,579 USD 152,213 — (1,298)
Standard CharteredBank 12/15/21 INR 7,360,000 USD 99,315 — (1,518)
Morgan StanleyCapital Services LLC 12/15/21 INR 7,360,000 USD 99,315 — (1,517)
Royal Bank ofCanada 12/15/21 INR 4,864,043 USD 64,235 396 —
Toronto-DominionBank 12/15/21 USD 78,355 HKD 608,766 104 —
500 (7,316)
HKD—Hong Kong dollar.INR—Indian rupee.USD—U.S. dollar.
Emerging Markets Stock Index Fund
133
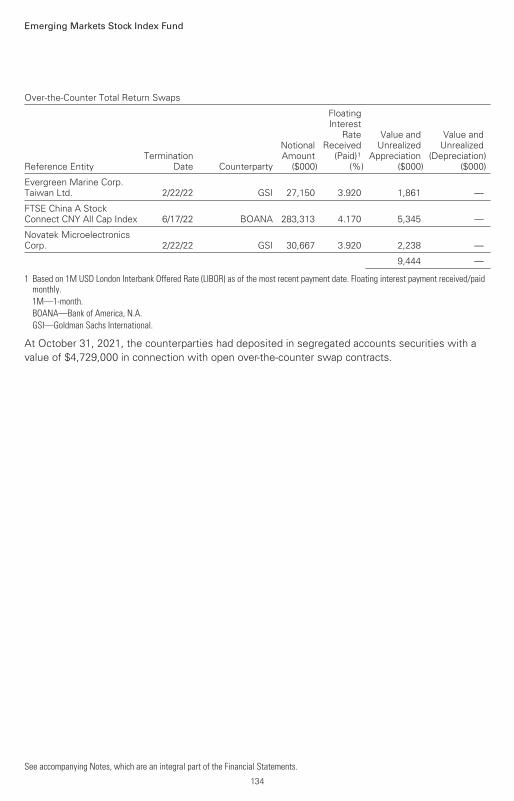
Over-the-Counter Total Return Swaps
Reference EntityTermination
Date Counterparty
NotionalAmount
($000)
FloatingInterest
RateReceived
(Paid)1
(%)
Value andUnrealized
Appreciation($000)
Value andUnrealized
(Depreciation)($000)
Evergreen Marine Corp.Taiwan Ltd. 2/22/22 GSI 27,150 3.920 1,861 —
FTSE China A StockConnect CNY All Cap Index 6/17/22 BOANA 283,313 4.170 5,345 —
Novatek MicroelectronicsCorp. 2/22/22 GSI 30,667 3.920 2,238 —
9,444 —
1 Based on 1M USD London Interbank Offered Rate (LIBOR) as of the most recent payment date. Floating interest payment received/paidmonthly.1M—1-month.BOANA—Bank of America, N.A.GSI—Goldman Sachs International.
At October 31, 2021, the counterparties had deposited in segregated accounts securities with avalue of $4,729,000 in connection with open over-the-counter swap contracts.
Emerging Markets Stock Index Fund
See accompanying Notes, which are an integral part of the Financial Statements.
134

($000s, except shares and per-share amounts) Amount
Assets
Investments in Securities, at Value
Unaffiliated Issuers (Cost $79,704,169) 109,648,452
Affiliated Issuers (Cost $2,652,866) 2,653,142
Total Investments in Securities 112,301,594
Investment in Vanguard 3,723
Cash 997
Foreign Currency, at Value (Cost $327,688) 325,101
Cash Collateral Pledged—Futures Contracts 41,980
Cash Collateral Pledged—Over-the-Counter Swap Contracts and Forward Currency Contracts 7,880
Receivables for Investment Securities Sold 6,919
Receivables for Accrued Income 64,581
Receivables for Capital Shares Issued 156,000
Unrealized Appreciation—Forward Currency Contracts 500
Unrealized Appreciation—Over-the-Counter Swap Contracts 9,444
Total Assets 112,918,719
Liabilities
Due to Custodian 4,050
Payables for Investment Securities Purchased 20,548
Collateral for Securities on Loan 1,323,129
Payables for Capital Shares Redeemed 25,612
Payables to Vanguard 2,732
Variation Margin Payable—Futures Contracts 10,458
Unrealized Depreciation—Forward Currency Contracts 7,316
Deferred Foreign Capital Gains Taxes 659,706
Total Liabilities 2,053,551
Net Assets 110,865,168
Emerging Markets Stock Index Fund
Statement of Assets and LiabilitiesAs of October 31, 2021
135
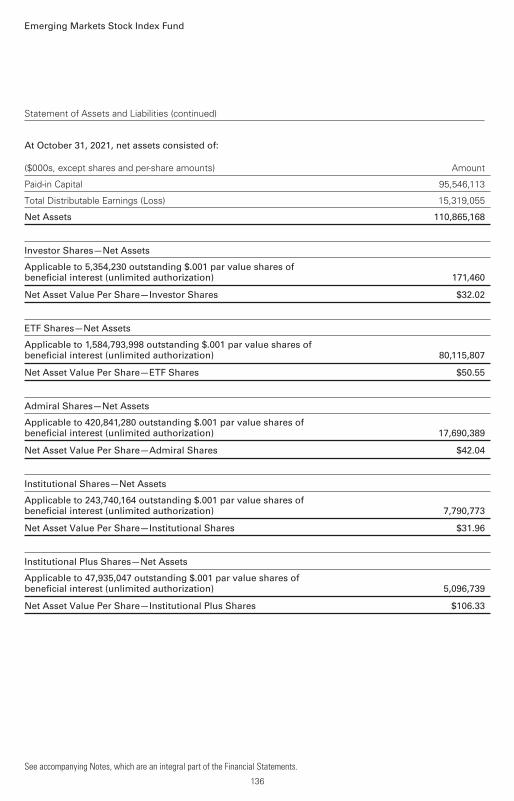
Statement of Assets and Liabilities (continued)
At October 31, 2021, net assets consisted of:
($000s, except shares and per-share amounts) Amount
Paid-in Capital 95,546,113
Total Distributable Earnings (Loss) 15,319,055
Net Assets 110,865,168
Investor Shares—Net Assets
Applicable to 5,354,230 outstanding $.001 par value shares ofbeneficial interest (unlimited authorization) 171,460
Net Asset Value Per Share—Investor Shares $32.02
ETF Shares—Net Assets
Applicable to 1,584,793,998 outstanding $.001 par value shares ofbeneficial interest (unlimited authorization) 80,115,807
Net Asset Value Per Share—ETF Shares $50.55
Admiral Shares—Net Assets
Applicable to 420,841,280 outstanding $.001 par value shares ofbeneficial interest (unlimited authorization) 17,690,389
Net Asset Value Per Share—Admiral Shares $42.04
Institutional Shares—Net Assets
Applicable to 243,740,164 outstanding $.001 par value shares ofbeneficial interest (unlimited authorization) 7,790,773
Net Asset Value Per Share—Institutional Shares $31.96
Institutional Plus Shares—Net Assets
Applicable to 47,935,047 outstanding $.001 par value shares ofbeneficial interest (unlimited authorization) 5,096,739
Net Asset Value Per Share—Institutional Plus Shares $106.33
See accompanying Notes, which are an integral part of the Financial Statements.
Emerging Markets Stock Index Fund
136

Year EndedOctober 31, 2021
($000)
Investment Income
Income
Dividends1 2,536,010
Interest2 978
Securities Lending—Net 38,606
Total Income 2,575,594
Expenses
The Vanguard Group—Note B
Investment Advisory Services 3,659
Management and Administrative—Investor Shares 476
Management and Administrative—ETF Shares 44,014
Management and Administrative—Admiral Shares 20,623
Management and Administrative—Institutional Shares 6,113
Management and Administrative—Institutional Plus Shares 3,102
Marketing and Distribution—Investor Shares 12
Marketing and Distribution—ETF Shares 1,634
Marketing and Distribution—Admiral Shares 639
Marketing and Distribution—Institutional Shares 216
Marketing and Distribution—Institutional Plus Shares 68
Custodian Fees 17,469
Auditing Fees 138
Shareholders’ Reports—Investor Shares 1
Shareholders’ Reports—ETF Shares 2,109
Shareholders’ Reports—Admiral Shares 225
Shareholders’ Reports—Institutional Shares 104
Shareholders’ Reports—Institutional Plus Shares 23
Trustees’ Fees and Expenses 32
Total Expenses 100,657
Net Investment Income 2,474,937
Realized Net Gain (Loss)
Investment Securities Sold2,3,4 (1,288,321)
Futures Contracts 189,522
Swap Contracts 52,445
Forward Currency Contracts 9,606
Foreign Currencies (4,114)
Realized Net Gain (Loss) (1,040,862)
Emerging Markets Stock Index Fund
Statement of Operations
137

Statement of Operations (continued)
Year EndedOctober 31, 2021
($000)
Change in Unrealized Appreciation (Depreciation)
Investment Securities2,5 13,652,962
Futures Contracts (19,256)
Swap Contracts 13
Forward Currency Contracts (6,816)
Foreign Currencies (1,106)
Change in Unrealized Appreciation (Depreciation) 13,625,797
Net Increase (Decrease) in Net Assets Resulting from Operations 15,059,872
1 Dividends are net of foreign withholding taxes of $296,904,000.2 Interest income, realized net gain (loss), and change in unrealized appreciation (depreciation) from an affiliated company of the fund
were $945,000, $18,000, and ($18,000), respectively. Purchases and sales are for temporary cash investment purposes.3 Realized Gain (Loss) is net of foreign capital gains taxes of $4,825,000.4 Includes $89,733,000 of net gain (loss) resulting from in-kind redemptions.5 The change in unrealized appreciation (depreciation) is net of the change in deferred foreign capital gains taxes of $581,693,000.
See accompanying Notes, which are an integral part of the Financial Statements.
Emerging Markets Stock Index Fund
138

Year Ended October 31,
2021($000)
2020($000)
Increase (Decrease) in Net Assets
Operations
Net Investment Income 2,474,937 1,944,587
Realized Net Gain (Loss) (1,040,862) (1,578,669)
Change in Unrealized Appreciation (Depreciation) 13,625,797 5,077,712
Net Increase (Decrease) in Net Assets Resulting from Operations 15,059,872 5,443,630
Distributions
Investor Shares (3,538) (5,308)
ETF Shares (1,706,366) (1,765,914)
Admiral Shares (377,206) (401,489)
Institutional Shares (172,185) (182,259)
Institutional Plus Shares (114,136) (109,778)
Total Distributions (2,373,431) (2,464,748)
Capital Share Transactions
Investor Shares (14,102) (82,198)
ETF Shares 9,871,776 (3,609,670)
Admiral Shares 997,818 (412,007)
Institutional Shares 225,108 (3,583)
Institutional Plus Shares (275,630) 1,698,268
Net Increase (Decrease) from Capital Share Transactions 10,804,970 (2,409,190)
Total Increase (Decrease) 23,491,411 569,692
Net Assets
Beginning of Period 87,373,757 86,804,065
End of Period 110,865,168 87,373,757
See accompanying Notes, which are an integral part of the Financial Statements.
Emerging Markets Stock Index Fund
Statement of Changes in Net Assets
139

Investor Shares
For a Share OutstandingThroughout Each Period
Year Ended October 31,
2021 2020 2019 2018 2017
Net Asset Value, Beginning of Period $27.86 $26.59 $24.02 $28.16 $23.85
Investment Operations
Net Investment Income1 .670 .528 .6432 .663 .601
Net Realized and Unrealized Gain (Loss) onInvestments 4.133 1.456 2.601 (4.187) 4.302
Total from Investment Operations 4.803 1.984 3.244 (3.524) 4.903
Distributions
Dividends from Net Investment Income (.643) (.714) (.674) (.616) (.593)
Distributions from Realized Capital Gains — — — — —
Total Distributions (.643) (.714) (.674) (.616) (.593)
Net Asset Value, End of Period $32.02 $27.86 $26.59 $24.02 $28.16
Total Return3 17.23% 7.55% 13.66% -12.73% 20.76%
Ratios/Supplemental Data
Net Assets, End of Period (Millions) $171 $162 $239 $1,283 $1,738
Ratio of Total Expenses to Average Net Assets 0.29% 0.29% 0.29% 0.29% 0.32%
Ratio of Net Investment Income toAverage Net Assets 2.05% 2.02% 2.48%2 2.36% 2.38%
Portfolio Turnover Rate4 9% 10% 9% 11% 6%
1 Calculated based on average shares outstanding.2 Net investment income per share and the ratio of net investment income to average net assets include $.171 and 0.66%, respectively,
resulting from a special dividend from Naspers Ltd. in September 2019.3 Total returns do not include account service fees that may have applied in the periods shown. Fund prospectuses provide information
about any applicable account service fees.4 Excludes the value of portfolio securities received or delivered as a result of in-kind purchases or redemptions of the fund’s capital
shares, including ETF Creation Units.
Emerging Markets Stock Index Fund
Financial Highlights
See accompanying Notes, which are an integral part of the Financial Statements.
140

FTSE Emerging Markets ETF Shares
For a Share OutstandingThroughout Each Period
Year Ended October 31,
2021 2020 2019 2018 2017
Net Asset Value, Beginning of Period $43.98 $41.99 $37.91 $44.47 $37.67
Investment Operations
Net Investment Income1 1.186 .954 1.3932 1.126 1.035
Net Realized and Unrealized Gain (Loss) onInvestments 6.506 2.249 3.826 (6.636) 6.781
Total from Investment Operations 7.692 3.203 5.219 (5.510) 7.816
Distributions
Dividends from Net Investment Income (1.122) (1.213) (1.139) (1.050) (1.016)
Distributions from Realized Capital Gains — — — — —
Total Distributions (1.122) (1.213) (1.139) (1.050) (1.016)
Net Asset Value, End of Period $50.55 $43.98 $41.99 $37.91 $44.47
Total Return 17.51% 7.77% 13.95% -12.64% 20.98%
Ratios/Supplemental Data
Net Assets, End of Period (Millions) $80,116 $61,434 $63,089 $53,765 $64,967
Ratio of Total Expenses to Average Net Assets 0.08% 0.10% 0.10% 0.12% 0.14%
Ratio of Net Investment Income toAverage Net Assets 2.29% 2.31% 3.40%2 2.53% 2.56%
Portfolio Turnover Rate3 9% 10% 9% 11% 6%
1 Calculated based on average shares outstanding.2 Net investment income per share and the ratio of net investment income to average net assets include $.271 and 0.66%, respectively,
resulting from a special dividend from Naspers Ltd. in September 2019.3 Excludes the value of portfolio securities received or delivered as a result of in-kind purchases or redemptions of the fund’s capital
shares, including ETF Creation Units.
Emerging Markets Stock Index Fund
Financial Highlights
See accompanying Notes, which are an integral part of the Financial Statements.
141
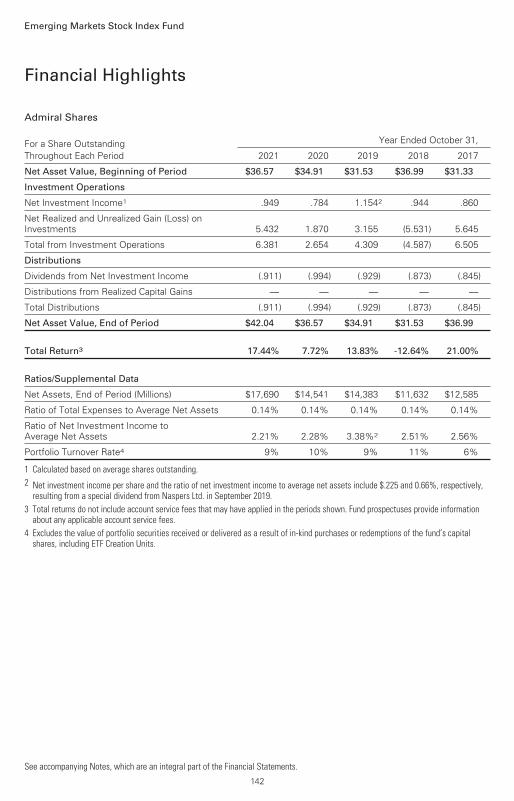
Admiral Shares
For a Share OutstandingThroughout Each Period
Year Ended October 31,
2021 2020 2019 2018 2017
Net Asset Value, Beginning of Period $36.57 $34.91 $31.53 $36.99 $31.33
Investment Operations
Net Investment Income1 .949 .784 1.1542 .944 .860
Net Realized and Unrealized Gain (Loss) onInvestments 5.432 1.870 3.155 (5.531) 5.645
Total from Investment Operations 6.381 2.654 4.309 (4.587) 6.505
Distributions
Dividends from Net Investment Income (.911) (.994) (.929) (.873) (.845)
Distributions from Realized Capital Gains — — — — —
Total Distributions (.911) (.994) (.929) (.873) (.845)
Net Asset Value, End of Period $42.04 $36.57 $34.91 $31.53 $36.99
Total Return3 17.44% 7.72% 13.83% -12.64% 21.00%
Ratios/Supplemental Data
Net Assets, End of Period (Millions) $17,690 $14,541 $14,383 $11,632 $12,585
Ratio of Total Expenses to Average Net Assets 0.14% 0.14% 0.14% 0.14% 0.14%
Ratio of Net Investment Income toAverage Net Assets 2.21% 2.28% 3.38%2 2.51% 2.56%
Portfolio Turnover Rate4 9% 10% 9% 11% 6%
1 Calculated based on average shares outstanding.2 Net investment income per share and the ratio of net investment income to average net assets include $.225 and 0.66%, respectively,
resulting from a special dividend from Naspers Ltd. in September 2019.3 Total returns do not include account service fees that may have applied in the periods shown. Fund prospectuses provide information
about any applicable account service fees.4 Excludes the value of portfolio securities received or delivered as a result of in-kind purchases or redemptions of the fund’s capital
shares, including ETF Creation Units.
Emerging Markets Stock Index Fund
Financial Highlights
See accompanying Notes, which are an integral part of the Financial Statements.
142

Institutional Shares
For a Share OutstandingThroughout Each Period
Year Ended October 31,
2021 2020 2019 2018 2017
Net Asset Value, Beginning of Period $27.81 $26.55 $23.98 $28.13 $23.82
Investment Operations
Net Investment Income1 .736 .611 .8882 .721 .659
Net Realized and Unrealized Gain (Loss) onInvestments 4.120 1.415 2.401 (4.198) 4.301
Total from Investment Operations 4.856 2.026 3.289 (3.477) 4.960
Distributions
Dividends from Net Investment Income (.706) (.766) (.719) (.673) (.650)
Distributions from Realized Capital Gains — — — — —
Total Distributions (.706) (.766) (.719) (.673) (.650)
Net Asset Value, End of Period $31.96 $27.81 $26.55 $23.98 $28.13
Total Return 17.45% 7.76% 13.88% -12.60% 21.06%
Ratios/Supplemental Data
Net Assets, End of Period (Millions) $7,791 $6,592 $6,309 $5,142 $5,647
Ratio of Total Expenses to Average Net Assets 0.10% 0.10% 0.10% 0.10% 0.11%
Ratio of Net Investment Income toAverage Net Assets 2.25% 2.34% 3.43%2 2.55% 2.59%
Portfolio Turnover Rate3 9% 10% 9% 11% 6%
1 Calculated based on average shares outstanding.2 Net investment income per share and the ratio of net investment income to average net assets include $.171 and 0.66%, respectively,
resulting from a special dividend from Naspers Ltd. in September 2019.3 Excludes the value of portfolio securities received or delivered as a result of in-kind purchases or redemptions of the fund’s capital
shares, including ETF Creation Units.
Emerging Markets Stock Index Fund
Financial Highlights
See accompanying Notes, which are an integral part of the Financial Statements.
143

Institutional Plus Shares
For a Share OutstandingThroughout Each Period
Year Ended October 31,
2021 2020 2019 2018 2017
Net Asset Value, Beginning of Period $92.51 $88.32 $79.77 $93.57 $79.26
Investment Operations
Net Investment Income1 2.412 2.123 3.1022 2.182 2.221
Net Realized and Unrealized Gain (Loss) onInvestments 13.779 4.635 7.869 (13.725) 14.266
Total from Investment Operations 16.191 6.758 10.971 (11.543) 16.487
Distributions
Dividends from Net Investment Income (2.371) (2.568) (2.421) (2.257) (2.177)
Distributions from Realized Capital Gains — — — — —
Total Distributions (2.371) (2.568) (2.421) (2.257) (2.177)
Net Asset Value, End of Period $106.33 $92.51 $88.32 $79.77 $93.57
Total Return 17.49% 7.78% 13.93% -12.58% 21.04%
Ratios/Supplemental Data
Net Assets, End of Period (Millions) $5,097 $4,645 $2,784 $1,973 $3,991
Ratio of Total Expenses to Average Net Assets 0.08% 0.08% 0.08% 0.08% 0.09%
Ratio of Net Investment Income toAverage Net Assets 2.22% 2.45% 3.59%2 2.57% 2.61%
Portfolio Turnover Rate3 9% 10% 9% 11% 6%
1 Calculated based on average shares outstanding.2 Net investment income per share and the ratio of net investment income to average net assets include $.571 and 0.66%, respectively,
resulting from a special dividend from Naspers Ltd. in September 2019.3 Excludes the value of portfolio securities received or delivered as a result of in-kind purchases or redemptions of the fund’s capital
shares, including ETF Creation Units.
Emerging Markets Stock Index Fund
Financial Highlights
See accompanying Notes, which are an integral part of the Financial Statements.
144

Vanguard Emerging Markets Stock Index Fund is registered under the Investment Company Act of1940 as an open-end investment company, or mutual fund. The fund offers five classes of shares:Investor Shares, ETF Shares, Admiral Shares, Institutional Shares, and Institutional Plus Shares.Each of the share classes has different eligibility and minimum purchase requirements, and isdesigned for different types of investors. ETF Shares, known as Vanguard FTSE Emerging MarketsETF Shares, are listed for trading on NYSE Arca; they can be purchased and sold through a broker.
The fund invests in securities of foreign issuers, which may subject it to investment risks notnormally associated with investing in securities of U.S. corporations. Further, at October 31, 2021,the fund had a concentration of its investments in securities issued in China, and the performanceof such investments may be impacted by the country’s social, political, and economic conditions.Market disruptions associated with the COVID-19 pandemic have had a global impact, anduncertainty exists as to the long-term implications. Such disruptions can adversely affect assets ofthe fund and thus fund performance.
A. The following significant accounting policies conform to generally accepted accountingprinciples for U.S. investment companies. The fund consistently follows such policies in preparingits financial statements.
1. Security Valuation: Securities are valued as of the close of trading on the New York StockExchange (generally 4 p.m., Eastern time) on the valuation date. Equity securities are valued at thelatest quoted sales prices or official closing prices taken from the primary market in which eachsecurity trades; such securities not traded on the valuation date are valued at the mean of thelatest quoted bid and asked prices. Securities for which market quotations are not readily available,or whose values have been affected by events occurring before the fund's pricing time but afterthe close of the securities’ primary markets, are valued at their fair values calculated according toprocedures adopted by the board of trustees. These procedures include obtaining quotations froman independent pricing service, monitoring news to identify significant market- or security-specificevents, and evaluating changes in the values of foreign market proxies (for example, ADRs, futurescontracts, or exchange-traded funds), between the time the foreign markets close and the fund’spricing time.When fair-value pricing is employed, the prices of securities used by a fund tocalculate its net asset value may differ from quoted or published prices for the same securities.Investments in Vanguard Market Liquidity Fund are valued at that fund's net asset value.Temporary cash investments are valued using the latest bid prices or using valuations based on amatrix system (which considers such factors as security prices, yields, maturities, and ratings),both as furnished by independent pricing services.
2. Foreign Currency: Securities and other assets and liabilities denominated in foreign currenciesare translated into U.S. dollars using exchange rates obtained from an independent third party asof the fund’s pricing time on the valuation date. Realized gains (losses) and unrealized appreciation(depreciation) on investment securities include the effects of changes in exchange rates since thesecurities were purchased, combined with the effects of changes in security prices. Fluctuations inthe value of other assets and liabilities resulting from changes in exchange rates are recorded asunrealized foreign currency gains (losses) until the assets or liabilities are settled in cash, at whichtime they are recorded as realized foreign currency gains (losses).
3. Futures Contracts: The fund uses index futures contracts to a limited extent, with the objectivesof maintaining full exposure to the stock market, maintaining liquidity, and minimizing transactioncosts. The fund may purchase futures contracts to immediately invest incoming cash in themarket, or sell futures in response to cash outflows, thereby simulating a fully invested position in
Emerging Markets Stock Index Fund
Notes to Financial Statements
145

the underlying index while maintaining a cash balance for liquidity. The primary risks associatedwith the use of futures contracts are imperfect correlation between changes in market values ofstocks held by the fund and the prices of futures contracts, and the possibility of an illiquid market.Counterparty risk involving futures is mitigated because a regulated clearinghouse is thecounterparty instead of the clearing broker. To further mitigate counterparty risk, the fund tradesfutures contracts on an exchange, monitors the financial strength of its clearing brokers andclearinghouse, and has entered into clearing agreements with its clearing brokers. Theclearinghouse imposes initial margin requirements to secure the fund’s performance and requiresdaily settlement of variation margin representing changes in the market value of each contract. Anysecurities pledged as initial margin for open contracts are noted in the Schedule of Investments.
Futures contracts are valued at their quoted daily settlement prices. The notional amounts of thecontracts are not recorded in the Statement of Assets and Liabilities. Fluctuations in the value ofthe contracts are recorded in the Statement of Assets and Liabilities as an asset (liability) and inthe Statement of Operations as unrealized appreciation (depreciation) until the contracts areclosed, when they are recorded as realized gains (losses) on futures contracts.
During the year ended October 31, 2021, the fund’s average investments in long and short futurescontracts represented 1% and 0% of net assets, respectively, based on the average of thenotional amounts at each quarter-end during the period.
4. Forward Currency Contracts: The fund enters into forward currency contracts to protect thevalue of securities and related receivables and payables against changes in future foreign exchangerates. The fund’s risks in using these contracts include movement in the values of the foreigncurrencies relative to the U.S. dollar and the ability of the counterparties to fulfill their obligationsunder the contracts. The fund mitigates its counterparty risk by entering into forward currencycontracts only with a diverse group of prequalified counterparties, monitoring their financialstrength, entering into master netting arrangements with its counterparties, and requiring itscounterparties to transfer collateral as security for their performance. In the absence of a default,the collateral pledged or received by the fund cannot be repledged, resold, or rehypothecated. Themaster netting arrangements provide that, in the event of a counterparty’s default (includingbankruptcy), the fund may terminate the forward currency contracts, determine the net amountowed by either party in accordance with its master netting arrangements, and sell or retain anycollateral held up to the net amount owed to the fund under the master netting arrangements. Theforward currency contracts contain provisions whereby a counterparty may terminate opencontracts if the fund’s net assets decline below a certain level, triggering a payment by the fund ifthe fund is in a net liability position at the time of the termination. The payment amount would bereduced by any collateral the fund has pledged. Any securities pledged as collateral for opencontracts are noted in the Schedule of Investments. The value of collateral received or pledged iscompared daily to the value of the forward currency contracts exposure with each counterparty,and any difference, if in excess of a specified minimum transfer amount, is adjusted and settledwithin two business days.
Forward currency contracts are valued at their quoted daily prices obtained from an independentthird party, adjusted for currency risk based on the expiration date of each contract. The notionalamounts of the contracts are not recorded in the Statement of Assets and Liabilities. Fluctuationsin the value of the contracts are recorded in the Statement of Assets and Liabilities as an asset(liability) and in the Statement of Operations as unrealized appreciation (depreciation) until thecontracts are closed, when they are recorded as realized gains (losses) on forward currencycontracts.
Emerging Markets Stock Index Fund
146

During the year ended October 31, 2021, the fund’s average investment in forward currencycontracts represented less than 1% of net assets, based on the average of the notional amountsat each quarter-end during the period.
5. Swap Contracts: The fund has entered into equity swap contracts to earn the total return onselected reference stocks in the fund’s target index. Under the terms of the swaps, the fundreceives the total return on the referenced stock (i.e., receiving the increase or paying thedecrease in value of the selected reference stock and receiving the equivalent of any dividends inrespect of the selected referenced stock) over a specified period of time, applied to a notionalamount that represents the value of a designated number of shares of the selected referencestock at the beginning of the equity swap contract. The fund also pays a floating rate that is basedon short-term interest rates, applied to the notional amount. At the same time, the fund generallyinvests an amount approximating the notional amount of the swap in high-quality temporary cashinvestments.
A risk associated with all types of swaps is the possibility that a counterparty may default on itsobligation to pay net amounts due to the fund. The fund’s maximum amount subject tocounterparty risk is the unrealized appreciation on the swap contract. The fund mitigates itscounterparty risk by entering into swaps only with a diverse group of prequalified counterparties,monitoring their financial strength, entering into master netting arrangements with itscounterparties, and requiring its counterparties to transfer collateral as security for theirperformance. In the absence of a default, the collateral pledged or received by the fund cannot berepledged, resold, or rehypothecated. In the event of a counterparty’s default (includingbankruptcy), the fund may terminate any swap contracts with that counterparty, determine the netamount owed by either party in accordance with its master netting arrangements, and sell orretain any collateral held up to the net amount owed to the fund under the master nettingarrangements. The swap contracts contain provisions whereby a counterparty may terminate opencontracts if the fund's net assets decline below a certain level, triggering a payment by the fund ifthe fund is in a net liability position at the time of the termination. The payment amount would bereduced by any collateral the fund has pledged. Any securities pledged as collateral for opencontracts are noted in the Schedule of Investments. The value of collateral received or pledged iscompared daily to the value of the swap contracts exposure with each counterparty, and anydifference, if in excess of a specified minimum transfer amount, is adjusted and settled within twobusiness days.
The notional amounts of swap contracts are not recorded in the Statement of Assets andLiabilities. Swaps are valued daily based on market quotations received from independent pricingservices or recognized dealers and the change in value is recorded in the Statement of Assets andLiabilities as an asset (liability) and in the Statement of Operations as unrealized appreciation(depreciation) until periodic payments are made or the termination of the swap, at which timerealized gain (loss) is recorded.
During the year ended October 31, 2021, the fund’s average amounts of investments in totalreturn swaps represented less than 1% of net assets, based on the average of notional amountsat each quarter-end during the period.
6. Federal IncomeTaxes: The fund intends to continue to qualify as a regulated investmentcompany and distribute all of its taxable income. The fund’s tax returns are open to examination bythe relevant tax authorities until expiration of the applicable statute of limitations, which is
Emerging Markets Stock Index Fund
147
generally three years after the filing of the tax return. Management has analyzed the fund’s taxpositions taken for all open federal and state income tax years, and has concluded that noprovision for income tax is required in the fund’s financial statements.
7. Distributions: Distributions to shareholders are recorded on the ex-dividend date. Distributionsare determined on a tax basis at the fiscal year-end and may differ from net investment incomeand realized capital gains for financial reporting purposes.
8. Securities Lending: To earn additional income, the fund lends its securities to qualifiedinstitutional borrowers. Security loans are subject to termination by the fund at any time, and arerequired to be secured at all times by collateral in an amount at least equal to the market value ofsecurities loaned. Daily market fluctuations could cause the value of loaned securities to be moreor less than the value of the collateral received.When this occurs, the collateral is adjusted andsettled before the opening of the market on the next business day. The fund further mitigates itscounterparty risk by entering into securities lending transactions only with a diverse group ofprequalified counterparties, monitoring their financial strength, and entering into master securitieslending agreements with its counterparties. The master securities lending agreements providethat, in the event of a counterparty’s default (including bankruptcy), the fund may terminate anyloans with that borrower, determine the net amount owed, and sell or retain the collateral up tothe net amount owed to the fund; however, such actions may be subject to legal proceedings.While collateral mitigates counterparty risk, in the event of a default, the fund may experiencedelays and costs in recovering the securities loaned. The fund invests cash collateral received inVanguard Market Liquidity Fund, and records a liability in the Statement of Assets and Liabilitiesfor the return of the collateral, during the period the securities are on loan. Collateral investmentsin Vanguard Market Liquidity Fund are subject to market appreciation or depreciation. Securitieslending income represents fees charged to borrowers plus income earned on invested cashcollateral, less expenses associated with the loan. During the term of the loan, the fund is entitledto all distributions made on or in respect of the loaned securities.
9. Credit Facilities and Interfund Lending Program: The fund and certain other funds managed byThe Vanguard Group ("Vanguard") participate in a $4.3 billion committed credit facility provided by asyndicate of lenders pursuant to a credit agreement and an uncommitted credit facility provided byVanguard. Both facilities may be renewed annually. Each fund is individually liable for itsborrowings, if any, under the credit facilities. Borrowings may be utilized for temporary oremergency purposes, subject to the fund’s regulatory and contractual borrowing restrictions.Withrespect to the committed credit facility, the participating funds are charged administrative fees andan annual commitment fee of 0.10% of the undrawn committed amount of the facility; these feesare allocated to the funds based on a method approved by the fund’s board of trustees andincluded in Management and Administrative expenses on the fund’s Statement of Operations. Anyborrowings under either facility bear interest at a rate based upon the higher of the one-monthLondon Interbank Offered Rate (or an acceptable alternate rate, if necessary), federal fundseffective rate, or overnight bank funding rate plus an agreed-upon spread, except that borrowingsunder the uncommitted credit facility may bear interest based upon an alternative rate agreed toby the fund and Vanguard.
In accordance with an exemptive order (the “Order”) from the SEC, the fund may participate in ajoint lending and borrowing program that allows registered open-end Vanguard funds to borrowmoney from and lend money to each other for temporary or emergency purposes (the “InterfundLending Program”), subject to compliance with the terms and conditions of the Order, and to theextent permitted by the fund’s investment objective and investment policies. Interfund loans and
Emerging Markets Stock Index Fund
148

borrowings normally extend overnight, but can have a maximum duration of seven days. Loansmay be called on one business day’s notice. The interest rate to be charged is governed by theconditions of the Order and internal procedures adopted by the board of trustees. The board oftrustees is responsible for overseeing the Interfund Lending Program.
For the year ended October 31, 2021, the fund did not utilize the credit facilities or the InterfundLending Program.
10. Other: Dividend income is recorded on the ex-dividend date. Non-cash dividends included inincome, if any, are recorded at the fair value of the securities received. Interest income includesincome distributions received from Vanguard Market Liquidity Fund and is accrued daily. Premiumsand discounts on debt securities are amortized and accreted, respectively, to interest income overthe lives of the respective securities, except for premiums on certain callable debt securities thatare amortized to the earliest call date. Taxes on foreign dividends and capital gains have beenprovided for in accordance with the fund's understanding of the applicable countries’ tax rules andrates. Deferred foreign capital gains tax, if any, is accrued daily based upon net unrealized gains.Security transactions are accounted for on the date securities are bought or sold. Costs used todetermine realized gains (losses) on the sale of investment securities are those of the specificsecurities sold.
Each class of shares has equal rights as to assets and earnings, except that each class separatelybears certain class-specific expenses related to maintenance of shareholder accounts (included inManagement and Administrative expenses) and shareholder reporting. Marketing and distributionexpenses are allocated to each class of shares based on a method approved by the board oftrustees. Income, other non-class-specific expenses, and gains and losses on investments areallocated to each class of shares based on its relative net assets.
B. In accordance with the terms of a Funds’ Service Agreement (the “FSA”) between Vanguardand the fund, Vanguard furnishes to the fund investment advisory, corporate management,administrative, marketing, and distribution services at Vanguard’s cost of operations (as defined bythe FSA). These costs of operations are allocated to the fund based on methods and guidelinesapproved by the board of trustees and are generally settled twice a month.
Upon the request of Vanguard, the fund may invest up to 0.40% of its net assets as capital inVanguard. At October 31, 2021, the fund had contributed to Vanguard capital in the amount of$3,723,000, representing less than 0.01% of the fund’s net assets and 1.49% of Vanguard’s capitalreceived pursuant to the FSA. The fund’s trustees and officers are also directors and employees,respectively, of Vanguard.
C. Various inputs may be used to determine the value of the fund’s investments and derivatives.These inputs are summarized in three broad levels for financial statement purposes. The inputs ormethodologies used to value securities are not necessarily an indication of the risk associated withinvesting in those securities.
Level 1—Quoted prices in active markets for identical securities.
Level 2—Other significant observable inputs (including quoted prices for similar securities, interestrates, prepayment speeds, credit risk, etc.).
Level 3—Significant unobservable inputs (including the fund’s own assumptions used todetermine the fair value of investments). Any investments and derivatives valued with significantunobservable inputs are noted on the Schedule of Investments.
Emerging Markets Stock Index Fund
149

The following table summarizes the market value of the fund's investments and derivatives as ofOctober 31, 2021, based on the inputs used to value them:
Level 1($000)
Level 2($000)
Level 3($000)
Total($000)
Investments
Assets
Common Stocks—North and SouthAmerica 8,476,286 19,470 8 8,495,764
Common Stocks—Other 6,133,199 94,932,599 86,890 101,152,688
Temporary Cash Investments 2,653,142 — — 2,653,142
Total 17,262,627 94,952,069 86,898 112,301,594
Derivative Financial Instruments
Assets
Forward Currency Contracts — 500 — 500
Swap Contracts — 9,444 — 9,444
Total — 9,944 — 9,944
Liabilities
Futures Contracts1 17,776 — — 17,776
Forward Currency Contracts — 7,316 — 7,316
Total 17,776 7,316 — 25,092
1 Includes cumulative appreciation (depreciation) on futures contracts and centrally cleared swaps, if any, as reported in the Schedule ofInvestments. Only current day’s variation margin is reported within the Statement of Assets and Liabilities.
D. At October 31, 2021, the fair values of derivatives were reflected in the Statement of Assetsand Liabilities as follows:
Statement of Assets and Liabilities
EquityContracts
($000)
ForeignExchangeContracts
($000)Total($000)
Unrealized Appreciation—Forward Currency Contracts — 500 500
Unrealized Appreciation—Over-the-Counter Swap Contracts 9,444 — 9,444
Total Assets 9,444 500 9,944
Unrealized Depreciation—Futures Contracts1 17,776 — 17,776
Unrealized Depreciation—Forward Currency Contracts — 7,316 7,316
Total Liabilities 17,776 7,316 25,092
1 Includes cumulative appreciation (depreciation) on futures contracts, if any, as reported in the Schedule of Investments. Only currentday’s variation margin is reported within the Statement of Assets and Liabilities.
Emerging Markets Stock Index Fund
150

Realized net gain (loss) and the change in unrealized appreciation (depreciation) on derivatives forthe year ended October 31, 2021, were:
Realized Net Gain (Loss) on Derivatives
EquityContracts
($000)
ForeignExchangeContracts
($000)Total($000)
Futures Contracts 189,522 — 189,522
Forward Currency Contracts — 9,606 9,606
Swap Contracts 52,445 — 52,445
Realized Net Gain (Loss) on Derivatives 241,967 9,606 251,573
Change in Unrealized Appreciation (Depreciation) on Derivatives
Futures Contracts (19,256) — (19,256)
Forward Currency Contracts — (6,816) (6,816)
Swap Contracts 13 — 13
Change in Unrealized Appreciation (Depreciation) on Derivatives (19,243) (6,816) (26,059)
E. Permanent differences between book-basis and tax-basis components of net assets arereclassified among capital accounts in the financial statements to reflect their tax character. Thesereclassifications have no effect on net assets or net asset value per share. As of period end,permanent differences primarily attributable to the accounting for in-kind redemptions, foreigncurrency transactions, passive foreign investment companies, swap agreements, and tax expenseon capital gains were reclassified between the following accounts:
Amount($000)
Paid-in Capital 89,522
Total Distributable Earnings (Loss) (89,522)
Temporary differences between book-basis and tax-basis components of total distributableearnings (loss) arise when certain items of income, gain, or loss are recognized in different periodsfor financial statement and tax purposes; these differences will reverse at some time in the future.The differences are primarily related to the deferral of losses from wash sales; the recognition ofunrealized gains or losses from certain derivative contracts; the recognition of unrealized gainsfrom passive foreign investment companies; and the classification of securities for tax purposes.As of period end, the tax-basis components of total distributable earnings (loss) are detailed in thetable as follows:
Amount($000)
Undistributed Ordinary Income 764,307
Undistributed Long-Term Gains —
Capital Loss Carryforwards (14,244,723)
Qualified Late-Year Losses —
Net Unrealized Gains (Losses) 28,799,471
Emerging Markets Stock Index Fund
151

The tax character of distributions paid was as follows:
Year Ended October 31,
2021Amount
($000)
2020Amount
($000)
Ordinary Income 2,373,431 2,464,748
Long-Term Capital Gains — —
Total 2,373,431 2,464,748
As of October 31, 2021, gross unrealized appreciation and depreciation for investments andderivatives based on cost for U.S. federal income tax purposes were as follows:
Amount($000)
Tax Cost 82,839,699
Gross Unrealized Appreciation 44,257,404
Gross Unrealized Depreciation (14,795,406)
Net Unrealized Appreciation (Depreciation) 29,461,998
F. During the year ended October 31, 2021, the fund purchased $20,620,374,000 of investmentsecurities and sold $9,895,309,000 of investment securities, other than temporary cashinvestments. Purchases and sales include $4,427,552,000 and $190,714,000, respectively, inconnection with in-kind purchases and redemptions of the fund’s capital shares.
G. Capital share transactions for each class of shares were:
Year Ended October 31,
2021 2020
Amount($000)
Shares(000)
Amount($000)
Shares(000)
Investor Shares
Issued 35,281 1,072 16,736 651
Issued in Lieu of Cash Distributions 3,538 109 5,308 195
Redeemed1 (52,921) (1,649) (104,242) (4,022)
Net Increase (Decrease)—Investor Shares (14,102) (468) (82,198) (3,176)
ETF Shares
Issued 9,871,776 187,928 825,514 20,070
Issued in Lieu of Cash Distributions — — — —
Redeemed — — (4,435,184) (125,800)
Net Increase (Decrease)—ETF Shares 9,871,776 187,928 (3,609,670) (105,730)
Admiral Shares
Issued1 3,864,155 89,841 3,245,146 97,262
Issued in Lieu of Cash Distributions 329,698 7,748 348,063 9,830
Redeemed (3,196,035) (74,341) (4,005,216) (121,465)
Net Increase (Decrease)—Admiral Shares 997,818 23,248 (412,007) (14,373)
Emerging Markets Stock Index Fund
152

Year Ended October 31,
2021 2020
Amount($000)
Shares(000)
Amount($000)
Shares(000)
Institutional Shares
Issued 2,271,838 69,396 1,781,929 68,805
Issued in Lieu of Cash Distributions 161,913 5,003 171,042 6,363
Redeemed (2,208,643) (67,714) (1,956,554) (75,769)
Net Increase (Decrease)—Institutional Shares 225,108 6,685 (3,583) (601)
Institutional Plus Shares
Issued 963,871 8,971 1,900,916 21,059
Issued in Lieu of Cash Distributions 106,546 991 103,316 1,160
Redeemed (1,346,047) (12,234) (305,964) (3,531)
Net Increase (Decrease)—Institutional Plus Shares (275,630) (2,272) 1,698,268 18,688
1 In November 2018, the fund announced changes to the availability and minimum investment criteria of the Investor and Admiral shareclasses. As a result, all of the outstanding Investor Shares automatically converted to Admiral Shares beginning in April 2019, with theexception of those held by Vanguard funds and certain other institutional investors. Investor Shares—Redeemed and AdmiralShares—Issued include 135 and 103 shares, respectively, in the amount of $4,000 from the conversion during the year endedOctober 31, 2020.
H. Management has determined that no events or transactions occurred subsequent toOctober 31, 2021, that would require recognition or disclosure in these financial statements.
Emerging Markets Stock Index Fund
153

To the Board of Trustees of Vanguard International Equity Index Funds and Shareholders ofVanguard Emerging Markets Stock Index Fund
Opinion on the Financial StatementsWe have audited the accompanying statement of assets and liabilities, including the schedule ofinvestments, of Vanguard Emerging Markets Stock Index Fund (one of the funds constitutingVanguard International Equity Index Funds, referred to hereafter as the "Fund") as of October 31,2021, the related statement of operations for the year ended October 31, 2021, the statement ofchanges in net assets for each of the two years in the period ended October 31, 2021, includingthe related notes, and the financial highlights for each of the five years in the period endedOctober 31, 2021 (collectively referred to as the "financial statements"). In our opinion, the financialstatements present fairly, in all material respects, the financial position of the Fund as ofOctober 31, 2021, the results of its operations for the year then ended, the changes in its netassets for each of the two years in the period ended October 31, 2021 and the financial highlightsfor each of the five years in the period ended October 31, 2021 in conformity with accountingprinciples generally accepted in the United States of America.
Basis for OpinionThese financial statements are the responsibility of the Fund’s management. Our responsibility isto express an opinion on the Fund’s financial statements based on our audits. We are a publicaccounting firm registered with the Public Company Accounting Oversight Board (United States)(PCAOB) and are required to be independent with respect to the Fund in accordance with the U.S.federal securities laws and the applicable rules and regulations of the Securities and ExchangeCommission and the PCAOB.
We conducted our audits of these financial statements in accordance with the standards of thePCAOB. Those standards require that we plan and perform the audit to obtain reasonableassurance about whether the financial statements are free of material misstatement, whether dueto error or fraud.
Our audits included performing procedures to assess the risks of material misstatement of thefinancial statements, whether due to error or fraud, and performing procedures that respond tothose risks. Such procedures included examining, on a test basis, evidence regarding the amountsand disclosures in the financial statements. Our audits also included evaluating the accountingprinciples used and significant estimates made by management, as well as evaluating the overallpresentation of the financial statements. Our procedures included confirmation of securitiesowned as of October 31, 2021 by correspondence with the custodian, transfer agent and brokers;when replies were not received from the transfer agent or brokers, we performed other auditingprocedures.We believe that our audits provide a reasonable basis for our opinion.
/s/PricewaterhouseCoopers LLPPhiladelphia, PennsylvaniaDecember 17, 2021
We have served as the auditor of one or more investment companies in The Vanguard Group ofFunds since 1975.
Report of Independent RegisteredPublic Accounting Firm
154

Special 2021 tax information (unaudited) for Vanguard Emerging Markets Stock Index Fund
This information for the fiscal year ended October 31, 2021, is included pursuant to provisions ofthe Internal Revenue Code.
The fund distributed $275,149,000 of qualified dividend income to shareholders during the fiscalyear.
The fund designates to shareholders foreign source income of $2,846,867,000 and foreign taxespaid of $281,120,000. Shareholders will receive more detailed information with their Form1099-DIV in January 2022 to determine the calendar-year amounts to be included on their 2021 taxreturns.
155

London Stock Exchange Group companies include FTSE International Limited (“FTSE”), Frank Russell Company(“Russell”), MTS Next Limited (“MTS”), and FTSE TMX Global Debt Capital Markets Inc. (“FTSE TMX”). All rightsreserved. “FTSE®”, “Russell®”, “MTS®”, “FTSE TMX®” and “FTSE Russell” and other service marks and trademarksrelated to the FTSE or Russell indexes are trademarks of the London Stock Exchange Group companies and are used byFTSE, MTS, FTSE TMX and Russell under license. All information is provided for information purposes only. Every effort ismade to ensure that all information given in this publication is accurate, but no responsibility or liability can be acceptedby the London Stock Exchange Group companies nor its licensors for any errors or for any loss from use of thispublication. Neither the London Stock Exchange Group companies nor any of their licensors make any claim, prediction,warranty or representation whatsoever, expressly or impliedly, either as to the results to be obtained from the use of theIndices or the fitness or suitability of the Indices for any particular purpose to which they might be put. The London StockExchange Group companies do not provide investment advice and nothing in this document should be taken asconstituting financial or investment advice. The London Stock Exchange Group companies make no representationregarding the advisability of investing in any asset. A decision to invest in any such asset should not be made in relianceon any information herein. Indexes cannot be invested in directly. Inclusion of an asset in an index is not arecommendation to buy, sell or hold that asset. The general information contained in this publication should not be actedupon without obtaining specific legal, tax, and investment advice from a licensed professional. No part of thisinformation may be reproduced, stored in a retrieval system or transmitted in any form or by any means, electronic,mechanical, photocopying, recording or otherwise, without prior written permission of the London Stock Exchange Groupcompanies. Distribution of the London Stock Exchange Group companies’ index values and the use of their indexes tocreate financial products require a license with FTSE, FTSE TMX, MTS and/or Russell and/or its licensors.
156

This page intentionally left blank.

This page intentionally left blank.

This page intentionally left blank.

This page intentionally left blank.

This page intentionally left blank.

This page intentionally left blank.

The trustees of your mutual fund are there to see that the fund is operated and managed in yourbest interests since, as a shareholder, you are a part owner of the fund. Your fund’s trustees alsoserve on the board of directors of The Vanguard Group, Inc., which is owned by the Vanguard fundsand provides services to them.
A majority of Vanguard’s board members are independent, meaning that they have no affiliationwith Vanguard or the funds they oversee, apart from the sizable personal investments they havemade as private individuals. The independent board members have distinguished backgrounds inbusiness, academia, and public service. Each of the trustees and executive officers oversees 214Vanguard funds.
Information for each trustee and executive officer of the fund appears below. That information, aswell as the Vanguard fund count, is as of the date on the cover of this fund report. The mailingaddress of the trustees and officers is P.O. Box 876, Valley Forge, PA 19482. More informationabout the trustees is in the Statement of Additional Information, which can be obtained, withoutcharge, by contacting Vanguard at 800-662-7447, or online at vanguard.com.
Interested Trustee1
Mortimer J. BuckleyBorn in 1969. Trustee since January 2018. Principaloccupation(s) during the past five years and otherexperience: chairman of the board (2019–present) ofVanguard and of each of the investment companiesserved by Vanguard; chief executive officer(2018–present) of Vanguard; chief executive officer,president, and trustee (2018–present) of each of theinvestment companies served by Vanguard; presidentand director (2017–present) of Vanguard; andpresident (2018–present) of Vanguard MarketingCorporation. Chief investment officer (2013–2017),managing director (2002–2017), head of the RetailInvestor Group (2006–2012), and chief informationofficer (2001–2006) of Vanguard. Chairman of theboard (2011–2017) and trustee (2009–2017) of theChildren’s Hospital of Philadelphia; and trustee(2018–present) and vice chair (2019–present) of TheShipley School.
Independent Trustees
Emerson U. FullwoodBorn in 1948. Trustee since January 2008. Principaloccupation(s) during the past five years and otherexperience: executive chief staff and marketingofficer for North America and corporate vice president(retired 2008) of Xerox Corporation (documentmanagement products and services). Formerpresident of theWorldwide Channels Group, LatinAmerica, andWorldwide Customer Service andexecutive chief staff officer of Developing Markets ofXerox. Executive in residence and 2009–2010Distinguished Minett Professor at the RochesterInstitute of Technology. Director of SPX FLOW, Inc.(multi-industry manufacturing). Director of theUniversity of Rochester Medical Center, the MonroeCommunity College Foundation, the UnitedWay ofRochester, North Carolina A&T University, andRobertsWesleyan College. Trustee of the Universityof Rochester.
Amy GutmannBorn in 1949. Trustee since June 2006. Principaloccupation(s) during the past five years and otherexperience: president (2004–present) of theUniversity of Pennsylvania. Christopher H. BrowneDistinguished Professor of Political Science, School ofArts and Sciences, and professor of communication,Annenberg School for Communication, withsecondary faculty appointments in the Department ofPhilosophy, School of Arts and Sciences, and at theGraduate School of Education, University ofPennsylvania.
1 Mr. Buckley is considered an “interested person,” as defined in the Investment Company Act of 1940, because he is an officer of theVanguard funds.
The People Who Govern Your Fund

F. Joseph LoughreyBorn in 1949. Trustee since October 2009. Principaloccupation(s) during the past five years and otherexperience: president and chief operating officer(retired 2009) and vice chairman of the board(2008–2009) of Cummins Inc. (industrial machinery).Chairman of the board of Hillenbrand, Inc. (specializedconsumer services). Director of the V Foundation.Member of the advisory council for the College ofArts and Letters and chair of the advisory board to theKellogg Institute for International Studies, both at theUniversity of Notre Dame. Chairman of the board ofSaint Anselm College.
Mark LoughridgeBorn in 1953. Trustee since March 2012. Principaloccupation(s) during the past five years and otherexperience: senior vice president and chief financialofficer (retired 2013) of IBM (information technologyservices). Fiduciary member of IBM’s RetirementPlan Committee (2004–2013), senior vice presidentand general manager (2002–2004) of IBM GlobalFinancing, vice president and controller (1998–2002)of IBM, and a variety of other prior management rolesat IBM. Member of the Council on Chicago Booth.
Scott C. MalpassBorn in 1962. Trustee since March 2012. Principaloccupation(s) during the past five years and otherexperience: chief investment officer (retired June2020) and vice president (retired June 2020) of theUniversity of Notre Dame. Assistant professor (retiredJune 2020) of finance at the Mendoza College ofBusiness, University of Notre Dame, and member ofthe Notre Dame 403(b) Investment Committee.Member of the board of Catholic InvestmentServices, Inc. (investment advisors) and the board ofsuperintendence of the Institute for theWorks ofReligion.
Deanna MulliganBorn in 1963. Trustee since January 2018. Principaloccupation(s) during the past five years and otherexperience: board chair (2020), chief executive officer(2011–2020), and president (2010–2019) of TheGuardian Life Insurance Company of America. Chiefoperating officer (2010–2011) and executive vicepresident (2008–2010) of Individual Life and Disabilityof the Guardian Life Insurance Company of America.Member of the board of the Economic Club ofNew York. Trustee of the Partnership for New YorkCity (business leadership), Chief Executives forCorporate Purpose, NewYork-Presbyterian Hospital,and the Bruce Museum (arts and science). Memberof the Advisory Council for the Stanford GraduateSchool of Business.
André F. PeroldBorn in 1952. Trustee since December 2004. Principaloccupation(s) during the past five years and otherexperience: George Gund Professor of Finance andBanking, Emeritus at the Harvard Business School(retired 2011). Chief investment officer andco-managing partner of HighVista Strategies (privateinvestment firm). Member of the board(2018–present) of RIT Capital Partners (investmentfirm). Member of the investment committee ofPartners Health Care System.
Sarah Bloom RaskinBorn in 1961. Trustee since January 2018. Principaloccupation(s) during the past five years and otherexperience: deputy secretary (2014–2017) of theUnited States Department of theTreasury. Governor(2010–2014) of the Federal Reserve Board.Commissioner (2007–2010) of financial regulation forthe State of Maryland. Professor (2020–present),Distinguished Fellow of the Global Financial MarketsCenter (2020–present), and Rubenstein Fellow(2017–2020) at Duke University. Trustee(2017–present) of Amherst College and member ofAmherst College Investment Committee(2019–present). Member of the Regenerative CrisisResponse Committee (2020–present).
David A.ThomasBorn in 1956. Trustee since July 2021. Principaloccupation(s) during the past five years and otherexperience: president of Morehouse College(2018–present). Professor of business administration,emeritus at Harvard University (2017–2018). Dean(2011–2016) and professor of management(2016–2017) at the Georgetown UniversityMcDonough School of Business. Director of DTEEnergy Company (2013–present). Trustee of CommonFund (2019–present).
Peter F. VolanakisBorn in 1955. Trustee since July 2009. Principaloccupation(s) during the past five years and otherexperience: president and chief operating officer(retired 2010) of Corning Incorporated(communications equipment) and director of CorningIncorporated (2000–2010) and Dow Corning(2001–2010). Director (2012) of SPX Corporation(multi-industry manufacturing). Overseer of the AmosTuck School of Business Administration, DartmouthCollege (2001–2013). Chairman of the board oftrustees of Colby-Sawyer College. Member of theBMW Group Mobility Council.

Executive Officers
Christine M. BuchananBorn in 1970. Principal occupation(s) during the pastfive years and other experience: principal of Vanguard.Chief financial officer (2021–present) and treasurer(2017–present) of each of the investment companiesserved by Vanguard. Partner (2005–2017) at KPMG(audit, tax, and advisory services).
David CermakBorn in 1960. Principal occupation(s) during the pastfive years and other experience: principal of Vanguard.Finance director (2019–present) of each of theinvestment companies served by Vanguard.Managing director and head (2017–present) ofVanguard Investments Singapore. Managing directorand head (2017–2019) of Vanguard Investments HongKong. Representative director and head (2014–2017)of Vanguard Investments Japan.
John GallowayBorn in 1973. Principal occupation(s) during the pastfive years and other experience: principal of Vanguard.Investment stewardship officer (September2020–present) of each of the investment companiesserved by Vanguard. Head of Investor Advocacy(February 2020–present) and head of MarketingStrategy and Planning (2017–2020) at Vanguard.Deputy assistant to the President of theUnited States (2015).
Peter MahoneyBorn in 1974. Principal occupation(s) during the pastfive years and other experience: principal of Vanguard.Controller (2015–present) of each of the investmentcompanies served by Vanguard. Head of InternationalFund Services (2008–2014) at Vanguard.
Anne E. RobinsonBorn in 1970. Principal occupation(s) during the pastfive years and other experience: general counsel(2016–present) of Vanguard. Secretary (2016–present)of Vanguard and of each of the investment companiesserved by Vanguard. Managing director(2016–present) of Vanguard. Managing director andgeneral counsel of Global Cards and ConsumerServices (2014–2016) at Citigroup. Counsel(2003–2014) at American Express.
Michael RollingsBorn in 1963. Principal occupation(s) during the pastfive years and other experience: finance director(2017–present) and treasurer (2017) of each of theinvestment companies served by Vanguard.Managing director (2016–present) of Vanguard. Chieffinancial officer (2016–present) of Vanguard. Director(2016–present) of Vanguard Marketing Corporation.Executive vice president and chief financial officer(2006–2016) of MassMutual Financial Group.
John E. SchadlBorn in 1972. Principal occupation(s) during the pastfive years and other experience: principal of Vanguard.Chief compliance officer (2019–present) of Vanguardand of each of the investment companies served byVanguard. Assistant vice president (2019–present) ofVanguard Marketing Corporation.
Vanguard Senior Management Team
Matthew Benchener Thomas M. RampullaJoseph Brennan Karin A. RisiMortimer J. Buckley Anne E. RobinsonGregory Davis Michael RollingsJohn James Nitin TandonJohn T. Marcante Lauren ValenteChris D. McIsaac

Connect withVanguard® > vanguard.com
Fund Information > 800-662-7447
Direct Investor Account Services > 800-662-2739
Institutional Investor Services > 800-523-1036
TextTelephone for PeopleWhoAre Deaf or Hard of Hearing > 800-749-7273
This material may be used in conjunctionwith the offering of shares of any Vanguardfund only if preceded or accompanied bythe fund’s current prospectus.
All comparative mutual fund data are from Lipper, aThomson Reuters Company, or Morningstar, Inc., unlessotherwise noted.
You can obtain a free copy of Vanguard’s proxy votingguidelines by visiting vanguard.com/proxyreporting or bycalling Vanguard at 800-662-2739. The guidelines arealso available from the SEC’s website, www.sec.gov. Inaddition, you may obtain a free report on how your fundvoted the proxies for securities it owned during the 12months ended June 30. To get the report, visit eithervanguard.com/proxyreporting or www.sec.gov.
You can review information about your fund on the SEC’swebsite, and you can receive copies of this information,for a fee, by sending a request via email addressed [email protected].
Source for Bloomberg indexes: Bloomberg IndexServices Limited. Copyright 2021, Bloomberg. All rightsreserved.
© 2021 The Vanguard Group, Inc.All rights reserved.U.S. Patent Nos. 6,879,964 and 7,720,749.Vanguard Marketing Corporation, Distributor.
Q5330 122021