A Supervised Constant Modulus Algorithm for Blind Equalization
Upload
khangminh22Category
view
3download
0
THE EQUALIZATION FUNDAudit of the Status of Water, Health and Road Sectors in 8 Marginalized Counties
© NGEC, 2017


Published by
National Gender and Equality Commission HeadquartersSolution Tech Place, 1st Flr, Longonot Road,
Upperhill, next to Crowne Plaza HotelP.O.BOX 27512-00506, Nairobi, Kenya
Tel +254 2(20)-272-7778/ +254 (20) 3213199www.ngeckenya.org
Twitter: @NGECKENYAwww.facebook.com/NGECKenya
Toll Free Line: 0800720187SMS: 20459
Kisumu OfficeReinsurance Plaza, 3rd Floor, Wing B
Oginga Odinga Street
Nakuru OfficeTamoh Plaza, 1st Floor, Kijabe Street
P.O BOX 15263-401 NAKURU
Garissa OfficeOpposite Care International Offices,
Garissa town
Malindi OfficeMalindi Complex, off Lamu-Malindi Road
Malindi town
Kitui OfficeNzambani Park, off Kitui Referral Hospital Road
Kitui town
©2018


III
TABLE OF CONTENTS
LIST OF TABLES ................................................................................................................................................V
LIST OF FIGURES ........................................................................................................................................... VII
LIST OF ABBREVIATIONS .............................................................................................................................VIII
FOREWORD .................................................................................................................................................... IX
ACKNOWLEDGEMENTS ..................................................................................................................................X
EXECUTIVE SUMMARY ................................................................................................................................. XI
1.0 BACKGROUND .......................................................................................................................................13
1.1 Marginalization in Kenya - Past, Present and Future Actions .....................................................14
1.2 Nature, Causes and Effects of Marginalization: A global perspective ..........................................16
1.3 The Concept of Devolution in Kenya .............................................................................................17
1.4 Equalization Fund in Kenya ...........................................................................................................17
1.5 Objective .........................................................................................................................................18
1.6 Scope of the Study ..........................................................................................................................18
1.7 Limitations of the Study .................................................................................................................18
1.8 Methodology Used ..........................................................................................................................18
2.0 LEGAL AND POLICY FRAMEWORK ON MARGINALIZATION.............................................................20
2.1 International Human Rights Treaties ............................................................................................20
2.2 Regional Human Rights Instruments .............................................................................................20
2.3 Constitutional Provisions in Kenya ................................................................................................20
2.3.1 Subsidiary Legislations ...................................................................................................................21
2.3.2 Policy Framework ...........................................................................................................................21
3.0 RESULTS AND FINDINGS PER COUNTY ...............................................................................................22
3.1 Tana River County ..........................................................................................................................22
3.1.1 Background Information ...............................................................................................................22
3.1.2 Overview of Health, Road and Water Sectors .............................................................................22
3.1.3 Financial Status FY 2013/14 and FY 2014/15 ..........................................................................23
3.1.4 Status of Development Projects Assessed .....................................................................................24
3.2 Kwale County ..................................................................................................................................29
3.2.1 Background Information ...............................................................................................................29
3.2.2 Overview of Health, Roads and Water Sectors ...........................................................................29
3.2.3 Financial Status FY 2013/2014 and 2014/2015 ......................................................................30
3.2.4 Status of Development Projects Assessed .....................................................................................31

IV
3.3 Isiolo County ...................................................................................................................................35
3.3.1 Background Information ..........................................................................................................35
3.3.2 Overview of Health, Roads and Water Sectors ...........................................................................35
3.3.3 Financial Status FY 2013/14 and FY 2014/2015 ......................................................................35
3.3.4 Status of Development Projects Assessed ....................................................................................36
3.4 Kilifi County ...................................................................................................................................40
3.4.1 Background Information ...............................................................................................................40
3.4.2 Overview of Health, Roads and Water Sectors ...........................................................................40
3.4.3 Financial Status FY 2013/14 and FY 2014/2015 ......................................................................41
3.4.4 Status of Development Projects Assessed .....................................................................................41
3.5 Marsabit County .............................................................................................................................47
3.5.1 Background Information ...............................................................................................................47
3.5.2 Overview of Road, Health and Water Sectors .............................................................................47
3.5.3 Financial Status for FY 2013/14 and FY 2014/2015 ................................................................47
3.6 Garissa County ................................................................................................................................52
3.6.1 Background information ...............................................................................................................52
3.6.2 Overview of Health, Water and Road Sectors .............................................................................52
3.6.3 Financial Records for FY 2013/14 and FY 2014/2015 ............................................................52
3.6.4 Status of Development Projects Assessed .....................................................................................53
3.7 Wajir County ..................................................................................................................................58
3.7.1 Background Information ...............................................................................................................58
3.7.2 Overview of Water, Health and Road Sectors .............................................................................58
3.7.3 Financial Status FY 2013/14 .......................................................................................................58
3.7.4 Status of Development Projects Assessed .....................................................................................59
3.8 Samburu County .............................................................................................................................61
3.8.1 Background Information ...............................................................................................................61
3.8.2 Overview of Water, Roads and Health Sectors ...........................................................................61
3.8.3 Financial Status for FY 2013/14 and FY 2014/2015 ................................................................61
3.8.4 Status of Development Projects Assessed .....................................................................................62
4.0 CONCLUSION AND RECOMMENDATIONS ..........................................................................................67
4.1 Conclusions .....................................................................................................................................67
4.2 Recommendations ...........................................................................................................................67
REFERENCES ...................................................................................................................................................68

V
LIST OF TABLES
Table 1: Financial Status and Trends FY 2013/14..............................................................................................................24
Table 2: Financial Status and Trends FY 2014/15..............................................................................................................24
Table 3: Health Projects Distribution by Sub-Counties ......................................................................................................25
Table 4: Road Development Projects by Sub-Counties .......................................................................................................26
Table 5: Water Sector Projects by Sub-Counties .................................................................................................................27
Table 6: Financial Status and Trends FY 2013/14..............................................................................................................30
Table 7: Financial Status and Trends FY 2014/15..............................................................................................................30
Table 8: Health Sector Development Projects ......................................................................................................................31
Table 9: Road Projects Distribution by sub County .............................................................................................................33
Table 10: Water Projects by Sub-Counties: ............................................................................................................................34
Table 11: Financial Status and Trends FY 2013/14..............................................................................................................36
Table 12: Financial Status FY 2013/14 ..................................................................................................................................36
Table 13: Health Sector Development Projects Distribution ...............................................................................................36
Table 14: Roads Projects Distribution by Sub-Counties: .......................................................................................................37
Table 15: Water Projects in the Water Sector by Sub-Counties ..........................................................................................39
Table 16: Financial Status FY 2013/14 ..................................................................................................................................41
Table 17: Financial Status FY 2014/15 ..................................................................................................................................41
Table 18: Health Sector Projects Distribution by Sub-County .............................................................................................42
Table 19: Road Projects by Sub-Counties ...............................................................................................................................43
Table 20: Water Projects by Sub-Counties .............................................................................................................................45
Table 21: Financial Status FY 2013/14 ..................................................................................................................................48
Table 22: Financial Status FY 2014/15 ..................................................................................................................................48
Table 23: Health Sector Projects by Sub-County ...................................................................................................................49
Table 24: Road Development Projects by Sub-Counties .......................................................................................................50
Table 25: Projects in the Water Sector by Sub-Counties ......................................................................................................51
Table 26: Financial Status for FY 2013/14 ............................................................................................................................53
Table 27: Financial Status for FY 2014/15 ............................................................................................................................53
Table 28: Health Projects by Sub-County ...............................................................................................................................54
Table 29: Road Projects and funds by Sub-Counties .............................................................................................................55
Table 30: Financial Status and Trends FY 2013/14..............................................................................................................59
Table 31: Financial Status FY 2014/15 ..................................................................................................................................59

VI
Table 32: Financial Status FY 2013/14 ..................................................................................................................................62
Table 33: Financial Status FY 2014/15 ..................................................................................................................................62
Table 34: Health Sector Projects by Sub-County ...................................................................................................................62
Table 35: Road Projects by Sub-Counties ...............................................................................................................................64
Table 36: Water Projects by Sub-Counties .............................................................................................................................65

VII
LIST OF FIGURES
Figure 1: Health Projects and funds distribution by Sub Counties .....................................................................................25
Figure 2: Road Projects and funds distribution by Sub Counties ........................................................................................27
Figure 3: Water Projects and Funding by Sub County .........................................................................................................28
Figure 4: Water projects implementation status by Sub-counties ......................................................................................28
Figure 5: Health Projects and funds distribution by Sub Counties .....................................................................................32
Figure 6: Projects Status of implementation by Sub Counties .............................................................................................32
Figure 7: Projects and fund distribution by Sub Counties ...................................................................................................33
Figure 8: Projects and funds distribution by Sub Counties ..................................................................................................34
Figure 9: Projects and funding levels by Sub Counties ........................................................................................................37
Figure 10: Project Distribution by Sub Counties .....................................................................................................................38
Figure 11: Distance (Km) to County HQ .................................................................................................................................38
Figure 12: Project and funding by Sub County .......................................................................................................................39
Figure 13: Projects and Funds distribution by sub counties ..................................................................................................42
Figure 14: Project Progress Status by Sub-Counties ...............................................................................................................42
Figure 15: Road Projects and funding by Sub-Counties .........................................................................................................44
Figure 16: Implementation Status of Roads Project by Sub Counties ....................................................................................44
Figure 17: Water Projects Funding Level by Sub County .......................................................................................................46
Figure 18: Health Projects and Funds allocations by Sub County .........................................................................................49
Figure 19: Project and funding by Sub Counties ....................................................................................................................50
Figure 20: Projects and funds Allocation by Sub County .......................................................................................................51
Figure 21: Health Projects and Funds by Sub County ............................................................................................................54
Figure 22: Estimated Distance from County HQ .....................................................................................................................55
Figure 23: Projects and funds allocation by Sub County .......................................................................................................56
Figure 24: Health Project Status by Sub County ......................................................................................................................56
Figure 25: Projects and Funds distribution by Sub County ....................................................................................................63
Figure 26: Health Projects Approximate Distance to Head quarter ......................................................................................63
Figure 27: Roads Projects by sub counties ...............................................................................................................................64
Figure 28: Project Status by Sub County ..................................................................................................................................65
Figure 29: Water Project by Sub County .................................................................................................................................66
Figure 30: Project Status by Sub County ..................................................................................................................................66

VIII
LIST OF ABBREVIATIONS
ACHPR African Charter on Human and Peoples’ Rights
AGPO Access to Government Procurement Opportunities
AIDS Acquired Immune Deficiency Syndrome
CDF Constituency Development Fund
CRA Commission on Revenue Allocation
ESCR Economic, Social, and Cultural Rights (ESCR).
FY Financial Year
HIV Human Immunodeficiency Virus
HQ Head Quarter
ICCPR International Covenant on Civil and Political Rights
ICESC International Covenant on Economic, Social and Cultural Rights.
KERRA Kenya Rural Roads Authority
KURA Kenya Urban Roads Authority
LAPSSET Lamu Port Southern Sudan-Ethiopia Transport
M&E Monitoring and Evaluation
MEAL Monitoring Evaluation and Learning
NGEC National Gender and Equality Commission.
PFM Public Finance Management
PWD Person with Disability
SIG Special Interest Group
TAWASCO Tana Water and Sanitation Company
TNA Training Needs Assessment
UN United Nations.
UNDP United Nations Development Program

IX
FOREWORD
Kenya is a signatory to the International Covenant on Economic, Social and Cultural Rights (ICESCR) which commits State parties to work towards granting of economic, social, and cultural rights including labour rights, right to health, right to education and right to an adequate standard of living. The framework for realization of Economic, Social and Cultural Rights (ECOSOC) Rights is provided for under Article 43 of the Constitution of Kenya. This provides citizens with the right to highest attainable standard of health, social security, education, accessible and adequate housing and safe water.
Article 204 of the Constitution of Kenya 2010 provides for the establishment of an Equalization Fund into which 0.5% of all the revenue collected by the national government each year calculated on the basis of the most recent audited accounts of revenue received shall go to provide basic services including water, roads, health facilities and electricity to marginalized areas. The Marginalization Policy developed by the Commission for Revenue allocation in line with article 216 (4) of the Consti-tution identified fourteen (14) counties to benefit from the Equalization Fund namely Turkana Mandera, Wajir, Marsabit, Samburu, West Pokot, Tana River, Narok, Kwale, Garissa, Kilifi, Taita Taveta, Isiolo and Lamu.
The Equalization Fund is an affirmative action legal instrument in line with Article 27(6) of the Constitution of Kenya that seeks to address the provision of these services by channelling resources to identified marginalized counties and by extension marginalised funds to bring the quality of those services to the level generally enjoyed by the rest of the nation. The National Gender and Equality Commission is mandated to among others work with other relevant institutions in the development of standards for the implementation of policies for the progressive realization of the economic and social rights specified in Article 43 of the Constitution and other written laws.
Since financial 2013/ 2014, the National Treasury has allocated money to the Equalization Fund to a tune of Kshs. 12.4 billion shillings by the financial year 2015/16. This amount remains unutilized despite the gazettement of the rules and regulations through a special issue of the Kenya Gazette No. 26 on March 13, 2015.
This study was commissioned with an aim to establish the number of development projects and their level of funding in three sectors of Water, Health and Roads in eight selected marginalized counties earmarked to receive Equalization Fund since 2013. The study also sought to determine the level of integration of equality principles in these counties. Even with the inordinate delay in the disbursement of the Equalization Fund to the select counties, county governments would be expected to adhere to a minimum aggregate allocation threshold to the three critical areas meant to be financed by the fund in the annual county budget estimates. The findings of this study will assist the Commission in developing standards for the realization of ECOSOC rights and provide a basis for providing necessary advisories to CRA, Parliament, counties and the National treasury.
DR. FLORENCE WACHIRA, MBSAG. CHAIRPERSON

X
ACKNOWLEDGEMENTS
This report has been prepared by the National Gender and Equality Commission. The findings in this report are based on information gathered from eight (8) of the 14 Counties gazetted to receive Equali-zation Fund. The eight (8) counties are; Tana River, Kwale, Isiolo, Kilifi, Marsabit, Garissa, Wajir and Samburu.
The study seek to document levels of equality and inclusion in design and implementation of projects in three sectors prior to receipt of the affirmative ‘equalization fund’.
We would wish to thank all the people involved in the compilation of this report for their commitment to seeing this assignment through in a timely and professional manner. We recognize in a special way the guidance of the Minority and Marginalized Program Convener Commissioner Dr. Gumato Ukur in framing the issues under research in this report. We are indebted to the County Govern-ments of Tana River, Kwale, Isiolo, Kilifi, Marsabit, Garissa, Wajir and Samburu for sharing with us information that was critical in coming up with this report.
Special thanks to members of the secretariat1 who participated in data collection and preparation of this report.
Finally we acknowledge the contributions of the Consultant Mr. Walter Ouma Onditi who assisted in compilation of this report.
SORA KATELOAG. CHIEF EXECUTIVE OFFICER
1 Tabitha Nyambura, Jackline Nekesa, Daniel Waitere, Shanta Odera, Linet Amollo, Davis Okeyo, Emma Kimencu and Jillo Bidu

XI
EXECUTIVE SUMMARY
This report presents the findings of a case study conducted in eight (8) Counties gazetted to receive Equalization Fund. The Constitution of Kenya 2010 creates a devolved governance structure that promises to bring development to all parts of the country among different regions and communities that have experienced past significant levels of disparities in economic development. The Consti-tution further directs the government to legislate measures to redress any disadvantages suffered by individuals or groups due to marginalization.
Equalization Fund is part of the funding framework established by the Constitution to address service level gaps in marginalized areas. According to Article 204(2) of the Constitution, the objective of the Fund was to provide basic services including water, roads, health facilities and electricity to margin-alized areas. According to Commission on Revenue Allocation, a marginalized area is any region where access to food, water, healthcare, energy, education, security, communication and transport is substantially below the level generally enjoyed by the rest of the nation.
In 2015, the National Gender and Equality Commission (NGEC) conducted an audit on levels of equality and inclusion in programmes and projects designed by 8 counties on water, health and infrastructure. The aim was to provide a baseline on potential of the equalization fund in promoting fair distribution of resources and opportunities. The audit was conducted in 8 select counties: Tana River; Kwale; Isiolo; Kilifi; Marsabit; Garissa; Wajir and Samburu. The report further establishes the level of integrating equality principle, the number of development projects and the level of funding in the three sectors of Water, Health and Infrastructure/road during the FY 2013/14 to FY 2014/2015.
The audit found an increase in the county budget and sector allocation in the year 2014/15 and recommends operationalization of the equalization fund and enhanced public finance management as well as strengthening of the monitoring evaluation and learning system by the counties.

XII

13
BACKGROUND
The National Gender and Equality Commission (NGEC) is an independent Constitutional Commission established pursuant to Article 59 (4) & (5) of the Constitution of Kenya, 2010 and operationalized by the National Gender and Equality Commission Act, 2011 (NGEC Act). The overall mandate of the Commission is to promote gender equality and freedom from discrimination in accordance with Article 27 of the Constitution. The Commission serves all Kenyans but with much focus to special interest groups among them women, children, youth, older members of society, persons with disabil-ities, minority and marginalized groups and communities. Key among its functions is to conduct audits, monitor, facilitate and advise on the status of special interest groups and development of affirmative action implementation policies as contemplated in the Constitution2.
The Constitution of Kenya 2010 creates a devolved governance structure which seeks to ensure equitable sharing of national and local resources and to promote the rights of minority and margin-alized communities. Formerly, political power and decision-making was centralized. This perpetuated marginalisation of some parts of the country from full participation in social, economic and political activities. The result has been significant levels of disparities in economic development among different regions and communities3.
The Constitution under Article 27(6) calls on the state to undertake legislative and other measures including affirmative action programmes and policies designed to redress any disadvantage suffered by individuals or groups due to past discrimination. Article 56 provides that the state shall put in place affirmative action programmes designed to ensure that minorities and marginalized groups partic-ipate and are represented in governance and other spheres of life; are provided special opportunities in education and economic fields; develop their cultural values; languages and practices and have reasonable access to water, health services and infrastructure. Article 204 establishes the Equalization Fund to provide basic services to marginalized areas to bring quality of services in those areas to the levels generally enjoyed by the rest of the country.
According to Commission on Revenue Allocation, “A marginalized area is a region where access to food, water, healthcare, energy, education, security, communication and transport is substantially below the level generally enjoyed by the rest of the nation.” Marginalization can be attributed to several factors: geographical factors, culture and life styles, domination by non-indigenous people, land legislation and administration, non-recognition of minority groups, ineffective political partici-pation and inequitable government policies.
The Commission on Revenue Allocation developed the marginalization policy in February, 2013 which stipulates the criteria by which to identify marginalized areas for purposes of the allocation and use of the Equalisation Fund. Fourteen (14) counties were identified as marginalized: Turkana, Mandera, Wajir, Marsabit, Samburu, West Pokot, Tana River, Narok, Kwale, Garissa, Kilifi, Taita Taveta, Isiolo and Lamu.
It is in line with its mandate that NGEC undertook an assessment on selected indicators to map levels of equality and inclusion in select counties among those gazetted to receive Equalization Fund to establish level of integration of principles of equality and inclusion in basic services. The study therefore covered
2 National Gender and Equality Commission Act, 20113 Commission on Revenue Allocation Policy, 2013
1.0

14 NATIONAL GENDER AND EQUALITY COMMISSION
eight (8) counties: Tana River, Kwale, Isiolo, Kilifi, Marsabit, Garissa, Wajir, Samburu and focused on three (3) basic services: water, healthcare and infrastructure (Roads) as stipulated in article 204 of the Constitution.
1.1 Marginalization in Kenya - Past, Present and Future ActionsIn 1966, the United Nations (UN) Special Rapporteur, Francesco Capotorti, proposed the following definition of minorities in the context of Article 27 of the International Covenant on Civil and Political Rights (ICCPR):
‘A group numerically inferior to the rest of the population of a State, and in a non-dominant position, whose members being nationals of the State possess ethnic, religious or linguistic characteristics differing from those of the rest of the population and show, if only implicitly, a sense of solidarity, directed towards preserving their culture, traditions, religions and language”
A refinement of this definition was proposed in 1985 by Jules Deschênesk as follows;
‘A group of citizens of a State, constituting a numerical minority and in a non-dominant position in that State, endowed with ethnic, religious or linguistic characteristics which differ from those of the majority of the population, having a sense of solidarity with one another, motivated, if only implicitly, by a collective will to survive and whose aim is to achieve equality with the majority in fact and in law.’
While both definitions contribute to an understanding of the concept of minorities they are not without their difficulties. For example, a distinct ethnic group can constitute a numerical majority and be in a non-dominant position, and thus be entitled to the application of minority rights standards, to protect their rights to non-discrimination and to their identity. Similarly, the limiting criterion of citizenship can be used to exclude certain groups from their rights as minorities. The UN Human Rights Committee (HRC) has stated in a General Comment to Article 27 of the ICCPR that a state party may not restrict the rights under Article 27 to its citizens alone.
1.1.1 Kenyan’s Perspectives on Minority and Marginalized CommunitiesArticle 260 of the Constitution of Kenya 2010, provides for the interpretations of the Marginalised Community as:-a) A community that, because of its relatively small population or for any other reason, has been
unable to fully participate in the integrated social and economic life of Kenya as a whole;b) A traditional community that, out of a need or desire to preserve its unique culture and identity
from assimilation, has remained outside the integrated social and economic life of Kenya as a whole;
c) An indigenous community that has retained and maintained a traditional lifestyle and livelihood based on a hunter or gatherer economy; or
d) Pastoral persons and communities, whether they are:i. nomadic; orii. a settled community that, because of its relative geographic isolation, has experienced only
marginal participation in the integrated social and economic life of Kenya as a whole.
Marginalised Group means:A group of people who, because of laws or practices before, on or after the effective date of the Consti-tution of Kenya 2010, were or are disadvantaged by discrimination on one or more of the grounds in article 27 (4).

15EQUALIZATION FUND REPORT
For the purposes of this report, and to provide some guidance in line with international norms, the following elements are to be considered when defining who is a minority in Kenya. A minority is: • Any ethnic, linguistic or religious group
within Kenya, which is in a non-dominant position. This raises the issue of public partic-ipation. In Kenya, 14 Counties have been underdeveloped and under-represented in public life when compared to the rest of the country; therefore they have been mapped and gazetted as marginalized.
• A group consisting of individuals who possess a sense of belonging to that group, and who are determined to preserve and develop their distinct ethnic identity. As a response to its relations with other segments of society, a minority group will normally develop a strong sense of group loyalty and other related behaviour;
• Likely to be discriminated against or margin-alized on the grounds of its ethnicity or lack of nationality (stateless people), language or religion.
Since attaining political independence in 1963, Kenya has been grappling with the persistent problem of unbalanced regional development. Through various policies and interventions, the government has tried to reverse the discrimi-native effects of colonial policies that had created wide disparities and imbalances between regions. However, after decades of experimenting with different economic and social policies, regional disparities and imbalances in economic, social and political development still persist. Wide disparities also exist between urban and rural areas, with 85 per cent of all poor people living in rural areas while the majority of the urban poor live in slums and peri-urban settlements.
Regional inequalities and imbalances have increasingly become a source of political and social conflict. In 2007/08, for example, Kenya experienced post-election violence predicated on extreme weaknesses of ethicised governance systems. These were rooted in numerous cases
of historical injustices emergent of marginali-sation associated with the previous government regimes. Common of the three regimes are the on-going crises of marginalisation and regional imbalances that various communities of differing ethnic origin, class, generation and gender have persistently experienced.
Even though Kenya developed and promul-gated a new Constitution in 2010, the country still suffers from traditional power imbalances between the male and female gender; resource distribution continues to entail a dark lining of inequality based on region, ethnicity, political affiliation and class; infrastructural development continues to marginalise the already marginalised communities; and public service continues to exhibit generalised ethnic imbalances in favour of communities whose members have occupied public offices.
While the new Constitution promises radical changes in the management of the country’s affairs and gives greater say to communities through participation in the devolved system, it also creates new avenues through which deepened cases of marginalisation and dispar-ities can emerge on the basis of the new county structures. The greatest allure of a devolved system is its promise to engender equitable distribution of national resources and, therefore, address socio-economic inequalities that were inherent in a centralised system for many decades. Yet, the biggest challenge of this system lies in new fears and in some cases old rivalries that were largely submerged by the centralized systems in the earlier years.
Addressing regional disparities in Kenya call for a fresh approach that provides a multifaceted and multi-sectoral framework that fosters more balanced economic development in the country. Such an approach could revolve around the formulation and implementation of equity-oriented policies (Affirmative Action which is constitutionally defined as affirm-ative action” includes any measure designed to overcome or ameliorate an inequity or the systemic denial or infringement of a right or

16 NATIONAL GENDER AND EQUALITY COMMISSION
fundamental freedom) and programmes (Affirmative Action Programmes); the formulation and implemen-tation of integrated regional development framework; reforms in the legal environment in order to create a more cohesive framework for addressing regional disparities and a robust monitoring framework that will develop and monitor the achievement of key indicators and milestones of balanced regional development.
Further, recognising the various actors in regional development is critical. However, lack of effective coordi-nation mechanisms could impede efforts to promote balanced regional development.
Kenya has set up an Equalization Fund to respond to uplifting marginalized areas caused by the previous legislated discrimination; geographical location; culture and lifestyles; external domination; land legislation and administration; Minority recognition groups; ineffectual political participation; and inequitable government policies. These marginalized areas exhibits high levels of absolute and relative poverty, food insecurity, poor infrastructure, poor state of basic social services and poor governance.
1.2 Nature, Causes and Effects of Marginali-zation: A global perspectiveMarginalization is caused by various factors that can be both common to and unique from, one place to another. The increasing importance of addressing the issue is shown by a number of countries that have carried out studies to identify marginalized areas using various criteria.
Australia identified marginalized areas as those that are distinct from the other parts of the state, in that they are not integrated socially and economically into broader community and economic networks and systems. The areas identified as marginalized are characterized by economic deprivation and dependence, social disconnect-edness and deviance, political inaction and apathy. Factors associated with social exclusion that was used to identify marginalized areas included: unemployment, health and the crime rate.
In China regional disparities were determined using five disparity measurements of population weighted co-efficiency, population weighted the Gini Index, and population weighted mean logarithmic deviation and the weighted Atkinson index.
In Liberia marginalization emanated from the exclusion of the indigenous population from political governance institutions, with little or no access to key economic assets. The central-ization of political power confined the decision-making processes to the elite and led to corruption. Margin-alization was then perpetuated by the urban bias of policies of successive administrations, which concentrated infrastructure and basic services in Monrovia and other main urban centers and excluded the rural hinter-lands (UNDP, 2007). Marginalization was also fostered by the economic and social challenges implicit in high levels of absolute and relative poverty, in both rural and urban sectors.
In the Horn of Africa and East Africa, literature shows that pastoralists are the most politically marginalized group. The major issues in pastoral development are related to policy and governance. These include conflicts and insecurity, livestock marketing, land rights, inadequate provision of services and infrastructure, drought and dependence on food aid. Therefore, the political marginali-zation of pastoralists is understood to be the result of an imbalanced power relation between the state and pastoral civil society. Other factors are the long-standing governance failures, non-responsive and unaccountable institutions, and politicians and policy-makers lacking the will and incentive to include pastoralists’ interests in national policy formulation.
Inequalities in Kenya are attributed to such factors as historical, natural resource endowments, political patronage, policy choices and cultural norms, factors such as trade and technology, and even bureaucratic

17EQUALIZATION FUND REPORT
excesses, exogenous communities that had access to schools, and those students who had access to high cost schools, had an advantage over the rest. In this regard, the education system reproduced, not altered, the economic, social and political structures inherited at independence.
Also, ethno-regional disparities, marginalisation and other inequalities in Kenya are related to the struggles to control the state or other institutions of the state. The recognition of minorities and indigenous peoples would contribute to the preser-vation of their identities and enable them to obtain equality with other groups in that state, including in relation to participation in political life as well as in development matter. Minorities and indigenous peoples lack participation in the decision-making processes, especially on issues that affect them either directly or indirectly. There are also the issues of a lack of recognition (both actual and constructive), and discrimination by institutions of government, which appear to be allowed by law either actively or by default.
The above factors become more pronounced in an environment where taxation and public expend-iture policies, budgeting and governance institu-tions are weak and not impervious to political and bureaucratic manipulations.
1.3 The Concept of Devolution in KenyaDevolution is a form of decentralization, or the transfer of authority and responsibility from the central to lowest feasible structure of government for a range of public functions. Kenya’s decentral-ization is among the most rapid and ambitious devolution processes going on in the world, with new governance challenges and opportunities as the country builds a new set of county governments from scratch.
Promulgation of the Constitution of Kenya 2010 marked a momentous point in the country’s history. The Constitution provided for, among others, enhanced checks and balances within the government, an enhanced role of parliament and citizens, an independent judiciary, and a most progressive Bill of Rights. Notably, the Constitution
provided for a major devolution not only of resources and functions, but also creating a whole new system of governance. Subsequently, the new policy and institu-tional framework have brought about a new regime of governance with multiple new laws to regulate operation of county governments as well as multiple national bodies and commissions with responsibil-ities for devolution.
The Constitution recognizes that access to basic services is a basic human right. It therefore requires the State, which includes both National and County governments, to work towards universal access to basic services among them health, water and infrastructure (roads). The Fourth Schedule of the Constitution outlines the distribution of functions between the National and County Governments. For purposes of the sectors under review in this report, parts 2, 5, and 11 under Section 2 of the Fourth Schedule give the County governments responsibilities to manage health, roads and water respectively.
1.4 Equalization Fund in KenyaArticle 204 of the Kenya Constitution (2010) creates equalization fund and gives the formula to be used. Article 204(1) states that “there is established a Fund into which shall be paid one half per cent of all the revenue collected by the national government each year calculated on the basis of the most recent audited accounts of revenue received, as approved by the National Assembly.” The Commission on Revenue Allocation developed the margin-alization policy which stipulates the criteria by which to identify marginalized areas for purposes of the allocation and use of the Equalisation Fund. Based on the criteria used in the policy, 14 counties were identified as marginalized: Turkana, Mandera, Wajir, Marsabit, Samburu, West Pokot,Tana River, Narok, Kwale, Garissa, Kilifi, Taita Taveta,Isiolo and Lamu.

18 NATIONAL GENDER AND EQUALITY COMMISSION
There is general agreement that this is a very small amount of money given the fund’s purpose, namely to address decades of historical marginalisation and unequal development across Kenya. With the right legal framework, creative allocation, and with locally accountable oversight, the fund could support real changes in the lives of Kenyans in marginalised communities.
1.5 ObjectiveTo carry out an audit to assess the status of three sectors (water, health and roads), opportunities and gaps of integrating equality and inclusion in basic services based project implemented by County Government and determine level of integration prior to receipt of equalization fund in select 8 counties.
1.6 Scope of the StudyEight (8) out of the Fourteen (14) Counties mapped and gazetted to receive equalization fund were sampled to provide baseline data on level of equality and inclusion prior to equali-zation fund. Data collected was gathered from sectors of water, health and road centred on the following domains of analysis and reporting: 1. Extent to which counties have considered
equality and inclusion principles in the three sectors.
2. Funds allocated in each sector by each county. Any affirmative actions were identified and analyzed.
3. Projects designed and implemented. Opportunities for positive discrimination were identified.
1.7 Limitations of the StudyThe audit experienced a number of limita-tions which hindered in-depth analysis. Data collected in study for analysis targeted to solicit information touching on various aspects of project management including; funding levels, management competencies and project sustain-ability. Some respondents were uncomfortable with the depth of assessment. To overcome this,
the study team created a favourable working relation with the respondents by explaining the purpose and importance of the assignment in county development and the opportunities that counties have in working with NGEC to promote principles of equality and inclusion in development.
The inadequate Information presented another challenge to the audit due to lack of updated records and documentation on projects activities, weak monitoring and evaluation framework and inadequate data management system. To overcome this, the study explored the use of past records, participatory engagement of community in interviews during site visits and use of secondary information published by the county governments.
1.8 Methodology Used The National Gender and Equality Commission designed an intervention to establish the baseline status of the county governments in respect to development projects, and inclusion in selected counties gazetted to receive Equali-zation Fund. This involved collection of sample data frame on projects in water, health and road sectors across the eight (8) Counties. The focus was to provide a baseline assessment on status, opportunities and gaps of integrating equality and inclusion in service based projects implemented by County Government prior to receipt of equalization fund.
Eight (8) Counties gazetted to receive equali-zation fund were randomly selected during the assignment period. Key information guide was developed and administered to Executive Committee members, Chief Officers and selected Directors in each County Government. In-depth interviews were also held with County Executive Committee members, Chief Officers and Directors and key stakeholders from water, infrastructure and health sectors. Physical observation of some development projects was conducted in all the selected Counties in the three sectors.
19EQUALIZATION FUND REPORT
NGEC officers also held meetings with community members as they visited project sites. A desktop review of secondary information about each County was also undertaken to single out historical factors and social evolution of the marginalization to set a context of the contemporary drivers of marginalization. The data gathered from the sources described was collated, analyzed and triangu-lated to a summary of findings presented in this report.

20
LEGAL AND POLICY FRAMEWORK ON MARGINALIZATION
2.1 International Human Rights TreatiesKenya has signed and ratified a wide range of international and regional human rights Instruments. All these instruments could be of great significance to Kenya‘s marginalized communities, since Article 2 of the Constitution stipulates that – The general rules of international law shall form part of the law of Kenya and any treaty or convention ratified by Kenya shall form part of the law of Kenya under this Constitution.
Kenya is party to the International Covenant on Economic, Social and Cultural Rights (ICESCR) which is relevant to marginalized communities in the sense that it seeks to promote dignified living and covers important areas of public policy such as the right to water, health, adequate housing and freedom from hunger, social security and education. Failure to realize these rights predisposes communities to marginalization.
2.2 Regional Human Rights InstrumentsKenya has also ratified or signed the African Charter on Human and Peoples’ Rights (ACHPR) which promotes and protects human rights and basic freedoms in African continent. Article two of ACHPR addresses the right to freedom from discrimination. Discrimination in distribution of resources subsequently leads to marginalization. Marginalized communities are not exempted from these rights.
2.3 Constitutional Provisions in KenyaKenya’s engagement with marginalised and minority issues is informed by its constitutional commitment to reduce social and economic inequalities that characterized the past.
Article 56 of the constitution provides that the State shall put in place affirmative action programmes designed to ensure that minorities and marginalised groups: a) Participate and are represented in governance and other spheres of life;b) Are provided special opportunities in educational and economic fields;c) Are provided special opportunities for access to employment;d) Develop their cultural values, languages and practices ande) Have reasonable access to water, health, and infrastructure
The Constitution of Kenya 2010 further creates a devolved governance structure that seeks to distribute resources equitably. To give effect to equity, the government is required to legislate on measures to redress any disadvantage suffered by individuals or groups due to marginalization. Specifically, article 204 establishes the equalization fund that shall be used to provide basic services to marginalized areas to the extent necessary to bring the quality of those services to the levels generally enjoyed by citizens in the rest of the country.
Article 216 (4) requires the Commission on Revenue Allocation to determine, publish and regularly review a policy in which it sets out the criteria by which to identify marginalized areas for the purposes of section 204(2) of the Constitution.
2.0

21EQUALIZATION FUND REPORT
2.3.1 Subsidiary LegislationsKenya has enacted a number of laws to promote and protect the rights of marginalised communities. Some of these laws include:
1. County government Act 2012 which emphasizes on equity, efficiency, accessi-bility, non-discrimination, transparency, accountability, participation and information sharing alongside a focus on basic needs, monitored through citizen service charters at all levels of county government. It also attempts at making inclusion of minorities in public service by creating a requirement that 30% of job vacancies are filled by communities that are not from the dominant ethnic group.
2. Constituency Development Fund Act 2013 which seeks to ensure that a specific portion of the national annual budget is devoted to the constituencies for purposes of infrastructural development, wealth creation and in the fight against poverty at that level.
3. Basic education Act of 2013 that promotes the right to basic education of every child in Kenya, and adult literacy.
4. Community Land Act 2016 which recognizes community land ownership and control.
5. Climate Change Act 2016 that establishes climate change council to develop, manage, implement and regulate mechanisms to enhance climate change resilience and low carbon development for sustainable development of Kenya.
2.3.2 Policy Framework1. Kenya vision 2030-The second Medium
Term plan of Vision 2030 (2013) outlines flagship projects for the period 2013-2017, some of the projects targeting margin-alized communities include; education in arid and semi-arid lands, school health and nutrition and school feeding.
2. Devolution policy that seeks to ensure inclusion of minorities and marginalized groups in public service delivery.
3. Policy on the Criteria for Identifying Marginalized Areas and Sharing of the Equalization Fund 2011- sets out the criteria for identifying marginalized areas in Kenya, and marginalized counties and also provides a framework that will guide in the planning, implementation, and monitoring and evaluation in the use of the Equalization Fund.
4. The National policy framework for nomadic education 2010 aims at enabling Kenya’s nomadic communities to access basic education and training. It is geared towards ensuring equitable access to education by children in nomadic areas, including disadvantaged and vulnerable groups.
5. Arid and semi-arid Lands policy whose goal is to facilitate and fast-track sustainable development in Northern Kenya and other arid lands by increasing investment in the region and ensuring that the use of those resources is fully reconciled with the realities of people’s lives.

22
RESULTS AND FINDINGS PER COUNTY
3.1 Tana River County3.1.1 Background Information
Tana River
Tana Delta
Hola
Madogo
Masalani
Garsen
Tana River County is in the former coast province. It has 35,375.8 square kilometers and a population of 240,075 according to the 2009 census. The County Headquarter is Hola. The major ethnic group are Pokomo who are farmers followed by Orma who are nomadic. There are also other minority tribes namely; the Munyoyaya, Malakote, Bajun and the Watta. Tana River County has 3 Sub counties namely; Bura, Galole, and Garsen. The County has seven (7) adminis-trative divisions namely; Bangale, Bura, Galole, Garsen, Kipiru, Madogo, Ilyana, Malakote and Wanje. The County is inhabited by farmers and nomads and therefore water has always been a source of conflict. The County is dry and prone to drought. Access to water and pasture have led to conflicts between farmers and nomadic people.
3.1.2 Overview of Health, Road and Water SectorsObservations and interviews with local communities indicate that roads in the County are weather-roads and are in urgent need of grading. Most parts of the County are inaccessible due to poor road networks which continuously hamper transportation of goods and services, though the County has started opening up feeder-roads to improve on service delivery and ease accessibility especially during the times of emergencies.
The County uses the former Hola District Hospital as its referral facility. The hospital has no maternity unit, has a small theatre and very few staff houses available. The County department of health has embarked on constructing more staff units to enable retain workers who in most cases have left due to poor or lack of housing. The introduction of free maternity services in the County has increased admission ratio of women delivering their babies in hospitals despite poor road networks, culture and institutional barriers. The County department of health is currently working on constructing dispen-saries and maternity units in selected villages across the County.
Majority of staff in Tana River County health department are female with most coming from outside the county. There is one officer with disability (paraplegic) and other local officers employed are from Munyoyaya, Malakote and Bajuni communities. The County resident’s hopes that the equalization fund will enable them construct a referral hospital and employ more staff including from local and marginalized communities in the county. In the meantime, the county focus is to urgently address the need to uplift the status of the current hospital for enhanced service delivery. There is need for recruitment of more staff to match the need.
It is noted that almost 90% of employees in the County health department are from other regions outside the county as opposed to local. This could be attributed to high illiteracy levels, making it not easy to get qualified personnel from the local environment.
3.0

23EQUALIZATION FUND REPORT
It was also observable that less than 50% of hospitals in the Counties are connected to piped water and electricity. The County is in need of high wheeled vehicles such as Four Wheel Drive (4WD) ambulances since most roads are impassable. The county has two mobile clinics and is considering waiving the cost of health services to Persons with Disabilities (PWDs). Incentives for employees in the County is critical to attract and retain professional staff. It is therefore the wish of majority of the County residents that the biggest portion of the equali-zation fund be allocated to health sector as a way to improve the quality of services.
In the water sector currently, all workers in the water department are employed and managed by Tana Water and Sanitation Company (TAWASCO). By the time of the assessment, water sector was recruiting county sector employees and therefore had lean staffing. So far there are 3 female, 13 male and 1 PWD employed in the sector, while the 5 technical staff have been seconded from National Government and all happen to be male, making the sector male dominated. However, there are 2 women support staff seconded to the sector.
While there is good progress being made, the water sector is faced by different challenges such as growing population. A case in point, Hola Water Supply which had been constructed in 1971/72 was meant to serve only 500 people yet the population has increased to over 20,000 people; Limited resources e.g. the farm production is not enough to cater for the growing population and as such there is need to access additional funding to expand water piping in all villages. The County by its geographical location and weather patterns continue to experience dry seasons every year hence the need to enhance water tracking, increased usage of water pumps in the inter-land and digging of more water dams for example in Bangale area which is worst hit by serious water problems with only one water supply track available to assist.
Currently, the County has complied with 30% tender reservation for the special groups
including youths in line with procurement laws. However, there still remain alleged abuses in procurement regulations, especially the political class and rich people who are believed to manipulate the tendering processes to favor their companies. These can be traced from reported cases in which PWDs were previously awarded contracts then later withdrawn and sold off to influential persons believed to have good connections with the county offices.
Youth, Women and PWDs are reported to lack the capacity to do business with County Government including the processes of registering companies under Access to Government Procurement Opportunities (AGPO) certification. This is further compounded with little knowledge on procurement requirements which makes them miss out procurement opportunities. This has called for the need to continuously sensitize and create awareness to these groups on the existing business and procurement opportunities within and outside the County. The County has civic educators employed by the County Government to facilitate Special Interest Groups (SIGs) partic-ipation in the county government initiatives. Some of the outcomes of this effort is the award of a tender to a PWD from minority group to supply water pump to Onjila, Tana delta.
3.1.3 Financial Status FY 2013/14 and FY 2014/15According to Commission for Revenue Allocation (CRA), Kenya county budget, 2013/2014 and the Controller of Budget (CoB), annual County Government Budget, FY 2014/2015 reports, allocation for water, health and roads was distributed as follows: Water sector budget allocation was consolidated for both Water and Sanitation sector, Health sector budget allocation was consolidated for both Health and Medical Services and road sector budget allocation was consolidated for public works and service. This is depicted in table 1 and table 2.
During the FY 2014/2015, the budget for the county increased by about 131% from FY 2013/2014. This being the year in which county

24 NATIONAL GENDER AND EQUALITY COMMISSION
government became operational for the first time after passage of the new constitution in 2010. The establishment of County government meant huge funding and spending requirements to make the county government operational including making progress in development of required infrastructure in the sectors of water, health and road. Infrastructure development was minimal or not taking place then and had to be prioritized with smooth transition from national to county government.
It was also notable that huge allocation was done for roads and health sectors in the FY 2014/2015. For the roads, the County had the first opportunity to open up rural access roads while improving the status of existing ones under the devolved function. The increased allocation to health during FY 2014/2015 was to improve the existing state of health infrastructure while constructing additional facilities noted as priority for the improved health quality and service in the county.
Further, substantial amount of funds was also allocated to the water sector to intervene on scarcity and incidence of waterborne diseases for improved hygiene and Sanitation. More water point’s facilities were also put in place to reduce the long distance in search of water. Scarcity of water was also noted to have made women become more vulnerable and school going girls and boys equally affected. Water intervention therefore meant animals lives were saved from severe weather and children could be retained in school.
Table 1: Financial Status and Trends FY 2013/14
Budget (Kshs)
Total Water and Sanitation Health & Medical Services Public Works and Services
1,167,45,000 178,687,000 69,955,000 692,500,000
Source: Commission for Revenue Allocation, Kenya county budget, 2013-14
Table 2: Financial Status and Trends FY 2014/15
Overall budget 2,705,000,000
Sector Allocation in Kshs. Expenditures Absorption Rate (%)
Health, Water & Sanitation 661,660,000 188,599,000 28.5
Roads & Public Work 1,218,200,000 537,280,000 44.1
Sources: Office of Controller of Budget, Annual County Government Budget, FY 2014/2015
3.1.4 Status of Development Projects AssessedHealth SectorThe sector focuses on providing adequate, affordable, quality basic health care, improving the cost sharing revenue, providing physical infrastructure in the hospital, health centers and dispensaries and rehabilitation of existing health facilities. Health service management through competent and skilled staff at all levels of service delivery is provided. Medical outreaches have also been emphasized in the hinterlands. The county has 71 health facilities in three sub counties: Garsen 30; Galore 20 and Bura 21. The department has a total of 437 staff making it the largest devolved Ministry in the county.

25EQUALIZATION FUND REPORT
The study therefore focused on interventions projects, looking at distribution in terms of numbers of project and funding across the three Sub-Counties. The focus of this initiative was to establish how accessible the services are to special interest groups.
The main health programs being implemented currently across the three Sub-Counties are: Immuni-zation (KEPI); Malaria prevention and control; TB control and care; Reproductive health care; Communicable disease control and surveillance; Nutrition services, HIV /AIDS programs; Maternal and Child Health; Essential health products and technologies and Diagnostic and imaging services
Table 3: Health Projects Distribution by Sub-Counties
Sub- Counties No of Project Funds Allocation Appr Distance to Hq
Galole 9 1,071,808,334.00 48
Garsen 12 106,455,834.00 153
Bura 10 162,695,000.00 128
31 1,340,959,168.00 109.67
Source: County Governmet of Tanariver.
Figure 1: Health Projects and funds distribution by Sub Counties
Under the funding and projects implemented, there are other factors that played a role in influencing the number of projects being undertaken across the County. For instance, Garsen had the least project funding yet it had highest number of projects being undertaken. This was attributed to existing number of technical expertise employed in the county and assigned to manage various projects within the sub county compared to others.
There is need to urgently address inequity in funding within the Sub-Counties to ensure all projects are implemented and completed in time. The county was lagging behind in development by the time of devolution and therefore requires a lot of financial support to complete and initiate new development projects specifically those interventions that would address the inequalities in health service. More interventions are required in health sector to ease accessibility burden on the residents. The county has to integrate a health service geared towards supporting the vulnerable population including, elderly, youth, persons with disability and children.

26 NATIONAL GENDER AND EQUALITY COMMISSION
Health facilities in Garsen were the furthest from County headquarters. This affects service delivery whenever emergencies requiring referral to County Headquarter occur. Galole’s health facilities were closer to the county headquarter making it relatively accessible.
Infrastructure Sector - RoadsTana River County has a total of 1,108 Km of classified road network. About 55 percent of the total road network is in good condition. Most of the roads are intercepted by seasonal rivers (commonly known as laghas) which makes them impassable during the rainy seasons. Although the county produces most of the marketed mango fruits in major towns in the Coast region, most of the produce ends up rotting in farms due to poor road network. The county government therefore, needs to allocate adequate resources for scaling up road improvement and opening up new roads to speed up the transportation of the produce while facilitating movements of people and other commodities within the county.
The County roads department mandate includes: Rehabilitation of road and improvement of drainage system; gravelling; construction of culverts; earthworks; upgrading to bitumen standard; street lighting; construction of the weighing bridges, foot bridges; adopt and develop the regional and national corridors through corridor development approach; develop and implement a Road Investment/Master Plan in line with vision 2030. Current and ongoing major road programmes and projects includes: Improvement by tarmacking of the major roads in the County Head Quarter (Hola Laza Roads); Spot Improvement of roads through graveling, bush clearing and roads construction
Ths study focused on establishing status of roads interventions projects in the county, what has been done or/are underway. Considerations were made on the changing funding levels in the sector over the past years fy 2013/14 to fy 2014/15. The study also focused on how initative in the road sector have enhanced accessibility across the County, specificaly the time taken to access county to current number of road networks in each sub-county.
Table 4: Road Development Projects by Sub-Counties
Sub-county No of Projects Funds Allocation Distance from Hq. Km
Bura 13 83,200,000.00 110
Galole 25 138,593,160.00 27
Garsen 20 136,648,396.00 132
Total 58 358,441,556.00

27EQUALIZATION FUND REPORT
Figure 2: Road Projects and funds distribution by Sub Counties
The distribution of funds for the sector was noted to be varying across sub-counties. Galole had the highest funds allocated and therefore had more road projects initiated and implemented while Bura Sub County had the least projects being implemented during the FY 2013/14 and FY 2014/15. While the county had varying priorities in the roads sector, many other factors may have contributed to the allocation variation. Future research may need to be conducted to establish the reason for the varying funding allocation in the three sub counties of Garsen, Galole and Bura. The county government needs to publish the justification for the unequal distribution of resources and how this affects overall service delivery.
Water SectorThe County Government’s focus on water is to provide access to safe and clean affordable water, improve the cost sharing revenue, provide physical infrastructure, and rehabilitate existing water facilities. The County has been making attempts to water service management through competent and skilled staff at all levels of service delivery.
Table 5: Water Sector Projects by Sub-Counties
Sub-county No of Projects Funds Allocation Distance from HQStatus
Ongoing Completed
Bura 7 83,000,000.00 182 2 5
Galole 9 99,500,000.00 89 2 7
Garsen 3 16,000,000.00 181 2 1
Total 19 198,500,000.00 6 13

28 NATIONAL GENDER AND EQUALITY COMMISSION
Figure 3: Water Projects and Funding by Sub County
The chart shows that project and funding distribution was not equal in all sub counties e.g. funding to Galole Sub County was at 50% while Garsen was the lowest at 8%. This has led to unequal projects being initiated across the sub counties. Galole has initiated 9 projects, Garsen 3 Projects with 2 ongoing and 1 having been completed. The county government needs to publish the justification for the unequal distribution of resources and how this affects overall service delivery.
Figure 4: Water projects implementation status by Sub-counties

29
3.2 Kwale County
3.2.1 Background Information
Kinango
Lunga Lunga
Matuga
Msambweni
The County is located in South Coast of Kenya. The County’s headquarter is Kwale Town which is located 30 km southwest of Mombasa and 15km inland. It borders the Shimba Hills National Reserve. It covers a total area of 8,270.20 square kilometers. Kwale County has monsoon type of climate which is good for agriculture. It has three main rivers and streams namely; Marere, Mwaluganje and Ramisi.
According to Kenya Population Census 2009, the County has a population of 649,931 with the main tribe being Digo and Duruma, other tribes include Kambas, Arabs and Indians and the minority and marginalized groups of Makonde, Watta, Twaskans, Kifundi, Wavumba and Wapemba. The county population growth rate stands at 3.1 per cent, and the sex ratio is 95 males per 100
females. The County has four constituencies namely Matuga, Kinango Msambweni and Lunga Lunga with twenty (20) County Assembly Wards. Kwale is divided into four sub-counties namely; Matuga, Msambweni, Kinango and Lunga Lunga.
3.2.2 Overview of Health, Roads and Water SectorsThe sub-sectors in the health sector include Medical Services, Public Health and Sanitation. Poor health services in Kwale County are attributed to: inadequate health workers; high disease incidences of preventable diseases such as malaria, diarrhea, HIV/AIDS; drugs and substance abuse, inadequate medicines due to poor supply chain for medicines, and inadequate health facilities. Interviews with officers in the County revealed that there are only two referral hospitals at Msambweni and Kinango.
Though not enough, the county has ambulances to deal with emergency cases. The County health department has adopted a policy aimed to construct maternity units in every health facility to improve on maternal health thereby reducing child mortality. However, further interview with Officers revealed that county lacks ICU facilities and therefore they refer critical patients to neighboring counties for specialist treatment. This was noted in Msambweni hospital. At the same time, the County lacked blood bank facility making it very difficult to handle emergency cases that require blood transfusion.
Most roads in Kwale County are earth roads and are quite impassable. The state of bad roads in the county hinders accessibility to health services and transportation of horticultural produce which is the county’s main agricultural produce alongside other essential services. Tourism in Shimba Hills has been affected by the bad roads. In attempts to improve road network, the county has purchased its own road equipment and machineries like tractors for road construction, repairs and maintenance. The County government has made effort in opening feeder-roads as acknowledged in Waa-Ngombeni Ward where the Makobe – Majimboni feeder-road has been opened.
A villager stated; “before the construction of this road, this area has been inaccessible for the past 20 years”.

30 NATIONAL GENDER AND EQUALITY COMMISSION
3.2.3 Financial Status FY 2013/2014 and 2014/2015According to Commission for Revenue Allocation (CRA), Kwale county budget for 2013/2014 alloca-tions were Ksh. 190,200,000 and 20,917,000 for Health & Water (2%) and Infrastructure (18%) of total development respectively. The Controller of Budget (CoB), annual County Government Budget, FY 2014/2015 reports, sector allocation for Medical & Public Health Services (16%), Infrastructure & Public Works (74%) and Water (11) respectively: This is depicted in Table 3.2.1 and Table 3.2.2.
The budgetary allocation for the FY 2013/14 was lower than the one for FY 2014/2015 since the government was still establishing the structure for devolvement of services. This budget increased by over 236% from FY 2013/2014 to FY 2014/2015. The establishment of County government meant huge funding and spending went towards operationalization of county governments.
Heavy investment in the County is noted in road sector with 74% allocation and utilization rate of 52.1%. For the roads, the County opened more rural access roads while improving the status of existing road networks falling under devolved management. The increased allocation to health was to improve the existing state of health infrastructure while constructing additional facilities noted as priority for the county.
Further, the area being prone to water conflicts between farmers and nomadic people, substantial amount of funds was also allocated to the water sector to intervene on its scarcity while also guaran-teeing on issues of hygiene and sanitation to limit incidence of water borne diseases. More water points were therefore put in place to ease accessibility. Interventions in water also meant animal lives were saved from drought in the area and boys could then be retained in school since herding was made bearable with the increased access to water points. Increased budgetary allocation to health sectors also meant more interventions in the sector to improve and increase access to health services across the entire county.
Table 6: Financial Status and Trends FY 2013/14
FY Budget (Ksh) Sector Allocation (ksh)
Total Health& Water Infrastructure
2013/2014 1,074,354,000 190,200,000 20,917,000
Source: Commission for Revenue Allocation, Kenya county budget, 2013-14
Table 7: Financial Status and Trends FY 2014/15
Overall budget 3,603,000,000
Sector Allocation in Kshs. Expenditures Absorption Rate %
Water 404,900,000 166,310,000 41.2
Medical & Public Health Services 587,650,000 273,130,000 46.3
Infrastructure & Public Works 300,490,000 156,440,000 52.1
Total 1,293,040,000 595,880,000 46.08
Sources: Office of Controller of Budget, Annual County Government Budget, FY 2014/2015

31EQUALIZATION FUND REPORT
3.2.4 Status of Development Projects AssessedA. Health SectorThe County has a total of three (3) government hospitals, eight (8) health centres and sixty- four (64) dispensaries located in Msambweni, Kwale and Kinango constituencies. The doctor and nurse population ratio stands at 1: 76,741 and 1: 3,133 respectively. In addition, the county has two (2) private hospitals both located in Diani town. The average distance to the nearest health facility within the County is seven (7) kilometres as compared to the required maximum of three (3) kilometers. The county delivery of health services is still poor. As a result child mortality rate is very high at 149 compared to the national figure of 116 deaths for 1000 live births. Most (77.2%) mothers still deliver at home without the assistance of skilled health personnel. Morbidity rate in the county is at 22.5% and Malaria prevalence rate is at 40 percent which is higher than the national average.
Poor delivery of health services is a major challenge in Kwale County and is attributable to a number of causes including inadequate health workers in the health facilities. Currently the 73 health facilities comprising 3 district hospitals, 5 health centres and 65 dispensaries are manned by only 612 staff both medical and non-medical. The deficit of health workers in the county is estimated to be 300. Lack of adequate health workers in various cadres is attributed to a shortage of local trained health staff workers as a result of few training opportunities provided to locals who are qualified to undertake medical courses. Local students are unable to get admission to medical training institutions because of the centralized system of recruiting students. Health workers from other parts of the country are posted in the remote health facilities. Most of them prefer working in health facilities located in urban areas or along the Mombasa – Lunga Lunga road.
Table 8: Health Sector Development Projects
Sub-County No. of Projects Funds AllocationStatus
Ongoing Completed
Msambweni 13 146,513,627.00 10 3
Matuga 2 5,259,052.00 2 0
Kinago 2 10,917,870.00 2 0
Lunga Lunga 5 26,629,526.00 5 0
Others 32 404,718,029.00 11 2
Total 54 594,038,104.00 30 5

32 NATIONAL GENDER AND EQUALITY COMMISSION
Figure 5: Health Projects and funds distribution by Sub Counties
Msambweni sub county had the highest funds allocation (25%) compared to all other sub counties and therefore initiated more projects (13), while Matuga had the lowest funding (1%) with the lowest projects being initiated (2).There are some projects whose location was not defined. A Strong data management and M&E system is highly recommended to ensure timely updates of the county records for realistic decision making. The weak M&E system could also have been attributed to inadequate M&E skills amongst the personnel.
Figure 6: Projects Status of implementation by Sub Counties
Msambweni Sub County has the highest number of ongoing and completed projects as compared to Matuga, Kinango and Lunga Lunga.

33EQUALIZATION FUND REPORT
B. Infrastructure -RoadsKwale County is endowed with many natural resources, but the existing infrastructure is inadequate to tap and develop these resources. For the realization of sustainable and rapid development, both physical and social infrastructure needs to be developed as enablers of other economic sectors. The road sector is a major provider of employment opportunities to the labor force and an avenue of exploitation of natural resources such as sand, ballast, poles and gravel. With only 212.5 Kms of tarmac, 120 Kms of gravel and approximately over 1695.5 Kms of earth roads, the existing road network in the County is deplorable and in poor condition. Coupled with time wasting at Likoni ferry crossing, the cost of doing business in Kwale County is prohibitive to investments and development.
Table 9: Road Projects Distribution by sub County
Sub Counties No of Projects Funds Allocation
Matuga 3 2,400,000.00
Lunga lunga 2 800,000.00
Kinago 3 43,800,000.00
Msambweni 1 34,500,000.00
Total 9 81,500,000.00
Figure 7: Projects and fund distribution by Sub Counties
Sub counties had varying funds allocation and multiple projects were initiated during the year 2013/14 and fy 2014/15.
The missing data on project status was an indication of weaknessses in data management. There is need to put a mechanism for tracking project completion in line with recommended financial reporting in the PFM act, 2012.

34 NATIONAL GENDER AND EQUALITY COMMISSION
C. Water Sector The main water resources in Kwale County comprise rivers (7), shallow wells (693), springs (54, protected and unprotected), water pans, dams (6), rock catchments and boreholes (110). However, most of the rivers are seasonal thus cannot be relied upon to supply the much needed water in the county for both agriculture and household uses. Kwale Water and Sewerage Company is mandated by the Coast Water Services Board to supply, control and manage all the water supply schemes within the county.
Private water service providers in liaison with the Kwale water services board have been supplying water to the community to ensure water is available for all. Other water supply schemes include community owned and managed boreholes, dams and even water pans. Local community partici-pation in the projects has been poor, thus creating problems of operation and maintenance.
The average distance to the nearest water point in the County is two (2) Kilometers. This is well above the internationally required five (5) meters distance to the nearest water source. The County has water towers in Shimba Hills, streams and rivers, which also supplies water to Mombasa and its environs. Kinango area is very dry due to charcoal burning and grazing.
Table 10: Water Projects by Sub-Counties:
Sub Counties No of Projects Funds Allocation
Kinango 5 2,860,780.00
Lunga lunga 5 3,227,040.00
Matuga 19 5,808,215.00
Msambweni 15 48,304,490.00
Total 44 60,200,525.00
Figure 8: Projects and funds distribution by Sub Counties
The funds allocation in the sector is unequal across all the sub counties. These may have also contributed to the unequal number of projects being initiated across the sub counties. While these distributions have been done according to the county’s priorities in development, it is useful that future studies are carried to establish if such distribution influences equitable distribution of development.

35EQUALIZATION FUND REPORT
3.3 Isiolo County3.3.1 Background Information
Isiolo North
Isiolo South
Isiolo County is in the former Eastern Province of Kenya. It has a population of 143,294 according to 2009 population census. The County is arid and semi-arid and in a total area of 25,336 square kilometers. The County is inhabited by the Borana, Somali, Turkana, Meru, Gabra, Samburu, Rendile and Watta Communities with Borana being the majority community. The level of marginalization is quite high, Isiolo being the second lowest funded county in Kenya.
The county is divided into three administrative sub-counties namely; Isiolo, Garbatulla and Merti. These are further divided into 11 divisions, 22 locations, and 44 sub-locations. The
county has two parliamentary constituencies, which is Isiolo North and Isiolo South. There three sub counties and 10 wards. This a vast county with sub-counties stretched further apart.
3.3.2 Overview of Health, Roads and Water SectorsIsiolo people derive their livelihood from entertaining tourists who come seasonally to watch and interact with the wildlife, the Isiolo Big five (Grevy Zebra, Oryx, Somali Ostrich, Lion, reticulated giraffe). According to the Governor, the wildlife and the culture of Isiolo people, the Samburu, Turkana, Borana, Gabra, Somali, Ameru are intertwined and must be conserved at all costs. An array of technologies such as surveillance aircrafts have been proposed to eradicate poaching and enhance security in the game parks. The Government of Isiolo also assured that the rapid infrastructural development in the region was designed well not to disrupt nature.
The county has only one referral hospital with people in the remotest region walking for over 300kms to access it. The hospitals lack equipment and well established infrastructure. There are very few staff in the health department and the county has not employed any new staff since its onset. There are very few employees from the local communities due to low literacy levels. Retention of already employed staff has been a problem due to harsh weather in the region. The county procures drugs which are fairly distributed though the demand is too high.
3.3.3 Financial Status FY 2013/14 and FY 2014/2015According to Commission for Revenue Allocation (CRA), Kenya county budget, 2013/2014 allocation development allocation for the county was Ksh. 1,716,625,000 with 255,520,000 for Water (15%), 236,500,000 for Health and Sanitation (14%) and 667,005,000(39%) Infrastructure sector respec-tively. The Controller of Budget (CoG) annual County Government Budget report FY 2014/2015 reports, county budget was 1,033,000,000. Sector allocation for Water (19%), Health and Sanitation (10%) and Infrastructure (33%) sector respectively.
The budgetary allocation was high for the FY 2013/14 due to the county demands on newly initiated development projects and operationalization of county functions. This budget reduced by over 40% from FY 2013/2014 to FY 2014/2015 since most offices and structures had been established during the last FY 2013/14. The establishment of County government meant huge funding and spending requirements on operational structures. The county got lower allocation in FY 2013/14, but had a high absorption rates in all the 3 sectors of Water (86%), health services (71.9%), roads, housing and work (77.7%) respectively.

36 NATIONAL GENDER AND EQUALITY COMMISSION
Heavy investment in the county is noted on infrastructure sector which according to CRA report received an allocation of 667,005,000 during the FY 2013/2014. More rural access roads were being opened up while improving on the status of existing roads that fall under the county government specifically those meant to enhance accessibility to newly created administrative units both at County Headquarters, sub counties and ward levels. The allocation for health was meant to improve on the existing state of health facilities while constructing additional ones for the county. Substantial amount of funds was allocated to the water sector with focus to ASAL regions. More water points were therefore put in place to reduce the long distance of travel in search of water especially for cattle and home use. Increased absorption rate was also noted in the health sector (71.9%) as more intervention were being initiated in the sector towards improved access to quality health services.
Table 11: Financial Status and Trends FY 2013/14
Budget (Ksh) Sector Allocation (Ksh)
Total Water Sector Health And Sanitation Infrastructure Sector
1,716,625,000 255,520,000 236,500,000 667,005,000
Source: Commission for Revenue Allocation, Kenya county budget, 2013-14
Table 12: Financial Status FY 2013/14
Overall budget 1,033,000,000
Sector Allocation in Kshs. Expenditures Absorption Rate %
Water and Environment 200,860,000 172,680,000 86
Health Services 104,170,000 74,890,000 71.9
Roads Housing and Work 343,160,000 266,680,000 77.7
3.3.4 Status of Development Projects Assessed A. Health Sector
Table 13: Health Sector Development Projects Distribution
Sub-County Total No. of Projects Funds Allocation
Isiolo 4 38,000,000.00
Garbatulla 6 5,000,000.00
Merti 6 12,900,000.00
16 55,900,000.00

37EQUALIZATION FUND REPORT
Figure 9 :Projects and funding levels by Sub Counties
Isiolo sub county had the highest project funding (68%) followed by Merti (23%) while Garbatulla had the lowest funding level (9%) during the FY 2013/14 and 2014/2015.On the other hand of projects, Isiolo had the least projects recorded and initiated. Garbatulla reported highest number of projects despite having received lower funding. This brings an interesting scenario worth exploring on other factors that influence number of projects undertaken other than funding. It may have been that Garbatulla had many ongoing projects unlike Isiolo and Merti and therefore required less funding for project completion, unlike Isiolo Sub County which could have had many start up projects. Capacity gaps could also explain these variations.
B. Infrastructure sector (roads)The Ministry in charge of Roads Isiolo County works closely with Kenya Rural Roads Authority (KERRA) to strengthen the capacity for the limited number of staff employed. Currently, there are only two officers in the County Executive (male) and Chief Officer who is female. The county tendering processes for the year 2014/2015 had been concluded by the time of the study awaiting funds approval by the County Assembly. Interactions with respondents further revealed that the strategic plan and work plan for the ministry of roads keeps changing making planning and services delivery very difficult.
Table 14: Roads Projects Distribution by Sub-Counties:
Sub Counties No of Projects Funds Allocation Appx Distance to HQ
Isiolo 11 150,000,000.00 119
Marti 2 36,773,746.00 32
Garbatula 10 68,569,187.00 100
23 255,342,933.00

38 NATIONAL GENDER AND EQUALITY COMMISSION
Figure 10: Project Distribution by Sub Counties
The distribution of funds and projects between 2013-15 financial years across sub-counties was not equal. There is need to establish the cause of disparity which was beyond the scope of this study.
Figure 11: Distance (Km) to County HQ
Isiolo Sub County is currently located furthest from the County headquarter but due to improved road network and road projects, it is easily accessible. The County needs more road interventions to enhance accessibility in all parts. This requires close collaboration and partnership amongst agencies working in road sector development e.g. the County Government, Ministry of Roads and Public Works, KURA, KeRRA.
C. Water sectorIsiolo is poised to become an economic center, an industrial hub and international trade center. Among the key projects to this urban are Isiolo Government plans to initiate the solar and wind energy farms, broadband connectivity to every primary school and massive irrigation projects. The water department has 58 staff in total with 80% of them non-technical staff.

39EQUALIZATION FUND REPORT
Table 15: Water Projects in the Water Sector by Sub-Counties
Sub-county No of Projects Funds Allocation
Merti 1 40,000,000.00
Isiolo 4 81,000,000.00
Garbatula 1 40,000,000.00
Total 6 161,000,000.00
Figure 12: Project and funding by Sub County
Financing of the project varies across all sub counties with Isiolo receiving the highest allocation (50%), Merti and Garbatula (25%) each. Isiolo Sub County has the highest number of project initiated. Merti and Garbatula had the least number of projects initiated and those currently under implemen-tation. While financing had great influence on number of projects initiated, there could have been other reasons why despite the heavy financing, projects were generally few across all the 3 sub counties. Weak data management may also have contributed to exclusion of some projects ongoing in the County and whose details were not provided to NGEC.

40
3.4 Kilifi County3.4.1 Background Information
Malindi
Kili�
Mariakani
Kilifi County is located in the former Coast Province of Kenya. Its capital is Kilifi town. The County is found within an area of 12,245.90 kilometers square with a population of 1,109,735 according to census 2009. Kilifi shares it borders with four other counties; Mombasa and Kwale to the south, Tana River to the north, and Taita Taveta to the west. The County has seven sub-counties namely Kilifi North, Kilifi South, Kaloleni, Rabai, Ganze, Malindi and Magarini. There are three main adminis-trative units namely; Malindi and Magarini, Bahari and Ganze, Kaloleni and Rabai. The main communities in Kilifi County include; the Mijikenda, Swahili, Bajuni, Indians, Arabs, European settlers and the Watta. Other communities include Kamba, Kikuyu, Luo, Kalanjin and Luhyah. The communities practice small scale farming with the main economic activities being agriculture, tourism and fishing.
Climate change in the County has seen an increase in intensity and frequency in occurrence of extreme weather events such as severe droughts and floods in Ganze, Kaloleni and Magarini constituencies. These extreme events have had negative socio-economic impacts on almost all sectors such as health, agriculture, environment and tourism. The county is endowed with a wide range of minerals such as Manganese in Ganze constituency, salt in Magarini constituency, coral rocks (stones) in Kilifi South and Kilifi North constituencies, sand in the entire County, and limestone in Kilifi South constituency and silica in Malindi constituency. Most of these minerals still remain unexploited due to inadequate knowledge on their status, economic viability and appropriate mining technologies.
3.4.2 Overview of Health, Roads and Water SectorsThe departments and ministries work closely for purposes of complementing each other e.g the department of water and health are working together to get water in every homestead. The County health department has put in place County Health Management Team in every sub-county. The County has few dispensaries and there are plans to put up at least three more health facilities every year. The department of health has invested in human resource by training members on emergency response in Mariakani, Malindi and Kilifi. To empower the young medical proffessions from the County, the health department has established an internship programme. Due to the shortage of doctors in the country, the County Government of Kilifi in conjunction with Pwani University intends to introduce telemedicine so as to enable them provide quality and timely consultation health services. In the Water Sector, the County has mapped water pipelines to put water kiosks for every community and village.
The County department in charge of transport and infrastructure aims at facilitating development and maintenance of an efficient, safe, secure and intergraded transport system; and quality public works. The department has been key in maintenance of road network within Mtwapa town, Kilifi Township, Malindi municipality and Mariakani Township.

41EQUALIZATION FUND REPORT
3.4.3 Financial Status FY 2013/14 and FY 2014/2015According to Commission for Revenue Allocation (CRA), Kenya county budget, Kilifi county development budget for projects for FY 2013/2014 was Ksh. 3,111,093,000, allocation for Water services, forestry, environment & natural resources (77,110,000), Health services (314,537,000) and Public works, roads& transport (515,469,000) per Sector respectively. The Controller of Budget (CoB), annual County Government Budget, FY 2014/2015 reports development budget as 4,600,000,000, County Health Services (611,830,000), Public Works and Services (1,163,500,000) each.
The budgetary allocation FY 2013/14 was higher thus many projects were initiated during the year. Allocation in Health sector also increased by 95% while that of Public Works and Services increased by 125%. The county had the highest absorption rates in the health sector compared to that of road during the FY 2014/2015. In this year, more health facilities were established and new vehicles in health sector were acquired.
The establishment of County governments required huge funding and spending to make the county government operational, thus the significant expenditures and funds utilization across all sectors in 2014/15.
Table 16: Financial Status FY 2013/14
Budget (Ksh) Sector Allocation (Ksh)
Water services, forestry, environment & natural resources.
Health servicesPublic works, roads & transport
3,111,093,000 77,110,000 314,537,000 515,469,000
Source: Commission for Revenue Allocation, Kenya county budget, 2013-14
Table 17: Financial Status FY 2014/15
Budget Sector Allocation (Ksh) Expenditures Absorption Rate %
County Health Services
Public Works and Services
County Health Services
Public Works and Services
County Health Services
Public Works and Services
4,600,000,000 611,830,000 1,163,500,000 373,402,000 666,860.000 61.0 57.3
3.4.4 Status of Development Projects AssessedA. Health SectorKilifi County has several healthcare facilities serving the residents. Large hospitals include Kilifi District Hospital, Malindi General Hospital and Watamu Hospital. The county is faced with a number of environmental challenges ranging from air pollution from the quarries and cement factories, water pollution, soil degradation, deforestation, poor solid waste management in the major urban centres. Less than 10 percent of the households disposed their garbage or solid waste through organized system.

42 NATIONAL GENDER AND EQUALITY COMMISSION
Table 18: Health Sector Projects Distribution by Sub-County
Sub Counties No. of Projects Funds AllocationStatus
Ongoing Completed
Ganze 2 15,575,357.00 2 0
Magarini 3 17,500,000.00 0 3
Kaloleni 7 41,006,048.00 7 0
Rabai 3 8,377,784.00 3 0
Kilifi North 4 44,275,330.00 4 0
Kilifi South 3 40,726,930.00 3 0
Malindi 4 24,444,728.00 4 0
Total 26 191,906,177.00 23 3
Figure 13: Projects and Funds distribution by sub counties
Funds distribution was unequal across all sub counties, this was also reflected on the number of projects that have been initiated and implemented. Kilifi North received the highest funding at 23% with 4 projects being implemented while the lowest allocation was to Rabai 4% and Ganze at 8% with 3 and 2 projects respectively.
Figure 14: Project Progress Status by Sub-Counties

43EQUALIZATION FUND REPORT
Magarini had the highest number of projects that had been completed while all other sub counties had ongoing projects. Magarini however had few projects and they all could have been a priority. It could also be possible that Kaloleni had other priority projects in other sectors other than health at the time of the study. The difference in the implementation status could be attributed to many factors including the beneficiary participation and ownership.
B. Infrastructure Sector - RoadsThe road sector has the mandate to develop and manage roads; manage the development of public transport services; manage public works services and offer consultancy services including roads network, communication, financial institutions, energy access, housing, market and urban Centers.
The roads in the county are classified in a manner that 326.2 Km are of bitumen standards, 542.3 gravel and 1139.5 earth surface, giving a total of 2008 Kms of classified road surface within the county. The county is envisioned in the Vision 2030 to be a resort city, therefore there is need to expand Malindi airport, Kilifi and Kijipwa airstrips to cater for the expected increase of visitors and residents in the county.
Majority of the houses in the county have walls made of mud/wood 59 % as the main walling material, bricks/blocks at 22.05 % and mud/cement at 5.95 %. On the floor, earth 73.5 % as the main floor materials, cement 25.05 %, tiles 1.15 % on roofing Makuti leads with 41.4 %, Corrugated iron sheets 32.9 % and grass 20.2 % as the main roofing materials. There are informal settlements coming up in the major urban centres especially Malindi and Kilifi towns.
Table 19: Road Projects by Sub-Counties
Sub Counties No of Projects Funds AllocationStatus
Ongoing Completed
Kilifi North 22 66,418,759.00 15 7
Ganze 12 80,961,356.00 12 0
Magarini 11 86,204,556.00 10 1
Malindi 12 19,236,544 12 0
Kaloleni 3 42,000,000 3 0
Rabai 8 44,277,448.00 0 8
Kilifi South 8 31,932,239.00 8 0
Others 1 46,778,160.00 1 0
Total 77 417,809,062.00 61 16

44 NATIONAL GENDER AND EQUALITY COMMISSION
Figure 15: Road Projects and funding by Sub-Counties
Funds distribution is not equal across all sub counties. Magarini had the highest project funding at 23% and Malindi had the leastfinancing of 5%. Malindi being the County headquarters, may have had an advantage in terms of development, thus may have required minimal development programs compared to other sub counties. Being the county heaquarter, projects in Malindi may have been for improvement of the existing ones as opposed to new projects more specifically the feeder and murram roads to improve accessibility. Kilifi North had the highest number of projects initiated (22).
Figure 16: Implementation Status of Roads Project by Sub Counties
Rabai Sub County had the highest number of completed projects out of eight (8) initiated, all had been completed at the time of this study. Kaloleni, Kilifi South, Malindi and Ganze have no projects completed out of those initiated. The completion of the projects depends on a number of factors that can be established through a detailed study. Among these factors include existing capacity and skills, and stakeholders’ ownership. The gaps in data collected are due to limited capacity and inadequate resources to support data management. Institutionalizing the M&E systems in the county is a possible solution towards enhanced data collection and reporting.
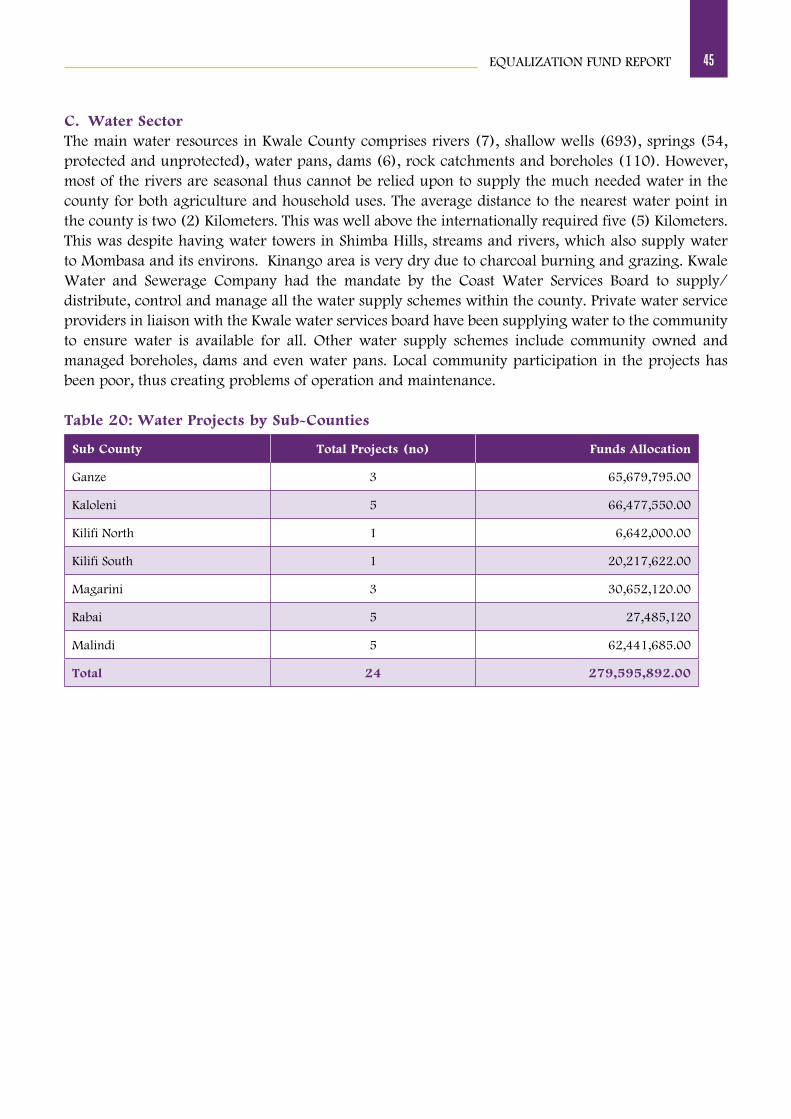
45EQUALIZATION FUND REPORT
C. Water SectorThe main water resources in Kwale County comprises rivers (7), shallow wells (693), springs (54, protected and unprotected), water pans, dams (6), rock catchments and boreholes (110). However, most of the rivers are seasonal thus cannot be relied upon to supply the much needed water in the county for both agriculture and household uses. The average distance to the nearest water point in the county is two (2) Kilometers. This was well above the internationally required five (5) Kilometers. This was despite having water towers in Shimba Hills, streams and rivers, which also supply water to Mombasa and its environs. Kinango area is very dry due to charcoal burning and grazing. Kwale Water and Sewerage Company had the mandate by the Coast Water Services Board to supply/distribute, control and manage all the water supply schemes within the county. Private water service providers in liaison with the Kwale water services board have been supplying water to the community to ensure water is available for all. Other water supply schemes include community owned and managed boreholes, dams and even water pans. Local community participation in the projects has been poor, thus creating problems of operation and maintenance.
Table 20: Water Projects by Sub-Counties
Sub County Total Projects (no) Funds Allocation
Ganze 3 65,679,795.00
Kaloleni 5 66,477,550.00
Kilifi North 1 6,642,000.00
Kilifi South 1 20,217,622.00
Magarini 3 30,652,120.00
Rabai 5 27,485,120
Malindi 5 62,441,685.00
Total 24 279,595,892.00

46 NATIONAL GENDER AND EQUALITY COMMISSION
Figure 17: Water Projects Funding Level by Sub County
The distribution of funds was not uniform across all sub counties. Kaloleni and Ganze had the highest allocation of funds at 24% with 5 and 3 projects respectively. Kilifi North had the least funding for projects and undertook only 1 project during the FY 2013/14 and FY 2014/15. While these may have been due to county priority area and needs, intervention to ensure the resources distributed taking into accounts the issue of equity within the county is critical for consideration.

47
3.5 Marsabit County 3.5.1 Background Information
North Horr
Laisamis Saku
Moyale
Marsabit County borders Ethiopia to the North and North East, Wajir County to the East, Isiolo County to the South East, Samburu County to the South and South West and Lake Turkana to the West and North West. Marsabit County is in the former Eastern Province and has an area spawning 70,961.3Km2. It has estimated population of 291,166 (52% Male & 48% Female). The County is made of 4 Sub-Counties including Moyale, North Horr, Saku and Laisamis The county comprises four constituencies (Saku, North Horr, Laisamis and Moyale). Minority tribes within are the El molo and Dasanach. Marsabit town is situated on the Nairobi-Addis Ababa highway, hosting the county headquarters and bordering the Marsabit National Park.
Most parts of the county are arid, with the exception of high potential areas around Mt. Marsabit such as Kulal, Hurri Hills
and the Moyale-Sololo escarpment. The county experiences extreme temperatures ranging from a minimum of 10.10 C to a maximum of 30.2o C, with an annual average of 20.10 C. Rainfall ranges between 200mm and 1,000mm per annum and its duration, amount and reliability increases with increase in altitude. North Horr (550m) has a mean annual rainfall of 150mm; Mt. Marsabit and Mt. Kulal 800mm while Moyale receives a mean annual rainfall of 700mm.
3.5.2 Overview of Road, Health and Water SectorsIn order to attract skilled workers, potential entrepreneurs, and tap into the immense benefits of the LAPSSET project, Marsabit town requires urgent attention in holistic planning which the County Government had committed to providing. The major challenge is lack of water, health, food security and roads. The county has put in place mechanisms to ensure fair representation of people by appointing an advisor who takes care of issues of the ethnic minority.
On average out of 160 projects that have been supervised, 5,600 employment opportunities has been created for both skilled and unskilled laborers benefiting directly and 28,000 family members as indirect beneficiaries’.
Soon after the establishment of the Department of Health, there was urgent need to renovate existing buildings and construct new ones as old ones were dilapidated and hardly sufficient for effective service delivery. During the previous financial years, a number of medical equipment had been purchased in order to improve the quality of health services in the county. With the advent of the devolution of health services, the immediate challenges facing the department has been shortage of staff in crucial areas including nursing, clinical officers, radiography department, dental department among others.
3.5.3 Financial Status for FY 2013/14 and FY 2014/2015According to Commission for Revenue Allocation (CRA), Kenya county budget, Marsabit County development budget for FY 2013/2014 was Ksh. 1,966,481,000. Allocation for Water, Environment & Natural Resource (230,000,000), Health (320,000,000) and Public Works, Roads & Transport (608,172,000). The Controller of Budget (CoB) report, FY 2014/2015 reports development budget as 3,001,000,000, sector allocation for Water, Environment & Natural Resources (529,900,000), County Health Services (230,000,000) and Roads & Public Work (215,480,000) . This is depicted in Table 22 and 23.

48 NATIONAL GENDER AND EQUALITY COMMISSION
The budgetary allocation for FY 2014/15 was high due to many project targeted during the year while planning to complete those still at initial stages of implementation. Allocation in Health sector reduced substantially by 28% while that of Roads and Public Works reduced by 65%. This could be attributed to the county having high priority in Water, Environment & Natural Resources sectors, perhaps from scarcity of water and attempts to tap into endowed natural resources in the county. Absorption rate was high in the Water, Environment & Natural Resources due to the high priority the county placed on increased access to water, specifically for livestock as a source of livelihood and the likely wealth expected from natural resources, like Minerals. There were minimal absorption rate in County Health Services, Roads & Public Work, at 45.6% and 48.3% respectively.
Table 21: Financial Status FY 2013/14
Budget (Ksh) Sector Allocation (Ksh)
Total Water, Environment & Natural Resource Health Public Works, Roads & Transport
1,966,481,000 230,000,000 320,000,000 608,172,000
Source: Commission for Revenue Allocation, Kenya county budget, 2013-14
Table 22: Financial Status FY 2014/15
Overall budget 3,001,000,000
Sector Allocation in Kshs Expenditures Absorption Rate %
Water, Environment & Natural Resources 529,900,000 355,710,000 67.1
County Health Services 230,000,000 104,708,000 45.6
Roads & Public Work 215,480,000 104,500,000 48.3
Sources: Office of Controller of Budget, Annual County Government Budget, FY 2014/2015
3.5.4 Status of Development Projects AssessedA. Health sectorThe Health Department is divided into several sub sectors: Medical Services, Public Health and Sanitation and Research and Development on Health. The department seeks to provide an efficient and high quality health care system that is accessible, acceptable and affordable for Marsabit county population. It aims to promote and participate in the provision of integrated and high quality promotive, preventive, curative and rehabilitative health care services to all. To realize these, the department has set benchmarks as it endeavors to attain the highest possible standard of health that is responsive to the needs of the population.

49EQUALIZATION FUND REPORT
Table 23: Health Sector Projects by Sub-County
Sub-County No. of Projects Funds Allocation
Moyale, 19 48,904,876.02
North Horr 30 114,057,572.56
Saku 9 44,220,224.00
Laisamis 3 17,709,030.00
Total 61 224,891,702.58
Figure 18: Health Projects and Funds allocations by Sub County
North Horr had the highest funding allocation at 51% and therefore undertook more projects while Laisamis had the lowest funding hence undertook the least project. This distribution was planned for and justified.
B. Infrastructure Sector (Roads)The Department of Roads, Public works and Transport is mandated to provide technical support for all public works, manage, develop, rehabilitate and maintain county roads that enhance socio-eco-nomic growth and prosperity. During the year 2013/2014 the department worked towards achieving two main objectives under its mandate. The first was to develop and maintain county roads. Out of the total 2,431 kilometers road network in the county, a total of 1842.3 kilometers are graded and 226 km graveled. However, there were several challenges during the year; the department had only one architect, one architect assistant and one quantity survey assistant in an acting capacity to handle the increased demands of technical support from the other departments. The roads section of the department had only one staff (Civil Engineer) at the county level and therefore the department heavily relied on the KeRRA staff to implement the entire roads projects, this was not easy given that KeRRA staff had also their core work to undertake. Project monitoring and evaluation had been challenging since the department had only one vehicle that was serviceable.
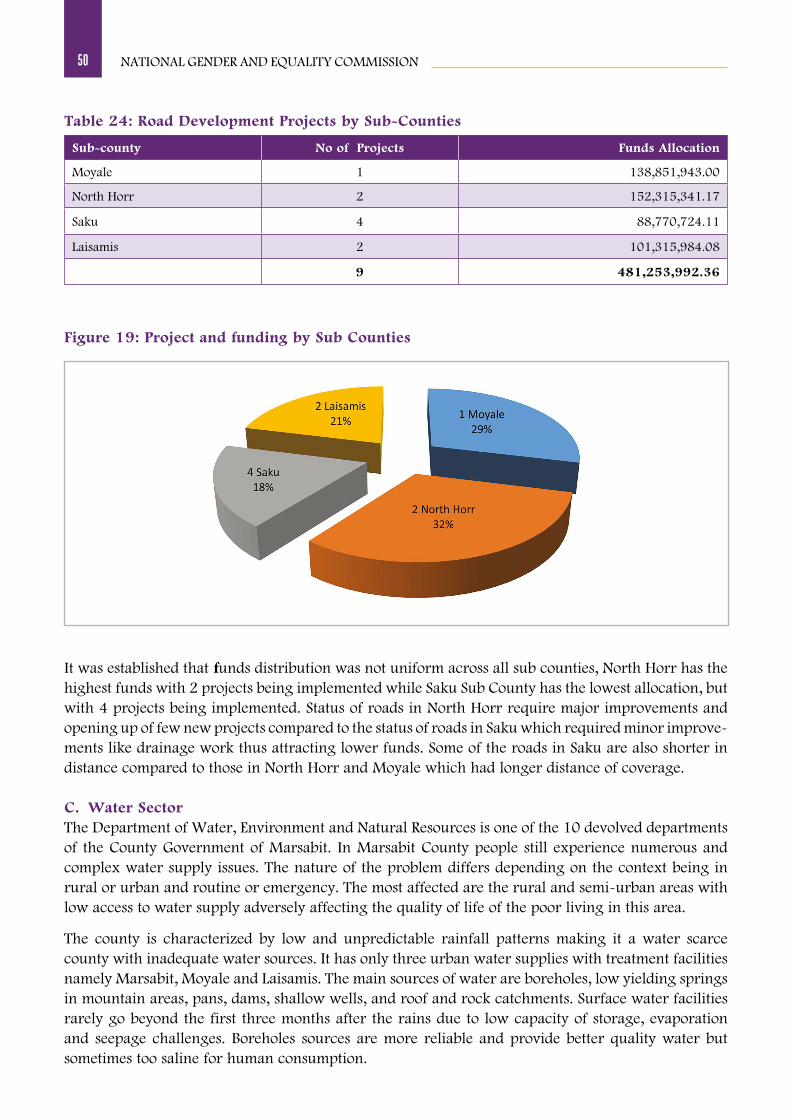
50 NATIONAL GENDER AND EQUALITY COMMISSION
Table 24: Road Development Projects by Sub-Counties
Sub-county No of Projects Funds Allocation
Moyale 1 138,851,943.00
North Horr 2 152,315,341.17
Saku 4 88,770,724.11
Laisamis 2 101,315,984.08
9 481,253,992.36
Figure 19: Project and funding by Sub Counties
It was established that funds distribution was not uniform across all sub counties, North Horr has the highest funds with 2 projects being implemented while Saku Sub County has the lowest allocation, but with 4 projects being implemented. Status of roads in North Horr require major improvements and opening up of few new projects compared to the status of roads in Saku which required minor improve-ments like drainage work thus attracting lower funds. Some of the roads in Saku are also shorter in distance compared to those in North Horr and Moyale which had longer distance of coverage.
C. Water SectorThe Department of Water, Environment and Natural Resources is one of the 10 devolved departments of the County Government of Marsabit. In Marsabit County people still experience numerous and complex water supply issues. The nature of the problem differs depending on the context being in rural or urban and routine or emergency. The most affected are the rural and semi-urban areas with low access to water supply adversely affecting the quality of life of the poor living in this area.
The county is characterized by low and unpredictable rainfall patterns making it a water scarce county with inadequate water sources. It has only three urban water supplies with treatment facilities namely Marsabit, Moyale and Laisamis. The main sources of water are boreholes, low yielding springs in mountain areas, pans, dams, shallow wells, and roof and rock catchments. Surface water facilities rarely go beyond the first three months after the rains due to low capacity of storage, evaporation and seepage challenges. Boreholes sources are more reliable and provide better quality water but sometimes too saline for human consumption.

51EQUALIZATION FUND REPORT
Table 25: Projects in the Water Sector by Sub-Counties
Sub-county No of Projects Funds Allocation
North Horr 7 55,970,000.00
Laisamis 11 37,820,000.00
Moyale 10 59,110,000.00
Saku 10 38,600,000.00
38 191,500,000.00
Figure 20: Projects and funds Allocation by Sub County
Projects and funds distribution – Moyale as the county Headquarters has the highest funds allocation with 10 projects being initiated while Saku and Laisamis which had the least funding had 10 and 11 projects initiated respectively. There exist, inequalities in the way funds are distributed amongst the sub-counties, which requires further research to establish the key determinants for funds and resource allocation in Marsabit County.
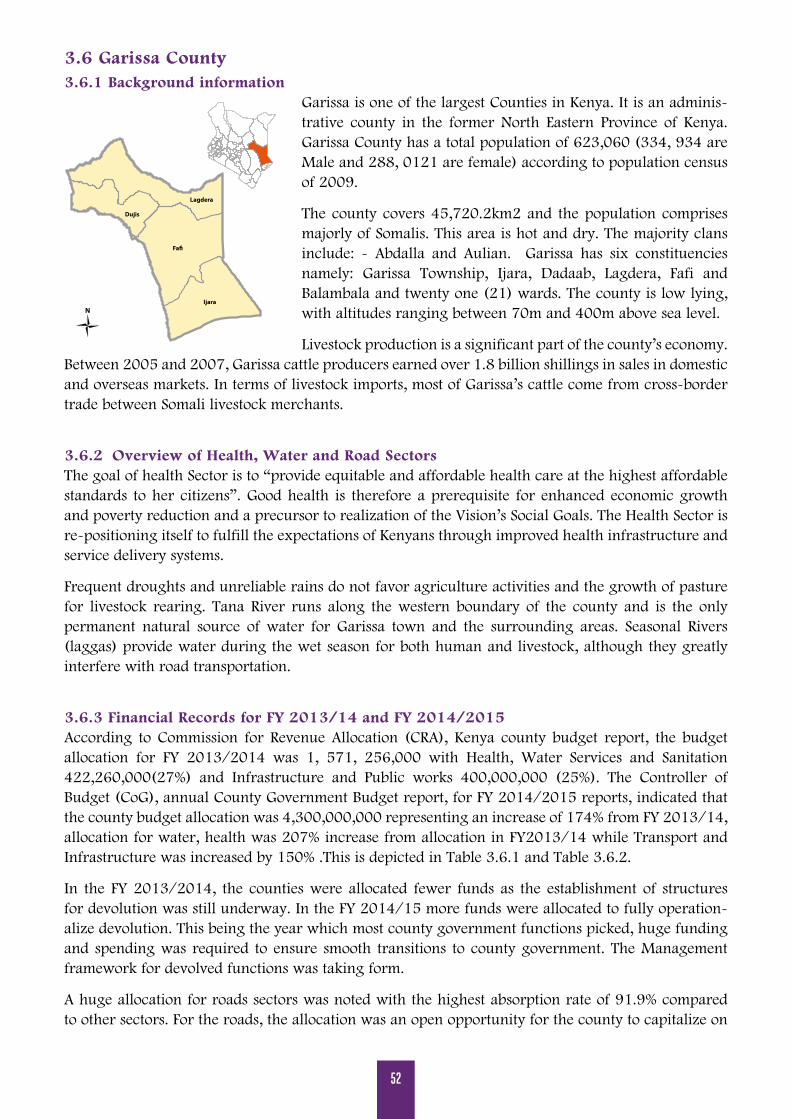
52
3.6 Garissa County3.6.1 Background information
Lagdera
Fa�
Ijara
Dujis
Garissa is one of the largest Counties in Kenya. It is an adminis-trative county in the former North Eastern Province of Kenya. Garissa County has a total population of 623,060 (334, 934 are Male and 288, 0121 are female) according to population census of 2009.
The county covers 45,720.2km2 and the population comprises majorly of Somalis. This area is hot and dry. The majority clans include: - Abdalla and Aulian. Garissa has six constituencies namely: Garissa Township, Ijara, Dadaab, Lagdera, Fafi and Balambala and twenty one (21) wards. The county is low lying, with altitudes ranging between 70m and 400m above sea level.
Livestock production is a significant part of the county’s economy. Between 2005 and 2007, Garissa cattle producers earned over 1.8 billion shillings in sales in domestic and overseas markets. In terms of livestock imports, most of Garissa’s cattle come from cross-border trade between Somali livestock merchants.
3.6.2 Overview of Health, Water and Road SectorsThe goal of health Sector is to “provide equitable and affordable health care at the highest affordable standards to her citizens”. Good health is therefore a prerequisite for enhanced economic growth and poverty reduction and a precursor to realization of the Vision’s Social Goals. The Health Sector is re-positioning itself to fulfill the expectations of Kenyans through improved health infrastructure and service delivery systems.
Frequent droughts and unreliable rains do not favor agriculture activities and the growth of pasture for livestock rearing. Tana River runs along the western boundary of the county and is the only permanent natural source of water for Garissa town and the surrounding areas. Seasonal Rivers (laggas) provide water during the wet season for both human and livestock, although they greatly interfere with road transportation.
3.6.3 Financial Records for FY 2013/14 and FY 2014/2015According to Commission for Revenue Allocation (CRA), Kenya county budget report, the budget allocation for FY 2013/2014 was 1, 571, 256,000 with Health, Water Services and Sanitation 422,260,000(27%) and Infrastructure and Public works 400,000,000 (25%). The Controller of Budget (CoG), annual County Government Budget report, for FY 2014/2015 reports, indicated that the county budget allocation was 4,300,000,000 representing an increase of 174% from FY 2013/14, allocation for water, health was 207% increase from allocation in FY2013/14 while Transport and Infrastructure was increased by 150% .This is depicted in Table 3.6.1 and Table 3.6.2.
In the FY 2013/2014, the counties were allocated fewer funds as the establishment of structures for devolution was still underway. In the FY 2014/15 more funds were allocated to fully operation-alize devolution. This being the year which most county government functions picked, huge funding and spending was required to ensure smooth transitions to county government. The Management framework for devolved functions was taking form.
A huge allocation for roads sectors was noted with the highest absorption rate of 91.9% compared to other sectors. For the roads, the allocation was an open opportunity for the county to capitalize on

53EQUALIZATION FUND REPORT
constructing new rural access roads which had stalled for a while despite the poor state. The increased allocation to health was aimed at increasing access to health services especially on facilities for women and children.
The area is dry and prone to water scarcity. It is inhabited by communities whose livelihood is purely nomadic hence a substantial amount of funds was allocated to the sector to intervene on its scarcity by setting up more water points to reduce the long distance. The water points were meant to cater for animals and domestic consumption. Scarcity of water was noted to have increased the burden to school going girls and boys who have to skip school in search of water for livelihood. More Interven-tions in water meant animals lives were saved from severe weather conditions and boys and girls could be retained in school in line with the vision to increase access to universal quality and affordable education.
Table 26: Financial Status for FY 2013/14
Budget (Ksh) Sector Allocation (Ksh)
Total Health, water services and sanitation Infrastructure and public works
1,571,256,00 422,260,000 400,000,000
Source: Commission for Revenue Allocation, Kenya county budget, 2013-1
Table 27: Financial Status for FY 2014/15
Overall budget 4,300,000,000
SECTOR Allocation in Kshs Expenditures Absorption Rate %
Health 529,000,000 895,000,000 66.3
Transport and infrastructure 1,000,000,000 919,200 91.9
Water 769,000,000 572,600,000 74.5
Sources: Office of Controller of Budget, Annual County Government Budget, FY 2014/2015
3.6.4 Status of Development Projects AssessedA. Health SectorThe mandate of Garissa county health sector is to support the attainment of the highest attainable medical care and sanitation services that will improve lives of Garissa county population at all levels of health care delivery. To fulfill the vision and mission, the Health Sector provides leadership through formulation of health policies and strategic direction, set standards, provide health services through public facilities and regulate all actors/services. The sector indicated that some of its priority projects are to: establish training Departments of Anesthetists, Radiographers and Orthopaedic technicians; develop Garissa county Level 5 into a Regional Referral Hospital and Research; recruit sufficient Human Resource for Health; develop sufficient Health Infrastructure at all levels of care; develop a Medical Supply Chain Management System; develop systems to mitigate against communicable and Non-communicable disease conditions; and develop an efficient and responsive patient referral system.
Hospitals in the county have no ICU, HDU, dialysis equipment, diabetes management center and

54 NATIONAL GENDER AND EQUALITY COMMISSION
other investigative medical facilities. The county is considering construction of facilities to take care of children with complex health disorders. The health sector has staff from diverse tribes. The county has set aside 20 million to train its own doctors as a way of ensuring sustainability in technical staff. At the same time, PWDs had not been considered much in employment and efforts are underway for optimal inclusion.
Table 28: Health Projects by Sub-County
Sub County No. of Projects Funds Allocation Approx distance HQ
Lagdera 5 29,102,076.00 160.33
Dadaab 3 20,657,522.00 106.67
Fafi 3 17,938,411.00 113.33
Ijara 6 36,578,909.00 275.5
Balambala 5 32,932,780.00 113
Total 22 137,209,698.00 153.8
Figure 21: Health Projects and Funds by Sub County
Ijara Sub County had the highest funding and therefore implemented a higher number of projects. This was an indication that Ijara was a focal area for development in the county as reflected in the high funding. This translated to reduced distance in accessing health facilities. Fafi received the least funding probably due to prior investments.

55EQUALIZATION FUND REPORT
Figure 22: Estimated Distance from County HQ
Ijara subcounty was the least accessible and required long to cover distance from the heaquarter compared to fafi sub county. The long distance means, emergency cases will take long to be attended to due to travel logistics. This lead to large number of ambulances purchased to facilitate patients’ mobility for quick access to health care service.
B. Infrastructure Sector - Roads
Table 29: Road Projects and funds by Sub-Counties
Sub Counties Total Projects (no) Funds AllocationStatus
Ongoing Completed
0 0 0 0
Lagdera 10 184,347,176.80 3 7
Dadaab 5 59,989,339.10 1 4
Fafi 7 164,339,949.44 2 5
Balambala 4 76,612,160.08 0 4
Garissa Township 2 39,848,134.50 0 2
Ijara 2 40,297,616.00 0 2
Total 30 565,434,375.92 6 24

56 NATIONAL GENDER AND EQUALITY COMMISSION
Figure 23: Projects and funds allocation by Sub County
Lagdera did not receive any funding for roads in the year under review, therefore had no intervention in the sector. The sub county priorities were on other interventions like water and health. Dadaab had the highest funding of 33% with 10 projects being initiated to make it more accessible to other facilities available at the county.
Figure 24: Health Project Status by Sub County
Daadab has the highest completed projects as well as the ongoing projects. Garissa Township, Ijara and Modogashe all had projects completed by the time of the study, probably because they initiated only a few projects. Variation in completion status was attributed to timely availability of resource and coordination. A stronger M&E System needs to be established to monitor completion of projects.

57EQUALIZATION FUND REPORT
C. Water SectorWater is scarce in the county and all appropriate infrastructure has to be put in place to ensure increased supply of water resources for domestic, industrial and irrigation use. Water and sanitation infrastructure are yet to be modernized to curb water wastages that impedes economic development. Some specific activities under consideration by the County Government include the following; Garissa Sewerage Project, a project which commenced in July 2009; Rural Support Projects aimed for the provision of clean drinking water to all villages and settlements . This includes piping water from the Tana River for all settlements along the river. Borehole drilling to be increased for clean water and piping of such water to a central location of each village will be undertaken. Similarly, storage of clean water will be enhanced through the use of modern water storage tanks. Other activities to be undertaken in this regard include rain water harvesting through the construction/desilting of dams.

58
3.7 Wajir County3.7.1 Background Information
Wajir North
Wajir East
Wajir South
Wajir West
Wajir is a Borana word that means coming together, Bequeathed to this part of the country because of the different clans and pastoral communities that used to congregate in areas around Wajir town to water their animals from the abundant and dependable shallow wells that characterize the general land geomorphology. The Projected Population for the county by 2017 would be 800,000 people. Due to its centrality to all major town in the region, with its abundant water resources and shallow wells and high human traffic, the British officially established Wajir Town in 1912, to serve as their colonial headquarters. Wajir town is now one of the oldest towns in Kenya after Malindi and Mji wa Kale in Mombasa. Its Centennial Anniversary was marked in 2012. The county comprises of six sub-counties namely: Wajir East; Wajir West; Wajir North; Wajir South; Eldas and
Tarbaj. Maximum temperatures range between 31°C in July and 36°C in March while minimum temperatures range between 21°C in July and 24o° C in April.
3.7.2 Overview of Water, Health and Road SectorsIn the year 2013, the county drilled 48 boreholes out of which 36 were operational at the time of study. The National Government had constructed 118 boreholes thus bringing to 154 operational boreholes. Water trucking services were also available. The county has 19 water boosters which include 2 trucks bought by the County Government which is used to distribute water to the residents free of charge.
The county has 102 health facilities which are operational. 64 of these facilities were established before devolution. Health Ministry has 8 ambulances out of which 4 ambulances were from the National Government and 1 ambulance was donated by the UNHCR.
The County Government is in the initial stages of road tarmacking and by 2014 had managed to tarmac 2 kilometers.
3.7.3 Financial Status FY 2013/14 According to the Commission for Revenue Allocation (CRA), Kenya county budget, 2013/2014 report, the county budget was 3,111,093,000. Allocation for Water services, Forestry, Environment & Natural resource was (77,110,000), Health services (314,537,000) and Public works, Roads& Transport (515,469,000). The Controller of Budget (CoB), annual County Government Budget, FY 2014/2015 reports, shows that Wajir County Budget was 4,380,000,000 representing an increase by 41% from previous FY 2013/14.
Allocation for Health Service was increased by 116%.Public Works, Roads and Transport allocation increased by 221% and absorption rate was high at 92.07%. The huge allocation and absorption rates indicate the demand to open more rural access roads and infrastructure in the sector for enhanced accessibility to headquarters and the neighboring counties. More roads were constructed across all sub counties while the existing roads were being improved to make them accessible and improve on the transportation due to the long distances in the county. Water, Sanitation & Natural Resources had the highest budgetary allocation increasing by above 100%. Probably the budget was fully absorbed due to the high demand for water. Table 31 and table 32 shows the financial status for the 2013-2015 financial year

59EQUALIZATION FUND REPORT
Table 30: Financial Status and Trends FY 2013/14
Budget (Ksh) Sector Allocation (ksh)
Water services, forestry, environment & natural resource
Health services Public works, roads& transport
3,111,093,000 77,110,000 314,537,000 515,469,000
Source: Commission for Revenue Allocation, Kenya county budget, 2013-14
Table 31: Financial Status FY 2014/15
Overall budget 4,380,000,000
Sector Allocation in Kshs Expenditures Absorption Rate %
Health Service 680,420,000 584,580,000 85.91
Public Works, Roads and Transport
1,654,530,000 1,523,400,000 92.07
Water, sanitation & Natural Resources
967,940,000 943.600.000 97.49
3.7.4 Status of Development Projects AssessedA. Health SectorThe County Department of Health has three divisions Public Health, Medical Services and Sanitation and the vision is to be a provider of choice for quality health care services in Wajir County. Most of the health Centre’s were not operational due to the large number of staff turnover over security concerns. The sector 3 staff with disability. The staff data available lacks adequate disaggregation by sex and job Category. The County did not have adequate number of staff to handle issues in the health sector. There are few specialists. There were no houses to cater for staff who would wish reside within the health facilities for enhanced accessibility in case of emergencies. There is need to come up with interventions to attract and retain professionals in the sector e.g. scholarships for professionals, good housing and all interventions that may make the county attractive for professionals from outside and within the county.
Most health facilities experienced shortage of drugs and delays in getting the drugs ordered from the headquarters. This tremendously affected service delivery. Participatory interventions amongst relevant government agencies was needed after and before the funds are released to find lasting solutions to address the routine drug shortage.
B. Infrastructure Sector - RoadsThe County Department of Public Works, Roads & Transport has three Public Departments namely Works, Roads and Transport. The Department has the vision of excellence in the Construction and Maintenance of Infrastructure. The department has the mandate of Traffic Management; Construction and maintenance of all county roads; Public roads transport including street lighting, road signs, parking and regulations of county public transport systems among others. By the time of study, the County Government was in the initial stages of road tarmacking and had managed to tarmac

60 NATIONAL GENDER AND EQUALITY COMMISSION
2 kilometers of roads. Currently the county is undertaking the following projects; Tarmacking; Gravelling; Bush clearing; Grading; and Drifts construction
C. Water SectorThe sector aims at ensuring sustainable access to cost effective energy and safe water in a clean and secure environment. It has the Mission to promote, conserve and protect the environment, improve access to water and energy for sustainable development. The mandates of the Department is to develop and maintain infrastructure to supply safe and adequate water in a sustainable environment.

61
3.8 Samburu County3.8.1 Background Information
Samburu CentralSamburu East
Samburu North
Samburu County has land coverage area of 20,826 Km2 with a total population of 224,000. The County borders Baringo County to the west, Laikipia County to the South, Isiolo County to the east, Turkana County to the northwest and Marsabit County to the north. Maralal town is it’s headquarter. Samburu County is administratively divided into three sub-counties namely: Samburu Central, Samburu East and Samburu North.
The County is inhabited by the Samburu who are the dominant community, Turkana, Somali and Rendille ethnic groups whose main livelihood is nomadic pastoralists. The county is home to Ewaso Nyiro River at its base in the south, Lake Turkana at is northern most tip and the Great Rift Valley as its western edge.
The vastness of Samburu land offers an unrivalled collection of impressive natural landscapes, ranging from volcanoes and deserts in the Suguta Valley, semi-arid grass lands, bush and sand rivers in the Great Plains to ancient mountains with impressive granite features. Ololokwe, Ol Lenkiyo, Ndoto and Ngiro mountains form islands of thick indigenous forest.
3.8.2 Overview of Water, Roads and Health SectorsThe county lacks basic infrastructure for its residents and for delivery of services and therefore was a priority for County Government since its establishment. These shall include roads, water, and other related public works. Much progress has been achieved in the implementation of road rehabili-tation and construction program. By the time of study, the County Government had upgraded 10 kilometers of Maralal town roads to probase roads, designed and construction Seyia Bridge, graded and maintained different roads and installed street lights in 5 major urban roads. Going forward, the County Government will continue to invest in expansion of road network to open up rural areas, ease movements of goods and passengers and encourage growth of commerce throughout the county.
Safe drinking water and sanitation also complement efforts towards improved primary health care and productive of labor force. For this reason, Government has sunk 26 boreholes, rehabilitated 9 water supplies, desilting of various water pans and supported the boreholes running costs in the 2013-2015 financial years. In addition, the County Government has supported the water company with Ksh 65 million.
3.8.3 Financial Status for FY 2013/14 and FY 2014/2015According to Commission for Revenue Allocation (CRA), Kenya county budget, 2013/2014 report, the county budget was 3,015,000 and allocation for Public works was (309,500). The Controller of Budget (CoB), annual County Government Budget, FY 2014/2015 reports states that the county Budget was 2,070,000,000. This being the second year in which County Government became operational.
Funds absorption for Health Service was increased by 79%, due to high demands and spending requirement in health services and facilities. The County Public works, County roads and water sector absorption rate was at 82.7% as shown in table 33 and table 34.

62 NATIONAL GENDER AND EQUALITY COMMISSION
Table 32: Financial Status FY 2013/14
Budget (Ksh) Sector Allocation (ksh)
Public Works
3,015,000 309,500
Source: Commission for Revenue Allocation, Kenya county budget, 2013-14
Table 33: Financial Status FY 2014/15
Overall budget 2,070,000,000
SECTOR Allocation in Kshs Expenditures Absorption Rate %
Health Service 224,190,000 177,200,000 79.0
Public works, County roads & water 586,680,000 707,810,000 82.7
Sources: Office of Controller of Budget, Annual County Government Budget, FY 2014/2015
3.8.4 Status of Development Projects AssessedA. Health SectorThe County Government’s strategy on health care reforms aims at building a lasting healthy Kenya with higher productivity for sustained economic transformation and long term development. This strategy builds on notable progress achieved, especially in controlling communicable diseases and attaining marked decrease in child mortality. To date, the County Government has been running free maternity program in health facilities and free primary. Further, inefficiency in health care system emanates from skewed distribution of resources, knowledge practice gaps as well as stock outs of drugs and medical supplies.
The Ministry has maternal shelters based in dispensaries and hospitals fully operational with nurses and doctors. For the County Health Management team to ensure accelerated uptake of health services, it is critical that cultural practices of the communities in the county are considered in the design and implementation of health interventions. The Sector experiences shortage of staff, more so the professionals who often leave the county due to challenges of poor infrastructure and harsh living condition. Incentives to attract and retain professionals in the field should be used e.g. offering full scholarships to Samburu people on health related courses like pharmacy and medicine. The Ministry of Health is supporting parallel programs for exceptional cases like orphans as a way to bridge the gap. The county should also consider special interest groups in in employment opportunities.
Data management in the sector was weak and needs to be strengthened. This is notable from quality of information given on the interventions areas and the fact that much of the data was not easily retrievable. The M&E system for the sector needs to be established
Table 34: Health Sector Projects by Sub-County
Sub County Total No. of Projects Funds Allocation Approximate distance from the county headquarters
Samburu East 4 14,920,675.00 184.75
Samburu West 8 39,733,311.00 21.125
Samburu North 4 13,608,883.00 123.75
Total 16 68,262,869.00 109.9

63EQUALIZATION FUND REPORT
Figure 25: Projects and Funds distribution by Sub County
Samburu West had the highest funding at 58% and implemented more projects compared to Samburu North and East with a funding levels at 20% and 22% respectively. The determinants for distribution of allocation could have been based on priority the county government had for each county in terms of development. Samburu West was accorded higher priority and identified to spur overall growth in the county. These issues are tied to the County integrated development plan which also places higher priorities to certain development initiatives with likely spillover effects on the whole county. Funding in Samburu North was lower since it is considered fairly developed.
Figure 26: Health Projects Approximate Distance to Head quarter
Samburu East was the furthest in terms of access to county. The Sub county therefore required more funding to undertake more roads projects that would enhance accessibility. More rural road networks will make health facilities accessible especially in cases of emergencies in health.

64 NATIONAL GENDER AND EQUALITY COMMISSION
B. Infrastructure (roads)This sector is vital for improving road network and thus ensuring ease of transport and water provision. The county governments have invested heavily in the road sector with purchase of plant, machinery and equipment. This will enable the government to carry out road construction works efficiently and effectively at lower costs. Contracts have been signed and work started for opening of new roads and improvement of existing roads in most parts of the county.
Besides another significant step achieved in road maintenance is through use of community labor. Street lighting in Maralal is complete and plans are underway to lighting Baragoi, Archers, Suguta Mar Mar, Kisima and Wamba at a total cost of ksh 21Million.
Table 35: Road Projects by Sub-Counties
Sub County No of Projects Status
Ongoing Completed
Samburu West 4 0 4
Samburu North 0 0 0
Samburu East 4 0 4
Samburu Central 0 0 0
Total 8 0 8
Figure 27: Roads Projects by sub counties
Samburu East and West were the only counties that initiated project during the FY 2013/14 to 2014/2015. Samburu North and Central sub counties had no records of any projects during the years under study. The County M&E and Data management system should be strengthened to ensure such gaps are eliminated.

65EQUALIZATION FUND REPORT
Figure 28: Project Status by Sub County
Both Samburu West and Samburu East completed the entire project initiated during the 2 financial years. There were no indications of projects initiated in Samburu Central and Samburu North. This could have been an issue with data management. From the data provided and the format of presentation, the county has a weak system of managing their data and this would continue to compromise information quality.
C. Water SectorTable 36: Water Projects by Sub-Counties
Sub County No of Projects Status
Ongoing Completed
Samburu West 5 0 5
Samburu North 5 0 5
Samburu East 7 0 7
Samburu Central 3 0 3
Total 20 0 20

66 NATIONAL GENDER AND EQUALITY COMMISSION
Figure 29: Water Project by Sub County
Samburu East had the highest water related projects initiated during the last 2 financial years while Samburu Central had the least of projects.
Figure 30: Project Status by Sub County
All projects were implemented during the financial years under review. This is an indication of the existing capacity and good will and support from the county on the sector.

67
CONCLUSION AND RECOMMENDATIONS4.1 ConclusionsAll the 8 counties have made remarkable progress in the empowerment of the marginalized counties since the promulgation on the new Constitution in 2010. The Budget for the counties increased in the financial year 2014/15. This signaled that devolution was taking form and County Govern-ments had been operationalized. It was therefore worthy noting that in all the 8 counties, absorption rates rose significantly in the FY 2014/2015. Counties did not have equal funding and number of projects initiated across board. This was an indication that all counties had unique priorities in the three sectors for example Garissa County had the highest of its total allocation going to health sector compared to other Counties.
All the 8 counties had weaknesses in data management. The specific weaknesses were in documen-tation and knowledge management processes. The information availed was scattered and extracted from the procurement plans, inventory of projects commissioned and the annual work-plans as there was no standardized formats or Management Information System universally adopted by the counties. This necessitated the challenges in the retrieval and the subsequent analysis of data.
4.2 Recommendations
i) National Governmenta) There is need to expedite the operationalization of the equalization fund so as to enable
the marginalized counties reap the benefits enshrined in the constitution. In addition, the National Government needs to create awareness on the administration of the fund as well as ensure participation of the marginalized communities in the, identification, implementation, monitoring and evaluation of the projects to be implemented through the fund.
b) The National Government needs to support the counties in establishing uniform monitoring, evaluation and learning System. This will aid in tracking progress, enhancing accountability as well as informing decisions on resource allocation. In addition, it will assist in studies and assessment of devolution impact in Kenya.
ii) County Governments a) Create mechanisms to ensure inclusion of the special interest groups that are susceptible to
discrimination in all the projects undertaken. This will reduce the tendency to create double marginalization of these groups within these areas. –
b) Improve county data management system and adhere to the legal requirement of publishing quarterly implementation reports. This will enhance information sharing with the public and other interested stakeholders.
c) Provide a clear justification on disparities in resource allocation and distribution of projects within the counties
iii) National Gender and Equality Commissiona) Promote gender equality and Inclusion in the sectors meant to receive equalization fund including
health, water, and electricity. This should also include promoting equality and inclusion principles in general annual budgeting and allocation of resources within counties to address the unexplained resource allocation disparities identified in this study. This may be done through conducting an analysis on areas of weaknesses and possible solutions towards attainment of equality in these sectors.
b) In partnership with County Governments, facilitate establishment of a framework for gathering data to enhance data collection and flow on equality and inclusion to the Commission for use in development of periodic country reports.
4.0

68
REFERENCES
1. Angeby, Martin, (2007). Social Integration in the Stockholm Region. A contribution to the Expert Group Meeting on “Creating Inclusive Society: Practical Strategies to Promote Social Integration”, Paris.
2. Barrientos, A. (2007). “Introducing Basic Social Protection in Low-Income Countries: Lessons from Existing Programmes”, Working Paper 6, University of Manchester, Brooks World Poverty Institute.
3. Capotorti, F. Study on the Rights of Persons Belonging to Ethnic, Religious and Linguistic Minorities, New York, United Nations, 1991, para. 568. 9.
4. Cooksey, B., David Court, and Ben Makau. “Education for Self-Reliance and Harambee” in Barkan J. (ed.) 1995. Beyond Capitalism vs. Socialism in Kenya and Tanzania. Nairobi: EAEP.
5. Government of Kenya. 2013. 2013/14 Budget Policy Statement. Nairobi: Ministry of Finance.
6. Kanyinga, K. “Governance Institutions and Inequality in Kenya” in SID (ed.) 2006. Readings on Inequality in Kenya: Sectoral Dynamics and Perspectives, Nairobi: SID.
7. Manchester Boesen, J.K. and T. Martin (2007). Applying a Rights-Based Approach. An Inspira-tional Guide for Civil Society, Danish Institute for Human Rights, Copenhagen.
8. Proposal Concerning a Definition of the term ‘Minority’, UN Doc. E/CN.4/Sub.2/1985/31.
9. Water Services Regulatory Board. 2008. Impact: A Performance Report of Kenya’s Water Services Sub-sector. Issue No. 5. Nairobi: WASREB.
10. World Bank. 2012. Devolution
11. World Bank. 2015. Kenya - Enhancing Decentralized Service Delivery through Participatory Project: Summary overview. Kenya devolution. Washington, DC: World Bank Group. Website: http://documents.worldbank.org/curated/en/765391468043160795/Kenya-Website: Enhancing-Decentralized-Service-Delivery-Through-Participatory-Project-Summary-overview


HeadquartersSolution Tech Place, 1st Flr, Longonot Road,
Upperhill, next to Crowne Plaza HotelP.O.BOX 27512-00506, Nairobi, Kenya
Tel +254 2(20)-272-7778/ +254 (20) 3213199www.ngeckenya.org
Twitter: @NGECKENYAwww.facebook.com/NGECKenya
Toll Free Line: 0800720187SMS: 20459
Kisumu OfficeReinsurance Plaza, 3rd Floor, Wing B
Oginga Odinga Street
Nakuru OfficeTamoh Plaza, 1st Floor, Kijabe Street
P.O BOX 15263-401 NAKURU
Garissa OfficeOpposite Care International Offices,
Garissa town
Malindi OfficeMalindi Complex, off Lamu-Malindi Road
Malindi town
Kitui OfficeNzambani Park, off Kitui Referral Hospital Road
Kitui town
Copyright © 2022 FDOKUMEN