THE DIGITAL SPACE - Tata Mutual Fund
34
INDIA IS INVESTING IN THE DIGITAL SPACE ARE YOU READY TO INVEST? Khud Pe Vishwaas Hai Sabse Badi Investment This product is suitable for investors who are seeking*: • Long Term Capital Growth. • An exchange traded fund that aims to provide returns that corresponds to the returns provided by Nifty India Digital Index, subject to tracking error. *Investors should consult their financial advisors if in doubt about whether the product is suitable for them Scheme Risk-O-Meter Risk-O-Meter of Nifty India Digital Index Mutual Fund investments are subject to market risks, read all scheme related documents carefully. NFO Opens: 14 th March 2022 | NFO Closes: 25 th March 2022
-
Upload
khangminh22 -
Category
Documents
-
view
3 -
download
0
Transcript of THE DIGITAL SPACE - Tata Mutual Fund

INDIA IS INVESTING IN
THE DIGITAL SPACEARE YOU READY TO INVEST?
Khud Pe Vishwaas Hai Sabse Badi Investment
This product is suitable for investors who are seeking*:
• Long Term Capital Growth.• An exchange traded fund that aims to provide
returns that corresponds to the returns provided by Nifty India Digital Index, subject to tracking error.
*Investors should consult their financial advisors if in doubt about whether the product is suitable for them
Scheme Risk-O-Meter Risk-O-Meter of Nifty India Digital Index
Mutual Fund investments are subject to market risks, read all scheme related documents carefully.
NFO Opens: 14th March 2022 | NFO Closes: 25th March 2022

Companies with theworld’s largest market capitalisation
2005 → 2022
1/8 Tech company →6/8 Tech companies
Source: Statista & companiesmarketcap.com (15th Feb 2022)
Tech
Oil/Energy
Finance
Physical Distribution
Conglomerate
Health
The Rise OfDigital Businesses
Apple
Microsoft
Saudi Aramco
Alphabet
Amazon
Tesla
Berkshire Hathaway
NVIDIA
General Electric
Exxon Mobil
MicrosoftCitigroup
BPWal-Mart
Royal Dutch ShellJohnson & Johnson
382
381263234221212211
200
2005
2,819
2,252
1,986
1,805
1,592
936
660
2022
705
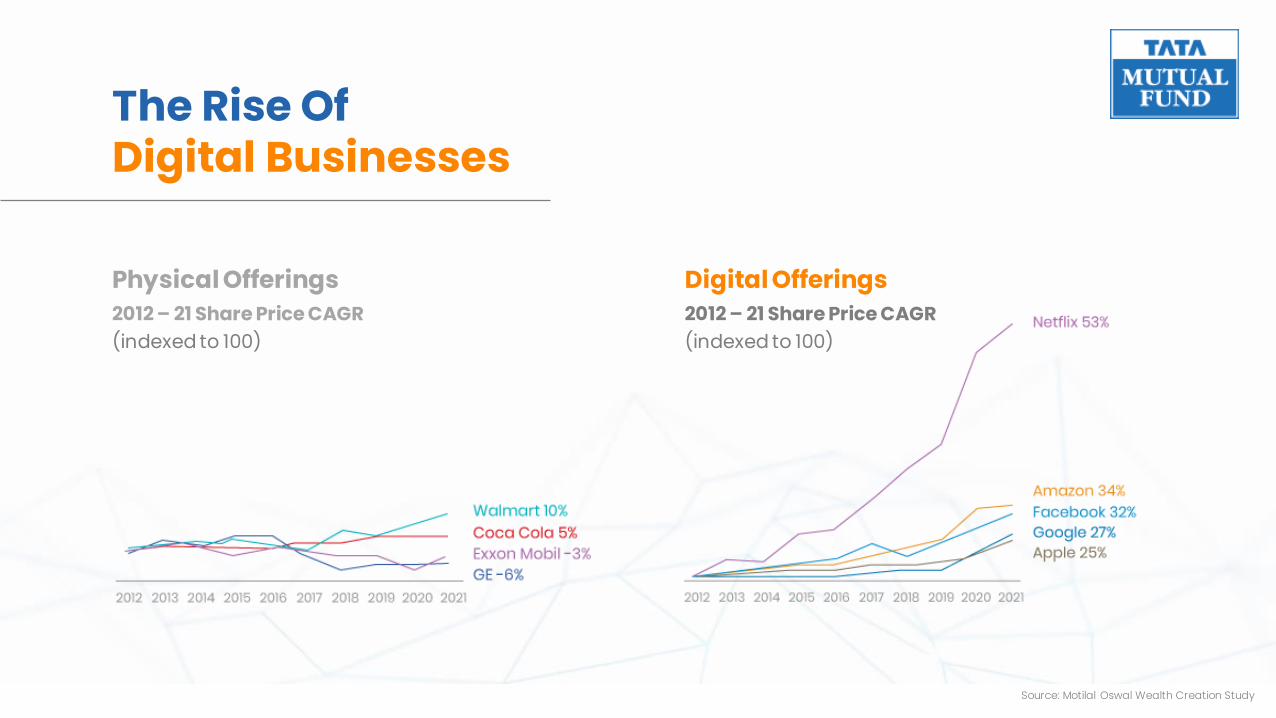
The Rise OfDigital Businesses
Source: Motilal Oswal Wealth Creation Study
Physical Offerings2012 – 21 Share Price CAGR(indexed to 100)
Digital Offerings2012 – 21 Share Price CAGR(indexed to 100)

How Are Digital Businesses Different
Source: Motilal Oswal Wealth Creation Study
Attribute Physical Business Digital Business
Asset Ownership
Replication of offering
Delivery
Network effects
Winner-takes-all/most
Owns tangible assets
High friction: Requires time, physical and financial resources
Time and Money to reach end user
Nil
Due to geographical limitation, there may be many large players
Generates intangible assetsScalability of opportunity
Frictionless: Low marginal costs
Reaches end user at negligible additional costs
Addition of every new buyer(s), attracts more sellers to register on the market place, in turn, leading to more buyers
No limitation on reach, a single business can capture most of the market

Digital BusinessesSubstitutes And Complements
Digital Businesses are displacingsome traditional businesses
Digital Businesses are supportingsome traditional businesses
Growth of online food services in IndiaDegrowth of Traditional TV and Cinema as OTTs gain share
Source: Redseer (Estimated for 2025)Source: eMarketer (Estimated for 2024)
Segment CAGR % 2020-2024Cinema
Traditional TV andHome Video
Books
Music, radio and podcast
Video Games and Esports
OTT Video
Total growth/de-growth(in $ Billion)
CAGR
2016
2017
2018
2019
2020
2025
Covid Impact
+ 148%
-32%
+35%

Unlocking The Potential Of TechnologyDigital India
343
749
2016 2017 2018 2019 2020
Number of Smartphone users (in Million)
305
748
2016 2017 2018 2019 2020
Number of Internet users(in Million)
18
22,331
FY17 FY18 FY19 FY20 FY21
UPI as a % of total Retail Payments (Volume)
2758
13462
2016 2017 2018 2019 2020
Average data consumption per user per month(in MB)
Source: Statista, NPCI

Macro Drivers In PlacePushing Digital Adoption
268.97
226.8
75.57
19.35 11.78 11.17 10.93.24 4.86 13.63
49.29
91.25
117.89
141.11
0
20
40
60
80
100
120
140
160
0
50
100
150
200
250
300
Dat
a Us
age
Dat
a C
ost
Data Cost to Subscriber per GB (in Rs.) Data Usage per Data Subscriber in GB
Internet subscribers
225%(2014-2020)
Wireless Teledensity
24.06%(2014-2020)
Data Usage
4500%(2014-2020)
Data Tariffs
2400%(2014-2020)
Source: TRAI

DIGITAL INDIALOGISTICS
COMMERCE
HEALTHCARE
EDUCATION
E-COMMERCE
Q-COMMERCE
HEALTH TECH
FOOD TECH
FINTECH
ED TECH
FINANCE
DIGITAL ENABLERS
DIGITAL CHANGE AGENTS
IT SERVICES
CLOUD TRANSFORMATION
AUTOMATION
ROBOTICS
IOT

DIGITAL INDIA
DIGITAL ENABLERS
DIGITAL CHANGE AGENTS
Refer to slide 30 for entire portfolio of Nifty India Digital Index. Naukri.com and Jeevansathi.com are offerings of Info Edge

Digital disruptions across sectors
Fintech
Healthtech
Edtech
E-Commerce
Q-Commerce
Food Tech
• Post the pandemic, technology adoption has increased
• Going Digital is helping sectors optimize cost
and drive revenues
• The impact of Digitisation is resulting in transformation across sectors
Digital Change Agents
Note: The sector(s)/stock(s)/issuer(s) mentioned in this document do not constitute any research report/recommendation of the same. Tata Nifty India Digital Exchange Traded Fund will replicate/ track constituents of Nifty India Digital Index.

Indian E-commerce Is Booming
49
36
2112
6855.5 50.5
26
Access to Internet Smartphone Users Online ServicesUsers
Online Shoppers
Online Consumers(% of total population)
2020 2025P
Drivers for Growth:
• Large Young Population
• Increasing Urbanisation
• Digitisation Trends
• Access to Internet
• Online Shoppers
• Smartphone Users
E-Commerce Q-Commerce Food Tech Fintech Health Tech Edtech
Source: Redseer Estimates, Averages of range. Numbers for 2025 are estimated

Growth Of OnlineBeauty & Personal Care
Online BPC retail platforms are resolving
industry challenges with the help of
• Superior technology
• Efficient supply chain
• Quality control
• Wide selection of products and brands14 70 912
68
0
5
10
0
50
100
2016 2019 2020
India Online Beauty and Personal Care Market
Market Size (Rs Billion) % of overal Market
6
3017.5
0
20
40
India China US
Online Beauty and Personal Care Market
% of overal MarketSource: Redseer Estimates
E-Commerce Q-Commerce Food Tech Fintech Health Tech Edtech

Growth Of Fashion Segment Led By Younger Population
• Online shopper base in Tier 2+ cities
• Digital maturity of young consumers
• Strong emergence of digital-first brands
• Adoption of e-commerce by premium brands
• Convenience of online shopping
• Hassle-free returns
16 436 4504 8
12
0
5
10
15
0
200
400
600
2016 2019 2020
India Fashion Market
Market Size (Rs Billion) % of overal Market
8
37.5 32.5
0
20
40
India China US
Online Fashion Market
% of overal MarketSource: Redseer Estimates
The rapid growth is led by
E-Commerce Q-Commerce Food Tech Fintech Health Tech Edtech

Quick-CommerceBooming
Online Quick Commerce Market GMV and Forecast
• Micro-warehouses close to the
point of delivery
• Restrict stock to focussed high-
demand items
• Existing online commerce use
their established delivery
mechanisms
E-Commerce Q-Commerce Food Tech Fintech Health Tech Edtech
Source: Redseer Estimates
Quick Commerce CAGR % (2021-25E)
CY2020 CY2021
+133%
+105%
+92%
+80%~ 0.1 Bn ~ 0.3 Bn
~ 5.3 Bn
~ 1.5 Bn
~0.8 Bn
~3.1 BnConservative
Scenario
Base Case
Aggressive Case
CY2025E2.6% 6.7% 10 to 17.5%
X%
Quick commerce: Delivery of ordered products in less than an hour
Drivers:

Growth Of Food Segment
Growth will be driven by • Changing consumer
behaviour• Reduced dependence on
home-cooked food/kitchen set-up
• Increasing participation of women in the workforce
• Increasing consumer disposable income and
spending• Higher adoption among the
smaller cities
9
5036
0
20
40
60
India China US
Online Food Delivery/Access to Internet
1058 54
0
100
India China US
Comparison of India, US and China Markets
Restaurant Food/Food Consumption
E-Commerce Q-Commerce Food Tech Fintech Health Tech Edtech
Source: Redseer Estimates, 2019

Cloud Kitchen: a commercial kitchen for the purpose of preparing food for delivery or takeout only
Drivers:• Allow restaurants to deliver
straight to customers• Operate in a fraction of
traditional restaurant space• Analytics to understand
customer preferences and buying patterns
E-Commerce Q-Commerce Food Tech Fintech Health Tech Edtech
Emerging Cloud KitchenGMV : Share Of Online Food Delivery Market In India To GlobalThe market growth rate in India is 15% in comparison to global 9.01%
ORDER NOW
Numbers for 2022 and 2023 are estimated
86.1 97.4 108.2 117.9 126.3 132.6
6.27.7
9.210.5
11.6 12.5
0
20
40
60
80
100
120
140
160
2018 2019 2020 2021 2022 2023
Global ($Bn) India ($Bn)
Source: Cloud Kitchen India Market Opportunity Report 2019
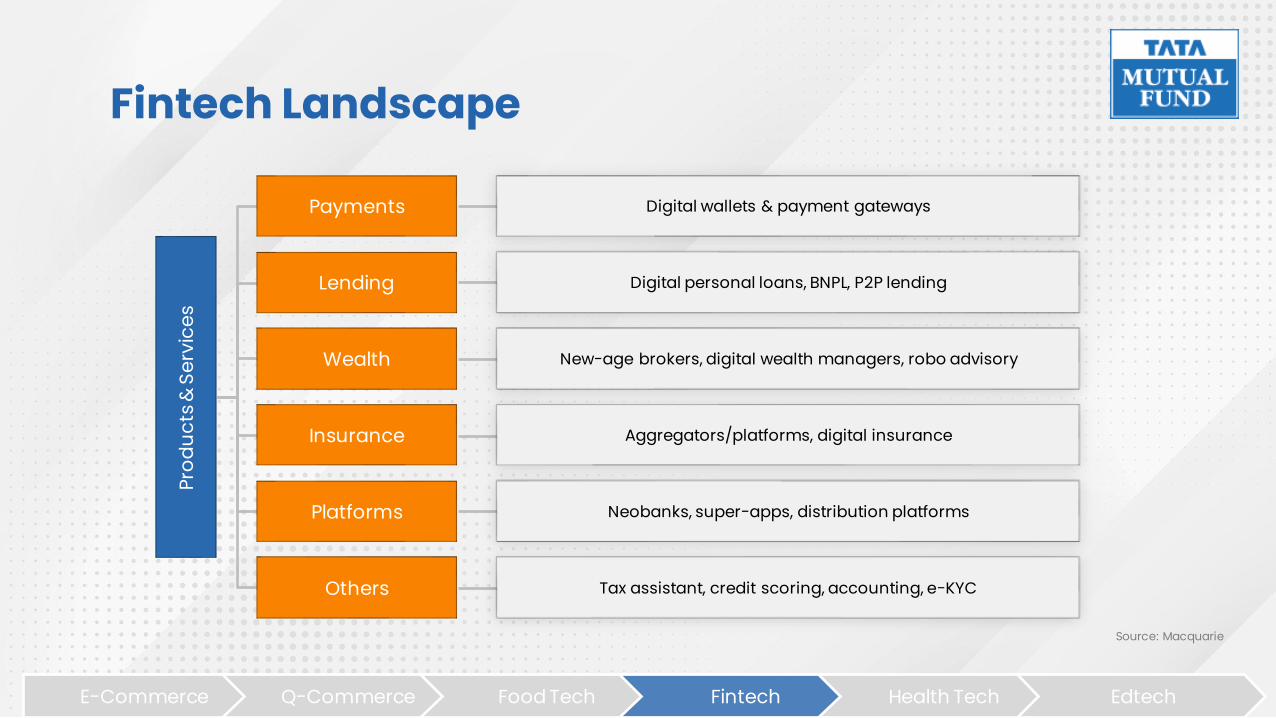
Fintech LandscapePr
oduc
ts &
Ser
vice
sPayments Digital wallets & payment gateways
Lending Digital personal loans, BNPL, P2P lending
Wealth New-age brokers, digital wealth managers, robo advisory
Insurance Aggregators/platforms, digital insurance
Platforms Neobanks, super-apps, distribution platforms
Others Tax assistant, credit scoring, accounting, e-KYC
E-Commerce Q-Commerce Food Tech Fintech Health Tech Edtech
Source: Macquarie

The Backbone Of Payments: UPI
UPI has shaken up the business case for standalone payments model
• Payments via UPI are instantaneous, hassle-free and completely free
• Digital wallets which charge Merchant Discount Rate for payments continue to lose relevance
• Many digital wallets now provide an option to pay for services via UPI
Share of UPI in retail payments has been continuously rising
0%
2%4%
6%8%
10%
12%
14%16%
2%6%
22%
36%
0%
10%
20%
30%
40%
50%
60%
70%
50%
59%
UPI as a % of total Retail Payments (Volume)
UPI as a % of total Retail Payments (Value, RHS)
FY17 FY18 FY19 FY20 FY21 FY22 till Jul’21Source: Macquarie
E-Commerce Q-Commerce Food Tech Fintech Health Tech Edtech

Fintech’s Monetising ‘Customer + Merchant’Ecosystems
Fintech payment platforms have built a large customer base
125 125 114
6039 24 24 12 7 6 2 2 1
Phon
ePe
Goo
gleP
ay
Payt
m
HDFC
Ban
k
ICIC
I Ban
k
Axis
Ban
k
BAF
- EM
I car
ds
SBIC
ARD
Sim
pl
Zest
Mon
ey
Kraz
ybee
Lazy
pay
Mob
ikw
ik Z
ip
No. of active customers (mn)
Payment Platforms as acquisition tools
Sizable consumer and merchant ecosystems
Ways to monetise• Digital Lending – Consumer lending / Buy Now
Pay Later, merchant lending, digital banking• Cross-selling other products - Super-apps
Fintech platforms have been successful in onboarding merchants at scale
21 20
7 5 5 1 0.10
5
10
15
20
25
Paytm PhonePe BharatPe Razorpay NormalPOS
Mswipe Pinelabs
Source: Macquarie
E-Commerce Q-Commerce Food Tech Fintech Health Tech Edtech

▪ Buying Behaviour ▪ Cash Flow ▪ Bill Payments ▪ Credit History ▪ Savings Patterns
Age Of Super Apps: Capturing Customer Life Cycles
Super-apps are helping Fintechs get access to:
E-Commerce Q-Commerce Food Tech Fintech Health Tech Edtech

Healthcare Segment The eHealth market saw increased
adoption with the onset of Covid
Online consultations, Medicine
Deliveries, Diagnostics helped
individuals seek treatment without
stepping out
The model further solves for-
• Low fill rates of unorganised
pharmacies
• Reduced the need to visit multiple
pharmacies
• Doctors are able to reach a wider
patient base
3289
0
50
100
2018 2020
India eHealthcare Market
Market Size (Rs Billion)
ePharma, 55
eOTC, 35
eDiagnostics, 4eConsultation,
6
India eHealth Market GMV Split
E-Commerce Q-Commerce Food Tech Fintech Health Tech Edtech
Source: Redseer Estimates

EdTech
E-Commerce Q-Commerce Food Tech Fintech Health Tech Edtech
The COVID-19 pandemic compelled parents and educational institutions to implement tech-enabled
learning solutions
EdTech is the most funded sector in the country
Drivers for the sector include:• Gamification
• Hybrid Models offline learning centres complement Online learning
• The National Education Policy 2020 emphasised
the importance of leveraging technology in
Education
Since 2020, India has seen four EdTech start-ups turn into unicorns and one into a decacorn
Source: IBEF
750 1048.3 1465.2 2047.92862.3
4000.7
2020 2021 2022 2023 2024 2025
Indian EdTech Industry (2020-2025) US $Mn
CAGR 39.77%
Indian EdTech Industry : By Category (2020)US $ 750 million 1
923
27
40Language and casual Learninig
Higher Education
Reskilling and online certifications
Test preparations
K-12
Source: IBEF. Numbers for 2022 to 2025 are estimated

What Doesn’t Change?
“I almost never get the question: ‘What’s not going to change in the next 10 years?’
And I submit to you that that second question is actually the more important of the two — because you can build a business strategy around the things that are stable in time … In our retail business, we know that customers want low prices, and I know that’s going to be true 10 years from now. They want fast delivery; they want vast selection.”
-Jeff Bezos

Digital India: Addressing The Stable Wants
Digital disruptions
across sectors
Fintech
Healthtech
EdtechE-Commerce
Q-Commerce
Food Tech
Cloud Kitchens
• Easier access to money• Variety of investment
options
• Access to multiple doctors and medicines
• Convenience
• Anytime-Anywhere learning• Advanced tech to improve
delivery methods
• Reducing cost
• Low Costs• Wide Variety
• Convenience
• Low Costs• Wide Variety• Convenience

growing & established
Digital Change AgentsRe-imagining Automation & New modes of Delivery
Blurring the definition of traditional sectors giving rise to hybrid segments
Digitalisation of the traditional businesses
IT Services/Cloud transformation/SaaS companies
Digital Enablers
DIGITAL INDIA
Investing In Digital India
Cloud Transformation
Automation
Robotics
IoT
EdTech
Health Tech
Food Tech
E-Commerce
Q-Commerce

The Rise Of New Age Digital Companies
The last two years have witnessed increasing spend on Digital Transformation
Companies across businesses, economic activities and various consumption chains are investing in/getting impacted by Digital Transformation
New age companies are re-imagining businesses or the modes of delivery of various goods and services.
These companies are benefiting from availability of risk capital
Due to the pandemic, they have also seen higher penetration and wider acceptance

Companies At The Forefront Of Transformation
The digitisation is still in the early stages. New Age Digital Companies are yet to achieve important milestones
Achieve Scale
Raise Capital
Get listedSuch companies may
increasingly become more prominent to the Economy
and Equity Markets
Play a Greater Role
Growing sales, reducing costs and maintaining customer satisfaction
Companies may go through multiple rounds of raising
capital as they seek to become profitable
The forerunners may look to raise more capital by getting
listed on the Equity Market
Investors can take exposure to companies which are in the forefront of this process through Tata Nifty India Digital Exchange Traded Fund

Digital Universe
• Transforming the traditional businesses by automation
• Re-imagining modes of delivery
• Set to grow strongly over the coming years
• Emergence of new hybrid segments like consumer tech, fintech, edtech, etc.
The Indian IT services companies which are ahead in digital and cloud capabilities are enabling:
• Digitalisation of the traditional businesses
• Helping fuel the growth of start-ups through technology solutions
Companies which are in the automation/robotics/IoT space
Digital change agents
Digital Enablers

Based On Nifty India Digital Index
Universe
Stock Selection
Use of AI & MLCapping
With NSE 500 as the universe, Basic industries are defined to cover companies which are focused on digital technology. Eg E-commerce, Digital Entertainment etc
The index selects top 30 companies based on market cap which below to pre defined set of basic industries
The index may use Artificial Intelligence (AI)/Machine Learning (ML) driven tools to identify companies focused on digital technology
Weight of index constituents are capped at the levels below on a quarterly basis:• Sector weights are capped at 50%• Stock weights are capped at 7.50%
Rebalancing & IPOs
• The index rebalances quarterly. • Reconstitution is done semi
annually• IPO inclusion is considered based
post a listing period of 1-3 months

Nifty India Digital IndexConstituents of Nifty India Digital Index as on 11th February 2022
SECURITY NAME WEIGHTAGE
Bharti Airtel Ltd. 8.76
Tata Consultancy Services Ltd. 8.31
Indian Railway Catering And Tourism Corporation Ltd. 8.02
Infosys Ltd. 7.60
Tata Communications Ltd. 7.58
HCL Technologies Ltd. 7.55
Info Edge (India) Ltd. 7.01
Tech Mahindra Ltd. 6.58
Honeywell Automation India Ltd. 5.57
Wipro Ltd. 5.43
Vodafone Idea Ltd. 5.03
Indiamart Intermesh Ltd. 4.46
Sterlite Technologies Ltd. 2.22
Justdial Ltd. 1.97
Larsen & Toubro Infotech Ltd. 1.79
Tata Elxsi Ltd. 1.65
Mindtree Ltd. 1.62
Mphasis Ltd. 1.62
Persistent Systems Ltd. 1.36
Coforge Ltd. 0.88
L&t Technology Services Ltd. 0.80
Tanla Platforms Ltd. 0.76
Oracle Financial Services Software Ltd. 0.56
Birlasoft Ltd. 0.49
Cyient Ltd. 0.48
Happiest Minds Technologies Ltd. 0.44
Affle (India) Ltd. 0.43
Intellect Design Arena Ltd. 0.38
Sonata Software Ltd. 0.37
Firstsource Solutions Ltd. 0.29

Large and Mega IT Services
Companies
Emerging Technologies and Services Companies
New Age Digital Change
Agents: Emerging
Technologies and Services Companies
Core Portfolio
Satellite Portfolio
How Is Tata Nifty India Digital Exchange Traded Fund Different?
Tata Nifty India Digital Exchange Traded Fund
Digital Enablers:Large and
Mega IT Services
Companies
Tata Digital India Fund(An open ended equity scheme investing in
Information Technology Sector)

Fund DetailsScheme Name TATA NIFTY INDIA DIGITAL EXCHANGE TRADED FUND
NFO Date 14th March 2022 to 25th March 2022
Investment Objective
The investment objective of the scheme is to provide returns that corresponds to the total returns of the securities as represented by the Nifty India Digital Index, subject to tracking error.However, there is no assurance or guarantee that the investment objective of the Scheme will be achieved.
Type Of Scheme An Open-Ended Exchange Traded Fund replicating / tracking Nifty India Digital Index
Fund Manager Meeta Shetty
Benchmark Nifty India Digital Index (TRI)
Min. Investment Amount (During NFO) Rs. 5,000/- and in multiple of Re.1/- thereafter
NFO Unit Price On Allotment, value of each unit will be approximately 1/100th of underlying index
Load Structure Entry Load: N.A. Exit Load: NIL

Toll Free Number : 022-62827777 | SMS: TMF to 57575 | www.tatamutualfund.com
Mutual Fund Investments are subject to market risks, read all scheme related documents carefully
This product is suitable for investors who are seeking*:
• Long Term Capital Growth.
• An exchange traded fund that aims to provide returns that correspond to the returns provided by Nifty India Digital Index, subject to tracking error.
*Investors should consult their financial advisors if in doubt about whether the product is suitable for them
33
(Mon to Sat 9:00 am to 5:30 pm)
Fund Benchmark
TATA NIFTY INDIA DIGITAL EXCHANGE TRADED FUND

TATA DIGITAL INDIA FUND
This product is suitable for investors who are seeking*:
• Long Term Capital Appreciation
• Investment in equity/equity related instruments of companies in the Information Technology Sector
*Investors should consult their financial advisors if in doubt about whether the product is suitable for them
Fund Benchmark
Toll Free Number : 022-62827777 | SMS: TMF to 57575 | www.tatamutualfund.com
Mutual Fund Investments are subject to market risks, read all scheme related documents carefully
(Mon to Sat 9:00 am to 5:30 pm)