Statement of Additional Information (SAI) - Invesco Mutual Fund
Upload
khangminh22Category
view
3download
0
Systematic Investment Plan (SIP)

Markets are down, should I stop or alter my SIP?
Pandemic have created job
losses
Will I have enough to save for retirement
Investments in stock market are fetching negative returns
Its going to get worseWhat
should I do?
2

This is not the 1st time markets have faced such volatility
Source: Invesco Asset Management (India)Disclaimer: The volatile periods mentioned above are used for illustration purpose only. There may be other volatile periods also, which may not be covered in above graph.
1992 HarshadMehta Scam
2001 Dot com bubble
2008 Global financial crisis
2016 Demonetisation
2020 Pandemic
Volatility in stock market
3

-72.53%
-23.24%-27.65%
-5.86%-2.66%
1.07%
20-Nov-08 31-May-20
XIR
R (%
)
1 Year 3 Year 5 Years
Rs. 10,000 is invested in S&P BSE Sensex Index on the last business day of every month
Lets us evaluate how SIP investments fared at the time of crisisAs per the below data the stress in short term was much deeper during the global financial crisis…
4
Past performance may or may not be sustained in future. Source: BSE India. For SIP calculated as at 20 November 2008; time period includes - 1 year period is from: December 2007 to November 2008, 3 years: December 2005 to November 2008, 5 years: December 2003 to November 2008. For SIP calculated as at 29 May 2020; time period includes - 1 year period is from: June 2019 to May 2020, 3 years: June 2017 to May 2020, 5 years: June 2015 to May 2020. Note: XIRR method is used to calculate SIP returns. The above investment simulation is for illustrative purpose only and should not be construed as a promise on minimum returns and safeguard of capital. Invesco Asset Management (India) Private Limited/Invesco Mutual Fund is not guaranteeing or promising or forecasting any returns. SIP does not ensure a profit or guarantee protection against a loss in a declining market. Please refer SIP Enrolment Form or contact nearest ISC for Load Structure. Please refer last slide for disclaimer and risk factors. We have showcased November 2008 SIP performance given the lowest point of Global financial crisis.
…but remember markets do react to events and gradually recover as things improve
Dec 07 to Nov 08SIP Period Dec 05 to Nov 08 Dec 03 to Nov 08 June 19 to May 20 June 17 to May 20 June 15 to May 20

So what if you had continued with your SIP throughout the global financial crisis (January 2008 to December 2012)
Past performance may or may not be sustained in future. Source: BSE India. Data as at 29 May 2020. Rs. 10,000 is invested in S&P BSE Sensex Index on the first business day of every month. For detail analysis refer to slide on annexure. Note: The above investment simulation is for illustrative purpose only and should not be construed as a promise on minimum returns and safeguard of capital. Invesco Asset Management (India) Private Limited/Invesco Mutual Fund is not guaranteeing or promising or forecasting any returns. SIP does not ensure a profit or guarantee protection against a loss in a declining market. Please refer SIP Enrolment Form or contact nearest ISC for Load Structure. Please refer last slide for disclaimer and risk factors. We have showcased November 2008 SIP performance given the lowest point of Global financial crisis. The effect of global financial crisis in India was seen from the month of January 2008.
Lesson Learnt – Continuing your SIP is beneficial
Consider if you would have started SIP of Rs. 10,000 in S&P BSE Sensex since December 2004 and now are in midst of the crisis period
You have the following Options
1. Stop SIP and withdraw full amount – SIP gains will be of Rs. 2.80 lakhs as at January 2008 end. (total investment amount – Rs. 3.80 lakhs)
2. Stop SIP but remain invested – SIP gains will be of Rs. 8.33 lakhs as at May 2020 end (total investment amount – Rs. 3.80 lakhs)
3. Continue the Monthly SIP - SIP gains would be of Rs. 16.10 lakhsas at May 2020 end (total investment amount – Rs. 18.60 lakhs)
5

108.28%
47.68%
3.99% 4.93%
-55.25%
-1.62%
21.10% 18.03%
-80%
-60%
-40%
-20%
0%
20%
40%
60%
80%
100%
120%
1 Year 5 Year 10 Year 15 Year
Ret
urns
Rolling Periods – Daily basis
Maximum
Minimum
…so, longer your investment horizon, better will be your potential returns
6
Past performance may or may not be sustained in futureData as on 29 May, 2020. Source: MFIE. The rolling returns (as represented by S&P BSE Sensex) are calculated on daily basis for various time frame. Returns greater than 1 year are compounded annualized. The above simulation is for illustration purpose only and should not be construed as a promise on minimum returns and safeguard of capital. The AMC/Mutual Fund is not guaranteeing or forecasting any returns. Data Period (May 31, 2005– May 29, 2020).
15 year average returns on daily basis: 12.85%
Sensex rolling returns on daily basis for various time periodPeriod: May 31, 2005 – May 29, 2020
Downside probability diminishes as time period of your investment increases

The percentage of time, the S&P BSE Sensex posted a positive return over different rolling time periods
And infact downside risk diminishes over time …
7
Past performance may or may not be sustained in future. Rolling returns calculated on a daily basis from 31.05.05 to 29.05.20.Source: Invesco Mutual Fund.Disclaimer: The above graphs is for illustrative purpose only and should not be construed as a promise on minimum returns, investment advice and safeguard of capital. It does not in any manner imply or suggest the performance of any Invesco Mutual Fund Scheme(s). Invesco Asset Management (India) Private Limited/Invesco Mutual Fund is not guaranteeing or promising or forecasting any returns.
The probability of generating positive rate of return is higher when invested for a longer period
1 Year Period 3 Year Period 5 Year Period 10 Year Period 15 Year Period
Positive Returns Negative Returns
79%
21%
96%
4%
98%
2%
100% 100%

1,666
2,672.19
551
0
500
1,000
1,500
2,000
2,500
3,000
1991
1992
1993
1994
1995
1996
1997
1998
1999
2000
2001
2002
2003
2004
2005
2006
2007
2008
2009
2010
2011
2012
2013
2014
2015
2016
2017
2018
2019
(Rs.
in T
hous
ands
)
Equities-Worst Day (investing when the markets were highest each year)Equities-Best Day (investing when the markets were lowest each year)Cash at Bank
Recurring investment of Rs. 10,000 at different times in the market each year
We re-emphasize - Any Time is a Good Time to Start Investing …
8
Source: Invesco Mutual Fund.Equity investment is represented by the value of Nifty 50 from 1991 onwards, and does not account for any fees or expenses. Cash investments are assumed to be growing at a constant rate of 4% p.a. R.H.S. – Market value as on 31st December 2019.Disclaimer: The illustration above is merely indicative in nature and should not be construed as investment advice. It does not in any manner imply or suggest the performance of any Invesco Mutual Fund Scheme(s).
It’s not when, but if you invest that counts more
Waiting for the right moment to enter the markets can lead to missed opportunities
The penalty of not investing at all is far greater than getting the market timing wrong
Even investing in worst market conditions can help us grow our wealth
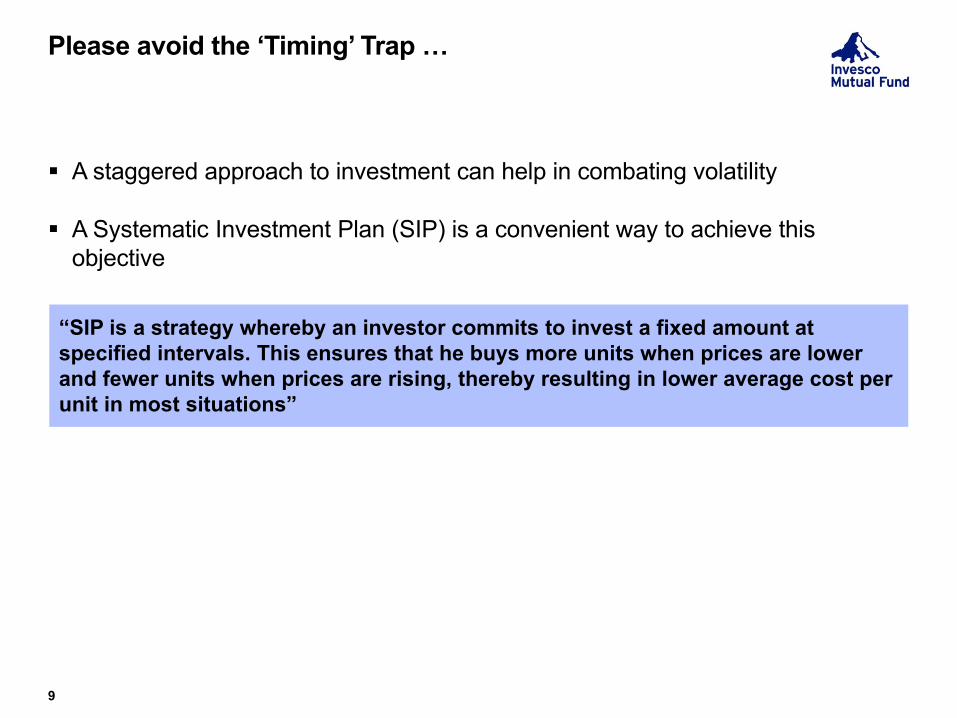
Please avoid the ‘Timing’ Trap …
A staggered approach to investment can help in combating volatility
A Systematic Investment Plan (SIP) is a convenient way to achieve this objective
9
“SIP is a strategy whereby an investor commits to invest a fixed amount at specified intervals. This ensures that he buys more units when prices are lower and fewer units when prices are rising, thereby resulting in lower average cost per unit in most situations”

Why SIP helps?
Works on the principle of rupee cost averaging
Investing at pre-defined intervals inculcates discipline
Works well in volatile market conditions
Allows you to buy more unit when markets are down, buys less units when markets are rising
Results in a lower average cost per unit in most situations
It is easy on the wallet too, as we don’t have to commit large sums of money at one go
10

Systematic investing ensures that the average cost of acquisition is lower in most situations
11
Note: NAVs as on the first business day of each month.
Disclaimer: The above investment simulation is for illustration purpose only and should not be construed as investment advice. It does not in any manner imply or suggest performance of any Invesco Mutual Fund Scheme(s). Rupee cost averaging neither ensures profit nor protects you from making a loss in declining markets. Please read disclaimer on last slide.
Investing Rs. 1,000 per month into a scheme that had a NAV of Rs. 10, at the time of initial investment
MonthAmount Invested
Rising Markets Falling Market Volatile Market
NAVUnits
Allotted NAVUnits
Allotted NAVUnits
Allotted
1 1,000 10 100 10 100 10 100
2 1,000 12 83.33 8 125 12 83.33
3 1,000 14 71.43 6 166.67 8 125
4 1,000 16 62.5 4 250 10 100
Total 4,000 317.26 641.67 408.33
Average cost per unit (Rs.)
12.61 6.23 9.8
MonthAmount Invested
Lumpsum Investment
NAVUnits
Allotted
1 4,000 10 400
2 –
3 –
4 –
Total 4,000
Average cost per unit (Rs.)
10
SIP investment in different market conditions Lumpsum investment

…plus it allows time and compounding work for you
12
Disclaimer: The above investment simulation is for illustration purpose only and should not be construed as investment advice. It does not in any manner imply or suggest performance of any Invesco Mutual Fund Scheme(s). The rate of interest assumed in the above slide is for illustration purpose only and actual rate of interest could be higher or lower. Please read disclaimer on last slide.
A deficit of Rs. 10 lacs in the total savings basket for Mr. A – due to starting late at an age of 35 vis-à-vis Mr. B – has made a difference of Rs. 1.07 crores in the retirement basket.
Mr. A
Starting age of investment 35 years
Annual savings Rs. 1 lac
Rate of interest 8% p.a
Total cumulative investment Rs. 25 lacs1
Investment value at age 60 Rs. 78.9 lacs2
Start Early!!
Mr. B
Starting age of investment 25 years
Annual savings Rs. 1 lac
Rate of interest 8% p.a
Total cumulative investment Rs. 35 lacs1
Investment value at age 60 Rs. 1.86 crores2
1 At the age of 602 Based on 8% p.a compounded annually
… (CONTINUED)
13
Disclaimer: The above investment simulation is for illustration purpose only and should not be construed as investment advice. It does not in any manner imply or suggest performance of any Invesco Mutual Fund Scheme(s). The rate of interest assumed in the above slide is for illustration purpose only and actual rate of interest could be higher or lower. Please read disclaimer on last slide.
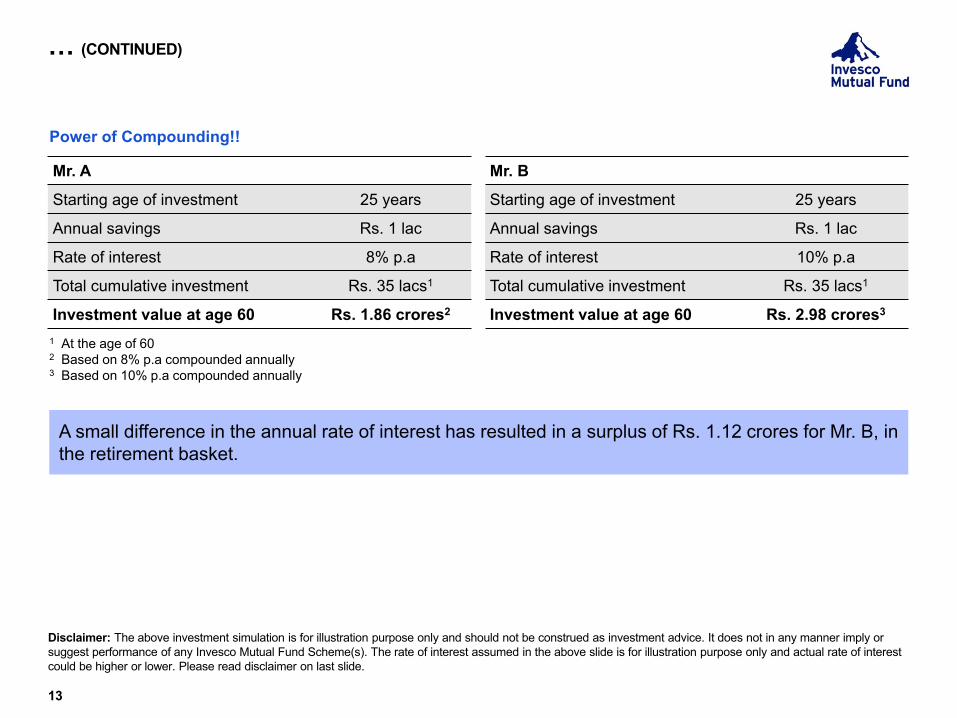
A small difference in the annual rate of interest has resulted in a surplus of Rs. 1.12 crores for Mr. B, in the retirement basket.
Mr. A
Starting age of investment 25 years
Annual savings Rs. 1 lac
Rate of interest 8% p.a
Total cumulative investment Rs. 35 lacs1
Investment value at age 60 Rs. 1.86 crores2
Power of Compounding!!
Mr. B
Starting age of investment 25 years
Annual savings Rs. 1 lac
Rate of interest 10% p.a
Total cumulative investment Rs. 35 lacs1
Investment value at age 60 Rs. 2.98 crores3
1 At the age of 602 Based on 8% p.a compounded annually3 Based on 10% p.a compounded annually

Some smart tips for you to choose
Invest in Instruments that tend to beat Inflation & suit your risk appetite
Adopt a disciplined & long term approach – Invest regularly and systematically
Start investing as early as possible
Allow your money to grow – stay invested & do not get distracted with market fluctuations
14

SIP in Select Equity Schemes of Invesco Mutual Fund

Invesco India Tax Plan(An open ended equity linked saving scheme with a statutory lock in of 3 years and tax benefit)
16
Note: XIRR method is used to calculate SIP returns. The above investment simulation is for illustrative purpose only and should not be construed as a promise on minimum returns and safeguard of capital. Invesco Asset Management (India) Private Limited/Invesco Mutual Fund is not guaranteeing or promising or forecasting any returns. SIP does not ensure a profit or guarantee protection against a loss in a declining market. Please refer SIP Enrolment Form or contact nearest ISC for Load Structure. Please refer last slide for disclaimer and risk factors.
SIP Analysis as on 29th May, 2020 (Rs. 10,000 invested on the first business day of every month)
SIP investmentTotal amount
invested (Rs.)
Scheme S&P BSE 200 TRI1 Nifty 50 TRI2
Market value (Rs.)SIP returns (%)
XIRR Market value (Rs.) SIP returns (%) XIRR Market value (Rs.)SIP returns (%)
XIRR
1 Year 120,000 108,381 -17.66% 105,863 -21.34% 105,176 -22.34%
3 Years 360,000 331,373 -5.33% 322,888 -6.97% 327,748 -6.03%
5 Years 600,000 625,893 1.67% 612,467 0.81% 620,547 1.33%
7 years 840,000 1,060,302 6.56% 984,978 4.49% 975,953 4.23%
10 years 1,200,000 1,976,768 9.65% 1,714,775 6.95% 1,677,504 6.53%
Since Inception 1,610,000 3,630,372 11.38% 2,841,179 8.07% 2,744,758 7.59%
Past performance may or may not be sustained in future. The performance details provided herein are of existing plan (non - direct plan) – Growth Option. Different plans have different expense structure. Load is not taken into consideration. Please refer relative performance table for non SIP returns. Inception date: 29th December 2006. Fund Managers : Mr. Dhimant Kothari managing since 29 March, 2018. Please refer to respective fund slide, for the fund performance of the other schemes managed by Dhimant Kothari. Benchmark Returns are calculated using Total Return variant of respective Benchmark Index. 1Scheme Benchmark. 2Additional Benchmark.
LOW HIGH
Investors understand that their principal will be at moderately high risk
RISKOMETERSuitable for investors who are seeking*: Capital appreciation over long-term Investment predominantly in equity and equity-related instruments
* Investors should consult their financial advisers if in doubt about whether the product is suitable for them.

Invesco India Growth Opportunities Fund(Large & Mid Cap Fund - An open ended equity scheme investing in both large cap and mid cap stocks)
17
Note: XIRR method is used to calculate SIP returns. The above investment simulation is for illustrative purpose only and should not be construed as a promise on minimum returns and safeguard of capital. Invesco Asset Management (India) Private Limited/Invesco Mutual Fund is not guaranteeing or promising or forecasting any returns. SIP does not ensure a profit or guarantee protection against a loss in a declining market. Please refer SIP Enrolment Form or contact nearest ISC for Load Structure. Please refer last slide for disclaimer and risk factors.
SIP Analysis as on 29th May 2020 (Rs. 10,000 invested on the first business day of every month)
SIP investmentTotal amount
invested (Rs.)
Scheme S&P BSE 250 Large Midcap 65:35 TRI1 Nifty 50 TRI2
Market value (Rs.)SIP returns (%)
XIRR Market value (Rs.) SIP returns (%) XIRR Market value (Rs.)SIP returns (%)
XIRR
1 Year 120,000 106,118 -20.97% 106,169 -20.90% 105,176 -22.34%
3 Years 360,000 326,662 -6.24% 316,959 -8.13% 327,748 -6.03%
5 Years 600,000 625,281 1.63% 601,913 0.13% 620,547 1.33%
7 Years 840,000 1,036,477 5.92% 991,543 4.68% 975,953 4.23%
10 Years 1,200,000 1,876,469 8.66% 1,750,276 7.34% 1,677,504 6.53%
Since Inception 1,540,000 2,951,437 9.63% 2,727,418 8.50% 2,550,729 7.53%
Past performance may or may not be sustained in future. The performance details provided herein are of existing plan (non - direct plan) – Growth Option. Different plans have different expense structure. Load is not taken into consideration. Please refer relative performance table for non SIP returns.Inception date: 9th August 2007. Fund Managers : Mr. Taher Badshah managing since 13 January, 2017 & Mr. Pranav Gokhale managing since 19 May, 2020. Please refer to respective fund slide, for the fund performance of the other scheme managed by Taher Badshah & Pranav Gokhale. Benchmark Returns are calculated using Total Return variant of respective Benchmark Index. 1Scheme Benchmark. 2Additional Benchmark.
LOW HIGH
Investors understand that their principal will be at moderately high risk
RISKOMETERSuitable for investors who are seeking*: Capital appreciation over long-term Investments predominantly in equity and equity-related instruments
of large and mid cap companies
* Investors should consult their financial advisers if in doubt about whether the product is suitable for them.

Invesco India Contra Fund(An open ended equity scheme following contrarian investment strategy)
18
Note: XIRR method is used to calculate SIP returns. The above investment simulation is for illustrative purpose only and should not be construed as a promise on minimum returns and safeguard of capital. Invesco Asset Management (India) Private Limited/Invesco Mutual Fund is not guaranteeing or promising or forecasting any returns. SIP does not ensure a profit or guarantee protection against a loss in a declining market. Please refer SIP Enrolment Form or contact nearest ISC for Load Structure. Please refer last slide for disclaimer and risk factors.
SIP Analysis as on 29th May 2020 (Rs. 10,000 invested on the first business day of every month)
SIP investmentTotal amount
invested (Rs.)
Scheme S&P BSE 500 TRI1 Nifty 50 TRI2
Market value (Rs.)SIP returns (%)
XIRR Market value (Rs.) SIP returns (%) XIRR Market value (Rs.)SIP returns (%)
XIRR
1 Year 120,000 109,922 -15.38% 105,250 -22.23% 105,176 -22.34%
3 Years 360,000 331,176 -5.37% 316,342 -8.25% 327,748 -6.03%
5 Years 600,000 640,902 2.61% 599,360 -0.04% 620,547 1.33%
7 Years 840,000 1,119,017 8.08% 967,630 3.99% 975,953 4.23%
10 Years 1,200,000 2,072,613 10.55% 1,681,525 6.57% 1,677,504 6.53%
Since Inception 1,580,000 3,577,244 11.67% 2,691,820 7.73% 2,658,678 7.56%
Past performance may or may not be sustained in future. The performance details provided herein are of existing plan (non - direct plan) – Growth Option. Different plans have different expense structure. Load is not taken into consideration. Please refer relative performance table for non SIP returns.Inception date: 11th April 2007. Fund Managers : Mr. Taher Badshah managing since 13 January, 2017 & Mr. Dhimant Kothari managing since 19 May, 2020. Please refer to respective fund slide, for the fund performance of the other scheme managed by Taher Badshah & Dhimant Kothari. Benchmark Returns are calculated using Total Return variant of respective Benchmark Index. 1Scheme Benchmark. 2Additional Benchmark.
LOW HIGH
Investors understand that their principal will be at moderately high risk
RISKOMETERSuitable for investors who are seeking*: Capital appreciation over long-term Investments predominantly in equity and equity related instruments
through contrarian investing.
* Investors should consult their financial advisers if in doubt about whether the product is suitable for them.

Invesco India Multicap Fund(Multi Cap Fund - An open ended equity scheme investing across large cap, mid cap, small cap stocks)
19
Note: XIRR method is used to calculate SIP returns. The above investment simulation is for illustrative purpose only and should not be construed as a promise on minimum returns and safeguard of capital. Invesco Asset Management (India) Private Limited/Invesco Mutual Fund is not guaranteeing or promising or forecasting any returns. SIP does not ensure a profit or guarantee protection against a loss in a declining market. Please refer SIP Enrolment Form or contact nearest ISC for Load Structure. Please refer last slide for disclaimer and risk factors.
SIP Analysis as on 29th May 2020 (Rs. 10,000 invested on the first business day of every month)
SIP investmentTotal amount
invested (Rs.)
Scheme S&P BSE AllCap TRI1 Nifty 50 TRI2
Market value (Rs.)SIP returns (%)
XIRR Market value (Rs.) SIP returns (%) XIRR Market value (Rs.)SIP returns (%)
XIRR
1 Year 120,000 107,969 -18.27% 105,067 -22.49% 105,176 -22.34%
3 Years 360,000 312,014 -9.11% 313,108 -8.89% 327,748 -6.03%
5 Years 600,000 576,950 -1.54% 591,728 -0.55% 620,547 1.33%
7 Years 840,000 1,004,260 5.04% 955,656 3.64% 975,953 4.23%
Since Inception – – – – – – –
Returns for other periods not available as the Scheme was close-ended and re-opened for purchase on 18 March 2011, first SIP installment is taken as 1 April 2011. Past performance may or may not be sustained in future. The performance details provided herein are of existing plan (non - direct plan) – Growth Option. Different plans have different expense structure. Load is not taken into consideration. Please refer relative performance table for non SIP returns. Inception date: 17th March 2008. Fund Managers : Mr. Taher Badshah & Mr. Pranav Gokhale managing since 29 March, 2018. Please refer to respective fund slide and slide on ‘SIP Performance of other schemes managed’, for the fund performance of the other scheme managed by Taher Badshah & Pranav Gokhale . Benchmark Returns are calculated using Total Return variant of respective Benchmark Index. 1Scheme Benchmark. 2Additional Benchmark.
LOW HIGH
Investors understand that their principal will be at moderately high risk
RISKOMETERSuitable for investors who are seeking*: Capital appreciation over long-term Investments in equity and equity related instruments across market
capitalization
* Investors should consult their financial advisers if in doubt about whether the product is suitable for them.
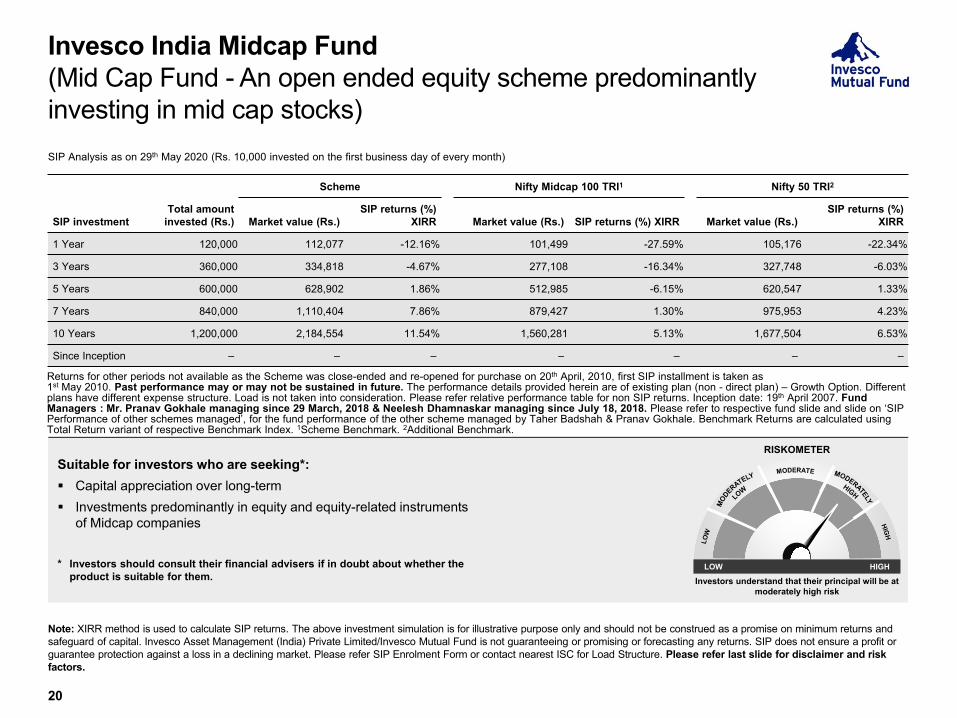
Invesco India Midcap Fund(Mid Cap Fund - An open ended equity scheme predominantly investing in mid cap stocks)
20
Note: XIRR method is used to calculate SIP returns. The above investment simulation is for illustrative purpose only and should not be construed as a promise on minimum returns and safeguard of capital. Invesco Asset Management (India) Private Limited/Invesco Mutual Fund is not guaranteeing or promising or forecasting any returns. SIP does not ensure a profit or guarantee protection against a loss in a declining market. Please refer SIP Enrolment Form or contact nearest ISC for Load Structure. Please refer last slide for disclaimer and risk factors.
SIP Analysis as on 29th May 2020 (Rs. 10,000 invested on the first business day of every month)
SIP investmentTotal amount
invested (Rs.)
Scheme Nifty Midcap 100 TRI1 Nifty 50 TRI2
Market value (Rs.)SIP returns (%)
XIRR Market value (Rs.) SIP returns (%) XIRR Market value (Rs.)SIP returns (%)
XIRR
1 Year 120,000 112,077 -12.16% 101,499 -27.59% 105,176 -22.34%
3 Years 360,000 334,818 -4.67% 277,108 -16.34% 327,748 -6.03%
5 Years 600,000 628,902 1.86% 512,985 -6.15% 620,547 1.33%
7 Years 840,000 1,110,404 7.86% 879,427 1.30% 975,953 4.23%
10 Years 1,200,000 2,184,554 11.54% 1,560,281 5.13% 1,677,504 6.53%
Since Inception – – – – – – –
Returns for other periods not available as the Scheme was close-ended and re-opened for purchase on 20th April, 2010, first SIP installment is taken as 1st May 2010. Past performance may or may not be sustained in future. The performance details provided herein are of existing plan (non - direct plan) – Growth Option. Different plans have different expense structure. Load is not taken into consideration. Please refer relative performance table for non SIP returns. Inception date: 19th April 2007. Fund Managers : Mr. Pranav Gokhale managing since 29 March, 2018 & Neelesh Dhamnaskar managing since July 18, 2018. Please refer to respective fund slide and slide on ‘SIP Performance of other schemes managed’, for the fund performance of the other scheme managed by Taher Badshah & Pranav Gokhale. Benchmark Returns are calculated using Total Return variant of respective Benchmark Index. 1Scheme Benchmark. 2Additional Benchmark.
LOW HIGH
Investors understand that their principal will be at moderately high risk
RISKOMETERSuitable for investors who are seeking*: Capital appreciation over long-term Investments predominantly in equity and equity-related instruments
of Midcap companies
* Investors should consult their financial advisers if in doubt about whether the product is suitable for them.

Invesco India Smallcap Fund(Small Cap Fund – An open-ended equity scheme predominantly investing in small cap stocks)
21
Note: XIRR method is used to calculate SIP returns. The above investment simulation is for illustrative purpose only and should not be construed as a promise on minimum returns and safeguard of capital. Invesco Asset Management (India) Private Limited/Invesco Mutual Fund is not guaranteeing or promising or forecasting any returns. SIP does not ensure a profit or guarantee protection against a loss in a declining market. Please refer SIP Enrolment Form or contact nearest ISC for Load Structure. Please refer last slide for disclaimer and risk factors.
SIP Analysis as on 29th May 2020 (Rs. 10,000 invested on the first business day of every month)
SIP investmentTotal amount invested (Rs.)
Scheme S&P BSE 250 Smallcap TRI1 Nifty 50 TRI2
Market value (Rs.)SIP returns (%)
XIRR Market value (Rs.) SIP returns (%) XIRR Market value (Rs.)SIP returns (%)
XIRR
1 Year 120,000 106,761 -20.03% 95,001 -36.57% 105,176 -22.34%
Since Inception 190,000 168,309 -13.91% 143,245 -30.15% 167,158 -14.66%
Past performance may or may not be sustained in future. The performance details provided herein are of existing plan (non - direct plan) – Growth Option. Different plans have different expense structure. Load is not taken into consideration. Please refer relative performance table for non SIP returns. The scheme has been in existence for less than 3 years.Inception date: 30th October 2018. Fund Managers: Taher Badshah managing since October 30, 2018 and Pranav Gokhale managing since March 01, 2019. Please refer to respective fund slide, for the fund performance of the other scheme managed by Taher Badshah and Pranav Gokhale. Benchmark Returns are calculated using Total Return variant of respective Benchmark Index. 1Scheme Benchmark. 2Additional Benchmark.
LOW HIGH
Investors understand that their principal will be at moderately high risk
RISKOMETERSuitable for investors who are seeking*: Capital appreciation over long term Investments predominantly in equity & equity related instruments of
smallcap companies
* Investors should consult their financial advisers if in doubt about whether the product is suitable for them.

Invesco India Infrastructure Fund(An open ended equity scheme following Infrastructure theme)
22
Note: XIRR method is used to calculate SIP returns. The above investment simulation is for illustrative purpose only and should not be construed as a promise on minimum returns and safeguard of capital. Invesco Asset Management (India) Private Limited/Invesco Mutual Fund is not guaranteeing or promising or forecasting any returns. SIP does not ensure a profit or guarantee protection against a loss in a declining market. Please refer SIP Enrolment Form or contact nearest ISC for Load Structure. Please refer last slide for disclaimer and risk factors.
SIP Analysis as on 29th May 2020 (Rs. 10,000 invested on the first business day of every month)
SIP investmentTotal amount
invested (Rs.)
Scheme S&P BSE India Infrastructure TRI1 Nifty 50 TRI2
Market value (Rs.)SIP returns (%)
XIRR Market value (Rs.) SIP returns (%) XIRR Market value (Rs.)SIP returns (%)
XIRR
1 Year 120,000 111,444 -13.11% 95,527 -35.85% 105,176 -22.34%
3 Years 360,000 329,255 -5.74% 248,259 -22.79% 327,748 -6.03%
5 Years 600,000 605,158 0.34% 444,466 -11.73% 620,547 1.33%
7 Years 840,000 1,016,822 5.39% 681,769 -5.94% 975,953 4.23%
Since Inception – – – – – – –
Returns for other periods not available as the Scheme was close-ended and re-opened for purchase on 23rd November 2010, first SIP installment is taken as 1st December 2010. Past performance may or may not be sustained in future. The performance details provided herein are of existing plan (non - direct plan) – Growth Option. Different plans have different expense structure. Load is not taken into consideration. Please refer relative performance table for non SIP returns. Inception date: 21st November 2007. Fund Manager: Mr. Pranav Gokhale managing since 14 August, 2012 & Neelesh Dhamnaskar managing since June 01, 2018. Please refer to respective fund slide and slide on ‘SIP Performance of other schemes managed’, for the fund performance of the other scheme managed by Pranav Gokhale & Neelesh Dhamnaskar. Benchmark Returns are calculated using Total Return variant of respective Benchmark Index. 1Scheme Benchmark. 2Additional Benchmark.
LOW HIGH
Investors understand that their principal will be at high risk
RISKOMETERSuitable for investors who are seeking*: Capital appreciation over long-term Investments predominantly in equity and equity-related instruments
of infrastructure companies
* Investors should consult their financial advisers if in doubt about whether the product is suitable for them.
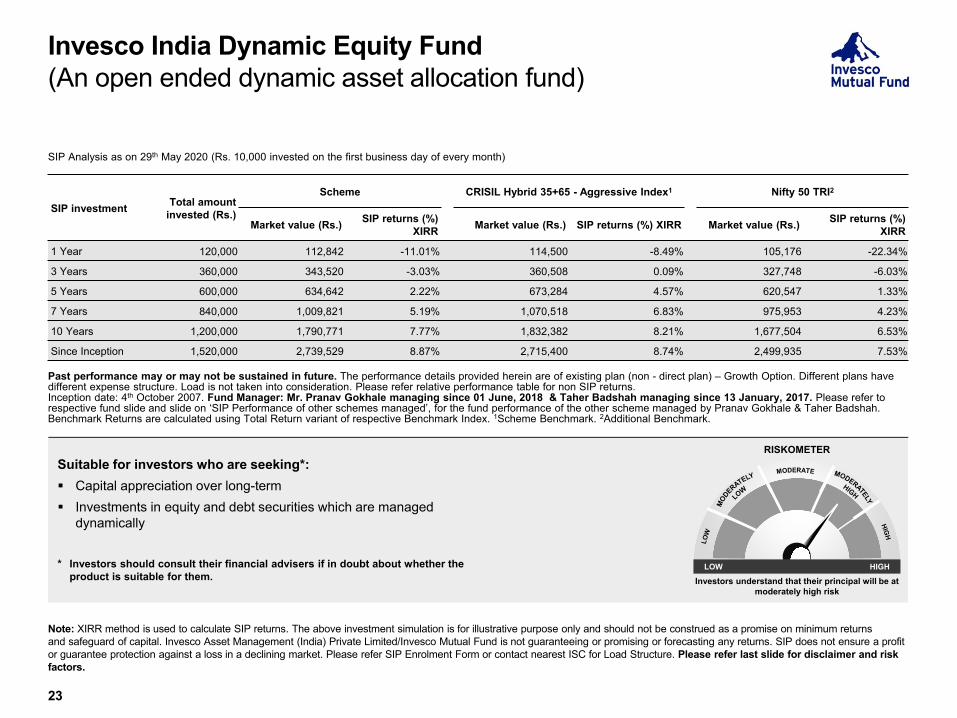
Invesco India Dynamic Equity Fund(An open ended dynamic asset allocation fund)
23
Note: XIRR method is used to calculate SIP returns. The above investment simulation is for illustrative purpose only and should not be construed as a promise on minimum returns and safeguard of capital. Invesco Asset Management (India) Private Limited/Invesco Mutual Fund is not guaranteeing or promising or forecasting any returns. SIP does not ensure a profit or guarantee protection against a loss in a declining market. Please refer SIP Enrolment Form or contact nearest ISC for Load Structure. Please refer last slide for disclaimer and risk factors.
SIP Analysis as on 29th May 2020 (Rs. 10,000 invested on the first business day of every month)
SIP investment Total amount invested (Rs.)
Scheme CRISIL Hybrid 35+65 - Aggressive Index1 Nifty 50 TRI2
Market value (Rs.) SIP returns (%) XIRR Market value (Rs.) SIP returns (%) XIRR Market value (Rs.) SIP returns (%)
XIRR
1 Year 120,000 112,842 -11.01% 114,500 -8.49% 105,176 -22.34%
3 Years 360,000 343,520 -3.03% 360,508 0.09% 327,748 -6.03%
5 Years 600,000 634,642 2.22% 673,284 4.57% 620,547 1.33%
7 Years 840,000 1,009,821 5.19% 1,070,518 6.83% 975,953 4.23%
10 Years 1,200,000 1,790,771 7.77% 1,832,382 8.21% 1,677,504 6.53%
Since Inception 1,520,000 2,739,529 8.87% 2,715,400 8.74% 2,499,935 7.53%
Past performance may or may not be sustained in future. The performance details provided herein are of existing plan (non - direct plan) – Growth Option. Different plans have different expense structure. Load is not taken into consideration. Please refer relative performance table for non SIP returns.Inception date: 4th October 2007. Fund Manager: Mr. Pranav Gokhale managing since 01 June, 2018 & Taher Badshah managing since 13 January, 2017. Please refer to respective fund slide and slide on ‘SIP Performance of other schemes managed’, for the fund performance of the other scheme managed by Pranav Gokhale & Taher Badshah. Benchmark Returns are calculated using Total Return variant of respective Benchmark Index. 1Scheme Benchmark. 2Additional Benchmark.
LOW HIGH
Investors understand that their principal will be at moderately high risk
RISKOMETERSuitable for investors who are seeking*: Capital appreciation over long-term Investments in equity and debt securities which are managed
dynamically
* Investors should consult their financial advisers if in doubt about whether the product is suitable for them.

Invesco India Financial Services Fund(An open ended equity scheme investing in financial services sector)
24
Note: XIRR method is used to calculate SIP returns. The above investment simulation is for illustrative purpose only and should not be construed as a promise on minimum returns and safeguard of capital. Invesco Asset Management (India) Private Limited/Invesco Mutual Fund is not guaranteeing or promising or forecasting any returns. SIP does not ensure a profit or guarantee protection against a loss in a declining market. Please refer SIP Enrolment Form or contact nearest ISC for Load Structure. Please refer last slide for disclaimer and risk factors.
SIP Analysis as on 29th May 2020 (Rs. 10,000 invested on the first business day of every month)
SIP investmentTotal amount
invested (Rs.)
Scheme Nifty Financial Services TRI1 Nifty 50 TRI2
Market value (Rs.)SIP returns (%)
XIRR Market value (Rs.) SIP returns (%) XIRR Market value (Rs.)SIP returns (%)
XIRR1 Year 120,000 93,703 -38.31% 91,550 -41.17% 105,176 -22.34%
3 Years 360,000 292,730 -13.04% 305,440 -10.43% 327,748 -6.03%
5 Years 600,000 584,529 -1.03% 622,999 1.49% 620,547 1.33%
7 Years 840,000 997,994 4.86% 1,053,384 6.38% 975,953 4.23%
10 Years 1,200,000 1,783,499 7.70% 1,910,074 9.00% 1,677,504 6.53%
Since Inception 1,430,000 2,664,516 9.97% 2,870,413 11.12% 2,311,710 7.75%
Past performance may or may not be sustained in future. The performance details provided herein are of existing plan (non - direct plan) – Growth Option. Different plans have different expense structure. Load is not taken into consideration. Please refer relative performance table for non SIP returns.Inception date: 14th July 2008. Fund Manager: Mr. Dhimant Kothari managing since 01 June, 2018 & Mr. Hiten Jain managing since 19 May, 2020 . Please refer to respective fund slide, for the fund performance of the other scheme managed by Dhimant Kothari & Hiten Jain. Benchmark Returns are calculated using Total Return variant of respective Benchmark Index. 1Scheme Benchmark. 2Additional Benchmark.
LOW HIGH
Investors understand that their principal will be at high risk
RISKOMETERSuitable for investors who are seeking*: Capital appreciation over long-term investment predominantly in equity and equity-related instruments of
companies engaged in the business of banking and financial services.
* Investors should consult their financial advisers if in doubt about whether the product is suitable for them.
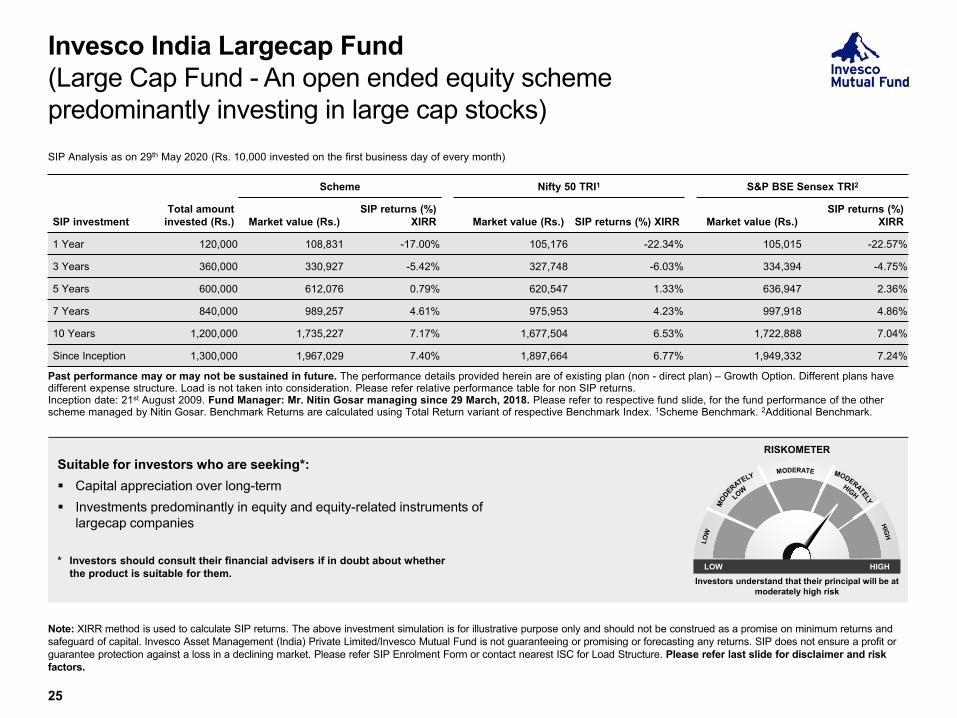
Invesco India Largecap Fund(Large Cap Fund - An open ended equity scheme predominantly investing in large cap stocks)
25
Note: XIRR method is used to calculate SIP returns. The above investment simulation is for illustrative purpose only and should not be construed as a promise on minimum returns and safeguard of capital. Invesco Asset Management (India) Private Limited/Invesco Mutual Fund is not guaranteeing or promising or forecasting any returns. SIP does not ensure a profit or guarantee protection against a loss in a declining market. Please refer SIP Enrolment Form or contact nearest ISC for Load Structure. Please refer last slide for disclaimer and risk factors.
SIP Analysis as on 29th May 2020 (Rs. 10,000 invested on the first business day of every month)
SIP investmentTotal amount
invested (Rs.)
Scheme Nifty 50 TRI1 S&P BSE Sensex TRI2
Market value (Rs.)SIP returns (%)
XIRR Market value (Rs.) SIP returns (%) XIRR Market value (Rs.)SIP returns (%)
XIRR
1 Year 120,000 108,831 -17.00% 105,176 -22.34% 105,015 -22.57%
3 Years 360,000 330,927 -5.42% 327,748 -6.03% 334,394 -4.75%
5 Years 600,000 612,076 0.79% 620,547 1.33% 636,947 2.36%
7 Years 840,000 989,257 4.61% 975,953 4.23% 997,918 4.86%
10 Years 1,200,000 1,735,227 7.17% 1,677,504 6.53% 1,722,888 7.04%
Since Inception 1,300,000 1,967,029 7.40% 1,897,664 6.77% 1,949,332 7.24%
Past performance may or may not be sustained in future. The performance details provided herein are of existing plan (non - direct plan) – Growth Option. Different plans have different expense structure. Load is not taken into consideration. Please refer relative performance table for non SIP returns.Inception date: 21st August 2009. Fund Manager: Mr. Nitin Gosar managing since 29 March, 2018. Please refer to respective fund slide, for the fund performance of the other scheme managed by Nitin Gosar. Benchmark Returns are calculated using Total Return variant of respective Benchmark Index. 1Scheme Benchmark. 2Additional Benchmark.
LOW HIGH
Investors understand that their principal will be at moderately high risk
RISKOMETERSuitable for investors who are seeking*: Capital appreciation over long-term Investments predominantly in equity and equity-related instruments of
largecap companies
* Investors should consult their financial advisers if in doubt about whether the product is suitable for them.

Invesco India PSU Equity Fund(An open ended equity scheme following PSU theme)
26
Note: XIRR method is used to calculate SIP returns. The above investment simulation is for illustrative purpose only and should not be construed as a promise on minimum returns and safeguard of capital. Invesco Asset Management (India) Private Limited/Invesco Mutual Fund is not guaranteeing or promising or forecasting any returns. SIP does not ensure a profit or guarantee protection against a loss in a declining market. Please refer SIP Enrolment Form or contact nearest ISC for Load Structure. Please refer last slide for disclaimer and risk factors.
SIP Analysis as on 29th May 2020 (Rs. 10,000 invested on the first business day of every month)
SIP investmentTotal amount
invested (Rs.)
Scheme S&P BSE PSU TRI1 Nifty 50 TRI2
Market value (Rs.)SIP returns (%)
XIRR Market value (Rs.) SIP returns (%) XIRR Market value (Rs.)SIP returns (%)
XIRR
1 Year 120,000 111,355 -13.24% 88,790 -44.76% 105,176 -22.34%
3 Years 360,000 330,082 -5.58% 236,024 -25.68% 327,748 -6.03%
5 Years 600,000 597,094 -0.19% 408,282 -15.02% 620,547 1.33%
7 Years 840,000 974,422 4.19% 602,349 -9.50% 975,953 4.23%
10 Years 1,200,000 1,548,499 4.99% 860,925 -6.76% 1,677,504 6.53%
Since Inception 1,270,000 1,661,106 4.95% 904,841 -6.54% 1,826,273 6.67%
Past performance may or may not be sustained in future. The performance details provided herein are of existing plan (non - direct plan) – Growth Option. Different plans have different expense structure. Load is not taken into consideration. Please refer relative performance table for non SIP returns.Inception date: 18th November 2009. Fund Manager: Mr. Nitin Gosar managing since 01 June, 2018 & Mr. Dhimant Kothari managing since 19 May, 2020. Please refer to respective fund slide and slide on ‘SIP Performance of other schemes managed’ for the fund performance of the other schemes managed by Nitin Gosar & Dhimant Kothari. Benchmark Returns are calculated using Total Return variant of respective Benchmark Index. 1Scheme Benchmark. 2Additional Benchmark.
LOW HIGH
Investors understand that their principal will be at high risk
RISKOMETERSuitable for investors who are seeking*: Capital appreciation over long-term Investments predominantly in equity and equity-related instruments
of Government companies (PSU’s)
* Investors should consult their financial advisers if in doubt about whether the product is suitable for them.
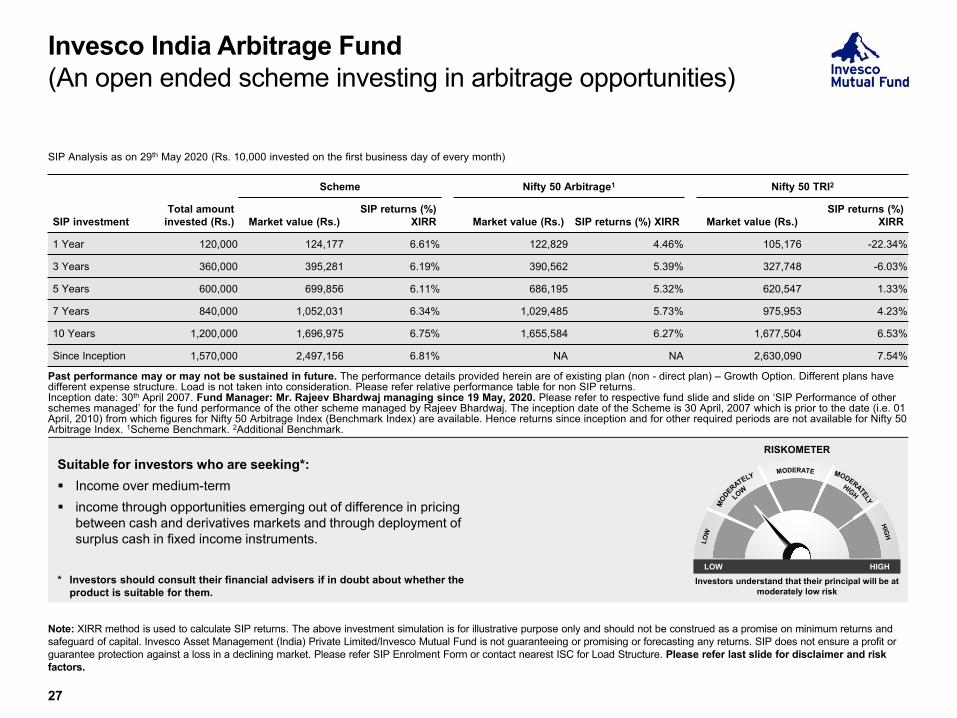
Invesco India Arbitrage Fund(An open ended scheme investing in arbitrage opportunities)
27
Note: XIRR method is used to calculate SIP returns. The above investment simulation is for illustrative purpose only and should not be construed as a promise on minimum returns and safeguard of capital. Invesco Asset Management (India) Private Limited/Invesco Mutual Fund is not guaranteeing or promising or forecasting any returns. SIP does not ensure a profit or guarantee protection against a loss in a declining market. Please refer SIP Enrolment Form or contact nearest ISC for Load Structure. Please refer last slide for disclaimer and risk factors.
SIP Analysis as on 29th May 2020 (Rs. 10,000 invested on the first business day of every month)
SIP investmentTotal amount
invested (Rs.)
Scheme Nifty 50 Arbitrage1 Nifty 50 TRI2
Market value (Rs.)SIP returns (%)
XIRR Market value (Rs.) SIP returns (%) XIRR Market value (Rs.)SIP returns (%)
XIRR
1 Year 120,000 124,177 6.61% 122,829 4.46% 105,176 -22.34%
3 Years 360,000 395,281 6.19% 390,562 5.39% 327,748 -6.03%
5 Years 600,000 699,856 6.11% 686,195 5.32% 620,547 1.33%
7 Years 840,000 1,052,031 6.34% 1,029,485 5.73% 975,953 4.23%
10 Years 1,200,000 1,696,975 6.75% 1,655,584 6.27% 1,677,504 6.53%
Since Inception 1,570,000 2,497,156 6.81% NA NA 2,630,090 7.54%
Past performance may or may not be sustained in future. The performance details provided herein are of existing plan (non - direct plan) – Growth Option. Different plans have different expense structure. Load is not taken into consideration. Please refer relative performance table for non SIP returns.Inception date: 30th April 2007. Fund Manager: Mr. Rajeev Bhardwaj managing since 19 May, 2020. Please refer to respective fund slide and slide on ‘SIP Performance of other schemes managed’ for the fund performance of the other scheme managed by Rajeev Bhardwaj. The inception date of the Scheme is 30 April, 2007 which is prior to the date (i.e. 01 April, 2010) from which figures for Nifty 50 Arbitrage Index (Benchmark Index) are available. Hence returns since inception and for other required periods are not available for Nifty 50 Arbitrage Index. 1Scheme Benchmark. 2Additional Benchmark.
LOW HIGH
Investors understand that their principal will be at moderately low risk
RISKOMETERSuitable for investors who are seeking*: Income over medium-term income through opportunities emerging out of difference in pricing
between cash and derivatives markets and through deployment of surplus cash in fixed income instruments.
* Investors should consult their financial advisers if in doubt about whether the product is suitable for them.

1Applicable for Invesco India Financial Services Fund, Invesco India Growth Opportunities Fund, Invesco India Largecap Fund, Invesco India Gilt Fund, Invesco India Corporate BondFund and Invesco India Treasury Advantage Fund only.
How to Start an SIP?
1st installment in form of a cheque
Fill the Common Application form and Auto Debit form
Choose from monthly or quarterly SIP investment option
Any date SIP – Choose your choice of date (except 29th, 30th and 31st)
Minimum investments:
28
Option Minimum amount*Minimum
installments
Monthly
Rs. 100 per month and in multiples of Re. 1/thereafter1 12
Rs. 500 per month and in multiples of Re. 1/thereafter 12
Rs. 1,000 per month and in multiples of Re. 1/thereafter 6
Quarterly
Rs. 300 per quarter and in multiples of Re. 1/thereafter1 4
Rs. 1,500 per quarter and in multiples of Re. 1/thereafter 4
Rs. 2,000 per quarter and in multiples of Re. 1/thereafter (for fixed income funds only) 4
* Except for Invesco India Tax Plan: Rs. 500/- per month/quarter and in multiples of Rs. 500/- thereafter.
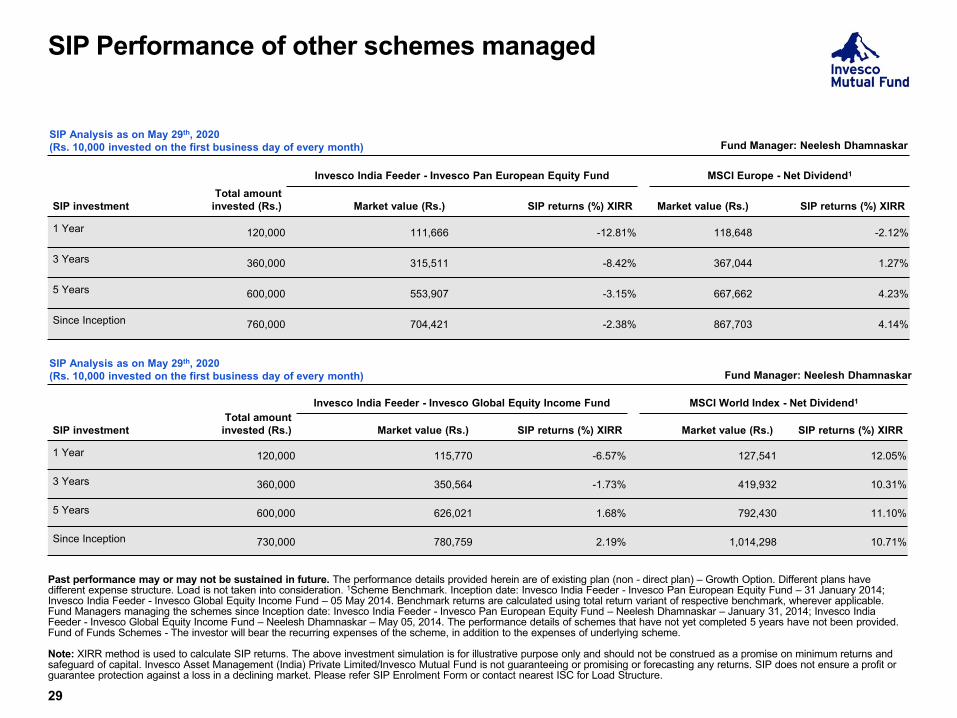
SIP Performance of other schemes managed
29
Past performance may or may not be sustained in future. The performance details provided herein are of existing plan (non - direct plan) – Growth Option. Different plans have different expense structure. Load is not taken into consideration. 1Scheme Benchmark. Inception date: Invesco India Feeder - Invesco Pan European Equity Fund – 31 January 2014; Invesco India Feeder - Invesco Global Equity Income Fund – 05 May 2014. Benchmark returns are calculated using total return variant of respective benchmark, wherever applicable. Fund Managers managing the schemes since Inception date: Invesco India Feeder - Invesco Pan European Equity Fund – Neelesh Dhamnaskar – January 31, 2014; Invesco India Feeder - Invesco Global Equity Income Fund – Neelesh Dhamnaskar – May 05, 2014. The performance details of schemes that have not yet completed 5 years have not been provided.Fund of Funds Schemes - The investor will bear the recurring expenses of the scheme, in addition to the expenses of underlying scheme.
Note: XIRR method is used to calculate SIP returns. The above investment simulation is for illustrative purpose only and should not be construed as a promise on minimum returns and safeguard of capital. Invesco Asset Management (India) Private Limited/Invesco Mutual Fund is not guaranteeing or promising or forecasting any returns. SIP does not ensure a profit or guarantee protection against a loss in a declining market. Please refer SIP Enrolment Form or contact nearest ISC for Load Structure.
SIP Analysis as on May 29th, 2020(Rs. 10,000 invested on the first business day of every month) Fund Manager: Neelesh Dhamnaskar
SIP investmentTotal amount
invested (Rs.)
Invesco India Feeder - Invesco Pan European Equity Fund MSCI Europe - Net Dividend1
Market value (Rs.) SIP returns (%) XIRR Market value (Rs.) SIP returns (%) XIRR
1 Year 120,000 111,666 -12.81% 118,648 -2.12%
3 Years 360,000 315,511 -8.42% 367,044 1.27%
5 Years 600,000 553,907 -3.15% 667,662 4.23%
Since Inception 760,000 704,421 -2.38% 867,703 4.14%
SIP Analysis as on May 29th, 2020(Rs. 10,000 invested on the first business day of every month)
SIP investmentTotal amount
invested (Rs.)
Invesco India Feeder - Invesco Global Equity Income Fund MSCI World Index - Net Dividend1
Market value (Rs.) SIP returns (%) XIRR Market value (Rs.) SIP returns (%) XIRR
1 Year 120,000 115,770 -6.57% 127,541 12.05%
3 Years 360,000 350,564 -1.73% 419,932 10.31%
5 Years 600,000 626,021 1.68% 792,430 11.10%
Since Inception 730,000 780,759 2.19% 1,014,298 10.71%
Fund Manager: Neelesh Dhamnaskar

SIP Performance of other schemes managed
30
Note: XIRR method is used to calculate SIP returns. The above investment simulation is for illustrative purpose only and should not be construed as a promise on minimum returns and safeguard of capital. Invesco Asset Management (India) Private Limited/Invesco Mutual Fund is not guaranteeing or promising or forecasting any returns. SIP does not ensure a profit or guarantee protection against a loss in a declining market. Please refer SIP Enrolment Form or contact nearest ISC for Load Structure. Please refer last slide for disclaimer and risk factors.
SIP investmentTotal amount invested (Rs.)
Invesco India Equity & Bond Fund CRISIL Hybrid 35 + 65 - Aggressive Index1 Nifty 50 TRI2
Market value (Rs.)SIP returns (%)
XIRR Market value (Rs.) SIP returns (%) XIRR Market value (Rs.)SIP returns (%)
XIRR
1 Year 120,000 109,251 -16.38% 114,500 -8.49% 105,176 -22.34%
Since Inception 230,000 211,604 -8.17% 223,693 -2.78% 202,121 -12.46%
Past performance may or may not be sustained in future. The performance details provided herein are of existing plan (non - direct plan) – Growth Option. Different plans have different expense structure. Load is not taken into consideration. Please refer relative performance table for non SIP returns. The scheme has been in existence for less than 3 years.Invesco India Equity & Bond Fund - Inception date: 30th June 2018. Invesco India Equity Savings Fund – Inception date: 07th March 2019. Fund Manager managing the scheme: Invesco India Equity & Bond Fund - Taher Badshah – Since June 30, 2018 & Pranav Gokhale – Since May 19, 2020 (For equity investments) and Krishna Cheemalapati (For debt investments) managing since June 30, 2018, Invesco India Equity Savings Fund – Dhimant Kothari – since May 19, 2020 (For equity investments) and Krishna Cheemalapati (For debt investments) managing since March 07, 2019. Benchmark Returns are calculated using Total Return variant of respective Benchmark Index. 1Scheme Benchmark. 2Additional Benchmark.
SIP Analysis as on May 29th, 2020(Rs. 10,000 invested on the first business day of every month) Fund Managers: Taher Badshah & Pranav Gokhale (For equity investments)
and Krishna Cheemalapati (For debt investments)
SIP investmentTotal amount invested (Rs.)
Invesco India Equity Savings Fund Nifty Equity Savings Index1 Nifty 50 TRI2
Market value (Rs.)SIP returns (%)
XIRR Market value (Rs.) SIP returns (%) XIRR Market value (Rs.)SIP returns (%)
XIRR
1 Year 120,000 118,647 -2.11% 118,846 -1.80% 105,176 -22.34%
Since Inception 150,000 148,911 -1.10% 149,288 -0.72% 130,597 -19.38%
SIP Analysis as on May 29th, 2020(Rs. 10,000 invested on the first business day of every month) Fund Managers: Dhimant Kothari (For equity investments)
and Krishna Cheemalapati (For debt investments)

Scheme Performance –Lumpsum Investments

Scheme Performance
32
Past performance may or may not be sustained in future. The performance details provided herein are of existing plan (non - direct plan) – Growth Option. Different plans have different expense structure. Returns greater than 1 year are compounded annualized. SI: Since Inception. Data as at 29 May 2020. Fund Managers: Invesco India Arbitrage Fund – Rajeev Bhardwaj managing since May 19, 2020;; Invesco India Dynamic Equity Fund – Pranav Gokhale managing since June 01, 2018 and Taher Badshah managing since January 13, 2017; Invesco India Multicap Fund - Taher Badshah managing and Pranav Gokhale managing since March 29, 2018; Invesco India Contra Fund – Taher Badshah managing since January 13, 2017 and Dhimant Kothari managing since May 19, 20020; Invesco India Growth Opportunities Fund - Taher Badshah managing since January 13, 2017 and Pranav Gokhale managing since May 19, 2020. Invesco India Feeder - Invesco Global Equity Income Fund – Neelesh Dhamnaskar – May 05, 2014; Invesco India Feeder - Invesco Pan European Equity Fund – Neelesh Dhamnaskar – January 31, 2014; Invesco India Smallcap Fund - Taher Badshah managing since October 30, 2018 and Pranav Gokhale managing since March 01, 2019. 3Fund of Funds Schemes - The investor will bear the recurring expenses of the scheme, in addition to the expenses of underlying scheme. Performance details of schemes that have not yet completed 3,5, 7 and 10 years have not been provided. Benchmark Returns are calculated using Total Return variant of respective Benchmark Index, wherever applicable. The inception date of the Invesco India Arbitrage Fund is 30 April, 2007 which is prior to the date (i.e. 01 April, 2010) from which figures for Nifty 50 Arbitrage Index (Benchmark Index) are available. Hence returns since inception and for other required periods are not available for Nifty 50 Arbitrage Index. For performance of direct plans please refer to latest factsheet on our website or click on the link: www.invescomutualfund.com/fund-performance.
Scheme/Benchmark NAV as on 29 May 2020
Returns % (CAGR) Value of Rs.10,000/- invested1 year 3 years 5 years 7 years 10 years SI 1 year 3 years 5 years 7 years 10 years SI
Fund Manager: Rajeev BhardwajInvesco India Arbitrage Fund2 24.2346 6.16% 6.05% 6.15% 6.76% 7.14% 7.00% 10,614 11,927 13,478 15,808 19,926 24,235Nifty 50 Arbitrage - 5.05% 5.26% 5.53% 6.42% 6.62% NA 10,504 11,660 13,092 15,457 18,996 NANifty 50 TRI1 - -18.62% 1.23% 3.93% 8.29% 7.87% 7.99% 8,143 10,372 12,126 17,460 21,331 27,366Fund Managers: Pranav Gokhale & Taher BadshahInvesco India Dynamic Equity Fund 26.95 -8.29% 1.14% 4.32% 9.89% 8.62% 8.15% 9,173 10,345 12,357 19,347 22,858 26,950CRISIL Hybrid 35+65 - Aggressive Index - -6.69% 3.81% 6.36% 9.41% 8.63% 7.67% 9,333 11,186 13,613 18,770 22,886 25,477Nifty 50 TRI1 - -18.62% 1.23% 3.93% 8.29% 7.87% 6.18% 8,143 10,372 12,126 17,460 21,331 21,362Fund Managers: Taher Badshah & Pranav GokhaleInvesco India Multicap Fund 40.54 -14.27% -2.73% 2.70% 13.05% 12.41% 12.15% 8,576 9,203 11,426 23,597 32,226 40,540S&P BSE Allcap TRI - -19.40% -1.31% 3.47% 8.88% 7.58% 7.75% 8,065 9,611 11,860 18,138 20,764 24,872Nifty 50 TRI1 - -18.62% 1.23% 3.93% 8.29% 7.87% 7.66% 8,143 10,372 12,126 17,460 21,331 24,636Invesco India Smallcap Fund 8.97 -16.37% - - - - -6.65% 8,368 - - - - 8,970S&P BSE 250 Smallcap TRI1 - -34.29% - - - - -18.94% 6,578 - - - - 7,176Nifty 50 TRI1 - -18.62% - - - - -2.77% 8,143 - - - - 9,565Invesco India Growth Opportunities Fund 29.46 -14.72% 1.49% 4.57% 11.30% 9.77% 8.80% 8,532 10,454 12,504 21,164 25,397 29,460S&P BSE 250 Large Midcap 65:35 TRI - -17.67% -0.69% 4.17% 9.93% 8.39% 7.98% 8,237 9,793 12,271 19,407 22,383 26,749Nifty 50 TRI1 - -18.62% 1.23% 3.93% 8.29% 7.87% 7.52% 8,143 10,372 12,126 17,460 21,331 25,310Fund Managers: Taher Badshah & Dhimant KothariInvesco India Contra Fund 41.69 -14.69% 1.77% 6.16% 14.34% 10.81% 11.48% 8,534 10,538 13,488 25,545 27,924 41,690S&P BSE 500 TRI - -18.93% -0.76% 3.75% 9.02% 7.72% 8.56% 8,112 9,775 12,024 18,309 21,039 29,435Nifty 50 TRI1 - -18.62% 1.23% 3.93% 8.29% 7.87% 8.44% 8,143 10,372 12,126 17,460 21,331 29,003Fund Manager: Neelesh DhamnaskarInvesco India Feeder - Invesco Global Equity Income Fund3 12.1067 0.95% 2.43% 2.11% - - 3.20% 10,094 10,747 11,102 - - 12,107
MSCI World Index – Net Dividend - 15.84% 11.66% 9.47% - - 10.10% 11,579 13,917 15,727 - - 17,938Invesco India Feeder - Invesco Pan European Equity Fund3 9.2552 -5.06% -3.40% -2.56% - - -1.22% 9,495 9,015 8,781 - - 9,255
MSCI Europe Index – Net Dividend - 3.77% 3.77% 3.48% - - 3.71% 10,376 11,175 11,869 - - 12,595

Scheme/Benchmark NAV as on 29 May 2020
Returns % (CAGR) Value of Rs.10,000/- invested1 year 3 years 5 years 7 years 10 years SI 1 year 3 years 5 years 7 years 10 years SI
Fund Managers: Pranav Gokhale & Neelesh DhamnaskarInvesco India Infrastructure Fund 15.40 -12.58% -1.12% 1.78% 11.95% 6.69% 3.51% 8,745 9,667 10,922 22,031 19,107 15,400S&P BSE India Infrastructure TRI - -37.30% -13.73% -4.93% 3.41% 1.12% -1.91% 6,278 6,424 7,765 12,644 11,176 7,856Nifty 50 TRI1 - -18.62% 1.23% 3.93% 8.29% 7.87% 5.69% 8,143 10,372 12,126 17,460 21,331 19,998Invesco India Midcap Fund 43.79 -10.51% 0.77% 4.81% 14.80% 13.15% 11.91% 8,951 10,234 12,652 26,285 34,399 43,790Nifty Midcap 100 TRI - -25.24% -7.89% 1.28% 9.14% 6.84% 8.91% 7,482 7,817 10,657 18,451 19,386 30,648Nifty 50 TRI1 - -18.62% 1.23% 3.93% 8.29% 7.87% 8.17% 8,143 10,372 12,126 17,460 21,331 28,024Fund Managers: Nitin Gosar & Dhimant KothariInvesco India PSU Equity Fund 16.31 -10.51% -4.82% 3.62% 7.82% 4.54% 4.75% 8,952 8,625 11,949 16,937 15,593 16,310S&P BSE PSU TRI - -40.17% -17.02% -7.43% -2.48% -4.43% -4.22% 5,992 5,717 6,796 8,386 6,359 6,349Nifty 50 TRI1 - -18.62% 1.23% 3.93% 8.29% 7.87% 7.55% 8,143 10,372 12,126 17,460 21,331 21,527Fund Managers: Dhimant Kothari & Hiten JainInvesco India Financial Services Fund 43.16 -27.88% -2.89% 4.34% 9.25% 9.65% 13.10% 7,219 9,158 12,370 18,571 25,137 43,160Nifty Financial Services TRI - -29.01% 0.70% 5.66% 10.13% 10.65% 13.96% 7,106 10,212 13,171 19,644 27,524 47,231Nifty 50 TRI1 - -18.62% 1.23% 3.93% 8.29% 7.87% 8.85% 8,143 10,372 12,126 17,460 21,331 27,381Fund Managers: Dhimant KothariInvesco India Tax Plan2 44.79 -13.65% 1.34% 4.67% 12.40% 10.96% 11.82% 8,638 10,407 12,567 22,667 28,294 44,790S&P BSE 200 TRI - -17.90% 0.29% 4.11% 9.13% 8.01% 8.32% 8,214 10,088 12,232 18,437 21,620 29,244Nifty 50 TRI1 - -18.62% 1.23% 3.93% 8.29% 7.87% 8.08% 8,143 10,372 12,126 17,460 21,331 28,378Fund Managers: Nitin GosarInvesco India Largecap Fund 25.01 -13.94% 0.30% 3.40% 9.35% 8.19% 8.88% 8,609 10,089 11,819 18,692 21,977 25,010Nifty 50 TRI - -18.62% 1.23% 3.93% 8.29% 7.87% 8.49% 8,143 10,372 12,126 17,460 21,331 24,075S&P BSE Sensex TRI1 - -17.41% 2.64% 4.48% 8.76% 8.24% 8.75% 8,264 10,813 12,451 18,006 22,070 24,701Fund Managers: Taher Badshah & Pranav Gokhale (For equity investments) and Krishna Cheemalapati (For debt investments)Invesco India Equity & Bond Fund 9.4416 -10.62% - - - - -2.96% 8,941 - - - - 9,442CRISIL Hybrid 35 + 65 - Aggressive Index - -6.69% - - - - 1.34% 9,333 - - - - 10,258Nifty 50 TRI1 - -18.62% - - - - -4.51% 8,143 - - - - 9,152Fund Managers: Dhimant Kothari (For equity investments) and Krishna Cheemalapati (For debt investments)Invesco India Equity Savings Fund 10.1852 -0.70% 1.50% 9,930 10,185Nifty Equity Savings Index - -0.99% 2.65% 9,901 10,327Nifty 50 TRI1 - -18.62% -9.89% 8,143 8,798
Scheme Performance (CONTINUED)
33
Past performance may or may not be sustained in future. The performance details provided herein are of existing plan (non - direct plan) – Growth Option. Different plans have different expense structure. Returns greater than 1 year are compounded annualized. SI: Since Inception. Data as at 29 May 2020. Fund Managers: Invesco India Infrastructure Fund - Pranav Gokhale managing the scheme since August 14, 2012 and Neelesh Dhamnaskar managing since June 01, 2018; Invesco India Midcap Fund - Pranav Gokhale managing the scheme since March 29, 2018 and Neelesh Dhamnaskar managing since July 18, 2018; Invesco India PSU Equity Fund - Nitin Gosar managing since June 01, 2018 and Dhimant Kothari managing since May 19, 2020; Invesco India Financial Services Fund - Dhimant Kothari managing since June 01, 2018 and Hiten Jain managing since May 19, 2020; Invesco India Tax Plan - Dhimant Kothari managing since March 29, 2018; Invesco India Largecap Fund - Nitin Gosar managing since March 29, 2018. Invesco India Equity & Bond Fund – Taher Badshah managing since June 30,2018, Pranav Gokhale managing since May 19, 2020 (For equity investments) and Krishna Cheemalapati (For debt investments) – June 30, 2018; Invesco India Equity Savings Fund – Dhimant Kothari managing since May 19, 2020 (For equity instrument) and and Krishna Cheemalapati (For debt investments) – March 07, 2019. Performance details of schemes that have not yet completed 3,5,7 & 10 years have not been provided. Benchmark Returns are calculated using Total Return variant of respective Benchmark Index, wherever applicable. For performance of direct plans please refer to latest factsheet on our website or click on the link: www.invescomutualfund.com/fund-performance.

Scheme Performance (CONTINUED)
34
1 Additional Benchmark. 2 Invesco India Arbitrage Fund performance is not strictly comparable with that of its additional benchmark since the scheme does not take directional call in equity markets but is limited to availing arbitrage opportunities etc.
Scheme Name Inception Date
Invesco India Tax Plan 29th December 2006
Invesco India Contra Fund 11th April 2007
Invesco India Midcap Fund 19th April 2007
Invesco India Arbitrage Fund 30th April 2007
Invesco India Growth Opportunities Fund 9th August 2007
Invesco India Dynamic Equity Fund 4th October 2007
Invesco India Infrastructure Fund 21st November 2007
Scheme Name Inception Date
Invesco India Multicap Fund 17th March 2008
Invesco India Financial Services Fund 14th July 2008
Invesco India Largecap Fund 21st August 2009
Invesco India PSU Equity Fund 18th November 2009
Invesco India Equity & Bond Fund 30th June 2018
Invesco India Smallcap Fund 30th October 2018
Invesco India Equity Savings Fund 07th March 2020
No. of Schemes managed by respective Fund Managers
Taher Badshah 6 Dhimant Kothari 5
Pranav Gokhale 7 Neelesh Dhamnaskar 4
Nitin Gosar 2 Hiten Jain 1
Krishna Cheemalapati 9 Rajeev Bhardwaj 1

Annexure
Source: BSE India. GFC: Global Financial crisis.Note: The above investment simulation is for illustrative purpose only and should not be construed as a promise on minimum returns and safeguard of capital. Invesco Asset Management (India) Private Limited/Invesco Mutual Fund is not guaranteeing or promising or forecasting any returns. SIP does not ensure a profit or guarantee protection against a loss in a declining market. Please refer SIP Enrolment Form or contact nearest ISC for Load Structure. Please refer last slide for disclaimer and risk factors. We have showcased November 2008 SIP performance given the lowest point of Global financial crisis.
SIP Investment Start Time
SIP Investment Stop Time
Total Investment (Rs. Lakhs)
Accumulated Corpus
(Rs. Lakhs)
Gain (Rs. Lakhs)
December 2004 January 2008 (SIP stop at start of GFC)
3.80 6.60 2.80
December 2004 January 2008 (SIP stop, but accumulated amount remained invested)
3.80 12.13 8.33
December 2004 Continued 18.60 34.70 16.10
SIP Analysis as on 31 May 2020. (Rs. 10,000 is invested in S&P BSE Sensex Index on the first business day of every month)
35

Disclaimer
Disclaimer: The information alone is not sufficient and shouldn’t be used for the development or implementation of an investment strategy. It should not be construed as investment advice to any party. All figures, charts/graphs and data included in this presentation are as on date and are subject to change without notice. The statements contained herein are based on our current views and involve known/unknown risks and uncertainties that could cause actual results, performance or events to differ materially from those expressed or implied in such statements. The data used in this presentation is obtained by Invesco Asset Management (India) Private Limited from the sources which it considers reliable. While utmost care has been exercised while preparing this presentation, Invesco Asset Management (India) Private Limited does not warrant the completeness or accuracy of the information and disclaims all liabilities, losses and damages arising out of the use of this information. The content of this presentation is intended solely for the use of the addressee. If you are not the addressee or the person responsible for delivering it to the addressee, any disclosure, copying, distribution or any action taken or omitted to be taken in reliance on it is prohibited and may be unlawful. The recipient(s) before acting on any information herein should make his/their own investigation and seek appropriate professional advice.
Mutual Fund investments are subject to market risks, read all scheme related documents carefully.
36


Get in Touch
Corporate Office:Invesco Asset Management (India) Private Limited 2101 A, 21st Floor, A- Wing, Marathon Futurex, N.M. Joshi Marg, Lower Parel, Mumbai – 400 013+91 22 67310000 F +91 22 23019422
To invest:Call 1800-209-0007 ∆ sms ‘Invest’ to 56677Invest Online www.invescomutualfund.com
Follow us on
Copyright © 2022 FDOKUMEN