Strengthen your portfolio with Invesco.
50
Strengthen your portfolio with Invesco. Fact Sheet - August 2021 Equity Funds Invesco India Tax Plan Invesco India Multicap Fund Invesco India Contra Fund Invesco India Largecap Fund Invesco India Focused 20 Equity Fund Invesco India Growth Opportunities Fund Invesco India Midcap Fund Invesco India Smallcap Fund Invesco India Financial Services Fund Invesco India Infrastructure Fund Invesco India PSU Equity Fund Invesco India ESG Equity Fund Hybrid Funds Invesco India Arbitrage Fund Invesco India Dynamic Equity Fund Invesco India Equity & Bond Fund Invesco India Equity Savings Fund Debt Funds Invesco India Liquid Fund Invesco India Overnight Fund Invesco India Treasury Advantage Fund Invesco India Short Term Fund Invesco India Money Market Fund Invesco India Ultra Short Term Fund Invesco India Medium Duration Fund Invesco India Credit Risk Fund Invesco India Gilt Fund Invesco India Corporate Bond Fund Invesco India Banking & PSU Debt Fund Fund of Funds Invesco India - Invesco Global Consumer Trends Fund of Fund Invesco India Feeder - Invesco Pan European Equity Fund Invesco India Feeder - Invesco Global Equity Income Fund Invesco India Gold Fund Exchange Traded Funds Invesco India Gold Exchange Traded Fund Invesco India Nifty Exchange Traded Fund
-
Upload
khangminh22 -
Category
Documents
-
view
3 -
download
0
Transcript of Strengthen your portfolio with Invesco.

Strengthen your portfoliowith Invesco.
Fact Sheet - August 2021
Equity FundsInvesco India Tax PlanInvesco India Multicap FundInvesco India Contra FundInvesco India Largecap FundInvesco India Focused 20 Equity FundInvesco India Growth Opportunities FundInvesco India Midcap FundInvesco India Smallcap FundInvesco India Financial Services FundInvesco India Infrastructure FundInvesco India PSU Equity FundInvesco India ESG Equity Fund
Hybrid FundsInvesco India Arbitrage FundInvesco India Dynamic Equity FundInvesco India Equity & Bond FundInvesco India Equity Savings Fund
Debt FundsInvesco India Liquid FundInvesco India Overnight FundInvesco India Treasury Advantage FundInvesco India Short Term FundInvesco India Money Market FundInvesco India Ultra Short Term FundInvesco India Medium Duration FundInvesco India Credit Risk FundInvesco India Gilt FundInvesco India Corporate Bond FundInvesco India Banking & PSU Debt Fund
Fund of FundsInvesco India - Invesco Global ConsumerTrends Fund of FundInvesco India Feeder - Invesco PanEuropean Equity FundInvesco India Feeder - Invesco GlobalEquity Income FundInvesco India Gold Fund
Exchange Traded FundsInvesco India Gold Exchange Traded FundInvesco India Nifty Exchange Traded Fund
2 of 49
Macro Economic ReviewEconomic activity continued to gain momentum in August as mobility increased. The vaccination rate continues to improve with almost 36.4% of adult population having taken one dose and 10.8% of population vaccinated with two doses (as on August end). Q1FY22 GDP came in at 20.1% largely due to base effect. Private final consumption expenditure (PFCE), the single largest component of India’s GDP grew by 19.3%, after a -26.2% fall during April-June 2020. Gross Fixed Capital Formation (GFCF), an indicator of investment demand, grew by 56.7% as against a steep -46.6% contraction in the year-ago quarter. The government cut its final consumption expenditure (GFCE) by 4.8% during April-June 2021 compared to a year ago. Imports grew at a faster clip (60.2%) than exports (39.1%). The economy witnessed a trade deficit amounting to -1.9% of GDP during April-July 2021 as against a trade surplus of 1.3% of GDP seen in the same quarter a year ago. GFCF’s overall contribution was lower at 27.2% vs 31.2% in previous quarter.Central Government’s gross fiscal deficit (GFD) during April-July 2021 amounted 21.3% of its annual budgeted target for FY 2022, compared to an average 69% attained by July for the period FY14 and FY20. At the same time last year, the government had overshot its annual deficit target by 3.1%. In absolute terms, the deficit during April-July 2021 amounted to INR 3.2 trillion, substantially lower than the last year’s INR 8.2 trillion. Government expenditure declined year-on-year by -4.7% to INR 10 trillion during April-July 2021. Revenue expenditure fell by -7% yoy to INR 8.8 trillion, while capital expenditure rose by 14.8% to INR 1.3 trillion. Gross Tax Revenue collection during the first four months of the fiscal came in at INR 6.9 trillion or 31% of full year target. During Apr-Jul 2020, the figure stood at INR 3.8 trillion as revenue collection plummeted during the lockdown. By July 2020, gross tax revenue collection was just 15% of budget estimate and 20% of revised estimate for the year. On an average, gross tax revenue collection during the first four months of the fiscal stands at ~23% of full year collection. This corroborates the fact that revenue collection has been very strong in FY22 so far. Net Tax Revenue also came in at INR 5.3 trillion till July 21 or 34% of full-year target. Non-tax revenue receipts jumped by 468.6 per cent to Rs.1.4 trillion and non-debt capital receipts, which mainly comprise of disinvestment proceeds, too rose by 159.2% to INR 141.5 billion.The headline CPI for July came in at 5.59% versus 6.26% in June 2021. Food inflation as measured by CFPI came down to 3.96% versus 5.15% in June 2021. Core Inflation came in at 6.02%. The downward movement in CPI was driven by higher than expected softening of food prices, slight moderation in core CPI and favorable base effects. Food inflation moderated across most food categories (except proteins & vegetables). Food inflation may likely moderate further in coming months, due to easing of supply chains and base effects. Core inflation may likely remain sticky. Services PMI jumped to 56.7 in August 2021 from 45.4 in July 2021. The index rose after three consecutive months of contraction as the Covid-19 pandemic continued to recede and vaccine access improved. Sales and output of service providers improved in August 2021 as several establishments re-opened after the second wave of Covid-19. This boosted business confidence. But, job creation remained muted as firms already had ample capacity to cater to the rising orders. Manufacturing PMI moderated to 52.3 in August 2021 from 55.3 in July 2021. Despite this fall, the August 2021 reading of the index indicates an improvement in overall operating conditions for the second straight month. Survey reported a growth in production for the second straight month amid reports of improved sales and demand. Order books continued expanding and businesses remained optimistic on the future. The Covid-19 pandemic and elevated price pressures remained the main constraints for the growth of manufacturing units. The pause on hiring efforts by the manufacturing units continued in August 2021.IIP for June 2021 was up 13.6% yoy but was -7.6% vs June 2019 as well as 15.8% lower than March 2021, the month before Covid-19 second wave. Whilst all sectors were soft, weakness was more pronounced in the manufacturing sector and particularly in capital goods and consumer durables. The output of eight core industries grew by 9.4% yoy in July 2021 against a contraction of -7.6% yoy in July 2020, aided by a low base. All the sectors except crude oil have registered a positive growth during the month. On a sequential basis, the core sector output grew by 5.4% mom in July 2021. The sharp improvement in output can be attributed to the gradual resumption of economic activities across states towards the end of Q1 FY2022. Robust coal production coupled with stellar growth of steel and cement production backed by Government’s infrastructure push have driven the growth during the month. Sequentially, all the sectors have witnessed an improvement over the month.On the trade front, a buoyant global economy meant that exports continued to do well. Merchandise export earnings have remained above the USD 30 billion mark consistently since March 2021. Merchandise exports rose yoy by 45.2 % to USD 33.1 billion in August 2021, as against a 12.2% fall registered in the year-ago month. Non-petroleum exports in August 2021 were 28.58 USD billion, registering a growth of 36.57% yoy of which engineering goods’ exports at 9.6 bn USD was up 58% yoy. India’s merchandise imports in August 2021 were USD 47.01 billion, an increase of 51.47% over USD 31.03 billion in August 2020 and an increase of 17.95% over USD 39.85 billion in August 2019. Non-petroleum imports were USD 35.37 billion in August 2021 with a growth of 43.8% yoy whereas petroleum imports were USD 11.6 bn, up 80% yoy. Gold imports were also up 82% yoy at 6.7 bn USD. The trade deficit in August 2021 was USD 13.87 billion compared to the trade deficit of USD 8.2 billion in August 2020, while it is USD 55.9 billion during April-August 2021 as compared to USD 22.7 billion during the same period of the previous year. The foreign exchange reserves ended August 2021 at USD 633.6 bn – up USD 13 bn for the month.E-way bills which are an early good indicator of activity levels saw a rebound from 4 crores in May 2021 to 5 crores in July, dipped to 4.6 crores in August. The number remains substantially lower than the high of 7 crores recorded in March 21. GST collections for the month of July (collected in August) remained healthy at INR 1.12 lakh crores down -3.8% mom, but up 29.6% yoy.Financing conditions continue to remain buoyant with record amounts of IPOs and domestic share sales. Domestic demand and activity levels have continued to improve in August. The services sector continues to improve slowly, but the manufacturing sector continues to be well positioned given strong global growth outlook and resilient domestic demand. Liquidity conditions remain benign and foreign exchange reserves continue to remain strong. With the pace and scale of Covid-19 vaccination continuing to improve, growth should remain good. Any third wave Covid-19 related lock-downs can likely sputter the improving growth trajectory.
Equity MarketTThe BSE-30 Index and Nifty-50 Index ended at record high levels, gaining 9.4% and 8.7% and India was the best performing market among global markets. Globally, rising Covid cases and consequent restrictions weighed on sentiment but hawkish expectations from Jackson Hole failed to materialize, supporting risk assets. In India, new Covid cases remained under control (30-40k) but worsening situation in the state of Kerala kept authorities on alert. Vaccinations gathered pace (~10mn+ doses on 2 days) and by end-Aug, India had inoculated atleast 50% of adult population with 1 dose and 15% with both doses. Rising regulatory concerns in China and push on “common prosperity” seemed to support other EMs, including India. Resultantly FIIs turned net buyers again (+$ 385 mn) while DII buying (+$1.2 bn) was driven by domestic MFs. In sectoral trends, IT / Energy / Utilities were the top performers while Realty / Metals were the laggards. In sectoral trends, Realty and Metals were the best performers while autos, utilities and energy lagged.On the global front, the US Federal Reserve kept the benchmark interest rates unchanged, at the record-low level of near zero. Spread of the Delta variant specially in unvaccinated parts of the population in the US is raising concerns of delay in the revival of economic growth and hence job markets – which are still far from full employment. In its most recent policy meet too, the Fed has chosen to maintain a vague stance on the path of evolution of its monetary stance even as some indications are suggestive of a possible exit from monetary accommodation by the end of this year. This is likely to unsettle markets although the degree of weakness will depend on the extent of the Fed’s unwind from monetary accommodation, which presently is running at ~US$120 bn/mth.Back in India, after a brief hiatus, domestic economic activity indicators continue to stabilise. Early data for July’21 indicate that 81.3% of indicators were in the positive territory, up from 69.7% as per early data for June’21. Final data for June’21 indicate that 76% of indicators were in the positive territory. GST collections in Aug’21 stood at INR 1,120bn, above the INR 1trn mark for the second consecutive month, although down 4% month-on-month due to seasonality. On a year-
Market Update
Source : Internal, https://www.worldometers.info/coronavirus/

3 of 49
on-year(YoY) basis, collections grew 30%, with domestic GST expanding 27% YoY, and import GST rising by 39% YoY. On a 2-years basis too, Aug’21 collections expanded 7%.The pace of vaccination has accelerated to over 10mn doses/day. This juxtaposed with various seroprevalence studies indicate India can well achieve herd immunity by the end of CY21. This will help keep a potential third wave under check and enable the economy to stabilise to pre-covid levels earlier than anticipated. Recovery in the manufacturing sector continues to lead the services sector as the latter does suffer due to regional lockdowns and limited social interactions.Cumulative rainfall deficit has widened to 9% (from Long Period Average or LPA) as of September 2nd, which falls within normal range (±10% from LPA). The rise in deficit reflects weak rainfall in August. However, spatial distribution remains broadly supportive with 53% of the country (area-wise) receiving normal rainfall. Sowing which had a delayed start, is gradually catching-up to last year levels, tracking at -1.8%YoY. We don’t expect kharif output to get impacted as rainfall in key producer states has been normal. That said, if reservoir levels reduce further it could impact rabi crops. Food prices remain moderate though is monitorable from the perspective of inflation expectations.On the policy front, the key development was the announcement of the National Asset Monetisation Pipeline, a program which is expected to run in parallel with the Govt’s ambitious National Infrastructure Pipeline program envisaging investments of ~US$1.25 trn over the next 4-5 years. This asset recycling in our view further strengthens our belief in India’s ability to kickstart a fresh investment cycle in the coming years.Equity markets have witnessed quite a comeback during the last 15 months and valuations (basis historic earnings) for the leading indices “optically” seem to be at 30% premium to long-term averages. However, once we adjust the earnings for a normalized 12-month forward earnings and also adjust for the lower cost of capital, valuations are either in-line with long-term averages or at a mild premium.The primary markets, on the other hand, continue to be vibrant as many new-age businesses get listed offering investors an opportunity to participate in their growth journey. The investors, however, need to exercise caution in valuing these fast growing but cash-guzzling businesses.Keeping all the above in view, we think risk-reward in the markets are quite evenly balanced at this stage. We continue with our view that the Indian economy should witness a recovery in 2021. The potential 3rd wave may slow down the activity levels, but a high vaccination rate of the population makes us believe that hospitalizations will remain low (as is seen in some of the countries where 3rd wave is underway and where vaccination rates are high). The damage to economic activity, hence, should remain limited. We continue with our pro-cyclical stance with investments in sectors like financials, industrials, consumer discretionary. We continue to remain invested in technology and healthcare as well but have moderated our positions due to sharp run-up in the space. India is well-positioned to commence on a new economic upcycle over the next few years, which can mean broad-based improvement across a variety of industries. This offers equity investors an opportunity to benefit over the medium to long term. We would recommend investors to continue with their SIPs and use any volatility in the equity markets to increase their equity allocation through lump-sum investments. Our chosen path to portfolio construction is a balanced approach regards sector exposure, market cap bias and the balance between growth and value. In general, our portfolios continue to be positioned for better risk-adjusted return outcomes over a 3-5-year period.
Fixed Income MarketEconomic activity gathered further momentum in August as Covid-19 cases remained stable & mobility increased. Fast pace of vaccination with almost 36.4% of adult population having taken one dose and 10.8% of population vaccinated with two doses (as on August end) also added confidence. Services PMI jumped sharply in August to 56.7 from 45.4 in previous month as more service establishments re-opened, however, manufacturing PMI marginally moderated to 52.3 from 55.3 reflecting supply side constraints & elevated price pressure. July eight core sector output rose by 9.4% vs 8.9% for previous month as all core industries except crude oil production witnessed y-o-y growth. On a sequential basis, the core sector output grew by 5.4% mom in July 2021. Q1FY22 GDP came in at 20.1% largely due to base effect. The headline CPI for July came in at 5.59% versus 6.26% in June 2021 and marginally lower than the market expectations. The downward movement in CPI was driven by higher than expected softening of food prices, slight moderation in core CPI and favorable base effects. Food inflation came down to 3.96% versus 5.15% in June 2021 as it moderated across most food categories (except proteins & vegetables). Food inflation may likely moderate further in coming months, due to easing of supply chains and base effects. Core Inflation came in at 6.02%, a marginal moderation from the previous 6.3%. The August trade deficit further widened to USD 13.9 bn from the previous month of USD 11.2 bn, as the imports normalized more in line of economic momentum. Imports in August increased 51.5% y-o-y and 1.3% m-o-m while the August exports increased 45.2% y-o-y & declined 6.5% on m-o-m basis. For 5mFY22, cumulative trade deficit is at USD 55.9 bn compared to USD 22.7 bn in 5mFY21 & USD 77.3 bn in 5mFY20. With the normalization in activity levels, FY2022 is again expected to slip in to trade deficit after recording a trade surplus in the previous year. The foreign exchange reserves continue to surge and has reached a record high of USD 633.6 bn on the back of robust FPIs inflow in equity market and provides comfort on external stability. During the August month, FPIs turned net buyers once again in equity segment after reporting outflows in the previous month. Encouragingly in the debt segment, FPIs turned net buyers in August with ~ INR 3,220 cr inflow after many months of reporting outflows. July GST revenues (collected in August) remained healthy at Rs 1.12 lac cr, though marginally down from the previous month of Rs 1.16 lac cr. Gross GST collections in 5mFY22 was at Rs5.65 lac cr which is 55% higher than 5MFY21 and even ~10% higher than the pre-pandemic 5mFY20. Healthy gross tax revenues – up by 83% y-o-y in 4mFY22 with marginal decline in expenditure of ~-4.7% in 4mFY22 has helped in containing the Fiscal Deficit in 4mFY22 at ~21.3% of FY22 Budget Estimates and provides more confidence that Central Govt will be able to contain its FY22 fiscal deficit within the budgeted target of 6.8% of GDP. Rates on highly rated Corporate bonds continued with a downward bias, especially at the short end – 1 to 5 year segment which rallied by 15-25 bps, while the longer end – 6 to 10 year segment rallied by 5 – 10 bps. G-Sec also rallied but underperformed the corporate bonds in 1 to 5 yr segment and outperformed in 6 to 10 year segment. However, 10 yr G-Sec benchmark ended the month 2 bps higher at 6.22%. OutlookAmidst the continuing growth uncertainty, we believe RBI will continue to maintain its growth supportive stance through the most of CY2021, while keeping a close watch on inflation. RBI’s upward revision of projected headline inflation for FY22 by 60 bps to 5.70% and still maintaining accommodative policy stance provides clarity in that direction. Having said that, we feel that RBI has taken a gradual approach towards the policy normalisation with the first initial step towards liquidity re-calibration amid massive built-up of surplus systemic liquidity. Second step of policy normalisation could be narrowing the policy rate corridor back to 25 bps by hiking the reverse repo rates in total of 40 bps, which is expected beginning of the next calendar year. Third step – which is to go for outright repo rate hike is still sometime away and would depend on the growth / inflation dynamics in a normal situation which is expected to be achieved only in FY23 or so.Against the backdrop of gradual normalization of policy rate corridor, we feel that 6-9 months segment of the yield curve is apt for risk-averse investors. At the same time, 2-5 years segment of the yield curve remains attractively placed from carry perspective given current steepness of the yield curve. This segment is neither too short to be adversely impacted by low yields nor too long to be exposed to high interest rate volatility amidst elevated fiscal supply. Accordingly, debt funds operating in the 2 – 5 year segment can provide the core allocation opportunities for the medium to long term investors. Investors with long term horizon & ability to absorb short term volatility may consider longer-end of the curve as a tactical allocation, which finds merit on the back of conviction that RBI will manage the yield curve and may support the long-term yields through the tools like Government Securities Acquisition Program (G-SAPs) and secondary market intervention. While the credit environment is expected to improve over the medium term, we believe credit dispersion will continue as of now and one must be cautious when getting onto the credit side. Selective AA / AA+ rated credits backed by strong conviction of improvement on their credit metrics may provide favorable risk-reward opportunities.
Market Update Contd...
Source : Internal, https://www.worldometers.info/coronavirus/

4 of 49
Invesco India Tax Plan(An open ended equity linked saving scheme with a statutory lock in of 3 years and tax benefit)
Low
Moderate High
Low to
Moderately Very
Mod
erate
High High
Investors understand that their principalwill be at very high risk
RISKOMETERSuitable for Investors who are seeking*l Capital appreciation over long-terml Investments in equity and equity-related instruments
*Investors should consult their financial advisers if in doubt about whether the product is suitable for them.
Industry Classification3
% of Net AssetsBanks 24.66%Software 13.75%Petroleum Products 8.54%Finance 6.11%Consumer Durables 5.22%Auto Ancillaries 5.03%Cement & Cement Products 3.98%Pharmaceuticals 3.93%Gas 3.70%Auto 3.44%Transportation 3.30%Chemicals 3.06%Industrial Products 2.68%Ferrous Metals 2.26%Capital Markets 1.96%Industrial Capital Goods 1.54%Telecom - Services 1.43%Consumer Non Durables 1.40%Construction 1.30%Aerospace & Defense 1.20%3Industrywise Classification as per AMFI.
IDCW DistributionRecord Date Rate (`/Unit) Cum-IDCW
NAV p. u. (`)IDCW Option19-Feb-21 2.30 22.7920-Dec-19 1.68 19.7318-Jan-19 1.77 19.89Direct Plan - IDCW Option19-Feb-21 2.30 25.8820-Dec-19 1.68 21.8818-Jan-19 1.77 21.60Past performance may or may not be sustained in future. IDCW is on face value of ` 10/- per unit. After the payment of IDCW, the per unit NAV will fall to the extent of Payout of Income Distribution cum capital withdrawal option and applicable statutory levy, if any.
Investment ObjectiveTo generate long term capital appreciation from a diversified portfolio of predominantly equity and equity-related instruments.
Key FactsLoad Structure Entry Load Nil Exit Load1 NilMinimum Investment ` 500/- & in multiples of ` 500/- thereafterAdditional Purchase` 500/- & in multiples of ` 500/- thereafterDate of Allotment 29th December, 2006NAV p.u. (`) As on 31st August, 2021Growth 79.83 IDCW 23.83 Direct PlanGrowth 90.12 IDCW 27.60 Portfolio Turnover Ratio (1 Year) 0.80Weighted Average Expense Ratio2 for the monthRegular 2.05%Direct 0.94%Benchmark IndexS&P BSE 200 TRIAAuM for the month of August 2021: ` 1,801.43 croresAuM as on31st August, 2021: ` 1,842.45 croresFund Manager & ExperienceAmit Nigam Total Experience 21 YearsExperience in managing this fund:Since September 3, 2020Dhimant KothariTotal Experience 16 Years Experience in managing this fund: Since March 29, 2018
Asset AllocationEquity Holdings 98.47%Cash & Cash Equivalent 1.53%
Performance AttributesStandard Deviation 6.31%Sharpe Ratio 0.16Beta 0.95Based on 3 years, monthly data points (Risk-free rate of 3.38% based on Overnight MIBOR)
Fund P/E - FY22E 25.5Fund P/B 4.1
Financial CharacteristicsAverage Weighted Market Capitalisation ` 356,117 crores
Median Market Capitalisation ` 40,088 crores
Source : Factset, Internal Data Files
Portfolio (As on 31st August, 2021) No. of Holdings : 40Company % of Net
AssetsEquity & Equity Related Instruments 98.47Reliance Industries Ltd. 8.54ICICI Bank Ltd. 7.93HDFC Bank Ltd. 7.84Infosys Ltd. 7.63Axis Bank Ltd. 4.34Kotak Mahindra Bank Ltd. 3.56Tech Mahindra Ltd. 3.42L&T Technology Services Ltd. 2.70Bajaj Finance Ltd. 2.36Tata Steel Ltd. 2.26Bajaj Auto Ltd. 2.14UltraTech Cement Ltd. 2.14Gland Pharma Ltd. 2.04VIP Industries Ltd. 1.98HDFC Asset Management Company Ltd. 1.96TCI Express Ltd. 1.95Vinati Organics Ltd. 1.90JB Chemicals & Pharmaceuticals Ltd. 1.89Indraprastha Gas Ltd. 1.86Gujarat Gas Ltd. 1.84Birla Corporation Ltd. 1.84
Company % of Net Assets
Minda Industries Ltd. 1.81KEI Industries Ltd. 1.79Motherson Sumi Systems Ltd. 1.71Whirlpool of India Ltd. 1.65Titan Company Ltd. 1.59Honeywell Automation India Ltd. 1.54MRF Ltd. 1.51Sterlite Technologies Ltd. 1.43Cholamandalam Investment and Finance Co. Ltd. 1.43United Breweries Ltd. 1.40Indian Railway Catering And Tourism Corporation Ltd.
1.35
G R Infraprojects Ltd. 1.30Ashok Leyland Ltd. 1.30MTAR Technologies Ltd. 1.20SBI Cards and Payment Services Ltd. 1.19Atul Ltd. 1.15Repco Home Finance Ltd. 1.13RBL Bank Ltd. 1.00Graphite India Ltd. 0.90Cash & Cash Equivalent 1.53Total 100.00
Lumpsum Performance (As on 31st August, 2021)
PeriodReturns % Value of ` 10,000 invested
Fund Benchmark Addl. BM Fund Benchmark Addl. BMS&P BSE 200 TRI Nifty 50 TRI S&P BSE 200 TRI Nifty 50 TRI
1 Year 52.17% 55.45% 52.24% 15,217 15,545 15,2243 Years 14.06% 14.96% 14.94% 14,844 15,198 15,1925 Years 15.25% 15.82% 15.70% 20,344 20,852 20,7387 Years 15.03% 13.93% 12.92% 26,708 24,953 23,45410 Years 16.72% 15.15% 14.48% 47,014 41,064 38,718Since Inception 15.20% 12.22% 11.82% 79,830 54,341 51,541(29 December, 2006)Past performance may or may not be sustained in future. BM - Benchmark. Returns above 1 year are CAGR. Different plans have different expense structure. For calculating returns since inception, NAV as on the date of allotment is taken as Rs. 10/-. Face Value per unit is Rs. 10/-. Please refer Page nos. 38-42 for performance of other Schemes managed by the Fund Managers and Page nos. 43-47 for performance of Direct Plans and respective Disclaimers. Also refer Note 1 below.
SIP Performance (As on 31st August, 2021)
SIPInvestment
Total amountinvested
(`)
Scheme S&P BSE 200 TRI Nifty 50 TRI2.1
Market value (`)
SIP Returns (%) XIRR
Market value (`)
SIP Returns (%) XIRR
Market value (`)
SIP Returns (%) XIRR
1 Year 120,000 150,057 49.50% 152,074 53.03% 150,620 50.48%3 Years 360,000 538,114 27.93% 546,177 29.04% 535,668 27.59%5 Years 600,000 973,896 19.46% 990,025 20.13% 983,594 19.86%7 Years 840,000 1,529,438 16.81% 1,550,639 17.20% 1,527,303 16.77%10 Years 1,200,000 3,043,595 17.71% 2,842,535 16.44% 2,726,714 15.67%Since Inception 1,760,000 6,670,330 16.55% 5,482,897 14.24% 5,186,122 13.58%(29 December, 2006)Past performance may or may not be sustained in future. 2.1Additional Benchmark. Load is not taken into consideration. XIRR method is used to calculate SIP returns assuming investment of Rs. 10,000/- on the first working day of every month. The above investment simulation is for illustrative purpose only and should not be construed as a promise on minimum returns and safeguard of capital. Also refer Note 1 below.Note 1 : Returns are of existing plan (non - direct plan) - Growth Option. Benchmark returns are calculated using Total Return variant of respective Benchmark Index.
Fund P/E - FY22E is current price to earnings for FY22E, Fund P/B is 12 months trailing price to book value. Both are arrived at using Weighted Harmonic Mean which is an average resulting from the multiplication of the reciprocal of the observation for each component by the weightage of that stock in the portfolio/index. For 1,2, Note on Direct Plan, IDCW Distribution and Disclaimer, refer page no. 49. IDCW - Income Distribution cum capital withdrawal option.

5 of 49
Invesco India Multicap Fund(Multi Cap Fund - An open ended equity scheme investing across large cap, mid cap, small cap stocks)
Low
Moderate High
Low to
Moderately Very
Mod
erate
High High
Investors understand that their principalwill be at very high risk
RISKOMETERSuitable for Investors who are seeking*l Capital appreciation over long-terml Investments in equity and equity related instruments
across market capitalization
*Investors should consult their financial advisers if in doubt about whether the product is suitable for them.
Industry Classification3
% of Net AssetsBanks 17.02%Software 10.70%Pharmaceuticals 9.13%Auto Ancillaries 8.77%Finance 6.17%Consumer Durables 6.00%Cement & Cement Products 4.35%Aerospace & Defense 4.04%Construction 3.50%Industrial Products 3.28%Ferrous Metals 3.03%Consumer Non Durables 2.78%Construction Project 2.75%Capital Markets 2.59%Transportation 2.30%Chemicals 2.08%Retailing 2.05%Auto 1.91%Gas 1.43%Healthcare Services 1.29%Telecom - Services 1.05%Insurance 1.05%3Industrywise Classification as per AMFI.
IDCW DistributionRecord Date Rate (`/Unit) Cum-IDCW
NAV p. u. (`)IDCW Option8-Aug-14 2.50 26.91Direct Plan - IDCW Option8-Aug-14 2.55 27.30Past performance may or may not be sustained in future. IDCW is on face value of ̀ 10/- per unit. After the payment of IDCW, the per unit NAV will fall to the extent of Payout of Income Distribution cum capital withdrawal option and applicable statutory levy, if any.
Investment ObjectiveTo generate capital appreciation by investing predominantly in Equity and Equity Related Instruments across market capitalization.
Key FactsLoad Structure Entry Load Nil Exit Load1 •Nil-ifupto10%ofUnitsallottedare
redeemed / switched-out within 1 year from the date of allotment.
•1%-foranyredemption/switch-out in excess of 10% of units allotted within one year from the date of allotment.
•Nil - if units are redeemed orswitched-out after 1 year from the date of allotment.
Switch between the Plans under the Scheme, please refer page no. 49.
Minimum Investment ` 1,000/- & in multiples of ` 1/- thereafterAdditional Purchase` 1,000/- & in multiples of ` 1/- thereafterDate of Allotment 17th March, 2008NAV p.u. (`) As on 31st August, 2021Growth 77.31 IDCW 70.10 Direct PlanGrowth 87.45 IDCW 79.16 Portfolio Turnover Ratio (1 Year) 0.81Weighted Average Expense Ratio2 for the monthRegular 2.24%Direct 0.96%Benchmark IndexNifty 500 Multicap 50:25:25AAuM for the month of August 2021: ` 1,523.92 croresAuM as on31st August, 2021: ` 1,573.08 croresFund Manager & ExperiencePranav GokhaleTotal Experience 19 Years Experience in managing this fund: Since March 29, 2018Amit NigamTotal Experience 21 Years Experience in managing this fund: Since September 3, 2020
Asset AllocationEquity Holdings 97.27%Mutual Fund Units 0.98%Cash & Cash Equivalent 1.75%
Performance AttributesStandard Deviation 7.03%Sharpe Ratio 0.15Beta 0.95Based on 3 years, monthly data points (Risk-free rate of 3.38% based on Overnight MIBOR)
Fund P/E - FY22E 22.5Fund P/B 3.5
Financial CharacteristicsAverage Weighted Market Capitalisation ` 101,742 crores
Median Market Capitalisation ` 20,361 crores
Source : Factset, Internal Data Files
Portfolio (As on 31st August, 2021) No. of Holdings : 47Company % of Net AssetsEquity & Equity Related Instruments 97.27ICICI Bank Ltd. 6.69Axis Bank Ltd. 4.95Mphasis Ltd. 3.03State Bank of India 3.02Bharat Electronics Ltd. 2.94Tech Mahindra Ltd. 2.90Birla Corporation Ltd. 2.82Larsen & Toubro Ltd. 2.75JB Chemicals & Pharmaceuticals Ltd. 2.71Gland Pharma Ltd. 2.65UTI Asset Management Company Ltd. 2.59Birlasoft Ltd. 2.55PNC Infratech Ltd. 2.33Minda Industries Ltd. 2.31TCI Express Ltd. 2.30VIP Industries Ltd. 2.27L&T Technology Services Ltd. 2.22Cholamandalam Investment and Finance Company Ltd.
2.16
Vinati Organics Ltd. 2.08V-Mart Retail Ltd. 2.05Whirlpool of India Ltd. 2.03Balkrishna Industries Ltd. 1.99Cipla Ltd. 1.94Bajaj Auto Ltd. 1.91
Company % of Net AssetsDr. Reddy’s Laboratories Ltd. 1.83Sundram Fasteners Ltd. 1.78Tata Steel Ltd. 1.77Bajaj Finance Ltd. 1.77Orient Electric Ltd. 1.70Timken India Ltd. 1.68United Breweries Ltd. 1.62AIA Engineering Ltd. 1.60Jamna Auto Industries Ltd. 1.56Ambuja Cements Ltd. 1.53Indraprastha Gas Ltd. 1.43RBL Bank Ltd. 1.29Krsnaa Diagnostics Ltd. 1.29Ratnamani Metals & Tubes Ltd. 1.26G R Infraprojects Ltd. 1.17SBI Cards and Payment Services Ltd. 1.16DFM Foods Ltd. 1.16Motherson Sumi Systems Ltd. 1.14MTAR Technologies Ltd. 1.10Repco Home Finance Ltd. 1.07Indian Bank 1.07Sterlite Technologies Ltd. 1.05SBI Life Insurance Company Ltd. 1.05Mutual Fund Units 0.98Mutual Fund Units 0.98Cash & Cash Equivalent 1.75Total 100.00
Lumpsum Performance (As on 31st August, 2021)
PeriodReturns % Value of ` 10,000 invested
FundBenchmark Addl. BM
FundBenchmark Addl. BM
Nifty 500 Multicap 50:25:25 Nifty 50 TRI Nifty 500 Multicap
50:25:25 Nifty 50 TRI1 Year 64.91% 64.92% 52.24% 16,491 16,492 15,2243 Years 13.64% 14.92% 14.94% 14,681 15,183 15,1925 Years 14.63% 15.62% 15.70% 19,798 20,668 20,7387 Years 15.07% 14.63% 12.92% 26,760 26,054 23,45410 Years 18.25% 15.92% 14.48% 53,539 43,879 38,718Since Inception 16.40% 13.51% 11.77% 77,310 55,098 44,745(17 March, 2008)Past performance may or may not be sustained in future. BM - Benchmark. Returns above 1 year are CAGR. Different plans have different expense structure. For calculating returns since inception, NAV as on the date of allotment is taken as Rs. 10/-. Face Value per unit is Rs. 10/-. Please refer Page nos. 38-42 for performance of other Schemes managed by the Fund Managers and Page nos. 43-47 for performance of Direct Plans and respective Disclaimers. Also refer Note 1 below.SIP Performance (As on 31st August, 2021)
SIPInvestment
Total amountinvested
(`)
Scheme Nifty 500 Multicap 50:25:25 Nifty 50 TRI2.1
Market value (`)
SIP Returns (%) XIRR
Market value (`)
SIP Returns (%) XIRR
Market value (`)
SIP Returns (%) XIRR
1 Year 120,000 157,743 63.05% 156,917 61.58% 150,620 50.48%3 Years 360,000 567,163 31.87% 574,658 32.86% 535,668 27.59%5 Years 600,000 981,157 19.76% 1,002,377 20.64% 983,594 19.86%7 Years 840,000 1,521,634 16.67% 1,571,297 17.57% 1,527,303 16.77%10 Years 1,200,000 3,212,140 18.71% 2,999,545 17.44% 2,726,714 15.67%Since Inception _ _ _ _ _ _ _(17 March, 2008)Past performance may or may not be sustained in future. 2.1Additional Benchmark. Returns for other periods not available as the Scheme was close-ended and re-opened for purchase on March 18, 2011, first SIP installment is taken as April 1, 2011. Load is not taken into consideration. XIRR method is used to calculate SIP returns assuming investment of Rs. 10,000/- on the first working day of every month. The above investment simulation is for illustrative purpose only and should not be construed as a promise on minimum returns and safeguard of capital. Also refer Note 1 below.Note 1 : Returns are of existing plan (non - direct plan) - Growth Option. Benchmark returns are calculated using Total Return variant of respective Benchmark Index.
Fund P/E - FY22E is current price to earnings for FY22E, Fund P/B is 12 months trailing price to book value. Both are arrived at using Weighted Harmonic Mean which is an average resulting from the multiplication of the reciprocal of the observation for each component by the weightage of that stock in the portfolio/index. For 1,2, Note on Direct Plan, IDCW Distribution and Disclaimer, refer page no. 49.
IDCW - Income Distribution cum capital withdrawal option.

6 of 49
Invesco India Contra Fund(An open ended equity scheme following contrarian investment strategy)
Low
Moderate High
Low to
Moderately Very
Mod
erate
High High
Investors understand that their principalwill be at very high risk
RISKOMETERSuitable for Investors who are seeking*l Capital appreciation over long-terml Investments predominantly in equity and equity related
instruments through contrarian investing.
*Investors should consult their financial advisers if in doubt about whether the product is suitable for them.
Industry Classification3
% of Net AssetsBanks 25.83%Software 13.66%Pharmaceuticals 7.42%Petroleum Products 5.61%Cement & Cement Products 4.79%Power 4.61%Construction 4.52%Auto 4.15%Construction Project 3.56%Capital Markets 2.81%Ferrous Metals 2.66%Auto Ancillaries 2.59%Gas 2.48%Industrial Products 2.42%Telecom - Services 2.42%Consumer Durables 2.24%Finance 2.11%Aerospace & Defense 2.07%Insurance 1.40%Pesticides 1.14%Chemicals 0.26%3Industrywise Classification as per AMFI.
IDCW DistributionRecord Date Rate (`/Unit) Cum-IDCW
NAV p. u. (`)IDCW Option26-Mar-21 2.75 30.7628-Mar-19 2.07 26.1923-Mar-18 3.25 27.18Direct Plan - IDCW Option26-Mar-21 2.75 37.6528-Mar-19 2.07 30.8823-Mar-18 3.25 31.11Past performance may or may not be sustained in future. IDCW is on face value of `10/- per unit. After the payment of IDCW, the per unit NAV will fall to the extent of Payout of Income Distribution cum capital withdrawal option and applicable statutory levy, if any.
Investment ObjectiveTo generate capital appreciation by investing predominantly in Equity and Equity Related Instruments through contrarian investing.
Key FactsLoad Structure Entry Load Nil Exit Load1 •Nil-ifupto10%ofUnitsallottedare
redeemed / switched-out within 1 year from the date of allotment.
•1% - for any redemption / switch-out in excess of 10% of units allotted within one year from the date of allotment.
•Nil - if units are redeemed or switched-out after 1 year from the date of allotment.
Switch between the Plans under the Scheme, please refer page no. 49.
Minimum Investment ` 1,000/- & in multiples of ` 1/- thereafterAdditional Purchase` 1,000/- & in multiples of ` 1/- thereafterDate of Allotment 11th April, 2007NAV p.u. (`) As on 31st August, 2021Growth 74.82 IDCW 33.58 Direct PlanGrowth 83.80 IDCW 42.08 Portfolio Turnover Ratio (1 Year) 0.67Weighted Average Expense Ratio2 for the monthRegular 1.80%Direct 0.55%Benchmark IndexS&P BSE 500 TRIAAuM for the month of August 2021: ` 7,964.28 croresAuM as on31st August, 2021: ` 8,198.57 croresFund Manager & ExperienceTaher BadshahTotal Experience 27 Years Experience in managing this fund: Since January 13, 2017Dhimant KothariTotal Experience 16 Years Experience in managing this fund: Since May 19, 2020
Asset AllocationEquity Holdings 98.73%Cash & Cash Equivalent 1.27%
Performance AttributesStandard Deviation 6.58%Sharpe Ratio 0.16Beta 0.98Based on 3 years, monthly data points (Risk-free rate of 3.38% based on Overnight MIBOR)
Fund P/E - FY22E 19.4Fund P/B 2.9
Financial CharacteristicsAverage Weighted Market Capitalisation ` 304,721 crores
Median Market Capitalisation ` 36,197 crores
Source : Factset, Internal Data Files
Portfolio (As on 31st August, 2021) No. of Holdings : 50Company % of Net AssetsEquity & Equity Related Instruments 98.73ICICI Bank Ltd. 8.19HDFC Bank Ltd. 7.21Infosys Ltd. 6.45Axis Bank Ltd. 4.37Reliance Industries Ltd. 4.17State Bank of India 4.04Sun Pharmaceutical Industries Ltd. 3.88UltraTech Cement Ltd. 3.77Larsen & Toubro Ltd. 3.56Tech Mahindra Ltd. 3.05UTI Asset Management Company Ltd. 2.81Ashok Leyland Ltd. 2.66HCL Technologies Ltd. 2.63Bharti Airtel Ltd. 2.42Tata Power Company Ltd. 2.31Motherson Sumi Systems Ltd. 2.15Bharat Electronics Ltd. 2.07Tata Steel Ltd. 1.96KEI Industries Ltd. 1.70KNR Constructions Ltd. 1.68Indraprastha Gas Ltd. 1.59Birlasoft Ltd. 1.52Bharat Petroleum Corporation Ltd. 1.44The Phoenix Mills Ltd. 1.42ICICI Prudential Life Insurance Co. Ltd. 1.40NTPC Ltd. 1.38
Company % of Net AssetsAurobindo Pharma Ltd. 1.30VIP Industries Ltd. 1.30Cipla Ltd. 1.23Rallis India Ltd. 1.14DCB Bank Ltd. 1.09Indian Railway Finance Corporation Ltd. 1.09Ambuja Cements Ltd. 1.03Shriram Transport Finance Co. Ltd. 1.02Maruti Suzuki India Ltd. 1.01Bata India Ltd. 0.94KEC International Ltd. 0.92Equitas Small Finance Bank Ltd. 0.91Petronet LNG Ltd. 0.89JB Chemicals & Pharmaceuticals Ltd. 0.76AIA Engineering Ltd. 0.72Mishra Dhatu Nigam Ltd. 0.69PNC Infratech Ltd. 0.61Dilip Buildcon Ltd. 0.57Escorts Ltd. 0.48MRF Ltd. 0.44Gujarat Narmada Valley Fertilizers and Chemicals Ltd.
0.26
Ajanta Pharma Ltd. 0.24G R Infraprojects Ltd. 0.23RBL Bank Ltd. 0.01Cash & Cash Equivalent 1.27Total 100.00
Lumpsum Performance (As on 31st August, 2021)
PeriodReturns % Value of ` 10,000 invested
Fund Benchmark Addl. BM Fund Benchmark Addl. BMS&P BSE 500 TRI Nifty 50 TRI S&P BSE 500 TRI Nifty 50 TRI
1 Year 50.91% 57.38% 52.24% 15,091 15,738 15,2243 Years 14.09% 14.88% 14.94% 14,857 15,165 15,1925 Years 16.67% 15.77% 15.70% 21,631 20,805 20,7387 Years 16.09% 13.97% 12.92% 28,481 25,026 23,45410 Years 17.43% 15.09% 14.48% 49,947 40,839 38,718Since Inception 15.00% 12.69% 12.23% 74,820 55,833 52,677(11 April, 2007)Past performance may or may not be sustained in future. BM - Benchmark. Returns above 1 year are CAGR. Different plans have different expense structure. For calculating returns since inception, NAV as on the date of allotment is taken as Rs. 10/-. Face Value per unit is Rs. 10/-. Please refer Page nos. 38-42 for performance of other Schemes managed by the Fund Managers and Page nos. 43-47 for performance of Direct Plans and respective Disclaimers. Also refer Note 1 below.SIP Performance (As on 31st August, 2021)
SIPInvestment
Total amountinvested
(`)
Scheme S&P BSE 500 TRI Nifty 50 TRI2.1
Market value (`)
SIP Returns (%) XIRR
Market value (`)
SIP Returns (%) XIRR
Market value (`)
SIP Returns (%) XIRR
1 Year 120,000 150,270 49.87% 153,191 54.99% 150,620 50.48%3 Years 360,000 541,736 28.43% 551,856 29.81% 535,668 27.59%5 Years 600,000 984,326 19.89% 990,907 20.17% 983,594 19.86%7 Years 840,000 1,577,676 17.68% 1,551,973 17.22% 1,527,303 16.77%10 Years 1,200,000 3,228,358 18.80% 2,850,851 16.50% 2,726,714 15.67%Since Inception 1,730,000 6,620,104 16.98% 5,311,449 14.33% 5,029,777 13.66%(11 April, 2007)Past performance may or may not be sustained in future. 2.1Additional Benchmark. Load is not taken into consideration. XIRR method is used to calculate SIP returns assuming investment of Rs. 10,000/- on the first working day of every month. The above investment simulation is for illustrative purpose only and should not be construed as a promise on minimum returns and safeguard of capital. Also refer Note 1 below. Note 1 : Returns are of existing plan (non - direct plan) - Growth Option. Benchmark returns are calculated using Total Return variant of respective Benchmark Index.
Fund P/E - FY22E is current price to earnings for FY22E, Fund P/B is 12 months trailing price to book value. Both are arrived at using Weighted Harmonic Mean which is an average resulting from the multiplication of the reciprocal of the observation for each component by the weightage of that stock in the portfolio/index. For 1,2, Note on Direct Plan, IDCW Distribution and Disclaimer, refer page no. 49.
IDCW - Income Distribution cum capital withdrawal option.

7 of 49
Invesco India Largecap Fund(Large Cap Fund - An open ended equity scheme predominantly investing in large cap stocks)
Low
Moderate High
Low to
Moderately Very
Mod
erate
High High
Investors understand that their principalwill be at very high risk
RISKOMETERSuitable for Investors who are seeking*l Capital appreciation over long-terml Investments predominantly in equity and equity-related
instruments of largecap companies
*Investors should consult their financial advisers if in doubt about whether the product is suitable for them.
Industry Classification3
% of Net AssetsBanks 32.78%Software 17.82%Petroleum Products 9.13%Pharmaceuticals 5.48%Construction Project 4.30%Cement & Cement Products 3.77%Auto Ancillaries 3.35%Telecom - Services 3.22%Finance 3.21%Ferrous Metals 2.62%Consumer Durables 2.39%Auto 2.02%Consumer Non Durables 1.80%Construction 1.69%Industrial Capital Goods 1.30%Aerospace & Defense 1.13%Capital Markets 1.04%Chemicals 0.92%Transportation 0.83%3Industrywise Classification as per AMFI.
IDCW DistributionRecord Date Rate (`/Unit) Cum-IDCW
NAV p. u. (`)IDCW Option26-Feb-21 2.40 22.8229-May-17 1.70 17.7722-Mar-16 1.90 16.08Direct Plan - IDCW Option26-Feb-21 2.40 25.6429-May-17 1.70 18.7522-Mar-16 1.90 16.62Past performance may or may not be sustained in future. IDCW is on face value of ̀ 10/- per unit. After the payment of IDCW, the per unit NAV will fall to the extent of Payout of Income Distribution cum capital withdrawal option and applicable statutory levy, if any.
Investment ObjectiveTo generate capital appreciation by investing predominantly in Largecap companies.
Key FactsLoad Structure Entry Load Nil Exit Load1 Nil
Minimum Investment ` 1,000/- & in multiples of ` 1/- thereafterAdditional Purchase` 1,000/- & in multiples of ` 1/- thereafterDate of Allotment 21st August, 2009NAV p.u. (`) As on 31st August, 2021Growth 43.31 IDCW 25.03 Direct PlanGrowth 49.18 IDCW 28.68
Portfolio Turnover Ratio (1 Year) 0.74Weighted Average Expense Ratio2 for the monthRegular 2.67%Direct 1.07%Benchmark IndexNifty 50 TRIAAuM for the month of August 2021: ` 383.43 croresAuM as on31st August, 2021: ` 397.70 croresFund Manager & ExperienceAmit NigamTotal Experience 21 Years Experience in managing this fund: Since September 3, 2020Nitin GosarTotal Experience 16 Years Experience in managing this fund: Since March 29, 2018
Asset AllocationEquity Holdings 98.80%Cash & Cash Equivalent 1.20%
Performance AttributesStandard Deviation 6.22%Sharpe Ratio 0.16Beta 0.94Based on 3 years, monthly data points (Risk-free rate of 3.38% based on Overnight MIBOR)
Fund P/E - FY22E 24.0Fund P/B 3.7
Financial CharacteristicsAverage Weighted Market Capitalisation ` 442,148 crores
Median Market Capitalisation ` 80,927 crores
Source : Factset, Internal Data Files
Portfolio (As on 31st August, 2021) No. of Holdings : 31
Company % of Net AssetsEquity & Equity Related Instruments 98.80HDFC Bank Ltd. 9.26Infosys Ltd. 9.16Reliance Industries Ltd. 9.13ICICI Bank Ltd. 9.08Kotak Mahindra Bank Ltd. 5.49Axis Bank Ltd. 5.24Tech Mahindra Ltd. 4.60Larsen & Toubro Ltd. 4.30State Bank of India 3.71Bharti Airtel Ltd. 3.22Bajaj Finance Ltd. 3.21Tata Steel Ltd. 2.62UltraTech Cement Ltd. 2.56Sun Pharmaceutical Industries Ltd. 2.48Mphasis Ltd. 2.33Motherson Sumi Systems Ltd. 2.10
Company % of Net AssetsBajaj Auto Ltd. 2.02United Breweries Ltd. 1.80Gland Pharma Ltd. 1.79L&T Technology Services Ltd. 1.72G R Infraprojects Ltd. 1.69VIP Industries Ltd. 1.40Siemens Ltd. 1.30Rolex Rings Ltd. 1.25JB Chemicals & Pharmaceuticals Ltd. 1.21Birla Corporation Ltd. 1.20MTAR Technologies Ltd. 1.13HDFC Asset Management Company Ltd. 1.04Whirlpool of India Ltd. 1.00Vinati Organics Ltd. 0.92TCI Express Ltd. 0.83Cash & Cash Equivalent 1.20Total 100.00
Lumpsum Performance (As on 31st August, 2021)
PeriodReturns % Value of ` 10,000 invested
FundBenchmark Addl. BM
FundBenchmark Addl. BM
Nifty 50 TRI S&P BSE Sensex TRI Nifty 50 TRI S&P BSE Sensex TRI 1 Year 50.07% 52.24% 50.55% 15,007 15,224 15,0553 Years 13.71% 14.94% 15.49% 14,706 15,192 15,4125 Years 13.38% 15.70% 16.48% 18,741 20,738 21,4517 Years 13.14% 12.92% 13.00% 23,771 23,454 23,57210 Years 14.43% 14.48% 14.72% 38,566 38,718 39,529Since Inception 12.95% 13.04% 13.22% 43,310 43,727 44,556(21 August, 2009)Past performance may or may not be sustained in future. BM - Benchmark. Returns above 1 year are CAGR. Different plans have different expense structure. For calculating returns since inception, NAV as on the date of allotment is taken as Rs. 10/-. Face Value per unit is Rs. 10/-. Please refer Page nos. 38-42 for performance of other Schemes managed by the Fund Managers and Page nos. 43-47 for performance of Direct Plans and respective Disclaimers. Also refer Note 1 below.
SIP Performance (As on 31st August, 2021)
SIPInvestment
Total amountinvested
(`)
Scheme Nifty 50 TRI S&P BSE Sensex TRI2.1
Market value (`)
SIP Returns (%) XIRR
Market value (`)
SIP Returns (%) XIRR
Market value (`)
SIP Returns (%) XIRR
1 Year 120,000 152,374 53.55% 150,620 50.48% 149,730 48.93%3 Years 360,000 530,779 26.91% 535,668 27.59% 534,049 27.37%5 Years 600,000 945,963 18.26% 983,594 19.86% 996,749 20.41%7 Years 840,000 1,454,760 15.41% 1,527,303 16.77% 1,550,429 17.20%10 Years 1,200,000 2,681,537 15.36% 2,726,714 15.67% 2,773,309 15.98%Since Inception 1,450,000 3,607,331 14.18% 3,647,582 14.34% 3,715,752 14.62%(21 August, 2009)Past performance may or may not be sustained in future. 2.1Additional Benchmark. Load is not taken into consideration. XIRR method is used to calculate SIP returns assuming investment of Rs. 10,000/- on the first working day of every month. The above investment simulation is for illustrative purpose only and should not be construed as a promise on minimum returns and safeguard of capital. Also refer Note 1 below. Note 1 : Returns are of existing plan (non - direct plan) - Growth Option. Benchmark returns are calculated using Total Return variant of respective Benchmark Index.
Fund P/E - FY22E is current price to earnings for FY22E, Fund P/B is 12 months trailing price to book value. Both are arrived at using Weighted Harmonic Mean which is an average resulting from the multiplication of the reciprocal of the observation for each component by the weightage of that stock in the portfolio/index. For 1,2, Note on Direct Plan, IDCW Distribution and Disclaimer, refer page no. 49.
IDCW - Income Distribution cum capital withdrawal option.

8 of 49
Invesco India Focused 20 Equity Fund(An open ended equity scheme investing in maximum 20 stocks across market capitalization (i.e. Multicap))
Industry Classification3
% of Net AssetsBanks 21.04%Software 14.76%Pharmaceuticals 10.69%Consumer Durables 7.79%Construction Project 6.56%Industrial Capital Goods 5.21%Capital Markets 5.11%Telecom - Services 5.10%Commercial Services 4.46%Finance 4.13%Insurance 3.33%Auto 3.12%Aerospace & Defense 2.76%Consumer Non Durables 1.95%3Industrywise Classification as per AMFI.
Investment ObjectiveTo generate capital appreciation by investing in upto 20 stocks across market capitalization.
Key FactsLoad Structure Entry Load Nil Exit Load1 •Nil-ifupto10%ofUnitsallottedare
redeemed / switched-out within 1 year from the date of allotment.
•1% - for any redemption / switch-out in excess of 10% of units allotted within one year from the date of allotment.
•Nil - if units are redeemed or switched-out after 1 year from the date of allotment.
Switch between the Plans under the Scheme, please refer page no. 49.
Minimum Investment ` 1,000/- & in multiples of ` 1/- thereafterAdditional Purchase` 1,000/- & in multiples of ` 1/- thereafterDate of Allotment 29th September, 2020NAV p.u. (`) As on 31st August, 2021Growth 14.99 IDCW 14.99 Direct PlanGrowth 15.24 IDCW 15.24 Portfolio Turnover Ratio (1 Year) 0.51Weighted Average Expense Ratio2 for the monthRegular 2.23%Direct 0.44%Benchmark IndexS&P BSE 500 TRIAAuM for the month of August 2021: ` 1,279.01 croresAuM as on31st August, 2021: ` 1,330.54 croresFund Manager & ExperienceTaher BadshahTotal Experience 27 Years Experience in managing this fund: Since September 29, 2020Nitin GosarTotal Experience 16 Years Experience in managing this fund: Since August 26, 2021
Asset AllocationEquity Holdings 96.03%Mutual Fund Units 1.95%Cash & Cash Equivalent 2.02%
Portfolio (As on 31st August, 2021) No. of Holdings : 20
Company % of Net AssetsEquity & Equity Related Instruments 96.03Infosys Ltd. 9.01Larsen & Toubro Ltd. 6.56ICICI Bank Ltd. 6.56HDFC Bank Ltd. 6.10L&T Technology Services Ltd. 5.75Gland Pharma Ltd. 5.47Divi’s Laboratories Ltd. 5.21Siemens Ltd. 5.21UTI Asset Management Company Ltd. 5.11Bharti Airtel Ltd. 5.10TeamLease Services Ltd. 4.46Kotak Mahindra Bank Ltd. 4.35
Company % of Net AssetsSBI Cards and Payment Services Ltd. 4.13Voltas Ltd. 4.04State Bank of India 4.03Bata India Ltd. 3.75ICICI Lombard General Insurance Company Ltd.
3.33
Tata Motors Ltd. 3.12MTAR Technologies Ltd. 2.76Manorama Industries Ltd. 1.95Mutual Fund Units 1.95Mutual Fund Units 1.95Cash & Cash Equivalent 2.02Total 100.00
For 1,2, Note on Direct Plan and Disclaimer, refer page no. 49.
Low
Moderate High
Low to
Moderately Very
Mod
erate
High High
Investors understand that their principalwill be at very high risk
RISKOMETERSuitable for Investors who are seeking*l Capital appreciation over long-terml Investments primarily in equity & equity related instruments
across market capitalization subject to maximum 20 stocks
*Investors should consult their financial advisers if in doubt about whether the product is suitable for them.
Lumpsum Performance (As on 31st August, 2021)
PeriodReturns % Value of ` 10,000 invested
Fund Benchmark Addl. BM Fund Benchmark Addl. BMS&P BSE 500 TRI Nifty 50 TRI S&P BSE 500 TRI Nifty 50 TRI
6 months 41.76% 40.06% 36.89% 12,128 12,041 11,880Past performance may or may not be sustained in future. BM - Benchmark. Returns less than 1 year are simple annualised. Different plans have different expense structure. Face Value per unit is Rs. 10/-. Please refer Page nos. 38-42 for performance of other Schemes managed by the Fund Managers and Page nos. 43-47 for performance of Direct Plans and respective Disclaimers. Also refer Note 1 below.
SIP Performance (As on 31st August, 2021)
SIPInvestment
Total amountinvested
(`)
Scheme S&P BSE 500 TRI Nifty 50 TRI2.1
Market value (`)
SIP Returns (%) XIRR
Market value (`)
SIP Returns (%) XIRR
Market value (`)
SIP Returns (%) XIRR
Since Inception 60,000 68,842 59.32% 67,866 51.89% 67,870 51.93%
Past performance may or may not be sustained in future. 2.1Additional Benchmark. Load is not taken into consideration. XIRR method is used to calculate SIP returns assuming investment of Rs. 10,000/- every month. The above investment simulation is for illustrative purpose only and should not be construed as a promise on minimum returns and safeguard of capital. Also refer Note 1 below. Note 1 : Returns are of regular plan - Growth Option. Benchmark returns are calculated using Total Return variant of respective Benchmark Index.
IDCW - Income Distribution cum capital withdrawal option.

9 of 49
Invesco India Growth Opportunities Fund(Large & Mid Cap Fund - An open ended equity scheme investing in both large cap and mid cap stocks)
Low
Moderate High
Low to
Moderately Very
Mod
erate
High High
Investors understand that their principalwill be at very high risk
RISKOMETERSuitable for Investors who are seeking*l Capital appreciation over long-terml Investments predominantly in equity and equity-related
instruments of large and mid cap companies
*Investors should consult their financial advisers if in doubt about whether the product is suitable for them.
Industry Classification3
% of Net AssetsBanks 20.96%Software 13.66%Consumer Durables 8.61%Auto Ancillaries 6.88%Petroleum Products 5.99%Pharmaceuticals 5.92%Consumer Non Durables 3.87%Finance 3.33%Cement & Cement Products 3.15%Auto 3.05%Healthcare Services 2.93%Aerospace & Defense 2.64%Chemicals 2.43%Construction Project 2.10%Insurance 2.05%Industrial Products 1.90%Ferrous Metals 1.79%Telecom - Services 1.55%Retailing 1.50%Pesticides 1.44%Power 1.20%Gas 1.18%Industrial Capital Goods 0.98%3Industrywise Classification as per AMFI.
IDCW DistributionRecord Date Rate (`/Unit) Cum-IDCW
NAV p. u. (`)IDCW Option28-Sep-17 1.50 16.3026-Mar-15 8.50 21.2630-Dec-10 1.25 13.76Direct Plan - IDCW Option28-Sep-17 1.50 17.6226-Mar-15 8.50 21.75Past performance may or may not be sustained in future. IDCW is on face value of ` 10/- per unit. After the payment of IDCW, the per unit NAV will fall to the extent of Payout of Income Distribution cum capital withdrawal option and applicable statutory levy, if any.
Investment ObjectiveTo generate capital appreciation from a diversified portfolio of predominantly Equity and Equity Related Instruments of Large and Midcap companies.
Key FactsLoad Structure Entry Load Nil Exit Load1 •Nil-ifupto10%ofUnitsallottedare
redeemed / switched-out within 1 year from the date of allotment.
•1% - forany redemption / switch-out in excess of 10% of units allotted within one year from the date of allotment.
•Nil - if units are redeemed orswitched-out after 1 year from the date of allotment.
Switch between the Plans under the Scheme, please refer page no. 49.
Minimum Investment ` 1,000/- & in multiples of ` 1/- thereafterAdditional Purchase` 1,000/- & in multiples of ` 1/- thereafterDate of Allotment 9th August, 2007NAV p.u. (`) As on 31st August, 2021Growth 51.00 IDCW 25.27 Direct PlanGrowth 57.59 IDCW 28.95 Portfolio Turnover Ratio (1 Year) 1.12Weighted Average Expense Ratio2 for the monthRegular 1.92%Direct 0.62%Benchmark IndexS&P BSE 250 Large Midcap 65:35 TRIAAuM for the month of August 2021: ` 4,084.23 croresAuM as on31st August, 2021: ` 4,153.44 croresFund Manager & ExperienceTaher BadshahTotal Experience 27 Years Experience in managing this fund: Since January 13, 2017Pranav GokhaleTotal Experience 19 Years Experience in managing this fund: Since May 19, 2020
Asset AllocationEquity Holdings 99.11%Cash & Cash Equivalent 0.89%
Performance AttributesStandard Deviation 6.08%Sharpe Ratio 0.15Beta 0.89Based on 3 years, monthly data points (Risk-free rate of 3.38% based on Overnight MIBOR)
Fund P/E - FY22E 25.9Fund P/B 4.2
Financial CharacteristicsAverage Weighted Market Capitalisation ` 295,128 crores
Median Market Capitalisation ` 45,476 crores
Source : Factset, Internal Data Files
Portfolio (As on 31st August, 2021) No. of Holdings : 47Company % of Net AssetsEquity & Equity Related Instruments 99.11ICICI Bank Ltd. 6.25Reliance Industries Ltd. 5.99Infosys Ltd. 5.42HDFC Bank Ltd. 5.22Mphasis Ltd. 3.18Axis Bank Ltd. 3.17Bajaj Finance Ltd. 2.79L&T Technology Services Ltd. 2.79Crompton Greaves Consumer Electricals Ltd. 2.70Hindustan Unilever Ltd. 2.68Bharat Electronics Ltd. 2.64Voltas Ltd. 2.58State Bank of India 2.46Vinati Organics Ltd. 2.43Gland Pharma Ltd. 2.36IndusInd Bank Ltd. 2.35Minda Industries Ltd. 2.22Kajaria Ceramics Ltd. 2.18Larsen & Toubro Ltd. 2.10SBI Life Insurance Company Ltd. 2.05UltraTech Cement Ltd. 2.03Ashok Leyland Ltd. 2.00Krishna Institute Of Medical Sciences Ltd. 1.93AIA Engineering Ltd. 1.90
Company % of Net AssetsDr. Reddy’s Laboratories Ltd. 1.83Tata Steel Ltd. 1.79Bharti Airtel Ltd. 1.55Endurance Technologies Ltd. 1.54Bandhan Bank Ltd. 1.51V-Mart Retail Ltd. 1.50Sumitomo Chemical India Ltd. 1.44Tech Mahindra Ltd. 1.25NTPC Ltd. 1.20Gujarat Gas Ltd. 1.18United Breweries Ltd. 1.18Whirlpool of India Ltd. 1.14Sona BLW Precision Forgings Ltd. 1.13The Ramco Cements Ltd. 1.11Hero MotoCorp Ltd. 1.05Cipla Ltd. 1.01Persistent Systems Ltd. 1.01Krsnaa Diagnostics Ltd. 1.00Balkrishna Industries Ltd. 0.99MRF Ltd. 0.99Honeywell Automation India Ltd. 0.98Aurobindo Pharma Ltd. 0.71IIFL Wealth Management Ltd. 0.54Cash & Cash Equivalent 0.89Total 100.00
Lumpsum Performance (As on 31st August, 2021)
Period
Returns % Value of ` 10,000 invested
FundBenchmark Addl. BM
FundBenchmark Addl. BM
S&P BSE 250 Large MidCap 65:35 TRI Nifty 50 TRI
S&P BSE 250 Large MidCap
65:35 TRINifty 50 TRI
1 Year 49.60% 59.71% 52.24% 14,960 15,971 15,2243 Years 12.59% 15.42% 14.94% 14,278 15,380 15,1925 Years 14.97% 16.30% 15.70% 20,095 21,288 20,7387 Years 14.47% 15.18% 12.92% 25,797 26,948 23,45410 Years 15.67% 15.93% 14.48% 42,929 43,936 38,718Since Inception 12.28% 12.39% 11.45% 51,000 51,721 45,970(09 August, 2007)Past performance may or may not be sustained in future. BM - Benchmark. Returns above 1 year are CAGR. Different plans have different expense structure. For calculating returns since inception, NAV as on the date of allotment is taken as Rs. 10/-. Face Value per unit is Rs. 10/-. Please refer Page nos. 38-42 for performance of other Schemes managed by the Fund Managers and Page nos. 43-47 for performance of Direct Plans and respective Disclaimers. Also refer Note 1 below.
SIP Performance (As on 31st August, 2021)
SIPInvestment
Total amountinvested
(`)
Scheme S&P BSE 250 Large MidCap 65:35 TRI Nifty 50 TRI2.1
Market value (`)
SIP Returns (%) XIRR
Market value (`)
SIP Returns (%) XIRR
Market value (`)
SIP Returns (%) XIRR
1 Year 120,000 148,302 46.46% 154,266 56.88% 150,620 50.48%3 Years 360,000 519,452 25.33% 563,178 31.34% 535,668 27.59%5 Years 600,000 943,872 18.17% 1,009,567 20.94% 983,594 19.86%7 Years 840,000 1,485,949 16.00% 1,593,646 17.97% 1,527,303 16.77%10 Years 1,200,000 2,851,376 16.50% 3,001,703 17.45% 2,726,714 15.67%Since Inception 1,690,000 5,306,265 14.97% 5,481,212 15.37% 4,833,714 13.80%(09 August, 2007)Past performance may or may not be sustained in future. 2.1Additional Benchmark. Load is not taken into consideration. XIRR method is used to calculate SIP returns assuming investment of Rs. 10,000/- on the first working day of every month. The above investment simulation is for illustrative purpose only and should not be construed as a promise on minimum returns and safeguard of capital. Also refer Note 1 below. Note 1 : Returns are of existing plan (non - direct plan) - Growth Option. Benchmark returns are calculated using Total Return variant of respective Benchmark Index.
Fund P/E - FY22E is current price to earnings for FY22E, Fund P/B is 12 months trailing price to book value. Both are arrived at using Weighted Harmonic Mean which is an average resulting from the multiplication of the reciprocal of the observation for each component by the weightage of that stock in the portfolio/index. For 1,2, Note on Direct Plan, IDCW Distribution and Disclaimer, refer page no. 49.
IDCW - Income Distribution cum capital withdrawal option.

10 of 49
Invesco India Midcap Fund(Mid Cap Fund - An open ended equity scheme predominantly investing in mid cap stocks)
Low
Moderate High
Low to
Moderately Very
Mod
erate
High High
Investors understand that their principalwill be at very high risk
RISKOMETERSuitable for Investors who are seeking*l Capital appreciation over long-terml Investments predominantly in equity and equity-related
instruments of Midcap companies
*Investors should consult their financial advisers if in doubt about whether the product is suitable for them.
Industry Classification3
% of Net AssetsAuto Ancillaries 16.21%Software 9.79%Banks 8.71%Pharmaceuticals 6.84%Consumer Durables 6.83%Gas 5.82%Industrial Products 4.88%Aerospace & Defense 4.68%Chemicals 4.66%Finance 4.59%Ferrous Metals 4.47%Power 3.75%Auto 3.05%Retailing 2.68%Healthcare Services 2.52%Construction 2.29%Cement & Cement Products 2.10%Pesticides 1.45%Insurance 1.37%Consumer Non Durables 1.35%Telecom - Services 0.45%3Industrywise Classification as per AMFI.
IDCW DistributionRecord Date Rate (`/Unit) Cum-IDCW
NAV p. u. (`)IDCW Option12-Mar-21 3.00 29.6207-Feb-20 2.21 25.3611-Jan-19 2.21 24.72Direct Plan - IDCW Option12-Mar-21 3.00 35.3007-Feb-20 2.21 29.3311-Jan-19 2.21 27.80Past performance may or may not be sustained in future. IDCW is on face value of ` 10/- per unit. After the payment of IDCW, the per unit NAV will fall to the extent of Payout of Income Distribution cum capital withdrawal option and applicable statutory levy, if any.
Investment ObjectiveTo generate capital appreciation by investing predominantly in Midcap companies.
Key FactsLoad Structure Entry Load Nil Exit Load1 •Nil-ifupto10%ofUnitsallottedare
redeemed / switched-out within 1 year from the date of allotment.
•1% - for any redemption / switch-out in excess of 10% of units allotted within one year from the date of allotment.
•Nil - if units are redeemed or switched-out after 1 year from the date of allotment.
Switch between the Plans under the Scheme, please refer page no. 49.
Minimum Investment ` 1,000/- & in multiples of ` 1/- thereafterAdditional Purchase` 1,000/- & in multiples of ` 1/- thereafterDate of Allotment 19th April, 2007NAV p.u. (`) As on 31st August, 2021Growth 81.86 IDCW 30.95 Direct PlanGrowth 93.49 IDCW 37.83 Portfolio Turnover Ratio (1 Year) 0.88Weighted Average Expense Ratio2 for the monthRegular 2.21%Direct 0.79%Benchmark IndexNifty Midcap 100 TRIAAuM for the month of August 2021: ` 1,847.92 croresAuM as on31st August, 2021: ` 1,879.22 croresFund Manager & ExperiencePranav GokhaleTotal Experience 19 Years Experience in managing this fund: Since March 29, 2018Neelesh DhamnaskarTotal Experience 16 Years Experience in managing this fund: Since July 18, 2018
Asset AllocationEquity Holdings 98.48%Cash & Cash Equivalent 1.52%
Performance AttributesStandard Deviation 6.65%Sharpe Ratio 0.18Beta 0.79Based on 3 years, monthly data points (Risk-free rate of 3.38% based on Overnight MIBOR)
Fund P/E - FY22E 21.3Fund P/B 3.6
Financial CharacteristicsAverage Weighted Market Capitalisation ` 41,343 crores
Median Market Capitalisation ` 25,275 crores
Source : Factset, Internal Data Files
Portfolio (As on 31st August, 2021) No. of Holdings : 49Company % of Net AssetsEquity & Equity Related Instruments 98.48Mphasis Ltd. 4.00Bharat Electronics Ltd. 3.50Endurance Technologies Ltd. 3.44Persistent Systems Ltd. 3.35Gujarat Gas Ltd. 3.33Balkrishna Industries Ltd. 3.04Minda Industries Ltd. 3.03Craftsman Automation Ltd. 2.84Vinati Organics Ltd. 2.81JB Chemicals & Pharmaceuticals Ltd. 2.75Gland Pharma Ltd. 2.71Crompton Greaves Consumer Electricals Ltd. 2.64Krishna Institute Of Medical Sciences Ltd. 2.52Voltas Ltd. 2.51Sundram Fasteners Ltd. 2.51L&T Technology Services Ltd. 2.44AIA Engineering Ltd. 2.30PNC Infratech Ltd. 2.29Cholamandalam Investment and Finance Company Ltd.
2.16
JK Cement Ltd. 2.10Trent Ltd. 2.05Steel Authority of India Ltd. 2.02Tata Power Company Ltd. 1.96City Union Bank Ltd. 1.88
Company % of Net AssetsAtul Ltd. 1.85ICICI Bank Ltd. 1.83KEC International Ltd. 1.79Axis Bank Ltd. 1.76Indian Bank 1.75Ashok Leyland Ltd. 1.68Kajaria Ceramics Ltd. 1.68Shriram Transport Finance Company Ltd. 1.55RBL Bank Ltd. 1.50Bayer Cropscience Ltd. 1.45KEI Industries Ltd. 1.42Ajanta Pharma Ltd. 1.37SBI Life Insurance Company Ltd. 1.37Escorts Ltd. 1.37Sona BLW Precision Forgings Ltd. 1.35United Breweries Ltd. 1.35Indraprastha Gas Ltd. 1.35Jindal Steel & Power Ltd. 1.31MTAR Technologies Ltd. 1.18Supreme Industries Ltd. 1.15Ratnamani Metals & Tubes Ltd. 1.14Mahanagar Gas Ltd. 1.14Mahindra & Mahindra Financial Services Ltd. 0.88Cartrade Tech Ltd. 0.63Sterlite Technologies Ltd. 0.45Cash & Cash Equivalent 1.52Total 100.00
Lumpsum Performance (As on 31st August, 2021)
PeriodReturns % Value of ` 10,000 invested
Fund Benchmark Addl. BM Fund Benchmark Addl. BMNifty Midcap 100 TRI Nifty 50 TRI Nifty Midcap 100 TRI Nifty 50 TRI
1 Year 57.70% 71.83% 52.24% 15,770 17,183 15,2243 Years 16.25% 13.60% 14.94% 15,718 14,664 15,1925 Years 16.56% 14.23% 15.70% 21,525 19,453 20,7387 Years 16.53% 15.50% 12.92% 29,236 27,476 23,45410 Years 18.85% 15.89% 14.48% 56,339 43,778 38,718Since Inception 15.75% 14.07% 11.98% 81,860 66,367 50,898(19 April, 2007)Past performance may or may not be sustained in future. BM - Benchmark. Returns above 1 year are CAGR. Different plans have different expense structure. For calculating returns since inception, NAV as on the date of allotment is taken as Rs. 10/-. Face Value per unit is Rs. 10/-. Please refer Page nos. 38-42 for performance of other Schemes managed by the Fund Managers and Page nos. 43-47 for performance of Direct Plans and respective Disclaimers. Also refer Note 1 below.
SIP Performance (As on 31st August, 2021)
SIPInvestment
Total amountinvested
(`)
Scheme Nifty Midcap 100 TRI Nifty 50 TRI2.1
Market value (`)
SIP Returns (%) XIRR
Market value (`)
SIP Returns (%) XIRR
Market value (`)
SIP Returns (%) XIRR
1 Year 120,000 152,501 53.77% 159,019 65.33% 150,620 50.48%3 Years 360,000 568,252 32.01% 585,912 34.34% 535,668 27.59%5 Years 600,000 1,020,019 21.36% 986,424 19.98% 983,594 19.86%7 Years 840,000 1,608,993 18.24% 1,549,511 17.18% 1,527,303 16.77%10 Years 1,200,000 3,435,431 19.95% 3,016,068 17.54% 2,726,714 15.67%Since Inception – – – – – – –(19 April, 2007)Past performance may or may not be sustained in future. 2.1Additional Benchmark. Returns for other periods not available as the Scheme was close-ended and re-opened for purchase on April 20, 2010, first SIP installment is taken as May 1, 2010. Load is not taken into consideration. XIRR method is used to calculate SIP returns assuming investment of Rs. 10,000/- on the first working day of every month. The above investment simulation is for illustrative purpose only and should not be construed as a promise on minimum returns and safeguard of capital. Also refer Note 1 below. Note 1 : Returns are of existing plan (non - direct plan) - Growth Option. Benchmark returns are calculated using Total Return variant of respective Benchmark Index.
Fund P/E - FY22E is current price to earnings for FY22E, Fund P/B is 12 months trailing price to book value. Both are arrived at using Weighted Harmonic Mean which is an average resulting from the multiplication of the reciprocal of the observation for each component by the weightage of that stock in the portfolio/index. For 1,2, Note on Direct Plan, IDCW Distribution and Disclaimer, refer page no. 49.
IDCW - Income Distribution cum capital withdrawal option.

11 of 49
Invesco India Smallcap Fund(Small Cap Fund - An open-ended equity scheme predominantly investing in small cap stocks)
Low
Moderate High
Low to
Moderately Very
Mod
erate
High High
Investors understand that their principalwill be at very high risk
RISKOMETERSuitable for Investors who are seeking*l Capital appreciation over long-terml Investments predominantly in equity and equity-related
instruments of smallcap companies
*Investors should consult their financial advisers if in doubt about whether the product is suitable for them.
Industry Classification3
% of Net AssetsSoftware 9.30%Consumer Durables 8.66%Auto Ancillaries 8.11%Construction 7.56%Consumer Non Durables 7.23%Cement & Cement Products 5.69%Pharmaceuticals 5.38%Aerospace & Defense 4.98%Finance 4.93%Industrial Products 4.72%Retailing 4.70%Chemicals 4.53%Healthcare Services 4.39%Power 3.12%Capital Markets 3.10%Transportation 3.02%Commercial Services 2.11%Telecom - Services 1.73%Banks 1.52%Paper 1.24%Ferrous Metals 1.14%Leisure Services 1.03%3Industrywise Classification as per AMFI.
Investment ObjectiveTo generate capital appreciation by investing predominantly in stocks of smallcap companies.
Key FactsLoad Structure Entry Load Nil Exit Load1 •Nil - if upto 10% of Units
allotted are redeemed / switched-out within 1 year from the date of allotment.
•1% - for any redemption / switch-out in excess of 10% of units allotted within one year from the date of allotment.
•Nil - if units are redeemed or switched-out after 1 year from the date of allotment.
Switch between the Plans under the Scheme, please refer page no. 49.
Minimum Investment ` 1,000/- & in multiples of ` 1/- thereafterAdditional Purchase` 1,000/- & in multiples of ` 1/- thereafterDate of Allotment 30th October, 2018NAV p.u. (`) As on 31st August, 2021Growth 20.07 IDCW 20.08 Direct PlanGrowth 21.02 IDCW 21.06 Portfolio Turnover Ratio (1 Year) 0.86Weighted Average Expense Ratio2 for the monthRegular 2.26%Direct 0.72%Benchmark IndexS&P BSE 250 Smallcap TRIAAuM for the month of August 2021: ` 1,181.18 croresAuM as on31st August, 2021: ` 1,194.43 croresFund Manager & ExperienceTaher BadshahTotal Experience 27 Years Experience in managing this fund: Since October 30, 2018Pranav GokhaleTotal Experience 19 Years Experience in managing this fund: Since March 1, 2019
Asset AllocationEquity Holdings 98.19%Mutual Fund Units 0.98%Cash & Cash Equivalent 0.83%
Fund P/E - FY22E 22.3Fund P/B 3.5
Financial CharacteristicsAverage Weighted Market Capitalisation ` 10,936 crores
Median Market Capitalisation ` 8,199 crores
Source : Factset, Internal Data Files
Portfolio (As on 31st August, 2021) No. of Holdings : 48Company % of Net AssetsEquity & Equity Related Instruments 98.19V-Mart Retail Ltd. 4.70Birla Corporation Ltd. 3.60KNR Constructions Ltd. 3.29KEC International Ltd. 3.12UTI Asset Management Company Ltd. 3.10Krishna Institute Of Medical Sciences Ltd. 3.09TCI Express Ltd. 3.02Craftsman Automation Ltd. 2.96JB Chemicals & Pharmaceuticals Ltd. 2.95MTAR Technologies Ltd. 2.77PNC Infratech Ltd. 2.74Kajaria Ceramics Ltd. 2.44Persistent Systems Ltd. 2.41Birlasoft Ltd. 2.39Indigo Paints Ltd. 2.33Orient Electric Ltd. 2.32Jamna Auto Industries Ltd. 2.28Bharat Electronics Ltd. 2.21VIP Industries Ltd. 2.19KEI Industries Ltd. 2.13TeamLease Services Ltd. 2.11JK Lakshmi Cement Ltd. 2.09Equitas Holdings Ltd. 1.97Accelya Solutions India Ltd. 1.90Minda Industries Ltd. 1.89IIFL Wealth Management Ltd. 1.89
Company % of Net AssetsSterlite Technologies Ltd. 1.73Radico Khaitan Ltd. 1.73Whirlpool of India Ltd. 1.70Balrampur Chini Mills Ltd. 1.64Vinati Organics Ltd. 1.62Prince Pipes And Fittings Ltd. 1.55Gujarat Narmada Valley Fertilizers and Chemicals Ltd.
1.54
DFM Foods Ltd. 1.54Ahluwalia Contracts (India) Ltd. 1.53Indian Bank 1.52Atul Ltd. 1.37Tata Elxsi Ltd. 1.35Krsnaa Diagnostics Ltd. 1.29Aarti Drugs Ltd. 1.27L&T Technology Services Ltd. 1.25JK Paper Ltd. 1.24Windlas Biotech Ltd. 1.16Ratnamani Metals & Tubes Ltd. 1.14Repco Home Finance Ltd. 1.06Timken India Ltd. 1.04Burger King India Ltd. 1.03Rolex Rings Ltd. 0.99Mutual Fund Units 0.98Mutual Fund Units 0.98Cash & Cash Equivalent 0.83Total 100.00
Lumpsum Performance (As on 31st August, 2021)
Period
Returns % Value of ` 10,000 invested
FundBenchmark Addl. BM
FundBenchmark Addl. BM
S&P BSE 250 Smallcap TRI Nifty 50 TRI S&P BSE 250
Smallcap TRI Nifty 50 TRI
1 Year 81.46% 82.89% 52.24% 18,146 18,289 15,224Since Inception 27.82% 22.76% 21.48% 20,070 17,896 17,373(30 October, 2018)Past performance may or may not be sustained in future. BM - Benchmark. Returns above 1 year are CAGR. Different plans have different expense structure. For calculating returns since inception, NAV as on the date of allotment is taken as Rs. 10/-. Face Value per unit is Rs. 10/-. Please refer Page nos. 38-42 for performance of other Schemes managed by the Fund Managers and Page nos. 43-47 for performance of Direct Plans and respective Disclaimers.
SIP Performance (As on 31st August, 2021)
SIPInvestment
Total amountinvested
(`)
Scheme S&P BSE 250 Smallcap TRI Nifty 50 TRI2.1
Market value (`)
SIP Returns (%) XIRR
Market value (`)
SIP Returns (%) XIRR
Market value (`)
SIP Returns (%) XIRR
1 Year 120,000 169,894 85.12% 165,646 77.32% 150,620 50.48%Since Inception 340,000 608,395 44.55% 588,900 41.80% 504,542 29.17%(30 October, 2018)Past performance may or may not be sustained in future. 2.1Additional Benchmark. Load is not taken into consideration. XIRR method is used to calculate SIP returns assuming investment of Rs. 10,000/- every month. The above investment simulation is for illustrative purpose only and should not be construed as a promise on minimum returns and safeguard of capital. Also refer Note 1 below. Note 1 : Returns are of existing plan (non - direct plan) - Growth Option. Benchmark returns are calculated using Total Return variant of respective Benchmark Index.
Fund P/E - FY22E is current price to earnings for FY22E, Fund P/B is 12 months trailing price to book value. Both are arrived at using Weighted Harmonic Mean which is an average resulting from the multiplication of the reciprocal of the observation for each component by the weightage of that stock in the portfolio/index. For 1,2, Note on Direct Plan, IDCW Distribution and Disclaimer, refer page no. 49.

12 of 49
Invesco India Dynamic Equity Fund(An open ended dynamic asset allocation fund)
Low
Moderate High
Low to
Moderately Very
Mod
erate
High High
Investors understand that their principalwill be at very high risk
RISKOMETERSuitable for Investors who are seeking*l Capital appreciation over long-terml Investments in equity and debt securities which are managed
dynamically
*Investors should consult their financial advisers if in doubt about whether the product is suitable for them.
Industry Classification3
% of Net AssetsBanks 18.15%Software 9.91%Petroleum Products 8.12%Pharmaceuticals 5.32%Auto 4.78%Telecom - Services 4.26%Finance 4.08%Healthcare Services 2.64%Insurance 2.51%Construction 2.45%Chemicals 2.40%Ferrous Metals 2.26%Construction Project 2.18%Cement & Cement Products 2.09%Auto Ancillaries 1.61%Power 1.27%Gas 1.17%Leisure Services 1.13%3Industrywise Classification as per AMFI.
IDCW DistributionRecord Date Rate (`/Unit) Cum-IDCW
NAV p. u. (`)Individuals/HUF OthersIDCW Option26-Aug-21 0.15000000 0.15000000 18.4422-Jul-21 0.20000000 0.20000000 18.5524-Jun-21 0.20000000 0.20000000 18.29Direct Plan - IDCW Option26-Aug-21 0.15000000 0.15000000 20.4022-Jul-21 0.20000000 0.20000000 20.4824-Jun-21 0.20000000 0.20000000 20.15Past performance may or may not be sustained in future. IDCW is on face value of ` 10/- per unit. After the payment of IDCW, the per unit NAV will fall to the extent of Payout of Income Distribution cum capital withdrawal option and applicable statutory levy, if any.
Investment ObjectiveTo generate capital appreciation by investing in equity and debt securities which are managed dynamically.Key FactsLoad Structure Entry Load Nil Exit Load1 •Nil - if upto 10% of Units allotted are
redeemed / switched-out within 3 months from the date of allotment.
•0.25% - for any redemption / switch-out in excess of 10% of units allotted within 3 months from the date of allotment.
•Nil - if units are redeemed or switched-out after 3 months from the date of allotment.
Switch between the Plans under the Scheme, please refer page no. 49.
Minimum Investment ` 1,000/- & in multiples of ` 1/- thereafterAdditional Purchase` 1,000/- & in multiples of ` 1/- thereafterDate of Allotment 4th October, 2007NAV p.u. (`) As on 31st August, 2021Growth 36.67 IDCW 18.61 Direct PlanGrowth 41.26 IDCW 20.60 Portfolio Turnover Ratio (1 Year) 2.78Weighted Average Expense Ratio2 for the monthRegular 2.37%Direct 1.05%Benchmark IndexCRISIL Hybrid 35+65 - Aggressive IndexAAuM for the month of August 2021: ` 632.91 croresAuM as on31st August, 2021: ` 688.17 croresFund Manager & ExperiencePranav GokhaleTotal Experience 19 Years Experience in managing this fund: Since June 1, 2018Taher BadshahTotal Experience 27 Years Experience in managing this fund: Since January 13, 2017
Asset AllocationEquity Holdings 76.32%Mutual Fund Units 9.38%Corporate Debt 7.51%Government Security 3.08%Cash & Cash Equivalent 3.71%
Performance AttributesStandard Deviation 4.01%Sharpe Ratio 0.11Beta 0.91Based on 3 years, monthly data points (Risk-free rate of 3.38% based on Overnight MIBOR)
Fund P/E - FY22E 21.3Fund P/B 3.5
Financial CharacteristicsAverage Weighted Market Capitalisation ` 364,338 crores
Median Market Capitalisation ` 76,803 crores
Source : Factset, Internal Data Files. The above calculation is based on Equity component.
Portfolio (As on 31st August, 2021) No. of Holdings : 35Company Rating % of Net
AssetsEquity & Equity Related Instruments 76.32Reliance Industries Ltd. 5.63HDFC Bank Ltd. 5.28Infosys Ltd. 5.22ICICI Bank Ltd. 5.15Bharti Airtel Ltd. 4.26Axis Bank Ltd. 2.95IndusInd Bank Ltd. 2.61Dr. Reddy’s Laboratories Ltd. 2.59Krishna Institute Of Medical Sciences Ltd.
2.55
Bharat Petroleum Corporation Ltd. 2.49PNC Infratech Ltd. 2.45Vinati Organics Ltd. 2.40Tata Steel Ltd. 2.26Larsen & Toubro Ltd. 2.18State Bank of India 2.16Gland Pharma Ltd. 2.16UltraTech Cement Ltd. 2.09Shriram Transport Finance Co. Ltd. 2.08SBI Cards and Payment Services Ltd. 2.00Persistent Systems Ltd. 1.98Ashok Leyland Ltd. 1.93
Company Rating % of Net Assets
Hero MotoCorp Ltd. 1.77Tata Consultancy Services Ltd. 1.44ICICI Prudential Life Insurance Co. Ltd. 1.42Accelya Solutions India Ltd. 1.28Tata Power Company Ltd. 1.27Gujarat Gas Ltd. 1.17Jubilant Foodworks Ltd. 1.13Motherson Sumi Systems Ltd. 1.10SBI Life Insurance Company Ltd. 1.09Escorts Ltd. 0.84Cipla Ltd. 0.56Rolex Rings Ltd. 0.51Maruti Suzuki India Ltd. 0.24Krsnaa Diagnostics Ltd. 0.09Corporate Debt 7.51Housing Development Finance Corporation Ltd.
CRISIL AAA 7.51
Government Security 3.08Government Bond7.26% GOI (MD 14/01/2029) Sovereign 3.08Mutual Fund Units 9.38Mutual Fund Units 9.38Cash & Cash Equivalent$ 3.71Total 100.00
Lumpsum Performance (As on 31st August, 2021)
Period
Returns % Value of ` 10,000 invested
FundBenchmark Addl. BM
FundBenchmark Addl. BM
CRISIL Hybrid 35+65 - Aggressive Index
Nifty 50 TRI
CRISIL Hybrid 35+65 - Aggressive Index
Nifty 50 TRI
1 Year 23.84% 36.26% 52.24% 12,384 13,626 15,2243 Years 7.71% 13.99% 14.94% 12,498 14,816 15,1925 Years 9.26% 13.57% 15.70% 15,578 18,898 20,7387 Years 9.59% 12.68% 12.92% 19,010 23,095 23,45410 Years 12.00% 13.28% 14.48% 31,103 34,856 38,718Since Inception 9.79% 10.33% 10.23% 36,670 39,275 38,798(04 October, 2007)Past performance may or may not be sustained in future. BM - Benchmark. Returns above 1 year are CAGR. Different plans have different expense structure. For calculating returns since inception, NAV as on the date of allotment is taken as Rs. 10/-. Face Value per unit is Rs. 10/-. Please refer Page nos. 38-42 for performance of other Schemes managed by the Fund Managers and Page nos. 43-47 for performance of Direct Plans and respective Disclaimers. Also refer Note 1 below.
SIP Performance (As on 31st August, 2021)
SIPInvestment
Total amountinvested
(`)
Scheme CRISIL Hybrid 35+65 - Aggressive Index Nifty 50 TRI2.1
Market value (`)
SIP Returns (%) XIRR
Market value (`)
SIP Returns (%) XIRR
Market value (`)
SIP Returns (%) XIRR
1 Year 120,000 134,617 23.34% 141,307 34.50% 150,620 50.48%3 Years 360,000 444,851 14.24% 498,829 22.37% 535,668 27.59%5 Years 600,000 780,488 10.46% 907,892 16.58% 983,594 19.86%7 Years 840,000 1,193,944 9.88% 1,417,336 14.68% 1,527,303 16.77%10 Years 1,200,000 2,175,247 11.44% 2,517,461 14.18% 2,726,714 15.67%Since Inception 1,670,000 3,901,101 11.40% 4,370,583 12.85% 4,741,461 13.89%(04 October, 2007)Past performance may or may not be sustained in future. 2.1Additional Benchmark. Load is not taken into consideration. XIRR method is used to calculate SIP returns assuming investment of Rs. 10,000/- on the first working day of every month. The above investment simulation is for illustrative purpose only and should not be construed as a promise on minimum returns and safeguard of capital. Also refer Note 1 below. Note 1 : Returns are of existing plan (non - direct plan) - Growth Option. Benchmark returns are calculated using Total Return variant of respective Benchmark Index.
$ The Gross Exposure Derivatives in the scheme is 17.32% of Net Assets.
Fund P/E - FY22E is current price to earnings for FY22E, Fund P/B is 12 months trailing price to book value. Both are arrived at using Weighted Harmonic Mean which is an average resulting from the multiplication of the reciprocal of the observation for each component by the weightage of that stock in the portfolio/index. For 1,2, Note on Direct Plan, IDCW Distribution and Disclaimer, refer page no. 49.
IDCW - Income Distribution cum capital withdrawal option.

13 of 49
Invesco India Financial Services Fund(An open ended equity scheme investing in financial services sector)
Low
Moderate High
Low to
Moderately Very
Mod
erate
High High
Investors understand that their principalwill be at very high risk
RISKOMETERSuitable for Investors who are seeking*l Capital appreciation over long-terml Investment predominantly in equity and equity-related
instruments of companies engaged in the business of banking and financial services.
*Investors should consult their financial advisers if in doubt about whether the product is suitable for them.
Industry Classification3
% of Net AssetsBanks 65.21%Finance 14.80%Capital Markets 10.95%Insurance 7.49%3Industrywise Classification as per AMFI.
IDCW DistributionRecord Date Rate (`/Unit) Cum-IDCW
NAV p. u. (`)IDCW Option14-Feb-19 2.66 28.9930-Nov-15 3.20 21.8703-May-13 2.50 17.79Direct Plan - IDCW Option14-Feb-19 2.66 31.9030-Nov-15 3.20 22.7103-May-13 2.50 17.79Past performance may or may not be sustained in future. IDCW is on face value of ` 10/- per unit. After the payment of IDCW, the per unit NAV will fall to the extent of Payout of Income Distribution cum capital withdrawal option and applicable statutory levy, if any.
Investment ObjectiveTo generate capital appreciation from a portfolio of Equity and Equity Related Instruments of companies engaged in the business of banking and financial services.
Key FactsLoad Structure Entry Load Nil Exit Load1 •Nil-ifupto10%ofUnitsallottedare
redeemed / switched-out within 1 year from the date of allotment.
•1% - for any redemption / switch-out in excess of 10% of units allotted within one year from the date of allotment.
•Nil - if units are redeemed or switched-out after 1 year from the date of allotment.
Switch between the Plans under the Scheme, please refer page no. 49.
Minimum Investment ` 1,000/- & in multiples of ` 1/- thereafterAdditional Purchase` 1,000/- & in multiples of ` 1/- thereafterDate of Allotment 14th July, 2008NAV p.u. (`) As on 31st August, 2021Growth 78.96 IDCW 40.27 Direct PlanGrowth 89.58 IDCW 46.18 Portfolio Turnover Ratio (1 Year) 0.18Weighted Average Expense Ratio2 for the monthRegular 2.48%Direct 1.24%Benchmark IndexNifty Financial Services TRIAAuM for the month of August 2021: ` 360.52 croresAuM as on31st August, 2021: ` 372.99 croresFund Manager & ExperienceDhimant KothariTotal Experience 16 Years Experience in managing this fund: Since June 1, 2018Hiten JainTotal Experience 12 Years Experience in managing this fund: Since May 19, 2020
Asset AllocationEquity Holdings 98.44%Cash & Cash Equivalent 1.56%
Performance AttributesStandard Deviation 8.34%Sharpe Ratio 0.13Beta 0.92Based on 3 years, monthly data points (Risk-free rate of 3.38% based on Overnight MIBOR)
Fund P/E - FY22E 21.0Fund P/B 2.8
Financial CharacteristicsAverage Weighted Market Capitalisation ` 361,221 crores
Median Market Capitalisation ` 53,097 crores
Source : Factset, Internal Data Files
Portfolio (As on 31st August, 2021) No. of Holdings : 24
Company % of Net AssetsEquity & Equity Related Instruments 98.44HDFC Bank Ltd. 22.68ICICI Bank Ltd. 15.94Axis Bank Ltd. 9.13State Bank of India 6.27Kotak Mahindra Bank Ltd. 5.71UTI Asset Management Company Ltd. 4.19Angel Broking Ltd. 3.52SBI Life Insurance Company Ltd. 3.51SBI Cards and Payment Services Ltd. 3.07IIFL Wealth Management Ltd. 2.37Equitas Holdings Ltd. 2.33HDFC Asset Management Company Ltd. 2.08ICICI Lombard General Insurance Co. Ltd. 2.01
Company % of Net AssetsICICI Prudential Life Insurance Co. Ltd. 1.97Cholamandalam Investment and Finance Company Ltd.
1.78
IndusInd Bank Ltd. 1.75DCB Bank Ltd. 1.61Can Fin Homes Ltd. 1.49Muthoot Finance Ltd. 1.38Indian Railway Finance Corporation Ltd. 1.36RBL Bank Ltd. 1.28Central Depository Services (India) Ltd. 1.15Repco Home Finance Ltd. 1.01City Union Bank Ltd. 0.86Cash & Cash Equivalent 1.56Total 100.00
Lumpsum Performance (As on 31st August, 2021)
Period
Returns % Value of ` 10,000 invested
FundBenchmark Addl. BM
FundBenchmark Addl. BM
Nifty Financial Services TRI Nifty 50 TRI Nifty Financial
Services TRI Nifty 50 TRI
1 Year 53.77% 59.45% 52.24% 15,377 15,945 15,2243 Years 12.25% 16.04% 14.94% 14,148 15,632 15,1925 Years 14.93% 17.95% 15.70% 20,061 22,844 20,7387 Years 15.58% 16.58% 12.92% 27,608 29,319 23,45410 Years 16.02% 17.60% 14.48% 44,260 50,690 38,718Since Inception 17.03% 18.22% 12.98% 78,960 90,226 49,731(14 July, 2008)Past performance may or may not be sustained in future. BM - Benchmark. Returns above 1 year are CAGR. Different plans have different expense structure. For calculating returns since inception, NAV as on the date of allotment is taken as Rs. 10/-. Face Value per unit is Rs. 10/-. Please refer Page nos. 38-42 for performance of other Schemes managed by the Fund Managers and Page nos. 43-47 for performance of Direct Plans and respective Disclaimers. Also refer Note 1 below.
SIP Performance (As on 31st August, 2021)
SIPInvestment
Total amountinvested
(`)
Scheme Nifty Financial Services TRI Nifty 50 TRI2.1
Market value (`)
SIP Returns (%) XIRR
Market value (`)
SIP Returns (%) XIRR
Market value (`)
SIP Returns (%) XIRR
1 Year 120,000 148,940 47.56% 150,634 50.51% 150,620 50.48%3 Years 360,000 505,913 23.40% 521,115 25.56% 535,668 27.59%5 Years 600,000 913,155 16.82% 992,067 20.22% 983,594 19.86%7 Years 840,000 1,485,212 15.99% 1,628,071 18.57% 1,527,303 16.77%10 Years 1,200,000 2,876,096 16.66% 3,176,729 18.50% 2,726,714 15.67%Since Inception 1,580,000 5,074,342 16.39% 5,686,656 17.91% 4,399,596 14.47%(14 July, 2008)Past performance may or may not be sustained in future. 2.1Additional Benchmark. Load is not taken into consideration. XIRR method is used to calculate SIP returns assuming investment of Rs. 10,000/- on the first working day of every month. The above investment simulation is for illustrative purpose only and should not be construed as a promise on minimum returns and safeguard of capital. Also refer Note 1 below. Note 1 : Returns are of existing plan (non - direct plan) - Growth Option. Benchmark returns are calculated using Total Return variant of respective Benchmark Index.
Fund P/E - FY22E is current price to earnings for FY22E, Fund P/B is 12 months trailing price to book value. Both are arrived at using Weighted Harmonic Mean which is an average resulting from the multiplication of the reciprocal of the observation for each component by the weightage of that stock in the portfolio/index. For 1,2, Note on Direct Plan, IDCW Distribution and Disclaimer, refer page no. 49.
IDCW - Income Distribution cum capital withdrawal option.

14 of 49
Invesco India Infrastructure Fund(An open ended equity scheme following Infrastructure theme)
Low
Moderate High
Low to
Moderately Very
Mod
erate
High High
Investors understand that their principalwill be at very high risk
RISKOMETERSuitable for Investors who are seeking*l Capital appreciation over long-terml Investments predominantly in equity and equity-related
instruments of infrastructure companies
*Investors should consult their financial advisers if in doubt about whether the product is suitable for them.
Industry Classification3
% of Net AssetsConstruction 12.75%Construction Project 11.07%Cement & Cement Products 10.72%Industrial Products 9.43%Auto Ancillaries 7.61%Power 7.27%Ferrous Metals 6.65%Petroleum Products 5.25%Industrial Capital Goods 5.14%Aerospace & Defense 5.12%Transportation 5.10%Gas 4.54%Consumer Durables 3.97%Telecom - Services 3.24%3Industrywise Classification as per AMFI.
IDCW DistributionRecord Date Rate (`/Unit) Cum-IDCW
NAV p. u. (`)IDCW Option19-Mar-21 2.15 20.4321-Nov-17 1.85 18.24Direct Plan - IDCW Option19-Mar-21 2.15 22.9021-Nov-17 1.85 19.53Past performance may or may not be sustained in future. IDCW is on face value of ` 10/- per unit. After the payment of IDCW, the per unit NAV will fall to the extent of Payout of Income Distribution cum capital withdrawal option and applicable statutory levy, if any.
Investment ObjectiveTo generate capital appreciation by investing in a portfolio that is predominantly constituted of Equity and Equity Related Instruments of infrastructure companies.
Key FactsLoad Structure Entry Load Nil Exit Load1 •Nil-ifupto10%ofUnitsallottedare
redeemed / switched-out within 1 year from the date of allotment.
•1% - for any redemption / switch-out in excess of 10% of units allotted within one year from the date of allotment.
•Nil - if units are redeemed or switched-out after 1 year from the date of allotment.
Switch between the Plans under the Scheme, please refer page no. 49.
Minimum Investment ` 1,000/- & in multiples of ` 1/- thereafterAdditional Purchase` 1,000/- & in multiples of ` 1/- thereafterDate of Allotment 21st November, 2007NAV p.u. (`) As on 31st August, 2021Growth 29.02 IDCW 23.34 Direct PlanGrowth 33.02 IDCW 26.63 Portfolio Turnover Ratio (1 Year) 0.42Weighted Average Expense Ratio2 for the monthRegular 2.79%Direct 1.46%Benchmark IndexS&P BSE India Infrastructure TRIAAuM for the month of August 2021: ` 242.95 croresAuM as on31st August, 2021: ` 260.92 croresFund Manager & ExperienceAmit NigamTotal Experience 21 Years Experience in managing this fund: Since September 3, 2020Neelesh DhamnaskarTotal Experience 16 Years Experience in managing this fund: Since June 1, 2018
Asset AllocationEquity Holdings 97.86%Cash & Cash Equivalent 2.14%
Performance AttributesStandard Deviation 7.32%Sharpe Ratio 0.19Beta 0.77Based on 3 years, monthly data points (Risk-free rate of 3.38% based on Overnight MIBOR)
Fund P/E - FY22E 19.9Fund P/B 3.6
Financial CharacteristicsAverage Weighted Market Capitalisation ` 136,244 crores
Median Market Capitalisation ` 14,842 crores
Source : Factset, Internal Data Files
Portfolio (As on 31st August, 2021) No. of Holdings : 36Company % of Net AssetsEquity & Equity Related Instruments 97.86Larsen & Toubro Ltd. 9.34Reliance Industries Ltd. 5.25UltraTech Cement Ltd. 5.06KNR Constructions Ltd. 5.05Indraprastha Gas Ltd. 4.54G R Infraprojects Ltd. 3.67KEI Industries Ltd. 3.51Bharat Electronics Ltd. 3.26Jamna Auto Industries Ltd. 2.95PNC Infratech Ltd. 2.95Tata Steel Ltd. 2.94Birla Corporation Ltd. 2.87Craftsman Automation Ltd. 2.84Tata Power Company Ltd. 2.83KEC International Ltd. 2.79The Ramco Cements Ltd. 2.79Honeywell Automation India Ltd. 2.79Thermax Ltd. 2.35
Company % of Net AssetsKajaria Ceramics Ltd. 2.12Ratnamani Metals & Tubes Ltd. 2.02Mahindra Logistics Ltd. 1.93TCI Express Ltd. 1.93Prince Pipes And Fittings Ltd. 1.90MTAR Technologies Ltd. 1.86Voltas Ltd. 1.85Rolex Rings Ltd. 1.82AIA Engineering Ltd. 1.73Sterlite Technologies Ltd. 1.73H.G. Infra Engineering Ltd. 1.73Steel Authority of India Ltd. 1.68NTPC Ltd. 1.65Bharti Airtel Ltd. 1.51Grindwell Norton Ltd. 1.32Container Corporation of India Ltd. 1.25Ahluwalia Contracts (India) Ltd. 1.08Graphite India Ltd. 0.97Cash & Cash Equivalent 2.14Total 100.00
Lumpsum Performance (As on 31st August, 2021)
Period
Returns % Value of ` 10,000 invested
FundBenchmark Addl. BM
FundBenchmark Addl. BM
S&P BSE India Infrastructure TRI Nifty 50 TRI S&P BSE India
Infrastructure TRI Nifty 50 TRI
1 Year 65.07% 76.54% 52.24% 16,507 17,654 15,2243 Years 18.46% 8.77% 14.94% 16,630 12,872 15,1925 Years 15.95% 9.17% 15.70% 20,968 15,510 20,7387 Years 13.68% 8.02% 12.92% 24,572 17,183 23,45410 Years 14.11% 10.18% 14.48% 37,494 26,387 38,718Since Inception 8.03% 3.43% 9.81% 29,020 15,925 36,321(21 November, 2007)Past performance may or may not be sustained in future. BM - Benchmark. Returns above 1 year are CAGR. Different plans have different expense structure. For calculating returns since inception, NAV as on the date of allotment is taken as Rs. 10/-. Face Value per unit is Rs. 10/-. Please refer Page nos. 38-42 for performance of other Schemes managed by the Fund Managers and Page nos. 43-47 for performance of Direct Plans and respective Disclaimers. Also refer Note 1 below.
SIP Performance (As on 31st August, 2021)
SIPInvestment
Total amountinvested
(`)
Scheme S&P BSE India Infrastructure TRI Nifty 50 TRI2.1
Market value (`)
SIP Returns (%) XIRR
Market value (`)
SIP Returns (%) XIRR
Market value (`)
SIP Returns (%) XIRR
1 Year 120,000 163,016 72.53% 163,207 72.88% 150,620 50.48%3 Years 360,000 586,581 34.43% 540,330 28.24% 535,668 27.59%5 Years 600,000 1,021,392 21.42% 854,379 14.11% 983,594 19.86%7 Years 840,000 1,550,979 17.21% 1,267,296 11.55% 1,527,303 16.77%10 Years 1,200,000 2,990,160 17.38% 2,166,408 11.37% 2,726,714 15.67%Since Inception – – – – – – –(21 November, 2007)Past performance may or may not be sustained in future. 2.1Additional Benchmark. Returns for other periods not available as the Scheme was close-ended and re-opened for purchase on November 23, 2010, first SIP installment is taken as December 1, 2010. Please refer relative performance table for non SIP returns. SIP doesn’t ensure profit or guarantee protection against loss in a declining market. Load is not taken into consideration. XIRR method is used to calculate SIP returns assuming investment of Rs. 10,000/- on the first working day of every month. The above investment simulation is for illustrative purpose only and should not be construed as a promise on minimum returns and safeguard of capital. Also refer Note 1 below. Note 1 : Returns are of existing plan (non - direct plan) - Growth Option. Benchmark returns are calculated using Total Return variant of respective Benchmark Index.
Fund P/E - FY22E is current price to earnings for FY22E, Fund P/B is 12 months trailing price to book value. Both are arrived at using Weighted Harmonic Mean which is an average resulting from the multiplication of the reciprocal of the observation for each component by the weightage of that stock in the portfolio/index. For 1,2, Note on Direct Plan, IDCW Distribution and Disclaimer, refer page no. 49.
IDCW - Income Distribution cum capital withdrawal option.

15 of 49
Invesco India PSU Equity Fund(An open ended equity scheme following PSU theme)
Low
Moderate High
Low to
Moderately Very
Mod
erate
High High
Investors understand that their principalwill be at very high risk
RISKOMETERSuitable for Investors who are seeking*l Capital appreciation over long-terml Investments predominantly in equity and equity-related
instruments of Government companies (PSU’s)
*Investors should consult their financial advisers if in doubt about whether the product is suitable for them.
Industry Classification3
% of Net AssetsPower 16.03%Gas 13.18%Banks 12.54%Petroleum Products 11.63%Finance 10.19%Ferrous Metals 6.20%Aerospace & Defense 6.06%Transportation 5.48%Capital Markets 5.04%Insurance 4.69%Non - Ferrous Metals 4.07%Chemicals 1.87%Industrial Capital Goods 1.13%3Industrywise Classification as per AMFI.
IDCW DistributionRecord Date Rate (`/Unit) Cum-IDCW
NAV p. u. (`)IDCW Option18-Nov-19 1.35 15.1930-Mar-17 1.67 16.3426-Nov-10 1.10 11.22Direct Plan - IDCW Option18-Nov-19 1.35 16.6930-Mar-17 1.67 17.2Past performance may or may not be sustained in future. IDCW is on face value of ̀ 10/- per unit. After the payment of IDCW, the per unit NAV will fall to the extent of Payout of Income Distribution cum capital withdrawal option and applicable statutory levy, if any.
Investment ObjectiveTo generate capital appreciation by investing in Equity and Equity Related Instruments of companies where the Central / State Government(s) has majority shareholding or management control or has powers to appoint majority of directors.
Key FactsLoad Structure Entry Load Nil Exit Load1 •Nil-ifupto10%ofUnitsallottedare
redeemed / switched-out within 1 year from the date of allotment.
•1% - for any redemption / switch-out in excess of 10% of units allotted within one year from the date of allotment.
•Nil - if units are redeemed or switched-out after 1 year from the date of allotment.
Switch between the Plans under the Scheme, please refer page no. 49.
Minimum Investment ` 1,000/- & in multiples of ` 1/- thereafterAdditional Purchase` 1,000/- & in multiples of ` 1/- thereafterDate of Allotment 18th November, 2009NAV p.u. (`) As on 31st August, 2021Growth 25.62 IDCW 18.66 Direct PlanGrowth 28.84 IDCW 21.12 Portfolio Turnover Ratio (1 Year) 0.40Weighted Average Expense Ratio2 for the monthRegular 2.61%Direct 1.20%Benchmark IndexS&P BSE PSU TRIAAuM for the month of August 2021: ` 308.31 croresAuM as on31st August, 2021: ` 314.67 croresFund Manager & ExperienceNitin GosarTotal Experience 16 Years Experience in managing this fund: Since June 1, 2018Dhimant KothariTotal Experience 16 Years Experience in managing this fund: Since May 19, 2020
Asset AllocationEquity Holdings 98.11%Cash & Cash Equivalent 1.89%
Performance AttributesStandard Deviation 6.75%Sharpe Ratio 0.14Beta 0.68Based on 3 years, monthly data points (Risk-free rate of 3.38% based on Overnight MIBOR)
Fund P/E - FY22E 10.9Fund P/B 1.7Financial CharacteristicsAverage WeightedMarket Capitalisation ` 85,695 crores
Median Market Capitalisation ` 39,102 crores
Source : Factset, Internal Data Files
Portfolio (As on 31st August, 2021) No. of Holdings : 24Company % of Net AssetsEquity & Equity Related Instruments 98.11State Bank of India 8.56Power Grid Corporation of India Ltd. 8.26NTPC Ltd. 7.78Bharat Petroleum Corporation Ltd. 6.51Bharat Electronics Ltd. 6.06Indraprastha Gas Ltd. 6.02Hindustan Petroleum Corporation Ltd. 5.13UTI Asset Management Company Ltd. 5.04Gujarat Gas Ltd. 4.71SBI Life Insurance Company Ltd. 4.69National Aluminium Company Ltd. 4.07Steel Authority of India Ltd. 3.70SBI Cards and Payment Services Ltd. 3.61
Company % of Net AssetsCan Fin Homes Ltd. 3.44Indian Railway Finance Corp. Ltd. 3.14Container Corporation of India Ltd. 3.05Mishra Dhatu Nigam Ltd. 2.49Indian Railway Catering And Tourism Corporation Ltd.
2.44
Bank of Baroda 2.09Indian Bank 1.89Gujarat Narmada Valley Fertilizers and Chemicals Ltd.
1.87
Petronet LNG Ltd. 1.51Mazagon Dock Shipbuilders Ltd. 1.13Mahanagar Gas Ltd. 0.94Cash & Cash Equivalent 1.89Total 100.00
Lumpsum Performance (As on 31st August, 2021)
PeriodReturns % Value of ` 10,000 invested
FundBenchmark Addl. BM
FundBenchmark Addl. BM
S&P BSE PSU TRI Nifty 50 TRI S&P BSE PSU TRI Nifty 50 TRI1 Year 41.16% 56.32% 52.24% 14,116 15,632 15,2243 Years 12.96% 3.04% 14.94% 14,418 10,941 15,1925 Years 10.03% 4.04% 15.70% 16,134 12,193 20,7387 Years 11.09% 2.66% 12.92% 20,914 12,023 23,45410 Years 9.86% 2.94% 14.48% 25,646 13,360 38,718Since Inception 8.31% 1.12% 12.26% 25,620 11,400 39,099(18 November, 2009)Past performance may or may not be sustained in future. BM - Benchmark. Returns above 1 year are CAGR. Different plans have different expense structure. For calculating returns since inception, NAV as on the date of allotment is taken as Rs. 10/-. Face Value per unit is Rs. 10/-. Please refer Page nos. 38-42 for performance of other Schemes managed by the Fund Managers and Page nos. 43-47 for performance of Direct Plans and respective Disclaimers. Also refer Note 1 below.
SIP Performance (As on 31st August, 2021)
SIPInvestment
Total amountinvested
(`)
Scheme S&P BSE PSU TRI Nifty 50 TRI2.1
Market value (`)
SIP Returns (%) XIRR
Market value (`)
SIP Returns (%) XIRR
Market value (`)
SIP Returns (%) XIRR
1 Year 120,000 148,980 47.63% 156,025 59.99% 150,620 50.48%3 Years 360,000 505,833 23.38% 472,112 18.42% 535,668 27.59%5 Years 600,000 846,588 13.74% 730,761 7.82% 983,594 19.86%7 Years 840,000 1,304,122 12.35% 1,047,199 6.20% 1,527,303 16.77%10 Years 1,200,000 2,277,684 12.31% 1,584,076 5.42% 2,726,714 15.67%Since Inception 1,420,000 2,802,164 10.92% 1,831,057 4.19% 3,517,919 14.43%(18 November, 2009)Past performance may or may not be sustained in future. 2.1Additional Benchmark. Load is not taken into consideration. XIRR method is used to calculate SIP returns assuming investment of Rs. 10,000/- on the first working day of every month. The above investment simulation is for illustrative purpose only and should not be construed as a promise on minimum returns and safeguard of capital. Also refer Note 1 below. Note 1 : Returns are of existing plan (non - direct plan) - Growth Option. Benchmark returns are calculated using Total Return variant of respective Benchmark Index.
Fund P/E - FY22E is current price to earnings for FY22E, Fund P/B is 12 months trailing price to book value. Both are arrived at using Weighted Harmonic Mean which is an average resulting from the multiplication of the reciprocal of the observation for each component by the weightage of that stock in the portfolio/index. For 1,2, Note on Direct Plan, IDCW Distribution and Disclaimer, refer page no. 49.
IDCW - Income Distribution cum capital withdrawal option.

16 of 49
Invesco India Arbitrage Fund(An open ended scheme investing in arbitrage opportunities)
Low
Moderate High
Low to
Moderately Very
Mod
erate
High High
Investors understand that their principalwill be at low risk
RISKOMETERSuitable for Investors who are seeking*l Income over medium-terml Income through opportunities emerging out of difference in
pricing between cash and derivatives markets and through deployment of surplus cash in fixed income instruments.
*Investors should consult their financial advisers if in doubt about whether the product is suitable for them.
For 1,2, Note on Direct Plan, IDCW Distribution and Disclaimer, refer page no. 49.
Investment ObjectiveTo generate income through arbitrage opportunities emerging out of difference in pricing between the cash market and the derivatives market and through deployment of surplus cash in fixed income instruments.
Key FactsLoad Structure Entry Load Nil Exit Load1 If redeemed/switched-out on or
before 15 Days from the date of allotment : 0.5%If redeemed/switched-out after 15 Days from the date of allotment : NilSwitch between the Plans under the Scheme, please refer page no. 49.
Minimum Investment ` 1,000/- & in multiples of ` 1/- thereafterAdditional Purchase` 1,000/- & in multiples of ` 1/- thereafterDate of Allotment 30th April, 2007NAV p.u. (`) As on 31st August, 2021Growth 25.1887 IDCW 13.4428 Bonus - Annual Bonus - Direct PlanGrowth 26.5523 IDCW 14.4182 Bonus - Annual Bonus 26.5496 Portfolio Turnover Ratio (1 Year) 9.69Weighted Average Expense Ratio2 for the monthRegular 1.00%Direct 0.40%Benchmark IndexNifty 50 ArbitrageAAuM for the month of August 2021: ` 805.24 croresAuM as on31st August, 2021: ` 892.27 croresFund Manager & ExperienceRajeev BhardwajTotal Experience 16 Years Experience in managing this fund: Since May 19, 2020
Asset AllocationEquity Holdings 67.18%Government Security 13.15%Mutual Fund Units 9.77%Corporate Debt 4.00%Fixed Deposits 1.28%Cash & Cash Equivalent $ 4.63%$ The Scheme is having exposure to Stock Futures (Short) against the above Equity Stocks and the Gross Exposure Derivatives is 67.25% of Net Assets.
Maturity Profile92 - 180 days 2.77%181 days - 1 year 10.38%1 - 2 years 4.00%
Portfolio (As on 31st August, 2021) Company % of Net AssetsEquity & Equity Related Instruments 67.18Reliance Industries Ltd. 7.83Bharti Airtel Ltd. 5.12Housing Development Finance Corp. Ltd. 4.70ITC Ltd. 4.22Adani Ports and Special Economic Zone Ltd.
4.14
Hindustan Unilever Ltd. 3.18Lupin Ltd. 3.14Sun Pharmaceutical Industries Ltd. 3.06Tata Consultancy Services Ltd. 2.72Divi’s Laboratories Ltd. 2.55Dr. Reddy’s Laboratories Ltd. 2.46United Spirits Ltd. 2.09ACC Ltd. 1.77ICICI Bank Ltd. 1.54LIC Housing Finance Ltd. 1.36Asian Paints Ltd. 1.33Maruti Suzuki India Ltd. 1.29Axis Bank Ltd. 1.26HDFC Life Insurance Company Ltd. 1.25Dabur India Ltd. 1.11Cipla Ltd. 1.07HCL Technologies Ltd. 0.96State Bank of India 0.90Apollo Hospitals Enterprise Ltd. 0.78Bharat Heavy Electricals Ltd. 0.70Sun TV Network Ltd. 0.67Tata Chemicals Ltd. 0.64Container Corporation of India Ltd. 0.63Vedanta Ltd. 0.62JSW Steel Ltd. 0.53Tata Power Company Ltd. 0.44MindTree Ltd. 0.42Punjab National Bank 0.40
Company % of Net AssetsHero MotoCorp Ltd. 0.38Marico Ltd. 0.33NMDC Ltd. 0.32Biocon Ltd. 0.18Bajaj Auto Ltd. 0.17Colgate Palmolive (India) Ltd. 0.15Indraprastha Gas Ltd. 0.15Alkem Laboratories Ltd. 0.14Berger Paints (I) Ltd. 0.11HDFC Asset Management Company Ltd. 0.08Bata India Ltd. 0.08Larsen & Toubro Ltd. 0.04Cadila Healthcare Ltd. 0.04Pidilite Industries Ltd. 0.04TVS Motor Company Ltd. 0.02Tata Consumer Products Ltd. 0.01Bharat Petroleum Corporation Ltd. 0.01Kotak Mahindra Bank Ltd. 0.01Corporate Debt 4.00Telesonic Networks Ltd. (Guaranteed by Bharti Airtel Ltd.)
1.69
National Bank For Agriculture and Rural Development
1.18
Indian Oil Corporation Ltd. 1.13Government Security 13.15364 Days Tbill (MD 30/03/2022) 3.85364 Days Tbill (MD 16/06/2022) 3.81182 Days Tbill (MD 23/12/2021) 2.77364 Days Tbill (MD 30/06/2022) 2.72Mutual Fund Units 9.77Mutual Fund Units 9.77Fixed Deposits 1.28HDFC Bank Ltd. 1.28Derivatives, Cash & Cash Equivalent$ 4.63Total 100.00
Lumpsum Performance (As on 31st August, 2021)
Period
Returns % Value of ` 10,000 invested
FundBenchmark Addl. BM
FundBenchmark Addl. BM
Nifty 50 Arbitrage^
CRISIL 1 Yr T Bill Index
Nifty 50 Arbitrage^
CRISIL 1 Yr T Bill Index
1 Year 3.74% 4.18% 3.92% 10,374 10,418 10,3923 Years 4.94% 4.68% 6.35% 11,558 11,472 12,0295 Years 5.28% 4.65% 6.21% 12,934 12,554 13,5157 Years 5.83% 5.41% 6.75% 14,882 14,470 15,80810 Years 6.58% 6.28% 6.91% 18,928 18,392 19,523Since Inception 6.65% NA 6.37% 25,189 NA 24,267(30 April, 2007)Past performance may or may not be sustained in future. BM - Benchmark. Returns above 1 year are CAGR. Different plans have different expense structure. For calculating returns since inception, NAV as on the date of allotment is taken as Rs. 10/-. Face Value per unit is Rs. 10/-. Please refer Page nos. 38-42 for performance of other Schemes managed by the Fund Managers and Page nos. 43-47 for performance of Direct Plans and respective Disclaimers. Also refer Note 1 below. SIP Performance (As on 31st August, 2021)
SIPInvestment
Total amountinvested
(`)
Scheme Nifty 50 Arbitrage^ CRISIL 1 Yr T Bill Index2.1
Market value (`)
SIP Returns (%) XIRR
Market value (`)
SIP Returns (%) XIRR
Market value (`)
SIP Returns (%) XIRR
1 Year 120,000 122,611 4.06% 122,980 4.64% 122,586 4.02%3 Years 360,000 384,880 4.39% 383,038 4.07% 390,466 5.35%5 Years 600,000 678,879 4.88% 670,631 4.40% 696,641 5.91%7 Years 840,000 1,011,767 5.24% 993,614 4.73% 1,047,648 6.21%10 Years 1,200,000 1,619,063 5.84% 1,585,811 5.44% 1,681,748 6.57%Since Inception 1,720,000 2,749,335 6.26% NA NA 2,805,625 6.52%(30 April, 2007)Past performance may or may not be sustained in future. 2.1Additional Benchmark. Load is not taken into consideration. XIRR method is used to calculate SIP returns assuming investment of Rs. 10,000/- on the first working day of every month. The above investment simulation is for illustrative purpose only and should not be construed as a promise on minimum returns and safeguard of capital. Also refer Note 1 below. Note 1 : Returns are of existing plan (non - direct plan) - Growth Option.^The inception date of the Scheme is 30 April, 2007 which is prior to the date (i.e. 01 April, 2010) from which figures for Nifty 50 Arbitrage Index (Benchmark Index) are available. Hence returns since inception and for other required periods are not available for Nifty 50 Arbitrage Index. NA - Not Available
$ The Scheme is having exposure to Stock Futures (Short) against the above Equity Stocks and the Gross Exposure Derivatives is 67.25% of Net Assets.
IDCW - Income Distribution cum capital withdrawal option.
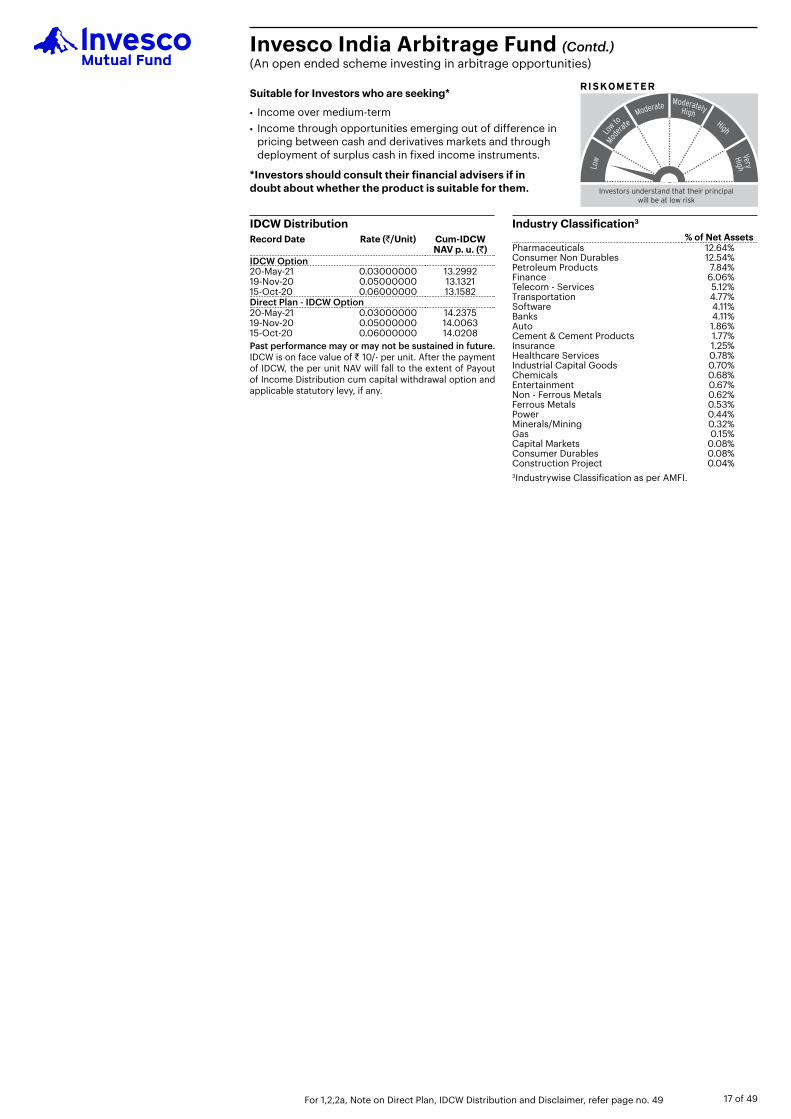
For 1,2,2a, Note on Direct Plan, IDCW Distribution and Disclaimer, refer page no. 49 17 of 49
Industry Classification3
% of Net AssetsPharmaceuticals 12.64%Consumer Non Durables 12.54%Petroleum Products 7.84%Finance 6.06%Telecom - Services 5.12%Transportation 4.77%Software 4.11%Banks 4.11%Auto 1.86%Cement & Cement Products 1.77%Insurance 1.25%Healthcare Services 0.78%Industrial Capital Goods 0.70%Chemicals 0.68%Entertainment 0.67%Non - Ferrous Metals 0.62%Ferrous Metals 0.53%Power 0.44%Minerals/Mining 0.32%Gas 0.15%Capital Markets 0.08%Consumer Durables 0.08%Construction Project 0.04%3Industrywise Classification as per AMFI.
IDCW DistributionRecord Date Rate (`/Unit) Cum-IDCW
NAV p. u. (`)IDCW Option20-May-21 0.03000000 13.299219-Nov-20 0.05000000 13.132115-Oct-20 0.06000000 13.1582Direct Plan - IDCW Option20-May-21 0.03000000 14.237519-Nov-20 0.05000000 14.006315-Oct-20 0.06000000 14.0208Past performance may or may not be sustained in future. IDCW is on face value of ` 10/- per unit. After the payment of IDCW, the per unit NAV will fall to the extent of Payout of Income Distribution cum capital withdrawal option and applicable statutory levy, if any.
Invesco India Arbitrage Fund (Contd.)(An open ended scheme investing in arbitrage opportunities)
Low
Moderate High
Low to
Moderately Very
Mod
erate
High High
Investors understand that their principalwill be at low risk
RISKOMETERSuitable for Investors who are seeking*l Income over medium-terml Income through opportunities emerging out of difference in
pricing between cash and derivatives markets and through deployment of surplus cash in fixed income instruments.
*Investors should consult their financial advisers if in doubt about whether the product is suitable for them.

For 1,2,2a, Note on Direct Plan, IDCW Distribution and Disclaimer, refer page no. 4918 of 49
Invesco India ESG Equity Fund(An open ended equity scheme investing in companies following Environmental, Social and Governance (ESG) theme)
Industry Classification3
% of Net AssetsSoftware 23.21%Banks 16.97%Consumer Durables 7.97%Pharmaceuticals 7.92%Auto Ancillaries 6.90%Retailing 5.16%Finance 3.14%Insurance 3.07%Capital Markets 2.92%Transportation 2.74%Auto 2.55%Industrial Products 2.30%Gas 2.26%Industrial Capital Goods 2.22%Telecom - Services 2.03%Aerospace & Defense 1.94%Construction 1.72%Power 1.71%Consumer Non Durables 1.41%Chemicals 0.94%3Industrywise Classification as per AMFI.
Investment ObjectiveTo generate capital appreciation from a diversified portfolio of Equity and Equity Related Instruments of companies which are selected based on Environmental, Social and Governance (ESG) criteria as defined by our proprietary investment framework.
Key FactsLoad Structure Entry Load Nil Exit Load1 •Nil-ifupto10%ofUnitsallottedare
redeemed / switched-out within 1 year from the date of allotment.
•1% - for any redemption / switch-out in excess of 10% of units allotted within one year from the date of allotment.
•Nil - if units are redeemed or switched-out after 1 year from the date of allotment.
Switch between the Plans under the Scheme, please refer page no. 49.
Minimum Investment ` 1,000/- & in multiples of ` 1/- thereafterAdditional Purchase` 1,000/- & in multiples of ` 1/- thereafterDate of Allotment 20th March, 2021NAV p.u. (`) As on 31st August, 2021Growth 12.37 IDCW 12.37 Direct PlanGrowth 12.47 IDCW 12.47 Portfolio Turnover Ratio (1 Year) 0.11Weighted Average Expense Ratio2 for the monthRegular 2.34%Direct 0.59%Benchmark IndexNifty 100 Enhanced ESG TRIAAuM for the month of August 2021: ` 709.61 croresAuM as on31st August, 2021: ` 739.46 croresFund Manager & ExperienceTaher BadshahTotal Experience 27 Years Experience in managing this fund: Since March 20, 2021Amit NigamTotal Experience 21 Years Experience in managing this fund: Since March 20, 2021
Asset AllocationEquity Holdings 99.07%Cash & Cash Equivalent 0.93%
Portfolio (As on 31st August, 2021) No. of Holdings : 35
Company % of Net AssetsEquity & Equity Related Instruments 99.07Infosys Ltd. 9.22Tata Consultancy Services Ltd. 6.42Kotak Mahindra Bank Ltd. 5.87ICICI Bank Ltd. 5.21Axis Bank Ltd. 4.81Titan Company Ltd. 4.25Divi’s Laboratories Ltd. 3.34Bajaj Finance Ltd. 3.14ICICI Lombard General Insurance Company Ltd.
3.07
HDFC Asset Management Company Ltd. 2.92Avenue Supermarts Ltd. 2.91Indian Railway Catering And Tourism Corporation Ltd.
2.74
L&T Technology Services Ltd. 2.72Larsen & Toubro Infotech Ltd. 2.70Gland Pharma Ltd. 2.58Bajaj Auto Ltd. 2.55KEI Industries Ltd. 2.30
Company % of Net AssetsWhirlpool of India Ltd. 2.30Indraprastha Gas Ltd. 2.26V-Mart Retail Ltd. 2.25Honeywell Automation India Ltd. 2.22Motherson Sumi Systems Ltd. 2.22Mphasis Ltd. 2.15Bharti Airtel Ltd. 2.03JB Chemicals & Pharmaceuticals Ltd. 1.99MTAR Technologies Ltd. 1.94Sundram Fasteners Ltd. 1.92Minda Industries Ltd. 1.74KNR Constructions Ltd. 1.72KEC International Ltd. 1.71Orient Electric Ltd. 1.42Manorama Industries Ltd. 1.41Bandhan Bank Ltd. 1.09Sona BLW Precision Forgings Ltd. 1.03Vinati Organics Ltd. 0.94Cash & Cash Equivalent 0.93Total 100.00
Low
Moderate High
Low to
Moderately Very
Mod
erate
High High
Investors understand that their principalwill be at very high risk
RISKOMETERSuitable for Investors who are seeking*l Capital appreciation over long terml Investments predominantly in equity and equity related
instruments of companies following ESG theme
*Investors should consult their financial advisers if in doubt about whether the product is suitable for them.
IDCW - Income Distribution cum capital withdrawal option.

For 1,2,2a, Note on Direct Plan, IDCW Distribution and Disclaimer, refer page no. 49 19 of 49
Invesco India - Invesco Global Consumer Trends Fund Of Fund(An open ended fund of fund scheme investing in Invesco Global Consumer Trends Fund)
Low
Moderate High
Low to
Moderately Very
Mod
erate
High High
Investors understand that their principalwill be at very high risk
RISKOMETERSuitable for Investors who are seeking*l Capital appreciation over long - term l Investment in units of Invesco Global Consumer Trends Fund,
an overseas equity fund
*Investors should consult their financial advisers if in doubt about whether the product is suitable for them.
Investment ObjectiveTo provide long-term capital appreciation by investing predominantly in units of Invesco Global Consumer Trends Fund, an overseas fund which invests in an international portfolio of companies predominantly engaged in the design, production or distribution of products and services related to the discretionary consumer needs of individuals.
Key FactsLoad Structure Entry Load Nil Exit Load1 •Nil - if upto 10%of Units allotted
are redeemed / switched-out within 1 year from the date of allotment.
•1% - for any redemption / switch-out in excess of 10% of units allotted within one year from the date of allotment.
•Nil - if units are redeemed or switched-out after 1 year from the date of allotment.
Switch between the Plans under the Scheme, please refer page no. 49.
Minimum Investment ` 1,000/- & in multiples of ` 1/- thereafterAdditional Purchase` 1,000/- & in multiples of ` 1/- thereafterDate of Allotment 24th December, 2020NAV p.u. (`) As on 31st August, 2021Growth 10.3145 IDCW 10.3143 Direct PlanGrowth 10.3972 IDCW 10.3999 Weighted Average Expense Ratio2, 2a
for the monthRegular 1.56%Direct 0.50%Benchmark IndexMSCI World Consumer Discretionary Index - Net DividendAAuM for the month of August 2021: ` 707.90 croresAuM as on31st August, 2021: ` 726.84 croresFund Manager & ExperienceEquity InvestmentsNeelesh DhamnaskarTotal Experience 16 Years Experience in managing this fund: Since December 24, 2020Debt InvestmentsKrishna CheemalapatiTotal Experience 24 Years Experience in managing this fund: Since December 24, 2020
Asset AllocationUnits of Overseas Mutual Fund 97.87%Cash & Cash Equivalent 2.13%
Portfolio (As on 31st August, 2021) Company % of Net AssetsOverseas Mutual Fund Units 97.87Invesco Global Consumer Trends Fund Accumulated S 97.87Cash & Cash Equivalent 2.13Total 100.00The investor will bear the recurring expenses of the scheme, in addition to the expenses of underlying scheme.
Underlying Fund Details - Invesco Global Consumer Trends Fund (As at July 31, 2021)
Top 10 Equity Holdings % of Net AssetsAmazon 10.00%Caesars Entertainment 4.40%Sony 3.80%EPR Properties 3.60%Farfetch 3.50%Penn National Gaming 3.00%Sea 2.80%HelloFresh 2.70%Booking Holdings 2.60%Lyft 2.50%
Sector Weightings (%) Fund IndexInternet & Catalog Retail 24.66 24.93Hotels, Restaurants & Leisure 16.94 14.88Entertainment 14.97 0Interactive Media & Services 9 0Specialty Retail 6.15 14.44Household Durables 4.71 5.7Road & Rail 4.63 0Equity Real Estate Investment Trusts (REITs) 3.56 0Automobiles 3.53 17.42Textiles, Apparel & Luxury Goods 3.4 12.69Food & Staples Retailing 2.46 0Auto Components 2.34 3.53Diversified Consumer Services 1.13 0Food Products 0.72 0Chemicals 0.6 0Media 0.57 0Aerospace & Defense 0.19 0Distributors 0 0.75Leisure Equipment & Products 0 1.17Multiline Retail 0 4.48
Geographical Weightings (%) Fund IndexUnited States 68.55 66.85China 7.97 0.06Japan 6.65 10.77United Kingdom 3.56 2.64Germany 3.5 4.63Taiwan 2.75 0Russia 1.76 0Others 1.37 7.06Argentina 1.29 1.01Macau 0.9 0.38France 0.7 6.6Brazil 0.29 0Poland 0.26 0
Source: Invesco Factsheet. Fund - Invesco Global Consumer Trends Fund. Benchmark - MSCI World Consumer Discretionary Index - Net Dividend. Holdings may change without notice. There is no guarantee that above mentioned securities are currently held or will be held by Invesco funds in the future nor a recommendation to buy/sell/hold the securities. This should not be seen as an investment advice.IDCW - Income Distribution cum capital withdrawal option.
Expense Ratio of Underlying Scheme, Invesco Global Consumer Trends Fund : 0.83%
Lumpsum Performance (As on 31st August, 2021)
Period
Returns % Value of ` 10,000 invested
FundBenchmark Addl. BM
FundBenchmark Addl. BM
MSCI World Consumer Discretionary Index -
Net DividendNifty 50
TRIMSCI World Consumer
Discretionary Index - Net Dividend
Nifty 50 TRI
6 Months -9.94% 19.57% 36.89% 9,494 10,997 11,880Past performance may or may not be sustained in future. BM - Benchmark. Returns less than 1 year are simple annualised. Returns are of Regular Plan - Growth Option. Different plans have different expense structure. Face Value per unit is Rs. 10/-. Please refer Page nos. 38-42 for performance of other Schemes managed by the Fund Managers and Page nos. 43-47 for performance of Direct Plans and respective Disclaimers.

For 1,2,2a, Note on Direct Plan, IDCW Distribution and Disclaimer, refer page no. 4920 of 49
Invesco India Feeder - Invesco Pan European Equity Fund(An open ended fund of fund scheme investing in Invesco Pan European Equity Fund)
Low
Moderate High
Low to
Moderately Very
Mod
erate
High High
Investors understand that their principalwill be at very high risk
RISKOMETERSuitable for Investors who are seeking*l Capital appreciation over long-terml Investment in units of Invesco Pan European Equity Fund,
an overseas equity fund
*Investors should consult their financial advisers if in doubt about whether the product is suitable for them.
Investment ObjectiveTo generate capital appreciation by investing predominantly in units of Invesco Pan European Equity Fund, an overseas equity fund which invests primarily in equity securities of European companies with an emphasis on larger companies. The Scheme may, at the discretion of Fund Manager, also invest in units of other similar Overseas Mutual Funds with similar objectives, strategy and attributes which may constitute a significant portion of its net assets.
Key FactsLoad Structure Entry Load Nil Exit Load1 •Nil-ifupto10%ofUnitsallottedare
redeemed / switched-out within 1 year from the date of allotment.
•1% - for any redemption / switch-out in excess of 10% of units allotted within one year from the date of allotment.
•Nil - if units are redeemed or switched-out after 1 year from the date of allotment.
Switch between the Plans under the Scheme, please refer page no. 49.
Minimum Investment ` 1,000/- & in multiples of ` 1/- thereafterAdditional Purchase` 1,000/- & in multiples of ` 1/- thereafterDate of Allotment 31st January, 2014NAV p.u. (`) As on 31st August, 2021Growth 13.3981 IDCW 13.3979 Direct PlanGrowth 14.3694 IDCW 14.3369 Weighted Average Expense Ratio2, 2a
for the monthRegular 0.67%Direct 0.29%Benchmark IndexMSCI Europe - Net DividendAAuM for the month of August 2021: ` 28.60 croresAuM as on31st August, 2021: ` 27.89 croresFund Manager & ExperienceNeelesh DhamnaskarTotal Experience 16 Years Experience in managing this fund: Since January 31, 2014
Asset AllocationUnits of Overseas Mutual Fund 97.83%Cash & Cash Equivalent 2.17%
Portfolio (As on 31st August, 2021) Company % of Net AssetsOverseas Mutual Fund Units 97.83Invesco Pan European Equity Fund Accumulated C 97.83Cash & Cash Equivalent 2.17Total 100.00
The investor will bear the recurring expenses of the scheme, in addition to the expenses of underlying scheme.
Lumpsum Performance (As on 31st August, 2021)
Period
Returns % Value of ` 10,000 invested
FundBenchmark Addl. BM
FundBenchmark Addl. BM
MSCI Europe - Net Dividend Nifty 50 TRI MSCI Europe -
Net Dividend Nifty 50 TRI
1 Year 31.55% 29.37% 52.24% 13,155 12,937 15,2243 Years 4.82% 10.80% 14.94% 11,519 13,605 15,1925 Years 8.55% 12.09% 15.70% 15,073 17,698 20,7387 Years 4.38% 8.21% 12.92% 13,510 17,393 23,454Since Inception 3.93% 7.83% 16.05% 13,398 17,713 30,926(31 January, 2014)Past performance may or may not be sustained in future. Returns above 1 year are CAGR. Returns are of existing plan (non - direct plan) - Growth Option. Different plans have different expense structure. For calculating returns since inception, NAV as on the date of allotment is taken as Rs. 10/-. Face Value per unit is Rs. 10/-. Please refer Page nos. 38-42 for performance of other Schemes managed by the Fund Managers and Page nos. 43-47 for performance of Direct Plans and respective Disclaimers.
Underlying Fund Details - Invesco Pan European Equity Fund (As at July 31, 2021)
Top 10 Equity Holdings % of Net AssetsRoche NES 3.7Sanofi 3.7Total 3.2UPM-Kymmene 3.0Deutsche Post 2.8Capgemini 2.6AstraZeneca 2.6Deutsche Telekom 2.4Carrefour 2.3Stellantis 2.2
Sector Weightings (%) Fund IndexFinancials 14.9 15.4Industrials 14.8 15.0Health Care 13.2 14.5Materials 11.9 8.5Utilities 10.2 4.2Consumer Discretionary 9.3 11.9Energy 7.3 4.2Information Technology 6.5 8.6Others 11.2 17.9Cash 0.6 0.0
Geographical Weightings (%) Fund IndexFrance 24.2 16.4United Kingdom 20.0 19.7Germany 11.7 14.0Switzerland 6.7 15.4Spain 5.9 3.7Finland 5.7 2.0Netherlands 4.9 6.8Italy 4.5 3.2Others 15.7 18.7Cash 0.6 0.0
Source: Invesco Factsheet. Fund: Invesco Pan European Equity Fund. Benchmark: MSCI Europe - ND. Holdings may change without notice. There is no guarantee that securities of the above mentioned sectors are currently held or will be held by Invesco funds in the future nor a recommendation to buy/sell/hold the securities. This should not be seen as an investment advice.
IDCW - Income Distribution cum capital withdrawal option.
Expense Ratio of Underlying Scheme, Invesco Pan European Equity Fund : 1.38%

For 1,2,2a, Note on Direct Plan, IDCW Distribution and Disclaimer, refer page no. 49 21 of 49
Invesco India Feeder - Invesco Global Equity Income Fund(An open ended fund of fund scheme investing in Invesco Global Equity Income Fund)
Low
Moderate High
Low to
Moderately Very
Mod
erate
High High
Investors understand that their principalwill be at very high risk
RISKOMETERSuitable for Investors who are seeking*l Capital appreciation and / or income over long-term l I nvestment in units of Invesco Global Equity Income Fund,
an overseas equity fund
*Investors should consult their financial advisers if in doubt about whether the product is suitable for them.
Investment ObjectiveTo provide capital appreciation and/or income by investing predominantly in units of Invesco Global Equity Income Fund, an overseas equity fund which invests primarily in equities of companies worldwide. The Scheme may, at the discretion of Fund Manager, also invest in units of other similar Overseas Mutual Funds with similar objectives, strategy and attributes which may constitute a significant portion of its net assets.
Key FactsLoad Structure Entry Load Nil Exit Load1 •Nil-ifupto10%ofUnitsallottedare
redeemed / switched-out within 1 year from the date of allotment.
•1% - for any redemption / switch-out in excess of 10% of units allotted within one year from the date of allotment.
•Nil - if units are redeemed or switched-out after 1 year from the date of allotment.
Switch between the Plans under the Scheme, please refer page no. 49.
Minimum Investment ` 1,000/- & in multiples of ` 1/- thereafterAdditional Purchase` 1,000/- & in multiples of ` 1/- thereafterDate of Allotment 5th May, 2014NAV p.u. (`) As on 31st August, 2021Growth 17.3819 IDCW 17.3566 Direct PlanGrowth 18.7940 IDCW 18.6266 Weighted Average Expense Ratio2, 2a
for the monthRegular 1.14%Direct 0.45%Benchmark IndexMSCI World Index - Net DividendAAuM for the month of August 2021: ` 9.98 croresAuM as on31st August, 2021: ` 10.03 croresFund Manager & ExperienceNeelesh DhamnaskarTotal Experience 16 Years Experience in managing this fund: Since May 5, 2014
Asset AllocationUnits of Overseas Mutual Fund 97.94%Cash & Cash Equivalent 2.06%
Portfolio (As on 31st August, 2021)Company % of Net AssetsOverseas Mutual Fund Units 97.94Invesco Global Equity Income Fund Accumulated C 97.94Cash & Cash Equivalent 2.06Total 100.00%The investor will bear the recurring expenses of the scheme, in addition to the expenses of underlying scheme.
Lumpsum Performance (As on 31st August, 2021)
Period
Returns % Value of ` 10,000 invested
FundBenchmark Addl. BM
FundBenchmark Addl. BM
MSCI World Index - Net Dividend Nifty 50 TRI MSCI World Index
- Net Dividend Nifty 50 TRI1 Year 30.89% 29.32% 52.24% 13,089 12,932 15,2243 Years 9.26% 16.03% 14.94% 13,048 15,626 15,1925 Years 10.43% 16.82% 15.70% 16,426 21,769 20,7387 Years 8.00% 13.76% 12.92% 17,158 24,701 23,454Since Inception 7.84% 13.81% 15.13% 17,382 25,804 28,081(05 May, 2014)Past performance may or may not be sustained in future. Returns above 1 year are CAGR. Returns are of existing plan (non - direct plan) - Growth Option. Different plans have different expense structure. For calculating returns since inception, NAV as on the date of allotment is taken as Rs. 10/-. Face Value per unit is Rs. 10/-. Please refer Page nos. 38-42 for performance of other Schemes managed by the Fund Managers and Page nos. 43-47 for performance of Direct Plans and respective Disclaimers.
Underlying Fund Details - Invesco Global Equity Income Fund (As at July 31, 2021)
Top 10 Equity Holdings % of Net AssetsMicrosoft 4.9Taiwan Semiconductor Manufacturing ADR 4.4Coca-Cola 4.3Alphabet ‘C’ 4.2American Tower ‘C’ 4.03i 3.9Progressive 3.9JPMorgan Chase 3.3Tencent 3.2Texas Instruments 3.2
Sector Weightings (%) Fund IndexFinancials 25.0 13.3Information Technology 16.3 22.5Communication Services 11.9 9.1Consumer Staples 11.6 7.0Consumer Discretionary 10.0 11.9Industrials 9.4 10.6Health Care 5.7 12.8Real Estate 4.0 2.8Others 5.8 10.1Cash 0.2 0.0
Geographical Weightings (%) Fund IndexUnited States 46.7 67.5United Kingdom 16.6 4.0Switzerland 11.1 2.9China 6.7 0.2Taiwan 4.4 0.0France 3.8 3.1South Korea 2.2 0.0Hong Kong 2.2 0.8Others 6.1 21.4Cash 0.2 0.0
Source: Invesco Factsheet. Fund - Invesco Global Equity Income. Benchmark- MSCI World Index - Net Dividend. Holdings may change without notice. There is no guarantee that above mentioned securities are currently held or will be held by Invesco funds in the future nor a recommendation to buy/sell/hold the securities. This should not be seen as an investment advice.
IDCW - Income Distribution cum capital withdrawal option.
Expense Ratio of Underlying Scheme, Invesco Global Equity Income Fund : 0.98%

22 of 49 For 1,2,4, Note on Direct Plan, IDCW Distribution and Disclaimer, refer page no. 49
Invesco India Equity & Bond Fund(An open ended hybrid scheme investing predominantly in equity and equity related instruments)
Low
Moderate High
Low to
Moderately Very
Mod
erate
High High
Investors understand that their principalwill be at very high risk
RISKOMETERSuitable for Investors who are seeking*l Capital appreciation and current income over medium to long
terml Investments in equity & equity related instruments and fixed
income securities.
*Investors should consult their financial advisers if in doubt about whether the product is suitable for them.
Industry Classification3
% of Net AssetsBanks 15.46%Software 10.08%Consumer Durables 6.29%Auto Ancillaries 5.06%Petroleum Products 4.42%Pharmaceuticals 4.36%Consumer Non Durables 2.82%Finance 2.42%Cement & Cement Products 2.34%Auto 2.24%Healthcare Services 2.15%Aerospace & Defense 1.95%Chemicals 1.73%Construction Project 1.53%Insurance 1.50%Industrial Products 1.40%Ferrous Metals 1.31%Retailing 1.27%Telecom - Services 1.15%Pesticides 1.08%Power 0.88%Gas 0.86%Industrial Capital Goods 0.72%3Industrywise Classification as per AMFI.
Investment ObjectiveTo generate capital appreciation and current income by investing in equity & equity related instruments as well as debt securities.
Key FactsLoad Structure Entry Load Nil Exit Load1 •Nil-ifupto10%ofUnitsallottedare
redeemed / switched-out within 1 year from the date of allotment.
•1% - for any redemption / switch-out in excess of 10% of units allotted within one year from the date of allotment.
•Nil - if units are redeemed or switched-out after 1 year from the date of allotment.
Switch between the Plans under the Scheme, please refer page no. 49.
Minimum Investment ` 1,000/- & in multiples of ` 1/- thereafterAdditional Purchase` 1,000/- & in multiples of ` 1/- thereafterDate of Allotment 30th June, 2018NAV p.u. (`) As on 31st August, 2021Growth 14.18 IDCW 14.19 Direct PlanGrowth 14.89 IDCW 14.86 Portfolio Turnover Ratio (1 Year) 1.13Weighted Average Expense Ratio2 for the monthRegular 2.52%Direct 0.88%Benchmark IndexCRISIL Hybrid 35 + 65 - Aggressive IndexAAuM for the month of August 2021: ` 389.75 croresAuM as on31st August, 2021: ` 395.66 croresFund Manager & ExperienceEquity InvestmentsTaher BadshahTotal Experience 27 Years Experience in managing this fund: Since June 30, 2018Pranav GokhaleTotal Experience 19 Years Experience in managing this fund: Since May 19, 2020Debt InvestmentsKrishna CheemalapatiTotal Experience 24 Years Experience in managing this fund: Since June 30, 2018
Performance AttributesStandard Deviation 4.61%Sharpe Ratio 0.14Beta 1.05Based on 3 years, monthly data points (Risk-free rate of 3.38% based on Overnight MIBOR)
Asset AllocationEquity Holdings 73.01%Corporate Debt 18.32%Government Security 4.80%Cash & Cash Equivalent 3.87%YTM4 4.81%Average Maturity 2.85 yearsMacaulay Duration 2.41 yearsModified Duration 2.32 years
Portfolio (As on 31st August, 2021)Company Ratings % of Net
AssetsEquity & Equity Related Instruments 73.01ICICI Bank Ltd. 4.64Reliance Industries Ltd. 4.42Infosys Ltd. 4.01HDFC Bank Ltd. 3.87Mphasis Ltd. 2.35Axis Bank Ltd. 2.34L&T Technology Services Ltd. 2.04Bajaj Finance Ltd. 2.02Crompton Greaves Consumer Electricals Ltd.
1.97
Hindustan Unilever Ltd. 1.96Bharat Electronics Ltd. 1.95Voltas Ltd. 1.89State Bank of India 1.81Gland Pharma Ltd. 1.74Vinati Organics Ltd. 1.73IndusInd Bank Ltd. 1.70Minda Industries Ltd. 1.62Kajaria Ceramics Ltd. 1.59Larsen & Toubro Ltd. 1.53UltraTech Cement Ltd. 1.51SBI Life Insurance Company Ltd. 1.50Ashok Leyland Ltd. 1.47Krishna Institute Of Medical Sciences Ltd. 1.41AIA Engineering Ltd. 1.40Dr. Reddy’s Laboratories Ltd. 1.36Tata Steel Ltd. 1.31V-Mart Retail Ltd. 1.27Bharti Airtel Ltd. 1.15Endurance Technologies Ltd. 1.14Bandhan Bank Ltd. 1.10Sumitomo Chemical India Ltd. 1.08
Company Ratings % of Net Assets
Tech Mahindra Ltd. 0.93NTPC Ltd. 0.88United Breweries Ltd. 0.87Gujarat Gas Ltd. 0.86Whirlpool of India Ltd. 0.83The Ramco Cements Ltd. 0.83Sona BLW Precision Forgings Ltd. 0.83Hero MotoCorp Ltd. 0.77Cipla Ltd. 0.74MRF Ltd. 0.74Persistent Systems Ltd. 0.74Krsnaa Diagnostics Ltd. 0.74Balkrishna Industries Ltd. 0.73Honeywell Automation India Ltd. 0.72Aurobindo Pharma Ltd. 0.52IIFL Wealth Management Ltd. 0.40Corporate Debt 18.32UltraTech Cement Ltd. CRISIL AAA 6.50National Bank For Agriculture and Rural Development
ICRA AAA 5.09
HDB Financial Services Ltd. CRISIL AAA 2.62Reliance Industries Ltd. CRISIL AAA 1.29REC Ltd. CRISIL AAA 1.27Bharti Hexacom Ltd. (Subsidiary of Bharti Airtel Ltd.)
CRISIL AA 1.26
Coastal Gujarat Power Ltd. (Guaranteed by Tata Power)
CARE AA(CE) 0.29
Government Security 4.80Government Bond6.79% GOI (MD 26/12/2029) Sovereign 3.916.45% GOI (MD 07/10/2029) Sovereign 0.90Cash & Cash Equivalent 3.87Total 100.00
Lumpsum Performance (As on 31st August, 2021)
PeriodReturns % Value of ` 10,000 invested
FundBenchmark Addl. BM
FundBenchmark Addl. BM
CRISIL Hybrid 35 + 65 - Aggressive Index Nifty 50 TRI CRISIL Hybrid 35 + 65
- Aggressive Index Nifty 50 TRI1 Year 34.08% 36.26% 52.24% 13,408 13,626 15,2243 Years 10.00% 13.99% 14.94% 13,315 14,816 15,192Since Inception 11.65% 15.54% 17.37% 14,184 15,813 16,623(30 June, 2018)Past performance may or may not be sustained in future. BM - Benchmark. Returns above 1 year are CAGR. Returns are of existing plan (non - direct plan) - Growth Option. Different plans have different expense structure. For calculating returns since inception, NAV as on the date of allotment is taken as Rs. 10/-. Face Value per unit is Rs. 10/-. Please refer Page nos. 38-42 for performance of other Schemes managed by the Fund Managers and Page nos. 43-47 for performance of Direct Plans and respective Disclaimers.
SIP Performance (As on 31st August, 2021)
SIPInvestment
Total amountinvested
(`)
Scheme CRISIL Hybrid 35 + 65 - Aggressive Index Nifty 50 TRI2.1
Market value (`)
SIP Returns (%) XIRR
Market value (`)
SIP Returns (%) XIRR
Market value (`)
SIP Returns (%) XIRR
1 Year 120,000 139,765 31.90% 141,307 34.50% 150,620 50.48%3 Years 360,000 472,499 18.48% 498,829 22.37% 535,668 27.59%Since Inception 380,000 500,384 17.67% 529,799 21.52% 567,954 26.31%(30 June, 2018)Past performance may or may not be sustained in future. 2.1Additional Benchmark. Load is not taken into consideration. XIRR method is used to calculate SIP returns assuming investment of Rs. 10,000/- on the first working day of every month. The above investment simulation is for illustrative purpose only and should not be construed as a promise on minimum returns and safeguard of capital. Also refer Note 1 below. Note 1 : Returns are of existing plan (non - direct plan) - Growth Option. Benchmark returns are calculated using Total Return variant of respective Benchmark Index.
IDCW - Income Distribution cum capital withdrawal option.

23 of 49For 1,2,4, Note on Direct Plan, IDCW Distribution and Disclaimer, refer page no. 49
Invesco India Equity Savings Fund(An open ended scheme investing in equity, arbitrage and debt)
Low
Moderate High
Low to
Moderately Very
Mod
erate
High High
Investors understand that their principalwill be at moderate risk
RISKOMETERSuitable for Investors who are seeking*l Capital appreciation and current incomel Investments in equity and equity related instruments,
arbitrage opportunities and fixed income instruments (including debt, government securities and money market instruments)
*Investors should consult their financial advisers if in doubt about whether the product is suitable for them.
Industry Classification3
% of Net AssetsBanks 12.83%Pharmaceuticals 8.19%Consumer Non Durables 8.09%Finance 6.89%Software 5.07%Petroleum Products 4.24%Telecom - Services 3.47%Cement & Cement Products 2.84%Auto 1.91%Consumer Durables 1.91%Auto Ancillaries 1.82%Gas 1.34%Insurance 1.33%Transportation 1.22%Construction Project 1.19%Chemicals 1.17%Industrial Products 0.94%Ferrous Metals 0.83%Capital Markets 0.71%Industrial Capital Goods 0.55%Aerospace & Defense 0.43%Construction 0.39%3Industrywise Classification as per AMFI.
Investment ObjectiveTo generate capital appreciation and income by investing in equity & equity related instruments, arbitrage opportunities and fixed income instruments (including debt, government securities and money market instruments).
Key FactsLoad Structure Entry Load Nil Exit Load1 •Ifredeemed/switched-outonor
before 1 month from the date of allotment : 0.25%.
•Ifredeemed/switched-outafter 1 month from the date of allotment : Nil
Switch between the Plans under the Scheme, please refer page no. 49.
Minimum Investment ` 1,000/- & in multiples of ` 1/- thereafterAdditional Purchase` 1,000/- & in multiples of ` 1/- thereafterDate of Allotment 7th March, 2019NAV p.u. (`) As on 31st August, 2021Growth 12.41 IDCW 12.41 Direct PlanGrowth 12.98 IDCW 12.94 Portfolio Turnover Ratio (1 Year) 5.55Weighted Average Expense Ratio2 for the monthRegular 2.33%Direct 0.67%Benchmark IndexNifty Equity Savings IndexAAuM for the month of August 2021: ` 133.23 croresAuM as on31st August, 2021: ` 154.02 croresFund Manager & ExperienceEquity InvestmentsAmit NigamTotal Experience 21 Years Experience in managing this fund: Since September 3, 2020Dhimant KothariTotal Experience 16 Years Experience in managing this fund: Since May 19, 2020Debt InvestmentsKrishna CheemalapatiTotal Experience 24 Years Experience in managing this fund: Since March 7, 2019
Asset AllocationEquity Holdings 67.36%Mutual Fund Units 10.56%Corporate Debt 5.65%Cash & Cash Equivalent 16.43%YTM4 3.40%Average Maturity 132 daysMacaulay Duration 125.57 daysModified Duration 119 days
Company Ratings % of Net Assets
Equity & Equity Related Instruments 67.36United Spirits Ltd. 5.22Housing Development Finance Corp. Ltd. 4.69Sun Pharmaceutical Industries Ltd. 4.40Reliance Industries Ltd. 4.24ICICI Bank Ltd. 3.82Bharti Airtel Ltd. 2.95State Bank of India 2.90HDFC Bank Ltd. 2.87Infosys Ltd. 2.79Marico Ltd. 1.70Divi’s Laboratories Ltd. 1.61Axis Bank Ltd. 1.60Bajaj Auto Ltd. 1.44Grasim Industries Ltd. 1.39HDFC Life Insurance Company Ltd. 1.33Kotak Mahindra Bank Ltd. 1.28Tech Mahindra Ltd. 1.27Larsen & Toubro Ltd. 1.19L&T Technology Services Ltd. 1.01Bajaj Finance Ltd. 0.84Tata Steel Ltd. 0.83Gland Pharma Ltd. 0.78UltraTech Cement Ltd. 0.77Vinati Organics Ltd. 0.74VIP Industries Ltd. 0.74TCI Express Ltd. 0.72JB Chemicals & Pharmaceuticals Ltd. 0.71HDFC Asset Management Company Ltd. 0.71Birla Corporation Ltd. 0.68Cipla Ltd. 0.68Indraprastha Gas Ltd. 0.67Gujarat Gas Ltd. 0.67
Company Ratings % of Net Assets
ITC Ltd. 0.66Minda Industries Ltd. 0.66Motherson Sumi Systems Ltd. 0.62Whirlpool of India Ltd. 0.60KEI Industries Ltd. 0.59Titan Company Ltd. 0.57Honeywell Automation India Ltd. 0.55MRF Ltd. 0.55Cholamandalam Investment and Finance Company Ltd.
0.53
Sterlite Technologies Ltd. 0.52United Breweries Ltd. 0.52Indian Railway Catering And Tourism Corporation Ltd.
0.49
Ashok Leyland Ltd. 0.48SBI Cards and Payment Services Ltd. 0.43MTAR Technologies Ltd. 0.43Atul Ltd. 0.42Repco Home Finance Ltd. 0.40G R Infraprojects Ltd. 0.39RBL Bank Ltd. 0.36Graphite India Ltd. 0.34Corporate Debt 5.65National Bank For Agriculture and Rural Development
ICRA AAA 3.27
Bharti Telecom Ltd. (Key promoter holding company of Bharti Airtel Ltd with largest shareholding in it)
CRISIL AA+ 1.99
ONGC Petro Additions Ltd. ICRA AA 0.39Mutual Fund Units 10.56Mutual Fund Units 10.56Cash & Cash Equivalent$ 16.43Total 100.00
$ Out of 67.35% equity exposure, unhedged is 35.88% and balance is hedged.
Lumpsum Performance (As on 31st August, 2021)
PeriodReturns % Value of ` 10,000 invested
FundBenchmark Addl. BM
FundBenchmark Addl. BM
Nifty Equity Savings Index
CRISIL 10 Yr Gilt Index
Nifty Equity Savings Index
CRISIL 10 Yr Gilt Index
1 Year 14.59% 20.27% 4.68% 11,459 12,027 10,468Since Inception 9.08% 12.15% 8.27% 12,414 13,301 12,186(7 March, 2019)Past performance may or may not be sustained in future. BM - Benchmark. Returns above 1 year are CAGR. Returns are of existing plan (non - direct plan) - Growth Option. Different plans have different expense structure. For calculating returns since inception, NAV as on the date of allotment is taken as Rs. 10/-. Face Value per unit is Rs. 10/-. Please refer Page nos. 38-42 for performance of other Schemes managed by the Fund Managers and Page nos. 43-47 for performance of Direct Plans and respective Disclaimers. SIP Performance (As on 31st August, 2021)
SIPInvestment
Total amountinvested
(`)
Scheme Nifty Equity Savings Index CRISIL 10 Yr Gilt Index2.1
Market value (`)
SIP Returns (%) XIRR
Market value (`)
SIP Returns (%) XIRR
Market value (`)
SIP Returns (%) XIRR
1 Year 120,000 129,469 14.95% 132,558 19.97% 121,811 2.81%Since Inception 300,000 346,519 11.56% 362,332 15.30% 321,554 5.47%(7 March, 2019)Past performance may or may not be sustained in future. 2.1Additional Benchmark. Load is not taken into consideration. XIRR method is used to calculate SIP returns assuming investment of Rs. 10,000/- on the first working day of every month. The above investment simulation is for illustrative purpose only and should not be construed as a promise on minimum returns and safeguard of capital. Also refer Note 1 below. Note 1 : Returns are of existing plan (non - direct plan) - Growth Option. Benchmark returns are calculated using Total Return variant of respective Benchmark Index.
IDCW - Income Distribution cum capital withdrawal option.
Portfolio (As on 31st August, 2021)
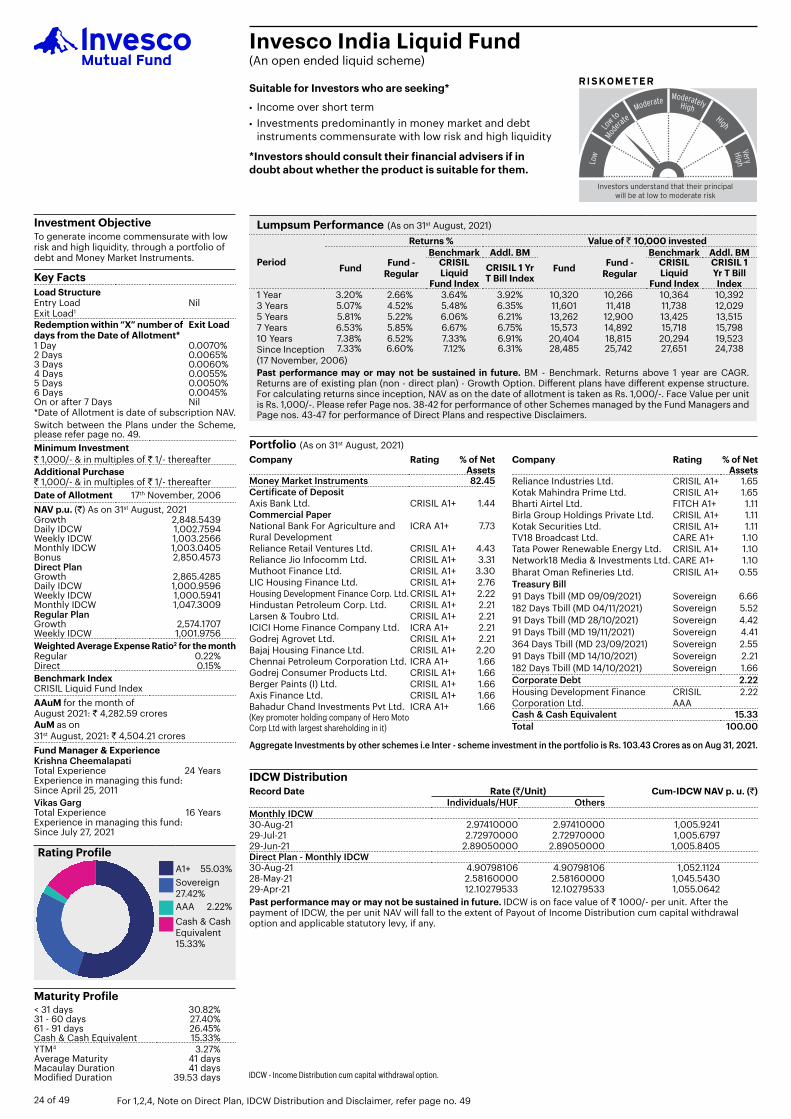
24 of 49 For 1,2,4, Note on Direct Plan, IDCW Distribution and Disclaimer, refer page no. 49
Company Rating % of Net Assets
Money Market Instruments 82.45Certificate of DepositAxis Bank Ltd. CRISIL A1+ 1.44Commercial PaperNational Bank For Agriculture and Rural Development
ICRA A1+ 7.73
Reliance Retail Ventures Ltd. CRISIL A1+ 4.43Reliance Jio Infocomm Ltd. CRISIL A1+ 3.31Muthoot Finance Ltd. CRISIL A1+ 3.30LIC Housing Finance Ltd. CRISIL A1+ 2.76Housing Development Finance Corp. Ltd.CRISIL A1+ 2.22Hindustan Petroleum Corp. Ltd. CRISIL A1+ 2.21Larsen & Toubro Ltd. CRISIL A1+ 2.21ICICI Home Finance Company Ltd. ICRA A1+ 2.21Godrej Agrovet Ltd. CRISIL A1+ 2.21Bajaj Housing Finance Ltd. CRISIL A1+ 2.20Chennai Petroleum Corporation Ltd. ICRA A1+ 1.66Godrej Consumer Products Ltd. CRISIL A1+ 1.66Berger Paints (I) Ltd. CRISIL A1+ 1.66Axis Finance Ltd. CRISIL A1+ 1.66Bahadur Chand Investments Pvt Ltd. (Key promoter holding company of Hero Moto Corp Ltd with largest shareholding in it)
ICRA A1+ 1.66
Company Rating % of Net Assets
Reliance Industries Ltd. CRISIL A1+ 1.65Kotak Mahindra Prime Ltd. CRISIL A1+ 1.65Bharti Airtel Ltd. FITCH A1+ 1.11Birla Group Holdings Private Ltd. CRISIL A1+ 1.11Kotak Securities Ltd. CRISIL A1+ 1.11TV18 Broadcast Ltd. CARE A1+ 1.10Tata Power Renewable Energy Ltd. CRISIL A1+ 1.10Network18 Media & Investments Ltd. CARE A1+ 1.10Bharat Oman Refineries Ltd. CRISIL A1+ 0.55Treasury Bill91 Days Tbill (MD 09/09/2021) Sovereign 6.66182 Days Tbill (MD 04/11/2021) Sovereign 5.5291 Days Tbill (MD 28/10/2021) Sovereign 4.4291 Days Tbill (MD 19/11/2021) Sovereign 4.41364 Days Tbill (MD 23/09/2021) Sovereign 2.5591 Days Tbill (MD 14/10/2021) Sovereign 2.21182 Days Tbill (MD 14/10/2021) Sovereign 1.66Corporate Debt 2.22Housing Development Finance Corporation Ltd.
CRISIL AAA
2.22
Cash & Cash Equivalent 15.33Total 100.00
IDCW DistributionRecord Date Rate (`/Unit) Cum-IDCW NAV p. u. (`)
Individuals/HUF OthersMonthly IDCW30-Aug-21 2.97410000 2.97410000 1,005.924129-Jul-21 2.72970000 2.72970000 1,005.679729-Jun-21 2.89050000 2.89050000 1,005.8405Direct Plan - Monthly IDCW30-Aug-21 4.90798106 4.90798106 1,052.112428-May-21 2.58160000 2.58160000 1,045.543029-Apr-21 12.10279533 12.10279533 1,055.0642Past performance may or may not be sustained in future. IDCW is on face value of ` 1000/- per unit. After the payment of IDCW, the per unit NAV will fall to the extent of Payout of Income Distribution cum capital withdrawal option and applicable statutory levy, if any.
Invesco India Liquid Fund(An open ended liquid scheme)
Low
Moderate High
Low to
Moderately Very
Mod
erate
High High
Investors understand that their principalwill be at low to moderate risk
RISKOMETERSuitable for Investors who are seeking*l Income over short terml Investments predominantly in money market and debt
instruments commensurate with low risk and high liquidity
*Investors should consult their financial advisers if in doubt about whether the product is suitable for them.
Investment ObjectiveTo generate income commensurate with low risk and high liquidity, through a portfolio of debt and Money Market Instruments.
Key FactsLoad Structure Entry Load Nil Exit Load1
Redemption within “X” number of days from the Date of Allotment*
Exit Load
1 Day 0.0070%2 Days 0.0065%3 Days 0.0060%4 Days 0.0055%5 Days 0.0050%6 Days 0.0045%On or after 7 Days Nil*Date of Allotment is date of subscription NAV.Switch between the Plans under the Scheme, please refer page no. 49.Minimum Investment ` 1,000/- & in multiples of ` 1/- thereafterAdditional Purchase` 1,000/- & in multiples of ` 1/- thereafterDate of Allotment 17th November, 2006NAV p.u. (`) As on 31st August, 2021Growth 2,848.5439 Daily IDCW 1,002.7594 Weekly IDCW 1,003.2566 Monthly IDCW 1,003.0405 Bonus 2,850.4573 Direct PlanGrowth 2,865.4285 Daily IDCW 1,000.9596 Weekly IDCW 1,000.5941 Monthly IDCW 1,047.3009 Regular PlanGrowth 2,574.1707 Weekly IDCW 1,001.9756 Weighted Average Expense Ratio2 for the monthRegular 0.22%Direct 0.15%Benchmark IndexCRISIL Liquid Fund IndexAAuM for the month of August 2021: ` 4,282.59 croresAuM as on31st August, 2021: ` 4,504.21 croresFund Manager & ExperienceKrishna Cheemalapati Total Experience 24 Years Experience in managing this fund: Since April 25, 2011Vikas GargTotal Experience 16 Years Experience in managing this fund: Since July 27, 2021
Portfolio (As on 31st August, 2021)
Lumpsum Performance (As on 31st August, 2021)
Period
Returns % Value of ` 10,000 invested
Fund Fund - Regular
Benchmark Addl. BMFund Fund -
Regular
Benchmark Addl. BMCRISIL Liquid
Fund Index
CRISIL 1 Yr T Bill Index
CRISIL Liquid
Fund Index
CRISIL 1 Yr T Bill Index
1 Year 3.20% 2.66% 3.64% 3.92% 10,320 10,266 10,364 10,3923 Years 5.07% 4.52% 5.48% 6.35% 11,601 11,418 11,738 12,0295 Years 5.81% 5.22% 6.06% 6.21% 13,262 12,900 13,425 13,5157 Years 6.53% 5.85% 6.67% 6.75% 15,573 14,892 15,718 15,79810 Years 7.38% 6.52% 7.33% 6.91% 20,404 18,815 20,294 19,523Since Inception 7.33% 6.60% 7.12% 6.31% 28,485 25,742 27,651 24,738(17 November, 2006)Past performance may or may not be sustained in future. BM - Benchmark. Returns above 1 year are CAGR. Returns are of existing plan (non - direct plan) - Growth Option. Different plans have different expense structure. For calculating returns since inception, NAV as on the date of allotment is taken as Rs. 1,000/-. Face Value per unit is Rs. 1,000/-. Please refer Page nos. 38-42 for performance of other Schemes managed by the Fund Managers and Page nos. 43-47 for performance of Direct Plans and respective Disclaimers.
Maturity Profile< 31 days 30.82%31 - 60 days 27.40%61 - 91 days 26.45%Cash & Cash Equivalent 15.33%YTM4 3.27%Average Maturity 41 daysMacaulay Duration 41 daysModified Duration 39.53 days
Aggregate Investments by other schemes i.e Inter - scheme investment in the portfolio is Rs. 103.43 Crores as on Aug 31, 2021.
Rating ProfileA1+ 55.03%Sovereign 27.42%AAA 2.22%Cash & Cash Equivalent 15.33%
IDCW - Income Distribution cum capital withdrawal option.

25 of 49For 1,2,4, Note on Direct Plan, IDCW Distribution and Disclaimer, refer page no. 49
IDCW DistributionRecord Date Rate (`/Unit) Cum-IDCW NAV p. u. (`)
Individuals/HUF OthersMonthly IDCW30-Aug-21 2.59735946 2.59735946 1,002.5974 29-Jul-21 2.52620000 2.52620000 1,002.5262 29-Jun-21 2.69840610 2.69840610 1,002.6985 Direct Plan - Monthly IDCW30-Aug-21 2.65280000 2.65280000 1,002.6543 29-Jul-21 2.57800000 2.57800000 1,002.5795 29-Jun-21 2.75570000 2.75570000 1,002.7572 Past performance may or may not be sustained in future. IDCW is on face value of ` 1000/- per unit. After the payment of IDCW, the per unit NAV will fall to the extent of Payout of Income Distribution cum capital withdrawal option and applicable statutory levy, if any.
Invesco India Overnight Fund(An open ended debt scheme investing in overnight securities)
Low
Moderate High
Low to
Moderately Very
Mod
erate
High High
Investors understand that their principalwill be at low risk
RISKOMETERSuitable for Investors who are seeking*l Income over short term with low risk and high liquidityl Investments in overnight securities having residual maturity
of 1 business day
*Investors should consult their financial advisers if in doubt about whether the product is suitable for them.
Investment ObjectiveTo generate income commensurate with low risk and high liquidity by investing in overnight securities having residual maturity of 1 business day.
Key FactsLoad Structure Entry Load Nil Exit Load1 NilMinimum Investment ` 1,000/- & in multiples of ` 1/- thereafterAdditional Purchase` 1,000/- & in multiples of ` 1/- thereafterDate of Allotment 8th January, 2020NAV p.u. (`) As on 31st August, 2021Growth 1,053.0428 Daily IDCW 1,000.0002 Weekly IDCW 1,000.0811 Monthly IDCW 1,000.0802 Direct PlanGrowth 1,054.0878 Daily IDCW 1,000.0000 Weekly IDCW 1,000.0820 Monthly IDCW 1,000.0828 Weighted Average Expense Ratio2 for the monthRegular 0.15%Direct 0.09%Benchmark IndexCRISIL Overnight IndexAAuM for the month of August 2021: ` 481.82 croresAuM as on31st August, 2021: ` 640.94 croresFund Manager & ExperienceKrishna CheemalapatiTotal Experience 24 Years Experience in managing this fund: Since January 8, 2020
YTM4 3.09%Average Maturity 1 day
Company Rating % of Net Assets
Cash & Cash Equivalent 100.00Total 100.00
Portfolio (As on 31st August, 2021)
Lumpsum Performance (As on 31st August, 2021)
Period
Returns % Value of ` 10,000 invested
FundBenchmark Addl. BM
FundBenchmark Addl. BM
CRISIL Overnight Index
CRISIL 1 YR T Bill Index
CRISIL Overnight Index
CRISIL 1 Yr T Bill Index
1 Year 3.02% 3.19% 3.92% 10,302 10,319 10,392Since Inception 3.19% 3.33% 5.08% 10,530 10,554 10,849(08 January, 2020)Past performance may or may not be sustained in future. BM - Benchmark. Returns are of existing plan (non - direct plan) - Growth Option. Different plans have different expense structure. For calculating returns since inception, NAV as on the date of allotment is taken as Rs. 1000/-. Face Value per unit is Rs. 1000/-. Please refer Page nos. 38-42 for performance of other Schemes managed by the Fund Managers and Page nos. 43-47 for performance of Direct Plans and respective Disclaimers.
IDCW - Income Distribution cum capital withdrawal option.
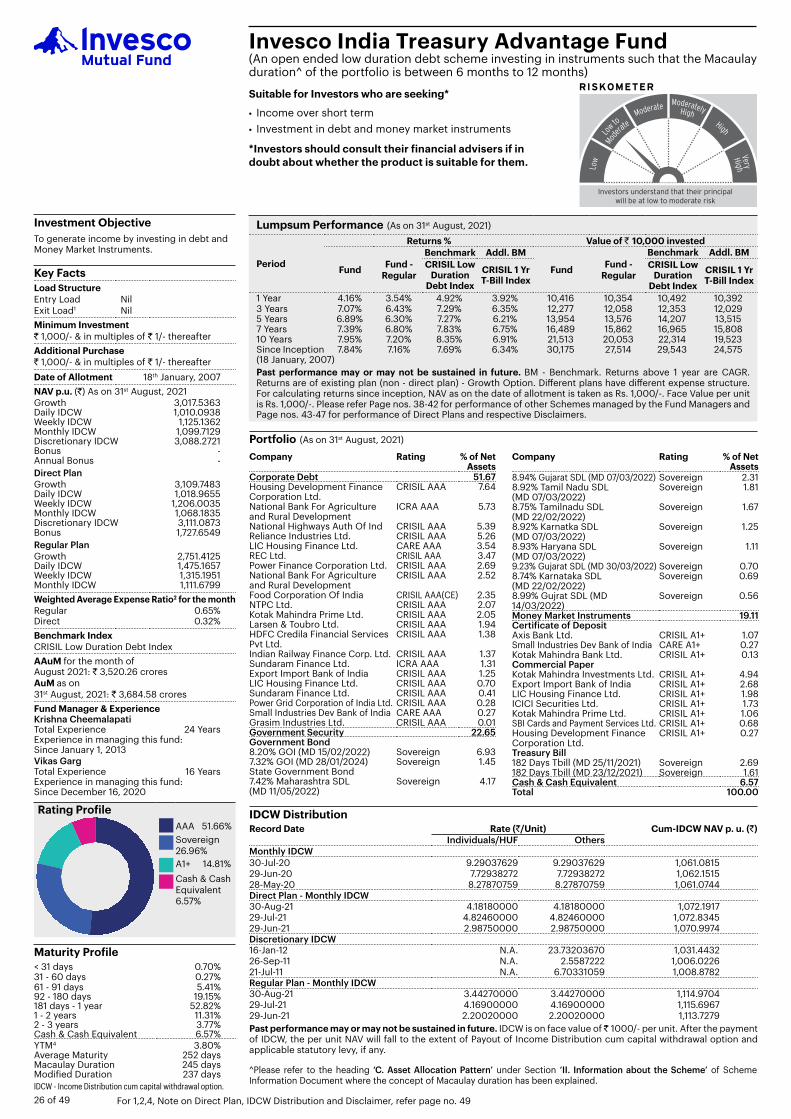
26 of 49 For 1,2,4, Note on Direct Plan, IDCW Distribution and Disclaimer, refer page no. 49
Company Rating % of Net Assets
Corporate Debt 51.67Housing Development Finance Corporation Ltd.
CRISIL AAA 7.64
National Bank For Agriculture and Rural Development
ICRA AAA 5.73
National Highways Auth Of Ind CRISIL AAA 5.39Reliance Industries Ltd. CRISIL AAA 5.26LIC Housing Finance Ltd. CARE AAA 3.54REC Ltd. CRISIL AAA 3.47Power Finance Corporation Ltd. CRISIL AAA 2.69National Bank For Agriculture and Rural Development
CRISIL AAA 2.52
Food Corporation Of India CRISIL AAA(CE) 2.35NTPC Ltd. CRISIL AAA 2.07Kotak Mahindra Prime Ltd. CRISIL AAA 2.05Larsen & Toubro Ltd. CRISIL AAA 1.94HDFC Credila Financial Services Pvt Ltd.
CRISIL AAA 1.38
Indian Railway Finance Corp. Ltd. CRISIL AAA 1.37Sundaram Finance Ltd. ICRA AAA 1.31Export Import Bank of India CRISIL AAA 1.25LIC Housing Finance Ltd. CRISIL AAA 0.70Sundaram Finance Ltd. CRISIL AAA 0.41Power Grid Corporation of India Ltd. CRISIL AAA 0.28Small Industries Dev Bank of India CARE AAA 0.27Grasim Industries Ltd. CRISIL AAA 0.01Government Security 22.65Government Bond8.20% GOI (MD 15/02/2022) Sovereign 6.937.32% GOI (MD 28/01/2024) Sovereign 1.45State Government Bond7.42% Maharashtra SDL (MD 11/05/2022)
Sovereign 4.17
Company Rating % of Net Assets
8.94% Gujarat SDL (MD 07/03/2022) Sovereign 2.318.92% Tamil Nadu SDL (MD 07/03/2022)
Sovereign 1.81
8.75% Tamilnadu SDL (MD 22/02/2022)
Sovereign 1.67
8.92% Karnatka SDL (MD 07/03/2022)
Sovereign 1.25
8.93% Haryana SDL (MD 07/03/2022)
Sovereign 1.11
9.23% Gujarat SDL (MD 30/03/2022) Sovereign 0.708.74% Karnataka SDL (MD 22/02/2022)
Sovereign 0.69
8.99% Gujrat SDL (MD 14/03/2022)
Sovereign 0.56
Money Market Instruments 19.11Certificate of DepositAxis Bank Ltd. CRISIL A1+ 1.07Small Industries Dev Bank of India CARE A1+ 0.27Kotak Mahindra Bank Ltd. CRISIL A1+ 0.13Commercial PaperKotak Mahindra Investments Ltd. CRISIL A1+ 4.94Export Import Bank of India CRISIL A1+ 2.68LIC Housing Finance Ltd. CRISIL A1+ 1.98ICICI Securities Ltd. CRISIL A1+ 1.73Kotak Mahindra Prime Ltd. CRISIL A1+ 1.06SBI Cards and Payment Services Ltd. CRISIL A1+ 0.68Housing Development Finance Corporation Ltd.
CRISIL A1+ 0.27
Treasury Bill182 Days Tbill (MD 25/11/2021) Sovereign 2.69182 Days Tbill (MD 23/12/2021) Sovereign 1.61Cash & Cash Equivalent 6.57Total 100.00
IDCW DistributionRecord Date Rate (`/Unit) Cum-IDCW NAV p. u. (`)
Individuals/HUF OthersMonthly IDCW30-Jul-20 9.29037629 9.29037629 1,061.081529-Jun-20 7.72938272 7.72938272 1,062.151528-May-20 8.27870759 8.27870759 1,061.0744Direct Plan - Monthly IDCW30-Aug-21 4.18180000 4.18180000 1,072.1917 29-Jul-21 4.82460000 4.82460000 1,072.8345 29-Jun-21 2.98750000 2.98750000 1,070.9974 Discretionary IDCW16-Jan-12 N.A. 23.73203670 1,031.443226-Sep-11 N.A. 2.5587222 1,006.022621-Jul-11 N.A. 6.70331059 1,008.8782Regular Plan - Monthly IDCW30-Aug-21 3.44270000 3.44270000 1,114.9704 29-Jul-21 4.16900000 4.16900000 1,115.6967 29-Jun-21 2.20020000 2.20020000 1,113.7279 Past performance may or may not be sustained in future. IDCW is on face value of ̀ 1000/- per unit. After the payment of IDCW, the per unit NAV will fall to the extent of Payout of Income Distribution cum capital withdrawal option and applicable statutory levy, if any.
^Please refer to the heading ‘C. Asset Allocation Pattern’ under Section ‘II. Information about the Scheme’ of Scheme Information Document where the concept of Macaulay duration has been explained.
Invesco India Treasury Advantage Fund(An open ended low duration debt scheme investing in instruments such that the Macaulay duration^ of the portfolio is between 6 months to 12 months)
Low
Moderate High
Low to
Moderately Very
Mod
erate
High High
Investors understand that their principalwill be at low to moderate risk
RISKOMETERSuitable for Investors who are seeking*l Income over short terml Investment in debt and money market instruments
*Investors should consult their financial advisers if in doubt about whether the product is suitable for them.
Investment ObjectiveTo generate income by investing in debt and Money Market Instruments.
Key FactsLoad Structure Entry Load Nil Exit Load1 NilMinimum Investment ` 1,000/- & in multiples of ` 1/- thereafterAdditional Purchase` 1,000/- & in multiples of ` 1/- thereafterDate of Allotment 18th January, 2007NAV p.u. (`) As on 31st August, 2021Growth 3,017.5363 Daily IDCW 1,010.0938 Weekly IDCW 1,125.1362 Monthly IDCW 1,099.7129 Discretionary IDCW 3,088.2721 Bonus - Annual Bonus - Direct PlanGrowth 3,109.7483 Daily IDCW 1,018.9655 Weekly IDCW 1,206.0035 Monthly IDCW 1,068.1835 Discretionary IDCW 3,111.0873 Bonus 1,727.6549 Regular PlanGrowth 2,751.4125 Daily IDCW 1,475.1657 Weekly IDCW 1,315.1951 Monthly IDCW 1,111.6799 Weighted Average Expense Ratio2 for the monthRegular 0.65%Direct 0.32%Benchmark IndexCRISIL Low Duration Debt IndexAAuM for the month of August 2021: ` 3,520.26 croresAuM as on31st August, 2021: ` 3,684.58 croresFund Manager & ExperienceKrishna Cheemalapati Total Experience 24 Years Experience in managing this fund: Since January 1, 2013Vikas GargTotal Experience 16 Years Experience in managing this fund: Since December 16, 2020
Lumpsum Performance (As on 31st August, 2021)
Period
Returns % Value of ` 10,000 invested
Fund Fund - Regular
Benchmark Addl. BM
Fund Fund - Regular
Benchmark Addl. BMCRISIL Low
Duration Debt Index
CRISIL 1 Yr T-Bill Index
CRISIL Low Duration
Debt Index
CRISIL 1 Yr T-Bill Index
1 Year 4.16% 3.54% 4.92% 3.92% 10,416 10,354 10,492 10,3923 Years 7.07% 6.43% 7.29% 6.35% 12,277 12,058 12,353 12,0295 Years 6.89% 6.30% 7.27% 6.21% 13,954 13,576 14,207 13,5157 Years 7.39% 6.80% 7.83% 6.75% 16,489 15,862 16,965 15,80810 Years 7.95% 7.20% 8.35% 6.91% 21,513 20,053 22,314 19,523Since Inception 7.84% 7.16% 7.69% 6.34% 30,175 27,514 29,543 24,575(18 January, 2007)Past performance may or may not be sustained in future. BM - Benchmark. Returns above 1 year are CAGR. Returns are of existing plan (non - direct plan) - Growth Option. Different plans have different expense structure. For calculating returns since inception, NAV as on the date of allotment is taken as Rs. 1,000/-. Face Value per unit is Rs. 1,000/-. Please refer Page nos. 38-42 for performance of other Schemes managed by the Fund Managers and Page nos. 43-47 for performance of Direct Plans and respective Disclaimers.
Maturity Profile< 31 days 0.70%31 - 60 days 0.27%61 - 91 days 5.41%92 - 180 days 19.15%181 days - 1 year 52.82%1 - 2 years 11.31%2 - 3 years 3.77%Cash & Cash Equivalent 6.57%YTM4 3.80%Average Maturity 252 daysMacaulay Duration 245 daysModified Duration 237 daysIDCW - Income Distribution cum capital withdrawal option.
Rating ProfileAAA 51.66%Sovereign 26.96%A1+ 14.81%Cash & Cash Equivalent 6.57%
Portfolio (As on 31st August, 2021)

27 of 49For 1,2,4, Note on Direct Plan, IDCW Distribution and Disclaimer, refer page no. 49
IDCW DistributionRecord Date Rate (`/Unit) Cum-IDCW NAV p. u. (`)
Individuals/HUF OthersMonthly IDCW30-Aug-21 5.47070000 5.47070000 1,052.8907 29-Jul-21 6.07700000 6.07700000 1,053.4970 28-May-21 4.42750000 4.42750000 1,051.8475 Direct Plan - Monthly IDCW28-Aug-20 24.34483898 24.34483898 1,956.4401 30-Jan-20 11.44779787 10.60072038 1,857.8926 30-Dec-19 1.55128660 1.43649947 1,844.1536 Plan B - Monthly IDCW29-Apr-13 14.15411326 12.05962963 1,086.388726-Mar-13 0.06962017 0.0596714 10.781327-Feb-13 0.01316549 0.01128417 10.7172Past performance may or may not be sustained in future. IDCW is on face value of ` 1000/- per unit. Face value changed from ` 10/- to ` 1,000/- w.e.f. close of business hours on April 18, 2013. IDCW declared prior to face value change is on face value of ` 10/- per unit. After the payment of IDCW, the per unit NAV will fall to the extent of Payout of Income Distribution cum capital withdrawal option and applicable statutory levy, if any.
^Please refer to the heading ‘C. Asset Allocation Pattern’ under Section ‘II. Information about the Scheme’ of Scheme Information Document where the concept of Macaulay duration has been explained.
Invesco India Short Term Fund(An open ended short term debt scheme investing in instruments such that the Macaulay duration^ of the portfolio is between 1 year to 3 years)
Low
Moderate High
Low to
Moderately Very
Mod
erate
High High
Investors understand that their principalwill be at low to moderate risk
RISKOMETERSuitable for Investors who are seeking*l Income over short to medium terml Investments in short term debt and money market
instruments
*Investors should consult their financial advisers if in doubt about whether the product is suitable for them.
Investment ObjectiveTo generate steady returns with a moderate risk for investors by investing in a portfolio of short term debt and Money Market Instruments.
Key FactsLoad Structure Entry Load Nil Exit Load1 NilMinimum Investment ` 1,000/- & in multiples of ` 1/- thereafterAdditional Purchase` 1,000/- & in multiples of ` 1/- thereafterDate of Allotment 24th March, 2007NAV p.u. (`) As on 31st August, 2021Growth 2,888.4263 Daily IDCW 1,036.8661 Weekly IDCW 1,019.5096 Monthly IDCW 1,047.9434 Discretionary IDCW 2,154.5965 Direct PlanGrowth 3,108.1845 Daily IDCW 1,023.5517 Weekly IDCW 1,019.5330 Monthly IDCW 2,045.3516 Discretionary IDCW 2,192.8831 Plan BGrowth 2,878.3608 Daily IDCW - Weekly IDCW 1,016.0172 Monthly IDCW 1,898.2014 Weighted Average Expense Ratio2 for the monthRegular 1.20%Direct 0.35%Benchmark IndexCRISIL Short Term Bond Fund IndexAAuM for the month of August 2021: ` 1,342.33 croresAuM as on31st August, 2021: ` 1,319.73 croresFund Manager & ExperienceVikas GargTotal Experience 16 Years Experience in managing this fund: Since September 26, 2020Krishna CheemalapatiTotal Experience 24 Years Experience in managing this fund: Since December 16, 2020
Maturity Profile< 31 days 0.36%92 - 180 days 3.05%181 days - 1 year 14.74%1 - 2 years 37.61%2 - 3 years 19.91%3 - 5 years 17.95%Cash & Cash Equivalent 6.38%YTM4 4.63%Average Maturity 2.10 yearsMacaulay Duration 1.89 yearsModified Duration 1.81 years
Company Rating % of Net Assets
Corporate Debt 62.04Reliance Industries Ltd. CRISIL AAA 7.59National Bank For Agriculture and Rural Development
CRISIL AAA 5.50
State Bank of India (Basel III Tier II Bond)
CRISIL AAA 4.10#
Sikka Ports and Terminals Ltd. CRISIL AAA 4.01LIC Housing Finance Ltd. CRISIL AAA 4.01Indian Oil Corporation Ltd. CRISIL AAA 3.87Kotak Mahindra Prime Ltd. CRISIL AAA 3.82National Bank For Agriculture and Rural Development
ICRA AAA 3.53
Power Finance Corporation Ltd. CRISIL AAA 3.33REC Ltd. CRISIL AAA 2.95Sundaram Finance Ltd. ICRA AAA 2.33Housing Development Finance Corporation Ltd.
CRISIL AAA 2.30
Mahindra & Mahindra Ltd. FITCH AAA 1.96HDB Financial Services Ltd. CRISIL AAA 1.96Bajaj Finance Ltd. CRISIL AAA 1.96UltraTech Cement Ltd. CRISIL AAA 1.95HDFC Credila Financial Services Pvt Ltd.
CRISIL AAA 1.93
Small Industries Dev Bank of India CARE AAA 1.92LIC Housing Finance Ltd. CARE AAA 1.90Bajaj Housing Finance Ltd. CRISIL AAA 0.76Power Grid Corporation of India Ltd. CRISIL AAA 0.34Tata Sons Private Ltd CRISIL AAA 0.02
Company Rating % of Net Assets
Government Security 23.94Government Bond7.32% GOI (MD 28/01/2024) Sovereign 4.035.63% GOI (MD 12/04/2026) Sovereign 3.036.18% GOI (MD 04/11/2024) Sovereign 2.957.68% GOI (MD 15/12/2023) Sovereign 2.836.17% GOI 2023 (MD. 12/06/2023) Sovereign 1.966.30% GOI 2023 (MD 09/04/2023) Sovereign 1.965.22% GOI (MD 15/06/2025) Sovereign 1.137.59% GOI(MD 11/01/2026) Sovereign 0.28State Government Bond5.44% Tamil Nadu SDL (MD 22/04/2023)
Sovereign 1.93
6.58% Odisha SDL (MD 24/03/2022)
Sovereign 1.93
4.54% Maharashtra SDL (MD 03/06/2022)
Sovereign 1.91
Money Market Instruments 7.64Certificate of DepositHDFC Bank Ltd. CARE A1+ 1.83Export Import Bank of India CRISIL A1+ 1.76Kotak Mahindra Bank Ltd. CRISIL A1+ 1.12Commercial PaperHousing Development Finance Corporation Ltd.
ICRA A1+ 1.82
Kotak Mahindra Investments Ltd. CRISIL A1+ 1.11Cash & Cash Equivalent 6.38Total 100.00
Lumpsum Performance (As on 31st August, 2021)
Period
Returns % Value of ` 10,000 invested
Fund Fund - Plan B
Benchmark Addl. BMFund Fund -
Plan B
Benchmark Addl. BMCRISIL Short
Term Bond Fund Index
CRISIL 10 Yr Gilt
Index
CRISIL Short Term Bond Fund Index
CRISIL 10 Yr Gilt
Index1 Year 4.60% 4.60% 6.02% 4.68% 10,460 10,460 10,602 10,4683 Years 7.70% 7.70% 8.74% 9.10% 12,494 12,495 12,862 12,9875 Years 6.82% 6.82% 7.79% 6.42% 13,907 13,908 14,556 13,6527 Years 7.40% 7.40% 8.30% 8.01% 16,495 16,499 17,494 17,16710 Years 7.79% 7.64% 8.48% 7.20% 21,187 20,901 22,588 20,059Since Inception 7.62% 7.59% 8.17% 6.89% 28,884 28,784 31,097 26,183(24 March, 2007)Past performance may or may not be sustained in future. BM - Benchmark. Returns above 1 year are CAGR. Returns are of existing plan (non - direct plan) - Growth Option. Different plans have different expense structure. For calculating returns since inception, NAV as on the date of allotment is taken as Rs. 1,000/-. Face Value per unit is Rs. 1,000/-. Please refer Page nos. 38-42 for performance of other Schemes managed by the Fund Managers and Page nos. 43-47 for performance of Direct Plans and respective Disclaimers.
Rating ProfileAAA 62.04%Sovereign 23.94%A1+ 7.64%Cash & Cash Equivalent 6.38%
IDCW - Income Distribution cum capital withdrawal option.
Portfolio (As on 31st August, 2021)
# Yield to Maturity (YTM) : 7.39%, Yield to Call (YTC) : 4.85%

28 of 49 For 1,2,4, Note on Direct Plan, IDCW Distribution and Disclaimer, refer page no. 49
Company Rating % of Net Assets
Money Market Instruments 65.60Certificate of DepositNational Bank For Agriculture and Rural Development
ICRA A1+ 7.48
Small Industries Dev Bank of India CARE A1+ 7.45Kotak Mahindra Bank Ltd. CRISIL A1+ 5.12Axis Bank Ltd. CRISIL A1+ 4.69HDFC Bank Ltd. CARE A1+ 3.19IndusInd Bank Ltd. CRISIL A1+ 2.35Commercial PaperKotak Mahindra Investments Ltd. CRISIL A1+ 4.47Reliance Industries Ltd. CRISIL A1+ 4.26Sundaram Finance Ltd. CRISIL A1+ 4.25Housing Development Finance Corporation Ltd.
CRISIL A1+ 3.84
LIC Housing Finance Ltd. CRISIL A1+ 3.20Kotak Mahindra Prime Ltd. CRISIL A1+ 2.55ICICI Securities Ltd. CRISIL A1+ 2.12Cholamandalam Investment and Finance Company Ltd.
CRISIL A1+ 2.12
Tata Capital Financial Services Ltd. CRISIL A1+ 2.12Hero Fincorp Ltd. CRISIL A1+ 1.06Bajaj Housing Finance Ltd. CRISIL A1+ 1.06Standard Chartered Invest & Loans Ltd. CRISIL A1+ 0.85
Company Rating % of Net Assets
Axis Finance Ltd. CRISIL A1+ 0.21Treasury Bill364 Days Tbill (MD 11/03/2022) Sovereign 3.20Government Security 30.40Government Bond8.20% GOI (MD 15/02/2022) Sovereign 11.74State Government Bond8.65% Karnataka SDL (MD 25/01/2022)
Sovereign 3.76
8.94% Gujarat SDL (MD 07/03/2022)
Sovereign 3.57
8.95% Maharashtra SDL (MD 07/03/2022)
Sovereign 2.68
8.93% Haryana SDL (MD 07/03/2022) Sovereign 2.238.92% Karnataka SDL (MD 07/03/2022) Sovereign 1.788.88% Harayana SDL (MD 22/02/2022)
Sovereign 1.33
8.72% Maharashtra SDL (MD 11/01/2022)
Sovereign 1.10
6.58% Odisha SDL(MD 24/03/2022) Sovereign 1.106.92% Maharashtra SDL (MD 11/01/2022)
Sovereign 1.10
Cash & Cash Equivalent 4.00Total 100.00
IDCW DistributionRecord Date Rate (`/Unit) Cum-IDCW NAV p. u. (`)
Individuals/HUF OthersMonthly IDCW30-Aug-21 3.40990000 3.40990000 1,021.1599 29-Jul-21 3.77630000 3.77630000 1,021.5263 29-Jun-21 2.53970000 2.53970000 1,020.2897 Direct Plan - Monthly IDCW30-Aug-21 3.78370000 3.78370000 1,038.0797 29-Jul-21 4.13620000 4.13620000 1,038.4322 29-Jun-21 2.89900000 2.89900000 1,037.1950 Regular Plan - Monthly IDCW30-Dec-19 0.97360357 0.90156197 1,096.302228-Nov-19 0.95214018 0.88168676 1,094.101930-Oct-19 0.94719344 0.87710606 1,090.4516Discretionary IDCW31-May-12 N.A. 0.25157612 10.3544Past performance may or may not be sustained in future. Past performance may or may not be sustained in future. IDCW is on face value of ` 1000/- per unit. Face value changed from ` 10/- to ` 1,000/- w.e.f. close of business hours on April 18, 2013. IDCW declared prior to face value change is on face value of ` 10/- per unit. After the payment of IDCW, the per unit NAV will fall to the extent of Payout of Income Distribution cum capital withdrawal option and applicable statutory levy, if any.
Invesco India Money Market Fund(An open ended debt scheme investing in money market instruments)
Low
Moderate High
Low to
Moderately Very
Mod
erate
High High
Investors understand that their principalwill be at low to moderate risk
RISKOMETERSuitable for Investors who are seeking*l Income over short term l Investment in money market instruments
*Investors should consult their financial advisers if in doubt about whether the product is suitable for them.
Investment ObjectiveTo generate superior risk-adjusted returns by investing in Money Market Instruments.
Key FactsLoad Structure Entry Load Nil Exit Load1 NilMinimum Investment ` 1,000/- & in multiples of ` 1/- thereafterAdditional Purchase` 1,000/- & in multiples of ` 1/- thereafterDate of Allotment 28th August, 2009NAV p.u. (`) As on 31st August, 2021Growth 2,429.8094 Daily IDCW 1,000.2900 Monthly IDCW 1,017.8366 Discretionary IDCW 2,432.9293 Direct PlanGrowth 2,487.1394 Daily IDCW 1,004.3120 Monthly IDCW 1,034.3939 Discretionary IDCW 2,227.9520 Regular PlanGrowth 2,209.2992 Daily IDCW 1,002.0000 Monthly IDCW 1,173.4228 Weighted Average Expense Ratio2 for the monthRegular 0.55%Direct 0.20%Benchmark IndexCRISIL Money Market IndexAAuM for the month of August 2021: ` 2,211.12 croresAuM as on31st August, 2021: ` 2,303.72 croresFund Manager & ExperienceKrishna Cheemalapati Total Experience 24 Years Experience in managing this fund: Since January 4, 2020Vikas GargTotal Experience 16 Years Experience in managing this fund: Since December 16, 2020
Maturity Profile92 - 180 days 38.05%181 days - 1 year 57.95%Cash & Cash Equivalent 4.00%YTM4 3.65%Average Maturity 177 daysMacaulay Duration 176 daysModified Duration 171 days
Lumpsum Performance (As on 31st August, 2021)
Period
Returns % Value of ` 10,000 invested
Fund Fund - Regular
Benchmark Addl. BM
Fund Fund - Regular
Benchmark Addl. BMCRISIL Money
Market Index
CRISIL 1 Yr T-Bill
Index
CRISIL Money
Market Index
CRISIL 1 Yr T-Bill
Index1 Year 3.70% 2.98% 4.22% 3.92% 10,370 10,298 10,422 10,3923 Years 5.94% 5.18% 6.22% 6.35% 11,893 11,637 11,986 12,0295 Years 6.34% 5.58% 6.55% 6.21% 13,601 13,123 13,738 13,5157 Years 6.99% 6.21% 7.09% 6.75% 16,066 15,255 16,163 15,80810 Years 7.84% 6.91% 7.73% 6.91% 21,297 19,524 21,069 19,523Since Inception 7.67% 6.82% 7.41% 6.36% 24,298 22,093 23,595 20,990(28 August, 2009)Past performance may or may not be sustained in future. BM - Benchmark. Returns above 1 year are CAGR. Returns are of existing plan (non - direct plan) - Growth Option. Different plans have different expense structure. For calculating returns since inception, NAV as on the date of allotment is taken as Rs. 1,000/-. Face Value per unit is Rs. 1,000/-. Please refer Page nos. 38-42 for performance of other Schemes managed by the Fund Managers and Page nos. 43-47 for performance of Direct Plans and respective Disclaimers.
Rating ProfileA1+ 62.40%
Sovereign 33.60%Cash & Cash Equivalent 4.00%
Aggregate Investments by other schemes i.e Inter - scheme investment in the portfolio is Rs. 50.87 Crores as on Aug 31, 2021
IDCW - Income Distribution cum capital withdrawal option.
Portfolio (As on 31st August, 2021)

29 of 49For 1,2,4, Note on Direct Plan, IDCW Distribution and Disclaimer, refer page no. 49
Company Rating % of Net Assets
Corporate Debt 43.77LIC Housing Finance Ltd. CRISIL AAA 5.71National Highways Auth Of Ind CRISIL AAA 5.63National Bank For Agriculture and Rural Development
ICRA AAA 4.45
UltraTech Cement Ltd. CRISIL AAA 3.91Food Corporation Of India CRISIL AAA(CE) 3.43Tata Steel Ltd. CARE AA+ 3.01Power Finance Corporation Ltd. CRISIL AAA 2.84Reliance Industries Ltd. CRISIL AAA 2.27REC Ltd. CRISIL AAA 2.24Bharti Telecom Ltd. (Key promoter holding company of Bharti Airtel Ltd with largest shareholding in it)
CRISIL AA+ 2.15
Hindalco Industries Ltd. CRISIL AA+ 1.74Manappuram Finance Ltd. CRISIL AA 1.68Telesonic Networks Ltd. (Guaranteed by Bharti Airtel Ltd.)
CRISIL AA 1.56
Tata Power Company Ltd. CRISIL AA 1.47Muthoot Finance Ltd. ICRA AA+ 1.11NTPC Ltd. CRISIL AAA 0.56Government Security 5.65State Government Bond8.74% Karnataka SDL (MD 22/02/2022)
Sovereign 2.84
Company Rating % of Net Assets
6.92% Maharashtra SDL (MD 11/01/2022)
Sovereign 2.80
8.66% Maharashtra SDL (MD 21/09/2021)
Sovereign 0.01
Money Market Instruments 39.30Certificate of DepositAxis Bank Ltd. ICRA A1+ 2.73Axis Bank Ltd. CRISIL A1+ 2.73National Bank For Agriculture and Rural Development
ICRA A1+ 2.73
Small Industries Dev Bank of India CARE A1+ 2.72IndusInd Bank Ltd. CRISIL A1+ 2.17Commercial PaperHousing Development Finance Corporation Ltd.
CRISIL A1+ 5.50
Kotak Mahindra Investments Ltd. CRISIL A1+ 4.90ICICI Securities Ltd. CRISIL A1+ 3.80Export Import Bank of India CRISIL A1+ 2.74Axis Finance Ltd. CRISIL A1+ 2.18Standard Chartered Invest & Loans Ltd.
CRISIL A1+ 1.63
Treasury Bill364 Days Tbill (MD 23/09/2021) Sovereign 3.87364 Days Tbill (MD 16/06/2022) Sovereign 1.62Cash & Cash Equivalent 11.28Total 100.00
IDCW DistributionRecord Date Rate (`/Unit) Cum-IDCW NAV p. u. (`)
Individuals/HUF OthersMonthly IDCW30-Aug-21 3.21410000 3.21410000 1,014.127229-Jul-21 3.20240000 3.20240000 1,014.115529-Jun-21 2.35190000 2.35190000 1,013.2650Direct Plan - Monthly IDCW28-Mar-19 1.59407427 1.47612106 1,333.7518 27-Feb-19 17.68514297 16.37653440 1,348.3425 30-Jan-19 22.45985861 20.79794592 1,372.6369 Quarterly IDCW15-Jun-21 2.29390000 2.29390000 1,102.850915-Mar-21 15.11524653 15.11524653 1,108.376615-Dec-20 40.04900000 40.04900000 1,141.5038Direct Plan - Quarterly IDCW15-Jun-21 10.25220000 10.25220000 1,035.011015-Mar-21 8.17000000 8.17000000 1,032.501715-Dec-20 11.51970000 11.51970000 1,035.9307Annual IDCW15-Mar-21 36.00840000 36.00840000 1,096.1820 16-Mar-20 62.74214658 58.09955416 1,135.3650 15-Mar-19 27.88375723 25.82050427 1,100.7578 Direct Plan - Annual IDCW15-Mar-16 62.63810000 58.03300000 1,183.566016-Mar-15 43.54200000 40.37940000 1,153.099518-Mar-14 105.39165439 N.A. 1,172.1483Past performance may or may not be sustained in future. IDCW is on face value of ` 1000/- per unit. After the payment of IDCW, the per unit NAV will fall to the extent of Payout of Income Distribution cum capital withdrawal option and applicable statutory levy, if any.^Please refer to the heading ‘C. Asset Allocation Pattern’ under Section ‘II. Information about the Scheme’ of Scheme Information Document where the concept of Macaulay duration has been explained.
Investment ObjectiveTo primarily generate accrual income by investing in a portfolio of short term Money Market and Debt Instruments.
Key FactsLoad Structure Entry Load Nil Exit Load1 NilMinimum Investment ` 1,000/- & in multiples of ` 1/- thereafterAdditional Purchase` 1,000/- & in multiples of ` 1/- thereafterDate of Allotment 30th December, 2010NAV p.u. (`) As on 31st August, 2021Growth 2,159.5848 Daily IDCW Reinvestment 1,140.1911 Monthly IDCW 1,011.0339 Quarterly IDCW 1,108.6473 Annual IDCW 1,077.3348 Direct PlanGrowth 2,259.4644 Daily IDCW Reinvestment 1,145.2343 Monthly IDCW 1,530.9733 Quarterly IDCW 1,033.7083 Annual IDCW 1,608.8197 Weighted Average Expense Ratio2 for the monthRegular 0.89%Direct 0.24%Benchmark IndexCRISIL Ultra Short Term Debt IndexAAuM for the month of August 2021: ` 753.55 croresAuM as on31st August, 2021: ` 902.41 croresFund Manager & ExperienceKrishna Cheemalapati Total Experience 24 Years Experience in managing this fund: Since January 4, 2020Vikas GargTotal Experience 16 Years Experience in managing this fund: Since July 27, 2021
Portfolio (As on 31st August, 2021)
Invesco India Ultra Short Term Fund(An open ended ultra-short term debt scheme investing in instruments such that the Macaulay duration^ of the portfolio is between 3 months to 6 months)
Low
Moderate High
Low to
Moderately Very
Mod
erate
High High
Investors understand that their principalwill be at low to moderate risk
RISKOMETERSuitable for Investors who are seeking*l income over short terml investments in a portfolio of short term money market and
debt instruments
*Investors should consult their financial advisers if in doubt about whether the product is suitable for them.
Maturity Profile< 31 days 4.99%61 - 91 days 9.96%92 - 180 days 30.35%181 days - 1 year 38.98%1 - 2 years 4.44%Cash & Cash Equivalent 11.28%YTM4 3.70%Average Maturity 171 daysMacaulay Duration 170 daysModified Duration 163 days
Lumpsum Performance (As on 31st August, 2021)
Period
Returns % Value of ` 10,000 invested
FundBenchmark Addl. BM
FundBenchmark Addl. BM
CRISIL Ultra Short Term Debt Index
CRISIL 1 Yr T-Bill Index
CRISIL Ultra Short Term Debt Index
CRISIL 1 Yr T-Bill Index
1 Year 3.28% 4.45% 3.92% 10,328 10,445 10,3923 Years 5.81% 6.57% 6.35% 11,847 12,105 12,0295 Years 6.38% 6.81% 6.21% 13,628 13,903 13,5157 Years 7.23% 7.31% 6.75% 16,311 16,403 15,80810 Years 7.44% 7.96% 6.91% 20,520 21,533 19,523Since Inception 7.48% 8.04% 6.85% 21,596 22,838 20,295(30 December, 2010)Past performance may or may not be sustained in future. BM - Benchmark. Returns above 1 year are CAGR. Returns are of existing plan (non - direct plan) - Growth Option. Different plans have different expense structure. For calculating returns since inception, NAV as on the date of allotment is taken as Rs. 1,000/-. Face Value per unit is Rs. 1,000/-. Please refer Page nos. 38-42 for performance of other Schemes managed by the Fund Managers and Page nos. 43-47 for performance of Direct Plans and respective Disclaimers.
Rating ProfileA1+ 33.81%
AAA 31.04%Sovereign 11.13%AA+ 8.02%
AA 4.72%Cash & Cash Equivalent 11.28%
IDCW - Income Distribution cum capital withdrawal option.IDCW Reinvestment - Reinvestment of Income Distribution cum capital withdrawal option.
Aggregate Investments by other schemes i.e Inter - scheme investment in the portfolio is Rs. 66.81 Crores as on Aug 31, 2021

30 of 49 For 1,2,4, Note on Direct Plan and Disclaimer, refer page no. 49
Investment ObjectiveTo generate income by investing in a portfolio of Debt and Money Market Instruments such that the Macaulay duration of the portfolio is between 3 years and 4 years.
Key FactsLoad Structure Entry Load Nil Exit Load1 NilMinimum Investment ` 1,000/- & in multiples of ` 1/- thereafterAdditional Purchase` 1,000/- & in multiples of ` 1/- thereafterDate of Allotment 16th July, 2021NAV p.u. (`) As on 31st August, 2021Regular PlanGrowth 1,010.5321 Quarterly IDCW 1,010.5323 Discretionary IDCW 1,010.5323 Direct PlanGrowth 1,011.7699 Quarterly IDCW 1,011.7684 Discretionary IDCW 1,011.7664 Weighted Average Expense Ratio2 for the monthRegular 1.35%Direct 0.39%Benchmark IndexCRISIL Medium Term Debt IndexAAuM for the month of August 2021: ` 487.50 croresAuM as on31st August, 2021: ` 639.58 croresFund Manager & ExperienceVikas GargTotal Experience 16 Years Experience in managing this fund: Since July 16, 2021Krishna CheemalapatiTotal Experience 24 Years Experience in managing this fund: Since July 16, 2021
Maturity Profile1 - 2 years 2.98%2 - 3 years 21.67%3 - 5 years 58.31%5 - 10 years 5.73%Cash & Cash Equivalent 11.31%YTM 5.58%Average Maturity 3.58 yearsMacaulay Duration 3.12 yearsModified Duration 2.99 years
Company Rating % of Net Assets
Corporate Debt 51.10LIC Housing Finance Ltd. CRISIL AAA 6.23Indian Oil Corporation Ltd. CRISIL AAA 4.04National Bank For Agriculture and Rural Development
ICRA AAA 3.93
Bajaj Housing Finance Ltd. CRISIL AAA 3.91Power Finance Corporation Ltd. CRISIL AAA 3.43Sikka Ports and Terminals Ltd. CRISIL AAA 3.18Muthoot Finance Ltd. CRISIL AA+ 3.18Housing Development Finance Corporation Ltd.
CRISIL AAA 3.12
State Bank of India (Basel III Tier II Bond)
CRISIL AAA 2.54#
Sundaram Finance Ltd. ICRA AAA 2.36Summit Digitel Infrastructure Pvt. Ltd. (Long term agreement with Reliance Jio Infocomm Ltd.)
CRISIL AAA 2.34
HDFC Bank Ltd. CRISIL AAA 1.69Aadhar Housing Finance Ltd. CARE AA 1.62SBI Cards and Payment Services Ltd. CRISIL AAA 1.62Coastal Gujarat Power Ltd. (Guaranteed by Tata Power)
CARE AA(CE) 1.60
Bharti Hexacom Ltd. (Subsidiary of Bharti Airtel Ltd.)
CRISIL AA 1.56
HDB Financial Services Ltd. CRISIL AAA 1.41
Company Rating % of Net Assets
Telesonic Networks Ltd. (Guaranteed by Bharti Airtel Ltd.)
CRISIL AA 1.37
ONGC Petro Additions Ltd. ICRA AA 1.16Tata Steel Ltd. FITCH AA 0.82Government Security 37.59Government Bond5.63% GOI (MD 12/04/2026) Sovereign 7.815.22% GOI (MD 15/06/2025) Sovereign 6.246.79% GOI (MD 15/05/2027) Sovereign 2.448.33% GOI 2026 (M/D 09/07/2026)
Sovereign 0.86
State Government Bond8.67% Karnataka SDL (MD 24/02/2026)
Sovereign 4.33
7.96% Maharastra SDL (MD 29/06/2026)
Sovereign 4.23
8.24% Kerala SDL (MD 13/05/2025)
Sovereign 3.40
8.14% Maharashtra SDL (MD 27/05/2025)
Sovereign 3.40
5.94% Rajasthan SDL (MD 09/04/2025)
Sovereign 3.17
8.27% Gujarat SDL (MD 13/01/2026)
Sovereign 1.70
Cash & Cash Equivalent 11.31Total 100.00
Portfolio (As on 31st August, 2021)
Invesco India Medium Duration Fund(An open ended medium term debt scheme investing in instruments such that the Macaulay Duration^ of the portfolio is between 3 years and 4 years)
Low
Moderate High
Low to
Moderately Very
Mod
erate
High High
Investors understand that their principalwill be at moderate risk
RISKOMETERSuitable for Investors who are seeking*l income over medium term l investments predominantly in debt and money l market instruments with portfolio Macaulay Duration of
3-4 years
*Investors should consult their financial advisers if in doubt about whether the product is suitable for them.
^Please refer to the heading ‘C. Asset Allocation Pattern’ under Section ‘II. Information about the Scheme’ of Scheme Information Document where the concept of Macaulay duration has been explained.
# Yield to Maturity (YTM) : 7.39%, Yield to Call (YTC) : 4.85%
Rating ProfileAAA 39.79%Sovereign 37.59%AA 8.13%AA+ 3.18%Cash & Cash Equivalent 11.31%
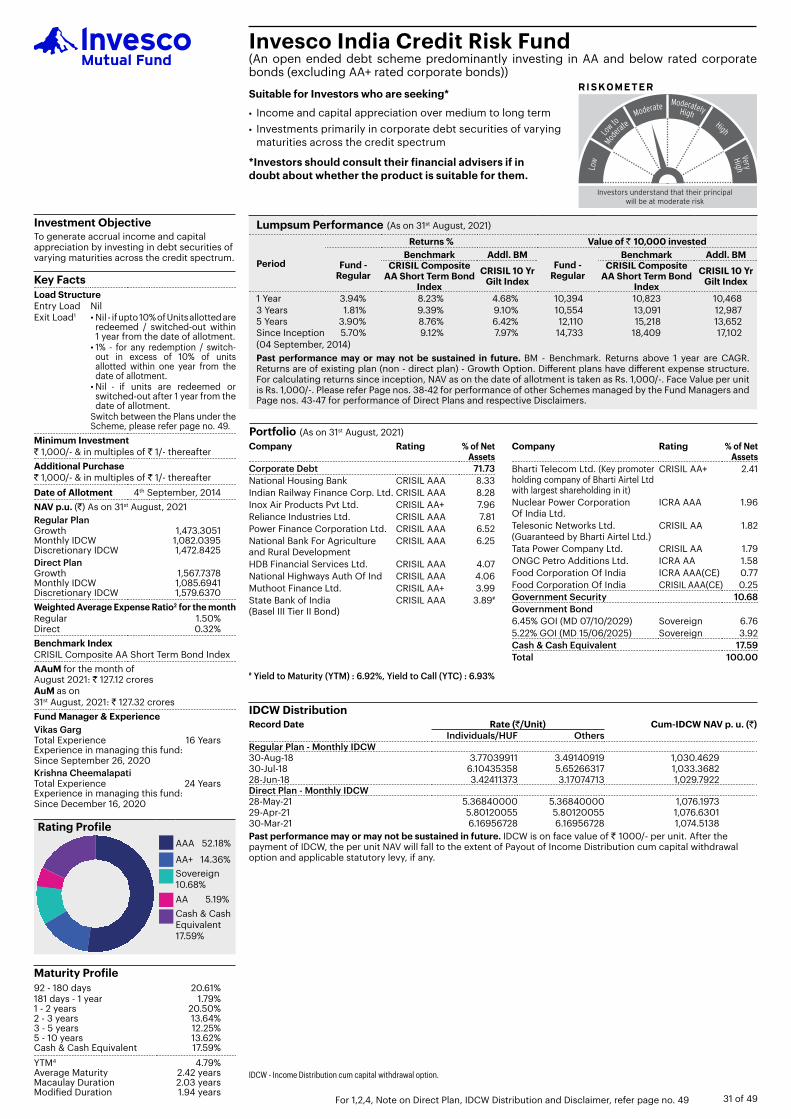
31 of 49For 1,2,4, Note on Direct Plan, IDCW Distribution and Disclaimer, refer page no. 49
Company Rating % of Net Assets
Corporate Debt 71.73National Housing Bank CRISIL AAA 8.33Indian Railway Finance Corp. Ltd. CRISIL AAA 8.28Inox Air Products Pvt Ltd. CRISIL AA+ 7.96Reliance Industries Ltd. CRISIL AAA 7.81Power Finance Corporation Ltd. CRISIL AAA 6.52National Bank For Agriculture and Rural Development
CRISIL AAA 6.25
HDB Financial Services Ltd. CRISIL AAA 4.07National Highways Auth Of Ind CRISIL AAA 4.06Muthoot Finance Ltd. CRISIL AA+ 3.99State Bank of India (Basel III Tier II Bond)
CRISIL AAA 3.89#
Company Rating % of Net Assets
Bharti Telecom Ltd. (Key promoter holding company of Bharti Airtel Ltd with largest shareholding in it)
CRISIL AA+ 2.41
Nuclear Power Corporation Of India Ltd.
ICRA AAA 1.96
Telesonic Networks Ltd. (Guaranteed by Bharti Airtel Ltd.)
CRISIL AA 1.82
Tata Power Company Ltd. CRISIL AA 1.79ONGC Petro Additions Ltd. ICRA AA 1.58Food Corporation Of India ICRA AAA(CE) 0.77Food Corporation Of India CRISIL AAA(CE) 0.25Government Security 10.68Government Bond6.45% GOI (MD 07/10/2029) Sovereign 6.765.22% GOI (MD 15/06/2025) Sovereign 3.92Cash & Cash Equivalent 17.59Total 100.00
IDCW DistributionRecord Date Rate (`/Unit) Cum-IDCW NAV p. u. (`)
Individuals/HUF OthersRegular Plan - Monthly IDCW30-Aug-18 3.77039911 3.49140919 1,030.462930-Jul-18 6.10435358 5.65266317 1,033.368228-Jun-18 3.42411373 3.17074713 1,029.7922Direct Plan - Monthly IDCW28-May-21 5.36840000 5.36840000 1,076.197329-Apr-21 5.80120055 5.80120055 1,076.630130-Mar-21 6.16956728 6.16956728 1,074.5138Past performance may or may not be sustained in future. IDCW is on face value of ` 1000/- per unit. After the payment of IDCW, the per unit NAV will fall to the extent of Payout of Income Distribution cum capital withdrawal option and applicable statutory levy, if any.
Investment ObjectiveTo generate accrual income and capital appreciation by investing in debt securities of varying maturities across the credit spectrum.
Key FactsLoad Structure Entry Load Nil Exit Load1 •Nil-ifupto10%ofUnitsallottedare
redeemed / switched-out within 1 year from the date of allotment.
•1% - for any redemption / switch-out in excess of 10% of units allotted within one year from the date of allotment.
•Nil - if units are redeemed or switched-out after 1 year from the date of allotment.
Switch between the Plans under the Scheme, please refer page no. 49.
Minimum Investment ` 1,000/- & in multiples of ` 1/- thereafterAdditional Purchase` 1,000/- & in multiples of ` 1/- thereafterDate of Allotment 4th September, 2014NAV p.u. (`) As on 31st August, 2021Regular PlanGrowth 1,473.3051 Monthly IDCW 1,082.0395 Discretionary IDCW 1,472.8425 Direct PlanGrowth 1,567.7378 Monthly IDCW 1,085.6941 Discretionary IDCW 1,579.6370 Weighted Average Expense Ratio2 for the monthRegular 1.50%Direct 0.32%Benchmark IndexCRISIL Composite AA Short Term Bond IndexAAuM for the month of August 2021: ` 127.12 croresAuM as on31st August, 2021: ` 127.32 croresFund Manager & ExperienceVikas GargTotal Experience 16 Years Experience in managing this fund: Since September 26, 2020Krishna CheemalapatiTotal Experience 24 Years Experience in managing this fund: Since December 16, 2020
Portfolio (As on 31st August, 2021)
Lumpsum Performance (As on 31st August, 2021)
Period
Returns % Value of ` 10,000 invested
Fund - Regular
Benchmark Addl. BMFund -
Regular
Benchmark Addl. BMCRISIL Composite
AA Short Term Bond Index
CRISIL 10 Yr Gilt Index
CRISIL Composite AA Short Term Bond
Index
CRISIL 10 Yr Gilt Index
1 Year 3.94% 8.23% 4.68% 10,394 10,823 10,4683 Years 1.81% 9.39% 9.10% 10,554 13,091 12,9875 Years 3.90% 8.76% 6.42% 12,110 15,218 13,652Since Inception 5.70% 9.12% 7.97% 14,733 18,409 17,102(04 September, 2014)Past performance may or may not be sustained in future. BM - Benchmark. Returns above 1 year are CAGR. Returns are of existing plan (non - direct plan) - Growth Option. Different plans have different expense structure. For calculating returns since inception, NAV as on the date of allotment is taken as Rs. 1,000/-. Face Value per unit is Rs. 1,000/-. Please refer Page nos. 38-42 for performance of other Schemes managed by the Fund Managers and Page nos. 43-47 for performance of Direct Plans and respective Disclaimers.
Maturity Profile92 - 180 days 20.61%181 days - 1 year 1.79%1 - 2 years 20.50%2 - 3 years 13.64%3 - 5 years 12.25%5 - 10 years 13.62%Cash & Cash Equivalent 17.59%YTM4 4.79%Average Maturity 2.42 yearsMacaulay Duration 2.03 yearsModified Duration 1.94 years
Invesco India Credit Risk Fund(An open ended debt scheme predominantly investing in AA and below rated corporate bonds (excluding AA+ rated corporate bonds))
Low
Moderate High
Low to
Moderately Very
Mod
erate
High High
Investors understand that their principalwill be at moderate risk
RISKOMETERSuitable for Investors who are seeking*l Income and capital appreciation over medium to long terml Investments primarily in corporate debt securities of varying
maturities across the credit spectrum
*Investors should consult their financial advisers if in doubt about whether the product is suitable for them.
Rating ProfileAAA 52.18%
AA+ 14.36%Sovereign 10.68%AA 5.19%Cash & Cash Equivalent 17.59%
IDCW - Income Distribution cum capital withdrawal option.
# Yield to Maturity (YTM) : 6.92%, Yield to Call (YTC) : 6.93%

32 of 49 For 1,2,4, Note on Direct Plan, IDCW Distribution and Disclaimer, refer page no. 49
Company Rating % of Net Assets
Government Security 88.89Government Bond6.45% GOI (MD 07/10/2029) Sovereign 21.076.1% GOI (MD 12/07/2031) Sovereign 20.646.64% GOI (MD 16/06/2035) Sovereign 20.566.76% GOI (MD 22/02/2061) Sovereign 19.917.59% GOI(MD 11/01/2026) Sovereign 6.71Cash & Cash Equivalent 11.11Total 100.00
IDCW DistributionRecord Date Rate (`/Unit) Cum-IDCW NAV p. u. (`)
Individuals/HUF OthersMonthly IDCW30-Aug-17 3.59838388 N.A. 1,050.6696 28-Jul-17 4.93672738 N.A. 1,058.1757 29-Jun-17 8.08344486 N.A. 1,061.9829 Direct Plan - Monthly IDCW27-Jun-13 15.51513735 14.85916859 1,040.909827-Feb-13 0.242765060 N.A. 10.4856Quarterly IDCW15-Jun-21 16.46220000 16.46220000 1,045.246415-Mar-21 16.03051155 16.03051155 1,041.908015-Dec-20 18.16700000 18.16700000 1,080.2763Direct Plan - Quarterly IDCW15-Jun-21 4.31430000 4.31430000 1,023.174315-Dec-20 18.20910000 18.20910000 1,037.667615-Sep-20 68.05840000 68.05840000 1,086.9184Annual IDCW15-Mar-21 14.52180000 14.52180000 1,117.9245 16-Mar-20 77.55165253 71.81323372 1,184.1159 15-Mar-19 112.55118792 104.22298559 1,216.4755 Direct Plan - Annual IDCW15-Mar-13 0.236960600 N.A. 11.5586Past performance may or may not be sustained in future. IDCW is on face value of ` 1000/- per unit. Face value changed from ` 10/- to ` 1,000/- w.e.f. close of business hours on April 18, 2013. IDCW declared prior to face value change is on face value of ` 10/- per unit. After the payment of IDCW, the per unit NAV will fall to the extent of Payout of Income Distribution cum capital withdrawal option and applicable statutory levy, if any.
Investment ObjectiveTo generate returns by investing predominantly in a portfolio of securities issued and guaranteed by Central and State Government across maturities.
Key FactsLoad Structure Entry Load Nil Exit Load1 NilMinimum Investment ` 1,000/- & in multiples of ` 1/- thereafterAdditional Purchase` 1,000/- & in multiples of ` 1/- thereafterDate of Allotment 9th February, 2008NAV p.u. (`) As on 31st August, 2021Growth 2,261.1417 Monthly IDCW 1,273.5731 Quarterly IDCW 1,030.8587 Annual IDCW 1,127.2772 Direct PlanGrowth 2,428.7896 Monthly IDCW 1,895.4138 Quarterly IDCW 1,022.7035 Annual IDCW 1,273.3220 Weighted Average Expense Ratio2 for the monthRegular 1.25%Direct 0.48%Benchmark IndexCRISIL 10 Year Gilt IndexAAuM for the month of August 2021: ` 24.07 croresAuM as on31st August, 2021: ` 24.02 croresFund Manager & ExperienceVikas GargTotal Experience 16 Years Experience in managing this fund: Since September 26, 2020Krishna CheemalapatiTotal Experience 24 Years Experience in managing this fund: Since July 27, 2021
Portfolio (As on 31st August, 2021)
Lumpsum Performance (As on 31st August, 2021)
PeriodReturns % Value of ` 10,000 invested
FundBenchmark
FundBenchmark
CRISIL 10 year Gilt Index CRISIL 10 year Gilt Index1 Year 2.31% 4.68% 10,231 10,4683 Years 7.71% 9.10% 12,498 12,9875 Years 5.96% 6.42% 13,360 13,6527 Years 7.65% 8.01% 16,767 17,16710 Years 7.15% 7.20% 19,962 20,059Since Inception 6.20% 6.61% 22,611 23,819(09 February, 2008)Past performance may or may not be sustained in future. BM - Benchmark. Returns above 1 year are CAGR. Returns are of existing plan (non - direct plan) - Growth Option. Different plans have different expense structure. For calculating returns since inception, NAV as on the date of allotment is taken as Rs. 1,000/-. Face Value per unit is Rs. 1,000/-. Please refer Page nos. 38-42 for performance of other Schemes managed by the Fund Managers and Page nos. 43-47 for performance of Direct Plans and respective Disclaimers.Note : As scheme benchmark is same as additional benchmark, returns of additional benchmark are not provided separately.
Maturity Profile3 - 5 years 6.71%5 - 10 years 41.71%10 - 15 years 20.56%15 years plus 19.91%Cash & Cash Equivalent 11.11%YTM4 6.26%Average Maturity 14.86 yearsMacaulay Duration 7.80 yearsModified Duration 7.55 years
Invesco India Gilt Fund(An open ended debt scheme investing in government securities across maturity)
Low
Moderate High
Low to
Moderately Very
Mod
erate
High High
Investors understand that their principalwill be at moderate risk
RISKOMETERSuitable for Investors who are seeking*l Credit risk free returns over medium to long terml Investments primarily in securities issued and guaranteed
by the Central and the State Government across maturities
*Investors should consult their financial advisers if in doubt about whether the product is suitable for them.
Rating ProfileSovereign 88.89%Cash & Cash Equivalent 11.11%
IDCW - Income Distribution cum capital withdrawal option.

33 of 49For 1,2,4, Note on Direct Plan, IDCW Distribution and Disclaimer, refer page no. 49
Company Rating % of Net Assets
Corporate Debt 72.90National Bank For Agriculture and Rural Development
ICRA AAA 6.18
National Housing Bank CRISIL AAA 5.57Reliance Industries Ltd. CRISIL AAA 5.52HDB Financial Services Ltd. CRISIL AAA 4.47Sikka Ports and Terminals Ltd. CRISIL AAA 4.33REC Ltd. CRISIL AAA 4.24Bajaj Housing Finance Ltd. CRISIL AAA 3.82LIC Housing Finance Ltd. CRISIL AAA 3.72Housing Development Finance Corp. Ltd.CRISIL AAA 2.91Bajaj Finance Ltd. CRISIL AAA 2.90Kotak Mahindra Prime Ltd. CRISIL AAA 2.64Sundaram Finance Ltd. CRISIL AAA 2.60Oil & Natural Gas Corporation Ltd. ICRA AAA 2.45Indian Oil Corporation Ltd. CRISIL AAA 2.38Power Finance Corporation Ltd. CRISIL AAA 2.25Jamnagar Utilities & Power Pvt. Ltd. CRISIL AAA 2.23Small Industries Dev Bank of India CARE AAA 2.06National Bank For Agriculture and Rural Development
CRISIL AAA 1.95
Larsen & Toubro Ltd. CRISIL AAA 1.69Summit Digitel Infrastructure Pvt. Ltd. (Long term agreement with Reliance Jio Infocomm Ltd.)
CRISIL AAA 1.62
State Bank of India (Basel III Tier II Bond)CRISIL AAA 1.61#
Mahindra & Mahindra Ltd. FITCH AAA 1.40Indian Railway Finance Corp. Ltd. CRISIL AAA 0.88NTPC Ltd. CRISIL AAA 0.70
Company Rating % of Net Assets
HDFC Credila Financial Services Pvt Ltd. CRISIL AAA 0.69LIC Housing Finance Ltd. CARE AAA 0.69Hindustan Petroleum Corp. Ltd. CRISIL AAA 0.68SBI Cards and Payment Services Ltd. CRISIL AAA 0.42Sundaram Finance Ltd. ICRA AAA 0.27Food Corporation Of India CRISIL AAA(CE) 0.02Government Security 15.51Government Bond7.68% GOI (MD 15/12/2023) Sovereign 3.775.22% GOI (MD 15/06/2025) Sovereign 3.656.18% GOI (MD 04/11/2024) Sovereign 1.487.32% GOI (MD 28/01/2024) Sovereign 1.445.63% GOI (MD 12/04/2026) Sovereign 1.357.27% GOI (MD 08/04/2026) Sovereign 0.724.48% GOI (MD 02/11/2023) Sovereign 0.686.79% GOI (MD 15/05/2027) Sovereign 0.42State Government Bond6.3% Rajasthan SDL (MD 08/04/2023) Sovereign 1.409.25% Maharashtra SDL (MD 09-Oct-2023)
Sovereign 0.59
Money Market Instruments 4.25Certificate of DepositHDFC Bank Ltd. CARE A1+ 2.66Axis Bank Ltd. CRISIL A1+ 0.27Commercial PaperHousing Development Finance Corp. Ltd. ICRA A1+ 0.67Bajaj Housing Finance Ltd. CRISIL A1+ 0.65Cash & Cash Equivalent 7.34Total 100.00
IDCW DistributionRecord Date Rate (`/Unit) Cum-IDCW NAV p. u. (`)
Individuals/HUF OthersMonthly IDCW30-Aug-21 9.21550000 9.21550000 1,474.5110 29-Jul-21 9.61570000 9.61570000 1,474.9112 29-Jun-21 0.10940000 0.10940000 1,465.4049 Direct Plan - Monthly IDCW 30-Aug-21 8.33660000 8.3366 1,263.4419 29-Jul-21 8.65390000 8.6539 1,263.7592 29-Jun-21 0.53390000 0.5339 1,255.6392 Quarterly IDCW15-Jun-21 22.78230000 22.78230000 1,156.719515-Mar-21 10.59906805 10.59906805 1,142.378415-Dec-20 21.62280000 21.62280000 1,169.1665Direct Plan - Quarterly IDCW15-Jun-21 23.89100000 23.89100000 1,159.028815-Mar-21 11.82019183 11.82019183 1,144.681315-Dec-20 22.81150000 22.81150000 1,171.5351Annual IDCW15-Mar-21 231.65430545 231.65430545 2,020.05516-Mar-20 95.82861447 88.73779558 1,996.586615-Mar-12 0.81094060 N.A. 11.1651Direct Plan - Annual IDCW15-Mar-21 107.13970000 107.13970000 1,318.719716-Mar-20 98.19573612 90.92976254 1,347.901915-Mar-19 680.56180836 630.20377535 2,173.7832Discretionary IDCW27-Jun-12 N.A. 0.45192015 10.6326Plan B - Monthly IDCW30-Jul-12 0.07448179 0.063792 10.922528-Feb-12 0.11589883 0.09920477 10.635828-Oct-11 0.03707525 0.03177745 10.4009Plan B - Quarterly IDCW15-Mar-13 0.2299179 N.A. 10.322615-Sep-12 0.163937603 N.A. 10.278215-Jun-12 0.05728105 N.A. 10.1165Plan A - Discretionary IDCW23-Jul-12 N.A. 0.05717367 10.1138Past performance may or may not be sustained in future. IDCW is on face value of ` 1000/- per unit. Face value changed from ` 10/- to ` 1,000/- w.e.f. close of business hours on April 18, 2013. IDCW declared prior to face value change is on face value of ` 10/- per unit. After the payment of IDCW, the per unit NAV will fall to the extent of Payout of Income Distribution cum capital withdrawal option and applicable statutory levy, if any.
Investment ObjectiveTo generate regular and stable income by investing predominantly in bonds issued by corporates. The scheme will invest in bonds which are rated AA+/ AAA by credit rating agencies.
Key FactsLoad Structure Entry Load Nil Exit Load1 Nil Minimum Investment ` 1,000/- & in multiples of ` 1/- thereafterAdditional Purchase` 1,000/- & in multiples of ` 1/- thereafterDate of Allotment 2nd August, 2007NAV p.u. (`) As on 31st August, 2021Growth 2,542.5751 Monthly IDCW 1,466.0474 Quarterly IDCW 1,146.2747 Annual IDCW 1,847.6975 Discretionary IDCW 2,667.5963
Direct PlanGrowth 2,685.1342 Monthly IDCW 1,255.7631 Quarterly IDCW 1,148.4567 Annual IDCW 1,254.1302 Discretionary IDCW 2,685.9746 Weighted Average Expense Ratio2 for the monthRegular 0.65%Direct 0.25%Benchmark IndexCRISIL AAA Short Term Bond IndexAAuM for the month of August 2021: ` 3,544.51 croresAuM as on31st August, 2021: ` 3,688.73 croresFund Manager & ExperienceVikas GargTotal Experience 16 Years Experience in managing this fund: Since September 26, 2020Krishna CheemalapatiTotal Experience 24 Years Experience in managing this fund: Since December 16, 2020
Portfolio (As on 31st August, 2021)
Lumpsum Performance (As on 31st August, 2021)
PeriodReturns % Value of ` 10,000 invested
FundBenchmark Addl. BM
FundBenchmark Addl. BM
CRISIL AAA Short Term Bond Index
CRISIL 10 Yr Gilt Index
CRISIL AAA Short Term Bond Index
CRISIL 10 Yr Gilt Index
1 Year 5.16% 5.95% 4.68% 10,516 10,595 10,4683 Years 8.74% 8.95% 9.10% 12,859 12,936 12,9875 Years 6.57% 8.15% 6.42% 13,750 14,801 13,6527 Years 7.60% 8.48% 8.01% 16,720 17,702 17,16710 Years 7.69% 8.75% 7.20% 20,988 23,168 20,059Since Inception 6.85% 8.76% 6.84% 25,426 32,639 25,416(02 August, 2007)Past performance may or may not be sustained in future. BM - Benchmark. Returns above 1 year are CAGR. Returns are of existing plan (non - direct plan) - Growth Option. Different plans have different expense structure. For calculating returns since inception, NAV as on the date of allotment is taken as Rs. 1,000/-. Face Value per unit is Rs. 1,000/-. Please refer Page nos. 38-42 for performance of other Schemes managed by the Fund Managers and Page nos. 43-47 for performance of Direct Plans and respective Disclaimers.
Maturity Profile31 - 60 days 0.66%92 - 180 days 0.98%181 days - 1 year 6.88%1 - 2 years 27.44%2 - 3 years 38.59%3 - 5 years 17.54%5 - 10 years 0.57%Cash & Cash Equivalent 7.34%YTM4 4.79%Average Maturity 2.29 yearsMacaulay Duration 2.08 yearsModified Duration 2.00 years
Invesco India Corporate Bond Fund(An open ended debt scheme predominantly investing in AA+ and above rated corporate bonds)
Low
Moderate High
Low to
Moderately Very
Mod
erate
High High
Investors understand that their principalwill be at moderate risk
RISKOMETERSuitable for Investors who are seeking*l Income over medium to long terml Investments in AA+ and above rated corporate bonds
*Investors should consult their financial advisers if in doubt about whether the product is suitable for them.
IDCW - Income Distribution cum capital withdrawal option.
Rating ProfileAAA 72.90%Sovereign 15.51%A1+ 4.25%Cash & Cash Equivalent 7.34%
# Yield to Maturity (YTM) : 7.39%, Yield to Call (YTC) : 4.85%

34 of 49 For 1,2,4, Note on Direct Plan, IDCW Distribution and Disclaimer, refer page no. 49
IDCW DistributionRecord Date Rate (`/Unit) Cum-IDCW NAV p. u. (`)
Individuals/HUF OthersMonthly IDCW30-Aug-21 6.76930000 6.76930000 1,026.1770 29-Jul-21 0.78610000 0.78610000 1,020.1938 28-May-21 8.37840000 8.37840000 1,027.7861 Direct Plan - Monthly IDCW 30-Aug-21 7.08090000 7.08090000 1,017.0809 29-Jul-21 1.50030000 1.50030000 1,011.5003 28-May-21 8.64090000 8.64090000 1,018.6409 Past performance may or may not be sustained in future. IDCW is on face value of ` 1000/- per unit. After the payment of IDCW, the per unit NAV will fall to the extent of Payout of Income Distribution cum capital withdrawal option and applicable statutory levy, if any.
Investment ObjectiveTo generate returns by investing primarily in debt & Money Market Instruments issued by banks, Public Financial Institutions (PFIs), Public Sector Undertakings (PSUs) and Municipal Bonds.
Key FactsLoad Structure Entry Load Nil Exit Load1 NilMinimum Investment ` 1,000/- & in multiples of ` 1/- thereafterAdditional Purchase` 1,000/- & in multiples of ` 1/- thereafterDate of Allotment 29th December, 2012NAV p.u. (`) As on 31st August, 2021Growth 1,841.1348 Daily IDCW 1,003.7200 Monthly IDCW 1,019.5755 Direct PlanGrowth 1,943.4392 Daily IDCW 1,020.6795 Monthly IDCW 1,010.1779 Weighted Average Expense Ratio2 for the monthRegular 0.65%Direct 0.23%Benchmark IndexCRISIL Banking and PSU Debt IndexAAuM for the month of August 2021: ` 391.80 croresAuM as on31st August, 2021: ` 392.41 croresFund Manager & ExperienceVikas GargTotal Experience 16 Years Experience in managing this fund: Since September 26, 2020Krishna CheemalapatiTotal Experience 24 Years Experience in managing this fund: Since December 16, 2020
Lumpsum Performance (As on 31st August, 2021)
Period
Returns % Value of ` 10,000 invested
Fund
Benchmark Addl. BM
Fund
Benchmark Addl. BMCRISIL Banking and PSU Debt
Index
CRISIL 10 Yr Gilt Index
CRISIL Banking and PSU Debt
Index
CRISIL 10 Yr Gilt Index
1 Year 4.58% 5.65% 4.68% 10,458 10,565 10,4683 Years 7.85% 8.82% 9.10% 12,549 12,889 12,9875 Years 7.13% 8.05% 6.42% 14,113 14,733 13,6527 Years 7.18% 8.75% 8.01% 16,267 18,011 17,167Since Inception 7.29% 8.74% 7.12% 18,411 20,685 18,171(29 December, 2012)Past performance may or may not be sustained in future. BM - Benchmark. Returns above 1 year are CAGR. Returns are of existing plan (non - direct plan) - Growth Option. Different plans have different expense structure. For calculating returns since inception, NAV as on the date of allotment is taken as Rs. 1,000/-. Face Value per unit is Rs. 1,000/-. Please refer Page nos. 38-42 for performance of other Schemes managed by the Fund Managers and Page nos. 43-47 for performance of Direct Plans and respective Disclaimers.
Maturity Profile2 - 3 years 6.44%5 - 10 years 82.66%10 - 15 years 6.69%Cash & Cash Equivalent 4.21%YTM4 6.45%Average Maturity 7.75 yearsMacaulay Duration 5.96 yearsModified Duration 5.64 years
Invesco India Banking & PSU Debt Fund(An open ended debt scheme predominantly investing in Debt instruments of banks, Public Sector Undertakings, Public Financial Institutions and Municipal Bonds)
Low
Moderate High
Low to
Moderately Very
Mod
erate
High High
Investors understand that their principalwill be at moderate risk
RISKOMETERSuitable for Investors who are seeking*l Returns over short to medium terml Investments primarily in debt & money market instruments
issued by Banks, PFIs, PSUs and Municipal Bonds
*Investors should consult their financial advisers if in doubt about whether the product is suitable for them.
Company Rating % of Net Assets
Corporate Debt 74.15Indian Oil Corporation Ltd. CRISIL AAA 8.51NTPC Ltd. CRISIL AAA 8.08ICICI Bank Ltd. ICRA AAA 7.57National Highways Auth Of Ind CRISIL AAA 6.61Small Industries Dev Bank of India CARE AAA 6.44Hindustan Petroleum Corp. Ltd. CRISIL AAA 6.31Indian Railway Finance Corporation Ltd.
CRISIL AAA 5.37
National Bank For Agriculture and Rural Development
ICRA AAA 5.17
Food Corporation Of India CRISIL AAA(CE) 5.13Power Finance Corporation Ltd. CRISIL AAA 3.99Export Import Bank of India CRISIL AAA 2.79NHPC Ltd. ICRA AAA 2.65
Company Rating % of Net Assets
State Bank of India (Basel III Tier II Bond)
CRISIL AAA 2.53#
HDFC Bank Ltd. CRISIL AAA 1.38Food Corporation Of India ICRA AAA(CE) 0.99Nuclear Power Corporation Of India Ltd.
ICRA AAA 0.64
Government Security 21.64Government Bond7.26% GOI (MD 14/01/2029) Sovereign 10.796.45% GOI (MD 07/10/2029) Sovereign 4.645.77% GOI (MD 03/08/2030) Sovereign 3.706.1% GOI (MD 12/07/2031) Sovereign 1.265.85% GOI (MD 01/12/2030) Sovereign 1.24Cash & Cash Equivalent 4.21Total 100.00
Portfolio (As on 31st August, 2021)
IDCW - Income Distribution cum capital withdrawal option.
Rating ProfileAAA 74.15%
Sovereign 21.64%Cash & Cash Equivalent 4.21%
# Yield to Maturity (YTM) : 6.92%, Yield to Call (YTC) : 6.93%

35 of 49For 1,2, Note on Direct Plan, IDCW Distribution and Disclaimer, refer page no. 49
Investment ObjectiveTo provide returns that closely corresponds to returns provided by Invesco India Gold Exchange Traded Fund.
Key FactsLoad Structure Entry Load Nil Exit Load1 NilMinimum Investment ` 1,000/- & in multiples of ` 1/- thereafterAdditional Purchase` 1,000/- & in multiples of ` 1/- thereafterDate of Allotment 5th December, 2011NAV p.u. (`) As on 31st August, 2021Growth 14.1983 IDCW 14.2001 Direct PlanGrowth 14.5691 IDCW 14.5482 Weighted Average Expense Ratio2 for the monthRegular 0.45%Direct 0.16%In addition, the TER of underlying fund is 0.55%Benchmark IndexPrice of GoldAAuM for the month of August 2021: ` 48.83 croresAuM as on31st August, 2021: ` 48.89 croresFund Manager & ExperienceKrishna Cheemalapati Total Experience 24 Years Experience in managing this fund: Since January 4, 2020
Asset AllocationExchange Traded Funds 98.91%Cash & Cash Equivalent 1.09%
Lumpsum Performance (As on 31st August, 2021)
PeriodReturns % Value of ` 10,000 invested
FundBenchmark
FundBenchmark
Price of Gold Price of Gold1 Year -9.42% -9.95% 9,058 9,0053 Years 14.50% 15.87% 15,016 15,5645 Years 7.71% 8.29% 14,500 14,8967 Years 6.49% 7.66% 15,547 16,784Since Inception 3.66% 4.96% 14,198 16,032(05 December, 2011)Past performance may or may not be sustained in future. BM - Benchmark. Returns above 1 year are CAGR. Returns are of existing plan (non - direct plan) - Growth Option. Different plans have different expense structure. For calculating returns since inception, NAV as on the date of allotment is taken as Rs. 1,000/-. Face Value per unit is Rs. 10/-. Please refer Page nos. 38-42 for performance of other Schemes managed by the Fund Managers and Page nos. 43-47 for performance of Direct Plans and respective Disclaimers.Note : The Scheme invests minimum 95% of its net assets in units of Invesco India Gold ETF and currently there is no suitable additional benchmark available for the Scheme.
Invesco India Gold Fund(An open ended fund of fund scheme investing in Invesco India Gold Exchange Traded Fund)
Low
Moderate High
Low to
Moderately Very
Mod
erate
High High
Investors understand that their principalwill be at moderately high risk
RISKOMETERSuitable for Investors who are seeking*l Regular income and capital appreciation over medium to long
terml Investment in units of Invesco India Gold Exchange Traded
Fund, which in turn invests in physical gold
*Investors should consult their financial advisers if in doubt about whether the product is suitable for them.
Company % of Net Assets
Exchange Traded Funds 98.91Invesco India Gold Exchange Traded Fund 98.91Cash & Cash Equivalent 1.09Total 100.00
The investor will bear the recurring expenses of the scheme, in addition to the expenses of underlying scheme.
Portfolio (As on 31st August, 2021)
IDCW - Income Distribution cum capital withdrawal option.

36 of 49 For 1,2, Note on Direct Plan, IDCW Distribution and Disclaimer, refer page no. 49
Investment ObjectiveTo generate returns that closely correspond to the returns provided by investment in physical gold in the domestic market, subject to tracking error.
Key FactsLoad Structure Entry Load Nil Exit Load1 Nil
(For redemption in Creation Unit size.)
Minimum Investment 1.1
On Exchange : 1 Unit Directly with Mutual Fund : 1,000 Units and in multiples thereof.Listing ExchangeNSE / BSENSE /BSE SymbolIVZINGOLDBSE Code533172ISININF205K01361Date of Allotment12th March, 2010Pricing per Unit1 gram of gold (approx.)NAV p.u. (`) As on 31st August, 2021Growth 4,257.5702 Weighted Average Expense Ratio2
for the month0.55%Tracking Error0.17% (annualised) Based on 3 years, monthly data pointsBenchmark IndexPrice of GoldAAuM for the month of August 2021: ` 77.23 croresAuM as on31st August, 2021: ` 77.13 croresFund Manager & ExperienceKrishna Cheemalapati Total Experience 24 Years Experience in managing this fund: Since January 4, 2020
Lumpsum Performance (As on 31st August, 2021)
PeriodReturns % Value of ` 10,000 invested
FundBenchmark
FundBenchmark
Price of Gold Price of Gold1 Year -10.20% -9.95% 8,980 9,0053 Years 15.19% 15.87% 15,290 15,5645 Years 7.50% 8.29% 14,356 14,8967 Years 6.79% 7.66% 15,849 16,78410 Years 4.80% 5.70% 15,985 17,419Since Inception 8.44% 9.39% 25,343 28,013(12 March, 2010)Past performance may or may not be sustained in future. BM - Benchmark. Returns above 1 year are CAGR. Returns are of Growth option only. Different plans have different expense structure. For calculating returns since inception, NAV as on the date of allotment is taken as Rs. 1,680.0014. Face Value per unit is Rs. 100/-. Please refer Page nos. 38-42 for performance of other Schemes managed by the Fund Managers and Page nos. 43-47 for performance of Direct Plans and respective Disclaimers.Note : The Scheme invests minimum 95% of its net assets in physical gold and currently there is no suitable additional benchmark available for the Scheme.
Invesco India Gold Exchange Traded Fund(An open ended scheme tracking returns provided by investment in physical gold)
Low
Moderate High
Low to
Moderately Very
Mod
erate
High High
Investors understand that their principalwill be at moderately high risk
RISKOMETERSuitable for Investors who are seeking*l Capital appreciation over long terml Generate returns that closely correspond to the returns
provided by investment in physical gold in the domestic market, subject to tracking error.
*Investors should consult their financial advisers if in doubt about whether the product is suitable for them.
Company % of Net Assets
Gold 98.23Gold 98.23Cash & Cash Equivalent 1.77Total 100.00
Portfolio (As on 31st August, 2021)
1.1Investor can purchase units from stock exchange at traded price or subscribe the units through Mutual Fund in Creation unit size for Cash or by submitting Portfolio deposit and Cash Component at applicable NAV.
IDCW - Income Distribution cum capital withdrawal option.

37 of 49For 1,2, Note on Direct Plan, IDCW Distribution and Disclaimer, refer page no. 49
Invesco India Nifty Exchange Traded Fund(An open ended scheme replicating Nifty 50 Index)
Low
Moderate High
Low to
Moderately Very
Mod
erate
High High
Investors understand that their principalwill be at very high risk
RISKOMETERSuitable for Investors who are seeking*l Capital appreciation over long-terml Generate returns that closely correspond to the returns
generated by securities represented by the Nifty 50, subject to tracking error, if any.
*Investors should consult their financial advisers if in doubt about whether the product is suitable for them.
Industry Classification3
% of Net AssetsBanks 25.18%Software 18.00%Petroleum Products 10.80%Consumer Non Durables 9.97%Finance 9.48%Auto 4.58%Pharmaceuticals 3.46%Insurance 2.90%Construction Project 2.72%Cement & Cement Products 2.49%Ferrous Metals 2.42%Telecom - Services 2.11%Power 1.55%Consumer Durables 1.08%Non - Ferrous Metals 0.92%Transportation 0.74%Oil 0.59%Pesticides 0.55%Minerals/Mining 0.41%3Industrywise Classification as per AMFI.
IDCW DistributionRecord Date Rate (`/Unit) Cum-IDCW
NAV p. u. (`)IDCW Option26-Dec-12 5 596.3176Past performance may or may not be sustained in future. IDCW is on face value of `10/- per unit. After the payment of IDCW, the per unit NAV will fall to the extent of Payout of Income Distribution cum capital withdrawal option and applicable statutory levy, if any.
Lumpsum Performance (As on 31st August, 2021)
Period
Returns % Value of ` 10,000 invested
FundBenchmark Addl. BM
FundBenchmark Addl. BM
Nifty 50 TRI S&P BSE Sensex TRI Nifty 50 TRI S&P BSE
Sensex TRI1 Year 51.99% 52.24% 50.55% 15,199 15,224 15,0553 Years 14.73% 14.94% 15.49% 15,107 15,192 15,4125 Years 15.51% 15.70% 16.48% 20,569 20,738 21,4517 Years 12.69% 12.92% 13.00% 23,119 23,454 23,57210 Years 14.10% 14.48% 14.72% 37,454 38,718 39,529Since Inception 12.80% 13.18% 13.43% 34,270 35,456 36,267(13 June, 2011)Past performance may or may not be sustained in future. BM - Benchmark. Returns above 1 year are CAGR. Returns are of Growth option only. Different plans have different expense structure. For calculating returns since inception, NAV as on the date of allotment is taken as Rs. 548.28. Face Value per unit is Rs. 10/-. Please refer Page nos. 38-42 for performance of other Schemes managed by the Fund Managers and Page nos. 43-47 for performance of Direct Plans and respective Disclaimers. Benchmark returns are calculated using Total Return variant of respective Benchmark Index.
Investment ObjectiveTo generate returns which closely correspond to the returns generated by securities as represented by Nifty 50, subject to tracking error, if any.
Key FactsLoad Structure Entry Load Nil Exit Load1, 1.1 Nil
(For redemption in Creation Unit size.)
Minimum Investment 1.2
On Exchange : 1 Unit Directly with Mutual Fund : 5,000 Units and in multiples thereof.Listing ExchangeNSENSE SymbolIVZINNIFTYISININF205K01DA9Date of Allotment 13th June, 2011Pricing per Unit1/10th of the value of Nifty 50 (approx.)NAV p.u. (`) As on 31st August, 2021Growth 1,863.2179 Weighted Average Expense Ratio2
for the month 0.10%Tracking Error0.10% (annualised) Based on 3 years, monthly data pointsBenchmark IndexNifty 50 TRIAAuM for the month of August 2021: ` 58.45 croresAuM as on31st August, 2021: ` 60.87 croresFund Manager & ExperienceKuber MannadiTotal Experience 16 Years Experience in managing this fund: Since May 19, 2020
1.1Please refer to Key Information Memorandum / Scheme Information Document for exit load applicable for redemption of units in other than creation unit size directly with the Mutual Fund. Exit Load charged, if any, will be credited back to the scheme, net of goods & services tax. 1.2Investor can purchase units from stock exchange at traded price or subscribe the units through Mutual Fund in Creation unit size for Cash or by submitting Portfolio deposit and Cash Component at applicable NAV.
Company % of Net AssetsEquity & Equity Related Instruments 99.94Reliance Industries Ltd. 9.82HDFC Bank Ltd. 9.29Infosys Ltd. 8.51Housing Development Finance Corp. Ltd. 6.79ICICI Bank Ltd. 6.70Tata Consultancy Services Ltd. 5.28Kotak Mahindra Bank Ltd. 3.46Hindustan Unilever Ltd. 3.27Axis Bank Ltd. 2.72Larsen & Toubro Ltd. 2.72Bajaj Finance Ltd. 2.69 ITC Ltd. 2.48State Bank of India 2.20Bharti Airtel Ltd. 2.11Asian Paints Ltd. 1.94HCL Technologies Ltd. 1.73Tata Steel Ltd. 1.53Bajaj Finserv Ltd. 1.39Wipro Ltd. 1.28Maruti Suzuki India Ltd. 1.22UltraTech Cement Ltd. 1.22Tech Mahindra Ltd. 1.21Sun Pharmaceutical Industries Ltd. 1.15Titan Company Ltd. 1.08Mahindra & Mahindra Ltd. 1.02Nestle India Ltd. 0.93
Company % of Net AssetsHindalco Industries Ltd. 0.92JSW Steel Ltd. 0.89Divi’s Laboratories Ltd. 0.89Power Grid Corporation of India Ltd. 0.81IndusInd Bank Ltd. 0.81HDFC Life Insurance Company Ltd. 0.80Grasim Industries Ltd. 0.77Dr. Reddy’s Laboratories Ltd. 0.77NTPC Ltd. 0.74Adani Ports and Special Economic Zone Ltd.
0.74
SBI Life Insurance Company Ltd. 0.71Tata Consumer Products Ltd. 0.70Tata Motors Ltd. 0.69Bajaj Auto Ltd. 0.65Cipla Ltd. 0.65Britannia Industries Ltd. 0.64Bharat Petroleum Corporation Ltd. 0.59Oil & Natural Gas Corporation Ltd. 0.59UPL Ltd. 0.55Shree Cement Ltd. 0.51Eicher Motors Ltd. 0.50Hero MotoCorp Ltd. 0.48Coal India Ltd. 0.41Indian Oil Corporation Ltd. 0.38Yes Bank Ltd. 0.00Cash & Cash Equivalent 0.06Total 100.00
Portfolio (As on 31st August, 2021)
IDCW - Income Distribution cum capital withdrawal option.
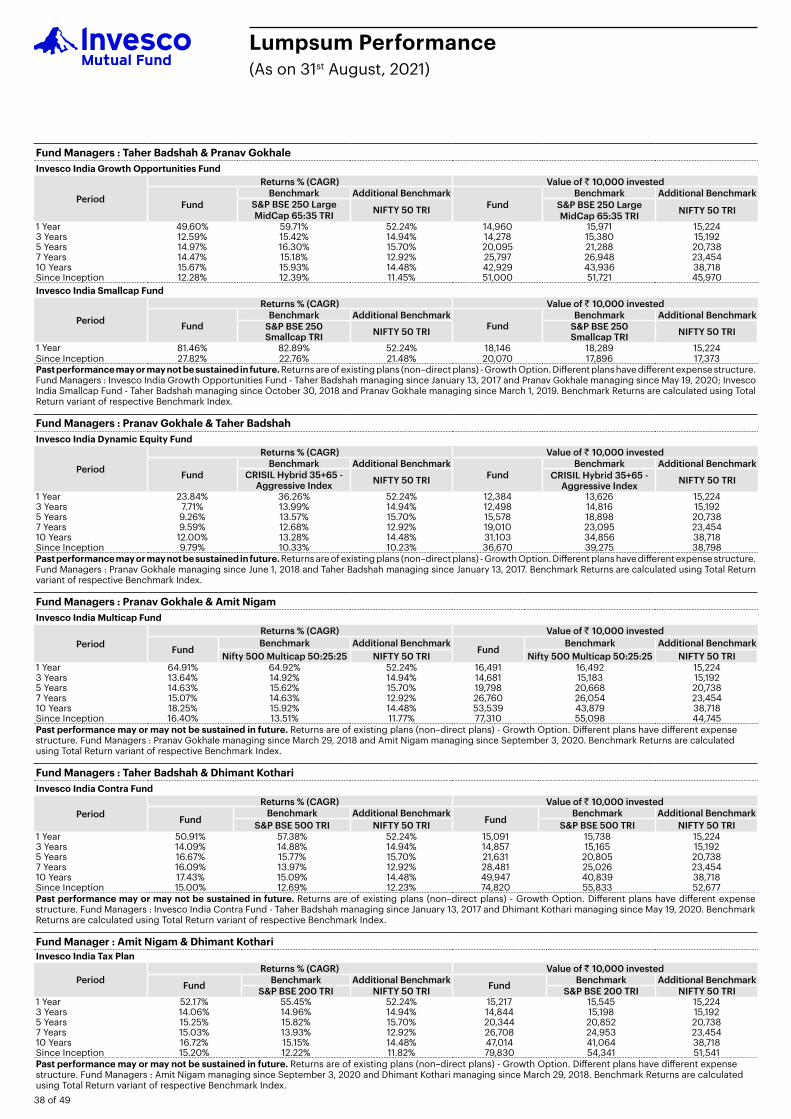
38 of 49
Lumpsum Performance(As on 31st August, 2021)
Fund Managers : Taher Badshah & Pranav GokhaleInvesco India Growth Opportunities Fund
Period
Returns % (CAGR) Value of ` 10,000 invested
FundBenchmark Additional Benchmark
FundBenchmark Additional Benchmark
S&P BSE 250 Large MidCap 65:35 TRI NIFTY 50 TRI S&P BSE 250 Large
MidCap 65:35 TRI NIFTY 50 TRI
1 Year 49.60% 59.71% 52.24% 14,960 15,971 15,2243 Years 12.59% 15.42% 14.94% 14,278 15,380 15,1925 Years 14.97% 16.30% 15.70% 20,095 21,288 20,7387 Years 14.47% 15.18% 12.92% 25,797 26,948 23,45410 Years 15.67% 15.93% 14.48% 42,929 43,936 38,718Since Inception 12.28% 12.39% 11.45% 51,000 51,721 45,970Invesco India Smallcap Fund
Period
Returns % (CAGR) Value of ` 10,000 invested
FundBenchmark Additional Benchmark
FundBenchmark Additional Benchmark
S&P BSE 250 Smallcap TRI NIFTY 50 TRI S&P BSE 250
Smallcap TRI NIFTY 50 TRI
1 Year 81.46% 82.89% 52.24% 18,146 18,289 15,224Since Inception 27.82% 22.76% 21.48% 20,070 17,896 17,373Past performance may or may not be sustained in future. Returns are of existing plans (non–direct plans) - Growth Option. Different plans have different expense structure. Fund Managers : Invesco India Growth Opportunities Fund - Taher Badshah managing since January 13, 2017 and Pranav Gokhale managing since May 19, 2020; Invesco India Smallcap Fund - Taher Badshah managing since October 30, 2018 and Pranav Gokhale managing since March 1, 2019. Benchmark Returns are calculated using Total Return variant of respective Benchmark Index.
Fund Managers : Pranav Gokhale & Taher BadshahInvesco India Dynamic Equity Fund
Period
Returns % (CAGR) Value of ` 10,000 invested
FundBenchmark Additional Benchmark
FundBenchmark Additional Benchmark
CRISIL Hybrid 35+65 - Aggressive Index NIFTY 50 TRI CRISIL Hybrid 35+65 -
Aggressive Index NIFTY 50 TRI
1 Year 23.84% 36.26% 52.24% 12,384 13,626 15,2243 Years 7.71% 13.99% 14.94% 12,498 14,816 15,1925 Years 9.26% 13.57% 15.70% 15,578 18,898 20,7387 Years 9.59% 12.68% 12.92% 19,010 23,095 23,45410 Years 12.00% 13.28% 14.48% 31,103 34,856 38,718Since Inception 9.79% 10.33% 10.23% 36,670 39,275 38,798Past performance may or may not be sustained in future. Returns are of existing plans (non–direct plans) - Growth Option. Different plans have different expense structure. Fund Managers : Pranav Gokhale managing since June 1, 2018 and Taher Badshah managing since January 13, 2017. Benchmark Returns are calculated using Total Return variant of respective Benchmark Index.
Fund Managers : Pranav Gokhale & Amit NigamInvesco India Multicap Fund
PeriodReturns % (CAGR) Value of ` 10,000 invested
FundBenchmark Additional Benchmark
FundBenchmark Additional Benchmark
Nifty 500 Multicap 50:25:25 NIFTY 50 TRI Nifty 500 Multicap 50:25:25 NIFTY 50 TRI 1 Year 64.91% 64.92% 52.24% 16,491 16,492 15,2243 Years 13.64% 14.92% 14.94% 14,681 15,183 15,1925 Years 14.63% 15.62% 15.70% 19,798 20,668 20,7387 Years 15.07% 14.63% 12.92% 26,760 26,054 23,45410 Years 18.25% 15.92% 14.48% 53,539 43,879 38,718Since Inception 16.40% 13.51% 11.77% 77,310 55,098 44,745Past performance may or may not be sustained in future. Returns are of existing plans (non–direct plans) - Growth Option. Different plans have different expense structure. Fund Managers : Pranav Gokhale managing since March 29, 2018 and Amit Nigam managing since September 3, 2020. Benchmark Returns are calculated using Total Return variant of respective Benchmark Index.
Fund Managers : Taher Badshah & Dhimant KothariInvesco India Contra Fund
PeriodReturns % (CAGR) Value of ` 10,000 invested
FundBenchmark Additional Benchmark
FundBenchmark Additional Benchmark
S&P BSE 500 TRI NIFTY 50 TRI S&P BSE 500 TRI NIFTY 50 TRI 1 Year 50.91% 57.38% 52.24% 15,091 15,738 15,2243 Years 14.09% 14.88% 14.94% 14,857 15,165 15,1925 Years 16.67% 15.77% 15.70% 21,631 20,805 20,7387 Years 16.09% 13.97% 12.92% 28,481 25,026 23,45410 Years 17.43% 15.09% 14.48% 49,947 40,839 38,718Since Inception 15.00% 12.69% 12.23% 74,820 55,833 52,677Past performance may or may not be sustained in future. Returns are of existing plans (non–direct plans) - Growth Option. Different plans have different expense structure. Fund Managers : Invesco India Contra Fund - Taher Badshah managing since January 13, 2017 and Dhimant Kothari managing since May 19, 2020. Benchmark Returns are calculated using Total Return variant of respective Benchmark Index.
Fund Manager : Amit Nigam & Dhimant KothariInvesco India Tax Plan
PeriodReturns % (CAGR) Value of ` 10,000 invested
Fund Benchmark Additional Benchmark Fund Benchmark Additional BenchmarkS&P BSE 200 TRI NIFTY 50 TRI S&P BSE 200 TRI NIFTY 50 TRI
1 Year 52.17% 55.45% 52.24% 15,217 15,545 15,2243 Years 14.06% 14.96% 14.94% 14,844 15,198 15,1925 Years 15.25% 15.82% 15.70% 20,344 20,852 20,7387 Years 15.03% 13.93% 12.92% 26,708 24,953 23,45410 Years 16.72% 15.15% 14.48% 47,014 41,064 38,718Since Inception 15.20% 12.22% 11.82% 79,830 54,341 51,541Past performance may or may not be sustained in future. Returns are of existing plans (non–direct plans) - Growth Option. Different plans have different expense structure. Fund Managers : Amit Nigam managing since September 3, 2020 and Dhimant Kothari managing since March 29, 2018. Benchmark Returns are calculated using Total Return variant of respective Benchmark Index.

39 of 49
Lumpsum Performance(As on 31st August, 2021)
Fund Managers : Dhimant Kothari & Hiten JainInvesco India Financial Services Fund
Period
Returns % (CAGR) Value of ` 10,000 invested
FundBenchmark Additional Benchmark
FundBenchmark Additional Benchmark
Nifty Financial Services TRI NIFTY 50 TRI Nifty Financial
Services TRI NIFTY 50 TRI
1 Year 53.77% 59.45% 52.24% 15,377 15,945 15,2243 Years 12.25% 16.04% 14.94% 14,148 15,632 15,1925 Years 14.93% 17.95% 15.70% 20,061 22,844 20,7387 Years 15.58% 16.58% 12.92% 27,608 29,319 23,45410 Years 16.02% 17.60% 14.48% 44,260 50,690 38,718Since Inception 17.03% 18.22% 12.98% 78,960 90,226 49,731Past performance may or may not be sustained in future. Returns are of existing plans (non–direct plans) - Growth Option. Different plans have different expense structure. Fund Managers : Dhimant Kothari managing since June 1, 2018 and Hiten Jain managing since May 19, 2020. Benchmark Returns are calculated using Total Return variant of respective Benchmark Index.
Fund Managers : Nitin Gosar & Dhimant KothariInvesco India PSU Equity Fund
PeriodReturns % (CAGR) Value of ` 10,000 invested
FundBenchmark Additional Benchmark
FundBenchmark Additional Benchmark
S&P BSE PSU TRI NIFTY 50 TRI S&P BSE PSU TRI NIFTY 50 TRI 1 Year 41.16% 56.32% 52.24% 14,116 15,632 15,2243 Years 12.96% 3.04% 14.94% 14,418 10,941 15,1925 Years 10.03% 4.04% 15.70% 16,134 12,193 20,7387 Years 11.09% 2.66% 12.92% 20,914 12,023 23,45410 Years 9.86% 2.94% 14.48% 25,646 13,360 38,718Since Inception 8.31% 1.12% 12.26% 25,620 11,400 39,099Past performance may or may not be sustained in future. Returns are of existing plans (non–direct plans) - Growth Option. Different plans have different expense structure. Nitin Gosar managing since June 1, 2018 and Dhimant Kothari managing since May 19, 2020. Benchmark Returns are calculated using Total Return variant of respective Benchmark Index.
Fund Managers : Amit Nigam & Nitin GosarInvesco India Largecap Fund
PeriodReturns % (CAGR) Value of ` 10,000 invested
Fund Benchmark Additional Benchmark Fund Benchmark Additional BenchmarkNIFTY 50 TRI S&P BSE Sensex TRI NIFTY 50 TRI S&P BSE Sensex TRI
1 Year 50.07% 52.24% 50.55% 15,007 15,224 15,0553 Years 13.71% 14.94% 15.49% 14,706 15,192 15,4125 Years 13.38% 15.70% 16.48% 18,741 20,738 21,4517 Years 13.14% 12.92% 13.00% 23,771 23,454 23,57210 Years 14.43% 14.48% 14.72% 38,566 38,718 39,529Since Inception 12.95% 13.04% 13.22% 43,310 43,727 44,556Past performance may or may not be sustained in future. Returns are of existing plans (non–direct plans) - Growth Option. Different plans have different expense structure. Fund Managers : Amit Nigam managing since September 3, 2020 and Nitin Gosar managing since March 29, 2018. Benchmark Returns are calculated using Total Return variant of respective Benchmark Index.
Fund Manager : Amit Nigam & Neelesh DhamnaskarInvesco India Infrastructure Fund
Period
Returns % (CAGR) Value of ` 10,000 invested
FundBenchmark Additional Benchmark
FundBenchmark Additional Benchmark
S&P BSE India Infrastructure TRI NIFTY 50 TRI S&P BSE India
Infrastructure TRI NIFTY 50 TRI
1 Year 65.07% 76.54% 52.24% 16,507 17,654 15,2243 Years 18.46% 8.77% 14.94% 16,630 12,872 15,1925 Years 15.95% 9.17% 15.70% 20,968 15,510 20,7387 Years 13.68% 8.02% 12.92% 24,572 17,183 23,45410 Years 14.11% 10.18% 14.48% 37,494 26,387 38,718Since Inception 8.03% 3.43% 9.81% 29,020 15,925 36,321Past performance may or may not be sustained in future. Returns are of existing plans (non–direct plans) - Growth Option. Different plans have different expense structure. Fund Managers : Amit Nigam managing since September 3, 2020 and Neelesh Dhamnaskar managing since June 1, 2018. Benchmark Returns are calculated using Total Return variant of respective Benchmark Index.
Fund Manager : Pranav Gokhale & Neelesh DhamnaskarInvesco India Midcap Fund
PeriodReturns % (CAGR) Value of ` 10,000 invested
FundBenchmark Additional Benchmark
FundBenchmark Additional Benchmark
Nifty Midcap 100 TRI NIFTY 50 TRI Nifty Midcap 100 TRI NIFTY 50 TRI 1 Year 57.70% 71.83% 52.24% 15,770 17,183 15,2243 Years 16.25% 13.60% 14.94% 15,718 14,664 15,1925 Years 16.56% 14.23% 15.70% 21,525 19,453 20,7387 Years 16.53% 15.50% 12.92% 29,236 27,476 23,45410 Years 18.85% 15.89% 14.48% 56,339 43,778 38,718Since Inception 15.75% 14.07% 11.98% 81,860 66,367 50,898Past performance may or may not be sustained in future. Returns are of existing plans (non–direct plans) - Growth Option. Different plans have different expense structure. Fund Managers : Pranav Gokhale managing since March 29, 2018 and Neelesh Dhamnaskar managing since July 18, 2018. Benchmark Returns are calculated using Total Return variant of respective Benchmark Index.

40 of 49
Lumpsum Performance(As on 31st August, 2021)
Fund Manager : Rajeev BhardwajInvesco India Arbitrage Fund1
PeriodReturns % (CAGR) Value of ` 10,000 invested
Fund Benchmark Additional Benchmark Fund Benchmark Additional BenchmarkNifty 50 Arbitrage# CRISIL 1 Yr T Bill Index Nifty 50 Arbitrage# CRISIL 1 Yr T Bill Index
1 Year 3.74% 4.18% 3.92% 10,374 10,418 10,3923 Years 4.94% 4.68% 6.35% 11,558 11,472 12,0295 Years 5.28% 4.65% 6.21% 12,934 12,554 13,5157 Years 5.83% 5.41% 6.75% 14,882 14,470 15,80810 Years 6.58% 6.28% 6.91% 18,928 18,392 19,523Since Inception 6.65% NA 6.37% 25,189 NA 24,267Past performance may or may not be sustained in future. Returns are of existing plans (non–direct plans) - Growth Option. Different plans have different expense structure. Invesco India Arbitrage Fund - managing since May 19, 2020. #The inception date of the Scheme is 30 April, 2007 which is prior to the date (i.e. 01 April, 2010) from which figures for Nifty 50 Arbitrage Index (Benchmark Index) are available. Hence returns since inception and for other required periods are not available for Nifty 50 Arbitrage Index. Benchmark Returns are calculated using Total Return variant of respective Benchmark Index, wherever applicable. 1Please refer Notes on page no. 42.
Fund Manager : Kuber MannadiInvesco India Nifty Exchange Traded Fund
PeriodReturns % (CAGR) Value of ` 10,000 invested
Fund Benchmark Additional Benchmark Fund Benchmark Additional BenchmarkNIFTY 50 TRI S&P BSE Sensex TRI NIFTY 50 TRI S&P BSE Sensex TRI
1 Year 51.99% 52.24% 50.55% 15,199 15,224 15,0553 Years 14.73% 14.94% 15.49% 15,107 15,192 15,4125 Years 15.51% 15.70% 16.48% 20,569 20,738 21,4517 Years 12.69% 12.92% 13.00% 23,119 23,454 23,57210 Years 14.10% 14.48% 14.72% 37,454 38,718 39,529Since Inception 12.80% 13.18% 13.43% 34,270 35,456 36,267Past performance may or may not be sustained in future. Returns are of Growth option only. Different plans have different expense structure. Managing since May 19, 2020. Benchmark Returns are calculated using Total Return variant of respective Benchmark Index, wherever applicable.
Fund Manager : Neelesh DhamnaskarInvesco India Feeder - Invesco Pan European Equity Fund@
PeriodReturns % (CAGR) Value of ` 10,000 invested
Fund Benchmark Addl. Benchmark Fund Benchmark Addl. BenchmarkMSCI Europe - ND Nifty 50 TRI MSCI Europe - ND Nifty 50 TRI
1 Year 31.55% 29.37% 52.24% 13,155 12,937 15,2243 Years 4.82% 10.80% 14.94% 11,519 13,605 15,1925 Years 8.55% 12.09% 15.70% 15,073 17,698 20,7387 Years 4.38% 8.21% 12.92% 13,510 17,393 23,454Since Inception 3.93% 7.83% 16.05% 13,398 17,713 30,926Invesco India Feeder - Invesco Global Equity Income Fund@
PeriodReturns % (CAGR) Value of ` 10,000 invested
Fund Benchmark Addl. Benchmark Fund Benchmark Addl. BenchmarkMSCI World Index - Net Dividend Nifty 50 TRI MSCI World Index - Net Dividend Nifty 50 TRI
1 Year 30.89% 29.32% 52.24% 13,089 12,932 15,2243 Years 9.26% 16.03% 14.94% 13,048 15,626 15,1925 Years 10.43% 16.82% 15.70% 16,426 21,769 20,7387 Years 8.00% 13.76% 12.92% 17,158 24,701 23,454Since Inception 7.84% 13.81% 15.13% 17,382 25,804 28,081Past performance may or may not be sustained in future. Returns are of Regular plans (non–direct plans) - Growth Option. Different plans have different expense structure. Invesco India Feeder - Invesco Pan European Equity Fund - managing since January 31, 2014; Invesco India Feeder - Invesco Global Equity Income Fund - managing since May 5, 2014. @Fund of Funds Schemes - The investor will bear the recurring expenses of the scheme, in addition to the expenses of underlying scheme.
Fund Managers : Neelesh Dhamnaskar (For Equity) & Krishna Cheemalapati (For Debt)Invesco India - Invesco Global Consumer Trends Fund of Fund@
Period
Returns % Value of ` 10,000 invested
FundBenchmark Addl. Benchmark
FundBenchmark Addl. Benchmark
MSCI World Consumer Discretionary Index ND Nifty 50 TRI MSCI World Consumer
Discretionary Index ND Nifty 50 TRI
6 Months -9.94% 19.57% 36.89% 9,494 10,997 11,880Past performance may or may not be sustained in future. Returns are of Regular plan (non–direct plan) - Growth Option. Different plans have different expense structure. Managing since December 24, 2020. @Fund of Funds Schemes - The investor will bear the recurring expenses of the scheme, in addition to the expenses of underlying scheme.
Fund Managers : Taher Badshah, Pranav Gokhale (For Equity) & Krishna Cheemalapati (For Debt)Invesco India Equity & Bond Fund
PeriodReturns % (CAGR) Value of ` 10,000 invested
FundBenchmark Additional Benchmark
FundBenchmark Additional Benchmark
CRISIL Hybrid 35 + 65 - Aggressive Index Nifty 50 TRI CRISIL Hybrid 35 + 65
- Aggressive Index Nifty 50 TRI1 Year 34.08% 36.26% 52.24% 13,408 13,626 15,2243 years 10.00% 13.99% 14.94% 13,315 14,816 15,192Since Inception 11.65% 15.54% 17.37% 14,184 15,813 16,623Past performance may or may not be sustained in future. Returns are of existing plan (non–direct plans) - Growth Option. Different plans have different expense structure. Fund Managers managing the scheme - Taher Badshah - since June 30, 2018, Pranav Gokhale - since May 19, 2020 & Krishna Cheemalapati - since June 30, 2018.
Fund Manager : Taher Badshah & Nitin GosarInvesco India Focused 20 Equity Fund
PeriodReturns % (CAGR) Value of ` 10,000 invested
Fund Benchmark Additional Benchmark Fund Benchmark Additional BenchmarkS&P BSE 500 TRI Nifty 50 TRI S&P BSE 500 TRI Nifty 50 TRI
6 Months 41.76% 40.06% 36.89% 12,128 12,041 11,880Past performance may or may not be sustained in future. Returns are of regular plan - Growth Option. Different plans have different expense structure. Fund Managers managing the scheme - Taher Badshah - since September 29, 2020 & Nitin Gosar - since August 26, 2021.

41 of 49
Lumpsum Performance(As on 31st August, 2021)
Fund Managers : Amit Nigam, Dhimant Kothari (For Equity) & Krishna Cheemalapati (For Debt)Invesco India Equity Savings Fund
PeriodReturns % (CAGR) Value of ` 10,000 invested
Fund Benchmark Additional Benchmark Fund Benchmark Additional BenchmarkNifty Equity Savings Index CRISIL 10 Yr Gilt Index Nifty Equity Savings Index CRISIL 10 Yr Gilt Index
1 Year 14.59% 20.27% 4.68% 11,459 12,027 10,468Since Inception 9.08% 12.15% 8.27% 12,414 13,301 12,186Past performance may or may not be sustained in future. Returns are of existing plan (non–direct plans) - Growth Option. Different plans have different expense structure. Fund Managers managing the scheme - Amit Nigam - since September 3, 2020, Dhimant Kothari - since May 19, 2020 & Krishna Cheemalapati - since March 7, 2019.
Fund Manager : Vikas Garg & Krishna CheemalapatiInvesco India Short Term Fund
Period
Returns % (CAGR) Value of ` 10,000 invested
Fund Fund - Plan B
Benchmark Additional BenchmarkFund Fund -
Plan B
Benchmark Additional BenchmarkCRISIL Short Term Bond Fund Index CRISIL 10 Yr Gilt Index CRISIL Short Term
Bond Fund Index CRISIL 10 Yr Gilt Index
1 Year 4.60% 4.60% 6.02% 4.68% 10,460 10,460 10,602 10,4683 Years 7.70% 7.70% 8.74% 9.10% 12,494 12,495 12,862 12,9875 Years 6.82% 6.82% 7.79% 6.42% 13,907 13,908 14,556 13,6527 Years 7.40% 7.40% 8.30% 8.01% 16,495 16,499 17,494 17,16710 Years 7.79% 7.64% 8.48% 7.20% 21,187 20,901 22,588 20,059Since Inception 7.62% 7.59% 8.17% 6.89% 28,884 28,784 31,097 26,183Invesco India Corporate Bond Fund
Period
Returns % (CAGR) Value of ` 10,000 invested
FundBenchmark Additional Benchmark
FundBenchmark Additional Benchmark
CRISIL AAA Short Term Bond Index CRISIL 10 Yr Gilt Index CRISIL AAA Short
Term Bond Index CRISIL 10 Yr Gilt Index
1 Year 5.16% 5.95% 4.68% 10,516 10,595 10,4683 Years 8.74% 8.95% 9.10% 12,859 12,936 12,9875 Years 6.57% 8.15% 6.42% 13,750 14,801 13,6527 Years 7.60% 8.48% 8.01% 16,720 17,702 17,16710 Years 7.69% 8.75% 7.20% 20,988 23,168 20,059Since Inception 6.85% 8.76% 6.84% 25,426 32,639 25,416Invesco India Banking & PSU Debt Fund
Period
Returns % (CAGR) Value of ` 10,000 invested
FundBenchmark Additional Benchmark
FundBenchmark Additional Benchmark
CRISIL Banking and PSU Debt Index CRISIL 10 Yr Gilt Index CRISIL Banking and
PSU Debt Index CRISIL 10 Yr Gilt Index
1 Year 4.58% 5.65% 4.68% 10,458 10,565 10,4683 Years 7.85% 8.82% 9.10% 12,549 12,889 12,9875 Years 7.13% 8.05% 6.42% 14,113 14,733 13,6527 Years 7.18% 8.75% 8.01% 16,267 18,011 17,167Since Inception 7.29% 8.74% 7.12% 18,411 20,685 18,171Invesco India Credit Risk Fund
Period
Returns % (CAGR) Value of ` 10,000 invested
Fund - RegularBenchmark Additional Benchmark
Fund - RegularBenchmark Additional Benchmark
CRISIL Composite AA Short Term Bond Index CRISIL 10 Yr Gilt Index CRISIL Composite AA
Short Term Bond Index CRISIL 10 Yr Gilt Index
1 Year 3.94% 8.23% 4.68% 10,394 10,823 10,4683 Years 1.81% 9.39% 9.10% 10,554 13,091 12,9875 Years 3.90% 8.76% 6.42% 12,110 15,218 13,652Since Inception 5.70% 9.12% 7.97% 14,733 18,409 17,102Invesco India Gilt Fund
PeriodReturns % (CAGR) Value of ` 10,000 invested
Fund Benchmark Fund BenchmarkCRISIL 10 year Gilt Index CRISIL 10 year Gilt Index
1 Year 2.31% 4.68% 10,231 10,4683 Years 7.71% 9.10% 12,498 12,9875 Years 5.96% 6.42% 13,360 13,6527 Years 7.65% 8.01% 16,767 17,16710 Years 7.15% 7.20% 19,962 20,059Since Inception 6.20% 6.61% 22,611 23,819Past performance may or may not be sustained in future. Returns are of existing plans (non–direct plans) - Growth Option. Different plans have different expense structure. Fund Managers: Invesco India Short Term Fund, Invesco India Corporate Bond Fund, Invesco India Banking & PSU Debt Fund, Invesco India Credit Risk Fund - Vikas Garg managing since September 26, 2020 and Krishna Cheemalapati managing since December 16, 2020. Invesco India Gilt Fund - Vikas Garg managing since September 26, 2020 and Krishna Cheemalapati managing since July 27, 2021.
Fund Manager : Krishna Cheemalapati & Vikas GargInvesco India Money Market Fund
Period
Returns % (CAGR) Value of ` 10,000 invested
Fund Fund - Regular
Benchmark Additional BenchmarkFund Fund -
Regular
Benchmark Additional BenchmarkCRISIL Money Market Index
CRISIL 1 Year T-Bill Index
CRISIL Money Market Index
CRISIL 1 Year T-Bill Index
1 Year 3.70% 2.98% 4.22% 3.92% 10,370 10,298 10,422 10,3923 Years 5.94% 5.18% 6.22% 6.35% 11,893 11,637 11,986 12,0295 Years 6.34% 5.58% 6.55% 6.21% 13,601 13,123 13,738 13,5157 Years 6.99% 6.21% 7.09% 6.75% 16,066 15,255 16,163 15,80810 Years 7.84% 6.91% 7.73% 6.91% 21,297 19,524 21,069 19,523Since Inception 7.67% 6.82% 7.41% 6.36% 24,298 22,093 23,595 20,990

42 of 49
Lumpsum Performance(As on 31st August, 2021)
Invesco India Treasury Advantage Fund
Period
Returns % (CAGR) Value of ` 10,000 invested
Fund Fund - Regular
Benchmark Additional Benchmark Fund Fund -
Regular
Benchmark Additional Benchmark
CRISIL Low Duration Debt Index
CRISIL 1 Yr T-Bill Index
CRISIL Low Duration Debt Index
CRISIL 1 Yr T-Bill Index
1 Year 4.16% 3.54% 4.92% 3.92% 10,416 10,354 10,492 10,3923 Years 7.07% 6.43% 7.29% 6.35% 12,277 12,058 12,353 12,0295 Years 6.89% 6.30% 7.27% 6.21% 13,954 13,576 14,207 13,5157 Years 7.39% 6.80% 7.83% 6.75% 16,489 15,862 16,965 15,80810 Years 7.95% 7.20% 8.35% 6.91% 21,513 20,053 22,314 19,523Since Inception 7.84% 7.16% 7.69% 6.34% 30,175 27,514 29,543 24,575Past performance may or may not be sustained in future. Returns are of existing plans (non–direct plans) - Growth Option. Different plans have different expense structure. Fund Managers : Invesco India Money Market Fund - Krishna Cheemalapati - managing Since January 4, 2020 and Vikas Garg - managing since December 16, 2020. Invesco India Treasury Advantage Fund - Krishna Cheemalapati - managing since January 1, 2013 and Vikas Garg - managing since December 16, 2020.
Fund Managers : Krishna Cheemalapati
Invesco India Gold Exchange Traded Fund
PeriodReturns % (CAGR) Value of ` 10,000 invested
FundBenchmark
FundBenchmark
Price of Gold Price of Gold1 Year -10.20% -9.95% 8,980 9,0053 Years 15.19% 15.87% 15,290 15,5645 Years 7.50% 8.29% 14,356 14,8967 Years 6.79% 7.66% 15,849 16,78410 Years 4.80% 5.70% 15,985 17,419Since Inception 8.44% 9.39% 25,343 28,013Invesco India Gold Fund @
PeriodReturns % (CAGR) Value of ` 10,000 invested
FundBenchmark
FundBenchmark
Price of Gold Price of Gold1 Year -9.42% -9.95% 9,058 9,0053 Years 14.50% 15.87% 15,016 15,5645 Years 7.71% 8.29% 14,500 14,8967 Years 6.49% 7.66% 15,547 16,784Since Inception 3.66% 4.96% 14,198 16,032Invesco India Overnight Fund
Period
Returns % (CAGR) Value of ` 10,000 invested
FundBenchmark Additional Benchmark
FundBenchmark Additional Benchmark
CRISIL Overnight Index CRISIL 1 Yr T Bill Index CRISIL Overnight Index CRISIL 1 Yr T Bill Index1 Year 3.02% 3.19% 3.92% 10,302 10,319 10,392Since Inception 3.19% 3.33% 5.08% 10,530 10,554 10,849
Past performance may or may not be sustained in future. Returns are of existing plans (non–direct plans) - Growth Option. Different plans have different expense structure. Invesco India Gold Exchange Traded Fund and Invesco India Gold Fund - managing since January 4, 2020. Invesco India Overnight Fund - managing since 08 January, 2020.
Fund Managers : Krishna Cheemalapati & Vikas Garg
Invesco India Liquid Fund
Period
Returns % (CAGR) Value of ` 10,000 invested
Fund Fund - RegularBenchmark Additional
Benchmark Fund Fund - RegularBenchmark Additional
BenchmarkCRISIL Liquid
Fund Index CRISIL 1 Yr T Bill Index
CRISIL Liquid Fund Index
CRISIL 1 Yr T Bill Index
1 Year 3.20% 2.66% 3.64% 3.92% 10,320 10,266 10,364 10,3923 Years 5.07% 4.52% 5.48% 6.35% 11,601 11,418 11,738 12,0295 Years 5.81% 5.22% 6.06% 6.21% 13,262 12,900 13,425 13,5157 Years 6.53% 5.85% 6.67% 6.75% 15,573 14,892 15,718 15,79810 Years 7.38% 6.52% 7.33% 6.91% 20,404 18,815 20,294 19,523Since Inception 7.33% 6.60% 7.12% 6.31% 28,485 25,742 27,651 24,738
Invesco India Ultra Short Term Fund
Period
Returns % (CAGR) Value of ` 10,000 invested
FundBenchmark Additional Benchmark
FundBenchmark Additional Benchmark
CRISIL Ultra Short Term Debt Index
CRISIL 1 Yr T-Bill Index
CRISIL Ultra Short Term Debt Index
CRISIL 1 Yr T-Bill Index
1 Year 3.28% 4.45% 3.92% 10,328 10,445 10,3923 Years 5.81% 6.57% 6.35% 11,847 12,105 12,0295 Years 6.38% 6.81% 6.21% 13,628 13,903 13,5157 Years 7.23% 7.31% 6.75% 16,311 16,403 15,80810 Years 7.44% 7.96% 6.91% 20,520 21,533 19,523Since Inception 7.48% 8.04% 6.85% 21,596 22,838 20,295Past performance may or may not be sustained in future. Returns are of existing plans (non–direct plans) - Growth Option. Different plans have different expense structure. Fund Managers : Invesco India Liquid Fund - Krishna Cheemalapati - managing since April 25, 2011 and Vikas Garg - managing since July 27, 2021. Invesco India Ultra Short Term Fund - Krishna Cheemalapati - managing since January 4, 2020 and Vikas Garg - managing since July 27, 2021.

43 of 49
Fund Managers : Taher Badshah & Pranav GokhaleInvesco India Growth Opportunities Fund
Period
Returns % (CAGR) Value of ` 10,000 invested
FundBenchmark Additional Benchmark
FundBenchmark Additional Benchmark
S&P BSE 250 Large MidCap 65:35 TRI NIFTY 50 TRI S&P BSE 250 Large
MidCap 65:35 TRI NIFTY 50 TRI
1 Year 51.67% 59.71% 52.24% 15,167 15,971 15,2243 Years 13.99% 15.42% 14.94% 14,816 15,380 15,1925 Years 16.59% 16.30% 15.70% 21,553 21,288 20,7387 Years 16.22% 15.18% 12.92% 28,695 26,948 23,454Since Inception 17.96% 16.15% 14.38% 41,853 36,608 32,056Invesco India Smallcap Fund
Period
Returns % (CAGR) Value of ` 10,000 invested
FundBenchmark Additional Benchmark
FundBenchmark Additional Benchmark
S&P BSE 250 Smallcap TRI NIFTY 50 TRI S&P BSE 250
Smallcap TRI NIFTY 50 TRI
1 Year 84.55% 82.89% 52.24% 18,455 18,289 15,224Since Inception 29.92% 22.76% 21.48% 21,020 17,896 17,373Past performance may or may not be sustained in future. Returns are of Direct plans - Growth Option. Different plans have different expense structure. Fund Managers: Invesco India Growth Opportunities Fund - Taher Badshah managing since January 13, 2017 and Pranav Gokhale managing since May 19, 2020; Invesco India Smallcap Fund - Taher Badshah managing since October 30, 2018 and Pranav Gokhale managing since March 1, 2019. Benchmark Returns are calculated using Total Return variant of respective Benchmark Index.
Fund Managers : Pranav Gokhale & Taher BadshahInvesco India Dynamic Equity Fund
Period
Returns % (CAGR) Value of ` 10,000 invested
FundBenchmark Additional Benchmark
FundBenchmark Additional Benchmark
CRISIL Hybrid 35+65 - Aggressive Index NIFTY 50 TRI CRISIL Hybrid 35+65 -
Aggressive Index NIFTY 50 TRI
1 Year 25.52% 36.26% 52.24% 12,552 13,626 15,2243 Years 9.04% 13.99% 14.94% 12,967 14,816 15,1925 Years 10.73% 13.57% 15.70% 16,651 18,898 20,7387 Years 11.22% 12.68% 12.92% 21,083 23,095 23,454Since Inception 13.51% 13.26% 14.38% 30,007 29,428 32,056Past performance may or may not be sustained in future. Returns are of Direct plans - Growth Option. Different plans have different expense structure. Fund Managers: Pranav Gokhale managing since June 1, 2018 and Taher Badshah managing since January 12, 2017. Benchmark Returns are calculated using Total Return variant of respective Benchmark Index.
Fund Managers : Pranav Gokhale & Amit NigamInvesco India Multicap Fund
PeriodReturns % (CAGR) Value of ` 10,000 invested
FundBenchmark Additional Benchmark
FundBenchmark Additional Benchmark
Nifty 500 Multicap 50:25:25 NIFTY 50 TRI Nifty 500 Multicap 50:25:25 NIFTY 50 TRI1 Year 67.11% 64.92% 52.24% 16,711 16,492 15,2243 Years 15.21% 14.92% 14.94% 15,296 15,183 15,1925 Years 16.36% 15.62% 15.70% 21,340 20,668 20,7387 Years 16.87% 14.63% 12.92% 29,836 26,054 23,454Since Inception 20.16% 16.15% 14.38% 49,129 36,618 32,056Past performance may or may not be sustained in future. Returns are of Direct plans - Growth Option. Different plans have different expense structure. Fund Managers: Pranav Gokhale managing since March 29, 2018 and Amit Nigam managing since September 3, 2020. Benchmark Returns are calculated using Total Return variant of respective Benchmark Index.
Fund Managers : Taher Badshah & Dhimant KothariInvesco India Contra Fund
PeriodReturns % (CAGR) Value of ` 10,000 invested
Fund
Benchmark Additional Benchmark Fund
Benchmark Additional BenchmarkS&P BSE 500 TRI NIFTY 50 TRI S&P BSE 500 TRI NIFTY 50 TRI
1 Year 52.92% 57.38% 52.24% 15,292 15,738 15,2243 Years 15.46% 14.88% 14.94% 15,399 15,165 15,1925 Years 18.27% 15.77% 15.70% 23,156 20,805 20,7387 Years 17.74% 13.97% 12.92% 31,445 25,026 23,454Since Inception 19.82% 15.15% 14.38% 47,941 33,971 32,056Past performance may or may not be sustained in future. Returns are of Direct plans - Growth Option. Different plans have different expense structure. Fund Managers: Taher Badshah managing since January 13, 2017 and Dhimant Kothari managing since May 19, 2020. Benchmark Returns are calculated using Total Return variant of respective Benchmark Index.
Fund Manager : Amit Nigam & Dhimant KothariInvesco India Tax Plan
PeriodReturns % (CAGR) Value of ` 10,000 invested
Fund Benchmark Additional Benchmark Fund Benchmark Additional BenchmarkS&P BSE 200 TRI NIFTY 50 TRI S&P BSE 200 TRI NIFTY 50 TRI
1 Year 54.08% 55.45% 52.24% 15,408 15,545 15,2243 Years 15.52% 14.96% 14.94% 15,424 15,198 15,1925 Years 16.90% 15.82% 15.70% 21,837 20,852 20,7387 Years 16.78% 13.93% 12.92% 29,674 24,953 23,454Since Inception 19.15% 15.14% 14.38% 45,653 33,937 32,056Past performance may or may not be sustained in future. Returns are of Direct plans - Growth Option. Different plans have different expense structure. Fund Managers: Amit Nigam managing since September 3, 2020 and Dhimant Kothari managing since March 29, 2018. Benchmark Returns are calculated using Total Return variant of respective Benchmark Index.
Lumpsum Performance - Direct Plan(As on 31st August, 2021)

44 of 49
Fund Managers : Dhimant Kothari & Hiten JainInvesco India Financial Services Fund
PeriodReturns % (CAGR) Value of ` 10,000 invested
Fund Benchmark Additional Benchmark Fund Benchmark Additional BenchmarkNifty Financial Services TRI NIFTY 50 TRI Nifty Financial Services TRI NIFTY 50 TRI
1 Year 55.87% 59.45% 52.24% 15,587 15,945 15,2243 Years 13.75% 16.04% 14.94% 14,724 15,632 15,1925 Years 16.67% 17.95% 15.70% 21,622 22,844 20,7387 Years 17.44% 16.58% 12.92% 30,879 29,319 23,454Since Inception 16.32% 16.51% 14.38% 37,078 37,604 32,056Past performance may or may not be sustained in future. Returns are of Direct plans - Growth Option. Different plans have different expense structure. Fund Managers: Dhimant Kothari managing since June 1, 2018 and Hiten Jain managing since May 19, 2020. Benchmark Returns are calculated using Total Return variant of respective Benchmark Index.
Fund Managers : Nitin Gosar & Dhimant KothariInvesco India PSU Equity Fund
PeriodReturns % (CAGR) Value of ` 10,000 invested
FundBenchmark Additional Benchmark
FundBenchmark Additional Benchmark
S&P BSE PSU TRI NIFTY 50 TRI S&P BSE PSU TRI NIFTY 50 TRI 1 Year 43.20% 56.32% 52.24% 14,320 15,632 15,2243 Years 14.41% 3.04% 14.94% 14,982 10,941 15,1925 Years 11.62% 4.04% 15.70% 17,332 12,193 20,7387 Years 12.78% 2.66% 12.92% 23,239 12,023 23,454Since Inception 12.60% 3.58% 14.38% 27,973 13,569 32,056Past performance may or may not be sustained in future. Returns are of Direct plans - Growth Option. Different plans have different expense structure. Fund Managers : Nitin Gosar managing since June 1, 2018 and Dhimant Kothari managing the scheme since May 19, 2020. Benchmark Returns are calculated using Total Return variant of respective Benchmark Index.
Fund Managers : Amit Nigam & Nitin GosarInvesco India Largecap Fund
PeriodReturns % (CAGR) Value of ` 10,000 invested
FundBenchmark Additional Benchmark
FundBenchmark Additional Benchmark
NIFTY 50 TRI S&P BSE Sensex TRI NIFTY 50 TRI S&P BSE Sensex TRI1 Year 52.07% 52.24% 50.55% 15,207 15,224 15,0553 Years 15.31% 14.94% 15.49% 15,340 15,192 15,4125 Years 15.14% 15.70% 16.48% 20,247 20,738 21,4517 Years 14.97% 12.92% 13.00% 26,598 23,454 23,572Since Inception 16.57% 14.38% 14.77% 37,773 32,056 33,016Past performance may or may not be sustained in future. Returns are of Direct plans - Growth Option. Different plans have different expense structure. Fund Managers: Amit Nigam managing since September 3, 2020 and Nitin Gosar managing since March 29, 2018. Benchmark Returns are calculated using Total Return variant of respective Benchmark Index.
Fund Manager : Amit Nigam & Neelesh DhamnaskarInvesco India Infrastructure Fund
PeriodReturns % (CAGR) Value of ` 10,000 invested
FundBenchmark Additional Benchmark
FundBenchmark Additional Benchmark
S&P BSE India Infrastructure TRI NIFTY 50 TRI S&P BSE India Infrastructure TRI NIFTY 50 TRI 1 Year 67.02% 76.54% 52.24% 16,702 17,654 15,2243 Years 20.17% 8.77% 14.94% 17,361 12,872 15,1925 Years 17.78% 9.17% 15.70% 22,679 15,510 20,7387 Years 15.55% 8.02% 12.92% 27,563 17,183 23,454Since Inception 18.31% 10.79% 14.38% 42,939 24,312 32,056Past performance may or may not be sustained in future. Returns are of Direct plans - Growth Option. Different plans have different expense structure. Fund Manager : Amit Nigam managing since September 3, 2020 and Neelesh Dhamnaskar managing since June 1, 2018. Benchmark Returns are calculated using Total Return variant of respective Benchmark Index.
Fund Manager : Pranav Gokhale & Neelesh DhamnaskarInvesco India Midcap Fund
PeriodReturns % (CAGR) Value of ` 10,000 invested
FundBenchmark Additional Benchmark
FundBenchmark Additional Benchmark
Nifty Midcap 100 TRI NIFTY 50 TRI Nifty Midcap 100 TRI NIFTY 50 TRI 1 Year 60.11% 71.83% 52.24% 16,011 17,183 15,2243 Years 18.01% 13.60% 14.94% 16,442 14,664 15,1925 Years 18.45% 14.23% 15.70% 23,326 19,453 20,7387 Years 18.50% 15.50% 12.92% 32,884 27,476 23,454Since Inception 21.21% 16.08% 14.38% 52,969 36,416 32,056Past performance may or may not be sustained in future. Returns are of Direct plans - Growth Option. Different plans have different expense structure. Fund Manager : Pranav Gokhale managing since March 29, 2018 and Neelesh Dhamnaskar managing since July 18, 2018. Benchmark Returns are calculated using Total Return variant of respective Benchmark Index.
Lumpsum Performance - Direct Plan(As on 31st August, 2021)

45 of 49
Fund Manager : Rajeev BhardwajInvesco India Arbitrage Fund1
PeriodReturns % (CAGR) Value of ` 10,000 invested
Fund Benchmark Additional Benchmark Fund Benchmark Additional BenchmarkNifty 50 Arbitrage CRISIL 1 Yr T Bill Index Nifty 50 Arbitrage CRISIL 1 Yr T Bill Index
1 Year 4.45% 4.18% 3.92% 10,445 10,418 10,3923 Years 5.62% 4.68% 6.35% 11,785 11,472 12,0295 Years 5.94% 4.65% 6.21% 13,347 12,554 13,5157 Years 6.46% 5.41% 6.75% 15,513 14,470 15,808Since Inception 6.94% 6.00% 6.76% 17,889 16,572 17,629Past performance may or may not be sustained in future. Returns are of Direct plans - Growth Option. Different plans have different expense structure. Managing since May 19, 2020. Benchmark Returns are calculated using Total Return variant of respective Benchmark Index, wherever applicable. 1Please refer Notes on Page no. 42.
Fund Manager : Neelesh DhamnaskarInvesco India Feeder - Invesco Pan European Equity Fund@
PeriodReturns % (CAGR) Value of ` 10,000 invested
Fund Benchmark Additional Benchmark Fund Benchmark Additional BenchmarkMSCI Europe - ND Nifty 50 TRI MSCI Europe - ND Nifty 50 TRI
1 Year 32.06% 29.37% 52.24% 13,206 12,937 15,2243 Years 5.44% 10.80% 14.94% 11,723 13,605 15,1925 Years 9.44% 12.09% 15.70% 15,702 17,698 20,7387 Years 5.33% 8.21% 12.92% 14,394 17,393 23,454Since Inception 4.89% 7.83% 16.05% 14,369 17,713 30,926Invesco India Feeder - Invesco Global Equity Income Fund@
Period
Returns % (CAGR) Value of ` 10,000 invested
FundBenchmark Additional Benchmark
FundBenchmark Additional Benchmark
MSCI World Index - Net Dividend Nifty 50 TRI MSCI World Index -
Net Dividend Nifty 50 TRI1 Year 31.85% 29.32% 52.24% 13,185 12,932 15,2243 Years 10.10% 16.03% 14.94% 13,349 15,626 15,1925 Years 11.50% 16.82% 15.70% 17,242 21,769 20,7387 Years 9.14% 13.76% 12.92% 18,470 24,701 23,454Since Inception 8.99% 13.81% 15.13% 18,794 25,804 28,081Past performance may or may not be sustained in future. Returns are of Direct plans - Growth Option. Different plans have different expense structure. Invesco India Feeder - Invesco Pan European Equity Fund - managing since January 31, 2014; Invesco India Feeder - Invesco Global Equity Income Fund - managing since May 5, 2014.@Fund of Funds Schemes - The investor will bear the recurring expenses of the scheme, in addition to the expenses of underlying scheme.
Fund Managers : Neelesh Dhamnaskar (For Equity) & Krishna Cheemalapati (For Debt)Invesco India - Invesco Global Consumer Trends Fund of Fund@
Period
Returns % Value of ` 10,000 invested
FundBenchmark Addl. Benchmark
Fund Benchmark Addl. Benchmark
MSCI World Consumer Discretionary Index ND Nifty 50 TRI MSCI World Consumer
Discretionary Index ND Nifty 50 TRI
6 Months -8.89% 19.57% 36.89% 9,547 10,997 11,880
Past performance may or may not be sustained in future. Returns are of Regular plan (non–direct plan) - Growth Option. Different plans have different expense structure. Managing since December 24, 2020. @Fund of Funds Schemes - The investor will bear the recurring expenses of the scheme, in addition to the expenses of underlying scheme.
Fund Managers : Taher Badshah, Pranav Gokhale (For Equity) & Krishna Cheemalapati (For Debt)Invesco India Equity & Bond Fund
Period
Returns % (CAGR) Value of ` 10,000 invested
FundBenchmark Additional Benchmark
FundBenchmark Additional Benchmark
CRISIL Hybrid 35 + 65 - Aggressive Index Nifty 50 TRI CRISIL Hybrid 35 + 65
- Aggressive Index Nifty 50 TRI
1 Year 36.31% 36.26% 52.24% 13,631 13,626 15,2243 Years 11.68% 13.99% 14.94% 13,935 14,816 15,192Since Inception 13.36% 15.54% 17.37% 14,888 15,813 16,623Past performance may or may not be sustained in future. Returns are of direct plan - Growth Option. Different plans have different expense structure. Fund Manager - Taher Badshah - since June 30, 2018, Pranav Gokhale - since May 19, 2020 & Krishna Cheemalapati - since June 30, 2018.
Fund Manager : Taher Badshah & Nitin GosarInvesco India Focused 20 Equity Fund
PeriodReturns % (CAGR) Value of ` 10,000 invested
Fund Benchmark Additional Benchmark Fund Benchmark Additional BenchmarkS&P BSE 500 TRI Nifty 50 TRI S&P BSE 500 TRI Nifty 50 TRI
6 Months 43.98% 40.06% 36.89% 12,241 12,041 11,880
Past performance may or may not be sustained in future. Returns are of direct plan - Growth Option. Different plans have different expense structure. Fund Managers managing the scheme - Taher Badshah - since September 29, 2020 & Nitin Gosar - since August 26, 2021.
Fund Managers : Amit Nigam & Dhimant Kothari (For Equity) & Krishna Cheemalapati (For Debt)Invesco India Equity Savings Fund
PeriodReturns % (CAGR) Value of ` 10,000 invested
Fund Benchmark Additional Benchmark Fund Benchmark Additional BenchmarkNifty Equity Savings Index CRISIL 10 Yr Gilt Index Nifty Equity Savings Index CRISIL 10 Yr Gilt Index
1 Year 16.56% 20.27% 4.68% 11,656 12,027 10,468Since Inception 11.04% 12.15% 8.27% 12,976 13,301 12,186Past performance may or may not be sustained in future. Returns are of direct plan - Growth Option. Different plans have different expense structure. Fund Manager - Amit Nigam - managing since September 3, 2020, Dhimant Kothari - managing since May 19, 2020 & Krishna Cheemalapati - since March 7, 2019.
Lumpsum Performance - Direct Plan(As on 31st August, 2021)

46 of 49
Fund Manager : Vikas Garg & Krishna CheemalapatiInvesco India Short Term Fund
Period
Returns % (CAGR) Value of ` 10,000 invested
FundBenchmark Additional Benchmark
FundBenchmark Additional Benchmark
CRISIL Short Term Bond Fund Index CRISIL 10 Yr Gilt Index CRISIL Short Term
Bond Fund Index CRISIL 10 Yr Gilt Index
1 Year 5.49% 6.02% 4.68% 10,549 10,602 10,4683 Years 8.61% 8.74% 9.10% 12,816 12,862 12,9875 Years 7.65% 7.79% 6.42% 14,459 14,556 13,6527 Years 8.28% 8.30% 8.01% 17,472 17,494 17,167Since Inception 8.26% 8.42% 7.03% 19,896 20,160 18,028Invesco India Corporate Bond Fund
Period
Returns % (CAGR) Value of ` 10,000 invested
FundBenchmark Additional Benchmark
FundBenchmark Additional Benchmark
CRISIL AAA Short Term Bond Index CRISIL 10 Yr Gilt Index CRISIL AAA Short
Term Bond Index CRISIL 10 Yr Gilt Index
1 Year 5.58% 5.95% 4.68% 10,558 10,595 10,4683 Years 9.21% 8.95% 9.10% 13,029 12,936 12,9875 Years 7.15% 8.15% 6.42% 14,127 14,801 13,6527 Years 8.30% 8.48% 8.01% 17,491 17,702 17,167Since Inception 8.00% 8.58% 7.03% 19,492 20,417 18,028Invesco India Banking & PSU Debt Fund
Period
Returns % (CAGR) Value of ` 10,000 invested
FundBenchmark Additional Benchmark
FundBenchmark Additional Benchmark
CRISIL Banking and PSU Debt Index CRISIL 10 Yr Gilt Index CRISIL Banking and
PSU Debt Index CRISIL 10 Yr Gilt Index1 Year 5.02% 5.65% 4.68% 10,502 10,565 10,4683 Years 8.32% 8.82% 9.10% 12,711 12,889 12,9875 Years 7.58% 8.05% 6.42% 14,411 14,733 13,6527 Years 7.76% 8.75% 8.01% 16,886 18,011 17,167Since Inception 7.92% 8.71% 7.03% 19,362 20,618 18,028Invesco India Credit Risk Fund
Period
Returns % (CAGR) Value of ` 10,000 invested
FundBenchmark Additional Benchmark
FundBenchmark Additional Benchmark
CRISIL Composite AA Short Term Bond Index CRISIL 10 Yr Gilt Index CRISIL Composite AA
Short Term Bond Index CRISIL 10 Yr Gilt Index1 Year 5.14% 8.23% 4.68% 10,514 10,823 10,4683 Years 2.91% 9.39% 9.10% 10,899 13,091 12,9875 Years 4.89% 8.76% 6.42% 12,695 15,218 13,652Since Inception 6.64% 9.12% 7.97% 15,677 18,409 17,102
Invesco India Gilt Fund
PeriodReturns % (CAGR) Value of ` 10,000 invested
Fund Benchmark Fund BenchmarkCRISIL 10 year Gilt Index CRISIL 10 year Gilt Index
1 Year 3.10% 4.68% 10,310 10,4683 Years 8.56% 9.10% 12,796 12,9875 Years 6.78% 6.42% 13,885 13,6527 Years 8.51% 8.01% 17,731 17,167Since Inception 8.01% 7.03% 19,507 18,028Past performance may or may not be sustained in future. Returns are of Direct plans - Growth Option. Different plans have different expense structure. Fund Managers : Invesco India Short Term Fund, Invesco India Corporate Bond Fund, Invesco India Banking & PSU Debt Fund, Invesco India Credit Risk Fund - Vikas Garg managing since September 26, 2020 and Krishna Cheemalapati managing since December 16, 2020. Invesco India Gilt Fund - Vikas Garg managing since September 26, 2020 and Krishna Cheemalapati managing since July 27, 2021.
Fund Managers : Krishna Cheemalapati & Vikas GargInvesco India Money Market Fund
Period
Returns % (CAGR) Value of ` 10,000 invested
FundBenchmark Additional Benchmark
FundBenchmark Additional Benchmark
CRISIL Money Market Index CRISIL 1 Yr T-Bill Index
CRISIL Money Market Index CRISIL 1 Yr T-Bill Index
1 Year 4.06% 4.22% 3.92% 10,406 10,422 10,3923 Years 6.26% 6.22% 6.35% 12,000 11,986 12,0295 Years 6.64% 6.55% 6.21% 13,793 13,738 13,5157 Years 7.28% 7.09% 6.75% 16,375 16,163 15,808Since Inception 7.77% 7.46% 6.76% 19,137 18,657 17,629Invesco India Treasury Advantage Fund
Period
Returns % (CAGR) Value of ` 10,000 invested
FundBenchmark Additional Benchmark
FundBenchmark Additional Benchmark
CRISIL Low Duration Debt Index CRISIL 1 Yr T-Bill Index CRISIL Low Duration
Debt Index CRISIL 1 Yr T-Bill Index
1 Year 4.50% 4.92% 3.92% 10,450 10,492 10,3923 Years 7.40% 7.29% 6.35% 12,392 12,353 12,0295 Years 7.27% 7.27% 6.21% 14,205 14,207 13,5157 Years 7.75% 7.83% 6.75% 16,885 16,965 15,808Since Inception 8.05% 8.12% 6.76% 19,568 19,668 17,629Past performance may or may not be sustained in future. Returns are of Direct plans - Growth Option. Different plans have different expense structure. Fund Managers : Invesco India Money Market Fund - Krishna Cheemalapati managing since January 4, 2020 and Vikas Garg managing since December 16, 2020. Invesco India Treasury Advantage Fund - Vikas Garg managing since December 16, 2020.
Lumpsum Performance - Direct Plan(As on 31st August, 2021)

47 of 49
Fund Managers : Krishna CheemalapatiInvesco India Gold Fund @
PeriodReturns % (CAGR) Value of ` 10,000 invested
Fund
Benchmark Fund
BenchmarkPrice of Gold Price of Gold
1 Year -9.10% -9.95% 9,090 9,0053 Years 14.92% 15.87% 15,183 15,5645 Years 8.07% 8.29% 14,741 14,8967 Years 6.82% 7.66% 15,887 16,784Since Inception 3.84% 5.00% 13,863 15,265Invesco India Overnight Fund
PeriodReturns % (CAGR) Value of ` 10,000 invested
FundBenchmark Additional Benchmark
FundBenchmark Additional Benchmark
CRISIL Overnight Index CRISIL 1 Yr T Bill Index CRISIL Overnight Index CRISIL 1 Yr T Bill Index1 Year 3.09% 3.19% 3.92% 10,309 10,319 10,392Since Inception 3.25% 3.33% 5.08% 10,541 10,554 10,849
Past performance may or may not be sustained in future. Returns are of Direct plans - Growth Option. Different plans have different expense structure. @Fund of Funds Schemes - The investor will bear the recurring expenses of the scheme, in addition to the expenses of underlying scheme. Invesco India Gold Fund - managing since January 4, 2020 and Invesco India Overnight Fund - managing since 08 January, 2020.
Fund Managers : Krishna Cheemalapati & Vikas GargInvesco India Liquid Fund
Period
Returns % (CAGR) Value of ` 10,000 invested
FundBenchmark Additional Benchmark
FundBenchmark Additional Benchmark
CRISIL Liquid Fund Index CRISIL 1 Yr T Bill Index CRISIL Liquid Fund
Index CRISIL 1 Yr T Bill Index
1 Year 3.27% 3.64% 3.92% 10,327 10,364 10,3923 Years 5.14% 5.48% 6.35% 11,625 11,738 12,0295 Years 5.88% 6.06% 6.21% 13,309 13,425 13,5157 Years 6.60% 6.67% 6.75% 15,650 15,718 15,798Since Inception 7.11% 7.15% 6.76% 18,141 18,191 17,629Invesco India Ultra Short Term Fund
Period
Returns % (CAGR) Value of ` 10,000 invested
FundBenchmark Additional Benchmark
FundBenchmark Additional Benchmark
CRISIL Ultra Short Term Debt Index CRISIL 1 Yr T-Bill Index CRISIL Ultra Short
Term Debt Index CRISIL 1 Yr T-Bill Index
1 Year 3.95% 4.45% 3.92% 10,395 10,445 10,3923 Years 6.42% 6.57% 6.35% 12,054 12,105 12,0295 Years 6.94% 6.81% 6.21% 13,987 13,903 13,5157 Years 7.75% 7.31% 6.75% 16,880 16,403 15,808Since Inception 7.79% 7.69% 6.76% 19,163 19,002 17,629Past performance may or may not be sustained in future. Returns are of Direct plans - Growth Option. Different plans have different expense structure. Fund Manager : Invesco India Liquid Fund - Vikas Garg - managing since July 27, 2021 and Invesco India Ultra Short Term Fund - Krishna Cheemalapati - managing since January 4, 2020 and Vikas Garg - managing since July 27, 2021.
Lumpsum Performance - Direct Plan(As on 31st August, 2021)
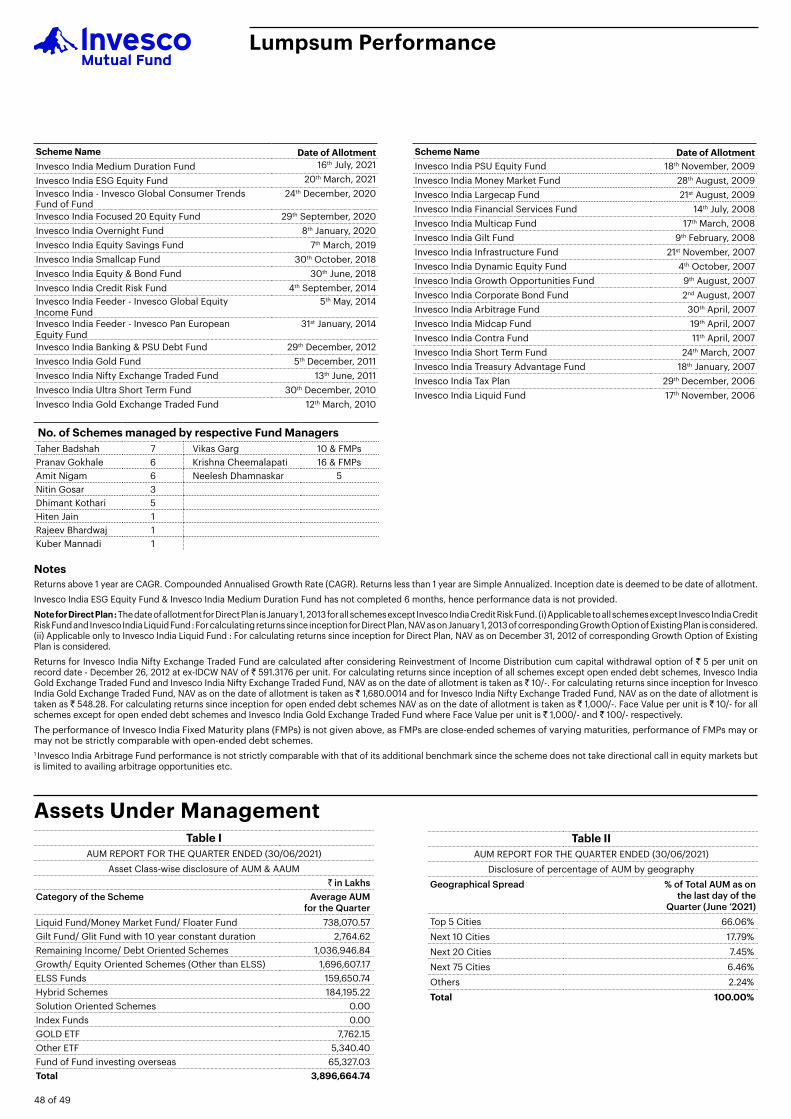
48 of 49
No. of Schemes managed by respective Fund ManagersTaher Badshah 7 Vikas Garg 10 & FMPsPranav Gokhale 6 Krishna Cheemalapati 16 & FMPsAmit Nigam 6 Neelesh Dhamnaskar 5Nitin Gosar 3Dhimant Kothari 5Hiten Jain 1Rajeev Bhardwaj 1Kuber Mannadi 1
NotesReturns above 1 year are CAGR. Compounded Annualised Growth Rate (CAGR). Returns less than 1 year are Simple Annualized. Inception date is deemed to be date of allotment.Invesco India ESG Equity Fund & Invesco India Medium Duration Fund has not completed 6 months, hence performance data is not provided.Note for Direct Plan : The date of allotment for Direct Plan is January 1, 2013 for all schemes except Invesco India Credit Risk Fund. (i) Applicable to all schemes except Invesco India Credit Risk Fund and Invesco India Liquid Fund : For calculating returns since inception for Direct Plan, NAV as on January 1, 2013 of corresponding Growth Option of Existing Plan is considered. (ii) Applicable only to Invesco India Liquid Fund : For calculating returns since inception for Direct Plan, NAV as on December 31, 2012 of corresponding Growth Option of Existing Plan is considered.Returns for Invesco India Nifty Exchange Traded Fund are calculated after considering Reinvestment of Income Distribution cum capital withdrawal option of ` 5 per unit on record date - December 26, 2012 at ex-IDCW NAV of ` 591.3176 per unit. For calculating returns since inception of all schemes except open ended debt schemes, Invesco India Gold Exchange Traded Fund and Invesco India Nifty Exchange Traded Fund, NAV as on the date of allotment is taken as ` 10/-. For calculating returns since inception for Invesco India Gold Exchange Traded Fund, NAV as on the date of allotment is taken as ` 1,680.0014 and for Invesco India Nifty Exchange Traded Fund, NAV as on the date of allotment is taken as ` 548.28. For calculating returns since inception for open ended debt schemes NAV as on the date of allotment is taken as ` 1,000/-. Face Value per unit is ` 10/- for all schemes except for open ended debt schemes and Invesco India Gold Exchange Traded Fund where Face Value per unit is ` 1,000/- and ` 100/- respectively.The performance of Invesco India Fixed Maturity plans (FMPs) is not given above, as FMPs are close-ended schemes of varying maturities, performance of FMPs may or may not be strictly comparable with open-ended debt schemes.1 Invesco India Arbitrage Fund performance is not strictly comparable with that of its additional benchmark since the scheme does not take directional call in equity markets but is limited to availing arbitrage opportunities etc.
Scheme Name Date of AllotmentInvesco India Medium Duration Fund 16th July, 2021
Invesco India ESG Equity Fund 20th March, 2021Invesco India - Invesco Global Consumer Trends Fund of Fund
24th December, 2020
Invesco India Focused 20 Equity Fund 29th September, 2020Invesco India Overnight Fund 8th January, 2020Invesco India Equity Savings Fund 7th March, 2019Invesco India Smallcap Fund 30th October, 2018Invesco India Equity & Bond Fund 30th June, 2018Invesco India Credit Risk Fund 4th September, 2014Invesco India Feeder - Invesco Global Equity Income Fund
5th May, 2014
Invesco India Feeder - Invesco Pan European Equity Fund
31st January, 2014
Invesco India Banking & PSU Debt Fund 29th December, 2012Invesco India Gold Fund 5th December, 2011Invesco India Nifty Exchange Traded Fund 13th June, 2011Invesco India Ultra Short Term Fund 30th December, 2010Invesco India Gold Exchange Traded Fund 12th March, 2010
Scheme Name Date of AllotmentInvesco India PSU Equity Fund 18th November, 2009Invesco India Money Market Fund 28th August, 2009Invesco India Largecap Fund 21st August, 2009Invesco India Financial Services Fund 14th July, 2008Invesco India Multicap Fund 17th March, 2008Invesco India Gilt Fund 9th February, 2008Invesco India Infrastructure Fund 21st November, 2007Invesco India Dynamic Equity Fund 4th October, 2007Invesco India Growth Opportunities Fund 9th August, 2007Invesco India Corporate Bond Fund 2nd August, 2007Invesco India Arbitrage Fund 30th April, 2007Invesco India Midcap Fund 19th April, 2007Invesco India Contra Fund 11th April, 2007Invesco India Short Term Fund 24th March, 2007Invesco India Treasury Advantage Fund 18th January, 2007Invesco India Tax Plan 29th December, 2006Invesco India Liquid Fund 17th November, 2006
Lumpsum Performance
Table IAUM REPORT FOR THE QUARTER ENDED (30/06/2021)
Asset Class-wise disclosure of AUM & AAUM` in Lakhs
Category of the Scheme Average AUM for the Quarter
Liquid Fund/Money Market Fund/ Floater Fund 738,070.57Gilt Fund/ Glit Fund with 10 year constant duration 2,764.62Remaining Income/ Debt Oriented Schemes 1,036,946.84Growth/ Equity Oriented Schemes (Other than ELSS) 1,696,607.17ELSS Funds 159,650.74Hybrid Schemes 184,195.22Solution Oriented Schemes 0.00Index Funds 0.00GOLD ETF 7,762.15Other ETF 5,340.40Fund of Fund investing overseas 65,327.03Total 3,896,664.74
Table IIAUM REPORT FOR THE QUARTER ENDED (30/06/2021)
Disclosure of percentage of AUM by geographyGeographical Spread % of Total AUM as on
the last day of the Quarter (June ‘2021)
Top 5 Cities 66.06%Next 10 Cities 17.79%Next 20 Cities 7.45%Next 75 Cities 6.46%Others 2.24%Total 100.00%
Assets Under Management

49 of 49
The upfront commission, if any, on investment made by the investor shall be paid by the investor directly to the Distributor, based on his assessment of various factors including the service rendered by the Distributor.1Exit load charged, if any, will be credited back to the scheme, net of goods & services tax.2Includes goods & services tax on management fee accrued and additional TER charged on account of inflows from beyond top 30 cities, wherever applicable.2aExcluding total recurring expense charged by the Underlying Fund.4YTM : Yield to maturity should not be construed as minimum return offered by Scheme.Note on Direct Plan : Pursuant to provisions of SEBI Circular No. CIR/IMD/DF/21/2012 dated September 13, 2012, a separate plan for direct investments (i.e. investments not routed through Distributor) under all Schemes of Invesco Mutual Fund (except Exchange Traded Funds) was introduced with effect from January 1, 2013. Direct Plan under Invesco India Feeder - Invesco Pan European Equity Fund, Invesco India Feeder - Invesco Global Equity Income Fund and Invesco India Credit Risk Fund is available since inception. Direct Plan will have a lower expense ratio excluding distribution expenses, commission for distribution of Units etc.Note on Exit Load Structure for Switch to & from Direct Plan within the Scheme : There will be no exit load for switch between the plans under the scheme i.e. Regular Plan / Existing Plan to Direct Plan and vice versa. (w.e.f March 9, 2020). Applicable to all Schemes, except Invesco India Tax Plan, Invesco India Gold ETF, Invesco India Nifty ETF and Invesco India Overnight Fund.Note Applicable to IDCW Distribution : The IDCW distribution table includes details of past 3 IDCWs declared and does not include details of all the IDCWs declared in the scheme(s) since inception, wherever applicable.Disclaimer of NSE Indices Limited : The “Product” offered by “the issuer” is not sponsored, endorsed, sold or promoted by NSE Indices Limited. NSE Indices Limited does not make any representation or warranty, express or implied (including warranties of merchantability or fitness for particular purpose or use) and disclaims all liability to the owners of “the Product” or any member of the public regarding the advisability of investing in securities generally or in the “the Product” linked to Nifty 50 / Nifty 50 Arbitrage / Nifty Financial Services / Nifty Midcap 100 / Nifty Equity Savings or particularly in the ability of the Nifty 50 / Nifty 50 Arbitrage / Nifty Financial Services / Nifty Midcap 100 / Nifty Equity Savings to track general stock market performance in
India. Please read the full Disclaimers in relation to the mentioned indices in the Offer Document / Prospectus / Information Statement.Disclaimer of AIPL: The (S&P BSE 200 / S&P BSE 500 / S&P BSE Sensex / S&P BSE PSU / S&P BSE India Infrastructure / S&P BSE 250 Large MidCap 65:35) is a product of AIPL, which is a joint venture of S&P Dow Jones Indices LLC or its affiliates (“SPDJI”) and BSE, and has been licensed for use by Invesco Asset Management (India) Pvt. Ltd. (IAMI), Standard & Poor’s® and S&P® are registered trademarks of Standard & Poor’s Financial Services LLC (“S&P”); BSE® is a registered trademark of BSE Limited (“BSE”); Dow Jones® is a registred trademark of Dow Jones Trademark Holdings LLC (“Dow Jones”); and these trademarks have been licensed for use by AIPL and sublicensed for certain purposes by IAMI. © Asia Index Private Limited 201[x]. All rights reserved. Redistribution, reproduction and/or photocopying in whole or in part are prohibited without written permission of AIPL. For more information on any of AIPL’s indices please visit http://www.asiandex.com/. None of AIPL, BSE, Dow Jones Trademark Holdings LLC, their affiliates nor their third party licensors make any representation or warranty, express or implied, as to the ability of any index to accurately represent the asset class or market sector that it purports to represent and none of AIPL, BSE, S&P Dow Jones Indices LLC, Dow Jones Trademark Holdings LLC or their affiliates nor their third party licensors shall have any liability for any errors, omissions, or interruptions of any index or the data included therein.The information contained herein should not be altered in any way, transmitted to, copied or distributed, in part or in whole, to any other person or to the media or reproduced in any form, without prior written consent of Invesco Asset Management (India) Pvt. Ltd. (IAMI). Any information contained in this publication does not constitute and shall be deemed not to constitute an advice, an offer to sell / purchase or as an invitation or solicitation to do so for any security of any entity, and further IAMI / affiliates / sponsor / trustee (IAMI Group) or their officers, employees, personnel, directors shall not be liable for any loss, damage, liability whatsoever for any direct or indirect loss arising from the use or access of any information that may be displayed in this publication from time to time. Recipients of the information contained herein should exercise due care and caution and read the scheme information documents/statement of additional information (including if necessary, obtaining the advice of tax / legal / accounting / financial / other professionals) prior to taking of any decision, acting or omitting to act, on the basis of the information contained herein.
How to read Fact SheetFund Manager : An employee of the asset management company such as a mutual fund or life insurer, who manages investments of the scheme. He is usually part of a larger team of fund managers and research analysts.Application Amount for Fresh Subscription : This is the minimum investment amount for a new investor in a mutual fund scheme.Minimum Additional Amount : This is the minimum investment amount for an existing investor in a mutual fund scheme.Yield to Maturity : The Yield to Maturity or the YTM is the rate of return anticipated on a bond if held until maturity. YTM is expressed as an annual rate. The YTM factors in the bond’s current market price, par value, coupon interest rate and time to maturity.SIP : SIP or systematic investment plan works on the principle of making periodic investments of a fixed sum. It works similar to a recurring bank deposit. For instance, an investor may opt for an SIP that invests ` 500 every 15th of the month in an equity fund for a period of three years.NAV : The NAV or the net asset value is the total asset value per unit of the mutual fund after deducting all related and permissible expenses. The NAV is calculated at the end of every business day. It is the value at which the investor enters or exits the mutual fund.Benchmark : A group of securities, usually a market index, whose performance is used as a standard or benchmark to measure investment performance of mutual funds, among other investments. Some typical benchmarks include the Nifty, Sensex, BSE 200, BSE 500, 10-Year Gsec.Entry Load : A mutual fund may have a sales charge or load at the time of entry and/or exit to compensate the distributor/agent. Entry load is charged at the time an investor purchases the units of a mutual fund. The entry load is added to the prevailing NAV at the time of investment. For instance, if the NAV is ` 100 and the entry load is 1%, the investor will enter the fund at ` 101.Note : SEBI, vide circular dated June 30, 2009 has abolished entry load and mandated that the upfront commission to distributors will be paid by the investor directly to the distributor, based on his assessment of various factors including the service rendered by the distributor.Exit Load : Exit load is charged at the time an investor redeems the units of a mutual
fund. The exit load is deducted from the prevailing NAV at the time of redemption. The investor will receive redemption proceeds at net value of NAV less exit load. For instance, if the NAV is ` 100 and the exit load is 1%, the investor will receive ` 99.Macaulay Duration : Macaulay duration of a bond is the number of years taken to recover the initial investment of a bond. It is calculated as the weighted average number of years to receive the cash flow wherein the present value of respective cash flows is multiplied with the time to that respective cash flows. The total of such values is divided by the price of the security to arrive at the duration.Modified Duration : Modified duration is the price sensitivity and the percentage change in price for a unit change in yield.Standard Deviation : Standard deviation is a statistical measure of the range of an investment’s performance. When a mutual fund has a high standard deviation, it means its range of performance is wide, implying greater volatility.Sharpe Ratio : The Sharpe Ratio, named after its founder, the Nobel Laureate William Sharpe, is a measure of risk-adjusted returns. It is calculated using standard deviation and excess return to determine reward per unit of risk.Beta : Beta is a measure of an investment’s volatility vis-à-vis the market. Beta of less than 1 means that the security will be less volatile than the market. A beta of greater than 1 implies that the security’s price will be more volatile than the market.AUM : AUM or assets under management refers to the recent / updated cumulative market value of investments managed by a mutual fund or any investment firm.Holdings : The holdings or the portfolio is a mutual fund’s latest or updated reported statement of investments/securities. These are usually displayed in terms of percentage to net assets or the rupee value or both. The objective is to give investors an idea of where their money is being invested by the fund manager.Nature of Scheme : The investment objective and underlying investments determine the nature of the mutual fund scheme. For instance, a mutual fund that aims at generating capital appreciation by investing in stock markets is an equity fund or growth fund. Likewise, a mutual fund that aims at capital preservation by investing in debt markets is a debt fund or income fund. Each of these categories may have sub-categories.Rating Profile : Mutual funds invest in securities after evaluating their creditworthiness as disclosed by the ratings. A depiction of the mutual fund in various investments based on their ratings becomes the rating profile of the fund. Typically, this is a feature of debt funds.
Agra : 0562 - 6459171 Ahmedabad : 079 - 66521550 Bengaluru : 080 - 42941000 Baroda : 07819064804 Bhopal : 0755 - 4253972 Bhubaneshwar : 09937082201 Chandigarh : 09041003653 Chennai : 09043000628 Coimbatore : 09843555682 Dehradun : 0135 - 6453212
Delhi : 011 - 43789000 Hyderabad : 09030015457 Indore : 07415000281 Jaipur : 0141 - 6451086 Jamshedpur : 09709099913 Kanpur : 0512 - 6451658 Kochi : 09037001509 Kolkata : 033 - 40639115 Lucknow : 0522 - 4000841 Ludhiana : 0161 - 6543354 Madurai : 0452 - 6460114
Mumbai (H.O) : 022 - 67310000 Nagpur : 0712 - 6463962 Nashik : 07507777375 Panaji : 0832 - 6650402 Patna : 09264457840 Pune : 020 - 41291015 Raipur : 0771 - 4056046 Surat : 0261 - 6450848 Varanasi : 0542 - 6055444
AMC Branches

Invesco Asset Management (India) Private LimitedCorporate & Registered O�ice: 2101-A, A Wing,21st Floor, Marathon Futurex, N.M. Joshi Marg,Lower Parel, Mumbai – 400 013CIN No: U67190MH2005PTC153471
T: +91 22 6731 0000F: +91 22 2301 9422E: [email protected]
To invest:Call 1800 209 0007SMS ‘invest’ to 56677
invescomutualfund.com
Follow us on
Mutual Fund investments are subject to market risks,read all scheme related documents carefully.