
The Case for US Real Estate Debt - Invesco
13
December 2021 invesco.com The appeal of maintaining an allocation to real estate in a portfolio is well-documented. With its generally low correlation to other asset classes, strong relative performance, characteristically stable income, and role as an inflation hedge, real estate offers a compelling case for investment throughout market cycles and particularly in an inflationary environment. While historically equity was the most common way investors sought to access the real estate asset class, debt has grown to play an equally important role. Real estate debt provides a differentiated exposure to many of the positive attributes also available to real estate equity investors via a more risk-averse position in the capital stack. The private real estate debt market is large and established with a long track record of performance, and the emergence of high-quality debt funds has provided a broad cross section of investors with greater opportunity to access the sector. Additionally, while some investors see real estate debt as a way to gain exposure to real estate in a downside mitigated strategy with low correlation to real estate equity returns, others view real estate debt as a higher-yielding fixed income investment that has a complementary and accretive return profile relative to their broader fixed income portfolios. This trend has been accentuated in the recent “lower for longer” interest rate environment. In this paper, consider the size of the US real estate debt opportunity, the evolution of the role of alternative lenders (most notably debt funds) in the market, the performance of real estate debt during the COVID disruption, and how adding real estate debt to investors’ existing portfolios could be beneficial in the period ahead. The Case for US Real Estate Debt Benefits to investors Predictable income • Debt positions focus on securing a fixed rate of return through repayment terms, fees and interest. • Predictable frequency of periodic cash flows. • Yield premium relative to fixed income alternatives Security in the capital stack • For loans underwritten with conservative loan-to-value ratios, the debt position is relatively more insulated against capital value movements on the underlying property. • Different positions in the capital stack have greater repayment and/or recourse priority. Diversification • Allocating capital across a large pool of loans mitigates single- asset risk exposure. • Debt positions have low-to-moderate correlations with other asset classes and with direct/equity real estate returns. • Accretive return profile relative to broader fixed income assets. Inflation hedge • Real estate has historically proven a good inflation hedge. • Floating rate debt adjusts in a rising rate environment, maintaining attractive relative income returns. Source: Invesco Real Estate as of November 2021 This document is for Professional Clients (as specified in the important information); for Sophisticated or Professional Investors in Australia; for Professional Investors in Hong Kong; in New Zealand for wholesale investors (as defined in the Financial Markets Conduct Act); for Institutional/Accredited Investors in Singapore; for Institutional Investors only in the United States; in Canada, this document is restricted to Accredited Investors as defined under National Instrument 45-106. It is not intended for and should not be distributed to, or relied upon by, the public or retail investors. Please do not redistribute this document. Circulation, disclosure, or dissemination of all or any part of this material to any unauthorized persons is prohibited. By accepting this document, you consent to communicate with us in English, unless you inform us otherwise. Figure 1: The role of real estate debt in investor portfolios Real estate debt can offer attractive returns while minimizing risk 1 Charlie Rose Managing Director, Portfolio Manager Teresa Zien Managing Director, Capital Markets Nicholas Buss Senior Director, Strategic Analytics Rivka Altman Director, Associate Portfolio Manager Peter Miller Insurance Research Strategist, Research & Analytics
-
Upload
khangminh22 -
Category
Documents
-
view
5 -
download
0
Transcript of The Case for US Real Estate Debt - Invesco

December 2021invesco.com
The appeal of maintaining an allocation to real estate in a portfolio is well-documented. With its generally low correlation to other asset classes, strong relative performance, characteristically stable income, and role as an inflation hedge, real estate offers a compelling case for investment throughout market cycles and particularly in an inflationary environment.
While historically equity was the most common way investors sought to access the real estate asset class, debt has grown to play an equally important role. Real estate debt provides a differentiated exposure to many of the positive attributes also available to real estate equity investors via a more risk-averse position in the capital stack. The private real estate debt market is large and established with a long track record of performance, and the emergence of high-quality debt funds has provided a broad cross section of investors with greater opportunity to access the sector.
Additionally, while some investors see real estate debt as a way to gain exposure to real estate in a downside mitigated strategy with low correlation to real estate equity returns, others view real estate debt as a higher-yielding fixed income investment that has a complementary and accretive return profile relative to their broader fixed income portfolios. This trend has been accentuated in the recent “lower for longer” interest rate environment.
In this paper, consider the size of the US real estate debt opportunity, the evolution of the role of alternative lenders (most notably debt funds) in the market, the performance of real estate debt during the COVID disruption, and how adding real estate debt to investors’ existing portfolios could be beneficial in the period ahead.
The Case for US Real Estate Debt
Benefits to investors
Predictable income
• Debt positions focus on securing a fixed rate of return throughrepayment terms, fees and interest.
• Predictable frequency of periodic cash flows.• Yield premium relative to fixed income alternatives
Security in the capital stack
• For loans underwritten with conservative loan-to-value ratios,the debt position is relatively more insulated against capital value movements on the underlying property.
• Different positions in the capital stack have greater repaymentand/or recourse priority.
Diversification
• Allocating capital across a large pool of loans mitigates single-asset risk exposure.
• Debt positions have low-to-moderate correlations with other asset classes and with direct/equity real estate returns.
• Accretive return profile relative to broader fixed income assets.
Inflation hedge
• Real estate has historically proven a good inflation hedge.• Floating rate debt adjusts in a rising rate environment,
maintaining attractive relative income returns.
Source: Invesco Real Estate as of November 2021
This document is for Professional Clients (as specified in the important information); for Sophisticatedor Professional Investors in Australia; for Professional Investors in Hong Kong; in New Zealand forwholesale investors (as defined in the Financial Markets Conduct Act); for Institutional/AccreditedInvestors in Singapore; for Institutional Investors only in the United States; in Canada, this documentis restricted to Accredited Investors as defined under National Instrument 45-106. It is not intendedfor and should not be distributed to, or relied upon by, the public or retail investors. Please do notredistribute this document. Circulation, disclosure, or dissemination of all or any part of this materialto any unauthorized persons is prohibited. By accepting this document, you consent to communicatewith us in English, unless you inform us otherwise.
Figure 1: The role of real estate debt in investor portfolios Real estate debt can offer attractive returns while minimizing risk
1
Charlie RoseManaging Director, Portfolio Manager
Teresa ZienManaging Director, Capital Markets
Nicholas BussSenior Director, Strategic Analytics
Rivka AltmanDirector, Associate Portfolio Manager
Peter MillerInsurance Research Strategist, Research & Analytics

Real estate debt yields vs. traditional fixed income
One of the first questions insurance CIOs ask themselves when considering a portfolio reallocation is “what is the relative pickup from making this change?” In today’s low interest rate environment, insurers find it as challenging as ever to find opportunities to enhance portfolio yield. Real estate debt represents one compelling opportunity to do just that. Considering U.S. investment grade corporate bond spreads vs. swaps are currently about 110 basis points, taxable muni spreads are about 90 basis points, and higher-risk fixed income such as high yield corporates and emerging market external debt both have spreads of roughly 300 bps --private real estate debt offers meaningfully higher spreads of 500 - 600 bps. For European insurers seeking local market private real estate debt exposure, spreads of 150 bps are also attractive relative to traditional fixed income where local spreads are similar to those in the U.S. Even a small allocation to this asset class can materially improve an insurer’s portfolio yield, and as we will discuss, this does not mean taking on meaningfully higher risk.
Invesco Real Estate: The Case for US Real Estate Debt 2
Regulatory Capital implications
Having established that real estate debt may add meaningful yield enhancement, the natural follow-up question is “what will this do to my portfolio’s risk profile?” Here we focus on risk-based capital (RBC) to represent an insurer’s risk constraint. Here again it is instructive to compare RBC requirements of real estate debt to traditional fixed income. A life insurer in the U.S. needs to set aside 1.3% (pre-tax) in RBC for NAIC 2 (BBB-rated) bonds and 4.6% for NAIC 3 (BB-rated) bonds. Contrast this with real estate debt RBC charges of 1.75% and 3.0% for Commercial Mortgage 2 and 3 exposures, respectively. Life insurers can maintain or even reduce their RBC requirements by allocating to real estate debt while increasing expected returns as discussed in the prior section. Importantly, this RBC treatment may be achieved even for investments in commingled funds provided the fund’s loan holdings adhere to loan-to-value and debt service coverage ratios corresponding to those RBC designations.
For European insurers we focus on the Solvency Capital Requirement (SCR) to represent a common risk constraint. Here again it is instructive to compare capital requirements of real estate debt to traditional fixed income. A life insurer in EMEA could use the unrated debt category to classify RE Debt, in which case capital intensity for credit risk would be slightly higher than for BBB Corporate bonds -- though the RE Debt income level is significantly higher. The users of Solvency II Internal Models and Internal Ratings could also achieve better capital treatment via the integration of the collateral as a risk mitigation technique.
Hence, Life insurers in Europe also can maintain or even reduce their capital requirements by allocating to real estate debt while increasing expected returns as discussed in the prior section.
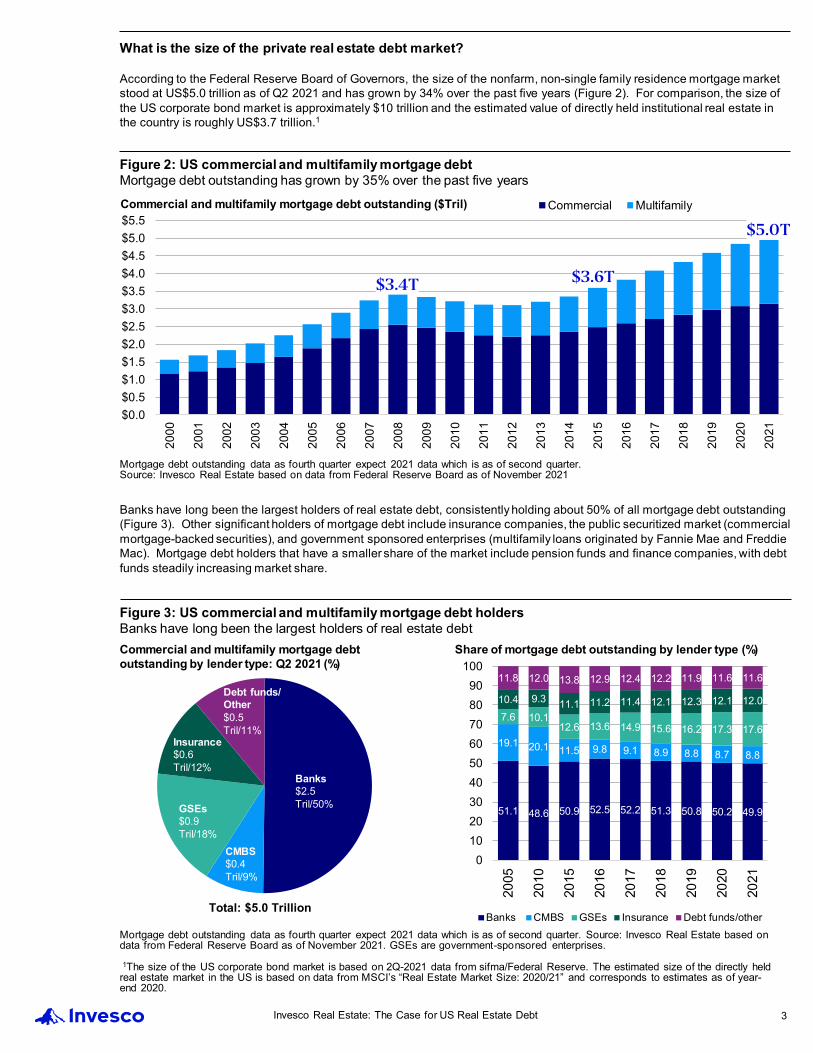
What is the size of the private real estate debt market?
According to the Federal Reserve Board of Governors, the size of the nonfarm, non-single family residence mortgage market stood at US$5.0 trillion as of Q2 2021 and has grown by 34% over the past five years (Figure 2). For comparison, the size ofthe US corporate bond market is approximately $10 trillion and the estimated value of directly held institutional real estate inthe country is roughly US$3.7 trillion.1
Banks have long been the largest holders of real estate debt, consistently holding about 50% of all mortgage debt outstanding(Figure 3). Other significant holders of mortgage debt include insurance companies, the public securitized market (commercial mortgage-backed securities), and government sponsored enterprises (multifamily loans originated by Fannie Mae and Freddie Mac). Mortgage debt holders that have a smaller share of the market include pension funds and finance companies, with debt funds steadily increasing market share.
Figure 2: US commercial and multifamily mortgage debtMortgage debt outstanding has grown by 35% over the past five years
$0.0$0.5$1.0$1.5$2.0$2.5$3.0$3.5$4.0$4.5$5.0$5.5
2000
2001
2002
2003
2004
2005
2006
2007
2008
2009
2010
2011
2012
2013
2014
2015
2016
2017
2018
2019
2020
2021
Commercial MultifamilyCommercial and multifamily mortgage debt outstanding ($Tril)
Mortgage debt outstanding data as fourth quarter expect 2021 data which is as of second quarter.Source: Invesco Real Estate based on data from Federal Reserve Board as of November 2021
Figure 3: US commercial and multifamily mortgage debt holdersBanks have long been the largest holders of real estate debt
51.1 48.6 50.9 52.5 52.2 51.3 50.8 50.2 49.9
19.1 20.1 11.5 9.8 9.1 8.9 8.8 8.7 8.8
7.6 10.112.6 13.6 14.9 15.6 16.2 17.3 17.6
10.4 9.3 11.1 11.2 11.4 12.1 12.3 12.1 12.0
11.8 12.0 13.8 12.9 12.4 12.2 11.9 11.6 11.6
0102030405060708090
100
2005
2010
2015
2016
2017
2018
2019
2020
2021
Banks CMBS GSEs Insurance Debt funds/other
Commercial and multifamily mortgage debt outstanding by lender type: Q2 2021 (%)
Share of mortgage debt outstanding by lender type (%)
Mortgage debt outstanding data as fourth quarter expect 2021 data which is as of second quarter. Source: Invesco Real Estate based on data from Federal Reserve Board as of November 2021. GSEs are government-sponsored enterprises.
1The size of the US corporate bond market is based on 2Q-2021 data from sifma/Federal Reserve. The estimated size of the directly held real estate market in the US is based on data from MSCI’s “Real Estate Market Size: 2020/21” and corresponds to estimates as of year-end 2020.
Banks$2.5 Tril/50%
Insurance$0.6 Tril/12%
CMBS$0.4 Tril/9%
GSEs$0.9 Tril/18%
Debt funds/Other$0.5 Tril/11%
Total: $5.0 Trillion
Invesco Real Estate: The Case for US Real Estate Debt 3
$3.6T$3.4T
$5.0T

As shown in Figure 4, commercial and multifamily annual origination volume has grown consistently over the past decade, surpassing $600 billion in 2019, before moderating to $442 billion in 2020 as the impact of the COVID pandemic slowed activity. Given the rapid recovery in real estate transaction volume in 2021, the COVID-driven moderation in mortgage originations is expected to be short lived. In the five years prior to COVID, annual origination volume grew at an average paceof 9% per year, underling the expanding scale of opportunity provided by the US real estate debt market.
With more than US$2.3 trillion in existing commercial and multifamily real estate loans maturing over the next five years (Figure 5), the US real estate debt market appears poised to continue to gain greater momentum in the period ahead, indicating a growing market opportunity for commercial real estate lenders in the US.
Figure 4: Commercial and multifamily mortgage originations by yearAnnual origination volume exceeded $600 billion in 2019, a new record
Total annual originations (as a lender), 2010-2020 ($Bil)
Source: Invesco Real Estate based on data from Mortgage Bankers Association as November 2021
Figure 5: Commercial & multifamily mortgage maturities by year Maturities in 2022-26 suggest refinancing needs will be plentiful
Source: Invesco Real Estate based on data from Trepp as November 2021
Trepp projection
$0
$50
$100
$150
$200
$250
$300
$350
$400
$450
$500
2004
2005
2006
2007
2008
2009
2010
2011
2012
2013
2014
2015
2016
2017
2018
2019
2020
2021
2022
2023
2024
2025
2026
2027
Banks CMBS Life Cos OtherMaturing mortgage debt by year by lender, 2000-2027 (US$, billions)
$345
$406
$508
$181
$82$119
$184
$244
$359$400
$504 $491$530
$574$601
$442
$0
$100
$200
$300
$400
$500
$600
2005
2006
2007
2008
2009
2010
2011
2012
2013
2014
2015
2016
2017
2018
2019
2020
Invesco Real Estate: The Case for US Real Estate Debt 4

How has the private real estate debt market evolved?
In the run-up to the Global Financial Crisis, pre-2007, leverage levels rose and underwriting standards weakened as banks and other lending institutions increased the number of high-risk construction loans and loans originated for commercial mortgage backed securities (CMBS) issuance in their commercial real estate portfolios. At the same time, these lenders focused on riskier adjustable and subprime mortgages in their residential portfolios. The combination of lax underwriting, high leverage ratios, rising interest rates and a slowing economy resulted in a significant spike in delinquencies and foreclosures as borrowers found property values falling below the debt owed on the property.
The severity of the recession, and banks’ contribution to it, prompted sweeping reforms of the financial services industry via the Dodd-Frank Wall Street Reform and Consumer Protection Act (more commonly known as Dodd-Frank). One provision arising from Dodd-Frank was the Volcker Rule, which, among other things, constrained banks’ abilities to use securitization as a part of real estate finance. Other rules required banks to increase reserves held against riskier real estate loans, such as construction financing. New loan originations initially fell, particularly for construction lending and CMBS securitization, creating a sizable financing gap that other sources of capital have sought to fill (Figure 6).
Alternative lenders, debt funds and insurance accounts have gained market share as a result of these managers’ ability to be more nimble than conventional lenders. Without wholesale reductions in credit standards, these lenders have captured share from established insurance companies, banks, GSEs and CMBS lenders by offering quicker response times, bespoke structures and a client-oriented approach.
Figure 6: Construction financing and CMBS issuanceIncreased post-GFC regulation resulted in a pullback in funding
$100
$150
$200
$250
$300
$350
$400
$450
$500
$550
$600
2004
2005
2006
2007
2008
2009
2010
2011
2012
2013
2014
2015
2016
2017
2018
2019
2020
2021
$0
$50
$100
$150
$200
$250
2004
2005
2006
2007
2008
2009
2010
2011
2012
2013
2014
2015
2016
2017
2018
2019
2020
Data as of fourth quarter except for 2021 which is as of second quarter.Source: Invesco Real Estate using data from Moody’s Analytics and Credit Suisse as of November 2021
Invesco Real Estate: The Case for US Real Estate Debt 5
Bank construction and land development loans outstanding ($Bil)
Commercial mortgage back securities issuance ($Bil)
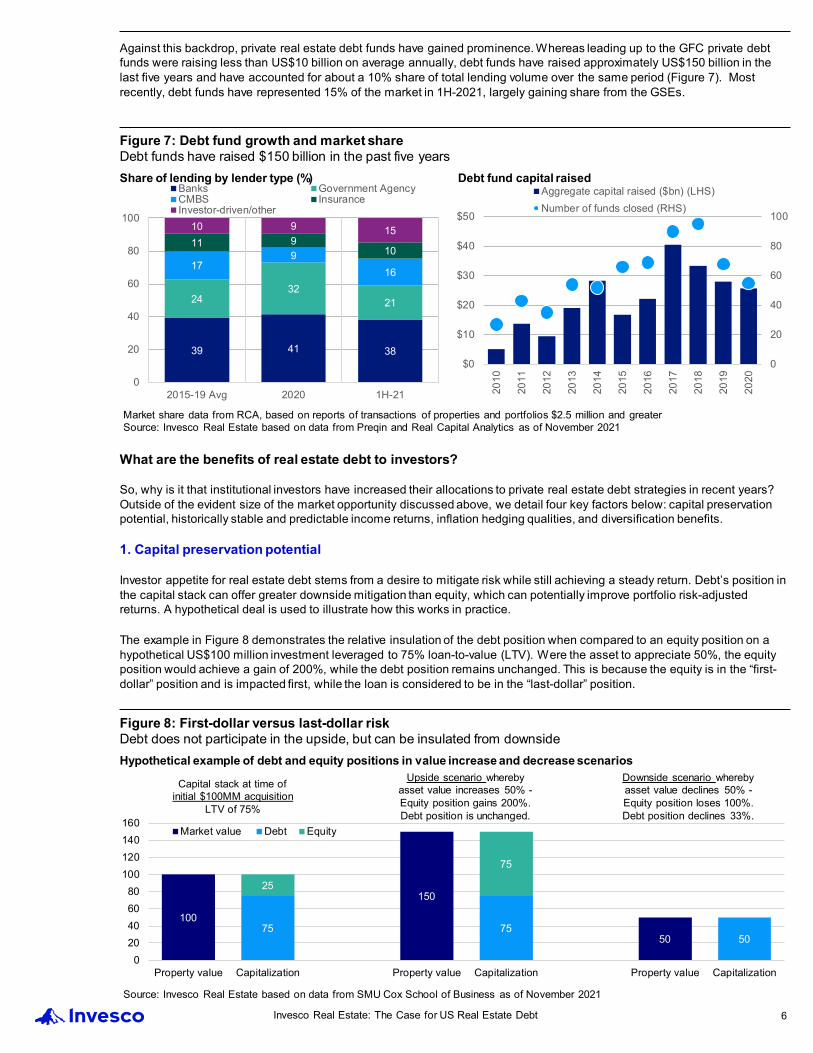
Against this backdrop, private real estate debt funds have gained prominence. Whereas leading up to the GFC private debt funds were raising less than US$10 billion on average annually, debt funds have raised approximately US$150 billion in the last five years and have accounted for about a 10% share of total lending volume over the same period (Figure 7). Most recently, debt funds have represented 15% of the market in 1H-2021, largely gaining share from the GSEs.
What are the benefits of real estate debt to investors?
So, why is it that institutional investors have increased their allocations to private real estate debt strategies in recent years? Outside of the evident size of the market opportunity discussed above, we detail four key factors below: capital preservationpotential, historically stable and predictable income returns, inflation hedging qualities, and diversification benefits.
1. Capital preservation potential
Investor appetite for real estate debt stems from a desire to mitigate risk while still achieving a steady return. Debt’s position in the capital stack can offer greater downside mitigation than equity, which can potentially improve portfolio risk-adjusted returns. A hypothetical deal is used to illustrate how this works in practice.
The example in Figure 8 demonstrates the relative insulation of the debt position when compared to an equity position on a hypothetical US$100 million investment leveraged to 75% loan-to-value (LTV). Were the asset to appreciate 50%, the equity position would achieve a gain of 200%, while the debt position remains unchanged. This is because the equity is in the “first-dollar” position and is impacted first, while the loan is considered to be in the “last-dollar” position.
Figure 7: Debt fund growth and market shareDebt funds have raised $150 billion in the past five years
Market share data from RCA, based on reports of transactions of properties and portfolios $2.5 million and greaterSource: Invesco Real Estate based on data from Preqin and Real Capital Analytics as of November 2021
Share of lending by lender type (%) Debt fund capital raised
0
20
40
60
80
100
$0
$10
$20
$30
$40
$50
2010
2011
2012
2013
2014
2015
2016
2017
2018
2019
2020
Aggregate capital raised ($bn) (LHS)Number of funds closed (RHS)
39 41 38
2432
21
179
16
11 910
10 9 15
0
20
40
60
80
100
2015-19 Avg 2020 1H-21
Banks Government AgencyCMBS InsuranceInvestor-driven/other
Figure 8: First-dollar versus last-dollar risk Debt does not participate in the upside, but can be insulated from downside
Source: Invesco Real Estate based on data from SMU Cox School of Business as of November 2021
Hypothetical example of debt and equity positions in value increase and decrease scenarios
100
150
5075 75
50
25
75
020406080
100120140160
Property value Capitalization Property value Capitalization Property value Capitalization
Market value Debt Equity
Capital stack at time of initial $100MM acquisition
LTV of 75%
Upside scenario whereby asset value increases 50% -Equity position gains 200%.Debt position is unchanged.
Downside scenario whereby asset value declines 50% -Equity position loses 100%.Debt position declines 33%.
Invesco Real Estate: The Case for US Real Estate Debt 6

Meanwhile, in a downside scenario (whereby the asset is depreciated 50%), the equity component of the capital stack is reduced to zero, while the debt position declines just 33%. Why? As equity is the first-dollar, it is the first to absorb the gains as well as the losses. This suggests that taking the debt position can offer greater downside mitigation, although at the expense of not participating in the potential upside.
While this is a simplified example where there is only one debt piece, different debt tranches exist that allow investors to move further out on the risk spectrum with the expectation of higher returns to compensate for the added level of risk (Figure 9).
2. Historically stable and predictable income returns
Further enhancing the case for debt is the predictability of cash flow from the note. Loans made to borrowers of real estate debt are used to acquire, refinance, renovate or develop specific properties. These properties serve as collateral for the loan in the event of default, but also provide a steady stream of income from operations that is then used to pay back the principal andinterest. As such, essentially all the return achieved from real estate debt is in the form of income, making it a competitive alternative to traditional fixed-income instruments.
Furthermore, private real estate debt in the US has historically delivered average total returns of 6.0% per year over the last 20 years (2001 to 2020), having recorded negative annual returns just once during that period, in 2008 during the GFC (Figure 10). Illustrating the durability of the sector during the highly disrupted COVID period, real estate debt delivered a total return of 6.3% in 2020.
Figure 9: Categories and seniority of private debt tranches Different tranches offer a wide range of risk/return profiles
Source: Invesco Real Estate as of November 2021
Examples of private debt structures (% of capital stack)
0
10
20
30
40
50
60
70
80
90
100
Whole loan B-note Mezzanine debt Preferred equity Full tranche
Lowerrisk
Higherrisk
Mortgage
Equity Equity EquityEquity
B-note
Seniormortgage
Seniormortgage
Seniormortgage
Mezzaninedebt
Mezzaninedebt
Preferredequity
Preferredequity
B Note
Seniormortgage
Equity
Figure 10: Private real estate debt return performance Private real estate debt has exhibited a resilient return profile this cycle
Source: Invesco Real Estate based on data from the Giliberto-Levy Commercial Mortgage Index as of November 2021. Past performance is not a guarantee of future results.
Annual total returns, Giliberto-Levy Commercial Mortgage Index (%)
14.3
8.8
15.7
5.3
5.4
3.7 4.7 5.6
-4.1
14.7
10.2
6.9
4.7
2.9
7.4
2.7
2.9 5.
6
2.7
8.4
6.3
-10
-5
0
5
10
15
20
2000
2001
2002
2003
2004
2005
2006
2007
2008
2009
2010
2011
2012
2013
2014
2015
2016
2017
2018
2019
2020
Invesco Real Estate: The Case for US Real Estate Debt 7
6.0% avg. total return2000-2020
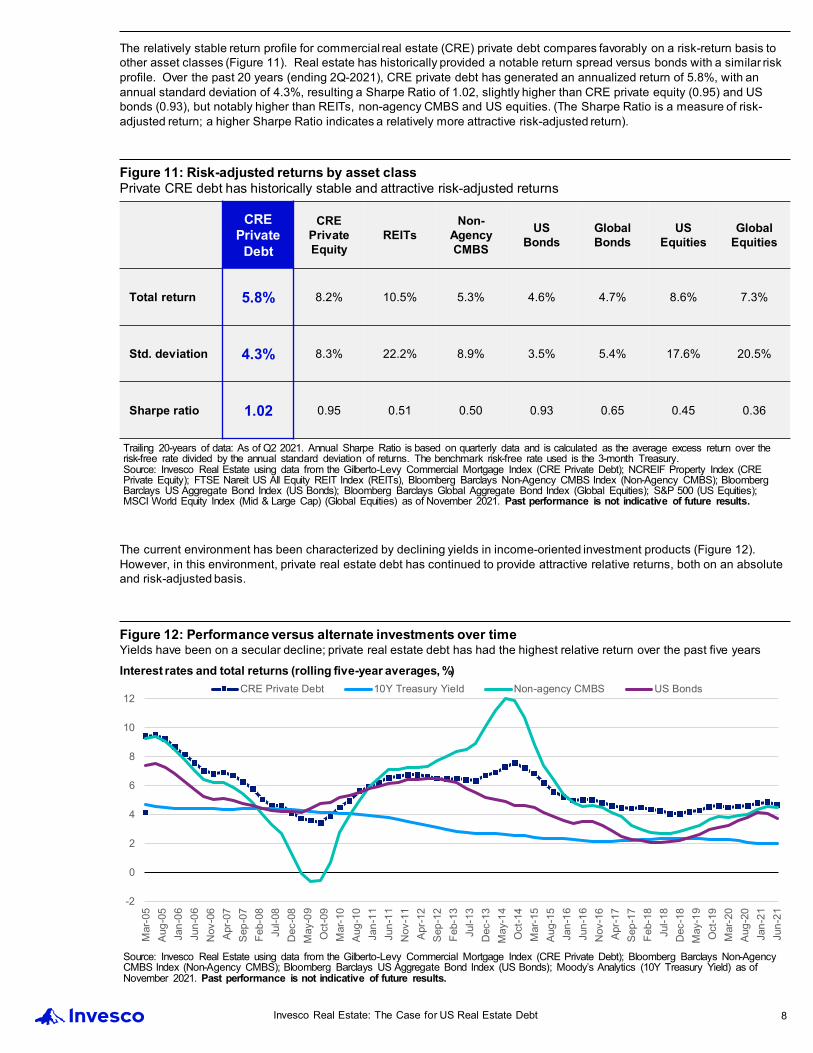
The relatively stable return profile for commercial real estate (CRE) private debt compares favorably on a risk-return basis to other asset classes (Figure 11). Real estate has historically provided a notable return spread versus bonds with a similar riskprofile. Over the past 20 years (ending 2Q-2021), CRE private debt has generated an annualized return of 5.8%, with an annual standard deviation of 4.3%, resulting a Sharpe Ratio of 1.02, slightly higher than CRE private equity (0.95) and US bonds (0.93), but notably higher than REITs, non-agency CMBS and US equities. (The Sharpe Ratio is a measure of risk-adjusted return; a higher Sharpe Ratio indicates a relatively more attractive risk-adjusted return).
The current environment has been characterized by declining yields in income-oriented investment products (Figure 12). However, in this environment, private real estate debt has continued to provide attractive relative returns, both on an absoluteand risk-adjusted basis.
Figure 11: Risk-adjusted returns by asset classPrivate CRE debt has historically stable and attractive risk-adjusted returns
Trailing 20-years of data: As of Q2 2021. Annual Sharpe Ratio is based on quarterly data and is calculated as the average excess return over the risk-free rate divided by the annual standard deviation of returns. The benchmark risk-free rate used is the 3-month Treasury.Source: Invesco Real Estate using data from the Gilberto-Levy Commercial Mortgage Index (CRE Private Debt); NCREIF Property Index (CRE Private Equity); FTSE Nareit US All Equity REIT Index (REITs), Bloomberg Barclays Non-Agency CMBS Index (Non-Agency CMBS); Bloomberg Barclays US Aggregate Bond Index (US Bonds); Bloomberg Barclays Global Aggregate Bond Index (Global Equities); S&P 500 (US Equities); MSCI World Equity Index (Mid & Large Cap) (Global Equities) as of November 2021. Past performance is not indicative of future results.
CRE Private
Debt
CRE Private Equity
REITsNon-
Agency CMBS
US Bonds
Global Bonds
US Equities
Global Equities
Total return 5.8% 8.2% 10.5% 5.3% 4.6% 4.7% 8.6% 7.3%
Std. deviation 4.3% 8.3% 22.2% 8.9% 3.5% 5.4% 17.6% 20.5%
Sharpe ratio 1.02 0.95 0.51 0.50 0.93 0.65 0.45 0.36
Figure 12: Performance versus alternate investments over timeYields have been on a secular decline; private real estate debt has had the highest relative return over the past five years
Source: Invesco Real Estate using data from the Gilberto-Levy Commercial Mortgage Index (CRE Private Debt); Bloomberg Barclays Non-Agency CMBS Index (Non-Agency CMBS); Bloomberg Barclays US Aggregate Bond Index (US Bonds); Moody’s Analytics (10Y Treasury Yield) as of November 2021. Past performance is not indicative of future results.
Interest rates and total returns (rolling five-year averages, %)
-2
0
2
4
6
8
10
12
Mar
-05
Aug-
05Ja
n-06
Jun-
06N
ov-0
6Ap
r-07
Sep-
07Fe
b-08
Jul-0
8D
ec-0
8M
ay-0
9O
ct-0
9M
ar-1
0Au
g-10
Jan-
11Ju
n-11
Nov
-11
Apr-1
2Se
p-12
Feb-
13Ju
l-13
Dec
-13
May
-14
Oct
-14
Mar
-15
Aug-
15Ja
n-16
Jun-
16N
ov-1
6Ap
r-17
Sep-
17Fe
b-18
Jul-1
8D
ec-1
8M
ay-1
9O
ct-1
9M
ar-2
0Au
g-20
Jan-
21Ju
n-21
CRE Private Debt 10Y Treasury Yield Non-agency CMBS US Bonds
Invesco Real Estate: The Case for US Real Estate Debt 8

3. Inflation Hedge
Commercial real estate has historically been a decent hedge against rising inflation. Lease structures allow landlords to move rents upon expiration and many have preset annual increases, often indexed to CPI. This provides some insulation for equityinvestors, maintaining income and an ability to pay debt service. In addition, for debt investors, floating rate product adjusts as interest rates move higher (which is typical in an inflationary period), maintaining a spread to the base rate and backstopping yields. As such, floating rate real estate debt may be doubly attractive to investors focused on the potential for inflationarypressures and/or a rising rate environment: the security of the loans should improve as underlying real estate values benefitfrom rent increases, while income should adjust in real time with any upward movement in rates.
4. Diversification
An allocation to US private real estate debt also improves portfolio volatility through its low correlations with other traditional asset classes. Figure 13 illustrates the correlations between US private real estate debt and various domestic traditional assetclasses, including stocks and bonds. A private real estate debt portfolio (represented by the Giliberto-Levy Commercial Mortgage Performance Index) has produced low/negative correlations with US and global equities and private equity real estate and modest correlations with public equity real estate and US and global bonds. In addition, real estate debt can offer investors a higher-yielding fixed income investment that has a complimentary and accretive return profile relative to their broader fixed income portfolios. In this way, an allocation to private real estate debt serves as a diversifier to a portfolio that already contains other types of real estate and fixed income exposure.
In the most recent 5-year period, the relative correlations of CRE private debt have strengthened somewhat. For example, the non-agency CMBS correlation coefficient to private CRE debt was 0.94 during the 5-year trailing period and the US Bond correlation coefficient to private CRE debt rose to 0.82 during the same period.
The diversification benefits from private real estate debt are best realized from allocation to a broad, diversified portfolio of multiple assets that further reduces any single-asset risk. Engaging an allocation to US real estate debt through a private fundmay offer a quicker, more capital efficient way of achieving asset diversification benefits than acquiring and compiling a book of loans one by one.
Figure 13: Correlations of real estate debt with other asset classesPrivate debt has virtually no correlation with private equity
Trailing 20-years of data: As of 2Q 2021Source: Invesco Real Estate using data from the Gilberto-Levy Commercial Mortgage Index (CRE Private Debt); NCREIF Property Index (CRE Private Equity); FTSE Nareit US All Equity REIT Index (REITs), Bloomberg Barclays Non-Agency CMBS Index (Non-Agency CMBS); Bloomberg Barclays US Aggregate Bond Index (US Bonds); Bloomberg Barclays Global Aggregate Bond Index (Global Equities); S&P 500 (US Equities); MSCI World Equity Index (Mid & Large Cap) (Global Equities) as of November 2021. Past performance is not indicative of future results.
Correlation coefficients
CRE Private Debt
CRE Private Equity
REITsNon-
Agency CMBS
US Bonds Global Bonds
US Equities
Global Equities
CRE Private Debt 1.00 -0.03 0.42 0.83 0.67 0.53 -0.02 0.01
CRE Private Equity 1.00 0.29 -0.03 -0.24 -0.12 0.21 0.21
REITs 1.00 0.69 0.01 0.12 0.66 0.71
Non-Agency CMBS 1.00 0.46 0.40 0.35 0.36
US Bonds 1.00 0.65 -0.39 -0.38
Global Bonds 1.00 -0.09 0.02
US Equities 1.00 0.93
Global Equities 1.00
Invesco Real Estate: The Case for US Real Estate Debt 9

How did private real estate debt period during the COVID disruption?
Illustrating the durability of the sector, during the highly disruptive COVID period real estate debt delivered an attractive total return of 6.3% in 2020.
The recent performance of the sector stands in contrast to its performance during the GFC. As Figure 14 illustrates, delinquency rates have for the most part remained very low and well below the levels seen during the GFC. (The exception to this is delinquency rates for CMBS loans secured by hotel and retail properties, two consumer-facing sectors that were essentially shut down due to COVID-related restrictions early in the pandemic.) Contributing to this performance has been a continued focus on disciplined underwriting, including leverage and debt service coverage ratios that have remained notably more conservative compared to the period prior to the GFC, and more regulated loan covenants.
In fact, as illustrated in Figure 14, the loan-to-value (LTV) ratio of CRE loans reached a historic low over the past several years while the debt-service coverage ratio reached historic highs.
Risks and considerations
With underwriting standards remaining historically strong, it is our view that real estate debt is an attractive option from a risk/return perspective relative to other fixed income alternatives. Additionally, with the size of the US mortgage market increasing, loan maturities expected to increase in coming years, and debt portfolios gaining market share, there is a growing opportunity for investors to access the asset class through pooled investments.
Capped upside/returns: During periods of asset inflation, credit investments may underperform equity investments due to the stated interest rates of these investments. Real estate debt similarly may log relative underperformance compared to real estate equity investments during periods of asset price growth. Investors may find that this limitation of upside potential is offset by the lower volatility and potential for downside mitigation offered by real estate debt, but each investor’s unique objectives must be considered.
Returns may be reliant upon use of leverage: Real estate debt strategies may be levered or unlevered, but increasingly alternative investment managers have utilized leverage to achieve returns in the high-single digit to low-double digit range. Acareful analysis of the underlying leverage utilized for a real estate credit strategy should be considered when reviewing any investment opportunities. Factors to consider include the amount of leverage utilized, the risk profile of loans to which leverage is applied, and the structure of such leverage (duration, margin call rights, etc.).
Structural considerations: Real estate debt investments are inherently more passive investments relative to equity. Accordingly, lenders have more limited oversight of property level decisions including leasing, property management, construction and cash management related matters. During periods of heightened competition, lenders may compete to win business by agreeing to “covenant light” transactions with less rigorous underwriting and/or ongoing oversight requirements. Additionally, different loans may have different rights for the pursuit of remedies after an event of default. As such, investors should understand the structures of underlying debt investments.
Conclusion
For many investors, an allocation to US private real estate debt is driven by a desire to preserve capital and hedge against inflation while still enjoying steady and accretive income-based returns. Debt offers investors a differentiated way to participate in the real estate asset class, and with historically low correlations to stocks, bonds, and public and private equity real estate, it can serve to enhance overall portfolio diversification.
Figure 14: Real estate debt performance during COVIDDelinquency rates remained low, reflecting more disciplined underwriting compared to the GFC
Bank data (FDIC) represents loans 90+ days past due and nonaccrual; ACLI data represents loans 90+ days past due; CMBS data (Trepp) represents conduit loans 60+ days past due, nonperforming loans, loans in foreclosure, and real estate owned (REO). Underwriting metrics from RCA; calendar year averages. Source: Invesco Real Estate based on data from Moody’s Analytics as of October 2020
Delinquency rates (% of loan value) Loan underwriting metrics: LTV and DSCR (%/x) Commercial properties
02468
1012141618
2002
2003
2004
2005
2006
2007
2008
2009
2010
2011
2012
2013
2014
2015
2016
2017
2018
2019
2020
2021
Banks (CRE/MF, 90+ days) Banks (Const, 90+ days)ACLI (90+ days) CMBS (60+ days)
1.2
1.3
1.4
1.5
1.6
1.7
1.8
1.9
2.0
58
60
62
64
66
68
70
72
2004
2005
2006
2007
2008
2009
2010
2011
2012
2013
2014
2015
2016
2017
2018
2019
2020
Loan-to-value (LHS) Debt service coverage ratio (RHS)
Invesco Real Estate: The Case for US Real Estate Debt 10

Contact Information | Client Portfolio Management
Max SwangoManaging Director | Dallas+1 (972) [email protected]
Kent YangManaging Director | Seoul+82 2 6330 [email protected]
LinlinChang Senior Director | Hong Kong+852 3128 [email protected]
Andrew Hills Managing Director | London+44 20 7543 [email protected]
Robert StolfoManaging Director | Munich+49 89 2060 [email protected]
Sebastien DaguenetDirector | Paris+33 1 5662 [email protected]
Henrik Haeuszler Senior Director | Munich+49 89 2060 [email protected]
Brooks Monroe Managing Director | Dallas+1 (972) [email protected]
Cinnamon Russell Senior Director | Toronto+1 (416) [email protected]
Laler DeCostaManaging Director | Atlanta+1 (404) [email protected]
De’Juan Collins Director | Dallas+1 (972) [email protected]
Simon Redman Managing Director | London+44 20 7543 [email protected]
Douglas Rowlands Director | London+44 20 8538 [email protected]
Lauren GoodmanSenior Associate | Dallas+1 (972) [email protected]
Glo
bal H
ead
Asi
a Pa
cific
Euro
peN
orth
Am
eric
aN
on-In
stitu
tiona
l Ex
-US
Debt
Pro
duct
M
anag
emen
t
Maria NemethAssociate | New York+1 (212) [email protected]
Invesco Real Estate: The Case for US Real Estate Debt 10
Amanda Clegg Director - Investment Strategy | Sydney+61 2 9006 [email protected]
Hidey Kato Head ofReal AssetProduct |Tokyo+81 3 6447 [email protected]
Hiromitsu WashizuAssociate | Tokyo+81 3 6447 [email protected]
Ayako Horiuchi Director | Tokyo+81 3 6447 [email protected]
Takaaki Tamai Director | Tokyo+81 3 6447 [email protected]
Institutional Support Japan
Institutional Support Australia
Chris Marx Managing Director |New York+1 (212) [email protected]
Matt Petre Director | New York+1 (212) [email protected]
Insurance Specialists

Risks WarningsThe value of investments and any income will fluctuate (this may partly be the result of exchange rate fluctuations) and investors may not getback the full amount invested. Property and land can be difficult to sell, so investors may not be able to sell such investments when they want to.The value of property is generally a matter of an independent valuer’s opinion and may not be realized.
Important informationThis document is for Professional Clients in Continental Europe (as defined below), Dubai, Ireland and the UK; for Sophisticated or ProfessionalInvestors in Australia; for Professional Investors in Hong Kong; in New Zealand for wholesale investors (as defined in the Financial MarketsConduct Act); for Institutional/Accredited Investors in Singapore; for Institutional Investors only in the United States; in Canada, this document isrestricted to Accredited Investors as defined under National Instrument 45-106. It is not intended for and should not be distributed to, or reliedupon by, the public or retail investors. Please do not redistribute this document. Circulation, disclosure, or dissemination of all or any part of thismaterial to any unauthorized persons is prohibited. By accepting this document, you consent to communicate with us in English, unless youinform us otherwise.For the distribution of this document, Continental Europe is defined as Andorra, Austria, Belgium, Croatia, Czech Republic, Denmark,Finland, France, Germany, Italy, Luxembourg, Netherlands, Norway, Spain, Sweden and Switzerland.Target figures, where mentioned, are not the actual allocations of a specific Invesco product. This document is marketing material and is notintended as a recommendation to invest in any particular asset class, security or strategy. Regulatory requirements that require impartiality ofinvestment/investment strategy recommendations are therefore not applicable nor are any prohibitions to trade before publication. Theinformation provided is for illustrative purposes only, it should not be relied upon as recommendations to buy or sell securities or financialinstruments. This marketing document is not an invitation to subscribe for shares in a fund or any other investment product and is by way ofinformation only, it should not be considered financial advice. The information contained in this document may not have been prepared ortailored for any audience. It does not take into account individual objectives, taxation position or financial needs. This does not constitute arecommendation of any investment strategy for a particular investor. Investors should consult a financial professional before making anyinvestment decisions if they are uncertain whether an investment is suitable for them.You may only reproduce, circulate and use this document (or any part of it) with the consent of Invesco. This material may contain statementsthat are “forward-looking statements.” These include, among other things, projections, forecasts, estimates of income, yield and return and arebased on information available on the date hereof. They are based upon certain beliefs, assumptions and expectations, which can change overtime. Accordingly, forecasts are not reliable indicators of future performance. You should not place undue reliance on these forward-lookingstatements.Where individuals or the business have expressed opinions, they are based on current market conditions, they may differ from those of otherinvestment professionals and are subject to change without notice.Continental Europe, Dubai, Ireland and the UKThe document is intended only for Professional Clients in Continental Europe, Dubai, Ireland, and the UK and is not for consumer use. Marketingmaterials may only be distributed without public solicitation and in compliance with any private placement rules or equivalent set forth in the laws,rules and regulations of the jurisdiction concerned. This document is not intended to provide specific investment advice including, withoutlimitation, investment, financial, legal, accounting or tax advice, or to make any recommendations about the suitability of any product for thecircumstances of any particular investor. You should take appropriate advice as to any securities, taxation or other legislation affecting youpersonally prior to investment. No part of this material may be copied, photocopied or duplicated in any form by any means or redistributedwithout Invesco’s prior written consent.
Invesco Real Estate: The Case for US Real Estate Debt 13

Important information (continued)Issued in:Austria, Germany, Belgium, Denmark, Finland, France, Italy, Netherlands, Spain, Sweden, Luxembourg, Norway, Switzerland, Dubai,The United Kingdom and Ireland by Invesco Asset Management Deutschland GmbH, An der Welle 5, 60322 Frankfurt am Main, Germany;Invesco Management S.A., President Building, 37A Avenue JF Kennedy, L-1855 Luxembourg, regulated by the Commission de Surveillance duSecteur Financier, Luxembourg; Invesco Asset Management Limited, Perpetual Park, Perpetual Park Drive, Henley-on-Thames, OxfordshireRG9 1HH, UK. Authorised and regulated by the Financial Conduct Authority; Invesco Asset Management (Schweiz) AG, Talacker 34, 8001Zurich, Switzerland; Invesco Asset Management Limited, PO Box 506599, DIFC Precinct Building No 4, Level 3, Office 305, Dubai, United ArabEmirates. Regulated by the Dubai Financial Services Authority.
AustraliaThis document has been prepared only for those persons to whom Invesco has provided it. It should not be relied upon by anyone else.Information contained in this document may not have been prepared or tailored for an Australian audience and does not constitute an offer of afinancial product in Australia. You may only reproduce, circulate and use this document (or any part of it) with the consent of Invesco
The information in this document has been prepared without taking into account any investor’s investment objectives, financial situation orparticular needs. Before acting on the information the investor should consider its appropriateness having regard to their investment objectives,financial situation and needs.
You should note that this information:+ may contain references to dollar amounts which are not Australian dollars;+ may contain financial information which is not prepared in accordance with Australian law or practices;+ may not address risks associated with investment in foreign currency denominated investments; and + does not address Australian tax issues.
Issued in Australia by Invesco Australia Limited (ABN 48 001 693 232), Level 26, 333 Collins Street, Melbourne, Victoria, 3000, Australia whichholds an Australian Financial Services Licence number 239916.
Hong KongThis document is provided to professional investors (as defined in the Securities and Futures Ordinance and the Securities and Futures(Professional Investor) Rules) only. It is not intended for and should not be distributed to, or relied upon, by the members of public or the retailinvestors.
Hong Kong by Invesco Hong Kong Limited, 41/F 景順投資管理有限公司, Champion Tower, Three Garden Road, Central, Hong Kong.
New ZealandThis document is issued only to wholesale investors (as defined in the Financial Markets Conduct Act) in New Zealand to whom disclosure is notrequired under Part 3 of the Financial Markets Conduct Act. This document has been prepared only for those persons to whom it has beenprovided by Invesco. It should not be relied upon by anyone else and must not be distributed to members of the public in New Zealand.Information contained in this document may not have been prepared or tailored for a New Zealand audience. You may only reproduce, circulateand use this document (or any part of it) with the consent of Invesco.
This document does not constitute and should not be construed as an offer of, invitation or proposal to make an offer for, recommendation toapply for, an opinion or guidance on Interests to members of the public in New Zealand. Applications or any requests for information frompersons who are members of the public in New Zealand will not be accepted.
Issued in New Zealand by Invesco Australia Limited (ABN 48 001 693 232), Level 26, 333 Collins Street, Melbourne, Victoria, 3000, Australiawhich holds an Australian Financial Services Licence number 239916.
SingaporeThis document may not be circulated or distributed, whether directly or indirectly, to persons in Singapore other than (i) to an institutional investorunder Section 304 of the Securities and Futures Act (the “SFA”), (ii) to a relevant person pursuant to Section 305(1), or any person pursuant toSection 305(2), and in accordance with the conditions specified in Section 305 of the SFA, or (iii) otherwise pursuant to, and in accordance withthe conditions of, any other applicable provision of the SFA.
This document is for the sole use of the recipient on an institutional offer basis and/ or accredited investors and cannot be distributed withinSingapore by way of a public offer, public advertisement or in any other means of public marketing.
Issued in Singapore by Invesco Asset Management Singapore Ltd, 9 Raffles Place, #18-01 Republic Plaza, Singapore 048619.
United StatesIssued in the US by Invesco Advisers, Inc., Two Peachtree Pointe, 1555 Peachtree Street, N.E., Suite 1800, Atlanta, GA 30309.
CanadaThis document is restricted to accredited investors as defined under National Instrument 45-106. All material presented is compiled from sourcesbelieved to be reliable and current, but accuracy cannot be guaranteed. This is not to be construed as an offer to buy or sell any financialinstruments and should not be relied upon as the sole factor in an investment making decision. As with all investments there are associatedinherent risks. Please obtain and review all financial material carefully before investing.
Issued in Canada by Invesco Canada Ltd., 120 Bloor Street East, Suite 700, Toronto, Ontario M4W 1B7.
II-CREDINS-FLY-1-E202112-1968998-GL
Invesco Real Estate: The Case for US Real Estate Debt 14