Strategic Debt
25
Strategic Debt CARLA NORRLÖF University of Toronto Introduction Everyone knows that the United States is the dominant state in the world today. It has by far the most powerful military, it has the largest economy and its currency is the primary medium of exchange for international transactions. In the language of international relations theory, the United States is a hegemon. But is it economically advantageous to hold this sort of hegemonic position? At first glance, this question might seem puzzling. Common sense tells us that it must be advantageous to be a hegemon because the most powerful state can use its power to advance its interests and achieve its goals more effectively than any other state. But common sense may be missing something. Even if we assume that a hegemon acts only with a view to its own interests, it may be that others can gain from the hege- mon’s actions and policies without bearing their proportional share of the costs. Consider how this might work. All states benefit if there is an inter- national order that is peaceful, that respects property rights ~so that eco- nomic actors are willing to trade and invest!, that contains relatively few barriers to trade and that has a reliable medium of exchange. But peace, secure property rights, a free trade regime and a stable inter- national monetary system are public goods and so face familiar collec- tive action problems. Why will any given state contribute to the costs of providing these goods if it could enjoy access to the goods as a free rider instead? If all states seek to ride free, how will the goods be pro- duced? One answer to these questions, most closely associated with the seminal work of Charles Kindleberger, is that the United States, as a I would like to thank Joe Carens, two anonymous reviewers, and the editor for excel- lent comments and assistance. Carla Norrlöf, Department of Political Science, University of Toronto, Sidney Smith Hall, Room 018, 100 St. George Street, Toronto, Ontario, Canada M5S 3G3, [email protected]. Canadian Journal of Political Science / Revue canadienne de science politique 41:2 (June/juin 2008) 411–435 doi:10.10170S0008423908080475 © 2008 Canadian Political Science Association ~l’Association canadienne de science politique! and0et la Société québécoise de science politique
Transcript of Strategic Debt

Strategic Debt
CARLA NORRLÖF University of Toronto
Introduction
Everyone knows that the United States is the dominant state in the worldtoday. It has by far the most powerful military, it has the largest economyand its currency is the primary medium of exchange for internationaltransactions. In the language of international relations theory, the UnitedStates is a hegemon. But is it economically advantageous to hold thissort of hegemonic position?
At first glance, this question might seem puzzling. Common sensetells us that it must be advantageous to be a hegemon because the mostpowerful state can use its power to advance its interests and achieve itsgoals more effectively than any other state. But common sense may bemissing something. Even if we assume that a hegemon acts only with aview to its own interests, it may be that others can gain from the hege-mon’s actions and policies without bearing their proportional share ofthe costs.
Consider how this might work. All states benefit if there is an inter-national order that is peaceful, that respects property rights ~so that eco-nomic actors are willing to trade and invest!, that contains relativelyfew barriers to trade and that has a reliable medium of exchange. Butpeace, secure property rights, a free trade regime and a stable inter-national monetary system are public goods and so face familiar collec-tive action problems. Why will any given state contribute to the costs ofproviding these goods if it could enjoy access to the goods as a freerider instead? If all states seek to ride free, how will the goods be pro-duced? One answer to these questions, most closely associated with theseminal work of Charles Kindleberger, is that the United States, as a
I would like to thank Joe Carens, two anonymous reviewers, and the editor for excel-lent comments and assistance.
Carla Norrlöf, Department of Political Science, University of Toronto, Sidney SmithHall, Room 018, 100 St. George Street, Toronto, Ontario, Canada M5S 3G3,[email protected].
Canadian Journal of Political Science / Revue canadienne de science politique41:2 (June/juin 2008) 411–435 doi:10.10170S0008423908080475
© 2008 Canadian Political Science Association ~l’Association canadienne de science politique!and0et la Société québécoise de science politique

hegemon, has an overwhelming interest in these goods so that it willprovide them even if it has to bear the full costs of provision on its own~Kindleberger, 1981; Kindleberger, 1973!. As Brawley has argued,Kindleberger implies that “a significantly large state would consumeenough of @the# public good that it would be willing to provide it byitself ”~1995: 88!. On the other hand, Kindleberger insists that leader-ship “thought of as the provision of the public good of responsibility,rather than exploitation of followers or the private good of prestige, ...remains a positive idea” ~1973: 304!.
Later work by Keohane and Snidal showed that, as America’s heg-emonic position declined somewhat and other states became more eco-nomically important, these other large economic actors would also findit in their interest to contribute to the provision of these collective goods,so that a co-operative international regime could be maintained even ifthe hegemon declined ~Keohane, 1984; Snidal, 1985!.
This position is often characterized as the “benevolent hegemon”theory, although it would be more precise to describe it as the “benefi-cial hegemon” theory, since the underlying assumption of most of thecontributors to the discussion is that states are rational actors pursuingtheir own interests. The claim is simply that, under the circumstances ofthe second half of the twentieth century, the United States’s pursuit of itsown interests ~properly understood! would lead to policies that benefitedrather than harmed other states.
This brief summary obviously overlooks the nuances and complex-ities of this literature. What is important about that literature from myperspective, however, is that it asserts, explicitly or implicitly, that theUnited States bears a disproportionate share of the costs of providing thecollective goods that make a co-operative international economic orderpossible while other states are able to ride free to varying degrees.1 So,while everyone gains from co-operation, others gain more, proportion-ally, from the international economic order than the United States.
That is the claim that I want to challenge. In the larger project ofwhich this is a part, I argue that the United States enjoys a crucial posi-tional advantage in the international economic order because of the sizeof its economy and because of its role as the provider of the key cur-rency for reserves and international exchange. This positional advantageenables the United States to tilt the rules of international trade to its ownadvantage and, what is less often noticed, to achieve distinctive benefitsin trade, investment, and currency transactions. Common sense may beright after all.
In this paper I will focus on one part of this overall argument: theadvantages of the US dollar’s position as the key currency. I will arguethat, even though all states gain from the existence of a reliable mediumof exchange for international trade, the United States has received impor-
412 CARLA NORRLÖF

tant economic gains ~beyond the ones like seignorage that are familiarfrom basic economics! from the fact that the dollar, as opposed to anothercurrency, is the key currency. I will also show how the size of the Amer-ican economy reinforces the dollar’s key role, strengthening the posi-tional advantage of the United States in international economic affairs.Lastly, I demonstrate why other states have not, to this point, mounted aserious challenge to the dollar’s role despite the disproportional benefitsit provides to the United States, and I will briefly touch upon the ques-tion of the extent to which this is likely to change with the rise of theeuro.
Let me make clear at the outset that this is a positive, not a norma-tive, analysis. Some may applaud these effects of American hegemonyand others bemoan them, but these are not my concerns in this paper.My goal is simply to draw attention to what I believe to be some neglectedfacts about how the current international economic order works and tooffer an explanation of why it works this way. In the first part of thepaper I look at the empirical data on the question of how much the UnitedStates gains ~or loses! from its position as provider of the key currency.In particular, I draw attention to new data in economics on the net inter-national investment position ~NIIP! and valuation adjustments that dem-onstrate that the United States gains from its position, and to a muchgreater extent than previously realized. In the second part of the paper, Ioffer an analysis of why the United States is able to achieve these gains.Throughout the analysis, I operate within a rational actor framework inwhich the underlying assumption is that every state pursues its own eco-nomic advantage in international economic interactions. So the puzzle isnot why the United States would seek economic gains but why it is ableto achieve such substantial gains in an environment in which other statesalso seek to maximize their gains.
Abstract. Accumulating debt is usually harmful for states, but a cyclical deficit policy andlarge-scale borrowing have been beneficial for the United States. While structural changes inthe international political economy may cap America’s future ability to process debt, an empir-ical analysis of the economic dimensions of hegemony over the last quarter century showsunambiguously that the hegemon reaps disproportionate gains in the area of trade and invest-ment. This finding provides new insight on whether it is advantageous to be a hegemon.
Résumé. Les États pâtissent généralement de l’accumulation des dettes, mais une politiquede déficit cyclique et le recours à de larges emprunts ont pourtant été bénéfiques aux États-Unis. La capacité future de la puissance américaine à gérer sa dette sera peut-être entamée parles changements structurels subis par l’économie politique mondiale. Toutefois, l’analyseempirique des dimensions économiques de la situation d’hégémonie durant les vingt-cinq dern-ières années met à jour, et sans ambiguïté aucune, les gains disproportionnés générés parl’hégémon dans les domaines du commerce et de l’investissement. Cette recherche apporte unéclairage nouveau au débat sur les avantages liés à la position d’hégémon.

The Extent of the Benefits
In presenting the evidence, I do not refute the liberal understanding thatall states are potential beneficiaries of a system of open exchange butsimply seek to show that the balance of gains from international com-mercial and monetary relations tend to benefit the hegemon more thanother states. Moreover, in elaborating the particular advantages the UnitedStates enjoys, I do not mean to imply that it is entirely free of the disci-pline of the market, or that it does not face political constraints but thatits room for policy maneuver is more elastic than it is for other states.Some will find this so obvious as not even worth stating, let alone sub-stantiating, but as indicated in the previous section this has not been thedefault position in the international relations literature.
There is a longstanding debate about whether it is advantageous tobe the key currency. In the 1970s, Benjamin Cohen ~1977! saw the sys-tem producing disproportionate benefits to the United States while FredBergsten ~1975! was more skeptical and thought the disadvantages out-weighed the advantages. It has long been known that key currency sta-tus produces certain advantages: the privilege of interest-free loans, theinflation tax ~seignorage! and policy autonomy. There are two compo-nents to seignorage. On the one hand, the key currency country, in thiscase the United States, receives an interest-free loan when people allover the world hold dollars. Dollars travel to other countries becauseAmericans have bought something from other countries, merchandise, aservice or an asset. As long as the dollars stay abroad and do not comeback in search of goods, services or assets, foreigners holding dollarsare extending an interest-free loan to the United States, or the Treasury,to be more precise. The dollars abroad are nothing but paper IOUs, thatis, claims on the United States, but as long as they stay abroad nothingis being claimed, and the funds can be recycled through the bankingsector.
The second aspect of seignorage is related to the first. The moredollars in circulation the more the United States is able to borrow inter-est free from foreigners. It therefore has an interest in extending dollaruse and may be tempted to print more dollars. Excess printing amountsto an inflation tax that increases the dollar supply and reduces the valueof the dollars held abroad and therefore the value of what the UnitedStates has to pay back in the form of goods, services or assets.
Aside from seignorage, the key currency country gains in terms ofpolicy autonomy since it can transfer the costs of adjustment onto othercountries. These gains were highlighted by Benjamin Cohen who arguedagainst a return to the dollar standard in the late 1970s ~1977!. Key cur-rency status also has disadvantages however. The downside of the UnitedStates’s key currency status was understood to be the comparative cost
414 CARLA NORRLÖF
of fiscal or monetary policy, as opposed to the exchange rate, as a toolof adjustment ~Bergsten, 1975!.
Under the Bretton Woods fixed exchange rate system, the UnitedStates had greater policy autonomy than other states because of itsliquidity-creating role, which allowed it to run balance of paymentsdeficits through dollar outflows on the financial ~what was then calledthe capital! account without generating a loss of confidence in the cur-rency. Eventually, however, foreigners lost faith in the United States’scommitment to convert dollar claims into gold, fixed at $35 per ounce,causing the United States to unilaterally suspend dollar convertibilityand for the system of fixed exchange rates to collapse.
Under flexible exchange rates, dollar outflows are instead correctedthrough a lower price of the key currency, as its supply exceeds demand,or higher interest rates to induce dollar inflows to counteract outflows.In today’s system of ~for the most part! flexible exchange rates, dollarsare being exported on current account, with Americans purchasing for-eign goods in exchange for dollars. The cost of persistent dollar exportson current account is the buildup of external liabilities as a consequenceof capital imports ~that is, exports of dollar assets! on the financialaccount, and the possibility of higher growth-inhibiting interest rates, tofinance the deficit. Under flexible exchange rates, the cost of deprecia-tion has for the most part been borne by foreigners because the UnitedStates primarily sells dollar denominated assets while Americans holdforeign currency denominated assets abroad. Therefore, external liabili-ties are more or less insulated from changes in the exchange rate. Dollardepreciation does not increase the value of the United States’s externalliabilities but increases the value of its external assets.
On the other hand, appreciation does not lower the value of externalliabilities but lowers the value of American assets. In principle, the twoeffects could cancel out, or appreciation could dominate the effect ofdepreciation or the other way around. In practice, however, over the lastquarter century, growth in net external liabilities has to a greater extentbeen curtailed by depreciation than raised by appreciation on a cumu-lated basis. Although there have been years when net external liabilitieshave increased as a result of appreciation, the net effect of exchange ratemovements—weighing years where appreciation contributed to growthin net external liabilities and years when depreciation diminished net exter-nal liabilities—has been to limit the growth in net external liabilities.Moreover, external liabilities are not only affected by exchange rate move-ments but by changes in the relative value of foreigners’ capital holdingsin the United States as compared with Americans’ capital holdings abroad.Again, it is of course possible for a key currency country to suffer capi-tal and exchange rate losses. For instance, a net capital exporter may stillsee its external liabilities grow faster than its external assets. This has
Strategic Debt 415

not, however, been the experience of the United States in the last quartercentury. There is now new evidence from economics that the United Stateshas consistently benefited from capital and exchange rate gains, that is,valuation adjustments ~Cline, 2005; Gourinchas and Rey, 2005; Laneand Milesi-Ferretti, 2002!. I will draw on that evidence and perform anempirical analysis based on data from the Bureau of Economic Analysis~BEA! and the statistical bureaus of other industrialized countries, to sup-port my claim about the advantageous position of the United States, whichis still the key currency country.
The empirical proof for the hegemon’s ability to reap disproportion-ate benefits has three components: first, a capacity to sustain a long-term deficit policy, second, a return differential between borrowing andlending and, third, valuation adjustments. The United States has been indeficit on current account for 30 of the 37 years in the period 1970 to2007. Elsewhere, I argue that deficits have increased flexibility at vari-ous levels: by enhancing consumer choice, by raising the government’spolicy autonomy and by providing the American government with a sourceof bargaining power to negotiate agreements that facilitate the outwardextension of American firms. However, all these aspects cannot be devel-oped here. Therefore, I concentrate on demonstrating how trade deficitshave produced monetary rewards in the form of valuation adjustmentsand a return differential on net lending.
Valuation adjustments are changes in the value of assets as a resultof changes in the market price of the asset or the currency in which theyare denominated. How have Americans gained in terms of valuationadjustments? The value of the smaller stock of American foreign assetshas increased at a faster rate than the larger stock of foreign assets heldin the United States. Averaged over a quarter century, the change in thevalue of American overseas assets has been a bit more than 2 per centhigher a year than the value of foreign assets in the United States.
A quick exposition of the net international investment position ~NIIP!and how it relates to the financial and current account, which togethercomprise the balance of payments, a country’s economic transactions withthe rest of the world, is helpful in explaining how valuation adjustmentswork. When the United States, or any other country, imports more goodsand services than it exports, the country is, in effect, exporting capital.2
In order to finance the current account deficit, and to balance payments,the United States must be a net capital importer on the financial account.The financial account is the difference between the amount of capitalbeing imported by exporting assets and the amount of capital beingexported by importing foreign assets.3 Transactions on the balance ofpayments are recorded as flows, how much capital is flowing in or out ofthe country on the current and financial account. The international invest-ment position ~IIP! or the foreign asset position ~FA!, on the other hand,
416 CARLA NORRLÖF

is a balance sheet over the stock of financial assets and liabilities withthe rest of the world. The United States’s IIP is the difference betweenthe value of American overseas assets and liabilities ~that is, foreign assetsheld in the United States!. If this seems a bit pedestrian, bear with me,the difference will turn out to be important.
Since American liabilities have outstripped assets since the mid-1980s, the United States is currently a net debtor.4 These external liabil-ities are a consequence of the capital it has imported on the financialaccount in order to offset the capital it has exported by running a tradedeficit on current account.5
So, what are valuation adjustments? They are changes in the valueof assets and liabilities on the IIP as a result of market fluctuations orfluctuations in the exchange rate. In which ways could such changes beadvantageous or disadvantageous? Your preference between these twoalternatives will help clarify what is involved. Under the following con-ditions, which would you prefer: to be the in the position of Americaninvestors investing abroad or foreign investors in the United States? TheUnited States runs current account deficits for five years, and thereforeattracts $3,200 in foreign capital during this period ~on the financialaccount!. Let us say this is done by importing assets worth $3,000 andexporting assets worth $6,200, for a net capital inflow of $3,200. Nowimagine that the value of American assets, initially at $6,900, increasesto $14,000, that is, by an amount of $7,100. Meanwhile, the value offoreign assets in the United States, initially at $9,200, increases to$16,200, that is, by an amount of $7,000. In other words, even thoughAmerican investors added less capital to their stock of assets than theirstock of liabilities, the value of American assets increased more thanthe value of American liabilities. The United States’s net liability posi-tion actually improves by $100, from an initial net liability of $2,300 toa net liability of $2,200 at the end of the five-year period, because ofvaluation changes and in spite of importing capital net of exports to thetune of $3,200. In the absence of valuation adjustments, net capitalinflows of $3,200 would raise net liabilities by the same amount. Theeffect of valuation changes is to make the United States look like a netcapital exporter on the financial account, exporting capital worth $100over this period. In millions of dollars, this example illustrates how val-uation adjustments improved the United States’s NIIP between 2001 and2006 despite substantial net capital inflows, which in the absence ofvaluation adjustments deteriorate the NIIP. If you are able to see howvaluation adjustments can offset the growth in net liabilities despite netcapital inflows, you would rather be in the position of American inves-tors during this five-year period.
How representative are these changes? While the United States’s netliability position improved despite considerable capital inflows during
Strategic Debt 417

this period, has it not at other times deteriorated more than we wouldexpect on the basis of net capital inflows so that differences between netfinancial f lows and the NIIP are ironed out over time? Even whenmeasured over a sustained period, such as the last quarter century, theUnited States has experienced significant exchange rate and capital gainson its net international investment position. As a result, growth in netliabilities has been smaller than what we would expect given the net finan-cial flows required to fund the deficit on current account. Put differ-ently, valuation adjustments curb the increase in America’s externalliabilities, limiting their constraining effect.
Thanks to the data made available by the BEA, which started report-ing the value of FDI in 1982, one can get an idea of the size of valuationadjustments over the last quarter century. Between 1983 and 2006, netfinancial flows into the United States were roughly $5.9 trillion. How-ever, during this period the NIIP only deteriorated by $2.3 trillion. Thedifference is $3.6 trillion, which averaged over 24 years is roughly $150billion a year. As a share of GDP, the United States attracted capital tothe tune of 65 per cent of GDP between 1982 and 2006 in order to funddeficits on current account but the NIIP only declined by 23 per cent ofGDP. Economists variably refer to the difference between cumulated netfinancial flows and total changes in the NIIP ~in the form of valuationadjustments! as a “transfer of wealth,” a “free ride” or “debt for free”~Cavallo, 2004; Cline, 2005!.
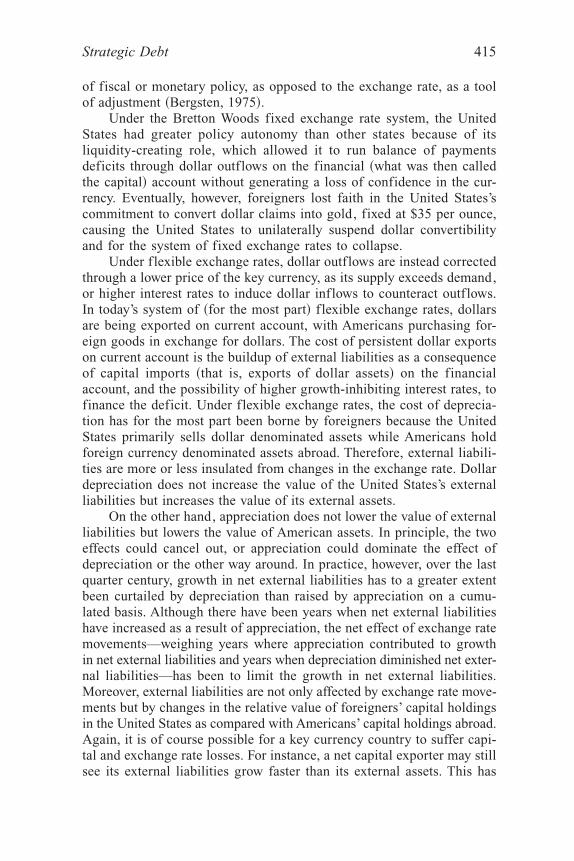
What would we expect valuation adjustments to look like if the UnitedStates did not have an advantage? Figure 1 shows what the NIIP wouldhave been if the market value of American assets and liabilities increasedat the pace of net capital imports. The shaded grey area shows the evolutionof the NIIP since the early 1980s and reveals that the United States becamea net debtor in 1989. If one were to calculate the NIIP on the basis ofcumulated net financial flows over this period without regard for fluctu-ations in asset price or in the dollar, and add that amount tothe 1982 value of the NIIP, one would end up with the white area abovethe thick grey line instead of the shaded grey area. As such, the white zonerepresents the deterioration in the NIIP as a result of “valuationadjustments”—changes in the net worth of assets due to changes in mar-ket price and the dollar. Of course, the predicted NIIP based on net finan-cial flows ~that is, the white area! assumes that countries have the sameportfolio, that price changes within each asset class are the same and thatforeign exchange prices remain constant or at least that the net effect ofchanges in currency price is the same across countries, which obviouslyis not the case.6 Nor is the point that all asset prices should change in thesame way or that the price of a specific asset should change in the sameway in different countries or to propose a return to fixed exchange rates;the point is to provide some sort of basis for considering valuation effects.
418 CARLA NORRLÖF

By comparing the NIIP with and without valuation effects, we can startto appreciate how important they have been in stabilizing net liabilities.
A closer look at Figure 1 shows how these valuation adjustments haveoffset the growth in net liabilities. From Figure 1, we see the evolution ofnet financial flows as represented by the dotted line, whose values canbe gauged from the secondary axis. The United States has imported morecapital than it has exported since 1983. Net capital inflows increased upuntil 1988. Although net capital imports remained positive, capital wasimported at a slower pace between 1988 and 1992. The NIIP ~again, theshaded grey area! continued to deteriorate. The trend from 1992 to 1998was again to increase net capital imports. Except for between 1993 and1994, when the NIIP actually improved about 5 per cent of GDP, therewas a general weakening in the net liability position. Similarly, the NIIPimproved by 1 per cent of GDP in 1999 even though net financial inflowsamounted to 2.5 per cent of GDP. The other surprise is the considerableimprovement in the NIIP between 2001 and 2006 ~as discussed in thenumerical example above! despite accelerating net capital inflows. Cumu-lated net capital imports between 2001 and 2006 amounted to 31 per centof GDP whereas the NIIP recovered by 1 per cent of GDP.7
Second, the return differential is the difference between the return oninvestments owned by Americans abroad and the return on investments
FIGURE 1Valuation Adjustments
Source: Author’s calculations based on data from Bureau of EconomicAnalysis, US Department of Commerce ~2007a, 2007b, 2007c!.
Notes: Net financial flows are measured on the second Y-axis.
Financial derivatives are not reflected in the data. Valuation adjustments wouldbe even higher if they were reflected.
Strategic Debt 419

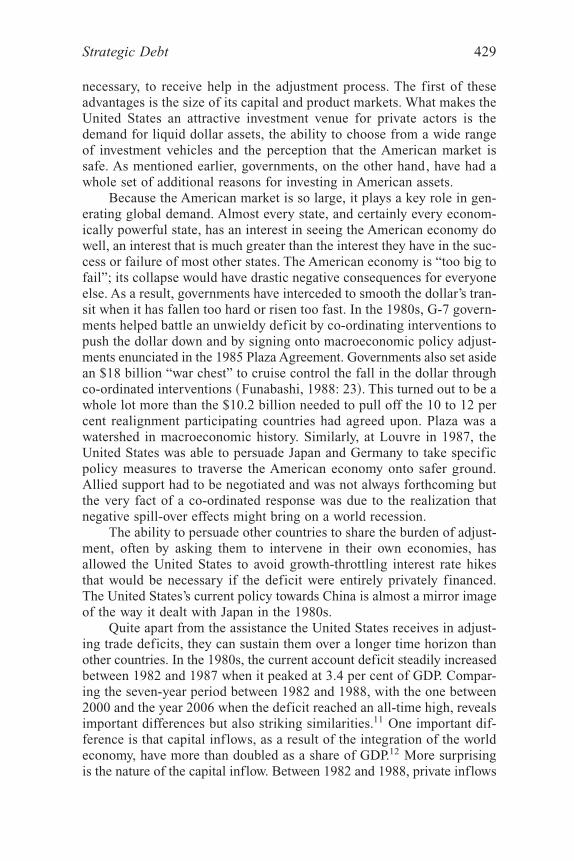
owned by foreigners in the United States. Americans have consistentlyreceived greater payments on a smaller stock of foreign assets than for-eigners have received on a greater stock of assets held in the United States.A positive return differential despite growth in net liabilities is unusual.Normally, we should expect a higher stock of liabilities than assets togenerate higher income payments than receipts. Yet, notwithstanding twodecades of net debtor status, income on American overseas investment hascontinued to exceed payments on foreign investment in the United States~see Figure 2!. The positive return differential implies that accumulatingnet liabilities has so far been less onerous than it usually is. Still, the sec-ular increase in net liabilities over the past 25 years involves risks. Reg-ular current account deficits and the associated increase in net liabilitiesleaves the United States vulnerable to higher interest rates in the futurethat could wipe out this positive differential.
Valuation Adjustments and the Return Differential in ComparativePerspective
Are other countries in a comparably favourable position? There are exam-ples of other countries gaining from valuation adjustments but no othercountry has such a large spread between net foreign assets and the cumu-lative current account ~Lane and Milesi-Ferretti, 2006: 31!. Nor is thereany country that has enjoyed positive investment income for such a longtime despite recurrent sizeable current account deficits and a concomi-
FIGURE 2Balance of Income
Source: Author’s calculations based on US Bureau of Economic Analysis~2007b!.
420 CARLA NORRLÖF

tant deterioration in its net international investment position. Whetherwe are surprised by the facts or not, the United States appears as some-thing of an anomaly.
According to Lane and Milesi-Ferretti, three other countries—Britain, Switzerland, and Canada—also benefit handsomely from the dis-crepancy between the value of the net foreign asset position and thecumulative current account in the period 1972–2004 ~2006: 31!. Amongthese countries, the United States and the United Kingdom stand out.Uniquely, they have benefited from persistent current account deficitsin the form of a positive income balance and valuation adjustments. Incontrast, Switzerland remains a net creditor. While valuation adjust-ments have worked in Canada’s favour, its trade balance has consis-tently been positive, its income balance has been negative for at least16 years, and on the whole its net liabilities are lower than the UnitedStates’s when scaled to either GDP or population ~DFAIT, 2006; Stat-can, 2006a; Statcan, 2006b; USCB, 2006!. Australia is another case inpoint. Like the United States, it has had persistent current account def-icits, and its net liabilities are much higher when scaled to GDP andpopulation but unlike the United States it did not experience substantialgains in the form of valuation adjustments or benefit during the personconsidered by Lane and Milesi-Ferretti from a positive income transferon current account.8 In particular, the change in net liabilities was actu-ally lower than the cumulated current account for the period 1972–2004and the income balance was negative for the entire duration of this period~Lane and Milesi-Ferretti, 2002!. So, while the United Kingdom andCanada have experienced substantial capital and exchange rate gains onthe net international investment position, Australia has not. And, whilethe United Kingdom, like the United States, benefits from positive netincome flows, Canada and Australia do not.
The United States and the United Kingdom are the only two coun-tries that have enjoyed a positive balance of income on current accountdespite large current account deficits. Only they have experienced sub-stantially positive capital and exchange rate gains notwithstanding netliabilities that are a sizeable share of GDP. Out of the two, the UnitedStates has enjoyed higher capital and exchange rate gains despite highernet liabilities. When scaled to population, the United States’s NIIP is 321per cent higher than the United Kingdom’s, 218 per cent higher whenscaled to GDP ~ONS, 2006a; ONS, 2006b!. The structure of the UnitedStates’s and the United Kingdom’s investment position is optimal; bothcountries are long in foreign equity and short in debt ~Lane and Milesi-Ferretti, 2006: 224!. It is certainly interesting to note that the currenthegemon of the international system, and the hegemon of the nineteenthcentury, have both experienced extraordinary positive valuation adjust-ments. At the moment, I do not have an account for the success of the
Strategic Debt 421

UK, but I think I can point to some positional advantages enjoyed by theUnited States that have contributed to these gains.
Why the Debt Is Strategic
Why has the United States experienced positive valuation changes and apositive return differential? A possible explanation is that American inves-tors are smarter, or better at picking winners, than foreigners investingin the United States. That would be an essentialist or cultural argument,one which locates the reason for these gains in American character, theattributes of the government or the American people. An alternative expla-nation is serendipity, chance or fate. A more plausible explanation, isthat the United States benefits because it enjoys a structural advantage.That is what I will try to show in this section. After pointing to the struc-tural advantage which make the benefits higher and the constraints looserfor the United States, I will highlight the risks associated with a tradedeficit strategy.
The Asymmetry in the Structure of the Investment Position
Why does the United States benefit from valuation adjustments and whatexplains the positive return differential in view of sizeable net liabili-ties? The reason can be found at three different levels: the structure ofthe United States’s international investment position, superior capital gainswithin each investment category and a hedge against the cost of depre-ciation by borrowing in dollars.
Before moving on to the next section, I should make clear right awaythat the current arrangement whereby foreigners are able to invest in theUnited States and Americans are able to invest abroad is mutually ben-eficial. The requisite monetary calculation may however look quite dif-ferent depending on whether the investors are private or official. Whereasprivate investors are motivated by narrow economic rewards, official inves-tors at times have broader, more long-term, political economy objec-tives, such as sustaining an export market, repaying dollar denominateddebt or avoiding inflation and social instability. For those reasons, for-eign governments are often willing to sacrifice monetary gains in theirdealings with the United States that they would not be prepared to sac-rifice in their dealings with other states.
Gapping
The ability to borrow at low cost is tied to the continued role of the dol-lar in the world economy. As world income grows, the demand for liquiddollar assets grows, and the United States is quite capable of providing a
422 CARLA NORRLÖF

wide range of assets—cash, bank deposits, public and private bonds~McKinnon, 2001: 4!. Recycling low-cost foreign capital by lending tohouseholds on soft terms, banks act as intermediaries between the inter-national and home market. The United States has long been regarded asa financial intermediary, providing long-term loans through direct invest-ment and purchases of other foreign securities while satisfying foreign-ers’ demand for liquidity by offering them low but “safe” returns onshort-term securities held in the United States ~Despres, Kindlebergerand Salant, 1966!.
This view of the United States as “banker of the world” has beentaken to another level in the characterization of the United States as a“world venture capitalist.” Over time, the net foreign asset position hasbecome increasingly leveraged; like a venture capitalist, the United Stateshas a leveraged portfolio, purchasing risky assets through low-cost bor-rowing ~Gourinchas and Rey, 2005: 15–16!. When undertaken by banks,the practice of borrowing short—in effect selling low-yield securities tobuy high-yield securities—is called “gapping.” Private investment bank-ers call this strategic debt.
The first structural advantage lies in the structure of the UnitedStates’s IIP. Since foreigners come to the American market for liquid dol-lar assets, we should expect the relative share of risky assets to be smalleron the liability side than on the asset side. This asymmetry is reinforcedby the fact that American investors do not seek safe investment solutionsin other countries but higher returns than they can achieve at home. Withaccess to a cheap ~foreign! supply of capital, they are well-positioned toundertake risky investments abroad.
It seems plausible that the American government’s ability to secureinvestments at home, both militarily and through a strong tradition of prop-erty rights protection, has reinforced the low risk premium on Americanborrowing. It also seems plausible that the American government’s influ-ence has encouraged risk taking on the part of its firms, especially whenundertaking foreign direct investment abroad, which would have been pro-hibitively costly for firms not backed by a government capable of advo-cating on their behalf. For example, there are many well known examplesof the American government negotiating with foreign regimes, and evenintervening militarily, to protect American property. However, space doesnot permit a systematic exploration of these hypotheses in this article.
In addition to the higher returns that arise as a result of the structureof the United States’s international investment position, the United Statesalso enjoys higher returns on its assets than it pays on liabilities withineach investment category ~Gourinchas and Rey, 2005: 17–18!. The returndifferential is highest on foreign direct investment. Returns on Americandirect investment abroad is 6 per cent higher than returns on foreign directinvestment in the United States ~Kouparitsas, 2005: 2!. Again, the pro-
Strategic Debt 423

pensity to venture into riskier areas could explain part of the higher returnon American foreign direct investment. There are other reasons as well.The Congressional Budget Office notes three reasons: a longer historyof American FDI abroad than FDI in the United States, greater risk tak-ing, tax incentives for foreign firms in the United States to under-reportprofits and for American firms to overstate overseas profits ~CBO, 2005!.According to the study, the incumbency advantage of American firmsabroad is the most plausible reason for the higher returns, while they seerisk taking as accounting for 20 per cent of the higher gains and findlittle support for tax-induced profit shifting ~CBO, 2005!.9
By collapsing the various dimensions of the United States’sadvantage—the asymmetry in the structure of its investment position, theasymmetry in what it receives and pays within each investment class, aswell as built-in safeguards against the cost of depreciation—we can get abetter idea of where the benefits are most conspicuous.
Table 1 provides a systematic comparison of the amount of capitalthe United States has attracted and the amount it has sent abroad, as wellas the change in the market value of the assets, by underlying detail. Inthe aggregate, investment over the 25-year period spanning 1982–2006,has been positive sum. American investors have gained from investingabroad and foreign investors have gained from investing in the Americanmarket. Of course, some American investors have lost money on theirforeign investment and some foreign investors have lost money on theirAmerican investments but overall the increased integration of financial
TABLE 1Capital flows and the Asset and LiabilityPosition in Comparative Perspective,1982–2006
US Outflow Relative to US Inflow
1 Total assets 55.2%A. Official assets 0.1%B. Private assets 66.1%i. portfolio investment 57.6%ii. FDI 99.2%
Change in Market Value of Assets Relative to Liabilities
2 Total assets 84.3%A. Official assets 2.8%B. Private assets 100.6%i. portfolio investment 90.0%ii. FDI 134.3%
Source: Author’s calculations based on US Bureau of Eco-nomic Analysis ~2007a, 2007b, 2007c!.
424 CARLA NORRLÖF

markets has been mutually rewarding. Notwithstanding these joint ben-efits, the tables below suggest greater benefits for American investorsabroad than for foreign investors in the United States.
The table depicts capital flows and changes in the international invest-ment position in comparative perspective in the quarter century between1982 and 2006. Row 1 in the table reveals that the United States exportsabout half the amount of capital it imports. If we compare Americancapital outflows with American capital inflows, we see two outliers. First,as shown in row 1A, American official investment is negligible in termsof official investment in the United States. Second, the amount of Amer-ican foreign direct investment is roughly the same as foreign direct invest-ment in the United States ~row 1B.ii!.
Despite overall outflows being about half the amount of inflows,row 2 indicates that the change in the value of all American assets heldabroad is 84 per cent of the change of all foreign assets held in the UnitedStates. As shown in row 2B, the change in the value of American pri-vately held overseas assets is comparable to the change in privately heldforeign assets in the United States.
Table 2 takes into account how much capital is exported and importedwhen comparing changes in the market value of American assets andliabilities. In so doing, it points to changes in the market value of Amer-ican foreign assets relative to foreign assets in the United States per dol-lar invested. Thus, we are able to see how much the United States gainsrelative to countries investing in the United States both on a cumulatedand yearly basis, as shown in rows 1 and 2, respectively.
TABLE 2Changes in the Market Value of AssetsRelative to Liabilities per Dollar Invested
Cumulative Changes Between 1982–2006
1 Total assets 152.7%A. Official assets 4075.3%B. Private assets 152.1%i. portfolio investment 156.2%ii. FDI 135.3%
Average Yearly Change
2 Total assets 2.2%A. Official assets 165.6%B. Private assets 2.2%i. portfolio investment 2.3%ii. FDI 1.5%
Source: Author’s calculations based on US Bureau ofEconomic Analysis ~2007a, 2007b, 2007c!.
Strategic Debt 425

Even when one takes into account how much Americans invest abroadand how much foreigners invest in the United States, thus looking at thechange per dollar invested, the change in the market value of Americanassets is still higher than it is for foreign investment in the United States.Despite substantially lower capital outflows than inflows, the change inAmerican assets held abroad relative to foreign assets held in the UnitedStates is 153 per cent ~see row 1!, which implies that American overseasassets have increased 53 per cent more than foreign-held assets in theUnited States on a cumulated basis since 1982. While governments oftenhave a mixed bag of political economy incentives when investing, pri-vate actors are presumably motivated by profit alone, so it is surprisingto see that the change in the market value of American private assetsexceeds the change in foreign private assets by 52 per cent ~row 1B!,portfolio assets by 56 per cent ~row 1B.i! and FDI by 35 per cent ~row1B.ii!. Disaggregating these gains, we see that the United States gains awhole lot more on its official investment abroad than foreign govern-ments gain on official investment in the United States ~row 1A!, moreprecisely 4075 per cent more.
The average yearly change is 2.2 per cent higher for American assetsthan liabilities ~row 2!, 165 per cent higher for foreign official invest-ment ~row 2A!, 2.2 per cent higher for private assets ~row 2B!, 2.3 percent higher for portfolio investment ~row 2B.i!, 1.5 per cent higher forFDI ~row 2B.ii!.
These valuation adjustments explain why the United States’s net lia-bility position has risen more slowly than net capital inflows. These gainsare not just a matter of the structure of the American investment posi-tion, since the change in the value of American assets is higher than thechange in its liabilities for every investment category. Moreover, whilesome of the positive valuation changes can be attributed to superior cap-ital gains, the advantage is also linked to the ability to borrow in dollar-denominated assets and to lend by purchasing assets predominantlydenominated in foreign currency. This is the topic of the next section.
Playing Dollar Cycles
As the reserve currency country, the United States has the privilege ofborrowing in its own currency. Borrowing can therefore be financed byprinting dollars and, as a result, downward pressure on the dollar, notilliquidity, is the main constraint on American borrowing. Of course, theUnited States itself cannot print dollars at will; someone also has to bewilling to hold them. At the same time, the American market’s ability toabsorb large amounts of goods, services and assets provides foreignerswith a motivation to hold dollars.
426 CARLA NORRLÖF

Under Bretton Woods, the steady outflow of dollars made it lessand less credible that the United States had enough gold reserves to hon-our outstanding dollar claims, the so called Triffin dilemma which led tothe system’s demise. The credibility issue remains a problem under flex-ible exchange rates but it has less drastic consequences as dollar depre-ciation intercedes to bring down the current account deficit and the ~dollar!value of net liabilities.
A falling dollar raises export competitiveness while increasing thevalue of whatever portion of overseas assets are denominated in foreigncurrency. Meanwhile, the negative effect that depreciation normally hason external liabilities when borrowing occurs in local currency is neu-tralized since most American borrowing from abroad is in dollars. Sinceprolonged deficits imply depreciation, the cost of adjustment would havebeen higher for the United States had it not been the key currency coun-try because the decline in the value of the dollar would have adverselyaffected liabilities. Although liabilities are not reduced as a result of appre-ciation when borrowing occurs in dollars ~as opposed to foreign cur-rency!, protecting against the cost of depreciation is especially importantwhen a country experiences a long-term decline in the value of its cur-rency. Although valuation adjustments seem to suggest a secular declinein the value of the dollar, whether the long term trend has been one ofdecline is of course an empirical question. According to the data avail-able from the Federal Reserve Bank of St. Louis, the dollar has declinedagainst major currencies over the period in question, that is, 1982–2006,but not on a broad trade-weighted average. This is a matter which meritsfurther research. In particular, the imperfect overlap between capital andmerchandise exporters to the United States suggests that the basket ofcurrencies against which the value of the dollar is gauged should beinvestment-weighted rather than trade-weighted.
It is true that investors in industrialized countries with advanced cap-ital markets also can borrow in their own currency, at least partially, andhedge against the remaining foreign currency risk. Hedging is expensive,though, prohibitively so for small-scale investors. To the extent that hedg-ing has occurred, it has not necessarily translated into exchange rate gainsin the form of valuation adjustments. For instance, by 2005, the financialsector in Australia, hedged about 85 per cent of its foreign currency debt~93 per cent in 2001! whereas other borrowers hedged 46 per cent of theirdebt ~38 per cent in 2001! but as mentioned earlier the results have beenmixed ~Harrison and Hawkins, 2007: 70!.
The dollar has come down about 40 per cent against major curren-cies in a period of five to seven years. There have been two major roundsof dollar appreciation. The first upward trend started at the end of the1970s when the dollar regained strength after falling for almost a decadebetween 1971 and 1978. From 1978 to 1985 the dollar appreciated sig-
Strategic Debt 427

nificantly against major currencies. Then in the decade spanning the mid-1980s until the mid-1990s the dollar parachuted again. This period wasfollowed by a second dollar rally which lasted until 2002. The dollar iscurrently in its third downward phase. This weakening is part of a regu-lar pattern of dollar cycles.
What plays a more prominent role in valuation adjustment, changesin asset price or exchange rate fluctuations? Both forces influence theNIIP, but as the value of the asset and liability positions continues toexpand in an increasingly globalized economy, we should expect greaterimpact from a fluctuating dollar. Size matters in considering valuationeffects ~Tille, 2003!. One way to illustrate how the size of the internationalinvestment position affects valuation adjustments is to compare two yearswhen the net international investment position was similar. For example,the NIIP in 2001 and 2006 were roughly equal in size, if anything the NIIPwas slightly higher in 2001 ~$2.34 trillion! than in 2006 ~$2.08 trillion!.How would a 10 per cent depreciation affect the NIIP in either year, assum-ing 63 per cent of American overseas assets were held in foreign curren-cy?10 In 2001, American overseas assets were $6.9 trillion ~and foreigninvestment in the US was $9.2 trillion!. In 2006 American overseas assetswere $15.3 trillion ~and foreign investment in the US was $17.4 trillion!.Since foreign investment in the United States is mostly dollar denomi-nated, depreciation of the dollar would not affect the value of foreigninvestment in the United States, but it would increase the dollar value ofAmerican investment abroad. The effect of a 10 per cent depreciationwould therefore have been to reduce the NIIP by $436 billion in 2001 andto reduce it by $966 billion in 2006. Despite a similar net internationalinvestment position in 2001 and 2006 ~in fact, a somewhat higher NIIPin 2001 than in 2006!, a 10 per cent depreciation would have reduced theNIIP by $530 billion more in 2006 than in 2001 because it would haveaffected a higher asset position. As a share of GDP, the reduction in netliabilities would have been 3 per cent higher in 2006 than in 2001.
The considerable size of the United States’s asset and liability posi-tion has served as a bulwark against a weakening of the NIIP. The UnitedStates’s structural advantage consists in being less affected on the liabil-ity side. As long as the beneficial effect of appreciation, by way of lim-iting the growth in external liabilities, pales in comparison with the benefitfrom protecting the liability position from deteriorating as a result ofdepreciation, this arrangement will continue to benefit the United States.
Who Bears the Cost?
The United States has a series of structural advantages, which allows itto prolong trade deficits for longer periods than other countries and, when
428 CARLA NORRLÖF
necessary, to receive help in the adjustment process. The first of theseadvantages is the size of its capital and product markets. What makes theUnited States an attractive investment venue for private actors is thedemand for liquid dollar assets, the ability to choose from a wide rangeof investment vehicles and the perception that the American market issafe. As mentioned earlier, governments, on the other hand, have had awhole set of additional reasons for investing in American assets.
Because the American market is so large, it plays a key role in gen-erating global demand. Almost every state, and certainly every econom-ically powerful state, has an interest in seeing the American economy dowell, an interest that is much greater than the interest they have in the suc-cess or failure of most other states. The American economy is “too big tofail”; its collapse would have drastic negative consequences for everyoneelse. As a result, governments have interceded to smooth the dollar’s tran-sit when it has fallen too hard or risen too fast. In the 1980s, G-7 govern-ments helped battle an unwieldy deficit by co-ordinating interventions topush the dollar down and by signing onto macroeconomic policy adjust-ments enunciated in the 1985 Plaza Agreement. Governments also set asidean $18 billion “war chest” to cruise control the fall in the dollar throughco-ordinated interventions ~Funabashi, 1988: 23!. This turned out to be awhole lot more than the $10.2 billion needed to pull off the 10 to 12 percent realignment participating countries had agreed upon. Plaza was awatershed in macroeconomic history. Similarly, at Louvre in 1987, theUnited States was able to persuade Japan and Germany to take specificpolicy measures to traverse the American economy onto safer ground.Allied support had to be negotiated and was not always forthcoming butthe very fact of a co-ordinated response was due to the realization thatnegative spill-over effects might bring on a world recession.
The ability to persuade other countries to share the burden of adjust-ment, often by asking them to intervene in their own economies, hasallowed the United States to avoid growth-throttling interest rate hikesthat would be necessary if the deficit were entirely privately financed.The United States’s current policy towards China is almost a mirror imageof the way it dealt with Japan in the 1980s.
Quite apart from the assistance the United States receives in adjust-ing trade deficits, they can sustain them over a longer time horizon thanother countries. In the 1980s, the current account deficit steadily increasedbetween 1982 and 1987 when it peaked at 3.4 per cent of GDP. Compar-ing the seven-year period between 1982 and 1988, with the one between2000 and the year 2006 when the deficit reached an all-time high, revealsimportant differences but also striking similarities.11 One important dif-ference is that capital inflows, as a result of the integration of the worldeconomy, have more than doubled as a share of GDP.12 More surprisingis the nature of the capital inflow. Between 1982 and 1988, private inflows
Strategic Debt 429

averaged 91 per cent of overall inflows whereas between 2000 and 2006they only averaged 82 per cent. Not only have official inflows increasedas a share of overall inflows but the interests financing the deficit havechanged as well. Elsewhere, I explore how the shifting composition ofreserve holders and Treasury purchasers might affect deficit financing.Although the analysis here is more retrospective, establishing a past advan-tage, the recent purchase of the Abu Dhabi Investment Authority ~asovereign wealth fund! of a 4.9 per cent stake in Citigroup in exchangefor a $7.5 billion cash injection, points to an interesting mix of incen-tives. Foreigners are not investing in the United States out of altruismbut pursuing the best alternatives available to them. By diversifying theirfunds, countries with high savings prevent their currencies from appre-ciating and can avoid inflationary pressures, which could exacerbateincome inequalities and fuel social unrest in their own countries. Byinvesting in the American economy, the dollars spent on oil and otherforeign goods are finding their way back to the United States to ensurethat the economy continues to thrive. The very expectation that foreigninvestors will step in to pick up assets at bargain prices may be one ofthe reasons why American investors behave as if they have some form ofsecurity in making riskier investments.
A Sustainable Advantage?
How long can this advantage persist? One of the points of my argumentis that the advantage has been sustainable because deficits have not beensustainable. If the United States were able to indefinitely raise importsover exports, dollar depreciation would never intercede to correct the def-icit, and valuation adjustments would not be significant. I highlight thedifference between the sustainability of the deficit and the sustainabilityof American privilege because my argument, which is the latter, is some-times mistaken for the former. While I do argue that the United States,as a result of its structural advantage, can maintain deficits for a longertime than other countries, I do not claim that it can do so forever or thatit can calculate or control when adjustment will set in. All I am claimingis that these cycles have been beneficial, that they have produced bothmonetary and policy ~autonomy! rewards, and that they are likely to doso in the future. This being said, there are of course risks and limits tosuch a policy.
To finance continuous deficits, the United States must sell more andmore assets, which means it must increase liabilities. No country canincrease liabilities to finance growing current account deficits in perpe-tuity. Anticipating a correction, the demand for American assets will falland so will the dollar. Private investors will be especially leery of plac-
430 CARLA NORRLÖF

ing capital in the United States as long as the prospect of purchasingAmerican assets at a discount does not adequately compensate for theexpectation of a continued fall in the dollar exchange rate. This dynamichas been played out since 2002. So far interest rates have not been growththrottling, but if foreigners expect a sharp decline in the dollar, they willdemand a higher risk premium to hold dollar-denominated assets. Inter-est rates would have to rise to prevent a precipitous slide in the dollarexchange rate. That would not only dampen investment and growth butincrease payments on the debt portion of external liabilities, which couldjeopardize the positive return differential. In short, the risk is a reces-sion, prolonged and aggravated, because of difficulty attracting foreigncapital. The effects on the economy could be huge. Although I have arguedthat structural advantages combine to limit the downside of running per-sistent trade deficits while maximizing the benefits, it is of course pos-sible that despite the four successful dollar rounds over the past 25 years,the current round marked the last winning cycle, putting the country’sfuture prosperity at risk. Indeed, some economists have predicted thatthe United States, as a result of growing liabilities, is headed for a longhard fall ~Gray, 2004; Obstfeld and Rogoff, 2005; Setser and Roubini,2005!.
There are good reasons to believe that the cycle could break. One ofthe most profound changes in the economic order after the breakdown ofthe Bretton Woods system of fixed exchange rates was the onset of acompetitor currency. A thorough treatment of how the arrival of the eurowill affect America is beyond the scope of this article, but some keyaspects that will determine whether the euro has the potential to under-cut the United State’s key position are worth noting.
While the euro serves as a limiting factor, the dollar can be expectedto play a continued special role in the world economy. The euro is mak-ing an inroad as the currency of denomination for invoicing but the dol-lar is still the main unit of account ~Cohen, 2003: 580!. Outside theeurozone, the euro has not yet emerged as a vehicle currency for trade~ECB, 2005!. Key commodities, such as oil, continue to be priced in dol-lars despite the occasional rumour that oil exporters are contemplating aswitch to euros ~Looney, 2004!. The dollar has continued to serve as theprimary medium of exchange and persists as the main store of value ininternational financial markets. Before the euro was launched in 1998,more than 43 per cent of all currency trades involved the dollar, a sharethat rose slightly above 44 per cent in 2004 ~BIS, 2005: 9!. As reservecurrency, the dollar is still the most popular currency with central banks.Almost 66 per cent of the $2.6 trillion foreign exchange reserves heldglobally in 2005 were in dollars ~IMF, 2005!.
However, the future direction of European monetary co-operationcould significantly boost the euro’s private use. At present, the United
Strategic Debt 431

States emerges well ahead of the eurozone but not ahead of a possibleEurope of 15 when all the indicators that determine the size of worldcapital markets are taken into account. The United States’s markets forequity and debt are considerably larger than those of the eurozone. Bankcredit is the only financial domain where the eurozone has a lead. Sincesecurities are more “fungible,” American capital markets which are basedon securities financing have a major advantage over financial markets inEurope which depend on financing through bank loans ~Hartmann andIssing, 2002: 320!. Simulations suggest that British participation in theeurozone, in particular, will determine its future ~Chinn and Frankel, 2005:20!. Yet for political reasons, Britain is one of the EU members leastkeen on adopting the euro. In addition, the battle for influence withinkey European institutions and real differences among euro economies alsomake it unlikely that the euro will be adopted on a scale similar to thedollar any time soon.
Conclusion
When the United States experienced large trade deficits in the 1980s,scholars debated whether a hegemon was needed for the system to remainstable. Central to the theory was the assumption of a benevolent hege-mon, willing to shoulder most of the costs of public good provision eventhough smaller actors would benefit disproportionately from them. In thiscontext, hegemonic decline was viewed as a major threat to internationalco-operation. Various explanations for why states might nonetheless col-laborate were offered in response to this dismal outlook. A seminal con-tribution to this debate seriously questioned the theory’s assumption of ahegemon unable to structure international relations in its favour ~cf. Snidal,1985!. The purpose of this article is to provide a better understanding ofthe benefits of a deficit policy, and how the United States’s reserve cur-rency status produces tangible and intangible benefits. The gains comein the form of a return differential on the balance of income and valua-tion adjustments that check the growth in net liabilities, as well as greaterpolicy manoeuvre. As in the 1980s, not everyone will agree that thesegains outweigh the knife-edge walk necessary to achieve them. Resolv-ing that trade-off requires probing into the probability of future failure.In light of the last quarter century, the system seems to have had built-instabilizers, and America’s relative decline to have taken place within well-defined limits. The ascendancy of Europe, the euro in particular, mighthave tightened those constraints. However, until now the United Stateshas conformed to the game-theoretic finding that an actor with largerresources can afford to wait longer and expose itself to greater risks thananyone else in the system.
432 CARLA NORRLÖF

Notes
1 This distributional feature of the theory did not receive much attention when the theorywas first developed because the focus of the literature was on the fundamental ques-tion of whether or not co-operation was possible, not on the allocation of gains fromco-operation.
2 The trade balance appears on the current account, along with net income receiptsand net unilateral transfers ~loosely, foreign aid!. Both net income receipts and netunilateral transfers are a much smaller portion of the current account and thereforedo little to counteract the capital outflow associated with the trade deficit.
3 The actors carrying out the transactions can be either private or official and the secu-rities themselves can be issued by a private or government entity.
4 Depending on whether one looks at the current or market value of the NIIP, one willconclude that American liabilities started to exceed American foreign assets in 1986or 1989.
5 Since the IIP is a record of all kinds of assets, debt instruments such as bonds, for-eign direct investment and stocks, it is preferable to refer to the net foreign claims onthe United States as external liabilities not external debt.
6 Specifically, it assumes that foreign investors collectively have the same portfolio ofAmerican assets as American investors do abroad, that price changes are the samewithin each asset class and that the net effect of changes in the price of the dollar hasbeen zero, or, alternatively, that the net effect of price changes emanating from dif-ferences in asset composition, from differential valuations within each asset classand in the value of the dollar is zero.
7 These calculations are based on BEA ~2007a, 2007b, 2007c!.8 Austraila did experience positive valuation adjustments in the period 1986–2006,
although these were not as strong as the United States’s. Author’s calculations basedon ~IMF, 2008!.
9 It is worth noting that the CBO does not include valuation adjustments in calculatingthe return differential between US FDI and foreign FDI ~in the US!.
10 The assumption of 63 per cent is conservative and based on Cline ~2005: 42!.11 Here I should flag that, as far as the composition of capital inflows is concerned,
there are marginal differences in choosing 2000–2006, as opposed to 1992–2006~which captures the long-term build-up in the deficit!, as the comparator group.
12 Between 1982 and 1988, average capital inflows were approximately 4 per cent ofGDP whereas they amounted to 10 per cent of GDP between 2000 and 2006. Author’scalculations of capital inflows in this section are based on BEA ~2007a, 2007b!.
References
BEA ~US Bureau of Economic Analysis!. 2007a. Balance of Payments: Table 1. US Inter-national Transactions. Washington, DC: Dept. of Commerce.
BEA ~US Bureau of Economic Analysis!. 2007b. Current-dollar and “Real” GDP. Wash-ington, DC: US Department of Commerce.
BEA ~US Bureau of Economic Analysis!. 2007c. Table 2. International Investment Posi-tion of the United States at Yearend, 1976–2006. Washington, DC: Bureau of Eco-nomic Analysis, US Department of Commerce.
Bergsten, Fred C. 1975. The Dilemmas of the Dollar. New York: New York UniversityPress.
BIS ~Bank for International Settlements!. 2005. Triennial Central Bank Survey: ForeignExchange and Derivatives Market Activity in 2004. Basel: Bank for InternationalSettlements.
Strategic Debt 433

Brawley, Mark. 1995. “Political Leadership and Liberal Economic Subsystems: The Con-straints of Structural Assumptions.” Canadian Journal of Political Science 27 ~1!:85–103.
Cavallo, Michele. 2004. “Exchange Rate Movements and the US International BalanceSheet.” FRBSF Economic Letter 25.
CBO ~Congressional Budget Office!. 2005. Why Does US Investment Abroad Earn HigherReturns than Foreign Investment in the United States? Washington, DC: Economicand Budget Issue Brief.
Chinn, Menzie and Jeffrey Frankel. 2005. “Will the Euro Eventually Surpass the Dollaras Leading International Reserve Currency?” National Bureau of Economic Research11510.
Cline, William R. 2005. The United States as a Debtor Nation. Washington, DC: Institutefor International Economics.
Cohen, Benjamin J. 1977. Organizing the World’s Money: The Political Economy of Inter-national Monetary Relations. New York: Basic Books.
Cohen, Benjamin. 2003. “Global Currency Rivalry: Can the Euro Ever Challenge the Dol-lar?” Journal of Common Market Studies 41 ~4!: 575–95.
Despres, Michael P., Charles P Kindleberger and Walter Salant. 1966. “The Dollar andWorld Liquidity: A Minority View.” The Economist, February 5.
DFAIT ~Department of Foreign Affairs and International Trade Canada!. 2006. InvestmentIncome. Ottawa: Foreign Affairs and International Trade Canada.
ECB ~European Central Bank!. 2005. Review of the International Role of the Euro. Frank-furt am Main: European Central Bank.
Funabashi, Yoichi. 1988. Managing the Dollar: From Plaza to the Louvre. WashingtonDC: Institute for International Economics.
Gourinchas, Pierre-Olivier and Hélène Rey. 2005. “From World Banker to World VentureCapitalist: US External Adjustment and the Exorbitant Privilege.” NBER Working Paper11563.
Gray, H. Peter. 2004. The Exhaustion of the Dollar. New York: Palgrave, Macmillan.Harrison, Jason and John Hawkins. 2007. How International Investment Income Flows
Affect Australia’s Balance of Payments.Hartmann, Philipp and Otmar Issing. 2002. “The International Role of the Euro.” Journal
of Policy Modeling 24 ~4!:315–345.IMF ~International Monetary Fund!. 2005. Currency Composition of Official Foreign
Exchange Reserves ~COFER!. Washington, DC: International Monetary Fund.IMF. 2008. International Financial Statistics. Washington D.C.: IMF.Keohane, Robert O. 1984. After Hegemony: Cooperation and Discord in the World Polit-
ical Economy. Princeton: Princeton University Press.Kindleberger, Charles P. 1973. The World in Depression 1929–1939. Harmondsworth:
Penguin.Kindleberger, Charles P. 1981. “Dominance and Leadership in the International Econ-
omy.” International Studies Quarterly 25: 242–54.Kouparitsas, Michael. 2005. “Is the U.S. current account sustainable?” Chicago Fed Let-
ter, June.Lane, Philip R. and Gian Maria Milesi-Ferretti. 2002. “The External Wealth of Nations:
Measures of Foreign Assets and Liabilities for Industrial and Developing Countries.”Journal of International Economics 55: 263–94.
Lane, Philip R. and Gian Maria Milesi-Ferretti. 2006. “The External Wealth ofNations Mark II: Revised and Extended Estimates of Foreign Assets and Liabilities,1970–2004.” In IMF Working Paper. Washington, DC: International MonetaryFund.
Looney, Robert. 2004. “Petroeuros: A Threat to US Interests in the Gulf?” Middle EastPolicy 11 ~1!:26–37.
434 CARLA NORRLÖF

McKinnon, Ronald. 2001. “The International Dollar Standard and Sustainability of theUS Current Account Deficit.” Paper presented at the Brookings Panel on EconomicActivity: Symposium on the US Current Account.
Obstfeld, Maurice and Kenneth Rogoff. 2005. The Unsustainable Current Account Posi-tion Revisited. Cambridge: National Bureau of Economic Research 10869.
ONS ~Office for National Statistics!. 2006a. “Amendment United Kingdom NationalAccounts:” The Blue Book 2006. London: National Statistics.
ONS ~Office for National Statistics!. 2006b. United Kingdom Balance of Payments: ThePink Book 2006. Hampshire: Palgrave Macmillan.
Setser, Brad and Nouriel Roubini. 2005. “How Scary is the Deficit?” Foreign AffairsJuly0August.
Snidal, Duncan. 1985. “The Limits of Hegemonic Stability Theory.” International Orga-nization 39 ~4!:580–614.
Statcan. 2006a. Canada’s International Investment Position: Canada’s National StatisticalAgency. http:00www40.statcan.ca01010cst010econ08.htm @accessed July 2007# .
Statcan. 2006b. Canada’s Population Clock. Statistics Canada. ^http:00www.statcan.ca0english0edu0clock0population.htm&. @accessed July 2007#
Tille, Cédric. 2003. “The Impact of Exchange Rate Movements on US Foreign Debt.”Current Issues in Economics and Finance 9 ~1!: 1–7.
USCB. 2006. US and World Population Clocks. Washington, DC: US Census Bureau.
Strategic Debt 435