Corporate taxes, strategic default, and the cost of debt
17
Corporate taxes, strategic default, and the cost of debt Ali Nejadmalayeri a,⇑ , Manohar Singh b a Spears School of Business, Oklahoma State University, 700 North Greenwood Dr., Tulsa, OK 74106, United States b Great Valley School of Graduate Professional Studies, Pennsylvania State University, 30 E. Swedesford Road, Malvern, PA 19355, United States article info Article history: Available online 10 August 2011 JEL classification: G11 G12 G13 Keywords: Corporate tax Credit spreads Endogenous bankruptcy Strategic default abstract The current US tax code’s loss carry provisions provide implicit tax subsidies to financially troubled firms. Since shareholders ultimately decide when to announce bankruptcy, such tax subsidies can incentivize them to strategically postpone default. Therefore, corporate taxation can influence corporate cost of debt. Using a large panel of corporate bonds, we find supporting evidence: credit spreads become smaller as tax loss carries grow larger. In contrast, tax shields such as depreciation, which limit loss carry gains, lead to wider spreads. Interestingly, when stockholders hold greater bargaining power – due to large mana- gerial ownership – larger corporate tax shields lead to even narrower credit spreads. Ó 2011 Elsevier B.V. All rights reserved. 1. Introduction Corporate taxation occupies a central place in firm valuation. Corporate taxation particularly plays a pivotal role in determining capital structure (see Graham, 2003). Since the value of corporate claims is intertwined with the firm’s capital structure (Leland, 1994), an interesting question arises: do corporate taxes influence corporate bond prices? The extant theory remains rather ambiguous about the impact of corporate taxation on corporate bond pricing. This is partly be- cause in the classical corporate debt pricing framework, corporate taxation is irrelevant. Firms service their debt with pre-tax earn- ings, and thus bondholders are unaffected by corporate taxes. Re- cent models of endogenous bankruptcy (Leland, 1994, 1998; Leland and Toft, 1996) and strategic default models (Anderson and Sundaresan, 1996; Mella-Barral and Perraudin, 1997; Fan and Sundaresan, 2000), however, hint at a possible role of corpo- rate taxation in determining corporate credit risk. In these models, since stockholders ultimately decide whether and when to de- fault, 1 they need to weigh the benefits of continued debt servic- ing—such as unutilized tax shields—that will be lost if default occurs. Large unutilized tax shields may persuade stockholders to continue to service debt and prevent bankruptcy. Such strategic debt servicing means that the default boundary, i.e., the value at which the firm announces bankruptcy, will be lower and hence the credit spreads will be smaller. However, as Goldstein et al. (2001) point out, this ameliorating effect of corporate taxes on credit spreads depends on whether such tax shields can accrue to the firm. If taxes 0378-4266/$ - see front matter Ó 2011 Elsevier B.V. All rights reserved. doi:10.1016/j.jbankfin.2011.07.021 ⇑ Corresponding author. Tel.: +1 918 594 8399; fax: +1 918 594 8281. E-mail addresses: [email protected] (A. Nejadmalayeri), m.singh@ psu.edu (M. Singh). 1 Eberhart et al. (1990, p. 1459) state that ‘‘... [the Bankruptcy Reform Act of 1978] confer[s] considerable power upon incumbent management, particularly in the crucial early stages of the reorganization process. With rare exceptions, management has the exclusive right to file a reorganization plan... [M]anagement has some discretion over the priority levels assigned to certain classes of claimants. ... The threat of downgrading a claimant’s priority may be used to convince certain creditors to accede to lower payments. In addition, management may exploit the provision of the Act whereby post-petition interest payments to unsecured creditors can be suspended. Thus management has considerable leverage in having a plan confirmed that results in deviations from the [absolute priority rule].’’ Thus, as Leland (2002, p. 3) describes it ‘‘... at each moment, equity holders face the question: is it worth meeting promised debt service payments? If the asset value exceeds the default boundary, the answer is ‘yes,’ and the firm will continue to meet debt service payments and will not default—even if, as is typical when asset values are low, it requires additional equity contributions. If the answer is ‘no,’ the firm does not meet the required debt service and defaults.’’ Grant (2010) shows that extending such lenient bankruptcy rules to households can benefit the economy and creditors because it leads to lower levels of unsecured household debt and smoother consumption. Journal of Banking & Finance 36 (2012) 2900–2916 Contents lists available at SciVerse ScienceDirect Journal of Banking & Finance journal homepage: www.elsevier.com/locate/jbf
-
Upload
independent -
Category
Documents
-
view
0 -
download
0
Transcript of Corporate taxes, strategic default, and the cost of debt

Journal of Banking & Finance 36 (2012) 2900–2916
Contents lists available at SciVerse ScienceDirect
Journal of Banking & Finance
journal homepage: www.elsevier .com/locate / jbf
Corporate taxes, strategic default, and the cost of debt
Ali Nejadmalayeri a,⇑, Manohar Singh b
a Spears School of Business, Oklahoma State University, 700 North Greenwood Dr., Tulsa, OK 74106, United Statesb Great Valley School of Graduate Professional Studies, Pennsylvania State University, 30 E. Swedesford Road, Malvern, PA 19355, United States
a r t i c l e i n f o
Article history:Available online 10 August 2011
JEL classification:G11G12G13
Keywords:Corporate taxCredit spreadsEndogenous bankruptcyStrategic default
0378-4266/$ - see front matter � 2011 Elsevier B.V. Adoi:10.1016/j.jbankfin.2011.07.021
⇑ Corresponding author. Tel.: +1 918 594 8399; faxE-mail addresses: [email protected] (
psu.edu (M. Singh).
a b s t r a c t
The current US tax code’s loss carry provisions provide implicit tax subsidies to financially troubled firms.Since shareholders ultimately decide when to announce bankruptcy, such tax subsidies can incentivizethem to strategically postpone default. Therefore, corporate taxation can influence corporate cost of debt.Using a large panel of corporate bonds, we find supporting evidence: credit spreads become smaller astax loss carries grow larger. In contrast, tax shields such as depreciation, which limit loss carry gains, leadto wider spreads. Interestingly, when stockholders hold greater bargaining power – due to large mana-gerial ownership – larger corporate tax shields lead to even narrower credit spreads.
� 2011 Elsevier B.V. All rights reserved.
1 Eberhart et al. (1990, p. 1459) state that ‘‘. . . [the Bankruptcy Reform Act of 1978]confer[s] considerable power upon incumbent management, particularly in thecrucial early stages of the reorganization process. With rare exceptions, managementhas the exclusive right to file a reorganization plan. . . [M]anagement has somediscretion over the priority levels assigned to certain classes of claimants. . . . Thethreat of downgrading a claimant’s priority may be used to convince certain creditorsto accede to lower payments. In addition, management may exploit the provision of
1. Introduction
Corporate taxation occupies a central place in firm valuation.Corporate taxation particularly plays a pivotal role in determiningcapital structure (see Graham, 2003). Since the value of corporateclaims is intertwined with the firm’s capital structure (Leland,1994), an interesting question arises: do corporate taxes influencecorporate bond prices?
The extant theory remains rather ambiguous about the impactof corporate taxation on corporate bond pricing. This is partly be-cause in the classical corporate debt pricing framework, corporatetaxation is irrelevant. Firms service their debt with pre-tax earn-ings, and thus bondholders are unaffected by corporate taxes. Re-cent models of endogenous bankruptcy (Leland, 1994, 1998;Leland and Toft, 1996) and strategic default models (Andersonand Sundaresan, 1996; Mella-Barral and Perraudin, 1997; Fanand Sundaresan, 2000), however, hint at a possible role of corpo-rate taxation in determining corporate credit risk. In these models,
ll rights reserved.
: +1 918 594 8281.A. Nejadmalayeri), m.singh@
since stockholders ultimately decide whether and when to de-fault,1 they need to weigh the benefits of continued debt servic-ing—such as unutilized tax shields—that will be lost if defaultoccurs. Large unutilized tax shields may persuade stockholders tocontinue to service debt and prevent bankruptcy. Such strategic debtservicing means that the default boundary, i.e., the value at whichthe firm announces bankruptcy, will be lower and hence the creditspreads will be smaller. However, as Goldstein et al. (2001) pointout, this ameliorating effect of corporate taxes on credit spreadsdepends on whether such tax shields can accrue to the firm. If taxes
the Act whereby post-petition interest payments to unsecured creditors can besuspended. Thus management has considerable leverage in having a plan confirmedthat results in deviations from the [absolute priority rule].’’ Thus, as Leland (2002, p.3) describes it ‘‘. . . at each moment, equity holders face the question: is it worthmeeting promised debt service payments? If the asset value exceeds the defaultboundary, the answer is ‘yes,’ and the firm will continue to meet debt servicepayments and will not default—even if, as is typical when asset values are low, itrequires additional equity contributions. If the answer is ‘no,’ the firm does not meetthe required debt service and defaults.’’ Grant (2010) shows that extending suchlenient bankruptcy rules to households can benefit the economy and creditorsbecause it leads to lower levels of unsecured household debt and smootherconsumption.

A. Nejadmalayeri, M. Singh / Journal of Banking & Finance 36 (2012) 2900–2916 2901
are treated only as net cash outflows to the government, they cannotaffect the default boundary. With such a treatment, higher corporatetax shields cannot mitigate credit risk and hence will have no impacton the cost of debt.2
We argue that the current US tax code allows certain unutilizedtax shields to be accrued to the firm.3 This provides a channel forcorporate taxation to affect credit spreads. Under the current UStax rules, firms in financial distress may benefit from loss carry pro-visions. Loss-making firms can experience cash inflows in the formof a refund for the past taxes paid or a reduction of future taxes. Inthis case, government essentially de facto subsidizes stockholders.These tax subsidies can incentivize stockholders to continue to ser-vice their debt and not opt for strategic default. The more likelyavoidance of default by stockholders can persuade bondholders toaccept lower credit spread. Thus, as tax subsidies afforded by the losscarry provisions grow larger, credit spreads should become smaller.
We empirically test our conjecture using a large panel of corpo-rate bonds for the period of 1994–2006. Controlling for importantdeterminants of credit spreads, including profitability, probabilityof default, and leverage, we employ a host of corporate tax proxiesto examine the relationship between corporate credit spreads andcorporate tax rates.4 Ex ante higher tax rates imply a greater poten-tial tax refund—resulting in a greater incentive for shareholders toavoid default—and thus smaller spreads. Indeed, we find that a largetax loss carry backward—as measured by the trichotomous tax rateand Graham’s (1996a) prefinancing marginal tax rate—significantlynegatively affects corporate credit spreads. We also find that firmswith operating losses and investment tax credits have even smallercredit spreads. This suggests that future tax shields associated withloss carries and investment credits mitigate credit risk and result inlower credit spreads. Overall, we interpret these results as indicatingthat tax-subsidy influences strategic debt service choices and that inturn impacts credit spreads. Our results are further confirmed by thefinding that firms with depreciation expenses face larger creditspreads. Since depreciation expense is cash-flow neutral, it is not ex-pected to affect credit spreads. However, firms with ex ante largenondebt tax shields pay lower taxes and thus do not have accruedlarge loss carry provisions as an incentive to avoid default.
2 Goldstein et al. (2001, p. 487) state that typical dynamic models of capitalstructure such as those of Leland (1994) and Leland and Toft (1996) suffer from amajor shortcoming in that, ‘‘. . . [these models] treat cash flows to government (viataxes) in a manner fundamentally different from that with which they treat cashflows to equity and debt. Indeed, they model the ‘tax benefit’ as an inflow of funds,rather than as a reduction of outflow of funds. . .. This characterization leads to severalproblems. . .. [They] predict that equity value is an increasing function of the tax rate,since the ‘tax benefit’ paid to equity increases with this rate. From a normativestandpoint, this prediction is in conflict with a discounted cash flow analysis of equitypricing.’’ Goldstein et al. (2001) show that by treating tax shields as a reduction inoutflows, one should expect credit spreads to increase with taxes and that defaultboundary has no relation with taxes.
3 According to the Internal Revenue Service’s 2010 instructions for corporate taxfiling, when taxable income is less than or equal to zero, then ‘‘. . . the corporation mayhave an net operating loss (NOL) that can be carried back or forward as a deduction toother tax years. Generally, a corporation first carries back an NOL 2 tax years.However, the corporation can elect to waive the carryback period and instead carrythe NOL forward to future tax years [up to 20 years].’’
4 These determinants are pertinent to the design of our study because they help usisolate the pure tax effect. In a graduated tax rate system, profitable firms face lowcredit spreads and have high marginal tax rates. However, with a flat tax rate (theway most extant contingent claim models treat taxation), the link between profitsand taxes no longer exists. Even in a graduated tax system, the link is not symmetric:a lower tax rate does not necessarily imply low profits. With large nondebt tax shieldssuch as those associated with depreciation or tax loss carry provisions, a largelyprofitable firm may pay little or no taxes. Since our goal is to test for a pure tax effecton credit spreads, we include a host of variables that capture effects of profitabilityand other known determinants of credit spreads. More importantly, we add netoperating loss, investment tax credit, and depreciation dummies to further isolate thetax effects that we attempt to examine.
Strategic default decisions are significantly influenced by therelative bargaining position of stockholders vis-à-vis bondholders(Fan and Sundaresan, 2000). If stockholders decide to strategicallyservice debt upon default, with large tax shields at stake, stock-holders will be constrained in forcing concessions from bondhold-ers. In fact, as Mella-Barral and Perraudin (1997, p. 549) suggest,stockholders may find that ‘‘. . .increasing bondholders’ bargainingpower . . . permits for better use of tax deductibility.’’ In a scenariowhere bondholders have significant bargaining power and expectto make fewer concessions to stockholders, bondholders may ac-cept ex ante lower credit spreads. Stockholders’ anticipated strate-gic actions at default should then affect the way corporate taxesinfluence credit spreads. We study various measures of strategicaction—liquidation costs, stockholders bargaining power, andrenegotiation frictions (respectively, measured by asset intangibil-ity, CEO shareholding, and bondholding diffusion)—and testwhether their interaction with corporate tax variables affects cred-it spreads. We find that as the stockholders’ bargaining positionstrengthens, higher corporate tax rates result in even lower creditspreads. Thus, large corporate tax shields can motivate powerfulstockholders/managers to avoid default because they can mean-ingfully concede enough of their bargaining position in favor ofbondholders.
Our paper sheds light on how corporate taxation can affectcredit risk and hence corporate cost of debt. Our results providepartial support in favor of endogenous bankruptcy models but alsohighlight the importance of government’s role as a stakeholder incorporate contingent claim pricing. In addition, our results arepartly consistent with the endogenous bankruptcy model of Leland(1994) and the strategic default model of Fan and Sundaresan(2000) wherein corporate taxes can lead to smaller credit spreadsthrough an endogenous strategic bankruptcy channel. However,while future tax benefits may persuade stockholders to strategi-cally avoid default, the tax subsidy afforded by the tax loss carryprovisions seems to be an important explanation for lower creditspreads.
The remainder of this paper is organized as follows: Section 2reviews the relevant literature, builds the testable hypotheses,and provides a simple illustration of our main conjecture. Section3 explains our empirical methodology and the variables. In Section4, we describe the data and offer our univariate analysis. Section 5presents the empirical findings and Section 6 offers results of var-ious robustness tests. Finally, Section 7 concludes the paper.
2. Background and hypothesis development
Starting with Merton’s (1974) seminal work, structural modelshave become staple means of pricing credit risk. In these models,equity is a call option on unlevered assets and remains valuableuntil default occurs. Merton’s (1974) original model assumes a‘‘positive net worth covenant’’ wherein a firm is at default if the va-lue of its assets falls below the face value of its bonds. Given theevidence that positive net worth covenants are not typical and thatfirms continue to operate even when they fail to meet the positivenet worth requirements (Huang and Huang, 2003), subsequent re-search modified the way default is modeled.
In an important extension of the Merton (1974) model, Blackand Cox (1976) allow for default to be triggered when firm valuereaches a specified lower boundary. Further, they endogenize thedefault boundary by assuming that firms can avoid default by issu-ing new equity. By making the default boundary endogenous, themodel allows for strategic default as a managerial decision: man-agers adopt a default boundary value that maximizes the equityvalue. The crucial question then becomes: what factors can affectthe endogenous default boundary?

2902 A. Nejadmalayeri, M. Singh / Journal of Banking & Finance 36 (2012) 2900–2916
Extending both the Merton (1974) and Black and Cox (1976)models, Leland (1994) incorporates tax benefits of debt into thestructural model of credit risk. His work shows that the equity va-lue maximizing endogenous default boundary is inversely relatedto corporate tax rates. In his framework, firms with higher tax rateshave a lower default boundary and hence face smaller creditspreads. Subsequently, Fan and Sundaresan (2000) introduce thenotion that stakeholders’ bargaining power may impact the endog-enous default boundary.5
To illustrate our main hypothesis that corporate tax rates affectcredit spreads, we start with Leland’s (1994) construct but followthe Fan and Sundaresan (2000) notational convention. In a simpleconstruct whereby firms have perpetual debt in place and taxshields and bankruptcy costs associated with leverage exist, Le-land’s (1994) default boundary, VB, is:
VB ¼cð1� sÞ
r� �k�
1� k�; ð1Þ
where c is the coupon on the perpetual bond, r is the risk-free rate, sis the flat corporate tax rate, and k_ is the elasticity of probability ofdefault to the firm value (which is negative, independent of the taxrate, and increases with the volatility of assets). By taking the deriv-ative of boundary value VB with respect to corporate tax rate s, wearrive at:
@VB
@s¼ � c
r� k�
1� k�< 0: ð2Þ
This shows that the default boundary decreases with the corporatetax rate. The lower default boundary means that stockholders con-tinue to service their debt at far lower asset values and hence keepthe firm afloat longer. This leads to Hypothesis 1.
H1 (Corporate tax rates and credit spreads). Higher corporate taxrates lead to a smaller endogenous default boundary and thuslower credit spreads.
Given the results of the Anderson and Sundaresan (1996) andMella-Barral and Perraudin (1997) default models, Fan and Sundar-esan (2000) show that the strategic debt service is, for the mostpart, a Pareto optimal solution and the optimal endogenous defaultboundary (i.e., strategic debt service), VS, equals:
VS ¼cð1� sþ gsÞ
r� �k�
1� k�� 1
1� gað3Þ
where a is the proportional liquidation cost (dead-weight cost ofbankruptcy), and g is the stockholders’ bargaining power. By takingthe derivative of strategic default boundary value VS with respect tocorporate tax rate s, we arrive at:
@VS
@s ¼ �cr� �k�
1� k�� 1� g
1� ga: ð4Þ
Clearly this demonstrates that strategic default is influenced by liq-uidation cost and stockholders’ bargaining power. To demonstratehow liquidation cost and stockholders’ bargaining power influencethe impact of corporate tax rate on strategic default boundary, wetake the partial derivative of the above-mentioned equation withrespect to liquidation costs and stockholders’ bargaining power.For 0 6 a 6 1 and 0 6 g 6 1:
5 Recent work further shows that the efficiency of insolvency system in maintain-ing, (a) creditor rights (Akbel and Schnitzer, 2011) and (b) employee rights(Verwijmeren and Jeroen Derwall, 2010), affects credit spreads.
@2VS
@s@a¼ � c
r� �k�
1� k�� ð1� gÞgð1� gaÞ2
¼ g1� ga
� @VS
@s; ð5Þ
@2VS
@s@g¼ c
r� �k�
1� k�� ð1� aÞð1� gaÞ2
¼ � 1� að1� gÞð1� gaÞ �
@VS
@s: ð6Þ
This leads us to the following hypothesis.
H2 (Impact of liquidation costs and stockholders’ bargaining poweron the link between corporate tax rates and credit spreads). Costlierliquidation and weaker stockholders’ bargaining power makecorporate taxes more effective in reducing the endogenous defaultboundary and thus strengthening their impact on credit spreads.
2.1. A simple illustration
To illustrate our main point, we utilize a simple example. Table1 demonstrates how different corporate tax rates, tax loss carrybackwards, and depreciation can affect interest coverage andhence cash flow needed to avoid default. Consider a firm that has$10 of annual interest expenses. Assume that the firm generatedrevenues of $105 last year. Given fixed costs of $80 without anydepreciation expenditures at a 40% flat corporate rate, the firmthen would have paid $6 of taxes and reported $9 of income.Now imagine that this year, the firm’s revenues drop to $85 butcosts remain at $80. In Leland’s (1994) framework, with the taxesbeing paid after servicing debt, stockholders need to pay only $5out of pocket to avoid default. However, in a regime where taxesare paid before debt servicing, stockholders would need to infuse$7 to save the firm. Conditioned on the fact that interest is taxdeductible in the US, Goldstein et al. (2001) suggest that tax ratesbecome irrelevant. This position, however, neglects one importantfeature of the existing tax code: tax loss carry backward.
Consider now that the same firm can recoup some or all of theprevious taxes paid to offset its current losses. As is noted in Table1, since the firm paid $6 of taxes in the previous year, it can recoverup $5 to offset the losses and report zero income. Of course, the $5tax refund can be used for servicing the debt, thereby avoiding de-fault. Tax loss carry backward can thus provide an implicit subsidyfrom the government to the shareholders to prevent default. Inaddition, higher tax rates in this scenario mean greater future sub-sidies. If corporate tax rates were lower, say at 30%, then the prioryear’s taxes paid would amount to $4.50. In this scenario, evenwith a tax refund, the firm would have defaulted unless stockhold-ers were willing and capable of paying $0.50 of their money. Lastly,we show that as far as corporate debt is concerned, nondebt taxshields like depreciation are not beneficial. Consider the same firmwith an annual depreciation expense of $10. Without tax loss carrybackward, depreciation is irrelevant. However, with tax loss carrybackward, the potential future tax refund subsidies are expectedto be smaller since large depreciation expenses reduce the amountof taxes paid previously. As is shown in Table 1, for our example ofa 40% tax rate, the firm can only get a $2 refund, which is not en-ough to prevent default without an additional cash infusion bystockholders.
3. Empirical methodology
Empirically, we investigate two main questions: (1) is there anegative relationship between credit spreads and corporate taxrates? (2) how is the link between credit spreads and corporatetax rates affected by liquidation cost and relative bargaining powerof shareholders and bondholders? The initial basic regression mod-el used in the paper is a panel regression OLS model as follows.
CSPRDi;t ¼ aþ b1MTRi;t þUXi;t þ ei;t ð7Þ

Table 1Impact of tax loss carry, depreciation, and marginal tax rates on default and interest coverage.
No tax loss carry, s = 40% With tax loss carry backward, s = 40% With tax loss carry backward, s = 30%
Last year This year Last year This year Last year This year
Panel A. Without depreciation exp.Revenue $105.00 $85.00 $105.00 $85.00 $105.00 $85.00Cost ($80.00) ($80.00) ($80.00) ($80.00) ($80.00) ($80.00)EBITDA $25.00 $5.00 $25.00 $5.00 $25.00 $5.00Depreciation $0.00 $0.00 $0.00 $0.00 $0.00 $0.00EBIT $25.00 $5.00 $25.00 $5.00 $25.00 $5.00Interest ($10.00) ($10.00) ($10.00) ($10.00) ($10.00) ($10.00)EBT $15.00 ($5.00) $15.00 ($5.00) $15.00 ($5.00)Taxes ($6.00) $0.00 ($6.00) $5.00 ($4.50) $4.50Net Income $9.00 ($5.00) $9.00 $0.00 $10.50 ($0.50)Cash Flow $9.00 ($5.00) $9.00 $0.00 $10.50 ($0.50)Debt Service $10.00 $5.00 $10.00 $10.00 $10.00 $9.50% Interest Covered 100% 50% 100% 100% 100% 95%Defaulted? No Yes No No No Yes
Panel B. With depreciation exp.Revenue $105.00 $85.00 $105.00 $85.00 $105.00 $85.00Cost ($80.00) ($80.00) ($80.00) ($80.00) ($80.00) ($80.00)EBITDA $25.00 $5.00 $25.00 $5.00 $25.00 $5.00Depreciation ($10.00) ($10.00) ($10.00) ($10.00) ($10.00) ($10.00)EBIT $15.00 ($5.00) $15.00 ($5.00) $15.00 ($5.00)Interest ($10.00) ($10.00) ($10.00) ($10.00) ($10.00) ($10.00)EBT $5.00 ($15.00) $5.00 ($15.00) $5.00 ($15.00)Taxes ($2.00) $0.00 ($2.00) $2.00 ($1.50) $1.50Net Income $3.00 ($15.00) $3.00 ($13.00) $3.50 ($13.50)Cash Flow $13.00 ($5.00) $13.00 ($3.00) $13.50 ($3.50)Debt Service $10.00 $5.00 $10.00 $7.00 $10.00 $6.50% Interest Covered 100% 50% 100% 70% 100% 65%Defaulted? No Yes No Yes No Yes
Notes: This table shows how tax loss carry backward and depreciation affect default and interest coverage for firms with and without depreciation. The baseline marginal taxrate (s) is 40%. Examples only demonstrate the impact of tax loss carry, depreciation, and marginal tax rate for financially troubled firms.
A. Nejadmalayeri, M. Singh / Journal of Banking & Finance 36 (2012) 2900–2916 2903
where the dependent variable (CSPRDi,t) is the credit spread on thedebt issue of firm i at time t; MTRi,t is the proxy for corporate taxrate for firm i at time t, and Xi,t is a vector of control variables forfirm i at time t. The explanatory variables in Xi,t control for macro-economic conditions, bond-level characteristics, and firm-levelattributes. The following sections discuss these control variablesat length. To prevent estimation biases in the time series, we alsoinclude time-series fixed effects in the regressions. There are indus-try-level, firm-level, and bond-level dummies in the baseline modelto ensure that spurious cross-sectional correlations between creditspreads and other bond and firm characteristics are not driving theresults.
To test the second hypothesis, we expand the basic regressionmodel to include asset intangibility, CEO ownership, and bond-holding diffusion as proxies for determinants of strategic defaultchoices. The modified panel regression model is as follows.
CSPRDi;t ¼ aþ b1MTRi;t þ b2INTANGi;t þ b21INTANGi;t �MTRi;t
þ b3CEOOWNi;t þ b31CEOOWNi;t �MTRi;t
þ b4IBDIFUSi;t þ b41BDIFUSi;t �MTRi;t þUXi;t þ ei;t ð8Þ
6 Although other more sophisticated methods can be used to find the fittedTreasury yield curve, Elton et al. (2001) note that these different proxies yieldqualitatively similar results. As a result, we use simple interpolated fitted Treasuryyields.
where the additional variables are defined as follows: INTANGi,t, isthe asset intangibility as a proxy for the liquidation cost of firm iat time t; CEOOWNi,t, is the CEO stock ownership as a proxy forthe stockholders’ bargaining power of firm i at time t; and BDIFUSi,t,
is the number of different bond issues outstanding as a proxy for therenegotiation frictions of firm i at time t. All other variables are asdefined in Eq. (7). Following Davydenko and Strebulaev (2007),we include the interaction terms sequentially one at a time andthen estimate the coefficients on interactions terms (i.e., b21, b31,
and b41). In the next section we describe computations of ourvariables.
3.1. Dependent variable: credit spread
Empirically, the credit spread is often computed as the differ-ence between the corporate bond yield and the fitted yield on anotherwise equivalent Treasury bond. Following Duffee (1998) andCollin-Dufresne et al. (2001), we use a linear interpolation schemefor computing the month-end Treasury yield rates for variousmaturities. Corporate credit spread (CSPRD) is then defined as thedifference between the reported yield-to-maturity of a corporatebond and the corresponding Treasury yield.6
3.2. Test variables: corporate tax rate and strategic action proxies
Our main goal is to isolate the effect of potential tax refunds(tax reductions) under the loss carry backward (loss carry forward)provision on stockholders’ incentives to avoid default. We use a tri-chotomous tax variable (TRITAX) originally used by MacKie-Mason(1990) and Graham (1996a) to measure corporate tax rates. Thisvariable takes on a value that is equal to the maximum statutoryrate if a firm’s taxable income is positive and the firm had no netoperating loss (NOL) carry forwards. If the firm has either a non-positive taxable income or positive NOL carry forwards, the vari-able is set to be equal to one-half the maximum statutory rate.Otherwise, the variable equals zero Alternatively, we use the cor-porate marginal tax rate – prefinancing (PREMTR) – estimated byGraham (1996a,b). The main difference between these two proxiesis that while Graham’s tax rate proxy reflects future tax benefits,the trichotomous tax rate variable captures tax subsidies affordedby loss carry backward provisions.

2904 A. Nejadmalayeri, M. Singh / Journal of Banking & Finance 36 (2012) 2900–2916
To separate the effects of future tax subsidies, we use net oper-ating losses (NOLDUM) and investment tax credits (ITCDUM) dum-mies. The idea here is that the greater the losses today, the largerthe tax shields in the future. As noted earlier, other tax shields thatreduce the efficacy of loss carry provisions should increase the costof debt. As such, we use a dummy variable indicating non-zerodepreciation (DEPDUM). This variable is used to capture the DeAn-gelo and Masulis (1980) nondebt tax shields.
For the strategic action proxies, we follow Davydenko andStrebulaev (2007) in using asset intangibility, CEO ownership,and bondholding diffusion, respectively, as proxies for liquidationcosts, stockholders’ bargaining power, and renegotiation frictions.Asset intangibility (INTANG) is defined as one minus the ratio ofnet property, plant, and equipment to total book-value of assets.CEO ownership (CEOOWN) is defined as the number shares ownedby a firm’s CEO (in thousands) divided by its total shares outstand-ing (in millions). Finally, we define bondholding diffusion (BDIFUS)as the ratio of the log of the number of distinct bond issues out-standing (multiplied by one thousand) to the log of the book valueof total liabilities.
3.3. Control variables
Based on previous research on the issue (see for example, Eltonet al., 2001; Collin-Dufresne et al., 2001; Campbell and Taksler,2003; Chen et al., 2007; and Guntay and Hackbarth, 2010), we in-clude several control variables. Table 2 provides a list of all vari-ables with brief descriptions. The variables are defined as follows.
3.3.1. Credit ratingAs in Collin-Dufresne et al. (2001) and Chen et al. (2007), we use
a numerical rating, CRD, as a possible determinant of creditspreads. Following the COMPUSTAT convention in assigning
Table 2Variable description and sample statistics.
Variable Description
CSPRD The difference between yield to maturity of the corporate bond and corrLIQ Number of months the bond traded in past 12 months divided by 12AGE Years past issuanceMAT Years to maturityLEVEL Yield on 2-year Treasury noteSLOPE The difference between yields on Treasury’s 10-year bonds and 2-year nEURO The difference between Eurodollar rate and Treasury’s 3-month bill yieldSIZE Log of the sum of market value of equity and book value of liabilitiesLTDB Long-term debt to total assetsVOLEARN 5-year volatility of EBITDA to salesROA EBITDA to assetsQUIK Cash and receivables to current liabilitiesINTCOV EBITDA to interest expenseTD2Cap Total liabilities to market value of equityRETVOL 2-year volatility of monthly equity returnsMKTVOL 2-year volatility of monthly CRSP market returnsJUMP Probability of jump per Collin-DuFresne et al. (2001)VIX Monthly level of VIX (SP500 volatility) indexTRITAX Trichotomous tax rate; equal to maximum statutory rate if the firm has n
income. If the firm has loss carry forwards or a nonpositive taxable incomof the maximum statutory tax rate. Otherwise, the trichotomous tax rate
PREMTR Graham’s (1996) prefinancing marginal tax rateDEPDUM Dummy variables indicating non-zero depreciationITCDUM Dummy variable indicating non-zero investment tax creditNOLDUM Dummy variable indicating non-zero net operating lossINTANG One minus property, plant, equipment to total assetsCEOOWN Number of shares owned by CEO (in thousands) to total shares outstandBDIFUS Log of number of distinct bond issues outstanding multiplied by 1000 to
Notes: This table reports the mean, minimum, and maximum of variables in the sampnonfinancial firms. The data is obtained from the Mergent’s FISD database. The sample pGovernors of Federal Reserve. The prefinancing marginal tax rate, PREMTR, is courtesy o
numerical values for different ratings, we utilize the average ofMoody’s rating and Standard and Poor’s rating.
3.3.2. Treasury term structureIn structural models of credit risk, a rise in the spot rate effec-
tively reduces the likelihood of default (Leland, 1994; Longstaffand Schwartz, 1995). Previous empirical studies (Duffee, 1998;Chen et al., 2007) indicate that credit spreads tend to fall whenTreasury yields rise. We use the 1-year Treasury bill yield, LEVEL,as a determinant of credit spreads. The slope of the term structureof Treasury interest rates seems to have explanatory power in pre-dicting both interest rate movements and macroeconomic growth.We use the difference between yields of 10-year and 2-year con-stant maturity Treasury bonds, SLOPE, as a determinant of creditspreads. Following Chen et al. (2007), we also use the spread be-tween the 3-month Euro-dollar rate and the 3-month Treasury billyield, EURO, to capture the overall market illiquidity.
3.3.3. Bond attributesMerton (1974) shows that credit spreads and maturity are non-
linearly related and this relationship is a function of credit quality.However, Helwege and Turner (1999) find that on average the termstructure of credit spreads is upward-sloping. The natural log ofmaturity of a bond, LogMAT, is included in the model to controlfor the term structure of credit spreads. Bond age has been shownto relate positively to credit spreads (see Warga, 1992; Perraudinand Taylor, 2004). We include the log of bond age, LogAGE, as acontrol. Bond age is defined as the number of years between thesettlement date and the issuing date. Recent work indicates thatliquidity is a priced risk (Chen et al., 2007; Covitz and Downing,2007; Guntay and Hackbarth, 2010; Chen et al., 2011). We usethe Guntay and Hackbarth (2010) measure of liquidity as a bond-level proxy for liquidity. We define liquidity, LIQ, as the number
Mean Minimum Maximum
esponding constant maturity Treasury bond 2.161 0.001 20.0580.111 0.000 1.0003.518 0.000 35.427
11.156 1.091 100.0003.638 0.880 7.320
otes 1.019 �0.520 2.7500.273 �0.170 2.3109.425 5.832 12.3700.359 0.085 1.0930.032 0.002 0.2880.134 �0.020 0.3211.651 0.111 10.0006.147 0.000 29.8652.820 0.117 61.064
10.142 0.000 69.6144.296 0.684 8.5400.350 0.083 0.824
20.216 10.818 38.205o loss carry forwards and has positive taxablee, the trichotomous tax rate is set to one-halfis equal to zero
0.263 0.000 0.350
0.321 0.000 0.3940.996 0.000 1.0000.347 0.000 1.0000.097 0.000 1.0000.411 0.012 0.998
ing (in millions) 14.341 0.000 249.924log of total liabilities 0.955 0.703 1.398
le. The sample consists of 77,278 coupon-paying, plain-vanilla corporate bonds oferiod covers the years 1994–2006. The data for term structure is from the Board off Professor John Graham. All accounting data are from the annual COMPUSTAT.

A. Nejadmalayeri, M. Singh / Journal of Banking & Finance 36 (2012) 2900–2916 2905
of months a bond has a market quote during the past 12 monthsdivided by 12.
3.3.4. VolatilityStructural models also predict that the volatility of a firm’s mar-
ket value is positively related to credit spreads (see Leland, 1994;Longstaff and Schwartz, 1995; Gemmill and Keswani, 2011). Sincefirm value and its volatility are unobservable, as suggested byCampbell and Taksler (2003), we utilize equity volatility, RETVOL,instead. Specifically, we define RETVOL as the annualized standarddeviation of a firm’s monthly stock returns over the preceding24 months. Additionally, we also use historical earnings volatility,VOLEARN, to capture expected riskiness of the future earningsstream. Historical earnings volatility is defined as the standarddeviation of the ratio of earnings before interest, taxes, deprecia-tion, and amortization (EBITDA) to assets measured over the previ-ous five years.
3.3.5. LeverageDefault risk is directly related to amount of debt outstanding. As
in Chen et al. (2007), we use two measures: the ratio of book valueof total liabilities to market value of equity, TD2Cap, and the ratioof the long-term debt to total book value of assets, LTDB.
3.3.6. Profitability and debt serviceFirms with a higher operational income can meet their debt ser-
vice easier and hence are less likely to default in the near future. Asin Guntay and Hackbarth (2010), we use the ratio of earnings be-fore taxes and depreciation to book value of total assets to controlfor firm profitability. In the short term, the inability to meet debtobligations can be mitigated by liquid assets. We use the quick ra-tio (i.e., the ratio of cash and receivables to total assets) as a mea-sure of asset liquidity. The ability to meet periodic debt service isthe first test in determining whether a borrower is at default. Fol-lowing Chen et al. (2007), we measure the incremental influence ofthe pre-tax coverage using four censored variables constructed perthe procedure outlined in Blume and MacKinlay (1998).
4. Data and summary statistics
4.1. Data
Our sample construction starts with all the bonds issued by USfirms that can be identified in the Fixed Income Securities Database(FISD) for the period between 1994 and 2006. For ensuring homo-geneity of the payout characteristics, we exclude bonds with op-tion-like features. We also exclude zero-coupon and floating-ratebonds. In line with previous bond pricing studies (see, e.g., Col-lin-Dufresne et al., 2001), we exclude regulated industries.
At the next stage we merge the above sample firm informationwith Treasury term structure information that is sourced from theBoard of Governors of the Federal Reserve. We obtain stock prices,stock return volatility, and market volatility information from themonthly CRSP tapes. The OptionMetrics database is used to obtainthe probability of return jump implied by the S&P500 Index op-tions. In the merged transaction, Treasury, CRSP, and OptionMet-rics data sets, we retain only those firms that have valid month-end stock prices and rolling two-year return standard deviations.Accounting information is derived from the COMPUSTAT annualdatabase. We utilize only those firms whose accounting informa-tion is available for three years prior to the transaction.
The estimated corporate marginal tax rates are obtained fromGraham’s (1996a,b) data. To avoid outliers, all of the accountingvariables are winsorized at the 2% level. After merging the transac-tion data with COMPUSTAT and Graham’s corporate tax data, the
final sample includes 77,278 firm-month observations for 1174firms.
4.2. Summary statistics
Table 2 provides summary descriptive statistics for the vari-ables analyzed. The mean credit spread for the sample issues is2.161%. The mean 1-year T-bill yield at the time of issue is3.638%, and the mean difference between 10-year and 2-year T-bond yields at the time of issue for the sample firms is 1.019%. Duf-fee (1998) shows that on average credit spreads are between 0.67%to 1.42% centered at 1.01 for the medium-term A-rated bonds. El-ton et al. (2001) show that credit spreads of industrial firms rangefrom 0.392% to 1.349% over the period of 1987 to 1996. They alsofind that the corresponding Treasury yields range from 5.265% to8.382%.
Considering that our sample includes the period 2000–2004,when credit spreads and Treasury yields were, respectively, at his-torically high and low levels, the sample characteristics reportedhere are comparable to previous studies. Firms in our sample havea mean size of about $17 billion in terms of market value and gen-erate a net positive return on assets. The mean long-term debt ra-tio for the sample firms is about 36% and is comparable to theratios reported in similar studies (see for example, Collin-Dufresneet al., 2001). For our sample bonds, the mean time-to-maturity is11.15 years. Additionally, the average Graham’s prefinancing mar-ginal tax rate for the sample firms is at 32%.
4.3. Univariate analyses and sample comparisons
To gain first insight into the relationship between credit spreadsand corporate tax rates, we plot the credit spread of each bond ver-sus the firm’s tax rate in Fig. 1. Panel A depicts the distribution ofcredit spreads across three levels of the trichotomous tax rate (TRI-TAX), while panel B shows the relationship between credit spreadsand the prefinancing marginal tax rate (PREMTR). The figure showsthe decline of average credit spreads as corporate tax rate in-creases. Additionally, the bulk of the distribution of credit spreadsbecomes denser as the tax rate rises.
Table 3 provides a comparison of credit spreads across indus-tries, ratings, maturities, firm sizes, and leverage levels. The major-ity of bonds in the sample are in consumer goods, auto, and retailindustries. With the exception of construction firms, firms withhigher tax rates face smaller credit spreads. For some industriessuch as steel and metals and retailers, the credit spreads for hightax-rate firms are less than one-half that of low tax-rate firms.Across all credit quality classes, the credit spreads decline as thetax rates increase. Interestingly, while the difference between highand low tax-rate firms’ credit spreads is 3 basis points for A-ratedfirms, the corresponding difference is 34 basis points for BB-ratedfirms. Firms with shorter maturity debt gain more with an increasein tax rates. While the credit spread differences between high andlow tax-rate firms for short-term maturity debtors is 129 basispoints, the corresponding difference is less than 41 basis pointsfor long maturity debtors. Similarly, in terms of lower creditspreads, smaller firms benefit more from higher tax rates. Thecredit spread differences between high and low tax-rate firms forsmall firms is 142 basis points, while the corresponding differenceis only 35 basis points for large firms. Lastly, highly levered firmsseem to gain more from higher tax rates than low leverage firms.Among high-leverage firms, low-tax firms face in excess of 131 ba-sis points of additional credit spreads. Among low-leverage firms,low-tax firms face only 54 basis points of additional credit spreads.
Our sample comparisons confirm the basic idea that higher taxrates lead to smaller credit spreads. However, tax rates can be aproxy for other firm attributes. To understand the extent to which

Fig. 1. Credit spreads and the corporate tax rate. Panel A box-plots the distribution of credit spreads across different levels of the trichotomous tax rate. The 25th–75thpercentiles are limits of the gray box with the median shown by a line in the middle. The outliers beyond 99th are shown with diamonds. Panel B plots credit spreads andGraham’s (1996) prefinancing marginal tax rate.
2906 A. Nejadmalayeri, M. Singh / Journal of Banking & Finance 36 (2012) 2900–2916
variability in tax rates corresponds to variability in other firm attri-butes, we perform a comparison of a variety of firm characteristicsacross various tax-rate categories. As noted in Table 4, all firmattributes of interest do vary with tax rates. While these variationsare statistically significant, their economic interpretation is com-plex. For instance, while a high tax-rate firm has an average ratingof A-, a low-tax rate firm has a BBB rating. High tax-rate firms aremore profitable, more liquid, less levered, and larger in size thantheir low tax-rate counterparts. Such differences may raise a con-cern about the correlation among different determinants of creditspreads distorting the analyses.
While not reported for brevity, the observed correlations areconsistent with current theory. The sample credit spreads andtax rates are significantly negatively correlated. To substantiatethe univariate results, we perform a multivariate estimation that
includes control variables and impose relevant econometricrestrictions. The results are reported in the next section.
5. Empirical results
As discussed previously, we estimate a reduced-form model ofcredit spreads. Controlling for various known determinants ofcredit spreads, we first run a series of fixed-effect pooled OLSregressions to clearly delineate the relationship between tax ratesand credit spreads. At the next stage, we extend the baseline modelto include proxies of strategic default actions and examine whetherthe estimated relationship between corporate tax rates and creditspreads is influenced by their inclusion in the model. As an exercisein robustness, we estimate the baseline model using different spec-ifications with Newey-West standard errors, Fama-MacBeth
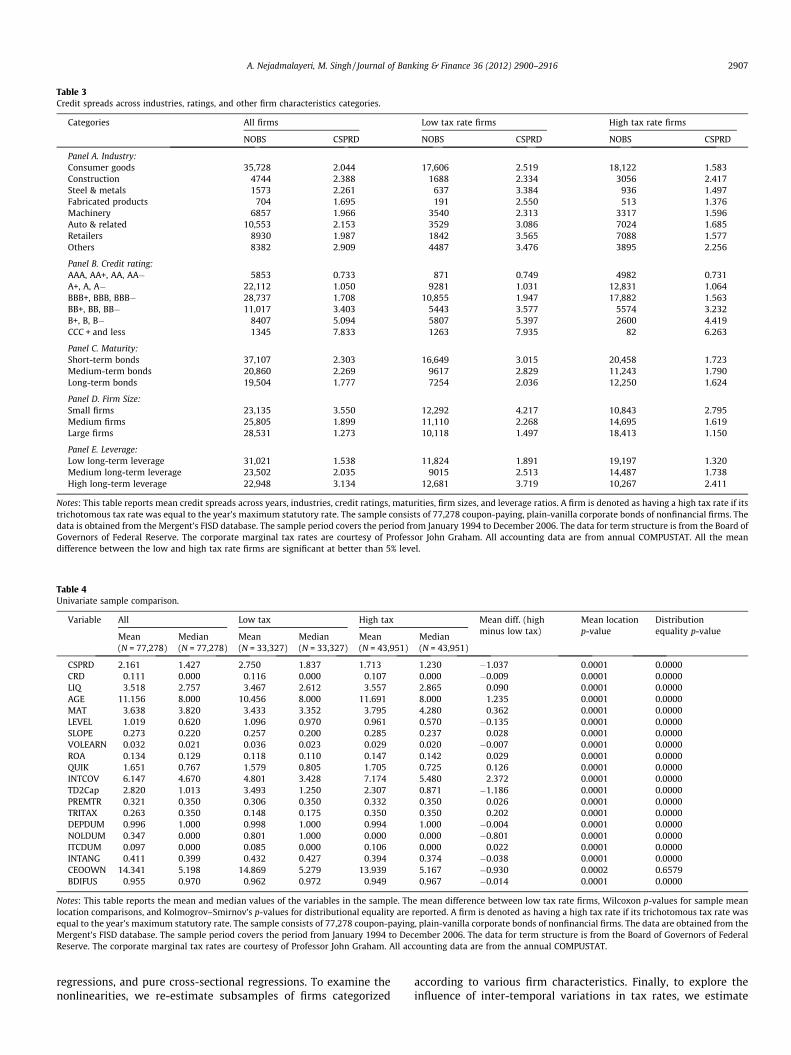
Table 3Credit spreads across industries, ratings, and other firm characteristics categories.
Categories All firms Low tax rate firms High tax rate firms
NOBS CSPRD NOBS CSPRD NOBS CSPRD
Panel A. Industry:Consumer goods 35,728 2.044 17,606 2.519 18,122 1.583Construction 4744 2.388 1688 2.334 3056 2.417Steel & metals 1573 2.261 637 3.384 936 1.497Fabricated products 704 1.695 191 2.550 513 1.376Machinery 6857 1.966 3540 2.313 3317 1.596Auto & related 10,553 2.153 3529 3.086 7024 1.685Retailers 8930 1.987 1842 3.565 7088 1.577Others 8382 2.909 4487 3.476 3895 2.256
Panel B. Credit rating:AAA, AA+, AA, AA� 5853 0.733 871 0.749 4982 0.731A+, A, A� 22,112 1.050 9281 1.031 12,831 1.064BBB+, BBB, BBB� 28,737 1.708 10,855 1.947 17,882 1.563BB+, BB, BB� 11,017 3.403 5443 3.577 5574 3.232B+, B, B� 8407 5.094 5807 5.397 2600 4.419CCC + and less 1345 7.833 1263 7.935 82 6.263
Panel C. Maturity:Short-term bonds 37,107 2.303 16,649 3.015 20,458 1.723Medium-term bonds 20,860 2.269 9617 2.829 11,243 1.790Long-term bonds 19,504 1.777 7254 2.036 12,250 1.624
Panel D. Firm Size:Small firms 23,135 3.550 12,292 4.217 10,843 2.795Medium firms 25,805 1.899 11,110 2.268 14,695 1.619Large firms 28,531 1.273 10,118 1.497 18,413 1.150
Panel E. Leverage:Low long-term leverage 31,021 1.538 11,824 1.891 19,197 1.320Medium long-term leverage 23,502 2.035 9015 2.513 14,487 1.738High long-term leverage 22,948 3.134 12,681 3.719 10,267 2.411
Notes: This table reports mean credit spreads across years, industries, credit ratings, maturities, firm sizes, and leverage ratios. A firm is denoted as having a high tax rate if itstrichotomous tax rate was equal to the year’s maximum statutory rate. The sample consists of 77,278 coupon-paying, plain-vanilla corporate bonds of nonfinancial firms. Thedata is obtained from the Mergent’s FISD database. The sample period covers the period from January 1994 to December 2006. The data for term structure is from the Board ofGovernors of Federal Reserve. The corporate marginal tax rates are courtesy of Professor John Graham. All accounting data are from annual COMPUSTAT. All the meandifference between the low and high tax rate firms are significant at better than 5% level.
Table 4Univariate sample comparison.
Variable All Low tax High tax Mean diff. (highminus low tax)
Mean locationp-value
Distributionequality p-value
Mean Median Mean Median Mean Median(N = 77,278) (N = 77,278) (N = 33,327) (N = 33,327) (N = 43,951) (N = 43,951)
CSPRD 2.161 1.427 2.750 1.837 1.713 1.230 �1.037 0.0001 0.0000CRD 0.111 0.000 0.116 0.000 0.107 0.000 �0.009 0.0001 0.0000LIQ 3.518 2.757 3.467 2.612 3.557 2.865 0.090 0.0001 0.0000AGE 11.156 8.000 10.456 8.000 11.691 8.000 1.235 0.0001 0.0000MAT 3.638 3.820 3.433 3.352 3.795 4.280 0.362 0.0001 0.0000LEVEL 1.019 0.620 1.096 0.970 0.961 0.570 �0.135 0.0001 0.0000SLOPE 0.273 0.220 0.257 0.200 0.285 0.237 0.028 0.0001 0.0000VOLEARN 0.032 0.021 0.036 0.023 0.029 0.020 �0.007 0.0001 0.0000ROA 0.134 0.129 0.118 0.110 0.147 0.142 0.029 0.0001 0.0000QUIK 1.651 0.767 1.579 0.805 1.705 0.725 0.126 0.0001 0.0000INTCOV 6.147 4.670 4.801 3.428 7.174 5.480 2.372 0.0001 0.0000TD2Cap 2.820 1.013 3.493 1.250 2.307 0.871 �1.186 0.0001 0.0000PREMTR 0.321 0.350 0.306 0.350 0.332 0.350 0.026 0.0001 0.0000TRITAX 0.263 0.350 0.148 0.175 0.350 0.350 0.202 0.0001 0.0000DEPDUM 0.996 1.000 0.998 1.000 0.994 1.000 �0.004 0.0001 0.0000NOLDUM 0.347 0.000 0.801 1.000 0.000 0.000 �0.801 0.0001 0.0000ITCDUM 0.097 0.000 0.085 0.000 0.106 0.000 0.022 0.0001 0.0000INTANG 0.411 0.399 0.432 0.427 0.394 0.374 �0.038 0.0001 0.0000CEOOWN 14.341 5.198 14.869 5.279 13.939 5.167 �0.930 0.0002 0.6579BDIFUS 0.955 0.970 0.962 0.972 0.949 0.967 �0.014 0.0001 0.0000
Notes: This table reports the mean and median values of the variables in the sample. The mean difference between low tax rate firms, Wilcoxon p-values for sample meanlocation comparisons, and Kolmogrov–Smirnov’s p-values for distributional equality are reported. A firm is denoted as having a high tax rate if its trichotomous tax rate wasequal to the year’s maximum statutory rate. The sample consists of 77,278 coupon-paying, plain-vanilla corporate bonds of nonfinancial firms. The data are obtained from theMergent’s FISD database. The sample period covers the period from January 1994 to December 2006. The data for term structure is from the Board of Governors of FederalReserve. The corporate marginal tax rates are courtesy of Professor John Graham. All accounting data are from the annual COMPUSTAT.
A. Nejadmalayeri, M. Singh / Journal of Banking & Finance 36 (2012) 2900–2916 2907
regressions, and pure cross-sectional regressions. To examine thenonlinearities, we re-estimate subsamples of firms categorized
according to various firm characteristics. Finally, to explore theinfluence of inter-temporal variations in tax rates, we estimate

2908 A. Nejadmalayeri, M. Singh / Journal of Banking & Finance 36 (2012) 2900–2916
the base model over time and also estimate a model relatingchanges in credit spreads to those in tax rates.
5.1. Taxes and credit spreads
The results of the estimated models presented in Eqs. (7) and(8) are presented in Table 5. Consistent with Hypothesis 1, creditspreads are decreasing in tax rates. The regression coefficients cor-responding to Graham’s prefinancing and trichotomous tax rates
Table 5Credit spreads and corporate tax rates.
(1) (2) (3) (4)
TRITAX �1.699*** �3.436***
(�4.600) (�6.740)PREMTR �0.797** �0
(�2.100) (�2DEPDUM 0.442 0
(1.480) (1NOLDUM �0.576*** 0
(�5.120) (0ITCDUM �0.061 �0
(�0.500) (�0CRD 0.289*** 0.278*** 0.288*** 0
(13.840) (11.800) (14.470) (11LEVEL �0.477*** �0.425*** �0.478*** �0
(�17.800) (�18.320) (�17.820) (�18SLOPE �0.668*** �0.619*** �0.664*** �0
(�15.850) (�15.680) (�15.820) (�15EUROD 0.569*** 0.568*** 0.576*** 0
(10.950) (10.710) (11.250) (10LogAGE 0.098*** 0.096*** 0.098*** 0
(13.500) (12.700) (13.450) (12LogMAT 0.176*** 0.186*** 0.173*** 0
(10.470) (11.560) (10.320) (11LIQ �0.076** �0.073** �0.081** �0
(�2.240) (�2.270) (�2.420) (�2VOLRET 0.079*** 0.088*** 0.076*** 0
(7.850) (7.650) (7.390) (7VOLEARN 0.129 0.094 0.133 0
(0.690) (1.150) (0.710) (1TD2CAP 0.093*** 0.110*** 0.092*** 0
(4.060) (3.530) (4.010) (3LTDB 1.152*** 1.061** 1.179*** 1
(3.000) (2.430) (3.230) (2QUIK �0.056** �0.074*** �0.036* �0
(�2.300) (�2.840) (�1.730) (�2ROA �2.433*** �3.036*** �1.753*** �3
(�3.990) (�5.310) (�2.780) (�5INTD1 0.014 0.014 0.002 0
(0.460) (0.420) (0.070) (0INTD2 0.013 0.011 0.009 0
(0.730) (0.660) (0.530) (0INTD3 0.027** 0.033*** 0.024** 0
(2.360) (2.890) (2.220) (2INTD4 0.009** 0.008* 0.009** 0
(2.020) (1.840) (2.100) (1Constant 0.777** 0.319 0.932** �0
(2.450) (0.900) (2.210) (�0Year Dummies Yes Yes Yes YesIndustry Dummies Yes Yes Yes YesFirm Dummies Yes Yes Yes YesBond Dummies – – – –NOBS 77,278 69,384 77,278 69,38Adj. R2 0.7494 0.7460 0.7517 0
Notes: This table reports results of the regression model of the credit spread using differehost of fixed effects dummy variables. For brevity, the coefficients on year, industry, filogarithms of bond’s age and maturity. INTD1, INTD2, INTD3, and INTD4 are censored intein Table 2. Robustness (heteroskedasticity, autocorrelation, and firm-clustering correcte*** Coefficient that is statistically different from zero is marked at 1% level.** Coefficient that is statistically different from zero is marked at 5% level.* Coefficient that is statistically different from zero is marked at 10% level.
are negative and in general statistically significant at better than5%. All regression models use robust estimation (White, 1980, het-eroskedasticity adjusted) with standard errors corrected for corre-lation across multiple observations for a given firm. All modelshave reasonably high explanatory power, as indicated by high R2
that exceed 74% and are comparable to recent research on creditspreads (see, e.g., Guntay and Hackbarth, 2010).
Clearly, higher corporate tax rates are associated with smallercredit spreads. The coefficient on Graham’s prefinancing marginaltax rate is negative and statistically significant at the 0.05 level
(5) (6) (7) (8)
�1.775*** �3.560***
(�4.430) (�6.180).786** �0.376 �0.361.080) (�0.960) (�0.930).553* 0.614* 0.814**
.890) (1.810) (2.030)
.012 �0.634*** �0.030
.150) (�4.960) (�0.320)
.115 �0.055 �0.088
.860) (�0.430) (�0.620)
.277*** 0.309*** 0.309*** 0.307*** 0.309***
.760) (10.640) (8.700) (11.260) (8.720)
.424*** �0.496*** �0.448*** �0.497*** �0.447***
.250) (�18.010) (�18.150) (�18.020) (�18.120)
.618*** �0.698*** �0.645*** �0.693*** �0.644***
.620) (�16.010) (�15.400) (�16.000) (�15.370)
.568*** 0.554*** 0.545*** 0.562*** 0.547***
.690) (10.500) (10.150) (10.760) (10.190)
.096*** 0.042*** 0.035*** 0.039*** 0.035***
.730) (3.390) (2.820) (3.270) (2.870)
.185*** �0.009 0.007 �0.003 0.006
.520) (�0.110) (0.080) (�0.040) (0.070)
.075** 0.028 0.022 0.024 0.021
.330) (0.910) (0.740) (0.800) (0.700)
.088*** 0.073*** 0.083*** 0.070*** 0.083***
.640) (7.230) (6.980) (6.750) (6.870)
.091 0.052 0.030 0.053 0.029
.130) (0.660) (0.390) (0.660) (0.370)
.110*** 0.051*** 0.056*** 0.050*** 0.056***
.610) (3.700) (3.100) (3.570) (3.120)
.031** 1.118*** 1.040** 1.171*** 1.042**
.480) (2.900) (2.440) (3.180) (2.550)
.068*** �0.069** �0.085*** �0.041 �0.074***
.640) (�2.100) (�2.870) (�1.460) (�2.600)
.181*** �2.198*** �2.940*** �1.545** �3.141***
.480) (�3.470) (�5.000) (�2.380) (�5.29)
.016 0.004 0.009 �0.008 0.012
.490) (0.130) (0.260) (�0.250) (0.340)
.010 �0.000 �0.005 �0.003 �0.005
.570) (�0.020) (�0.250) (�0.160) (�0.300)
.034*** 0.016 0.023** 0.013 0.023**
.940) (1.430) (2.080) (1.230) (2.070)
.008* 0.009⁄ 0.007 0.010** 0.008*
.900) (1.770) (1.460) (2.080) (1.760)
.257 1.327*** 0.624 1.333** �0.286
.600) (2.810) (1.140) (2.530) (�0.450)Yes Yes Yes YesYes Yes Yes Yes– – – –Yes Yes Yes Yes
4 77,278 69,384 77,278 69,384.7462 0.7783 0.7759 0.7806 0.7761
nt measures of the corporate marginal tax rate, a number of control variables, and arm, and bond dummy variables are not reported. LogAGE and LogMAT are naturalrest coverage ratios per Blume and MacKinlay (1998). All other variables are definedd) t-statistics are reported in parentheses. Text in bold highlights test variables.

A. Nejadmalayeri, M. Singh / Journal of Banking & Finance 36 (2012) 2900–2916 2909
when bond-specific dummies are not used. Irrespective of modelspecification, the coefficient on the trichotomous tax rate is alsonegative and statistically significant at the 0.01 level. Moreover,the trichotomous variable seems to have the most statistically sig-nificant and economically meaningful impact on credit spreads. Inthe models excluding nondebt tax shield proxies, the estimatedcoefficients lie between �1.699 and �1.775. In terms of economicsignificance, the interpretation is that for two otherwise identicalfirms, the firm with a marginal tax rate of 35%—currently the high-est statutory tax rate—should pay a credit spread that is 60(�1.699 � 0.35) basis points lower than the firm with a zero taxrate. Furthermore, we report that firms with higher depreciationexpenses pay wider credit spreads. We interpret this as suggestingthat the higher the level of prior large nondebt tax deductions, thelower the potential tax subsidy benefits and the higher the creditspread. Firms with large net operating losses, as predicted, canbenefit from tax subsidies and thus they face smaller spreads.
Perhaps more interestingly, the apparent low sensitivity ofcredit spreads to the prefinancing tax variable and the significantpositive impact of depreciation together hint at a greater relativeimportance of the corporate tax subsidy as opposed to future taxshields. Graham (1996a,b) uses an expansive simulation routinethat incorporates firm attributes such as growth and volatility ofrevenues and earnings to construct these tax rates. As such, Gra-ham’s simulated tax rates capture future tax shields more pro-nouncedly. The trichotomous tax variable, on the other hand,heavily weighs the tax loss carry provisions. A firm with large pastprofits and tax payments that is experiencing higher current lossesfaces lower current tax liabilities. When faced with a strategic de-fault situation, such a firm can utilize the tax loss carry provisionsmore effectively and generate cash inflows in terms of a tax refund.We conjecture that these NOL consequent tax-refund cash inflowspartially enhance a firm’s debt service capacity and result in the
Table 6Robustness regressions for credit spreads and corporate tax rates.
Newey-West standarderrors
Fama-McBethregressions
Cross-sectionalregressions
Panel ATRITAX �1.009*** �0.713*** �1.267***
(�14.950) (�6.270) (�5.460)DEPDUM
NOLDUM
ITCDUM
N. Obs. 77,278 77,278 4248Adj. RSQ 0.5983 0.6837 0.6887
Panel B.PREMTR �0.198* �0.672*** �0.296
(�1.880) (�3.540) (�1.000)DEPDUM
NOLDUM
ITCDUM
N. Obs. 69,384 69,384 3802Adj. R2 0.5933 0.6871 0.6939
Notes: This table reports the results of the robustness regression models of the credit spcontrol variables. In these regressions, the impact of year, industry, firm, and bond fixedresults with Newey-West, Fama-McBeth, and cross-sectional regressions are reported. Thloss carry forwards and has positive taxable income. If the firm has loss carry forwards ormaximum statutory tax rate. Otherwise, the trichotomous tax variable is equal to zero. Aare not reported. Robustness (heteroskedasticity, autocorrelation, and firm-clustering cor*** Coefficient that is statistically different from zero is marked at 1% level.** Coefficient that is statistically different from zero is marked at 5% level.* Coefficient that is statistically different from zero is marked at 10% level.
lower credit spread. At the same time, a firm’s ability to utilizetax subsidies is limited by the magnitude of prior tax deductions.Larger depreciation expenses—indicating smaller taxes paid in pre-vious years—would reduce the potential future tax loss carry pro-vision refunds.
All of the control variables, regardless of model specification,exhibit signs in the predicted direction. For instance, we find thatboth the Treasury bill yield (LEVEL) and the Treasury term spread(SLOPE) are negatively related to credit spreads across all empiricalspecifications. Firms with better credit quality (CRD) have smallercredit spreads. The proxies for equity risk exhibit their predictedpositive signs. More profitable firms and firms with better assetliquidity have smaller credit spreads. In addition, while more lev-ered firms have wider credit spreads, firms with longer maturitybonds and older bonds also experience higher credit spreads. Final-ly, bonds with more trading liquidity (LIQ) have smaller spreads.
5.2. Robustness: alternative specifications and estimations
One concern with the estimation of our baseline model may bethe influence of time-series correlation among the residuals. Weaddress this concern in three different ways and present our re-sults in Table 6. For brevity, we report only the test variable coef-ficients. First, we run OLS regressions with Newey-West standarderrors. Notably, the main test variables come up significant at bet-ter than the 1% level. The coefficient estimates for trichotomousand prefinancing variables are very similar to the ones reportedfor the baseline model. The alternative econometric specificationtherefore provides further support for the view that the relation-ship between credit spreads and corporate tax rates is reliablynegative.
Next, we adopt the Fama-Macbeth approach by running cross-sectional regressions for each month and reporting the average
Newey-West standarderrors
Fama-McBethregressions
Cross-sectionalregressions
�4.909*** �3.598*** �5.282***
(�32.260) (�13.740) (�11.280)�0.023 �0.001 0.106
(�0.320) (�0.020) (0.390)�0.958*** �0.675*** �0.930***
(�32.950) (�13.450) (�9.870)�0.174*** �0.124*** �0.194**
(�10.760) (�7.870) (�2.380)77,278 77,278 4248
0.6112 0.6985 0.6959
�0.192* �0.746*** �0.279(�1.810) (�3.890) (�0.940)
0.131* �0.081* 0.371(1.870) (�1.930) (1.290)�0.067*** 0.001 �0.018
(�5.340) (0.070) (�0.390)�0.166*** �0.125*** �0.138*
(�10.220) (�7.190) (�1.680)69,384 69,384 3802
0.5941 0.6912 0.6940
read using prefinancing and trichotomous tax rates and controlling for a number ofeffects are controlled for using a series of dummy variables. The panel regression
e trichotomous tax variable is equal to the maximum statutory rate if the firm has noa nonpositive taxable income, the trichotomous tax variable is set to one-half of thell control variables are defined in Table 2 and for brevity their coefficient estimatesrected) t-statistics are reported in parentheses. Text in bold highlights test variables.

2910 A. Nejadmalayeri, M. Singh / Journal of Banking & Finance 36 (2012) 2900–2916
coefficient estimates. We find that the coefficient estimate of thetrichotomous tax rate variable is negative and significant at the1% level. To further verify the results, we run a pure cross-sectionalregression based on the time-series averages of bond-level obser-vations. Under this alternative econometric specification, boththe economic and statistical importance of the tax rate variablesremain comparable to that reported for the Newey-West andFama-McBeth estimates.
In sum, the baseline results are robust across different econo-metric specifications. We conclude that the corporate tax ratesare economically important and statistically significant determi-nants of credit spreads beyond what has been previously reportedin the literature.
6. Tax effects and default risk
6.1. Interactions between tax variables and strategic action proxies
Fan and Sundaresan (2000) note that the existence of debt taxshields may provide an opportunity to renegotiate strategic debtservice in a manner whereby both bondholders and shareholdersare better off. They suggest that the relatively greater bargainingpower of shareholders may make claimants perceive renegotia-tions as costly. With increasing tax rates, the value of foregone po-tential tax benefits increases in case the firm defaults. Theshareholders’ incentive to avoid losses attributable to foregone fu-ture tax benefits places them in a weaker bargaining position rela-tive to bondholders. With their bargaining position relativelystronger, the bondholders may actually find renegotiation optimaland be willing to accept lower credit spreads. That is, higher taxrates may lead to lower credit spreads as shareholders concedegreater bargaining power to bondholders. Davydenko and Strebu-laev (2007) find that measures of strategic actions (asset intangi-
Table 7Credit spreads, corporate tax rates, and strategic default actions.
(1) (2) (3) (4)
TRITAX �3.305*** �2.653*** �2.849*** �1(�6.670) (�3.280) (�5.670) (�1
DEPDUM 0.522* 0.530* 0.511* 0(1.660) (1.780) (1.660) (1
NOLDUM �0.540*** �0.547*** �0.542*** �0(�4.790) (�4.970) (�4.910) (�4
ITCDUM �0.076 �0.073 �0.077 �0(�0.610) (�0.590) (�0.620) (�0
INTANG 1.759*** 2.202*** 1.744*** 1(3.920) (2.770) (3.870) (3
CEOOWN 0.618* 0.607* 2.455*** 0(1.800) (1.770) (3.260) (1
BDIFUS �0.015 �0.012 �0.015 0(�0.090) (�0.080) (�0.100) (0
INTANG�TRITAX �1.696(�0.980)
CEOOWN�TRITAX �6.827***
(�2.890)BDIFUS�TRITAX �1
(�1Year dummies Yes Yes Yes YesIndustry dummies Yes Yes Yes YesFirm dummies Yes Yes Yes YesBond dummies – – – –NOBS 77,278 77,278 77,278 77,2Adj. R2 0.7532 0.7533 0.7536 0
Notes: This table reports results of the regression model of the credit spread using differenvariables, and a host of fixed effects dummy variables. For brevity, the coefficients on yecoefficient estimates for test variables are reported. Robustness (heteroskedasticity, autVariables are as defined in Table 2. Text in bold highlights test variables.*** Coefficient that is statistically different from zero is marked at 1% level.** Coefficient that is statistically different from zero is marked at 5% level.* Coefficient that is statistically different from zero is marked at 10% level.
bility, bargaining power, renegotiation frictions) significantlyinfluence credit spreads. By including Davydenko and Strebulaev(2007) measures of strategic action, we examine the individualand tax-interactive affects of shareholders’ bargaining power oncredit spreads. We expect that lower shareholders’ bargainingpower (associated with higher tax rates) will relate to lower creditspreads.
Following Davydenko and Strebulaev (2007), we use assetintangibility (one minus fixed assets to total assets ratio), CEOshareholdings, and number of bonds outstanding, respectively, asmeasures of asset liquidation costs, bargaining power, and renego-tiation frictions. The evidence, presented in Table 7, suggests thattax subsidies are an important factor in explaining corporate bondspreads. The coefficient estimate for the trichotomous tax rate isnegative and statistically significant except when we considerthe interactions between corporate taxes and liquidation costs orrenegotiation frictions. These statistically significant (1% level)coefficients on the trichotomous tax rate vary from �2.653 to�3.305. Since both of our measures of marginal tax rates yield sim-ilar results, for brevity, we only report trichotomous tax rateresults.
More interestingly, the favorable impact of tax subsidies is fur-ther intensified for firms with more powerful management. Thecoefficients on the interaction terms between the trichotomoustax rate and managerial ownership are �6.827 and �7.079. The re-sults provide support for the Mella-Barral and Perraudin (1997)conjecture. To avoid costly renegotiations and save tax shields,stockholders might concede their bargaining advantage tobondholders.
6.2. Tax effects across subsamples
A valid concern with respect to our analysis is that the effect ofthe marginal tax rate may be confounded by the inherent nonlin-
(5) (6) (7) (8)
.838 �3.411*** �3.105*** �2.944*** �2.480
.270) (�6.020) (�3.530) (�5.040) (�1.170)
.522* 0.710** 0.702** 0.714** 0.713**
.650) (2.020) (2.040) (2.120) (2.010)
.543*** �0.593*** �0.596*** �0.595*** �0.596***
.830) (�4.660) (�4.770) (�4.770) (�4.730)
.077 �0.083 �0.081 �0.082 �0.084
.620) (�0.660) (�0.650) (�0.650) (�0.670)
.747*** 1.938*** 2.148*** 1.930*** 1.934***
.910) (4.050) (2.630) (3.980) (4.050)
.621* 0.676* 0.674* 2.634*** 0.675*
.820) (1.930) (1.930) (3.190) (1.930)
.383 0.843 0.857 0.905 1.110
.970) (1.150) (1.190) (1.270) (1.240)�0.802
(�0.470)�7.079***
(�2.710).540 �0.990.160) (�0.490)
Yes Yes Yes YesYes Yes Yes Yes– – – –Yes Yes Yes Yes
78 77,278 77,278 77,278 77,278.7532 0.7821 0.7821 0.7825 0.7821
t measures of the corporate marginal tax rate, strategic default, a number of controlar, industry, firm, and bond dummy variables are not reported. For brevity, only theocorrelation, and firm clustering corrected) t-statistics are reported in parentheses.
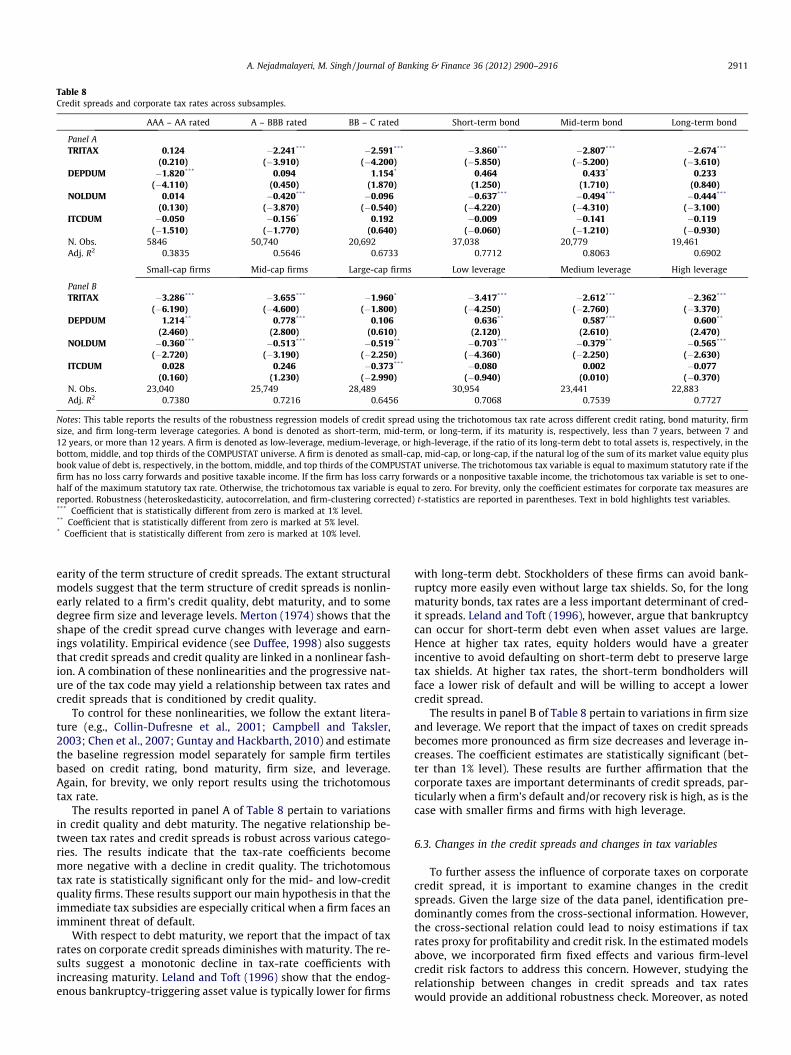
Table 8Credit spreads and corporate tax rates across subsamples.
AAA – AA rated A – BBB rated BB – C rated Short-term bond Mid-term bond Long-term bond
Panel ATRITAX 0.124 �2.241*** �2.591*** �3.860*** �2.807*** �2.674***
(0.210) (�3.910) (�4.200) (�5.850) (�5.200) (�3.610)DEPDUM �1.820*** 0.094 1.154* 0.464 0.433* 0.233
(�4.110) (0.450) (1.870) (1.250) (1.710) (0.840)NOLDUM 0.014 �0.420*** �0.096 �0.637*** �0.494*** �0.444***
(0.130) (�3.870) (�0.540) (�4.220) (�4.310) (�3.100)ITCDUM �0.050 �0.156* 0.192 �0.009 �0.141 �0.119
(�1.510) (�1.770) (0.640) (�0.060) (�1.210) (�0.930)N. Obs. 5846 50,740 20,692 37,038 20,779 19,461Adj. R2 0.3835 0.5646 0.6733 0.7712 0.8063 0.6902
Small-cap firms Mid-cap firms Large-cap firms Low leverage Medium leverage High leverage
Panel BTRITAX �3.286*** �3.655*** �1.960* �3.417*** �2.612*** �2.362***
(�6.190) (�4.600) (�1.800) (�4.250) (�2.760) (�3.370)DEPDUM 1.214** 0.778*** 0.106 0.636** 0.587*** 0.600**
(2.460) (2.800) (0.610) (2.120) (2.610) (2.470)NOLDUM �0.360*** �0.513*** �0.519** �0.703*** �0.379** �0.565***
(�2.720) (�3.190) (�2.250) (�4.360) (�2.250) (�2.630)ITCDUM 0.028 0.246 �0.373*** �0.080 0.002 �0.077
(0.160) (1.230) (�2.990) (�0.940) (0.010) (�0.370)N. Obs. 23,040 25,749 28,489 30,954 23,441 22,883Adj. R2 0.7380 0.7216 0.6456 0.7068 0.7539 0.7727
Notes: This table reports the results of the robustness regression models of credit spread using the trichotomous tax rate across different credit rating, bond maturity, firmsize, and firm long-term leverage categories. A bond is denoted as short-term, mid-term, or long-term, if its maturity is, respectively, less than 7 years, between 7 and12 years, or more than 12 years. A firm is denoted as low-leverage, medium-leverage, or high-leverage, if the ratio of its long-term debt to total assets is, respectively, in thebottom, middle, and top thirds of the COMPUSTAT universe. A firm is denoted as small-cap, mid-cap, or long-cap, if the natural log of the sum of its market value equity plusbook value of debt is, respectively, in the bottom, middle, and top thirds of the COMPUSTAT universe. The trichotomous tax variable is equal to maximum statutory rate if thefirm has no loss carry forwards and positive taxable income. If the firm has loss carry forwards or a nonpositive taxable income, the trichotomous tax variable is set to one-half of the maximum statutory tax rate. Otherwise, the trichotomous tax variable is equal to zero. For brevity, only the coefficient estimates for corporate tax measures arereported. Robustness (heteroskedasticity, autocorrelation, and firm-clustering corrected) t-statistics are reported in parentheses. Text in bold highlights test variables.*** Coefficient that is statistically different from zero is marked at 1% level.** Coefficient that is statistically different from zero is marked at 5% level.* Coefficient that is statistically different from zero is marked at 10% level.
A. Nejadmalayeri, M. Singh / Journal of Banking & Finance 36 (2012) 2900–2916 2911
earity of the term structure of credit spreads. The extant structuralmodels suggest that the term structure of credit spreads is nonlin-early related to a firm’s credit quality, debt maturity, and to somedegree firm size and leverage levels. Merton (1974) shows that theshape of the credit spread curve changes with leverage and earn-ings volatility. Empirical evidence (see Duffee, 1998) also suggeststhat credit spreads and credit quality are linked in a nonlinear fash-ion. A combination of these nonlinearities and the progressive nat-ure of the tax code may yield a relationship between tax rates andcredit spreads that is conditioned by credit quality.
To control for these nonlinearities, we follow the extant litera-ture (e.g., Collin-Dufresne et al., 2001; Campbell and Taksler,2003; Chen et al., 2007; Guntay and Hackbarth, 2010) and estimatethe baseline regression model separately for sample firm tertilesbased on credit rating, bond maturity, firm size, and leverage.Again, for brevity, we only report results using the trichotomoustax rate.
The results reported in panel A of Table 8 pertain to variationsin credit quality and debt maturity. The negative relationship be-tween tax rates and credit spreads is robust across various catego-ries. The results indicate that the tax-rate coefficients becomemore negative with a decline in credit quality. The trichotomoustax rate is statistically significant only for the mid- and low-creditquality firms. These results support our main hypothesis in that theimmediate tax subsidies are especially critical when a firm faces animminent threat of default.
With respect to debt maturity, we report that the impact of taxrates on corporate credit spreads diminishes with maturity. The re-sults suggest a monotonic decline in tax-rate coefficients withincreasing maturity. Leland and Toft (1996) show that the endog-enous bankruptcy-triggering asset value is typically lower for firms
with long-term debt. Stockholders of these firms can avoid bank-ruptcy more easily even without large tax shields. So, for the longmaturity bonds, tax rates are a less important determinant of cred-it spreads. Leland and Toft (1996), however, argue that bankruptcycan occur for short-term debt even when asset values are large.Hence at higher tax rates, equity holders would have a greaterincentive to avoid defaulting on short-term debt to preserve largetax shields. At higher tax rates, the short-term bondholders willface a lower risk of default and will be willing to accept a lowercredit spread.
The results in panel B of Table 8 pertain to variations in firm sizeand leverage. We report that the impact of taxes on credit spreadsbecomes more pronounced as firm size decreases and leverage in-creases. The coefficient estimates are statistically significant (bet-ter than 1% level). These results are further affirmation that thecorporate taxes are important determinants of credit spreads, par-ticularly when a firm’s default and/or recovery risk is high, as is thecase with smaller firms and firms with high leverage.
6.3. Changes in the credit spreads and changes in tax variables
To further assess the influence of corporate taxes on corporatecredit spread, it is important to examine changes in the creditspreads. Given the large size of the data panel, identification pre-dominantly comes from the cross-sectional information. However,the cross-sectional relation could lead to noisy estimations if taxrates proxy for profitability and credit risk. In the estimated modelsabove, we incorporated firm fixed effects and various firm-levelcredit risk factors to address this concern. However, studying therelationship between changes in credit spreads and tax rateswould provide an additional robustness check. Moreover, as noted

Table 9Changes in credit spreads and changes in corporate tax rates.
Panel regression(1)
Panel regression(2)
Panel regression(3)
Panel regression(4)
Newey-West standarderrors
Fama-McBethregressions
Cross-sectionalregression
DTRITAX �2.877*** �2.718*** �2.237*** �1.799*** �2.877*** �2.079*** �5.842***
(�5.690) (�5.190) (�4.230) (�3.370) (�11.020) (�3.190) (�14.140)DDEPDUM �0.003 0.159 0.414 0.442 �0.003 0.256 �0.240
(�0.020) (0.960) (1.500) (1.400) (�0.030) (1.690) (�0.490)DNOLDUM �0.042 0.005 0.017 0.017 �0.042 0.020 �0.097
(�0.390) (0.050) (0.140) (0.110) (�0.530) (0.310) (�0.670)DITCDUM �0.331*** �0.334*** �0.253** �0.241* �0.331*** �0.314** �0.489***
(�2.870) (�3.180) (�2.310) (�1.910) (�5.340) (�2.980) (�4.050)DCRD 0.401*** 0.406*** 0.394*** 0.374*** 0.401*** 0.319*** 0.399***
(7.340) (7.760) (7.290) (7.230) (15.580) (5.020) (18.780)DLEVEL �0.197** �0.711*** �0.655*** �0.549*** �0.197*** �0.642*** �0.511***
(�2.320) (�4.850) (�4.170) (�5.470) (�5.190) (�5.560) (�7.420)DSLOPE �0.570*** �0.916*** �0.890*** �0.947*** �0.570*** �0.852*** �0.593***
(�5.170) (�6.270) (�5.740) (�5.840) (�10.250) (�5.150) (�5.010)DEURO �0.621*** 0.323** 0.369** 0.311* �0.621*** 0.080 �0.787***
(�4.220) (2.080) (2.340) (1.740) (�5.180) (0.140) (�4.060)DLogAGE 0.034** 0.050*** 0.076*** 0.113*** 0.034*** 0.055 0.072***
(2.480) (3.200) (3.690) (3.540) (2.690) (1.400) (2.810)DLogMAT �0.649 �0.427 �0.476 �0.262 �0.649*** 0.067 �0.824***
(�1.320) (�0.960) (�1.040) (�0.670) (�3.030) (0.160) (�5.130)DRETVOL 0.064*** 0.050*** 0.042** 0.026 0.064*** 0.062*** 0.109***
(4.100) (3.240) (2.530) (1.630) (7.690) (3.700) (15.070)DVIX 0.062*** 0.025*** 0.024*** 0.031*** 0.062*** 0.006 0.035***
(6.910) (3.450) (3.230) (3.020) (13.810) (0.590) (5.130)DJUMP 0.261 �0.126 �0.118 �0.044 0.261* 0.357 �0.563**
(1.370) (�0.740) (�0.640) (�0.220) (1.650) (0.830) (�1.970)MKTVOL 0.106*** �0.243** �0.228** �0.136 0.106*** 0.201 �0.063**
(3.170) (�2.520) (�2.000) (�1.130) (5.860) (0.340) (�2.320)DLIQ 0.100 0.174 0.186 0.222 0.100 0.178 �0.344
(0.860) (1.480) (1.540) (1.480) (0.930) (1.630) (�1.210)Constant �0.521*** 0.987** 1.028** 0.284 �0.521*** 0.000 0.134
(�4.850) (2.450) (2.200) (0.920) (�7.260) (0.000) (1.040)Year dummies Yes Yes Yes Yes – – –Industry
dummies– Yes Yes Yes – – –
Firm dummies – – Yes – – – –Bond dummies – – – Yes – – –N. Obs. 11,151 11,151 11,151 11,151 11,151 11,151 3289Adj. R2 0.2125 0.2449 0.2999 0.2370 0.2125 0.2627 0.3842
Notes: This table reports the results of the regression model of the credit spread using different measures of the corporate marginal tax rate and a number of control variables.LogAGE and LogMAT are natural logarithms of the bond’s age and maturity. All other variables are defined in Table 2. Robustness (heteroskedasticity, autocorrelation, andfirm-clustering corrected) t-statistics are reported in parentheses. Text in bold highlights test variables.*** Coefficient that is statistically different from zero is marked at 1% level.** Coefficient that is statistically different from zero is marked at 5% level.* Coefficient that is statistically different from zero is marked at 10% level.
7 We follow an estimation procedure similar to that in Collin-Dufresne et al. (2001)to construct the jump probability. We first impute implied volatilities from 1-monthout-of-the-money put options and in-the-money call options on the S&P 100 index.We then estimate the OLS parameters of a quadratic regression, r(K) = a + bK + cK2, ofimplied volatilities r(K) on strike prices K. The JUMP variable is then defined asJUMP = r(0.9S) � r(S), where S is the level of the S&P 100 index at the time of bondtransaction.
2912 A. Nejadmalayeri, M. Singh / Journal of Banking & Finance 36 (2012) 2900–2916
by Collin-Dufresne et al. (2001), this represents an opportunity tostudy determinants of changes in credit spreads.
Change in credit spreads, DCSPRDi,t, is defined as the differencein credit spreads between two consecutive years. We arrive at a to-tal of 11,151 DCSPRDi,t observations in the full sample from January1994 to December 2006. To test our main hypothesis that highercorporate tax rates lead to smaller credit spreads, we estimatethe following regression equation.
DCSPRDi;t ¼ dþ g1DMTRi;t þWDZi;t þ ni;t ð9Þ
where the dependent variable (DCSPRDi,t) is the annual change incredit spread for firm i at time t, DMTRi,t is a proxy for annualchange in corporate tax rate for firm i at time t, and DZi,t is a vectorof control variables for firm i at time t. Following Duffee (1998) andCollin-Dufresne et al. (2001), DZi,t includes the annual change in the3-month Treasury bill yield (DLEVEL), the annual change in the 10-year/1-year Treasury yield spread (DSLOPE), the annual change inthe Treasury/Eurodollar spread (DEURO), the annual change in thelog of bond age (DLogAGE), the annual change in the log of bondmaturity (DLogMAT), the annual change in the rolling 12-monthstock return volatility (DRETVOL), the annual change in the CBOE’s
volatility index (DVIX), the annual change in the likelihood of jump7
(DJUMP), and market volatility (MKTVOL). Following Chen et al.(2007), we also include the annual change in bond liquidity mea-sured as a fraction of the past 12 months that a bond has traded(DLIQ). To avoid biases caused by spurious correlations, we also in-clude year, industry, firm, and bond dummies.
Table 9 reports the estimation results of pooled OLS regressionfor Eq. (9). All models have reasonable explanatory power, as indi-cated by R2 ranging from 20% to 30%. The coefficients on the changein the trichotomous tax rate are statistically significant (at the 1% le-vel). The estimated coefficients for the changes in the trichotomoustax proxies are �2.237 and �1.799 for the models that (in additionto year and industry dummies) include firm and bond dummies,respectively. These results are consistent with earlier findings in

Table 10Robustness to financial crisis.
(1) (2) (3) (4) (5) (6) (7) (8)1994–2009 1994–2009 2007–2009 2007–2009 1994–2009 1994–2009 2007–2009 2007–2009
TRITAX �3.159*** �5.731*** �3.155*** �5.515***
(�6.490) (�3.750) (�6.520) (�3.470)PREMTR �0.972** �1.346 �0.721* �1.058
(�2.370) (�1.390) (�1.840) (�1.080)DEPDUM 0.142** 0.163*** 0.243 0.307* 0.170*** 0.186*** 0.261 0.335*
(2.210) (2.610) (1.410) (1.740) (2.730) (3.170) (1.420) (1.740)NOLDUM �0.508*** 0.070 �1.400*** �0.270 �0.531*** 0.029 �1.269*** �0.265
(�4.310) (0.840) (�3.460) (�1.040) (�4.420) (0.330) (�3.060) (�0.950)ITCDUM 0.024 0.011 0.247 0.338⁄ 0.079 0.083 0.281⁄ 0.375⁄
(0.270) (0.130) (1.500) (1.800) (0.870) (0.870) (1.690) (1.960)CRD 0.272*** 0.248*** 0.292*** 0.266*** 0.264*** 0.243*** 0.291*** 0.264***
(16.560) (14.560) (4.920) (4.550) (13.580) (12.040) (4.070) (3.800)LEVEL �0.574*** �0.518*** �1.303*** �1.235*** �0.576*** �0.521*** �1.264*** �1.191***
(�19.400) (�18.780) (�15.280) (�12.860) (�19.030) (�18.280) (�14.190) (�11.920)SLOPE �0.684*** �0.627*** �1.626*** �1.471*** �0.685*** �0.626*** �1.734*** �1.587***
(�18.280) (�17.450) (�12.760) (�11.390) (�17.910) (�16.760) (�12.550) (�11.460)EUROD 0.764*** 0.750*** 0.665*** 0.597*** 0.768*** 0.748*** 0.667*** 0.592***
(21.670) (18.990) (14.870) (13.250) (20.980) (18.380) (14.300) (12.860)LogAGE 0.093*** 0.091*** 0.041*** 0.044*** 0.010 0.008 �0.049*** �0.044**
(13.480) (12.620) (3.990) (4.050) (0.970) (0.760) (�2.880) (�2.460)LogMAT 0.145*** 0.159*** 0.050** 0.055** �0.135* �0.113 �1.932*** �1.938***
(9.330) (10.710) (2.320) (2.450) (�1.820) (�1.470) (�6.720) (�6.900)LIQ 0.097*** 0.103*** 0.165*** 0.151*** 0.092*** 0.099*** 0.171*** 0.155***
(9.790) (9.660) (7.590) (7.750) (9.320) (9.120) (7.190) (7.570)VOLRET 0.047*** 0.075*** 0.096*** 0.261*** 0.032*** 0.053*** 0.059*** 0.239***
(4.680) (4.430) (4.090) (4.660) (4.080) (4.230) (3.180) (4.520)VOLEARN 1.090*** 1.007** 0.873 0.135 1.106*** 0.988** 1.610 0.470
(2.790) (2.380) (0.730) (0.100) (2.690) (2.240) (1.160) (0.340)TD2CAP �0.045 �0.055 �0.011 �0.070 �0.043 �0.051 0.017 0.007
(�1.310) (�1.540) (�0.060) (�0.340) (�1.180) (�1.340) (0.080) (0.020)LTDB �0.159** �0.140* 0.047 0.196 �0.134* �0.093 0.084 0.200
(�2.100) (�1.900) (0.250) (0.880) (�1.870) (�1.200) (0.410) (0.850)QUIK �1.930*** �3.396*** �2.573 �5.105*** �2.213*** �3.845*** �2.340 �4.908***
(�3.780) (�7.190) (�1.460) (�3.500) (�4.230) (�7.710) (�1.250) (�3.130)ROA 0.024* 0.031⁄⁄ 0.125** 0.091 0.029** 0.034*** 0.114* 0.089
(1.920) (2.520) (2.010) (1.120) (2.320) (2.610) (1.750) (1.070)INTD1 �0.008 �0.009 �0.122*** �0.110** �0.013 �0.011 �0.115*** �0.112**
(�0.620) (�0.660) (�3.090) (�2.470) (�1.050) (�0.920) (�2.760) (�2.370)INTD2 0.004 0.002 0.053* 0.030 0.011 0.005 0.061* 0.039
(0.380) (0.250) (1.750) (1.090) (1.190) (0.640) (1.790) (1.260)INTD3 0.004 0.004 �0.008 0.002 0.002 0.004 �0.007 0.001
(0.830) (0.830) (�0.890) (0.360) (0.390) (0.760) (�0.720) (0.200)INTD4 �0.115*** �0.113*** 0.034 �0.007 0.032 0.030 0.203** 0.158*
(�3.490) (�3.660) (0.580) (�0.110) (1.140) (1.080) (2.490) (1.820)Constant 2.021*** 1.352*** 4.697*** 3.595*** 2.406*** 1.555*** 8.040*** 7.188***
(5.850) (4.080) (5.040) (3.150) (6.350) (4.180) (7.310) (5.630)Year dummies Yes Yes Yes Yes Yes Yes Yes YesIndustry dummies Yes Yes Yes Yes Yes Yes Yes YesFirm dummies Yes Yes Yes Yes – – – –Bond dummies – – – – Yes Yes Yes YesN. Obs. 88,813 78,529 13,760 11,424 88,813 78,529 13,760 11,424Adj. R2 0.7466 0.7442 0.7881 0.7964 0.7799 0.7802 0.7988 0.8124
Notes: This table reports results of the regression model of the credit spread using different measures of the corporate marginal tax rate, a number of control variables, and ahost of fixed effects dummy variables. For brevity, the coefficients on year, industry, firm, and bond dummy variables are not reported. LogAGE and LogMAT are naturallogarithms of bond’s age and maturity. INTD1, INTD2, INTD3, and INTD4 are censored interest coverage ratios per Blume and MacKinlay (1998). All other variables are definedin Table 2. Robustness (heteroskedasticity, autocorrelation, and firm-clustering corrected) t-statistics are reported in parentheses. Text in bold highlights test variables.*** Coefficient that is statistically different from zero is marked at 1% level.** Coefficient that is statistically different from zero is marked at 5% level.* Coefficient that is statistically different from zero is marked at 10% level.
A. Nejadmalayeri, M. Singh / Journal of Banking & Finance 36 (2012) 2900–2916 2913
that for a rise in the marginal tax rate of 35%, the credit spreadsdrop almost 70 basis points. These findings support the hypothesisthat an increase in corporate tax rates relates to a decline in creditspreads. Finally, using various specifications including Newey-West standard errors, Fama-MacBeth regressions, and pure cross-sectional regressions, we verify that our results are robust.
6.4. Effects of financial crisis and stock market performance
One concern about our analysis may be whether our proxies forprofitability control for the interlink between corporate credit
spreads and stock performance, especially during the recent finan-cial crisis. To address this issue, we first extend our sample to in-clude the financial crisis period of 2007–2009. As is reported inTable 10, our results remain virtually same when our baselinemodel is re-estimated for the 1994–2009 period [shown in Eqs.(1) and (2) with firm fixed effects and in Eqs. (5) and (6) with bondfixed effects]. Interestingly, for the 2007–2009 subperiod [shownin Eqs. (3) and (4) with firm fixed effects and in Eqs. (7) and (8)with bond fixed effects], the coefficient estimates for TRITAX andNOLDUM are, respectively, �5.731 and �1.400. These coefficientsare approximately twice and three times larger, respectively, than

Table 11Robustness to stock market profitability.
(1) (2) (3) (4) (5) (6) (7) (8)
TRITAX �3.101*** �2.722*** �3.076*** �2.746***
(�6.360) (�5.640) (�6.390) (�5.780)PREMTR �0.965** �0.984** �0.714* �0.790**
(�2.260) (�2.430) (�1.760) (�2.060)DEPDUM 0.101 0.127** 0.094 0.110* 0.131** 0.151** 0.126** 0.136**
(1.560) (2.000) (1.530) (1.850) (2.080) (2.570) (2.130) (2.470)NOLDUM �0.502*** 0.063 �0.435*** 0.067 �0.514*** 0.029 �0.456*** 0.034
(�4.250) (0.730) (�3.730) (0.810) (�4.340) (0.320) (�3.920) (0.400)ITCDUM 0.025 0.013 0.034 0.018 0.078 0.079 0.073 0.073
(0.270) (0.140) (0.360) (0.200) (0.800) (0.810) (0.770) (0.740)STKRET2YR �0.105*** �0.107*** �0.117*** �0.122***
(�6.260) (�5.730) (�6.340) (�5.790)STKRET5YR �0.371*** �0.368*** �0.381*** �0.389***
(�10.380) (�9.810) (�10.060) (�10.090)CRD 0.267*** 0.246*** 0.282*** 0.263*** 0.257*** 0.239*** 0.269*** 0.253***
(16.590) (14.620) (17.540) (15.270) (13.490) (12.040) (14.390) (12.880)LEVEL �0.562*** �0.506*** �0.550*** �0.498*** �0.564*** �0.508*** �0.553*** �0.499***
(�19.140) (�18.580) (�19.290) (�18.620) (�18.700) (�17.930) (�18.860) (�18.030)SLOPE �0.669*** �0.614*** �0.665*** �0.608*** �0.670*** �0.612*** �0.667*** �0.605***
(�18.050) (�17.220) (�17.970) (�16.900) (�17.720) (�16.550) (�17.600) (�16.230)EUROD 0.755*** 0.742*** 0.726*** 0.713*** 0.758*** 0.739*** 0.728*** 0.709***
(21.920) (19.250) (21.600) (19.080) (21.380) (18.810) (20.920) (18.470)LogAGE 0.091*** 0.088*** 0.090*** 0.088*** 0.006 0.002 0.004 0.001
(13.430) (12.390) (13.640) (12.820) (0.580) (0.190) (0.410) (0.130)LogMAT 0.145*** 0.159*** 0.143*** 0.157*** �0.129* �0.106 �0.157** �0.126*
(9.240) (10.530) (8.990) (10.350) (�1.740) (�1.370) (�2.160) (�1.660)LIQ 0.093*** 0.099*** 0.092*** 0.098*** 0.087*** 0.093*** 0.087*** 0.092***
(9.210) (9.100) (9.500) (9.280) (8.840) (8.500) (9.060) (8.710)VOLRET 0.044*** 0.073*** 0.041*** 0.067*** 0.030*** 0.051*** 0.028*** 0.047***
(4.380) (4.220) (4.280) (4.030) (3.940) (4.050) (3.860) (3.960)VOLEARN 1.009** 0.943** 0.855** 0.741* 1.061*** 0.951** 0.880** 0.707*
(2.550) (2.210) (2.210) (1.770) (2.600) (2.160) (2.230) (1.650)TD2CAP �0.043 �0.052 �0.038 �0.048 �0.041 �0.048 �0.036 �0.044
(�1.410) (�1.600) (�1.250) (�1.50) (�1.200) (�1.360) (�1.080) (�1.290)LTDB �0.184** �0.157** �0.163** �0.147** �0.147** �0.098 �0.143** �0.110
(�2.430) (�2.120) (�2.220) (�2.09) (�2.050) (�1.270) (�2.080) (�1.500)QUIK �1.091** �2.440*** �0.780 �1.911*** �1.281** �2.751*** �1.071** �2.343***
(�1.990) (�4.770) (�1.530) (�4.01) (�2.390) (�5.420) (�2.140) (�4.850)ROA 0.026** 0.033*** 0.022* 0.028** 0.031** 0.036*** 0.026** 0.030**
(2.170) (2.800) (1.870) (2.45) (2.500) (2.810) (2.130) (2.420)INTD1 �0.007 �0.007 �0.014 �0.013 �0.010 �0.008 �0.017 �0.015
(�0.500) (�0.530) (�1.030) (�1.05) (�0.880) (�0.710) (�1.350) (�1.290)INTD2 0.002 0.001 0.005 0.004 0.009 0.003 0.013 0.008
(0.250) (0.070) (0.560) (0.46) (0.990) (0.400) (1.490) (1.020)INTD3 0.003 0.003 0.004 0.004 0.002 0.004 0.002 0.004
(0.680) (0.710) (0.890) (0.86) (0.390) (0.780) (0.450) (0.800)INTD4 �0.126*** �0.126*** �0.144*** �0.140*** 0.023 0.019 0.014 0.015
(�3.860) (�4.100) (�4.510) (�4.58) (0.800) (0.700) (0.540) (0.560)Constant 2.103*** 1.420*** 1.846*** 1.272*** 2.459*** 1.598*** 2.327*** 1.572***
(6.090) (4.300) (5.510) (3.97) (6.360) (4.250) (6.180) (4.330)Year dummies Yes Yes Yes Yes Yes Yes Yes YesIndustry dummies Yes Yes Yes Yes Yes Yes Yes YesFirm dummies Yes Yes Yes Yes – – – –Bond dummies – – – – Yes Yes Yes YesN. Obs. 88,813 78,529 88,813 78,529 88,813 78,529 88,813 78,529Adj. R2 0.7497 0.7475 0.7560 0.7531 0.7830 0.7835 0.7886 0.7888
Notes: This table reports results of the regression model of the credit spread using different measures of the corporate marginal tax rate, a number of control variables, and ahost of fixed effects dummy variables. For brevity, the coefficients on year, industry, firm, and bond dummy variables are not reported. STOKRET2YR and STKRET5YR are thecumulative stock returns, respectively, for the past 24 and 60 months prior to the trading month. LogAGE and LogMAT are natural logarithms of bond’s age and maturity.INTD1, INTD2, INTD3, and INTD4 are censored interest coverage ratios per Blume and MacKinlay (1998). All other variables are defined in Table 2. Robustness (heter-oskedasticity, autocorrelation, and firm-clustering corrected) t-statistics are reported in parentheses. Text in bold highlights test variables.*** Coefficient that is statistically different from zero is marked at 1% level.** Coefficient that is statistically different from zero is marked at 5% level.* Coefficient that is statistically different from zero is marked at 10% level.
2914 A. Nejadmalayeri, M. Singh / Journal of Banking & Finance 36 (2012) 2900–2916
the comparable coefficient estimates for the entire sample. Theseresults support our main hypothesis that relatively larger lossesin a crisis period have a greater impact on credit spread reductionthrough tax subsidies.
To re-affirm the results and to make sure that our results are notconfounded by the firm’s ex ante profitability, we control for his-torical cumulative stock returns and then re-estimate the baseline
model over the extended period of 1994–2009. The intuition issimple: profitable firms are more likely to face a large run-up instock prices and thus stock returns would capture the expectationabout future profitability. Since more profitable firms also paymore taxes, using stock-related proxies allows for ex ante controlsfor profitability. This is particularly important during a financialcrisis because profitable and high tax-rate firms are more likely

A. Nejadmalayeri, M. Singh / Journal of Banking & Finance 36 (2012) 2900–2916 2915
to enjoy favorable stock price run-ups. We use two different prox-ies of past stock price run-ups: STKRET2YR and STKRET5YR, prior2- and 5-year cumulative stock price appreciations. As is evidentin Table 11, results using STKRET2YR [shown in Eqs. (1) and (2)with firm fixed effects and in Eqs. (5) and (6) with bond fixed ef-fects] and STKRET5YR [shown in Eqs. (3) and (4) with firm fixed ef-fects and in Eqs. (7) and (8) with bond fixed effects] indicate thatpast stock appreciations have the expected negative coefficients(significant at 1% level). More importantly, even after controllingfor stock performance, our tax variables still carry significant neg-ative effects on credit spreads. Overall, our robustness results con-firm the original findings that tax subsidies associated with losscarry provisions lead to smaller credit spreads.
7. Conclusion
Under current US laws, managers and their principal sharehold-ers have the right to announce bankruptcy and seek protectionfrom creditors. The important question is what would motivateshareholders to avoid default. We argue that tax subsidies affordedby loss carry provisions offer a strong incentive for shareholders tosave the firm. With tax loss carry backwards, stockholders receivea refund for the past taxes paid, and that reduces the cost of keep-ing the firm as a going concern. Alternatively, shareholders infusecash to pay bondholders but utilize the loss carry forward provi-sion to reduce their future tax liabilities. Since default terminatesshareholders’ ability to utilize these tax shields, they have anadded incentive to avoid default in order to capture large tax sub-sidies. Thus, conditional upon a firm’s performance and capitalstructure, one may expect that higher corporate tax shields affor-ded by loss carry provisions reduce the likelihood of default andhence result in narrower credit spreads. We empirically examinethis issue by studying the relationship between corporate taxesand credit spreads.
Using a variety of model specifications and numerous proxiesfor test variables, we find evidence that otherwise similar corpo-rate bonds carry significantly smaller credit spreads when ex antecorporate taxes rates, net operating loss carries, and investmenttax credits are higher. Firms with large depreciation expenses havelimited loss carry tax shields and face larger credit spreads. We alsoreport that when managerial ownership is high, these large taxsubsidies help to lower credit spreads even further. These findingsare robust to the inclusion of a variety of measures of strategic ac-tions (liquidation costs, stockholders’ bargaining power, and rene-gotiation frictions), various control variables, stratification of thesample, and alternative econometric specifications. We also docu-ment that changes in corporate tax rates reliably predict changes incredit spreads in a manner consistent with our cross-sectionalresults.
The results lend support to the notion that debt pricing incorpo-rates the possibility of stockholders’ willingness to prevent bank-ruptcy for the sake of preserving tax shields, particularly whenstockholders can expect to be subsidized by past taxes paid. More-over, when managerial incentives are aligned with those of stock-holders, firms are more likely to utilize tax subsidies to preventdefault. The results also indicate that stockholders’ willingness toavoid bankruptcy for tapping tax subsidies and preserving largedebt tax shields increases with stockholders’ ex ante bargainingpower. At default, stockholders with greater bargaining powercan offer more meaningful concessions to bondholders and avoidbankruptcy. From a contract design perspective, bondholders andstockholders will both benefit from a debt contract that allowsfor seamless strategic debt service procedures that utilize corpo-rate tax shields. From a policy standpoint, the tax codes that allow
for greater loss carries may lead to an overall reduction in aggre-gate defaults and credit spreads.
Acknowledgments
We would like to thank an anonymous referee for very con-structive comments. For further discussions and guidance, wethank the Editor Ike Mathur. We thank Professor John Grahamfor the use of his estimated marginal tax rate data. While retainingfull culpability, we also thank Paul Brockman, Dan Dhaliwal, JoelHarper, Rezaul Kabir, April Knill, Raynolde Pereira, Darius Miller,Kenneth Roskelley, Klaus Toft, and seminar participants at the2007 Southwestern Finance Symposium, the 2007 Southern Fi-nance Association Meetings, and the 2010 International CorporateFinance and Governance conference for their helpful comments.
References
Akbel, B., Schnitzer, M., 2011. Creditor rights and debt allocation withinmultinationals. Journal of Banking and Finance 35, 1367–1379.
Anderson, R.W., Sundaresan, S.M., 1996. The design and valuation of debt contracts.Review of Financial Studies 9, 37–68.
Black, F., Cox, J.C., 1976. Valuing corporate securities: some effects of bondindenture provisions. Journal of Finance 31, 351–367.
Blume, M.F.L., MacKinlay, C., 1998. The declining credit quality of US corporatedebt: myth or reality. Journal of Finance 53, 1389–1413.
Campbell, J.Y., Taksler, G.B., 2003. Equity volatility and corporate bond yields.Journal of Finance 58, 2321–2349.
Chen, L., Lesmond, D.A., Wei, J., 2007. Corporate yield spreads and bond liquidity.Journal of Finance 62, 119–149.
Chen, T.K., Liao, H.H., Tsai, P.L., 2011. Internal liquidity risk in corporate bond yieldspreads. Journal of Banking and Finance 35, 978–987.
Collin-Dufresne, P., Goldstein, R., Martin, J.S., 2001. The determinants of creditspread changes. Journal of Finance 56, 2177–2207.
Covitz, D., Downing, C., 2007. Liquidity or credit risk? The determinants of veryshort-term corporate yield spreads. Journal of Finance 62, 2303–2328.
Davydenko, S.A., Strebulaev, I.A., 2007. Strategic actions and credit spreads: anempirical investigation. Journal of Finance 62, 2633–2671.
DeAngelo, H., Masulis, R.W., 1980. Optimal capital structure under corporate andpersonal taxation. Journal of Financial Economics 53, 2225–2241.
Duffee, G., 1998. The relationship between treasury yields and corporate bondyields spreads. Journal of Finance 53, 2225–2241.
Eberhart, A., Moore, C., Rosenfeldt, R., 1990. Security pricing and deviations from theabsolute priority rule in bankruptcy proceedings. Journal of Finance 45, 1457–1469.
Elton, E., Gruber, M., Agrawal, D., Mann, C., 2001. Explaining the rate spreads oncorporate bonds. Journal of Finance 56, 247–277.
Fan, H., Sundaresan, S.M., 2000. Debt valuation, renegotiation, and optimal dividendpolicy. Review of Financial Studies 13, 1057–1099.
Gemmill, G., Keswani, A., 2011. Downside risk and the size of credit spreads. Journalof Banking and Finance 35, 2021–2036.
Goldstein, R., Ju, N., Leland, H., 2001. An EBIT-based model of dynamic capitalstructure. Journal of Business 74, 483–512.
Graham, J.R., 1996a. Proxies for the corporate marginal tax rate. Journal of FinancialEconomics 42, 187–221.
Graham, J.R., 1996b. Debt and the marginal tax rate. Journal of Financial Economics41, 41–73.
Graham, J.R., 2003. Taxes and corporate finance: a review. Review of FinancialStudies 16, 1075–1129.
Grant, C., 2010. Evidence on the insurance effect of bankruptcy exemptions. Journalof Banking and Finance 34, 2247–2254.
Guntay, L., Hackbarth, D., 2010. Corporate bond credit spreads and forecastdispersion. Journal of Banking and Finance 34, 2328–2345.
Helwege, J., Turner, C.M., 1999. The slope of the credit yield curve for speculative-grade issuers. Journal of Finance 54, 1869–1884.
Huang, M., Huang, J., 2003. How much of the Corporate-Treasury Yield Spread isDue to Credit Risk? Working Paper, Penn State University.
Leland, H., 1994. Corporate debt value, bond covenants, and optimal capitalstructure. Journal of Finance 49, 1213–1252.
Leland, H., 1998. Agency costs, risk management, and capital structure. Journal ofFinance 53, 1213–1243.
Leland, H., 2002. Predictions of Expected Default Frequencies in Structural Modelsof Debt. Working Paper, University of California-Berkeley.
Leland, H., Toft, K., 1996. Optimal capital structure, endogenous bankruptcy, and theterm structure of credit spreads. Journal of Finance 51, 987–1019.
Longstaff, F.A., Schwartz, E.S., 1995. A simple approach to valuing risky fixed andfloating rate debt. Journal of Finance 50, 789–819.
MacKie-Mason, J.K., 1990. Do taxes affect corporate financial decisions? Journal ofFinance 45, 1471–1493.
Mella-Barral, P., Perraudin, W.R.M., 1997. Strategic debt service. Journal of Finance52, 531–556.

2916 A. Nejadmalayeri, M. Singh / Journal of Banking & Finance 36 (2012) 2900–2916
Merton, R.C., 1974. On the pricing of corporate debt: the risk structure of interestrates. Journal of Finance 29, 449–470.
Perraudin, W., Taylor, A.P., 2004. On the consistency of ratings and bond marketyields. Journal of Banking and Finance 28, 2769–2788.
Verwijmeren, P., Jeroen Derwall, J., 2010. Employee well-being, firm leverage, andbankruptcy risk. Journal of Banking and Finance 34, 956–964.
Warga, A., 1992. Bond returns, liquidity, and missing data. Journal of Financial andQuantitative Analysis 27, 605–617.
White, H., 1980. A heteroskedasticity-consistent covariance matrix estimator and adirect test for heteroskedasticity. Econometrica 48, 817–838.