Chinese banks - Debt 101
36
Deutsche Bank Markets Research Asia China Banking / Finance Banks Industry Chinese banks - Debt 101 Date 9 January 2017 Industry Update Dealing with debt... pivoting from corporate to government & household What is in this report? ________________________________________________________________________________________________________________ Deutsche Bank AG/Hong Kong Deutsche Bank does and seeks to do business with companies covered in its research reports. Thus, investors should be aware that the firm may have a conflict of interest that could affect the objectivity of this report. Investors should consider this report as only a single factor in making their investment decision. DISCLOSURES AND ANALYST CERTIFICATIONS ARE LOCATED IN APPENDIX 1. MCI (P) 057/04/2016. Hans Fan, CFA Research Analyst (+852 ) 2203 6353 [email protected] Jacky Zuo Research Associate (+852 ) 2203 6255 [email protected] Stephen Andrews, CFA Research Analyst (+852 ) - 2203 6191 [email protected] Top picks ICBC (1398.HK),HKD4.73 Buy China Merchants Bank (3968.HK),HKD18.62 Buy Source: Deutsche Bank Companies Featured ICBC (1398.HK),HKD4.73 Buy China Construction Bank (0939.HK),HKD5.83 Buy Agri. Bank of China (1288.HK),HKD3.26 Hold Bank of China (3988.HK),HKD3.52 Buy Bank of Communications (3328.HK),HKD5.74 Hold China Merchants Bank (3968.HK),HKD18.62 Buy China CITIC Bank (0998.HK),HKD5.12 Hold China Minsheng Bank (1988.HK),HKD8.45 Hold CEB (6818.HK),HKD3.62 Hold Chongqing Rural Bank (3618.HK),HKD4.58 Hold Huishang Bank (3698.HK),HKD3.97 Sell Bank of Chongqing (1963.HK),HKD6.69 Sell Shanghai Pudong Bank (600000.SS),CNY16.18 Sell Industrial Bank (601166.SS),CNY16.18 Sell Ping An Bank (000001.SZ),CNY9.13 Hold Bank of Beijing (601169.SS),CNY9.84 Buy Bank of Nanjing (601009.SS),CNY11.22 Sell Bank of Ningbo (002142.SZ),CNY17.25 Sell Source: Deutsche Bank We value Chinese banks using a three- stage Gordon Growth Model (PV= (ROE- g)/(COE-g)), with target prices based on 2016E book values. Upside risk: the removal or softening of the GDP target. Downside risk: a property price correction. China’s rapidly-growing debt has been the market’s focus for years. In this report we summarize our comprehensive proprietary studies into this issue. We mainly aim to answer three simple questions: 1) How big is China’s debt issue? 2) How to deal with it? 3) How does it impact Chinese banks? We use a structured framework to assess China’s debt risks, which breaks down the debt balance by funding source, financing channel and borrower (Fig 4). We expect a structural downtrend in ROE of the China banking sector, as China will leverage up govt while restructuring corporate debt. The only sweet spot is household leveraging-up, which should benefit retail-orientated banks. How big is China’s debt issue? (page 2-7) China boasts a total debt balance of Rmb195tr (or US$28tr) as of Sept 2016, accounting for 275% of GDP, we estimate. The absolute level of debt leverage is not the highest globally, but the pace of increase indeed is. Amid elevated leverage, we estimate around 8-11% of debt has higher risks. Corporate debt is the key (c.60% of total debt), 13-18% of which is “evergreened” in 2018E. From borrowers’ perspective, how to deal with it? (page 8-10) The root cause of China’s debt issue is the GDP targeting. With a 6.5% target in place, there is double-digit credit growth embedded and we model China’s debt-to-GDP ratio to rise above 300% by 2018. In contrast to deleveraging the whole economy, a more likely scenario is to leverage up China’s government and household, while attempting to delever the corporate sector. How does it impact Chinese banks? (page 11-19) The likelihood of a hard landing and systemic banking crisis is very low, as government could leverage up and liquidity risk is limited both externally and internally. However, government leveraging-up and the ongoing restructuring of SOE debts are likely to compress the asset yield of Chinese banks, leading to a structural downtrend in ROE. The only positive is household leveraging-up, which should benefit retail-orientated banks, i.e., CMB and big-four. From the perspective of funding sources, how to deal with it? (Page 20-24) There is an increasingly uneven distribution of risks within China’s banking system. Big banks and CMB have been de-risking, while other banks are growing their asset base aggressively. Policy banks are growing rapidly to support infrastructure build, which is effectively government leveraging itself up. Smaller banks are the weaker link in the banking system, featuring heavy shadow banking exposure and mounting capital risks. We expect more consolidation among smaller banks to happen, which is positive for big banks. From the perspective of financing channels, how to deal with it? (page 25-27) Among the financing channels, shadow banking has experienced remarkable growth, leading to rising capital and liquidity risk for the banking system. However, all financial regulators have been tightening up on shadow banking since May 2016, which may impact the capital and earnings of smaller banks. Prefer retail-orientated banks over the long run; CMB is our top pick While sector ROE may decline structurally, we expect retail banks to record sustained profitability. In the long run, CMB is our top pick, as it is the only bank to achieve ROA recovery and to sustain a mid-teen ROE. Distributed on: 08/01/2017 22:12:27 GMT
-
Upload
khangminh22 -
Category
Documents
-
view
0 -
download
0
Transcript of Chinese banks - Debt 101

Deutsche Bank Markets Research
Asia
China
Banking / Finance
Banks
Industry
Chinese banks - Debt 101
Date
9 January 2017
Industry Update
Dealing with debt... pivoting from corporate to government & household
What is in this report?
________________________________________________________________________________________________________________
Deutsche Bank AG/Hong Kong
Deutsche Bank does and seeks to do business with companies covered in its research reports. Thus, investors should be aware that the firm may have a conflict of interest that could affect the objectivity of this report. Investors should consider this report as only a single factor in making their investment decision. DISCLOSURES AND ANALYST CERTIFICATIONS ARE LOCATED IN APPENDIX 1. MCI (P) 057/04/2016.
Hans Fan, CFA
Research Analyst
(+852 ) 2203 6353
Jacky Zuo
Research Associate
(+852 ) 2203 6255
Stephen Andrews, CFA
Research Analyst
(+852 ) - 2203 6191
Top picks
ICBC (1398.HK),HKD4.73 Buy
China Merchants Bank (3968.HK),HKD18.62
Buy
Source: Deutsche Bank
Companies Featured
ICBC (1398.HK),HKD4.73 Buy
China Construction Bank (0939.HK),HKD5.83
Buy
Agri. Bank of China (1288.HK),HKD3.26 Hold
Bank of China (3988.HK),HKD3.52 Buy
Bank of Communications (3328.HK),HKD5.74
Hold
China Merchants Bank (3968.HK),HKD18.62
Buy
China CITIC Bank (0998.HK),HKD5.12 Hold
China Minsheng Bank (1988.HK),HKD8.45 Hold
CEB (6818.HK),HKD3.62 Hold
Chongqing Rural Bank (3618.HK),HKD4.58 Hold
Huishang Bank (3698.HK),HKD3.97 Sell
Bank of Chongqing (1963.HK),HKD6.69 Sell
Shanghai Pudong Bank (600000.SS),CNY16.18
Sell
Industrial Bank (601166.SS),CNY16.18 Sell
Ping An Bank (000001.SZ),CNY9.13 Hold
Bank of Beijing (601169.SS),CNY9.84 Buy
Bank of Nanjing (601009.SS),CNY11.22 Sell
Bank of Ningbo (002142.SZ),CNY17.25 Sell
Source: Deutsche Bank
We value Chinese banks using a three-
stage Gordon Growth Model (PV= (ROE-
g)/(COE-g)), with target prices based on
2016E book values.
Upside risk: the removal or softening of
the GDP target. Downside risk: a
property price correction.
China’s rapidly-growing debt has been the market’s focus for years. In this report we summarize our comprehensive proprietary studies into this issue. We mainly aim to answer three simple questions: 1) How big is China’s debt issue? 2) How to deal with it? 3) How does it impact Chinese banks? We use a structured framework to assess China’s debt risks, which breaks down the debt balance by funding source, financing channel and borrower (Fig 4). We expect a structural downtrend in ROE of the China banking sector, as China will leverage up govt while restructuring corporate debt. The only sweet spot is household leveraging-up, which should benefit retail-orientated banks.
How big is China’s debt issue? (page 2-7) China boasts a total debt balance of Rmb195tr (or US$28tr) as of Sept 2016, accounting for 275% of GDP, we estimate. The absolute level of debt leverage is not the highest globally, but the pace of increase indeed is. Amid elevated leverage, we estimate around 8-11% of debt has higher risks. Corporate debt is the key (c.60% of total debt), 13-18% of which is “evergreened” in 2018E.
From borrowers’ perspective, how to deal with it? (page 8-10) The root cause of China’s debt issue is the GDP targeting. With a 6.5% target in place, there is double-digit credit growth embedded and we model China’s debt-to-GDP ratio to rise above 300% by 2018. In contrast to deleveraging the whole economy, a more likely scenario is to leverage up China’s government and household, while attempting to delever the corporate sector.
How does it impact Chinese banks? (page 11-19) The likelihood of a hard landing and systemic banking crisis is very low, as government could leverage up and liquidity risk is limited both externally and internally. However, government leveraging-up and the ongoing restructuring of SOE debts are likely to compress the asset yield of Chinese banks, leading to a structural downtrend in ROE. The only positive is household leveraging-up, which should benefit retail-orientated banks, i.e., CMB and big-four.
From the perspective of funding sources, how to deal with it? (Page 20-24) There is an increasingly uneven distribution of risks within China’s banking system. Big banks and CMB have been de-risking, while other banks are growing their asset base aggressively. Policy banks are growing rapidly to support infrastructure build, which is effectively government leveraging itself up. Smaller banks are the weaker link in the banking system, featuring heavy shadow banking exposure and mounting capital risks. We expect more consolidation among smaller banks to happen, which is positive for big banks.
From the perspective of financing channels, how to deal with it? (page 25-27) Among the financing channels, shadow banking has experienced remarkable growth, leading to rising capital and liquidity risk for the banking system. However, all financial regulators have been tightening up on shadow banking since May 2016, which may impact the capital and earnings of smaller banks.
Prefer retail-orientated banks over the long run; CMB is our top pick While sector ROE may decline structurally, we expect retail banks to record sustained profitability. In the long run, CMB is our top pick, as it is the only bank to achieve ROA recovery and to sustain a mid-teen ROE.
Distributed on: 08/01/2017 22:12:27 GMT

9 January 2017
Banks
Chinese banks - Debt 101
Page 2 Deutsche Bank AG/Hong Kong
How big is China’s debt issue?
China boasts a total debt balance of Rmb195tr (or US$28tr) as of Sept 2016, accounting for 275% of GDP, we estimate.
The absolute level of debt leverage is not the highest globally, but the pace of increase indeed is. This is the reason for market concerns on banks’ asset quality.
Figure 1: China’s debt-to-GDP ratio has spiked since 2008
38 40 40 40 42 48 55 56 53 55 61 61 58 53 48 44 43 56 58 57 53 49 49 49 46 45 44 42 45 50 58 58 63 70 73 83 85 88 91 15 16 17 18 19 22
26 27 26 28 32 33 33 31 29 28 28
40 44 45 41 43 47 52 54 48 46 43 39 50
50 48 53
57 62 67 69 69 66
2 2 3 3 3 4
7 8 9
11 12 14 16 17 17 17 19 18
23 31 32
33 38
39 41 42 44 46
2 2 2 2 2 2 2
2 4 4 5
6 8 9 11 11
15 17 16
16 14 18 16
17 16 15
15 16
17
18 18 18 19
1 2 3 4
5 6 7 8 9
11 13 14 15 16 17 18
26 26 27
30 32
38
44 47 51 53
53 57 58 58 62 71
83 86 81 85 96 99 96 89 85 82 84
114 124 127 124 125
137 147 147 141 139 139 135
166 182 180
195
213 228
253 261
270 275
0
50
100
150
200
250
300% China's debt-to-GDP ratio during 1980-3Q16
Local
governments
Central
government
Households
Private enterprises
SOEs
+140ppt in
7.75 years
Source: Deutsche Bank estimates, PBOC, CBRC, CIRC, SAFE, NBS, MOF, CEIC, WIND, Chinabond.com.cn, Trustee Association of China, SAC, HKMA, media reports Note: 1) We have included loans, bonds, shadow banking and offshore credit; 2) We have eliminated the overlapping between different financing channels; 3) We classify LGFV debt into local government debts.

9 January 2017
Banks
Chinese banks - Debt 101
Deutsche Bank AG/Hong Kong Page 3
Figure 2: China’s credit leverage is not the highest… Figure 3: …but its pace of increase is one the of fastest
23
26
54
50
45
51
66
106
83
72
168
89
156
105
75
115
99
17
16
16
10
25
71
71
90
123
79
42
61
44
59
88
100
66
28
36
16
69
75
32
55
43
35
97
46
110
69
91
89
72
213
6 8
7 8
8 6
1 2 9
1 4 5
1 5 3
1 9 2
2 3 9
2 4 5
2 5 5
2 5 5
2 6 0
2 7 1
2 7 8
0 100 200 300 400
Indonesia
Mexico
Russia
India
Brazil
Thailand
Malaysia
Korea
Australia
US
China - BIS
Singapore
China - DBe
Euro area
UK
Canada
Japan
Global comparison - Credit-to-GDP ratio (1H16)
Non-financial corporation
Household
Government
(%)
3 9 7
2 9 5
2 7 0
129.7
106.6
70.0
62.0
55.3
46.0
45.3
39.0
38.0
37.8
33.2
27.8
23.4
19.5
16.1
9.6
0.5
0 10 20 30 40 50 60 70 80 90 100 110 120 130 140
China - DBe
China - BIS
Japan
Canada
Singapore
Australia
Malaysia
Thailand
Korea
Euro area
Brazil
UK
Mexico
Russia
US
Indonesia
India
Global comparison - Credit-to-GDP ratio change during 2008-1H16
(%) Source: Deutsche Bank estimates, BIS Source: Deutsche Bank estimates, BIS
How high is the risk and where are the weaker links?
We use a structured framework to assess the risks of China’s debt, splitting Rmb195tr debt by: 1) funding source; 2) financing channel; 3) borrower. In this report, we firstly focus on the risk profile of different borrowers, and then we also provide detailed analysis on key risks in funding sources and channels.
From borrowers’ perspective, we assign a debt-at-risk ratio to each type of borrower and we estimate the system debt-at-risk ratio to be around 8-11%
under a hard-landing scenario. Corporate debt (57% of total debt) is the key, for which we assign a notably higher debt-at-risk ratio of 13-18%.

9 January 2017
Banks
Chinese banks - Debt 101
Page 4 Deutsche Bank AG/Hong Kong
Figure 4: Overview of total system credit by funding source, financing channel, borrower and risk profile
On-
B/S
Non-bank financial
institutions (9%)
Corporates (7%)
Individuals (6%)
SOEs (Rmb64tr, 33% of total)
Bank loans(Rmb106tr, 55% of total)
FUNDING SOURCES FINANCING CHANNELS BORROWERS
Private enterprises (Rmb47tr, 24% of total)
Households(Rmb32tr, 17% of total)
Local governments(Rmb37tr, 19% of total)
Central governments(Rmb13tr, 7% of total)
Bonds(Rmb41tr, 21% of total)
Shadow banking(Rmb42tr, 22% of total)
Offshore credit (2% of
total)
Banks (78%)
13-18%
5%
0%
DEBT AT RISK
RATIO
8-11%
SYSTEM
DEBT AT RISK
RATIO
$ $
Source: Deutsche Bank estimates, PBOC, CBRC, CIRC, SAFE, NBS, MOF, CEIC, WIND, Chinabond.com.cn, Trustee Association of China, SAC, HKMA, media reports Note: 1) We have eliminated the overlapping between different financing channels; 2) We classify LGFV debt into local government debts.
How to assess corporate debt risks? It is about the degree of evergreening
We define “evergreening debt” as when underlying corporate borrowers are unable to generate sufficient cash flows and/or do not have sufficient excess cash to meet their debt obligations, so that they have to borrow new credit to repay their debt. This represents a stress test on corporate debt servicing capacity.

9 January 2017
Banks
Chinese banks - Debt 101
Deutsche Bank AG/Hong Kong Page 5
Our proprietary studies suggest that approximately 12-15% of corporate credit, or Rmb13-17tr, was evergreening in 2016, and the proportion might
increase to 13-18% by 2018. We did two studies, i.e. top-down and bottom-up.
Top-down study: One can quantify the evergreening credit for all corporates in China by sizing the gap between 1) debt services, item (1) in the below table, which measures the principal due and interest repayment for all corporates for one year; and 2) corporate debt serving capacity, item (2) in the below table, which include operating cash flows, excess cash and equity raising.
For more details, please see our report The degree of evergreening, dated 23 February 2016.
Figure 5: Our proprietary top-down analysis of China’s evergreening credit
Rmb trn Item 2002 2003 2004 2005 2006 2007 2008 2009 2010 2011 2012 2013 2014 2015 2016 2017E 2018E
Corporate debt services (1) 7.7 8.8 10.5 12.1 12.9 14.5 16.1 18.3 23.4 29.5 35.9 44.8 53.5 60.9 68.9 75.8 83.4
- Principal repayment 7.1 8.1 9.7 11.1 11.7 12.9 14.7 16.6 20.7 25.7 31.5 39.5 47.1 54.7 62.4 68.6 75.5
- Interest repayment 0.6 0.7 0.9 1.0 1.2 1.6 1.3 1.7 2.8 3.8 4.4 5.3 6.3 6.2 6.5 7.2 7.9
Corporate debt serving capacity (2) 7.2 7.5 8.7 11.7 14.6 16.6 18.8 23.3 28.4 31.5 35.7 42.3 47.5 50.5 55.5 60.1 64.9
- Operating cash flows 3.6 3.3 3.7 5.8 7.5 8.2 8.9 12.0 12.8 14.1 18.5 22.3 24.0 23.6 25.0 26.6 28.3
- Excess cash 3.5 4.2 4.9 5.8 6.7 7.8 9.4 10.8 14.8 16.8 16.8 19.7 22.8 25.0 27.2 29.1 31.0
- Equity raising 0.0 0.1 0.1 0.1 0.3 0.6 0.5 0.5 0.8 0.6 0.4 0.3 0.7 1.9 3.3 4.4 5.6
Evergreening debt (3) = (1) - (2) 0.5 1.3 1.8 0.3 (1.7) (2.1) (2.7) (5.1) (4.9) (2.0) 0.2 2.5 6.0 10.4 13.4 15.8 18.5
- As a % of corporate credit (4) = (3) / (6) 5% 9% 12% 2% -9% -9% -10% -15% -11% -4% 0% 3% 7% 10% 12% 13% 13%
- As a % of system credit (5) = (3) / (7) 3% 6% 8% 1% -6% -6% -6% -9% -7% -2% 0% 2% 4% 6% 7% 7% 8%
Total corporate credit balance (6) 11.7 13.9 16.0 17.3 19.7 22.8 26.6 34.6 44.2 51.3 62.4 74.8 85.9 101.1 114.0 125.4 138.0
Total system credit balance (7) 16.5 20.1 23.6 26.2 30.2 37.3 42.9 57.5 74.3 87.1 104.1 125.3 145.2 171.2 200.9 221.0 243.1 Source: Deutsche Bank estimates, PBOC, CBRC, CIRC, SAFE, NBS, MOF, CEIC, WIND, Chinabond.com.cn, Trustee Association of China, SAC, HKMA, media reports
How to assess corporate debt issue? The bottom-up study on the degree of evergreening
The top-down study on evergreening debt may underestimate the problem, as it nets out the weaker part of corporates due to the aggregate data. So we did another bottom-up study, which checked the debt service on 1,500 corporate bond issuers.
Using the same methodology as the top-down analysis, we calculate the debt service amount and debt serving capacity per annum for every single sampled company. We add all the debt balance of corporates that could not generate sufficient debt serving capacity to cover their debt services, and divided by total debt of the entire sample.
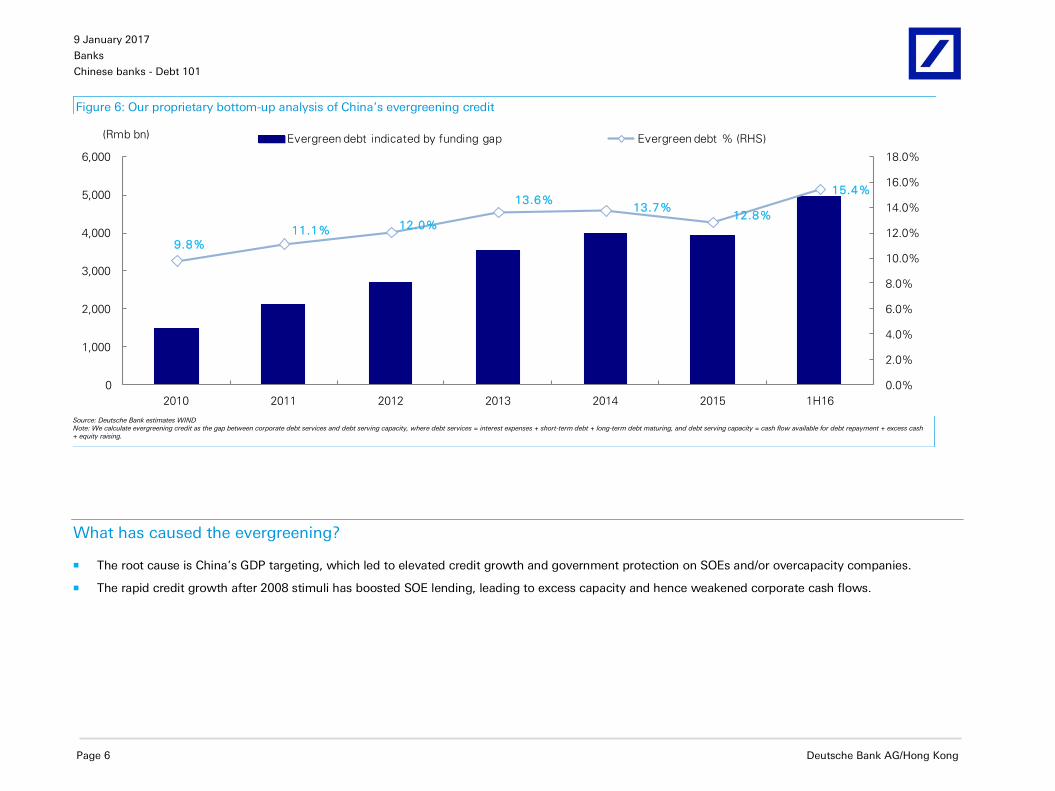
Our bottom-up study concludes that the evergreening debt amounted to 15.4% of the total debt of these companies as of 1H16.
9 January 2017
Banks
Chinese banks - Debt 101
Page 6 Deutsche Bank AG/Hong Kong
Figure 6: Our proprietary bottom-up analysis of China’s evergreening credit
9.8%
11.1% 12.0%
13.6%13.7%
12.8%
15.4%
0.0%
2.0%
4.0%
6.0%
8.0%
10.0%
12.0%
14.0%
16.0%
18.0%
0
1,000
2,000
3,000
4,000
5,000
6,000
2010 2011 2012 2013 2014 2015 1H16
Evergreen debt indicated by funding gap Evergreen debt % (RHS)(Rmb bn)
Source: Deutsche Bank estimates WIND Note: We calculate evergreening credit as the gap between corporate debt services and debt serving capacity, where debt services = interest expenses + short-term debt + long-term debt maturing, and debt serving capacity = cash flow available for debt repayment + excess cash + equity raising.
What has caused the evergreening?
The root cause is China’s GDP targeting, which led to elevated credit growth and government protection on SOEs and/or overcapacity companies.
The rapid credit growth after 2008 stimuli has boosted SOE lending, leading to excess capacity and hence weakened corporate cash flows.

9 January 2017
Banks
Chinese banks - Debt 101
Deutsche Bank AG/Hong Kong Page 7
Figure 7: China’s SOE debt has grown faster than private sector debt since 2008
52
24
0
10
20
30
40
50
60
70
80
% Corporate credit breakdown 1980-3Q16 - SOEs vs. private enterprises
SOE debt
(SOE+LGFV)
% total credit
Private debt
% total credit
2008-now -
"Guo Jin Min Tui"
Faster growth in SOE
credit
1998-2008 -
"Guo Tui Min Jin"
Faster growth in
private sector credit
after SOE reform
1980-1998 - SOE-dominated economy
Before SOE reform in 1998
144
66
0
20
40
60
80
100
120
140
160
% Credit-to-GDP during 1980-3Q16 - SOEs vs. private enterprises
SOE debt
(SOE+LGFV)
% GDP
Private debt
% GDP
2008-now -
"Guo Jin Min Tui"
Faster growth in SOE
credit
1998-2008 -
"Guo Tui Min Jin"
Faster growth in
private sector credit
after SOE reform
1980-1998 - SOE-dominated economy
Before SOE reform in 1998
Source: Deutsche Bank estimates, PBOC, CBRC, CIRC, SAFE, NBS, MOF, CEIC, WIND, Chinabond.com.cn, Trustee Association of China, SAC, HKMA, media reports Note: 1) We have eliminated the overlapping between different financing channels; 2) We classify LGFV debt into local government debts.
What has caused the evergreening?
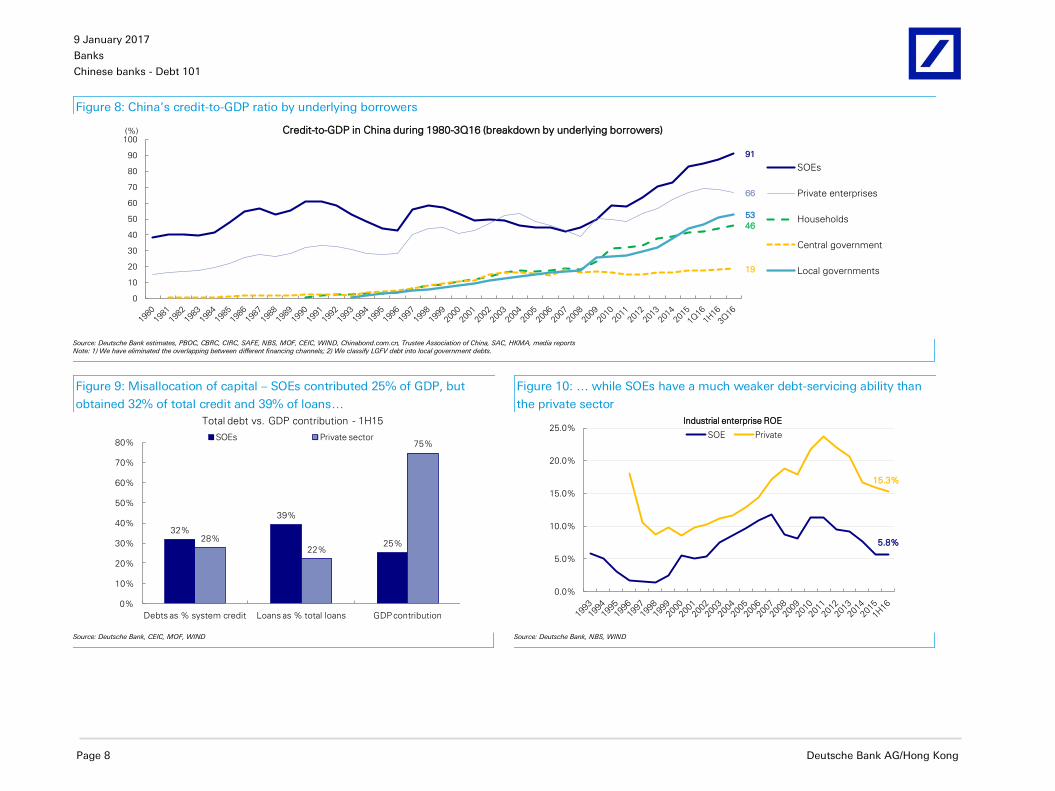
The protection on SOEs has led to misallocation of capital in the system and hence lower productivity and mounting risks. The SOE sector has gained stronger credit support from financial institutions, which are disproportionate to their GDP contribution and despite their weaker profitability.
9 January 2017
Banks
Chinese banks - Debt 101
Page 8 Deutsche Bank AG/Hong Kong
Figure 8: China’s credit-to-GDP ratio by underlying borrowers
91
66
46
19
53
0
10
20
30
40
50
60
70
80
90
100Credit-to-GDP in China during 1980-3Q16 (breakdown by underlying borrowers)
SOEs
Private enterprises
Households
Central government
Local governments
(%)
Source: Deutsche Bank estimates, PBOC, CBRC, CIRC, SAFE, NBS, MOF, CEIC, WIND, Chinabond.com.cn, Trustee Association of China, SAC, HKMA, media reports Note: 1) We have eliminated the overlapping between different financing channels; 2) We classify LGFV debt into local government debts.
Figure 9: Misallocation of capital – SOEs contributed 25% of GDP, but
obtained 32% of total credit and 39% of loans…
Figure 10: … while SOEs have a much weaker debt-servicing ability than
the private sector
32%
39%
25%28%
22%
75%
0%
10%
20%
30%
40%
50%
60%
70%
80%
Debts as % system credit Loans as % total loans GDP contribution
Total debt vs. GDP contribution - 1H15
SOEs Private sector
5.8%
15.3%
0.0%
5.0%
10.0%
15.0%
20.0%
25.0%SOE Private
Industrial enterprise ROE
Source: Deutsche Bank, CEIC, MOF, WIND Source: Deutsche Bank, NBS, WIND

9 January 2017
Banks
Chinese banks - Debt 101
Deutsche Bank AG/Hong Kong Page 9
How to deal with it? Why can’t China banks recognize evergreening debt as NPLs and write them off in one go?
The root cause of China’s debt issue, in our view, is the GDP target. As China has targeted to grow GDP by 6.5% annually by 2020, there is a double-digit credit growth rate embedded in order to support this target. If China banks recognize all evergreening debt as NPLs, credit growth is likely to fall sharply and GDP growth to drop, which is against China’s GDP target.
Thus we expect China’s debt-to-GDP to rise to over 300% by 2018E, if China sticks to its 6.5% GDP target. In absolute terms, we model that China needs
to generate US$12-13tr of new credit during 2016-18. For details please refer to our report FITT – Waking the consumer banking giants, dated 6 April 2016.
Figure 11: Modeling China’s credit growth: Debt to GDP could rise above 300% by YE18
(RMB bn) 2010 2011 2012 2013 2014 2015 2016E 2017E 2018E
Nominal GDP 40,890 48,412 53,412 58,802 63,591 67,671 73,115 79,247 84,485
Nominal growth rate 18.3% 18.4% 10.3% 10.1% 8.1% 6.4% 8.0% 8.4% 6.6%
US$ bn 6,041 7,490 8,466 9,564 10,320 10,767 10,891 11,321 11,721
Avg FX rate 6.77 6.46 6.31 6.15 6.16 6.28 6.71 7.00 7.21
M2 72,585 85,159 97,415 110,652 122,837 139,228 158,720 179,988 201,587
Growth rate 18.9% 17.3% 14.4% 13.6% 11.0% 13.3% 14.0% 13.4% 12.0%
Total Credit Assets (BIS
data)76,650 90,645 108,195 129,088 148,721 171,308 197,713 225,373 254,483
YoY 21.5% 18.3% 19.4% 19.3% 15.2% 15.2% 15.4% 14.0% 12.9%
Credit/GDP 187% 187% 203% 220% 234% 253% 270% 284% 301%
Credit multiplier 1.18x 0.99x 1.87x 1.91x 1.87x 2.37x 1.92x 1.67x 1.95x
Total Bank assets 96,161 113,787 133,686 152,475 172,203 199,156 226,739 257,743 289,277
YoY growth 18.8% 18.3% 17.5% 14.1% 12.9% 15.7% 13.9% 13.7% 12.2%
US$ bn 14,593 18,079 21,457 24,835 27,757 30,670 32,391 36,820 39,091
Source: Deutsche Bank, CEIC, Bank of International Settlements
9 January 2017
Banks
Chinese banks - Debt 101
Page 10 Deutsche Bank AG/Hong Kong
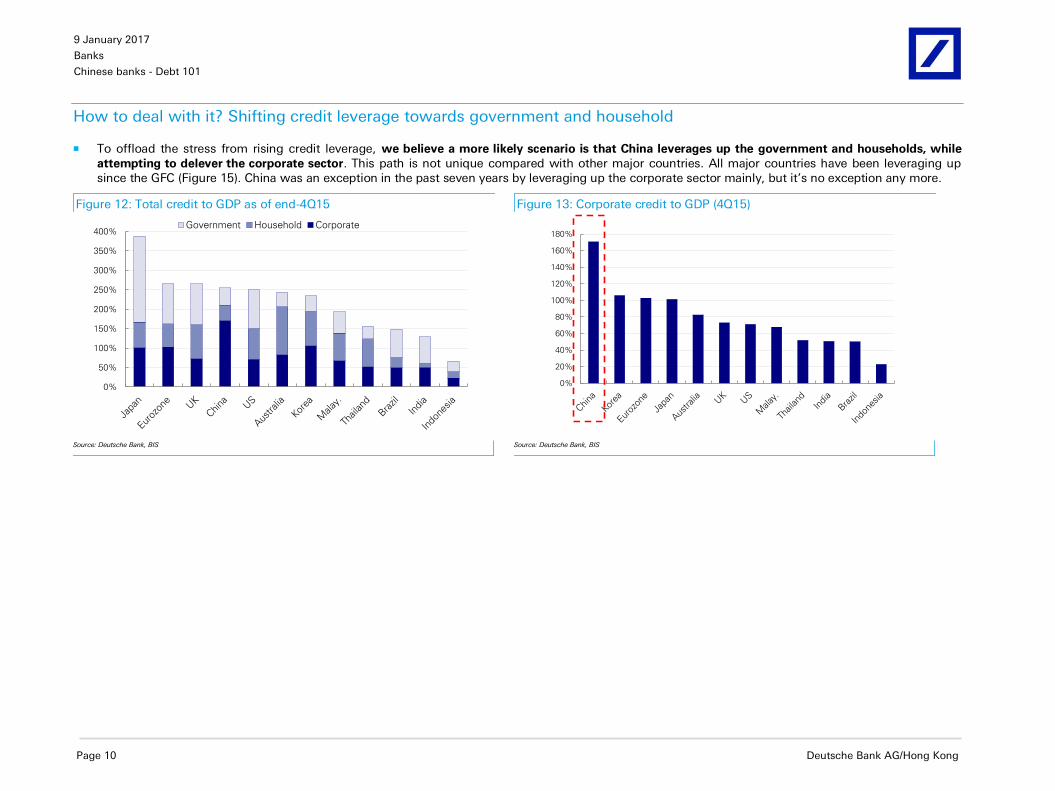
How to deal with it? Shifting credit leverage towards government and household
To offload the stress from rising credit leverage, we believe a more likely scenario is that China leverages up the government and households, while
attempting to delever the corporate sector. This path is not unique compared with other major countries. All major countries have been leveraging up since the GFC (Figure 15). China was an exception in the past seven years by leveraging up the corporate sector mainly, but it’s no exception any more.
Figure 12: Total credit to GDP as of end-4Q15 Figure 13: Corporate credit to GDP (4Q15)
0%
50%
100%
150%
200%
250%
300%
350%
400%Government Household Corporate
0%
20%
40%
60%
80%
100%
120%
140%
160%
180%
Source: Deutsche Bank, BIS Source: Deutsche Bank, BIS
9 January 2017
Banks
Chinese banks - Debt 101
Deutsche Bank AG/Hong Kong Page 11
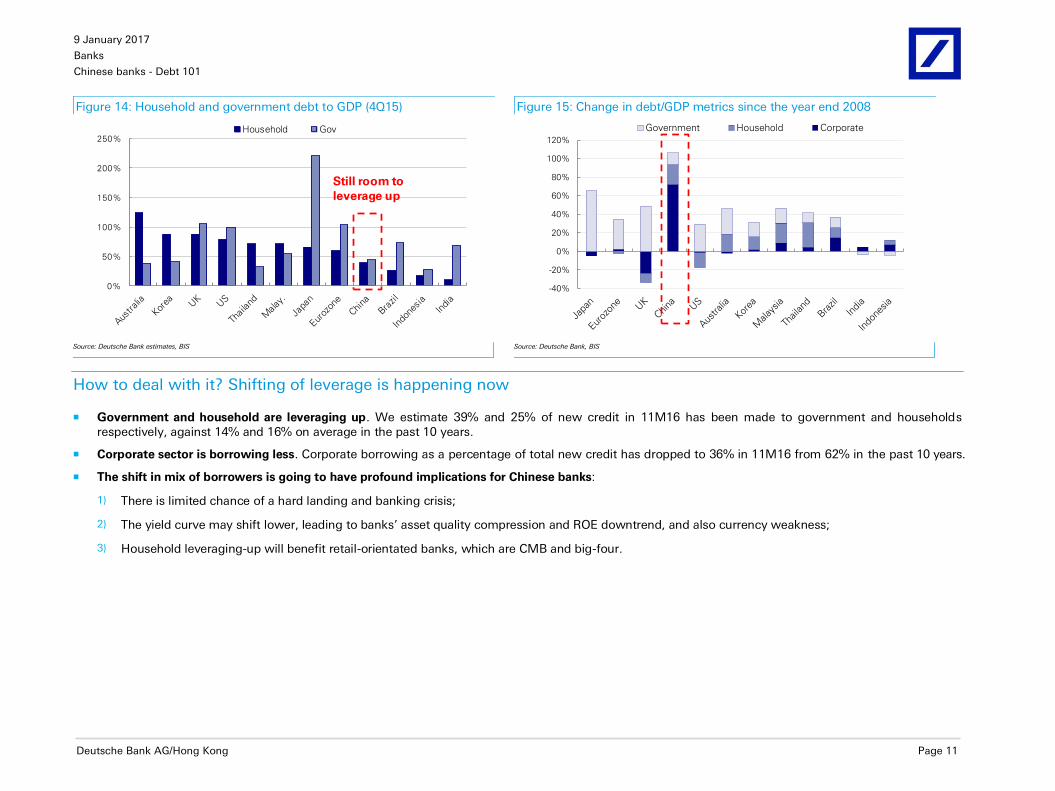
Figure 14: Household and government debt to GDP (4Q15) Figure 15: Change in debt/GDP metrics since the year end 2008
0%
50%
100%
150%
200%
250%Household Gov
Still room to
leverage up
-40%
-20%
0%
20%
40%
60%
80%
100%
120%
Government Household Corporate
Source: Deutsche Bank estimates, BIS Source: Deutsche Bank, BIS
How to deal with it? Shifting of leverage is happening now
Government and household are leveraging up. We estimate 39% and 25% of new credit in 11M16 has been made to government and households respectively, against 14% and 16% on average in the past 10 years.
Corporate sector is borrowing less. Corporate borrowing as a percentage of total new credit has dropped to 36% in 11M16 from 62% in the past 10 years.
The shift in mix of borrowers is going to have profound implications for Chinese banks:
1) There is limited chance of a hard landing and banking crisis;
2) The yield curve may shift lower, leading to banks’ asset quality compression and ROE downtrend, and also currency weakness;
3) Household leveraging-up will benefit retail-orientated banks, which are CMB and big-four.
9 January 2017
Banks
Chinese banks - Debt 101
Page 12 Deutsche Bank AG/Hong Kong
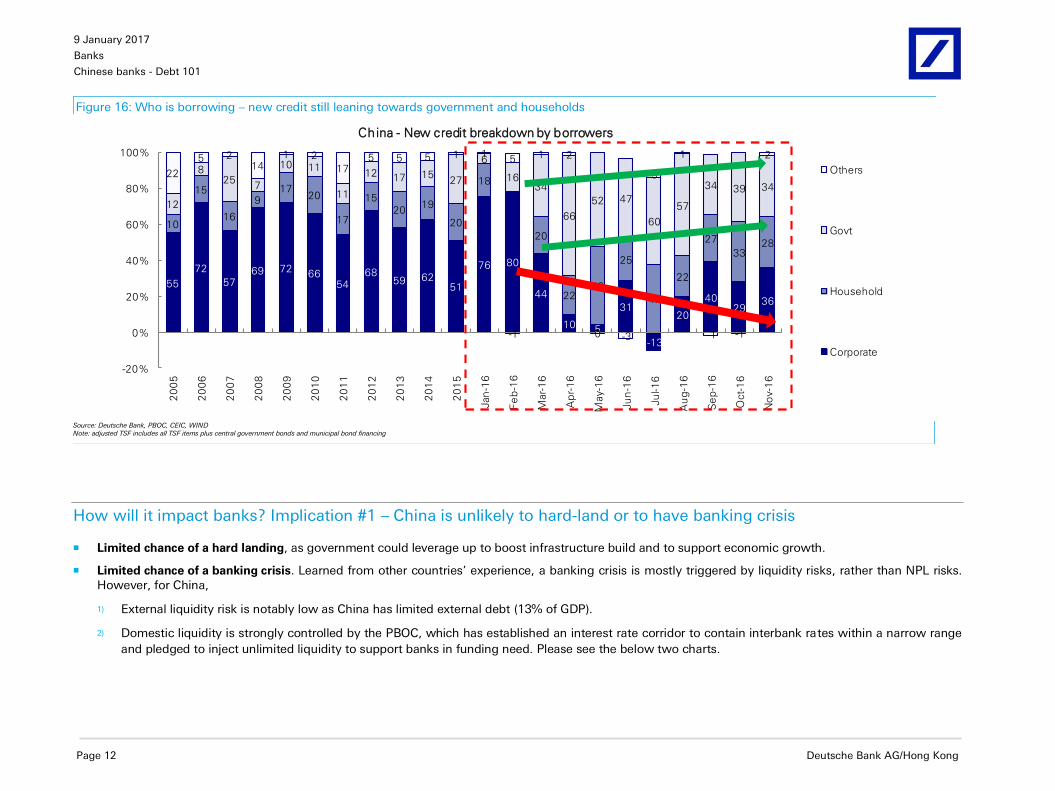
Figure 16: Who is borrowing – new credit still leaning towards government and households
55
72
5769 72
6654
6859 62
51
76 80
44
10 5
31
-13
20
4029
36
10
15
16
917
20
17
15
2019
20
18
-1
20
2243
25
47
22
27
3328
12
825
7
10 11
11
12 17 1527
6
1634
66
52 47
60
57
34 39 34
22
5 214
1 2
175 5 5 1 1
5 1 2
0 -3
5
1
-1 -1
2
-20%
0%
20%
40%
60%
80%
100%
20
05
20
06
20
07
20
08
20
09
20
10
20
11
20
12
20
13
20
14
20
15
Jan
-16
Fe
b-1
6
Mar-
16
Ap
r-1
6
May-1
6
Ju
n-1
6
Ju
l-1
6
Au
g-1
6
Se
p-1
6
Oct-
16
No
v-1
6
China - New credit breakdown by borrowers
Others
Govt
Household
Corporate
Source: Deutsche Bank, PBOC, CEIC, WIND Note: adjusted TSF includes all TSF items plus central government bonds and municipal bond financing
How will it impact banks? Implication #1 – China is unlikely to hard-land or to have banking crisis
Limited chance of a hard landing, as government could leverage up to boost infrastructure build and to support economic growth.
Limited chance of a banking crisis. Learned from other countries’ experience, a banking crisis is mostly triggered by liquidity risks, rather than NPL risks. However, for China,
1) External liquidity risk is notably low as China has limited external debt (13% of GDP).
2) Domestic liquidity is strongly controlled by the PBOC, which has established an interest rate corridor to contain interbank rates within a narrow range
and pledged to inject unlimited liquidity to support banks in funding need. Please see the below two charts.
9 January 2017
Banks
Chinese banks - Debt 101
Deutsche Bank AG/Hong Kong Page 13
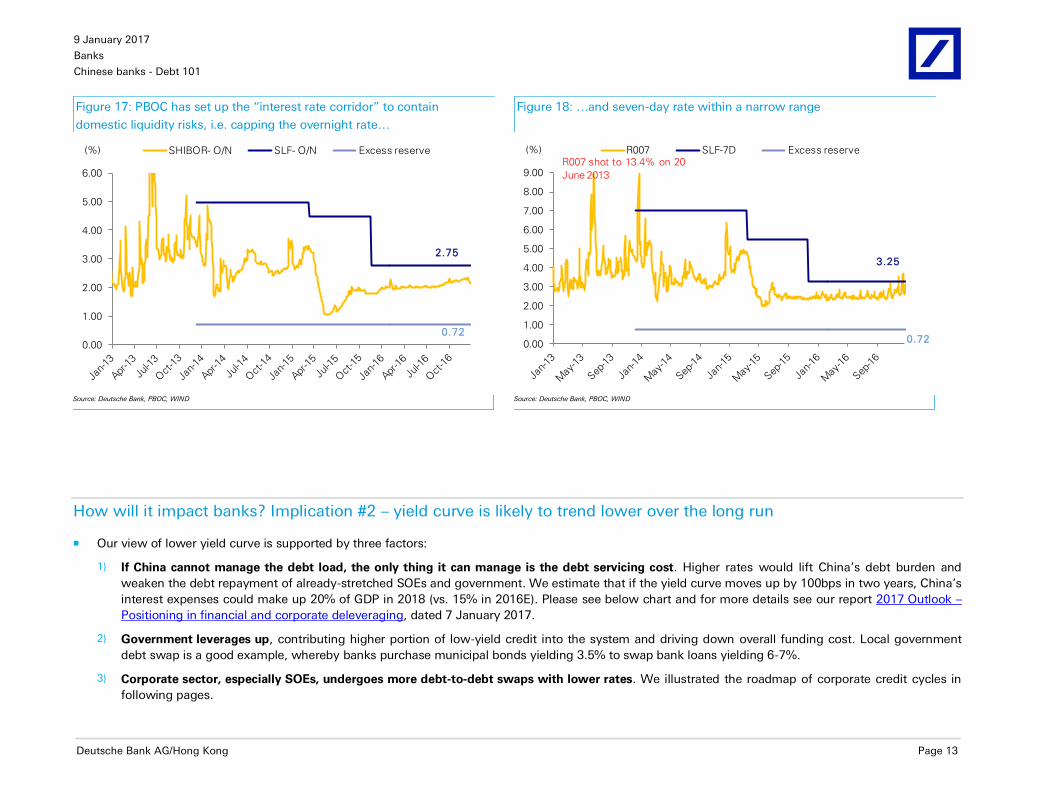
Figure 17: PBOC has set up the “interest rate corridor” to contain
domestic liquidity risks, i.e. capping the overnight rate…
Figure 18: …and seven-day rate within a narrow range
2.75
0.72
0.00
1.00
2.00
3.00
4.00
5.00
6.00
SHIBOR- O/N SLF- O/N Excess reserve(%)
3.25
0.720.00
1.00
2.00
3.00
4.00
5.00
6.00
7.00
8.00
9.00
R007 SLF-7D Excess reserve(%)
R007 shot to 13.4% on 20
June 2013
Source: Deutsche Bank, PBOC, WIND Source: Deutsche Bank, PBOC, WIND
How will it impact banks? Implication #2 – yield curve is likely to trend lower over the long run
Our view of lower yield curve is supported by three factors:
1) If China cannot manage the debt load, the only thing it can manage is the debt servicing cost. Higher rates would lift China’s debt burden and
weaken the debt repayment of already-stretched SOEs and government. We estimate that if the yield curve moves up by 100bps in two years, China’s
interest expenses could make up 20% of GDP in 2018 (vs. 15% in 2016E). Please see below chart and for more details see our report 2017 Outlook –
Positioning in financial and corporate deleveraging, dated 7 January 2017.
2) Government leverages up, contributing higher portion of low-yield credit into the system and driving down overall funding cost. Local government
debt swap is a good example, whereby banks purchase municipal bonds yielding 3.5% to swap bank loans yielding 6-7%.
3) Corporate sector, especially SOEs, undergoes more debt-to-debt swaps with lower rates. We illustrated the roadmap of corporate credit cycles in
following pages.

9 January 2017
Banks
Chinese banks - Debt 101
Page 14 Deutsche Bank AG/Hong Kong
Figure 19: If yield curve moves up by 100bps in two years, China’s interest expenses may make up 20% of GDP in 2018E (vs. 15% in 2016E)
2.2%
10.0%
7.9%
9.5%
6.8%
15.7%
13.6%
16.5%
19.5%
0.0%
5.0%
10.0%
15.0%
20.0%
25.0%
China's interest burdens (total interest expenses as a % of GDP)DB
estimates
+100bps
flat yield
- 100bps
Source: Deutsche Bank estimates, PBOC, CBRC, CIRC, SAFE, NBS, MOF, CEIC, WIND, Chinabond.com.cn, Trustee Association of China, SAC, HKMA, media reports
How will it impact banks? Implication #2 – yield curve is likely to trend lower over the long run (Continued)
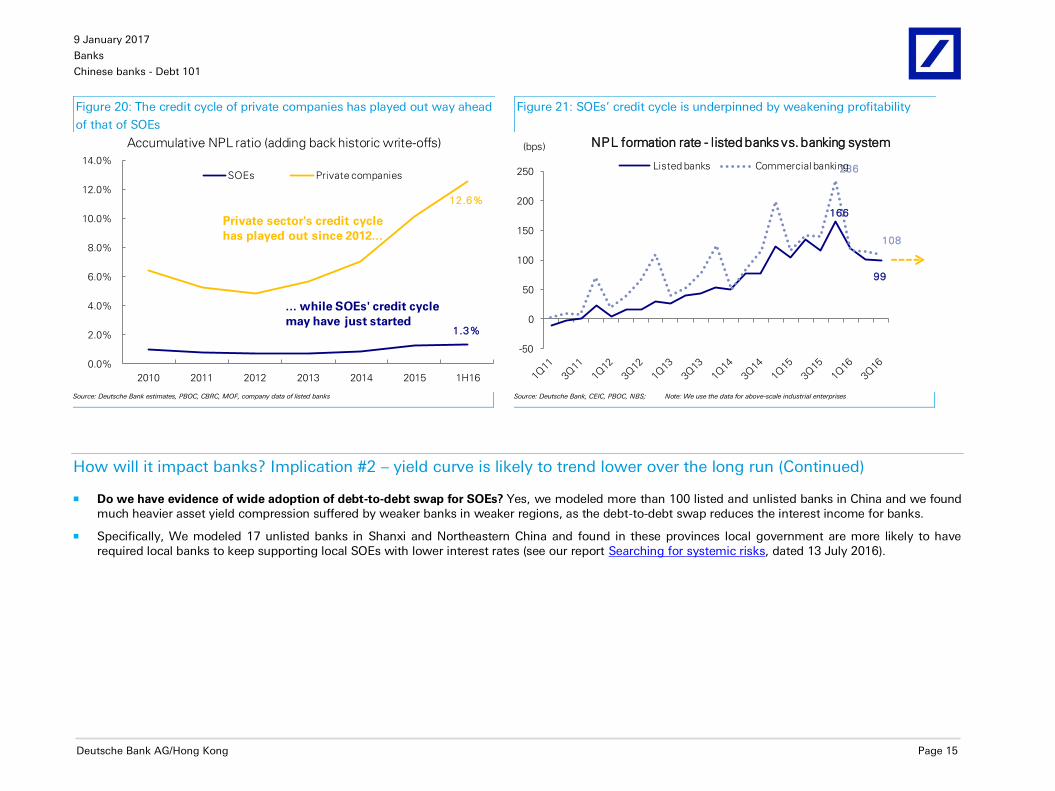
China’s corporate sector is running two credit cycles in parallel but at different stages. While the credit cycle for private companies has likely peaked out with an NPL ratio of 13%, the SOE credit cycle has probably just started, with NPL ratio of only 1.3% (Figure 20). Please see our report Transition between two credit cycles, dated 19 September 2016, for more details.
How will the SOE credit cycle play out? We believe debt-to-debt swaps, i.e. lengthening loan tenors and lowering interest rates, are likely to be much
more widely adopted than other measures (which may include debt-to-equity swap, bankruptcy and M&As). The debt restructuring plan for Shanxi’s seven major coal companies is a good example, whereby banks are lengthening short-term loans into long-term ones and also lowering the interest rates. Before and after the restructure, the troubled SOEs are all classified as performing loans.
As such, the impact on banks from the SOE credit cycle would be asset yield compression, not a bad debt charge. This partly explains why NPL formation of China banking system has moderated recently (Figure 21).
For more details, please see our report The roadmap of SOE credit cycle dated 19 October 2016.
9 January 2017
Banks
Chinese banks - Debt 101
Deutsche Bank AG/Hong Kong Page 15
Figure 20: The credit cycle of private companies has played out way ahead
of that of SOEs
Figure 21: SOEs’ credit cycle is underpinned by weakening profitability
1.3%
12.6%
0.0%
2.0%
4.0%
6.0%
8.0%
10.0%
12.0%
14.0%
2010 2011 2012 2013 2014 2015 1H16
Accumulative NPL ratio (adding back historic write-offs)
SOEs Private companies
Private sector's credit cycle
has played out since 2012...
... while SOEs' credit cycle
may have just started
166
99
236
108
-50
0
50
100
150
200
250
NPL formation rate - listed banks vs. banking system
Listed banks Commercial banking
(bps)
Source: Deutsche Bank estimates, PBOC, CBRC, MOF, company data of listed banks Source: Deutsche Bank, CEIC, PBOC, NBS; Note: We use the data for above-scale industrial enterprises
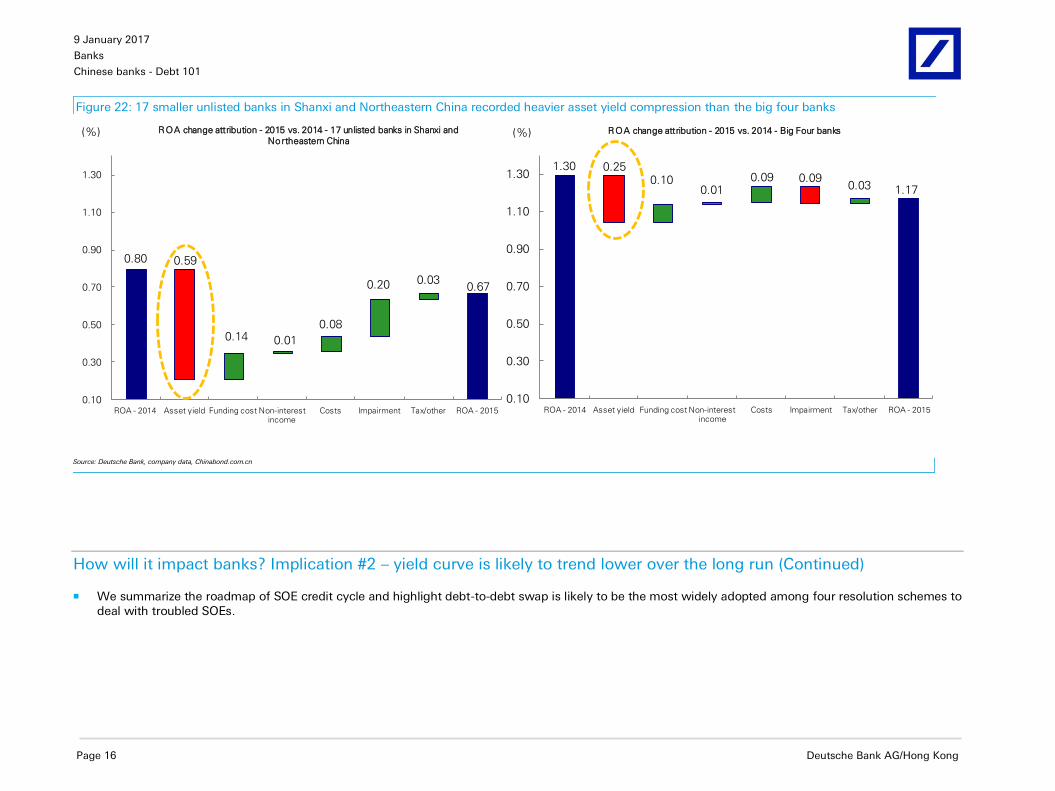
How will it impact banks? Implication #2 – yield curve is likely to trend lower over the long run (Continued)
Do we have evidence of wide adoption of debt-to-debt swap for SOEs? Yes, we modeled more than 100 listed and unlisted banks in China and we found much heavier asset yield compression suffered by weaker banks in weaker regions, as the debt-to-debt swap reduces the interest income for banks.
Specifically, We modeled 17 unlisted banks in Shanxi and Northeastern China and found in these provinces local government are more likely to have required local banks to keep supporting local SOEs with lower interest rates (see our report Searching for systemic risks, dated 13 July 2016).
9 January 2017
Banks
Chinese banks - Debt 101
Page 16 Deutsche Bank AG/Hong Kong
Figure 22: 17 smaller unlisted banks in Shanxi and Northeastern China recorded heavier asset yield compression than the big four banks
0.80 0.59
0.14 0.01
0.08
0.20 0.030.67
0.10
0.30
0.50
0.70
0.90
1.10
1.30
ROA - 2014 Asset yield Funding cost Non-interest income
Costs Impairment Tax/other ROA - 2015
(%) ROA change attribution - 2015 vs. 2014 - 17 unlisted banks in Shanxi and
Northeastern China
1.30 0.250.10
0.010.09 0.09
0.03 1.17
0.10
0.30
0.50
0.70
0.90
1.10
1.30
ROA - 2014 Asset yield Funding cost Non-interest income
Costs Impairment Tax/other ROA - 2015
(%) ROA change attribution - 2015 vs. 2014 - Big Four banks
Source: Deutsche Bank, company data, Chinabond.com.cn
How will it impact banks? Implication #2 – yield curve is likely to trend lower over the long run (Continued)
We summarize the roadmap of SOE credit cycle and highlight debt-to-debt swap is likely to be the most widely adopted among four resolution schemes to deal with troubled SOEs.

9 January 2017
Banks
Chinese banks - Debt 101
Deutsche Bank AG/Hong Kong Page 17
Figure 23: The roadmap to deal with distressed SOEs and the impacts on banks would mostly be asset yield compression, rather than bad debt charges
Bankruptcy
M&A or asset disposal
Debt-to-equity swap
Debt-to-debt swap
(i.e. lowering lending
rates & lengthening
durations)
Resolution schemes
Banks
Social capital
(e.g. WMPs, social
security funds,
insurers)
Governments and
SOEs
Funding sources
3rd party entities for DES
Impacts on banks
Banks’ own subsidiaries
State-owned capital mgmt cos.
AMCs
Insurers’ asset mgmt arms
Hybrid schemes
NPL
Asset quality pressure
Int. income Risks Fees
Int. income Asset quality pressure
P&L impact from haircut
Int. income Asset quality pressure
Int. income Asset yield compression
Asset quality pressure
LT benefit
Source: Deutsche Bank, CBRC, State Council, Caixin report Note: 1) The size of the colored boxes largely represents the size of the resolution schemes; 2) regarding the impacts on banks, the color of arrows refers to positive or negative – if green, positive; if red, negative – the direction of arrows refers to the trends.
How will it impact banks? Implication #2 – yield curve is likely to trend lower over the long run (Continued)
Looking ahead, we expect a lower yield curve to lead to a structural downtrend in the asset yield and ROE of Chinese banks. As shown in the below chart, asset yield compression is likely to become the single largest contributing factor to ROA decline, rather than bad debt charge.

9 January 2017
Banks
Chinese banks - Debt 101
Page 18 Deutsche Bank AG/Hong Kong
Figure 24: The roadmap to deal with distressed SOEs and the impacts on banks would mostly asset yield compression, rather than bad debt charge
1.13 1.16
0.590.03
0.35 0.010.05 0.92
-0.20
0.00
0.20
0.40
0.60
0.80
1.00
1.20
(%) Listed banks' ROA change attribution - 2015 vs 2018E
Source: Deutsche Bank estimate, company data
How will it impact banks? Implication #3 – Household leverage-up to benefit retail-orientated banks
Can Chinese households leverage up further? This is probably the first question investors think of when referring to household leverage.
We believe so, as China’s household leverage looks low:
1) From the perspective of household balance sheet (Figure 25), household debt is modest when compared with household financial assets. We estimate the total household debt balance accounted for only 29% of household financial assets in China as of 1H16.

9 January 2017
Banks
Chinese banks - Debt 101
Deutsche Bank AG/Hong Kong Page 19
2) From the perspective of household income statement (Figure 26), the average household in China needs to manage annual retail loan repayments (interest + principal) equivalent to 16% of their disposal income in 1H16, lower than 45% for Korea and 27% for the US.
For more details, please see our report Analyzing the property exposure, dated 10 November 2016.
Figure 25: Household leverage (debt % financial assets) is low in China
even for less wealthy families
Figure 26: Household debt services as a % of disposal income in China is
lower than other countries
22%
33%
29%
10%
15%
20%
25%
30%
35%
2004 2005 2006 2007 2008 2009 2010 2011 2012 2013 2014 2015 1H16
Household debts as % of household financial assets - CNHigh net worth family Common family CN household
16%
27%
45%
0%
5%
10%
15%
20%
25%
30%
35%
40%
45%
50%
1996
1997
1998
1999
2000
2001
2002
2003
2004
2005
2006
2007
2008
2009
2010
2011
2012
2013
2014
2015
1H
16
Household debt services as % disposal income
( i nterest rates adjusted)China US Korea
Source: Deutsche Bank Estimate, BCG China Private Banking Report 2015, PBOC Note: High net worth family is defined as household financial assets above Rmb6mn
Source: Deutsche Bank, PBOC, US Federal Reserve, Statistics Korea Note: we assume on average 15-year payment time for mortgage loans in each country and adjust interest rate level using the average interest rate in history
How will it impact banks? Implication #3 – Households’ leverage-up to benefit retail-orientated banks (continued)
Households leveraging-up is a long-term positive for retail-orientated banks (i.e. CMB and big-four), as it is likely to create notable revenue opportunities for the retail banking business. Please refer to our report FITT – Waking the consumer banking giants, dated 6 April 2016. We have already witnessed rising retail profit contributions for retail-oriented banks (Figure 27). Looking ahead, the improving return profile of retail banking (Figure 29 & 30) should help offset the asset yield compression for the big-four and CMB.

9 January 2017
Banks
Chinese banks - Debt 101
Page 20 Deutsche Bank AG/Hong Kong
Figure 27: Rising retail banking profit contribution Figure 28: Estimated capital allocation of big-four vs. joint-stock banks
60%
34%
17%
0%
10%
20%
30%
40%
50%
60%
70%
2010 2011 2012 2013 2014 2015 1H16
Retail banking PBT contribution - 1H16
CMB
Big 4
banks
Other
banks
63% 68%
30% 16%
8%17%
0%
10%
20%
30%
40%
50%
60%
70%
80%
90%
100%
Big 4 JSB
Treasury/other Retail Corporate
Source: Deutsche Bank, company data Source: Deutsche Bank, company data
Figure 29: China big 4 banks division ROA for corporate vs. retail banking Figure 30: China big 4 banks division ROE for corporate vs. retail banking
0.96%
1.04%
0.00%
0.20%
0.40%
0.60%
0.80%
1.00%
1.20%
1.40%
1.60%
1.80%
Retail banking - big-four Corporate banking - big-four
19.3%
10.8%
0.0%
5.0%
10.0%
15.0%
20.0%
25.0%
30.0%Retail banking - big-four Corporate banking - big-four
Source: Deutsche Bank estimate, company data Source: Deutsche Bank estimate, company data
How will it impact banks? Implication #3 – Households’ leverage-up to benefit retail-orientated banks (continued)
We estimate retail banks are likely to generate higher, more sustained profitability than corporate banks. Hence our top picks are CMB and ICBC.

9 January 2017
Banks
Chinese banks - Debt 101
Deutsche Bank AG/Hong Kong Page 21
Figure 31: Retail banks (big-four + CMB) should have higher ROA… Figure 32: … and higher ROE than corporate banks
0.60%
0.70%
0.80%
0.90%
1.00%
1.10%
1.20%
1.30%
1.40%
1.50%
1.60%
2007 2008 2009 2010 2011 2012 2013 2014 2015 2016E 2017E 2018E
ROA
CMB Big-four Other listed banks
DB estimates
10.0%
12.0%
14.0%
16.0%
18.0%
20.0%
22.0%
24.0%
26.0%
28.0%
30.0%
2007 2008 2009 2010 2011 2012 2013 2014 2015 2016E 2017E 2018E
ROE
CMB Big-four Other listed banks
DB estimates
Source: Deutsche Bank estimate, company data Source: Deutsche Bank estimate, company data
Figure 33: Chinese banks’ exposure to SOEs Figure 34: Chinese banks’ retail banking PBT contribution
31%
27%
25% 25%24% 24%
22% 22% 21% 21% 21% 21% 21% 20% 20% 19%18% 18%
22%
0%
5%
10%
15%
20%
25%
30%
35%
IND
B
SP
DB
CN
CB
BO
NJ
CE
B
BO
CQ
BO
NB
ICB
C
Huis
hang
PA
B
CR
CB
CC
B
BO
C
BoC
om
AB
C
MS
B
BO
BJ
CM
B
Avg
SOE exposure % total assets (on- & off-BS)
Retail banks
60%
38%35% 35% 34%
30%28% 26%
24%
16%14%
10% 10% 9%
-5%
32%
-10%
0%
10%
20%
30%
40%
50%
60%
70%
CM
B
ICB
C
CC
B
AB
C
CR
CB
BO
NB
BO
C
BoC
om
CE
B
CN
CB
BO
BJ
MS
B
BO
CQ
Huis
hang
PA
B
Avg
Retail PBT contribution % (1H16)
Retail banks Source: Deutsche Bank estimate, company data Source: Deutsche Bank estimate, company data

9 January 2017
Banks
Chinese banks - Debt 101
Page 22 Deutsche Bank AG/Hong Kong
How to deal with it? From the perspective of funding sources, we see changing dynamics
In the above analysis we discuss how to deal with China’s debt from the perspective of borrowers. In the following pages we discuss the debt issue from the perspective of funding providers. Banks are obviously the key funding providers in China, financing nearly 80% of credit.
Within the banking system, we have long argued that there exists an uneven distribution of risks, with big banks having been de-risking while other
banks are taking more risks. While unlisted banks account for 40% of total banking assets, they are growing their asset base much faster than listed big-four banks and joint-stock banks.
There are two types of banks that have been expanding assets aggressively, i.e. policy banks and smaller city/rural commercial banks. The asset expansion of each type is going to have profound implications for listed banks.
Figure 35: China banking system structure – by total assets of 2015
Figure 36: Big-five banks grew their assets much more slowly than city-
commercial banks and JSBs
39%
19%
10%
4%
11%
12%
3%
1%
Big-four banks
- ICBC
- CCB
- ABC
- BOC
Policy banks
- China Development Bank
- China Agricultural Development Bank
- Export and Import Bank of China
Joint-stock banks
Postal Bank of China
City commercial banks
Rural FIs
- Rural commercial banks
- Rural credit cooperatives
Non-Bank FIs
Foreign banks
Listed banks
accounted for
~60% of total
Relatively riskier
part of the system
1 0 .3%
1 5 .7%
2 3 .8%
1 6 .1%
2 6 .1%
0.0%
5.0%
10.0%
15.0%
20.0%
25.0%
30.0%
35.0%
Banking assets yoy growth by type
Large commercial bank Joint-stock commercial bank
City commercial bank Rural financial institutions
Policy banks & other FIs
Source: Deutsche Bank, CBRC Source: Deutsche Bank, CBRC

9 January 2017
Banks
Chinese banks - Debt 101
Deutsche Bank AG/Hong Kong Page 23
How to deal with it? From the perspective of funding sources, we see rise of policy banks as government leverages up
China’s big three policy banks now in aggregate have over US$3trn of assets (c.10% of banking system). Their growth rate has been impressive at a 20% CAGR for the past five years. They have been major funding providers for China’s booming infrastructure build.
Funding side, policy banks rely on bond issuance and PBOC funding. Bond issuance still makes up 60% of policy banks’ funding in China. Elsewhere, the PBOC has been supporting policy banks’ asset expansion by injecting capital (US$100bn in 2015) and direct lending via the PSL scheme (US$290bn).
The implications of a rise in policy banks include:
1) It takes some of the strain of supporting China’s economic growth off the shoulders of listed banks;
2) It is also a way that government leverages itself up, which may lead to fewer credit risks but lower bank returns.
3) This can help lower financial risk in the short term, but comes at the expense of rising national debt in the medium to long term and can prolong misallocation of capital.
For details please refer to our report Policy banks: Driving growth and restructuring, dated 12 October 2016.
Figure 37: Asset growth of China’s three policy
banks has been rapid
Figure 38: Funding mix of policy banks vs. Big-4
and JSBs
Figure 39: Aggregate Equity Capital raisings of
China commercial banks vs. policy banks
(US$bn)
1,176
1,494
1,825
2,069
2,551
3,024
0
500
1,000
1,500
2,000
2,500
3,000
3,500
US$ bnTotal assets of policy banks in China
EXIM ADBC CDB
0%
10%
20%
30%
40%
50%
60%
70%
80%
90%
100%
Policy Banks Big 4 JSBs
Equity Other Debt securities Deposits Due to Banks/ Financials
0
20
40
60
80
100
120
Big A & H-share listed commercial banks Policy Banks
Source: Deutsche Bank, company data Source: Deutsche Bank, company data Source: Deutsche Bank, PBOC, company data
9 January 2017
Banks
Chinese banks - Debt 101
Page 24 Deutsche Bank AG/Hong Kong
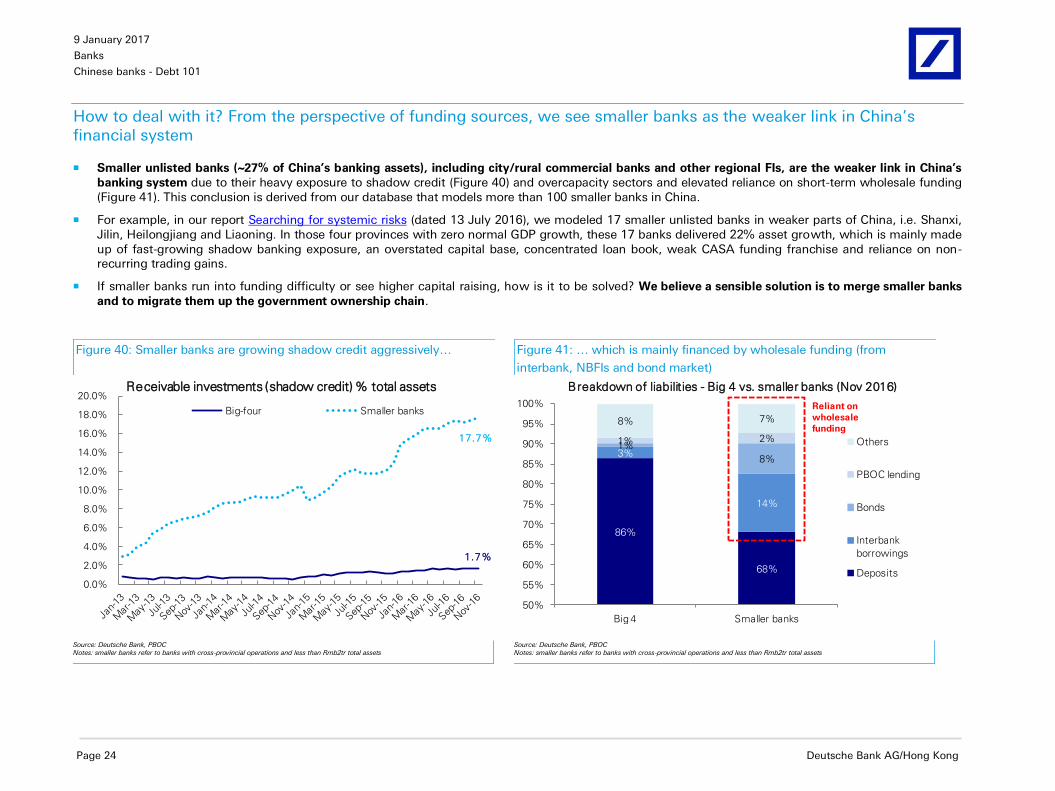
How to deal with it? From the perspective of funding sources, we see smaller banks as the weaker link in China’s financial system
Smaller unlisted banks (~27% of China’s banking assets), including city/rural commercial banks and other regional FIs, are the weaker link in China’s
banking system due to their heavy exposure to shadow credit (Figure 40) and overcapacity sectors and elevated reliance on short-term wholesale funding (Figure 41). This conclusion is derived from our database that models more than 100 smaller banks in China.
For example, in our report Searching for systemic risks (dated 13 July 2016), we modeled 17 smaller unlisted banks in weaker parts of China, i.e. Shanxi, Jilin, Heilongjiang and Liaoning. In those four provinces with zero normal GDP growth, these 17 banks delivered 22% asset growth, which is mainly made up of fast-growing shadow banking exposure, an overstated capital base, concentrated loan book, weak CASA funding franchise and reliance on non-recurring trading gains.
If smaller banks run into funding difficulty or see higher capital raising, how is it to be solved? We believe a sensible solution is to merge smaller banks
and to migrate them up the government ownership chain.
Figure 40: Smaller banks are growing shadow credit aggressively…
Figure 41: … which is mainly financed by wholesale funding (from
interbank, NBFIs and bond market)
1.7%
17.7%
0.0%
2.0%
4.0%
6.0%
8.0%
10.0%
12.0%
14.0%
16.0%
18.0%
20.0%Receivable investments (shadow credit) % total assets
Big-four Smaller banks
86%
68%
3%
14%
1%
8%
1% 2%
8% 7%
50%
55%
60%
65%
70%
75%
80%
85%
90%
95%
100%
Big 4 Smaller banks
Breakdown of liabilities - Big 4 vs. smaller banks (Nov 2016)
Others
PBOC lending
Bonds
Interbank
borrowings
Deposits
Reliant on
wholesale
funding
Source: Deutsche Bank, PBOC Notes: smaller banks refer to banks with cross-provincial operations and less than Rmb2tr total assets Source: Deutsche Bank, PBOC
Notes: smaller banks refer to banks with cross-provincial operations and less than Rmb2tr total assets

9 January 2017
Banks
Chinese banks - Debt 101
Deutsche Bank AG/Hong Kong Page 25
How to deal with it? Migrating up the government ownership chain to cope with troubled smaller banks
The sensible solution to cope with troubled smaller banks is consolidation and migration up the government ownership chain. This has been the typical solution for troubled smaller banks in the past 20 years, i.e. merge them together, with a higher level of government injecting capital and carving out NPLs.
The implication on big banks would be positive, as it would rebut the market perception that big banks may be required to acquire the smaller ones. However, over the past 20 years, we see no case for big banks buying smaller ones. We expect government to keep the core assets clean in the system.
Figure 42: Ownership structure of China banking sector – we may see more consolidation in small banks and risk migration up to higher level government
Ownership Bank category
Policy banks (CDB, ADBC, EXIMB) and
Postal Bank
Big 4: ICBC, CCB, ABC, BOC
JSBs (BoCom, CEB, CMB, CNCB)
Central Huijin MOF
Central SOEs AMCs
Huarong Xiangjiang Bank etc.
JSBs (SPDB, INDB, Zheshang Bank,
Bohai Bank, etc.)
City Commercial banks: BOBJ, BOSH,
Huishang Bank, Jiangxi Bank,
Zhongyuan Bank, etc.
Provincial
Finance Bureau
Provincial
SOEs
Large POEsForeign strategic
investors
Rural commercial banks: CRCB, Tianjin
Rural Commercial Bank, etc.
~16
banks
20-25
banks
Municipal
Finance Bureau
Municipal
SOEs
POEs and
individuals
Foreign strategic
investors
City Commercial banks: BONJ, BONB,
Shengjing Bank etc.
Rural commercial banks
POEs and
individuals
Foreign strategic
investors
Private-owned banks: MSB, PAB,
WeBank, etc.
Rural commercial banks and credit
unions
>110
banks
>2,200
banks
5 private
banks
approved
in 2014
Migrating
risks up to
higher level
govt
Central
Provincial
Municipal
Private
~62% of
banking
assets
~11% of
banking
assets
~27% of
banking
assets
Source: Deutsche Bank, CBRC, PBOC

9 January 2017
Banks
Chinese banks - Debt 101
Page 26 Deutsche Bank AG/Hong Kong
How to deal with it? Migrating up the government ownership chain to cope with troubled smaller banks (continued)
In fact, a new round of consolidation may have already begun. We identified a list of seven provincial-level banks set up since 2010 by merging municipal-level banks, or simply upgrading the ownership from municipal to provincial governments (Hebei Bank).
Figure 43: Summary of set up of provincial-level commercial banks during 2010-2015
Bank Merge date Type Merger targetsOwnership nature
before merger
Ownership nature
after mergerMajor shareholders after merger
Jiangxi Bank 15/12/2015City Commercial
Bank
Nanchang Bank absorbs Jingdezhen Commercial
Bank and renamed as Jiangxi Bank.Municipal Provincial
Jiangxi Provincial Expressway Investment
Group (20.04%, SOE);
Jiangxi Financial Holding Group (5.98%,
SOE);
Nanchang MOF (5.42%, Gov);
Zhongyuan Bank 26/12/2014City Commercial
Bank
13 city commercial banks based in Henan
Province: Kaifeng Bank, Anyang Bank, Hebi Bank,
Xinxiang Bank, Puyang Bank, Xuchang Bank,
Luohe Bank, Sanmenxia Bank, Nanyang Bank,
Shangqiu Bank, Xinyang Bank, Zhoukou Bank and
Zhumadian Bank - merged into a new entity -
Zhongyuan Bank.
Municipal Provincial
Henan Investment Group (9.02%, SOE);
Yongcheng Median Holding Group (7.4%,
SOE);
Henan Shengrui Holding Group (4.5%,
POE);
Guizhou Bank 11/10/2012City Commercial
Bank
Merged and restructured from Zunyi Commercial
Bank, Liupanshui Commercial Bank, and Anshun
Commercial Bank, backed by Guizhou provincial
government.
Municipal Provincial
Guizhou MOF (9.6%, Gov);
63.95% of bank's shares are held by the
Gov&SOEs.
Hebei Bank 25/07/2012City Commercial
Bank
Hebei Bank was upgraded to a provincial
governed bank from a municipal governed bank
in 2012.
Municipal Provincial
GD Power Development Co (19.02%,
SOE);
Hebei Port Group (9.55%, SOE);
China City Construction Holding Group
(9.29%, SOE)
Gansu Bank 11/11/2011City Commercial
Bank
Merged and restructured from Pingliang
Commercial Bank and Baiyin Commercial Bank,
with newly introduced shareholders including
provisional SOEs, strategic investors and POEs.
Municipal Provincial
Gansu Provincial Highway Aviation Tourism
Investment Group (15.78%, SOE);
Baoshang Bank (11.48%, POE);
Gansu Electricity Power Investment (8.6%,
SOE);
Hubei Bank 27/02/2011City Commercial
Bank
Merged and restructured from Huangshi Bank,
Yichang Commercial Bank, Fanxiang Commercial
Bank, Jinzhou Commercial Bank, and Xiaogan
Commercial Bank.
Municipal Provincial
Hubei Energy (9.28%, SOE);
China Three Gorges Corp (9.28%, SOE);
Wuhan Iron&Steel Group (9.28%, SOE);
Yichang MOF (6.23%, Gov)
Huarong Xiangjiang Bank 12/10/2010City Commercial
Bank
Merged from Hunan Xiangtan, Zhuzhou,
Yueyang, Hengyang Commercial Bank and
Shaoyang City Credit Union. Besides, Huarong
Asset Management injected capital into and take
full control of the newly established entity.
Municipal Central govtChina Huarong Asset Management
(50.98%, SOE)
Source: Deutsche Bank, company data, media news

9 January 2017
Banks
Chinese banks - Debt 101
Deutsche Bank AG/Hong Kong Page 27
How to deal with it? From the perspective of financing channels, there is no more hiding from shadow
Among the financing channels, shadow banking in China has experienced remarkable growth in recent years. We estimate total shadow banking credit recorded a 27% CAGR during 2011-3Q16 to Rmb42tr, or 22% of the system credit balance.
Since May 2016, we note all financial regulators, including PBOC, CBRC, CSRC and CIRC, have intensified the tightening of shadow banking. The directions are to deleverage shadow credit by requiring banks to set aside sufficient capital and provisions and lowering SPVs’ leverage at NBFIs.
For details, please refer to three of our reports: 1) No more hiding from shadow, dated 19 May 2016; 2) Tightening regulatory noose on shadow credit, dated 6 June 2016; and 3) New WMP draft rules: continued tightening on shadow credit, dated 28 July 2016.
Figure 44: Intensified, more coordinated regulatory actions on shadow credit since May 2016
Receivable
investments
Corporate lending
• LGFVs (the majority)
• PPP projects
• Property developers
• Overcapacity sectors
• NPLs (relatively rare)
Discounted bills
Interbank deposits
$$
Funding sourcesSPVs packaged by
NBFIsUnderlying assets
Trust plans
Brokers’ asset mgmt
schemes
Mutual funds’ asset
mgmt schemes
Private funds
Insurance debt
schemes
Corporate bonds
A-share market
Banks’ shadow credit
Other assets
$
Reverse repos
Wealth
management products
On-B/S of
banks
Off-B/S of
banks
MOF/AMC bonds
$
$
Treasury bonds
PBOC and CBRC
[5/May]
CBRC
[18/Mar]
CBRC
Circular 82
[28/Apr]
CBRC
Window
guidance
[1/Jun]
CSRC &
AMAC
[18/May]
CIRC
[end-May]
CSRC
[16/Jul]
New draft rules on
WM businesses
[27/Jul]
Further regulation
on entrusted
management
[25/Jul]
Risk inspection
in 2H16
[26/Jul]
PBOC to include
WMP into MPA
[26/Nov]
Source: Deutsche Bank, PBOC, CBRC, CSRC, CIRC, media reports. Note: the underlying structure is how China’s shadow banking works. The red circles represent the recent new regulation or window guidance.
9 January 2017
Banks
Chinese banks - Debt 101
Page 28 Deutsche Bank AG/Hong Kong
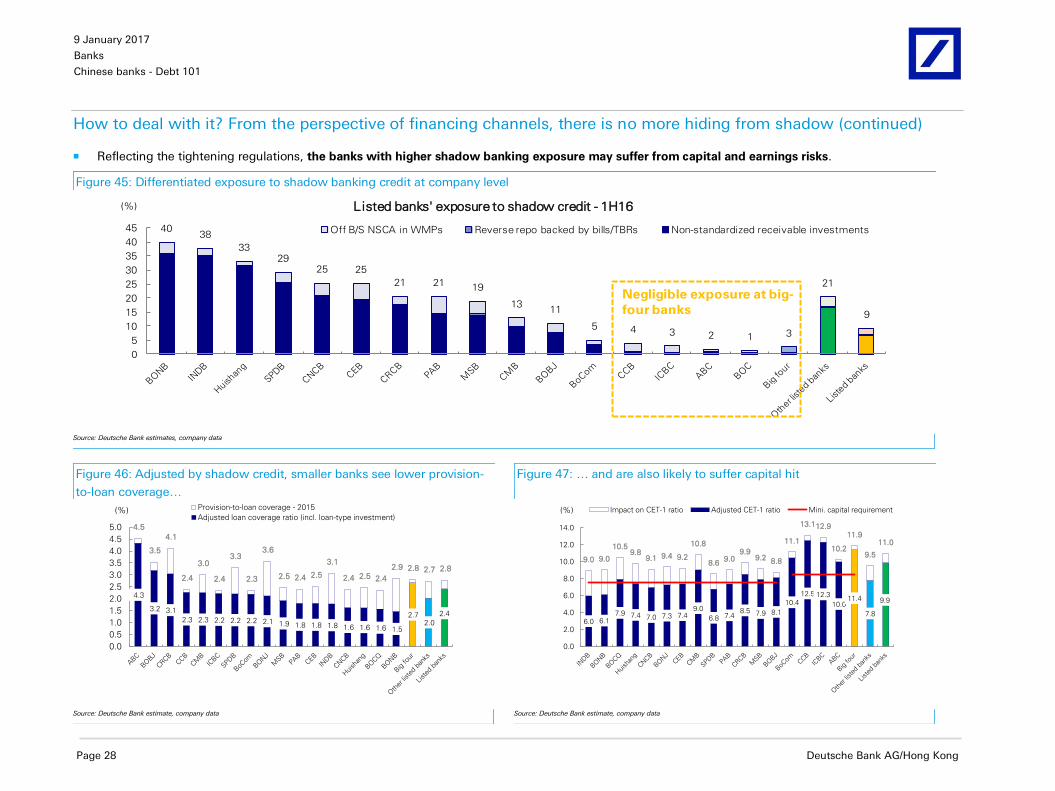
How to deal with it? From the perspective of financing channels, there is no more hiding from shadow (continued)
Reflecting the tightening regulations, the banks with higher shadow banking exposure may suffer from capital and earnings risks.
Figure 45: Differentiated exposure to shadow banking credit at company level
4038
3329
25 25
21 2119
1311
5 4 3 2 1 3
21
9
0
5
10
15
20
25
30
35
40
45
(%) Listed banks' exposure to shadow credit - 1H16
Off B/S NSCA in WMPs Reverse repo backed by bills/TBRs Non-standardized receivable investments
Negligible exposure at big-
four banks
Source: Deutsche Bank estimates, company data
Figure 46: Adjusted by shadow credit, smaller banks see lower provision-
to-loan coverage…
Figure 47: … and are also likely to suffer capital hit
4.3
3.2 3.1
2.3 2.3 2.2 2.2 2.2 2.1 1.9 1.8 1.8 1.8 1.6 1.6 1.6 1.5
2.7 2.0
2.4
4.5
3.5
4.1
2.4
3.0
2.4
3.3
2.3
3.6
2.5 2.4 2.5
3.1
2.4 2.5 2.4
2.9 2.8 2.7 2.8
0.0
0.5
1.0
1.5
2.0
2.5
3.0
3.5
4.0
4.5
5.0
(%) Provision-to-loan coverage - 2015
Adjusted loan coverage ratio (incl. loan-type investment)
6.0 6.17.9 7.4 7.0 7.3 7.4
9.0
6.8 7.48.5 7.9 8.1
10.4
12.5 12.3
10.011.4
7.8
9.9
9.0 9.0
10.59.8
9.1 9.4 9.2
10.8
8.69.0
9.99.2 8.8
11.1
13.112.9
10.2
11.9
9.5
11.0
0.0
2.0
4.0
6.0
8.0
10.0
12.0
14.0
(%) Impact on CET-1 ratio Adjusted CET-1 ratio Mini. capital requirement
Source: Deutsche Bank estimate, company data Source: Deutsche Bank estimate, company data

9 January 2017
Banks
Chinese banks - Debt 101
Deutsche Bank AG/Hong Kong Page 29
Appendix – Total credit breakdown by financing channels and total social funding cost
Figure 48: Total social funding cost has been declining since implementation of monetary easing in 4Q14, with further room to decline
Total system credit (Rmb bn) and funding cost (%) 2011 2012 2013 2014 2015 1H16 3Q16 2011 2012 2013 2014 2015 1H16
Outstanding balance Funding cost (%)
Large + medium corporate (excl. LGFVs) 21,990 25,813 28,530 32,918 39,266 42,322 43,118 6.76 6.70 6.44 6.50 5.60 5.10
MSEs + personal business loan 14,661 17,262 20,088 23,075 25,743 27,577 28,028 9.39 9.30 8.94 9.03 7.78 7.09
Personal consumption loan 1,742 2,344 3,181 3,856 4,489 5,160 5,604 10.15 10.05 9.66 9.75 8.40 7.65
Mortgage 7,137 8,100 9,800 11,520 14,180 16,550 17,806 7.00 6.63 6.37 6.71 5.32 4.63
LGFVs 9,118 9,300 10,119 10,119 9,107 8,652 8,219 7.52 7.44 7.16 7.22 6.22 5.67
Others (incl. FCY loans, overseas loans, etc.) 3,117 3,860 3,013 2,972 2,822 3,376 3,618 7.52 7.44 7.16 7.22 6.22 5.67
Total bank loans (RMB&FCY) 57,763 66,679 74,731 84,460 95,607 103,636 106,392 7.72 7.63 7.37 7.48 6.35 5.75
Bonds Outstanding balance Funding cost (%)
Treasury bonds 6,993 7,783 9,296 10,248 11,382 11,878 12,447 3.02 2.89 3.91 4.00 2.96 2.66
Local govt bonds 600 650 862 1,162 4,826 8,289 9,717 3.75 3.19 3.80 3.73 3.39 2.99
Corporate bonds 5,226 7,481 9,293 11,690 14,630 16,470 17,310 5.78 5.51 5.63 5.86 4.48 3.98
ABS 19 39 48 298 706 746 837 4.92 4.92 5.62 5.94 5.06 4.58
Private placement bonds 9 39 109 623 900 990 8.92 9.14 8.88 7.14 5.35
Non-bank fins bonds 54 37 36 45 123 153 176 5.60 4.65 5.42 5.90 4.29 3.58
Foreign bonds 4 4 3 3 1 1 4 5.73 5.49 5.57 6.43 4.74 4.19
Total bonds 12,897 16,004 19,577 23,555 32,292 38,438 41,481 4.19 4.14 4.74 4.96 3.85 3.40
Shadow banking Outstanding balance Funding cost (%)
Entrusted Loans 3,391 4,675 7,221 9,330 10,930 12,060 12,520 13.53 13.40 14.31 14.44 11.20 10.21
Trust Loans 1,708 2,993 4,833 5,350 5,390 5,730 5,930 12.03 12.22 11.80 12.13 11.84 10.31
Undiscounted bank acceptance 5,059 6,108 6,884 6,760 5,850 4,580 3,800 7.96 5.83 4.30 5.67 4.26 3.62
Banks' wealth mangement products 4,590 7,100 10,240 15,000 23,000 27,000 28,000 7.83 7.84 7.64 7.97 7.63 6.71
Brokers' asset management schemes 282 1,890 5,200 7,946 11,890 15,003 15,753 12.53 12.72 12.30 12.63 12.34 10.81
Fund subsidiaries' asset management schemes 971 3,739 8,571 11,060 11,613 12.53 12.72 12.30 12.63 12.34 10.81
Insurers' debt schemes 294 582 1,100 1,161 1,439 1,550 9.36 9.59 9.42 8.40 7.65
Financial leasing 930 1,550 2,100 3,200 4,440 4,746 4,888 10.15 10.05 9.66 9.75 8.40 7.65
Group finance companies 1,112 1,300 1,570 1,698 1,715 6.50 5.60 5.10
Small loan company 392 592 819 942 941 936 920 19.99 19.99 19.30 17.88 17.25 16.76
Pawn loans 55 71 87 86 103 115 115 21.59 21.59 20.30 19.99 19.22 18.35
Private lending 3,380 3,380 4,090 3,681 2,660 2,400 2,400 21.59 21.59 20.30 19.99 19.22 18.35
P2P loan 1 6 27 104 439 621 713 18.90 19.13 21.25 16.26 13.81 11.38
Total shadow banking 13,644 18,424 27,869 34,145 38,333 41,511 42,328 13.11 11.92 10.87 11.31 10.00 9.07
Offshore credit Outstanding balance Funding cost (%)
External government debt 313 341 355 342 723 750 750 4.00 4.00 4.00 4.00 4.00 4.00
Corporate foreign debt 2,477 2,697 2,811 2,712 4,217 4,093 4,093 5.00 5.00 5.00 5.00 5.00 5.00
Foreign debt 2,790 3,038 3,166 3,055 4,940 4,843 4,843 4.89 4.89 4.89 4.89 4.85 4.85
Total system credit 87,094 104,144 125,344 145,215 171,171 188,428 195,044 Total system funding cost (%)
% of GDP 184% 200% 213% 228% 253% 270% 275% 7.95 7.77 7.67 7.91 6.65 5.98 Source: Deutsche Bank estimates, PBOC, CBRC, CSRC, WIND, CEIC, Chinabond.com.cn, Trustee Association of China, HKMA, NBS Note: We have adjusted for overlapping among shadow banking components

9 January 2017
Banks
Chinese banks - Debt 101
Page 30 Deutsche Bank AG/Hong Kong
Valuation and risks
We value Chinese banks using a three-stage Gordon Growth Model (PV= (ROE-g)/(COE-g)), with target prices based on 2017E book values. Our valuations of
the Chinese banks under our coverage assume a near-term (2016-18E) ROE of 11.0-16.0%, a medium-term (2019-21E) ROE of 10.0-13.0% and a terminal ROE
of 7.5-11.5%, with a COE of 11-13.5%. In the below chart, we highlight our valuation comparison of the listed banks. On our estimates, H-share/A-share listed
Chinese banks are trading at 2017E P/Bs of 0.70x/0.78x and 2017E P/Es of 5.45x/6.06x.
Figure 49: Chinese banks’ valuation summary
Ticker Rating TP Price Upside Mkt. Cap
LC LC (%) (US$mn) 15A 16E 17E 15A 16E 17E 15A 16E 17E 15A 16E 17E 15A 16E 17E 15A 16E 17E
ICBC-H 1398.HK Buy 5.73 4.71 21.6% 226,565 5.12 5.43 5.32 0.82 0.78 0.71 3.1 3.3 3.1 17.1% 15.2% 14.0% 1.30% 1.22% 1.16% 5.9% 5.6% 5.7%
CCB-H 0939.HK Buy 6.67 5.85 14.1% 189,027 5.37 5.68 5.59 0.87 0.82 0.75 3.1 3.2 3.0 17.2% 15.3% 14.0% 1.30% 1.20% 1.15% 5.6% 5.3% 5.4%
ABC-H 1288.HK Hold 3.56 3.26 9.3% 146,587 4.98 5.26 5.18 0.78 0.75 0.68 2.8 3.1 2.9 16.8% 15.0% 13.8% 1.07% 0.99% 0.93% 6.1% 5.8% 5.9%
BOC-H 3988.HK Buy 4.20 3.50 19.9% 143,649 5.20 5.53 5.53 0.72 0.69 0.64 3.0 2.9 3.1 14.6% 13.1% 12.0% 1.07% 0.97% 0.89% 6.0% 5.6% 5.6%
BCOM-H 3328.HK Hold 6.13 5.73 7.0% 58,933 5.36 5.68 5.60 0.69 0.67 0.62 3.2 3.3 3.2 13.4% 12.2% 11.4% 1.00% 0.90% 0.84% 5.6% 5.3% 5.4%
CMB-H 3968.HK Buy 23.37 18.74 24.7% 65,319 6.82 6.72 6.02 1.10 1.03 0.92 2.9 2.8 2.6 17.1% 16.3% 16.2% 1.06% 1.05% 1.10% 4.4% 4.5% 5.0%
CITIC Bank-H 0998.HK Hold 4.26 5.12 -16.8% 43,405 5.10 5.31 5.28 0.66 0.64 0.58 2.2 2.1 1.9 14.3% 12.6% 11.5% 0.89% 0.76% 0.68% 4.9% 4.7% 4.7%
Minsheng-H 1988.HK Hold 7.91 8.51 -7.0% 46,577 5.64 5.94 5.77 0.86 0.81 0.73 2.7 2.7 2.5 17.0% 14.5% 13.3% 1.10% 0.99% 0.93% 3.3% 3.1% 3.2%
CEB-H 6818.HK Hold 3.10 3.62 -14.4% 25,985 4.79 5.04 5.00 0.70 0.67 0.61 2.3 2.4 2.3 15.4% 13.9% 12.8% 1.00% 0.91% 0.82% 6.3% 6.3% 6.4%
CRCB 3618.HK Hold 5.26 4.62 13.8% 5,541 4.98 5.00 4.64 0.77 0.73 0.65 2.8 2.7 2.4 16.4% 15.4% 14.8% 1.08% 1.00% 0.98% 5.2% 5.2% 5.6%
Huishang 3698.HK Sell 2.89 3.97 -27.1% 5,657 5.96 5.94 5.29 0.89 0.85 0.76 3.2 2.7 2.4 15.9% 15.1% 15.1% 1.10% 0.94% 0.92% 4.8% 4.8% 5.4%
BOCQ 1963.HK Sell 5.28 6.75 -21.8% 2,722 5.58 5.33 4.59 0.83 0.78 0.69 3.3 2.7 2.3 17.0% 15.5% 16.0% 1.07% 1.00% 1.01% 4.7% 4.9% 5.7%
H-share sector mean 5.31 5.58 5.45 0.81 0.77 0.70 3.0 3.0 2.9 16.3% 14.6% 13.5% 1.16% 1.07% 1.01% 5.6% 5.3% 5.4%
ICBC-A 601398.SS Buy 5.47 4.44 23.1% 226,565 5.76 5.76 5.65 0.93 0.83 0.75 3.5 3.5 3.3 17.1% 15.2% 14.0% 1.30% 1.22% 1.16% 5.3% 5.3% 5.4%
CCB-A 601939.SS Buy 6.37 5.49 16.1% 189,027 6.02 6.01 5.91 0.97 0.87 0.79 3.5 3.4 3.2 17.2% 15.3% 14.0% 1.30% 1.20% 1.15% 5.0% 5.0% 5.1%
ABC-A 601288.SS Hold 3.40 3.13 8.7% 146,587 5.71 5.68 5.61 0.90 0.81 0.74 3.2 3.3 3.2 16.8% 15.0% 13.8% 1.07% 0.99% 0.93% 5.3% 5.3% 5.4%
BOC-A 601988.SS Hold 4.01 3.46 15.8% 143,649 6.14 6.16 6.15 0.85 0.77 0.71 3.5 3.2 3.5 14.6% 13.1% 12.0% 1.07% 0.97% 0.89% 5.1% 5.0% 5.0%
BCOM-A 601328.SS Hold 5.85 5.80 0.9% 58,933 6.47 6.48 6.38 0.83 0.76 0.70 3.8 3.8 3.6 13.4% 12.2% 11.4% 1.00% 0.90% 0.84% 4.7% 4.6% 4.7%
CMB-A 600036.SS Buy 22.32 18.10 23.3% 65,319 7.87 7.31 6.55 1.27 1.12 1.00 3.4 3.0 2.8 17.1% 16.3% 16.2% 1.06% 1.05% 1.10% 3.8% 4.1% 4.6%
CITIC Bank-A 601998.SS Sell 4.07 6.79 -40.1% 43,405 8.07 7.93 7.88 1.05 0.95 0.87 3.5 3.1 2.9 14.3% 12.6% 11.5% 0.89% 0.76% 0.68% 3.1% 3.2% 3.2%
Minsheng-A 600016.SS Sell 7.56 9.08 -16.8% 46,577 7.18 7.13 6.93 1.10 0.98 0.88 3.5 3.2 3.0 17.0% 14.5% 13.3% 1.10% 0.99% 0.93% 2.6% 2.6% 2.7%
SPDB 600000.SS Sell 12.26 16.30 -24.8% 51,174 6.73 6.83 6.68 1.17 1.02 0.91 3.2 3.1 2.9 18.7% 16.4% 14.4% 1.08% 0.96% 0.88% 3.2% 2.8% 2.9%
Industrial Bank 601166.SS Sell 13.78 16.33 -15.6% 45,183 6.20 6.00 5.98 1.08 0.96 0.85 2.9 2.7 2.6 18.8% 16.9% 15.1% 0.96% 0.91% 0.83% 3.7% 3.9% 3.9%
CEB - A 601818.SS Sell 2.96 3.94 -24.9% 22,779 6.23 6.18 6.13 0.90 0.82 0.75 3.0 2.9 2.8 15.4% 13.9% 12.8% 1.00% 0.91% 0.82% 4.8% 4.9% 4.9%
Ping An Bank 000001.SZ Hold 9.44 9.17 2.9% 22,866 7.20 6.74 6.22 0.97 0.86 0.77 2.7 2.2 2.0 15.0% 13.6% 13.0% 0.93% 0.86% 0.87% 1.7% 1.5% 1.6%
Bank of Beijing 601169.SS Buy 12.80 9.88 29.6% 21,819 7.44 7.20 6.64 1.12 0.99 0.88 4.1 3.8 3.5 16.2% 14.6% 14.1% 1.00% 0.90% 0.89% 2.3% 2.3% 2.5%
Bank of Nanjing 601009.SS Sell 7.02 11.40 -38.4% 10,031 9.87 9.54 9.11 1.46 1.30 1.17 4.4 3.6 3.1 17.6% 14.5% 13.5% 1.02% 0.78% 0.64% 3.5% 2.0% 2.1%
Bank of Ningbo 002142.SZ Sell 10.95 17.32 -36.8% 9,809 10.32 9.40 8.95 1.68 1.48 1.32 5.7 4.5 4.1 17.6% 16.8% 15.6% 1.03% 0.92% 0.80% 2.6% 2.9% 3.0%
A-share sector mean 6.28 6.20 6.06 0.97 0.87 0.78 3.4 3.3 3.1 16.2% 14.5% 13.4% 1.12% 1.03% 0.98% 4.5% 4.5% 4.6%
P/E (x) P/B (x) P/PPOP ROAE ROAA Div. Yield (%)
Source: Deutsche Bank estimates, Bloomberg Finance LP; Note: market cap is sum of A and H shares; data as of January 5 2017
Downside risks: property price correction, as 25% of banking assets are closely tied to the property market; failure of PBOC to contain interbank rates amid
tight liquidity; and maintaining of 150% provision coverage ratio by the CBRC.
Upside risks: removal or softening of GDP targeting, signaling reform may start; real progress of supply-side reform to cut excess capacity; softer-than-
expected regulation on shadow credit; and better-than-expected improvement in corporate financial health.

9 January 2017
Banks
Chinese banks - Debt 101
Deutsche Bank AG/Hong Kong Page 31
Appendix 1
Important Disclosures
*Other information available upon request
Prices are current as of the end of the previous trading session unless otherwise indicated and are sourced from local exchanges via Reuters, Bloomberg and other vendors . Other information is sourced from Deutsche Bank, subject companies, and other sources. For disclosures pertaining to recommendations or estimates made on securities other than the primary subject of this research, please see the most recently published company report or visit our global disclosure look-up page on our website at http://gm.db.com/ger/disclosure/DisclosureDirectory.eqsr. Aside from within this report, important conflict disclosures can also be found at https://gm.db.com/equities under the "Disclosures Lookup" and "Legal" tabs. Investors are strongly encouraged to review this information before investing.
Analyst Certification
The views expressed in this report accurately reflect the personal views of the undersigned lead analyst about the subject issuers and the securities of those issuers. In addition, the undersigned lead analyst has not and will not receive any compensation for providing a specific recommendation or view in this report. Hans Fan
Equity rating key Equity rating dispersion and banking relationships
Buy: Based on a current 12- month view of total share-holder return (TSR = percentage change in share price from current price to projected target price plus pro-jected dividend yield ) , we recommend that investors buy the stock.
Sell: Based on a current 12-month view of total share-holder return, we recommend that investors sell the stock
Hold: We take a neutral view on the stock 12-months out and, based on this time horizon, do not recommend either a Buy or Sell.
Newly issued research recommendations and target prices supersede previously published research.
53 %
37 %
10 %17 % 19 % 20 %
050
100150200250300350400450500
Buy Hold Sell
Asia-Pacific Universe
Companies Covered Cos. w/ Banking Relationship

9 January 2017
Banks
Chinese banks - Debt 101
Page 32 Deutsche Bank AG/Hong Kong
Additional Information
The information and opinions in this report were prepared by Deutsche Bank AG or one of its affiliates (collectively
"Deutsche Bank"). Though the information herein is believed to be reliable and has been obtained from public sources
believed to be reliable, Deutsche Bank makes no representation as to its accuracy or completeness.
If you use the services of Deutsche Bank in connection with a purchase or sale of a security that is discussed in this
report, or is included or discussed in another communication (oral or written) from a Deutsche Bank analyst, Deutsche
Bank may act as principal for its own account or as agent for another person.
Deutsche Bank may consider this report in deciding to trade as principal. It may also engage in transactions, for its own
account or with customers, in a manner inconsistent with the views taken in this research report. Others within
Deutsche Bank, including strategists, sales staff and other analysts, may take views that are inconsistent with those
taken in this research report. Deutsche Bank issues a variety of research products, including fundamental analysis,
equity-linked analysis, quantitative analysis and trade ideas. Recommendations contained in one type of communication
may differ from recommendations contained in others, whether as a result of differing time horizons, methodologies or
otherwise. Deutsche Bank and/or its affiliates may also be holding debt or equity securities of the issuers it writes on.
Analysts are paid in part based on the profitability of Deutsche Bank AG and its affiliates, which includes investment
banking, trading and principal trading revenues.
Opinions, estimates and projections constitute the current judgment of the author as of the date of this report. They do
not necessarily reflect the opinions of Deutsche Bank and are subject to change without notice. Deutsche Bank provides
liquidity for buyers and sellers of securities issued by the companies it covers. Deutsche Bank research analysts
sometimes have shorter-term trade ideas that are consistent or inconsistent with Deutsche Bank's existing longer term
ratings. Trade ideas for equities can be found at the SOLAR link at http://gm.db.com. A SOLAR idea represents a high
conviction belief by an analyst that a stock will outperform or underperform the market and/or sector delineated over a
time frame of no less than two weeks. In addition to SOLAR ideas, the analysts named in this report may from time to
time discuss with our clients, Deutsche Bank salespersons and Deutsche Bank traders, trading strategies or ideas that
reference catalysts or events that may have a near-term or medium-term impact on the market price of the securities
discussed in this report, which impact may be directionally counter to the analysts' current 12-month view of total return
or investment return as described herein. Deutsche Bank has no obligation to update, modify or amend this report or to
otherwise notify a recipient thereof if any opinion, forecast or estimate contained herein changes or subsequently
becomes inaccurate. Coverage and the frequency of changes in market conditions and in both general and company
specific economic prospects make it difficult to update research at defined intervals. Updates are at the sole discretion
of the coverage analyst concerned or of the Research Department Management and as such the majority of reports are
published at irregular intervals. This report is provided for informational purposes only and does not take into account
the particular investment objectives, financial situations, or needs of individual clients. It is not an offer or a solicitation
of an offer to buy or sell any financial instruments or to participate in any particular trading strategy. Target prices are
inherently imprecise and a product of the analyst’s judgment. The financial instruments discussed in this report may not
be suitable for all investors and investors must make their own informed investment decisions. Prices and availability of
financial instruments are subject to change without notice and investment transactions can lead to losses as a result of
price fluctuations and other factors. If a financial instrument is denominated in a currency other than an investor's
currency, a change in exchange rates may adversely affect the investment. Past performance is not necessarily
indicative of future results. Unless otherwise indicated, prices are current as of the end of the previous trading session,
and are sourced from local exchanges via Reuters, Bloomberg and other vendors. Data is sourced from Deutsche Bank,
subject companies, and in some cases, other parties.
The Deutsche Bank Research Department is independent of other business areas divisions of the Bank. Details regarding
our organizational arrangements and information barriers we have to prevent and avoid conflicts of interest with respect
to our research is available on our website under Disclaimer found on the Legal tab.
Macroeconomic fluctuations often account for most of the risks associated with exposures to instruments that promise
to pay fixed or variable interest rates. For an investor who is long fixed rate instruments (thus receiving these cash

9 January 2017
Banks
Chinese banks - Debt 101
Deutsche Bank AG/Hong Kong Page 33
flows), increases in interest rates naturally lift the discount factors applied to the expected cash flows and thus cause a
loss. The longer the maturity of a certain cash flow and the higher the move in the discount factor, the higher will be the
loss. Upside surprises in inflation, fiscal funding needs, and FX depreciation rates are among the most common adverse
macroeconomic shocks to receivers. But counterparty exposure, issuer creditworthiness, client segmentation, regulation
(including changes in assets holding limits for different types of investors), changes in tax policies, currency
convertibility (which may constrain currency conversion, repatriation of profits and/or the liquidation of positions), and
settlement issues related to local clearing houses are also important risk factors to be considered. The sensitivity of fixed
income instruments to macroeconomic shocks may be mitigated by indexing the contracted cash flows to inflation, to
FX depreciation, or to specified interest rates – these are common in emerging markets. It is important to note that the
index fixings may -- by construction -- lag or mis-measure the actual move in the underlying variables they are intended
to track. The choice of the proper fixing (or metric) is particularly important in swaps markets, where floating coupon
rates (i.e., coupons indexed to a typically short-dated interest rate reference index) are exchanged for fixed coupons. It is
also important to acknowledge that funding in a currency that differs from the currency in which coupons are
denominated carries FX risk. Naturally, options on swaps (swaptions) also bear the risks typical to options in addition to
the risks related to rates movements.
Derivative transactions involve numerous risks including, among others, market, counterparty default and illiquidity risk.
The appropriateness or otherwise of these products for use by investors is dependent on the investors' own
circumstances including their tax position, their regulatory environment and the nature of their other assets and
liabilities, and as such, investors should take expert legal and financial advice before entering into any transaction similar
to or inspired by the contents of this publication. The risk of loss in futures trading and options, foreign or domestic, can
be substantial. As a result of the high degree of leverage obtainable in futures and options trading, losses may be
incurred that are greater than the amount of funds initially deposited. Trading in options involves risk and is not suitable
for all investors. Prior to buying or selling an option investors must review the "Characteristics and Risks of Standardized
Options”, at http://www.optionsclearing.com/about/publications/character-risks.jsp. If you are unable to access the
website please contact your Deutsche Bank representative for a copy of this important document.
Participants in foreign exchange transactions may incur risks arising from several factors, including the following: ( i)
exchange rates can be volatile and are subject to large fluctuations; ( ii) the value of currencies may be affected by
numerous market factors, including world and national economic, political and regulatory events, events in equity and
debt markets and changes in interest rates; and (iii) currencies may be subject to devaluation or government imposed
exchange controls which could affect the value of the currency. Investors in securities such as ADRs, whose values are
affected by the currency of an underlying security, effectively assume currency risk.
Unless governing law provides otherwise, all transactions should be executed through the Deutsche Bank entity in the
investor's home jurisdiction. Aside from within this report, important conflict disclosures can also be found at
https://gm.db.com/equities under the "Disclosures Lookup" and "Legal" tabs. Investors are strongly encouraged to
review this information before investing.
United States: Approved and/or distributed by Deutsche Bank Securities Incorporated, a member of FINRA, NFA and
SIPC. Analysts located outside of the United States are employed by non-US affiliates that are not subject to FINRA
regulations.
Germany: Approved and/or distributed by Deutsche Bank AG, a joint stock corporation with limited liability incorporated
in the Federal Republic of Germany with its principal office in Frankfurt am Main. Deutsche Bank AG is authorized under
German Banking Law and is subject to supervision by the European Central Bank and by BaFin, Germany’s Federal
Financial Supervisory Authority.
United Kingdom: Approved and/or distributed by Deutsche Bank AG acting through its London Branch at Winchester
House, 1 Great Winchester Street, London EC2N 2DB. Deutsche Bank AG in the United Kingdom is authorised by the
Prudential Regulation Authority and is subject to limited regulation by the Prudential Regulation Authority and Financial
Conduct Authority. Details about the extent of our authorisation and regulation are available on request.
Hong Kong: Distributed by Deutsche Bank AG, Hong Kong Branch.
9 January 2017
Banks
Chinese banks - Debt 101
Page 34 Deutsche Bank AG/Hong Kong
India: Prepared by Deutsche Equities India Pvt Ltd, which is registered by the Securities and Exchange Board of India
(SEBI) as a stock broker. Research Analyst SEBI Registration Number is INH000001741. DEIPL may have received
administrative warnings from the SEBI for breaches of Indian regulations.
Japan: Approved and/or distributed by Deutsche Securities Inc.(DSI). Registration number - Registered as a financial
instruments dealer by the Head of the Kanto Local Finance Bureau (Kinsho) No. 117. Member of associations: JSDA,
Type II Financial Instruments Firms Association and The Financial Futures Association of Japan. Commissions and risks
involved in stock transactions - for stock transactions, we charge stock commissions and consumption tax by
multiplying the transaction amount by the commission rate agreed with each customer. Stock transactions can lead to
losses as a result of share price fluctuations and other factors. Transactions in foreign stocks can lead to additional
losses stemming from foreign exchange fluctuations. We may also charge commissions and fees for certain categories
of investment advice, products and services. Recommended investment strategies, products and services carry the risk
of losses to principal and other losses as a result of changes in market and/or economic trends, and/or fluctuations in
market value. Before deciding on the purchase of financial products and/or services, customers should carefully read the
relevant disclosures, prospectuses and other documentation. "Moody's", "Standard & Poor's", and "Fitch" mentioned in
this report are not registered credit rating agencies in Japan unless Japan or "Nippon" is specifically designated in the
name of the entity. Reports on Japanese listed companies not written by analysts of DSI are written by Deutsche Bank
Group's analysts with the coverage companies specified by DSI. Some of the foreign securities stated on this report are
not disclosed according to the Financial Instruments and Exchange Law of Japan. Target prices set by Deutsche Bank's
equity analysts are based on a 12-month forecast period.
Korea: Distributed by Deutsche Securities Korea Co.
South Africa: Deutsche Bank AG Johannesburg is incorporated in the Federal Republic of Germany (Branch Register
Number in South Africa: 1998/003298/10).
Singapore: by Deutsche Bank AG, Singapore Branch or Deutsche Securities Asia Limited, Singapore Branch (One Raffles
Quay #18-00 South Tower Singapore 048583, +65 6423 8001), which may be contacted in respect of any matters
arising from, or in connection with, this report. Where this report is issued or promulgated in Singapore to a person who
is not an accredited investor, expert investor or institutional investor (as defined in the applicable Singapore laws and
regulations), they accept legal responsibility to such person for its contents.
Taiwan: Information on securities/investments that trade in Taiwan is for your reference only. Readers should
independently evaluate investment risks and are solely responsible for their investment decisions. Deutsche Bank
research may not be distributed to the Taiwan public media or quoted or used by the Taiwan public media without
written consent. Information on securities/instruments that do not trade in Taiwan is for informational purposes only and
is not to be construed as a recommendation to trade in such securities/instruments. Deutsche Securities Asia Limited,
Taipei Branch may not execute transactions for clients in these securities/instruments.
Qatar: Deutsche Bank AG in the Qatar Financial Centre (registered no. 00032) is regulated by the Qatar Financial Centre
Regulatory Authority. Deutsche Bank AG - QFC Branch may only undertake the financial services activities that fall
within the scope of its existing QFCRA license. Principal place of business in the QFC: Qatar Financial Centre, Tower,
West Bay, Level 5, PO Box 14928, Doha, Qatar. This information has been distributed by Deutsche Bank AG. Related
financial products or services are only available to Business Customers, as defined by the Qatar Financial Centre
Regulatory Authority.
Russia: This information, interpretation and opinions submitted herein are not in the context of, and do not constitute,
any appraisal or evaluation activity requiring a license in the Russian Federation.
Kingdom of Saudi Arabia: Deutsche Securities Saudi Arabia LLC Company, (registered no. 07073-37) is regulated by the
Capital Market Authority. Deutsche Securities Saudi Arabia may only undertake the financial services activities that fall
within the scope of its existing CMA license. Principal place of business in Saudi Arabia: King Fahad Road, Al Olaya
District, P.O. Box 301809, Faisaliah Tower - 17th Floor, 11372 Riyadh, Saudi Arabia.
United Arab Emirates: Deutsche Bank AG in the Dubai International Financial Centre (registered no. 00045) is regulated

9 January 2017
Banks
Chinese banks - Debt 101
Deutsche Bank AG/Hong Kong Page 35
by the Dubai Financial Services Authority. Deutsche Bank AG - DIFC Branch may only undertake the financial services
activities that fall within the scope of its existing DFSA license. Principal place of business in the DIFC: Dubai
International Financial Centre, The Gate Village, Building 5, PO Box 504902, Dubai, U.A.E. This information has been
distributed by Deutsche Bank AG. Related financial products or services are only available to Professional Clients, as
defined by the Dubai Financial Services Authority.
Australia: Retail clients should obtain a copy of a Product Disclosure Statement (PDS) relating to any financial product
referred to in this report and consider the PDS before making any decision about whether to acquire the product. Please
refer to Australian specific research disclosures and related information at
https://australia.db.com/australia/content/research-information.html
Australia and New Zealand: This research is intended only for "wholesale clients" within the meaning of the Australian
Corporations Act and New Zealand Financial Advisors Act respectively.
Additional information relative to securities, other financial products or issuers discussed in this report is available upon
request. This report may not be reproduced, distributed or published without Deutsche Bank's prior written consent.
Copyright © 2017 Deutsche Bank AG

David Folkerts-Landau Group Chief Economist and Global Head of Research
Raj Hindocha Global Chief Operating Officer
Research
Michael Spencer Head of APAC Research
Global Head of Economics
Steve Pollard Head of Americas Research
Global Head of Equity Research
Anthony Klarman Global Head of Debt Research
Paul Reynolds Head of EMEA
Equity Research
Dave Clark Head of APAC
Equity Research
Pam Finelli Global Head of
Equity Derivatives Research
Andreas Neubauer Head of Research - Germany
Stuart Kirk Head of Thematic Research
International locations
Deutsche Bank AG Deutsche Bank Place
Level 16
Corner of Hunter & Phillip Streets
Sydney, NSW 2000
Australia
Tel: (61) 2 8258 1234
Deutsche Bank AG Große Gallusstraße 10-14
60272 Frankfurt am Main
Germany
Tel: (49) 69 910 00
Deutsche Bank AG Filiale Hongkong
International Commerce Centre,
1 Austin Road West,Kowloon,
Hong Kong
Tel: (852) 2203 8888
Deutsche Securities Inc. 2-11-1 Nagatacho
Sanno Park Tower
Chiyoda-ku, Tokyo 100-6171
Japan
Tel: (81) 3 5156 6770
Deutsche Bank AG London
1 Great Winchester Street
London EC2N 2EQ
United Kingdom
Tel: (44) 20 7545 8000
Deutsche Bank Securities Inc.
60 Wall Street
New York, NY 10005
United States of America
Tel: (1) 212 250 2500


![[5365]-11 MBA 101](https://static.fdokumen.com/doc/165x107/6322631aae0f5e819105deed/5365-11-mba-101.jpg)