
Debt Management
194
Debt Management Report The Government Debt Management and the State of Public Debts Financial Bureau, Ministry of Finance, JAPAN
-
Upload
khangminh22 -
Category
Documents
-
view
0 -
download
0
Transcript of Debt Management
Debt M
anagement R
eport 2021 The G
overnment Debt M
anagement and the State of Public Debts
Financial Bureau, Ministry of Finance, JAPAN
Debt ManagementReport The Government Debt Management
and the State of Public Debts
The Government Debt Managementand the State of Public Debts
www.mof.go.jp
Debt Management Report 2021
Financial Bureau, Ministry of Finance, JAPAN
Financial Bureau, Ministry of Finance, JAPAN
□ This printed matter was prepared using the paper that satisfies the judgment criteria of the basic policy under the Law Concerning the Promotion of Procurement of Eco-Friendly Goods and Services by the State and Other Entities (Law on Promoting Green Purchasing).
□ Indication of the recyclability : Recyclable to paper This printed matter was prepared using only the material fit for recycling to printing papers (Rank A) according to the judgment criteria “printing” of the basic policy under the Green Purchasing Law.

i
2021
Contents
Preface
I FY2021 Debt Management Policies
1 About “Debt Management Report” 22 What is Debt Management Policy? 3
(1) Overview 3 (2) Framework of “Government Funding Activities” 4 (3) Debts with Public Characteristics 5 Column1 JGB Yields 7 Column2 Demand for JGBs with negative yields 9
1 Trends of JGB Market in FY2020 12 (1) Review 12 (2) Investor Trends 14
2 JGB Issuance Plan for FY2021 18 (1) Announcement of JGB Issuance Plan for FY2021 18 (2) Overview of Discussions at Various Panels 18 (3) Scheduled Issuance Amount of JGBs 19 (4) JGB Issuance Plan Based on Market Trends and Needs 22 Column3 Increases in FY2020 JGB Issuance and Future Outlook 24 Column4 Front-loading Refunding Bonds to level calendar-base market issuance 28
29 (1) JGB Holdings by Retail Investors 30 (2) JGB Holdings by Foreign Investors 32
The Government Debt Management and the State of Public Debts
Debt Management Report
ii
II Framework of Debt Management
1 Primary Market for Government Bonds 38 (1) JGBs by Legal Grounds of Issuance 38 (2) Types of JGBs 41 (3) Methods of Issuance 43 (4) JGB Market Special Participants Scheme 48 (5) Government Bond Administration 50 Column5 Debt Management Policies in Foreign Countries 53
2 Secondary Market for Government Bonds 64 (1) JGB Market Liquidity Maintenance and Enhancement 64 (2) OTC Transactions and Transactions on the Stock Exchange 64 (3) Improvements to the JGB Transaction Settlement System 66 (4) WI Transaction 68 (5) Bond Gensaki and Bond-Lending Transactions 69 (6) STRIPS 73 (7) JGB Futures Trading 74 Column6 Investors in JGB futures 76
3 Debt Management Systems 79 (1) Redemption System 79 (2) Liquidity Enhancement Auctions 86 (3) Buy-back Program 87 (4) Interest Rate Swap Transaction 90 (5) Dialogue with Market Participants 90 Column7 Debt management authorities’ business operations under COVID-19 92
4 Taxation of Government Bonds 93 (1) Individuals (Residents) 93 (2) Domestic Corporations 94 (3) Nonresident Individuals and Foreign Corporations 95 (4) Tax Exemption Scheme for Nonresident Individuals and Foreign Corporations 95 Column8 Response to digitalization of JGB-related procedures 98
1 Financing Bills 99 (1) Legal Grounds of Financing Bills 99 (2) Status of Financing Bills in the Budget 99 (3) Auction Methods, etc. 100 (4) Outline of Cash Management of the National Treasury 100
2 Borrowings 101 (1) Legal Grounds of Borrowings 101 (2) Status of Borrowings in the Budget 101 (3) Source of Borrowings 101 (4) Borrowings from the Private Sector 102
◆ Chapter 1 Government Bonds (JGBs)
◆ Chapter 2 Financing Bills, Borrowings, Government-Guaranteed Debt and Subsidy Bonds
iii
III Appendices
1 Primary Market for Government Bonds 116 (1) Issuance Amount of Government Bonds 116 (2) Historical Changes in JGB Market Issuance by JGB Types 117 (3) Auction Results for JGBs and T-Bills in FY2020 118 (4) Issuance Amount of JGBs and T-Bills Offered to the Market at Each Auction 121 (5) Principal/Coupon Payment Corresponding to Days of Issuance in FY2021 122 (6) Successful Bids Share for JGBs by Investor Type in FY2020 123 (7) Issuance of JGBs for Retail Investors 124 (8) Issuance by the Bank of Japan Rollover 125 (9) Front-Loading Issuance of Refunding Bonds 125 (10) List of Commissions for Issuing JGBs, etc. 126
2 Secondary Market for Government Bonds 127 (1) 10-Year JGB Yield 127 (2) 10-Year Government Bonds Yields 127 (3) Yields of JGBs in FY2020 128 (4) JGB Yield Curves 128 (5) Various Rates in the Short-term Financial Market in FY2020 129
129 (7) Market Price of 15-Year Floating-Rate Bonds 130 (8) JGB Share in Total Trading Volume of Yen Bonds 130 (9) JGB Share in Total Issuance Amount of Yen Bonds 131 (10) Portfolio Investment Assets in FY2020 132 (11) Portfolio Investment Liabilities in FY2020 132 (12) Trends in JGB Transactions (by investor type) in FY2020 133
1 Local Government Bonds (LGBs) 109 (1) Basic Scheme of LGBs 109 (2) LGB Program 111
2 Debt of Incorporated Administrative Agencies, etc. 113 (1) Debt of Incorporated Administrative Agencies, etc. 113 (2) Financial Conditions of Incorporated Administrative Agencies, etc. 114
(5) Borrowing through Public Auction on Private-sector Borrowings 103
3 Government-Guaranteed Debt 104 (1) Legal Ground of Government Guarantee 104 (2) Features of Government-Guaranteed Debt 104 (3) Treatment in the Budget and Examination Process 104
4 Subsidy Bonds 107 107
(2) Subscription/Contribution Bonds 107 (3) Others 107
◆ Chapter 1 Government Bonds (JGBs)
◆ Chapter 3 Other Public Debt
iv
(13) Trading Volume of Yen Bonds 134 (14) Trading Volume of JGB Futures 134 (15) Trading Volume of Bond Gensaki 134 (16) Trading Volume of Bond-Lending 135 (17) Trading Volume of JGB Option by OTC 135 (18) Trading Volume of JGB Futures Options 136 (19) Outstanding Amount of STRIPS-Principal-Only Book-entry Transfer JGBs 136 (20) Japan's Sovereign Rating by Major Credit Rating Agencies 137 (21) List of Sovereign Ratings by Major Credit Rating Agencies 137
3 Debt Management Systems 138 (1) Revenues and Expenditures for the Special Account for the GDCF (FY2021 Initial Budget) 138 (2) Payment Status of Debt Redemption Expenses and Interest, Discount Expenses
and so on of the Each Account (FY2021 Initial Budget, FY2019 Settlement of Accounts) 139
(3) Transfer of Redemption Sources, Redemption Amount, Outstanding Amount and Refunding Amount of the GDCF (FY2021 Initial Budget) 140
(4) GDCF Investment in JGBs 140 (5) Budgetary Surplus of the Special Account of the GDCF 141 (6) Results of Liquidity Enhancement Auctions in FY2020 141 (7) Buy-back Results in FY2020 141 (8) Buy-back Results 141 (9) Various Councils 142 (10) History of Postwar Debt Management Policy 146 (11) Government Bond-related Legal Systems 148
1 Financing Bills (FBs) 151 (1) Outstanding Amount of FBs-Breakdown by the Types (as of the end of FY2020) 151 (2) Outstanding Amount of FBs 151 (3) Issuance Amount of FBs in FY2020-Breakdown by Funding Resources 152 (4) Receipts and Payments on the National Treasury for FY2020 152
2 Borrowings 153 (1) Outstanding Amount of Borrowings 153 (2) Outstanding Amount of Borrowings -Breakdown by the Types of Account (as of the end of FY2020) 153 (3) Outstanding Amount of Borrowings of the Special Account for Local Allocation Tax 154 (4) Amount of Bids Accepted and Average Interest Rate at Each Auction by the Special Account for Local Allocation Tax 154 (5) Auction Results of the Borrowings of the Special Account for Local Allocation Tax in FY2020 155 (6) Auction Results of the Borrowings of the Special Account for the National Forest Debt Management in FY2020 156 (7) Auction Results of the Borrowings of the Special Account for Energy Policy in FY2020 156
3 Government-Guaranteed Debt 157 (1) Changes in the Outstanding Amount of Government-Guaranteed Debt 157 (2) Changes in the Issuance Amount of Government-Guaranteed Domestic Bonds Offered to the Market 157 (3) Breakdown of the Government-Guaranteed Debt by Agencies 158
◆ Chapter 2 Financing Bills, Borrowings and Government-Guaranteed Debt
v
(4) Issuance Calendar of Government-Guaranteed Domestic Bonds by Agencies in FY2020 159 (5) Outstanding Amount of Government-Guaranteed Foreign Bonds-Breakdown by
Denomination and by Agencies (as of the end of FY2020) 161 (6) Yields of 10-Year Government-Guaranteed Bonds in FY2020 161
1 Local Government Bonds (LGBs) 162 (1) Overview of LGB Program in FY2021 162 (2) LGB Program-Breakdown by Funding Resources 162 (3) Outstanding Amount of LGB Program-Breakdown by Funding Resources 163 (4) Issuance Conditions of Public Offering LGBs in FY2020 164 (5) Issuance Amount of Public Offering LGBs 164
2 Debt of Incorporated Administrative Agencies, etc. 165 (1) FY2021 FILP Plan 165 (2) Planned and Actual Issuance Amount of FILP Agency Bonds 166 (3) Yields of 10-Year FILP Agency Bonds in FY2020 167
(1) Trend in General Account Tax Revenues, Total Expenditures and Government Bond Issuances 168 (2) Government Bond Issuance and Bond Dependency Ratio 168 (3) Changes in Ratio of Primary Balance to GDP 169 (4) Projections in Primary Balance (Central and Local government basis; percentage of GDP) 169 (5) Government Debt-related Expenditures in the General Account-Breakdown by Categories (FY2021) 170 (6) Historical Changes in Government Debt-related Expenditures 170 (7) Projection of the FY2021 Budget Impact on Following Year's Expenditure and Revenue 171
172 (9) Changes in the Outstanding Amount of JGBs, Financing Bills, Borrowings and
Government-Guaranteed Debt 173 (10) Long-term Debt Outstanding of Central and Local Governments 174 (11) Breakdown of the Outstanding Amount of General Bonds by Remaining Years to Maturity 175 (12) Term-to-maturity Structure of General Bonds (FY2021 Initial Budget Basis) 175 (13) Breakdown of the Outstanding Amount of General Bonds by Maturity Types and
Their Average Interest Rate at the end of FY2020 176 (14) Outstanding Interest Rate Weighted Average, Interest Payment of General Bonds
and Average Years to Maturity 176 (15) Outstanding Amount of JGB and T-Bill -Breakdown by Holders- 177 (16) Balance Sheet of Japanese Government (General Account and Special Accounts) (as of the end of FY2019) 179 (17) International Comparison of General Government Financial Balance to GDP 180 (18) International Comparison of General Government Gross Debt to GDP 181 (19) International Comparison of General Government Net Debt to GDP 181 Reference JGB-related Advertisements and Publications 182
◆ Chapter 3 Other Public Debt
◆【Supplement】 Fiscal Conditions and Debt Outstandings
Ⅲ Appendices
(Body Text)
Ⅱ Framework
Chapter 1G
overnment Bonds
2 Secondary Market
for Governm
ent Bonds
Chapter 1G
overnment Bonds
2 Secondary Market
for Governm
ent Bonds
vi

Preface

Preface
2
About “Debt Management Report”1
The objective of the “Debt Management Report,” which has been published since 2004, is to
provide readers across a wide spectrum spanning domestic and foreign markets, government
affairs, and research, etc., with the opportunity of gaining a deeper understanding of Japan’s
debt management policy. This report, though focusing on Japanese Government Bond (JGB)
management policy as debt management policy, covers issues involving public debts in general.
To begin with, Part I, headed “FY2021 Debt Management Policies,” discusses the recent trends
Part II, headed “Framework,” concerns itself with the fundamental mechanism of public debts
and debt management policy in general.
section should be used with reference to Part II “Framework.”
In this latest report as well, we provide a lot of cross-references including some that link Part
II “Framework” with Part III “Appendices” so that readers will be able to quickly access the
information that they want. Your comments are highly appreciated for further improvements of
this report.
Preface
3
What is Debt Management Policy?2
(1) OverviewUnder the FY2021 budget (April-March), the central government plans to issue JGBs worth
236.0 trillion yen, posting an increase of 82.5 trillion yen from the initial level for FY2020.
Construction Bonds and Special Deficit-Financing Bonds to provide General Account
revenues increase by 11.0 trillion yen from the initial level for the previous year to 43.6
trillion yen. On the other hand, JGBs outstanding at the end of FY2020 totaled as much as
1,065.3 trillion yen.
The government raises funds with Financing Bills and Borrowings as well as JGBs.
If including Financing Bills and Borrowings, outstanding government debts except
government-guaranteed debt came to 1,216.5 trillion yen. Moreover, the government gives
guarantees to Incorporated Administrative Agencies in order for them to carry out funding to
implement public projects, and the government-guaranteed debt totals 34.0 trillion yen (The
The government’s fundraising amount or flow has become enormous. Outstanding debts
on stock basis have been increasing persistently. Government debt management affects not
In turn, changes in market interest rates influence government funding activities and the
activities of every economic entity.
JGB issuance, absorption, distribution and redemption measures to allow government debts
(JGBs, Financing Bills, Borrowings, Government-Guaranteed Debt and Subsidy Bonds) to
be smoothly accepted at each stage of the national economy. These measures represent “debt
management policy.” In Japan, based on the following basic goals for JGB Management
Policy, the government carefully implements “communications with the market” through
various meetings for the development and operation of the JGB Issuance Plan, tries to base
(1) Ensuring the smooth and secure issuance of Japanese Government Bonds
(2) Minimizing medium- to long-term fundraising costs
Meanwhile, any excessive response to temporary or short-term changes in market demand
could affect the market’s transparency and predictability for market participants, leading to
a rise in medium- to long-term fundraising costs. In Japan where massive government debt
issuance is expected for the future, therefore, the government will try to issue JGBs more
stably and transparently while identifying medium- to long-term demand trends.
The “Guidelines for Public Debt Management,” published by the International Monetary
Fund and the World Bank in 2001, describes sovereign debt management as “the process
of establishing and executing a strategy for managing the government’s debt in order to
raise the required amount of funding” and the objective of sovereign debt management as
lowest possible cost over the medium to long run, consistent with a prudent degree of risk.”
Preface
4
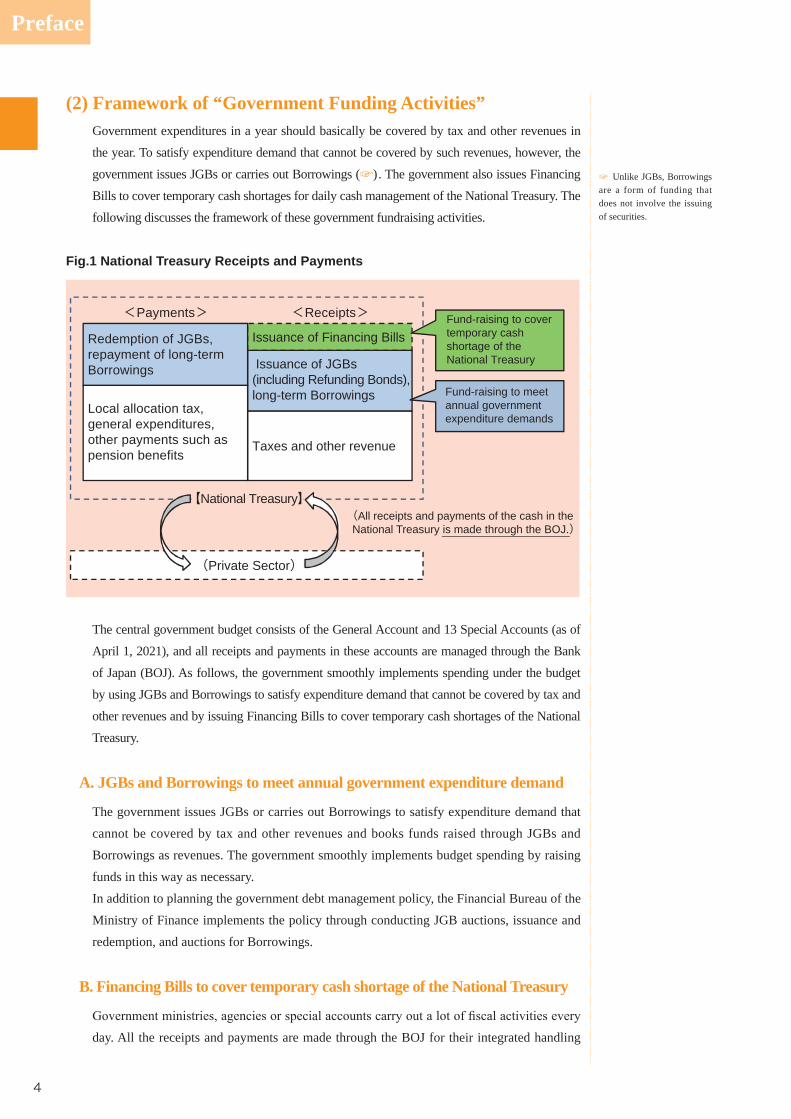
(2) Framework of “Government Funding Activities”Government expenditures in a year should basically be covered by tax and other revenues in
the year. To satisfy expenditure demand that cannot be covered by such revenues, however, the
government issues JGBs or carries out Borrowings (☞). The government also issues Financing
Bills to cover temporary cash shortages for daily cash management of the National Treasury. The
following discusses the framework of these government fundraising activities.
Fig.1 National Treasury Receipts and Payments
The central government budget consists of the General Account and 13 Special Accounts (as of
April 1, 2021), and all receipts and payments in these accounts are managed through the Bank
of Japan (BOJ). As follows, the government smoothly implements spending under the budget
by using JGBs and Borrowings to satisfy expenditure demand that cannot be covered by tax and
other revenues and by issuing Financing Bills to cover temporary cash shortages of the National
Treasury.
A. JGBs and Borrowings to meet annual government expenditure demand
The government issues JGBs or carries out Borrowings to satisfy expenditure demand that
cannot be covered by tax and other revenues and books funds raised through JGBs and
Borrowings as revenues. The government smoothly implements budget spending by raising
funds in this way as necessary.
In addition to planning the government debt management policy, the Financial Bureau of the
Ministry of Finance implements the policy through conducting JGB auctions, issuance and
redemption, and auctions for Borrowings.
B. Financing Bills to cover temporary cash shortage of the National Treasury
day. All the receipts and payments are made through the BOJ for their integrated handling
☞ Unlike JGBs, Borrowings are a form of funding that does not involve the issuing of securities.
<Payments> <Receipts>
Issuance of Financing BillsRedemption of JGBs,repayment of long-termBorrowings
Local allocation tax,general expenditures,other payments such as pension benefits
Taxes and other revenue
【National Treasury】
(Private Sector)
(All receipts and payments of the cash in theNational Treasury is made through the BOJ.)
Fund-raising to cover temporary cash shortage of the National Treasury Issuance of JGBs
(including Refunding Bonds),long-term Borrowings Fund-raising to meet
annual government expenditure demands
Preface
5
in the National Treasury. As explained in section A, the government raises funds with
JGBs and Borrowings to meet expenditure demand that cannot be covered by tax and other
revenues. However, the government sees temporary cash shortages and surpluses due to lags
of day-to-day receipts and payments of National Treasury funds. The Financial Bureau of
the Ministry of Finance makes adjustments through the issuance of Financing Bills in the
case of shortage, and through the temporary use of the treasury surplus in the case of surplus
(“Cash Management in the National Treasury”) (☞).
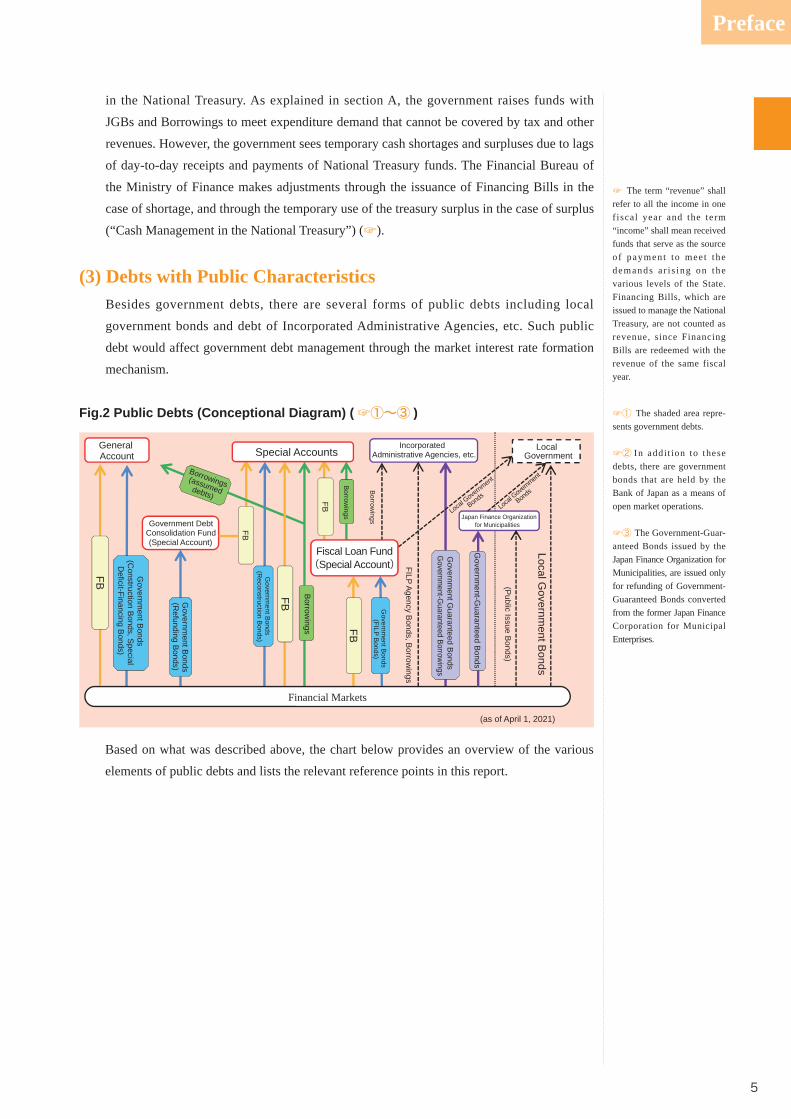
(3) Debts with Public Characteristics Besides government debts, there are several forms of public debts including local
government bonds and debt of Incorporated Administrative Agencies, etc. Such public
debt would affect government debt management through the market interest rate formation
mechanism.
Fig.2 Public Debts (Conceptional Diagram) (☞①~③ ) ☞① The shaded area repre-sents government debts.
☞② In addit ion to these debts, there are government bonds that are held by the Bank of Japan as a means of open market operations.
☞③ The Government-Guar-anteed Bonds issued by the Japan Finance Organization for Municipalities, are issued only for refunding of Government-Guaranteed Bonds converted from the former Japan Finance Corporation for Municipal Enterprises.
☞ The term “revenue” shall refer to all the income in one f iscal year and the term “income” shall mean received funds that serve as the source o f payment to mee t the demands a r i s ing on the various levels of the State. Financing Bills, which are issued to manage the National Treasury, are not counted as revenue, since Financing Bills are redeemed with the revenue of the same fiscal year.
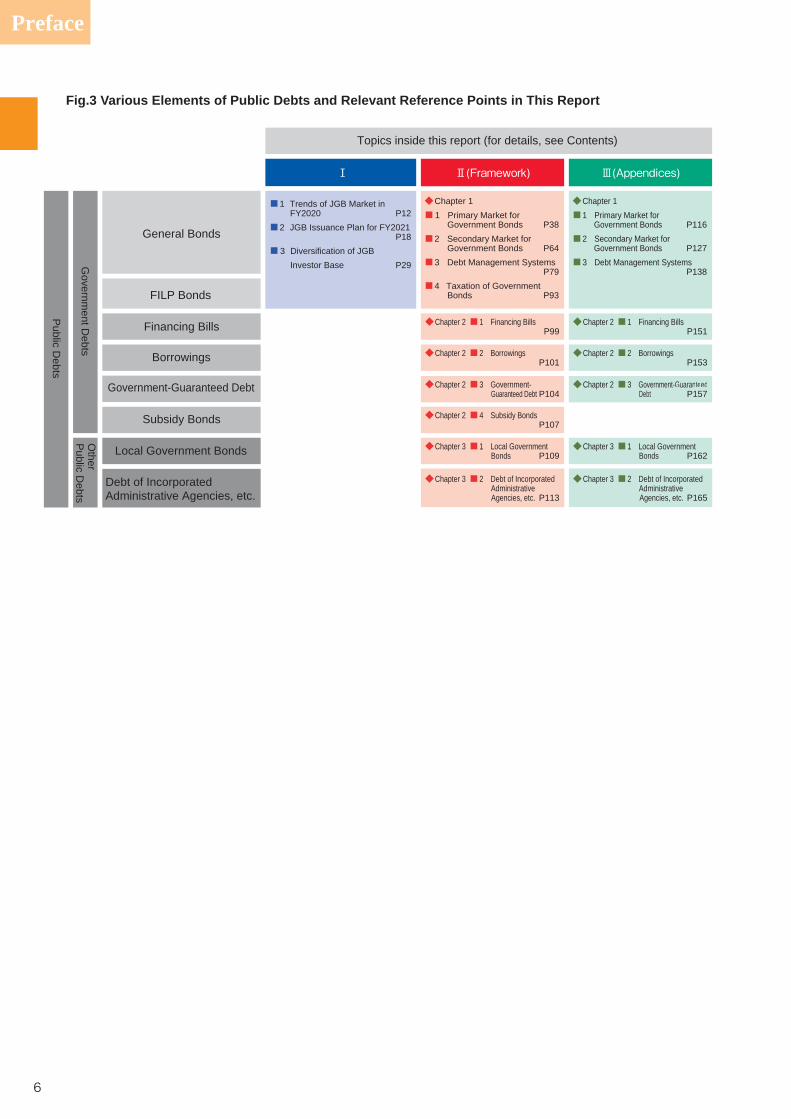
Based on what was described above, the chart below provides an overview of the various
elements of public debts and lists the relevant reference points in this report.
Borrowings
General Account Special Accounts
Government Debt Consolidation Fund (Special Account)
Financial Markets
Incorporated Administrative Agencies, etc.
Japan Finance Organization for Municipalities
Local Government
(as of April 1, 2021)
FB
Governm
ent Bonds
(Construction B
onds, Special
Deficit-Financing B
onds)
Governm
ent Bonds
(Refunding B
onds)
Governm
ent Bonds (R
econstruction Bonds)
Governm
ent Bonds (FILP B
onds)
FB
Borrow
ings FB
Governm
ent Guaranteed B
onds G
overnment-G
uaranteed Borrowings
FB
FB
Borrowings
FILP Agency B
onds, Borrow
ings
(Public Issue B
onds)
Local Governm
ent Bonds
Governm
ent-Guaranteed B
onds
Fiscal Loan Fund(Special Account)
Borrowings (assumed debts)
Local Government
Bonds
Local
Governm
ent
Bonds
Preface
6
Fig.3 Various Elements of Public Debts and Relevant Reference Points in This Report
◆Chapter 2 ■1 Financing Bills P99
◆Chapter 2 ■2 Borrowings P101
◆Chapter 2 ■3 Government- Guaranteed Debt P104
◆Chapter 2 ■4 Subsidy Bonds P107
◆Chapter 3 ■1 Local Government Bonds P109
◆Chapter 3 ■2 Debt of Incorporated Administrative Agencies, etc. P113
Topics inside this report (for details, see Contents)
Financing Bills
General Bonds
Borrowings
FILP Bonds
Government-Guaranteed Debt
Local Government Bonds
Debt of Incorporated Administrative Agencies, etc.
Other
Public D
ebts
Public D
ebts
Subsidy Bonds
Governm
ent Debts
Ⅱ(Framework)Ⅰ
■1 Trends of JGB Market in FY2020 P12
■2 JGB Issuance Plan for FY2021 P18■ 3 Diversification of JGB
Investor Base P29
◆Chapter 1■ 1 Primary Market for
Government Bonds P38■2 Secondary Market for
Government Bonds P64■3 Debt Management Systems
P79■4 Taxation of Government
Bonds P93
◆Chapter 2 ■1 Financing Bills P151
◆Chapter 2 ■2 Borrowings P153
◆Chapter 2 ■3 Government-Guaranteed Debt P157
◆Chapter 3 ■1 Local Government Bonds P162
◆Chapter 3 ■2 Debt of Incorporated Administrative Agencies, etc. P165
Ⅲ(Appendices)
◆Chapter 1■1 Primary Market for
Government Bonds P116■2 Secondary Market for
Government Bonds P127■3 Debt Management Systems
P138
Preface
7
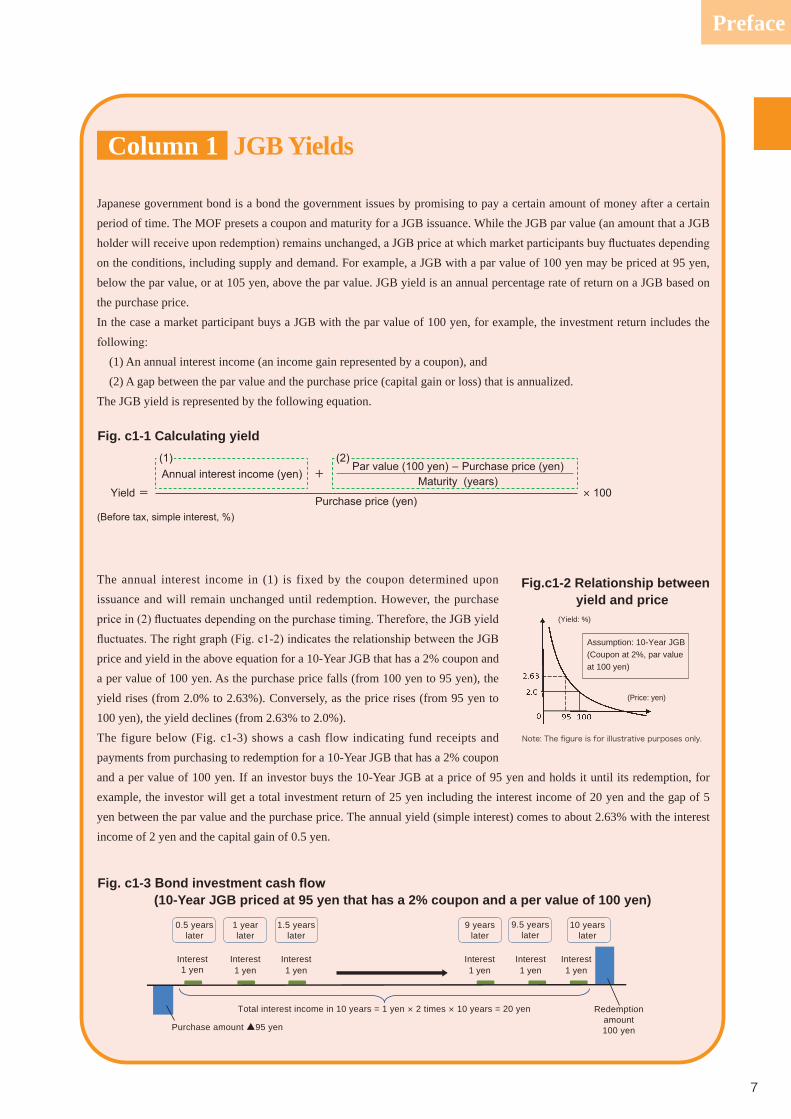
Japanese government bond is a bond the government issues by promising to pay a certain amount of money after a certain period of time. The MOF presets a coupon and maturity for a JGB issuance. While the JGB par value (an amount that a JGB
on the conditions, including supply and demand. For example, a JGB with a par value of 100 yen may be priced at 95 yen, below the par value, or at 105 yen, above the par value. JGB yield is an annual percentage rate of return on a JGB based on the purchase price.In the case a market participant buys a JGB with the par value of 100 yen, for example, the investment return includes the
(1) An annual interest income (an income gain represented by a coupon), and(2) A gap between the par value and the purchase price (capital gain or loss) that is annualized.
The JGB yield is represented by the following equation.
The annual interest income in (1) is fixed by the coupon determined upon issuance and will remain unchanged until redemption. However, the purchase
price and yield in the above equation for a 10-Year JGB that has a 2% coupon and a per value of 100 yen. As the purchase price falls (from 100 yen to 95 yen), the yield rises (from 2.0% to 2.63%). Conversely, as the price rises (from 95 yen to 100 yen), the yield declines (from 2.63% to 2.0%).The figure below (Fig. c1-3) shows a cash flow indicating fund receipts and payments from purchasing to redemption for a 10-Year JGB that has a 2% coupon and a per value of 100 yen. If an investor buys the 10-Year JGB at a price of 95 yen and holds it until its redemption, for example, the investor will get a total investment return of 25 yen including the interest income of 20 yen and the gap of 5 yen between the par value and the purchase price. The annual yield (simple interest) comes to about 2.63% with the interest income of 2 yen and the capital gain of 0.5 yen.
JGB YieldsColumn 1
Fig. c1-1 Calculating yield
-
=+
×
Fig. c1-3 ond investment cash o (10-Year JGB priced at 95 yen that has a 2% coupon and a per value of 100 yen)
0.5 yearslater
1 yearlater
1.5 yearslater
9 yearslater
9.5 yearslater
10 yearslater
Interest1 yen
Interest1 yen
Interest1 yen
Interest1 yen
Interest1 yen
Interest1 yen
Redemptionamount100 yenPurchase amount ▲95 yen
Total interest income in 10 years = 1 yen × 2 times × 10 years = 20 yen
Fig.c1-2 Relationship bet een yield and price
(Yield: %)
(Price: yen)
Assumption: 10-Year JGB(Coupon at 2%, par value at 100 yen)
Note: The figure is for illustrative purposes only.
Preface
8
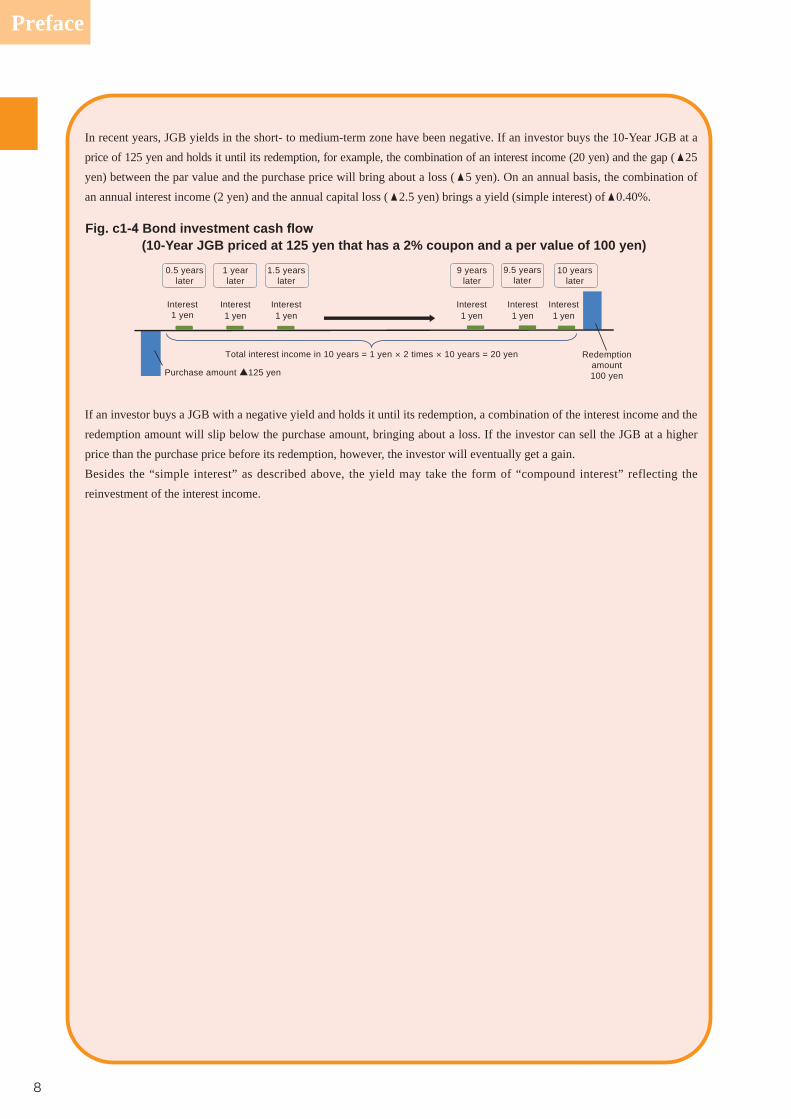
In recent years, JGB yields in the short- to medium-term zone have been negative. If an investor buys the 10-Year JGB at a price of 125 yen and holds it until its redemption, for example, the combination of an interest income (20 yen) and the gap ( ▲25 yen) between the par value and the purchase price will bring about a loss ( ▲5 yen). On an annual basis, the combination of an annual interest income (2 yen) and the annual capital loss ( ▲2.5 yen) brings a yield (simple interest) of ▲0.40%.
If an investor buys a JGB with a negative yield and holds it until its redemption, a combination of the interest income and the redemption amount will slip below the purchase amount, bringing about a loss. If the investor can sell the JGB at a higher price than the purchase price before its redemption, however, the investor will eventually get a gain.Besides the “simple interest” as described above, the yield may take the form of “compound interest” reflecting the reinvestment of the interest income.
Fig. c1- Bond investment cash o (10-Year JGB priced at 125 yen that has a 2% coupon and a per value of 100 yen)
0.5 yearslater
1 yearlater
1.5 yearslater
9 yearslater
9.5 yearslater
10 yearslater
Interest1 yen
Interest1 yen
Interest1 yen
Interest1 yen
Interest1 yen
Interest1 yen
Redemptionamount100 yenPurchase amount ▲125 yen
Total interest income in 10 years = 1 yen × 2 times × 10 years = 20 yen
Preface
9
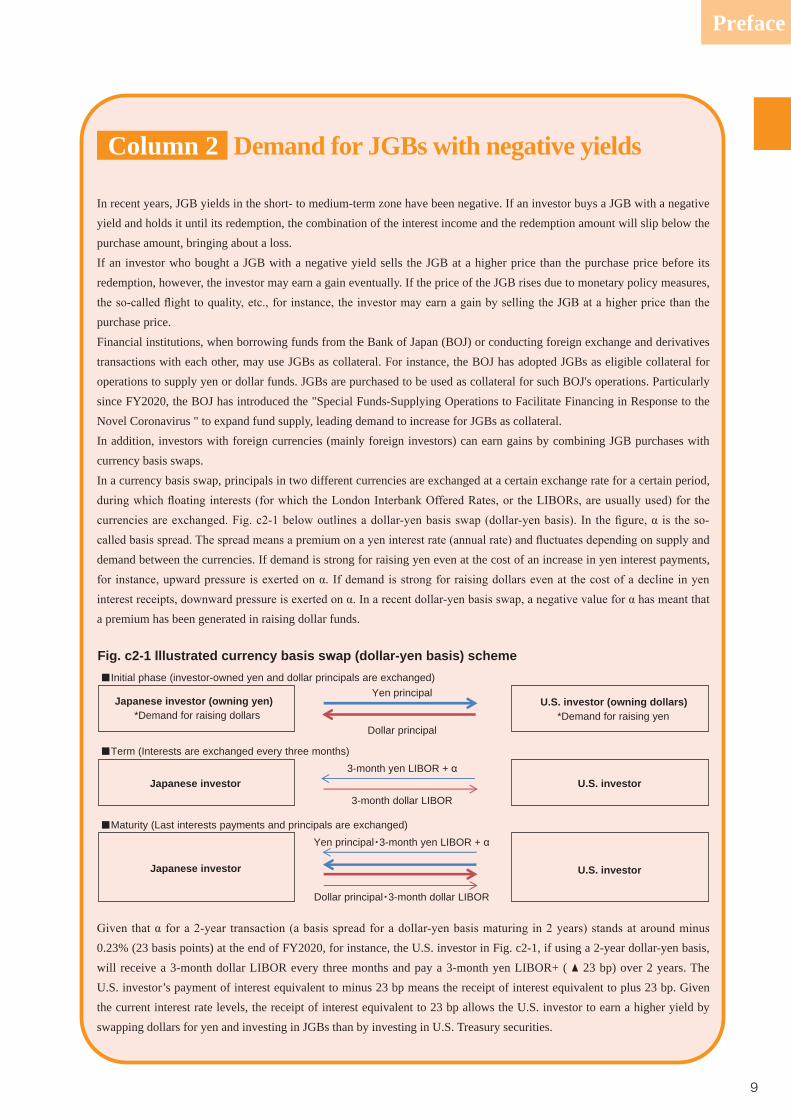
In recent years, JGB yields in the short- to medium-term zone have been negative. If an investor buys a JGB with a negative yield and holds it until its redemption, the combination of the interest income and the redemption amount will slip below the purchase amount, bringing about a loss.If an investor who bought a JGB with a negative yield sells the JGB at a higher price than the purchase price before its redemption, however, the investor may earn a gain eventually. If the price of the JGB rises due to monetary policy measures,
purchase price.Financial institutions, when borrowing funds from the Bank of Japan (BOJ) or conducting foreign exchange and derivatives transactions with each other, may use JGBs as collateral. For instance, the BOJ has adopted JGBs as eligible collateral for operations to supply yen or dollar funds. JGBs are purchased to be used as collateral for such BOJ's operations. Particularly since FY2020, the BOJ has introduced the "Special Funds-Supplying Operations to Facilitate Financing in Response to the Novel Coronavirus " to expand fund supply, leading demand to increase for JGBs as collateral.In addition, investors with foreign currencies (mainly foreign investors) can earn gains by combining JGB purchases with currency basis swaps.In a currency basis swap, principals in two different currencies are exchanged at a certain exchange rate for a certain period,
demand between the currencies. If demand is strong for raising yen even at the cost of an increase in yen interest payments,
a premium has been generated in raising dollar funds.
0.23% (23 basis points) at the end of FY2020, for instance, the U.S. investor in Fig. c2-1, if using a 2-year dollar-yen basis, will receive a 3-month dollar LIBOR every three months and pay a 3-month yen LIBOR+ ( ▲ 23 bp) over 2 years. The U.S. investor’s payment of interest equivalent to minus 23 bp means the receipt of interest equivalent to plus 23 bp. Given the current interest rate levels, the receipt of interest equivalent to 23 bp allows the U.S. investor to earn a higher yield by swapping dollars for yen and investing in JGBs than by investing in U.S. Treasury securities.
Demand for JGBs with negative yieldsColumn 2
Fig. c2-1 llustrated currency basis s ap (dollar-yen basis) schemeInitial phase (investor-owned yen and dollar principals are exchanged)
Term (Interests are exchanged every three months)
Maturity (Last interests payments and principals are exchanged)Yen principal 3-month yen LIBOR +
Dollar principal 3-month dollar LIBOR
Japanese investor (owning yen)*Demand for raising dollars
Yen principalU.S. investor (owning dollars)
*Demand for raising yenDollar principal
Japanese investor 3-month yen LIBOR +
U.S. investor 3-month dollar LIBOR
Japanese investor U.S. investor
Preface
10
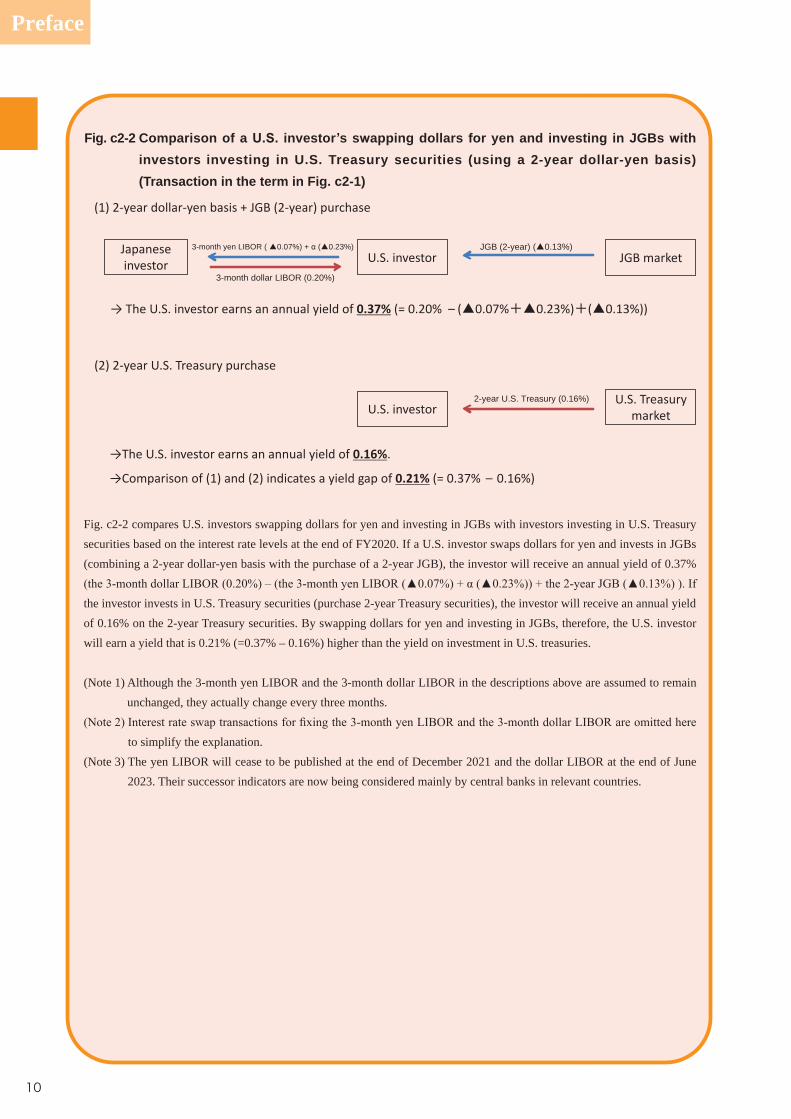
Fig. c2-2 compares U.S. investors swapping dollars for yen and investing in JGBs with investors investing in U.S. Treasury securities based on the interest rate levels at the end of FY2020. If a U.S. investor swaps dollars for yen and invests in JGBs (combining a 2-year dollar-yen basis with the purchase of a 2-year JGB), the investor will receive an annual yield of 0.37%
the investor invests in U.S. Treasury securities (purchase 2-year Treasury securities), the investor will receive an annual yield of 0.16% on the 2-year Treasury securities. By swapping dollars for yen and investing in JGBs, therefore, the U.S. investor will earn a yield that is 0.21% (=0.37% – 0.16%) higher than the yield on investment in U.S. treasuries.
(Note 1) Although the 3-month yen LIBOR and the 3-month dollar LIBOR in the descriptions above are assumed to remain unchanged, they actually change every three months.
to simplify the explanation.(Note 3) The yen LIBOR will cease to be published at the end of December 2021 and the dollar LIBOR at the end of June
2023. Their successor indicators are now being considered mainly by central banks in relevant countries.
Fig. c2-2 Comparison of a . . investor s s apping dollars for yen and investing in JGBs ith investors investing in U.S. Treasury securities (using a 2-year dollar-yen basis) (Transaction in the term in Fig. c2-1)
3-month yen LIBOR ( 0.07%) + ( 0.23%)
3-month dollar LIBOR (0.20%)
Japanese investor U.S. investor
JGB (2-year) ( 0.13%)
(1) 2-year dollar-yen basis + JGB (2-year) purchase
U.S. investor earns an annual yield of 0.37% (= 0.20% – ( 0.07% 0.23%) ( 0.13%))
(2) 2-year U.S. reasury purchase
2-year U.S. Treasury (0.16%)
of (1) and (2) indicates a yield gap of 0.21% (= 0.37% – 0.16%)
U.S. investor earns an annual yield of 0.16%.
JGB ket
U.S. investor U.S. reasury
ket
FY 2021 Debt Management Policies
Ⅰ
This part provides the most recent updates onFY 2021 Debt Management Policies
Ⅰ FY2021 Debt Management Policies
1 Trends of JG
B M
arket in FY2020
12
Trends of JGB Market in FY2020
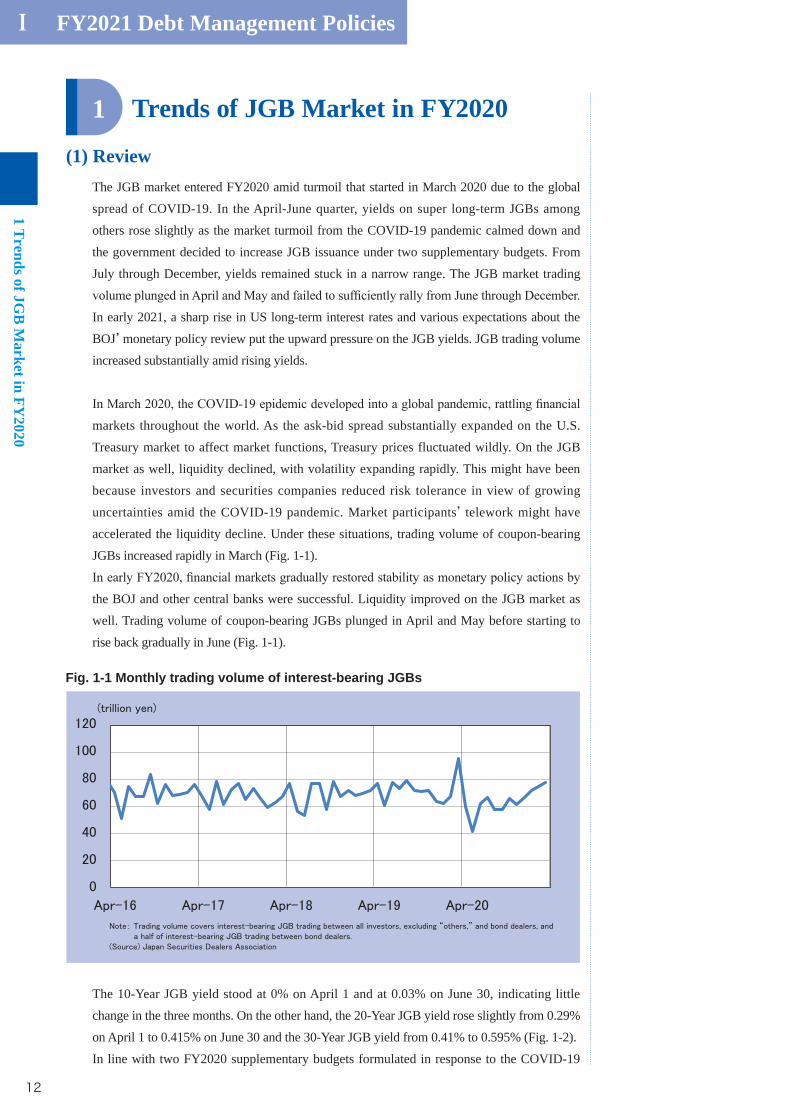
(1) ReviewThe JGB market entered FY2020 amid turmoil that started in March 2020 due to the global
spread of COVID-19. In the April-June quarter, yields on super long-term JGBs among
others rose slightly as the market turmoil from the COVID-19 pandemic calmed down and
the government decided to increase JGB issuance under two supplementary budgets. From
July through December, yields remained stuck in a narrow range. The JGB market trading
In early 2021, a sharp rise in US long-term interest rates and various expectations about the
BOJ’ monetary policy review put the upward pressure on the JGB yields. JGB trading volume
increased substantially amid rising yields.
markets throughout the world. As the ask-bid spread substantially expanded on the U.S.
Treasury market to affect market functions, Treasury prices fluctuated wildly. On the JGB
market as well, liquidity declined, with volatility expanding rapidly. This might have been
because investors and securities companies reduced risk tolerance in view of growing
uncertainties amid the COVID-19 pandemic. Market participants’ telework might have
accelerated the liquidity decline. Under these situations, trading volume of coupon-bearing
JGBs increased rapidly in March (Fig. 1-1).
the BOJ and other central banks were successful. Liquidity improved on the JGB market as
well. Trading volume of coupon-bearing JGBs plunged in April and May before starting to
rise back gradually in June (Fig. 1-1).
The 10-Year JGB yield stood at 0% on April 1 and at 0.03% on June 30, indicating little
change in the three months. On the other hand, the 20-Year JGB yield rose slightly from 0.29%
on April 1 to 0.415% on June 30 and the 30-Year JGB yield from 0.41% to 0.595% (Fig. 1-2).
In line with two FY2020 supplementary budgets formulated in response to the COVID-19
1
Fig. 1-1 Monthly trading volume of interest-bearing JGBs
Ⅰ FY2021 Debt Management Policies1 T
rends of JGB
Market in FY
2020
13
’s planned JGB issuance amount was increased by about
100 trillion yen. JGB issuance amounts for a wide range of maturities were raised, though the
amount for Treasury Discount Bill was most notably increased. Nevertheless, the increased
issuance was auctioned smoothly as investors’ demand increased accordingly.
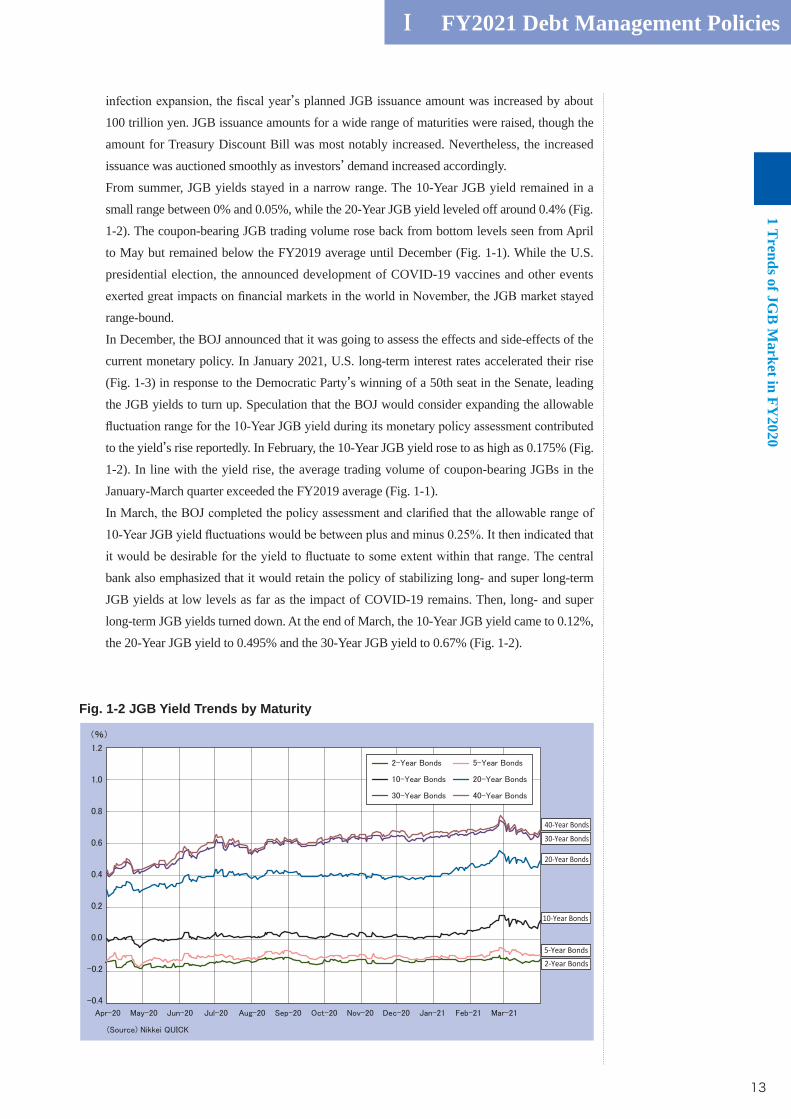
From summer, JGB yields stayed in a narrow range. The 10-Year JGB yield remained in a
small range between 0% and 0.05%, while the 20-Year JGB yield leveled off around 0.4% (Fig.
1-2). The coupon-bearing JGB trading volume rose back from bottom levels seen from April
to May but remained below the FY2019 average until December (Fig. 1-1). While the U.S.
presidential election, the announced development of COVID-19 vaccines and other events
range-bound.
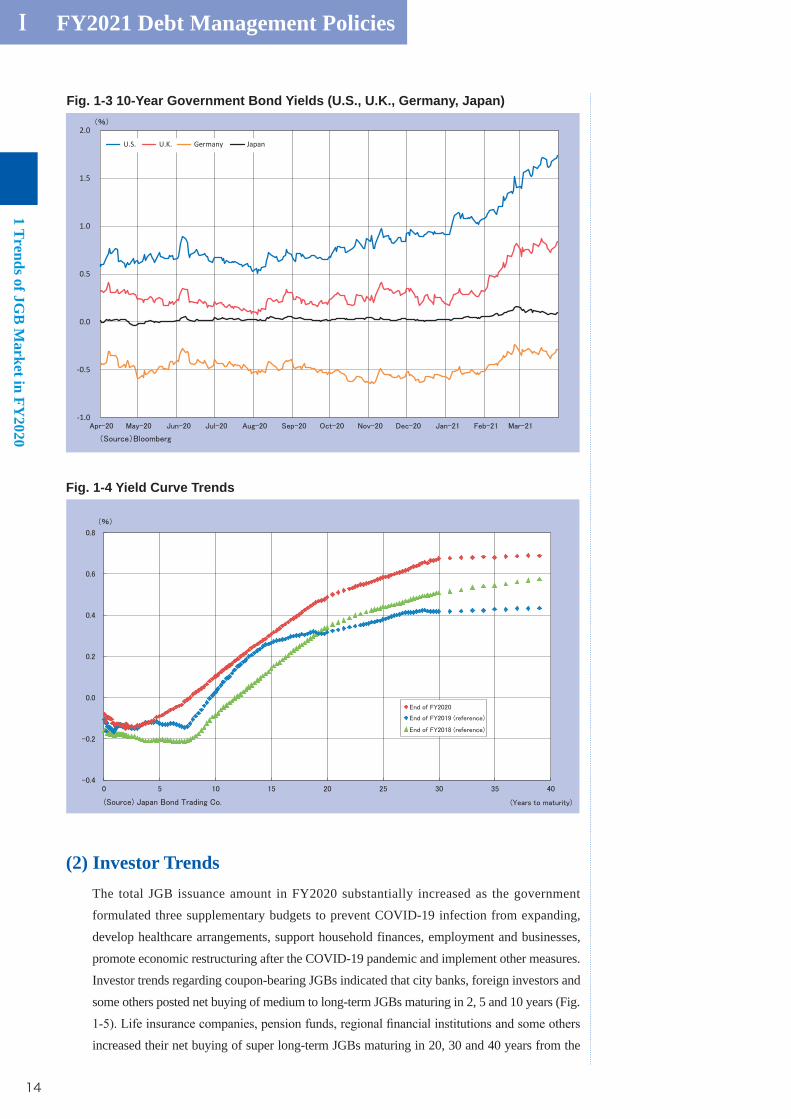
In December, the BOJ announced that it was going to assess the effects and side-effects of the
current monetary policy. In January 2021, U.S. long-term interest rates accelerated their rise
(Fig. 1-3) in response to the Democratic Party’s winning of a 50th seat in the Senate, leading
the JGB yields to turn up. Speculation that the BOJ would consider expanding the allowable
to the yield’s rise reportedly. In February, the 10-Year JGB yield rose to as high as 0.175% (Fig.
1-2). In line with the yield rise, the average trading volume of coupon-bearing JGBs in the
January-March quarter exceeded the FY2019 average (Fig. 1-1).
bank also emphasized that it would retain the policy of stabilizing long- and super long-term
JGB yields at low levels as far as the impact of COVID-19 remains. Then, long- and super
long-term JGB yields turned down. At the end of March, the 10-Year JGB yield came to 0.12%,
the 20-Year JGB yield to 0.495% and the 30-Year JGB yield to 0.67% (Fig. 1-2).
Fig. 1-2 JGB Yield Trends by Maturity
40-Year Bonds
30-Year Bonds
20-Year Bonds
10-Year Bonds
5-Year Bonds2-Year Bonds
Ⅰ FY2021 Debt Management Policies
1 Trends of JG
B M
arket in FY2020
14
(2) Investor TrendsThe total JGB issuance amount in FY2020 substantially increased as the government
formulated three supplementary budgets to prevent COVID-19 infection from expanding,
develop healthcare arrangements, support household finances, employment and businesses,
promote economic restructuring after the COVID-19 pandemic and implement other measures.
Investor trends regarding coupon-bearing JGBs indicated that city banks, foreign investors and
some others posted net buying of medium to long-term JGBs maturing in 2, 5 and 10 years (Fig.
increased their net buying of super long-term JGBs maturing in 20, 30 and 40 years from the
Fig. 1-4 Yield Curve Trends
Fig. 1-3 10-Year Government Bond Yields (U.S., U.K., Germany, Japan)
-1.0
-0.5
0.0
0.5
1.0
1.5
2.0
U.S. U.K. Germany Japan

Ⅰ FY2021 Debt Management Policies1 T
rends of JGB
Market in FY
2020
15
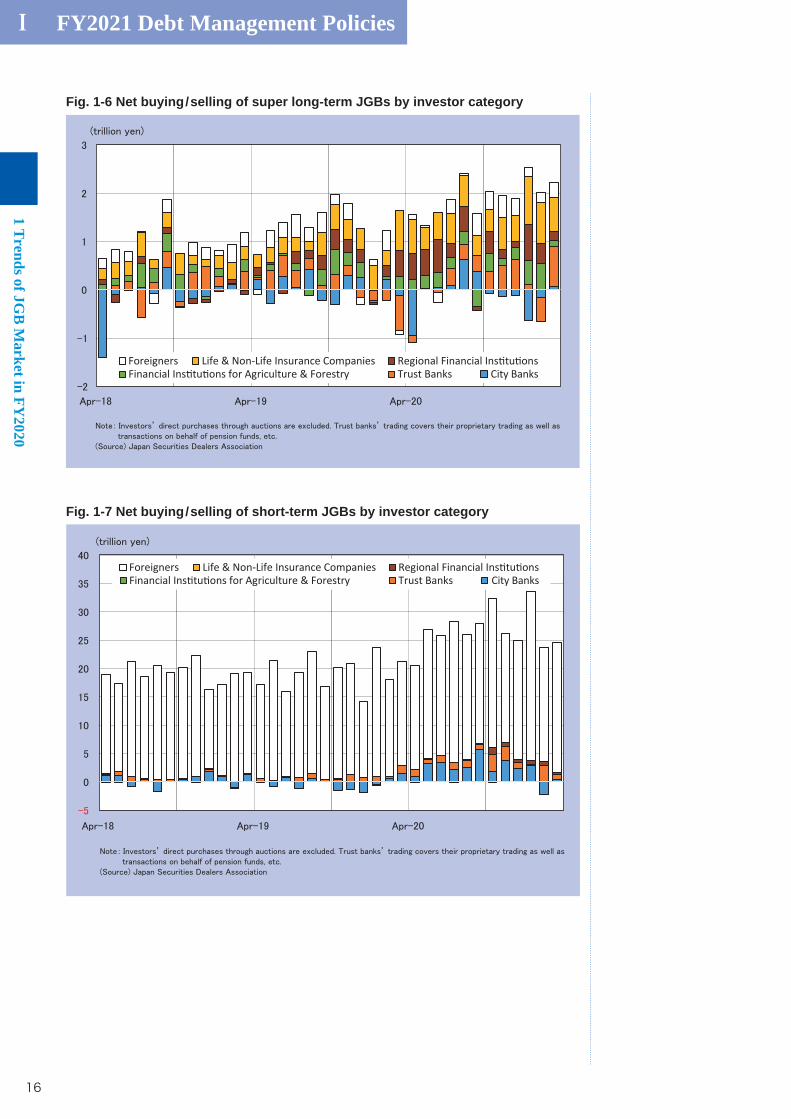
previous year (Fig. 1-6).
Life insurance companies apparently enhanced their buying of super long-term JGBs due to
unattractive yields on foreign bonds after currency hedging and the need for responding to
new international capital regulations. Pension funds might have implemented operations to
sell stocks and buy bonds to adjust their investment portfolios in view of a substantial stock
market upsurge. Regional financial institutions might have expanded investment in longer-
than-10-year JGBs with positive yields. Foreign investors’ trading in medium to long-term and
(Figs. 1-5 and 1-6).
On the short-term JGB (Treasury Discount Bill) market, city banks and pension funds became
relatively large net buyers in FY2020, joining foreign investors that have traditionally been net
buyers (Fig. 1-7). Although dollar premiums for short-term dollar-yen basis swaps slackened
(Fig. 1-8), short-term dollar interest rate falls helped to keep JGBs after currency hedging
attractive for foreign investors. As a result, foreign investors’ demand for short-term JGBs
remained at high levels throughout FY2020. City banks also maintained their short-term JGB
investment at high levels throughout the year. They might have invested increased deposits in
short-term JGBs and bought short-term JGBs for collateral for lending from the BOJ. Pension
funds also activated investment in short-term JGBs.
Fig. 1-5 Net buying/selling of medium to long-term JGBs by investor category
Foreigners Life & Non-Life Insurance Companies Regional Financial Ins tu onsFinancial Ins tu ons for Agriculture & Forestry Trust Banks City Banks
Ⅰ FY2021 Debt Management Policies
1 Trends of JG
B M
arket in FY2020
16
Foreigners Life & Non-Life Insurance Companies Regional Financial Ins tu onsFinancial Ins tu ons for Agriculture & Forestry Trust Banks City Banks
Fig. 1-7 Net buying/selling of short-term JGBs by investor category
Fig. 1-6 Net buying/selling of super long-term JGBs by investor category
Foreigners Life & Non-Life Insurance Companies Regional Financial Ins tu onsFinancial Ins tu ons for Agriculture & Forestry Trust Banks City Banks

Ⅰ FY2021 Debt Management Policies1 T
rends of JGB
Market in FY
2020
17
Fig. 1-8 Dollar-Yen Basis Swap Spread
-120
-100
-80
-60
-40
-20
0
20
40
(bp)O
ct-1
3
Jan-
14
Apr-
14
Jul-1
4
Oct
-14
Jan-
15
Apr-
15
Jul-1
5
Oct
-15
Jan-
16
Apr-
16
Jul-1
6
Oct
-16
Jan-
17
Apr-
17
Jul-1
7
Oct
-17
Jan-
18
Apr-
18
Jul-1
8
Oct
-18
Jan-
19
Apr-
19
Jul-1
9
Oct
-19
Jan-
20
Apr-
20
Jul-2
0
Oct
-20
Jan-
21
3M 1 Year 2 Year 30 Year10 Year
Ⅰ FY2021 Debt Management Policies
2 JGB
Issuance Plan for FY2021
18
JGB Issuance Plan for FY2021
(1) Announcement of JGB Issuance Plan for FY2021
general JGBs estimated at about 990.3 trillion yen for the end of FY2021 and outstanding
long-term central and local government debts at 1,212 trillion yen. It is getting more important
for the Japanese government to adequately implement JGB Management Policy to secure the
market’s stable absorption of JGBs.
On December 21, 2020, the Japanese government publicly announced the JGB Issuance Plan
for FY2021 in line with a Cabinet decision on the draft FY2021 government budget.
When developing the JGB Issuance Plan for FY2021 where JGB issues including Refunding
Bonds will total 236.0 trillion yen, the government held careful dialogues with market
participants through the Meeting of JGB Market Special Participants and some other dialogue
sessions and has formulated JGB Issuance Plans for each bond issuance method, paying
attention to investors’ needs and market trends.
(2) Overview of Discussions at Various Panels The Advisory Council on Government Debt Management at its meeting in November
2020 started discussions for the development of the JGB Issuance Plan for FY2021. It then
and a medium- to long-term outlook on investors’ JGB demand. Main opinions were as
follows:
・ In the future, the government must correct the average JGB maturity that has substantially
been shortened by a sharp increase in short-term bond issues under supplementary budgets
in FY2020 but should consider interest rate risks regarding super long-term issuances.
・ Given that life insurance companies are expanding investment in super long-term bonds in
anticipation of the introduction of an economic value-based solvency regulation, demand
may increase for super long-term bonds to some extent.
At the Meeting of JGB Market Special Participants (primary dealers) and the Meeting of
JGB Investors in November 2020, participants discussed details of the JGB Issuance Plan for
FY2021. Main opinions were as follows:
・ As regards T-Bills, the issuance amount should be gradually reduced basically because the
heightened depending on the auction results, despite the T-Bill market is generally stable,
supported by the BOJ and collateral demand.
・ Although the current interest rate level is low and the situation does not allow a full-
insurance companies are very strong from the perspective of ALM.
Based on discussions at these panels, the government has developed the JGB Issuance Plan for
FY2021.
2

Ⅰ FY2021 Debt Management Policies2 JG
B Issuance Plan for FY
2021
19
(3) Scheduled Issuance Amount of JGBs
A. Breakdown by legal grounds
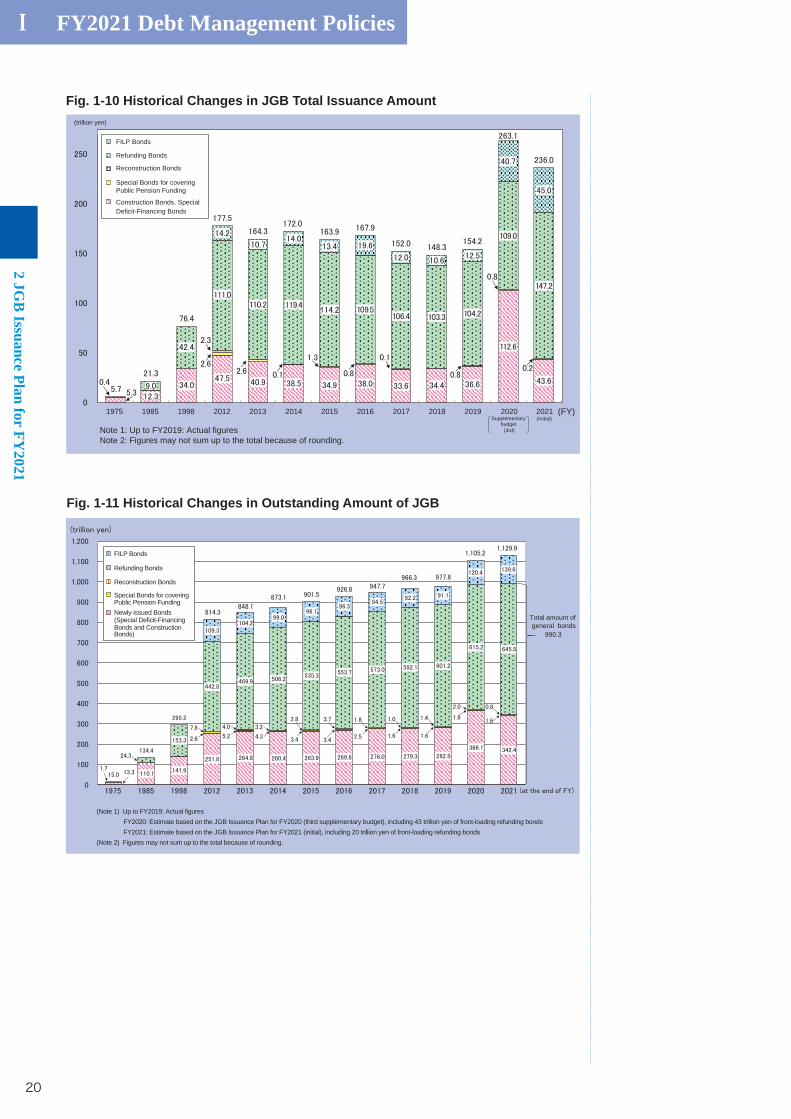
Under the FY2021 budget, the MOF plans to increase the JGB issuance amount by 82.5
trillion yen from the initial level for FY2020 to a very high level of 236.0 trillion yen.
Financing Bonds issues to provide revenues for the General Account Budget have been
increased by 11.0 trillion yen from the initial level for FY2020 to 43.6 trillion yen. Aiming
at financing reconstruction projects for recovering from the Great East Japan Earthquake,
and other revenues are receivable to the government. In FY2021, the government is planning
to issue Reconstruction Bonds worth 0.2 trillion yen, down 0.7 trillion yen from the initial
level for the previous year. The FILP Bonds issuance amount is determined not only by the
scale of new lending under the Fiscal Loan Program but also by the financial position of
the overall Fiscal Loan Fund. The FY2021 FILP Bonds issuance amount is increased by
33.0 trillion yen from the initial level for the previous year to 45.0 trillion yen. Refunding
Bonds are issued to refund the General Bonds that were issued in the past and are due to
mature, accounting for a majority of total annual JGB issues. In FY2021, the Refunding
Bonds issuance amount is planned to increase by 39.2 trillion yen from the initial level of the
previous year to 147.2 trillion yen.
Ref: II Chapter 1 1(1) “JGBs by Legal Grounds of Issuance” (P38)
Fig. 1-9 JGB Issuance Plan for FY2021 (Breakdown by Legal Grounds) (☞①~③) (Unit: billion yen)
FY2020 (Initial)FY2020
(3rd Supplementary Budget)
FY2021 (Initial)
(a) (b) (c) (c)-(a) (c)-(b)
Newly-issued Bonds 32,556.2 112,553.9 43,597.0 11,040.8 ▲ 68,956.9
Construction Bonds 7,110.0 22,596.0 6,341.0 ▲ 769.0 ▲ 16,255.0
Financing Bonds 25,446.2 89,957.9 37,256.0 11,809.8 ▲ 52,701.9
Reconstruction Bonds 924.1 782.4 218.3 ▲ 705.8 ▲ 564.1
FILP Bonds 12,000.0 40,700.0 45,000.0 33,000.0 4,300.0
Refunding Bonds 107,981.8 109,029.2 147,192.9 39,211.1 38,163.8
For matured Reconstruction Bonds
1,693.2 2,725.4 2,871.0 1,177.8 145.5
Total 153,462.1 263,065.5 236,008.2 82,546.1 ▲ 27,057.3
☞①Figures may not sum up to total because of rounding.
☞② Buy-backs from the market in FY2021 will be de-termined based on the MOF’s discussion with market partici-pants and market conditions.
☞③The maximum amount of front-loading issuance of Refunding Bonds in FY2021 is 20 trillion yen.
Ⅰ FY2021 Debt Management Policies
2 JGB
Issuance Plan for FY2021
20
Fig. 1-10 Historical Changes in JGB Total Issuance Amount
Fig. 1-11 Historical Changes in Outstanding Amount of JGB
FILP Bonds
Refunding Bonds
Reconstruction Bonds
Special Bonds for covering Public Pension Funding
Construction Bonds, SpecialDeficit-Financing Bonds
1975 1985 1998 2012 2013 2014 2015 2016 2017 2018 2019 2020 2021 (FY)(Initial)Supplementary
budget (3rd)Note 1: Up to FY2019: Actual figures
Note 2: Figures may not sum up to the total because of rounding.
(trillion yen)
(Note 1) Up to FY2019: Actual figuresFY2020: Estimate based on the JGB Issuance Plan for FY2020 (third supplementary budget), including 43 trillion yen of front-loading refunding bondsFY2021: Estimate based on the JGB Issuance Plan for FY2021 (initial), including 20 trillion yen of front-loading refunding bonds
(Note 2) Figures may not sum up to the total because of rounding.
990.3
Total amount ofgeneral bonds
FILP Bonds
Refunding Bonds
Reconstruction Bonds
Special Bonds for coveringPublic Pension FundingNewly-issued Bonds(Special Deficit-Financing Bonds and ConstructionBonds)
Ⅰ FY2021 Debt Management Policies2 JG
B Issuance Plan for FY
2021
21
B. Breakdown by Issuance Methods
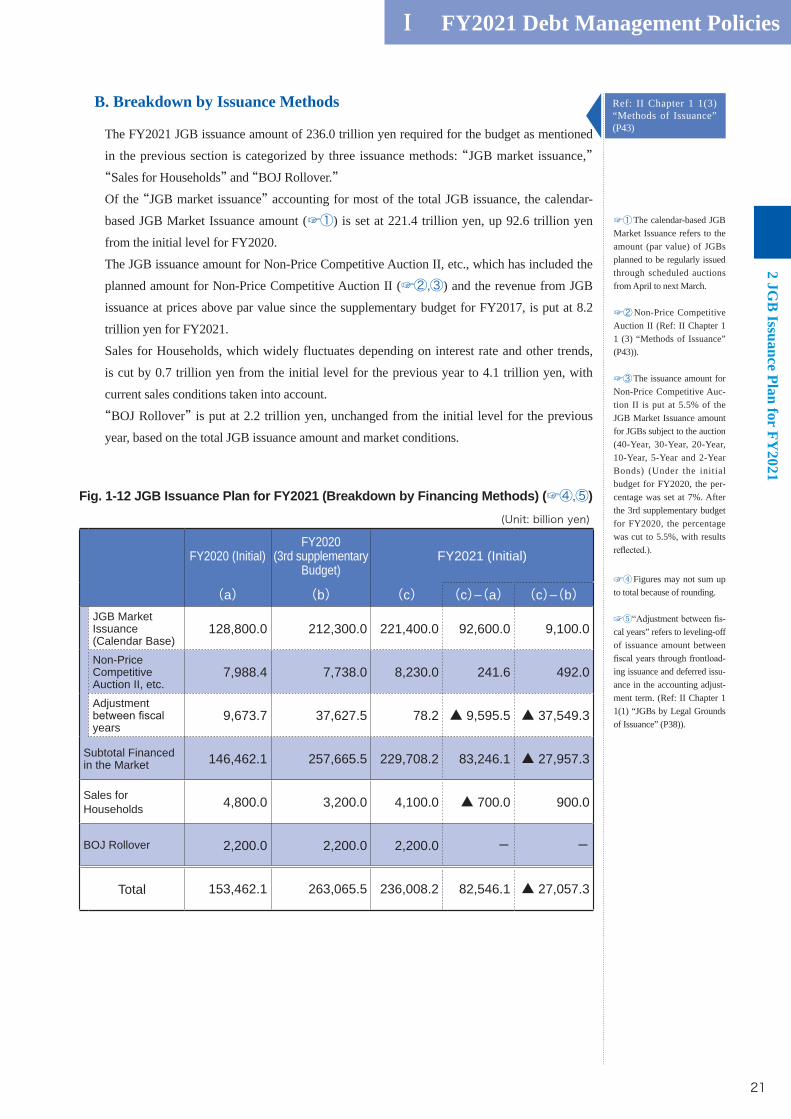
The FY2021 JGB issuance amount of 236.0 trillion yen required for the budget as mentioned
in the previous section is categorized by three issuance methods: “JGB market issuance,” “Sales for Households” and “BOJ Rollover.”Of the “JGB market issuance” accounting for most of the total JGB issuance, the calendar-
based JGB Market Issuance amount (☞①) is set at 221.4 trillion yen, up 92.6 trillion yen
from the initial level for FY2020.
The JGB issuance amount for Non-Price Competitive Auction II, etc., which has included the
planned amount for Non-Price Competitive Auction II (☞②,③) and the revenue from JGB
issuance at prices above par value since the supplementary budget for FY2017, is put at 8.2
trillion yen for FY2021.
Sales for Households, which widely fluctuates depending on interest rate and other trends,
is cut by 0.7 trillion yen from the initial level for the previous year to 4.1 trillion yen, with
current sales conditions taken into account.
“BOJ Rollover” is put at 2.2 trillion yen, unchanged from the initial level for the previous
year, based on the total JGB issuance amount and market conditions.
☞①The calendar-based JGB Market Issuance refers to the amount (par value) of JGBs planned to be regularly issued through scheduled auctions from April to next March.
☞②Non-Price Competitive Auction II (Ref: II Chapter 1 1 (3) “Methods of Issuance” (P43)).
☞③The issuance amount for Non-Price Competitive Auc-tion II is put at 5.5% of the JGB Market Issuance amount for JGBs subject to the auction (40-Year, 30-Year, 20-Year, 10-Year, 5-Year and 2-Year Bonds) (Under the initial budget for FY2020, the per-centage was set at 7%. After the 3rd supplementary budget for FY2020, the percentage was cut to 5.5%, with results
Fig. 1-12 JGB Issuance Plan for FY2021 (Breakdown by Financing Methods) (☞④,⑤)
☞④Figures may not sum up to total because of rounding.
☞⑤ -cal years” refers to leveling-off of issuance amount between
-ing issuance and deferred issu-ance in the accounting adjust-ment term. (Ref: II Chapter 1 1(1) “JGBs by Legal Grounds of Issuance” (P38)).
Ref: II Chapter 1 1(3) “Methods of Issuance” (P43)
(Unit: billion yen)
FY2020 (Initial)FY2020
(3rd supplementaryBudget)
FY2021 (Initial)
(a) (b) (c) (c)-(a) (c)-(b)JGB Market Issuance(Calendar Base)
128,800.0 212,300.0 221,400.0 92,600.0 9,100.0
Non-Price Competitive Auction II, etc.
7,988.4 7,738.0 8,230.0 241.6 492.0
Adjustment
years9,673.7 37,627.5 78.2 ▲ 9,595.5 ▲ 37,549.3
Subtotal Financed in the Market 146,462.1 257,665.5 229,708.2 83,246.1 ▲ 27,957.3
Sales for Households 4,800.0 3,200.0 4,100.0 ▲ 700.0 900.0
BOJ Rollover 2,200.0 2,200.0 2,200.0 - -
Total 153,462.1 263,065.5 236,008.2 82,546.1 ▲ 27,057.3
Ⅰ FY2021 Debt Management Policies
2 JGB
Issuance Plan for FY2021
22
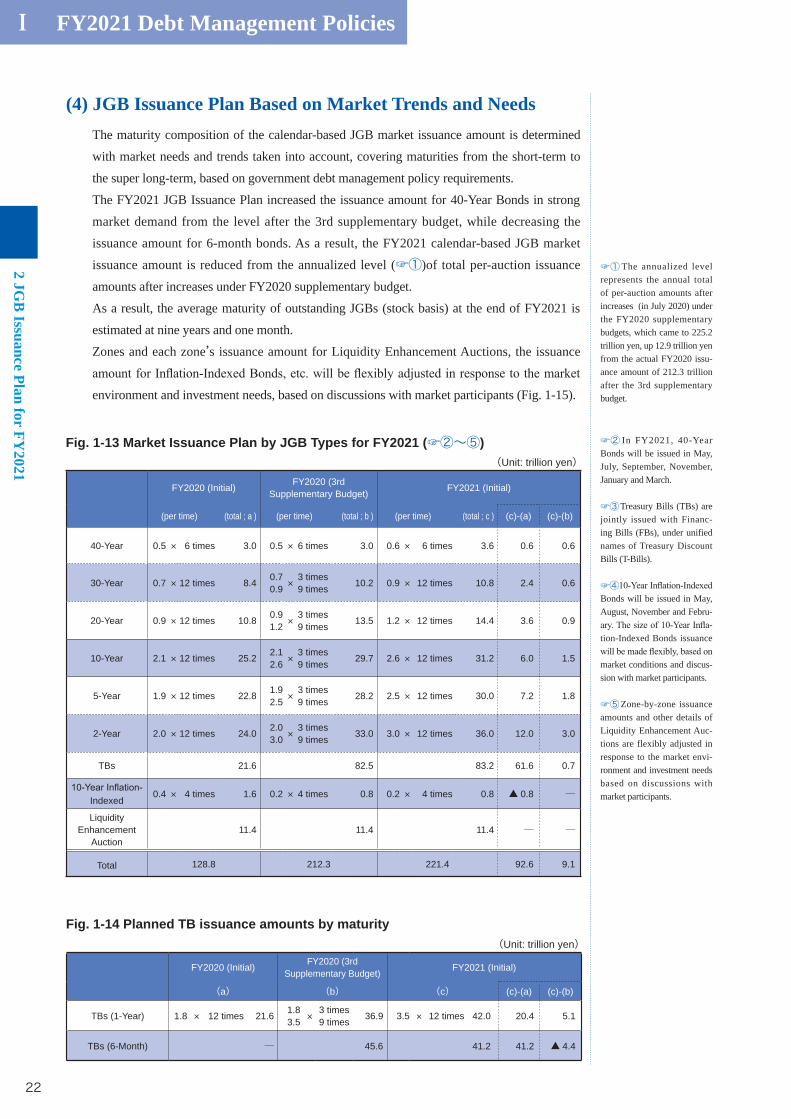
(4) JGB Issuance Plan Based on Market Trends and Needs The maturity composition of the calendar-based JGB market issuance amount is determined
with market needs and trends taken into account, covering maturities from the short-term to
the super long-term, based on government debt management policy requirements.
The FY2021 JGB Issuance Plan increased the issuance amount for 40-Year Bonds in strong
market demand from the level after the 3rd supplementary budget, while decreasing the
issuance amount for 6-month bonds. As a result, the FY2021 calendar-based JGB market
issuance amount is reduced from the annualized level (☞①)of total per-auction issuance
amounts after increases under FY2020 supplementary budget.
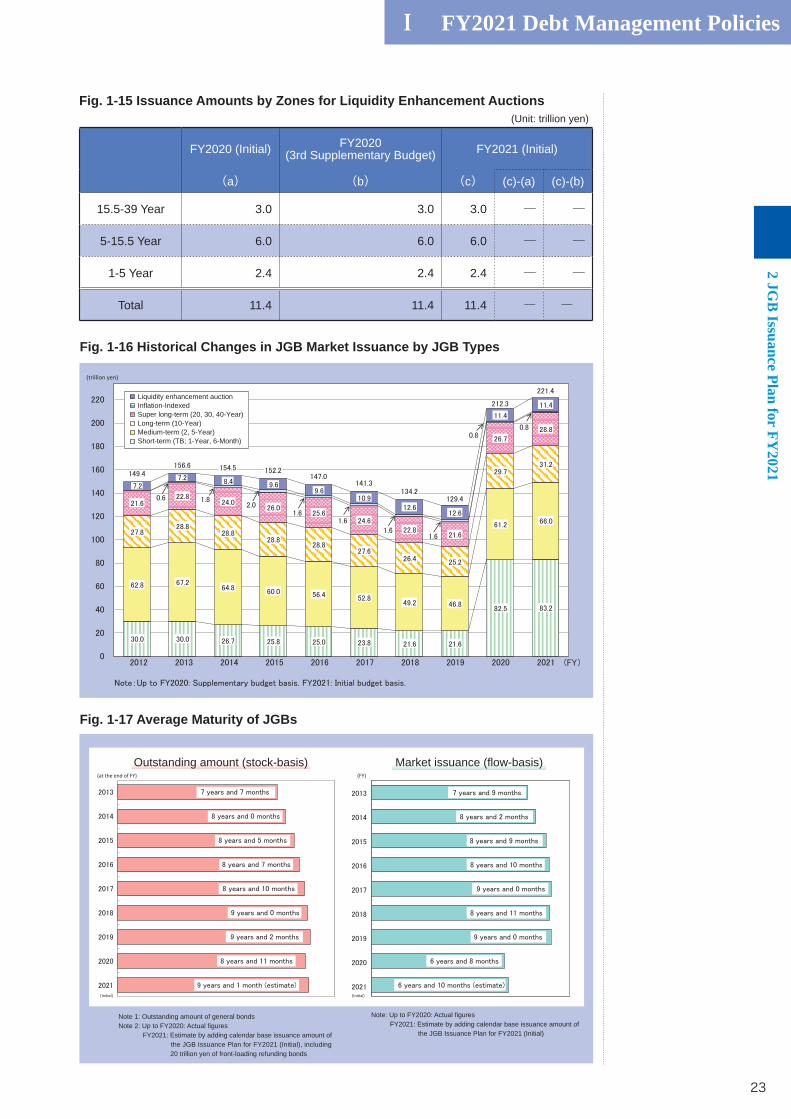
As a result, the average maturity of outstanding JGBs (stock basis) at the end of FY2021 is
estimated at nine years and one month.
Zones and each zone’s issuance amount for Liquidity Enhancement Auctions, the issuance
environment and investment needs, based on discussions with market participants (Fig. 1-15).
Fig. 1-13 Market Issuance Plan by JGB Types for FY2021 (☞②~⑤)
☞① The annualized level represents the annual total of per-auction amounts after increases (in July 2020) under the FY2020 supplementary budgets, which came to 225.2 trillion yen, up 12.9 trillion yen from the actual FY2020 issu-ance amount of 212.3 trillion after the 3rd supplementary budget.
☞② In FY2021, 40-Year Bonds will be issued in May, July, September, November, January and March.
☞③Treasury Bills (TBs) are jointly issued with Financ-ing Bills (FBs), under unified names of Treasury Discount Bills (T-Bills).
☞④Bonds will be issued in May, August, November and Febru-
-tion-Indexed Bonds issuance
market conditions and discus-sion with market participants.
☞⑤Zone-by-zone issuance amounts and other details of Liquidity Enhancement Auc-tions are flexibly adjusted in response to the market envi-ronment and investment needs based on discussions with market participants.
(Unit: trillion yen)
FY2020 (Initial) FY2020 (3rd Supplementary Budget) FY2021 (Initial)
(a) (b) (c) (c)-(a) (c)-(b)
TBs (1-Year) 1.8 × 12 times 21.6 1.83.5 ×
3 times9 times 36.9 3.5 × 12 times 42.0 20.4 5.1
TBs (6-Month) ─ 45.6 41.2 41.2 ▲ 4.4
Fig. 1-14 Planned TB issuance amounts by maturity
(Unit: trillion yen)
FY2020 (Initial) FY2020 (3rd Supplementary Budget) FY2021 (Initial)
(per time) (total ; a ) (per time) (total ; b ) (per time) (total ; c ) (c)-(a) (c)-(b)
40-Year 0.5 × 6 times 3.0 0.5 × 6 times 3.0 0.6 × 6 times 3.6 0.6 0.6
30-Year 0.7 × 12 times 8.4 0.70.9 ×
3 times9 times 10.2 0.9 × 12 times 10.8 2.4 0.6
20-Year 0.9 × 12 times 10.8 0.91.2 ×
3 times9 times 13.5 1.2 × 12 times 14.4 3.6 0.9
10-Year 2.1 × 12 times 25.2 2.12.6 ×
3 times9 times 29.7 2.6 × 12 times 31.2 6.0 1.5
5-Year 1.9 × 12 times 22.8 1.92.5 ×
3 times9 times 28.2 2.5 × 12 times 30.0 7.2 1.8
2-Year 2.0 × 12 times 24.0 2.03.0 ×
3 times9 times 33.0 3.0 × 12 times 36.0 12.0 3.0
TBs 21.6 82.5 83.2 61.6 0.7
Indexed0.4 × 4 times 1.6 0.2 × 4 times 0.8 0.2 × 4 times 0.8 ▲ 0.8 ─
Liquidity Enhancement
Auction11.4 11.4 11.4 ─ ─
Total 128.8 212.3 221.4 92.6 9.1
Ⅰ FY2021 Debt Management Policies2 JG
B Issuance Plan for FY
2021
23
Fig. 1-16 Historical Changes in JGB Market Issuance by JGB Types
Fig. 1-17 Average Maturity of JGBs
Fig. 1-15 Issuance Amounts by Zones for Liquidity Enhancement Auctions (Unit: trillion yen)
FY2020 (Initial) FY2020 (3rd Supplementary Budget) FY2021 (Initial)
(a) (b) (c) (c)-(a) (c)-(b)
15.5-39 Year 3.0 3.0 3.0 ─ ─
5-15.5 Year 6.0 6.0 6.0 ─ ─
1-5 Year 2.4 2.4 2.4 ─ ─
Total 11.4 11.4 11.4 ― ―
(trillion yen)
Liquidity enhancement auctionInflation-IndexedSuper long-term (20, 30, 40-Year)Long-term (10-Year)Medium-term (2, 5-Year)Short-term (TB; 1-Year, 6-Month)
(FY)(at the end of FY)
Note: Up to FY2020: Actual figures FY2021: Estimate by adding calendar base issuance amount of the JGB Issuance Plan for FY2021 (Initial)
Note 1: Outstanding amount of general bondsNote 2: Up to FY2020: Actual figures FY2021: Estimate by adding calendar base issuance amount of the JGB Issuance Plan for FY2021 (Initial), including
20 trillion yen of front-loading refunding bonds
(Ini al)(Ini al)
Outstanding amount (stock-basis) Market issuance (flow-basis)
Ⅰ FY2021 Debt Management Policies
2 JGB
Issuance Plan for FY2021
24
Increases in FY2020 JGB Issuance and Future Outlook
Column 3
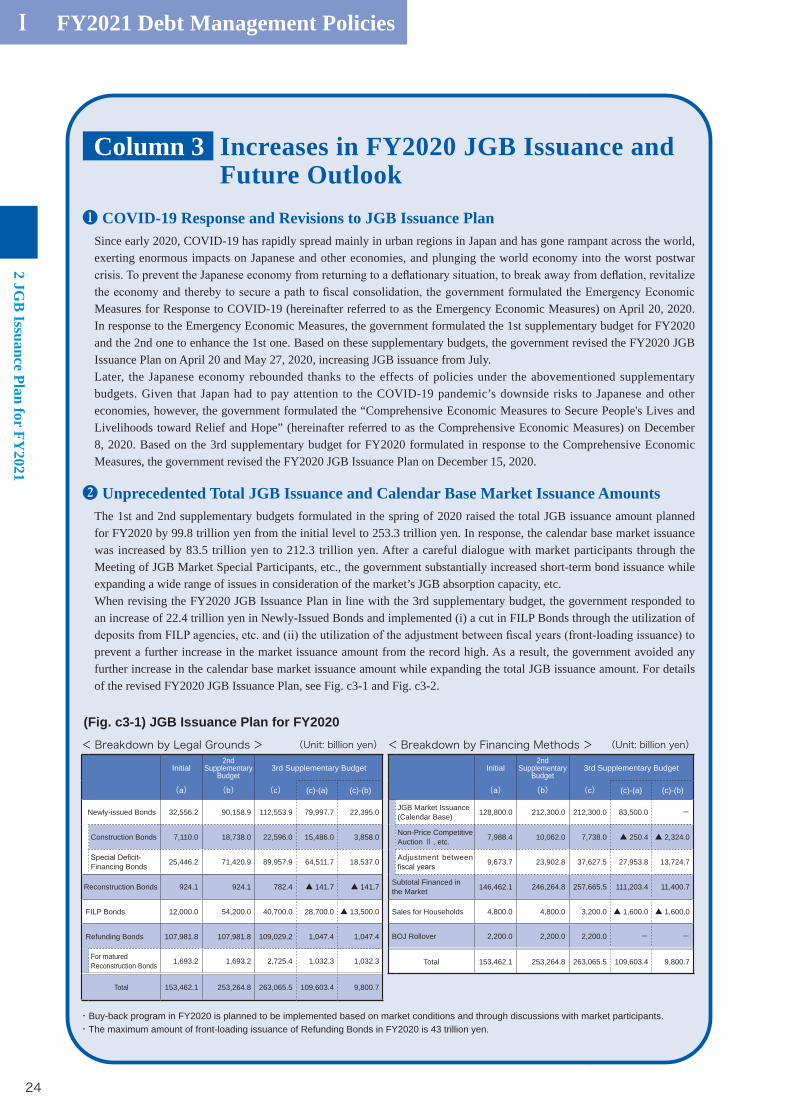
❶ COVID-19 Response and Revisions to JGB Issuance PlanSince early 2020, COVID-19 has rapidly spread mainly in urban regions in Japan and has gone rampant across the world, exerting enormous impacts on Japanese and other economies, and plunging the world economy into the worst postwar
Measures for Response to COVID-19 (hereinafter referred to as the Emergency Economic Measures) on April 20, 2020. In response to the Emergency Economic Measures, the government formulated the 1st supplementary budget for FY2020 and the 2nd one to enhance the 1st one. Based on these supplementary budgets, the government revised the FY2020 JGB Issuance Plan on April 20 and May 27, 2020, increasing JGB issuance from July.Later, the Japanese economy rebounded thanks to the effects of policies under the abovementioned supplementary budgets. Given that Japan had to pay attention to the COVID-19 pandemic’s downside risks to Japanese and other economies, however, the government formulated the “Comprehensive Economic Measures to Secure People's Lives and Livelihoods toward Relief and Hope” (hereinafter referred to as the Comprehensive Economic Measures) on December 8, 2020. Based on the 3rd supplementary budget for FY2020 formulated in response to the Comprehensive Economic Measures, the government revised the FY2020 JGB Issuance Plan on December 15, 2020.
❷ Unprecedented Total JGB Issuance and Calendar Base Market Issuance AmountsThe 1st and 2nd supplementary budgets formulated in the spring of 2020 raised the total JGB issuance amount planned for FY2020 by 99.8 trillion yen from the initial level to 253.3 trillion yen. In response, the calendar base market issuance was increased by 83.5 trillion yen to 212.3 trillion yen. After a careful dialogue with market participants through the Meeting of JGB Market Special Participants, etc., the government substantially increased short-term bond issuance while expanding a wide range of issues in consideration of the market’s JGB absorption capacity, etc.When revising the FY2020 JGB Issuance Plan in line with the 3rd supplementary budget, the government responded to an increase of 22.4 trillion yen in Newly-Issued Bonds and implemented (i) a cut in FILP Bonds through the utilization of
prevent a further increase in the market issuance amount from the record high. As a result, the government avoided any further increase in the calendar base market issuance amount while expanding the total JGB issuance amount. For details of the revised FY2020 JGB Issuance Plan, see Fig. c3-1 and Fig. c3-2.
(Fig. c3-1) JGB Issuance Plan for FY2020
・Buy-back program in FY2020 is planned to be implemented based on market conditions and through discussions with market participants.・The maximum amount of front-loading issuance of Refunding Bonds in FY2020 is 43 trillion yen.
<Breakdown by Legal Grounds > (Unit: billion yen)
Initial2nd
Supplementary Budget
3rd Supplementary Budget
(a) (b) (c) (c)-(a) (c)-(b)
Newly-issued Bonds 32,556.2 90,158.9 112,553.9 79,997.7 22,395.0
Construction Bonds 7,110.0 18,738.0 22,596.0 15,486.0 3,858.0
Financing Bonds 25,446.2 71,420.9 89,957.9 64,511.7 18,537.0
Reconstruction Bonds 924.1 924.1 782.4 ▲ 141.7 ▲ 141.7
FILP Bonds 12,000.0 54,200.0 40,700.0 28,700.0 ▲ 13,500.0
Refunding Bonds 107,981.8 107,981.8 109,029.2 1,047.4 1,047.4
For matured Reconstruction Bonds 1,693.2 1,693.2 2,725.4 1,032.3 1,032.3
Total 153,462.1 253,264.8 263,065.5 109,603.4 9,800.7
<Breakdown by Financing Methods > (Unit: billion yen)
Initial2nd
Supplementary Budget
3rd Supplementary Budget
(a) (b) (c) (c)-(a) (c)-(b)
JGB Market Issuance(Calendar Base) 128,800.0 212,300.0 212,300.0 83,500.0 -
Non-Price CompetitiveAuction Ⅱ , etc. 7,988.4 10,062.0 7,738.0 ▲ 250.4 ▲ 2,324.0
Adjustment between 9,673.7 23,902.8 37,627.5 27,953.8 13,724.7
Subtotal Financed in the Market 146,462.1 246,264.8 257,665.5 111,203.4 11,400.7
Sales for Households 4,800.0 4,800.0 3,200.0 ▲ 1,600.0 ▲ 1,600.0
BOJ Rollover 2,200.0 2,200.0 2,200.0 - -
Total 153,462.1 253,264.8 263,065.5 109,603.4 9,800.7
Ⅰ FY2021 Debt Management Policies2 JG
B Issuance Plan for FY
2021
25
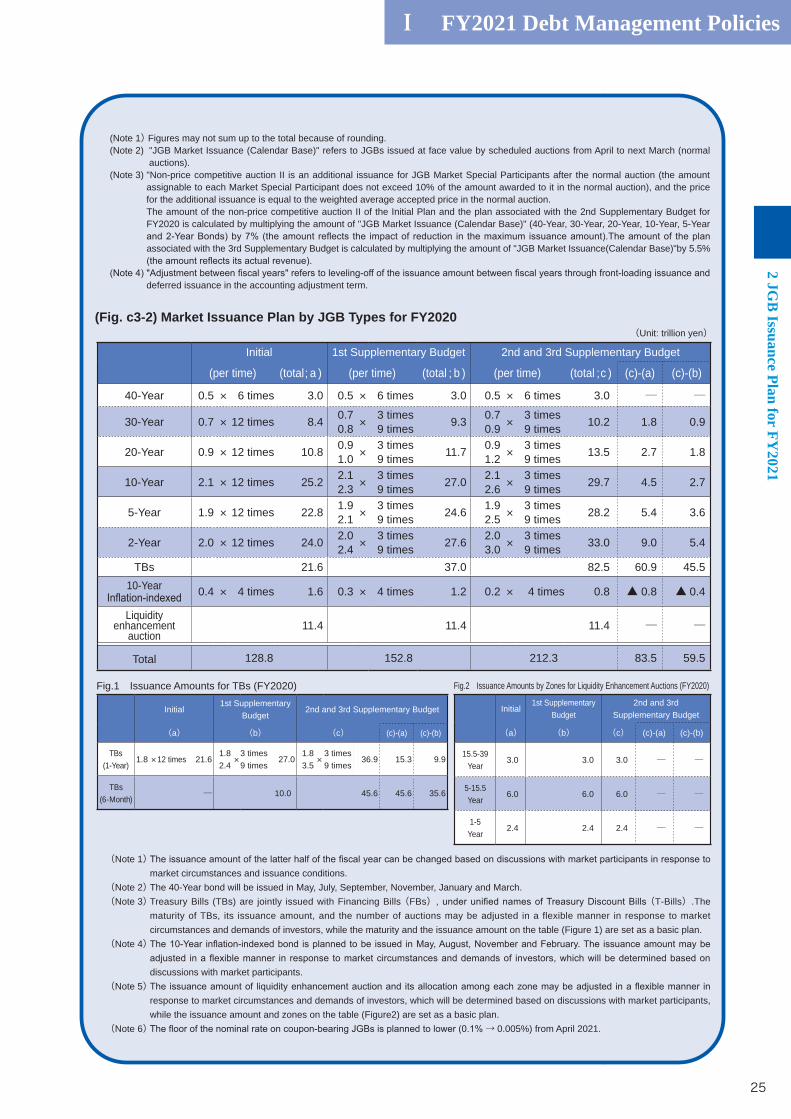
(Note 1) Figures may not sum up to the total because of rounding.(Note 2) "JGB Market Issuance (Calendar Base)" refers to JGBs issued at face value by scheduled auctions from April to next March (normal
auctions).(Note 3) "Non-price competitive auction II is an additional issuance for JGB Market Special Participants after the normal auction (the amount
assignable to each Market Special Participant does not exceed 10% of the amount awarded to it in the normal auction), and the price for the additional issuance is equal to the weighted average accepted price in the normal auction.The amount of the non-price competitive auction II of the Initial Plan and the plan associated with the 2nd Supplementary Budget for FY2020 is calculated by multiplying the amount of "JGB Market Issuance (Calendar Base)" (40-Year, 30-Year, 20-Year, 10-Year, 5-Year
associated with the 3rd Supplementary Budget is calculated by multiplying the amount of "JGB Market Issuance(Calendar Base)"by 5.5%
deferred issuance in the accounting adjustment term.
(Unit: trillion yen)
Initial 1st Supplementary Budget 2nd and 3rd Supplementary Budget
(per time) (total ; a ) (per time) (total ; b ) (per time) (total ; c ) (c)-(a) (c)-(b)
40-Year 0.5 × 6 times 3.0 0.5 × 6 times 3.0 0.5 × 6 times 3.0 ─ ─
30-Year 0.7 × 12 times 8.4 0.70.8 ×
3 times9 times 9.3 0.7
0.9 ×3 times9 times 10.2 1.8 0.9
20-Year 0.9 × 12 times 10.8 0.91.0 ×
3 times9 times 11.7 0.9
1.2 ×3 times9 times 13.5 2.7 1.8
10-Year 2.1 × 12 times 25.2 2.12.3 ×
3 times9 times 27.0 2.1
2.6 ×3 times9 times 29.7 4.5 2.7
5-Year 1.9 × 12 times 22.8 1.92.1 ×
3 times9 times 24.6 1.9
2.5 ×3 times9 times 28.2 5.4 3.6
2-Year 2.0 × 12 times 24.0 2.02.4 ×
3 times9 times 27.6 2.0
3.0 ×3 times9 times 33.0 9.0 5.4
TBs 21.6 37.0 82.5 60.9 45.5 10-Year 0.4 × 4 times 1.6 0.3 × 4 times 1.2 0.2 × 4 times 0.8 ▲ 0.8 ▲ 0.4
Liquidity enhancement
auction11.4 11.4 11.4 ─ ─
Total 128.8 152.8 212.3 83.5 59.5
Fig.1 Issuance Amounts for TBs (FY2020)
Initial1st Supplementary
Budget2nd and 3rd Supplementary Budget
(a) (b) (c) (c)-(a) (c)-(b)
TBs (1-Year)
1.8 ×12 times 21.61.82.4×3 times
9 times27.0
1.83.5 × 3 times
9 times36.9 15.3 9.9
TBs (6-Month)
─ 10.0 45.6 45.6 35.6
Fig.2 Issuance Amounts by Zones for Liquidity Enhancement Auctions (FY2020)
Initial1st Supplementary
Budget2nd and 3rd
Supplementary Budget
(a) (b) (c) (c)-(a) (c)-(b)
15.5-39Year
3.0 3.0 3.0 ─ ─
5-15.5Year
6.0 6.0 6.0 ─ ─
1-5Year
2.4 2.4 2.4 ─ ─
(Fig. c3-2) Market Issuance Plan by JGB Types for FY2020
(Note 1)market circumstances and issuance conditions.
(Note 2) The 40-Year bond will be issued in May, July, September, November, January and March. (Note 3) Treasury Bills (TBs) are jointly issued with Financing Bills (FBs) (T-Bills).The
maturity of TBs, its issuance amount, and the number of auctions may be adjusted in a flexible manner in response to market circumstances and demands of investors, while the maturity and the issuance amount on the table (Figure 1) are set as a basic plan.
(Note 4)
discussions with market participants. (Note 5)
response to market circumstances and demands of investors, which will be determined based on discussions with market participants, while the issuance amount and zones on the table (Figure2) are set as a basic plan.
(Note 6) → 0.005%) from April 2021.
Ⅰ FY2021 Debt Management Policies
2 JGB
Issuance Plan for FY2021
26
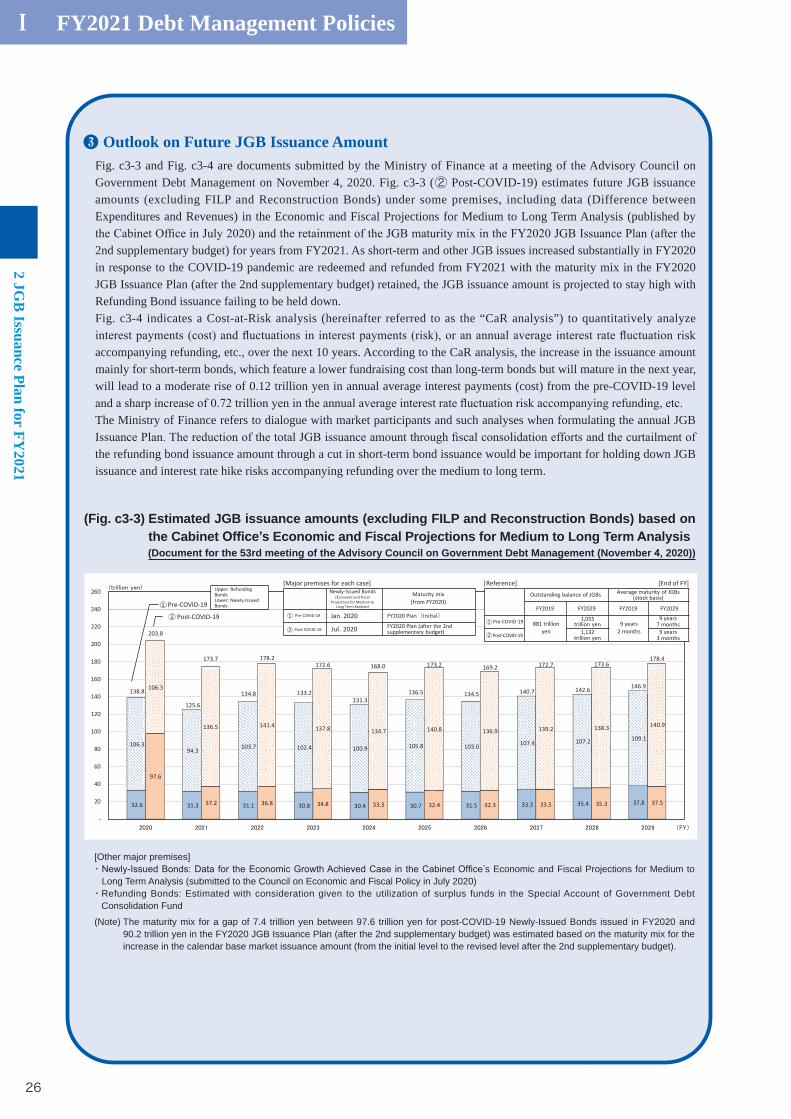
❸ Outlook on Future JGB Issuance Amount Fig. c3-3 and Fig. c3-4 are documents submitted by the Ministry of Finance at a meeting of the Advisory Council on Government Debt Management on November 4, 2020. Fig. c3-3 (② Post-COVID-19) estimates future JGB issuance amounts (excluding FILP and Reconstruction Bonds) under some premises, including data (Difference between Expenditures and Revenues) in the Economic and Fiscal Projections for Medium to Long Term Analysis (published by
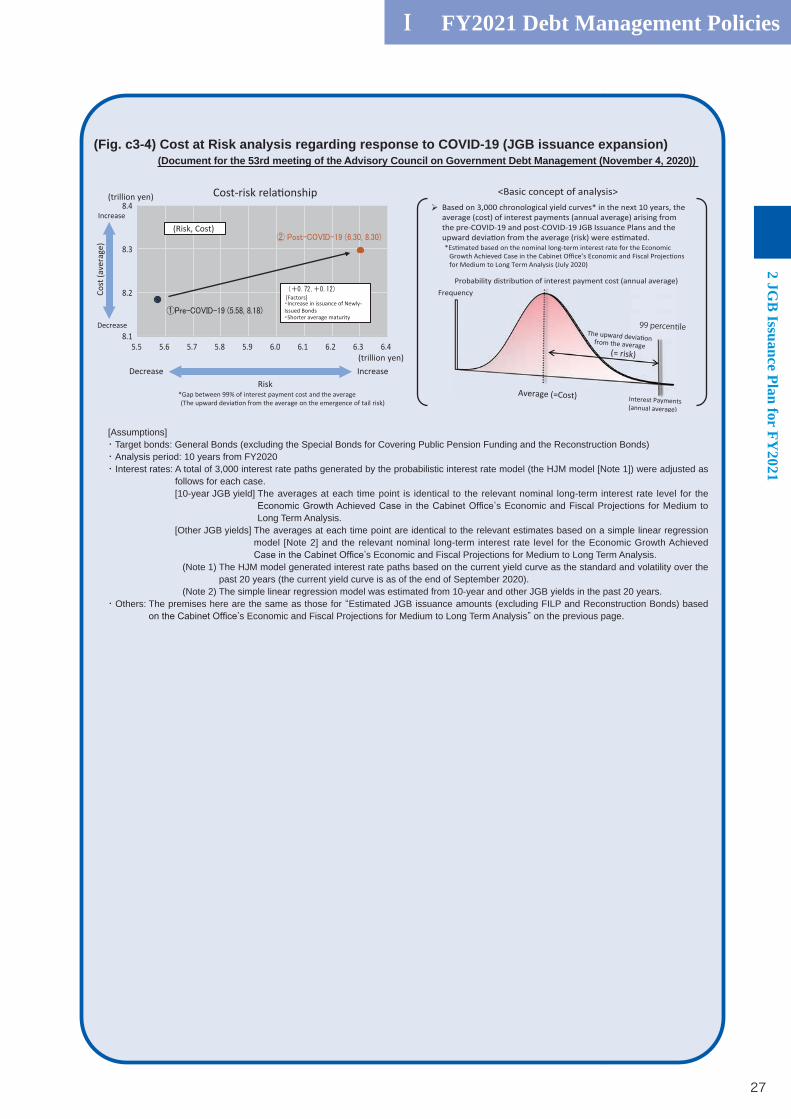
2nd supplementary budget) for years from FY2021. As short-term and other JGB issues increased substantially in FY2020 in response to the COVID-19 pandemic are redeemed and refunded from FY2021 with the maturity mix in the FY2020 JGB Issuance Plan (after the 2nd supplementary budget) retained, the JGB issuance amount is projected to stay high with Refunding Bond issuance failing to be held down.Fig. c3-4 indicates a Cost-at-Risk analysis (hereinafter referred to as the “CaR analysis”) to quantitatively analyze
accompanying refunding, etc., over the next 10 years. According to the CaR analysis, the increase in the issuance amount mainly for short-term bonds, which feature a lower fundraising cost than long-term bonds but will mature in the next year, will lead to a moderate rise of 0.12 trillion yen in annual average interest payments (cost) from the pre-COVID-19 level
The Ministry of Finance refers to dialogue with market participants and such analyses when formulating the annual JGB
the refunding bond issuance amount through a cut in short-term bond issuance would be important for holding down JGB issuance and interest rate hike risks accompanying refunding over the medium to long term.
(Fig. c3-3) Estimated JGB issuance amounts (excluding FILP and Reconstruction Bonds) based on the Cabinet f ce s Economic and Fiscal Pro ections for Medium to Long Term nalysis (Document for the 53rd meeting of the dvisory Council on Government Debt Management (November 2020))
[Other major premises]・ ’s Economic and Fiscal Projections for Medium to
Long Term Analysis (submitted to the Council on Economic and Fiscal Policy in July 2020)・ Refunding Bonds: Estimated with consideration given to the utilization of surplus funds in the Special Account of Government Debt
Consolidation Fund
(Note) The maturity mix for a gap of 7.4 trillion yen between 97.6 trillion yen for post-COVID-19 Newly-Issued Bonds issued in FY2020 and 90.2 trillion yen in the FY2020 JGB Issuance Plan (after the 2nd supplementary budget) was estimated based on the maturity mix for the increase in the calendar base market issuance amount (from the initial level to the revised level after the 2nd supplementary budget).
Pre-COVID-19
Upper: Refunding BondsLower: Newly-Issued Bonds
[Major premises for each case]
Pre-COVID-19
Post-COVID-19
Newly-Issued Bonds(Economic and Fiscal
Projec ons for Medium to Long Term Analysis)
Maturity mix (from FY2020)
FY2020 Plan( )FY2020 Plan (a er the 2nd supplementary budget)
Jan. 2020
Jul. 2020Pre-COVID-19
Post-COVID-19
[Reference]
Outstanding balance of JGBs Average maturity of JGBs (stock basis)
(End of FY]
FY2019 FY2029 FY2019 FY2029
881 trillion yen
1,055 trillion yen
1,132 trillion yen
9 years2 months
9 years7 months
9 years3 months
Post-COVID-19
-
20
40
60
80
100
120
140
160
180
200
220
240
260
32.6 31.3 31.1 30.8 30.4 30.7 31.5 33.3 35.4 37.8
106.3 94.3 103.7 102.4 100.9 105.8 103.0 107.4 107.2 109.1
97.6
37.2 36.8 34.8 33.3 32.4 32.3 33.5 35.3 37.5
106.3
136.5 141.4 137.8 134.7 140.8 136.9 139.2 138.3 140.9
138.8
125.6
134.8 133.2 131.3
136.5 134.5 140.7 142.6 146.9
203.8
173.7 178.2 172.6 168.0 173.2 169.2 172.7 173.6
178.4
Ⅰ FY2021 Debt Management Policies2 JG
B Issuance Plan for FY
2021
27
(Fig. c3- ) Cost at Risk analysis regarding response to C VID-19 (JGB issuance expansion)(Document for the 53rd meeting of the dvisory Council on Government Debt Management (November 2020))
Cost-risk rela ship(trillio ye )
6.45.5 5.6 5.7 5.8 5.9 6.0 6.1 6.2 6.38.1
8.2
8.3
8.4crease
Decrease
Cost
(ave
rage
)
RiskDecrease crease
*Gap betwee 99% of terest payme t cost a the average o the emerge ce of tail risk)
(trillio ye )
(Risk, Cost)
<Basic c pt of a alysis>
Freque cy
Base o 3,000 chro ological yiel curves* i the ext 10 years, the average (cost) of i terest payme ts (a ual average) arisi g from the pre COVID 19 a post COVID 19 JGB Issua ce Pla s a the upwar evia o from the average (risk) were ate .* mate base o e omi al lo g term erest rate for the Eco omic
Growth Achieve Case the Cabi et O ce’s Eco omic a Fiscal Projec o for Me ium to Lo g Term alysis (July 2020)
Probability istribu o of i terest payme t cost ( al average)
- - - -
-
I crease iss ce of Newly-Issue Bo
Shorter average maturity
[Factors]
(a al average)
Average (=Cost)
from the average(= risk)
99 percentile
[Assumptions]・Target bonds: General Bonds (excluding the Special Bonds for Covering Public Pension Funding and the Reconstruction Bonds)・Analysis period: 10 years from FY2020・ Interest rates: A total of 3,000 interest rate paths generated by the probabilistic interest rate model (the HJM model [Note 1]) were adjusted as
follows for each case.[10-year JGB yield] The averages at each time point is identical to the relevant nominal long-term interest rate level for the
’s Economic and Fiscal Projections for Medium to Long Term Analysis.
[Other JGB yields] The averages at each time point are identical to the relevant estimates based on a simple linear regression model [Note 2] and the relevant nominal long-term interest rate level for the Economic Growth Achieved
’s Economic and Fiscal Projections for Medium to Long Term Analysis.(Note 1) The HJM model generated interest rate paths based on the current yield curve as the standard and volatility over the
past 20 years (the current yield curve is as of the end of September 2020).(Note 2) The simple linear regression model was estimated from 10-year and other JGB yields in the past 20 years.
・ Others: The premises here are the same as those for “Estimated JGB issuance amounts (excluding FILP and Reconstruction Bonds) based ’s Economic and Fiscal Projections for Medium to Long Term Analysis” on the previous page.
Ⅰ FY2021 Debt Management Policies
2 JGB
Issuance Plan for FY2021
28
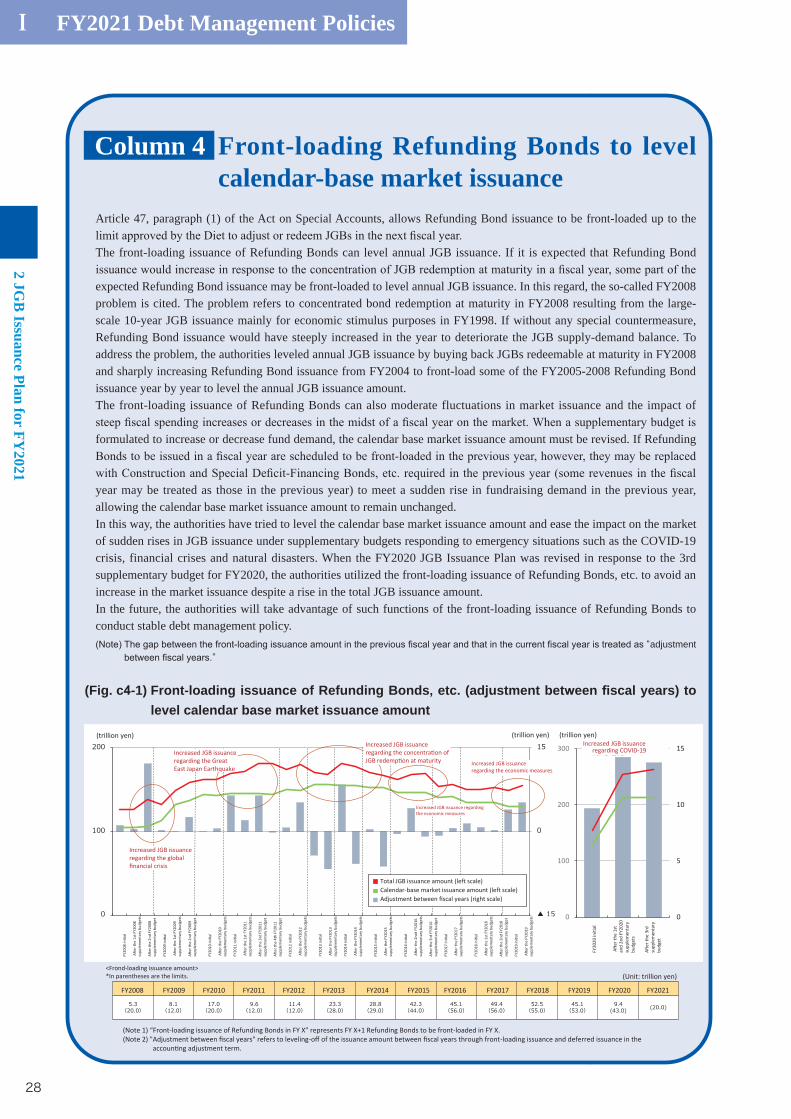
Article 47, paragraph (1) of the Act on Special Accounts, allows Refunding Bond issuance to be front-loaded up to the
The front-loading issuance of Refunding Bonds can level annual JGB issuance. If it is expected that Refunding Bond
expected Refunding Bond issuance may be front-loaded to level annual JGB issuance. In this regard, the so-called FY2008 problem is cited. The problem refers to concentrated bond redemption at maturity in FY2008 resulting from the large-scale 10-year JGB issuance mainly for economic stimulus purposes in FY1998. If without any special countermeasure, Refunding Bond issuance would have steeply increased in the year to deteriorate the JGB supply-demand balance. To address the problem, the authorities leveled annual JGB issuance by buying back JGBs redeemable at maturity in FY2008 and sharply increasing Refunding Bond issuance from FY2004 to front-load some of the FY2005-2008 Refunding Bond issuance year by year to level the annual JGB issuance amount.The front-loading issuance of Refunding Bonds can also moderate fluctuations in market issuance and the impact of
formulated to increase or decrease fund demand, the calendar base market issuance amount must be revised. If Refunding
year may be treated as those in the previous year) to meet a sudden rise in fundraising demand in the previous year, allowing the calendar base market issuance amount to remain unchanged.In this way, the authorities have tried to level the calendar base market issuance amount and ease the impact on the market of sudden rises in JGB issuance under supplementary budgets responding to emergency situations such as the COVID-19 crisis, financial crises and natural disasters. When the FY2020 JGB Issuance Plan was revised in response to the 3rd supplementary budget for FY2020, the authorities utilized the front-loading issuance of Refunding Bonds, etc. to avoid an increase in the market issuance despite a rise in the total JGB issuance amount.In the future, the authorities will take advantage of such functions of the front-loading issuance of Refunding Bonds to conduct stable debt management policy.
“adjustment ”
Front-loading Refunding Bonds to level calendar-base market issuance
Column 4
(Fig. c -1) Front-loading issuance of Refunding Bonds etc. (ad ustment bet een scal years) to level calendar base market issuance amount
0
5
10
15
0
100
200
300
Increased JGB issuance regarding the global
nancial crisis
FY2008 FY2009 FY2010 FY2011 FY2012 FY2013 FY2014 FY2015 FY2016 FY2017 FY2018 FY2019 FY2020 FY2021
Increased JGB issuance regarding the Great East Japan Earthquake
(trillion yen)Increased JGB issuance
regarding COVID-19
FY20
20
Aer
the
1st
and
2nd
FY20
20
supp
lem
enta
ry
budg
ets
Aer
the
3rd
supp
lem
enta
ry
budg
et
FY20
08 in
ial
Aer
the
1st F
Y200
8 su
pple
men
tary
bud
gets
Aer
the
2nd
FY20
08
supp
lem
enta
ry b
udge
t
FY20
09 in
ial
Aer
the
1st F
Y200
9 su
pple
men
tary
bud
gets
Aer
the
2nd
FY20
09
supp
lem
enta
ry b
udge
t
FY20
10 in
ial
Aer
the
FY20
10
supp
lem
enta
ry b
udge
ts
FY20
11 in
ial
Aer
the
1st F
Y201
1 su
pple
men
tary
bud
gets
Aer
the
3rd
FY20
11
supp
lem
enta
ry b
udge
t
Aer
the
4th
FY20
11
supp
lem
enta
ry b
udge
t
FY20
12 in
ial
Aer
the
FY20
12
supp
lem
enta
ry b
udge
ts
FY20
13 in
ial
Aer
the
FY20
13
supp
lem
enta
ry b
udge
ts
FY20
14 in
ial
Aer
the
FY20
14
supp
lem
enta
ry b
udge
ts
FY20
15 in
ial
Aer
the
FY20
15
supp
lem
enta
ry b
udge
ts
FY20
16 in
ial
Aer
the
2ndt
FY2
016
supp
lem
enta
ry b
udge
ts
Aer
the
3rd
FY20
16
supp
lem
enta
ry b
udge
t
FY20
17 in
ial
Aer
the
FY20
17
supp
lem
enta
ry b
udge
ts
FY20
18 in
ial
Aer
the
1st F
Y201
8 su
pple
men
tary
bud
gets
Aer
the
2nd
FY20
18
supp
lem
enta
ry b
udge
t
FY20
19 in
ial
Aer
the
FY20
19
supp
lem
enta
ry b
udge
ts
(trillion yen) (trillion yen)
(Note 1) “Front loading issuance of Refunding Bonds in FY X” represents FY X+1 Refunding Bonds to be front loaded in FY X.(Note 2) "Adjustment between scal years" refers to leveling loading issuance and deferred issuance in the
accoun ng adjustment term.
- --o of the issuance amount between scal years through front-
<Frond loading issuance amount>In parentheses are the limits.
-* (Unit: trillion yen)
Increased JGB issuance regarding the concentra on of JGB redem on at maturity Increased JGB issuance
regarding the economic measures
Increased JGB issuance regarding the economic measures
Total JGB issuance amount (le scale)Calendar-base market issuance amount (le scale)Adjustment between cal years (right scale)
Ⅰ FY2021 Debt Management Policies3 D
iversification of JGB
Investor Base
29
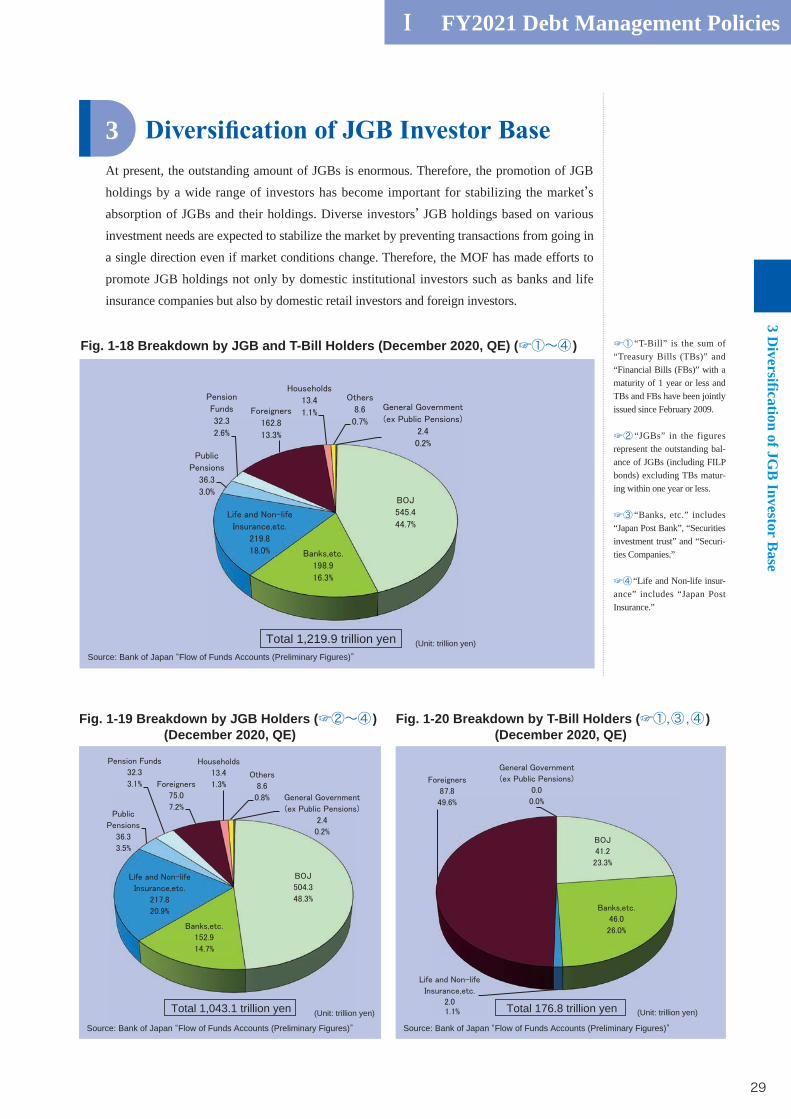
At present, the outstanding amount of JGBs is enormous. Therefore, the promotion of JGB
holdings by a wide range of investors has become important for stabilizing the market’s
absorption of JGBs and their holdings. Diverse investors’ JGB holdings based on various
investment needs are expected to stabilize the market by preventing transactions from going in
a single direction even if market conditions change. Therefore, the MOF has made efforts to
promote JGB holdings not only by domestic institutional investors such as banks and life
insurance companies but also by domestic retail investors and foreign investors.
3
Fig. 1-18 Breakdown by JGB and T-Bill Holders (December 2020, QE) (☞①~④ )
Total 1,219.9 trillion yen (Unit: trillion yen)
Source: Bank of Japan “Flow of Funds Accounts (Preliminary Figures)”
☞① “T-Bill” is the sum of “Treasury Bills (TBs)” and “Financial Bills (FBs)” with a maturity of 1 year or less and TBs and FBs have been jointly issued since February 2009.
☞② “JGBs” in the figures represent the outstanding bal-ance of JGBs (including FILP bonds) excluding TBs matur-ing within one year or less.
☞③ “Banks, etc.” includes “Japan Post Bank”, “Securities investment trust” and “Securi-ties Companies.”
☞④“Life and Non-life insur-ance” includes “Japan Post Insurance.”
Source: Bank of Japan “Flow of Funds Accounts (Preliminary Figures)”
Total 1,043.1 trillion yen (Unit: trillion yen)
Fig. 1-19 Breakdown by JGB Holders (☞②~④ )(December 2020, QE)
Fig. 1-20 Breakdown by T-Bill Holders (☞①,③,④ )(December 2020, QE)
Source: Bank of Japan “Flow of Funds Accounts (Preliminary Figures)”
Total 176.8 trillion yen (Unit: trillion yen)
Ⅰ FY2021 Debt Management Policies
3 Diversification of JG
B Investor B
ase
30
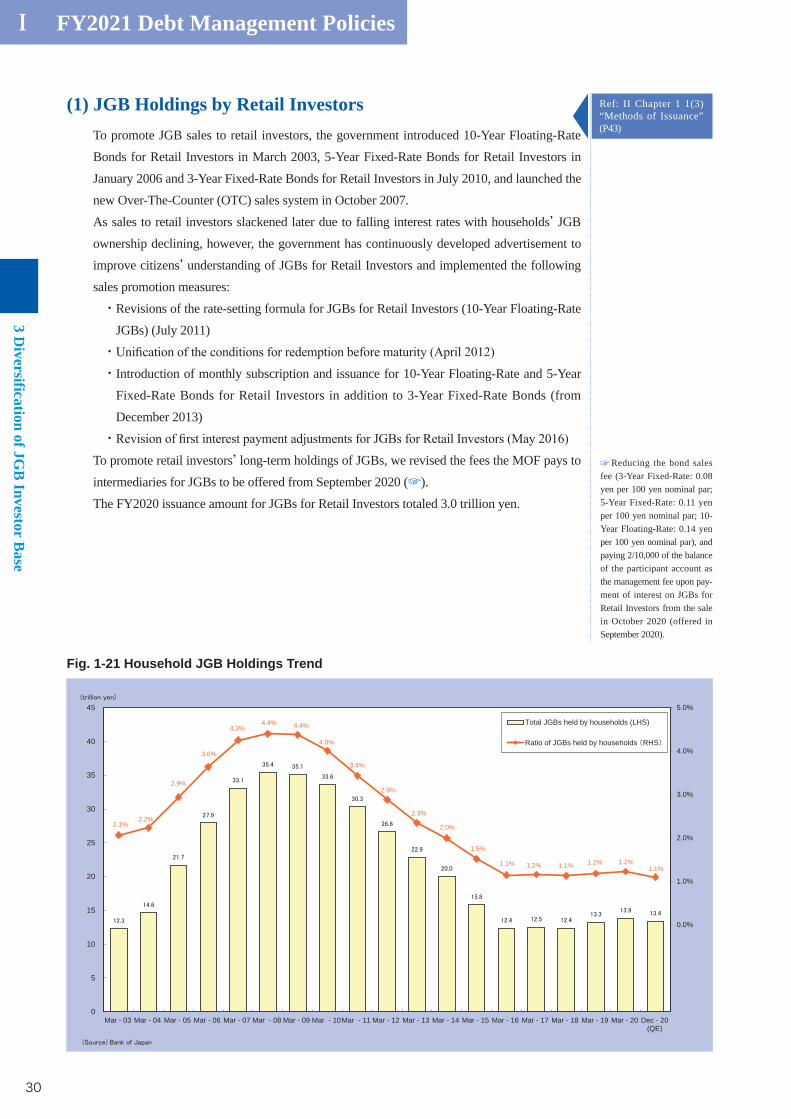
(1) JGB Holdings by Retail InvestorsTo promote JGB sales to retail investors, the government introduced 10-Year Floating-Rate
Bonds for Retail Investors in March 2003, 5-Year Fixed-Rate Bonds for Retail Investors in
January 2006 and 3-Year Fixed-Rate Bonds for Retail Investors in July 2010, and launched the
new Over-The-Counter (OTC) sales system in October 2007.
As sales to retail investors slackened later due to falling interest rates with households’ JGB
ownership declining, however, the government has continuously developed advertisement to
improve citizens’ understanding of JGBs for Retail Investors and implemented the following
sales promotion measures:
・ Revisions of the rate-setting formula for JGBs for Retail Investors (10-Year Floating-Rate
JGBs) (July 2011)
・・ Introduction of monthly subscription and issuance for 10-Year Floating-Rate and 5-Year
Fixed-Rate Bonds for Retail Investors in addition to 3-Year Fixed-Rate Bonds (from
December 2013)
・To promote retail investors’ long-term holdings of JGBs, we revised the fees the MOF pays to
intermediaries for JGBs to be offered from September 2020 (☞).
The FY2020 issuance amount for JGBs for Retail Investors totaled 3.0 trillion yen.
Ref: II Chapter 1 1(3) “Methods of Issuance” (P43)
2.1%2.2%
2.9%
3.6%
4.3%4.4% 4.4%
4.0%
3.4%
2.9%
2.3%
2.0%
1.5%
1.1% 1.2% 1.1% 1.2% 1.2%1.1%
0.0%
1.0%
2.0%
3.0%
4.0%
5.0%
0
5
10
15
20
25
30
35
40
45
Mar - 03 Mar - 04 Mar - 05 Mar - 06 Mar - 07 Mar - 08 Mar - 09 Mar - 10Mar - 11 Mar - 12 Mar - 13 Mar - 14 Mar - 15 Mar - 16 Mar - 17 Mar - 18 Mar - 19 Mar - 20 Dec - 20(QE)
Total JGBs held by households (LHS)
Ratio of JGBs held by households RHS
Fig. 1-21 Household JGB Holdings Trend
☞Reducing the bond sales fee (3-Year Fixed-Rate: 0.08 yen per 100 yen nominal par; 5-Year Fixed-Rate: 0.11 yen per 100 yen nominal par; 10-Year Floating-Rate: 0.14 yen per 100 yen nominal par), and paying 2/10,000 of the balance of the participant account as the management fee upon pay-ment of interest on JGBs for Retail Investors from the sale in October 2020 (offered in September 2020).
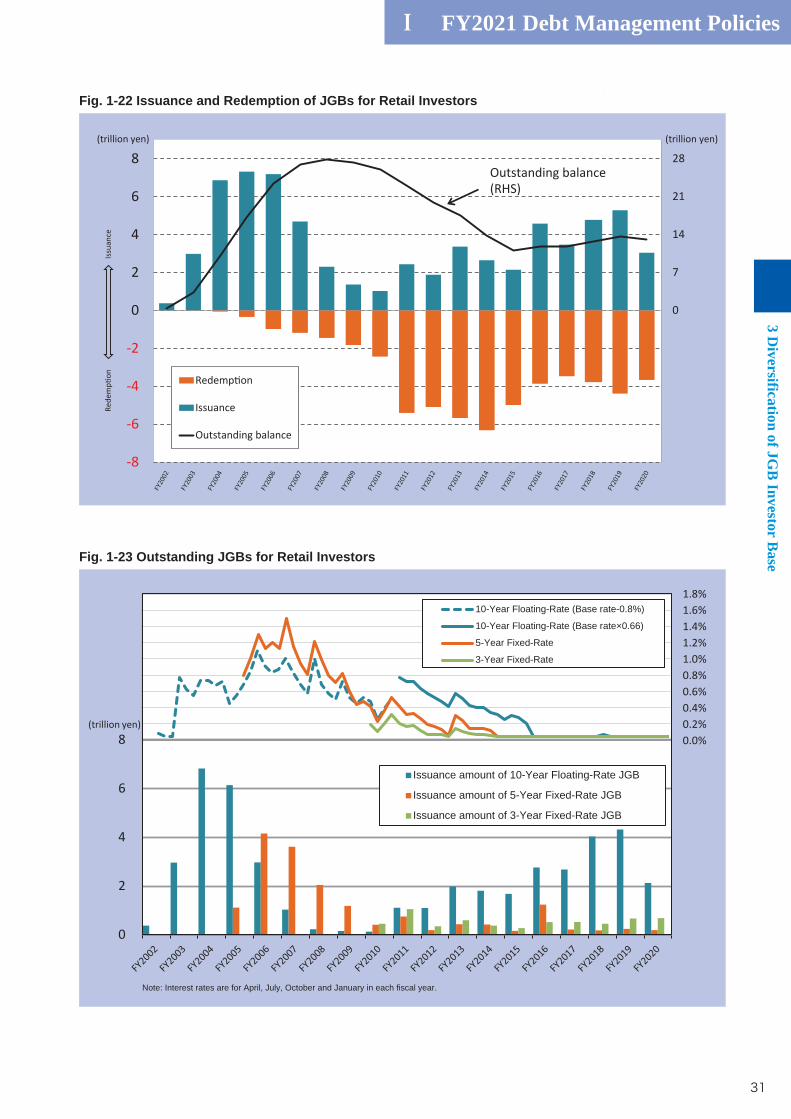
Ⅰ FY2021 Debt Management Policies3 D
iversification of JGB
Investor Base
31
0
7
14
21
28
-8
-6
-4
-2
0
2
4
6
8Outstanding balance(RHS)
(trillion yen)(trillion yen)
Issu
ance
Rede
mp
on Redemp on
Issuance
Outstanding balance
Fig. 1-22 Issuance and Redemption of JGBs for Retail Investors
0.0%0.2%0.4%0.6%0.8%1.0%1.2%1.4%1.6%1.8%
Note: Interest rates are for April, July, October and January in each fiscal year.
0
2
4
6
8(trillion yen)
Issuance amount of 10-Year Floating-Rate JGB
Issuance amount of 5-Year Fixed-Rate JGB
Issuance amount of 3-Year Fixed-Rate JGB
10-Year Floating-Rate (Base rate-0.8%)
10-Year Floating-Rate (Base rate×0.66)
5-Year Fixed-Rate
3-Year Fixed-Rate
Fig. 1-23 Outstanding JGBs for Retail Investors
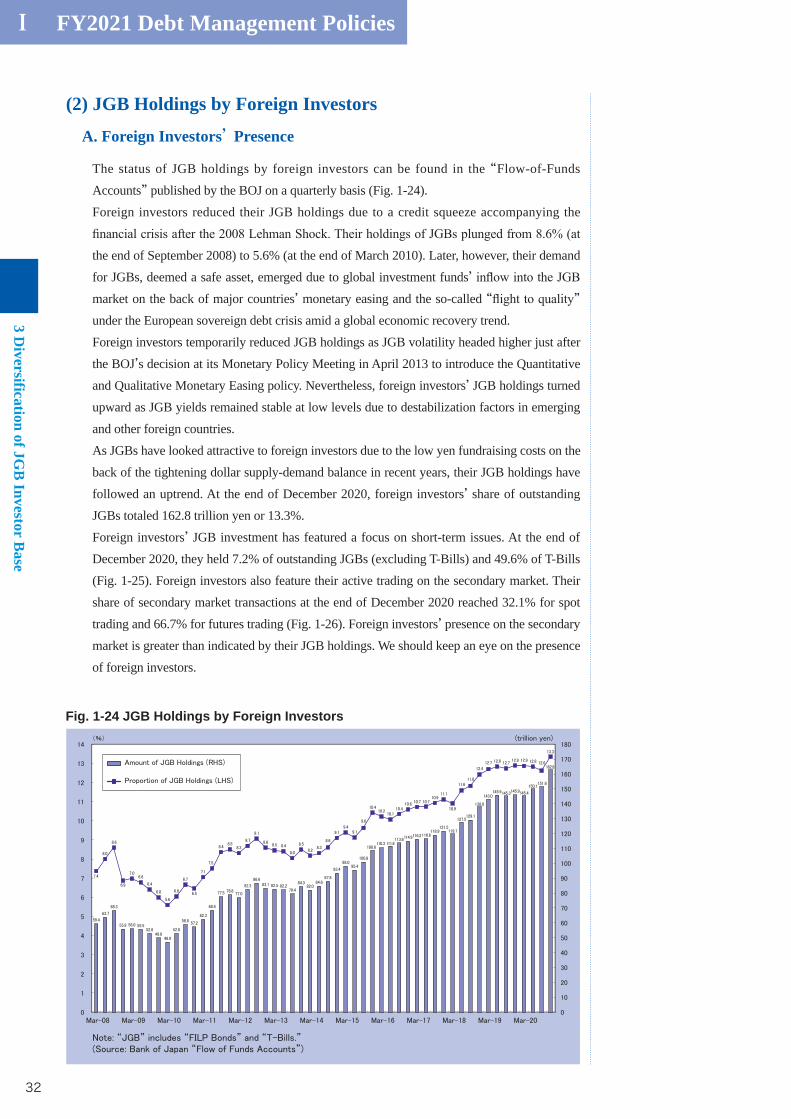
Ⅰ FY2021 Debt Management Policies
3 Diversification of JG
B Investor B
ase
32
(2) JGB Holdings by Foreign Investors
A. Foreign Investors’ Presence
The status of JGB holdings by foreign investors can be found in the “Flow-of-Funds
Accounts” published by the BOJ on a quarterly basis (Fig. 1-24).
Foreign investors reduced their JGB holdings due to a credit squeeze accompanying the
the end of September 2008) to 5.6% (at the end of March 2010). Later, however, their demand
for JGBs, deemed a safe asset, emerged due to global investment funds’market on the back of major countries’ monetary easing and the so-called “ ” under the European sovereign debt crisis amid a global economic recovery trend.
Foreign investors temporarily reduced JGB holdings as JGB volatility headed higher just after
the BOJ’s decision at its Monetary Policy Meeting in April 2013 to introduce the Quantitative
and Qualitative Monetary Easing policy. Nevertheless, foreign investors’ JGB holdings turned
upward as JGB yields remained stable at low levels due to destabilization factors in emerging
and other foreign countries.
As JGBs have looked attractive to foreign investors due to the low yen fundraising costs on the
back of the tightening dollar supply-demand balance in recent years, their JGB holdings have
followed an uptrend. At the end of December 2020, foreign investors’ share of outstanding
JGBs totaled 162.8 trillion yen or 13.3%.
Foreign investors’ JGB investment has featured a focus on short-term issues. At the end of
December 2020, they held 7.2% of outstanding JGBs (excluding T-Bills) and 49.6% of T-Bills
(Fig. 1-25). Foreign investors also feature their active trading on the secondary market. Their
share of secondary market transactions at the end of December 2020 reached 32.1% for spot
trading and 66.7% for futures trading (Fig. 1-26). Foreign investors’ presence on the secondary
market is greater than indicated by their JGB holdings. We should keep an eye on the presence
of foreign investors.
Fig. 1-24 JGB Holdings by Foreign Investors
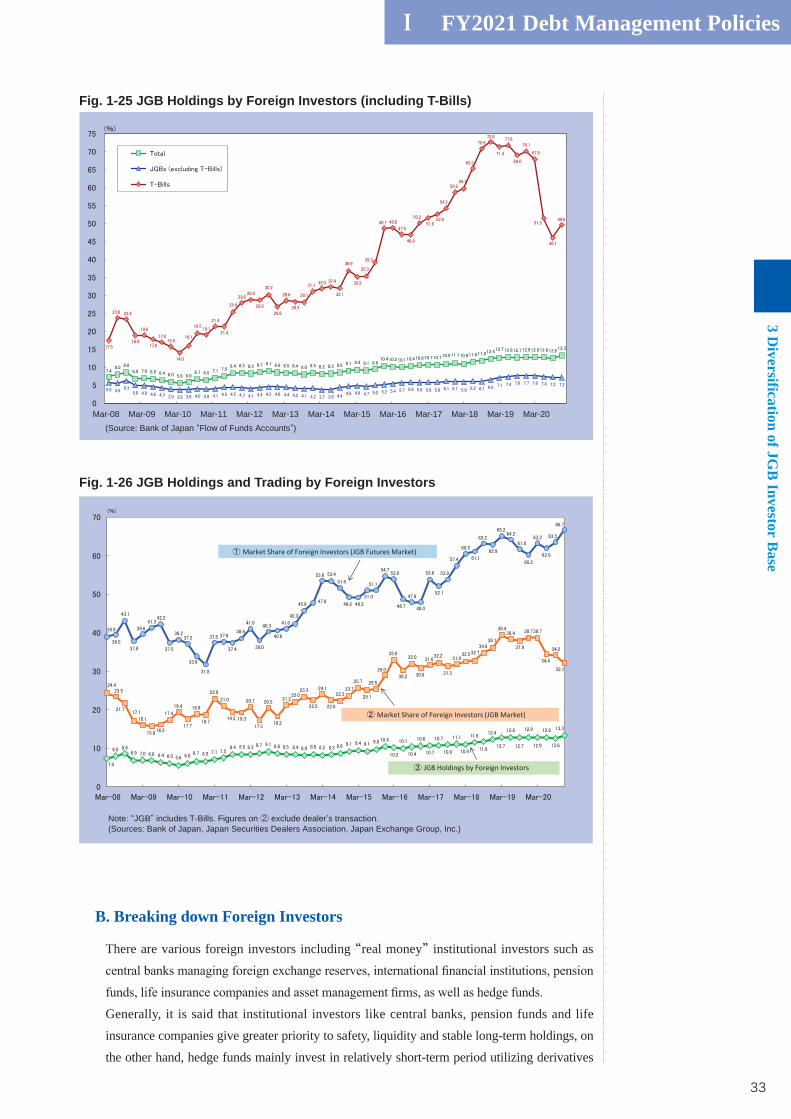
Ⅰ FY2021 Debt Management Policies3 D
iversification of JGB
Investor Base
33
B. Breaking down Foreign Investors
There are various foreign investors including “real money” institutional investors such as
Generally, it is said that institutional investors like central banks, pension funds and life
insurance companies give greater priority to safety, liquidity and stable long-term holdings, on
the other hand, hedge funds mainly invest in relatively short-term period utilizing derivatives
Fig. 1-25 JGB Holdings by Foreign Investors (including T-Bills)
Fig. 1-26 JGB Holdings and Trading by Foreign Investors
Mar-08 Mar-09 Mar-10 Mar-11 Mar-12 Mar-13 Mar-14 Mar-15 Mar-16 Mar-17 Mar-18 Mar-19 Mar-20(Source: Bank of Japan “Flow of Funds Accounts”)
Market Share of Foreign Investors (JGB Futures Market)
Market Share of Foreign Investors (JGB Market)
JGB Holdings by Foreign Investors
Note: “JGB” includes T-Bills. Figures on ② exclude dealer’s transaction.(Sources: Bank of Japan, Japan Securities Dealers Association, Japan Exchange Group, Inc.)
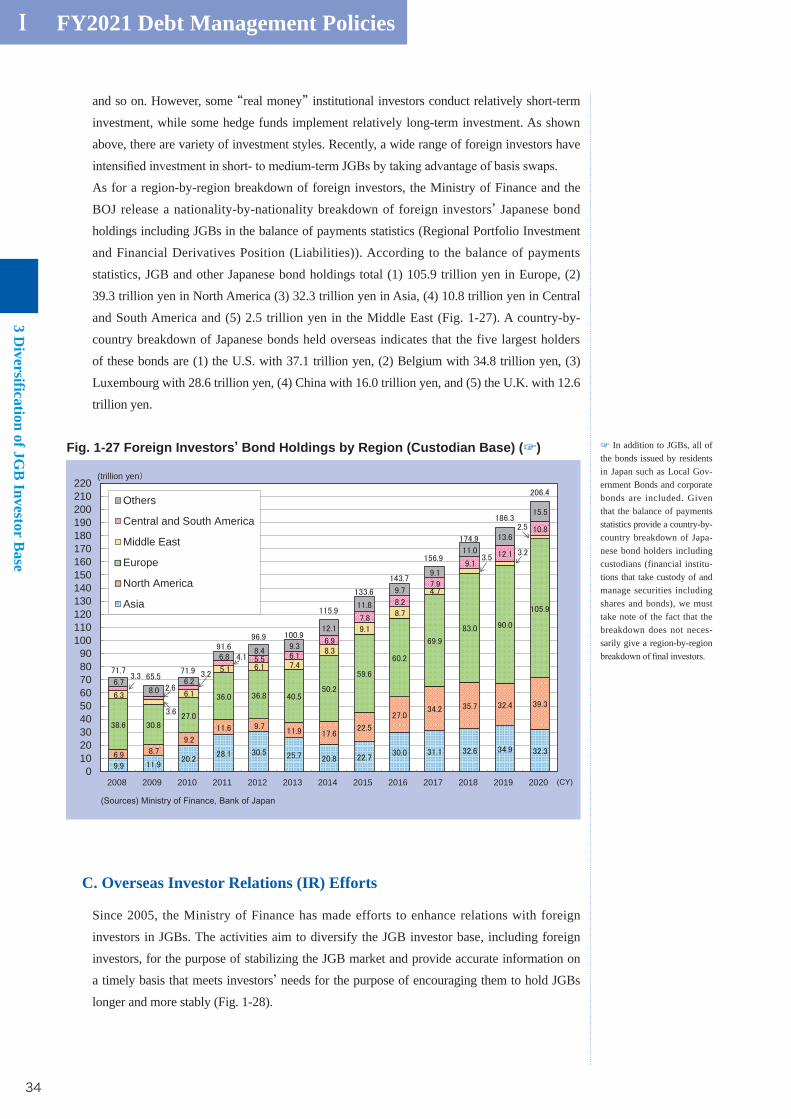
Ⅰ FY2021 Debt Management Policies
3 Diversification of JG
B Investor B
ase
34
and so on. However, some “real money” institutional investors conduct relatively short-term
investment, while some hedge funds implement relatively long-term investment. As shown
above, there are variety of investment styles. Recently, a wide range of foreign investors have
As for a region-by-region breakdown of foreign investors, the Ministry of Finance and the
BOJ release a nationality-by-nationality breakdown of foreign investors’ Japanese bond
holdings including JGBs in the balance of payments statistics (Regional Portfolio Investment
and Financial Derivatives Position (Liabilities)). According to the balance of payments
statistics, JGB and other Japanese bond holdings total (1) 105.9 trillion yen in Europe, (2)
39.3 trillion yen in North America (3) 32.3 trillion yen in Asia, (4) 10.8 trillion yen in Central
and South America and (5) 2.5 trillion yen in the Middle East (Fig. 1-27). A country-by-
country breakdown of Japanese bonds held overseas indicates that the five largest holders
of these bonds are (1) the U.S. with 37.1 trillion yen, (2) Belgium with 34.8 trillion yen, (3)
Luxembourg with 28.6 trillion yen, (4) China with 16.0 trillion yen, and (5) the U.K. with 12.6
trillion yen.
C. Overseas Investor Relations (IR) Efforts
Since 2005, the Ministry of Finance has made efforts to enhance relations with foreign
investors in JGBs. The activities aim to diversify the JGB investor base, including foreign
investors, for the purpose of stabilizing the JGB market and provide accurate information on
a timely basis that meets investors’ needs for the purpose of encouraging them to hold JGBs
longer and more stably (Fig. 1-28).
☞ In addition to JGBs, all of the bonds issued by residents in Japan such as Local Gov-ernment Bonds and corporate bonds are included. Given that the balance of payments statistics provide a country-by-country breakdown of Japa-nese bond holders including custodians (financial institu-tions that take custody of and manage securities including shares and bonds), we must take note of the fact that the breakdown does not neces-sarily give a region-by-region
0102030405060708090
100110120130140150160170180190200210220
2008 2009 2010 2011 2012 2013 2014 2015 2016 2017 2018 2019 2020
(trillion yen
Others
Central and South America
Middle East
Europe
North America
Asia
Fig. 1-27 Foreign Investors’ Bond Holdings by Region (Custodian Base) (☞)
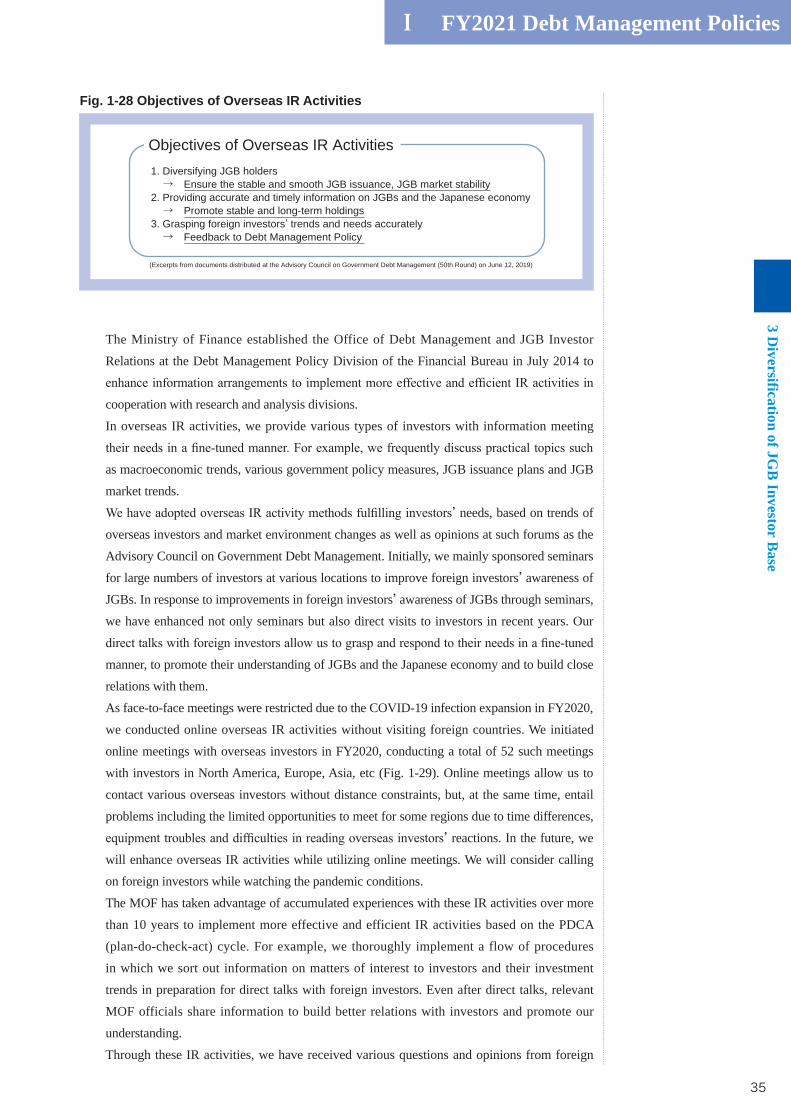
Ⅰ FY2021 Debt Management Policies3 D
iversification of JGB
Investor Base
35
The Ministry of Finance established the Office of Debt Management and JGB Investor
Relations at the Debt Management Policy Division of the Financial Bureau in July 2014 to
cooperation with research and analysis divisions.
In overseas IR activities, we provide various types of investors with information meeting
as macroeconomic trends, various government policy measures, JGB issuance plans and JGB
market trends.
’ needs, based on trends of
overseas investors and market environment changes as well as opinions at such forums as the
Advisory Council on Government Debt Management. Initially, we mainly sponsored seminars
for large numbers of investors at various locations to improve foreign investors’ awareness of
JGBs. In response to improvements in foreign investors’ awareness of JGBs through seminars,
we have enhanced not only seminars but also direct visits to investors in recent years. Our
manner, to promote their understanding of JGBs and the Japanese economy and to build close
relations with them.
As face-to-face meetings were restricted due to the COVID-19 infection expansion in FY2020,
we conducted online overseas IR activities without visiting foreign countries. We initiated
online meetings with overseas investors in FY2020, conducting a total of 52 such meetings
with investors in North America, Europe, Asia, etc (Fig. 1-29). Online meetings allow us to
contact various overseas investors without distance constraints, but, at the same time, entail
problems including the limited opportunities to meet for some regions due to time differences,
’ reactions. In the future, we
will enhance overseas IR activities while utilizing online meetings. We will consider calling
on foreign investors while watching the pandemic conditions.
The MOF has taken advantage of accumulated experiences with these IR activities over more
than 10 years to implement more effective and efficient IR activities based on the PDCA
(plan-do-check-act) cycle. For example, we thoroughly implement a flow of procedures
in which we sort out information on matters of interest to investors and their investment
trends in preparation for direct talks with foreign investors. Even after direct talks, relevant
MOF officials share information to build better relations with investors and promote our
understanding.
Through these IR activities, we have received various questions and opinions from foreign
(Excerpts from documents distributed at the Advisory Council on Government Debt Management (50th Round) on June 12, 2019)
Objectives of Overseas IR Activities1. Diversifying JGB holders → Ensure the stable and smooth JGB issuance, JGB market stability2. Providing accurate and timely information on JGBs and the Japanese economy → Promote stable and long-term holdings3. Grasping foreign investors’ trends and needs accurately → Feedback to Debt Management Policy
Fig. 1-28 Objectives of Overseas IR Activities

Ⅰ FY2021 Debt Management Policies
3 Diversification of JG
B Investor B
ase
36
effectively. We have also established a question-and-answer column in the “JGB Newsletter” (English version) in an effort to develop better communications with investors.
Separately from overseas IR activities, we usually provide lectures in foreign countries. As
most international conferences were canceled in FY2020, however, we failed to provide
lectures overseas. We also provide lectures for foreign investors invited to seminars in Japan
and interview foreign investors visiting Japan. In FY2020, however, we used webinars for all
these activities.
In this way, the overseas IR activities play a role in directly providing investors with accurate
information on Japanese government debt management and economic policies while
responding to wide-ranging and deep needs for information not only on JGBs but also on the
Note 1: The figures are limited to meetings arranged by Office of Debt Management and JGB Investor RelationsNote 2: The number for FY2020 is of foreign investors subjected to online meetings.
FY2016 FY2017 FY2018 FY2019 FY2020
98
131 139
60 52
Fig.1-29 Number of Foreign Investors Subjected to Overseas Interviews

Framework of Debt Management
Ⅱ
This part explains the fundamental frameworkof debt management.

Ⅱ Framework
38
Chapter 1 G
overnment B
onds (JGB
s)1 Prim
ary Market for G
overnment B
onds
Primary Market for Government Bonds
(1) JGBs by Legal Grounds of IssuanceJGBs can be divided into two main categories: General Bonds, and Fiscal Investment and
Loan Program Bonds (FILP Bonds). While the government mainly relies on tax revenue to
redeem General Bonds, the redemption and the interest payments on FILP Bonds are covered
by the collection of Fiscal Loan receivable. However, both General Bonds and FILP Bonds
instruments and are treated in the same manner on the market as well.
Fig. 2-1 JGBs by Legal Grounds of Issuance
JGBsGeneral Bonds
Construction Bonds
Reconstruction Bonds
A. General Bonds
General Bonds consist of Construction Bonds, Special Deficit-Financing Bonds,
Reconstruction Bonds and Refunding Bonds. Construction Bonds and Special Deficit-
Financing Bonds are issued under the General Account and the revenue from their issuance is
reported as the government revenue of the General Account.
On the other hand, Reconstruction Bonds are issued under the Special Account for
Reconstruction from the Great East Japan Earthquake and Refunding Bonds under the Special
Account of Government Debt Consolidation Fund and the revenue from their issuance is
reported as the government revenue of each Special Account.
a. Construction Bonds
Article 4, paragraph (1) of the “Public Finance Act” prescribes that annual government
expenditure has to be covered in principle by annual government revenue generated from
other than government bonds or borrowings. But as an exception, a proviso of the Article
allows the government to raise money through bond issuance or borrowings for the purpose
of public works, capital subscription or lending. Bonds governed by this proviso of Article 4,
paragraph (1) are called “Construction Bonds.” The Article prescribes that the government can issue Construction Bonds within the amount
approved by the Diet, and the ceiling amount is provided under the general provisions of the
General Account budget (☞ ).
1
Chapter 1 Government Bonds (JGBs)
☞ -
Ⅱ Framework
39
1 Primary M
arket for Governm
ent Bonds
Chapter 1 G
overnment B
onds (JGB
s)
When estimating a shortage of government revenue despite the issuance of Construction
Bonds, the government can issue government bonds based on a special act (☞① ) to raise
money for the purpose of other than public works and the like. These bonds are generally
called “ ”
Bonds within the amount approved by the Diet and the ceiling amount is provided under the
general provisions of the General Account budget (☞② ).
government has to minimize the issuance amount as much as possible within the amount
approved by the Diet, while taking into account the state of tax and other revenues (☞③ ).
c. Reconstruction Bonds
To recover from the Great East Japan Earthquake disasters, the government is supposed
to issue Reconstruction Bonds from FY2011 to FY2025 in accordance with the “Act on
Special Measures concerning the securing of financial resources to execute measures
necessary for recovery from the Great East Japan Earthquake (Reconstruction Funding
Act).”for Reconstruction, the government will issue Reconstruction Bonds as bridging finance
until these revenues are receivable to the government.
The government may issue these Reconstruction Bonds within the amount as approved
by the Diet. The ceiling amount is provided under the general provisions of the Special
Account budget from FY2012 onwards.
d. Refunding Bonds
As for General Bonds, Refunding Bonds are issued in order to raise funds for refunding
part of matured JGBs. Among General Bonds, as for Construction Bonds and Special
in accordance with the 60-year redemption rule. As for Reconstruction Bonds, Refunding
Bonds are issued depending on the amount of the revenue from Special Taxes for
☞ ).
Refunding Bonds are the JGBs issued through the Special Account for the Government
Debt Consolidation Fund (GDCF). Revenues from Refunding Bonds are directly posted to
the fund.
In the issuance of Refunding Bonds, the government is not required to seek the Diet
approval for the maximum issuance amount. This is because unlike in the case of bonds
Financing Bonds, issuing Refunding Bonds does not lead to an increase in the total amount
of outstanding debt.
As massive bonds redemption at maturity is expected to continue, the government is
allowed to front-load the issuance of Refunding Bonds in order to mitigate the impact of
concentration of bonds redemption at maturity, to control substantial volatility of JGB
☞②--
☞③ -
-
☞①-
-
☞
Ⅱ Framework
40
Chapter 1 G
overnment B
onds (JGB
s)1 Prim
ary Market for G
overnment B
onds
Front-loading issuance of Refunding Bonds can be made within the upper limit approved by
the Diet in accordance with Article 47, Paragraph (1) of the “Act on Special Accounts.” The
The gap between “the amount of the front-loading issuance of Refunding Bonds that had
” and “those that are scheduled
”year’s financial resources under the government debt management policy. This is called
“ ☞ )” in terms of issuance type in the JGB Issuance Plan.
☞
-
-
-
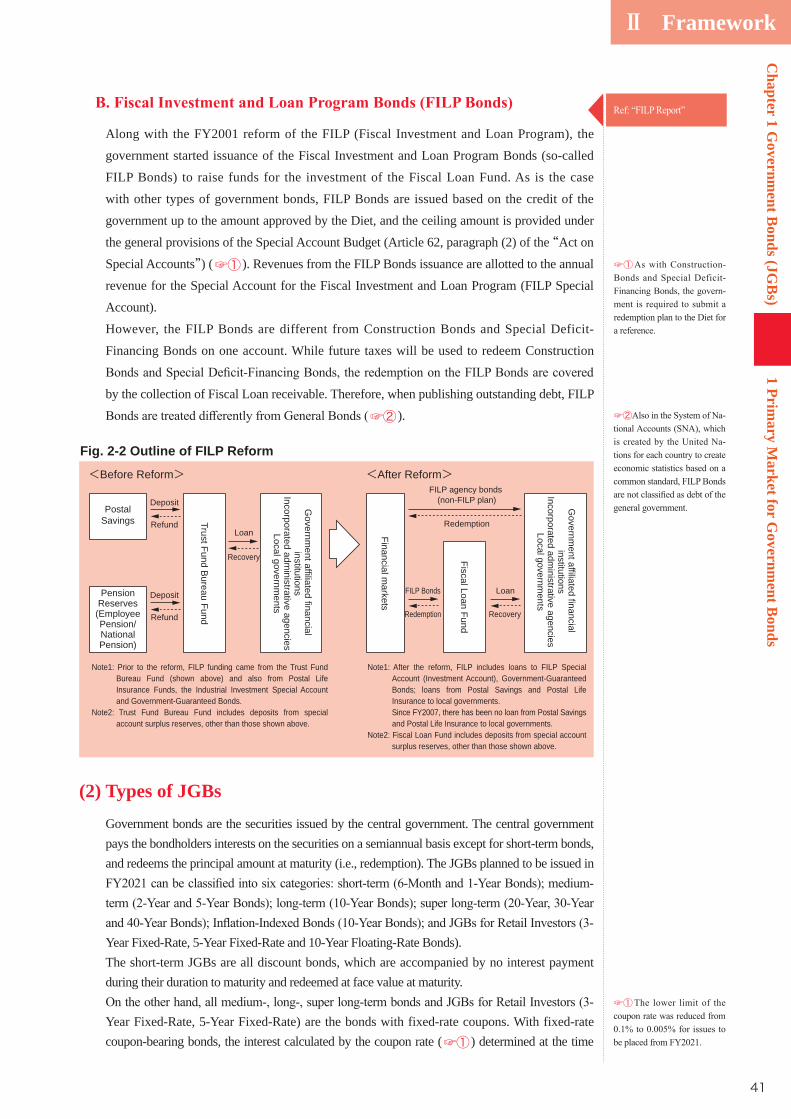
Ⅱ Framework
41
1 Primary M
arket for Governm
ent Bonds
Chapter 1 G
overnment B
onds (JGB
s)
☞① -
-
☞② -
-
Along with the FY2001 reform of the FILP (Fiscal Investment and Loan Program), the
government started issuance of the Fiscal Investment and Loan Program Bonds (so-called
FILP Bonds) to raise funds for the investment of the Fiscal Loan Fund. As is the case
with other types of government bonds, FILP Bonds are issued based on the credit of the
government up to the amount approved by the Diet, and the ceiling amount is provided under
the general provisions of the Special Account Budget (Article 62, paragraph (2) of the “Act on
Special Accounts”) (☞① ). Revenues from the FILP Bonds issuance are allotted to the annual
revenue for the Special Account for the Fiscal Investment and Loan Program (FILP Special
Account).
However, the FILP Bonds are different from Construction Bonds and Special Deficit-
Financing Bonds on one account. While future taxes will be used to redeem Construction
by the collection of Fiscal Loan receivable. Therefore, when publishing outstanding debt, FILP
☞② ).
(2) Types of JGBsGovernment bonds are the securities issued by the central government. The central government pays the bondholders interests on the securities on a semiannual basis except for short-term bonds, and redeems the principal amount at maturity (i.e., redemption). The JGBs planned to be issued in
Year Fixed-Rate, 5-Year Fixed-Rate and 10-Year Floating-Rate Bonds).The short-term JGBs are all discount bonds, which are accompanied by no interest payment during their duration to maturity and redeemed at face value at maturity.
Year Fixed-Rate, 5-Year Fixed-Rate) are the bonds with fixed-rate coupons. With fixed-rate coupon-bearing bonds, the interest calculated by the coupon rate (☞①) determined at the time
Governm
ent affiliated financial institutions
Incorporated administrative agencies
Local governments
Fiscal Loan Fund
Financial markets
Governm
ent affiliated financial institutions
Incorporated administrative agencies
Local governments
Trust Fund Bureau Fund
PostalSavings Refund
Deposit
Loan
FILP Bonds Loan
FILP agency bonds (non-FILP plan)
Redemption
Recovery
Refund
Deposit
<Before Reform> <After Reform>
PensionReserves
(EmployeePension/NationalPension)
RecoveryRedemption
Note1: Prior to the reform, FILP funding came from the Trust Fund Bureau Fund (shown above) and also from Postal Life Insurance Funds, the Industrial Investment Special Account and Government-Guaranteed Bonds.
Note2: Trust Fund Bureau Fund includes deposits from special account surplus reserves, other than those shown above.
Note1: After the reform, FILP includes loans to FILP Special Account (Investment Account), Government-Guaranteed Bonds; loans from Postal Savings and Postal Life Insurance to local governments.
Since FY2007, there has been no loan from Postal Savings and Postal Life Insurance to local governments.
Note2: Fiscal Loan Fund includes deposits from special account surplus reserves, other than those shown above.
Fig. 2-2 Outline of FILP Reform
☞①
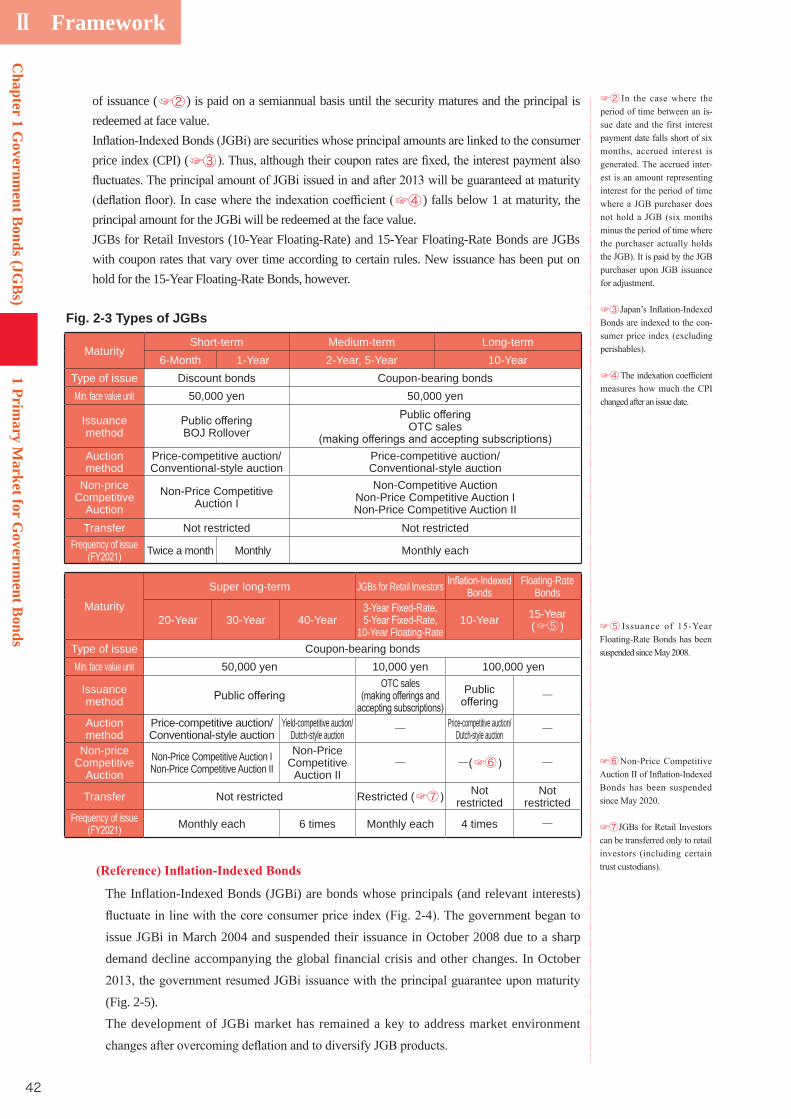
Ⅱ Framework
42
Chapter 1 G
overnment B
onds (JGB
s)1 Prim
ary Market for G
overnment B
onds
of issuance (☞② ) is paid on a semiannual basis until the security matures and the principal is redeemed at face value.
price index (CPI) (☞③
☞④ ) falls below 1 at maturity, the principal amount for the JGBi will be redeemed at the face value.JGBs for Retail Investors (10-Year Floating-Rate) and 15-Year Floating-Rate Bonds are JGBs with coupon rates that vary over time according to certain rules. New issuance has been put on hold for the 15-Year Floating-Rate Bonds, however.
Fig. 2-3 Types of JGBs
MaturityShort-term Medium-term Long-term
6-Month 1-Year 2-Year, 5-Year 10-YearType of issue Discount bonds Coupon-bearing bondsMin. face value unit 50,000 yen 50,000 yen
Issuance method BOJ Rollover OTC sales
Auction method
Price-competitive auction/Conventional-style auction
Price-competitive auction/Conventional-style auction
Non-priceCompetitive
AuctionNon-Price Competitive
Auction INon-Competitive Auction
Non-Price Competitive Auction INon-Price Competitive Auction II
Transfer Not restricted Not restrictedFrequency of issue Twice a month Monthly Monthly each
Maturity
Super long-term JGBs for Retail Investors BondsFloating-Rate
Bonds
20-Year 30-Year 40-Year10-Year Floating-Rate
10-Year 15-Year (☞⑤
Type of issue Coupon-bearing bondsMin. face value unit 50,000 yen 10,000 yen 100,000 yen
Issuance method
OTC sales Public ―
Auction method
Price-competitive auction/ Conventional-style auction
Yield-competitive auction/ Dutch-style auction ― Price-competitive auction/
Dutch-style auction ―
Non-priceCompetitive
AuctionNon-Price Competitive Auction I Non-Price Competitive Auction II
Non-Price Competitive Auction II
― ―(☞⑥ ―
Transfer Not restricted Restricted (☞⑦ Not restricted
Not restricted
Frequency of issue Monthly each 6 times Monthly each 4 times ―
The Inflation-Indexed Bonds (JGBi) are bonds whose principals (and relevant interests)
issue JGBi in March 2004 and suspended their issuance in October 2008 due to a sharp
demand decline accompanying the global financial crisis and other changes. In October
(Fig. 2-5).
The development of JGBi market has remained a key to address market environment
☞②-
-
☞③-
☞④
☞⑤
☞⑥
☞⑦
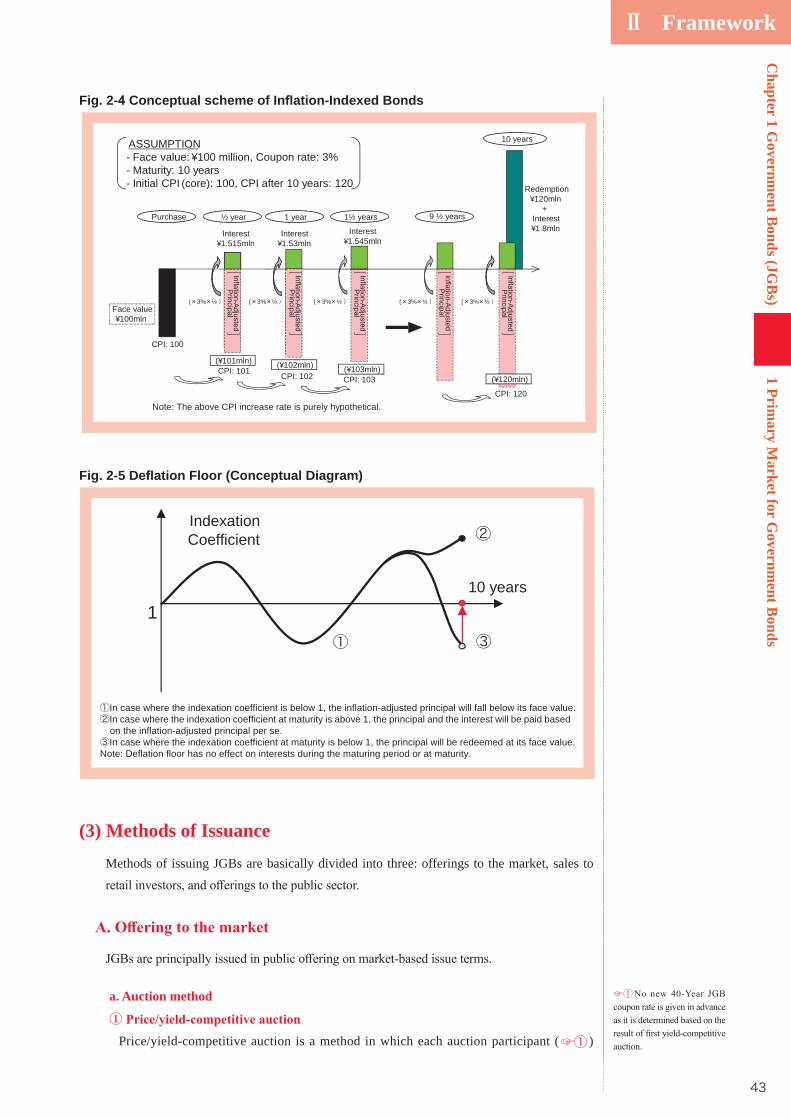
Ⅱ Framework
43
1 Primary M
arket for Governm
ent Bonds
Chapter 1 G
overnment B
onds (JGB
s)
(3) Methods of IssuanceMethods of issuing JGBs are basically divided into three: offerings to the market, sales to
a. Auction method
①Price/yield-competitive auction is a method in which each auction participant (☞① )
Fig. 2- Conceptual scheme of In ation-Indexed Bonds
Redemption ¥120mln
+ Interest ¥1.8mln
10 years
Interest ¥1.545mln
9 ½ years
( 3% ½
CPI: 100
CPI: 101 CPI: 102 CPI: 103
CPI: 120
(¥120mln)
( 3% ½
(¥103mln)
( 3% ½
1½ years 1 year ½ year
Interest ¥1.53mln
Interest ¥1.515mln
(¥102mln)
( 3% ½
(¥101mln)
( 3% ½ Face value ¥100mln
Purchase
ASSUMPTION - Face value: ¥100 million, Coupon rate: 3% - Maturity: 10 years - Initial CPI (core): 100, CPI after 10 years: 120
Inflation-Adjusted Principal
Inflation-Adjusted Principal
Inflation-Adjusted Principal
Inflation-Adjusted Principal
Inflation-Adjusted Principal
Note: The above CPI increase rate is purely hypothetical.
Fig. 2-5 De ation Floor (Conceptual Diagram)
1
②
① ③
①In case where the indexation coefficient is below 1, the inflation-adjusted principal will fall below its face value.②In case where the indexation coefficient at maturity is above 1, the principal and the interest will be paid based
on the inflation-adjusted principal per se.③In case where the indexation coefficient at maturity is below 1, the principal will be redeemed at its face value.Note: Deflation floor has no effect on interests during the maturing period or at maturity.
Indexation
10 years
Coefficient
☞①
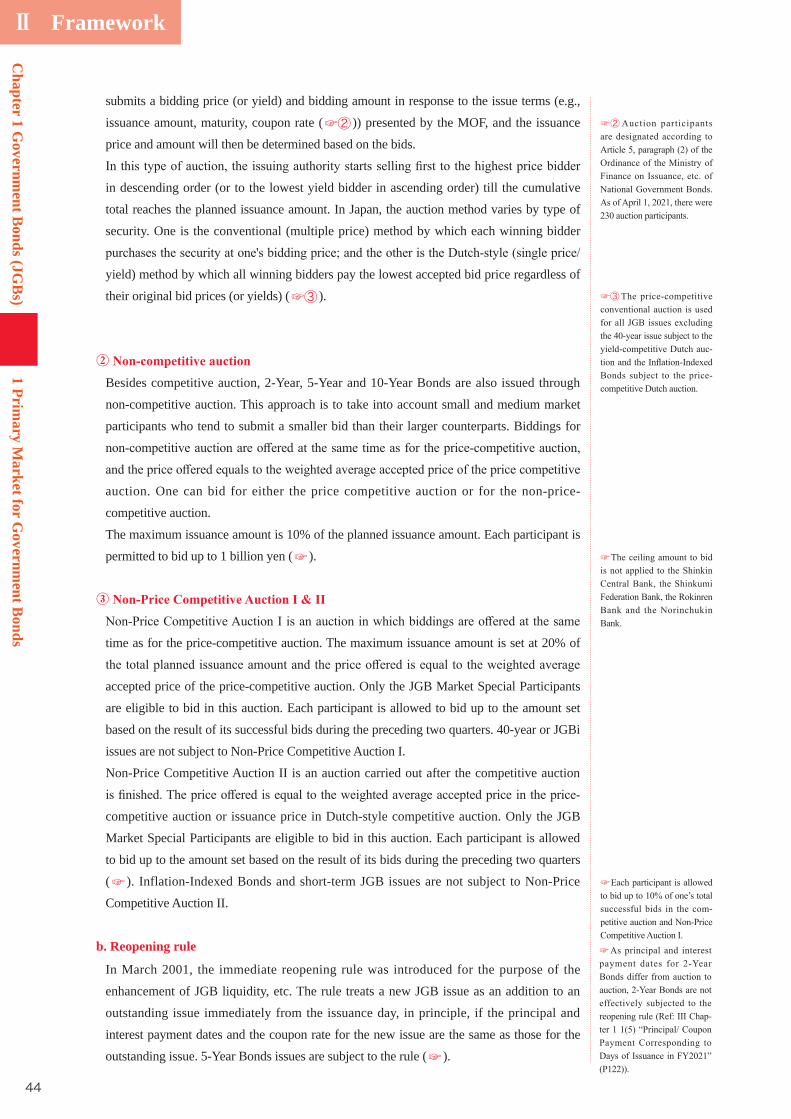
Ⅱ Framework
44
Chapter 1 G
overnment B
onds (JGB
s)1 Prim
ary Market for G
overnment B
onds
submits a bidding price (or yield) and bidding amount in response to the issue terms (e.g.,
issuance amount, maturity, coupon rate (☞② )) presented by the MOF, and the issuance
price and amount will then be determined based on the bids.
in descending order (or to the lowest yield bidder in ascending order) till the cumulative
total reaches the planned issuance amount. In Japan, the auction method varies by type of
security. One is the conventional (multiple price) method by which each winning bidder
yield) method by which all winning bidders pay the lowest accepted bid price regardless of
their original bid prices (or yields) (☞③ ).
②Besides competitive auction, 2-Year, 5-Year and 10-Year Bonds are also issued through
non-competitive auction. This approach is to take into account small and medium market
participants who tend to submit a smaller bid than their larger counterparts. Biddings for
auction. One can bid for either the price competitive auction or for the non-price-
competitive auction.
The maximum issuance amount is 10% of the planned issuance amount. Each participant is
permitted to bid up to 1 billion yen (☞ ).
③
time as for the price-competitive auction. The maximum issuance amount is set at 20% of
accepted price of the price-competitive auction. Only the JGB Market Special Participants
are eligible to bid in this auction. Each participant is allowed to bid up to the amount set
based on the result of its successful bids during the preceding two quarters. 40-year or JGBi
issues are not subject to Non-Price Competitive Auction I.
Non-Price Competitive Auction II is an auction carried out after the competitive auction
competitive auction or issuance price in Dutch-style competitive auction. Only the JGB
Market Special Participants are eligible to bid in this auction. Each participant is allowed
to bid up to the amount set based on the result of its bids during the preceding two quarters
(☞ ). Inflation-Indexed Bonds and short-term JGB issues are not subject to Non-Price
Competitive Auction II.
b. Reopening rule
In March 2001, the immediate reopening rule was introduced for the purpose of the
enhancement of JGB liquidity, etc. The rule treats a new JGB issue as an addition to an
outstanding issue immediately from the issuance day, in principle, if the principal and
interest payment dates and the coupon rate for the new issue are the same as those for the
outstanding issue. 5-Year Bonds issues are subject to the rule (☞ ).
☞
☞②
☞
-
☞
-
☞③
-
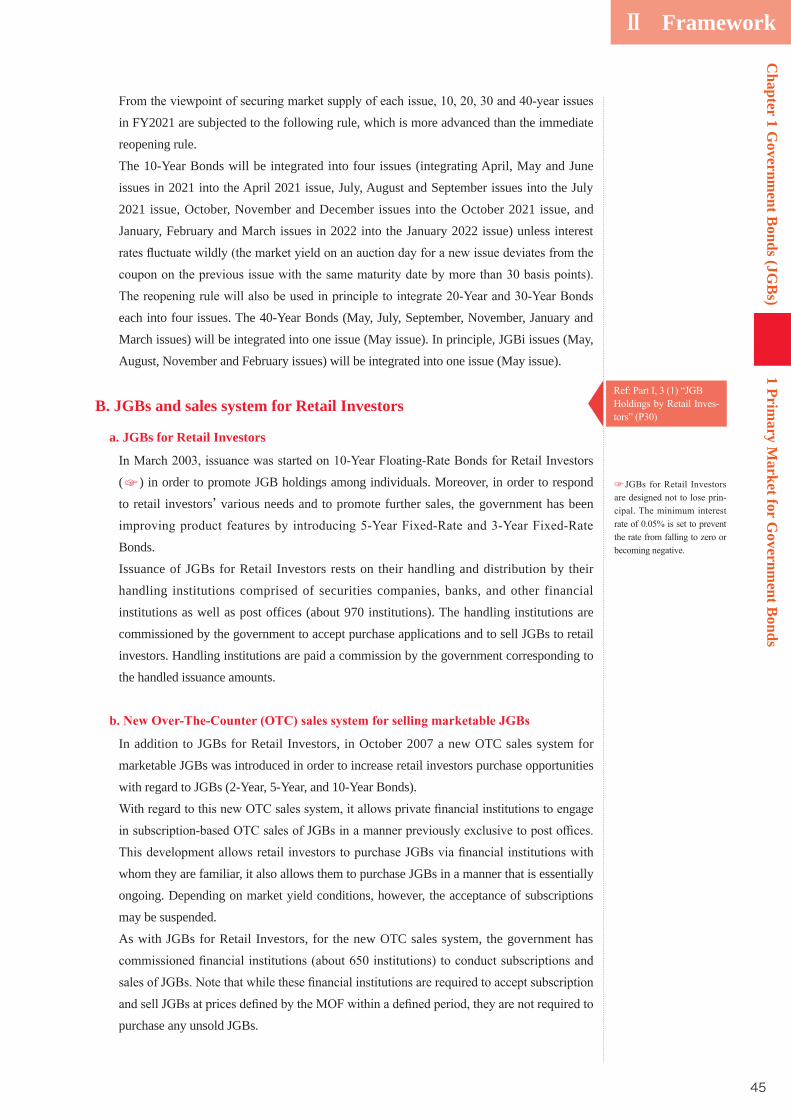
Ⅱ Framework
45
1 Primary M
arket for Governm
ent Bonds
Chapter 1 G
overnment B
onds (JGB
s)
in FY2021 are subjected to the following rule, which is more advanced than the immediate
reopening rule.
The 10-Year Bonds will be integrated into four issues (integrating April, May and June
issues in 2021 into the April 2021 issue, July, August and September issues into the July
2021 issue, October, November and December issues into the October 2021 issue, and
January, February and March issues in 2022 into the January 2022 issue) unless interest
each into four issues. The 40-Year Bonds (May, July, September, November, January and
March issues) will be integrated into one issue (May issue). In principle, JGBi issues (May,
August, November and February issues) will be integrated into one issue (May issue).
B. JGBs and sales system for Retail Investors
a. JGBs for Retail Investors
(☞ ) in order to promote JGB holdings among individuals. Moreover, in order to respond
to retail investors’ various needs and to promote further sales, the government has been
Bonds.
Issuance of JGBs for Retail Investors rests on their handling and distribution by their
handling institutions comprised of securities companies, banks, and other financial
institutions as well as post offices (about 970 institutions). The handling institutions are
commissioned by the government to accept purchase applications and to sell JGBs to retail
investors. Handling institutions are paid a commission by the government corresponding to
the handled issuance amounts.
In addition to JGBs for Retail Investors, in October 2007 a new OTC sales system for
marketable JGBs was introduced in order to increase retail investors purchase opportunities
with regard to JGBs (2-Year, 5-Year, and 10-Year Bonds).
whom they are familiar, it also allows them to purchase JGBs in a manner that is essentially
ongoing. Depending on market yield conditions, however, the acceptance of subscriptions
may be suspended.
As with JGBs for Retail Investors, for the new OTC sales system, the government has
purchase any unsold JGBs.
☞-
-
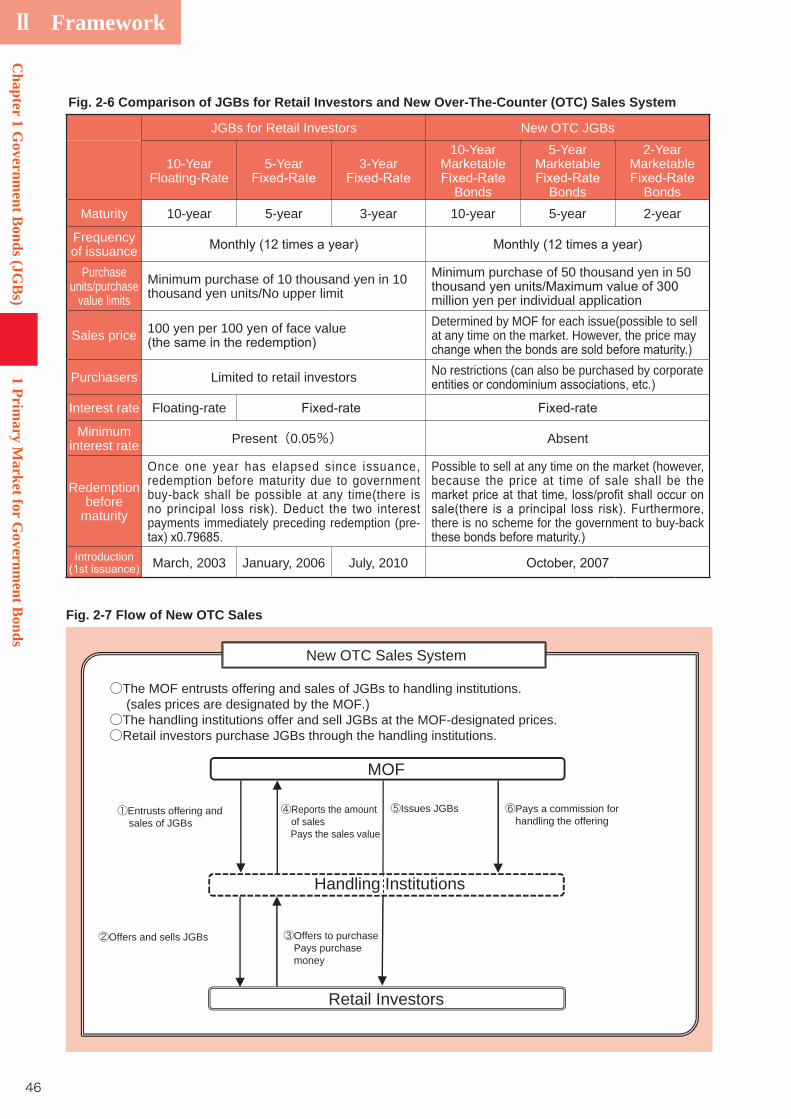
Ⅱ Framework
46
Chapter 1 G
overnment B
onds (JGB
s)1 Prim
ary Market for G
overnment B
onds
Fig. 2- Comparison of JGBs for Retail Investors and Ne Over-The-Counter (OTC) Sales System
JGBs for Retail Investors New OTC JGBs
10-Year Floating-Rate
5-Year 3-Year 10-Year
Marketable
Bonds
5-YearMarketable
Bonds
2-YearMarketable
BondsMaturity 10-year 5-year 3-year 10-year 5-year 2-year
Frequency of issuance
Purchaseunits/purchase
value limitsMinimum purchase of 10 thousand yen in 10 thousand yen units/No upper limit
Minimum purchase of 50 thousand yen in 50
million yen per individual application
Sales price 100 yen per 100 yen of face value Determined by MOF for each issue(possible to sell at any time on the market. However, the price may
Purchasers Limited to retail investors No restrictions (can also be purchased by corporate
Interest rate Floating-rate
Minimum interest rate Present(0.05%) Absent
Redemptionbefore
maturity
Once one year has elapsed since issuance, redemption before maturity due to government buy-back shall be possible at any time(there is
payments immediately preceding redemption (pre-
Possible to sell at any time on the market (however, because the price at time of sale shall be the
there is no scheme for the government to buy-back
Introduction March, 2003 January, 2006 July, 2010
MOF
①Entrusts offering and sales of JGBs
Handling Institutions
②Offers and sells JGBs
Retail Investors
③Offers to purchase Pays purchase money
⑤Issues JGBs ⑥Pays a commission for handling the offering
④Reports the amount of sales Pays the sales value
New OTC Sales System
○The MOF entrusts offering and sales of JGBs to handling institutions. (sales prices are designated by the MOF.) ○The handling institutions offer and sell JGBs at the MOF-designated prices. ○Retail investors purchase JGBs through the handling institutions.
Fig. 2- Flo of Ne OTC Sales
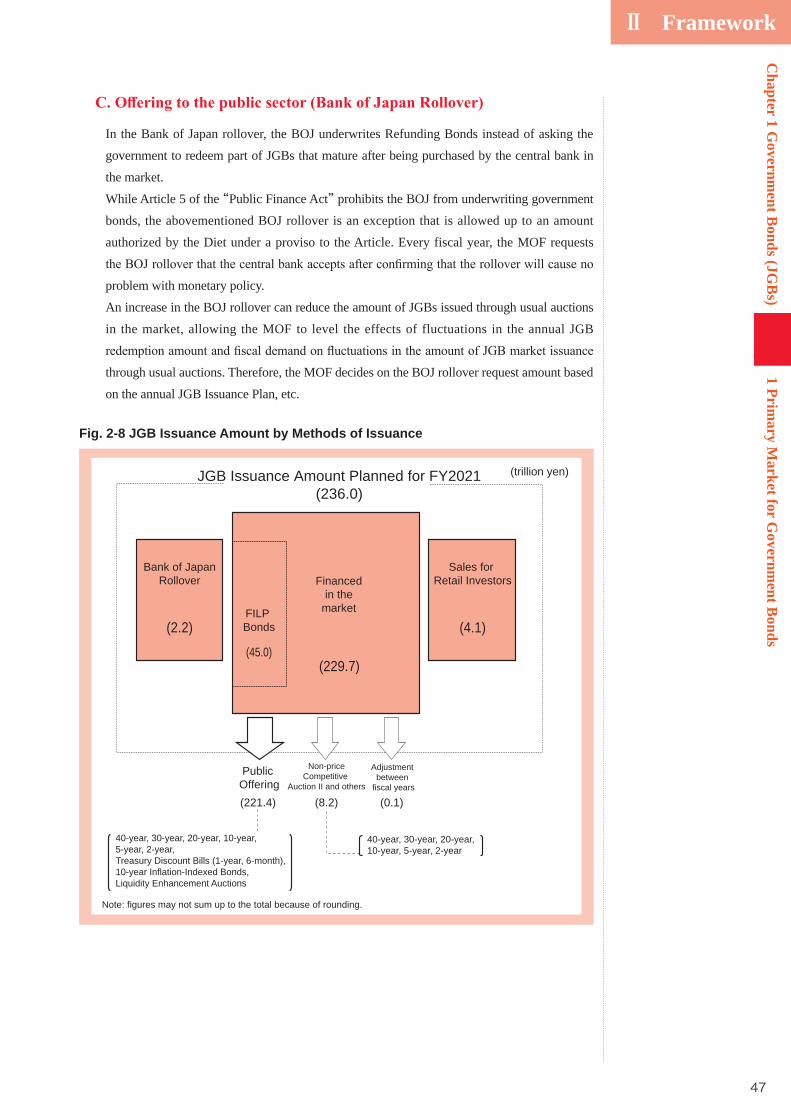
Ⅱ Framework
47
1 Primary M
arket for Governm
ent Bonds
Chapter 1 G
overnment B
onds (JGB
s)
In the Bank of Japan rollover, the BOJ underwrites Refunding Bonds instead of asking the
government to redeem part of JGBs that mature after being purchased by the central bank in
the market.
While Article 5 of the “Public Finance Act” prohibits the BOJ from underwriting government
bonds, the abovementioned BOJ rollover is an exception that is allowed up to an amount
authorized by the Diet under a proviso to the Article. Every fiscal year, the MOF requests
problem with monetary policy.
An increase in the BOJ rollover can reduce the amount of JGBs issued through usual auctions
in the market, allowing the MOF to level the effects of fluctuations in the annual JGB
through usual auctions. Therefore, the MOF decides on the BOJ rollover request amount based
on the annual JGB Issuance Plan, etc.
(2.2)
Sales for Retail Investors
Bank of JapanRollover
FILP Bonds
Public Offering
Non-priceCompetitive
Auction II and others
Adjustment between
fiscal years
JGB Issuance Amount Planned for FY2021(236.0)
(45.0)(229.7)
Financed in the market
(4.1)
(8.2)(221.4) (0.1)
40-year, 30-year, 20-year, 10-year, 5-year, 2-year, Treasury Discount Bills (1-year, 6-month),10-year Inflation-Indexed Bonds, Liquidity Enhancement Auctions
40-year, 30-year, 20-year, 10-year, 5-year, 2-year
(trillion yen)
Note: figures may not sum up to the total because of rounding.
Fig. 2-8 JGB Issuance Amount by Methods of Issuance
Ⅱ Framework
48
Chapter 1 G
overnment B
onds (JGB
s)1 Prim
ary Market for G
overnment B
onds
(4) JGB Market Special Participants SchemeAmid expectations that JGB issuance in large volumes will continue, the “JGB Market Special
Participants Scheme” was introduced in Japan in October 2004 to promote the market’s stable
absorption of JGBs and to maintain and enhance the liquidity of the JGB market.
This scheme is designed based on the so-called “Primary Dealer System” introduced in major
European countries and the U.S. To achieve the abovementioned purpose of the scheme, the
MOF grants special entitlements to certain auction participants who carry out responsibilities
essential to debt management policies, such as active participation in JGB auctions.
The following is an outline of the scheme.
A. Responsibilities of JGB Market Special Participants
・Bidding responsibility:
In every auction, the Special Participants shall bid for an adequate amount (at least 5% of
the planned issue amount) at reasonable prices.
・Purchasing responsibility:
term, long-term, medium-term and short-term zones in auctions for the preceding two
quarters.
・Responsibility in the secondary market:
・Provision of Information:
The Special Participants shall provide information on JGB markets and related transactions
to the MOF.
B. Entitlements of JGB Market Special Participants
・Entitlement to participate in the Meeting of JGB Market Special Participants:
The Special Participants may participate in the Meeting of JGB Market Special Participants
to exchange opinions with the MOF.
・Entitlement to participate in Non-Price Competitive Auctions I & II:
The Special Participants may participate in Non-Price Competitive Auction I held
concurrently with a normal competitive auction and in Non-Price Competitive Auction
II held after a normal competitive auction. These auctions enable Special Participants to
obtain JGBs at the weighted average accepted price in a competitive auction (or at the
issuance price in a Dutch-style auction) up to the maximum amount preset for each Special
Participant on the basis of the amount of past successful bids (Non-Price Competitive
Auction I) and past bids as a whole (Non-Price Competitive Auction II).
・Entitlement to participate in Liquidity Enhancement Auctions:
The Special Participants may participate in Liquidity Enhancement Auctions that are
designed to maintain and enhance the liquidity of the JGB market.
・Entitlement to participate in Auctions for Buy-backs:
The Special Participants may participate in Auctions for Buy-backs.
・Entitlement to apply for separating and integrating STRIPS Bonds:
The Special Participants may apply for the separation and integration of STRIPS Bonds.
Ⅱ Framework
49
1 Primary M
arket for Governm
ent Bonds
Chapter 1 G
overnment B
onds (JGB
s)
C. History of the Scheme
・ October 2004: JGB Market Special Participants Scheme was introduced, including designation of Special Participants, holding the first round of Meeting of JGB Market Special Participants and launch of Non-Price Competitive Auction II.
・April 2005: Non-Price Competitive Auction I was launched.・January 2006: Interest rate swap transactions started.・March 2006: The government bond syndicate underwriting system was abolished.・April 2006: Liquidity Enhancement Auction was launched.・ January 2009: The maximum bid for Non-Price Competitive Auction II was raised from
“10% of one’s total successful bids” to “15%” (☞① ).・ April 2015: The maximum amount of bidding by each auction participant was reduced
from “100% of the planned issuance amount” to “50% of the amount” and the minimum bidding responsibility amount was raised from “planned issuance amount” to “4% of the amount.”
・ July 2017: The maximum issuance amount for Non-Price Competitive Auction I was raised from “10% of the total planned issuance amount” to “20% of the amount” and the minimum bidding responsibility amount from “4% of the planned issuance amount” to “5% of the amount.”
・January 2020: The maximum bid for Non-Price Competitive Auction II was lowered from “15% of one’s total successful bids” to “10%” (☞① ).
・April 2020: Non-Price Competitive Auction II for the Inflation-Indexed Bonds was canceled.
☞①
-
Ⅱ Framework
50
Chapter 1 G
overnment B
onds (JGB
s)1 Prim
ary Market for G
overnment B
onds
(5) Government Bond Administration
A. Items the Bank of Japan handles
The government does not directly undertake the government bond-related administrative tasks, such as issuance and redemption, but entrusts the BOJ with most of those tasks based on Article 1, paragraph (2) of the “Act on National Government Bonds.” Those administrative tasks entrusted to the BOJ are as follows (☞ ).・
bids, collects payments, issues the securities, and receives and handles revenues.・Redemption/interest payment: The BOJ pays a principal and interests on JGBs, and receives
and handles funds to be used for redemption, and makes their disbursement.
B. The Bank of Japan government bond network system
The BOJ operates the Bank of Japan Financial Network System (BOJ-NET) JGB Services (☞①
institutions.Banks, securities companies, money market brokers, insurance companies, etc. participate in the BOJ-NET JGB Services that implement JGB issuance, redemption and other administrative tasks online.Under the “Act on Book-Entry Transfer of Corporate Bonds and Shares,” at present, JGBs traded between financial institutions are paperless. JGB transfers are done in the form of transfers on accounts managed by the transfer institution (the BOJ) (☞② ).The BOJ-NET JGB Services allow the following procedures to be completed online:・・Bidding (from bidders to the BOJ)・Counting the number of bidding and reporting to the MOF on total bidding・・Issuance and payment (from the BOJ to purchasers / from purchasers to the BOJ)
☞①
☞
-
☞② -
-
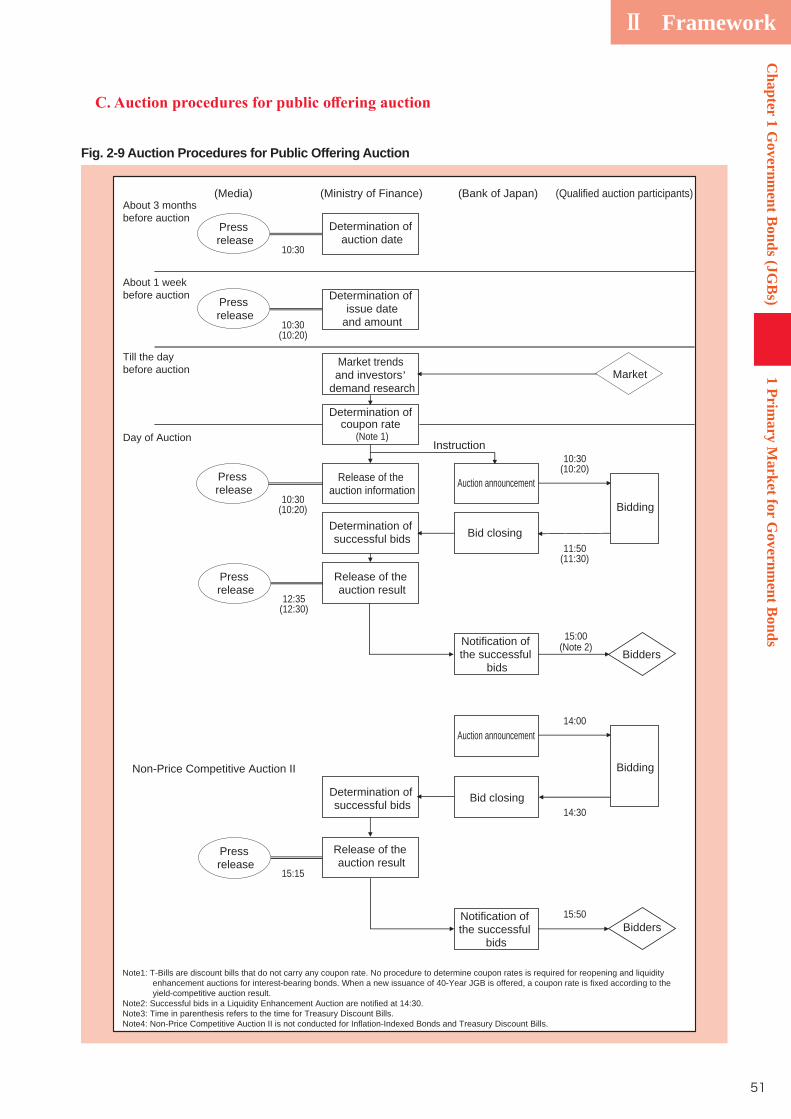
Ⅱ Framework
51
1 Primary M
arket for Governm
ent Bonds
Chapter 1 G
overnment B
onds (JGB
s)
(Qualified auction participants)(Bank of Japan)(Media)
MarketMarket trends and investors’
demand research
About 3 monthsbefore auction
About 1 weekbefore auction
Till the daybefore auction
Day of Auction
Determination of coupon rate
(Note 1)
Release of the auction information
Instruction
Determination of successful bids
10:30(10:20)
14:30
(10:20)10:30
Auction announcement
Bid closing
12:35
15:15
(12:30)
10:30(10:20)
10:30
(Ministry of Finance)
Determination of issue date
and amount
Determination of auction date
Release of the auction result
Notification of the successful
bids
Bidders15:50
Determination of successful bids
Release of the auction result
Bid closing
Bidding
Auction announcement14:00
Notification of the successful
bids
Bidders
Bidding
11:50(11:30)
15:00(Note 2)
Press release
Press release
Press release
Press release
Press release
Non-Price Competitive Auction II
Note1: T-Bills are discount bills that do not carry any coupon rate. No procedure to determine coupon rates is required for reopening and liquidity enhancement auctions for interest-bearing bonds. When a new issuance of 40-Year JGB is offered, a coupon rate is fixed according to the yield-competitive auction result.
Note2: Successful bids in a Liquidity Enhancement Auction are notified at 14:30.Note3: Time in parenthesis refers to the time for Treasury Discount Bills.Note4: Non-Price Competitive Auction II is not conducted for Inflation-Indexed Bonds and Treasury Discount Bills.
Fig. 2-9 Auction Procedures for Public Offering Auction
Ⅱ Framework
52
Chapter 1 G
overnment B
onds (JGB
s)1 Prim
ary Market for G
overnment B
onds
D. Shortening of Settlement Cycles in Primary JGB Market
In a manner to meet the shortening of the settlement cycle to T+1 for the secondary JGB
market (☞ ), Japan shortened the settlement cycle (between auction and issuance dates) from
T+2 to T+1 in principle for auctions as from May 1, 2018.
issues) coming in massive JGB redemption months (March, June, September and December)
and a 2-year issue every month.
①
20th day of each month (the next business day if the 20th day fell on a holiday) irrespective
of auction dates, settlement cycles were shortened to T+1, with their issuance set to come
on the next business day of the auction, as from May 1, 2018.
②For a 2-year JGB issue coming every month for which an issuance date had been set at the
15th day (the next business day if the 15th day fell on a holiday) of a month after an auction
each month.
☞-

Ⅱ Framework
53
1 Primary M
arket for Governm
ent Bonds
Chapter 1 G
overnment B
onds (JGB
s)
❶ Debt Management Policies, Issuance Plans
In Japan, the basic objectives of the debt management policy are set as: (1) ensuring the smooth and secure issuance of Japanese Government Bonds and (2) minimizing medium- to long-term fundraising costs. In line with these
on investor needs and market trends. Basically, foreign countries also take almost the same stance on their debt management policies, but they have their unique characteristics.Further, the JGB Issuance Plan is established in line with annual budget formulation and an annual planned issuance amount for each maturity and other data are published in Japan but methods for publishing such data also
disclosure during the period from the announcement of a planned issuance amount to an actual auction for the issue also varies from country to country (Figs. c5-1 and c5-2).
Debt Management Policies in Foreign CountriesColumn 5
Japan U.S. U.K. Germany France
Debt Management Financial Bureau,
Ministry of Finance
Department of the
Debt ManagementDepartment of the
Treasury, Bureau of the Fiscal Service
HM Treasury,UK Debt Management
Bundes ministerium der Finanzen,
Bundesrepublik Deutschland -
Finanzagentur GmbH(German Finance
Ministère de l'Économie et des
Finances,Direction générale du Trésor, Agence
The Objective of Debt
Management Policy
・ Ensuring stable smooth issuance of JGBs・ Minimizing medium-
to-long term
・government borrowing needs at the lowest cost over time・ To issue debt in
a regular and predictable pattern
・To minimise, over the long term, the costs of meeting the government’s
needs, taking into account risk, while ensuring that debt management policy is consistent with the aims of monetary policy.
・To keep interest costs as low as possible across a number of years and market phases while limiting the interest rate risks resulting from the portfolio structure.
・ funds on the
the State by keeping the debt burden to
a minimum under optimum conditions of security.
Fiscal Year April to October previous year to September
April to January toDecember
January toDecember
Issuance Plan
・ Announcement of total JGB issuance amount
year, breakdowns by maturity, and frequency of issuance, etc. in late-December each year.
・ Announcement of planned issuance amounts by maturity, auction schedule, etc. on a quarterly basis (February, May, August and
・ Announcement of total issuance amount for the
breakdowns by maturity, etc. in March each year.・ Announcement of
issues and auction schedule on a quarterly basis.
・ Announcement of planned issuance amounts by maturity, auction schedule, New issue/Reopening, etc. for
in December each year. Thereafter, announcement of auction schedule again on a quarterly basis.
・ Announcement of total issuance amount for the
December each year.・
amounts are determined at a meeting with PD held in the week preceding the issuance date.
’ debt management authorities
Fig. c5-1 Debt Management Policies in Japan and Foreign Countries
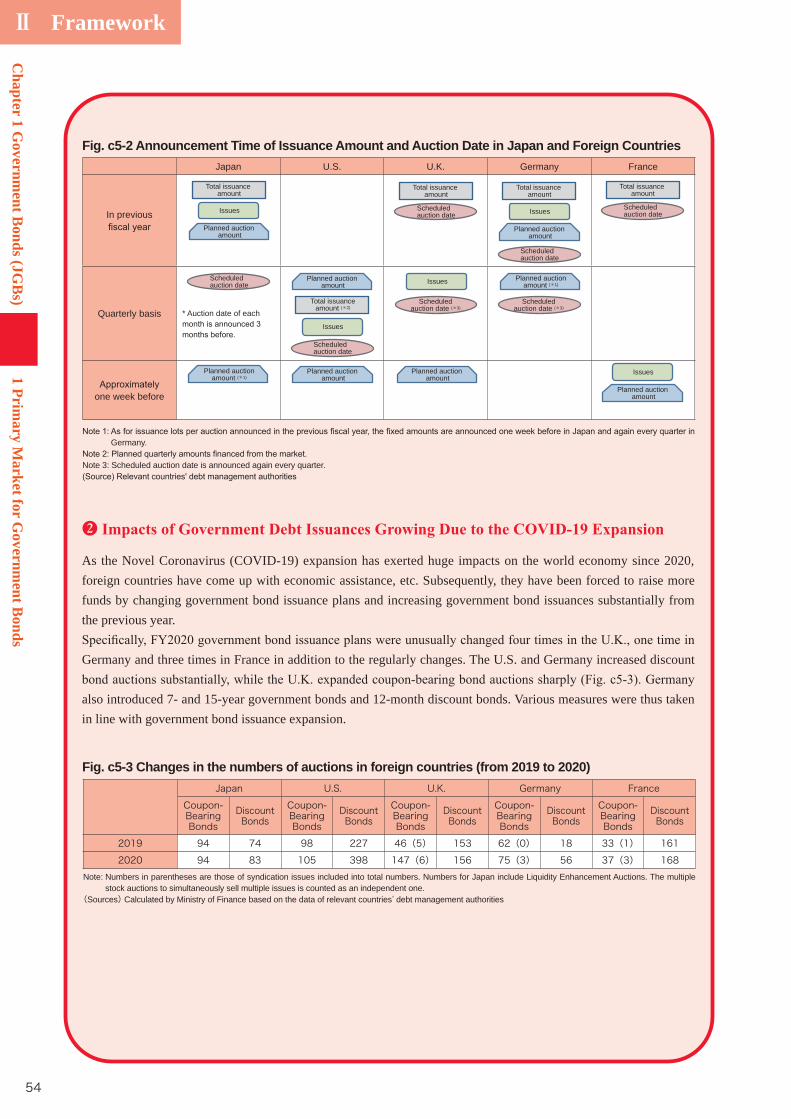
Ⅱ Framework
54
❷
As the Novel Coronavirus (COVID-19) expansion has exerted huge impacts on the world economy since 2020, foreign countries have come up with economic assistance, etc. Subsequently, they have been forced to raise more funds by changing government bond issuance plans and increasing government bond issuances substantially from the previous year.
Germany and three times in France in addition to the regularly changes. The U.S. and Germany increased discount
also introduced 7- and 15-year government bonds and 12-month discount bonds. Various measures were thus taken in line with government bond issuance expansion.
Fig. c5-2 Announcement Time of Issuance Amount and Auction Date in Japan and Foreign CountriesJapan U.S. U.K. Germany France
In previous
Quarterly basis * Auction date of each
one week before
Germany.
Note 3: Scheduled auction date is announced again every quarter.
Scheduledauction date (*3)
Scheduledauction date (*3)
Planned auctionamount (*1)
Total issuance amount
Total issuance amount
Total issuance amount
Total issuance amount
Total issuanceamount (*2)
Issues Issues
Issues
Issues
Issues
Planned auction amount
Planned auction amount
Planned auction amount
Planned auction amount
Planned auction amount
Scheduledauction date
Scheduledauction date
Scheduledauction date
Scheduledauction date
Planned auctionamount (*1)
Scheduledauction date
Planned auction amount
Japan U.S. U.K. Germany FranceCoupon-BearingBonds
DiscountBonds
Coupon-BearingBonds
DiscountBonds
Coupon-BearingBonds
DiscountBonds
Coupon-BearingBonds
DiscountBonds
Coupon-BearingBonds
DiscountBonds
2019 94 74 98 227 46(5) 153 62(0) 18 33(1) 1612020 94 83 105 398 147(6) 156 75(3) 56 37(3) 168
Note: Numbers in parentheses are those of syndication issues included into total numbers. Numbers for Japan include Liquidity Enhancement Auctions. The multiple stock auctions to simultaneously sell multiple issues is counted as an independent one.
(Sources) Calculated by Ministry of Finance based on the data of relevant countries’ debt management authorities
Fig. c5-3 Changes in the numbers of auctions in foreign countries (from 2019 to 2020)C
hapter 1 Governm
ent Bonds (JG
Bs)
1 Primary M
arket for Governm
ent Bonds
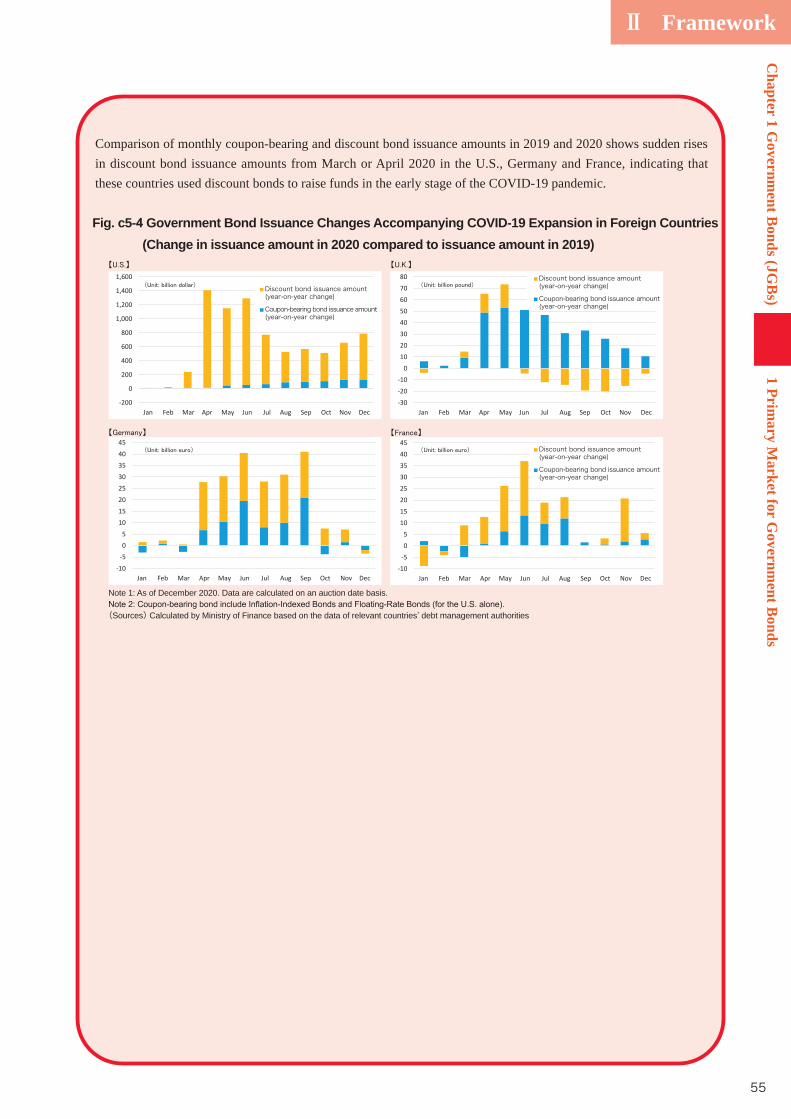
Ⅱ Framework
55
Comparison of monthly coupon-bearing and discount bond issuance amounts in 2019 and 2020 shows sudden rises in discount bond issuance amounts from March or April 2020 in the U.S., Germany and France, indicating that these countries used discount bonds to raise funds in the early stage of the COVID-19 pandemic.
Fig. c5- Government Bond Issuance Changes Accompanying COVID-19 Expansion in Foreign Countries (Change in issuance amount in 2020 compared to issuance amount in 2019)
-200
0
200
400
600
800
1,000
1,200
1,400
1,600
Jan Feb Mar Apr May Jun Jul Aug Sep Oct Nov Dec-30-20-10
01020304050607080
Jan Feb Mar Apr May Jun Jul Aug Sep Oct Nov Dec
-10-505
1015202530354045
Jan Feb Mar Apr May Jun Jul Aug Sep Oct Nov Dec-10
-505
1015202530354045
Jan Feb Mar Apr May Jun Jul Aug Sep Oct Nov Dec
Discount bond issuance amount(year-on-year change)
Coupon-bearing bond issuance amount(year-on-year change)
Discount bond issuance amount(year-on-year change)
Coupon-bearing bond issuance amount(year-on-year change)
Discount bond issuance amount(year-on-year change)
Coupon-bearing bond issuance amount(year-on-year change)
Note 1: As of December 2020. Data are calculated on an auction date basis.
(Sources) Calculated by Ministry of Finance based on the data of relevant countries’ debt management authorities
1 Primary M
arket for Governm
ent Bonds
Chapter 1 G
overnment B
onds (JGB
s)
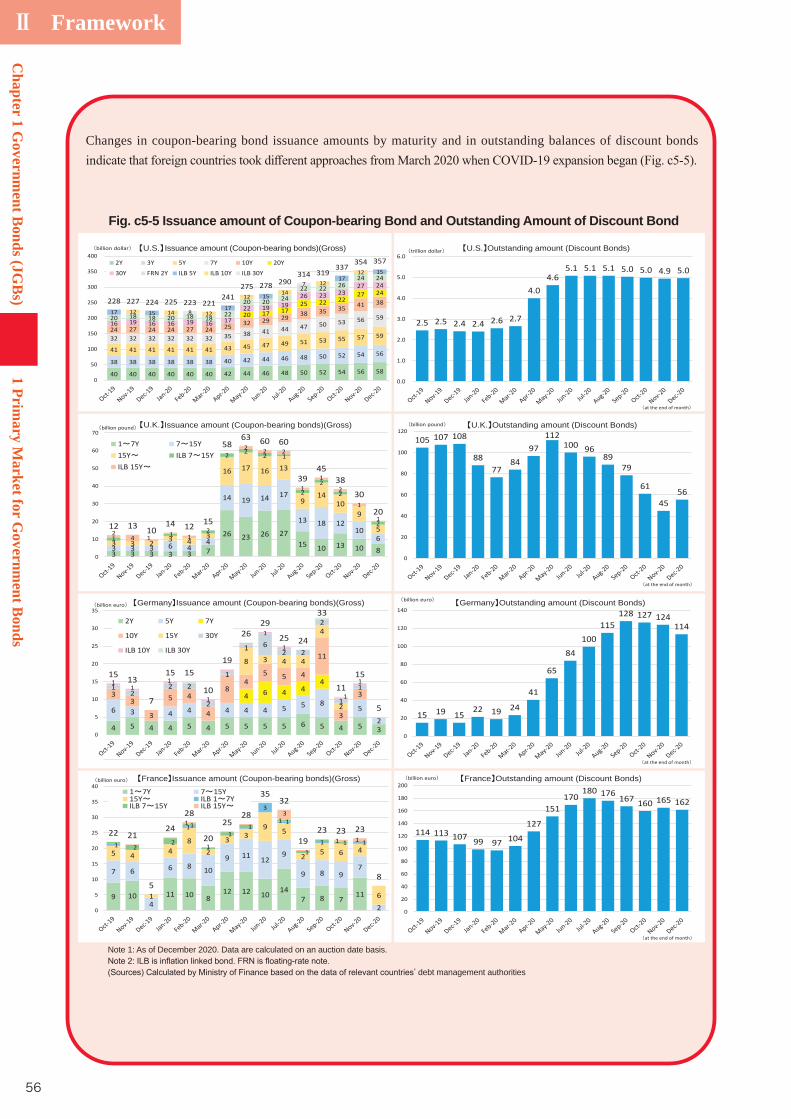
Ⅱ Framework
56
Changes in coupon-bearing bond issuance amounts by maturity and in outstanding balances of discount bonds
40 40 40 40 40 40 42 44 46 48 50 52 54 56 58 38 38 38 38 38 38 40 42 44 46 48 50 52 54 56 41 41 41 41 41 41 43 45 47 49 51 53 55 57 59 32 32 32 32 32 32 35 38 41 44 47 50 53 56 59
24 27 24 24 27 24 25 32 29 29 38 35 35 41 38
20 17 1725 22 22
27 24
16 19 16 16 19 16 17
22 19 19 26 23 23
27 24
20 18 18 20 18 18 22
20 20 24 22 22 26
24 24
17 15 17
15
17 15
12 14 12
12 14
12
12
8
7
228 227 224 225 223 221241
275 278 290314 319
337354 357
0
50
100
150
200
250
300
350
400Issuance amount (Coupon-bearing bonds)(Gross)
2Y 3Y 5Y 7Y 10Y 20Y30Y FRN 2Y ILB 5Y ILB 10Y ILB 30Y
2.5 2.5 2.4 2.4 2.6 2.7
4.0 4.6
5.1 5.1 5.1 5.0 5.0 4.9 5.0
0.0
1.0
2.0
3.0
4.0
5.0
6.0U.S. Outstanding amount (Discount Bonds)trillion dollar
at the end of month
3 3 3 3 3 7
26 23 26 2715 10 13 10 83 3 3 6 4
4
14 19 14 17
13 18 1210
63 3 2 3 43
16 17 16 13
914
109
51 1 2
2 22 1
22
2
22
4 1 1
2 2 2
11
2
1
112 13 10
14 12 15
5863 60 60
3945
3830
20
0
10
20
30
40
50
60
70Issuance amount (Coupon-bearing bonds)(Gross)
1 7Y 7 15Y15Y ILB 7 15YILB 15Y
billion pound
105 107 108
88 77
84 97
112 100 96
89 79
61
45 56
0
20
40
60
80
100
120U.K. Outstanding amount (Discount Bonds)billion pound
at the end of month
4 5 4 4 5 4 5 5 5 5 6 5 4 5 3
6 3 4 4 4 4 4 5 5 85
2
4 6 4 44
33
3
5 4
4
84
5 5 4
11
3
3
8 3 4 4
4
2
12
2 2
2
1
1 62 2
2
1
111
1
1
1
1
1
115 13
7
15 15
10
19
2629
25 24
33
1115
5
0
5
10
15
20
25
30
35Germany Issuance amount (Coupon-bearing bonds)(Gross)
2Y 5Y 7Y
10Y 15Y 30Y
ILB 10Y ILB 30Y
billion euro
15 19 15 22 19 24
41
65
84 100
115 128 127 124
114
0
20
40
60
80
100
120
140Germany Outstanding amount (Discount Bonds)billion euro
at the end of month
9 10 11 10 812 12 10 14
7 8 711
7 6
4
6 8 109 11 12
9
9 8 97
2
5 4
1
48
23 3
9 5
2 5 6 4
6
1
1
3
1
1 12
2
1
1
11
1
11
13
1 122 21
5
24
28
20
2528
3532
1923 23 23
8
0
5
10
15
20
25
30
35
40France Issuance amount (Coupon-bearing bonds)(Gross)billion euro
114 113 107 99 97 104
127
151 170
180 176 167 160 165 162
0
20
40
60
80
100
120
140
160
180
200France Outstanding amount (Discount Bonds)billion euro
at the end of month
1 7Y 7 15Y15Y ILB 1 7YILB 7 15Y ILB 15Y
U.S.
U.K.
billion dollar
Fig. c5-5 Issuance amount of Coupon-bearing Bond and Outstanding Amount of Discount Bond
Note 1: As of December 2020. Data are calculated on an auction date basis.
’ debt management authorities
Chapter 1 G
overnment B
onds (JGB
s)1 Prim
ary Market for G
overnment B
onds
Ⅱ Framework
57
The U.S. gradually increased coupon-bearing bond issuance amounts from March to December 2020. For instance,
10-year or longer issues gradually. Discount bond issuances were rapidly expanded within a short period of time,
total monthly issuance amount rose sharply from 15.0 billion pounds in March 2020 to 58.5 billion pounds in April. The monthly coupon-bearing bond issuance amount was maintained until July, while changes in the outstanding balance of discount bonds were not as large as that of coupon-bearing bonds.Germany in March 2020 revised its government bond issuance plan published in December 2019 to increase
5- and 6-month bonds ever issued. It revised the plan again in April to introduce 7- and 15-year coupon-bearing bonds and 9- and 11-month discount bonds in May. As a result, coupon-bearing bond issuances increased mainly in the 7- to 15-year zone, with changes limited for 2- and 5-year issues. The outstanding balance of discount bonds gradually increased from April and peaked in September, in contrast to the U.S. balance that rose rapidly within a short period of time.In France, coupon-bearing bond issuances gradually grew from March 2020, but those from August fell back to levels before COVID-19 spread. The outstanding balance of discount bonds gradually increased from April and peaked in July, indicating a trend similar to the German one.
❸ Bond Types and Issuance Methods
marketable bonds).Marketable bonds are normally offered mainly through the public auction method which uses both competitive and
price (conventional) method (Note 1) for almost all maturities as is the case of Japan while the U.S. employs the single price
Note 1: Auction method by which each winning bidder purchases the security at one’s bidding price (or yield).Note 2: Auction method by which all winning bidders pay the lowest accepted bid price regardless of their original bid prices (or
yields).
1 Primary M
arket for Governm
ent Bonds
Chapter 1 G
overnment B
onds (JGB
s)
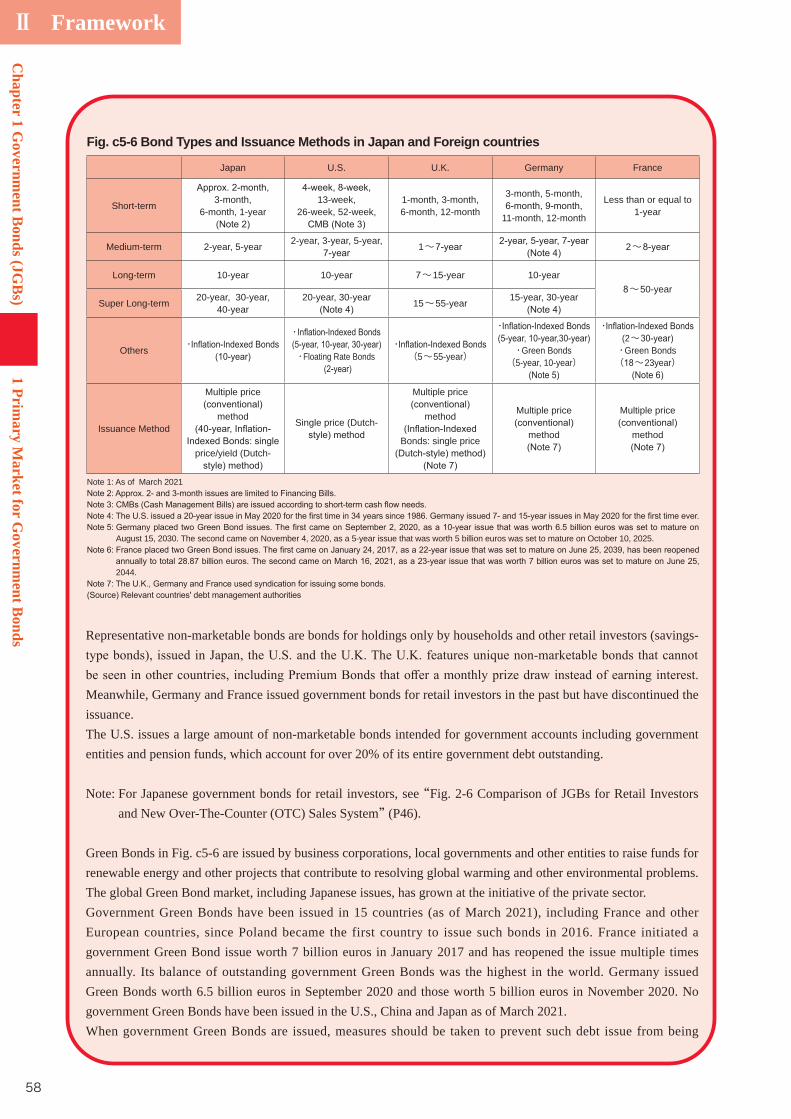
Ⅱ Framework
58
Representative non-marketable bonds are bonds for holdings only by households and other retail investors (savings-
Meanwhile, Germany and France issued government bonds for retail investors in the past but have discontinued the issuance.The U.S. issues a large amount of non-marketable bonds intended for government accounts including government entities and pension funds, which account for over 20% of its entire government debt outstanding.
Note: For Japanese government bonds for retail investors, see “Fig. 2-6 Comparison of JGBs for Retail Investors and New Over-The-Counter (OTC) Sales System” (P46).
Green Bonds in Fig. c5-6 are issued by business corporations, local governments and other entities to raise funds for renewable energy and other projects that contribute to resolving global warming and other environmental problems. The global Green Bond market, including Japanese issues, has grown at the initiative of the private sector.Government Green Bonds have been issued in 15 countries (as of March 2021), including France and other European countries, since Poland became the first country to issue such bonds in 2016. France initiated a government Green Bond issue worth 7 billion euros in January 2017 and has reopened the issue multiple times annually. Its balance of outstanding government Green Bonds was the highest in the world. Germany issued Green Bonds worth 6.5 billion euros in September 2020 and those worth 5 billion euros in November 2020. No government Green Bonds have been issued in the U.S., China and Japan as of March 2021.When government Green Bonds are issued, measures should be taken to prevent such debt issue from being
Japan U.S. U.K. Germany France
Short-term 3-month,6-month, 1-year
13-week, 26-week, 52-week,
1-month, 3-month,6-month, 12-month
3-month, 5-month,
11-month, 12-month
Less than or equal to 1-year
Medium-term 2-year, 5-year 2-year, 3-year, 5-year, 1~ 2~
Long-term 10-year 10-year ~15-year 10-year~50-year
Super Long-term 20-year, 30-year, 40-year
20-year, 30-year 15~55-year 15-year, 30-year
Others ・・
・Floating Rate Bonds・(5~55-year)
・
・Green Bonds(5-year, 10-year)
・(2~・Green Bonds( ~23year)
Issuance Method
Multiple price
method
price/yield (Dutch-
Single price (Dutch-
Multiple price
method
Bonds: single price
Multiple price
method
Multiple price
method
Note 1: As of March 2021
August 15, 2030. The second came on November 4, 2020, as a 5-year issue that was worth 5 billion euros was set to mature on October 10, 2025.
2044.
Fig. c5-6 Bond Types and Issuance Methods in Japan and Foreign countries
Chapter 1 G
overnment B
onds (JGB
s)1 Prim
ary Market for G
overnment B
onds
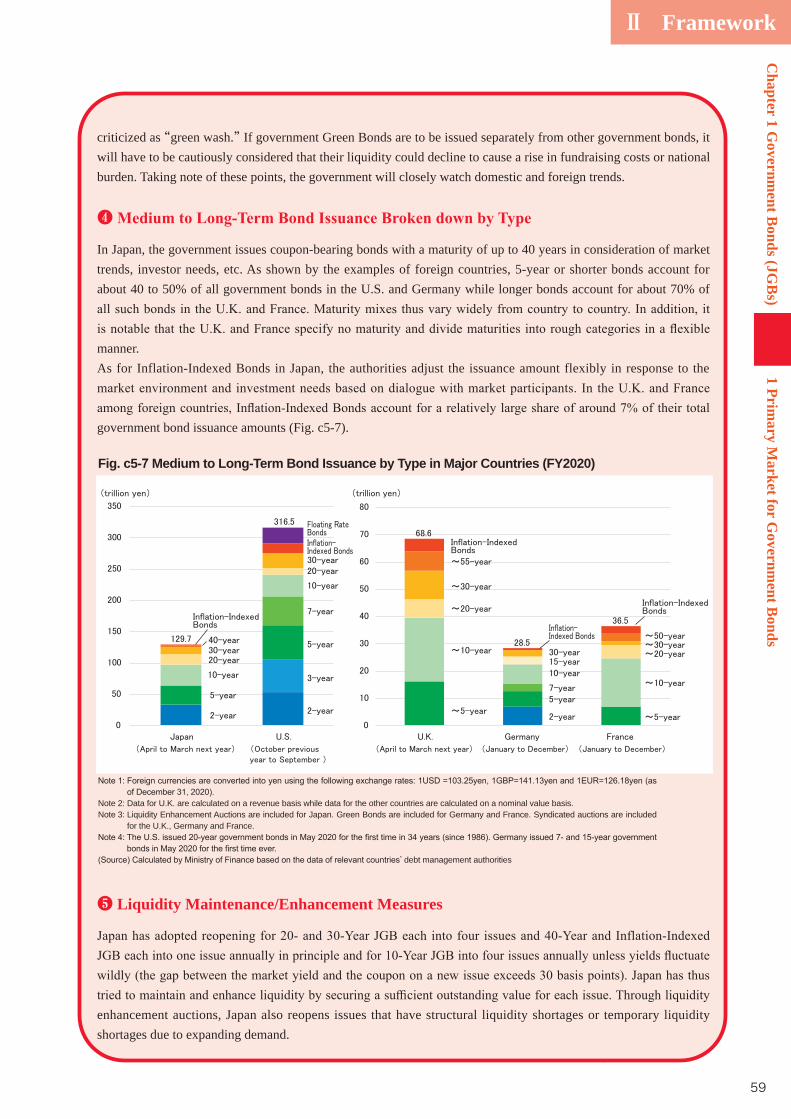
Ⅱ Framework
59
criticized as “green wash.” If government Green Bonds are to be issued separately from other government bonds, it will have to be cautiously considered that their liquidity could decline to cause a rise in fundraising costs or national burden. Taking note of these points, the government will closely watch domestic and foreign trends.
❹
In Japan, the government issues coupon-bearing bonds with a maturity of up to 40 years in consideration of market trends, investor needs, etc. As shown by the examples of foreign countries, 5-year or shorter bonds account for about 40 to 50% of all government bonds in the U.S. and Germany while longer bonds account for about 70% of
manner.As for Inflation-Indexed Bonds in Japan, the authorities adjust the issuance amount flexibly in response to the
government bond issuance amounts (Fig. c5-7).
❺ Liquidity Maintenance/Enhancement Measures
enhancement auctions, Japan also reopens issues that have structural liquidity shortages or temporary liquidity shortages due to expanding demand.
Fig. c5- Medium to Long-Term Bond Issuance by Type in Ma or Countries (FY2020)
Note 2: Data for U.K. are calculated on a revenue basis while data for the other countries are calculated on a nominal value basis.Note 3: Liquidity Enhancement Auctions are included for Japan. Green Bonds are included for Germany and France. Syndicated auctions are included
for the U.K., Germany and France.
’ debt management authorities
1 Primary M
arket for Governm
ent Bonds
Chapter 1 G
overnment B
onds (JGB
s)
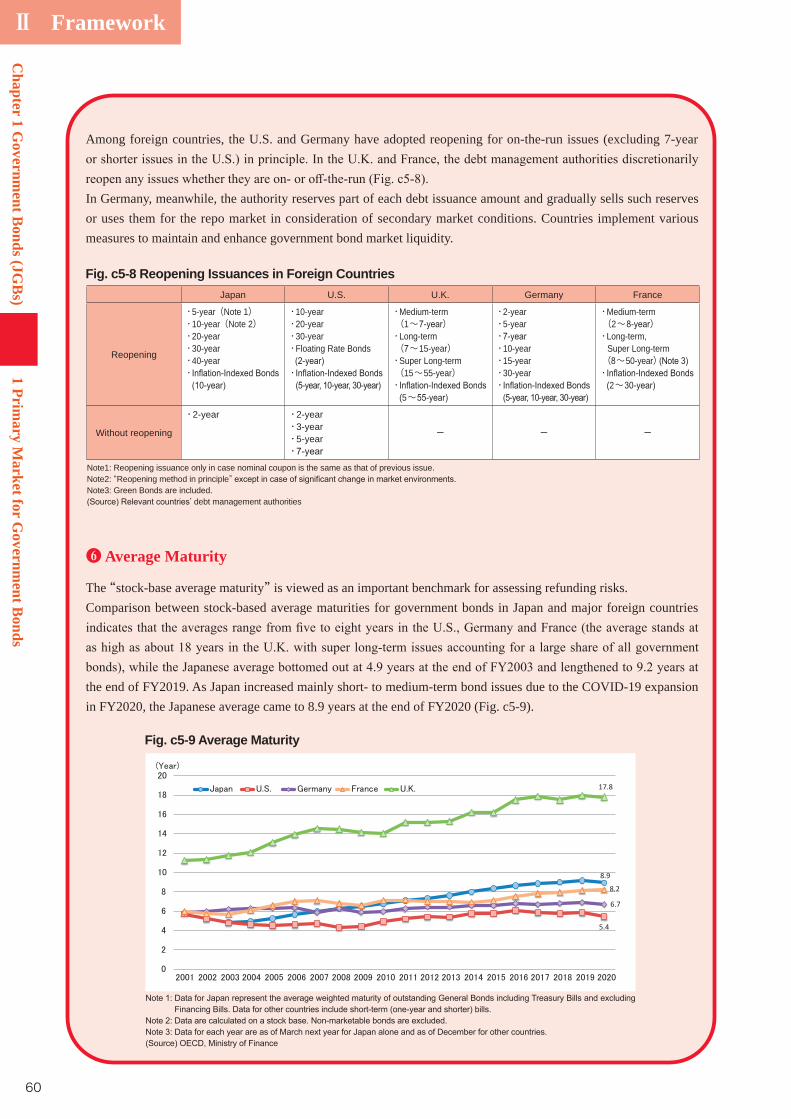
Ⅱ Framework
60
Among foreign countries, the U.S. and Germany have adopted reopening for on-the-run issues (excluding 7-year
In Germany, meanwhile, the authority reserves part of each debt issuance amount and gradually sells such reserves or uses them for the repo market in consideration of secondary market conditions. Countries implement various measures to maintain and enhance government bond market liquidity.
❻ Average Maturity
The “stock-base average maturity” is viewed as an important benchmark for assessing refunding risks.Comparison between stock-based average maturities for government bonds in Japan and major foreign countries
the end of FY2019. As Japan increased mainly short- to medium-term bond issues due to the COVID-19 expansion in FY2020, the Japanese average came to 8.9 years at the end of FY2020 (Fig. c5-9).
8.9
5.4
6.7
8.2
17.8
Fig. c5-8 Reopening Issuances in Foreign CountriesJapan U.S. U.K. Germany France
Reopening
・5-year(Note 1)・10-year(Note 2)・20-year・30-year・40-year・
・10-year・20-year・30-year・ Floating Rate Bonds
・
・Medium-term (1~ )・Long-term ( ~15-year)・Super Long-term (15~55-year)・
(5~
・2-year・5-year・・10-year・15-year・30-year・
・Medium-term (2~ )・Long-term, Super Long-term ( ~50-year)・
(2~
Without reopening
・2-year ・2-year・3-year・5-year・
- - -
Note1: Reopening issuance only in case nominal coupon is the same as that of previous issue.Note2: “Reopening method in principle”Note3: Green Bonds are included.
’ debt management authorities
Fig. c5-9 Average Maturity
Chapter 1 G
overnment B
onds (JGB
s)1 Prim
ary Market for G
overnment B
onds

Ⅱ Framework
61
The stock-base average maturity is an indicator of overall outstanding government bonds, computed by weighted-averaging remaining maturities for outstanding government bonds. On the other hand, the following indicator is
are scheduled to be refunded or mature within one year and three years.In the U.S., Germany and France that increased mainly short-term bond issuances to raise funds required for responding to the COVID-19 spread, the proportions at the end of December 2020 increased year on year. In the U.S.,
spread, however, the proportion for those maturing within one year declined.
❼ Breakdown by Government Bond Holders
approximately 50% in Germany and France (Fig. c5-11).
Note 1: Data for each year are as of December.
Fig. c5-10 Proportion of outstanding ith remaining maturity ithin 1 year and 3 years
government-controlled public institutions, trust funds, etc. but include non-marketable government bonds held by the Federal Government Employee Retirement Funds, etc. In Germany and France, the total covers municipal bonds (the central bank’
France: Banque de France
Fig. c5-11 Breakdown of government bonds by holder category
1 Primary M
arket for Governm
ent Bonds
Chapter 1 G
overnment B
onds (JGB
s)
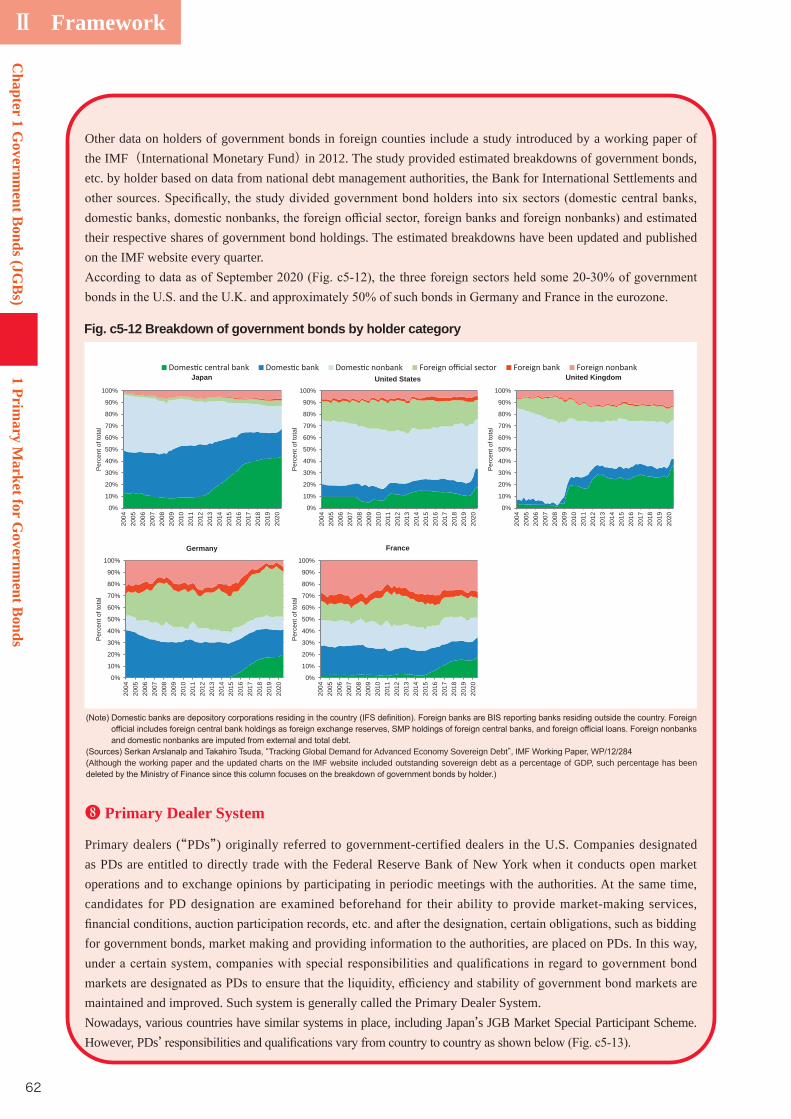
Ⅱ Framework
62
Other data on holders of government bonds in foreign counties include a study introduced by a working paper of the IMF(International Monetary Fund) in 2012. The study provided estimated breakdowns of government bonds, etc. by holder based on data from national debt management authorities, the Bank for International Settlements and
their respective shares of government bond holdings. The estimated breakdowns have been updated and published on the IMF website every quarter.
❽ Primary Dealer System
Primary dealers (“PDs”) originally referred to government-certified dealers in the U.S. Companies designated as PDs are entitled to directly trade with the Federal Reserve Bank of New York when it conducts open market operations and to exchange opinions by participating in periodic meetings with the authorities. At the same time, candidates for PD designation are examined beforehand for their ability to provide market-making services,
for government bonds, market making and providing information to the authorities, are placed on PDs. In this way,
maintained and improved. Such system is generally called the Primary Dealer System.Nowadays, various countries have similar systems in place, including Japan’s JGB Market Special Participant Scheme. However, PDs’
0%
10%
20%
30%
40%
50%
60%
70%
80%
90%
100%
2004
2005
2006
2007
2008
2009
2010
2011
2012
2013
2014
2015
2016
2017
2018
2019
2020
Per
cent
of t
otal
United States
1
0%
10%
20%
30%
40%
50%
60%
70%
80%
90%
100%
2004
2005
2006
2007
2008
2009
2010
2011
2012
2013
2014
2015
2016
2017
2018
2019
2020
Per
cent
of t
otal
United Kingdom
1
0%
10%
20%
30%
40%
50%
60%
70%
80%
90%
100%
2004
2005
2006
2007
2008
2009
2010
2011
2012
2013
2014
2015
2016
2017
2018
2019
2020
latot fo tnecreP
Germany
0%
10%
20%
30%
40%
50%
60%
70%
80%
90%
100%
2004
2005
2006
2007
2008
2009
2010
2011
2012
2013
2014
2015
2016
2017
2018
2019
2020
Per
cent
of t
otal
France
Do t k Do a k Do a Foreig se Foreig k Foreig
0%
10%
20%
30%
40%
50%
60%
70%
80%
90%
100%
2004
2005
2006
2007
2008
2009
2010
2011
2012
2013
2014
2015
2016
2017
2018
2019
2020
latot fo tnecreP
Japan
1
“Tracking Global Demand for Advanced Economy Sovereign Debt”(Although the working paper and the updated charts on the IMF website included outstanding sovereign debt as a percentage of GDP, such percentage has been
Fig. c5-12 Breakdown of government bonds by holder category
Chapter 1 G
overnment B
onds (JGB
s)1 Prim
ary Market for G
overnment B
onds
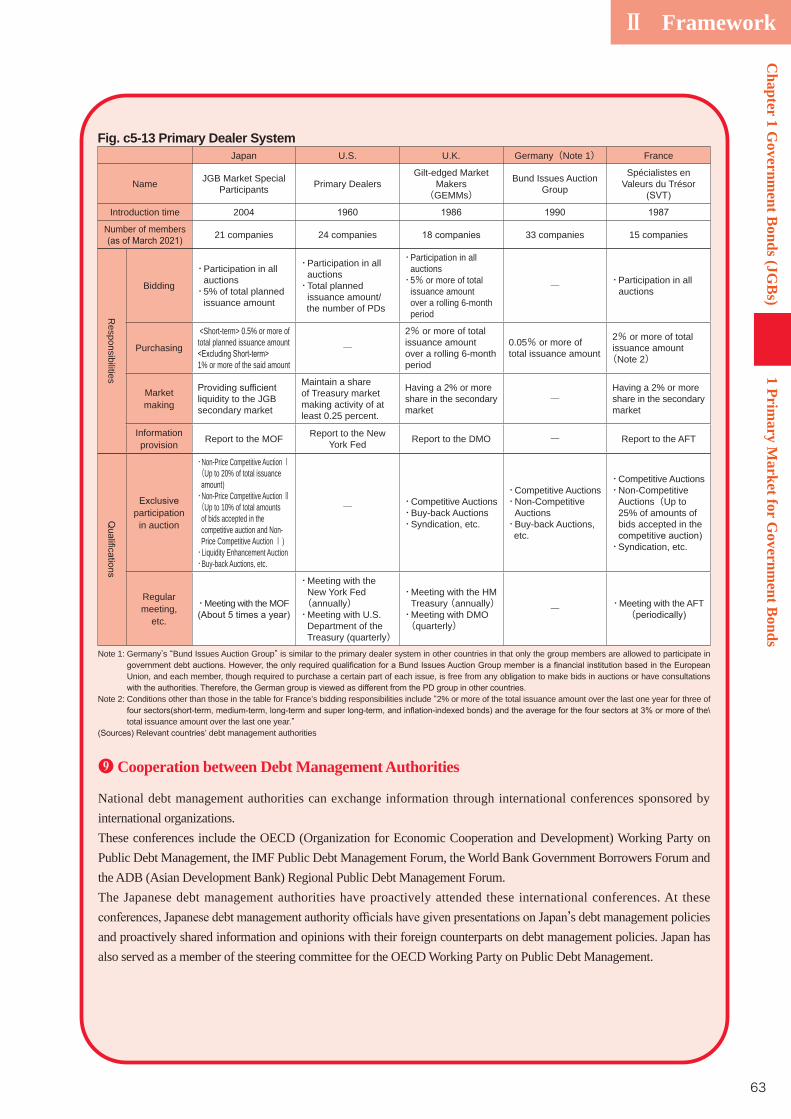
Ⅱ Framework
63
❾ Cooperation between Debt Management Authorities
National debt management authorities can exchange information through international conferences sponsored by international organizations.These conferences include the OECD (Organization for Economic Cooperation and Development) Working Party on Public Debt Management, the IMF Public Debt Management Forum, the World Bank Government Borrowers Forum and the ADB (Asian Development Bank) Regional Public Debt Management Forum.The Japanese debt management authorities have proactively attended these international conferences. At these
’s debt management policies and proactively shared information and opinions with their foreign counterparts on debt management policies. Japan has also served as a member of the steering committee for the OECD Working Party on Public Debt Management.
Fig. c5-13 Primary Dealer SystemJapan U.S. U.K. Germany(Note 1) France
Name JGB Market Special Participants Primary Dealers
Gilt-edged Market Makers
(GEMMs)Bund Issues Auction
Group
Spécialistes en Valeurs du Trésor
Introduction time 2004
Number of members 21 companies 24 companies 33 companies 15 companies
Responsibilities
Bidding
・ Participation in all auctions・ 5% of total planned
issuance amount
・ Participation in all auctions・ Total planned
issuance amount/ the number of PDs
・ Participation in all auctions・ 5% or more of total
issuance amount over a rolling 6-month period
― ・Participation in all auctions
Purchasing
<Short-term> 0.5% or more oftotal planned issuance amount
1% or more of the said amount
―2% or more of total issuance amount over a rolling 6-month period
0.05% or more oftotal issuance amount
2% or more of total issuance amount(Note 2)
Market making liquidity to the JGB
secondary market
Maintain a share of Treasury market making activity of at least 0.25 percent.
Having a 2% or more share in the secondary market
―Having a 2% or more share in the secondary market
Information provision Report to the MOF Report to the New
York Fed Report to the DMO ― Report to the AFT
participation in auction
・Non-Price Competitive Auction Ⅰ (Up to 20% of total issuance
・Non-Price Competitive Auction Ⅱ (Up to 10% of total amounts of bids accepted in the competitive auction and Non-Price Competitive Auction Ⅰ・Liquidity Enhancement Auction・Buy-back Auctions, etc.
― ・ Competitive Auctions・ Buy-back Auctions・ Syndication, etc.
・ Competitive Auctions・ Non-Competitive
Auctions・ Buy-back Auctions, etc.
・ Competitive Auctions・ Non-Competitive
Auctions(Up to 25% of amounts of bids accepted in the
・Syndication, etc.
Regular meeting,
etc.
・Meeting with the MOF
・ Meeting with the New York Fed(annually)・ Meeting with U.S.
Department of the Treasury (quarterly)
・ Meeting with the HM Treasury (annually)・ Meeting with DMO (quarterly)
― ・Meeting with the AFT(
Note 1: Germany’s “Bund Issues Auction Group” is similar to the primary dealer system in other countries in that only the group members are allowed to participate in
Union, and each member, though required to purchase a certain part of each issue, is free from any obligation to make bids in auctions or have consultations
Note 2: Conditions other than those in the table for France’s bidding responsibilities include “2% or more of the total issuance amount over the last one year for three of
total issuance amount over the last one year.”’ debt management authorities
1 Primary M
arket for Governm
ent Bonds
Chapter 1 G
overnment B
onds (JGB
s)
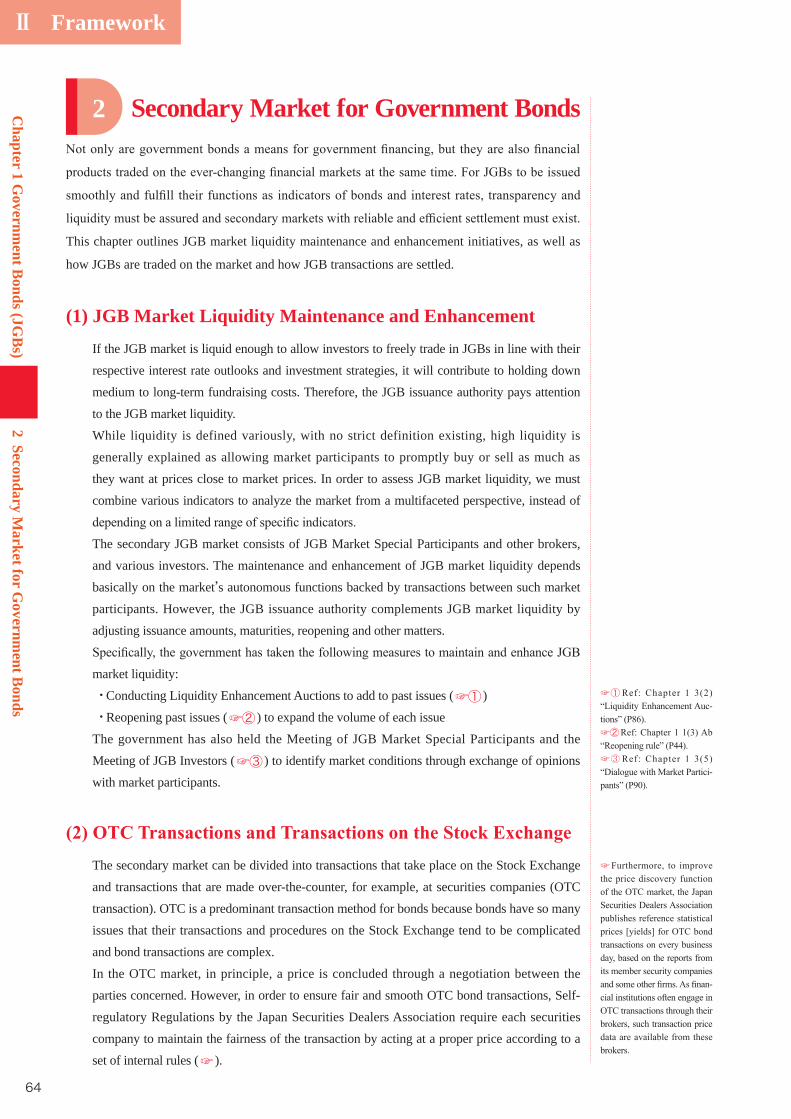
Ⅱ Framework
64
Chapter 1 G
overnment B
onds (JGB
s)2
Secondary Market for G
overnment B
onds
Secondary Market for Government Bonds
This chapter outlines JGB market liquidity maintenance and enhancement initiatives, as well as
how JGBs are traded on the market and how JGB transactions are settled.
(1) JGB Market Liquidity Maintenance and EnhancementIf the JGB market is liquid enough to allow investors to freely trade in JGBs in line with their
respective interest rate outlooks and investment strategies, it will contribute to holding down
medium to long-term fundraising costs. Therefore, the JGB issuance authority pays attention
to the JGB market liquidity.
While liquidity is defined variously, with no strict definition existing, high liquidity is
generally explained as allowing market participants to promptly buy or sell as much as
they want at prices close to market prices. In order to assess JGB market liquidity, we must
combine various indicators to analyze the market from a multifaceted perspective, instead of
The secondary JGB market consists of JGB Market Special Participants and other brokers,
and various investors. The maintenance and enhancement of JGB market liquidity depends
basically on the market’s autonomous functions backed by transactions between such market
participants. However, the JGB issuance authority complements JGB market liquidity by
adjusting issuance amounts, maturities, reopening and other matters.
market liquidity:
・Conducting Liquidity Enhancement Auctions to add to past issues (☞① )
・Reopening past issues (☞② ) to expand the volume of each issue
The government has also held the Meeting of JGB Market Special Participants and the
Meeting of JGB Investors (☞③ ) to identify market conditions through exchange of opinions
with market participants.
The secondary market can be divided into transactions that take place on the Stock Exchange
and transactions that are made over-the-counter, for example, at securities companies (OTC
transaction). OTC is a predominant transaction method for bonds because bonds have so many
issues that their transactions and procedures on the Stock Exchange tend to be complicated
and bond transactions are complex.
In the OTC market, in principle, a price is concluded through a negotiation between the
parties concerned. However, in order to ensure fair and smooth OTC bond transactions, Self-
regulatory Regulations by the Japan Securities Dealers Association require each securities
company to maintain the fairness of the transaction by acting at a proper price according to a
set of internal rules (☞ ).
2
☞
-
☞①-
☞②
☞③-
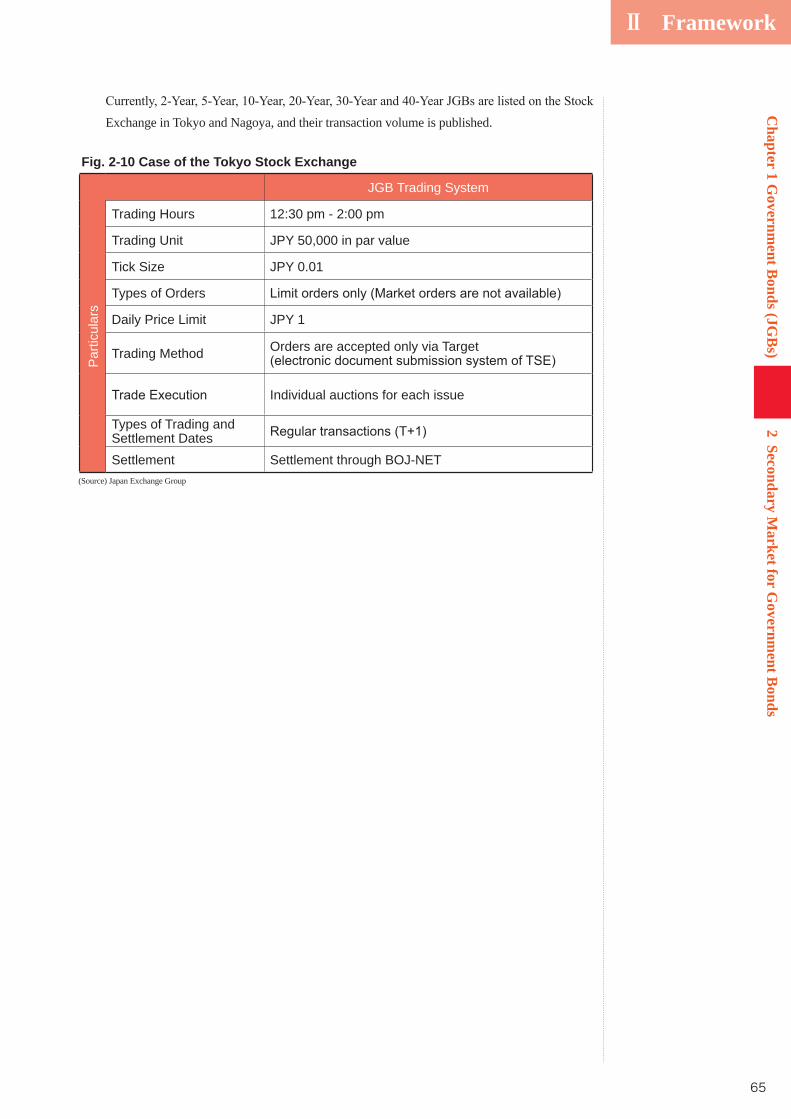
Ⅱ Framework
65
Chapter 1 G
overnment B
onds (JGB
s)2
Secondary Market for G
overnment B
onds
Exchange in Tokyo and Nagoya, and their transaction volume is published.
Fig. 2-10 Case of the Tokyo Stock Exchange
JGB Trading System
Par
ticul
ars
Trading Hours 12:30 pm - 2:00 pm
Trading Unit JPY 50,000 in par value
Tick Size JPY 0.01
Types of Orders
Daily Price Limit JPY 1
Trading Method Orders are accepted only via Target
Individual auctions for each issue
Types of Trading and Settlement DatesSettlement Settlement through BOJ-NET
(Source) Japan Exchange Group

Ⅱ Framework
66
Chapter 1 G
overnment B
onds (JGB
s)2
Secondary Market for G
overnment B
onds
(3) Improvements to the JGB Transaction Settlement SystemAs for the book-entry transfer system for JGB transactions on the secondary JGB market, the
Bank of Japan is designated as the transfer institution under the “Act on Book-Entry Transfer
of Corporate Bonds and Shares” and operates the system. The system uses book-entry transfer
for JGB delivery accompanying JGB transactions between market participants. Practically,
settlements are conducted through the BOJ-NET JGB Services in which many private
The MOF has developed the JGB transaction settlement system in cooperation with the BOJ
section reviews the deliberations concerning the JGB transaction settlement system to date.
In 1994, the BOJ-NET adopted Delivery-versus-Payment (DVP) settlement (☞① ), and in
January 2001 changed from the Designated-time Net Settlement (DTNS) (☞② ) to Real-Time
Gross Settlement (RTGS) (☞③ ), to prevent the occurrence of any systemic risk event.
The BOJ began to construct a new system (hereinafter referred to as the New BOJ-NET) in
New BOJ-NET came into full operation in 2015. Its operation hours were extended until 21:00
in 2016.
“Fail” refers to a case of non-delivery of specific securities by the scheduled time due to
reasons other than the creditworthiness of the relevant trade counterparty. “Fails Practice” refers to a market routine that prescribes general clerical procedures to be performed between
the parties in a Fail instance and provides as a principle that a Fail event does not automatically
imply default (☞① ).
Fails Practice was introduced in January 2001 when the RTGS system for JGB settlement
was adopted in Japan. Back then, a fair number of parties neither understood the need for
Fails Practice nor had the clerical processing frameworks in place, which prevented Fails
Practice from becoming established procedure. However, in connection with the collapse
of the investment bank Lehman Brothers in September 2008, default contagion caused an
unprecedented surge in Fail events. Subsequently, as a means for market participants to reduce
Fail risk, avoiding new repurchase transactions altogether became increasingly widespread,
which reduced liquidity not only in the repurchase (repo) market but also in the JGB market.
Based on such experience, Fails Practice was revised since November 2010 to introduce Fails
Charge (☞② ☞③ ).
C. Shortening of settlement periods
An increase in unsettled transactions through defaults and fails after the September 2008
global financial crisis prompted market participants to strongly perceive settlement risks,
leading once again to the realization that shortening settlement periods would be indispensable
☞①
-
-
☞②
-
-
-
☞③
☞①
☞② -
-
☞③
-

Ⅱ Framework
67
Chapter 1 G
overnment B
onds (JGB
s)2
Secondary Market for G
overnment B
onds
the Working Group on Shortening of JGB Settlement Cycle established as a subordinate organ
of the Promotion Meeting for Reform of the Securities Clearing and Settlement (☞① ), the
to T+1 on May 1, 2018 (☞② ).
D.
Together with the change in January 2001 to JGB settlement by RTGS, Bilateral Netting (☞① )
was also introduced. Since in the JGB market outright transactions and repurchase transactions
are being carried out constantly by multiple market participants, settling all transactions by
and also compel consideration of counterparty risk when making transactions. With regard
to transactions contracted between market participants, this situation gave rise to the demand
for an arrangement in which payments and JGBs deliveries of JGB transactions are netted
under the guarantee of settlement implementations by a clearing institution taking the position
between parties (☞② ).
Securities Clearing Corporation or JSCC at present) (☞③ )) was established as the Central
Counterparty (CCP) for the JGB market. As a result, the relation of rights and obligations
now exist between the JGBCC and each participant, with each party’s counterparty risk now
posed by the JGBCC instead of the transaction counterparty. Moreover, since participants
and the JGBCC settle only the net balance of funds and identical JGB issues, the amounts of
settlements, and funds and JGBs necessary for settlement, as well as their exposures during
Later, clearing functions were improved through the enhancement of JGBCC governance and
the participation in the JGBCC by trust banks that account for a large share of JGB transaction
settlements.
☞①
--
☞②
-
☞①
--
-
☞②
-
-
☞③
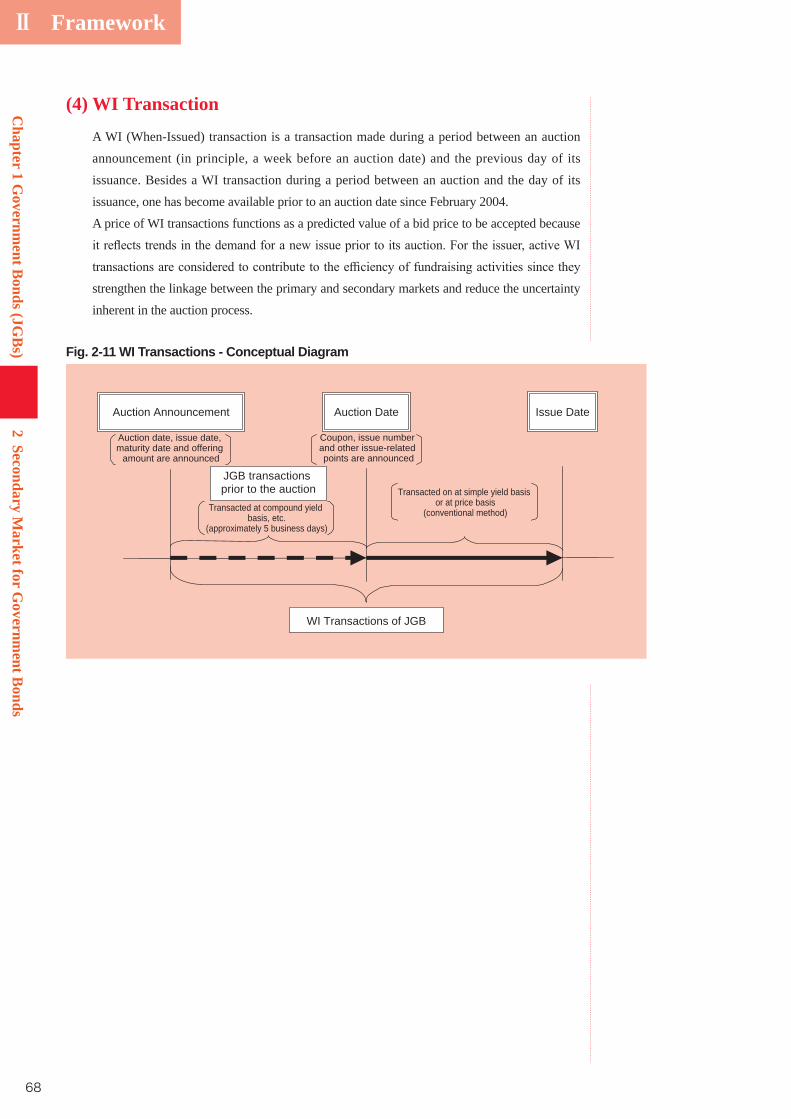
Ⅱ Framework
68
Chapter 1 G
overnment B
onds (JGB
s)2
Secondary Market for G
overnment B
onds
(4) WI TransactionA WI (When-Issued) transaction is a transaction made during a period between an auction
announcement (in principle, a week before an auction date) and the previous day of its
issuance. Besides a WI transaction during a period between an auction and the day of its
issuance, one has become available prior to an auction date since February 2004.
A price of WI transactions functions as a predicted value of a bid price to be accepted because
strengthen the linkage between the primary and secondary markets and reduce the uncertainty
inherent in the auction process.
Issue DateAuction DateAuction Announcement
Auction date, issue date, maturity date and offering
amount are announced
Coupon, issue number and other issue-related points are announced
WI Transactions of JGB
Transacted on at simple yield basis or at price basis
(conventional method)
JGB transactions prior to the auction
Transacted at compound yield basis, etc.
(approximately 5 business days)
Fig. 2-11 WI Transactions - Conceptual Diagram
Ⅱ Framework
69
Chapter 1 G
overnment B
onds (JGB
s)2
Secondary Market for G
overnment B
onds
☞① -
☞②
--
☞③-
-
☞④
-
☞⑤-
(5) Bond Gensaki
A. Bond Gensaki Transactions
Bond Gensaki Transactions are bond sales transactions in which the traded bonds are traded
advance between the parties to the transaction.
Bond Gensaki Transactions were a principal fundraising means for financial institutions
widely accepted by investors later, however, Bond Gensaki Transactions have been replaced
by Bond-Lending Transactions and other means because Bond Gensaki Transactions are Gensaki
Transactions were thus limited to those trading mainly in Treasury Bills and Financing Bills
(today’s Treasury Discount Bills) free from the securities transaction tax.
Following a recommendation from the “Sub-Council on the Internationalization of the Yen” under the Committee on Foreign Exchange and Other Transactions that Japan’s repurchase
market promote transaction formats consistent with global standards (☞① ) and the abolition
of the securities transaction tax in March 1999, a new Bond Gensaki Transaction format was
introduced in April 2001 that incorporated risk management methods such as the use of a
package settlement provision (☞② ), margin call feature (☞③ ), and substitution (☞④ ).
Based on discussions at the Working Group on Shortening of JGB Settlement Cycle
established in September 2009 (☞⑤ ), T+1 was implemented as the standard settlement cycle
for JGB transactions on May 1, 2018. On this occasion, the settlement cycle for GC (General
Collateral) repurchase transactions using unspecified bonds as collateral was shortened
from T+1 to T+0, with new Gensaki transactions used for developing GC repos under the
Subsequent Collateral Allocation Method, leading new Gensaki transactions to replace Bond-
Lending Transactions.
Since November 2002, the BOJ has introduced JGB Gensaki operations using new Gensaki
transactions in place of operations using the traditional Bond-Lending Transactions.
Bond-Lending Transactions are Loan Transaction that one party (a lender) lends bonds to a
kind and in the same amount to the lender, thereby settling the lending transaction.
Bond-Lending Transactions were introduced in 1989 concurrent with the deregulation of
the short-selling of bonds to promote the development of the secondary bond market. Bond-
Lending Transactions were for the most part fully uncollateralized initially because regulations
were imposed on interest on cash collateral to prevent competition with the Bond Gensaki
Transactions and because collateralized Bond-Lending Transactions using non-cash collateral
such as substitute securities were shunned by market participants due to complicated clerical
work.
The collapse of the Barings Bank in February 1995 served as a fresh reminder of the
risk associated with unsecured dealings. In order to mitigate credit risk, Bond-Lending
Transactions underwent a review towards collateralization, modeled after the U.S. repurchase
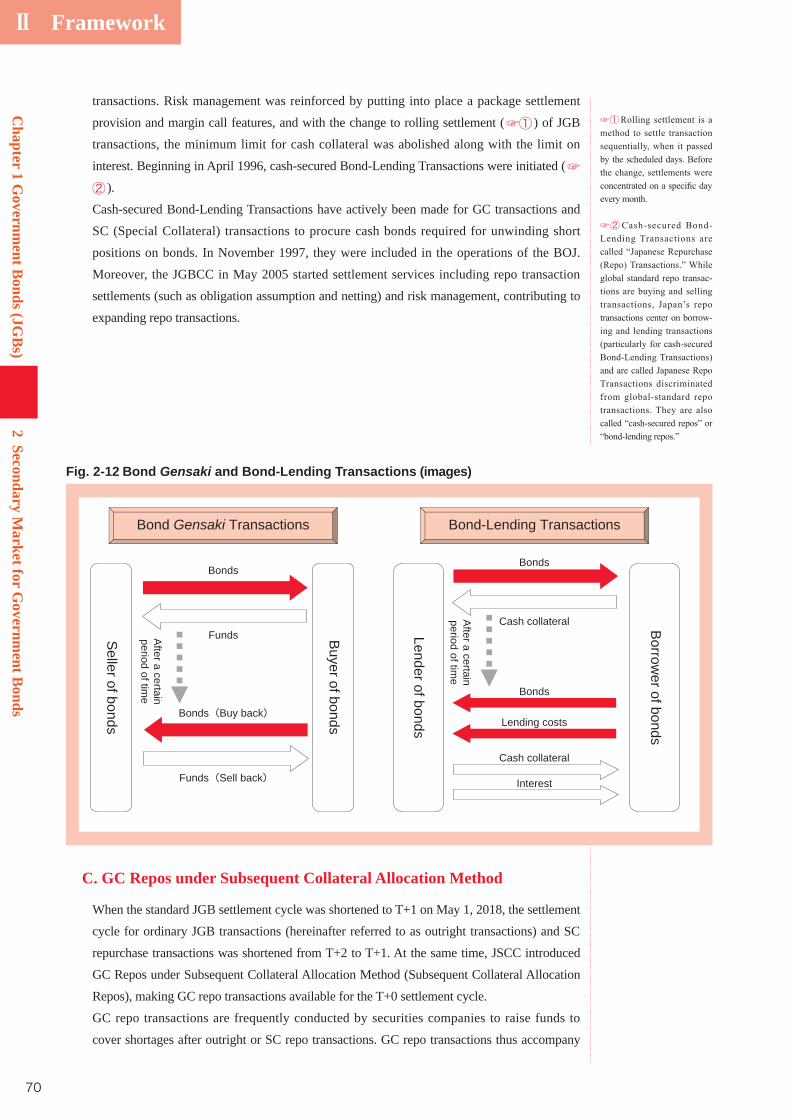
Ⅱ Framework
70
Chapter 1 G
overnment B
onds (JGB
s)2
Secondary Market for G
overnment B
onds
transactions. Risk management was reinforced by putting into place a package settlement
provision and margin call features, and with the change to rolling settlement (☞① ) of JGB
transactions, the minimum limit for cash collateral was abolished along with the limit on
interest. Beginning in April 1996, cash-secured Bond-Lending Transactions were initiated (☞② ).
Cash-secured Bond-Lending Transactions have actively been made for GC transactions and
SC (Special Collateral) transactions to procure cash bonds required for unwinding short
positions on bonds. In November 1997, they were included in the operations of the BOJ.
Moreover, the JGBCC in May 2005 started settlement services including repo transaction
settlements (such as obligation assumption and netting) and risk management, contributing to
expanding repo transactions.
C. GC Repos under Subsequent Collateral Allocation Method
When the standard JGB settlement cycle was shortened to T+1 on May 1, 2018, the settlement
cycle for ordinary JGB transactions (hereinafter referred to as outright transactions) and SC
repurchase transactions was shortened from T+2 to T+1. At the same time, JSCC introduced
GC Repos under Subsequent Collateral Allocation Method (Subsequent Collateral Allocation
Repos), making GC repo transactions available for the T+0 settlement cycle.
GC repo transactions are frequently conducted by securities companies to raise funds to
cover shortages after outright or SC repo transactions. GC repo transactions thus accompany
☞①
☞②
-
-
Bond-Lending Transactions
Bonds
Funds
Bonds(Buy back)
Funds(Sell back)
After a certain
period of time
Bond Gensaki Transactions
After a certain
period of time
Bonds
Cash collateral
Lending costs
Bonds
Cash collateral
Interest
Borrow
er of bonds
Lender of bonds
Buyer of bonds
Seller of bonds
Fig. 2-12 Bond Gensaki and Bond-Lending Transactions (images)
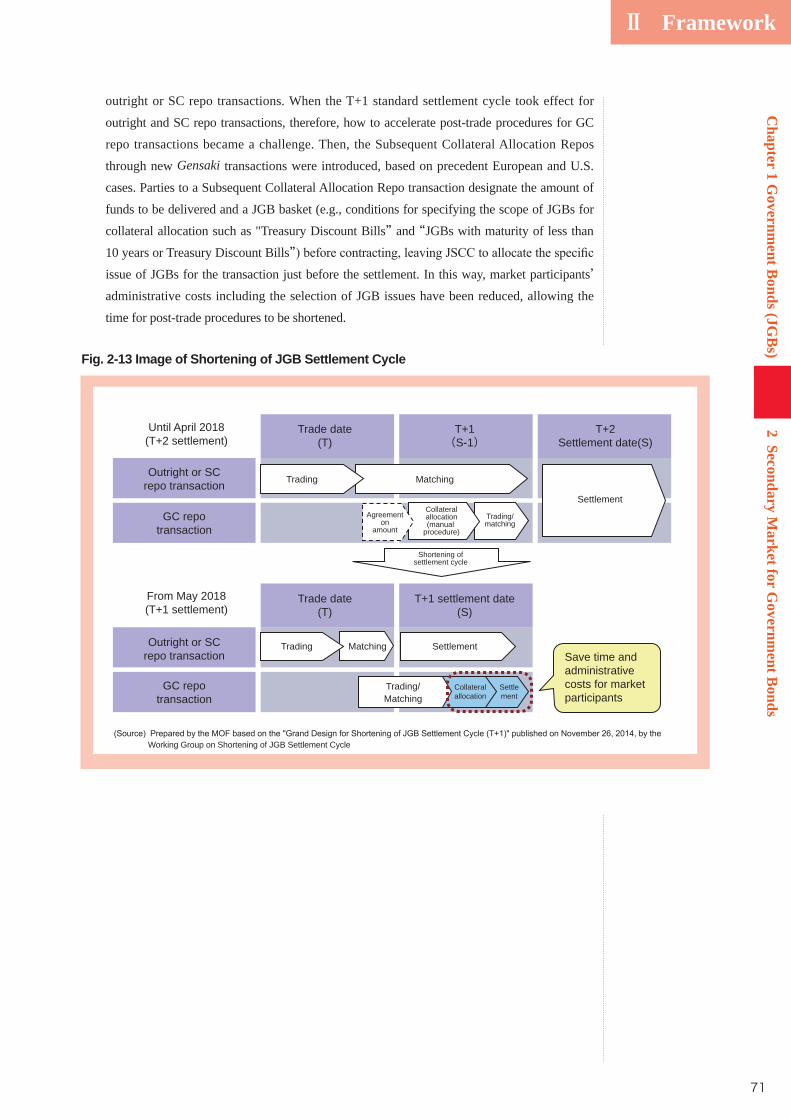
Ⅱ Framework
71
Fig. 2-13 Image of Shortening of JGB Settlement Cycle
Until April 2018(T+2 settlement)
Trade date(T)
Outright or SCrepo transaction
GC repotransaction
From May 2018(T+1 settlement)
Outright or SCrepo transaction
GC repotransaction
Trading Matching
SettlementAgreement
onamount
Trading Matching Settlement
Trading/Matching
Collateralallocation
Settlement
Save time and administrative costs for market participants
Collateralallocation(manual
procedure)
Shortening ofsettlement cycle
Trading/matching
T+1(S-1)
Trade date(T)
T+1 settlement date(S)
T+2Settlement date(S)
Working Group on Shortening of JGB Settlement Cycle
Chapter 1 G
overnment B
onds (JGB
s)2
Secondary Market for G
overnment B
onds
outright or SC repo transactions. When the T+1 standard settlement cycle took effect for
outright and SC repo transactions, therefore, how to accelerate post-trade procedures for GC
repo transactions became a challenge. Then, the Subsequent Collateral Allocation Repos
through new Gensaki transactions were introduced, based on precedent European and U.S.
cases. Parties to a Subsequent Collateral Allocation Repo transaction designate the amount of
funds to be delivered and a JGB basket (e.g., conditions for specifying the scope of JGBs for
collateral allocation such as "Treasury Discount Bills” and “JGBs with maturity of less than
10 years or Treasury Discount Bills”issue of JGBs for the transaction just before the settlement. In this way, market participants’ administrative costs including the selection of JGB issues have been reduced, allowing the
time for post-trade procedures to be shortened.
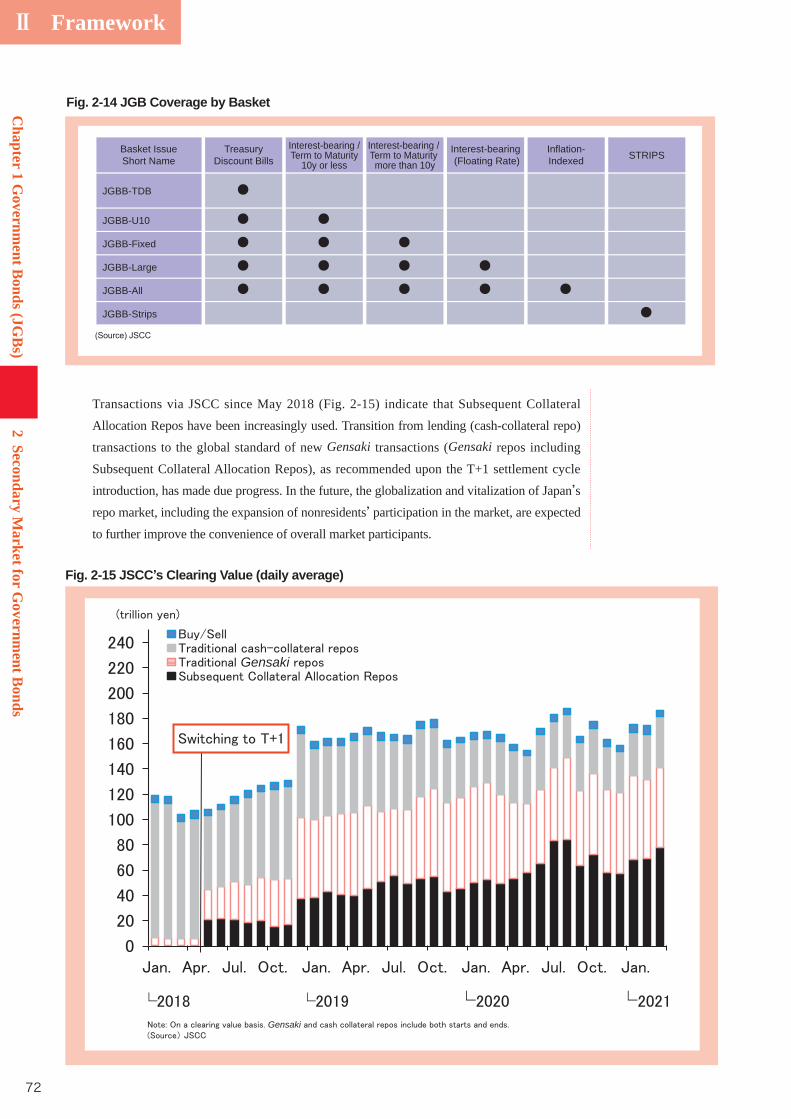
Ⅱ Framework
72
Chapter 1 G
overnment B
onds (JGB
s)2
Secondary Market for G
overnment B
onds
Transactions via JSCC since May 2018 (Fig. 2-15) indicate that Subsequent Collateral
Allocation Repos have been increasingly used. Transition from lending (cash-collateral repo)
transactions to the global standard of new Gensaki transactions (Gensaki repos including
Subsequent Collateral Allocation Repos), as recommended upon the T+1 settlement cycle
introduction, has made due progress. In the future, the globalization and vitalization of Japan’s
repo market, including the expansion of nonresidents’ participation in the market, are expected
to further improve the convenience of overall market participants.
Fig. 2-15 JSCC s Clearing Value (daily average)
Gensaki
Gensaki
Basket IssueShort Name
JGBB-TDB
JGBB-U10
JGBB-Fixed
JGBB-Large
JGBB-All
JGBB-Strips
TreasuryDiscount Bills
Interest-bearing /Term to Maturity
10y or less
Interest-bearing / Term to Maturity more than 10y
Interest-bearing (Floating Rate)
Inflation-Indexed STRIPS
Fig. 2-14 JGB Coverage by Basket
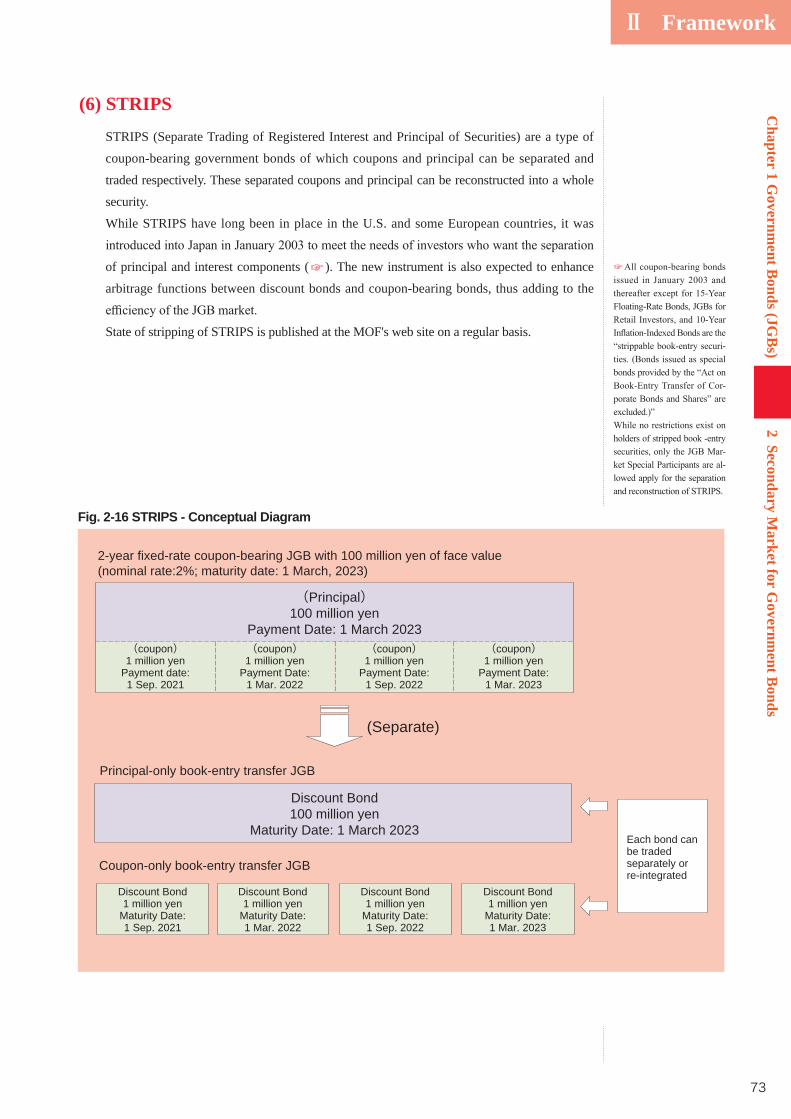
Ⅱ Framework
73
Chapter 1 G
overnment B
onds (JGB
s)2
Secondary Market for G
overnment B
onds
(6) STRIPSSTRIPS (Separate Trading of Registered Interest and Principal of Securities) are a type of
coupon-bearing government bonds of which coupons and principal can be separated and
traded respectively. These separated coupons and principal can be reconstructed into a whole
security.
While STRIPS have long been in place in the U.S. and some European countries, it was
of principal and interest components (☞ ). The new instrument is also expected to enhance
arbitrage functions between discount bonds and coupon-bearing bonds, thus adding to the
State of stripping of STRIPS is published at the MOF's web site on a regular basis.
☞
-
-
--
(coupon)1 million yen
Payment date:1 Sep. 2021
(Separate)
Discount Bond100 million yen
Maturity Date: 1 March 2023
Principal-only book-entry transfer JGB
Coupon-only book-entry transfer JGB
(Principal)100 million yen
Payment Date: 1 March 2023
2-year fixed-rate coupon-bearing JGB with 100 million yen of face value (nominal rate:2%; maturity date: 1 March, 2023)
(coupon)1 million yen
Payment Date:1 Mar. 2022
(coupon)1 million yen
Payment Date:1 Sep. 2022
(coupon)1 million yen
Payment Date:1 Mar. 2023
Discount Bond1 million yen
Maturity Date:1 Sep. 2021
Discount Bond1 million yen
Maturity Date:1 Mar. 2022
Discount Bond1 million yen
Maturity Date:1 Sep. 2022
Discount Bond1 million yen
Maturity Date:1 Mar. 2023
Each bond can be traded separately or re-integrated
Fig. 2-16 STRIPS - Conceptual Diagram
Ⅱ Framework
74
Chapter 1 G
overnment B
onds (JGB
s)2
Secondary Market for G
overnment B
onds
JGB futures are used for hedging risks associated with JGB trading (☞① ) and serve as a
bond market trend indicator.
While there are four types of JGB futures –5-year, 10-year, 20-year and mini 10-year JGB
futures (Fig. 2-17), 10-year JGB futures account for most of the JGB futures trading volume.
All JGB futures contracts are listed on the Osaka Exchange. 10-year JGB futures are listed on
the Singapore Exchange as well as the Osaka Exchange.
In JGB futures trading, trading instruments, trading units, the last trading day (☞② ), the
delivery settlement date (☞③ ) and other trading terms and conditions are standardized on
the premise that many unspecified market participants trade in JGB futures on securities
exchanges. Particularly, trading instruments are not actually issued JGBs but notional JGBs
called “standardized instruments” (☞④ ). Only by paying margin as set by the exchange,
any party can trade in JGB futures. Any party can implement a massive futures transaction by
paying margin money that is far less than the full transaction value. This is a feature of futures
trading.
For settling a futures transaction, a party may at any time before the last trading day make
are used for most of futures trading.
☞⑤ ) will be
delivered in place of notional JGBs. As a standardized instrument and a delivery-qualified
for adjusting a delivery price. This rate is called “conversion factor.”price is computed by multiplying a futures price and a conversion factor for a delivery-
☞⑥ ).
has the right to select an issue for delivery. An issue costing the delivering party least is called
the cheapest issue (☞⑦by selecting the cheapest issue for delivery, the cheapest issue is usually selected for delivery.
Therefore, futures prices tend to be closely linked to prices of the cheapest issues.
☞①
-
-
☞②
☞③
-
☞④ -
-
☞⑤ -
☞⑥
-
☞⑦
--
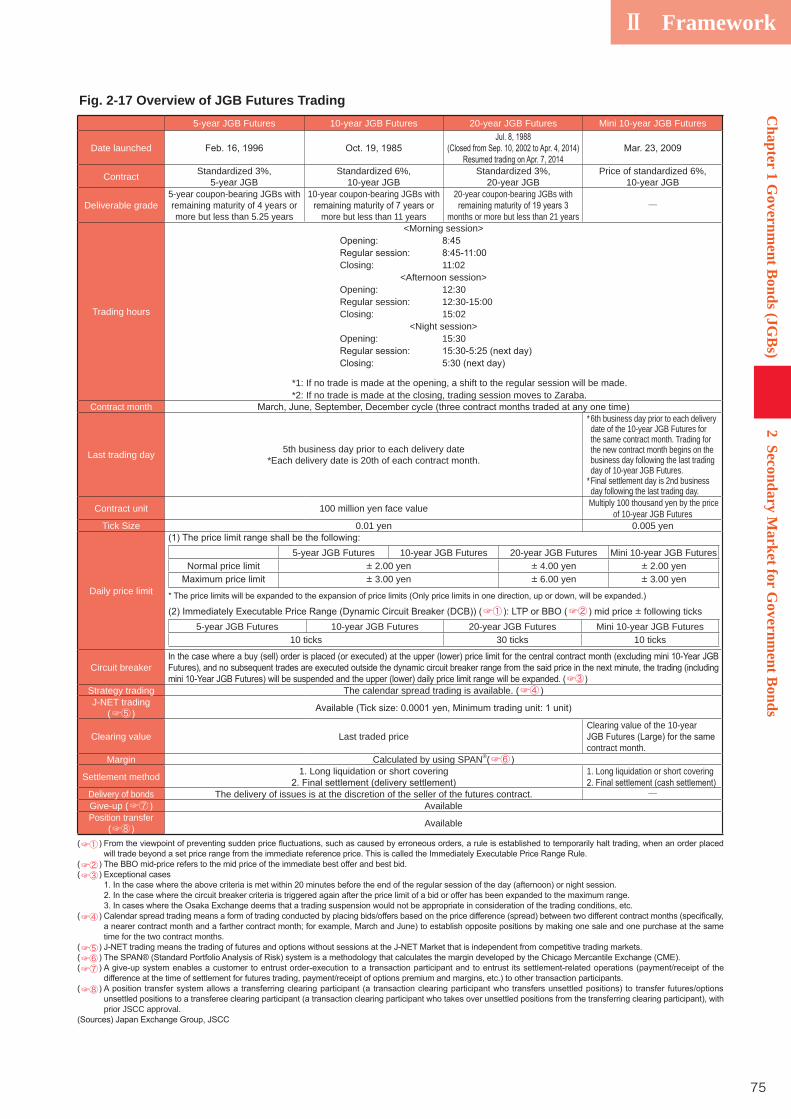
Ⅱ Framework
75
Chapter 1 G
overnment B
onds (JGB
s)2
Secondary Market for G
overnment B
onds
Fig. 2-17 Overview of JGB Futures Trading5-year JGB Futures 10-year JGB Futures 20-year JGB Futures Mini 10-year JGB Futures
Date launched
Contract Standardized 3%, 5-year JGB
Standardized 6%, 10-year JGB
Standardized 3%, 20-year JGB
Price of standardized 6%, 10-year JGB
Deliverable grade5-year coupon-bearing JGBs with remaining maturity of 4 years or more but less than 5.25 years
10-year coupon-bearing JGBs with
more but less than 11 years
20-year coupon-bearing JGBs with
months or more but less than 21 years―
Trading hours
<Morning session>
Closing: 11:02<Afternoon session>
Opening: 12:30 Regular session: 12:30-15:00 Closing: 15:02
<Night session> Opening: 15:30
*1: If no trade is made at the opening, a shift to the regular session will be made. *2: If no trade is made at the closing, trading session moves to Zaraba.
Contract month
Last trading day 5th business day prior to each delivery date*Each delivery date is 20th of each contract month.
* 6th business day prior to each delivery date of the 10-year JGB Futures for the same contract month. Trading for the new contract month begins on the business day following the last trading day of 10-year JGB Futures.
* Final settlement day is 2nd business day following the last trading day.
Contract unit 100 million yen face value Multiply 100 thousand yen by the price of 10-year JGB Futures
Tick Size 0.01 yen 0.005 yen
Daily price limit
5-year JGB Futures 10-year JGB Futures 20-year JGB Futures Mini 10-year JGB FuturesNormal price limit ± 2.00 yen ± 4.00 yen ± 2.00 yen
± 3.00 yen ± 6.00 yen ± 3.00 yen
☞① ☞② ± following ticks5-year JGB Futures 10-year JGB Futures 20-year JGB Futures Mini 10-year JGB Futures
10 ticks 30 ticks 10 ticks
Circuit breaker☞③
Strategy trading The calendar spread trading is available. (☞④J-NET trading
(☞⑤
Clearing value Last traded priceClearing value of the 10-year
contract month.Margin Calculated by using SPAN®(☞⑥
Settlement method 1. Long liquidation or short covering 1. Long liquidation or short covering
Delivery of bonds The delivery of issues is at the discretion of the seller of the futures contract. ―Give-up (☞⑦ AvailablePosition transfer
(☞⑧ Available
(☞①
(☞②(☞③
(☞④
time for the two contract months. (☞⑤(☞⑥(☞⑦
(☞⑧
prior JSCC approval.
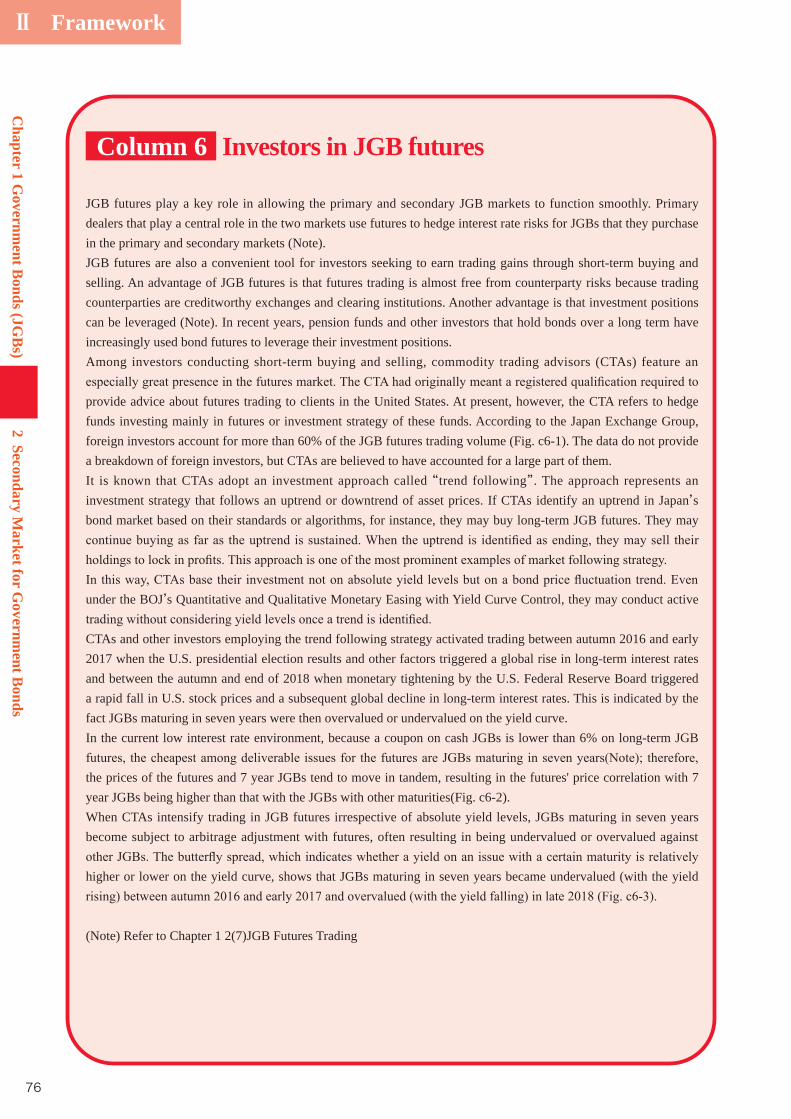
Ⅱ Framework
76
Chapter 1 G
overnment B
onds (JGB
s)2
Secondary Market for G
overnment B
onds
JGB futures play a key role in allowing the primary and secondary JGB markets to function smoothly. Primary dealers that play a central role in the two markets use futures to hedge interest rate risks for JGBs that they purchase in the primary and secondary markets (Note).JGB futures are also a convenient tool for investors seeking to earn trading gains through short-term buying and selling. An advantage of JGB futures is that futures trading is almost free from counterparty risks because trading counterparties are creditworthy exchanges and clearing institutions. Another advantage is that investment positions can be leveraged (Note). In recent years, pension funds and other investors that hold bonds over a long term have increasingly used bond futures to leverage their investment positions.Among investors conducting short-term buying and selling, commodity trading advisors (CTAs) feature an
provide advice about futures trading to clients in the United States. At present, however, the CTA refers to hedge funds investing mainly in futures or investment strategy of these funds. According to the Japan Exchange Group, foreign investors account for more than 60% of the JGB futures trading volume (Fig. c6-1). The data do not provide a breakdown of foreign investors, but CTAs are believed to have accounted for a large part of them.It is known that CTAs adopt an investment approach called “trend following”. The approach represents an investment strategy that follows an uptrend or downtrend of asset prices. If CTAs identify an uptrend in Japan’s bond market based on their standards or algorithms, for instance, they may buy long-term JGB futures. They may
under the BOJ’s Quantitative and Qualitative Monetary Easing with Yield Curve Control, they may conduct active
CTAs and other investors employing the trend following strategy activated trading between autumn 2016 and early 2017 when the U.S. presidential election results and other factors triggered a global rise in long-term interest rates and between the autumn and end of 2018 when monetary tightening by the U.S. Federal Reserve Board triggered a rapid fall in U.S. stock prices and a subsequent global decline in long-term interest rates. This is indicated by the fact JGBs maturing in seven years were then overvalued or undervalued on the yield curve.In the current low interest rate environment, because a coupon on cash JGBs is lower than 6% on long-term JGB
the prices of the futures and 7 year JGBs tend to move in tandem, resulting in the futures' price correlation with 7 year JGBs being higher than that with the JGBs with other maturities(Fig. c6-2).When CTAs intensify trading in JGB futures irrespective of absolute yield levels, JGBs maturing in seven years become subject to arbitrage adjustment with futures, often resulting in being undervalued or overvalued against
higher or lower on the yield curve, shows that JGBs maturing in seven years became undervalued (with the yield
(Note) Refer to Chapter 1 2(7)JGB Futures Trading
Investors in JGB futuresColumn 6
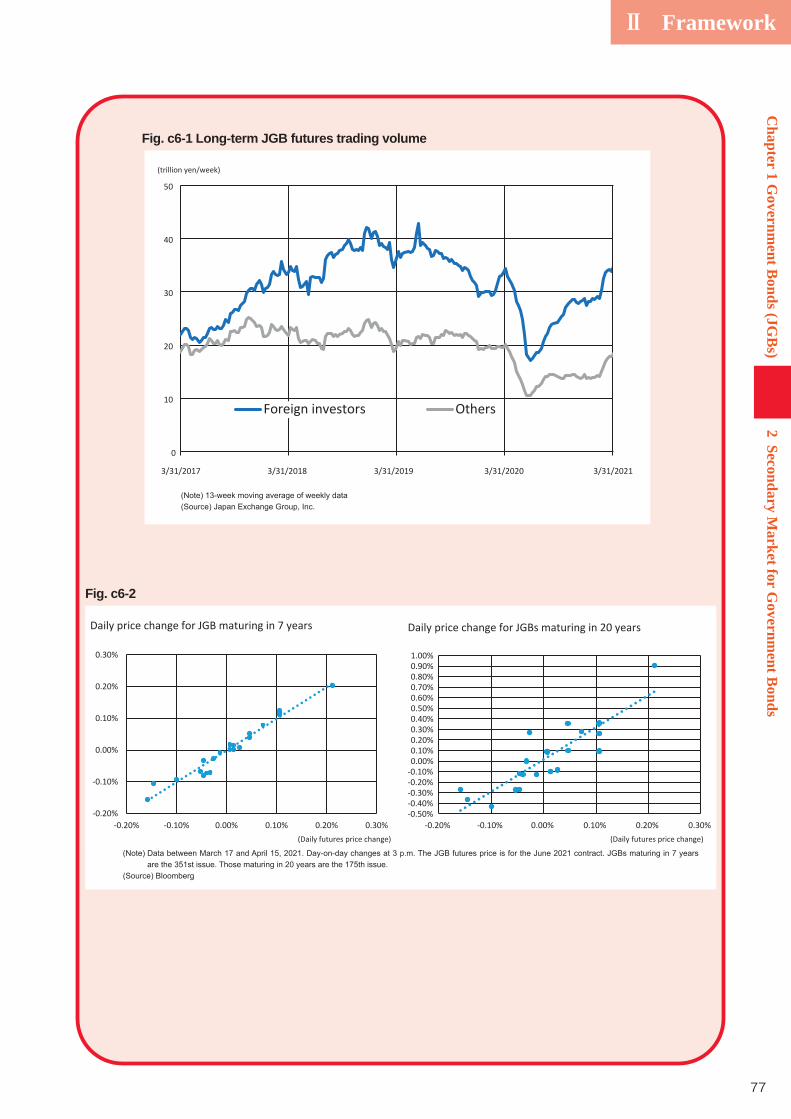
Ⅱ Framework
77
Chapter 1 G
overnment B
onds (JGB
s)2
Secondary Market for G
overnment B
onds
0
10
20
30
40
50
3/31/2017
Others
(trillion yen/week)
Foreign investors
3/31/2018 3/31/2019 3/31/2020 3/31/2021
Fig. c6-1 Long-term JGB futures trading volume
-0.20%
-0.10%
0.00%
0.10%
0.20%
0.30%
-0.20% -0.10% 0.00% 0.10% 0.20% 0.30%(Daily futures price change)
Daily price change for JGB maturing in 7 years
-0.50%-0.40%-0.30%-0.20%-0.10%0.00%0.10%0.20%0.30%0.40%0.50%0.60%0.70%0.80%0.90%1.00%
-0.20% -0.10% 0.00% 0.10% 0.20% 0.30%(Daily futures price change)
Daily price change for JGBs maturing in 20 years
Fig. c6-2
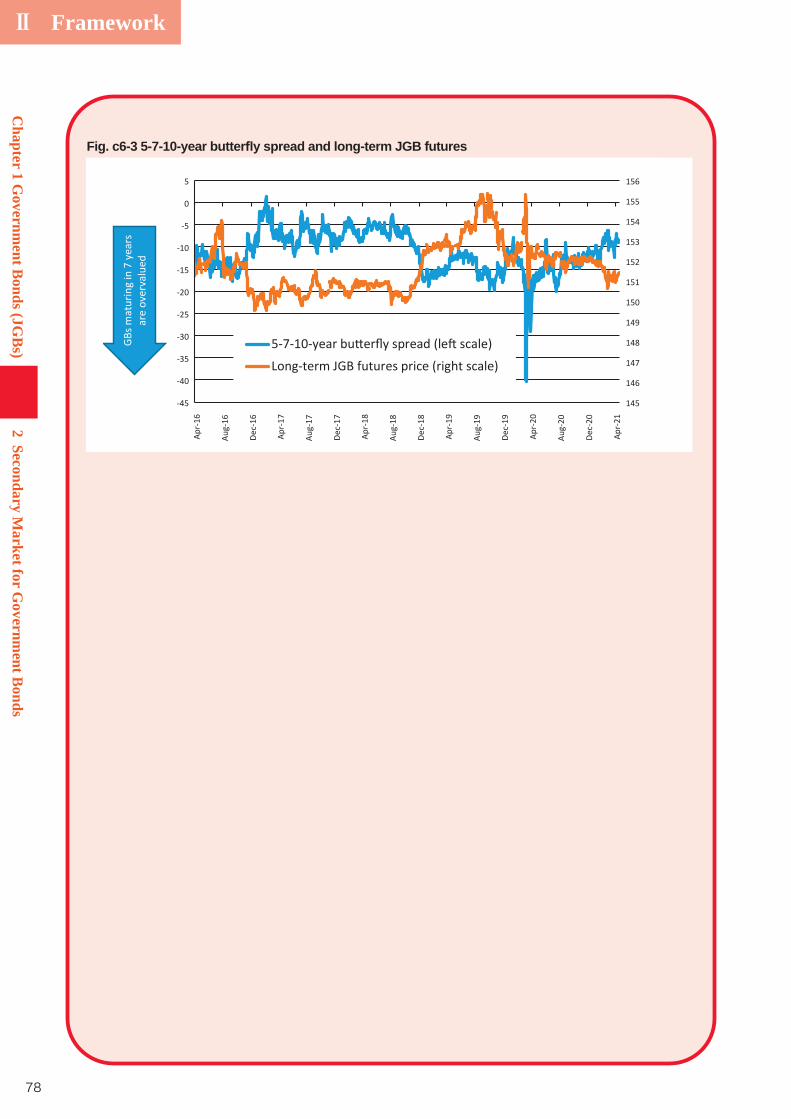
Ⅱ Framework
78
Chapter 1 G
overnment B
onds (JGB
s)2
Secondary Market for G
overnment B
onds
Fig. c6-3 5-7-10-year butter y spread and long-term JGB futures
145
146
147
148
149
150
151
152
153
154
155
156
-45
-40
-35
-30
-25
-20
-15
-10
-5
0
5Ap
r-16
Aug-
16
Dec-
16
Apr-1
7
Aug-
17
Dec-
17
Apr-1
8
Aug-
18
Dec-
18
Apr-1
9
Aug-
19
Dec-
19
Apr-2
0
Aug-
20
Dec-
20
Apr-2
1
sraey 7 ni gnirutam sBGar
e ov
erva
lued
5-7-10-year bu e spread (le scale)Long-term JGB futures price (right scale)

79
Ⅱ FrameworkC
hapter 1 Governm
ent Bonds (JG
Bs)
3D
ebt Managem
ent Systems
Debt Management Systems
(1) Redemption SystemAll the JGBs issued to fund a shortfall in General Account and Special Accounts of the
national budget are redeemed through the Government Debt Consolidation Fund (GDCF).
To ensure stable redemption, redemption funds are transferred from each Account to the
GDCF based on certain rules. In addition, revenues from Refunding Bonds, issued through
the GDCF Special Account, are posted to the GDCF. Moreover, the proceeds from the sales of
government-owned shares that belong to the GDCF Special Account are also transferred into
the GDCF.
Simply put, fiscal resources for government bond redemption are all funneled through the
GDCFfrom reception and accumulation to disbursements.
This section explains applicable redemption methods and redemption resources for each JGB
A. Redemption Methods
When redeeming JGBs, redemption rules will be applicable as set forth in related legislations.
Bonds)
The 60-year redemption rule is applicable to redeeming Construction Bonds and Special
redeemed in a 60-year period (☞①
3
General Account
GDCF Special Account
Private Sector Public Sector
・Fixed-rate transfer ・Transfer of budgetary surplus ・Direct budget transfer
・Proceeds from sales of government-owned shares belonging to the GDCF Special Account
・Revenues from investment management ・Revenue from tobacco special tax
Revenues from Refunding Bonds
Redemption
Note 1: Redemption System of JGBs belonging to the General Account. Note 2: Proceeds from sales of government-owned shares of Tokyo Metro Co., LTD, and Japan Post Holdings Co., Ltd, etc. are appropriated for the redemption resources of Reconstruction Bonds.
Fig. 2-18 Mechanism of Redemption
☞①
--
-
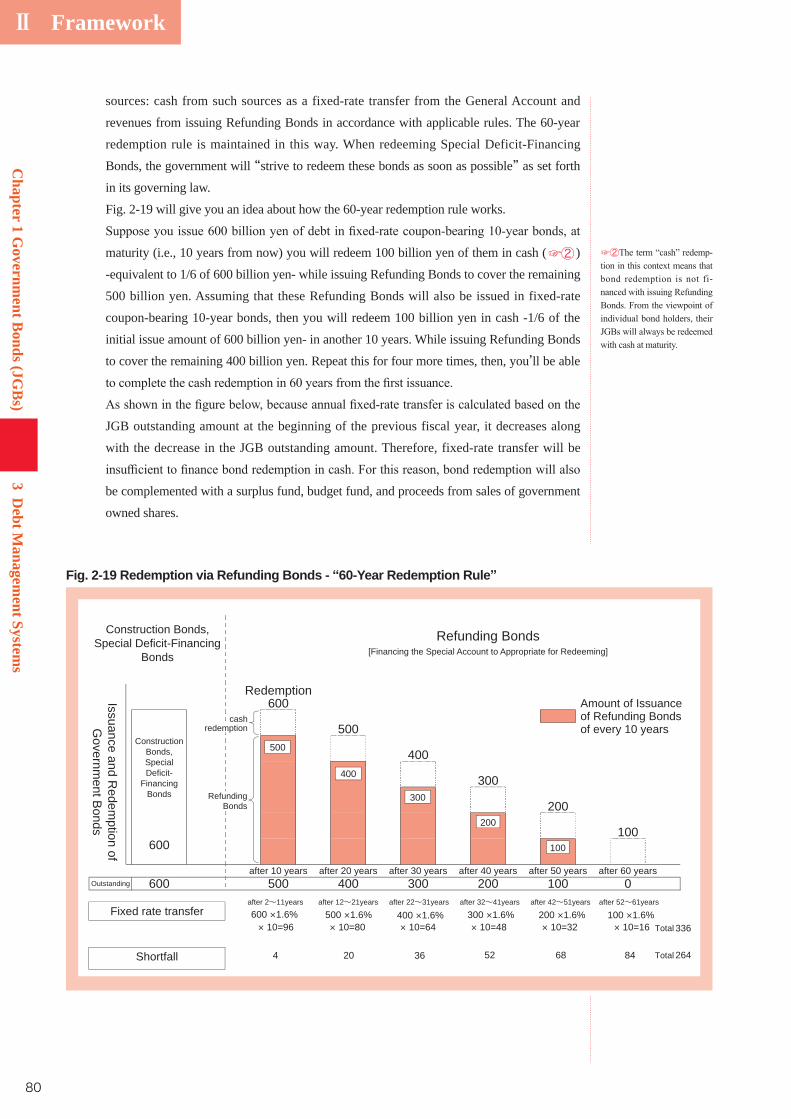
80
Ⅱ Framework
Chapter 1 G
overnment B
onds (JGB
s)3
Debt M
anagement System
s
sources: cash from such sources as a fixed-rate transfer from the General Account and
revenues from issuing Refunding Bonds in accordance with applicable rules. The 60-year
redemption rule is maintained in this way. When redeeming Special Deficit-Financing
Bonds, the government will “strive to redeem these bonds as soon as possible” as set forth
in its governing law.
Fig. 2-19 will give you an idea about how the 60-year redemption rule works.
maturity (i.e., 10 years from now) you will redeem 100 billion yen of them in cash (☞② )
-equivalent to 1/6 of 600 billion yen- while issuing Refunding Bonds to cover the remaining
500 billion yen. Assuming that these Refunding Bonds will also be issued in fixed-rate
coupon-bearing 10-year bonds, then you will redeem 100 billion yen in cash -1/6 of the
initial issue amount of 600 billion yen- in another 10 years. While issuing Refunding Bonds
to cover the remaining 400 billion yen. Repeat this for four more times, then, you’ll be able
JGB outstanding amount at the beginning of the previous fiscal year, it decreases along
with the decrease in the JGB outstanding amount. Therefore, fixed-rate transfer will be
be complemented with a surplus fund, budget fund, and proceeds from sales of government
owned shares.
☞② -
-
Redemption600
500
400
300
200
100600
after 10 years after 20 years after 30 years after 40 years after 50 years after 60 years600 500 400 300 200 100 0Outstanding
Construction Bonds,Special Deficit-Financing
Bonds
Refunding Bonds[Financing the Special Account to Appropriate for Redeeming]
Issuance and Redem
ption ofG
overnment B
onds
ConstructionBonds,SpecialDeficit-
FinancingBonds
Fixed rate transferTotal
Total
Amount of Issuance of Refunding Bonds of every 10 years
cashredemption
Refunding Bonds
Shortfall 20 36 52 68
500 ×1.6%600 ×1.6% 400 ×1.6% 300 ×1.6% 200 ×1.6% 100 ×1.6%after 2~11years after 12~21years after 22~31years after 32~41years after 42~51years after 52~61years
× 10=16× 10=32× 10=48× 10=64× 10=80× 10=96
4 84
500
400
300
200
100
336
264
Fig. 2-19 Redemption via Refunding Bonds - 60-Year Redemption Rule
81
Ⅱ FrameworkC
hapter 1 Governm
ent Bonds (JG
Bs)
3D
ebt Managem
ent Systems
b. Redemption Methods for Reconstruction Bonds
Reconstruction Bonds, including their Refunding Bonds, will be entirely redeemed in
of Reconstruction Bonds. This is because “Basic Guidelines for Reconstruction in response
to the Great East Japan Earthquake” states that the financial resources for recovery and
reconstruction shall “basically be borne by the entire current generation, collectively
” and
Specifically, a portion of Reconstruction Bonds (including Refunding Bonds for
Reconstruction Bonds) redeemable each year will be redeemed with cash to the extent of
equities that are transferred to the GDCF Special Account as redemption resources, while
the remaining portion will be entirely covered with Refunding Bonds. The government
is planning to finish the redemption of Reconstruction Bonds by repeating cash-based
latest.
c. Other Redemption Methods for JGBs
General Bonds subject to redemption methods other than those above include Special
issued up until FY1984. For this reason, the 60-year redemption rule did not apply to JGBs
redeemable by FY1984 (☞① ), but the rule becomes applicable to JGBs redeemable from
ending in FY1994 as initially scheduled. Of Tax Cut Special Deficit-Financing Bonds,
those set to be redeemed in 20 years (☞② ) were all redeemed by FY2017. Special Bonds
for Covering Public Pension Funding and relevant Refunding Bonds will be redeemed by
Unlike ordinary JGBs that are redeemed with tax and other revenues, FILP Bonds are
redeemed with such revenues as loan repayments to the Fiscal Loan Fund. In this case,
the government transfers necessary redemption funds from the “Fiscal Loan Fund Special
Account”
B. Redemption Resources
resources used for cash-based redemption.
Bonds
① Transfer from the General Account
General Account to the GDCF Special Account.
☞①
-
☞②
-
82
Ⅱ Framework
Chapter 1 G
overnment B
onds (JGB
s)3
Debt M
anagement System
s
The fixed-rate transfer is based on Article 42, paragraph (2) of the “Act on Special
Accounts.”
Account to the GDCF Special Account on the basis of the 60-year redemption rule. Those
(Construction Bonds, Special Deficit-Financing Bonds (excluding Special Bonds for
covering Public Pension Funding)), and Borrowings (excluding Temporary Borrowings)
and their Refunding Bonds (☞ ).
ii. Transfer of a budgetary surplus (A minimum of half of the surplus in the General
Pursuant to Article 6, paragraph (1) of the “Public Finance Act,” when surplus is generated
in the General Account as a result of the settlement, at least half the surplus must be
transferred to the GDCF Special Account within two years from the said fiscal year in
which the surplus was generated (☞ ).
budget when necessary)In addition to the above transfers, to ensure smooth redemption of government bonds,
Article 42, paragraph (5) of the “Act on Special Accounts” prescribes that a discretionary
to the GDCF Special Account.
② Others
Proceeds from sales and dividends of government-owned shares that belong to the GDCF
Special Account shall be set aside as a resource for redemption of JGBs.
A part of Nippon Telegraph and Telephone Corporation (NTT) shares, a part of shares of
Japan Tobacco Inc. (JT), an equity stake in Teito Rapid Transit Authority (☞ ) and a part of
the shares of Japan Post Holdings Co., Ltd. were transferred to the GDCF Special Account
as the JGB redemption resources in FY1985, FY1985, FY1998 and FY2007, respectively.
The MOF finished selling out NTT shares and JT shares (a portion held initially) in the
GDCF Special Account in September 2005 and June 2004, respectively. Proceeds from the
sale of shares currently belonging to the GDCF Special Account (including JT shares newly
allocated to the GDCF Special Account in accordance with the “Reconstruction Funding
Act”) will be spent for redeeming Reconstruction Bonds.
ii. Proceeds from allocationThe surplus of the GDCF can be invested into JGBs or deposited to the Fiscal Loan Fund.
the need to secure adequate levels of liquidity in order to ensure smooth implementation
of large-scale redemption and refunding. Proceeds from the allocation are credited to the
GDCF Special Account to be included in its revenues.
☞ -
-
-
☞ -
--
☞ --
-
83
Ⅱ FrameworkC
hapter 1 Governm
ent Bonds (JG
Bs)
3D
ebt Managem
ent Systems
b. Redemption Resources for Reconstruction Bonds
①As tax measures to finance restoration and reconstruction from the Great East Japan
Earthquake, the government created Special Taxes for Reconstruction that are additional
income and corporation taxes for limited durations (Special Income Tax for Reconstruction
and Special Corporation Tax for Reconstruction).
Specifically, the Special Income Tax for Reconstruction is a limited-duration measure
Special Corporation Tax for Reconstruction is a limited-duration measure from FY2012
to FY2014 to impose an additional 10% corporation tax. However, the special corporation
tax was terminated one year ahead of schedule under the FY2014 tax reform to encourage
corporations to use earnings for raising wages.
②
From reserves in the Fiscal Loan Fund Account of the FILP Special Account, an amount
designated in the annual budget could be used for redeeming Reconstruction Bonds from
FY2012 to FY2015. From revenues from assets in the Investment Account of the FILP
Special Account, an amount designated in the annual budget can be used for the same
purpose from FY2016 to FY2022.
Regarding JT shares (excluding the government’s mandatory shareholding (☞① )), shares
of Tokyo Metro Co., Ltd. (☞② ) and shares of Japan Post Holdings Co., Ltd. (excluding
the government’s mandatory shareholding (☞③ )) belonging to the GDCF Special
Account, proceeds generated from the sale of those shares no later than FY2027 will be
spent for redeeming Reconstruction Bonds.
③ Utilizing Settlement SurplusThe supplementary provisions of the “Reconstruction Funding Act” stipulate that, if
settlement surplus in the General Account revenues and expenditures from FY2011 to
government is supposed to put a higher priority on redemption of Reconstruction Bonds.
c. Redemption Resources for Other JGBs
①The government has created the Special Tobacco Tax in accordance with the “Act on
Special Measures for Securing Necessary Financial Resources Incidental to Transfer of
Debt to General Account” in order to cover a cost increase for the General Account to take
over the Japanese National Railway (JNR) Settlement Corporation’s long-term debt and
the National Forest Service’s accumulated debt. Special Tobacco Tax revenues are directly
transferred to the GDCF Special Account to repay principals and interests of the JNR
Settlement Corporation’s long-term debt and the National Forest Service’s accumulated
debt.
☞① -
-
☞②
☞③ -
-
-
84
Ⅱ Framework
Chapter 1 G
overnment B
onds (JGB
s)3
Debt M
anagement System
s
② OthersAmong General Bonds, Special Bonds for Covering Public Pension Funding are set
to be redeemed with a tax revenue increase through the implementation of the revised
Consumption Tax Act from FY2014.
Among the other bonds, FILP Bonds are redeemed with the collection of Fiscal Loan
receivable.
The GDCF Special Account is an independent account created for the purpose of clarifying the
status of the country’s total debt management, centered on the government debt issued under
the General Account. It is a special account for the payment of the principals and interests of
JGBs.
a. Basic roles
JGBs, and their Refunding Bonds in accordance with the 60-year redemption rule, the
GDCF temporarily accumulates resources for secure redemption. In addition, by making
sure steady redemption, the fund also plays a role in maintaining market confidence in
JGBs.
b. Secondary roles
The GDCF plays the secondary roles as follows.
①
Bills.
②
to the Account Settlement Adjustment Fund. If the GDCF transfers some funds to the
Account Settlement Adjustment Fund, the funds will be transferred back to the GDCF from
transfer, avoiding any JGB redemption resource shortage.
Recent measures for the GDCF Special Account are explained below:
The GDCF is annually accumulated in the GDCF Special Account under a certain framework to
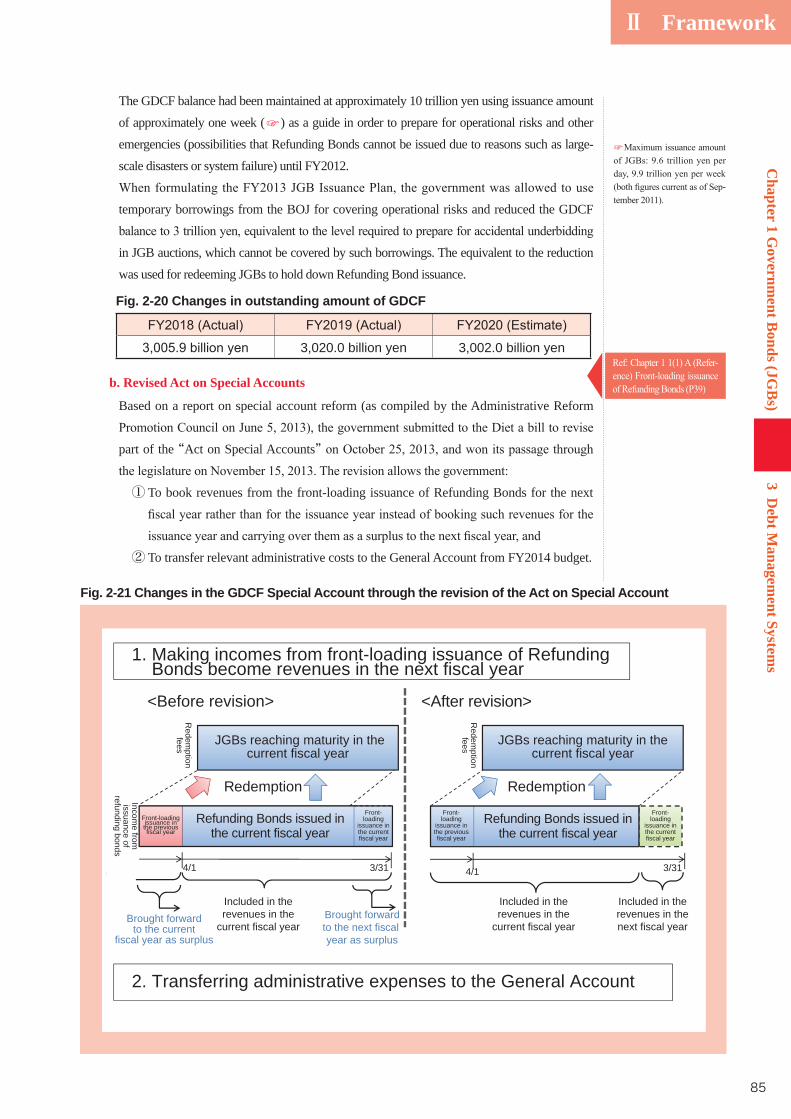
85
Ⅱ FrameworkC
hapter 1 Governm
ent Bonds (JG
Bs)
3D
ebt Managem
ent Systems
The GDCF balance had been maintained at approximately 10 trillion yen using issuance amount
of approximately one week (☞) as a guide in order to prepare for operational risks and other
emergencies (possibilities that Refunding Bonds cannot be issued due to reasons such as large-
scale disasters or system failure) until FY2012.
temporary borrowings from the BOJ for covering operational risks and reduced the GDCF
in JGB auctions, which cannot be covered by such borrowings. The equivalent to the reduction
was used for redeeming JGBs to hold down Refunding Bond issuance.
b. Revised Act on Special Accounts
Based on a report on special account reform (as compiled by the Administrative Reform
part of the “Act on Special Accounts”
① To book revenues from the front-loading issuance of Refunding Bonds for the next
② To transfer relevant administrative costs to the General Account from FY2014 budget.
☞
-
-
1. Making incomes from front-loading issuance of Refunding Bonds become revenues in the next fiscal year
JGBs reaching maturity in thecurrent fiscal year
Redem
ptionfees
Redem
ptionfees
Income from
issuance ofrefunding bonds
<Before revision> <After revision>
Redemption RedemptionFront-
loadingissuance inthe currentfiscal year
Refunding Bonds issued inthe current fiscal year
Front-loadingissuance inthe previousfiscal year
Included in therevenues in the
current fiscal year
4/1 3/31
Brought forwardto the current
fiscal year as surplus
Brought forwardto the next fiscal year as surplus
Refunding Bonds issued inthe current fiscal year
4/1 3/31
Included in therevenues in the
current fiscal year
Included in therevenues in thenext fiscal year
2. Transferring administrative expenses to the General Account
JGBs reaching maturity in thecurrent fiscal year
Front-loading
issuance inthe previousfiscal year
Front-loading
issuance inthe currentfiscal year
Fig. 2-21 Changes in the GDCF Special Account through the revision of the Act on Special Account
Fig. 2-20 Changes in outstanding amount of GDCF
3,020.0 billion yen 3,002.0 billion yen
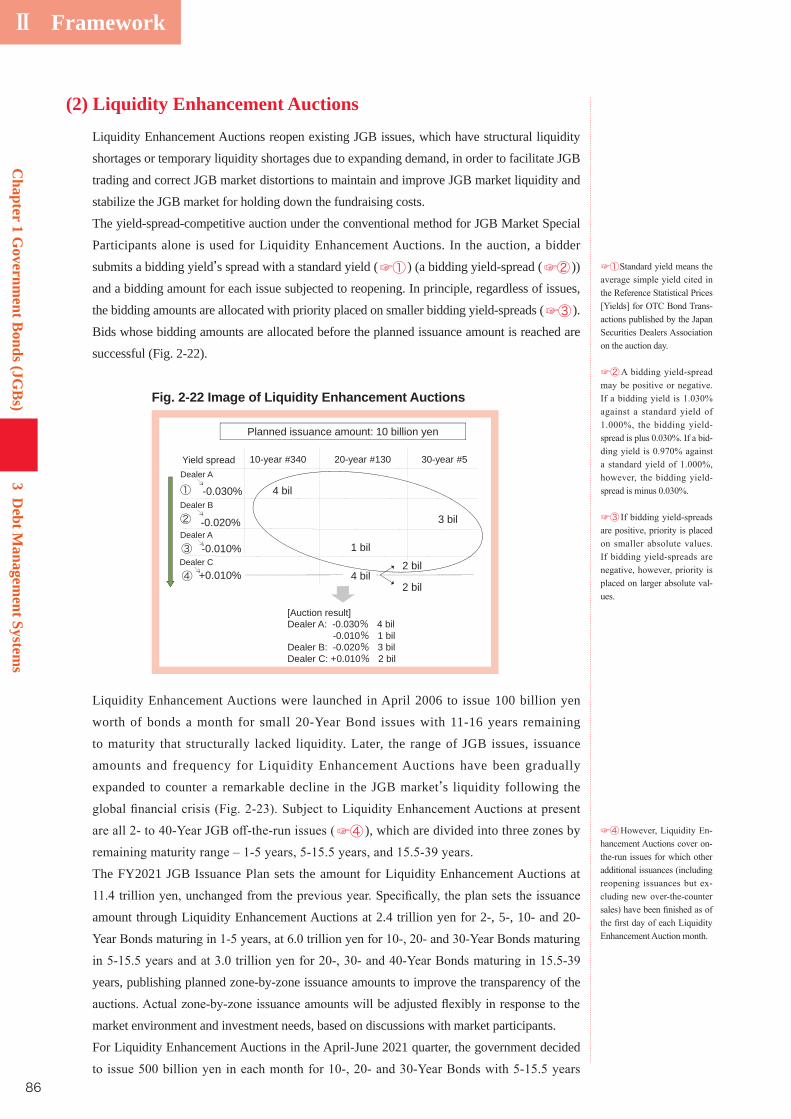
86
Ⅱ Framework
Chapter 1 G
overnment B
onds (JGB
s)3
Debt M
anagement System
s
(2) Liquidity Enhancement AuctionsLiquidity Enhancement Auctions reopen existing JGB issues, which have structural liquidity
shortages or temporary liquidity shortages due to expanding demand, in order to facilitate JGB
trading and correct JGB market distortions to maintain and improve JGB market liquidity and
stabilize the JGB market for holding down the fundraising costs.
The yield-spread-competitive auction under the conventional method for JGB Market Special
Participants alone is used for Liquidity Enhancement Auctions. In the auction, a bidder
submits a bidding yield’s spread with a standard yield (☞① ) (a bidding yield-spread (☞② ))
and a bidding amount for each issue subjected to reopening. In principle, regardless of issues,
the bidding amounts are allocated with priority placed on smaller bidding yield-spreads (☞③ ).
Bids whose bidding amounts are allocated before the planned issuance amount is reached are
successful (Fig. 2-22).
Liquidity Enhancement Auctions were launched in April 2006 to issue 100 billion yen
worth of bonds a month for small 20-Year Bond issues with 11-16 years remaining
to maturity that structurally lacked liquidity. Later, the range of JGB issues, issuance
amounts and frequency for Liquidity Enhancement Auctions have been gradually
expanded to counter a remarkable decline in the JGB market’s liquidity following the
☞④ ), which are divided into three zones by
The FY2021 JGB Issuance Plan sets the amount for Liquidity Enhancement Auctions at
amount through Liquidity Enhancement Auctions at 2.4 trillion yen for 2-, 5-, 10- and 20-
years, publishing planned zone-by-zone issuance amounts to improve the transparency of the
market environment and investment needs, based on discussions with market participants.
For Liquidity Enhancement Auctions in the April-June 2021 quarter, the government decided
☞④ -
-
☞①
-
☞②
-
☞③
-
Fig. 2-22 Image of Liquidity Enhancement Auctions
Dealer A
Dealer B
Dealer C
Planned issuance amount: 10 billion yen
-0.020%
-0.030%
+0.010%
4 bil
4 bil 2 bil
2 bil
[Auction result] Dealer A: -0.030% 4 bil -0.010% 1 bil Dealer B: -0.020% 3 bil Dealer C: +0.010% 2 bil
①
②
④
10-year #340 20-year #130 30-year #5
3 bil
Yield spread
Dealer A
-0.010% 1 bil ③
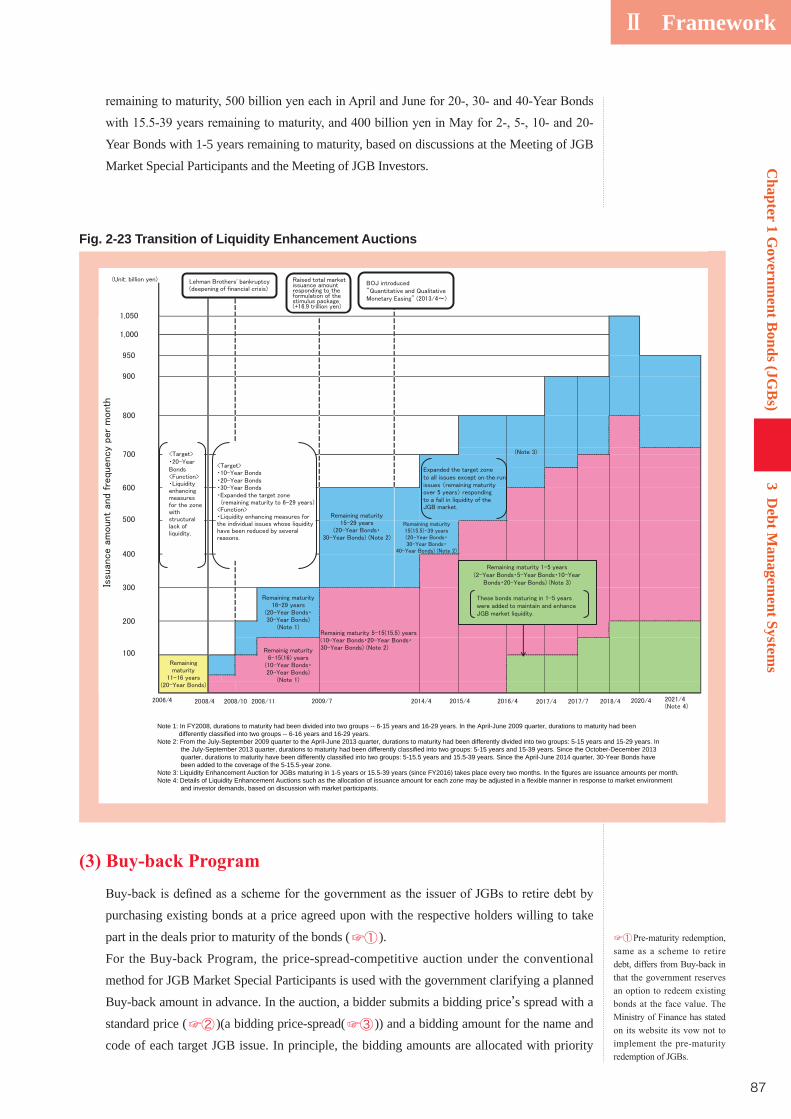
87
Ⅱ FrameworkC
hapter 1 Governm
ent Bonds (JG
Bs)
3D
ebt Managem
ent Systems
Year Bonds with 1-5 years remaining to maturity, based on discussions at the Meeting of JGB
Market Special Participants and the Meeting of JGB Investors.
purchasing existing bonds at a price agreed upon with the respective holders willing to take
part in the deals prior to maturity of the bonds (☞① ).
For the Buy-back Program, the price-spread-competitive auction under the conventional
method for JGB Market Special Participants is used with the government clarifying a planned
Buy-back amount in advance. In the auction, a bidder submits a bidding price’s spread with a
standard price (☞② )(a bidding price-spread(☞③ )) and a bidding amount for the name and
code of each target JGB issue. In principle, the bidding amounts are allocated with priority
Fig. 2-23 Transition of Liquidity Enhancement Auctions
Note 1: In FY2008, durations to maturity had been divided into two groups -- 6-15 years and 16-29 years. In the April-June 2009 quarter, durations to maturity had been differently classified into two groups -- 6-16 years and 16-29 years.Note 2: From the July-September 2009 quarter to the April-June 2013 quarter, durations to maturity had been differently divided into two groups: 5-15 years and 15-29 years. In the July-September 2013 quarter, durations to maturity had been differently classified into two groups: 5-15 years and 15-39 years. Since the October-December 2013 quarter, durations to maturity have been differently classified into two groups: 5-15.5 years and 15.5-39 years. Since the April-June 2014 quarter, 30-Year Bonds have been added to the coverage of the 5-15.5-year zone.Note 3: Liquidity Enhancement Auction for JGBs maturing in 1-5 years or 15.5-39 years (since FY2016) takes place every two months. In the figures are issuance amounts per month.Note 4: Details of Liquidity Enhancement Auctions such as the allocation of issuance amount for each zone may be adjusted in a flexible manner in response to market environment and investor demands, based on discussion with market participants.
☞①
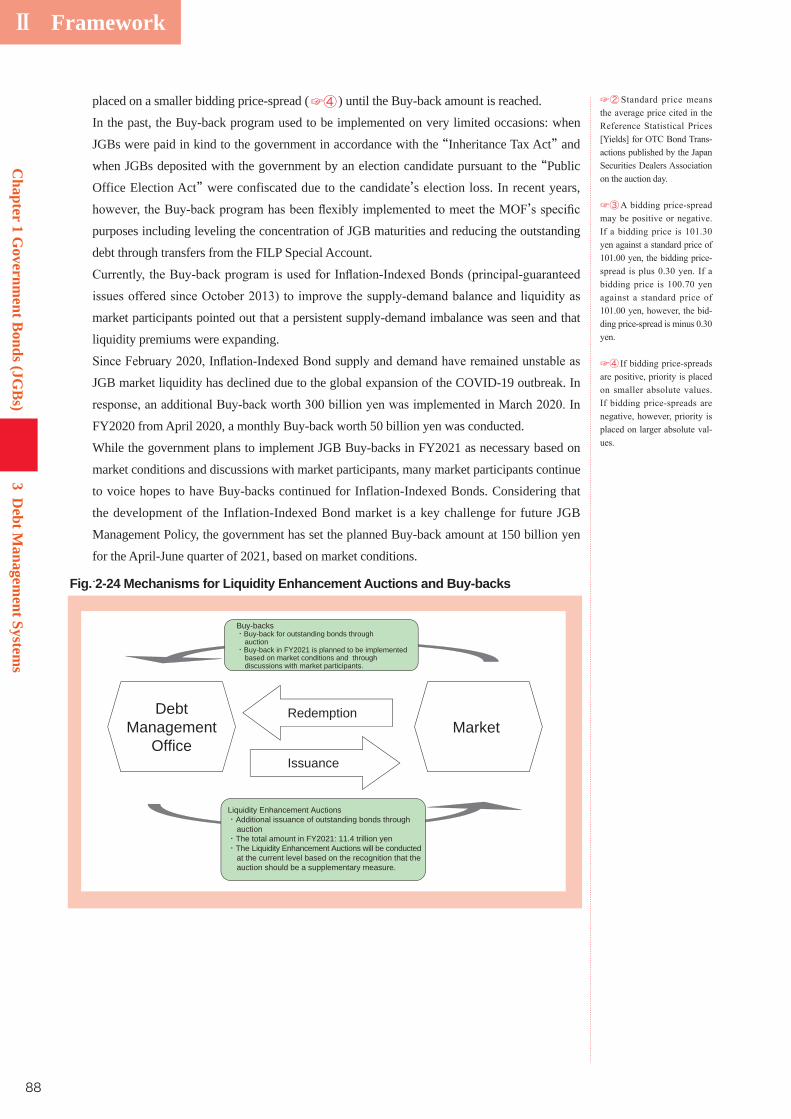
88
Ⅱ Framework
Chapter 1 G
overnment B
onds (JGB
s)3
Debt M
anagement System
s
placed on a smaller bidding price-spread (☞④ ) until the Buy-back amount is reached.
In the past, the Buy-back program used to be implemented on very limited occasions: when
JGBs were paid in kind to the government in accordance with the “Inheritance Tax Act” and
when JGBs deposited with the government by an election candidate pursuant to the “Public
Office Election Act” were confiscated due to the candidate’s election loss. In recent years,
’purposes including leveling the concentration of JGB maturities and reducing the outstanding
debt through transfers from the FILP Special Account.
market participants pointed out that a persistent supply-demand imbalance was seen and that
liquidity premiums were expanding.
JGB market liquidity has declined due to the global expansion of the COVID-19 outbreak. In
FY2020 from April 2020, a monthly Buy-back worth 50 billion yen was conducted.
While the government plans to implement JGB Buy-backs in FY2021 as necessary based on
market conditions and discussions with market participants, many market participants continue
to voice hopes to have Buy-backs continued for Inflation-Indexed Bonds. Considering that
the development of the Inflation-Indexed Bond market is a key challenge for future JGB
Management Policy, the government has set the planned Buy-back amount at 150 billion yen
for the April-June quarter of 2021, based on market conditions.
.
☞②
-
☞③
-
☞④
-
MarketDebt
ManagementOffice
Issuance
Liquidity Enhancement Auctions・Additional issuance of outstanding bonds through auction・The total amount in FY2021: 11.4 trillion yen・The Liquidity Enhancement Auctions will be conducted at the current level based on the recognition that the auction should be a supplementary measure.
Buy-backs・Buy-back for outstanding bonds through auction・Buy-back in FY2021 is planned to be implemented based on market conditions and through discussions with market participants.
Redemption
Fig. 2-24 Mechanisms for Liquidity Enhancement Auctions and Buy-backs
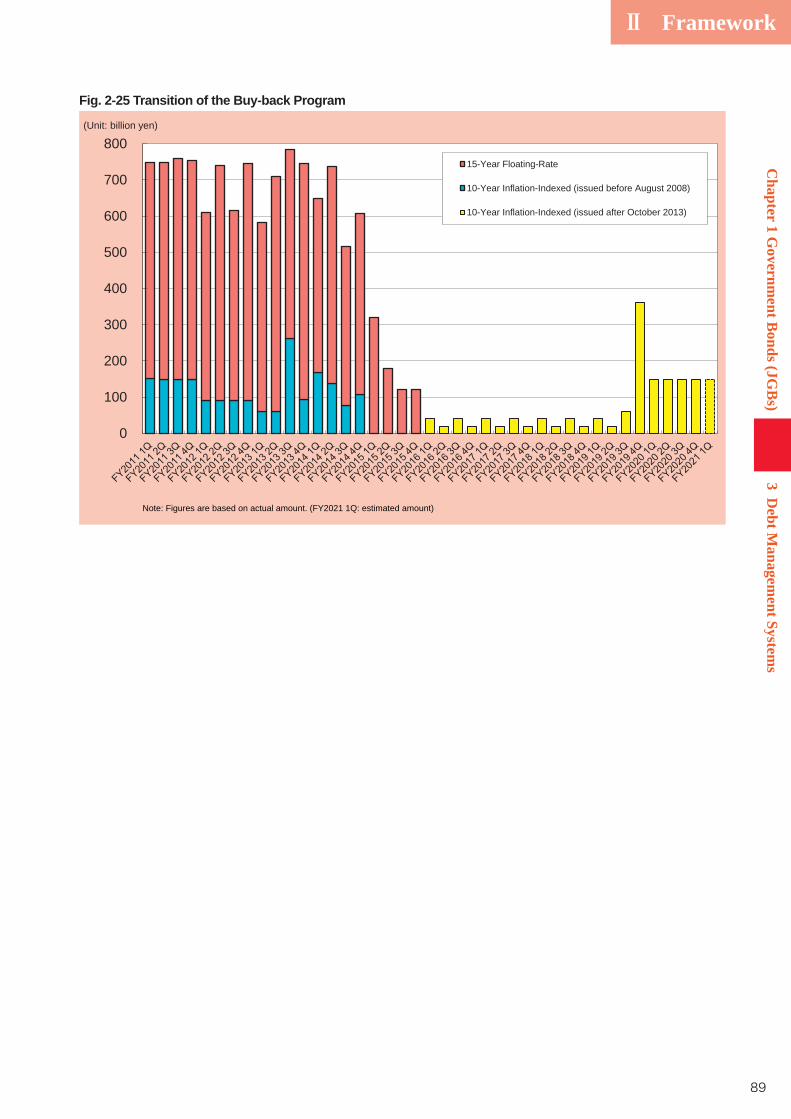
89
Ⅱ FrameworkC
hapter 1 Governm
ent Bonds (JG
Bs)
3D
ebt Managem
ent Systems
0
100
200
300
400
500
600
700
800(Unit: billion yen)
Note: Figures are based on actual amount. (FY2021 1Q: estimated amount)
15-Year Floating-Rate
10-Year Inflation-Indexed (issued before August 2008)
10-Year Inflation-Indexed (issued after October 2013)
Fig. 2-25 Transition of the Buy-back Program
90
Ⅱ Framework
Chapter 1 G
overnment B
onds (JGB
s)3
Debt M
anagement System
s
(4) Interest Rate Swap Transaction
Interest rate swap transaction in connection with JGBs became possible under the “Act for
the Special Account for the GDCF,” as amended in June 2002. In the “New Promotion of
JGB Management Policy”would utilize swap transactions (starting in FY2005) in order to control the duration of the
outstanding JGBs, thereby managing interest rate risk.
In consideration of the above, the MOF has worked to upgrade the relevant systems, and
entered into a master agreement with counterparties, most of which are JGB Market Special
Participants, pursuant to the guidelines issued by ISDA (the International Swaps and
Derivatives Association, Inc.). Since February 2006, swap transactions have been started.
Transaction results are published on a semi-annual basis on the MOF website (in April and
October).
No new transactions have been implemented since the second half of FY2009.
(5) Dialogue with Market Participants
liquidity of JGBs, the MOF Financial Bureau aims to promote the dialogue with market and
A. The Advisory Council on Government Debt Management
Since November 2004, the MOF has convened the Advisory Council on Government Debt
Management to receive opinions and advice from private sector experts with a high degree of
insight on public debt management with a focus on Debt Management Policy from a medium
to long-term perspective.
The council compiled “Current Situation and Future Challenges of Debt Management Policy
―Discussion Paper―” (December 16, 2009) and another report (June 18, 2014) and has
widely discussed the fiscal situation, monetary policy and financial regulations involving
government debt.
B. The Meeting of JGB Market Special Participants
Since the introduction of the JGB Market Special Participants scheme in October 2004, the
MOF also has hosted the Meeting of JGB Market Special Participants to exchange opinions
between members and the MOF concerning important topics relating to the bond market.
The MOF hosts the meeting every quarter to deal mainly with methods for implementing
Liquidity Enhancement Auctions and Buy-backs, and JGB market trends. In addition, the
MOF calls the meeting to receive opinions from market participants for formulating and
revising an annual JGB Issuance Plan.
C. The Meeting of JGB Investors
The MOF has hosted the Meeting of JGB Investors since April 2002, to directly and
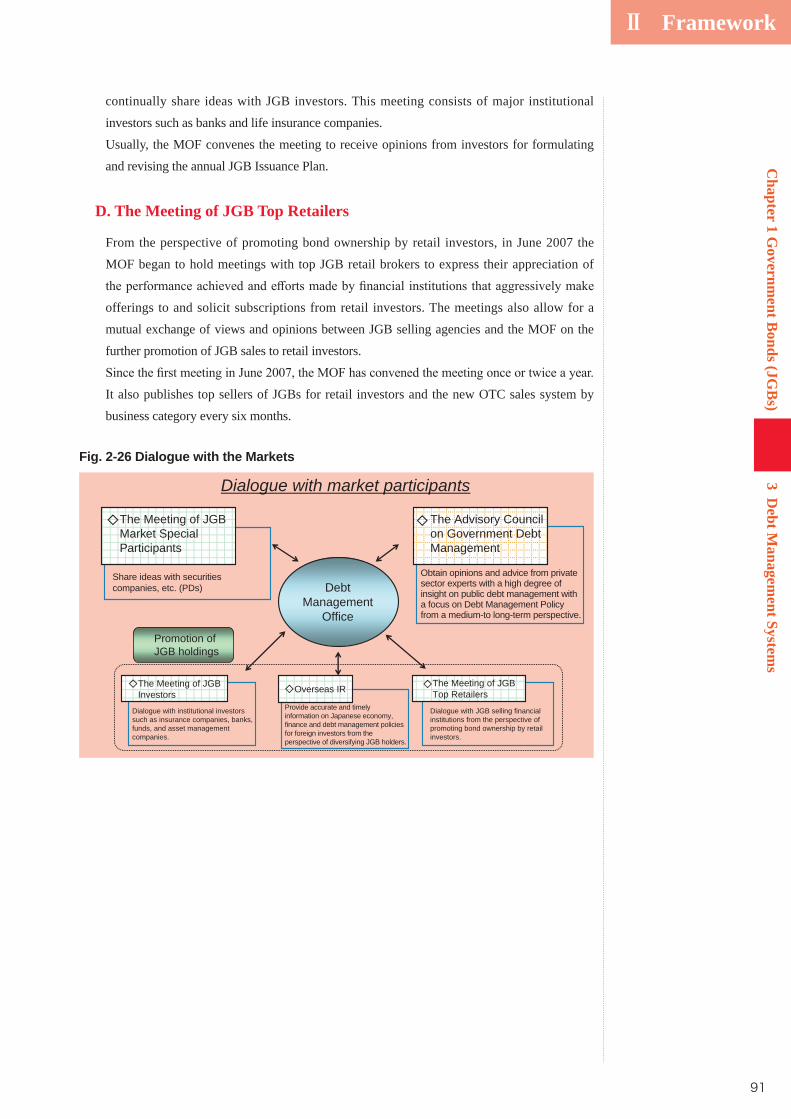
91
Ⅱ FrameworkC
hapter 1 Governm
ent Bonds (JG
Bs)
3D
ebt Managem
ent Systems
continually share ideas with JGB investors. This meeting consists of major institutional
investors such as banks and life insurance companies.
Usually, the MOF convenes the meeting to receive opinions from investors for formulating
and revising the annual JGB Issuance Plan.
D. The Meeting of JGB Top Retailers
From the perspective of promoting bond ownership by retail investors, in June 2007 the
MOF began to hold meetings with top JGB retail brokers to express their appreciation of
offerings to and solicit subscriptions from retail investors. The meetings also allow for a
mutual exchange of views and opinions between JGB selling agencies and the MOF on the
further promotion of JGB sales to retail investors.
It also publishes top sellers of JGBs for retail investors and the new OTC sales system by
business category every six months.
Dialogue with market participants
Obtain opinions and advice from private sector experts with a high degree of insight on public debt management with a focus on Debt Management Policy from a medium-to long-term perspective.
Dialogue with institutional investors such as insurance companies, banks, funds, and asset management companies.
The Advisory Councilon Government DebtManagement
The Meeting of JGBInvestors
Provide accurate and timely information on Japanese economy, finance and debt management policies for foreign investors from the perspective of diversifying JGB holders.
Dialogue with JGB selling financial institutions from the perspective of promoting bond ownership by retail investors.
The Meeting of JGBTop Retailers
Promotion ofJGB holdings
DebtManagement
Office
Share ideas with securities companies, etc. (PDs)
The Meeting of JGBMarket SpecialParticipants
◇Overseas IR◇ ◇
◇◇
Fig. 2-26 Dialogue with the Markets
92
Ⅱ Framework
Since early 2020, COVID-19 has spread throughout the world. Japan has plunged into a serious infection situation, forcing the government to declare a state of emergency three times.As government bonds have been required to be securely and smoothly issued and redeemed even in such a situation, we have taken various infection prevention measures and implemented online conferences and meetings to manage government debt.This column introduces our business continuity planning arrangements, online interviews with foreign investors, conference management, etc.
❶ Business continuity planning arrangements
We implement the following measures to keep government bond issuance unaffected even if debt management
①operations through telework and other measures to reduce their contacts.
②③ Increasing officials in charge of auctions and other JGB issuance operations to further enhance business
arrangements (planned)
❷ Online meetings with foreign investors, etc.
As for overseas IR activities, we focus on visiting foreign investors to enhance our relationships with them. As it
free from distance and time constraints, allowing us to contact various investors in multiple overseas cities in a day.
’ expressions and reactions. In the future, we will qualitatively improve online meetings to build our close relationships with various foreign investors and
❸ Conference management, etc.
As described in this chapter, we have established the Advisory Council on Government Debt Management to receive opinions and advice from experts on debt management policies, the Meeting of JGB Market Special Participants and the Meeting of JGB Investors for our exchange of opinions with market participants and the
investors’ JGB holdings. To secure our exchange of opinions with such experts and market participants even under the COVID-19 catastrophe in FY2020, we held two online meetings of the Advisory Council, 12 online or written Meetings of JGB Market Special Participants and JGB Investors and a telephone Meeting of JGB Top Retailers.
Debt management authorities’ business operations under COVID-19Column 7
Chapter 1 G
overnment B
onds (JGB
s)3
Debt M
anagement System
s
93
Ⅱ FrameworkC
hapter 1 Governm
ent Bonds (JG
Bs)
4Taxation of G
overnment B
onds
Taxation of JGBs varies depending on the bondholdere.g. resident individual, domestic
and on
and certain corporations, but also to nonresident individuals and foreign corporations (☞ ) as
explained in (4).
(1) Individuals (Residents)
Interest, capital gains and profits from redemption on coupon-bearing bonds are subject to
separate self-assessment taxation at a rate of 20% (15% income tax + 5% local tax) (☞ ) and
With regards to interest, taxes are withheld when a coupon is paid.
Other tax breaks, known as “Maruyu” and “Tokubetsu-Maruyu” tax-free saving schemes
disabilities and certain other types of individuals.
(principal-only book-entry transfer JGBs and coupon-only book-entry transfer JGBs) are
subject to separate self-assessment taxation at a rate of 20% (15% income tax + 5% local tax)
(☞
○ See Fig. 2-27 for taxation for individuals.
4
☞
-
-
☞-
☞-
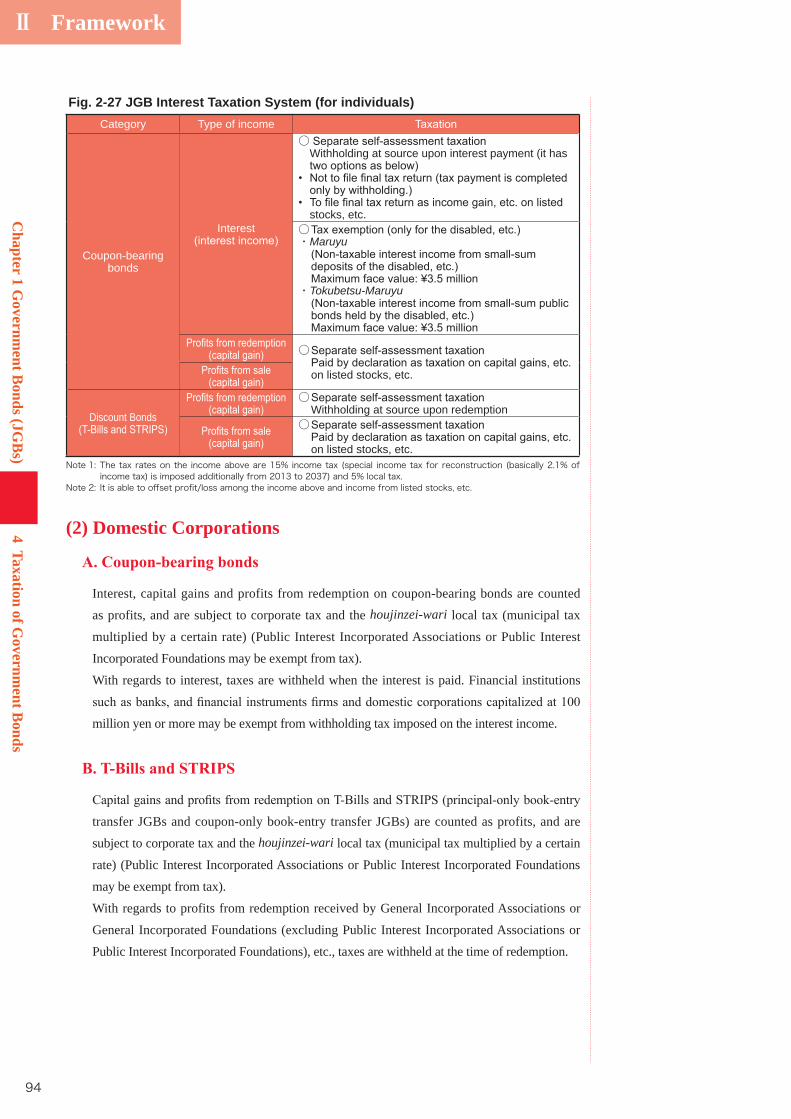
94
Ⅱ Framework
Chapter 1 G
overnment B
onds (JGB
s)4
Taxation of Governm
ent Bonds
(2) Domestic Corporations
Interest, capital gains and profits from redemption on coupon-bearing bonds are counted
as profits, and are subject to corporate tax and the houjinzei-wari local tax (municipal tax
multiplied by a certain rate) (Public Interest Incorporated Associations or Public Interest
Incorporated Foundations may be exempt from tax).
With regards to interest, taxes are withheld when the interest is paid. Financial institutions
million yen or more may be exempt from withholding tax imposed on the interest income.
transfer JGBs and coupon-only book-entry transfer JGBs) are counted as profits, and are
subject to corporate tax and the houjinzei-wari local tax (municipal tax multiplied by a certain
rate) (Public Interest Incorporated Associations or Public Interest Incorporated Foundations
may be exempt from tax).
With regards to profits from redemption received by General Incorporated Associations or
General Incorporated Foundations (excluding Public Interest Incorporated Associations or
Public Interest Incorporated Foundations), etc., taxes are withheld at the time of redemption.
Fig. 2-27 JGB Interest Taxation System (for individuals)Category Type of income
Coupon-bearing bonds
Interest
○ Withholding at source upon interest payment (it has
stocks, etc.○・Maruyu
・Tokubetsu-Maruyu
○
on listed stocks, etc.
Discount Bonds
○ Withholding at source upon redemption○
on listed stocks, etc. Note 1: The tax rates on the income above are 15% income tax (special income tax for reconstruction (basically 2.1% of
income tax) is imposed additionally from 2013 to 2037) and 5% local tax.Note 2: It is able to offset profit/loss among the income above and income from listed stocks, etc.
95
Ⅱ FrameworkC
hapter 1 Governm
ent Bonds (JG
Bs)
4Taxation of G
overnment B
onds
redemption of T-Bills and STRIPS) held by nonresident individuals or foreign corporations
without a permanent establishment in Japan are exempt from tax under certain conditions
under the tax exemption scheme as described in (4) below. Aside from such tax exemption
scheme, if there is a tax treaty in effect between Japan and the country of residence of the
nonresident individuals or the country where the foreign corporation is located, and the tax
rate on interest stipulated under the treaty is set lower than 15%, the withholding tax rate on
the interest, etc. from book-entry transfer JGBs will be lowered to match the rate stipulated
under the treaty, provided that the relevant procedures have been completed.
In addition, for coupon-bearing bonds held by foreign corporations with a permanent
establishment in Japan, the income tax is withheld, but the income tax withheld will be
deducted from their corporation tax.
In order to secure smooth and stable financing at a time when large-scale JGB issuance is
expected to continue, it is essential to have a deep, diverse investor base. Toward this goal,
since September 1999, various tax schemes, including a tax exemption scheme for interest
on book-entry transfer JGBs, have been introduced to enable nonresident individuals and
foreign corporations to invest more easily in JGBs. Such schemes have been established with
and foreign corporations under certain conditions
Securities Investment Trusts and Foreign Pension Trusts) without a permanent establishment
in Japan in transfer accounts at a JGB Book-Entry System Participant in Japan (JBESP) (☞ )
requirements have been met.
☞
-
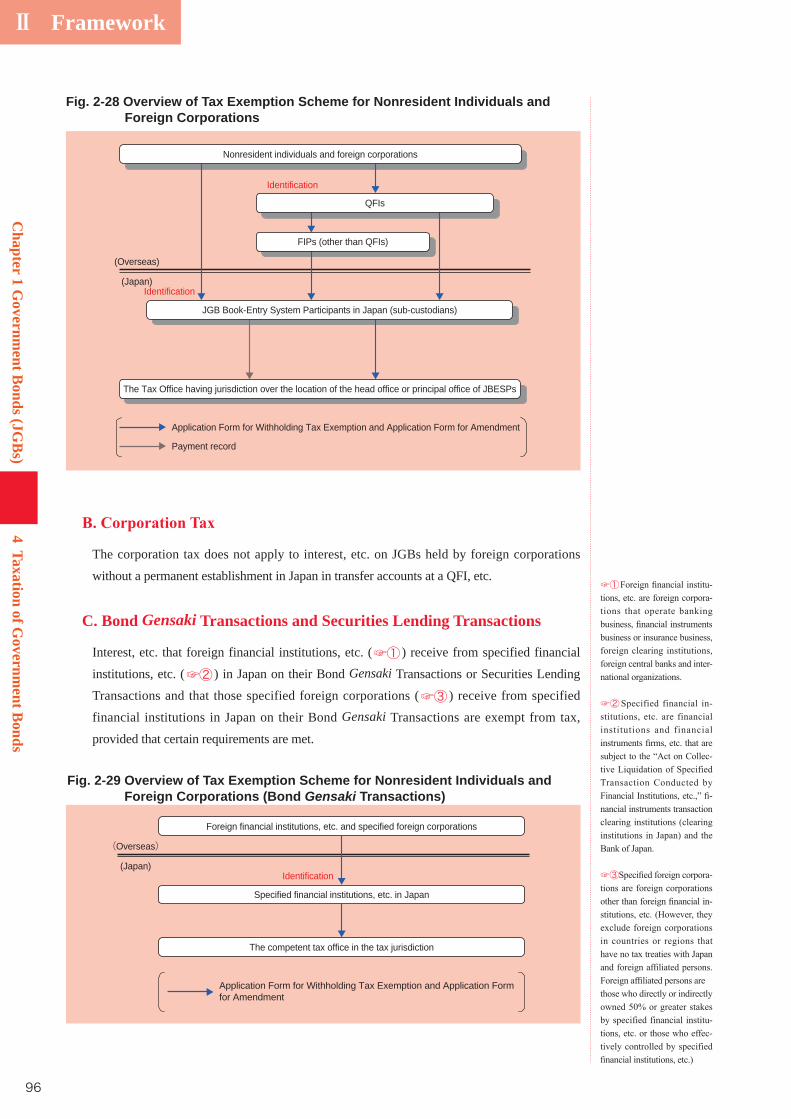
96
Ⅱ Framework
Chapter 1 G
overnment B
onds (JGB
s)4
Taxation of Governm
ent Bonds
The corporation tax does not apply to interest, etc. on JGBs held by foreign corporations
without a permanent establishment in Japan in transfer accounts at a QFI, etc.
C. Bond Gensaki Transactions and Securities Lending Transactions
Interest, etc. that foreign financial institutions, etc. (☞① ) receive from specified financial
institutions, etc. (☞② ) in Japan on their Bond Gensaki Transactions or Securities Lending
Transactions and that those specified foreign corporations (☞③ ) receive from specified
financial institutions in Japan on their Bond Gensaki Transactions are exempt from tax,
provided that certain requirements are met.
Fig. 2-28 Overview of Tax Exemption Scheme for Nonresident Individuals and Foreign Corporations
Nonresident individuals and foreign corporations
JGB Book-Entry System Participants in Japan (sub-custodians)
The Tax Office having jurisdiction over the location of the head office or principal office of JBESPs
Application Form for Withholding Tax Exemption and Application Form for Amendment
Payment record
QFIs
(Overseas)
(Japan)
Identification
Identification
FIPs (other than QFIs)
☞① --
-
☞② -
-
-
☞③ -
-
--
The competent tax office in the tax jurisdiction
Application Form for Withholding Tax Exemption and Application Form for Amendment
(Overseas)
(Japan)Identification
Foreign financial institutions, etc. and specified foreign corporations
Specified financial institutions, etc. in Japan
Fig. 2-29 Overview of Tax Exemption Scheme for Nonresident Individuals and Foreign Corporations (Bond Gensaki Transactions)
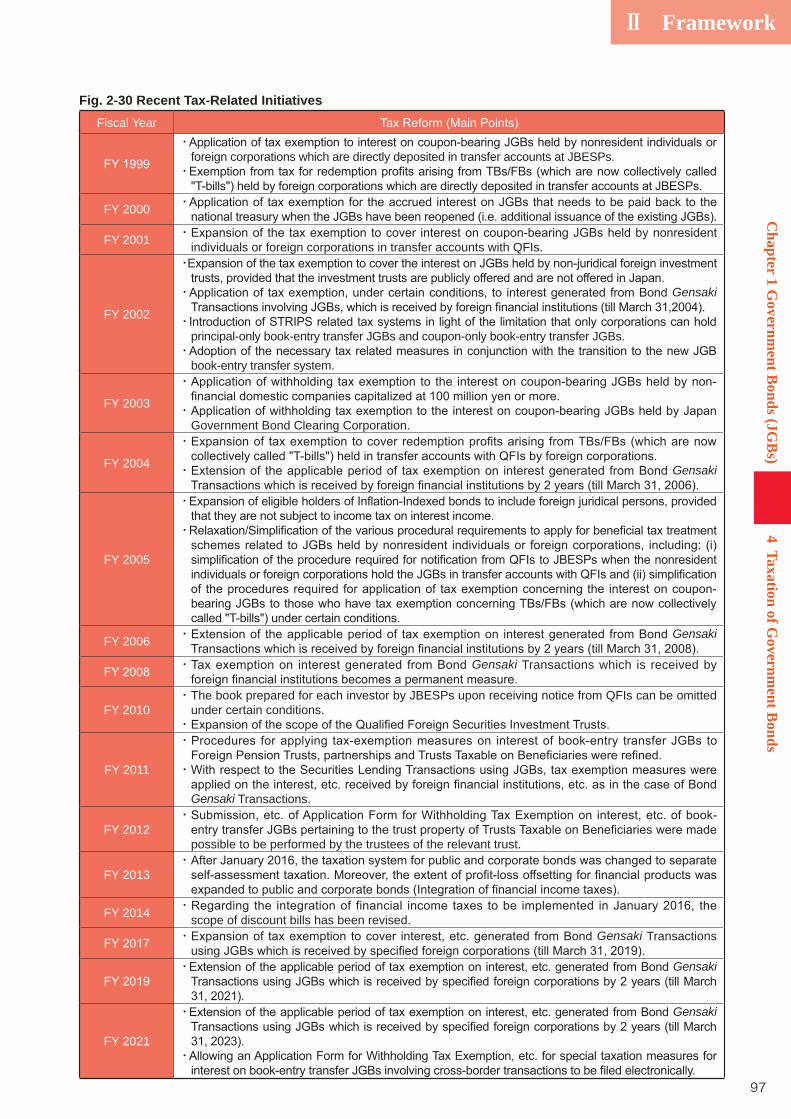
97
Ⅱ FrameworkC
hapter 1 Governm
ent Bonds (JG
Bs)
4Taxation of G
overnment B
onds
Fig. 2-30 Recent Tax-Related InitiativesFiscal Year
・foreign corporations which are directly deposited in transfer accounts at JBESPs.
・
FY 2000 ・
FY 2001 ・individuals or foreign corporations in transfer accounts with QFIs.
FY 2002
・
・ Gensaki
・principal-only book-entry transfer JGBs and coupon-only book-entry transfer JGBs.
・book-entry transfer system.
FY 2003
・
・Government Bond Clearing Corporation.
FY 2004
・
・ Gensaki
FY 2005
・
・
FY 2006 ・ Gensaki
・ Gensaki Transactions which is received by
FY 2010・The book prepared for each investor by JBESPs upon receiving notice from QFIs can be omitted
under certain conditions.・
FY 2011
・
・
Gensaki Transactions.
FY 2012・
possible to be performed by the trustees of the relevant trust.
FY 2013・
FY 2014 ・scope of discount bills has been revised.
・ Gensaki Transactions
・ Gensaki
FY 2021
・ Gensaki
・
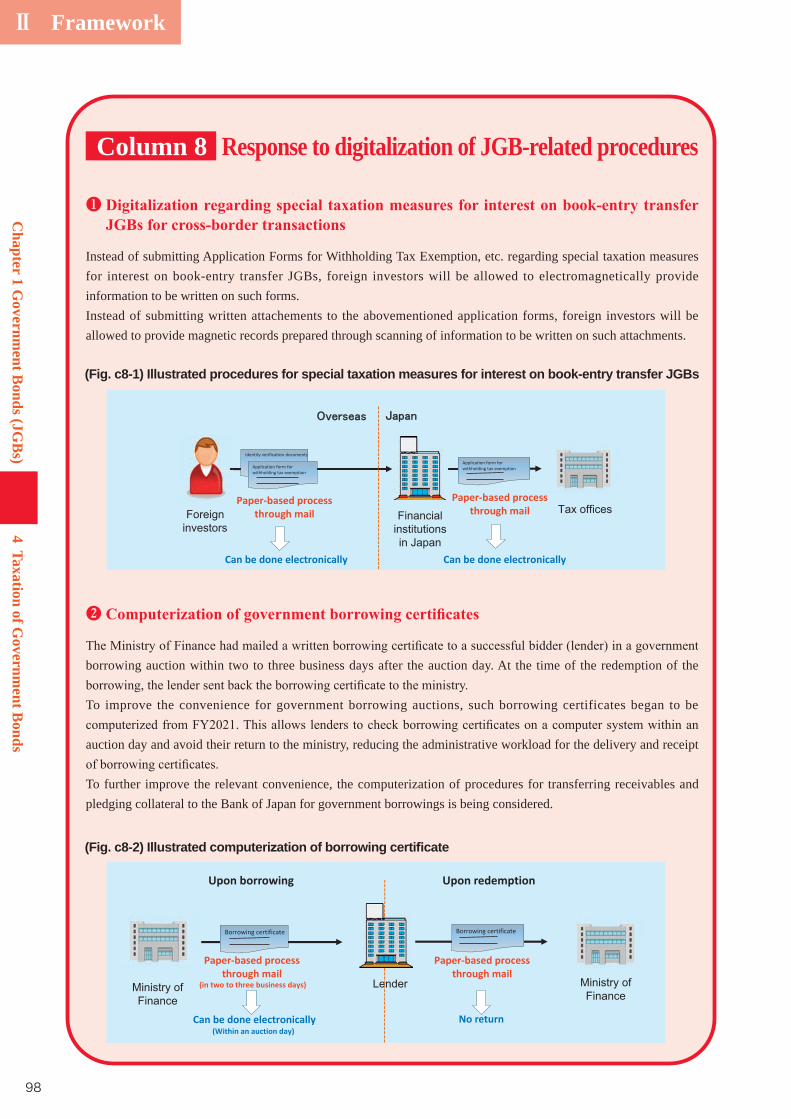
98
Ⅱ Framework
Chapter 1 G
overnment B
onds (JGB
s)4
Taxation of Governm
ent Bonds
❶
Instead of submitting Application Forms for Withholding Tax Exemption, etc. regarding special taxation measures for interest on book-entry transfer JGBs, foreign investors will be allowed to electromagnetically provide information to be written on such forms.Instead of submitting written attachements to the abovementioned application forms, foreign investors will be allowed to provide magnetic records prepared through scanning of information to be written on such attachments.
❷
borrowing auction within two to three business days after the auction day. At the time of the redemption of the
To improve the convenience for government borrowing auctions, such borrowing certificates began to be
auction day and avoid their return to the ministry, reducing the administrative workload for the delivery and receipt
To further improve the relevant convenience, the computerization of procedures for transferring receivables and pledging collateral to the Bank of Japan for government borrowings is being considered.
(Fig. c8-2) Illustrated computeri ation of borrowing certi cate
Response to digitalization of JGB-related proceduresColumn 8
Identity verification documents
Application form forwithholding tax exemption
Application form forwithholding tax exemption
(Fig. c8-1) Illustrated procedures for special taxation measures for interest on book-entry transfer JGBs
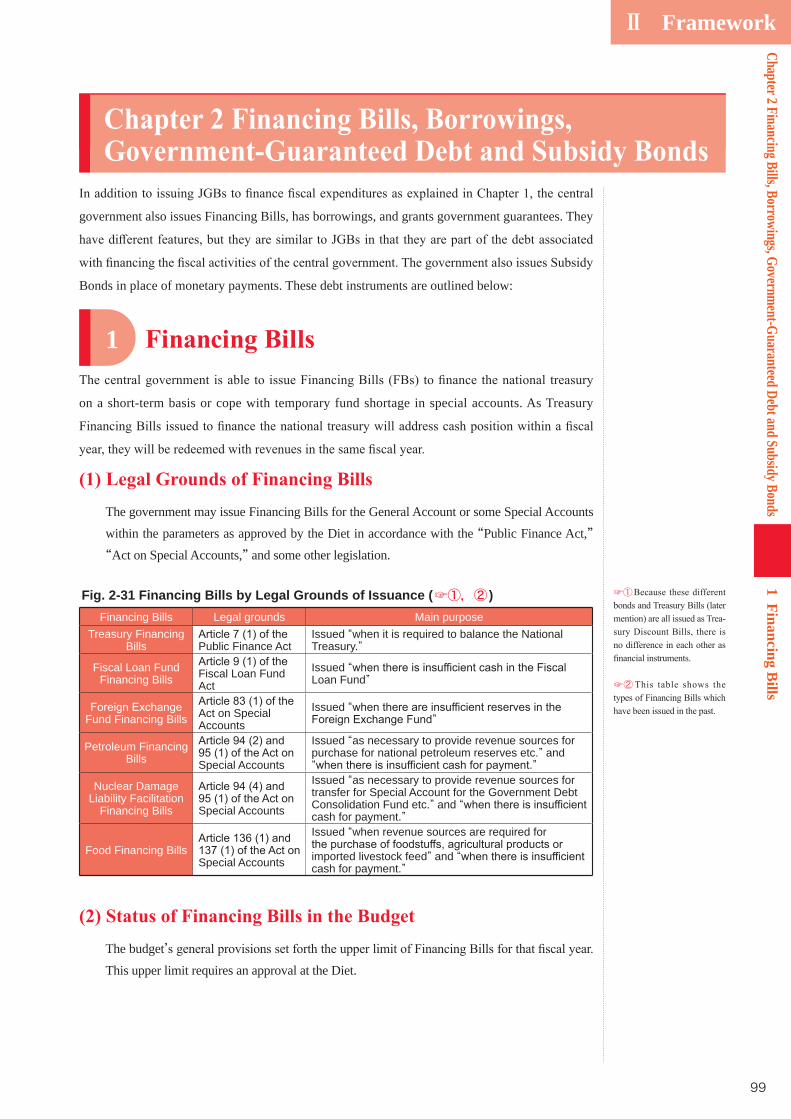
99
Ⅱ FrameworkChapter 2 Financing Bills, Borrowings, Governm
ent-Guaranteed Debt and Subsidy Bonds1
Financing Bills
government also issues Financing Bills, has borrowings, and grants government guarantees. They
Bonds in place of monetary payments. These debt instruments are outlined below:
on a short-term basis or cope with temporary fund shortage in special accounts. As Treasury
The government may issue Financing Bills for the General Account or some Special Accounts
within the parameters as approved by the Diet in accordance with the “Public Finance Act,” “Act on Special Accounts,” and some other legislation.
Fig. 2-31 Financing Bills by Legal Grounds of Issuance (☞①,② )Financing Bills Legal grounds Main purpose
Treasury Financing Bills Public Finance Act
Issued “when it is required to balance the National Treasury.”
Fiscal Loan Fund Financing Bills Fiscal Loan Fund
ActIssued “Loan Fund”
Fund Financing Bills Act on Special Accounts
Issued “”
Petroleum Financing Bills Special Accounts
Issued “as necessary to provide revenue sources for purchase for national petroleum reserves etc.” and “ ”
Nuclear Damage Liability Facilitation
Financing Bills Special Accounts
Issued “as necessary to provide revenue sources for transfer for Special Account for the Government Debt Consolidation Fund etc.” and “cash for payment.”
Food Financing BillsSpecial Accounts
Issued “when revenue sources are required for
imported livestock feed” and “cash for payment.”
The budget’This upper limit requires an approval at the Diet.
1
☞①
-
☞②
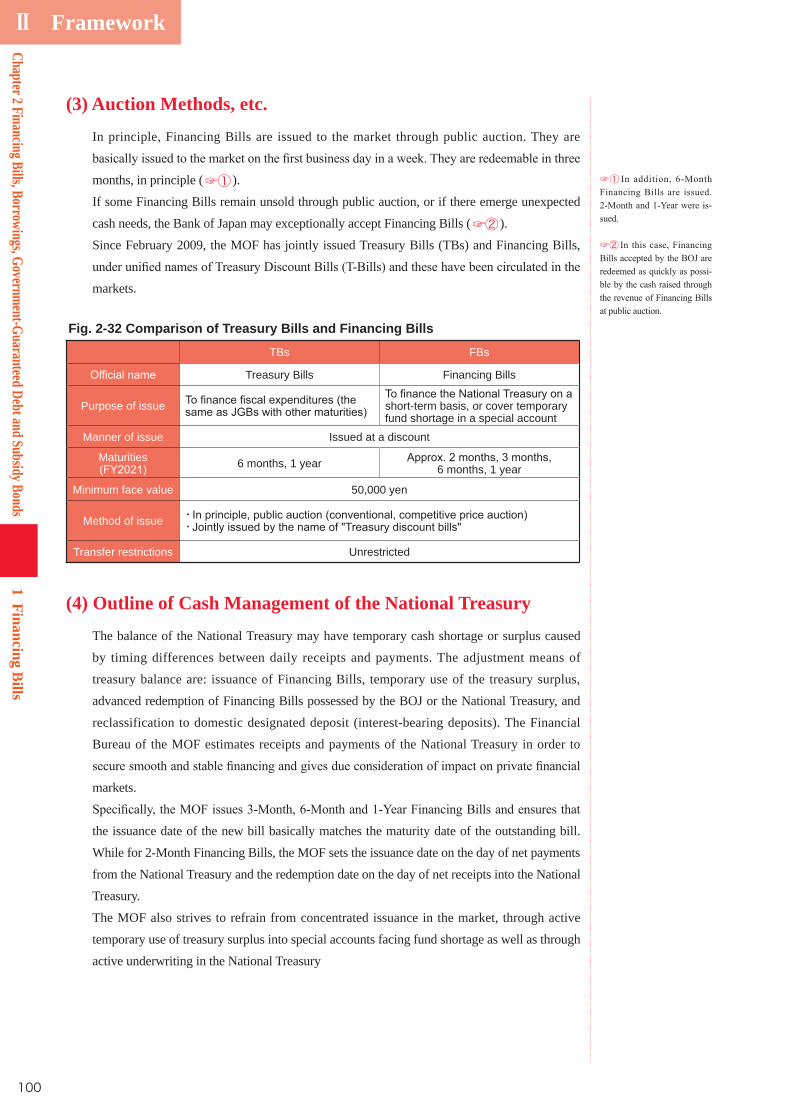
100
Ⅱ Framework
Chapter 2 Financing Bills, Borrowings, Government-Guaranteed Debt and Subsidy Bonds
1Financing B
ills
(3) Auction Methods, etc.In principle, Financing Bills are issued to the market through public auction. They are
months, in principle (☞① ).
If some Financing Bills remain unsold through public auction, or if there emerge unexpected
cash needs, the Bank of Japan may exceptionally accept Financing Bills (☞② ).
Since February 2009, the MOF has jointly issued Treasury Bills (TBs) and Financing Bills,
markets.
Fig. 2-32 Comparison of Treasury Bills and Financing Bills
TBs FBs
Treasury Bills Financing Bills
Purpose of issue short-term basis, or cover temporary fund shortage in a special account
Manner of issue Issued at a discount
Maturities 6 months, 1 year 6 months, 1 year
Minimum face value 50,000 yen
Method of issue ・・
Transfer restrictions Unrestricted
(4) Outline of Cash Management of the National TreasuryThe balance of the National Treasury may have temporary cash shortage or surplus caused
by timing differences between daily receipts and payments. The adjustment means of
treasury balance are: issuance of Financing Bills, temporary use of the treasury surplus,
advanced redemption of Financing Bills possessed by the BOJ or the National Treasury, and
reclassification to domestic designated deposit (interest-bearing deposits). The Financial
Bureau of the MOF estimates receipts and payments of the National Treasury in order to
markets.
the issuance date of the new bill basically matches the maturity date of the outstanding bill.
While for 2-Month Financing Bills, the MOF sets the issuance date on the day of net payments
from the National Treasury and the redemption date on the day of net receipts into the National
Treasury.
The MOF also strives to refrain from concentrated issuance in the market, through active
temporary use of treasury surplus into special accounts facing fund shortage as well as through
active underwriting in the National Treasury
☞①
-
☞②
-
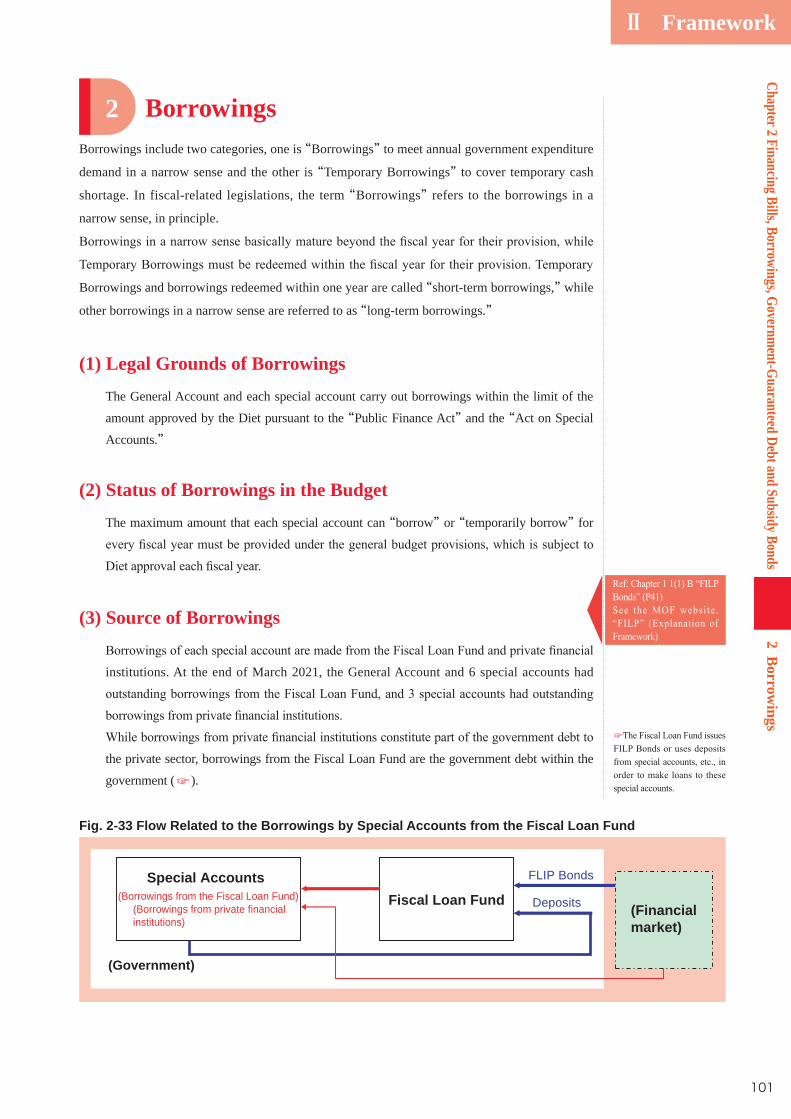
101
Ⅱ Framework2
Borrow
ingsChapter 2 Financing Bills, Borrowings, Governm
ent-Guaranteed Debt and Subsidy Bonds
BorrowingsBorrowings include two categories, one is “Borrowings” to meet annual government expenditure
demand in a narrow sense and the other is “Temporary Borrowings” to cover temporary cash
shortage. In fiscal-related legislations, the term “Borrowings” refers to the borrowings in a
narrow sense, in principle.
Borrowings and borrowings redeemed within one year are called “short-term borrowings,” while
other borrowings in a narrow sense are referred to as “long-term borrowings.”
(1) Legal Grounds of BorrowingsThe General Account and each special account carry out borrowings within the limit of the
amount approved by the Diet pursuant to the “Public Finance Act” and the “Act on Special
Accounts.”
(2) Status of Borrowings in the BudgetThe maximum amount that each special account can “borrow” or “temporarily borrow” for
(3) Source of Borrowings
institutions. At the end of March 2021, the General Account and 6 special accounts had
the private sector, borrowings from the Fiscal Loan Fund are the government debt within the
government (☞ ).
2
☞
(Financialmarket)
FLIP Bonds
Deposits
Special Accounts(Borrowings from the Fiscal Loan Fund)
(Borrowings from private financialinstitutions)
Fiscal Loan Fund
(Government)
Fig. 2-33 Flow Related to the Borrowings by Special Accounts from the Fiscal Loan Fund
102
Ⅱ Framework
2B
orrowings
Chapter 2 Financing Bills, Borrowings, Governm
ent-Guaranteed Debt and Subsidy Bonds
(4) Borrowings from the Private SectorThe Special Account for Allotment of Local Allocation Tax and Local Transfer Tax (the
Special Account for Local Allocation Tax), the Special Account for the National Forest Debt
Management, and the Special Account for Energy Policy carry out borrowings from private
Since July 2000, the Special Account has been borrowing partly from private financial
institutions. However, from FY2007, it decided to stop borrowing additional funds. It now
borrows only to repay outstanding debt.
Borrowings by the Special Account had been designed to cover the forest environment
transfer tax during a transitional period to the creation of the forest environment transfer tax.
In FY2020, however, the government decided to use the reserves for interest rate volatility at
the Japan Finance Organization for Municipalities, instead of the borrowings by the Special
Account for Local Allocation Tax, for the coverage and to take in no new borrowings. The
borrowings regarding the forest environment transfer tax were repaid in FY2020.
The Special Account for National Forest Service has undergone certain reforms in FY1998
enforcing the “Special Measure Act for the Reform of the National Forest Service.” In that
To ensure that such borrowings are made in a fair, equitable and transparent manner, in
obtaining loans by public auctions.
Pursuant to the “Law concerning Partial Revision, Etc. of Laws, Etc. including the Law on
Management and Operation of the National Forests to Enhance the Public Interest Functions
of National Forests”Forest Service was abolished, whereupon obligations relating to borrowings attributed to the
Account were transferred to the Special Account for the National Forest Debt Management.
Borrowings of the Special Account for the National Forest Debt Management from private
financial institutions are to be used to repay the outstanding debt. No new additional
borrowings are being made.
C. Special Account for Energy Policy
Japan National Oil Corporation (JNOC) was abolished in accordance with “Reorganization
and Rationalization Plan for Special Public Institutions.” The state oil reserves that had until
that point been taken care of by JNOC came under the direct control and management of the
government in the form of the Special Accounts for Petroleum and the More Sophisticated
Structure of Demand and Supply of Energy Policies (the Special Account for Petroleum) (☞
103
Ⅱ Framework2
Borrow
ingsChapter 2 Financing Bills, Borrowings, Governm
ent-Guaranteed Debt and Subsidy Bonds
①costs and expenses related to the construction of stockpiling facilities.
Pursuant to the “Act on Special Accounts”for Petroleum was abolished, whereupon the rights and obligations attributed to the Account
were transferred to the Special Account for Energy Policy.
be used to repay the outstanding debt. No new additional borrowings are being made.
The government has borrowed funds in the Nuclear Damage Liability Facilitation Account
since February 2012 to cover the redemption of JGBs granted to the Nuclear Damage
Compensation and Decommissioning Facilitation Corporation (☞② ).
(5) For borrowings from private sectors, the government employs the interest rate competitive
bidding or noncompetitive bidding process (only for the Special Account for Local Allocation
Tax) in which the government will accept biddings that offer lower interest rates until the
borrowing amount reaches the scheduled fundraising amount. Bidding participants are private
☞①-
-
☞②
--
-
104
Ⅱ Framework
3G
overnment-G
uaranteed Debt
Chapter2 Financing Bills, Borrowings, Governm
ent-Guaranteed Debt and Subsidy Bonds
Incorporated administrative agencies run businesses for public purposes as government agencies.
The government guarantees their debt within the maximum amount provided in the budget to
make it easier for them to raise funds. As is the case with JGBs, the government works to ensure
smooth and stable fundraising and to make sure that the given terms and conditions are favorable
and appropriate as government-guaranteed debt.
(1) Legal Ground of Government Guarantee
“Act on Restrictions on Financial Assistance by Government to Corporations.” Exceptions are
i) Conducting businesses for highly public purposes as agencies for the government.
thus the use of guaranteed-debt borrowing and repayment schedules are thoroughly
monitored.
are exercised at the ministries and agencies that hold jurisdiction over the relevant agencies.
Government-guaranteed debt is broadly divided into Government-Guaranteed Bonds and
Borrowings. Government-Guaranteed Bonds are divided into domestic and foreign bonds.
Raising funds through Government-Guaranteed Borrowings generally has the advantage of
secondary market as compared to Government-Guaranteed Bonds.
A. Treatment in the budget
acts, as mentioned above. These acts also provide that the government must receive Diet
approval for the maximum amount of government guarantee. Therefore, the maximum
amount for individual corporations is provided under the general provisions of the General
above. The government guarantees for those agencies that are eligible for FILP lending or
in the FILP Plan based on Article 5, paragraph (2), item(iii) of the Act for the Special
Measures on the Long-Term Management of the Fiscal Loan Fund.
3

105
Ⅱ Framework3
Governm
ent-Guaranteed D
ebtChapter 2 Financing Bills, Borrowings, Governm
ent-Guaranteed Debt and Subsidy Bonds
Every fiscal year, the MOF plans the issuance amount of Government-Guaranteed Bonds
announces them together with the JGB Issuance Plan (For FY2021, the scheduled issuances
are tabulated below.). Furthermore, whenever an agency raises funds through issuance of
Government-Guaranteed Bonds or Borrowings, the MOF examines whether or not interest
rates and prices in each case are appropriate for the guaranteed debt.
Fig. 2-34 Breakdown of the Planned Issuance Amount for FY2021 of Government-Guaranteed Bonds
FY2020 FY2020(3rd FY2021
Main Issuer
⒜ ⒝ ⒞ ⒞-⒜ ⒞-⒝
40-year 5.0 -65.0 -65.0
30-year ー ー 60.0 60.0 60.0
20-year 6.2 JEHDRA, Organization for Promoting Urban Development, etc.
10-year 143.4 623.4 611.6 etc.
130.0 130.0 20.0 -110.0 -110.0 DBJ
5-Year ー ー Japan Housing Finance Agency, Private Finance Initiative Promotion Corporation of Japan
4-Year 430.0 430.0 620.0
Deposit Insurance Corporation of Japan
Japan Finance Organization for Municipalities, etc.
3-Year 250.0 250.0 150.0 -100.0 -100.0
Japan International Cooperation Agency
Nuclear Damage Compensation and Decommissioning Facilitation Corporation
2-Year 610.0 610.0 -230.0 -230.0 DICJ
Subtotal 2,205.4 511.4 Short-Term
Bonds ー 500.0 300.0 300.0 -200.0 JFC
Foreign Bonds 2,266.5 -1,002.0 Japan Bank for International Cooperation,
JICA, etc.
Total
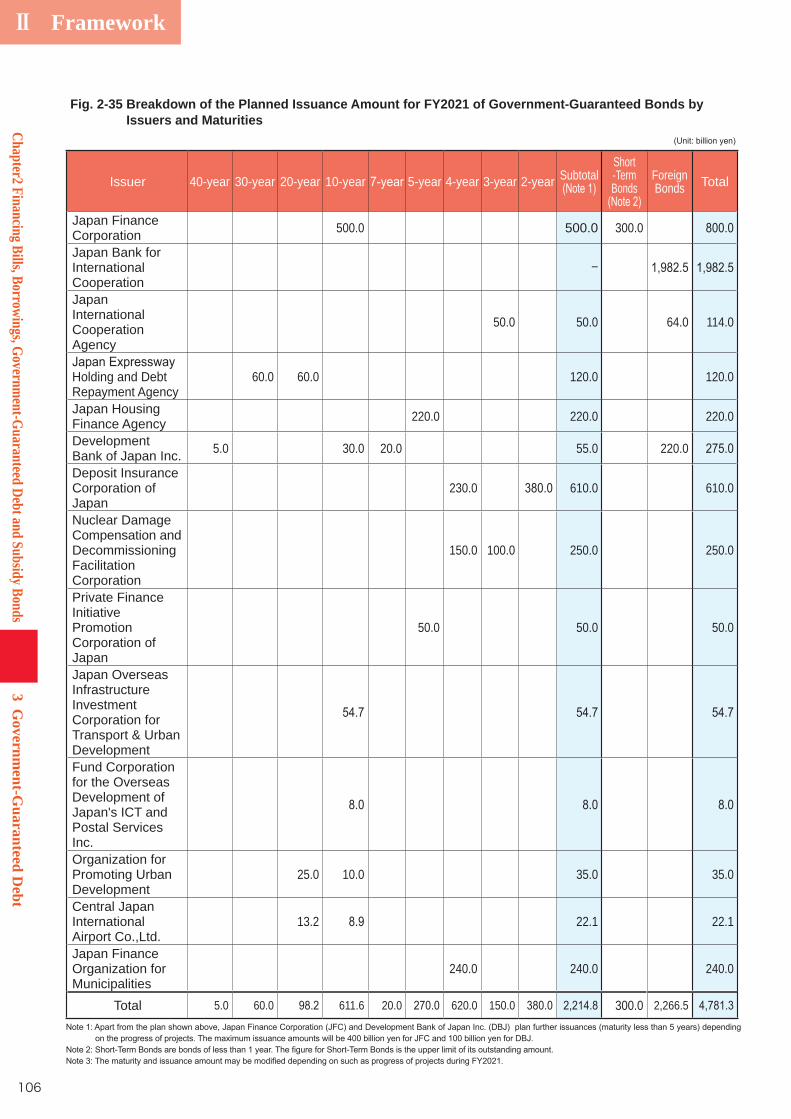
106
Ⅱ Framework
3G
overnment-G
uaranteed Debt
Chapter2 Financing Bills, Borrowings, Governm
ent-Guaranteed Debt and Subsidy Bonds
Fig. 2-35 Breakdown of the Planned Issuance Amount for FY2021 of Government-Guaranteed Bonds by Issuers and Maturities
Issuer 40-year 30-year 20-year 10-year 5-year 4-year 3-year 2-year SubtotalShort -TermBonds
Foreign Bonds Total
Japan Finance Corporation 500.0 500.0 300.0
Japan Bank for International Cooperation
ー
Japan International Cooperation Agency
50.0 50.0 64.0 114.0
Holding and Debt Repayment Agency
60.0 60.0 120.0 120.0
Japan Housing Finance Agency 220.0 220.0 220.0
Development Bank of Japan Inc. 5.0 30.0 20.0 55.0 220.0
Deposit Insurance Corporation of Japan
230.0 610.0 610.0
Nuclear Damage Compensation and Decommissioning Facilitation Corporation
150.0 100.0 250.0 250.0
Private Finance Initiative Promotion Corporation of Japan
50.0 50.0 50.0
Japan Overseas Infrastructure Investment Corporation for Transport & Urban DevelopmentFund Corporation for the Overseas Development of Japan's ICT and Postal Services Inc.Organization for Promoting Urban Development
25.0 10.0 35.0 35.0
Central Japan International Airport Co.,Ltd.
13.2 22.1 22.1
Japan Finance Organization for Municipalities
240.0 240.0 240.0
Total 5.0 60.0 611.6 20.0 620.0 150.0 300.0 2,266.5
Ⅱ Framework
107
Chapter 2 Financing Bills, Borrowings, Government-Guaranteed Debt and Subsidy Bonds
4Subsidy B
onds
Subsidy BondsSubsidy Bonds are the government bonds issued in place of provision of cash. Accordingly,
issuance of Subsidy Bonds does not generate revenues (☞ ).
Subsidy Bonds include (narrowly defined) Subsidy Bonds issued by the government in place
Bonds issued for subscriptions or contributions to international organizations such as the
International Monetary Fund.
Subsidy Bonds are currently issued to the bereaved families of the war dead or those who
others based on the “Act on Relief of War Victims and Survivors” (Act No.127, 1952)
established in 1952. Since then, a total of 46 types of Subsidy Bonds have been issued under
relevant special laws by the end of FY2020. The number of such bond issues totals 19.27
110.4 billion yen.
several years on an installment payment basis (☞ ).
(2) Subscription/Contribution BondsSubscription/Contribution Bonds (☞ ) are kinds of Subsidy Bonds, and are issued to pay
the subscription or contribution in whole or in part to international institutions, in lieu of the
amount to be paid in the currency. Thus, these bonds are non-interest bearing, nontransferable,
and payable on demand (whenever the institution concerned needs the currency and requests
for encashment, the cash should be paid to the institution).
As of the end of FY2020, there is a total of 19 outstanding issues of subscription or
agreement for each institution, using government bonds to make a payment to an international
institution is permitted only when the institution concerned does not require the currency for
the time being for the conduct of its operations.
Domestically, the Accession Measures Act for each international institution provides a legal
base for the issuance of these Subscription/Contribution Bonds.
(3) Others
A. Government Bonds issued to Development Bank of Japan
Government Bonds issued to the Development Bank of Japan (DBJ) are government bonds
issued/provided for the purpose of strengthening the financial foundations of the DBJ to
4
☞-
☞
-
☞ --
-
-
Chapter2 Financing Bills, Borrowings, Governm
ent-Guaranteed Debt and Subsidy Bonds
4Subsidy B
onds
Ⅱ Framework
108
are non-interest bearing, non-transferable, and payable on demand (whenever the DBJ needs
the DBJ).
B. Government Bonds issued to Nuclear Damage Compensation and
Government Bonds issued to the Nuclear Damage Compensation and Decommissioning
Facilitation Corporation (NDF) are issued/provided to raise funds for the NDF to cover special
financial assistance. These bonds are non-interest-bearing, non-transferable, and payable
on demand (whenever the NDF needs to subsidize funds for a nuclear energy firm to pay
damages compensation and requests the encashment of these bonds, the cash should be paid to
the NDF).
It should be noted that these bonds are redeemed with cash at the expense of the Special
Account for Energy Policy (Nuclear Damage Liability Facilitation Account).
109
Ⅱ Framework
In addition to the bonds or borrowings explained in chapter 1 and 2 such as Construction
Bonds, there are other categories of Public Debt, such as Public Pensions, Local Government
Bonds (LGBs), and the debt of Incorporated Administrative Agencies, etc. Although these
JGBs and Borrowings by the central government, and none of these debt categories relate to
’s debt management principles. The following
Local Government Bonds (LGBs)
(1) Basic Scheme of LGBs
A. Basic scheme
LGBs are issued by local governments to cover part of their expenditures and constitute their
debt.
While, in principle, LGBs can only be issued as resources for construction expenses, etc. as
stipulated in Article 5 of the “Local Government Finance Act,” there are exceptions such as
☞ ), etc.
When a local government intends to issue LGBs, it needs to consult with the Minister for
the Minister is planning to grant his/her consent in the consultation process, he/she needs to
consult with the Minister of Finance in advance.
with private funds, etc. from FY2012 and with a part of public funds from FY2016 by giving
Chapter 3 Other Public Debt
1
☞
-

110
Ⅱ Framework
Chapter 3 O
ther Public Debt
1Local Governm
ent Bonds (LGBs)
The planned issuance amount of LGBs for the following fiscal year is announced by the
central government in the LGB Program at the time of determination of a government budget
the breakdown by funding resources, project types and accounts.
a. Breakdown by funding resource
LGBs can be classified by the funding resources: Public Funds (Fiscal Loan Funds and
Funds and Private Placement Funds). The LGB Program provides the planned issuance
amount for each group.
From the viewpoint of encouraging local governments’governments should basically employ LGBs to raise private funds, while public funds
should rather play complementary roles.
b. Breakdown by project type
As for project types financed with LGBs, General Account Bonds are covering public
works, disaster restoration projects, education/welfare facilities development projects,
depopulation and remote region projects, and some other projects. On the other hand,
Fig. 2-37 Breakdown by Funding Resources of LGBs
Local GovernmentBonds
Public FundsFiscal Loan FundsJapan Finance Organization for
(☞ )
Private FundsPrivate Placement Funds
Minister of Finance
Minister for Internal A
ffairs and Com
munications
(or Prefectural G
overnors)
Prior notice
[Notice]
[Consultation]
[Approval]
LGB issuance
LGB issuance with consent
LGB issuance
Report to its local assembly
LGB issuance without consent
Local Governm
ent
In case of consent
In case of dissent
In case of approval
Consultation
Consultation
Consultation
Consent
Consent
Consent
Approval
Application
Notice
Local governments with: The real deficit at zero The real debt service ratio at below 18% The future burden ratio at below 400% (below 350% for ordinary municipalities), etc.
Local governments with: The real deficit above a certain level or moreThe real debt service ratio at 18% or more The tax rate below a standard rate future burden ratio, etc.
Private-sector Funds A part of Public Funds
LGBs subjected to prior notice and which are expected to acquire consent in response to consultation:・Principal redemption and interest payments for these LGBs are included into the Local Public Finance Program.・These LGBs are covered by special subletting loans, central government budget loans, etc. out of public funds.
LGBs subjected to consent: ・These LBGs are covered by public funds.・Principal redemption and interest payments for these LGBs are included into the Local Public Finance Program.
LGBs subjected to approval:・These LGBs are covered by public funds.・Principal redemption and interest payments for these LGBs are included into the Local Public Finance Program.
Fig. 2-36 Consultation System for the LGB Issuance
-
☞
-
-
111
Ⅱ Framework
Municipal Enterprise Bonds are financing water-supply projects, transportation projects,
hospital and elderly care service projects, and sewage projects. The LGB Program sets forth
the budgeted LGB amount for each project type.
c. Breakdown by accounts issuing LGBs
☞ ) and public
enterprise account.
An outlook on annual revenues and expenditures for the following year appearing in
the Local Public Finance Program is submitted to the Diet. The LGB issuance amount
appearing in the Local Public Finance Program covers only ordinary accounts, excluding
public enterprise accounts.
(2) LGB ProgramThe FY2021 LGB Program has been designed to secure local bond funds required for
steadily promoting measures implemented urgently by local governments to prevent and
reduce disasters, the adequate management of public facilities and the vitalization of local
billion yen in FY2020) are planned for promoting the development of infrastructure linked
closely to local residents’ livelihood (☞ ).
Public Offering Funds mean the funds that local governments will raise by issuing
their security certificates through markets. Local governments are urged to take greater
decentralization.
①
“Joint-LGBs” are issued every month
under the name of local governments, and the bonds are the joint debt of local governments
based on Article 5-7 of the “Local Government Finance Act”.
Since March 2002, apart from “ ” “Citizen Participatory-
type Public Offering LGB” have been issued. This is not only to diversify financing
methods of public offerings targeting at individual investors but also to encourage the
residents’ participation in local government.
☞
-
☞
-
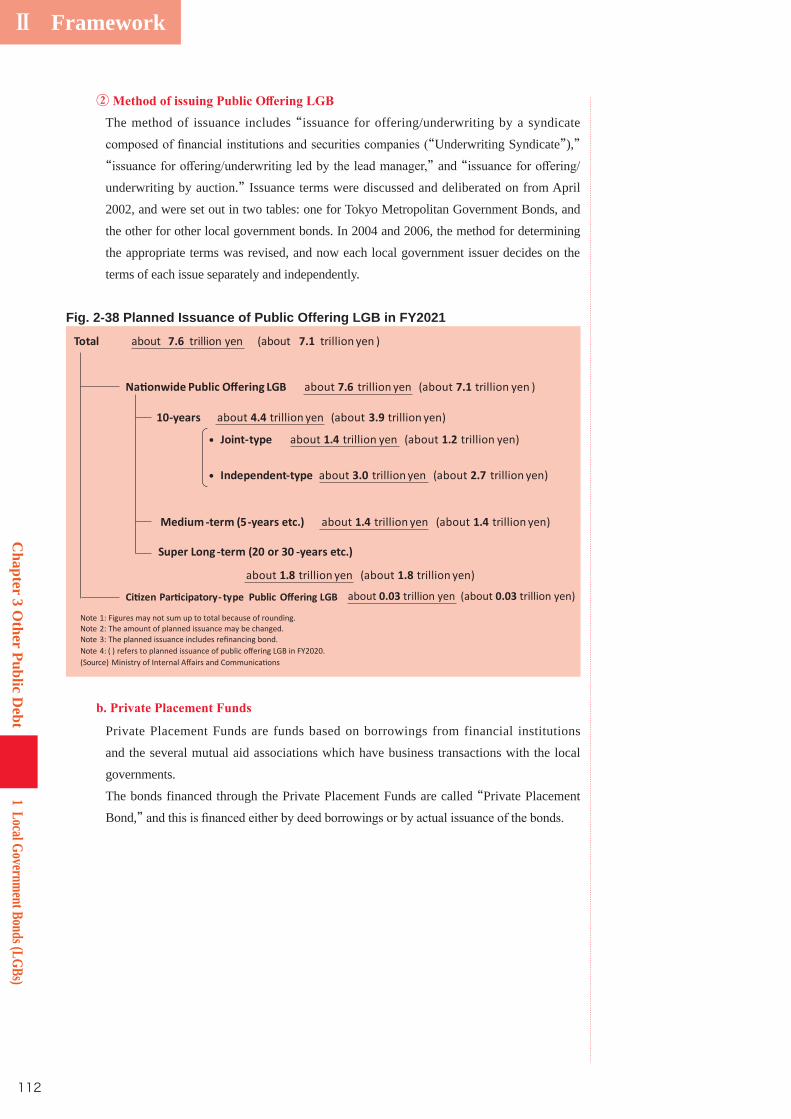
112
Ⅱ Framework
Chapter 3 O
ther Public Debt
1Local Governm
ent Bonds (LGBs)
②The method of issuance includes “issuance for offering/underwriting by a syndicate
“Underwriting Syndicate”),” “ ” and “underwriting by auction.” Issuance terms were discussed and deliberated on from April
2002, and were set out in two tables: one for Tokyo Metropolitan Government Bonds, and
the other for other local government bonds. In 2004 and 2006, the method for determining
the appropriate terms was revised, and now each local government issuer decides on the
terms of each issue separately and independently.
Private Placement Funds are funds based on borrowings from financial institutions
and the several mutual aid associations which have business transactions with the local
governments.
The bonds financed through the Private Placement Funds are called “Private Placement
Bond,”
Fig. 2-38 Planned Issuance of Public Offering LGB in FY2021
Total about 7.6 trillion yen (about 7.1 trillion yen )
Na onwide Public O ering LGB about 7.6 trillion yen (about 7.1 trillion yen )
10-years about 4.4 trillion yen (about 3.9 trillion yen)
• Joint-type about 1.4 trillion yen (about 1.2 trillion yen)
• Independent-type about 3.0 trillion yen (about 2.7 trillion yen)
Medium -term (5-years etc.) about 1.4 trillion yen (about 1.4 trillion yen)
Super Long -term (20 or 30 -years etc.)
about 1.8 trillion yen (about 1.8 trillion yen)
Ci zen Par cipatory- type Public O ering LGB about 0.03 trillion yen (about 0.03 trillion yen)
Note 1: Figures may not sum up to total because of rounding.Note 2: The amount of planned issuance may be changed.Note 3: Note 4: ( ) (Source)
113
Ⅱ FrameworkC
hapter 3 Other Public D
ebt2Debt of Incorporated Administrative Agencies, etc.
(1) Debt of Incorporated Administrative Agencies, etc.The debt of “Incorporated Administrative Agencies, etc.” includes government-guaranteed
debt, borrowings from the General Account, the Fiscal Loan Fund, and other Special
private sector.
“Incorporated Administrative Agencies, etc.” refer to Incorporated Administrative Agencies
(☞① ), public corporations (☞② ), and authorized organizations (☞③ ). All of these
are corporations that are engaged in public policy implementation under governmental
supervision.
Some projects of “Incorporated Administrative Agencies, etc.” are financed by FILP to
that utilize FILP are called FILP Agencies.
b. Other Borrowings from the central government
There are also interest-free loans from the General Account and Special Accounts to
“Incorporated Administrative Agencies, etc.”
As a result of the FILP reform, FILP Agency Bonds, which are not guaranteed by the
Agencies to raise funds independently. It is thought that FILP Agencies promote information
Some kinds of “Incorporated Administrative Agencies, etc.”need Diet authorization to issue bonds. Furthermore, an approval from the Competent Minister
is required in general for a FILP Agency to issue bonds or make long-term borrowings. The
Competent Minister can give their approval only after consulting with the Minister of Finance.
2 Debt of Incorporated Administrative Agencies, etc.☞①
-
--
-
-
-
☞②-
-
-
-
☞③-
-
114
Ⅱ Framework
Chapter 3 O
ther Public Debt
2Debt of Incorporated Administrative Agencies, etc.
etc.“Incorporated Administrative Agencies, etc.”in various forms.
Incorporated Administrative Agencies compile financial statements, which are based on
corporate accounting principles as a general rule, pursuant to the provisions of order of
the competent ministry, in accordance with the “Act on General Rules for Incorporated
Administrative Agencies.” The financial statements are audited by an auditor and an
accounting auditor and are approved by the Competent Minister before their disclosure (☞ ).
Government supervision of Incorporated Administrative Agencies has shifted its focus from
ex-ante control to ex-post check in order to strengthen their independence. The financial
statements of Incorporated Administrative Agencies contribute not only to better understanding
of how these agencies conduct businesses but also to appropriate evaluations of their business
results.
Each public corporation and authorized organization also compiles financial statements
in accordance with the Act under which it was established, receives approval from the
Competent Minister, and discloses this information. Each institution compiles and discloses
an “administrative cost analysis statement,” etc., based on corporate accounting principles to
The financial statements of major “Incorporated Administrative Agencies, etc.” in which
the government has invested are attached to the budget submitted to the Diet as reference
materials as stipulated in Article 28 of the “Public Finance Act.”
☞
--
-
Appendices
Ⅲ
This part contains supplementary informationwhich was not covered in previous parts of this brochure.
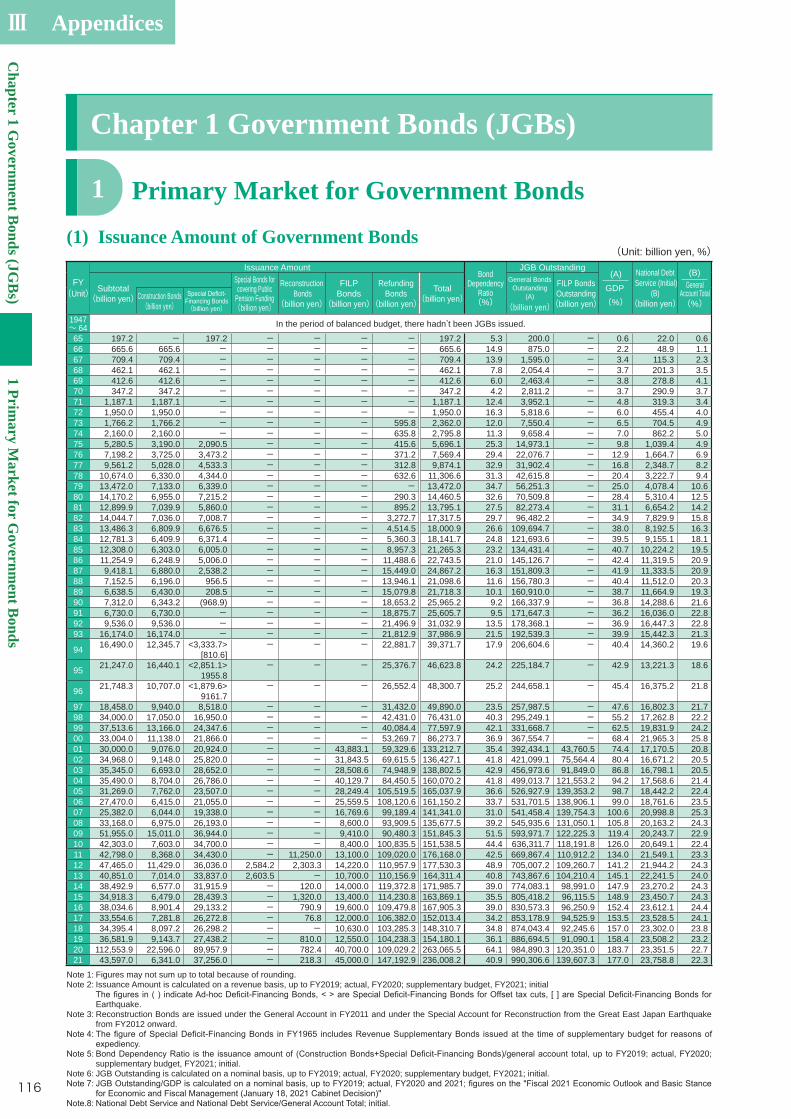
Ⅲ Appendices
Chapter 1 G
overnment B
onds (JGB
s)1 Prim
ary Market for G
overnment B
onds
116
Chapter 1 Government Bonds (JGBs)
Primary Market for Government Bonds1
(1) Issuance Amount of Government Bonds(Unit: billion yen, %)
FY(Unit)
Issuance AmountBond
DependencyRatio(%)
JGB Outstanding (A) GDP(%)
National Debt Service (Initial)
(B)(billion yen)
(B) General
Account Total(%)
Subtotal(billion yen)
Special Bonds for covering Public
Pension Funding(billion yen)
Reconstruction Bonds
(billion yen)
FILP Bonds
(billion yen)
RefundingBonds
(billion yen)Total
(billion yen)
General Bonds Outstanding
(A)
FILP Bonds Outstanding(billion yen)
Construction Bonds(billion yen) Financing Bonds
(billion yen) (billion yen)1947~ 64 In the period of balanced budget, there hadn’t been JGBs issued.
65 197.2 - 197.2 - - - - 197.2 5.3 200.0 - 0.6 22.0 0.666 665.6 665.6 - - - - - 665.6 14.9 875.0 - 2.2 48.9 1.167 709.4 709.4 - - - - - 709.4 13.9 1,595.0 - 3.4 115.3 2.368 462.1 462.1 - - - - - 462.1 7.8 2,054.4 - 3.7 201.3 3.569 412.6 412.6 - - - - - 412.6 6.0 2,463.4 - 3.8 278.8 4.170 347.2 347.2 - - - - - 347.2 4.2 2,811.2 - 3.7 290.9 3.771 1,187.1 1,187.1 - - - - - 1,187.1 12.4 3,952.1 - 4.8 319.3 3.472 1,950.0 1,950.0 - - - - - 1,950.0 16.3 5,818.6 - 6.0 455.4 4.073 1,766.2 1,766.2 - - - - 595.8 2,362.0 12.0 7,550.4 - 6.5 704.5 4.974 2,160.0 2,160.0 - - - - 635.8 2,795.8 11.3 9,658.4 - 7.0 862.2 5.075 5,280.5 3,190.0 2,090.5 - - - 415.6 5,696.1 25.3 14,973.1 - 9.8 1,039.4 4.976 7,198.2 3,725.0 3,473.2 - - - 371.2 7,569.4 29.4 22,076.7 - 12.9 1,664.7 6.977 9,561.2 5,028.0 4,533.3 - - - 312.8 9,874.1 32.9 31,902.4 - 16.8 2,348.7 8.278 10,674.0 6,330.0 4,344.0 - - - 632.6 11,306.6 31.3 42,615.8 - 20.4 3,222.7 9.479 13,472.0 7,133.0 6,339.0 - - - - 13,472.0 34.7 56,251.3 - 25.0 4,078.4 10.680 14,170.2 6,955.0 7,215.2 - - - 290.3 14,460.5 32.6 70,509.8 - 28.4 5,310.4 12.581 12,899.9 7,039.9 5,860.0 - - - 895.2 13,795.1 27.5 82,273.4 - 31.1 6,654.2 14.282 14,044.7 7,036.0 7,008.7 - - - 3,272.7 17,317.5 29.7 96,482.2 - 34.9 7,829.9 15.883 13,486.3 6,809.9 6,676.5 - - - 4,514.5 18,000.9 26.6 109,694.7 - 38.0 8,192.5 16.384 12,781.3 6,409.9 6,371.4 - - - 5,360.3 18,141.7 24.8 121,693.6 - 39.5 9,155.1 18.185 12,308.0 6,303.0 6,005.0 - - - 8,957.3 21,265.3 23.2 134,431.4 - 40.7 10,224.2 19.586 11,254.9 6,248.9 5,006.0 - - - 11,488.6 22,743.5 21.0 145,126.7 - 42.4 11,319.5 20.987 9,418.1 6,880.0 2,538.2 - - - 15,449.0 24,867.2 16.3 151,809.3 - 41.9 11,333.5 20.988 7,152.5 6,196.0 956.5 - - - 13,946.1 21,098.6 11.6 156,780.3 - 40.4 11,512.0 20.389 6,638.5 6,430.0 208.5 - - - 15,079.8 21,718.3 10.1 160,910.0 - 38.7 11,664.9 19.390 7,312.0 6,343.2 (968.9) - - - 18,653.2 25,965.2 9.2 166,337.9 - 36.8 14,288.6 21.691 6,730.0 6,730.0 - - - - 18,875.7 25,605.7 9.5 171,647.3 - 36.2 16,036.0 22.892 9,536.0 9,536.0 - - - - 21,496.9 31,032.9 13.5 178,368.1 - 36.9 16,447.3 22.893 16,174.0 16,174.0 - - - - 21,812.9 37,986.9 21.5 192,539.3 - 39.9 15,442.3 21.3
94 16,490.0 12,345.7 <3,333.7>[810.6]
- - - 22,881.7 39,371.7 17.9 206,604.6 - 40.4 14,360.2 19.6
95 21,247.0 16,440.1 <2,851.1>1955.8
- - - 25,376.7 46,623.8 24.2 225,184.7 - 42.9 13,221.3 18.6
96 21,748.3 10,707.0 <1,879.6>9161.7
- - - 26,552.4 48,300.7 25.2 244,658.1 - 45.4 16,375.2 21.8
97 18,458.0 9,940.0 8,518.0 - - - 31,432.0 49,890.0 23.5 257,987.5 - 47.6 16,802.3 21.798 34,000.0 17,050.0 16,950.0 - - - 42,431.0 76,431.0 40.3 295,249.1 - 55.2 17,262.8 22.299 37,513.6 13,166.0 24,347.6 - - - 40,084.4 77,597.9 42.1 331,668.7 - 62.5 19,831.9 24.200 33,004.0 11,138.0 21,866.0 - - - 53,269.7 86,273.7 36.9 367,554.7 - 68.4 21,965.3 25.801 30,000.0 9,076.0 20,924.0 - - 43,883.1 59,329.6 133,212.7 35.4 392,434.1 43,760.5 74.4 17,170.5 20.802 34,968.0 9,148.0 25,820.0 - - 31,843.5 69,615.5 136,427.1 41.8 421,099.1 75,564.4 80.4 16,671.2 20.503 35,345.0 6,693.0 28,652.0 - - 28,508.6 74,948.9 138,802.5 42.9 456,973.6 91,849.0 86.8 16,798.1 20.504 35,490.0 8,704.0 26,786.0 - - 40,129.7 84,450.5 160,070.2 41.8 499,013.7 121,553.2 94.2 17,568.6 21.405 31,269.0 7,762.0 23,507.0 - - 28,249.4 105,519.5 165,037.9 36.6 526,927.9 139,353.2 98.7 18,442.2 22.406 27,470.0 6,415.0 21,055.0 - - 25,559.5 108,120.6 161,150.2 33.7 531,701.5 138,906.1 99.0 18,761.6 23.507 25,382.0 6,044.0 19,338.0 - - 16,769.6 99,189.4 141,341.0 31.0 541,458.4 139,754.3 100.6 20,998.8 25.308 33,168.0 6,975.0 26,193.0 - - 8,600.0 93,909.5 135,677.5 39.2 545,935.6 131,050.1 105.8 20,163.2 24.309 51,955.0 15,011.0 36,944.0 - - 9,410.0 90,480.3 151,845.3 51.5 593,971.7 122,225.3 119.4 20,243.7 22.910 42,303.0 7,603.0 34,700.0 - - 8,400.0 100,835.5 151,538.5 44.4 636,311.7 118,191.8 126.0 20,649.1 22.411 42,798.0 8,368.0 34,430.0 - 11,250.0 13,100.0 109,020.0 176,168.0 42.5 669,867.4 110,912.2 134.0 21,549.1 23.312 47,465.0 11,429.0 36,036.0 2,584.2 2,303.3 14,220.0 110,957.9 177,530.3 48.9 705,007.2 109,260.7 141.2 21,944.2 24.313 40,851.0 7,014.0 33,837.0 2,603.5 - 10,700.0 110,156.9 164,311.4 40.8 743,867.6 104,210.4 145.1 22,241.5 24.014 38,492.9 6,577.0 31,915.9 - 120.0 14,000.0 119,372.8 171,985.7 39.0 774,083.1 98,991.0 147.9 23,270.2 24.315 34,918.3 6,479.0 28,439.3 - 1,320.0 13,400.0 114,230.8 163,869.1 35.5 805,418.2 96,115.5 148.9 23,450.7 24.316 38,034.6 8,901.4 29,133.2 - 790.9 19,600.0 109,479.8 167,905.3 39.0 830,573.3 96,250.9 152.4 23,612.1 24.417 33,554.6 7,281.8 26,272.8 - 76.8 12,000.0 106,382.0 152,013.4 34.2 853,178.9 94,525.9 153.5 23,528.5 24.118 34,395.4 8,097.2 26,298.2 - - 10,630.0 103,285.3 148,310.7 34.8 874,043.4 92,245.6 157.0 23,302.0 23.819 36,581.9 9,143.7 27,438.2 - 810.0 12,550.0 104,238.3 154,180.1 36.1 886,694.5 91,090.1 158.4 23,508.2 23.220 112,553.9 22,596.0 89,957.9 - 782.4 40,700.0 109,029.2 263,065.5 64.1 984,890.3 120,351.0 183.7 23,351.5 22.721 43,597.0 6,341.0 37,256.0 - 218.3 45,000.0 147,192.9 236,008.2 40.9 990,306.6 139,607.3 177.0 23,758.8 22.3
Note 1: Figures may not sum up to total because of rounding.Note 2: Issuance Amount is calculated on a revenue basis, up to FY2019; actual, FY2020; supplementary budget, FY2021; initial
Earthquake.Note 3: Reconstruction Bonds are issued under the General Account in FY2011 and under the Special Account for Reconstruction from the Great East Japan Earthquake
from FY2012 onward.
supplementary budget, FY2021; initial.Note 6: JGB Outstanding is calculated on a nominal basis, up to FY2019; actual, FY2020; supplementary budget, FY2021; initial.
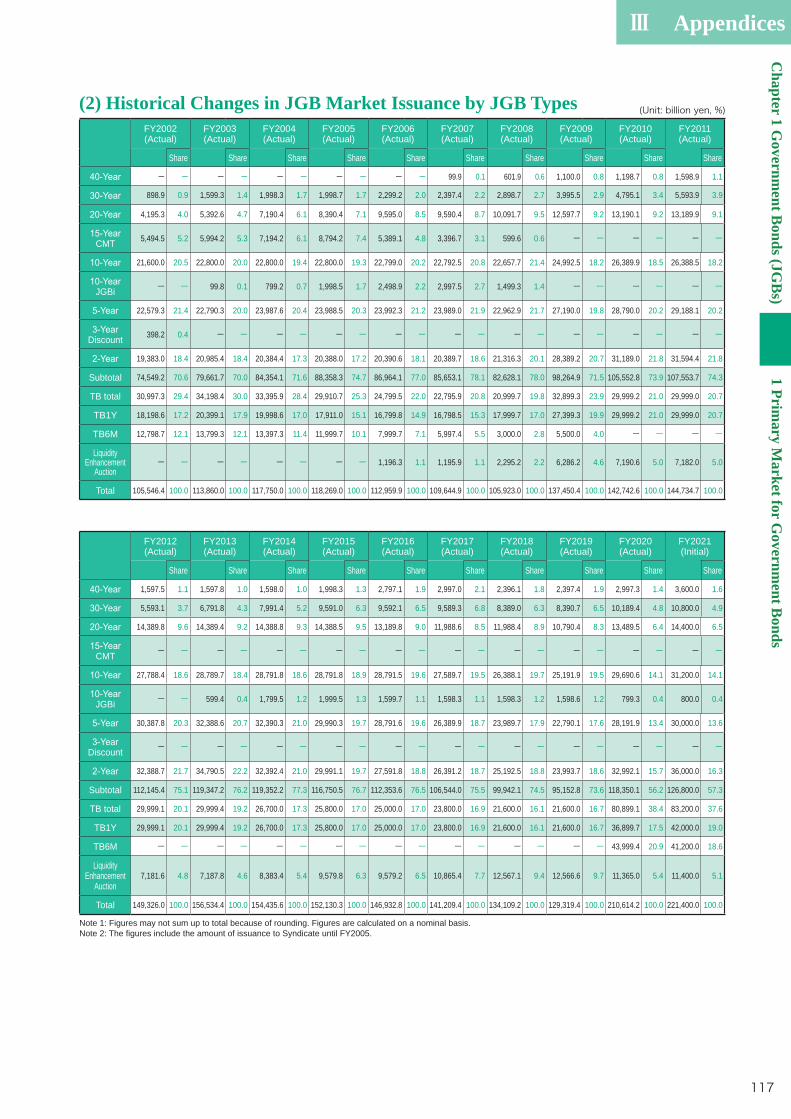
Ⅲ AppendicesC
hapter 1 Governm
ent Bonds (JG
Bs)
1 Primary M
arket for Governm
ent Bonds
117
(2) Historical Changes in JGB Market Issuance by JGB Types (Unit: billion yen, %)
FY2002(Actual)
FY2003(Actual)
FY2004(Actual)
FY2005(Actual)
FY2006(Actual)
FY2007(Actual)
FY2008(Actual)
FY2009(Actual)
FY2010(Actual)
FY2011(Actual)
Share Share Share Share Share Share Share Share Share Share
ー ー ー ー ー ー ー ー ー ー 99.9 0.1 601.9 0.6 1,100.0 0.8 1,198.7 0.8 1,598.9 1.1
898.9 0.9 1,599.3 1.4 1,998.3 1.7 1,998.7 1.7 2,299.2 2.0 2,397.4 2.2 2,898.7 2.7 3,995.5 2.9 4,795.1 3.4 5,593.9 3.9
4,195.3 4.0 5,392.6 4.7 7,190.4 6.1 8,390.4 7.1 9,595.0 8.5 9,590.4 8.7 10,091.7 9.5 12,597.7 9.2 13,190.1 9.2 13,189.9 9.1
CMT 5,494.5 5.2 5,994.2 5.3 7,194.2 6.1 8,794.2 7.4 5,389.1 4.8 3,396.7 3.1 599.6 0.6 ー ー ー ー ー ー
21,600.0 20.5 22,800.0 20.0 22,800.0 19.4 22,800.0 19.3 22,799.0 20.2 22,792.5 20.8 22,657.7 21.4 24,992.5 18.2 26,389.9 18.5 26,388.5 18.2
JGBi ー ー 99.8 0.1 799.2 0.7 1,998.5 1.7 2,498.9 2.2 2,997.5 2.7 1,499.3 1.4 ー ー ー ー ー ー
22,579.3 21.4 22,790.3 20.0 23,987.6 20.4 23,988.5 20.3 23,992.3 21.2 23,989.0 21.9 22,962.9 21.7 27,190.0 19.8 28,790.0 20.2 29,188.1 20.2
Discount 398.2 0.4 ー ー ー ー ー ー ー ー ー ー ー ー ー ー ー ー ー ー
19,383.0 18.4 20,985.4 18.4 20,384.4 17.3 20,388.0 17.2 20,390.6 18.1 20,389.7 18.6 21,316.3 20.1 28,389.2 20.7 31,189.0 21.8 31,594.4 21.8
Subtotal 74,549.2 70.6 79,661.7 70.0 84,354.1 71.6 88,358.3 74.7 86,964.1 77.0 85,653.1 78.1 82,628.1 78.0 98,264.9 71.5 105,552.8 73.9 107,553.7 74.3
TB total 30,997.3 29.4 34,198.4 30.0 33,395.9 28.4 29,910.7 25.3 24,799.5 22.0 22,795.9 20.8 20,999.7 19.8 32,899.3 23.9 29,999.2 21.0 29,999.0 20.7
TB1Y 18,198.6 17.2 20,399.1 17.9 19,998.6 17.0 17,911.0 15.1 16,799.8 14.9 16,798.5 15.3 17,999.7 17.0 27,399.3 19.9 29,999.2 21.0 29,999.0 20.7
TB6M 12,798.7 12.1 13,799.3 12.1 13,397.3 11.4 11,999.7 10.1 7,999.7 7.1 5,997.4 5.5 3,000.0 2.8 5,500.0 4.0 ー ー ー ー
Liquidity Enhancement
Auction ー ー ー ー ー ー ー ー 1,196.3 1.1 1,195.9 1.1 2,295.2 2.2 6,286.2 4.6 7,190.6 5.0 7,182.0 5.0
Total 105,546.4 100.0 113,860.0 100.0 117,750.0 100.0 118,269.0 100.0 112,959.9 100.0 109,644.9 100.0 105,923.0 100.0 137,450.4 100.0 142,742.6 100.0 144,734.7 100.0
FY2012(Actual)
FY2013(Actual)
FY2014(Actual)
FY2015(Actual)
FY2016(Actual)
FY2017(Actual)
FY2018(Actual)
FY2019(Actual)
FY2020(Actual)
FY2021(Initial)
Share Share Share Share Share Share Share Share Share Share
1,597.5 1.1 1,597.8 1.0 1,598.0 1.0 1,998.3 1.3 2,797.1 1.9 2,997.0 2.1 2,396.1 1.8 2,397.4 1.9 2,997.3 1.4 3,600.0 1.6
5,593.1 3.7 6,791.8 4.3 7,991.4 5.2 9,591.0 6.3 9,592.1 6.5 9,589.3 6.8 8,389.0 6.3 8,390.7 6.5 10,189.4 4.8 10,800.0 4.9
14,389.8 9.6 14,389.4 9.2 14,388.8 9.3 14,388.5 9.5 13,189.8 9.0 11,988.6 8.5 11,988.4 8.9 10,790.4 8.3 13,489.5 6.4 14,400.0 6.5
CMT ー ー ー ー ー ー ー ー ー ー ー ー ー ー ー ー ー ー ー ー
27,788.4 18.6 28,789.7 18.4 28,791.8 18.6 28,791.8 18.9 28,791.5 19.6 27,589.7 19.5 26,388.1 19.7 25,191.9 19.5 29,690.6 14.1 31,200.0 14.1
JGBi ー ー 599.4 0.4 1,799.5 1.2 1,999.5 1.3 1,599.7 1.1 1,598.3 1.1 1,598.3 1.2 1,598.6 1.2 799.3 0.4 800.0 0.4
30,387.8 20.3 32,388.6 20.7 32,390.3 21.0 29,990.3 19.7 28,791.6 19.6 26,389.9 18.7 23,989.7 17.9 22,790.1 17.6 28,191.9 13.4 30,000.0 13.6
Discount ー ー ー ー ー ー ー ー ー ー ー ー ー ー ー ー ー ー ー ー
32,388.7 21.7 34,790.5 22.2 32,392.4 21.0 29,991.1 19.7 27,591.8 18.8 26,391.2 18.7 25,192.5 18.8 23,993.7 18.6 32,992.1 15.7 36,000.0 16.3
Subtotal 112,145.4 75.1 119,347.2 76.2 119,352.2 77.3 116,750.5 76.7 112,353.6 76.5 106,544.0 75.5 99,942.1 74.5 95,152.8 73.6 118,350.1 56.2 126,800.0 57.3
TB total 29,999.1 20.1 29,999.4 19.2 26,700.0 17.3 25,800.0 17.0 25,000.0 17.0 23,800.0 16.9 21,600.0 16.1 21,600.0 16.7 80,899.1 38.4 83,200.0 37.6
TB1Y 29,999.1 20.1 29,999.4 19.2 26,700.0 17.3 25,800.0 17.0 25,000.0 17.0 23,800.0 16.9 21,600.0 16.1 21,600.0 16.7 36,899.7 17.5 42,000.0 19.0
TB6M ー ー ー ー ー ー ー ー ー ー ー ー ー ー ー ー 43,999.4 20.9 41,200.0 18.6
Liquidity Enhancement
Auction7,181.6 4.8 7,187.8 4.6 8,383.4 5.4 9,579.8 6.3 9,579.2 6.5 10,865.4 7.7 12,567.1 9.4 12,566.6 9.7 11,365.0 5.4 11,400.0 5.1
Total 149,326.0 100.0 156,534.4 100.0 154,435.6 100.0 152,130.3 100.0 146,932.8 100.0 141,209.4 100.0 134,109.2 100.0 129,319.4 100.0 210,614.2 100.0 221,400.0 100.0
Note 1: Figures may not sum up to total because of rounding. Figures are calculated on a nominal basis.Note 2: The figures include the amount of issuance to Syndicate until FY2005.
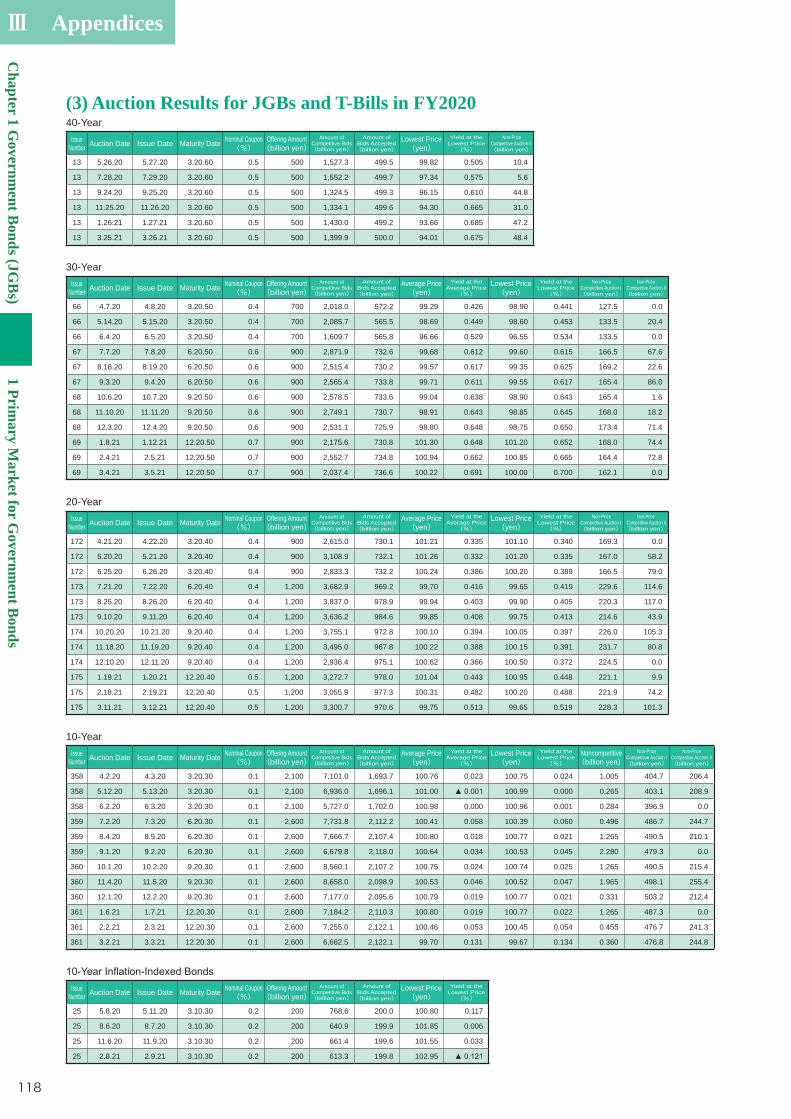
Ⅲ Appendices
Chapter 1 G
overnment B
onds (JGB
s)1 Prim
ary Market for G
overnment B
onds
118
10-YearIssue
Number Auction Date Issue Date Maturity Date Nominal Coupon(%)
Offering Amount(billion yen)
Amount of Competitive Bids(billion yen)
Amount of Bids Accepted(billion yen)
Average Price(yen)
Yield at the Average Price(%)
Lowest Price(yen)
Yield at the Lowest Price(%)
Noncompetitive(billion yen)
Non-Price Competitive Auction I(billion yen)
Non-Price Competitive Auction II(billion yen)
358 4.2.20 4.3.20 3.20.30 0.1 2,100 7,101.0 1,693.7 100.76 0.023 100.75 0.024 1.005 404.7 206.4
358 5.12.20 5.13.20 3.20.30 0.1 2,100 6,936.0 1,696.1 101.00 100.99 0.000 0.265 403.1 208.9
358 6.2.20 6.3.20 3.20.30 0.1 2,100 5,727.0 1,702.0 100.98 0.000 100.96 0.001 0.284 396.9 0.0
359 7.2.20 7.3.20 6.20.30 0.1 2,600 7,731.8 2,112.2 100.41 0.058 100.39 0.060 0.496 486.7 244.7
359 8.4.20 8.5.20 6.20.30 0.1 2,600 7,666.7 2,107.4 100.80 0.018 100.77 0.021 1.265 490.5 210.1
359 9.1.20 9.2.20 6.20.30 0.1 2,600 6,679.8 2,118.0 100.64 0.034 100.53 0.045 2.280 479.3 0.0
360 10.1.20 10.2.20 9.20.30 0.1 2,600 8,560.1 2,107.2 100.75 0.024 100.74 0.025 1.265 490.5 215.4
360 11.4.20 11.5.20 9.20.30 0.1 2,600 8,658.0 2,098.9 100.53 0.046 100.52 0.047 1.965 498.1 255.4
360 12.1.20 12.2.20 9.20.30 0.1 2,600 7,177.0 2,095.6 100.79 0.019 100.77 0.021 0.331 503.2 212.4
361 1.6.21 1.7.21 12.20.30 0.1 2,600 7,184.2 2,110.3 100.80 0.019 100.77 0.022 1.265 487.3 0.0
361 2.2.21 2.3.21 12.20.30 0.1 2,600 7,255.0 2,122.1 100.46 0.053 100.45 0.054 0.455 476.7 241.3
361 3.2.21 3.3.21 12.20.30 0.1 2,600 6,662.5 2,122.1 99.70 0.131 99.67 0.134 0.360 476.8 244.8
(3) Auction Results for JGBs and T-Bills in FY202040-Year
Issue Number Auction Date Issue Date Maturity Date Nominal Coupon
(%)Offering Amount(billion yen)
Amount of Competitive Bids(billion yen)
Amount of Bids Accepted(billion yen)
Lowest Price(yen)
Yield at the Lowest Price(%)
Non-Price Competitive Auction II(billion yen)
13 5.26.20 5.27.20 3.20.60 0.5 500 1,527.3 499.5 99.82 0.505 10.4
13 7.28.20 7.29.20 3.20.60 0.5 500 1,552.2 499.7 97.34 0.575 5.6
13 9.24.20 9.25.20 3.20.60 0.5 500 1,324.5 499.3 96.15 0.610 44.8
13 11.25.20 11.26.20 3.20.60 0.5 500 1,334.1 499.6 94.30 0.665 31.0
13 1.26.21 1.27.21 3.20.60 0.5 500 1,430.0 499.2 93.66 0.685 47.2
13 3.25.21 3.26.21 3.20.60 0.5 500 1,399.9 500.0 94.01 0.675 48.4
30-YearIssue
Number Auction Date Issue Date Maturity Date Nominal Coupon(%)
Offering Amount(billion yen)
Amount of Competitive Bids(billion yen)
Amount of Bids Accepted(billion yen)
Average Price(yen)
Yield at the Average Price(%)
Lowest Price(yen)
Yield at the Lowest Price(%)
Non-Price Competitive Auction I(billion yen)
Non-Price Competitive Auction II(billion yen)
66 4.7.20 4.8.20 3.20.50 0.4 700 2,018.0 572.2 99.29 0.426 98.90 0.441 127.5 0.0
66 5.14.20 5.15.20 3.20.50 0.4 700 2,085.7 565.5 98.69 0.449 98.60 0.453 133.5 20.4
66 6.4.20 6.5.20 3.20.50 0.4 700 1,609.7 565.8 96.66 0.529 96.55 0.534 133.5 0.0
67 7.7.20 7.8.20 6.20.50 0.6 900 2,871.9 732.6 99.68 0.612 99.60 0.615 166.5 67.6
67 8.18.20 8.19.20 6.20.50 0.6 900 2,515.4 730.2 99.57 0.617 99.35 0.625 169.2 22.6
67 9.3.20 9.4.20 6.20.50 0.6 900 2,565.4 733.8 99.71 0.611 99.55 0.617 165.4 86.0
68 10.6.20 10.7.20 9.20.50 0.6 900 2,578.5 733.6 99.04 0.638 98.90 0.643 165.4 1.6
68 11.10.20 11.11.20 9.20.50 0.6 900 2,749.1 730.7 98.91 0.643 98.85 0.645 168.0 18.2
68 12.3.20 12.4.20 9.20.50 0.6 900 2,531.1 725.9 98.80 0.648 98.75 0.650 173.4 71.4
69 1.8.21 1.12.21 12.20.50 0.7 900 2,175.6 730.8 101.30 0.648 101.20 0.652 168.0 74.4
69 2.4.21 2.5.21 12.20.50 0.7 900 2,552.7 734.8 100.94 0.662 100.85 0.665 164.4 72.8
69 3.4.21 3.5.21 12.20.50 0.7 900 2,037.4 736.6 100.22 0.691 100.00 0.700 162.1 0.0
20-YearIssue
Number Auction Date Issue Date Maturity Date Nominal Coupon(%)
Offering Amount(billion yen)
Amount of Competitive Bids(billion yen)
Amount of Bids Accepted(billion yen)
Average Price(yen)
Yield at the Average Price(%)
Lowest Price(yen)
Yield at the Lowest Price(%)
Non-Price Competitive Auction I(billion yen)
Non-Price Competitive Auction II(billion yen)
172 4.21.20 4.22.20 3.20.40 0.4 900 2,615.0 730.1 101.21 0.335 101.10 0.340 169.3 0.0
172 5.20.20 5.21.20 3.20.40 0.4 900 3,108.9 732.1 101.26 0.332 101.20 0.335 167.0 58.2
172 6.25.20 6.26.20 3.20.40 0.4 900 2,833.3 732.2 100.24 0.386 100.20 0.389 166.5 79.0
173 7.21.20 7.22.20 6.20.40 0.4 1,200 3,682.9 969.2 99.70 0.416 99.65 0.419 229.6 114.6
173 8.25.20 8.26.20 6.20.40 0.4 1,200 3,837.0 978.9 99.94 0.403 99.90 0.405 220.3 117.0
173 9.10.20 9.11.20 6.20.40 0.4 1,200 3,636.2 984.6 99.85 0.408 99.75 0.413 214.6 43.9
174 10.20.20 10.21.20 9.20.40 0.4 1,200 3,755.1 972.8 100.10 0.394 100.05 0.397 226.0 105.3
174 11.18.20 11.19.20 9.20.40 0.4 1,200 3,495.0 967.8 100.22 0.388 100.15 0.391 231.7 80.8
174 12.10.20 12.11.20 9.20.40 0.4 1,200 2,936.4 975.1 100.62 0.366 100.50 0.372 224.5 0.0
175 1.19.21 1.20.21 12.20.40 0.5 1,200 3,272.7 978.0 101.04 0.443 100.95 0.448 221.1 9.9
175 2.18.21 2.19.21 12.20.40 0.5 1,200 3,055.9 977.3 100.31 0.482 100.20 0.488 221.9 74.2
175 3.11.21 3.12.21 12.20.40 0.5 1,200 3,300.7 970.6 99.75 0.513 99.65 0.519 228.3 101.3
Issue Number Auction Date Issue Date Maturity Date Nominal Coupon
(%)Offering Amount(billion yen)
Amount of Competitive Bids(billion yen)
Amount of Bids Accepted(billion yen)
Lowest Price(yen)
Yield at the Lowest Price(%)
25 5.8.20 5.11.20 3.10.30 0.2 200 768.6 200.0 100.80 0.117
25 8.6.20 8.7.20 3.10.30 0.2 200 640.9 199.9 101.85 0.006
25 11.6.20 11.9.20 3.10.30 0.2 200 661.4 199.6 101.55 0.033
25 2.8.21 2.9.21 3.10.30 0.2 200 613.3 199.8 102.95

Ⅲ AppendicesC
hapter 1 Governm
ent Bonds (JG
Bs)
1 Primary M
arket for Governm
ent Bonds
119
2-YearIssue
Number Auction Date Issue Date Maturity Date Nominal Coupon(%)
Offering Amount(billion yen)
Amount of Competitive Bids(billion yen)
Amount of Bids Accepted(billion yen)
Average Price(yen)
Yield at the Average Price(%)
Lowest Price(yen)
Yield at the Lowest Price(%)
Noncompetitive(billion yen)
Non-Price Competitive Auction I(billion yen)
Non-Price Competitive Auction II(billion yen)
412 4.23.20 5.1.20 5.1.22 0.1 2,000 8,808.9 1,622.5 100.483 100.475 0.000 377.1 163.2
413 5.28.20 6.1.20 6.1.22 0.1 2,000 8,550.6 1,620.5 100.546 100.540 1.000 378.0 29.2
414 6.30.20 7.1.20 7.1.22 0.1 3,000 11,390.0 2,432.2 100.474 100.465 0.000 567.3 250.6
415 7.30.20 8.3.20 8.1.22 0.1 3,000 11,094.0 2,432.1 100.467 100.460 0.000 567.2 47.7
416 8.27.20 9.1.20 9.1.22 0.1 3,000 11,403.8 2,444.9 100.433 100.430 1.000 553.4 101.2
417 9.29.20 10.1.20 10.1.22 0.1 3,000 9,856.1 2,450.6 100.485 100.480 0.000 548.5 124.1
418 10.27.20 11.2.20 11.1.22 0.1 3,000 9,744.1 2,445.8 100.461 100.455 0.000 553.5 0.0
419 11.27.20 12.1.20 12.1.22 0.1 3,000 8,092.6 2,519.5 100.481 100.470 0.000 480.0 0.0
420 12.24.20 1.4.21 1.1.23 0.1 3,000 10,709.7 2,562.4 100.458 100.455 0.000 436.8 41.8
421 1.28.21 2.1.21 2.1.23 0.1 3,000 12,112.4 2,436.2 100.456 100.450 0.000 562.7 128.4
422 2.26.21 3.1.21 3.1.23 0.1 3,000 10,500.3 2,456.4 100.399 100.395 0.000 543.0 148.1
423 3.30.21 4.1.21 4.1.23 0.005 3,000 8,892.7 2,453.9 100.263 100.250 0.000 545.0 12.5
5-YearIssue
Number Auction Date Issue Date Maturity Date Nominal Coupon(%)
Offering Amount(billion yen)
Amount of Competitive Bids(billion yen)
Amount of Bids Accepted(billion yen)
Average Price(yen)
Yield at the Average Price(%)
Lowest Price(yen)
Yield at the Lowest Price(%)
Noncompetitive(billion yen)
Non-Price Competitive Auction I(billion yen)
Non-Price Competitive Auction II(billion yen)
143 4.9.20 4.10.20 3.20.25 0.1 1,900 7,669.8 1,541.1 100.97 100.96 0.000 358.4 189.1
143 5.18.20 5.19.20 3.20.25 0.1 1,900 6,919.0 1,540.3 101.08 101.07 0.000 358.9 87.1
143 6.18.20 6.19.20 3.20.25 0.1 1,900 5,837.5 1,544.1 101.05 101.04 0.000 355.2 0.0
144 7.9.20 7.10.20 6.20.25 0.1 2,500 8,589.0 2,019.0 101.01 101.00 0.000 480.3 219.1
144 8.20.20 8.21.20 6.20.25 0.1 2,500 7,236.5 2,036.9 100.94 100.93 1.000 461.3 0.0
144 9.8.20 9.9.20 6.20.25 0.1 2,500 7,247.6 2,037.9 100.92 100.90 0.000 461.3 0.0
145 10.8.20 10.9.20 9.20.25 0.1 2,500 9,978.1 2,038.2 100.95 100.94 0.000 461.3 249.1
145 11.12.20 11.13.20 9.20.25 0.1 2,500 7,179.4 2,036.8 101.00 101.00 1.000 461.3 195.4
145 12.8.20 12.9.20 9.20.25 0.1 2,500 8,055.6 2,035.3 101.05 101.03 0.000 464.0 39.9
146 1.13.21 1.14.21 12.20.25 0.1 2,500 7,773.5 2,030.2 101.05 101.02 0.000 469.0 0.0
146 2.16.21 2.17.21 12.20.25 0.1 2,500 7,153.5 2,049.4 100.98 100.96 0.000 450.1 0.0
146 3.9.21 3.10.21 12.20.25 0.1 2,500 6,685.5 2,056.8 100.78 100.74 0.000 442.8 0.0
Issue Number Auction Date Issue Date Maturity Date Offering Amount
(billion yen)Amount of
Competitive Bids(billion yen)
Amount of Bids Accepted(billion yen)
Average Price (yen)
Yield at the Average Price(%)
Lowest Price (yen)
Yield at the Lowest Price(%)
Non-Price Competitive Auction I(billion yen)
898 4.3.20 4.6.20 7.6.20 5,040.0 15,686.60 4,089.56 100.0304 ▲ 0.1218 100.0255 ▲ 0.1022 950.40
899 4.9.20 4.10.20 10.12.20 2,900.0 11,537.80 2,354.98 100.074 ▲ 0.1458 100.072 ▲ 0.1419 545.00
900 4.10.20 4.13.20 7.13.20 5,040.0 15,499.80 4,090.55 100.0357 ▲ 0.1431 100.0300 ▲ 0.1202 949.40
901 4.16.20 4.20.20 4.20.21 1,900.0 7,054.50 1,545.99 100.155 ▲ 0.1547 100.148 ▲ 0.1477 354.00
902 4.17.20 4.20.20 7.20.20 5,040.0 13,446.00 4,089.55 100.0341 ▲ 0.1367 100.0315 ▲ 0.1263 950.40
903 4.24.20 4.27.20 7.27.20 5,740.0 16,322.50 4,657.78 100.0320 ▲ 0.1283 100.0285 ▲ 0.1142 1,082.20
904 5.1.20 5.7.20 8.3.20 7,240.0 22,746.85 5,896.47 100.0256 ▲ 0.1061 100.0240 ▲ 0.0995 1,343.50
905 5.7.20 5.11.20 11.10.20 2,500.0 12,344.50 2,032.69 100.074 ▲ 0.1474 100.072 ▲ 0.1435 467.30
906 5.8.20 5.11.20 8.11.20 7,240.0 22,461.77 5,933.43 100.0310 ▲ 0.1229 100.0280 ▲ 0.1110 1,306.50
907 5.15.20 5.18.20 8.17.20 7,240.0 21,298.40 5,873.63 100.0288 ▲ 0.1154 100.0275 ▲ 0.1102 1,366.30
908 5.19.20 5.20.20 5.20.21 2,500.0 9,297.30 2,029.07 100.166 ▲ 0.1657 100.161 ▲ 0.1607 470.90
909 5.22.20 5.25.20 8.24.20 8,140.0 21,321.49 6,600.26 100.0291 ▲ 0.1166 100.0275 ▲ 0.1102 1,539.70
910 5.27.20 6.1.20 11.25.20 2,500.0 11,486.60 2,027.37 100.079 ▲ 0.1627 100.078 ▲ 0.1607 472.60
911 5.29.20 6.1.20 8.31.20 8,140.0 18,154.30 6,618.26 100.0269 ▲ 0.1078 100.0250 ▲ 0.1002 1,521.70
912 6.5.20 6.8.20 9.7.20 9,140.0 22,086.80 7,428.32 100.0246 ▲ 0.0986 100.0230 ▲ 0.0922 1,711.60
913 6.9.20 6.10.20 12.10.20 2,800.0 11,294.70 2,271.67 100.088 ▲ 0.1753 100.087 ▲ 0.1733 528.30
914 6.12.20 6.15.20 9.14.20 9,140.0 23,044.30 7,436.83 100.0254 ▲ 0.1018 100.0245 ▲ 0.0982 1,703.10
915 6.15.20 6.16.20 12.16.20 2,800.0 10,365.70 2,300.19 100.088 ▲ 0.1753 100.087 ▲ 0.1733 499.80
916 6.18.20 6.22.20 6.21.21 3,000.0 10,780.90 2,434.28 100.196 ▲ 0.1961 100.193 ▲ 0.1931 565.70
917 6.19.20 6.22.20 9.23.20 8,140.0 19,957.60 6,609.35 100.0273 ▲ 0.1071 100.0260 ▲ 0.1020 1,530.60
918 6.26.20 6.29.20 9.28.20 8,140.0 22,452.90 6,613.26 100.0236 ▲ 0.0946 100.0225 ▲ 0.0902 1,526.70
919 7.3.20 7.6.20 10.5.20 8,140.0 23,290.81 6,618.24 100.0240 ▲ 0.0962 100.0220 ▲ 0.0882 1,521.70
920 7.9.20 7.10.20 1.12.21 3,000.0 13,159.90 2,433.56 100.090 ▲ 0.1764 100.088 ▲ 0.1725 566.40
921 7.10.20 7.13.20 10.12.20 7,640.0 19,530.29 6,202.10 100.0230 ▲ 0.0922 100.0215 ▲ 0.0862 1,437.80
922 7.16.20 7.20.20 7.20.21 3,500.0 11,448.30 2,838.57 100.182 ▲ 0.1816 100.164 ▲ 0.1637 661.40
923 7.17.20 7.20.20 10.19.20 7,640.0 21,270.60 6,194.93 100.0218 ▲ 0.0874 100.0205 ▲ 0.0822 1,445.00
924 7.21.20 7.27.20 1.25.21 3,100.0 9,754.10 2,521.06 100.085 ▲ 0.1703 100.082 ▲ 0.1643 578.90
925 7.22.20 7.27.20 10.26.20 7,640.0 19,030.50 6,194.61 100.0214 ▲ 0.0858 100.0205 ▲ 0.0822 1,445.30
926 7.31.20 8.3.20 11.2.20 7,550.0 17,479.70 6,145.73 100.0215 ▲ 0.0862 100.0200 ▲ 0.0802 1,404.20
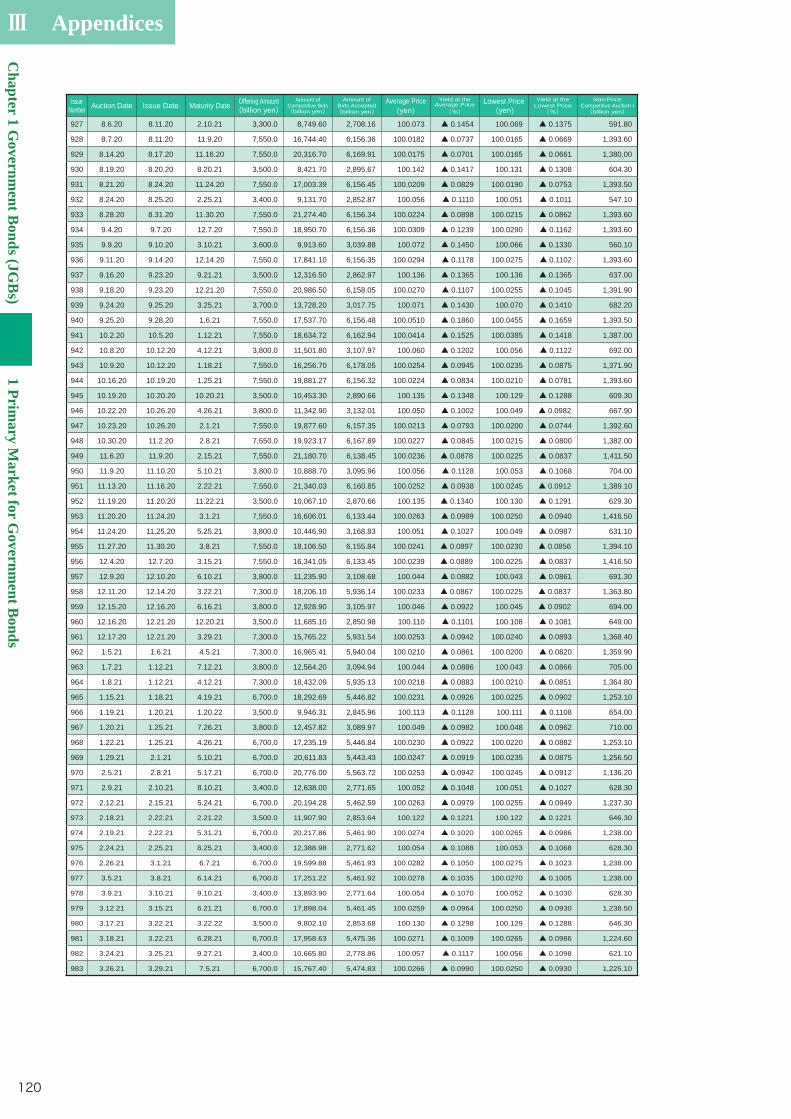
Ⅲ Appendices
Chapter 1 G
overnment B
onds (JGB
s)1 Prim
ary Market for G
overnment B
onds
120
Issue Number Auction Date Issue Date Maturity Date Offering Amount
(billion yen)Amount of
Competitive Bids(billion yen)
Amount of Bids Accepted(billion yen)
Average Price (yen)
Yield at the Average Price(%)
Lowest Price (yen)
Yield at the Lowest Price(%)
Non-Price Competitive Auction I(billion yen)
927 8.6.20 8.11.20 2.10.21 3,300.0 8,749.60 2,708.16 100.073 ▲ 0.1454 100.069 ▲ 0.1375 591.80
928 8.7.20 8.11.20 11.9.20 7,550.0 16,744.40 6,156.36 100.0182 ▲ 0.0737 100.0165 ▲ 0.0669 1,393.60
929 8.14.20 8.17.20 11.16.20 7,550.0 20,316.70 6,169.91 100.0175 ▲ 0.0701 100.0165 ▲ 0.0661 1,380.00
930 8.19.20 8.20.20 8.20.21 3,500.0 8,421.70 2,895.67 100.142 ▲ 0.1417 100.131 ▲ 0.1308 604.30
931 8.21.20 8.24.20 11.24.20 7,550.0 17,003.39 6,156.45 100.0209 ▲ 0.0829 100.0190 ▲ 0.0753 1,393.50
932 8.24.20 8.25.20 2.25.21 3,400.0 9,131.70 2,852.87 100.056 ▲ 0.1110 100.051 ▲ 0.1011 547.10
933 8.28.20 8.31.20 11.30.20 7,550.0 21,274.40 6,156.34 100.0224 ▲ 0.0898 100.0215 ▲ 0.0862 1,393.60
934 9.4.20 9.7.20 12.7.20 7,550.0 18,950.70 6,156.36 100.0309 ▲ 0.1239 100.0290 ▲ 0.1162 1,393.60
935 9.9.20 9.10.20 3.10.21 3,600.0 9,913.60 3,039.88 100.072 ▲ 0.1450 100.066 ▲ 0.1330 560.10
936 9.11.20 9.14.20 12.14.20 7,550.0 17,841.10 6,156.35 100.0294 ▲ 0.1178 100.0275 ▲ 0.1102 1,393.60
937 9.16.20 9.23.20 9.21.21 3,500.0 12,316.50 2,862.97 100.136 ▲ 0.1365 100.136 ▲ 0.1365 637.00
938 9.18.20 9.23.20 12.21.20 7,550.0 20,986.50 6,158.05 100.0270 ▲ 0.1107 100.0255 ▲ 0.1045 1,391.90
939 9.24.20 9.25.20 3.25.21 3,700.0 13,728.20 3,017.75 100.071 ▲ 0.1430 100.070 ▲ 0.1410 682.20
940 9.25.20 9.28.20 1.6.21 7,550.0 17,537.70 6,156.48 100.0510 ▲ 0.1860 100.0455 ▲ 0.1659 1,393.50
941 10.2.20 10.5.20 1.12.21 7,550.0 18,634.72 6,162.94 100.0414 ▲ 0.1525 100.0385 ▲ 0.1418 1,387.00
942 10.8.20 10.12.20 4.12.21 3,800.0 11,501.80 3,107.97 100.060 ▲ 0.1202 100.056 ▲ 0.1122 692.00
943 10.9.20 10.12.20 1.18.21 7,550.0 16,256.70 6,178.05 100.0254 ▲ 0.0945 100.0235 ▲ 0.0875 1,371.90
944 10.16.20 10.19.20 1.25.21 7,550.0 19,881.27 6,156.32 100.0224 ▲ 0.0834 100.0210 ▲ 0.0781 1,393.60
945 10.19.20 10.20.20 10.20.21 3,500.0 10,453.30 2,890.66 100.135 ▲ 0.1348 100.129 ▲ 0.1288 609.30
946 10.22.20 10.26.20 4.26.21 3,800.0 11,342.90 3,132.01 100.050 ▲ 0.1002 100.049 ▲ 0.0982 667.90
947 10.23.20 10.26.20 2.1.21 7,550.0 19,877.60 6,157.35 100.0213 ▲ 0.0793 100.0200 ▲ 0.0744 1,392.60
948 10.30.20 11.2.20 2.8.21 7,550.0 19,923.17 6,167.89 100.0227 ▲ 0.0845 100.0215 ▲ 0.0800 1,382.00
949 11.6.20 11.9.20 2.15.21 7,550.0 21,180.70 6,138.45 100.0236 ▲ 0.0878 100.0225 ▲ 0.0837 1,411.50
950 11.9.20 11.10.20 5.10.21 3,800.0 10,888.70 3,095.96 100.056 ▲ 0.1128 100.053 ▲ 0.1068 704.00
951 11.13.20 11.16.20 2.22.21 7,550.0 21,340.03 6,160.85 100.0252 ▲ 0.0938 100.0245 ▲ 0.0912 1,389.10
952 11.19.20 11.20.20 11.22.21 3,500.0 10,067.10 2,870.66 100.135 ▲ 0.1340 100.130 ▲ 0.1291 629.30
953 11.20.20 11.24.20 3.1.21 7,550.0 16,606.01 6,133.44 100.0263 ▲ 0.0989 100.0250 ▲ 0.0940 1,416.50
954 11.24.20 11.25.20 5.25.21 3,800.0 10,446.90 3,168.83 100.051 ▲ 0.1027 100.049 ▲ 0.0987 631.10
955 11.27.20 11.30.20 3.8.21 7,550.0 18,106.50 6,155.84 100.0241 ▲ 0.0897 100.0230 ▲ 0.0856 1,394.10
956 12.4.20 12.7.20 3.15.21 7,550.0 16,341.05 6,133.45 100.0239 ▲ 0.0889 100.0225 ▲ 0.0837 1,416.50
957 12.9.20 12.10.20 6.10.21 3,800.0 11,235.90 3,108.68 100.044 ▲ 0.0882 100.043 ▲ 0.0861 691.30
958 12.11.20 12.14.20 3.22.21 7,300.0 18,206.10 5,936.14 100.0233 ▲ 0.0867 100.0225 ▲ 0.0837 1,363.80
959 12.15.20 12.16.20 6.16.21 3,800.0 12,928.90 3,105.97 100.046 ▲ 0.0922 100.045 ▲ 0.0902 694.00
960 12.16.20 12.21.20 12.20.21 3,500.0 11,685.10 2,850.98 100.110 ▲ 0.1101 100.108 ▲ 0.1081 649.00
961 12.17.20 12.21.20 3.29.21 7,300.0 15,765.22 5,931.54 100.0253 ▲ 0.0942 100.0240 ▲ 0.0893 1,368.40
962 1.5.21 1.6.21 4.5.21 7,300.0 16,965.41 5,940.04 100.0210 ▲ 0.0861 100.0200 ▲ 0.0820 1,359.90
963 1.7.21 1.12.21 7.12.21 3,800.0 12,564.20 3,094.94 100.044 ▲ 0.0886 100.043 ▲ 0.0866 705.00
964 1.8.21 1.12.21 4.12.21 7,300.0 18,432.09 5,935.13 100.0218 ▲ 0.0883 100.0210 ▲ 0.0851 1,364.80
965 1.15.21 1.18.21 4.19.21 6,700.0 18,292.69 5,446.82 100.0231 ▲ 0.0926 100.0225 ▲ 0.0902 1,253.10
966 1.19.21 1.20.21 1.20.22 3,500.0 9,946.31 2,845.96 100.113 ▲ 0.1128 100.111 ▲ 0.1108 654.00
967 1.20.21 1.25.21 7.26.21 3,800.0 12,457.82 3,089.97 100.049 ▲ 0.0982 100.048 ▲ 0.0962 710.00
968 1.22.21 1.25.21 4.26.21 6,700.0 17,235.19 5,446.84 100.0230 ▲ 0.0922 100.0220 ▲ 0.0882 1,253.10
969 1.29.21 2.1.21 5.10.21 6,700.0 20,611.83 5,443.43 100.0247 ▲ 0.0919 100.0235 ▲ 0.0875 1,256.50
970 2.5.21 2.8.21 5.17.21 6,700.0 20,776.00 5,563.72 100.0253 ▲ 0.0942 100.0245 ▲ 0.0912 1,136.20
971 2.9.21 2.10.21 8.10.21 3,400.0 12,638.00 2,771.65 100.052 ▲ 0.1048 100.051 ▲ 0.1027 628.30
972 2.12.21 2.15.21 5.24.21 6,700.0 20,194.28 5,462.59 100.0263 ▲ 0.0979 100.0255 ▲ 0.0949 1,237.30
973 2.18.21 2.22.21 2.21.22 3,500.0 11,907.90 2,853.64 100.122 ▲ 0.1221 100.122 ▲ 0.1221 646.30
974 2.19.21 2.22.21 5.31.21 6,700.0 20,217.86 5,461.90 100.0274 ▲ 0.1020 100.0265 ▲ 0.0986 1,238.00
975 2.24.21 2.25.21 8.25.21 3,400.0 12,388.98 2,771.62 100.054 ▲ 0.1088 100.053 ▲ 0.1068 628.30
976 2.26.21 3.1.21 6.7.21 6,700.0 19,599.88 5,461.93 100.0282 ▲ 0.1050 100.0275 ▲ 0.1023 1,238.00
977 3.5.21 3.8.21 6.14.21 6,700.0 17,251.22 5,461.92 100.0278 ▲ 0.1035 100.0270 ▲ 0.1005 1,238.00
978 3.9.21 3.10.21 9.10.21 3,400.0 13,893.90 2,771.64 100.054 ▲ 0.1070 100.052 ▲ 0.1030 628.30
979 3.12.21 3.15.21 6.21.21 6,700.0 17,898.04 5,461.45 100.0259 ▲ 0.0964 100.0250 ▲ 0.0930 1,238.50
980 3.17.21 3.22.21 3.22.22 3,500.0 9,802.10 2,853.68 100.130 ▲ 0.1298 100.129 ▲ 0.1288 646.30
981 3.18.21 3.22.21 6.28.21 6,700.0 17,958.63 5,475.36 100.0271 ▲ 0.1009 100.0265 ▲ 0.0986 1,224.60
982 3.24.21 3.25.21 9.27.21 3,400.0 10,665.80 2,778.86 100.057 ▲ 0.1117 100.056 ▲ 0.1098 621.10
983 3.26.21 3.29.21 7.5.21 6,700.0 15,767.40 5,474.83 100.0266 ▲ 0.0990 100.0250 ▲ 0.0930 1,225.10
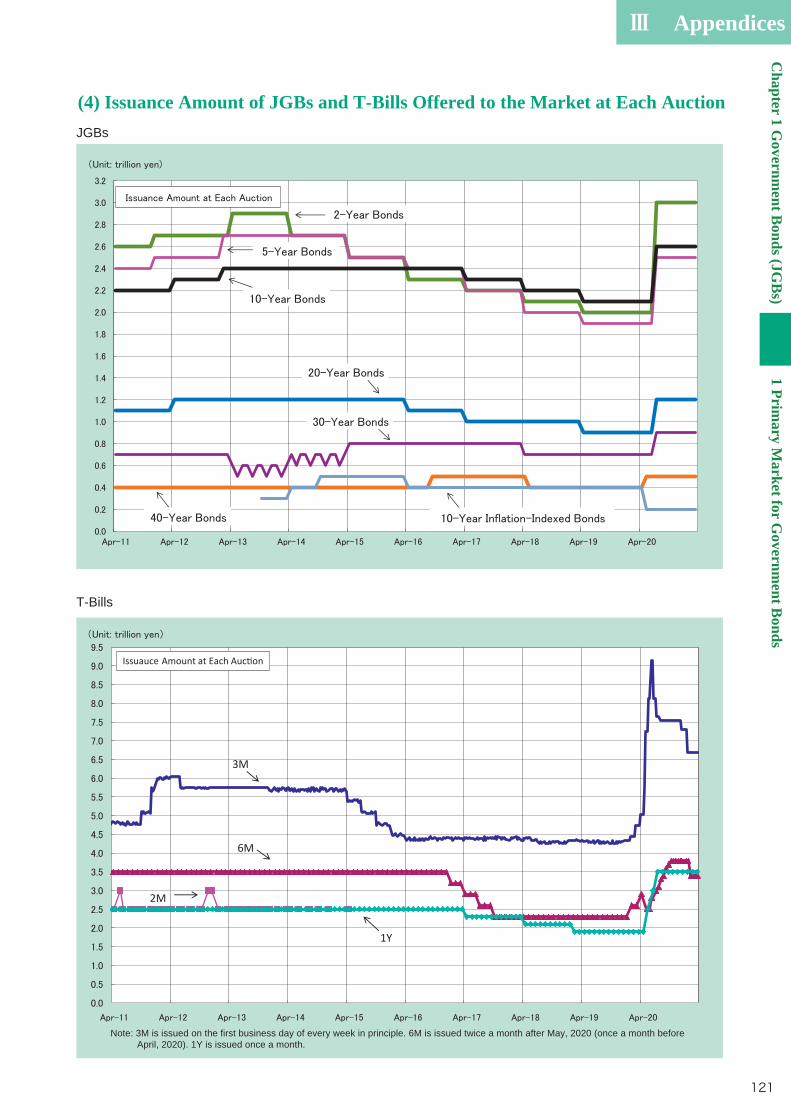
Ⅲ AppendicesC
hapter 1 Governm
ent Bonds (JG
Bs)
1 Primary M
arket for Governm
ent Bonds
121
(4) Issuance Amount of JGBs and T-Bills Offered to the Market at Each AuctionJGBs
T-Bills
3M
2M
1Y
6M
Issuauce Amount at Each Au on
Note: 3M is issued on the first business day of every week in principle. 6M is issued twice a month after May, 2020 (once a month before April, 2020). 1Y is issued once a month.

Ⅲ Appendices
Chapter 1 G
overnment B
onds (JGB
s)1 Prim
ary Market for G
overnment B
onds
122
(5) Principal/Coupon Payment Corresponding to Days of Issuance in FY2021
Month of Issuance Initial Coupon Payment Month Coupon Payment Months Month of Redemption Maturity
April September March, September March Maturity – 1 month
May September March, September March Maturity – 2 months
June September March, September March Maturity – 3 months
July December June, December June Maturity – 1 month
August December June, December June Maturity – 2 months
September December June, December June Maturity – 3 months
October March March, September September Maturity – 1 month
November March March, September September Maturity – 2 months
December March March, September September Maturity – 3 months
January June June, December December Maturity – 1 month
February June June, December December Maturity – 2 months
March June June, December December Maturity – 3 months
Note 1: The coupon payment date and the redemption date are the twentieth of the month.Note 2: Issuance shall occur on T+1 (day of auction + 1 business day).
Month of Issuance Initial Coupon Payment Month Coupon Payment Months Month of Redemption Maturity
April October April, October April As for term
May November May, November May As for term
June December June, December June As for term
July January January, July July As for term
August February February, August August As for term
September March March, September September As for term
October April April, October October As for term
November May May, November November As for term
December June June, December December As for term
January July January, July January As for term
February August February, August February As for term
March September March, September March As for term
Month of Issuance Initial Coupon Payment Month Coupon Payment Months Month of Redemption Maturity
May September March, September March Maturity – 2 months
July September March, September March Maturity – 4 months
September March March, September March Maturity – 6 months
November March March, September March Maturity – 8 months
January March March, September March Maturity – 10 months
March September March, September March Maturity – 12 months
Note 1: The coupon payment date and redemption date are the twentieth of the month.Note 2: Issuance shall occur on T+1 (day of auction + 1 business day).
Month of Issuance Initial Coupon Payment Month Coupon Payment Months Month of Redemption Maturity
May September March, September March Maturity – 2 months
August September March, September March Maturity – 5 months
November March March, September March Maturity – 8 months
February March March, September March Maturity – 11 months
Note 1: The coupon payment date and redemption date are the tenth of the month.Note 2: Issuance shall occur on T+1 (day of auction + 1 business day).
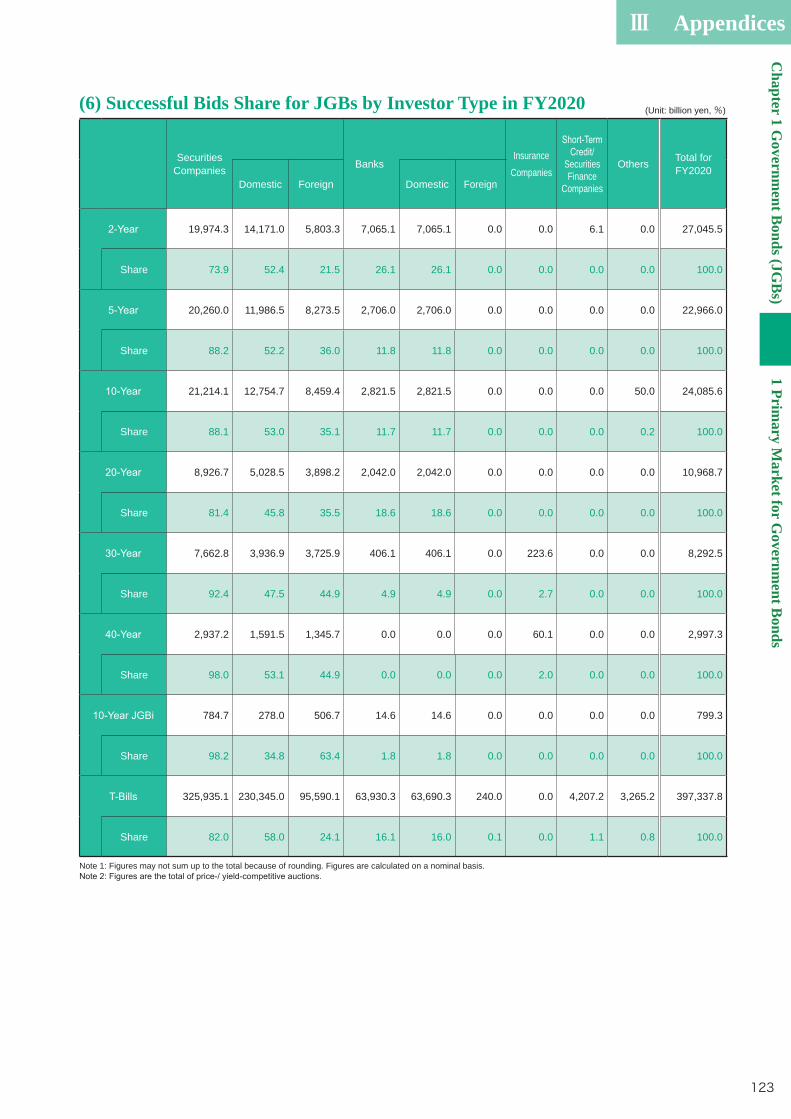
Ⅲ AppendicesC
hapter 1 Governm
ent Bonds (JG
Bs)
1 Primary M
arket for Governm
ent Bonds
123
(Unit: billion yen, %)
Securities Companies Banks
Insurance Companies
Securities Finance
Companies
Others Total forFY2020
Domestic Foreign Domestic Foreign
19,974.3 14,171.0 5,803.3 7,065.1 7,065.1 0.0 0.0 6.1 0.0 27,045.5
Share 73.9 52.4 21.5 26.1 26.1 0.0 0.0 0.0 0.0 100.0
20,260.0 11,986.5 8,273.5 2,706.0 2,706.0 0.0 0.0 0.0 0.0 22,966.0
Share 88.2 52.2 36.0 11.8 11.8 0.0 0.0 0.0 0.0 100.0
21,214.1 12,754.7 8,459.4 2,821.5 2,821.5 0.0 0.0 0.0 50.0 24,085.6
Share 88.1 53.0 35.1 11.7 11.7 0.0 0.0 0.0 0.2 100.0
8,926.7 5,028.5 3,898.2 2,042.0 2,042.0 0.0 0.0 0.0 0.0 10,968.7
Share 81.4 45.8 35.5 18.6 18.6 0.0 0.0 0.0 0.0 100.0
7,662.8 3,936.9 3,725.9 406.1 406.1 0.0 223.6 0.0 0.0 8,292.5
Share 92.4 47.5 44.9 4.9 4.9 0.0 2.7 0.0 0.0 100.0
2,937.2 1,591.5 1,345.7 0.0 0.0 0.0 60.1 0.0 0.0 2,997.3
Share 98.0 53.1 44.9 0.0 0.0 0.0 2.0 0.0 0.0 100.0
784.7 278.0 506.7 14.6 14.6 0.0 0.0 0.0 0.0 799.3
Share 98.2 34.8 63.4 1.8 1.8 0.0 0.0 0.0 0.0 100.0
325,935.1 230,345.0 95,590.1 63,930.3 63,690.3 240.0 0.0 4,207.2 3,265.2 397,337.8
Share 82.0 58.0 24.1 16.1 16.0 0.1 0.0 1.1 0.8 100.0
Note 1: Figures may not sum up to the total because of rounding. Figures are calculated on a nominal basis.
(6) Successful Bids Share for JGBs by Investor Type in FY2020
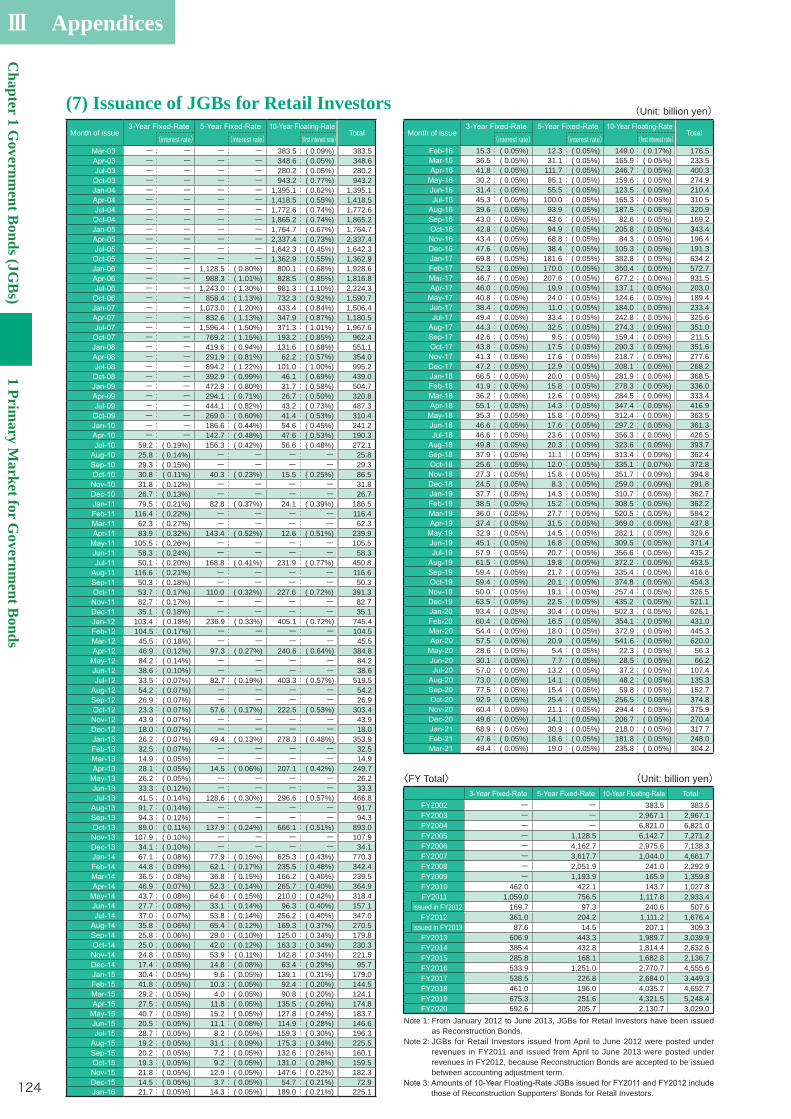
Ⅲ Appendices
Chapter 1 G
overnment B
onds (JGB
s)1 Prim
ary Market for G
overnment B
onds
124
(7) Issuance of JGBs for Retail Investors
TotalFY2002 ー ー 383.5 383.5 FY2003 ー ー 2,967.1 2,967.1 FY2004 ー ー 6,821.0 6,821.0 FY2005 ー 1,128.5 6,142.7 7,271.2 FY2006 ー 4,162.7 2,975.6 7,138.3 FY2007 ー 3,617.7 1,044.0 4,661.7 FY2008 ー 2,051.9 241.0 2,292.9 FY2009 ー 1,193.9 165.9 1,359.8 FY2010 462.0 422.1 143.7 1,027.8 FY2011 1,059.0 756.5 1,117.8 2,933.4
issued in FY2012 169.7 97.3 240.6 507.6 FY2012 361.0 204.2 1,111.2 1,676.4
issued in FY2013 87.6 14.5 207.1 309.3 FY2013 606.9 443.3 1,989.7 3,039.9 FY2014 385.4 432.8 1,814.4 2,632.6 FY2015 285.8 168.1 1,682.8 2,136.7 FY2016 533.9 1,251.0 2,770.7 4,555.6 FY2017 538.5 226.8 2,684.0 3,449.3 FY2018 461.0 196.0 4,035.7 4,692.7 FY2019 675.3 251.6 4,321.5 5,248.4 FY2020 692.6 205.7 2,130.7 3,029.0
〈FY Total〉 (Unit: billion yen)
Note 1: From January 2012 to June 2013, JGBs for Retail Investors have been issued as Reconstruction Bonds.
Note 2: JGBs for Retail Investors issued from April to June 2012 were posted under revenues in FY2011 and issued from April to June 2013 were posted under revenues in FY2012, because Reconstruction Bonds are accepted to be issued between accounting adjustment term.
those of Reconstruction Supporters' Bonds for Retail Investors.
Month of issue Total(interest rate) (interest rate) ( )
ー ー ー ー 383.5 ( 0.09%) 383.5 ー ー ー ー 348.6 ( 0.05%) 348.6 ー ー ー ー 280.2 ( 0.05%) 280.2 ー ー ー ー 943.2 ( 0.77%) 943.2 ー ー ー ー 1,395.1 ( 0.62%) 1,395.1 ー ー ー ー 1,418.5 ( 0.55%) 1,418.5 ー ー ー ー 1,772.6 ( 0.74%) 1,772.6 ー ー ー ー 1,865.2 ( 0.74%) 1,865.2 ー ー ー ー 1,764.7 ( 0.67%) 1,764.7 ー ー ー ー 2,337.4 ( 0.73%) 2,337.4 ー ー ー ー 1,642.3 ( 0.45%) 1,642.3 ー ー ー ー 1,362.9 ( 0.55%) 1,362.9 ー ー 1,128.5 ( 0.80%) 800.1 ( 0.68%) 1,928.6 ー ー 988.3 ( 1.01%) 828.5 ( 0.85%) 1,816.8 ー ー 1,243.0 ( 1.30%) 981.3 ( 1.10%) 2,224.3 ー ー 858.4 ( 1.13%) 732.3 ( 0.92%) 1,590.7 ー ー 1,073.0 ( 1.20%) 433.4 ( 0.84%) 1,506.4 ー ー 832.6 ( 1.13%) 347.9 ( 0.87%) 1,180.5 ー ー 1,596.4 ( 1.50%) 371.3 ( 1.01%) 1,967.6 ー ー 769.2 ( 1.15%) 193.2 ( 0.85%) 962.4 ー ー 419.6 ( 0.94%) 131.6 ( 0.68%) 551.1 ー ー 291.9 ( 0.81%) 62.2 ( 0.57%) 354.0 ー ー 894.2 ( 1.22%) 101.0 ( 1.00%) 995.2 ー ー 392.9 ( 0.99%) 46.1 ( 0.69%) 439.0 ー ー 472.9 ( 0.80%) 31.7 ( 0.58%) 504.7 ー ー 294.1 ( 0.71%) 26.7 ( 0.50%) 320.8 ー ー 444.1 ( 0.82%) 43.2 ( 0.73%) 487.3 ー ー 269.0 ( 0.60%) 41.4 ( 0.53%) 310.4 ー ー 186.6 ( 0.44%) 54.6 ( 0.45%) 241.2 ー ー 142.7 ( 0.48%) 47.6 ( 0.53%) 190.3
59.2 ( 0.19%) 156.3 ( 0.42%) 56.6 ( 0.48%) 272.1 25.8 ( 0.14%) ー ー ー ー 25.8 29.3 ( 0.15%) ー ー ー ー 29.3 30.8 ( 0.11%) 40.3 ( 0.23%) 15.5 ( 0.25%) 86.5 31.8 ( 0.12%) ー ー ー ー 31.8 26.7 ( 0.13%) ー ー ー ー 26.7 79.5 ( 0.21%) 82.8 ( 0.37%) 24.1 ( 0.39%) 186.5
116.4 ( 0.22%) ー ー ー ー 116.4 62.3 ( 0.27%) ー ー ー ー 62.3 83.9 ( 0.32%) 143.4 ( 0.52%) 12.6 ( 0.51%) 239.9
105.5 ( 0.26%) ー ー ー ー 105.5 58.3 ( 0.24%) ー ー ー ー 58.3 50.1 ( 0.20%) 168.8 ( 0.41%) 231.9 ( 0.77%) 450.8
116.6 ( 0.21%) ー ー ー ー 116.6 50.3 ( 0.18%) ー ー ー ー 50.3 53.7 ( 0.17%) 110.0 ( 0.32%) 227.6 ( 0.72%) 391.3 82.7 ( 0.17%) ー ー ー ー 82.7 35.1 ( 0.18%) ー ー ー ー 35.1
103.4 ( 0.18%) 236.9 ( 0.33%) 405.1 ( 0.72%) 745.4 104.5 ( 0.17%) ー ー ー ー 104.5 45.5 ( 0.18%) ー ー ー ー 45.5 46.9 ( 0.12%) 97.3 ( 0.27%) 240.6 ( 0.64%) 384.8 84.2 ( 0.14%) ー ー ー ー 84.2 38.6 ( 0.10%) ー ー ー ー 38.6 33.5 ( 0.07%) 82.7 ( 0.19%) 403.3 ( 0.57%) 519.5 54.2 ( 0.07%) ー ー ー ー 54.2 26.9 ( 0.07%) ー ー ー ー 26.9 23.3 ( 0.07%) 57.6 ( 0.17%) 222.5 ( 0.53%) 303.4 43.9 ( 0.07%) ー ー ー ー 43.9 18.0 ( 0.07%) ー ー ー ー 18.0 26.2 ( 0.07%) 49.4 ( 0.13%) 278.3 ( 0.48%) 353.9 32.5 ( 0.07%) ー ー ー ー 32.5 14.9 ( 0.05%) ー ー ー ー 14.9 28.1 ( 0.05%) 14.5 ( 0.06%) 207.1 ( 0.42%) 249.7 26.2 ( 0.05%) ー ー ー ー 26.2 33.3 ( 0.12%) ー ー ー ー 33.3 41.5 ( 0.14%) 128.6 ( 0.30%) 296.6 ( 0.57%) 466.8 91.7 ( 0.14%) ー ー ー ー 91.7 94.3 ( 0.12%) ー ー ー ー 94.3 89.0 ( 0.11%) 137.9 ( 0.24%) 666.1 ( 0.51%) 893.0
107.9 ( 0.10%) ー ー ー ー 107.9 34.1 ( 0.10%) ー ー ー ー 34.1 67.1 ( 0.08%) 77.9 ( 0.15%) 625.3 ( 0.43%) 770.3 44.8 ( 0.09%) 62.1 ( 0.17%) 235.5 ( 0.48%) 342.4 36.5 ( 0.08%) 36.8 ( 0.15%) 166.2 ( 0.40%) 239.5 46.9 ( 0.07%) 52.3 ( 0.14%) 265.7 ( 0.40%) 364.9 43.7 ( 0.08%) 64.6 ( 0.15%) 210.0 ( 0.42%) 318.4 27.7 ( 0.08%) 33.1 ( 0.14%) 96.3 ( 0.40%) 157.1 37.0 ( 0.07%) 53.8 ( 0.14%) 256.2 ( 0.40%) 347.0 35.8 ( 0.06%) 65.4 ( 0.12%) 169.3 ( 0.37%) 270.5 25.8 ( 0.06%) 29.0 ( 0.10%) 125.0 ( 0.34%) 179.8 25.0 ( 0.06%) 42.0 ( 0.12%) 163.3 ( 0.34%) 230.3 24.8 ( 0.05%) 53.9 ( 0.11%) 142.8 ( 0.34%) 221.5 17.4 ( 0.05%) 14.8 ( 0.08%) 63.4 ( 0.29%) 95.7 30.4 ( 0.05%) 9.6 ( 0.05%) 139.1 ( 0.31%) 179.0 41.8 ( 0.05%) 10.3 ( 0.05%) 92.4 ( 0.20%) 144.5 29.2 ( 0.05%) 4.0 ( 0.05%) 90.8 ( 0.20%) 124.1 27.5 ( 0.05%) 11.8 ( 0.05%) 135.5 ( 0.26%) 174.8 40.7 ( 0.05%) 15.2 ( 0.05%) 127.8 ( 0.24%) 183.7 20.5 ( 0.05%) 11.1 ( 0.08%) 114.9 ( 0.28%) 146.6 28.7 ( 0.05%) 8.2 ( 0.05%) 159.3 ( 0.30%) 196.3 19.2 ( 0.05%) 31.1 ( 0.09%) 175.3 ( 0.34%) 225.5 20.2 ( 0.05%) 7.2 ( 0.05%) 132.6 ( 0.26%) 160.1 19.3 ( 0.05%) 9.2 ( 0.05%) 131.0 ( 0.28%) 159.5 21.8 ( 0.05%) 12.9 ( 0.05%) 147.6 ( 0.22%) 182.3 14.5 ( 0.05%) 3.7 ( 0.05%) 54.7 ( 0.21%) 72.9 21.7 ( 0.05%) 14.3 ( 0.05%) 189.0 ( 0.21%) 225.1
Month of issue Total(interest rate) (interest rate) ( )
15.3 ( 0.05%) 12.3 ( 0.05%) 149.0 ( 0.17%) 176.5 36.5 ( 0.05%) 31.1 ( 0.05%) 165.9 ( 0.05%) 233.5 41.8 ( 0.05%) 111.7 ( 0.05%) 246.7 ( 0.05%) 400.3 30.2 ( 0.05%) 85.1 ( 0.05%) 159.6 ( 0.05%) 274.9 31.4 ( 0.05%) 55.5 ( 0.05%) 123.5 ( 0.05%) 210.4 45.3 ( 0.05%) 100.0 ( 0.05%) 165.3 ( 0.05%) 310.5 39.6 ( 0.05%) 93.9 ( 0.05%) 187.5 ( 0.05%) 320.9 43.0 ( 0.05%) 43.6 ( 0.05%) 82.6 ( 0.05%) 169.2 42.8 ( 0.05%) 94.9 ( 0.05%) 205.8 ( 0.05%) 343.4 43.4 ( 0.05%) 68.8 ( 0.05%) 84.3 ( 0.05%) 196.4 47.6 ( 0.05%) 38.4 ( 0.05%) 105.3 ( 0.05%) 191.3 69.8 ( 0.05%) 181.6 ( 0.05%) 382.8 ( 0.05%) 634.2 52.3 ( 0.05%) 170.0 ( 0.05%) 350.4 ( 0.05%) 572.7 46.7 ( 0.05%) 207.6 ( 0.05%) 677.2 ( 0.06%) 931.5 46.0 ( 0.05%) 19.9 ( 0.05%) 137.1 ( 0.05%) 203.0 40.8 ( 0.05%) 24.0 ( 0.05%) 124.6 ( 0.05%) 189.4 38.4 ( 0.05%) 11.0 ( 0.05%) 184.0 ( 0.05%) 233.4 49.4 ( 0.05%) 33.4 ( 0.05%) 242.8 ( 0.05%) 325.6 44.3 ( 0.05%) 32.5 ( 0.05%) 274.3 ( 0.05%) 351.0 42.6 ( 0.05%) 9.5 ( 0.05%) 159.4 ( 0.05%) 211.5 43.8 ( 0.05%) 17.5 ( 0.05%) 290.3 ( 0.05%) 351.6 41.3 ( 0.05%) 17.6 ( 0.05%) 218.7 ( 0.05%) 277.6 47.2 ( 0.05%) 12.9 ( 0.05%) 208.1 ( 0.05%) 268.2 66.5 ( 0.05%) 20.0 ( 0.05%) 281.9 ( 0.05%) 368.5 41.9 ( 0.05%) 15.8 ( 0.05%) 278.3 ( 0.05%) 336.0 36.2 ( 0.05%) 12.6 ( 0.05%) 284.5 ( 0.06%) 333.4 55.1 ( 0.05%) 14.3 ( 0.05%) 347.4 ( 0.05%) 416.9 35.3 ( 0.05%) 15.8 ( 0.05%) 312.4 ( 0.05%) 363.5 46.6 ( 0.05%) 17.6 ( 0.05%) 297.2 ( 0.05%) 361.3 46.6 ( 0.05%) 23.6 ( 0.05%) 356.3 ( 0.05%) 426.5 49.8 ( 0.05%) 20.3 ( 0.05%) 323.6 ( 0.05%) 393.7 37.9 ( 0.05%) 11.1 ( 0.05%) 313.4 ( 0.09%) 362.4 25.6 ( 0.05%) 12.0 ( 0.05%) 335.1 ( 0.07%) 372.8 27.3 ( 0.05%) 15.8 ( 0.05%) 351.7 ( 0.09%) 394.8 24.5 ( 0.05%) 8.3 ( 0.05%) 259.0 ( 0.09%) 291.8 37.7 ( 0.05%) 14.3 ( 0.05%) 310.7 ( 0.05%) 362.7 38.5 ( 0.05%) 15.2 ( 0.05%) 308.5 ( 0.05%) 362.2 36.0 ( 0.05%) 27.7 ( 0.05%) 520.5 ( 0.05%) 584.2 37.4 ( 0.05%) 31.5 ( 0.05%) 369.0 ( 0.05%) 437.8 32.9 ( 0.05%) 14.5 ( 0.05%) 282.1 ( 0.05%) 329.6 45.1 ( 0.05%) 16.8 ( 0.05%) 309.5 ( 0.05%) 371.4 57.9 ( 0.05%) 20.7 ( 0.05%) 356.6 ( 0.05%) 435.2 61.5 ( 0.05%) 19.8 ( 0.05%) 372.2 ( 0.05%) 453.5 59.4 ( 0.05%) 21.7 ( 0.05%) 335.4 ( 0.05%) 416.6 59.4 ( 0.05%) 20.1 ( 0.05%) 374.8 ( 0.05%) 454.3 50.0 ( 0.05%) 19.1 ( 0.05%) 257.4 ( 0.05%) 326.5 63.5 ( 0.05%) 22.5 ( 0.05%) 435.2 ( 0.05%) 521.1 93.4 ( 0.05%) 30.4 ( 0.05%) 502.3 ( 0.05%) 626.1 60.4 ( 0.05%) 16.5 ( 0.05%) 354.1 ( 0.05%) 431.0 54.4 ( 0.05%) 18.0 ( 0.05%) 372.9 ( 0.05%) 445.3 57.5 ( 0.05%) 20.9 ( 0.05%) 541.6 ( 0.05%) 620.0 28.6 ( 0.05%) 5.4 ( 0.05%) 22.3 ( 0.05%) 56.3 30.1 ( 0.05%) 7.7 ( 0.05%) 28.5 ( 0.05%) 66.2 57.0 ( 0.05%) 13.2 ( 0.05%) 37.2 ( 0.05%) 107.4 73.0 ( 0.05%) 14.1 ( 0.05%) 48.2 ( 0.05%) 135.3 77.5 ( 0.05%) 15.4 ( 0.05%) 59.8 ( 0.05%) 152.7 92.9 ( 0.05%) 25.4 ( 0.05%) 256.5 ( 0.05%) 374.8 60.4 ( 0.05%) 21.1 ( 0.05%) 294.4 ( 0.05%) 375.9 49.6 ( 0.05%) 14.1 ( 0.05%) 206.7 ( 0.05%) 270.4 68.9 ( 0.05%) 30.9 ( 0.05%) 218.0 ( 0.05%) 317.7 47.6 ( 0.05%) 18.6 ( 0.05%) 181.8 ( 0.05%) 248.0 49.4 ( 0.05%) 19.0 ( 0.05%) 235.8 ( 0.05%) 304.2
(Unit: billion yen)
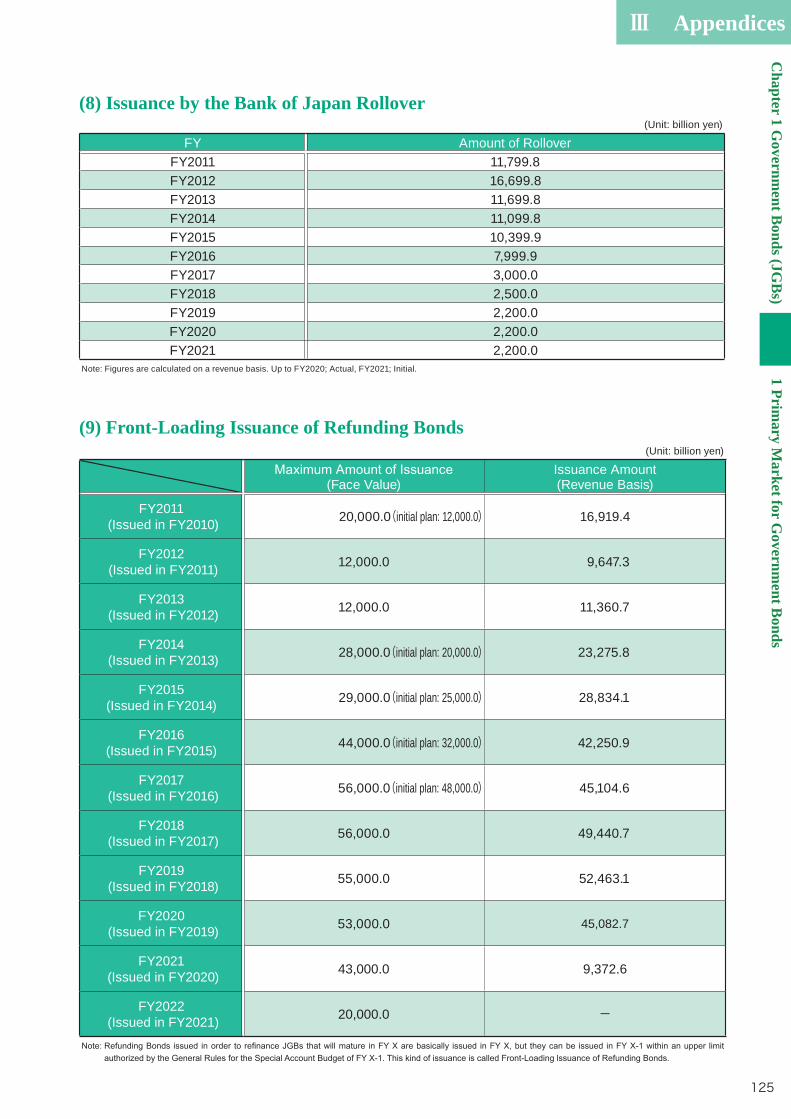
Ⅲ AppendicesC
hapter 1 Governm
ent Bonds (JG
Bs)
1 Primary M
arket for Governm
ent Bonds
125
(8) Issuance by the Bank of Japan Rollover
(9) Front-Loading Issuance of Refunding Bonds(Unit: billion yen)
(Face Value)Issuance Amount(Revenue Basis)
FY2011 (Issued in FY2010) 20,000.0(initial plan: 12,000.0) 16,919.4
FY2012 (Issued in FY2011) 12,000.0 9,647.3
FY2013 (Issued in FY2012) 12,000.0 11,360.7
FY2014 (Issued in FY2013) 28,000.0(initial plan: 20,000.0) 23,275.8
FY2015 (Issued in FY2014) 29,000.0(initial plan: 25,000.0) 28,834.1
FY2016 (Issued in FY2015) 44,000.0(initial plan: 32,000.0) 42,250.9
FY2017 (Issued in FY2016) 56,000.0(initial plan: 48,000.0) 45,104.6
FY2018 (Issued in FY2017) 56,000.0 49,440.7
FY2019 (Issued in FY2018) 55,000.0 52,463.1
FY2020 (Issued in FY2019) 53,000.0 45,082.7
FY2021 (Issued in FY2020) 43,000.0 9,372.6
FY2022 (Issued in FY2021) 20,000.0 -
(Unit: billion yen)
FY Amount of RolloverFY2011 11,799.8FY2012 16,699.8FY2013 11,699.8FY2014 11,099.8FY2015 10,399.9FY2016 7,999.9FY2017 3,000.0FY2018 2,500.0FY2019 2,200.0FY2020 2,200.0FY2021 2,200.0
Note: Figures are calculated on a revenue basis. Up to FY2020; Actual, FY2021; Initial.
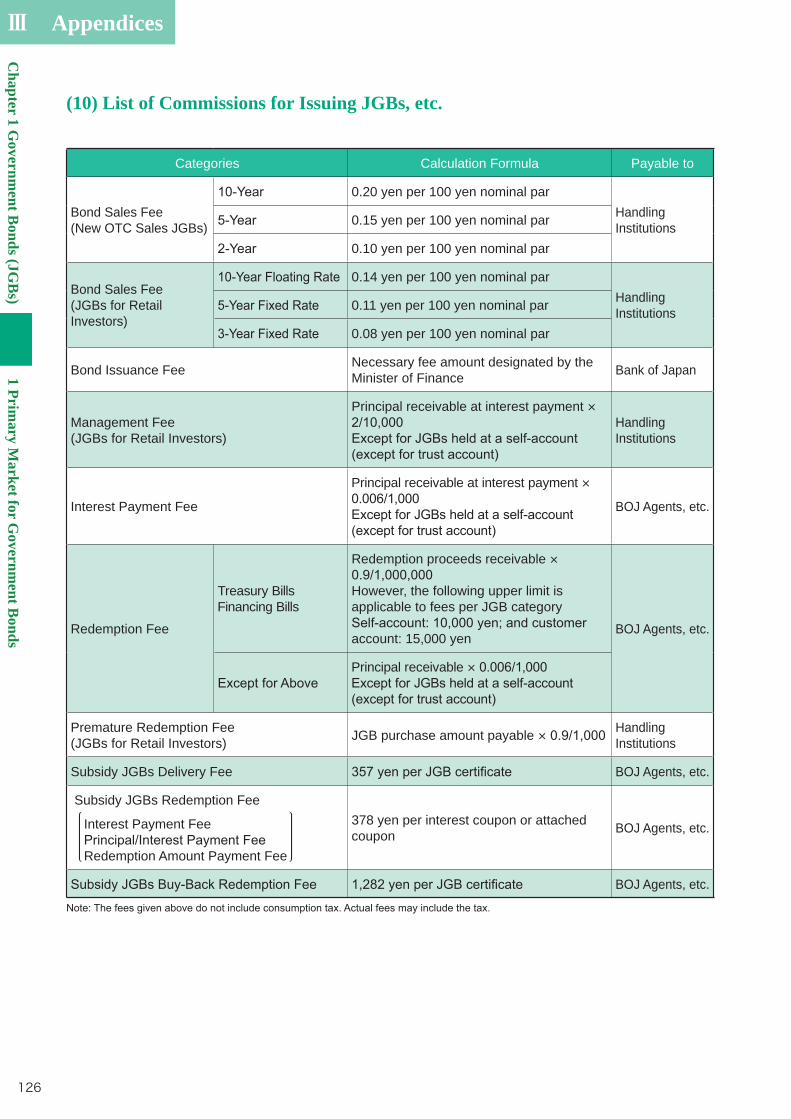
Ⅲ Appendices
Chapter 1 G
overnment B
onds (JGB
s)1 Prim
ary Market for G
overnment B
onds
126
(10) List of Commissions for Issuing JGBs, etc.
Categories Calculation Formula Payable to
Bond Sales Fee(New OTC Sales JGBs)
0.20 yen per 100 yen nominal parHandling Institutions0.15 yen per 100 yen nominal par
0.10 yen per 100 yen nominal par
Bond Sales Fee(JGBs for Retail Investors)
0.14 yen per 100 yen nominal parHandling Institutions0.11 yen per 100 yen nominal par
0.08 yen per 100 yen nominal par
Bond Issuance Fee Necessary fee amount designated by the Minister of Finance Bank of Japan
Management Fee (JGBs for Retail Investors)
Principal receivable at interest payment × Handling
Institutions
Interest Payment Fee
Principal receivable at interest payment × BOJ Agents, etc.
Redemption Fee
Treasury Bills Financing Bills
Redemption proceeds receivable ×
However, the following upper limit is applicable to fees per JGB category
account: 15,000 yenBOJ Agents, etc.
Principal receivable ×
Premature Redemption Fee (JGBs for Retail Investors) JGB purchase amount payable × Handling
Institutions
Subsidy JGBs Delivery Fee BOJ Agents, etc.
Subsidy JGBs Redemption Fee
Interest Payment Fee Redemption Amount Payment Fee
378 yen per interest coupon or attached coupon BOJ Agents, etc.
BOJ Agents, etc.
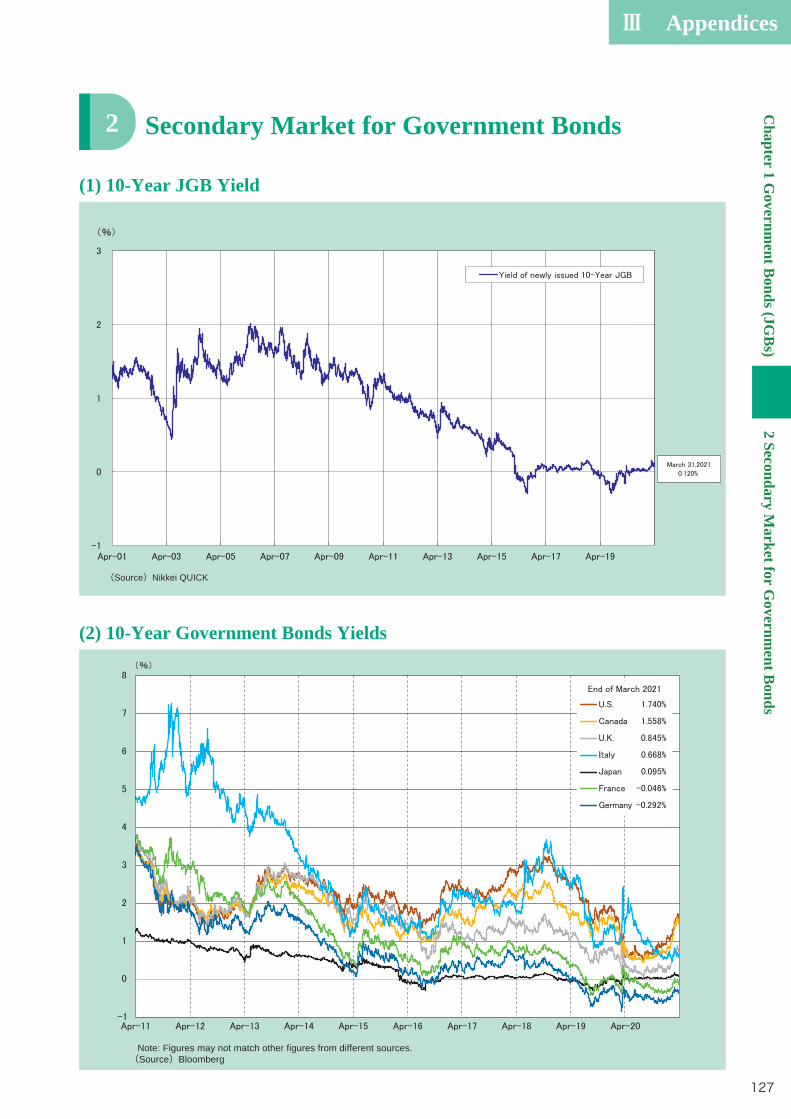
Ⅲ AppendicesC
hapter 1 Governm
ent Bonds (JG
Bs)
2 Secondary Market for G
overnment B
onds
127
Secondary Market for Government Bonds2
(1) 10-Year JGB Yield
(2) 10-Year Government Bonds Yields
Note: Figures may not match other figures from different sources.(Source)Bloomberg
(Source)Nikkei QUICK
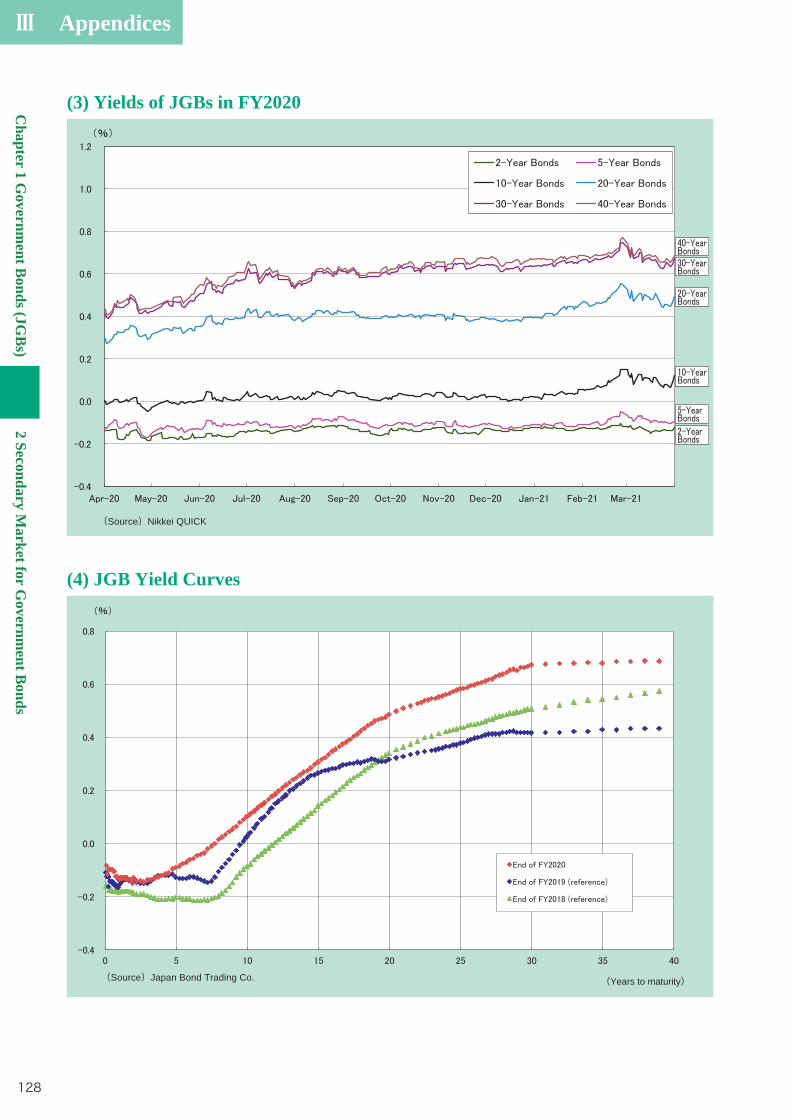
Ⅲ Appendices
Chapter 1 G
overnment B
onds (JGB
s)2 Secondary M
arket for Governm
ent Bonds
128
(3) Yields of JGBs in FY2020
(4) JGB Yield Curves
(Source)Nikkei QUICK
(Years to maturity)(Source)Japan Bond Trading Co.
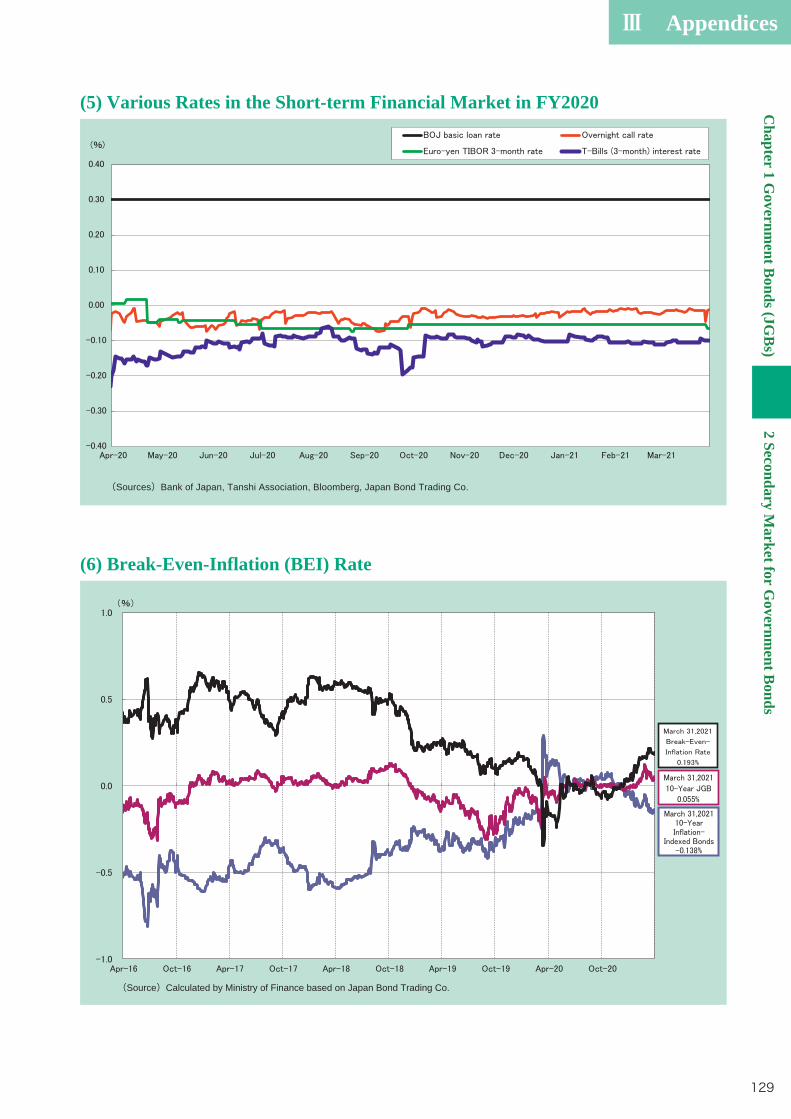
Ⅲ AppendicesC
hapter 1 Governm
ent Bonds (JG
Bs)
2 Secondary Market for G
overnment B
onds
129
(5) Various Rates in the Short-term Financial Market in FY2020
(6) Break-Even-Inflation (BEI) Rate
(Sources)Bank of Japan, Tanshi Association, Bloomberg, Japan Bond Trading Co.
(Source)Calculated by Ministry of Finance based on Japan Bond Trading Co.

Ⅲ Appendices
Chapter 1 G
overnment B
onds (JGB
s)2 Secondary M
arket for Governm
ent Bonds
130
(7) Market Price of 15-Year Floating-Rate Bonds
(8) JGB Share in Total Trading Volume of Yen Bonds
15Y44th(α▲45bp)15Y45th(α▲45bp)
15Y46th(α▲40bp)15Y47th(α▲45bp)
15Y48th(α▲20bp)
(Source)Nikkei QUICK
(FY)Note 1: Yen Bonds indicate all yen denominated bonds issued in Japan. Note 2: JGBs include T-Bills.Note 3: Bond Gensaki(Source) Japan Securities Dealers Association

Ⅲ AppendicesC
hapter 1 Governm
ent Bonds (JG
Bs)
2 Secondary Market for G
overnment B
onds
131
(9) JGB Share in Total Issuance Amount of Yen Bonds
84.9% 85.7% 85.8% 86.0% 87.1% 85.2% 85.0%83.7% 82.2%
87.5%
0%
20%
40%
60%
80%
100%
0
20
40
60
80
100
120
140
160
180
200
220
240
260
11 12 13 14 15 16 17 18 19 20
Note 1: Yen Bonds indicate the total of publicly offered public bonds (government bonds, municipal bonds, government-guaranteed bonds and FILP-Agency bonds), publicly offered private bonds, bank debentures and non-resident bonds.
Note 2: JGBs include TBs. FBs, converted debt bonds, subsidy bonds and subscription bonds are excluded.(Source) Japan Securities Dealers Association
(FY)
(Unit: trillion yen) Yen bonds issuance amount (LHS)JGB issuance amount (LHS)% (RHS)
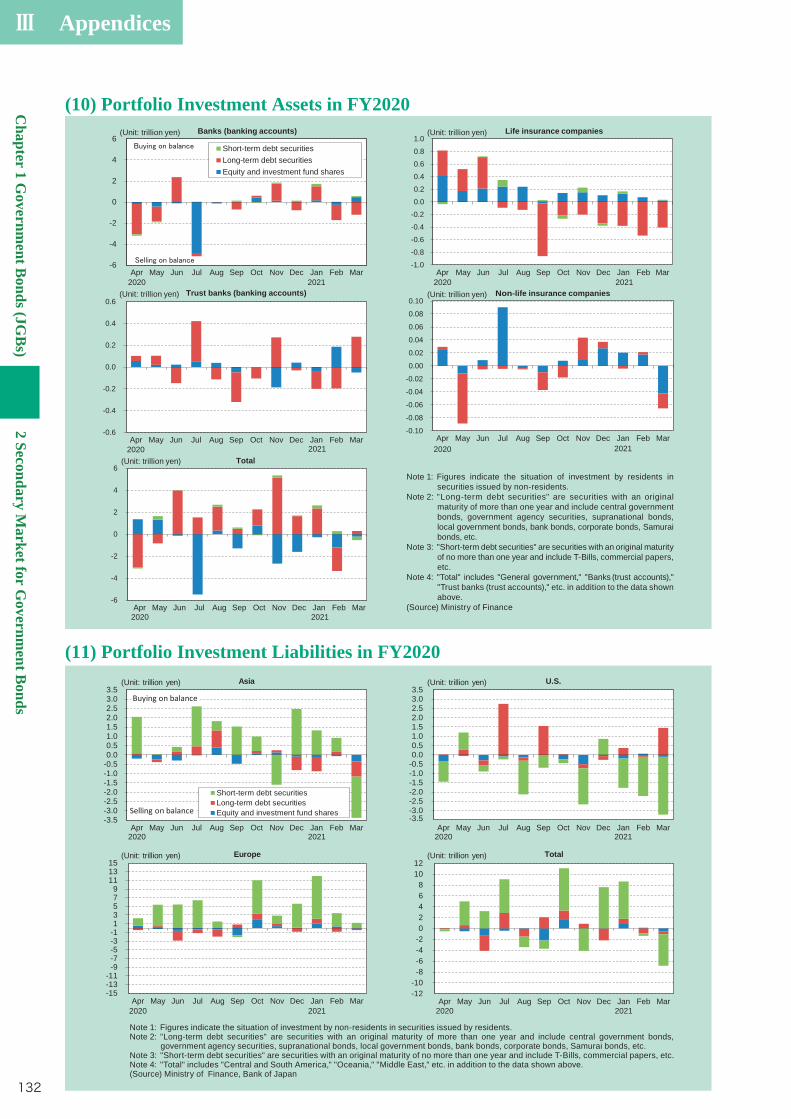
Ⅲ Appendices
Chapter 1 G
overnment B
onds (JGB
s)2 Secondary M
arket for Governm
ent Bonds
132
Note 1: Figures indicate the situation of investment by non-residents in securities issued by residents.Note 2: "Long-term debt securities" are securities with an original maturity of more than one year and include central government bonds,
government agency securities, supranational bonds, local government bonds, bank bonds, corporate bonds, Samurai bonds, etc. Note 3: "Short-term debt securities" are securities with an original maturity of no more than one year and include T-Bills, commercial papers, etc. Note 4: "Total" includes "Central and South America," "Oceania," "Middle East," etc. in addition to the data shown above.(Source) Ministry of Finance, Bank of Japan
-3.5-3.0-2.5-2.0-1.5-1.0-0.50.00.51.01.52.02.53.03.5
Apr May Jun Jul Aug Sep Oct Nov Dec Jan Feb Mar
(Unit: trillion yen) U.S.
2020 2021
-12-10
-8-6-4-202468
1012
Apr May Jun Jul Aug Sep Oct Nov Dec Jan Feb Mar
(Unit: trillion yen) Total
2020 2021
-15-13-11
-9-7-5-3-113579
111315
Apr May Jun Jul Aug Sep Oct Nov Dec Jan Feb Mar
(Unit: trillion yen) Europe
2020 2021
(10) Portfolio Investment Assets in FY2020
(11) Portfolio Investment Liabilities in FY2020
-3.5-3.0-2.5-2.0-1.5-1.0-0.50.00.51.01.52.02.53.03.5
Apr May Jun Jul Aug Sep Oct Nov Dec Jan Feb Mar
(Unit: trillion yen) Asia
Short-term debt securitiesLong-term debt securitiesEquity and investment fund shares
2020 2021
Buying on balance
Note 1: Figures indicate the situation of investment by residents in securities issued by non-residents.
Note 2: "Long-term debt securities" are securities with an original maturity of more than one year and include central government bonds, government agency securities, supranational bonds, local government bonds, bank bonds, corporate bonds, Samurai bonds, etc.
Note 3: "Short-term debt securities" are securities with an original maturity of no more than one year and include T-Bills, commercial papers, etc.
Note 4: "Total" includes "General government," "Banks (trust accounts)," "Trust banks (trust accounts)," etc. in addition to the data shown above.
(Source) Ministry of Finance-6
-4
-2
0
2
4
6
Apr May Jun Jul Aug Sep Oct Nov Dec Jan Feb Mar
(Unit: trillion yen) Total
2020 2021
-1.0
-0.8
-0.6
-0.4
-0.2
0.0
0.2
0.4
0.6
0.8
1.0
Apr May Jun Jul Aug Sep Oct Nov Dec Jan Feb Mar
(Unit: trillion yen) Life insurance companies
2020 2021
-0.6
-0.4
-0.2
0.0
0.2
0.4
0.6
Apr May Jun Jul Aug Sep Oct Nov Dec Jan Feb Mar
(Unit: trillion yen) Trust banks (banking accounts)
2020 2021
(Unit: trillion yen)
-0.10
-0.08
-0.06
-0.04
-0.02
0.00
0.02
0.04
0.06
0.08
0.10
Apr May Jun Jul Aug Sep Oct Nov Dec Jan Feb Mar2020 2021
Non-life insurance companies
Mar-6
-4
-2
0
2
4
6
Apr May Jun Jul Aug Sep Oct Nov Dec Jan Feb
(Unit: trillion yen) Banks (banking accounts)
Short-term debt securitiesLong-term debt securitiesEquity and investment fund shares
2020 2021
Selling on balance
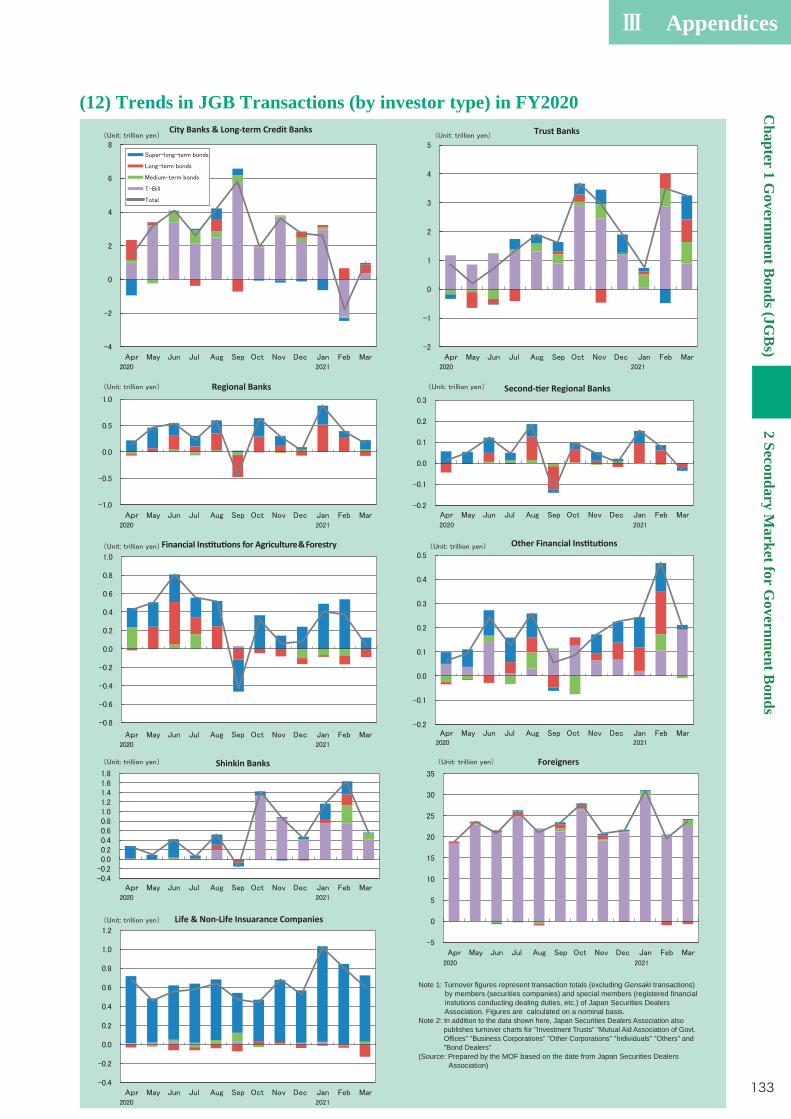
Ⅲ AppendicesC
hapter 1 Governm
ent Bonds (JG
Bs)
2 Secondary Market for G
overnment B
onds
133
(12) Trends in JGB Transactions (by investor type) in FY2020City Banks & Long-term Credit Banks
Regional Banks
Trust Banks
e & Forestry
Shinkin Banks Foreigners
Note 1: Turnover figures represent transaction totals (excluding Gensaki transactions) by members (securities companies) and special members (registered financial instutions conducting dealing duties, etc.) of Japan Securities Dealers Association. Figures are calculated on a nominal basis.Note 2: In addition to the data shown here, Japan Securities Dealers Association also publishes turnover charts for "Investment Trusts" "Mutual Aid Association of Govt. Offices" "Business Corporations" "Other Corporations" "Individuals" "Others" and "Bond Dealers"(Source: Prepared by the MOF based on the date from Japan Securities Dealers Association)
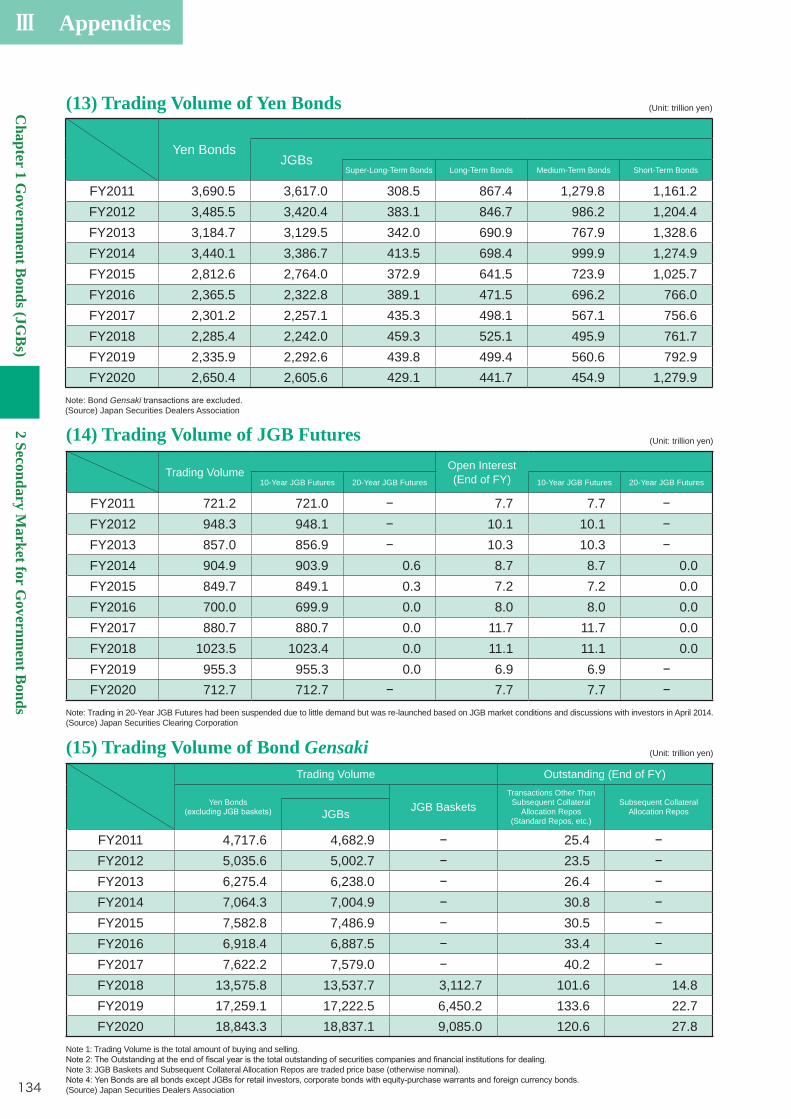
Ⅲ Appendices
Chapter 1 G
overnment B
onds (JGB
s)2 Secondary M
arket for Governm
ent Bonds
134
(Unit: trillion yen)
Yen BondsJGBs
Super-Long-Term Bonds Long-Term Bonds Medium-Term Bonds Short-Term Bonds
FY2011 3,690.5 3,617.0 308.5 867.4 1,279.8 1,161.2FY2012 3,485.5 3,420.4 383.1 846.7 986.2 1,204.4FY2013 3,184.7 3,129.5 342.0 690.9 767.9 1,328.6FY2014 3,440.1 3,386.7 413.5 698.4 999.9 1,274.9FY2015 2,812.6 2,764.0 372.9 641.5 723.9 1,025.7FY2016 2,365.5 2,322.8 389.1 471.5 696.2 766.0FY2017 2,301.2 2,257.1 435.3 498.1 567.1 756.6FY2018 2,285.4 2,242.0 459.3 525.1 495.9 761.7FY2019 2,335.9 2,292.6 439.8 499.4 560.6 792.9FY2020 2,650.4 2,605.6 429.1 441.7 454.9 1,279.9
Note: Bond Gensaki(Source) Japan Securities Dealers Association
(Unit: trillion yen)
Trading Volume Open Interest (End of FY)10-Year JGB Futures 20-Year JGB Futures 10-Year JGB Futures 20-Year JGB Futures
FY2011 721.2 721.0 7.7 7.7FY2012 948.3 948.1 10.1 10.1FY2013 857.0 856.9 10.3 10.3FY2014 904.9 903.9 0.6 8.7 8.7 0.0FY2015 849.7 849.1 0.3 7.2 7.2 0.0FY2016 700.0 699.9 0.0 8.0 8.0 0.0FY2017 880.7 880.7 0.0 11.7 11.7 0.0FY2018 1023.5 1023.4 0.0 11.1 11.1 0.0FY2019 955.3 955.3 0.0 6.9 6.9FY2020 712.7 712.7 7.7 7.7
Note: Trading in 20-Year JGB Futures had been suspended due to little demand but was re-launched based on JGB market conditions and discussions with investors in April 2014.(Source) Japan Securities Clearing Corporation
(Unit: trillion yen)
Trading Volume Outstanding (End of FY)
Yen Bonds JGB BasketsTransactions Other Than
Subsequent Collateral Allocation Repos
(Standard Repos, etc.)
Subsequent Collateral Allocation ReposJGBs
FY2011 4,717.6 4,682.9 25.4FY2012 5,035.6 5,002.7 23.5FY2013 6,275.4 6,238.0 26.4FY2014 7,064.3 7,004.9 30.8FY2015 7,582.8 7,486.9 30.5FY2016 6,918.4 6,887.5 33.4FY2017 7,622.2 7,579.0 40.2FY2018 13,575.8 13,537.7 3,112.7 101.6 14.8FY2019 17,259.1 17,222.5 6,450.2 133.6 22.7FY2020 18,843.3 18,837.1 9,085.0 120.6 27.8
Note 1: Trading Volume is the total amount of buying and selling.
Note 3: JGB Baskets and Subsequent Collateral Allocation Repos are traded price base (otherwise nominal).
(Source) Japan Securities Dealers Association
(13) Trading Volume of Yen Bonds
(14) Trading Volume of JGB Futures
(15) Trading Volume of Bond Gensaki
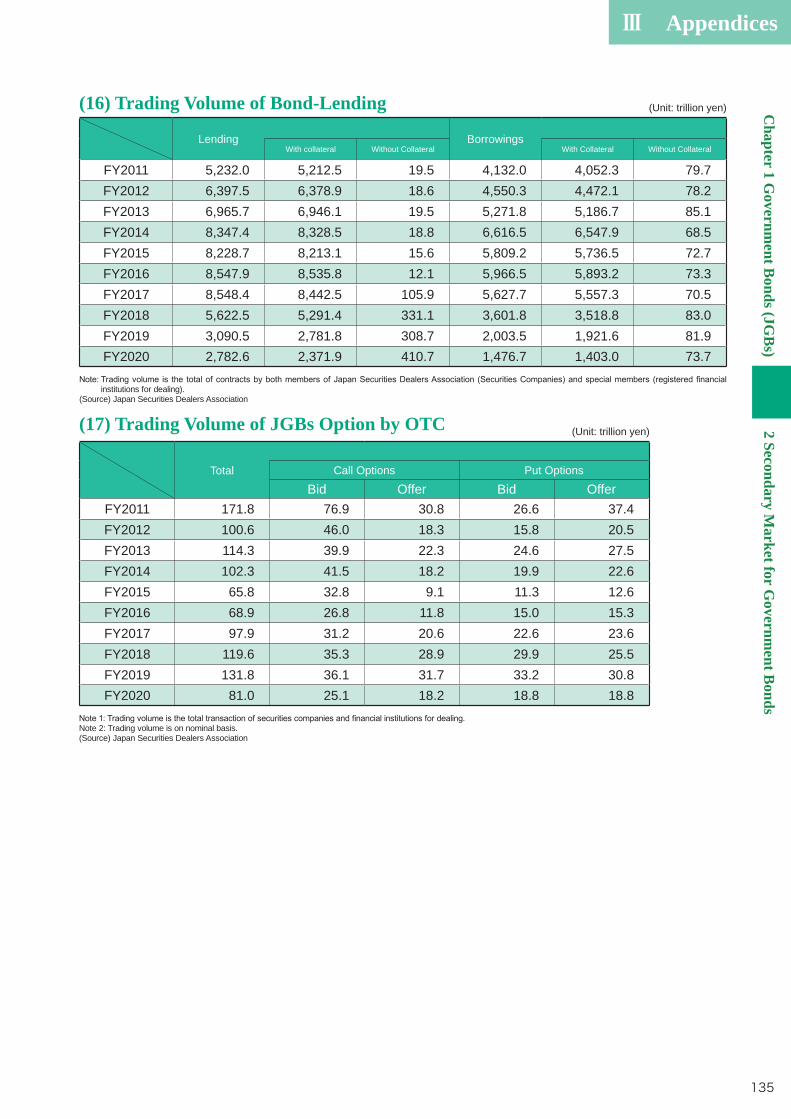
Ⅲ AppendicesC
hapter 1 Governm
ent Bonds (JG
Bs)
2 Secondary Market for G
overnment B
onds
135
(Unit: trillion yen)
Lending BorrowingsWith collateral Without Collateral With Collateral Without Collateral
FY2011 5,232.0 5,212.5 19.5 4,132.0 4,052.3 79.7FY2012 6,397.5 6,378.9 18.6 4,550.3 4,472.1 78.2FY2013 6,965.7 6,946.1 19.5 5,271.8 5,186.7 85.1FY2014 8,347.4 8,328.5 18.8 6,616.5 6,547.9 68.5FY2015 8,228.7 8,213.1 15.6 5,809.2 5,736.5 72.7FY2016 8,547.9 8,535.8 12.1 5,966.5 5,893.2 73.3FY2017 8,548.4 8,442.5 105.9 5,627.7 5,557.3 70.5FY2018 5,622.5 5,291.4 331.1 3,601.8 3,518.8 83.0FY2019 3,090.5 2,781.8 308.7 2,003.5 1,921.6 81.9FY2020 2,782.6 2,371.9 410.7 1,476.7 1,403.0 73.7
institutions for dealing).(Source) Japan Securities Dealers Association
(16) Trading Volume of Bond-Lending
(Unit: trillion yen)
Total Call Options Put Options
Bid Offer Bid OfferFY2011 171.8 76.9 30.8 26.6 37.4FY2012 100.6 46.0 18.3 15.8 20.5FY2013 114.3 39.9 22.3 24.6 27.5FY2014 102.3 41.5 18.2 19.9 22.6FY2015 65.8 32.8 9.1 11.3 12.6FY2016 68.9 26.8 11.8 15.0 15.3FY2017 97.9 31.2 20.6 22.6 23.6FY2018 119.6 35.3 28.9 29.9 25.5FY2019 131.8 36.1 31.7 33.2 30.8FY2020 81.0 25.1 18.2 18.8 18.8
Note 2: Trading volume is on nominal basis.(Source) Japan Securities Dealers Association
(17) Trading Volume of JGBs Option by OTC
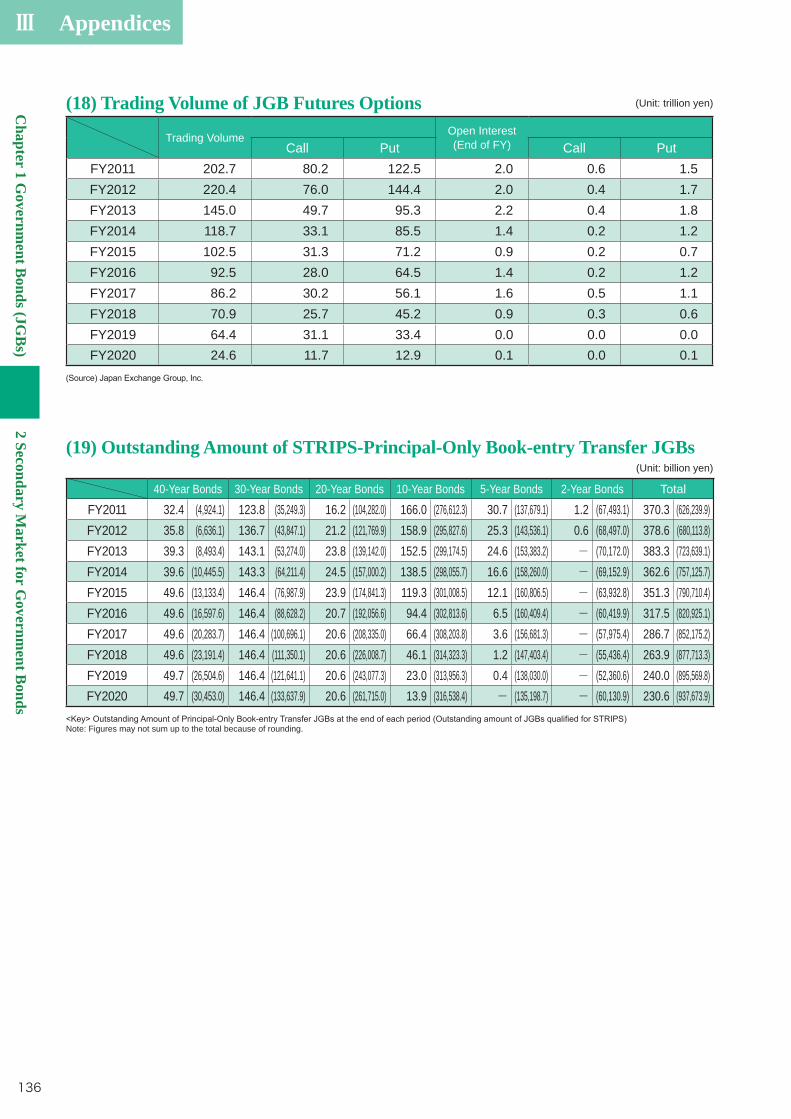
Ⅲ Appendices
Chapter 1 G
overnment B
onds (JGB
s)2 Secondary M
arket for Governm
ent Bonds
136
(18) Trading Volume of JGB Futures Options (Unit: trillion yen)
Trading Volume Open Interest (End of FY)Call Put Call Put
FY2011 202.7 80.2 122.5 2.0 0.6 1.5FY2012 220.4 76.0 144.4 2.0 0.4 1.7FY2013 145.0 49.7 95.3 2.2 0.4 1.8FY2014 118.7 33.1 85.5 1.4 0.2 1.2FY2015 102.5 31.3 71.2 0.9 0.2 0.7FY2016 92.5 28.0 64.5 1.4 0.2 1.2FY2017 86.2 30.2 56.1 1.6 0.5 1.1FY2018 70.9 25.7 45.2 0.9 0.3 0.6FY2019 64.4 31.1 33.4 0.0 0.0 0.0FY2020 24.6 11.7 12.9 0.1 0.0 0.1
(19) Outstanding Amount of STRIPS-Principal-Only Book-entry Transfer JGBs (Unit: billion yen)
40-Year Bonds 30-Year Bonds 20-Year Bonds 10-Year Bonds 5-Year Bonds 2-Year Bonds Total
FY2011 32.4 (4,924.1) 123.8 (35,249.3) 16.2 (104,282.0) 166.0 (276,612.3) 30.7 (137,679.1) 1.2 (67,493.1) 370.3 (626,239.9) FY2012 35.8 (6,636.1) 136.7 (43,847.1) 21.2 (121,769.9) 158.9 (295,827.6) 25.3 (143,536.1) 0.6 (68,497.0) 378.6 (680,113.8) FY2013 39.3 (8,493.4) 143.1 (53,274.0) 23.8 (139,142.0) 152.5 (299,174.5) 24.6 (153,383.2) - (70,172.0) 383.3 (723,639.1) FY2014 39.6 (10,445.5) 143.3 (64,211.4) 24.5 (157,000.2) 138.5 (298,055.7) 16.6 (158,260.0) - (69,152.9) 362.6 (757,125.7) FY2015 49.6 (13,133.4) 146.4 (76,987.9) 23.9 (174,841.3) 119.3 (301,008.5) 12.1 (160,806.5) - (63,932.8) 351.3 (790,710.4) FY2016 49.6 (16,597.6) 146.4 (88,628.2) 20.7 (192,056.6) 94.4 (302,813.6) 6.5 (160,409.4) - (60,419.9) 317.5 (820,925.1) FY2017 49.6 (20,283.7) 146.4 (100,696.1) 20.6 (208,335.0) 66.4 (308,203.8) 3.6 (156,681.3) - (57,975.4) 286.7 (852,175.2) FY2018 49.6 (23,191.4) 146.4 (111,350.1) 20.6 (226,008.7) 46.1 (314,323.3) 1.2 (147,403.4) - (55,436.4) 263.9 (877,713.3) FY2019 49.7 (26,504.6) 146.4 (121,641.1) 20.6 (243,077.3) 23.0 (313,956.3) 0.4 (138,030.0) - (52,360.6) 240.0 (895,569.8) FY2020 49.7 (30,453.0) 146.4 (133,637.9) 20.6 (261,715.0) 13.9 (316,538.4) - (135,198.7) - (60,130.9) 230.6 (937,673.9)
Note: Figures may not sum up to the total because of rounding.
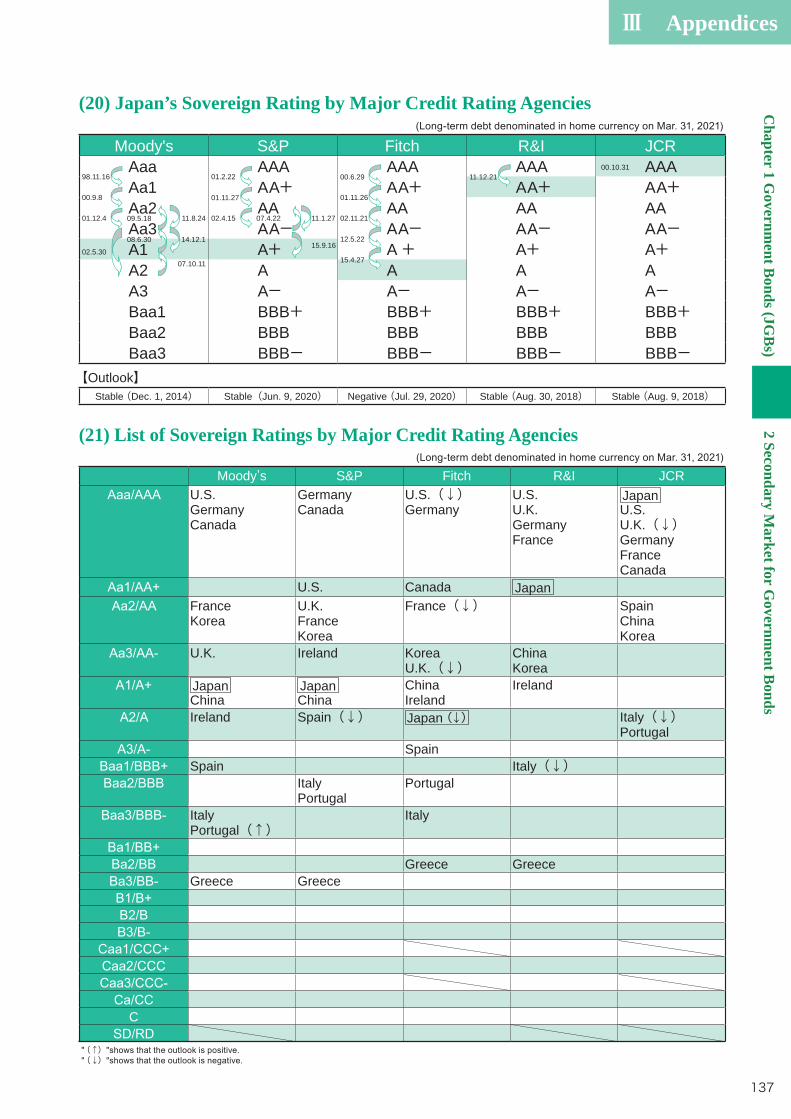
Ⅲ AppendicesC
hapter 1 Governm
ent Bonds (JG
Bs)
2 Secondary Market for G
overnment B
onds
137
(20) Japan’s Sovereign Rating by Major Credit Rating Agencies
(21) List of Sovereign Ratings by Major Credit Rating Agencies
Moody's S&P Fitch R&I JCRAaa AAA AAA AAA AAAAa1 AA+ AA+ AA+ AA+Aa2 AA AA AA AAAa3 AA- AA- AA- AA-A1 A+ A+ A+ A+A2 A A A AA3 A- A- A- A-Baa1 BBB+ BBB+ BBB+ BBB+Baa2 BBB BBB BBB BBBBaa3 BBB- BBB- BBB- BBB-
【Outlook】Stable (Dec. 1, 2014) Stable(Jun. 9, 2020) Negative (Jul. 29, 2020) Stable (Aug. 30, 2018) Stable (Aug. 9, 2018)
Moody’s S&P Fitch R&I JCRU.S.GermanyCanada
GermanyCanada
U.S.(↓)Germany
U.S.U.K.GermanyFrance
JapanU.S.U.K.(↓)GermanyFranceCanada
U.S. Canada JapanFranceKorea
U.K.FranceKorea
France(↓) SpainChinaKorea
U.K. Ireland KoreaU.K.(↓)
ChinaKorea
JapanChina
JapanChina
ChinaIreland
Ireland
Ireland Spain(↓) Japan(↓) Italy(↓)Portugal
SpainSpain Italy(↓)
ItalyPortugal
Portugal
ItalyPortugal(↑)
Italy
Greece GreeceGreece Greece
C
(↑)(↓)
98.11.1600.10.31
01.2.22 00.6.29 11.12.21
02.11.21
01.11.26
02.5.30
11.1.2702.4.15
01.11.27
15.4.2707.10.11
01.12.4
00.9.8
12.5.2215.9.16
11.8.24
14.12.1
07.4.2209.5.18
08.6.30
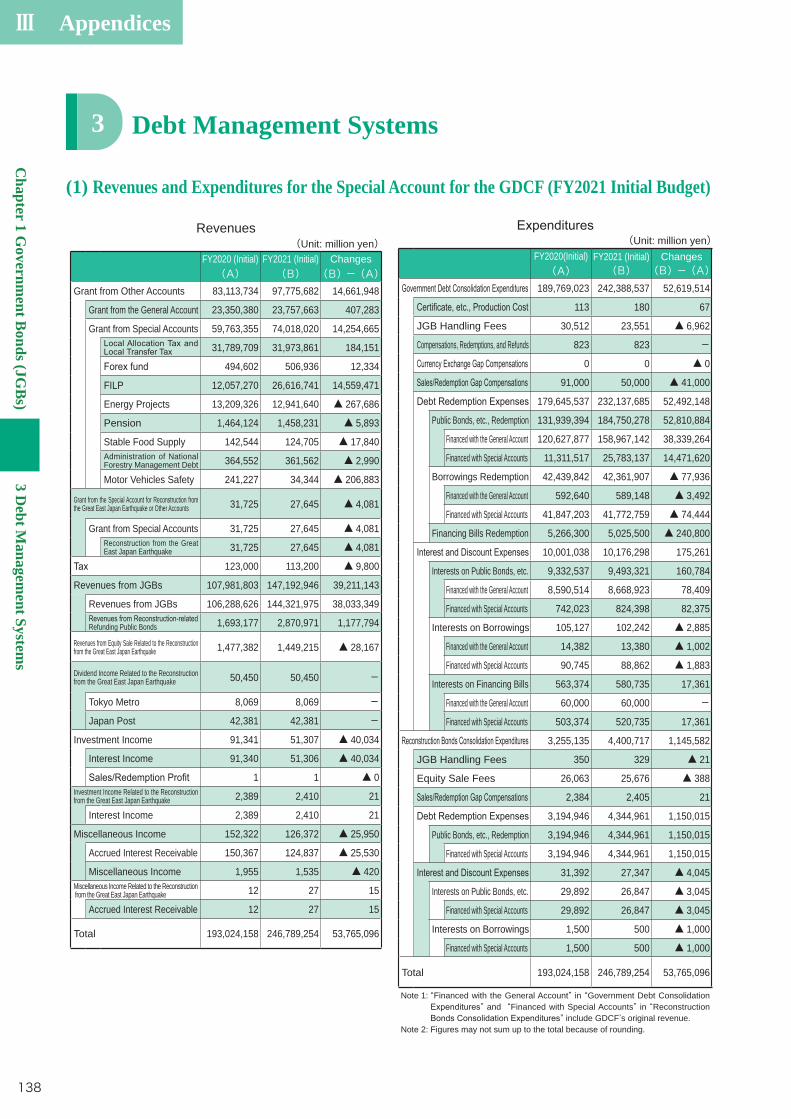
Ⅲ Appendices
Chapter 1 G
overnment B
onds (JGB
s)3 D
ebt Managem
ent Systems
138
Debt Management Systems3
(1) Revenues and Expenditures for the Special Account for the GDCF (FY2021 Initial Budget)
(Unit: million yen)FY2020(Initial)(A)
FY2021 (Initial)(B)
Changes(B)-(A)
189,769,023 242,388,537 52,619,514
113 180 67
JGB Handling Fees 30,512 23,551 ▲ 6,962
Compensations, Redemptions, and Refunds 823 823 -0 0 ▲ 0
91,000 50,000 ▲ 41,000
179,645,537 232,137,685 52,492,148
Public Bonds, etc., Redemption 131,939,394 184,750,278 52,810,884
Financed with the General Account 120,627,877 158,967,142 38,339,264
Financed with Special Accounts 11,311,517 25,783,137 14,471,620
Borrowings Redemption 42,439,842 42,361,907 ▲ 77,936
Financed with the General Account 592,640 589,148 ▲ 3,492
Financed with Special Accounts 41,847,203 41,772,759 ▲ 74,444
Financing Bills Redemption 5,266,300 5,025,500 ▲ 240,800
10,001,038 10,176,298 175,261
Interests on Public Bonds, etc. 9,332,537 9,493,321 160,784
Financed with the General Account 8,590,514 8,668,923 78,409
Financed with Special Accounts 742,023 824,398 82,375
Interests on Borrowings 105,127 102,242 ▲ 2,885
Financed with the General Account 14,382 13,380 ▲ 1,002
Financed with Special Accounts 90,745 88,862 ▲ 1,883
Interests on Financing Bills 563,374 580,735 17,361
Financed with the General Account 60,000 60,000 -Financed with Special Accounts 503,374 520,735 17,361
3,255,135 4,400,717 1,145,582
JGB Handling Fees 350 329 ▲ 21
Equity Sale Fees 26,063 25,676 ▲ 388
2,384 2,405 21
3,194,946 4,344,961 1,150,015
Public Bonds, etc., Redemption 3,194,946 4,344,961 1,150,015
Financed with Special Accounts 3,194,946 4,344,961 1,150,015
31,392 27,347 ▲ 4,045
Interests on Public Bonds, etc. 29,892 26,847 ▲ 3,045
Financed with Special Accounts 29,892 26,847 ▲ 3,045
Interests on Borrowings 1,500 500 ▲ 1,000
Financed with Special Accounts 1,500 500 ▲ 1,000
Total 193,024,158 246,789,254 53,765,096
Note 1: “Financed with the General Account” in “Government Debt Consolidation ” and “Financed with Special Accounts” in “Reconstruction
” include GDCF’s original revenue.Note 2: Figures may not sum up to the total because of rounding.
Revenues(Unit: million yen)
FY2020 (Initial)(A)
FY2021 (Initial)(B)
Changes(B)-(A)
Grant from Other Accounts 83,113,734 97,775,682 14,661,948
Grant from the General Account 23,350,380 23,757,663 407,283
Grant from Special Accounts 59,763,355 74,018,020 14,254,665
31,789,709 31,973,861 184,151
494,602 506,936 12,334
FILP 12,057,270 26,616,741 14,559,471
Energy Projects 13,209,326 12,941,640 ▲ 267,686
Pension 1,464,124 1,458,231 ▲ 5,893
Stable Food Supply 142,544 124,705 ▲ 17,840 Administration of National Forestry Management Debt 364,552 361,562 ▲ 2,990
Motor Vehicles Safety 241,227 34,344 ▲ 206,883
Grant from the Special Account for Reconstruction from the Great East Japan Earthquake or Other Accounts 31,725 27,645 ▲ 4,081
Grant from Special Accounts 31,725 27,645 ▲ 4,081 Reconstruction from the Great East Japan Earthquake 31,725 27,645 ▲ 4,081
123,000 113,200 ▲ 9,800
Revenues from JGBs 107,981,803 147,192,946 39,211,143
Revenues from JGBs 106,288,626 144,321,975 38,033,349
Refunding Public Bonds 1,693,177 2,870,971 1,177,794
Revenues from Equity Sale Related to the Reconstruction from the Great East Japan Earthquake 1,477,382 1,449,215 ▲ 28,167
Dividend Income Related to the Reconstruction from the Great East Japan Earthquake 50,450 50,450 -
Tokyo Metro 8,069 8,069 -Japan Post 42,381 42,381 -
Investment Income 91,341 51,307 ▲ 40,034
Interest Income 91,340 51,306 ▲ 40,034
1 1 ▲ 0 Investment Income Related to the Reconstruction from the Great East Japan Earthquake 2,389 2,410 21
Interest Income 2,389 2,410 21
Miscellaneous Income 152,322 126,372 ▲ 25,950
Accrued Interest Receivable 150,367 124,837 ▲ 25,530
Miscellaneous Income 1,955 1,535 ▲ 420 Miscellaneous Income Related to the Reconstruction from the Great East Japan Earthquake 12 27 15
Accrued Interest Receivable 12 27 15
Total 193,024,158 246,789,254 53,765,096
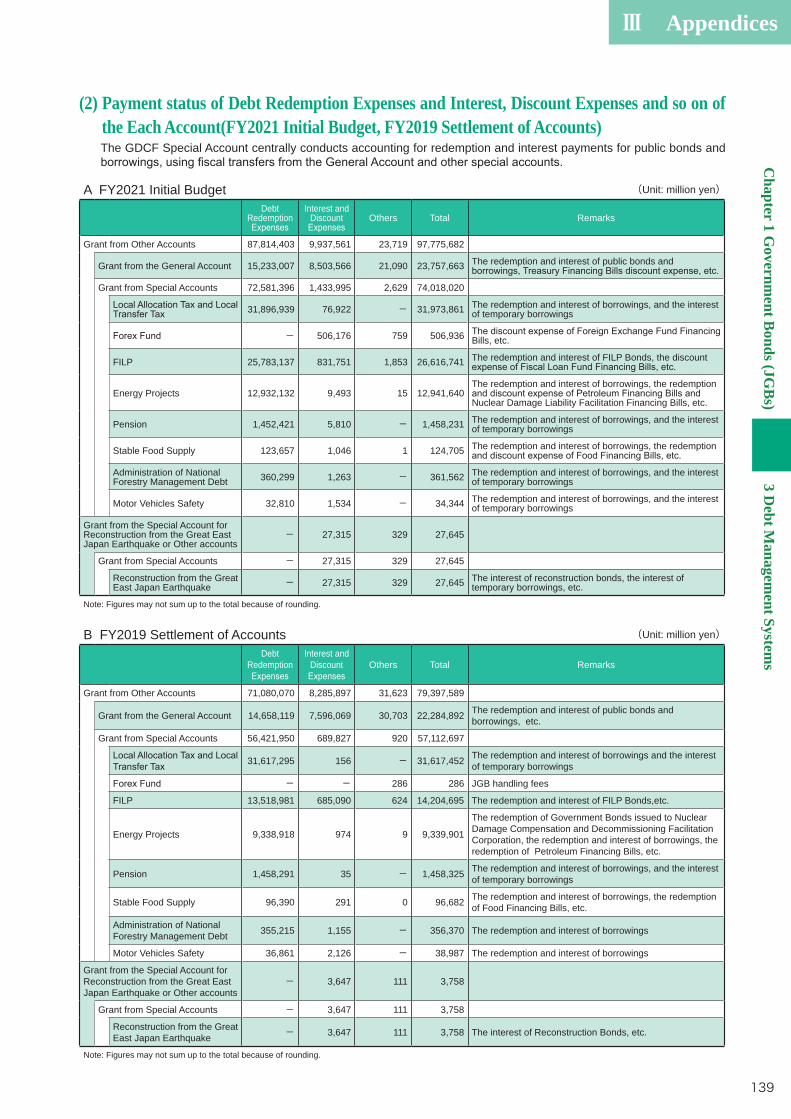
Ⅲ AppendicesC
hapter 1 Governm
ent Bonds (JG
Bs)
3 Debt M
anagement System
s
139
(2) Payment status of Debt Redemption Expenses and Interest, Discount Expenses and so on of the Each Account(FY2021 Initial Budget, FY2019 Settlement of Accounts)
The GDCF Special Account centrally conducts accounting for redemption and interest payments for public bonds and
A FY2021 Initial Budget (Unit: million yen)Debt
Redemption Interest and
Discount Others Total Remarks
Grant from Other Accounts 87,814,403 9,937,561 23,719 97,775,682
Grant from the General Account 15,233,007 8,503,566 21,090 23,757,663 The redemption and interest of public bonds and
Grant from Special Accounts 72,581,396 1,433,995 2,629 74,018,020
31,896,939 76,922 - 31,973,861 The redemption and interest of borrowings, and the interest of temporary borrowings
- 506,176 759 506,936 Bills, etc.
FILP 25,783,137 831,751 1,853 26,616,741 The redemption and interest of FILP Bonds, the discount
Energy Projects 12,932,132 9,493 15 12,941,640 The redemption and interest of borrowings, the redemption
Nuclear Damage Liability Facilitation Financing Bills, etc.
Pension 1,452,421 5,810 - 1,458,231 The redemption and interest of borrowings, and the interest of temporary borrowings
Stable Food Supply 123,657 1,046 1 124,705 The redemption and interest of borrowings, the redemption
Administration of National Forestry Management Debt 360,299 1,263 - 361,562 The redemption and interest of borrowings, and the interest
of temporary borrowings
Motor Vehicles Safety 32,810 1,534 - 34,344 The redemption and interest of borrowings, and the interest of temporary borrowings
Grant from the Special Account for Reconstruction from the Great East Japan Earthquake or Other accounts
- 27,315 329 27,645
Grant from Special Accounts - 27,315 329 27,645
Reconstruction from the Great East Japan Earthquake - 27,315 329 27,645 The interest of reconstruction bonds, the interest of
temporary borrowings, etc.
Note: Figures may not sum up to the total because of rounding.
B FY2019 Settlement of Accounts (Unit: million yen)Debt
Redemption Interest and
Discount Others Total Remarks
Grant from Other Accounts 71,080,070 8,285,897 31,623 79,397,589
Grant from the General Account 14,658,119 7,596,069 30,703 22,284,892 The redemption and interest of public bonds and borrowings, etc.
Grant from Special Accounts 56,421,950 689,827 920 57,112,697
31,617,295 156 - 31,617,452 The redemption and interest of borrowings and the interest of temporary borrowings
- - 286 286 JGB handling fees
FILP 13,518,981 685,090 624 14,204,695 The redemption and interest of FILP Bonds,etc.
Energy Projects 9,338,918 974 9 9,339,901
The redemption of Government Bonds issued to Nuclear Damage Compensation and Decommissioning Facilitation Corporation, the redemption and interest of borrowings, the redemption of Petroleum Financing Bills, etc.
Pension 1,458,291 35 - 1,458,325 The redemption and interest of borrowings, and the interest of temporary borrowings
Stable Food Supply 96,390 291 0 96,682 The redemption and interest of borrowings, the redemption of Food Financing Bills, etc.
Administration of National Forestry Management Debt 355,215 1,155 - 356,370 The redemption and interest of borrowings
Motor Vehicles Safety 36,861 2,126 - 38,987 The redemption and interest of borrowings
Grant from the Special Account for Reconstruction from the Great East Japan Earthquake or Other accounts
- 3,647 111 3,758
Grant from Special Accounts - 3,647 111 3,758
Reconstruction from the Great East Japan Earthquake - 3,647 111 3,758 The interest of Reconstruction Bonds, etc.
Note: Figures may not sum up to the total because of rounding.
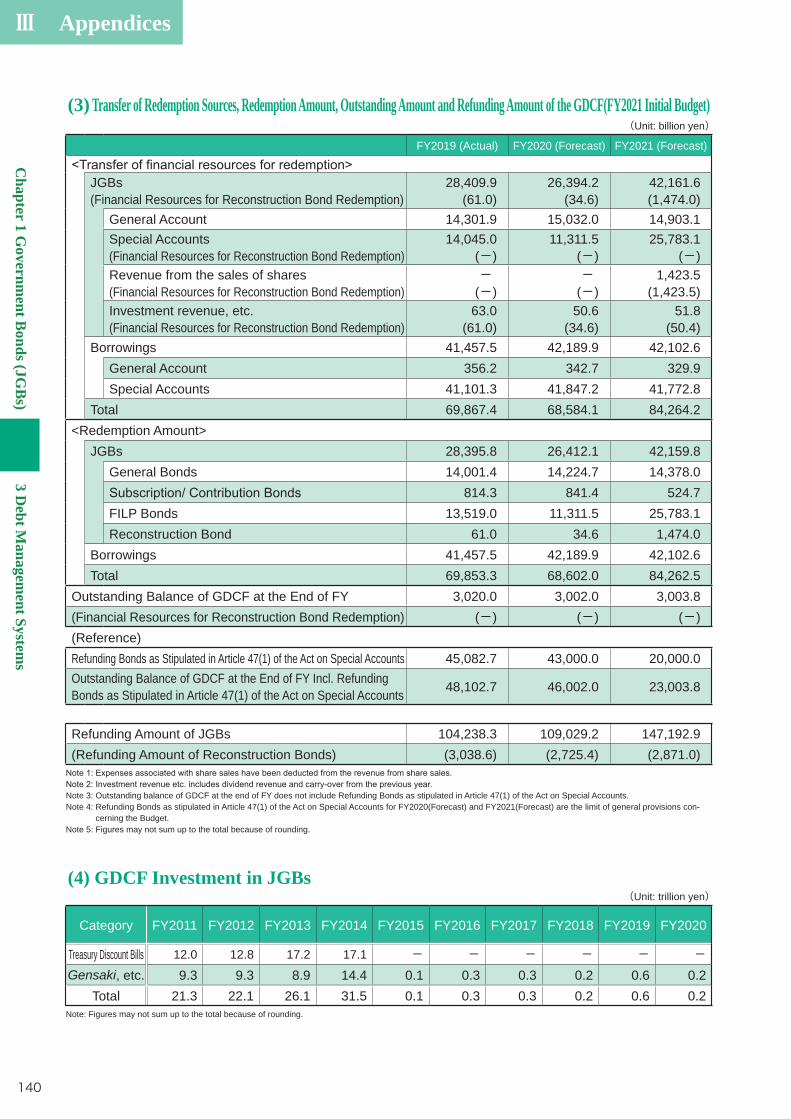
Ⅲ Appendices
Chapter 1 G
overnment B
onds (JGB
s)3 D
ebt Managem
ent Systems
140
(4) GDCF Investment in JGBs(Unit: trillion yen)
Category FY2011 FY2012 FY2013 FY2014 FY2015 FY2016 FY2017 FY2018 FY2019 FY2020
Treasury Discount Bills 12.0 12.8 17.2 17.1 - - - - - -Gensaki, etc. 9.3 9.3 8.9 14.4 0.1 0.3 0.3 0.2 0.6 0.2
Total 21.3 22.1 26.1 31.5 0.1 0.3 0.3 0.2 0.6 0.2Note: Figures may not sum up to the total because of rounding.
(3) Transfer of Redemption Sources, Redemption Amount, Outstanding Amount and Refunding Amount of the GDCF(FY2021 Initial Budget)(Unit: billion yen)
FY2019 (Actual) FY2020 (Forecast) FY2021 (Forecast)
JGBs(Financial Resources for Reconstruction Bond Redemption)
28,409.9(61.0)
26,394.2(34.6)
42,161.6(1,474.0)
General Account 14,301.9 15,032.0 14,903.1Special Accounts(Financial Resources for Reconstruction Bond Redemption)
14,045.0(-)
11,311.5(-)
25,783.1(-)
Revenue from the sales of shares(Financial Resources for Reconstruction Bond Redemption)
-(-)
-(-)
1,423.5(1,423.5)
Investment revenue, etc.(Financial Resources for Reconstruction Bond Redemption)
63.0(61.0)
50.6(34.6)
51.8(50.4)
Borrowings 41,457.5 42,189.9 42,102.6General Account 356.2 342.7 329.9Special Accounts 41,101.3 41,847.2 41,772.8
Total 69,867.4 68,584.1 84,264.2<Redemption Amount>
JGBs 28,395.8 26,412.1 42,159.8General Bonds 14,001.4 14,224.7 14,378.0
814.3 841.4 524.7FILP Bonds 13,519.0 11,311.5 25,783.1Reconstruction Bond 61.0 34.6 1,474.0
Borrowings 41,457.5 42,189.9 42,102.6Total 69,853.3 68,602.0 84,262.5
Outstanding Balance of GDCF at the End of FY 3,020.0 3,002.0 3,003.8(Financial Resources for Reconstruction Bond Redemption) (-) (-) (-)(Reference)Refunding Bonds as Stipulated in Article 47(1) of the Act on Special Accounts 45,082.7 43,000.0 20,000.0Outstanding Balance of GDCF at the End of FY Incl. Refunding Bonds as Stipulated in Article 47(1) of the Act on Special Accounts 48,102.7 46,002.0 23,003.8
Refunding Amount of JGBs 104,238.3 109,029.2 147,192.9(Refunding Amount of Reconstruction Bonds) (3,038.6) (2,725.4) (2,871.0)
Note 3: Outstanding balance of GDCF at the end of FY does not include Refunding Bonds as stipulated in Article 47(1) of the Act on Special Accounts.Note 4: Refunding Bonds as stipulated in Article 47(1) of the Act on Special Accounts for FY2020(Forecast) and FY2021(Forecast) are the limit of general provisions con
cerning the Budget.Note 5: Figures may not sum up to the total because of rounding.

Ⅲ AppendicesC
hapter 1 Governm
ent Bonds (JG
Bs)
3 Debt M
anagement System
s
141
307th 308th 309th 310th 311st 312nd 313rd 314th 315th 316th 317th 318thAuction Date 4/14/20 4/16/20 5/1/20 5/22/20 6/11/20 6/15/20 7/14/20 7/16/20 8/12/20 8/14/20 9/15/20 9/18/20
Amount of Competitive Bids (billion yen) 1,194.8 1,870.1 1,315.3 1,726.8 1,200.7 1,636.7 1,940.1 1,500.1 1,010.6 1,664.0 2,083.9 1,421.0
Amount of Bids Accepted (billion yen) 499.1 499.2 399.4 498.4 499.2 498.7 497.4 398.7 499.0 498.9 497.3 399.5
Average Accepted Spread (%) 0.016 0.014 0.009 0.008 0.000
Highest Accepted Spread (%) 0.022 0.018 0.014 0.011 0.002
319th 320th 321st 322nd 323rd 324th 325h 326th 327th 328th 329th 330thAuction Date 10/13/20 10/15/20 11/16/20 11/20/20 12/15/20 12/22/20 1/15/21 1/22/21 2/10/21 2/24/21 3/16/21 3/23/21
Amount of Competitive Bids (billion yen) 1,161.4 2,203.0 1,628.8 1,428.7 1,957.4 1,313.6 2,287.6 1,905.3 1,548.6 2,522.6 1,825.4 1,596.1
Amount of Bids Accepted (billion yen) 498.4 497.9 498.5 398.5 498.0 498.2 497.6 398.5 498.8 498.5 498.2 399.1
Average Accepted Spread (%) 0.002 0.000
Highest Accepted Spread (%) 0.000 0.000 0.002 0.003 0.002
(6) Results of Liquidity Enhancement Auctions in FY2020
(7) Buy-back Results in FY2020
Auction Date Amount of Bids Received (billion yen)
Amount of Bids Accepted (billion yen)
Average Accepted Spread (yen)
Highest Accepted Spread (yen)
176.2 50.2 ▲ 0.298 ▲ 0.20181.7 50.1 ▲ 0.218 ▲ 0.15172.8 50.1 ▲ 0.368 ▲ 0.23175.4 50.0 ▲ 0.217 ▲ 0.13184.1 50.1 ▲ 0.147 ▲ 0.06223.6 50.3 ▲ 0.281 ▲ 0.22170.9 50.1 ▲ 0.155 ▲ 0.05216.2 50.1 ▲ 0.038 0.00176.7 50.1 0.019 0.14126.2 50.3 ▲ 0.180 ▲ 0.06166.8 50.0 ▲ 0.031 0.11166.4 50.2 ▲ 0.160 ▲ 0.08
(8) Buy-back Results(On nominal basis, billion yen)
FY2012 FY2013 FY2014 FY2015 FY2016 FY2017 FY2018 FY2019 FY2020
From the Market 2,712.4 2,825.2 2,512.6 741.4 120.2 120.4 120.5 481.0 601.6 From Bank of Japan 350.4 200.0 200.0 ー ー ー ー ー ー
Total 3,062.8 3,025.2 2,712.6 741.4 120.2 120.4 120.5 481.0 601.6 Note: Figures may not sum up to the total because of rounding.
(5) Budgetary Surplus of the Special Account of the GDCF(Unit: billion yen)
Budgetary SurplusOutstanding Balance of GDCF
FY 2014 3,071.0 3,000.6FY 2015 3,618.8 3,543.3FY 2016 3,082.4 3,006.2FY 2017 3,093.2 3,007.4FY 2018 3,076.4 3,005.9FY 2019 3,091.8 3,020.0FY 2020 3,002.0 3,002.0FY 2021 3,003.8 3,003.8
Note 1: Trends since FY2014 after the revision of the Act on Special Accounts.Note 2: Data for FY2020 and FY2021 are based on the initial budget for FY2021.

Ⅲ Appendices
Chapter 1 G
overnment B
onds (JGB
s)3 D
ebt Managem
ent Systems
142
(9) Various CouncilsA. The Advisory Council on Government Debt Management<Members>
Ltd.
Okasan Securities Co., Ltd. Hideki Sakata Senior Managing Director, Nomura Securities Co., Ltd. Hidenori Suezawa Assistant General Manager, Financial Market and Fiscal analyst, Financial
Market & Economic Research SMBC Nikko Securities Inc.
Junko Koeda School of Political Science and Economics, Waseda University, Associate Professor
Keito Shimbu President & CEO,JA Mitsui Leasing, Ltd. Koji Shimamoto President and Representative Director, Societe Generale Securities Japan
Limited Main Kohda Author(Chairperson) Naoki Tanaka President of Center for International Public Policy Studies Naoyuki Yoshino Professor Emeritus of Keio University Director of Financial Research Center, Financial Services Agency Visiting Professor, National Graduate Institute for Policy Studies Robert Alan Feldman Senior Advisor, Morgan Stanley MUFG Securities Co., Ltd.
Takashi Yamada Senior Managing Director, Daiwa Securities Co. Ltd. Toshiki Tomita Guest Scholar, Nomura Institute of Capital Markets Research Yoko Takeda Deputy General Manager, Think Tank Unit General Manager, Center for
Policy and Economy, Mitsubishi Research Institute Yuri Okina Chairperson, The Japan Research Institute, Limited.
(17 members)(Alphabetical order)
(As of June 24. 2021)<Actual Achievement>
Date ContentOctober 25, 2019
(51st Round)・Current state and future trends of the JGB market environment・Current debt management policy
June 22, 2020(52nd Round)
*Online conference
・Current and future JGB issuance・・Current status of and future efforts in the JGB futures market
November 4, 2020(53rd Round)
*Online conference
・・・Current status and the Outlook of Japanese Government Bond (JGB) issuance
June 24, 2021 (54th Round)
*Online conference・Efforts so far and future issues on the debt management policy
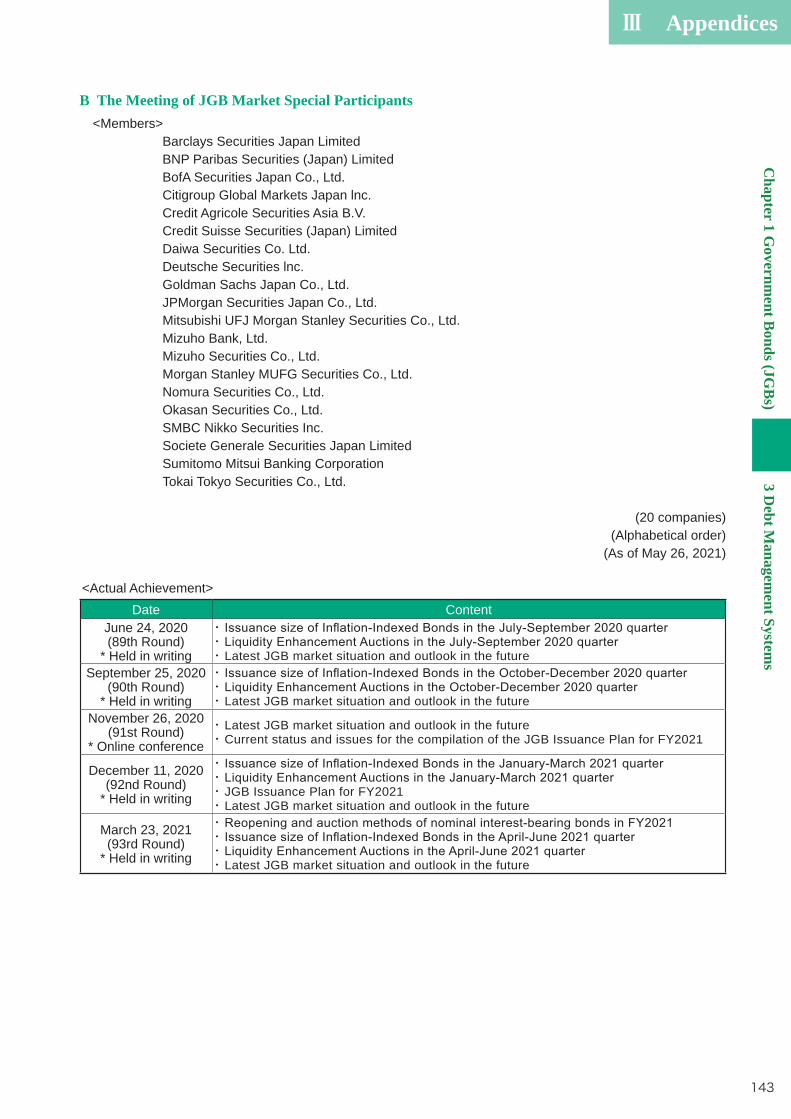
Ⅲ AppendicesC
hapter 1 Governm
ent Bonds (JG
Bs)
3 Debt M
anagement System
s
143
B The Meeting of JGB Market Special Participants<Members>
Barclays Securities Japan LimitedBNP Paribas Securities (Japan) LimitedBofA Securities Japan Co., Ltd.Citigroup Global Markets Japan lnc.Credit Agricole Securities Asia B.V.Credit Suisse Securities (Japan) LimitedDaiwa Securities Co. Ltd.Deutsche Securities lnc.Goldman Sachs Japan Co., Ltd.JPMorgan Securities Japan Co., Ltd.Mitsubishi UFJ Morgan Stanley Securities Co., Ltd.Mizuho Bank, Ltd.Mizuho Securities Co., Ltd.Morgan Stanley MUFG Securities Co., Ltd.Nomura Securities Co., Ltd.Okasan Securities Co., Ltd.SMBC Nikko Securities Inc.Societe Generale Securities Japan LimitedSumitomo Mitsui Banking CorporationTokai Tokyo Securities Co., Ltd.
(20 companies)(Alphabetical order)
(As of May 26, 2021)
<Actual Achievement>Date Content
June 24, 2020(89th Round)
* Held in writing
・・・ Latest JGB market situation and outlook in the future
September 25, 2020(90th Round)
* Held in writing
・・・ Latest JGB market situation and outlook in the future
November 26, 2020(91st Round)
* Online conference・ Latest JGB market situation and outlook in the future・ Current status and issues for the compilation of the JGB Issuance Plan for FY2021
December 11, 2020(92nd Round)
* Held in writing
・・・ JGB Issuance Plan for FY2021・ Latest JGB market situation and outlook in the future
March 23, 2021(93rd Round)
* Held in writing
・・・・ Latest JGB market situation and outlook in the future
Ⅲ Appendices
Chapter 1 G
overnment B
onds (JGB
s)3 D
ebt Managem
ent Systems
144
C The Meeting of JGB Investors<Members>1. Investors
Capula Investment Management LLPJapan Post Bank Co., Ltd.Japan Post Insurance Co., Ltd.MUFG Bank, Ltd.National Mutual Insurance Federation of Agricultural CooperativesNippon Life Insurance CompanyPension Fund AssociationPGIM Japan Co., Ltd.Shinkin Central BankSumitomo Mitsui Trust Asset Management Co., Ltd.Sumitomo Mitsui Trust Bank, LimitedThe Bank of Yokohama, Ltd.The Ehime Bank, Ltd.The Norinchukin BankTokio Marine & Nichido Fire Insurance Co., Ltd.
(15 companies) (Alphabetical order)
2. AcademicsKOHYAMA Hiroyuki
TOMITA Toshiki
(Chairperson)YOSHINO Naoyuki
(3 members)(Alphabetical order)
(As of April 28, 2021)
<Actual Achievement>Date Content
November 26, 2020(85th Round)
* Online conference
・ Latest JGB market situation and outlook for future investments・ Current status and issues for the compilation of the JGB Issuance Plan for FY2021
March 23, 2021(86th Round)
* Held in writing
・・・・ Latest JGB market situation and outlook for future investments
Ⅲ AppendicesC
hapter 1 Governm
ent Bonds (JG
Bs)
3 Debt M
anagement System
s
145
D The Meeting of JGB Top Retailers<Members>
Chuo Labour Bank Sumitomo Mitsui Banking CorporationDaiwa Securities Co. Ltd. Sumitomo Mitsui Trust Bank, Limited
Japan Post Bank Co., Ltd. The Hokkaido Bank, Ltd. Mizuho Bank, Ltd. The Joyo Bank, Ltd.Mizuho Securities Co., Ltd. The Keiyo Bank, Ltd.MUFG Bank, Ltd. The Saitama Credit Cooperative Nomura Securities Co., Ltd. The Saitamaken Shinkin Bank
SMBC Nikko Securities Inc. Tomato Bank, Ltd(20 companies)
(Alphabetical order)(As of May 28, 2021)
<Actual Achievement>Date Content
November 9, 2016(16th Round)
・for Retail Investors, advertisement of JGBs for Retail Investors, and the treatment of
・
February 19, 2018(17th Round)
・JGBs for Retail Investors, recent investment behavior of retail investors, and advertisement of JGBs for Retail Investors
・
May 30, 2019(18th Round)
・for Retail Investors and advertisement of JGBs for Retail Investors
・
June 10, 2020(19th Round)
*Teleconference
・
Investors and advertisement of JGBs for Retail Investors・
June 7, 2021(20th Round)
*Online conference
・for Retail Investors, initiative cases by handling institutions for the sale of JGBs for Retail Investors, enhancement of cooperation between the Financial Bureau and handling institutions and advertisement of JGBs for Retail Investors・
Investors・
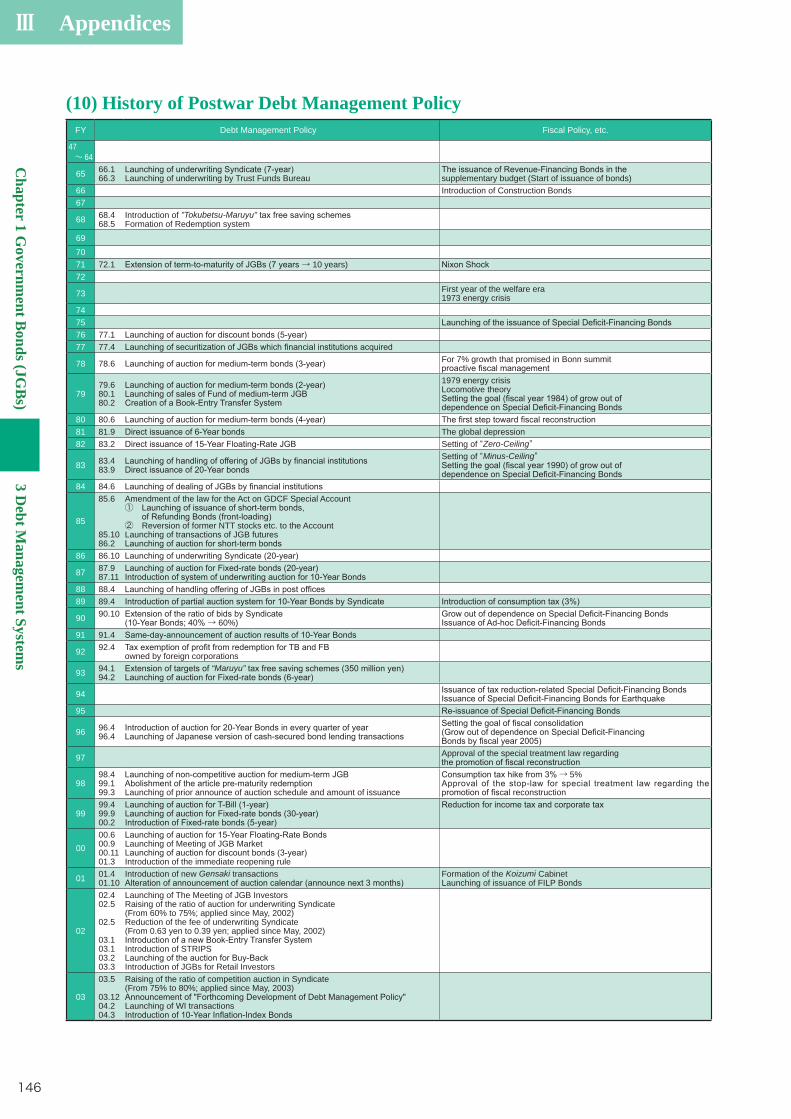
Ⅲ Appendices
Chapter 1 G
overnment B
onds (JGB
s)3 D
ebt Managem
ent Systems
146
FY Debt Management Policy Fiscal Policy, etc.
47~ 64
65 66.166.3 Launching of underwriting by Trust Funds Bureau supplementary budget (Start of issuance of bonds)
66 Introduction of Construction Bonds67
68 68.468.5
Introduction of "Tokubetsu-Maruyu"Formation of Redemption system
69
7071 72.1 → 10 years)72
73 First year of the welfare era1973 energy crisis
747576 77.177 77.4
78 78.6 For 7% growth that promised in Bonn summit
7979.680.180.2
1979 energy crisisLocomotive theory
80 80.681 81.9 The global depression82 83.2 Setting of “Zero-Ceiling”
83 83.483.9
Setting of “Minus-Ceiling”
84 84.6
85
85.6
85.1086.2
Amendment of the law for the Act on GDCF Special Account① ② Reversion of former NTT stocks etc. to the AccountLaunching of transactions of JGB futures
86 86.10
87 87.987.11
88 88.489 89.4
90 90.10→ 60%)
91 91.4
92 92.4owned by foreign corporations
93 94.194.2
“Maruyu”
94
95
96 96.496.4
97 Approval of the special treatment law regarding
9898.499.199.3 Launching of prior announce of auction schedule and amount of issuance
→ 5%
reconstruction
9999.499.900.2
0000.600.900.1101.3
Launching of Meeting of JGB Market
Introduction of the immediate reopening rule
01 01.401.10
Introduction of new Gensaki transactions Formation of the Koizumi CabinetLaunching of issuance of FILP Bonds
02
02.402.5
02.5
03.103.103.203.3
Launching of The Meeting of JGB InvestorsRaising of the ratio of auction for underwriting Syndicate(From 60% to 75%; applied since May, 2002)Reduction of the fee of underwriting Syndicate(From 0.63 yen to 0.39 yen; applied since May, 2002)
Introduction of STRIPS
Introduction of JGBs for Retail Investors
03
03.5
03.1204.204.3
Raising of the ratio of competition auction in Syndicate(From 75% to 80%; applied since May, 2003)
Launching of WI transactions
(10) History of Postwar Debt Management Policy
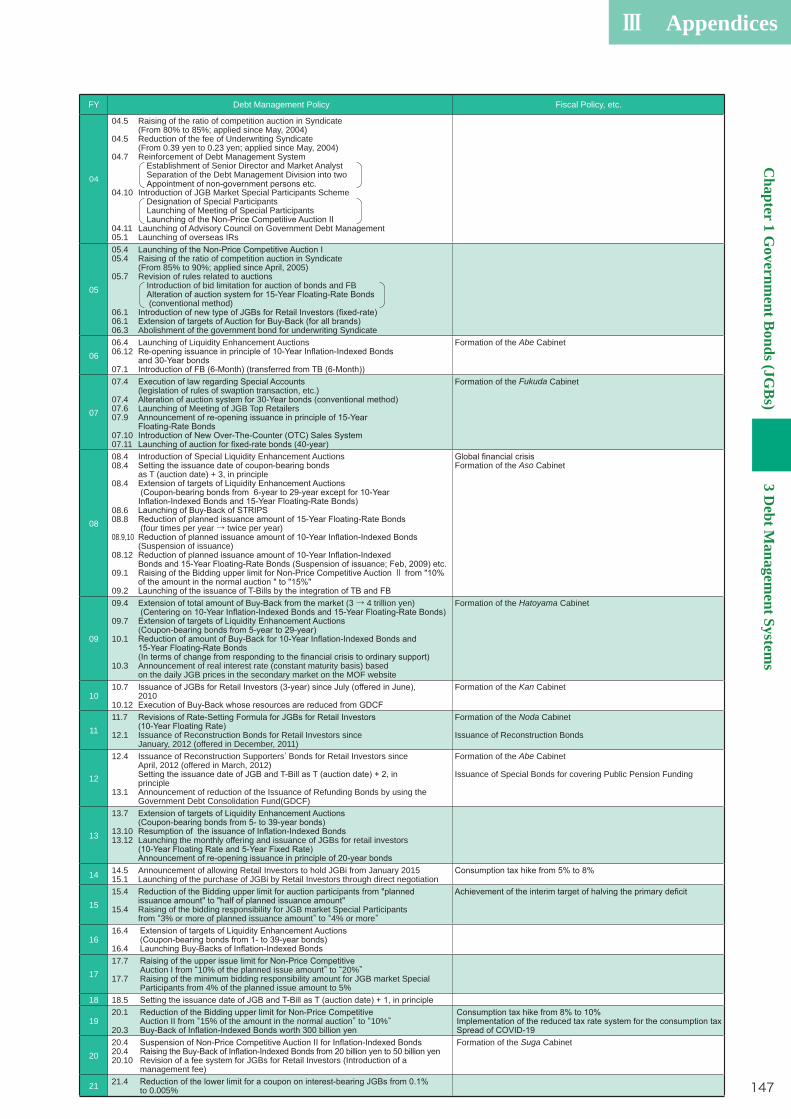
Ⅲ AppendicesC
hapter 1 Governm
ent Bonds (JG
Bs)
3 Debt M
anagement System
s
147
FY Debt Management Policy Fiscal Policy, etc.
04
04.5
04.5
04.7
04.10
04.1105.1
Raising of the ratio of competition auction in Syndicate(From 80% to 85%; applied since May, 2004)Reduction of the fee of Underwriting Syndicate(From 0.39 yen to 0.23 yen; applied since May, 2004)Reinforcement of Debt Management System Establishment of Senior Director and Market Analyst Separation of the Debt Management Division into two Introduction of JGB Market Special Participants Scheme Designation of Special Participants Launching of Meeting of Special Participants Launching of Advisory Council on Government Debt ManagementLaunching of overseas IRs
05
05.405.4
05.7
06.106.106.3
Raising of the ratio of competition auction in Syndicate(From 85% to 90%; applied since April, 2005)Revision of rules related to auctions Introduction of bid limitation for auction of bonds and FB (conventional method)
Abolishment of the government bond for underwriting Syndicate
0606.406.12
07.1
Launching of Liquidity Enhancement Auctions Formation of the Abe Cabinet
07
07.4
07.407.607.9
07.1007.11
(legislation of rules of swaption transaction, etc.)
Launching of Meeting of JGB Top Retailers
Formation of the Fukuda Cabinet
08
08.408.4
08.4
08.608.8
08.9,10
08.12
09.1
09.2
Introduction of Special Liquidity Enhancement Auctions
as T (auction date) + 3, in principle
(four times per year → twice per year)
(Suspension of issuance)
Ⅱ
Formation of the Aso Cabinet
09
09.4
09.7
10.1
10.3
→ 4 trillion yen)
Announcement of real interest rate (constant maturity basis) based on the daily JGB prices in the secondary market on the MOF website
Formation of the Hatoyama Cabinet
1010.7
10.122010
Formation of the Kan Cabinet
1111.7
12.1 Issuance of Reconstruction Bonds for Retail Investors sinceJanuary, 2012 (offered in December, 2011)
Formation of the Noda Cabinet
Issuance of Reconstruction Bonds
12
12.4
13.1
Issuance of Reconstruction Supporters’ Bonds for Retail Investors since April, 2012 (offered in March, 2012)
principleAnnouncement of reduction of the Issuance of Refunding Bonds by using the Government Debt Consolidation Fund(GDCF)
Formation of the Abe Cabinet
Issuance of Special Bonds for covering Public Pension Funding
13
13.7
13.1013.12 Launching the monthly offering and issuance of JGBs for retail investors
14 14.515.1
Announcement of allowing Retail Investors to hold JGBi from January 2015Launching of the purchase of JGBi by Retail Investors through direct negotiation
1515.4
15.4 Raising of the bidding responsibility for JGB market Special Participantsfrom “3% or more of planned issuance amount” to “4% or more”
1616.4
16.4
1717.7
17.7Auction I from “10% of the planned issue amount” to “20%”Raising of the minimum bidding responsibility amount for JGB market SpecialParticipants from 4% of the planned issue amount to 5%
18 18.5
1920.1
20.3Auction II from “15% of the amount in the normal auction” to “10%”
2020.420.420.10 Revision of a fee system for JGBs for Retail Investors (Introduction of a
management fee)
Formation of the Suga Cabinet
21 21.4to 0.005%
Ⅲ Appendices
Chapter 1 G
overnment B
onds (JGB
s)3 D
ebt Managem
ent Systems
148
(11) Government Bond-related Legal SystemsA Legal basis of issuance
All JGBs are issued in accordance with applicable laws. Depending on legal grounds, JGBs are categorized into JGBs
a Public Finance Act, Art. 4(1), Proviso (Construction Bonds)
Ⅲ AppendicesC
hapter 1 Governm
ent Bonds (JG
Bs)
3 Debt M
anagement System
s
149
recovery from the Great East Japan Earthquake, Art. 69(1) and (4) (Reconstruction Bonds)
d Act on Special Accounts, Art. 46(1) and Art. 47(1) (Refunding Bonds)
e Act on Special Accounts, Art. 62(1) (FILP Bonds)
f Others (Financing Bills, etc.)
Corporation.
B Other lawsa Act on National Government Bonds (Basic matters of JGB)
・
Ⅲ Appendices
Chapter 1 G
overnment B
onds (JGB
s)3 D
ebt Managem
ent Systems
150
・・・・・
b Act on Special Accounts, Art. 38 through 49 (Redemption of JGBs, etc.)
・・・・
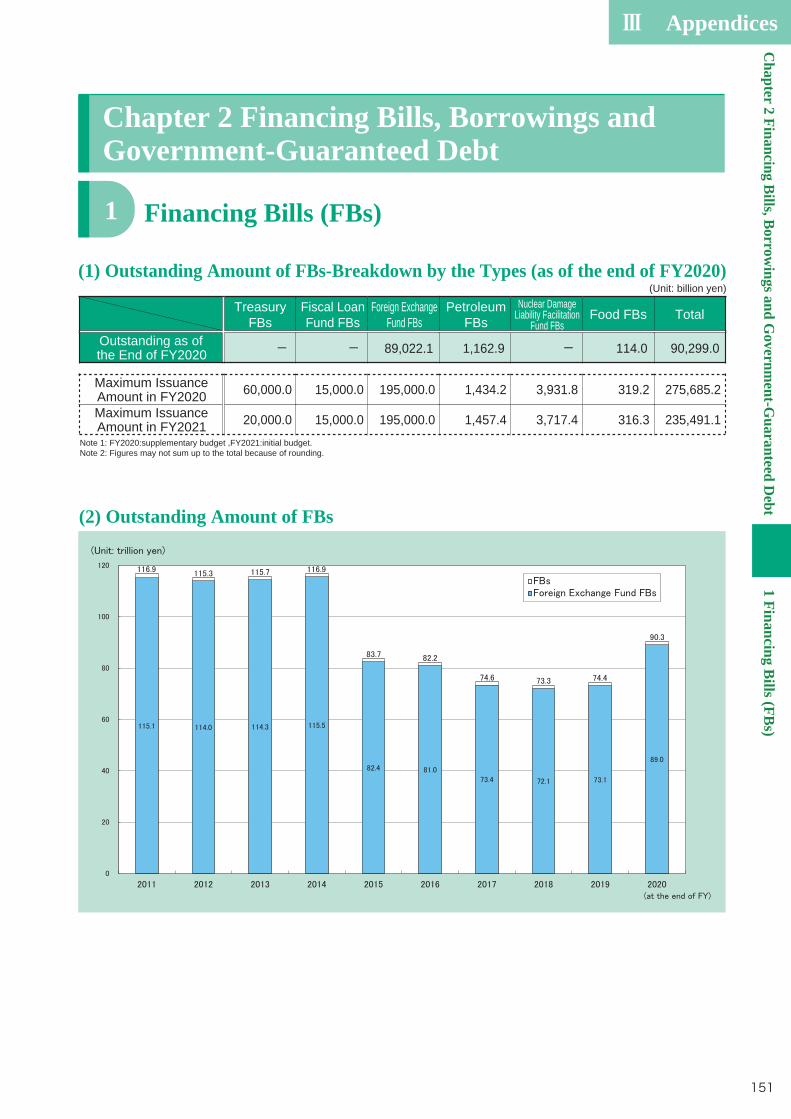
Ⅲ AppendicesC
hapter 2 Financing Bills, Borrowings and G
overnment-G
uaranteed Debt
1 Financing Bills (FB
s)
151
1,562
4,203
3,972
-
8,904
35,306
12,041
15,858
15,864
1,155,280
1,950,000
1,950,000
-
150,000
150,000
-
200,000
200,000
(1) Outstanding Amount of FBs-Breakdown by the Types (as of the end of FY2020)
(2) Outstanding Amount of FBs
Chapter 2 Financing Bills, Borrowings and Government-Guaranteed Debt
Financing Bills (FBs)1
(Unit: billion yen)
TotalFood FBsNuclear Damage
Liability FacilitationFund FBs
PetroleumFBs
Foreign ExchangeFund FBs
Fiscal LoanFund FBs
TreasuryFBs
Outstanding as ofthe End of FY2020
Maximum Issuance Amount in FY2020Maximum Issuance Amount in FY2021
Note 1: FY2020:supplementary budget ,FY2021:initial budget.Note 2: Figures may not sum up to the total because of rounding.
90,299.0 114.0 - 1,162.9 89,022.1 - -
60,000.0 15,000.0 195,000.0 1,434.2 3,931.8 319.2 275,685.2
20,000.0 15,000.0 195,000.0 1,457.4 3,717.4 316.3 235,491.1
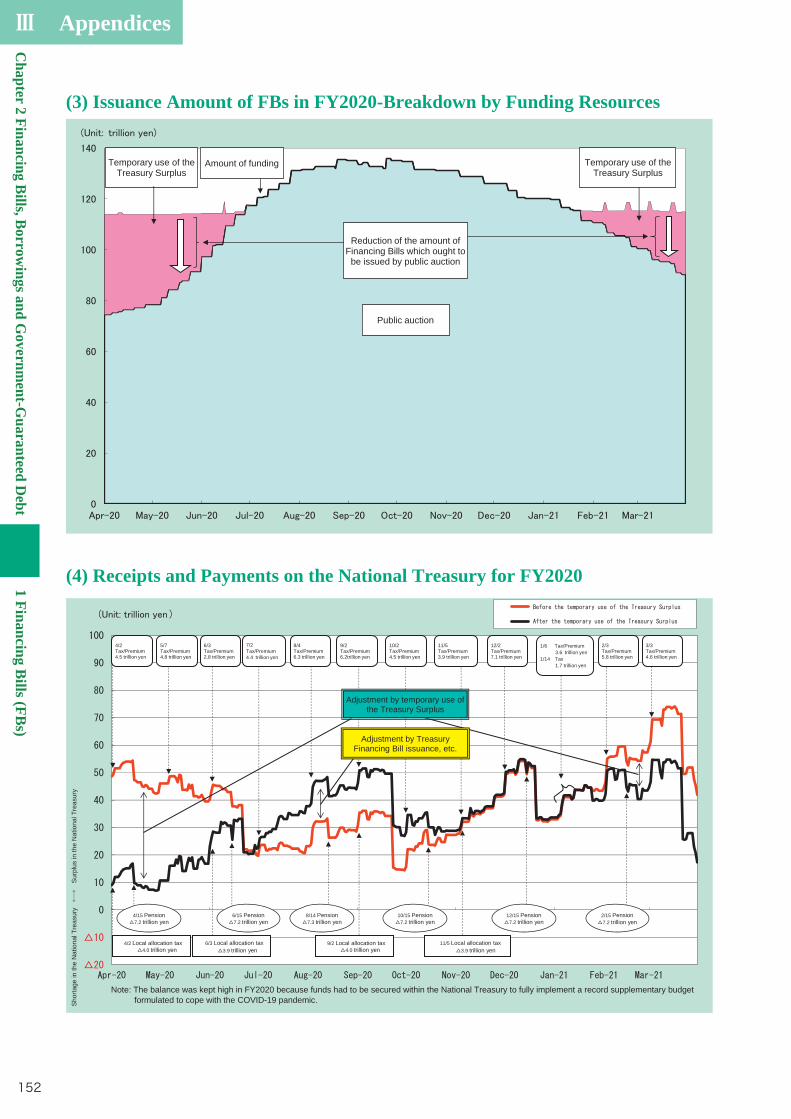
Ⅲ Appendices
Chapter 2 Financing Bills, Borrow
ings and Governm
ent-Guaranteed D
ebt1 Financing B
ills (FBs)
152
(4) Receipts and Payments on the National Treasury for FY2020
(3) Issuance Amount of FBs in FY2020-Breakdown by Funding Resources
Public auction
Reduction of the amount of Financing Bills which ought to
be issued by public auction
Temporary use of the Treasury Surplus
Amount of fundingTemporary use of the Treasury Surplus
Adjustment by temporary use of the Treasury Surplus
4/2Tax/Premium4.5 trillion yen
5/7Tax/Premium4.8 trillion yen
6/3Tax/Premium2.8 trillion yen
8/4Tax/Premium6.3 trillion yen
9/2Tax/Premium6.2trillion yen
10/2Tax/Premium4.5 trillion yen
11/5Tax/Premium3.9 trillion yen
12/2Tax/Premium7.1 trillion yen
1/6 Tax/Premium3.6 trillion yen
1/14 Tax1.7 trillion yen
4/15 Pension7.2 trillion yen
6/15 Pension7.2 trillion yen
8/14 Pension7.3 trillion yen
10/15 Pension7.2 trillion yen
12/15 Pension7.2 trillion yen
4/2 Local allocation tax4.0 trillion yen
6/3 Local allocation tax3.9 trillion yen
9/2 Local allocation tax4.0 trillion yen
11/5 Local allocation tax3.9 trillion yen
2/3Tax/Premium5.8 trillion yen
2/15 Pension7.2 trillion yen
7/2Tax/Premium4.4 trillion yen
3/3Tax/Premium4.6 trillion yen
Adjustment by Treasury Financing Bill issuance, etc.
Sho
rtage
in th
e N
atio
nal T
reas
ury
→←
Sur
plus
in th
e N
atio
nal T
reas
ury
Note: The balance was kept high in FY2020 because funds had to be secured within the National Treasury to fully implement a record supplementary budget formulated to cope with the COVID-19 pandemic.
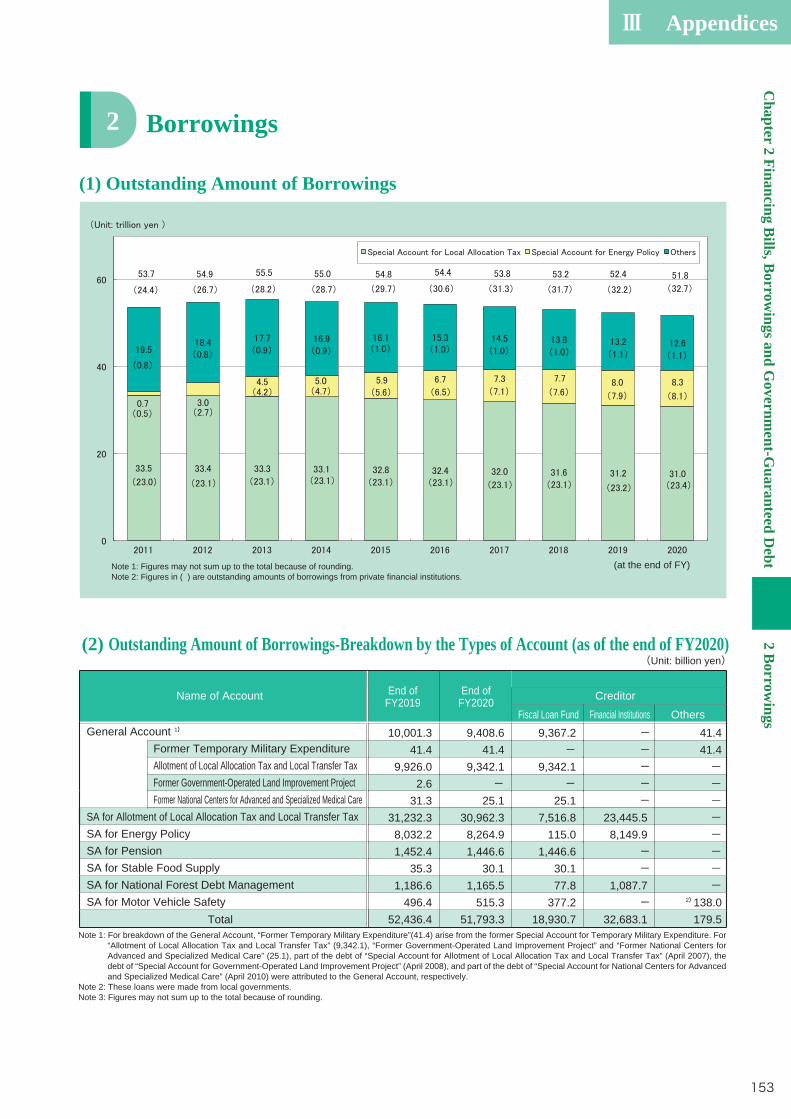
Ⅲ AppendicesC
hapter 2 Financing Bills, B
orrowings and G
overnment-G
uaranteed Debt
2 Borrow
ings
153
41.4 41.4--------
138.0179.5
- - - --
23,445.5 8,149.9
- -
1,087.7 -
32,683.1
9,367.2 -
9,342.1 -
25.1 7,516.8
115.0 1,446.6
30.1 77.8
377.2 18,930.7
9,408.6
41.4 9,342.1
- 25.1
30,962.3 8,264.9 1,446.6
30.1 1,165.5
515.3 51,793.3
10,001.3 41.4
9,926.0 2.6
31.3 31,232.3
8,032.2 1,452.4
35.3 1,186.6
496.4 52,436.4
(1) Outstanding Amount of Borrowings
(2) Outstanding Amount of Borrowings-Breakdown by the Types of Account (as of the end of FY2020)
Borrowings2
(Unit: billion yen)
End ofFY2020
End ofFY2019Name of Account
Creditor
OthersFinancial InstitutionsFiscal Loan FundGeneral Account Former Temporary Military Expenditure Allotment of Local Allocation Tax and Local Transfer Tax Former Government-Operated Land Improvement Project
Former National Centers for Advanced and Specialized Medical Care SA for Allotment of Local Allocation Tax and Local Transfer TaxSA for Energy PolicySA for PensionSA for Stable Food SupplySA for National Forest Debt ManagementSA for Motor Vehicle Safety
1)
2)
TotalNote 1: For breakdown of the General Account, “Former Temporary Military Expenditure”(41.4) arise from the former Special Account for Temporary Military Expenditure. For
“Allotment of Local Allocation Tax and Local Transfer Tax” (9,342.1), “Former Government-Operated Land Improvement Project” and “Former National Centers for Advanced and Specialized Medical Care” (25.1), part of the debt of “Special Account for Allotment of Local Allocation Tax and Local Transfer Tax” (April 2007), the debt of “Special Account for Government-Operated Land Improvement Project” (April 2008), and part of the debt of “Special Account for National Centers for Advanced and Specialized Medical Care” (April 2010) were attributed to the General Account, respectively.
Note 2: These loans were made from local governments.Note 3: Figures may not sum up to the total because of rounding.
(at the end of FY)Note 1: Figures may not sum up to the total because of rounding.Note 2: Figures in ( ) are outstanding amounts of borrowings from private financial institutions.
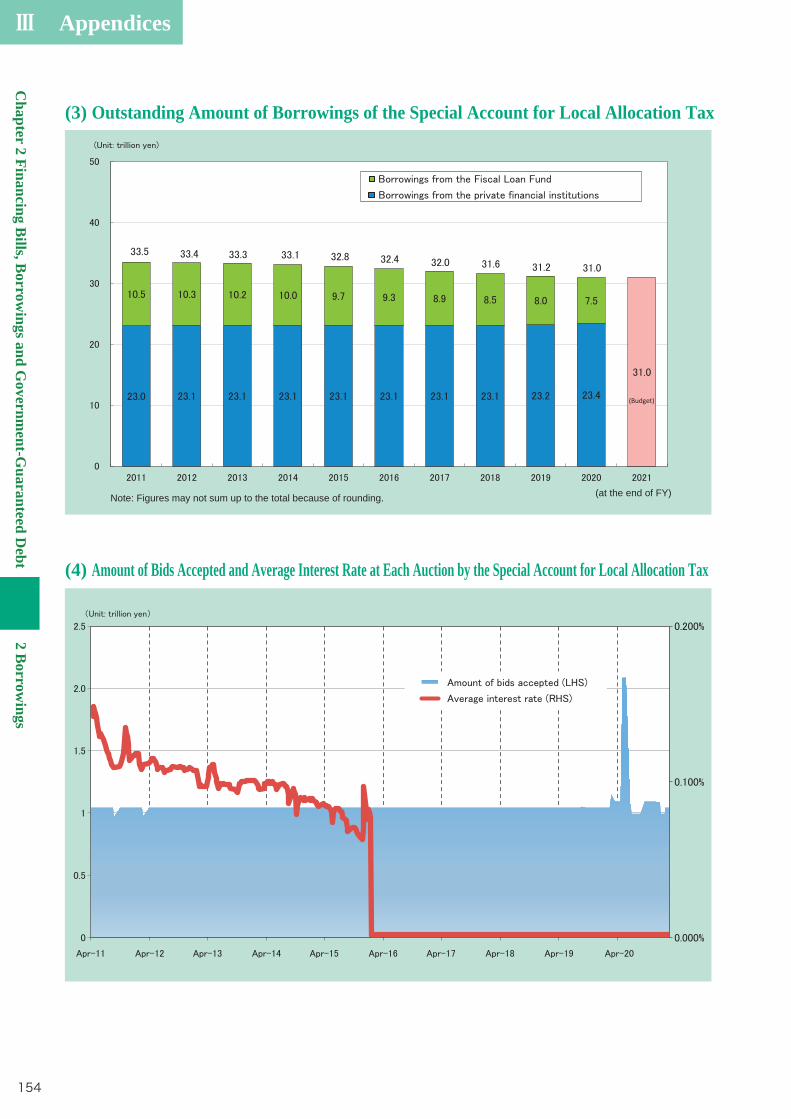
Ⅲ Appendices
Chapter 2 Financing B
ills, Borrow
ings and Governm
ent-Guaranteed D
ebt2 B
orrowings
154
(3) Outstanding Amount of Borrowings of the Special Account for Local Allocation Tax
(4) Amount of Bids Accepted and Average Interest Rate at Each Auction by the Special Account for Local Allocation Tax
(Budget)
(at the end of FY)Note: Figures may not sum up to the total because of rounding.
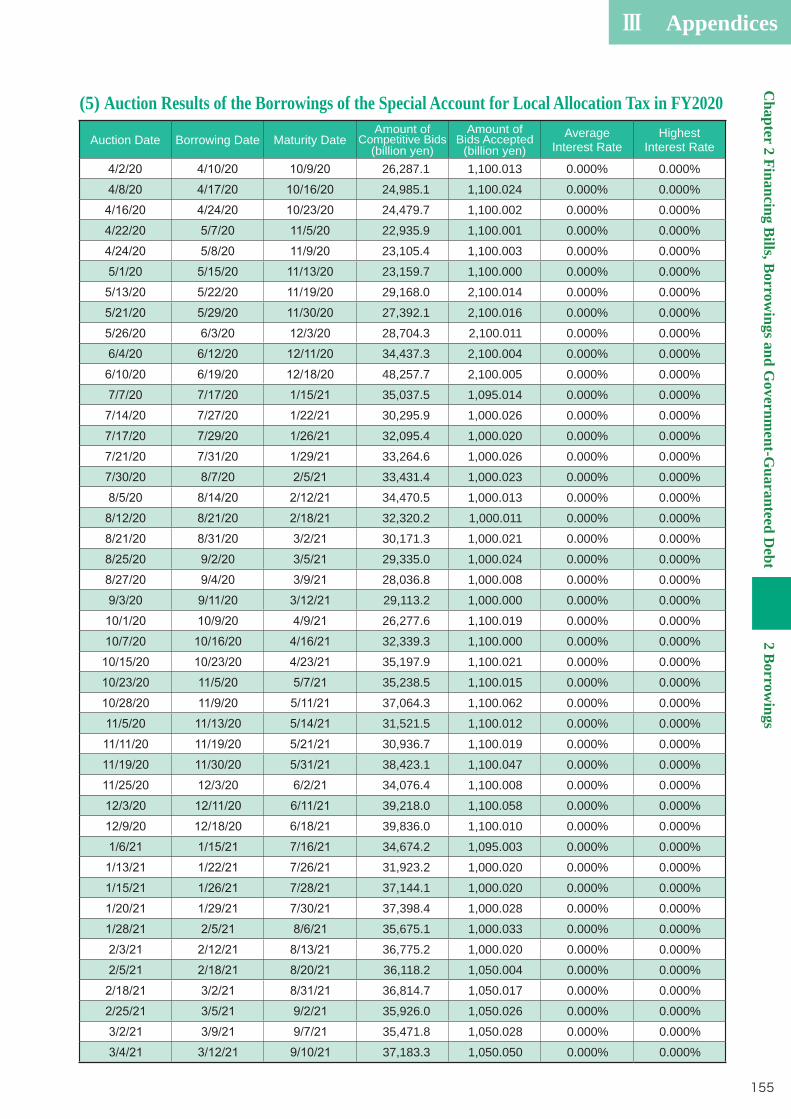
Ⅲ AppendicesC
hapter 2 Financing Bills, B
orrowings and G
overnment-G
uaranteed Debt
2 Borrow
ings
155
(5) Auction Results of the Borrowings of the Special Account for Local Allocation Tax in FY2020
Auction Date Borrowing Date Maturity DateAmount of
Competitive Bids (billion yen)
Amount of Bids Accepted
(billion yen)Average
Interest RateHighest
Interest Rate
26,287.1 1,100.013 0.000% 0.000%
24,985.1 1,100.024 0.000% 0.000%
24,479.7 1,100.002 0.000% 0.000%
22,935.9 1,100.001 0.000% 0.000%
23,105.4 1,100.003 0.000% 0.000%
23,159.7 1,100.000 0.000% 0.000%
29,168.0 2,100.014 0.000% 0.000%
27,392.1 2,100.016 0.000% 0.000%
28,704.3 2,100.011 0.000% 0.000%
34,437.3 2,100.004 0.000% 0.000%
48,257.7 2,100.005 0.000% 0.000%
35,037.5 1,095.014 0.000% 0.000%
30,295.9 1,000.026 0.000% 0.000%
32,095.4 1,000.020 0.000% 0.000%
33,264.6 1,000.026 0.000% 0.000%
33,431.4 1,000.023 0.000% 0.000%
34,470.5 1,000.013 0.000% 0.000%
32,320.2 1,000.011 0.000% 0.000%
30,171.3 1,000.021 0.000% 0.000%
29,335.0 1,000.024 0.000% 0.000%
28,036.8 1,000.008 0.000% 0.000%
29,113.2 1,000.000 0.000% 0.000%
26,277.6 1,100.019 0.000% 0.000%
32,339.3 1,100.000 0.000% 0.000%
35,197.9 1,100.021 0.000% 0.000%
35,238.5 1,100.015 0.000% 0.000%
37,064.3 1,100.062 0.000% 0.000%
31,521.5 1,100.012 0.000% 0.000%
30,936.7 1,100.019 0.000% 0.000%
38,423.1 1,100.047 0.000% 0.000%
34,076.4 1,100.008 0.000% 0.000%
39,218.0 1,100.058 0.000% 0.000%
39,836.0 1,100.010 0.000% 0.000%
34,674.2 1,095.003 0.000% 0.000%
31,923.2 1,000.020 0.000% 0.000%
37,144.1 1,000.020 0.000% 0.000%
37,398.4 1,000.028 0.000% 0.000%
35,675.1 1,000.033 0.000% 0.000%
36,775.2 1,000.020 0.000% 0.000%
36,118.2 1,050.004 0.000% 0.000%
36,814.7 1,050.017 0.000% 0.000%
35,926.0 1,050.026 0.000% 0.000%
35,471.8 1,050.028 0.000% 0.000%
37,183.3 1,050.050 0.000% 0.000%
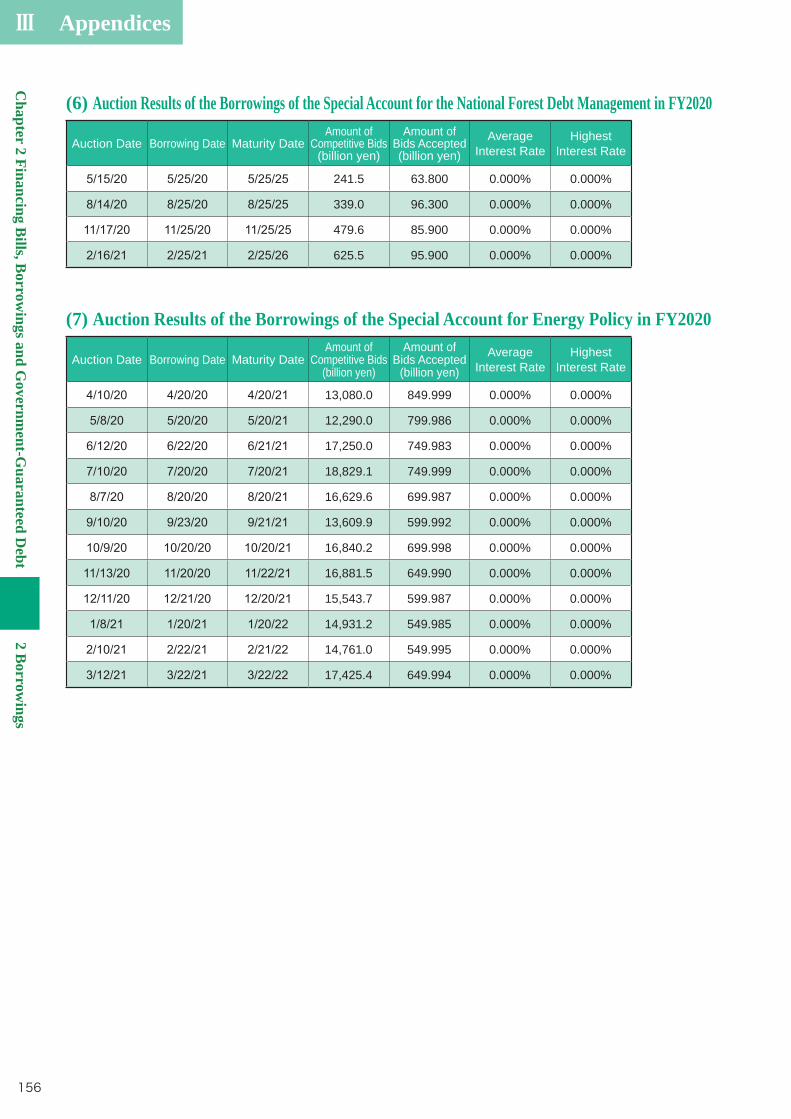
Ⅲ Appendices
Chapter 2 Financing B
ills, Borrow
ings and Governm
ent-Guaranteed D
ebt2 B
orrowings
156
(6) Auction Results of the Borrowings of the Special Account for the National Forest Debt Management in FY2020
(7) Auction Results of the Borrowings of the Special Account for Energy Policy in FY2020
Auction Date Borrowing Date Maturity DateAmount of
Competitive Bids (billion yen)
Amount of Bids Accepted (billion yen)
Average Interest Rate
Highest Interest Rate
241.5 63.800 0.000% 0.000%
339.0 96.300 0.000% 0.000%
479.6 85.900 0.000% 0.000%
625.5 95.900 0.000% 0.000%
Auction Date Borrowing Date Maturity DateAmount of
Competitive Bids (billion yen)
Amount of Bids Accepted
(billion yen)Average
Interest RateHighest
Interest Rate
13,080.0 849.999 0.000% 0.000%
12,290.0 799.986 0.000% 0.000%
17,250.0 749.983 0.000% 0.000%
18,829.1 749.999 0.000% 0.000%
16,629.6 699.987 0.000% 0.000%
13,609.9 599.992 0.000% 0.000%
16,840.2 699.998 0.000% 0.000%
16,881.5 649.990 0.000% 0.000%
15,543.7 599.987 0.000% 0.000%
14,931.2 549.985 0.000% 0.000%
14,761.0 549.995 0.000% 0.000%
17,425.4 649.994 0.000% 0.000%
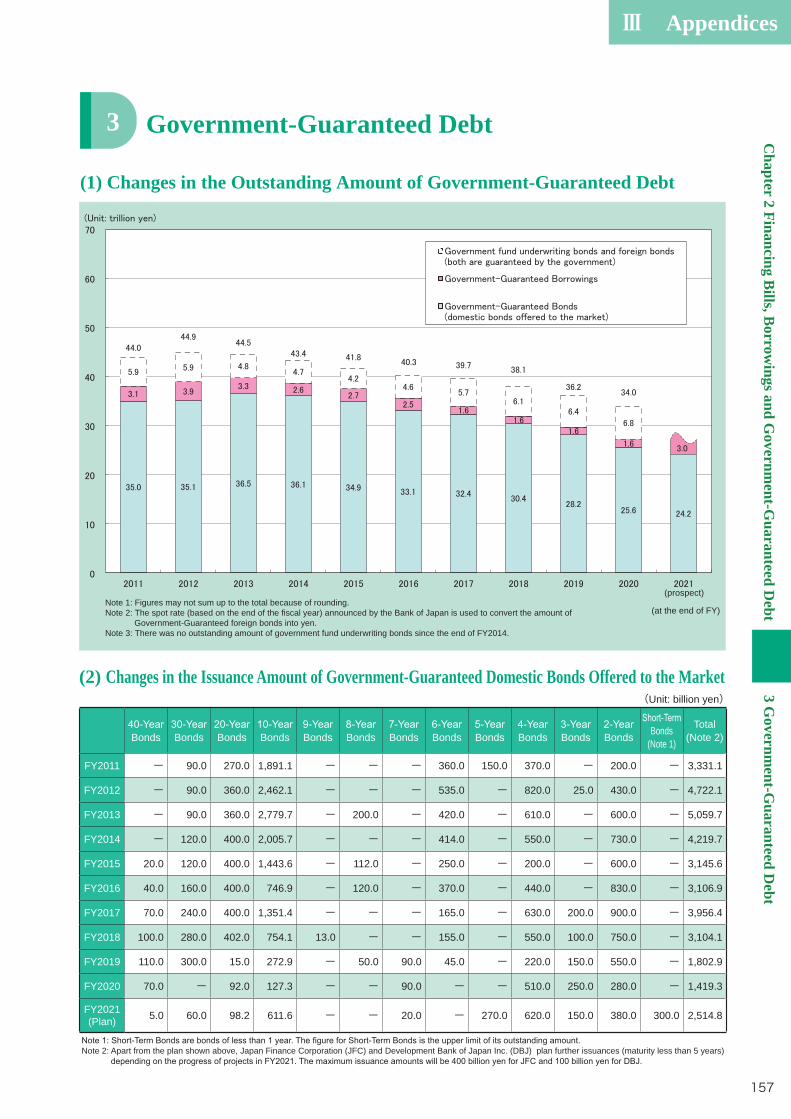
Ⅲ AppendicesC
hapter 2 Financing Bills, B
orrowings and G
overnment-G
uaranteed Debt
3 Governm
ent-Guaranteed D
ebt
157
(1) Changes in the Outstanding Amount of Government-Guaranteed Debt
Government-Guaranteed Debt3
Note 1: Figures may not sum up to the total because of rounding.Note 2: The spot rate (based on the end of the fiscal year) announced by the Bank of Japan is used to convert the amount of
Government-Guaranteed foreign bonds into yen.Note 3: There was no outstanding amount of government fund underwriting bonds since the end of FY2014.
(at the end of FY)
(prospect)
(2) Changes in the Issuance Amount of Government-Guaranteed Domestic Bonds Offered to the Market(Unit: billion yen)
Bonds
Bonds
Bonds
Bonds
Bonds
Bonds
Bonds
Bonds
Bonds
Bonds
Bonds
Bonds Bonds
(Note 1)
Total(Note 2)
FY2011 ー 90.0 270.0 1,891.1 ー ー ー 360.0 150.0 370.0 ー 200.0 ー 3,331.1
FY2012 ー 90.0 360.0 2,462.1 ー ー ー 535.0 ー 820.0 25.0 430.0 ー 4,722.1
FY2013 ー 90.0 360.0 2,779.7 ー 200.0 ー 420.0 ー 610.0 ー 600.0 ー 5,059.7
FY2014 ー 120.0 400.0 2,005.7 ー ー ー 414.0 ー 550.0 ー 730.0 ー 4,219.7
FY2015 20.0 120.0 400.0 1,443.6 ー 112.0 ー 250.0 ー 200.0 ー 600.0 ー 3,145.6
FY2016 40.0 160.0 400.0 746.9 ー 120.0 ー 370.0 ー 440.0 ー 830.0 ー 3,106.9
FY2017 70.0 240.0 400.0 1,351.4 ー ー ー 165.0 ー 630.0 200.0 900.0 ー 3,956.4
FY2018 100.0 280.0 402.0 754.1 13.0 ー ー 155.0 ー 550.0 100.0 750.0 ー 3,104.1
FY2019 110.0 300.0 15.0 272.9 ー 50.0 90.0 45.0 ー 220.0 150.0 550.0 ー 1,802.9
FY2020 70.0 ー 92.0 127.3 ー ー 90.0 ー ー 510.0 250.0 280.0 ー 1,419.3
FY2021 (Plan) 5.0 60.0 98.2 611.6 ー ー 20.0 ー 270.0 620.0 150.0 380.0 300.0 2,514.8
Note 2: Apart from the plan shown above, Japan Finance Corporation (JFC) and Development Bank of Japan Inc. (DBJ) plan further issuances (maturity less than 5 years)
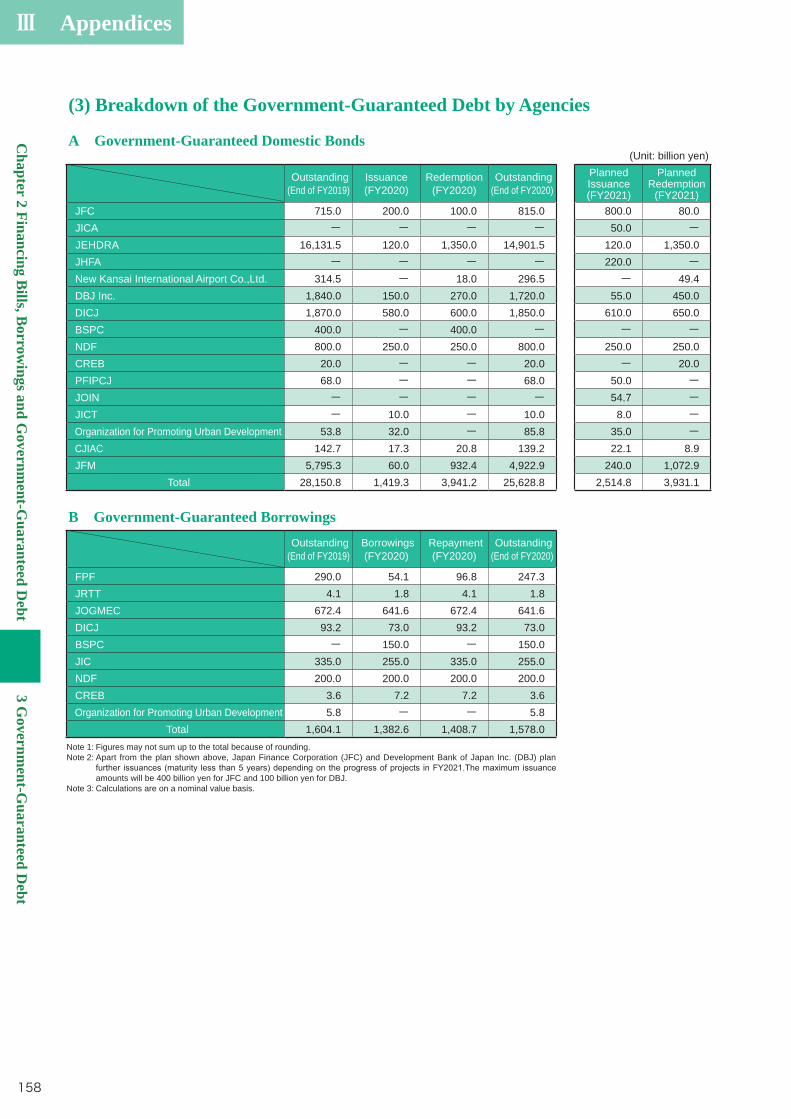
Ⅲ Appendices
Chapter 2 Financing B
ills, Borrow
ings and Governm
ent-Guaranteed D
ebt3 G
overnment-G
uaranteed Debt
158
(3) Breakdown of the Government-Guaranteed Debt by Agencies
A Government-Guaranteed Domestic Bonds(Unit: billion yen)
Outstanding (End of FY2019)
Issuance (FY2020)
Redemption (FY2020)
Outstanding (End of FY2020)
Planned Issuance (FY2021)
Planned Redemption
(FY2021) JFC 715.0 200.0 100.0 815.0 800.0 80.0 JICA ー ー ー ー 50.0 ー JEHDRA 16,131.5 120.0 1,350.0 14,901.5 120.0 1,350.0 JHFA ー ー ー ー 220.0 ー New Kansai International Airport Co.,Ltd. 314.5 ー 18.0 296.5 ー 49.4 DBJ Inc. 1,840.0 150.0 270.0 1,720.0 55.0 450.0 DICJ 1,870.0 580.0 600.0 1,850.0 610.0 650.0 BSPC 400.0 ー 400.0 ー ー ー NDF 800.0 250.0 250.0 800.0 250.0 250.0 CREB 20.0 ー ー 20.0 ー 20.0 PFIPCJ 68.0 ー ー 68.0 50.0 ー JOIN ー ー ー ー 54.7 ー JICT ー 10.0 ー 10.0 8.0 ー Organization for Promoting Urban Development 53.8 32.0 ー 85.8 35.0 ー CJIAC 142.7 17.3 20.8 139.2 22.1 8.9 JFM 5,795.3 60.0 932.4 4,922.9 240.0 1,072.9
Total 28,150.8 1,419.3 3,941.2 25,628.8 2,514.8 3,931.1
B Government-Guaranteed Borrowings Outstanding (End of FY2019)
Borrowings (FY2020)
Repayment (FY2020)
Outstanding (End of FY2020)
FPF 290.0 54.1 96.8 247.3 JRTT 4.1 1.8 4.1 1.8 JOGMEC 672.4 641.6 672.4 641.6 DICJ 93.2 73.0 93.2 73.0 BSPC ー 150.0 ー 150.0 JIC 335.0 255.0 335.0 255.0 NDF 200.0 200.0 200.0 200.0 CREB 3.6 7.2 7.2 3.6 Organization for Promoting Urban Development 5.8 ー ー 5.8
Total 1,604.1 1,382.6 1,408.7 1,578.0 Note 1: Figures may not sum up to the total because of rounding.Note 2: Apart from the plan shown above, Japan Finance Corporation (JFC) and Development Bank of Japan Inc. (DBJ) plan
amounts will be 400 billion yen for JFC and 100 billion yen for DBJ.Note 3: Calculations are on a nominal value basis.
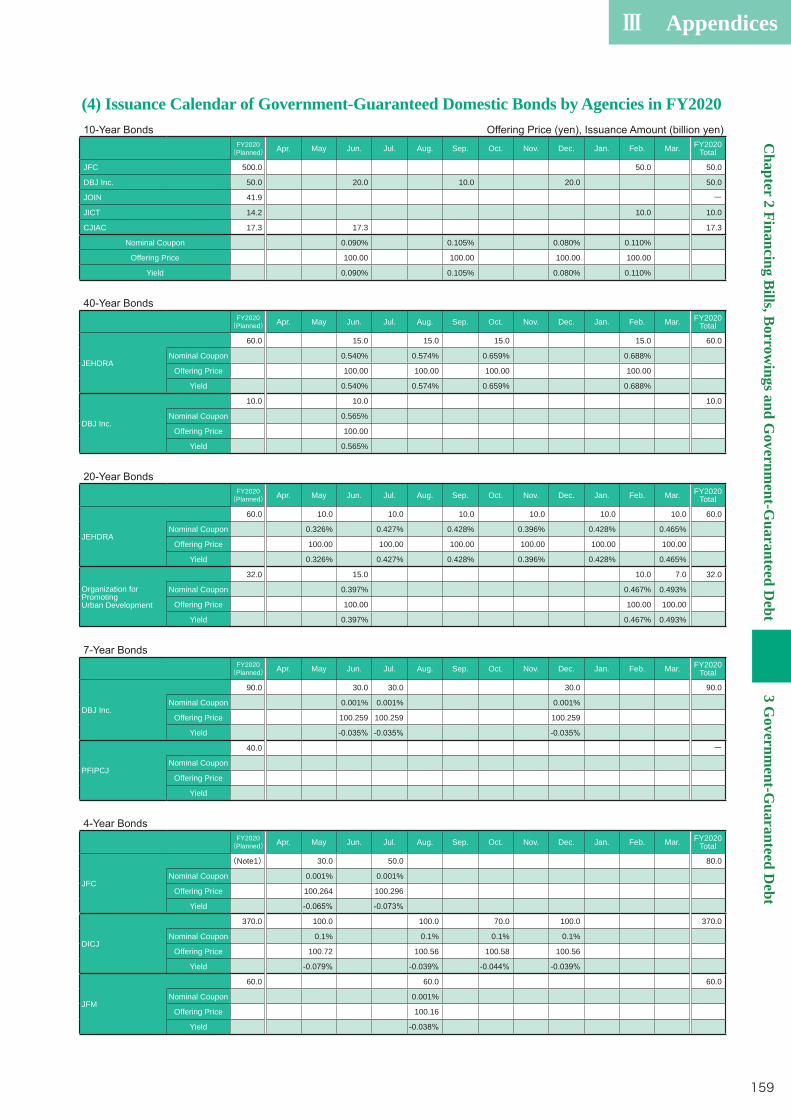
Ⅲ AppendicesC
hapter 2 Financing Bills, B
orrowings and G
overnment-G
uaranteed Debt
3 Governm
ent-Guaranteed D
ebt
159
(4) Issuance Calendar of Government-Guaranteed Domestic Bonds by Agencies in FY2020
FY2020 (Planned) Apr. May Jun. Jul. Aug. Sep. Oct. Nov. Dec. Jan. Feb. Mar. FY2020
Total
JFC 500.0 50.0 50.0
DBJ Inc. 50.0 20.0 10.0 20.0 50.0
JOIN 41.9 ー
JICT 14.2 10.0 10.0
CJIAC 17.3 17.3 17.3
Nominal Coupon 0.090% 0.105% 0.080% 0.110%
Offering Price 100.00 100.00 100.00 100.00
Yield 0.090% 0.105% 0.080% 0.110%
FY2020 (Planned) Apr. May Jun. Jul. Aug. Sep. Oct. Nov. Dec. Jan. Feb. Mar. FY2020
Total
JEHDRA
60.0 15.0 15.0 15.0 15.0 60.0
Nominal Coupon 0.540% 0.574% 0.659% 0.688%
Offering Price 100.00 100.00 100.00 100.00
Yield 0.540% 0.574% 0.659% 0.688%
DBJ Inc.
10.0 10.0 10.0
Nominal Coupon 0.565%
Offering Price 100.00
Yield 0.565%
FY2020 (Planned) Apr. May Jun. Jul. Aug. Sep. Oct. Nov. Dec. Jan. Feb. Mar. FY2020
Total
JEHDRA
60.0 10.0 10.0 10.0 10.0 10.0 10.0 60.0
Nominal Coupon 0.326% 0.427% 0.428% 0.396% 0.428% 0.465%
Offering Price 100.00 100.00 100.00 100.00 100.00 100.00
Yield 0.326% 0.427% 0.428% 0.396% 0.428% 0.465%
Organization for Promoting Urban Development
32.0 15.0 10.0 7.0 32.0
Nominal Coupon 0.397% 0.467% 0.493%
Offering Price 100.00 100.00 100.00
Yield 0.397% 0.467% 0.493%
FY2020 (Planned) Apr. May Jun. Jul. Aug. Sep. Oct. Nov. Dec. Jan. Feb. Mar. FY2020
Total
DBJ Inc.
90.0 30.0 30.0 30.0 90.0
Nominal Coupon 0.001% 0.001% 0.001%
Offering Price 100.259 100.259 100.259
Yield
PFIPCJ
40.0 ー
Nominal Coupon
Offering Price
Yield
FY2020 (Planned) Apr. May Jun. Jul. Aug. Sep. Oct. Nov. Dec. Jan. Feb. Mar. FY2020
Total
JFC
(Note1) 30.0 50.0 80.0
Nominal Coupon 0.001% 0.001%
Offering Price 100.264 100.296
Yield
DICJ
370.0 100.0 100.0 70.0 100.0 370.0
Nominal Coupon 0.1% 0.1% 0.1% 0.1%
Offering Price 100.72 100.56 100.58 100.56
Yield
JFM
60.0 60.0 60.0
Nominal Coupon 0.001%
Offering Price 100.16
Yield
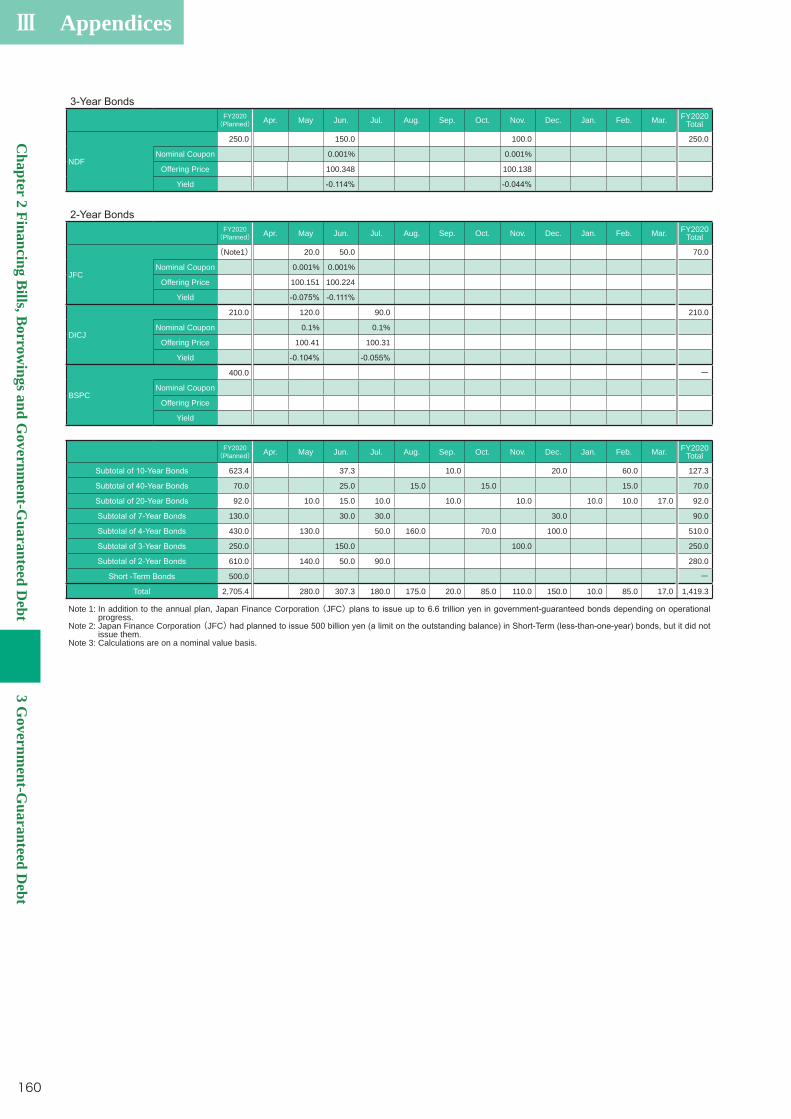
Ⅲ Appendices
Chapter 2 Financing B
ills, Borrow
ings and Governm
ent-Guaranteed D
ebt3 G
overnment-G
uaranteed Debt
160
FY2020 (Planned) Apr. May Jun. Jul. Aug. Sep. Oct. Nov. Dec. Jan. Feb. Mar. FY2020
Total
NDF
250.0 150.0 100.0 250.0
Nominal Coupon 0.001% 0.001%
Offering Price 100.348 100.138
Yield
FY2020 (Planned) Apr. May Jun. Jul. Aug. Sep. Oct. Nov. Dec. Jan. Feb. Mar. FY2020
Total
JFC
(Note1) 20.0 50.0 70.0
Nominal Coupon 0.001% 0.001%
Offering Price 100.151 100.224
Yield
DICJ
210.0 120.0 90.0 210.0
Nominal Coupon 0.1% 0.1%
Offering Price 100.41 100.31
Yield
BSPC
400.0 ー
Nominal Coupon
Offering Price
Yield
FY2020 (Planned) Apr. May Jun. Jul. Aug. Sep. Oct. Nov. Dec. Jan. Feb. Mar. FY2020
Total
623.4 37.3 10.0 20.0 60.0 127.3
70.0 25.0 15.0 15.0 15.0 70.0
92.0 10.0 15.0 10.0 10.0 10.0 10.0 10.0 17.0 92.0
130.0 30.0 30.0 30.0 90.0
430.0 130.0 50.0 160.0 70.0 100.0 510.0
250.0 150.0 100.0 250.0
610.0 140.0 50.0 90.0 280.0
500.0 ー
Total 2,705.4 280.0 307.3 180.0 175.0 20.0 85.0 110.0 150.0 10.0 85.0 17.0 1,419.3
Note 1: In addition to the annual plan, Japan Finance Corporation (JFC)progress.
Note 2: Japan Finance Corporation (JFC)issue them.
Note 3: Calculations are on a nominal value basis.
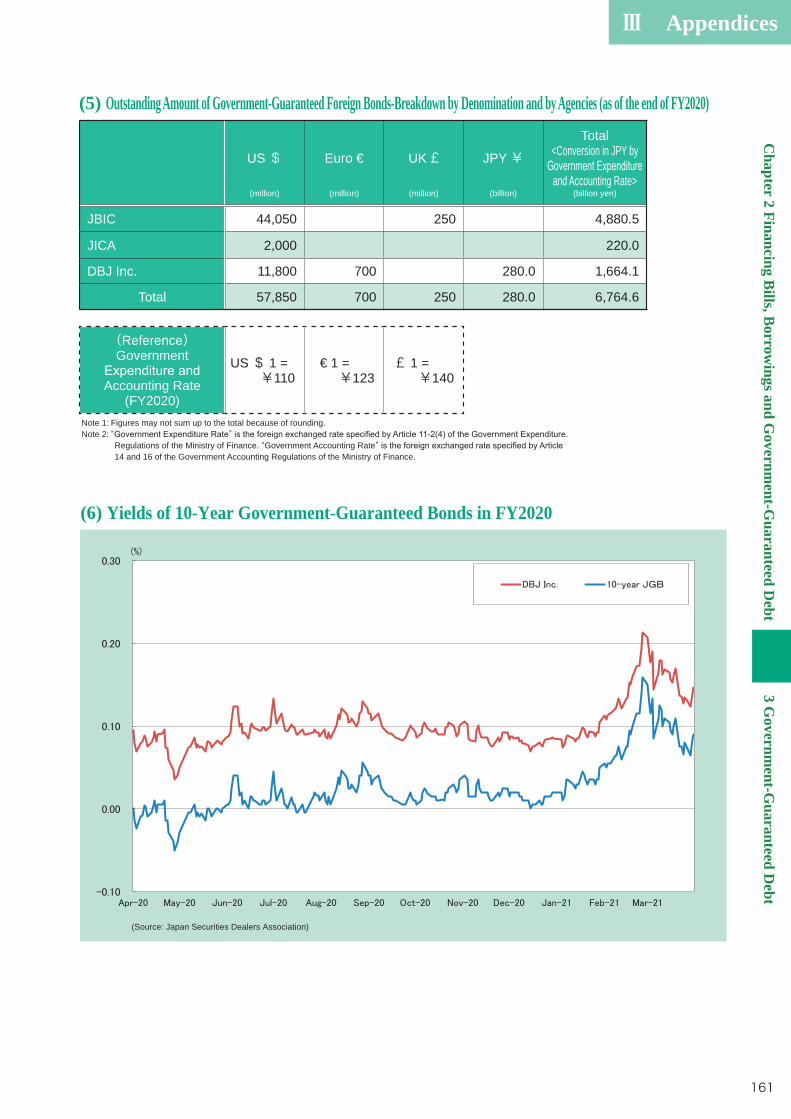
Ⅲ AppendicesC
hapter 2 Financing Bills, B
orrowings and G
overnment-G
uaranteed Debt
3 Governm
ent-Guaranteed D
ebt
161
(6) Yields of 10-Year Government-Guaranteed Bonds in FY2020
(Source: Japan Securities Dealers Association)
(5) Outstanding Amount of Government-Guaranteed Foreign Bonds-Breakdown by Denomination and by Agencies (as of the end of FY2020)
US $
(million)
Euro €
(million)
UK £
(million)
JPY ¥
(billion)
Total<Conversion in JPY by
and Accounting Rate>(billion yen)
JBIC 44,050 250 4,880.5
JICA 2,000 220.0
DBJ Inc. 11,800 700 280.0 1,664.1
Total 57,850 700 250 280.0 6,764.6
(Reference)Government
Accounting Rate(FY2020)
US $ 1 =¥110
€ 1 =¥123
£ 1 =¥140
Note 1: Figures may not sum up to the total because of rounding.Note 2: “ ” Regulations of the Ministry of Finance. “Government Accounting Rate” 14 and 16 of the Government Accounting Regulations of the Ministry of Finance.
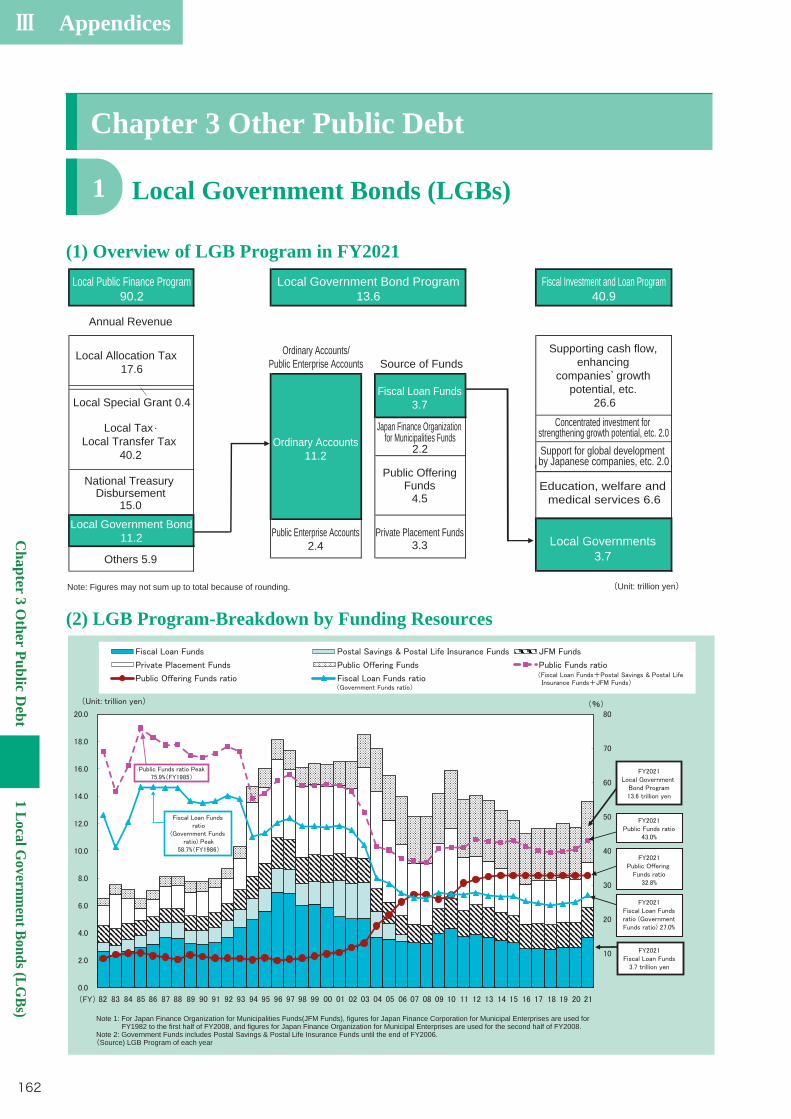
Ⅲ Appendices
Chapter 3 O
ther Public Debt
1 Local Governm
ent Bonds (LGBs)
162
(2) LGB Program-Breakdown by Funding Resources
Local Government Bonds (LGBs)1
Chapter 3 Other Public Debt
(1) Overview of LGB Program in FY2021
Local Allocation Tax 17.6
Local Special Grant 0.4
Local Tax.Local Transfer Tax
40.2
National Treasury Disbursement
15.0
Others 5.9
Local Public Finance Program90.2
Local Government Bond11.2
Annual Revenue
Source of FundsOrdinary Accounts/
Public Enterprise Accounts
Japan Finance Organization for Municipalities Funds
2.2
Private Placement Funds3.3
Public Enterprise Accounts2.4
Public OfferingFunds
4.5
Local Government Bond Program13.6
Ordinary Accounts11.2
Fiscal Loan Funds3.7
Concentrated investment for strengthening growth potential, etc. 2.0Support for global development by Japanese companies, etc. 2.0
Local Governments3.7
Education, welfare and medical services 6.6
Supporting cash flow, enhancing
companies’ growth potential, etc.
26.6
Fiscal Investment and Loan Program40.9
(Unit: trillion yen)Note: Figures may not sum up to total because of rounding.
Note 1: For Japan Finance Organization for Municipalities Funds(JFM Funds), figures for Japan Finance Corporation for Municipal Enterprises are used for FY1982 to the first half of FY2008, and figures for Japan Finance Organization for Municipal Enterprises are used for the second half of FY2008.Note 2: Government Funds includes Postal Savings & Postal Life Insurance Funds until the end of FY2006.(Source) LGB Program of each year
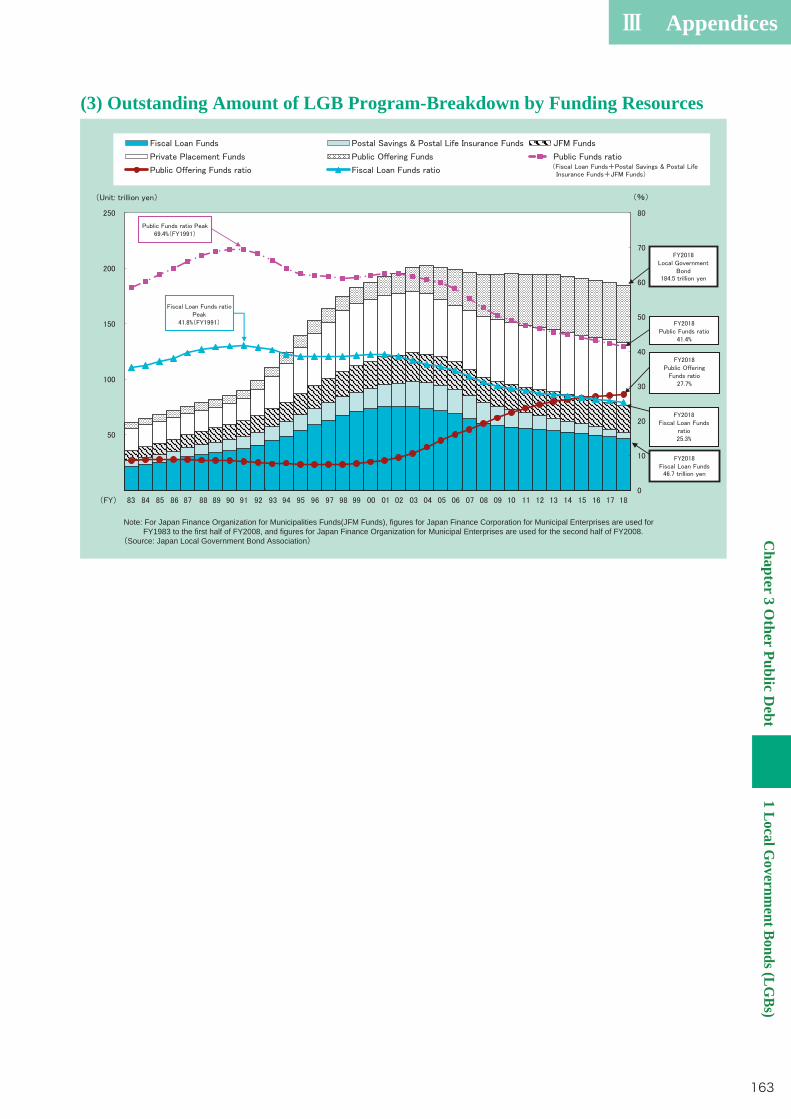
Ⅲ AppendicesC
hapter 3 Other Public D
ebt1 Local G
overnment Bonds (LG
Bs)
163
(3) Outstanding Amount of LGB Program-Breakdown by Funding Resources
Note: For Japan Finance Organization for Municipalities Funds(JFM Funds), figures for Japan Finance Corporation for Municipal Enterprises are used for FY1983 to the first half of FY2008, and figures for Japan Finance Organization for Municipal Enterprises are used for the second half of FY2008.(Source: Japan Local Government Bond Association)
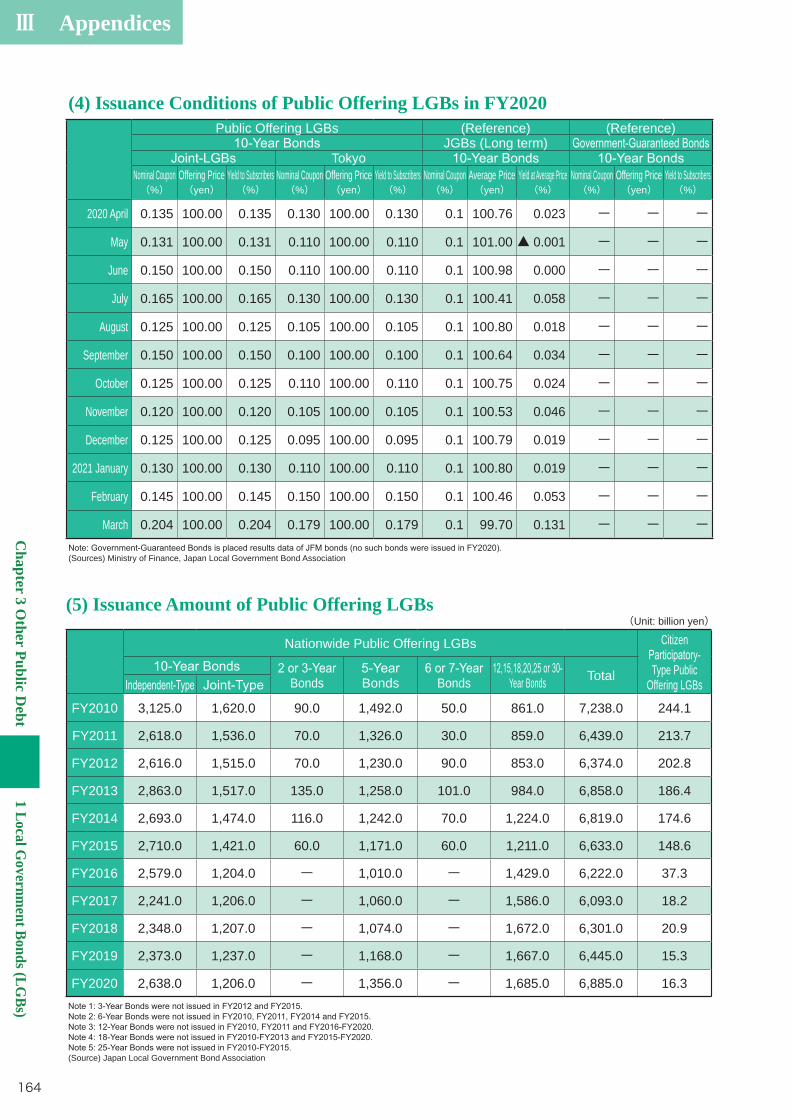
Ⅲ Appendices
Chapter 3 O
ther Public Debt
1 Local Governm
ent Bonds (LGBs)
164
(4) Issuance Conditions of Public Offering LGBs in FY2020Public Offering LGBs (Reference) (Reference)
JGBs (Long term)Tokyo
Nominal Coupon (%)
Offering Price (yen)
Yield to Subscribers (%)
Nominal Coupon (%)
Offering Price (yen)
Yield to Subscribers (%)
Nominal Coupon (%)
Average Price (yen)
Yield at Average Price (%)
Nominal Coupon (%)
Offering Price (yen)
Yield to Subscribers (%)
2020 April 0.135 100.00 0.135 0.130 100.00 0.130 0.1 100.76 0.023 ー ー ー
May 0.131 100.00 0.131 0.110 100.00 0.110 0.1 101.00 ▲ 0.001 ー ー ー
June 0.150 100.00 0.150 0.110 100.00 0.110 0.1 100.98 0.000 ー ー ー
July 0.165 100.00 0.165 0.130 100.00 0.130 0.1 100.41 0.058 ー ー ー
August 0.125 100.00 0.125 0.105 100.00 0.105 0.1 100.80 0.018 ー ー ー
September 0.150 100.00 0.150 0.100 100.00 0.100 0.1 100.64 0.034 ー ー ー
October 0.125 100.00 0.125 0.110 100.00 0.110 0.1 100.75 0.024 ー ー ー
November 0.120 100.00 0.120 0.105 100.00 0.105 0.1 100.53 0.046 ー ー ー
December 0.125 100.00 0.125 0.095 100.00 0.095 0.1 100.79 0.019 ー ー ー
2021 January 0.130 100.00 0.130 0.110 100.00 0.110 0.1 100.80 0.019 ー ー ー
February 0.145 100.00 0.145 0.150 100.00 0.150 0.1 100.46 0.053 ー ー ー
March 0.204 100.00 0.204 0.179 100.00 0.179 0.1 99.70 0.131 ー ー ー
(Sources) Ministry of Finance, Japan Local Government Bond Association
(Unit: billion yen)
Nationwide Public Offering LGBs Citizen
Type Public Offering LGBsBonds Bonds Bonds Year Bonds Total
FY2010 3,125.0 1,620.0 90.0 1,492.0 50.0 861.0 7,238.0 244.1
FY2011 2,618.0 1,536.0 70.0 1,326.0 30.0 859.0 6,439.0 213.7
FY2012 2,616.0 1,515.0 70.0 1,230.0 90.0 853.0 6,374.0 202.8
FY2013 2,863.0 1,517.0 135.0 1,258.0 101.0 984.0 6,858.0 186.4
FY2014 2,693.0 1,474.0 116.0 1,242.0 70.0 1,224.0 6,819.0 174.6
FY2015 2,710.0 1,421.0 60.0 1,171.0 60.0 1,211.0 6,633.0 148.6
FY2016 2,579.0 1,204.0 ー 1,010.0 ー 1,429.0 6,222.0 37.3
FY2017 2,241.0 1,206.0 ー 1,060.0 ー 1,586.0 6,093.0 18.2
FY2018 2,348.0 1,207.0 ー 1,074.0 ー 1,672.0 6,301.0 20.9
FY2019 2,373.0 1,237.0 ー 1,168.0 ー 1,667.0 6,445.0 15.3
FY2020 2,638.0 1,206.0 ー 1,356.0 ー 1,685.0 6,885.0 16.3
(Source) Japan Local Government Bond Association
(5) Issuance Amount of Public Offering LGBs
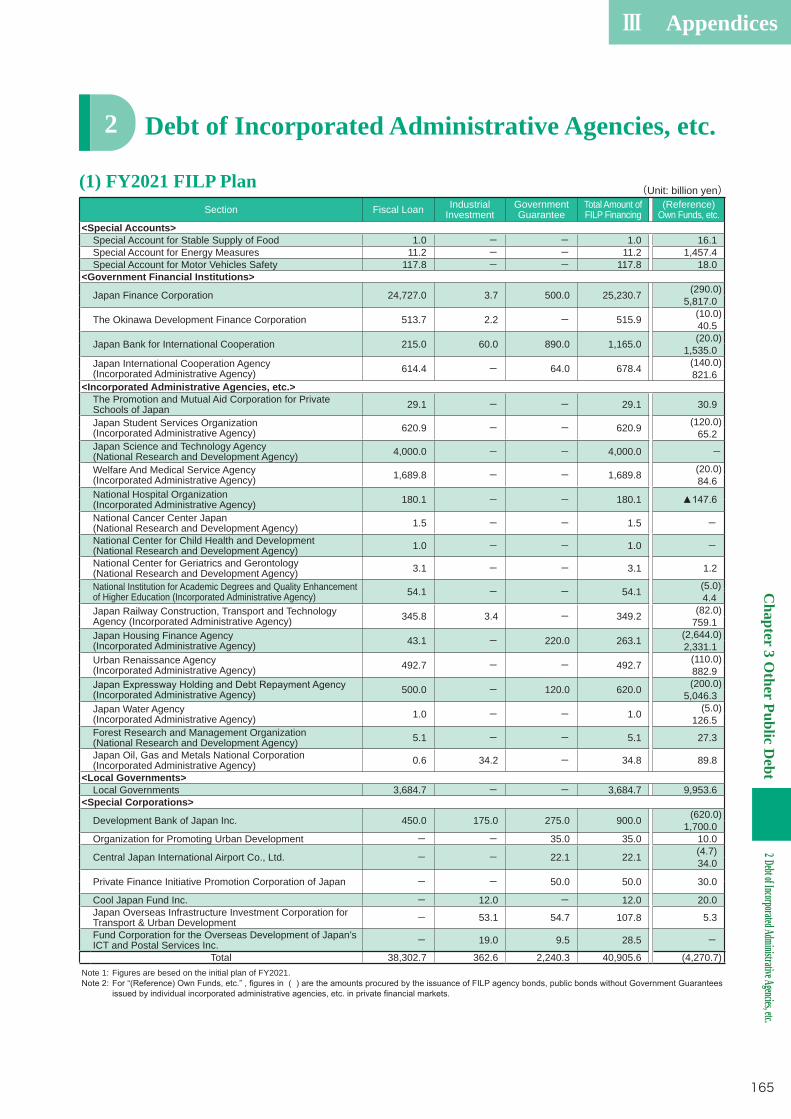
Ⅲ AppendicesC
hapter 3 Other Public D
ebt2 Debt of Incorporated Administrative Agencies, etc.
165
(1) FY2021 FILP Plan (Unit: billion yen)Section Fiscal Loan Industrial
InvestmentGovernment Guarantee
Total Amount ofFILP Financing
(Reference)Own Funds, etc.
<Special Accounts>Special Account for Stable Supply of Food 1.0 - - 1.0 16.1Special Account for Energy Measures 11.2 - - 11.2 1,457.4Special Account for Motor Vehicles Safety 117.8 - - 117.8 18.0
<Government Financial Institutions>
Japan Finance Corporation 24,727.0 3.7 500.0 25,230.7 (290.0) 5,817.0
The Okinawa Development Finance Corporation 513.7 2.2 - 515.9 (10.0) 40.5
Japan Bank for International Cooperation 215.0 60.0 890.0 1,165.0 (20.0) 1,535.0
Japan International Cooperation Agency(Incorporated Administrative Agency) 614.4 - 64.0 678.4 (140.0)
821.6<Incorporated Administrative Agencies, etc.>
The Promotion and Mutual Aid Corporation for Private Schools of Japan 29.1 - - 29.1 30.9
Japan Student Services Organization(Incorporated Administrative Agency) 620.9 - - 620.9 (120.0)
65.2Japan Science and Technology Agency(National Research and Development Agency) 4,000.0 - - 4,000.0 -Welfare And Medical Service Agency(Incorporated Administrative Agency) 1,689.8 - - 1,689.8 (20.0)
84.6National Hospital Organization(Incorporated Administrative Agency) 180.1 - - 180.1
National Cancer Center Japan(National Research and Development Agency) 1.5 - - 1.5 -National Center for Child Health and Development(National Research and Development Agency) 1.0 - - 1.0 -National Center for Geriatrics and Gerontology(National Research and Development Agency) 3.1 - - 3.1 1.2
National Institution for Academic Degrees and Quality Enhancement of Higher Education (Incorporated Administrative Agency) 54.1 - - 54.1 (5.0)
4.4Japan Railway Construction, Transport and Technology Agency (Incorporated Administrative Agency) 345.8 3.4 - 349.2 (82.0)
759.1Japan Housing Finance Agency(Incorporated Administrative Agency) 43.1 - 220.0 263.1 (2,644.0)
2,331.1Urban Renaissance Agency(Incorporated Administrative Agency) 492.7 - - 492.7 (110.0)
882.9
(Incorporated Administrative Agency) 500.0 - 120.0 620.0 (200.0) 5,046.3
Japan Water Agency(Incorporated Administrative Agency) 1.0 - - 1.0 (5.0)
126.5Forest Research and Management Organization(National Research and Development Agency) 5.1 - - 5.1 27.3
Japan Oil, Gas and Metals National Corporation(Incorporated Administrative Agency) 0.6 34.2 - 34.8 89.8
<Local Governments>Local Governments 3,684.7 - - 3,684.7 9,953.6
<Special Corporations>
Development Bank of Japan Inc. 450.0 175.0 275.0 900.0 (620.0) 1,700.0
Organization for Promoting Urban Development - - 35.0 35.0 10.0
Central Japan International Airport Co., Ltd. - - 22.1 22.1 (4.7) 34.0
Private Finance Initiative Promotion Corporation of Japan - - 50.0 50.0 30.0
Cool Japan Fund Inc. - 12.0 - 12.0 20.0Japan Overseas Infrastructure Investment Corporation for Transport & Urban Development - 53.1 54.7 107.8 5.3
Fund Corporation for the Overseas Development of Japan’s ICT and Postal Services Inc. - 19.0 9.5 28.5 -
Total 38,302.7 362.6 2,240.3 40,905.6 (4,270.7) Note 1: Figures are besed on the initial plan of FY2021.
Debt of Incorporated Administrative Agencies, etc.2
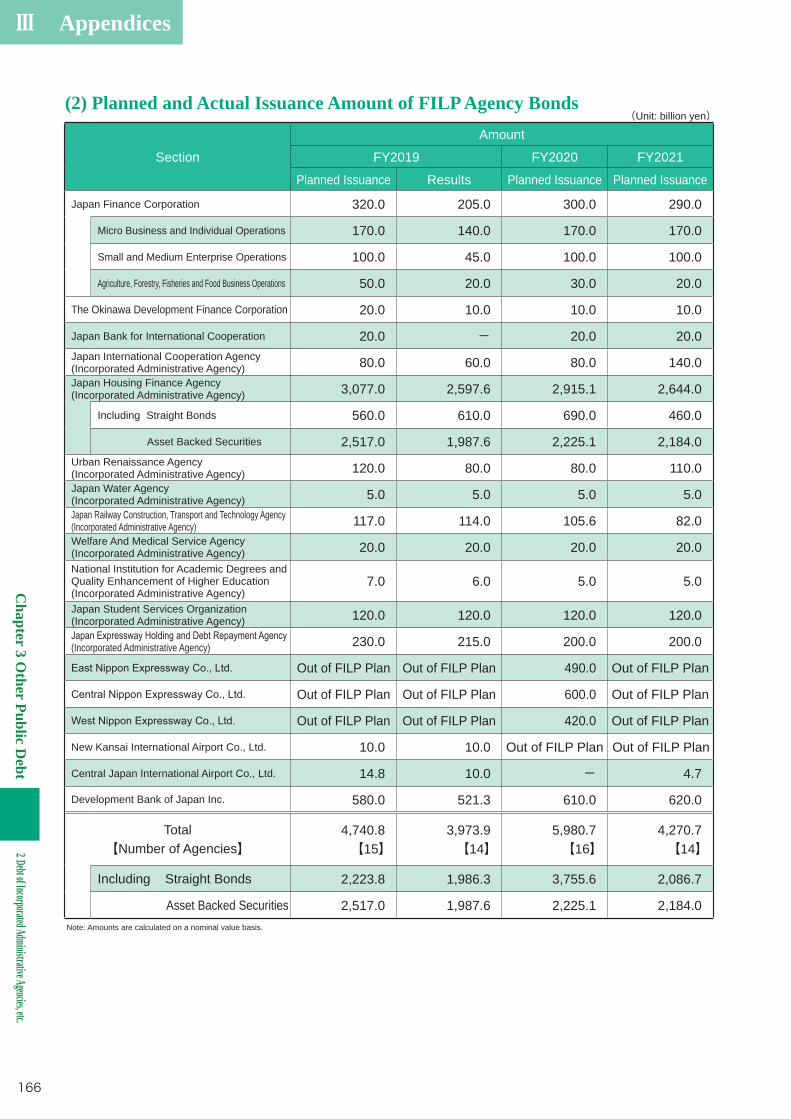
Ⅲ Appendices
Chapter 3 O
ther Public Debt
2 Debt of Incorporated Administrative Agencies, etc.
166
(2) Planned and Actual Issuance Amount of FILP Agency Bonds(Unit: billion yen)
Section
Amount
FY2019 FY2020 FY2021
Planned Issuance Results Planned Issuance Planned Issuance
Japan Finance Corporation 320.0 205.0 300.0 290.0
Micro Business and Individual Operations 170.0 140.0 170.0 170.0
Small and Medium Enterprise Operations 100.0 45.0 100.0 100.0
Agriculture, Forestry, Fisheries and Food Business Operations 50.0 20.0 30.0 20.0
The Okinawa Development Finance Corporation 20.0 10.0 10.0 10.0
Japan Bank for International Cooperation 20.0 - 20.0 20.0 Japan International Cooperation Agency(Incorporated Administrative Agency) 80.0 60.0 80.0 140.0 Japan Housing Finance Agency(Incorporated Administrative Agency) 3,077.0 2,597.6 2,915.1 2,644.0
Including Straight Bonds 560.0 610.0 690.0 460.0
Asset Backed Securities 2,517.0 1,987.6 2,225.1 2,184.0 Urban Renaissance Agency(Incorporated Administrative Agency) 120.0 80.0 80.0 110.0 Japan Water Agency(Incorporated Administrative Agency) 5.0 5.0 5.0 5.0 Japan Railway Construction, Transport and Technology Agency(Incorporated Administrative Agency) 117.0 114.0 105.6 82.0 Welfare And Medical Service Agency(Incorporated Administrative Agency) 20.0 20.0 20.0 20.0 National Institution for Academic Degrees and Quality Enhancement of Higher Education(Incorporated Administrative Agency)
7.0 6.0 5.0 5.0
Japan Student Services Organization(Incorporated Administrative Agency) 120.0 120.0 120.0 120.0
(Incorporated Administrative Agency) 230.0 215.0 200.0 200.0
Out of FILP Plan Out of FILP Plan 490.0 Out of FILP Plan
Out of FILP Plan Out of FILP Plan 600.0 Out of FILP Plan
Out of FILP Plan Out of FILP Plan 420.0 Out of FILP Plan
New Kansai International Airport Co., Ltd. 10.0 10.0 Out of FILP Plan Out of FILP Plan
Central Japan International Airport Co., Ltd. 14.8 10.0 - 4.7
Development Bank of Japan Inc. 580.0 521.3 610.0 620.0
Total【Number of Agencies】
4,740.8【15】
3,973.9【14】
5,980.7【16】
4,270.7【14】
Including Straight Bonds 2,223.8 1,986.3 3,755.6 2,086.7
Asset Backed Securities 2,517.0 1,987.6 2,225.1 2,184.0 Note: Amounts are calculated on a nominal value basis.
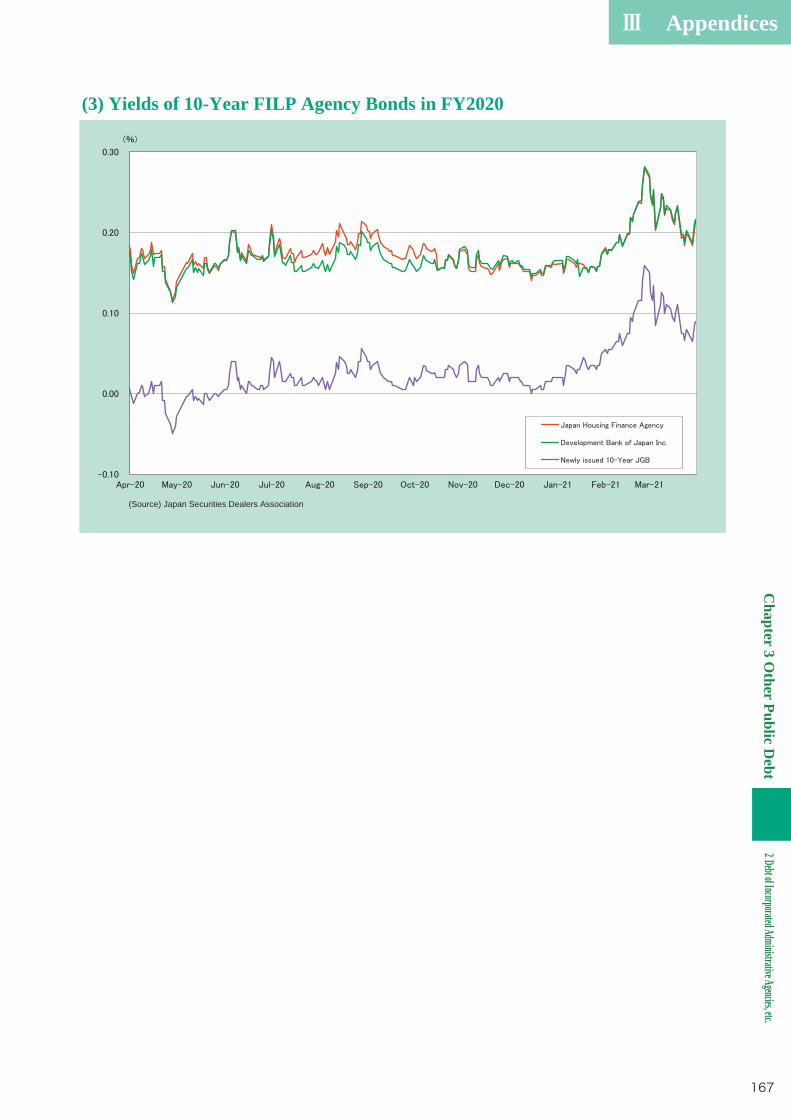
Ⅲ AppendicesC
hapter 3 Other Public D
ebt2 Debt of Incorporated Administrative Agencies, etc.
167
(3) Yields of 10-Year FILP Agency Bonds in FY2020
(Source) Japan Securities Dealers Association
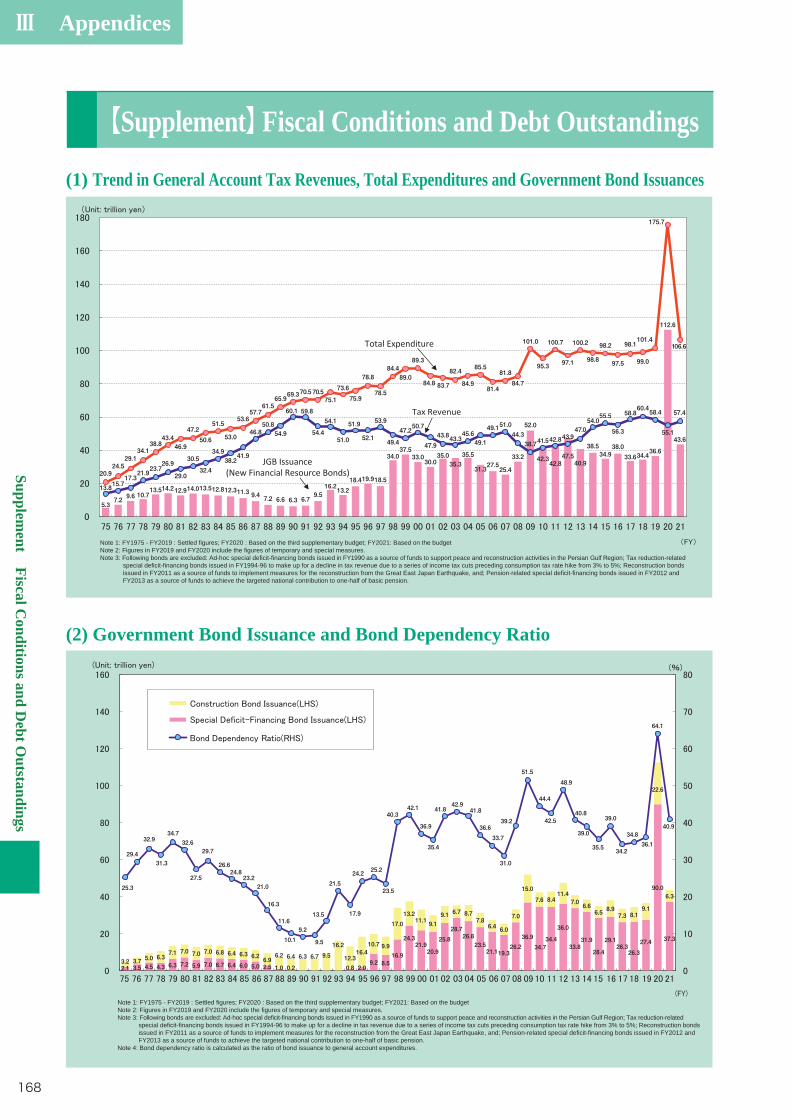
Ⅲ Appendices
Supplement Fiscal C
onditions and Debt O
utstandings
168
(1) Trend in General Account Tax Revenues, Total Expenditures and Government Bond Issuances
【Supplement】Fiscal Conditions and Debt Outstandings
(2) Government Bond Issuance and Bond Dependency Ratio
4.5 4.3 6.3 7.2 5.9 7.0 6.7 6.4 6.0 5.0 9.2 8.5
16.9
24.3 21.9 20.9
25.8
28.7 26.8 23.5 21.1 19.3
26.2
36.9
34.7 34.4
36.0
33.8 31.9
28.4
29.1 26.3 26.3
27.4
90.0
37.3
5.0 6.3 7.1 7.0 7.0 7.0 6.8 6.4 6.3 6.2
6.9 6.2 6.4 6.3 6.7 9.5
16.2
12.3 16.4 10.7 9.9
17.0
13.2 11.1 9.1
9.1 6.7 8.7 7.8 6.4 6.0
7.0
15.0
7.6 8.4 11.4
7.0 6.6 6.5 8.9 7.3 8.1
9.1
22.6
6.3 25.3
29.4
32.9
31.3
34.7 32.6
27.5
29.7
26.6 24.8
23.2 21.0
16.3
11.6
10.1
9.2
9.5
13.5
21.5
17.9
24.2 25.2
23.5
40.3 42.1
36.9
35.4
41.8 42.9
41.8
36.6
33.7
31.0
39.2
51.5
44.4
42.5
48.9
40.8
39.0
35.5
39.0
34.2
34.8 36.1
64.1
40.9
2.1 3.5 3.2 3.7
2.5 1.0 0.2 0.8 2.0
Note 1: FY1975 - FY2019 : Settled figures; FY2020 : Based on the third supplementary budget; FY2021: Based on the budgetNote 2: Figures in FY2019 and FY2020 include the figures of temporary and special measures.Note 3: Following bonds are excluded: Ad-hoc special deficit-financing bonds issued in FY1990 as a source of funds to support peace and reconstruction activities in the Persian Gulf Region; Tax reduction-related special deficit-financing bonds issued in FY1994-96 to make up for a decline in tax revenue due to a series of income tax cuts preceding consumption tax rate hike from 3% to 5%; Reconstruction bonds issued in FY2011 as a source of funds to implement measures for the reconstruction from the Great East Japan Earthquake, and; Pension-related special deficit-financing bonds issued in FY2012 and FY2013 as a source of funds to achieve the targeted national contribution to one-half of basic pension.Note 4: Bond dependency ratio is calculated as the ratio of bond issuance to general account expenditures.
Note 1: FY1975 - FY2019 : Settled figures; FY2020 : Based on the third supplementary budget; FY2021: Based on the budgetNote 2: Figures in FY2019 and FY2020 include the figures of temporary and special measures.Note 3: Following bonds are excluded: Ad-hoc special deficit-financing bonds issued in FY1990 as a source of funds to support peace and reconstruction activities in the Persian Gulf Region; Tax reduction-related special deficit-financing bonds issued in FY1994-96 to make up for a decline in tax revenue due to a series of income tax cuts preceding consumption tax rate hike from 3% to 5%; Reconstruction bonds issued in FY2011 as a source of funds to implement measures for the reconstruction from the Great East Japan Earthquake, and; Pension-related special deficit-financing bonds issued in FY2012 and FY2013 as a source of funds to achieve the targeted national contribution to one-half of basic pension.
5.37.2 9.6
10.713.514.212.914.013.512.812.311.3 9.4 7.2 6.6 6.3 6.7
9.513.2
18.419.918.5
34.0 33.030.035.035.335.5
31.327.525.4
33.2
52.0
42.3
42.8
47.540.9
38.534.938.033.634.4
112.6
43.6
20.924.529.1
38.843.4
46.9
47.2
50.6
51.5
53.0
57.761.565.969.370.5 70.5
75.1
73.6
75.9
78.8
78.5
84.489.0
89.3
82.4 85.5
81.4
81.8
101.0
95.3
100.7
97.1
100.2
98.8
98.2
97.5
98.1
99.0
101.4
175.7
106.6
13.817.321.923.726.9
29.0
30.5
32.438.241.9
46.850.854.9
60.1 59.8
54.4
54.1
51.0
51.9
52.1
53.9
49.4
47.250.7
47.9
43.843.345.649.1
49.151.044.338.741.5
42.8
43.947.054.0
56.3
58.860.458.4
55.1
57.4Tax Revenue
Total Expenditure
JGB Issuance(New Financial Resource Bonds)
84.8 83.7 84.9 84.7
34.1
53.6
15.7
34.9
55.5
36.6
16.2
37.5
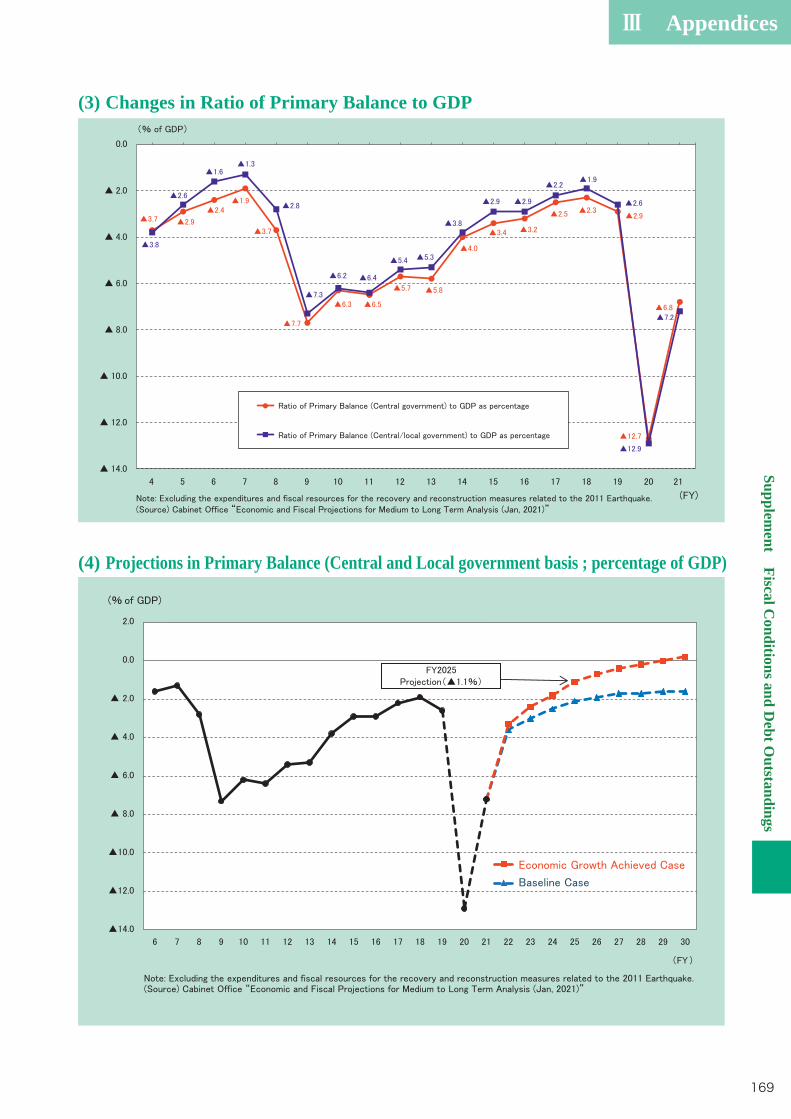
Ⅲ AppendicesSupplem
ent Fiscal Conditions and D
ebt Outstandings
169
(4) Projections in Primary Balance (Central and Local government basis ; percentage of GDP)
(3) Changes in Ratio of Primary Balance to GDP
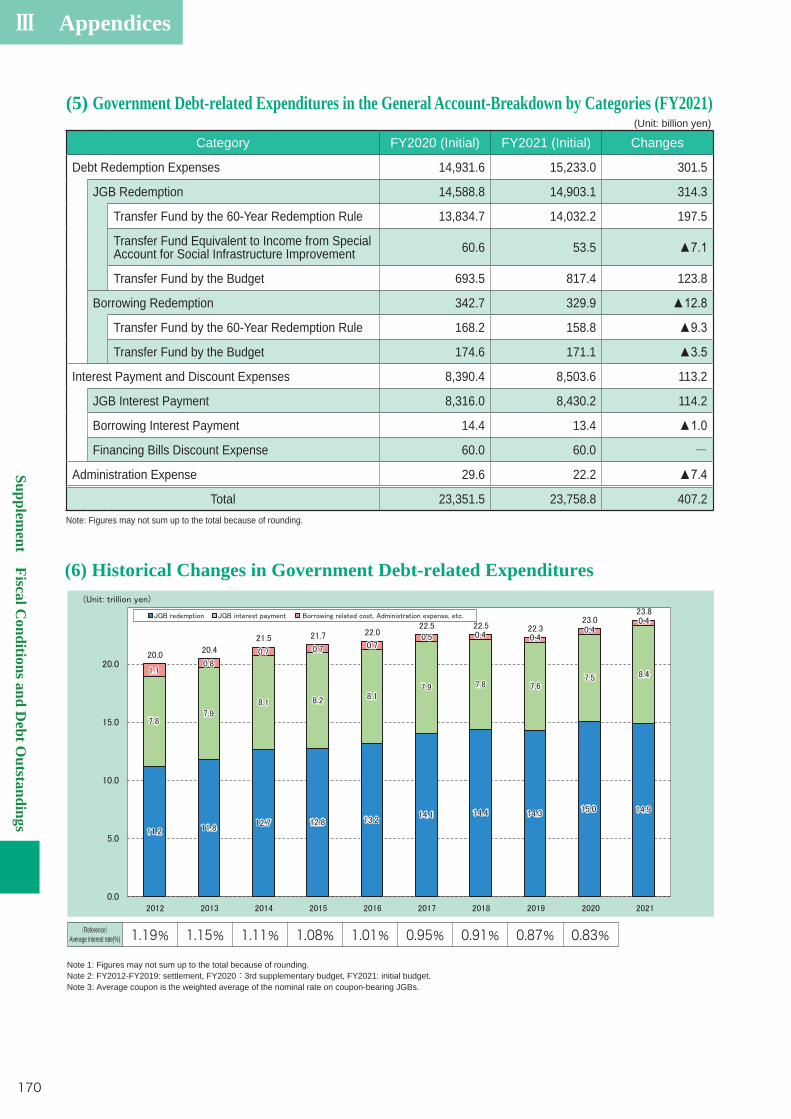
Ⅲ Appendices
Supplement Fiscal C
onditions and Debt O
utstandings
170
(6) Historical Changes in Government Debt-related Expenditures
(Reference)Average interest rate(%) 1.19% 1.15% 1.11% 1.08% 1.01% 0.95% 0.91% 0.87% 0.83%
Note 1: Figures may not sum up to the total because of rounding.Note 2: FY2012-FY2019: settlement, FY2020:3rd supplementary budget, FY2021: initial budget.Note 3: Average coupon is the weighted average of the nominal rate on coupon-bearing JGBs.
(5) Government Debt-related Expenditures in the General Account-Breakdown by Categories (FY2021)(Unit: billion yen)
Category FY2020 (Initial) FY2021 (Initial) Changes
Debt Redemption Expenses 14,931.6 15,233.0 301.5
JGB Redemption 14,588.8 14,903.1 314.3
Transfer Fund by the 60-Year Redemption Rule 13,834.7 14,032.2 197.5
Transfer Fund Equivalent to Income from Special Account for Social Infrastructure Improvement 60.6 53.5
Transfer Fund by the Budget 693.5 817.4 123.8
Borrowing Redemption 342.7 329.9
Transfer Fund by the 60-Year Redemption Rule 168.2 158.8
Transfer Fund by the Budget 174.6 171.1
Interest Payment and Discount Expenses 8,390.4 8,503.6 113.2
JGB Interest Payment 8,316.0 8,430.2 114.2
Borrowing Interest Payment 14.4 13.4
Financing Bills Discount Expense 60.0 60.0 -Administration Expense 29.6 22.2
Total 23,351.5 23,758.8 407.2Note: Figures may not sum up to the total because of rounding.

Ⅲ AppendicesSupplem
ent Fiscal Conditions and D
ebt Outstandings
171
Note: FY2020: Initial budget; FY2021: budget; FY2022-FY2024: Projections based on the systems and policies underlying the FY2021 budget a) Figures are mechanically estimated. b) ““③ Social Security-Related Expenditure” for FY2022 and the following years are estimated by adding the expenditure for the enhancement of social security
associated with implementation of the “Comprehensive Reform of Social Security and Tax” and “New Economic Policy Package” to the expenditure projected based on the systems and policies underlying the FY2021 budget.
c) “ ③ Social Security-Related Expenditure” and “ ⑤ Others” in FY 2020 is re-estimated for the comparison with the FY 2021 Budget. d) “⑦ Primary Balance Expenditure” is obtained by subtracting interest payments and debt redemption (excluding subsidy bonds) from the total expenditure.
Note: FY2020: Initial budget; FY2021: budget; FY2022-FY2024: Projections based on the systems and policies underlying the FY2021 budget a) Figures are mechanically estimated. b) “③ Social Security-Related Expenditure” for FY2022 and the following years are estimated by adding the expenditure for the enhancement of social security
associated with implementation of the “Comprehensive Reform of Social Security and Tax” and “New Economic Policy Package” to the expenditure projected based on the systems and policies underlying the FY2021 budget.
c) “ ③ Social Security-Related Expenditure” and “⑤ Others” in FY 2020 is re-estimated for the comparison with the FY 2021 Budget. d) “⑦Primary Balance Expenditure" is obtained by subtracting interest payments and debt redemption (excluding subsidy bonds) from the total expenditure.
FY2020 FY2021 FY2022 FY2023 FY2024
Expenditure
① Central Debt Service Cost 23.4 23.8 25.7 26.9 28.1② Interest Payment 8.4 8.5 9.0 9.9 10.7
③ Social Security-Related Expenditure 35.7 35.8 36.8 37.6 38.4④ Local Allocation Tax Grants, etc. 15.8 15.9 15.3 15.0 15.4⑤ Others 27.8 31.1 26.9 26.3 26.4⑥ Total Expenditure 102.7 106.6 104.7 105.7 108.3
⑦ Primary Balance Expenditure 79.7 83.4 79.4 79.2 80.5
Tax Revenue,etc.
⑧ Tax Revenue 63.5 57.4 59.4 61.4 63.5⑨ Other Revenues 6.6 5.6 5.7 5.7 5.7⑩ Total Revenue 70.1 63.0 65.1 67.1 69.2
⑪ Difference of Balance(⑥-⑩) 32.6 43.6 39.6 38.6 39.1⑫ Primary Balance
⑬ Fiscal Balance
(Unit: trillion yen)
(Unit: trillion yen)
(7) Projection of the FY2021 Budget Impact on Following Year's Expenditure and Revenue[CASE 1] 【Case of 3.0% nominal economic growth rate】
[CASE 2] 【Case of 1.5% nominal economic growth rate】
FY2020 FY2021 FY2022 FY2023 FY2024
Expenditure
① Central Debt Service Cost 23.4 23.8 25.7 26.8 27.9② Interest Payment 8.4 8.5 9.0 9.9 10.5
③ Social Security-Related Expenditure 35.7 35.8 36.8 37.5 38.3④ Local Allocation Tax Grants, etc. 15.8 15.9 15.5 15.4 15.2⑤ Others 27.8 31.1 26.8 26.2 26.2⑥ Total Expenditure 102.7 106.6 104.8 105.8 107.6
⑦ Primary Balance Expenditure 79.7 83.4 79.5 79.5 80.1
Tax Revenue,etc.
⑧ Tax Revenue 63.5 57.4 58.4 59.4 60.5⑨ Other Revenues 6.6 5.6 5.7 5.7 5.7⑩ Total Revenue 70.1 63.0 64.1 65.1 66.2
⑪ Difference of Balance(⑥-⑩) 32.6 43.6 40.7 40.7 41.4⑫ Primary Balance
⑬ Fiscal Balance
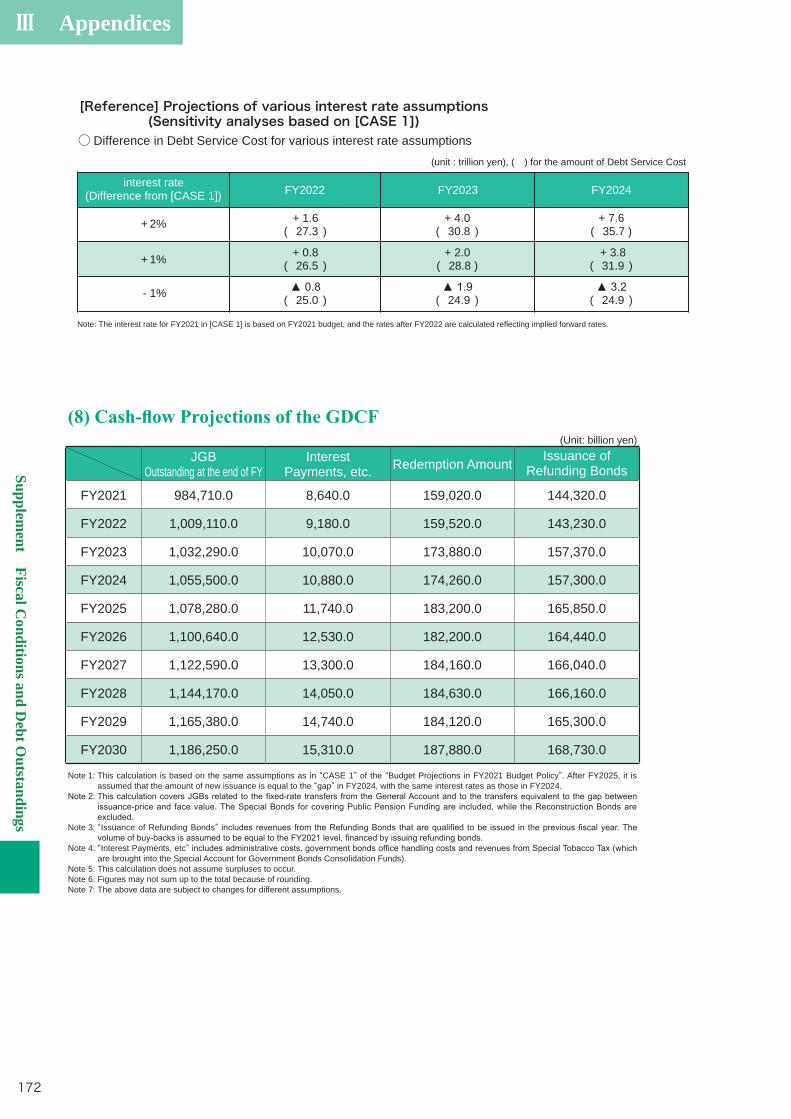
Ⅲ Appendices
Supplement Fiscal C
onditions and Debt O
utstandings
172
(Unit: billion yen)
JGB Outstanding at the end of FY
Interest Payments, etc. Redemption Amount Issuance of
Refunding Bonds
FY2021 984,710.0 8,640.0 159,020.0 144,320.0
FY2022 1,009,110.0 9,180.0 159,520.0 143,230.0
FY2023 1,032,290.0 10,070.0 173,880.0 157,370.0
FY2024 1,055,500.0 10,880.0 174,260.0 157,300.0
FY2025 1,078,280.0 11,740.0 183,200.0 165,850.0
FY2026 1,100,640.0 12,530.0 182,200.0 164,440.0
FY2027 1,122,590.0 13,300.0 184,160.0 166,040.0
FY2028 1,144,170.0 14,050.0 184,630.0 166,160.0
FY2029 1,165,380.0 14,740.0 184,120.0 165,300.0
FY2030 1,186,250.0 15,310.0 187,880.0 168,730.0
Note 1: This calculation is based on the same assumptions as in “CASE 1” of the “Budget Projections in FY2021 Budget Policy”. After FY2025, it is assumed that the amount of new issuance is equal to the “gap” in FY2024, with the same interest rates as those in FY2024.
Note 3: “Issuance of Refunding Bonds”
Note 4: “Interest Payments, etc”are brought into the Special Account for Government Bonds Consolidation Funds).
Note 5: This calculation does not assume surpluses to occur.Note 6: Figures may not sum up to the total because of rounding.Note 7: The above data are subject to changes for different assumptions.
○ Difference in Debt Service Cost for various interest rate assumptions(unit : trillion yen), ( ) for the amount of Debt Service Cost
Note: The interest rate for FY2021 in [CASE 1] is based on FY2021 budget, and the rates after FY2022 are calculated reflecting implied forward rates.
[Reference] Projections of various interest rate assumptions (Sensitivity analyses based on [CASE 1])
interest rate(Difference from [CASE 1]) FY2024FY2023FY2022
+ 2%
+ 1%
- 1%
+ 1.6( 27.3 )
+ 0.8( 26.5 )
( 25.0 )
+ 4.0( 30.8 )
+ 2.0( 28.8 )
( 24.9 )
+ 7.6( 35.7 )
+ 3.8( 31.9 )
( 24.9 )
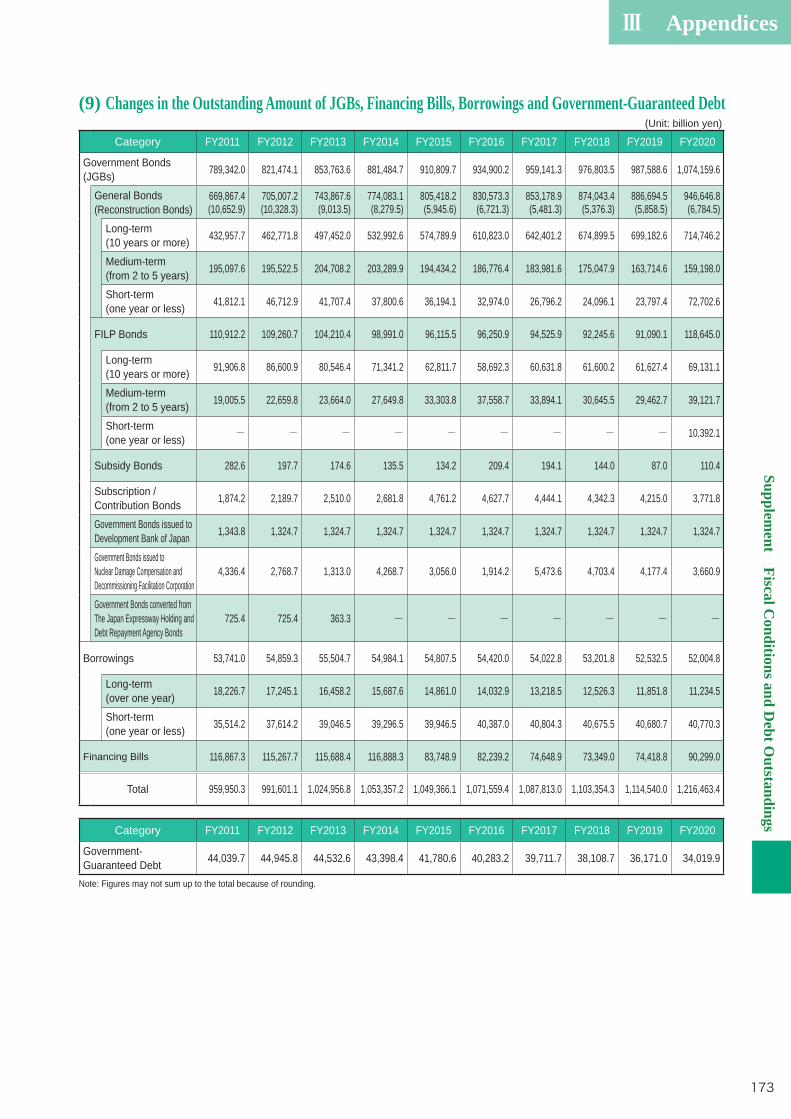
Ⅲ AppendicesSupplem
ent Fiscal Conditions and D
ebt Outstandings
173
(9) Changes in the Outstanding Amount of JGBs, Financing Bills, Borrowings and Government-Guaranteed Debt(Unit: billion yen)
Category FY2011 FY2012 FY2013 FY2014 FY2015 FY2016 FY2017 FY2018 FY2019 FY2020
Government Bonds (JGBs) 789,342.0 821,474.1 853,763.6 881,484.7 910,809.7 934,900.2 959,141.3 976,803.5 987,588.6 1,074,159.6
General Bonds (Reconstruction Bonds)
669,867.4(10,652.9)
705,007.2(10,328.3)
743,867.6(9,013.5)
774,083.1(8,279.5)
805,418.2(5,945.6)
830,573.3(6,721.3)
853,178.9(5,481.3)
874,043.4(5,376.3)
886,694.5(5,858.5)
946,646.8(6,784.5)
Long-term (10 years or more) 432,957.7 462,771.8 497,452.0 532,992.6 574,789.9 610,823.0 642,401.2 674,899.5 699,182.6 714,746.2
Medium-term (from 2 to 5 years) 195,097.6 195,522.5 204,708.2 203,289.9 194,434.2 186,776.4 183,981.6 175,047.9 163,714.6 159,198.0
Short-term (one year or less) 41,812.1 46,712.9 41,707.4 37,800.6 36,194.1 32,974.0 26,796.2 24,096.1 23,797.4 72,702.6
FILP Bonds 110,912.2 109,260.7 104,210.4 98,991.0 96,115.5 96,250.9 94,525.9 92,245.6 91,090.1 118,645.0
Long-term (10 years or more) 91,906.8 86,600.9 80,546.4 71,341.2 62,811.7 58,692.3 60,631.8 61,600.2 61,627.4 69,131.1
Medium-term (from 2 to 5 years) 19,005.5 22,659.8 23,664.0 27,649.8 33,303.8 37,558.7 33,894.1 30,645.5 29,462.7 39,121.7
Short-term (one year or less) - - - - - - - - - 10,392.1
Subsidy Bonds 282.6 197.7 174.6 135.5 134.2 209.4 194.1 144.0 87.0 110.4
Subscription / Contribution Bonds 1,874.2 2,189.7 2,510.0 2,681.8 4,761.2 4,627.7 4,444.1 4,342.3 4,215.0 3,771.8
Government Bonds issued to Development Bank of Japan 1,343.8 1,324.7 1,324.7 1,324.7 1,324.7 1,324.7 1,324.7 1,324.7 1,324.7 1,324.7
Government Bonds issued to Nuclear Damage Compensation and Decommissioning Facilitation Corporation
4,336.4 2,768.7 1,313.0 4,268.7 3,056.0 1,914.2 5,473.6 4,703.4 4,177.4 3,660.9
Government Bonds converted from The Japan Expressway Holding and Debt Repayment Agency Bonds
725.4 725.4 363.3 - - - - - - -
Borrowings 53,741.0 54,859.3 55,504.7 54,984.1 54,807.5 54,420.0 54,022.8 53,201.8 52,532.5 52,004.8
Long-term (over one year) 18,226.7 17,245.1 16,458.2 15,687.6 14,861.0 14,032.9 13,218.5 12,526.3 11,851.8 11,234.5
Short-term (one year or less) 35,514.2 37,614.2 39,046.5 39,296.5 39,946.5 40,387.0 40,804.3 40,675.5 40,680.7 40,770.3
Financing Bills 116,867.3 115,267.7 115,688.4 116,888.3 83,748.9 82,239.2 74,648.9 73,349.0 74,418.8 90,299.0
Total 959,950.3 991,601.1 1,024,956.8 1,053,357.2 1,049,366.1 1,071,559.4 1,087,813.0 1,103,354.3 1,114,540.0 1,216,463.4
Category FY2011 FY2012 FY2013 FY2014 FY2015 FY2016 FY2017 FY2018 FY2019 FY2020
Government- Guaranteed Debt 44,039.7 44,945.8 44,532.6 43,398.4 41,780.6 40,283.2 39,711.7 38,108.7 36,171.0 34,019.9
Note: Figures may not sum up to the total because of rounding.
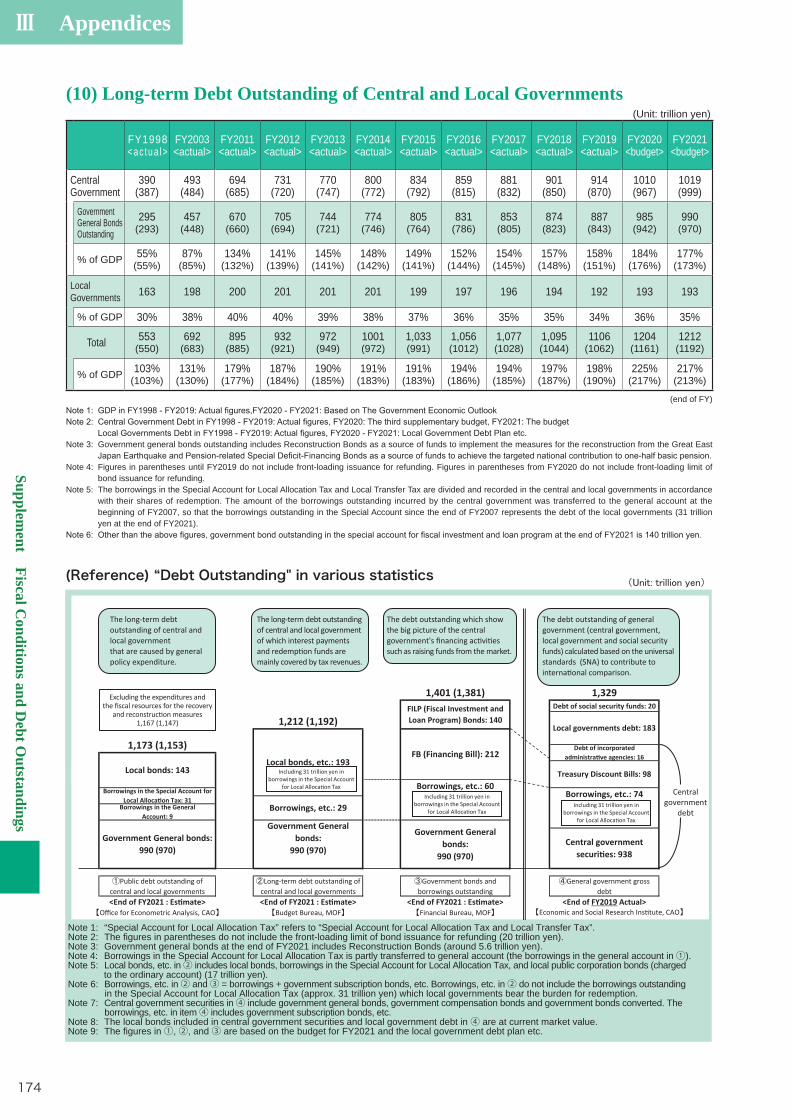
Ⅲ Appendices
Supplement Fiscal C
onditions and Debt O
utstandings
174
(10) Long-term Debt Outstanding of Central and Local Governments(Unit: trillion yen)
FY1998<ac tua l>
FY2003<actual>
FY2011<actual>
FY2012<actual>
FY2013<actual>
FY2014<actual>
FY2015<actual>
FY2016<actual>
FY2017<actual>
FY2018<actual>
FY2019<actual>
FY2020<budget>
FY2021<budget>
Central Government
390(387)
493(484)
694(685)
731(720)
770(747)
800(772)
834(792)
859(815)
881(832)
901(850)
914(870)
1010(967)
1019(999)
GovernmentGeneral BondsOutstanding
295(293)
457(448)
670(660)
705(694)
744(721)
774(746)
805(764)
831(786)
853(805)
874(823)
887(843)
985(942)
990(970)
% of GDP 55%(55%)
87%(85%)
134%(132%)
141%(139%)
145%(141%)
148%(142%)
149%(141%)
152%(144%)
154%(145%)
157%(148%)
158%(151%)
184%(176%)
177%(173%)
Local Governments 163 198 200 201 201 201 199 197 196 194 192 193 193
% of GDP 30% 38% 40% 40% 39% 38% 37% 36% 35% 35% 34% 36% 35%
Total 553(550)
692(683)
895(885)
932(921)
972(949)
1001(972)
1,033(991)
1,056(1012)
1,077(1028)
1,095(1044)
1106(1062)
1204(1161)
1212(1192)
% of GDP 103%(103%)
131%(130%)
179%(177%)
187%(184%)
190%(185%)
191%(183%)
191%(183%)
194%(186%)
194%(185%)
197%(187%)
198%(190%)
225%(217%)
217%(213%)
(end of FY)
Note 3: Government general bonds outstanding includes Reconstruction Bonds as a source of funds to implement the measures for the reconstruction from the Great East
Note 4: Figures in parentheses until FY2019 do not include front-loading issuance for refunding. Figures in parentheses from FY2020 do not include front-loading limit of bond issuance for refunding.
Note 5: The borrowings in the Special Account for Local Allocation Tax and Local Transfer Tax are divided and recorded in the central and local governments in accordance with their shares of redemption. The amount of the borrowings outstanding incurred by the central government was transferred to the general account at the beginning of FY2007, so that the borrowings outstanding in the Special Account since the end of FY2007 represents the debt of the local governments (31 trillion yen at the end of FY2021).
(Reference) “Debt Outstanding" in various statistics
Debt of social security funds: 20
Public debt outstanding ofcentral and local governments
Long-term debt outstanding ofcentral and local governments
Government bonds andborrowings outstanding
General government grossdebt
<End of FY2021 : Es e> <End of FY2021 : Es e> <End of FY2021 : Es e> <End of FY2019 Actual>O ce for Econometric Analysis, CAO Budget Bureau, MOF Financial Bureau, MOF
1,401 (1,381) 1,329
1,212 (1,192)FILP (Fiscal Inves ent andLoan Progr Bonds: 140
1,173 (1,153)Local govern ents debt: 183
Local bonds, etc.: 193FB (Financing Bill): 212
Govern ent Generalbonds:
990 (970)Central govern ent
securi es: 938
Economic and Social Research Ins tute, CAO
Debt of incorporatedad inistra ve agencies: 16
Local bonds: 143 Treasury Discount Bills: 98Borrowings, etc.: 60Borrowings in the Special Account for
Local Alloca on Tax: 31Borrowings, etc.: 74
Borrowings, etc.: 29Borrowings in the GeneralAccount: 9
Govern ent General bonds:990 (970)
Govern ent Generalbonds:
990 (970)
Including 31 trillion yen in borrowings in the Special Account
for Local Alloca on TaxIncluding 31 trillion yen in
borrowings in the Special Account for Local Alloca on Tax
Including 31 trillion yen in borrowings in the Special Account
for Local Alloca on Tax
Centralgovernment
debt
Note 1: “Special Account for Local Allocation Tax” refers to “Special Account for Local Allocation Tax and Local Transfer Tax”.Note 2: The figures in parentheses do not include the front-loading limit of bond issuance for refunding (20 trillion yen).Note 3: Government general bonds at the end of FY2021 includes Reconstruction Bonds (around 5.6 trillion yen).Note 4: Borrowings in the Special Account for Local Allocation Tax is partly transferred to general account (the borrowings in the general account in ①). Note 5: Local bonds, etc. in ② includes local bonds, borrowings in the Special Account for Local Allocation Tax, and local public corporation bonds (charged to the ordinary account) (17 trillion yen).Note 6: Borrowings, etc. in ② and ③ = borrowings + government subscription bonds, etc. Borrowings, etc. in ② do not include the borrowings outstanding in the Special Account for Local Allocation Tax (approx. 31 trillion yen) which local governments bear the burden for redemption.Note 7: Central government securities in ④ include government general bonds, government compensation bonds and government bonds converted. The borrowings, etc. in item ④ includes government subscription bonds, etc. Note 8: The local bonds included in central government securities and local government debt in ④ are at current market value.Note 9: The figures in ①, ②, and ③ are based on the budget for FY2021 and the local government debt plan etc.
Excluding the expenditures and
1,167 (1,147)
The long-term debt outstanding of central and local governmentthat are caused by general policy expenditure.
The long-term debt outstanding of central and local government of which interest payments
mainly covered by tax revenues.
The debt outstanding which show the big picture of the central
such as raising funds from the market.
The debt outstanding of general government (central government, local government and social security funds) calculated based on the universalstandards (SNA) to contribute to
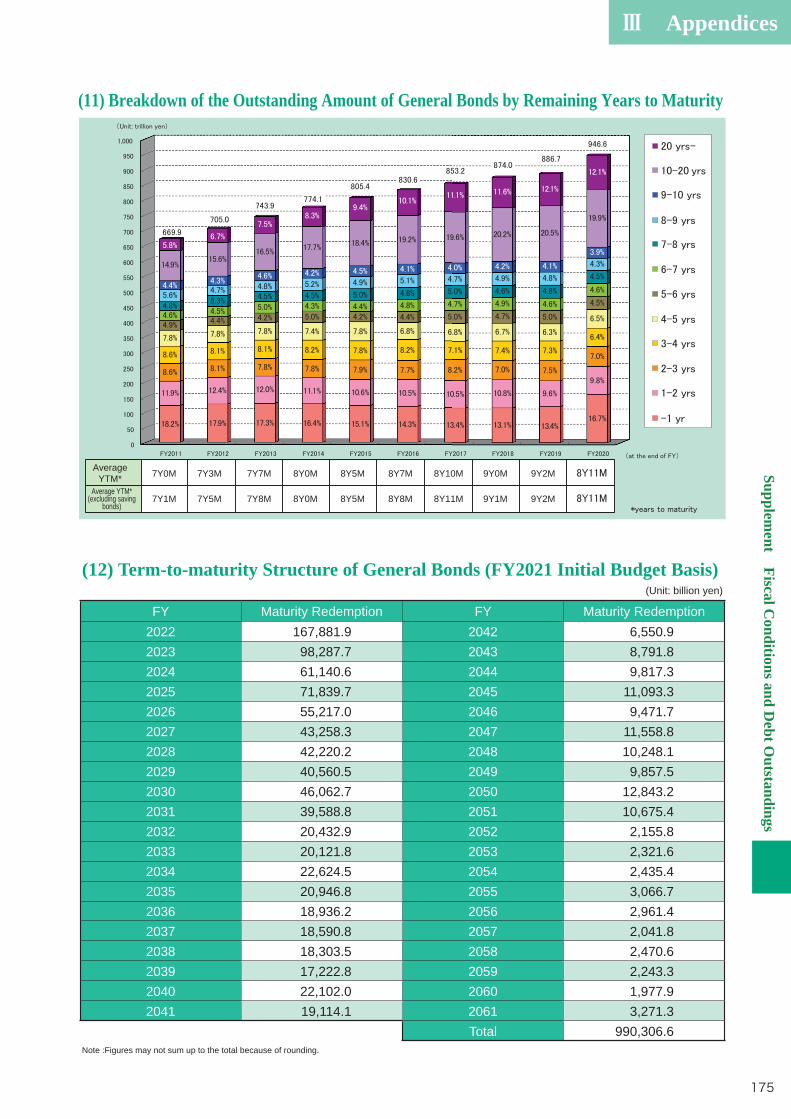
Ⅲ AppendicesSupplem
ent Fiscal Conditions and D
ebt Outstandings
175
(11) Breakdown of the Outstanding Amount of General Bonds by Remaining Years to Maturity
AverageYTM* 7Y0M 7Y3M 7Y7M 8Y0M 8Y5M 8Y7M 8Y10M 9Y0M 9Y2M
7Y1M 7Y5M 7Y8M 8Y0M 8Y5M 8Y8M 8Y11M 9Y1M 9Y2M Average YTM*
(excluding savingbonds)
(12) Term-to-maturity Structure of General Bonds (FY2021 Initial Budget Basis)(Unit: billion yen)
FY Maturity Redemption FY Maturity Redemption2022 167,881.9 2042 6,550.9 2023 98,287.7 2043 8,791.8 2024 61,140.6 2044 9,817.3 2025 71,839.7 2045 11,093.3 2026 55,217.0 2046 9,471.7 2027 43,258.3 2047 11,558.8 2028 42,220.2 2048 10,248.1 2029 40,560.5 2049 9,857.5 2030 46,062.7 2050 12,843.2 2031 39,588.8 2051 10,675.4 2032 20,432.9 2052 2,155.8 2033 20,121.8 2053 2,321.6 2034 22,624.5 2054 2,435.4 2035 20,946.8 2055 3,066.7 2036 18,936.2 2056 2,961.4 2037 18,590.8 2057 2,041.8 2038 18,303.5 2058 2,470.6 2039 17,222.8 2059 2,243.3 2040 22,102.0 2060 1,977.9 2041 19,114.1 2061 3,271.3
Total 990,306.6 Note :Figures may not sum up to the total because of rounding.
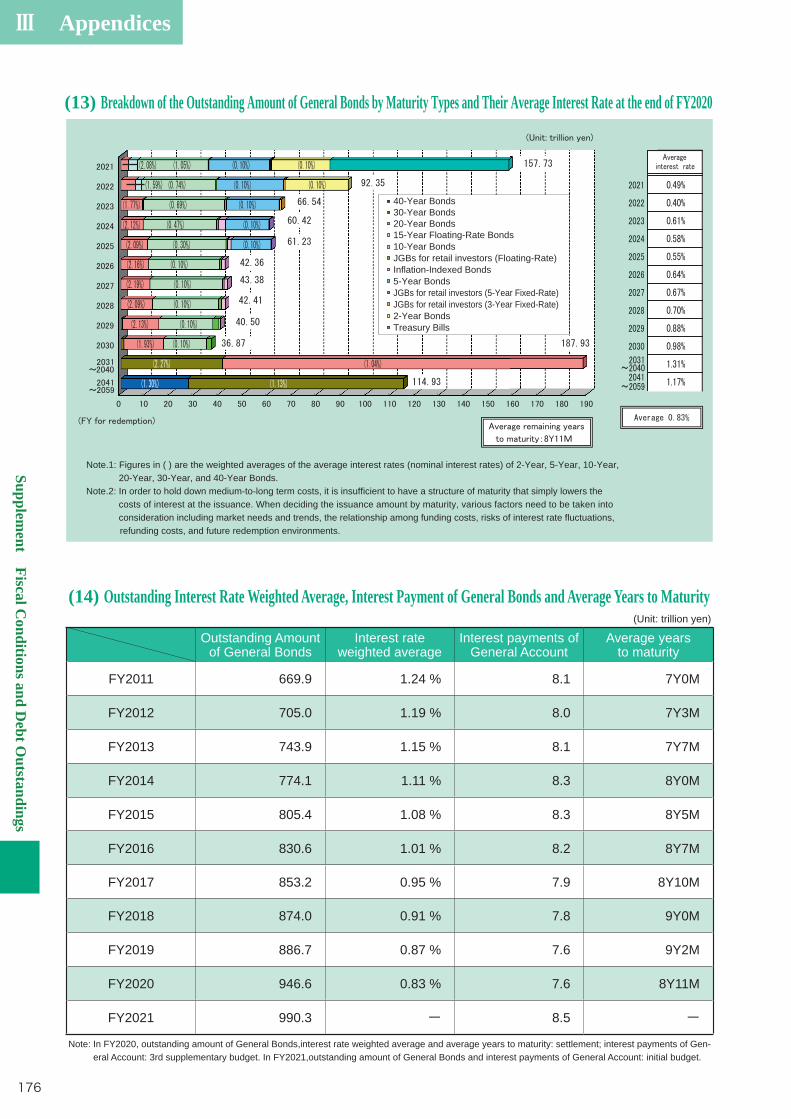
Ⅲ Appendices
Supplement Fiscal C
onditions and Debt O
utstandings
176
(13) Breakdown of the Outstanding Amount of General Bonds by Maturity Types and Their Average Interest Rate at the end of FY2020
Note.1: Figures in ( ) are the weighted averages of the average interest rates (nominal interest rates) of 2-Year, 5-Year, 10-Year, 20-Year, 30-Year, and 40-Year Bonds.
Note.2: In order to hold down medium-to-long term costs, it is insufficient to have a structure of maturity that simply lowers the costs of interest at the issuance. When deciding the issuance amount by maturity, various factors need to be taken into consideration including market needs and trends, the relationship among funding costs, risks of interest rate fluctuations,
refunding costs, and future redemption environments.
40-Year Bonds30-Year Bonds20-Year Bonds15-Year Floating-Rate Bonds10-Year BondsJGBs for retail investors (Floating-Rate)Inflation-Indexed Bonds5-Year BondsJGBs for retail investors (5-Year Fixed-Rate)JGBs for retail investors (3-Year Fixed-Rate)2-Year BondsTreasury Bills
(14) Outstanding Interest Rate Weighted Average, Interest Payment of General Bonds and Average Years to Maturity(Unit: trillion yen)
Outstanding Amount of General Bonds
Interest rate weighted average
Interest payments of General Account
Average years to maturity
FY2011 669.9 1.24 % 8.1 7Y0M
FY2012 705.0 1.19 % 8.0 7Y3M
FY2013 743.9 1.15 % 8.1 7Y7M
FY2014 774.1 1.11 % 8.3 8Y0M
FY2015 805.4 1.08 % 8.3 8Y5M
FY2016 830.6 1.01 % 8.2 8Y7M
FY2017 853.2 0.95 % 7.9 8Y10M
FY2018 874.0 0.91 % 7.8 9Y0M
FY2019 886.7 0.87 % 7.6 9Y2M
FY2020 946.6 0.83 % 7.6 8Y11M
FY2021 990.3 ー 8.5 ー
Note: In FY2020, outstanding amount of General Bonds,interest rate weighted average and average years to maturity: settlement; interest payments of General Account: 3rd supplementary budget. In FY2021,outstanding amount of General Bonds and interest payments of General Account: initial budget.
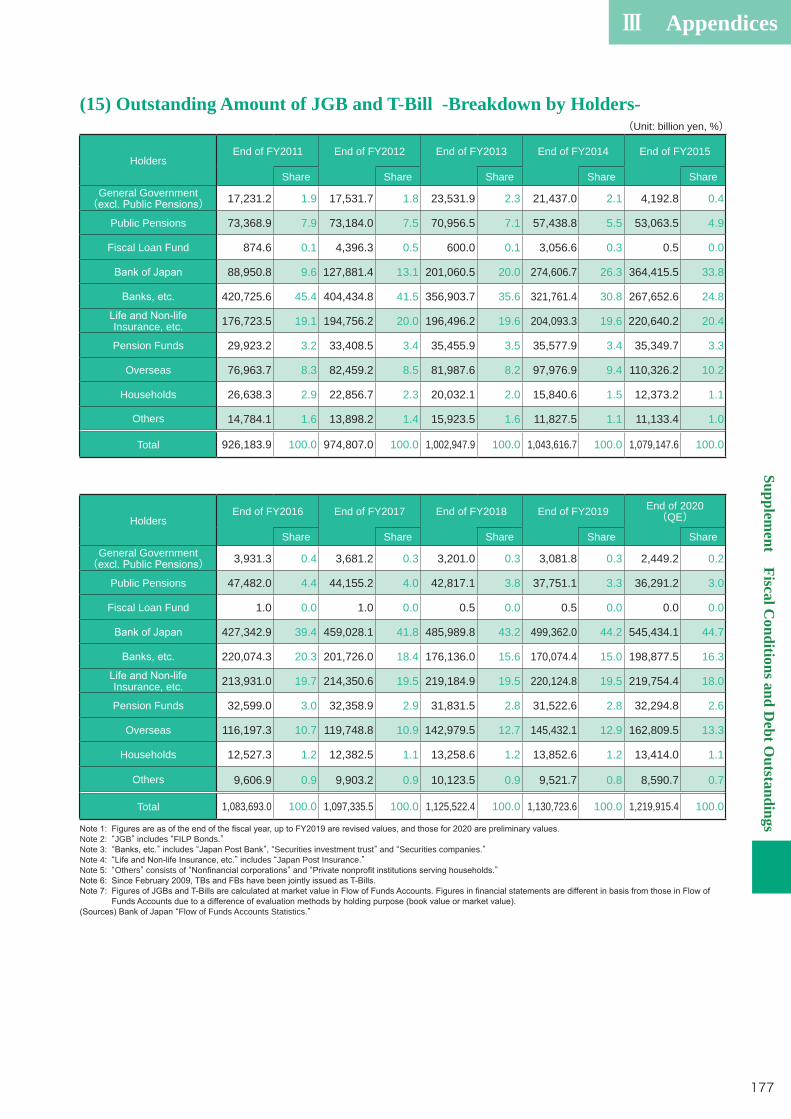
Ⅲ AppendicesSupplem
ent Fiscal Conditions and D
ebt Outstandings
177
(15) Outstanding Amount of JGB and T-Bill -Breakdown by Holders-(Unit: billion yen, %)
HoldersEnd of FY2011 End of FY2012 End of FY2013 End of FY2014 End of FY2015
Share Share Share Share ShareGeneral Government
( ) 17,231.2 1.9 17,531.7 1.8 23,531.9 2.3 21,437.0 2.1 4,192.8 0.4
Public Pensions 73,368.9 7.9 73,184.0 7.5 70,956.5 7.1 57,438.8 5.5 53,063.5 4.9
Fiscal Loan Fund 874.6 0.1 4,396.3 0.5 600.0 0.1 3,056.6 0.3 0.5 0.0
88,950.8 9.6 127,881.4 13.1 201,060.5 20.0 274,606.7 26.3 364,415.5 33.8
420,725.6 45.4 404,434.8 41.5 356,903.7 35.6 321,761.4 30.8 267,652.6 24.8
Insurance, etc. 176,723.5 19.1 194,756.2 20.0 196,496.2 19.6 204,093.3 19.6 220,640.2 20.4
Pension Funds 29,923.2 3.2 33,408.5 3.4 35,455.9 3.5 35,577.9 3.4 35,349.7 3.3
Overseas 76,963.7 8.3 82,459.2 8.5 81,987.6 8.2 97,976.9 9.4 110,326.2 10.2
Households 26,638.3 2.9 22,856.7 2.3 20,032.1 2.0 15,840.6 1.5 12,373.2 1.1
Others 14,784.1 1.6 13,898.2 1.4 15,923.5 1.6 11,827.5 1.1 11,133.4 1.0
Total 926,183.9 100.0 974,807.0 100.0 1,002,947.9 100.0 1,043,616.7 100.0 1,079,147.6 100.0
HoldersEnd of FY2016 End of FY2017 End of FY2018 End of FY2019 End of 2020
(QE)
Share Share Share Share ShareGeneral Government
( ) 3,931.3 0.4 3,681.2 0.3 3,201.0 0.3 3,081.8 0.3 2,449.2 0.2
Public Pensions 47,482.0 4.4 44,155.2 4.0 42,817.1 3.8 37,751.1 3.3 36,291.2 3.0
Fiscal Loan Fund 1.0 0.0 1.0 0.0 0.5 0.0 0.5 0.0 0.0 0.0
427,342.9 39.4 459,028.1 41.8 485,989.8 43.2 499,362.0 44.2 545,434.1 44.7
220,074.3 20.3 201,726.0 18.4 176,136.0 15.6 170,074.4 15.0 198,877.5 16.3
Insurance, etc. 213,931.0 19.7 214,350.6 19.5 219,184.9 19.5 220,124.8 19.5 219,754.4 18.0
Pension Funds 32,599.0 3.0 32,358.9 2.9 31,831.5 2.8 31,522.6 2.8 32,294.8 2.6
Overseas 116,197.3 10.7 119,748.8 10.9 142,979.5 12.7 145,432.1 12.9 162,809.5 13.3
Households 12,527.3 1.2 12,382.5 1.1 13,258.6 1.2 13,852.6 1.2 13,414.0 1.1
Others 9,606.9 0.9 9,903.2 0.9 10,123.5 0.9 9,521.7 0.8 8,590.7 0.7
Total 1,083,693.0 100.0 1,097,335.5 100.0 1,125,522.4 100.0 1,130,723.6 100.0 1,219,915.4 100.0
Note 2: “JGB” includes “FILP Bonds.” Note 3: “ ” includes “ ”, “Securities investment trust” and “Securities companies.” Note 4: “ ” includes “Japan Post Insurance.” Note 5: “Others” consists of “ ” and “ ”
“Flow of Funds Accounts Statistics.”
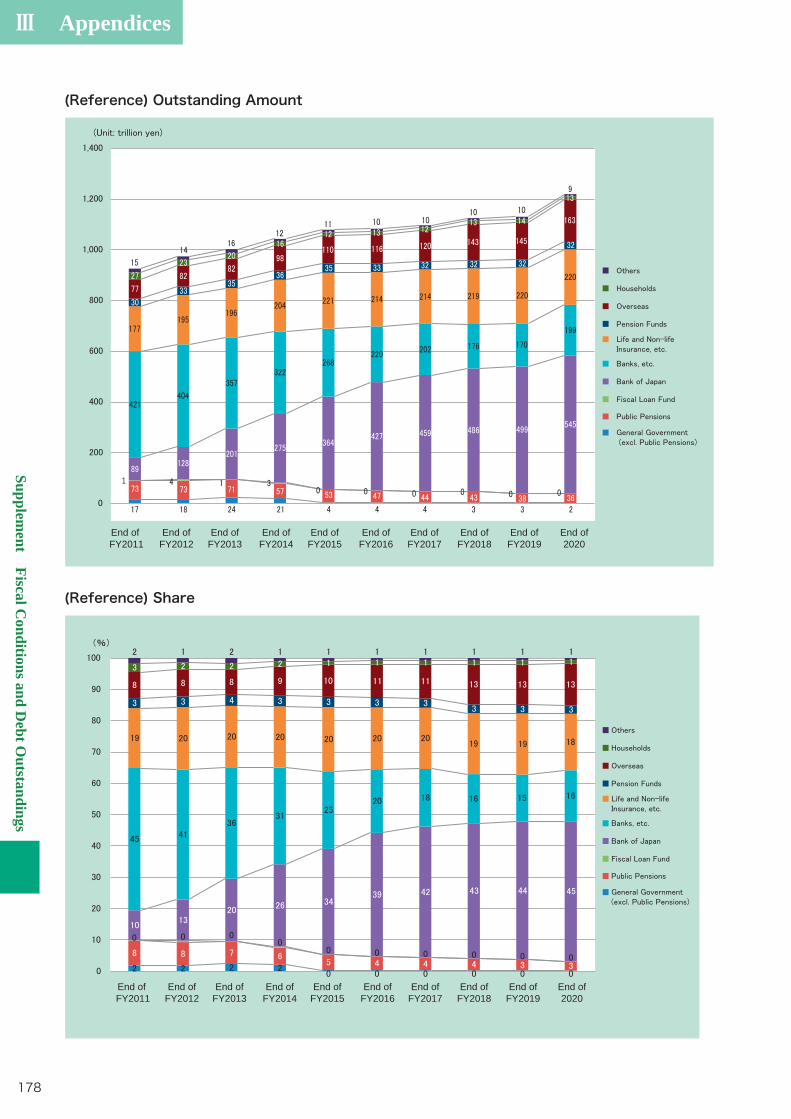
Ⅲ Appendices
Supplement Fiscal C
onditions and Debt O
utstandings
178
(Reference) Share
(Reference) Outstanding Amount
1
End of FY2011
End ofFY2012
End ofFY2013
End ofFY2014
End ofFY2015
End ofFY2016
End ofFY2017
End ofFY2018
End ofFY2019
End of2020
End of FY2011
End ofFY2012
End ofFY2013
End ofFY2014
End ofFY2015
End ofFY2016
End ofFY2017
End ofFY2018
End ofFY2019
End of2020
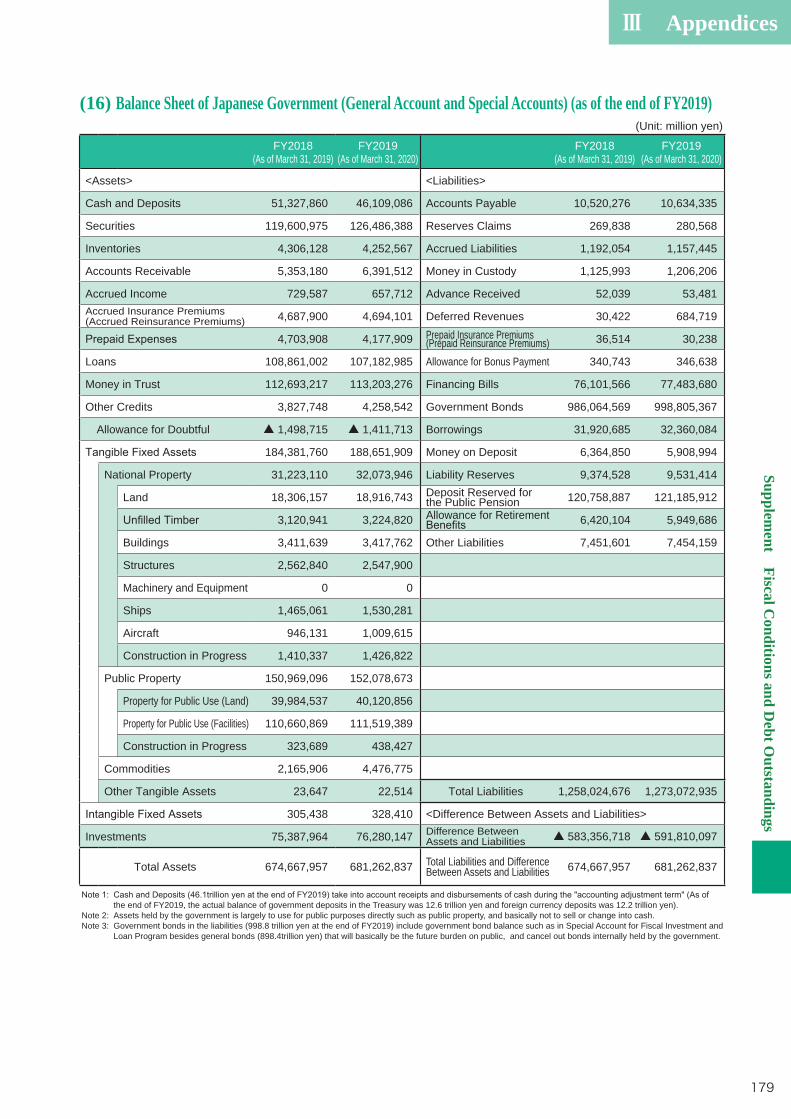
Ⅲ AppendicesSupplem
ent Fiscal Conditions and D
ebt Outstandings
179
(16) Balance Sheet of Japanese Government (General Account and Special Accounts) (as of the end of FY2019)(Unit: million yen)
FY2018(As of March 31, 2019)
FY2019(As of March 31, 2020)
FY2018(As of March 31, 2019)
FY2019(As of March 31, 2020)
<Assets> <Liabilities>
Cash and Deposits 51,327,860 46,109,086 Accounts Payable 10,520,276 10,634,335
Securities 119,600,975 126,486,388 Reserves Claims 269,838 280,568
Inventories 4,306,128 4,252,567 Accrued Liabilities 1,192,054 1,157,445
Accounts Receivable 5,353,180 6,391,512 Money in Custody 1,125,993 1,206,206
Accrued Income 729,587 657,712 Advance Received 52,039 53,481Accrued Insurance Premiums (Accrued Reinsurance Premiums) 4,687,900 4,694,101 Deferred Revenues 30,422 684,719
4,703,908 4,177,909 Prepaid Insurance Premiums (Prepaid Reinsurance Premiums) 36,514 30,238
Loans 108,861,002 107,182,985 Allowance for Bonus Payment 340,743 346,638
Money in Trust 112,693,217 113,203,276 Financing Bills 76,101,566 77,483,680
Other Credits 3,827,748 4,258,542 Government Bonds 986,064,569 998,805,367
Allowance for Doubtful ▲ 1,498,715 ▲ 1,411,713 Borrowings 31,920,685 32,360,084
184,381,760 188,651,909 Money on Deposit 6,364,850 5,908,994
National Property 31,223,110 32,073,946 Liability Reserves 9,374,528 9,531,414
Land 18,306,157 18,916,743 Deposit Reserved for the Public Pension 120,758,887 121,185,912
3,120,941 3,224,820 Allowance for Retirement 6,420,104 5,949,686
Buildings 3,411,639 3,417,762 Other Liabilities 7,451,601 7,454,159
Structures 2,562,840 2,547,900
Machinery and Equipment 0 0
Ships 1,465,061 1,530,281
Aircraft 946,131 1,009,615
Construction in Progress 1,410,337 1,426,822
Public Property 150,969,096 152,078,673
Property for Public Use (Land) 39,984,537 40,120,856
Property for Public Use (Facilities) 110,660,869 111,519,389
Construction in Progress 323,689 438,427
Commodities 2,165,906 4,476,775
Other Tangible Assets 23,647 22,514 Total Liabilities 1,258,024,676 1,273,072,935
305,438 328,410 <Difference Between Assets and Liabilities>
Investments 75,387,964 76,280,147 Difference Between Assets and Liabilities ▲ 583,356,718 ▲ 591,810,097
Total Assets 674,667,957 681,262,837 Total Liabilities and Difference Between Assets and Liabilities 674,667,957 681,262,837
the end of FY2019, the actual balance of government deposits in the Treasury was 12.6 trillion yen and foreign currency deposits was 12.2 trillion yen).
Note 2: Assets held by the government is largely to use for public purposes directly such as public property, and basically not to sell or change into cash. Note 3: Government bonds in the liabilities (998.8 trillion yen at the end of FY2019) include government bond balance such as in Special Account for Fiscal Investment and
Loan Program besides general bonds (898.4trillion yen) that will basically be the future burden on public, and cancel out bonds internally held by the government.
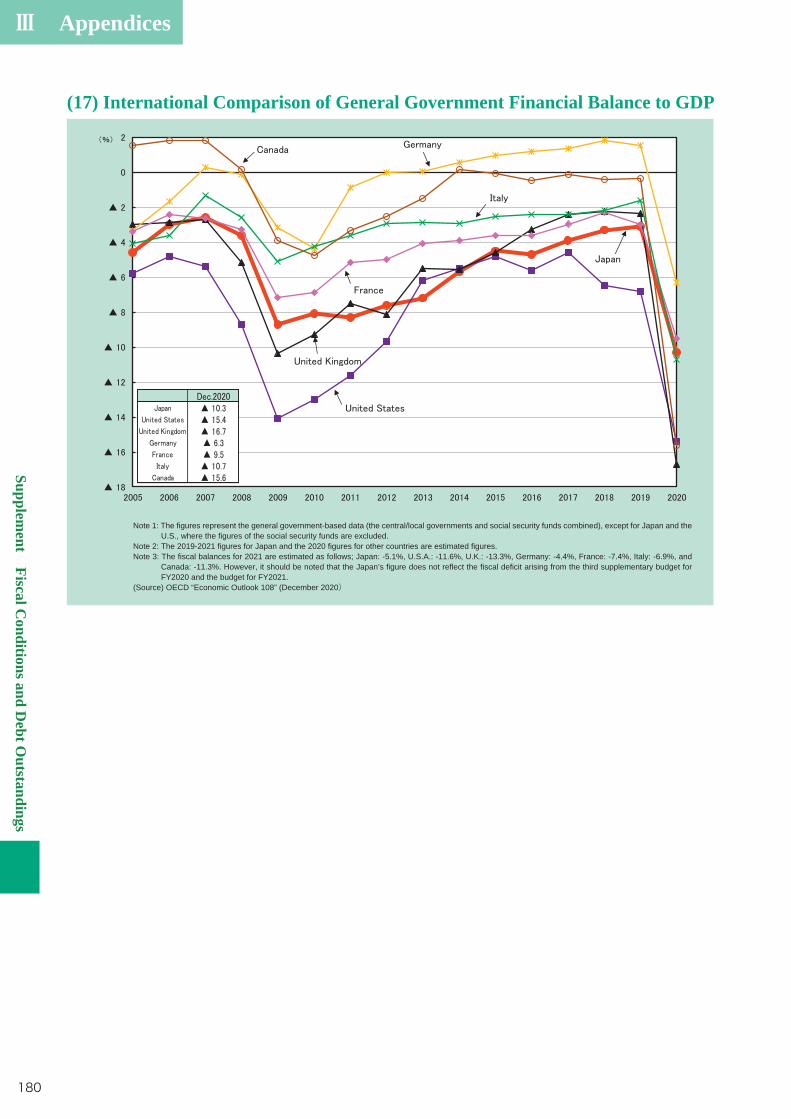
Ⅲ Appendices
Supplement Fiscal C
onditions and Debt O
utstandings
180
(17) International Comparison of General Government Financial Balance to GDP
Note 1: The figures represent the general government-based data (the central/local governments and social security funds combined), except for Japan and the U.S., where the figures of the social security funds are excluded.
Note 2: The 2019-2021 figures for Japan and the 2020 figures for other countries are estimated figures. Note 3: The fiscal balances for 2021 are estimated as follows; Japan: -5.1%, U.S.A.: -11.6%, U.K.: -13.3%, Germany: -4.4%, France: -7.4%, Italy: -6.9%, and
Canada: -11.3%. However, it should be noted that the Japan’s figure does not reflect the fiscal deficit arising from the third supplementary budget for FY2020 and the budget for FY2021.
(Source) OECD “Economic Outlook 108” (December 2020)
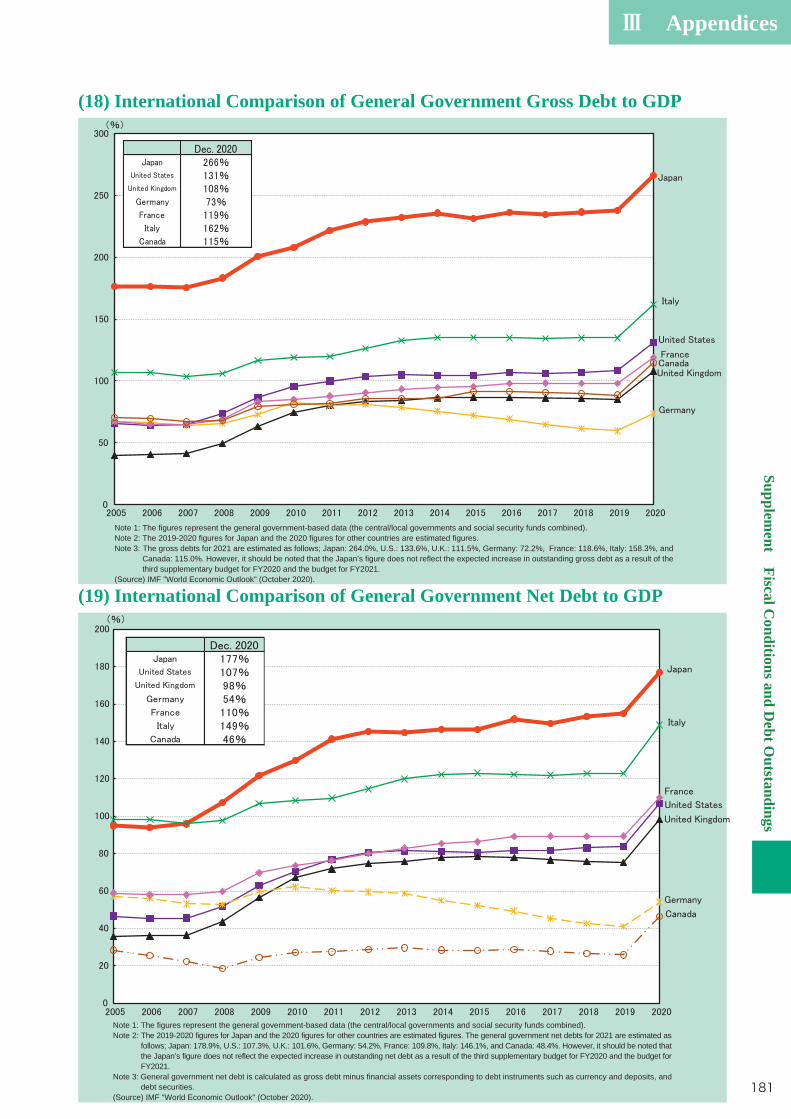
Ⅲ AppendicesSupplem
ent Fiscal Conditions and D
ebt Outstandings
181
(18) International Comparison of General Government Gross Debt to GDP
(19) International Comparison of General Government Net Debt to GDP
Note 1: The figures represent the general government-based data (the central/local governments and social security funds combined).Note 2: The 2019-2020 figures for Japan and the 2020 figures for other countries are estimated figures.Note 3: The gross debts for 2021 are estimated as follows; Japan: 264.0%, U.S.: 133.6%, U.K.: 111.5%, Germany: 72.2%, France: 118.6%, Italy: 158.3%, and
Canada: 115.0%. However, it should be noted that the Japan’s figure does not reflect the expected increase in outstanding gross debt as a result of the third supplementary budget for FY2020 and the budget for FY2021.
(Source) IMF "World Economic Outlook" (October 2020).
Note 1: The figures represent the general government-based data (the central/local governments and social security funds combined).Note 2: The 2019-2020 figures for Japan and the 2020 figures for other countries are estimated figures. The general government net debts for 2021 are estimated as
follows; Japan: 178.9%, U.S.: 107.3%, U.K.: 101.6%, Germany: 54.2%, France: 109.8%, Italy: 146.1%, and Canada: 48.4%. However, it should be noted that the Japan’s figure does not reflect the expected increase in outstanding net debt as a result of the third supplementary budget for FY2020 and the budget for FY2021.
Note 3: General government net debt is calculated as gross debt minus financial assets corresponding to debt instruments such as currency and deposits, and debt securities.
(Source) IMF "World Economic Outlook" (October 2020).
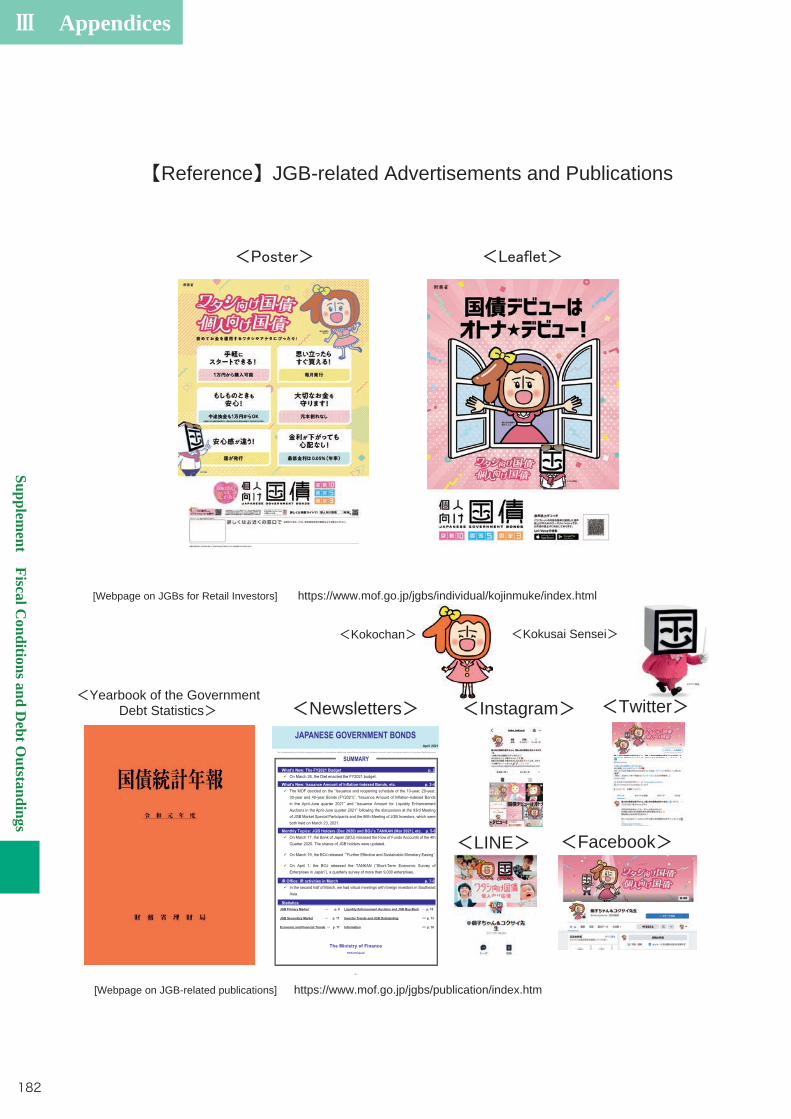
Ⅲ Appendices
Supplement Fiscal C
onditions and Debt O
utstandings
182
-1-
Yearbook of the Government Debt Statistics Newsletters
[Webpage on JGB-related publications] https://www.mof.go.jp/jgbs/publication/index.htm
[Webpage on JGBs for Retail Investors] https://www.mof.go.jp/jgbs/individual/kojinmuke/index.html
Kokusai Sensei Kokochan
Facebook LINE
Reference JGB-related Advertisements and Publications
TwitterInstagram
I
IndexA ・Accounting adjustment term issuance 39 ・Advisory Council on Government Debt Management 90,142 ・Auction Result Auction Results for JGBs and T-Bills in FY2020 118 Results of Liquidity Enhancement Auctions in FY2020 141 Buy-back Results in FY2020 141 Auction Results of the Borrowings of the Special Account for Local Allocation Tax in FY2020 155 Auction Results of the Borrowings of the Special Account for the National Forest Debt Management
in FY2020 156 Auction Results of the Borrowings of the Special Account for Energy Policy in FY2020 156 ・Average Maturity 23,60
B ・BOJ Rollover 47,125 ・BOJ-NET 50,66 ・Bond Gensaki Transactions 69,96,134 ・Bond-Lending Transactions 69,135 ・Borrowings 101,153 ・Break-Even-Inflation Rate 129 ・Buy-back 87,141
C ・Cheapest Issues 74 ・Clearing Institution 67 ・Construction Bonds 38,79,81,148 ・Conventional (multiple price) Method 44,58 ・Conversion Factor 74 ・Cost-at-Risk (CaR) analysis 27 ・Coupon-Bearing Bonds 41 ・Coupon-only book-entry transfer JGB 73 ・Custodian 34
D ・Debt Management Policy 3 What is Debt Management Policy? 3 Debt Management Policies in Foreign Countries 53 ・Delivery-qualified issues 74 ・Delivery-versus-Payment (DVP) Settlement 66 ・Direct budget transfer 82 ・Discount Bonds, TBs (Treasury Bills) 41,100 ・Dutch-Style (single price/yield) Method 44,58
F ・Fail, Fails Practice 66 ・Fails Charge 66 ・FBs(Financing Bills) 99,151 Financing Bills by Legal Grounds of Issuance 99 ・FILP Agency Bonds 113,166 ・FILP Bonds (Fiscal Investment and Loan Program Bonds) 41,83,149 ・FILP Plan 104,165 ・FILP Reform 41
II
・Fiscal Loan Fund 41 ・Fixed-Rate Transfer 82 ・Floating-Rate Bonds 41,130 ・Foreign Investors 32 JGB Holdings by Foreign Investors 32 JGB Holdings by Foreign Investors (including T-Bills) 33 JGB Holdings and Trading by Foreign Investors 33 Foreign Investors' Bond Holdings by Region (Custodian Base) 34 ・Front-Loading Issuance of Refunding Bonds 39,125,149 ・Futures Trading 74,134
G ・General Bonds 38,175 ・Government Bonds (JGBs) 38 JGBs by Legal Grounds of Issuance 38 Types of JGBs 41 Historical Changes in JGB Total Issuance Amount 20 Historical Changes in Outstanding Amount of JGB 20 Breakdown by JGB and T-Bill Holders 29,177 Breakdown by JGB Holders 29,177 Government Bond-related Legal Systems 148 Taxation of Government Bonds 93 List of Commissions for Issuing JGBs, etc. 126 ・Government Bonds issued to Development Bank of Japan 107 ・Government Bonds issued to Nuclear Damage Compensation and Decommissioning Facilitation Corporation 108
・Government Debt Consolidation Fund (GDCF), Special Account for the Government Debt Consolidation Fund (GDCF) 79,138,172
・Government Debt Outstanding Public Debt Outstanding of Central and Local Governments 174 Long-term Debt Outstanding of Central and Local Governments 174 Government Bonds and Borrowings Outstanding 174 General Government Gross Debt 174 ・Government-Guaranteed Debt 104,157 Breakdown of the Planned Issuance Amount for FY2021 of Government-Guaranteed Bonds 105 Breakdown of the Planned Issuance Amount for FY2021 of Government-Guaranteed Bonds by
Issuers and Maturities 106 ・Green Bonds 58
I ・Incorporated Administrative Agencies 113 ・Inflation-Indexed Bonds(JGBi) 42
J ・JGB Issuance Plan 18,53 JGB Issuance Plan for FY2021 (Breakdown by Legal Grounds) 19 JGB Issuance Plan for FY2021 (Breakdown by Financing Methods) 21,47 Market Issuance Plan by JGB Types for FY2021 22 ・JGB Management Policy 3 Basic Objectives for JGB Management Policy 3 History of Postwar JGB Management Policy 146 ・JGB Market Issuance (Calendar Base) 21 Historical Changes in JGB Market Issuance by JGB Types 23,117 ・JGB Market Liquidity 64 ・JGB Market Special Participants Scheme 48,62 ・JGBs for Retail Investors 45,124,182
III
Comparison of JGBs for Retail Investors and New Over-The-Counter (OTC) Sales System 46 JGB Holdings by Retail Investors 30 Outstanding JGBs for Retail Investors 31
K ・Kokochan 182 ・Kokusai Sensei 182
L ・LGBs (Local Government Bonds) 109,162 Consultation System for the LGB Issuance 110 Planned Issuance of Public Offering LGB in FY2021 112 ・Liquidity Enhancement Auctions 86,141 ・Long-Term Bonds 41,58 ・Long-Term JGB Yield 10-Year JGB Yield 127 10-Year Government Bonds Yields 127
M ・Marketable bonds 57 ・Medium-Term Bonds 41,58 ・Meeting of JGB Investors 90,144 ・Meeting of JGB Market Special Participants 90,143 ・Meeting of JGB Top Retailers 91,145
N ・National Treasury 4,100 ・New Over-The-Counter(OTC) Sales System 45 ・Non-Competitive Auction 44 ・Non-marketable bonds 58 ・Non-Price Competitive Auction I 44,48 ・Non-Price Competitive Auction II 44,48
O ・OECD Working Party on Public Debt Management 63 ・Operational risks 85 ・Overseas IR 34,91
P ・Price-Competitive Auction 43 ・Principal-only book-entry transfer JGB 73,136 ・Public Offering 43,100,102 Auction Procedures for Public Offering Auction 51
R ・Rating 137 ・Real-Time Gross Settlement (RTGS) 66 ・Reconstruction Bonds 39,81,83,149 ・Redemption System 79 ・Refunding Bonds 39,149 ・Reopen 44,60,64 ・Revisions to Government Bond Issuance Plan Government Bond Issuance Changes Accompanying COVID-19 Expansion in Foreign Countries 55
IV
S ・Short-Term Bonds 41,58 ・Special Account for Energy Policy 102,156 ・Special Account for Local Allocation Tax 102,154,155 ・Special Account for the National Forest Debt Management 102,156 ・Special Bonds for Covering Public Pension Funding 39,81,84 ・Special Deficit-Financing Bonds 39,79,81,148 ・STRIPS (Separate Trading of Registered Interest and Principal of Securities) 73 ・Subscription/Contribution Bonds 107 ・Subsidy Bonds 107 ・Super Long-Term Bonds 41,58 ・Swap Transaction 90
T ・T-Bills (Treasury Discount Bills) 100 ・Transfer of a Budgetary Surplus 82
W ・WI Transaction 68
Y ・Yield Curves 128 JGB Yield Curves 128 ・Yield-Competitive Auction 42
Numeric Character ・60-year Redemption Rule 79,82 Redemption via Refunding Bonds - "60-Year Redemption Rule" 80
Debt M
anagement R
eport 2021 The G
overnment Debt M
anagement and the State of Public Debts
Financial Bureau, Ministry of Finance, JAPAN
Debt ManagementReport The Government Debt Management
and the State of Public Debts
The Government Debt Managementand the State of Public Debts
www.mof.go.jp
Debt Management Report 2021
Financial Bureau, Ministry of Finance, JAPAN
Financial Bureau, Ministry of Finance, JAPAN
□ This printed matter was prepared using the paper that satisfies the judgment criteria of the basic policy under the Law Concerning the Promotion of Procurement of Eco-Friendly Goods and Services by the State and Other Entities (Law on Promoting Green Purchasing).
□ Indication of the recyclability : Recyclable to paper This printed matter was prepared using only the material fit for recycling to printing papers (Rank A) according to the judgment criteria “printing” of the basic policy under the Green Purchasing Law.