INDIA REAL ESTATE - Naredco
44
AHMEDABAD | BENGALURU | CHENNAI | HYDERABAD | MUMBAI | NCR | PUNE RESEARCH INDIA REAL ESTATE RESIDENTIAL AND OFFICE JULY - DECEMBER 2015
-
Upload
khangminh22 -
Category
Documents
-
view
1 -
download
0
Transcript of INDIA REAL ESTATE - Naredco

AHMEDABAD | BENGALURU | CHENNAI | HYDERABAD | MUMBAI | NCR | PUNE
RESEARCH
Knight Frank Research Reports are available at KnightFrank.com/Research
© Knight Frank India Pvt.Ltd
RESEARCH Dr. Samantak DasChief Economist and National Director, [email protected]
RESIDENTIAL AGENCY Mudassir ZaidiNational Director, Residential [email protected]
OFFICE AGENCYViral DesaiNational Director, Of�ce Agency [email protected]
CAPITAL MARKETSRajeev BairathiExecutive Director, Capital [email protected]
ADVISORYSaurabh MehrotraNational Director, Advisory [email protected]
CITIES
Mumbai (Corporate Office)Shishir BaijalChairman & Managing Director [email protected]
AhmedabadBalbirsingh Khalsa, National [email protected]
BengaluruSatish BN, Executive [email protected]
ChennaiKanchana Krishnan, Director [email protected]
HyderabadVasudevan Iyer, [email protected]
NCRRajeev Bairathi, Executive [email protected]
PuneShantanu Mazumder, [email protected]
For the latest news, views and analysisof the commercial property market, visit
knightfrankblog.com/commercial-briefing/
COMMERCIAL BRIEFING
This report is published for general information only and not to be relied upon in anyway. Although high standards have been used in the preparation of the information analysis, views and projections presented in the report, no responsibility or liability whatsoever can be accepted by Knight Frank for any loss or damage resultant from any use of, reliance on or reference to the contents of this document.As a general report this material does not necessarily represent the view of Knight Frank in relation to particular properties or projects. Reproduction of this report in whole or in part is not allowed without prior written approval of Knight Frank to the form and content within which it appears.
Knight Frank India research provides development and strategic advisory to a wide range of clients worldwide. We regularly produce detailed and informative research reports which provide valuable insights on the real estate market. Our strength lies in analysing existing trends and predicting future trends in the real estate sector from the data collected through market surveys and interactions with real estate agents, developers, funds and other stakeholders.
RECENT MARKET-LEADING RESEARCH PUBLICATIONS
GLOBAL CITIES 2016 REPORT
GUJARAT’SSHINING JEWELS
RESIDENTIALINVESTMENT ADVISORYREPORT 2016
IND
IA R
EA
L ES
TATE
- RE
SID
EN
TIA
L AN
D O
FF
ICE
JULY
- DE
CE
MB
ER
2015
INDIA REAL ESTATERESIDENTIAL AND OFFICE JULY - DECEMBER 2015
REAL ESTATESENTIMENT INDEXQ3 2015
For the latest news, views and analysisof the commercial property market, visit
knightfrankblog.com/commercial-briefing/
COMMERCIAL BRIEFING
CIN No. – U74140MH1995PTC093179

2

3
RESEARCHINDIA REAL ESTATE
CONTENT04 INDIA
09 AHMEDABAD
12 BENGALURU
17 CHENNAI
22 HYDERABAD
27 MUMBAI
33 NCR
38 PUNE

4
INDIA
Hetal BachkaniwalaVice President - Research

5
RESEARCHINDIA REAL ESTATE
RESIDENTIAL MARKET• 2015 ended with the lowest
number of new launches and sales volumes across the top eight cities of India since 2010. While the sales volume during the year was similar to that in 2014, new launches fell sharply, by 21%.
• NCR (-20%), Mumbai (-36%) and Bengaluru (-27%) witnessed the sharpest drops in new launches during 2015.
• While sales grew by 3% during H2 2015 compared to H2 2014, launches continued to fall by 13%. The recovery in sales was largely on account of the better-than-expected sales volume during the festive season.
• NCR led in terms of sales volume growth at 15% during H2 2015. However, Mumbai and Chennai are still lagging behind, with a fall in sales volume by 6% and 9%, respectively.
• Steady sales volume and restricted new launches have helped in bringing down the stress level in the residential market, with the unsold inventory reverting to the 2013 level. While Mumbai leads in this unwinding, Hyderabad and Pune follow.
• Price growth across all the eight cities continues to fall, but there is no imminent threat of a sharp correction. The unwinding of unsold inventory has helped in stabilising prices and hence, we do not expect prices to fall.
• In fact, the upward pressure on prices is being felt in the coming six months, with Bengaluru likely to be the first city to start this trend with a 7% price rise in H1 2016.
• Encouraged by the improving sales volume, we believe that developers will start pushing new projects in the coming six months. In H1 2016, new launches and sales are estimated to jump by 8% and 10%,
LAUNCHES ABSORPTION
FIGURE 1
ANNUAL NEW LAUNCHES AND ABSORPTION TREND IN THE TOP EIGHT CITIES
200,000
100,000
2011 2012 2013 2014 2015
300,000
400,000
500,000
Num
ber
of u
nits
Source: Knight Frank Research
0
466,
422
368,
568
458,
228
359,
548
419,
439
329,
630
309,
730
274,
109
244,
944
263,
720
Note: The top eight cities are Mumbai, NCR, Bengaluru, Pune, Chennai, Hyderabad, Kolkata and Ahmedabad
Note: The top eight cities are Mumbai, NCR, Bengaluru, Pune, Chennai, Hyderabad, Kolkata and Ahmedabad
LAUNCHES ABSORPTION
FIGURE 2
HALF-YEARLY NEW LAUNCHES AND ABSORPTION TREND IN THE TOP EIGHT CITIES
100,000
75,000
125,000
175,000
50,000
25,000
H1 2014 H2 2014 H1 2015 H2 2015 H1 2016 E
150,000
200,000
Num
ber
of u
nits
Source: Knight Frank Research
0
159,
259
135,
644
150,
471
138,
165
113,
499
121,
051
131,
445
142,
671
122,
402
133,
556
respectively, compared to the same period of the previous year.
• Pune and Bengaluru continue to be among the best performing residential markets in the country, with low quarters to sell unsold inventory and minimal age of unsold inventory.
• NCR continues to be the worst performing market in India, as it will take more than four years to unwind the existing unsold inventory of 206,000 units. This is significantly higher than the average time of less than three years that other cities will take.

6
FIGURE 3
UNSOLD INVENTORY LEVELS IN THE TOP EIGHT CITIES
600,000
620,000
640,000
660,000
680,000
700,000
720,000
H1 2013 H2 2013 H1 2014 H2 2014 H1 2015 H1 2015
Num
ber
of u
nits
Source: Knight Frank Research
0
644,
345
691,
300
714,
577
714,
972
710,
340
691,
591
H1 2015 H2 2015 H1 2016 E
FIGURE 4
CITY-WISE HALF-YEARLY NEW LAUNCHES
24,000
16,000
8,000
MUMBAI NCR BENGALURU PUNE CHENNAI
32,000
Num
ber
of u
nits
Source: Knight Frank Research
0
18,8
8720
,776
16,9
98
29,4
5834
,000
28,0
00
21,4
0028
,284
29,8
70
12,7
6218
,135
13,9
00
9,10
26,
340
8,50
0
HYDERABAD
5,45
75,
740
5,30
0
KOLKATA
8,37
210
,680
10,7
60
AHMEDABAD8,
062
7,49
19,
070
H1 2015 H2 2015 H1 2016 E
FIGURE 5
CITY-WISE HALF-YEARLY ABSORPTION
25,000
20,000
15,000
10,000
5,000
MUMBAI NCR BENGALURU PUNE CHENNAI
35,000
30,000
Num
ber
of u
nits
Source: Knight Frank Research
0
28,4
4634
,135
29,8
68
25,0
0023
,800
26,0
00
22,2
3429
,684
28,3
67
15,5
2420
,740
16,4
49
9,09
19,
420
9,00
0
HYDERABAD
7,12
37,
780
7,45
0
KOLKATA
5,88
38,
036
8,34
5
AHMEDABAD
7,75
19,
075
8,07
7

7
RESEARCHINDIA REAL ESTATE
H2 2014 H1 2015 H2 2015
FIGURE 6
CITY-WISE UNSOLD INVENTORY LEVEL
200,000
150,000
100,000
50,000
MUMBAI NCR BENGALURU PUNE CHENNAI
Num
ber
of u
nits
Source: Knight Frank Research
0
204,
070
194,
510
181,
151
191,
370
195,
828
206,
028
100,
968
105,
525
98,7
34 39,1
2337
,847
36,3
54
39,1
2337
,846
36,3
54
HYDERABAD
35,1
8333
,517
31,4
77
KOLKATA
35,1
8336
,950
35,8
74
AHMEDABAD
41,2
0541
,368
39,7
82
H1 2015 H2 2015 H1 2016 E
FIGURE 7
CITY-WISE PRICE MOVEMENT
6,000
4,000
2,000
MUMBAI NCR BENGALURU PUNE CHENNAI
8,000
Wei
ghte
d a
vg. p
rice
( ` /
sq.ft
.)
Source: Knight Frank Research
0
7,90
07,
990
8,00
0
4,50
04,
580
4,58
0
4,65
04,
780
4,99
0
4,82
04,
830
4,88
0
4,53
04,
600
4,66
0
HYDERABAD
3,51
03,
620
3,65
0
KOLKATA
3,49
03,
540
3,60
0
AHMEDABAD
2,64
02,
730
2,77
0
Source: Knight Frank Research
FIGURE 8
CITY-WISE QTS VS AGE OF UNSOLD INVENTORY ANALYSIS
5
7
9
11
13
17
15
5 7 119 17 1913 15
Age
of u
nsol
d in
vent
ory
in q
uart
ers
QTS
HYDERABAD
PUNE
CHENNAI
MUMBAI
AHMEDABAD
BEGALURU
KOLKATA
NCR
Note: The size of the bubble indicates the quantum of unsold inventory. QTS is the quarter to sell unsold inventory
Note: The prices indicated for each city are the weighted average price

8
OFFICE MARKET• Vacancy levels in India reached an
eight-year low of 15.8% in 2015. Bengaluru had the lowest vacancy level in the country, at 8%, and Pune followed with 11.3%.
• Similar to 2014, demand surpassed new completions in 2015 as well. While 40.8 mn sq ft of office space was absorbed in 2015, only 35.5 mn sq ft was delivered. This helped in bringing down the vacancy level in the past year.
• In terms of absorption, 2015 managed to surpass the 2014 numbers. While 38.3 mn sq ft of space was absorbed during 2014, it increased by 7% in 2015.
• Chennai and Pune led in terms of annual absorption growth, at 37% and 15%, respectively. In terms of new completions, NCR and Bengaluru witnessed the fastest growth, at 56% and 13%, respectively.
• H2 2015 also observed a healthy growth in absorption and new launches, at 11% and 7%, respectively. However, new completions are expected to grow at a faster pace of 8% in the next six months, compared to just 4% in absorption growth.
• Rents in most of the cities have increased steadily since the last two years. Going forward, this trend is expected to continue in the coming six-month period, with Pune and Bengaluru projected to grow at the fastest pace.
NEW COMPLETION ABSORPTION
FIGURE 2
NEW COMPLETIONS AND ABSORPTION- ANNUAL
20
10
2011 2012 2013 2014 2015
30
40
50
mn
sq.ft
Source: Knight Frank Research
0
48.3
41.2
43.1
32.2
36.3
33.6
34.8
38.6
35.5
40.8
NEW COMPLETION ABSORPTION
FIGURE 3
NEW COMPLETIONS AND ABSORPTION- HALF-YEARLY
10
5
H1 2014 H2 2014 H1 2015 H2 2015 H1 2016 E
15
20
mn
sq.ft
Source: Knight Frank Research
0
16.4
17.9
18.5
20.4
15.7
17.9
19.7
22.5
17.0
18.6
STOCK OCCUPIED STOCK VACANCY (RHS)
FIGURE 1
OFFICE SPACE STOCK AND VACANCY LEVELS- ANNUAL
200
100
2011 2012 2013 2014 2015
300
400
500
600
mn
sq.ft
.
Source: Knight Frank Research
0 12%
16%
20%
24%
408
330
454
360
490
393
525
432
561
472
19.0%
21.0%20.0%
18.0%
15.8%

9
RESEARCHINDIA REAL ESTATE
AHMEDABADHetal BachkaniwalaVice President - Research

10
RESIDENTIAL MARKET
• The situation in Ahmedabad’s residential markets deteriorated in 2015. While the sales volume continued to fall, new launches made a quick recovery.
• The sales volume in Ahmedabad fell by 9% during 2015 to 16,826 units from 18,490 a year ago. This is the city’s lowest sales volume in the last six years and has nearly halved from its peak of 30,000 units in 2012.
• On the other hand, new launches have recovered by 11% during 2015, to 15,552 units from 14,011 in 2014. This has increased the stress in the market and worsened the oversupply situation in the city.
• However, H2 2015 brings in some cheer, with a positive sales volume growth compared to the same period last year. Fuelled by the festive season during the second half of the year, demand pushed the sales volume up by 13%.
• Going forward, we expect new launches to increase by 13% during H1 2016, with North and East Ahmedabad leading the way. However, the sales volume will witness a muted growth, as homebuyer sentiment is still lackadaisical.
AHMEDABAD MARKET TRENDS
MICRO-MARKETS OF THE AHMEDABAD
Micro-market Locations
Central Paldi, Vasna, Navrangpura, Maninagar, Dudeshwar, Ambawadi
East Naroda, Vastral, Nikol, Kathwada Road, Odhav
North Gota, New Ranip, Tragad, Chand Kheda, Motera
South Narol, Vatwa, Vinzol, Hathijan
West S G Highway, Prahlad Nagar, Bopal, Thaltej, Science City Road
LAUNCHES ABSORPTION
FIGURE 1
AHMEDABAD MARKET TREND- ANNUAL
20,000
10,000
2011 2012 2013 2014 2015
30,000
40,000
50,000
Num
ber
of u
nits
Source: Knight Frank Research
0
45,1
2029
,694
30,7
5830
,577
23,8
67
25,5
92
14,0
1118
,490
15,5
52
16,8
26
LAUNCHES ABSORPTION WT. AVG. PRICE (RHS)
FIGURE 2
AHMEDABAD MARKET TRENDS - HALF-YEARLY
4,000
2,000
H1 2014 H2 2014 H1 2015 H2 2015 H1 2016 E
6,000
8,000
10,000
12,000
Num
ber
of u
nits
` /
sq ft
Source: Knight Frank Research
0 2,000
2,200
2,400
2,600
2,800
3,000
9,02
110
,472
4,99
18,
019
8,06
2
7,75
1
7,49
19,
075
9,07
0
8,07
7
11
RESEARCHINDIA REAL ESTATE
H2 2014 H1 2015 H2 2015
FIGURE 3
MICRO-MARKET SPLIT OF LAUNCHED UNITS
1,500
1,000
500
CENTRAL EAST NORTH SOUTH WEST
2,000
2,500
3,000
Num
ber
of u
nits
Source: Knight Frank Research
0
270
503
1,45
0
1,45
82,
103
1,11
8
959
1,82
52,
617
578
1,74
763
6
1,72
51,
891
1,67
0H2 2014 H1 2015 H2 2015
FIGURE 4
MICRO-MARKET-WISE RESIDENTIAL SALES
1,500
1,000
500
CENTRAL EAST NORTH SOUTH WEST
2,000
2,500
3,000
Num
ber
of u
nits
Source: Knight Frank Research
0
353
647
813
2,85
22,
474
2,76
0
2,39
12,
190
2,69
1
1,09
51,
050
1,22
8
1,32
81,
390
1,58
4
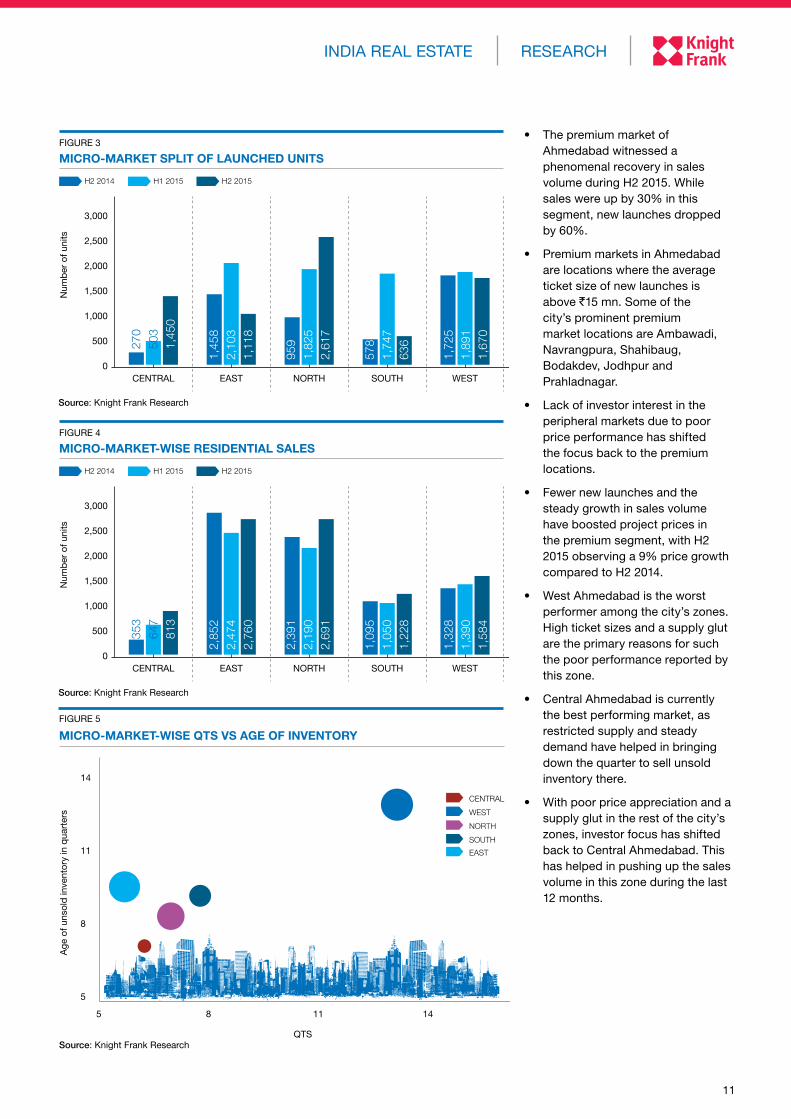
• The premium market of Ahmedabad witnessed a phenomenal recovery in sales volume during H2 2015. While sales were up by 30% in this segment, new launches dropped by 60%.
• Premium markets in Ahmedabad are locations where the average ticket size of new launches is above `15 mn. Some of the city’s prominent premium market locations are Ambawadi, Navrangpura, Shahibaug, Bodakdev, Jodhpur and Prahladnagar.
• Lack of investor interest in the peripheral markets due to poor price performance has shifted the focus back to the premium locations.
• Fewer new launches and the steady growth in sales volume have boosted project prices in the premium segment, with H2 2015 observing a 9% price growth compared to H2 2014.
• West Ahmedabad is the worst performer among the city’s zones. High ticket sizes and a supply glut are the primary reasons for such the poor performance reported by this zone.
• Central Ahmedabad is currently the best performing market, as restricted supply and steady demand have helped in bringing down the quarter to sell unsold inventory there.
• With poor price appreciation and a supply glut in the rest of the city’s zones, investor focus has shifted back to Central Ahmedabad. This has helped in pushing up the sales volume in this zone during the last 12 months.
EAST
CENTRAL
WEST
NORTH
SOUTH
Source: Knight Frank Research
FIGURE 5
MICRO-MARKET-WISE QTS VS AGE OF INVENTORY
5
8
11
14
5 8 11 14
Age
of u
nsol
d in
vent
ory
in q
uart
ers
QTS

12
BENGALURU
Sangeeta Sharma DuttaLead Consultant - Research

13
RESEARCHINDIA REAL ESTATE
RESIDENTIAL MARKET• On an annual basis, steep decline
in new project launches observed in 2015, to the tune of 27% as compared to 2014 - the lowest number of launches in five years
• This can be largely attributed to the cautiousness shown by developers in the first half of the year, restricting their project launches
• Absorption, although the lowest in three years, fell by just 7% in 2015 vis-à-vis 2014
• New launches continue to fall Y-O-Y in H2 2015 as compared to H2 2014, to the tune of 13%; sales witnesses a marginal recovery of 4% during the same period.
• On the other hand, H2 2015 performed better as compared to the number of launches in H1 2015 by 32%
• Weighted average price continued to move upwards. H2 2015 saw weighted average price increase by 4%.
• While other markets saw decline in new launches, South Bengaluru bucks the trend in H2 2015. An increase of 30% in new launches Y-o-Y was witnessed in the South.
• Almost 88% of the total new launches in H2 2015 in the budget housing segment (ticket size of below INR 2.5 mn) were in South Bengaluru
• Majority of these launches were observed in the distant peripheral locations of South Bengaluru, such as Chandapura, Electronics City, Begur and Hosa Road
• North Bengaluru accounted for 45% of the total new launches in the premium housing segment (ticket size of above INR 20 mn), in areas such as Hennur Road, Thanisandra and Hebbal
BENGALURU MARKET TRENDS
LAUNCHES ABSORPTION
FIGURE 1
BENGALURU MARKET TREND- ANNUAL
20,000
10,000
2011 2012 2013 2014 2015
30,000
40,000
60,000
70,000
80,000
50,000
90,000N
umb
er o
f uni
ts
Source: Knight Frank Research
0
63,2
6141
,944
67,7
7350
,692
78,3
00
57,3
66
68,1
3455
,701
49,6
84
51,9
18
LAUNCHES ABSORPTION WT. AVG. PRICE (RHS)
FIGURE 2
BENGALURU MARKET TRENDS - HALF-YEARLY
10,000
5,000
H1 2014 H2 2014 H1 2015 H2 2015 H1 2016 E
15,000
20,000
25,000
30,000
35,000
40,000
Num
ber
of u
nits
` /
sq ft
0 4,000
4,500
5,000
5,500
35,5
4527
,256
32,5
8928
,445
21,4
00
22,2
34
28,2
8429
,684
29,8
70
28,3
67
Source: Knight Frank Research
• Notably, 66% of the total new launches witnessed in Bengaluru belonged to the ticket size of INR 2.5-7.5 mn

14
H2 2014 H1 2015 H2 2015
FIGURE 3
MICRO-MARKET SPLIT OF LAUNCHED UNITS
6,000
4,000
2,000
CENTRAL EAST NORTH SOUTH WEST
8,000
10,000
12,000
Num
ber
of u
nits
Source: Knight Frank Research
0
55 0 30
8,97
34,
759
7,40
3
11,0
087,
888
7,05
0
8,26
06,
811
10,7
25
4,29
3 1,94
73,
075
H2 2014 H1 2015 H2 2015
FIGURE 4
MICRO-MARKET-WISE RESIDENTIAL SALES
6,000
4,000
2,000
CENTRAL EAST NORTH SOUTH WEST
8,000
10,000
12,000
14,000
Num
ber
of u
nits
Source: Knight Frank Research
0
48 74 29
6,68
15,
034
7,69
8
7,43
96,
455
7,40
1
12,0
038,
901
11,6
18
2,27
51,
771
2,93
8
MICRO-MARKETS OF THE BENGALURU
Micro-market Locations
Central MG Road, Lavelle Road, Langford Town, Vitthal Mallya Road, Richmond Road
East Whitefield, Old Airport Road, Old Madras Road, KR Puram, Marathahalli
West Malleswaram, Rajajinagar, Yeshwanthpur, Tumkur Road, Vijayanagar
North Hebbal, Bellary Road, Hennur, Jakkur, Yelahanka, Banaswadi
SouthKoramangala, Sarjapur Road, Jayanagar, JP Nagar, HSR Layout, Kanakapura Road, Bannerghatta Road
• Demand in Bengaluru witnessed sluggish growth of 4% in H2 2015 vis-à-vis H2 2014.
• In terms of sales growth, West Bengaluru leads with 30% increment Y-o-Y. Metro connectivity and availability of lifestyle projects is attracting home-buyers in the region.
• East Bengaluru, accounting for almost 50% of the new launches in the INR 2.5-5 mn ticket size, also saw increased sales in H2 2015, while marginal decline was observed in North and South Bengaluru.
• West Bengaluru the best performing market in the city with lowest QTS
• South Bengaluru, in spite of having the highest launches, performed poorly in H2 2015

15
RESEARCHINDIA REAL ESTATE
Source: Knight Frank Research
FIGURE 5
MICRO-MARKET-WISE QTS VS AGE OF INVENTORY
5
6
7
8
9
10
5 76 98 121110
Age
of u
nsol
d in
vent
ory
in q
uart
ers
QTS
CENTRAL EAST WEST NORTH SOUTH
OFFICE MARKET• The Bengaluru office market
continued to lead the way with the highest office space absorption in the country. With 5 mn sq ft transacted in H2 2015, the city recorded a total absorption of 11.10 mn sq ft in 2015.
• The absorption in 2015 emerged as the highest in four years, falling marginally short of the absorption in 2011.
• Bengaluru attracted substantial occupier interest in 2015, the demand being driven primarily
by the IT/ITeS and e-commerce sectors.
• E-commerce accounted for 3.4 mn sq ft absorption in 2015, including pre-committed deals of 3.2 mn sqft, compared with 0.5 mn sq ft transacted in 2014.
NEW COMPLETION ABSORPTION
FIGURE 1
NEW COMPLETIONS AND ABSORPTION- ANNUAL
2
1
2011 2012 2013 2014 2015
3
4
6
5
13
7
8
9
10
12
11
mn
sq.ft
Source: Knight Frank Research
0
4.3
11.5
7.4
9.4
7.2
9.5
7.5
10.4
8.5
11.1

16
NEW COMPLETION ABSORPTION
FIGURE 3
NEW COMPLETIONS AND ABSORPTION- HALF-YEARLY
2.0
1.0
H1 2014 H2 2014 H1 2015 H2 2015 H1 2016 E
3.0
4.0
5.0
6.0
7.0
mn
sq.ft
Source: Knight Frank Research
0
3.0
6.0
4.5
4.4
4.0
6.1
4.5
5.0
5.5
6.0
STOCK OCCUPIED STOCK VACANCY (RHS)
FIGURE 2
OFFICE SPACE STOCK AND VACANCY LEVELS- HALF-YEARLY
40
20
H1 2014 H2 2014 H1 2015 H2 2015 H1 2016 E
60
80
100
120
140
mn
sq.ft
.
Source: Knight Frank Research
0 0%
2%
4%
6%
8%
12%
10%
109.
597
.9
114.
010
2.3
118.
0
108.
3
122.
511
3.3
128.
0
119.
3
10%
8%8%
7%
11%
FIGURE 4
WEIGHTED AVERAGE RENTAL MOVEMENT
40
35
H1 2012 H2 2012 H1 2013 H2 2013 H1 2014 H2 2014 H1 2015 H2 2015 H1 2016E
45
50
55
INR
/ s
q.ft
./m
onth
Source: Knight Frank Research
30
44.0 45.5
49.0
47.5
47.0 48.5 50.0 51.5 55.0
• Consistent absorption and slightly improved new completions contributed to steady vacancy rates in H2 2015, maintaining it a level of 8%.
• The city is progressively witnessing additions to its total office space stock, currently standing at 122.5 mn sq ft, with the occupied stock at 113.3 mn sq ft.
• The total absorption during H2 2015 was 5 mn sq ft, while 4.5 mn sq ft of new office space came online.
• Going forward, owing to improving business sentiment and the macroeconomic scenario, we expect the office market to sustain its momentum in H1 2016 as well and envisage absorption of approximately 6 mn sq ft.
• The weighted average rental values witnessed an increase of 6%, from `48.5/sq ft/month in H2 2015 to `51.5/sq ft/month in H2 2015.
• Going forward, the weighted average rentals are expected to increase by 7% from the current values in H2 2015 to around `55/sq ft/month in H2 2015.

17
RESEARCHINDIA REAL ESTATE
CHENNAIYashwin BangeraAssistant Vice President - Research

18
RESIDENTIAL MARKET• Annual demand and supply levels
dropped to five-year lows in 2015 as homebuyers and developers continued to shy away from the market, waiting for more concrete signs of revival.
• Development activity continued to erode as stakeholder confidence threatened to weaken further in the face of the infrastructure breakdown during the recent floods. However, the impact was not as bad as expected.
• H2 2015 experienced a 13% drop in launches and a 9% drop in sales, while prices grew at a nominal 1.5% YoY, the lowest in five years.
• However, the unsold inventory has proved to be a silver lining, as it has continuously trended down since H1 2013, from approximately 43,800 units to the current 36,350 units.
• Going forward, we expect H1 2016 to be better than H2 2015, as the first half of the year constitutes the festival season in Chennai and developers prefer to launch their projects during this time of the year. However, YoY growth will be hampered, as the market sentiment is yet to recover from the aftermath of the floods.
• We forecast that H1 2016 will experience launches and absorption levels to the tune of 8,500 and 9,000 units – a modest drop of 7% and 1% YoY, respectively.
CHENNAI MARKET TRENDS
MICRO-MARKETS OF CHENNAI
LAUNCHES ABSORPTION
FIGURE 1
CHENNAI MARKET TRENDS – ANNUAL
10,000
5,000
2011 2012 2013 2014 2015
15,000
20,000
30,000
25,000
40,000
35,000
Num
ber
of u
nits
Source: Knight Frank Research
0
37,0
4128
,013
37,0
7929
,422
24,8
46
24,4
44
18,6
9520
,556
15,4
42
18,5
11
LAUNCHES ABSORPTION WT. AVG. PRICE (RHS)
FIGURE 2
CHENNAI MARKET TRENDS - HALF - YEARLY
4,000
2,000
H1 2014 H2 2014 H1 2015 H2 2015 H1 2016 E
6,000
8,000
10,000
12,000
Num
ber
of u
nits
` /
sq ft
Source: Knight Frank Research
0 3,900
4,100
4,300
4,700
4,500
11,3
7710
,212
7,31
810
,343
9,10
2
9,09
1
6,34
09,
420
8,50
0
9,00
0
Micro-market Locations
Central Chennai Anna Nagar, Adyar, Kilpauk, T. Nagar, Alandur
West Chennai Porur, Ambattur Mogappair, Iyyappanthangal, Sriperumbudur
South Chennai Perumbakkam, Chrompet, Sholinganallur, Guduvancheri, Kelambakkam
North Chennai Tondiarpet, Kolathur, Madhavaram, Perambur

19
RESEARCHINDIA REAL ESTATE
• Buyer behaviour has been largely consistent across the last three periods, with an inevitable dip in demand for South Chennai due to the floods.
• Buyers responded favourably to the increasing and lower-priced supply in the West zone. Western micro-markets, such as Thiruverkadu, saw an increase in traction due to an increased uptake of the lower-priced inventory and good connectivity with SBD locations such as Mount Poonamallee High Road and Valasaravakkam.
• Absorption numbers dropped by 18% in the South zone, while increased homebuyer interest in more affordable locations in the West, such as Thiruverkadu, caused demand to increase 12% YoY in that zone.
• Demand has decelerated by 9% YoY in H2 2015 and over half the buyers bought apartments priced under `5 mn.
• Landmark Constructions, Doshi Housing, Emami Constructions, Vijay Raja Group and Godrej Properties were the most active during this period and contributed to over half of the units launched during H2 2015.
• The QTS of the Chennai residential market has been trending upward steadily, from 6.1 quarters in H2 2013 to 7.4 quarters in H2 2015.
• The budget segment in Chennai has traditionally underperformed in the overall market, as it is plagued with endemic infrastructure and connectivity issues, and the current slowdown has caused it to regress further. Currently, it holds about 10.5 quarters of unsold inventory compared to the 7.4 of the overall market.
• Central Chennai emerged as the best performing micro-market in H2 2015, with a QTS and inventory age of seven quarters each. Comprising locations mostly included in the strong premium
H2 2014 H1 2015 H2 2015
FIGURE 3
MICRO-MARKET SPLIT OF LAUNCHED UNITS
3,000
2,000
1,000
CENTRAL SOUTH
4,000
5,000
6,000
7,000
Num
ber
of u
nits
Source: Knight Frank Research
016
2016
030
6
NORTH
757
9 960
1,74
65,
763
3,20
2
WEST
3,19
53,
170
1,87
3
H2 2014 H1 2015 H2 2015
FIGURE 4
MICRO-MARKET-WISE RESIDENTIAL SALES
3,000
2,000
1,000
CENTRAL SOUTH
4,000
5,000
6,000
7,000
Num
ber
of u
nits
Source: Knight Frank Research
0
610
294
695
NORTH
306
222
184
6,73
56,
190
5,53
4
WEST
2,69
32,
385
3,00
8
segment, this performance can be attributed to the steady demand and steep fall in launches that this zone has been experiencing over the last six quarters.
• Relatively affordable residential prices, proximity to employment hubs and improving social infrastructure continue to drive the South and West micro-markets.
• North Chennai is the worst performing micro-market, with a QTS and age of inventory of just over 10 quarters, though its QTS has been reducing over the last four analysis periods.

20
CENTRAL WEST NORTH SOUTH
Source: Knight Frank Research
FIGURE 5
MICRO-MARKET-WISE QTS VS AGE OF INVENTORY
5
6
7
8
9
10
13
11
12
5 6 7 8 9 10 11 12 13
Age
of u
nsol
d in
vent
ory
in q
uart
ers
QTS
OFFICE MARKET
NEW COMPLETION ABSORPTION
FIGURE 1
NEW COMPLETIONS AND ABSORPTION- ANNUAL
4.0
2.0
2011 2012 2013 2014 2015
6.0
8.0
mn
sq.ft
Source: Knight Frank Research
0
4.5
5.6
6.8
3.3
4.2
3.5
2.6
3.7
2.1
5.1
• The Chennai office space market moved from strength to strength as demand rose for the third consecutive year.
• 2015 recorded 5.1 mn sq ft of absorption, 37% higher than the 3.7 mn sq ft absorbed during 2014. 2015 also witnessed 2.1 mn
sq ft of office space come online, compared to 2.6 mn sq ft in the previous year.
• Spiralling absorption numbers, coupled with falling supply, has pushed down vacancy levels from 24% in 2013 to 15.4% at the end of 2015.
• H2 2015 experienced the highest absorption levels of any half-yearly period in the history of the Chennai office space market on the back of big-ticket transactions by Yes Bank, AstraZeneca, Sutherland and Ericsson among others.

21
RESEARCHINDIA REAL ESTATE
NEW COMPLETION ABSORPTION
FIGURE 3
NEW COMPLETIONS AND ABSORPTION- HALF-YEARLY
1.0
0.5
H1 2014 H2 2014 H1 2015 H2 2015 H1 2016 E
1.5
3
2.5
2.0
mn
sq.ft
Source: Knight Frank Research
0
1.5
1.8
1.1
1.9
0.9
2.0
1.2
3.1
1.4
2.4
STOCK OCCUPIED STOCK VACANCY (RHS)
FIGURE 2
OFFICE SPACE STOCK AND VACANCY LEVELS- HALF-YEARLY
20
10
H1 2014 H2 2014 H1 2015 H2 2015 H1 2016 E
30
40
50
60
70
mn
sq.ft
.
Source: Knight Frank Research
0 0%
5%
10%
15%
20%
25%
57 44 58 45 59 47 60 51 61 53
22.9%
18.9% 19.0%
15.4%13.4%
FIGURE 4
WEIGHTED AVERAGE RENTAL MOVEMENT
42
40
H1 2012 H2 2012 H1 2013 H2 2013 H1 2014 H2 2014 H1 2015 H2 2015 H1 2016E
44
46
54
48
50
52
INR
/ s
q.ft
./m
onth
Source: Knight Frank Research
38
43
45
45
47
48
49
52 52
50
• Rental values have seen a sustained rise since 2012 on the back of steady demand and a lesser amount of office space inventory coming online in successive years.
• Severe shortage of good quality office space in prime areas has turned the market in favour of landlords, who are asking for higher rents from tenants with each passing quarter.
• We expect the demand pipeline to continue to be strong, while supply shows signs of revival.
• This will boost rental levels even further, with an estimated 4% rise in H1 2016 compared to H1 2015.
• We estimate that the strong demand pipeline will push absorption levels up 20% YoY in H1 2016, while around 1.4 mn sq ft is expected to come online during the same period.

22
HYDERABADYashwin BangeraAssistant Vice President - Research

23
RESEARCHINDIA REAL ESTATE
RESIDENTIAL MARKET• 2015 ended on a flat note as the
Hyderabad residential market has yet to show definite signs of recovery in market activity, albeit demand has stayed virtually the same as in 2014.
• While the sales volume fell marginally, by 1% in 2015 compared to the previous year, new launches dropped by a more pronounced 14% during the same period.
• The end of the year did show some promise in terms of supply, as H2 2015 saw an 11% growth in the number of units launched compared to the previous period. On the other hand, the festive season did not boost absorption levels, which stayed largely stagnant.
• Steady absorption, coupled with falling demand, has reduced the unsold inventory levels to their lowest point since 2010.
• These factors helped residential prices, which have been moving at a steady clip, to grow at a 3.1% YoY during H2 2015.
• This prolonged consolidation is expected to persist in H1 2016 as well, as developers wait for further inventory unwinding to continue.
• However, steady demand over the last three half-yearly periods shows a positive undercurrent and leads us to believe that a modest recovery in absorption levels of 5% YoY during H1 2016 is warranted.
HYDERABAD MARKET TRENDS
MICRO-MARKETS OF HYDERABAD
LAUNCHES ABSORPTION
FIGURE 1
HYDERABAD MARKET TRENDS – ANNUAL
16,000
12,000
2011 2012 2013 2014 2015
20,000
24,000N
umb
er o
f uni
ts
Source: Knight Frank Research
8000 19,9
1916
,902
22,7
2519
,050
18,6
43
18,4
28
13,0
5015
,111
11,1
97
14,9
03
LAUNCHES ABSORPTION WT. AVG. PRICE (RHS)
FIGURE 2
HYDERABAD MARKET TRENDS – HALF YEARLY
2,000
1,000
H1 2014 H2 2014 H1 2015 H2 2015 H1 2016 E
3,000
4,000
5,000
6,000
7,000
8,000
9,000
Num
ber
of u
nits
` /
sq ft
Source: Knight Frank Research
0 3,000
3,300
3,600
3,900
7,89
97,
282
5,15
17,
829
5,45
7
7,12
3
5,74
07,
780
5,30
0
7,45
0
Micro-market Locations
HMR – Central Begumpet, Banjara Hills, Jubilee Hills, Panjagutta, Somajiguda
HMR – West Kukatpally, Madhapur, Kondapur, Gachibowli, Raidurgam
HMR – East Uppal, Malkajgiri, L. B. Nagar
HMR – North Kompally, Medchal, Alwal, Quthbullapur
HMR – South Rajendra Nagar, Shamshabad
24
H2 2014 H1 2015 H2 2015
FIGURE 3
MICRO-MARKET SPLIT OF LAUNCHED UNITS
1,500
1,000
500
HMRCENTRAL
HMREAST
HMRNORTH
HMRSOUTH
HMRWEST
2,000
2,500
3,000
3,500
4,000
4,500
Num
ber
of u
nits
Source: Knight Frank Research
0
907
634
657
399
76 59 246
322
867
609
835
166
2,99
03,
590
3,99
1
H2 2014 H1 2015 H2 2015
FIGURE 4
MICRO-MARKET-WISE RESIDENTIAL SALES
1,000
HMRCENTRAL
HMREAST
HMRNORTH
HMRSOUTH
HMRWEST
2,000
3,000
4,000
5,000
Num
ber
of u
nits
Source: Knight Frank Research
0
945
798
782
1,05
682
662
0 909
958
1,35
0
383
463
425
4,53
64,
077
4,60
3
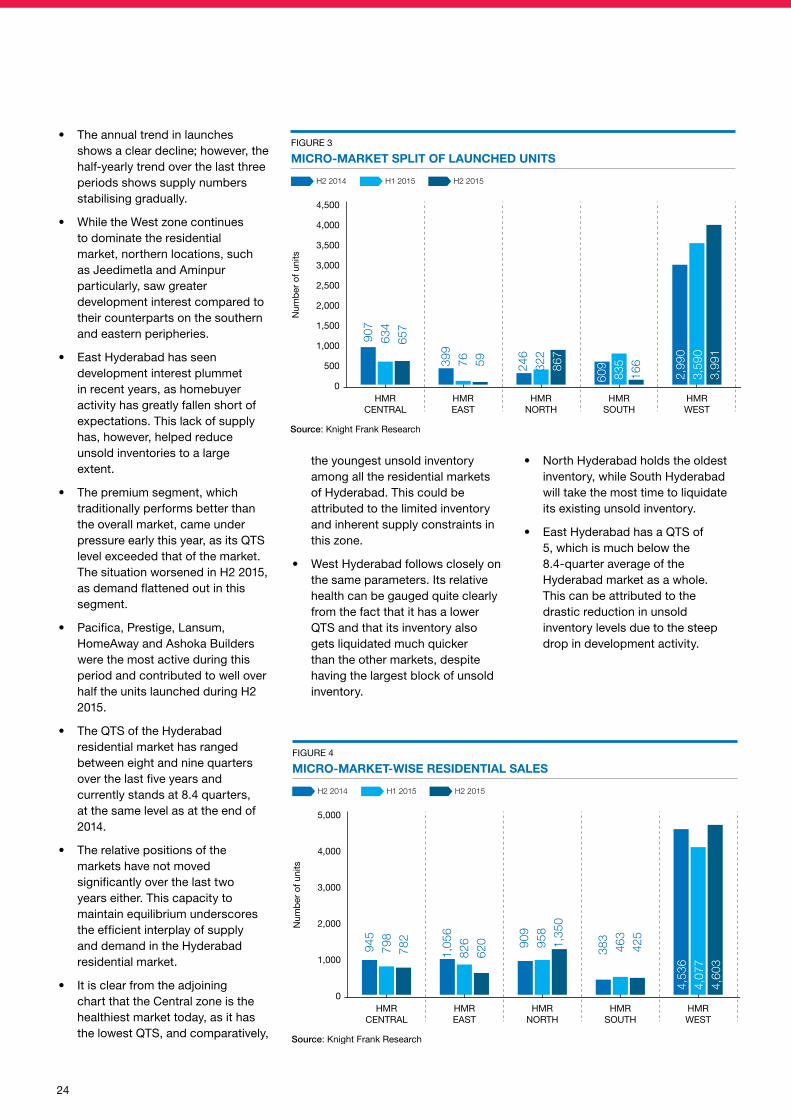
• The annual trend in launches shows a clear decline; however, the half-yearly trend over the last three periods shows supply numbers stabilising gradually.
• While the West zone continues to dominate the residential market, northern locations, such as Jeedimetla and Aminpur particularly, saw greater development interest compared to their counterparts on the southern and eastern peripheries.
• East Hyderabad has seen development interest plummet in recent years, as homebuyer activity has greatly fallen short of expectations. This lack of supply has, however, helped reduce unsold inventories to a large extent.
• The premium segment, which traditionally performs better than the overall market, came under pressure early this year, as its QTS level exceeded that of the market. The situation worsened in H2 2015, as demand flattened out in this segment.
• Pacifica, Prestige, Lansum, HomeAway and Ashoka Builders were the most active during this period and contributed to well over half the units launched during H2 2015.
• The QTS of the Hyderabad residential market has ranged between eight and nine quarters over the last five years and currently stands at 8.4 quarters, at the same level as at the end of 2014.
• The relative positions of the markets have not moved significantly over the last two years either. This capacity to maintain equilibrium underscores the efficient interplay of supply and demand in the Hyderabad residential market.
• It is clear from the adjoining chart that the Central zone is the healthiest market today, as it has the lowest QTS, and comparatively,
the youngest unsold inventory among all the residential markets of Hyderabad. This could be attributed to the limited inventory and inherent supply constraints in this zone.
• West Hyderabad follows closely on the same parameters. Its relative health can be gauged quite clearly from the fact that it has a lower QTS and that its inventory also gets liquidated much quicker than the other markets, despite having the largest block of unsold inventory.
• North Hyderabad holds the oldest inventory, while South Hyderabad will take the most time to liquidate its existing unsold inventory.
• East Hyderabad has a QTS of 5, which is much below the 8.4-quarter average of the Hyderabad market as a whole. This can be attributed to the drastic reduction in unsold inventory levels due to the steep drop in development activity.

25
RESEARCHINDIA REAL ESTATE
Source: Knight Frank Research
FIGURE 5
MICRO-MARKET-WISE QTS VS AGE OF INVENTORY
4
6
8
10
12
14
16
18
20
22
0 105 2015 3025
Age
of u
nsol
d in
vent
ory
in q
uart
ers
QTS
HMR CENTRAL HMR EAST HMR NORTH HMR SOUTH HMR WEST
OFFICE MARKET
NEW COMPLETION ABSORPTION
FIGURE 1
NEW COMPLETIONS AND ABSORPTION- ANNUAL
4.0
2.0
2011 2012 2013 2014 2015
6.0
8.0
mn
sq.ft
Source: Knight Frank Research
0
4.5
5.6
5.1
4.1
6.7
3.7
5.0
4.7
3.9
4.6
• The Hyderabad office space market continues its upward trend as demand stays robust and supply tapers down for the second straight year.
• 2015 recorded 4.6 mn sq ft of absorption, marginally lower than the 4.7 mn sq ft absorbed during 2014. 2015 also saw 3.9 mn sq
ft of office space come online, compared to the 5 mn sq ft in the previous year.
• Robust absorption numbers, coupled with falling supply, has pushed down vacancy levels from 17.7% in 2013 to 14.4% at the end of 2015.
• H2 2015 experienced the highest absorption levels of any half-yearly period in history on the back of big-ticket transactions by Qualcomm, Salesforce, Unitedhealth Group and J.P. Morgan.

26
STOCK OCCUPIED STOCK VACANCY (RHS)
FIGURE 2
OFFICE SPACE STOCK AND VACANCY LEVELS- HALF-YEARLY
20
10
H1 2014 H2 2014 H1 2015 H2 2015 H1 2016 E
30
40
50
60
70
mn
sq.ft
.
Source: Knight Frank Research
0 0%
2%
4%
6%
8%
10%
12%
14%
16%
18%
20%
60 49 61 51 62 52 65 55 67 57
18.6%16.7% 16.3%
14.6% 14.4%
NEW COMPLETION ABSORPTION
FIGURE 3
NEW COMPLETIONS AND ABSORPTION- HALF-YEARLY
1.0
0.5
H1 2014 H2 2014 H1 2015 H2 2015 H1 2016 E
1.5
3.5
3.0
2.5
2.0
mn
sq.ft
Source: Knight Frank Research
0
3.0
1.9
1.9
2.7
1.5
1.4
2.4
3.1
1.9
1.8
FIGURE 4
WEIGHTED AVERAGE RENTAL MOVEMENT
36
34
H1 2012 H2 2012 H1 2013 H2 2013 H1 2014 H2 2014 H1 2015 H2 2015 H1 2016E
38
40
44
42
INR
/ s
q.ft
./m
onth
Source: Knight Frank Research
32
36
37 37 37 37
39
42
43
40
• Rental values have been increasing steadily since 2012 and picked up momentum especially after H2 2014, post the resolution of the Telangana issue, as demand started trending up significantly.
• Severe shortage of good quality office space in prime areas has turned the market in favour of landlords, who are asking for higher rents from tenants with each passing quarter.
• We expect the demand pipeline to continue to be strong, while supply shows some signs of revival.
• This will boost rental levels even further, with an estimated 7% rise in H1 2016 compared to H1 2015.
• We estimate that the strong demand pipeline will push absorption levels up 23% YoY in H1 2016, while close to 1.9 mn sq ft is expected to come online H1 2016.

27
RESEARCHINDIA REAL ESTATE
MUMBAI
Vivek RathiVice President - Research

28
RESIDENTIAL MARKET
• Drastic reduction in new project launches to combat demand slowdown, averted price correction in the MMR residential market.
• In H2 2015, 23% less or 20,776 houses were launched, compared to the same period last year. Demand shrunk by 6% to 34,135 houses.
• As a result of such demand-supply dynamics, the annual price increase in the region stood at just 3%, presenting a great opportunity for homebuyers.
• Developers in the peripheral markets are the most concerned. Many put brakes on new project plans in H2 2015.
• The Peripheral Central Suburbs (Kalyan, Karjat, Kasara, etc.) and Navi Mumbai are the worst hit, seeing launches lower by 44% and 59%, respectively.
• The South and Central Mumbai markets are critical for the industry because of their value. Even though they represent just 3% of the MMR’s unsold inventory volume, they contribute a massive 29% to its value.
• The MMR has an unsold inventory worth `2,020 bn, of which `595 bn is in the South and Central Mumbai markets.
• The premium South and Central Mumbai markets witnessed a ten-fold jump in new project launches, to 956 units in H2 2015 compared to just 100 units in H2 2014.
LAUNCHES ABSORPTION
FIGURE 1
MMR MARKET TREND- ANNUAL
40,000
20,000
2011 2012 2013 2014 2015
60,000
80,000
120,000
100,000
140,000N
umb
er o
f uni
ts
Source: Knight Frank Research
0
114,
710
96,2
26
121,
615
85,9
78
109,
229
74,0
94
62,3
4567
,715
39,6
63
62,5
81
LAUNCHES ABSORPTION WT. AVG. PRICE (RHS)
FIGURE 2
MMR MARKET TRENDS - HALF-YEARLY
10,000
5,000
H1 2014 H2 2014 H1 2015 H2 2015 H1 2016 E
15,000
20,000
25,000
30,000
40,000
35,000
Num
ber
of u
nits
` /
sq ft
Source: Knight Frank Research
0 7,000
7,500
8,000
8,500
35,5
1231
,210
26,8
3336
,505
18,8
87
28,4
46
20,7
7634
,135
16,9
98
29,8
68
MMR MARKET TRENDS

29
RESEARCHINDIA REAL ESTATE
MICRO-MARKETS OF THE MMR
H2 2014 H1 2015 H2 2015
FIGURE 3
MICRO-MARKET SPLIT OF LAUNCHED UNITS
3,000
2,000
1,000
CENTRALMUMBAI
CENTRALSUBURBS
NAVIMUMBAI
PERIPHERALCENTRALSUBURBS
PERIPHERALWESTERNSUBURBS
4,000
5,000
7,000
6,000
8,000
9,000
10,000
Num
ber
of u
nits
Source: Knight Frank Research
0
- - 748
5,24
05,
194
3,22
4
6,63
02,
224
2,72
4
9,78
04,
325
5,46
9
560
1,93
51,
473
SOUTHMUMBAI
100
32 208
THANE
1,39
02,
486
3,91
8
WESTERNSUBURBS
3,13
32,
686
3,01
2
H2 2014 H1 2015 H2 2015
FIGURE 4
MICRO-MARKET-WISE RESIDENTIAL SALES
2,000
CENTRALMUMBAI
CENTRALSUBURBS
NAVIMUMBAI
PERIPHERALCENTRALSUBURBS
PERIPHERALWESTERNSUBURBS
4,000
6,000
8,000
10,000
12,000
Num
ber
of u
nits
Source: Knight Frank Research
0
794
674
636
3,06
82,
728
3,05
6
6,21
84,
554
5,44
3
11,5
558,
716
9,67
7
7,66
35,
904
7,45
1
SOUTHMUMBAI
145
125
220
THANE
2,73
32,
074
3,09
7
WESTERNSUBURBS
4,33
03,
671
4,55
5
Micro-market Locations
Central Mumbai Dadar, Lower Parel, Mahalakshmi, Worli, Prabhadevi
Central Suburbs Sion, Chembur, Wadala, Kurla, Ghatkopar, Vikhroli, Bhandup, Mulund
Navi Mumbai Vashi, Nerul, Belapur, Kharghar, Airoli, Panvel, Ulwe, Sanpada
Peripheral Central Suburbs Kalyan, Kalwa, Dombivli, Ambernath, Bhiwandi, Mumbra, Karjat
Peripheral Western Suburbs Vasai, Virar, Boisar, Palghar, Bhayandar, Nala Sopara
South Mumbai Malabar, Hill, Napean Sea Road, Walkeshwar, Altamount Road, Colaba
Thane Naupada, Ghodbunder Road, Pokhran Road, Majiwada, Khopat, Panchpakhadi
Western Suburbs Bandra, Andheri, Goregaon, Kandivali, Borivali, Santacruz, Vile Parle

30
• Even though demand shrunk by 6% in the MMR, Thane bucked the trend with a growth of 13%.
• Good connectivity to office markets, coupled with the right ticket size products made Thane successful in attracting buyers. Incidentally, Thane’s Majiwada–Kasarvadavali belt also featured as a top investment destination in our last report.
• Incremental infrastructure in terms of the 32-km Mumbai Metro Line 4 (Wadala–Ghatkopar–Thane–Kasarvadavali) is scheduled for implementation in 2017–2023.
• Employment hubs in the peripheral business district (PBD), which includes the office markets of Thane and Navi Mumbai, have an office stock of 23 mn sq ft, out of which 5.4 mn sq ft is present in localities such as Wagle Estate and Ghodbunder Road, Thane. Going forward, we estimate an incremental office space addition of 13.7 mn sq ft in the PBD in the next five years (2016–2020). Of this, approximately 5 mn sq ft (62,500 jobs) will be in Wagle Estate and Ghodbunder Road.
• A silver lining emerged in the MMR residential market, in terms of lower unsold inventory and QTS. The MMR QTS has come down from 12 in Dec 2014 to 11 in Dec 2015 on account of the sharp decline in new launches. At 181,000 units, the unsold inventory is 11% lower than its previous 204,070 units.
• Going forward in H1 2016, infrastructure thrust, the improving office market and stable house prices will aid the housing market revival.
• The Central and state governments are pushing critical transit-oriented infrastructure projects in the MMR and aim at completion by 2019.
1 The Mumbai Trans Harbour Link has secured the environment clearance, and the bidding process will begin in March 2016.
2 Mumbai’s coastal road has secured the forest and CRZ clearances. The bidding process will begin in June 2016.
3 The metro rail for the Dahisar to DN Nagar, Dahisar East to Andheri East, and Cuffe Parade
to SEEPZ corridors has been expedited. Construction is to begin this year.
4 The Navi Mumbai International Airport construction contract is to be awarded by June 2016.
• Amidst demand revival, new launches are to be lower and prices stagnant on account of the inventory backlog.
Source: Knight Frank Research
FIGURE 5
MICRO-MARKET-WISE QTS VS AGE OF INVENTORY
5
8
11
14
17
20
5 8 1411 2017
Age
of u
nsol
d in
vent
ory
in q
uart
ers
QTS
CENTRAL MUMBAI
CENTRAL SUBURBS
NAVI MUMBAI
PERIPHERAL CENTRAL SUBURBS
PERIPHERAL WESTERN SUBURBSSOUTH MUMBAI
THANEWESTERN SUBURBS

31
RESEARCHINDIA REAL ESTATE
OFFICE MARKET
• In 2015, demand exceeded supply for the first time in the MMR since 2008, as only 5.8 mn sq ft of new project completions were recorded against an occupier demand of 7.5 mn sq ft.
• In H2 2015, new completions comprised 3.5 mn sq ft or 45% lower and absorption was at 5 mn sq ft or 3% higher than same period last year.
• As a result of the improving demand-supply equation, the vacancy level trended down from 22.6% in H2 2014 to 20% in H2 2015.
• Surpassing the BFSI sector, the IT/ITeS industry emerged as the top occupier of office space in the MMR, contributing 46% of the demand in H2 2015 compared to 26% in H2 2014.
• The manufacturing sector boosted its share even further, with leading engineering and pharmaceutical companies taking up more space in H2 2015 compared to the same period last year.
• With an 83% jump in demand, e-commerce raised its head. The sector generated 122,000 sq ft of office demand in H2 2015, led by players such as Amazon, Zomato and Toppr.
• The demand share of the PBD (Thane and Navi Mumbai) increased from 32% in H2 2014 to 53% in H2 2015 on account of the robust demand from the IT/ITeS industry.
• The IT/ITeS industry remained an active consumer of office space in the relatively affordable, yet well connected peripheral markets of
Thane and Thane-Belapur Road.
• The IT/ITeS occupier thrust also ensured a jump of 34% in the average deal size, from 27,700 sq ft in H2 2014 to 37,300 sq ft in H2 2015.
NEW COMPLETION ABSORPTION
FIGURE 1
NEW COMPLETIONS AND ABSORPTION- ANNUAL
4.0
2.0
2011 2012 2013 2014 2015
6.0
8.0
12.0
10.0
16.0
14.0
mn
sq.ft
.
Source: Knight Frank Research
0
14.5
8.0
12.0
6.0
7.6
6.2
9.2
7.3
5.8
7.5
STOCK OCCUPIED STOCK VACANCY (RHS)
FIGURE 2
OFFICE SPACE STOCK AND VACANCY LEVELS- HALF-YEARLY
40
20
H1 2014 H2 2014 H1 2015 H2 2015 H1 2016 E
60
80
100
120
140
mn
sq.ft
.
Source: Knight Frank Research
0 18%
19%
20%
21%
22%
23%
106
82 112
87 114
89 118
94 121
79
22.5% 22.6%
21.9%
20.0%19.7%

32
NEW COMPLETION ABSORPTION
FIGURE 3
NEW COMPLETIONS AND ABSORPTION- HALF-YEARLY
4.0
2.0
H1 2014 H2 2014 H1 2015 H2 2015 H1 2016 E
6.0
8.0
mn
sq.ft
Source: Knight Frank Research
0
2.9
2.5
6.4
4.8
2.3
2.5
3.5
5.0
2.9
2.8
• Owing to the improved demand-supply dynamics, office market rents are trending up.
• Government focus, and IT/ITeS and manufacturing sector leadership will improve the MMR office market prospects, going forward.
• New completions will grow by 26% in H1 2016 and absorption will improve steadily by 9%, translating into a lower vacancy level of 19.7% compared to 21.9% during the same period last year.
BUSINESS DISTRICT-WISE RENTAL MOVEMENT
Business districtRental value range in H2 2015 (`/sq ft/
month)6-month change
BKC & off-BKC 210–310 2%
CBD & off-CBD 160–260 -2%
Central Mumbai 150–190 2%
PBD 50–70 3%
SBD Central 80–130 -1%
SBD West 90–130 3%
Source: Knight Frank Research

33
RESEARCHINDIA REAL ESTATE
NCRAnkita SoodConsultant - Research

34
RESIDENTIAL MARKET• NCR saw the leanest year in terms
of new launches since 2010.
• Dropping to 63,460 units in 2015, new launches registered a 20% dip YoY compared to the same period in 2014.
• Piling-up inventory and a low sales velocity led developers to restrict the supply of new launches in 2015.
• New launches in NCR have been on a constant decline since 2010. The average number of launched units has come down from 86,000 in 2010 to 31,700 units in 2015.
• Residential projects under the Haryana government’s Affordable Housing Policy 2013 contributed significantly to the new launches in NCR in H1 2015.
• However, developers released their pent-up supply in the market in H2 2015, pinning new launches at 34,000 units – a 15% increase from H1 2015.
• On the other hand, demand also witnessed a recovery in H2 2015. The market registered a 15% recovery in sales in H2 2015 compared to the same period in 2014.
• Along with the impact of macroeconomic factors, delays in the delivery of some major large-scale projects had put buyers on the back foot.
• The growth rate of the weighted average price has been witnessing a downward trend since 2013, and has slowed down considerably, from 6% in H1 2013 to a mere 1% in H2 2015.
• This muted price growth of three years indicates that residential real estate is facing a strong price resistance against unattractive and unaffordable prices in NCR.
NCR MARKET TRENDS
LAUNCHES ABSORPTION
FIGURE 1
NCR MARKET TREND- ANNUAL
40,000
20,000
2011 2012 2013 2014 2015
60,000
80,000
180,000
160,000
140,000
120,000
100,000
200,000N
umb
er o
f uni
ts
Source: Knight Frank Research
0
172,
571
117,
559
110,
751
93,9
86
100,
259
74,0
94
79,5
7748
,630
63,4
58
48,8
00
LAUNCHES ABSORPTION WT. AVG. PRICE (RHS)
FIGURE 2
NCR MARKET TRENDS - HALF-YEARLY
10,000
5,000
H1 2014 H2 2014 H1 2015 H2 2015 H1 2016 E
15,000
20,000
25,000
30,000
35,000
40,000
45,000
50,000
Num
ber
of u
nits
` /
sq ft
Source: Knight Frank Research
0 4,300
4,350
4,400
4,600
4,450
4,500
4,550
34,5
7728
,000
45,0
0020
,630
29,4
58
25,0
00
34,0
0023
,800
28,0
00
26,0
00

35
RESEARCHINDIA REAL ESTATE
H2 2014 H1 2015 H2 2015
FIGURE 3
MICRO-MARKET SPLIT OF LAUNCHED UNITS
6,000
4,000
2,000
8,000
12,000
10,000
16,000
20,000
18,000
14,000
Num
ber
of u
nits
Source: Knight Frank Research
0DELHI
95 573
71FARIDABAD
344
254
260
GHAZIABAD
7,79
03,
620
5,88
6
GREATERNOIDA
18,4
015,
240
13,9
03
GURGAON
12,0
0215
,138
9,06
8
NOIDA
6,36
84,
664
4,81
1
H2 2014 H1 2015 H2 2015
FIGURE 4
MICRO-MARKET-WISE RESIDENTIAL SALES
6,000
4,000
2,000
8,000
14,000
12,000
10,000
Num
ber
of u
nits
Source: Knight Frank Research
0DELHI
59 166
65
FARIDABAD
382
396
463
GHAZIABAD
4,17
95,
064
4,88
2
GREATERNOIDA
8,98
610
,846
10,5
18
GURGAON
3,94
44,
774
4,45
1NOIDA
3,08
03,
753
3,42
1
• Greater Noida continues to have the maximum number of project launches in NCR, with a 40% share of the total new launches in H2 2015. A massive 88% of the new launches fall in the `2.5–5 mn category.
• Affordable and mid-segment project launches saw a push in Ghaziabad, with 79% of the total new launches falling in the `<5 mn category.
• Both Greater Noida and Ghaziabad have established themselves as affordable residential choices, with the lowest capital values in NCR.
• Gurgaon also contributed significantly to the new launches in NCR in H2 2015, taking up 27% of the overall pie. A substantial 35% of the new launches fall in the `2.5–7.5 mn category.
• Approximately 23,800 units were sold in the second half of 2015, compared to 20,630 units in H2 2014, thus registering a YoY increase of 15%.
• Affordability drives sales in the micro-markets of Greater Noida and Ghaziabad. Both these markets together make up a considerable 64% share of the overall sales in H2 2015.
• Gurgaon registered a 13% uptick in sales in H2 2015 compared to the same period in 2014. Fresh launches in New Gurgaon and New Sohna have provided buyers with several options in the steep price market of Gurgaon.
• Though 2015 was the leanest in terms of new launches, the slowdown in sales velocity has pushed the QTS to nearly five years.
• The unsold inventory stands at approximately 206,028 units till December 2015.
• Pushed by the affordable and mid-segment demand, Ghaziabad and Greater Noida are the best performing markets of NCR, with a QTS of 14 and 15, respectively.
Source: Knight Frank Research
FIGURE 5
MICRO-MARKET-WISE QTS VS AGE OF INVENTORY
6
8
10
12
16
14
18
12 1614 2018 28 30 32 383634262422
Age
of u
nsol
d in
vent
ory
in q
uart
ers
QTS
DELHI FARIDABAD GHAZIABAD GREATER NOIDA GURGAON NOIDA

36
OFFICE MARKET
NEW COMPLETION ABSORPTION
FIGURE 1
NEW COMPLETIONS AND ABSORPTION- ANNUAL
4.0
2.0
2011 2012 2013 2014 2015
6.0
8.0
12.0
10.0
14.0
mn
sq.ft
Source: Knight Frank Research
0
12.6
7.2
9.6
6.4
7.0
6.6
8.1
7.6
11.1
7.4
STOCK OCCUPIED STOCK VACANCY (RHS)
FIGURE 2
OFFICE SPACE STOCK AND VACANCY LEVELS- HALF-YEARLY
40
20
H1 2014 H2 2014 H1 2015 H2 2015 H1 2016 E
60
80
100
120
160
140
mn
sq.ft
.
Source: Knight Frank Research
0 18%
19%
20%
21%
22%
23%
121.
696
.5
126.
010
1.0
131.
7
104.
4
138.
710
8.1
143.
2
111.
6
21%
20%
21%
22% 22%
• The NCR office market maintained its absorption appetite, achieving a total of 7.4 mn sq ft of absorbed space at the end of 2015.
• Gurgaon emerged as the most preferred business district in NCR, taking up 66% of the total absorption pie.
• A pent-up supply of 11 mn sq ft in the NCR market led to a 37% growth in new completions in 2015 compared to the previous year.
• Quality office space attracts occupiers, and instead of high volume, it was the high-value transactions that characterised the market in 2015.
• The office stock in NCR stood at 139 mn sq ft till the end of Dec 2015, of which 108 mn sq ft is occupied stock.
• The influx of pent-up project completions in the second half has been instrumental in nudging the vacancy levels from 20.7% in H1 2015 to 22% in H2 2015, with the micro-market of Greater Noida contributing significantly to the new supply.

37
RESEARCHINDIA REAL ESTATE
NEW COMPLETION ABSORPTION
FIGURE 3
NEW COMPLETIONS AND ABSORPTION- HALF-YEARLY
4.0
3.0
2.0
1.0
H1 2014 H2 2014 H1 2015 H2 2015 H1 2016 E
7.0
6.0
5.0
8.0
mn
sq.ft
Source: Knight Frank Research
0
4.0
3.5
4.1
4.1
5.5
3.7
7.0
3.7
4.5
3.5
FIGURE 4
WEIGHTED AVERAGE RENTAL MOVEMENT
54
52
H1 2012 H2 2012 H1 2013 H2 2013 H1 2014 H2 2014 H1 2015 H2 2015 H1 2016E
56
58
68
62
64
66
60
INR
/ s
q.ft
./m
onth
Source: Knight Frank Research
50
53 53
52
53
56
58
62
64
67
• On the half-yearly demand side, office leasing in NCR saw a marginal 10% dip in leasing activity in H2 2015 compared to the same period in 2014.
• The total absorption during H2 2015 was 3.7 mn sq ft, while 7 mn sq ft of new office space came online.
• Going forward, we expect the office market of NCR to sustain its half-yearly momentum in H1 2016 as well, and envisage the absorption of approximately 3.5 mn sq ft.
• The weighted average rental values witnessed a sharp increase of 11%, from `58 per sq ft per month in H2 2014 to `64 per sq ft per month in H2 2015.
• Going forward, we expect the weighted average rentals to increase by 5% from the current values in H2 2015 to around `67 per sq ft per month in H1 2016.
• However, quality office space in micro-markets such as Gurgaon is expected to witness a significant upward pressure on price.

38
PUNEHetal BachkaniwalaVice President - Research

39
RESEARCHINDIA REAL ESTATE
RESIDENTIAL MARKET• 2015 was the best time to buy
property in Pune, as the steady sales volume and stagnant price growth provided an ideal opportunity for homebuyers.
• While the sales volume grew marginally by 4% during 2015 compared to the previous year, new launches dropped by 8% during the same period.
• However, encouraged by the consistent growth in sales volume, developers were back in action during H2 2015. New launches increased by 9% during H2 2015 compared to H2 2014.
• Nonetheless, new launches are still happening at old prices. The majority of the new launches during H2 2015 are in price ranges similar to those of H1 2015.
• The price growth in Pune has fallen from above 12% to less than 2% over the last three years. This consistent drop in price growth presented a good opportunity for homebuyers to buy property.
• Going forward, developers are expected to push new launches during H1 2016 on the back of the steady sales volume. We expect a 9% jump in new launches during H1 2016 compared to H1 2015.
• The majority of these new launches would be focused in peripheral areas, such as Wagholi, Dhanori, Hinjewadi, Shivane, Pisoli and Pirangut, among others.
• We estimate that most of these new launches will be at 2015 prices, as the scope for a price rise is limited, given the huge unsold inventory in these locations.
PUNE MARKET TRENDS
LAUNCHES ABSORPTION
FIGURE 1
PUNE MARKET TREND- ANNUAL
20,000
10,000
2011 2012 2013 2014 2015
30,000
40,000
60,000
50,000
Num
ber
of u
nits
Source: Knight Frank Research
0
54,1
4745
,725
55,9
7148
,017
45,3
72
38,7
95
33,5
8034
,870
30,8
90
36,2
60
LAUNCHES ABSORPTION WT. AVG. PRICE (RHS)
FIGURE 2
PUNE MARKET TRENDS - HALF-YEARLY
10,000
5,000
H1 2014 H2 2014 H1 2015 H2 2015 H1 2016 E
15,000
20,000
25,000
Num
ber
of u
nits
` /
sq ft
Source: Knight Frank Research
0 4,400
4,600
4,800
5,000
16,8
8014
,720
16,7
0020
,150
12,7
60
15,5
20
18,1
3020
,740
13,9
00
16,5
00
Micro-market Locations
CentralKoregaon Park, Boat Club Road, Erandwane, Deccan, Kothrud, Model Colony
East Viman Nagar, Kharadi, Wagholi, Hadapsar, Dhanori
West Aundh, Baner, Wakad, Hinjewadi, Bavdhan, Pashan
North Pimpri, Chinchwad, Moshi, Chikhali, Chakan, Talegaon
South Kondhwa, Ambegaon, Undri, Dhayari, Warje, Sinhgad Road
Micro markets of Pune

40
• Mid-segment housing is leading in terms of sales traction. The maximum sales traction is being witnessed in the mid segment (ticket size between of `2.5 mn - 10 mn), with the premium (ticket size above `20 mn) and budget (ticket size below `2.5 mn) segments lagging behind.
• Despite its low ticket size, the budget segment is not witnessing sufficient traction due to the considerable distance of these projects from the major employment centres of the city. Additionally, the lack of social infrastructure has resulted in a lukewarm response from homebuyers towards this segment. Some of the prominent locations in the budget segment are Lonikand, Pirangut, Pisoli, Phursungi and Shivane.
• The stress level in the premium segment is reducing due to falling launches and a steady sales volume. While the sales volume has remained consistent, in the range of 180 - 240 units in each of the six-monthly periods since 2013, new launches have been decreasing steadily from 492 units in H2 2013 to zero during H2 2015. Some of the prominent locations in the premium segment are Koregaon Park, Boat Club Road, Kalyani Nagar, Prabhat Road and Bhosale Nagar.
• South Pune witnessed a phenomenal recovery in the last two years. One of the worst performing zones in H1 2014, it has emerged as one of the best performing markets in H2 2015. The QTS (quarters to sell unsold inventory) has fallen from 9 in H1 2014 to less than 5.7 in H2 2015.
• A steady sales volume, fewer new launches and lower ticket sizes have helped South Pune improve its performance compared to the city’s other zones. The advantage of being located between the two major employment hubs of Hinjewadi in the east & and the
Hadapsar-Kharadi belt in the west has sustained homebuyer interest in this zone.
• West Pune continues to be the best performing zone in Pune, with a QTS of 5.7 in H2 2015. Strong demand, on the back of the incremental employment generation in Hinjewadi and Wakad, has helped this zone sustain in terms of sales volume.
• The situation in Central Pune has worsened, as sales volume in this zone has been falling consistently since 2013. Higher ticket sizes and a lack of investor interest have resulted in Central Pune’s poor performance.
H2 2014 H1 2015 H2 2015
FIGURE 3
MICRO-MARKET SPLIT OF LAUNCHED UNITS
3,000
2,000
1,000
CENTRAL EAST WEST NORTH SOUTH
4,000
5,000
6,000
Num
ber
of u
nits
Source: Knight Frank Research
038
255
416
0
4,84
23,
046
5,47
0
2,79
65,
120
5,71
0
5,31
62,
374
2,73
3
3,33
61,
666
4,05
7
H2 2014 H1 2015 H2 2015
FIGURE 4
MICRO-MARKET-WISE RESIDENTIAL SALES
3,000
2,000
1,000
CENTRAL EAST WEST NORTH SOUTH
4,000
5,000
6,000
Num
ber
of u
nits
Source: Knight Frank Research
0
414
273
310
4,96
34,
013
5,44
4
5,30
84,
254
6,30
7
4,61
13,
633
3,71
4
4,85
33,
351
4,96
6

41
RESEARCHINDIA REAL ESTATE
• Office space demand in Pune continues to outstrip new completions for the fourth straight year. 2015 recorded 5.2 mn sq ft of absorption, which was 15% higher than the 4.5 mn sq ft mark in 2014.
• In terms of new completions, only 2.7 mn sq ft of office space was delivered during the year led by Blue Ridge in Hinjewadi and Commerzone in Yerwada. This was higher by 6% from the 2.5 mn sq ft delivered during 2014.
• With demand consistently outstripping supply, vacancy levels have witnessed a free fall from 28% in 2009 to 11% in 2015.
• H2 2015 recorded one of the highest absorptions, at 3 mn sq ft. This was 26% higher than H2 2014, when 2.4 mn sq ft of space was absorbed. Certain large-sized deals by companies such as HSBC, Siemens and Northern Trust Bank have helped in pushing the absorption numbers to this level.
• On the other hand, new completions have remained tepid at 1.1 mn sq ft during H2 2015. Although this is more than double the 0.5 mn sq ft achieved during H2 2014, it is still considerably lower in comparison to absorption.
CENTRAL EAST WEST NORTH SOUTH
Source: Knight Frank Research
FIGURE 5
MICRO-MARKET-WISE QTS VS AGE OF INVENTORY
6
7
8
9
10
11
5 7 9 11
Age
of u
nsol
d in
vent
ory
in q
uart
ers
QTS
OFFICE MARKET
NEW COMPLETION ABSORPTION
FIGURE 1
NEW COMPLETIONS AND ABSORPTION- ANNUAL
2
1
2011 2012 2013 2014 2015
3
4
5
6
mn
sq.ft
Source: Knight Frank Research
0
3.6
3.2
2.2
3.0
3.6
4.0
2.5
4.5
2.7
5.2

42
• Rental values have been on a steady rise since 2012 as demand continues to surpass new supply. Currently, the weighted average rent in Pune is around `56 per sq ft per month - 50% higher than in 2012.
• Severe shortage of good quality office space in prime areas has turned the market in favour of landlords, who are asking for higher rents from tenants with each passing quarter.
• While absorption is expected to hold steady at its H1 2015 level of 2.2 mn sq ft, new completions are estimated to drop further in H1 2016, by 44% to 0.86 mn sq ft.
• Since no new major office projects are expected to be completed in the coming six months, vacancy levels will witness a further fall to the single-digit level.
• This will put additional pressure on rents, which are estimated to rise by 22% in H1 2016 compared to H1 2015.
NEW COMPLETION ABSORPTION
FIGURE 3
NEW COMPLETIONS AND ABSORPTION- HALF-YEARLY
1.0
0.5
H1 2014 H2 2014 H1 2015 H2 2015 H1 2016 E
1.5
2.0
2.5
3.0
3.5
mn
sq.ft
Source: Knight Frank Research
0 2.0
2.1
0.5
2.4
1.5
2.2
1.1
3.0
0.9
2.2
STOCK OCCUPIED STOCK VACANCY (RHS)
FIGURE 2
OFFICE SPACE STOCK AND VACANCY LEVELS- HALF-YEARLY
20
10
H1 2014 H2 2014 H1 2015 H2 2015 H1 2016 E
30
40
50
60
70
mn
sq.ft
.
Source: Knight Frank Research
0 0%
5%
10%
15%
20%
25%
54.3
43.4
54.8
45.8
56.3
47.9
57.5
51.0
58.3
53.2
20%
16%15%
11%9%
FIGURE 4
WEIGHTED AVERAGE RENTAL MOVEMENT
45
40
H1 2012 H2 2012 H1 2013 H2 2013 H1 2014 H2 2014 H1 2015 H2 2015 H1 2016E
50
55
60
65
INR
/ s
q.ft
./m
onth
Source: Knight Frank Research
35
37 37
39
41
43
47
50
56
61

43
RESEARCHINDIA REAL ESTATE

AHMEDABAD | BENGALURU | CHENNAI | HYDERABAD | MUMBAI | NCR | PUNE
RESEARCH
Knight Frank Research Reports are available at KnightFrank.com/Research
© Knight Frank India Pvt.Ltd
RESEARCH Dr. Samantak DasChief Economist and National Director, [email protected]
RESIDENTIAL AGENCY Mudassir ZaidiNational Director, Residential [email protected]
OFFICE AGENCYViral DesaiNational Director, Of�ce Agency [email protected]
CAPITAL MARKETSRajeev BairathiExecutive Director, Capital [email protected]
ADVISORYSaurabh MehrotraNational Director, Advisory [email protected]
CITIES
Mumbai (Corporate Office)Shishir BaijalChairman & Managing Director [email protected]
AhmedabadBalbirsingh Khalsa, National [email protected]
BengaluruSatish BN, Executive [email protected]
ChennaiKanchana Krishnan, Director [email protected]
HyderabadVasudevan Iyer, [email protected]
NCRRajeev Bairathi, Executive [email protected]
PuneShantanu Mazumder, [email protected]
For the latest news, views and analysisof the commercial property market, visit
knightfrankblog.com/commercial-briefing/
COMMERCIAL BRIEFING
This report is published for general information only and not to be relied upon in anyway. Although high standards have been used in the preparation of the information analysis, views and projections presented in the report, no responsibility or liability whatsoever can be accepted by Knight Frank for any loss or damage resultant from any use of, reliance on or reference to the contents of this document.As a general report this material does not necessarily represent the view of Knight Frank in relation to particular properties or projects. Reproduction of this report in whole or in part is not allowed without prior written approval of Knight Frank to the form and content within which it appears.
Knight Frank India research provides development and strategic advisory to a wide range of clients worldwide. We regularly produce detailed and informative research reports which provide valuable insights on the real estate market. Our strength lies in analysing existing trends and predicting future trends in the real estate sector from the data collected through market surveys and interactions with real estate agents, developers, funds and other stakeholders.
RECENT MARKET-LEADING RESEARCH PUBLICATIONS
GLOBAL CITIES 2016 REPORT
GUJARAT’SSHINING JEWELS
RESIDENTIALINVESTMENT ADVISORYREPORT 2016
IND
IA R
EA
L ES
TATE
- RE
SID
EN
TIA
L AN
D O
FF
ICE
JULY
- DE
CE
MB
ER
2015
INDIA REAL ESTATERESIDENTIAL AND OFFICE JULY - DECEMBER 2015
REAL ESTATESENTIMENT INDEXQ3 2015
For the latest news, views and analysisof the commercial property market, visit
knightfrankblog.com/commercial-briefing/
COMMERCIAL BRIEFING
CIN No. – U74140MH1995PTC093179