Commercial Real Estate: Is Another Crisis Looming? Commercial Real Estate Mortgages and...
22
CORNERSTONE RESEARCH Commercial Real Estate: Is Another Crisis Looming? Commercial Real Estate Mortgages and Mortgage-Backed Securities
-
Upload
independent -
Category
Documents
-
view
1 -
download
0
Transcript of Commercial Real Estate: Is Another Crisis Looming? Commercial Real Estate Mortgages and...
CORNERSTONE RESEARCH
Commercial Real Estate: Is Another Crisis Looming?
Commercial Real Estate Mortgages and Mortgage-Backed Securities

Cornerstone Research specializes in assisting attorneys with the complex business issues encountered in litigation and regulatory proceedings. Our staff and experts possess distinctive skills and experience in using economic, financial, accounting, and market-ing research to analyze the issues of a case and develop effective testimony. We provide objective, state-of-the-art analysis that has earned us a reputation for excellence and effectiveness.
We maintain a close relationship with many leading academic and industry experts throughout the country and, through them, have access to even broader networks of expertise.
Reports such as this one are purposely brief, often summarizing published works or other research by Cornerstone Research consultants and affiliated experts, and do not necessarily repre-sent the views of Cornerstone Research.
Additional information about Cornerstone Research consulting services is available through our Boston, Los Angeles, Menlo Park, New York, San Francisco, and Washington, DC, offices as well as from www.cornerstone.com.

1
CORNERSTONE RESEARCH
OVERVIEW
With more than $1 trillion in commercial real estate loans maturing over the next few years, there is some concern that the commercial real estate market will follow the residential real estate market into a sharp decline that has negative consequences for the national economy. Although commercial real estate differs substantially from residential real estate, both in terms of the characteristics of the properties and the means by which property transactions are financed, there has recently been open speculation about an impending commercial real estate crisis. While some market participants believe that the commercial real estate market is headed for a recovery along with the rest of the economy, others continue to warn that significant downside risk remains in the market. For example, the Federal Open Market Committee noted in its June 2010 meeting that the outlook in commercial real estate markets remained weak, with commercial property prices falling, commercial property sales volume remaining light, and the delinquency rate for securitized commercial mortgages continuing to climb.1 Federal Deposit Insurance Corporation (FDIC) Chairman Sheila Bair observed in a July 21, 2010, interview that, while construction and development loan portfolios have already experienced significant losses, the problems in other types of commercial real estate loans will play out over a longer period of time, and their severity will depend upon conditions in the economy.2 Fitch Ratings reported on July 30, 2010, that defaults on fixed-rate conduit U.S. commercial mortgage-backed securities (CMBS) loans were continuing at record speeds, with an 11 percent cumulative default rate expected by year-end 2010.3
This monograph provides a brief overview of commercial real estate markets, commercial real estate lending, and the securitization of commercial real estate mortgages. It also examines recent developments in commercial real estate markets that have led to concerns about a potential commercial mortgage crisis and discusses the regulatory measures intended to ward off such a crisis.
2
CORNERSTONE RESEARCH
COMMERCIAL/MULTIFAMILY MORTGAGE BANKERS ORIGINATIONS INDEXSource: Mortgage Bankers Association
Figure 1
0
50
100
150
200
250
300
2002 2009200820072006200520042003
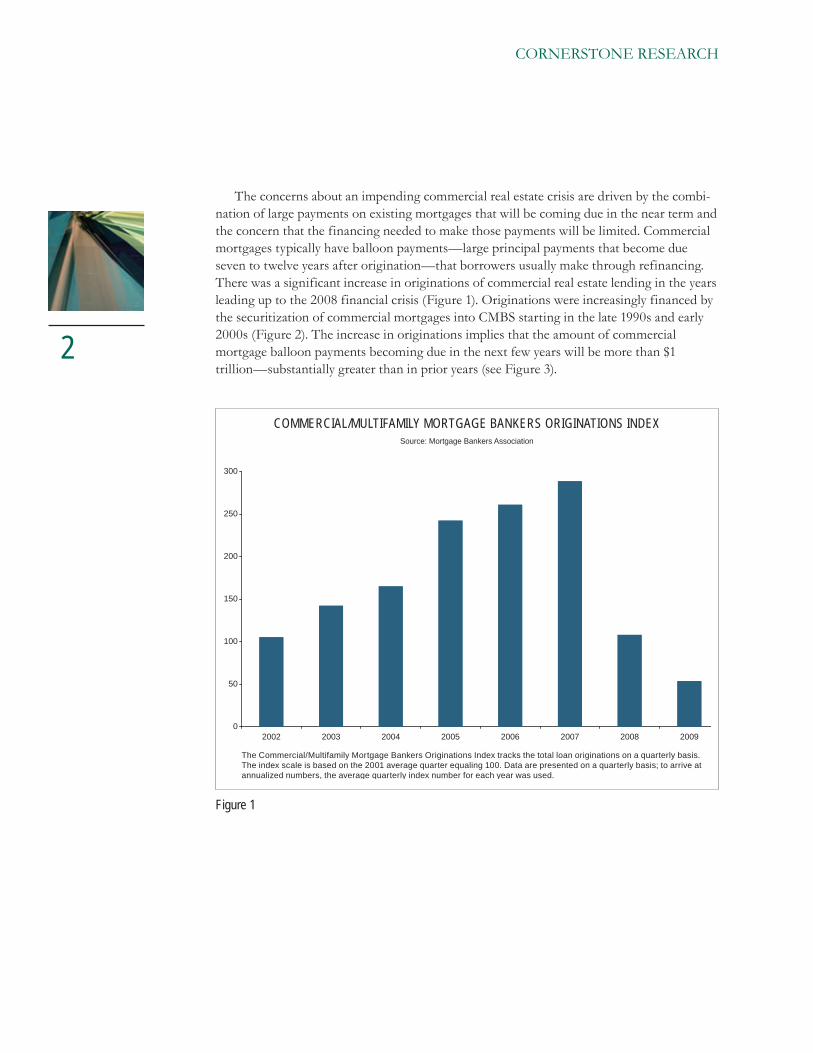
The Commercial/Multifamily Mortgage Bankers Originations Index tracks the total loan originations on a quarterly basis. The index scale is based on the 2001 average quarter equaling 100. Data are presented on a quarterly basis; to arrive at annualized numbers, the average quarterly index number for each year was used.
The concerns about an impending commercial real estate crisis are driven by the combi-nation of large payments on existing mortgages that will be coming due in the near term and the concern that the financing needed to make those payments will be limited. Commercial mortgages typically have balloon payments—large principal payments that become due seven to twelve years after origination—that borrowers usually make through refinancing. There was a significant increase in originations of commercial real estate lending in the years leading up to the 2008 financial crisis (Figure 1). Originations were increasingly financed by the securitization of commercial mortgages into CMBS starting in the late 1990s and early 2000s (Figure 2). The increase in originations implies that the amount of commercial mortgage balloon payments becoming due in the next few years will be more than $1 trillion—substantially greater than in prior years (see Figure 3).

Figure 2
COMMERCIAL MORTGAGE-BACKED SECURITIES ISSUANCESDollars in Billions
Source: Bloomberg
$0
$50
$100
$150
$200
$250
$300
1991 1992 1993 1994 1995 1996 1997 1998 1999 2009200820072006200520042003200220012000
Per Bloomberg, 1991 was the first year of U.S. CMBS issuances greater than $1 billion.
Figure 3
COMMERCIAL MORTGAGE MATURITIES
Dollars in BillionsSource: Foresight Analytics
$0
$50
$100
$150
$200
$250
$300
$350
1980 199519901985 20202015201020052000
Multifamily
Nonresidential Commercial
3
CORNERSTONE RESEARCH

CUMULATIVE LOSSES OF COMMERCIAL MORTGAGE-BACKED SECURITIES
BY YEAR OF ISSUANCEDollars in Millions
Source: Bloomberg
Figure 4
$0
$500
$1,000
$1,500
$2,000
$2,500
$3,000
$3,500
$4,000
1995 2008200720062005200420032002200120001999199819971996
Illustrative Potential Loss Based on Historical Experience
Actual Loss at End of 2009
Illustrative potential losses for CMBS issuances from 2001–2008 are estimated such that actual and expected losses combined for a given year match a historical average loss percentage. The historical average loss percentage used is the actual CMBS loss as a percentage of total U.S. issuances (1.3%) for the years 1995–2000 as of the end of 2009.
4
CORNERSTONE RESEARCH
Commercial mortgage originations and securitizations declined dramatically in 2008 and 2009 in the wake of the residential mortgage and credit crises (Figures 1 and 2). This slowdown suggests that, as large commercial mortgage balloon payments become due in the next few years, borrowers may not have access to new loans that will enable them to make these payments. In fact, unfavorable conditions in commercial real estate markets already have caused large losses in commercial mortgages whose balloon payments recently became due. Note, for example, in Figure 4 the actual losses of CMBS originated in 1998. These losses, experienced through 2009, may foreshadow much higher losses associated with the record levels of commercial mortgages that have yet to mature. Using historical loss rates to project potential losses for CMBS issuances originating in 2001 and later results in unprecedented levels of future losses, as illustrated in Figure 4.

CommerCIal morTgage deBT ouTsTandIng, fourTh quarTer, 2009 Source: Mortgage Bankers Association, Commercial Real Estate/Multifamily Finance Quarterly Data Book, Fourth Quarter, 2009
figure 5
Millions Percent
Commercial banks $1,506,200 44.50%CMBS, CDO, and other ABS issuers 690,451 20.40%Life insurance companies 307,409 9.10%Savings institutions 197,759 5.80%Government-sponsored enterprises 183,812 5.40%Agency- and GSE-backed mortgage pools 164,845 4.90%State and local government 82,448 2.40%Federal government 77,479 2.30%Finance companies 69,624 2.10%REITS 29,661 0.90%Nonfarm noncorporate business 25,661 0.80%Household sector 19,220 0.60%Private pension funds 14,098 0.40%State and local government retirement funds 7,852 0.20%Other insurance companies 4,578 0.10%Nonfinance corporate business 1,797 0.10%Total $3,382,954
5
CORNeRStONe ReSeARCh
Should a full-scale commercial mortgage crisis become a reality, commercial mortgage borrowers and lenders and CMBS investors stand to suffer substantial losses. Commercial banks; issuers of CMBS, collateralized debt obligations (CDO), and other asset-backed securities (ABS); and life insurance companies hold nearly 75 percent of total commercial and multifamily mortgage debt outstanding and are, therefore, particularly vulnerable (Figure 5).
On the following pages we provide a brief description of commercial real estate markets, commercial real estate lending, and the securitization of commercial mortgages. We also examine recent developments in commercial real estate markets that lead to concerns about a potential commercial mortgage crisis.

6
CORNERSTONE RESEARCH
Commercial real estate encompasses income-producing properties, such as multifamily housing (apartment buildings), office buildings, hospitals, warehouses, shopping centers, and hotels/motels. These assets were valued at approximately $6.7 trillion, roughly 13 per-cent of the U.S. gross domestic product (GDP), as of July 2009.4
A property’s income-generating capacity (annual net operating income or NOI) and the rate of return required by investors (capitalization rate or cap rate) typically drive the valua-tion of a commercial property: Value = NOI/Cap Rate.5
Depending on the type of commercial property, the ability of tenants to make timely payments and the costs of maintaining the property determine NOI. Lower NOI, holding all else constant, results in reduced commercial real estate values.
Investors’ perception of the risk involved in a commercial real estate venture and the investors’ appetite for risk largely determine cap rates. Holding all else constant, a percep-tion of higher risk and/or increased risk aversion will lead to higher cap rates, resulting in lower commercial real estate values.
Commercial real estate valuation metrics commonly are derived from recent transactions involving similar properties. Obtaining appropriate values for these metrics becomes chal-lenging in a declining commercial real estate market, as transactions decline in number and increasingly reflect financial distress.
COMMERCIAL REAL ESTATE MARKETS

7
CORNERSTONE RESEARCH
Commercial real estate loans are mortgages on commercial real estate, similar to residential mortgages that homeowners obtain to finance the purchase of homes. However, commercial mortgages differ from residential mortgages in a number of ways.
Residential mortgage borrowers are homeowners who are personally responsible for making the periodic interest and principal payments on their mortgage. In many states a residential mortgagor may be personally responsible for repayment of a delinquent loan. As such, the focus in residential mortgages is often on the credit risk of the borrower.
In contrast, commercial mortgage borrowers often are real estate investors who rely on cash flows from tenants and customers to make principal and interest payments on their mortgages, and commercial mortgages generally are structured as nonrecourse loans in which only the value of the property constitutes the collateral for repayment of a delinquent loan. As such, the focus in a commercial real estate mortgage often is on the credit risk of the property, not of the borrower. The failure of a commercial property to generate suf-ficient cash may lead to delinquency or default on the mortgage and threaten the lender’s ability to recover.
In addition, unlike traditional residential mortgages, the majority of which are fully amortizing over the life of the loan (usually twenty to thirty years), commercial mortgages often have a balloon payment that requires the borrower to pay the outstanding balance on the mortgage between seven and twelve years from the origination date. Many com-mercial mortgages also have provisions to extend the due date for a balloon payment for a limited time.
A borrower usually makes a balloon payment by refinancing the mortgage. The ability of the borrower to refinance depends on the value of the collateral (loan-to-value ratio) and the property’s income-generating potential (debt-service-coverage ratio) at the time of refinancing. Therefore, the performance of a commercial mortgage can be heavily depen-dent on the conditions in the local commercial real estate markets at the time the balloon payment comes due.6
COMMERCIAL REAL ESTATE LOANS
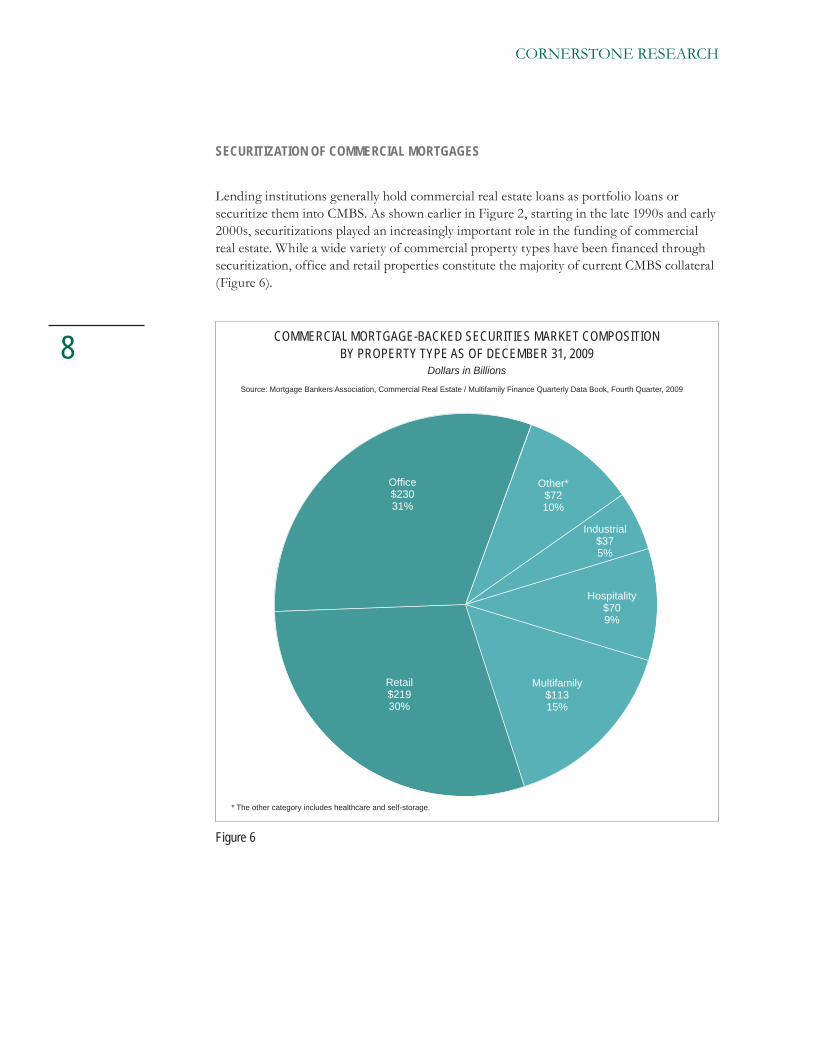
COMMERCIAL MORTGAGE-BACKED SECURITIES MARKET COMPOSITION
BY PROPERTY TYPE AS OF DECEMBER 31, 2009Dollars in Billions
Source: Mortgage Bankers Association, Commercial Real Estate / Multifamily Finance Quarterly Data Book, Fourth Quarter, 2009
Figure 6
Retail$21930%
Multifamily$11315%
Hospitality$709%
Industrial$375%
Other*$7210%
Office$23031%
* The other category includes healthcare and self-storage.
8
CORNERSTONE RESEARCH
Lending institutions generally hold commercial real estate loans as portfolio loans or securitize them into CMBS. As shown earlier in Figure 2, starting in the late 1990s and early 2000s, securitizations played an increasingly important role in the funding of commercial real estate. While a wide variety of commercial property types have been financed through securitization, office and retail properties constitute the majority of current CMBS collateral (Figure 6).
SECURITIZATION OF COMMERCIAL MORTGAGES

COMMERCIAL REAL ESTATE MARKET: SECURITIZATION PROCESS AND KEY PLAYERS
Figure 7
Lenders
Shareholdersand Other
Claim Holders
Special Purpose Entities(Pool and Repackage Loans)
$
$
Underwriters
$
$
Mortgage Servicers
Law Firms,Accountants
Secondary Investors
$
InstitutionalInvestors
HedgeFunds
CDOs
Specialized Hedge Funds and Others
(Sell Default ProtectionUsing Credit
Default Swaps)
Insurers,Ratings Agencies
$
Mortgage Brokers
$
CMBS
Property 1 Property 2 Property 3
Developers/Owners
CMBS
9
CORNERSTONE RESEARCH
The securitization process for commercial real estate loans can be highly complex and often involves many different parties. In the current environment, each party in this complex process can face challenges due to declining activity, values, and liquidity in com-mercial real estate markets. Figure 7 depicts the securitization process and key players in the process.
In addition to the differences between commercial and residential mortgages, another factor that typically sets CMBS apart from residential mortgage-backed securities (RMBS) is that CMBS generally are less diversified than RMBS. For example:
• Individual loan sizes are often significantly larger in CMBS than in RMBS. A given RMBS may include thousands of mortgages in its collateral, whereas a CMBS generally includes only hundreds or even dozens of commercial mortgages.
• CMBS tend to be less geographically diversified than RMBS.
• Some CMBS may have a concentration in a single tenant.

MIT TRANSACTION-BASED INDEX OF U.S. COMMERCIAL REAL ESTATE
Source: MIT Center for Real Estate
Figure 8
0
50
100
150
200
250
Q4 1990 Q4 1992 Q4 1994 Q4 1996 Q4 1998 Q4 2000 Q4 2002 Q4 2004 Q4 2006 Q4 2008
Price Index1984=100
39.5%Drop from
Peak
Data are quarterly.
10
CORNERSTONE RESEARCH
After enjoying a period of unprecedented growth, commercial real estate prices declined sharply in the United States in the wake of the residential mortgage and credit crises (Figure 8).
RECENT DEVELOPMENTS IN COMMERCIAL REAL ESTATE MARKETS

VACANCY RATES BY PROPERTY TYPES
Source: Mortgage Bankers Association, Commercial Real Estate/Multifamily Finance Quarterly Data Book, Fourth Quarter, 2009
Figure 9
5%
10%
15%
20%
Q4 2003 Q4 2004 Q4 2005 Q4 2006 Q4 2007 Q4 2008 Q4 2009
AverageVacancy
Rate
Office
Retail
Industrial
Multifamily
Data are quarterly.
11
CORNERSTONE RESEARCH
As the economy has weakened in recent years, national vacancy rates have increased (Figure 9) and rents have fallen across all property types. This pattern was especially evi-dent in office and retail properties, which constitute the majority of CMBS collateral.

NCREIF’S PROPERTY INDEX Source: National Council of Real Estate Investment Fiduciaries
Figure 10
-10%
-8%
-6%
-4%
-2%
0%
2%
4%
6%
8%
2000 200920082007200620052004200320022001
The NPI is a quarterly time series composite total rate of return measure of investment performance of a very large pool of individual commercial real estate properties acquired in the private market for investment purposes only. All properties in the NPI have been acquired, at least in part, on behalf of tax-exempt institutional investors—the great majority being pension funds. As such, all properties are held in a fiduciary environment.
NPI
12
CORNERSTONE RESEARCH
Increasing vacancies, lower rents, and declining property values caused commercial real estate investment returns to plummet and delinquencies to increase. Figure 10 shows the dramatic decline in 2008 and 2009 in NCREIF’s Property Index (NPI), which measures total rate of return on a large pool of commercial real estate properties acquired for invest-ment purposes. Declines in investment returns are concurrent with increasing delinquency rates on commercial real estate mortgages as depicted in Figure 11.

COMMERCIAL MORTGAGE-BACKED SECURITIES MONTHLY DELINQUENCY RATESSource: Exhibit 5, CRE Finance Council Compendium of Statistics
Figure 11
0%
1%
2%
3%
4%
5%
6%
Dec 2002 Dec 2003 Dec 2004 Dec 2005 Dec 2009Dec 2008Dec 2007Dec 2006
30 Day+ Delinquencies
60 Day+ Delinquencies
DelinquencyRate
13
CORNERSTONE RESEARCH

Figure 12
CHANGES TO LENDING STANDARDSSource: Federal Reserve Board
-40%
-20%
0%
20%
40%
60%
80%
100%
Tightening of Lending Standards
Easing of Lending Standards
Figures reflect net percentage of institutions that reported a tightening/easing of lending standards.
2003 200920082007200620052004
14
CORNERSTONE RESEARCH
Borrowers seeking financing or refinancing for commercial properties face a difficult economic environment and heightened credit standards. As shown in Figure 12, lenders have significantly tightened standards for commercial real estate loans in the late 2000s.

100
110
120
Q4 1990 Q4 1992 Q4 1994 Q4 1996 Q4 1998 Q4 2000 Q4 2002 Q4 2004 Q4 2006 Q4 2008
1. Shaded regions refer to periods of national recession as defined by the National Bureau of Economic Research.2. The National Association of Realtors has developed a CLI designed to provide early signals of turning points in commercial real estate activity.3. Data are quarterly. Q3 2009 is preliminary and subject to adjustments.
CLI Index
COMMERCIAL LEADING INDICATOR INDEX7
Source: National Association of Realtors
Figure 13
15
CORNERSTONE RESEARCH
Figure 13 presents the Commercial Leading Indicator (CLI), an index of expected real estate brokerage activity. The index is designed by the National Association of Realtors to provide early signals of turning points between expansions and contractions of commercial real estate brokerage activity. Recent CLI declines reflect a steep decline in expectations starting in 2008. Despite leveling off in the third quarter of 2009, expectations for commer-cial real estate brokerage activity remain low relative to recent history.
16
CORNERSTONE RESEARCH
U.S. federal agencies have responded to the difficulties in the commercial real estate market in a number of ways. Three federal programs that have provided either direct or indirect support to commercial real estate markets are the Term Asset-Backed Securities Loan Facility (TALF), the Public Private Investment Program (PPIP), and the Capital Purchase Program (CPP).8
In the fall of 2008, the U.S. Federal Reserve created the TALF program to increase credit availability by supporting the issuance of ABS collateralized by different loan types. In early 2009 the Treasury Department announced that it would extend the TALF to include CMBS. Implementation of the TALF started in May 2009 and covered the most senior securities (generally AAA-rated) for qualifying new issuances and for legacy CMBS.9
In the spring of 2009, the U.S. Treasury Department announced the PPIP to encourage new private capital. The PPIP had two components. The first entailed buying troubled quali-fying RMBS and CMBS (the Legacy Securities PPIP), and the second entailed buying whole loans (Legacy Loans Program).10
Lastly, the CPP, which expired at the end of 2009, offered indirect support to com-mercial real estate by purchasing preferred stock in financial institutions, some of which held large concentrations of commercial real estate loans. Institutions that qualified for the CPP were thus able to increase their capital levels, allowing them to absorb commercial real estate losses more easily.11
The federal agencies that regulate financial institutions also have provided some sup-port for commercial real estate markets. U.S. financial regulatory agencies issued a joint policy statement on October 30, 2009,12 encouraging banks to work with their creditworthy borrowers to restructure troubled commercial real estate loans in a prudent manner and reminding examiners that, absent other adverse factors, a loan should not be classified as impaired based solely on a decline in collateral value.
The degree to which these measures will help stabilize the markets for CMBS and be sufficient to ward off a deepening crisis in the commercial real estate market remains to be seen.
U.S. FEDERAL AGENCY RESPONSES

17
CORNERSTONE RESEARCH
IMPLICATIONS FOR LITIGATION
Should a commercial mortgage crisis become a reality, commercial mortgage borrowers and lenders, as well as investors in CMBS, stand to suffer substantial losses. Potential litigation resulting from such a crisis may affect many parties involved in the origination and subsequent securitization of commercial real estate loans. These parties may include property owners and developers, originators, purchasers of commercial real estate loans or CMBS, brokers, appraisers, servicers, trustees, underwriters, rating agencies, insurers, and credit default swap counterparties, as well as the regulators, auditors, shareholders, and creditors of these various institutions. Similar to current litigation involving subprime mortgages, potential disputes between these parties will likely require them to address issues in several key areas, including real estate economics, finance, valuation, corporate governance, and accounting.

18
CORNERSTONE RESEARCH
1 Minutes of the Federal Open Market Committee, June 22–23, 2010.
2 “Debriefing Bair,” Forbes.com.
3 “Fitch U.S. CMBS Newsletter: Cumulative Loan Defaults Rise to 9.5%,” Fitch Ratings, July 30, 2010.
4 Testimony of Jeffrey D. DeBoer before the U.S. Congress Joint Economic Committee, July 9, 2009.
5 There are two additional approaches used to value income properties: the “market approach,” in which sales of comparable properties are analyzed, and the “cost approach,” in which the value of a property is based on the cost of producing a similar property.
6 This aspect of commercial mortgages is similar to subprime residential mortgages in which bor-rowers relied on refinancing to avoid paying the high interest rates charged by lenders following introductory low “teaser” rates. Declining property values meant that home prices often fell below outstanding mortgage balances (i.e., the mortgages were “underwater”), leaving many homeowners unable to refinance when the teaser rates expired and subsequently leading them to default on their mortgages.
7 NAR’s CLI Index incorporates the following components to create the composite index: industrial production, REIT price index, NCREIF total return, personal income minus transfer payments, jobs in financial activities, jobs in professional business service, jobs in temporary help, jobs in retail trade, initial claims for unemployment insurance, manufacturers’ durable goods shipment, wholesale merchant sales, and retail sales for food service.
8 Concerns about commercial real estate received some attention in the passage of the Emergency Economic Stabilization Act of 2008, but the focus of the Treasury Department’s efforts to date have been directed more toward the larger residential real estate market and on the banking system gener-ally rather than on commercial real estate. The Congressional Oversight Panel’s February report, “Commercial Real Estate Losses and the Risk to Financial Stability,” February 2010, pp. 6, 26.
9 The Congressional Oversight Panel’s February report, “Commercial Real Estate Losses and the Risk to Financial Stability,” February 2010, pp. 121–126.
10 The Congressional Oversight Panel’s February report, “Commercial Real Estate Losses and the Risk to Financial Stability,” February 2010, pp. 126–128.
11 The Congressional Oversight Panel’s February report, “Commercial Real Estate Losses and the Risk to Financial Stability,” February 2010, p. 128.
12 Board of Governors of the Federal Reserve System, “Policy Statement on Prudent Commercial Real Estate Loan Workouts,” October 30, 2009, http://www.federalreserve.gov/boarddocs/srletters/2009/sr0907a1.pdf.
ENDNOTES


Boston617.927.3000
Los Angeles213.553.2500
Menlo Park650.853.1660
New York212.605.5000
San Francisco415.229.8100
Washington202.912.8900
www.cornerstone.com
© 2010 by Cornerstone Research, Inc. All Rights Reserved. Cornerstone Research is a registered service mark of Cornerstone Research, Inc. C logo and design is a registered trademark of Cornerstone Research, Inc.