Law Firm Real Estate Strategy - Colliers
18
North America Report LAW FIRM SERVICES 2018 NORTH AMERICA OUTLOOK Law Firm Real Estate Strategy: How to Achieve Space Efficiency and Control Costs While Attracting the Best Talent > Space Efficiency in a Competitive Hiring Environment: Despite differences between markets, the drive for space efficiency and creation of the optimal work environment are still consistent themes. Although law firms, and financial and professional services firms in general, continue to focus on bottom-line costs, they are also competing to attract and retain the best talent, which impacts premises strategy. For the international firms there is also an increased focus on global real estate standards. > Benefits of Leasing Premium Space: When the opportunity exists, it can make both financial and business sense to lease the best new space, but with a reduced footprint and a configuration that fosters engagement, creativity and collaboration to provide the best client service. Implementation of such a strategy is, in part, dependent upon the availability of new space which is tight in the core office markets. > Renewals Present Opportunities: Renewals continue to dominate law firm leasing activity, in part because of supply constraints but mostly reflecting the continued drive for cost containment. With investment of sufficient capital, it can also be possible to creatively restructure a firm’s existing space, provided it is not too outmoded to enable efficiency gains. > Local Market Conditions: While the U.S. office market remains largely healthy, tenants could see some localized easing of market conditions. Rent growth has largely abated and, barring a rebound in demand, there could be upward pressure on vacancy until new construction recedes. Overview and Key Themes The North American office market is nearing a potential inflection point while law firms continue to wrestle with implementing new real estate standards. To provide insight into the key real estate trends for law firms to consider, this report highlights the office market characteristics and law firm activity in each of the 24 North American real estate markets covered by Colliers’ Law Firm Services Group Of the 24 markets that we cover in this report, two are in Canada. Both Toronto and Vancouver are the premier markets in Canada and are both in very strong points in their cycle.
-
Upload
khangminh22 -
Category
Documents
-
view
0 -
download
0
Transcript of Law Firm Real Estate Strategy - Colliers

North America ReportLAW FIRM SERVICES2018 NORTH AMERICA OUTLOOK
Law Firm Real Estate Strategy: How to Achieve Space Efficiency and Control Costs While Attracting the Best Talent
> Space Efficiency in a Competitive Hiring Environment: Despite differences between markets, the drive for space efficiency and creation of the optimal work environment are still consistent themes. Although law firms, and financial and professional services firms in general, continue to focus on bottom-line costs, they are also competing to attract and retain the best talent, which impacts premises strategy. For the international firms there is also an increased focus on global real estate standards.
> Benefits of Leasing Premium Space: When the opportunity exists, it can make both financial and business sense to lease the best new space, but with a reduced footprint and a configuration that fosters engagement, creativity and collaboration to provide the best client service. Implementation of such a strategy is, in part, dependent upon the availability of new space which is tight in the core office markets.
> Renewals Present Opportunities: Renewals continue to dominate law firm leasing activity, in part because of supply constraints but mostly reflecting the continued drive for cost containment. With investment of sufficient capital, it can also be possible to creatively restructure a firm’s existing space, provided it is not too outmoded to enable efficiency gains.
> Local Market Conditions: While the U.S. office market remains largely healthy, tenants could see some localized easing of market conditions. Rent growth has largely abated and, barring a rebound in demand, there could be upward pressure on vacancy until new construction recedes.
Overview and Key ThemesThe North American office market is nearing a potential inflection point while law firms continue to wrestle with implementing new real estate standards. To provide insight into the key real estate trends for law firms to consider, this report highlights the office market characteristics and law firm activity in each of the 24 North American real estate markets covered by Colliers’ Law Firm Services Group
Of the 24 markets that we cover in this report, two are in Canada. Both Toronto and Vancouver are the premier markets in Canada and are both in very strong points in their cycle.

2018 North America Outlook Report | Law Firm Services Group | Colliers International2
Here are our observations on the leading market indicators.
Vacancy Stays Low but Absorption Falls Over the Year > The U.S. office market vacancy rate stands at 12.1% and has stayed in a 30-basis-point (BPS) range for the past eight quarters, providing continued evidence that the market has plateaued.
> Downtown markets still maintain an occupancy edge over the suburbs. Vacancy stands at 10.8% in downtown markets and 12.8% in the suburbs, with both witnessing a fall of 60 BPS over the year.
> U.S. office absorption fell for a second successive year in 2017, down by 28% to 42 million square feet following a 40% fall in 2016.
> Out-performing downtown markets in 2017 included Nashville, where absorption equaled 8.3% of inventory, Raleigh/Durham (6.3%), Seattle (3.7%) and Austin (3.7%.) Among the larger suburban markets, Dallas saw the greatest absorption rate at 2.2% of inventory, reflecting a series of major corporate move-ins in Far North Dallas, followed by 1.9% in both Phoenix and South Florida.
Rents Hold Firm - Growth is Mostly Over
> Office rent growth slowed in 2017 with only minimal changes from quarter to quarter. Annual rent growth for 2017 was just 1.8%, only one-third of 2016’s rent growth rate of 5.4%.
> Average Class A rents stand at $46.40 per square foot in downtown markets and $29.90 per square foot in the suburbs. Downtown Class A rents fell by 1.5% in 2017, driven by lower absorption, while suburban Class A rents rose by 3.6%.
> The modest fall in downtown Class A rents is a recent phenomenon, while suburban Class A rent growth primarily occurred at the beginning of the year with the Q4 2017 growth rate a mere 0.5%.
> While average asking rents may move upward in markets where prime new properties are set for completion in 2018, this growth should be offset by rising tenant improvement allowances.
Quarterly Under Construction Totals
0
20
40
60
80
100
120
140
Q4
2005
Q1 2
006
Q2
2006
Q3
2006
Q4
2006
Q1 2
007
Q2
2007
Q3
2007
Q4
2007
Q1 2
008
Q2
2008
Q3
2008
Q4
2008
Q1 2
009
Q2
2009
Q3
2009
Q4
2009
Q1 2
010
Q2
2010
Q3
2010
Q4
2010
Q1 2
011
Q2
2011
Q3
2011
Q4
2011
Q1 2
012
Q2
2012
Q3
2012
Q4
2012
Q1 2
013
Q2
2013
Q3
2013
Q4
2013
Q1 2
014
Q2
2014
Q3
2014
Q4
2014
Q1 2
015
Q2
2015
Q3
2015
Q4
2015
Q1 2
016
Q2
2016
Q3
2016
Q4
2016
Q1 2
017
Q2
2017
Q3
2017
Q4
2017
Under Construction Average
Mill
ions
Source: Colliers International
U.S. Office Market | Q4 2015 - Q4 2017
11.6
11.8
12
12.2
12.4
12.6
12.8
0
5
10
15
20
25
30
35
Q4 2015 Q1 2016 Q2 2016 Q3 2016 Q4 2016 Q1 2017 Q2 2017 Q3 2017 Q4 2017
Absorption (MSF) New Supply (MSF) Vacancy Rate (%)
Mill
ions
SF
Vaca
ncy
%
Source: Colliers International
Deliveries Peaked in 2017 > While still elevated, the volume of office space under construction fell slightly for the second successive quarter in Q4 2017, declining from 109 to 107 million square feet. Of this total, 46 million square feet are underway in downtown markets with 61 million square feet in the suburbs.
> There was 71 million square feet of new office space delivered 2017, up from 54 million square feet in 2016. With construction starts declining, 2017 should represent the peak year for new supply in the current cycle.
> Five metros collectively account for half of the space currently underway: the San Francisco Bay Area at 15.3 million square feet, Washington, D.C. at 10.8 million square feet, New York at 10.6 million square feet, Dallas-Fort Worth at 8.9 million square feet and Seattle-Puget Sound with 6.8 million square feet.
> The volume of space underway is starting to fall in the San Francisco Bay Area and Dallas-Fort Worth as corporate campuses in the suburbs are delivered. When current construction is measured as a share of inventory, Austin leads at 6%, followed by the San Francisco Bay Area (5.6%) and Seattle-Puget Sound (4.8%.)

2018 North America Outlook Report | Law Firm Services Group | Colliers International3
North American Office Markets | Q4 2017MARKET CLASS A DOWNTOWN ASKING RENT (1) DOWNTOWN VACANCY RATE (2) MARKET SENTIMENT LAW FIRMS SEEKING NEW SPACE (3)
Atlanta, GA $30.34 12.1% Equal Footing Declining
Birmingham, AL $21.50 18.0% Tenants' Market Static
Boston, MA $59.83 10.5% Landlords' Market Static
Chicago, IL $44.63 11.6% Landlords' Market Declining
Dallas, TX $27.12 23.1% Landlords' Market Declining
Denver, CO $35.61 14.1% Landlords' Market Static
Houston, TX $44.37 20.6% Tenants' Market Static
Fairfield County, CT (4) $44.51 17.1% Equal Footing Declining
Long Island, NY (4) $30.46 8.4% Landlords' Market Static
Los Angeles, CA $41.57 20.0% Tenants' Market Static
Manhattan, NY $78.30 6.2% Equal Footing Expanding
Milwaukee, WI $21.95 8.2% Tenants' Market Static
Nashville, TN $33.67 7.7% Equal Footing Expanding
Northern New Jersey (4) $29.98 16.1% Tenants' Market Static
Philadelphia, PA $31.62 10.1% Landlords' Market Static
San Diego, CA $35.76 15.9% Equal Footing Static
San Francisco, CA $84.51 6.9% Landlords' Market Expanding
Seattle, WA $46.50 7.1% Landlords' Market Expanding
South Florida, FL $41.38 10.7% Equal Footing Expanding
Tampa, FL $28.72 11.1% Landlords' Market Static
Toronto, ON (5) $46.70 2.1% Landlords' Market Static
Vancouver, BC (5) $39.50 5.1% Landlords' Market Expanding
Washington, D.C. $60.27 11.8% Tenants' Market Declining
Westchester County, NY (4) $28.29 17.7% Landlords’ Market Expanding
Average of Markets $41.13 12.2%
(1) Where the rent change is between -1.0% 10 1.0% the direction is considered to be flat(2) Where the vacancy rate change is 30 bps or lower the direction is considered to be flat(3) Change since Q4 2016(4) These are suburban markets without a distinct Downtown submarket(5) Converted to USD
Note: Directional indicators reflect YOY changeSource: Colliers International
In the remainder of this report we focus on the office landscape and law firm activity in the 24 North American markets represented by Colliers’ Law Firm Services. The focus of this analysis is on each metro’s downtown office market, where the majority of law firms are located.
In 2017, Class A office rents ranged from $21.50 per square foot in Birmingham to almost $85 per square foot in San Francisco. The average rent across the 24 markets is $41.13 per square foot, with four markets at or above $60 per square foot: Boston, Manhattan, San Francisco and Washington, D.C. Five other markets have rents above the average: Chicago, Houston, Los Angeles, Seattle and Toronto.
While the overall pace of rent appreciation is slowing, just over half of the markets surveyed showed Class A rent growth of above
1% in 2017. The largest percentage gains took place in Atlanta, Nashville and San Francisco — all of which grew by more than 10%. Vacancy trends were mixed in 2017. Vacancy fell in 38% of the 24 markets, remained flat in 17% and rose in 46%.
Average vacancy across the markets surveyed was 12.2% in 2017, effectively in line with the U.S. national rate of 12.1%. The lowest downtown vacancy, by far, is in Toronto at a mere 2.1%. Eight other markets have vacancy rates below 10%, led by Manhattan, San Francisco, Seattle and Vancouver. Downtown Dallas has the highest vacancy rate at 23.1%. Two other markets have vacancy of 20% or more – Houston and Los Angeles.
Rents are Still Rising in Most Law Firm Markets, but Vacancy is Turning

2018 North America Outlook Report | Law Firm Services Group | Colliers International4
Lease renewals continue to dominate the law firm leasing landscape as the drive for efficiency and cost control continues. Eight of the 10 largest law firm leases signed in 2017 involved tenants choosing to stay in place and renew their existing leases. Three of these involved a reduction in the amount of space leased. Looking at the three largest law firm leases signed in each market in 2017, all but two of the markets included at least one renewal. Renewals accounted for all three of the largest 2017 law firm leases in numerous major office markets including Atlanta, Chicago, Dallas, Houston and Manhattan.
Five of the top six leases across the markets in 2017 were renewals. Sidley Austin LLP – who also accounted for 2016’s largest renewal – recommitted to 352,000 square feet at 787 Seventh Avenue in Manhattan. In the process, they reconfigured their space to accommodate an additional headcount of 100 people within the same footprint. The largest new lease signed in 2017 was at 2100 Pennsylvania Avenue, NW in Washington, D.C. where WilmerHale leased 288,000 square feet.
Top 10 Law Firm Leases Signed in 2017LAW FIRM SF LEASED BUILDING NAME ADDRESS MARKET NEW LEASE OR RENEWAL QUARTER
Sidley Austin LLP 352,112 - 787 7th Ave. Manhattan Renewal Q3
King & Spalding LLP 320,000 1180 Peachtree 1180 Peachtree St. Atlanta Renewal & Contraction Q1
WilmerHale 288,000 - 2100 Pennsylvania Ave. NW Washington, D.C. New Lease Q4
Kramer Levin Naftalis & Frankel LLP 265,638 - 1177 Avenue of the Americas Manhattan Renewal Q1
Wachtell, Lipton, Rosen & Katz 250,762 CBS Building 51 W 52nd St. Manhattan Renewal & Expansion Q4
Mintz, Levin, Cohn, Ferris, Glovsky and Popeo, P.C. 205,000 One Financial Center 1 Financial Center Boston Renewal Q1
Akin Gump Strauss Hauer & Feld LLP 185,000 - 2001 K St. NW Washington, D.C. New Lease & Contraction Q1
Schiff Hardin LLP 181,000 Willis Tower 223 S Wacker Dr. Chicago Renewal Q2
Eversheds Sutherland LLP 175,700 999 Peachtree 999 Peachtree St. NE Atlanta Renewal & Contraction Q3
Torys LLP 172,000 TD Centre 79 Wellington St. W Toronto Renewal Q3
Source: Colliers International
Renewals Continue to Dominate Law Firm Leasing Activity
2018 North America Outlook Report | Law Firm Services Group | Colliers International5
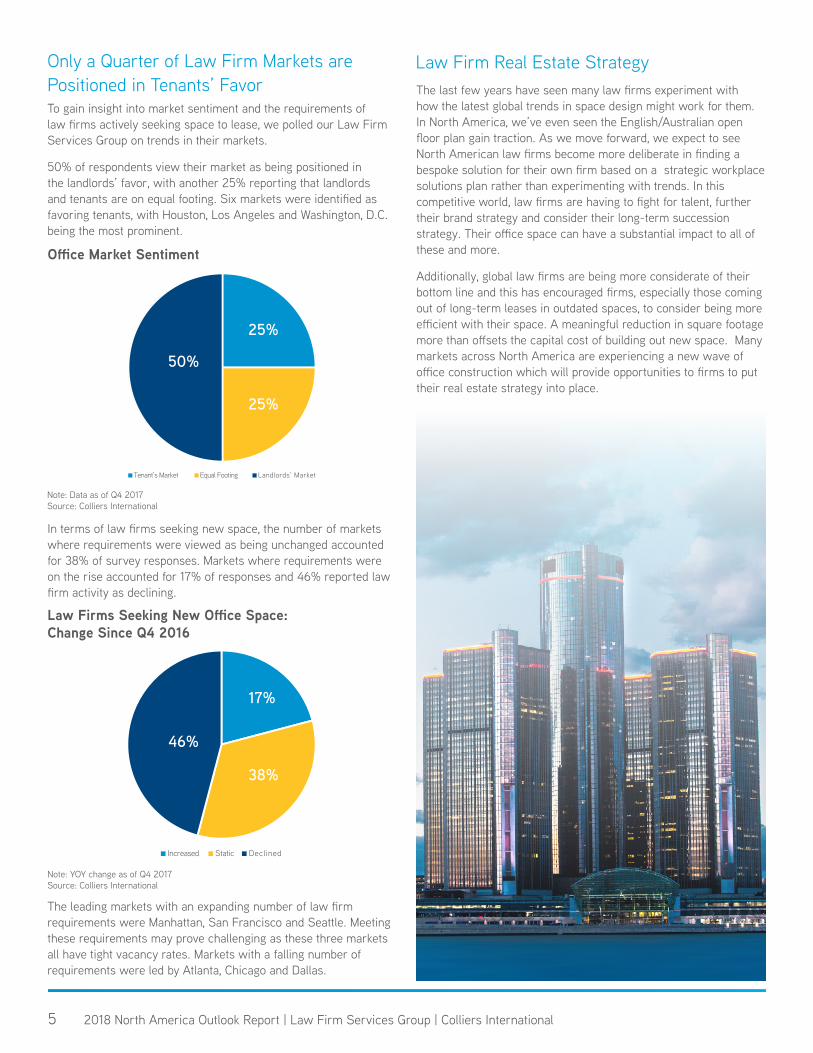
To gain insight into market sentiment and the requirements of law firms actively seeking space to lease, we polled our Law Firm Services Group on trends in their markets.
50% of respondents view their market as being positioned in the landlords’ favor, with another 25% reporting that landlords and tenants are on equal footing. Six markets were identified as favoring tenants, with Houston, Los Angeles and Washington, D.C. being the most prominent.
In terms of law firms seeking new space, the number of markets where requirements were viewed as being unchanged accounted for 38% of survey responses. Markets where requirements were on the rise accounted for 17% of responses and 46% reported law firm activity as declining.
The leading markets with an expanding number of law firm requirements were Manhattan, San Francisco and Seattle. Meeting these requirements may prove challenging as these three markets all have tight vacancy rates. Markets with a falling number of requirements were led by Atlanta, Chicago and Dallas.
The last few years have seen many law firms experiment with how the latest global trends in space design might work for them. In North America, we’ve even seen the English/Australian open floor plan gain traction. As we move forward, we expect to see North American law firms become more deliberate in finding a bespoke solution for their own firm based on a strategic workplace solutions plan rather than experimenting with trends. In this competitive world, law firms are having to fight for talent, further their brand strategy and consider their long-term succession strategy. Their office space can have a substantial impact to all of these and more.
Additionally, global law firms are being more considerate of their bottom line and this has encouraged firms, especially those coming out of long-term leases in outdated spaces, to consider being more efficient with their space. A meaningful reduction in square footage more than offsets the capital cost of building out new space. Many markets across North America are experiencing a new wave of office construction which will provide opportunities to firms to put their real estate strategy into place.
Office Market Sentiment
Note: Data as of Q4 2017Source: Colliers International
Tenant’s Market Equal Footing Landlords’ Market
50%
25%
25%
Law Firms Seeking New Office Space:Change Since Q4 2016
Note: YOY change as of Q4 2017Source: Colliers International
Increased Static Declined
46%
17%
38%
Only a Quarter of Law Firm Markets arePositioned in Tenants’ Favor
Law Firm Real Estate Strategy

2018 North America Outlook Report | Law Firm Services Group | Colliers International6
ATLANTAThe Atlanta office market saw further gains in 2017 as vacancy fell and rents increased by almost $2 per square foot from a year ago. While net absorption was down from 2016’s total, it still remained firmly in the black at over 800,000 square feet for the year. Encouragingly, the final quarter of 2017 saw the strongest absorption.
Class A vacancy in Midtown, which is the premier location for law firms in Atlanta, has edged up to 9.9%. However, this is comfortably below the 13.8% Class A vacancy rate for the metro. Additionally, Midtown saw the greatest absorption among Atlanta’s urban submarkets, out-pacing Buckhead by a fair margin, and edging out Downtown slightly.
Law firms in Atlanta continue to reduce their office footprints; seeking to improve the efficiency of their space and to cater to their younger associates. Some of the city’s largest, and most notable, law firms signed renewals in 2017 with each of them contracting their spaces by multiple floors.
BIRMINGHAMThe 20 million square feet Birmingham office market closed out 2017 with a 12.9 % vacancy rate. Class A vacancy is lower at 11.7%. The 5.5 million square feet CBD submarket posted positive absorption in 2017, driven by tenants moving from suburban locations to the more vibrant CBD.
Class A vacancy in the CBD has risen to 14.9% in large part due to the vacation of the AT&T Alabama headquarters building and Regions Bank giving back 220,000 square feet. Class A asking rates in the CBD in Q4 2017 were $21.50 per square foot compared with $22.50 for suburban Class A space. There is no office space under construction in the CBD.
There are two large law firms currently exploring whether to renew in place or relocate to current vacancies. Although the market has significant vacancy, there are only two existing options for users over 50,000 square feet.
Leading Law Firm Lease Transactions in 2017 | Atlanta
LAW FIRM SF LEASED PROPERTY NAME ADDRESS NEW LEASE OR RENEWAL QUARTER
King & Spalding LLP 320,000 1180 Peachtree 1180 Peachtree St. NE Renewal & Contraction Q1
Eversheds Sutherland LLP 175,700 999 Peachtree 999 Peachtree St. NE Renewal & Contraction Q3
Nelson Mullins Riley & Scarborough LLP 103,156 201 17th Street 201 17th St. NW Renewal Q2
Source: Colliers International
Q4 2017 Key Indicators | Atlanta
Class A Asking Rent (PSF) $30.34
Downtown Vacancy Rate 12.1%
Number of Law Firms in the Market Declining
Market Sentiment Equal Footing
Source: Colliers International
Q4 2017 Key Indicators | Birmingham
Class A Asking Rent (PSF) $21.50
Downtown Vacancy Rate 18.0%
Number of Law Firms in the Market Static
Market Sentiment Tenants’ Market
Source: Colliers International
Leading Law Firm Lease Transactions in 2017 | Birmingham
LAW FIRM SF LEASED PROPERTY NAME ADDRESS NEW LEASE OR RENEWAL QUARTER
Confidential 18,185 Regions Harbert Plaza 1901 6th Ave. N New Q4
Source: Colliers International

2018 North America Outlook Report | Law Firm Services Group | Colliers International7
BOSTONThe Downtown Boston office market saw further improvement in 2017 and has become one of the most dynamic office markets in the U.S. Average Class A asking rates stand at just shy of $60 per square foot on par with Washington, D.C. and bettered by only Manhattan and San Francisco.
Seaport remains the strongest of the downtown Boston submarkets with a 7.6% vacancy rate, comfortably below the 10.5% market average. Class A vacancy in Seaport is a minimal 2.9%. Vacancy rates in Back Bay and the Financial District are 12.5% and 11.9% respectively. The latter is the principal location for law firms in Downtown Boston. Vacancy in the upper floors of the Financial District’s Class A towers is receding as the rental premium over lower floors has tightened.
A major positive for the Boston office market is the size of tenant requirements (estimated at around six million square feet) in the market with evidence in early 2018 that they are translating into signed leases.
Major law firms are still right-sizing their operations as leases expire. But smaller firms are growing and taking more space than they have attorneys to fill it.
CHICAGOChicago’s Downtown office market held firm in 2017. Vacancy reached a 16-year low in 2016 and stayed virtually flat in 2017 rising by only 30 BPS. Downtown Class A asking rents rose by $2 per square foot in 2017 with the highest rates found in the West Loop, where trophy properties can command rents above $60 per square foot. There are numerous firms currently exploring whether to renew or relocate.
There are signs that vacancy may start to increase in 2018. While there are almost 30 large blocks of over 100,000 square feet available Downtown, half of which are in the West Loop, there is an additional 6.5 million square feet under construction. The delivery of new office towers is set to pause after 151 N. Franklin Street, which is dueto complete in Q2 2018. The 807,000-square-foot development by The John Buck Company will be anchored by CNA Insurance and Hinshaw Culbertson and is only 53% pre-leased. It is seeking rents of around $60 per square foot once the building is fully stabilized. There is a two-year gap before the next new high-rise tower is scheduled to deliver in 2020, providing 1.45 million square feet at the Hughes Tower, 110 N. Wacker Drive in the West Loop. Bank of America has pre-leased 500,000 square feet to anchor the new building.
In terms of law firm activity in Chicago, 2017 was a relatively slow year with no firms seeking over 100,000 square feet. The five largest transactions completed in 2017 all were renewals for either the same space or less.
Leading Law Firm Lease Transactions in 2017 | Boston
LAW FIRM SF LEASED PROPERTY NAME ADDRESS NEW LEASE OR RENEWAL QUARTER
Mintz, Levin, Cohn, Ferris, Glovsky and Popeo, P.C. 205,000 One Financial Center 1 Financial Center Renewal Q1
Holland & Knight LLP 105,000 10 Saint James Avenue 10 St James Ave. Renewal Q2
Kirkland & Ellis LLP 60,000 200 Clarendon 200 Clarendon St. New Lease Q4
Source: Colliers International
Q4 2017 Key Indicators | Boston
Class A Asking Rent (PSF) $59.83
Downtown Vacancy Rate 10.5%
Number of Law Firms in the Market Static
Market Sentiment Landlord’s Market
Source: Colliers International
Q4 2017 Key Indicators | Chicago
Class A Asking Rent (PSF) $44.63
Downtown Vacancy Rate 11.6%
Number of Law Firms in the Market Declining
Market Sentiment Landlord’s Market
Source: Colliers International
Leading Law Firm Lease Transactions in 2017 | Chicago
LAW FIRM SF LEASED ADDRESS NEW LEASE OR RENEWAL QUARTER
Schiff Hardin LLP 181,000 223 S Wacker Dr. Renewal Q2
Barack Ferrazzano Kirschbaum & Nagelberg LLP 99,756 200 W Madison St. Renewal Q2
Barnes & Thornburg LLP 95,475 1 N Wacker Dr. Renewal Q4
Source: Colliers International

2018 North America Outlook Report | Law Firm Services Group | Colliers International8
DALLASDowntown Dallas office vacancy increased further in 2017 and is now the second highest among the markets covered by this report. While net absorption was strong across the metro at over 4.5 million square feet this was dominated by large move-ins to new corporate campuses in Far North Dallas. Downtown Dallas saw negative absorption of 200,000 square feet in 2017.
Rents continued to climb slightly in Downtown Dallas, with average Class A rents just over $27 per square foot all-in. The Arts District, the closest part of the CBD to Uptown, commands the highest rates with new trophy properties topping $50 per square foot gross. The more prestigious and close-in submarkets of Preston Center and Uptown/Turtle Creek are seeing rents above $50 per square foot and there is speculation that they may break through $60 per square foot on new trophy space. Despite gross rents Downtown that are effectively equal to net rents in these submarkets, Downtown Dallas has yet to see any significant leasing traction.
National law firms are continuing the trend of expanding to Dallas and acquiring local firms to establish an immediate presence. Recruiting and retention of talent is the primary focus of every firm.
DENVERDowntown Denver’s key indicators saw modest change in 2017. Class A asking rents increased marginally while the vacancy rate moved up by 130 BPS. Most of net absorption in 2017 occurred in the Downtown and Southeast submarkets and tenant demand remains skewed toward the best quality space.
The metro Denver office market added over 2.5 million square feet of inventory in 2017, three times the total seen in 2016. Current construction activity totals over 4 million square feet. The CBD is set for delivery of its largest office project in over 30 years at the 660,000-square-foot 1144 Fifteenth.
The majority of Denver law firms took advantage of the depressed market early in the decade and secured new long-term leases. Hence there has been reduced leasing activity over the last couple of years which is expected to continue.
Leading Law Firm Lease Transactions in 2017 | Dallas
LAW FIRM SF LEASED PROPERTY NAME ADDRESS NEW LEASE OR RENEWAL QUARTER
Thompson & Knight LLP 160,000 One Arts Plaza 1722 Routh St. Renewal Q1
Baker Botts LLP 104,000 Trammell Crow Center 2001 Ross Ave. Renewal Q2
Vinson & Elkins LLP 110,000 Trammell Crow Center 2001 Ross Ave. Renewal Q2
Source: Colliers International
Q4 2017 Key Indicators | Dallas
Class A Asking Rent (PSF) $27.12
Downtown Vacancy Rate 23.1%
Number of Law Firms in the Market Declining
Market Sentiment Landlord’s Market
Source: Colliers International
Q4 2017 Key Indicators | Denver
Class A Asking Rent (PSF) $35.61
Downtown Vacancy Rate 14.1%
Number of Law Firms in the Market Static
Market Sentiment Landlord’s Market
Source: Colliers International
Leading Law Firm Lease Transactions in 2017 | Denver
LAW FIRM SF LEASED PROPERTY NAME ADDRESS NEW LEASE OR RENEWAL QUARTER
Norton Rose Fulbright 18,666 17th Street Plaza 1225 17th St. New Lease Q2
Haynes and Boone, LLP 13,616 Independence Plaza 1050 17th St. New Lease (Sublease) Q2
McElroy, Deutsch, Mulvaney & Carpenter, LLP 12,080 Quebec Corporate Plaza 5600 S Quebec St. Renewal Q2
Source: Colliers International

2018 North America Outlook Report | Law Firm Services Group | Colliers International9
FAIRFIELD COUNTY, CTThe Fairfield County office market took a small step backwards in 2017. The overall vacancy rate rose 100 BPS to 17.7% by Q4 2017 from 16.7% last year. Asking lease rates slowly climbed 1.1% from $35.71 per square foot to $36.09 per square foot, as higher quality space was brought back to the market.
Occupiers within the legal field were relatively quiet in 2017, with an average deal size of just over 4,000 square feet. Though velocity was limited, there continues to be a clear preference for Class A space, with 75% of leasing activity occurring in higher quality properties.
Leading Law Firm Lease Transactions in 2017 | Fairfield County
LAW FIRM SF LEASED ADDRESS NEW LEASE OR RENEWAL QUARTER
Chipman, Mazzucco, Land & Pennarola, LLC 7,604 44 Old Ridgebury Rd. New Q3
Shipman & Goodwin LLP 6,050 289 Greenwich Ave. Renewal Q3
Connecticut Legal Services, Inc. 4,806 1000 Lafayette Blvd. New Q2
Source: Colliers International
Q4 2017 Key Indicators | Fairfield County
Class A Asking Rent (PSF) $44.51
Downtown Vacancy Rate 17.1%
Number of Law Firms in the Market Declining
Market Sentiment Equal Footing
Source: Colliers International
HOUSTONThe Downtown Houston office market remains stubbornly challenged. Vacancy moved back above 20% in 2017, while Class A asking rents showed no growth. While not yet sufficient to drive expansion, the rise in crude oil prices (currently at around $70 per barrel) is an encouraging sign.
Large blocks of sublease space vacated by energy companies still dominate the market. A key unknown is how owners will reposition this space with several leases set to expire over the next two to three years. This space is skewed toward secondary Class B properties built in the 1980s. If it can be repositioned at attractive rental levels there could be an uplift for the Downtown market.
Law firm activity in Houston is healthy, with an increasing number of acquisitions of local firms by newcomers to the Houston market.Q4 2017 Key Indicators | Houston
Class A Asking Rent (PSF) $44.37
Downtown Vacancy Rate 20.6%
Number of Law Firms in the Market Static
Market Sentiment Tenant’s Market
Source: Colliers International
Leading Law Firm Lease Transactions in 2017| Houston
LAW FIRM SF LEASED PROPERTY NAME ADDRESS NEW LEASE OR RENEWAL QUARTER
Porter Hedges LLP 105,000 1000 Main 1000 Main St. Renewal Q2
Morgan, Lewis & Bockius LLP 89,500 Wells Fargo Plaza 1000 Louisiana St. Renewal Q2
Jackson Walker LLP 77,015 5 Houston Center 1401 McKinney St. Renewal Q4
Source: Colliers International

2018 North America Outlook Report | Law Firm Services Group | Colliers International10
LONG ISLANDThe Downtown Long Island office market held firm in 2017 with Class A rents holding steady and a 20 BPS reduction in the vacancy rate to 8.4%. Similar trends were seen in the overall market.
Within the Long Island market, Nassau County continues to outperform Suffolk Country. Vacancy in Nassau is still falling and at 7% and stands at 170 BPS below the Suffolk level. Nassau accounted for 47% of the total Long Island net absorption in 2017. Leasing activity was strongest in Western Nassau but turned negative in Central Nassau.
Law firms in Long Island continue to focus on efficiency and productivity. Further mergers and acquisitions are anticipated.
Q4 2016 Key Indicators | Long Island
Class A Asking Rent (PSF) $30.46
Downtown Vacancy Rate 8.4%
Number of Law Firms in the Market Static
Market Sentiment Landlords’ Market
Source: Colliers International
Leading Law Firm Lease Transactions in 2016 | Long Island
LAW FIRM SF LEASED ADDRESS QUARTER
Harris Beach, PLLC 10,000 Mitchell Field, NY Q2
Barnes, Catterson, LoFrumento & Barnes, LLP 5,000 Melville, NY Q3
Source: Colliers International
LOS ANGELESAs predicted in last year’s report, the Greater Los Angeles office market reached equilibrium in 2017. Vacancy rose by 30 BPS and rents grew by 2%. There is 5.1 million square feet of new office space under construction focused primarily on Downtown and West Los Angeles.
Downtown Los Angeles is facing challenges from a combination of an elevated vacancy rate, which remains stubbornly high at 20%, and an onset of new space under construction. There is 1.4 million square feet of new office space underway in Downtown Los Angeles in five projects, four of which should deliver in 2018, led by Waterbridge Capital LLC’s 500,000-square-foot project at 801 S. Broadway.
Some residual right-sizing remains, although most of Los Angeles’ law firms have renewed or relocated out of larger footprints signed in the past decade. The focus going forward will be on modernizing space by blending traditional law firm appeal with amenities and an atmosphere commensurate with the market’s other main industries —media and technology.
Q4 2017 Key Indicators | Los Angeles
Class A Asking Rent (PSF) $41.57
Downtown Vacancy Rate 20.0%
Number of Law Firms in the Market Static
Market Sentiment Tenants’ Market
Source: Colliers International
Leading Law Firm Lease Transactions in 2017 | Los Angeles
LAW FIRM SF LEASED PROPERTY NAME ADDRESS NEW LEASE OR RENEWAL QUARTER
Mitchell Silberberg & Knupp LLP 62,482 Century Plaza Towers 2049 Century Park E New Lease Q4
Holland & Knight LLP 41,664 400 South Hope 400 S Hope St. Renewal Q3
Foley & Lardner LLP 36,859 City National Plaza South 515 S Flower St. Renewal & Downsize Q2
Source: Colliers International

2018 North America Outlook Report | Law Firm Services Group | Colliers International11
MANHATTANAt 37.1 million square feet, Manhattan leasing volume in 2017 was the second highest since 2003, increasing by 11% year over year. Vacancy held firm at 6.2%, the third lowest of the markets covered in this report. Average Class A asking rates also held steady at $78.30 per square foot, second only to San Francisco.
Vacancy rates are firmly in single digits across all of Manhattan, ranging from 1.7% in Hudson Yards/Manhattan West to 8.9% in the World Trade Center. The shortage of large blocks of available space persists. Only six contiguous blocks of 250,000 square feet or above are immediately available in Manhattan, half the total available at the beginning of 2017.
Construction deliveries in 2018 are set to be the highest level in Manhattan in almost 30 years. A further 6.9 million square feet is set to arrive in the remainder of 2018, of which 2.9 million square feet has yet to be leased. The bulk of the available space is in 3 World Trade Center. With a clear tenant preference for premium space, this space is not expected to linger on the market. The larger question is what will be required to fuel an up-tick in leasing activity to fill the space left behind?
In 2017, Manhattan law firm leasing was up 16%, year over year, to 2.7 million square feet, the highest volume since 2014. Seven leases of more than 100,000 square feet were signed in 2017, compared to five in 2016. The focus is on workplace strategies, including fitting more lawyers in less space. Retaining and attracting talent is critical in today’s competitive market.
Q4 2017 Key Indicators | Manhattan
Class A Asking Rent (PSF) $78.30
Downtown Vacancy Rate 6.2%
Number of Law Firms in the Market Expanding
Market Sentiment Equal Footing
Source: Colliers International
Leading Law Firm Lease Transactions in 2017 | Manhattan
LAW FIRM SF LEASED PROPERTY NAME ADDRESS NEW LEASE OR RENEWAL QUARTER
Sidley Austin LLP 352,112 - 787 7th Ave. Renewal Q3
Kramer Levin Naftalis & Frankel LLP 265,638 - 1177 Avenue of the Americas Renewal Q1
Wachtell, Lipton, Rosen & Katz 250,762 CBS Building 51 W 52nd St. Renewal & Expansion Q4
Source: Colliers International
MILWAUKEEThe Milwaukee office market posted solid performance in 2017. The metro office vacancy rate held steady while vacancy downtown fell from 8.6% to 8.2%. Class A asking rents moved up to $19.75 per square foot for the overall market and $21.95 per square foot downtown.
Downtown Milwaukee is at the forefront of market activity. Net absorption in the 19.9-million-square-foot Downtown market totaled 1.1 million square feet in 2017, out of a metro total of 1.6 million square feet. Downtown is also dominating construction activity. Northwestern Mutual’s 1.1 million square feet downtown headquarters was completed in Q3 2017 and there is 620,000 square feet of new space underway downtown in three projects.
The bulk of law firm growth in the Milwaukee market has occurred through mergers and acquisitions by both local and national firms. While there is a drive for better space by moving to a new building or development, space efficiency is a key consideration to contain occupancy costs.
Q4 2017 Key Indicators | Hartford
Class A Asking Rent (PSF) $21.95
Downtown Vacancy Rate 8.2%
Number of Law Firms in the Market Static
Market Sentiment Tenants’ Market
Source: Colliers International
Leading Law Firm Lease Transactions in 2017 | Hartford
LAW FIRM SF LEASED PROPERTY NAME ADDRESS NEW LEASE OR RENEWAL QUARTER
Reinhart Boerner Van Deuren s.c. 89,580 1000 North Water 1000 N Water St. Renewal & Reduction Q2
Michael Best & Friedrich LLP 59,000 BMO Tower 790 N Water St. New Lease (Relocation) Q3
Michael Best & Friedrich LLP 28,669 Two Riverwood Place N19W24133 Riverwood Dr. Renewal Q3
Source: Colliers International

2018 North America Outlook Report | Law Firm Services Group | Colliers International12
Q4 2017 Key Indicators | Nashville
Class A Asking Rent (PSF) $33.67
Downtown Vacancy Rate 7.7%
Number of Law Firms in the Market Expanding
Market Sentiment Equal Footing
Source: Colliers International
Leading Law Firm Lease Transactions in 2017 | Nashville
LAW FIRM SF LEASED PROPERTY NAME ADDRESS NEW LEASE OR RENEWAL QUARTER
Bradley Arant Boult Cummings LLP 105,747 Roundabout Plaza 1600 Division St. Renewal Q3
Lewis, Thomason, King, Krieg, & Waldrop P.C. 27,690 Fifth Third Center 424 Church St. Expansion Q4
Lieff Cabraser Heimann & Bernstein, LLP 8,392 - 222 2nd Ave. S New Q2
Source: Colliers International
NASHVILLENashville is establishing itself as an upper-tier secondary market and was one of the strongest performing U.S. office markets in 2017. Downtown Nashville led all markets in 2017 in terms of absorption when expressed as a percentage of inventory. Absorption equaled 8.3% of inventory compared with a meager 0.4% for downtown markets across the U.S. overall. In addition, Downtown Class A rent growth was the greatest of the markets covered in this report at 11.6%.
Nashville’s strong economic growth, popularity with expanding and relocating companies, steady population increases, educated work force and reputation as a national hub for the creative class have all lent support to vibrant demand for office space. According to data from the Nashville Area Chamber of Commerce, Nashville ranked third nationally for job growth in 2017. This marks the metro’s sixth consecutive year within the top 10. Competitive rental rates, year-end absorption totaling over 1.5 million square feet and record new supply in 2017 (now 86% leased) have collectively paved the way for a strong 2018.
Law firms remain active in the Nashville market. Most law firms that have relocated in the last two years have moved into new construction and firms actively looking to relocate
NORTHERN NEW JERSEYWhile the Northern New Jersey office market has shown signs of incremental improvement in 2017, corporate relocations and consolidations continued to inhibit sustained growth. A slowdown in leasing activity together with large new availabilities resulted in negative absorption for the year. However, the adaptive reuse of older office product had a positive effect on the vacancy rate, which improved by 80 basis points to 16.1% year over year. Outside of Newark and the Hudson Waterfront, Northern New Jersey is predominantly suburban in nature, with the other principal concentrations of office inventory in Morristown and Parsippany. Newark continues to out-pace the overall market, with an overall vacancy rate of 14.9% and an average asking rent of $30.47 per square foot — 13.2% higher than the overall market. Vacancy in both Morristown and Parsippany is elevated and above the overall market level.
Refurbished, older office buildings are attracting law firms seeking a more creative workspace.
Leading Law Firm Lease Transactions in 2017 | Northern New Jersey
LAW FIRM SF LEASED PROPERTY NAME ADDRESS NEW LEASE OR RENEWAL QUARTER
Gibbons P.C. 111,000 One Gateway Center Newark, NJ Renewal Q2
Brach Eichler LLC 45,000 - 101 Eisenhower Pkwy. Renewal & Expansion Q3
Archer & Greiner P.C. 31,000 - 21 Main St. Renewal Q2
Source: Colliers International
Q4 2017 Key Indicators | Northern New Jersey
Class A Asking Rent (PSF) $29.98
Downtown Vacancy Rate 16.1%
Number of Law Firms in the Market Static
Market Sentiment Tenant’s Market
Source: Colliers International

2018 North America Outlook Report | Law Firm Services Group | Colliers International13
PHILADELPHIAAfter falling into single digits in 2016, vacancy in the Philadelphia central business district (CBD) has inched back up to 10.1%. Class A asking rates are holding steady at approximately $31.60 per square foot. CBD vacancy is the lowest in the region and comfortably below the market average of 11.9%.
Looking across all office occupier sectors, four of the region’s largest leases signed in 2017 took place in the CBD. Comcast remains a dominant player both renewing and expanding its footprint at 1717 Arch Street to 300,000 square feet. There are fewer large law firms looking for space, but mid-range, full-floor firms have been active. Firms are continuing to reduce their office footprint by achieving space efficiencies, more consistent office standards and technology investment. Q4 2017 Key Indicators | Philadelphia
Class A Asking Rent (PSF) $31.62
Downtown Vacancy Rate 10.1%
Number of Law Firms in the Market Static
Market Sentiment Landlords’ Market
Source: Colliers International
Leading Law Firm Lease Transactions in 2017 | Philadelphia
LAW FIRM SF LEASED PROPERTY NAME ADDRESS NEW LEASE OR RENEWAL QUARTER
BakerTilly Virchow Krause, LLP 49,394 One Liberty Place 1650 Market St. Renewal Q4
Tierney 31,214 - 1700 Market St. New Lease Q1
Simon & Simon, PC 30,000 - 1818 Market St. New Lease Q4
Source: Colliers International
SAN DIEGOThe San Diego County Office Market remained steady in 2017. Downtown Class A office buildings are achieving all-time high asking rates. Downtown landlords are investing more money in renovating their office projects and adding amenities to attract higher rent-paying tenants. New high-profile office projects will break ground in 2018 as vacancy continues to improve. The 1.1-million-square-foot Manchester Pacific Gateway, located downtown on the San Diego waterfront, is set to break ground in mid-2018.
Refurbishment of many older, obsolete office buildings has attracted law firms due to new amenities and the provision of a live-work-play environment. Downtown rents are 30% lower than in UTC, however the parking costs for Downtown continue to increase. Shifting demographics and advances in technology are causing law firms to rethink their office space requirements. Although it has been a slow process, larger law firms are beginning to embrace shrinking their footprint by adopting more open layouts and outsourcing back-office functions, while the smaller firms are already doing so along with working remotely.
Q4 2017 Key Indicators | San Diego
Class A Asking Rent (PSF) $35.76
Vacancy Rate 15.9%
Number of Law Firms in the Market Static
Market Sentiment Equal Footing
Source: Colliers International
Leading Law Firm Lease Transactions in 2017 | San Diego
LAW FIRM SF LEASED PROPERTY NAME ADDRESS NEW LEASE OR RENEWAL QUARTER
Procopio, Cory, Hargreaves & Savitch LLP 40,325 One Del Mar 12544 High Bluff Dr. Renewal & Expansion Q3
Neil, Dymott, Frank, McFall, Trexler, McCabe & Hudson 17,463 110 Plaza 110 W A St. New Lease Q3
Andrews Lagasse Branch & Bell LLP 13,059 Pacifica Tower 4365 Executive Dr. Renewal & Expansion Q4
Source: Colliers International

2018 North America Outlook Report | Law Firm Services Group | Colliers International14
SAN FRANCISCOThe San Francisco Bay Area office market remains one of the strongest in the U.S., commanding the highest rents among the markets in this report at $84.50 per square foot and the fifth-lowest vacancy rate. Strong leasing by the tech sector is showing no signs of abating. One sign of the market’s strength is that its high rents continue to be underpinned by actual lease transactions rather than new space entering the market with higher asking rates. Rents in San Francisco’s core submarkets of the Financial District and SOMA are holding up at approximately $80 per square foot. The rental delta between Class A and Class B office space is relatively small, reflecting strong demand and low availability.
The dominance of the tech sector cannot be overstated. Dropbox signed the largest lease in San Francisco market history in Q4 2017, taking 737,000 square feet at 100 Owens Street. Office space under construction is predominantly pre-leased, further reflecting market strength.
Law firms remain active in San Francisco with two national firms seeking a combined 150,000 feet of new space. Regional firms are also looking to expand.
Q4 2017 Key Indicators | San Francisco
Class A Asking Rent (PSF) $84.51
Downtown Vacancy Rate 6.9%
Number of Law Firms in the Market Expanding
Market Sentiment Landlords’ Market
Source: Colliers International
Leading Law Firm Lease Transactions in 2017 | San Francisco
LAW FIRM SF LEASED PROPERTY NAME ADDRESS NEW LEASE OR RENEWAL QUARTER
Covington & Burling LLP 77,667 Salesforce Tower 415 Mission St. New Lease Q1
Gibson, Dunn & Crutcher LLP 70,789 555 Mission Street 555 Mission St. Renewal Q4
San Francisco City Attorney's Office 69,400 Fox Plaza 1390 Market St. Renewal Q2
Source: Colliers International
SEATTLEThe Seattle office market continues to post strong performance. Amazon remains at the center of the story, recently moving into 528,000 square feet across two properties in the Lake Union submarket, while pre-leasing the entire 720,000-square-foot Rainier Tower II in the CBD.
Seattle rents are still on the rise. Average asking rents stand at $40.25 per square foot. The highest Class A asking rates are in the CBD ($46.50 per square foot) and Lake Union ($41.30 per square foot). Steady pre-leasing of new space is driving rent growth and keeping availability tight. Construction activity remains elevated with 5.2 million square feet of office space underway across the Seattle office market, 71% of which is pre-leased. This development is concentrated in three submarkets: Belltown/Denny Regrade (1.2 million square feet and 100% pre-leased), Lake Union (2.2 million square feet and 66% pre-leased) and the Seattle CBD (1.4 million square feet and 52% pre-leased). Given strong, sustained tenant demand in Seattle and the continued growth of the tech sector, we do not perceive any supply-side risk.
Law firms are becoming more efficient and thus taking less space than they needed 10 years ago. This includes fewer paralegal stations and consistent private office sizes.
Leading Law Firm Lease Transactions in 2017 | Seattle
LAW FIRM SF LEASED PROPERTY NAME ADDRESS NEW LEASE OR RENEWAL QUARTER
Dorsey & Whitney LLP 54,088 Columbia Center 701 5th Ave. Extension Q3
Hagens Berman Sobol Shapiro LLP 31,081 Russell Investments Center 1301 2nd Ave. New Lease Q4
Harrigan Leyh Farmer & Thomsen LLP 13,874 Wells Fargo Center 999 3rd Ave. New Lease Q2
Source: Colliers International
Q4 2017 Key Indicators | Seattle
Class A Asking Rent (PSF) $46.50
Downtown Vacancy Rate 7.1%
Number of Law Firms in the Market Expanding
Market Sentiment Landlords’ Market
Source: Colliers International

2018 North America Outlook Report | Law Firm Services Group | Colliers International15
Q4 2017 Key Indicators | South Florida
Class A Asking Rent (PSF) $41.38
Downtown Vacancy Rate 10.7%
Number of Law Firms in the Market Expanding
Market Sentiment Equal Footing
Source: Colliers International
Leading Law Firm Lease Transactions in 2017 | South Florida
LAW FIRM SF LEASED PROPERTY NAME ADDRESS NEW LEASE OR RENEWAL QUARTER
DLA Piper LLP (US) 39,759 Southeast Financial Center 200 S Biscayne Blvd. Renewal Q1
Podhurst Orseck, P.A. 36,102 SunTrust International Center 1 SE 3rd Ave. New Q1
Becker & Poliakoff, P.A. 27,506 1 E Broward 1 E Broward Blvd. Renewal Q3
Source: Colliers International
SOUTH FLORIDAThe office market in Miami-Dade County stabilized in 2017 with vacancy running at close to 9% throughout the year. Class A rental rates stand at $41 per square foot in line with the average for South Florida as a whole.
The Broward County office market posted solid performance with vacancy falling by a further 130 BPS to 9%. Net absorption exceeded 1 million square feet for a second successive year. Construction activity remains elevated with almost 700,000 square feet delivered in 2017 with a further half-million square feet still underway.
While demand exists, the shortage of both labor and available quality space are notable challenges for law firms seeking to expand.
TAMPAVacancy in the Tampa CBD fell by a robust 230 BPS in 2017 to 11.2% while rents held firm at $28.70 per square foot, which is in line with the overall Tampa Bay average. Rents in the St. Petersburg CBD are at a similar level, but vacancy is the lowest in Tampa Bay at 7.8%.
Net absorption in 2017 was concentrated in the suburbs and in Westshore in particular. However, the Tampa CBD is relatively small with total inventory of 6.8 million square feet compared to 14.5 million square feet in Westshore.
Law firm leasing in Tampa is subdued. National and regional firms are primarily renewing in place. No national or regional firms have opened new offices in Tampa for the past few years.
Q4 2017 Key Indicators | Tampa
Class A Asking Rent (PSF) $27.82
Downtown Vacancy Rate 11.2%
Number of Law Firms in the Market Static
Market Sentiment Landlords’ Market
Source: Colliers International
Leading Law Firm Lease Transactions in 2017 | Tampa
LAW FIRM SF LEASED PROPERTY NAME ADDRESS NEW LEASE OR RENEWAL QUARTER
Phelps Dunbar LLC 30,000 Wells Fargo Center 100 Ashley Dr. S Renewal Q1
Lewis Brisbois Bisgaard & Smith LLP 20,000 SunTrust Financial Centre 401 E Jackson St. New Lease/Relocation Q1
Maney | Gordon | Zeller, P.A. 14,000 Bank of America Plaza 101 E Kennedy Blvd. Renewal Q2
Source: Colliers International

2018 North America Outlook Report | Law Firm Services Group | Colliers International16
TORONTOToronto remains one of, if not the, strongest markets covered in our report. The vacancy rate for the Greater Toronto Area (GTA) has fallen below 5% and availability is at a 17-year low.
While suburban markets are improving, performance is being driven by across-the-board demand for space Downtown, which is virtually at full occupancy with a mere 2.1% vacancy rate. As tenants move in to AAA-class buildings, the space left behind is quickly backfilled, creating a shortage of availabilities for medium to large tenants with upcoming lease expirations.
This lack of high-end space is fueling growth in Class B rents which rose by 6.5% in 2017 compared to 1.9% in AAA-class buildings. While financial and insurance firms accounted for 45% of space requirements in the market and law firms account for 5%, technology was the leading industry occupying space over the past year.
Extremely low vacancy, coupled with spiking rents and limited incentives, is causing law firms to re-think workplace efficiency from both cost and culture perspectives.
Q4 2017 Key Indicators | Toronto
Class A Asking Rent (PSF) $46.71
Downtown Vacancy Rate 2.1%
Number of Law Firms in the Market Static
Market Sentiment Landlords’ Market
Source: Colliers International
Leading Law Firm Lease Transactions in 2017 | Toronto
LAW FIRM SF LEASED PROPERTY NAME ADDRESS NEW LEASE OR RENEWAL QUARTER
Torys LLP 172,000 TD Centre 79 Wellington St. W Renewal Q3
Norton Rose Fulbright 98,000 TD Centre 222 Bay St. New Lease Q2
Baker McKenzie LLP 64,000 Brookfield Place 181 Bay St. Renewal & Expansion Q1
Source: Colliers International
VANCOUVERThe Vancouver office market continues to go from strength to strength. The Downtown vacancy rate sits at a tight 5.2% — the second lowest among all the markets and bettered only by Toronto. Class A rents posted further gains in 2017 and closed the year at $39.50 per square foot.
Demand remains strong with 2.2 million square feet of known tenant requirements across the Greater Vancouver market. Law firms account for 5% of this total. Construction activity is modest. The 235,000-square-foot Exchange Tower delivered in the Downtown core in late 2017 at 60% pre-leased. Vancouver Center II is the only sizable speculative project on the horizon and is not expected to deliver until 2021.
Availability is tight and the next wave of construction will not be arriving until 2021 to 2023. As a result, there should be a race to be the first in these new buildings to accommodate expansion. In the interim, the redesign of existing law firm space is set to continue.
Q4 2017 Key Indicators | Vancouver
Class A Asking Rent (PSF) $39.47
Downtown Vacancy Rate 5.2%
Number of Law Firms in the Market Static
Market Sentiment Landlords’ Market
Source: Colliers International
Leading Law Firm Lease Transactions in 2017 | Vancouver
LAW FIRM SF LEASED PROPERTY NAME ADDRESS NEW LEASE OR RENEWAL QUARTER
Lawson Lundell LLP 70,000 Cathedral Place 925 W Georgia St. Renewal Q2
Harris & Company LLP 30,000 Bentall 5 550 Burrard St. Renewal Q4
Gowling WLG 10,000 Bentall 5 550 Burrard St. Expansion Q4
Source: Colliers International

2018 North America Outlook Report | Law Firm Services Group | Colliers International17
WASHINGTON, D.C.The Washington, D.C. office market (the District) posted mixed performance in 2017. Rents continued to rise but vacancy is on the increase. Class A asking rates stand at $60.25 per square foot — the third-highest among the markets addressed by this report.
While the Federal Government and legal sector signs many of the large-scale leases, most transactions involve an element of contraction and downsizing. Construction activity remains elevated and rising with 7 million square feet underway in the District, which is the highest total seen since Q4 2004. There is 4.5 million square feet scheduled for delivery in 2018, which is 41% pre-leased.
Despite being one of the largest demand drivers in the District, large law firms have continued to reduce their space requirements. There has been growth in smaller law firm footprints as they start to outgrow their efficient space. Q4 2017 Key Indicators | Washington, D.C.
Class A Asking Rent (PSF) $60.27
Downtown Vacancy Rate 11.8%
Number of Law Firms in the Market Declining
Market Sentiment Tenants’ Market
Source: Colliers International
Leading Law Firm Lease Transactions in 2017 | Washington, D.C.
LAW FIRM SF LEASED ADDRESS NEW LEASE OR RENEWAL QUARTER
WilmerHale 288,000 2100 Pennsylvania Ave. NW New Lease Q4
Akin Gump Strauss Hauer & Feld LLP 185,000 2001 K St. NW New Lease & Contraction Q1
K&L Gates LLP 126,910 1601 K St. NW Renewal & Contraction Q4
Source: Colliers International
WESTCHESTER COUNTY, NYOverall, Westchester’s office market was steady in 2017, aside from one significant event. After falling to 15.4% in Q1 2017, the vacancy rate rose 290 BPS in the second quarter, after IBM officially marketed their massive 1.1 million square feet former headquarters in Northern Westchester. Vacancy has declined since, falling to 17.7%. The average asking lease rate has remained essentially flat, falling just 1.4% since last year to $26.75 per square foot. The weakening in suburban markets is offset by gains in the White Plains CBD. This desire to be in a more urban environment was reflected by law firms as well. In 2017, 50% of the leasing activity completed by legal firms was signed in the White Plains CBD submarket, while almost non-existent in Northern Westchester.
Q4 2017 Key Indicators | Westchester County
Class A Asking Rent (PSF) $28.29
Downtown Vacancy Rate 17.7%
Number of Law Firms in the Market Expanding
Market Sentiment Landlord’s Market
Source: Colliers International
Leading Law Firm Lease Transactions in 2017 | Westchester County
LAW FIRM SF LEASED ADDRESS NEW LEASE OR RENEWAL QUARTER
Milber Makris Plousadis & Seiden, LLP 29,573 709 Westchester Ave. New Q2
Greenberg Traurig, LLP 26,356 445 Hamilton Ave. Renewal Q2
Goldberg Segalla 21,085 1-11 Martine Ave. Renewal & Expansion Q2
Source: Colliers International

2018 North America Outlook Report | Law Firm Services Group | Colliers International18
Copyright © 2018 Colliers International.The information contained herein has been obtained from sources deemed reliable. While every reasonable effort has been made to ensure its accuracy, we cannot guarantee it. No responsibility is assumed for any inaccuracies. Readers are encouraged to consult their professional advisors prior to acting on any of the material contained in this report.
COLIN SCARLETTExecutive Vice President,Personal Real Estate Corporation+1 604 661 0879 [email protected]
STEPHEN NEWBOLDNational Director,Office Research | USA+1 202 534 [email protected]
DANIEL ARENDSPrincipal,Office Advisory Group+1 312 612 [email protected]
LAW FIRM SERVICES GROUP CONTACTS RESEARCH CONTACT