
Firm profitability and relative firm power
13
Strategic Management Journal, Vol. 4, 237-249 (1983) Firm Profitability and Relative Firm Power CRAIG S. GALBRAITH Graduate School of Management, University of California, Irvine, California, U.S.A. CURT H. STILES Graduate School of Business Administration, University of Southern California, Los Angeles, California, U.S.A. Summary This paper e-ypands the notion of’ extended rivalry as cross-industry ri,lutions bi,ithin the chain of’ production and distribution, and argues that ,firm power resides in the exclusivity and essentiality of the firm’s jirnction in the chain. A cross-section of’ US. manufacturing ,firms rt.prescwting componentsfor,finishedgoods, capital goods, and supplies or consumable products is examined. The unalysis of’the three industry g~v0up.s by simultaneous equation estimation prorides general support .for the hypothesis that ,firm power, as expressed in inter-industry transuctions. und industry structure, is associared with,firm projtability. INTRODUCTION Since Bain’s seminal work (Bain, 1951, 1956) a large number of research studies have appeared in the economic literature attempting to explain firm profitability by means of industry structure. The essential logic underlying such research is that ‘market structure plays a powerful role in determining or conditioning business conduct and business conduct, in turn, determines the ultimate quality of industrial performance’ (Vernon, 1972: 1). In general, empirical studies purporting to test this relationship have posited single industry models in which firm profitability becomes a function of industry concentration, entry barriers, and market demand conditions. Such single industry models, however, have largely ignored the effects of the structural and behavioural characteristics of the industries with which the firm must deal across markets, purchase markets in which the firm deals as a buyer and sales markets in which the firm deals as a seller (Phillips, 1976). In reality, firms purchase factors of production and intermediate goods, and in turn, sell to other users, thus the structural and behavioural elements in both the purchase market and sales market should theoretically affect firm profitability (Porter, 1976). Indeed, the exploitation of the market relationships between adjacent stages of production and distribution is an implicit, and often explicit, strategy of modern business organizations (Hofer and Schendel, 1978; Porter, 1980). Business planners and strategists make decisions within the context of their economic understanding of the chain of production, both as ‘unitas multiplex’, from raw material to final customer, and as the individual constituents in the chain. Unfortunately, business strategy research, although explicitly focusing on the behaviour and conduct of firms and the complex of interrelated decisions about the allocation of a business’ available resources, has generally discussed strategy in terms of the lateral relationships among direct and indirect competitors. Strategy researchers have only recently started to examine empirically the vertical relationships describing the firm’s transactions with suppliers of inputs and purchasers of outputs. 0143-2095/83/030237-13$01.30 Recei~d I2 Fcbruary I982 Rerued 30 July 1982 1983 by John Wiley & Sons, Ltd.
Transcript of Firm profitability and relative firm power

Strategic Management Journal, Vol. 4, 237-249 (1983)
Firm Profitability and Relative Firm Power CRAIG S. GALBRAITH Graduate School of Management, University of California, Irvine, California, U.S.A.
CURT H. STILES Graduate School of Business Administration, University of Southern California, Los Angeles, California, U.S.A.
Summary This paper e-ypands the notion of’ extended rivalry as cross-industry ri,lutions bi,ithin the chain of’ production and distribution, and argues that ,firm power resides in the exclusivity and essentiality of the firm’s jirnction in the chain. A cross-section of’ U S . manufacturing ,firms rt.prescwting componentsfor,finishedgoods, capital goods, and supplies or consumable products is examined. The unalysis of’the three industry g~v0up.s by simultaneous equation estimation prorides general support .for the hypothesis that ,firm power, as expressed in inter-industry transuctions. und industry structure, is associared with,firm projtability.
INTRODUCTION
Since Bain’s seminal work (Bain, 1951, 1956) a large number of research studies have appeared in the economic literature attempting to explain firm profitability by means of industry structure. The essential logic underlying such research is that ‘market structure plays a powerful role in determining or conditioning business conduct and business conduct, in turn, determines the ultimate quality of industrial performance’ (Vernon, 1972: 1 ) . In general, empirical studies purporting to test this relationship have posited single industry models in which firm profitability becomes a function of industry concentration, entry barriers, and market demand conditions. Such single industry models, however, have largely ignored the effects of the structural and behavioural characteristics of the industries with which the firm must deal across markets, purchase markets in which the firm deals as a buyer and sales markets in which the firm deals as a seller (Phillips, 1976). In reality, firms purchase factors of production and intermediate goods, and in turn, sell to other users, thus the structural and behavioural elements in both the purchase market and sales market should theoretically affect firm profitability (Porter, 1976).
Indeed, the exploitation of the market relationships between adjacent stages of production and distribution is an implicit, and often explicit, strategy of modern business organizations (Hofer and Schendel, 1978; Porter, 1980). Business planners and strategists make decisions within the context of their economic understanding of the chain of production, both as ‘unitas multiplex’, from raw material to final customer, and as the individual constituents in the chain. Unfortunately, business strategy research, although explicitly focusing on the behaviour and conduct of firms and the complex of interrelated decisions about the allocation of a business’ available resources, has generally discussed strategy in terms of the lateral relationships among direct and indirect competitors. Strategy researchers have only recently started to examine empirically the vertical relationships describing the firm’s transactions with suppliers of inputs and purchasers of outputs. 0143-2095/83/030237-13$01.30 R e c e i ~ d I2 Fcbruary I982
Rerued 30 July 1982 1983 by John Wiley & Sons, Ltd.

238 Craig S. Galbraith and Curt H . Stiles
This paper adds to the study of firm profitability by expanding the industry model to include cross-industry relations within the chain of production and distribution. It infers a relationship between profitability, and the relative power between producing firms, their suppliers, and their customers. It also finds that intra-industry rivalry, expressed by concentration levels and entry barriers, is associated with firm profitability.
IMPORTANCE O F RELATIVE FIRM POWER
‘Extended rivalry’, in Porter’s terms, refers to the fact that competitors to firms in an industry comprise a broader group of firms than the set of firms actually in the industry itself. The concept of extended rivalry includes (1) the intensity of competition within an industry, (2) the intensity of rivalry with substitutable products from closely related industry, ( 3 ) barriers to entry and exit, and (4) the relative power of suppliers and customers (Porter, 1980:6).
Whereas the first three components listed above have been, either singularly or jointly, the focus of a number of studies in the economic literature, the notion of relative power within the production and distribution chain has received little empirical attention. From a theoretical perspective, however, the concept of relative firm power is firmly embedded in the development of bilateral oligopoly theory (Adelman, 1949; McKie, 1959; Lustgarten, 1975; Porter, 1976), whereas the related Nash equilibrium, for example, is solely dependent upon the relative power of the respective bargaining firms (Nash, 1950). What is lacking, though, is an understanding of the sources of relative firm power. To a large degree, the paucity of research on the economic implications of relative power between buyers and sellers is due to the lack of clarity regarding the power concept itself.
Broadly speaking, economic power is simply the ability of a firm to influence prices, contracts, distribution privileges, and the like, which ultimately affect profitability (Shepherd, 1979). Power conditions can be expressed within the purchase market interactions, sales market interactions, or both. The parties in a power relationship are tied together by their mutual dependence, suppliers to the firm and the firm to its customers. Because the manifestation of economic power requires the interaction of two or more ‘traders’, power resides explicitly in the other’s dependency.
Simply stated, Firm A has power over Firm B to the extent that Firm A can get Firm B to do something it would not otherwise do. The basis for such power is grounded in: (1) the essentiality (or importance) of the function a firm performs in the production chain, either by product or service, and (2) the exclusivity by which the firm performs that function. The dual notion of essentiality and exclusivity keys the power relationships within the chain of production and distribution. For example, the availability of alternative sources of supply, or the existence of substitutable inputs, diffuses the power of suppliers, i.e. there is a lack of exclusivity in the supplier’s market. Likewise, a product or service that is relatively unimportant or non-essential to the livelihood of the buyers provides only a weak power base for their suppliers.
As a case in point, the public investigation into the Rolls Royce bankruptcy of 1969 revealed several circumstances where Rolls Royce was able to gain advantages owing to its position as the major or dominant industrial customer for a number of firms. For many suppliers Rolls Royce represented a substantial and essential portion of their total sales. Such dependency created vulnerabilities, and ultimately contributed to a weak bargaining position with respect to Rolls Royce. In addition, some suppliers to Rolls Royce had established highly product- specific skills, not easily transferable to other markets and technologies. For example, Smith Clayton Forge developed a forging technique unique to the production of titanium blades,

Firm Profitability and Relatice Firm Power 239
used by Rolls Royce in their engines. The exclusivity of Rolls Royce’s position as sole purchaser of such product-specific technologies created a situation where suppliers of these technologies were unable to gain a favourable power base.
If we initially consider the manifestation of power to be summarized in the price mechanism, then power on the purchase side of the production chain is captured by a firm’s cost function. A dominant purchaser should be able to extract substantial control over the supplier’s marketing, distribution, labour, materials, credit, and price decisions, and essentially dictate the fee schedule and contract conditions of their relationship. Consistent with this hypothesis, the official receiver in the Rolls Royce bankruptcy case reported unusually large levels of credit extended to Rolls Royce by some of its suppliers, whereas a minor customer with less power would have likely been given normal credit terms (Blois, 1972). In a similar manner, bargaining power on the sales side of the production chain is captured in a firm’s price structure, reflecting the higher prices charged to less powerful users.
In practice, given equal power conditions, the price mechanism will vary according to the degree that the pertinent information required for market transactions is actually reflected in market prices (Stiglitz, 1979), and whether the transacting firms are sales maximizers, profit maximizers, or profit satisficers (Miller and Romeo, 1979). Clearly, however, a firm, or collection of firms, that enjoys the dual conditions for power, exclusiveness and essentiality of their products or services, can command advantageous price/cost contracts with firms in adjacent phases of production and distribution, and hence enjoy greater profit rates.
Power linkages are also multi-directional between adjacent stages in the production chain. In part, a firm’s strategy and ensuing profitability can be explained by its desire and ability to maximize the firm’s power relative to suppliers and customers and, in turn, to minimize the power suppliers and customers hold over the firm. The effort to minimize the power potential of suppliers and customers can address either the exclusivity or essentiality conditions of power. Whereas a firm holding a dominant position in the production chain enjoys what Blois labels ‘vertical quasi-integration’, that is, the ability to obtain the benefits of vertical integration without the potential costs associated with the physical extension of its operations, actual vertical integration provides a type of defensive strategy aimed at reducing the exclusiveness of upstream or downstream roles in the production chain. Horizontal diversification, however, addresses the essentiality condition by providing a strategic option which localizes the impact of manifested power by dominant suppliers of inputs, or purchasers of outputs.
The propensity to internalize the market, whether by vertical integration or horizontal diversification, is based on the cost of doing transactions within the organization relative to the cost of market transactions. Because the power of suppliers and customers is manifested ultimately in the cost of market transactions, there should be a direct link between diversification and integration efforts and the relative bargaining power of adjacent phases in the production chain. The direction of diversification and/or integration depends on which of the two conditions for power, when internalized, sufficiently reduces the cost of market transactions relative to the increased cost of bounded rationality incurred with the strategy (Williamson, 1970; Kay, 1982).
HYPOTHESIS
For the purpose of this study we have mapped a three tiered chain of production and distribution. The chain has the following components:
f - - - - - - - - - - - - - Suppliers Customers + Firm f _---_______ 5

240 Craig S. Galbraith and Curt H . Stiles
where the solid arrows represent the flow of goods and services, and the broken arrows represent the movement of money. This of course is a simplified mapping of the production and distribution chain. In reality, a firm may purchase a number of materials and intermediate goods, each from a different industry group, that will be ultimately assembled into the final product and sold to the next stage in the production chain.
Taking the perspective of a firm in the middle component of the production chain map, we are concerned about the effect on a firm’s profits of the distribution of power within the purchase market relationships between the firm and suppliers (purchase market conditions) and of the distribution of power within the sales market relationship between the firm and customers (sales market conditions). In general, we expect that as the essentiality and exclusivity of suppliers increases, profitability of the firm decreases. Similarly, a corresponding relationship between customer power and firm profitability is anticipated.
This leads us to the general hypothesis that:
Firm projitability is inJluenced by the essentiality and exclusiuity of the market relationships between t h e j r m and its suppliers and between thejirm and its customers in the chain of production and distribution.
Also, in accordance with received economic theory, we must allow for the fact that the profitability of the firm’scomponent of the production chain is also influenced by the structural characteristics of the firm’s industry, particularly the height of entry barriers. This relationship is complex since entry barriers should cause profitability to be higher, but, simultaneously, high profitability will attract entry. In this instance the relationship between entry and profitability would be negative, but the direction of influence would be uncertain. Alternatively, low profitability may cause the industry to be unattractive and forestall entry even though barriers are low. In this instance the relationship would be positive, but the influence would be from profitability to entry.
The equivocality of the entry-profitability relationship can lead to results that appear to be anomalous, such as in the well known case of Crown Cork and Seal Company. The tin can industry was highly concentrated and had seen little entry, two conditions that would be expected to be associated with high industry profitability. But a high threat of entry diminished the exclusivity and essentiality of the tin can producers’ function so greatly that the profitability of the industry was instead low. The low profitability in turn discouraged entry and maintained the high degree of concentration.
Thus, a profitability model not only must include as exogenous variables the level of competitor entry and other industry conditions, but also must simultaneously allow for the effects on entry of profitability and industry conditions. The relationships predicted are:
Purchase Sales market Firm profitability market
conditions \ I / conditions
Entry
Industry conditions

Firm Profitability and Relative Firm Power 241
DATA
A cross-section of U.S. manufacturing firms serves as the database for testing the hypothesis. The Profit Impact of Market Strategy (PIMS) database employed for the study is maintained and administered by the Strategic Planning Institute. Currently, more than 200 corporations representing over 1200 separate businesses participate in the PIMS programme. The majority of the companies are drawn from the top 500 companies on the Fortune list, although many medium-sized companies are represented. Only U .S. based businesses have been selected for this study. The unit observation for this study is at the business level, that is, an individual operating unit or division with an identifiable market and set of competitors; not the total corporation of which the business unit may only be a component.
MODEL AND VARIABLES
To investigate the hypothesized economic consequences of relative firm power relationships within the chain-of-production model, a two equation simultaneous system was specified. Two endogenous variables were selected from the PIMS database. As endogenous variables, firm profitability, measured by return on sales (ROS), and the incidence of competitor entry into the market (ENTRY), were assumed to be determined by the simultaneous interaction of the linkages in the model. The model therefore acknowledges that, whereas attractive profit rates may entice increased competitor entry, a lack of entry activity may signal the existence of significant entry barriers, and hence, magnify profitability.
As a general system, the equations take the following form:
ROS =J’( ENTRY, exogenous variables) (1)
ENTRY =f’(ROS, exogenous variables) (2)
In the first equation, hereafter labelled the ‘ROS’ equation, ROS i s assumed to be the dependent variable. The corresponding first set of exogenous variables reflects the postulated power positions and competitive economic relationships between the firm and its suppliers and customers which ultimately affect profitability. Within this first equation, ENTRY serves as a variable measuring potential entry barriers. This aspect of entry barriers is, in turn, determined by the second equation, hereafter called the ‘ENTRY equation. The set of exogenous variables in the ENTRY equation measures salient factors that serve to inhibit and induce the entry of new competitors. In this context, superior profit levels act to induce new rival entry in the second equation.
Because the PIMS data allow the measurement of many variables, both industry and firm specific, within the chain of production, the theoretical discussion of each variable is kept
’ By examining the structural relationships of production chains in this manner we recognize that profitability is part of a system of power relationships that may be simultaneous in nature. A parsimonious method for estimating such structural dependencies, such as the two-way relationship between profitability and the incidence of competitor entry, is through a simultaneous equation regression system. Within simultaneous equation regression analysis exogenous variables are defined as variables whose values are determined in a way that is independent or outside the system’s mechanism. The values of endogenous variables, however. are determined by the simultaneous interaction of the relationships in the model (Johnson, 1972).
A three equation model including a separate equation measuring the incidence of competitor exit was also specified and estimated. We felt that little or no insight was gained from the ‘exit’ equation, and for simplicity purposes it was dropped from the model.
242 Craig S. Galbraith and Curt H . Stiles
brief. It should be noted that in selecting these variables every effort was made to minimize the multicollinearity problems associated with much of the PIMS based r e ~ e a r c h . ~ In accordance with the chain of production map outlined in the previous section, we group the discussion of relevant variables into four sections. They include: endogenous variables, purchase market condition exogenous variables, sales market condition exogenous variables, and industry condition exogenous variables.
Endogenous variables ROS is defined as before tax income as a percentage of total sales. As the deiiominator, sales was preferred over investment or assets because of the varying effects of depreciation method, length of depreciation schedule on accounting investment figures, and the precision of sales reporting over investment or assets in the PIMS data. Equity, as the denominator, was unavailable owing to the disaggregate, business specific (versus corporate specific) nature of the data. ROS should be positively related to ENTRY in the ENTRY equation; that is, the higher the profit rates, the greater incidence of new competitor entry.
ENTRY is a dummy variable, equal to one if at least one new competitor entered the market and claimed a market share of five per cent or more during the previous four years. In the ROS equation, ENTRY should be negatively rekited to ROS. Here, ENTRY represents potential entry barriers such that low entry activity may mark steep entry barriers, and hence, greater profits.
Purchase market conditions X P U R SUPPL is the percentage of total purchases made from the business’s three largest external suppliers. The higher this percentage, the more dependent and vulnerable a firm is with respect to these suppliers. As a firm’s purchases become more concentrated among few suppliers, the suppliers are more likely to command greater power and authority in the production chain. Thus, %PUR SUPPL should negatively influence ROS in the first equation. This variable is not used in the ENTRY equation.
%REV SUPPL measures the sales of the three largest suppliers to the business as a percentage of the suppliers total revenues. The greater this percentage, the more essential the particular business appears to the supplier’s livelihood. In the ROS equation, %REV SUPPL should be positively related to ROS, reflecting the increased authority and bargaining power of the firm as its purchases become more important to the suppliers. %REV SUPPL is not employed in the second equation.
SOURCE SUPPL is a three level variable (no; yes, but with difficulty; yes, with no difficulty) defining the availability of good alternative sources of supplies. According to our hypothesis, as alternative sources of supplies become more available, the authority and power of suppliers in the chain of production is abridged; firms can seek out new suppliers if needed. SOURCE SUPPL should, therefore, be positively related to ROS in the first equation. The lack of alternative sources of supplies can also act to discourage entry to new rivals and is included in the ENTRY equation as an entry barrier.
Sales market conditions CONC ZMM CUST indicates the proportion of the total number of immediate customers accounting for 50 per cent of the firm’s total sales. We believe that as this proportion increases,
For several reasons, manyofthevariablesfound in the PIMS databaseare highlycorrelated (see Galbraith, 1981 :45-62). Much of the PIMS based research employing collinear variables has produced anomalistic and counter theoretical results. See Caves and Porter (1978) for an example.
Firm Profitability and Relative Firm Power 243
the power and authority of the immediate customer base, relative to the firm base, become more fragmented and diffused. In a sense, this variable acts as a counter measure of customer concentration. Thus, in the ROS equation, CONC IMM CUST should be positively related to profitability. The variable is not included in the ENTRY equation.
N U M IMM CUST indicates the approximate number of immediate customers served by the b u ~ i n e s s . ~ In the ROS equation we expect that NUM IMM CUST is positively related to ROS, reflecting the diffusion of buying power among many customers. NUM IMM CUST is not employed in the ENTRY equation.
IMP IMM CUST and IMP END USER are the percentage of the typical immediate customer’s and typical user’s total annual purchases accounted for by this type of product or service. The importance of the product or service to buyers should reflect an ability by the firm to dictate advantageous price/cost conditions. In the ROS equation, IMP IMM CUST is expected to show a positive association with profitability. Likewise, the importance of the product or service to the end user, expressed by IMP END USER, should act as an inducement for new competitor entry in the second e q ~ a t i o n . ~
A U X SERV is a three level dummy variable measuring the importance of installation, repair, customer service, and other auxiliary services provided to the end user. If such auxiliary services are material in selling or distributing a product, they may provide a firm an opportunity to differentiate itself, and thus, encourage entry. AUX SERV is not employed in the ROS equation.
REL CUST NUM and R E L C U S T S I Z E estimate the breadth of the firm’s served market, relative to the average of its leading competitors with respect to the number of customers and size of customers. We expect that the larger a firm’s customer base becomes the more the purchase market power will be discussed among many buyers. Thus, the selling firm should enjoy advantageous pricing policies. However, the larger the purchasing firms. as reflected by REL CUST SIZE, the more influential these customers are likely to be in setting the terms of market transactions.
Industry conditions CO NC is the percentage of industry shipments that is accounted for by the shipments of the four largest firms in that four-digit SIC industry group. If the industry spans several SIC groups a weighted average using dollar shipments as weights is employed. As concentration of the firm’s industry expands, we expect competition within both the purchase market and the sales market to decrease, and the power of the firm’s component in the production chain to multiply. CONC should, therefore, be positively associated with profitability in the ROS equation. High concentration, reflecting the inflated potential for collusive behaviour, can also act as a deterrent to competitor entry activity.
SHARE is computed as the firm’s sales in the industry expressed as a percentage of the top four firms’ annual sales. This variable assesses the authority and economic power of an individual firm, relative to its rivals. SHARE should positively influence profitability in the ROS equation. It is not employed in the second equation.
GROWTH is defined as the average annual percentage change in the size, expressed in real dollars, of the industry group. Clearly, high market growth is expected to induce new firms to
NUM I M M CUST has been recoded to fit into a linear system. A product or service that is important to the final consumer should encourage what the marketing literature labels a ‘pull’
distribution network, i.e. customer demand pulls that product through the chain of production and distribution. We considered a ‘pull’ situation (versus the alternative ‘push’ network) an inducement for competitor entry.
244 Craig S. Galbraith and Curt H . Stiles
join competition. Thus, we predict GROWTH to have a positive relationship with the incidence of entry activity in the ENTRY equation. GROWTH is not used in the ROS equation.
PROD PATand PROC PAT are dummy variables, equal to one if the business benefits to a significant degree from patents, trade secrets, or other proprietary methods of production or operations. PROD PAT reflects benefits pertaining to products or services, whereas PROC PAT pertains to processes. In the ROS equation both PROD PAT and PROC PAT should positively affect profit levels. In the second equation, proprietary conditions should act to disillusion firms contemplating market entry.
FINDINGS
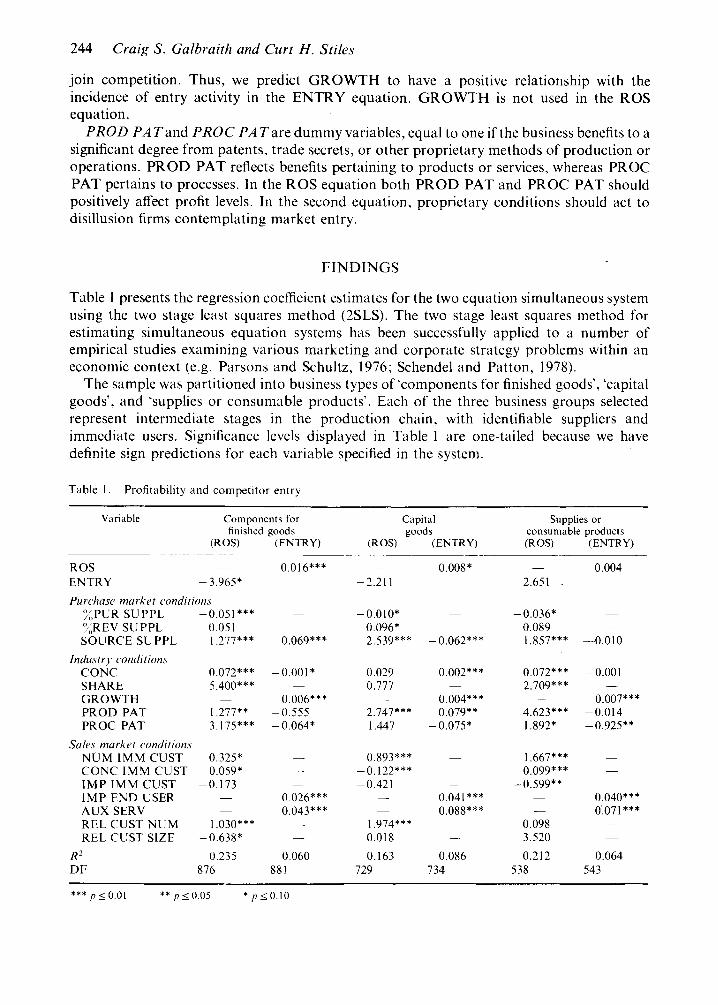
Table 1 presents the regression coefficient estimates for the two equation simultaneous system using the two stage least squares method (2SLS). The two stage least squares method for estimating simultaneous equation systems has been successfully applied to a number of empirical studies examining various marketing and corporate strategy problems within an economic context (e.g. Parsons and Schultz, 1976; Schendel and Patton, 1978).
The sample was partitioned into business types of 'components for finished goods', 'capital goods', and 'supplies or consumable products'. Each of the three business groups selected represent intermediate stages in the production chain, with identifiable suppliers and immediate users. Significance levels displayed in Table 1 are one-tailed because we have definite sign predictions for each variable specified in the system.
Table 1. Profitability and competitor entry
Variable Components for finished goods
( R W (ENTRY)
ROS -
ENTRY - 3.965* Purchase market conditions
':;,PUR SUPPL -0.051*** ":,REV SU PPL -0.051 SOURCE SUPPL I .277***
lndust ry conditions CONC 0.072*** SHARE 5.400*** GROWTH -
PROD PAT 1.277** PROC PAT 3. I75***
NUM IMM CUST 0.325* CONC IMM CUST 0.059* I M P IMM CUST -0.173 I M P E N D USER -
AUX SERV -
REL CUST NUM I .030*** REL CUST SIZE -0.638*
Sales market conditions
R2 0.235 D F 876
0.016*** -
~
0.069***
-0.001* -
0.006*** -0.555 - 0.064*
-.
0.026*** 0.043 * * *
0.060 88 1
Capital goods
(ENTRY) _ _
( R W -
~ 0.008* -2.21 1 ~
- 0.01 o* - 0.096*
~
~
2.539*** -0.062***
0.029 0.002** * 0.777 - 0.004***
2.747" * * 0.079**
~
1.447 -0.075*
0.893*** ~
-0.122*** -
-0.421 -
- 0.041 *** - 0.088***
1.974*** ~
0.018 -
0.163 0.086 729 734
Supplies or consumable products ( R W (ENTRY)
- 0.004 __.
2.651 . ~
-0.036* - 0.089
~
-
1.857*** -0.010
0.072*** -0.001 2.709* * * -
- 0.007** * 4.623*** -0.014 1.892* -0.925**
1.667*** -
0.099* ** -
-0.599** ~
~ 0.040* * * - 0'.071***
0.098 3.520 0.212 0.064
-
~
538 543 ~
*** p l 0 O l * * p < O 05 * P I 0 10

Firm Profitability and Rrlatice Firm Power 245
As previously mentioned, the ROS equation is the key equation to test the hypothesized relationships between profitability, competitive conditions, and relative firm power within the chain of production and distribution. However, we believe that in order to properly interpret the results of the complete model, the estimated coefficients of the second or ENTRY model should also make economic sense.
For thecomponents for the finished goods segment, the estimated model appears to support our hypothesis. Only two of the variables in the key ROS equation- %REV SU PPL and IMP IMM CUST, have signs opposite to the predicted direction, and these are insignificant from zero. Every other variable is significant at 0.10 or better. The purchase market condition variables of XPUR SUPPL and SOURCE SUPPL suggest that as reliance on a few suppliers is reduced, and alternative supply sources become more available, the firm is able to command- more power in the production chain, and hence, greater profitability. Because of alternative sources of supply, no single supplier can exploit the exclusivity condition for power. A similar argument can be made from the sales market condition variables. Diffused customer bases and customer power are strongly related to higher levels of profitability for the firm, as per our hypo thesis.
Industry conditions also influence profitability levels. Lack of competitor entry, shown by the negative sign on the endogenous variabk ENTRY, proprietary product and process advantages, and increased sellers concentratiok are all positively related to ROS. Firm specific market power, expressed by SHARE, also displays a strong positive relationship with profitability.
For the ENTRY equation, all variables display the predicted sign directions. In addition, with the exception of PROD PAT, all variables are significant at 10 per cent or better.
Only mixed support for the hypothesis is offered from the estimated model for capital goods. Four variables in the ROS equation display signs opposite to the predicted direction, although two are not significantly different from zero. Surprisingly, three of these variables (CONC IMM CUST, IMP IMM CUST, and REL CUST SIZE) reflect sales market conditions in the production chain. The other improperly signed variable, %REV SUPPL, is a purchase market condition factor.
The eight remaining exogenous variables, and the endogenous ENTRY variable, display estimated coefficients which are signed in the predicted direction. The significance level for these factors is rather disappointing, though. Competitor entry (ENTRY), market concentration (CONC), firm share of concentration (SHARE), and process proprietary advantages (PROC PAT) are all insignificant at 0.10 even though they show the hypothesized relationships. The purchase market condition variables of %PUR SU PPL and SOURCE SUPPL are significant, however, and are consistent with the findings for the components for finished goods category. Increased sources of supplies, and a reduction of reliance on a few suppliers, positively influence profitability. A diffused supply base, or the opportunity for diffusion, appear advantageous to a firm’s cost function.
The results for the ENTRY equation are also mixed. Five of the eight variables in this equation are properly signed, and significant at 0.10. The three variables displaying signs opposite to the hypothesized direction are also significant, however.
Support for our hypothesis appears somewhat stronger for the supplies or consumable products group, although not as strong as we observed in the components for finished goods category. Four variables in the ROS equation have signs opposite to the hypothesized relationship, although two of them (ENTRY and %REV SUPPL) are not significant. In contrast with the results for capital goods, the remaining variables supporting the predicted relationships display much higher significance levels.

246 Craig S. Galbraith and Curt H . Stiles
As with the previous product groups, the purchase market condition factors, expressed by XPUR SU PPL and SOURCE SU PFL, suggest that the availability of alternative supply sources, and the diffision of purchases among several suppliers, reduce supplier power and contribute to firm profitability. In a similar vein, sales market condition factors measured by NUM IMM CUST, CONC IMM CUST, and REL CUST NUM, establish the same relationship between customer power and profit levels, although this interpretation must be tempered somewhat by the anomalistic coefficients on the two sales market condition variables, IMP IMM CUST and REL CUST SIZE.
IMP IMM CUST and %REV SU PPL are the only variables that have signs consistently different than those hypothesized, indicating the need for an alternative explanation. Both of these variables measure the importance to the customer and to the supplier of the relationship with the firm. NUM IMM CUST measures the number ofcustomers, and SOURCE SUPPLis the best available measure of the availability of suppliers. The association between the number of immediate customers and profitability is very direct and positive, but the association
Table 2. Management significance of power variables: two scenarios ~~~~ ~ ~~~~~ ~
Scenario 1 (High power) vs . Scenario 2 (Low power) Effect on ROS" (Gain for high power)
Purchase market conditions %PUR SUPPL Purchases from 3 largest suppliers are 20 of firm total purchases (20).h XPUR SUPPL Firm purchases account for 35 ?(,of the 3 largest suppliers' sales (35). SOURCE SUPPL There is no difficulty locating alter- native sources of supplies (2).
Sales market conditions N U M IMM CUST The firm has between 50 and 99 im- mediate customers (5 ) . CONC IMM CUST 30% of these customers account for one half of firm total sales (30). I M P IMM CUST These sales represent between 5 and 25% of firm immediate customer purchases (4). REL CUST NUM The breadth of customer number is greater than that of leading com- petitors (3). REL CUST SIZE Average customer size is less than that of leading competitors ( I ) .
Purchases from 3 largest suppliers are 30 2, of firm total purchases (30).
Firm purchases account for 30 :(, of the 3 largest suppliers' sales (30).
There is some dificulty locating alter- native sources of supplies ( I ) .
The firm has between 20 and 49 im- mediate customers (4).
20% of these customers account for one half of firm total sales (20).
These sales represent between 1 '2, and 52) of firm immediate customer purchases (3).
The breadth of customer number is about the same as that of leading com- petitors (2).
Average customer size is about the same as that of leading competitors (2).
+0.51
-0.25
+ 1.27
-1-0.32
+0.59
-0.17
+ 1.03
+Oh4
Total effect on ROS of high power scenario over low power scenario' = + 3.94
Expressed in percentage points added to ROS.
Industry conditions and the incidence of competitor entry are assumed to be the same between the two scenarios * The actual values of the variables used in the equation are shown in the parentheses.
Firm ProJtability and Relative Firm Power 247
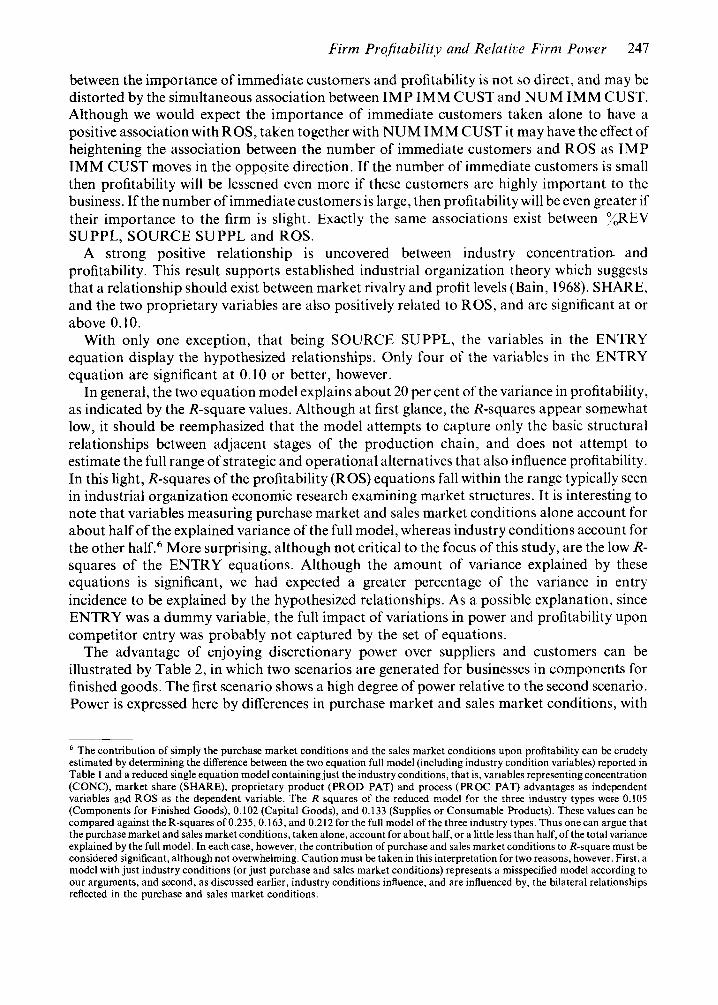
between the importance of immediate customers and profitability is not so direct, and may be distorted by the simultaneous association between IMP IMM CUST and NUM IMM CUST. Although we would expect the importance of immediate customers taken alone to have a positive association with ROS, taken together with NUM IMM CUST it may have the effect of heightening the association between the number of immediate customers and ROS as IMP IMM CUST moves in the opposite direction. If the number of immediate customers is small then profitability will be lessened even more if these customers are highly important to the business. If the number of immediate customers is large, then profitability will be even greater if their importance to the firm is slight. Exactly the same associations exist between %REV SUPPL, SOURCE SUPPL and ROS.
A strong positive relationship is uncovered between industry concentration and profitability. This result supports established industrial organization theory which suggests that a relationship should exist between market rivalry and profit levels (Bain, 1968). SHARE, and the two proprietary variables are also positively related to ROS, and are significant at or above 0.10.
With only one exception, that being SOURCE SUPPL, the variables in the ENTRY equation display the hypothesized relationships. Only four of the variables in the ENTRY equation are significant at 0.10 or better, however.
In general, the two equation model explains about 20 per cent of the variance in profitability, as indicated by the R-square values. Although at first glance, the R-squares appear somewhat low, it should be reemphasized that the model attempts to capture only the basic structural relationships between adjacent stages of the production chain, and does not attempt to estimate the full range of strategic and operational alternatives that also influence profitability. In this light, R-squares of the profitability (ROS) equations fall within the range typically seen in industrial organization economic research examining market structures. It is interesting to note that variables measuring purchase market and sales market conditions alone account for about half of the explained variance of the full model, whereas industry conditions account for the other half.6 More surprising, although not critical to the focus of this study, are the low R- squares of the ENTRY equations. Although the amount of variance explained by these equations is significant, we had expected a greater percentage of the variance in entry incidence to be explained by the hypothesized relationships. As a possible explanation, since ENTRY was a dummy variable, the full impact of variations in power and profitability upon competitor entry was probably not captured by the set of equations.
The advantage of enjoying discretionary power over suppliers and customers can be illustrated by Table 2, in which two scenarios are generated for businesses in components for finished goods. The first scenario shows a high degree of power relative to the second scenario. Power is expressed here by differences in purchase market and sales market conditions, with
The contribution of simply the purchase market conditions and the sales market conditions upon profitability can be crudely estimated by determining the difference between the two equation full model (including industry condition variables) reported in Table 1 and a reduced single equation model containing just the industry conditions, that is, variables representing concentration (CONC), market share (SHARE), proprietary product (PROD PAT) and process (PROC PAT) advantages as independent variables and ROS as the dependent variable. The R squares of the reduced model for the three industry types wese 0.105 (Components for Finished Goods), 0.102 (Capital Goods), and 0.133 (Supplies or Consumable Products). These values can be compared against the R-squares of 0.235,0.163, and 0.212 for the full model of the three industry types. Thus one can argue that the purchase market and sales market conditions, taken alone, account for about half, or a little less than half, of the total variance explained by the full model. In each case, however, the contribution of purchase and sales market conditions to R-square must be considered significant, although not overwhelming. Caution must be taken in this interpretation for two reasons, however. First, a model with just industry conditions (or just purchase and sales market conditions) represents a misspecified model according to our arguments, and second, as discussed earlier, industry conditions influence, and are influenced by, the bilateral relationships reflected in the purchase and sales market conditions.

248 Craig S. Galbraith and Curt H . Stiles
the assumption that industry conditions and competitor entry are the same for the two scenarios. Ceteris paribus, high power, as expressed by scenario 1, is worth about 3.94 percentage points added to ROS over scenario 2. Management significance of thecoefficients is indicated by each variable’s contribution to the total ROS figure. Of course, the effect of ROS varies by the values attached to the different variables.
CONCLUSION
The significance of this paper lies in its emphasis on interindustry transactions as one of the determinants of industry, and thus firm, profitability. The premise is that firm profitability is determined not only by the structure of its own industry but also by the relative power of the firms and industries from which goods are purchased and sold. The important elements of market transactions are those that concern the essentiality and the exclusivity of functions firms perform in the chain of production and distribution. If the function provided by one party to a transaction is more essential to the transaction than the function provided by the second party, then the power to set the terms of the transaction will lie with the first party. Likewise, if the contribution of a transaction is confined more exclusively to one of two firms, then the power to set the transaction terms will lie with the firm performing the more exclusive function. The power to set market transaction terms will partly determine which of the two firms will be more profitable. The consequence of this argument is that firms whose transactions have favourable essentiality and exclusivity characteristics should reveal a tendency toward greater profitability.
To test this proposition, variables in the PIMS database are identified that reveal the characteristics of interindustry transactions. The variables are fitted by means of two-stage least squares to a pair of simultaneous equations. The simultaneous equations put dual requirements on the model, first, for the variables to provide a good fit with each equation and second, for the two equations together to meet the logical requirements of our hypothesis.
In general, the results of the estimated model support the hypothesis that power conditions between adjacent stages in the production chain are related to firm profitability. Across the three business types investigated, the amount of variance captured by the equations is within the range traditionally revealed in similar industrial organization research. Interestingly, the closeness of fit of the equations varies across the three business types. The fit is reasonably good in components for finished goods and in supplies or consumable products while being slightly weaker for firms involved in capital goods manufacturing, although in each case the results were statistically significant. Since both intra and inter-industry characteristics must differ across these business types, the inconsistent outcome can give rise to interesting speculation as to how the different characteristics are associated with performance within different business types, something revealed but not further explored in this study.
Several limitations of this research are identified. In particular, the variables available from the PIMS data base are not balanced between the three stages of production activity. Variables measuring conditions for bargaining power in one stage, such as in the purchase market, may not have exact counterparts in the sales market, and vice versa. Ideally, one should have identically specified variables measuring the essentiality and exclusivity conditions in both purchase and sales markets. In addition, many of the variables used were constructed as dummy variables within the PIMS study, a fact which inhibits the full estimation of possible power relationships, and their impact upon firm profitability.
In this light, the current study must be considered exploratory in nature, although the

Firm Projitability and Relatitle Firm Power 249
implications to be drawn are clear. Corporate managers and strategy researchers need to expand their understanding of the impact of strategy upon firm performance beyond the locus of lateral relationships between competitors by considering as well the vertical conditions among sellers of inputs and purchasers of outputs. Although the exact contribution to firm performance of exploited power in the production chain is unascertained, the expanding collection of strategy and economic research examining this issue make a strong case for its significance.
ACKNOWLEDGEMENTS
We wish to thank Dr. Schoeffler and the Strategic Planning Institute for providing access to the data employed in this research.
REFERENCES
Adelman, M. A. ‘The large firm and its suppliers’, Ret3iew of’ Economics and Statistics, May 1949,
Bain, J. ‘Relations of profit rate to industry concentration, American manufacturing, 1936- 1940,
Bain, J. Barriers to New Competition, Harvard University Press, Cambridge, Mass., 1956. Bain, J . Industrial Organization, Wiley, New York, 1968. Blois, K. J . ‘Vertical quasi-integration’, Journal of Industrial Economics, July 1972, pp. 253-272. Caves, R . E. and M. E. Porter. ‘Market structure, oligopoly, and stability of market shares’, Journal of
Galbraith, C. S. A Heteromorphic Model of’ Business Strategy, Unpublished dissertation, Purdue
Hofer, C. and D. Schendel. Strategy Formulation: Analytitul Concepts, West, St Paul, 1978. Johnson, J . Econometric MPthodLs, 2nd edition, McGraw-Hill, New York, 1972. Kay, N. The Evolving Firm, Macmillan, London, 1982. Lustgarten, S . R. ‘The impact of buyer concentration in manufacturing industries’, Review ofEconomics
McKie, J . Tin Cans and Tin Plate, Harvard University Press, Cambridge, Mass., 1959. Miller, S. M. and A. A. Romeo. ‘Alternate goals and uncertainty in the theory of the firm’, Southern
Nash, J. F. ‘The bargaining problem’, Economrtricu, 18, 1950, pp. 155-162. Phillips, A. ‘A critique of empirical studies of relations between market structure and profitability’,
Parsons, L. J . and R. L. Schultz. Marketing Models and Econometric Research, American Elsevier
Porter, M . E. Interbrand Choice, Strategy, and Bilateral Market Power, Harvard University Press,
Porter, M . E. Competitive Strategy, The Free Press, New York, 1980. Schendel, D. E. and G. R. Patton. ‘A simultaneous equation model of corporate strategy’, Management
Shepherd, W. G. The Economics of’ Industrial Organization, Prentice-Hall, Englewood Cliffs, N. J.,
Stiglitz, J . E. ‘Equilibrium in product markets with imperfect information’, American Economic Review,
Vernon, J. M. Market Structure and Industrial Performance: A Review of’ Statistical Findings, Allyn and
Williamson, 0. E. Corporate Control and Business Beharior, Prentice-Hall, Inc., Englewood Cliffs,
pp. 113-118.
Quarterly Journal of’ Economics, August 195 1, pp. 293-324.
Industrial Economics, XXVI(4), June 1978, pp. 289-313.
University, 1981.
and Statistics, May 1975, pp. 125-132.
Economic Journal, July 1979, pp. 189-206.
Journal of Industrial Economics, XXIV(4), June 1976, pp. 241-249.
Publishing, New York, 1976.
Cambridge, Mass., 1976.
Science, November 1978, pp. 161 1-1621.
1979.
May 1979, pp. 339-345.
Bacon, Inc., Boston, 1972.
N. J., 1970.