Profitability and Performance Management | Stampa Partners
9
1 Profitability and Performance Management How efficiently can you track the profitability and cost management of your services and operations? 1. Case Study One of the most common uses of PAPM is the cost allocation. This paper covers an example of a cost monitoring program scenario using PAPM. Global company MS 1 is a global entity present in 4 geographical areas, with 43 offices worldwide. Part of its Opex (15% as of Jun2019, circa CHF100m) is cost run by the HQ. The geographic distribution and the breakdown of Opex is presented below: 1 MS is a fictional company only used for the presentation of this case study. As experts in delivering solutions for Analytics, Planning, Consolidation and Reporting we can assess and help you defining flexible profitability models. A powerful solution that address the objectives of an optimal profitability model is SAP Profitability and Performance Management (PAPM). This tool is built on SAP HANA and empowers teams and decision-makers with clear insights on: how their business runs and is being feed understand, control and manage cost drivers how value is generated and can be optimised SAP PAPM’s models can be quickly built, personalised, tested and simulated by end users. Data from multiple sources can be used to calculate results swiftly without data replication. It is also capable of performing complex calculations in just second and it is fully transparent, traceable and auditable. About the author André Almeida André is a Manager at Stampa Partners and Chartered Fellow of the Chartered Institute for Securities & Investment MCSI. He has over 10 years of international experience advising and auditing clients in Africa, Europe and Middle East. As a consultant, André developed expertise in finance transformation, process optimization and regulatory and internal reporting.
-
Upload
khangminh22 -
Category
Documents
-
view
0 -
download
0
Transcript of Profitability and Performance Management | Stampa Partners
1
Profitability and Performance Management
How efficiently can you track the profitability and cost management of
your services and operations?
1. Case Study
One of the most common uses of PAPM is the cost allocation. This paper covers an example of a cost monitoring
program scenario using PAPM.
Global company MS1 is a global entity present in 4 geographical areas, with 43 offices worldwide. Part of its Opex
(15% as of Jun2019, circa CHF100m) is cost run by the HQ.
The geographic distribution and the breakdown of Opex is presented below:
1 MS is a fictional company only used for the presentation of this case study.
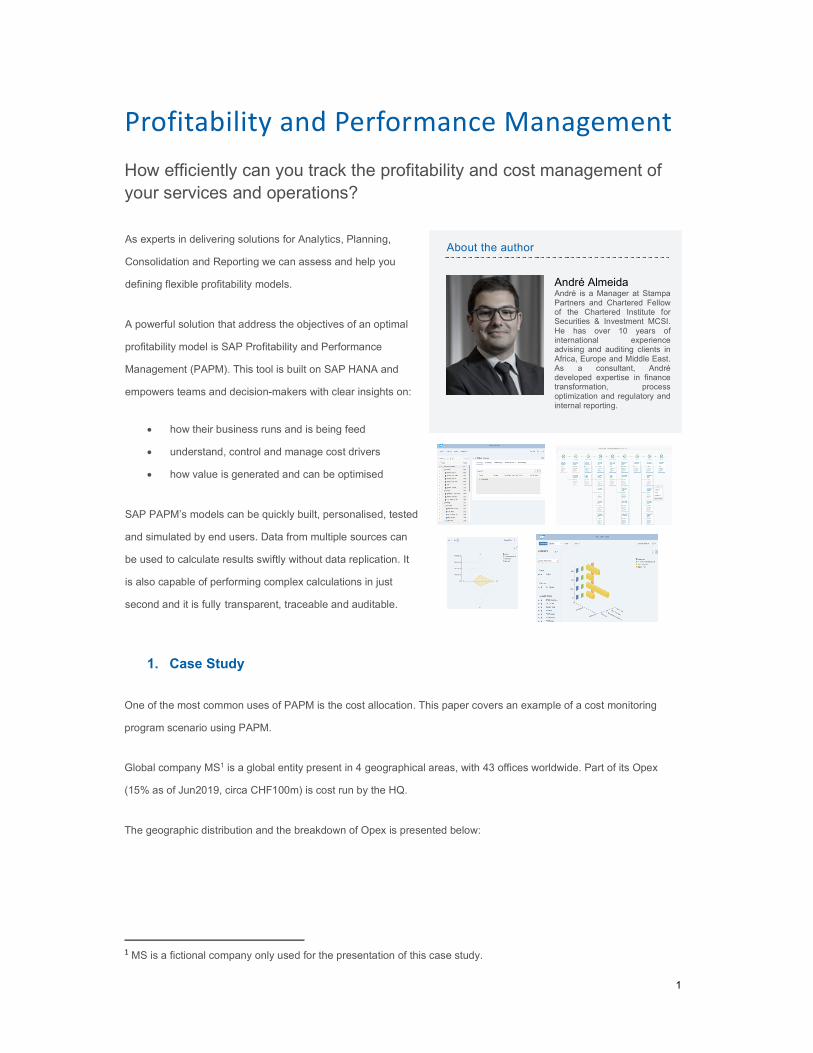
As experts in delivering solutions for Analytics, Planning,
Consolidation and Reporting we can assess and help you
defining flexible profitability models.
A powerful solution that address the objectives of an optimal
profitability model is SAP Profitability and Performance
Management (PAPM). This tool is built on SAP HANA and
empowers teams and decision-makers with clear insights on:
how their business runs and is being feed
understand, control and manage cost drivers
how value is generated and can be optimised
SAP PAPM’s models can be quickly built, personalised, tested
and simulated by end users. Data from multiple sources can
be used to calculate results swiftly without data replication. It
is also capable of performing complex calculations in just
second and it is fully transparent, traceable and auditable.
About the author
André Almeida André is a Manager at Stampa Partners and Chartered Fellow of the Chartered Institute for Securities & Investment MCSI.
He has over 10 years of international experience advising and auditing clients in Africa, Europe and Middle East. As a consultant, André developed expertise in finance transformation, process optimization and regulatory and internal reporting.

2
Each main regional office submits on a quarterly basis information on their operations into an internal platform. This
information is processed by the Global Finance team.
More recently, MS started a cost monitoring program. One of the objectives of this program is to gradually narrow
salary gaps between top paid and lower paid employees. Recent media coverage has put greater scrutiny on how
companies distribute income to workers.
MS uses the regional office data to allocate overheads to its local operations using a waterfall structure.
The allocation process supports the pursuit of those goals:
o Infrastructure country’s headcount as proxy
o IT Service Desk charges (number of minutes) per call to IT Service Desk
o HR Costs Salary x Salary GAP x Headcount as a proxy
o Admin expenses Operating expenses
In order to speed the process and reduce effort and risk of the manual solution in place, MS decided to adopt SAP
PAPM (PAPM). How will this tool use its features to address MS objective efficiently?

3
Process and Build Up
Phase 1 - Adding and aggregating units
SAP PAPM contains a broad set of functions that can be used for different purposes. This allows the user to build a
scenario from scratch, define the allocation drivers and analyse the results at the end of each round.
When starting PAPM, MS can access the modelling environment as well as to the defined processes, activities and
reports. In this case study only the first is presented. Main steps were followed:
1. MS defined the info objects in HANA (in alternative MS could have done it directly in the Environment):
2. Data sources were received from the 4 Main Offices (reported by the 43 local offices) and financial data on
cost to be allocated from the Headquarters;
3. MS aggregated all the sources (info from Offices) and drivers (info from HQ) using a join function (i.e. Op.
and Drivers Cross Info);
4. MS transform the resulting table into a Model BW using a writer function and use the result as an input
query for reporting purposes (i.e. Initial Input Query):
4
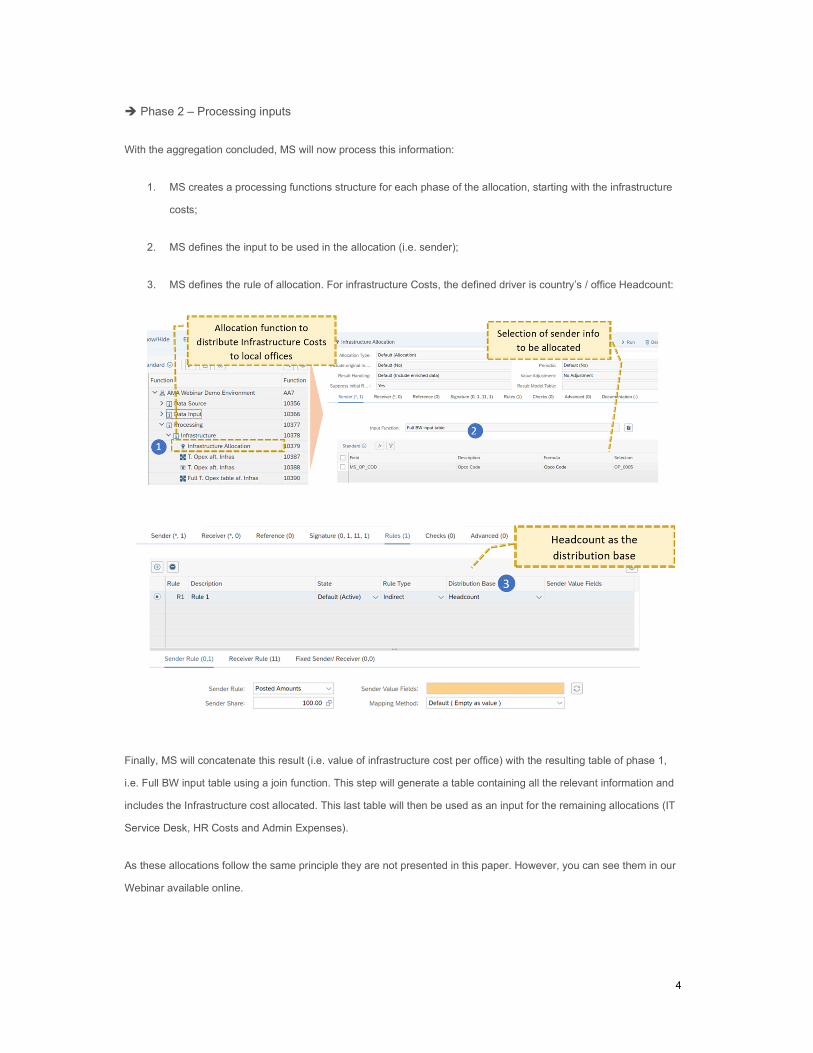
Phase 2 – Processing inputs
With the aggregation concluded, MS will now process this information:
1. MS creates a processing functions structure for each phase of the allocation, starting with the infrastructure
costs;
2. MS defines the input to be used in the allocation (i.e. sender);
3. MS defines the rule of allocation. For infrastructure Costs, the defined driver is country’s / office Headcount:
Finally, MS will concatenate this result (i.e. value of infrastructure cost per office) with the resulting table of phase 1,
i.e. Full BW input table using a join function. This step will generate a table containing all the relevant information and
includes the Infrastructure cost allocated. This last table will then be used as an input for the remaining allocations (IT
Service Desk, HR Costs and Admin Expenses).
As these allocations follow the same principle they are not presented in this paper. However, you can see them in our
Webinar available online.

5
Results
The first allocation round presented the distribution of HQ’s Infrastructure costs which amount to circa CHF 20m. The
allocation of Infrastructure cost will use the proportion of the chosen driver, i.e. Local office’s headcount. The allocation
result is the following:
The first allocation round used 3% of MS’s total cost and impacted more on Asia Pacific with higher proportional
headcount.
Following a waterfall structure in SAP PAPM, MS will allocate the remaining HQ’s costs and drivers:
o IT Service Desk charges (number of minutes) per call to IT Service Desk
o HR Costs Salary x Salary GAP x Headcount as a proxy
o Admin expenses Operating expenses
From initial to after
first allocation
46%
26%
13%
15%
48%
26%
14%
12%

6
The Opex allocation results at end of each round were the following:
The weight of HQ costs in the structure of MS decreased gradually from 15% until 0% at the end of the four rounds of
cost allocation. This process impacted more heavily in Asia Pacific (+18.7%), followed by North & South America
(+18.5%) and EMEA (+15.8%). Partial impacts were the following:
The impact of each round impacted differently each region:
1. Infrastructure costs impacted more Asia Pacific as it has the higher proportional headcount;
2. IT Service Desk costs impacted more Asia Pacific as the region with higher number of Service Desk calls;
3. HR costs impacted more the North and South America region as it presented higher salary gaps than the
other three;
4. Admin expenses impacted equally.
Using SAP PAPM, MS can analyse the distribution of flows of its several graphical representations including Volume
Flows at the end of each round:
Output Query for
reporting
Write function to
transform
environment to BW
Graphical abilities

7
2. Profitability and cost management as a tool
SAP PAPM is a powerful and flexible solution that can empower users to build up models that support business
decisions. You can use this tool for several uses which can increase significantly the ROI of this implementation.
Examples:
Integrated queries and
reports allow for analysis
of current data and
generated results

8
Cross Industry Profitability
PAPM enables users to optimize profitability by providing deep insights into granular revenue and cost information at
any customised level (e.g. product, service, channel, customer).
You can use in all types of industries:
1. Oil & Gas: Profitability of upstream that focuses on extraction of crude oil and natural gas, on refining,
trading and distribution in Downstream of business units
2. Banking and Insurance: Profitability of each back office or front office activities, according to the business
division and region
3. Healthcare: Profitability of hospitalization, medical screening, laboratory analysis, surgery and pharmacy
4. Lifesciences: Profitability of pricings, and the impact on profitability of considering legal aspects and by
applying quality control resources
5. Manufacturing: profitability of production process (e.g. of industrial machinery, heavy equipment, industrial
components, laboratory instruments, semiconductors, among others).
ABC Costing
PAPM allows to cross-charge direct and indirect costs using allocation processes and by applying activity-based
costing (ABC). As an example, you can perform an ABC model, incorporating a set of activities to actual, planning and
forecasting data for a product and / or service profitability. With this model setup you can then run a what-if simulation.
You can also do the same for your shared services in IT and HR. As an example, within healthcare sector, you can
allocate costs of your services to procedures, physicians, facilities, diagnoses and patient, thus enabling drill down to
the most detailed level. The complete calculation of the cost model is available including input/output values of each
process step. On top of that, you can run allocation processes not only for actual data, but also for planning and
forecast data.
3. Controlling and Metrics
Controlling
PAPM can be used for project-based planning and controlling for different types of activities and businesses. For
example, for constructing companies, it can be a relevant tool for project management and supervision of residential,
commercial, industrial or civil construction and engineering.

9
Metrics
PAPM is a tool that can handle specific metrics and reports for any type of industry. Well designed, it can provide a
complete multidimensional P&L at granular level.
Calculation of activity data
Assignment of GL accounts to resources
Allocation of resources to activities, activities to services and service groups, products and services to
customers and subscriptions and of marketing costs to processes, campaigns, customer groups and
products and services
Value flow report (as presented in our case study), which gives the user end to end traceability from
resources through all applied drivers to the result.
PAPM is also a flexible and strong tool to handle any relevant metrics / ratios, such as:
Net profit margin per dimension
Net working capital
Inventory turnover
Cost of services, supplies and other areas of operations on a per case basis
This is relevant for any business user that pretends to use the tool to support business decisions and comply with
reporting. The user can use it as a planning tool, but also to measure defined ratios, identify and reassess target
ranges for ratios to maximize how resources are been used, to realize overhead optimization, optimize the supply
chain and fulfil with broad regulatory reporting requirements for compliance with regulatory bodies.
We also organized a Webinar on this case study. If you are interested please check our website where you can find
the link or contact us.
…………………………………………………………………………………………………………
We at Stampa & Partners have an extensive track record working with CFOs and supporting organisations in
Europe successfully digitalise finance functions, leverage analytics and ensure compliance with new accounting
standards. Therefore, we can advise your business with the best solutions to fulfil your goals.
Your Contacts:
Stampa & Partners AG ● Marcel Frey ● Grafenauweg 6 ● 6304 Zug ● Switzerland ● T +41 41 727 19 11
Stampa Group Deutschland GmbH ● Florian Schmidt ● Theresienstrasse 1 ● 80333 München ● Germany ● T +41 41 727 19 11
imisys GmbH ● H. P. Kammergruber ● Carl-Jordan-Str. 9 ● 83059 Kolbermoor ● Germany ● T +49 8031 90965 0