WILSON IHRIG & ASSOCIATES - Partners
40
WILSON IHRIG & ASSOCIATES ACOUSTICAL AND VIBRATION CONSULTANTS CALIFORNIA NEW YORK WASHINGTON 6001 SHELLMOUND STREET SUITE 400 EMERYVILLE, CA 94608 www.wiai.com Tel: 510-658-6719 Fax: 510-652-4441 MEMORANDUM (In progress draft revision) DATE: 15 July 2013 +-+ TO: Chuck Hymes, Connector Partnership FROM: Deborah Jue, Richard Carman SUBJECT: Noise and Vibration - Bid Period Services Phase Update Walt Disney Concert Hall Construction and Operational Vibration Impact – Updated Results WIA#10-088 Executive Summary This memorandum addresses the updated analysis for the Walt Disney Concert Hall (WDCH) based on new vibration control commitments as a result of recent testing completed for the nearby Colburn School. As a result of that work, Metro has developed a criteria methodology for special spaces such as the performance spaces WDCH, some of which are used for recording. This methodology has been used to develop design criteria for the Colburn School analysis and to determine the required vibration control performance to achieve those criteria. Due to the closer proximity of the project to the Colburn School than WDCH, we expect that the vibration control requirements at Colburn School will be more than adequate for the WDCH facilities. Further ambient sound monitoring (i.e., 24 hour noise survey) at WDCH is required to confirm the Metro criterion for WDCH and complete this analysis. Previous reports on this subject were completed in April and July 2011 1 . Field tests were conducted in May 2011 to quantify some outstanding issues identified during the April 2011 analysis. Two of the main issues were a) how would vibration propagate from the alignment tunnel depth to the WDCH building, and b) how would vibration propagate through the WDCH building into the sensitive spaces. The results from the May 2011 sound and vibration measurements conducted at and near the WDCH indicated that there would be a potential noise impact based on the FTA criterion for a single train passby at the Choral Hall, a performance, rehearsal and recording space, which has an unusually high level of structural amplification. Also there would be potential noise impact during tunnel construction in the Choral Hall and in the audience seating area for the Main Auditorium, the primary performance, rehearsal and recording space within WDCH, as well as in the LA Philharmonic Association (LAPA) conference room. That July 2011 analysis recommended some form of vibration mitigation such 1 Historic Resources memo prepared for Task 6.1.4.4, revision date 7 April 2011 for the FEIS/FEIR, Technical Memo for WDCH revised 12 July 2011.
-
Upload
khangminh22 -
Category
Documents
-
view
5 -
download
0
Transcript of WILSON IHRIG & ASSOCIATES - Partners
WILSON IHRIG & ASSOCIATESACOUSTICAL AND VIBRATION CONSULTANTS
CALIFORNIA NEW YORK WASHINGTON
6001 SHELLMOUND STREET
SUITE 400
EMERYVILLE, CA 94608
w w w. w i a i . co m
Te l : 510-658-6719
Fax: 510-652-4441
MEMORANDUM
(In progress draft revision)
DATE: 15 July 2013
+-+
TO: Chuck Hymes, Connector Partnership
FROM: Deborah Jue, Richard Carman
SUBJECT: Noise and Vibration - Bid Period Services Phase Update
Walt Disney Concert Hall
Construction and Operational Vibration Impact – Updated Results
WIA#10-088
Executive Summary
This memorandum addresses the updated analysis for the Walt Disney Concert Hall (WDCH)
based on new vibration control commitments as a result of recent testing completed for the
nearby Colburn School. As a result of that work, Metro has developed a criteria methodology
for special spaces such as the performance spaces WDCH, some of which are used for recording.
This methodology has been used to develop design criteria for the Colburn School analysis and
to determine the required vibration control performance to achieve those criteria. Due to the
closer proximity of the project to the Colburn School than WDCH, we expect that the vibration
control requirements at Colburn School will be more than adequate for the WDCH facilities.
Further ambient sound monitoring (i.e., 24 hour noise survey) at WDCH is required to confirm
the Metro criterion for WDCH and complete this analysis.
Previous reports on this subject were completed in April and July 20111. Field tests were
conducted in May 2011 to quantify some outstanding issues identified during the April 2011
analysis. Two of the main issues were a) how would vibration propagate from the alignment
tunnel depth to the WDCH building, and b) how would vibration propagate through the WDCH
building into the sensitive spaces. The results from the May 2011 sound and vibration
measurements conducted at and near the WDCH indicated that there would be a potential noise
impact based on the FTA criterion for a single train passby at the Choral Hall, a performance,
rehearsal and recording space, which has an unusually high level of structural amplification.
Also there would be potential noise impact during tunnel construction in the Choral Hall and in
the audience seating area for the Main Auditorium, the primary performance, rehearsal and
recording space within WDCH, as well as in the LA Philharmonic Association (LAPA)
conference room. That July 2011 analysis recommended some form of vibration mitigation such
1 Historic Resources memo prepared for Task 6.1.4.4, revision date 7 April 2011 for the FEIS/FEIR, Technical
Memo for WDCH revised 12 July 2011.
WILSON, IHRIG & ASSOCIATES Regional Connector
Walt Disney Concert Hall
Noise and Vibration
2
as rail suspension fasteners or isolated slab track in the tunnel to eliminate the operational
groundborne noise impacts based on FTA criteria. It also recommended that Metro coordinate
tunneling construction activity with the schedule of events in WDCH, using slow tunnel train
speed, and other measures to eliminate the effect of groundborne noise impacts during
construction.
In the July 2011 report, the infrequent case of two trains in the tunnels was discussed,
Subsequent systems analysis with the specific operational schedule has since been performed,
indicating that a passby of trains in opposite tunnels will be a very rare event during normal
operations.
This current analysis for the WDCH incorporates the same vibration control anticipated to be
required to eliminate impacts at the critical spaces used in the Colburn School used for
performances, rehearsals and recording. Given the close proximity of the Colburn School, the
application of the same groundborne noise control at WDCH as in front of Colburn will result in
noise levels in WDCH which are well below the existing conditions.
Introduction
A previous study, dated 12 July 2011, was completed during the FEIS/FEIR phase, in which the
potential for noise and vibration impacts at the WDCH was identified, based on conservative
assumptions regarding a) how vibration would propagate from the alignment tunnel depth to the
WDCH building, and b) how vibration would propagate through the WDCH building into the
sensitive spaces. This analysis included application of results obtained from the May 2011 field
tests with the cooperation of the Music Center Staff and tenants. These tests were primarily done
during the late night/early morning hours, so as to minimize disruption with operations and
activities at the WDCH, and to minimize the effects of ambient vibration on the measurement
results.
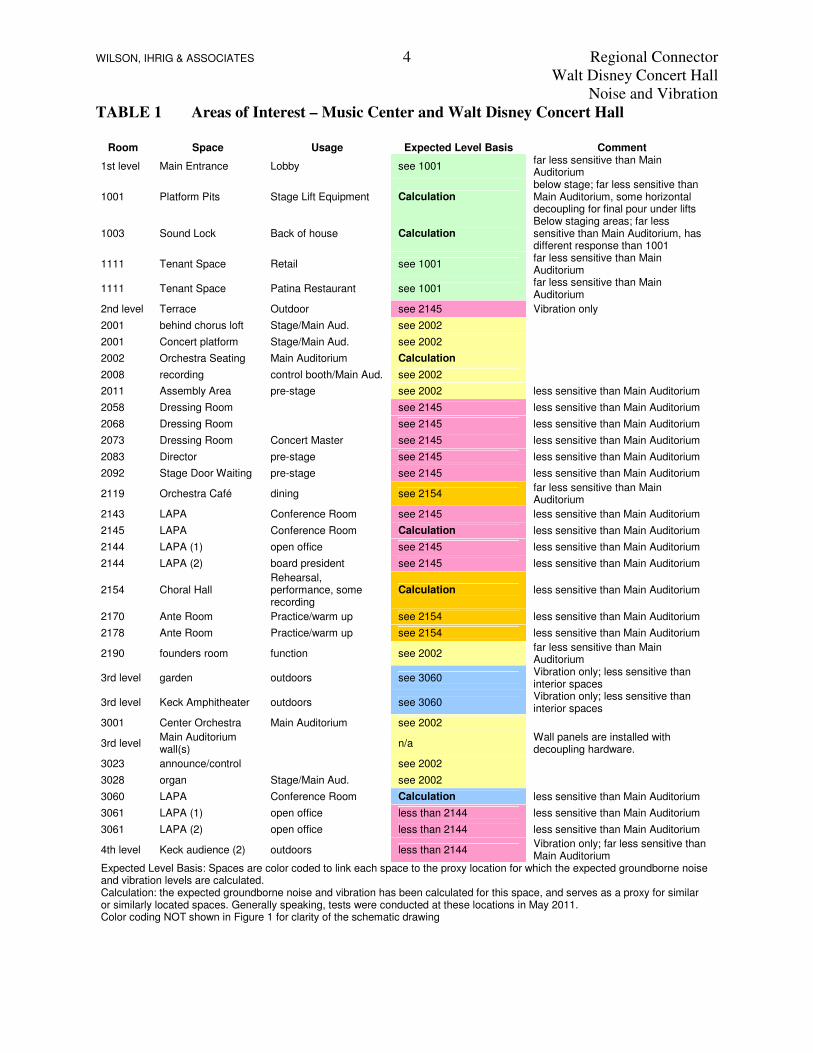
A test plan document was prepared, and a copy of that document is included in Appendix A for
reference. In the test plan, a matrix of potentially noise sensitive spaces was listed, as identified
by Music Center staff. That matrix is reproduced below in Table 1 with a few updates. The
entries in Table 1 are color coded to indicate which calculations of the expected groundborne
noise and vibration levels are used to represent different spaces (expected level basis).
Figure 1 illustrates a schematic cross section of the field test measurements in relation to the
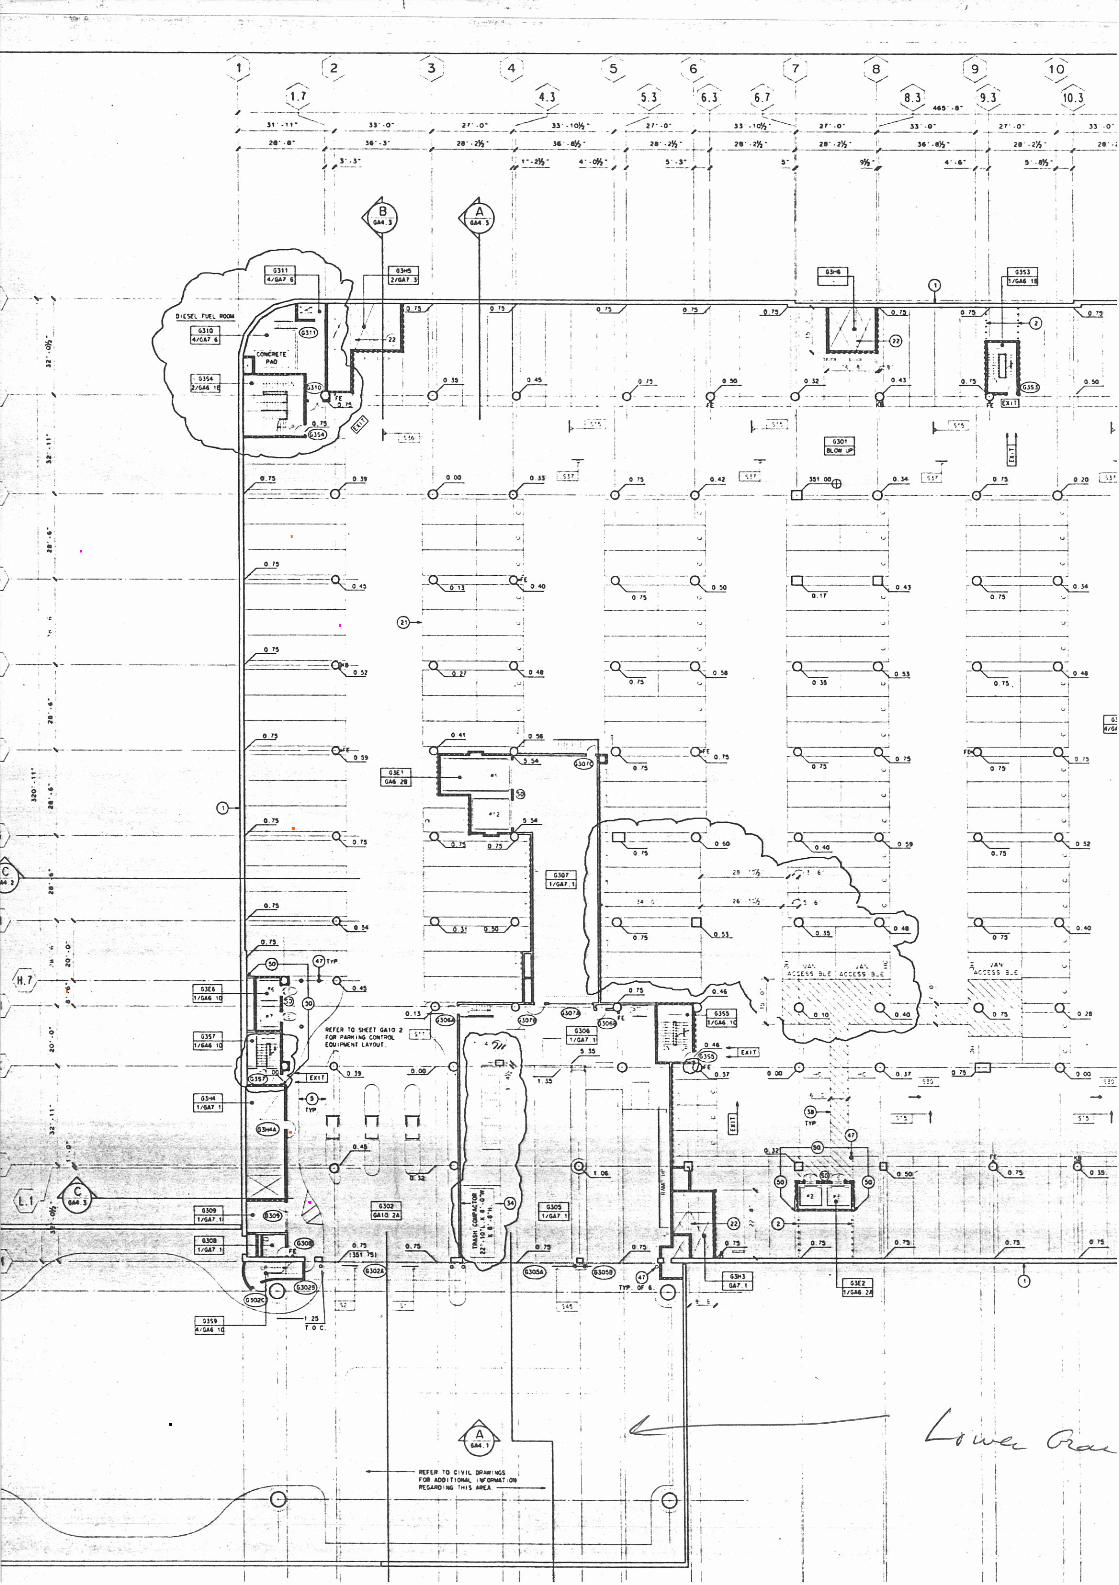
WDCH building. Additional drawings showing the test locations within the parking structure and
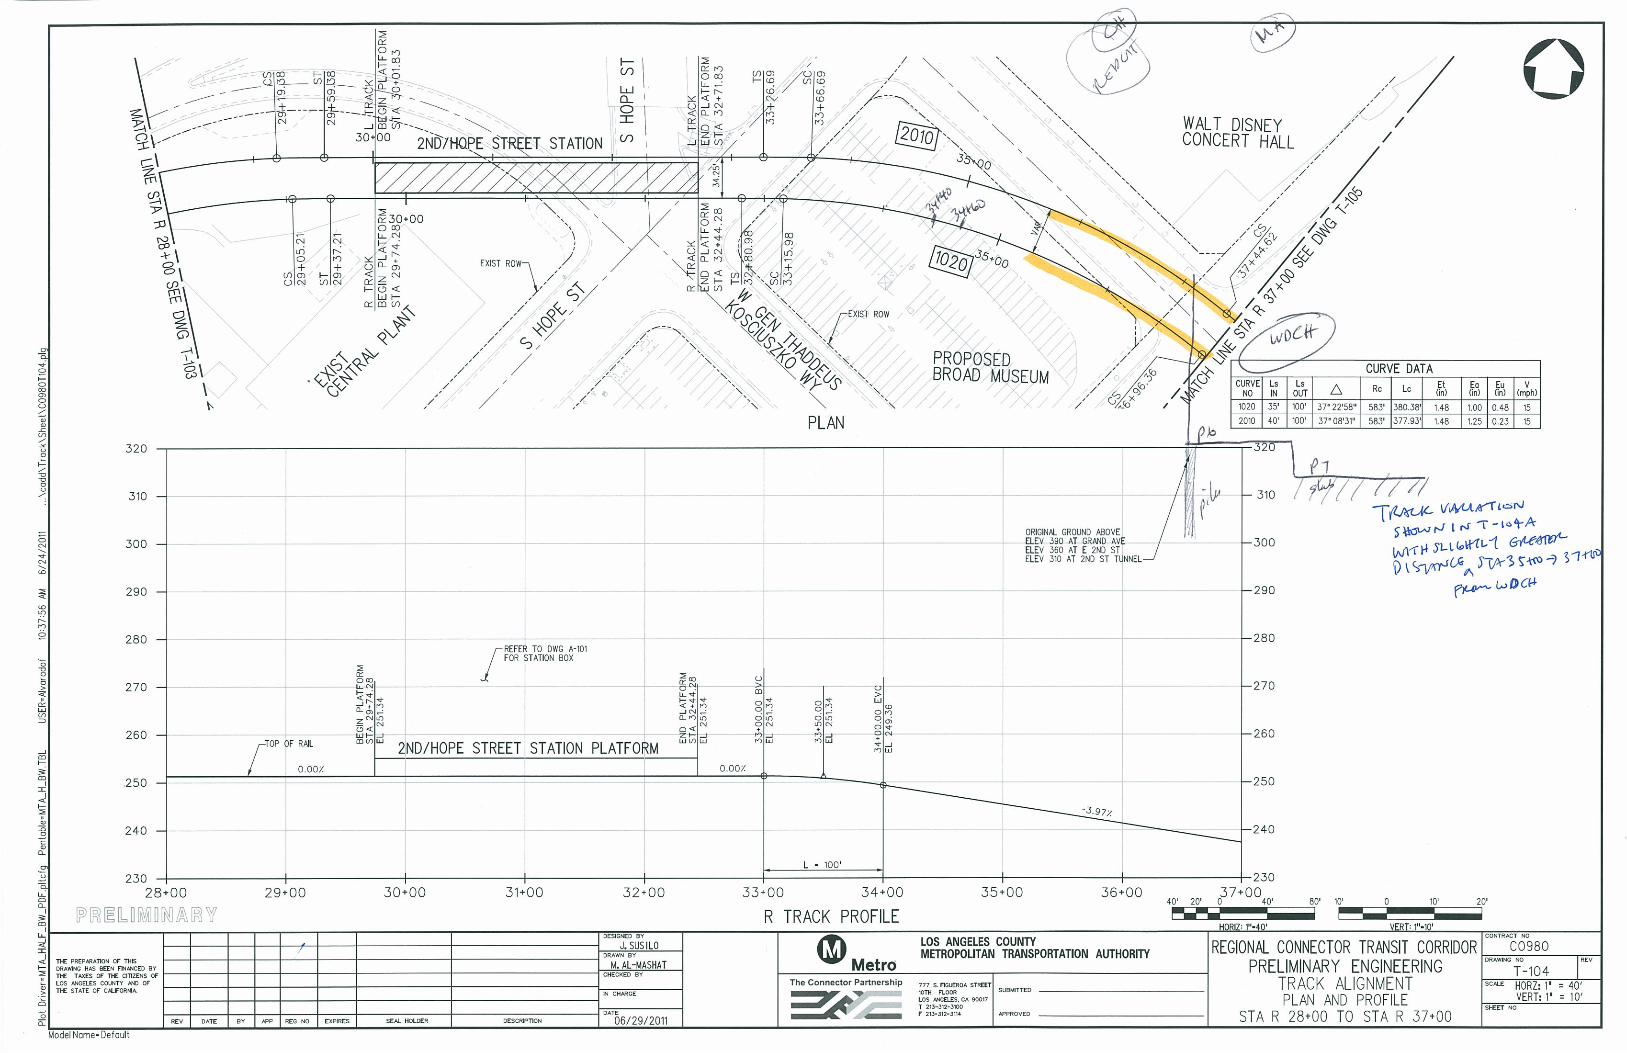
WDCH are provided in the Appendix. The Track Plan and Profile drawings dated 6/29/2011
were used for the 2011 analysis, and it has been confirmed that no substantive changes to the
alignment have been made since then which would affect subway noise and vibration. Drawings
of the parking structure and WDCH construction were received on 4/13/2011. Representative
plan and cross section drawings used for this analysis are included in the Appendix.
Since that time, it has been determined that the nearby Colburn School will require high-
performance vibration control measures due to the School’s close proximity to the project
alignment. This updated study for WDCH incorporates the same vibration isolation performance
for the mitigation measure determined to be necessary for the Colburn School and presents these
updated results. Once the Metro Criterion methodology had been applied to the Main Auditorium
and the Choral Hall, these updated results will be compared to the Metro Criterion.

WILSON, IHRIG & ASSOCIATES Regional Connector
Walt Disney Concert Hall
Noise and Vibration
3
FIGURE 1 Schematic Cross Section, Field Tests Conducted May 2011
WILSON, IHRIG & ASSOCIATES Regional Connector
Walt Disney Concert Hall
Noise and Vibration
4
TABLE 1 Areas of Interest – Music Center and Walt Disney Concert Hall
Room Space Usage Expected Level Basis Comment
1st level Main Entrance Lobby see 1001 far less sensitive than Main Auditorium
1001 Platform Pits Stage Lift Equipment Calculation below stage; far less sensitive than Main Auditorium, some horizontal decoupling for final pour under lifts
1003 Sound Lock Back of house Calculation Below staging areas; far less sensitive than Main Auditorium, has different response than 1001
1111 Tenant Space Retail see 1001 far less sensitive than Main Auditorium
1111 Tenant Space Patina Restaurant see 1001 far less sensitive than Main Auditorium
2nd level Terrace Outdoor see 2145 Vibration only
2001 behind chorus loft Stage/Main Aud. see 2002
2001 Concert platform Stage/Main Aud. see 2002
2002 Orchestra Seating Main Auditorium Calculation
2008 recording control booth/Main Aud. see 2002
2011 Assembly Area pre-stage see 2002 less sensitive than Main Auditorium
2058 Dressing Room see 2145 less sensitive than Main Auditorium
2068 Dressing Room see 2145 less sensitive than Main Auditorium
2073 Dressing Room Concert Master see 2145 less sensitive than Main Auditorium
2083 Director pre-stage see 2145 less sensitive than Main Auditorium
2092 Stage Door Waiting pre-stage see 2145 less sensitive than Main Auditorium
2119 Orchestra Café dining see 2154 far less sensitive than Main Auditorium
2143 LAPA Conference Room see 2145 less sensitive than Main Auditorium
2145 LAPA Conference Room Calculation less sensitive than Main Auditorium
2144 LAPA (1) open office see 2145 less sensitive than Main Auditorium
2144 LAPA (2) board president see 2145 less sensitive than Main Auditorium
2154 Choral Hall Rehearsal, performance, some recording
Calculation less sensitive than Main Auditorium
2170 Ante Room Practice/warm up see 2154 less sensitive than Main Auditorium
2178 Ante Room Practice/warm up see 2154 less sensitive than Main Auditorium
2190 founders room function see 2002 far less sensitive than Main Auditorium
3rd level garden outdoors see 3060 Vibration only; less sensitive than interior spaces
3rd level Keck Amphitheater outdoors see 3060 Vibration only; less sensitive than interior spaces
3001 Center Orchestra Main Auditorium see 2002
3rd level Main Auditorium wall(s)
n/a Wall panels are installed with decoupling hardware.
3023 announce/control see 2002
3028 organ Stage/Main Aud. see 2002
3060 LAPA Conference Room Calculation less sensitive than Main Auditorium
3061 LAPA (1) open office less than 2144 less sensitive than Main Auditorium
3061 LAPA (2) open office less than 2144 less sensitive than Main Auditorium
4th level Keck audience (2) outdoors less than 2144 Vibration only; far less sensitive than Main Auditorium
Expected Level Basis: Spaces are color coded to link each space to the proxy location for which the expected groundborne noise and vibration levels are calculated. Calculation: the expected groundborne noise and vibration has been calculated for this space, and serves as a proxy for similar or similarly located spaces. Generally speaking, tests were conducted at these locations in May 2011. Color coding NOT shown in Figure 1 for clarity of the schematic drawing
WILSON, IHRIG & ASSOCIATES Regional Connector
Walt Disney Concert Hall
Noise and Vibration
5
Operational Noise and Vibration
This analysis follows the Federal Transit Administration (FTA) methodology for “Detailed
Analysis”2 which uses the following equation for vibration:
(1) LV(in building) = LF (speed) + TMLine (distance from track centerline) + CTunnel + CBuild
Where
LV = Vibration at a specific horizontal distance from the alignment in decibels re 1
micro-inch/second
LF = Force density or system input spectrum of the light rail vehicle (LRV) on the
track structure. This is a function of parameters such as:
• Speed
• Wheel/rail condition (corrugation, wear, etc.)
• Rail configuration (joints, special trackwork, tangent, curved, etc.)
• Track structure (direct fixation on invert, ballasted track, resilient
fasteners, floating slab, etc.)
TMLine = Transfer mobility of the intervening ground or subsurface layers for a line input
of a specified length (typically the length of a train consist) as measured at the receiver.
CTunnel = Although this factor is not explicitly called out in the FTA methodology, it is
used to account for coupling loss between the tunnel structure and the surrounding soil.
CBuild = Adjustments to account for ground-to-building coupling losses, floor to floor
attenuation and room surfaces structural response to vibration
Groundborne noise is determined by the groundborne vibration level, and it is calculated as
follows:
(2) LA = LV + Krad + KA-wt
Where
LA = A-weighted noise level in dB re 20 micro-inch/second
Krad = Adjustment for conversion of vibration velocity to sound pressure, taking into
account the acoustical absorption in the room and the sound radiating characteristics of
the room surfaces
KA-wt = A-weighting adjustment curve
The following parameters were used for this analysis:
• LRV
o 3-car train
o 15 mph maximum speed (limited by design speed of curves and nearby station)
o Direct fixation (resilient fasteners on the order of 140,000 lb/in dynamic stiffness)
o LF in this case is taken from an energy-average of measurements conducted by
WIA of LRVs operating on direct fixation fasteners on the Metro system
including LA Metro Blue Line (Nippon-Sharyo P865), LA Metro Goldline
Eastside extension (Breda P2550). This energy-average also includes the
anticipated LRV contributions from other vehicles including the Siemens P2000,
Nippon-Sharyo 2020 and the soon to be delivered Kinki-Sharyo P3010. The
Kinki-Sharyo P3010 is based on measurements WIA has conducted for Sound
Transit (Kinki-Sharyo). The Sound Transit LF dominates the average in the 50
and 63 Hz 1/3 octave bands and includes the effect of a curve in the rail
2 Originally developed in 1986 by WIA, this method has been incorporated into the FTA Guidance Manual.

WILSON, IHRIG & ASSOCIATES Regional Connector
Walt Disney Concert Hall
Noise and Vibration
6
alignment. Based on this information, the assumed LF spectrum for the analysis
was selected as shown by the energy average curve in Figure 2. This figure
appears to show a primary suspension resonance of in the 8 to10 Hz region, but
this needs to be confirmed during final design.
o One train in the tunnel structure.
• Operation Schedule
o The hourly train schedule does not affect the FTA evaluation criteria.
o The general train frequency for each feeder (branch) line is included here for
reference:
� Peak commute: 12 trains per direction
� Base operation: 6 trains per direction
� Owl operation: 3 to 4 trains per direction
o The approximate timeframes:
� Peak: 6:15 to 9 AM and 3:15 to 6:30 PM
� Base: 9 AM to 3:15 PM and 6:30 PM to 12 midnight
� Owl: 4:30 to 5 AM and 12 midnight to 2:15 AM
FIGURE 2 Range of Applicable Force Density (LF) Spectra
15 mph Direct Fixation Fasteners
• Potential Mitigation Measures
o High compliance fastener such as a Cologne Egg or HA-LVT (50kips/in static
stiffness with a dynamic to static stiffness ratio of 1.2)
o Rail suspension fastener systems such as Delta DFF manufactured by Advanced
Track Products or Panguard manufactured by Pandrol (14 to 16kips/in static
stiffness with a dynamic to static stiffness ratio of 1.4 or less )
WILSON, IHRIG & ASSOCIATES Regional Connector
Walt Disney Concert Hall
Noise and Vibration
7
o Isolated slab trackbed using a 1” resilient mat between the tunnel invert and the
concrete trackbed such as the Sylomer mat manufactured by Getzner e.g., 64
lb/in2 dynamic stiffness modulus)
o Heavier isolated or floating slab trackbed requiring a nominal natural frequency in
the range of 5 to 12 Hz to provide greater than 30 dB dynamic insertion loss at the
50 and 63 Hz 1/3 octave bands and higher. This most likely requires the use of
discrete steel springs or rubber pads to support the trackbed.
o For optimal performance, the dynamic/static stiffness ratio (kd/ks) of a bonded DF
fastener should ideally fall within the range of 1.0 to 1.3 for natural rubbers; for
synthetic rubber, the optimal ratio is typically within the range of 1.4 to 1.8. The
above ratios indicated are obtainable from manufacturers of commercially
available rail fasteners.
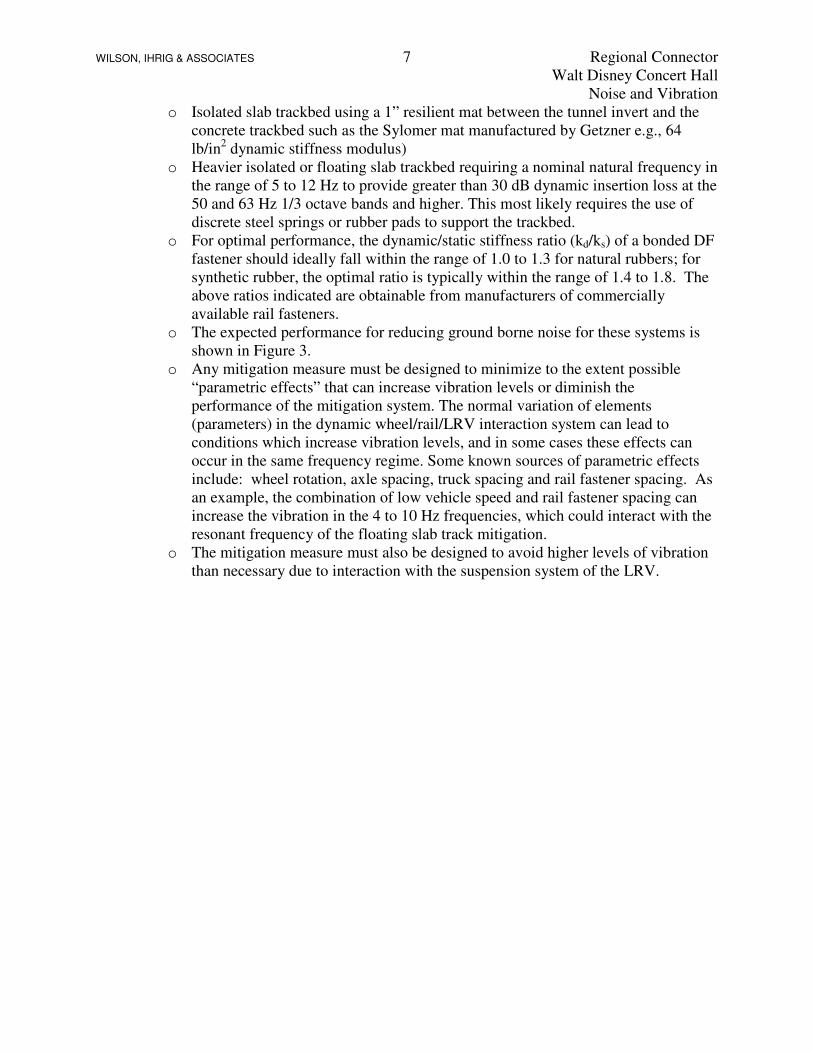
o The expected performance for reducing ground borne noise for these systems is
shown in Figure 3.
o Any mitigation measure must be designed to minimize to the extent possible
“parametric effects” that can increase vibration levels or diminish the
performance of the mitigation system. The normal variation of elements
(parameters) in the dynamic wheel/rail/LRV interaction system can lead to
conditions which increase vibration levels, and in some cases these effects can
occur in the same frequency regime. Some known sources of parametric effects
include: wheel rotation, axle spacing, truck spacing and rail fastener spacing. As
an example, the combination of low vehicle speed and rail fastener spacing can
increase the vibration in the 4 to 10 Hz frequencies, which could interact with the
resonant frequency of the floating slab track mitigation.
o The mitigation measure must also be designed to avoid higher levels of vibration
than necessary due to interaction with the suspension system of the LRV.
WILSON, IHRIG & ASSOCIATES Regional Connector
Walt Disney Concert Hall
Noise and Vibration
8
Frequency, Hz
High Compliance FastenerRail Suspension FastenerIsolated Slab Track (12 Hz)Floating Slab Track (~5 to 6 Hz)Expected Range for Floating Track with Resilient Fasteners (5-20 Hz)
4 8 16 31.5 63 125 250 500 1k AWOA-50
-40
-30
-20
-10
0
10
20
FIGURE 3 Mitigation Options – Relative Vibration Performance of Different Methods
• Tunnel
o Bored tunnel – the analysis assumes no coupling loss with the Fernando
Formation
o At station R 34+40 the top-of-rail is near 250 ft elevation and at station T2 37+00
the top-of-rail is near 240 ft elevation.
o Thus, the top-of-rail at R 37+00 is about 115 ft below Lower Grand Avenue.
• Subsurface conditions
o The geotechnical studies indicate that the alignment tunnel would be founded in
Fernando Formation in this area3
o Fernando Formation is exposed at the ground surface of nearby Broad building
site
o Transfer mobility derived from field tests conducted in May 2011 from tunnel
depths to P6 level within WDCH.
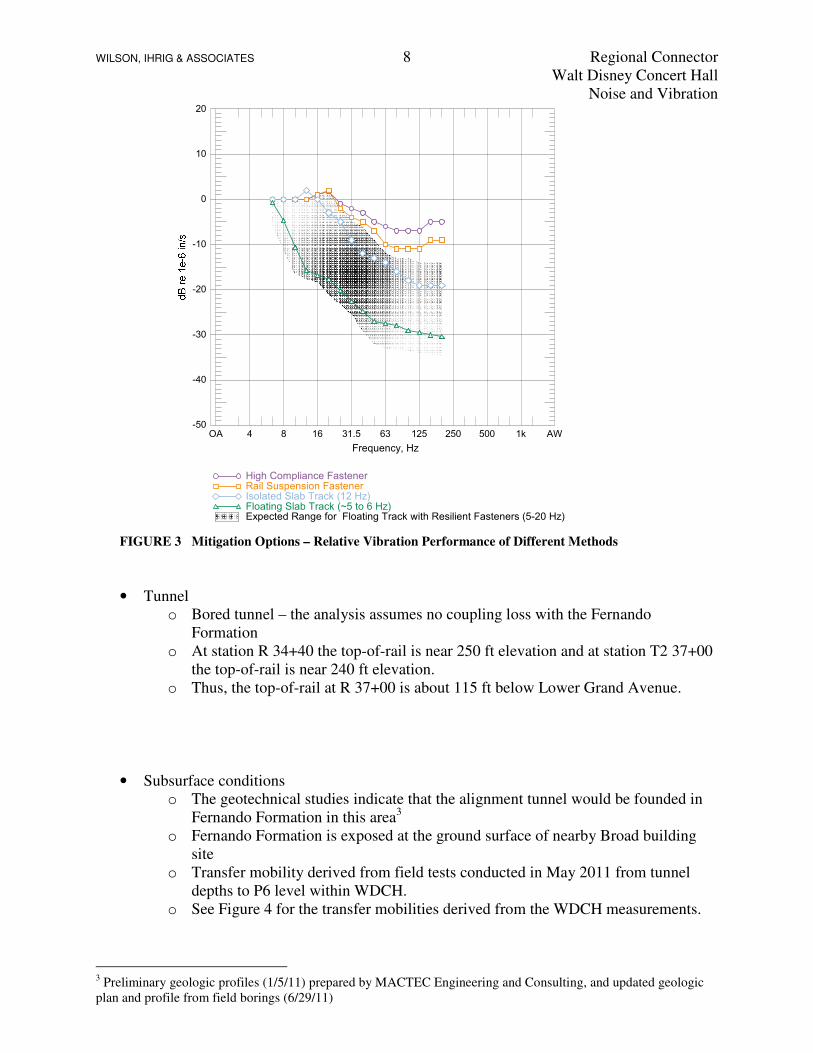
o See Figure 4 for the transfer mobilities derived from the WDCH measurements.
3 Preliminary geologic profiles (1/5/11) prepared by MACTEC Engineering and Consulting, and updated geologic
plan and profile from field borings (6/29/11)
WILSON, IHRIG & ASSOCIATES Regional Connector
Walt Disney Concert Hall
Noise and Vibration
9
� TM at 30 ft horizontal distance used for worst case condition with train
centered at southwest corner of WDCH, near Sta R 37+00 and top-of-rail
about 84 ft below P6 level.
� TM at 95 ft horizontal distance used for worst case condition at Choral
Hall with train centered south of the WDCH, near Sta R 34+40 and top of
rail about 74 ft below P6 level.
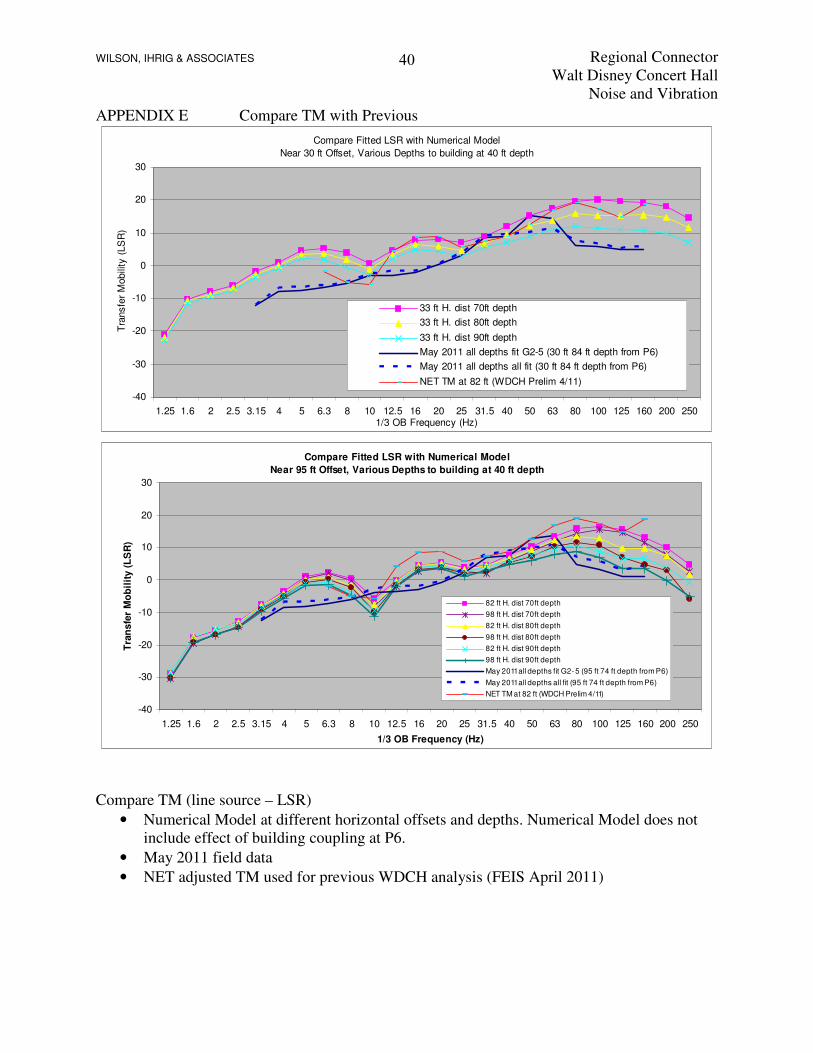
o A comparison of field test results with previous Transfer Mobility models is
contained in the Appendix.
Frequency, Hz
1/3
Octa
ve B
and T
ransfe
r M
obili
ty,
dB
3 car train LSR at 30 ft Horiz distance 84 ft TOR to P63 car train LSR at 95 ft Horiz distance 74 ft TOR to P6
2 4 8 16 31.5 63 125 250 500OA
-40
-30
-20
-10
0
10
20
30
FIGURE 4 Transfer Mobility for Line Source – Fernando Formation
• Walt Disney Concert Hall
o Along the 2nd
Street, the original seven-level parking structure was founded on
piles at the 6th
level (P6) for the south perimeter. However, the 7th
level does not
extend as far south and the drawings indicate that it has a slab-on-grade
foundation, ending around column line 5.3, as shown schematically in Figure 1.
o The elevation of P6 is approximately 318 ft, so that the Project tunnel would be
about 68 to 78 ft below P6.
o Portions of the upper floors of the parking structure were demolished for
construction of the WDCH and the Roy and Edna Disney/CalArts Theater
(REDCAT)

WILSON, IHRIG & ASSOCIATES Regional Connector
Walt Disney Concert Hall
Noise and Vibration
10
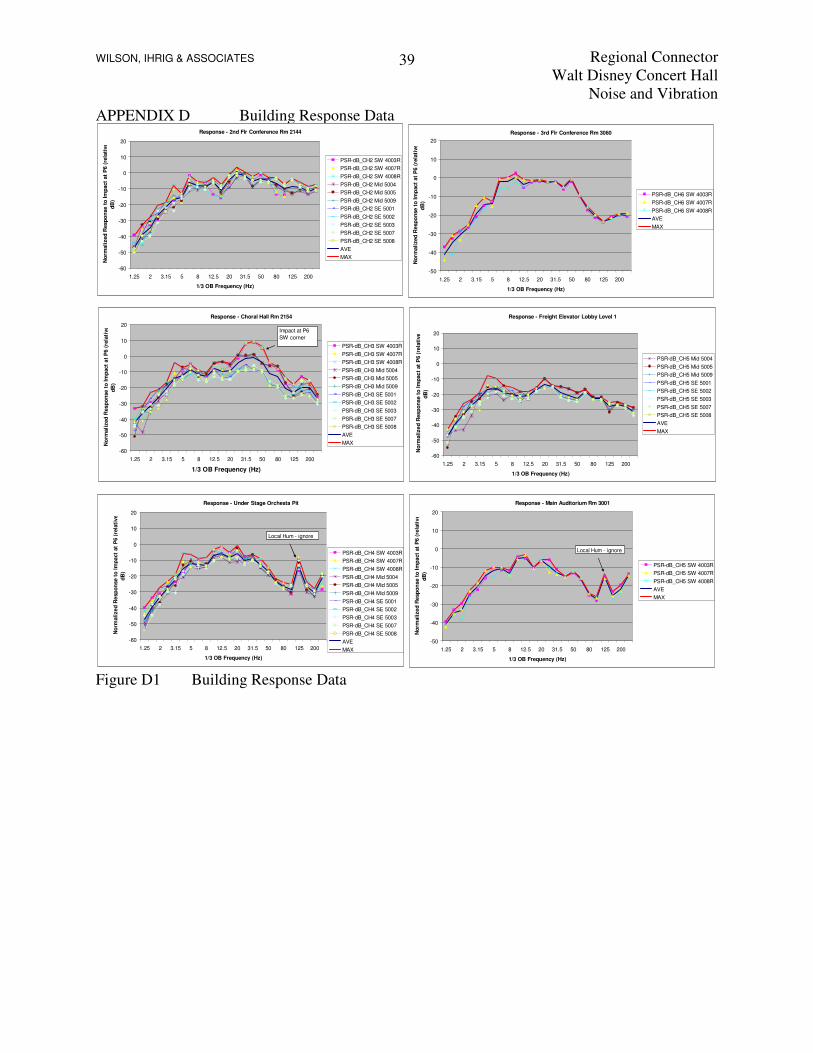
o Correction Factors included in CBuild:
� Measured loss from P6 parking level to representative spaces within
WDCH. (Figure 5)
• The maximum response was used for each location
• In most cases the range response was well clustered, regardless of
P6 impact location. See Appendix.
• At the Choral Hall, a significantly higher response was measured
when the source impact was done at the southwest corner of P6.
This response was used with 95 ft horizontal distance transfer
mobility, as discussed above.
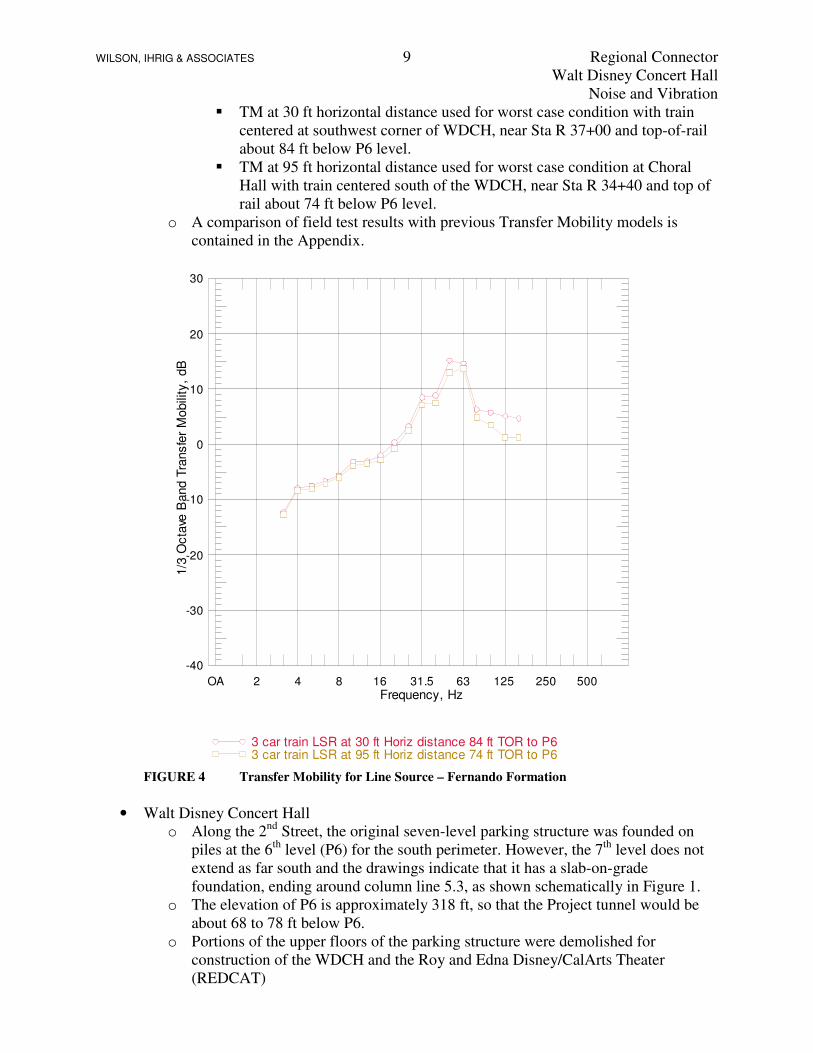
� Room response factor assumes only minor acoustical absorption in the
spaces (Figure 6); were unable to generate a sufficient level of vibration to
measure the actual relationship between groundborne vibration and
groundborne noise within the Main Auditorium, so this (conservative)
factor has been retained from the preliminary analysis.
� Measured insertion loss between structure and REDCAT auditorium,
across the isolation joint (Figure 7)
FIGURE 5 Building Response Factors WDCH
WILSON, IHRIG & ASSOCIATES Regional Connector
Walt Disney Concert Hall
Noise and Vibration
11
Relative Level, dB
FIGURE 6 Vibration to Noise Conversion Factor
Relative Vibration Level, dB
FIGURE 7 Vibration Isolation, REDCAT
• Criteria (FTA)
WILSON, IHRIG & ASSOCIATES Regional Connector
Walt Disney Concert Hall
Noise and Vibration
12
o FTA Criteria were developed to address the typical needs and expectations within
different categories of buildings. The specific categories and criteria applicable to
WDCH are indicated below.
o Frequent Events (greater than 70 events per day)
� Default: FTA Category 3 (Institutional)
• 75 VdB for groundborne vibration
• 40 dBA for groundborne noise
• For reference, a 35 dBA level would be just noticeable to the
careful listener, a 30 dBA level would generally not be audible in a
live performance setting, and a 25 dBA level could be measured,
but would not be audible to the naked ear.
� REDCAT
• FTA Special Buildings (Theater):
o 72 VdB for groundborne vibration
o 35 dBA for groundborne noise
� Choral Hall
• FTA Special Buildings (Auditoriums)
o 72 VdB for groundborne vibration
o 30 dBA for groundborne noise
o This space is used for rehearsals with some
recitals/chamber performances and archival recordings
� Main Auditorium
• FTA Special Buildings (Concert Halls and Recording):
o 65 VdB for groundborne vibration
o 25 dBA for groundborne noise
o This space is used for rehearsals, performances, archival
recordings and some commercial recordings.
o This is the most sensitive space within the WDCH
complex, due to number of performances and performer
and audience expectations
o Occasional Events (from 30 to 70 event per day)
� FTA Category 3: 78 VdB and 43 dBA
� FTA Special Building (Theater): 80 VdB and 43 dBA
� FTA Special Building (Auditorium): 80 VdB and 38 dBA
� FTA Special Building (Concert Hall and Recording): 65 VdB and 25 dBA
o Other information
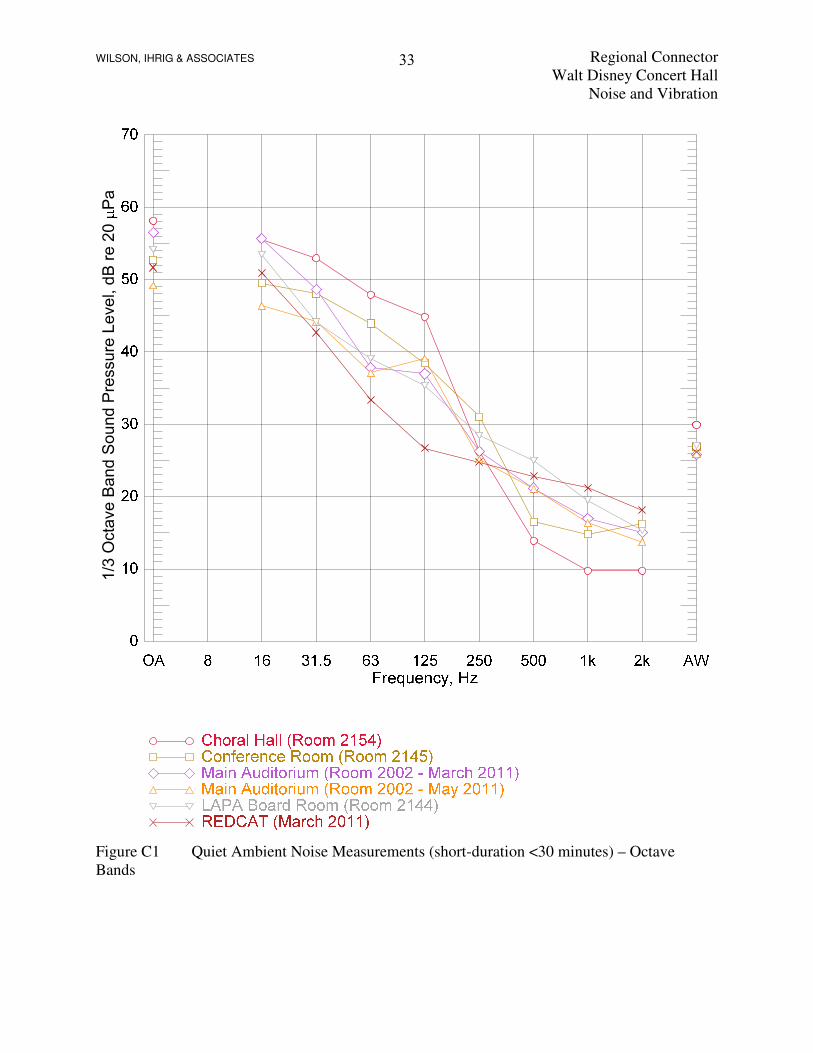
� Table 2 summarizes the ambient conditions and the corresponding NC
levels.
� The ambient noise results are included in the Appendix.
• Criteria (Metro)
o In addition to the FTA criteria, Metro has developed a methodology for a spectral-
based criterion. This is consistent with FTA guidance to use a spectral-based
criterion on a case by case basis when vibration spectral estimates are available.
Metro has committed to having no impact on WDCH with the Regional
Connector operations, and to achieve that, the Metro groundborne noise criterion
will be less than the existing environment for comparably occurring events. More
ambient sound data will be provided subsequent to the completion of a 24-hour
noise survey conducted at the WDCH facilities in the next few months.
WILSON, IHRIG & ASSOCIATES Regional Connector
Walt Disney Concert Hall
Noise and Vibration
13
• Miscellaneous
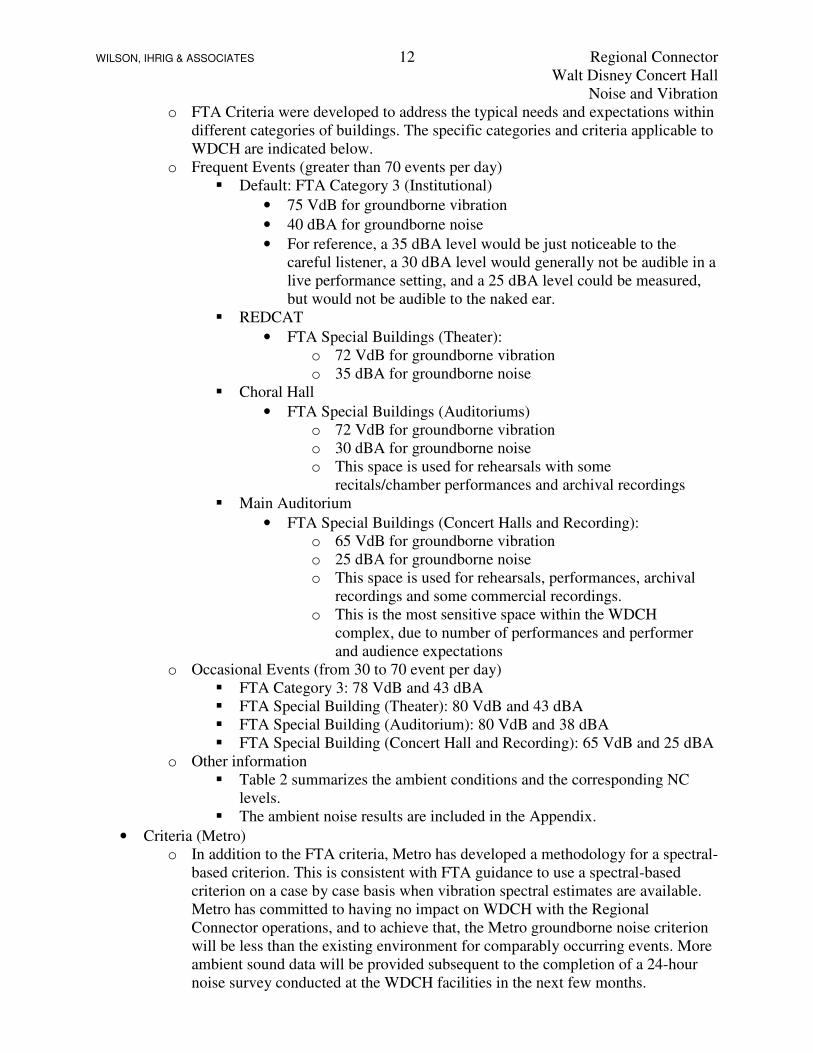
o The engineering design factor accounts for the statistical variability of all factors
in the analysis and is shown in Figure 8. This curve is based on the estimated net
uncertainty in derivation of LF ,TM and other factors used in calculating
groundborne noise and vibration
� Based on our experience, the typical variability in the LF for a given fleet
of vehicles is small for reasonably well-maintained rails and wheels.
� Since the LF in this analysis is based on measured data for both the Gold
Line and Blue Line vehicles, we expect the actual LF value to be within 1
or 3 dB of the curve shown in Figure 2 to account for differences in
vehicle speeds, track conditions and fasteners.
� The typical variability in the field measured TM and coupling loss
parameters also adds another 2 to 4 dB uncertainty for data between 12
and 160 Hz.
� The validity of using this design factor and the accuracy of the FTA
prediction model has been examined in a paper presented by WIA to the
American Public Transit Association in 19954.
o Further, some additional conservatism has been included:
� In the effect of the curve on the LF which could be overstated in Figure 2;
this effect primarily influences the 50 and 63 Hz 1/3-octave bands which
dominate the groundborne noise calculations.
� In the groundborne noise prediction by assuming that the vibration of the
wall and ceiling surfaces is the same level as the floor vibration. Typically
there should be some loss from floor to ceiling and from horizontal plane
(floor) to the vertical plane (walls).
� In the groundborne noise prediction since it does not include the effect of
resilient supports for the wall panels in the Main Auditorium; thus the
conversion from vibration to noise could be less than predicted.
� In the groundborne noise prediction by assuming only minor acoustical
absorption as mentioned above.
o This model assumes reasonably well-maintained rails and wheels, and thus does
not include the effects of occasional moderate flat wheels or poorly maintained
rail.
o This model assumes that the potentially high variability in high frequency
vibration would be controlled through regular rail grinding and wheel
maintenance programs.
4 Carman, Richard, “Rail Transit – Groundborne Noise and Prediction Models, A Comparison of Predicted and
Measured Data,” June 1995.
WILSON, IHRIG & ASSOCIATES Regional Connector
Walt Disney Concert Hall
Noise and Vibration
14
Frequency, Hz
Relative Vibration, dB
Engineering Factor
2 4 8 16 31.5 63 125 250 500 AWOA
-50
-40
-30
-20
-10
0
10
20
FIGURE 8 Engineering Design Factor
Groundborne Vibration Calculation
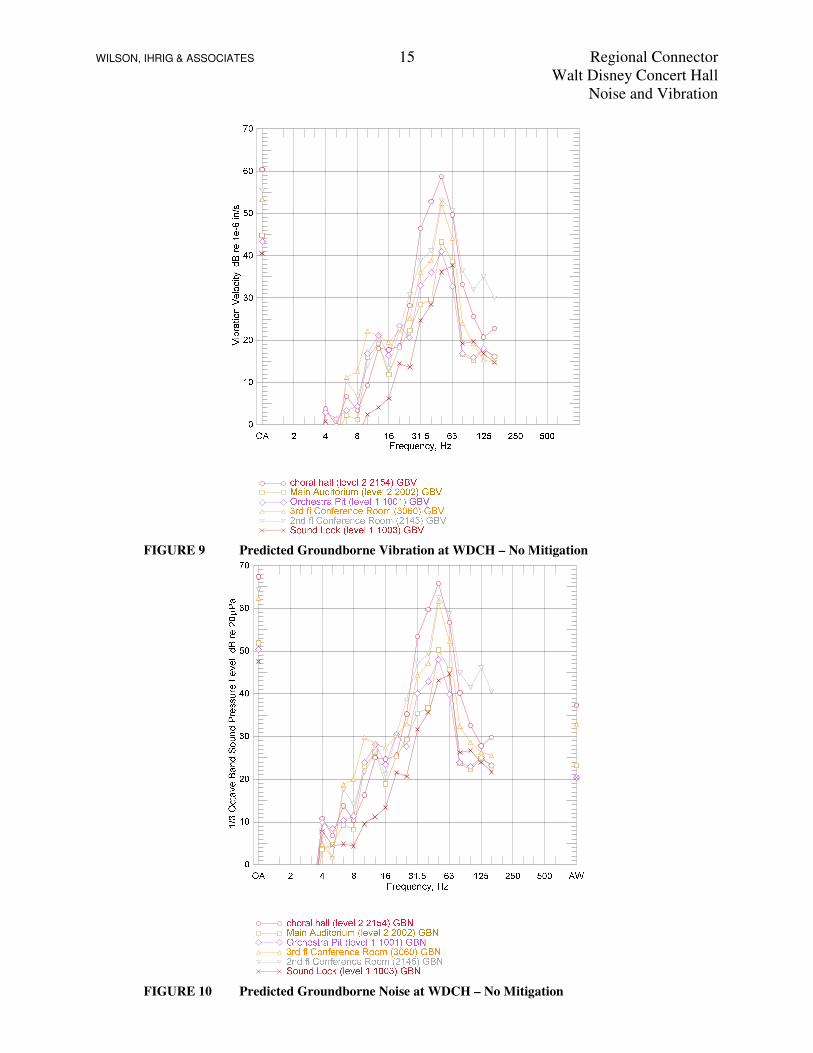
The predicted results for groundborne vibration at different spaces within the WDCH for a single
train passby are shown in Figure 9, and the corresponding results for groundborne noise are
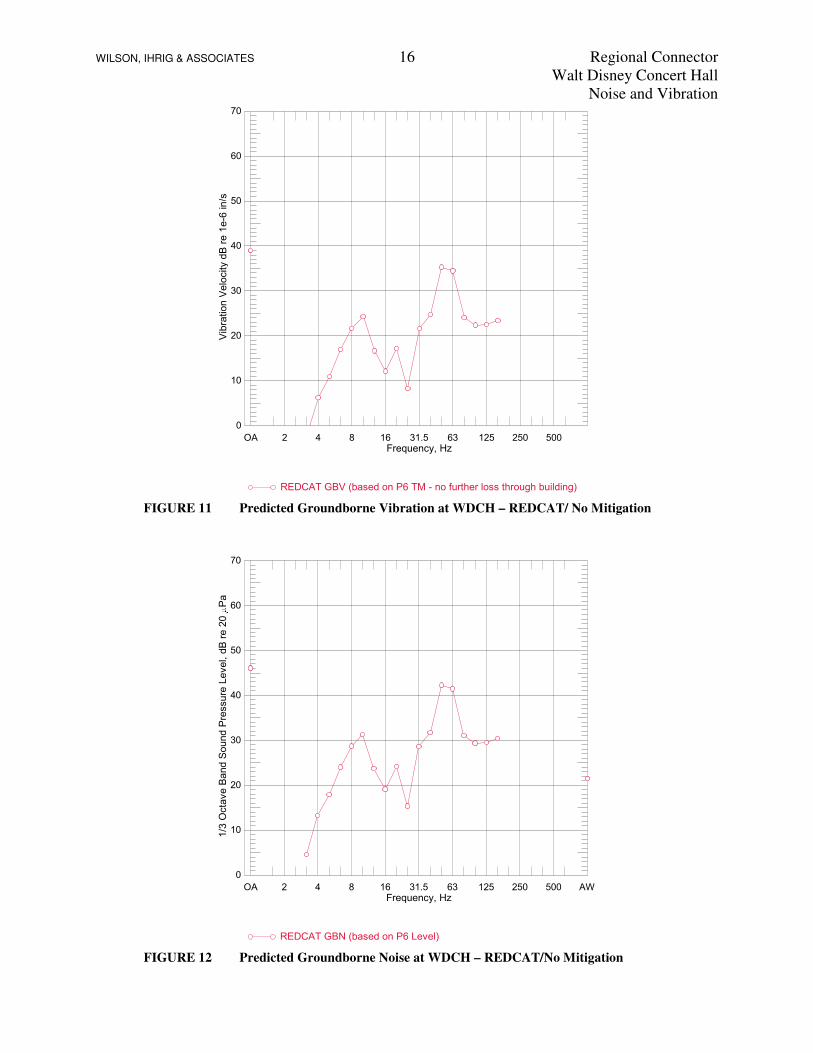
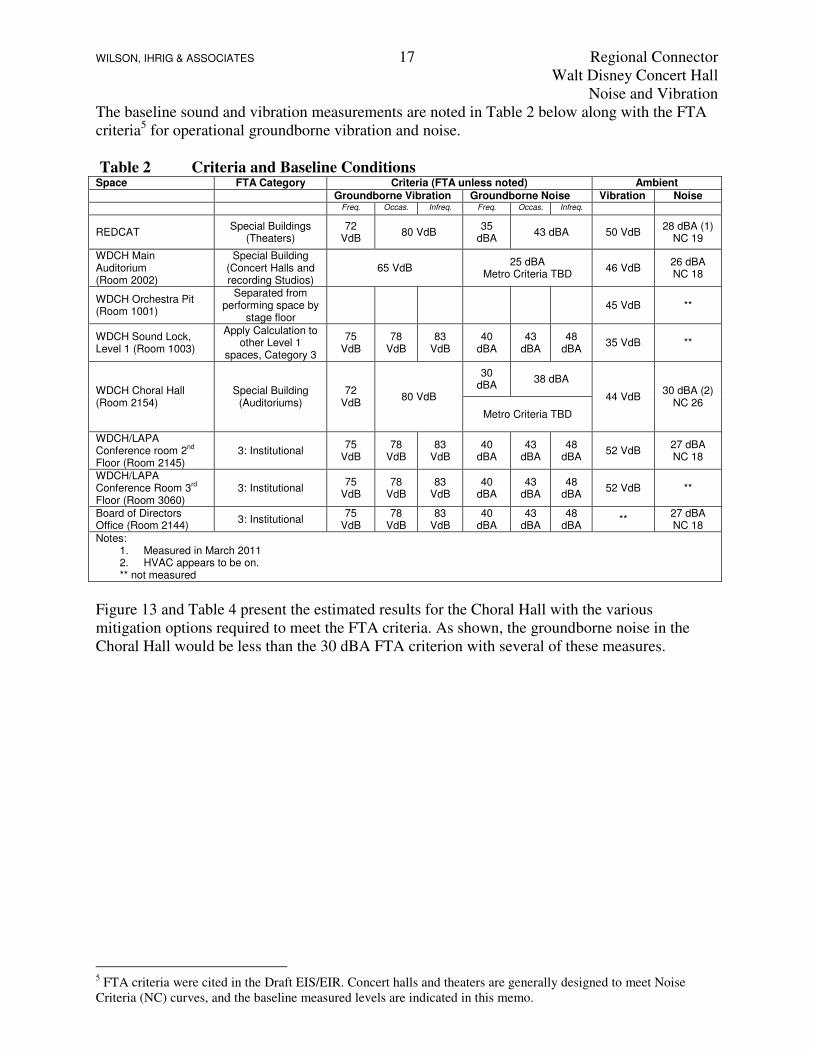
shown in Figure 10. Results for the REDCAT have also been updated, and they are shown in
Figures 11 and 12.
As shown in the left axis of Figure 9 and Figure 11, all groundborne vibration is expected to be
less than 65 VdB.
The groundborne vibration calculations were converted to groundborne noise (Figure 10 and
Figure 12), applying the highest vibration to noise conversion factor to the vibration estimate.
As shown in the right axis, the groundborne noise range is expected to range from 22 dBA at the
REDCAT to 37 dBA at the Choral Hall.
WILSON, IHRIG & ASSOCIATES Regional Connector
Walt Disney Concert Hall
Noise and Vibration
15
FIGURE 9 Predicted Groundborne Vibration at WDCH – No Mitigation
FIGURE 10 Predicted Groundborne Noise at WDCH – No Mitigation
WILSON, IHRIG & ASSOCIATES Regional Connector
Walt Disney Concert Hall
Noise and Vibration
16
Frequency, Hz
Vibration Velocity dB re 1e-6 in/s
REDCAT GBV (based on P6 TM - no further loss through building)
2 4 8 16 31.5 63 125 250 500OA
0
10
20
30
40
50
60
70
FIGURE 11 Predicted Groundborne Vibration at WDCH – REDCAT/ No Mitigation
Frequency, Hz
1/3 Octave Band Sound Pressure Level, dB re 20
Pa
REDCAT GBN (based on P6 Level)
2 4 8 16 31.5 63 125 250 500 AWOA
0
10
20
30
40
50
60
70
FIGURE 12 Predicted Groundborne Noise at WDCH – REDCAT/No Mitigation
WILSON, IHRIG & ASSOCIATES Regional Connector
Walt Disney Concert Hall
Noise and Vibration
17
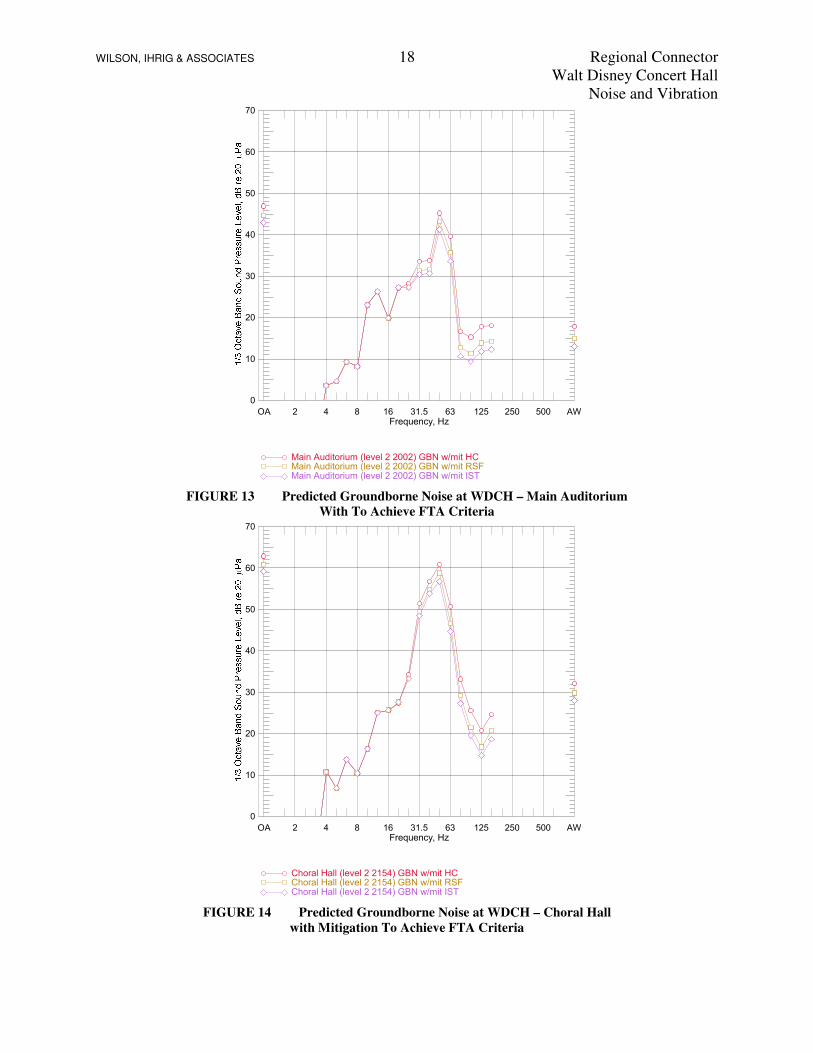
The baseline sound and vibration measurements are noted in Table 2 below along with the FTA
criteria5 for operational groundborne vibration and noise.
Table 2 Criteria and Baseline Conditions Space FTA Category Criteria (FTA unless noted) Ambient
Groundborne Vibration Groundborne Noise Vibration Noise
Freq. Occas. Infreq. Freq. Occas. Infreq.
REDCAT Special Buildings
(Theaters) 72
VdB 80 VdB
35 dBA
43 dBA 50 VdB 28 dBA (1)
NC 19
WDCH Main Auditorium (Room 2002)
Special Building (Concert Halls and recording Studios)
65 VdB 25 dBA
Metro Criteria TBD 46 VdB
26 dBA NC 18
WDCH Orchestra Pit (Room 1001)
Separated from performing space by
stage floor 45 VdB **
WDCH Sound Lock, Level 1 (Room 1003)
Apply Calculation to other Level 1
spaces, Category 3
75 VdB
78 VdB
83 VdB
40 dBA
43 dBA
48 dBA
35 VdB **
WDCH Choral Hall (Room 2154)
Special Building (Auditoriums)
72 VdB
80 VdB
30 dBA
38 dBA
44 VdB 30 dBA (2)
NC 26 Metro Criteria TBD
WDCH/LAPA Conference room 2
nd
Floor (Room 2145) 3: Institutional
75 VdB
78 VdB
83 VdB
40 dBA
43 dBA
48 dBA
52 VdB 27 dBA NC 18
WDCH/LAPA Conference Room 3
rd
Floor (Room 3060) 3: Institutional
75 VdB
78 VdB
83 VdB
40 dBA
43 dBA
48 dBA
52 VdB **
Board of Directors Office (Room 2144)
3: Institutional 75
VdB 78
VdB 83
VdB 40
dBA 43
dBA 48
dBA **
27 dBA NC 18
Notes: 1. Measured in March 2011 2. HVAC appears to be on. ** not measured
Figure 13 and Table 4 present the estimated results for the Choral Hall with the various
mitigation options required to meet the FTA criteria. As shown, the groundborne noise in the
Choral Hall would be less than the 30 dBA FTA criterion with several of these measures.
5 FTA criteria were cited in the Draft EIS/EIR. Concert halls and theaters are generally designed to meet Noise
Criteria (NC) curves, and the baseline measured levels are indicated in this memo.
WILSON, IHRIG & ASSOCIATES Regional Connector
Walt Disney Concert Hall
Noise and Vibration
18
Frequency, Hz
Main Auditorium (level 2 2002) GBN w/mit HCMain Auditorium (level 2 2002) GBN w/mit RSFMain Auditorium (level 2 2002) GBN w/mit IST
2 4 8 16 31.5 63 125 250 500 AWOA
0
10
20
30
40
50
60
70
FIGURE 13 Predicted Groundborne Noise at WDCH – Main Auditorium
With To Achieve FTA Criteria
Frequency, Hz
Choral Hall (level 2 2154) GBN w/mit HCChoral Hall (level 2 2154) GBN w/mit RSFChoral Hall (level 2 2154) GBN w/mit IST
2 4 8 16 31.5 63 125 250 500 AWOA
0
10
20
30
40
50
60
70
FIGURE 14 Predicted Groundborne Noise at WDCH – Choral Hall
with Mitigation To Achieve FTA Criteria
WILSON, IHRIG & ASSOCIATES Regional Connector
Walt Disney Concert Hall
Noise and Vibration
19
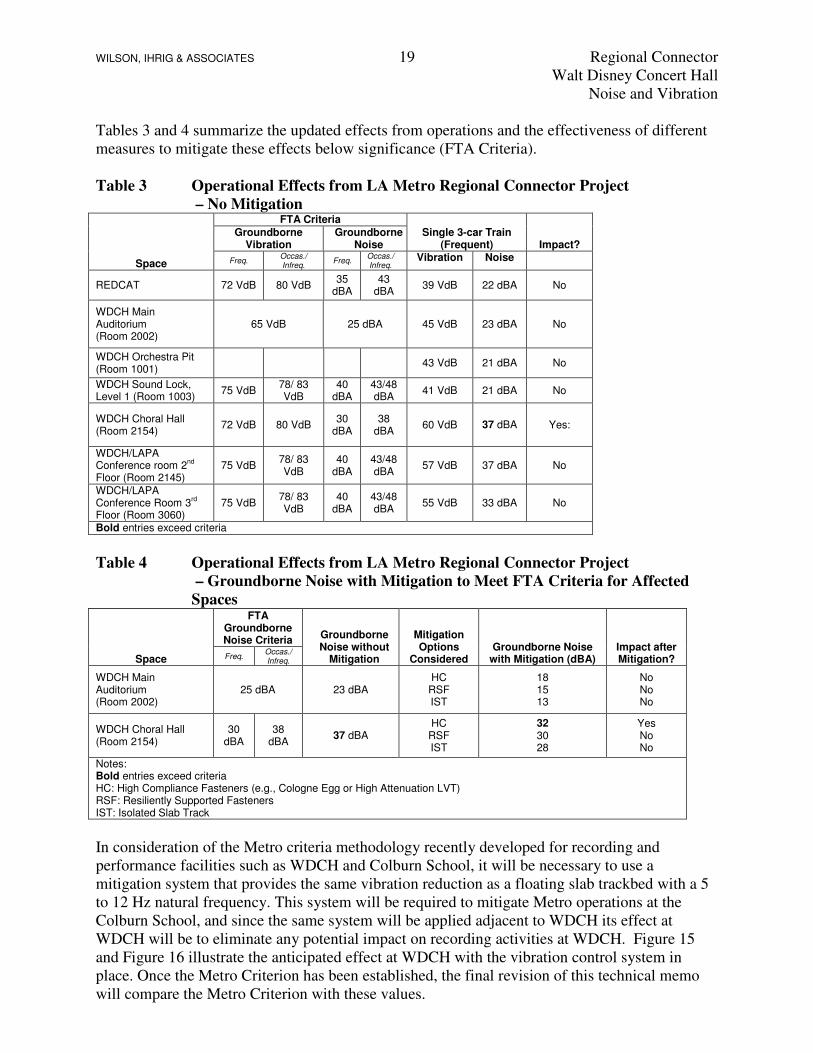
Tables 3 and 4 summarize the updated effects from operations and the effectiveness of different
measures to mitigate these effects below significance (FTA Criteria).
Table 3 Operational Effects from LA Metro Regional Connector Project
– No Mitigation
Space
FTA Criteria
Single 3-car Train (Frequent) Impact?
Groundborne Vibration
Groundborne Noise
Freq. Occas./ Infreq.
Freq. Occas./ Infreq.
Vibration Noise
REDCAT 72 VdB 80 VdB 35
dBA 43
dBA 39 VdB 22 dBA No
WDCH Main Auditorium (Room 2002)
65 VdB 25 dBA 45 VdB 23 dBA No
WDCH Orchestra Pit (Room 1001)
43 VdB 21 dBA No
WDCH Sound Lock, Level 1 (Room 1003)
75 VdB 78/ 83 VdB
40 dBA
43/48 dBA
41 VdB 21 dBA No
WDCH Choral Hall (Room 2154)
72 VdB 80 VdB 30
dBA 38
dBA 60 VdB 37 dBA Yes:
WDCH/LAPA Conference room 2
nd
Floor (Room 2145) 75 VdB
78/ 83 VdB
40 dBA
43/48 dBA
57 VdB 37 dBA No
WDCH/LAPA Conference Room 3
rd
Floor (Room 3060) 75 VdB
78/ 83 VdB
40 dBA
43/48 dBA
55 VdB 33 dBA No
Bold entries exceed criteria
Table 4 Operational Effects from LA Metro Regional Connector Project
– Groundborne Noise with Mitigation to Meet FTA Criteria for Affected
Spaces
Space
FTA Groundborne Noise Criteria
Groundborne Noise without
Mitigation
Mitigation Options
Considered Groundborne Noise
with Mitigation (dBA) Impact after Mitigation? Freq.
Occas./ Infreq.
WDCH Main Auditorium (Room 2002)
25 dBA 23 dBA HC
RSF IST
18 15 13
No No No
WDCH Choral Hall (Room 2154)
30 dBA
38 dBA
37 dBA HC
RSF IST
32 30 28
Yes No No
Notes: Bold entries exceed criteria HC: High Compliance Fasteners (e.g., Cologne Egg or High Attenuation LVT) RSF: Resiliently Supported Fasteners IST: Isolated Slab Track
In consideration of the Metro criteria methodology recently developed for recording and
performance facilities such as WDCH and Colburn School, it will be necessary to use a
mitigation system that provides the same vibration reduction as a floating slab trackbed with a 5
to 12 Hz natural frequency. This system will be required to mitigate Metro operations at the
Colburn School, and since the same system will be applied adjacent to WDCH its effect at
WDCH will be to eliminate any potential impact on recording activities at WDCH. Figure 15
and Figure 16 illustrate the anticipated effect at WDCH with the vibration control system in
place. Once the Metro Criterion has been established, the final revision of this technical memo
will compare the Metro Criterion with these values.
WILSON, IHRIG & ASSOCIATES Regional Connector
Walt Disney Concert Hall
Noise and Vibration
20
There would be rare occasions where two trains would pass each other in the tunnels adjacent to
WDCH (one westbound and the other eastbound). During these events, the vibration and
groundborne noise could increase over the single train condition. Systems analysis with the
specific operational schedule has since been performed, indicating that a two-train passby will be
a very rare event during normal operations, and thus, no further consideration has been made for
this condition.
WILSON, IHRIG & ASSOCIATES Regional Connector
Walt Disney Concert Hall
Noise and Vibration
21
1/3 Octave Band Sound Pressure Level, dB re 20 Pa
Figure 15 Predicted Groundborne Noise at WDCH with Mitigation Required at Colburn School
(third-octave band plot)
Frequency, Hz
1/3 Octave Band Sound Pressure Level, dB re 20 Pa
Choral hallMain Auditorium
4 8 16 31.5 63 125 250 500 1k AWOA0
10
20
30
40
50
60
70
Figure 16 Predicted Groundborne Noise at WDCH with Mitigation Required at Colburn School
(octave band plot)
WILSON, IHRIG & ASSOCIATES Regional Connector
Walt Disney Concert Hall
Noise and Vibration
22
Construction Impacts
Building damage criteria and impacts were previously discussed in the 7 April 2011
memorandum where the potential for building damage impacts from cut and cover activities
were indicated.
The FTA also provides criteria for short-term impacts (or annoyance) during construction, with
the criteria equivalent to the same criteria provided for operational groundborne vibration and
noise discussed above.
For tunneling vibration, the EIS/EIR indicates that tunnel boring machines (TBM) can generate
vibration as high as 0.055 in/sec peak particle velocity (PPV) at a distance of 33 feet from the
TBM source. Since the alignment refinements have not brought the alignment closer than 40 feet
to historic resources, no new construction vibration impacts are expected due to the change in
tunnel depth. No new mitigation measures would be required.
Thus, TBM vibration of 0.018 in/sec PPV at 70 ft6 would result in an RMS vibration level of
approximately 73 VdB at the lowest parking level. The corresponding groundborne noise could
be on the order of 40 to 53 dBA. Taking into account building isolation and losses through the
parking structure, the short-duration noise and vibration from TBM at Walt Disney Concert Hall
and at the REDCAT, are indicated in Table 5 and would potentially exceed the criteria for
groundborne noise at the Main Auditorium during performances and recording sessions and at
the LAPA conference room on the 2nd
floor (Room 2145). It is possible that some of the other 2nd
floor LAPA office spaces would experience the same effects as Room 2145. The duration of
impact would be on the order of 10 days assuming 35 ft per day progress.
Groundborne noise and vibration would also be generated by delivery trains in the tunnel during
construction assuming delivery trains are the method selected to move soil from tunnel to
surface. These slow moving trains have greater groundborne noise and vibration effects than the
trains used for operations due to the presence of wheel flats or jointed construction rails, and
even with a correction for the slower tunnel train speed (5 to 10 mph) it is estimated that the
vibration would be on the order of 0 to 5 dB greater than that generated by the LA Metro
operations. Thus, at WDCH Main Auditorium this would result in groundborne vibration on the
order of 50 VdB and groundborne noise of 23 to 28 dBA, potentially exceeding the groundborne
noise criterion. At the Choral Hall the tunnel train would generate groundborne noise of 37 to 42
dBA, which potentially exceeds the groundborne noise criterion. Groundborne vibration from the
tunnel train would comply with criteria.
Table 5 summarizes the short-term effects from construction, and Table 6 indicates the
anticipated effects of mitigation on the potential impacts at the Main Auditorium and the Choral
Hall.
The following mitigation measures were considered for construction impacts:
• Tunnel Boring Machine
6 Scaled for distance as PPV(distance) = PPVref(ref_dist/dist)
1.5, per FTA Guidance Manual
WILSON, IHRIG & ASSOCIATES Regional Connector
Walt Disney Concert Hall
Noise and Vibration
23
o Maintenance and Operation: minimize vibration from jacking or pressing
operations (if applicable, perhaps the action could smoothed out to avoid a sharp
push), and maintain machinery in good working order.
o Coordination and Notification: There would be times when the Main Auditorium
is vacant or not used for a noise-sensitive activity, thereby eliminating any noise
impact from TBM. Similarly, there would be times at the LAPA Conference
Room (and offices) when activities are not particularly noise sensitive. Close
coordination with the WDCH would ensure that the noise-generating parts of
TBM operations would be conducted so as to avoid noise sensitive periods.
• Tunnel Train
o Speed: Limiting the speed of the tunnel train to 5 mph in the vicinity of the
WDCH would reduce the groundborne noise to the lower range, or 5 dBA from
the maximum range.
o Resilient Mat: A resilient system to support and fasten the tunnel train tracks
would reduce the groundborne noise at least 4 dBA. Such as system would
include a) resilient mat under the tracks and b) a resilient grommet or bushing
under the heads of any track fasteners (assuming some kind of anchor or bolt
system). The hardness of the resilient mat should be in the 40 to 50 durometer
range, and be about 1 to 2" thick, depending on how heavily loaded the cars
would be. The contractor would need to select the mat thickness so that the rail
doesn't bottom out during a car passby.
o Coordination and Notification: There would be times when the Main Auditorium
and Choral Hall are vacant or not used for noise-sensitive activities, thereby
eliminating any noise impact from the tunnel train. Close coordination with the
WDCH would ensure that the tunnel train passbys would be conducted to avoid
noise sensitive periods.
Table 5 Construction Short-Term (Annoyance) Effects – No Mitigation
Space
Criteria (Occasional) TBM Tunnel Train
Impact? Vibration Noise Vibration Noise Vibration Noise
REDCAT 80 VdB 43 dBA 53 VdB 18 to 33 dBA 44 VdB 21 to 26 dBA No
WDCH Main Auditorium (Room 2002)
65 VdB 25 dBA 53 VdB 18 to 33 dBA 50 VdB 23 to 28 dBA Yes,
groundborne noise
WDCH Orchestra Pit (Room 1001)
** ** 53 VdB 18 to 33 dBA 48 VdB 21 to 26 dBA No
WDCH Sound Lock, Level 1 (Room 1003)
78 VdB 43 dBA 53 VdB 18 to 33 dBA 46 VdB 20 to 25 dBA No
WDCH Choral Hall (Room 2154)
80 VdB 38 dBA 58 VdB 23 to 38 dBA 65 VdB 37 to 42 dBA
Yes, tunnel train
groundborne noise
WDCH/LAPA Conference room 2
nd
Floor (Room 2145) 78 VdB 43 dBA 68 VdB 33 to 48 dBA 62 VdB 37 to 42 dBA
Yes, TBM groundborne
noise
WDCH/LAPA Conference Room 3
rd
Floor (Room 3060) 78 VdB 43 dBA 53 VdB 18 to 33 dBA 60 VdB 33 to 38 dBA No
Bold entries exceed criteria
WILSON, IHRIG & ASSOCIATES Regional Connector
Walt Disney Concert Hall
Noise and Vibration
24
Table 6 Construction Short-Term (Annoyance) Effects
– Groundborne Noise with Mitigation for Affected Spaces
Space
Groundborne Noise Criteria (Occasional)
Groundborne Noise without Mitigation
(dBA) Mitigation Options
Considered
Groundborne Noise with Mitigation (dBA)
Impact after Mitigation? TBM
Tunnel Train TBM
Tunnel Train
WDCH Main Auditorium (Room 2002)
25 dBA 18 to 33 23 to 28
Speed Mat
Maint Coord
n/a n/a
18 to 33 18 to 33
23 19 to 24
n/a 23 to 28
No, LA Metro will use one or more of
the mitigation options to meet
FTA criteria
WDCH Choral Hall (Room 2154)
38 dBA 23 to 38 37 to 42
Speed Mat
Maint Coord
Not req.
37 33 to 38
n/a 37 to 42
No, LA Metro will use one or more of
the mitigation options to meet
FTA criteria
WDCH/LAPA Conference room 2
nd Floor (Room
2145)
43 dBA 33 to 48 37 to 42
Speed Mat
Maint Coord
n/a n/a
33 to 48 33 to 48
Not req.
No, LA Metro will use one or more of
the mitigation options to meet
FTA criteria
Notes: Bold entries exceed criteria Speed: Speed reduction – near 5 mph near WDCH Mat: Resilient mat – 40 to 50 durometer hardness, 1 to 2” thick with resilient grommet or bushing under the track fastener heads (assuming an anchor or bolt fastening system) Maint: Maintenance and operation of the equipment to minimize vibration. TBM: minimize vibration from jacking or pressing operations, and maintain machinery in good working order. Coord: Coordination with WDCH to conduct these construction activities around noise sensitive activities in the affected spaces; the groundborne noise level would not be lessened, but there would be no sensitive activity to impact
WDCH_BSP_071513_draft_nocomments_r1WIA.doc
WILSON, IHRIG & ASSOCIATES Regional Connector
Walt Disney Concert Hall
Noise and Vibration
25
APPENDICES
A. Field setup WDCH and parking garage (PDF)
B. Plan and Profile Drawings (marked up from June 29 Draft Submittal, Drawing T104)
C. Quiet Ambient measurement results
D. Building response data ranges
E. Compare TM with previous
Prelim Test DrawingsPrelim Test Drawings
Deborah
Deborah
Deborah
Deborah
Deborah
Deborah
Deborah
Deborah
Noise Ambient
Deborah
Deborah
Vibration Measurements
Deborah
Deborah
Orchestra Pit
Deborah
Elevator Lobby
Deborah
Concert Hall Level 1
Office
Text Box
APPENDIX A

Prelim Test DrawingsPrelim Test Drawings
Deborah
Deborah
Deborah
Deborah
Deborah
Deborah
Noise Ambient
Deborah
Deborah
Deborah
Deborah
Deborah
Vibration Measurements
Deborah
Deborah
board pres office
Deborah
Deborah
Choral Hall
Deborah
Conf Rm 2145
Deborah
Concert Hall Level 2
Prelim Test DrawingsPrelim Test Drawings
Deborah
Deborah
Conf. Room 3060
Deborah
Deborah
Noise Ambient
Deborah
Deborah
Vibration Measurements
Deborah
Concert Hall Level 3

Prelim Test DrawingsPrelim Test Drawings
Deborah
Deborah
Deborah
Orch Pit
Deborah
Auditorium
Deborah
Deborah
Noise Ambient
Deborah
Deborah
Vibration Measurements
Deborah
POSITION OF IMPACT LOCATIONS AT P6 LEVEL P4 Level base drawing shown NTS
Deborah
Deborah
Deborah
8 ft offset
Deborah
Deborah
Deborah
Deborah
Deborah
Deborah
Deborah
Deborah
Deborah
100 ft offset
Deborah
40 ft offset
Deborah
2nd Street Tunnel
Deborah
Deborah
SW
Deborah
Mid
Deborah
SE
Office
Text Box
APPENDIX B
WILSON, IHRIG & ASSOCIATES Regional Connector
Walt Disney Concert Hall
Noise and Vibration
32
APPENDIX C Quiet Ambient measurements
WILSON, IHRIG & ASSOCIATES Regional Connector
Walt Disney Concert Hall
Noise and Vibration
33
1/3 Octave Band Sound Pressure Level, dB re 20
Pa
Figure C1 Quiet Ambient Noise Measurements (short-duration <30 minutes) – Octave
Bands
WILSON, IHRIG & ASSOCIATES Regional Connector
Walt Disney Concert Hall
Noise and Vibration
34
Figure C2 Quiet Ambient Noise Measurements (4 minutes) – March 2011, Main Auditorium
WILSON, IHRIG & ASSOCIATES Regional Connector
Walt Disney Concert Hall
Noise and Vibration
35
Frequency, Hz
Octave Band Sound Pressure Level, dB re 20 Pa
L10
L90
16 31.5 63 125 250 500 1k 2k 4k AWOA0
10
20
30
40
50
60
70
Figure C3 Quiet Ambient Noise Measurements (5 minutes) – May 2011, Main Auditorium
WILSON, IHRIG & ASSOCIATES Regional Connector
Walt Disney Concert Hall
Noise and Vibration
36
Octave Band Sound Pressure Level, dB re 20 Pa
Figure C4 Quiet Ambient Noise Measurements (13 minutes) – May 2011, Choral Hall
WILSON, IHRIG & ASSOCIATES Regional Connector
Walt Disney Concert Hall
Noise and Vibration
37
Figure C5 Quiet Ambient Noise Measurements – March 2011, REDCAT
WILSON, IHRIG & ASSOCIATES Regional Connector
Walt Disney Concert Hall
Noise and Vibration
38
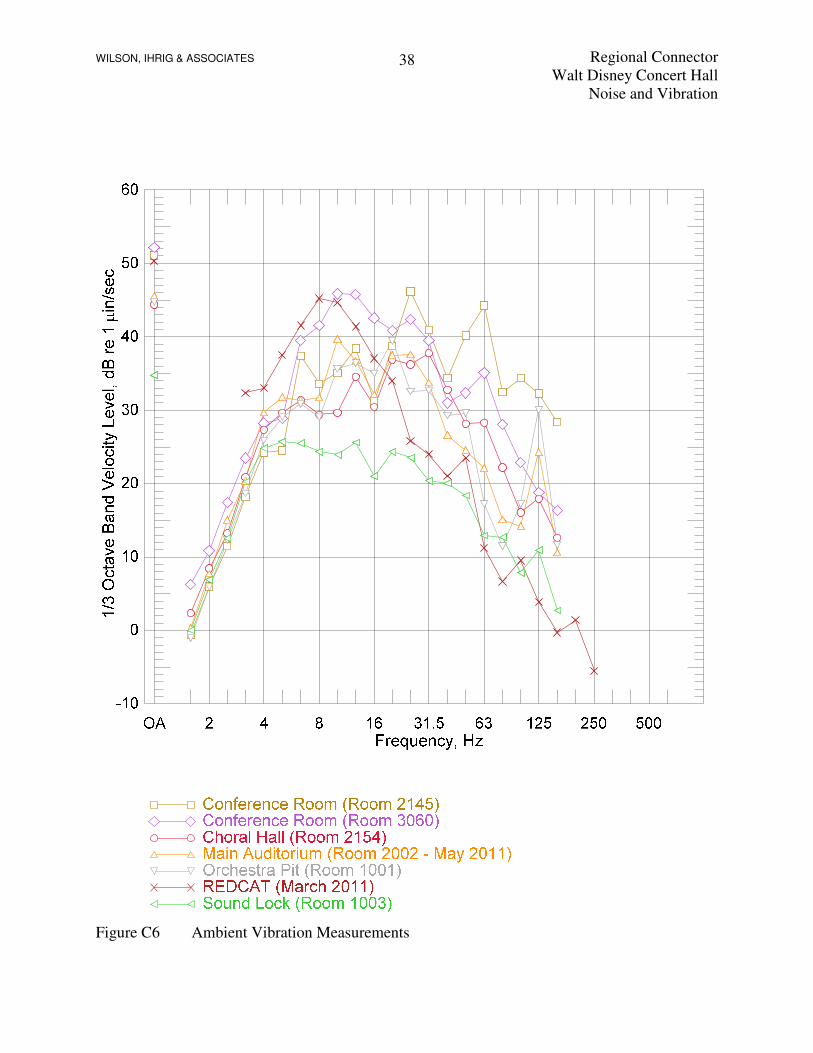
Figure C6 Ambient Vibration Measurements
WILSON, IHRIG & ASSOCIATES Regional Connector
Walt Disney Concert Hall
Noise and Vibration
39
APPENDIX D Building Response Data Response - 2nd Flr Conference Rm 2144
-60
-50
-40
-30
-20
-10
0
10
20
1.25 2 3.15 5 8 12.5 20 31.5 50 80 125 200
1/3 OB Frequency (Hz)
No
rmali
zed
Resp
on
se t
o I
mp
act
at
P6 (
rela
tive
dB
)
PSR-dB_CH2 SW 4003R
PSR-dB_CH2 SW 4007R
PSR-dB_CH2 SW 4008R
PSR-dB_CH2 Mid 5004
PSR-dB_CH2 Mid 5005
PSR-dB_CH2 Mid 5009
PSR-dB_CH2 SE 5001
PSR-dB_CH2 SE 5002
PSR-dB_CH2 SE 5003
PSR-dB_CH2 SE 5007
PSR-dB_CH2 SE 5008
AVE
MAX
Response - 3rd Flr Conference Rm 3060
-50
-40
-30
-20
-10
0
10
20
1.25 2 3.15 5 8 12.5 20 31.5 50 80 125 200
1/3 OB Frequency (Hz)
No
rmali
zed
Resp
on
se t
o I
mp
act
at
P6 (
rela
tive
dB
)
PSR-dB_CH6 SW 4003R
PSR-dB_CH6 SW 4007R
PSR-dB_CH6 SW 4008R
AVE
MAX
Response - Choral Hall Rm 2154
-60
-50
-40
-30
-20
-10
0
10
20
1.25 2 3.15 5 8 12.5 20 31.5 50 80 125 200
1/3 OB Frequency (Hz)
No
rmali
zed
Resp
on
se t
o I
mp
act
at
P6 (
rela
tive
dB
)
PSR-dB_CH3 SW 4003R
PSR-dB_CH3 SW 4007R
PSR-dB_CH3 SW 4008R
PSR-dB_CH3 Mid 5004
PSR-dB_CH3 Mid 5005
PSR-dB_CH3 Mid 5009
PSR-dB_CH3 SE 5001
PSR-dB_CH3 SE 5002
PSR-dB_CH3 SE 5003
PSR-dB_CH3 SE 5007
PSR-dB_CH3 SE 5008
AVE
MAX
Impact at P6
SW corner
Response - Main Auditorium Rm 3001
-50
-40
-30
-20
-10
0
10
20
1.25 2 3.15 5 8 12.5 20 31.5 50 80 125 200
1/3 OB Frequency (Hz)
No
rmali
zed
Resp
on
se t
o I
mp
act
at
P6 (
rela
tive
dB
)
PSR-dB_CH5 SW 4003R
PSR-dB_CH5 SW 4007R
PSR-dB_CH5 SW 4008R
AVE
MAX
Local Hum - ignore
Response - Under Stage Orchesta Pit
-60
-50
-40
-30
-20
-10
0
10
20
1.25 2 3.15 5 8 12.5 20 31.5 50 80 125 200
1/3 OB Frequency (Hz)
No
rmali
zed
Resp
on
se t
o I
mp
act
at
P6 (
rela
tive
dB
)
PSR-dB_CH4 SW 4003R
PSR-dB_CH4 SW 4007R
PSR-dB_CH4 SW 4008R
PSR-dB_CH4 Mid 5004
PSR-dB_CH4 Mid 5005
PSR-dB_CH4 Mid 5009
PSR-dB_CH4 SE 5001
PSR-dB_CH4 SE 5002
PSR-dB_CH4 SE 5003
PSR-dB_CH4 SE 5007
PSR-dB_CH4 SE 5008
AVE
MAX
Local Hum - ignore
Response - Freight Elevator Lobby Level 1
-60
-50
-40
-30
-20
-10
0
10
20
1.25 2 3.15 5 8 12.5 20 31.5 50 80 125 200
1/3 OB Frequency (Hz)
No
rmali
zed
Resp
on
se t
o I
mp
act
at
P6 (
rela
tive
dB
)
PSR-dB_CH5 Mid 5004
PSR-dB_CH5 Mid 5005
PSR-dB_CH5 Mid 5009
PSR-dB_CH5 SE 5001
PSR-dB_CH5 SE 5002
PSR-dB_CH5 SE 5003
PSR-dB_CH5 SE 5007
PSR-dB_CH5 SE 5008
AVE
MAX
Figure D1 Building Response Data
WILSON, IHRIG & ASSOCIATES Regional Connector
Walt Disney Concert Hall
Noise and Vibration
40
APPENDIX E Compare TM with Previous
Compare Fitted LSR with Numerical Model
Near 30 ft Offset, Various Depths to building at 40 ft depth
-40
-30
-20
-10
0
10
20
30
1.25 1.6 2 2.5 3.15 4 5 6.3 8 10 12.5 16 20 25 31.5 40 50 63 80 100 125 160 200 2501/3 OB Frequency (Hz)
Tra
nsfe
r M
obili
ty (
LS
R)
33 ft H. dist 70ft depth
33 ft H. dist 80ft depth
33 ft H. dist 90ft depth
May 2011 all depths fit G2-5 (30 ft 84 ft depth from P6)
May 2011 all depths all fit (30 ft 84 ft depth from P6)
NET TM at 82 ft (WDCH Prelim 4/11)
Compare Fitted LSR with Numerical Model
Near 95 ft Offset, Various Depths to building at 40 ft depth
-40
-30
-20
-10
0
10
20
30
1.25 1.6 2 2.5 3.15 4 5 6.3 8 10 12.5 16 20 25 31.5 40 50 63 80 100 125 160 200 250
1/3 OB Frequency (Hz)
Tra
nsfe
r M
ob
ilit
y (
LS
R)
82 ft H. dist 70ft depth
98 ft H. dist 70ft depth
82 ft H. dist 80ft depth
98 ft H. dist 80ft depth
82 ft H. dist 90ft depth
98 ft H. dist 90ft depth
May 2011 all depths fit G2- 5 (95 ft 74 ft depth from P6)
May 2011 all depths all fit (95 ft 74 ft depth from P6)
NET TM at 82 ft (WDCH Prelim 4/11)
Compare TM (line source – LSR)
• Numerical Model at different horizontal offsets and depths. Numerical Model does not
include effect of building coupling at P6.
• May 2011 field data
• NET adjusted TM used for previous WDCH analysis (FEIS April 2011)