Chapter 8 - Cost of cultivation and profitability of CF and NCF
Upload
independentCategory
view
1download
0
Electronic copy available at: http://ssrn.com/abstract=1540479
14 Commercial Cultivation and Profitability
A.A. REDDY,1 V.C. MATHUR,2 M. YADAV3 AND S.S. YADAV4
1Indian Institute of Pulses Research, Kanpur 208024, Uttar Pradesh, India; 2Division of Agricultural Economics, Indian Agricultural Research Institute, New Delhi 110012, India; 3College of Business Administration, Tarleton State University, (Texas A&M University System), Stephenville, TX 76402, USA; 4Pulse Research Laboratory, Division of Genetics, Indian Agricultural Research Institute, New Delhi 110012, India
Introduction
Chickpea (Cicer arietinum (L.) ), commonly known as bengal gram or garbanzo, belongs to the family Leguminosae and is a major pulse crop that contributes ~20% of the world pulse production after dry beans and dry peas. There are two types of chickpea: the desi type (mostly brown seeded), traditionally grown in warmer climates of Asia and Africa, mostly in India, Pakistan, Bangladesh, Myanmar and Ethiopia; and the kabuli type (white-seeded), a large-seeded variety more suited to the temperate climates of Turkey, Mexico, the USA, Afghanistan and Iran (West Asia, North Africa and America). Some countries like Canada and Australia produce both desi and kabuli types. Kabuli type constitutes ~15% of global chickpea production and desi type constitutes the remaining 85%.
Production
Globally, chickpea is grown in approximately 40 countries across all continents. In 2005, the world chickpea production was 9.2 million tonnes on area of 11.2 million hectares. Most of the chickpea is produced in developing countries; in 2005, these countries accounted for ~97% of the world area and 96% of the world production. Asia accounts for 91% of the global area and 90% of the global production. Africa and North and Central America contribute ~4% of the glob-al production, each from 4% and 2% of global area, while Oceania accounts for 2% of the area and production. South America contributes a mere 0.08% of global production and 0.06% of the global area (FAOSTAT database, 2006).
During the last 30 years, global production of chickpea has increased by ~64% from 5.2 million tonnes in 1975 to 9.2 million tonnes in 2005. Although
©CAB International 2007. Chickpea Breeding and Management(ed. S.S. Yadav) 291
Electronic copy available at: http://ssrn.com/abstract=1540479
292 A.A. Reddy et al.
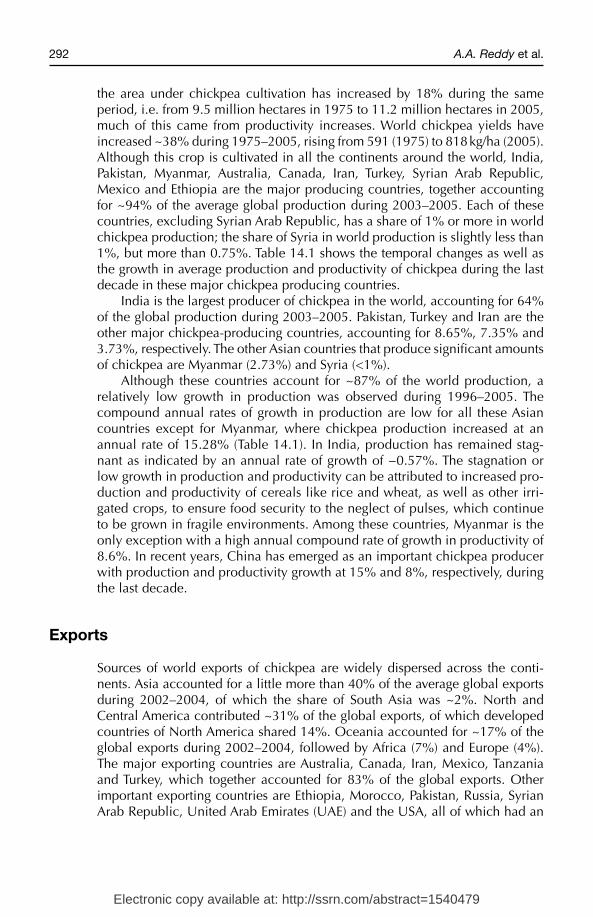
the area under chickpea cultivation has increased by 18% during the same period, i.e. from 9.5 million hectares in 1975 to 11.2 million hectares in 2005, much of this came from productivity increases. World chickpea yields have increased ~38% during 1975–2005, rising from 591 (1975) to 818 kg/ha (2005). Although this crop is cultivated in all the continents around the world, India, Pakistan, Myanmar, Australia, Canada, Iran, Turkey, Syrian Arab Republic, Mexico and Ethiopia are the major producing countries, together accounting for ~94% of the average global production during 2003–2005. Each of these countries, excluding Syrian Arab Republic, has a share of 1% or more in world chickpea production; the share of Syria in world production is slightly less than 1%, but more than 0.75%. Table 14.1 shows the temporal changes as well as the growth in average production and productivity of chickpea during the last decade in these major chickpea producing countries.
India is the largest producer of chickpea in the world, accounting for 64% of the global production during 2003–2005. Pakistan, Turkey and Iran are the other major chickpea-producing countries, accounting for 8.65%, 7.35% and 3.73%, respectively. The other Asian countries that produce significant amounts of chickpea are Myanmar (2.73%) and Syria (<1%).
Although these countries account for ~87% of the world production, a relatively low growth in production was observed during 1996–2005. The compound annual rates of growth in production are low for all these Asian countries except for Myanmar, where chickpea production increased at an annual rate of 15.28% (Table 14.1). In India, production has remained stag-nant as indicated by an annual rate of growth of −0.57%. The stagnation or low growth in production and productivity can be attributed to increased pro-duction and productivity of cereals like rice and wheat, as well as other irri-gated crops, to ensure food security to the neglect of pulses, which continue to be grown in fragile environments. Among these countries, Myanmar is the only exception with a high annual compound rate of growth in productivity of 8.6%. In recent years, China has emerged as an important chickpea producer with production and productivity growth at 15% and 8%, respectively, during the last decade.
Exports
Sources of world exports of chickpea are widely dispersed across the conti-nents. Asia accounted for a little more than 40% of the average global exports during 2002–2004, of which the share of South Asia was ~2%. North and Central America contributed ~31% of the global exports, of which developed countries of North America shared 14%. Oceania accounted for ~17% of the global exports during 2002–2004, followed by Africa (7%) and Europe (4%). The major exporting countries are Australia, Canada, Iran, Mexico, Tanzania and Turkey, which together accounted for 83% of the global exports. Other important exporting countries are Ethiopia, Morocco, Pakistan, Russia, Syrian Arab Republic, United Arab Emirates (UAE) and the USA, all of which had an

Com
mercial C
ultivation293
Table 14.1. Temporal changes and growth in production and productivity of chickpea in major producing countries. (Computed by the authors using FAOSTAT database, 2006.)
Production Productivity
Total Total CAGR Coeffi cient Average Average CAGR Coeffi cient of estimate estimate 1996–2005 of variation yield yield 1996–2005 variation 1993–1995 2003–2005 (percentage/ 1996–2005 1993–1995 2003–2005 (percentage/ 1996–2005Country (‘000 t) (‘000 t) annum) (%) (kg/ha) (kg/ha) annum) (%)
Australia 183 169 −4.53 24.98 990 1154 3.06 29.70Bangladesh 64 10 −20.83 88.42 733 729 −0.13 5.63Canada 1 72 26.38 106.11 1385 1306 −0.79 14.38Ethiopia 86 128 0.33 16.31 598 806 −1.40 9.20India 5278 5300 −0.59 16.71 774 784 0.56 6.38Iran, Islamic
Republic 316 310 1.81 18.61 485 411 1.06 10.25Mexico 163 240 2.36 24.90 1522 1600 0.21 5.80Myanmar 78 229 15.28 49.25 625 1104 8.60 27.64Pakistan 439 718 −0.34 24.91 421 706 0.98 20.34Syrian Arab
Republic 48 63 2.02 32.10 634 671 −0.20 18.30Turkey 707 610 −1.49 10.75 928 953 0.10 5.76World 7677 8302 −0.13 5.63 729 781 0.74 4.23
CAGR: Compound annual growth rate.

294 A.A. Reddy et al.
average share of >1% during 2002–2004. India, though the largest producer of chickpea in the world, only accounted for 0.78% of the global exports.
The shares of some important chickpea-producing countries are shown in Table 14.2. The cumulative share of the various countries shown in Table 14.2 is 93% of world exports. Three South Asian countries, India, Pakistan and Bangladesh, account for 50% of world imports. This indicates that even though South Asia produces ~73% of world production, it is still deficit in chickpea production (Fig. 14.1). Sources of world exports widely spread across conti-nents, i.e. Turkey, Australia, Mexico, Iran, Canada and Tanzania, account for 80% of world chickpea exports. Developing countries are net importers, while developed countries are net exporters. Chickpea production in Asia, Africa and Europe is deficient, whereas it is in surplus in America and Oceania. Yield levels are high in America, Oceania and Europe compared with developing countries (Fig. 14.1). Many new countries entered into chickpea production considering the continuing opportunities in exports and diversified uses like animal feed and the major ingredient of snack and other food items. Production loss due to biotic (helicoverpa pod borer [$500 million], fusarium wilt [$250 million], ascochyta blight [$250 million], botrytis gray mold [$100 million]) and abiotic (drought $1 billion) stresses is very high, as it is mostly grown in semiarid tropics by resource-poor farmers. As a result, world chickpea produc-tion is very unstable with a coefficient of variation of 10%. The major stresses for chickpea yield reduction cause huge loss ($2 billion).
Table 14.2. Share of important producing and exporting countries of chickpea in global exports during 2002–2004. (Computed by the authors from FAOSTAT database, 2006.)
Average Share in world Exports as proportion Unit valueCountry exports (t) exports (%) of domestic production (%) ($/t)
India 5,790 0.78 0.11 571Australia 129,206 17.44 85.38 316Canada 89,473 12.08 97.5 375Ethiopia 17,123 2.31 11.76 303Iran 104,017 14.04 Neg 529Mexico 122,436 16.53 51.37 627Morocco 9,524 1.29 20.96 381Pakistan 9,460 1.23 1.72 312Russia 11,331 1.53 84.98 223Syrian Arab
Republic 12,719 1.72 17.26 435Tanzania 24,370 3.29 77.76 290Turkey 142,448 19.23 22.85 468UAE 12,375 1.67 – 333USA 16,776 2.64 – 534World 740,877 100.00 9.25 451
Neg: negligible; –: proportion could not be computed as data on domestic production in UAE and the USA are not available.

Commercial Cultivation 295
Imports
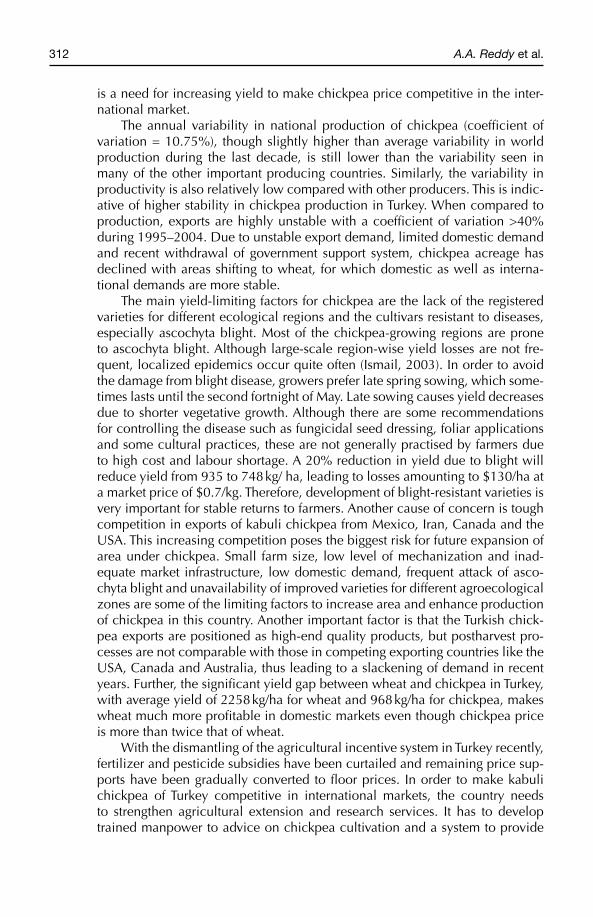
During 2002–2004, 19 countries around the world accounted for 87% of global chickpea imports (Table 14.3). Bangladesh, India, Pakistan and Sri Lanka in South Asia accounted for 51% of the global imports. Although India is the larg-est producer of chickpea in the world, it also accounts for nearly a quarter of the world imports. Algeria, Jordan, Tunisia, Saudi Arabia, UAE, Spain, Italy, the UK and the USA are some of the other major chickpea-importing countries.
Export Prices
Unit values of exports per tonne vary considerably between countries. The average unit value of exports for the world as a whole was $451/t during 2002–2004 (Table 14.2). For other important exporting nations, unit values of exports ranged between $223 and $627. For several European and South-east Asian countries, the realized export prices per tonne were considerably higher than those of the major exporting countries. High export prices may be attributed to the differences in quality of the chickpea, particularly in terms of the large-sized seeds as in the case of the kabuli type.
The data presented above show that there is significant diversity in the geographical distribution of production, exports and imports of chickpea. In recent years, the share of the top three exporters (Turkey, Australia and Mexico) has declined substantially and many new countries have started producing and exporting chickpea in international markets. The recent trend of reduction in
0
200
400
600
800
1000
1200
1400
1600
Asia
South
Asia
Europ
eAfri
ca
Ocean
ia
Amer
ica
Develo
ped
Develo
ping
Wor
ld
Continent
Yie
ld (
kg/h
a) a
nd p
rodu
ctio
n (1
0,00
0 t)
0
100
200
300
400
500
600
700
800
900
Impo
rts/
expo
rts
(1,0
00 t)
Yield
Production
Imports
Exports
Fig. 14.1. World production, yield, import and export scenario (2005).
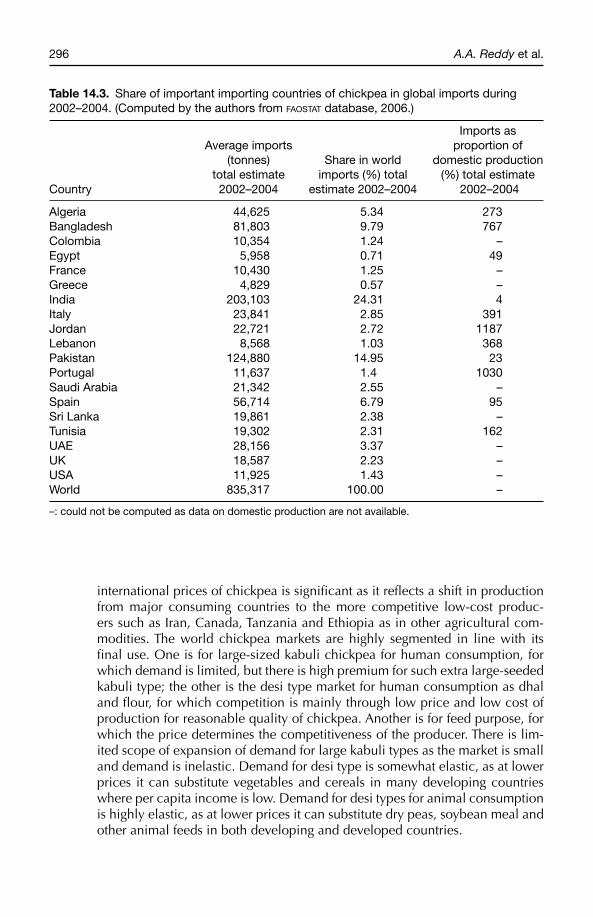
296 A.A. Reddy et al.
international prices of chickpea is significant as it reflects a shift in production from major consuming countries to the more competitive low-cost produc-ers such as Iran, Canada, Tanzania and Ethiopia as in other agricultural com-modities. The world chickpea markets are highly segmented in line with its final use. One is for large-sized kabuli chickpea for human consumption, for which demand is limited, but there is high premium for such extra large-seeded kabuli type; the other is the desi type market for human consumption as dhal and flour, for which competition is mainly through low price and low cost of production for reasonable quality of chickpea. Another is for feed purpose, for which the price determines the competitiveness of the producer. There is lim-ited scope of expansion of demand for large kabuli types as the market is small and demand is inelastic. Demand for desi type is somewhat elastic, as at lower prices it can substitute vegetables and cereals in many developing countries where per capita income is low. Demand for desi types for animal consumption is highly elastic, as at lower prices it can substitute dry peas, soybean meal and other animal feeds in both developing and developed countries.
Table 14.3. Share of important importing countries of chickpea in global imports during 2002–2004. (Computed by the authors from FAOSTAT database, 2006.)
Imports as Average imports proportion of (tonnes) Share in world domestic production total estimate imports (%) total (%) total estimateCountry 2002–2004 estimate 2002–2004 2002–2004
Algeria 44,625 5.34 273Bangladesh 81,803 9.79 767Colombia 10,354 1.24 –Egypt 5,958 0.71 49France 10,430 1.25 –Greece 4,829 0.57 –India 203,103 24.31 4Italy 23,841 2.85 391Jordan 22,721 2.72 1187Lebanon 8,568 1.03 368Pakistan 124,880 14.95 23Portugal 11,637 1.4 1030Saudi Arabia 21,342 2.55 –Spain 56,714 6.79 95Sri Lanka 19,861 2.38 –Tunisia 19,302 2.31 162UAE 28,156 3.37 –UK 18,587 2.23 –USA 11,925 1.43 –World 835,317 100.00 –
–: could not be computed as data on domestic production are not available.

Commercial Cultivation 297
Competitiveness and Profi tability
Given the highly diversified production and consumption scenarios across countries and the increase in world chickpea trade (global trade in chickpea [exports plus imports] increased by 129% and 43% in quantum and value terms, respectively, between 1995 and 2004), there is a need to examine the competitiveness and profitability of chickpea cultivation in major producing and consuming countries. The structure of production and marketing costs and quality are the major factors that determine a country’s competitiveness in the international market. The acreage under chickpea is determined not only by international competitiveness, but also by the profitability of competing crops within the country. This section deals with the production costs and profitabil-ity of chickpea in some important countries. For comparison, five developed countries, Australia, Canada, the USA, Spain and France, and four developing countries, India, Turkey, Algeria and Jordan, have been selected for detailed study. These countries represent a mix of chickpea producers, exporters and importers. As India is the largest producer and consumer of chickpea in the world, it has been selected as a case to examine the availability of improved production technology and constraints in its adoption, potential and actual yields and yield gaps and cost of production.
Developed Countries
The five developed countries considered for the purposes of comparison are Australia from Oceania, Canada and the USA from North America, and Spain and France from Europe.
Australia
Australia produces ~180,000 t of chickpea annually. It produces both desi and kabuli types. Approximately 85% of the total production is exported. Australian chickpea production is characterized by high variability in yield and acreage due to frequent outbreaks of ascochyta blight. Recently, there has been sig-nificant reduction in the production of chickpea. During 1996–2005, although yields increased at an annual rate of 3.06%, growth in production was negative at −4.53% per annum. Variability was high in both productivity and produc-tion at ~30% and 25%, respectively. Chickpea harvest often clashes with wheat harvest and traditionally wheat has been given priority in Australia. Average yield of chickpea during 2003–2005 was 1154 kg/ha, while the yield of wheat was 2119 kg/ha (FAOSTAT database, 2006), which indicates that chickpea price should at least be double that of wheat in order to be competitive.
Table 14.4 depicts the details of cost–benefit analysis of chickpea in medium- and low-risk ascochyta blight regions in Australia. Like in the USA and Canada, farmers use all the recommended practices suggested by agricul-tural scientists. As average farm size is more than 500 ha, farms are completely

298 A.A. Reddy et al.
mechanized. Economies of scale operate at farm level, resulting in low operat-ing cost per hectare of $183 and $196/ha, respectively, in medium- and low-risk areas. Farmers use herbicides, pesticides, fungicides and inoculants as per recommended practice. The yield reported is 1500 kg/ha in medium-risk zones and 1300 kg/ha in low-risk zones. At a selling price of $0.3/kg, the net profit over variable cost is approximately $254 and $207/ha. If we assume a total fixed cost of $100/ha, the net profit over total cost is $154 and $107/ha in medium- and low-risk areas, respectively. Profits are lower in Australia when
Table 14.4. Cost of cultivation ($/ha) of Australian desi chickpea in 2004. (From Wayne et al., 2003. Available at: www.pir.sa.gov.au/factsheets)
Medium-risk ascochyta blight Low-risk ascochyta blight
Number of Number ofItem operations Cost/unit Cost/ha operations Cost/unit Cost/ha
Glyphosate 3 × 1.2 3 × 1.2fallow spray l/ ha 5.50/l 19.8 l/ha 5.50/l 19.8
Planting 1 4.50/ha 4.5 1 4.50/ha 4.5Ground rig
(own equipment) 8 2/ha 16 6 2/ha 12Harvesting
(own equipment) 1 10/ha 10 1 10/ha 10Transport 1 × 1.5 1 × 1.3
(100 km contract) t/ha 10.00/t 15 t/ha 10.00/t 13Labour cost 1 10/ha 10 1 10/ ha 10Planting seed
(treated) 45 kg/ha 1.20/kg 54 45 kg/ha 1.20/kg 54Inoculation 1 3/100 kg 1.35 1 3/100 kg 1.35
seed seedSimazine (PSPE) 1.5 l/ha 6.00/l 9 1.5 l/ha 6.00/l 9Dithane DF 2 × 1
fungicide kg/ha 7.50/kg 15 – – –NPV insecticide 1 × 375 1 × 0.375
+ Aminofeed ml/ha 70.00/l 27 l/ha 70.00/l 27Larvin 375® – – – 1 × 0.75 25.00/l 18.75
l/haDesiccation 1.2 l + 5
(glyphosate + ally) g/ha 9.60/ha 9.6 – – –Agronomist 1 4.00/ha 4 1 4.00/ ha 4Total variable cost – – 196 – – 183Yield (1.5 t/ha) – – – – 1.3 t/ha –Price ($300/t) – – – – – –Gross income – – 450 – – 390Net return over
variable cost – – 254 – – 207Net return over total
cost assuming fi xed cost ($100/ha) – – 154 – – 107

Commercial Cultivation 299
compared with the USA, because desi types are largely cultivated here, which fetch a lower price of $0.3/kg as against $0.49/kg in the USA.
In the international market, Australian varieties are regarded as inferior to both Canadian and US varieties. There is need to increase area under kab-uli type to realize higher prices in the international market. It is likely that kabuli chickpea material bred at the International Center for Research in Dry Land Agriculture (ICARDA), Aleppo, Syria, may have considerable potential for Australia, especially considering the disease-resistant traits of some of the germplasm (Siddique et al., 2004). Ascochyta blight is a serious problem and is the major cause of reduction in area under chickpea in recent years. Australia is expected to enjoy a net benefit of $0.89 million annually for the next 20 years, if disease-resistant varieties are propagated (Siddique et al., 2004). Given the favourable climatic conditions in South Australia and the current chickpea pro-duction deficits in Asia and Africa, there is considerable potential for chickpea exports from Australia.
Canada
Chickpea acreage in Canada constitutes a small share of the total cropped area in Canada and appears to be declining in recent years. Area under chickpea declined from 283,000 ha in 2000 to 65,000 ha in 2005. Approximately 90% of chickpea produced in Canada is of kabuli type. Cultivation includes the large kabuli type with a seed size of 8–9 mm and the small kabuli type with a more uniform seed size of ~7 mm. Yields of the desi and small-seeded kabuli types are ~20% higher than that of the large-seeded kabuli types. The maturity period is 95–105 days for desi type and 100–110 days for kabuli type. Cultivation of kabuli type is more dispersed and therefore shows less variability than desi type. The Canadian chickpea harvest generally occurs during the period mid-August to early October (Agriculture and Agri-Food Canada, 2005).
Chickpea acreage in Canada ranges from 50 to 500 ha. All farm opera-tions including land preparation, sowing, harvesting and threshing are done mechanically. The farmers cultivate modern improved varieties and apply her-bicides, insecticides and fertilizers as recommended. Due to large-scale adop-tion of improved production, plant protection practices and mechanization, farm produce is of uniform quality and fetches high prices in international mar-kets. Uniform quality also facilitates easy grading, postharvest operations and branding.
However, in recent years, area under chickpea decreased by 55% due to: (i) lower potential returns from kabuli type; (ii) increased costs and risks of ascochyta blight disease; and (iii) higher risk associated with this crop as com-pared with some of the alternative crops such as wheat. Even though the gap between yield of wheat (2599 kg/ha) and chickpea (1509 kg/ha) is narrow in Canada, producers feel that chickpea production is highly risky in relation to both productivity and price. In order to compete in international markets, desi types are replaced by kabuli types in recent years. Iran, Mexico and Syria are the major competitors of Canada for kabuli-type chickpea exports. Although

300 A.A. Reddy et al.
the yields of kabuli types are nearly 20% lower than that of desi types, the inter-national price premiums are sufficient to compensate lower yields. Chickpea farm gate prices range between $0.22–0.40/kg for desi type and $0.48–0.88/kg for 9 mm kabuli type. The international demand scenario of main product seg-ments in which Canada is interested is given below (Agriculture and Agri-Food Canada, 2004; Saskatchewan Pulse Growers, 2005).
PricesCanadian prices are largely determined in the international markets because Canada exports most of its production. Although prices of the large-seeded kabuli are higher than prices of the desi, they are also more volatile. Prices of the large-seeded kabuli increase as the seed size increases from 7 to 10 mm. The producer receives a weighted average price for kabuli chickpea based on the percentage of various seed sizes. The price of the small-seeded kabuli type is generally higher than that of the desi type, but lower than the weighted average price of the large-seeded kabuli type. Prices are negotiated directly between the dealers and customers based on supply and demand factors for each type of chickpea. The prices negotiated could be for immediate delivery or for delivery at some future date.
Large-calibre chickpea (8–9 mm)Canada directly competes with Mexico for export of large-calibre kabuli chick-pea to India, Europe, North Africa and the Middle East. Mexico is best suited for large-calibre chickpea production but, since kabuli chickpea prices have been in a slump, other crops have tended to replace it, resulting in significant con-traction in area under kabuli type in recent years. The USA also produces large-calibre kabuli types, but its production has shrunk in response to low prices.
Small-calibre chickpea (7 mm)Canada exports small-calibre chickpea mostly to Pakistan. Hence, increased demand for Canadian small-calibre chickpea depends upon production pros-pects in Pakistan, demand and supply position of large-calibre kabuli chickpea in Canada and competition from Australia. Competitive harvest cycles in import-ing countries and competing exporting countries are important for exploring enhanced export opportunities. India and Pakistan typically harvest their win-ter crop in March–April; Mexico also tends to harvest in March–April. Turkey and Syria harvest chickpea in May–June. In the USA, the European Union (EU) and Ukraine, harvest time is July. Canada harvests chickpea from mid-August to early October. In Australia, chickpea is harvested during December and January. Canada and Australia can easily adjust their acreage according to the production trends in Pakistan and India. Sowing time in Canada is March–April and in Australia is July–August, by which time production figures of Pakistan and India are available.
Ascochyta blight is a severe problem in Canada also. Estimates of 2005 reported that only 70% of seeded area under this crop was harvested (Saskatchewan Pulse Growers, 2005). In addition, chickpea production must compete with wheat. Even though the yield gap between wheat and chickpea

Commercial Cultivation 301
is low, wheat producers get government support in terms of loans and crop insurance as substantial incentives that are not currently available to many of the chickpea farmers.
The Canadian chickpea-processing industry is efficient in terms of both cost and quality. Large-scale processors make the Canadian chickpea com-petitive in global markets with high-end consumers. Agro-industries purchase, transport, grade, pack and deliver chickpea to domestic ports or directly to importing port destinations. Buyers generally purchase chickpea from farmers on a free-on-board (FOB) basis at the farm gate. Farmers sometimes deliver produce to packing units and are compensated accordingly. This imparts con-siderable flexibility to producers and variability in prices received by them. As the cost structure of Canada is similar to that of the USA, this is discussed in detail in the following section.
USA
The USA is also a typical example of the production system in a developed country characterized by large landholdings, high levels of mechanization, high adoption rate of modern technology and high yield per hectare (Brester et al., 2003). The average farm size is 180 ha, but operational farm holding ranges from 200 to 800 ha depending upon size of leased land. Using a full-costing method (including costs of inputs, machinery use, labour, management and land), it is estimated that the total economic cost of production of dryland chickpea is $554/ha (Table 14.5). Capital depreciation (27% of total cost), land rent (20%), wages (10%), seed (10%), fuel and electricity (8%), fertilizer (6%) and chemicals (3%) constitute a major chunk of the total cost of production (South Dakota State University Extension, 2005).
Tables 14.5 and 14.6 show the costs and returns of chickpea produced under dryland (rainfed) and irrigated cropping systems, respectively. The aver-age seed yields realized are 1475 and 2497 kg/ha in dryland and irrigated land, respectively. With these yields, net return per hectare is $109/ha in dryland and $282/ha in irrigated land. The net profit, as proportion of costs, is ~20% both
Table 14.5. Cost and return for dryland chickpea at different yield levels. (From South Dakota State University Extension, 2005.)
Item Dryland chickpea grain yield (kg/ha)
Grain price ($/kg) 2043 1702 1475 1021 681Large (65%) $0.52/kg 696 580 499 349 232Medium (25%) $0.37/kg 189 158 136 95 63Small (10%) $0.19/kg 38 32 28 20 13Total revenue ($/ha) 923 769 663 462 308(−) Total cost ($/ha) 554 554 554 554 554(=) Net return ($/ha) 369 215 109 −92 −246
Actual average yield realized is 1475 kg/ha.

302 A.A. Reddy et al.
for dryland and irrigated land. These average figures indicate that profitability is reasonably high for both irrigated and dryland chickpea farmers.
The revenues presented in these tables for different assumed grain yields are based on a three-tiered pricing schedule. For example, in dryland system, on an average, 65% of production is categorized as large seeds, 25% as medium seeds and 10% as small seeds. The contract price is $0.52/kg for large-seeded, $0.37/kg for medium-seeded and $0.19/kg for small-seeded types. Data in Tables 14.5 and 14.6 indicate that at these contract prices, net returns can be adversely affected by even a small reduction in grain yield, especially in dryland chickpea. The farmers incur losses when yields fall below 1220 kg/ha in drylands and 1914 kg/ha in irrigated lands. In addition to grain yield reduc-tions, there are also potential losses associated with reduced seed size that are not quantified in these tables. The economic viability of a specialty crop such as chickpea will ultimately depend on several factors including market devel-opment, contract and seed pricing, supply conditions in large consumers like India, pesticide availability and production capability. Price (2002) suggests that competitiveness of chickpea in the USA is also determined by several other factors that are summarized below:
● US pulses are high-quality commodities, commanding price premiums. Many price-sensitive segments of foreign markets are unwilling to pay sig-nificant premiums for such quality, especially when lower-cost pulses from other countries are plentiful. For example, India imports many of its pulses from Myanmar, Canada and Australia, where both prices and quality are lower than in the USA.
● US exporters bag and containerize shipments to preserve quality. Although this results in less product damage, the process is more costly than bulk shipping.
● US transportation costs are relatively high. Long distances lead to high trucking costs, particularly in the Northern Plains. Rail freight rates to ports are also high.
● The high value of the US dollar relative to other currencies makes US exports more expensive than those from other countries.
Table 14.6. Cost and return for irrigated chickpea at different seed yields. (From South Dakota State University Extension, 2005.)
Item Irrigated chickpea grain yield (kg/ha)
Grain price ($/kg) 2724 2497 2043 1703 1362Large (85%) $0.52/kg 1214 1104 910 759 608Medium (10%) $0.37/kg 101 92 76 63 50Small (5%) $0.19/kg 25 24 20 15 13Total revenue ($/ha) 1334 1220 1001 834 667(−) Total cost ($/ha) 938 938 938 938 938(=) Net return ($/ha) 397 282 63 −104 −271
Actual average yield realized is 2497 kg/ha.

Commercial Cultivation 303
Europe
Europe is the net importer of chickpea. The average imports of chickpea by Europe during 2002–2004 were 140,000 t while the average exports during the same period were merely 28,000 t. Most of the EU chickpea imports come from Mexico, Turkey, Canada and the USA. Spain, Italy, France, Portugal and the UK are the main importing countries. The EU generally imports large-seeded kabuli types.
Spain
Spain is the only major chickpea producer in the EU, with an average pro-duction of ~59,000 t during 2002–2004. The country mostly produces the kabuli type and is therefore an important kabuli chickpea importing country. During 2002–2004, it imported ~57,000 t of chickpea, implying that nearly half of its annual consumption is met through imports. Most of its imports comprise large-seeded kabuli types (11–12 mm) from Mexico and Canada (Saskatchewan Pulse Growers, 2005). The last 10 years marked a drastic reduction in chickpea area in the country with acreage declining from 104,000 ha in 1995 to 63,000 ha in 2005. The occurrence of ascochyta blight coupled with imports of cheap-quality chickpea from Mexico adversely affected chickpea cultivation in Spain. The average yield was 708 kg/ha during 2002–2004 and just 281 kg/ha in 2005 (FAOSTAT database, 2006). By merely using rational systems of cultivation, some farmers have been able to double their yields, even with their traditional landraces (Gubero et al., 1990). Experimental results suggest that shifting of chickpea acreage from traditional spring to winter season can give four times more yield. The lack of adequate transfer of technology from research institutions to farmers is the primary cause of low yield.
Prospects of chickpea cultivation in SpainThere is a good potential for expansion of area under chickpea in Spain for feed purposes as most of the food demand is met from imports of large-seeded kabuli chickpea from Mexico. The Spanish animal feed industry is mostly based on soybean meal, and chickpea as an alternative animal feed has to compete with the currently used animal feeds like soybean meal. Further, good-quality large-seeded chickpea preferred for human consumption fetches three times higher prices than that used for animal feed. As such, farmers are reluctant to cultivate chickpea for animal feed. Although some areas not suitable for culti-vation of high-quality chickpea for human consumption need to be diverted to the cultivation of chickpea for animal feed, an alternative for increasing area under chickpea is by increasing yield to compensate for low price. There is a need for right policy options to increase chickpea consumption as feed and increase cropped area under high-yielding varieties with proper extension and breeding programmes.
304 A.A. Reddy et al.
France
Current demand for chickpea in France is mainly for human consumption and the country imports more than 10,000 t/year for the purpose. With a yield of 2000 kg/ha, 5000 ha is enough to saturate the French market for kabuli chickpea (Pluvinage, 1990). Thus, the current demand is low and on the basis of the above yield and a price of $0.57/kg, as in the USA, the expected gross revenue from chickpea is approximately $1140/ha. Assuming the normal cultivation cost of $938/ha as in the USA under dry-land or irrigated conditions, farmers can receive ~21% net profit over costs.
The situation is less clear for chickpea grown for animal consumption, which should however benefit from a bigger market for crops containing protein as has happened for the fodder pea. At a price of $0.23/kg, which is identical to that of the fodder pea, a yield of 5500 kg/ha must be attained with chickpea to obtain the same margin of profit. This appears to be possible on the basis of the results obtained at the research stations. Chickpea can therefore become a highly competitive crop for the rotation system in the dry cereal areas of the French Mediterranean, as it is more suitable and less costly than sunflower (Pluvinage, 1990).
It is obvious that the future of this crop is linked to its yield, as the market is relatively favourable. However, it is necessary, from the economic point of view, to work in accordance with several related considerations of opportunity cost as compared with the other crops. In the countries north of the Mediterranean Sea (Spain and France), the development of chickpea production techniques aimed at human consumption will rapidly encounter some constraints due to a limited market. On the other hand, if the cultivars with higher yield potential are developed, they could help in alleviating the shortage of animal feed as has occurred with fodder peas in the temperate zone. The market for this type of chickpea could be substantial, and it could permit restoration of some area in the region to a traditional Mediterranean crop.
The experiences of both Spain and France indicate that in European coun-tries, demand of chickpea for human consumption is very limited and it is met substantially through import of kabuli chickpea from Turkey, Mexico, Canada and Australia. Scope for expansion of area under feed-quality chickpea exists, provided it is produced at low cost compared to soybean meal, dry peas and other fodder crops, as the demand for animal feed is increasing but is highly price-elastic due to availability of substitutes.
Developing Countries
Among developing countries, India from South Asia, Turkey and Jordan from the Mediterranean and Algeria from Africa have been included for detailed study.
India
In India, area under chickpea is ~6.72 million hectares and production is 5.30 million tonnes (total estimate 2003–2005 average), which constitute 63% and
Commercial Cultivation 305
64% of world chickpea area and production, respectively, with an average yield of 784 kg/ha. Chickpea is a major pulse crop of the country, accounting for ~30% of the total pulse area and 40% of the total pulse production. In terms of area of cultivation, it ranks second after dry beans, while in terms of production it ranks first among pulses. However, in the last 10 years, at the national level, a certain amount of stagnation has crept into the production, productivity and area under chickpea, as indicated by the triennium averages for these variables during 1993–2005. Since chickpea is cultivated in several parts of the country, it would be interesting to examine the region-wise trends in area, production and productivity.
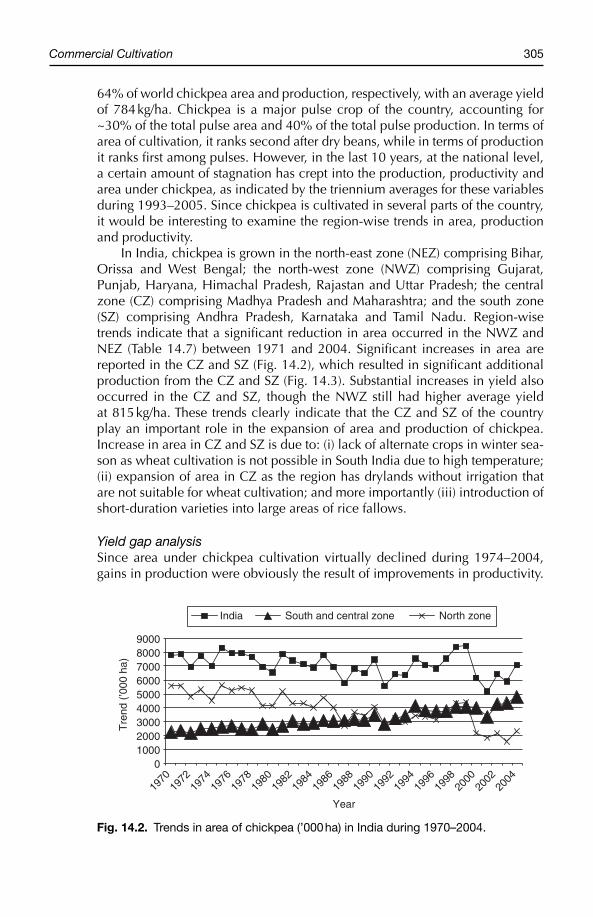
In India, chickpea is grown in the north-east zone (NEZ) comprising Bihar, Orissa and West Bengal; the north-west zone (NWZ) comprising Gujarat, Punjab, Haryana, Himachal Pradesh, Rajastan and Uttar Pradesh; the central zone (CZ) comprising Madhya Pradesh and Maharashtra; and the south zone (SZ) comprising Andhra Pradesh, Karnataka and Tamil Nadu. Region-wise trends indicate that a significant reduction in area occurred in the NWZ and NEZ (Table 14.7) between 1971 and 2004. Significant increases in area are reported in the CZ and SZ (Fig. 14.2), which resulted in significant additional production from the CZ and SZ (Fig. 14.3). Substantial increases in yield also occurred in the CZ and SZ, though the NWZ still had higher average yield at 815 kg/ha. These trends clearly indicate that the CZ and SZ of the country play an important role in the expansion of area and production of chickpea. Increase in area in CZ and SZ is due to: (i) lack of alternate crops in winter sea-son as wheat cultivation is not possible in South India due to high temperature; (ii) expansion of area in CZ as the region has drylands without irrigation that are not suitable for wheat cultivation; and more importantly (iii) introduction of short-duration varieties into large areas of rice fallows.
Yield gap analysisSince area under chickpea cultivation virtually declined during 1974–2004, gains in production were obviously the result of improvements in productivity.
0100020003000400050006000700080009000
1970
1972
1974
1976
1978
1980
1982
1984
1986
1988
1990
1992
1994
1996
1998
2000
2002
2004
Year
Tre
nd (
’000
ha)
India South and central zone North zone
Fig. 14.2. Trends in area of chickpea (’000 ha) in India during 1970–2004.

306 A.A. Reddy et al.
0
1000
2000
3000
4000
5000
6000
7000
8000
1970
1972
1974
1976
1978
1980
1982
1984
1986
1988
1990
1992
1994
1996
1998
2000
2002
2004
Year
Pro
duct
ion
(’000
t)
India South and central zone North zone
Fig. 14.3. Trends in production of chickpea (’000 t) in India during 1970–2004.
Table 14.7. Chickpea production trends during 1971–2004. (From IIPR, 2006.)
Item Year/change NEZ NWZ CZ SZ India
Area (’000 ha) 1971–1974 383 4678 2137 226 7420 2001–2004 314 1818 3236 786 6158 Percentage change −18 −61 51 248 −17Yield (kg/ha) 1971–1974 570 663 467 421 598 2001–2004 749 815 702 773 782 Percentage change 31 23 50 84 31Production (’000 t) 1971–1974 223 2883 1234 83 4433 2001–2004 243 1460 2531 596 4838 Production percentage 9 −49 105 614 9 change
NEZ: north-east zone (Bihar, Orissa and West Bengal); NWZ: north-west zone (Gujarat, Punjab, Haryana, Himachal Pradesh, Rajastan and Uttar Pradesh); CZ: central zone (Madhya Pradesh and Maharashtra); SZ: south zone (Andhra Pradesh, Karnataka and Tamil Nadu).
At the national level, a 31% increase in yield was observed in 2004 over 1974 (Table 14.7). However, intrazonal increases in yield varied over the period. Mean yields of All India Coordinated Trials (research station) indicate that the CZ reported highest potential yield (2070 kg/ha) for desi type, while the NWZ reported the highest potential yield (1462 kg/ha) for kabuli type (Table 14.8). Yield gap analysis (YGA) shows that significant yield differences exist between desi and kabuli cultivars on research stations. These differences range from 330 kg/ha in the NEZ to 783 kg/ha in the CZ. Yield gap I, which is the gap between research station and on-farm trial yields, is highest in the SZ (30%) for desi variety and lowest (17%) in the NWZ. Yield gap II, which is the gap between on-farm trials and zonal average yields, is very large in all zones, ranging from 64% in the NEZ to 148% in the CZ. Wider yield gap II is an indication that

Commercial Cultivation 307
there is a large gap between on-farm demonstration yield and zonal average yield, which can be bridged by wider adoption of technology by farmers. The existing technology has the potential of doubling production at national level without increasing area under chickpea if farmers adopt recommended pack-age of practices.
India: micro-level evidencesField surveys were conducted during 2002–2005 in Hamirpur and Fatehpur districts of Uttar Pradesh to examine the economics of chickpea cultivation at farm level. The survey covered a total of 120 farmers including 60 adopters who participated in on-farm trials of technology developed at the Indian Institute of Pulses Research, Kanpur, India, and 60 who were non-adopters of the tech-nologies developed. Average area under chickpea of sample farmers was only 0.4 ha accounting for ~40% of area under cultivation in winter season.
Cost structureThe cost structure of chickpea production of sample farmers (pooled) is pre-sented in Table 14.9 for 2004. The total cost is $289/ha, which is relatively lower than many developed and even developing countries. Variable costs contribute to ~68% of the total costs. Most of the operations are performed manually, except land preparation. Seed rate is 60 kg/ha, which is lower than recommended rate of 70–80 kg/ha. Low seed rate is the main cause for low plant population, which ultimately determines yield. Fertilizer is either applied in suboptimal doses or not applied at all. Generally, farmers do not spray any insecticides and fungicides, but under severe attack of pod borer, farmers apply suboptimal doses of pesticides. Many farmers practise manual weeding. Most of the operations are carried out by family labour with the help of neighbouring farmers on exchange basis. Only harvesting and threshing is done on contract basis, with payment in kind (1:11 of the harvested grain has to be given for harvesting and threshing). A few farmers provide only a life-saving irrigation at flowering or pod-formation stage. Most of the farmers use their own seeds or procure them from neighbouring farmers. There is little availability of certified seeds at private seed shops or government seed agencies. The average yield
Table 14.8. Zone-wise yield gaps in chickpea production in India during 2000–2005. (From Annual Report of All India Coordinated Research Projects [AICRP] on chickpea, 2005.)
Yield (kg/ha)
Research Research Difference station station desi and On-farm Zonal Yield gap Yield gapZone – desi – kabuli kabuli trial average I (%) II (%)
NEZ 1491.2 1161.6 329.6 1230.0 749.0 21.2 64.2NWZ 1825.6 1461.8 363.8 1558.0 815.0 17.2 91.2CZ 2069.6 1286.2 783.4 1745.0 702.0 18.6 148.6SZ 1676.8 1316.8 360.0 1290.0 773.0 30.0 66.9

308 A.A. Reddy et al.
obtained in the study area is 938 kg/ha. At a selling price of $0.4/kg, the gross revenue is about $386/ha and net profit over total cost is $96/ha.
Yield gap analysis of sample farmersOn-farm demonstrations are mainly conducted on improved cultural practices, integrated nutrient management (INM), integrated pest management (IPM) and difference in variety. It is recommended to use INM (9 Kg N/ha +23 Kg P2O5/ha+10 Kg S/ha + Rhizobium culture) and IPM (seed treatment with Trichoderma + Vitavax + spray of NPV 250 l/ha and one spray of Endosulphan 0.07%), as well as one life-saving irrigation at flowering or pod-formation stage. On-farm trials were conducted on more than 200 farmers’ fields. The detailed methodology for decomposition of yield gap II has been given in the Appendix. The average yield realized in on-farm trials is 1510 kg/ha, while in farmers’ fields it is 938 kg/ha. The yield gap between on-farm and local yield is ~61%, with 29% being attributable to the differences in cultural practices (Table 14.10).
Economics of chickpea cultivationOn the input side, the use of improved seeds accounted for a substantial 12.5% difference in yields. Examination on costs and returns from chickpea for adopters
Table 14.9. Cost of cultivation of chickpea per hectare on farmers’ fi elds in 2004. (From fi eld survey.)
Item Physical $/unit Total $
Land preparation (tractor hours) 7.7 4.89 39. 11 (13.5)Seed (kg) 59.8 0.56 33. 33 (11.5)Sowing labour (man days) 7.5 1.11 8. 89 (3.1)Weeding/uprooting (man days) 24 1.11 26. 67 (9.2)Insecticide (l) 0.5 6.22 16. 89 (5.8)Irrigation (hours) 9.8 1.56 15. 56 (5.4)Fertilizer (kg) 20.5 0.22 4. 44 (1.5)Harvesting (man days) 19.7 – 22. 22 (7.7)Threshing (man days) 16 – 19. 11 (6.6)Interest on variable cost – – 11. 17 (3.9)Total variable cost (A) – – 197. 39 (68.1)Rental value of land – – 81. 46 (28.1)Depreciation on implements – – 5. 64 (1.9)Interest on fi xed capital – – 5. 22 (1.8)Total fi xed cost (B) – – 92. 32 (31.9)Total cost (A + B) – – 289. 71 (100)Grain yield (kg/ha) 938 0.4 375Value of by-product – – 11. 1Gross return (Rs/ha) – – 386. 1Net profi t (Rs/ha) – – 96. 3Benefi t/cost ratio – – 1. 33Total man days 70 – –
Figures within parentheses in the last column indicate percentage of total cost.

Commercial Cultivation 309
and non-adopters of certified seeds indicated that for adopters average yield is 1270 kg/ha (Table 14.11), while for non-adopters, it was ~920 kg/ha. The aver-age cost per hectare in the case of adopters was estimated at $304/ha, which is higher than that of non-adopters at $281/ha. However, net profit is also higher in the case of adopters ($204/ha) than that of non-adopters ($87/ha). There is no significant difference between farm sizes with respect to profits, but cost per hectare is high for large farm category. These results indicate that net profit can increase by more than 130% with the adoption of improved certified seeds.
Profitability of chickpea compared with other competing cropsWheat, barley, lentils and mustard are the competing crops of chickpea in India. Even though kabuli chickpea yield is 20% less than that of desi chickpea (Table 14.12), the market price for kabuli type is attractive ($0.78/kg). The highest net profit per hectare was estimated for kabuli chickpea followed by wheat and barley. The benefit/cost ratio was also highest for kabuli chickpea at 1.56, fol-lowed by barley and lentils. Profitability of desi chickpea was low in compari-son with wheat and barley on account of low yields. Chickpea yield is about one-third of wheat and barley. Even though the price received for desi chickpea
Table 14.10. Sources of yield gap in chickpea. (From fi eld survey.)
Source of difference Yield gap (%)
Total difference in output 60.8(yield gap II)
Sources contributing to yield gapDifferences in cultural practices 28.6Input use gap Labour 5.7 Seed 12.5 Nutrients 3.7 Pesticides 1.2 Irrigation 9.1All inputs combined 32.2
Table 14.11. Economics of chickpea cultivation of adopters and non-adopters of quality seed. (From fi eld survey.)
Adopters Non-adopters
Gross Gross Cost Yield revenue Profi t Cost Yield revenue Profi tFarm size ($/ha) (kg/ha) ($/ha) ($/ha) ($/ha) (kg/ha) ($/ha) ($/ha)
Small 316 1300 520 204 282 950 380 98Medium 296 1290 516 220 274 845 338 64Large 308 1200 480 172 300 940 376 76All groups 304 1270 508 204 281 920 368 87

310 A.A. Reddy et al.
is more than twice that of wheat and barley, it is not sufficient to compensate for low yields. As a result, chickpea is substituted by wheat wherever irrigation facilities are available, and by barley in some unirrigated tracts. These figures indicate that there is good scope for expansion of area under kabuli chickpea in India, provided adequate quality seed is available.
Profitability of rice–chickpea systemWith the data of the field survey, it was also estimated that replacement of wheat with kabuli chickpea in the rice–wheat system of North India can gener-ate additional net returns of 83% (Table 14.13) for the producers, mainly on account of lower production costs per hectare, besides reducing water and fertilizer requirement by ~35% and 40%, respectively. Replacing wheat by desi chickpea also significantly reduced water and fertilizer requirement and cost per hectare, but resulted in lower net returns.
Import–export scenario of IndiaAlthough India is the world’s largest producer of chickpea, it also imports chick-pea to meet domestic requirements. Iran, Turkey and Mexico are the major sources of kabuli chickpea, while Canada, Australia and Myanmar are the main sources of desi chickpea (Price et al., 2003). Approximately 40% of the total chickpea imports to India are of the kabuli type. Mexican kabuli chickpea
Table 14.12. Relative profi tability of chickpea and competing crops in India. (From fi eld survey.)
Chickpea Chickpea Item Wheat (desi) (kabuli) Barley Lentil Mustard
Gross return ($/ha) 490 385 585 352 318 326Variable cost ($/ha) 342 289 375 238 254 253Net profi t over variable
cost ($/ha) 148 96 210 114 64 73Benefi t/cost ratio ($/ha) 1.43 1.33 1.56 1.48 1.25 1.29Yield/ha 2724 938 750 2705 816 814Price ($/kg) 0.18 0.41 0.78 0.13 0.39 0.40
Table 14.13. Rice–wheat vs rice–chickpea cropping system in Uttar Pradesh, India. (From fi eld survey.)
Gross Grain Water Plant revenue Cost production (number of nutrients Net returnSystem ($/ha) ($/ha) (kg/ha) irrigations) (kg/ha) ($/ha)
1. Rice–wheat 1020 703.2 5400 8 250 316.82. Rice–chickpea (desi) 956 647.8 3740 5 140 308.23. Rice–chickpea (kabuli) 1251 670.8 3500 5 150 580.2Gain: 2 over 1 (%) −6.3 −7.9 −30.7 −35 −44 −2.7Gain: 3 over 1 (%) 22.6 −4.6 −35.2 −35 −40 83.1
Paddy yield = 2700 kg/ha, price = $0.20/kg; wheat yield = 2700 kg/ha, price = $0.18/kg; chickpea (desi) yield = 1040 kg/ha, price = $0.4/kg; chickpea (kabuli) yield = 800 kg/ha, price = $0.89/kg.

Commercial Cultivation 311
is of the extra-large type and commands a premium of more than 50% over Turkish chickpea (Table 14.14). Canadian, Australian and Myanmar varieties are cheaper. Importers prefer Myanmar chickpea compared with Canadian and Australian chickpea due to similarities in taste and cooking quality to locally produced chickpea, as well as lower transport and other logistics costs, as Myanmar is closer to India. However, in case of supply shortages during off-season, imports are also made from Australia and Canada.
India also exports chickpea dhal mostly to the USA, UK, Kuwait, UAE and other countries where Indians reside (Table 14.14). These exports fetch a pre-mium in these countries, as they cater to the demand of ethnic Indians.
Turkey
Turkey is a net food-exporting country. Annual production of chickpea in Turkey is 600,000 t, of which 23% is exported mainly to Europe, Arab markets and India. As it is one of the three crops promoted by the country for limiting fallow lands, chickpea has received considerable attention and large additional areas have come under its cultivation during the 1980s and 1990s. However, due to reduced attention by government and competition from other export-ing countries, area under chickpea has reduced significantly in recent years. Production has declined by ~20% from 755,000 to 603,000 t during the last 10 years mainly due to reduction in area by ~18% and in yield by ~3%. Mean yield during 2000–2005 was 935 kg/ha.
Per capita consumption of chickpea in Turkey is high at 6.65 kg/year (FAO-STAT database, 2006). Domestic preference is for kabuli chickpea, which is used in a number of ways in Turkish kitchens in items such as chickpea bread, main dishes, humus and pastry as well as for garnishing meat and rice plates (Acikgoz, 1990). It is also consumed as a snack in various forms including the sweetened ones. However, domestic demand is not sufficient to boost produc-tion, as the population is small. The only way to do this is by increasing exports. Mostly medium-sized kabuli chickpea (8–9 mm) is produced in Turkey. There
Table 14.14. Indian imports of chickpea and exports of dhal in 2001/02. (From Government of India, 2005.)
Imports (chickpea) Exports (dhal)
Country Quantity (t) Unit value ($/kg) Country Quantity (t) Unit value ($/kg)
Canada 103,617 0.32 USA 1,189 0.56Iran 70,305 0.38 UK 596 0.59Australia 75,736 0.34 Malaysia 371 0.61Myanmar 33,112 0.34 Kuwait 381 0.57Turkey 20,258 0.41 UAE 364 0.54Mexico 9,061 0.62 Sri Lanka 463 0.42Others 55,097 0.33 Others 908 0.59Total 367,186 0.35 Total 4,276 0.57
312 A.A. Reddy et al.
is a need for increasing yield to make chickpea price competitive in the inter-national market.
The annual variability in national production of chickpea (coefficient of variation = 10.75%), though slightly higher than average variability in world production during the last decade, is still lower than the variability seen in many of the other important producing countries. Similarly, the variability in productivity is also relatively low compared with other producers. This is indic-ative of higher stability in chickpea production in Turkey. When compared to production, exports are highly unstable with a coefficient of variation >40% during 1995–2004. Due to unstable export demand, limited domestic demand and recent withdrawal of government support system, chickpea acreage has declined with areas shifting to wheat, for which domestic as well as interna-tional demands are more stable.
The main yield-limiting factors for chickpea are the lack of the registered varieties for different ecological regions and the cultivars resistant to diseases, especially ascochyta blight. Most of the chickpea-growing regions are prone to ascochyta blight. Although large-scale region-wise yield losses are not fre-quent, localized epidemics occur quite often (Ismail, 2003). In order to avoid the damage from blight disease, growers prefer late spring sowing, which some-times lasts until the second fortnight of May. Late sowing causes yield decreases due to shorter vegetative growth. Although there are some recommendations for controlling the disease such as fungicidal seed dressing, foliar applications and some cultural practices, these are not generally practised by farmers due to high cost and labour shortage. A 20% reduction in yield due to blight will reduce yield from 935 to 748 kg/ ha, leading to losses amounting to $130/ha at a market price of $0.7/kg. Therefore, development of blight- resistant varieties is very important for stable returns to farmers. Another cause of concern is tough competition in exports of kabuli chickpea from Mexico, Iran, Canada and the USA. This increasing competition poses the biggest risk for future expansion of area under chickpea. Small farm size, low level of mechanization and inad-equate market infrastructure, low domestic demand, frequent attack of asco-chyta blight and unavailability of improved varieties for different agroecological zones are some of the limiting factors to increase area and enhance production of chickpea in this country. Another important factor is that the Turkish chick-pea exports are positioned as high-end quality products, but postharvest pro-cesses are not comparable with those in competing exporting countries like the USA, Canada and Australia, thus leading to a slackening of demand in recent years. Further, the significant yield gap between wheat and chickpea in Turkey, with average yield of 2258 kg/ha for wheat and 968 kg/ha for chickpea, makes wheat much more profitable in domestic markets even though chickpea price is more than twice that of wheat.
With the dismantling of the agricultural incentive system in Turkey recently, fertilizer and pesticide subsidies have been curtailed and remaining price sup-ports have been gradually converted to floor prices. In order to make kabuli chickpea of Turkey competitive in international markets, the country needs to strengthen agricultural extension and research services. It has to develop trained manpower to advice on chickpea cultivation and a system to provide

Commercial Cultivation 313
market information, besides developing efficient transportation and posthar-vest processes, as Turkey kabuli chickpea is mostly imported by developed countries or targeted to high-end consumers in developing countries. Recent government initiatives to promote private seed sector, organic production, mar-ket-oriented and integrated research activities as well as improved technol-ogy transfer systems can enhance chickpea competitiveness (Ismail, 2003). The Exporters Union of Turkey established an Exporters Union Seed and Research Company called Industrial Technology Advisors (ITAs) in 1998 to improve the production and quality of food legumes. ITAs has launched an innovative and integrated technology transfer project, which has resulted in increase in area and production in a very short period of time (Ismail, 2003).
Algeria
Algeria is one of the largest countries in Africa, but only 3.5% of its total area is used for agricultural production. Cereals are the predominant crops grown by Algerian farmers, covering ~40% of total agricultural land. Scarcity of under-ground water resources, low and erratic rainfall, drought recurrence, high tem-peratures and salinity are the key constraints to agricultural production.
In Algeria, production of chickpea declined from 20,000 to 15,000 t in the last decade. During the same period, yield increased from 457 to 735 kg/ha, but area decreased from 45,000 to 21,000 ha despite a remunerative price ($0.7/kg in 2004). The main reason for decrease in area under chickpea is that it has to compete with wheat, whose yield of 3714 kg/ha is about five times that of chickpea (750 kg/ha). Fodder crops, which are very remunerative because of high prices of meat, also impart strong competition to chickpea. As a result, Algeria imports ~273% of its domestic production annually, mostly consisting kabuli chickpea (FAOSTAT database, 2006).
Production cost of chickpeaProduction costs are derived from published secondary sources. Direct pro-duction costs of the crop during the early 1990s were estimated at $333/ha with mechanical harvesting and at $416/ha with manual harvesting (Pluvinage, 1990; ICARDA, 2003). The loss of seed with mechanical harvesting was ~100 kg/ha, which makes the two methods equivalent in terms of costs, since the selling price of kabuli chickpea was $0.7/kg. It is thus necessary to harvest at least 480 kg/ha (mechanical harvesting) or 590 kg/ha (manual harvesting) to cover the direct costs, without taking into account the general running costs. At the current average yield of 735 kg/ha, gross revenue is $514/ha with manual harvesting and $444/ha after adjusting for 100 kg loss with mechanized har-vesting. The profit over total cost is $98/ha (23%) and $111 (33%), respectively. Although profit is low when compared with Jordan and some developed coun-tries like the USA and Australia, it is in line with profit realized in India.
The major cause of low profitability and reduction in area under chickpea is that the adoption of modern high-yielding varieties is <50% for chickpea in both Asia and Africa and most of the developing countries, but adoption rate is

314 A.A. Reddy et al.
~90% for wheat. Susceptibility of high-yielding varieties to various biotic and abiotic stresses further restricts the area expansion approach. As a result, Asia and Africa remain chickpea-deficient continents (ICARDA, 2003).
Jordan
Jordan, though a developing country, depends mostly on oil exports, with agriculture contributing merely 3% to the gross domestic product (GDP). Contribution of agriculture is low on account of limited cultivable land. Jordan is the net importer of food, including its staple wheat. Jordan imports more than ten times its domestic production of chickpea. Chickpea rotates with cereals, mostly wheat, in rainfed areas where annual rainfall is usually 300–400 mm. It has also diverted a major chunk of land for cultivation of wheat, barley and fruit crops for export purpose. As a result, the average area under chickpea reduced from 3000 ha during 1987–1995 to 1000 ha during 2000–2005. Production of chickpea was stagnant at ~2000 t/year during 1987–2005 (FAOSTAT database, 2006). In the same period, chickpea yield increased significantly from 860 to 1627 kg/ha. Even though chickpea yields are competitive in comparison with wheat average yields of 1358 kg/ha, wheat and other crops have replaced chick-pea in recent years. In the case of wheat and barley, most of the operations are mechanized with low cost, while most of the operations of chickpea cultiva-tion are done manually, as small acreage and short plant type of chickpea do not permit mechanization. Farmers are also shifting to remunerative fruit crops like almonds, grapes and apricots for export market and some are cultivating vegetables like tomato and cucumber to increase profits per unit area.
Problems in adoption of improved technologyTo ensure good reserves of soil moisture control weeds, and to avoid the occa-sional incidence of ascochyta blight disease, farmers usually delay chickpea sowing to spring, usually until March. However, spring sowing of chickpea leads to reduction in yields due to short growing season and terminal drought. Farmers still use the traditional cultural practices for different reasons, mainly due to lack of capital, even though they are relatively aware of its usefulness. Most of the time they spend money on seed and fertilizer only. Weak agricul-tural extension network further limits efficient transfer of technology.
Until now, research does not offer optimum means of mechanical har-vest, especially for small farms. The average size of the agricultural holding is ~3.9 ha; the acreage under chickpea is still less, which does not permit mecha-nized production and concerned long-term research efforts. Furthermore, the cost resulting from production inputs such as drilling and levelling, weed and pest control and fertilization is relatively high and farmers are not willing to spend money for a risky crop like chickpea. Jordan is a Mediterranean country characterized by highly variable and irregular rainfall, which increases crop and economic loss. In the past, the government was backing the prices in favour of the farmers by offering them a buying price for their produce higher than that of the market. The recent liberalization policies resulted in the withdrawal of

Commercial Cultivation 315
government support, which increased cost of production and domestic prices, and ultimately increased imports.
Cost factorsThe FAO data indicate that the national average yield over the recent period was 1627 kg/ha. Most of the farmers use recommended seed rate and fertilizer doses, but only suboptimal doses of herbicides and pesticides. Mostly all oper-ations except threshing are performed by manual labour. Chickpea cultivation is done with relatively high input conditions to maximize returns. Table 14.15
Table 14.15. Cost of cultivation and returns of chickpea per hectare in Jordan. (From Nidal and Nanish, 2002.)
Recommended Farmers’ practice practice
Item Unit Quantity Value ($) Quantity Value ($)
Seed (kg) 120 88.9 120 88.9Fertilizer (kg) 100 28.2 100 28.2Herbicide (l) – – 1 35.3Pesticide (l) – – 1 28.2Bags (No.) 10 9.9 10 9.9Total – – 127.0 – 190.5
Machine labourLand preparation including
harrowing to cover the seeds (h) 0.3 3.5 1.7 26.7Seed drilling and fertilization (h) – – 0.6 14.2Spraying (herbicide and pesticide) (h) – – 0.8 4.5Threshing (h) 4 45.1 4 45.1Sieving (t) 1600 7.8 2100 10.6Transport (t) 1600 4.7 2100 4.7Total – – 61.1 – 105.8
Labour workHand sowing (spreading) (h) 17 12.0 – –Fertilizer spreading (h) 17 12.0 – –Weeding (h) 100 105.8 – –Hand-harvest (h) 120 108.7 120 108.7Straw racking, packing, loading
and unloading, others (h) 14 10.6 14 10.6Total – – 249.1 – 119.3Interest (6.0%) – – 25.5 – 25.0Land rent – – 282.1 – 282.1Grand total – – 744.8 – 722.7Average seed yield (kg/ha) – 1600 – 2100 –Average straw yield (kg/ha) – 2500 – 3409 –Total income ($/ha) – – 1222 – 1617Net return ($/ha) – – 477.2(64) – 895 (123)
Figures within parentheses in the last row indicate percentage of total cost.

316 A.A. Reddy et al.
presents farmers’ practice of cultivation of chickpea along with recommended practice. The cost of production under farmers’ practice is ~$745/ha (Nidal and Nanish, 2002). Cost of production is high compared with other developing countries due to high input cost.
Although chickpea productivity and profitability is high, area under chick-pea declined mainly due to the withdrawal of government support, scarcity of land and high level of import dependence. While cultivation of crops like chickpea faces many risks from increased imports at lower prices, decline in domestic prices and production loss due to disease outbreak and drought and demand uncertainty, the competing wheat crop has a triple advantage in a small country like Jordan because of its stable domestic demand, relatively higher insulation from international price fluctuations through government support and its use as a staple food. As a result, farmers go for wheat cultivation even though chickpea is comparatively more profitable. Farmers are also shift-ing to the cultivation of fruits and vegetable crops due to high and stable export prices and rising export and domestic demand. Since scope for expanding area under chickpea is limited in Jordan, the alternative for increased production is the adoption of improved varieties and other practices to increase yield.
Conclusions
Among developed countries, cost of production is high in France and the USA and low in Australia. The USA produces mostly large, high-quality kabuli type of chickpea that fetches higher prices in the international market. In all these developed countries, farm size is large, which facilitates mechanization of all farm operations. Most of the farmers use fungicides, fertilizers and pesticides in optimal doses as advised by extension specialists. However, cultivation of chickpea does not get adequate support from government as in the case of wheat. All these countries produce chickpea mostly for export purposes. The USA and, to some extent, Canada specialize in producing and exporting kabuli types, while Australia produces and exports both desi and kabuli types. The competitive advantage for developed countries comes from large-scale produc-tion, processing and marketing. In European countries, the production base is very limited except in Spain. In Europe, demand for human consumption is limited and most of the demand is met through imports of extra-large kabuli chickpea from Mexico, Canada and the USA. However, there is large scope for expansion of area under chickpea for use as animal feed, if yields can be improved to match those of dry peas and soybean meals by breeding high-yielding varieties and developing appropriate management practices.
Among the developing countries considered, only Turkey is a frequent and large exporter of chickpea. While Jordan imports about ten times its domestic production, Algeria imports more than 200%. India imports ~5% of domes-tic production. Turkey is facing competition from other exporters like Canada, Mexico, the USA, Australia and Iran to share the same pie. As Turkey’s exports are positioned as high-quality supplies, quality produce from the USA, Canada and Mexico, with superior postharvest infrastructure, gets preference over

Commercial Cultivation 317
Turkish chickpea. In this scenario, Turkey has to increase its productivity as well as postharvest processing efficiency to increase or stabilize market share. Jordan is a food-deficient country and imports about ten times its domestic production of chickpea. In spite of high chickpea yields, Jordan faces problems in production due to land limitation and competition for the existing land from competing crops on account of high export potential of horticultural commodi-ties and price support for wheat, and has to import to meet domestic consump-tion requirements. In the case of Algeria, chickpea yield levels are too low to compete for area with alternate crops like wheat, and its domestic chickpea production is not able to compete with imported chickpea. Chickpea also com-petes with fodder crops as demand for fodder has increased in recent years due to increased demand for meat, thus making fodder crops more remunerative. There is a need in Algeria to at least double chickpea yields through concerted research and extension efforts. There is also a possibility of cultivating chick-pea as fodder crop if yield can be increased to the level of dry peas in view of increasing demand for fodder.
Being the largest producer and consumer of chickpea, India occupies spe-cial status in world chickpea markets. In recent years, large tracts of rice fallows are replaced by rice–chickpea cropping system in both Central and South India due to introduction of short-duration varieties. There is considerable scope for expansion of area under chickpea by replacing wheat with chickpea in water-deficient and resource-poor regions. This will help to reduce imports of chick-pea and may even reverse India’s current position of a net importer. Scope exists for increasing area under kabuli chickpea production, as there is a ready domestic and international market for it. There should be greater emphasis on development of improved seeds that give higher and stable yields, as farmers are willing to pay a premium price for better seeds.
The imbalance in technology adoption in developed and developing coun-tries needs to be addressed to bridge the gap in productivity. There is a need to increase seed replacement rate in most of the developing countries. With the increase in labour cost, there is an urgent need for mechanization of peak season operations like harvesting and threshing in developing countries, which will increase scope of area expansion and also reduce cost of production.
References
Acikgoz, N. (1990) Chickpea production in Turkey. In: Options Méditerranéennes.CIHEAM, Paris, pp. 167–170.
Agriculture and Agri-Food Canada (2004) Chickpea situation and outlook. Market Analysis Division (bi-weekly bulletin) 17(15), 14 September.
Agriculture and Agri-Food Canada (2005) Euro-pean Union: pulse crops situation and out-look. Market Analysis Division (bi-weekly bulletin) 18(12), 17 June. Available at:
http://www.agr.gc.ca/maddam/e/bulletine/v18e/v18n12_e.htm
Annual Report (2005) All India Coordinated Research Project on Chickpea. Indian Institute of Pulses Research, Kanpur, India.
Brester, G.W., Buschena, D. and Gray, K. (2003) Economic issues related to chick-pea production in the northern plains. Agricultural Marketing Policy Center Linfield Hall, Montana State University Bozeman, Briefing No. 33.
318 A.A. Reddy et al.
FAOSTAT Database (2006) Food and Agriculture Organization, Rome. Available at: www.fao.org
Government of India (2005) Ministry of Com-merce, DGCI&S.
Gubero, J.I., Moreno, M.T. and Gil, T. J. (1990) Chickpea breeding in Spain. In: OptionsMéditerranéennes. CIHEAM, Paris, pp. 157–161.
ICARDA (2003) Algeria and ICARDA, Twenty-five years of collaboration in scien-tific agricultural research between the Democratic and Popular Algerian Republic (DPAR) and the International Center for Agricultural Research in the Dry Areas (ICARDA): Ties that Bind. No. 20. Institut Technique des Grandes Cultures (ITGC), Algérie. Available at: http://www.icarda.org/Publications/Donors/Algeria/Algeria.pdf
IIPR (2006) Data Base on Production of Pulse Crops. Indian Institute of Pulses Research, Kanpur, India.
Ismail, K. (2003) Participatory transfer of inte-grated technology: a promising approach to increase food legume production in Turkey. Seed Info No. 23, ICARDA, Aleppo, Syria, July 2003. Available at: http://www.icarda.org/News/Seed%20Info/SeedInfo_25/Research.htm
Nidal, M.A. and Nanish, H. (2002) Lentil and chickpea production in Jordan Food Legume Improvement Project at National Center for Agricultural Research and Technology Transfer (NCARTT), Jordan.
Available at: http://www.solutions-site.org/artman/publish/article_8.shtml
Pluvinage, J. (1990) Chickpea in Mediterranean production systems: two contrasting exam-ples of possible developments in Algeria and France. In: Options Méditerranéennes.CIHEAM, Paris, pp. 133–136.
Price, G.K. (2002) Will the Farm Act get pulses racing? Agricultural Outlook AGO-296November, 18–21.
Price, G.K., Landes, R. and Govindan, A. (2003) India’s Pulse Sector Results from the Field Research. Electronic Outlook Report from the Economic Research Service. United State Department of Agriculture, WRS-03-01. Available at: www.ers.usda.gov
Saskatchewan Pulse Growers (2005) Overview of Chickpea Markets. Available at: http:// www.saskpulse.com/media/pdfs/market-overview-chickpea.pdf
Siddique, K.H.M., Regan, K.L. and Baker, M.J. (2004) New ascochyta blight resistant, high quality kabuli chickpea varieties for Australia. In: Proceedings of the 4th International Crop Science Congress. Brisbane, Australia. Available at: http://www.cropscience.org.au/ icsc2004/symposia/6/1/467_siddique.htm
South Dakota State University Extension (2005) Chickpea Production in the High Plains,Fact Sheet No. 922.
Wayne, H., John, H. and Heinjus, D. (2003) Growing Chickpeas. Primary Industries and Resources of South Australia, Fact Sheet No. 20/99. Available at: www.pir.sa.gov.au/factsheets

Commercial Cultivation 319
Appendix 1 Comparative cost and benefi t of chickpea in different
countries.
Yield Gross return Cost Net return Net return over (kg/ha) ($/ha) ($/ha) ($/ha) cost (%)
Turkey 935 – – – –Jordan 1600 1222 745 477 64.0Algeria 735 514 333 181 54.4Canada 1509 – – – –USA 1475 723 462 261 56.5Australia 969 450 296 154 52.0Spain 620 – – – –France 2000 1140 782 358 45.8India 938 386 289 97 33.6
Appendix 2 Comparative yields of wheat and chickpea
(kg/ha). (From FAOSTAT database, 2006.)
Wheat Chickpea Ratio
Algeria 3714 750 5.0Australia 2119 969 2.2Canada 2599 1509 1.7India 2738 833 3.3Jordan 1358 1454 0.9Mexico 5000 1600 3.1Spain 1689 281 6.0France 6982 – –Turkey 2258 968 2.3Syria 2452 663 3.7UAE 3429 – –USA 2823 – –Iran 2339 411 5.7Ethiopia 1375 794 1.7Italy 3539 1179 3.0

320 A.A. Reddy et al.
Appendix 3World imports and exports (000 tonnes) of chickpea (2002–2004).
(From FAOSTAT database, 2006.)
Imports 2002–2004 Exports 2002–2004
CV 1995– CV 1995–Country Mean Share 2004 (%) Country Mean Share 2004 (%)
India 203.1 25.1 89.6 Turkey 142.4 19.3 40.2Pakistan 124.9 15.4 75.9 Australia 129.2 17.5 55.2Bangladesh 81.8 10.1 79.2 Mexico 122.4 16.6 28.8Spain 56.7 7.0 16.7 Iran 104 14.1 74.8Algeria 44.6 5.5 32.3 Canada 89.5 12.1 100.4UAE 28.2 3.5 68.3 Tanzania 24.4 3.3 117.9Italy 23.8 2.9 18 Ethiopia 17.1 2.3 295.3Jordan 22.7 2.8 33.3 USA 16.8 2.3 54Saudi Arabia 21.3 2.6 21.4 Syria 12.7 1.7 102.6Sri Lanka 19.9 2.5 39.7 UAE 12.4 1.7 69.5Others 208.3 22.6 11.6 Others 70.0 9 42.2World 835.3 100 35.9 World 740.8 100 28.3
Copyright © 2022 FDOKUMEN