Credit Risk management and Profitability of Selected Commercial Banks in Zimbabwe (2009-2014)
Upload
khangminh22Category
view
3download
0
| Volume: 4 | Issue: 12 | December| 2019 Journal DOI: https://doi.org/10.36713/epra2016 | www.eprajournals.com |74 |
CREDIT RISK AND BANK PROFITABILITY OF COMMERCIAL BANKS IN GHANA
1Cheng Li Mei
1School of Finance and Economics, Jiangsu University, 301 Xuefu Road, Zhenjiang, Jiangsu, P.R China
Takyi Kwabena Nsiah2
2School of Finance and Economics, Jiangsu University, 301 Xuefu Road, Zhenjiang, Jiangsu, P.R China
Richard Barfi3
3School of Management, Jiangsu University, 301 Xuefu Road, Zhenjiang, Jiangsu, P.R China
Mandella Osei-Assembly Bonsu4
4School of Finance and Economics, Jiangsu University, 301 Xuefu Road, Zhenjiang, Jiangsu, P.R China
DOI: https://doi.org/10.36713/epra3836
Funding: This study was supported by National Social Science Fund Project” The breakthrough path of homing migrant workers' double survival dilemma in the view of rural entrepreneurship” (18BRK003)
ABSTRACT This study attempted to explore the connection between credit risk management and the profitability of the Ghana
Stock Exchange (GSE) listed commercial banks. The study specifically sought to examine the relationship between
credit risk and the profitability of the firms as measured by ROA. The study adopted these variables to measure credit
risk (non-performing loan ratio, cost per loan asset, capital reserved 0.1ratio and asset growth ratio) and return on
asset (ROA) as a profitability estimator. Following some diagnostic and specification studies to address the
fundamental assumptions of the Classical Linear Regression Model (CLRM). The study uncovered that NPLR had
a significantly negative effect on the firms’ profitability as measured by ROA [β=-0.1671, (p=0.1360)>0.05]. Also,
the cost per loan asset (CPLA) had a positive influence on the firms’ profitability as measured by ROA [β= 0.0249,
(p=0.8252)>0.05]. For the other variables of credit risk measurements, capital reserved ratio, and assets growth
ratio. The capital reserve ratio had a significant positive association with ROA [β=0.2867, (p=0.0095) <0.05.
Similarly, asset growth ratio had a statistically significant negative connection with firm’s profitability measured by
ROA [β=-0.3835, (p=0.0004) <0.05. Based on the results, the study suggested that since credit risk had a negative
association with the firm’s profitability, the companies should adopt efficient credit risk management methods to assist
guide their profitability. This point is raised because, as demonstrated by the results of the study, an increase in credit
risk led to a decrease in the profitability of the companies.
KEYWORDS: Credit risk, Commercial banks, Loans, Profitability, Ghana Stock Exchange.
SJIF Impact Factor: 6.260| ISI I.F.Value:1.241 Volume: 4 | Issue: 12 | December | 2019 ISSN: 2455-7838(Online)
EPRA International Journal of Research and Development (IJRD)
Peer Reviewed Journal

______|EPRA International Journal of Research and Development (IJRD) |ISSN:2455-7838 (Online) | SJIF Impact Factor: 6.260| ISI I.F.Value:1.241|_________
| Volume: 4 | Issue: 12 | December| 2019 Journal DOI: https://doi.org/10.36713/epra2016 | www.eprajournals.com |75 |
1.0 INTRODUCTION Can you think of an economy without a banking system in place? Without banks, there will be no credit to firms or the establishment of new firms. Banks do not only provide credit but also keep the deposit of customers. The banking business of Ghana has become very competitive with many foreign banks coming into the country year after year. The bank of Ghana is the central bank of Ghana with other banks such as commercial banks, Rural banks, Deposit mobilization banks, Savings and loans banks, Microfinance and Microcredit banks. However, there are other non-financial institutions that together form the financial system of Ghana. Banks provide a country with great service to its products and services. The role and products offered will depend on the business of banking it belongs to Commercial banks, for instance, collect the deposit and in so doing grant credit (loans) out of the deposits (Altman et al., 2002 and Howells and Bain, 2008). Commercial banks in the process of granting loans are faced with different types of risk. These risks significantly affect the profitability of the banks and even leads to the closed down of many banking institutions in Ghana. These risks include credit risk, operational risk, liquidity risk, market risk, interest rate risk, foreign risk and many more. According to Magnifique (2011), the supremacy of financial institutions particularly commercial banks in money creation is of great importance in business operations. Commercial banks are the major financial intermediaries in any economy and they are the major providers of credits to the individuals and firms. Credit can be defined as granting or offering advances under specific repayment contracts by a bank to its customers under the belief that the loans shall be repaid as agreed. Risk is uncertainty concern the outcome of a loss (Rejda 2008). In this case, uncertainties associated with the profitability of the banks. The management of this risk is of great importance to credit managers. Hull (2007) describes that one of the fundamental structures of each organization, most importantly a bank, is to comprehend the risk portfolio that it faces now and the risk that it intends to bring in the future, the risk that all financial institutions face can be divided into three distinct kinds from a leadership view. These are the risk that easy company procedures can eliminate or avoid, the risk that can be transferred to other parties, and the risk that must be actively managed at the company level. Credit risk management is one of the most important aspects of financial institutions. Management is to balance the difference between the assets structure and capital structure of the firm. Financing a firm with more debt than equity is very risky and the same as keeping more current assets like cash in the firm. According to Waweru and Kalami
(2009), the business of commercial banks let them be exposed to greater credit risk. This is because commercial banks have the highest number of deposits as compare to other financial institutions. Non-performing loans as a result of commercial banks’ lending is a problem for managers because about 85% of the commercial bank's income comes from lending to individuals and corporations. The Basel Committee on Banking Supervision (2016) clarified relevant credit risk problems as the likelihood of losing an outsourcing loan as a consequence of default. The traditional role of commercial banks in granting credit to gain interest in such lending (Carey, 2002, Saunders and Cornett, 2005, Louzis et al. 2011). Garr (2013) stated that financial institutions find it difficult and complex to manage credit risk since the credit risk of financial institutions is hard to predict because of individual bank macro and microeconomics factors. The stability of an economy is the basis for sound macroeconomic policy development by managers. As microeconomics policies of an economy so firms also change. Factors that affect a firm’s profitability are many and as such credit risk management should be the middle point to control all these risks in the organization. Those there are other factors that reduce profitability. For years now academia and researchers have been researching the effects of credit risk on the bank's performance. The problems of bank credit risk are found in both big and small firms (Richard et al., 2008). The unfortunate performance of some commercial banks has resulted in the closure and merger of some by the BOG as of August 2018. The Bank of Ghana in its report identified the cause of failed commercial banks as management incompetence , fraud, misappropriation, negligence or ineffective board of directors, improper accounting records, non-compliance with regulations in granting insider credit, persistent operational losses, poor loan recovering and corruption, poor deposit mobilization, non-submission of prudential returns, unearning assets and non- performing credit portfolios. There are various factors that affect the performance of the bank in any economy. Credit risk management should be at the center of bank operations in order to maintain financial sustainability and reaching more clients. Regardless of the numerous studies and their varied findings on the connection between the credit risk and profitability of companies, few studies have been carried out in particular to investigate the link between the credit risk and the firm profitability of Ghana Stock Exchange (GSE) non-financial companies. Also, few of the research control for cost per loan asset in the context of developing countries but this study control for cost per loan assets.

______|EPRA International Journal of Research and Development (IJRD) |ISSN:2455-7838 (Online) | SJIF Impact Factor: 6.260| ISI I.F.Value:1.241|_________
| Volume: 4 | Issue: 12 | December| 2019 Journal DOI: https://doi.org/10.36713/epra2016 | www.eprajournals.com |76 |
1.2 1.1 OBJECTIVE OF THE STUDY As a result of the recent financial crises that have resulted in the bank of Ghana closing many banks and merging others due to the poor credit risk management in the bank institutions in Ghana. The objective of this research is to find out the association that exit between bank credit risk management and profitability and also add to the body of knowledge in credit Rik management in the financial institution sector. This research will also help potential investors and other stakeholders in making a decision regarding investment.
1.3 HYPOTHESIS OF THE STUDY There were two hypotheses develop for the purpose of this research. The two hypotheses are based on the connection the independent variable has no dependent variable. Kithinji (2010) showed that there is an indirect affiliation between non-performing loans and profitability. The first research hypothesis will consider the relationship between credit risk and return on assets of all the commercial banks consider for the study. The second hypothesis will consider the association between credit risk and return on asset. Studies by Li and Zou (2014) and Alshatti (2015) show that non-performing loans as a measure of credit risk have a positive relationship with total assets as a measure of firm performance. Similar studies by Gizaw et al. (2015) found that capital adequacy ratio has a significant positive effect on ROA. H1: There is a statistically significant relationship between credit risk and ROA. H2: There is a statistically significant no relationship between credit risk and ROA.
2.0 REVIEW OF RELATED LITERATURE Rejda 2008, defines credit as a liability resulting from the granting of advances. Credit risk according to them is the uncertainties resulting from a counterparty to fail to pay the loan granted to them when the time is due for payment. Commercial banks in Ghana are faced with numerous risks ranging from interest rate risk, operational risk, market risk, inflation risk, and liquidity risk. Greuning and Bratanovic (2009), define credit risk as to the chance that a debtor or issuer of a financial instrument an individual, a corporation, or a country will not repay principal and investment-related cash flow according to the terms specified in a credit agreement. In the banking sector, credit risk means that payments may be delayed or not made at all , which can cause cash flows problems and affect a bank’s risk-adjusted rate of return by maintaining credit risk exposure within acceptable limits may be delayed or not made at all, which can cause cash flow problems and affect a bank’s liquidity and profitability. The goal of credit risk management is to maximize a bank’s
risk-adjusted rate of return by maintaining credit risk exposure within acceptable parameters. The Basel Committee on Banking Supervision (2016) explained credit risk as to the possibility of losing an outstanding loan partly or totally, as a result of the default. A credit risk officer needs quality information and risk management strategies to avoid merger or acquisition. The management of credit risk has become an area of focus recently for many researchers due to the dynamic changes in the economy of countries. The management of credit and profitability of firms have been studied by many academia but still the issues of credit risk in firms exit. According to Dhakal (2015) in their study found a negative and significant relationship between capital adequacy ratio and transfer for loan loss. Tan and Flors (2012) use both a one-stage difference estimator and a one-stage system estimator to investigate the impact of stock market volatility on Chinese bank performance over the period 2003-2009. Four performance indicators were used, equity returns (ROE), excess equity returns (EROE), net interest margin (NIM) and economic value added (EVA). The study findings indicated that state-owned and higher-taxed joint-stock business banks have reduced ROE and EROE, while higher-capitalized joint-stock business banks have reduced ROE and EROE. Moreover, they report greater EVA and NIM for state-owned and joint-stock business banks with reduced overhead costs and greater employee productivity. They also realize that state-owned commercial banks with a greater diverse company rate have reduced EVA and NIM levels. Heffernan and Fu (2010) to evaluate the efficiency determinants of public, joint-stock, city and rural business banks over the period 1999-2006 using the two-step GMM estimator and the fixed effect estimator. Their findings show that the performance of banks with greater efficiency is better and the listing of banks contributes to improved performance. They also find that the profitability of Chinese banks is affected by real GDP growth and unemployment, while the impact of bank size and off-balance-sheet activities on bank profitability is statistically insignificant. Finally, they concluded that state-owned, joint-stock, city and rural banks in China have a better performance. Shrestha (2014) study of the relationship between credit risk and bank profitability of commercial banks. The study finding shows that returns on asset, returns on equity, net interest margins, and capital adequacy ratios have a statistically significant positive relationship with non-performing loans. However, the proportion of total loans to total deposit and total asset logarithm has a negative association with non-performing lending. Bhattarai (2014) disclosed that the non-performing credit ratio has a significant negative impact on bank performance, while the cost per loan asset has a positive impact on bank performance. The
______|EPRA International Journal of Research and Development (IJRD) |ISSN:2455-7838 (Online) | SJIF Impact Factor: 6.260| ISI I.F.Value:1.241|_________
| Volume: 4 | Issue: 12 | December| 2019 Journal DOI: https://doi.org/10.36713/epra2016 | www.eprajournals.com |77 |
outcome also suggested that indices of credit risk and the development proportion of investments had a positive impact on bank performance. Capital adequacy ratio and cash reserve are not regarded to influence bank efficiency factors. This research found that a positive association exists between variables of bank performance and credit risk. Serhat (2018) conducted a study on 13 post-soviet countries, using a panel regression and GMM. The study finding suggested that loan amounts, non-interest income, and economic growth are significant indicators of profitability. Also, Liu and Wilson (2010) study the association between credit risk and profitability of commercial banks in Japan for the period 2000-2007. The assessment of the research was performed by using both the two-step GMM estimator and the estimator of the fixed effect. Their research finding indicates that well-capitalized and effective banks with reduced loan risk tend to have greater profitability than less-capitalized and less-efficient banks with greater credit risk, while the concentration of sector, development of stock markets, and growth of GDP significantly affect the profitability of banks. Noman et al. (2015) study the effects of credit risk on the profitability of banks in Bangladesh. The researcher adopted the GMM estimator to measure the effects of credit risk on the bank's profitability. The study finding concluded that capital adequacy, inflation rates, and size for the banks have a positive association with profitability but the real interest rate negatively affects profitability. Also, Gyamerah and Amoah (2015) conducted similar research in Ghana. Their result after data regression analysis shows that credit risk variables have a significant effect on the profitability of banks. They concluded, therefore, that; risk management
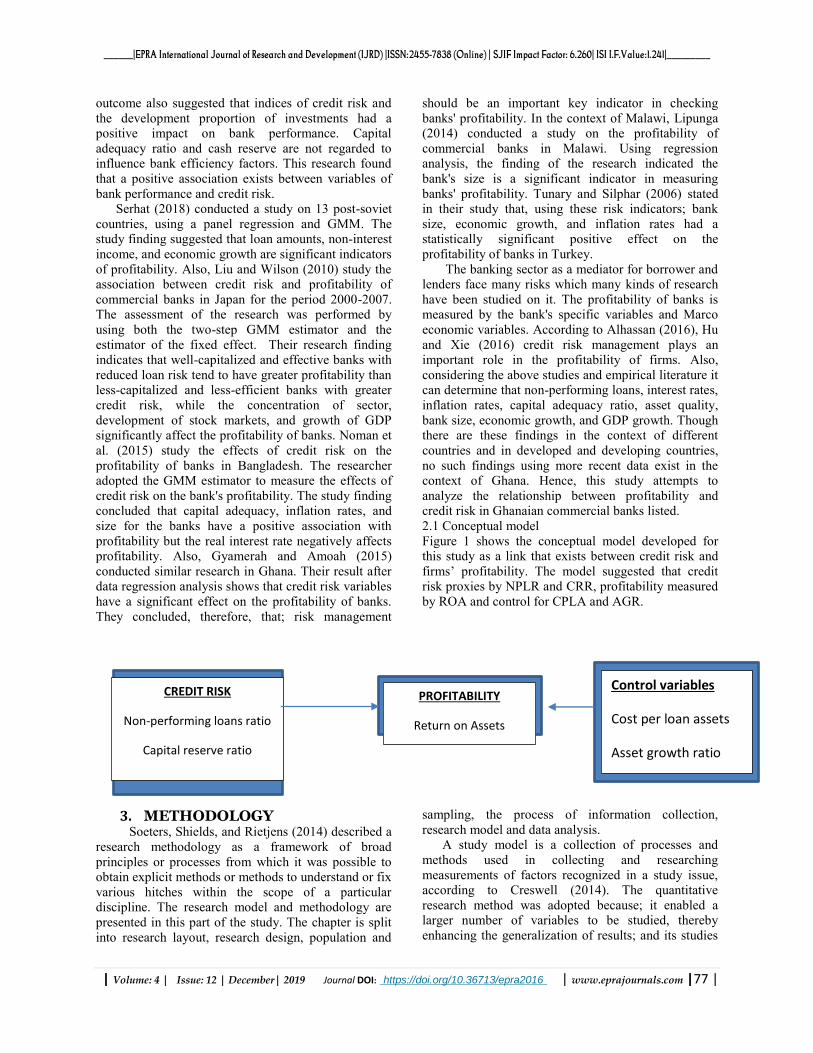
should be an important key indicator in checking banks' profitability. In the context of Malawi, Lipunga (2014) conducted a study on the profitability of commercial banks in Malawi. Using regression analysis, the finding of the research indicated the bank's size is a significant indicator in measuring banks' profitability. Tunary and Silphar (2006) stated in their study that, using these risk indicators; bank size, economic growth, and inflation rates had a statistically significant positive effect on the profitability of banks in Turkey. The banking sector as a mediator for borrower and lenders face many risks which many kinds of research have been studied on it. The profitability of banks is measured by the bank's specific variables and Marco economic variables. According to Alhassan (2016), Hu and Xie (2016) credit risk management plays an important role in the profitability of firms. Also, considering the above studies and empirical literature it can determine that non-performing loans, interest rates, inflation rates, capital adequacy ratio, asset quality, bank size, economic growth, and GDP growth. Though there are these findings in the context of different countries and in developed and developing countries, no such findings using more recent data exist in the context of Ghana. Hence, this study attempts to analyze the relationship between profitability and credit risk in Ghanaian commercial banks listed. 2.1 Conceptual model Figure 1 shows the conceptual model developed for this study as a link that exists between credit risk and firms’ profitability. The model suggested that credit risk proxies by NPLR and CRR, profitability measured by ROA and control for CPLA and AGR.
3. METHODOLOGY Soeters, Shields, and Rietjens (2014) described a research methodology as a framework of broad principles or processes from which it was possible to obtain explicit methods or methods to understand or fix various hitches within the scope of a particular discipline. The research model and methodology are presented in this part of the study. The chapter is split into research layout, research design, population and
sampling, the process of information collection, research model and data analysis. A study model is a collection of processes and methods used in collecting and researching measurements of factors recognized in a study issue, according to Creswell (2014). The quantitative research method was adopted because; it enabled a larger number of variables to be studied, thereby enhancing the generalization of results; and its studies
CREDIT RISK
Non-performing loans ratio
Capital reserve ratio
PROFITABILITY
Return on Assets
Control variables
Cost per loan assets
Asset growth ratio

______|EPRA International Journal of Research and Development (IJRD) |ISSN:2455-7838 (Online) | SJIF Impact Factor: 6.260| ISI I.F.Value:1.241|_________
| Volume: 4 | Issue: 12 | December| 2019 Journal DOI: https://doi.org/10.36713/epra2016 | www.eprajournals.com |78 |
could be replicated or repeated because of their high reliability (Babbie, 2010). Also, in nature, the study was panel or longitudinal because it followed the sample over time and made repeated observations (Teotonio, 2012). The study was finally conclusive in nature because it was conducted to test the formulated hypothesis; it provided a reliable or representative picture of the population by applying a valid research tool, and its findings were considered as significant as they could have theoretical or applied implications. The target population of the study was created by all commercial banks listed on the Ghana Stock Exchange. The total number of companies listed on the Ghanaian stock market currently is thirty-eight (38). Of this figure, twenty-eight (28) non-financial companies represent 68.29% of the total figure of listed companies and the remaining 31.71% for financial firms. Since the study wanted to use balanced data, the selective method of sampling was used to make a sample from the total population. Companies with incomplete financial statements were rejected, companies with other currency other than the Ghanaian currency also dropped and unaudited financial statements. Finally, the sample totaled nine (9) representing 82.14 % of the target population or 28.59% of the total number of listed firms. The nine (9) selected commercial banks were; Access bank, Ecobank Ghana Ltd, Bank of Africa Ghana Ltd, Cal bank Ltd, GCB bank Ltd, Republic bank Ltd, Société General Ghana Ltd, Standard bank Ltd and Trust bank of Gambia The research accepted secondary data obtained from the chosen banks audited and released annual accounts for the period 2010 to 2018. The annual reports included the Comprehensive Statement of income, Financial Statement, Statement of Cash Flows, Statement of Equity Changes and Notes to accounts. Ratios related to the credit risk and profitability of the firms were then calculated using different measurements or formulas outlined for the study from the annual reports. Gathering data from the right source (i.e. the Ghana Stock Exchange) to ensure validity in this study. For the research, descriptive and inferential data analysis methods were used. The mean, standard deviation, variance, minimum and maximum values, range, skewness, and kurtosis of the variables were analyzed in the descriptive analysis. While the data analysis technique of the Pearson Product-Moment Correlation Coefficient was adopted to examine the relationship between credit risk and the financial profitability of the firms. All the analysis was carried out through the software package of STATA version 14.
Model Specification Profitability = f (NPLR, CRR, CPLS, AGR)
ROAit = Dependent variables ROA- Return on the asset: This is a dependent variable and it measures how the firms are able to use its available assets to generate revenue. It is an indicator of profitability. Independent variables Non-performing loan ratio
A non-performing loan is a measure of credit risk management. It is a measure of the total, and advance by the total assets of the bank. Its effect is statistically negative measured by return on assets. However, other studies by researches have provided different results. According to Li and Zou (2014) and Alshatti (2015) found the positive effect of non-performing/ gross loans ratio on the financial performance of banks. Cash Reserve Ratio (CRR)
This is the minimum amount required by the central bank, that commercial banks as a fraction of the total deposits of customers, which commercial banks hold as reserves either in cash or as deposits. CRR is set according to the guidelines of the central bank of a country. The amount specified as the CRR is held in cash and cash equivalents are stored in bank vaults or parked with the Reserve Bank of Ghana. Cost per loan assets
Cost per loan assets is the average cost per loan advanced to a customer in monetary term. Cost per loan assets is calculated dividing total operating costs by the total amount of loans. The function of this is to point out efficiency in distributing loans to customers. Therefore, the relationship between the two should be negative. However, a study in Nigeria by Kurawa and Garba (2014) have found a significant positive association between cost per loan assets ratio and banks’ profitability (ROA). Assets growth ratio
Asset quality ratios determine the quality of loans of a financial institution. If the ratio is high the more at risk the loans are. The lower the ratio, the less likely the loan would be at risk. Assets growth ratio is generally used to capture potential economies or diseconomies of scale in the banking sector. It is used it assess the performance of the bank and as such should have a positive relationship with profitability.
We expected the independent variable to have the following relationship after the study.

______|EPRA International Journal of Research and Development (IJRD) |ISSN:2455-7838 (Online) | SJIF Impact Factor: 6.260| ISI I.F.Value:1.241|_________
| Volume: 4 | Issue: 12 | December| 2019 Journal DOI: https://doi.org/10.36713/epra2016 | www.eprajournals.com |79 |
Tables 1: study variables Variables Definition Measurement Proxy Expected sign
ROA Return on assets Net income / total assets Profitability + NPLR Non-performing
loan ratio Non-performing loans/Total
Loans and Advances Credit risk -
CRR Capital reserve ratio
Reserves / total deposits Credit risk -
CPLA Cost per loan asset Total operating cost / total amount of loans
Control variable -
AGR Asset growth ratio Natural log of total assets Control variable +
4. DATA ANALYSIS AND DISCUSSION
This section of the research first introduces some diagnostic tests on the Classical Linear Regression Model (CLRM) assumptions. These tests include the data normality test, multicollinearity, heteroscedasticity, and serial or autocorrelation tests. Second, descriptive assessment is provided on both dependent and independent variables. Third, correlation assessment is provided on the intensity and direction of the degree of connection that occurred between credit risk and profitability of the companies, while the chapter is concluded by the multivariate
regression analysis that took into account the impact of credit risk on the profitability of the study’s companies.
4.1 TEST FOR MULTICOLLINEARITY Multicollinearity is seen as a critical problem
because its existence could render it less accurate to assess the effect of one variable on the reaction variable while waiting for the other than if the predictors were uncorrelated. Multi-collinearity could, therefore, render it tedious to evaluate the comparative significance of the independent variables in describing differences in the reaction variable (Gujarati & Porter, 2009).
Table 2: VIF and Tolerance Test Variable VIF 1/VIF
NPLR 1.31 0.761378 CRR 1.30 0.770901 AGR 1.09 0.917781 CPLA 1.08 0.921859
Mean VIF 1.20 Note: VIF is the variance inflation factor.
After running the Ordinary Least Squares (OLS) regression with ROA as the response variable and NPLR, CRR, AGR, and CPLA as the explanatory variables, multicollinearity was not detected via the Variance Inflation Factor (VIF) or the degree of tolerance (1/VIF). The rule of thumb was that a VIF variable is higher than 5 (VIF>5) or a tolerance level less than 0.2 (1/VIF < 0.2) was deemed extremely collinear with other explanatory variables. From Table 3, the NPLR, CRR, AGR and CPLA VIFs with their corresponding degrees of tolerance (1/VIF) indicates that the factors [ VIF < 5; 1/VIF > 0.2] were not extremely associated. This means that in the operating model, NPLR, CRR, AGR, and CPLA were right to be used together.
4.2 TEST FOR DATA NORMALITY To check the normality of the information, the
Shapiro-Wilk (1965) test was introduced. It is a normality test with the null hypothesis in frequentist statistics that a sample X1..... Xn originated from a usually distributed population (Shapiro & Wilk, 1965). Thus, the Shapiro Wilk test's null hypothesis is that usually the population is spread (Razali & Wah, 2011). In other words, if the p-value is lower than the alpha level selected, then the null hypothesis is dismissed and there is proof that the information being analyzed does not come from a normally distributed population. On the other side, if the p-value is higher than the alpha level selected, then it is not possible to reject the null hypothesis that the information collected originated from a normally distributed population (Razali & Wah, 2011).

______|EPRA International Journal of Research and Development (IJRD) |ISSN:2455-7838 (Online) | SJIF Impact Factor: 6.260| ISI I.F.Value:1.241|_________
| Volume: 4 | Issue: 12 | December| 2019 Journal DOI: https://doi.org/10.36713/epra2016 | www.eprajournals.com |80 |
Table 3: Shapiro-Wilk test for Data Normality Variable OBS W V Z Prob>Z
ROA 81 0.94130 4.071 3.078 0.00104 NPLR 81 0.59740 27.918 7.300 0.00000 CPLA 81 0.94553 3.777 2.914 0.00179 CRR 81 0.95524 3.104 2.484 0.00650 AGR 81 0.84753 10.573 5.171 0.00000
The alpha concentration selected for this research
was 5% (α=0.05). Thus, the Shapiro-Wilk test checked the null hypothesis that all ROA, NPLR, CPLA, CRR and AGR data values were not normally distributed at the 5 percent significance level. As shown in the table, ROA had a W-test of 0.94130, a V-value of 4.071, a Z-value of 3.078, and a p-value of 0.00104. At a significant level of 5% (p<0.05), the study was statistically significant. The study, therefore, rejected the null theory that all ROA data values were usually distributed and adopted the alternative theory that not all ROA data values were usually distributed at a significant level of 5%. Also, NPLR had a W-test of 0.59740, a V-value of 27.918, a Z-value of 7.300, and a p-value of 0.0000. At the significant confidence interval at 95% (p<0.05), the test was statistically significant. The study, therefore, dismissed the null theory that all NPLR data values were usually distributed and adopted the alternative theory that not all NPLR data values were usually distributed at a significant level of 5%. This also applies to CPLA data values, which had a W-test coefficient of 0.94553, a V-value of 3.777, a Z-value of 2.914, and a p-value of 0.00261, which indicates that the test was significant at a confidence interval of 95 percent. The study, therefore, rejected the null hypothesis that all CPLA data values were normally distributed and accepted the alternative hypothesis that all CPLA data values were not normally distributed at a significant level of 5%.
Similarly, the W-test for CRR of 0.95524 with a V-value of 3.104, a Z-value of 2.484 and a p-value of 0.00650, indicates that the test was significant at
α=5%. The study, therefore, rejected the null hypothesis that all CRR data values were normally distributed and accepted the alternative hypothesis that, at the 95 percent confidence interval, all CRR data values were not normally distributed. Finally, at the 95 percent confidence interval, a z-value of 5.171 with a probability of 0.00000 for AGR indicated the significance of the variable. Therefore, the study did not accept the null hypothesis that AGR data values came from a normally distributed population and concluded that AGR data values were not normally distributed. All the ROA, NPLR, CPLA, CRR and
AGR data values were not normally distributed at α=5 percent (p<0.05) from the results of the study. Therefore, a more generalized estimator of regression was considered suitable to assist explain data abnormality issue.
4.3 TEST FOR HETEROSCEDASTICITY The existence of heteroscedasticity means to
Muhammad (2012), that the Ordinary Least Squares (OLS) estimators are no longer the Best Linear Unbiased Estimators (BLUE) because they become inefficient and lead to imprecise projections. Also, the results of the hypotheses (t-test, F-test) become void due to the inconsistency in the covariance matrix of the projected regression coefficients.
Table 4: Heteroscedasticity Test Results MODEL CHI2(1) Prob>Chi2
ROA 0.88 0.3478 The Bleusch-Pagan (1979) and Cook-
Weisberg's (1983) test for heteroscedasticity was adopted for this study. The study tested the null hypothesis that there was absence of heteroscedasticity among all the fitted values of the ROA working models at the 5% level of significance, as against the alternative hypothesis. From Table 5 the ROA working model's chi2 value of 0.88 was not statistically
significant at α=5 percent [ (p=0.3478)>0.05] the 5 percent significant level [ (p=0.0000) <0.05]. The study, therefore, failed to reject the null hypothesis of the absence of heteroscedasticity among the ROA working model's fitted values and concluded that there was no heteroscedasticity among the ROA working model's fitted values.
4.4 TEST FOR SERIAL CORRELATION OR AUTO SERIAL CORRELATION
Serial or autocorrelation is a mathematical depiction of the degree of resemblance across consecutive time periods between a specified time series and a lagged form of itself (Verbeek, 2012). Self-correlation is consequential because its presence may lead to false hypothesis findings or trials. For this research, the Durbin Watson Test, which studies the null hypothesis that, in a model, the errors or residuals are serially uncorrelated (Durbin & Watson, 1951; and Field, 2009).

______|EPRA International Journal of Research and Development (IJRD) |ISSN:2455-7838 (Online) | SJIF Impact Factor: 6.260| ISI I.F.Value:1.241|_________
| Volume: 4 | Issue: 12 | December| 2019 Journal DOI: https://doi.org/10.36713/epra2016 | www.eprajournals.com |81 |
Table 5: Serial correlation Test Results Model Durbin-Watson d-statistic ROA 0.7892321
The study indicated a d-statistic with a value from 0 to 4 where; 2 is no autocorrelation,0 to < 2 is positive autocorrelation, and > 2 to 4 is negative autocorrelation (Durbin & Watson). The Durbin-Watson d-statistical test result shows a value of 0.7892321 as indicated in table 6, Based on this test, the study did not accept the null hypothesis that the errors were serially uncorrelated and found that in the residuals of the ROA working model there was positive autocorrelation in the first step. Therefore, a more generalized and robust regression estimator was considered right for estimating the working model of the study.
4.5 DESCRIPTIVE STATISTICS This part provides a descriptive assessment of
the aspects of the study variables their means, standard deviations, variances, minimum and maximum values, ranges, skewness, and kurtosis. As indicated in the table, the mean value of the ROA was 0.0288081. The mean ROA figure of 0.0288081 implies that the companies produced a profit of 0.2.88081 pesewas on each cedi of investment between 2010 and 2018. The positive mean value for ROA is an indication that
executives used the company's resources or investments to produce earnings effectively. The maximum value of the ROA was 0.096098 and a minimum value of -0.0403572 leading to a range of 0.109967. The company ROA also had a standard deviation of 0.0191315 and 0.000366 variance. The figure-0.5915341 being the ROA skewness indicates that the ROA distribution was skewed or skewed to the left in a highly negative way. This is an indication that a greater portion of the ROA distribution fell on the right side. The kurtosis coefficient of 5.199147 [excess (K)=5.199147-3.0=2.199147] shows that the ROA distribution was slender in shape.
The companies’ NPLR had a mean figure of 0.4477442, a maximum figure of 2.220542, and a minimum figure of 0.0925431, which resulted in a range of 2.127999. The mean Non-performance loans ratio value of 0.4477442 shows that the companies were unable to collect 44.77% of the loans granted within the 2010 – 2018. The standard deviation and variance values were 0.5408708 and 0.0580188 respectively. For the skewness and kurtosis, the values result for NPLR was 4.886883 and 37.39809.
Table 6: Descriptive Statistics on Study Variables
Variables obs means standard
deviation
variance maximum minimum range skewness kurtosis
ROA 81 0.0288081 0.0191315 0 .000366 0.0696098 -
0.0403572 0.109967
-
0.5915341
5.199147
NPLR 81 0.4477442 0.2408708 0.0580188 2.220542 0.0925431 2.127999 4.886883 37.39809
CPLA 81 0.0699453 0 .0266288 0.0007091 0.1579687 0.0077583 0.15021 0 .7711608 4.707198
CRR 81 0.1087128 0.0684163 0.0046808 0.326503 0.0004301 0.326073 0.740658 3.526411
AGR 81 7.166121 1.141064 1.302026 9.445564 5.29399 4.151574 0.7860272 2.211797
The average value of the cost per loan asset
(CPLA) was 0.0699453. This means that, on average, a cedi cost on loan granted out of the total assets of the firms. Managements of the firms have to put proper measures to reduce the cost associated with the loans granted. CPLA had a maximum and a minimum value of 0.1579687 and 0.0077583, resulting in a range of 0.15021. similarly, the CRR means of the study indicates a value of 0.1087128. This implies that on average firms keep 10.87% of their capital as reserves with the bank of Ghana for the period 2010-2018. The companies also had 0.0684163 standard deviations and 0.0045808 variances for their CRR. This means that the average CRR was 0.0684163 dispersions, which is
an indication that, the data values of the capital reserves ratio have been normally distributed or deviated from the mean. Finally, table 6, shows a means value of 7.166121. with their maximum and minimum values as 9.445564 and 5.29399. leading to a range of 4.151574. The average value of AGR implies that the firm’s growth rate for the period 2010-2018 was 7.166121 (716.6121%). This could be as a result of the restructured capital in the year 2015-2017. The standard deviation and variance were 1.141064 and 1.302026.
4.6 CORRELATION ANALYSIS The Pearson Product-Moment Correlation data analysis coefficient was introduced to detect the connection

______|EPRA International Journal of Research and Development (IJRD) |ISSN:2455-7838 (Online) | SJIF Impact Factor: 6.260| ISI I.F.Value:1.241|_________
| Volume: 4 | Issue: 12 | December| 2019 Journal DOI: https://doi.org/10.36713/epra2016 | www.eprajournals.com |82 |
between credit risk and the firm’s profitability. The study result test shows that there was a significant negative association between ROA and NPLR. This implies that as NPLR increases the profitability of the study’s firms will decrease and vice versa. This connection is evidence since the commercial bank's greater returns are from loans granted to outside
borrowers. However, the test indicated an insignificant positive link between cost per loan asset and return of assets. This result indicates that a rise in cost per loan asset results in a rise in asset yield. This means that commercial banks in Ghana do proper loan screen to select the best candidates for loans.
Table 7: Test results of the correlation Matrix of Study Variables
Variables ROA NPLR CPLA CRR AGR
ROA 1.0000
NPLR -0.1671 (0.1360)
1.0000
CPLA 0.0249 (0.8252)
0.0064 (0.9547)
1.0000
CRR 0.2867* (0.0095)
-0.4398* (0.0000)
0.1824 (0.1032)
1.0000
AGR -0.3835* (0.0004)
0.2163 (0.0524)
-0.1825 (0.0524)
-0.0940 (0.4037)
1.0000
* Correlation is significant at the 0.05 level (2-tailed) Similarly, CRR shows a statistically positive relation with ROA. The result was also at a 5% significant level. This implies a high rise in CRR will lead to a high rise in ROA. Finally, the correlation test result revealed a negative association between asset growth and return on asset.
5.0 SUMMARY AND CONCLUSION This research aimed to investigate the link between credit risk management and the profitability of commercial banks in Ghana. Secondary panel data obtained from the audited and published annual reports of all the listed banks on the Ghana Stock Exchange for the period 2010-2018. In order to preserve economic sustainability and reach more customers, credit risk management should be at the core of bank activities. Nzuve (2016) indicated loan risk management models included a company's processes, processes, and controls to guarantee the effective collection of client payments and the risk of non-payment. In order to achieve the goal of maximizing the wealth of owners, banks should efficiently manage their assets, liabilities, and capital. In doing so, credit policy should set out the lending viewpoint of the bank as well as particular processes and ways to monitor lending activity. The study is based on 81 observations from 9 commercials in Ghana. In the case of descriptive statistics, some diagnostic studies for the linear model hypothesis of regression were provided for correlation assessment. The models of regression are estimated in Ghana commercial banks to evaluate the significance and importance of credit risk management on profitability. Pearson Product-Moment Correlation Coefficient output of the study indicates that there is a negative correlation between ROA and NPLR but insignificant at the 5% level. Also, CPLA shows a positive coefficient with ROA. It was statistically
insignificant at the level. However, CRR and AGR were all statistically significant at a 5% level. Based on the results, the research proposes that since credit risk had a negative association with bank profitability of the companies at the 5 percent significant level, the companies should adopt efficient credit risk management methods to assist guide their profitability.
REFERENCE 1. Alshatti, A. S. (2015). The effect of credit risk
management on the financial performance of the Jordanian commercial banks. Journal of Investment Management and Financial Innovations, 12 (1), 338-345.
2. Altman, E. I., S. T. Bharath & A. Saunders (2002). Credit ratings and the BIS capital adequacy reform agenda. Journal of banking and finance, 26(5), 909-921.
3. Aftab, Nadeem Samad, and Tehreem Husain (2015). Historical Analysis of Bank profitability Using Camel Parameters: Role of Ownership and Political Regimes in Pakistan. International Journal of Economics and Finance 7: 144-155 [CrossRef]
4. Ahmed, Rubi, Eric H. Y. Koh, and Shahrin Saaid Shaharuddin (2016). Determinates of banks profitability: A comparative study of East Asia and Latin America. International Journal of Banking, Accounting and Finance 7:34-51. [CrossRef].
5. Anarfo, S.A., Ampoteng, E., & Yin, L. (2015). The Impact of Capital Structure on Banks Listed on the Ghana Stock Exchange. Research Journal of Finance and Accounting, 6(16): 26-34.
6. Babbie, E. R. (2010). The practice of social research (12th ed). Belmont, CA: Wadsworth Cengage. pp. 436-440. ISBN 0-495-59841-0.
7. Bhattarai, Y. R. (2014). Effect of credit risk on the performance of Nepalese commercial banks. Journal of Management and Finance, 1(1), 41-64.
8. Carey, M. (2002). A guide to choosing absolute bank capital requirements. Journal of Banking and Finance, 26(1), 929–951.

______|EPRA International Journal of Research and Development (IJRD) |ISSN:2455-7838 (Online) | SJIF Impact Factor: 6.260| ISI I.F.Value:1.241|_________
| Volume: 4 | Issue: 12 | December| 2019 Journal DOI: https://doi.org/10.36713/epra2016 | www.eprajournals.com |83 |
9. Dawood, Usman. (2014). Factors impacting the profitability of commercial banks in Pakistan for the period of (2009-2012). International Journal of Scientific and Research Publication 4:1-7.
10. Deng, Angela (2016). Determinates and differences between domestic and foreign commercial banks Profitability. Master Thesis University of New Hampshire, Durham, Nh, USA.
11. Djalilov, Khurshid, and Jenifer Piesse (2016). Determinates of banks profitability in transition countries: What matters most? Research in International Business and Finance 38:69-82. [CrossRef]
12. Garr, D. K. (2013). Determinants of credit risk in the banking industry of Ghana. Journal of Finance, 3(11), 64-77.
13. Gizaw, M., M. Kebede & S. Selvaraj (2015). The impact of credit risk on the profitability performance of commercial banks in Ethiopia. African Journal of Business Management, 9(2), 59-66
14. Gyamerah, I. A., & Amoah, B. A. B. (2015). Determinants of Bank Profitability in Ghana. International Journal of Accounting and Financial Reporting, 5(1), Pages-173
15. Heffrnan, S., Fu, X., (2010). Determinants of financial performance in Chinese Banking. Appl. Finance. Econ. 20(20), 1585-1600.
16. Hi Ti, and Chi Xie (2016). Competition, Innovation, Risk-Taking, and profitability in Chinese banking Sector: An empirical analysis based on Structural Equation Modeling: Discrete dynamic in nature and society. [Crossref].
17. Hull, J. C. (2007), Risk Management and Financial Institutions, Pearson Prentice Hall, New Jersey, pp. 1-10. International Fund for Agricultural Development (2008), The Republic of Ghana Rural and Agricultural Finance Program, IFAD, RAFiP, Rome.
18. Howells, P. G. A. & K. Bain (2008). The economics of money, banking, and finance: a European. Journal of Banking and Finance, 35(2), 323-330.
19. Islam, Mr. Shahidul, and Shin-Michi Nishiyama (2016). The determinates of banks profitability: Dynamic Panel Evidence from South Asia countries. Journal of Applied Finance and Banking 6: 77-97
20. Kithinji, A. M. (2010). Credit risk management and profitability of commercial banks in Kenya. International Review of Financial Analysis, 11 (1), 229–248.31.
21. Kolap, Funso Tajudeen, Lawrence B. Ajayi, and Olufemi Adwali Aluko (2016). How is Size related to profitability? Post- Consolidation evidence from selected banks in Nigeria. International Journal of Finance and Banking Studies 5: 30-38.
22. Liu, H., Wilson, J.O.S. (2013). Competition and risk in Japan banking. European Journal of Finance 19 (1), 1-8.
23. Louzis, D. P., A. T. Vouldis & V. L. Metaxas (2011). Macroeconomic and bank-specific determinants of non-performing loans in Greece: A comparative study of mortgage, business, and consumer loan portfolios. Journal of Banking & Finance, 36(4), 1012-1027.
24. Lipunga, Andrews Munthopa (2014). Determinates of Profitability of Listed Commercial Banks in
developing countries: Evidence from Malawi. Research Journal on Finance and Accounting
25. Magnifique, U. J. (2011). The effect of credit risk management on the financial performance of commercial banks in Rwanda. Journal of Finance, 39(1), 575-592.
26. Muhammad, I. (2012). Introduction, reasons, and consequences of heteroscedasticity. Retrieved from http://itfeature.com/correlation-and-regression-analysis/introduction-reasonsand- consequences-of-heteroscedasticity.
27. Noman, A., Pervin, S., Chowdhury, M. (2015). The Effect of Credit Risk in Banking Profitability: A Case on Bangladesh, Global Journals Inc. (USA), vol. 15, no. 3
28. Petria, Nicolas, Bogdan Capraru, and Iulian Ihnatov (2015). Determines of banks’ profitability: evidence from EU 27 banking systems. Procedia Economics and Finance 20: 518-24.
29. Regehr, Kristen, and Rajdeep Sengupta (2016). Has the relationship between bank size and profitability changed? Economics Review – Federal Reserve Bank of Kansas City 101:49-72.
30. Rejda G., E (2008).’’ Principles of Risk Management and Insurance’’, Pearson International Publication, 10th Edition.
31. Richard, E., M. Chijoriga, E. Kaijage, C. Peterson & H. Bohman (2008). Credit risk management system of a commercial bank in Tanzania. International Journal of Emerging Markets 3(3), 323-332.
32. Saunders, S. & L. Cornett (2005). Financial institution management. Journal of Banking and Finance 34 (1), 399–408.
33. Serhart, Y., Shahariyar, M., Elvin, M., and Mustafa, O. (2018). Determinates of profitability in the banking sector: An analysis of post-Soviet countries. Economics (MDPI).
34. Shrestha, D. (2014). The relationship between risk and capital in commercial banks. Journal of Banking & Finance, 16(2), 439-457.
35. Soeters, J., Shields, P., & Rietjens, S. (2014). Handbook of research methods in military studies. New York: Routledge.
36. Tan. Y., Floros, C. (2012). Stock Market Volatility and bank performance in China. Stud. Econ. Finance 29(3) 221-228.
37. Teotonio, I. (2012). Landmark study on aging to follow 50,000 Canadians over the next two decades. Toronto Life. Toronto Star Newspapers Ltd.
38. Turnay, K. Bath, and A. Murat Silpar (2006). Determinates of banks profitability in Azerbaijan. Akademik Bakis Dergisi 54: 689-704.
39. Waweru, N. M & V. M. Kalani (2009). Commercial banking crises in Kenya: causes and remedies. African Journal of accounting, Economics, Finance and
Banking Research, 4 (4), 12-33
Copyright © 2022 FDOKUMEN