Profitability Performance of Supermarkets - Stockholm School ...
294
Profitability Performance of Supermarkets The effects of scale of operation, local market conditions, and conduct on the economic performance of supermarkets Mikael Hernant
-
Upload
khangminh22 -
Category
Documents
-
view
1 -
download
0
Transcript of Profitability Performance of Supermarkets - Stockholm School ...

Profitability Performance of Supermarkets
The effects of scale of operation, local market conditions, and conduct on the
economic performance of supermarkets
Mikael Hernant

Dissertation for the Degree of Doctor of Philosophy, Ph.D Stockholm School of Economics 2009.
© EFI and the author, 2009 ISBN 978-91-7258-778-6 Keywords: Retailing, Store performance, Profitability, Economies of scale, Competition Cover layout: Håkan Solberg, Media Production AB Author photo: Erik Doverholm, Ateljé Doverholm, Skövde Printed by: Elanders, Vällingby 2009 Distributed by: EFI, The Economic Research Institute Stockholm School of Economics Box 6501, SE-113 83 Stockholm, Sweden www.hhs.se/efi

Preface
This report is a result of a research project carried out at the Center for Consumer Marketing at the Economic Research Institute at the Stockholm School of Economics.
This volume is submitted as a doctor’s thesis at the Stockholm School of Economics. As usual at the Economic Research Institute, the author has been entirely free to conduct and present his research in his own ways as an expression of his own ideas.
The institute is grateful for the financial support which has made it possible to fulfill the project.
Stockholm January 19, 2009 Filip Wijkström Magnus Söderlund
Director of the Economic Research Institute at the Stockholm School of Economics
Director of the Center for Consumer Marketing at the Stockholm School of Economics

EFI Mission EFI, the Economic Research Institute at the Stockholm School of Economics, is a scientific institution that works independently of economic, political and sectional interests. It conducts theoretical and empirical research in the management and economic sciences, including selected related disciplines. The Institute encourages and assists in the publication and distribution of its research findings and is also involved in the doctoral education at the Stockholm School of Economics. At EFI, the researchers select their projects based on the need for theoretical or practical development of a research domain, on their methodological interests, and on the generality of a problem.
Research Organization The research activities at the Institute are organized into 20 Research Centres. Centre Directors are professors at the Stockholm School of Economics.
EFI Research Centre: Centre Director: Management and Organisation (A) Sven-Erik Sjöstrand Centre for Entrepreneurship and Business Creation (E) Carin Holmquist Public Management (F) Nils Brunsson Information Management (I) Mats Lundeberg
Centre for People and Organization (PMO) Andreas Werr Centre for Innovation and Operations Management (T) Pär Åhlström Centre for Media and Economic Psychology (P) Richard Wahlund Centre for Consumer Marketing (CCM) Magnus Söderlund Centre for Information and Communication Research (CIC) Per Andersson Marketing, Distribution and Industrial Dynamics (D) Björn Axelsson Centre for Strategy and Competitiveness (CSC) Örjan Sölvell Accounting and Managerial Finance (B) Johnny Lind Centre for Financial Analysis and Managerial Economics in Kenth Skogsvik Accounting (BFAC) Finance (FI) Clas Bergström Centre for Health Economics (CHE) Magnus
Johannesson International Economics and Geography (IEG) Mats Lundahl Economics (S) Paul Segerstrom Economic Statistics (ES) Anders Westlund
Centre for Business Law (RV) Johnny Herre Centre for Tax Law (SR) Bertil Wiman
Chair of the Board: Professor Carin Holmquist Director: Associate Professor Filip Wijkström
Address: EFI, Box 6501, SE-11383 Stockholm, Swden• Website: www.hhs.se/efi/
Telephone: +46(0)8-736 90 00 • Fax: +46(0)8-31 62 70 • E-mail [email protected]

To my wife and my children


Acknowledgements As I am now in the process of closing my investigation into the
antecedents of supermarket profitability performance, I am filled with gratitude to a number of people, without who I would never had come to this phase of the project.
First and foremost there is professor Claes-Robert Julander, who has been my main thesis supervisor. The support and advice I have received from Claes-Robert have been crucial for my finding the way through the project and for the overcoming of a seemingly endless flood of obstacles. His extraordinary knowledge and experience from his own research on retail issues, along with his ability to comment on details while maintaining focus on the overall picture as well as practical implications have been of vital importance for the completion of this thesis. Adding to this the great pleasure associated with meeting with him – I always have fun when he is around – along with his patience (thanks for not giving up on me, Claes-Robert…), I am forever grateful for having had him as my main supervisor.
Micael Dahlén and Magnus Söderlund have been members of the thesis committee. To both I owe a lot for their valuable support in various stages of the project. Special thanks to Micael, who became involved at a late stage, for his multiple provision of revitalizing comments in a phase where I had difficulties in “seeing the forest due to all the trees”.
In addition to my supervisors, professors Douglas J. Tigert at the Babson College, and Lawrence J. Ring at the College of William and Mary – both in the U.S. – provided important advice during the initial phases of the project.
I am grateful for all support I have received from the ICA Group, where I worked while taking PhD courses. Special thanks to my previous bosses at ICA – Jan-Ove Hallgren, Kjell Gunnarsson, Lasse Persson, and Peter Dettmann in chronological order – for their trust and for providing the prerequisites for my participation in the PhD program at the Stockholm School of Economics.
In the final phase of the project, Hakon Swenson Stiftelsen provided financial support, for which I express my gratitude. This support created highly favorable working conditions for the final phase of my work with this dissertation. Special thanks to Jens Nordfält for his support and processing of my application.

Thanks also to all former and present colleagues at the ICA Group, the Stockholm School of Economics, and the University of Skövde. At all instances during the years I have been working, I have been richly blessed with a large cadre of highly qualified co-workers, who have made the ordinary day fun and developing. Special thanks to Thomas Andersson, Margareta Boström, and Mikael Wickelgren for reading and commenting on the manuscript in the final round of the process, as well as providing other elements of support.
Finally, my warmest thanks goes to my wife, my children, my parents, and my brother, all who are a never failing support.
Mikael Hernant Skövde, January 2009

TABLE OF CONTENTS
1. INTRODUCTION 1.1 Why profitability of supermarkets? 11.2 The research problem 41.3 Purpose of the study 121.4 Delimitations and perspective 131.5 Theoretical underpinnings and research method 151.6 Outline of the thesis 15
2. THEORY 2.1 Outline of the chapter 172.2 Theoretical underpinnings 172.3 Store performance 292.4 Scale of operation and Economies of scale 36 2.4.1 Scale of operation on the retail store level 36
2.4.2 Economies of scale on the retail store level 39
2.4.3 To what extent does the scale of operation of supermarkets make a difference for their performance?
41
2.5 Store conduct 47 2.5.1 The role of retail store attributes in a performance
context 47
2.5.2 The marketing mix on the retail store level 52
2.5.3 To what extent does the scale of operation of supermarkets make a difference for their conduct?
56
2.5.4 To what extent does the conduct of supermarkets make a difference for their performance?
59
2.6 Potential demand and –supply in the local market 75 2.6.1 Saturation of local markets 75
2.6.2 To what extent do potential demand and supply conditions of local markets make a difference for the performance of supermarkets?
77

2.7 Structure of local competition 79 2.7.1 The nature of competition in a retail context 79
2.7.2 “Imperfect competition” of local markets in a retail context
84
2.7.3 To what extent does the structure of local competition make a difference for the conduct and performance of supermarkets?
92
2.8 Structure of local demand 106 2.8.1 Structure of local demand in a retail context 106
2.8.2 To what extent does the structure of local demand make a difference for the conduct and performance of supermarkets?
107
3. METHOD 3.1 Outline of the chapter 1123.2 Design of the study 1123.3 The ICA Retail Corporation 1143.4 Designs of previous studies – An overview 1163.5 Delineation of local markets 1263.6 Data sources and data collection procedures 1283.7 Operationalization of variables 129 3.7.1 Store performance 129
3.7.2 Scale of operation 137
3.7.3 Store conduct 138
3.7.4 Potential of local demand and local supply 142
3.7.4 Structure of local competition 144
3.7.6 Structure of local demand 149
3.7.7 A note on the issue of defining local markets 151
3.8 Research instruments 1523.9 Evaluation of the research design 157
4. RESULTS 4.1 Outline of the chapter 162

4.2 Profitability of supermarkets and their overall performance 1624.3 Scale of operation, local market conditions, and supermarket
conduct 174
4.4 Scale of operation, local market conditions, and supermarket performance
178
4.4.1 Scale of operation, local market conditions, and market based performance
178
4.4.2 Scale of operation, local market conditions, and productivity performance
181
4.4.3 Scale of operation, local market conditions, and financial performance
184
4.5 Conduct and supermarket performance 190 4.5.1 Conduct and market based performance 190
4.5.2 Conduct and productivity performance 193
4.5.3 Conduct and financial performance 195
4.6 Profitability performance of supermarkets in a context of scale, market conditions, conduct, and various aspects of economic performance
202
4.6.1 Economic performance in a context of scale, market conditions, and conduct
202
4.6.2 Routes to high and low profitability, and their antecedents
209
5. A SUMMARY OF FINDINGS 5.1 To what extent does scale of operation of supermarkets
make a difference for their conductc and performance? 227
5.2 To what extent does the conduct of supermarkets make a difference for their performance?
231
5.3 To what extent do potential demand and supply in local markets make a difference for the performance of supermarkets?
237
5.4 To what extent does the structure of competition in local markets make a difference for the conduct and performance of supermarkets?
240
5.5 To what extent does the structure of demand in local markets make a difference for the conduct and performance of supermarkets?
244

6. CONCLUSIONS 6.1 Why do supermarkets achieve the profitability performance
that they do? 247
6.2 Discussion 255 6.2.1 Contributions to previous studies on economies of scale 256
6.2.2 Contributions to previous SCP studies
6.2.3 Contributions to previous studies of store location and store assessment.
257
6.2.4 Contributions to previus studies – A summary 258
6.3 Managerial implications 2596.4 Limitations of the study 2636.5 Suggestions for future research 264
REFERENCES 267

- 1 -
1. INTRODUCTION
1.1 Why profitability of supermarkets? As for any other business firm, the profitability of a grocery retail store
is a consequence of the interplay between environmental factors and internal factors. Retail managers are constantly faced with the challenge of making decisions and taking actions, in order to satisfy consumers’ needs and wants, and respond to the actions of competitors. Retail store management is, indeed, a life of highly complex operations, comprising tasks that are long-term as well as short-term by character. On the store level these tasks involve strategical (e.g. selecting location for a store), tactical (e.g. issues on price, merchandise and service attributes), as well as operational issues (e.g. scheduling staff members, organizing daily routines, monitoring and evaluating current performance).
Breheny (1988) portrays the span of issues faced by retailers in a framework of sequential steps, starting with the search for locations, followed by the considering of factors on a successively more detailed level, to issues referring to the evaluation and impact of the decisions made in each step:
SEARCH ISSUES
VIABILITY ISSUES
In-store factors
IMPACT ISSUES
EVALUATION ISSUES
Trade area factors
Micro-site factors
Fig. 1.1.1 A classification of the issues facing a retailer. (Breheny 1988).

- 2 -
In a world of an almost infinite number of environental and internal factors making a difference for store performance, there is a call for retail managers to understand both the relative importance of various factors, and the causal ordering by which they operate in a context of retail store performance. The better knowledge managers possess about the interplay between environmental and internal antecedents of various aspects of store performance, and about the interplay between these antecedents, the better and more efficient the collection and assessment of relevant information, and the more effective the transformation of it into more effective and efficient conduct, and by extension the better the performance.
The performance of grocery stores and their managers is further of general interest to society. As food is essential to life, issues relating to the conduct and performance of the grocery industry are – more or less – of everyone’s concern. Grocery retailing is, indeed, an important sector of the overall economy of western societies. Sweden is no exception: at present consumers spend about 17% of their overall consumption on groceries and everyday commodities (SCB 2006). The volume of the sector makes its performance vital for the performance of the economy as a whole. As the volume and performance of the sector is an aggregate of the functioning of stores in numerous local markets harboring different conditions of demand and supply, knowledge about the antecedents of performance differences on the store level are crucial for the understanding of the sector as a whole. The general interest of the sector is not seldom reflected by the media attention directed to the conduct and performance of grocery stores. From time to time, there is a (sometimes intense) public debate about supra-normal level of profits on the store level, and about deficiencies in competition in the Swedish grocery retail sector.
The large volume of the sector, with more than SEK 200 billions of sales on the store level (ICA Nyheter 2009), indeed justifies research aiming at refining the knowledge concerning the antecedents of store performance. An ever so little better understanding of the complex network of causes and effects that are summarized by store performance figures can make huge differences for the welfare of both retail firms and consumers. For instance, with gross sales of 200 billions, a 0.1 percentage lower cost level imply an aggregate cost saving of 200 millions (!).
Ever since it was rolled out on the market in the 1950’s and -60’s, the supermarket format of grocery stores has played a major role in Swedish grocery retailing, as well as in many other countries. Generally defined as a self

- 3 -
service grocery store of between 3,000 and 25,000 square feet (McGoldrick 2002), the supermarket remains an important format of the Swedish grocery retailing industry. Currently, supermarkets represent about half of the total volume of sales in the industry (Fri Köpenskap 2009). Although the very nature of grocery retailing as a “self-service industry” has remained stable ever since the supermarkets were introduced to the market, the “rules of the game” of the Swedish grocery retail industry has changed, and changes, and are very different from those of before. The sector has evolved – and continues to do so – into a business of higher levels of risk, and into a more complex and more intense competitive environment.
The risks involved are growing higher, as there is an apparent trend towards a larger scale of operation on the store level. The average grocery store of today is substantially larger than the average store twenty or thirty years ago. This change is a consequence of both (1) many small stores having left or been forced out from the market, and (2) a larger size of new stores entering the market. Hence, on average there is nowadays a larger capital investment at stake. The Swedish Competition Authority formulates this trend as follows:
“[…] the average store is becoming increasingly larger – in 1993 the average was just below 400 square meters, while today it approaches 600 square meters. The number of population per square meter, a measure that reflects the room for grocery retailing in relation to the volume of population, is constant during the period.” [Swedish Competition Authority, Report series 2004:1]
The competition of yesteryear, which primarily was between
conventional supermarkets and between supermarkets and small grocery stores, has gradually shifted into a competition between a greater variety of store formats (both domestic and foreign). Chiefs among these are discount stores and hypermarkets, which now jointly occupy a substantial part of the Swedish retail market for groceries. This development into higher risk levels and changing competitive environment further underscores the importance of understanding the antecedents of store performance.
Questions referring to retail store performance have been addressed by a variety of researchers, representing various fields of science and taking on different perspectives. It may appear presumptuous to conduct yet another study. Nevertheless, it may be argued that there remains a need for further

- 4 -
understanding, from primarily two reasons. First, there remains a need for understanding of the antecedents of profitability performance of retail stores, as previous studies with few exceptions have been able to analyze bottom line performance. Second, the scientific discourse on issues referring to store performance appear to take place between researchers within various fields of science, taking an interest in certain antecedents and certain aspects of store performance, rarely interrelating their ideas and observations with those of other fields.
Before elaborating further on the need for further understanding it is appropriate to explicitly recognize that “store performance” is a multi-dimensional construct, and that the magnitude of the effects from various antecedents may vary, depending on what aspect of store performance one is referring to. Dunne and Lusch (1999) classify store performance in terms of economic results into three broad categories: (1) market-based performance, which captures how well a store succeeds in the competition for shoppers in the local market where it operates (measured by, e.g., sales volume and market share), (2) productivity performance, (e.g. sales per square meter floor area, sales per labor hour), and (3) financial performance, which captures revenues, costs, profits, and profitability of the store.
1.2 The research problem In essence, scientific research is about answering questions about “why”
certain phenomena occur and the overall research question of this study may be formulated as:
“Why do supermarkets achieve the profitability performance that they do?” The question addressed in this study is, thus, concerned with the
antecedents of performance differences between supermarkets. As such, the study takes part in a scientific discourse referring to performance differences between firms.
In sharp contrast to the world of perfect competition where performance differences are absent by definition and demand is homogeneous, leaving no room for product differentiation, managers in the actual life of grocery retailing business devote a substantial amount of their time to responding to insufficient business performance by adapting and adjusting their strategy and operations to the conditions of demand and

- 5 -
competition. Their actual life is a far cry from the price-taking and output adjusting tasks of neoclassical economics.
The deviation between empirically observed differences in performance between firms and the absence of such differences in the orthodoxy of neoclassical economic theory has attracted the attention of researchers from various disciplines, providing various theories of explanation.
In broad terms, theories aiming at explaining observed differences in business performance have in common a recognition of the interplay between a firm’s performance, its behavior, and conditions of its environment (market):
The nature and structure of these factors and interrelationships differ
between theories and are, indeed, a subject of debate. An overview of theories is provided in chapter 2.
With Figure 1.2.1 as background, the scope of the present study is delimited in the sense that the supermarket of the grocery retailing industry is adopted as the “firm”, (1) the economic results of supermarkets are adopted as “firm performance”, (2) the marketing mix and scale of supermarkets is adopted as “firm behavior”, and (3) conditions of demand and competition in the local markets of supermarkets are adopted as “environmental conditions”. The core of the study presented in this dissertation, thus, is an investigation
Firm behavior
Firm performance
Environmental conditions
Fig. 1.2.1 Performance of firms is generally considered in frameworks of interplay between internal and environ-mental factors.

- 6 -
into the relationship between (1) the economic results of supermarkets, (2) their scale of operation, (3) their marketing mix and (4) conditions of their local markets.
The economic results of a supermarket centers around net sales, cost of goods sold, and operating costs (see table 1.1) on the one hand, and the amount of capital invested in merchandise and fixed assets, on the other.
Table 1.2.1 Revenues, costs, and profits of supermarkets.
Net sales The revenues received by a supermarket during a given time period. Net sales is determined by (1) the number of customers during the time period, and (2) the size of the transaction per customer.
Cost of goods sold The amount paid to acquire the merchandise that is sold during a given time period.
Gross profit The difference between net sales and the cost of goods sold.
Operating costs The costs of running a supermarket. Operating costs may be further separated into, e.g., labor cost, rent cost, promotion cost, other operating costs, and cost of capital.
Net profit before taxes
The profit earned after all costs have been reduced from net sales.
Profitability in terms of, e.g. return on assets of a supermarket is, by
definition, the amount to which gross profits exceeds operating costs, related to the amount invested in the store. As such, profitability performance is related to other aspects of economic performance, and may be viewed upon as the “ultimate” economic performance.
As for any other business firm, the antecedents of the economic performance of retail store can be broadly categorized into factors of the environment (local demand- and competitive conditions) and to internal factors. The number of factors within these broad categories can be itemized into an almost infinite number, and each may have a more or less impact on store performance. Further, a certain factor may have differential effects on various aspects of performance. For instance and other things equal, a substantial lowering of prices is likely to improve sales performance, but most likely have detrimental consequences for gross- and operating profits.

- 7 -
As one goes through the vast body of previous research on store performance and its antecedents, two aspects referring to the need for further understanding become apparent. For one thing, previous research often takes an interest into the impact of either external or internal factors on performance. Further, in the cases both external and internal factors are investigated for their effects on performance, the potential interplay between them is generally not considered. Second, previous research is mostly concerned with the impact of various factors on one (or at best two) of the performance categories suggested by Dunne and Lusch (1999), thus not comprising the potential differential effect of various factors on various categories of performance.
These aspects of needs for further understanding are elaborated on in the following.
One area of previous research into the economic performance of stores refers to investigations of economies of scale on the retail store level. Indeed, the existence of scale economies could be among the factors explaining the contemporary trend of grocery retailing in terms of an increase in the average size of stores. To some extent, the existence of scale economies on the grocery store level is evident – in the full absence of it, each individual would produce only for his or her own consumption.
Previous studies have generally shown that increased scale on the store level, typically measured in terms of sales volume or in terms of some measure of physical size such as floor area, is associated with lower average operating costs. In particular, labor cost has been the prime target for such studies. Some studies have established a linear relationship between scale and costs (Nooteboom 1982), while others have found diminishing returns to scale (Eliasson and Julander 1991; Aalto-Setälä 2002). Further, some have concluded that scale economies exists only up to the lower-end of the size class of supermarkets while non-existent thereafter (Arndt and Olsen 1975), while yet others have found scale economies in labor costs to prevail even among substantially lager supermarkets (Thorpe and Shepherd 1977).
After reviewing these and other studies on scale economies at the grocery store level one remains, however, with a question if scale is associated with higher profit performance, or if the gains from scale economies are passed on to consumers via lower prices, and thus brings about lower gross margins. Aalto-Setälä (2000) found larger stores having lower mark-ups, compared to small stores, although the cost savings were greater than the reduction in mark-ups, indicating a positive impact from scale on net profit. His study,

- 8 -
however, did not provide information on gross margins, or scale economies (diseconomies) in operating cost items other than labor cost.
As mentioned above, previous studies have primarily reported on scale economies in labor costs, and as such to a large extent left the effect of scale on other elements of operating costs (e.g. promotion cost, rent cost, and other operating costs) unaddressed. Thus, there also remains a question on to what extent the scale of operation of a supermarket is related to its overall operating costs, or merely to certain cost items. For one thing, as larger stores are associated with higher levels of investment and financial risk, one may speculate that scale is related to other “short-term” store attributes (e.g. prices, open hours, promotion) in the sense that retailers induce “more” on such attributes in large stores in order to “protect” the larger investment, and thus induce higher levels of costs on certain cost items, offsetting the effects from scale economies on others. Further, previous inquiries also suffer from a limitation in the sense of lack of data to control for the potential impact of environmental attributes on store costs. For instance, to the extent larger stores are more frequently located in more attractive areas with higher land value, increased rent costs may offset savings in labor cost.
Hence, there remains a need for further understanding on issues relating to the effects of supermarkets’ scale of operation. The first question of the present study thus addresses the influence of scale on the conduct and performance of supermarkets:
Q1. To what extent does the scale of operation of supermarkets make a
difference for their conduct and performance?
In fact, should there exist a relationship between scale and conduct,
much of previous findings referring to “scale effects” could be spurious and merely a reflection of larger stores “behaving” differently in the market compared to smaller stores. This brings the discussion to questions about the influence of conduct on performance.
Previous studies comprise a stream of research on store performance that has taken interest into the impact from store location and store attributes on performance. These studies have as their prime focus to develop models for predicting sales or market share of a planned new store at a certain location. The precursor of these studies is Newton’s law of gravitation, applied in a “gravitation theory” of social science originally developed by

- 9 -
Reilly (1931) and put into further empirical context by Converse (1949) and Huff (1962, 1964). The “typical" study within this field empirically establishes relationships between the sales volume and/or market share performance of existing stores and their location and attributes, and infer these relationships to predict performance of a new store (“store location research”), or to evaluate the performance of existing stores by comparing their achieved performance to some performance potential based on market conditions and store attributes (“store assessment research”). Findings from these studies have shown higher “attractiveness” of stores positively related with perform-ance. Store attractiveness have been measured in several ways, encompassing proxy measures such as floor area (Huff 1964), service attributes such as credit card services and number of checkouts (Jain and Mahajan 1979), price level (Cottrell 1973), open hours (Reinartz and Kumar 1999), while yet others have applied stores’ image (Stanley and Sewall 1976) to depict attractiveness. However, although it appears to be an undisputable result that more attractive stores perform better in terms of sales and market share, compared to less attractive ones, one remains with questions concerning to what extent such an attractiveness → performance relationship hold at the gross-, and net profit level. If, for instance, the effect on profit of higher sales from increased attractiveness is offset by costs for bringing about the higher attractiveness, it may be doubted if anything has been "won".
Thus, there remains a need for further understanding of to what extent the conduct of supermarkets makes a difference for the performance beyond the established influence on sales volume. The second question of the present study thus becomes:
Q2. To what extent does the conduct of supermarkets make a difference for
their performance?
Sales performance of grocery stores has also been shown positively
related to favorable environmental conditions in terms of low levels of saturation, high levels of population density, and high levels of socioeconomic standards of residents (Kumar and Karande 2000). However, as a highly and densely populated area makes room for higher levels of retail acitivity, such areas are likely associated also with more intense competition, and thus prices (and by extension gross margins) should be pressed down in accordance with

- 10 -
economic theory, thus leaving the question about the impact from potential demand conditions on profits open.
The third question of the present study addresses the influence of potential demand and supply in local markets on supermarket performance.
Q3. To what extent do potential demand and supply in local markets make a
difference for the performance of supermarkets?
Next, there is the question about the effects of local competition on
supermarket performance. Lamm’s (1981) study of the relationship between grocery price levels and grocery retail competition in geographically separated local markets is the precursor of a vast body of studies that have investigated the relationship between local market structure of competition and prices on the store level or local market level. The overall findings of these studies are that deficiency of competition, typically measured by measures of concentration on the supply side of the market, imply higher prices, and intertype competition, e.g. competition between various strategic groups, such as supermarkets, discount stores, and hypermarkets, has a downward pressure on prices.
Based on findings that low intensity of competition is generally associated with higher prices, one is tempted to infer this to imply higher gross margins and gross profits on the store level, although there appear to be no previous study showing such an inference to hold. Furthermore, even if such a relationship between higher prices and higher gross profits should be at hand in areas with less competition, one remains with the question if such a relationship implies higher operating profit and net profit in stores located in such areas as well, or if stores having the opportunity to charge higher prices make more expensive, higher quality differentiated offers, that injects more operating costs that offset the gains in gross profit from higher prices. Another source for the persistence of a non-relationship between prices and profits may be that less intense competitive conditions induce "slack" in store operations that lowers productivity and increases operating costs that offset the gains in gross profit.
Further, as it is an observed fact that there is a relationship between local supply and local demand potential for groceries (i.e. the number of stores in a local market is associated with the level of population), one could also question the relationship between prices, gross margin, and gross profit.
- 11 -
To the extent increased concentration on the supply side emanates from lower levels of population, there may be a potential only for low levels of sales (“output”) that offsets the effect of higher margins on gross profits.
The effect of local competition on various aspects of conduct and performance on the store level certainly is a complex one, addressed by the fourth question of the present study:
Q4. To what extent does the structure of competition in local markets make
a difference for the conduct and performance of supermarkets?
The fifth and final question that will be addressed in the forthcoming
refers to the influence of local demand structure on supermarket conduct and performance. Structural characteristics of demand in terms of e.g. demographics and socioeconomics, may have an impact on supermarket conduct and performance to the extent they make a difference for preferences, constraints in the time available for shopping, price elasticity etc. For instance, Hoch et al (1995) proposed that households or individuals with high socio-economic status (SES) are having high opportunity costs with respect to time and thus willing to pay for added convenience. This added convenience could comprise purchases of different products in order to save time, which in turn leads to higher spending. It could also mean that these households prefer one-stop shopping, which could induce a preference for grocery stores with high degrees of scrambled merchandise, or preferences for grocey stores located in shopping centers. In addition, Hoch et al proposed that households with high SES are willing to spend more money for a certain bundle of products, due to a link between high SES and time consuming lifestyle activities.
Thus, there are reasons to expect an influence from the structure of the demand side of local markets on the conduct and performance on the store level in grocery retailing. This issue is addressed by the fifth, and final, question of this study:
Q5. To what extent does the structure of demand in local markets make a
difference for the conduct and performance of supermarkets?
These are the five research questions that will be addressed in the
forthcoming. To summarize at this point: There have been substantial

- 12 -
research on various aspects of store performance and its antecedents, indeed leaving answers to each of the five questions. Nevertheless, previous research provide, although important, merely partial explanations of store performance and performance differences between stores, mainly leaving questions about (1) profit and profitability on the store level, and (2) the potential interplay between scale, conduct, and local market conditions, unanswered. In the present study, an effort will be made to bridge the approaches taken in previous research. By combining theories, methods, and procedures from each of the areas of previous research, explicitly considering the potential effect from each on various aspects of store performance, further knowledge on the antecedents of various aspects of store performance is gained.
With the five questions of above, figure 1.2.1 may now be refined to illustrate the questions and proposed relationships of the present study:
Based on this background and five research questions, illustrated by the
figure above, the purpose of the study, and the ambitions of it in terms of contributions to existing knowledge is formally stated in the next section.
1.3 Purpose of the study The overall purpose of this study is to explain the economic
performance of supermarkets. In more specific terms, the purpose is to investigate the effects of scale of operation, supermarket conduct, and local market conditions, on supermarkets’ market-based peformance, productivity,
Fig. 1.2.2 An illustration of the five research questions of the present study, and proposed relationships.
Q3, Q4, Q5 ?
? (Q3, Q4, Q5) Q2 ?
Q1 ?
Scale of operation
Supermarket conduct
Supermarket (economic)
performance
Q1 ? Local market
conditions

- 13 -
and financial performance. In doing so, the study will also comprise an investigation into the effects of scale of operation and local market conditions on supermarket conduct.
By fulfilling this purpose in order to contribute to the scientific discourse on performance differences between firms, it is further hoped that a contribution is made to retail managers by (1) providing a framework for a better understanding of the importance and causal ordering of various factors having an influence on various aspects of performance on the store level, and (2) providing a frame of reference on how to collect and organize information in order to better monitor and evaluate performance on the store level.
1.4 Delimitations and perspective Store performance is, indeed, a multidimensional construct, that can
embrace several meanings depending on the perspective one chooses for approaching it. Serpkenci (1984) presents a classificatory schema to delineate alternative perspectives one may take in a study of retail stores and their performance. The perspectives are in two dimensions: (1) a micro vs. macro perspective on the “level” of analysis, and (2) a perspective of the “unit” of analysis, i.e. the store as an economic entity vs. a socio-political entity.
The micro-macro distinction refers to the degree by which the activities (and the consequences of these activities) of a store are viewed from the perspective of the store itself, or from the society’s perspective. In this regard, the present study is delimited in the sense that it is a study of microretailing performance, primarily dealing with performance from the perspective of the individual store. This is in contrast to macroretailing studies, which focus on the societal impact of the performance of retail units, for instance at the level of an industry or sector.
The perspective of unit of analysis, refers to the primary conceptual-ization of the retailing unit either as an economic entity or a socio-political entity. The present study takes on a perspective of the retail store as an economic entity, thus emphasizing the activities and outcome of activities directed towards the production of outputs, value and wealth. This is in contrast to the socio-political perspective, which conceptualization, on the other hand, stresses the activities or patterns of behavior directed towards the generation of social welfare, and the effects or outcomes of the distribution and use of power and influence.
In summary, the perspective taken in the present study is that of “a micro-level analysis of performance of retail stores as economic entities”. A

- 14 -
major concern of the study refers to the identification and causal ordering of external factors as well as in-store factors which may impact store performance. Further, in this study only a single dimension of the performance concept, namely the “economic results” of store operations, is considered.
Table 1.4.1 The perspective of the present study in terms of level and unit of analysis (based on Serpkenci 1984)
Perspective on level of analysis:
Micro Macro
Economic entity
[PERSPECTIVE OF THE
PRESENT STUDY]
Perspective of
the unit:
Socio-political entity
It should be re-emphasized, however, that the term “economic results”,
in itself, implies multiple constructs that can embrace different meanings depending on the perspective one chooses for approaching it. Kumar and Karande (2000) points at the usefulness of taking into account several types of performance:
"It is useful to study all types of store performance measures because these measures of store performance are mutually exclusive. For example, stores with high dollar sales might not ensure a high productivity-based performance (e.g. sales per square foot) or a high profitability-based performance (e.g. gross margins)." [Kumar and Karande (2000), p 168]
The present study addresses all three performance categories suggested
by Dunne and Lusch (1999). Thus, the present study explicitly bridges the gap between previous studies from various traditions, by integrating the effects from various proposed antecedents on (1) market based performance (e.g. sales volume), (2) productivity (e.g. sales per labor hour), and (3) financial

- 15 -
performance (e.g. gross margin, average costs). As such, the study also will provide insights into what extent profitability is related to, for instance, market based performance.
1.5 Theoretical underpinnings and research method In any attempt at explanation, prediction and understanding of a
phenomenon, there is always a framework that guides the research and the researcher, and it is one’s duty as a researcher to explicitly declare the assumptions and delimitations of one’s study. The paradigm that will be relied on as the fundament for the present study is the structure-conduct-performance (SCP) paradigm.
In answering the overriding question “Why do supermarkets achieve the profitability performance that they do?”, the present study proceeds from the assumption that performance of a supermarket is fundamentally due to its conduct, which in turn is assumed to be a consequence of its adjustments to the conditions of its local market.
The standpoint is taken that, at a given point in time, it is logically inconsistent to expect a causal loop or feedback from present performance to conduct. Although it may be argued that “expected” performance may be a causal factor in explaining the present conduct of a store, it would then be erroneous to refer to performance as outcomes; rather one would have to implement performance as “potential outcomes”. In a similar manner, the standpoint is taken that, at a certain point in time, it is logically inconsistent to expect a causal loop or feedback from conduct to market structure. However, given a sufficiently long time frame, one cannot exclude such dynamic relationships. These possibilities, although recognized, are not part of this study.
The empirical part of the study takes the form of a cross-sectional study of the performance of 168 supermarkets, all affiliated to the Swedish ICA Retail corporation, ranging in size (floor area) from 400 to 2,000 square meters.. A unique database will be created by pooling data from various sources, facilitating comprehensive analyses of a proposed context by which scale of operation, conduct, and local market conditions relate to various aspects of store peformance.
1.6 Outline of the thesis The thesis is organized around six chapters. Following this introductory
chapter, the next chapter provides a discussion referring to the theoretical

- 16 -
framework of the study, along with a review of previous research and development of hypotheses for the empirical analyses. Chapter 3 contains a report of the design of the study, and of the methods and research instruments applied for providing the data and analyses of the empirical study. This chapter provides a list of all operationalized variables on scale of operation, local market conditions, conduct, and store performance. In chapters 4 and 5 the empirical results are reported along with responses to the hypotheses developed in chapter 2. The analyses starts out in chapter 4 with results referring to the relationships between profitability and other categories and measures of economic performance, for example to what extent sales volume and productivity are related to profitability, followed by analyses of the relationships between scale, market conditions, conduct, and various aspects of economic performance. The results are summarized, along with accepting or rejecting the hypotheses, in chapter 5. Chapter 6 contains conclusions and managerial implications from the study, along with a discussion on the limitations of the study. Finally, some directions for future research are suggested.

- 17 -
2. THEORY
2.1 Outline of the chapter This chapter contains an elaboration of the theoretical underpinnings of
the study, along with hypotheses for the empirical analyses. The outline of the chapter is as follows. Section 2.2 comprises a general background for the study and states the structure-conduct-performance (SCP) paradigm as the main theoretical point of departure. In section 2.3 the concept of performance is discussed. Section 2.4 provides an elaboration on the concepts of “scale of operation” and “economies of scale” in a retail context, along with hypotheses for the relationships between supermarkets’ scale of operation on the one hand, and their conduct and economic performance on the other. Sections 2.5 through 2.8 provide discussions about the interplay between on the one side supermarket performance, and on the other side conduct (2.5), potential of local demand and supply (2.6), structure of local competition (2.7), and structure of local demand (2.8). Due to the multifaceted character of the theoretical constructs of market conditions, conduct, and performance, specific hypotheses of the relationships between various aspects of each are developed in these sections, rather than proposals of relationships between broad definitions of each construct.
2.2. Theoretical underpinnings As for any other retail store, the operations of a supermarket does not
take place in isolation from its local environment. On the contrary, supermarkets are by nature highly interactive with their local environment. Thus, the antecedents of a supermarket’s performance are likely to be found among factors that refer to conditions of its local market, as well as among factors that refer to the supermarket itself. Factors within and between these two broad categories are in the present study expected to be interrelated, forming a complexity of relationships between environmental (market) factors, store factors, and store performance.
In essence, supermarket business is about bringing about an offer in terms of products and services that induces exchanges with consumers and provides revenues through their payments. The economic results will depend on to what extent the revenue gained from these payments, i.e. the sales volume, exceeds the costs for bringing about the offer. The starting point of

- 18 -
store performance can, thus, be expressed as the bringing about of an offer that consumers are willing to pay for (Ghosh 1992):
Although the understanding of consumers’ needs and wants, and the
matching of their preferences with “products and services that consumers value” may be an ever so challenging task, the challenge usually does not limit itself into such a matching issue. The challenge is further complicated as the bringing about of an overall offer to consumers usually takes place in an environmental context, where characteristics of heterogeneous consumers and competitors constitute a set of factors, intertwined in a complex interplay.
The interplay between offers, consumers, competition, and store performance is synthesized in frameworks by Falk and Julander (1983), and by Marjanen (1993). Although these studies did not aim at explaining store performance, they neverthelsess serve as fruitful starting-points for a study like the present one, as they explicitly consider store-level performance in a context of local market conditions and store attributes.
According to Falk and Julander (see fig 2.2.2), store performance is a consequence of environmental factors and the extent to which the store is patronized by consumers, which in turn is a consequence of how well store attributes (e.g. location, open hours, merchandise, store layout, service, advertising), correspond to consumers’ evaluative critieria for their store choice behavior. Further, store attributes, or rather the retailer’s decision on store attributes, are influenced by underlying factors, such as local competition and local demand characteristics (demand potential, demand characteristics).
Products and services that consumers value
Consumer payments
CONSUMER RETAILER
Fig. 2.2.1 The starting point of store performance is the attraction of consumers, by making an offer they are willing to pay for (Ghosh 1992).

- 19
-
Fact
ors
influ
encin
g co
nsum
ers’
stor
e ch
oice
.
Cons
umer
dec
ision
cr
iteria
. Re
taile
r dec
ision
cr
iteria
. Fa
ctor
s in
fluen
cing
reta
ilers
’ dec
ision
on
reta
il m
ix.
Cons
eque
nces
Goa
l
Geo
grap
hic
stru
ctur
e - D
istan
ce to
st
ore
- adj
acen
t sto
res
and
serv
ices
- pub
lic
trans
port
- roa
d ne
twor
ks
- car
par
king
So
cio-
econ
omic
fact
ors
- sex
- a
ge
- edu
catio
n - c
ar o
wne
rshi
p - i
ncom
e - f
amily
st
ruct
ure
Psyc
holo
gica
l fa
ctor
s -a
ttitu
des
- int
eres
ts
- hab
its
Acc
essib
ility
of
the
stor
es
Pric
es
Ass
ortm
ent
Stor
e lay
out
Serv
ice
Info
rmat
ion
Loca
tion
Ope
n ho
urs
Pric
es
Ass
ortm
ent
Stor
e lay
out
Serv
ice
Adv
ertis
ing
Size
and
stru
ctur
e of
dem
and
Char
acte
ristic
s of
cons
umer
s La
bor m
arke
t G
ener
al pr
ice a
nd
inco
me
leve
l Co
mpe
titiv
e sit
uatio
n Co
mm
unica
tion
syst
em
Dec
ision
s mad
e by
the
auth
oriti
es
Cost
Prof
itabi
lity
Reve
nues
Stor
e ch
oice
Sa
tisfa
ctio
n
Cons
umer’
s goa
l
Reta
iler’s
goal
Figu
re 2
.2.2
Fac
tors
affe
ctin
g re
taile
rs' a
nd c
onsu
mer
s goa
l ach
ieve
men
t (Fa
lk a
nd
Julan
der 1
983)

- 20 -
The framework of Falk and Julander was somewhat adjusted by Marjanen (1993). In her framework (fig. 2.2.3), store costs are a more immediate consequence of the retailer’s decision on store attributes, which in turn are influenced by “factors affecting the retailer’s decisions”, referring primarily to conditions of local demand and local competition. Marjanen explicitly brings together the retailer’s marketing decisions and costs on the one side, with consumers’ store choice behavior and consumer satisfaction on the other, in order to manifest and understand the interplay between the two.
Factors influencing consumers’ store choice
Consumer decision criteria
Retailer decision criteria
Factors influencing retailers’ decision on retail mix
Cost
Profitability
Revenues
Store choice
Satisfaction
Fig. 2.2.3 The interplay between consumer behavior, store conduct, consumer satisfaction, and store performance (Marjanen 1993).

- 21 -
Although neither the study by Falk and Julander, nor the one by Marjanen was directed to issues explicitly referring to the economic performance of stores, they serve as important sources of inspiration for the present study, as they highlight the interplay between local market conditions, store attributes, and store performance.
Differences in performance between firms and the antecedents of such differences have been a subject for research within a variety of disciplines. Taking on various perspectives, scholars have developed theories where empirically observed performance differences between firms are explained by certain factors, external and/or internal to the firm, and by certain interrelations between them. Stoelhorst and van Raaij (2004) describe various schools of thought as reactions to the assumptions of perfect competition1 in neoclassical economics, and identify four schools of organizational economics, each relaxing various assumptions of neoclassical theory and arguing for different explanations of observed performance differences between firms. The four schools of organizational economics are (1) industrial organization, (2) the Chicago school, (3) the Schumpeterian view, and (4) the Resource based view. Each of these provides an alternative theory to neoclassical economics by relaxing the assumptions and bringing theory closer to what is empirically observed.
Further, Stoelhorst and van Raaij (2004) show how these four schools serve as underlying theories for six funamental theories of Strategic management, and Marketing. The various schools of organizational economics are shown serving as underlying theories to (a) the positioning school, and (b) the competence based school of Strategic management, and to (c) the functionalist school, (d) the SPP framework, (e) the dynamic disequilibrium paradigm, and (f) the Resource Advantage theory, of Marketing.
Figure 2.2.4 and Tables 2.2.1 - 2.2.2 provide a summary of the main characteristics of the various schools of thought, and the relationships between them. For an elaboration, see Stoelhorst and van Raaij (2004). With these core characteristics of various approaches to explanations of
1 The well-known assumptions of (1) an infinite number of small buyers and sellers, that each are price takers, (2) homogenous demand within product categories, providing no room for product differentiation, (3) perfectly divisible and mobile resources, (4) nonexistent barriers to entry to and exit from the market, (5) perfectly informed buyers and sellers, (6) utility-maximizing buyers and profit-maximizing sellers, and (7) costless transactions.

- 22 -
performance differences between firms, the position of the present study can now be explicitly declared.
The theoretical underpinnings of the present study follow the world view of the “industrial organization” box of figure 2.2.4. The present study proceeds from an assumption that the performance of a supermarket is a consequence of its adjustments to market conditions in accordance with the structure-conduct-performance (SCP) paradigm.
Figure 2.2.4 Ten schools of thought referring to the explanation of performance differences between firms. Based on Stoelhorst and van Raaij (2004).
Neoclassical theory of perfect competition
The competence-based school
The positioning school
The Resource Advantage
theory
Dynamic disequilibrium
paradigm
The SPP framework
The functionalist
school
Stragegic management Marketing
Resource based view (RBV)
Schumpeterian view
The Chicago school
Industrial organization
Organizational economics

- 23
-
Ta
ble
2.2.
1 F
our s
choo
ls of
org
aniz
atio
nal e
cono
mics
. Fro
m S
toel
hors
t and
van
Raa
ij (2
004)
.
Scho
ol o
f tho
ught
: In
dust
rial o
rgan
izat
ion
Chica
go sc
hool
Sc
hum
pete
rian
view
Re
sour
ce-b
ased
view
Root
s of o
rigin
: Ch
ambe
rlin
(193
3);
Mas
on (1
939)
; Bain
(195
1)
Dem
setz
(197
3); S
tigler
(1
986)
Sc
hum
pete
r (19
34)
Penr
ose
(195
9)
Sour
ce o
f per
form
ance
di
ffer
ence
s: Pr
oduc
t diff
eren
tiatio
n
Mar
ket p
ower
Effi
cienc
y di
ffere
nces
be
twee
n fir
ms
Inno
vatio
n U
niqu
e or
cos
tly-to
-cop
y re
sour
ces
Cent
ral t
heor
etica
l con
cept
: St
ruct
ure-
Cond
uct-
Perf
orm
ance
par
adig
m
Cost
s of i
nfor
mat
ion
Crea
tive
dest
ruct
ion
Firm
het
erog
eneit
y
View
of c
ompe
titio
n Co
mpe
titio
n as
stru
ctur
e St
rugg
le fo
r tem
pora
ry
com
petit
ive
adva
ntag
e by
ef
ficien
ces g
ained
thro
ugh
info
rmat
ion
proc
essin
g
Com
petit
ion
as p
roce
ss
Stru
ggle
for u
niqu
e, or
co
stly-
to-c
opy
reso
urce
s
View
of m
anag
emen
t rol
e: To
diff
eren
tiate
or r
estri
ct
outp
ut.
To se
ek e
fficie
ncies
in
prod
uctio
n or
dist
ribut
ion.
To
cre
ate
new
co
mbi
natio
ns th
at m
ake
rivals
’ pos
ition
s obs
olet
e.
To a
cqui
re, d
evelo
p,
com
bine
and
dep
loy
valu
able,
rare
and
in
imita
ble
reso
urce
s.

- 24
-
Ta
ble
2.2.
2 T
wo
scho
ols o
f Stra
tegi
c m
anag
emen
t, an
d fo
ur sc
hool
s of M
arke
ting
prov
idin
g ex
plan
atio
ns fo
r per
form
ance
diff
eren
ces
betw
een
firm
s. Fr
om S
toelh
orst
and
van
Raa
ij (2
004)
.
St
rate
gic
man
agem
ent
Mar
ketin
g
Scho
ol o
f tho
ught
: Po
sitio
nal s
choo
lCo
mpe
tenc
e-ba
sed
scho
ol
Func
tiona
list
scho
ol
Sour
ces-
Posit
ions
-Pe
rfor
man
ce
(SPP
) fra
mew
ork
Dise
quili
briu
m
para
digm
Re
sour
ce
Adv
anta
ge (R
A)
theo
ry
Root
s of o
rigin
: Po
rter (
1980
) Pr
ahala
d an
d H
amel
(199
0)
Ald
erso
n (1
957)
D
ay a
nd W
ensle
y (1
988)
D
ickso
n (1
992)
H
unt a
nd M
orga
n (1
995,
199
6)
Sour
ce o
f pe
rfor
man
ce
diff
eren
ces:
Posit
iona
l ad
vant
ages
pr
otec
ted
by
barr
iers t
o co
mpe
titio
n.
Man
ager
ial v
ision
an
d co
re
com
pete
ncies
Diff
eren
tial
adva
ntag
e
Inno
vatio
n
Supe
rior s
kills
and
re
sour
ces;
Supe
rior c
usto
mer
va
lue;
Low
er re
lativ
e co
sts
Self-
impr
ovem
ent
driv
e; Pe
rcep
tiona
l ac
uten
ess;
Impl
emen
tatio
n sp
eed;
H
ighe
r-ord
er
learn
ing
capa
bilit
y
Fina
ncial
, phy
sical,
le
gal,
hum
an, o
rg-
aniz
atio
nal,
info
rmat
iona
l, an
d re
latio
nal
reso
urce
s.
Und
erlyi
ng th
eory
In
dust
rial o
rg.
Chica
go sc
hool
Schu
mpe
ter
RBV
Indu
stria
l org
.
Schu
mpe
ter
RBV
Indu
stria
l org
.
Chica
go sc
hool
Schu
mpe
ter
RBV

- 25
-
Ta
ble
2.2.
2 (co
ntin
ued)
Tw
o sc
hool
s of S
trate
gic
man
agem
ent,
and
four
scho
ols o
f Mar
ketin
g pr
ovid
ing
expl
anat
ions
for p
erfo
rman
ce
diffe
renc
es b
etw
een
firm
s. Fr
om S
toelh
orst
and
van
Raa
ij (2
004)
.
St
rate
gic
man
agem
ent
Mar
ketin
g
Scho
ol o
f tho
ught
: Po
sitio
nal s
choo
lCo
mpe
tenc
e-ba
sed
scho
ol
Func
tiona
list
scho
ol
Sour
ces-
Posit
ions
-Pe
rfor
man
ce
(SPP
) fra
mew
ork
Dise
quili
briu
m
para
digm
Re
sour
ce
Adv
anta
ge (R
A)
theo
ry
View
of
com
petit
ion
Cham
berli
nian
di
ffere
ntiat
ion
Schu
mpe
teria
l pr
oces
s St
rugg
le be
twee
n fir
ms f
or
com
petit
ive
adva
ntag
e lea
ding
to
inno
vatio
n.
Stru
ggle
betw
een
firm
s for
co
mpe
titiv
e ad
vant
age
in
reso
urce
s tha
t yie
lds p
ositi
onal
adva
ntag
e
Firm
s’ ad
apta
tion
to te
mpo
rary
so
urce
s of
com
petit
ive
adva
ntag
e
Stru
ggle
for
com
petit
ive
adva
ntag
e in
res-
ourc
es
View
of
man
agem
ent r
ole:
To a
nalyz
e in
dust
ry st
ruct
ure
and
choo
se a
ge
neric
stra
tegy
“Stra
tegy
as f
it”
To c
hang
e th
e ru
le of
the
gam
e by
de
velo
ping
and
ex
ploi
ting
core
co
mpe
tenc
ies.
“Stra
tegy
as
stre
tch”
To se
ek so
me
adva
ntag
e ov
er
othe
r firm
s to
assu
re th
e pa
trona
ge o
f a
grou
p of
ho
useh
olds
.
To se
ek d
iagno
stic
insig
hts f
rom
bot
h co
mpe
titiv
e an
d cu
stom
er
pers
pect
ive
To c
reat
e di
sequ
ilibr
ium
that
be
nefit
s the
firm
. To
lear
n an
d im
prov
e th
e co
mpe
teiti
ve
proc
ess.
“Key
succ
ess
fact
ors”
To re
cogn
ize,
unde
rsta
nd,
crea
te, s
elect
and
m
odify
stra
tegi
es

- 26 -
The SCP paradigm has a long tradition of explaining “empirical regularities” such as the relationship between competition and performance, and continues to be a useful tool for investigating economic issues as it is fundamentally consistent with economic theory (Pilloff and Rhoades 2002). Advocates of the industrial organization school of economics are traced back to Chamberlin (1933) in their recognition of heterogenous demand, leaving room for product differentiation, and to Mason (1939) and Bain (1951) in their recognition of barriers to competition and market power of firms. Central to industrial organizationalists’ view is the acceptance of economies of scale and the structure-conduct-performance (SCP) paradigm, according to which market structure have effects on the conduct of firms, which in turn have effects on their performance. The firm itself is thus incorporated among the factors that determine performance, and the view of the manager is not solely the one of a neoclassical price-taking output adjuster. Rather, management has an opportunity to differentiate the firm from others. More specific, the theory argues that the more “imperfect” the competition, the greater the market power of firms in the market, i.e. the greater their opportunity to set the selling price above costs and earn above-normal profits.
A recent comparison of four models of firm profitability by Slade (2004) provided strong support for the SCP model. Further, the SCP serves as an underlying theory for contemporary development of marketing theory (Matsuno et al 2005).
The fundamental theoretical concepts of the present study emanate from the SCP paradigm, and definitions are provided in Table 2.2.3 below. Forthcoming sections will provide discussions and elaboration on issues of each definition, as well as addressing issues referring to demarcations of these concepts.
At this stage already, however, it is appropriate to bring two main definitional issues into the open. It is important to note that the “market” concept in the present study refers to a geographic area, where sellers (stores) belonging to a certain industry compete and interrelate with buyers (consumers), and that “competition” between stores is assumed to be formed by the “structure” of the market, which refers to the organizational properties of supply (stores).
The theoretical concepts of Table 2.2.3 refer to abstract and unobservable properties of social and economic entities, and as Bagozzi and Phillips (1982, ref. in Serpkenci 1984) note they:

- 27 -
“… achieve their meaning through formal connections to other derived, and empirical concepts as well as their definition … and usually consist of descriptors of phenomena provided by sentences reflecting the conceptual vocuabulary of the theory.” [Bagozzi and Phillips (1982 p 485, ref. in Serpkenci 1984, p. 117)]
In forthcoming sections thus, these theoretical concepts will be further
developed into derived concepts, which are connected to each other in a set of hypotheses for the empirical study. Both the theoretical and derived concepts refer to unobservable constructs, which are operationalized into empirically observable concepts in the next chapter (chapter 3).
Table 2.2.3 Definitions of theoretical concepts of the present study.
Theoretical construct Definition
Market An interrelated group of sellers and buyers in a geographical area.
Potential demand The aggregate level of total outputs that may be desired in a market.
Potential supply The aggregate level of the potential for outputs available in a market.
Competition The rivalrous efforts of two or more units, acting independently, to secure mutually desired resources of limited supply.
Structure of competition (competitive structure)
The organizational properties of the seller side of a market.
Structure of demand (demand structure)
The organizational properties of the demand side of a market.
Store capacity The transactional capacity of a store in a certain time period and market.
Store conduct The patterns of behavior, that a store follows in adopting and adjusting to the market.
Store performance Economic outcomes of the activities of a store in a certain time period and market.

- 28 -
The overall proposition of the present study is summarized in figure 2.2.5. In accordance with the propositions of SCP, performance of supermarkets is considered a consequence of their conduct, which in turn are considered as consequences of the structure of the local markets in which they operate. Further, scale of operation and conditions of “potential demand and potential supply” are incorporated by the overall proposition. Scale of operation is proposed to have both a direct effect (economies of scale) on performance, and an indirect effect via conduct (i.e. conduct is expected to be different over the range of supermarket scale). Potential demand- and supply is expected to have a direct effect on performance as the potential “output volume” of a supermarket is expected to be related to the extent to which potential demand is served by potential supply (stores).
Figure 2.2.5 is an extended version of fig. 1.2.2 (see chapter 1), by which the five research questions of the present study were presented graphically. The difference between fig. 1.2.2 and the figure below refers to the categor-ization of “local market conditions” into three different categories of conditions, (1) structure of competition, (2) structure of demand, and (3) potential demand and supply.
Conduct
Scale of operation
Structure of competition
Structure of demand
Potential demand and
-supply
Performance
Figure 2.2.5 The overall proposition of the present study is that the economic performance of a supermarket is related to its scale of operation, conduct, and the conditions of its local market.

- 29 -
2.3 Store Performance The “performance” concept refers to an, indeed, ambiguous
phenomenon as well in ordinary language as in a scientific context. The ambiguity springs from the fact that its validity of utilization is dependent on the context in which it is applied; a context which need to be explicitly recognized in order to provide a clear definition of what aspects and properties of “performance” that are referred to. Otherwise, there is likely to arise confusion, as the definition of the concept will remain implicit, at worst differing between parties of a discourse. For instance, an implicit reliance on some universal definition in terms of “financial performance”, “productivity performance”, “market performance” etc., without explicitly and clearly stating its meaning by which it is utilized, causes danger to the outcome of any discussion on performance issues. At the outset of a scientific inquiry of performance and its antecedents, such as the present one, it is therefore necessary to review certain general and central features of the performance concept and clarify how it will be applied in the forthcoming, in order to provide an understanding of what it will be referring to in the context of the study.
Serpkenci (1984) discusses the concept of store performance from several perspectives. To start with, one should recognize that the term “performance” may refer to either the consequences (outcomes) of a behavior, as well as to the behavior (conduct) anteceding these consequences. This dual conceptualization of performance into a behaviour/outcome aspect gives rise to different, although related, inquiries in attempts to explain it. Explanations of “outcome” aspects are of little value if the antecedent behavior behind the outcomes are unknown; and explanations of “behavior” may have antecedents that are not related to the outcome.
Whereas the former explanation would suffer from substantial insufficiency without information about the behavior preceeding the outcome, the latter explanation of performance (in the sense of behavior) may have determinants that are unrelated to outcomes. Consequently, in a theoretical framework of a scientific study it is important to explicitly declare on what definition of performance on this behavior/outcome issue one will rely.
Next, it should be recognized the difficulties in measuring the performance concept. For one thing, it is impossible to identify an “absolute zero” of performance; there is no meaningful way to refer to non-

- 30 -
performance2. In other words, one may only refer to the degree of “low” or “high” performance in a certain context. A consequence following from this is that the concept of performance always will imply normative content, as it requires some contextual benchmark for evaluation.
Further, the very nature of the performance concept is multidimensional. In the context of the present study, for example, one can list a number of dimensions of supermarket performance, such as economic performance (e.g. sales, productivity, profit), social performance (e.g. employee and customer satisfaction), legal performance (e.g. obeying of laws and law-like recommendations), or social performance (e.g. adoption of conduct norms based on ethical considerations). Such a list of various dimensions of the performance construct can can be prolonged, and various dimensions can be combined to create further new dimensions.
The standpoints one takes as a researcher on these issues will, of course, depend on one’s orientation and interest. In terms of standpoints for the present study, the discussion above (based on Serpkenci 1984) can be summarized as follows. First, supermarket performance is viewed as the “results” or “outcomes” of the actions of the supermarket as opposed to its “behavior”. Other terms, such as conduct, operations, routines, or strategy, are recognized as more appropriate to describe the process-oriented meaning of the performance construct, which will be discussed in section 2.5 below.
Second, the present study addresses issues referring to the identification and causal ordering of factors which may influence the “systematic variation” in store performance. The ambition of this study is not normative, in the sense that the objective is to identify the determinants of “good vs. bad” performance. Hence, the performance concept of this study is not, and should not be interpreted as, a relative or normative quality of a supermarket. Third, only a single dimension of the performance concept is addressed – the “economic results” of supermarkets.
In summary, performance in the context of the present study is defined as the economic results of the conduct of a retail store at a certain time, and in a certain market. Furthermore, an implicit assumption is made, in the sense that these economic results are represented in measures of sales volume (output), and measures of productivity and financial performance.
2 Naturally, a certain operationalized measure of “performance” may take on the value of zero. However, this is not an indication of “non-performance” but merely a position over the range from low to high.

- 31 -
As mentioned in chapter 1, the term economic results, in itself, comprises multiple constructs. In the present study economic results of supermarkets are conceptualized on the basis of Dunne and Lusch’s (1999) categorization of store performance, i.e. market based performance, productivity performance, and financial performance.
The economic results of a supermarket centers around net sales, cost of goods sold, and operating costs (Berman and Evans 1998, see table 2.3.1), on the one hand, and the amount of capital invested in merchandise and fixed assets, on the other.
Table 2.3.1 Revenues, costs, and profits of supermarkets.
Net sales The revenues received by a supermarket during a given time period. Net sales is determined by (1) the number of customers during the time period, and (2) the size of the transaction per customer.
Cost of goods sold The amount paid to acquire the merchandise that is sold during a given time period.
Gross profit The difference between net sales and the cost of goods sold.
Operating costs The costs of running a supermarket. Operating costs may be further separated into, e.g., labor cost, rent cost, promotion cost, other operating costs, and cost of capital.
Net profit before taxes
The profit earned after all costs have been reduced from net sales.
Profitability in terms of return on assets of a supermarket is, by
definition, the amount to which gross profits exceeds operating costs, related to the amount invested in the store. As such, profitability performance is related to other aspects of economic performance, and may be viewed upon as the “ultimate” economic result. The well-known ”DuPont-model” (in the forthcoming referred to as the strategic profitability model, SPM) highlights the interplay between the three categories of store performance (market based-, productivity-, and profitability performance), suggested by Dunne and Lusch (1999). In its most basic version, the SPM establishes two major routes to improved profitability: increased profit margins or increased productivity in terms of asset turnover:

- 32 -
AssetsTotalSalesNet
SalesNet ProfitNet
AssetsTotalProfitNet Assetson Return •==
In an investigation of profitability of supermarket chains, Livingstone
and Tigert (1987) found the “key” to high profitability performance to be high operating profit margin. Operating margin (the spread between gross margin and operating costs as a percentage of sales) was uncovered substantially more important for profitability performance than high productivity; a two percent of relative improvement in operating profit margin was found to increase profitability (return on equity) by nearly five percentage units, while a five percent of relative improvement in asset turnover left profitability virtually un-changed. Chains performing high profitability were observed to bring about high operating margins in one of two different ways: (1) high gross margins, with high operating costs, or (2) low gross margins, with low operating costs:
“Success in the supermarket business seems to be the result of either cost leadership, or service leadership. The cost leaders earn high net income, through low gross margins and low operating expenses. The service leaders also earn high net income, based on high gross margins and high operating expenses. The high profitability performers are either the cost leaders or the service leaders.” [Livingstone and Tigert (1987) p. 20]
Although the low price/low cost leaders in the study reported low on
productivity, those succeeding in maintaining low operating costs were able to generate a high return on investment: “Winning lies in the spread between gross margin and operating expenses, and there are a number of different ways to achieve this goal.” (Livingstone and Tigert 1987, p. 22). As conducted on the chain level, the study of Livingstone and Tigert does not, however, provide findings referring to the antecedents of gross margins and operating costs on the store level.
The perspective taken on the productivity aspects of store performance in the present study refers to the internal – efficiency – aspect of it, rather than an external – effectiveness – perspective. Productivity performance is thus defined as the rate by which a certain resource item is converted into outputs. Leaving aside, for the moment, the far from unproblematic issue of defining “output” of retail stores (see section 2.4 for a discussion on this issue), the

- 33 -
resources required for operating a supermarket may be described by three broad categories of resources: merchandise, floor space, and labor (Lusch and Serpkenci 1983; Lusch 1986; Ring, Tigert and Serpkenci 2002).
Lusch (1986) developed the ”Strategic Resource Model”, SRM, defining productivity performance as sales volume per unit of resource, i.e. sales per unit of inventory investment, sales per square meter, and sales per unit of labor (sales per labor hour, sales per employee). The SRM further incorporates the gross margin percent and by a multiplication of each of these measures defines “gross margin return on inventory” (GMROI), “gross margin return on selling area” (GMROS), and “gross margin return on labor” (GMROL) as measures of productivity. Ring, Tigert and Serpkenci (2002) further extended the SRM by the incorporation of operating costs per unit of resource, providing measures of profit per unit of utilized resource.
In the present study, store performance in terms of all three categories suggested by Dunne and Lusch (1999) are addressed in forthcoming sections. Six constructs of performance are derived from this categorization (see Table 2.3.2 below).
Before leaving this section it should be explicitly declared that an underlying assumption of the present study refers to the assumption that the objective of retailers are to make profit, and that retailers prefer more profit to less. From a practical and managerial, point of view such an assumption is perhaps uncontroversial, but still important to make explicit in a scientific inquiry as the present one. Thus, in the present study supermarkes are assumed to be for-profit firms; they exist to make money. As pointed out by Carter and Perloff (1999) – as well as others – managers may have other objectives than profit maximization of the firm that they manage. However, as pointed out by Carter and Perloff, there are various forces that keep managers from deviating from profit-maximizing behavior:
“If a firm is run inefficiently and unprofitably, it may be driven out of business by rival firms that do maximize profits. Managers who lose their jobs when their firm is driven out of business or who are fired for inefficiency or laziness find it difficult to obtain new jobs. Incentives, such as stock ownership and other bonuses, also motivate managers to maximize profits.” [Carter and Perloff (1999), p 13]
Forthcoming sections will address issues referring to various potential
antecedents of store performance, and hypotheses referring to the effects

- 34 -
from various antecedents on various aspects of performance will be developed. As mentioned previously, the multidimensionality of the performance construct necessitates a development of hypotheses referring to various aspects of it. Thus, rather than serving broad propositions referring to the influence of various broad definitions of antecedents on broad definitions of performance, specific hypotheses will be developed on the expected influence of various aspects of antecedents on various aspects of each performance category.

- 35 -
Table 2.3.2 Constructs of store performance in the present study.
Theoretical construct
Definition Derived constructs
Definition
Store performance
Economic outcomes of the activities of a store in a given time period and market.
Market based performance
The amount of demand attracted by a store.
Inventory productivity performance
The rate at which the products hold for sale by a store are converted to output.
Space productivity performance
The rate at which the physical space of a store is converted to output.
Labor productivity performance
The rate at which the labor resources of a store are converted to output.
Gross profit performance
The degree to which customer payments exceeds the cost for acquiring sold goods.
Operating cost performance
The costs for the resources acquired for operating a store.
Operating profit performance
The difference between gross profit and operating costs.
Profitability performance
The rate at which assets are converted to operating profit.

- 36 -
2.4 Scale of operation and Economies of scale
2.4.1 Scale of operation on the retail store level By definition, economies of scale (or “scale economies”; these terms will
be used interchangeably in the forthcoming) are at hand in the case average cost (i.e. cost per unit of output) decreases with increased volume of output (Scherer and Ross 1989, Carter and Perloff 1999). Thus, according to this definition “scale of operation” is synonomous to “volume of output”. This brings the discussion to the issue of defining “output” on the store level in retailing.
In practice, as well as in scientific research, a frequently applied measure of a store’s output is its “volume of sales” (the present study is no exception), and measures of efficiency of store operations are frequently operationalized as “output” in terms of sales divided by some measure of “input”, e.g. sales per labor hour or sales per square meter of floor area. However, as a matter of intellectual honesty of a researcher, the term “output” in a retail context requires a moment of reflection. Indeed, among the first challenges facing empirical studies on store performance refers to the “output” concept, and the question about to what extent sales volume is a valid representative of output. In the case a retailer is a one-product firm, and the level of service is constant irrespective of store or shoppers’ purchase sizes, then output could without doubt be measured by volume of sales. However, retail stores typically sell a variety of products with – often – different levels of service attached to them, and the appliance of sales volume as a measure of output meets with conceptual problems.
Achabal et al. (1984) provide a discussion of the complexity of the "output" concept in retailing and point out that, for a retailer, the answer to the question "What is output?" is not as straightforward as for a manufacturing firm. For a manufacturer, the definition of output is the volume of physical products produced (but not necessarily sold). For a retailer, output cannot be, strictly, conceptualized in such a direct manner. By definition, a retailer purchase manufactured products to sell in retail markets. Although the appearance of the physical products may be unchanged, they are altered by retailers in the sense that they are integrated into a context of other attributes, and thus becomes part of an overall strategy formed by the retailer. The "production" of a retailer is thus, according to Achabal et al., mostly about adding "service utilities" (e.g. time, place, assortment) to the physical product,

- 37 -
and the "output" of retailers is an "extended product", which is difficult to measure.
Ideally, when analyzing performace of retail stores, one should distinguish between "output" in terms of (1) the extended product on the one hand, and (2) sales of that product on the other, as resources in a retail store may be very efficiently utilized in creating the extended product, but the demand for the product may be small. In a similar vein, stores may benefit from favorable environmental conditions and achieve high levels of sales, although inefficiently creating the extended product. Eliasson and Julander (1991) summarize this aspect of the output problem by the following:
“Two stores may offer exactly the same ‘product’, using the same amount of labor and capital. However, they may have very different environments in terms of demand structure and competitive situation. When such differences exist, it would be wrong to say that the store with higher demand and limited competition is more productive than the one with the lesser demand and tougher competition. It may very well be so that the store in a market with the higher demand is less productive, since the store has less pressure to utilize the resources as productively as possible.” [Eliasson and Julander (1991), p. 40]
To resolve the problem, Eliasson and Julander (1991) proposed the
application of the strategy chosen by a retail store as a reflection of its product or “output”. As the function of a retailer is to produce immediate availability of an assortment of products through location and opening hours, the authors argue, “output” in terms of store attributes is a better reflection of what is “produced” in a store, free from demand-side distortions.
In her seminal work, Douglas (1962, p 161) writes: "in retailing … the outputs are services, and these are almost impossible to measure in real terms". Various proximate measures of store output have been adopted. Ideally, the selected measure should reflect as accurately as possible the services created by retailing. Physical units sold has been proposed as a measure (Carey and Otto 1977), but Ingene (1984) rejects this proposal, since retailers typically sell several products and the service attached to each product is likely to differ. The solution put forward by Douglas (1962) is to accept a measure of "dollar volume of sales", assuming a more-or-less standardized bundle of services associated with each dollar of sales. Ingene (1984) also concludes that retail output must be measured pecuniary. Ofer (1973) suggests gross profit as the

- 38 -
best measure of output to use on the basis that if one could assume perfect competition in the entire retail industry, the value added by a store would be an exact measure of its service output. In practice, however, competition and product variety rarely meet with the specifications of perfect competition. Savitt (1975) and Ingene (1984) argue that sales is an appropriate measure of output given that a retailer sells a selection of goods as well as services.
To summarize, applying sales volume as a representative for store “output” can be misleading, as it encompasses demand-side effects of output that are not due to the “production” part of output. Despite this shortcoming of it, sales volume will be used to depict supermarket output in the present study. Aside from the practical problem of separating out the demand side- from the “production” side of output, the argument presented by Ofer (1973) is assimilated, namely that the demand side effect is similar to the effects enjoyed by many manufacturers due to larger “run” sizes, which to a large extent depend upon the nature of demand.
From using sales volume as a measure of output then follows that average cost is identical to costs per unit of sales, i.e. a cost percentage, and to the extent scale economies persist, this cost percentage will decline with increased sales volume. However, such a relationship would be a mere trivial illustration of cost efficiencies, as it would capture mostly the effect of allocating fixed costs over a greater volume of “output”. Further, this brings the discussion back to the demand-side effect on sales, and underscores the difficulties to attribute differences in cost behavior between stores to “economies of scale”, visavi differences caused by dissimilar market opportunities (e.g. demand potential of the local market).
In the context of the present study the problematic issue of “output” visavi “scale” is pronounced, as treating “scale” as synonomous to “sales volume” would inject a conflict between the theoretical construct of “performance”, and the construct of “scale” as one of its proposed antecedents. Hence, for the purpose of the present study, the “output” concept will not be treated as synonomous to the concept of “scale of operation”. Instead, the latter will be incorporated as a derived concept from the theoretical construct store “capacity”, which is defined as the transactional capacity of a certain store in a given time period and market, which is assumed to be closely related to its physical size. To summarize: in the present study a supermarket’s “scale of operation” is derived from its transactional capacity, and defined in terms of its physical size:

- 39 -
Table 2.4.1 Construct of scale of operation in the present study.
Theoretical construct
Definition Derived construct
Definition
Store capacity The transactional capacity of a store in a certain time period and market.
Scale of operation The physical size of a store’s establishment.
It is recognized that such a “non-output” definition of “scale” conflicts
with the definition of “scale of operation” (cf. above). Applying capacity as a measure of scale, while defining output in terms of sales volume, alters the definition of economies of scale into “declining costs per unit of output with increased store capacity”. However, such a re-definition is not in controversy with how issues referring to “economies of scale on the retail store level” has been previously dealt with in scientific research, as will be seen in the review of previous research below.
2.4.2 Economies of scale on the retail store level Further aspects of the relationship between capacity and performance
refer to a question concerning the sources of economies of scale on the store level. Scholars have defined three general sources of economies of scale:
1. Product-specific economies, associated with the volume of any
single product made and sold. 2. Plant-specific economies, associated with the total output of any
entire plant or plant complex. 3. Multiplant economies, associated with a firm’s operation of
multiple plants. [Scherer and Ross (1989) p. 97] Scherer and Ross (1989) provide the following demarcations of these
sources. An essentially product-specific economy refers to the specialization and division of labor. This type of scale economies was pronounced already by Adam Smith; handling larger volumes of output of a certain product, workers can specialize, build up greater expertise, and carry out their tasks with greater effectiveness. Further, product-specific economies of scale have an important dynamic dimension, in the sense that when difficult labor
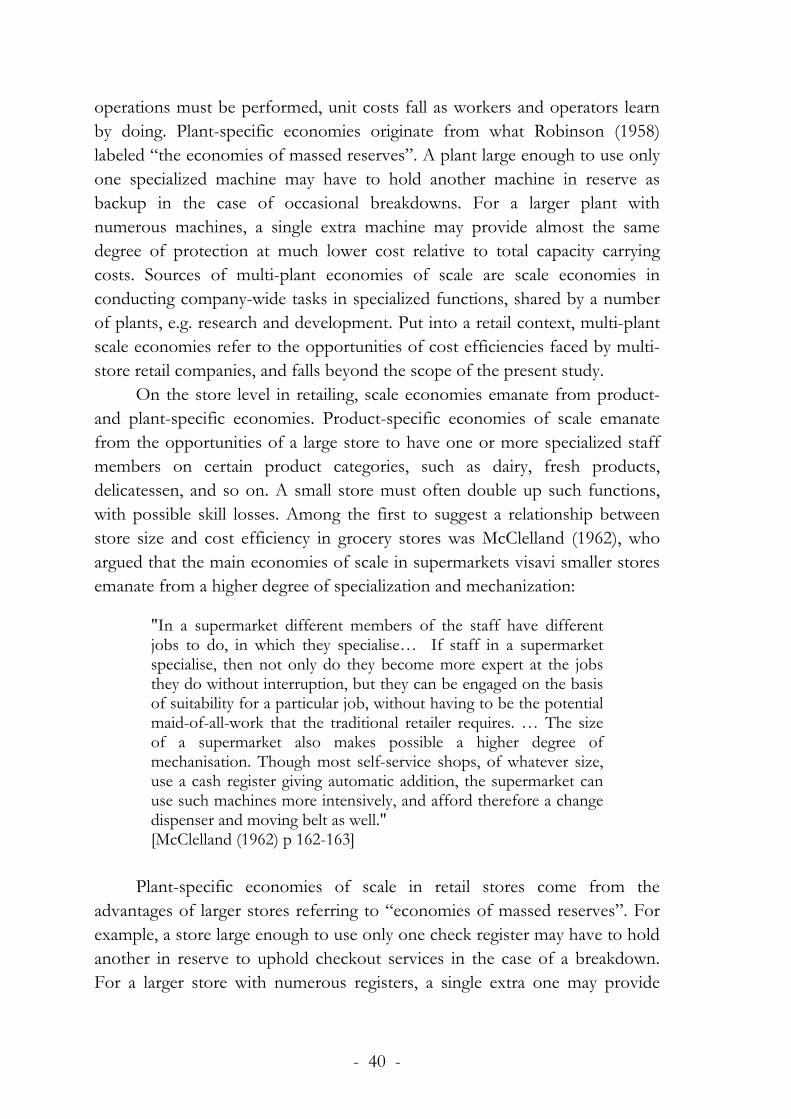
- 40 -
operations must be performed, unit costs fall as workers and operators learn by doing. Plant-specific economies originate from what Robinson (1958) labeled “the economies of massed reserves”. A plant large enough to use only one specialized machine may have to hold another machine in reserve as backup in the case of occasional breakdowns. For a larger plant with numerous machines, a single extra machine may provide almost the same degree of protection at much lower cost relative to total capacity carrying costs. Sources of multi-plant economies of scale are scale economies in conducting company-wide tasks in specialized functions, shared by a number of plants, e.g. research and development. Put into a retail context, multi-plant scale economies refer to the opportunities of cost efficiencies faced by multi-store retail companies, and falls beyond the scope of the present study.
On the store level in retailing, scale economies emanate from product- and plant-specific economies. Product-specific economies of scale emanate from the opportunities of a large store to have one or more specialized staff members on certain product categories, such as dairy, fresh products, delicatessen, and so on. A small store must often double up such functions, with possible skill losses. Among the first to suggest a relationship between store size and cost efficiency in grocery stores was McClelland (1962), who argued that the main economies of scale in supermarkets visavi smaller stores emanate from a higher degree of specialization and mechanization:
"In a supermarket different members of the staff have different jobs to do, in which they specialise… If staff in a supermarket specialise, then not only do they become more expert at the jobs they do without interruption, but they can be engaged on the basis of suitability for a particular job, without having to be the potential maid-of-all-work that the traditional retailer requires. … The size of a supermarket also makes possible a higher degree of mechanisation. Though most self-service shops, of whatever size, use a cash register giving automatic addition, the supermarket can use such machines more intensively, and afford therefore a change dispenser and moving belt as well." [McClelland (1962) p 162-163]
Plant-specific economies of scale in retail stores come from the
advantages of larger stores referring to “economies of massed reserves”. For example, a store large enough to use only one check register may have to hold another in reserve to uphold checkout services in the case of a breakdown. For a larger store with numerous registers, a single extra one may provide

- 41 -
almost the same degree of protection at much lower cost relative to total capacity carrying costs. Further, every store must carry some overhead costs. Within limits, cost savings may be realized by specializing overhead functions and spreading cost over a larger volume.
Ofer (1973) argued that retail stores enjoy economies of scale from three reasons. First, many retail activities contatin a fixed-cost element, and an increase in scale distributes this element over an increasing number of output units. Shaw et al (1989) emphasized the importance to divide such fixed-cost allocation effects between those occurring due to different levels of utilization of a store’s capacity (sales per square meter), and those occurring from different levels of store size (i.e. capacity), as the former are not economies of scale but have to be examined in order to be separated from the possible reductions in costs that are associated with larger store sizes.
Second, a retailer is confronted with uncertainty about the stream of shoppers and their specific demands. By the rule of large numbers, the cost of uncertainty per unit of output is reduced as scale increases (cf. “the economies of massed reserves” of Robinson 1958).
A third source of incrasing returns to scale, according to Ofer (1973), is the association between store size and size of transaction, since it is an observed fact that there are increasing returns on transaction size to stores and consumers (Hall et al. 1961; Schwartzmann 1969; Savitt 1975). This third factor depends partly on the demand for the services of various stores and only partly on the nature of “production” of these services, like the bringing of a wider merchandise mix into an individual store. It could be claimed that only the latter part of the increased transaction size should be included in the estimation of economies of scale. However, aside from the practical problem of separating out the two effects, Ofer (1973) pointed out that the demand side effect is similar to scale effects enjoyed by many industries due to larger “run” sizes which to a large extent depend upon the nature of demand.
2.4.3 To what extent does the scale of operation of supermarkets make a difference for their performance?
The question in the heading of this section relates to the relationship between capacity (scale of operation) and performance. One source of impact stems from the early recognition that the size of a store makes a difference for its “gravitation” on the environment. Reilly’s (1931) "law of retail gravitation" postulates that the gravitation of a certain store is increasing with its size and decreasing with the distance separating it from the consumer. Put into further

- 42 -
empirical context by subsequent researchers, size has been found a major determinant of market based performance on the store level (see section 2.5.4). The first hypothesis of the present study refers to an expected positive relationship between scale of operation of supermarkets and their market based performance:
H1: The scale of operation of a supermarket is positively related to its
market based performance.
Previous empirical studies of to what extent economies of scale prevail
on the store level of grocery retailing have primarily been concerned with how scale of operation in terms of either sales volume or “physical” size (floor area) are related to costs. Nooteboom (1982) analyzed empirically the costs on the retail store level in stores categorized into various "store types", defined as a "class of stores that are homogeneous with respect to assortment composition, service level, own production and mode of supply to the store" (p 163), and found store costs in general, and labor cost in particular, depending on the sales volume per store. For a particular store type, Nooteboom showed that costs on the store level could be accurately estimated according to a linear function with a positive intercept:
QC 10 αα += where C = store costs and Q = annual sales. In essence, thus, the proposition (along with empirical support) by Nooteboom is that stores have fixed costs, and that output (sales) increases store costs proportionally. The theoretical justification for the fixed cost component of the function, i.e. for the intercept α0, is that at a given opening time per year, the store must have at least one person and the required space of floor area available during that opening time, to achieve any level of sales at all, no matter how much of the time that person and space is occupied. The linear cost curve implies very pronounced economies of scale at the lower end of the scale as fixed costs are distributed over a larger volume of "output", while at the higher end of the scale they tend to fade away. In other words, small stores will benefit more in terms of efficiency and cost reductions from increases in output, compared to large stores. Thurik (1981) applied Nooteboom’s method to large scale French retailers and replicated the findings.

- 43 -
Aalto-Setälä (1999) argued that to the extent Nooteboom's underlying assumption is violated, i.e. to the extent stores are not homogeneous but rather differentiated with respect to characteristics such as, e.g. service and assortment, measurements of the cost structure based on aggretate sales may impose restrictions. Aalto-Setälä applied a hedonic cost function to data, in order to capture the effect of various store characteristics on store costs, i.e. a cost function of aggretate output and hedonic variables descibing the ”output mix”, in terms of store attributes. In his analysis, Aalto-Setälä incorporated measures of three store characteristics besides output (which was measued as "quantity sold", calculated as sales volume divided by a store-specific price index): (1) labour intensity (measued by dividing the number of working hours by sales volume), (2) cost of housing in the postal area where the store is located, and (3) product assortment (number of items offered out of a defined basket of 345 products). Aalto-Setälä's results showed the most powerful explanatory variables for total costs are quantity sold (Q). Further, Aalto-Setälä incorporated squared quantity of output (Q2) in the model, and uncovered that it entered the estimated model with a negative sign, indicating that increasing volumes of output raises the total costs of stores, but at a decreasing rate. Hence, the findings of Aalto-Setälä’s study contradict the Nooteboom’s proposition, i.e. that the cost structure of the stores is characterized by fixed costs plus constant marginal costs. Specifically, Aalto-Setälä's findings suggest that stores have decreasing marginal costs, and thus experience economies of scale from other reasons than merely the distibution of fixed costs over a larger volume. It should be noted that the stores comprised by the study encompassed a huge span between “small” and “large”.
Several studies have directed the attention to the relationship between the physical size of a store (e.g. square meters of floor area) and its costs, based on the hypothesis that larger stores benefit from economies of scale. Tilley and Hicks (1970) provided empirical evidence that "running costs" (toal costs excluding the cost of goods sold) per square meter decreases as selling area of a store increases
Ofer (1973) and Arndt and Olsen (1975) used gross margins and gross profit, respectively, as measure of output in their investigation of scale economies on the store level. Ofer (1973) examined three retail sectors and found evidence for increasing returns most apparent in the food sector. Arndt and Olsen (1975) found gross margin per employee increasing with store size, although there were implications from their results that labor productivity increased degressively with scale of operation. Stores in their sample were
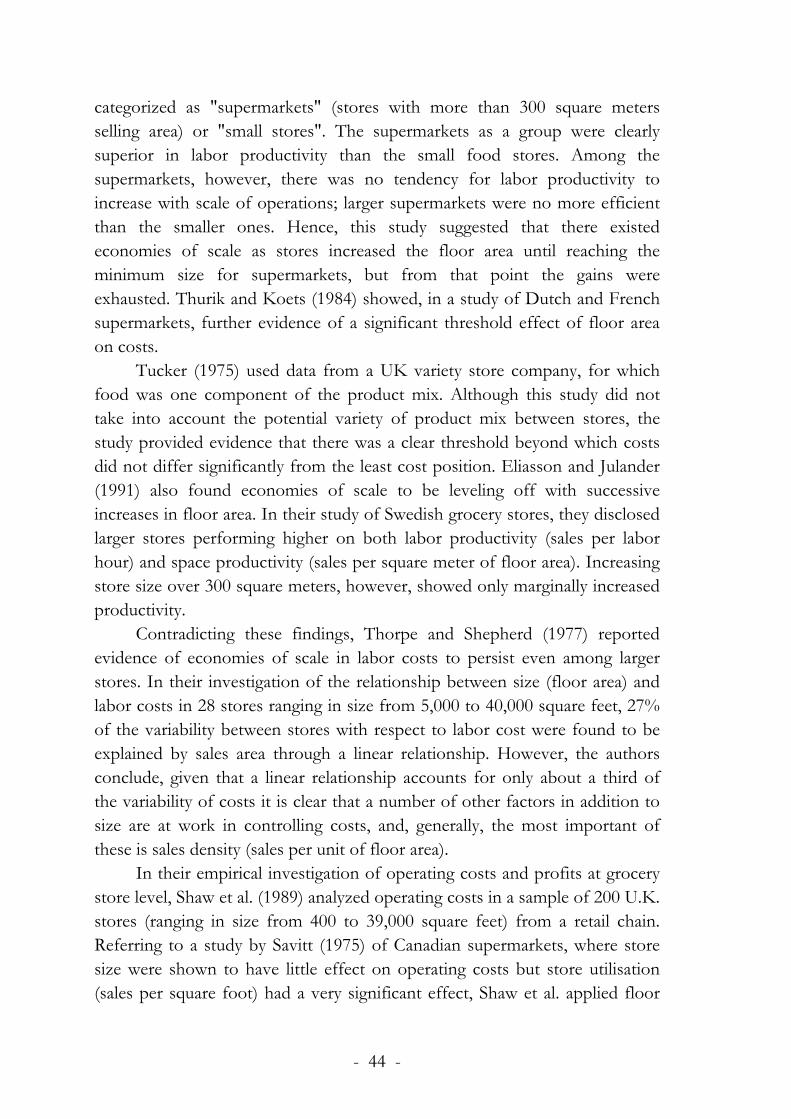
- 44 -
categorized as "supermarkets" (stores with more than 300 square meters selling area) or "small stores". The supermarkets as a group were clearly superior in labor productivity than the small food stores. Among the supermarkets, however, there was no tendency for labor productivity to increase with scale of operations; larger supermarkets were no more efficient than the smaller ones. Hence, this study suggested that there existed economies of scale as stores increased the floor area until reaching the minimum size for supermarkets, but from that point the gains were exhausted. Thurik and Koets (1984) showed, in a study of Dutch and French supermarkets, further evidence of a significant threshold effect of floor area on costs.
Tucker (1975) used data from a UK variety store company, for which food was one component of the product mix. Although this study did not take into account the potential variety of product mix between stores, the study provided evidence that there was a clear threshold beyond which costs did not differ significantly from the least cost position. Eliasson and Julander (1991) also found economies of scale to be leveling off with successive increases in floor area. In their study of Swedish grocery stores, they disclosed larger stores performing higher on both labor productivity (sales per labor hour) and space productivity (sales per square meter of floor area). Increasing store size over 300 square meters, however, showed only marginally increased productivity.
Contradicting these findings, Thorpe and Shepherd (1977) reported evidence of economies of scale in labor costs to persist even among larger stores. In their investigation of the relationship between size (floor area) and labor costs in 28 stores ranging in size from 5,000 to 40,000 square feet, 27% of the variability between stores with respect to labor cost were found to be explained by sales area through a linear relationship. However, the authors conclude, given that a linear relationship accounts for only about a third of the variability of costs it is clear that a number of other factors in addition to size are at work in controlling costs, and, generally, the most important of these is sales density (sales per unit of floor area).
In their empirical investigation of operating costs and profits at grocery store level, Shaw et al. (1989) analyzed operating costs in a sample of 200 U.K. stores (ranging in size from 400 to 39,000 square feet) from a retail chain. Referring to a study by Savitt (1975) of Canadian supermarkets, where store size were shown to have little effect on operating costs but store utilisation (sales per square foot) had a very significant effect, Shaw et al. applied floor

- 45 -
area and sales density (sales per square foot) as “scale” variables, and analyzed each for their relationship with store costs, gross profit, and net profit, all expressed as a percentages of sales. The area in which scale economies were most notably observed was labor cost (wages). Net profit margin was found positively related to both floor area and sales density. A quadratic specification of the independent variables provided indications of a shallow "U"-shaped relationship between scale and costs.; in terms of sales area the function turned upwards at 24,000 square feet.
A short-coming of many previous studies on scale economies on the store level in retailing is the absence of potentially cost affecting non-scale attributes in the analyses. This short-coming is explicitly recognized by Shaw et al. (1989):
“More research is needed on the way in which service levels and the provision of a variety of trading formats in large stores affects the economics of their operations. More research is needed to isolate the effects of store catchment areas from costs of operations for stores of different sizes.” [Shaw et al. (1989), p 25]
Non-scale attributes were incorporated in a study by Aalto-Setälä (2000).
In a study of 158 grocery stores, ranging in size from 100 to 20,000 sqm, in Finland, Aalto-Setälä analyzed empirically how store costs (measured as cost of goods sold plus labor cost) per "unit of sold quantity", where ”sold quantity” of a store is calculated as its sales volume divided by its price index, were related to physical size and non-scale variables. The estimated cost function in this study was:
TimeCentreLabourlnSizeAC 654321 ββββββ +++++= Kgroup
where lnSize is the logarithmic total space (floor area) of the store, Labour is the labour intensity of the store (working hours divided by “sold quantity) and is applied as a proxy of the service level in a store, Centre is a "city centre indicator" which equals one if the postal code of the store places it in the centre of the city and zero otherwise, Kgroup is a "chain affiliation" variable which equals one if the store belongs to the “retail group K” and zero otherwise, Time is a dummy variable denoting the year of observation (as observations were from two separate years, before and after the entrance of Finland into the European Union), and AC refers to the average cost of the

- 46 -
store. The costs comprised by this study were cost of goods sold and labor costs. Average costs were calculated as:
Quantity SoldcostsLabor plus groceriesinput ofCost Cost Average =
Estimates of the cost equation showed evidence of store-level scale
economies; increased floor area is related to lower average cost. Other variables affecting the average costs of the store are "labor intensity" and the "time indicator". High labor intensity raises the costs of the store; the time indicator showed that costs were 10% lower in 1995 than in 1994, while neither the city centre indicator (“likely due to cost data not including rental cost”) or the store group K indicator (“the size of the retail group does not affect the costs at store level”) had any impact on store costs.
Based on theory and previous research the overall expectation of the present study is to find economies of scale prevailing in supermarket operations. Increased scale is thus expected to induce an increase in labor productivity performance, and a decrease in average operating costs:
+(H2) Scale of
operation
Labor productivity
-(H3)
Average operating
cost
Fig. 2.4.1 Illustration of H2 and H3.

- 47 -
Formally stated, the hypotheses referring to the effect of scale of operation on productivity and operating costs are:
H2: The scale of operation of a supermarket is positively related to its
labor productivity performance.
H3: The scale of operation of a supermarket is negatively related to its average operating costs (i.e. operating costs%).
2.5 Store conduct
2.5.1 The role of retail store attributes in a performance context A major proposition of the present study is that the scale of a
supermarket, and the conditions of its local market make a difference for its performance. But, plausibly, these conditions are not the definite determinants of supermarket performance. If this would be the case, one would remain with an unreasonable proposition that only large supermarkets facing favorable market conditions would perform "better". Most certainly, there are other factors but capacity that refer to the store itself that makes a difference for its performance, i.e. factors referring to the conduct by which it is operated and presented to the market, and by which consumers perceive and experience the store.
In the present study, the marketing mix school of thought is adopted as a framework for depicting store conduct. That is, rather than in-store processes by which supermarkets are operated, conduct is depicted in terms of store attributes. As a first step, before moving on to a discussion of the marketing mix concept in a retail context, it is appropriate to reflect on the nature of store attributes in a store performance context. To what extent is it valid to consider store attributes as the factors that determine output and other aspects of economic performance? One way to approach this issue is to discuss the existence of a “production function” in retailing (Nooteboom 1980). To what extent is output (sales volume) and performance in a given retail store at a given time and market endogenous (determined by store attributes) or exogenous (determined by environmental factors)? In the latter case, performance would be “simply” an issue of minimizing costs. Indeed, one could argue that having chosen and implemented a certain marketing mix, the “output” (sales volume) is to a large extent determined by the conditions of the local environment in terms of consumers and competitors. In the short

- 48 -
run, a retailer is rarely faced with an opportunity to change the location of his (her) store, and profound changes in service levels and merchandise mix would be a case of implementing a new marketing mix. However, small adjustments in price, promotion, services and assortment are of course options also in the short run and such changes are likely to have effects on “output”. But is it valid to view this as a matter of “production”?
Hence, there emerges a discussion on to what extent it is relevant to incorporate the concept of “production function” at all in a discourse of retail store conduct and retail store performance. By definition, retail stores do not produce anything; they provide shopping opportunities for consumers. In manufacturing “labor”, “machines”, “raw material”, and “semi-manufactures” are inputs for a certain method of production, and as such determinants of the volume that is and can be produced. In retailing, the “inputs” that determine “output” in terms of sales volume are the consumers that choose to patronize the store. Store attributes (among which staff, merchandise and fixed assets are three) are merely “indirect causes” of output, as they bring about the overall offer of the store that is evaluated by the consumer.
Further, due to the nature of retail store “output” in terms of “extended products” (the addition of a bundle of services to physical products), a straight-forward application of the concept of a production function to the operations of retail stores becomes awkward as there is no homogeneity with respect to the “product” – no two stores offer the same marketing mix (at least, each store has a unique location).
Thus, although retail store conduct is partly a matter of efficiency, it is also, perhaps foremost, a matter of “effectiveness” in terms of bringing about “differentiation” in the local market. Put in another way, store conduct is a matter of “commercial” as well as “operational” efficiency (Nooteboom 1980). This is in contrast to the task of firms in the theoretical market of “perfect competition”, where firms are price takers by definition, and conduct is entirely a matter of “operational” efficiency. In the actual life of retailing, pricing is a difficult and complex challenge, and in the overall offer (the marketing mix) it constitutes only one attribute that is virtually impossible to vary independently.
A summary at this point puts one in a rather uncomfortable state of mind. On the one hand, environmental factors are expected to be among the determinants of performance, although not likely the definitive ones. On the other hand, store attributes are not analogous to production factors in manufacturing. So, where does that leave one for moving on to analyze store

- 49 -
performance as an effect of environmental factors and store factors? Are the determinants of store performance to be found in the environment, or are they to be found among intrinsic characteristics of the store itself?
The key to understand the determinants of store performance lies in interpreting store attributes as intervening factors between environmental conditions and store performance. Performance of supermarkets is thus not solely determined by either market conditions or store conduct. Rather, economic performance is established by the interplay of the two. Although market conditions may have a direct effect on performance (e.g. “cherry-picking” in markets with a high share of highly price- and promotion sensitive consumers), one must also recognize their indirect effect on performance, via store conduct. In other words, performance is directly influenced by market conditions and store conduct (attributes), which in turn are influenced by market conditions, that thus has an indirect effect on performance along with its direct effects. For instance, as will be seen in forthcoming sections, local competition and local demand characteristics makes a difference for store prices, and prices makes a difference for store performance.
In the present study, the conduct of supermarkets is expected to influence their performance in two ways; (1) conduct will have an impact on consumers’ store choice behavior and thus an effect on the volume of sales (“output”), and (2) conduct will have an effect on gross margin and costs.
Research on consumer store choice behavior and consumer patronage have shown that the frequency of customer patronage, and thus by extension store performance, is related to the attributes of stores. In a meta-analysis of 80 empirical studies of consumer patronage, Pan and Zinkhan (2006) found product selection reporting the highest average correlation with store choice, followed by service, quality, store atmosphere, low price levels, convenient location, fast checkout, convenient open hous, friendliness of sales-people, and convenient facilities. For frequent supermarket shoppers, Carpenter and Moore (2006) found the highest ranked store attributes to be cleanliness, product selection, price competitiveness, crowding, and courtesy of personnel. For occasional shoppers, parking facilities and ease of access were ranked as 4th and 5th most important attributes.
Seiders and Tigert (2000) found location and product quality to be important attributes for supermarket shoppers in their patronage decisions. Promotion frequency of stores have further been dosclosed influencing consumers’ store choice behavior (Fox et al. 2004). In a study of the Danish grocery retailing industry, Hansen and Solgaard (2004) showed product

- 50 -
assortment as the most influential variable, followed by price level and location. These findings are in line with what was found by Baltas and Papastathopoulu (2003) in a study of the Greek grocery retailing sector, reporting assortment, quality, store brands, and location as the main attributes affecting consumers’ patronage behavior.
According to Engel et al (1995), consumer store choice behavior is a matter of a comparison process, by which salient store attributes of various stores are evaluated both separately, and jointly in terms of an overall perception of store image (see figure 2.5.1).
The better the match between evaluative criteria of consumers and their perception of store characteristics, the more likely are consumers to patronize the store, experience customer satisfaction and develop loyalties towards the store, and, by extension, the better is store performance. For instance, Gomez et al (2004) found customers’ perception of attributes related to customer satisfaction, and customer satisfaction related to sales performance. Hence, at this stage it is reasonable to recognize that scale and local market conditions may not be the sole, or even the "primary", determinants of store performance.
Evaluative criteria
1. Location 2. Assortment 3. Price 4. Promotion 5. Store personnel 6. Services 7. Other
Perceived charac-teristics of stores: 1. Location 2. Assortment 3. Price 4. Promotion 5. Store personnel 6. Services 7. Other
Comparison process
Acceptable stores Unacceptable stores
Fig. 2.5.1 Consumers’ store choice process as a funcion of salient factors (Engel et al. 1995)

- 51 -
Although the process by which consumers choose among alternative retail stores is complex, one step involves selecting the desired quality of shopping (Ghosh and McLafferty 1987). The attributes of merchandise quality, service level (in a broad sese of the word, encompassing availability, accessibility and other micro-site characteristics of location), and atmosphere, put together, may be viewed holistically as the “quality of shopping experience” offered at a store, or the “attractiveness” of a store. In combination with the price level, the quality of shopping experience brings about the “value” of a store’s offer, in the eyes of the consumer. The value a consumer receives from shopping at a particular store is thus determined jointly by the quality of the shopping experience and price (Ghosh and McLafferty 1987). The hypothetical “value line” in fig. 2.5.2 below portrays different combinations of price and quality that provide the same value to consumers.
Thus, price is an important factor for consumers’ perceived value of a
store, but it is not the one and only factor. Rather, it is the combination of high/low prices vs. high/low non-price factors that determines consumers’ perception of value. Further, many retailers do not use price as a basis for achieving a sustainable competitive advantage because it is too easy for competitors to copy a low-price strategy (Levy et al. 2004).
In other words, the very origin of a supermarket’s economic performance is its ability to bring about an offer in terms of products and services (in a broad sense of the word, including location), that induces exchanges with consumers and provides revenues through their payments.
Value line
Quality of shopping
experience
Price
Figure 2.5.2 The value of a store is a function of price and quality of shopping experience.

- 52 -
The economic results will depend on to what extent the amount gained from these payments, i.e. the sales volume, exceeds the costs for bringing about the offer.
2.5.2 The marketing mix on the retail store level As stated above, the marketing mix school of thought is adopted for
depicting store conduct in the present study. The concept of the marketing mix is one of the core anchors of marketing, first introduced by Neil Borden in his presidential address to the AMA in 1953 (van Waterschoot and van den Bulte 1992). Although various scholars have suggested various schemata for its conceptualization, the term "marketing mix" is generally accepted as referring to some mixture of elements useful for a seller in pursuing a certain market response. To facilitate practical application of the concept to concrete operating problems, early followers of Borden suggested various categorizations of the large number of potential ingredients of the marketing mix (e.g. Frey 1956, 1961; McCarthy 1960; Lazer and Kelly 1961; Borden 1964). Of the many suggestions put by advocates of the marketing mix, the most well-known is McCarthy's (1960), which has become the most cited and the most often used classification system for the marketing mix, both in marketing literature and in marketing practices (van Waterschoot and van den Bulte 1992). McCarthy “invented” the four P:s of marketing, in distinguishing between four categories of marketing mix elements: Product, Price, Place and Promotion.
In a retail context, the original 4P classification by McCarthy is used (with some modifications) by Lewison and DeLozier (1986), Davies and Brooks (1989) and Bolen (1988), although generally researchers in the retail field of marketing has found the 4P’s formula associated with limitations, primarily due to arguments relying on the “service character” of retail output (Douglas 1962; Achabal et al. 1984). Indeed, the lack of clarity as to what should be considered as potential elements or classes of elements in the marketing mix is reflected in writings on retailing (Davies and Liu 1995). As a consequence, additional factors have been proposed to extend the original classification (e.g., Magrath 1986; Grönroos 1990; Collier 1991; Ellis and Mosher 1993), or even to reconceptualize the mix (Beaven and Scotti 1990), usually under the term "retail marketing mix" or "retail mix". These efforts have produced more or less extended versions of the 4P’s: Piercy (1988) attempted to produce a classification based on empirical evidence and suggested four groupings of activities: Product and Pricing Policy, Marketing

- 53 -
Services, Corporate Strategy and Marketing Communications, while Greenley and Shipley (1992) list sixteen elements in their retail marketing mix. As one goes through definitions in various retailing textbooks there is strikingly little consensus on the topic. Store atmosphere or store design has been suggested as an addition to the basic classification by Walters and White (1987), O'Brien and Harris (1991) and Ghosh (1992). Others suggest the grouping together of elements into a small number of sub-mixes, particularly goods and services, and communications (Kelley and Lazer 1967; Samli 1989).
Based on arguments that there are five major ways in which a store can differentiate itself from other retailers in the marketplace, Tigert et al. (1988), and Ring and Tigert (1995) used a “Pentagon” to illustrate the retail mix with one corner representing each element. The corners are labeled value (price and quality), people (service, knowledge, climate), communication (promotion, positioning), place (location, size, layout/design) and product (intensity, assortment and style/fashion).
In Table 2.5.2 below, a list of a selection of propositions of retail mix elements is summarized. For the purposes of the present study, store conduct is conceptualized by its retail mix in terms of its “location”, “price level”, “merchandise variety”, “service level”, and “promotion level”. Location is further depicted by “accessibility” and “cluster location” (see Table 2.5.1). As can be seen from the previous discussion and Table 2.5.2, this conceptualization closely follows an “average” of previous suggestions in the retailing literature.
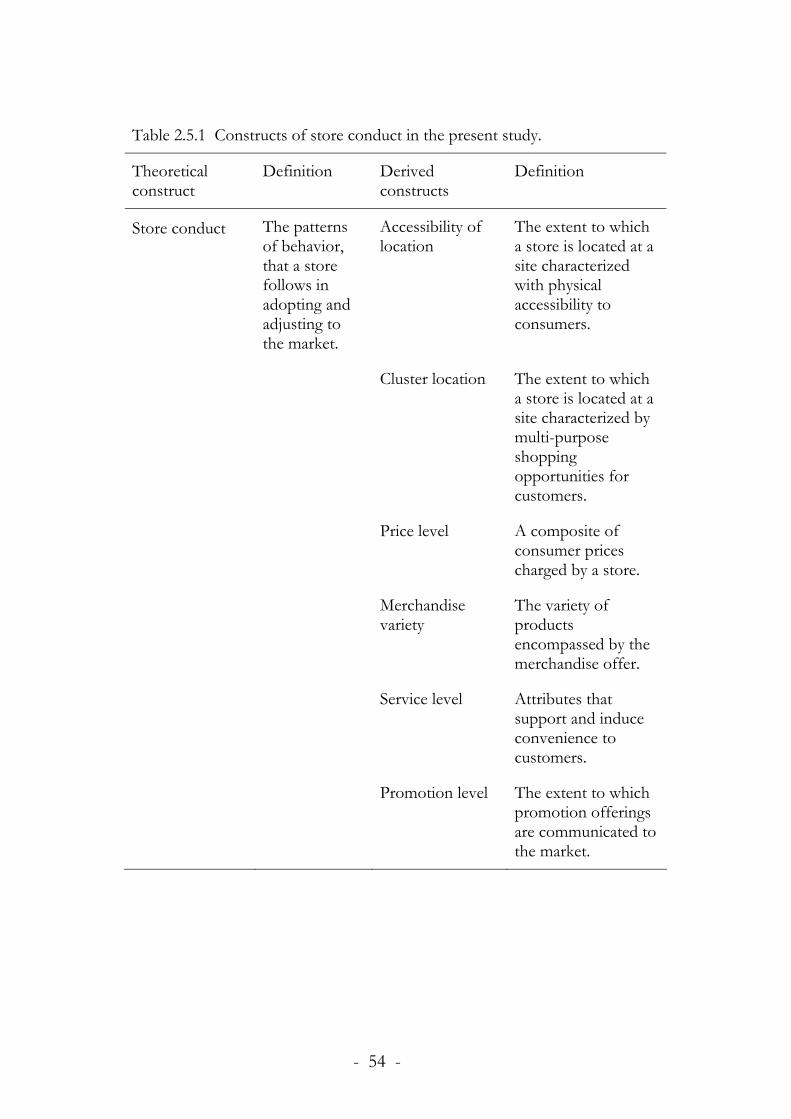
- 54 -
Table 2.5.1 Constructs of store conduct in the present study.
Theoretical construct
Definition Derived constructs
Definition
Store conduct The patterns of behavior, that a store follows in adopting and adjusting to the market.
Accessibility of location
The extent to which a store is located at a site characterized with physical accessibility to consumers.
Cluster location The extent to which a store is located at a site characterized by multi-purpose shopping opportunities for customers.
Price level A composite of consumer prices charged by a store.
Merchandise variety
The variety of products encompassed by the merchandise offer.
Service level Attributes that support and induce convenience to customers.
Promotion level The extent to which promotion offerings are communicated to the market.

- 55
-
Tabl
e 2.
5.2
Var
ious
pro
posit
ions
of e
lemen
ts o
f the
reta
il m
ix.
Berm
an a
nd E
vans
(2
006)
M
cGol
drick
(200
2)
Levy
and
Weit
z (2
001)
D
unne
and
Lus
ch (1
999)
Gho
sh (1
992)
1. S
tore
loca
tion
1. L
ocat
ion
1. L
ocat
ion
1. M
erch
andi
se
1. L
ocat
ion
2. O
pera
ting
proc
edur
es
2. P
rodu
ct se
lectio
n 2.
Mer
chan
dise
A
ssor
tmen
t 2.
Pric
e 2.
Mer
chan
dise
3. G
oods
/ser
vice
s of
fere
d 3.
Ret
ailer
’s ow
n br
ands
3.
Pric
ing
3. A
dver
tisin
g an
d Pr
omot
ion
3. S
tore
atm
osph
ere
4. P
ricin
g ta
ctics
4.
Ret
ail p
ricin
g 4.
Adv
ertis
ing
and
prom
otio
n 4.
Cus
tom
er se
rvice
s 4.
Cus
tom
er se
rvice
5. S
tore
atm
osph
ere
5. A
dver
tisin
g an
d pr
omot
ion
5. S
tore
des
ign
and
disp
lay
5. L
ocat
ion
5. P
rice
6. C
usto
mer
serv
ices
6. S
ellin
g en
viro
nmen
t 6.
Cus
tom
er se
rvice
6.
Sto
re la
yout
and
de
sign
6. A
dver
tisin
g
7. P
rom
otio
n 7.
Ret
ail se
rvice
7.
Per
sona
l sell
ing
8. S
ales i
ncen
tive
prog
ram
s

- 56 -
2.5.3 To what extent does the scale of operation of supermarkets make a difference for their conduct?
Aside a categorization of retail mix elements based on what aspects of conduct they refer to (as in Tables 2.5.1 and 2.5.2), retail mix elements can be distiguished through a broad categorization of “strategic”, long-term elements (e.g. location and physical size), that are typically decided upon at the time of establishment of the store, and more "operational", short-term, elements such as price, promotion, and certain service attributes, like open hours (Hise et al. 1983).
Based on such a broad categorization, there follows the question if – and if so, to what extent – short-term attributes of a supermarket are related to characteristics of its long-term attributes. Cotterill (1986, 1999), for instance, found supermarket prices following in a "U"-shaped manner, with prices decreasing up to a store size of 13,600 square feet and 36,700 square feet, respectively. Cotterill interpreted the "U"-shaped findings in terms of opportunities of "enterprise differentiation", with small stores being able to pass on their higher costs to consumers due to – possibly – more convenient locations, and large stores being able to differentiate themselves in the product dimension and thus enable them to exert market power.
Such a negative relationship between store size and prices was also found in a comprehensive price study of Swedish grocery stores by Asplund and Friberg (2002). In this study, prices were found systematically related to various store formats; compared to other formats "discount stores", "hypermarkets" and "large supermarkets" set prices significantly lower. Similar “format effect” on prices was found by Marion (1998).
Aalto-Setälä (2002) showed further evidence on the interplay between store size and short-term conduct. In an estimation of a price mark-up function (P=MC+markup, where MC is marginal cost), Aalto-Setälä found large stores conducting higher markups than small ones. However, Aalto-Setälä emphasized that although the markup increase with store size, prices are not higher in large stores; store size has a negative effect on marginal cost that is larger than the positive effect on markup.
A proposition of the present study is that decisions on the location and capacity of a supermarket constitutes prerequisites for decisions on many of its short-term attributes. The decision on where to locate the supermarket will, per definition, be a decision on in what local environment the store will compete, and the influences of this decision on short-term attributes are as
- 57 -
such partly incorporated in questions on how local market structure affect the retail mix. However, the location decision also comprise decisions referring to store size as well as micro-site considerations, such as the accessibility of the store (e.g. parking places) and clustering with other retail facilities that do not constitute primary competition.
In the present study prices are hypothesised to be negatively related to scale of operation, as cost efficiencies from increased scale makes feasible an upholding of profits at lower prices. In other words, it is expected that at least a part of the cost savings from scale economies is passed on to consumers.
The capacity of a store is strongly related to the size of investment required for its establishment, and consequently to the risk involved and plausibly perceived by the retailer. Further, the capacity provides the physical prerequisites (and constraints) for the merchandise- and service offer. Hence, it seems reasonable to assume that a supermarket’s capacity in terms of its "long-term" physical size will affect its "short-term" attributes. Eliasson and Julander (1991) argued:
“The size of the store was expected to be a factor that has a positive effect on assortment, on level of technology, consumer service level (measured as the presence of deli counter, fresh seafood department, in-store bakery etc.) and so on. The model states that the larger the store, the wider and deeper the assortment and the higher the consumer service level in terms of special departments and so on. … Large stores should operate longer hours because they have a greater need to utilize their extensive sales space and equipment.” [Eliasson and Julander (1991), p. 94]
Thus, aside a relationship with price, scale is also expected to be related
to non-price elements of the retail mix. The larger the scale, the larger the investment, and the greater the incentives for a retailer to implement “more” on non-price attributes, in order to “protect” the larger investment. Price level is expected to decrease, while merchandise variety, service level, and promotion level are expected to decrease with scale of operation:

- 58 -
Formally stated the hypothesised relationships between scale and
conduct are: H4: The scale of operation of a supermarket is…
H4a: … negatively related to its price level.
H4b: … positively related to its merchandise variety.
H4c: … positively related to its service level.
H4d: … positively related to its promotion level.
H4b+
H4c +
H4d+
H4a-
Scale of operation
Service level
Promotion level
Merchandise variety
Price level
Fig. 2.5.3 Illustration of H4.

- 59 -
2.5.4 To what extent does the conduct of supermarkets make a difference for their performance?
This section addresses the question about the effects of store attributes on store performance. The notion that attractiveness of retail establishments makes a difference is key to Reilly's (1931) "law of retail gravitation", postulating that the gravitation (or “attractiveness”) of a certain center is increasing with its size and decreasing with the distance separating it from the consumer; the trade area boundary between two retail centers is determined by the distance separating the two centers and their relative sizes. Reilly's work is the precursor of the development of models usually referred to as "gravity models", which are the most widely used types of spatial interaction models (Marjanen 1993). Reilly's work was the first to explicitly recognize that consumers trade off the cost of travel with the attractiveness of alternative shopping opportunities. The model has been put into further empirical context by Converse (1949) and Huff (1962, 1964) and developed, in the sense of allowing for more attributes but “size” to be embraced by the “attractiveness” component, through propositions of consumer utility functions including both locational and non-locational factors (e.g. Nakanishi and Cooper 1974; Stanley and Sewall 1976; Achabal, Gorr and Mahajan 1982).
The underlying argument for these proposed models are that consumers rate alternatives on the basis of their evaluation of the total utility of stores, and not solely on their location. The underlying consumer utility function for retail stores in spatial interaction models typically has the following general form (Ghosh and McLafferty 1987):
βα −•= ijjij DAU
where Uij is the utility of store j to consumer i, Aj is a measure of the attractiveness of store j, Dij is the distance separating store j from consumer i, and α and β are parameters that reflect the consumer's sensitivity to store attraction and distance, respectively. Since utility decreases as distance to the store increases, the parameter β has a negative sign. The negative impact of distance, however, can be compensated for by enhanced store attractiveness based on such factors as store image, merchandise mix, service etc.
Huff (1962, 1964) was the first to suggest that market areas are complex, continuous and probabilistic, rather than non-overlapping geometrical areas. As his major argument, Huff put forward that consumers residing in an area

- 60 -
harboring more than one store will choose to patronize several stores rather than single out one for all their purchases. The Huff model opened up the interpretation of "attractiveness" and allowed it to be treated as an independent variable that could be estimated in its own right.
For the objectives of the present study, previous studies on the association between store performance and store attributes are collected from research usually entitled "store location research" and "store assessment research". Store location studies are concerned with developing models for predicting the sales volume and/or market share to be achieved by a new store at a particular location, planned to be equipped by certain attributes. Store assessment research, in contrast, is oriented towards an evaluation of existing branch stores held by a company. Store assessment research may be seen as an extension of store location research to the extent that it draws upon many of the same research methodologies and techniques, except that these are applied retrospectively rather than in a future context (Rogers 1984).
Stanley and Sewall (1976) explicitly investigated the impact of store image on store performance. Images were measured by asking shoppers about the similarity-dissimilarity of pairs of supermaket chains, and by comparing actual chains to a chain perceived as "ideal" by the shopper. The inclusion of the image measure, along with store size (floor space) and geographic distance between the store and consumers' residential area, increased the model's ability to explain variations in consumer patronage behavior. However, the authors concluded that distance remained the major factor in predicting consumers' store choice.
Jain and Mahajan (1979) estimated an empirical market share model based on locational- and non-locational attributes of eighteen supermarkets in a U.S. metropolitan area. The particular supermarket characteristics considered included consumer evaluations of image, appearance, price, and service level, as well as objective measures like the number of checkout counters, employee composition, location at an intersection, and availability of credit card services as components of the utility function. The supermarkets under study were found to predominantly differ in terms of: (1) location at intersection, (2) sales area, (3) credit card service, and (4) number of checkout counters. Market shares of supermarkets were found to relate positively each of these five attributes, and negatively related to distance.
Cottrell (1973) reported results of an investigation based on a sample of 37 supermarkets, randomly selected from a chain operating a total of 800 stores. In this study, sales performance was related to a number of in-store

- 61 -
factors, and local market factors. The results showed sales per square meter significantly related to store size (floor area), price level, and number of checkouts.
The gravitation of local centers were explicitly incorporated in a study by Morphet (1991), who assigned a numerical "order" to each local urban area under study, by setting it equal to the number of grocery stores found within it. Based on the order of the urban area and the order of the neares urban area of higher order, two variables "Distance to nearest center of higher order", and "PULL" (relating the order of the urban area to the order of the nearest area of higher order). The analyses showed that the longer the distance to the nearest located area of higher order, the higher the sales volume of a store; and the smaller the relative order of a market area, the lower the sales volume.
In a study by Reinartz and Kumar (1999), socio-economic status of households and demand potential of local markets, along with store attractiveness, were analyzed for their relationship with the performance of 595 U.S. grocery stores. In this study, five variables were applied to depict store attractiveness: (1) degree of grocery scrambling (i.e. a count of all existing grocery scrambling features, such as bakery, gourmet coffee, breakfast bar), (2) degree of non-grocery scrambling (all hardware scrambling, such as automotive, film processing, sporting goods, and video department), (3) newness of store (dummy variable), (4) open for 24 hours (dummy), and (5) offering of double couponing (doubling the value of manufacturers' coupons). The results from a structural equation modeling of data support the notion that a store's attractiveness has a positive impact on its sales volume. Productivity performance (sales per square foot of floor area), however, was uncovered negatively related to store attractiveness. The authors’ interpretation of these findings was that “marginal returns on successively more and better offerings” are negative.
Kumar and Karande (2000) found convenience, promotion intensity, and availability positively related with sales and productivity.. In their study, the impact of five in-store factors – checkouts, double couponing, open 24 hours, assortment depth, and in-store banking services – were analyzed for their influence on sales volume. All five were found positively related to sales volume. Three of the five (checkouts, double couponing and open 24 hours) were also found positively related to sales per square foot, while assortment depth and in-store banking were negatively related to sales per square foot. Market based performance was thus found positively related to all factors, while productivity performance was found positively related to more

- 62 -
convenience (checkouts per square feet of selling area), more intense promotion (double couponing), and higher availability (open 24 hours), while negatively related to assortment depth (number of non-grocery products offered) and add-on services (in-store banking).
In a comprehensive study of productivity in grocery stores, Eliasson and Julander (1991) studied the determinants of sales per square meter in 7,710 Swedish grocery stores. Store size (measured by sales and square meters jointly), availability (open hours), and service level (presence of deli counters and in-store bakery) were all found positively related to space productivity (sales per square meter).
Hise et al. (1983) conducted a study of 132 (non-food) retail chain store units. Eighteen independent variables covering four proposed major areas of performance determinants – store characteristics, competition, location, and store management – were used to predict three performance measures: sales volume, contribution income (gross margin less direct expenses), and return on assets. Sales volume was found most strongly related to store characteristics: three out of four variables significantly related to sales adhered to the group of store characteristics variables. Contribution income and return on assets were found positively related to inventory level, number of employees and experience of store management, while negatively related to competition.
After having reviewed the previous studies above, one’s overall impression is that attractiveness of a store is positively related to market based performance. Stores offering “more” through their retail mix attract more consumers, and thus achieve higher market based performance. However, the answer to a question on to what extent enhanced attractiveness relates to higher profit performance remains open, as previous empirical studies suffer from a lack of cost data. With one exception (Hise et al. 1983) the dependent variable of previous research has been some measure of market based performance, or productivity performance.
The apparent unavailability of cost data on the store level to researchers is further reflected in the application of “proxies” for store costs in empirical studies. For instance, Lamm (1981) applied regional wage rate data and producer price indexes for “finished consumer goods” as proxies for store costs, while Binkley and Connor (1998) used data on cost of rental housing in the metro area of stores along with average retail wage cost, all captured from secondary data on the metropolitan area level.

- 63 -
Thus, a remaining question after a review of previous research refers to the influence of store attributes on costs and profits. Offering "more" in order to enhance attractiveness is likely to increase the costs for operating the store, although there is limited empirical findings on to what extent this is the case. For instance, high service levels may attract more consumers and thus positively relate to sales volume, but to the extent higher service requires more labor hours, the effect on labor productivity and labor cost (as a percentage of sales) is equivocal; lower prices may yield higher performance in terms of sales and market share, but other things equal, lower prices will reduce gross margin, and the effect on profitability would depend on the relative impact of the price reduction on sales and gross margin, respectively; a wider assortment may meet with more needs and wants of consumers, and increase the sales per shopper and thus sales volume, but productivity in terms of sales per inventory may decline.
Another aspect of the “attractiveness” of a supermarket goes beyond the attributes of its own, and refers to “micro-site” attributes of its location. In the case there are more stores located at the site of a supermarket’s location, there may be an enhanced propensity for consumers to patronize it, due to an enhanced attractivity of the “center” constituted by several stores. Such joint location of several stores that are not direct competitors is in the forthcoming referred to as “cluster location” and supermarkets being “cluster located” are expected to benefit from the joint attractiveness of the cluster of stores.
The main source of competitive advantage from a cluster location stems from the opportunities it provides for consumers to carry out “one-stop shopping”. Consumers, and by extenstion supermarkets, benefit from clustered locations, because consumers may reduce the travel and search costs for satisfying different needs and wants, beyond the need for groceries (Ghosh 1986; Ghosh and McLafferty 1987). Such multipurpose shopping introduces scale economies on the consumer side, through reduced travel costs and therefore rationally becomes part of households’ shopping behavior (Vandell and Carter 1993). Clustering provides opportunities for shoppers to economize on the amount of time spent shopping, by making multi-purpose shopping trips, combining purchases for different product categories and reducing the number of trips at a particular time period (Leszczyc et al. 2004).
In other words, opportunities of multipurpose shopping in a market may reduce demand for supermarkets at non-clustered locations because of

- 64 -
time savings and reduced overall consumer transportation costs from multipurpose shopping.
Based on theory and previous research, the overall expectation of the present study is that the retail mix of a supermarket makes a difference for its performance. The overriding hypothesis is that by setting lower prices and/or offering "more" on non-price attributes, a supermarket's attractiveness is enhanced. Attractiveness is exptected to be positively related to market based performance:
The formal hypotheses referring to the effect of conduct on market
based performance are stated as: H5: The price level of a supermarket is negatively related to its market
based performance.
H6+
H7+
H8+
H5-
Service level
Promotion level
Merchandise variety
Price level
Market based perf-orrmance
Fig. 2.5.4 Illustration of H5, H6. H7, and H8.

- 65 -
H6: The merchandise variety of a supermarket is positively related to its market based performance.
H7: The service level of a supermarket is positively related to its market based performance.
H8: The promotion level of a supermarket is positively related to its market based performance.
The effects of prices, service level, and promotion level on market based
performance is expected to translate into inventory productivity. However, merchandise variety is expected to be negatively related to inventory productivity, as merchandise variety is expected to be brought about by subsequential adding of slower moving products:
-(H10)
+(H11)
+(H12)
-(H9)
Service level
Promotion level
Merchandise variety
Price level
Inventory productivity
Fig. 2.5.5 Illustration of H9, H10. H11, and H12.

- 66 -
The formal hypotheses are stated as: H9: The price level of a supermarket is negatively related to its inventory
productivity performance.
H10: The merchandise variety of a supermarket is negatively related to its inventory productivity performance.
H11: The service level of a supermarket is positively related to its inventory productivity performance.
H12: The promotion level of a supermarket is positively related to its inventory productivity performance.
In the short term, the physical space of a supermarket is constant and
the effect of conduct on market based performance is expected to translate into higher space productivity:
H14 +
H15+
H16+
H13-
Service level
Promotion level
Merchandise variety
Price level
Space productivity
Fig. 2.5.6 Illustration of H13, H14. H15, and H16

- 67 -
Formally stated: H13: The price level of a supermarket is negatively related to its space
productivity performance..
H14: The merchandise variety of a supermarket is positively related to its space productivity performance.
H15: The service level of a supermarket is positively related to its space productivity performance.
H16: The promotion level of a supermarket is positively related to its space productivitiy performance.
The effects of prices and promotion on market based performance is
expected to translate into labor productivity, as the level of these attributes are virtually unrelated to input volume of labor hours. Furthermore, as lower prices is associated with lower profit margins (other things equal), price conduct is expected to go “hand-in-hand” with the “discipline” by which daily operations are carried out. Thus, lower prices are expected to bring about more “discipline” and by extension higher labor productivity.
The hypotheses are formally stated as: H17: The price level of a supermarket is negatively related to its labor
productivity performance.
H18: The promotion level of a supermarket is positively related to its labor productivity performance.
+(H18)
-(H17)
Promotion level
Price level
Labor productivity
Fig. 2.5.7 Illustration of H17 and H18.

- 68 -
The variety of the merchandise offer, and the level of service are less
“virtually unrelated” to the input volume of labor hours. A greater variety requires more time for tasks in association with ordering and delivery, and a higher service level (e.g. personal selling, longer open hours, add-on services) is generally related to the number of labor hours. Hence, the effect of these attributes on labor productivity will depend on their differential effect on market based performance (“output”) and labor hours:
The influence of conduct on financial performance is expected to work
through a complex network of effects. First, the price level is expected to be related to average gross profit (gross margin%). Given the purchase prices for acquiring the merchandise, the level of consumer prices will have an immediate effect on gross margin%. This immediate effect does not, however, fully explain the effect of prices on gross margin%, as there are other antecedents of this particular performance item, foremost the cost of wastage. The amount of wastage is expected to be related to the rate of turnover in inventory (i.e. inventory productivity); the higher the rate of turnover, the smaller the amount of wastage.
Hence, the effect of prices on gross margin% goes in yet another direction besides its “immediate” effect, namely through its effect on market based performance and inventory productivity. Prices will have a positive
-
++
+ Labor hours
Market based perf.
Merchandise variety
Service level
Labor productivity
Fig. 2.5.8 Illustration of expected effects of merchandise variety and service level on labor productivity.

- 69 -
effect on gross margin if the “immediate” effect is not offset by the effects of higher prices on inventory productivity:
Thus, the effect of prices on average gross profit is equivocal. However,
in a fast moving product industry like grocery retailing, where the turnover rate in inventory is high by nature, the indirect effect of prices on gross margin, via inventory productivity, is expected to be of less magnitude compared to the direct effect of prices on gross margin. Thus the hypothesis is that the price level of a supermarket is positively related to its average gross profit.
The hypotheses referring to the effect of merchandise variety, service level, and promotion level on inventory productivity are expected to translate into effects on average gross profits (gross margin%). Merchandise variety is thus exprected to be negatively related to gross margin, while service level and promotion level are expected to be positively related. It should, however, be explicitly noted that these hypotheses implicitly rely on assumptions (1) that the gross margin% of the merchandise comprised by the extension of the variety corresponds to the average gross margin%, (2) that the price level is unrelated to the levels of service and promotion.
The figure below summarizes the hypotheses referring to conduct and average gross profit:
- +
+Inventory
productivity Average
gross profit
Price level
Fig. 2.5.9 Illustration of expected effects of price level on average gross profit.

- 70 -
The formal hypotheses of effects from conduct on gross margins of
supermarket, thus, are: H19: The price level of a supermarket is positively related to its average
gross profit performance (i.e. gross margin%).
H20: The merchandise variety of a supermarket is negatively related to its average gross profit performance (i.e. gross margin%).
H21: The service level of a supermarket is positively related to its average gross profit performance (i.e. gross margin%).
H22: The promotion level of a supermarket is positively related to its average gross profit performance (i.e. gross margin%).
The relationships between a supermarket’s conduct and its cost
performance is equivocal. Although the expectation of the present study is that offering “more” is associated with more costs, it does not necessarily imply higher average costs. The reasons for this lie in the expected effect of conduct on productivity, and an expectation that higher space productivity
H20 -
H21 +
H22 +
-
H19+
+Inventory
productivity Average
gross profit
Price level
Service level
Promotion level
Merchandise variety
Fig. 2.5.10 Illustration of H19, H20, H21, and H22.

- 71 -
and labor productivity is associated with lower average costs. Labor cost constitutes a major part of the cost structure of grocery retailing on the store level, and labor productivity is expected to play an important role for operating costs. Higher space productivity is expected to be negatively related to (average) operating costs, as fixed costs of a store are allocated over a larger volume of sales with increasing space productivity:
The effects of various aspects of conduct on costs will thus depend on
the differential effect on absolute costs, market based performance, and productivity.
Higher prices are expected to be associated with higher average operating costs, as higher prices are expected to be associated with lower productivity performance. Prices are expected to have a negative relationship with “output” (cf. above), and in combination with introducing “slack” in operations (lower prices are expected to be associated with lower gross margin, calling for more “discipline” in daily routines) thus induce lower space productivity, and labor productivity. As space- and labor productivity is expected to be negatively related to costs, the price level is expected to be positively related to average operating costs. The price level of a supermarket is thus expected to be positively related to its average cost performance:
H23: The price level of a supermarket is positively related to its average
cost performance (i.e. operating costs%).
-
-
Space productivity
Average operating
cost
Labor productivity
Fig. 2.5.11 Illustration of expected effects of space productivity and labor productivity on average operating costs.

- 72 -
The effects of merchandise variety, service level, and promotion level on
average operating costs will depend on the differential effect of these attributes on productivity on the one side, and the costs of bringing them about on the other.
- (H17)
- (H13) -
-Labor productivity
Average operating
cost
Space productivity
Price level
Fig. 2.5.12 Illustration of H23.
+ +
+/-
+ -
-
Labor productivity
Average operating
cost
Space productivity
Service level
Promotion level
Merchandise variety
Volume of costs
Fig. 2.5.13 Illustration of expected effects of merchandise variety, service level, and promotion level on average operating cost.
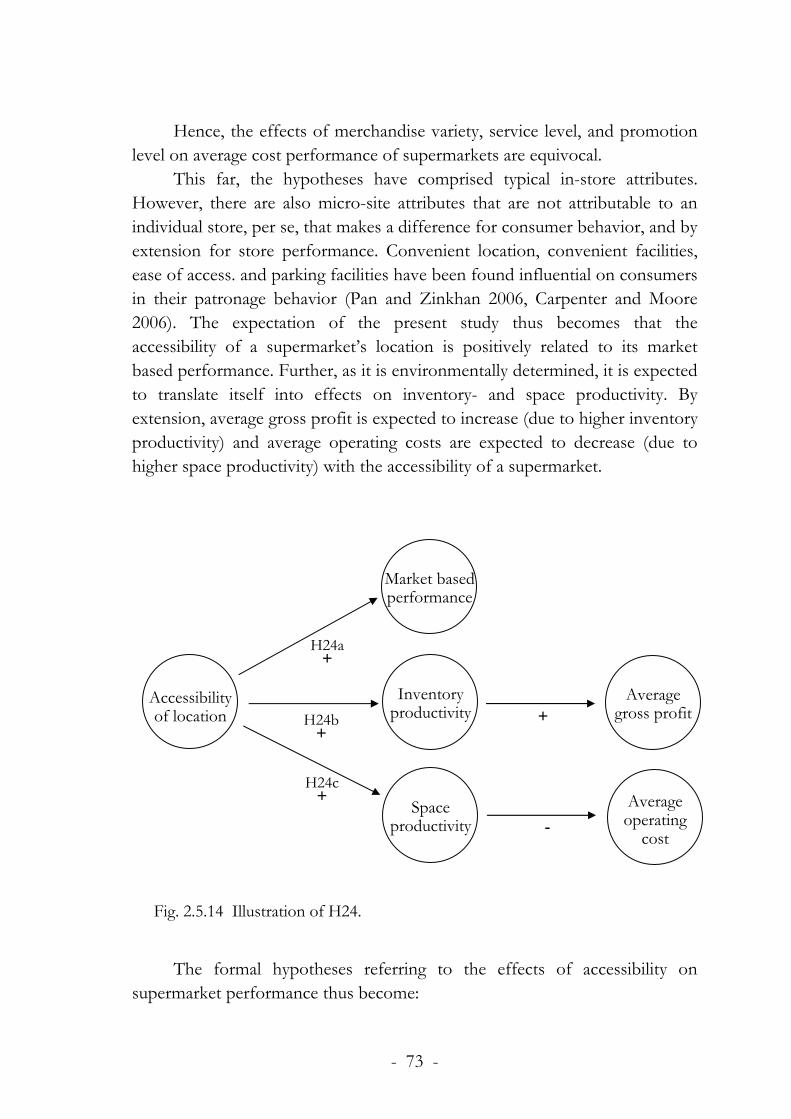
- 73 -
Hence, the effects of merchandise variety, service level, and promotion
level on average cost performance of supermarkets are equivocal. This far, the hypotheses have comprised typical in-store attributes.
However, there are also micro-site attributes that are not attributable to an individual store, per se, that makes a difference for consumer behavior, and by extension for store performance. Convenient location, convenient facilities, ease of access. and parking facilities have been found influential on consumers in their patronage behavior (Pan and Zinkhan 2006, Carpenter and Moore 2006). The expectation of the present study thus becomes that the accessibility of a supermarket’s location is positively related to its market based performance. Further, as it is environmentally determined, it is expected to translate itself into effects on inventory- and space productivity. By extension, average gross profit is expected to increase (due to higher inventory productivity) and average operating costs are expected to decrease (due to higher space productivity) with the accessibility of a supermarket.
The formal hypotheses referring to the effects of accessibility on
supermarket performance thus become:
H24b+
H24c+
H24a+
Accessibility of location
Space productivity
Inventory productivity
Market based performance
+Average
gross profit
-Average operating
cost
Fig. 2.5.14 Illustration of H24.

- 74 -
H24: The accessibility of a supermarket’s location is…
H24a: … positively related to its market based performance.
H24b: … positively related to its inventory productivity performance.
H24c: … positively related to its space productivity performance.
H24d: … positively related to its average gross profit performance (i.e. gross margin%).
H24e: … negatively related to its average operating cost performance (i.e. operating costs%).
In a similar vein, “cluster location” of a supermarket, in the sense of
clustering with stores not directing their offer to similar consumer needs and wants, is expected to have a positive effect on market based performance, due to opportunities for multipurpose shopping of consumers. In other words, a supermarket located in proximity to non-food retail establishments are expected to benefit from this clustering in terms of attractiveness, compared to freestanding stores, and thus achieve higher sales volume. As clustering is environmentally determined, the positive impact on market based perform-ance is expected to translate itself into higher productivity and financial performance:
H25: Clustering of a supermarket with non-food retail establishments is…
H25a: … positively related its market based performance.
H25b: … positively related to its inventory productivity performance.
H25c: … positively related to its space productivity performance.
H25d: … positively related to its average gross profit performance (i.e. gross margin%).
H25e: … negatively related to its average operating cost performance (i.e. operating costs%).

- 75 -
2.6 Potential demand and supply in the local market
2.6.1 Saturation of local markets Groceries are daily necessities that are used and purchased frequently by
all households, and a reasonable assumption thus is that the economic performance of a supermarket is, other things equal, associated with the level of population in its local market. Supermarkets located in highly and densely populated areas face greater potential demand, and at a first glance it does not seem far-fetched to assume a positive link between the level of local population and supermarket performance. However, the “other things equal” assumption about a relationship between potential demand and store performance may be questioned. A high level of potential demand in a market makes it more attractive for grocery retailing, and thus the level of supply (e.g. the number of stores), and by extension competition, may be a function of demand conditions. Hence, to the extent favorable demand conditions is associated with more intensely competitive conditions, and performance is negatively related to competition, the positive relationship between demand conditions and performance may be offset or even reverted.
Although any given geographic market area contains a relatively fixed amount of potential demand for groceries, and that it is a reasonable assumption that the level of supply is associated with this potential, it would be erroneous to assume that the level of supply is perfectly related to the level of demand. On the contrary, it appears likely that some markets, from historical or whatever reasons, have higher levels of demand relative to the level of supply, than other markets. Assuming two supermarkets located in markets with identical conditions of potential demand, the performance potential of each then may differ due to dissimilarities in supply conditions. In such a case, one source for dissimilar performance potential emanates from the two markets differing in terms of retail saturation.
The basic idea underlying the concept of retail saturation is that the saturation of any market area for a certain product (e.g. groceries) can be expressed as the amount of expenditures spent on the product by consumers within a market, divided by the amount of supply (e.g. number of stores or amount of floor area) in the market. The concept of retail saturation thus refers to the relationship between potential demand and potential supply in a market, i.e. the extent to which demand is currently served by stores. Saturation theory provides the means for depicting “market attractiveness”, in

- 76 -
terms of the performance potential facing a store located in a certain market area (Dunne and Lusch 1999).
Hence, the saturation of local markets is the first environmental construct defined for the purposes of the present study:
Table 2.6.1 Constructs of potential demand and supply in the present study.
Theoretical construct
Definition Derived construct
Definition
Potential demand (supply)
The aggregate level of outputs that may be desired (supplied) in a market
Saturation The degree to which buyers are currently served by sellers in a market
Among the first to explicitly recognize saturation among the
determinants of store performance was LaLonde (1962), combining potential demand and potential supply of a local geographic area in an “index of retail saturation” (IRS):
i
iii RF
RECIRS
•=
where IRSi is the index of retail saturation for area i, Ci is the number of consumers in area i, REi is retail expenditures per consumer in area i, and RFi is the amount of retail facilities in area i. Retail supply can be defined as total floor space, total number of stores or some other aggregated measure of supply (Ingene 1984). The IRS thus captures potential demand relative to the potential supply that compete for this demand. The higher the IRS, the less saturated is the market, and hence the greater is the performance potential for stores located in the market (Vandell and Carter 1993). It should be noted that nominator of the IRS formula may require more or less sophisticated information, depending on the nature of product under study. For some products, like groceries, for which consumption is fairly equal among consumers, population on its own may serve as an indicator of the level of demand, while for others more detailed information on per capita expenditure may be required.

- 77 -
2.6.2 To what extent do potential demand and supply conditions of local markets make a difference for the performance of supermarkets?
Several studies have shown conditions of potential demand and/or saturation to be related to store performance. Lord and Lynds (1981) found the level of population in the local market (measured as a circular area with a 1.5 miles radius around the stores) having a positive relationship with sales volume. Cottrell (1973) showed, in a study of 37 supermarkets, that local IRS was significantly and positively related to performance. Reinartz and Kumar (1999) and Kumar and Karande (2000) delineated the local markets of supermarkets by an implicit recognition of local competition when establishing the geographic area constituting the “market”, and found potential demand in the defined local markets to have a positive impact on both sales volume as well as sales productivity (sales per square foot).
The expectation of the present study is to find that performance of a supermarket is positively related to the index of retail saturation of its local market. The number of shoppers, and consequently the volume of sales, are expected to increase with higher values of the index of retail saturation, and as it is environmentally determined, saturation is expected to translate itself into higher inventory productivity and space productivity. Further, based on the expectations of relationships between productivity on the one hand, and average gross profit and average operating costs on the other, financial performance is expected to be positively related to saturation:
H26b+
H26c+
H26a+
Saturation index of
local market
Space productivity
Inventory productivity
Market based performance
+Average
gross profit
-
Average operating
cost
Fig. 2.6.1 Illustration of H26.

- 78 -
The formal hypotheses referring to the effect of saturation on the economic performance of supermarkets thus become:
H26: The saturation index of a local market is…
H26a: … positively related to the market based performance of supermarkets.
H26b: … positively related to the inventory productivity performance of supermarkets.
H26c: … positively related to the space productivity performance of supermarkets.
H26d: … positively related to the average gross profit performance (i.e. gross margin%) of supermarkets.
H26e: … negatively related to the average operating cost performance (i.e. operating costs%) of supermarkets.

- 79 -
2.7 Structure of local competition
2.7.1 The nature of competition in a retail context In the previous section, saturation of a supermarket’s local market area
was hypothesised to be related to its economic performance. Supermarkets in less saturated areas are expected to benefit from a greater volume of performance potential, due to more favorable local market conditions in terms of to the extent by which potential on the demand side of the market is served by a potential on the supply side. Saturation conditions thus comprise the volume of demand and supply as environmental conditions for performance. This section turns to another issue related to the supply side of the market, namely to the structure of the supply side of the market, forming the conditions of local competition. To the extent the volume of potential demand is associated with the volume of potential supply, and to the extent the volume of potential supply is associated with competitive conditions, saturation on its own does not provide sufficient information about the performance potential for supermarkets.
This may be illustrated by a simplistic example. Assuming two local markets with identical levels of saturation, in one case brought about by a low volume of potential demand served by a single store, and in the other case brought about by a high volume of potential demand served by a dozen of stores, it is intuitively recognized that the performance potential on the store level differ between the two markets. Although the sales potential for two identical stores in both cases are very similar, the conditions for profit performance are likely different, due to competitive forces introduced by the larger number of stores in the second case.
One would expect such an inconsistensy between sales potential and profit potential if, for example, increased competition brings about a downward pressure on prices, and by extension on gross margins, leaving less gross profit per unit of sales for covering operating costs. Turning this around, stores operating in highly saturated areas may perform worse in terms of sales, but to the extent competition is less intense in such an area, they may exercise market power, i.e. setting prices that excessively cover the costs of merchandise, and thus induce higher gross profit. Further, to the extent increased competition is associated with increased non-price differentiation efforts in terms of, e.g., higher service or more intense promotion, operating

- 80 -
costs for bringing about this differentiation may have a negative impact on profit.
At this point it is appropriate to make a halt and reflect on the concept of “competition”, and the way it will be implemented in the present study. Competition is one of the core concepts of economics since its beginning as a science. Through the years, various aspects of the concept have been discussed, and various researchers have approached it with various perspectives and definitions. High (2001) provides an excellent overview of the development of the concept of competition and how the interpretation of it has changed over the last 200 years. A short version of this overview is reproduced below in order to provide a basis for an explicit declaration of the perspective taken on competition in the present study.
During the classical period (up to 1870), pioneers such as Smith, Ricardo and Mill regarded competition as the process that aligns the market price with the “natural” price of a product. This price was dependent on some prior process, caused by the rivalry among supply actors for similar resources in terms of land, labor and capital. It was the prices for these resources that determined the production costs, and consequently the natural price of a product. During this period, thus, competition was fundamental to the price formation of products, based on the prices of land, labor, and capital that produced them.
The neoclassical period (1870 to 1920) comprised a rethinking concerning the underlying causal factors constituting the market prices for products. Rather than considering product prices as a reflection of the prices of production factors, the valuation placed on products was treated as the determinant of how much producers were willing to pay for land, labor and capital. Hence, the prices of producer goods were derived from the prices of consumer goods, not the other way around as during the classical period. During this period, one can say that there was a “revolution in price theory”, although the conception of competition was kept unchanged from the classical period preceding it.
The work of Knight in the early 1920’s was the starting-point of a significant change in economists’ thinking about competition. The approach by Knight was to imagine a hypothetical economy, in which there was no profit, and then compare this with actual economies, where profit is a source of income. The proposition of Knight was that the sources of profit must lie in the differences between the hypothetical and actual economies. Most basic among Knight’s constructions was an economy with “perfect competitive

- 81 -
conditions”, in which prices equal production costs. Knight made no secret concerning the “unrealistic” assumptions regarding his hypothetical economy; the very point of his proposition is that by facing up to the unrealistic assumption of perfect competition and compare it to the conditions of actual economic life, means are provided to better understand the forces of competition and its impact on the performance of markets and welfare of society.
Nevertheless, other economists, such as Chamberlin and Robinson, were disturbed by the fundamental distance between actual economic conditions and theoretical concepts such as “perfect” competition. A reaction to the unrealistic conditions of perfect competition were the developments of theories of imperfect and monopolistic competition. During the period between 1920 and 1940, substantial analytic attention was directed to the analysis of competition, which comprised two elements – market structure and firm behavior within that structure. By relaxing the assumptions of perfect competition, most notably those of a flat demand curve, homogenous products, and large number of sellers, competition in economic theory was brought more into accordance with observed economic conditions.
Competition thus, at this point, had traveled from a state of “rivalry” to a state of “market structure”, which caused reactions from other economists, chiefs among which are Hayek and Schumpeter. Although the underlying reasons for the reactions from Hayek and Schumpeter differed, both argued competition to be a process, rather than a structure. According to this view, the full effect of competition can not be understood at an instant in time, as did the analyses of perfect or imperfect competition. The major argument forwarded was that hypothetical market structures masked the very features that are most significant in actual business operations, namely the conduct of strategy. To emphasize this, Schumpeter referred to the core of perfect competition that everyone take prices and products as given, as the “principle of excluded strategy”. Under Schumpeter’s view, the significance of competition is the “creative destruction” of the old into new; a “creative destruction” that starts off with an entrepreneur that initiate a new combination of conduct, and ends when the combination has worked itself into the routine circular flow of equilibrium.
Schumpeter was the first to emphasize strategy as a feature of competition. Until then, economists recognized strategy in considering the solutions to duopoly and oligopoly, but they arrived at their solutions by
- 82 -
postulating “mechanical” responses to the actions of competitors; in other forms of market structure, strategy was absent.
However, strategy in the sense of thoughtful positioning of resources to achieve an objective, is such an important part of business life that it cannot be easily wiped out from the competitive theory of economists, and Porter (1980) has worked it back into competitive analysis by the application of economics to business decisions. Porter brings rivalry and strategy back into competitive analysis by not considering market structure per se to be competition. Rather, competition is a kind of behavior, the rivalry emphasized by the classical economists (c.f. above). By contrast, market structure is the environment in which the firm competes. The structures of economic theory affect competition, since they constrain the strategies that firms can adopt: a strategy that is appropriate for an industry with many small competitors will generally not be appropriate for an industry with a few large ones. By taking structure as the environment in which competition operates, Porter significantly extends the range over which market structures are relevant to managerial strategy. As such, the competitive analysis of Porter integrates economic structure and rivalry between firms. Porter brings rivalry and strategy into competitive analysis by not considering market structure per se to be competition; competition is rather a kind of firm “behavior”. Market structure, by contrast, is the environment in which the firm must compete. According to this view, structure affect competition, because structure constrain the strategies that firms can reasonably adopt.
This brief odyssey of the conceptualization of “competition” (reproduced in condensed form from High 2001) shows that scholars are far from unanimous on how to define competition as a phenomenon. In fact, contemporary discourse show an intense debate on how to approach it, manifested by, e.g. Blaug (2001): “…competition…is widely misunderstood by many economists, both as a market phenomenon and as an organizing principle of economic reasoning” (p. 37).
When applying the concept of competition in an empirical investigation into the relationships between competition, store conduct and store performance, there appears no clear-cut way to specify neither the causal ordering nor to explicate the precise manner in which these relations may occur in time. On the one hand, theories of imperfect competition implies that the conduct (strategy) and performance of stores is a concequence of the structure of the market in which they operate. Hence, the causal ordering of phenomena flow from the elements of competitive structure, as the causative

- 83 -
factors, to conduct and performance, as the effects. On the other hand, the process-oriented Schumpeterian view of competition suggests an inversion of the causal ordering; as the alteration of stores’ conduct (possibly due to a perception of insufficient performance) causes an effect in terms of a change in the structure of competition. Thus, the implied causal ordering in this case appears to be from a given set of store conduct factors (and possibly even performance) to competitive structure. Clearly, given a sufficiently long time frame, a case can be made for a pattern of dynamic relationships between structure, conduct (strategy), and performance. However, in the short run, and with cross sectional research designs, it appears exceedingly difficult to assess which “snapshot” of this process is captured by an investigator.
As stated previously, the present study relies on the structure-conduct-performance (SCP) paradigm. It should be explicitly stressed that this paradigm by no means induce an exclusion of the behavioral aspects of competition. Competition is by its very nature an aspect of human behavior, and in the SCP paradigm the behavioral dimension of competition is never far distant; the merit of the paradigm is precisely that it premises that behavior is dependent upon the context in which the behavior occurs (Brown 2002). Hence, the theoretical framework guiding the forthcoming postulates a causal ordering from structure, via conduct, to performance. Conduct will be applied in a “Porterian” sense, and thus refer to the offering strategy of a supermarket, which in turn is assumed to be an effect of the local market structure in which it operates. As such, the present study do not rely solely on the assumption that competition is inducing efficiency-seeking behavior to stores, but also effectiveness-seeking behavior.
Admittedly, the selection of the SCP paradigm, and the interpretation of it, comprises not only a theoretical framework for the present study, but also a delimitation. The delimitation introduced is the standpoint taken that, at a given point in time, it is logically inconsistent to expect a causal loop or feedback from present performance to conduct (strategy), or from conduct to structure. For one thing, although it may be argued that expected, or experienced, performance may be a causal factor in explaining the present offering strategy of a store, it would then not be valid to refer to performance as outcomes; rather one would have to implement performance as “potential outcomes” (Serpkenci 1984). In a similar vein, at a certain point in time it would be erroneous to expect a certain store’s offering strategy to be a causal factor in explaining market structure; rather one would have to implement market structure as “potential structure”.

- 84 -
However, given a sufficiently long time frame, one cannot exclude the possibility of a causal link from either performance to offering strategy or from offering strategy to local market structure. Indeed, one could also argue that performance is linked to structure, as low performing stores may be forced out from the market and thus cause an immediate change in its structure. The delimitation introduced simultaneously with the selection of the SCP paradigm for the study is that such possibilities of dynamic relationships between structure, conduct and performance, although recognized, will not be explicitly modeled or tested in this study.
2.7.2 “Imperfect competition” of local markets in a retail context Theories of imperfect competition describe competition in terms of to
what degree market structures diverge from the theoretical state of “perfect competition”, and approaches “monopoly”. High (2001) categorizes the analysis of market structure into four categories:
1. At one end of the spectrum lies perfect competition. Within this
structure, large number of independent firms produce an identical product. No legal impediments to exit or entry exist, and resoures can be moved costlessly into and out of the industry. … Output is greater, and price lower, under this structure than under any of the imperfect variants of competition.
2. By taking out the assumption of identical products, and replacing it with large numbers of firms selling slightly differentiated products, we define a second market structure – monopolistic competition with large groups. […] In this structure, firms maximise profit by equating marginal cost and marginal revenue. […] This market structure will have higher costs and lower output than perfect competition, but this disadvantage is offset by increased product variety within the industry.
3. Keeping differentiated products but substituting few for many firms, we get a third market structure – monopolistic competition with small groups, of which we may consider duopoly a particular case. In this market structure, price and output are indeterminate. The key feature of this structure is not product differentiation, but competitive interaction. [ … ]
4. Finally, by assuming a single firm that controls the entire supply of an industry, the firm's demand curve is the same as the industry's demand curve, which is a fourth industry structure –

- 85 -
perfect monopoly. … Provided that the cost curves are the same for the perfectly competitive and the monopoly firms, output will be smaller and price higher under monopoly
[High (2001), pp xxvi] In general, theories of imperfect competition postulate that as market
structure deviates from the conditions of “perfect competition”, firms have the opportunity to make use of market power, i.e. an opportunity to set prices that excessively cover costs, and gain higher profit. However, exactly how equilibrium prices are related to market structure is contingent on on detailed assumptions of the case under analysis. The relation will depend not only on the nature of the short-run interaction but also on the potential for long-run overt or tacit collusion.
The details of economic theories on imperfect competition are rarely observable in practice, and thus difficult to subject to empirical tests. One response to the large number of unobservable factors has been to empirically study the degree of “imperfectness”, typically captured by seller concentration measures, such as concentration ratios and the Herfindahl index, in different geographical markets within the same industry, as will be the approach of the present study. The motivation for such an approach is that the nature of competition can be assumed to be similar across markets, while the market structure differs due to market size differences and/or historical reasons (Asplund and Friberg 2002).
The present study, thus, will be carried out in a vein similar to previous empirical work not explicitly explaining exactly how the intensity of competition changes with market structure, but rather testing broad predictions on the impact of structure on performance via conduct. Before turning to a review of previous research and developing hypotheses, it is appropriate to make a halt and reflect over some other issues related to competition in a study personified by a grocery retailing context.
Indeed, as if the obscurity referring to the causal ordering between structure, conduct and performance (discussed above) was not enough, the present study’s context of grocery retailing makes issues on competition even more complex. To address this complexity in some detail, one may take as a starting-point the question if grocery retailing is characterized by a situation of “many small firms selling close substitutes”, which constitutes one of the core assumptions of “perfect competition”.

- 86 -
The answer to this question must be that although there are a large number of stores selling similar grocery products, this does not imply that grocery retailing satisfies the condition of “perfect competition” in the sense that firms are price-takers with respect to a homogenous product. First, as discussed in previous sections, retailing does not provide a physical product like manufacturing, to be transported to selling locations, but an “extended product” at a certain location. In their activities the large number of retailers serve different, and geographically separated local markets, not one single market. Rather than “How many grocery stores are involved in supplying a given group of people?” the relevant question becomes “Between how many grocery stores do people in that group ususally make their choice?” (Nooteboom 1980). This spatial character of grocery retail competition introduces elements absent in aspatial competition (Eaton and Lipsey 1979), and all stores enjoy some degree of monopoly power over their immediate market area (Craig et al. 1984). As a consequence, there may well be partial, or spatial, monopolies within a seemingly fierce competitive market at some level of aggregation. Such partial monopolies typically occur when the distances between competitors are large relative to the distances that consumers are willing, or able, to travel (Nooteboom 1980).
Second, one could question the extent to which grocery retailers offer close substitutes. In one sense one is tempted to answer “yes”, as the products sold in different stores are often identical, and indeed are substitutes from a consumer perspective. However, in at least one aspect – location – every grocery store is unique. Further, in addition to the location of the store one must also consider other attributes, such as merchandise mix and service level. As mentioned earlier, the “product” of a grocery store is a “bundle of services” (Achabal et al. 1984) with several dimensions, such as the price level, location (proximity), accessibility (e.g. car parking facilities), the merchandise mix and other aspects of service, in a retail mix which is not homogeneous across competitors. Indeed, to consumers price is an important factor, but not necessarily the only or, perhaps, even the one of top priority.
Furthermore, in the minds of consumers the relative importance of various factors of a stores’ offers may be disproportional and anything but uniform across individuals and households. For instance, the merchandise mix offered in grocery stores is often complex, and the detailed relations between price, cost and quality for the numerous SKU’s and cateogries of SKU’s are most probably to a large extent unclear to the average consumer. Consumers are also, often, faced by certain constraints and opportunities (income, available time etc.), and possess psychological characteristics (e.g. personality,

- 87 -
attitudes, beliefs, preferences) that have more or less important implications for their shopping behavior. Thus, managing a grocery retailing business comprises considerations of a highly complex and anything but homogeneous context.
One conclusion from this reasoning is obvious, and indeed grasped à priori – retail competition is not “perfect” in the sense that one can speak of a uniform price for a uniform product, demanded by uniform consumers. When one looks at the locational aspects of a store, there are arguments in favour of partial (spatial) monopolies. Looking at other aspects, one can see arguments in favor of oligopoly or arguments that point in a direction to perfect competition.
One aspect of retail competition refers to the “level” of competition, in the sense to what extent it takes place on the “retail store level”, or at the “retail chain level”. Within a certain industry, local markets often contain several stores affiliated to retail chains. In such cases, there is a competition not only between stores, but also between chains. The question then emerges to what extent stores affiliated to the same chain are competitors, or if competition is constituted merely at the chain level. From a consumer perspective, all stores may be potential shopping destinations, and in this sense all stores are competitors, regardless of chain affiliation. At the extreme, however, where all stores in a local market are affiliated to the same chain, the chain may exercise monopoly power, leaving the competition between stores only fictional. The extent to which competition is at hand on the store level in such a case would depend on the “rules of administration” of the chain, i.e. the extent to which store managers are autonomous referring to how to operate and compete, and on the “rules of evaluation” and incentive programs of store managers, implemented by the chain.
Leaving aside such “administrative” aspects of competition, e.g. by assuming a local market where there are no chains among the actors in a certain industry, or by assuming a one-to-one relationship between stores and chains, one is nevertheless left with questions about to what extent deviations from the state of perfect competition in terms of seller concentration provide a full picture of the intensity of local competition between stores. Two local markets may appear very similar with respect to concentration, but dissimilar with respect to the competitive activities of the stores encompassed by the concentration measure. This brings us back to the definition of the “product” in retailing as a “bundle of services”, and the question to what extent stores, although selling the same products are close substitutes.

- 88 -
This question arises, not least, as one apparent development in the retail sector over the last decades has been the diversification of store formats (Kumar 1997). Marion (1984, 1998) interpreted this diversification in terms of “strategic groups” (Porter 1980) and proposed a categorization of grocery stores into eight store formats (see fig. 2.7.1). Such a description of the diversification of stores provides a richer description of competitive conditions. The boundaries between the groups is jointly determined by three store attributes: (1) prices, (2) service, and (3) merchandise. The proposition by Marion is that the eight strategic groups fall into at least two relevant markets: those on or above the horizontal axis that compete with each other for the major shopping trips of consumers, while the remaining three groups below the horizontal axis largely compete for fill-in shopping:
Warehouse stores LOW PRICE
LOW SERVICE
HIGH PRICEHIGH SERVICE
Specialty markets (meat produce, etc.)
Mom-n-Pop stores
Convenience stores
Super warehouse stores
Combination stores
LIMITED ASSORTMENTFILL-IN AND SPECIALTY
SHOPPING
BROAD ASSORTMENTSONE-STOP SHOPPING
Super stores
Conventional supermarkets
Figure 2.7.1 Retail food store formats (Marion 1984, 1998).

- 89 -
Although the specific store formats of figure 2.7.1 are not referring to the Swedish retail market, its message nevertheless serves as an important part of the theoretical framework of the present study. In its recognition of store formats, it explicitly provides important implications for the interpretation of competition on the retail store level. These implications refer to the first two dimensions of competition defined by Palamountain (1955), who made a distinction between the dimensions of (1) horizontal competition, i.e. competition between similar stores directing their offer to similar needs and wants of consumers, and (2) intertype competition, i.e. competition between dissimilar stores directing their offer to similar needs and wants.3
In a similar manner, based on the strategic group concept, Ghosh and McLafferty (1987) identified three levels at which retailing competition occurs. First, there exists competition between stores within a particular strategic group. Second, there is competition between strategic groups that offer similar types of merchandise (i.e. between the groups of the chart above), i.e. “intertype” competition (Palamountain 1955; Levy and Weitz 2001). Third, competition exists between groups of stores offering different types of products and services (i.e. between the strategic groups in the chart above, and those groups of some other chart). This third level of competition is the most general type of competition and to large extent the most unpredictable, since it occurs between firms offering products or services that are substitutes only in the broadest sense of the word.
In horizontal competition there is, by definition, less differentiation in the marketing mixes of stores than in intertype competition, and Gonzalez-Benito et al (2005) provided empirical results showing this type of competition more intense, compared to competition at the inter-format level. Further evidence of intratype (horizontal) competition being more intense compared to intertype competition was found by Rhee and Bell (2002), who found that the majority of consumer transitions between stores occur across competing stores of the same price format, suggesting a “format loyalty” as an important aspect of shopper behavior.
However, before horizontal competition is taken as an indication of moving competition in the direction of perfect competition, one must recall that the argument holds only if stores are located close to each other, relative
3 Palamountain (1955) also considered a third dimension – the vertical struggle between producers, wholesalers, and retailers (which falls beyond the scope of the present study).

- 90 -
to the mobility of customers. If not, an element of spatial monopoly is introduced. Palamountain also proposed that in horizontal competition there is an element of oligopoly, in the sense that competitors tacitly follow a shared practice of setting uniform profit margins, while competing in non-price dimensions (“service” in a broad sense of the word) of the retail mix. But once services have been introduced they are generally difficult to abolish, and this results in a gradual “trading up” within a format. Over time, this is likely to contribute to the emergence of a new store type with a different method of selling or a different merchandise mix with lower prices, in positions of intertype competition.
This process of succession among different types of stores is further formalized in the “Wheel of retailing” theory (Hollander 1960), and shows remarkable similarities with Schumpeter’s “destructive construction” (c.f. section 2.7.1 above). Palamountain in fact referred to Schumpeter and his statement that “In … retail trade the competition that matters arises not from additional shops of the same type, but from the department store, the chain store, the mail-order house, and the supermarket” (Palamountain 1955, p. 38).
The standpoint taken in the present study follows these later remarks. Thus, in the present study the competition facing a supermarket is assumed to increase with the presence of intertype competitors, such as discount stores and hypermarkets.
Summing up the discussion above on the complexity surrounding issues on market structure and competition, and the application of these concepts in a retail context, the present study proceeds from the assumption that the market structure facing a supermarket is constituted by three dimensions: (1) concentration, (2) the extent to which the supermarket possesses spatial monopoly, and (3) intertype competition:

- 91 -
Table 2.7.1 Constructs of competitive structure in the present study.
Theoretical construct
Definition Derived constructs
Definition
Structure of competition (Competitive structure)
The organizat-ional proper-ties of seller side in a market.
Concentration The degree to which the seller side of a market diverge from the infinite number of sellers of perfect competition.
Spatial monopoly The degree to which a store is geographically separated from its competitors.
Intertype competition
The degree to which the seller side of a market is constituted by various store formats.
Market structure is considered associated with gradually more comp-
etition as concentration decreases, spatial monopoly decreases, and intertype competition increases:
-
+
-
Spatial monopoly
Intertype competition
Competition
Concen-tration
Fig. 2.7.2 Competition facing a supermarket is considered decreasing with concentration and spatial monopoly, and increasing with intertype competition.

- 92 -
2.7.3 To what extent does the structure of local competition make a difference for the conduct and performance of supermarkets?
As stated earlier, the structural perspective of competition is adopted for the present study. In other words, this study proceeds from the assumption that conduct and performance of a supermarket are influenced by the competition in its local market area, and that competition is associated with the market structure. Early empirical studies of the impact of market structure on performance typically focused on the analysis of cross-sectional data with industries as the unit of observation. In essence, these studies empirically studied the relationship between market structure of various industries, and the performance, e.g. rate of return on investment, of the firms within in those industries. The body of research in this tradition has “well established” a positive correlation between the rate of profit and industry concentration (Gisser and Sauer 2000). The structural variable most frequently applied to depict the degree of competition in these studies is some empirical measure of industry concentration, e.g. the distribution of market shares between firms in terms of a concentration ratio of the n largest firms (CRn) or the Herfindahl-Hirschman Index (HHI). The overriding hypothesis of these studies are that the more concentrated the market structure of an industry, the higher the profitability of the firms in that industry:
"There should be some long-run tendency for higher seller concentration within industries to be associated with relatively higher profits and for lower concentration to be associated with lower profits. … In a more specific form, this hypthesis should read as follows: High seller concentration within industries should be associated with substantial excesses of selling price over long-run average costs, moderately high concentration with appreciable but lower excesses over costs, and lower concentration with no excesses at all." [Bain (1968), p. 439]
Lamm (1981) pointed out that in the case of grocery retailing, such
broad cross-section studies overlook the fact that the structure of the industry as a whole may be different from the structure of the local markets in which stores carry out their operations. To overcome these biases, more recent industrial organization studies of market power in the grocery retailing industry analyzed the relationship between prices on the store level and the

- 93 -
structure of locally defined markets. The empirical prerequisites for such studies are generally recognized as meningful, as the spatial character of retail competition imply that competition on the store level takes place in local markets that are separated geographically. As mentioned above, the underlying assumption of these studies is that the nature of competition is similar across geographical markets, while the market structure differs due to market size differences and/or historical reasons (Asplund and Friberg 2002).
Lamm (1981) found significantly higher prices in more concentrated areas, in a study of 72 stores located in eighteen U.S. standard metropolitan statistical areas (SMSAs). Lamm applied various concentration ratios in his analysis, and found that the choice of measure is important for determining the nature of the structure-price relationship in the food retailing industry: a one-firm concentration ratio was found to have no significance in explaining price varaition between the local markets, while the 2-firm and 3-firm ratio were substantially related.
Cotterill (1986) applied the Hirschman-Herfindahl Index (HHI) as structural measure of local competition in a study of 35 U.S supermarkets and found significant support for the notion that market power is being exercised in more concentrated markets; supermarkets located in more concentrated markets charged higher prices. Cotterill further analyzed to what extent a store’s position in the local market was associated with its prices, by replacing the HHI with the store’s market share as a structural measure. Market share was unovered to have a strong positive and statistically significant effect on prices: an increase in the market share of a store by ten percentage points increased its prices by 0.6 percentage points.
Aalto-Setälä (2002) estimated a mark-up price function of 182 grocery stores in Finland, showing local market concentration to be positively associated with markups. The price (P) function estimated was on the form P=MC+markup, where MC is marginal cost, estimated taking into account the (1) cost structure (cost of sold goods plus labor cost) of the stores, (2) store characteristics, and (3) the oligopolistic structure of the retail groups supplying the stores. Local market structure was measured by three variables, (1) Herfindahl index among stores, (2) Herfindahl index among retail groups, and (3) the capacity-share of the store’s retail group in the market area (i.e. the group’s share of total number of square meters of floor area in the local market). Capacity share showed the most powerful explanatory variable, interpreted by the author as market power being more unilateral (a high

- 94 -
market share is related to high prices and the success of the firm), than coordinated (through implicit market agreement spawned by concentration).
To summarize this far, there are support for the notion that local market structure in terms of concentration makes a difference for prices on the store level in grocery retailing.
Intertype competition, i.e. local competition between various strategic groups in terms of store formats, has been found influencing prices on the local market level. For instance, in a study of grocery store prices in narrowly defined markets (roughly equivalent to a postal code area) across Sweden, the study of Asplund and Friberg (2002) found market shares (at the municipality level) of hypermarkets and large supermarkets to be negatively related with prices, i.e. the more substantial the presence of these store formats in a local market, the lower the prices. The study further uncovered local market concentration (HHI) related to higher prices.
Marion (1998) investigated the influence on food prices from various store formats. In a study of annual percentage changes in prices of 25 U.S. SMSAs, the hypothesis was that markets with strong presence of discounters and hypermarkets experience lower price increases, compared to markets without such strong presence. Along with a four-firm concentration ratio, six dummy variables were constructed to reflect the presence of discount stores and hypermarkets. Increased concentration was disclosed associated with increases in food prices, and the introduction of discount or hypermarket competition into a market were found negatively related to prices, i.e. associated with lower prices. The results further showed that when discounters and hypermarkets made significant inroads into a market (capturing a 5% up to 30% market share), food prices were lowered. However, as the market share of hese formats exceeded 30%, the effect on food prices leveled off.
Binkley and Connor (1998) included fast food restaurants among the competitors to grocery stores, in an investigation into the impact of competition on prices of grocery products and fresh products, respectively. For 95 U.S. cities, a four-firm concentration ratio was applied along with six other measures of local competition:
1. The market share of discount stores. 2. The market share of small stores is incorprated as a source of
competition, assumed to be associated with higher market prices due to higher operating costs of such stores.

- 95 -
3. The percent of supermarkets in the city owned by chains, assumed to be negatively related to market prices due to economies of specialization and integrated wholesale distribution.
4. The average per person expenditure on low-cost fast food restaurants in the market area.
5. Average store size (square feet) in market area, assumed to be associated with more services and higher costs.
6. The number of grocery items with large quarterly price changes.
Higher concentration was found associated with higher prices on dry groceries, and discount competition with lower prices on both dry and fresh products, implying that supermarkets respond to discounters by lowering prices for goods that are not stocked by these firms. The market share of small grocery retailers had no significant impact on prices. Average consumer expenditure on fast food reported a negative relationship with the prices on dry goods, while positive with fresh product prices. The authors finds the interpretation of these findings “problematic”, and concludes that “it is unlikely that the results … are measures of supermarket reaction to fast food competition”. Average store size in the market area was found positively related to prices of dry groceries, and negatively related to prices of fresh products, while the variation in prices over time had a negative imapct on prices of both dry and fresh products.
In a study of prices in 107 stores in 34 U.S. towns, Cotterill (1999) found increased three-firm concentration ratios associated with higher prices, and increased market shares of discount operators with lower prices. Further, stores cateogorized as “warehouse stores” were found to charge lower prices, compared to stores categorized as “traditional supermarkets” (i.e. units not categorized as warehouses and that did not have staff at counters to provide customized delicatessen, seafood, etc.). The study specifically addressed to what extent market power is unilateral (i.e. related to market share of individual stores) or coordinated (i.e. related to market concentration), and found, in contrast to Aalto-Setälä’s (2002, c.f. above) study, no support for unilateral market power.
Most oligopoly theory also makes predictions about profits, and as mentioned earlier empirical research up to the 1970’s mainly emphasized the relationship between market structure and rate of profits; it apparently seemed to make sense to compare profit rates between industries rather than price. Not all theories of imperfect competition points to higher profits in

- 96 -
concentrated markets, though. For example, in the Chamberlain model, the effects of entry and excess capacity leave the oligopolist with only normal profits, and Posner (1975) argued that oligopolists presented with opportunities to set the price above marginal cost will incur greater costs to attain higher sales. Posner expects this process to continue until marginal costs have risen to the level of price.
Leibenstein (1966, 1976) argued that when competition is weak, business organizations will suffer from higher costs, due to the tolerance and maintenance of “X-inefficiencies”. The reasoning behind this argument is that the consequences of inefficient behavior are different for monopolies than for firms operating under intense competitive conditions. Applying this to the area of the present study, the expectation is that an inefficient supermarket in a highly competitive market area may not be able to remain in business because prices (and by extension gross profit) are low, translating inefficiency into low profit, while an inefficient supermarket possessing a monopoly position in a local market can remain profitable enough, due to the market power opportunitiy to charge higher prices (and earn higher gross profits). Such an argument may be rejected based on the notion that a retailer with a monopoly position, like any other, prefer more to less. However, a monoply supermarket may not have the same ability to operate as efficiently as a supermarket operating under intense competition; the latter can observe, and learn, market prices and relate these to operational efficiency and draw conclusions on its costs relative to those of competitors. Hence, a supermarket facing intense competition may operate more efficiently than a monopoly supermarket, because it is more difficult for a monopolist to monitor internal efficiency.
In other words, although supermarkets located in markets with higher intensity of competition may be expected to have less market power, and thus lower prices and lower gross margin%, there may be no impact on operating- and net profit, in the case intense competition brings about a greater “discipline” in store operations, resulting in improved productivity and lower operating costs. On the other hand, if intensity of competition is high but the level of potential demand is low, productivity may suffer from low levels of sales volume (i.e. from low levels of “output”). Other things equal, however, it is reasonable to expect that productivity would be higher in areas with high intensity of competition, since the pressures on prices (and gross margins) from intense competition should be such that only the most efficient could continue to operate under such conditions.

- 97 -
As stated earlier, the view taken on the interplay between market structure and store conduct (retail mix) in the present study is that the former will be conditions around which the competitive environment is shaped, and within which stores operate in constant interaction, and develop their retail mixes for differentiating themselves from competitors. As such, the present study joins the view of Porter (1980). A key element of Porter’s work recognizes product differentiation in the strategic planning of practicing managers, with the purpose to position the firm so that its rivals do not force profits down to the floor level of perfect competition.
Put into the context of supermarket performance and the present study, the assumption made is that when developing the retail mix for a supermarket, the retailer considers the demand and competitive conditions of his (her) store’s local environment. Theory holds, and previous research have shown, that prices are related to competition; in general, prices are increasing with increased concentration among sellers in a market due to the execution of market power (c.f. above). The price level of a store may then be expected to be an attribute that shows an immediate response to local market structure. But a grocery store competes also with its quality of shopping experience, constituting a major part of its value for money in the eyes of consumers. Thus, it follows a reasonable assumption that also non-price attributes of the retail mix are influenced by market structure. More specific, the expectation of the present study is that the more competitive a supermarkets’ local market, the greater will be the efforts of the retailer to differentiate the supermarket from local competitors by providing “more” on non-price attributes.
Previous studies of performance on the store level have only to a small extent comprised a test on how non-price retail mix elements relate to competitive structure. Cotterill (1999) is an exception, explicitly incorporating five non-price attributes in a structural equation modelling of competition and price. Comparing the results from a regression analysis, where the impact of competitive structure on price was estimated directly, with the results from a structural equation model left room for an interpretation that stores in more concentrated markets offer fewer services. These results suggest that market power is being exercised in the quality dimension as well as in the price dimension. The results further showed that for chains and affililated independent stores, promotion activity was significantly (p<0.10) decreasing with increased concentration.
The expectations of the present study are that the more competitive the local market of a supermarket, the greater the incentives for a retailer to make

- 98 -
efforts to differentiate the supermarket from competitors, and the greater the incentives for launching promotion activities aiming at attracting consumers away from competitors. Hence, the expectations of the present study are to find a relationship between market structure and the non-price conduct of supermarkets.
In summary, the expectation of the present study is to find the conduct of a supermarket related to competition in its local market. More specific, the hypotheses are to find competition negatively related to prices, positively related to merchandise variety, positively related to service level, and positively related to promotion level:
H27d+
H27c+
H27b+
H27a--
Price level
-
+
Spatial monopoly
Intertype competition
Service level
Concen-tration
Merchandise variety
Promotion level
Competition
Fig. 2.7.3 Illustration of H27.
- 99 -
The hypotheses in formal statements are the following: H27: Competition in a local market is…
H27a: … negatively related to the price level of supermarkets.
H27b: … positively related to the merchandise variety of supermarkets.
H27c: … positively related to the service level of supermarkets.
H27d: … positively related to the promotion level of supermarkets.
The expected effects of competition on store performance may now be
derived from previous hypotheses of the effects of conduct on performance. However, it should be noticed that competition also may have a direct effect on performance, besides the indirect effects via conduct. For instance, competition may, per se, have effects on consumer behavior, and by extension store performance. For instance, average transaction sizes per shopper may be influenced, as the lower the competition facing a supermarket, the less the number of alternatives for consumers’ “major shopping trips”. Turning this argument around, the higher the competition (i.e. lower concentration, less spatial monopoly and intertype competition) the greater the opportunities for consumers to choose between various destinations for their “major” shopping. To a certain supermarket, the share of “major” shopping trips is likely to thus decline with increased competition. Further, in market structures by low concentration (i.e. many stores), and low spatial monopoly, the opportunities for “fill-in shopping” and “cherry-picking” are better for consumers and the prerequisites for developing “multi-store loyalties” (Lessig 1973; Laaksonen 1993) are greater.
Despite these arguments in favor of higher market based performance in less competitive markets, the expectation of the present study is to find a positive relationship between competition and market based performance. The reasons for this expectation are the expectations of lower level of prices, and higher levels of non-price attributes in supermarkets located in more competitive markets. As lower prices and higher levels of non-price attributes are expected to increase market based performance, the hypothesis of the present study is that market based performance of supermarkets is positively related to local competition:

- 100 -
Hence, the formal hypotheses referring to structure of local competition
and market based performance of supermarkets is: H28 Competition in local markets is positively related to the market based
performance of supermarkets.
The effects of local market structure on market based performance is
expected to translate into effects on productivity. First, low levels of competition is expected to be associated with less “discipline” in operations, as opportunities to exercise market power under such conditions leaves more gross profit for the covering of operating costs. Second, the expectations of lower levels of “output” (market based performance) under such conditions further points in the direction of decreasing productivity. Although inventory productivity may be argued to have a negative relationship with local
+
+
+
-
+
+
+
--
Price level
-
+
Spatial monopoly
Intertype competition
Service level
Concen-tration
Merchandise variety
Promotion level
Competition Market based performance
Fig. 2.7.4 Illustration of H28.

- 101 -
competition (as merchandise variety is expected to increase with competition, and merchandise variety is expected to be negatively related to inventory productivity), the expectation is that the effect of competition on the “output” factor of productivity in conjunction with successively greater “discipline” in monitoring turnover rates of various parts of the merchandise offer as competition increases will be greater, and thus leave a positive relationship between competition and inventory productivity.
The formal hypothesis is stated as: H29: Competition in a local market is positively related to the inventory
productivity performance of supermarkets.
+
+
+
-
+
-
-
-
Price level
-
+
Spatial monopoly
Intertype
competition
Service level
Concen-tration
Merchandise variety
Promotion level
Inventory productivity Competition
+
Fig. 2.7.5 Illustration of H29.

- 102 -
In the short run, the floor space of a supermarket is fixed, and thus the effect of competition on market based performance is expected to translate into higher space productivity performance:
Formally stated, the hypothesis referring to competition and space
productivity of supermarkets is: H30: Competition in a local market is positively related to the space
productivity performance of supermarkets.
The effects of competition on prices and promotion levels, are expected
to translate into a positive effect on labor productivity. Merchandise variety and service levels may be argued positively related to the required input of labor (a greater variety and higher level of service call for more labor hours of
+
+
+
-
+
+
-
+
Price level
-
+
Spatial monopoly
Inttertype
competition
Service level
Concen-tration
Merchandise variety
Promotion level
Space productivity Competition
+
Fig. 2.7.6 Illustration of H30.

- 103 -
work), and the effect on labor productivity will depend on this effect relative to the effect of variety and service on market based performance (“output” in terms of sales volume). Nevertheless, the hypothesis is that local competition is positively related to labor productivity of supermarkets, as pressure on prices call for more “discipline” in operations, and as more promotion under such conditions induce higher levels of “output” (market based performance).
Formally stated: H31: Competition in a local market is positively related to the labor
productivity performance of supermarkets.
The effects of competition on the financial performance of
supermarkets is expected to go through a complex network of effects. First,
+
+
+
-
+/-
-
-
+/-
Price level
-
+
Spatial monopoly
Intertype competition
Service level
Concen-tration
Merchandise variety
Promotion level
Labor productivity Competition
+
Fig. 2.7.7 Illustration of H31.

- 104 -
local competition has an equivocal effect on average gross profit (gross margin%). On the one hand, as more competition is expected to be associated with lower prices, one may argue for a negative effect from competition on gross margins. On the other hand, however, market based performance and inventory productivity is expected to be positively related to competition, which thus by extension potentially offsets the effect from lower prices on gross margins:
Average operating costs of supermarkets are expected to be negatively
related to competition. First, as prices are expected to decrease with competition, and lower prices are expected to be positively related to both space- and labor productivity, the effects of local competition works itself into the costs of supermarkets through its effect on price conduct:
+ +
+-
Competition
Price level
Inventory productivity
Average gross profit
Fig. 2.7.8 Illustration of expected effects of competition on average gross profit.
-
-
- -
-Labor productivity
Average operating
cost
Space productivity
Price level Competition
Fig. 2.7.9 Illustration of expected effects of competition on average cost, via expected effect on price level.

- 105 -
Second, local competition is expected to work itself into the costs of
supermarkets through effects on their non-price conduct. In previous sections, merchandise variety, service level, and promotion level were hypothesised to be positively related to competition. Thus, the volume of costs is expected to be higher under such conditions. However, the level of average costs is affected also by the effect of non-price attributes on market based performance, and space- and labor productivity, leaving an equivocal effect from competition on average costs:
In summary, the effects of local competition on average gross profit and
average operating costs are equivocal and depend on the differential impact of various effects. The equivoal character of effects are further underscored as one proceeds to consider the expected results referring to profit margins and absolute profits.
The effect of local competition profit margins is contingent on the differential effect on gross margin and average cost. Absolute profit, in turn, will depend not only on the performance in terms of margins, but also on the
+ + +
+/-
+-
-
Labor productivity
Average operating
cost
Space productivity
Service level
Promotion level
Merchandise variety
Volume of costs
Competition
Fig. 2.7.10 Illustration of expected effect of competition on average operating cost, via effect on merchandise variety, service level, and promotion level.

- 106 -
volume of sales by which the margin achieved will transform into profits. As one moves towards supermarket performance on the “bottom line” the expected results are extremely difficult to predict via logical reasoning, and consequently virtually impossible to formulate in terms of hypotheses. Hence, issues referring to these aspects of performance are empirical by character, and will be addressed as such without formal hypotheses of expected directions of effects.
2.8 Structure of local demand
2.8.1 Structure of local demand in a retail context The previous section considered the effect of local structure of
competition on supermarket conduct and performance. This section is directed to the question on to what extent the structure of demand may have an impact on performance. More specific, this section comprises the issue referring to the potential impact of local demographics and local socio-economics on supermarket performance.
Characteristics of the demand side of the local market may have both a direct and indirect relationship with performance. The direct relationship refers to effects on performance originating from the influence of consumer characteristics on consumer behavior. For instance, as a household’s need for groceries increases with its size, a reasonable assumption is that “big” households make larger purchases per shopping trip, and thus the share of “big” households in the local market may have an impact on the average transaction size per shopper. Demographic conditions may also be related to the time available for shopping in an area. For instance, in local markets with high share of unemployed or retired residents there is presumably more time available for shopping, which may impact the number of shopping visits. By extension, to the extent average transaction and number of shopping visits is associated with store costs, demographics will have an impact on performance.
Hoch et al (1995) proposed that households or individuals with high socio-economic status (SES, most notably households with high income) to have high opportunity costs with respect to time and thus willing to pay for added convenience. This added convenience could comprise purchases of different products in order to save time, which in turn leads to higher spending. It could also mean that these households prefer one-stop shopping, which could induce a preference for grocery stores with high degrees of

- 107 -
scrambled merchandise, or preferences for grocey stores located in shopping centers. In addition, Hoch et al proposed that households with high SES are willing to spend more money for a certain bundle of products, due to a link between high SES and time consuming lifestyle activities.
The indirect relationships between demand structure and store performance refer to the impact on performance via an influence from demand structure on the conduct of stores, i.e. on stores’ retail mix. For example, as socioeconomics of a market area reflect the amount of pecuniary resources that are available to consumers, socioeconomics in terms of low incomes in an area induce budget constraints to consumers, and thus may be related to pricing conduct of supermarkets and, by extension, to gross margins. Consequently, to the extent such factors are related to price- and income elasticities of demand for groceries, socioeconomic characteristics of households in a local market may impose restrictions on pricing issues of supermarkets. By extension, socioeconomics may indeed make a difference for gross profit performance, as lower selling prices, by definition and other things equal, are directly related to lower gross margin.
In the present study, structure of local demand refers to the socioeconomic status of the residents in a local market. Socioeconomic status is defined in a broad sense, comprising the demographic, social, and economic characteristics of the population in a local market.
Table 2.8.1 Constructs of demand structure in the present study.
Theoretical construct
Definition Derived construct
Definition
Structure of demand (Demand structure)
The organizational properties of the demand side of a market.
Socioeconomic status of local demand
Demographic, social, and economic characteristics of population in a certain market.
2.8.2 To what extent does the structure of demand in local markets make a difference for the conduct and performance of supermarkets?
There are several studies reporting significant relationships between demand structure and store performance. For instance, Lord and Lynds

- 108 -
(1981) found, besides a positive relationship between sales volume and the level of population in the local market (measured as a circular area with a 1.5 miles radius around the stores), a positive impact from mean household income on sales. Cottrell (1973) showed, in a study of performance of 37 supermarkets, sales performance to be higher in blue-collar neighborhoods, compared to other locations. Morphet (1991) undertook a study of sales volume of 77 english village center stores ranging size from 400 to 1,700 square feet, and disclosed a positive impact on sales from population size and socioeconomic characteristics. The share of married women in the local area who were “economically active” was applied as an indicator of socioeconomic status of the area, and was found positively related to sales, interpreted as influential both by increasing family income (and thus expenditure on groceries), and by inducing time constraints on the household, inducing incentives to patronize the local center.
Reinartz and Kumar (1999) found socioeconomics unrelated to sales, but negatively related with productivity performance of grocery stores. In their study, market potential was defined by two indicators, besides the number of househods residing in the trade area – the percentage of households with four or more members, and the percentage of households with children. Socioeconomic status (SES) of households in the trade area was measured by (1) yearly income, (2) percent of households with college degree, and (3) percent of households owning three or more vehicles. SES of households disclosed no relationship with sales volume, but a negative effect on sales productivity, i.e. with an increasing SES of the local market, sales productivity diminishes, “plausibly indicating that consumers with high SES tend to shop in stores which are larger and offer more services”, as the study reported larger stores to perform lower on productivity.
Other studies have looked into the impact of socioeconomics on price. Cotterill (1986) proposed a relationship between income and prices based on an assumption that consumers with high income demand a higher quality of shopping experience in form of costly extra services, which in turn would result in higher prices in market areas where incomes are high. Hoch et al. (1995) argued that households or individuals with higher socioeconomic status have high opportunity cost with respect to time and thus are willing to pay for added convenience.
The findings of empirical studies addressing the relationship between socioeconomics of local market areas and prices of grocery stores are inconclusive. Some studies report a positive relationship, i.e. that higher

- 109 -
income in the local market area is associated with higher prices (Newmark 1990; Marion 1998; Asplund and Friberg 2002; Aalto-Setälä 2002), while others find no support for income being related to prices (Cotterill 1986, 1999), and yet others uncover a negative relationship (Binkley and Connor 1998).
Aalto-Setälä (1999) points out that aside socioeconomics, other organizational properties of the demand side of a local market area may have an impact on prices and gross margins. Household size, for instance, may affect the price elasticity for groceries. This follows from the likely association between household size and size of the shopping basket. Big households are likely to make larger purchases, compared to small households. Thus, potential savings due to lower prices are more substantial for big households, compared to small.
The hypothesis of the present study is that there is a relationship between the socioeconomic status (SES) of population in local markets and the price level of supermarkets. Although previous studies have disclosed an income elasticity of groceries considerably less than one (Aalto-Setälä 1999), i.e. the amount purchased remains quite constant regardless of income level, it appears reasonable to assume that consumers’ price elasticity of groceries decrease when their income increase. That is, local markets with high SES are assumed to have more inelastic demand curves for groceries because groceries represent a smaller portion of a high income person’s expenditure (Cotterill 1986).
Hence, based on theory and previous research, the hypothesis is that, other things equal, prices of supermarkets increase with increased SES of their local market.
Formally stated: H32: Socioeconomic status of local demand is positively related to the
H32+
Socio-economic status of demand
Price level
Fig. 2.8.1 Illustration of H32.

- 110 -
price level of supermarkets.
Further, it is expected that productivity of supermarkets is related to the
SES of their local markets. The rationale for this hypothesis is that as prices are influenced by structural conditions of demand, there follows an influence on store operations, in the sense that supermarkets located in more price elastic markets are required to implement more “discipline” to gain higher productivity in order to survive in the market. Further, the effect of higher prices on “output” (market based performance) Hence, the hypotheses is that productivity is higher in markets with low SES, and lower in markets with high SES:
The hypotheses are formally expressed as: H33: Socioeconomic status of local demand is…
H33a: … negatively related to the inventory productivity performance of supermarkets.
H33b: … negatively related to the space productivity performance of supermarkets.
H33c: … negatively related to the labor productivity performance of supermarkets.
-+
Socio-economic status of demand
Price level
Labor productivity
Inventory productivity
Space productivity
Fig. 2.8.2 Illustration of H33.

- 111 -
As the price level of a supermarket is expected to increase its gross margin, there follows an expectation that socioeconomic status of local markets is positively related to the gross margin of supermarkets:
H34: Socioeconomic status of local demand is positively related to the
average gross profit (i.e. gross margin%) performance of supermarkets.
The effect of socioeconomics on profit performance, however, is
equivocal, as higher prices are expected to translate into lower productivity, and by extension into higher costs:
Formally stated: H35: Socioeconomic status of local demand is positively related to the
average operating cost performance (i.e. operating costs%) of supermarkets.
Finally, it is appropriate to explicitly recognize that relationships
between socioeconomic status of local demand on the one hand, and non-price conduct on the other, are left to an empirical investigation without formal hypotheses. The reason for this is that the demand for such aspects of a supermarket’s offer is considered, in the present study, more related to psychographic characteristics of demand, such as attitudes, preferences, life-styles rather than socioeconomic characteristics. As such they fall beyond the scope of the present study.
+
-
- -
- Labor productivity
Average operating
cost
Space productivity
Price level
Socio-economic status of demand
Fig. 2.8.3 Illustration of H35.

- 112 -
3. METHOD
3.1 Outline of the chapter This chapter is devoted to a description of the design of the empirical
study, the data collection procedures, and of the operationalized variables. The chapter is organized around seven sections. Section 3.2 states the overall design of the study as following the “analytical-oriented methodology” of business research, followed by a brief description of the ICA Retail Corp. in Sweden (in section 3.3), that provided the data for the empirical study. Section 3.4 provides an overview of the designs of previous studies on store performance, from three research areas (1) store location/store assessment research, (2) economies of scale research, and (3) SCP studies.
After a discussion on the issue of delineating local markets in section 3.5, there follows a description (section 3.6) of the data sources utilized, and the procedures applied, for the collection of data for the empirical study. Section 3.7 provides the operationalized variables.
Section 3.8 gives a brief account for the research instruments utilized in the statistical analyses. Finally, in section 3.9, an evaluative discussion of the strengths and weaknesses of the research design concludes the chapter.
3.2 Design of the study The decisions one makes as a researcher referring to one’s design of a
study are contingent on the standpoints taken on ontological and epistemological issues. Scholars have suggested several methodologies referring to the design of business research studies, and according to Arbnor and Bjerke (1994) there are three overriding methodologies for business research. For an elaboration of these various methodologies, see Arbnor and Bjerke (1994):
1. The analytical-oriented methodology
2. The system-oriented methodology
3. The actor-oriented methodology
The present study closely follows the analytical-oriented methodology,
in its reliance on available theory (the SCP paradigm and the marketing mix

- 113 -
school of thought), its testing of developed hypotheses based on theory and previous research, and its view of a reality constitued by causal relationships where causes and effects are keys for understanding phenomena.
In more specific terms, the empirical part of this study joins a tradition of “natural experimentation” for explaining business performance. Studies in this tradition typically use cross-sectional research designs for investigating the impact of particular factors on performance, applying statistical techniques to to data in order to hold other causal factors constant (Capon et al. 1990):
“Much of what we know about the determinants of industry, firm and business financial performance is in the form of measures of individual relationships in models linking various hypothesized causal variables to various performance measures. This causal variables usually describe some combination of elements of environment, firm strategy and organizational characteristics. This work is found in several disciplines including economics, management, business policy, finance, accounting, management science, international business, sociology and marketing.” [Capon et al. (1990)]
The fundamental theoretical underpinning of this study is that the
performance of a store is a consequence of its conduct (behavior), which in turn is a consequence of its adaption to the structure of the local market. Hence, a major issue for the empirical part is to design it in a way that upholds a close link between local market conditions, store attributes, and store performance. In other words, structural measures should be measured locally, and store-level performance measures should preferrably encompass only revenues and costs that follow from conduct in response to local market conditions, and not from, e.g., more or less arbitrary allocation of overhead costs by a retail chain. Further, store conduct should preferrably be decided upon locally, on the store level, in order to provide prerequisites for reliable tests of the relationships between local market conditions, conduct, and performance.
A cross-sectional design is developed for the study by pooling data on store performance, store attributes, and local market conditions. In conjunction with the department of market research department at ICA Retail Corporation (see section 3.3 for a descriptive overview of this retail company), a unique database is constructed, containing the performance of 168

- 114 -
supermarkets along with (1) a description of their attributes, and (2) a description of the conditions of their local market area.
3.3 The ICA Retail Corporation The ICA Retail Corp. is the parent organization of a federative
organization, in which the stores are operated and owned by individual retailers. Decisions on store operations and on store attributes are mainly made by the individual retailer. As such, the conduct of the stores is mainly a consequence of decisions made by managers in individual stores, and the performance of the stores is closely related to the economic well-being of each manager. Hence, provided a description of the conditions of competition and demand on the store level can be established, prerequisites are provided for an empirical investigation of the relationships between local market conditions, store conduct, and store performance.
At this stage, it is appropriate to make an explicit description of the operating conditions facing the retail stores and store owners that constitute the sample of the present study. As mentioned above, the ICA retail organization from which the data for this study have been collected is highly decentralized referring to store operations, and to decisions referring to the offering strategy on the store level. Specifically, the following features of the store owners’ autonomy are important to mention:
1. Each of the stores set their own prices; there is no centralised mark-up policy, to which the individual retailers must adhere. Pricing policy is left to the discretion of store owners and is therefore not uniform among stores. All stores follow a “HiLo” pricing strategy, where special offers play a substantial role, rather than an every-day-low-prices strategy.
2. Each of the store owners makes his (her) decisions on what merchandise to stock, mix and display. There are no central instructions on what merchandise to include in the offer or how to allocate space for various products or categories.
3. Each store operates with the same checkout scanning system, which has been developed by the central organisation exclusively for ICA stores
4. Issues referring to education and training of management and staff are decided upon by each individual retailer and are not centrally supervised, although various education programs are
- 115 -
offered exclusively for ICA retailers and their staff, through an education subsidiary of the ICA Corp.
5. Decisions to hire or dismiss labor is undertaken on the store level. There are no centrally determined staffing ratios that must be observed, although there are certain guidelines in terms of experience based recommendations on sales per labor hour for various store departments.
6. Store owners are responsible for the control of shrinkage cost, rent cost, promotion cost (except for joint promotion, see point 7 below), administration cost, and certain other store operation costs that vary directly with output.
7. There is a minimum of procedures for allocating centralised costs to stores. The revenues of the central ICA organizations is mainly the revenues from the wholesale operations; on average ICA stores make approximately ¾ of their purchases from the ICA wholesale company. The major allocation of centralised costs refer to the joint promotional program, which all ICA stores have agreed to follow. The costs for this program is allocated to the stores based on each store’s annual sales volume.
8. Decisions relating to the location of new stores, i.e. to additions to the number of stores, are taken at the center. Decisions on alteration of stores, their replacement of fixed assets or changes in the offering strategy, are taken on the store level.
9. The setting of performance targets are undertaken on the store level. There is no central supervision or monitoring control of stores undertaken at the central ICA organisation.
10. Each store in the sample of the present study is categorized as a supermarket located in a “neighborhood area” in the internal classification system of the organisation. The stores vary with respect to environmental conditions; there are stores in large metropolaritan areas, as there are stores located in smaller municipalities in the less populated areas of Sweden.
11. Labor cost per working hour is fairly uniform between the stores, since all employees remains with the same labor union, and wages are negotiated by central employer and employee organizations.

- 116 -
3.4 Designs of previous studies – An overview Chapter 2 reported several previous studies from three research
traditions referring to the relationships between local market structure, scale of operation, store conduct, and store performance. An overview of the designs of these studies is provided by Tables 3.4.1 through 3.4.3. The overview is organized based on the “stream of research” to which the studies adhere. Table 3.4.1 contains studies from the “store location“ and “store assessment” field of research. Table 3.4.2 show a summary of studies adhering to the field of “industrial organization” research based on the SCP paradigm, while Table 3.4.3 reports the main characteristics of previous studies of economies of scale on the retail store level.
The overall and remaining impression from such an overview as the one provided by Tables 3.4.1 to 3.4.3 is the disparity between the studies referring to both the data set for empirical analysis, and the utilization of research instruments.
The studies of the “industrial organization” stream of research rely on theoretical concepts of competition (e.g. cocentration ratios, Herfindahl index), while competition in “store location/assessment research” is measured by more “ready available” variables, such as the gross number of competitors or the focal store’s share of floor area in the local market. Further, among the “economies of scale” studies, there is no store explicitly incorporating local competition into the analysis.
The definition of the local market is carried out in several ways, clearly illustrating a far from unanimous approach on how to delineate the geo-graphical area that represents a store’s local market.
Studies of scale economies on the store level has primarily taken an interest in labor costs, leaving the question about economies of scale at the total operating cost level mainly open. Further, these studies, with few exceptions, do not incorporate store conduct in the analyses, and thus potentially misinterpret the effects of scale on performance.
Store performance in the “store location” studies have primarily been defined in terms of market based performance, most notably the volume of sales. Thus, although these studies provide important findings referring to the antecedents of sales volume, the questions about the effect on costs and profits remain open.

- 117 -
In a similar vein, the industrial organizational studies about the effect of local market structure on store prices leave open the questions on to what extent these effects are translated into store performance.
The overview provided by the Tables 3.4.1 through 3.4.3 serves as a benchmark for the design of the present study. By considering the characteristics of each of the three research traditions, the present study overcomes major limitations of each of the three, and explicitly relies on a design created from a joint consideration of the strengths of each. In the procedures of collecting data and operationalizing variables the three research traditions are, thus, considered jointly, providing a unique set of data of the market based performance, productivity, and financial performance of 168 supermarkets, along with a rich description of their scale of operation, conduct and conditions of their local markets.

- 11
8 -
Tabl
e 3.
4.1
Ove
rall
desig
n of
seve
n pr
evio
us c
ross
-sec
tiona
l stu
dies
from
the
area
of s
tore
loca
tion/
stor
e as
sess
men
t res
earc
h.
Lo
cal m
arke
t co
nditi
ons
Stor
e at
tribu
tes
Perfo
rman
ce
Res
earc
h in
stru
men
ts
Mar
ket d
efin
ition
Cottr
ell (1
973)
Popu
latio
n pe
r squ
are
foot
of s
ellin
g ar
ea in
on
e m
ile ra
dius
N
eighb
orho
od
cate
goriz
atio
n - B
lue
colla
r - B
lack
neig
hbor
hood
- S
mall
tow
n ne
ighb
orho
od
Disc
ount
com
petit
ion
Regu
lar c
ompe
titio
n
Selli
ng a
rea
Num
ber o
f che
ckou
ts
Price
leve
l Sh
oppi
ng c
ente
r lo
catio
n
Sales
per
squa
re fo
ot
Gro
ss m
argi
n O
pera
ting
cost
Regr
essio
n an
alysis
Ci
rcul
ar a
reas
of o
ne
and
two
mile
s.
Stan
ley a
nd S
ewall
(1
976)
Tota
l num
ber o
f sq
uare
feet
selli
ng a
rea
Dist
ance
(driv
ing
time)
fr
om su
rrou
ndin
g re
siden
tial a
reas
Selli
ng a
rea
Stor
e im
age
Mar
ket s
hare
(bas
ed
on p
atro
nage
be
havi
or)
Mul
tiplic
ativ
e Co
mpe
titiv
e In
tera
ctio
n m
odel
(MCI
)
One
neig
hbor
hood
ar
ea
Jain
and
Mah
ajan
(197
9)
Num
ber o
f co
mpe
titor
s D
istan
ce fr
om st
ore
to
cons
umer
s’ re
siden
tial
area
Selli
ng a
rea
Num
ber o
f che
ckou
ts
Cred
it ca
rd se
rvice
Lo
catio
n at
in
ters
ectio
n Pr
ice, s
ervi
ce a
nd
mer
chan
dise
(per
c-eiv
ed b
y co
nsum
ers)
Mar
ket s
hare
(bas
ed
on p
atro
nage
be
havi
or)
Mul
tiplic
ativ
e Co
mpe
titiv
e In
tera
ctio
n m
odel
(MCI
)
Met
ropo
litan
are
a

- 11
9 -
Ta
ble
3.4.
1 co
ntin
ued
Hise
, Kell
y, G
able
and
McD
onald
(1
983)
Mar
ket s
ize
Num
ber o
f prim
ary
com
petit
ors i
n m
all.
Num
ber o
f sec
onda
ry
com
petit
ors i
n m
all.
Stor
e man
ager
- Age
- M
arita
l sta
tus
- Edu
catio
n lev
el - H
ours
wor
ked/
wee
k - E
xper
ience
St
ore:
- Sel
ling
area
- F
ixed
ass
ets
- Inv
ento
ry le
vel
- Yea
rs st
ore
open
ed
- Em
ploy
ees p
er st
ore
Loca
tion:
- Mall
size
- M
arke
t siz
e (S
MSA
cla
ssifi
catio
n)
Sales
vol
ume
Cont
ribut
ion
Inco
me
Retu
rn o
n as
sets
Regr
essio
n an
alysis
SM
SA c
lassif
icatio
n
Mor
phet
(199
1)
Po
pulat
ion
“Ord
er"
of m
arke
t Pe
rcen
t of p
opul
atio
n in
man
ufac
turin
g Pe
rcen
t in
soc.
class
3
Perc
ent o
f mar
ried
wom
en e
con.
activ
e Ca
rs p
er h
ouse
hold
St
ore's
selli
ng a
rea
vs.
tota
l mar
ket.;
Dist
ance
to
nea
rest
mar
ket.
n.a.
Sales
vol
ume
Regr
essio
n an
alysis
U
rban
are
a of
loca
tion

- 12
0 -
Ta
ble
3.4.
1 co
ntin
ued
Rein
artz
and
Kum
ar
(199
9)
Num
ber o
f ho
useh
olds
in tr
adin
g ar
ea
Perc
ent o
f hou
seho
lds
with
4 o
r mor
e m
embe
rs
Perc
ent o
f hou
seho
lds
with
chi
ldre
n Y
early
inco
me
Perc
ent o
f hou
seho
ld
head
s with
col
lege
degr
ee
Perc
ent o
f hou
seho
lds
owni
ng th
ree
or m
ore
vehi
cles
Deg
ree
of g
roce
ry
scra
mbl
ing
Deg
ree
of n
on-g
roce
ry
scra
mbl
ing
New
ness
of s
tore
O
pen
24 h
ours
O
fferin
g of
dou
ble
coup
onin
g
Sales
vol
ume
Sales
per
squa
re fo
ot
Stru
ctur
al E
quat
ion
Mod
elin
g Po
lygon
aro
und
each
st
ore
loca
tion
to
enclo
se a
n ar
ea th
at
supp
ort t
he a
ll co
mm
odity
valu
e of
th
e st
ore.
Kum
ar a
nd K
aran
de
(200
0)
Tota
l num
ber o
f ho
use-
hold
s in
trade
ar
ea
Perc
enta
ge o
f ho
useh
olds
: - w
ith h
igh
inco
me
- with
4+
mem
bers
- o
wni
ng th
eir
resid
ence
'R
egio
n' c
lassif
icatio
n
Num
ber o
f che
ckou
ts
Ext
ent o
f scr
ambl
ed
mer
-cha
ndise
Co
upon
dou
blin
g O
pen
24 h
ours
Pr
esen
ce o
f ban
k in
st
ore
Sales
vol
ume
Sales
per
squa
re fo
ot
Regr
essio
n an
alysis
Po
lygon
aro
und
each
st
ore
loca
tion
to
enclo
se a
n ar
ea th
at
supp
ort t
he a
ll co
mm
odity
valu
e of
th
e st
ore.

- 12
1 -
Ta
ble
3.4.
2 O
vera
ll de
sign
of te
n pr
evio
us c
ross
-sec
tiona
l stu
dies
from
the
area
of S
CP re
sear
ch.
Auth
or(s
)
Loca
l mar
ket
cond
ition
s St
ore
attri
bute
s Pe
rform
ance
R
esea
rch
inst
rum
ents
M
arke
t Def
initi
on
Lam
m (1
981)
Co
ncen
tratio
n ra
tio
Prox
y m
easu
res f
or
stor
e co
sts (
e.g. B
LS
prod
ucer
pric
e in
dex,
w
age
rate
s, re
gion
al ‘d
umm
y’ va
riabl
es)
Prox
y fo
r pric
es v
ia BL
S pr
ice
inde
x fo
r 18
SMSA
’s
n.a.
Regr
essio
n an
alysis
SM
SA c
lassif
icatio
n
Buck
lin (1
986)
Bi
nary
var
iable
repr
esen
ting
the
two
cities
(Sto
ck-h
olm
or
Got
henb
urg)
Price
inde
x at
stor
e lev
el ba
sed
on
“num
erou
s” it
ems i
n 68
stor
es in
Sto
ckho
lm
and
Got
henb
urg
Stor
e se
lling
spac
e (s
qm);
num
ber o
f ho
urs o
pen
per w
eek;
n.a.
Regr
essio
n an
alysis
Tw
o cit
ies (S
tock
holm
an
d G
othe
nbur
g)
Cotte
rill (
1986
) H
erfin
dahl
Inde
x;
Conc
entra
tion
indi
ces
Per c
apita
inco
me;
popu
latio
n gr
owth
Price
inde
x ba
sed
on
121
prod
uct p
rices
. In
depe
nden
t/ch
ain
affil
iated
; rela
tive
mar
ket s
hare
; sel
lng
spac
e (s
qft);
sales
per
sq
ft;
n.a.
Regr
essio
n an
alysis
18
loca
l mar
kets
bas
ed
on a
fixe
d di
stan
ce (1
5 m
iles)
and
topo
grap
hic
natu
ral b
arrie
rs.

- 12
2 -
Tabl
e 3.
4.2
cont
inue
d.
New
mar
k (1
990)
Co
ncen
tratio
n ra
tio
Inco
me
Ave
rage
pric
es o
f 35
groc
ery
item
s in
27 U
S cit
ies
n.a.
Regr
essio
n an
alysis
M
etro
polit
an a
rea
Bink
ley a
nd C
onno
r (1
998)
Co
ncen
tratio
n ra
tio;
pres
ence
of w
areh
ouse
st
ores
; pre
senc
e of
fa
stfo
od re
taile
rs;
groc
ery
sales
by
small
st
ores
; ave
rage
stor
e siz
e (s
ellin
g ar
ea)
Popu
latio
n de
nsity
; po
pulat
ion
grow
th;
aver
age
inco
me
Ave
rage
pric
e of
26
groc
ery
item
s in
95 U
S cit
ies
Prox
y m
easu
res f
or
stor
e co
sts (
labor
and
re
nt c
osts
); re
gion
al ‘d
umm
y’ va
riabl
es
n.a.
Regr
essio
n an
alysis
M
etro
polit
an a
rea
Mar
ion
(199
8)
Conc
entra
tion
ratio
; w
areh
ouse
stor
es’
mar
ket s
hare
In
com
e, po
pulat
ion
Ann
ual p
erce
ntag
e ch
ange
in B
LS fo
od-
at-h
ome
price
inde
x 19
77-1
992.
Pr
oxy
mea
sure
s for
st
ore
cost
s (lab
or a
nd
rent
cos
ts)
n.a.
Regr
essio
n an
alysis
M
etro
polit
an a
rea
Cotte
rill (
1999
) Co
ncen
tratio
n ra
tios
Her
finda
hl In
dex
Mar
ket g
row
th ra
te
Per c
apita
inco
me
Price
inde
x “W
areh
ouse
” du
mm
y va
r. Se
rvice
dum
my
varia
ble
Prox
ies f
or c
osts
n.a.
Regr
essio
n an
alysis
Th
ree-
stag
e lea
st
squa
res
n.a.
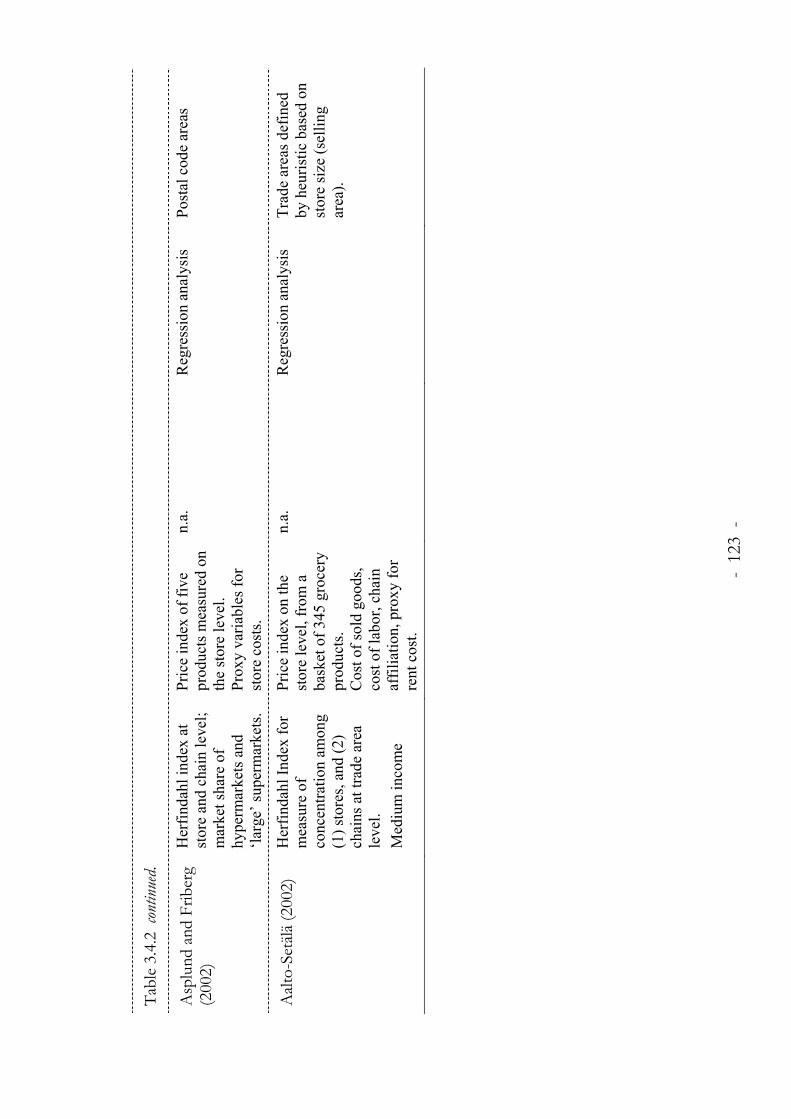
- 12
3 -
Tabl
e 3.
4.2
cont
inue
d.
Asp
lund
and
Frib
erg
(200
2)
Her
finda
hl in
dex
at
stor
e an
d ch
ain
leve
l; m
arke
t sha
re o
f hy
perm
arke
ts a
nd
‘larg
e’ su
perm
arke
ts.
Pric
e in
dex
of fi
ve
prod
ucts
mea
sure
d on
th
e st
ore
leve
l. Pr
oxy
varia
bles
for
stor
e co
sts.
n.a.
R
egre
ssio
n an
alys
is
Post
al c
ode
area
s
Aalt
o-Se
tälä
(200
2)
Her
finda
hl In
dex
for
mea
sure
of
conc
entra
tion
amon
g (1
) sto
res,
and
(2)
chai
ns a
t tra
de a
rea
leve
l. M
ediu
m in
com
e
Pric
e in
dex
on th
e st
ore
leve
l, fr
om a
ba
sket
of 3
45 g
roce
ry
prod
ucts
. C
ost o
f sol
d go
ods,
cost
of l
abor
, cha
in
affil
iatio
n, p
roxy
for
rent
cos
t.
n.a.
R
egre
ssio
n an
alys
is
Trad
e ar
eas d
efin
ed
by h
euris
tic b
ased
on
stor
e si
ze (s
ellin
g ar
ea).

- 12
4 -
Ta
ble
3.4.
3 O
vera
ll de
sign
of th
irtee
n pr
evio
us c
ross
-sec
tiona
l stu
dies
of e
cono
mies
of s
cale
on th
e gr
ocer
y st
ore
level.
Auth
or(s
) Lo
cal m
arke
t co
nditi
ons
Stor
e at
tribu
tes
Perfo
rman
ce
Res
earc
h in
stru
men
ts
Mar
ket D
efin
ition
McC
lellan
d (1
962)
n.
a. Fl
oor a
rea
Wag
e co
sts
Tabu
lar a
nalys
is n.
a.
Tille
y an
d H
icks
(197
0)
n.a.
Floo
r are
a Sa
les p
er sq
uare
foot
G
ross
pro
fit p
er sq
ft O
pera
ting
cost
s per
sq
ft N
et p
rofit
per
sqft
Tabu
lar a
nalys
is n.
a.
Ofe
r (19
73)
n.a.
Floo
r are
a V
alue
adde
d Pr
oduc
tion
func
tion
n.a.
Arn
dt a
nd O
lsen
(197
5)
n.a.
Floo
r are
a G
ross
pro
fit p
er
empl
oyee
G
ross
pro
fit p
er sq
m
Prod
uctio
n fu
nctio
n n.
a.
Savi
tt (1
975)
n.
a. Fl
oor a
rea
Ope
ratin
g co
sts
Regr
essio
n an
alysis
n.
a.
Thor
pe a
nd
Shep
herd
(197
7)
n.a.
Floo
r are
a La
bor c
ost
“Oth
er”
cost
s Ta
bular
ana
lysis
n.a.
Noo
tebo
om (1
980)
n.
a. Sa
les v
olum
e La
bor c
ost
Regr
essio
n an
alysis
n.
a.
Thur
ik (1
981)
n.
a. Sa
les v
olum
e Sa
les p
er la
bor h
our
Prod
uctio
n fu
nctio
n n.
a.
Inge
ne (1
984)
n.
a. Fl
oor a
rea
Sales
per
squa
re fo
ot
Sales
per
labo
r hou
r Pr
oduc
tion
func
tion
n.a.

- 12
5 -
Ta
ble
3.4.
3 co
ntin
ued.
Thur
ik a
nd K
oets
(1
984)
n.
a. Fl
oor a
rea
Pr
oduc
tion
func
tion
n.a.
Shaw
, Nisb
et a
nd
Daw
son
(198
9)
n.a.
Fl
oor a
rea
Labo
r cos
t R
egre
ssio
n an
alys
is
n.a.
Elia
sson
and
Ju
lande
r (19
91)
n.a.
Fl
oor a
rea
Sale
s per
em
ploy
ee
Sale
s per
sqm
Pr
oduc
tion
func
tion
n.a.
Aalt
o-Se
tälä
(200
0)
n.a.
Fl
oor a
rea
Labo
r int
ensi
ty
City
-cen
tre in
dica
tor
Cos
t of g
oods
sold
La
bor c
ost
Reg
ress
ion
anal
ysis
n.
a.

- 126 -
3.5 Delineation of local markets An important issue in a study incorporating the effect of market
conditions on conduct and performance refers to the delineation of the “local” market area, i.e. the determination of what geographical area to inspect for establishing the conditions of demand and competition. It is appropriate to halt a moment at the issue referring to the demarcation of the geographic area that constitutes the relevant market for a supermarket. How does one proceed in order to identify the relevant market for a supermarket before characterizing its structure, and investigate its effect on performance?
This is a difficult but important issue. It is important because the results of the analyses are probably strongly affected by the delineation of the market area. If markets are defined too narrowly, actual competitors and consumers will be excluded from the analysis; and if defined too widely, the analysis will be disturbed by the incorporation of irrelevant competitors and consumers. It is also a difficult issue because there is no general principle according to which the boundaries of market areas are to be established, and because the demarcation will depend on preferences and on the substitutability of the products. Although it is unanimously accepted in previous research that supermarkets compete for demand in their local market, and that “local” refers to a certain geographic area surrounding the store, there is far from a unanimous agreement on how to demarcate this geographic area.
Previous studies have taken various approaches to this issue. Some studies rely on political or statistical boundaries, measuring competition at, for example, the “town” or “municipality” level. Asplund and Friberg (2002) used postal code areas as market areas, i.e. competition and demand are measured in the area within a town defined by the boundaries of areas used by a mail distribution company. Others rely on some “rules of thumb”, and suggests that an area of a certain fixed distance (e.g. one mile) separating the store from its environment is to be inspected for demand and competitive conditions. Aalto-Setälä (1999) defines the local market by a heuristic algorithm, allowing store size in terms of square meters of selling area affect the size of the “local” market.
Gripsrud and Grönhaug (1985) argue that the definition of the “local” market of a store should incorporate the judgement of the store manager. The argument for this standpoint is that it is the local manager’s perception of what is the “local” market that is instrumental in his or hers decisions on conduct issues.

- 127 -
In the present study, “local” markets are defined in two ways. The first way is to define local markets by drawing circles around the stores with subsequently greater radii. The distances applied are 500 meters, 1000, 1500, 3000, 4500, and 6000 meters. Competition and demand characteristics are defined for the geographic areas comprised by each of these distances. The second approach follows the recommendation of Gripsrud and Grönhaug (1985), defining the radius of a geographic area surrounding each store in accordance with each of the 168 store managers’ perception of what area constitutes the trade area. A store’s trade area is generally defined as the geographic area from which 80% of its customers originate (Berman and Evans 1998; Levy and Weitz 2001). Thus, this perception of each store’s trade area was captured by asking each individual retailer about the distance around the store from which 80% of its customers originate.
To summarize, the local market of each of the 168 stores in the sample is defined both in terms of subsequently larger geographical areas based on a radius defined by each individual retailer, and by subsequently increased radii.
Table 3.5.1 Empirical concepts of trade area.
Derived construct(s) Definition Empirical concept(s)
Trade area The geographical area from which a certain store attracts its customers.
The radius of a circular area surrounding a store comprising the origin of 80% of its customers. Subsequentially larger radii of circular areas surrounding a store.
The average (median) trade area has a radius of 3 km, with a substantial
variation between the stores:
Table 3.5.2 Local market structure variables. Descriptive statistics.
Mean St.dev. Median Min Max
Trade area Trade area (radius in meters)
5,000 4,553 3,000 1,000 30,000

- 128 -
3.6 Data sources and data collection procedures Data on store performance and store conduct were provided for 200
randomly selected ICA supermarkets for the fiscal year of 1996. These data were delivered by the internal Accounting Service Bureau of ICA, supporting the ICA stores with both services on daily accounting and annual reports. All stores in the sample thus follow the same principles and procedures for recording revenues and costs, providing prerequisites for reliable comparisons of the figures between the stores.
Attributes of the 200 stores were gathered in collaboration with the ICA market research department. This collaboration provided data on prices, store attributes, and locational characteristics of 168 supermarkets – of the 200 randomly selected, 32 were unwilling to participate in the study. Pooling these data with the data on performance ended up in a data set of 168 supermarkets, for which a complete description of attributes and performance are available. A detailed list of collected items are reported in section 3.7 below.
A complete list of all grocery stores operating in the Swedish retail sector was the starting-point for a description of the local competition facing each of the 168 remaining stores in the sample. This list is maintained and updated annually by “Dagligvaruleverantörernas Förbund” (DLF), an organization supporting the grocery suppliers in Sweden. The list contains information on all stores in Sweden, i.e. not only ICA stores. The information comprises the size (annual sales volume and selling area), address (the list is used by suppliers for mailing and visiting activities on the store level), store format (i.e. if the store is a hypermarket, discount store, upgraded petrol station or “other” store), and to which retail chain organization the store is affiliated. Further, the information contains the geographic location of the store, in terms of an (x.y)-coordinate. These pieces of information facilitate a description of the local competitive conditions for each of the 168 supermarkets. A computer program was constructed, establishing – for each of the 168 stores – which stores from the list were located within certain various distances from the store. For a detailed list of which measures of competition and what distances applied for depicting the market area, see section 3.7 below.
Characteristics of demand in the local market areas of each of the 168 stores was made available through data from the Statistical Bureau of Sweden (SCB). SCB provided data on population and demographics for geographic

- 129 -
“squares” measuring 250x250 meters (1000x1000 meters for less populated areas) for the entire surface of Sweden. Each square was identified by an (x,y)-coordinate of the center-point of the square. Similar to the procedure described above, a computer program was constructed that established which squares were located within various distances from each of the 168 stores.
3.7 Operationalization of variables
3.7.1 Store Performance The Accounting Service Bureau of ICA provided, for each of the 168
supermarkets, income statements and balance sheets of the fiscal year 1996. Further, information per supermarket was delivered on physical size (floor area in square meters), number of labor hours and average transaction size per shopper. Based on these data, a comprehensive description of the performance of each supermarket is created, comprising three measures of market based performance, three measures of productivity, and six measures of financial performance.
3.7.1.1 Variables of market based performance Based on delivered data on market based performance in terms of sales
volume and average transaction per shopper, the number of shoppers for an average week was computed for each supermarket. Thus, for each supermarket there is information on to what extent the overall volume of sales is achieved through the attraction of a volume of shoppers and volume of sales per shopper.
Table 3.7.1 Empirical concepts of market based performance.
Derived concept(s) Definition Empirical concept(s)
Market-based performance
The amount of demand attracted by a store.
Sales volume Number of shoppers per week Average transaction per shopper
Descriptives of the three variables of market based performance are
proviced in Table 3.7.2 and intracorrelation coefficients in Table 3.7.3. The

- 130 -
results show the 168 stores differ substantially on all measures. On average, annual sales volume of the stores is SEK 38 millions, ranging from 6 to 168. This 30:1 ratio between the largest and smallest store is accompanied by a 11:1 ratio on number of shoppers, and a 3:1 ratio on average transaction per shopper.
The correlation analyses show the number of shoppers to be the most substantial “determinant” of sales volume (r=0.90, p<0.01), wile average transaction per shopper report a substantially smaller correlation, although highly significant (r=0.30, p<0.01).
Table 3.7.2 Market based performance variables. Descriptive statistics.
Mean St.dev. Median Min Max
Net sales (‘000 SEK) 38,031 21,211 31,077 6,058 168,034
Number of shoppers/week 6,624 3,724 5,584 1,958 23,280
Average transaction/shopper
112 25 110 55 187
Table 3.7.3 Correlation coefficients between variables of market based performance.
X1 X2 X3
Net sales X1 1.00
Number of shoppers per week X2 0.90a 1.00
Average transaction per shopper X3 0.30a -0.09 1.00
3.7.1.2 Variables of productivity performance Productivity measures are defined in accordance with the ”Strategic
Resource Model”, SRM, (Lusch and Serpkenci, 1983, Lusch 1986). The SRM recognizes merchandise, floor area, and labor as the “critical” resources of a retail store. By applying sales as a measure of output, and dividing sales volume by the amount of each resource utilized, three productivity measures – sales per inventory investment, sales per square meter, and sales per labor hour – are defined.

- 131 -
Table 3.7.4 Empirical concepts of productivity performance.
Derived concept(s) Definition Empirical concept(s)
Productivity performance
The rate at which the resources of a store are converted to outputs.
Sales per inventory investment Sales per square meter floor area Sales per labor hour
Descriptives of the three variables of productivity are provided in Table
3.7.5. The results show a substantial variation between the supermarkets, the most substantial referring to a 7:1 ratio between the most and least performing on space productivity. Corresponding ratios are 5:1 on inventory productivity, and 3:1 on labor productivity. The correlation coefficients between the productivity measures (Table 3.7.6) show a high correlation (r=0.60, p<0.01) between inventory- and space productivity, while both these measures are uncorrelated with labor productivity.
Table 3.7.5 Productivity performance variables. Descriptive statistics.
Mean St.dev. Median Min Max
Sales per inventory 18.2 5.0 17.4 8.1 38.8
Sales per square meter 48,573 15,957 45,421 15,144 100,083
Sales per labor hour 1,279 208 1,258 818 2,425
Table 3.7.6 Correlation coefficients between productivity performance variables.
X1 X2 X3
Sales per inventory X1 1.00
Sales per square meter X2 0.60a 1.00
Sales per labor hour X3 0.09 0.08 1.00

- 132 -
3.7.1.3 Variables of financial performance Income statements and balance sheets at the supermarket level provide
the prerequisites for acquiring a detailed description of financial performance. The defined measures are the following:
Table 3.7.7 Empirical concepts of financial performance.
Derived concept(s) Definition Empirical concept(s)
Gross profit performance
The degree to which customer payments exceed the cost for acquiring sold products.
Gross profit Gross margin%
Operating cost performance
The costs for the resources acquired for operating a store.
Promotion cost (SEK and %) Labor cost (SEK and %) Depreciation cost (SEK and %) Other operating costs (SEK and %)
Operating profit performance
The difference between gross profit and operating costs.
Operating profit Operating margin%
Profitability performance
The rate at which assets are converted to operating profit.
Return on controllable assets (%) Operating profit per square meter
Some adjustments of the original income statements were carried out, in
order to make them more valid for the purposes of the present study:
1. Labor costs were adjusted for the salary to the retail manager. The salary paid to the retail manager was delivered separate from the overall labor cost and found differing substantially between the stores. As such, profit performance comparisons between the stores are distorted from reasons that were judged improper for the purposes of the study. Hence, the salary paid

- 133 -
to the retail manager was substituted by the salary paid to managers of ICA stores operated as subsidiaries to the ICA Retail corporation.
2. In forty-one of the stores, the fixed assets were leased from a finance company within the ICA Retail corporation. Hence, the net book value of these fixed assets are not part of the balance sheet on the store level. Further, the cost structure of the stores leasing their assets differ from the other stores. To facilitate a comparison of these stores with the other stores that own their fixed assets, data on the leased assets were acquired from the finance company and the income statements and balance sheets of the forty-one stores were updated to an appearance as if the assets were owned by the stores.
3. Part of the promotion costs on the store level are costs that are allocated to the stores from the parent organization, ICA Retail Corp. These costs refer to promotion activities initiated by, and carried out by, the retail chain. These costs are allocated based on the size of the store. As the promotion activities are identical by content and frequency for all 168 stores, these costs are eliminated from the promotion costs on the store level.
Through a sequential reduction of gross profit by various cost items,
operating profit and net profit are defined. See Table 3.7.8. The absolute measures of sales volume, gross profit, and operating costs
are almost perfectly correlated, and each of the measures is almost perfectly correlated with scale of operation (floor area):
Table 3.7.9 Correlation coefficients between scale of operation and absolute measures of performance (a=p<0.01, b=p<0.05, c=p<0.10).
X1 X2 X3 X4
Scale of operation (floor area) (X1) 1.00
Sales volume (X2) 0.90a 1.00
Gross profit (X3) 0.88a 0.99a 1.00
Operating costs (X4) 0.90a 0.98a 0.97a 1.00

- 134 -
Table 3.7.8 Profitability performance variables. Descriptive statistics.
(‘000 SEK) Mean St.dev. Median Min Max
Net sales 38,031 23,211 31,077 6,058 168,034
Cost of sold goods 30,167 18,458 24,882 4,861 131,511
Gross margin 7,863 4,823 6,531 1,197 36,523
Promotion cost 431 373 329 36 2,756
Labor cost 4,067 2,266 3,488 771 16,136
Other operating costs 2,278 1,476 1,922 500 9,823
Operating profit 1,087 1,318 833 -3,156 8,519
Depreciation 354 372 257 15 3,245
Net profit 733 1,190 571 -4,218 7,506
Inventory investment 2,137 1,291 1,758 442 10,514
Fixed assets investment 2,698 2,612 2,379 252 23,470
Total assets investment 4,835 3,414 3,747 695 28,549
Hence, it is necessary to “scale” the absolute measures to have a
common basis for comprison across stores with different scale of operation. Without such scaling, high absolute gross profit and operating costs, for a store merely represents scale differential, rather than the differential performance of the store. The scaling is carried out by dividing the absolute values of the income statement (1) by square meters of floor area, providing absolute measures of cost- and profit performance per square meter of each store, and (2) sales volume, providing measures of costs and profit as percentages of sales. A check for the extent to which the two sets of scaled measures of cost- and profit performance reports small or zero correlation between the measures:
Table 3.7.10 Correlation coefficients between scaled measures of gross profit and operating costs. (a=p<0.01, b=p<0.05, c=p<0.10).
Gross margin%
Operating costs%
Gross profit per sqm 0.15b - 0.27a
Operating costs per sqm - 0.02 - 0.02

- 135 -
Table 3.7.11 reports these measures in terms of a percentage of sales,
and asset turnover and return on asset figures. Table 3.7.12 presents descriptives of revenues and costs per square meter of floor area. These tables show a substantial variation on all items of financial performance. On average, operating profit margin% on the bottom level after reducing all operating costs from gross profit, is 1.8%, with a standard deviation of 2.2%, ranging from -6.2% to 8.1%. Out of the 168 supermarkets in the sample, thirty perform negative on operating profit.
The most substantial operating cost item is labor costs, constituting about sixty percent of overall operating costs. On average, the supermarkets’ share of sales spent on labor costs is 11%, out of a total of about 18% overall operating costs.
Profitability (return on assets, ROA) is most substantially related to the operating margin% (r=0.90, p<0.01), although significantly related to asset turnover as well (r=0.38, p<0.01).

- 136 -
Table 3.7.11 Financial performance (%) variables. Descriptive statistics.
Mean St.dev. Median Min Max
Net sales 100.0 n.a. n.a. 100.0 100.0
Cost of sold goods% 79.2 1.7 79.3 73.5 83.3
Gross margin% 20.8 1.7 20.7 16.7 26.5
Promotion cost% 1.1 0.5 1.0 0.2 2.3
Labor cost% 11.0 1.3 10.8 8.2 15.8
Other operating costs% 6.1 1.2 6.0 3.2 11.3
Operating margi% 2.7 2.2 2.9 -5.7 9.1
Depreciation 0.9 0.6 0.8 0.1 4.6
Net margin% 1.8 2.2 2.1 -6.2 8.1
Turnover in inventory 18.2 5.0 17.4 8.1 38.8
Turnover in fixed assets 18.5 8.2 17.8 2.9 46.4
Turnover controllable assets
8.6 2.4 8.6 2.6 14.8
Return on controllable assets
16.5 19.7 17.1 -52.5 101.0
Table 3.7.12 Financial performance (per square meter) variables. Descriptive statistics.
Mean St.dev. Median Min Max
Net sales per sqm 48,573 15,957 45,421 15,144 100,083
Cost of sold goods/sqm 38,508 12,770 36,112 12,152 80,259
Gross margin per sqm 10,065 3,334 9,371 2,992 21,598
Promotion cost per sqm 520 311 464 83 2,258
Labor cost per sqm 5,279 1,762 4,871 1,929 14,531
Other oper. costs per sqm 2,880 952 2,769 1,094 7,887
Operating profit per sqm 1,386 1,292 1,224 -3,064 6,428
Depreciation per sqm 451 346 379 28 2,273
Net profit per sqm 934 1,236 836 -4,095 5,717

- 137 -
3.7.2 Scale of operation In the present study, a supermarket’s “scale of operation” is derived
from its capacity, rather than from its “output” in terms of sales volume. See chapter 2 for a discussion on the issue of “output” in a retail store context. Two measures of physical size – floor area (square meters) and number of checkouts – are defined for describing a supermarket’s scale of operation:
Table 3.7.13 Empirical concepts of scale of operation.
Derived concept(s) Definition Empirical concept(s)
Scale of operation The physical size of a store’s establishment.
Floor area (square meters) Number of checkouts
Descriptives of the two measures are provided in table 3.7.14, showing
a substantial variation between the 168 supermarkets. Floor area ranges due to the sampling procedure from 400 to 2,000 square meters. Number of checkouts has a minimum of 2 in the smallest stores, and a maximum of 11:
Table 3.7.14 Scale of operation variables. Descriptive statistics.
Mean St.dev. Median Min Max
Floor area (square meters) 782 364 698 400 2,000
Number of checkouts 3.9 1.6 3.0 2 11
The two measures are highly correlated (r=0.81, p<0.01). A principal
component analysis on the two variables show highly significant results for a one-component solution. A single component contain 90% of the overall variance between the two variables, with components loadings of 0.95.
In forthcoming analyses of the effect of scale on supermarket conduct and performance, the principal component score from the principal component analyses is applied as the measure of scale.
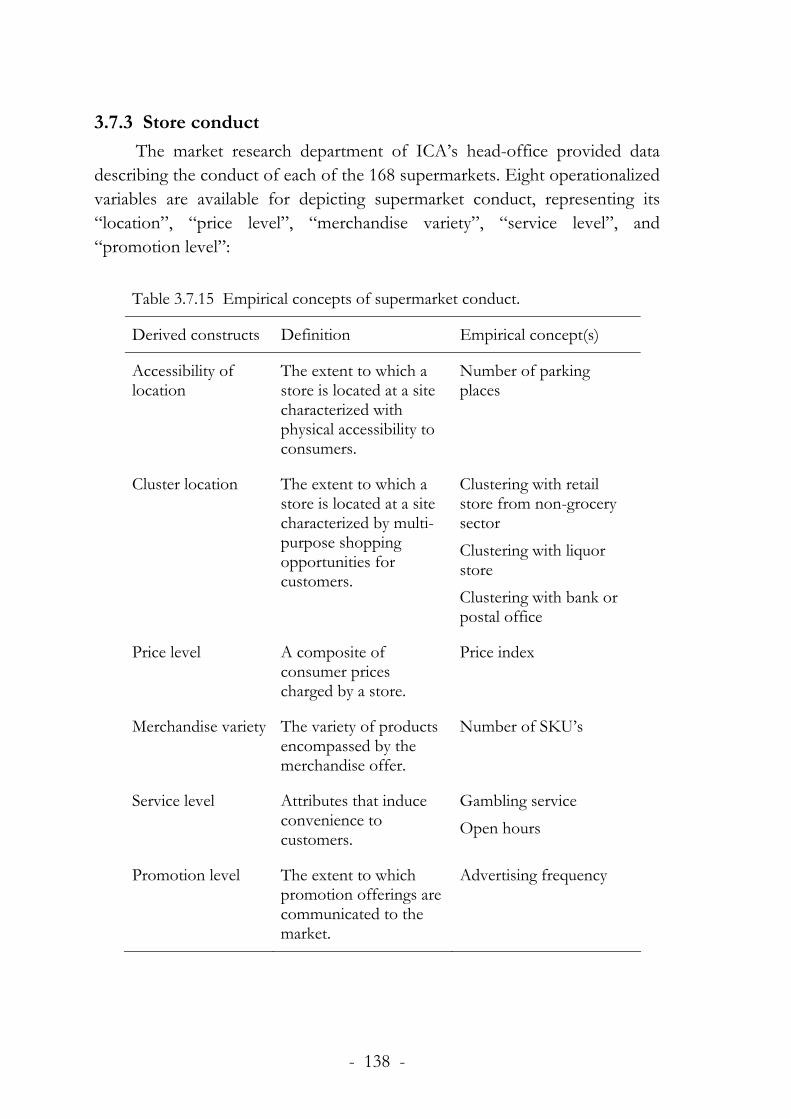
- 138 -
3.7.3 Store conduct The market research department of ICA’s head-office provided data
describing the conduct of each of the 168 supermarkets. Eight operationalized variables are available for depicting supermarket conduct, representing its “location”, “price level”, “merchandise variety”, “service level”, and “promotion level”:
Table 3.7.15 Empirical concepts of supermarket conduct.
Derived constructs Definition Empirical concept(s)
Accessibility of location
The extent to which a store is located at a site characterized with physical accessibility to consumers.
Number of parking places
Cluster location The extent to which a store is located at a site characterized by multi-purpose shopping opportunities for customers.
Clustering with retail store from non-grocery sector Clustering with liquor store Clustering with bank or postal office
Price level A composite of consumer prices charged by a store.
Price index
Merchandise variety The variety of products encompassed by the merchandise offer.
Number of SKU’s
Service level Attributes that induce convenience to customers.
Gambling service Open hours
Promotion level The extent to which promotion offerings are communicated to the market.
Advertising frequency

- 139 -
Four variables are dichotomous (all three cluster location variables, and the “gambling service” variable). Descriptive statistics on each variable is reported in Table 3.7.16. Correlation coefficients between the non-dichotomous variables (Table 3.7.17) show significant and positive, but low, correlation (r<0.30 in all cases).
The price level of the 168 supermarkets is represented by a composite price index from a basket of 347 products. In collaboration with an external market research company, the market research department of ICA regularly collect and process price data on the store- and product item level. For the purposes of the present study, the data collection of november 1996 was complemented to comprise all the supermarkets of this study.
Merchandise variety is represented by the total number of stock-keeping units (SKU’s) comprised by the merchandise offer.
The service level is described by two measures, (1) open hours, and (2) add-on services in terms of opportunities for shoppers to make bets on sport events and horse races. This add-on service is in form of being a representative of governmentally owned companies. Forty of the 168 super-markets are such representatives of the governmentally owned gambling service company, offering add-on service to shoppers in terms of opportunities to make bets on sport events and horse races. All 168 stores were found offering personal selling of delicatessen. As this service item is not differentiating the stores from each other, it is not incorporated in the data set.
Promotion level is measured by a measure of frequency by which the store conducts “external” promotion in terms of advertising offers or direct mailing offers. The measures takes on an integer value ranging from 1 to 6, representing “never” (1), “less than once a month” (2), “once a month” (3), “more often than once a month” (4), “once a week” (5), and “more often than once a week” (6).
Of the 168 supermarkets, seventy are free-standing stores, while ninety-eight are clustered with some other retail establishment (i.e. clustered with either a non-grocery retail store, a liquor store, or bank- or postal office).
Forty of the 168 supermarkets are representatives of the governmentally owned gambling service company, thus offering add-on service to shoppers in terms of opportunities to make bets on sport events and horse races.

- 140 -
Table 3.7.16 Store conduct variables. Descriptive statistics.
Mean St.dev. Median Min Max
Location
Number of adjacent parking places
88 96 50 0 700
Clustered with non-grocery store
n.a n.a n.a 0 1
Clustered with liquor store n.a n.a n.a 0 1
Clustered with bank- or postal office
n.a n.a n.a 0 1
Price level
Price index 100.5 3.8 101.1 86.4 109.5
Merchandise variety
Number of SKU’s in assortment
8,310 2,456 8,000 2,000 16,500
Service level
Gambling service (dummy) n.a n.a n.a 0 1
Open hours 69.0 8.7 69.0 48 98
Promotion level
Promotion frequency 3.5 1.9 4.0 1 6
Table 3.7.17 Correlation coefficients between store conduct variables (a=p<0.01; b=p<0.05; c=p<0.10).
X1 X2 X3 X4 X5
Number of parking places X1 1.00
Price index X2 -0.26a 1.00
Number of SKU’s in assortment X3 0.24a 0.07 1.00
Open hours X4 0.30a -0.19b 0.05 1.00
Promotion frequency X5 0.30a -0.11 0.19b 0.18b 1.00

- 141 -
A comparison of average figures on each of the non-dichotomous conduct variables in the No/Yes groups of stores referring to the clustering and gambling service variables show no significant differences between the groups, the exception being open hours in stores offering gambling service (having four more open hours per week).
Table 3.7.18 Average conduct of clustered and non-clustered supermarkets.
Clustered location
No (n=70)
Yes (n=98)
Sig.
Price index 100.1 100.8 n.s.
Number of SKU’s 8,064 8,486 n.s.
Number of open hours 68.6 69.4 n.s.
Advertising frequency 3.4 3.6 n.s.
Table 3.7.19 Average conduct of supermarkets offering / not offering gambling services..
Gambling service
No (n=128)
Yes (n=49)
Sig.
Price index 100.4 101.0 n.s.
Number of SKU’s 8,265 8,455 n.s.
Number of open hours 68.1 72.0 p<0.05
Advertising frequency 3.5 3.7 n.s.
All empirical measures of conduct, thus, are found virtually unrelated.
Hence, the defined empirical variables are interpreted as individual representatives of various elements, or aspects, of conduct rather than joint reflection(s) of a singular, or sub-sets of, dimension(s) of conduct.

- 142 -
3.7.4 Potential of local demand and local supply Potential demand and supply in local markets of the 168 supermarkets
are measured by the level of local saturation. Two measures of local market saturation are defined for the analyses of to what extent demand- and supply conditions of local markets make a difference for supermarket performance. Local market saturation is operationalized by two measures, through relating the level of population within various distances from the store to (1) the total number of grocery stores, and (2) the total number of square meters of floor area supplied by these stores, within the corresponding distances. This procedure yields two indices of saturation, (1) population per store, and (2) population per square meter.
Table 3.7.20 Empirical concepts of market saturation.
Derived concept(s) Definition Empirical concept(s)
Saturation The degree to which buyers are currently served by sellers in a market
Population per store in trade area Population per sqm in trade area
Descriptives of Table 3.7.21 provide a general picture of substantial
variation in the demand- and supply conditions of the local markets faced by the supermarkets of this study. There are stores operating in local markets with “low”, “intermediate”, and “high” levels of both potential demand and potential supply.
The two measures of saturation are highly correlated (r=0.69; p<0.01). A single-component solution from a principal component analysis show 85 percent of the overall variance in the two variables explained by a single factor, forming a “saturation factor”, comprising both original indices. Both original measures of satuation have component loadings of 0.92.
In the forthcoming empirical analyses, local saturation is represented by the factor score from the principal component analysis.

- 143 -
Table 3.7.21 Trade area descriptives.
Mean St.dev. Median Min Max
Demand volume
Population in trade area 10,856 10,128 7,314 873 57,546
Supply volume
Number of stores in trade area
8.4 7,9 6.0 1 50
Number of square meters of grocery stores’ floor area in trade area
2,973 3,246 1,707 400 14,947
Saturation
Population per store 1,252 690 1,096 177 4,678
Population per square meter
3.3 1.7 2.9 0.7 11.9

- 144 -
3.7.5 Structure of local competition Six variables are defined for describing the structure of competition in
local markets. Three of the variables refer to concentration, one to spatial monopoly, and two to intertype competition:
Table 3.7.22 Empirical concepts of trade area.
Derived concept(s) Definition Empirical concept(s)
Concentration The degree to which the seller side of a market diverge from the “large number of competing firms” prerequisite of perfect competition.
One-firm concentration ratio Herfindahl Index at store level Herfindahl Index at chain level
Spatial monopoly The degree to which a store is geographically separated from its competitors.
The distance separating a store from its nearest competitor of at least 400 sqm selling area
Intertype competition The degree to which the seller side of a market is constituted by non-supermarket store formats.
Discount stores’ share of market Hypermarkets’ share of market
Descriptives of the variables are provided in Table 3.7.23 below.
Concentration differs substantially between the local markets of the 168 supermarkets in the sample. In the upper end of the scale, there are six stores not facing competition in their trade area (i.e. CR-One is 100, and Herfindahl Index is 10,000), and in the other end there are stores facing local markets of low concentration.
Spatial monopoly is defined as the distance separating a supermarket from its nearest competitor, of at least supermarket size (400 square meters). The range in the empirical variable of spatial monoply is the most substantial of all structure variables – in the one end there are supermarkets located next door to their nearest competitor (i.e. spatial monoply is zero), and in the other end there are supermarkets located almost 30 kilometers from their nearest

- 145 -
competitor (of at least 400 square meters). A comparison of the mean value (2.9 km) with the median value (0.78 km) indicates a skewed distribution of this measures, i.e. a small number of supermarkets in the sample scoring exceptionally high (compared to a majority of sample stores) on spatial monopoly.
Table 3.7.23 Local market structure variables. Descriptive statistics.
Mean St.dev. Median Min Max
Concentration
Number of competing stores
8.4 7.9 6.0 0 50
Concentration ratio (CR1, store level)
45.9 22.9 42.0 7.2 100.0
Herfindahl Index (store level)
3,527 2,201 3.080 288 10,000
Herfindahl Index (chain level)
4,854 1,834 4,439 2,311 10,000
Spatial monopoly
Distance (meters) to nearest competing store
2,954 5,312 776 0 28,002
Intertype competition
Discount stores’ share (%) of floor area
6.5 9.5 0.0 0.0 41.7
Hypermarkets’ share (%) of floor area
3.8 9.9 0.0 0.0 77.9
Table 3.7.24 shows the correlation coefficients between all measures of
competitive structure. Most notably, the measures of concentration are highly correlated (r>0.70 in all cases). A single-factor solution of a principal component analysis of the three variables retains more than 85% of the total variance in the three variables, with component loadings of 0.96 (Herfindahl Index at store level), 0.91 (Herfindahl index at chain level), and 0.91 (one-firm concentration ratio).

- 14
6 -
Tabl
e 3.
7.24
Cor
rela
tion
coef
ficie
nts b
etw
een
mea
sure
s of l
ocal
stru
ctur
e co
mpe
titio
n.
X 1
1 X 1
2 X 1
3 X 2
1 X 2
2 X 3
1
Con
cent
ratio
n
Con
cent
ratio
n ra
tio (C
R-O
ne) X
11
1.00
Her
finda
hl In
dex
(sto
re le
vel)
X12
0.
82a
1.00
Her
finda
hl In
dex
(cha
in le
vel)
X13
0.
70a
0.84
a 1.
00
Inte
rtyp
e co
mpe
titio
n
Dis
coun
t sto
res’
shar
e of
floo
r are
a X 2
1 -0
.24a
-0.3
4a -0
.26a
1.00
Hyp
erm
arke
ts’ s
hare
of f
loor
are
a X 2
2 -0
.07
-0.1
7b -0
.10
0.04
1.00
Spat
ial m
onop
oly
Dis
tanc
e (m
eter
s) to
nea
rest
com
petin
g st
ore
X31
0.
43a
0.47
a 0.
49a
-0.2
7a -0
.11
1.00

- 147 -
Turning to intertype competition, a frequency analysis (Table 3.7.25
below) show that out of the 168 supermarkets, there are eighty-eight not facing intertype competition from either a discount store or a hypermarket. Thirty stores face competition from both discounters and hypermarkets:
Table 3.7.25 Frequency of intertype competitive conditions of the 168 local markets.
n
No intertype competition 88
Discount competition (not hypermarkets) 45
Hypermarket competition (not discount) 5
Discount and Hypermarket competition 30
An analysis of the intrarelationship between the dimensions of
competition (i.e. between concentration, spatial monopoly, and intertype competition) shows that concentration and spatial monopoly is strongly related. The correlation coefficient between the principal component score of concentration and the measure of spatial monopoly (i.e. the distance separating a supermarket from its nearest competitor) is positive and highly significant (r=0.50, p<0.01); spatial monopoly of supermarkets thus increase with increased concentration of competition in local markets.
Further, intertype competition conditions is associated with concentration and spatial monopoly. The correlation coefficient between the market share of discount stores and hypermarkets on the one side, and concentration (r=-0.29) and spatial monopoly (r=-0.26) on the other are highly significant (p<0.01). A higher level of intertype competition is thus associated with more intense competition in terms of less concentration and –spatial monopoly. On average, local markets containing discount stores and/or hypermarkets are substantially less concentrated, and supermarkets in these markets possess – on average – substantially less spatial monopoly over their immediate market area:

- 148 -
Table 3.7.26 Average concentration and spatial monopoly in local markets where intertype is not present and present. T-test for test of significance.
No intertype competition
(n=88)
Intertype competition
(n=80)
Sig.
Concentration (principal component score)
0.4 - 0.5 p<0.01
Spatial monopoly 4,755 972 p<0.01
A principal component analysis of the measures of the three dimensions
of competitive structure (the principal component score of concentration, the distance to nearest competitor, and the market share of discount stores and hypermarkets) report significant support for a single component solution of an overall “competition” factor, retaining 57 percent of the variance with an eigenvalue of 1.7. The correlation coefficients between the factor and the original variables are 0.82 (concentration), 0.80 (spatial monopoly) and -0.63 (intertype competition). Although the share of variance retained by this principal component is substantially lower, compared to the previous ones of saturation and concentration, it still is in accordance with acceptable standards. For instance, according to Hair et al.(1996):
“… in the social sciences, …. it is not uncommon for the analyst to consider a solution that accounts for 60 percent of the total variance (and in some instances even less) as a satisfactory solution.” [Hair et al. (1996), p. 378]
For the forthcoming empirical analyses, the principal component score
from the principal component analysis is applied as a measure of the competitive structure. In order to attain a measure that takes on successively higher values as the structural conditions indicate successively higher levels of competition, the factor score is multiplied by (-1). The variable is labeled “Competition”, as higher value of the score is associated with less concentration, less spatial monopoly, and greater presence of intertype competition.
Before leaving this section of measures of local competition, and their intracorrelation, a note is appropriate referring to the relationship between the level of population in an area, and the level of competition. A correlation

- 149 -
analysis report highly significant results referring to this; the higher the level of population in a local market, the higher the level competition. The correlation coefficient between the principal component score and population (number of residents) is 0.54 (p<0.01). Corresponding coefficients are for concentration r= -0-55, for spatial monopoly r= -0.34, and for intertype competition r=0.32, all significant at p<0.01. The level of population thus plays an important role in terms of basic conditions for the structure of local competition.
3.7.6 Structure of local demand The structure of demand in the local markets of each of the 168
supermarkets are described by three measures of “share of population” possessing certain characteristics:
Table 3.7.27 Empirical concepts of local demand structure.
Derived concept(s) Definition Empirical concept(s)
Socio-economic status Demographic, social, and economic characteristics of population in a certain market..
Share of trade area residents aged below 65 years Share of trade area households with 1+ children Share of trade area residents not in lowest income class (SCB classification)
Descriptives of these variables are reported in Table 3.7.28 below. The
average local market contains a mix of nearly 1/5 of retired residents, ¼ of the households have at least one child, and 30% of the residents are in the lowest income class:

- 150 -
Table 3.7.28 Local structure of demand variables. Descriptive statistics.
Mean St.dev. Median Min Max
Household size
Share (%) of population aged 65+
18.3 4.4 19.4 7.3 28.4
Share (%) of households with children
24.6 6.5 23.7 11.1 44.2
Socioeconomic status
Share (%) of population with low income
29.6 6.7 31.1 8.6 42.8
Table 3.7.29 shows highly significant correlation coefficients between
these measures (absolute values of r>0.70 in all cases). Higher share of retired residents is associated with higher share of low-income residents, and smaller share of child households:
Table 3.7.29 Correlation coefficients between variables of local demand structure.
X31 X32 X33
Household size
Share (%) of population aged 65+ X31 1.00
Share (%) of households with children X32 -0.71a 1.00
Socioeconomic status
Share (%) of pop. with low income X33 0.79a -0.87a 1.00
After a transformation of the first and third variable into “share of
population aged below 65 years”, and “share of population not in lowest income class” to have positive correlation coefficients in all cells of table 3.7.29, a single-factor solution from principal component analysis retains more than 86% of the total variance in the three variables, with all loadings positive and above 0.90. The interpretation of this component solution is in terms of “socioeconomic status” of demand in a local market area, as higher values of the component score is strongly correlated with a larger share of non-retired,

- 151 -
non-low income residents, and with a larger share of households with 1+ child.
In forthcoming analyses, the principal component score from the principal component analysis is applied as a measure of the “socioeconomic status” of demand in the trade areas of the 168 supermarkets.
3.7.7 A note on the issue of defining local markets The importance of the procedure applied for delineating the “local”
market area of a study like the present one has been underscored in previous sections. A too narrow or too wide delineation of a market will render either an exclusion of relevant, or inclusion of irrelevant, demand and supply conditions. However, as pointed out by Morphet (1991) the consequences of erratic delineations will depend on the statistical associations between measures of market conditions of the delineated geographic area, and the corresponding measures of the “true” market area.
In the present study, the measures taken on market condition variables are referring to a local market area, based on the judgment of each individual retailer. Table 3.7.30 shows the correlation coefficients between the measures taken, and the measures of the corresponding measure of each variable when the market is defined by circular geographic areas of arbitrarily defined radii (meters).
The results report highly significant correlation coefficients between the measures taken and used in the forthcoming, and those of the measures taken of alternative market areas.

- 152 -
Table 3.7.30 Correlation coefficients between market condition variables of trade area (as defined by each retailer) and corresponding variables of various “arbitrarily” defined market areas.
Radius (meters) of circular geographic area
500 1000 1500 3000 4500 6000
Saturation
Population per store 0.51a 0.54a 0.61a 0.65a 0.58a 0.53a
Population per square meter 0.51a 0.51a 0.63a 0.64a 0.47a 0.24a
Competition
Concentration ratio (CROne) 0.49a 0.54a 0.59a 0.61a 0.60a 0.60a
Herfindahl Index (store level) 0.59a 0.61a 0.81a 0.91a 0.89a 0.89a
Herfindahl Index (chain level) 0.53a 0.60a 0.68a 0.77a 0.78a 0.81a
Socioeconomic status
Share of elderly (65+ years) residents 0.73a 0.79a 0.83a 0.85a 0.86a 0.84a
Share of houshoulds with children 0.77a 0.77a 0.79a 0.81a 0.80a 0.81a
Share (%) of pop. with low income 0.79a 0.80a 0.82a 0.83a 0.85a 0.81a
3.8 Research instruments The variables that were operationalized in section 3.7 above are sent to
statistical analyses in chapters 4 and 5. The research instruments applied in these chapters comprise bivariate and multivariate techniques. In the investigations of relationships between the variables, data are analyzed by correlation analysis, regression analysis, and t-tests of average values of dependent variables in “low/high” classifications of independent variables. In some instances, where average values are compared between subsamples of a small number of stores, the non-parametric Mann-Whitney U-test is applied.
The descriptives of section 3.7 showed many variables possessing a skewed distribution, thus potentially inducing interpretation problems of the results from regression analyses. In a first round of regressions, these problems were confirmed in terms of heteroscedasticity and non-normal distribution of the residuals in all but one regression model. Hence, before

- 153 -
sending data to regression analysis all variables are transformed by taking the natural logarithm of their original values. As many of the original variables take on negative values (e.g. the profit meaures, and principal component scores), and as many variables are in the span between one and zero, where the natural logarithm takes on a measure approaching infinity, the transformation was preceded by yet another transformation of certain variables. For negative values, the natural logarithm is taken on the absolute value, and subsequently assigned a negative sign. For variables taking on values between zero and one, the scale was adjusted by adding the value of one to the absolute value of all observations. Thus, for these variables, there are no values in the range between (-1) and (+1), and the natural logarithm approaches zero from both the negative and positive side.
These transformations eliminated the problems of heteroscedasticity and non-normal distribution of the residuals in the regression analyses. Kolmongornov-Smirnov tests with Lilliefors modification support a normal distribution of the residuals of all regressions reported in chapter 4. The regression results were also checked for muliticollinearity (through tolerance values) and influential observations (standardized residuals greater than 2.0). Unless stated differently, the interpretation of the results are not disturbed by any of these sources.
Correlation analysis and regression analysis are the most widely applied techniques in the previous studies reviewed in chapter 2. However, correlation analysis, regression analysis, and t-tests all share one common limitation in that they all examine only a single relationship at a time. Although each hypothesis of the present study addresses an expected one-to-one relationship, and thus may be properly tested by these statistical techniques, the hypotheses taken together provide a network of direct and indirect relationships, where in many instances one dependent variable becomes an independent variable in subsequent dependence relationships. Indeed, the SCP paradigm inherently comprises such multiple relationships as conduct is a dependent variable visavi structure, but an independent variable visavi performance.
Thus, there is a call for complementary analyses of such multiple relationships proposed by the hypotheses. What is called for is an instrument that allows for the treatment of a system of multiple regression models. In the present study, partial least squares (PLS) is chosen as instrument for putting performance of supermarkets in a context of scale of operation, conduct, and local market conditions. PLS is one technique within a category of statistical
- 154 -
techniques usually referred to as structural equation modeling (SEM). SEM has been proposed as attractive for analyses of multiple relationships, as it deals with such relationships simultaneously while providing statistical efficiency (Hair et al. 1996).
SEM techniques are distinguished by two characteristics: (1) estimation of multiple and interrelated dependence relationships, and (2) the ability to represent unobserved concepts in these relationships, and account for measurement error in the estimation process (Hair et al. 1996). The unobservable concepts are usually referred to as latent variables of a SEM analysis, which are measured by one or several manifest variables. The manifest variables are thus a set of operationalized variables that are used to measure, or “indicate” the latent variables. In essence, SEM analysis is about combining factor analysis and mulitple regression analysis simultaneously.
The way SEM is applied in the present study refers to the first of these two characteristics, i.e. SEM is applied to examine the structural relationships among the variables of the present study, rather than to investigate measurement issues. As such, it falls into a category of SEM applications referred to as “single-indicator structural models” by Baumgartner and Homburg (1996).
The most well known SEM techniques are covariance-baed methods as exemplified by LISREL and AMOS. These methods calculates a covariance matrix from the sample data set, followed by a selection of parameter selection for a given model such that the implied covariance based on the model parameter estimates is as similar as that of the data set (Chin 1998). In other words, covariance-based techniques consists of selecting parameters between manifest variables and latent variables, and between latent variables, that reproduces the sample correlations as closely as possible.
PLS is an alternative technique, also available for SEM analysis. See Table 3.8.1 for a comparison of PLS with one covariance-based method (LISREL) provided by Wahlund (1991). PLS starts off with another goal compared to covariance-based methods. The aim of PLS is to help the researcher obtain determinate values of the latent variables for predictive purposes. Instead of using the model for explaining the covariation of all the indicators sent to analysis, PLS aims at minimizing the variance of all dependent variables; parameter estimates are obtained based on the ability to minimize the residual variances of dependent variables (Chin 1998). As opposed to the covariance-based approach, PLS does not rigidly adhere to an underlying theoretical model, i.e. to the extent of explaining all observed

- 155 -
correlations. Hence, there is no test for the overall validity of a PLS model. The extent to which the theoretical model is true is determined by the strength of the path relations among the latent variables, and the share of variance explained by dependent variables. To evaluate the significance of the path coefficients (the effect of one latent variable on another), a jackknife estimation procedure is applied within PLS. The general approach of jackknifing is to delete every n:th case or observation, estimate the model parameters and repeat this sample-resample procedure to generate a set of standard errors for the model parameters. Simple t-statistics are then computed to determine whether the parameters are different from zero. For the re-sampling procedure it has been recommended that 5% of the sample is removed at the time (Nilsson et al. 2001).
In many ways, PLS has been argued a more suitable technique, compared to covariance based methods (Chin 1998). Perhaps the most important advantages of PLS are its minimal demands on measurement scales, sample size, and residual distributions (Wold 1985). Further, PLS avoids two problems often encountered in covariance-based methods: inadmissible solutions and factor indeterminacy (Fornell and Bookstein 1982). Because the iterative algorithm performed in a PLS analysis generally consists of a series of ordinary least squares (OLS) analyses, identification is not a problem for recursive models nor does it presume any distributional form for measured variables (Chin 1998).

- 156 -
Table 3.8.1 Comparison between PLS and LISREL (from Wahlund 1991).
1. PLS is general and comprise other least-square techniques such as regression-, principal component-, and canonical correlation analysis.
2. PLS is, as is LISREL, useful for the analyis of causal systems of factors that are measured directly (manifest variables) or indirectly (latent variables).
3. In PLS latent variables are formed by linear combinations of indicators in a similar way to principal component analysis. In LISREL latent variables are formed by maximum likelihood estimations in a similar way to factor analysis.
4. In PLS latent variables are either reflective or formative constructs of one or several indicators (manifest variables). In LISREL there are only reflective latent variables.
5. In PLS there is an optimization of specified variances in manifest variables. LISREL explains all covariations between the manifest variables.
6. PLS thus aims at data fitting, i.e. optimal prediction is prioritized over optimal precision in parameter estimation. PLS estimations are consistent, i.e. approaches the true value of as the sample size increases and as the number of indicators of latent variables increases.
7. Input in PLS can be either correlations between all manifest variables or original measures. If original measures are utilized, the effects disclosed can be traced back to the manifest variables. In LISREL this is not possible, as latent variables are defined from covariances.
8. PLS may be used for large models and small samples. LISREL requires large samples and can seldom handle a large number of variables or a large number of relationships between latent variables.
9. LISREL can handle (small) non-recursive systems, which presently available versions of PLS cannot.
10. PLS is both distribution-free and independence free, while LISREL relies on rigid assumptions of the distribution of variables.
11. PLS models are evaluated based on R2 for endogenous variables and the magnitude of path coefficients, weights of formative indicators, and loadings of reflective indicators and residuals.

- 157 -
3.9 Evaluation of the research design As any other study, the present one is associated with strengths and
limitations. This section is devoted to a discussion on to what extent the present study is associated with acceptable standards referring to its validity and reliability.
At the outset in chapter 1 it was argued that much of what we know about retail store performance are partial explanations, generated by various streams of research. In the ambition to overbridge these fields of partial knowledge, an important aspect of this study is to have a design in which all these partial contributions are considered simultaneously. This chapter has shown the procedures that were undertaken for creating such a design. At this stage, it is appropriate to reflect on to what extent the data are valid and reliable.
Overall, the design of the present study maintains a close link between local market conditions, store conduct, and store performance. The store manager of the stores in the study is also the owner of the store, possessing a vast amount of autonomy referring to tactical and operational decisions.
One question referring to these issues is if the measurements taken are measuring the correct phenomena for the purposes of the study. Further, besides this question on what aspects of reality is “captured” by the measurements there are questions to what extent there are items missing among them, and if there are “inappropriate” indicators in the variable set.
First of all, the measurements of store performance is more “rich” in the present study, compared to most previous studies. Performance is, in the present study, described by measures of all three categories of Dunne and Lusch (1999), while most other studies have captured measures of market based performance, complemented by at best productivity performance. Further, in the present study operating costs and profits are measured on all cost items down to net operating profit. Previous studies of the store location/assessment tradition and the industrial organziational SCP tradition have to a large extent not comprised operating costs or relied on proxy measures, while studies of economies of scale on the store level primarily have comprised labor cost.
The measures of competition in the present study relies on a theoretical fundament of economics, closely following the measures adopted in previous SCP studies, thus overcoming the limitations of previous studies from the “store location/assessment” and “scale economies” fields of research.

- 158 -
In the present study, local market conditions are measured in terms of conditions relating to both competition and demand, while in several other studies only one of the two are included in the analyses. Further, referring to competition the present study explicitly recognizes the spatial character of retail competition, as well as the intra- and intertype dimensions of competition.
One way to evaluate the validity of the measurements used in a study is to compare it with similar previous studies. A summary of previous studies’ set of variables were provided in Tables 3.4.1 through 3.4.3. Overall, the measurements of the present study conforms to previous research. In fact, one may conclude that the operationalizations made and the measurements taken are “uncontroversial”, based on how market conditions, conduct and performance have been dealt with previously. However, the present study has some major strengths and limitations compared to previous studies.
First of all, there is the novelty of putting together the “state of the art” from three different streams of research in an integrated study. This has been elaborated on previously, and need not be further explicated here.
Second, the measurements of market conditions and store performance are substantially stronger than in most previous research. The definitions of various empirical measures on these categories of variables rely on theoretical foundations, and capture in both cases several dimensions of an overall theoretical concept.
Conduct of supermarkets is captured via seven operationalized variables. Although these variables are representatives of most categories of retail mix elements proposed by scholars, there nevertheless is a limitation on the extent to which they reflect various dimensions of the overall offering strategy of stores. For instance, “service” is captured by two measures – open hours and gambling services – leaving a desire for a more rich description of this dimension of this aspect of conduct. Similar limitations are at hand for other elements of the retail mix, as well. Perhaps the most severe limitation of the study refers to the absence of “people” in the set of conduct variables. These limitations, however, are shared with most previous studies. The picture created by the set of variables depicting conduct of the 168 supermarkets in the present study is in agreement with the picture created by previous studies.
On the market condition side of data, there is a lack of “people” description as well. Besides the socioeconomic status of local demand, further information about its “psychographic” status in terms of e.g. preferences and attitudes are likely among the determinants of consumer behavior, and by

- 159 -
extension of store performance. Such data are not among the empirical variables in the study.
However, the overall conclusion referring to the design of the study and to the data set must be an approval of its fullfilment of “good” standards of validity. Although one could wish “more” data on some instances, the data incorporated in the empirical analyses are derived from theoretical concepts and closely follow the standards of previous research.
Next, there is the question about the generalizability of the findings. To what extent do the results apply to objects outside the research sample? As with any other cross-sectional study, the results cannot be inferred to anything else but the population from which the sample is drawn. As such, inherent in the present study lies a limitation that is important to explicitly recognize. This limitation refers to the circumstance that the empirical results refer to a single store format (supermarkets) of a single retail corporation (ICA).
Before moving on and elaborating on the consequences of this limitation, it is appropriate to point out that this limitation in another sense provides advantages to the study. These advantages refer to the reliability of performance data, and to issues referring to the interpretation of the empirical results. One potential obstacle in studies like the present one is the non-comparability of data between objects under study. In the present study, all objects (stores) face similar “backup” of their operations from the same chain organization, and they all face similar terms-of-trade for their merchandise acquisition.
Nevertheless, the sample of supermarkets from one retail chain impose restrictions on the generalizability of the results. However, this study was never aimed for “generalizations” in terms of inferences of the value of some estimated variable to the “true” value of it in a larger population. Although the “true” value of performance measures of ICA supermarkets may be inferred and its level of confidence established, this is not the objective of this study. Even less is the objective been to establish the “true” value of perfomance of supermarkets not affiliated to ICA, or of stores adhering to other format categories or retail industries but grocery retailing. It is important to reemphasize these “non”-objectives of the present study when evaluating its generalizability.
Rather, the generalizability of the results should be evaluated based on the objectives of the study, namely to investigate the relationships between various aspects of supermarket performance and some of its antecedents. The relevant question referring to the issue of generalization thus becomes if the

- 160 -
relationships that are found between antecedents and performance are possible to generalize.
The question thus becomes to what extent the empirical relationships found are possible to generalize to a theoretical level. This brings the issue of the generalizability of the present study to a different arena. In this regard, the answer must be “Yes”. The hypotheses developed from the research questions all rely on established theories (from various research traditions) and the direction of effects are based on theory and logical reasoning based on findings of previous research. An objection to generalization of the relationships, and their direction, between the variables of the study based on an argument that they are a consequence of characteristics of the objects under study must be considered as invalid.
In a similar vein, objections to the generalizatibility of found relationships between scale, market conditions, conduct, and performance based on the fact that the empirical observations are somewhat dated (recall that the data refers to observations of the fiscal year of 1996) may be dismissed. Although some empirical measurements may appear outdated in the light of contemporary business of grocery retailing (e.g. the incorporation of “gambling service” at a time where almost everyone makes bets via Internet), this is merely a question about a selection of relevant indicators of non-observable variables (add-on services in the “gamling service” case) at a certain point-in-time. The underlying assumption of a relationship between structure, conduct, and performance is nevertheless valid.
This brings the discussion to the limitations imposed by the selection of the SCP paradigm as the underlying theoretical framework for the study. This issue has been discussed earlier (see chapter 2), and need no further elaboration here. It has been recognized that there are important aspects of “competition”, foremost behavioral aspects of it, that are excluded from a cross-sectional study with a structural perspective on competition. However, as a researcher one has to make choices and delineate one’s project, and the choices and delineations of the present study has been explicitly recognized in the previous.
The cross-sectional design of the present study raises questions referring to issues of “causality” interpretation of the results. Is there room for interpreting the findings of the present study in terms of causes and effects, or are the results merely statistical relationships? Commenting upon this issue, one should first emphasize that all of the “causal inferences” in the study are based on logical criteria from theoretical reasoning and from findings of

- 161 -
previous research, rather than on the statistical results on their own. It is acknowledged that the criteria of “temporal sequence” between cause and effect never can be fulfilled within a cross-sectional study. However, it is argued here that the results, as they are based on established theory and conform to previous studies, indeed imply causative relationships.
In this context it should also be underscored that the research instruments applied for the empirical analyses takes the analyses further than most previous research. The research instruments of previous studies have relied on either techniques lacking statistical rigidity or, at best, multivariate techniques belonging to the “first generation multivariate analysis techniques”, most frequently regression analysis. Such techniques, however, do not facilitate the disclosure of the complex network of indirect and direct effects surrounding the phenomenon of store performance. The present study, utilizing SEM technique, will provide a more rich description of the interrelationships between the antecedents of performance differentials between stores.
Finally, there is the question about the reliability of the results. Are there sources of erratic responses to the empirical analyses that are due to the way the study was designed and conducted? In this regard, one should first establish that the reliance on foremost “hard” data from secondary data sources removes a range of spurious effects referring to interactions between the researcher and the objects under study (e.g. the “interviewer” effect). Second, the analyses are carried out by statistical techniques, incorporating a minimum of subjective judgment in the measurements of various effects. Overall, this reliance of statistical techniques for the empirical analyses secures the intersubjectivity criterion of “good” research – anyone conducting similar analyses of the data would come up with the same results.
Third, local markets are not delineated by political or statistical borders, as is often the case in previous studies. Rather, local markets are defined in accordance with the perception of “local” of each store manager, along with a number of delineation by predefined geographical distances. Thus, the reliability of market condition measures is enhanced, both from opportunities to carry out empirical analyses of various definitions of “local”, and – perhaps foremost – as a market definition based on local managerial perception induces an instrumental definition of market boundaries (and thus reduce the risk of including or excluding e.g. relevant competitors).

- 162 -
4. RESULTS
4.1 Outline of the chapter This chapter reports the results from empirical analyses of the
relationships between supermarkets’ economic performance, and their scale of operation, their conduct and the conditions of their local markets. The chapter is organized around six sections. Section 4.2 provides analyses of to what extent profitability of supermarkets is a consequence of overall performance, i.e. to what extent high (low) profitability is a consequence of high (low) levels of market based performance, high (low) productivity, high (low) gross margin, and low (high) costs%.
Sections 4.3 through 4.5 report the empirical findings of analyses of the effects of various antecedents on supermarket conduct and various aspects of economic performance. The analyses are carried out in three sequential steps. First, supermarket conduct is analyzed for its relationships with scale of operation and local market conditions (section 4.3). Second, section 4.4 reports the results referring to relationships between various aspects of super-market performance, and scale of operation and local market conditions. Third, findings referring to the relationships between various aspects of supermarket performance and supermarket conduct are reported in section 4.5.
Section 4.6 brings supermarket profitability into a context of direct and indirect effects between scale of operation, local market conditions, supermarket conduct, and various aspects of supermarket performance. Further, section 4.6 directs attention to the characteristics (scale, market conditions, conduct, and overall economic performance) of the most and least profitable supermarkets (the lower and upper quartile) in the sample of 168.
The next chapter (chapter 5) delivers a summary of the findings, organized around the five research questions from chapter 1, and responses to each of the hypotheses developed in chapter 2 are reported in numerical order.
4.2 Profitability of supermarkets and their overall economic performance This section is devoted to an analysis of to what extent profitability of
supermarkets is a consequence of their overall performance. The measure of profitability performance chosen as a starting point is “Operating profit per

- 163 -
square meter”. This measure is highly correlated (r=0.86, p<0.01) with return on assets (ROA). The ROA measure is not selected, as the calculation of it comprises the net book value of fixed assets in the denominator. Hence, to an individual store the reported ROA figure to a large extent will be a consequence of the volume of accumulated depreciations on fixed assets. The “Operating profit per square meter” do not suffer from such a potential anomaly, as both the nominator (Operating profit) and denominator (square meter of floor area) are unaffected by depreciations.
Descriptive statistics of the 168 supermarkets in chapter 3 reported an average Operating profit per square meter of SEK 1,386 (mean) and SEK 1,224 (median), with a wide spread below and above these averages. The spread between “low” and “high” profitability is brought into the open by the histogram in Figure 4.2.1, showing the bulk of stores ranging from -500 to 3,000 with few stores performing below and above these figures.
-3000 -2000 -1000 0 1000 2000 3000 4000 5000 6000
Operating profit per sqm
10
20
30
40
Freq
uenc
y
By definition, the measure “Operating profit per sqm” is determined by
(1) sales per sqm, and (2) the profit margin, i.e. “Operating margin%”, which can be further decomposed into gross margin and various cost items.
This section provides analyses of to what extent successively higher levels of profitability are a consequences of successively higher levels of other
Figure 4.2.1 Histogram of “Operating profit per square meter” of the 168 supermarkets.

- 164 -
aspects of economic performance. As a starting-point for these analyses, the stores are sorted from lowest to highest on profitability, i.e. Operating profit per square meter. Then, the lower and upper quartile boundaries are applied to create three sub-samples of stores performing “low”, “medium”, and “high” on profitability. The number of stores in each sub-sample thus becomes 42, 84, and 42, respectively.
Table 4.2.1 below contains the average figures of various measures of economic performance for supermarkets performing low, medium, and high profitability. The results show that the most profitable, on average, perform significantly better on all measures of various categories of performance. Most notably, the comparison indicates profit margin to be the characteristic of highly profitable stores - there is an approximately 50:1 ratio on average profit margin between the upper and lower quartile, while sales per square meter is 50% higher.
Table 4.2.1 Average performance of supermarkets performing “low”, “medium” and “high” on profitability performance. One-way ANOVA for test of differences between groups.
Operating profit per square meter
LOW (n=42)
MEDIUM (N=84)
HIGH (n=42)
Sig.
Sales volume 100.0 100.0 100.0 Cost of sold goods% 80.2 79.2 78.2 Gross margin% 19.8 20.8 21.8 p<0.01 Promotion cost% 1.3 1.0 0.9 p<0.01 Labor cost% 11.7 10.9 10.4 p<0.01 Other oper.costs% 7.0 5.9 5.4 p<0.01 Total oper.costs% 19.9 17.8 16.7 p<0.01 Operating margin% -0.1 3.0 5.0 p<0.01 Sales per inventory 16.8 17.3 21.4 p<0.01 Sales per sqm 42,209 44,871 62,340 p<0.01 Sales per labor hour 1,222 1,275 1,342 p<0.05 Sales volume 32,806 34,983 49,351 p<0.01 Shoppers per week 6,355 5,947 8,246 p<0.01 Average transaction 102 115 114 p<0.05

- 165 -
This opening comparison of the most and least profitable supermarkets provides a picture of the most profitable as better performing “overall”. The profit margin turns out as the major differential over the range from low to high profitability. The most profitable stores report significantly higher profit margin, induced by significantly higher gross margin and significantly lower operating costs. Further, they report lower averages on all cost items.
Correlation analyses underscore the importance of profit margins for profitability. The correlation coefficient between Operating profit per sqm, and gross margin and Operating margin% are positive and highly significant (r=0.44 and r=0.89, p<0.01 in both cases), while operating costs% is negatively correlated (r=-0.66, p<0.01).
Table 4.2.1 reports a relationship between sales volume and profitability. The most profitable are performing an approximately 50% larger sales volume, on average, compared to the least profitable. Correlation analyses between Operating profit per square meter and the three measures of market based performance report positive coefficients. Sales volume and number of shoppers are significantly correlated with Operating profit per sqm (r=0.30 and r=0.24 respectively, p<0.01 in both cases), and average transaction per shopper is just-about significant (r=0.14, p=0.08).
Further, analyses of the correlation between sales volume and each of the three measures of productivity report positive and significant results. The correlation coefficients are positive and significant; the volume of sales of the 168 supermarkets are positively related to sales per square meter (r=0.54, p<0.01), sales per inventory (r=0.32, p<0.01), and sales per labor hour (r=0.25, p<0.01). All aspects of productivity are increasing with sales volume.
Productivity performance of supermarkets is related to their profitability. On average, the most profitable are reporting higher levels on all three measures of productivity. The correlation coefficients between productivity and Operating profit per sqm are r=0.51 for sales per square meter, r=0.44 for sales per inventory, and r=0.22 for sales per labor hour; all significant at p<0.01. One source of this relationship is definitional; it is the amount of sales per square meter that converts the profit margin% into profit per square meter. Another source, however, is an effect from productivity on the profit margin. Correlation analyses show a positive relationship between productivity and profit margin. Operating margin% is increasing with sales per square meter (r=0.20, p<0.01), sales per inventory (r=0.22, p<0.01), and sales per labor hour (r=0.20, p<0.01). In general thus, higher productivity is associated with higher profit margin.

- 166 -
This effect of productivity on profit margin goes primarily through an effect on costs%. The gross margin of the 168 supermarkets is insignificantly correlated with their sales per square meter (r= -0.10, p=0.19) and sales per inventory (r=0.12, p=0.13) while sales per labor hour is negatively correlated with gross margin (r= -0.17, p<0.05). All measures of productivity, however, report a negative correlation with operating costs% – the correlation coefficients are for sales per square meter r= -0.34 (p<0.01), for sales per inventory r= -0.15 (p<0.05), and for sales per labor hour r= -0.40 (p<0.01).
Of the various cost items, labor cost% is negatively correlated with both sales per square meter (r=-0.23, p<0.01) and sales per labor hour (r=-0.63, p<0.01), while uncorrelated with sales per inventory; promotion cost% is uncorrelated with all measures of productivity, and other operating costs% are negatively correlated with sales per square meter (r=-0.31, p<0.01).
These intrarelationships between market based performance, productivity, gross margin, operating costs, and profitability are illustrated by figure 4.2.2 below. The figure summarizes a PLS analysis of direct and indirect effects between the various categories of supermarket performance.
0.09
0.61a Sales volume
Sales per inventory (R2=0.13)
Sales per sqm
(R2=0.38)
Sales per labor hour (R2=0.13)
Operating costs%
(R2=0.31)
Gross margin% (R2=0.01)
Oper. profitper sqm
(R2=0.92)
0.36a
0.29a
0.65a
-0.41a
-0.33a-0.72a
0.31a
Fig. 4.2.2 Intrarelationships between various aspects of supermarket performance. Path coefficients and determination coefficients from PLS analysis.

- 167 -
Profitability of supermarkets, thus, is foremost about profit margin.
Higher gross margin and lower operating costs% have substantial impact on profitability, although sales per square meter is significantly and positively related as well. Further, operating costs to a large extent is a matter of productivity, which in turn is a significant matter of sales volume (volume of “output”).
The main route to high (low) profitability thus goes via high (low) sales per square meter, high (low) gross margin, and low (high) operating costs. However, further analyses of the economic performance of the most and least profitable stores tell a somewhat different story, and disclose various “sub-routes” to high and low profitability.
Table 4.2.2 serves as an introduction to these analyses. This table shows the frequency of low-medium-high performing stores referring to profitability, that perform low-medium-high on sales volume, sales per sqm, profit margin, gross margin, and operating costs%. The frequencies in the various cells demonstrates the point made above. High profitability is to large extent a matter of large sales volume, high productivity, as well as high gross margin and low costs%. However, there are ways that deviate from this “main route” to profitability. Among the most (least) profitable supermarkets, there are some (although few) stores performing low (high) on gross margin as well as there are stores performing high (low) on costs%. Further, there are a substantial number of high and low performing stores performing on the medium level of other aspects of economic performance.

- 168 -
Table 4.2.2 Frequency of supermarkets in combinations of low-medium-high profitability, and low-medium-high performance on sales, productivity, and profit margins.
Operating profit per square meter
Low (n=42)
Medium (n=84)
High (n=42)
Low (n=42) 13 27 2
Medium (n=84) 22 39 24
Sale
s vo
lum
e
High (n=42) 8 18 16
Low (n=42) 19 22 1
Medium (n=84) 17 50 17
Sale
s per
sq
m
High (n=42) 6 12 24
Low (n=42) 37 5 0
Medium (n=84) 5 71 8
Ope
ratin
g m
argi
n%
High (n=42) 0 8 34
Low (n=42) 18 19 5
Medium (n=84) 20 45 19
Gro
ss
mar
gin%
High (n=42) 4 20 18
Low (n=42) 1 19 22
Medium (n=84) 15 51 18
Ope
ratin
g co
sts%
High (n=42) 26 14 2
Table 4.2.2 shows that in many instances, the route to high profitability
does not go via high sales per square meter and high gross margin and low costs%. The results indicate that there are routes that involve e.g. low gross margin but that, combined with low costs% and/or high productivity, still renders high profitability. Similarly, there are stores ending up with low profitability, due to high gross margin combined with high costs and/or low productivity.
Clearly, an understanding of “why supermarkets achieve the profitability performance that they do” requires further analyses of these deviations from the main route to high and low profitability. The remaining part of this section

- 169 -
provides such analyses. First, attention is directed to the 42 most profitable supermarkets. In a second step, the 42 least profitable are subject of analyses.
Table 4.2.3 shows the combinations of profit margin and sales per square meter of the 42 most profitable supermarkets. A vast majority (17+16=33) are combining a high level of profit margin with a medium or high level of sales per square meter. Clearly, the main route to high profitability goes through performing high on either sales per square meter or (first and foremost) profit margin. There is only a single store not peforming “high” on neither of the two. Although the profit margin is the major determinant of profitability, sales per square meter nevertheless plays an important role – only a single store among the 42 most profitable is among the least performing on sales per square meter.
Table 4.2.3 The 42 most profitable supermarkets. Frequency of stores combining low-medium-high profit margin performance with low-medium-high space productivity performance.
O p e r a t i n g p r o f i t % LOW MEDIUM HIGH
LOW 0 0 1
MEDIUM 0 1 16
Sale
s per
sq
m
HIGH 0 7 17
In other words, among the 42 most profitable supermarkets in the
sample, there are 17 (1+16) stores compensating low or medium performance on sales per square meter with high profit margins, while 8 (1+7) stores are among the most profitable despite a non-high performance on profit margin.
By definition, the profit margin is the difference between gross margin and operating costs%, and a certain level of the profit margin can be a consequence of various combinations over the range from low to high performance on these two. In Table 4.2.4 the profit margin of the 42 most profitable stores is represented by the gross margin and operating costs% .

- 170 -
Table 4.2.4 The 42 most profitable supermarkets. Frequency of stores combining low-medium-high gross margin with low-medium-high operating costs%.
O p e r a t i n g c o s t s % LOW MEDIUM HIGH
LOW 5 0 0
MEDIUM 12 7 0
Gro
ss
mar
gin
HIGH 5 11 2
All but seven of the 42 most profitable stores perform either low on
operating costs%, or high on gross margin. Five stores are in the most favorable cell of the table, combining high gross margins with low operating costs%.
In summary, the overall picture of the most profitable supermarkets is one of stores performing medium or high on sales per square meter, in combination with either high gross margin, or low costs%.
Now, attention is directed to the 42 least profitable supermarkets (the lower quartile) in the overall sample of 168. The overall picture of the performance of the 42 least profitable stores is, not surprisingly, to a large extent the “opposite” of the most profitable. Table 4.2.5 shows the combinations of profit margin and sales per square meter of the 42 least profitable supermarkets. All but 5 of the 42 least profitable supermarkets in the sample of 168 report low on profit margin, and there is no store performing high profit margin. Nearly half the number (14+5) are among the worst performing on sales per square meter, while six are among the best performing. Fourteen stores are are in the “worst” combination of low sales per sqm and low profit margin:

- 171 -
Table 4.2.5 The 42 least profitable stores. Frequency of stores combining low-medium-high profit margin performance with low-medium-high space productivity performance.
O p e r a t i n g p r o f i t % LOW MEDIUM HIGH
LOW 14 5 0
MEDIUM 17 0 0
Sale
s per
sq
m
HIGH 6 0 0
Breaking up the profit margin into gross margin and operating costs,
and cross-tabulating the least profitable stores performance on each of these variables provides the results reported in the table below. A vast majority (all but 4) are reporting either low gross margin or high operating costs. Six supermarkets are in the least favorable cell, where low gross margin is combined with high operating costs:
Table 4.2.6 The 42 least profitable supermarkets. Frequency of stores combining low-medium-high gross margin with low-medium-high operating costs%.
O p e r a t i n g c o s t s % LOW MEDIUM HIGH
LOW 1 11 6
MEDIUM 0 4 16
Gro
ss
mar
gin
HIGH 0 0 4
In summary, the overall picture of the least profitable supermarkets is
one of stores performing low or medium on sales per square meter, in combination with either low gross margin or high costs%.
The analyses this far have shown that profitability peformance of supermarkets is a complex issue, that requires an understanding of the intra-relationships between various aspects of economic performance, where market based performance, productivity, and financial performance are intertwined in a network of effects, by which there are ways of compensating

- 172 -
(offsetting) poor (good) performance on certain aspects of performance with good (poor) performance on others. In forthcoming sections attention is directed to analyses of the effects of various antecedents on these various aspects of economic performance. Sections 4.3 through 4.5 report analyses of these relationships. The scope of each of these sections are shown in figure 4.2.3:
Section 4.6 brings scale, market conditions, and conduct into an
integrated framework with market based performance, productivity, and financial performance. Further, section 4.6 provides further analyses of the most (least) profitable supermarkets reporting high/low (low/high) combinations of gross margin and operating costs.
Before moving on to section 4.3 and commencing the analyses of the relationships between scale, conduct, market conditions, and supermarket performance there is, however, a call for a check of the statistical association between the operationalized measures of scale of operation and local market conditions. The recognition of such associations within the data set are important, since both scale and local market conditions are treated as independent variables (causes) of dependent variables in terms of conduct and performance of supermarkets (effects). In the case measures of scale, and measures of market conditions are associated, the interpretation of bivariate relationships between the independent and dependent variables in statistical analyses is problematic, since the results would be partly overlapping. Should there exist such relationships in the database, the overlapping effect of each
(4.3)
Fig. 4.2.3 The scope of sections 4.3 through 4.5.
(4.3)
(4.4) (4.5)
(4.4)
Scale of operation
Supermarket conduct
Supermarket (economic)
performance
Local market conditions

- 173 -
need to be separated out in the analyses in order to determine the differential effect of each.
Correlation coefficients between the principal component scores of scale of operation and the three component scores of market conditions (saturation, competition, and socioeconomic status) report a positive and significant association between scale of operation and competition, and a just-about significant relationship between scale and socioeconomic status. Thus, in the sample of 168 supermarkets scale of operation is increasing with competition.
Further, there is a relationship between socioeconomic status of local markets and their saturation and competitive structure. The higher the value of the component score of socioeconomic status, the higher the saturation index (i.e. the less saturated are local markets), and the lower the measure of competition (i.e. the less competitive are local markets).
Table 4.2.7 Correlation coefficients between measures (principal comp-onents) of scale of operation, and of local market conditions. (a=p<0.01; b=p<0.05; c=p<0.10).
X1 X2 X3 X4
Scale of operation (X1) 1.00
Saturation index (X2) -0.01 1.00
Competition (X3) 0.29a 0.04 1.00
Socioeconomic status (X4) -0.13 0.43a 0.18b 1.00
Results from bivariate statistical analyses between independent and
dependent variables, thus, will to some extent be disturbed by these associations. However, the associations are not of a magnitude that induce problems of multicollinearity in multivariate analyses. Hence, when analyzing the effects of scale and market conditions on conduct and performance in the three-step procedure of sections 4.3, 4.4, and 4.5, bivariate analyses are supplemented by regression analyses, in order to separate out the effects from each. In the regression analyses, all variables are transformed by taking the natural logarithm of their original values, in order to eliminate the potential problems of heteroscedasticity and non-normal distribution of the residuals (cf. section 3.8 in chapter 3). Unless stated otherwise, the regression analyses have passed the Kolmogornov-Smirnov tests with Lilliefors modification of normal distribution of the residuals. Similarly, unless stated differently the

- 174 -
analyses have passed checks for influential cases and multicollinearity diagnostics.
4.3 Scale of operation, local market conditions, and supermarket conduct This section contains results from the empirical analyses of the effect
from scale of operation of supermarkets and conditions of their local markets, on their conduct. The four measures of “variable” conduct – prices, number of SKU’s, open hours, and promotion frequency – are analysed for their relationships with scale and local market conditions:
Results from correlation analysis and regression analysis between the
measures of supermarket conduct, and scale and market conditions are reported in Tables 4.3.1 and 4.3.2 below. In this context it is also appropriate to report that one of the “non-variable” conduct variables – number of parking places – is strongly related to scale of operation. The correlation coefficient between the principal component score of scale, and the number of parking places is positive and highly significant (r=0.73, p<0.01).
Fig. 4.3.1 Scope of section 4.3.
?
? ?
?
Scale of operation
Supermarket conduct
Supermarket (economic)
performance
? Local market conditions

- 175 -
Table 4.3.1 Correlation coefficients (raw) between scale of operation and local market conditions, and supermarket conduct. (a=p<0.01; b=p<0.05; c=p<0.10).
Price index
Number of SKU’s
Open hours
Promotion frequency
Scale of operation - 0.20a 0.43a 0.36a 0.36a
Competition - 0.35a - 0.05 0.32a 0.21a
Saturation index -0.00 - 0.13c 0.21a - 0.11
Socioeconomic status 0.19b - 0 04 0.01 -0.23a
Table 4.3.2 Regression analyses of supermarket conduct on scale of operation and and local market conditions. Standardized regression coefficients. (a:p<0.01; b:p<0.05; c:p<0.10)
Scale of operation
Saturation index
Compet-ition
Socio-economic
status
Adj. R2
Price index - 0.07 - 0.06 -0.28a 0.17b 0.12a
Number of SKU’s 0.58a -0.12 -0.19a 0.06 0.27a
Number of open hours 0.30a 0.21a 0.20b 0.02 0.20a
Promotion frequency 0.33a -0.05 0.06 -0.12 0.14a
The results show that the scale of operation of supermarkets makes a
difference for their conduct. Three of the four conduct variables are significantly related to scale of operation, price index being the exception. Although the correlation analysis between scale and price reports a negative coefficient (p<0.01), the regression analysis report a coefficient insignificantly different from zero after the effects of local market conditions have been accounted for. A comparison of average conduct between the 84 smallest with the 84 largest supermarkets in the sample shows that large supermarkets carry 2,000 SKU’s more in their merchandise offer, are open four hours longer per week, and are promoted “more than once a month” compared to the “once a month” frequency of small stores:

- 176 -
Table 4.3.3 Average conduct of small and large supermarkets. T-test for test of significance.
Small (n=84)
Large (n=84)
Sig.
Price index 100.8 100.3 p=0.37
Number of SKU’s 7,260 9,360 p<0.01
Open hours 67 71 p<0.01
Promotion frequency 2.9 4.2 p<0.01
The results further show significant relationships between the structure
of local competition and store conduct. Competition is related to three of the four conduct variables, promotion frequency being the exception. A comparison of average conduct in local markets with “high” and “low” conditions of local competition are reported in Table 4.3.4, showing results that are consistent with the regression coefficients. Price indices of the 168 supermarkets are decreasing with competition. On average, prices are 3%-units higher in supermarkets located in “highly” concentrated markets, 2½%-units higher in supermarkets possessing a “high” level of spatial monopoly, and nearly 2%-units lower in supermarkets located in markets containing intertype competition:
Table 4.3.4 Average conduct of supermarkets in local markets of low and high concentration, low and high spatial monopoly, and non-presence/presence of intertype competition. T-test for test of significance (a: p<0.01; b: p<0.05; c: p<0.10)
Concentration Spatial monopoly Intertype competition
Low (n=84)
High (n=84)
Low (n=84)
High (n=84)
No (n=88)
Yes (n=80)
Price index 99.0 102.0a 99.8 101.3a 101.3 99.6a
Number of SKU’s 8,024 8,596 8,620 8,000c 8,498 8,103
Number of open hours 71 67a 71 67a 67 71a
Promotion frequency 3.9 3.1a 3.9 3.1a 3.4 3.7
Socioeconomic status of demand is positively related to the price index
of supermarkets. Both the (raw) correlation coefficient and the regression coefficient of socioeconomic status are positive and significant. On average, price index is 1.2%-units higher among supermarkets in the 84 markets of

- 177 -
highest socioeconomic status, compared to the prices in the 84 with low socioeconomics (101.1 vs 99.9, p<0.05).
Recall that the principal component “socioeconomic status” is formed from the three variables (1) share of non-retired residents, (2) share of child households, and (3) share of non-low income residents of local markets. In other words, the interpretation of the positive correlation coefficient is that lower prices are associated with markets of high share of retired residents, high share of low-income residents, and high share of non-child households.

- 178 -
4.4 Scale of operation, local market conditions, and supermarket performance This section reports the empirical results referring to the effects from
scale of operation of supermarkets and conditions of their local markets, on their economic performance. Measures of the three categories of performance – market based performance, productivity performance, and financial performance - are investigated for their relationships with scale and local market conditions in terms of saturation, competition, and socioeconomic status of demand:
The results are reported in three sub-sections. Section 4.4.1 reports the
effects of scale and local market conditions on the market based performance of supermarkets, while the next two sections report the effects on productivity performance (4.4.2) and financial performance (4.4.3).
4.4.1 Scale of operation, local market conditions, and market based performance
Results from correlation analysis and regression analysis between the measures of market based performance, and scale and market conditions are reported in Tables 4.4.1 and 4.4.2 below.
Fig. 4.4.1 Scope of section 4.4.
? ?
Scale of operation
Supermarket conduct
Supermarket (economic)
performance
Local market conditions

- 179 -
Table 4.4.1 Correlation coefficients (raw) between scale of operation and local market conditions, and market based performance of supermarkets (a:p<0.01; b:p<0.05; c:p<0.10).
Sales volume
Number of shoppers
Average trans.
Scale of operation 0.90a 0.83a 0.27a
Index of saturation 0.06 0.14c - 0.23a
Competition 0.27a 0.38a - 0.23a
Socioeconomic status -0.11 -0.17b 0.06
Table 4.4.2 Regression analyses of market based performance of supermarkets on scale and local market conditions. Standardized regression coefficients. (a:p<0.01; b:p<0.05; c:p<0.10)
Scale of operation
Saturation index
Compet-ition
Socio-economic
status
Adj. R2
Sales volume 0.89a 0.10b - 0.01 - 0.02 0.79a
Number of shoppers 0.74a 0.23a 0.16a - 0.11b 0.79a
Average transaction per shopper
0.41a - 0.26a -0.35a 0.19b 0.27a
The scale of operation of supermarkets has a positive effect on their
market based performance. Both the correlation coefficients and the regression coefficients are significant and positive. A comparison between the 84 “small” and 84 “large” supermarkets (based on the median value of the principal component score of scale of operation) reports significantly higher average performance on all three measures of market based performance. The number of shoppers are nearly doubled between the groups, and average transaction per shopper is nearly 20% higher in large supermarkets:

- 180 -
Table 4.4.3 Average market based performance of small and large supermarkets. T-test for test of significance.
Small (n=84)
Large (n=84)
Sig.
Sales volume 24,260 51,801 p<0.01
Number of shoppers 4,574 8,674 p<0.01
Average transaction 105 118 p<0.01
Saturation conditions of local markets make a difference for the market
based performance of supermarkets. The regression coefficient is significant and positive, reporting increasing sales volumes with saturation indices. Comparing the supermarkets in local markets of low and high saturation shows a significantly higher performance in terms of number of shoppers and sales volume:
Table 4.4.4 Average market based performance of supermarkets in local markets of “low” and “high” saturation levels. T-test for test of significance.
Low saturation
index (n=84)
High saturation
index (n=84)
Sig.
Sales volume 33,864 42,198 p<0.05
Number of shoppers 5,798 7,450 p<0.01
Average transaction 114 109 p=0.15
The results from bivariate analyses referring to the effect from
competition on market based performance show that sales volume are increasing with competition. The correlation coefficients are positive, and a comparison of average performance of supermarkets located in markets of low and high values on (1) concentration, (2) spatial monopoly, and (3) intertype competition shows results that are in congruence with these coefficients. Sales volume is significantly smaller in supermarkets operating in markets of high concentration, possessing high spatial monopoly, and not facing intertype competition.

- 181 -
These results are spurious, however, as scale was found signficantly correlated with the measure of competition (see section 4.2 above). The regression analysis shows no effect from local competition on sales volume, after the effect of scale has been accounted for. Although the number of shoppers is increasing with competition, this effect is not translated into sales volume, as average transaction per shopper is decreasing with competition.
Table 4.4.5 Average market based performance of supermarkets located in markets of low and high concentration, low and high spatial monopoly, and non-presence/presence of intertype competition. T-test for test of significance (a:p<0.01; b:p<0.05; c:p<0.10).
Concentration Spatial monopoly Intertype competition
Low (n=84)
High (n=84)
Low (n=84)
High (n=84)
No (n=88)
Yes (n=80)
Sales volume 42,528 33,533b 44,802 31,259a 34,462 41,957b
Number of shoppers 7,776 5,472a 7,868 5,381a 5,509 7,851a
Average transaction 105 118a 110 113 120 103a
4.4.2 Scale of operation, local market conditions, and productivity performance
The correlation coefficients and the regression coefficients between the measures of productivity performance, and scale and market conditions are reported in Tables 4.4.6 and 4.4.7 below.
Table 4.4.6 Correlation coefficients (raw) between scale of operation and local market conditions, and productivity performance of supermarkets (a:p<0.01; b:p<0.05; c:p<0.10).
Sales per inventory
Sales per square meter
Sales per labor hour
Scale of operation 0.17b 0.27a 0.28a
Index of saturation 0.33a 0.23a -0.04
Competition 0.20a 0.16b 0.23a
Socioeconomic status 0.09 -0.01 -0.21a

- 182 -
Table 4.4.7 Regression analyses of productivity performance of supermarkets on scale and local market conditions. Standardized regression coefficients (a:p<0.01; b:p<0.05; c:p<0.10)
Scale of operation
Saturation index
Compet-ition
Socio-economic
status
Adj. R2
Sales per inventory 0.08 0.37a 0.12 - 0.08 0.14a
Sales per square meter 0.21a 0.30a -0.03 - 0.08 0.11a
Sales per labor hour 0.29a - 0.10 0.10 - 0.10 0.13a
The results show a positive effect from the scale of supermarkets on
their productivity performance. All correlation coefficients between scale and measures of productivity are positive and significant. A comparison of average productivity between the 84 “small” and the 84 “large” supermarkets in the sample reports higher averages among the “large”, although barely significant for two of the three measures. After the effect of local market conditions is taken out in the regression analysis, scale of operation reports a significant and positive effect on space- and labor productivity performance, while insignificant referring to inventory productivity.
Table 4.4.8 Average productivity performance of small and large supermarkets. T-test for test of significance.
Small (n=84)
Large (n=84)
Sig.
Sales per inventory 17.7 18.8 p=0.17
Sales per square meter 46,331 50,815 p=0.07
Sales per labor hour 1,227 1,331 p<0.01
Conditions of local market saturation makes a difference for the
productivity of supermarkets. The saturation index is positively related to inventory- and space productivity, while unrelated to labor productivity. The correlation coefficients and regression coefficients between the saturation index and sales per inventory, and sales per square meter are positive and significant. The coefficients are consistent with average productivity in local markets of “low” and “high” values of the saturation index (based on the median value). The difference in average inventory productivity and space

- 183 -
productivity between the two groups of local markets is significant and substantial, while labor productivity is indifferent between the groups:
Table 4.4.9 Average productivity performance of supermarkets in local markets of low and high saturation levels. T-test for test of significance.
Low saturation
index (n=84)
High saturation
index (n=84)
Sig.
Sales per inventory 16.6 19.8 p<0.01
Sales per square meter 44,195 52,951 p<0.01
Sales per labor hour 1,297 1,261 p=0.27
Referring to local competition and productivity of supermarkets, the
correlation coefficients are positive and significant. A comparison of average productivity between supermarkets located in markets with “low” and “high” levels of concentration, spatial monopoly and intertype competition report significantly different levels of inventory productivity and space productivity between different levels of concentration and intertype competition. These results are spurious, however, as the measure of local competition is significantly correlated with the measure of scale of operation. Although initial correlation analyses and average comparisons report significant results, the regression coefficient of competition is nevertheless insignificant, when entered along with scale and other variables of market conditions.
Table 4.4.10 Average productivity performance of supermarkets in local markets of low and high concentration, low and high spatial monopoly, and non-presence/presence of intertype competition. T-test for test of significance. (a: p<0.01; b: p<0.05; c: p<0.10).
Concentration Spatial monopoly Intertype competition
Low (n=84)
High (n=84)
Low (n=84)
High (n=84)
No (n=88)
Yes (n=80)
Sales per inventory 19.1 17.4b 18.4 18.0 17.1 19.4a
Sales per sqm 51,502 45,642a 48,777 48,368 46,565 50,781c
Sales per labor hour 1,298 1,259 1,300 1,258 1,261 1,298

- 184 -
Bivariate analyses show socioeconomic status of demand negatively related to labor productivity. The correlation coefficient is negative and significant, and average labor productivity is significantly lower in the supermarkets located in the 84 markets of highest socioeconomic status. These results are spurious, however, due to the significant relationship between socioeconomics and saturation (r=0.43, p<0.01). When entered in a regression analysis, the coefficient of socioeconomics is not significantly different from zero.
Table 4.4.11 Average productivity performance of super-markets located in markets of low and high socioeconomic status. T-test for test of significance.
Socioeconomic status
Low (n=84)
High (n=84)
Sig.
Sales per inventory 18.6 17.9 p=0.38
Sales per square meter 50,301 46,845 p=0.16
Sales per labor hour 1,309 1,249 p=0.06
4.4.3 Scale of operation, local market conditions, and financial performance
The correlation coefficients and the regression coefficients between the measures of financial performance, and scale and market conditions are reported in Tables 4.4.12 through 4.4.15 below.
Table 4.4.12 Correlation coefficients (raw) between scale of operation and local market conditions, and financial performance of supermarkets. (a:p<0.01; b:p<0.05; c:p<0.10).
Gross margin%
Promotioncost%
Labor cost%
Other operatingcosts%
Operating costs%
Operating margin%
Scale of operation 0.09 0.35a -0.31a 0.07 - 0.09 0.01
Saturation index 0.10 0.01 0.01 0.07 0.05 0.03
Competition -0.30a 0.39a -0.18b 0.06 0.00 -0.24a
Socioeconomic status
0.22a -0.22a 0.10 0.13c 0.10 0.08

- 185 -
Table 4.4.13 Correlation coefficients (raw) between scale of operation and local market conditions, and profit performance of supermarkets (a:p<0.01; b:p<0.05; c:p<0.10).
Gross profit
per sqm
Operating costs
per sqm
Operating profit
per sqm
Scale of operation 0.20a 0.20a 0.10
Saturation index 0.27a 0.25a 0.16b
Competition 0.09 0.16b -0.11
Socioeconomic status 0.05 0.01 0.09
Table 4.4.14 Regression analyses of financial performance of supermarkets on scale and local market conditions. Standardized regression coefficients. (a:p<0.01; b:p<0.05; c:p<0.10)
Scale of operation
Saturation index
Compet-ition
Socio-economic
status
Adj. R2
Gross margin% 0.02 0.06 - 0.29a 0.12 0.10a
Promotion cost% 0.30a 0.10 0.25a - 0.16b 0.24a
Labor cost% - 0.29a 0.03 - 0.07 0.00 0.08a
Other operating costs% n.s. n.s. n.s. n.s. n.s.
Total operating costs% n.s. n.s. n.s. n.s. n.s.
Operating margin% 0.06 - 0.01 - 0.24a 0.01 0.03c
Table 4.4.15 Regression analyses of profit performance of supermarkets on scale and local market conditions. Standardized regression coefficients. (a:p<0.01; b:p<0.05; c:p<0.10)
Scale of operation
Saturation index
Compet-ition
Socio-economic
status
Adj. R2
Gross profit per sqm 0.21a 0.31a -0.08 -0.05 0.11a
Operating costs per sqm 0.20a 0.34a 0.09 - 0.06 0.13a
Operating profit per sqm n.s. n.s. n.s. n.s. n.s.

- 186 -
The results show no significant effect from scale of operation on total operating costs. Although there is a significant result referring to decreasing labor cost as scale of operation increases, this effect is not translated into lower total costs, as the negative effect on labor cost is offset by a positive effect on promotion cost. This result is further illustrated by the comparison of profitability performance between “small” and “large” supermarkets:
Table 4.4.16 Average financial performance of small and large supermarkets. T-test for test of significance.
Small (n=84)
Large (n=84)
Sig.
Gross margin% 20.9 20.7 p=0.37
Promotion cost% 0.9 1.2 p<0.01
Labor cost% 11.2 10.7 p<0.01
Other operating costs% 6.0 6.1 p=0.55
Total operating costs% 18.1 18.0 p=0.75
Operating margin% 2.8 2.6 p=0.67
On average, promotion cost% are 0.3%-units higher, and labor cost%
are 0.5% lower in “large” supermarkets, leaving no difference neither on the total operating costs level, nor on the bottom line profit margin. Hence, although prevalence of economies of scale is found in labor cost, it is not translated into total operating costs, due to a positive relationship between scale and promotion cost.
Referring to local market conditions, the results report no effect from saturation on gross margin and average operating costs. Neither the correlation analyses, nor the regression analyses report significant coefficients. A comparison of average figures between the sub-samples of “low” and “high” saturation conditions report no signficant differences in performance between the sub-samples (the figures are not shown).
However, there are significant effects from the saturation index of local markets on supermarket gross profit performance and cost performance, in absolute terms. Both gross profit and costs are increasing with the saturation index. Further, the gross profit performance and bottom line profit performance are substantially higher – on average – in the local markets with saturation indices above the median value (see Table 4.4.17). On average,

- 187 -
supermarkets in 84 local markets with “high” values of the saturation index perform 30% higher on bottom line profit:
Table 4.4.17 Average profit performance of supermarkets in local markets of “low” and “high” saturation levels. T-test for test of significance.
Low saturation
index (n=84)
High saturation
index (n=84)
Sig.
Gross profit per sqm 9,103 11,026 p<0.01
Total operating costs/sqm 7,928 9,430 p<0.01
Operating profit per sqm 1,175 1,595 p<0.05
Competition is negatively correlated with gross margin – the more
competitive a local market, the lower the gross margin of supermarkets. This effect is further translated into lower profit margin on the bottom line, as average operating costs are found unrelated to local competition. Although the correlation analyses report significant associations between competition, and two of the cost items (promotion cost and labor cost), the effects goes in opposite directions, leaving total operating costs uncorrelated with local competition. A comparison of average profit margins further shows significantly higher average profit margins in supermarkets located in markets with “high” concentration, and markets not containing intertype competition:

- 188 -
Table 4.4.18 Average financial performance of supermarkets in local markets of low and high concentration, low and high spatial monopoly, and non-presence/presence of intertype competition. T-test for test of significance (a: p<0.01, b:p<0.05, c:p<0.10).
Concentration Spatial monopoly Intertype competition
Low (n=84)
High (n=84)
Low (n=84)
High (n=84)
No (n=88)
Yes (n=80)
Gross margin% 20.2 21.3a 20.6 20.9 21.1 20.4a
Promotion cost% 1.2 0.9a 1.1 1.0b 0.9 1.2a
Labor cost% 10.8 11.2b 10.9 11.1 11.1 10.8c
Other operating cost% 6.1 6.0 6.1 6.0 6.0 6.1
Total operating cost% 18.1 18.1 18.1 18.0 18.1 18.1
Operating margin% 2.2 3.2a 2.5 2.9 3.1 2.3b
The effects of competition on gross- and profit margins are not
translated into higher profit performance, in absolute terms. Bottom line profit performance is unrelated to local competition. The only significant relationship between local competition and profit performance, is a negative correlation coefficient between competition and costs per sqm.
Table 4.4.19 Average profit performance of supermarkets in local markets of low and high concentration, low and high spatial monopoly, and non-presence/presence of intertype competition. T-test for test of significance (a: p<0.01, b:p<0.05, c:p<0.10).
Concentration Spatial monopoly Intertype competition
Low (n=84)
High (n=84)
Low (n=84)
High (n=84)
No (n=88)
Yes (n=80)
Gross profit per sqm 10,422 9,707 10,078 10,051 9,812 10,342
Operating costs per sqm 9,193 8,165b 8,721 8,637 8,349 9,042c
Operating profit per sqm 1,229 1,542 1,415 1,164 1,464 1,299
Socioeconomic status of local markets is positively correlated with gross
margins of supermarkets, while uncorrelated with bottom line profit margin. Despite a negative correlation with promotion cost%, socioeconomics is positively (although not significant, p=0.18) correlated with total operating costs, offsetting the effect on the bottom line. A comparison of average

- 189 -
performance between supermarkets in markets of “low” vs. “high” socioeconomic status, however shows significant results on the bottom level. The average profit margin is nearly 1%-unit higher in the markets of “high” socioeconomics:
Table 4.4.20 Average financial performance of super-markets in local markets of low and high socioeconomic status. T-test for test of significance (a:p<0.01, b:p<0.05, c:p<0.10).
Socioeconomic status
Sig.
Low (n=84)
High (n=84)
Gross margin% 20.3 21.3a p<0.01
Promotion cost% 1.2 0.9a p<0.01
Labor cost% 10.9 11.1 p=0.39
Other operating cost% 6.0 6.2 p=0.29
Total operating cost% 18.0 18.2 p=0.56
Operating margin% 2.3 3.1b p<0.05
Profit performance, in absolute terms, is unrelated to socioeconomics.
Neither gross profit per square meter, costs per square meter, nor Operating profit per square meter, are significantly different between the two groups of low and high socioeconomic status

- 190 -
4.5 Conduct and supermarket performance This section reports the empirical results referring to the effects from
the conduct of supermarkets on their economic performance. Measures of the three categories of performance – market based performance, productivity, and financial performance - are investigated for their relationships with conduct:
4.5.1 Conduct and market based performance Results from correlation analysis and regression analysis between the
measures of supermarket conduct, and market based performance are reported in Tables 4.5.1 and 4.5.2 below.
Sales volume of supermarkets is negatively related to their price level, and positively related to all non-price attributes. Number of shoppers is related to all measures of conduct but gambling service, while average transaction per shopper is found significantly related to three of the seven conduct variables; (1) the more SKU’s in the assortment, (2) the more frequent the promotion of supermarkets, and (3) the more parking places adjacent to the store, the higher the average transaction per shopper.
Fig. 4.5.1 Scope of section 4.5.
?
Scale of operation
Supermarket conduct
Supermarket (economic)
performance
Local market conditions

- 191 -
Table 4.5.1 Correlation (raw) coefficients between store conduct and market based performance (a:p<0.01; b:p<0.05; c:p<0.10).
Net sales Number of shoppers
Average trans.
Price index -0.20a -0.28a 0.10
Number of SKU’s 0.34a 0.26a 0.31a
Open hours 0.46a 0.53a -0.09
Promotion frequency 0.38a 0.38a 0.36a
Number of parking places 0.71s 0.68a 0.14c
Table 4.5.2 Regression analyses of market based performance of supermarkets on their conduct. Standard regression coefficients. (a:p<0.01; b:p<0.05; c:p<0.10)
Price index
SKU’s Open hours
Gamble services
Prom. freq.
Parking places
Cluster location
Adj. R2
Sales volume -0.11b 0.28a 0.28a 0.09c 0.18a 0.33a 0.21a 0.63a
Number of shoppers
-0.18a 0.17a 0.39a 0.07 0.14b 0.23a 0.20a 0.54a
Average transaction
0.12c 0.26a -0.20a 0.05 0.10 0.23a 0.04 0.19a
Comparing average performance between sub-samples of stores
reporting “low” and “high” values on each conduct variable (based on the median value) show results that are consistent with the correlation and regression coefficients:
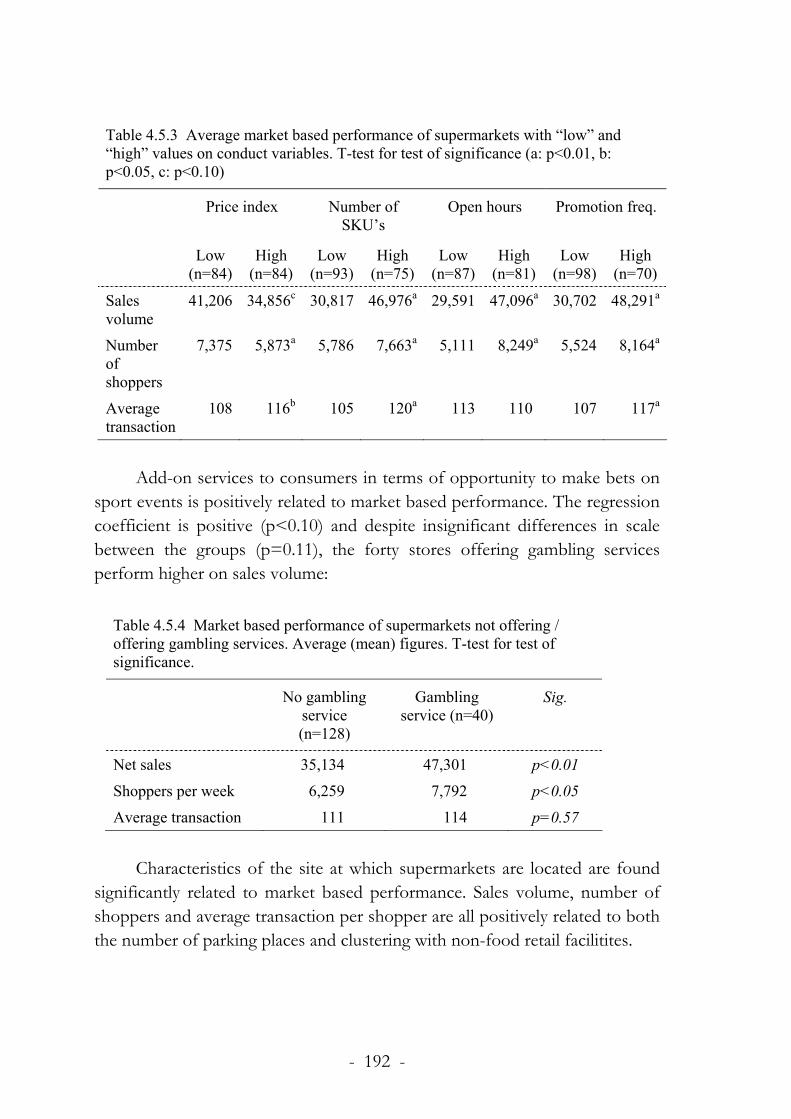
- 192 -
Table 4.5.3 Average market based performance of supermarkets with “low” and “high” values on conduct variables. T-test for test of significance (a: p<0.01, b: p<0.05, c: p<0.10)
Price index Number of SKU’s
Open hours Promotion freq.
Low (n=84)
High (n=84)
Low (n=93)
High (n=75)
Low (n=87)
High (n=81)
Low (n=98)
High (n=70)
Sales volume
41,206 34,856c 30,817 46,976a 29,591 47,096a 30,702 48,291a
Number of shoppers
7,375 5,873a 5,786 7,663a 5,111 8,249a 5,524 8,164a
Average transaction
108 116b 105 120a 113 110 107 117a
Add-on services to consumers in terms of opportunity to make bets on
sport events is positively related to market based performance. The regression coefficient is positive (p<0.10) and despite insignificant differences in scale between the groups (p=0.11), the forty stores offering gambling services perform higher on sales volume:
Table 4.5.4 Market based performance of supermarkets not offering / offering gambling services. Average (mean) figures. T-test for test of significance.
No gambling service (n=128)
Gambling service (n=40)
Sig.
Net sales 35,134 47,301 p<0.01
Shoppers per week 6,259 7,792 p<0.05
Average transaction 111 114 p=0.57
Characteristics of the site at which supermarkets are located are found
significantly related to market based performance. Sales volume, number of shoppers and average transaction per shopper are all positively related to both the number of parking places and clustering with non-food retail facilitites.

- 193 -
Table 4.5.5 Average market based performance of supermarkets with “low” and “high” number of parking places, and not clustered/clustered with non-food retail establishments. T-test for test of significance (a: p<0.01, b: p<0.05, c: p<0.10)
Parking places Cluster location
Low (n=88)
High (n=80)
No (n=70)
Yes (n=98)
Sales volume 27,169 49,484a 29,621 44,038a
Number of shoppers 5,099 8,301a 5,405 7,495a
Average transaction 108 116b 108 114
4.5.2 Conduct and productivity performance Correlation coefficients and regression coefficients between conduct
and productivity of supermarkets are reported below.
Table 4.5.6 Correlation coefficients between supermarket conduct and productivity performance (a: p<0.01; b: p<0.05; c: p<0.10).
Sales per inventory
Sales per square meter
Sales per labor hour
Price index - 0.03 - 0.14c -0.16b
Number of SKU’s - 0.13c 0.05 0.01
Open hours 0.14c 0.41a 0.17b
Promotion frequency 0.14c 0.26a 0.16b
Number of parking places 0.22a 0.22a 0.23a
Table 4.5.7 Regression analyses of productivity performance of supermarkets as a function of their conduct. Standardized regression coefficients. (a: p<0.01; b: p<0.05; c: p<0.10)
Price SKU’s Open hours
Gamble services
Prom. freq.
Parking places
Cluster location
Adj. R2
Sales per inv. n.s. n.s. n.s. n.s. n.s. n.s. n.s. n.s.
Sales per sqm -0.04 0.03 0.34a 0.14c 0.16b 0.04 0.09 0.21a
Sales per labor hour
-0.13c -0.09 0.05 -0.01 0.11 0.29a 0.15b 0.15a

- 194 -
The results show consistent support for a relationship between open
hours, gambling service and promotion frequency, and space productivity (sales per square meter).
Inventory productivity reports only a barely significant relationship with conduct. The only highly significant relationship turns out in the comparison of average productivity between the supermarkets conducting “low” and “high” on promotion frequency. The regression equation of inventory productivity is insignificant, leaving no room for interpretation of the relationship between conduct and inventory productivity.
Labor productivity of supermarkets is found significantly and negatively related to their price level, while positively related to the number of parking places adjacent to the store and to cluster location. When entered in the sales per labor hour regression, the regression coefficient of price index is negative, although just-about significant (p<0.10), while the coefficients of “parking places” and “cluster location” are positive and significant.
Comparing average productivity performance in sub-samples of stores conducting “low” and “high” on each variable (based on the median value of each) show results that correspond to the correlation coefficients:
Table 4.5.8 Average productivity performance of supermarkets with “low” and “high” values on conduct variables.T-test for test of significance (a: p<0.01, b: p<0.05, c: p<0.10)
Price index Number of SKU’s
Open hours Promotion freq.
Low (n=84)
High (n=84)
Low (n=93)
High (n=75)
Low (n=87)
High (n=81)
Low (n=98)
High (n=70)
Sales per inventory
18.0 18.5 18.5 17.9 17.6 18.9c 17.4 19.4a
Sales per square meter
50,223 46,922 47,366 50,069 46,693 53,814a 44,845 53,792a
Sales per labor hour
1,308 1,249c 1,252 1,312c 1,254 1,305c 1,255 1,311c
Add-on service in terms of gambling services is positively related to
space productivity, but unrelated to inventory- and labor productivity. The 40

- 195 -
supermarkets offering gambling services report, on average, 20% higher sales per square meter, compared to supermarkets not offering such service:
Table 4.5.9 Productivity performance of supermarkets not offering / offering gambling services. Average (mean) figures. T-test for test of significance.
No gambling services (n=128)
Gambling services (n=40)
Sig.
Sales per inventory 18.2 18.3 p=0.90
Sales per square meter 46,645 54,740 p<0.01
Sales per labor hour 1,273 1,296 p=0.57
Average labor productivity is significantly higher in the group of stores
with “high” number of parking places and among the supermarkets that are cluster located. Space productivity and inventory productivity barely differ between the groups.
Table 4.5.10 Average productivity performance of supermarkets with “low” and “high” number of parking places, and not clustered/clustered with non-food retail establishments. T-test for test of significance (a: p<0.01, b: p<0.05, c: p<0.10)
Parking places Cluster location
Low (n=88)
High (n=80)
No (n=70)
Yes (n=98)
Sales per inventory 17.8 18.7 17.4 18.8c
Sales per square meter 46,954 50,749c 40,257 50,227
Sales per labor hour 1,218 1,346a 1,238 1,308b
4.5.3 Conduct and financial performance The correlation coefficients and regression coefficients between conduct
of supermarkets and their profit margins and average costs are shown in Tables 4.5.11 and 4.5.12 below.

- 196 -
Table 4.5.11 Correlation coefficients between store conduct and financial performance (% of sales, a: p<0.01; b: p<0.05; c: p<0.10).
Gross margin%
Prom. cost%
Labor cost%
Oter oper.
costs%
Operating costs%
Operating margin%
Price index 0.39a -0.24a 0.25a -0.01 0.12 0.20a
Number of SKU’s -0.07 0.14c -0.11 -0.07 - 0.09 0.07
Open hours -0.03 0.25a -0.23a -0.03 - 0.12 -0.03
Promotion freq. -0.06 0.30a -0.26a -0.06 - 0.15b 0.02
Number of parking places
-0.07 0.23a -0.32a 0.08 - 0.12 0.05
Table 4.5.12 Regression analyses of financial performance of supermarkets on their conduct. Standardized regression coefficients. (a: p<0.01; b: p<0.05; c: p<0.10)
Price SKU’s Open hours
Gamble services
Prom. freq.
Parking places
Cluster location
Adj. R2
Gross margin% 0.36a 0.03 -0.11 0.07 -0.08 -0.03 -0.10 0.15a
Promotion cost% -0.16b 0.03 0.18b -0.06 0.22a 0.09 0.03 0.14a
Labor cost% 0.20a -0.02 -0.09 -0.02 -0.14c -0.24a -0.12c 0.19a
Other oper. costs% n.s. n.s. n.s. n.s. n.s. n.s. n.s. n.s.
Total oper. costs% n.s. n.s. n.s. n.s. n.s. n.s. n.s. n.s.
Oper. margin% n.s. n.s. n.s. n.s. n.s. n.s. n.s. n.s.
The results show that higher prices are associated with higher gross
margins. The correlation coefficient and the regression coefficient are positive and significant. A comparison of average gross margin in supermarkets with “low” and “high” prices (based on the median value) shows a 1.5% higher gross margin in supermarkets with “high” prices.
Gross margin is unrelated to number of SKU’s, open hours, and promotion frequency, except from the 81 stores with “high” number of open hours reporting 1.0%-units lower gross margins.
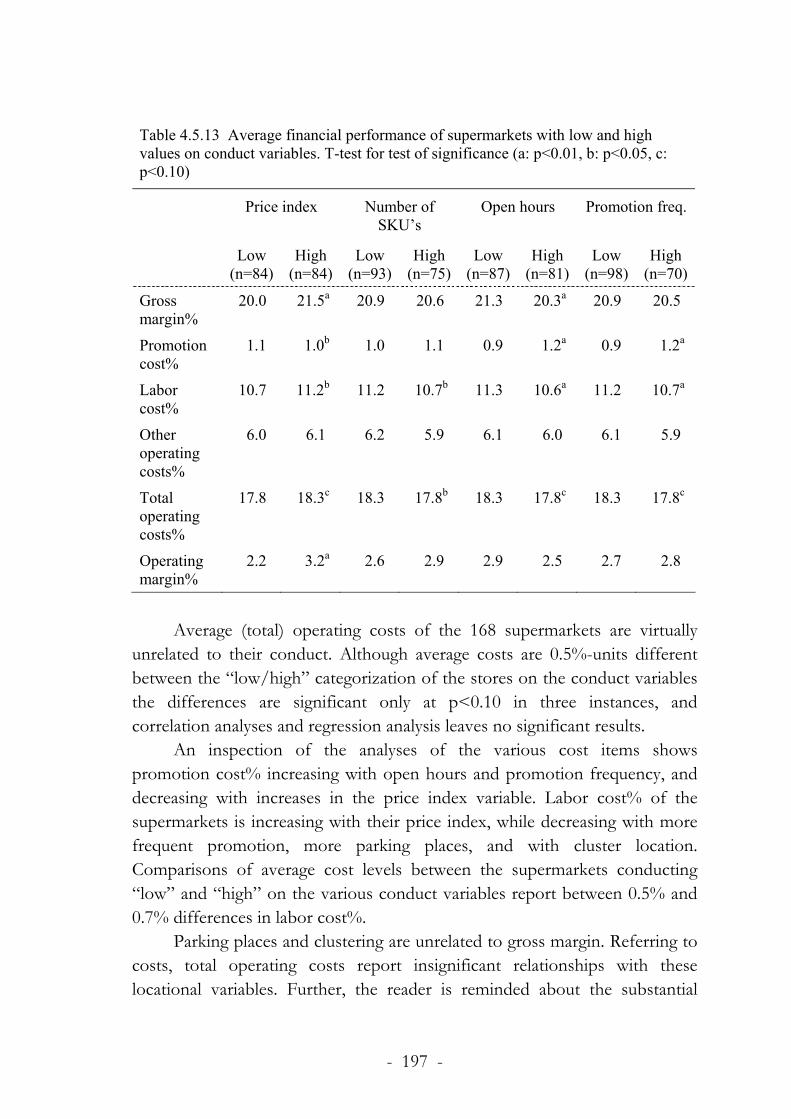
- 197 -
Table 4.5.13 Average financial performance of supermarkets with low and high values on conduct variables. T-test for test of significance (a: p<0.01, b: p<0.05, c: p<0.10)
Price index Number of SKU’s
Open hours Promotion freq.
Low (n=84)
High (n=84)
Low (n=93)
High (n=75)
Low (n=87)
High (n=81)
Low (n=98)
High (n=70)
Gross margin%
20.0 21.5a 20.9 20.6 21.3 20.3a 20.9 20.5
Promotion cost%
1.1 1.0b 1.0 1.1 0.9 1.2a 0.9 1.2a
Labor cost%
10.7 11.2b 11.2 10.7b 11.3 10.6a 11.2 10.7a
Other operating costs%
6.0 6.1 6.2 5.9 6.1 6.0 6.1 5.9
Total operating costs%
17.8 18.3c 18.3 17.8b 18.3 17.8c 18.3 17.8c
Operating margin%
2.2 3.2a 2.6 2.9 2.9 2.5 2.7 2.8
Average (total) operating costs of the 168 supermarkets are virtually
unrelated to their conduct. Although average costs are 0.5%-units different between the “low/high” categorization of the stores on the conduct variables the differences are significant only at p<0.10 in three instances, and correlation analyses and regression analysis leaves no significant results.
An inspection of the analyses of the various cost items shows promotion cost% increasing with open hours and promotion frequency, and decreasing with increases in the price index variable. Labor cost% of the supermarkets is increasing with their price index, while decreasing with more frequent promotion, more parking places, and with cluster location. Comparisons of average cost levels between the supermarkets conducting “low” and “high” on the various conduct variables report between 0.5% and 0.7% differences in labor cost%.
Parking places and clustering are unrelated to gross margin. Referring to costs, total operating costs report insignificant relationships with these locational variables. Further, the reader is reminded about the substantial

- 198 -
correlation between number of parking places and the measure of scale of operation (r=0.73, p<0.01). The interpretation of findings referring to parking places, thus, to a large extent overlaps with a scale effect on costs.
Table 4.5.14 Financial performance of supermarkets not offering / offering gambling services. Average (mean) figures. T-test for test of significance.
No gambling services (n=128)
Gambling services (n=40)
Sig.
Gross margin% 20.7 21.0 p=0.40
Promotion cost% 1.1 1.0 p=0.84
Labor cost% 11.0 10.8 p=0.47
Other operating costs% 6.1 5.9 p=0.47
Total operating costs% 18.2 17.8 p=0.30
Operating margin% 2.6 3.2 p=0.13
Table 4.5.15 Average financial performance of supermarkets with “low” and “high” number of parking places, and not clustered/clustered with non-food retail establishments. T-test for test of significance (a: p<0.01, b: p<0.05, c: p<0.10)
Parking places Cluster location
Low (n=88)
High (n=80)
No (n=70)
Yes (n=98)
Gross margin% 21.1 20.5b 20.9 20.7
Promotion cost% 0.9 1.2a 1.0 1.1
Labor cost% 11.4 10.5a 11.2 10.8b
Other operating costs% 6.1 6.1 6.1 6.0
Total operating costs% 18.4 17.7b 18.3 17.9c
Operating margin% 2.7 2.7 2.6 2.8
The analyses now moves on to profit performance (in absolute terms).
The correlation coefficients and regression coefficients are shown in Tables 4.5.16 and 4.5.17 below.

- 199 -
Table 4.5.16 Correlation coefficients (raw) between conduct and profit performance of supermarkets. (a:p<0.01; b:p<0.05; c:p<0.10).
Gross profit
per sqm
Operating costs per sqm
Operating profit
per sqm
Price index -0.05 -0.11 0.10
Number of SKU’s 0.04 0.02 0.05
Open hours 0.37a 0.39a 0.13c
Promotion frequency -0.06 0.23a 0.08
Number of parking places 0.20a 0.18b 0.15c
Table 4.5.17 Regression analyses of profit performance of supermarkets on their conduct. Standardized regression coefficients. (a: p<0.01; b: p<0.05; c: p<0.10)
Price SKU’s Open hours
Gamble services
Prom. freq.
Parking places
Cluster location
Adj. R2
Gross profit/sqm 0.05 0.03 0.31a 0.16b 0.13c 0.03 0.06 0.16a
Oper. costs/sqm -0.01 0.01 0.35a 0.13c 0.14c 0.01 0.06 0.17a
Oper. profit/sqm n.s. n.s. n.s. n.s. n.s. n.s. n.s. n.s.
These results show that the effect of the price index on gross margin%
is not translated into an effect on gross profit. Clearly, the effect of higher prices on market based performance and space productivity leaves a smaller volume of “output” as prices increase, offsetting the effect of prices on gross margin. Open hours, gamble service, and promotion frequency was found unrelated to gross margin%, but gross profit are increasing with the values of these variables, reporting a translation of the previously found positive effect from these variables on market based performance and space productivity into gross profit performance.
Bottom-line profits, however, report no relationship with conduct. Although there is a just-about significant and positive bivariate correlation between open hours and bottom-line profits (r=0.13, p<0.10), the regression analysis is insignificant. Further, a comparison of average profit performance between supermarkets conducting “low” and “high” on the variable conduct measures shows no significant results:

- 200 -
Table 4.5.18 Average profit performance of supermarkets, based on their scale of operation. T-test for test of significance (a: p<0.01, b: p<0.05, c: p<0.10)
Price index Number of SKU’s
Open hours Promotion freq.
Low (n=84)
High (n=84)
Low (n=93)
High (n=75)
Low (n=87)
High (n=81)
Low (n=98)
High (n=70)
Gross profit/sqm
10,070 10,059 9,894 10,276 9,251 10,939a 9,379 11,024a
Operating costs per sqm
8,842 8,516 8,584 8,797 7,893 9,523a 8,094 9,498a
Operating profit per sqm
1,278 1,543 1,309 1,480 1,357 1,415 1,285 1,526
Similarly, a classification of the supermarkets into categories referring to
gambling service and locational characteristics report no difference in bottom line profit between the groups:
Table 4.5.19 Financial performance of supermarkets not offering / offering gambling services. Average (mean) figures. T-test for test of significance.
No gambling services (n=128)
Gambling services (n=40)
Sig.
Gross profit per sqm 9,635 11,438 p<0.01
Operating costs/sqm 8,357 9,711 p<0.05
Operating profit per sqm 1,279 1,727 p=0.06

- 201 -
Table 4.5.20 Average profit performance of supermarkets with “low” and “high” number of parking places, and not clustered/clustered with non-food retail establishments. T-test for test of significance (a: p<0.01, b: p<0.05, c: p<0.10)
Parking places Cluster location
Low (n=88)
High (n=80)
No (n=70)
Yes (n=98)
Gross profit per sqm 9,781 10,736 9,753 10,344
Operating costs/sqm 8,492 8,885 8,424 8,862
Operating profit per sqm 1,290 1,490 1,249 1,482

- 202 -
4.6 Profitability performance of supermarkets in a context of scale, market conditions, conduct, and various aspects of economic performance
4.6.1 Economic performance in a context of scale, market conditions, and conduct
The analyses of sections 4.2 through 4.5 have provided a body of significant results referring to the antecedents of various aspects of supermarkets’ economic performance. Section 4.2 showed that profitability to a large extent is a matter of overall economic performance – the most profitable supermarkets, on average, peform better on market based performance, productivity, as well as gross margin and costs%. The main differential over the range from low to high profitable stores turned out to be the profit margin, i.e. the spread between gross margin and operating costs%.
Further, section 4.2 showed that the profit margin of supermarkets is related to their productivity, which in turn is related to their sales volume. Thus, the results in section 4.2 show that profitbility performance of supermarkets is a consequence of a network of intrarelationships between various aspects of economic performance.
Sections 4.3 through 4.5 provided significant results of scale, local market conditions, and conduct making a difference for various aspects of economic performance. Further, the results showed that the conduct of supermarkets is related to their scale of operation, and to conditions of their local markets.
Thus, answering the question “Why do supermarkets achieve the profitability performance that they do?” turns out as a highly complex issue. Various aspects of economic performance are intrarelated, and related to scale of operation, market conditions, and conduct. Conduct, in turn, is related to scale and market conditions. Clearly, there is a network of direct and indirect effects making a difference for profitability performance.
Figure 4.6.1 below shows the results from a simultaneous analysis (by PLS) of these effects of various antecedents on various aspects of economic performance, as well as the intrarelationships between these aspects of performance. Scale of operation and local market conditions are implemented as antecedents of conduct, which in turn is implemented as antecedent of performance. Further, the model incorporates a direct link between scale and

- 203 -
labor productivity, in order to test the prevalence of economies of scale after the effect from scale on performance, via conduct, is taken out.
Similar to the regression analyses of sections 4.3 through 4.5, the PLS analysis is based on the variables after a transformation by taking the natural logarithm of their original values (cf. section 3.8 in chapter 3). Number of parking places are omitted from the variable set for the PLS analysis, due to its substantial correlation with the principal component score of scale of operation (r=0.73, p<0.01). The significance of the path coefficients are evaluated by the jackknife estimation procedure within PLS. Following the recommendations of Nilsson et al. (2001) a set of sub-samples are generated from removing 5% of the observations at the time. In the present study, thus, every 8:th case is removed at the time, the model parameters are estimated and this sample-resample procedure is repeated to generate a set of standard errors for the model parameters, providing adjusted t-statistics to determine whether the parameters are different from zero.
The right-hand side of the model refers to the intrarelationships between various aspects of supermarkets’ economic performance (section 4.2 above), manifesting that sales volume plays a significant role in explaining profitability of supermarkets, via effects on productivity.
Increased volume of sales in supermarkets is thus associated with increased productivity, and by extension profitability, via lower costs%. Sales volume is related to conduct. More SKU’s, longer open hours, more frequent promotion, lower prices, and cluster location are significantly related to higher volume of sales. Further, local market saturation makes a difference for sales volume. The higher the saturation index, i.e. the less saturated a local market, the higher the volume of sales of supermarkets.
The conduct of supermarkets, in turn, is affected by their scale of operation, and by local competition. Scale works itself into profitability via a direct and positive effect on labor productivity, by extension decreasing operating costs. Further, scale has an indirect and negative effect on costs%, via conduct. Scale of operation is positively related to the number of SKU’s, open hours, and promotion frequency, inducing larger volume of sales. By extension, scale has a positive effect on space productivity, and further on operating costs%.
Competition works itself into store performance via positive as well as negative effects on conduct and various aspects of performance. The model reports significant and negative effects from competition on price. The more competition, the lower the price index. Lower price index, in turn, is

- 204 -
significantly related to gross margin, and by extension competition thus has a negative effect on profitability. However, lower prices is associated with lower levels of costs, via an effect on labor productivity, and lower prices is further associated with higher sales volume and by extension space productivity. The effect of competition on prices thus also works in direction to lower costs%, via increased productivity performance. In a similar vein, socioeconomic status of demand in the local market is associated with higher prices, working itself into higher gross margin, but lower sales volume and labor productivity. By extension, socioeconomic status of demand is positively related to costs%.
Further, competition is associated with higher sales volume via effects on open hours; the more competition, the longer the open hours which in turn is associated with higher volume of sales.
Competition also has a negative effect on sales volume, via a negative effect on merchandise variety (number of SKU’s), and by extension a negative effect on productivity. Note however that merchandise variety has a direct and negative effect on inventory productivity (sales per inventory). Thus, although the effect of competition on merchandise variety is associated with lower volume of sales, this effect is not fully translated into lower inventory productivity, as less merchandise variety is associated with higher sales per inventory.
Figure 4.6.1 closely follows the world view of the SCP paradigm, supporting the notion of performance being a consequence of conduct, which in turn being a consequence of local market conditions. The results suggest that the main route to high profitability goes through high gross margin, low costs%, and high productivity. High productivity, in turn, is a matter of scale and sales volume. Local market conditions have conflicting effects on various aspects of economic performance.
However, the analyses of section 4.2 above showed that the route to high profitability not necessarily goes through higher gross margins and lower costs and higher sales per square meter. Analyses showed that there are stores among the most (least) profitable that are not among the best (worst) performing on all aspects of economic performance. In other words, although the results show that the main route to high profitability goes through better performance overall, the results also show the opportunities for supermarkets to compensate a moderate or low performance on some aspects of economic performance, with high performance on others. Similarly, although the main route to low profitability goes through poor overall performance, the results of section 4.2 showed that there are stores that remain with low profitability

- 205 -
performance despite moderate or high performance on some aspects of economic performance, due to low performance on others. Specifically, the results of section 4.2 indicated two major “sub-routes” to high profitability, one going through high gross margins, and the other going via low costs%, with a small number of stores combining high gross margins with low costs%. Similarly, the results indicated two major “sub-routes” to low profitability, one via low gross margins and the other via high costs%, with a small number of stores combining these characterics.
Further, the effects of various antecedents in many instances have conflicting effects on various aspects of economic performance, with conflicting subsequential effects on profitability performance. These findings are underscored by a comparison of scale, conduct and market conditions between categories of the least and most profitable supermarkets (see Table 4.6.1), and by cross-tabulations of categories of low-medium-high profitability performing supermarkets, with a low-medium-high categorization referring to scale, competition, and saturation (see Tables 4.6.2 through 4.6.4). These results show that there is very little in terms of overall and general characteristics differentiating the less profitable from the highly profitable, and that there are supermarkets performing high and low on profitability in all categories of scale, and located in markets characterized by low and high conditions of saturation as well as competition.
To supplement the analyses this far, the next and final section of this chapter is devoted to further analyses of the most and least profitable supermarkets (the lower and upper quartile). In the next section, thus, the various “sub-routes” to high and low profitability identified in section 4.2 are analyzed further, by a comparison of the market conditions and supermarket conduct behind each route.

- 20
6 -
0.27
a
Figu
re 4
.6.1
PLS
ana
lysis
of th
e re
latio
nshi
psbe
twee
n sc
ale o
f ope
ratio
n, lo
cal m
arke
t co
nditi
ons,
cond
uct a
nd p
erfo
rman
ce o
f sup
erm
arke
ts. P
ath
coef
ficien
ts a
nd d
eter
min
atio
n co
effic
ients
(a: p
<0.
01; b
: p<
0.05
; c: p
<0.
10).
0.08
0.21
b
-0.0
7
0.55
a
0.30
a
0.34
a
-0.3
3a -0.4
2a
-0.7
2a
0.65
a
0.09
0.61
a0.
30a
0.23
a
- 0.2
2a
Scale
of
oper
atio
n
Prom
otio
n fr
eque
ncy
(R2 =
0.14
)
Ope
n ho
urs
(R2 =
0.17
)
Num
ber o
f SK
U’s
(R2 =
0.28
)
Price
inde
x (R
2 =0.
14)
Com
petit
ion
Socio
-ec
onom
ic st
atus
- 0.2
9a 0.14
c
Sales
vo
lum
e (R
2 =0.
57)
-0.1
5b
0.38
a
Satu
ratio
n in
dex 0.
12a
Clus
ter
loca
tion
0.29
a
Gam
ble
serv
ice
0.10
Sales
per
in
vent
ory
(R2 =
0.23
)
Sales
per
sq
m
(R2 =
0.38
)
Sales
per
lab
or h
our
(R2 =
0.13
)
Ope
ratin
g co
sts%
(R
2 =0.
31)
Gro
ss
mar
gin%
(R
2 =0.
16)
Ope
r. pr
ofit
perr
sqm
(R
2 =0.
92)
-0.1
3c
-0.3
5a
0.53
a
0.29
a
0.39
a
0.05

- 207 -
Table 4.6.1 Average scale, conduct, and local market conditions of supermarkets performing “low”, “medium”, and “high” on profitability per-formance. One-way ANOVA for test of differences between groups.
Operating profit per square meter
LOW (n=42)
MEDIUM (N=84)
HIGH (n=42)
Sig.
Scale of operation Component score -0.04 -0.06 0.16 p=0.49 Floor area 787 779 785 p=0.36 No. of checkouts 3.7 3.7 4.3 p<0.10
Conduct Price index 100.0 100.6 100.9 p<0.05 Number of SKU’s 7,929 8,417 8,478 p=0.72 Open hours 69 68 72 p<0.10 Promotion frequency 3.2 3.6 3.8 p=0.45 Gamble service 0.17 0.18 0.43 n.a. Parking places 79 83 107 p<0.10 Cluster location 0.50 0.58 0.67 n.a.
Saturation Component score 0.14 -0.19 0.24 p<0.05 Population per store 1,423 1,112 1,363 p<0.05 Population per sqm 3.3 3.0 3.8 p<0.10
Competition Component score -0.26 0.01 0.12 p=0.13 CROne 42.5 49.3 42.6 p=0.20 HHI on store level 3,028 3,774 3,532 p=0.11 HHI on chain level 4,348 4,978 5,114 p<0.10 Distance to nearest 2,184 3,532 2,568 p=0.19 Discounters share 9,4 5.3 6.2 p<0.10 Hypermarkets’ share 3.8 4.4 2.6 p=0.42
Socioeconomics Component score -0.02 -0.08 0.18 p=0.37 % non-retired 81.9 81.1 82.9 p<0.05 % child households 24.0 24.6 25.4 p=0.35 % non-low income 70.5 69.9 71.2 p=0.26

- 208 -
Table 4.6.2 Frequency of LOW-MEDIUM-HIGH profitability performance of supermarkets in various categories of scale.
O p e r a t i n g p r o f i t p e r s q m
LOW MEDIUM HIGH
SMALL 10 21 11 (42)
MEDIUM 22 44 18 (84)
Scal
e of
op
erat
ion
LARGE 10 19 13 (42)
(42) (84) (42) (168)
Table 4.6.3 Frequency of LOW-MEDIUM-HIGH profitability performance of supermarkets in markets of different saturation conditions.
O p e r a t i n g p r o f i t p e r s q m
LOW MEDIUM HIGH
LOW 7 28 7 (42)
MEDIUM 24 41 19 (84)
Satu
ratio
n in
dex
HIGH 11 15 16 (42)
(42) (84) (42) (168)
Table 4.6.4 Frequency of LOW-MEDIUM-HIGH profitability performance of supermarkets in markets of different competitive conditions.
O p e r a t i n g p r o f i t p e r s q m
LOW MEDIUM HIGH
LOW 6 26 10 (42)
MEDIUM 22 40 22 (84)
Com
petit
ion
HIGH 14 18 10 (42)
(42) (84) (42) (168)

- 209 -
4.6.2 Routes to high and low profitability, and their antecedents The results of sections 4.2 through 4.6 provided insights into the
antecedents of various aspects of economic performance of supermarkets. Profitability performance has been found a consequence of an interplay of various aspects of performance, which in turn are anteceded by an interplay with scale, local market conditions, and conduct. However, comparing scale, market conditions, and conduct between the least and most profitable revealed only small differences. Answering the question “Why do supermarkets achieve the profitability performance that they do?” thus calls for additional analyses. This section provides such analyses by investigating the characteristics of the most and least profitable. More specific, this section provides a further investigation into the scale of operation, market conditions, and conduct of the 42 least profitable and the 42 most profitable supermarkets (the lower and upper quartile) in the sample.
The analyses of section 4.2 above showed that a majority (n=30) of the 42 most profitable supermarkets were found achieving high profit margins by being among the best performing on either gross margin (n=13) or operating costs% (n=17), while a small group (n=5) of stores being among the best performing on both gross margin and costs%. Seven of the 42 most profitable are not among the best performing on either gross margin or costs%, thus qualifying for the group of most profitable through overall good but not “best” performance.
Similarly, a majority (n=32) of the 42 least profitable were among the worst performing on either low gross margin (n=12) or operating costs% (n=20), while a small group (n=6) being among the worst performing on both gross margin and costs%. Four of the 42 least profitable are not among the best performing on either gross margin or costs%, thus qualifying for the group of least profitable through overall poor but not “worst” performance.
The remaining part of this chapter is devoted to a group by group, and store by store comparison between the supermarkets constituting these various groups of different combinations of gross margin and costs% ending up in high or low profitability. The section is organized around five sub-sections:

- 210 -
Section Comparison 4.6.2.1 High gross margin vs. low costs% to high
profitability
4.6.2.2 High gross margin to high profitability vs. low gross margin to low profitability.
4.6.2.3 Low costs% to high profitability vs. high costs% to low profitability.
4.6.2.4 Low gross margin vs. high costs% to low profitability
4.6.2.5 A summary of 4.6.2.1 – 4.6.2.4 Tables 4.6.9 through 4.6.14 at the end of this chapter provide details on
a store-by-store basis of the internal and external characteristics of the stores comprised by various combinations of gross margin and costs%. In the following sections, these tables serve as a basis for the comparisons. In each table, the stores are sorted by in descendent order, with the most profitable on the top row of each sorted list. Concentration is depicted by a transformation of the Herfindahl index on store level into a “HHI-equivalent”, by taking the inverted value of the original index divided by 10,000. The interpretation becomes “the level of concentration corresponding to x number of stores of identical market share” in the market. The reason for this transforrmation is that the interpretation of such an HHI equivalent for depicting concentration is more intuitively understood than an original HHI value, when comparing on a store by store basis.
Initial analyses showed small differences between the various groups of stores referring to non-price conduct (i.e. number of SKU’s, open hours, promotion frequency, gambling service, and cluster location). However, when going through Tables 4.6.9 through 4.6.14 it turned out that in many instances there seemed to be combinations of non-price conduct constituting the differential between the groups, rather than differences in each conduct item. For this reason, in forthcoming comparisons between the groups of stores, besides comparing each conduct item, non-price conduct is aggregated into two variables, one depicting a summary of “variable” conduct (number of SKU’s, open hours, and promotion frequency) and one depicting “non-variable” conduct (gamble service and cluster location).

- 211 -
More specific – in the comparisons of conduct between the stores, the conduct of each store in terms of (1) number of SKU’s, (2) open hours, and (3) promotion frequency are added up into a single variable, labeled “Non-price” conduct. To facilitate such an addition, the first two are transformed into a scale from 1 to 10, based on a categorization into deciles. The promotion frequency variable ranges from 1 to 6, and the “Non-price” variable thus may take on values from a minimum of 3, to a maximum of 26.
In a similar way, the two dichotomous variables of gambling service and cluster location are added up. The variable thus constructed is labeled “Multipurpose”, as it reflects the extent to which the store facilitates multipurpose shopping opportunities to consumers. The “Multipurpose” variable thus may take on values from a minimum of 0 to a maximum of 2.
Thus, besides the original conduct variables, in forthcoming sections conduct for each store is described by three variables, (1) Price conduct (price index), (2) Non-price conduct, and (3) Multipurpose offer. Further, labor productivity (sales per labor hour) is incorporated in the comparisons, as a reflection of the “discipline” by which daily operations are conducted.
4.6.2.1 High gross margin vs. low costs% to high profitability Compared to the supermarkets achieving high profitability via low
costs%, the supermarkets achieving high profitability through high gross margin are located in markets where saturation indices are higher, competition is lower, and socioeconomic status of local demand is higher. These high gross margin stores price more than 3%-units higher, on average, compared to the low cost% stores, while non-price conduct and labor productivity are significantly lower. Further, labor productivity is higher in the group of stores achieving high profitability via low costs%:

- 212 -
Table 4.6.5 A comparison of the supermarkets achieving high profitability through high gross margin, and through low costs%. Mann-Whitney U-test of significance.
High gross
margin (n=13)
Low costs% (n=17)
Sig.
Sales per sqm 57,092 67,070 p=0.12
Gross margin 23.9 20.2 p<0.01
Operating costs% 18.4 15.4 p<0.01
Saturation 0.71 0.01 p=0.10
Competition - 0.30 0.38 p=0.06
Socioeconomic status 0.52 -0.10 p=0.10
Price index 102.7 99.5 p<0.01
Non-price 13.5 17.1 p=0.06
Labor productivity 1,239 1,433 p<0.01
Local market conditions Table 4.6.9 reports the details on market conditions and conduct of the
stores achieving high profitability through high gross margin (denoted “route A” in the following). Of the 13 of these route A stores, all but 5 are located in markets where competition is below the overall average. The 5 stores that are located in markets of high competition are denoted B8, C3, B4, B1, B2. A further inspection of local market conditions of these shows that in 2 cases (C3, B4) competitive conditions are close to the overall average. In 2 other cases (B1, B2) the supermarkets possess substantial spatial monopoly, although overall competition is categorized as high. Hence, there remains one (B8) of the 13 route A supermarkets, for which the local market is characterized by high competition on all measures of competitive structure.
Out of the 17 supermarkets relying on low costs% (denoted “route B” in the following) to achieve high profitability, 12 are located in markets where competition is categorized as high, while 5 are in markets of low competition (see Table 4.6.10). Of these 5 supermarkets in markets of low competition, 4 are in markets that report close to average on concentration (B12, A5, C7, A3) The remaining fifth supermarket (C4) is a large supermarket in a highly

- 213 -
concentrated market with no intertype competition, possessing substantial spatial monopoly.
Socioeconomic status of local residents is further significantly different between the markets of route A and route B stores. The high gross margin stores of route A face markets with higher share of non-retired residents, higher share of child households, and higher share of non-low income residents. Of the 13 route A (high gross margin) stores, 10 are in markets where socioeconomic status is above the overall average, compared to 7 of 17 route B stores.
Referring to saturation, 9 of 13 route A, and 11 of 17 route B supermarkets are located in markets where saturation indices are above the overall average. In other words, in 20 of 30 cases where route A or route B are followed to high profitability, saturation indices are “high”. An inspection of the 10 markets where saturation is low shows that in 7 cases, saturation conditions are close to average (B7, B1, C2, B6, A4, A3, B12), while substantially below the overall average in only 3 cases.
Conduct A vast majority of the route A stores set prices above the overall
average; only 2 of the 13 conduct lower prices. One (B5) is a small store with prices close to the overall average. One (B8) is located in a market of high competition.
Of the 17 low costs% route B stores, a minority (n=6) conduct above-average prices. One of these (C5) is pricing very close to overall average, while 5 (B12, C10, A4, B10, B9) price substantially above the overall average. Of these 5 stores, one is located in a market of low competition (B12), 2 are possessing substantial spatial monopoly (C10, B10), and 2 are small stores in markets of high competition (B9, A4). All but one (C10) of these five supermarkets price less than 1.5% above the overall average.
In 9 of 17 cases, the route B stores conduct long hours and highly frequent promotion (in combination with a low price level in 7 of these 9 cases), compared to only 3 of 13 stores following route A. Further, internal efficiency is distinguishing the routes from each other; labor productivity is above overall average in 15 of 17 route B stores, compared to 6 of 13 stores following route A. There is a strong association between low price conduct and high labor productivity. In only one case where prices are below average, labor productivity is below average. This store (A5) is a small store located in a market of low competition.

- 214 -
There are 3 route A stores that conduct long open hours and high frequent promotion (B8, C3, B7). All 3 are large stores. Two (B8, C3) are located in markets of high competition, while the third (B7) face competitive conditions close to the overall average.
There are 5 route A stores conducting high prices, along with short open hours and low frequent promotion (B1, B6, B3, A1, B2). Four of these are small stores. These 5 stores all possess substantial spatial monopoly, and concentration is above average in 4 of 5 cases.
Four route B stores are conducting a combination of short open hours and low promotion frequency. All these 4 (B12, A3, B13, B9) are small stores, 3 of which possess spatial monopoly above average. In other words, 13 of the 17 stores either conduct long open hours or highly frequent promotion, and 9 of these combine long open hours and frequent promotion (7 of these 9 also conduct low prices). Conduct of route B stores is, thus, characterized by a high level of “activeness” in the market. Further, 7 of 17 are offering gambling services at a cluster location, and yet 8 others offer either gambling service or cluster location (2 offer gambling services, and 6 are cluster located). Thus, 15 of 17 stores are either offering gambling services or are cluster located.
4.6.2.2 High gross margin to high profitability vs. Low gross margin to low profitability.
Comparing the highly profitable, high gross margin stores (route A) with the low profitable, low gross margin ones (referred to as route F), show significant differences in saturation, competition, and socioeconomic status between the stores. The low gross margin group of stores are located in more competitive, and more saturated markets of lower socioeconomic status. The average price indices in the groups differ by 3.5%-units. See Table 4.6.6 below.
Aside the 13 stores performing high gross margin of Table 4.6.9, there are yet 5 performing a combination of high gross margin and low costs%. These are referred to as “route D” (see Table 4.6.11). All these 5 stores are located in markets of low competition, facing no intertype competition.
Aside the 12 stores performing low on gross margin, there are yet 6 others performing a combination of low gross margin and high costs%. These are referred to as “route H” (Table 4.6.14). Four of these are located in markets where competition is above the overall average, while 2 face below average competitive markets. One of these 2 stores (D7) faces competition

- 215 -
close to the overall average, and the other (F7) is located in a market where concentration is substantially below average but spatial monopoly is zero.
A comparison of conduct in these most and least favorable routes to high and low profitability, i.e. route D (high gross margin and low costs%) and route H (low gross margin and high costs%) shows pricing and productivity constituting the main differentials. Of the 5 stores following route D to high profitability, 3 are pricing above the overall average while 5 of the 6 stores following route H price substantially below average. Four of the 5 route D stores perform above average on space productivity, while 5 of 6 route H stores perform below. Labor productivity is above average in 4 of 5 stores following route D, compared to 2 of 6 in route H.
Table 4.6.6 A comparison of the most and least profitable supermarkets reporting high vs. low gross margins. Mann-Whitney U-test of significance.
High gross
margin (n=13)
Low gross
margin (n=12)
Sig.
Sales per sqm 57,092 43,773 p<0.01
Gross margin 23.9 18.6 p<0.01
Operating costs% 18.4 18.0 p=0.51
Saturation 0.71 -0.01 p<0.05
Competition - 0.30 0.42 p=0.07
Socioeconomic status 0.52 -0.33 p<0.05
Price index 102.7 99.2 p<0.05
Local market conditions Compared to the high gross margin supermarkets of route A, the low
gross margin, low profitable, supermarkets of route F face local markets where competition is higher. Of the 12 stores following route F to low profitability, 8 are located in markets of high competition, while 4 are in markets where competition is below the overall average. A further inspection of the market conditions of these 4 stores in Table 4.6.12 shows that only one face a market of substantially low competition: One (E4) is in a market where competition is close to overall average; another (E6) face substantial intertype

- 216 -
competition, and a third (E5) posess spatial monopoly substantially below average.
Socioeconomic status of local residents is further significantly different between the markets of route A and route F stores. The high gross margin stores of route A face markets with higher share of non-retired residents, higher share of child households, and higher share of non-low income residents. In 8 of 12 cases, the route F stores are located in markets where socioeconomic status is below overall average.
Saturation conditions are more favorable in the markets of route A, where 9 of 13 stores face markets where the saturation index is above average. Among the route F stores, 5 of 12 face such saturation conditions.
Conduct Comparing the stores achieving high profitability through high gross
margin (Route A, Table 4.6.9), with the ones achieving low profitability through low gross margin (Route F, Table 4.6.12) show the main differential referring to the pricing conduct of the supermarkets comprised by each route. Of the 13 stores following route A, 11 are pricing above the overall average. In the group of stores following route F, 9 of 12 are pricing below average.
4.6.2.3 Low costs% to high profitability vs. High costs% to low profitability.
The main differences between the low costs%, highly profitable stores (route B), and the high costs%, low profitable ones (referred to as route G) refer to their productivity and conduct. Prices are indifferent between the two groups, but non-price conduct differ significantly. Further, the low costs% stores are more often offering gambling service and/or clustered location. Labor productivity is significantly higher in the highly profitable, low costs%, stores.
Local market conditions Market conditions do not differ between the group of stores achieving
high profitability via low costs%, and the group of stores achieving low profitability via high costs%.

- 217 -
Table 4.6.7 A comparison of the most and least profitable supermarkets reporting low vs. high costs. Mann-Whitney test of significance.
Low costs% (n=17)
High costs% (n=20)
Sig.
Sales per sqm 67,070 41,805 p<0.01Gross margin 20.2 20.9 p<0.05Operating costs% 15.4 21.0 p<0.01Non-price 17.1 13.5 p=0.06Multiple 1.29 0.65 p<0.01Labor productivity 1,433 1,179 p<0.01
Conduct A comparison of the highly profitable low cost% stores (route B) with
the low profitable high costs% ones (denoted route G in the following) shows the main differential referring to their level of productivity. Of the 17 low costs% stores (route B), only one is performing below the overall average on space productivity (sales per square meter), and 15 of the 17 report above average labor productivity. This is in sharp contrast to the 20 high costs% route G stores (Table 4.6.13), where 6 are performing above the overall average on space productivity, and 5 are reporting labor productivity above overall average.
These differences between the two groups of low and high costs% stores are traced back to differences in their conduct, rather than their market conditions. Nine of the 17 stores achieving low costs% conduct long open hours in combination with frequent promotion (promoting once a week or more often). Seven of these 9 stores are also pricing below the overall average.
The stores of route G are more “passive” in their conduct. There are only 3 of the 20 stores conducting long open hours and high frequent promotion (E11, E15, F3), 2 of which conduct high prices. Nearly half, or nine out of the 20, conduct a combination of short open hours and low frequent promotion, four of which also conduct high prices (E20, E17, E16, F5). Further, of the 17 low costs% route B stores, 9 offer gambling service and 13 are cluster located (7 stores conduct a combination of both gamble services and cluster location). Among the 20 high costs% stores, 4 offer

- 218 -
gambling services, 9 are cluster located, and only 2 conduct a combination of both gambling services and cluster location.
4.6.2.4 Low gross margin vs. high costs% to low profitability Comparing the low profitable stores of route F (low gross margin) and
G (high costs%) report significant difference in labor productivity. Market conditions, prices, and non-price conduct are indifferent between the two groups.
Table 4.6.8 A comparison of the supermarkets achieving low profitability through low gross margin, and through high costs%. Mann-Whitney U-test of significance. Mann-Whitney test of significance.
Low gross
margin (n=12)
High costs% (n=20)
Sig.
Sales per sqm 43,773 41,805 p=0.18
Gross margin 18.6 20.9 p<0.01
Operating costs% 18.0 21.0 p<0.01
Labor productivity 1,309 1,179 p<0.01
Local market conditions Eight of the 12 stores adhering to the low gross margin route to low
profitability (route F) are located in markets of high competition, while half the number of the 20 high costs% stores (route G) face low, and half face low competition. However, there is no significant difference in competition between the to groups.
Neither does saturation, nor socioeconomic status differ between the markets of routes F and G.
Conduct Eight of the 12 stores following route F to low profitability are
conducting low prices. Of the 20 supermarkets following high costs% route G, 9 are pricing below average, and 11 are pricing above. However, there is no significant difference in the price indices between the two groups.
A main characteristic of the high costs% route G stores were previously found to be there “passivity” in the market. Referring to non-price conduct,

- 219 -
the route F stores are more often “active” in their conduct. Of the 12 route F stores, there are 6 that conduct long open hours and high promotion frequency. Five of these (F1, F2, E6, E5, E7) are large stores, and the sixth (E1) is very close to the overall average on scale of operation. There are yet two other route F stores that conduct long open hours (D2, E2) and one that conduct high frequent promotion (E3). All 3 are in markets of high competition.
Of the 20 route G supermarkets, only 4 report high labor productivity. This is in contrast to the route F stores, of which 8 of 12 report high labor productivity. Of the 4 route F stores reporting low labor productivity, all but one (E6) are close to the overall average.
4.6.2.5 Routes to high and low profitability – A summary The group by group, and store by store comparisons of the most and
least profitable stores in this section have provided supplementary information on the antecedents of profitability performance of supermarkets. Overall, the results have shown that different routes to high and low profitability via combinations of high and low gross margin and costs can be traced back to dissimilarities in market conditions and conduct.
The results have shown that among the 42 most profitable supermarkets, there are 13 achieving high profitability via high gross margin, while 17 achieve high profitability via low costs%. Comparing the market conditions and conduct between these two groups of stores showed that the high gross margin route occur in favorable markets – competition is lower, saturation indices are higher, and socioeconomic status are higher, compared to the group of stores following the low cost route.
The 13 supermarkets performing high gross margins are conducting significantly higher prices, compared to the 17 achieving high profitability via low costs%. These 17 stores, however, are conducting significantly “more” on non-price conduct. Further, labor productivity is significantly higher among the low costs% supermarkets.
Both these groups of highly profitable supermarkets are performing substantially higher on sales per square meter, compared to the groups of least profitable. In the case of high gross margin supermarkets, this was traced back to favorable saturation conditions of the local markets, while in the case of low costs% stores, it was traced back to “active” conduct.
Comparing the 13 highly profitable, high gross margin, supermarkets with the 12 low profitable, low gross margin ones showed significant

- 220 -
differences in pricing conduct – prices are significantly higher among the stores achieving high gross margin. These differences were traced back to significant differences in competition and socioeconomic status. Further, sales per square meter is significantly higher in the high gross margin stores, which was traced back to these stores facing more favorable markets in terms of saturation conditions.
Comparing the 17 highly profitable, low cost%, supermarkets with the 20 low profitable, high costs% ones showed significant differences in space productivity and labor productivity. Sales per square meter and sales per labor hour were significantly higher among the low costs% supermarkets achieving high profitability. These differences were traced back to differences in conduct, while market conditions were found indifferent between the groups. The low costs% supermarkets reported a high degree of “activeness” in their conduct, and further more often offering gamble service and/or cluster located.
Between the groups of stores achieving low profitability via low gross margin, and high costs%, respectively, no significant differences in market conditions and conduct were found. Both groups contain stores that face market where competition is substantial, and saturation conditions are unfavorable. In one respect, however, the groups are significantly different – the low gross margin stores perform higher on labor productivity.

- 22
1 -
Ta
ble
4.6.
9 T
he th
irtee
n su
perm
arke
ts f
ollo
win
g ro
ute
A (h
igh
gros
s m
argi
n) to
hig
h pr
ofita
bilit
y pe
rfor
man
ce. “
Small
/Lar
ge”,
and
“Lo
w/H
igh”
ref
ers
to
posit
ions
visa
vi th
e ov
erall
med
ian v
alue
of th
e 16
8 su
perm
arke
ts.
Figu
res in
itali
cs ar
e over
all a
verag
es of
the s
ample
of 1
68 su
perm
arke
ts.
Store number
Route
Sales per sqm
Gross margin%
Operating costs%
Scale of operation
Floor area
Checkouts
Competition
HHI-equivalent
Spatial monopoly
Intertype comp.%
Saturation index
Population / store
Population / sqm
Socioeconomic status
Sales per labor hour
Price index
Number of SKU’s
Open hours
Promotion freq.
Gambling service
Parking places
Cluster location
B8
A
83,3
7723
.917
.9
Larg
e 50
05
Hig
h27
.220
07
Hig
h 1,
645
5.6
Low
1,
293
89.4
7,00
084
5 0
10
1
C1
A
56,7
8125
.017
.1
Larg
e 1,
090
5 Lo
w1.
720
00
Hig
h 1,
823
3.6
Hig
h1,
606
104.
55,
500
911
0 11
0 1
C3
A
76,4
7122
.717
.1
Larg
e 1,
400
10
Hig
h4.
075
512
Hig
h 1,
997
3.4
Hig
h1,
331
101.
27,
000
715
0 40
0 1
B4
A
51,2
9726
.518
.7
Larg
e 83
04
Hig
h4.
778
413
Hig
h 2,
723
5.8
Hig
h1,
437
105.
87,
500
844
1 30
0 1
B7
A
61,8
6222
.417
.5
Larg
e 74
44
Low
3.6
615
0Lo
w
1,22
42.
0Lo
w
1,48
410
9.5
9,50
072
6 0
200
1
B5
A
53,2
8322
.617
.1
Small
53
04
Low
5.2
02
Hig
h 2,
454
6.5
Hig
h1,
341
100.
59,
000
721
0 60
0
B1
A
43,0
0025
.318
.6
Larg
e 86
04
Hig
h3.
11,
788
29Lo
w
921
3.3
Hig
h1.
112
102.
96,
500
553
1 10
1
C2
A
62,7
0726
.021
.4
Larg
e 1,
115
5 Lo
w1.
816
30
Low
93
82.
8Lo
w
818
104.
311
,000
635
0 80
0
A2
A
63,4
1223
.118
.7
Small
47
53
Low
1.5
8,87
40
Hig
h 3,
318
8.6
Hig
h1,
183
102.
27,
000
742
1 25
0
B6
A
53,7
0324
.119
.1
Small
56
03
Low
1.5
7,20
20
Low
74
42.
9H
igh
1,06
210
1.8
6,50
054
3 0
50
1
B3
A
50,6
7421
.817
.3
Small
51
33
Low
1.2
1,72
80
Hig
h 1,
028
3.7
Hig
h1,
115
103.
416
,000
571
0 10
0 0
A1
A
38,4
5324
.218
.5
Small
45
02
Low
1.0
13,8
050
Hig
h 1,
023
5.2
Hig
h1,
191
107.
08,
400
663
0 50
1
B2
A
47,0
8423
.819
.7
Small
51
54
Hig
h5.
91,
456
34H
igh
2,40
24.
0H
igh
1,12
810
2.8
7,50
064
1 1
50
0
Mea
n: 48
,573
20.8
18.1
782
3.9
4.
42,
954
10
1,25
23.
31,
279
100.
58,
310
693.
5
88
Med
ian:
45,4
2120
,718
,0
69
83.
0
3.2
776
0
1,09
62.
91,
258
101.
18,
000
694.
0
50

- 22
2 -
Tabl
e 4.
6.10
The
seve
ntee
n su
perm
arke
ts fo
llow
ing
rout
e B
(low
cos
ts%
) to
high
pro
fitab
ility
per
form
ance
. Figu
res in
itali
cs ar
e over
all a
verag
es of
the s
ample
., Store number
Route
Sales per sqm
Gross margin%
Operating costs%
Scale of operation
Floor area
Checkouts
Competition
HHI-equivalent
Spatial monopoly
Intertype comp.%
Saturation index
Population / store
Population / sqm
Socioeconomic status
Sales per labor hour
Price index
Number of SKU’s
Open hours
Promotion freq.
Gambling service
Parking places
Cluster location
C12
B 88
,782
20.3
15.1
La
rge
750
5 H
igh
8.5
489
Hig
h 1,
398
5.7
Hig
h1.
507
95.7
9,00
076
6 0
60
0 C1
1 B
83,9
4919
.914
.6
Larg
e 1,
650
8 H
igh
3.4
022
Hig
h 2,
479
4.4
Hig
h1,
629
98.6
9,00
098
2 1
500
1 B1
2 B
73,7
5620
.714
.8
Small
53
53
Low
4.1
975
0Lo
w
753
3.0
Hig
h1,
638
102.
65,
000
671
0 89
1
A5
B 89
,365
21.0
16.2
Sm
all
430
3 Lo
w4.
92,
719
13H
igh
1,45
75.
7H
igh
1,18
499
.810
,493
706
1 45
0
C10
B 79
,294
19.6
14.9
La
rge
1,00
06
Hig
h7.
31,
201
26H
igh
1,84
33.
0Lo
w
1,38
310
5.2
10,0
0065
6 1
180
1 A
4 B
58,8
3220
.514
.9
Small
48
53
Hig
h5.
626
510
Low
1,
009
2.6
Low
1,
226
102.
56,
700
775
0 44
1
C7
B 62
,275
20.5
15.7
La
rge
1,18
57
Low
3.2
00
Hig
h 1,
453
2.0
Low
1,
281
94.8
12,5
0073
6 1
200
1 B1
0 B
52,5
1421
.315
.7
Larg
e 75
04
Hig
h3.
31,
166
13H
igh
2,05
65.
8H
igh
1,29
210
2.2
8,50
084
5 1
60
0 C9
B
70,5
3619
.014
.8
Larg
e 91
55
Hig
h6.
079
520
Hig
h 1,
372
3.3
Low
1,
443
100.
68,
000
776
1 60
1
B11
B 69
,812
20.5
16.4
La
rge
626
4 H
igh
2.6
637
35Lo
w
626
2.0
Hig
h1,
312
98.2
6,00
069
5 0
120
1 C5
B
51,3
1021
.115
.6
Larg
e 1,
750
7 H
igh
2.6
529
29H
igh
1,55
13.
8Lo
w
1,63
110
1.3
12,0
0084
4 1
200
1 A
3 B
49,4
2720
.515
.0
Small
40
02
Low
3.7
19,0
760
Low
40
02.
6Lo
w
1,56
299
.57,
000
632
0 50
1
B13
B 99
,037
19.0
16.4
Sm
all
401
4 H
igh
11.3
909
23H
igh
954
3.4
Low
1,
387
93.8
8,00
067
2 0
82
1 C4
B
43,0
8719
.514
.2
Larg
e 1,
350
5 Lo
w1.
92,
529
0H
igh
1,36
03.
3H
igh
1,51
399
.18,
500
761
1 22
1
B9
B 47
,617
21.7
16.8
Sm
all
560
3 H
igh
3.6
00
Low
29
31.
2Lo
w
1,50
710
2.0
8,70
063
2 0
49
0 C6
B
52,0
1920
.416
.4
Larg
e 1,
240
5 H
igh
5.2
026
Hig
h 1,
438
3.1
Low
1,
302
98.1
9,00
070
6 1
300
1 C8
B
68,5
7917
.915
.1
Larg
e 1,
000
5 H
igh
5.7
565
Low
76
21.
7Lo
w
1,56
098
.811
,728
756
0 10
0 1
Mea
n: 48
,573
20.8
18.1
782
3.9
4.
42,
954
10
1,25
23.
31,
279
100.
58,
310
693.
5
88
Med
ian:
45,4
2120
,718
,0
69
83.
0
3.2
776
0
1,09
62.
91,
258
101.
18,
000
694.
0
50

- 22
3 -
Tabl
e 4.
6.11
The
supe
rmar
kets
follo
win
g ro
ute
C (h
igh
sales
per
sqm
, mod
erat
e gr
oss m
argi
n an
d co
sts)
, D (h
igh
gros
s mar
gin
and
low
cos
ts%
), an
d E
(ove
rall
good
per
form
ance
) to
hig
h pr
ofita
bilit
y pe
rfor
man
ce.
“Sm
all/L
arge
”, a
nd “
Low
/Hig
h” r
efer
s to
pos
ition
s vi
savi
the
ove
rall
med
ian v
alue
of t
he 1
68
supe
rmar
kets
. Figu
res in
itali
cs ar
e over
all a
verag
es of
the s
ample
of 1
68 su
perm
arke
ts.
Store number
Route
Sales per sqm
Gross margin%
Operating costs%
Scale of operation
Floor area
Checkouts
Competition
HHI-equivalent
Spatial monopoly
Intertype comp.%
Saturation index
Population / store
Population / sqm
Socioeconomic status
Sales per labor hour
Price index
Number of SKU’s
Open hours
Promotion freq.
Gambling service
Parking places
Cluster location
B14
C 67
,907
21.2
17.6
La
rge
750
4 Lo
w2.
144
70
Low
92
13.
2H
igh
1,25
910
0.8
9,00
084
2 1
55
1
A8
C 76
,075
20.1
17.1
Sm
all
460
3 H
igh
2.7
632
0H
igh
815
3.7
Hig
h1,
227
101.
25,
000
622
0 10
1
B15
C 68
,065
21.3
18.0
La
rge
712
5 H
igh
7.0
111
27H
igh
1,47
82.
1Lo
w
1,47
699
.210
,000
692
1 10
0 1
A7
C 70
,681
20.5
17.4
Sm
all
445
3 H
igh
3.0
00
Hig
h 1,
226
4.0
Hig
h1,
322
102.
78,
300
846
0 47
1
A6
C 61
,091
20.8
17.2
Sm
all
440
3 H
igh
4.4
1,36
711
Hig
h 1,
296
4.6
Hig
h1,
297
96.8
6,00
070
6 0
50
0
A10
D
70
,794
23.6
14.5
Sm
all
400
3 Lo
w1.
39,
338
0H
igh
2,97
511
.9H
igh
1,37
610
5.1
8,00
060
1 0
50
0
C13
D
86,1
7121
.716
.7
Larg
e 1,
950
11
Low
4.3
460
0H
igh
1,19
33.
3Lo
w1,
378
99.4
10,0
0084
6 1
300
1
A9
D
59,4
7421
.916
.8
Small
45
93
Low
1.8
00
Hig
h 1,
270
2.7
Hig
h1,
179
101.
86,
070
666
0 12
0 0
B17
D
46,6
8822
.016
.8
Small
70
03
Low
1.9
00
Low
49
32.
2H
igh
1,31
210
0.2
7,00
074
6 1
40
0
B16
D
31,1
3422
.715
.4
Larg
e 94
03
Low
3.1
2,22
90
Low
37
21.
5H
igh
1,55
910
1.5
10,5
0060
2 0
28
1
A11
E
50
,882
21.6
17.0
Sm
all
487
3 Lo
w3.
024
,797
0Lo
w
350
1.8
Low
1,27
610
0.3
9,70
063
4 1
28
1
B18
E
46,2
9721
.517
.4
Small
60
03
Low
2.1
00
Hig
h 1,
407
3.4
Low
1,26
810
1.6
8,00
074
6 0
48
0
Mea
n: 48
,573
20.8
18.1
782
3.9
4.
42,
954
10
1,25
23.
31,
279
100.
58,
310
693.
5
88
Med
ian:
45,4
2120
,718
,0
69
83.
0
3.2
776
0
1,09
62.
91,
258
101.
18,
000
694.
0
50
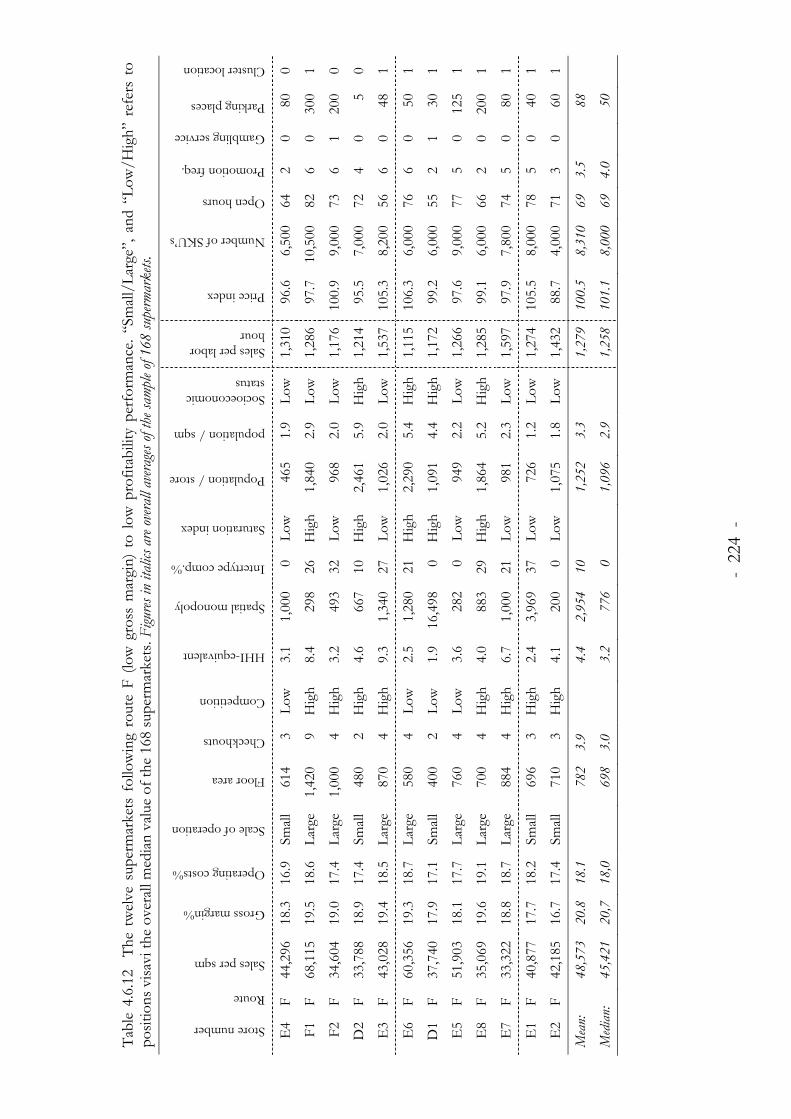
- 22
4 -
Tabl
e 4.
6.12
Th
e tw
elve
supe
rmar
kets
fol
low
ing
rout
e F
(low
gro
ss m
argi
n) t
o lo
w p
rofit
abili
ty p
erfo
rman
ce. “
Small
/Lar
ge”,
and
“Lo
w/H
igh”
ref
ers
to
posit
ions
visa
vi th
e ov
erall
med
ian v
alue
of th
e 16
8 su
perm
arke
ts. F
igures
in it
alics
are o
verall
aver
ages
of th
e sam
ple of
168
supe
rmar
kets.
Store number
Route
Sales per sqm
Gross margin%
Operating costs%
Scale of operation
Floor area
Checkhouts
Competition
HHI-equivalent
Spatial monopoly
Intertype comp.%
Saturation index
Population / store
population / sqm
Socioeconomic status
Sales per labor hour
Price index
Number of SKU’s
Open hours
Promotion freq.
Gambling service
Parking places
Cluster location
E4
F 44
,296
18.3
16.9
Sm
all
614
3 Lo
w3.
11,
000
0Lo
w
465
1.9
Low
1,
310
96.6
6,50
064
2 0
80
0
F1
F 68
,115
19.5
18.6
La
rge
1,42
09
Hig
h8.
429
826
Hig
h 1,
840
2.9
Low
1,
286
97.7
10,5
0082
6 0
300
1
F2
F 34
,604
19.0
17.4
La
rge
1,00
04
Hig
h3.
249
332
Low
96
82.
0Lo
w
1,17
610
0.9
9,00
073
6 1
200
0
D2
F 33
,788
18.9
17.4
Sm
all
480
2 H
igh
4.6
667
10H
igh
2,46
15.
9H
igh
1,21
495
.57,
000
724
0 5
0
E3
F 43
,028
19.4
18.5
La
rge
870
4 H
igh
9.3
1,34
027
Low
1,
026
2.0
Low
1,
537
105.
38,
200
566
0 48
1
E6
F 60
,356
19.3
18.7
La
rge
580
4 Lo
w2.
51,
280
21H
igh
2,29
05.
4H
igh
1,11
510
6.3
6,00
076
6 0
50
1
D1
F 37
,740
17.9
17.1
Sm
all
400
2 Lo
w1.
916
,498
0H
igh
1,09
14.
4H
igh
1,17
299
.26,
000
552
1 30
1
E5
F 51
,903
18.1
17.7
La
rge
760
4 Lo
w3.
628
20
Low
94
92.
2Lo
w
1,26
697
.69,
000
775
0 12
5 1
E8
F 35
,069
19.6
19.1
La
rge
700
4 H
igh
4.0
883
29H
igh
1,86
45.
2H
igh
1,28
599
.16,
000
662
0 20
0 1
E7
F 33
,322
18.8
18.7
La
rge
884
4 H
igh
6.7
1,00
021
Low
98
12.
3Lo
w
1,59
797
.97,
800
745
0 80
1
E1
F 40
,877
17.7
18.2
Sm
all
696
3 H
igh
2.4
3,96
937
Low
72
61.
2Lo
w
1,27
410
5.5
8,00
078
5 0
40
1
E2
F 42
,185
16.7
17.4
Sm
all
710
3 H
igh
4.1
200
0Lo
w
1,07
51.
8Lo
w
1,43
288
.74,
000
713
0 60
1
Mea
n: 48
,573
20.8
18.1
782
3.9
4.
42,
954
10
1,25
23.
31,
279
100.
58,
310
693.
5
88
Med
ian:
45,4
2120
,718
,0
69
83.
0
3.2
776
0
1,09
62.
91,
258
101.
18,
000
694.
0
50

- 22
5 -
Tabl
e 4.
6.13
The
twen
ty su
perm
arke
ts fo
llow
ing
rout
e G
(hig
h co
sts%
) to
low
pro
fitab
ility
per
form
ance
. Fi
gures
in it
alics
are o
verall
aver
ages
of th
e sam
ple of
168
. Store number
Route
Sales per sqm
Gross margin%
Operating costs%
Scale of operation
Floor area
Checkouts
Competition
HHI-equivalent
Spatial monopoly
Intertype comp.%
Saturation index
Population / store
Population / sqm
Socioeconomic status
Sales per labor hour
Price index
Number of SKU’s
Open hours
Promotion freq.
Gambling service
Parking places
Cluster location
D6
G
35,8
3821
.319
.6
Small
44
03
Low
2.6
3,23
36
Hig
h 2,
138
7.5
Hig
h97
910
1.0
7,00
054
10
50
0 D
5 G
33
,297
22.3
20.8
Sm
all
410
3 H
igh
4.5
531
0H
igh
1,71
32.
6Lo
w
979
99.0
4,00
077
10
0 0
E18
G
26
,336
21.0
19.3
Sm
all
900
2 H
igh
11.7
238
25Lo
w
730
2.5
Low
1,
153
92.4
11,0
0058
10
26
0 E
12
G
54,0
5320
.519
.8
Small
58
03
Hig
h5.
540
00
Low
1,
213
1.8
Low
1,
067
102.
29,
000
565
0 0
1 E
14
G
71,4
4520
.920
.5
Small
48
84
Low
4.5
848
4Lo
w
1,20
82.
2H
igh
1,25
497
.27,
000
671
0 50
0
E21
G
35
,964
21.0
20.3
Sm
all
613
3 Lo
w2.
41,
668
15H
igh
2,39
17.
0H
igh
1,15
010
0.9
6,50
064
50
10
0 E
20
G
31,0
8421
.220
.5
Larg
e 94
34
Hig
h4.
046
728
Low
98
52.
0Lo
w
1,25
810
1.4
7,00
069
20
75
1 E
17
G
26,0
9021
.420
.6
Larg
e 89
23
Low
1.5
18,0
160
Low
37
61.
7Lo
w
1,20
710
3.5
10,0
0050
10
40
1 E
11
G
53,2
5820
.420
.1
Larg
e 69
34
Low
2.0
1,92
26
Low
1,
161
2.2
Hig
h1,
301
102.
010
,000
775
0 50
0
E16
G
24
,812
22.6
22.0
La
rge
1,15
03
Low
1.1
12,8
400
Hig
h 1,
132
2.9
Hig
h1,
003
104.
916
,500
642
0 65
0
E15
G
10
0,08
321
.621
.5
Larg
e 69
05
Hig
h4.
499
525
Hig
h 1,
363
6.3
Low
89
197
.48,
000
895
1 38
0
F4
G
32,2
7922
.221
.9
Larg
e 1,
520
6 H
igh
8.0
333
13Lo
w
989
2.3
Low
1,
027
103.
711
,800
676
0 40
0 1
E19
G
29
,848
20.7
20.8
La
rge
830
4 H
igh
3.6
1,25
928
Hig
h 4,
678
5.6
Low
2,
425
101.
89,
000
842
0 10
0 0
F5
G
33,2
2019
.720
.0
Larg
e 1,
136
5 H
igh
2.3
179
42H
igh
1,82
13.
8H
igh
1,14
010
2.3
15,0
0060
20
100
1 E
13
G
59,1
6219
.719
.9
Small
63
73
Low
2.1
3,91
40
Hig
h 1,
247
3.6
Hig
h1,
338
99.6
6,50
073
21
50
1 E
10
G
41,0
0422
.323
.1
Small
74
03
Low
2.2
00
Low
69
42.
1H
igh
1,03
010
4.7
10,0
0084
11
45
0 E
9 G
40
,814
19.9
20.8
Sm
all
605
3 H
igh
10.2
242
9Lo
w
931
3.1
Low
1,
188
108.
37,
000
733
0 40
1
D4
G
22,2
8620
.622
.3
Small
55
22
Hig
h3.
71,
341
33H
igh
1,39
93.
5H
igh
868
100.
06,
000
611
0 30
0
D3
G
15,1
4419
.822
.9
Small
40
02
Hig
h9.
357
325
Low
1,
217
1.6
Low
1,
287
96.1
2,00
059
10
10
1 F3
G
70
,079
19.7
24.1
La
rge
1,03
06
Low
2.5
200
0H
igh
1,34
52.
8Lo
w
1,03
910
1.2
10,0
00
70
61
62
1 M
ean:
48,5
7320
.818
.1
78
23.
9
4.4
2,95
410
1,
252
3.3
1,27
910
0.5
8,31
069
3.5
88
Med
ian:
45,4
2120
,718
,0
69
83.
0
3.2
776
0
1,09
62.
91,
258
101.
18,
000
694.
0
50

- 22
6 -
Tabl
e 4.
6.14
The
supe
rmar
kets
follo
win
g ro
ute
H (l
ow g
ross
mar
gin
and
high
cos
ts%
) and
J (o
vera
ll po
or p
erfo
rman
ce) t
o lo
w p
rofit
abili
ty p
erfo
rman
ce. “
Small
/-La
rge”
, and
“L
ow/H
igh”
refe
rs to
pos
ition
s visa
vi th
e ov
erall
med
ian v
alue
of th
e 16
8 su
perm
arke
ts. F
igures
in it
alics
are o
verall
aver
ages
of th
e sam
ple of
168
supe
rmar
kets.
Store number
Route
Sales per sqm
Gross margin%
Operating costs%
Scale of operation
Floor area
Checkouts
Competition
HHI-equivalent
Spatial monopoly
Intertype comp.%
Saturation index
Population / store
Population / sqm
Socioeconomic status
Sales per labor hour
Price index
Number of SKU’s
Open hours
Promotion freq.
Gambling service
Parking places
Cluster location
F7
H
30,7
6118
.519
.6
Larg
e 2,
000
5 Lo
w2.
10
0Lo
w
1,49
81.
4H
igh
1,22
293
.414
,000
702
0 20
0 1
F9
H
36,3
1119
.020
.2
Larg
e 86
55
Hig
h8.
146
88
Low
59
51.
7Lo
w
1,35
395
.84,
000
634
0 45
0
F8
H
33,0
1217
.519
.9
Larg
e 94
54
Hig
h4.
852
60
Hig
h 1,
078
3.1
Low
1,
227
105.
47,
500
741
0 70
1
D8
H
40,7
4618
.520
.4
Small
48
03
Hig
h9.
999
722
Hig
h 1,
899
4.9
Low
1,
319
96.5
6,00
064
30
50
0
F6
H
47,0
2317
.920
.4
Larg
e 95
86
Hig
h7.
825
328
Low
1,
174
2.2
Low
1,
183
99.3
8,00
080
60
30
0
D7
H
38,5
0818
.223
.9
Small
42
52
Low
4.5
632
0Lo
w
1,34
32.
0Lo
w
947
98.6
6,70
074
30
25
0
D10
J
46,2
5620
.319
.1
Small
40
02
Low
1.6
9,65
10
Hig
h 2,
000
6.2
Hig
h1,
041
100.
25,
500
631
0 60
0
E22
J
55,2
3719
.919
.1
Larg
e 81
64
Hig
h7.
61,
206
8H
igh
1,20
23.
4Lo
w
1,46
397
.15,
000
654
1 30
0 0
D9
J 45
,843
20.0
19.1
Sm
all
450
3 H
igh
2.6
09
Hig
h 3,
565
7.1
Hig
h1,
012
100.
65,
000
772
0 40
0
F10
J 37
,722
20.0
19.2
La
rge
1,35
55
Hig
h2.
989
418
Low
94
12.
7H
igh
1,26
710
4.1
10,0
0066
20
60
1
Mea
n: 48
,573
20.8
18.1
782
3.9
4.
42,
954
10
1,25
23.
31,
279
100.
58,
310
693.
5
88
Med
ian:
45,4
2120
,718
,0
69
83.
0
3.2
776
0
1,09
62.
91,
258
101.
18,
000
694.
0
50

- 227 -
5. A SUMMARY OF FINDINGS This chapter provides a summary of the findings from chapter 4. The
results referring to the relationships between various variables are summarized by a “+”, “-“, or “0”. A “+” is assigned if the results from the correlation analyses, regression analyses, and average comparisons reported in sections 4.3 through 4.5 are reporting a positive relationshhip between the variables. A “-“ is assigned if the results report a negative relationship, and a “0” is assigned if the relationship is insignificant. This summary of the results are then commented based on the findings from the analyses in section 4.2 and 4.6. Finally, the results are interpreted in terms of supporting or not supporting the hypotheses developed in chapter 2.
5.1 To what extent does the scale of operation of supermarkets make a difference for their conduct and performance? The results of the study show that scale of operation is related to the
conduct, market based performance, productivity, and financial performance of supermarkets.
The results show a substantial support for the notion that scale makes a difference for the sales volume of a supermarket. The effect goes both via a larger number of shoppers and a larger average transaction per shoppers.
Table 5.1.1 The effects of scale of operation on market based- and productivity performance of supermarkets.
Net sales Number of
shoppers
Average trans.
Sales per inventory
Sales per square meter
Sales per labor hour
Scale of operation + + + 0 + +
The results show consistent support for the hypothesis of a positive
relationship between scale of operation and market based performance. Scale is positively related to both number of shoppers and average transaction per shopper, and consequently to the volume of sales. H1 is supported.
H1: The scale of operation of a supermarket is positively
related to its market based performance. Supported

- 228 -
Further, the effect of scale on market based performance is translated into higher productivity. Sales per square meter, and sales per labor hour are significantly and positively related to the scale of operation. The results provide consistent support for the hypothesis referring to a positive relationship between scale of operation of supermarkets and their labor productivity. On average, labor productivity is nearly 10% higher in “large” supermarkets, and the correlation coefficient and regression coefficient are positive and significant. H2 is supported.
H2: The scale of operation of a supermarket is postively
related to its labor productivity performance. Supported
These results support a notion of scale economies in labor costs on the
supermarket level. Labor productivity is increasing with scale of operation, and labor cost% is decreasing. These scale economies in labor costs are, however, not translated into scale economies in average total operating costs, as promotion cost is increasing with scale, leaving both total average costs and operating margin unaffected by scale:
Table 5.1.2 The effects of scale of operation on profitability performance of super-markets.
Gross margin%
Promotion cost%
Labor cost%
Other operating costs%
Total operating costs%
Operating margin%
Scale of operation 0 + - 0 0 0
Although economies of scale is found in labor cost, it is not translated
into total operating costs, leaving H3 unsupported. H3: The scale of operation of a supermarket is
negatively related to its average operating costs (i.e. operating costs%).
Not supported
Bottom-line profitability was found unrelated to scale of operation.
Although the gross profit per square meter is increasing with scale, this effect is not translated into profit performance, as it is offset by a corresponding increase in costs per sqm:

- 229 -
Table 5.1.3 The effects of scale of operation on profit performance of supermarkets.
Gross profit per
sqm
Operating costs per sqm
Operating profit per sqm
Scale of operation + + 0
Referring to the relationships between scale and conduct, the results
showed prices unrelated to scale of operation, while all non-price attributes were positively related:
Table 5.1.4 The effects of scale of operation on supermarket conduct.
Price index
Number of SKU’s
Open hours
Promotion frequency
Scale of operation 0 + + +
Although the raw correlation coefficient between scale and price index
was found significant and negative, as expected, there is no support for H4a after the effect of local market conditions are taken out. In bivariate analyses, price indices were found decreasing with increased scale of operation, but this relationship between scale and prices was found merely a cosequence of an association between scale and more competitive conditions of local markets; regression analysis reports regression coefficients indifferent from zero, and the path coefficient between scale and prices in the PLS analysis is insignificant. H4a is not supported.
The number of SKU’s, open hours, and promotion frequency are positively related to scale of operation. The results thus support the hypothesis of positive relationships between scale of operation of supermarkets, and their merchandise variety, levels of service and level of promotion. H4b, H4c and H4d are supported:
H4: The scale of operation of a supermarket is…
H4a: … negatively related to its price level. Not supported

- 230 -
H4b: … positively related to its merchandise variety. Supported
H4c: … positively related to its service level. Supported
H4d: … positively related to its promotion level. Supported
Scale, thus, is related to several aspects of economic performance.
However, part of these relationships refer to a relationship between scale and conduct; large stores “behave” differently in the market. further, it should be emphasized, again, that there is a significant, although small, statistical association between the measure of scale and the measures of local market conditions.
Finally, it should be emphasized that the results do not provide support for a notion that large supermarkets are more profitable compared to small ones. When comparing the characteristics of the most and least profitable, scale did not turn out as a significant differential.

- 231 -
5.2 To what extent does the conduct of supermarkets make a difference for their performance? The conduct of supermarkets were found related to all categories of
performance. Conduct makes a difference for market based performance, productivity, and financial performance of supermarkets.
Sales volume is decreasing with higher prices, and increasing with higher levels of non-price conduct.
Table 5.2.1 The effects of supermarket conduct on their market based performance.
Net sales Number of
shoppers
Average trans.
Sales per inventory
Sales per square meter
Sales per labor hour
Number of parking pl. + + + 0 0 +
Cluster location + + 0 0 0 +
Price index - - 0 0 0 -
Number of SKU’s + + + 0 0 0
Open hours + + 0 0 + 0
Gambling service + 0 0 0 + 0
Promotion frequency + + 0 0 + 0
The results show consistent support for the hypoteheses referring to
effects of conduct on market based performance. Sales volume of supermarkets is negatively related to their price index, and positively related to their number of SKU’s, open hours, gambling service, and promotion frequency. The price level, merchandise variety, service level, and promotion level of supermarkets thus makes a difference for their market based performance. H5, H6, H7, and H8 are supported.
H5: The price level of a supermarket is negatively related
to its market based performance. Supported
H6: The merchandise variety of a supermarket is positively related to its market based performance.
Supported
H7: The service level of a supermarket is positively related to its market based performance.
Supported

- 232 -
H8: The promotion level of a supermarket is positively related to its market based performance.
Supported
Correlation analyses between conduct and inventory productivity
reported a negative coefficient for number of SKU’s, while open hours and promotion frequency reported positive coefficients (although barely significant, p<0.10). Regression analysis of sales per inventory on conduct turned out insignificant, leaving no room for interpretation of the direct effects of conduct on inventory productivity. In the PLS analysis, number of SKU’s reported a signficant and negative path coefficient to inventory productivity, although this effect of number of SKU’s is offset by its effect on sales volume. In summary, there are no consistent support from the analyses of a relationship between conduct and inventory productivity of supermarkets.
H9: The price level of a supermarket is negatively
related to its inventory productivity performance. Not supported
H10: The merchandise variety of a supermarket is negatively related to its inventory productivity performance.
Not supported
H11: The service level of a supermarket is positively related to its inventory productivity performance.
Not supported
H12: The promotion level of a supermarket is positively related to its inventory productivity performance.
Not supported
Space productivity of supermarkets, however, was found related to their
conduct. The results show consistent support for a positive relationship between open hours, gambling service, and promotion frequency, and sales per square meter. The service level and promotion level of supermarkets is thus found making a difference for their space productivity, while price level and merchandise variety do not. H15 and H16 are supported, while H13 and H14 are not supported.
H13: The price level of a supermarket is negatively
related to its space productivity performance.. Not supported
H14: The merchandise variety of a supermarket is Not supported

- 233 -
postively related to its space productivity performance.
H15: The service level of a supermarket is positively related to its space productivity performance.
Supported
H16: The promotion level of a supermarket is positively related to its space productivitiy performance.
Supported
Labor productivity of supermarkets was found negatively related to their
price index, and unrelated to their promotion frequency. H17 is supported and H18 is not supported:
H17: The price level of a supermarket is negatively
related to its labor productivity performance. Supported
H18: The promotion level of a supermarket is positively related to its labor productivity performance.
Not supported
The analyses of the effects of conduct on financial performance
reported eight signficant relationships:
Table 5.2.2 The effects of supermarket conduct on their financial performance.
Gross margin%
Promotion cost%
Labor cost%
Other operating costs%
Total operating costs%
Operating margin%
Number of parking pl. 0 0 - 0 0 0
Cluster location 0 0 - 0 0 0
Price index + - + 0 0 0
Number of SKU’s 0 0 0 0 0 0
Open hours 0 + 0 0 0 0
Gambling service 0 0 0 0 0 0
Promotion frequency 0 + - 0 0 0
The price index of supermarkets were found significantly and positively
related to their average gross profit (the gross margin), while number of SKU’s, open hours, and promotion frequency were found unrelated. The

- 234 -
price level is thus found related to gross margin, supporting H19. Merchandise variety, service level, and promotion level are unrelated. H20, H21, and H22 are not supported.
H19: The price level of a supermarket is positively
related to its average gross profit performance (i.e. gross margin%).
Supported
H20: The merchandise variety of a supermarket is negatively related to its average gross profit performance (i.e. gross margin%).
Not supported
H21: The service level of a supermarket is positively related to its average gross profit performance (i.e. gross margin%).
Not supported
H22: The promotion level of a supermarket is positively related to its average gross profit performance (i.e. gross margin%).
Not supported
The results report consistent support for a relationship between
supermarkets’ price index and their labor cost%. The correlation coefficient and regression coefficient are significant and positive, as expected. However, this effect is not translated into an effect on average (total) operating costs, as it is offset by a negative relationship between prices and promotion costs. H23 is not supported.
H23: The price level of a supermarket is positively
related to its average cost performance (i.e. operating costs%).
Not supported
Micro-site characteristics of supermarkets’ location are significantly
related to their performance. Sales volume is positively related to both the number of parking places and clustering with non-food retail establishments. Accessibility and cluster location is thus related to market based performance of supermarkets, in support of H24a and H25a.
Neither the number of parking places, nor cluster location reported significant relationships with inventory productivity and space productivity. H24b, H24c, H25b, H25c are not supported.

- 235 -
Parking places and clustering are unrelated to gross margin. Referring to costs, total operating costs report insignificant relationships with these locational variables. Although both parking places and clustering are found significantly and negatively related to labor costs, there is no support for a negative relationship with total costs. H24d, H24e, H25d, and H25e are not supported.
H24: The accessibility of a supermarket’s location is…
H24a: … positively related to its market based performance.
Supported
H24b: … positively related to its inventory productivity performance.
Not supported
H24c: … positively related to its space productivity performance.
Not supported
H24d: … positively related to its average gross profit performance (i.e. gross margin%).
Not supported
H24e: … negatively related to its average operating cost performance (i.e. operating costs%).
Not supported
H25: Clustering of a supermarket with non-food retail
establishments is…
H25a: … positively related its market based performance.
Supported
H25b: … positively related to its inventory productivity performance.
Not supported
H25c: … positively related to its space productivity performance.
Not supported
H25d: … positively related to its average gross profit performance (i.e. gross margin%).
Not supported
H25e: … negatively related to its average operating cost performance (i.e. operating costs%).
Not supported
None of the conduct variables are related to bottom line profits.
Although open hours and and promotion frequency were found positively

- 236 -
related to gross profit, this effect is not translated into bottom-line profits, as operating costs are increasing with service and promotion, offsetting the effect on gross profit.
Table 5.2.3 The effects of supermarket conduct on their profit performance.
Gross profit per
sqm
Operating costs per
sqm
Operating profit per
sqm
Number of parking pl. 0 0 0
Cluster location 0 0 0
Price index 0 0 0
Number of SKU’s 0 0 0
Open hours + + 0
Gambling service + + 0
Promotion frequency + + 0
In other words, in spite of significant effects from conduct on market
based performance and productivity, on the bottom level these effects cancel out, leaving no impact from conduct on profit. Conduct thus have effects on various aspects of economic performance that go in different directions, leaving no clear-cut relationship with bottom-line performance.
These findings of no effects from conduct on profit and profitability, however, were somewhat modified by the comparison of various routes to high and low profitability peformance. To a large extent, achieving high profitability through high gross margin was traced back to pricing above average, and achieving low profitability through low gross margin was traced to pricing below average. A low costs% route to high profitability was found associated with above average performance of space productivity, and stores following this route to a large extent reported more “active” conduct, in terms of combinations of long open hours, frequent promotion, gambling service, cluster location, and often below average prices.
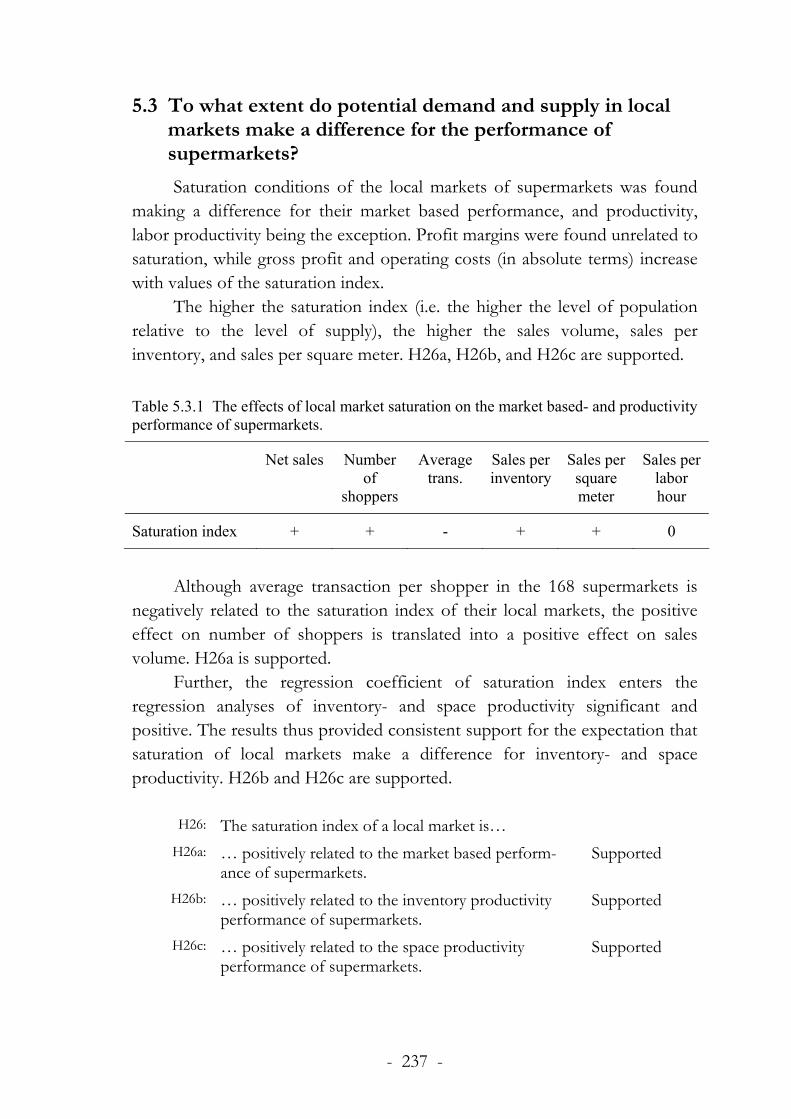
- 237 -
5.3 To what extent do potential demand and supply in local markets make a difference for the performance of supermarkets? Saturation conditions of the local markets of supermarkets was found
making a difference for their market based performance, and productivity, labor productivity being the exception. Profit margins were found unrelated to saturation, while gross profit and operating costs (in absolute terms) increase with values of the saturation index.
The higher the saturation index (i.e. the higher the level of population relative to the level of supply), the higher the sales volume, sales per inventory, and sales per square meter. H26a, H26b, and H26c are supported.
Table 5.3.1 The effects of local market saturation on the market based- and productivity performance of supermarkets.
Net sales Number of
shoppers
Average trans.
Sales per inventory
Sales per square meter
Sales per labor hour
Saturation index + + - + + 0
Although average transaction per shopper in the 168 supermarkets is
negatively related to the saturation index of their local markets, the positive effect on number of shoppers is translated into a positive effect on sales volume. H26a is supported.
Further, the regression coefficient of saturation index enters the regression analyses of inventory- and space productivity significant and positive. The results thus provided consistent support for the expectation that saturation of local markets make a difference for inventory- and space productivity. H26b and H26c are supported.
H26: The saturation index of a local market is…
H26a: … positively related to the market based perform-ance of supermarkets.
Supported
H26b: … positively related to the inventory productivity performance of supermarkets.
Supported
H26c: … positively related to the space productivity performance of supermarkets.
Supported

- 238 -
Financial performance was found unrelated to saturation. Gross margins and all measures of average operating costs of supermarkets show no response to variations in saturation conditions of local markets:
Table 5.3.2 The effects of local market saturation on the profitability performance of supermarkets.
Gross margin%
Promotion cost%
Labor cost%
Other operating costs%
Total operating costs%
Operating margin%
Saturation index 0 0 0 0 0 0
The expectations were to find (1) a positive relationship between the
saturation index and gross margins, and (2) a negative relationship between saturation index and operating costs, and consequently a positive relationship between the saturation index of local markets and the profit margin performance of supermarkets. The results are not in line with these expectations. H26d and H26e are not supported.
H26: The saturation index of a local market is…
H26d: … positively related to the average gross profit performance (i.e. gross margin%) of supermarkets.
Not supported
H26e: … negatively related to the average operating cost performance (i.e. operating costs%) of supermarkets.
Not supported
However, gross profit of supermarkets is significantly affected by
saturation. This effect is not translated into bottom-line profits, however, as costs are increasing corresponsingly:
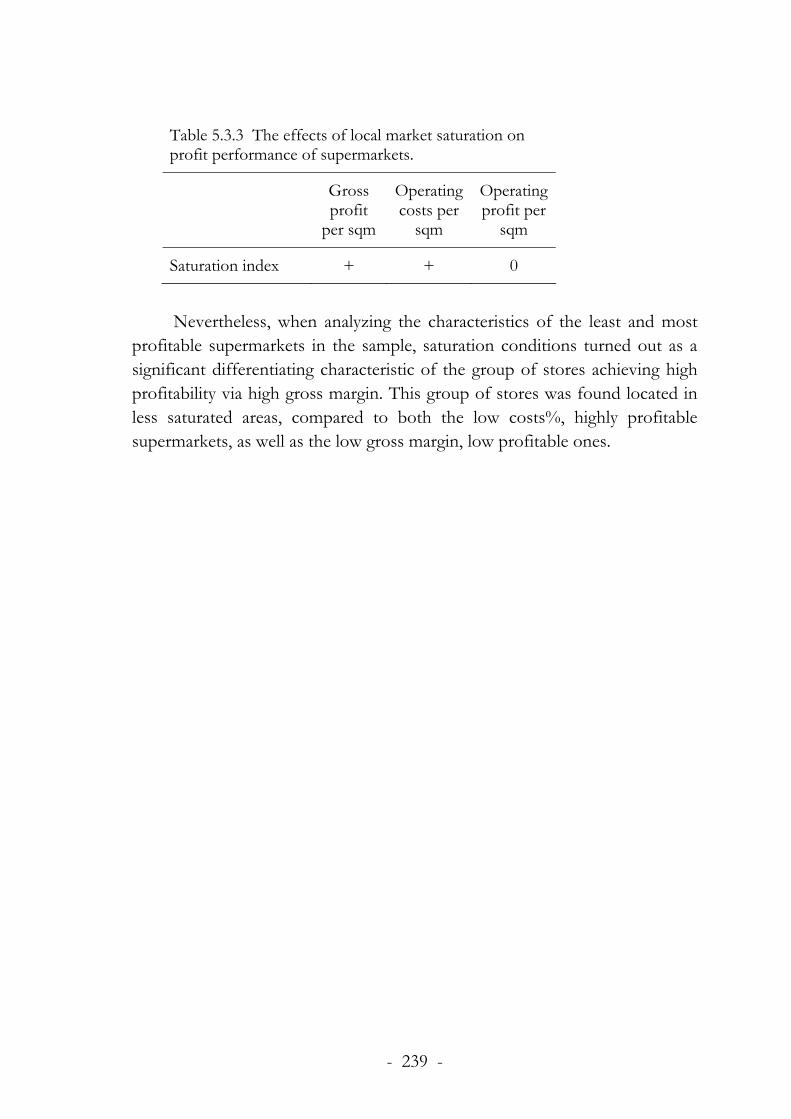
- 239 -
Table 5.3.3 The effects of local market saturation on profit performance of supermarkets.
Gross profit
per sqm
Operating costs per
sqm
Operating profit per
sqm
Saturation index + + 0
Nevertheless, when analyzing the characteristics of the least and most
profitable supermarkets in the sample, saturation conditions turned out as a significant differentiating characteristic of the group of stores achieving high profitability via high gross margin. This group of stores was found located in less saturated areas, compared to both the low costs%, highly profitable supermarkets, as well as the low gross margin, low profitable ones.

- 240 -
5.4 To what extent does the structure of competition in local markets make a difference for the conduct and performance of supermarkets? Both price conduct and non-price conduct of supermarkets were found
signficantly related to the structure of local competition in their local markets. Further, structure of competition was found making a difference for market based performance, productivity, and financial performance of supermarkets.
The higher the competition (i.e. the lower the concentration and spatial monopoly, and the greater the presence of intertype competition), the lower the prices, and the longer the number of open hours. Merchandise variety was found dereasing with increased competition while promotion frequency was found unrelated to competition:
Table 5.4.1 The effects of structure of local competition on supermarket conduct.
Price index
Number of SKU’s
Open hours
Promotion frequency
Competition - - + 0
H27a is supported – the price level of supermarkets is negatively related
to local competition in their local markets. The number of SKU’s in supermarkets is signficantly related to local
competition, although not in the expected direction. The higher the competition, the smaller the variety of the merchandise offer. Contrary to the expectations, merchandise variety is decreasing with increased competition. H27b is not supported.
As competition becomes higher, open hours per week becomes longer, supporting the hypothesis of a positive relationship between local competition and the service level of supermarkets. H27c is supported.
The results report no support for the expected findings of a relationship between local competition and the level of promotion of supermarkets. Although the raw correlation coefficient between competition and promotion frequency is positive and significant, as expected, the beta coefficient of competition in the regression of promotion on scale and conduct is insignficant, as well as the path coefficient of the PLS analysis. H27d is not supported

- 241 -
H27: Competition in a local market is…
H27a: … negatively related to the price level of supermarkets.
Supported
H27b: … positively related to the merchandise variety of supermarkets.
Not supported
H27c: … positively related to the service level of supermarkets.
Supported
H27d: … positively related to the promotion level of supermarkets.
Not supported
Market based performance was found virtually unrelated to local
competition. The expectation was to find lower levels of market based performance in less competitive markets, as prices under such conditions were expected to be higher, and the levels on non-price conduct variables lower. Although such a relationship was found with the number of shoppers, it is not translated into lower sales volume, as average transaction per shopper is increasing with decreased intensity of competition. Clearly, the greater merchandise variety of supermarkets in less competitive markets compensates for the “loss” in number of shoppers, by inducing a larger average transaction per shopper.
Table 5.4.2 The effects of structure of local competition on the market based- and productivity performance of supermarkets.
Net sales Number of
shoppers
Average trans.
Sales per inventory
Sales per square meter
Sales per labor hour
Competition 0 + - 0 0 0
Although the number of shoppers is increasing with competition, this
effect is not translated into sales volume, as average transaction per shopper is decreasing as competition increases. H28 is not supported.
H28 Competition in a local market is positively related to
the market based performance of supermarkets. Not supported

- 242 -
Referring to productivity of supermarkets, and the local structure of
competition, the bivariate analyses supported the expectations of higher productivity in markets of high competition. However, these results turned out as merely a consequence of the association between scale and competition in the data set; the regression coefficient of competition on productivity is not significant, when entered along with scale and other variables of market conditions. Contrary to expectations, thus, the results do not provide support for the hypotheses that local competition makes a difference for the productivity of supermarkets. H29, H30 and H31 are not supported.
H29: Competition in a local market is positively related
to the inventory productivity performance of supermarkets.
Not supported
H30: Competition in a local markets is positively related to the space productivity performance of supermarkets.
Not supported
H31: Competition in a local market is positively related to the labor productivity performance of supermarkets.
Not supported
Gross- and operating profit margins of supermarkets are significantly
related to the structure of competition. The less competitive the local market, the higher the gross- and operating profit margins%. Average operating costs, however, turned out unrelated to competition. Although competition was found indirectly related to labor costs, as higher prices were found associated with higher labor costs%, the more frequent promotion in more competitive markets induces higher promotion costs that clearly offset the effect on total costs:
Table 5.4.3 The effects of structure of local competition on the profitability performance of supermarkets.
Gross margin%
Promotion cost%
Labor cost%
Other operating costs%
Total operating costs%
Operating margin%
Competition - + 0 0 0 -

- 243 -
The effect of competitive structure on operating margins is not translated into bottom line profits.
Table 5.4.4 The effects of structure of local competition on the profit performance of supermarkets.
Gross profit per
sqm
Operating costs per sqm
Operating profit per sqm
Competition 0 0 0
In the comparison between the groups of stores achieving low and high
profitability via various routes, however, competition turned out as a significant differential in several instances. Routes following the high (low) gross margin route to high (low) profitability was associated with low (high) competitive conditions.
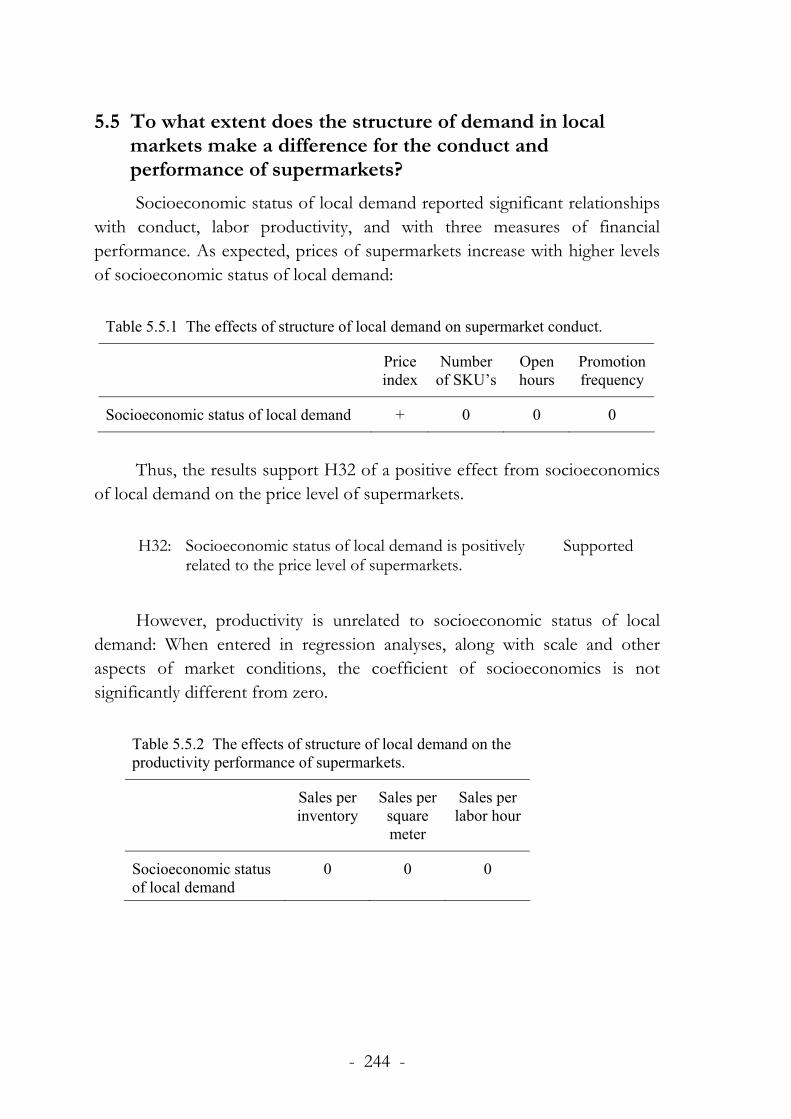
- 244 -
5.5 To what extent does the structure of demand in local markets make a difference for the conduct and performance of supermarkets? Socioeconomic status of local demand reported significant relationships
with conduct, labor productivity, and with three measures of financial performance. As expected, prices of supermarkets increase with higher levels of socioeconomic status of local demand:
Table 5.5.1 The effects of structure of local demand on supermarket conduct.
Price index
Number of SKU’s
Open hours
Promotion frequency
Socioeconomic status of local demand + 0 0 0
Thus, the results support H32 of a positive effect from socioeconomics
of local demand on the price level of supermarkets. H32: Socioeconomic status of local demand is positively
related to the price level of supermarkets. Supported
However, productivity is unrelated to socioeconomic status of local
demand: When entered in regression analyses, along with scale and other aspects of market conditions, the coefficient of socioeconomics is not significantly different from zero.
Table 5.5.2 The effects of structure of local demand on the productivity performance of supermarkets.
Sales per inventory
Sales per square meter
Sales per labor hour
Socioeconomic status of local demand
0 0 0

- 245 -
Thus, there is no support for a relationship between socioeconomic status of local demand and supermarket productivity. H33 is not supported.
H33: Socioeconomic status of local demand is…
H33a: … negatively related to the inventory productivity performance of supermarkets.
Not supported
H33b: … negatively related to the space productivity performance of supermarkets.
Not supported
H33c: … negatively related to the labor productivity performance of supermarkets.
Not supported
Further, the effect of socioeconomics on prices of supermarkets is
translated into higher gross margin. Although the biviarate correlation coefficient between socioeconomic status and gross margin is positive and significant, there is no significance in the regression coefficient of socioeconomics, when entered along with scale and other aspects of market conditions. Although the sign of the regression coefficient is positive, as expected, it is nevertheless not significantly different from zero.
Table 5.5.3 The effects of structure of demand on the profitability performance of supermarkets.
Gross margin%
Promotion cost%
Labor cost%
Other operating costs%
Total operating costs%
Operating margin%
Socioeconomic status of local demand
0 - 0 0 0 0
Socioeconomics were found unrelated to gross margin and operating
costs. H34 and H35 are not supported: H34: Socioeconomic status of local demand is positively
related to the average gross profit (i.e. gross margin%) performance of supermarkets.
Not supported

- 246 -
H35: Socioeconomic status of local demand is positively related to the average operating cost performance (i.e. operating costs%) of supermarkets.
Not supported
Socioeconomics was found unrelated to profit performance: Table 5.5.4 The effects of scale, conduct, and market conditions on the market based performance of supermarkets.
Gross profit per
sqm
Operating costs per sqm
Operating profit per sqm
Socioeconomic status of local demand
0 0 0
However, the analyses of the various groups of stores achieving the
lowest and highest profitability via various routes showed socioeconomics playing a role. The high gross margin route to high profitability occurred significantly more often in markets of high socioeconomic status, compared to the low costs% route to high profitability. Furthermore, stores performing low on gross margin, and achieving low profitability, were located in markets of significantly lower socioeconomic status, compared to the highly profitable, high gross margin stores.

- 247 -
6. CONCLUSIONS
6.1 Why do supermarkets achieve the profitability performance that they do? The present study has reported the results from a cross-sectional study
of the economic performance of 168 supermarkets. With theoretical underpinnings closely following the structure-conduct-performance (SCP) paradigm, analyses of a unique database, created through pooling data from various sources, have provided answers to the question:
“Why do supermarkets achieve the profitability performance that they do?” In more specific terms, the purpose of this study has been to investigate
the effects of scale of operation, local market conditions, and supermarket conduct on supermarkets’ market-based peformance, productivity, and financial performance. This chapter reports the conclusions that can be drawn from the investigation along with a discussion on the contributions made to previous research, and managerial implications of the results. Finally, some directions for future research are suggested.
Profitability performance of supermarkets has turned out as an outcome of a complex network of direct and indirect effects between scale, conduct, market conditions, and various aspects of economic performance, leaving an anything but straight-forward answer to the question “Why do supermarkets achieve the profitability performance that they do?”. Nevertheless, in one sense the answer is straight-forward. Supermarkets achieve the profitability that they do primarily due to their profit margin, i.e. due to their ability to maintain a spread between gross margin and operating costs%:
1. Profitability performance of supermarkets is foremost an issue of
profit margin, i.e. an issue of maintaining a spread between gross margin and average operating cost (operating costs%)
The importance of the profit margin is in congruence with Livingstone
and Tigert’s (1987) study of profitability on the supermarket chain level. The antecedents of this spread have been found working through a
network of causes and effects. An important finding refers to the intrarelationships between various aspects of the categories of store

- 248 -
peformance, suggested by Dunne and Lusch (1999), i.e. market based performance, productivity, and financial performance. Besides obvious and definitional relationships, such as sales volume making a difference for profit as it is the volume of sales that converts the profit margin into the volume of profit, the results have shown that the profit margin, in itself, is related to sales volume, and productivity.:
2. Market based performance and productivity of supermarkets
make a difference for their profit margin.
The effects of market based performance and productivity on profit
margin performance goes through an effect on cost performance; larger sales volume is associated with higher productivity, which in turn is associated with lower average cost performance.
The investigation into the antecedents of the economic performance of supermarkets have shown that factors referring to the supermarket itself have substantial effects on various aspects of its performance.
3. The conduct of supermarkets makes a difference for their
economic performance.
In other words, economic performance of supermarkets is not totally
beyond the control of retail management. The conduct of supermarkets makes a difference for their market based
performance. Lower prices, greater merchandise variety, higher service level, and more promotion are associated with larger volume of sales. Further, accessibility of the location and the presence of non-food retail establishments on the location of supermarkets were found positively related to sales volume. These findings are in line with previous studies into the antecedents of sales performance of grocery stores (e.g. Cottrell 1973, Jain and Mahajan 1979, Kumar and Karande 2000).
By extension, conduct makes a difference for productivity and average cost, via its effect on sales volume. However, the results have also indicated “trade-offs” referring to the effects of conduct on various aspects of economic performance. Specifically, the effect of conduct on productivity via sales volume was found offset by a negative effect from merchandise variety on inventory productivity. Adding more to the merchandise offer thus

- 249 -
apparently meets with more needs and wants of consumers, increasing the sales volume, but decreases the rate of turnover in inventory, plausibly due to the addition of successively more slow-moving products to the merchandise offer.
In a similar vein, higher price levels is associated with higher gross margins, but lower volume of sales and lower labor productivity. Thus, the study has provided support for a notion that higher gross margins via higher prices introduce “slack” (less “discipline”) in store operations, inducing lower productivity and higher costs.
Although economic performance of supermarkets to a large extent is a consequence of the on-going conduct implemented by retail management factors that are not part of this on-going conduct also make a difference.
One such factor refers to the scale of operation of supermarkets. The results have provided support for the existence of economies of scale in labor cost on the supermarket level in grocery retailing:
4. There exists economies of scale in labor cost on the supermarket
level.
Labor productivity is increasing, and labor costs decreasing, with scale
of operation over the range from small to large supermarkets. As such, the present study supports the findings of Thorpe and Shepherd (1977) and Aalto-Setälä (2002), that scale economies exists even after a “threshold” scale of a few hundred square meters, found in other studies (e.g. Arndt and Olsen 1975, Shaw et al 1989, Eliasson and Julander 1991).
Another factor refers to local competition, which make a difference for the prices on the store level, and by extension for gross margin performance of supermarkets. The results of this study thus support the SCP notion of the exertion of market power in markets of low levels of competition:
5. Deficient competition on the local market level is associated with
exertion of market power of supermarkets.
Concentration, spatial monopoly, and absence of intertype competition
(discount stores and hypermarkets) in local markets have been found related to higher price levels of supermarkets. These findings are consistent with

- 250 -
results of previous studies (e.g. Lamm 1981, Aalto-Setälä 2000, Asplund and Friberg 2002).
However, the results have not shown that profitability performance of supermarkets primarily is an issue of large scale and low levels of competition. Among the most profitable supermarkets, as well as among the least profitable, there are small and large stores, facing little as well much competition. Thus, despite economies of scale in labor cost, and the exertion of market power neither scale nor local competition turns out as the explaining factor of supermarkets’ profitability performance:
6. Neither scale of operation, nor structure of local competition is
the explaining factor of profitability performance of supermarkets.
Rather, scale and competition work themselves into the economic
performance of supermarkets via effects on their price conduct as well as non-price conduct.
7. Scale of operation and local competition make a difference for
the price conduct and the non-price conduct of supermarkets.
Scale of operation of supermarkets is related to their market based
performance, productivity, as well as financial performance. The larger the scale of operation, the higher the number of shoppers, the greater the average transaction per shopper, and consequently the volume of sales. The effect of scale on volume of sales goes via an effect on conduct. The results have shown scale having a positive effect on merchandise variety, service level, and promotion level.
Thus, part of the scale → performance relationships belongs to an effect from large stores “behaving” differently in the market, compared to small. Nevertheless, the results support the existence of economies of scale in labor even after controlling for market conditions, and conduct.
However, there is no support for prices being related to scale, after the effect of local competition on prices is taken out. Thus, this study report no support for a proposition that cost savings from scale economies in supermarkets are passed on to consumers via lower prices. However, it should be emphasized that the bivariate analyses between supermarkets’ scale and

- 251 -
price levels showed significantly lower price indices with increasing scale of operation. Hence, the results have shown that within the sample of 168 supermarkets of the study, the price level is decreasing with scale of operation, although as a consequence of a statistical association between the measures of scale and competition.
In a cross-sectional study as the present one, there is no room for interpreting these findings further, although one may speculate that more intense competitive conditions favor large scale supermarkets, possessing a productivity and cost advantage over small scale ones, facilitating economic survival under lower prices and forcing small stores with cost disadvantages out of the market.
The effects of scale on labor productivity and labor costs% were not found translating into lower total costs%, due to a positive relationship between scale and promotion costs; the larger the supermarket, the larger the share of sales spent on promotion. The increase in promotion costs along the range from small to large supermarkets in the sample were traced to a significant relationship between scale of operation and frequency of promotion; the larger the supermarket in the sample, the more frequent its promotion.
The effect of competition on prices was found translating into an effect on supermarkets’ gross margin and profit margin. However, profit in absolute terms and profitability performance was found unrelated to local competition. In other words, although low competition was found associated with higher prices, and that higher prices translate into higher gross margins, there is no straight-forward support for a notion that low levels of competition is related to higher levels of supermarket profitability. Clearly, local competition works itself into supermarket profitability performance in yet other ways than through effects on prices and profit margins.
For one thing, higher prices are negatively related to the volume of sales, thus offsetting the effect of higher margins on profit in absolute terms. Further, the results showed that non-price conduct of supermarkets is related to local competition. The merchandise variety is decreasing, and the service level is increasing with competition, and the effects from these conduct elements (along with the effect of higher prices) on market based performance are apparently offsetting the magnitude of the effect from competition on the prices→profit margin relationship, on profit and profitability performance. In this context it should also be pointed out that the gross volume of local demand was found positively related to the level of competition, i.e. the larger

- 252 -
the volume of population in a local market, the higher the level of competition. In other words, a seemingly “favorable” market of little competition may contain a low of demand, rendering a small volume of sales and by extension calling for higher gross margin and profit margin in order to provide sustainable level of profit.
Thus, the effect of scale on labor cost, and the effect of competition on prices and gross margin, is not translating into profitability performance in a clear-cut, straightforward, manner. Both scale and competition work themselves into profitability performance in yet other ways, via a network of direct and indirect effects on conduct and various aspects of economic performance, that offset the immediate effects on labor costs and gross margin. Although scale and local competition make a difference for the economic performance of supermarkets, understanding profitability perform-ance of supermarkets requires the understanding of the complex network of effects on conduct and various aspects of economic performance.
Further, beside the effects of competition there are other aspects of local market conditions but competition that make a difference for the conduct and performance of supermarkets:
8. Other aspects of local market conditions but competition make a
difference for the conduct and economic performance of supermarkets.
Local market saturation is related to the market based performance, and
productivity of supermarkets. The greater the volume of population per unit of supply (number of stores, number of units of floor area) in the local market, the higher the sales volume, inventory productivity, and space productivity performance. Socioeconomic status of the local population is related to the price level, and thus by extension to economic performance (cf. above).
An investigation into the most and least profitable supermarkets in the sample provided further insights into the antecedents of profitability performance. To a large extent, high profitability is a matter of high overall economic performance. On average, the most profitable are performing better compared to the least profitable on all aspects of economic performance. Most important, the group of most profitable stores perform substantially higher on space productivity, and profit margin. The most profitable are, on average, performing higher on gross margin, as well as lower on costs%.

- 253 -
However, the results showed that only few of the most profitable are among the best performing on both gross margin and costs%. Rather, high profitability performance goes through either high gross margins (along with moderate or high costs%) or low costs (along with moderate or low gross margin):
9. Although high (low) profitability performance of supermarkets is
foremost about high (low) profit margin, it is not primarily an issue of high (low) gross margin and low (high) costs%.
Two major routes to high profitability performance were identified. One
that goes through high gross margin combined with moderate operating costs%. Another that goes through moderate gross margin, combined with high productivity and low operating costs. These routes were found significantly related to dissimilarities in market conditions, and conduct. The high gross margin route is primarily associated with low levels of competition, high saturation indices, high socioeconomic status of residents, and high price levels. The low cost route is associated with more competitive conditions, lower saturation indices, lower prices, higher levels of non-price conduct at clustered locations, and higher labor productivity, compared to the stores following the high gross margin route.
Similarly, two major routes to low profitability performance were identified. One working itself into low profitability through low gross margin, and one through high operating costs. Compared to the highly profitable stores following the high gross margin route, the low gross margin stores were more often found in markets of high competition, and reporting lower price indices. The stores following the high cost route to low profitability were found substantially less performing on space productivity and labor productivity, underscoring the importance of commercial effectiveness and internal efficiency for avoiding high costs. A comparison of the conduct between the low cost and high cost routes to high and low profitability, showed the high cost stores substantially more “passive” in the market, conducting shorter open hours and less frequent competition, in combination with more seldom offering add-on services and multipurpose shopping opportunities from clustered locations.
Again, the main characteristic of highly profitable supermarkets are their ability to maintain a spread between gross margin and operating costs, and sales performance and productivity plays an important role in achieving this spread. There are, however, several routes to attain a high profit margin,

- 254 -
primarily going through combinations of high (low or moderate) gross margins and moderate or high (low) costs. Pricing, non-price conduct, and internal efficiency are important differentials between these routes, and these differentials can be further traced back to conditions of the local market.
So, finally, where do all this leave one in answering the question “Why do supermarkets achieve the profitability performance that they do?”? The overall conclusion of the study refers to the support provided for the SCP paradigm. Economic performance of supermarkets is related to their conduct, which in turn is related to conditions of their local markets. Nevertheless, the results have also shown that a certain aspect of local market conditions – saturation – has a direct influence on performance. Further, the results have also shown that although market conditions make a difference for conduct, and by extension for performance, conduct is far from perfectly associated with conditions of the local market. In other words, retailers are not slaves under untouchable environmental conditions, although their conduct has been found related to local competition and local socioeconomics. The profitability performance of supermarkets do not follow a straight-forward causal chain by which one can predict profitability solely based on information about market conditions. There are highly profitable supermarkets as well as low profitable ones in markets of both “favorable” and “unfavorable” conditions. Rather, the dividing lilne between the low vs. highly profitable lies in the interplay between market conditions and conduct. The results of this study have shown that there are ways to overcome seemingly “unfavorable” market conditions and achieve “high” profitability, as well as there are ways to remain with “low” profitability in “favorable” markets.

- 255 -
6.2 Discussion The purpose that was set up for this study was to explain the effects of,
and interrelationships between, scale of operation, conduct, and local market conditions, on the economic performance of supermarkets. From an overall research question formulated as “Why do supermarkets achieve the profitability performance that they do?”, five questions were developed and further broken down into a set of hypotheses, most of which contatining a further set of sub-hypotheses. The answers provided by the results from testing each of these hypotheses may, indeed, be justified on their own.
However, the main value of the present study lies perhaps not so much in the one-to-one relationships of each hypothesis. Rather, the main value lies in the network of relationships between various antecedents and various aspects of store performance. As such, the study provides an important support for the validity of the structure-conductc-performance (SCP) paradigm. From a theoretical perspective, the perhaps most important finding of the present study is that, when put into a context of environmental and in-store factors, the economic performance of retail stores may be interpreted as a consequence of their conduct, which in turn may be interpreted in terms of local market conditions..
At the outset of this study, it was noted that much of what we know about store performance refer to partial explanations, taking on certain aspects of antecedents and certain aspects of performance as the target of the analyses. It was argued that by integrating theories, methods, and procedures from these streams of research further understanding of store performance would be achieved. Thus, at this point it is appropriate to consider and discuss to what extent this study has extended the knowledge provided these “partial” explanations, and to what extent the present study has improved the “state of the art” of investigating store performance.
In chapter 1, the research questions were formulated based on various streams of research, taking various perspectives on the phenomenon of store performance. One way to evaluate the study in this respect is to compare its characteristics with the characteristics of previous studies, based on the summary of their characteristics in chapter 3. Such a comparison uncovers several important improvements of previous research, the primary one being perhaps the comprehensive measurement of various aspects of the performance construct. Indeed, the findings of the present study underscore the importance to investigate different dimensions of economic performance

- 256 -
when evaluating the effects of various antecedents. Aside this improvement in “measurement taking” of the dependent variable, this study has provided an extension of current knowledge and research methodology in several directions. These are elaborated on in sections 6.2.1 through 6.2.3 below.
6.2.1 Contributions to previous studies on economies of scale First, the present study has overcome a major limitation of previous
studies on scale economies on the store level, as the potential influence of non-scale factors, both environmental and in-store factors, have explicitly been taken into consideration. In this study, scale has been put into perspective, and the effects of scale have been isolated from the effects of non-scale factors, both in-store factors and environmental factors. Further, previous studies have mainly taken an interest into scale economies in labor costs, not taking into account the potential off-setting effect from diseconomies of scale in other cost items. The results of the present study have provided further support for the prevalence of scale economies in labor costs even after the effect from non-scale variables has been taken out, but it has also shown important diseconomies in promotion costs, which leaves no economies of scale in total costs. This study is the first to analyze the effect of scale on all items of the income statement on the store level, all the way to bottom-line profit. Further, the effects of scale on short-term conduct has been incorporated in the analysis. As such, it provides important findings and contributions to present knowledge.
For one thing, it has been shown that short-term conduct is related to scale. Merchandise variety, service levels, and promotion frequency were found significantly related to scale. Further, the findings show that the gains in labor costs are not passed on to consumer via lower prices. Rather, the gain in labor costs from larger scale of operation is utilized for more “intense” competitive action in the marketplace, most notably through more frequent promotion activities. As a consequence, it was found that the gain in labor cost is offset at the total operating cost level by higher promotion cost. However, the raw correlation between scale and prices was found negative, but this relationship could be established as spurious, and merely a consequence of large stores in the sample being located in more competitive areas, and thus a consequence of the effects from competition on prices. These findings imply that the reasons for the current trend towards larger stores in the Swedish grocery sector to some extent is a consequence of scale economies on the store level. Large stores have better prerequisites to survive

- 257 -
under more intense competitive conditions, due to lower labor costs, leaving room for more “intense” marketing conduct.
This more “intense” conduct was found manifested in increasing space- and inventory productivity with increased scale of operation. However, an important finding of this study is that large supermarkets are not in general more profitable than small.
6.2.2 Contributions to previous SCP studies Second, the present study has taken the “traditional” SCP studies
further. This extension goes in several directions. One direction is the explicit recognition of three dimensions of the structure of local competition (concentration, spatial monopoly, and intertype competition). Previous studies have mainly considered concentration, or at best concentration and intertype competition.
Another direction of extension of previous SCP studies lies in the incorporation of various of aspects of economic performance in the analyses. Previous studies have primarily taken an interest in explaining variations in prices on the store level, or local market level, in terms of variations in the structure of local competition. However, the impact of the “price effect” on store performance have previously not been considered. This study has disclosed several important relationships in this regard. Productivity, gross margins and operating costs have all been found related to the structure of competition. Further, the research instruments applied in this study is partly an improvement compared to many previous SCP studies. By utilizing a “second generation multivariate technique” in terms of structural equation modelling, a more correct reflection of the postulated links between structure, conduct and performance have been subject to analysis. Previous studies have relied on techniques from the “first” generation, most notably regression analysis.
6.2.3 Contributions to previous studies of store location and store assessment
Third, compared to previous studies in the field of “store location research“ and “store assessment research”, the present study have relied on more profound theoretical constructs in several instances. Chief among these improvements is the introduction of more theoretically correct measures of local competition. Previous studies have mainly relied on rather “crude” measures of competition.

- 258 -
Further, compared to previous studies the present study provides an extension of current knowledge in the sense that it has brought store performance all the way to the bottom level, while previous research primarily have taken an interest in explaining sales performance. Researchers within this stream of research may also benefit from this study in the same respect as researchers in the SCP and scale economy “tradition”, in the sense the scope of this study brings performance beyond the impact of conduct and locational characteristics on sales volume performance. In this area of findings, the insignificant results of this study provide some important observations into the open. Locational characteristics in terms of clustering and car parking facilities, as well as service- and promotion levels was found significantly and substantially affecting sales volume performance, but in no case these variables was found significantly related to profitability performance.
6.2.4 Contributions to previous studies – A summary At this final stage one may, thus, conclude that the present study has
extended current knowledge on store peformance and its antecedents. The research that has been undertaken has been guided by a framework that has combined elements of economic theory with more managerially oriented models of store performance. In previous research, the phenomenon of store performance have been approached from these two angles by different streams of research, relatively isolated from each others and hence the research streams have been severly disjointed. The design of the present study have drawn upon theories, methods and procedures from several fields, and thus bridged the fields in which they reside by tradition. As such, perhaps the most important finding of this study is that scale, conduct, and market conditions are interrelated in a complex network of effects that have differential, and in many instances conflicting, effects on various aspects of supermarkets’ economic performance.
In fact, to some extent one may, humbly, argue that the present study has provided a skeleton for a general theory for the explanation of performance on the store level in retailing. A number of theoretical and derived constructs from various schools have been proposed, operationalized, and interrelated in a network of relations. As such, the conceptualization of this study provide a genereal frame of reference which others can build and expand upon.
Further, the study also provides a contribution to research methodology. Previous studies have mainly overlooked the complexity of indirect and

- 259 -
indirect effects between various antecedents of store performance. This study has shown that the application of structural equation modelling to data by the utilization of PLS provides means for representing theoretical constructs and proposed causal theoretical relationships from various schools of thought in a network of effects. The added benefit of structural equational modelling may be argued in terms of a more rigorous and realistic way of looking at the interplay between various factors, compared to single state techniques, such as regression analysis.
6.3 Managerial implications It is recognized that the present study provides theoretical and statistical
findings that are not any more “directional” in practical terms than those reported by previous research. The conclusions drawn on the basis of statistical significance does not necessarily imply “practical significance”. Furthermore, it is recognized that at some instances it may even be statistical insignificance between variables that is of significant practical importance.
As stated in previous chapters, this study is not “normative” in the sense it has as its objective to establish what antecedents are most important for achieving “high” performance. Nevertheless, the results certainly have normative implications. Thus, in this section the results will be put in the perspective of the retail manager. What can retail managers learn from reading this dissertation? The framework provided by Breheny (1988; see chapter 1) is revisited to serve as a guide for the interpretation of the results in practical terms.
Trade area factors
VIABILITY ISSUES
In-store factors
SEARCH ISSUES
IMPACT ISSUES
EVALUATION ISSUES
Micro-site factors
- 260 -
The findings have implications on all “levels” of the figure. The results
have shown that factors on trade area, micro-site and in-store factors have important influences on the performance of supermarkets. Further, the findings show that trade area factors have important influences on in-store factors.
One direct implication of the empirical findings is that retail managers should carefully consider the conditions of local markets and micro-site factors, when deciding on store location. Store location is one of the most important decisions made by retailers. The high capital costs of store construction and the long-term financial commitment associated with it makes locational decisions of vital strategic importance. Although this decision, once it is made, is fairly long-run and irreversible in nature, management can have an influence over location attributes before decisions are made. The results of this study show that conditions of competition, saturation and socioeconomic status of demand make a difference for conduct and performance. All these aspects of local markets thus should be on a retailer’s agenda when searching for areas of future locations. To retail analysts of market research departments the findings strongly suggest the prioritization of searching for local markets areas with favorable saturation conditions. Saturation on the local market level was found an important driver of store performance.
Once a store is at place, the results have shown important interrelationships between trade area factors and in-store factors. Clearly, the “degrees of freedom” for a retailer in making decisions on in-store factors is delimited by environmental conditions. This finding has implications for on-going operations of existing stores. While managers cannot directly influence the actions of competitors, and certainly not the socioeconomic status of demand, they can, beyond the decision upon the store’s location, alter the store’s offering strategy. When designing and fine-tuning the combination of various in-store factors, the present study strongly advises managers to consider the conditions of the local market. Both competition and demand characteristics have an impact on the “room for manoeuvre” faced by the retailer. The more competitive, and the lower the socioeconomic status of demand, the more will there be a pressure on prices, leaving the route to profitability via higher margins substantially more closed, compared to local markets with the opposite characteristics. Further, supermarkets operating

- 261 -
under intense competition was found “forced” to engage in costly conduct in terms of higher levels of promotion and higher service levels.
These results have further implications for issues on the design of the offering strategy of similar stores, operating under various market conditions. Contemporary retailing practice is to a large extent centered around a management of a portfolio of store formats, to which stores in an overall network of stores adhere. However, as the present study is concerned with only a single format (supermarkets) the results from it indicates that such an “portfolio strategy” may not be fully adequate. Based on the findings of relationships between market conditions, conduct, and performance, there is a call for explicit incorporation of such factors in the defining of “portfolios” for managing. The challenges facing stores of the same format differ between local markets of various demand conditions and competitive conditions, and management could certainly benefit from a recognition of such differences when organizing managerial procedures.
One area of retail management that is comprised by this observation refers to the evaluation and the setting of performance targets for stores, and for store managers. The findings strongly suggest a separation of evaluation and target setting for stores on the one side, and for managers on the other. Indeed, standards for evaluating the performance of store managers in retail companies with numerous stores are difficult to formulate because of the differences in the performance potentials of the various stores. As found in this study, differences in measured performance is to some extent explained by differences in the local market conditions. Thus, without separating out this effect from performance target setting, and performance evaluation, some store managers could benefit from a greater performance potential, while others would suffer from “tougher” conditions. As the evaluation of managers should reflect his (her) capabilities and achievements, the effect of non-managerial factors on store performance should be separated out.
Although the study does not explictly incorporate the capabilities of store managers among the antecedents of store performance, it nevertheless provides implications for the recruitment of store managers. Depending on the conditions of local market, certain capabilities of the manager appointed to the responsibility of a store should be priorited. For instance, the relationship between local competition and price suggests that managers of stores in intensely competitive markets should have developed skills in running stores with high efficiency. Stores facing less competition do not

- 262 -
require a focus on operational efficiency to the same extent, as gross margins under such conditions may be maintained at a higher level.
Micro-site characteristics were found significantly related to supermarket performance. Both clustering and accessibility on the micro-site level were found positively related to store performance. The implications for management from these results are obvious, and hardly need further explanation. However, beside the obvious consideration of such character-istics in the search and selection of future locations, these results also have implications for decision on the closure of existing stores. Underperforming stores, or stores forecast to be underperforming due to anticipated changes in the competitive environment, should be evaluated on their micro-site potential of such attributes.
A further implication for retail managers refers to the differential impact of various antecedents on various aspects of store performance. The results clearly point to the importance of understanding the effect of various environmental factors and in-store factors on various dimensions of performance. Not least, this has implications for the selection of measurements for performance evaluation on the store level. To the extent the choice of such measurements makes a difference for the behavior of store managers, the selection will have a differential impact on bottom line profits. For example, if sales volume is selected as the prime target for store managers, the results of the present study suggest that they are encouraged to increase the merchandise variety in order to accomplish this goal. However, such conduct is associated with lower inventory turnover, and by extension possibly lower return on assets.
Up to this point, the managerial implications from this study have been concerned with implications based on the results of the empirical analyses. However, the present study has important implications for the practice of retailing, that not so much refer to the results per se, but rather to its overall characteristics. At a more general level the contribution of this study to the practice of retailing lies not so much in these “findings” but in the “overall methodology” of the research. In an on-going retail business, there is a call for regular feedback to managers on how things are developing and to what extent current performance is in line with expectations and objectives. In this regard, the framework provided by the present study provides a road map for setting up a system for continuous monitoring of performance on the store level.

- 263 -
The unique database that was created for the purpose of this study was constructed via pooling of data from various sources. These sources are “readily available” for retail firms, and hence the database can be attained, maintained, and updated for on-going monitoring and evaluation of the operations of a retail company. By adopting the procedures described in the third chapter of this dissertation, retailers have a “hands on” guide on how to design a performance monitoring system that takes into account both environmental factors and in-store factors. For the purposes of retail management, the database could be developed, e.g. by substituting the annual performance data of the present study with a continous inflow of scanner data. Such a development of the database opens up an ocean of opportunities for monitoring, evaluating, and improving store operations and store performance. With a continuous inflow of scanner data to the “performance box” of the data set of the present study, one would have the opportunities to monitor and evaluate the effect of various measures taken to improve performance. Having availability to scanner data, one would be able to effectively identify areas in need of improvement. Not only could one with such data identify underperforming stores within the network of stores, but also underperforming products and product categories.
Furthermore, the rigorous analyses of structural equation modelling conducted in this study also provide implications for the conduct of market research activities by research firms. Such analyses, providing the means for more “realistic” models of causative factors and effects, are not exclusive to the domain of scientific research but can be profitably used in more practical applications as well. In this regard, it is hoped that this study provides not only a “theoretical” framework for future research, but also a “practical” framework for the retail analysts and retail executives in their conduct of business operations.
6.4 Limitations of the study As any other study, the present one is associated with strengths and
limitations. This section is devoted to a discussion on to what extent the present study is associated with acceptable standards referring to its validity and reliability.
First, it should be admitted that the cross sectional design of the study, and the structural perspective taken on competition constitutes a limitation in itself. As such, the study leaves no room for a process-oriented interpretation of competition. Although the measures taken of performance in the present

- 264 -
study, in many instances, may be viewed as reflections of certain process characteristics, they nevertheless do not provide anything close to the Schumpeterian view of competition.
Second, the analyses of the present study have relied on an implicit assumption of linear relationships. It should be recognized that many previous studies have discovered non-linear relationships between, for example, scale of operation and cost performance. However, many of these studies have comprised a greater span between the min and max values of the variables. The present study comprise stores adhering to the same store format (supermarkets) ranging in size from 400 to 2,000 square meters. Although it may be argued that an investigation into nonlinear relationships would be associated with an enhancement of the results, the absence of it do not incur a major fallacy.
Third, the stores under study emanate from the same retail industry, the same country, the same retail chain, and the data refer to a single year. Certainly, these characterstics put boundaries for the generalizability of the results. However, it should be repeated here that the aim of the present study has been to investigate the “systematic variation” between supermarket performance and some of its antecedents. The ambition has never been to provide an ultimate answer to the research question that is valid for “any retail store”. At the same time as these characteristics constitute a limitation referring to the generalizability of the results, they also induce reliability. The homogeneity of the units under observation, referring to their similaritiy in organizational domicile to some extent contributes to a sense of enhanced reliability.
6.5 Suggestions for future research On the basis of the findings in this study, some areas that would be
fruitful avenues for future research on store performance issues may be pointed out.
The first avenue pertains to the issue of generalization of the results. It was argued that this study has provided a “skeleton” for other researchers to build and develop upon. An application of the proposed model to stores adhering to other retail industries but groceries would constitute an important test of the model’s external validity.
Second, the “people” dimension of demand and conduct is not among the antecedents of the present study. One avenue for future extensions of the knowledge would be to incorporate variables of management and staff

- 265 -
member cababilities into the model, as well as consumer preferences, attitudes, and perceptions.
Third, the structural perspective of competition taken in this study could be complemented by a study taking on a more “behaviorally” oriented perspective on competition. This could take the form of a case study of one or a small set of stores, which are followed over a period of time, and the manifestation of competitive actions in the local marketplace investigated for their correspondence with the actions and decisions of managers and staff.

- 266 -

- 267 -
REFERENCES
Aalto-Setälä, Ville (1999); “Economies of Scale, Product Differentiation, and Market Power”; Helsinki School of Economics and Business Administration
Aalto-Setälä, Ville (2000); “Economies of scale in grocery retailing in Finland”; Journal of Retailing and Consumer Services, 7, pp 207-213.
Aalto-Setälä, Ville (2002); “The effect of concentration and market power on food prices: evidence from Finland”; Journal of Retailing, 78, pp 207-216.
Achabal, Dale D., John M. Heineke and Shelby H. McIntyre (1984); "Issues and Perspectives on Retail Productivity"; Journal of Retailing, vol 60, Number 3, Fall, pp 107-127.
Achabal, Dale D., Wilpen R. Gorr and Vijay Mahajan (1982); “MULTILOC: A Multiple Store Location Decision Model”; Journal of Retailing, 58, No. 2 (Summer), pp 5-25.
Alderson, W. (1957); “Marketing behavior and executive action”; Homewood, IL: Irwin.
Arbnor, Ingeman and Björn Bjerke (1994); “Företagsekonomisk metodlära”, 2nd edition; Studentlitteratur: Lund.
Arndt, Johan and Leif Olsen (1975); "A Research Note on Economies of Scale in Retailing"; Swedish Journal of Economics, vol 77, pp 207-228.
Asplund, Marcus and Richard Friberg (2002); "Food Prices and Market Structure in Sweden"; Scandinavian Journal of Economics, vol 104, issue 4, pp 547-566.
Bagozzi, Richard P. (1982); “A Field Investigation of Causal Relations Among Cognitions, Affect, Intentions, and Behavior”; Journal of Marketing Research, 19 (November), pp. 562-584.
Bain, Joe S. (1951); “Relation of profit rate to industry concentration: American manufacturing, 1936-1949”; Quarterly Journal of Economics, 65, pp 293-324.
Bain, Joe S. (1968); "Industrial Organization"; New York: John Wiley and Sons.
- 268 -
Baltas, G. and P. Papastathopoulu (2003); “Shopper characteristics, produt and store choice criteria: a survey in the Greek grocery sector”; International Journal of Retail and Distribution Management, vol. 31, No. 10, pp. 498-507-
Baumgartner, Hans and Christian Homburg (1996); "Applications of Structural Equation Modeling in Marketing and Consumer Research: A Review"; International Journal of Research in Marketing, 13, pp. 139-161.
Beaven, M.H. and D.J. Scotti (1990); "Service Orientated Thinking and its Implications for the Marketing Mix"; The Journal of Services Marketing, 4(4) : 5.
Berman, Barry and Joel R. Evans (1998); “Retail Management – A Strategic Approach”, 6th edition; Prentice-Hall Inc.: Upper Saddle River, New Jersey.
Berman, Barry and Joel R. Evans (2006); Retail Management – A Strategic Approach”, 9th edition; Prentice-Hall Inc.: Upper Saddle River, New Jersey.
Binkley, James K. and John M. Connor (1998); "Grocery Market Pricing and the New Competitive Environment"; Journal of Retailing, vol 74(2), pp. 273-294.
Blaug, Mark (2001); “Is Competition such a Good Thing? Static Efficiency versus Dynamic Efficiency”; Review of Industrial Organization;, 19, pp 37-48.
Breheny, Michael J. (1988); ”Practical Methods of Retail Location: A Review”, in Wrigley (ed): “Store choice, store location and market analysis”, Routledge: London and New York.
Bolen, W.H. (1988); "Contemporary Retailing"; Englewood Cliffs, NJ:Prentice-Hall.
Borden, Neil H. (1964); "The Concept of the Marketing Mix"; Journal of Advertising Research, 4 (June), pp 2-7.
Brown, John Howard (2002); “Structure-Conduct-Performance: A Comment on Blaug’s ‘Is Competition Such a Good Thing? Static Efficiency versus Dynamic Efficiency’”; Review of Industrial Organization; 21, pp 103-105.
Bucklin, Louis P. (1986); “Competition among European food distribution systems in concentrated markets”; International Journal of Research in Marketing, 3, pp. 249-262

- 269 -
Capon, Noel, John U. Farley, and Scott Hoenig (1990); “Determinants of Financial Performance: A Meta-Analysis”; Management Science, vol 36, No. 10 (October), pp 1143-1159.
Carey, J. and P. Otto (1977); "Output per Unit of Labor Input in the Retail Food Store Industry", Monthly Labor Review, 100 (January), pp 42-47.
Carpenter, Jason M. and Marguerite Moore (2006) Consumer demograhics, store attributes, and retail format choice in the US grocery market”; International Journal of Retail and Distribution management, vol. 34, No. 6, pp. 434-452.
Carter, Dennis W. and Jeffrey M. Perloff (1999); "Modern Industrial Organization"; Addison-Wesley Longman Inc.
Chamberlin, Edward H. (1933); “The theory of Monopolistic Competition”; Cambridge: Harvard University Press.
Chin, Wynne W. (1998); “The Partial Least Squares Approach to Structural Equation Modeling”; in: Modern Methods for Business Research, edited by George A Marcoulides; Lawrence Erlbaum Associates, Publisher; Mahwah, New Jersey.
Collier, D.A. (1991); "New Marketing Mix Stresses Service"; The Journal of Business Strategy, March/April : 42.
Converse, Paul D. (1949); “New Laws of Retail Gravitation”; Journal of Marketing, 14, pp 379-384.
Cotterill, Ronald W. (1986); "Market Power in the Retail Food Industry: Evidence from Vermont"; The Review of Economics and Statistics, vol 68m oo 379-386.
Cotterill, Ronald W. (1999); “Market Power and the Demsetz Quality Critique: An Evaluation for Food Retailing”; Agribusiness, 15, No. 1, pp 101-118.
Cottrell, J. (1973); ”An Environmental Model of Performance Measurement in a Chain of Supermarkets”, Journal of Retailing, vol 49, Fall, pp. 51-63.
Craig, Samuel C., Avijit Ghosh and Sara McLafferty (1984); "Models of the Retail Location Process: A Review", Journal of Retailing; vol 60, No 1, Spring 1984, pp. 5-36.
Davies, G.J. and J.M. Brooks (1989); "Positioning Strategy in Retailing"; London: Paul Chapman.

- 270 -
Davies, Gary and Hong Liu (1995); "The retailer's marketing mix and commercial performance"; The International Review of Retail, Distribution and Consumer Research, 5:2, April, pp 147-163.
Day, GS and R. Wensley (1988); “Assessing advantage: a framework for diagnosing competitive superiority”; Journal of Marketing, 52 (April), pp 1-20.
Demsetz, H. (1973); “Industry structure, market rivalry, and public policy”; The Journal of Law and Economics, 16 (April), pp 1-10.
Dickson, PR (1992); “Toward a general theory of competitive rationality”; Journal of Marketing, 56 (January), pp 69-83.
Douglas, Edna (1962); "Size of Firm and the Structure of Costs in Retailing"; Journal of Business, vol 25 (April), pp 158-190.
Dunne, Patrick and Robert F. Lusch (1999); "Retailing", 3rd Ed, The Dryden Press.
Eaton, B. and R. Lipsey (1979); "The Theory of Market Preemption: The Persistence of Excess Capacity and Monopoly in Growing Spatial Markets"; Economica, 46, pp 149-158.
Eliasson, Magnus and Claes-Robert Julander (1991); "Productivity in Swedish Grocery Retailing: Changes over Time and a Causal Model"; The Foundation for Distribution Research, EFI: Stockholm School of Economics.
Ellis, B. and J.S. Mosher (1993); "Six Ps for Four Characteristics"; Journal of Professional Service Marketing, 9(1), pp. 129-145.
Engel, J.F., R.D Blackwell and P.W Miniard (1995); “Consumer Behavior”, Forth Worth: The Dryden Press.
Falk, Thomas and Claes-Robert Julander (1983); “Köpcentrum i stadskärnan - inverkan på detaljhandel och konsumenter”; LiberFörlag: Malmö.
Fornell, Claes and F.L Bookstein (1982); “Two structural equation models: LISREL and PLS applied to consumer exit-voice theory”; Journal of Marketing Research, 19, pp. 440-452
Fornell, Claes (1987); “Marketing Research and Information: A Second Generation of Multivariate Analysis. Classification of Methods and Implilcations for Marketing Research”; The Review of Marketing, 5, American Marketing Association.

- 271 -
Fox, E., A. Montgomery, and L. Lodish (2004); “Consumer shopping and spending across retail formats”; Journal of Business, vol. 77, No. 2, pp. S25-S60.
Frey, Albert W. (1956); "The Effective Marketing Mix: Programming for Optimum Results”. Hanover. NH: The Amos Tuck School of Business Administration, Dartmouth College.
Frey, Albert W. (1961); "Advertising"; 3rd ed. New York: The Ronald Press.
Fri Köpenskap (2009); Vol. 66, No 2, January 16.
Ghosh, Avijit (1986); “The value of a mall and other insights from a revised central place model”; Journal of Retailing, 62, pp 79-97.
Ghosh, Avijit (1992); "Retail Management – A Strategic Approach"; Second Ed., The Dryden Press.
Ghosh, Avijit and Sara McLafferty (1987); "Location Strategies for Retail and Service Firms"; Lexington Books.
Gisser, Micha and Raymond D. Sauer (2000); “The Aggregate Relation between Profits and Concentration Is Consistent with Cournot Behavior”; Review of Industrial Organization, 16, pp 229-246.
Gomez, Miguel I., Edward W McLaughlin and Dick R. Wittink; “Customer satisfaction and retail sales performance: an empirical investigation”; Journal of Retailing; 80 (2004), pp 265-278.
Gonzales-Benito,
Oscar, Pablo A. Munoz-Gallego and Praveen K. Kopalle (2005); “Assymetric competition in retail store formats: Evaluating inter- and intra-format spatial effects”; Journal of Retailing, 81, 1, pp 59-73.
Greenley, G.E. and D. Shipley (1992); "A Comparative Study of Operational Marketing Practices among British Department Stores and Supermarkets", European Journal of Marketing, 12(8), pp 22-35.
Gripsrud, Geir and Kjell Gronhaug (1985); "Structure and Strategy in Grocery Retailing: A Sociometric Approach"; The Journal of Industrial Economics; vol XXXIII, No 3, March, pp 339-347.
Grönroos, C. (1990); "Marketing Redefined", Management Decision 28(8):5.
Hair, Joseph F., Rolph E. Anderson, and Ronald L. Tatham (1996); “Multivariate Data Analysis”, 4th edition; Pearson Prentice Hall.

- 272 -
Hall, M., J. Knapp and C.H. Winsten (1961); “Distribution in Great Britain and North America”; Oxford University Press: Oxford.
Hansen, T. and H. Solgaard (2004); “New Perspectives on Retailing and Store Patronage Behavior”; Journal of Retailing, vol. 53, No. 4, pp. 59-72.
High, Jack (2001); “Competition”; Elgar Reference Collection, Cheltenham UK, Noethampton, MA, USA.
Hise, R.T., J.P Kelly, M. Gable and J.B. McDonald (1983); ”Factors Affecting the Performance of Individual Chain Store Units: An Empirical Analysis”; Journal of Retailing, vol 59, pp. 1-18.
Hoch, S.J., B. Kim, A.L. Montgomery and P.E. Rossi (1995); Determinants of Store-Level Price Elasticity”; Journal of Marketing Research, 32 (February), pp 17-29.
Hollander, Stanley C. (1960); “The Wheel of Retailing”; Journal of Marketing, July, pp. 37-42.
Huff, David L. (1962); ”Determinants of Intra-Urban Retail Trade Area”; Real Estate Research Program, Los Angeles; University of California.
Huff, David L. (1964); ”Defining and Estimating a Trade Area”; Journal of Marketing, vol 28, pp. 34-38.
Hunt, Shelby D. and Dale F. Duhan (2002); “Competition in the third millenium. Efficiency or effectiveness?”; Journal of Business Research, 55, pp 97-102.
Hunt, Shelby D. and R.M. Morgan (1995); “The competitive advantage theory of competition”; Journal of Marketing, 59 (April), pp 1-15.
Hunt, Shelby D., and R.M. Morgan (1996); “The resource-advantage theory of competition: dynamics, path dependencies, and evolutionary dimensions”; Journal of Marketing, 60 (October), pp 107-114.
ICA Nyheter, (2009); No 3, January 16.
Ingene, Charles A. (1984); "Structural Determinants of Market Potential"; Journal of Retailing, vol 60, Number 1 (Spring), pp 37-64.
Ingene, Charles A (1984); "Scale Economies in American Retailing": A Cross Industry Comparison"; Journal of Macromarketing, Fall, pp. 49-63.

- 273 -
Jain, A. and V. Mahajan (1979); "Evaluating the Competitive Environment in Retail Using Multiplicative Competitive Model", in: Sheth, J. (Ed.): Research in marketing, vol. 5 JAI Press, Greenwich C.T.
Kelley, W. and E.J. Lazer (1967); "The Retailing Mix"; in R.R. Gist (ed.) Management Perspectives in Retailing, New York: Wiley.
Kumar, Nirmalya (1997); “The Revolution in Retailing: from Market Driven to Market Driving”; Long Range Planning, vol. 30, No. 6, pp 830-835.
Kumar, Kumar, V. and Kiran Karande (2000); "The Effect of Retail Store Environment on Retailer Performance"; Journal of Business Research, 49, pp. 167-181.
Laaksonen, Marti (1993); Retatil Patronage Dynamics: Learning About Daily Shopping Behavior in contexts of Changing Retail Structures”; Journal of Business Research, 28 (Sept/Oct), pp. 3-174.
LaLonde, Bernard J. (1962); “The Logistics of Retail Location”; in: The Social Responsibilities of Marketing, eds. William D. Stevens, pp 567-575.
Lamm, R. McFall (1981); Prices and Concentration in the Food Retailing Industry"; The Journal of Industrial Economics, vol XXX, No 1, September, pp. 67-78.
Lazer, William and Eugene J. Kelly (1961); “The Retailing Mix: Planning and Managgement”; Journal of Retailing, Spring, pp. 34-41.
Leibenstein, Harvey (1966); “Allocative efficiency vs. X-Efficiency”; American Economic Review, vol. 56 (June), pp. 392-415.
Leibenstein, Harvey (1976); “Beyond Ecoomic Man: A New Foundation for Microeconomics”; Cambridge: Harard University Press.
Lessig, P. (1973); “Consumer Store Images and Store Loyalties”; Journal of Marketing, 37 (October), pp. 72-84
Levy, Michael, Dhruv Grewal, Praveen K. Kopalle, and James D. Hess (2004); “Emerging trends in retail pricing practice: implications for research”; Journal of Retailing, 80, pp. xiii-xxi.
Leszczyc, Peter T.L, Ashish Sinha, and Anna Sahgal (2004); “The effect of multi-purpose shopping on pricing and location strategy for grocery stores”; Journal of Retailing, vol. 80, pp. 85-99.

- 274 -
Levy, Michael and Weitz (2001); “Retailing Management”; Boston: Irvin/McGraw-Hill.
Lewison, D.M. and M.W. DeLozier (1986); "Retailing", 2nd ed, Ohio: Merrill.
Livingstone, John L. and Douglas J. Tigert (1987); “Strategy Implementation: Competition among Supermarkets”; Planning Review, Nov/Dec, pp. 14-22.
Lord, J. and C. Lynds (1981); ”The Use of Regression Models in Store Location Research: A Review and Case Study"; Akron Business and Economic Review, vol 10, pp. 13-19.
Lusch, Robert F. and Ray R. Serpkenci (1983); "Improving your Financial Performance in Retailing"; Business, vol. 33, January-March, pp 9-18.
Lusch, Robert F. (1986); ”The New Albegra of High Performance Retail Management”; Retail Control, September.
Magrath, A.J. (1986); "When Marketing Services, 4Ps are not Enough"; Business Horizons, May-June, pp. 44-50.
Marion, Bruce W. (1984); “Strategic Groups, Entry Barriers and Competitive Behavior in Grocery Retailing”; Working Paper 81; Madison, WI: NC 117.
Marion, Bruce W. (1998); "Competition in Grocery Retailing: The Impact of a New Strategic Group on BLS Price Increases; Review of Industrial Organization, vol 13, pp. 381-399.
Marjanen, Heli (1993); “Store Location Analysis and the Mystery of Consumer Spatial Behavior”; Publications of the Turku School of Economics and Business Administration, Turku, Finland.
Mason, Edward S. (1939); "Price and Production Policies of Large-Scale Enterprise"; American Economic Review, supp 29, pp 61-74.
Mason, Edward S. (1949); "The Current State of the Monopoly Problem in the United States"; Harvard Law Review, 62, pp 1265-1285.
Matsuno, Ken, John T. Mentzer and Joseph O. Rentz (2005); “A conceptual and empirical comparison of three market orientation scales”; Journal of business Research; 58, pp 1-8.
McCarthy, E. Jerome (1960); “Basic Marketing”: A Managerial Approach; Homewoood IL: Richard D. Irwin Inc.
McClelland, W.G (1962); "Economics of the Supermarket"; The Economic Journal, vol 75, No 285, pp 154-170.

- 275 -
McGoldrick, Peter (2002); “Retail Marketing”, 2nd edition; McGraw-Hill.
Morphet, Clive S. (1991); "Applying Multiple Regression Analysis to the Forecasting of Grocery Store Sales: An Application and Critical Appraisal"; The International Review of Retail, Distribution, and Consumer Research, vol 1, No 1, April, pp. 329-351.
Nakanishi, M. and L.G. Cooper (1974); ”Parameter Estimation for Multiplicative Interactive Choice Model: Least Squares Approach”; Journal of Marketing Research, vol 11. pp. 303-311.
Newmark, Craig M. (1990); “A New Test of the Price-Concentration relationship in Grocery Retailing”; Economics Letters, 33, pp 369-373; Elsevier Science Publishers (North-Holland).
Nilsson, Lars, Michael D. Johnson, and Anders Gustafsson (2001); “The impact of quality practices on customer satisfaction and business results: product versus service organizations”; Journal of Quality Management, 6, pp 5-27.
Nooteboom, B. (1980); "Retailing: Applied Analysis in the Theory of the Firm"; Vithoorn, Holland, J.C. Gieben.
Nooteboom, B. (1982); "A New Theory of Retailing Costs"; European Economic Review, 17, May, pp 163-186.
O'Brien, L. and F. Harris (1991); "Retailing"; London: David Fulton.
Ofer, Gur (1973); "Returns to Scale in Retail Trade"; Review of Income and Wealth, 19 (December), pp. 363-384.
Palamountain, J.C. (1955); “The Politics of Distribution”; Cambridge MA, USA.
Pan, Yue and George M. Zinkhan (2006); “Determinants of retail patronage: A meta-analytical perspective”; Journal of Retailing, vol 82, No. 3, pp 229-243.
Penrose, E.T. (1959); “The theory of the growth of the firm”; Oxford: Blackwell.
Piercy, N. (1988); The Role of the Marketing Department in UK Retailing Organisations"; International Journal of Retailing, 14(2), pp 46-65.
Pilloff, Steven J. and Stephen A. Rhoades (2002); “Structure and Profitability in Banking Markets”; Review of Industrial Organization, 20, pp 81-98.

- 276 -
Porter, Michael E. (1980); “Competitive Strategy: Techniques for Analyzing Industries and Competitors”; New York, NY: Free Press.
Posner, Richard A. (1975); “The Social Costs of Monopoly and Regulation”; Journal of Political Economy, 83, pp. 807-827.
Prahalad, C.K. and G. Hamel (1980); “The core competence of the corporation”; Harvard Business Review, 68, pp 79-91.
Reilly, W.J (1931); “The Law of Retail Gravitation”; New York: Knickerbrocker Press.
Reinartz, Werner J. and V. Kumar (1999); "Store-, Market-, and Consumer-characteristics: The Drivers of Store Performance"; Marketing Letter 10:1 pp 5-22, Kluwer Academic Publishers, Netherlands.
Rhee, Hongjai and David R. Bell (2002); “The inter-store mobility of supermarket shoppers”; Journal of Retailing, 78, pp 225-237.
Ring, Lawrence J. and Douglas J Tigert (1995); "Building Competitive Advantage in Retailing"; The College of William&Mary Graduate Schoool of Business Administration and Babson College; W&M-M-116, BAB-0695.
Ring, Lawrence J., Douglas J. Tigert and Ray R. Serpkenci (2002); "The Strategic Resource Management (SRM) Model Revisited"; International Journal of Retail & Distribution Management, volume 30, number 11, pp. 544-561.
Robinson, E.A.G (1958); “The Structure of Competitive Industry”; University of Chicago Press, Chicago.
Rogers, David S. (1984); “Modern Methods of Sales Forecasting”; in: Store Location and Store Assessment Research, eds R.L. Davies and D.S. Rogers, John Wiley: Chichester, pp 319-332
Samli, A.C. (1989); "Retail Marketing Strategy"; New York:Quorum Books.
Savitt, R. (1975); "Economies of Scale in Canadian Supermarkets"; Canadian Association of Administrative Science, Conference Proceedings, University of Alberta, Edmonton.
SCB (2006); “Hushållens utgifter (HUT)”, 2006A01.
Scherer, F.M and David Ross (1989); "Industrial Market Structure and Economic Performance"; Boston: Houghton Mifflin Company.

- 277 -
Schumpeter, J.A. (1934); “The theory of economic development: an inquiry into profits, capital, credit, interest, and the business cycle”; Cambridge, MA, Harvard University Press.
Schwartzmann, D. (1969); “The growth of Sales per Man-Hour in Retail Trade, 1929-1963”; in Victor R. Fuchs (Ed), “Production and Productivity in the Service Industries”. pp. 201-229; National Bureau of Economic Research: Studies in Income and Wealth vol 34; New York: Columbia University Press.
Seiders, Kathleen and Douglas J. Tigert (2000); “The impact of supercenters on traditional food retailers in four markets”; International Journal of Retail and Distribution management, vol. 28, No 4/5, pp 191-193.
Serpkenci, Ray (1984); "An Investigation into the Determinants of Retail Store Performance"; Doctoral Dissertation, University of Oklahoma, USA.
Shaw, Susan A, Donald J. Nisbet and John A Dawson (1989); "Economies of Scale in U.K. Supermarkets": Some Preliminary Findings"; International Journal of Retailing, vol 4, No 5, pp 12-26.
Sheth, J.N., D.M. Gardner, and D.E. Garrett (1988); “Marketing theory: evolution and evaluation”; New York, NY: Wiley.
Slade, Margaret E. (2004); “Competing models of firm profitability”; International Journal of Industrial Organization, 22, pp 289-308.
Stanley, T.J. and M.A. Sewall (1976); ”Image Inputs to a Probabilistic Model: Predicting Retail Potential”; Journal of Marketing, vol 40, pp. 48-53.
Stigler, G.J. (1986); “The organization of industry”; Homewood: Irwin.
Stoelhorst, J.W., and Erik M. van Raaij (2004); “On explaining performance differentials. Marketing and the managerial theory of the firm”; Journal of Business Research, 57, pp 462-477.
Swedish Competitition Authority (2004); Report Series 2004:1.
Thorpe, D. and P.M. Shepherd (1977); "Some Aspects of Economies of Scale in Food Retailing"; Retail Outlets Research Unit (Manchester Business School), Research Report 26 (April).

- 278 -
Thurik, A.R. (1981); “Transaction Size per Customer in Retailing: Theoretical and Empirical Aspects Concerning French Supermarkets”; Research Institute for Small and Medium-sized Business in the Netherlands, Research Paper 8106.
Thurik, A.R. and J. Koets (1984); "On the Use of Supermarket Floorspace and its Efficiency"; in Angeli, F. (Ed.), The Economics of Distribution, CESCOM/IRM, Milan.
Tigert, Douglas J., Lawrence J. Ring and Bert McCammon (1988); ”Change the Strategy, Change the Management System: Do The Department Stores Dare Risk Success?”; The Journal of Services Marketing, vol 2, No 2, Spring, pp. 5-18.
Tilley, R.P.R. and R. Hicks (1970); "Economies of Scale in Supermarkets"; Journal of Industrial Economics, vol 19, No 1, pp 1-5.
Tucker, K.A (1975); "Economies of Scale in Retailing: An Empirical Study of Plant Size and Cost Structure"; Saxon House, D.C. Heath Ltd, Westmead, Farnborough, Hants, England.
Wahlund, Richard (1991); “Skatter och ekonomiska beteenden”; Doctoral dissertation, EFI, Stockholm School of Economics.
Walters, D. and D. White (1987); "Retail Marketing Management", Basingstoke: Macmillan.
Vandell, Kerry D. and Charles C. Carter (1993); “Retail Store Location and Market Analysis: A Review of the Research”; Journal of Real Estate Literature; 1, pp 13-45.
van Watershoot, Walter and Christophe van den Bulte; “The 4P Classification of the Marketing Mix Revisited”; Journal of Marketing, 58 (October), pp 83-93.
Wold, Herman (1982); “Model construction and evaluation when theoretical knowledge is scarce: Theory and application of partial least squares”; in J. Kmenta and J.b. Ramsey (Eds): Evaluation of econometric models, pp. 47-74; New York: Academic Press.
Wold, Herman (1985); “Partial Least Squares”; in S.Koetz and N.L. Johnson (Eds), Encyclopedia of statistical sciences, vol 6, pp. 581-591.
Wrigley, Neil (1988); ”Store Choice, Store Location and Market Analysis”; Routledge New York.

- 279 -
EFI, The Economic Research Institute
Published in the language indicated by the title. A complete publication list can be found at www.hhs.se/efi. Books and dissertations can be ordered from EFI via e-mail: [email protected]
Reports since 2006
2008
Books Breman, Anna. Forskning om filantropi. Varför skänker vi bort pengar? Forskning i
Fickformat. Einarsson, Torbjörn. Medlemskapet i den svenska idrottsrörelsen: En studie av
medlemmar i fyra idrottsföreningar. EFI Civil Society Reports. Helgesson, Claes-Fredrik and Hans Winberg (eds). Detta borde vårddebatten
handla om. Jennergren, Peter, Johnny Lind, Walter Schuster and Kenth Skogsvik (eds).
Redovisning i fokus. EFI:s Årsbok 2008. EFI/Studentlitteratur. Kraus, Kalle. Sven eller pengarna? Styrningsdilemman i äldrevården. Forskning i
Fickformat. Petrelius Karlberg, Pernilla. Vd under press – om medialiseringen av näringslivets
ledare. Forskning i Fickformat. Portnoff, Linda. Musikbranschens styrningsproblematik. Forskning i Fickformat. Östman, Lars. Den finansiella styrningens realiteter och fiktioner. Dissertations Benson, Ilinca. Organisering av övergångar på arbetsmarknaden: en studie av
omställningsprogram. Elhouar, Mikael. Essays on interest rate theory. Farooqi Lind, Raana. On capital structure and debt placement in Swedish companies. Granström, Ola. Aid, drugs, and informality: essays in empirical economics. Hvenmark, Johan. Reconsidering membership: a study of individual members’ formal
affiliation with democratically governed federations. Höglin, Erik. Inequality in the labor market: insurance, unions, and discrimination. Johansson, Marjana. Engaging resources for cultural events: a performative view. Kviselius, Niklas Z. Trust-building and communication in SME internationalization: a
study of Swedish-Japanese business relations.

- 280 -
Landberg, Anders. New venture creation: resistance, coping and energy. Pemer, Frida. Framgång eller fiasko? En studie av hur konsultprojekt värderas i klient-
organisationer. Rosengren, Sara. Facing Clutter: On Message Competition in Marketing
Communication. Schilling, Annika. Kan konsulter fusionera?: en studie av betydelsen av identitet vid en
fusion mellan konsultföretag. Schriber, Svante. Ledning av synergirealisering i fusioner och förvärv. Sjödin, Henrik. Tensions of extensions: adverse effects of brand extension within consumer
relationship. Strandqvist, Kristoffer. Kritiska år: formativa moment för den svenska
flygplansindustrin 1944–1951. Strömqvist, Maria. Hedge funds and international capital flow. Söderström, Johan. Empirical studies in market efficiency. Sölvell, Ingela. Formalization in high-technology ventures. Thorsell, Håkan. The pricing of corporate bonds and determinants of financial structure. Ulbrich, Frank. The adoption of IT-enabled management ideas: insights from shared
services in government agencies. Östling, Robert. Bounded rationality and endogenous preferences. 2007 Books Andersson, Per, Ulf Essler and Bertil Thorngren (eds). Beyond mobility. EFI
Yearbook 2007. EFI/Studentlitteratur. Einarsson, Torbjörn and Filip Wijkström. Analysmodell för sektorsöverskridande
statistik: fallet vård och omsorg. EFI Civil Society Reports. Ericsson, Daniel. Musikmysteriet: organiserade stämningar och motstämningar. Samuelson, Lennart (ed). Bönder och bolsjeviker: den ryska landsbygdens historia
1902–1939.
Dissertations Ahlersten, Krister. Empirical asset pricing and investment strategies.
Alexius, Susanna. Regelmotståndarna : om konsten att undkomma regler. Andersson, Magnus. Essays in empirical finance.
Berg, Bengt Åke. Volatility, integration and grain bank : studies in harvests, rye prices and institutional development of the parish magasins in Sweden in the 18th and 19th centuries.
- 281 -
Bianchi, Milo. Of speculators, migrants and entrepreneurs : essays on the economics of trying your fortune.
Brodin, Karolina. Consuming the commercial break : an ethnographic study of the potential audiences for television advertising.
Elger, Max. Three essays on investment-specific technical change. Hagberg, Axel. Bankkrishantering : aktörer, marknad och stat. Hinnerich, Mia. Derivatives pricing and term Structure modeling. Hjalmarson, Hanna. En växande marknad : studie av nöjdheten med
konsumtionsrelaterade livsområden bland unga konsumenter. Hjelström, Tomas. The closed-end investment company premium puzzle : model
development and empirical tests on Swedish and British data. Kraus, Kalle. Sven, inter-organisational relationships and control : a case study of
domestic care of the elderly. Lindqvist, Erik. Essays on privatization, identity, and political polarization. Macquet, Monica. Partnerskap för hållbar utveckling : systrar av Oikos och
guvernanten som blev diplomat. Melian, Catharina. Progressive open source
Nilsson, Daniel. Transactions in cyberspace : the continued use of Internet banking. Petrelius Karlberg, Pernilla. Den medialiserade direktören. Portnoff, Linda. Control, cultural production and consumption : theoretical perspectives,
empirical dilemmas, and Swedish music industry practices. Sköld, Martin. Synergirealisering : realisering av produktsynergier efter företags-
sammanslagningar. Sonnerby, Per. Contract-theoretic analyses of consultants and trade unions.
Tyrefors, Björn. Institutions, policy and quasi-experimental evidence. Valiente, Pablo. Re-innovating the existing : a study of wireless IS capabilities to support
mobile workforces.
2006
Books Lundeberg, Mats, Pär Mårtensson and Magnus Mähring (eds) IT & business
performance: a dynamic relationship. EFI Yearbook 2006. EFI / Studentlitteratur.
Thodenius, Björn. Organisering av kunskap: en studie av Wallenberg Consortium North. EFI Civil Society Reports.

- 282 -
Wijkström, Filip and Torbjörn Einarsson. Från nationalstat till näringsliv?: det civila samhällets organisationsliv i förändring.
Wijkström, Filip, Stefan Einarsson and Ola Larsson. Staten och det civila samhället: idétraditioner och tankemodeller i den statliga bidragsgivningen till ideella organisationer.
Östman, Lars. Lysande ögonblick och finansiella kriser: Dramaten under ett sekel. Dissertations Argenton, Cedric. Quality provision in duopoly. Beckerman, Carina. The clinical eye : constructiong and computerizing an anesthesia
patient record. Borglund, Tommy. Aktievärden i fokus : internationell påverkan på intressentrelationer
vid förvärv och fusion. Breman, Anna. The Economics of altruism, paternalism and self-control. Edquist, Harald. Technological breakthroughs and productivity growth. Eklund, Jana. Essays on forecasting and bayesian model averaging. Frostenson, Magnus. Legitimitetskontrollen : en studie av etiska värderingars roll i
gränsöverskridande förvärv och fusioner. Gaspar, Raquel M. Credit risk and forward price models. Gustafsson, Peter. Essays on trade and technological change. Hopkins, Elisabeth. Is a higher degree of local currency pricing associated with lower
exchange rate pass-through?: a study of import pricing in 51 Swedish industries. Kling, Ragnar. Developing product development in times of brutal change. Langenskiöld, Sophie. Peer influence on smoking : causation or correlation? Lychnell, Lars-Olof. ”Och fungerar det inte, gör vi på något annat sätt” : en klinisk
fallstudie av IT-relaterat förändringsarbete i småföretag Meitz, Mika. Five contributions to econometric theory and the econometrics of ultra-high-
frequency data. Mendicino, Caterina. Financial market imperfections, business cycle fluctuations and
economic growth. Ovanfors, Anna. Essays on nonlinear time series analysis and health economics. Paltseva, Elena. Essays on commitment and inefficiency in political economy. Rogberg, Martin. Den modeföljande organisationen : om acceptansen av TQM och andra
populära managementmodeller. Silvennoinen, Annastiina. Essays on autoregressive conditional heteroskedasticity. Sjögren, Ebba. Reasonable drugs : making decisions with ambiguous knowledge. Slinko, Irina. Essays in option pricing and interest rate models. Wilander, Fredrik. Essays on exchange rates and prices.