COMPETITIVE ADVANTAGE, PROFITABILITY, AND GROWTH
117
Running head: COMPETITIVE ADVANTAGE, PROFITABILITY, AND GROWTH 1 Comparative Analysis of Competitive Advantage, Profitability, and Growth Jack C. Rinehart Rader School of Business Milwaukee School of Engineering Author Note Jack Rinehart, Rader School of Business, Milwaukee School of Engineering. A Thesis Submitted in May 2017 to the Faculty of the Milwaukee School of Engineering in Partial Fulfillment of the Degree of Master of Science in Engineering Management, Milwaukee, Wisconsin. Correspondence regarding this article should be directed to Jack Rinehart, Milwaukee School of Engineering, 1025 N. Broadway, Milwaukee, WI 53202. E-mail: [email protected]
-
Upload
khangminh22 -
Category
Documents
-
view
0 -
download
0
Transcript of COMPETITIVE ADVANTAGE, PROFITABILITY, AND GROWTH
Running head: COMPETITIVE ADVANTAGE, PROFITABILITY, AND GROWTH 1
Comparative Analysis of Competitive Advantage, Profitability, and Growth
Jack C. Rinehart
Rader School of Business
Milwaukee School of Engineering
Author Note
Jack Rinehart, Rader School of Business, Milwaukee School of Engineering.
A Thesis Submitted in May 2017 to the Faculty of the Milwaukee School of Engineering
in Partial Fulfillment of the Degree of Master of Science in Engineering Management,
Milwaukee, Wisconsin.
Correspondence regarding this article should be directed to Jack Rinehart, Milwaukee
School of Engineering, 1025 N. Broadway, Milwaukee, WI 53202. E-mail:
COMPETITIVE ADVANTAGE, PROFITABILITY, AND GROWTH 2
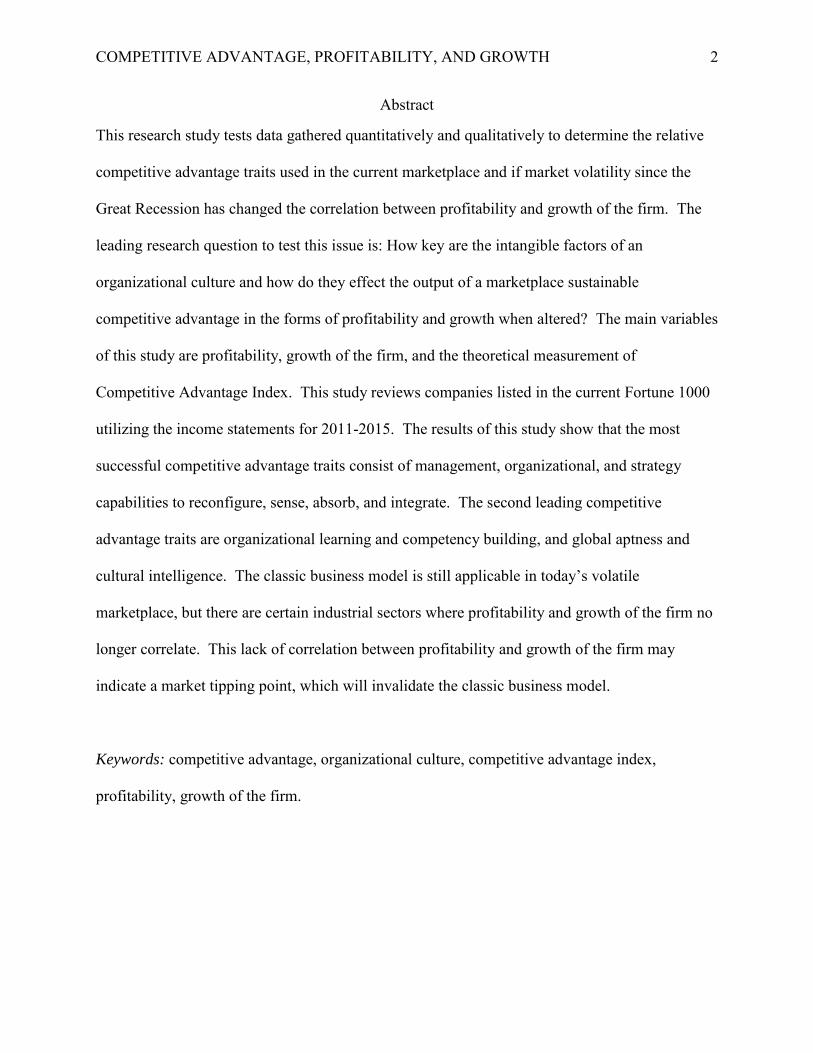
Abstract
This research study tests data gathered quantitatively and qualitatively to determine the relative
competitive advantage traits used in the current marketplace and if market volatility since the
Great Recession has changed the correlation between profitability and growth of the firm. The
leading research question to test this issue is: How key are the intangible factors of an
organizational culture and how do they effect the output of a marketplace sustainable
competitive advantage in the forms of profitability and growth when altered? The main variables
of this study are profitability, growth of the firm, and the theoretical measurement of
Competitive Advantage Index. This study reviews companies listed in the current Fortune 1000
utilizing the income statements for 2011-2015. The results of this study show that the most
successful competitive advantage traits consist of management, organizational, and strategy
capabilities to reconfigure, sense, absorb, and integrate. The second leading competitive
advantage traits are organizational learning and competency building, and global aptness and
cultural intelligence. The classic business model is still applicable in today’s volatile
marketplace, but there are certain industrial sectors where profitability and growth of the firm no
longer correlate. This lack of correlation between profitability and growth of the firm may
indicate a market tipping point, which will invalidate the classic business model.
Keywords: competitive advantage, organizational culture, competitive advantage index,
profitability, growth of the firm.

COMPETITIVE ADVANTAGE, PROFITABILITY, AND GROWTH 3
Table of Contents
List of Figures ................................................................................................................................. 6
List of Tables .................................................................................................................................. 8
Comparative Analysis of Competitive Advantage, Profitability, and Growth ............................... 9
Overview ..................................................................................................................................... 9
Statement of the Problem .......................................................................................................... 10
Purpose ...................................................................................................................................... 12
Research Questions and Present Hypotheses ............................................................................ 13
Significance of the Research ..................................................................................................... 14
Limitations and Delimitations of the Study .............................................................................. 15
Summary ................................................................................................................................... 15
Literature Review.......................................................................................................................... 16
Introduction: Topic, Purposes, and Methods of the Review ..................................................... 16
Research of Scholarly Literature ............................................................................................... 16
Competitive advantage definition and description. .............................................................. 16
Organizational culture definition and description. ................................................................ 23
Utilizing organizational culture to alter competitive advantage. .......................................... 26
Competitive advantage index. ............................................................................................... 28
Application for industry. ....................................................................................................... 29
Proposal for future research. ................................................................................................. 33
Summary of Literature Review ................................................................................................. 34
Study Methodology ....................................................................................................................... 34
Introduction ............................................................................................................................... 34
Population and Sample .............................................................................................................. 35
Variables.................................................................................................................................... 35
Main Research Questions .......................................................................................................... 36
Corollary Hypotheses ................................................................................................................ 36
Methods and Data Analysis ...................................................................................................... 37
Limitations and Assumptions .................................................................................................... 37
Summary ................................................................................................................................... 38
Results ........................................................................................................................................... 38
Overview ................................................................................................................................... 38

COMPETITIVE ADVANTAGE, PROFITABILITY, AND GROWTH 4
Research Purpose, Research Questions and Related Hypotheses ............................................. 38
Statistical techniques used. ................................................................................................... 39
Description of the profile of the sample and selection criteria. ............................................ 40
Industrial Sector Specific Results ............................................................................................. 41
Aerospace and defense. ......................................................................................................... 41
Apparel. ................................................................................................................................. 45
Business services. ................................................................................................................. 48
Chemicals. ............................................................................................................................. 51
Energy. .................................................................................................................................. 54
Engineering and construction. .............................................................................................. 57
Financials. ............................................................................................................................. 60
Food and drug stores. ............................................................................................................ 60
Food, beverages and tobacco. ............................................................................................... 60
Health care. ........................................................................................................................... 63
Hotels, restaurants and leisure. ............................................................................................. 66
Household products. ............................................................................................................. 69
Industrials. ............................................................................................................................. 71
Materials. .............................................................................................................................. 75
Media. ................................................................................................................................... 78
Motor vehicles and parts. ...................................................................................................... 81
Retailing. ............................................................................................................................... 83
Technology. .......................................................................................................................... 87
Telecommunications. ............................................................................................................ 90
Transportation. ...................................................................................................................... 93
Wholesalers. .......................................................................................................................... 96
Examination of Research Questions and Testing of Hypotheses .............................................. 99
Main research questions. ....................................................................................................... 99
Corollary hypotheses. ......................................................................................................... 103
Summary of Research Findings .............................................................................................. 105
Conclusions and Recommendations ........................................................................................... 105
Recapitulation of Research Findings ...................................................................................... 106
Recapitulation of Literature Review ....................................................................................... 106

COMPETITIVE ADVANTAGE, PROFITABILITY, AND GROWTH 5
Statement of the problem. ................................................................................................... 107
Purpose. ............................................................................................................................... 107
Research questions and present hypotheses. ....................................................................... 108
Researcher Conclusions and Recommendations ..................................................................... 109
Implications for practice ..................................................................................................... 108
References ................................................................................................................................... 112

COMPETITIVE ADVANTAGE, PROFITABILITY, AND GROWTH 6
List of Figures
Figure 1. The dimensions of competitive advantage .................................................................... 17
Figure 2. Theoretical constructs and variables ............................................................................. 19
Figure 3. The dimensions of cultural identity ............................................................................... 24
Figure 4. The gap between external market environment and internal organization
environment ...................................................................................................................... 28
Figure 5. Institutional renewal and adaptation conceptual framework ......................................... 30
Figure 6. Profitability and growth of the firm for the Aerospace and Defense Sector. ................ 43
Figure 7. Competitive Advantage Index for the Aerospace and Defense Sector. ........................ 44
Figure 8. Profitability and growth of the firm for the Apparel Sector. ......................................... 46
Figure 9. Competitive Advantage Index for the Apparel Sector. ................................................. 47
Figure 10. Profitability and growth of the firm for the Business Services Sector. ....................... 49
Figure 11. Competitive Advantage Index for the Business Services Sector. ............................... 50
Figure 12. Profitability and growth of the firm for the Chemicals Sector. ................................... 52
Figure 13. Competitive Advantage Index for the Chemicals Sector. ........................................... 53
Figure 14. Profitability and growth of the firm for the Energy Sector. ........................................ 55
Figure 15. Competitive Advantage Index for the Energy Sector.................................................. 56
Figure 16. Profitability and growth of the firm for the Engineering and Construction Sector ..... 58
Figure 17. Competitive Advantage Index for the Engineering and Construction Sector. ............ 59
Figure 18. Profitability and growth of the firm for the Food, Beverages and Tobacco Sector .... 61
Figure 19. Competitive Advantage Index for the Food, Beverages and Tobacco Sector ............. 62
Figure 20. Profitability and growth of the firm for the Health Care Sector.................................. 64
Figure 21. Competitive Advantage Index for the Health Care Sector. ......................................... 65
COMPETITIVE ADVANTAGE, PROFITABILITY, AND GROWTH 7
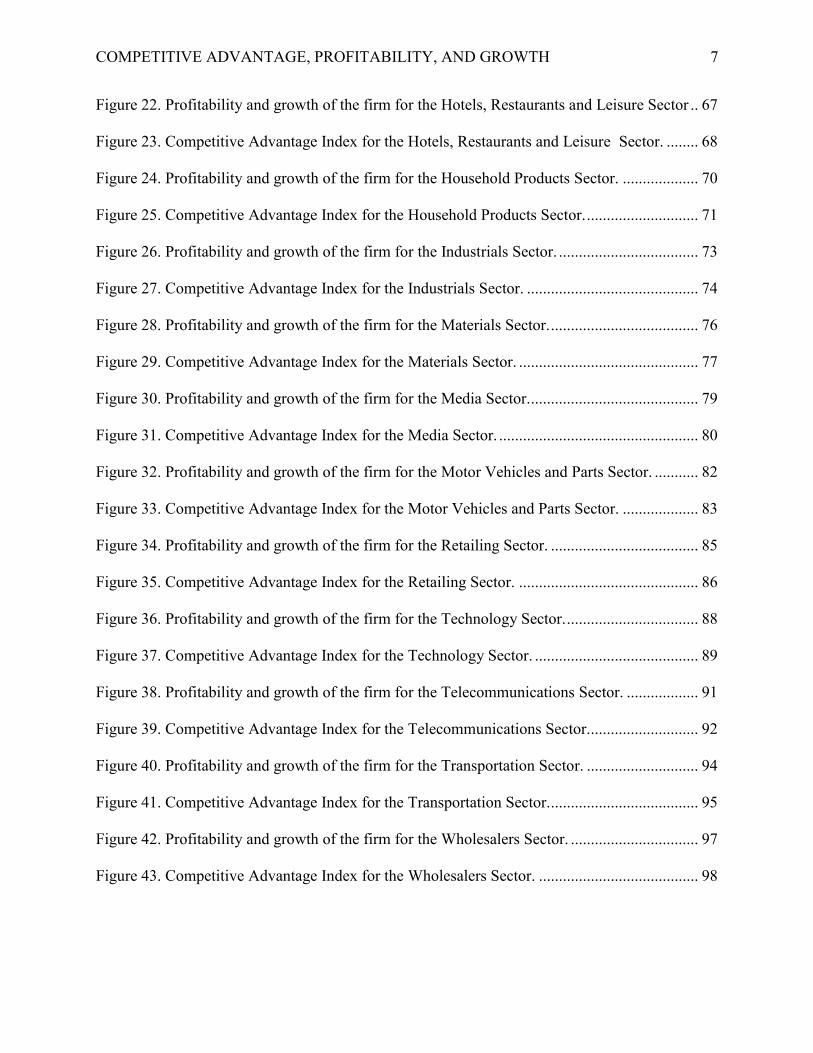
Figure 22. Profitability and growth of the firm for the Hotels, Restaurants and Leisure Sector .. 67
Figure 23. Competitive Advantage Index for the Hotels, Restaurants and Leisure Sector. ........ 68
Figure 24. Profitability and growth of the firm for the Household Products Sector. ................... 70
Figure 25. Competitive Advantage Index for the Household Products Sector. ............................ 71
Figure 26. Profitability and growth of the firm for the Industrials Sector. ................................... 73
Figure 27. Competitive Advantage Index for the Industrials Sector. ........................................... 74
Figure 28. Profitability and growth of the firm for the Materials Sector. ..................................... 76
Figure 29. Competitive Advantage Index for the Materials Sector. ............................................. 77
Figure 30. Profitability and growth of the firm for the Media Sector........................................... 79
Figure 31. Competitive Advantage Index for the Media Sector. .................................................. 80
Figure 32. Profitability and growth of the firm for the Motor Vehicles and Parts Sector. ........... 82
Figure 33. Competitive Advantage Index for the Motor Vehicles and Parts Sector. ................... 83
Figure 34. Profitability and growth of the firm for the Retailing Sector. ..................................... 85
Figure 35. Competitive Advantage Index for the Retailing Sector. ............................................. 86
Figure 36. Profitability and growth of the firm for the Technology Sector. ................................. 88
Figure 37. Competitive Advantage Index for the Technology Sector. ......................................... 89
Figure 38. Profitability and growth of the firm for the Telecommunications Sector. .................. 91
Figure 39. Competitive Advantage Index for the Telecommunications Sector............................ 92
Figure 40. Profitability and growth of the firm for the Transportation Sector. ............................ 94
Figure 41. Competitive Advantage Index for the Transportation Sector...................................... 95
Figure 42. Profitability and growth of the firm for the Wholesalers Sector. ................................ 97
Figure 43. Competitive Advantage Index for the Wholesalers Sector. ........................................ 98
COMPETITIVE ADVANTAGE, PROFITABILITY, AND GROWTH 8
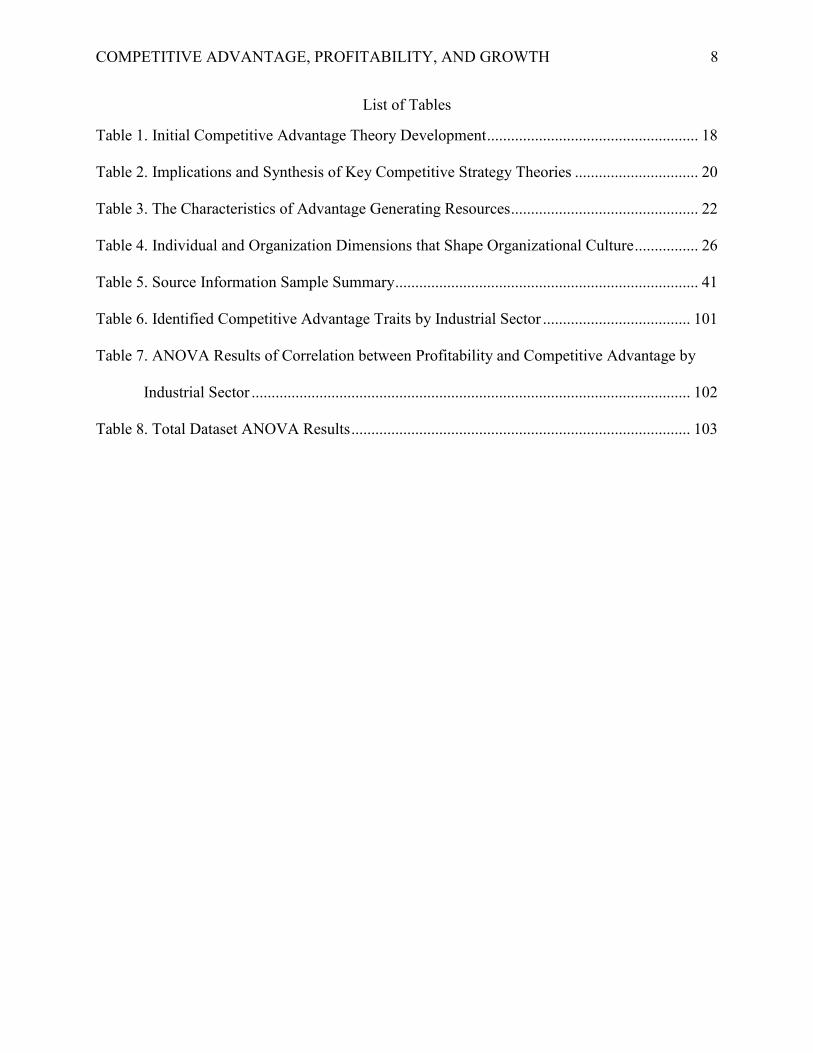
List of Tables
Table 1. Initial Competitive Advantage Theory Development ..................................................... 18
Table 2. Implications and Synthesis of Key Competitive Strategy Theories ............................... 20
Table 3. The Characteristics of Advantage Generating Resources ............................................... 22
Table 4. Individual and Organization Dimensions that Shape Organizational Culture ................ 26
Table 5. Source Information Sample Summary ............................................................................ 41
Table 6. Identified Competitive Advantage Traits by Industrial Sector ..................................... 101
Table 7. ANOVA Results of Correlation between Profitability and Competitive Advantage by
Industrial Sector .............................................................................................................. 102
Table 8. Total Dataset ANOVA Results ..................................................................................... 103
COMPETITIVE ADVANTAGE, PROFITABILITY, AND GROWTH 9
Comparative Analysis of Competitive Advantage, Profitability, and Growth
Overview
Since the Great Recession of 2008, the level of disruption in the marketplace is
increasing. In the classic model of business, profitability and growth of the firm are correlated.
The validity of the classic model of business relies on a stable market environment. The ever-
increasing volatility of the market since 1980 may be ending the applicability of the classic
model of business. A new business model may be required for strategic management in the near
future.
This study on competitive advantage and its traits utilizes the metric of Competitive
Advantage Index as defined by Alfadda (2010). This study argues that the Competitive
Advantage Index is a valid measurement by which potential future profitability and growth of the
firm can be predicted. The researcher applied the Competitive Advantage Index to measure new
revenue gained per organization compared to the whole of the relative industrial sector.
Competitive advantage and the intangible traits which make a firm more successful than
another with similar resources, are not items which can be identified on a balance sheet. With
the classic model of business, as a business grew more profitable, the size of the company also
grew. Because of market changes such as the increasingly global marketplace and the
introduction of technologies which eliminate the need for additional employees, the business of
the future may not be required to grow in size in order to increase profitability. In the future, the
features which will be the determining factors of success will be in the intangible traits of an
organization’s competitive advantage.
The level of relevance for the classic model of business will be directly related to the
industrial sector type being compared. Competitive advantage traits will vary across the
different industrial sectors as industrial sectors have diverse market requirements from their

COMPETITIVE ADVANTAGE, PROFITABILITY, AND GROWTH 10
customers. However, when analyzing the market as a whole, without regard for industrial sector,
there will be competitive advantage traits that stand out. These traits will indicate strong market
demand trends. Early adopters of a trending competitive advantage trait will be hard to identify
without longitudinal comparative data.
Statement of the Problem
Competitive advantage is an important factor in determining sustainable success of the
firm. What is considered a competitive advantage and how it is defined is up for debate (Klein,
2002). Competitive advantage is not specific in nature to firms or products. The product
attributes desired for the successful entry of a particular market are identified through
forecasting. The initial forecasted market outlook is done through strategic management. While
strategic management market outlooks may be able to correctly forecast the competitive needs of
a future market, the organization’s culture may be too slow or unable to match market demand.
Some steps, such as adapting team size or structure, may help an organization to react quickly to
shifting market demand.
It is common practice for members of an organization to be laid out in functional groups
or teams to accomplish a shared task. Some teams are more ‘functional’ than others at
accommodating a task. Different features of the functional teams can be tailored to make them
more successful. Where an organization’s competitive advantage is defined as its ability to be
successful at delivering on certain tasks, can the team size be altered to be tailor fit to the type of
task at hand (Klein, 2002)? More specifically, how tangible is the link between team size and
the type of competitive advantage that can be optimally delivered?
Lockheed Martin’s Skunk Works is an example of an organization utilizing a specific,
tailored team to meet a customer demand, which Lockheed could not meet with its traditional

COMPETITIVE ADVANTAGE, PROFITABILITY, AND GROWTH 11
company culture. The Skunk Works became such a successful model that it is now a ubiquitous
term relating to an intrapreneurship shelter to protect innovators from the operations of daily
business (Rich & Janos, 1994). The Skunk Works began during WWII in 1952 under Chief
Engineer Kelly Johnson. Johnson’s motto was “Be quick, be quiet, be on time.” This business
model was drastically different from the standard model for government contractors, which were
slow moving and bureaucracy laden. The Skunk Works’ ability to meet customer demand for
speed to solution, innovative abilities, and maintaining confidentiality requirements allowed the
Skunk Works to be an industry leader in the most volatile segment of their industrial market
sector.
Although customers may demand change, one size does not fit all—different market
segments require unique organizational, cultural solutions. The focus of an organization needs to
be on organizational culture, because only through organizational culture does a firm develop its
competitive advantages to meet customer need. Furthermore, an organization needs to develop
niche market requirements through strategic planning. Certain features of an organization’s
culture will favor some competitive advantages over others. The true driver of competitive
advantage is matching cultural traits to the market demand.
Market segments have changed significantly since the Skunk Works start in 1952;
however, the need for organizations to meet customer demand has not. Currently, there is a push
for organizations to fit into particular operational models, to shift organizational cultures, and to
adapt quality management plans. This push for organizations to be adaptable is caused by
increased market volatility. This increased market volatility results from the adoption of new
technologies and the speed at which these new innovated solutions are brought to market.
COMPETITIVE ADVANTAGE, PROFITABILITY, AND GROWTH 12
Purpose
The purpose of this study is to examine the competitive advantage traits of an
organization and how these traits relate to achieving profitability and growth of the firm. This
knowledge may be utilized as a roadmap by strategic managers pushing to either achieve or
maintain a particular competitive advantage. Business internal workings and how internal
operations are performed determine the final output of any organization. The analysis of the
relationships between culture and market advantage performance needs to be further analyzed
beyond resource-based competitive advantage theorist Porter’s organizational outline and deeper
than Denison’s single trait analysis.
Market volatility has more than doubled since 1980 (Reeves & Deimler, 2011) and
profitability does not directly correlate to market share anymore. These two realities of modern
business make the classic model of developing a business strategy—building an implicitly static
competitive advantage in the market through either a niche product placement or a more
competitive product delivery—potentially obsolete. This classic approach was successful in the
past, but companies must learn and be proactive at innovating.
A goal of this study is to show a relationship between organizations which adapt their
competitive advantage traits to match consumer market demand and success of those
organizations. If a correlation is found between cultural traits and market success, it will show
that the classic model of business is no longer applicable in the increasing volatility of the
marketplace. The knowledge will help guide strategic managers to explore alternative models
for guiding business decisions.

COMPETITIVE ADVANTAGE, PROFITABILITY, AND GROWTH 13
Research Questions and Present Hypotheses
In this study, the researcher sought to explore questions concerning organizational
effectiveness. An organization utilizing non-excluding attributes, such as tailoring internal
organization characteristics to match market demand most appropriately, is considered non-
market competitive (Klein, 2002). Non-market competition at the firm level is referred to as
organizational effectiveness.
The main research question (H1) and the three related research questions, numbered (H2)
through (H4), are as follows:
H1: How important are the intangible factors of an organizational culture and how do
they affect the output of a marketplace sustainable competitive advantage in the forms of
profitability and growth when altered?
H2: How is competitive advantage distributed within a defined industrial sector?
H3: How is competitive advantage distribution similar or different between different
industrial sectors?
H4: Is there a correlation between organization growth and profitability, and if so, does it
still validate the conventional business model?
From the research questions above, there are three related corollary hypotheses, numbered (H5)
through (H7).
H5: Certain competitive advantage traits are more valuable than others and there are
trends per industrial sector.
H6: There are trends between industrial sectors displaying early adopters to competitive
advantage traits.

COMPETITIVE ADVANTAGE, PROFITABILITY, AND GROWTH 14
H7: There is no longer a predictable correlation between profitability and growth of the
firm.
Significance of the Research
Researching the relationship between competitive advantage, profitability, and growth of
a firm is important to identify and to understand the correlation of these three factors to
organization success. Businesses are always in need of a competitive advantage, and a need to
maintain their market sustainability, or they are encouraging increasing risk to their future
profitability. When a market need is identified, different competitive advantages will allow a
business to be competitive in that market space. The business should tailor itself to the demands
of the market so that it is able to satisfy its stakeholders. Traditionally, in the author’s opinion,
businesses that have not adapted to changing markets have lost or ended their ability to be
competitive.
Competitive advantages are developed by an organization in order to maintain, or
improve, their place in the market. Tangible or intangible advantages are what differentiate the
vendors for a particular product audience. Historically, staffing volumes have been analyzed as a
whole organization or for very specific projects. One of the first significant instance of a
company creating a separate team for a specific product that contained its own ideals and norms
is Lockheed’s Skunk Works department (Rich & Janos, 1994).
Current marketplace volatility requires organizations to achieve organizational changes to
meet market demands. Organizations do have the ability to change their cultures organically
over time based on adaptations to the external environment. However, if an external
environment changes faster than the organization, the organization may be at risk of failure
(Dengler, 2006). Welch states that there is a looming gap between the need for increasing speed

COMPETITIVE ADVANTAGE, PROFITABILITY, AND GROWTH 15
of solution and the capacity for organizational cultures to adjust to changing market conditions
(as cited in Dengler, 2006).
This research is relevant to business and industries where a particular market case needs
an identifiable deliverable and the organization is designing itself to fit that need. A slow speed
of external market change is no longer a reality, and as a result, developing a rapid pace of
culture change is a market adaption necessity. If this hypothesis is true, organizational
management would need to carry out strategic forecasting goals in the form of culture change to
create a firm that will be a “best fit” for their market.
Limitations and Delimitations of the Study
No corporate culture survey was done for this study. The scope of this project was to
base findings and inferences from already existing literature sources. The available data were
employed to produce unique findings which may not be readily identifiable in existing resources.
Organizations used in this project were large in nature because of the availability of information
about them. A potential weakness of making inferences about industry trends from large
organizations is that small, medium, or even startups, can alter a forming trend. Statistically,
only inferences can be made from the available data on organizational cultures, because there are
little or no published comparisons or rankings similar to financial performance rankings. Ideally,
this would be a study of multiple organizations participating in a similar industry over an
extended period of time.
Summary
In the introductory section, the researcher discussed the topic of achieving competitive
advantage through managing organizational culture of the firm and how the efforts of strategic
management are altering to better match the requirements of the modern day increasingly

COMPETITIVE ADVANTAGE, PROFITABILITY, AND GROWTH 16
volatile economy. The research questions and hypotheses were stated, as well as the developed
theories from the literature review. Finally, limitations and delimitations of the study were
summarized.
In the literature review, the main findings from published works and online sources are
highlighted. Next, the research design and methodology are explained, followed by the summary
of the research findings. Finally, the thesis ends with the study’s main conclusions and
recommendations.
Literature Review
Introduction: Topic, Purposes, and Methods of the Review
This chapter features a discussion and review of some of the relevant scholarly literature
related to the study. Baseline concepts and variables are outlined. Inferences for the study are
drawn throughout the literature review. The topics of competitive advantage, organizational
culture, and their application to industry are the core concepts. This literature review explores
the intangible resources which determine business competitive success in a relatively balanced
playing field.
Research of Scholarly Literature
Competitive advantage definition and description. Competitive advantages are
the tangible or intangible traits which allow a business to have more success than another. Firms
are able to utilize or create competitive advantage in whatever way the organization feels it can
best meet or exceed the expectations of the market. Some firms create competitive advantages in
unique resources that are not anticipated by the market (Soh, 2005). There are three main
dimensions to competitive advantage: the amount of exploitation for market opportunities
compared to that of competitors, the level of competitive threat neutralization, and the level of
COMPETITIVE ADVANTAGE, PROFITABILITY, AND GROWTH 17
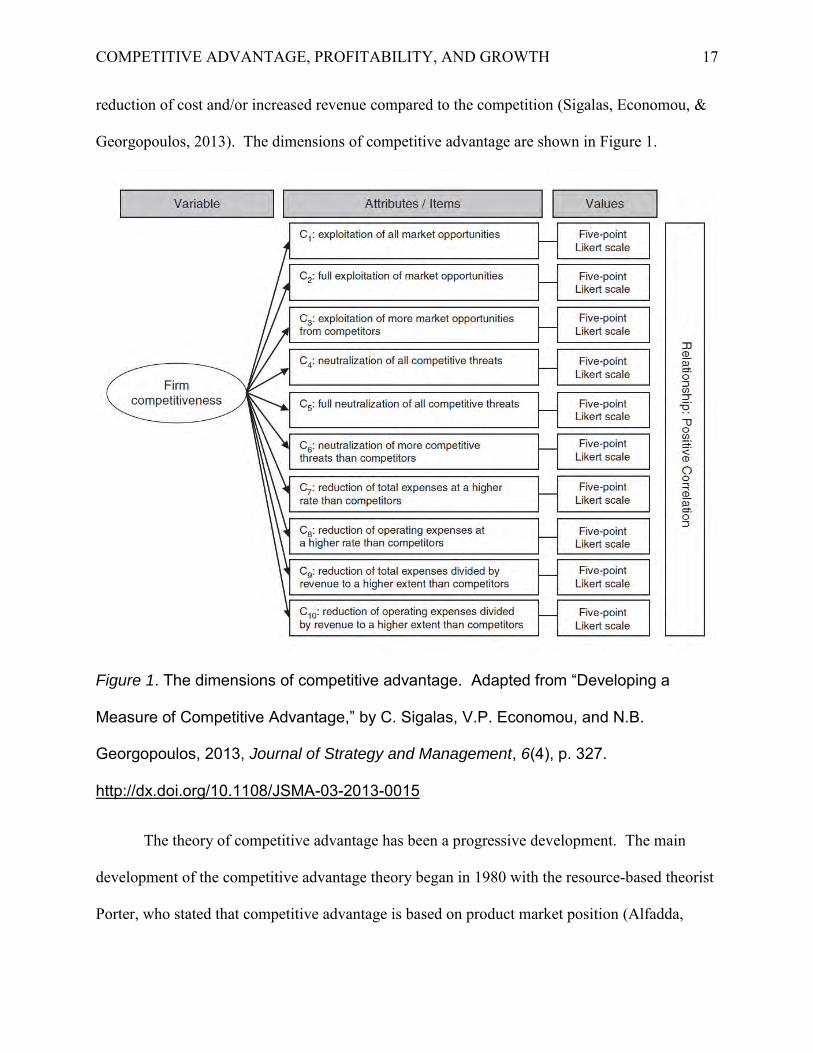
reduction of cost and/or increased revenue compared to the competition (Sigalas, Economou, &
Georgopoulos, 2013). The dimensions of competitive advantage are shown in Figure 1.
Figure 1. The dimensions of competitive advantage. Adapted from “Developing a
Measure of Competitive Advantage,” by C. Sigalas, V.P. Economou, and N.B.
Georgopoulos, 2013, Journal of Strategy and Management, 6(4), p. 327.
http://dx.doi.org/10.1108/JSMA-03-2013-0015
The theory of competitive advantage has been a progressive development. The main
development of the competitive advantage theory began in 1980 with the resource-based theorist
Porter, who stated that competitive advantage is based on product market position (Alfadda,

COMPETITIVE ADVANTAGE, PROFITABILITY, AND GROWTH 18
2010). From this point, the theory grew to encapsulate the variables of the amount of revenue
generation and the amount of resource attributes. The initial theories of competitive advantage
are shown in Table 1. These initial theories of competitive advantage were based on the classic
model of business which better applied to the economy of the time.
Table 1
Initial Competitive Advantage Theory Development
1980 Porter Market-Based Theorist Competitive advantage based on product market position.
1984 Wernerfelt Resource-Based Theorist Firm develops resources to implement market strategy.
1984 Rumelt Resource-Based Theorist Why firms exist focuses efforts on business strengths to generate revenue.
1986 Barney Resource-Based Theorist Persistent firm performance based on resource attributes.
1989 Dierickx and Cool
Developed the attribute of using a firm’s resources as a unit of analysis.
Note. Adapted from “Institutional Renewal and Adaptation (IRA): Creating and Managing Sustainable Competitive Advantage (SCA),” by B. Alfadda, 2010, pp. 22. Retrieved from http://www.proquest.com/; “A Correlational Study of the Relationship Between a Firm's Intangible Resources and its Sustainable Competitive Advantage,” by M. Soh, 2005, pp. 21-22. Retrieved from http://proquest.com/
According to Porter (as cited in Alfadda, 2010), cost, differentiation, and focus are the
three fundamental types of competitive advantage. Competitive advantage can be institutionally
embedded in an organization as cognitive capital, normative capital, and regulative capital. Core
competencies refer to an organization’s collective knowledge. Core competencies can be built
upon or enhanced.
Competitive advantages for firms are based on bundles of related resources (Soh, 2005).
These bundles of related resources, competitive advantages, are specific to the firm. There is
generally overlap from one or two main competitive advantage traits into other secondary traits.
Competitive advantage traits are intangible resources. The variables relating to intangible
resources of competitive advantage will depend on the type of industry, number of employees

COMPETITIVE ADVANTAGE, PROFITABILITY, AND GROWTH 19
the business has, and the market capitalization of the business. Figure 2 is a visual representation
of a firm’s intangible resources and its sustainable competitive advantage.
Figure 2. Theoretical constructs and variables. This figure explains the relationship
between a firm’s intangible resources and its ability to maintain a competitive
advantage. Adapted from “A Correlational Study of the Relationship Between a Firm's
Intangible Resources and its Sustainable Competitive Advantage,” by M. Soh, 2005, p.
21. Retrieved from http://proquest.com/
Resources for a business can be almost anything (Soh, 2005). While resources can be
almost anything, they must also be rare or not be able to be obtained by a large number of firms.
Barney (as cited in Soh, 2005) states resources that are valuable but not scarce can only be

COMPETITIVE ADVANTAGE, PROFITABILITY, AND GROWTH 20
sources of competitive parity. Barriers to resource mobility are what make resources rare and
inhibit imitation (Ambrosini as cited in Soh, 2005). Table 2 shows seven theories of competitive
advantage strategy.
Table 2
Implications and Synthesis of Key Competitive Strategy Theories
Note. Adapted from “Institutional Renewal and Adaptation (IRA): Creating and Managing Sustainable Competitive Advantage (SCA),” by B. Alfadda, 2010, p.36. Retrieved from http://www.proquest.com/
The chosen competitive advantage traits to be followed for this study are shown in Table
2 and are as follows:
Innovation in resources, capabilities, and markets.
Social legitimacy.
Flexibility of cultural values.
Organizational learning and competency building.
Management, organizational, and strategy capabilities to reconfigure, sense, absorb, and
integrate.
Global aptness and cultural intelligence.
COMPETITIVE ADVANTAGE, PROFITABILITY, AND GROWTH 21
According to the Resource-Based View (RBV), the strategic assets of the organization
determine the competitive advantage and organization profitability (Wernerfelt as cited in
Michalisin, Smith, & Kline, 1997). In order for a resource to become a strategic asset to the
organization, it must be simultaneously valuable, rare, imperfectly imitable, and non-
substitutable (Barney as cited in Michalisin, Smith, & Kline, 1997). An organization correctly
exercising strategic assets should earn superior profits. An underlying factor in the RBV is the
limited competition before a resource can be an advantage and control of competition after a
resource is an advantage (Peteraf as cited in Michalisin, Smith & Kline, 1997). Sustainability is
a function of a resource’s inimitability. Inimitability is a function of rareness and lack of
strategic substitutes. Distinctions are drawn between assets and capabilities. Just because an
organization has an asset does not mean that the capability exists to utilize the asset. Table 3
shows characteristics of resources, which three theorists believed were necessary for firms to
develop and maintain competitive advantages.

COMPETITIVE ADVANTAGE, PROFITABILITY, AND GROWTH 22
Note. Adapted from “A Correlational Study of the Relationship Between a Firm's Intangible Resources and its Sustainable Competitive Advantage,” by M. Soh, 2005, pp. 23, 33. Retrieved from http://proquest.com/; “In Search of Strategic Assets,” by M. D. Michalisin, R. D. Smith, and D. M. Kline, 1997, International Journal of Organizational Analysis, 5(4), p. 360-362. http://dx.doi.org/10.1108/eb028874
The contribution of competitive advantage to a firm’s revenue must be calculated.
According to Klein (2002), “Glaxo’s competitive advantage can be measured by looking at the
ratio of added value to the firm’s gross or net output” (p. 320). The calculation for finding
revenue input for strategically pursuing competitive advantage can then be used to mitigate risk
when changing strategic direction and allocating funds. Equation (1) shows Klein’s method of
calculation:
1995Barney• Value• Rareness• Inimitability• Non-substitutability
1991Grant• Inimitability• Durability• Appropriability• Substitutability• Competitive Superiority
1993Amit and Schoemaker• Complementary• Scarcity• Low Tradability• Inimitability• Limited Substitutability• Appropriability• Durability• Overlap with Strategic Industry Factors
Table 3
The Characteristics of Advantage Generating Resources
COMPETITIVE ADVANTAGE, PROFITABILITY, AND GROWTH 23
𝐶𝑜𝑚𝑝𝑒𝑡𝑖𝑡𝑖𝑣𝑒 𝐴𝑑𝑣𝑎𝑛𝑡𝑎𝑔𝑒 =
𝐴𝑚𝑜𝑢𝑛𝑡 𝑜𝑓 𝐴𝑑𝑑𝑒𝑑 𝑉𝑎𝑙𝑢𝑒
𝐹𝑖𝑟𝑚′𝑠 𝐺𝑟𝑜𝑠𝑠 𝑜𝑟 𝑁𝑒𝑡 𝑂𝑢𝑡𝑝𝑢𝑡 .
(1)
Organizational culture definition and description. Organizational culture is a
qualitative area of business. The intangible traits of organizational culture are the factors which
are key in determining the competitiveness of a firm in the leveled playing field of a global
economy. Collins (as cited in Soh, 2005) states that the best employees tend to work harder to
hire employees who fit the culture of the company, and Bennett and Bell (as cited in Soh, 2005)
argue for managers to hire for attitude and train for skills.
While internal organizational culture may be nearly all empirical, the external reputations
of businesses can be ranked by using the reputation quotient of a brand or business (Soh, 2005).
Reputation quotient is how people feel about a certain company (Soh, 2005). Factors relating to
company rankings include emotional appeal, products and services, financial performance,
vision and leadership, workplace environment, and social responsibility.
An organizational culture is a function of strategic emphasis and environmental needs
(Denison, 1990; Daft as cited in Michalisin, Smith & Kline, 1997). It has been found that strong
organizational culture in itself does not ensure the success of an organization. Organizational
culture may be leveraged to match market demand but unless the organization fulfills its product
niche, it will not be profitable.
According to Trefry (2006), “Large complex organizations rarely exhibit homogeneous
behavioral norms and belief systems” (p. 566). There is a distinct difference between the ‘Real
Culture (or culture in use)’ versus ‘Constructed Culture (or espoused)’. Moreover, there are
substantial differences between functional and divisional subcultures. Members of an
organization learn from both explicit and implicit rules regarding types of behaviors to be

COMPETITIVE ADVANTAGE, PROFITABILITY, AND GROWTH 24
avoided and behaviors that will be rewarded. Figure 3 shows individual traits of organizational
culture and how they develop into cultural values.
Figure 3. The dimensions of cultural identity. Adapted from A Healthy Workplace: The
Role of Organizational Culture, by E. M. Lagerstrom, 2005, p. 13. Retrieved from
http://www.proquest.com/
COMPETITIVE ADVANTAGE, PROFITABILITY, AND GROWTH 25
The top five employee perceptions about a healthy work environment include trust in the
employer for fair treatment, respect from the employer, safe working conditions, good
communication, and work-life balance (Lagerstrom, 2005). What brings the different factors of
workplace culture together is the level of inclusiveness (Trefry, 2006). Organizations have the
ability to learn internally from utilizing the multiple frames of reference. Similar to cultural
diversity, organizational diversity must be enabled and empowered in order to be effective. The
dimensions of the workplace organizational culture and how they relate from the individual level
up to the organizational level are shown in Table 4.

COMPETITIVE ADVANTAGE, PROFITABILITY, AND GROWTH 26
Table 4
Individual and Organizational Dimensions that Shape Organizational Culture
Note. Adapted from A Healthy Workplace: The Role of Organizational Culture, by E. M. Lagerstrom, 2005, p.25. Retrieved from http://proquest.com
Utilizing organizational culture to alter competitive advantage. An effective
team utilizing Customer Relationship Management (CRM) focuses on winning the patronage of
customers to build long lasting relationships (Ballantyne, 2005). The length of relationship is
determined by the product market. Ballantyne (2005) claims that the only lasting
(organizational) competence is characterized by continuous learning. Arguably, Total Quality
COMPETITIVE ADVANTAGE, PROFITABILITY, AND GROWTH 27
Management (TQM) is similar in that it focuses on finding a good organizational competency fit,
which can be easily upset in volatile market sectors. CRM and TQM focus on a relationship of
process(es), which create mutual benefits, such as cost reduction that encourages the longevity of
the relationship. Both CRM and TQM should be considered for mature, low volatility market
sectors (Ballantyne, 2005).
Strong organizational cultures place employees in a prevailing frame of reference,
limiting the usefulness of a SWOT analysis (Trefry, 2006). This narrowed view of the industrial
marketplace can be a serious fault of strong organizational cultures. External organizational
analysis can become constricted and incomplete of key points needed to adjust internal vision.
Figure 4 shows how internal and external operating environments of a business interact.

COMPETITIVE ADVANTAGE, PROFITABILITY, AND GROWTH 28
Figure 4. The gap between external market environment and internal organization
environment. Adapted from Fast-Acting OD Intervention for Expedited Organization
Culture Change: A Quantitative Evaluation of a Field Experiment in a Large Utility
Undergoing an Intentionally Violent Transformational Change, by R. Dengler, 2006, p.
3. Retrieved from http://www.proquest.com/
Competitive advantage index. The competitive advantage index proposed by
Alfadda (2010) is a theoretical metric for analyzing sustainable competitive advantage across
organizations in a similar industry based upon changes in market share over an extended period
of time. Sustainable competitive advantage implies that an organization has the ability to
outperform others over the long term. A sustained competitive advantage over time is promoted
COMPETITIVE ADVANTAGE, PROFITABILITY, AND GROWTH 29
and built through an organizational culture of institutional renewal and adaption. The promoted
internal culture of developed traits is what perpetuates into the market successfully and becomes
captured market share. Alfadda proposes the use of Equations (2) and (3) to calculate the
competitive advantage of a firm:
Competitive Advantage Index (CAI) of a firm =
Firm’s annual revenue growth rate – Relevant industry growth rate. (2)
Note: Values in Equation (2) are in revenue growth percentage at or above average industry
profitability.
And:
Competitive Advantage Intex (CAI) of a firm =
Market Share for year (x) – Market Share for year (x-1). (3)
Application for industry. According to Reeves and Deimler (2011), the challenge for
change in the current market is real. Strategy makers are encouraged to look at the mavericks,
identify and address the uncertainties, put an initiative on every risk, examine multiple
alternatives, and increase the rate at which change is made. Organizations need to be ready to
adapt to market changes. The relationship between organizational adaption and competitive
advantage theories is shown in Figure 5.

COMPETITIVE ADVANTAGE, PROFITABILITY, AND GROWTH 30
Figure 5. Institutional renewal and adaptation conceptual framework. Adapted from
Institutional Renewal and Adaptation (IRA): Creating and Managing Sustainable
Competitive Advantage (SCA), by B. Alfadda, 2010, p.68. Retrieved from
http://proquest.com/
Many organizations struggle through modification of their strategic direction, but slight
adjustments led by executive staff may prove inefficient to meet desired market performance
(Dengler, 2006). Beer predicts that if an organization cannot develop the tools and approaches to

COMPETITIVE ADVANTAGE, PROFITABILITY, AND GROWTH 31
meet short term market demand, then the failure of the organization is imminent (as cited in
Dengler, 2006). Therefore, the key to any organizational modification is speed.
When building a team, it is important that the assembled group will rise above the clutter
of competition and maintain its resistance to competitors trying to ambush their progress (Fahy,
Farrelly, & Quester, 2004). What defines an effective team is their ability to exceed and define
what is clutter.
An organization’s cultural identity is always evolving as its members modify their
beliefs, mental models, and values (Lagerstrom, 2005). Where an organization’s cultural identity
is the constructed or real culture of corresponding values, conflicting values are the individual’s
internal conflict with the constructed or real culture. Where burnout or attrition is a risk, highly
valuable employees need to be aligned with an organizational culture that will correctly align
personal workplace cultural identity with that of the person-environment fit.
Dengler (2006) observes,
For, in order for an organization to produce Beer’s capacities of ‘fit’—the match with its
environment—and ‘fitness’—the capacity for adaptive change—the organization must
have the capability to influence the operationalization process to address accuracy,
sustainability, and timeliness of performance. (p. 29)
When changes are made to an existing organizational culture, only a few individuals will
adopt the innovation in sequential time periods. The slow, and sometimes nonexistent, adoption
of the driven cultural innovation means that an organization loses critical time adapting to
changing market conditions. The standard model for the rate of innovative cultural adoption can
work for mature industries participating with products that emulate the standard empirical
distribution of the product lifecycle. In industries where product markets do not emulate the
COMPETITIVE ADVANTAGE, PROFITABILITY, AND GROWTH 32
standard empirical curve, profitability favors those that are quickest to adapt to the market needs.
In either scenario, an organization must understand the product markets that they participate in.
Once a strategic market focus is defined, a specific group with an appropriate organizational
culture and accompanying competitive advantages should be chartered. An organization’s speed
to solution to meet consumer demand represents their “gap to ideal” (Dengler, 2006). The “gap
to ideal” is the amount of time, and associated profits, lost between when an organization
determines a strategy and the lag before the strategy is fully implemented.
Within any organization, some employees are so entrenched in their ways that culture
change methodology will have little effect (Dengler, 2006). Resistance to change by a
percentage of employees is consistent with traditional organizational culture theory. Situations
such as these demonstrate the need for chartered rotating teams. It is important to have groups
that are chartered to meet particular organizational goals and that these chartered groups are
disassembled at the conclusion of a project, once objectives have been achieved. Disassembling
groups at the conclusion of a project helps eliminate entrenchment and enables a nimble
organization. Each specific product market requires a unique organizational culture in order to
maximize the balance between meeting consumer demand and achieving profitability. In this
author’s opinion, structure and control-oriented workplace culture is more appropriate for mature
industries requiring high levels of documentation. However, in cases where complex and
creatively productive work is required, a highly structured workplace culture would stifle
employee performance.
Once the charter’s goal is complete, the group disbands, reorganizes, and outlines a
revised charter and group for a new project. The charter or “rules of engagement” can be shown
as an example from Skunk Works Kelly Johnson’s Operating Rules other than just motto (Rich

COMPETITIVE ADVANTAGE, PROFITABILITY, AND GROWTH 33
& Janos, 1994, p.51). The development of a “Tiger Team” or DARPA, would be another
example of a specific group with a charter defining their scope. The key factors are specific
focus and finite project lifespan. Rotation of formalized teams is paramount for the quick
adaption to occur. Rotation will allow for area specialists to do what they do best right away,
instead of redeveloping skills, and will also allow for cross training of other individuals along the
way.
The degree to which a firm has a competitive advantage within a market will determine
its success and prosperity in that market. Lockheed Martin’s Skunk Works is a premier example
of an organization utilizing a specific, tailored team to meet a customer demand, which
Lockheed could not meet with its traditional company culture. The Skunk Works became such a
successful model that it is now a ubiquitous term relating to an intrapreneurship shelter to protect
innovators from the operations of daily business (Rich & Janos, 1994). Businesses are not given
their advantages, but have developed traits, e.g. skills, knowledge and capabilities as a unit
within their organizations, and have made these part of their organizational culture.
Proposal for future research. If the approach to competitive advantage is to be a
holistic process, involving a firm to be competitive at conception through the user experience of
the product, then determining organization type based on its size should be considered a critical
step of product development.
Adaptive manufacturers are working to push profitable activities outside the company in
a fashion that does not benefit competitors (Reeves & Deimler, 2011). This breaks the classic
management supervisory style of relying on strong control mechanisms. To enable a system
without direct control mechanisms, a reputable trust needs to be developed between the
participants in the system.

COMPETITIVE ADVANTAGE, PROFITABILITY, AND GROWTH 34
Organization employee size does not seem to affect the company’s
interaction/moderating effect (Soh, 2005). A key looking forward for businesses will be the
correlation between growth of the firm and profitability. Touch labor and physical location
employment positions are continuing to dwindle with the implementation of new technologies.
The removal of human labor, with the increasing demand for speed to solution in the
marketplace, is what will need to be tracked in order to find the next model for business. As the
classic business model defines business success through correlation of profitability and growth of
the firm, the future model of business may be a correlation between competitive advantage and
profitability.
Summary of Literature Review
The literature review features a definition of competitive advantage and a discussion of
the intangible traits leading to sustaining a competitive advantage. Organizational culture was
discussed and how the many inputs to an organizational culture lead to a different experience for
the individual and the firm as a whole. It was noted that the difficult to duplicate factors of
organizational culture can be adjusted and tuned to create competitive advantage. The
theoretical metric of Competitive Advantage Index was defined. Competitive advantages
intangible traits in relation to their use in general industry were discussed. A proposal to further
examine the correlation of profitability, growth of the firm, and competitive advantage over time
was made to better understand changes in the increasingly volatile marketplace.
Study Methodology
Introduction
The following section outlines the research methodology and design for this study.
Research variables are identified. Research questions with their corollary hypotheses are stated.

COMPETITIVE ADVANTAGE, PROFITABILITY, AND GROWTH 35
Methods and data are analyzed. Limitations and assumptions are outlined. The subsequent
section provides concluding results for the study and interprets the findings.
Population and Sample
The target population for this study was publicly traded companies in the United States of
America as ranked by the Fortune Magazine. The population for the study was the companies
listed and ranked in the Fortune 1000. This population was chosen because of the amount of
data available to the public in both detail and spanning over a defined five-year timeframe.
Financial income statements from 2011 to 2015 were acquired for each organization from
Morningstar.com. Articles for analysis of organization market behavior were sourced from The
Motley Fool, which is a financial trade discussion website.
Variables
The researcher chose to use Alfadda’s (2010) theoretical model of the Competitive
Advantage Index (CAI) as the primary indicator of a firm’s competitive advantage in this study.
Essential values necessary to calculate the CAI of a firm are that firm’s annual revenue growth
rate and the relative industry revenue growth rate. These variables were derived from the income
statements of the companies from the Fortune 1000 list.
Additional variables were pulled from the income statements to provide a comparison
between the Competitive Advantage Index and profitability and growth of the firm. Profitability
is defined as yearly change in net income. Growth of the firm is defined as yearly change in
gross profit.
In order to provide a framework for analysis, the researcher looked to Alfadda’s (2010)
key performance enablers of competitive advantage. According to Alfadda, key performance
enablers of competitive advantage include innovation; social legitimacy; flexibility of cultural
COMPETITIVE ADVANTAGE, PROFITABILITY, AND GROWTH 36
values; organizational learning and competency building; management, organizational, and
strategy capabilities to reconfigure, sense, absorb, integrate, and innovate; and global aptness and
cultural intelligence. Using graphical analysis of a relative industry’s CAI, the firm, or firms,
with the greatest competitive advantage were identified. An individual organization’s activities
were then analyzed through a review of articles from The Motley Fool website. The developed
literature review enabled the researcher to identify which CAI enabler(s) the organization
utilized in order to achieve ‘best in class’ competitive advantage in its industry sector.
Main Research Questions
The main research question (H1) and the three related research questions, numbered (H2)
through (H4), are as follows:
H1: How important are the intangible factors of an organizational culture and how do
they affect the output of a marketplace sustainable competitive advantage in the forms of
profitability and growth when altered?
H2: How is competitive advantage distributed within a defined industrial sector?
H3: How is competitive advantage distribution similar or different between different
industrial sectors?
H4: Is there a correlation between organization growth and profitability, and if so, does it
still validate the conventional business model?
Corollary Hypotheses
From the research questions above, there are three related corollary hypotheses,
numbered (H5) through (H7).
H5: Certain competitive advantage traits are more valuable than others and there are
trends per industrial sector.

COMPETITIVE ADVANTAGE, PROFITABILITY, AND GROWTH 37
H6: There are trends between industrial sectors displaying early adopters to competitive
advantage traits.
H7: There is no longer a predictable correlation between profitability and growth of the
firm.
Methods and Data Analysis
Competitive advantage can be specific to industrial area; therefore, the study population
was organized by both Fortune 1000 rank and by industrial area. Fortune identified a total of 21
different industrial sectors, which the researcher applied to the companies in this study.
Individual firm data were then collected and the variables for profitability, growth of the firm,
revenue growth, and competitive advantage index were calculated. Four years of data were then
averaged. The results are displayed graphically. The statistical comparison between variables
was done by analysis of variance (ANOVA). The results are displayed in a matrix. Utilizing the
competitive advantage index comparison, businesses breaking the standard trend were
investigated for competitive advantage traits contributing to their success. Competitive
advantage traits were then recorded in a comparison matrix.
Limitations and Assumptions
This study relies on the viability of the theoretical framework of the Competitive
Advantage Index (CAI) as defined by Alfadda (2010). Without this type of statistical measure
from available public data, a study such as this would require an enormous scope to
appropriately poll and survey industrial sectors. Industrial sector market growth is defined from
the sample in the Fortune 1000. It is known that the specified market sectors are larger than
what the Fortune 1000 defines. Data used in the study must be in the form of a similar income
statement in order to be comparable.

COMPETITIVE ADVANTAGE, PROFITABILITY, AND GROWTH 38
Summary
In the study methodology section, the researcher discussed the research and analysis
outline for the project. The project population and sample were outlined, and data analysis and
limitations of the study were summarized. Research findings are presented in the next section.
The final section discusses the study’s main conclusions and recommendations.
Results
Overview
The results section of the paper covers the process of obtaining answers to the main and
corollary hypothesizes. Leading up to interpretation of the findings, the individual concluding
results are analyzed and discussed. Finalized results from the hypothesizes are interpreted and
recommendations are made based on the findings. The author concludes the section with
remarks regarding the present and future implications of the study.
Research Purpose, Research Questions and Related Hypotheses
The purpose of this research is to determine the relationship between competitive
advantage and profitability and growth of the firm. A lack of correlation between profitability
and growth of the firm would prove whether or not the conventional business model is still valid
in today’s volatile marketplace. If the conventional business model no longer holds, then
industry needs new tools for determining success of the firm. This research analyzes the
viability of six competitive advantage traits and their distribution of use by leaders within
relative industrial sectors. This analysis should provide a framework for understanding market
trends for sustainable business growth. To test these predictions, the main research question (H1)
and the three related research questions, numbered (H2) through (H4), are as follows:

COMPETITIVE ADVANTAGE, PROFITABILITY, AND GROWTH 39
H1: How important are the intangible factors of an organizational culture and how do
they affect the output of a marketplace sustainable competitive advantage in the forms of
profitability and growth when altered?
H2: How is competitive advantage distributed within a defined industrial sector?
H3: How is competitive advantage distribution similar or different between different
industrial sectors?
H4: Is there a correlation between organization growth and profitability, and if so, does it
still validate the conventional business model?
From the research questions above, there are three related corollary hypotheses, numbered (H5)
through (H7).
H5: Certain competitive advantage traits are more valuable than others and there are
trends per industrial sector.
H6: There are trends between industrial sectors displaying early adopters to competitive
advantage traits.
H7: There is no longer a predictable correlation between profitability and growth of the
firm.
Statistical techniques used. This study utilized two primary statistical techniques
for analysis – ANOVA and the Competitive Advantage Index.
Analysis of Variance (ANOVA: Single Factor) was used to test the significance of the
linear relationship of separate variables. The variables of profitability, growth of the
firm, and Competitive Advantage Index (CAI) were all compared independently and
together.

COMPETITIVE ADVANTAGE, PROFITABILITY, AND GROWTH 40
Competitive Advantage Index (CAI) is a theoretical model used to develop a numerical
value to summarize a firm’s competitive advantage. CAI was calculated in this study
using the growth of the firm’s value averaged over the sample time period and then
compared to the relative industry sector’s growth during the same time frame (Alfadda,
2010).
Description of the profile of the sample and selection criteria. Two sets of data
for the sample were obtained from the following sources.
1. The Fortune 1000 list (2017) of the top 1000 companies in the U.S. by revenues. The
companies are ranked by their respective financial years. The companies were organized
into 21 different relative industrial sectors as identified by the Fortune 1000. The total
Fortune 1000 list was utilized in the study to allow the largest sample size possible for the
21 identified relative industrial sectors.
2. Morningstar.com (2017) was used to gather the correlating income statements for the
listed companies in the Fortune 1000. These are the income statements for publicly
traded companies only and the data were presented as the company presented it. Income
statements could only be utilized if the areas of net income, gross profit, and revenue
were explicitly listed.
Table 5 shows a summary of information on the industrial sectors chosen for this research,
including population size, sample size, etc.

COMPETITIVE ADVANTAGE, PROFITABILITY, AND GROWTH 41
Note. This table shows the industrial sector breakup of the Fortune 1000 List analyzed in this study.
Industrial Sector Specific Results
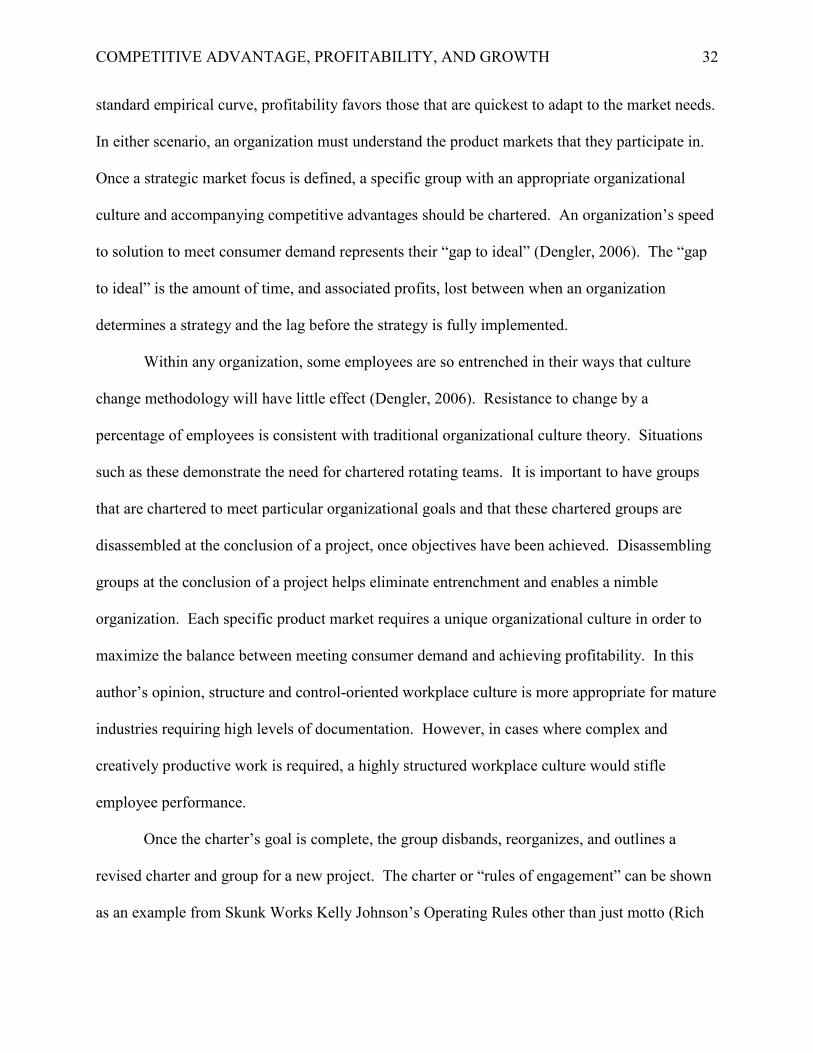
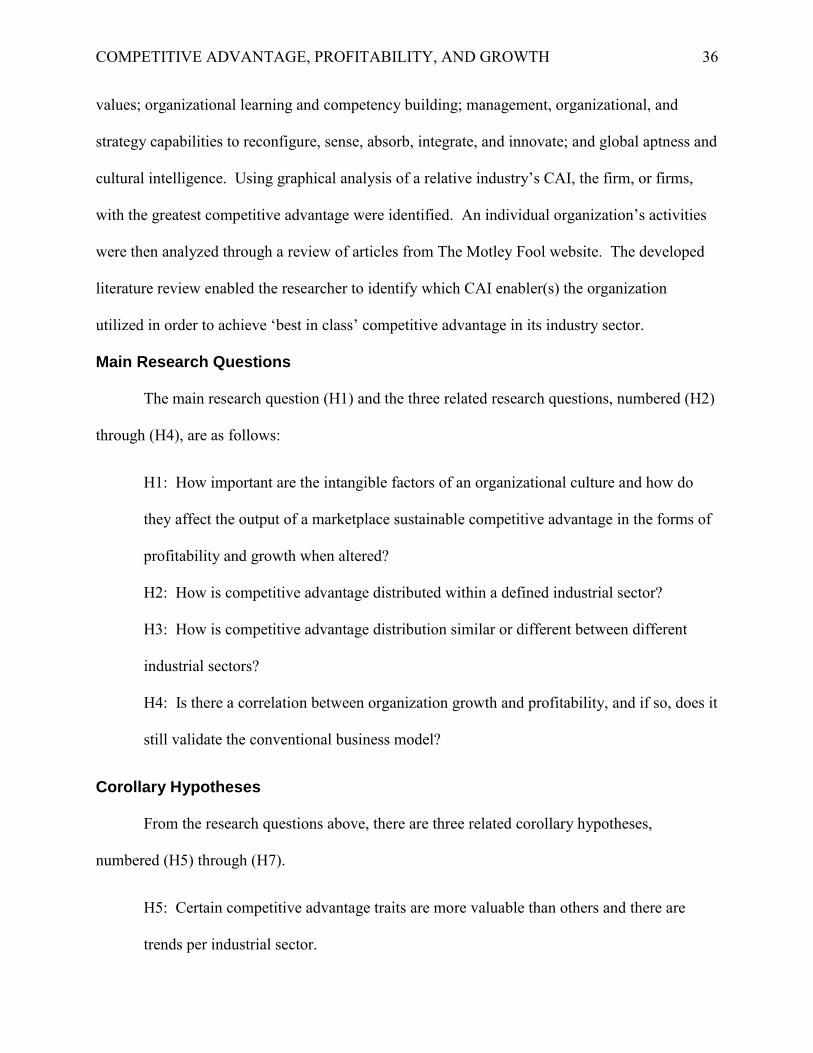
Aerospace and defense. Boeing is dominating the field in competitive advantage
and market share of the Aerospace and Defense industrial market sector (see Figure 6 and Figure
7). Boeing’s defense business is 40% larger than Airbus (Smith R., 2016b). Boeing recently
received a contract for Apache helicopters from the UAE. Because of the speed at which Boeing
is able to produce the Apache helicopter, their bottom line will get an immediate boost. In the
area of space launches, Boeing’s partnership with Lockheed Martin, United Launch Alliance, is
utilizing added payload capacity to carry CubeSats into orbit (Smith, 2016a). The area of
Industrial SectorPopulation
Size
Number of
Invalid
Entries
Sample Size
Used
Sample Size Used
(Must be >30%)
Maximum
Sample Size
Resolution
(Accuracy >15%)
Aerospace & Defense 20 7 13 65% 8%
Apparel 15 7 8 53% 13%
Business Services 51 18 33 65% 3%
Chemicals 32 12 20 63% 5%
Energy 122 16 106 87% 1%
Engineering & Construction 26 9 17 65% 6%
Financials 137 133 4 3% 25%
Food and Drug Stores 15 10 5 33% 20%
Food, Beverages & Tobacco 43 15 28 65% 4%
Health Care 75 26 49 65% 2%
Hotels, Restaurants & Leisure 25 6 19 76% 5%
Household Products 28 12 16 57% 6%
Industrials 46 15 31 67% 3%
Materials 43 10 33 77% 3%
Media 25 10 15 60% 7%
Motor Vehicles & Parts 24 5 19 79% 5%
Retailing 80 55 25 31% 4%
Technology 102 50 52 51% 2%
Telecommunications 15 2 13 87% 8%
Transportation 36 3 33 92% 3%
Wholesalers 40 18 22 55% 5%
Total 1000 439 561 56% 0%
Fortune 1000 List Source Information
Table 5
Source Information Sample Summary

COMPETITIVE ADVANTAGE, PROFITABILITY, AND GROWTH 42
CubeSats and other small inexpensive satellites is experiencing a renaissance of cost reduction.
Within the aerospace and defense industry, organizational strategy and global aptness were
identified as key competitive advantages. Organizational strategy was identified because of
Boeing’s ability to be an industry leader through multiple product markets and partnerships.
Global aptness was determined because of Boeing’s ability to meet customer needs overseas and
dominate the market share internationally.
COMPETITIVE ADVANTAGE, PROFITABILITY, AND GROWTH 43
Fig
ure
6. Pr
ofita
bilit
y an
d gr
owth
of t
he fi
rm fo
r the
Aer
ospa
ce a
nd D
efen
se S
ecto
r.
COMPETITIVE ADVANTAGE, PROFITABILITY, AND GROWTH 44
Fig
ure
7. C
ompe
titiv
e Ad
vant
age
Inde
x fo
r the
Aer
ospa
ce a
nd D
efen
se S
ecto
r.

COMPETITIVE ADVANTAGE, PROFITABILITY, AND GROWTH 45
Apparel. The company’s VF and Under Armour are leading the apparel industry in
competitive advantage (see Figure 8 and Figure 9). VF is the parent company to clothing brands
The North Face, Vans, and Timberland (Marder, 2013). Under Armour is doing better than ever
financially as the popularity of exercise continues to grow in the United States. VF’s action
sports division is their largest division and continues to grow with the exercise trend. The
primary growth for both companies is in the form of amateur athletes and casual wear for those
who want to look the part of being athletic (McNew, 2016). The greatest trend growth has been
in youth casual sportswear like branded hoodies and t-shirts. Social legitimacy and cultural
intelligence were identified as the winning competitive advantages for the apparel sector. Social
legitimacy was selected because of the United States’ willingness to identify with the solution to
the rising obesity crisis. Cultural intelligence was chosen because of VF and Under Armour
identifying people’s willingness to adopt athletic casual wear more than actual fitness wear.

COMPETITIVE ADVANTAGE, PROFITABILITY, AND GROWTH 46
Fig
ure
8. Pr
ofita
bilit
y an
d gr
owth
of t
he fi
rm fo
r the
App
arel
Sec
tor.

COMPETITIVE ADVANTAGE, PROFITABILITY, AND GROWTH 47
Fig
ure
9. C
ompe
titiv
e Ad
vant
age
Inde
x fo
r the
App
arel
Sec
tor.

COMPETITIVE ADVANTAGE, PROFITABILITY, AND GROWTH 48
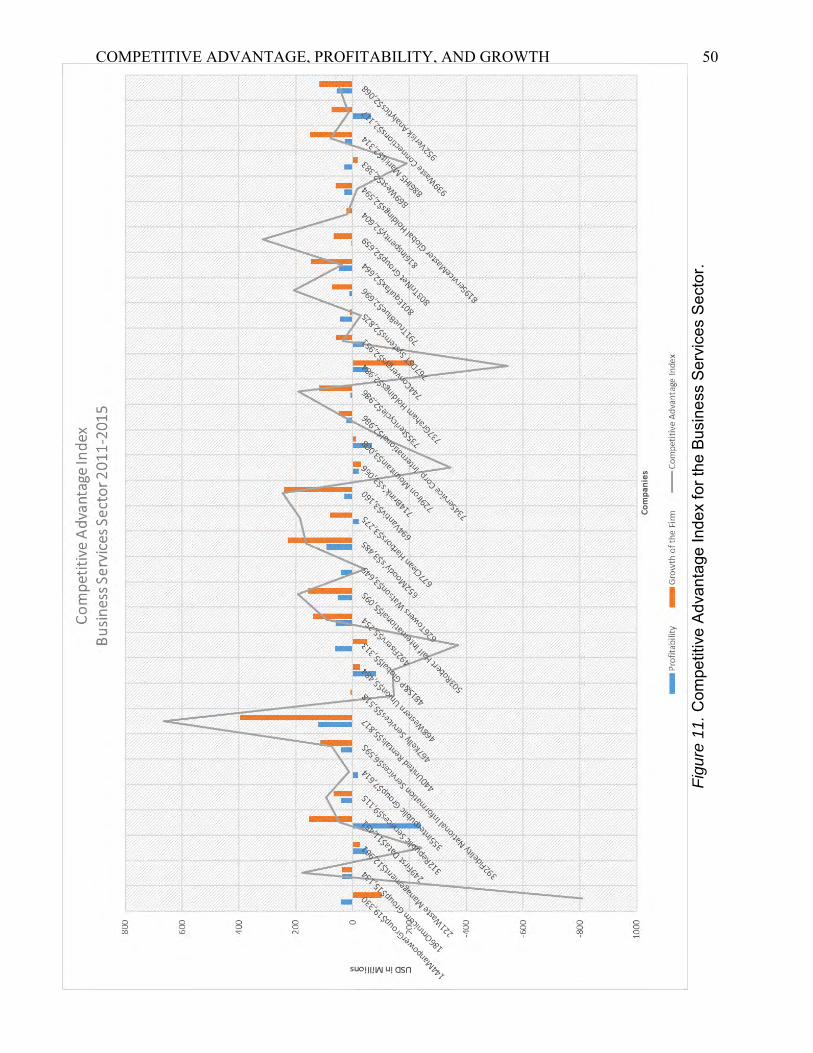
Business services. United Rentals is the most competitive firm in the business
services sector (see Figure 10 and Figure 11). The heavy equipment rental industry is highly
fragmented, which is a key reason the consolidated United Rentals model of business works so
well (Fee, 2014). The commercial construction industry is on the rise as well, which contributes
to the added growth. United Rentals was identified as implementing management strategy and
cultural intelligence as competitive advantages. Management strategy was selected because of
the original eight owners pushing for a consolidated approach in a typically fragmented industry.
Cultural intelligence was identified because of United Rentals adapting to “big construction’s”
needs and providing a “one stop shop” for their customers.

COMPETITIVE ADVANTAGE, PROFITABILITY, AND GROWTH 49
Fig
ure
10
. Pro
fitab
ility
and
grow
th o
f the
firm
for t
he B
usin
ess
Serv
ices
Sec
tor.
COMPETITIVE ADVANTAGE, PROFITABILITY, AND GROWTH 50
Fig
ure
11
. C
ompe
titiv
e Ad
vant
age
Inde
x fo
r the
Bus
ines
s Se
rvic
es S
ecto
r.

COMPETITIVE ADVANTAGE, PROFITABILITY, AND GROWTH 51
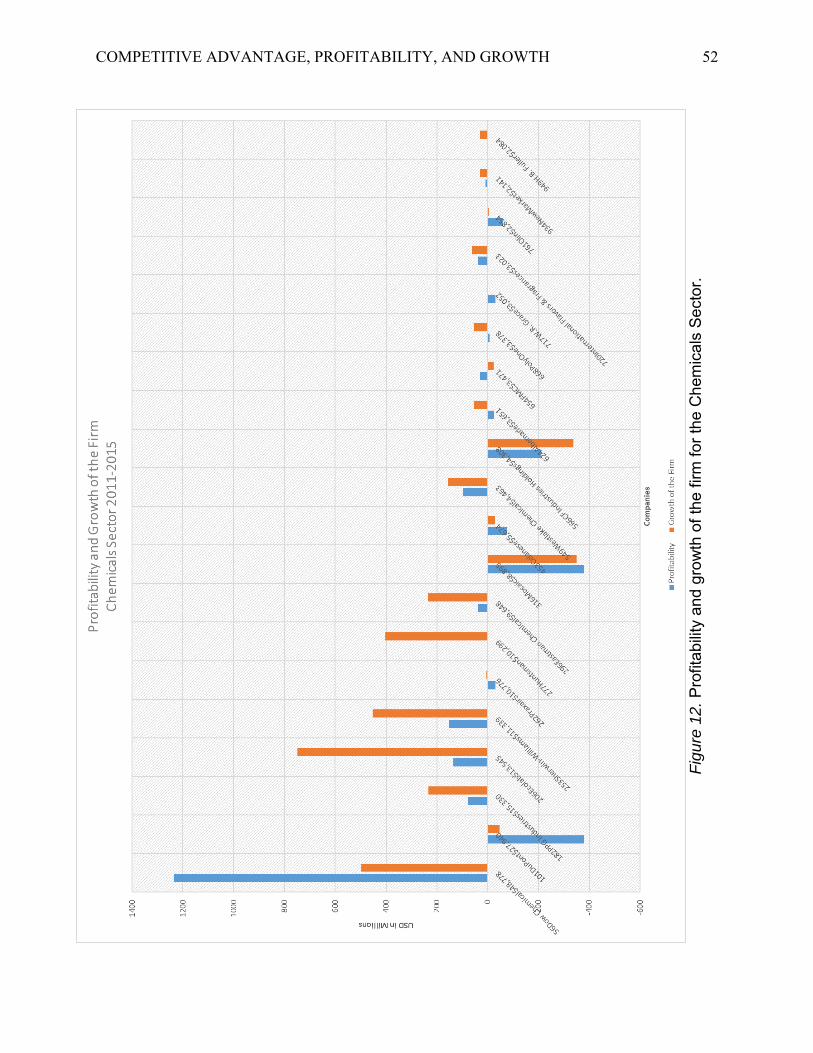
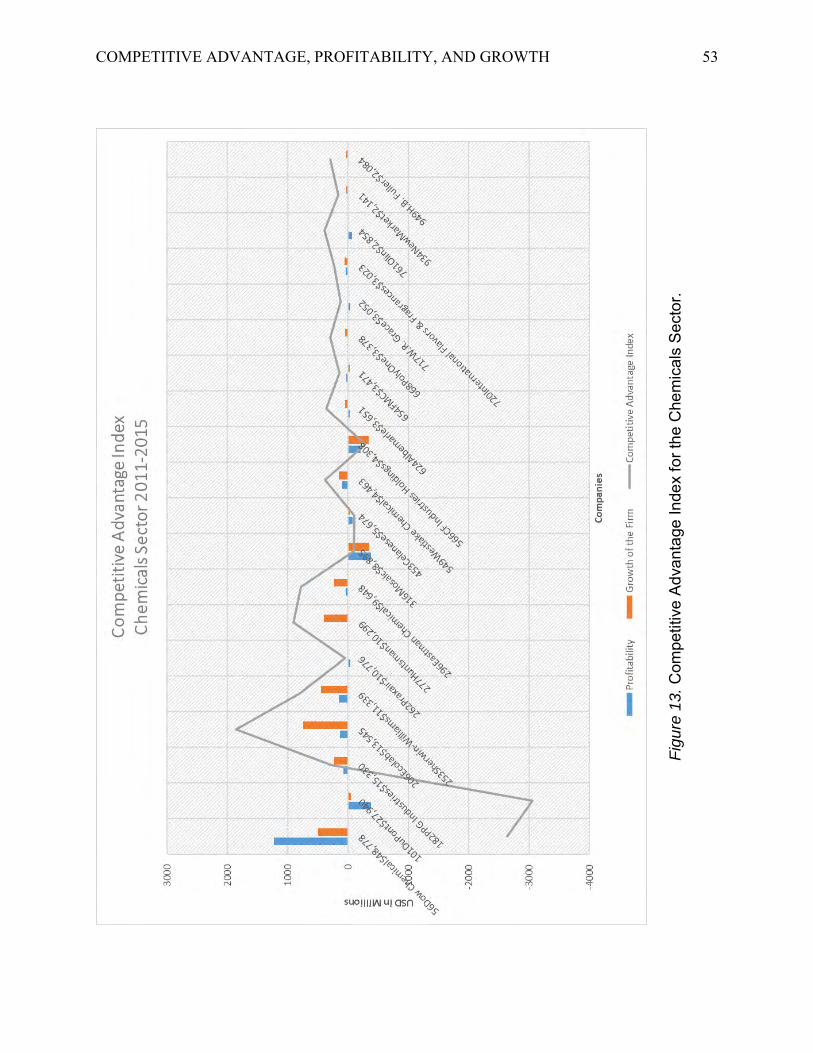
Chemicals. Ecolabs is leading the chemical sector in competitive advantage (see
Figure 12 and Figure 13). Ecolabs’s advantage comes from targeting niche industries with large
growth potential, such as in developing regions which need assistance with wastewater (Planes,
2013). A big area for growth being pursued by Ecolabs is the Indian wastewater treatment
market. Because of Ecolabs’s ability to identify and respond with market demand globally,
global aptness was chosen as a competitive advantage. Ecolabs operates in the mining and
resource exploration industry as well, which produces wastewater which needs treatment. The
treatment of this environmental waste shows a competitive advantage trait of social legitimacy.
Finally, with innovation as a competitive advantage, Ecolabs is introducing a new kitchen
cleaner for the restaurant industry.
COMPETITIVE ADVANTAGE, PROFITABILITY, AND GROWTH 52
Fig
ure
12
. Pr
ofita
bilit
y an
d gr
owth
of t
he fi
rm fo
r the
Che
mic
als
Sect
or.
COMPETITIVE ADVANTAGE, PROFITABILITY, AND GROWTH 53
Fig
ure
13
. C
ompe
titiv
e Ad
vant
age
Inde
x fo
r the
Che
mic
als
Sect
or.

COMPETITIVE ADVANTAGE, PROFITABILITY, AND GROWTH 54
Energy. Marathon Petroleum is leading the energy sector in competitive advantage (see
Figure 14 and Figure 15). Marathon Petroleum has seen large internal cost savings in the form
of synergy within the organization (Crowe, 2015, October 30). The company is changing all of
its Hess-branded stations to the Speedway brand. The management strategy changes saved
Marathon Petroleum an estimated $75 million annually and gave the organization a significant
competitive advantage (Crowe, 2015, October 30). Another internal consolidation is between
MPLX and MarkWest Energy Partners. Alternatively, Marathon Petroleum’s management also
decided to cancel its $2.2 billion Residual Oil Upgrader Expansion project (Crowe, 2015,
October 30). This project was cancelled because of better options in the current oil and gas
market. The energy sector is defined by a competitive advantage in management strategy
because of internal organizational changes streamlining the consumer experience.

COMPETITIVE ADVANTAGE, PROFITABILITY, AND GROWTH 55
Fig
ure
14
. Pr
ofita
bilit
y an
d gr
owth
of t
he fi
rm fo
r the
Ene
rgy
Sec
tor.

COMPETITIVE ADVANTAGE, PROFITABILITY, AND GROWTH 56
Fig
ure
15
. C
ompe
titiv
e Ad
vant
age
Inde
x fo
r the
Ene
rgy
Sect
or.

COMPETITIVE ADVANTAGE, PROFITABILITY, AND GROWTH 57
Engineering and construction. Lennar, the nation’s second largest homebuilder, is
leading the engineering and construction sector in competitive advantage (Frankel, 2015, June
18). See Figure 16 and Figure 17. Lennar has been able to recover faster compared to its
competition after the housing collapse. The recovery rate is determined by Lennar’s ability to
grow profitability. A main strategy that assisted in Lennar’s recovery was diversifying into land
acquisitions purchased from distressed land owners dealing during the recession. Since then,
Lennar has changed its strategy to “buy and build quickly” (Frankel, 2015, June 18). Two
innovative strategies are putting Lennar products above its competition. First, by uniformly
upgrading all housing built, a higher end product can be offered at a more competitive price.
Second, Lennar is producing multigenerational homes for either relatives or children with aging
adults. The multigenerational homes now make up 25% of all of Lennar’s business (Frankel,
2015, June 18). The two areas that stand out as Lennar’s competitive advantages are flexibility
of cultural values and management, organizational, and strategy capabilities to reconfigure,
sense, absorb and integrate. Flexibility of cultural values was chosen because of Lennar’s ability
to adapt from the market need to build multigenerational homes instead of solely single family
homes. Management strategy was chosen because of Lennar’s management seeing a shift in the
industry and responding by making strategic changes to the organization’s approach to the
market.
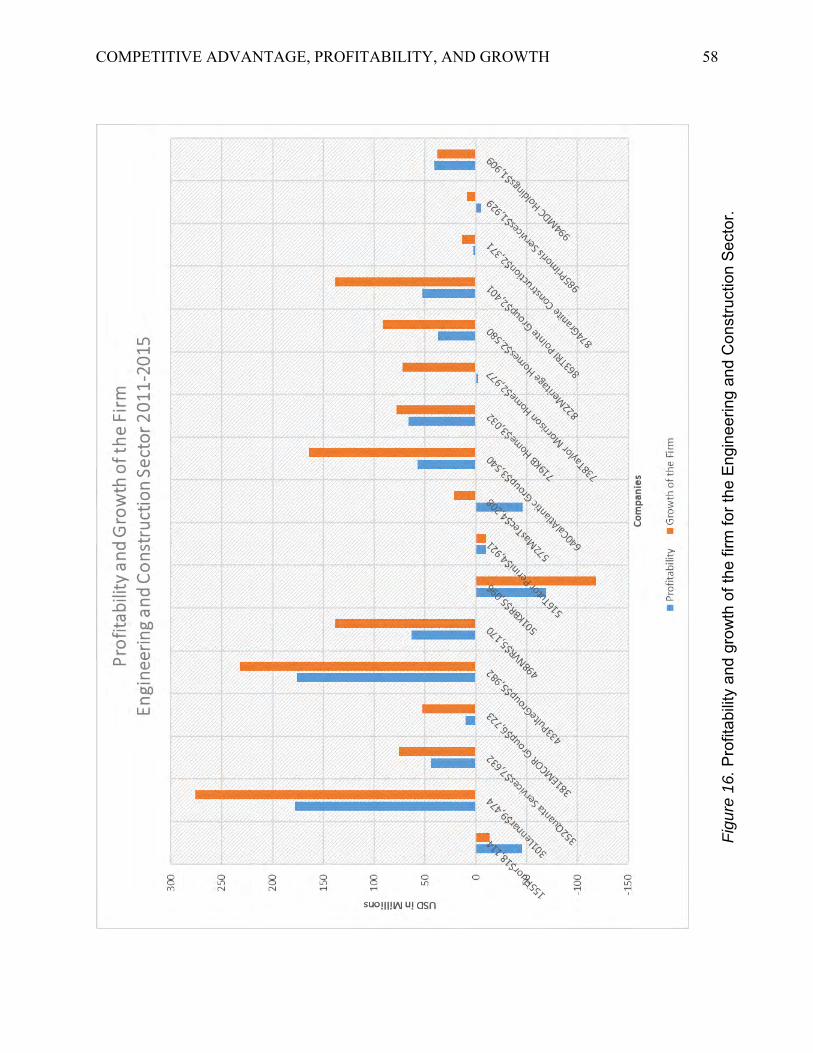
COMPETITIVE ADVANTAGE, PROFITABILITY, AND GROWTH 58
Fig
ure
16
. Pr
ofita
bilit
y an
d gr
owth
of t
he fi
rm fo
r the
Eng
inee
ring
and
Con
stru
ctio
n Se
ctor
.

COMPETITIVE ADVANTAGE, PROFITABILITY, AND GROWTH 59
Fig
ure
17
. C
ompe
titiv
e Ad
vant
age
Inde
x fo
r the
Eng
inee
ring
and
Con
stru
ctio
n Se
ctor
.

COMPETITIVE ADVANTAGE, PROFITABILITY, AND GROWTH 60
Financials. Because of a small size and several invalid entries on income statements
for firms within the financials sector, an analysis could not be made regarding trends in
competitive advantage, profitability, and growth of the firms in this industrial sector.
Food and drug stores. Similar to the financials sector, the sample size in the food
and drug stores sector was limited and statistically significant results could not be generated.
Additionally, income statements in this industrial sector were not consistent across and direct
comparisons could not be made.
Food, beverages and tobacco. Leucadia National, a conglomerate created by
Warren Buffett, is leading the food, beverages, and tobacco sectors in competitive advantage
(Ditz, 2014, July 25). See Figure 18 and Figure 19. Acting similar to financial conglomerate
Berkshire Hathaway, Leucadia National owns subsidiaries in many industries. One of its major
holdings is a 79% share in National Beef Packing (Ditz, 2014, July 25). This is significant
because of the majority beef in the United States being produced by four major beef processing
facilities, of which National Beef Packing is one. Currently, the US beef market is weak, but
looking forward, prospects are optimistic if overseas bans on US beef are removed. Leucadia’s
long-term goal is to maximize exports of natural gas from its recent purchase of Oregon LNG
(Ditz, 2014, July 25). The US Department of Energy has approved a future annual export limit
of 2.04 billion dollars of natural gas (Ditz, 2014, July 25). Leucadia National’s competitive
advantage seems to be derived from their management strategy and global aptness. Leucadia
National’s ability to position itself in diverse and profitable markets has made it a leader in this
sector. Leucadia National’s global aptness is positioning the company to make future gains from
its understanding of global markets.
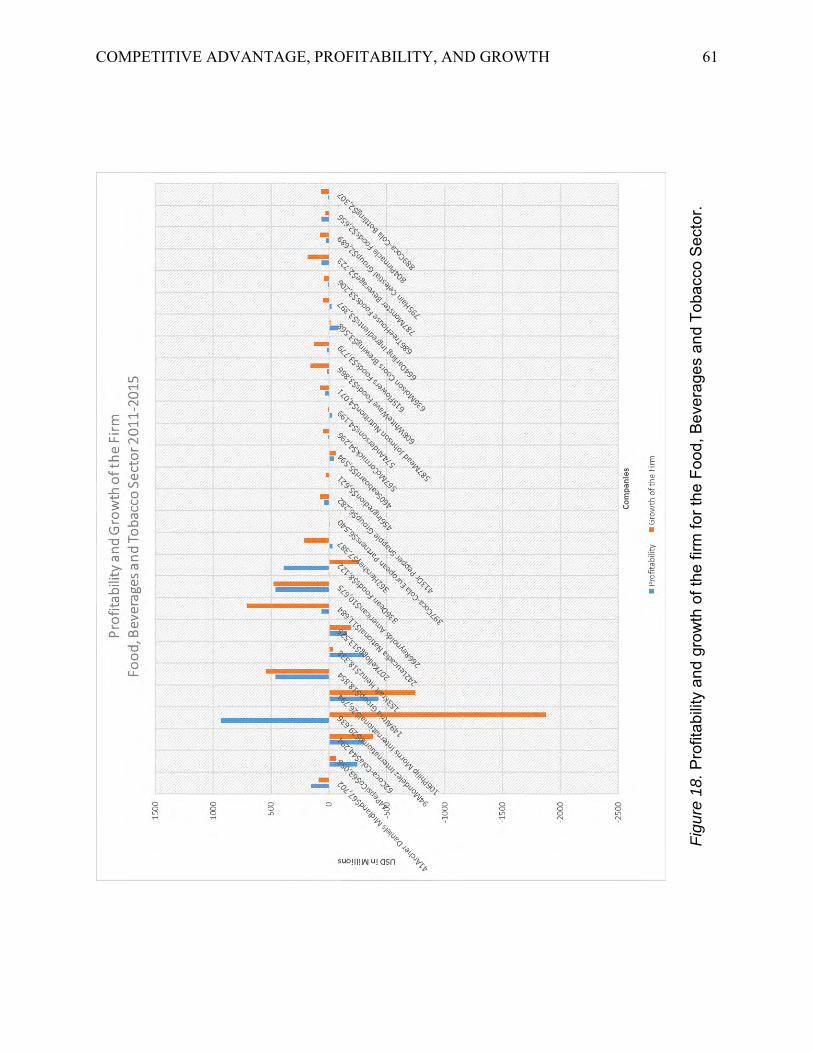
COMPETITIVE ADVANTAGE, PROFITABILITY, AND GROWTH 61
Fig
ure
18
. Pr
ofita
bilit
y an
d gr
owth
of t
he fi
rm fo
r the
Foo
d, B
ever
ages
and
Tob
acco
Sec
tor.
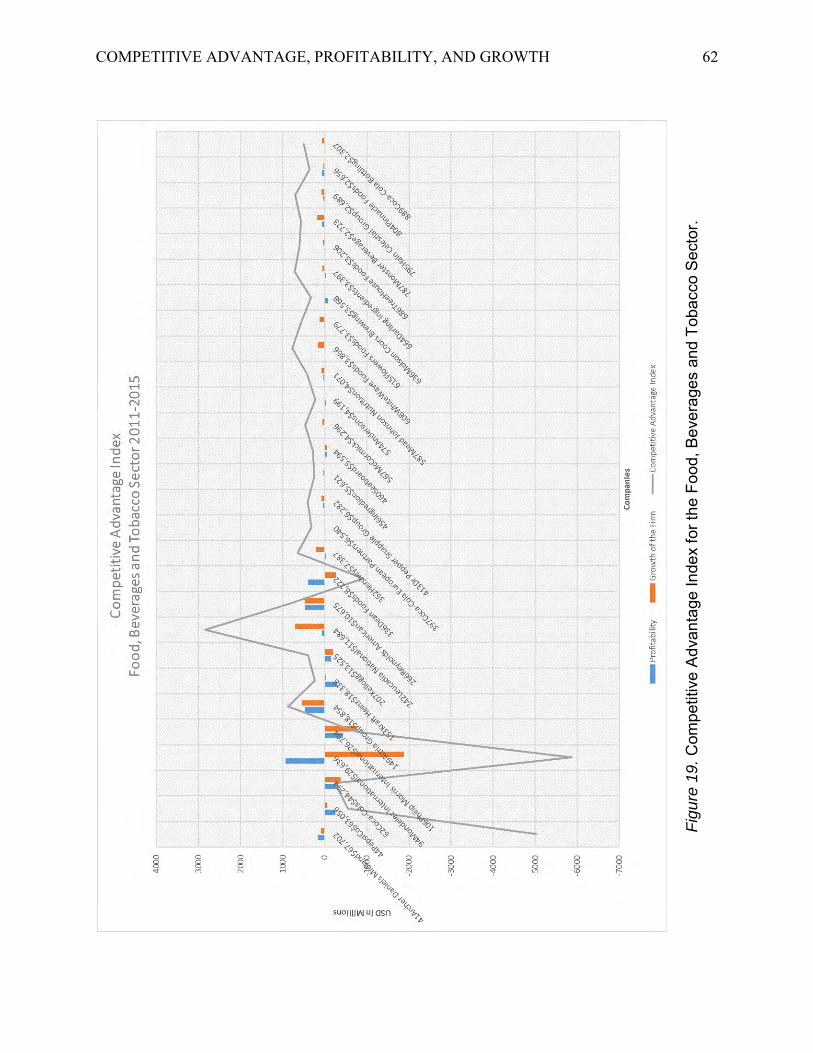
COMPETITIVE ADVANTAGE, PROFITABILITY, AND GROWTH 62
Fig
ure
19
. C
ompe
titiv
e Ad
vant
age
Inde
x fo
r the
Foo
d, B
ever
ages
and
Tob
acco
Sec
tor.

COMPETITIVE ADVANTAGE, PROFITABILITY, AND GROWTH 63
Health care. Gilead Sciences, a biotech pharmaceutical company, is leading the health
care sector in competitive advantage (Williams, 2015, December 7). See Figure 20 and Figure
21. Pushing Gilead to the lead is its hepatitis C solutions for patients with a 90% cure rate, with
little to no side effects (Williams, 2015, December 7). The HCV solution contributes to 60% of
Gilead’s sales (Williams, 2015, December 7). Upcoming innovative treatments from Gilead
include inhibiting fibrotic diseases, treatments for blood cancers, and further HCV solutions to
cover all six genotypes of the virus (Williams, 2015, December 7). Because of Gilead’s
innovative products and growth from past product knowledge, the competitive advantages
identified are innovation and organizational learning and competency building.
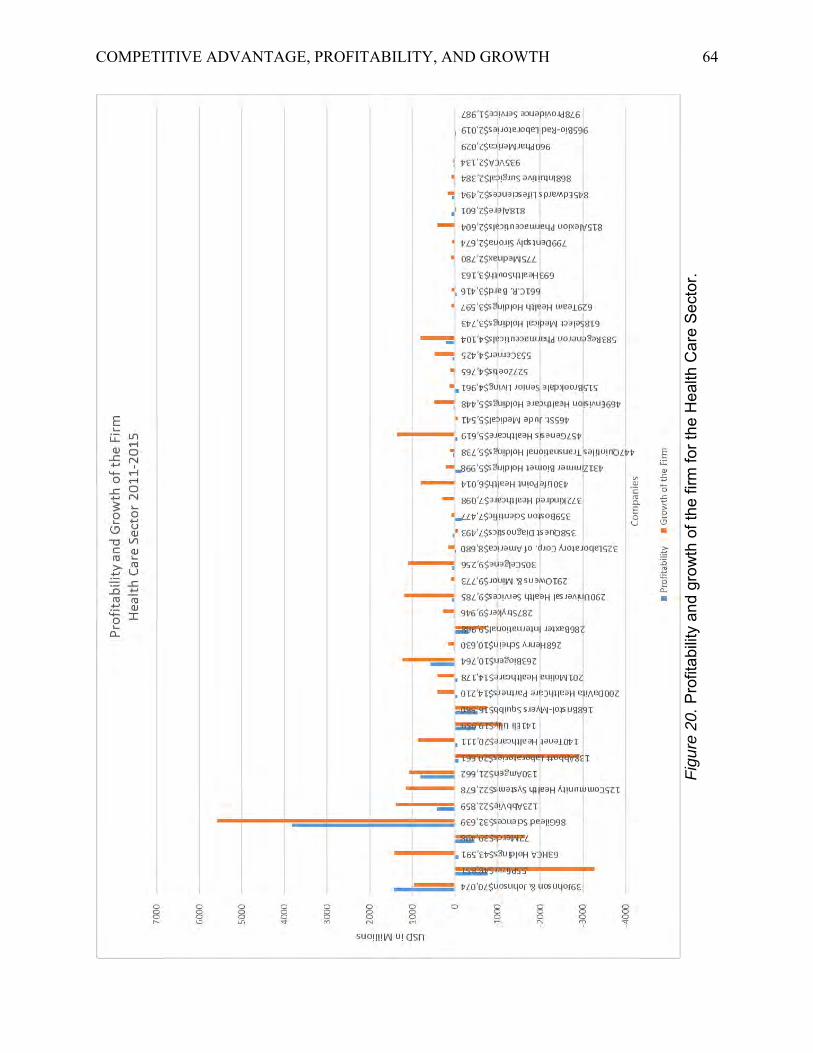
COMPETITIVE ADVANTAGE, PROFITABILITY, AND GROWTH 64
Fig
ure
20
. Pr
ofita
bilit
y an
d gr
owth
of t
he fi
rm fo
r the
Hea
lth C
are
Sect
or.
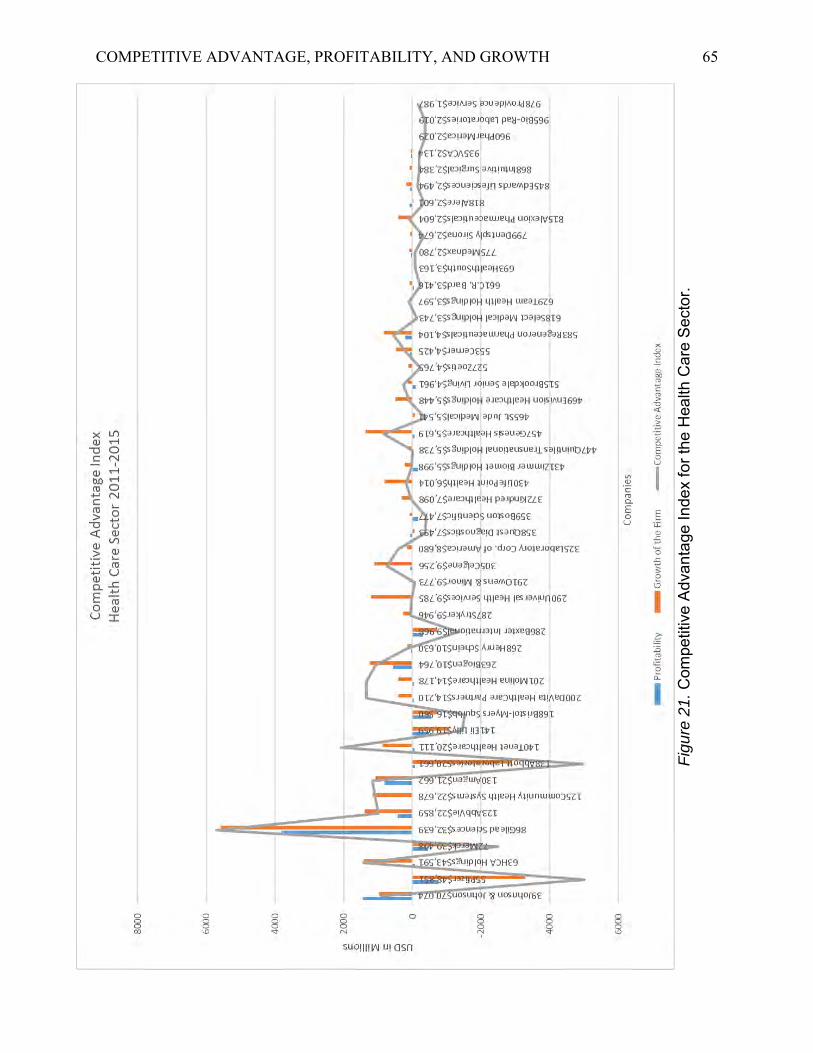
COMPETITIVE ADVANTAGE, PROFITABILITY, AND GROWTH 65
Fig
ure
21
. C
ompe
titiv
e Ad
vant
age
Inde
x fo
r the
Hea
lth C
are
Sect
or.

COMPETITIVE ADVANTAGE, PROFITABILITY, AND GROWTH 66
Hotels, restaurants and leisure. Hilton Worldwide Holdings maintains the greatest
competitive advantage for the hotels, restaurants and leisure sector (Hanley, 2014, February 9).
See Figure 22 and Figure 23. Hilton has a couple of unique features as a sector leader. First,
Hilton Worldwide Holdings was not on the public market for six years after being bought out by
The Blackstone Group. The Blackstone Group restructured Hilton Worldwide Holdings with a
more international approach. The change to Hilton’s approach was successful and the company
showed growth for multiple years. Secondly, Hilton has a debt laden balance sheet (Hanley,
2014, February 9). It is most likely this second factor which holds Hilton back from having an
even greater competitive advantage over the competition. Future growth for the company
includes 185,000 rooms, of which over 60% are in international markets (Hanley, 2014,
February 9). Hilton Worldwide Holdings was found to have competitive advantage factors in the
areas of management strategy and global aptness. Management strategy was chosen because of
the restructuring of the company to place it in a more competitive position for the industry.
Global aptness was chosen because of the company’s ability to identify and tap into foreign
markets.
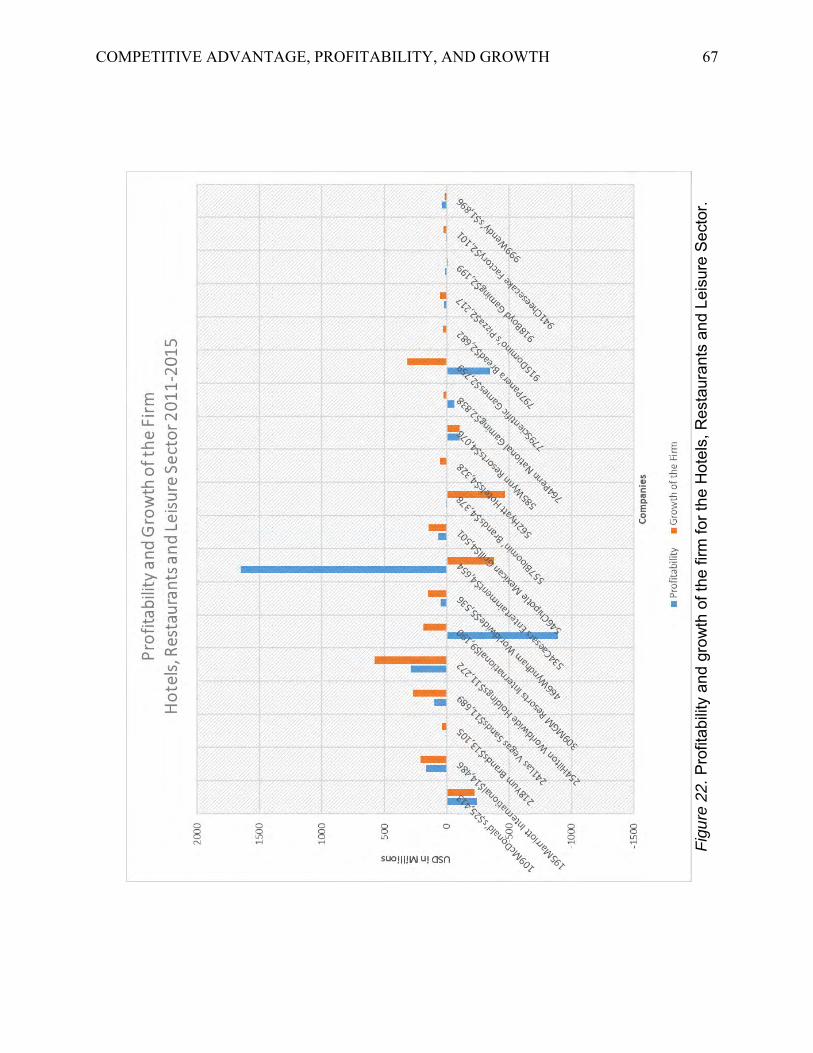
COMPETITIVE ADVANTAGE, PROFITABILITY, AND GROWTH 67
Fig
ure
22
. Pr
ofita
bilit
y an
d gr
owth
of t
he fi
rm fo
r the
Hot
els,
Res
taur
ants
and
Lei
sure
Sec
tor.

COMPETITIVE ADVANTAGE, PROFITABILITY, AND GROWTH 68
Fig
ure
23
. C
ompe
titiv
e Ad
vant
age
Inde
x fo
r the
Hot
els,
Res
taur
ants
and
Lei
sure
Sec
tor.

COMPETITIVE ADVANTAGE, PROFITABILITY, AND GROWTH 69
Household products. Mohawk Industries, a company specializing in floor-coverings,
is the sector leader for household products (Bowman, 2013, August 2). See Figure 24 and Figure
25. Two main reasons for Mohawk Industries’ success are an improving housing market and
recent acquisitions (Bowman, 2013, August 2). Mohawk recently acquired Pergo, Marazzi, and
Spano, which caused a 34.4% jump in sales in 2013 (Bowman, 2013, August 2). Organic sales
are also improving at about 6% in quarter in 2013. Improvements in the housing marked include
higher average home prices, increased number of new homes being completed, and faster
turnaround time for new home constructions between permitting and project completion
(Speights, 2012, June 25). Management strategy is likely the main competitive advantage being
utilized by Mohawk Industries. Management’s decision to purchase new acquisitions and their
ability to read the market sector supports this analysis.

COMPETITIVE ADVANTAGE, PROFITABILITY, AND GROWTH 70
Fig
ure
24
. Pr
ofita
bilit
y an
d gr
owth
of t
he fi
rm fo
r the
Hou
seho
ld P
rodu
cts
Sect
or.

COMPETITIVE ADVANTAGE, PROFITABILITY, AND GROWTH 71
Fig
ure
25
. C
ompe
titiv
e Ad
vant
age
Inde
x fo
r the
Hou
seho
ld P
rodu
cts
Sect
or.

COMPETITIVE ADVANTAGE, PROFITABILITY, AND GROWTH 72
Industrials. Colfax, a pump and valve maker, is leading the industrial sector and has
the greatest competitive advantage (see Figure 26 and 27). In 2011, Colfax moved to acquire
Charter (Chatterjee, 2011, September 27). Charter owns Howden, which covers air and gas
handling, and ESAB, which works with welding, cutting and automation (Chatterjee, 2011,
September 27). Howden is a great addition, which will improve Colfax’s pump and valve
business. ESAB will give Colfax a solid foundation to compete in the fabrication industry.
Competency building and management strategy were determined to be the competitive
advantages that Colfax leverages best. The research identified competency building as one of
the key competitive advantages held by Colfax because of its making acquisitions to transfer
knowledge and to improve its standing in the pump and valve market. The acquisitions, which
were made to better position the organization for future growth and stability, indicate that
management strategy is also a strength of Colfax.
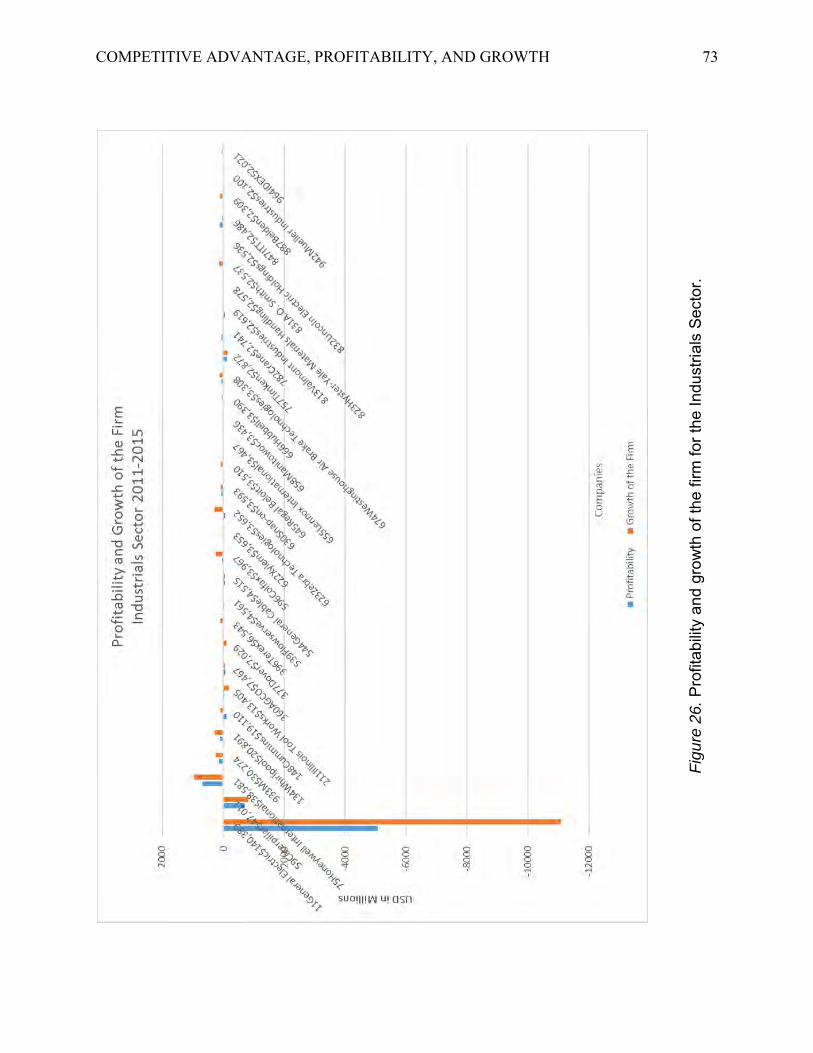
COMPETITIVE ADVANTAGE, PROFITABILITY, AND GROWTH 73
Fig
ure
26
. Pr
ofita
bilit
y an
d gr
owth
of t
he fi
rm fo
r the
Indu
stria
ls S
ecto
r.

COMPETITIVE ADVANTAGE, PROFITABILITY, AND GROWTH 74
Fig
ure
27
. C
ompe
titiv
e Ad
vant
age
Inde
x fo
r the
Indu
stria
ls S
ecto
r.

COMPETITIVE ADVANTAGE, PROFITABILITY, AND GROWTH 75
Materials. Packaging Corporation of America, a producer of high-quality packaging
solutions, is the competitive advantage leader for the materials sector (Saglimbeni, 2013, April
22). See Figure 28 and Figure 29. Packaging Corp. is the fastest growing company in the
materials sector because of economic demand (Saglimbeni, 2013, April 22). The current
industrial market requires more packaging because of more goods being shipped by individual
consumers and businesses (Saglimbeni, 2013, April 22). Packaging Corp. has also recently
acquired its closest rival Boise to increase the organization’s overall capacity. The acquisition
positioned Packaging Corp. to be the fourth largest company in the industry (Saglimbeni, 2013,
April 22). Packaging Corp. was identified to have competency building and management
strategy as competitive advantages. The recent acquisition was a solid move to become an
industry leader through removing competition while reading the market for future areas of
growth. The acquisition also positioned Packaging Corp. to grow to effectively meet market
demand with additional production capabilities and a new competency area.

COMPETITIVE ADVANTAGE, PROFITABILITY, AND GROWTH 76
Fig
ure
28
. Pr
ofita
bilit
y an
d gr
owth
of t
he fi
rm fo
r the
Mat
eria
ls S
ecto
r.

COMPETITIVE ADVANTAGE, PROFITABILITY, AND GROWTH 77
Fig
ure
29
. C
ompe
titiv
e Ad
vant
age
Inde
x fo
r the
Mat
eria
ls S
ecto
r.

COMPETITIVE ADVANTAGE, PROFITABILITY, AND GROWTH 78
Media. Discovery Communications and Live Nation Entertainment are leading the
media sector and have the greatest competitive advantage. Discovery Communications is
achieving industry leading revenue growth (Saglimbeni, 2014, April 22). See Figure 30 and
Figure 31. Most of this growth is connected to the hit show The Deadliest Catch (Saglimbeni,
2014, April 22). Learning from the show’s success, Discovery Communications has produced
other similar shows, such as Gold Rush and Naked and Afraid. This genre expansion has been
inexpensive and has maintained Discovery Communications’ positioning in the market.
Live Nation Entertainment, a live entertainment organization operating in live music
events, ticketing services, sponsorship and advertising sales, and artist management and services,
is expanding its gross profit margins through internal competency expansion (Malin, 2015, July
20). Although the overall number of fans going to live events is slowly dropping, Live National
Entertainment can increase the profit from each fan through multiple integrated purchases. A
typical fan buys tickets from a ticket platform, like Ticketmaster, sees advertising sold by the
company, and purchases merchandise. The integration of multiple purchases per user garners
Live Nation Entertainment an additional 14.4% profit above its functional profit margin (Malin,
2015, July 20). The competitive advantage factor which is most effective in the media sector is
competency building, which is indicated by Discovery Communications and Live Nation
Entertainment’s ability to effectively build internal products to enhance the customer experience
and to maintain their customer base.

COMPETITIVE ADVANTAGE, PROFITABILITY, AND GROWTH 79
Fig
ure
30
. Pro
fitab
ility
and
grow
th o
f the
firm
for t
he M
edia
Sec
tor.

COMPETITIVE ADVANTAGE, PROFITABILITY, AND GROWTH 80
Fig
ure
31
. C
ompe
titiv
e Ad
vant
age
Inde
x fo
r the
Med
ia S
ecto
r.

COMPETITIVE ADVANTAGE, PROFITABILITY, AND GROWTH 81
Motor vehicles and parts. Ford Motors is the competitive advantage leader for the
motor vehicles and parts sector (see Figure 32 and Figure 33). Ford is seeing major growth in
the United States because of a changeover to an aluminum-body F-150 (Levine-Weinberg,
2015b, December 6). The switch from a steel to aluminum body disrupted Ford’s sales during
2015, but they recovered by the end of the year with more retail than fleet sales 150 (Levine-
Weinberg, 2015b, December 6). It was initially thought that Ford would have to increase its
incentives to see a F-150 sales recovery, but Ford maintained steady sales growth. Ford is also
seeing sales growth in China because of their crossover SUVs (Rosevear, 2015, December 7).
Ford pursued the Chinese market by sending over 15 new vehicle makes in 2015 and offering a
China exclusive Lincoln Continental. Ford has the competitive advantage traits of innovation
and global aptness. Innovation is one of Ford’s competitive advantage traits because of the
development and market entry of an aluminum bodied automobile. Global aptness is a
competitive advantage trait because of the market entry and retail growth of the Chinese
automotive market.

COMPETITIVE ADVANTAGE, PROFITABILITY, AND GROWTH 82
Fig
ure
32
. Pr
ofita
bilit
y an
d gr
owth
of t
he fi
rm fo
r the
Mot
or V
ehic
les
and
Parts
Sec
tor.

COMPETITIVE ADVANTAGE, PROFITABILITY, AND GROWTH 83
Fig
ure
33
. C
ompe
titiv
e Ad
vant
age
Inde
x fo
r the
Mot
or V
ehic
les
and
Parts
Sec
tor.

COMPETITIVE ADVANTAGE, PROFITABILITY, AND GROWTH 84
Retailing. Penske Automotive Group is the company with the strongest competitive
advantage in the retailing sector (see Figure 34 and Figure 35). Penske Automotive Group is a
new- and used-car dealer with strong sales in both the U.S. and the U.K. (Duprey, 2013, July 17).
The economy from 2013 through 2016 was slow going for sales globally (Smith, 2016c, October
27). In the slow global economy, a big factor holding back Penske Automotive Group from
better revenue, was the weak exchange rate with the U.K. (Smith, 2016c, October 27). Penske
Automotive Group’s top competitive advantage trait is global aptness for the ability to maintain
sales overseas in a slow market.
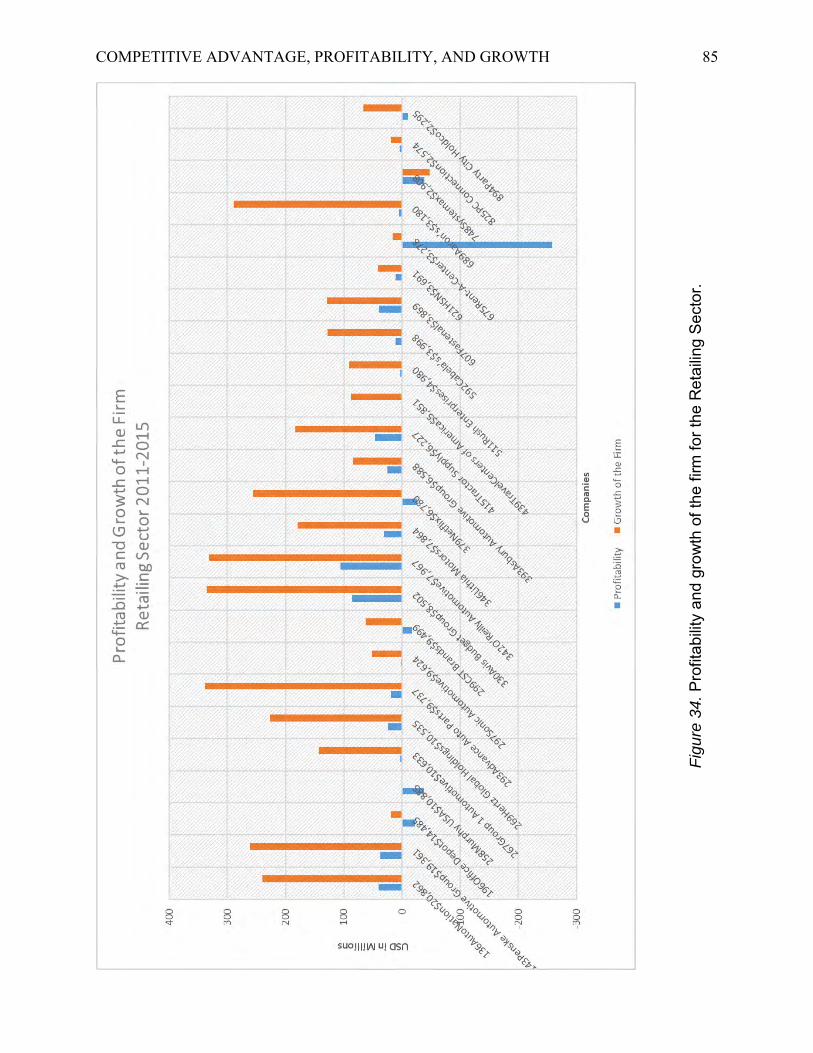
COMPETITIVE ADVANTAGE, PROFITABILITY, AND GROWTH 85
Fig
ure
34
. Pr
ofita
bilit
y an
d gr
owth
of t
he fi
rm fo
r the
Ret
ailin
g Se
ctor
.

COMPETITIVE ADVANTAGE, PROFITABILITY, AND GROWTH 86
Fig
ure
35
. C
ompe
titiv
e Ad
vant
age
Inde
x fo
r the
Ret
ailin
g Se
ctor
.

COMPETITIVE ADVANTAGE, PROFITABILITY, AND GROWTH 87
Technology. Amazon is the competitive advantage leader in the technology sector (see
Figure 36 and Figure 37). Amazon created competitive advantage for itself in several ways:
Amazon Web Services, Amazon Prime memberships, and utilization of Fulfilment by Amazon
(Levy, 2015, December 23). Amazon Web Services has been growing at a rate of 49% for years
and profit margins have been maintained despite price cuts to remain competitive (Levy, 2015,
December 23). Prime Day was created to celebrate the company’s 20th anniversary in 2014 and
bring Christmas to all Amazon Prime members in July. After the introduction of Prime Day, the
number of Amazon Prime memberships greatly increased (Levy, 2015, December 23). Also, the
success of Prime Day shipments for third-party sellers greatly increased Amazon’s logistics
group, Fulfilment by Amazon. Because of these developments, Amazon is being identified with
the competitive advantages of innovation and organizational learning and competency building.

COMPETITIVE ADVANTAGE, PROFITABILITY, AND GROWTH 88
Fig
ure
36
. Pr
ofita
bilit
y an
d gr
owth
of t
he fi
rm fo
r the
Tec
hnol
ogy
Sect
or.
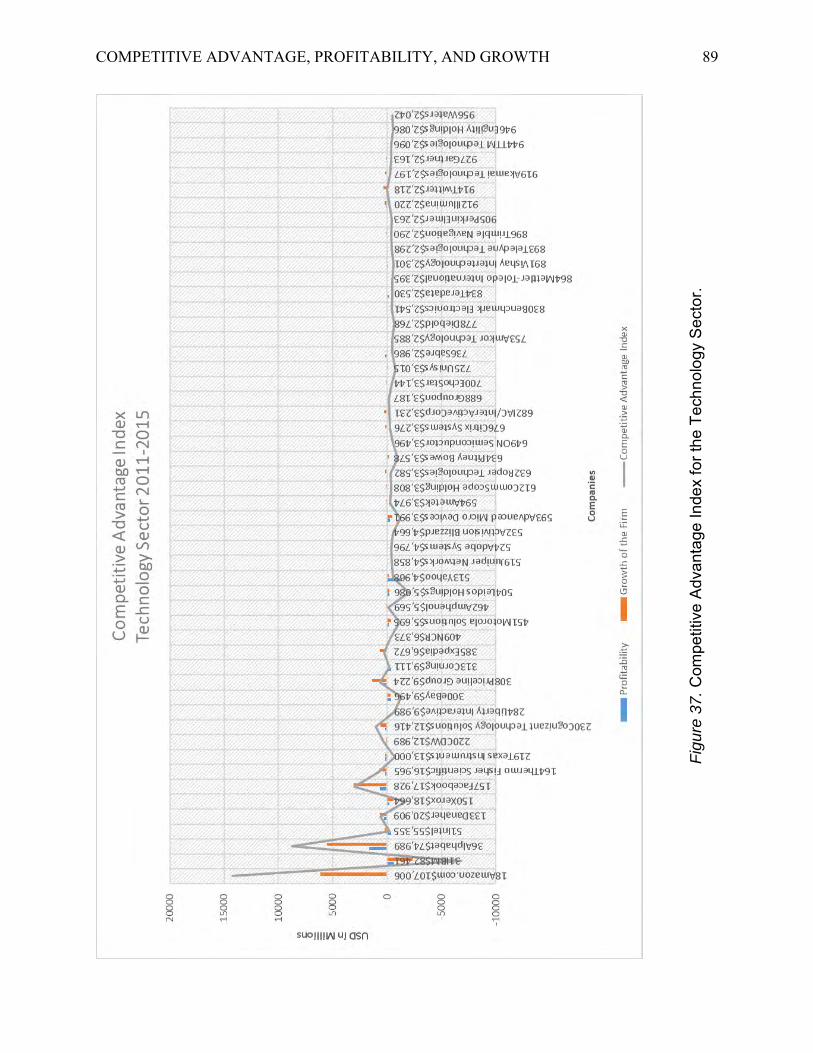
COMPETITIVE ADVANTAGE, PROFITABILITY, AND GROWTH 89
Fig
ure
37
. C
ompe
titiv
e Ad
vant
age
Inde
x fo
r the
Tec
hnol
ogy
Sect
or.

COMPETITIVE ADVANTAGE, PROFITABILITY, AND GROWTH 90
Telecommunications. Verizon is leading the pack in competitive advantage for the
telecommunications sector (see Figure 38 and Figure 39). When it comes to having an
advantage, having the best product is a good place to start. Verizon Communications’ network is
the top-performing network in the nation and it is unlikely that the competition will be able to
beat them anytime soon (Neiger, 2015, August 22). This does not come without a cost, though,
as Verizon is investing heavily in its infrastructure to ensure its network dominance. Verizon is
also taking an aggressive stance when it comes to customer retention and upselling products
(Kline, 2015, June 1). Verizon currently is monitoring “billions of data points a day from 7
million Verizon FiOS customers” (Kline, 2015, June 1, para. 6). Using this information from
data mining, customer service agents can accurately assess customer resizing packages and sell
new services. Verizon Communications leverages organizational learning and competency
building and organizational strategy capabilities to maintain its competitive advantage.

COMPETITIVE ADVANTAGE, PROFITABILITY, AND GROWTH 91
Fig
ure
38
. Pro
fitab
ility
and
grow
th o
f the
firm
for t
he T
elec
omm
unic
atio
ns S
ecto
r.

COMPETITIVE ADVANTAGE, PROFITABILITY, AND GROWTH 92
Fig
ure
39
. C
ompe
titiv
e Ad
vant
age
Inde
x fo
r the
Tel
ecom
mun
icat
ions
Sec
tor.
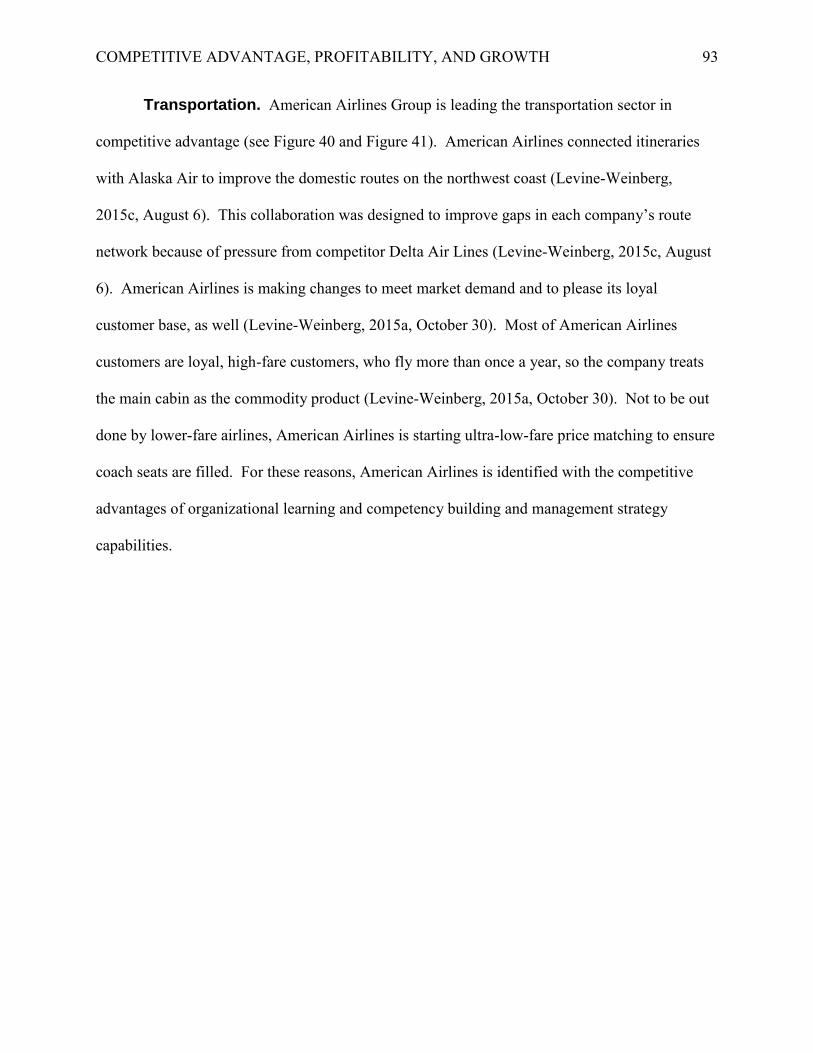
COMPETITIVE ADVANTAGE, PROFITABILITY, AND GROWTH 93
Transportation. American Airlines Group is leading the transportation sector in
competitive advantage (see Figure 40 and Figure 41). American Airlines connected itineraries
with Alaska Air to improve the domestic routes on the northwest coast (Levine-Weinberg,
2015c, August 6). This collaboration was designed to improve gaps in each company’s route
network because of pressure from competitor Delta Air Lines (Levine-Weinberg, 2015c, August
6). American Airlines is making changes to meet market demand and to please its loyal
customer base, as well (Levine-Weinberg, 2015a, October 30). Most of American Airlines
customers are loyal, high-fare customers, who fly more than once a year, so the company treats
the main cabin as the commodity product (Levine-Weinberg, 2015a, October 30). Not to be out
done by lower-fare airlines, American Airlines is starting ultra-low-fare price matching to ensure
coach seats are filled. For these reasons, American Airlines is identified with the competitive
advantages of organizational learning and competency building and management strategy
capabilities.

COMPETITIVE ADVANTAGE, PROFITABILITY, AND GROWTH 94
Fig
ure
40
. Pr
ofita
bilit
y an
d gr
owth
of t
he fi
rm fo
r the
Tra
nspo
rtatio
n Se
ctor
.

COMPETITIVE ADVANTAGE, PROFITABILITY, AND GROWTH 95
Fig
ure
41
. C
ompe
titiv
e Ad
vant
age
Inde
x fo
r the
Tra
nspo
rtatio
n Se
ctor
.

COMPETITIVE ADVANTAGE, PROFITABILITY, AND GROWTH 96
Wholesalers. SpartanNash, a supermarket chain, gas station convenience store chain,
and grocery distributer leads the wholesalers group in competitive advantage (see Figure 42 and
Figure 43). Spartan runs its grocery business out of Indiana and Michigan (Smith, 2012, August
6). A benefit to Spartan’s business has been the 2009 increase of food stamps which supported
15% of the U.S. population (Marasco, 2013, November 7). The food stamp increase from the
recession has since been repealed, but Spartan was ready with a strategic plan to remodel its
stores to attract a higher-income demographic. Spartan is associated with the competitive
advantages of organizational learning and competency building and management strategy
capabilities.

COMPETITIVE ADVANTAGE, PROFITABILITY, AND GROWTH 97
Fig
ure
42
. Pr
ofita
bilit
y an
d gr
owth
of t
he fi
rm fo
r the
Who
lesa
lers
Sec
tor.

COMPETITIVE ADVANTAGE, PROFITABILITY, AND GROWTH 98
Fig
ure
43
. C
ompe
titiv
e Ad
vant
age
Inde
x fo
r the
Who
lesa
lers
Sec
tor.

COMPETITIVE ADVANTAGE, PROFITABILITY, AND GROWTH 99
Examination of Research Questions and Testing of Hypotheses
Main research questions. The main research question (H1) and the three related
research questions, numbered (H2) through (H4), are as follows:
H1: How important are the intangible factors of an organizational culture and how do
they affect the output of a marketplace sustainable competitive advantage in the forms of
profitability and growth when altered?
The intangible factors of competitive advantage are very important for determining a
company’s overall market holding and potential for future growth. The importance of intangible
factors upon marketplace performance is most noticeable in organizations that are trending up or
down in market share growth. Companies can be identified as being profitable or growing by
their income statements, but the Competitive Advantage Index (CAI) identifies current and
potential future growth patterns over the entire relevant industrial sector. If the identified factors
of competitive advantage were removed from the identified ‘best in class,’ nearly all the relative
industry revenue growth would be removed. Since there is no industrial sector with little or no
defined change in the Competitive Advantage Index (CAI), the researcher concludes that the
ranking of revenue growth within a relative industrial sector will be determined by the speed at
which an organization meets consumer demand compared to the offering of a competing firm.
H2: How is competitive advantage distributed within a defined industrial sector?
The distribution of competitive advantage varies from sector to sector, but there are
common patterns that emerged in this research. There are two main patterns which occur. One
pattern is a small group of one or more leaders which dominate most of the competitive
advantage for the sector. This trend indicates that most of the revenue growth for the industrial
sector is constantly being absorbed by the business or businesses with the greatest competitive

COMPETITIVE ADVANTAGE, PROFITABILITY, AND GROWTH 100
advantage. This trend also indicates the competition in this sector is far behind or unable to
duplicate the intangible identified trait of competitive advantage. This first trend should indicate
that these businesses with far reaching competitive advantages will have sustainable and
consistent growth for years to come.
The second pattern involves a small group of leaders being closely followed by their
competitors. In this second pattern, the leaders are leveling out and their competition is
beginning to catch up. This trend indicates a good portion of the revenue growth for the
industrial sector is constantly being absorbed by the business or businesses with the greatest
competitive advantage. This trend also indicates the competition in this sector is closing in on
the sector leaders or is finding newly identified intangible traits of competitive advantage. This
second trend should indicate that the businesses with marginally better competitive advantages
may have difficulty sustaining their competitive advantages and there may be a new sector leader
in the near future.
H3: How is competitive advantage distribution similar or different between different
industrial sectors?
As seen in Table 6, there is a full distribution of competitive advantage traits between the
relevant industrial sectors, but there are predominate traits in today’s marketplace. Management,
organizational, and strategy capabilities to reconfigure, sense, absorb and integrate as a
competitive advantage trait was the most commonly utilized. The second most utilized
competitive advantage traits were organizational learning and competency building and global
aptness and culteral intelligence. These initial traits were identified as the most tangible of the
competitive advantage traits, since they include the finding of new markets, new management
practices, or learning a new dicipline. Innovation was found to be the third most utilized

COMPETITIVE ADVANTAGE, PROFITABILITY, AND GROWTH 101
competitive advantage trait. Innovation, while utilized far less than the first or second ranking
competitive advantage traits, gave the businesses the furthest lead above their competitiors.
Social legitimacy and flexibility of cultural values were the least used competitive advantage
traits.
Table 6
Identified Competitive Advantage Traits by Industrial Sector
Note. This table shows the distribution of identified competitive advantage traits per relative industrial sector.
H4: Is there a correlation between organization growth and profitability, and if so,
does it still validate the conventional business model?
There is a correlation between organizational growth and profitability of the firm over all
the relative industrial sectors, as shown in Table 7. Among most relative industrial sectors,
profitability and growth of the firm are correlated, but there are some industrial sectors where
Industrial Sector InnovationSocial
Legitimacy
Flexibility of
Cultural Values
Organizational
Learning &
Competency
Building
Management, organizational, and
strategy capabilities to
reconfigure, sense, absorb and
integrate
Global
aptness and
cultural
intelligence
Aerospace & Defense X X
Apparel X X
Business Services X X
Chemicals X X X
Energy X
Engineering & Construction X X
Financials - - - - - -
Food and Drug Stores - - - - - -
Food, Beverages & Tobacco X X
Health Care X X
Hotels, Restaurants & Leisure X X
Household Products X
Industrials X X
Materials X X
Media X
Motor Vehicles & Parts X X
Retailing X
Technology X X
Telecommunications X X
Transportation X X
Wholesalers X X
Total 4 2 1 8 12 8
Competitive Advantage Traits

COMPETITIVE ADVANTAGE, PROFITABILITY, AND GROWTH 102
profitability and growth of the firm are not correlated—see Table 7 for details. Apparel,
business services, retailing and wholesalers were industrial sectors where there is not a
correlation between profitability and growth. These finding show that the conventional model of
business still applies to today’s volatile marketplace; however, industry trends point to this
model possibly becoming obsolete in the coming years.
Table 7
ANOVA Results of Correlation between Profitability, Growth and Competitive Advantage
by Industrial Sector
Note. This table shows the correlations between profitability and growth of the firm per relative industrial sector.
Industrial Sector Profitability and GrowthGrowth of the Firm and
Competitive Advantage
Profitability and
Competitive Advantage
Profitability, Growth of the Firm,
and Competitive Advantage
Aerospace & Defense Correlation Correlation Correlation Correlation
Apparel Not Correlated Not Correlated Correlation Not Correlated
Business Services Not Correlated Correlation Correlation Correlation
Chemicals Correlation Correlation Correlation Correlation
Energy Correlation Correlation Correlation Correlation
Engineering & Construction Correlation Correlation Correlation Correlation
Financials N/A N/A N/A N/A
Food and Drug Stores N/A N/A N/A N/A
Food, Beverages & Tobacco Correlation Correlation Correlation Correlation
Health Care Correlation Correlation Correlation Correlation
Hotels, Restaurants & Leisure Correlation Correlation Correlation Correlation
Household Products Correlation Correlation Correlation Correlation
Industrials Correlation Correlation Correlation Correlation
Materials Correlation Correlation Correlation Correlation
Media Correlation Correlation Correlation Correlation
Motor Vehicles & Parts Correlation Correlation Correlation Correlation
Retailing Not Correlated Correlation Correlation Correlation
Technology Correlation Correlation Correlation Correlation
Telecommunications Correlation Correlation Correlation Correlation
Transportation Correlation Not Correlated Correlation Not Correlated
Wholesalers Not Correlated Correlation Correlation Correlation
ANOVA Results

COMPETITIVE ADVANTAGE, PROFITABILITY, AND GROWTH 103
Table 8
Total Dataset ANOVA Result
Note. This table shows the positive correlation between profitability and growth of the firm over all combined industrial sectors.
Corollary hypotheses. From the research questions above, there are three related
corollary hypotheses, including (H5), (H6), and (H7).
H5: Certain competitive advantage traits are more valuable than others and there are
trends per industrial sector.
Industrial Sector Profitability Growth of the Firm
Aerospace & Defense 107 73
Apparel 33 186
Business Services 7 63
Chemicals 31 109
Energy -554 -404
Engineering & Construction 32 74
Food, Beverages & Tobacco 40 -22
Health Care 92 263
Hotels, Restaurants & Leisure 40 48
Household Products -23 12
Industrials -164 -310
Materials -10 25
Media 0 26
Motor Vehicles & Parts -128 45
Retailing 4 141
Technology -6 326
Telecommunications 628 870
Transportation 215 431
Wholesalers 12 83
2011-2015 Market Combined Results Excluding Unfit Data
ANOVA Correlation between Profitability and Growth of the Firm

COMPETITIVE ADVANTAGE, PROFITABILITY, AND GROWTH 104
True. There are trends per industrial sector, which define certain competitive advantage
traits as being more valuable. A certain trait, or traits, of competitive advantage are associated
with a small group of one or more as revenue leaders in new market share growth. Not only did
the research identify traits as being more, or less, valuable, but the amount of value that a
particular intangible asset has can be measured.
H6: There are trends between industrial sectors displaying early adopters to
competitive advantage traits.
True. There are two separate trends seen by the leaders or early adopters of competitive
advantage traits. An industrial sector leader is absorbing nearly all the revenue growth for an
industrial sector, or the leader is simply leading the pack with the competitors not far behind.
Early adopters can be identified as a leader of an industrial sector in competitive advantage, but
the competition is not close to being able to capture comparable revenue growth. A caveat to
this conclusion is the possibility of an early adopter in a competitive advantage trait, which is not
utilized by the majority. If a competitive advantage trait was innovation, then the innovation
may seem like a fluke instead of an indicator of a market demand shift.
H7: There is no longer a predictable correlation between profitability and growth of
the firm.
False and True. When all the market segments are combined, there is a correlation
between profitability and growth. Furthermore, most of the industrial segments do have a
correlation between profitability and growth of the firm. However, there are several industrial
segments in which profitability and growth of the firm do not correlate. This could be an
emergent trend indicating that the classic model of correlation between profitability and growth
of the firm is eroding.

COMPETITIVE ADVANTAGE, PROFITABILITY, AND GROWTH 105
Summary of Research Findings
It was found in this study that the classic model of business—where profitability is
directly related to growth of the firm—does still apply in today’s fast-paced and increasingly
volatile marketplace. The correlation between profitability and growth of the firm existed when
the industrial segments were aggregated and in most of the individual industrial sectors. There is
a small group of industrial sectors in which profitability did not correlate with growth of the
firm, which might indicate a slow shift away from the classic model of business.
This study found that management, organizational, and strategy capabilities to
reconfigure, sense, absorb and integrate as a competitive advantage trait was the most commonly
utilized. The second most utilized competitive advantage traits were organizational learning and
competency building and global aptness and cultural intelligence. The third most utilized
competitive advantage trait was innovation. These trends occur in the vast majority of the
industrial segments, indicating that these are competitive advantage traits managers should look
at closely to promote the chances of future revenue growth.
Conclusions and Recommendations
This section offers a brief summary of the research findings, literature review, and
conclusions and recommendations made by the researcher. Research findings are summarized
from the results section. The literature review features a discussion of key concepts of the
literature review section and re-states the research purpose, research questions, and correlated
hypothesizes. Finally, conclusions made by the researcher are stated, with recommendations to
general industry.
COMPETITIVE ADVANTAGE, PROFITABILITY, AND GROWTH 106
Recapitulation of Research Findings
The classic model of business—where profitability is correlated to growth of the firm—
still applies, despite the increasing volatility of the modern marketplace. However, there is no
correlation between profitability and growth in several individual industrial sectors. This lack of
dependence of business growth on profitability may be signaling a change in the marketplace and
could foreshadow the potential need for a new model of business.
Analyzing current market trends shows that the most utilized competitive advantage trait
is management, organizational, and strategy capabilities to reconfigure, sense, absorb and
integrate. The second most utilized competitive advantage traits were organizational learning
and competency building and global aptness and cultural intelligence. Early adopters in the area
of competitive advantage traits would be difficult to identify without long-term market trends.
Recapitulation of Literature Review
The literature review featured a discussion of what competitive advantage is and the
intangible traits leading to sustaining a competitive advantage. Organizational culture was
discussed and how the many inputs to an organizational culture lead to a different experience for
the individual and the firm as a whole. It was found that the difficult to duplicate factors of
organizational culture can be adjusted and tuned to create competitive advantage.
A key metric for this study, the Competitive Advantage Index, was defined.
Additionally, competitive advantage intangible traits in relation to their use in general industry
were discussed. A proposal to further examine the correlation of profitability, growth of the
firm, and competitive advantage over time was made to better understand the changes in the
increasingly volatile marketplace.

COMPETITIVE ADVANTAGE, PROFITABILITY, AND GROWTH 107
Statement of the problem. Competitive advantage as a theoretical concept is studied
in economics and business courses around the world. However, concrete analysis and
measurement of competitive advantage traits is difficult and the discussion is contentious (Klein,
2002). Competitive advantage is not specific to firms or products. It spans across firms and
industrial sectors.
Research has been conducted regarding some competitive advantage traits, theories have
been developed, and inferences have been drawn from case studies. Some theorists have focused
on team sizes, layouts, and group charters for projects (Klein, 2002). Implementation of small,
functional groups with a specific project charge enabled Lockheed Martin’s Skunk Works to be
nimble and to meet customer demand for speed to solution (Rich & Janos, 1994). However,
manipulating team sizes and project scopes may not fit the needs of all companies—different
market segments require different organizational, cultural solutions. An organization needs to
develop niche market requirements through strategic planning. Certain features of an
organization’s culture will favor some competitive advantages over others.
A complicating factor across industrial sectors is increased market volatility resulting
from the adoption of new technologies and the speed at which these technologies are brought to
market. Existing theoretical models may not provide the insight that strategic managers need to
guide their companies to succeed.
Purpose. The purpose of this study was to examine the competitive advantage traits of
an organization and how these traits relate to achieving profitability and growth of the firm. This
knowledge may be utilized as a roadmap by strategic managers pushing to either achieve or to
maintain a competitive advantage in current volatile markets, where profitability does not
directly correlate to market share.

COMPETITIVE ADVANTAGE, PROFITABILITY, AND GROWTH 108
Since the classic business model does not necessarily apply to all industrial sectors,
companies must learn to be innovative and adaptable. A goal of this study was to show a
relationship between organizations, which adapt their competitive advantage traits to match
consumer market demand, and success of the firm.
Research questions and present hypotheses. The main research question (H1)
and the three related research questions, numbered (H2) through (H4), are as follows:
H1: How important are the intangible factors of an organizational culture and how do
they affect the output of a marketplace sustainable competitive advantage in the forms of
profitability and growth when altered?
H2: How is competitive advantage distributed within a defined industrial sector?
H3: How is competitive advantage distribution similar or different between different
industrial sectors?
H4: Is there a correlation between organization growth and profitability, and if so, does it
still validate the conventional business model?
From the research questions above, there are three related corollary hypotheses, numbered (H5)
through (H7).
H5: Certain competitive advantage traits are more valuable than others and there are
trends per industrial sector.
H6: There are trends between industrial sectors displaying early adopters to competitive
advantage traits.
H7: There is no longer a predictable correlation between profitability and growth of the
firm.

COMPETITIVE ADVANTAGE, PROFITABILITY, AND GROWTH 109
Researcher Conclusions and Recommendations
The study of competitive advantage traits will be an area to watch as markets transform
from stable to unstable growth as disruptive technologies change the paradigm of how business
as usual is performed. The current model, the classic model of business, still applies, and that
may be because of the entrenched norms of certain industries and existing brand values. There
are dangers to the strategic manager from both trusting and ignoring the classic business model.
If the classic business model is trusted, then new market revenue may be lost by failing to change
quickly enough or by adapting to disruptive technologies. If the classic business model is
ignored, then revenue may be lost by lack of product consistency or weakening of fundamental
brand value. This double-sided issue complicates the strategic manager’s choice of when to
hold, adapt, or innovate.
Results from this study show that the investor and strategic manager should continue to
use the classic model of business as a baseline when determining success of a firm. Income
statements will be able to serve as a guide by showing profitability and growth of the firm. The
Competitive Advantage Index is a valid metric, at a minimum, to display gross variances of new
revenue within an industrial sector. The combination of the classic model of business with the
Competitive Advantage Index should form a solid foundation of data to project strategic
movements, combining both present day results with sustainable future solutions.
The most interesting correlation was the growth of the firm with competitive advantage.
When growth of the firm and competitive advantage were not correlated, the whole industry did
not fit the classic model of business. This result is significant as the relationship between the
growth of the firm and competitive advantage may be the most powerful metric to see market
trends and to determine future market success. With the reduction of touch labor and an influx

COMPETITIVE ADVANTAGE, PROFITABILITY, AND GROWTH 110
of technology, removing human labor, the use of such a metric is necessary to guide future of
business.
Intangible solutions are what will make or break an organization in this new area of
technology and global business. Market information is fluid and it is arguable that most
businesses are on a similar footing with respect to their strategic management decisions. With
the playing field leveled, businesses must rely on their intangible features to be competitive. The
most frequently used of the competitive advantage traits among the firms analyzed in this study
was the ability for an organization to make good management or organizational changes based
on market strategy. This finding drives home the idea that good or bad management will truly
decide the fate of a business, not solely the product offering.
An interesting finding in this study is that innovation was used much less than the other
competitive advantage traits. Because of marketplace volatility and the emphasis on new
technologies in industry, one would assume that innovation would have played a much larger
role in the growth of revenue for the businesses studied. Innovation is the most tangible and
potentially highest risk of the competitive advantage traits, so the innovation of new products
may not be as fiercely pursued as the other traits. Since this study focuses on the review of
financial results, the amount of effort and resources put forth to capture revenue with innovative
solutions is unknown.
For a more thorough approach to understanding the Competitive Advantage Index and
the competitive advantage traits being used in the market, additional research will need to be
performed. Trend predictions over an extended period of time should be employed to validate
the results of this study. Further investigation of the appropriate application of the Competitive
Advantage Index is also needed.

COMPETITIVE ADVANTAGE, PROFITABILITY, AND GROWTH 111
Implications for practice. This tool should be used in strategic management planning
for one- , three- , and five-year outlooks. Although it is important to understand competitive
advantage in your industrial sector, it is also wise to look at changes across the whole market. A
holistic market view allows the user to see consumer buying habits, areas of growth and loss, and
what types of competitive advantage are currently attracting customers. A business that is a
leader in its industrial sector should align with the similar leading competitive advantage traits of
its closest competitor(s). A business that is losing market share will most likely not align with
the winning competitive advantage traits and should strive to enhance itself in the identified
competitive advantages, which are more effective within its industrial sector. Small companies,
not competing in the Fortune 1000 level, may be able to use their smaller size to an advantage by
capturing least commonly utilized competitive advantage traits to create a niche offering for a
customer segment. A benefit to business managers using this type of strategic management
planning is that short-term gains or losses will not distract from the long-term trends of consumer
habits. Finally, looking to early adopters across industrial sectors will give strategic managers an
outline of what to emulate in the future.

COMPETITIVE ADVANTAGE, PROFITABILITY, AND GROWTH 112
References
Alfadda, B. (2010). Institutional renewal and adaptation (IRA): Creating and managing
sustainable competitive advantage (SCA; Doctoral dissertation). Available from
ProQuest Dissertations and Theses database. (UMI No. 3475086)
Anderson, S., & Mohan, K. (2011). Social networking in knowledge management. IT
Professional, 13(4), 24-28. https://dx.doi.org/10.1109/MITP.2011.68
Ballantyne, D. (2005). Customer relationship management: Creating competitive advantage
through win-win relationship strategies. Managing Service Quality: An International
Journal, 15(5), 485-488. http://dx.doi.org/10.1108/09604520510617329
Bowman, J. (2013, August 2). Why Mohawk Industries shares jumped. The Motley Fool.
Retrieved from http://www.fool.com
Chatterjee, A. (2011, September 27). A sharp move by Colfax. The Motley Fool. Retrieved from
http://www.fool.com
Crowe, T. (2015, October 30). Marathon Petroleum may have missed earnings expectations, but
still had a great quarter. The Motley Fool. Retrieved from http://www.fool.com
Dengler, R. (2006). Fast-acting OD intervention for expedited organization culture change: A
quantitative evaluation of a field experiment in a large utility undergoing an intentionally
violent transformational change (Doctoral dissertation). Available from ProQuest
Dissertations and Theses database. (UMI No. 3197910)
Denison, D. R. (1996). What is the difference between organizational culture and organizational
climate? A native's point of view on a decade of paradigm wars. The Academy of
Management Review, 21(3), 619-654. Retrieved from http://www.jstor.org/stable/258997
COMPETITIVE ADVANTAGE, PROFITABILITY, AND GROWTH 113
Ditz, J. (2014, July 25). Underpants, ground beef, and car dealerships: A history of Leucadia
National. The Motley Fool. Retrieved from http://www.fool.com
Duprey, R. (2013, July 17). Penske dividend zooms ahead 7%. The Motley Fool. Retrieved from
https://www.fool.com/
Fahy, J., Farrelly, F., & Quester, P. (2004). Competitive advantage through sponsorship: A
conceptual model and research propositions. European Journal of Marketing, 38(8),
1013-1030. http://dx.doi.org/10.1108/03090560410539140
Fee, M. (2014, June 10). How United Rentals Inc. is quietly building its rental empire. The
Motley Fool. Retrieved from http://www.fool.com
Fortune.com. (2017). Fortune 1000. Retrieved from Fortune: http://beta.fortune.com/fortune500/
Frankel, M. (2015, June 18). Stocks to watch in homebuilding: Lennar. The Motley Fool.
Retrieved from http://www.fool.com
Hanley, R. (2014, February 9). Is newly public hotelier Hilton a good bet? The Motley Fool.
Retrieved from http://www.fool.com
Klein, J. (2002). Beyond competitive advantage. Strategic Change, 11(6), 317-327.
http://dx.doi.org/10.1002/jsc.606
Kline, D. B. (2015, June 1). Is Verizon Communications Inc. going too far to keep you as a
customer? The Motley Fool. Retrieved from https://www.fool.com
Lagerstrom, E. M. (2005). A healthy workplace: The role of organizational culture (Master’s
thesis). Available from ABI/INFORM Global. Retrieved from
http://ezproxy.msoe.edu/login?url=http://search.proquest.com/docview/305354101?accou
ntid=9445

COMPETITIVE ADVANTAGE, PROFITABILITY, AND GROWTH 114
Levine-Weinberg, A. (2015a, October 30). 5 things American Airlines Group, Inc. wants you to
know. The Motley Fool. Retrieved from https://www.fool.com
Levine-Weinberg, A. (2015b, December 6). Ford F-150 sales finally take off. The Motley Fool.
Retrieved from https://www.fool.com
Levine-Weinberg, A. (2015c, August 6). Why American Airlines and Alaska Air are teaming up.
The Motley Fool. Retrieved from https://www.fool.com
Levy, A. (2015, December 23). How Jeff Bezos made $29.5 billion in 2015. Retrieved from The
Motley Fool: https://www.fool.com
Malin, A. (2015, July 20). Live Nation Entertainment Inc: Dominant market position is music to
my ears. The Motley Fool. Retrieved from https://www.fool.com
Marasco, B. (2013, November 7). How the food stamps cut will affect the U.S. economy. The
Motley Fool. Retrieved from https://www.fool.com
Marder, A. (2013, October 21). How VF is winning the apparel war. The Motley Fool. Retrieved
from http://www.fool.com
McNew, B. S. (2016, December 10). Under Armour, Inc.'s best moves in 2016. The Motley Fool.
Retrieved from https://www.fool.com
Michalisin, M. D., Smith, R. D., & Kline, D. M. (1997). In search of strategic assets.
International Journal of Organizational Analysis, 5(4), 360-387.
http://dx.doi.org/10.1108/eb028874
Morningstar.com. (2017). Morningstar. Retrieved from http://beta.morningstar.com/
Neiger, C. (2015, August 22). Verizon Communications Inc. network still reigns supreme. The
Motley Fool. Retrieved from https://www.fool.com

COMPETITIVE ADVANTAGE, PROFITABILITY, AND GROWTH 115
Planes, A. (2013, October 14). Is Ecolab destined for greatness? The Motley Fool. Retrieved
from http://www.fool.com
Porter, M. E. (1987). From competitive advantage to corporate strategy. Harvard Business
Review, 65(3), 43-59. Retrieved from
http://www.hbs.edu/faculty/Pages/item.aspx?num=6112
Reeves, M., & Deimler, M. (2011, July/August). Adaptability: The new competitive advantage.
Harvard Business Review. Retrieved from https://hbr.org/2011/07/adaptability-the-new-
competitive-advantage
Rich, B. R., & Janos, L. (1994). Skunk works: A personal memoir of my years at Lockheed (1st
ed.). New York: Little, Brown and Company.
Rosevear, J. (2015, December 7). Ford continues to find sales growth in China. The Motley Fool.
Retrieved from https://www.fool.com
Saglimbeni, P. (2013, December 7). Great things come in small packages. The Motley Fool.
Retrieved from http://www.fool.com
Saglimbeni, P. (2014, April 22). Is this company the best catch in media stocks? The Motley
Fool. Retrieved from https://www.fool.com
Sigalas, C., Economou, V. P., & Georgopoulos, N. B. (2013). Developing a measure of
competitive advantage. Journal of Strategy and Management, 6(4), 320-342.
http://dx.doi.org/10.1108/JSMA-03-2013-0015
Smith, R. (2012, August 6). Get ready for the bounce. The Motley Fool. Retrieved from
https://www.fool.com
Smith, R. (2016a, December 18). "Small satellites" explode in popularity -- and size. The Motley
Fool. Retrieved from http://www.fool.com

COMPETITIVE ADVANTAGE, PROFITABILITY, AND GROWTH 116
Smith, R. (2016b, December 12). Boeing bags a $3.5 billion order -- for helicopters. The Motley
Fool. Retrieved from http://www.fool.com
Smith, R. (2016c, October 27). Foreign exchange headwinds blunt growth at Penske Automotive
Group, Inc. The Motley Fool. Retrieved from https://www.fool.com
Soh, M. (2005). A correlational study of the relationship between a firm's intangible resources
and it sustainable competitive advantage (Doctoral dissertation). Available from
ProQuest Dissertations and Theses database. (UMI No. 3161598)
Speights, K. (2012, June 25). 3 encouraging trends in housing. The Motley Fool. Retrieved from
http://www.fool.com
Trefry, M. G. (2006). A double-edged sword: Organizational culture in multicultural
organizations. International Journal of Management, 23(3), 563-575. Retrieved from
http://digitalcommons.sacredheart.edu/wcob_fac/33
Williams, S. (2015, December 7). The 3 most important drugs in Gilead Sciences' pipeline. The
Motley Fool. Retrieved from http://www.fool.com

COMPETITIVE ADVANTAGE, PROFITABILITY, AND GROWTH 117
Engineering Management
Thesis Approval Form
Master of Science in Engineering Management – MSEM
Milwaukee School of Engineering
This thesis, titled “Comparative Analysis of Competitive Advantage, Profitability, and Growth,” submitted by the student, Jack C. Rinehart, has been approved by the following committee:
Faculty Advisor: _________________________________ Date: __________________
Dr. Paul Hudec, Ph.D.
Faculty Member: _________________________________ Date: __________________
Professor Gene Wright, MSEM
Faculty Member: _________________________________ Date: __________________
Dr. Bruce Thompson, Ph.D.