Sustaining competitive advantage of the Chinese clothing ...
320
Coventry University DOCTOR OF PHILOSOPHY Sustaining competitive advantage of the Chinese clothing industry a resource-based view Cao, Dongmei Award date: 2014 Awarding institution: Coventry University Link to publication General rights Copyright and moral rights for the publications made accessible in the public portal are retained by the authors and/or other copyright owners and it is a condition of accessing publications that users recognise and abide by the legal requirements associated with these rights. • Users may download and print one copy of this thesis for personal non-commercial research or study • This thesis cannot be reproduced or quoted extensively from without first obtaining permission from the copyright holder(s) • You may not further distribute the material or use it for any profit-making activity or commercial gain • You may freely distribute the URL identifying the publication in the public portal Take down policy If you believe that this document breaches copyright please contact us providing details, and we will remove access to the work immediately and investigate your claim. Download date: 25. Sep. 2022
-
Upload
khangminh22 -
Category
Documents
-
view
0 -
download
0
Transcript of Sustaining competitive advantage of the Chinese clothing ...

Coventry University
DOCTOR OF PHILOSOPHY
Sustaining competitive advantage of the Chinese clothing industry
a resource-based view
Cao, Dongmei
Award date:2014
Awarding institution:Coventry University
Link to publication
General rightsCopyright and moral rights for the publications made accessible in the public portal are retained by the authors and/or other copyright ownersand it is a condition of accessing publications that users recognise and abide by the legal requirements associated with these rights.
• Users may download and print one copy of this thesis for personal non-commercial research or study • This thesis cannot be reproduced or quoted extensively from without first obtaining permission from the copyright holder(s) • You may not further distribute the material or use it for any profit-making activity or commercial gain • You may freely distribute the URL identifying the publication in the public portal
Take down policyIf you believe that this document breaches copyright please contact us providing details, and we will remove access to the work immediatelyand investigate your claim.
Download date: 25. Sep. 2022

i
SUSTAINING COMPETITIVE
ADVANTAGE OF THE CHINESE
CLOTHING INDUSTRY: A
RESOURCE-BASED VIEW
By
Dongmei Cao
December 2014
A thesis submitted in partial fulfillment of the University’s requirements for the
Degree of Philosophy

ii
ACKNOWLEDGEMENTS
Foremost, I am grateful to my parents, my husband and my beloved son for their
support and understanding. My family has made considerable sacrifices to enable me to
complete my PhD. Their support and understanding mean a great deal to me, even
though I may not have fully acknowledged this in the past. It is they who have offered
me a further chance to “grow”. It is they who have made my dream come true. Also, it
is their love and support that make me strong enough to fight against all the difficulties
and to make the best of my opportunities.
I would like to gratefully acknowledge my Director of Studies and my supervisors,
Professor Nigel Berkeley, Doctor Donald Finlay, Professor Shengxiao Li and Doctor
Husni Kharouf. I appreciate their encouragement and help throughout the journey.
Without their help, it would have been impossible for me to complete my PhD. I am
particularly grateful to Professor Nigel Berkeley (Director of Studies), who guided me
throughout, kept me on the right path and helped me improve my academic capabilities.
Moreover, he always encourages me and builds up my confidence. From him, I have
also learned professional ways to behave. Also, I would like to express my particular
gratitude to Doctor Donald Finlay, who is more than my academic supervisor. He
helped me become a PhD student of Coventry University and also provided material
help in my personal development.
In particular, I want to express my deep gratitude to Professor Peter Reynolds for his
help with all aspects of my research progress.
Finally, I thank all those who have helped me in many ways during my PhD journey,
particularly staff and colleagues at Coventry University who helped me with data
analysis, colleagues and friends in China who helped me with data collection and those
who participated in the interviews and responded to the questionnaire.
Coventry University, August 2014

iii
ABSTRACT
China has established strong competitive advantage in the global apparel industry,
accounting for almost 40% of world clothing exports in 2012. However, this position
has been largely established through an export-oriented approach in the low labour-cost
manufacturing segment of the industry. For Chinese clothing firms, sustaining this
competitive advantage has been increasingly challenged within the context of global
market depression and rising domestic production costs since 2008. Against this
background, this research explores and tests sources of Sustained Competitive
Advantage (SCA) of the Chinese clothing industry using a uniquely synthesised
theoretical framework underpinned by global value chain theory and the
Resource-Based View (RBV) of the firm. The hypothesized resources-SCA
relationships are tested by using Structural Equation Modelling and with data collected
from over 200 Chinese clothing companies. The results are largely consistent with RBV
theory: constructs of Fundamental Resource and Upgrading Capability are shown to be
significantly related to sustained competitive advantage whilst, interestingly Dynamic
Capability is not. At the same time, all three resource constructs are significantly
correlated to each other, confirming the importance of resource bundling effects on
SCA. Based on the data analysis, strategic recommendations are provided for SCA of
the Chinese clothing industry offering solutions to the challenges of rising costs,
price-based competition and the lack of strong brands. Cost-control strategies are
highlighted as key to retaining competitive advantage in the manufacturing segment of
the industry, whilst upgrading strategies are the critical driver in sustaining competitive
advantage of the entire industry as it seeks to compete on quality and brand rather than
price. The research extends knowledge in the discipline in four key ways: firstly, the
synthesised research framework originally designed for this study; secondly, the holistic
research model testing RBV logic which is also originally formulated for this study;
thirdly, measurement and operationalisation of the relevant concepts which are also
originally developed for this study; and fourthly empirical test of RBV and the resource
bundling effect.

iv
TABLE OF CONTENTS
ACKNOWLEDGEMENTS .................................................................................................................. II
ABSTRACT ......................................................................................................................................... III
TABLE OF CONTENTS .................................................................................................................... IV
LIST OF TABLES .....................................................................................................................................IX
LIST OF FIGURES .............................................................................................................................XI
ABBREVIATIONS ........................................................................................................................... XIII
CHAPTER ONE: INTRODUCTION .................................................................................................. 1
1.1 THESIS CONCERNS ............................................................................................................................... 1 1.1.1 Research issue and background .................................................................................................. 1 1.1.2 Research scope ............................................................................................................................ 2 1.1.3 Research aim, research questions and research objectives ......................................................... 3
1.2 RESEARCH BRIEF ................................................................................................................................. 4 1.2.1 Theoretical foundations ............................................................................................................... 4 1.2.2 Methodological overview ............................................................................................................ 5 1.2.3 Main findings and contributions ................................................................................................. 5
1.3 THESIS STRUCTURE ............................................................................................................................. 6
CHAPTER TWO: CHINESE CLOTHING INDUSTRY IN THE GLOBAL VALUE CHAIN .......... 9
2.1 CHAPTER INTRODUCTION .................................................................................................................... 9 2.2 OVERVIEW OF THE GLOBAL CLOTHING INDUSTRY .............................................................................. 10
2.2.1 Production costs ........................................................................................................................ 10 2.2.2 Trade patterns ........................................................................................................................... 12 2.2.3 Dynamics of the global clothing industry .................................................................................. 13
2.2.3.1 Employment ....................................................................................................................... 13 2.2.3.2 Trade regulations: from MFA to ATC ................................................................................ 16 2.2.3.3 Dynamics of clothing trade pattern .................................................................................... 17 2.2.3.4 Changing location of global apparel production ................................................................ 22 2.2.3.5 Changes of global apparel consumption ............................................................................ 25
2.2.4 Summary of the global clothing industry .................................................................................. 27 2.3 OVERVIEW OF THE CHINESE CLOTHING INDUSTRY ............................................................................ 27
2.3.1 Historical development ............................................................................................................. 28 2.3.2 Clothing production .................................................................................................................. 33 2.3.3 Leading players ......................................................................................................................... 34 2.3.4 Employment ............................................................................................................................... 36 2.3.5 Labour costs .............................................................................................................................. 37 2.3.6 Domestic market ....................................................................................................................... 40 2.3.7 Geographic distribution and local industrial clusters .............................................................. 42 2.3.8 World largest manufacturer and exporter ................................................................................. 45 2.3.9 Sustained competitive advantage of the Chinese clothing industry........................................... 48
2.4 CHAPTER SUMMARY .......................................................................................................................... 49
CHAPTER THREE: SOURCES OF SUSTAINED COMPETITIVE ADVANTAGE ...................... 51
3.1 CHAPTER INTRODUCTION .................................................................................................................. 51 3.2 GLOBAL VALUE CHAINS AND THE CLOTHING INDUSTRY ..................................................................... 53
3.2.1 Theory background and origins ................................................................................................ 53 3.2.2 Theory development and the apparel industry .......................................................................... 55
3.2.2.1 Governance in the global clothing industry ....................................................................... 56 3.2.2.2 Industrial upgrading and sustained competitive advantage ................................................ 58

v
3.3 RESOURCE-BASED VIEW AND SUSTAINED COMPETITIVE ADVANTAGE................................................. 64 3.3.1 Theory background ................................................................................................................... 64 3.3.2 Theory origins ........................................................................................................................... 66 3.3.3 Theory development .................................................................................................................. 67
3.3.3.1 Resources concept and classification ................................................................................. 67 3.3.3.2 Resources accumulation and acquisition............................................................................ 72 3.3.3.3 Resources exploitation and resource bundling ................................................................... 73 3.3.3.4 Resource effect on sustained competitive advantage ......................................................... 75 3.3.3.5 Dynamic capabilities and sustained competitive advantage .............................................. 80
3.3.4 Summary of resource-based theory ........................................................................................... 81 3.3.4.1 Theoretical logic and development .................................................................................... 81 3.3.4.2 Empirical tests .................................................................................................................... 82 3.3.4.3 Contributions and limitations ............................................................................................. 83
3.4 CHAPTER SUMMARY .......................................................................................................................... 85
CHAPTER FOUR: CONCEPTUAL FRAMEWORK ...................................................................... 86
4.1 CHAPTER INTRODUCTION .................................................................................................................. 86 4.2 CONCEPTUAL FRAMEWORK FOR THIS STUDY ..................................................................................... 87 4.3 MEASURED VARIABLES FOR THE CONCEPTS ....................................................................................... 88
4.3.1 Measured variables for the concept of resources ...................................................................... 88 4.3.2 Measured variables for the concept of Sustained Competitive Advantage (SCA) ..................... 93
4.3.2.1 Concept of SCA ................................................................................................................. 94 4.3.2.2 Measures of SCA ............................................................................................................... 94
4.4 CHAPTER SUMMARY .......................................................................................................................... 99
CHAPTER FIVE: RESEARCH METHODOLOGY ...................................................................... 100
5.1 CHAPTER INTRODUCTION ................................................................................................................ 100 5.2 PHILOSOPHICAL CONSIDERATIONS FOR RESEARCH DESIGN .............................................................. 101
5.2.1 Epistemological considerations .............................................................................................. 102 5.2.2 Ontological considerations ..................................................................................................... 103 5.2.3 Axiological considerations ...................................................................................................... 103 5.2.4 Summary of philosophical influences ...................................................................................... 103
5.3 OTHER CONSIDERATIONS FOR RESEARCH DESIGN ............................................................................ 105 5.3.1 Reiterating research questions ................................................................................................ 105 5.3.2 Referring to literature ............................................................................................................. 106
5.4 RESEARCH DESIGN .......................................................................................................................... 108 5.4.1 Research approach .................................................................................................................. 108 5.4.2 Research purpose .................................................................................................................... 109 5.4.3 Research strategy .................................................................................................................... 109 5.4.4 Reliability and validity ............................................................................................................ 111 5.4.5 Research ethics ........................................................................................................................ 113
5.5 RESEARCH DATA .............................................................................................................................. 113 5.5.1 Data generation procedure ..................................................................................................... 113 5.5.2 Survey design .......................................................................................................................... 116
5.5.2.1 Instrument design ............................................................................................................. 116 5.5.2.2 Survey sampling............................................................................................................... 118
5.6 CHAPTER SUMMARY ........................................................................................................................ 120
CHAPTER SIX: STATISTICAL ANALYSIS .................................................................................. 121
6.1 CHAPTER INTRODUCTION ................................................................................................................ 121 6.2 DESCRIPTIVE STATISTICS ................................................................................................................. 122
6.2.1 Demographic data of respondents and the sample units ......................................................... 124 6.2.2 Descriptive statistics for resources ......................................................................................... 130 6.2.3 Descriptive statistics for performance .................................................................................... 131

vi
6.3 EXPLORATORY FACTOR ANALYSIS .................................................................................................... 132 6.3.1 Assessing the appropriateness of factor analysis .................................................................... 134 6.3.2 Deriving factors via principal component analysis ................................................................. 134
6.4 STRUCTURAL EQUATION MODELING ................................................................................................ 139 6.4.1 Rationale for adopting structural equation modeling ............................................................. 139
6.4.1.1 Advantages of SEM ......................................................................................................... 139 6.4.1.2 Limitations of SEM .......................................................................................................... 140 6.4.1.3 Empirical applications and references.............................................................................. 141
6.4.2 Adoption of a two-step analytical approach ............................................................................ 142 6.4.3 Data screening and evaluation of underlying assumptions ..................................................... 143
6.4.3.1 Data screening .................................................................................................................. 143 6.4.3.2 Assumption 1- Sample size .............................................................................................. 144 6.4.3.3 Assumption 2- Multivariate normality ............................................................................. 145 6.4.3.4 Assumption 3- Outliers .................................................................................................... 146 6.4.3.5 Assumption 4- Multicollinearity and singularity.............................................................. 148 6.4.3.6 Assumption 5- Linearity................................................................................................... 149
6.4.4 SEM step one: Measurement modeling ................................................................................... 149 6.4.4.1 Reflective versus formative ............................................................................................. 149 6.4.4.2 Defining individual constructs ......................................................................................... 150 6.4.4.3 Specifying the measurement model ................................................................................. 154 6.4.4.4 Assessing the measurement model ................................................................................... 156 6.4.4.5 Summary of the confirmatory factor analysis .................................................................. 166
6.4.5 SEM step two: Structural modeling......................................................................................... 166 6.4.5.1 Developing research hypotheses and specifying the structural model ............................. 166 6.4.5.2 Assessing the structural model and testing structural relationships ................................. 169
6.5 COMPARISON OF MODELS ................................................................................................................ 173 6.5.1 Alternative model 1 ................................................................................................................. 173 6.5.2 Alternative model 2 ................................................................................................................. 175 6.5.3 Alternative model 3 ................................................................................................................. 176
6.6 CHAPTER SUMMARY ........................................................................................................................ 178
CHAPTER SEVEN: CASE STUDIES ............................................................................................. 179
7.1 CHAPTER INTRODUCTION ................................................................................................................ 179 7.1.1 Rationale for the case studies.................................................................................................. 180 7.1.2 Profile of the case companies .................................................................................................. 180 7.1.3 Analysis logic and structure .................................................................................................... 182
7.2 SUSTAINED COMPETITIVE ADVANTAGE OF THE CASE COMPANIES ..................................................... 183 7.2.1 Evidence of SCA inTedelon ..................................................................................................... 183 7.2.2 Evidence of SCA in Youngor.................................................................................................... 185 7.2.3 Evidence of SCA in Kaiqi ........................................................................................................ 186
7.3 RESOURCES CONTRIBUTING TO SUSTAINED COMPETITIVE ADVANTAGE ........................................... 187 7.3.1 Evidence of Fundamental Resource ........................................................................................ 188 7.3.2 Evidence of Upgrading Capability .......................................................................................... 192
7.3.2.1 Upgrading via Branding ................................................................................................... 192 7.3.2.2 Upgrading via Information Technology (IT) .................................................................... 200
7.3.3 Evidence of resource bundling effect ....................................................................................... 201 7.4 CHAPTER SUMMARY ....................................................................................................................... 203
CHAPTER EIGHT: DISCUSSION & CONCLUSIONS ................................................................ 204
8.1 CHAPTER INTRODUCTION ................................................................................................................ 204 8.2 PROBLEMS WITH SUSTAINING COMPETITIVE ADVANTAGE - TO RESEARCH Q1 .................................. 205
8.2.1 Competitive advantage of the Chinese clothing industry ........................................................ 206 8.2.2 Problems with sustainability of the competitive advantage .................................................... 207
8.2.2.1 Rising production costs .................................................................................................... 207 8.2.2.2 Lack of strong brand ........................................................................................................ 208

vii
8.2.2.3 Price-based competition ................................................................................................... 209 8.3 SIGNIFICANT RESOURCES FOR SUSTAINED COMPETITIVE ADVANTAGE ............................................. 210
8.3.1 Main resources for SCA - To research Q2 ............................................................................... 210 8.3.2 Significant resources for SCA of the Chinese clothing industry - To research Q3 .................. 211 8.3.3 Resource bundling - To research Q4 ....................................................................................... 212
8.4 RECOMMENDATIONS OF SCA STRATEGIES ....................................................................................... 213 8.4.1 Cost-control strategies ............................................................................................................ 214
8.4.1.1 Cost control: Subcontract manufacture and outsource manufacture ................................ 214 8.4.1.2 Cost control: Relocation manufacture overseas or inland China ..................................... 215
8.4.2 Upgrading strategies ............................................................................................................... 217 8.4.2.1 Upgrading via branding ................................................................................................... 217 8.4.2.2 Upgrading via Information Technology ........................................................................... 224
8.4.3 The executive plan ................................................................................................................... 227 8.5 CONTRIBUTIONS AND IMPLICATIONS OF THE RESEARCH .................................................................. 231
8.5.1 Research contributions ............................................................................................................ 231 8.5.1.1 Theoretical contributions ................................................................................................. 231 8.5.1.2 Empirical contributions .................................................................................................... 233
8.5.2 Research implications ............................................................................................................. 234 8.5.2.1 Implications of significant resources ............................................................................... 234 8.5.2.2 Implications of resources bundling .................................................................................. 236 8.5.2.3 Implications of measures of business performance .......................................................... 237
8.6 LIMITATIONS AND FUTURE RESEARCH DIRECTIONS .......................................................................... 237
LIST OF REFERENCES ................................................................................................................. 239
APPENDIXES .................................................................................................................................. 262
APPENDIX 2-1: CHINA CLOTHING BRAND ANNUAL AWARDS (WITH BRAND NAME IN CHINESE), 2004-2013
.............................................................................................................................................................. 262 APPENDIX 4-1: MAIN DIMENSIONS OF THE CONTEMPORARY BPMS MODELS ........................................ 262 APPENDIX 4-2: CHECK THE MEASURES BASED ON DIMENSIONS OF BPMS MODELS................................................. 263 APPENDIX 5-1: SUMMARY OF TWO ETHICS PROJECTS ............................................................................ 263 APPENDIX 5-2: QUESTIONNAIRE IN ENGLISH VERSION 1 ....................................................................... 264 APPENDIX 5-3: QUESTIONNAIRE IN ENGLISH VERSION 2 ....................................................................... 267 APPENDIX 5-4: QUESTIONNAIRE IN ENGLISH VERSION 3 (FINAL VERSION) ........................................... 271 APPENDIX 5-5:QUESTIONNAIRE IN CHINESE VERSION 3 ..................................................................... 275 APPENDIX 5-6: INTERVIEW QUESTIONS AND PROTOCOL .................................................................... 278 APPENDIX 5-7: DEMOGRAPHIC DATA OF THE INTERVIEWEES............................................................................... 280 APPENDIX 6-1: ASSESSING APPROPRIATENESS OF FACTOR ANALYSIS ..................................................... 280
Appendix 6-1a: Assessing appropriateness of factor analysis: correlations and overall MSA ........ 280 Appendix 6-1b: Assessing the appropriateness of factor analysis: MSA for individual variable ..... 281 Appendix 6-1c: Assessing the appropriateness of factor analysis with revised set of variables (ES
deleted): correlations and overall MSA ........................................................................................... 282 APPENDIX 6-2: EXPLORATORY FACTOR ANALYSIS ............................................................................... 283
Appendix 6-2a: Deriving factors via PCA- total variance explained............................................... 283 Appendix 6-2b: Deriving factors via PCA- unrotated factor matrix and communality ................... 283 Appendix 6-2c: Deriving factors via PCA - rotated factor matrix and communality ....................... 284 Appendix 6-2d: Deriving factors via PCA- 1
st re-specifying factors (LP deleted) ........................... 285
APPENDIX 6-3: SEM- ASSUMPTION TESTS ............................................................................................ 285 Appendix 6-3a: SPSS multivariate outlier statistics ......................................................................... 285 Appendix 6-3b: Critical values of Chi Squasre ( ) ( Tabachnick & Fidell 2007: 949) .............. 286 Appendix 6-3c: Matrix inverses and determinants ........................................................................ 286 Appendix 6-3d: SPSS statistics for multicollinearity........................................................................ 287
APPENDIX 6-4: THE MEASURED VARIABLES AND CONSTRUCTS FOR THIS STUDY ................................... 288 APPENDIX 6-5: CONFIRMATORY FACTOR ANALYSIS .............................................................................. 289

viii
Appendix 6-5a: Model fit indices (Measurement model 1) .............................................................. 289 Appendix 6-5b: Path estimates of CFA1 ......................................................................................... 290 Appendix 6-5c: Modification indices of CFA1 (highest M.I. values selected) .................................. 291 Appendix 6-5d: Model fit indices (Measurement model 2) .............................................................. 291 Appendix 6-5e: Modification indices of CFA2 (highest M.I. values selected) .................................. 292 Appendix 6-5f: Model fit indices ( Measurement model 3) ........................................................... 292 Appendix 6-5g: Estimates of Measurement model 3 ...................................................................... 294
APPENDIX 6-6: STRUCTURAL MODEL STATISTICS ............................................................................... 296 Appendix 6-6a: Model Fit Summary (original structural model) ................................................. 296 Appendix 6-6b: Comparison of Goodness-of-fit measures between the measurement model and the
structural model ............................................................................................................................... 298 Appendx 6-6c: Comparison of standardised factor loadings and construct reliabilities between the
measurement model 3 and the original structural model ................................................................. 298 Appendix 6-6d: Comparison of constructal relationships l between the structural model and the
measurement model .......................................................................................................................... 299 Appendix 6-6e: Standardised residual covariances of the structural model ................................. 300
APPENDIX 7-1: TEDELON’S MAIN AWARDS AND HONORS, 1995-2011................................................................ 300 APPENDIX 7-2: TEDELON’S FOUR STAGES OF DEVELOPMENT, 1995-2010.............................................. 300 APPENDIX 7-3: YOUNGOR’S MAIN AWARDS AND HONORS, 1995-2011 .............................................................. 302 APPENDIX 7-4: COMPREHENSIVE MARKET SHARE OF YOUNGOR’S SHIRTS IN CHINA, 1997-2011 ............................. 302 APPENDIX 7-5: YOUNGOR’S DEVELOPMENT STAGES, 1979-2011 ...................................................................... 302
PUBLICATIONS AND RESEARCH PROJECT ............................................................................ 305
CONFERENCE AND SEMINAR .................................................................................................... 305

ix
LIST OF TABLES
Table 2-1: Clothing employment in selected economies (Unit: 1,000 persons) 1 ....................... 15
Table 2-2: World clothing exports of major regions/economies by destination (units: billion
USD, %) 1 ........................................................................................................................... 18
Table 2-3: World clothing imports of major regions/economies by destination (units: billion
USD,%) 1 ............................................................................................................................ 19
Table 2-4: Share changes of world leading clothing exporters, 2000-2012 (unit: %) 1 .............. 21
Table 2-5: Share changes of world leading clothing importers, 2000-2012 (unit: %) 1 ............. 22
Table 2-6: Youngor’s upgrading progress from OEM to ODM and further to OBM 1 ............... 32
Table 2-7: Main indicators of the clothing enterprises*, 2005-2011 (unit: billion RMB) 1 ....... 33
Table 2-8: China clothing brand annual awards, 2003-2012 1.................................................... 35
Table 2-9: Annual average employed persons in China’s clothing enterprises above designed
size* (unit: 1,000 persons) 1 ........................................................................................... 36
Table 2-10: Average annual wages in the urban manufacturing segment by province in three
economic regions of China, 2012 (unit:100*) 1 .................................................................. 39
Table 2-11: Retail value of the apparel industry in the selected economies (units: billion
USD, %) 1 ........................................................................................................................... 41
Table 2-12: Economic indices of the Chinese clothing companies above designated size in three
main provinces, January to November of 2010 1 ............................................................... 43
Table 2-13: Some notable clothing LICs and the specialised segments in China 1 .................... 45
Table 2-14: SWOT of the Chinese clothing industry in terms of SCA 1 .................................... 48
Table 3-1: Key RBV terminology and the relations among them 1 ............................................ 68
Table 3-2: Taxonomy of resources 1 ........................................................................................... 70
Table 4-1: Measured variables of resources with references 1 ................................................... 89
Table 4-2: Measured variables of SCA with references 1 ........................................................... 97
Table 5-1: Philosophical beliefs and corresponding research designs 1 ................................... 104
Table 5-2: Research design for study of SCA of the Chinese clothing industry 1 .................... 108
Table 5-3: Primary data generation process 1 ........................................................................... 114

x
Table 6-1: Educational background of the respondents 1 ......................................................... 124
Table 6-2: Firms’ history in the clothing industry 1 .................................................................. 125
Table 6-3: Employed persons in the clothing firms 1 ............................................................... 125
Table 6-4: Gross sales profit margin of the clothing firms 1 ..................................................... 126
Table 6-5: Labour productivity of the clothing firms (unit: 10,000 RMB) 1 ............................ 126
Table 6-6: Years of operation with own clothing brand of the firms 1 ...................................... 127
Table 6-7: Sales proportion with own clothing brand of the firms 1 ........................................ 128
Table 6-8: Exports sales revenue as a proportion of the total sales revenue 1 .......................... 128
Table 6-9: Export pattern(s) of the clothing firms 1.................................................................. 129
Table 6-10: Business function of the clothing firms 1 .............................................................. 129
Table 6-11: Descriptive statistics for resources 1 ...................................................................... 130
Table 6-12: Comparing descriptive statistics for resources between firm and industry 1 ......... 131
Table 6-13: Descriptive statistics for performance 1 ................................................................ 132
Table 6-14: Deriving factors via PCA- 2nd
re-specifying factors (SP and MSI further deleted) 1
.......................................................................................................................................... 137
Table 6-15: SPSS frequencies output 1 ..................................................................................... 144
Table 6-16: Goodness of fit statistics and the guidelines 1 ....................................................... 161
Table 6-17: Convergence validity- Loadings estimates, S.E., t-value, standardised loadings,
AVE, construct reliability and Chronbach’s Alpha 1 ........................................................ 163
Table 6-18: Construct correlation matrix (standardised) and construct variance 1 ................... 165
Table 6-19: Structural parameter estimate- standardised and unstandardised, t-value, and ρ
value 1 ............................................................................................................................... 170
Table 6-20: Comparisons of fit indices of the three hypothesised models 1 ............................. 175
Table 7-1: Profile of the case companies 1 ............................................................................... 180
Table 7-2: Youngor’s distribution channel, 2011 1 ................................................................... 194
Table 8-1: Research contributions 1 .......................................................................................... 232

xi
LIST OF FIGURES
Figure 1-1: Clothing industry and the supply and supporting industries 1 --------------------------- 3
Figure 2-1: Thesis structure and focuses of Chapter 2 1 ............................................................... 9
Figure 2-2: Hourly labour costs in the apparel industry of selected countries, 2005 and 2008
(unit: USD) 1 -------------------------------------------------------------------------------------------- 11
Figure 2-3: World leading clothing exporters by market share, 2012 (unit: %) 1 ....................... 12
Figure 2-4: World leading clothing importer by market share, 2012 (unit: %) 1 ........................ 13
Figure 2-5: Employment of the clothing industry in world leading economies, 2008* 1 ........... 14
Figure 2-6: Clothing production shift by location and the main patterns in the Pacific Rim 1 - 23
Figure 2-7: Profit margin of the world leading apparel companies (unit: %) 1 .......................... 26
Figure 2-8: Average size of the clothing enterprises by employed persons in China (unit: Ge) 1
............................................................................................................................................ 37
Figure 2-9: Changes of China’s per capita GDP and of the corresponding average yearly wages
in the urban units, 2005-2012 (unit: RMB) 1 ...................................................................... 38
Figure 2-10: Average wage in the urban clothing manufacturing enterprises in China by
ownership, 2012 (unit: RMB) 1 .......................................................................................... 40
Figure 2-11: Value structures of the apparel retail by segment in China and the world, 2009 1 . 42
Figure 2-12: Main specialised clothing LICs in China 1 ----------------------------------------------- 44
Figure 2-13: Clothing exports value of China (unit: billion USD) 1 .......................................... 46
Figure 2-14: China's leading clothing markets in 2005 and 2012 1 ............................................ 46
Figure 2-15: Regional shares of Chinese clothing exports in the global leading markets, 2005
and 2012 1 ........................................................................................................................... 47
Figure 3-1: Thesis structure and focuses of Chapter 3 1 ............................................................. 51
Figure 3-2: An example of the clothing global value chain 1 ..................................................... 55
Figure 3-3: Five types of governance in global value chains 1 ................................................... 57
Figure 3-4: Trajectory of functional upgrading in the developing economies 1 ......................... 60
Figure 3-5: Conditions for SCA based on RBV 1 ....................................................................... 80
Figure 3-6: Theoretical logic and development of RBV 1 .......................................................... 82
Figure 4-1: Thesis structure and focuses of Chapter 4 1 ............................................................. 86

xii
Figure 4-2: Conceptual framework for the research on SCA of the Chinese clothing industry 1
............................................................................................................................................ 87
Figure 5-1: Thesis structure and focuses of Chapter 5 1 ........................................................... 100
Figure 5-2: Influences on social research 1............................................................................... 101
Figure 6-1: Thesis structure and focuses of Chapter 6 1 ........................................................... 121
Figure 6-2: Sample distribution of the respondents 1 ............................................................... 123
Figure 6-3: Procedure for developing better measure for constructs 1 ..................................... 133
Figure 6-4: Scree test for factor number extracted 1 ................................................................. 137
Figure 6-5: Construct of Fundamental Resource 1 ................................................................... 151
Figure 6-6: Construct of Dynamic Capability 1 ........................................................................ 152
Figure 6-7: Construct of Upgrading Capability 1 ..................................................................... 152
Figure 6-8: Construct of Performance 1 ................................................................................... 153
Figure 6-9: Measurement model 1 1 ......................................................................................... 154
Figure 6-10: Structural model for SCA of the Chinese clothing industry 1 .............................. 168
Figure 6-11: Standardised output in path diagram for the overall model 1 ............................... 171
Figure 6-12: Alternative model 1 1 ........................................................................................... 174
Figure 6-13: Alternative model 2 1 ........................................................................................... 176
Figure 6-14: Alternative model 3 1 ........................................................................................... 177
Figure 7-1: Thesis structure and focuses of Chapter 7 1 ........................................................... 179
Figure 7-2: Recap of the research model for SCA of Chinese clothing industry 1 ................... 182
Figure 7-3: Recap of the structural relationships of the research model 1 ................................ 188
Figure 7-4: Youngor's timeline of non-iron technology development 1 ................................... 195
Figure 7-5: Tedelon’s new brand name and new logo 1 ----------------------------------------------- 198
Figure 8-1: Executive summary of the research 1 .................................................................... 204
Figure 8-2: Recommendation of SCA strategies to the Chinese clothing industry in the GVC 1
........................................................................................................................................ 228

xiii
ABBREVIATIONS
AAGR (Average Annual Growth Rate)
AGR (Annual Growth Rate)
ATC (Agreement on Textile and Clothing)
AVE (Average Variance Extracted)
BDCC (Buyer-Driven Commodity Chain)
Business Performance Management System (BPMS)
Br (Branding)
CBI (Carribean Basin Initiative)
CC (Cost Control)
CFA (Confirmatory Factor Analysis)
CR (Customer relationship)
EFA (Exploratory Factor Analysis)
EC (External Communication)
En (Entrepreneurship)
EU (European Union)
FIEs (Foreign Envestment Enterprises)
FMM (Formative Measurement Model)
GCC (Global Commodity Chain)
GDP (Gross Domestic Product)
GVCs (Global Value Chains)
HRM (Human resource management)
IC (Internal Cohesion)
In (Innovation)
IT (Information Technology)
LIC (Local Industrial Cluster)
LP (Labour Productivity)
MFA (Multi-fibre Agreement)
MSI (Market Share Increase)
NAFTA (North America Free Trade Agreement)

xiv
NIEs (Newly Industrialised Economies)
OA (Order Acquisition)
OBM (Original Brand Manufacture/ Manufacturer/Manufacturing)
ODM (Original Design Manufacture/ Manufacturer/Manufacturing)
OEA (Original Equipment Assembly)
OEM (Original Equipment Manufacture/ Manufacturer/Manufacturing)
OL (Organisational Learning)
PCA (Principal Component Analysis)
PDCC (Producer-Driven Commodity Chain)
PE (Plant & Equipment)
RMM (Reflecctive Measurement Model)
QC (Quality Control)
QR (Quick Response)
RBV (Resource- Based View)
VRIN (Value, Rare, Inimitable and Non-substitutable)
SA (Strategic Adaptability)
SCA (Sustained Competitive Advatage)
SEM (Structural Equation Modeling)
SG (Sales Growth)
SP (Sales Profit)
SPG (Sales Profit Growth)
SR (Supplier Relationship)
SW (Skilful Worker)
WTO (World Trade Organisation)

1
SUSTAINING COMPETITIVE ADVANTAGE OF
THE CHINESE CLOTHING INDUSTRY: A
RESOURCE-BASED VIEW
CHAPTER ONE: INTRODUCTION
This chapter generally introduces the thesis concerns and the research. It starts with a
brief introduction to the thesis including an outline of the research issue and background,
research scope, research aim and objectives. This is followed by the research process
which considers theoretical foundations, methodology, main findings and contributions.
The final section summarises the thesis structure.
1.1 Thesis concerns
1.1.1 Research issue and background
This thesis explores and examines the sources for Sustained Competitive Advantage
(SCA) of the Chinese clothing industry. SCA is the research issue and the Chinese
clothing industry is the research background.
The clothing industry is one of the traditional pillar-industries in China and it has played
a significant role in the national economic and social development, particularly in
national employment and foreign trade (Details in Chapter 2.3). For example, the
clothing industry employed an average of about 5 million persons in 2011, which
accounted for over 12% of total employment in the manufacturing industries1. Moreover,
according to the national statistics, clothing exports steadily grew from 181.8 billion
RMB (i.e. about 29.0 billion USD2) in 2003 up to 321.8 billion RMB (i.e. about 51.3
billion USD) in 20113.
The Chinese clothing industry has integrated into the global clothing value chain and
China is now the world’s largest clothing manufacturer and exporter. According to
World Trade Organisation (WTO), China’s clothing exports was $160 billion by value,
accounting for over 37.8% of world clothing exports in 20124
. However, the
1Source: 2011-2012 China Garment Industry Development Report (China National Garment Association 2012). 2 According to the State Administration of Foreign Exchange (SAFE), the middle exchage rate of RMB/ USD on 27th
June 2014 is 6.27. This exchange rate is used throughout the thesis where equiulent value is provided. 3 The clothing exports include manufacture of clothing, footwear and caps by industrial enterprises above designated
size. From January 2011 on, industrial enterprises above a designated size refer to those with the annual revenue over
20 million RMB (about 3.2 million USD) from the principal business while the figure was 5 million RMB (roughly
equal to 0.8 million USD) from 2007 to 2010. 4 Source: WTO’s database, International Trade Statistics in 2013, [online] available from < www.wto.org/statistics>

2
competitive advantage of the Chinese clothing industry in the global market is based on
low labour-cost manufacture. Sustaining this competitive advantage has been
increasingly challenged by external dynamics, particularly by rising domestic
production costs and global market recession since 2008.
In this context, the issue of sustaining competitive advantage has become a big concern
in China amongst policy makers, domain scholars and experts, and industrial
practitioners.
The SCA issue is often positioned at the centre of strategic management field (Details in
Chapter 3.3). Academics and practitioners are interested in exploring where and how
competitive advantage is gained and sustained. For a long time before the
resource-based view started to gain popularity in the 1990s, the dominant approach
investigating the issue was from external perspectives such as the PEST analysis
framework and Michael Porter’s Five Forces model. The PEST framework is used to
analyse external-macro (i.e., national or international) factors while the Five Forces
model is used to analyse external-meso (i.e., industrial) factors.
However, the external theories fail to explain variations in business performance and
competitive advantage between companies which share similar external contexts. In
contrast, the Resource-Based View (RBV) of the firm argues that the heterogeneous and
valuable firm-level resources are the source of competitive advantage and the firm
sustains competitive advantage unless the valuable and rare resource bundle is
duplicated by other firms (Details in Chapter 3.3). RBV arguments and underpinnings
provide an appropriate theoretical foundation to address the issue which external
theories could not. In this context, since the early 1990s, RBV has gradually become
popular in the field of strategic management, particularly concerning issues of
competitive advantage and SCA. In view of the above analysis, this research adopts
RBV as the theoretical foundation.
1.1.2 Research scope
To clarify the research scope, key terms in the title need to be defined. Firstly, it is quite
common that the term “clothing” consists of both textile and apparel industries (Figure
1-1). The primary reason is that textiles constitute the primary input into apparel
production and some apparel companies do extend and include this upstream industry.
However, this research focuses only on the apparel industry with textiles excluded since
the two industries are quite different in terms of their main inputs. Particularly, textile
manufacturing is more capital-intensive while apparel production is more
labour-intensive (Dicken 2011). Secondly, this study addresses the sustainability issue
[4th May 2014]. The world clothing exports was about 423billion USD in 2012.

3
of the Chinese apparel industry but not that of the foreign direct investment (FDI) in
China. In other words, the Chinese clothing companies (i.e., the nationality identity)
rather than the clothing companies in China (i.e., the geographical identity) is the focus.
Thirdly, the Chinese clothing industry is dominanted by manufacturers while
specialised clothing retailers and branded clothing marketers are relatively weak. More
often than not, many of the clothing manufacturers have extended their businesses to
distribution, retailing and marketing. Therefore this research focuses on, though it is not
strictly limited to, the manufacturers of the Chinese clothing industry. That is to say, in
addition to apparel manufacturing, the other segments of entire clothing value chain are
not excluded (Figure 1-1).
Fibre Textile production Apparel industry and its value chain
Artificial/or
synthetic
fibres
Natural
fibres
Thread spinning
Clothing weaving
Knitting or knitwear
Finishing (dyeing,
printing)
(scope of this research)
Apparel design
Apparel R&D
Apparel manufacturing
Sub-contracting
Apparel branding and marketing
Apparel wholesale & retail
Textile-related industries:
Textile machinery
Chemicals
Figure 1-1: Clothing industry and the supply and supporting industries 1
Source: author’s creation based on Cammett (2006)
In summary, the scope of this research is the Chinese clothing industry, focusing on the
apparel manufacturers and covering the whole value-chain segments such as apparel
manufacturing, design, R&D, sub-contracting, branding and marketing, etc.
1.1.3 Research aim, research questions and research objectives
This study aims to explore and test firm specific sources for sustained competitive
advantage of the Chinese clothing industry. To this end, the principal research questions
are raised as follows.
Q1: What are the main problems concerning the Sustained Competitive Advantage
(SCA) of the Chinese clothing industry?
Q2: What are the main firm-level resources for SCA from the perspective of the
resource-based view of the firm?
Q3: Which of the potential resources are significant in leading to SCA of the Chinese

4
clothing industry?
Q4: How and why do the identified resources contribute to SCA of the Chinese clothing
companies?
According to the intended research aim and the stated questions, the research objectives
are set as follows, which break the aim into steps to make it achievable. In addition, the
objectives address the above corresponding questions, e.g., Obj1 to Q1, Obj2 to Q2,
Obj3 to Q3 and Obj4 to Q4.
Obj1: To investigate the problems with sustained competitive advantage of the Chinese
clothing industry in the global value chain.
Obj2: To identify the main firm-level resources for SCA based on the resource-based
view of the firm and taking into account the global value chain for reference.
Obj3: To test effects of the identified resources on SCA of the Chinese clothing industry
in a hypothesised model designed for this study.
Obj4: To contextualise and illustrate the statistical results through case studies of
clothing firms.
In addition, based on the research findings in terms of the above 4 objectives, this study
also intends to provide strategic recommendations and a correponding executive plan to
the clothing managers and the policy makers concerning SCA of the Chinese clothing
industry.
1.2 Research brief
After the main concerns of the thesis are clarified, this section previews the research
including theoretical foundations, methodology and main findings.
1.2.1 Theoretical foundations
Two main theories adopted as the research foundations are Resource-Based View of the
firm (RBV) and Global Value Chains (GVCs). RBV provides the theoretical base
determining the source of SCA, i.e., firm-level resources, whilst GVC provides the
influential contexts (Figure 4-1).
RBV is a relatively new theory but has increasingly gained its popularity in the strategic
management field since the 1990s. The theory holds that the firm-level resources with
the VRIN (i.e., Valuable, Rare, Inimitable and Non-Substitutable) attributes are the
source of SCA and that dynamic capability reconfigures and updates resources to

5
achieve SCA in the dynamic environment, particularly in the clothing GVC.
In the clothing GVC, the power relationship is asymmetric in terms of the governance
structure. The dominant powers and the lead firms on the one hand, mainly located in
the developed economies such as the USA and the UK, are global non-factory
manufacturers such as Levi’s and Lee, branded marketers such as Zara and Adidas, and
giant retailers such as Wal-Mart and M&S. They specialize in the high value-added
segments such as clothing design, R&D and marketing but outsource clothing
manufacturing to low labour-cost economies. On the other hand, the clothing
manufacturers, which are dependent on the global market are mostly located in the
developing economies such as China, India and Vietnam, specialize in the low
value-added manufacturing segment. Their already thin profit margins are subject to
both increasingly rising production costs and pressure to reduce prices. In this context,
the GVC literature suggests that upgrading toward higher value-added ends is a
practical strategy for the manufacturers to sustain their competitive advantage and
correspondingly upgrade their capabilities.
1.2.2 Methodological overview
In order to achieve the research aim and objectives, this study follows a series of
sequential steps. The first step reviews relevant literature to explore key firm-level
resources which contribute to SCA. As a result of the literature review, 12 specific
resources are identified and the conceptual research framework is drawn up. The second
step conducts primary research, involving collection of data through a survey
questionnaire to provide data for the statistical analysis and interviews to provide
materials for the case studies. The third step is analysis of the primary data collected.
Three main factors are extracted through Exploratory Factor Analysis (EFA). The three
factors capture dimensions of resources, namely, Fundamental Resource for sustaining
current competitive advantage in the clothing manufacturing segment, Dynamic
Capability for updating and reconfiguring resources for SCA in dynamic environment
and Upgrading Capability for further SCA of the entire Chinese Clothing industry.
Structural Equation Modeling (SEM) is adopted as the method of analysis and it follows
a two-step approach. That is, Confirmatory Factor Analysis (CFA) as the first step
validates constructs and the measurement model and the second step tests the
hypothesised relationships between the exogenous constructs (measures of resources)
and the endogenous construct (measure of SCA) using the survey data collected from
the Chinese Clothing industry. The fourth step is an explanatory study of three cases,
which provide detailed and contextual interpretations of the statistical results.
1.2.3 Main findings and contributions
Main findings of this study are summarised as follows. Firstly, the Chinese clothing

6
industry has developed its competitive advantage in the global market. As the world’s
largest clothing exporter, its primary competitive advantage is the clothing manufacture
in terms of capability, capacity, quality and flexibility. Secondly, however, this
competitive advantage is based on low labour costs and cheap prices and sustaining
competitive advantage has been increasingly challenged due to both rising domestic
production costs and competition from the other lower-cost global manufacturers.
Thirdly, the statistical results (Details in Chapter 6) suggest that both Fundamental
Resource and Upgrading Capability are significantly related to SCA of the Chinese
clothing industry but Dynamic Capability is not. The statistical results also indicate that
all the three constructs of resources, namely, Fundamental Resource, Upgrading
Capability and Dynamic Capability, are correlated to each other which confirm a
bundling effect on sustained competitive advantage of the Chinese clothing industry.
These statistical results are further evidenced and illustrated within the rich contexts of
three individual cases (Details in Chapter 7).
The statistical results are consistent with the RBV theory in terms of the resources-SCA
relationships and the resource bundling effect. Therefore, this research makes both
theoretical and empirical contributions to the RBV theory. The theoretical contributions
are summarised into the following aspects (Details in Chapter 8.5). 1) This study
develops a synthesised framework, combining internal resources with external dynamic
environment, to explore and test sources for SCA. 2) This study formulates a holistic
model to test the RVB logic. 3) To quantify the research, this study develops and
operationalises the measures of main concepts involved in RBV, namely, resources and
SCA.
The research results also provide implications for SCA of the Chinese clothing industry.
The implications are concerned with significant resources contributing to SCA, the
resource bundling effect and measures of business performance (Details in Chapter 8.5).
The implications are mainly for the business managers in the Chinese clothing industry
and also to relevant policy makers in the government. Based on the research findings,
recommendations of SCA strategies and a suggested executive plan are also provided
(Details in Chapter 8.4)
1.3 Thesis structure
This thesis comprises eight chapters. The contents and the logical structure are
summarised as follows.
Chapter one: Introduction
This chapter briefly introduces the thesis and the research. It starts by outlining the main

7
issue and the background, from which the research aim, questions and objectives are
developed. This is followed by the research brief in terms of research theories, methods
and main findings. This chapter ends with a summary of the thesis structure.
Chapter two: Chinese clothing industry in the global value chain
The chapter examines the status quo of the Chinese clothing industry in the context of
the global clothing industry. An overview of the global clothing industry comes firstly in
terms of main characteristics of the industry and dynamics of the global clothing
industry. This is followed by an overview of the Chinese clothing industry, particularly
in terms of its competitive advantage and sustained competitive advantage. From the
research background, problems of sustained competitive advantage with the Chinese
clothing industry are revealed.
Chapter three: Sources of sustained competitive advantage
This chapter reviews relevant literature and provides the theoretical foundations, from
which the research framework concerning sources of sustained competitive advantage is
formulated in the next chapter. This chapter reviews two main theories, namely the
Resource-Based View (RBV) and Global Value Chains (GVCs). RBV functions as the
internal and fundamental theory, which explores the firm specific resources as the
source of SCA, while the clothing GVC is the external and influential context affecting
the firm’s strategic development of its resources and thereby SCA.
Chapter four: Conceptual framework
Based on a synthesis of the RBV and GVC theories, a conceptual framework is
formulated. The research framework consists of a conceptual framework and an
operationalised framework. The conceptual framework involves the concepts of
resources and SCA and the relationships between them. The operationalised framework
concerns measures and measurement of the concepts involved, i.e., constructs and the
corresponding indicators, and the hypothesised relationships between the constructs.
This chapter discusses and generates the conceptual framework (Figure 4-2) and
identifies the initial indicators (Tables 4-1 and 4-2) drawn from the literature review
while the operationalised framework is the subject of Chapter 6.
Chapter five: Research methodology
This chapter details the research methods. It starts with a discussion of philosophical
considerations, which underlie theory for the subsequent discussion of the research
paradigm. This is followed by discussion of the research design in terms of the research
approaches, the relevant research purposes and corresponding research strategies (Table

8
5-1). This chapter also introduces data generation process and survey design.
Chapter six: Statistical analysis
This chapter focuses on the statistical analysis, using the data generated from the survey
questionnaire. The analysis begins with data description and proceeds to extract a set of
constructs (Figture 6-9) from the initial indicators drawn from the literature via
Exploratory Factor Analysis (EFA). The extracted constructs are then used to test the
hypothesized model (Figure 6-10) by adopting a two-step approach of Structural
Equation Modeling (SEM). This chapter ends with comparison of alternative models
with the original model to further verify appropriateness of the hypothesized reserach
model.
Chapter seven: Case studies
This chapter presents studies of three cases, aiming to further understand the statistical
results and to offer a rich context and evidence to illustrate and to interpret these
statistical results in terms of how and why the key resources leading to SCA of the
Chinese clothing industry.
Chapter eight: Discussion and conclusion
This chapter discusses and concludes the research findings by examining whether and
how the research questions have been answered. Based on the findings, this chapter also
provides recommendations of SCA for the Chinese clothing industry. Contributions,
limitations and opportunities for future research are identified and reflected on at the
end of this chapter.

9
CHAPTER TWO: CHINESE CLOTHING INDUSTRY IN
THE GLOBAL VALUE CHAIN
2.1 Chapter introduction
Source: The Author.
As stated in the preceding introductory chapter, the primary aim of this research is to
explore and examine firm specific resources for Sustained Competitive Advantage
(SCA) of the Chinese clothing industry. To this aim, the study follows a series of
research steps (Figure 2-1). This chapter looks into the Chinese clothing industry from
both its historical development and status quo, aiming to reveal the problems with SCA.
Chapter2: Chinese clothing
industry in the global value chain
Chapter3: Sources of sustained
competitive advantage
Chapter5: Research methodology
Chapter6: Statistical analysis
Chapter7: Case studies
Chapter8: Discussion and conclusions
Chapter1: Introduction
This research aims to explore and test sources for sustained competitive
advantage of Chinese clothing industry.
CHINESE CLOTHING
INDUSTRY IN THE GLOBAL
VALUE CHAIN
Global clothing industry
Chinese clothing industry:
Historical development
Status quo in terms of SCA
Chapter 4: Conceptual framework
THESIS STRUCTURE
Figure 2-1: Thesis structure and focuses of Chapter 2 1

10
The Chinese clothing industry has integrated into the Global Value Chain (GVC) and
therefore the global clothing industry and its changing environment definitely
influences the Chinese clothing industry and its development (Bonacich et al. 1994). In
this context, the bigger picture of the global clothing industry is first profiled and this is
followed by a detailed overview of the Chinese clothing industry.
2.2 Overview of the global clothing industry
This section is structured into four subsections. The issue of production costs is first
addressesed because this is a key in understanding the structure of the global clothing
industry and also because it underlies global dynamics of the industry (Subsection
2.2.1). Next, trade patterns of the global clothing industry are introduced in Subsection
2.2.2, followed by an analysis of the dynamics of the global clothing industry in terms
of production, consumption and trade (Subsection 2.2.3). The last subsection provides a
summary of the global apprarel industry (Subsection 2.2.4).
2.2.1 Production costs
The clothing industry is primarily characterised by high labour intensity and simple
technology inputs (Taplin & Winterton 2004). Technology development in the industry
is mainly reflected in two major aspects:
Quick response to demand and markets and
Improving productivity and reducing labour costs.
Concerning the former for example, electronic point-of-sale technologies and
application of electronic bar codes establish a direct link between sales and production.
This enables the manufacturers’ quick response to the market and facilitates better
inventory control.
An example of improving productivity and reducing labour costs is the application of
microelectronic techniques such as computer-aided cutting and trimming and
computer-aided design, enormously saves on materials wastage and greatly increases
the speed of the process. For example, ‘…computer-controlled cutting can reduce the
time taken to cut out a suit from one hour to four minutes’ (Dicken 2007: 259).
However, a problem is that out of the total labour costs, the sewing and assembly
segment accounts for the largest proportion (about 80%) but so far has achieved very
limited technology innovation and therefore clothing manufacturing remains a
labour-intensive industry with labour costs representing about 30-50% of the final
product costs (Liu & Gu 2007). This is the key explanation for the fact that over its
history, clothing manufacturing has been continuously relocated to low-wage locations

11
worldwide due to widely varying labour costs in different geographic locations of the
world. For example, in 2008, the hourly labour cost was about $41 in Switzerland, $31
in France, $18.5 in the UK while only $2.5 in Mexico, $1.8 in China and $0.5 in
Bangladesh (Figure 2-2). The majority of the listed economies experienced rising labour
costs between 2005 and 2008 although the rate of increase varies. Among them, China
had the highest rate of increase (125%), France (45%) followed, and the others were
India (25%), Italy (24%), Switzerland (17%) and the USA (13%) while the hourly
labour costs in three countries, namely UK, Germany and South Korea, decreased
during the period. Generally, the increase in labour costs is related to economic growth
and inflation while the decrease is broadly related to efficiency and innovation in
technology and organisation.
Figure 2-2: Hourly labour costs in the apparel industry of selected countries, 2005 and 2008
(unit: USD) 1
Source: Adapted from Dicken (2007, 2011: 309).
Production cost is not the only factor to determine production locations. For example,
fashion garments are subject to a quick response to market demand and therefore
geographical proximity is taken into consideration. That is why Mexico is a favoured
manufacturing site for the American market; the Western European market prefers sites
in North Africa and Eastern Europe; Japan prefers offshore manufacturing in the East
and South Asian region (Gereffi 1999).
41.5
31 30.5
25.5 23
19 18 17.5
8 6 5
3 2.5 1.8 1.5 1.4 1 0.8 0.6 0.4 0
5
10
15
20
25
30
35
40
45
2005
2008

12
2.2.2 Trade patterns
The clothing industry is one of the most globalized industries and this is mainly
reflected in international trade and globally dispersed production. For example, the
global clothing trade amounted to about $316 billion in 2009, which accounted for over
30% of the global clothing retail value and 2.6% of the world’s total merchandise
exports5.
Global clothing production is mainly located in the cheap labour-cost developing
economies and regions. Among the global top ten leading exporters, which accounted
for 87.9% of the total clothing trade in 2012, 55.4% of the value of exports was from
the developing economies (Figure 2-3). China alone represented 37.8% of global
clothing exports by value and the other important clothing suppliers included Hong
Kong (7.3%), Bangladesh (4.7%), Turkey (3.4%), India (3.3%) and Vietnam (3.3%).
Source: Adapted from WTO’s International Trade Statistics, 20136.
The main clothing markets (i.e., clothing importers) are situated in the developed
economies and regions (Figure 2-4). The global top ten importers accounted for 82.5%
of the total trade and among them the top three, European Union, United States and 5 Source: DATAMONITOR (2010): Global Apparel Retail [online] available from <www.datamonitor.com> [4th May
2012]; WTO’s International Trade Statistics of 2010 [online] available from <www.wto.org> [4th May 2012]. 6 Source: [online] available from <http://www.wto.org/english/res_e/statis_e/its2013_e/its2013_e.pdf> [5th April
2014].
China, 37.8
EU(27), 25.8
Hong Kong, China, 5.4
Bangladesh, 4.7
Turkey, 3.4
India, 3.3
Viet Nam, 3.3
Indonesia, 1.8 Others, 14.5
Figure 2-3: World leading clothing exporters by market share, 2012 (unit: %) 1

13
Japan, are the major global clothing markets, accounting for 66.1% of the total clothing
imports by value. The other important clothing importers include Japan (7.7%), Hong
Kong (3.8%), Canada (2.1%), Russian (2.1%), South Korea (1.4%) and Australia
(1.4%).
Figure 2-4: World leading clothing importer by market share, 2012 (unit: %) 1
Source: Adapted from WTO’s International Trade Statistics, 20137.
2.2.3 Dynamics of the global clothing industry
Globalisation of the clothing industry is a gradual and dynamic process. The dynamics,
particularly during the last three decades, is mainly reflected in three aspects, namely,
trade patterns, apparel production and apparel consumption. The dynamics of the global
clothing industry are fundamentally attributable to the labour-intensiveness of the
industry. Moreover, the employment issue and thereby relevant trade regulations,
materially affect and reinforce these changes.
2.2.3.1 Employment
The employment issue in the clothing industry is closely linked to its labour-intensive
nature of the industry and also related to the regulatory regime of the global clothing
industry. Almost all governments in the world adopt various means to protect their
7 Source: [online] available from <http://www.wto.org/english/res_e/statis_e/its2013_e/its2013_e.pdf> [5th April
2014].
EU(27), 38.5
US, 19.9
Japan, 7.7
Hong Kong, 3.8
Canada, 2.1
Russian, 2.1
South Korea, 1.4
Australia, 1.4
Others , 23.1

14
domestic clothing markets to some extent. One of the key reasons is that the clothing
industry, especially clothing manufacturing, remains labour-intensive so it provides
substantial job opportunities especially for non-skilled workers in both developed and
developing countries (Figure 2-5). However, clothing manufacturing mainly locates in
the developing economies where there is an endowment of comparatively abundant and
cheap labour. The top four countries with the highest employment in the clothing
industry are China (about 4.6 million), Indonesia (about 1.3 million), Mexico (907,000)
and Turkey (714,000).
Figure 2-5: Employment of the clothing industry in world leading economies, 2008* 1
Source8: Author’s creation based on database of International Labour Organisation (ILO), 2011.
Note: * This is the up-to-date data from the ILO website (Laborsta) and data of the last years are
unavailable.
Global clothing manufacturing has been steadily moving from the established
developed economies to the Newly Industrialised Economies (NIEs) and then to the
transition economies, which has resulted in employment shifts amongst those
economies involved. For example, employment in the clothing industry of the US has
declined steadily since 1973 where total employment fell from 1.4 million in 1973 to
8 India’s employment data in 2008 (about 338.700 persons) is author’s calculations based on its ILO employment
number in 2000 (i.e., about 186,000), which was access to the online website available from
<http://laboursta.ilo.org/STP/guest> [5th April 2014]. The employment number of Indian clothing industry is
estimated with reference to India’s apparel export growth rate during the same period (about 82.11%). India’s apparel
export growth rate is calculated based on data from WTO’s International Trade Statistics of various years [online]
available from <www.wto.org>[5th April 2014] . China’s data is based on China Statistic Yearbook, 2009.
0
500000
1000000
1500000
2000000
2500000
3000000
3500000
4000000
4500000
5000000
Employment in the world leading clothing economies,2008

15
1.3 in 1979, 1.1 million in 1989, 763,000 in 1998, and 684,000 in 1999 (Brown, 2001)
and that is, total employment in apparel manufacture declined by 52.4% from 1973 to
1999. Employment in the UK clothing industry shrank even more. For example,
employment fell by 59.7% between 1978 and 1999 (Jones & Hayes 2004). During the
eight years from 2000 to 2008, almost all of the developed economies witnessed a
further and steady decline in clothing employment (Table 2-1). The US, Canada and the
UK were the worst amongst them, with employment falling by more than 50%, while
Italy, which has maintained most of its clothing manufacturing segment untill now,
experienced a 20% decrease. In contrast, the employment figures in the developing
countries, like China (by 158%), India (by 82%), Indonesia (64%) and Turkey (21%),
have steadily increased. However, the developed economies have not abandoned the
whole industry, but instead their competitive advantage has upgraded into high
value-added segments such as design, marketing and retailing.
Table 2-1: Clothing employment in selected economies (Unit: 1,000 persons) 1
Economy 2000 2001 2002 2003 2004 2005 2006 2007 2008
Canada 92 102 88 86 78 63 62 55 44
China 1780 1760 1870 2892 3203 4817 3776 4142 4587
France 134 124 116 91 91 90 79 79 84
Hong Kong SAR 37 30 24 23 23 22 20 17 14
Japan n/a n/a n/a 480 430 410 410 390 370
Germany 151 155 137 132 120 97 98 98 86
Greece 56 60 54 54 45 40 39 33 34
India 186 230 236 n/a n/a n/a n/a n/a 339
Indonesia 764 747 n/a n/a n/a n/a n/a 1177 1252
Italy 374 371 350 339 331 310 277 280 300
Mexico 1056 944 874 841 912 987 929 878 907
Philippines n/a 335 367 410 415 413 376 362 324
Portugal 223 215 200 188 164 151 154 146 120
Spain 208 202 200 192 181 158 133 129 115
Turkey 590 558 611 619 701 745 735 743 714
UK 140 122 103 100 86 77 67 63 62
USA 552 473 400 348 320 290 269 248 232
Source9: author’s calculations based on ILO database, 2011.
10
9 Notes: The data are based on the International Standard Industry Classification (ISIC), by ISIC categories of D18
(i.e., manufacturing of wearing apparel except footwear) and D20 (manufacturing of footwear). Among the ILO data,
some of the data are based on labour force surveys (Mexico, Canada, Indonesia-2007 and 2008, Italy, Greece,

16
Note: This is the up-to-date data and data of the last years are unavailable. China’s data is based on
China Statistics Yearbook, from 2003 to 2008. India’s data of 2000 is the average amount of1999
(i.e., 179,000) and 2001 (i.e., 192,000); India’s data of 2008 is author’s estimation (Details referring
to Footnote 7).
2.2.3.2 Trade regulations: from MFA to ATC
The two prevailing trade agreements which substantially affect the dynamics of the
global clothing industry are the Uruguay Multi-Fiber Arrangement (MFA) and its
subsequent WTO Agreement on Textile and Clothing (ATC) (Dicken 2007).
In the 1970s, to respond to increasingly severe competition from the low labour-cost
producers in the developing economies, the established apparel producers, mainly the
United States and EU members, turned to trade regulations for protection of their
domestic markets and employment. This is the background to the emergence of the
MFA, which came into force on 1st January 1974.
The MFA was a temporary regulation to allow developed countries to impose quotas on
the imports of textile and clothing from the developing economies, in particular the
threat posed by the traditional garment producers such as China and India. The import
quotas are based on bilateral negotiations. However it has not stopped the steady
process of apparel production moving out of the developed countries or the dispersion
of global production capacity amongst some 140 low-cost developing economies
(Appelbaum 2008). Due to the MFA quotas, the traditional production economies such
as China and India have had to restrain their trade to the EU and the US markets.
Under these circumstances, some apparel manufacturers moved their facilities to the
countries which were not signatories to the MFA or whose quotas were not fully used
by domestic producers. As a result, for example, in Bangladesh and Cambodia where
the EU imposed no restrictions or duties on imports, the apparel production experienced
explosive growth and by 2009 clothing exports in both countries accounted for over 71%
of their national total merchandise exports (Dicken 2007: 261). The Nien Hsing
Corporation, the Taiwanese multinational and the world’s largest jeans maker, has
established factories in Taiwan, Mexico, Nicaragua and Lesotho since the mid 1970s,
where 40 million pairs of jeans were produced in 2000 for Wal-Mart, JC Penny, K-Mart,
Gap, Sears and Target (Appelbaum 2008).
Germany, France-2005 -2008, Japan, Philippines, Portugal, Spain), some on establishment surveys (USA, India,
Indonesia-2000 and 2001, Hong Kong SAR), which are less comprehensive than the labour force surveys, and the
others on official estimate (UK, France-2000-2004), so the data provide only a rough picture of employment
comparisons rather than a strict comparisons among the economies. 10 Source ILO Table: Employment-2F paid employment in manufacturing (thousand) [online] available from
<http://laboursta.ilo.org> [5th April 2014].

17
The adoption of triangular manufacturing is another consequence. To respond to the
tightening grip of the MFA quotas from the mid 1970s through the 1980s and 1990s,
East Asian NIEs organised triangular manufacturing arrangements (Gereffi 1999). In
these arrangements, manufacturers based in NIEs shifted some or all production of
clothing orders from the US or other overseas buyers to affiliated offshore factories in
low-wage countries (further referring to Figure 2-6). This triangular pattern of
manufacturing ‘thus changes the status of NIE manufacturers from established suppliers
for US retailers and designers to middlemen in buyer-driven commodity chains that can
include as many as 50 to 60 exporting countries’ (Gereffi 1996: 85).
In summary, the MFA has played an important part in leading to the present globally
dispersed or decentralized production and in shaping the trade patterns in the global
clothing industry from 1974 to 1995. Meanwhile, the MFA greatly curtailed the
momentum of apparel import penetration into the developed markets from the
developing suppliers.
After a ten-year phase-out period, on 1st January 2005, the MFA was finally abolished
and the apparel trade was incorporated into the framework of WTO and started to be
subject to the Agreement on Textile and Clothing (ATC). In this context, those
countries whose apparel exports heavily rely on the quota system had witnessed a big
market loss while China and India were among the big winners. However, the USA and
EU cited China's WTO accession agreement allowing them to restrict the rate of growth
to 7.5% per year until 200811
.
2.2.3.3 Dynamics of clothing trade pattern
By the end of 2012, eight years having passed since abolition of the MFA, the
post-MFA clothing trade pattern has changed dramatically. The dynamics of the
post-MFA era, particularly during the economic recession from the end of 2007 and
beginning of 2008, are reflected as follows.
Tables 2-2 presents main global clothing exports by regions, showing changes in market
share and export value between 2005 and 2012. Asia ($246bn), Europe ($127bn) and
South & Central America ($16bn) account for about 92.0% of the world’s total clothing
exports by value (in 2012), whilst China itself ($160bn) accounts for 37.8%. The annual
growth rate (AGR) of the global clothing exports was 6% over the period, amongst
which Asia’s exports AGR (9%) grew faster than the world average while both
Europe’s (3%) and South & Central America’s (1%) grew more slowly. Remarkable
AGRs are noted as follows:
11 In June 2005, China agreed with the EU to limit the rate to 10% for 3 years while no such bilateral agreement was
reached with the USA

18
Table 2-2: World clothing exports of major regions/economies by destination (units: billion
USD, %) 1
Region/economy 2012
Value
2005
Share in world
exports
2012
Share in world
export
2005-12
Annual
change(%)
World 423 -- -- 6
Asia
--World 246 48.3 58.1 9
--Europe 72 13.1 17.1 10
--North American 71 17.6 16.9 6
--Asia 60 11.6 14.1 9
China
--world 160 26.7 37.8 12
--Asia
--Europe
--North America
47
41
35
8.9
6.3
6.6
11.2
9.6
8.4
10
13
10
Europe
--World 127 36.2 30.0 3
--Europe 103 30.3 24.3 3
--Asia 7 1.5 1.7 8
South and Central America
--World 16 5.1 3.7 1
--Noth America 10 4.3 2.5 -2
--South & Central America 5 0.7 1.1 14
Total above 3 regions 389.0 89.6 92.0
Source: author’s recreation based on WTO’s International Trade Statistics, 2013 [online] available
from <http://www.wto.org/english/res_e/statis_e/its2013_e/its2013_e.pdf> [5th April 2014].
a) China’s export AGR (12%) was twice the global figure (6%) and grew fairly evenly
across the main destinations such as Asia/intra-region (10%), Europe (13%), and North
America (10%);
b) Europe’s AGR to Asia (8%) was much higher than to the world as a whole (3%),
which suggests Europe increased its exports to Asia in comparison to everywhere else;

19
c) South & Central America’s AGR to North America was -2% while its internal AGR
was 14%, which suggests that South & Central America lost the market share to North
America while increasing its intra-regional exports.
Concerning changes in market share between 2005 and 2012, Asia (from 48.3% in 2005
up to 58.1% in 2012) particularly China (from 26.7% in 2005 up to 37.8% in 2012) is a
clear winner while both Europe (36.2% in 2005 down to 30.0% in 2012) and South &
Central America (from 5.1% in 2005 down to 3.7% in 2012) are losers.
Table 2-3 presents world clothing imports of major regions/economies showing changes
in imports share and imports value between 2005 and 2012.
Table 2-3: World clothing imports of major regions/economies by destination (units: billion
USD,%) 1
Region/economy 2012
Value
2005*
share in region/world
imports
2012
Share in region/world
imports
2005-12
Annual
chang(%)
World 423 100 100 4
United States
--World 88.0 29.0 19.9 1
--Asia 67.2 65.2 76.4 4
-- South & CentralAmerica 9.8 14.5 11.1 -2
--North America 4.6 9.8 5.3 -7
European Union (27)
--World 170.1 46.7 38.5 4
--Europe 93.7 59.0 55.1 3
--Asia 67.4 33.6 39.7 6
Japan
--world 33.9 8.2 7.7 6
--Asia 31.8 90.4 93.8 7
--Europe 1.7 7.7 4.9 -1
Total above 3 292.0 83.9 65.7
Source: Author’s recreation based on WTO’s International Trade Statistics of 2013 [online] available
from <http://www.wto.org/english/res_e/statis_e/its2013_e/its2013_e.pdf> [5th April 2014].
Note: * Figures in this column are based on WTO’s International Trade Statistics, 2006 [online]
available from <http://www.wto.org/english/res_e/statis_e/its2006_e/its06_toc_e.htm> [6th April

20
2014]; European Union’s data is based on 25 nations in 2006. On 1st January 2007, Romania and
Bulgaria became EU members and therefore, Statistics for EU consist of 27 members between 2007
and 2012. On 1st July 2013, Croatia became the 28th EU member and therefore the 2013 data are 28
EU members.
The three major import regions/ economies, namely the US, European Union and Japan,
accounted for 65.7% of world imports by value (in 2012). From 2005 to 2012, all three
of the major importing regions/ economies have decreased their shares of world import,
e.g., the US from 29.0% in 2005 down to 19.9% in 2012,EU from 46.7% down to 38.5%
and Japan from 8.2% down to 7.7%. Meanwhile, all three regions/ economies have
remarkably increased the share of their imports coming from Asia, e.g., US from 65.2%
up to 76.4% (with annual change by 4%), European Union from 33.6% up to 39.7%
(with annual change by 6%), and Japan from 90.4% up to 93.8% (with annual change
by 7%).
To summarise, the world clothing trade increased between 2005 and 2012. Concerning
clothing production and exports, the comparative advantage amongst regions/
economies varied, of which Asia, particularly China, was the biggest winner at the cost
of the other regions. However, the developed regions and economies such as the EU and
the US, specialised in high value-added segments such as marketing, retailing and
design. Another remarkable feature is that US, EU and Japan, as the global major
clothing markets, their shares of world purchasing power have been reduced. For
example, their total share in world imports accounted for 83.9% in 2005 and steadily
reduced to 65.7% in 2012. Who has gained then? According to the WTO database, those
major economies who gained the clothing import shares were Russion Federation (up
by 39%), Turkey (up by 19%), Chile (up by 17%), China (up by16%), United Arab
Emirates and Saudi Arabia (both up by13%), which might be related to economic
development in these economies.
Table 2-4 presents changes in shares of the world leading exporters between 2000 and
2012. Among the world’s leading clothing exporters in 2012, China and EU are
dominant, accounting for 63.6% the market shares, with the next seven most important
exporters having a total share of 22.6%; including Hong Kong (5.4%), Turkey (3.4%),
India (3.4%), Bangladesh (4.7%), Vietnam (3.3%), US (1.3%) and Mexico (1.1%).
During 2000-2012, China’s clothing exports experienced fast and steady growth; its
market share rising from 18.3% in 2000 to 37.8% in 2012, representing a growth of
100.1% over the 12-year period. Though with quite small absolute shares, Bangladesh
and Vietnam even grew faster with their shares growing by 135% and 266.7%
respectively. The major reason for their market-share growth is related to the fact that
the developed regions and economies such as the EU and the US were outsourcing
clothing production to these economies. The other possible explanation might be the

21
stable economic growth in the leading global clothing markets, which resulted in
increased clothing consumption. The increasing dispersal of the global clothing
manufacturing was also influenced by the international regulations (e.g., MFA) and
regional economic integration agreements (e.g., EU and NAFTA).
In contrast, during the same period (Table 2-4), export shares dropped dramatically in
some regions, e.g., US exports dropped by 70.5%, Mexico by 75.0%, and Hong Kong
by 56.1%. Mexico’s decrease in market share may result from its major buyer, the US’s
market shrinking and shifting to Asia suppliers while the decrease of market shars in the
US and Hong Kong reflects the general trend of clothing production moving to low-cost
manufacturing economies. The other three leading regions/ economies (i.e., Turkey,
India and EU) had only slight changes in their shares of imports throughout the same
period.
Table 2-4: Share changes of world leading clothing exporters, 2000-2012 (unit: %) 1
Economy/region 2000 2005 2006 2007 2008 2009 2010 2011 2012
China 18.3 26.9 30.6 33.4 33.2 34.0 36.9 37.3 37.8
European Union* 27.0 29.2 26.8 29.9 31.3 30.7 28.1 28.2 25.8
Hong Kong 12.3 12.2 9.1 8.3 7.7 7.3 6.8 6.1 5.4
Turkey 3.3 4.3 3.8 4.1 3.8 3.7 3.6 3.4 3.4
India 3.1 3.0 3.3 2.8 3.0 3.6 3.2 3.5 3.3
Bangladesh 2.0 2.3 2.8 2.9 3.0 3.4 4.5 4.8 4.7
Vietnam 0.9 1.7 1.7 2.1 2.5 2.7 3.1 3.2 3.3
United States 4.4 1.8 1.6 1.2 1.2 1.3 1.3 1.3 1.3
Mexico 4.4 2.6 2.0 1.5 1.4 1.3 1.2 1.1 1.1
Source: Author’s creation based on data of WTO’s International Trade of various years.
Note*: Statistics for EU consists of 25 members before 2006. On 1 January 2007, Romania and
Bulgaria became EU members and therefore, Statistics for EU consists of 27 members since 2007.
Table 2-5 shows share changes of the world leading clothing importers during
2000-2012. Their total share accounted for 78.2% in 2012, amongst which the top three,
namely EU, US and Japan, accounted for 66.1% and the next six for 12.1%. In
comparison with the corresponding figures in 2000, the import shares reduced among
the EU (-3.5%), the US (-38.6%), Japan (-18.9%), Hong Kong (-50%) and Switzerland
(-13.3%) in 2012 by varied degrees while at the same time the import shares increased

22
among the rest four, e.g. Australia (55.6%), South Korea (133.3%), Canada (16.7%) and
Russia (61.5%). An explanation for the relative changes of the import shares might be
related to the outsourcing and offshore production in these economies during this period
and other reasons such as the decline in EU imports since 2009, keeping in mind the
impact of the global economic recession from 2008 and the subsequently introduced
austerity measures into these countries. This was also coupled with economic
development in emerging economies.
Table 2-5: Share changes of world leading clothing importers, 2000-2012 (unit: %) 1
Economy/region 2000 2005 2006 2007 2008 2009 2010 2011 2012
European Union 39.9 44.8 43.6 45.5 47.3 48.5 44.7 43.8 38.5
United States 32.4 27.9 25.6 23.7 22.0 21.8 22.3 20.5 19.9
Japan 9.5 7.8 7.4 6.7 6.9 7.7 7.3 7.6 7.7
Hong Kong 7.6 6.7 6.1 5.4 5.1 5.1 4.8 4.1 3.8
Canada 1.8 2.1 2.1 2.1 2.3 2.3 2.3 2.2 2.1
Russian Federation 1.3 2.7 4.1 2.5 5.7 2.2 2.0 1.8 2.1
Switzerland 1.5 1.6 1.4 1.4 1.5 1.6 1.4 1.4 1.3
Australia 0.9 1.1 1.0 1.0 1.1 1.2 1.3 1.4 1.4
South Korea 0.6 1.0 1.2 1.2 1.1 1.0 1.2 1.4 1.4
Source: Author’s creation based on data from WTO’s International Trade Statistics of various years
[online] available from < http://www.wto.org/english/res_e/statis_e/statis_e.htm> [4th
May 2014].
2.2.3.4 Changing location of global apparel production
In the late 1950s and early 1960s, global apparel production started to shift out of the
developed regions such as Western Europe and North America. Throughout the
subsequent three decades, especially in the 1980s and 1990s, the pace of the production
shift accelerated away from the high-cost developed regions/economies of West Europe,
the US and Japan12
to the low-cost developing regions/ economies; initially to East
Asian NIEs (e.g., Taiwan, Hong Kong and South Korea) in the late 1960s throughout
the 1970s, and later on in the 1980s expanding to mainland China and other Asian
12 Japan developed its clothing manufacturing during the 1950s and 1960s and shifted the production to Eastern Asia
NIEs in the 1970s and 1980s.
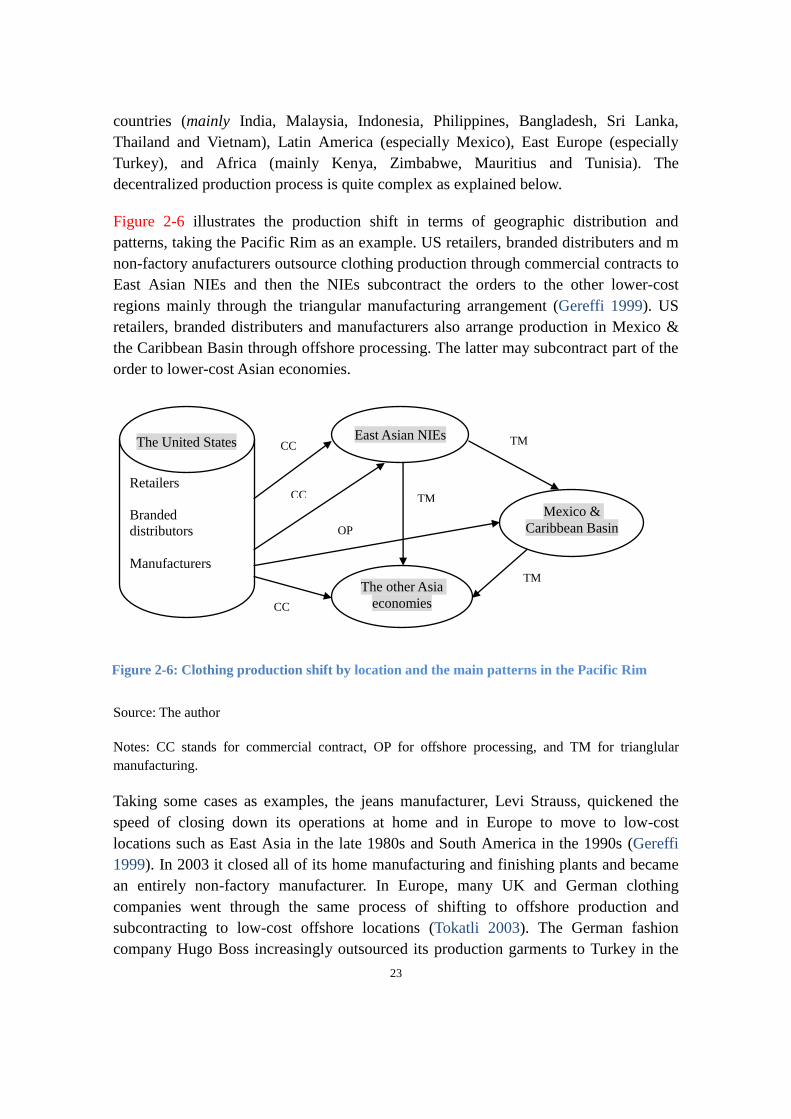
23
countries (mainly India, Malaysia, Indonesia, Philippines, Bangladesh, Sri Lanka,
Thailand and Vietnam), Latin America (especially Mexico), East Europe (especially
Turkey), and Africa (mainly Kenya, Zimbabwe, Mauritius and Tunisia). The
decentralized production process is quite complex as explained below.
Figure 2-6 illustrates the production shift in terms of geographic distribution and
patterns, taking the Pacific Rim as an example. US retailers, branded distributers and m
non-factory anufacturers outsource clothing production through commercial contracts to
East Asian NIEs and then the NIEs subcontract the orders to the other lower-cost
regions mainly through the triangular manufacturing arrangement (Gereffi 1999). US
retailers, branded distributers and manufacturers also arrange production in Mexico &
the Caribbean Basin through offshore processing. The latter may subcontract part of the
order to lower-cost Asian economies.
Source: The author
Notes: CC stands for commercial contract, OP for offshore processing, and TM for trianglular
manufacturing.
Taking some cases as examples, the jeans manufacturer, Levi Strauss, quickened the
speed of closing down its operations at home and in Europe to move to low-cost
locations such as East Asia in the late 1980s and South America in the 1990s (Gereffi
1999). In 2003 it closed all of its home manufacturing and finishing plants and became
an entirely non-factory manufacturer. In Europe, many UK and German clothing
companies went through the same process of shifting to offshore production and
subcontracting to low-cost offshore locations (Tokatli 2003). The German fashion
company Hugo Boss increasingly outsourced its production garments to Turkey in the
Figure 2-6: Clothing production shift by location and the main patterns in the Pacific Rim 1
The United States
Retailers
Branded
distributors
Manufacturers
East Asian NIEs
Mexico &
Caribbean Basin
The other Asia
economies
CC
CC
OP
CC
TM
TM
TM

24
1990s and the company itself concentrated on design, marketing and logistics (Tokatli
2007b). Even Italy, which enjoys fame for its highly fashionable and designer-label
garments in the world clothing industry, started to join in the offshore production
arrangements. Armani is a case in point, which is now outsourcing to China. As a result
of these global shifts, clothing production in the high-wage economies is often regarded
as a “sunset” industry (Taplin 1997).
The key and long-term reason for the global geographic shift in apparel production is
labour costs. However, low cost is not the only factor to determine production location.
Other influential factors include perceived product quality of sourcing economies,
geographic proximity and both international and regional trade regulatory agreements.
Quality, in addition to labour costs, is another consideration in determining outsourcing
locations (Jones 2006). Luxury branded companies, such as Gucci and Ralph Lauren,
require high quality of products and skillful workers for their orders, so the main
sourcing destinations would be South Korea, Taiwan, Hong Kong and Singapore, which
enjoy customers’ perception of high-quality. Specialty stores and branded companies
such as Gap, Calvin Klein and Liz Claiborne, usually place their orders for top-quality,
high-priced garments with manufacturers in China, Turkey, Mexico or Indonesia. Large
orders from the mass merchandisers such as Sears and J.C. Penney, or from discount
chains with low-priced goods such as Wal-Mart and Kmart, most probably choose
contractors in small Southeast Asian countries (e.g., Sri Lanka, Bangladesh and Pakistan)
or African countries (e.g., Zimbabwe, Mauritius and Kenya), which have customers’
perception of low quality (Gereffi 1994, Gereffi & Pan 1994, Dicken 2007).
Geographic proximity is another important factor in determining production locations.
This is the major reason why ‘US manufacturers go to Mexico and the Caribbean Basin,
European Union firms look to North Africa and Eastern Europe, and Japan and the East
Asian NIEs look to lower-wage regions within Asia’ (Gereffi 1999:39). This is
especially true for West European apparel companies.
European outsourcing processing trade favored the Eastern and Central European
and Mediterranean countries more than the Asian suppliers’ and therefore ‘Turkey
has emerged as the second most important individual clothing supplier to the EU
after China. (Dicken 2007:275-276)
The factor of geographic proximity is especially important for the fashion-based apparel
companies since the time to meet orders or the principle of agile supply becomes even
more important than the costs in this context (Tokatli 2007a). One typical example is the
Spanish fashion-garment producer, Zara whose production is based on the principle of
geographic proximity.

25
An entirely new Zara garment takes about five weeks from design to delivery; a new
version of an existing model can be in the shops within two weeks. In a typical year,
Zara launches some 11,000 new items, compared with the 2,000 to 4,000 from
companies like H&M or America’s giant casual-fashion chain, GAP. (Dicken,
2011:320)
Another ubiquitously influential set of factors affecting the location of clothing
production is the regime of international trade regulations and the regional economic
integration process. The industrial trade regulations, MFA and ATC, have had a great
impact on the global decentralisation of production, which has been discussed in the
previous sub-section. Concerning regional integration, the North American Free Trade
Agreement (NAFTA) and the European Union (EU) are the two most influential. With
implementation of the regional integration agreement of NAFTA between the United
States, Canada and Mexico in 1994, and the subsequent preferential arrangement of the
Caribbean Basin Initiative (CBI) amongst the Caribbean countries, the import shares of
both Mexico and the Caribbean Basin in the United States’ Market increased greatly. By
2000, Mexico had overtaken China to become the leading source of clothing imports
into the United States (Dicken 2007:270). However, since China’s entry into the WTO
in 2001, it regained its position as the main supplier to the American market (Jones
2006: 76).
2.2.3.5 Changes of global apparel consumption
In addition to the dispersed production discussed above, the dynamics of the global
clothing industry is also reflected in consumption in terms of the changing pattern of
consumption for fashion and for product differentiation.
The most salient and general determinant of apparel demand is personal income (Dicken
2007, Jones & Hayes 2002). The booming clothing market of the late 1980s in the UK
is interpreted as being ‘supported by high earnings and personal disposable income,
driving consumer expenditure’ (TMS 1996:1). Jones and Hayes (2002:330) also
consider the effects of income elasticity of demand on the consumption patterns,
‘…over time clothing has changed from being a necessity (with a positive- but- less-
than- one income elasticity) to a luxury (with a positive income elasticity of over one)
while always being a normal good’. In the comments, the reference to ‘always being a
normal good’ is consistent with the general principle that the clothing consumption is
always characterised by price sensitivity, especially for mass products. However, with
growing consumption power, clothing purchases become wants driven rather than needs
driven (Jones & Hayes 2002). This is consistent with the effects of income elasticity on
clothing consumption. That is, with economic development and increased personal
disposal income, clothing consumption goes beyond satisfying basic human needs (e.g.,

26
keeping the wearer warm), more influenced by ‘a whole variety of complex social and
cultural forces’ (Dicken, 2007:254). For example, people may desire to display their
individual identity or superior socio-economic class through their choice of clothing. So
clothing retailers and manufacturers have to cater for these fast growing needs by
offering higher-margin fashion-basic garments. Furthermore, they seek to stimulate this
demand through fashion change and a diverse range of differentiated products. Due to
the consumers’ preference for fast fashion, procurement based on two seasons is not
enough and has to extend to 4 lots of procurement and supply. Moreover, the
consumption trend also affects companies’ performance which is discussed below.
Figure 2-7: Profit margin of the world leading apparel companies (unit: %) 1
Source: author’s creation based on data from DATAMONITOR (2010) about Global Apparel Retail, [online]
available from <www.datamonitor.com> [4th May 2012].
Note: This is the up-to-date data and data of the recent years are unavailable.
Generally, garments can be classified roughly into three major types, namely, basic
garments (e.g., TJX), fashion-basic garments (e.g., GAP) and fashion garments (e.g.,
H&M) (Dicken 2007:254). Figure 2-7 provides a comparison of the three world-leading
apparel companies in terms of their profit margins during 2005-2009. Despite the ups
and downs throughout the period, the highest average profit margin goes to the Swedish
fashion-oriented company H&M (e.g., 13.9% in 2009), over three times higher than the
lowest one, the US apparel retailer TJX companies (e.g., 4.6%). Situated in the middle
is the US casual apparel company, GAP with a profit margin of 6.7% in 2009.
6.9
4.9 4.9 5.3
6.7
12.9 13.5
14.7 14.7 13.8
4.1 4.3 4.2 4.1 4.6
0
2
4
6
8
10
12
14
16
2005 2006 2007 2008 2009
GAP H&M TJX companies Inc.

27
Therefore, it is inevitable that consumption trends in fashion affects the development
strategies of the global clothing companies.
2.2.4 Summary of the global clothing industry
The following three points briefly summarise the attributes, present conditions and
dynamics of the global apparel industry.
Clothing remains a labour-intensive industry and labour costs vary substantially
between the various apparel economies, which is the primary and long-term
reason for the shift of global production from high-wage to low-wage
economies.
The clothing industry, particularly the manufacturing segment, makes a
substantial contribution to national employment, which is the key reason for the
protective regulations constraining clothing imports. Even so, employment has
substantially declined in the developed economies/ regions whilst increasing in
the developing economies over the past four decades.
The global dynamics of the apparel industry are embodied in production, trade
and consumption as follows. First, since the 1960s, global clothing production
has been constantly shifting from high-cost developed economies and regions,
particularly the EU and US, towards low-cost developing economies, firstly
Japan, then Asian NIEs, and followed by China, Bangladesh, Vietnam, etc.
Second, concerning the clothing trade, Asia particularly China, is the biggest
market winner at the expense of the other regions, while the developed regions
and economies focus on high value-added segments of the industry, such as
marketing, retailing and design. Third, the increasing apparel consumption has
led to substantial product differentiation and a growth in casual garments and
fashions, which leaves space and opportunities for clothing companies in the
developing economies to establish and develop new clothing brands through
functional upgrading.
2.3 Overview of the Chinese clothing industry
Following examination of the general background in the previous section, this section
focuses on the specific research background, the Chinese clothing industry. An initial
overview of the historical development of the industry is followed by an analysis of the
status quo of the industry such as production, leading players, employment, labour costs,
consumption, etc. Based on both vertical and horizontal description, the main problems
associated with sustaining competitive advantage of the industry are revealed and
summarised at the end of this section.

28
2.3.1 Historical development
The last three decades have witnessed rapid development of the Chinese clothing
industry in three significant development phases. This sub-section provides a summary
of the development contexts and the main features of the phases. Three historic events
mark the background and the watershed for division of the phases, that is, China’s
adoption of the opening-up and reform policy in 1979, Den Xiaoping’s “Southbound
Tour” in 1992 and China’s entry into the WTO in 2001.
Initial development phase (1979-1991)
The initial development phase covers a period from 1979 to 1991. The background was
that the Chinese government started to adopt the opening-up and reform policy in 1979.
This was a period when China started to develop clothing manufacturing and to
integrate into the global clothing industry as a manufacturer and exporter. Through this
period, the Chinese stepped out of the “murky grey” (in clothing colors) and “starving”
(in clothing consumption) era. “Murky grey” describes the color, design and style of
Chinese clothing at that time, which was dull and monotonous, while the term “starving”
refers to a situation whereby supply of clothing was insufficient to meet demand (Chen
2008).
At the beginning, there was no notion of a clothing industry in China. Mostly, clothing
was produced in collective-owned processing workshops all around the nation and in
only a few well-known shirt factories. For a long time, the dominant colors were army
green, navy blue, dark and grey, so clothing in other colors was highly demanded. This
is generally referred to as the ‘starving consumption’ era in the history of Chinese
clothing development. Under these circumstances, consumers were unsophisticated and
followed “fashions” on the basis of one-sided viewpoint. The early “fashions” came
from Hong Kong to the neighboring city of Guangzhou, which was one of the earliest
cities to open up to the outside world, and then from Guangzhou the “fashions” clothing
sold all over China (Chen 2008).
Until the mid and late 1980s, some Sino-foreign joint ventures started in the eastern
coast regions (e.g., Guangdong, Zhejiang, Jiangsu and Shandong provinces) and the
special economic zones (e.g., Shenzhen, Dongguan and Ningbo). These joint ventures
brought advanced technology and manufacturing experience. The majority of the
investors came from Hong Kong attracted by both government preferential policies and
the cheap labour costs. Meanwhile, some Chinese clothing enterprises were established,
originally via two main routes, namely, through reform of the former state-owned or
collective-owned clothing factories (e.g., Youngor), or through private- and family-
owned establishments, of which the founders and owners had once been staff in the

29
foreign trade enterprises.
At the same time, from the 1980s and throughout the 1990s, the shift in global clothing
production to China accelerated. Under these circumstances, the Chinese clothing
industry started as clothing manufactures for global buyers and gradually integrated into
the clothing GVC. Due to the low entry barriers, the early development was at a rapid
pace.
Scale expansion, global integration together with brand development (1992-2000)
The development phase from 1992 to 2000 was typically characterised by scale
expansion and industrialisation whilst at the same time the Chinese clothing industry
gradually integrated into the world market and started developing its own brands. The
background was Deng Xiaoping’s “Southbound Tour” in 1992. Prior to the tour, the
government still implemented strict regulations on private enterprises and many private
clothing firms had to become a department or branch of state-owned or collective
enterprises. During the tour, Deng made a famous speech, encouraging further
opening-up policy, which clarified the political direction and resulted in a boost for the
Chinese clothing industry and further integration into the global economy.
The Chinese clothing industry gradually increased its manufacturing capacity and
competitive advantage in the manufacturing segment during this period. For example, as
a world leading clothing exporter, China gained 18.3% of the global market share in
2000, a substantial increase from the share of 8.9% in 199013
. In addition to the
favorable international environment and the labour-intensive attribute of the clothing
industry (discussed in above Chapter 2.2), these achievements are also attributable to
national and industrial environmental conditions. The first condition relates to
industrial leadership and organisation. The government gradually shifted its role from
being a governor or controller to being a service provider. Various national or local
organisations such as the China Textile Industry Association, China Garment
Association, China Clothing Designers’ Association, Wenzhou Chamber of Commerce,
Ningbo Clothing Association, Shanghai Clothing industrial Association, etc., played a
very important role in boosting industrial development. The second context was the
organisation of national and regional clothing fairs such as the China International
Clothing & Accessories Fair. These fairs provided platforms for the Chinese clothing
industry to display, to communicate and to get access to the global market. The third
context was the emergence of the clothing designer as a career. The proposal of
‘Famous designer and well-known brand project’ in 1997 and the first ‘Chinese
Clothing Design Expo’ and ‘China International Fashion Week’ held in the same year
promoted the social status of the designers and led the domestic clothing companies to
13 Source: WTO’s World Trade Statistics, 2006.

30
pay more attention to clothing design, seeking competitive advantage based on brand
and differentiation. In addition, other favorable conditions also contributed to the fast
development of the Chinese clothing industry during this period, including the
substantial emergence of the clothing-specific media and educational development in
clothing which prepared more technicians and talents for the industrial development.
Moreover, a large number of international clothing brands rushed into the Chinese
market, creating a more competitive environment for industrial development and
international communication which introduced China’s clothing culture into the global
market.
However, China’s clothing enterprises did not fully enter into the era of brand operation
until the late 1990s when they were increasingly challenged by both domestic and
global competitors. In the early 1980s, some foreign clothing brands such as Lacoste
and Montagut started to enter into China and in the mid 1990s, more and more
international brands, particularly luxury brands such as Dunhill, CHANEL and PRADA
came to seize the market. Nowadays China is the world no. 2 luxury market. Whilst
domestic clothing manufacturers oversupplied the market with homogeneous products,
Chinese customers became choosier in comparison with the shortage era in the 1980s
and earlier 1990s and were in a better position to buy and wear what they liked by
comparing price, quality, style and brand. In this context, in the late 1990s, the situation
changed which is described as follows.
The fast development started to slow down; inventories began to pile up; expected
payment of goods was difficult to complete; the agent sellers who had to queue for
delivery in the past started to bargain; what’s more, gross profit started to decrease
from the past 30% to 12%. (Zheng 2011:16)
In this context, Chinese clothing enterprises came to understand that their development
strategy based on homogeneous products and price competition was not sustainable and
that developing their own brands was a necessity for sustainable development whatever
at home and abroad. Many of today’s most well-known clothing brands were born
during that period, e.g., menswear brands like Lilanz (利郎) born in 1987,Sevenwolves
(七匹狼) born in 2001,Baoxiniao (报喜鸟) born in 1996,Eve Group (依文) born in
1994 and Judge (庄吉) born in 1993, and womenswear brands like Fairyfair (淑女屋)
born in 1991,Marisfrolg (玛丝菲尔) born in 1993,JNBY (江南布衣) born in 1994,
White Collar (白领) born in 1994 and ELLASSAY (歌力思) born in 1996.
However, brand building at the initial stage was little more than an awareness of selling
trademarks. Gradually, from the late 1990s, the branded Chinese clothing companies
started to discover and meditate on brand management: they started to study “Blueprint

31
strategy”14
and “Long tail theory”15
; understood artistry and the commercial value of
cultural power; started to learn leveraging capital; realised their social responsibility
(Chen 2008:3). This early experience of brand management leads to the latest
development stage of the Chinese clothing industry, namely, upgrading and
internationalisation.
Industrial transformation and upgrading (2001 up to date)
Since China’s accession into the World Trade Organisation (WTO) on 11th
December
2001, the Chinese clothing industry has started to step into a new development phase.
This new phase is typically characterised by industrial transformation and upgrading,
particularly upgrading of the functions in design, marketing and branding (i.e., brand
development and brand management), which are weaknesses of the Chinese clothing
enterprises in the GVC.
In this phase, China has formally participated in international competition. The Chinese
domestic market has become more open to the rest of the world and thus more foreign
clothing brands have gained access to the booming market. Therefore, Chinese clothing
enterprises have had to compete with the internationals even in the domestic market.
Meanwhile, after over 20 years’ development, the Chinese clothing industry has
achieved its global competitive advantage in the manufacturing segment. However,
sustaining competitive advantage of the Chinese clothing industry has been increasingly
challenged, particularly due to the effects of the world financial crisis in 2007 and the
follow-up global recession.
In this context, many Chinese clothing companies have adopted upgrading strategies.
The model of strategic progression can be defined as one of sequential role shifts
following the trajectory of Original Equipment Manufacturers (OEMs) through to
Original Design Manufacturers (ODMs) and further to Original Brand Manufacturers
(OBMs) (Humphrey & Schmitz 2001). OEMs mainly take on the function of production.
In addition to production, ODMs move up the ladder handling the clothing design
function. Further moving up the trajectory, OBMs can obtain access to the global
market as designers, producers, marketers and retailers for their own products under
their own brands (Reference to Section 3.2.2.2).
Table 2-6 illustrates the evolution process by taking Youngor for an example. In the first
14 The printing process allowed rapid and accurate reproduction of documents used in construction and industry.
Hence here “Blueprint strategy” means to create a brand’s new competitive advantage, to find out the new demand,
and to create the new marketing mode, etc. 15 Long tail in statistics refers to a probability distribution of a large number of occurrences far from the "head" or
central part. The term long tail is borrowed here to describe the retailing strategy of selling a large number of unique
items with relatively small quantities sold of each in contrast to selling fewer popular items in large quantities.

32
stage througout the 1990s, Youngor took over clothing outsource manufacturing for
global buyers such as: Pierre Cardin, Armani, Reebok, Nike, Gap, Lee, Polo, Zara and
H&M. Youngor accumulated capital and business size whilst also developing
production capability, capacity, quality and flexibility during this first stage. In the
second stage, Youngor set up an R&D studio in 2005, and established design centres in
Italy, New York, Shanghai, Hong Kong and Ningbo. Youngor could design and sell its
products with its own intellectual property rights in design. According to Youngor’s
Annual Report, Youngor had transformed from OEM into ODM by 2007. In the third
stage, Youngor focused on brand enhancement and brand management, opening its
brand office in the US in 2004, acquiring the Xinma Group in 2008 and launching its
multiple-brand strategy in 2009. All these operations marked Youngor’s step towards
OBM.
Table 2-6: Youngor’s upgrading progress from OEM to ODM and further to OBM 1
Youngor’s
upgrading
Foreign buyer Stage/function
OEM Armani, Polo, Calvin Klein, Zara,
Nike, etc.
Stage One:
Clothing processing
ODM DALLARD’S, a top-five American
department store,
ENVOY, a Sri Lanka clothing brand
Stage Two:
Developing own R&D,
Clothing design,
Manufacturing clothing with own
intellectual property right in design.
OBM
Sales channels and business operations
abroad with Youngor’s own brands
Stage Three:
Manufacturing clothing with own
design and own brand,
Brand managent in distribution,
retailing and marketing,
Brand enhancement and
internationalization.
Source: The author.
More and more clothing companies are adopting branding strategies. This includes
development and management of the companies’ own brands. On the one hand, more
national clothing companies, i.e., the OEMs and the ODMs which have previously
engaged in clothing manufacturing for foreign customers, are now building up their own
brands so that they can sell their own branded products in the domestic market instead
of merely manufacturing for global buyers. On the other hand, those companies with

33
already established brands (i.e., OBMs) are managing and strengthening their brands by
introducing multiple brands, brand enhancement (e.g., through development of brand
culture) and brand internationalisation (more in Chapter 7). Brand internationalisation in
design and style has been particularly noticeable, e.g., GXG with French origin and
style, ICICLE with Japanese fashion element and DAZZLE with Italian fashion style
and design.
However, corresponding firm-level resources and capabilities are needed for the
establishment of a successful and strong brand. Due to varying endowments of
resources and capabilities, some enterprises may become more successful by
establishing and sustaining their brands while others may fail to do so or may not
sustain them even after they are established.
2.3.2 Clothing production
Table 2-7 shows changes of the clothing production during 2005 to 2011 in terms of
main indicators such as revenues, costs, profits and exports.
Table 2-7: Main indicators of the clothing enterprises*, 2005-2011 (unit: billion RMB) 1
Indicator 2005 2006 2007 2008 2009 2010 2011
Revenue from principal
business
478.00 591.02 733.58 907.41 1014.05 1198.86 1321.44
Cost of principal business 411.31 505.83 622.80 769.51 862.60 1106.74 1102.05
Total profits 20.62 27.34 35.71 48.73 61.12 85.19 95.20
Exports by value 232.35 269.11 315.83 329.39 314.58 334.46 321.85
Source: Author’s creation based on data from China National Bureau of Statistics, [online] available
from
<http://data.stats.gov.cn/workspace/index;jsessionid=F499F1528B4FE05D17E147A48CAE6B13?m
=hgnd> [15th April 2014].
Notes *: The clothing enterprises are above designated size and include manufacturers of clothing,
headwear and footwear. According to the National Bureau of Statistics of China, during 1998-2006,
the industrial enterprise ‘above designated size’ refers to all state-owned enterprises and those
non-state-owned enterprises with annual revenue from their principal business equal to or above 5
million RMB; during 2007-2010, the National Bureau of Statistic defined industrial enterprise above
designated size as referring to all the industrial enterprises with annual revenue from principle
business equal or above 5 million RMB; since 2011, under the approval of the State Council, the
standard has changed from 5 million RMB to 20 million RMB, which means that industrial
enterprises above designated size now refers to those with annual revenue from the principal
business equal to or above 20 million RMB. This research applies the criteria of the designated size
in China. Data concerning clothing enterprises used in this study is subject to this standard.

34
Firstly, all indicators increased but to varing degrees (Table 2-6). For example, the total
revenue of clothing manufacturing enterprises above designated size was 1,321 billion
RMB (equal to about 211 billion USD) in 2011, which increased by 176% in
comparison with the 478 billion RMB achieved in 2005. The corresponding costs rose
by 167%, from 411.31 billion RMB in 2005 up to 1,102 billion RMB in 2011. The
corresponding total profit increased by 363%, which was much higher than either
revenue or cost. These results reflect higher added value of the products, which
arguably to a large extent reflects improvement and functional upgrading of the industry.
Secondly, the ratios of exports to total revenue have gradually reduced (Table 2-6). For
example, this ratio was 48.61% in 2005 down to 24.35% in 2011, which suggests the
domestic sales have risen more rapidly than exports. The big difference between the two
markets is that sales to the domestic market are mainly based on own brand and are to
the end users while sales to the global market are based on clothing manufacturing
without own brand and are to non-endusers. Therefore, this result provides additional
support to the statement above that the Chinese clothing industry has been going
through functional upgrading during the recent decade.
2.3.3 Leading players
The following six are the leading clothing enterprises in China:
Youngor Group (雅戈尔集团),
Hongdou Group (红豆集团有限公司),
HLA (海澜之家),
Bosideng International Holdings Limited (波司顿国际控股有限公司),
Metersbonwe (上海美特斯邦威股份有限公司), and
Shanshan Group (杉杉集团).
According to the China National Garment Association (2011), they are amongst the top
six clothing enterprises both by sales and by total profit. They are all clothing
manufacturers and manage their own design, distribution and marketing as well. In
addition, these enterprises have also established their own brands and to some extent
have achieved brand development (Table 2-8).

35
Table 2-8: China clothing brand annual awards, 2003-2012 1
Award 1st
(2003)
Brand
2nd
(2004)
Brand
3rd
(2005)
Brand
4th
(2006)
Brand
5th
(2007)
Brand
6th
(2008)
Brand
7th
(2009)
Brand
8th
(2011)
Brand
9th
(2012)
Brand
Style White
collar
Sunfed Excepti
on
ELLASS
AY
JNBY Eachway GXG QROQ
UIS
ICICLE
Quality Baoxiniao Red collar Joe
Leighto
Creation TRAND
S
Yeliya Mailya
rd
Romon M.SUY
A
Planning Shanshan Metersbo
nwe
Aimer Should be
large
Lilanz K-Boxing Tebu Gloria Octma
mi
Innovatio
n
EVE Paclantic Peacebi
rd
White
collar
Cabbean VANCL N&Q Showlo
ng
Biemlfd
kk
Potential Compro Sinoer HLA Barabara Notting-
hill
Tonlion Nancy
K
Raidy
Boer
DAZZL
E
Marketin
g
Metersbo
nwe
HLA White
collar
Youngor Semir Peacbird Yiner Elegant Lancy
Public Youngor Seven
wolves
Boside
ng
Metersbo
nwe
Jeanswe
st
Erdos Anta Lilanz Edenbo
Value Bosideng Hongdou Seven
wolves
Baoxiniao Lining Anta Aimer Peacebir
d
ELLAS
SA
Achievem
ent
Shanshan Youngor Hongd
ou
Bosideng Seven
wolves
Metersbo
nwe
Jeansw
est
Aimer Baoxini
ao
Source: The China National Garment Association (2011). The 8th & 9
th -year data are [online]
available from <http://www.efu.com.cn/data/2012/2012-03-26/430796.shtml> [16th April 2014].
Notes: The corresponding Chinese names of the enterprises refer to Appendix 2-1; those shaded are
the leading players in the Chinese clothing industry.
To encourage and guide enterprises’ brand development, such as in design, quality,
marketing and innovation, and also to promote social awareness and social influence of
the clothing brand, since 2004 the China National Garment Association has started to
organise annual "Chinese clothing brand annual awards" events. Each year, awards
cover branding efforts and achievement aspects including style, quality, planning,
innovation, potential, marketing, publicity, values and achievement. Table 2-7 lists the
up-to-date 9 years’ “Chinese clothing brand annual awards” as follows (China National
Garment Association 2011:123).
There are some successful newly-developed brands such as Baoxiniao (2001), HLA
(2002), Biemlfdkk (2003), QROQUIS (2005) and ICICLE (2006). Also some relatively

36
old brands still keep active such as Hongdou (1984), Lilanz (1987), Septwolves (1990),
Bosideng (1992), Metersbonwe (1995) and Peacebird (1996).
2.3.4 Employment
The clothing industry contributes substantially to national employment (Table 2-9). For
example, there were about 4.47 million people employed in clothing enterprises in
China in 2010, which accounted for about 13% of the total national employment in the
urban manufacturing segment. Amongst the three different forms of ownership,
employment in the private enterprises was rising steadily while that in the state-owned
enterprises fell from 2006 through 2010. For example, the employment ratio of the
private enterprises to total employment rose from about 32.07% (1.21million persons)
in 2006 up to 40.93% (1.83 million persons) in 2010 while the corresponding figures for
both the state-owned enterprises and the Foreign Investment Enterprises (FIEs) fell. The
state-owned enterprises declined from 2.45% (92,700 persons) down to 1.93% (86,400
persons) and the FIEs from 51.48% down to 44.87%.
Table 2-9: Annual average employed persons in China’s clothing enterprises above designed
size* (unit: 1,000 persons) 1
2006 2007 2008 2009 2010
Total national employed persons in manufacture 29,630 30,953 32,103 33,322 34,687
Employed persons in urban clothing manufacture ** 3,776 4,142 4,587 4,493 4,470
Employment ratio of clothing to national total (%) 12.74 13.38 14.29 13.48 12.89
Employed persons in clothing enterprises by ownership (Ge)
In state-owned enterprises 92.7 97.8 90.3 90.6 86.4
In private-owned enterprises 1211.1 1326.5 1695.1 1745.8 1829.7
FIEs *** 1943.7 2185.8 2290.4 2126.7 2005.8
Source: China Statistics Yearbook for various years (2007-2011), [online] available from
<http://data.stats.gov.cn/publish/index?m? [19th April 2014].
Note: * This table includes relevant data from 2006 to 2010 due to the comparable nature during this
period. Data after 2011 are not included for two main reasons. One reason is the updated data is
unavailable and the other reason is that since the standard of defining the industrial enterprise above
designated size has sustantially changed before 2006 and after 2010 (Details refer to the note of
Table 2-7). ** The clothing industry here includes manufacture of apparel, headwear and footwear.
*** FIEs include those companies from Hong Kong, Macau and Taiwan regions of China (HMT).
Moreover, the size of firm by average number of employees varies amongst the three
different ownerships (Figure 2-8). The state-owned enterprises have the largest size, e.g.,

37
with an average of 439 persons in 2006, rising steadily through to 2010 with an average
size of 491 persons. The FIEs have the second largest size and have kept relatively
stable, employment ranging from 337 persons to 361 persons over the same period. The
private enterprises have the smallest size and went through a stable decline from 204
persons in 2006 down to 177 persons in 2010. In addition to these figures, there are
many smaller private clothing firms that are outside the scope of the national statistics,
typically with only tens of employees. Those small businesses also play their part in
national employment and economic development.
Figure 2-8: Average size of the clothing enterprises by employed persons in China (unit: Ge) 1
Source: China Statistics Yearbook of various years (2007-2011).
2.3.5 Labour costs
Labour costs have risen dramatically particularly since China’s entry into WTO in 2001
and this is one of the fundamental factors affecting the sustained competitive advantage
of the Chinese clothing industry in the global market. The preceding Figure 2-2
indicates that China’s hourly labour costs went up faster than those of the other
developing economies. For example, the average hourly labour costs in China, Vietnam,
Bangladesh and Indonesia were $0.8, $0.5, $0.4 and $0.6 respectively in 2005 while in
2008 the corresponding figures changed to $1.8, $0.6, $0.4 and $0.8. That is, China’s
labour costs increased by 125% during the three years while Vietnam and Indonesia
went up by 20% and 33% respectively and Bangladesh even experienced no change.
Therefore, the cost-based competitive advantage of the Chinese clothing industry,
particularly in the manufacturing segment, is increasingly challenged.
Figure 2-9 illustrates that the national average wage in the urban units almost rose at a
similar pace to that of China’s per capital GDP during the period from 2005 to 2012. In
0
100
200
300
400
500
600
2006 2007 2008 2009 2010
National average FIEs Private State-owned

38
other words, China’s economic development is one of the main reasons leading to the
rising costs.
Figure 2-9: Changes of China’s per capita GDP and of the corresponding average yearly wages
in the urban units, 2005-2012 (unit: RMB) 1
Source: China’s National Bureau of Statistics, [online] available from
<http://data.stats.gov.cn/workspace/index?m=hgnd> [17th April 2014].
However, labour costs in China are imbalanced between different economic regions and
different forms of ownership16
. Table 2-10 shows differences of average wage of
employed persons in the urban areas in 2012. The absolute figures are coded into
indexes. The mean of average annual wages of 43,390 RMB (about 6,920 USD) is
indexed as 100 and the other figures are indexed accordingly.
Amongst the four different economic regions, the lowest wages are in the Northestern
(mean = 90) and Central (mean = 94) economic regions; the highest is in the Eastern
region (mean = 125); the Western region (mean = 100) is situated in the middle range.
Therefore, the large population in the rural regions is migrating towards the eastern
coast cities where wages are highest. Those immigration workers coming from the
central and western rural regions are normally unskilled and less educated and thus in a
poor bargaining position. So in the beginning they are paid low wages in the clothing
factories of the eastern region and receive no social security benefits which full-time 16 According to The 11th Five-Year Guidelines for National Economic and Social Development, China is divided into
four economic regions based on the situations of economic and social development in the regions: East Region,
Central Region, West Region, and Northeast Region. The East Region is a prioritized developed region and includes
3 municipalities (Beijing, Shanghai, and Tianjing) and 7 provinces (Hebei, Jiangsu, Zhejiang, Fujian, Shandong,
Guangdong, Hainan). The Northeast Region is the old industrial base, including 3 provinces (Liaoning, Jilin, and
Heilongjiang). The Central Region includes 6 provinces (Shanxi, Anhui, Jiangxi, Henan, Hubei, Hunan) and the West
Region includes 1 municipality (Chongqing city) and 11 provinces (Inner Mongonia, Guangxi, Sichuan, Guizhou,
Yunnan, Tibet, Shanxi, Gansu, Qinghai, Ningxia, and Xinjiang). The regional economic development in China is
following the Guidelines’ spreading direction: from South to North, East to West, and periphery to center.
0
10000
20000
30000
40000
50000
2005 2006 2007 2008 2009 2010 2011 2012
Average wage Per capita GDP
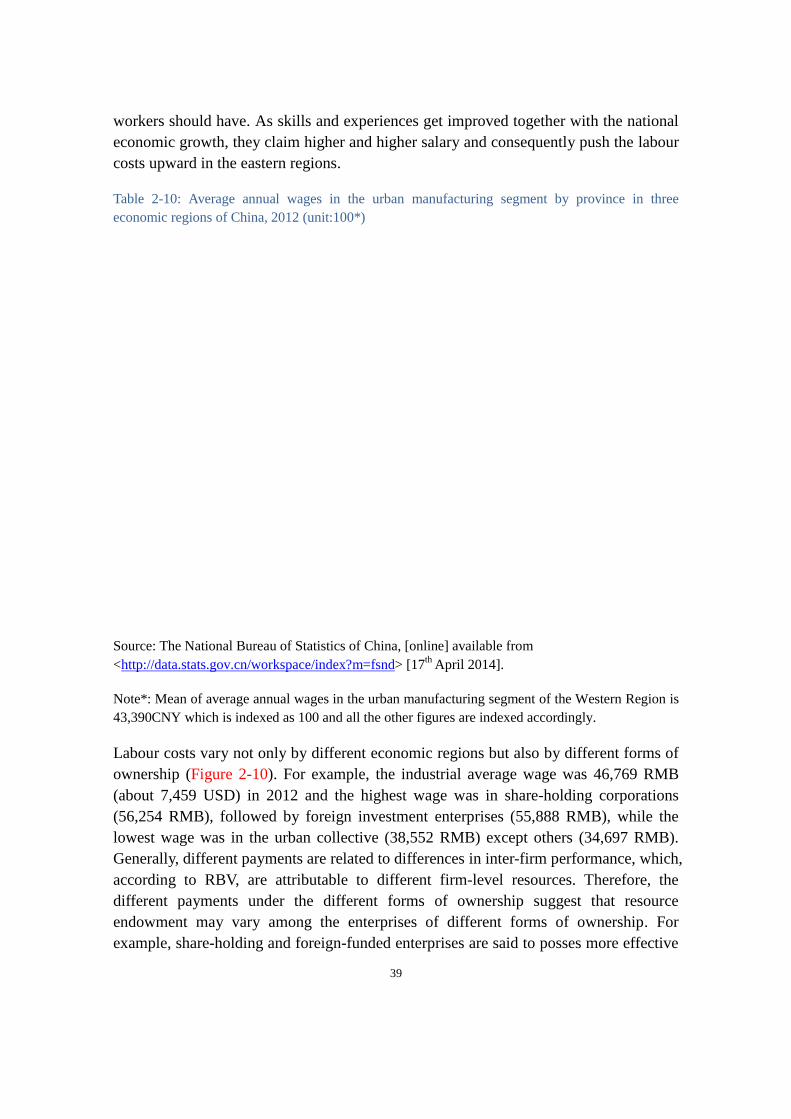
39
workers should have. As skills and experiences get improved together with the national
economic growth, they claim higher and higher salary and consequently push the labour
costs upward in the eastern regions.
Table 2-10: Average annual wages in the urban manufacturing segment by province in three
economic regions of China, 2012 (unit:100*) 1
Source: The National Bureau of Statistics of China, [online] available from
<http://data.stats.gov.cn/workspace/index?m=fsnd> [17th April 2014].
Note*: Mean of average annual wages in the urban manufacturing segment of the Western Region is
43,390CNY which is indexed as 100 and all the other figures are indexed accordingly.
Labour costs vary not only by different economic regions but also by different forms of
ownership (Figure 2-10). For example, the industrial average wage was 46,769 RMB
(about 7,459 USD) in 2012 and the highest wage was in share-holding corporations
(56,254 RMB), followed by foreign investment enterprises (55,888 RMB), while the
lowest wage was in the urban collective (38,552 RMB) except others (34,697 RMB).
Generally, different payments are related to differences in inter-firm performance, which,
according to RBV, are attributable to different firm-level resources. Therefore, the
different payments under the different forms of ownership suggest that resource
endowment may vary among the enterprises of different forms of ownership. For
example, share-holding and foreign-funded enterprises are said to posses more effective
aa0682
Typewritten Text
This table has been removed

40
managerial processes compared to the others so they perform better and thereby are in a
position to better renumerate their employees.
Figure 2-10: Average wage in the urban clothing manufacturing enterprises in China by
ownership, 2012 (unit: RMB) 1
Source: The National Bureau of Statistics of China, [online] available from
<http://data.stats.gov.cn/workspace/index?m=fsnd> [17th April 2014].
Note: HMT refers to Hong Kong, Macao, and Taiwan regions.
In addition to rising labour costs, the rising price of raw materials also squeezes the
profit margins of manufacturing companies. In order to protect the farmers’ benefits, the
government imposes a quota on cotton imports so as to protect the domestic cotton price.
For example, the domestic cotton price (about 10000 RMB/ ton) was twice the price in
the international market (about 5000 RBM/ ton) in 2012. Also the China Yuan has been
appreciating particularly since 2005. For example, from 21st June 2005 when the
exchange rate of CNY/USD was 8.27 to 27th
June 2014 when the corresponding rate
was 6.27, the appreciation rate of CNY to USD was more than 24%. This further
undermines the original cost-based competitive advantage of the Chinese clothing
industry in the global market.
2.3.6 Domestic market
Historically, clothing consumption in China has lagged behind production but
consumption has grown rapidly during the last decade (Du 2011: 23). For example,
average annual clothing sales increased by 14.64% between 2001 and 2010, exceeding
the 10.66% corresponding GDP growth rate during the same period. By comparison, the
average annual consumption growth rate was just 5.95% in the 1980s which was far
aa0682
Typewritten Text
This graph has been removed

41
lower than the corresponding GDP growth rate (9.31%) during the same period; in the
1990s, the consumption growth rate was up to 6.43% but still lower than the
corresponding GDP growth rate (10.27%). However, the rising domestic consumption
provides a strong foundation for sustained and rapid development of the Chinese
clothing industry.
The average annual growth rate (AAGR) of the clothing sales in China has increased
more than the corresponding global AAGR in recent years (Table 2-11). The world’s
retailing AAGR was 3.1% during the period spanning 2005-2009. The world’s major
clothing markets such as Japan (0.8%) and France (0.6%) were amongst the lowest
AAGRs; UK (1.9%) and USA (3.2%) were in the next lowest. By comparison, the
developing economies such as India (9.9%) and China (7.9%) achieved the highest
growth rates. In 2009, Chinese clothing retail revenue reached $102 billion, accounting
for nearly 10% of the world total.
Table 2-11: Retail value of the apparel industry in the selected economies (units: billion
USD, %) 1
Source: DATAMONITA, 2010.
Notes: This is the up-to-date data and data after 2010 is unavailable; AAGR is for Average annual
growth rate.
The most profitable market segment in the Chinese clothing industry is menswear, with
total retail revenue of $45.4 billion, representing 44.4% of overall revenue while the
sales revenue shares in womenswear and childrenswear are 34.9% and 20.7%
respectively (Figure 2-11). By comparison, the most lucrative segment in global
clothing retailing is womenswear, accounting for 51.8% ($1032 billion) of all sales
value whilst the menswear share is 32.5% and the childrenswear share is 15.7%. These
differences in profit between segments, compared to the world market, reflect some
weaknesses of the Chinese clothing industry. Normally, in comparison with menswear
aa0682
Typewritten Text
This table has been removed

42
and childrenswear, womenswear demands for more diversity in style and more skills
and capabilities in fashion design, which are among the weaknesses of the Chinese
clothing industry as a whole.
Market preferences within clothing consumption in China also follow a similar trend to
the world market. That is, general consumers tend to follow fast fashion on the one hand,
whilst there is a growing demand for diversity and luxury brands on the other hand.
Source: DATAMONITA, 2010.
2.3.7 Geographic distribution and local industrial clusters
Due to political and geographical reasons, development of the Chinese clothing industry
has varied considerably between regions. For example, the eastern coast region has
more convenient transportation and also is the earliest opening area to the outside world
and therefore the eastern coast region is better and earlier developed than the other parts
of China. The three provinces in the eastern coast regions, namely, Zhejiang, Jiangsu
and Guangdong, account for 52.87% of the national total clothing sales and 56.33% of
the total number of clothing enterprises (Table 2-12). Amongst them, Zhejiang accounts
for about 13.08% ($2.20 million) of the national total revenue ($16.80 million) by sales.
In addition, Zhejiang is more export-oriented, exporting about 42.88 % of its total sales
compared with the national average level of 28.56%. Jiangsu accounts for 21.16%
($3.56 million) of national sales revenue, which is the highest proportion of the three,
but only 26.83% of its sales are for export and the majority (73.17%) for the domestic
market. Guangdong accounts for 18.64% ($3.13 million) of national sales revenue with
about 32.43% of its sales going for exports. Interestingly, higher gross profit margins
are correspondingly related to the higher export ratios, with Zhejiang province (17.36%)
having the highest profit margin of the three provinces, followed by Guangdong
(12.70%) and Jiangsu (11.74%).
Figure 2-11: Value structures of the apparel retail by segment in China and the world, 2009 1

43
Table 2-12: Economic indices of the Chinese clothing companies above designated size in three
main provinces, January to November of 2010 1
Region Enterprise
number (Ge)
Gross sales
profit %
Export
proportion %
Domestic sales
revenue* (million USD)
Zhejiang 3,254 17.36 42.88 2.20
Jiangsu 3,434 11.74 26.83 3.56
Guangdong 3,449 12.70 32.43 3.13
National
total
17,996 14.72 28.56 16.80
Source: China National Garment Association 2011: 131.
Note: *Author’s calculation based on the middle exchange rate on 27th June 2014, i.e.,
RMB/USD=6.2717
.
The presence of local industrial clusters (LICs) is a distinctive feature of the Chinese
clothing industry. The industrial cluster paradigm emphasises how geographically
bounded and business-specialised clusters of firms horizontally and vertically link
together and form a collective network, which boosts industrial growth and local
economic development (Schmitz & Nadvi 1999). Specialisation, cooperation and
competition within the LICs promote competitiveness and catch-up effects in addition
to intra-industrial spillover effects (Krugman 1991, Cammett 2006). Moreover, LICs in
developing economies facilitate the industrial upgrading process through both
intra-cluster networks and external linkages to GVCs (Rabellotti 1999). The external
buyer-seller linkage and cooperation between overseas buyers and domestic
manufacturers in the clusters allow a great degree of local learning about the upstream
and downstream segments of an industry from the lead firms and this learning facilitates
industrial upgrading in developing economies (Liu & Gu 2007).
According to China National Textile and Apparel Councial, there are about 50 big
clothing LICs in China, most of which are located in the East coastal regions,
particularly the Yangtze River Delta, the Pearl River Delta and the Bohai-Rim region.
Figure 2-12 displays 39 main spcialized clothing LICs in China, among which 8
spcialised LICs in both Fujian and Jiangsu provinces, 7 in Guangdong province, 6 in
Zhejiang province, 3 in Hebei province, 2 in Shangdon province, and 1 in each of
Shanghai, Anhui, Jiangxi, Hunan and Henan province/municipality.
17
The exchange rate is [online] available from < http://www.safe.gov.cn/wps/portal/sy/tjsj_hlzjj_inquire>
[27th June 2014].

44
Figure 2-12: Main specialised clothing LICs in China 1
Source: Author’s creation based on data from China National Garment Association18
.
Table 2-13 lists some famous clothing specialised LICs which are situated in three main
provinces, i.e., Guangdong, Zhejiang and Jiangsu. Taking Zhejiang province as an
example, Ningbo LIC is characterised by specialisation in men’s suits and shirts, with
famous brands like Youngor, ShanShan, Romon, Peacbird and Progen, while Hangzhou
LIC specialises in women’s fashion garments with popular brands like Roman
Sentiment, Leises, Hopeshow and JNBY. Wenzhou LIC is the national largest
leisure-wear and sports-wear wholesale market. Haining LIC is famous for its
specialisation in leather garments. It has been estimated that over 70% of the total
output of clothing in China is produced in these LICs19
. However, a major issue in the
clothing LICs is dependence upon price-based competition and over-production of
similar products, which is increasingly challenging the sustainability of their
competitive advantage. To a large extent, insufficient firm-level resources in design,
branding and innovation are the key reasons for the existing problems.
18 The distribution map was generated through the software Arc GIS 10.1 version. The data concerning geographic
location, i.e., longitude and latitude, were gained by referring to China gazeteer. 19 Source: China National Garment Association [online] available from <http://www.cnga.org.cn/fzxh3/13cygs.asp>
[10 April 2014].

45
Table 2-13: Some notable clothing LICs and the specialised segments in China 1
LICs location Province Specialisation Own brand or OEM
Dongwan
Humen
Guangdong Childrenswear Brand:Yichun, Songying
OEM
Chaozhou Guangdong Wedding dress,
evening dress
Brand: Famory, Feona
OEM
Shantou
Chaonan
Guangdong Underwear,
pajamas
Brand:Qiulu, Meibiao
OEM
Changshu city,
Changshu Guli,
Gaoyou
Jiangsu Down garment Brand:Bosideng,Xuezhongfei,Dahongying,fe
ngzhiyun
OEM
Changshu
Shajiabing
Jiangsu Casual garment Brand: Kabulang, Kuobo, Jinyue
OEM: Playboy, Valentino
Jintan Jiangsu Export
processing
OEM: Gap, Lee, JCP, Polo, Nautica,
Valentino
Shengzhou Zhejiang Necktie Brand: Babei, Shenshi, Junshi, Zunlong,
Mengtianjiao
OEM: Pierre Cardin, Armani, Tintori
Pinghu Zhejiang Export
processing
OEM: Reebok, Rainforst, Lee, Nike, Tom
allor, Extpress
Huzhou Zhejiang Childrenswear Brand: Red yellow blue, Jiujiu, Mendeli
Ningbo Zhejiang menswear Brand: Youngor, Rouse, Romon, Progen,
Seduno
OEM: Adidas, Reebok, Campus, Umbro,
H&M, Zara, Sears, OTTO, TCM
Source: Author.
2.3.8 World largest manufacturer and exporter
In spite of the global economic recession since 2008, China’s apparel exports are still
growing steadily (Figure 2-13) and gaining in global market share (Table 2-4). For
example, according to the WTO’s International Trade Statistics, China’s clothing
exports value was about 74.16 billion US dollars, accounting for 26.9% of global
exports in 2005 and it gradually rose to 160 billion dollars, accounting for 37.8% of
global exports in 2012.

46
Figure 2-13: Clothing exports value of China (unit: billion USD) 1
Source: Chinese Statistic Yearbook, various years.
China’s major clothing export markets include the European Union (EU 27), the United
States (US), Japan and Canada (Figure 2-14). In 2012, these four markets accounted for
64.33% of the total value of China’s clothing exports (160 billion dollars) while the
corresponding figure was 87.90% (74.16 billion dollars) in 2005. Between 2005 and
2012, China diversified its clothing exports markets by developing others such as the
Middle East and South Africa thereby causing a decline in the shares of its hitherto main
markets. For example, the EU market share declined from 31.03% in 2005 to 23.51% in
2012 and the US market from 28.50% down to 21.68%.
Source: Author’s creation based on data from WTO’s International Trade Statistics, 2006 and 2013.
Note: European Union (EU) includes 25 members in 2005 while 27 members in 2012.
0
20
40
60
80
100
120
140
160
180
2005 2006 2007 2008 2009 2010 2011 2012
2005 2012
Figure 2-14: China's leading clothing markets in 2005 and 2012 1

47
The world’s leading clothing markets include the EU, the US, Japan and Canada.
According to WTO’s statistics, the leading markets accounted for 82.6% of the value of
global imports in 2005 and 68.6% in 2012. Except for Japan, China’s shares of the
clothing sales in these markets all increased between 2005 and 2012 (Figure 2-15). For
example, China’s clothing exports market share in the US exhibited a big increase, from
26.4% in 2005 up to 39.4% in 2012; the corresponding market shares slightly increased
in both Canada (from 46.8% up to 47.3%) and the EU (from 17.9% up to 22.1%). In
contrast, China’s share of the total clothing sales in Japan slightly declined from 80.9%
in 2005 down to 77.2% in 2012.
Source: Author’s creation based on data from WTO’s International Trade Statistics, 2006 and 2013.
Note: European Union (EU) includes 25 members in 2005 while 27 members in 2012.
At present, the Chinese clothing industry is highly integrated into the clothing global
value chain (Details in the following Chapter 3.2) mainly through international trade as
a full package supplier20
to many international major buyers of brand retailers or
marketers such as NEXT, ZARA, A&F, ADIDAS, NIKE, etc. The major sellers in
China are the private-owned firms, accounting for 44% of the value of national clothing
20 The full package supplier undertakes more functions than the export-oriented assembler does. For example, the
supplier organises the manufacturing process from all inputs toward the finished products according to buyers’
specifications whereas in the assembling mode, the buyer provides pre-cut components or materials with explicit
instructions about the manufacturing.
46.8%
26.4%
17.9%
80.9%
47.3%
39.4%
22.1%
77.2%
Canada
US
EU
Japan
0.0% 10.0% 20.0% 30.0% 40.0% 50.0% 60.0% 70.0% 80.0% 90.0%
2012
2005
Figure 2-15: Regional shares of Chinese clothing exports in the global leading markets,
2005 and 2012 1

48
output21. Foreign participation has played a critical role in China’s fast growing clothing
exports since 1979. FIEs are much more export-oriented than domestic firms and 92.3%
of their total output of clothing is exported whereas domestic firms exports only 65.5%
(Balasubramanyam & Wei 2005).
2.3.9 Sustained competitive advantage of the Chinese clothing industry
In summary, China has achieved its competitive advantage in the global clothing
industry. However, due to the external dynamics, sustaining competitive advantage of
this industry has been increasingly challenged. Table 2-14 presents a SWOT analysis of
the Chinese clothing industry in terms of SCA.
Table 2-14: SWOT of the Chinese clothing industry in terms of SCA 1
External origins Internal origins
Favo
rable
Opportunities (O)
Freer international trade agreements
(e.g.,ATC)
Stable economic development
Growing domestic consumption power
Demand for fashion and diversity
Strengths (S)
Manufacturing capability, capacity,
flexibility and quality
Relatively complete industrial chain
Local industrial clusters (LICs)
Long-established relationships with
foreign buyers
Un
favo
rable
Threats (T)
Competition from the global manufacturers
Rising production costs
Constant appreciation of RMB
Dominant governance by global lead firms
Weaknesses (W)
Design
Innovation
Branding
Homogeneous products
Source: The author.
Sustaining competitive advantage of the Chinese clothing industry is achievable due to
the favorable opportunities and the strengths that the industry has built throughout its
historical development. However, sustaining competitive advantage of the Chinese
clothing indusry is subject to the condition that the challenges (i.e., external threats and
the weaknesses of the industry) have to be dealt with (Table 2-13).
Through decades of development, the Chinese clothing industry has evolved and
considerably updated (Table 2-13). From the GVC perspective, the competitive
21 Source: Author’s calculation based on Tables 14.10 and 14.2 in China Statistic Yearbook, 2010.

49
advantage of the Chinese clothing industry is primarily based on the low cost
manufacturing segment and the built-up strengths include quality, capability, capacity
and flexibility in clothing manufacturing and also consist of relatively complete
industrial chain (e.g., raw materials, textile, dying and printing), local industrial clusters
(LICs) and long-established relationships with foreign buyers.
Sustained competitive advantage of the Chinese clothing industry is backed up by
favourable external environment (i.e., opportunities) (Table 2-13). At the international
and national level, the opportunities consist of freer international trade agreements (e.g.,
ATC), stable economic development which lead to growing consumption power, and
customers’ demand for fashion and diversity.
However, the cost-based competitive advantage of the Chinese clothing industry has
been gradually challenged. The threats include competition from the global lower-cost
manufacturers and domestic rising production costs (e.g., labour costs and material
costs) in addition to continual appreciation of RMB and dominant governance by the
global lead firms in the clothing global value chain.
In addition, weaknesses in design, innovation and particularly branding are the main
problems mitigating SCA of the industry. There are no official statistics on the ratio of
branded clothing enterprises to the national total. A recent survey was conducted based
on a sample of 60 clothing manufacturing firms in three different cities in the Bohai
Trim region: Qingdao, Yantai and Weihai (Yang & Lin 2008). The research results
indicate that only 15 firms (25%) have their own brands: 31 firms (about 52%) are
interested but are facing some difficulty in building up their own brands; the remaining
14 firms (about 23%) have not yet had the intention. The results support the statement
that lack of brand is one of the main problems in the Chinese clothing industry
(Berkeley &Steuer 2000).
2.4 Chapter summary
This chapter has examined the research background of the Chinese clothing industry in
terms of its sustained competitive advantage. Both the global and Chinese clothing
industries are examined.
The global clothing industry provides the general research background. The clothing
industry, particularly the clothing production, remains labour-intensive. This is the key
reason for clothing manufacturing to have been continuously relocted to low-wage
developing economies over the history. In the global clothing trade, low-cost
developing economies are the manufacturers and exporters such as China, Bagladesh,
and Turkey while the main markets and importers are in the developed economies such

50
as the EU, the US and Japan. Dynamics of the global clothing industry are mainly
reflected in relocation of production, consumption trend and thereby the trade pattern.
The dynamics impact on competitive advantage and SCA of the Chinese clothing
industry which has integrated into the global clothing industry.
Through examination of the Chinese clothing industry, it is revealed that the primary
competitive advantage of the Chinese clothing industry is in the cost-based manufacture
such as the product quality, manufacturing capacity, capability and flexibility and that
SCA of the industry has been increasingly challenged mainly due to intensified global
lower-cost competition, domestic rising production costs, and weaknesses in design,
innovation and branding.
From the GVCs’ perspective, industrial upgrading and particularly functional upgrading
towards value-added segments such as design, marketing and branding is a practical
strategy for the clothing companies, particularly the clothing manufacturers in the
development economies, to get out of the low value-added trap and to achieve SCA.
Keeping this research background in mind, the next chapter reviews relevant literature
so as to gain theoretical underpinnings for this research.

51
CHAPTER THREE: SOURCES OF SUSTAINED
COMPETITIVE ADVANTAGE
3.1 Chapter introduction
Source: The author.
Chapter2: Chinese clothing
industry in the global value chain
The primary competitive advantage of
the Chinese clothing industry is based
on the low-cost manufacture and SCA of the industry has been increasingly
challenged mainly due to rising production costs, weakness in branding
and intensified global competition.
Chapter3: Sources of sustained
competitive advantage
Chapter5: Research methodology
Chapter6: Statistical analysis
Chapter7: Case studies
Chapter8: Discussion and conclusions
Chapter1: Introduction
SOURCES OF SUSTAINED
COMPETITIVE ADVANTAGE
Global Value Chain (GVC):
Governance in the clothing
GVC
Industrial upgrading and
Sustained Competitive
Advantage (SCA)
Resource-Based View (RBV):
External or internal
framework to seek SCA
Resources-SCA relationship
Chapter 4: Conceptual framework
THESIS STRUCTURE
Figure 3-1: Thesis structure and focuses of Chapter 3 1

52
The aim of this research is to explore and examine sources of Sustained Competitive
Advantage (SCA) of the Chinese clothing industry. The preceding chapter has
overviewed the Chinese clothing industry and it is revealed that the primary competitive
advantage is based on the low-cost manufacturing segment. However, sustaining
competitive advantage of the Chinese clothing industry is increasingly challenged
mainly by its inherent weaknesses in brand, dramatically rising production costs and
intensified global competition (Figure 3-1). This chapter provides an in-depth review of
relevant theories and literature pertaining to SCA, aiming to establish the theoretical
foundation for the research.
In strategic management, theories pertaining to SCA can be broadly classified into
“external” and “internal” perspectives. Before the Resource-Based View (RBV) started
to gain popularity in the 1990s, the dominant approach investigating the SCA issue was
from “external” perspectives such as the PEST analysis framework and Michael Porter’s
Five Forces model. The “external” theories provide conceptual frameworks to analyse
the external environment including national/international and industrial factors to
answer questions as to where and how competitive advantage can be obtained and
sustained. However, the external theories fail to explain variations in business
performance and competitive advantage between companies which share similar
external environment.
In this context, since the early 1990s, RBV has gradually become popular because its
arguments and underpinnings provide an appropriate theoretical foundation to address
the issue which external theories could not. RBV is an “internal” theory which looks
inside the firm for the source of SCA. RBV argues that the heterogeneous and valuable
firm-level resources are the source of competitive advantage and the firm has SCA
before the valuable and rare resource bundle is duplicated by other firms (Details in
Chapter 3.3). Therefore, this research adopts RBV as the theoretical foundation.
At the same time, this chapter also reviews Global Value Chains (GVCs), an “external”
analysis framework (Details in Chapter 3.2). The GVC theory provides a broader view
looking outside the firm and taking into consideration its external environmental factors
that affect SCA. Therefore, the conceptual framework for this research (Details in
Chapter 4.2) involves synthesis of the two theories, among which, the RBV theory
underpins the choice of the resources contributing to SCA of the Chinese clothing
industry and the GVC theory underpins analysis of the external context which affect the
SCA.

53
3.2 Global value chains and the clothing industry
3.2.1 Theory background and origins
During the 1950s and throughout the 1960s, overseas direct investment by multinational
enterprises was the dominant pattern of global business engagement. However, since the
1970s, the global economy has become increasingly integrated through international
trade (Dicken 2007). Trade-based globalisation refers to cross-border transactions
between legally independent firms while investment-driven globalisation mainly
involves internal transactions among subsidiaries of transnational companies (Gereffi
2001). This new form of globalisation was not widely recognised until the mid-1990s
when a number of economies became more integrated into the global economy mainly
through export-oriented industrialisation. The most notable examples were the East
Asian “Tigers” in the 1960s and 1970s, Latin America countries such as Brazil and
Mexico, and China in the 1980s and 1990s. However international trade should not
merely be analysed through arms-length market-based transactions but also through the
governance systems that link firms together in a variety of sourcing and contracting
arrangements (Gereffi 2001, Gereffi et al. 2001).
With the accelerated pace of global economic integration, an extensive literature
attempted to explain the constructs and organisations of this phenomenon. The earliest
can be traced back to the world-systems formulated by Hopkins and Wallerstein (1977).
The original term “commodity chain” was defined by Hopkins and Wallerstein (1986:
159) as ‘a network of labour and production processes whose end result is a finished
commodity’, which involves a series of activities or processes from product design,
production and distribution to marketing (Gereffi 1999). When these inter-firm activities
in an industry are operated and organised globally, a Global Commodity Chain (GCC)
comes into being.
Since the mid-1990s, there has been a growing body of literature on the economic
phenomenon from the GCC perspective. The GCC framework is developed by Gereffi
and colleagues (Gereffi & Korzeniewicz 1995, Gereffi 1999). GCC is defined as ‘sets of
inter-organisational networks clustered around one commodity or product, linking
households, enterprises, and states to one another within the world-economy’ (Gereffi,
Korzeniewicz, M. & Korzeniewicz, R. 1994:2). However, there is significant
disjuncture between the GCC and the former world-systems. For example, in the
world-systems view, ‘world-systems theorists are most fundamentally interested in how
commodity chains structure and reproduce a stratified and hierarchical world-system’
particularly from a historical perspective rather than focus on value-added actitivities
(Bair 2008: 347). However, the GCC is ‘principally concerned with understanding how
global industries are organised’ along a series of sequential value-added activities for a

54
particular good or services (Bair 2005:155-156). Four dimensions of GCCs are
identified, namely, input-output structures, geographic structure, governance structures
and the institutional framework (Gereffi 1994, Gereffi & Korzeniewicz 1995).
The concept of Global Value Chains (GVCs) has appeared quite recently in the
literature (Gereffi, Humprey & Sturgeon 2005). Discussions about the relationships
between GCCs and GVCs can be found in the relevant literature (e.g., Bair 2005, Ponte
& Gibbon 2005). However, there is little significant distinction behind the two different
terms (Bair 2008)22
. For example, both concern value-added activities such as product
design, production, distributrion and marketing; both focus on the study of inter-firm
economic development issues across countries or regions.
One of the big differences between GCC and GVC is concerned about governance
analysis. Governance is defined as authority and power relationships in GCCs in
contrast with the coordination mechanism in GVCs (Gereffi, Humphrey & Sturgeon
2005). The GCCs framework is based on asymmetrical power relationships among the
global firms in the chain network and the major themes involve analysis the inter-firm
governance by the lead firms. The lead firms in the chains leverage and govern the other
roles in the network, capturing high returns and gaining the power advantage via
barriers to entry (Gereffi 1994, 1999, Kaplinsky 1998). However, the GVC paradigm
places more stress on the coordination mechanism between the global buyers and
producers along the chains (Sturgeon 2002, 2008, Humphrey & Schmitz 2003, Ponte &
Gibbon 2005).
In addition, the power relationships in GVCs are not static. Some suppliers of formal
assemblers and contractors gradually grow stronger both functionally and financially
through functional upgrading. In this context, the inter-firm relationship is becoming
more symmetrical and coordinative under the framework of GVCs.
This research studies the Chinese clothing industry from a dynamic perspective and the
term “GVC” is adopted in line with the synthesised research framework (Chapter 4.2).
The concept of GVCs is further illustrated in Figure 3-2. Taking the global clothing
industry as an example, the figure summarises four fundamental elements of the GVC
framework as follows:
Global allocation of value-added activities (e.g., design, production, distribution
22 From GCC to GVC: “In the early 2000s, an interdisciplinary group of scholars began a multi-year initiative with
support from the Rockefeller Foundation to examine different approaches to the study of global production networks.
The group proposed that a terminological shift from GCC to GVC was warranted because ‘commodity’ might be
thought to denote very basic, undifferentiated products (e.g. plain white t-shirts as commodity garments) or
agricultural staples. As a result, many scholars who had identified with the GCC framework began instead to define
their approach as GVC analysis.” (Bair 2008: 351)

55
and marketing)
Governance of the value-added activities among the global players (e.g., clothing
lead firms, apparel manufacturers, traders, retailers and marketers)
The global players distributed across countries and regions (e.g., EU, Turkey,
America, Mexico, Asia and China)
Coordinative and organised inter-firm networks (e.g., component, product, export
and marketing networks)
Design
(Clothing lead firms)
Production
(Apparel manufacturers)
Distribution
(Traders/ leader firms)
Marketing
(Retailers/marketers)
EU and America
Asia, Europe and America
EU and America
Component networks Product networks Export networks Marketing networks
Figure 3-2: An example of the clothing global value chain 1
Source: The author.
3.2.2 Theory development and the apparel industry
GVC is widely applied in analysis of the global clothing industry. Empirical researchers
have mainly analysed the apparel industry in East Asia (Appelbaum 2008, Gereffi 2011),
India (Ramaswamy & Gereffi 2000), Turkey (Tokatli 2003, 2007a, 2007b, Tokatli &
Kizilgun 2004, Tokatli & Eldener 2004, Neidik & Gereffi 2006), EU and USA
(Winterton, J. & Winterton, R. 2002,Taplin & Winterton 1995, Taplin 1997, 2002, 2006,
Taplin, Winterton, J. & Winterton, R. 2003, Taplin & Winterton 2004) and North
America and Mexico (Gereffi 2000, 2001, Gereffi & Memedovic 2003, Bair & Peters
2006). The reasons for this research convergence are that these regions or economies are
either the world’s leading apparel exporters/manufacturers (e.g., Asia, Turkey, India and
Mexico) or the world’s major clothing importers/markets (e.g., EU and USA)
Existing literature concerning the apparel GVC framework mainly covers the following
themes: global shifts in apparel production (Bair & Gereffi 2001, Gereffi, Humphrey &
Sturgeon 2005), value chain governance and the asymmetric power relationship (Gereffi
Chinese, Mexican
and Turkish
garmentcontractors
Domestic and
overseas
subcontractors
Descriptions
and
components
Brand-name
apparel
companies,
Trading
companies,
Retailers
Specialty stores,
Mass merchandise
chains,
Department stores,
Factory outlets,
Discout chains,
Web sell and others

56
1994, 1996, Gereffi et al. 2001, Gibbon & Ponte 2008), the changing patterns of
consumption (Tokatli, Wrigley & Kizilgun 2008, Tokatli, Kizilgan & Cho 2011), labour
issues (Bair & Gereffi 2003, Gereffi 2006, Taplin, Winterton, J. & Winterton, R. 2003),
the trade regulatory regime, industrial upgrading and sustaining competitiveness in the
developing economies (Bair & Gereffi 2002, Humphrey & Schmitz 2003, Tokatli 2007a,
2007b, Bair & Peters 2006, Gibbon 2008).
In the preceding chapter, some of the above themes have been discussed and therefore
the following section focuses on two closely related topics, namely, governance in the
clothing GVC (Gereffi 1999, Sturgeon 2002, Humphrey & Schmitz 2000, 2003, Gereffi,
Humphrey & Sturgeon 2005) and industrial upgrading for SCA (Bair & Gereffi 2001,
2003, Bair 2005).
3.2.2.1 Governance in the global clothing industry
Governance in GCCs is defined as ‘authority and power relationships’ among the global
players, which determine how production and consumption are globally organised and
how added value is allocated and flows within a chain in the globe (Gereffi 1994: 97).
The GCC followers maintain that there is an asymmetric power relationship among the
global firms in a GCC. According to Gereffi (1999), there are two types of commodity
chains, namely, the buyer-driven commodity chain (BDCC) and the producer-driven
commodity chain (PDCC). PDCC is dominant in technology and capital-intensive
industries such as automobiles, aircrafts and heavy machinery. In PDCC, global giant
manufacturers are the lead firms, who enjoy greatest profitability and who exert control
other roles in the chain via raw material or component suppliers, and have forward
linkages into distributors and retailers. BDCC is common in labour-intensive and
consumer-goods industries such as clothing, toys and handicrafts. In BDCC, the lead
firms are usually global giant retailers, branded marketers and non-factory
manufacturers, who specialise in design, sales, marketing and financial services. Those
lead firms in both PDCC and BDCC retain their leverage through the establishment of
barriers to entry so as to generate different kinds of “rents” (returns from scarce assets).
PDCC primarily relies on technology rents or organisational rents while BDCC relies on
relational rents, trade-policy rents or brand name rents (Gereffi 1999).
The apparel industry is a typical BDCC (Gereffi 1999, Bair & Gereffi 2002). In the
apparel industry, the pivotal roles are played by the lead firms, which are of three types:
large retailers like Wal-Mart and JC Penney, branded marketers like Liz Claiborne and
Nike, and branded no-factory manufacturers such as Levis Strauss and Sara Lee. These
lead firms are predominantly located in industrialised countries, controlling and
governing the clothing GCC (Dicken & Hassler 2000, Hassler 2003).

57
In contrast, the GVC scholars argue that there is more coordination and symmetric
power among the global firms in a GVC. Gereffi, Humphrey and Sturgeon (2005: 82-84)
identify five types of global value chain governance, namely, markets, modular,
relational, captive and hierarchy, which range from high to low levels of explicit
coordination and power asymmetry (Figure 3-3). Among them, “Markets” and
“Hierarchy” relationships are the two extreme ends of the spectrum. “Markets”
represent equal or fair coordinations between buyers and suppliers while “Hierachy” is
characterised by total power asymmetry, with control emanating from headquarter to
subsidiaries and affiliates or from managers to subordinators. The remainders comprise
intermediate modes of value chain governance. For example, in “Modular” value chains,
there are various coordinations between supplier and lead firm on a specific transaction.
For example, the full-package supplier has to meet the leader firm’s demand by
following specifications in the contract but there are some other flexible details have to
be discussed and coordinated between them. In “Relational” value chains, there is more
complex interaction and coordination between sellers and buyers; mutual dependence
and high levels of asset specificity are involved. Normally, the relationships are built up
over time and managed through reputation, family or ethnic ties. In “Captive” value
chains, small suppliers are dependent on much larger buyers and also face significant
switching costs and thus are captive by the buyers.
Source: Author’s recreation (Gereffi, Humphrey & Sturgeon 2005)
The real business world of the clothing industry demonstrates clear evidence to suggest
that the power relationships between buyers and sellers are moving from an earlier
asymmetric set of relationships towards a more symmetric and more coordinative
situation (Gereffi, Humphrey & Sturgeon 2005). That is, there is a trend away from the
Market-based
Fair
coordination;
transactions
can be
repeated
Hierarchy
Vertical integration
from headquarter
to subsidiaries and
affiliates;
managerial control
from managers to
subordinators
Degree of explicit coordination/ power symmetry Low High
Captive
Small suppliers
transactionally
dependent and
thus controlled
by large firms
to a large
extent
Relational
Complex
interaction;
mutual
dependence;
relationships
built up over
time
Modular
Somehow
coordination
on a specific
transaction
Figure 3-3: Five types of governance in global value chains 1

58
original “Captive” type of relationship towards the more complex and coordinative
“Relational” type interactions between buyers and suppliers. In the “Relational” GVC,
firms in different parts of the world have to coordinate with each other and to integrate
all internationally dispersed functional activities from design, production and
distribution to retailing and marketing, which as a result often creates mutual
dependence (Gereffi, Humphrey & Sturgeon 2005, Jia 2013).
Since the 1960s, with rising production costs, more and more large Western clothing
enterprises have started to outsource their production processes to global low-cost
clothing manufacturers in developing economies. In the late 1970s and through the
1980s, increasingly stronger retailers further fuelled the process of offshore sourcing. In
this context, branded marketers or retailers such as Gap, ZARA, H&M and Ralph
Lauren, do not produce apparel on their own, but concentrate on more profitable
segments such as design, branded marketing and distribution (Appelbaum & Gereffi
1994). As a result, these buyers have grown more powerful, leveraging the suppliers to
provide more flexible and complex products in the global clothing industry, identified as
a “Captive” GVC.
However, with production fragmented across the globe and a growing demand for
product variety and flexibility on the one hand, and with the suppliers’ growing
expertise and production capabilities on the other hand, global apparel governance is
pushed rapidly from a “Captive” to a more complex “Relational” value chain. This is
particularly happening in the Pacific Rim region in the past decade. That is, the
emergence of giant retailers coincides with the emergence of commensurately large
factory contractors who serve them (Appelbaum 2008).
One such example is the giant apparel contractor, the Taiwanese multinational Nien
Hsing Corporation, the world’s largest jeans maker and the world’s sixth-largest denim
maker. A similar example is the Korean multinational Yupoong Inc., the world’s second
largest cap manufacturer. Both have evolved by upgrading from Original Equipment
Manufacturer (OEM) to Original Brand Manufacturer (OBM) and now both are
coordinating with global multi-buyers of giant retailers, branded markets and
non-factory manufacturers in broad areas such as product design, production,
distribution and services.
3.2.2.2 Industrial upgrading and sustained competitive advantage
Under the GVC framework, there is a substantial literature which suggests that
industrial upgrading is a practical and necessary strategy for sustaining competitive
advantage of the clothing industry in developing economies (Gereffi 1999, Bair &
Gereffi 2003, Humphrey & Schumitz 2000, 2002, Tokatli 2003, Bair 2005, Gibbon

59
2008, Gibbon & Ponte 2008). The existing literature contributing to the upgrading issue
can logically be categorised into three relevant fields, namely, concept of upgrading,
rationales of upgrading and ways of upgrading.
Concept of upgrading: Definitions and classifications
Gereffi (1999: 51-52) defines upgrading as ‘a process of improving the ability of a firm
or an economy to move to more profitable and/or technologically sophisticated capital
and skill-intensive economic niches’. In the value chain system, upgrading is defined as
‘improving a firm’s position within the chain’, which results in improved
competitiveness and greater value added (Humphrey & Schmitz, 2002: 1020). Further,
the authors summarise four types of upgrading: process upgrading, product upgrading,
functional upgrading and inter-chain upgrading. Among the four types, product and/or
process upgrading are the fundamental steps and prior conditions for functional
upgrading. Product upgrading refers to a move into more sophisticated product lines
with a higher premium prices. In apparel manufacturing, for example, upgrading from
production of basic garments to fashion-basic garments, or upgrading from production
of essentials to formal wear or outwear, are the cases under discussion. Process
upgrading refers to adopting more efficient production processes by improving
technology and/or by reorganiseing production systems, for example by the introduction
of just-in-time practice and the use of computer-aided-design techniques. Inter-chain
upgrading refers to shifting productive activities to another new industry. Functional or
intra-chain upgrading fundamentally applies to development of the manufacturing
industries in developing economies. It can be defined as sequential role shifts, where
these shifts follow the trajectory of Original Equipment Assembly (OEA), OEM, ODM
and OBM in turn (Humphrey & Schmitz 2001) (Figure 3-4).

60
Rationales of upgrading: Sustained competitive advantage
Source: Author’s creation based on Humphrey and Schmitz (2002).
Figure 3-4 depicts functional upgrading in the clothing industry. Assembly is the
primary step by which most clothing firms from the developing countries integrate into
the GVC (Gereffi 1989, 1999, Humphrey & Schmitz 2002, Bair 2005, Gibbon & Ponte
2008). At this stage, suppliers merely follow buyers’ specifications and it is the buyers
who provide product design, materials and components while the suppliers just focus on
production. At the subsequent OEM stage, which is sometimes referred to as, “full
package production”, the suppliers take on more functions in addition to production,
which include procurement of materials and components, arranging shipment and other
backward linkages with the domestic firms. ODM is the third stage, in which the
suppliers further move up the ladder handling the clothing design process. Further
moving up the trajectory toward the OBM stage, the suppliers can acquire autonomy
and obtain access into the GVC as designers, producers, marketers and retailers for their
own products under their own brands.
Rationales of upgrading: Development strategy for SCA
Upgrading, particularly functional upgrading is the development strategy for SCA of the
clothing industry in the developing economies (Bair & Gereffi 2003, Humphrey &
Schmitz 2002, Gereffi 2006, Bair & Peters 2006, Tokatli & Eldener 2004, Gibbon &
Ponte 2008).
In the clothing GVC, the most labour-intensive manufacturing segment is situated in
Figure 3-4: Trajectory of functional upgrading in the developing economies 1
ODM
(Design)
OBM
(Brand, marketing,
retail, distribution)
Products
Design,
material, order,
brand
Design, order,
brand
Order,
brand
Order
Global
non-factory
clothing
manufacturers,
Global branded
clothing
marketers,
Giant global
clothing
retailers.
Foreign markets
Domestic markets
F
un
ction
al u
pg
rad
ing
trajecto
ry
OEA
(Assembly)
OEM
(Backward linkage,
logistics)

61
developing economies (Gereffi 1989, 1999). However with economic development,
wages will rise along with growth of per capita income (Details in Chapters 2.2.1 and
2.3.5). In this sense, low-cost competition from other less-developed economies, as well
as buyers’ downward price pressure may further squeeze the manufacturers’ profit
margins. Therefore, upgrading to higher value-added segments such as branding and
marketing is a practical way out of the manufacturing trap and also an unavoidable
strategic choice for SCA by clothing companies in the developing economies (Gereffi
1999, Bair & Gereffi 2003, Tokatli & Eldener 2004, Tokatli & Kizligun 2004, Gibbon
2008). Of course, along with the process of functional upgrading in the clothing industry,
some industrial capital may shift to more value-added capital- or technology-intensive
industries on the one hand (Tokatli 2007b), whilst on the other hand some clothing firms,
especially low-efficiency and small-sized firms, may struggle for survival simply by
remaining at the OEM stage. However, this research focuses on SCA of the whole
clothing industry as a development trend rather than on individual enterprises.
Ways of upgrading: Major influential factors and upgrading paths
Scholars have discussed the topic of how to upgrade from various perspectives (Bair &
Gereffi 2003, Tokatli & Kizilgun 2004, Gereffi, Humphrey & Sturgeon 2005, Bair &
Peters 2006). The fundamental and necessary step for industrial upgrading of clothing
manufacturers in developing economies is to participate in the clothing GVC because it
provides opportunities for firms and economies on potentially dynamic learning curves
(Bair & Gereffi 2003). The upgrading experience of NIEs in East Asia derives ‘in large
measure from its ability to establish close linkages with a diverse array of lead firms in
buyer-driven chains’ (Gereffi 1999:40). According to the author, the diverse lead firms
provide a variety of learning opportunities for the apparel suppliers’ to develop via
upgrading. For example, the branded manufacturers primarily prefer the assembly
arrangement so the relevant learning opportunity focuses on the production segment. In
contrast, retailers and branded marketers prefer the OEM contract, so suppliers have to
learn more business functions such as logistics and design in addition to apparel
production, which enables the suppliers to continue upgrading from OEM to OBM.
However, functional upgrading, especially in the form of moving-up the ladder from
OEM to OBM,has proved to be difficult for many firms. For example, no Mexican
clothing firm until now has developed its own brands in the US market despite the
advantages of the NAFTA arrangement and geographic proximity to the US market
(Humphray & Schmitz 2001). Upgrading towards higher value-added activities such as
design, marketing, branding and retailing in the clothing GVC is discouraged and even
impeded by the lead firms in industrialised countries since this sort of upgrading
encroaches on the lead firms’ core competence (Humphray & Schmitz 2001).

62
Therefore, transformation into branded manufacturers and retailers is far from merely a
natural process. Even though virtually every full-package manufacturer possesses the
potential, only a small number of them are qualified and actually create their own
brands successfully.
First of all, those manufacturing firms with a strategic intent of branding can acquire
the learning opportunities to achieve successful upgrading (Humphrey & Schmitz 2002;
Tokatli & Eldener 2004; Tokatli, Wrigley & Kizilgun 2008). Strategic intent is a
long-term goal of an organisation and accordingly implementation of the strategic plan
requires long-term efforts.
Secondly, active and effective management processes/ activities guide, stimulate and
integrate all the efforts of the company towards the strategic goal (Keller 2003, Ray,
Barney & Muhanna 2004, Bititci et al. 2010). The strategic intent is about “what” the
company is going to do and the management processes tell “how” the company is going
to achieve the goal. In the context of the clothing industry, for example, the company
needs to begin by creating clear and unique brand positioning to support the upgrading
strategy because brand positioning offers an image occupying a distinct and valued
place in the target customers’ minds, enabling the firm to differentiate itself from its
competitors. Next, when the manufacturers have participated in the clothing GVC and
have also started a branding strategy, then according to Humphray & Schmitz (2001), an
exclusive concentration with a small number of lead firms (especially retailers or
marketers rather than non-factory branded manufacturers) may put the supplier in a
better position to successfully transform, in comparison to those preoccupied with
satisfying the needs of a large number of firms, particularly those small non-factory
branded manufacturers.
Thirdly, firm-level valuable and unique resources (e.g., customer relationship, corporate
culture and distribution channel)23
are the pivotal and fundamental prerequisites for
functional upgrading towards becoming branded manufacturers (Aaker 1996,
Humphray & Schmitz 2002, Tokatli & Kizilgun 2004).
Fourthly, even so there is no unique path for upgrading process and a more realistic and
practical way is to maintain dual roles, that is, the role as a manufacturer both for others
and for their own brands (Tokatli & Kizilgun 2004, Tokatli & Eldener 2004).
Finally, the factor of local industrial clusters (LIC) also played an important role in the
industrial upgrading process (Discussed in Chapter 2.3.7). However, Rabellotti (1999)
examined the Guadalajara shoe cluster economy in Mexico and the results suggest that
23 Further analysis and discussion will be in the following literature review chapterconcerning resource-based view
of the firm.

63
trade liberalisation disproportionately benefited the large exporting firms and shaped
different inter-firm performance in the cluster.
…the extent to which export-oriented clusters in industrializing countries can
achieve industrial upgrading objectives and positive developmental outcomes will
depend on the way in which firms in these clusters become incorporated into global
chains, and who has power in particular chains, and how that power is exercised.
(Bair & Gereffi 2001:1888)
Research on the Torreon apparel cluster in Mexico elaborates upon this statement
further (Bair & Gereffi 2001). On the one hand, the North America Free Trade
Agreement (NAFTA) facilitated upgrading in the Torreon apparel cluster. Consequently,
the major US customers shifted their sourcing from East Asia to the Torreon cluster and
these lead firms drove the clothing manufacturers in the Torreon cluster towards
evolving from pre-NAFTA pure assembliers to a post-NAFTA mix consisting of
assembliers and full-package manufacturers. On the other hand, just a limited number of
tier 1 suppliers (only four among the top-ten manufacturers) upgraded as full-package
manufacturers whilst majority of the others became half-package producers24
. This
result implies that the “internal” factor is more important than the “external” factor for
the upgrading. Therefore, this implication provide an additional reason to examine
effects of firm-level resources on sustained competitive advantage, which is a
theoretical argument in the resource-based view of the firm (RBV).
There have been some successful upgrading practices in the global clothing industry
(Gereffi 1999). As the archetypes for functional upgrading among developing
economies, the clothing firms of the East Asian NIEs rapidly transited from being initial
assemblers to becoming OEM contractors. At the OEM production stage, from the
various types of buyers the OEM contractors not only learned about the standard of
quality, flexibility and production capabilities, but they expanded their activities from
mere production to more broader areas of downstream and upstream segments across
the apparel value chain. Then under challenges from other low-cost suppliers from the
Third World and appreciating currencies, some former OEM suppliers in the NIEs were
pushed to upgrade to the OBM role. For example, Episode, one of the former OEM
suppliers for Liz Claiborne, gradually sold its own brand clothing in its own stores
across the globe. Giordano, another famous Hong Kong clothing brand, underwent a
similar development route.
In Europe, some Slovakian and Turkish clothing manufacturers moved up the higher
value-added chains and became branded manufacturers (Smith 2003). For example,
24 One major difference from the full-package producers, half-package producers do not buy the fabric by themselves
(Bair & Gereffi 2001).

64
Turkish manufacturers, Orka Group, Damat-Tween, Jordan, Baharain, Ipekyol and Sarar,
to name a few, succeeded in retailing their own brands abroad (Tokatli 2007a, 2007b).
Even though these cases are not sufficient for generalisation, they serve as early
pioneers demonstrating the feasibility of upgrading development.
Having examined the GVC theory, particularly in terms of governance in the clothing
GVC and upgrading strategy for SCA, the following section reviews RBV theory, a
fundamental ground for this research framework.
3.3 Resource-based view and sustained competitive advantage
A growing literature has contributed to the underpinnings of RBV particularly since the
1990s. The theory’s fundamental assumption is that the heterogeneous firm-level
resource bundle is the source of competitive advantage. This section reviews literature
on RBV and the review is structured into four subsections. Subsection 3.3.1 introduces
the background of the theory. Subsection 3.3.2 elaborates upon the origins of the theory.
Subsection 3.3.3 traces back development of the theory. In this subsection, the concepts
of resource, competitive advantage, and SCA are reviewed and discussed. Literature
about the resource attributes, classification, expoitation, and the bundling effect is
critically reviewed. Subsection 3.3.4 summarises development and logic of the RBV
theory. This is followed by a review of empirical tests of the theory and assessing the
RBV theory in terms of its contributions and limitations which are important factors in
affecting the design of this study.
3.3.1 Theory background
In the strategic management field, the issue of achieving and sustaining competitive
advantage is at the forefront of the mainstream literature. Strategic researchers and
business experts tend to address the issue mainly from two principal schools: the
market-based view or the resource-based view (RBV). These two alternative theories
view firms from different strategic angles. The former is “external” while the latter is
“internal”.
Until the mid 1980s, the major paradigm was market-based view (Grant 1991).
Market-based view explores inter-industry competitive advantage by taking industry as
the unit of analysis and all firms in the industry are taken as given. Popular analytical
frameworks include PEST and the Five Forces Model.
The PEST framework analyses the external macro (i.e., national or international) factors,
which influence and determine a company’s decisions and operations for competitive
advantage and SCA. The PEST factors consist of political factors such as foreign trade

65
regulations, taxation and employment policies, economic factors such as GDP, interest
rate, labour costs and foreign direct investment, social-cultural factors such as attitudes
to work and leisure, demographic changes and social mobility, and technological factors
such as R&D, innovation, automation and adoption of new technology. Adding
environmental and legal factors expands the framework to PESTEL.
Michael Porter’s Five Forces Model is a technique to analyse external micro (i.e.,
industrial level) factors influencing organisational decisions and operations in seeking a
competitive advantage and a sustained competitive advantage (Porter 1986). The Five
Forces Model dominated the field among the others. It is argued that the industrial
structures of five forces, that is, threat of new entrants, threat of substitute product or
services, bargaining power of customers, bargaining power of suppliers and intensity of
competitive rivalry, may determine the inter-industrial competitive advantage. In this
context, competitive advantage may be realised through generic strategies of cost
leadership, focus or differentiation (Porter 1986).
However, the assumption of identical performance among firms is not in accordance
with the real business world. For example, historically, the clothing industry in the UK
and the US has been characterised by prosperity followed by decline, but even
nowadays both countries still have some world-class famous clothing companies. In
other words, due to economic development in the economies, some industries as a
whole may become “sunset” industries. However, inter-firm performance varies in real
business practice. That is, whilst many companies in a “mature” or “declining” industry
struggle to survive, some exemplar firms may prosper in the same industry (Tully &
Berkeley 2004).
Moreover, inter-firm differences in performance are much greater due to the
intra-industry factors than the inter-industry factors. Rumelt’s (1991) empirical results
indicate that the stable business-unit effects (i.e., the variance in business-unit returns)
are six times more important than stable industry effects in explaining the dispersion of
returns, let alone transient industry effects.
Then, how to explain the performance difference among firms in the same industry with
identical external environment? The market-based view theory fails to provide a
satisfactory explanation behind the economic phenomena, especially under today’s
dynamic and intensified competitive environment. In business practices, the traditional
strategies of differentiation and specific market niches, which are based on
market-based view, may not be sufficient or appropriate for a company to achieve SCA
since its competitors can easily surpass it through cloning and simulation (Quinn,
Doorley & Paquette 1990). Therefore, a more appropriate theory is needed to replace
market-based view and hence the context for the development of RBV.

66
3.3.2 Theory origins
In contrast with market-based view, RBV provides an appropriate framework to analyse
and interpret inter-firm performance differences from within a firm. The origin of RBV
can be traced back to Penrose’s (1959) seminal book, The Theory of the Growth of the
Firm. In this book, Penrose identifies two key contributors to the growth of the firm,
namely, productive resources and managerial activities. The two factors link
performance with the firm’s internal source rather than the external market which the
dominant literature focuses at that time.
However, it was not until 1984 that the resource-based view was introduced into
mainstream strategic management literature (Rumelt 1984, Wernerfelt 1984). The two
authors attribute competitive advantage and inter-firm performance mainly to the firm’s
heterogeneous resource bundle rather than to the external environment or product
market power. However, the concept of RBV did not receive much attention or
prominent influence in academic research until several years later when subsequent
papers were published in the same field. Therefore, RBV is an accumulative
contribution of many scholars (e.g., Penrose 1959, Andrews 1971, Wernerfelt 1984,
Rumelt 1984, Barney 1986, 1989, 1991, Dierickx & Cool 1989, Peteraf 1993, Prahalad
& Hamel 1990. Nelson 1991, Teece & Pisano 1994, Teece, Pisano & Shuen 1997,
Lippman & Rumelt 2003, Peteraf & Barney 2003, Wiklund & Shepherd 2003, 2009,
Ray, Barney & Muhanna 2004, Armstrong & Shimizu 2007, Newbert 2007, 2008,
Lockett, Thompson & Morgenstern 2009, Barney 2012).
Over the last three decades, the resource-based view has gradually gained more
popularity over the market-based view and it has become one of the dominant research
fields in strategic management (Barney, Ketchen & Wright 2011). The theory of RBV is
developed mostly during the 1990s and 2000s and increasing empirical research appears
in the latest decade. Therefore, this thesis reviews the literature accordingly. That is,
most of the theoretical literature reviewed in this chapter is from the 1990s and 2000s
while the empirical literature, which is reviewed in Chapter 4, is mainly from the latest
decade.
In view of the theory background and also through analysis of the research context,
RBV is an appropriate theory to be applied in this research concerned with sustaining
competitive advantage of the Chinese clothing industry. However, adopting the internal
theoretic ground and focusing on firm-specific factors does not mean that external
factors are not important but rather, the external dynamic environment is also
considered as an influential factor. The following section focuses on development of the
RBV theory.

67
3.3.3 Theory development
3.3.3.1 Resources concept and classification
RBV holds that heterogeneous resource endowment is the key source of (sustained)
competitive advantage of the firm. The relevant concepts, e.g., “resources” and
“sustained competitive advantage”, need to be clarified first.
Concept of resources
The concept “resources” is still ‘an amorphous heap’ (Barney 1995), which has not been
clearly defined (Table 3-1). In Wernerfelt’s original work (Wernerfelt, 1984: 172),
resources are broadly defined as ‘anything which could be thought of as a strength or
weakness of a given firm’ and resources are semi-permanent assets to the firm at a given
time, e.g., brand names, customer loyalty, in-house knowledge of technology, trade
contacts, efficient procedure and capital. Barney (1991) further specifies resources as all
assets, capabilities, organisational processes, firm attributes, information, knowledge,
etc., which can improve effectiveness and efficiency. Grant (1991) further defines
capabilities as organisational processes or a number of interacting managerial routines
among different segments including the R&D segment, manufacturing department,
executive teams and integrated segments.
Ambiguity as to the key distinction between assets and capabilities arises and needs to
be clarified. According to Amit & Schoemaker (1993), assets are stocks of available
factors that are owned or controlled by the firm and that can be converted into products
or services while capabilities are capacities which enable the company to deploy
resources or perform some tasks or activities. Companies’ capabilities are developed
over time through complex interactions among the firm’s resources and on the basis of a
wide range of information. Therefore, resources are firm-specific and information-based
while capabilities are often characterised by human capital-linked and resource-complex
interaction; are in the forms of tangible or intangible processes, highly reliable services
or product innovations, manufacturing flexibility, responsiveness to market trends, and
short product development cycles. In short, the notion of resources is what the firm “has”
while the notion of capacities is what the firm “does”.
Further, Teece, Pisano & Shuen (1997) define organisational processes or managerial
routines as distinctive activities which are performed based on firm-specific assets and
integrated environmental conditions. That is, these processes include external
integration and internal coordination of the various assets.

68
Table 3-1: Key RBV terminology and the relations among them 1
References Key terms Definitions Relationships
Wernerfelt
(1984)
Resource --Resource (B): Anything which could be
thought of as a strength or weakness of a
given firm … tangible and intangible,
semi-permanent assets to the firm… e.g.
brand names, in-house knowledge of
technology, machinery, capital, efficient
procedures, etc.
Resource(B*)=
Asset(B)
Barney
(1991)
Resource Resource (B): All assets, capabilities,
organisational processes, firm attributes,
information, knowledge, etc., controlled and
exploited by a firm to strategically improve
effectiveness and efficiency.
Resource(B)=
Asset(N)
+capability(N*),
etc.
Grant
(1991)
Resource,
capability,
organisational
process or
routine
--Resources (N) are inputs into the production
process. It is non-productive and the source of
capabilities. It includes items of capital
equipment, skills of individual employees,
patents, brand names …
--Capability (N) is the capacity for the term of
resources to perform some task or activity. It
is, in essence, a routine, or a number of
interacting routines.
--Organisational routines are regular and
predictable patterns of activity which are
made up of a sequence of coordinated actions
by individuals.
Resource(B)
=Capability(N)
+asset(N)
Capability(N)
=Organisational
process or
routine(N)
Resource(N)
=Asset(N)
Amit &
Schoemaker
(1993)
Resource,
capability
--Resources (N): stocks of available factors
that are owned or controlled by the firm…
converted into final products or services.
--Capability (N): a firm's capacity to deploy
resources, usually in combination, using
organisational processes to affect a desired
end.
Resource(N)=
Asset(N);
Resource(B)=
Asset(N)+
capability(N)
Teece,
Pisano &
Shuen
(1997)
Organisational
competence or
routine,
Resource
--Organisational routine/competence (N):
Distinctive activities performed based on
firm-specific assets and integrated external
conditions.
--Resource (N): Firm-specific assets that are
difficult or costly imitate such as tacit
knowledge and trade secrets.
Capability(N) =
Organisational
routine/
competence(N)
Resource (N)=
Asset(N)

69
Source: The author.
Note *: The letter B denotes the broad definition and the letter N denotes the narrow definition.
Table 3-1 summarises the key RBV terms and their relationships with references. All the
above definitions - resources, assets, capabilities and organisational processes/
routines/ competences are listed on the basis of four dimensions, namely, ownership,
attribute, function and the existing form. The ambiguity of the terms used in the
literature lies in the implied scope of the concepts. Each term has broad (B) and narrow
notions (N) but few papers in the existing literature distinguish the two scopes by
explicitly clarifying while using them, which may leave readers confused. The terms of
organisation routine, organisation process, organisation competence and capability are
generally used in a narrow sense while the term resource is used in both narrow and
broad interpretations.
In summary, the term “resources” refers to static assets in a narrow scope, which is
owned or controlled by a firm and strategically applied for economic effectiveness and
efficiency; when the term “resources” is used as a broad notion, it refers to assets and
capabilities. For the sake of clarity, in the rest of this thesis, the term “resources” refer to
its broad concept, i.e., assets and capabilities, while the terms “capabilities”,
“organisational processes” or organisational routines” are used interchangeably.
Taxonomy of resources
The literature contains various classifications of the diverse resources. Table 3-2
summarises taxonomy of the resources with corresponding references.
The simple division is between tangible and intangible (Wernerfelt 1984). The author
listed some resources such as brand names, in-house knowledge of technology,
employment of skilled personnel, trade contacts, machinery, efficient procedures, capital,
etc. Comparatively the intangible resources are more complex. Hall (1993) develops a
taxonomy of the intangible resources: “having” resources (e.g., patents) and “doing”
capabilities (e.g., know-how), legally protectable (e.g., contract and licenses) and not
legally protectable (e.g., personal and organisational networks), people dependent (e.g.,
reputation) and people independent (e.g., databases), functional capabilities (e.g.,
advertising) and cultural capabilities25
(e.g., ability of managing change). Obviously
these classifications are based on various criteria and not exclusive to one another.
However, this perception-based method of classification is usually utilised for
description of static objects without the dynamic sense of processes.
25 Functional capability relates to the ability to do specific things; it results from the knowledge, skill and experience
of employees and others. Cultural capability incorporates the habits, attitudes, beliefs and values which permeate the
individuals and groups comprising the organiseation. It applies to the organiseation as a whole (Hall 1993:610).

70
Table 3-2: Taxonomy of resources 1
Taxonomy of resources Examples of resources References
Resources (B):
Tangible resources: e.g., skilful workers, machinery, capital, etc. Wernerfelt 1984, Hall
1993 Intangible resources:
--“Having” capabilities
vs. “doing” capabilities
--Legally protectable vs.
not legally protectable
--People dependent vs.
people independent
--Functional capabilities
vs. cultural capabilities
e.g., patents vs. know-how
e.g., contract & licenses vs. personal and
organisational networks
e.g., reputation vs. databases
e.g., advertising, learning capability.
Resources (N) & capabilities:
Productive resources:
--Human resources
--Physical resources
e.g., skilled staff, plant & equipment, location,
access to raw material, and physical technology.
e.g., details below in “Capabilities”
Penrose 1959, Barney
1991
Managerial capabilities
Capabilities:
Function capabilities e.g., product development, production,
marketing, distribution, financial control and
operation management etc.
Grant 1991, Teece,
Pisano & Shuen 1997
Integrative capabilities
--External integration
--Internal coordination
e.g., Human resource management
e.g., supplier relationship, customer
relationship, competitor relationship.
Dynamic capabilities e.g. organisational culture, organisational
learning, leadership, innovation etc.
Source: The author.
Note: Resources (B) refers to the firm specific resources from a broad scope and resources (N) from
a narrow scope.
Penrose (1959) mentions two categories of resources: productive resources and
managerial capabilities. The author divides the productive resources into physical
resources and human resources. The physical resources consist of tangible things (e.g.,

71
plant, equipment, land and natural resources, raw materials, semi-finished goods, waste
products and by products, and even unsold stocks of finished goods) while human
resources include unskilled and skilled labour, clerical, administrative, financial, legal,
technical and managerial staff. Penrose did not describe managerial capabilities in detail.
Penrose’s classification has some in common with Barney’s (1991). Barney sorts the
firm resources into three categories: physical resources (e.g., machines, manufacturing
facilities, and buildings firms use in their operations), human resources (e.g., all the
experience, knowledge, judgment, risk taking propensity, and wisdom of individuals
associated with a firm) and organisational resources (e.g., history, relationships, trust
and organisational culture). Despite of the different criteria used by Penrose and Barney,
Barney’s three-class category is quite similar to Penrose’s two-class category where
organisational resources in Barney’s classification closely resemble managerial
capabilities in Penrose (1959)26
. However, “organisational resources” or “managerial
capabilities” are still a general notion.
Grant (1991) suggested two classes of the firms’ capabilities: functional capability and
integrative capability. The functional capabilities are present in product development,
market research, financial control and operation management; the integrative
capabilities consist of internal coordination and external integration. Integration and
alliance of the external activities are increasingly important especially in terms of
linking design tailoring for customers’ needs and in lean production. The internal
coordination involves relationships of people to people and of people to the other
resources. The relationships lead to the capabilities in entrepreneurial orientation,
administrative decision making, human resource management, collective learning and
manufacturing capacity. Any specific organisational activity, say, developing a new
product, involves both functional capabilities and integrative capabilities (Grant 1991).
Dynamic capability is defined as the firm's ability to integrate, build and reconfigure
internal and external competences to address rapidly changing environment (Teece,
Pisano & Shuen 1997). Given environmental dynamics, dynamic capabilities thus
reflect and emphasise an organisation's ability to achieve new and innovative forms of
competitive advantage (Teece, Pisano & Shuen 1997).
However, there is no absolute distinguishing criterion between functional or integrative
capabilities and dynamic capabilities. A specific firm capability, for instance,
customer-communication, may belong to dynamic capability when emphasising
dynamics of communication with customers, and may fall into integrative capability
when emphasising integration of external with internal resources in a static state.
26 Different terms in literature papers are used interchangeably, such as managerial capabilities (Penrose 1959),
organisational processes (Porter 1986), organiseational resources (Barney 1991) and organisational routines (Nelson
& Winter 1982). These terms are not be distinguished strictly in this research as all refer to firm capabilities.

72
However, some capabilities such as innovation, organisational learning and
entrepreneurship are more likely to fall into dynamic capability (Teece, Pisano & Shuen
1997).
The literature on RBV sheds special light on the effects of organisational capabilities on
SCA (Barney 1989, Barney, Fuerst & Mata 1995, Teece, Pisano & Shuen 1997,
Wiklund & Shepherd 2003, Ray, Barney & Muhanna 2004, Barney 2012). Since
organisational capabilities are tacit and also less likely to be acquired through the
perfectly competitive market, firms can develop or accumulate their capabilities only by
themselves. In addition, the internal accumulation process is not independent or isolated,
but rather, it is a continuous interaction process with external dynamics through
organisational learning mechanisms (Prahalad & Hamel 1990, Crossan & Berdrow
2003). This development process is characterised by complexity, high-level coherence
and inherence, historical contexts and quite difficult for any other firms to imitate or
duplicate. Therefore, organisational capabilities, here including functional, integrative
and dynamic capabilities, are subject to VRIN resources and hence a source of SCA.
3.3.3.2 Resources accumulation and acquisition
In addition to the “what” issues regarding the firm’s resources, RBV literature also pays
attention to issues about “where” the resources come from and how they are obtained.
Generally, the unique and scarce resources may develop either through internal
accumulation over a long history (i.e., asset stocks) or external acquisition from the
imperfectly competitive factor markets (i.e., asset flows) (Dierickx & Cool 1989).
There are two kinds of resource requirement for a firm to implement a strategy. One is
active requirement, when the resources required for implementation of the strategy are
not in resource stocks and thereby have to be acquired from the external market. To
achieve competitive advantage from the acquired resources for implementation of a
strategy, there are two premises. One is that competitive imperfections exist in the
strategic factor markets and the other is accurate expectation of the potential returns
from the acquired resources through implementation of the strategy (Barney 1986). The
author coins a concept of “strategic factor markets”, where firms buy and sell the
resources necessary to implement their strategies. In a perfectly competitive market,
normal returns accrue to the firm from implementing its market strategy. In contrast,
above normal returns may be obtained only in an imperfectly competitive market, where
firms may efficiently acquire the strategic resources at lower cost than their potential
value (Morgan 1999). These competitive imperfections in the strategic factor markets
may result from information asymmetry due to a unique history or other combined
factors of financial strengths, entry barriers or casual ambiguity.

73
The other is proactive requirement. Strategic management always calls for proactively
examining and estimating the impact of environmental dynamics on a firm’s strategy
and strategic resources, which in turn results in a proactive requirement of resources
(Barney & Zajac 1994). In other words, a firm has to proactively manage both tradable
and non-tradable resources prior to implementation of its strategies. Given a perfectly
competitive market, tradable assets can be sold and bought in the strategic factor
markets, and therefore they are not firm specific assets and may not guarantee SCA. In
contrast, asset stocks of the firm, such as customer loyalty and organisational culture,
are accumulated over a long history and under complex social environment. These
assets with the VRIN attributes are firm specific and non-tradable and thus are a
potential source of SCA (Dierickx & Cool 1989). Moreover, firm-specific capabilities
such as capabilities of R&D, innovation, collective learning, manufacturing experience
and human resources management are non-tradable and generally have to be built by the
firm itself.
However, non-tradable resources can also be accessed through alliance or merger and
acquisition (M&A) (Wernerfelt 1984, Harrison, Hoskisson & Ireland 2001, Wiklund &
Shepherd 2009)27
. Because of a low level of transparency in an imperfect market, both
the buyer and seller are in a difficult situation to accurately evaluate the transaction. In
addition, the alliance or M&A strategy is to obtain the supplementary or complementary
resources rather than to be product or market oriented.
In summary, acquisition and accumulation are the two main ways to access the
resources necessary to implement organisational strategies, that is, market acquisition
for tradable resources and self accumulation for the non-tradable ones. A condition for
acquisition of resources from external markets is that markets are imperfectly
competitive, which enables profitable bargains to be made. Also the resources acquired
from external markets are often related with non-uniqueness. The unique resources
often have to be developed within the organisation, which then ensures competitive
advantage and superior performance. M&A is a very important alternative channel to
get access to those non-marketable resources.
3.3.3.3 Resources exploitation and resource bundling
It is not only the strategy of resource identification but also that of resource deployment
that explains firms’ development and SCA (Perose 1959, Wernerfelt 1984, Lockett,
Thompson & Morgenstern 2009). The RBV literature discusses resource configuration
27 Acquisitions are transactions in which one firm buys a controlling interest in another firm and the acquired
business becomes a subsidiary of the acquirer’s portfolio. Alliances, from a strategic perspective, are partnerships
between firms where their resources, capabilities, and core competencies are combined to pursue mutual interests
(Wiklund and Shepherd, 2009).

74
and reconfiguration by using the term “resource bundle/bundling”.
Resource bundling
Resource bundling refers to the way that various resources are effectively exploited
through combination and integration to achieve the strategic ends of the firm (Powell
1992, 1995 Amit & Schoemaker 1993).
The earliest research on resource bundling can be traced back to Powell (1992). The
author regards organisational alignment skills as a strategic resource leading to
competitive advantage. The author then examines the effect of organisational
alignments (i.e., integrative capacity of environment and internal resources) on financial
performance. The empirical results suggest that the structural internal fit28
has a strong
partial-correlation with performance. Further, Powell (1995) argues that correlated and
complementary resources of a firm are difficult for its competitors to acquire or imitate,
and therefore they are a source of sustained competitive advantage.
Now it is a generally accepted idea that a specific or single resource is not sufficient to
create SCA but combined or bundled resources have the potential (Ray, Barney &
Muhanna 2004, Wiklund & Sheperd 2009). Given dynamic environment, a responsive
and dynamic organisation which exploits bundling resources such as leadership, human
resource management, corporate culture, design and systems enables to achieve
sustained competitive advantage (Srivastava, Franklin & Martinette 2013).
This theoretical idea has been tested in a number of empirical studies. For example,
Macduffie (1995) examines how integrative bundles of human resource practices are
related to manufacturing performance29
. The research results in a high level of
correlation between the two variables, which indicates that human resource practices
affect performance in an internally consistent "bundle" or system. Further empirical
research suggests that under external dynamics, it is necessary for firms to use dynamic
capabilities to achieve an appropriate bundle of the internal resources with
organisational changes (Peteraf & Reed 2007). Among other capabilities, managerial
capabilities mainly work for organisational alignment and facilitate effective bundling
of the firm’s resource portfolios (Sirmon, Gove & Hitt 2008). Furlan, Vinelli and Pont
(2011) examine the existence of complementarities between Just-in-time (JIT) and total
quality management (TQM) and the research results indicate that the human resource
28 The fit refers to the internal integration of organiseational assets and capabilities involving organiseational skills in
terms of creativity, interpersonal skills, tolerance of ambiguity, and the ability to engage in multiple leadership styles,
and also strategic differentiation in terms of production cost, innovation, production differentiation (Powell 1992). 29 Resource bundle here refers to interrelated and internal consistency of the resources and the author claims that
"more is better" with respect to the impact on performance because of the overlapping and mutually reinforcing effect
of multiple practices (Macduffie 1995).

75
management bundle is an enhancer of the complementarities between Just-In-Time and
Total-Quality-Management.
Strategic researchers go further than just understanding the bundling effect of the
existing resources. Dierickxs and Cool (1989) agree on the importance of the
interconnectedness of asset stocks and the authors proceed to argue that accumulation of
a new asset should be complement to the original asset stock. For example, when a new
product has met the customers’ needs, the relevant extensive services also should be
ready to match the new product. Similarly, resources acquired through acquisition or
alliance should be combined into a new resource bundle. Whether or not the newly
acquired resource bundle can accrue to performance largely depends on the
effectiveness of the resource combination and match (Wiklund & Shepherd 2009). Both
of the two papers study the significance of the effective combination of the new
acquired resources with the existing resources, which can be captured by the more
precise term, “resource reconfiguration”.
In summary, SCA of a company is determined by its internal resource bundle. However,
the external industry environment also influences the effect of the internal resource
bundle (Barney 1995), described by Collis and Montgomery (1995: 123) as, ‘a resource
that is valuable in a particular industry or at a particular time might fail to have the same
value in a different industry or chronological context’. Therefore, analysis of how the
internal resources are bundled should include not only coordination of the existing
resources but resource recoordination, i.e., changes of resource bundles due to different
industries and chronological contexts.
3.3.3.4 Resource effect on sustained competitive advantage
RBV holds that heterogeneous and valuable resources are the source of competitive
advantage of the firm. This argument is from the strategic management perspective and
what lies behind this relationship is the belief that it is the economic value of the firm’s
resources that is important. This section discusses effects of resources first from the
economic perspective and then from the strategic management perspective.
Resource values: From the economic perspective
From the economic perspective, heterogeneous resources can create Ricardian rent
and/or Schumpeteriun rent.
The concept of Ricardian rent or Economic rent is involved at the center of this debate
about the economic values of the firm resources (Rumelt 1984, 1987, Peteraf 1993,
Amit & Schoemaker 1993, Winter 1995, Lippman & Rumelt 2003).

76
The term rent originated from Classical Economics and is defined as the ‘portion of the
produce of the earth, which is paid to the landlord for the use of the original and
indestructible powers of the soil’ (Ricardo 1821:11). According to Ricardo, rent is due
to differences in quality and scarcity in quantity as well as external influence, ‘when in
the process of society (i.e., external influence), land of the second degree of fertility (i.e.,
land quality) is taken into cultivation, rent immediately commences on that of the first
quality (i.e., implying land scarcity), and the amount of that rent will depend on the
difference in the quality of these two portions of land’ (Ricardo 1821:11). Following this
reasoning, then when the third-best land is cultivated rent commences to the second-best
land, and so on. Therefore rent is always generated on superior land and the least
favorable or “marginal” land pays little or no rent.
Based on Ricardo (1821), Peteraf’s (1993) illustrates the rent-generation mechanism in
the condition of resource heterogeneity. Resource heterogeneity in an industry may
reflect limited supply of superior resources which means firms with the superior
resources face somewhat inelastic supply curves, in that they cannot expand supply
accordingly to price changes, a situation which is similar to that in the monopolistic
product market structure, where monopoly rent is generated from a deliberate control of
supply. In this context, firms with the superior resources may have lower average costs
and therefore at industrial equilibrium, those low cost firms earns rents from the scarce
resources with price exceeding average cost (P>AC) while high-cost firms breakeven
(P=AC).
Obviously, there is no concept of opportunity cost in this original Ricardian rent while
opportunity cost is incorporated into Economic rent in Neoclassical Economics. The
Economic rent refers to ‘the portion of a payment (i.e., resource revenue) in excess of
the minimum required to transfer the resource from one use to another’ (Lippman and
Rumelt 2003). In this context, the value of a firm’s heterogeneous resources refers to
economic profits or surplus which derives from returns by deploying valuable and
scarce resources in excess of the value in the second-best use (Rumelt 1987, Peteraf
1993, Amit & Schoemaker 1993, Winter 1995). However, the notion of Economic rent
in Neoclassical Economics has no operational meaning because ‘it relies on a fairly
arbitrary division of all activities and decision into this use and alternative uses’ and
therefore this Neoclassical micro-foundation is criticised as ‘indeterminacy in the
concept of cost induced by the existence of economic rents’ (Limpper & Rumelt 2003:
925).
So far, discussion about resource value has been in a static setting. In practice, however,
decisions about business strategies are always made in dynamic environment. In this
context, Schumpeterian rents highlight the importance of dynamic capability for rent
creation and sustained competitive advantage in environmental dynamics (Teece,

77
Pisano & Shuen 1997, Peteraf & Bergen 2003). Schumpeter (1934) dismisses price and
other competitive factors of firms as being of secondary importance since these are
useful only in a relative stable industry and market. However, in the long run, given
competitive dynamics, revolutionary innovation is among the most important factors for
the firm to obtain competitive advantage. Innovation enables the firm to enjoy the rents
until imitation or substitution comes into existence. Then the firm has to create profits
(rents) through new innovations. The new innovation becomes another source of rents.
The firm continues to make innovations and go through the cyclical process of rent
creation, disappearance, recreation, re-disappearance due to imitation and substitution
from the external dynamic environments.
Given the background of analysis, it seems that ‘Ricardian and Schumpeterian rents are
mutually exclusive and competitive’ (Parayitam & Guru-Gharana 2010:88). However,
when one takes into consideration effects of the background upon strategies and
resources, it makes sense to combine the two analytical frameworks (i.e., RBV and
dynamic capability approach) into one for this research.
In summary, from the economic perspective, resource value involves both returns and
costs (e.g., opportunity cost for the alternative use and physical costs for market
acquisition and the inputs), and takes various forms of superior performance (e.g.,
economic rents or profits). The resource attributes of scarcity and heterogeneity are the
fundamental conditions needed to achieve competitive advantage and superior
performance in a static equilibrium while Schumpeterian rents stress the contribution of
innovation for sustained competitive advantage in dynamic environment. Both views
have contributions and limitations as well. Ricardian rents, for example, lack
consideration of the external dynamics and Schumpeterian rents neglect contributions
from other resources (e.g. organisational culture and human resource management) and
their combinations. Thus, a combination of both analytical tools appears to enhance
adaptablility and applicability.
Resource effects: from the strategic management perspective
From a strategic management perspective, firm specific resources contribute to
competitive advantage and/or sustained competitive advantage.
The Strategic Management literature attempts to define the term “competitive
advantage” from various angles but there is no universally accepted definition. These
various notions contain at least two aspects. The first aspect is about measures of
competitive advantage and it is generally accepted in the literature that competitive
advantage is based on a relative concept in the sense of better performance than a
benchmark which relates to all other rivals in the same industry. It is in the form of

78
superior economic performance (e.g., profit indicators) or some other non-economic
performance (e.g., efficiency and/or effectiveness of business processes) (Detailed
discussion in Chapter 4.3.2). The other aspect is about sources of competitive advantage.
A variety of interpretations and arguments relating to this aspect are noted and discussed
below.
As discussed earlier (in preceding Chapter 3.3.1), before the mid 1980s, most literature
explored sources of firms’ competitive advantage based on an external environment
analysis, such as the PEST framework at the macro level, Five Forces Model or Life
Cycle theory at the micro level. However, the external market-based concept treats
firms as “black boxes”, which cannot provide explanations as to why some firms
perform better than others in the same industry and under identical external environment
and conditions.
RBV approaches the concept of competitive advantage from the perspective of
firm-level resources. In this context, competitive advantage derives from a bundle of
internal heterogeneous resources of the firm (Wernerfelt 1984, Rumelt 1984). This
uniqueness of the resources is embedded where a firm implements ‘a value creating
strategy not simultaneously being implemented by any current or potential competitors’
(Barney 1991:102). However, not all heterogeneous resources may be used favorably in
firm strategies. Some of them may not be applied to a specific strategy and some may
result in dysfunction (Peteraf 1993). Only the valuable resources may contribute to the
competitive advantage of the firm. Valuable resources mean that the resources facilitate
the firm to achieve improved strategic efficiency and effectiveness, which in turn leads
to higher returns over its costs by reducing costs and/or responding to environmental
opportunities and threats (Barney 1986, 1991, Peteraf & Barney 2003). In other words,
heterogeneous and valuable resources generate competitive advantage and competitive
advantage takes the form of performance efficiency and effectiveness, e.g.,
outperforming its rivals in terms of cost, quality, delivery, speed, innovation and
adaptability to the dynamic environment (Carpinetti, Galdamez & Gerolamo 2008,
Talaja 2012).
Although the two terms of competitive advantage and superior performance are often
used interchangeably in many literature papers (Siqueira & Cosh 2008), the two
concepts are not equal in connotation (Ray, Barney & Muhanna 2004). In fact
competitive advantage is a conceptual expression, and an internal necessary condition
for the firm to build its possible superior performance but not necessarily to create
superior performance in the end. In other words, superior performance is a “mirror” or
manifestation of competitive advantage. As a necessary but not sufficient condition,
competitive advantage can be transformed into superior performance in the forms of
monopolistic rents in the protected market, or Ricardian rents from the heterogeneous

79
firm resources, or Schumpeterian rents against dynamic environment subject to
effective exploitation of the firm’s resources (Powell 1992, 2001). There are many
measured indicators of superior performance and detailed discussion refers to Chapter
4.3.
In summary, based on an understanding of the above literature, this study defines
competitive advantage as a relatively superior situation than a benchmark which relates
to some or all other rivals in an industry, in the forms of better value created (i.e.,
superior performance).
Sustained competitive advantage traditionally refers to retaining a competitive
advantage for a longer period. However, it is hard to determine the period criteria of
sustainability, say, five years, or ten years, or longer.
Strategic theorists interpret sustainability in quite different ways from the traditional
measurement by calendar time. In the market-based view, when a firm enjoys a
competitive advantage position over its rivals in a niche product market, the edge can be
sustained by building up entry barriers over its rivals or potential competitors through
economies of scale, accumulated experience, buyer switching costs or differentiated
products or services (Porter 1980, 1986). In this context, competitive advantage can
be sustained until the entry barriers are broken down by other competitors in the market.
The mainstream literature on the resource-based theory adopts similar criteria to SCA.
Wernerfelt (1984) argues that a firm possesses a competitive advantage such as the first
mover and it could be sustained by establishing a resource position barrier such as
customer loyalty and technology criteria. Since unexpected or uncertain events may
happen to disturb the established equilibrium, Rumelt (1984) coins the concept,
isolating mechanism, which makes competitive positions, e.g. the first-mover
advantage, stable and defensible30
. The isolating mechanisms are embedded in causal
ambiguity, switching and search costs, patents, trademarks and other legal restrictions
on entry. Dierickx & Cool (1989) argue that an asset stock comes out of the
accumulation processes and the characteristics of casual ambiguity of the processes
make imitation costly or next to impossible. Barney (1991, 1997) simply argues that the
valuable, rare, inimitable and non-tradable (VRIN) resources are the source of SCA.
That is, when the valuable, rare, inimitable, non-substitutable and non-tradable
resources are exploited to their full potential through organisational capabilities, the
firm realises sustained competitive advantage. In other words, the firm sustains its
competitive advantage before the resource position barrier is broken through by its
competitors.
30 A resource position barrier is the mechanism which makes a resource-related advantage defensible again another
resource holder (Wernerfelt 1984).

80
Peteraf (1993) then summarises conditions for sustained competitive advantage, namely,
pre-limit and post-limit to competition (Figure 3-5).
Source: Author’s recreation based on Peteraf (1993)
Pre-limit to competition refers to limited competition for a valuable and heterogeneous
resource position prior to any firm’s establishing that position. Pre-limits to competition
are a condition for achieving competitive advantage as it ensures that rents are not offset
by costs.
Post-limit to competition refers to preserving the valuable and heterogeneous resources
that may produce rents. Imperfect imitability, imperfect substitutability and imperfect
mobility are factors to limit post competition. Empirical literature suggests that those
intangible and socially complex resources such as learning mechanisms, managerial
process, organisational culture and reputation are more likely to be immune from
imitation and enable firms to achieve SCA (Wiklund & Shepherd 2003, Ray, Barney &
Muhanna 2004). Imperfect substitutability of the resources is necessary for SCA
because substitution of identical strategies or of similar resources may deprive the
similar competitive advantage, leading the firm to lose its superior resource position of
uniqueness (Barney 1991). Imperfect mobility may sustain the firm-specific advantage
by excluding the other users of the specific resources.
3.3.3.5 Dynamic capabilities and sustained competitive advantage
The argument of sustaining competitive advantage by means of a protection mechanism
is criticised as a static view because it has not taken account of the influential factors in
dynamic environment. More recently, studies have focused on the dynamic capability
approach to address the issue of sustainability under dynamic environment (Teece,
CA SCA
Resources subject to
--value
--rareness
Resources subject to
--imperfect imitability
--imperfect substitutability
--imperfect mobility
Pre-limit to competition Post-limit to competition
Figure 3-5: Conditions for SCA based on RBV 1

81
Pisano & Shuen 1997). A successful firm will not be locked into old and dysfunctional
organisational routines in a new environment. Given the external dynamics, however,
the organisational processes are expected to seize external opportunities and sustain
competitiveness through dynamic capabilities by adapting new organisational routines
to match the changes (Collis 1991, Winter 2003, Teece 2000). In this context, a
substantial literature has attempted to integrate dynamic capability approach into the
RBV framework (Makadok 2001, Helfat & Peteraf 2003, Fos & Knudseii 2003, Foss &
Ishikawa 2007, Helfat et al. 2007, Parayitam & Guru-Gharana 2010).
Dynamic capability is defined as a ‘subset of the competences/ capabilities which allow
the firm to create new products and processes, and respond to changing market
circumstances’ (Teece & Pisano 1994: 541). The word “subset” indicates that dynamic
capabilities are still classified as firm-level resources and are hence amongst the
organisational capabilities. This definition highlights two specific functions of dynamic
capabilities: to create new products or processes and to respond to changing market
circumstances. The latter function enables dynamic capabilities to be a source of SCA
by renewing and updating resources rather than protecting the existing ones. Therefore,
the issue of external changes has been taken into consideration in the definition, which
is its major contribution and extension to RBV. This extension alters the RBV from a
static approach to a dynamic one. In the dynamic environment, dynamic capabilities are
far more significant in explaining SCA than mere static resources (Newbert 2008).
Based on the above understanding, Teece, Pisano and Shuen (1997: 516) further define
dynamic capability as ‘the firm's ability to integrate, build and reconfigure internal and
external competences to address rapidly changing environment’. This definition, in
addition to addressing something of what dynamic capability is (i.e., ‘the firm’s ability’)
and of what dynamic capability is for (i.e., ‘to address rapidly changing environment’),
provides more precise wording towards how dynamic capability works, i.e., ‘to
integrate, build and reconfigure internal and external competences’. Therefore, this
study adopts this definition for dynamic capability.
3.3.4 Summary of resource-based theory
This section summarises the resource-based theory in terms of the theoretical logic and
development (subsection 3.3.4.1), empirical tests (subsection 3.3.4.2), and contributions
and limitations of the theory (subsection 3.3.4.3).
3.3.4.1 Theoretical logic and development
RBV theory explores and discusses how firm-specific resource bundles achieve and
sustain competitive advantage. Figure 3-6 reflects the logic flow and development of the
theory. The arrow displays the relationships between variables and reflects the logical

82
flow. The firm starts from the condition of owning or controlling a valuable and
heterogeneous resource bundle, which is the source of competitive advantage.
Transformation of the competitive advantage into superior performance requires
effective utilisation of the resources through organisational capabilities. The firm cannot
proceed to reach SCA unless the resources have VRIN attributes. Further, given
environmental dynamics in a long run, dynamic capability enables to respond to the
environmental dynamics and to facilitate SCA by updating and reconfiguring the
existing resources. There are two external competitive contexts within which a firm
operates. One is incumbents and potential competitors and the other is environmental
dynamics. The former affects realisation of competitive advantage of the firm while the
latter is the reason for the requirement that the dynamic capabilities are necessary to
achieve SCA.
Figure 3-6: Theoretical logic and development of RBV 1
Source: The author
3.3.4.2 Empirical tests
RBV as a theoretical framework has gradually gained its popularity in the strategic
management field. A growing literature has contributed to empirical testing of the RBV
logic since the 2000s (Armstrong & Shimizu 2007). The empirical research essentially
tests the relationships between firm resources (independent variable) and sustainable
competitive advantage or competitive advantage (dependent variable). Barney and
Ariken (2001) study 166 empirical papers and find that 98% of the tests are consistent
valuable & rare resource bundles contribute to CA
effective organizational capabilities facilitate SP
VRIO contributes to SCA
dynamic capabilities facilitate SCA
Environmental dynamics
Incumbents and potential competitors

83
with the theory. However, based on Barney’s conceptual logic (Barney 1991)31
,
Newbert’s (2007) meta-analysis of the empirical research papers finds that the RBV has
received only modest overall support (53%) and that the varying support within the
literature is related considerably to different variables and methodologies employed
(Newbert 2007). For example, among the independent variables, the two most
frequently used variables, i.e., special resource32
and special capability, gain quite
different results (e.g., Deephouse 2000, Hult & Ketchen 2001). That is, tests of special
capability results in much higher support (71%) while tests of special resource receive
much lower support (37%).
3.3.4.3 Contributions and limitations
Contributions of the theory
RBV has been widely acknowledged as a dominant paradigm examining competitive
advantage and sustained competitive advantage by both researchers and practitioners in
the strategic management field. Contributions from the up-to-date literature are
summarised as follows.
Firstly, to address the strategic issues of competitive advantage or/and sustained
competitive advantage, the previous dominant theories in the 1980s are within the
external paradigm, which focused on external factors including both micro (i.e.,
industrial) and macro (i.e. national and international) environmental perspectives. In
contrast, RBV is an internal theory and looks within the firm for influences of the
internal resources on competitive advantage and sustained competitive advantage.
Therefore, RBV opens a new and innovative view for both research and practice in
strategic management. In this way, RBV complements and enriches strategic business
management theories.
Secondly, RBV holds that heterogeneous and valuable resources lead to competitive
advantage and that resources with the VRIN attributes are the source of sustained
competitive advantage. In other words, companies in the same industry, either a “sunrise”
or “sunset” industry, can realise sustained competitive advantage by effectively and
efficiently employing the VRIN resources. This is particularly useful for companies in
mature industries such as clothing manufacturing to sustain their competitive advantage.
Mature industries or “sunset” industries are particularly related to labour-intensive
products in the developing economies such as China.
Thirdly, the dynamic capability approach takes into consideration the influence of
31 The conceptual logic refers to the relevance of the firm heterogeneous resources either to competitive advantage or
to performance. 32 Resource here refers to specific asset or the narrow concept of resource (Detailed discussion in Chapter 3.3).

84
external dynamics on firms’ sustained competitive advantage and it is an evolution of
RBV. Synthesis of RBV and dynamic capability approach provides a more pragmatic
and rational analytical framework by combining both internal and external factors and
both static and dynamic views.
Therefore, finally, the combined framework involves broad interdisciplinary research.
For example, it links to organisational economics (e.g., transaction cost economics and
economic rents), organisational theory (e.g., strategic management) and organisational
behavior (e.g., entrepreneurship).
Limitations and research gaps of the theory
Despite great contributions and commonalities across the original literature research,
RBV as a theory is still in the development stage due to the existing disputes and
research limitations. Firstly, there are still some issues such as the tautology issue and
classification of resources open to discussion (Priem & Butler 2001)33
. Secondly, the
prevalent critique of RBV theory is about its static analytic framework, an original logic
without incorporation of dynamic capability approach. However, external environment
such as national or industrial economic dynamics may change the functions and values
of firms’ resources. Therefore, empirical research of a specific industry in a specific
economy should take into consideration the research background and the external
dynamics.
Three research limitations or gaps are identified as follows. The first gap concerns the
empirical research model. Most existing empirical literature on RBV focuses on
identifying resources and testing the causal relationship between resources and
competitive advantage/ performance/ SCA (Newbert 2007). However, few holistic
models can be referred to for the test of relationships between firm-level resources and
SCA of an industry. Related to the first gap, the second gap is about the measures and
measurement of the key concepts such as resources and SCA involved in the theory. For
example, more often than not, existing empirical literature just chooses a specific
resource or capability to represent the concept of resources. In addition to lack of
consideration of the resource bundling effect, the empirical results also have limited
power in terms of supporting the RBV theory. Moreover, financial performance
indicators are traditionally adopted representing performance/SCA. However, these
measures and measurements neglect the uniqueness of resources in individual firms
which is fundamental in the RBV theory (Ray, Barney & Muhanna 2004). Also it is
33 Priem & Butler (2001b) define tautology as a statement of relationship that is true by logic when concepts used in
the relationship can be defined in the same terms. For example, the RBV statement ‘if a resource is valuable and rare,
it is a source of competitive advantage’ is a tautology but true by logic. The reasoning behind this statement is that
when ‘valuable resources’ are defined as those achieving increased efficiency and/or effectiveness, and ‘competitive
advantage’ is also defined enabling increases in efficiency and/or effectiveness’.

85
practically difficult to get access to the financial performance data due to sensitive
information involved (Detailed discussion in Chapter 4.3). Thirdly, concerning the
bundling effect of resources on sustained competitive advantage, there is an insufficient
study of both theoretical and empirical aspects. For example, most existing literature
discusses the existence of the effects. However, rare research focuses on such topics as
which resource should bundle with which others and how the resource bundle affects
SCA. Therefore, the research design takes these into account and the research findings
make a limited contribution towards further understanding of these relationships
(Details in Chapter 8.5).
3.4 Chapter summary
This chapter mainly reviews two theories, GVC and RBV. The above review of the
literature in GVCs suggests that functional upgrading is a strategic option to achieve
SCA of the clothing industry in developing economies. However, functional upgrading
is not an automatic or necessary process even though the external environment is
favorable. It is a fundamental and comprehensive change of resources for the clothing
manufacturers, e.g., to develop their own brands. In other words, the core competences
or advantages in the manufacturing segment have to be transformed into and expanded
to other segments such as research & development (R&D), design, branding and
marketing. Therefore, a wide range of firm-level resources are required to be developed
and acquired for the companies to implement an upgrading strategy successfully.
The RBV theory has made significant contributions towards understanding the causes of
SCA. In contrast to the market-based theory, the RBV theory maintains that firm-level
resources are the source of SCA. However not all resources but only the resources with
the VRIN attributes contribute to SCA. Further, in dynamic contexts, organisational
capabilities, particularly dynamic capabilities facilitate the firms to update and
reconfigure their resources for sustained competitive advantage.
However, in spite of the tremendous contributions, there is much space for development
in both the empirical and theoretical aspects of RBV. Therefore, this research aims to
contribute to RBV, particularly to the identified gaps of the theory.
Based on the theories reviewed and discussed in this chapter, the next chapter
formulates the conceptual framework and selects measured variables for this study.

86
CHAPTER FOUR: CONCEPTUAL FRAMEWORK
4.1 Chapter introduction
Source: The author.
The preceding chapter reviewed relevant literature which provides theoretical grounds
as well as methodological reference for this study (Figure 4-1). By synthesising theories
of RBV and GVC, this chapter first formulates a conceptual framework for the study
(Figure 4-2). This is followed by selecting measured variables reflecting the concepts
Chapter2: Chinese clothing
industry in the global value chain
Chapter3: Sources of sustained
competitive advantage
VRIN resources are the source of SCA;
dynamic capability is particularly
important for SCA in the dynamic environment; functional upgrading is a
development strategy for SCA of the clothing industry in developing
economies in the GVC.
Chapter5: Research methodology
Chapter6: Statistical analysis
Chapter7: Case studies
Chapter8: Discussion and conclusions
Chapter1: Introduction
CONCEPTUAL FRAMEWORK
Conceptual framework for this
study
Selected indicators for resources
Selected indicators for Sustained
Competitive Advantage (SCA)
Chapter 4: Conceptual framework
THESIS STRUCTURE
Figure 4-1: Thesis structure and focuses of Chapter 4 1

87
(i.e., resources and SCA) involved in the framework. Both building up the conceptual
framework and selecting the measured variables are based on relevant literature that is
reviewed in the preceding chapter.
4.2 Conceptual framework for this study
The primary aim of this research is to explore and examine resources for SCA of the
Chinese clothing industry. Given the external dynamics and its effects on SCA, a
conceptual framework is developed by combining the external analytical framework
(i.e., the clothing GVC) into the internal theory (i.e., RBV) (Figure 4-2). That is, VRIN
resources contribute to SCA (Barney 1991) whilst dynamics in the Clothing GVC affact
update and reconfiguration of the resources for SCA (Gereffi 1999, 2000, 2006). This is
a synthesised research framework, combining both the external and internal theories.
Source: The author.
This synthesised framework provides a feasible and more appropriate way for this
research. From a theoretical perspective, few doubts that external factors influence a
firm’s SCA and also the internal theory, RBV, is criticised for lack of consideration of
external factors. Therefore, this study combines RBV with dynamic capability approach,
Research backgrounds: Clothing industry
External theory: GVC
Research aim: Sustaining competitive advantage of the Chinese clothing industry
Internal theory: RBV
Value, Rare, Inimitable, and
Non-substitutable resources
SCA of the firm
Figure 4-2: Conceptual framework for the research on SCA of the Chinese clothing industry 1

88
which enables consideration impacts of environmental dynamics on SCA. In this
context, the GVC theory provides framework to analyse the dynamic environment.
From a practical perspective, effective adjustment to the firm’s external dynamic
environment by updating and reconfiguring resources of the firm is a key determinant
for sustaining competitive advantage since both the internal resources and external
competitive environment are essentials in a strategic decision process (Priem & Butler
2001).
Therefore, by adopting the synthesised framework this research provides a possible
analytical tool to address the issue of sustained competitive advantage of the Chinese
clothing industry from within the firms and also by taking account of the external
influential factors, which is as Penrose’s stated (1959: 35):
Of the three classes of explanation why there may be a limit to the growth of firms
- managerial ability, product or factor markets, and uncertainty and risk- the
first refers to conditions within the firm, the second to conditions outside the firm,
and the third is a combination of internal attitudes and external conditions.
4.3 Measured variables for the concepts
Two concepts in this research framework are required to be operationalised. With
reference to literature, particularly the empirical studies, a pool of measured variables
are selected for the operationalisation of the two concepts, namely, resources and SCA,
4.3.1 Measured variables for the concept of resources
The independent variable for this study is resources. Based on RBV literature, 12
measured variables are selected to represent the concept of resources (Table 4-1). These
12 specific resources are evenly selected from the four categories of resources, namely,
productive resources, integrative capabilities, functional capabilities and dynamic
capabilities (Table 3-2).
Productive Resources (skillful worker, plant & equipment and information technology):
Skillful Worker and Plant & Equipment are in a list of productive resources (Penrose
1959, Barney 1991) (Table 3-2). In the labor-intensive clothing production, these two
resources are fundamental for building up competitive advantage and for sustaining
competitive advantage. Information Technology (IT) has been studied as a source to
create SCA in RBV literature because of its nature of heterogeneity and immobility
(Mata, Fuerest & Barney 1995). IT allows smooth coordination of organisational
processes throughout value chains and logistics (Daneshvar & Ramesh 2010, Hazen &
Byrd 2012). However, IT alone does not produce sustained performance advantages but

89
it does when IT is used to leverage tangible and complementary resources such as
human resources and plant & equipment (Powell & Dent-Micallef 1997).
Table 4-1: Measured variables of resources with references 1
Measured variables References
Productive Resouces:
Skilful Worker (SW)
Plant & Equipment (PE)
Information Technology
(IT)
(Penrose 1959, Barney 1991)
(Penrose 1959, Barney 1991)
(Powell & Dent-Micallef 1997, Daneshvar & Ramesh 2010, Hazen &
Byrd 2012 )
Integrative Capabilities:
Customer Relationship
(CR)
Supplier Relationship (SR)
(Teece & Pisano 1994, Boyd, Bergh & Ketchen 2010, Pereira, Ferreira
& Alves 2012)
(Bonaccorsi & Lipparini 1994, Koufteros, Vonderembse & Doll 2002,
Wu et al. 2011)
Human Resource
Management (HRM)
(Amit & Belcourt 1999, Gowen III, McFadden & Tallon 2006,
Progoulaki & Theotokas 2010)
Functional Capabilities:
Quality Control (QC)
Quick Response (QR)
(Douglas & Judge 2001, Laframbise & Reyes 2005, Tuan & Yoshi
2010, Al-Qudah 2012, Munizu 2013)
(Gowen, McFadden & Tallon 2006, Lewis 2000, Krishnan,
Kapuscinskj & Butz 2010)
Branding (Br) (Aaker 1989, Hoeffler & Keller 2003, Keller 2009, Jones & Bonevac
2013)
Dynamic Capabilities:
Organisational
Learning(OL)
(Crossan & Berdrow 2003, De Geus 1988,Camison & Villar-Lopez
2011)
Entrepreneurship (En)
(Lumpkin & Dess 1996, Alvarez & Barney 2004, Ireland & Webb
2007, Simon 2010, Jimenez-Jimenez & Sanz-Valle 2011)
Innovation (In) (Lengnick-Hall 1992, Damanpour, Walter & Avellaneda 2009,
Terziovski 2010, Camison & Villar-Lopez 2011)
Source: The author.
Integrative Capabilities (customer relationship, supply relationship and human
resource management):

90
SCA requires integrative capabilities of management relationships with outside partners
such as customers and suppliers which are termed Customer Relationship and Supplier
Relationship in this study (Teece & Pisano 1994, Barney 1991). Empirical studies
suggest that stable and effective supplier relationship improves quality, reduces costs
and contributes to lead-time advantage and thereby competitive advantage (Bonaccorsi
& Lipparini 1994, Koufteros, Vonderembse & Doll 2002, Wu et al. 2011). Customer
relationship management facilitates to establish good reputation and customer retention,
which are derived from complicated interactions of internal and external capabilities
(Boyd, Bergh & Ketchen 2010). These integrative capabilities (i.e., customer
relationship and supplier relationship) often persist for a long time, which are
firm-specific in nature. In addition, the integration processes often display high levels of
coherence and ambiguity, making replication difficult, and therefore tacit knowledge
deriving from the effective relationships management is a source of sustained
competitive advantage (Pereira, Ferreira & Alves 2012).
Human Resource Management (HRM) is traditionally viewed as a collection of
activities involving human capital acquisition, retention, training, motivation,
coordination and deployment (Lado & Wilson 1994, Chadwick & Dabu 2009). However,
this view lacks internal consistency or alignment with corporate strategy, which is
emphasised in RBV. RBV literature views HRM as organisational processes or
capabilities with the VRIN attribute and therefore it is a source of SCA (Amit &
Belcourt 1999, Gowen, McFadden & Tallon 2006, Progoulaki & Theotokas 2010).
HRM enhances a firm’s economic performance by either increasing revenues or/and
decreasing costs and therefore it is valuable. Also HRM processes are firm-specific
because the processes are embedded in the automatic routines which create tacit
attributes that are non-tradable or inimitable.
Functional Capabilities (quality control, quick response and branding):
Quality can be perceived through purchased inputs and embedded in product
engineering skills, strict quality control and the quality and effectiveness of customer
services (Tuan & Yoshi 2010). Therefore, Quality Control involves complex aspects
and their interactions in terms of leadership & commitment, team works, training &
education of staff, organisational culture, etc. (Barney 1991, Spitzer 1993, Powell 1995).
Quality control is examined in substantial studies and the results suggest that it
contributes to competitive advantage and SCA (e.g., Leed, Lemak & Mero 2000,
Douglas & Judge 2001, Laframbise & Reyes 2005, Al-Qudah 2012, Munizu 2013).
Quick Response is primarily due to an ‘emphasis on customer pull rather than
organisation push’ and can be practically achieved by ‘improving the flow of material
and information across business functions’ (Lewis 2000: 963). Taking production for

91
example, quick response in production follows some general rules in manufacturing
processes, human resource management and supplier inputs management, which results
in improved productivity (Womack & Jones 1996). In addition to the coordination and
management between various functional departments within an organisation, quick
response also requires close working partnerships externally between manufacturer,
supplier and retailer, which can be realised through the adoption of new ITs such as bar
coding and through the establishment of new business strategies, new relationships or
new procedures to speed the flow of information and merchandise (Ko, Kincade &
Brown 2000, Krishnan, Kapuscinskj & Butz 2010, Choi & Sethi 2010). Therefore,
quick response improves effectiveness and efficiency leading to competitive advantage.
A strong brand can bring possible benefits to an organisation, including economic
values (e.g., higher profit margins in comparison with the competitors, market coverage
and market share), emotional values (e.g., perceived quality, brand recognition and
greater customer loyalty) (Vukasovic 2009, Jones & Bonevac 2013) and adaptability to
market dynamics (e.g., less vulnerability to dynamic markets, more elastic customer
response to price decreases and inelastic customer response to price increase) (Hoeffler
& Keller 2003). Therefore, Branding is an important source for SCA for the business
(Aaker 1989).
How much a firm can benefit from its brand equity depends on its own brand
management capabilities such as brand positioning, brand marketing and abilities to
sustain brand equity (Keller 2003, 2009) (Details in Chapter 8.4.2). For example, the
major types of marketing communication to build brand equity include advertising,
sales promotion, public relations and publicity, direct marketing, interactive marketing,
word-of-mouth marketing and personal selling. Those marketing communication in turn
results in consumers’ knowledge about the brand, forming customer-based brand equity
of perceived quality, brand loyalty, brand associations and brand awareness (Aaker
1991).
Dynamic Capabilities (organisational learning, entrepreneurship and innovation):
When a learning process is undertaken by an organisation it is termed Organisational
Learning and organisational learning could be referred to either a result or process or
both. From the resulting perspective, Organisational learning is defined as ‘information
(knowledge, understanding, know-how, techniques or practices) of any kind and by
whatever means’ acquired (Argyris & Schon 1996:3). Organisational learning is also
viewed as systematic and continuous processes which generate knowledge or/and
information and the processes operate through the three different levels, namely,
individual level, group level and organisational level (Crossan, Lane and White 1999).
For example, knowledge and information are generated through individual’s intuiting

92
and interpreting, proceeding to integrating among groups and final process of
institutionalising.Through the processes, knowledge and information from individuals
and groups are incorporated into the organisation and transformed into organisational
capabilities and routines.
Moreover, organisational learning is characterised by interactive processes or adaptable
routines between an organisation and its environment ‘by which knowledge about
action outcome relationships between the organisation and the environment is
developed’ (Duncan & Weiss 1979: 84, Dixon 1992, Crossan & Berdrow 2003). For
example, an empirical research of 30 successful and long-lived companies (over 75
years) found that their abilities of organisational learning enabled those companies ‘to
live in harmony with the business environment, to switch from a survival mode when
times were turbulent to a self-development mode when the pace of change was slow’
(DeGeus 1988: 70). In this context, organisational learning enables more flexible and
adaptable response to new challenges and therefore it contributes to sustained
competitive advantage against the environmental dynamics (DeGeus 1988, Crossan &
Berdrow 2003, Camison & Villar-Lopez 2011, Jimenez-Jimenez & Sanz-Valle 2011,
Ussahawanitchakit 2012).
Entrepreneurship scholars provide different definitions from various perspectives
(Kobia 2010). However, most of them agree that entrepreneurship involves ‘the
innovative combination of resources in order to introduce new goods or services, ways
of organising, markets, processes or raw materials’ (Abreu & Grinevich 2013:409).
However, in addition to innovation, also there are other dimensions about the attributes
of entrepreneurship. According to Lumpkin and Dess (1996), entrepreneurship is
characterised by five elements, i.e., competitive aggressiveness, proactiveness,
innovativeness, risk taking and autonomy.
Covin and colleagues argue that entrepreneurship is a source of SCA due to its
continuous efforts in ‘sustained regeneration, organisational rejuvenation, strategic
renewal, and domain redefinition’ (Covin & Miles 1999:50, Covin & Slevin 1991).
Entrepreneurial orientation is a crucial dynamic capability for an organisation to achieve
SCA in times of environmental turbulence because it ‘seizes opportunities and enables
the reconfiguration of resources, skills and competences, tempering imagination where
necessary … responsive to change’ (Simon 2010: 20). In line with innovativeness in the
above concept, the presence of innovative entreprenurship is most agreed element for
obtaining sustained competitive advantage (Covin & Miles 1999, Ireland & Webb 2007,
Jimenez-Jimenez & Sanz-Valle 2011).
Literature defines Innovation as adoption of a new idea or behavior either an outcome
or a process or both (knight 1967, Wolfe 1994, Damanpour 1991, Jimenez-Jimenez &

93
Sanz-Valle 2011). Literature distinguishs two types, namely, technical innovations such
as new products, new services or new processes and non-technical innovations such as
new organisational forms and procedures (Damanpour, Walter & Avellaneda 2009,
Damanpour & Gopalakrishnan 2001).
From resource-base view, innovation is characterised as a dynamic capability and a key
source of SCA (Sakchutchawan et al. 2011). Particularly, those innovations that fit with
other aspects of the configuration of a firm are more likely to lead to sustained
competitive advantage and those more adaptable and reflecting market realities and the
timing characteristics of the relevant industry are more likely to lead to innovation
(Lengnick-Hall 1992). Empirical researchs suggest innovations promote SCA
(Jimenez-Jimenez & Sanz-Valle 2011, Camison &Willar-Lopez 2011).
4.3.2 Measured variables for the concept of Sustained Competitive
Advantage (SCA)
The dependent variable for this study is Sustained Competitive Advantage (SCA).
Although a growing literature has contributed to empirical testing of the RBV logic
since the 2000s, most existing quantitative tests of this theory have focused on
identifying and operationalising the explanatory variable, i.e., resources, while the
dependent variable, i.e., SCA, has rarely been explored. Further, SCA is traditionally
measured by financial performance indicators in the empirical studies, which is not only
inconsistent with the theory but alsos proves to be practically difficult in access to the
data (Ray, Barney & Muhanna 2004, Armstrong & Shimizu 2007)
Ray, Barney and Muhanna (2004) argue that an aggregated firm performance as a
dependent variable may lead to misleading conclusions since the overall performance
may not reflect the structure and levels of the firm advantages. Instead, the authors
propose the effectiveness of multiple business processes as an alternative measure of
SCA, which offers a more appropriate way to test resource-based logic. In addition,
Armstrong and Schimizu (2007) review and evaluate empirical RBV studies between
1991 and 2005. Regarding measuring sustainability of competitive advantage, the
authors find that 47 out of 125 empirical studies (38%) adopt longitudinal data while the
remaining 78 studies (62%) apply a cross-sectional setting. However, it is argued that a
time-series approach may better test “sustainability” of competitive advantage, through
which the dynamic relationships over time can be examined because the resources
developed or acquired in one period will affect the strategic advantages of firms in the
subsequent periods due to time-lags (Barney & wright 1998, Armstrong & Schimizu
2007).
To develop effective measures of SCA, the rest of this section firstly refers to the

94
concept of SCA (subsection 4.3.2.1) and examines measures of SCA in relevant
literature (subsection 4.3.2.2). This is followed by developing measured variables of
SCA (subsection 4.3.2.3).
4.3.2.1 Concept of SCA
Based on RBV, a competitive advantage is defined as the benefits a firm gains ‘when it
is implementing a value creating strategy not simultaneously being implemented by any
current or potential competitors’ and the competitive advantage is sustained before it
dies away due to the duplication of the value creating strategy by other firms (Barney,
1991:109) (Details in Chapter 3.3.3). Sustained competitive advantage of a firm is
reflected in the form of better performance compared to a benchmark as some or all
other rivals (Wernerfelt 1984, Barney 1991, Peteraf 1993, Teece, Pisano & Shuen 1997).
Business performance is embedded in the effectiveness and efficiency in terms of better
quality, reduction of costs, exploitation of market opportunities, and/or neutralisation of
competitive threats (Barney 1991).
This definition and interpretation of SCA is consistent with Business Performance
Management System (BPMS). According to BPMS, business performance is defined as
efficiency and effectiveness of actions and business performance measurement system
as the set of metrics used to quantify both the efficiency and effectiveness of actions
(Neely, Gregory & Platts 1996, Bititci, Carrie & McDevitt 1997, Bititci et al. 2010,
2011). For instance, in a situation of providing services to customers, effectiveness
refers to the extent to which customer requirements are met and therefore may be better
measured using non-financial indicators, while efficiency refers to how economically
the firm's resources are utilised when providing a given level of customer satisfaction
and is therefore appropriately measured using financial indicators (Bititci et al. 2011).
Therefore, BPMS provides a large picture to refer to for measure of SCA.
4.3.2.2 Measures of SCA
This subsection first examines main dimensions of an effective BPMS design, which
provides implications and principles for development measures and measurement of
SCA for this study. This is followed by examining both financial and non-financial
performance measures and measurement of SCA.
BPMS is a topic of long and increasing attention to both academics and practitioners but
is complicated by its multi-dimensional nature. Through meta-analysis of the relevant
literature, Garengo, Biazzo and Bititici (2005) summarise the main dimensions of an
effective BPMS design (Appendix 4-1). The nine dimensions of business performance
measurement are summarised as strategic alignment, strategic development, focus on
stakeholders, balance, dynamic adaptability, process orientation, depth & breadth,

95
casual relationships, and clarity & simplicity (Garengo, Biazzo & Bititici 2005: 37). The
authors then use the dimensions as a checklist to examine the contemporary BPMS
models developed from the mid-1980s: performance measurement matrix (Keegan,
Eiler & Jones 1989), performance pyramid system (Lynch & Cross 1991), result and
determinants framework (Moon & Fitzgerald 1996), balanced scorecard (Kaplan &
Norton 1992, 1996), integrated performance measurement system (Bititci, Carrie &
McDevitt 1997), performance prism (Neely et al. 1996), organisational performance
measurement (Chennell et al. 2000), integrated performance measurement for small
firms (Laitinen 2002). The results provide implications and principles for developing
measures of SCA for this study as follows.
All the BPMS models are characterised with one of the dimensions, “balance”,
which implies that “balance” is the most important dimension in measuring
business performance. Balance is reflected by using both financial and
non-financial measures and/or by having both internal and external objectives. The
Balanced Scorecard is the most popular model and typically reflects this aspect. It
transformed the conventional measure of financial performance by promoting
balanced metrics of performance between financial and non-financial, and between
internal and external. The model informs managers of the basic principle of BPMS
with the aligned and long-term strategic objectives from four perspectives: financial,
internal, customer, and innovation & learning (Kaplan & Norton 1992, 1996).
Dimension of “process orientation” is increasingly present in the latest models,
implying that process performance measure is at least a complement, if not a
substitute, in business performance measurements. For example, in the earlier two
models (i.e., Performance Pyramid System and Balanced Scorecard), process
performance is partly presented but it is emphasised in all the latest four models.
For example, in Integrated Performance Measurement Model (Bititci, Carrie &
McDevitt 1997), processes measure is one of the four levels (corporate, business,
processes and activities); Performance Prism Model (Lynch & Cross, 1991)
consists of three “prisms”, namely, stakeholders’ satisfaction, processes and
capabilities; process performance is also one of the three principles (alignment,
practicability and process thinking) in the Organisation Performance Measurement
model (Chennell et al. 2000); Integrated Performance Measurement for small firms
(Laitinen 2002) also includes both dimensions of internal production process and
external companies’ position.
Financial performance measure
Traditionally, financial performance measures have been widely adopted in the
empirical literature (e.g. Powell 1992, Powell & Dent-Micallef 1997, Bharadwaj 2000,
Zhu 2004, Zhang 2007, Wiklund & Shepherd 2009). However, financial performance

96
measures alone may not give an appropriate measure of SCA for the following reasons.
Firstly, this measure implies the assumption that superior performance generates SCA.
However, Powell (2001) argues that competitive advantage leads to improved
performance but not necessarily the reverse. Secondly, RBV holds that it is
heterogeneous resources that contribute to SCA. Using financial performance to
measure SCA is based on the mean contribution from general resources, which
statistically neutralizes resource heterogeneity which neglects the theoretical ground
about the individual firm differences in resources (Hansen, Perry & Reese 2004).
Thirdly, simply examining the relationship between a specific resource and its overall
financial performance can lead to misleading conclusions on some occasions (Ray,
Barney & Muhanna 2004). For example, when firms have competitive advantages in
some resources and competitive disadvantages in others, examining the relationship
between these different resources and the firm's overall financial performance can lead
to biased conclusions.
Nonetheless, the above analysis is not sufficient to abandon the financial performance
measure of SCA due to its merits of comparability, objectivity, feasibility and popularity.
Rather it is understood that the financial performance measure alone may not be
appropriate. In this circumstance, this study does not adopt financial performance as the
only measure, and instead, it will be aligned with a non-financial measure of SCA i.e.,
process performance measure.
Process performance measure
Process performance measures effectiveness of business processes. It avoids the
possible misleading conclusions that the financial performance measure may result in
and it provides an alternative and more appropriate way to measure a firm’s SCA
(Barney 1999, Ray, Barney & Muhanna 2004). At least two rationales support this
argument. One is that the process performance measure conforms to the underpinnings
of RBV and thus enables researchers to avoid those drawbacks associated with the
financial performance measure, which has been discussed earlier. The other reason is
that multiple business processes themselves are a source of SCA and therefore process
performance is the direct measure of SCA (Barney 1991).
There are three main types of business processes, namely, managerial processes,
operational processes and supportive processes. Among them it is suggested that
operational and supportive processes deliver performance while managerial processes
sustain performance in the future (Bititci et al. 2011). Operational processes are
processes that constitute the core business, e.g., getting order, manufacturing product,
marketing and sales service. Supportive processes provide support to the core processes,
e.g., personnel support, technical support and facilities. Managerial processes are the

97
processes that govern operation of a system, e.g., setting direction, managing strategy,
building organisational competence, managing performance and managing change.
Therefore, operationalising process performance needs to take into consideration of
balance among the different classifications.
4.3.2.3 Measured variables of SCA
With reference to the literature, this study develops 10 measured variables representing
SCA. Five among them are the financial performance indicators, namely, sales profit,
labour productivity, sales growth, sales profit growth and market share increase. The
remaining 5 are process performance indicators, namely, quick response, order
acquisition, cost control, external communication and internal cohesion (Table 4-2).
Table 4-2: Measured variables of SCA with references 1
Measured variables Reference
Sales Profit (SP) (Zhu 2004, Powell 1992, Zhang 2007)
Labour Productivity (LP) (Koch & McGrath1996, Wu 2010)
Sales Growth (SG) (Powell 1992, Wiklund & Shepherd 2009)
Sales Profit Growth (SPG) (Powell & Dent-Micallef 1997)
Market Share Increase (MSI) (Makadok 1999)
Strategic Adaptability (SA) (Wu 2010)
Cost Control (CC) (Zhu 2004)
Order Acquisition (OA) (Bititica et al. 2011)
External Communication (EC) (Lee,C., Lee,K. & Pennin 2001, Bititica et al. 2011)
Internal Cohesion (IC) (Lee,C., Lee,K. & Pennin 2001, Bititica et al. 2011)
Source: The author.
Indicators of Process Performance
There is no widely accepted criterion to refer to for the selection of indicators of process
performance. Selection of the 5 indicators in this study is based on two considerations.
One is business process in terms of its attribute and classification and the other is
research context, i.e., the Chinese clothing industry. In the preceding Subsection 4.3.2.2,
it is understood that business processes are composed of operational process, supportive
process and managerial process (Bititci et al. 2011). Operational process is represented

98
by Order Acquisition and External Communication; supportive process represented by
Internal Cohesion and Cost Control; managerial process represented by Strategic
Adaptability. Also from the research background, it is clear that current competitive
advantage of the Chinese clothing industry has been increasingly challenged by rising
costs (hence indicator of Cost Control), intensified competition (hence indicator of
Order Acquisition) and increasing external dynamics over the latest years (hence
indicator of Strategic Adaptability) (Details in Chapter 2.3). Dynamic environment of
the clothing industry requires for integration of both internal and external resources and
for adjustment to the external market changes (hence indicators of External
Communication and Internal Cohesion).
Therefore, Process Performance in this study is operationalised as 5 indicators
(Table4-2), namely, Order Acquisition (Bititci et al. 2011), External Communication (C.
Lee, K. Lee & Pennin 2001, Bititci et al. 2011), Internal Cohesion (Lee, C., Lee, K. &
Pennin 2001, Bititci et al. 2011), Strategic Adaptability (Wu 2010) and Cost Control
(Zhu 2004).
Literature references for the selection of these indicators show in Table 4-2. For
example, Wu (2010) verifies the application of RBV under environment volatility.
Strategic Adapatability is included in the four measures34
. Zhu (2004) assesses the
business value of e-commerce capability and Information Technology (IT)
infrastructure at the firm level by adopting financial performance indicators including
Cost Control and other35
. Effectiveness of External Communication with customers,
suppliers and other parties is a measure of SCA. For example, Ray, Barney and
Muhanna (2004) use effectiveness of customer service as an indicator of Process
Performance36
. Bititci et al. (2011) argue that business process sustains competitive
advantage and in their empirical analysis, Internal Cohesion and External
Communication are included in the measures of business processes37
.
Indicators of Financial Performance
Labour productivity is used to measure firm-level financial performance and it is
measured as sales per employee (e.g. Koch & McGrath 1996). The authors use
longitudinal data to test the causality relationship between human resource management
(independent variable) and labour productivity (dependent variable).
34 The remaining three measures are production efficiency, product quality and innovation speed (Wu 2010). 35 Four indicators are return on assets, sales per employee, cost reduction and inventory turnover (Zhu 2004). 36 Three objective measures are developed for the process performance, namely, customer retention rate, quality of
customer service and complaints ratio (Ray, Barney & Muhanna 2004). 37 The authors employ specific terms accordingly as employee satisfaction and customer satistisfaction & morale
(Bititci 2011).

99
Sales growth is commonly used as an indicator of financial performance (e.g. Wiklund
& Shepherd 2009). The authors study effect of resource combinations on the
performance of alliance and acquisition by using objective data from financial
statements. The sales growth is calculated from the database containing several years’
annual financial statements.
However, due to data non-availability as many privately owned and unlisted companies
treat their financial data as confidential and are not willing to provide them, subjective
performance data are widely used and often preferred to financial statement data in the
business research literature (e.g., Powell 1992, Powell & Dent-Micallef 1997). Powell
& Dent-Micallef (1997) investigate linkages between Information Technology (IT) and
firm performance by using subjective indicators of both financial performance (e.g.,
Sales Profit) and process performance (e.g., Sales Profit Growth). In their study, the
process performance of IT includes 5 statements about the effects of IT processes on the
firms’ productivity, competitive position, sales growth, sales profit growth and overall
performance. Respondents are asked to indicate the extent to which they agreed or
disagreed with each of the statements by using a 5-point Likert scale ranging from 5 (5
= strongly agree) to 1 (1= strongly disagree).
Examining the 10 measured indicators of SCA against the main measurement
dimensions based on Garengo, Biazzo & Bititci (2005:37) suggests that all the
dimensions are met (Appendix 4-2) 38
.
4.4 Chapter summary
In summary, this chapter formulates the conceptual framework. In the synthesised
framework, RBV is adopted as the fundamental theory, of which the fundamental
argument is that firm-level VRIN resources contribute to SCA. Given dynamic
environment, GVC is also incorporated into the research framework for analysis of the
external dynamics which influence resource updating and reconfigurating.
With reference to the relevant literature, a pool of measured variables for both concepts
of resources and SCA are developed. Among them, 12 indictors represent resources
(Table 4-1) and the remaining 10 indictors represent SCA (Table 4-2). These 22
indicators will be used to extract constructs measuring concepts of resources and SCA
respectively in Chapter 6. Keeping this in view, the next chapter discusses and designs
research methods for this study. 38 Garengo, Biazzo and Bititci (2005: 37) summarise eight main measurement dimensions, which are main
characteristics of the contemporary BPMS models (Appendix 4-1). According to relevance principle, five out of the
eight measurement dimensions are selected as criteria to check the measure variables of SCA for this study while the
other four dimensions are dropped due to irrelevance to this study. The dimension of longitudinal or cross-section
settings discussed in the RBV literature is incorporated here into the dimension of dynamics.
100
CHAPTER FIVE: RESEARCH METHODOLOGY
5.1 Chapter introduction
Source: The author.
In the preceding chapter, the conceptual framework has been formulated and this
chapter elaborates on the methodology underpinning this research (Figure 5-1).
Chapter2: Chinese clothing
industry in the global value chain
Chapter3: Sources of sustained
competitive advantage
Chapter5: Research methodology
Chapter6: Statistical analysis
Chapter7: Case studies
Chapter1: Introduction
RESEARCH METHODOLOGY
Philosophical stance of the
research
Research design in terms of
research approach, research
purpose and research strategy
Reliability and validity
Research ethics
Research data:
Data generation process
Survey design
Chapter 4: Conceptual framework
The conceptual framework is based on
synthesised theories of RBV and GVC. VRIN resources contribute to SCA
based on RBV whilst dynamics in the Clothing GVC affacts update and
reconfiguration of the resources for
SCA.
THESIS STRUCTURE
Chapter8: Discussion and conclusions
Figure 5-1: Thesis structure and focuses of Chapter 5 1

101
Research methodology ‘helps to ensure project aims are achieved and facilitates the
process of answering the research questions and meeting the deliverables’ (Phillips &
Pugh 2000: 1092). However, there is no general agreement or principle concerning
which method is better or more appropriate. A number of considerations influence the
choice of research methods. These include the researcher’s underlying philosophical
position in terms of epistemology, ontology and axiology. There is also the need to
maintain consistency with the theoretical underpinnings of the research and to take
account of practical considerations associated with the research design and the research
strategy (Figure 5-2).
Source: (Bryman 2004:21)
In the light of these influences, this chapter starts to discuss the philosophical issues in
terms of epistemology, ontology and axiology. This is followed by examining the other
considerations for designing the research methods (e.g., reiteration of the research aim
and objectives and reviewing the research methods adopted in the domain literature for
reference). Based on these considerations, research design in terms of research
approaches (deduction and induction), research purposes (exploratory, descriptive and
explanatory), research strategies (interview, survey and case study) and others is
discussed. Finally, data generation and survey design for this study are introduced.
5.2 Philosophical considerations for research design
The research philosophy you adopt contains important assumptions about the way
in which you view the world. These assumptions will underpin your research
strategy and the methods you choose as part of that strategy. (Saunders, Lewis &
Thornhill 2007:101)
Social researchers need to understand research philosophy in terms of epistemology (i.e.,
approach to the development of knowledge), ontology (i.e., nature of entities) and
axiology (i.e., researcher’s value orientation).
Social research
Theory Epistemology
Axiology Ontology
Practical considerations
Figure 5-2: Influences on social research 1

102
5.2.1 Epistemological considerations
Epistemology is concerned with the question ‘what is (or should be) regarded as
acceptable knowledge in a discipline’ (Bryman 2004:11). Positivism, realism and
interpretivism are the major epistemological positions (Bryman 2004, Saunders, Lewis
& Thornhill 2007)39
.
Positivism has its roots in the natural sciences. Positivism assumes that social identities
are observable, objective and independent of the researcher and that the research results
can be generalised to develop laws or principles in a similar way to physical and natural
scientific studies (Remenyi et al. 1998:11). In accordance with this philosophical
position, research should be undertaken as far as possible away from the researcher’s
involvement. Therefore, the research often collects ‘facts that provide the basis for
subsequent hypothesis testing’ (Saunders, Lewis & Thornhill 2007:103) and therefore
generates quantitative data and follows a deductive approach to investigate the social
phenomena (Collis & Hussey 2009: 56). In this way, the research, including data
collection and the process of analysis, excludes the researcher's values or personal
feelings.
In contrast, interpretivism criticises positivism by arguing that the social world is too
complex to be generalised into theories. Moreover, social science is subjective and is
influenced by the researcher’s values, perceptions and interpretations. Therefore,
interpretivism advocates research that aims at the understanding of ‘differences between
humans in our roles as social actors’ (Saunders, Lewis & Thornhill 2007:106).
Therefore, qualitative data are often collected and an inductive approach undertaken, in
which findings are interpreted based on the researcher’s understanding of the social
phenomena, particularly in business and management fields such as marketing and
human resource management (Collis & Hussey 2009: 57).
Realism, as a branch of epistemology, is similar to positivism in terms of its scientific
approach to the development of knowledge. That is, social phenomena are treated as
external realities that are separate and distinct from researchers’ descriptions and these
realities can be studied and explained. Two forms of realism, i.e., critical realism and
direct realism, have different views on the development of knowledge. Critical realism
claims that there are two steps. The first step is ‘the thing itself and the sensation it
conveys’ and the second step is ‘the mental processing that goes on sometime after that
sensation meets our senses’ (Saunders, Lewis & Thornhill 2007:105). Therefore, the
39 There are different classifications to the research paradigms. Cavana, Delahaye & Sekaran (2001:8) broadly define
three: positivist, interpretivist and critical research. Saunders, Lewis and Thornhill (2007) examine three
philosophical views: positivism, interpretivism and realism. Guba and Lincoln (1994: 105) analyse four competing
paradigms: positivism, postpositivism, critical theory and constructivism.

103
social phenomena are understandable if the researcher can capture the social structures
that underlie the phenomena. This underpins a better approach to conducting
multiple-level research, which involves different social actors. However, direct realism
insists that the first step is enough and that reality can be understood if an appropriate
method is used. This view is criticised as superficial since it ‘fails to recognise that there
are enduring structures and generative mechanisms underlying and producing
observable phenomena and events’ (Bhaskar 1989:2). Despite the differences, both
direct and critical realism are important in business and management research (Saunders,
Lewis & Thornhill 2007).
5.2.2 Ontological considerations
Social ontology concerns the nature of social reality; objectivism and subjectivism are
the two main positions (Bryman 2004, Saunders, Lewis & Thornhill 2007). Objectivism
in the social sciences argues that social entities exist independently from the social
actors. In contrast, subjectivism holds that social existence is socially constructed and
that it is not only created ‘through social interaction’ with social actors but also ‘in a
constant state of revision’ (Bryman 2004: 30). Due to differences in their understanding
of social ontology, different social researchers may view, study and interpret the same
social reality in varying ways. Hence, this leads to different approaches to the design of
research and collection of data. For example, objectivists may prefer applying statistical
analysis and subjectivists may prefer case studies.
5.2.3 Axiological considerations
Axiology in any social study refers to researchers’ values and judgments. Different
values of the researchers have an influence on the conduct of the social research process,
including topic selection, research ethics, choice of data collection strategies and the
drawing of conclusions (Saunders, Lewis & Thornhill 2007).
5.2.4 Summary of philosophical influences
Different research designs and corresponding research methods reflect different
philosophical stances of researchers, which are basic belief systems based on
epistemology, ontology and axiology. In other words, philosophical considerations
underlie research design and choice of research methods (Table 5-1).
Social researchers who work within a positivist paradigm design their research
accordingly. They are likely to prefer the quantitative method. They begin with a model
or theory from which they derive one or more hypotheses and then they test the
hypotheses. This is a deductive research approach. During data gathering and analysis,
the researcher stands independently from the research subject so as not to influence

104
what is being studied. In contrast, interpretivism researchers prefer qualitative data,
which is gathered through interviews and the analysis of the data results in generation of
theories. In this context, the interpretivist researchers often analyse and interpret
respondents’ viewpoints, attitudes, emotions and feelings, aiming to uncover a socially
constructed meaning of reality. This is an inductive research approach of reasoning
(Table 5-1).
Table 5-1: Philosophical beliefs and corresponding research designs 1
Epistemology Positivism Realism Interpretivism
Ontology Objective Objective/ subjective Subjective
Research
design
Research
approach Deductive process Deductive process Inductive process
Research
strategy
e.g., Experiment,
survey, etc
e.g., Survey, interviews,
etc
e.g., interviews, Case
study, etc
Data
nature Quantitative Quantitative/qualitative Qualitative
Data
analysis
Context free,
Testing theories,
Free of social roles,
Allow results to be
generalised from the
sample to the
population
Testing theories,
Researchers play roles
to some extent,
Allow results to be
generalised from the
sample to the
population
Context bound,
Generating theories,
Allow findings to be
generalised from one
setting to another
similar setting
Source: The author.
However, there is no clear-cut line between the positivist and interpretivist research
paradigms and it is a continuum with positivism at one end and interpretivism at the
other (Saunders, Lewis & Thornhill 2007). There are some research positions such as
realism is somewhere in the middle of the continuum and therefore it contains
combined stances of the two extreme paradigms. For example, both quantitative and
qualitative data and both survey and interview strategies are involved. Researchers and
other social roles (e.g., research respondents or participants) involved may put their own
interpretation on the social phenomena although the social phenomena are viewed as
existing independently of the social roles.
In view of the above understanding, this research design has a fundamental stance with
positivism which reflects objectivism in ontology and deduction in the research
105
approach and which is suggestive of the survey as research strategy to collect
quantitative data and to test theories (Table 5-1). The research results are allowed to be
generalised from the sample to the population. However, this study also involves
combined research methods, which can generally be referred to as pragmatism in
research paradigm (Details in Chapter 5.4). In pragmatic research, ‘it is perfectly
possible to work with variations in your epistemology, ontology and axiology’
(Saunders, Lewis & Thornhill 2007:110). Also from a pragmatic perspective, ‘the most
important determinant of the research philosophy adopted is the research questions -
one approach may be ‘better’ than the other for answering particular questions’
(Saunders, Lewis & Thornhill 2007:110). This point of view is reflected in this research.
For example, both survey and case study strategies are adopted in this study because
they enable to address the different research questions. That is, the survey is used to
address what resources contribute to SCA (i.e., research question 3) while case studies
are used to illustrate and interpret how the resources-SCA relationships work in the real
contexts (i.e., research question 4).
5.3 Other considerations for research design
5.3.1 Reiterating research questions
An appropriate research design should enable the researcher to address the research aim
and the corresponding questions effectively (Saunders, Lewis & Thornhill 2007).
Therefore, this subsection reiterates the research questions. The primary aim of this
study is to explore and examine resources for sustained competitive advantage of the
Chinese clothing industry. To this end, a series of research questions are defined as
follows:
Q1: What are the main problems concerning sustained competitive advantage (SCA) of
the Chinese clothing industry?
Q2: What are the main firm-level resources leading to SCA from the perspective of the
resource-based view of the firm?
Q3: Which of the potential resources are significant in leading to SCA of the Chinese
clothing industry?
Q4: How and why do the identified resources contribute to SCA of the Chinese clothing
companies?
Since the first two questions have been answered from study of the research background
and from review of the literature respectively, next focuses move on to Q3 and Q4. To
answer Q3, quantitative data about firm-level resource of the Chinese clothing
106
companies are required to test which of the identified resources have a significant effect
on SCA. To answer Q4, evidence and contextual information (i.e., qualitative data) for
illustration of the statistical results are required. Therefore, these requirements were
taken into account in the research design.
5.3.2 Referring to literature
In addition to philosophical considerations and research questions, relevant empirical
literature are also useful for seeking appropriate research methods and research design
for this study. Therefore, in this subsection literature in terms of data and research
strategy are briefly reviewed to provide the reference.
Data
Empirical studies of the RBV theory traditionally use both primary and secondary data
sources. For primary data, interviews and questionnaire surveys or a combination of the
two are the most commonly used strategies for the data collection. For secondary data,
public available sources include annual reports of companies, government statistics,
data bases of international and national organisations such as OECD (Organisation of
Economic Cooperation and Developmen), WTO (World Trade Organisation), WBL
(World Brand Lab) and ILO (Internaitonal Labour Organisation) and particulary
industrial associations such as China National Garment Assoication.
As for the data nature, both objective and subjective data are employed in the empirical
literature (Makakok 1999, Ray, Barney & Muhanna 2004). Objective data are usually
collected from public accessible sources to measure firm performance such as financial
indices of profitability, productivity, sales, sales increase and market shares. Empirical
literature also uses subjective data such as increased quality (e.g., Lee, C., Lee, K. &
Pennings 2001), production efficiency (e.g., Pisano & Wheelwright 1995, Hill & Jones
2007) and competitive advantage and SCA (e.g., Powell 1992, 1995). The subjective
and self-reported data are preferred in this research area because of both sensitivity and
conceptual reasons. Conceptually, RBV is about the heterogeneous resource and its
superior performance and therefore statistical methods have to take account of the
different performance of individual firms resulting from the unique and valuable
resource bundles (Hansen, Perry & Reese 2004). Also, sensitivity of the data makes it
different to get access to objective information and therefore it is practical to adopt this
alternative way. The subjective data are often generated from questionnaires based on
people’s points of view on the variables, using scales such as 5- or 7-point Likert scale,
ranging from strongly disagree to strongly agree.
Research strategy

107
Literature concerning SCA of the clothing industry suggests that the most widely used
empirical research methods are interviews and case studies (e.g., Taplin 2002, Bair &
Gereffi 2001, 2003, Tokatli 2007a, 2007b, 2008). There are also some, though not many,
quantifying studies, published in the last decade, involving quantitative data obtained
through questionnaire survey (e.g., Taplin, Winterton, J. & Winterton, R. 2003), most of
which are related to the RBV theory (e.g., (Hansen, Perry & Reese 2004, Bhatt &
Grover 2005, Simon 2010).
Different research methods are mainly determined by the corresponding research aims
and objectives.
A case study of Hungarian privatised clothing firms, which attempt to reposition to a
higher value-added niche and thereby avoid the intense competition of a cost-based
competitive strategy, explores the issue of work re-organisation by changing the
workplace culture and refining the measurement of worker effort (Taplin 2002). The
paper focuses on how changes are implemented and on the problems that emerge. To
this end, semi-structured interviews with owners, managers, and union officials are
conducted to generate the qualitative data. In contrast, Taplin, Winterton, J. &
Winterton, R. (2003) studying the issue of labour turnover in the British clothing
industry used a questionnaire to create quantitative data for testing hypotheses.
Tokatli, Nebahat and colleagues study the upgrading of the Turkish clothing industry
through extensive case studies and the authors prefer the publicly available quantitative
data (Tokatli 2003, Tokatli & Eldener 2004, Tokatli & Kizilgun 2004, Tokatli 2007a,
2007b, 2008). For example, Tokatli (2008) uses Zara as a case to study global sourcing
of the global clothing industry. These researches use secondary data from publicly
available data sources, including Journal papers and articles in newspapers and
magazines such as The Observer, Financial Times, Newsweek, New Yorker, The
Economist, Sunday Business and Spiegel Magazine, to name a few.
Likewise, an empirical study of the Mexican clothing industry focuses on the industrial
upgrading, linking institutional contexts of local industrial clusters (LICs) with GVCs
and NAFTA (Bair & Gereffi 2001, 2003). Both secondary materials and primary data
and both qualitative and quantitative data are adopted in this study. Also, case studies
and interviews are the dominant primary data collection methods while official statistics,
local newspapers, industry documents, and journal papers are the main secondary data
sources.
Among these empirical studies, Taplin and colleagues are particularly interested in the
topic of industrial restructuring in developed countries such as the UK and the US (e.g.,
Taplin & Winterton 1995, Taplin 1996, 1997, Taplin 2003, Taplin, Winterton, J. &

108
Winterton, R. 2003) as well as in transitional economies such as Hungary (Taplin 2002).
As for data source, both secondary (e.g., Taplin & Winterton, 1995, Taplin 1996, 2003,
Taplin, Winterton, J. & Winterton, R. 2003) and primary data, obtained through
interviews (e.g., Taplin 2002) and surveys (e.g., Taplin, Winterton, J. & Winterton, R.
2003) are employed. The primary data are of both quantitative (e.g., Taplin, Winterton, J.
& Winterton, R. 2003) and qualitative nature (e.g., Taplin 2002).
5.4 Research design
Based on the positivist’s philosophical stance, this research design adopts a pragmatic
research paradigm (Discussed in Section 5.2.4). This section discusses and elaborates
the research design in terms of research approach, research purpose, research strategy,
reliability and validity, and research ethics (Table 5-2).
Table 5-2: Research design for study of SCA of the Chinese clothing industry 1
APPROACH PURPOSE STRATEGY
n/a Describe:
Status quo of SCA in the Chinese clothing industry
Archive study
n/a Explore:
Measures and measurement of resources and SCA
Literature review
Statistics (EFA)
Deductive Confirm:
Hypothesised resources-SCA relationships
Survey
Statistics (SEM)
n/a Explain:
How and why the resources-SCA work in the real
context
Case studies
Interviews
Source: the author.
5.4.1 Research approach
Deductive and inductive reasoning are two major research logics. Choice between the
different approaches is largely determined by different philosophical stances. The
deductive approach is used extensively in positivist research while the inductive
approach is common within interpretivism (Saunders, Lewis & Thornhill 2007).
Deduction involves a series of sequential steps moving from theory or hypothesis to
testing (Robson 2002). The belief behind the deductive steps is that a theory can be
subjected to a rigorous test and that the test results could provide interpretation of the
social world. Advocators of the inductive approach criticise the idea of a simple test of

109
cause-effect relationships between particular variables without knowledge of the rich
context related to the variables. Instead, inductive research is particularly concerned
with the context in which event/phenomenon takes place and induction involves a series
of sequential steps moving from phenomenon to theory or proposal. Therefore,
inductive researchers are more likely to collect qualitative data through interviews or
case studies to gain an understanding of the meanings that humans attach to
phenomenon. Adoption of inductive research also implies that there is very limitated
knowledge or research to the phenomenon.
However, there is not a rigid division between the deductive and inductive approaches
in social research. The combined approach is common since, ‘not only is it perfectly
possible to combine approaches within the same piece of research, but in our experience
it is often advantageous to do so’ (Saunders, Lewis & Thornhill 2007:88). That is, the
combined methodology maintains the advantages and avoids the disadvantage of both
methods. Therefore, it maintains methodological rigor, as well as enhancing reliability
and validity and thereby strengthens the researchers' findings.
In view of the above understanding, this study adopted deductive approach, which
enables to address the main research purpose, that is, to explore and test significant
resources contributing to sustaining competitive advantage of the Chinese clothing
industry (Table 5-2).
5.4.2 Research purpose
The reasons for research are for the purposes of exploration, description, confirmation
or explanation. However, since a research project may involve more than one research
question, the same research project may serve two or more research purposes (Saunders
et al. 2007:133).
This study has a variety of research purposes to address the different research questions
that have been raised (Table 5-2). For example, description of the research background
aimed to reveal problems with SCA of the Chinese clothing industry (i.e., research
question 1); exploration of resources for SCA was used via a literature review (i.e.,
research question 2); confirmation was used in testing the hypotheses (i.e., research
question 3); explaination was also used for illustration of the statistical results through
case studies (i.e., research question 4).
5.4.3 Research strategy
Survey, case study and experiment are the main strategies applied in business and
management research. Each of these research strategies has its both its advantages and
disadvantages.

110
Survey research is one of the popular research stratiegies. Survey research is
deterministic since survey data are used to clarify relationships between variables.
Survey research leads to generalisation from a sample to a population (Babbie 1990).
Survey methodology is based on experimental or quasi-experimental settings. These
‘highly structured settings’ enable researchers to ‘manipulate variables thought to be
important’ and to generalise tendencies and common patterns or processes (Bentz &
Shapiro 1998:122-123). However, survey research neglects complex and subtle features
of individuals and fails to take account of the dynamic context involved. Also, it is
parsimonious since survey researchers construct various models and select one best
suited to their aim (Babbie1990).
The Case study is widely used in business and management research. It involves an
empirical investigation of a particular contemporary phenomenon within its real life
context using multiple sources of evidence (Yin 1984). The real life context in business
and management often involve people so interviews with people concerning their points
of view are most commonly used techniques for data collection. With contextual
analyses of the data collected, researchers can gain insight into the complicated business
reality, both in depth and breadth. In addition, the insight and understandings of a
specific case may also provide implications for other organisations or social phenomena
which share certain characteristics with the specific case. Despite all of its merits, the
case study method also has its inherent deficiencies relating to knowledge generalisation
(Yin 1984, Bryman 1989).
Observation, experiment and ethnography are other alternative but not dominant
research strategies in social science. Observation may take place in a laboratory setting
or in a natural setting. A natural setting may be preferred in the interpretive research
paradigm since the context contains more trustworthy information. The experiment has
its roots in natural science and laboratory-based research, and it measures on a small
number of the variables under control of other variables. Ethnography emanates from
the field of anthropology and is firmly rooted in the inductive approach.
However, no research strategy is inherently superior or inferior to any other. Choice of a
research strategy or strategies will be determined by the research questions and
objectives, the extent of existing knowledge, the amount of time and other resources
available to researchers, as well as the researcher’s own philosophical underpinnings
(Saunders, Lewis & Thornhill 2007:135). In addition, different strategies are not
mutually exclusive and combining more than one strategy in a single research
programme may be appropriate and can be more effective (Saunders, Lewis & Thornhill
2007).
Based on the above considerations, this study adopts combined strategies exploring key

111
resources which contribute to SCA of the Chinese clothing industry (Table 5-2). For this
research purpose, literature review enables to identify those resources which might
potentially contribute to SCA and then using a deductive approach, the resources-SCA
relationships are tested and confirmed. Therefore, relevant strategies for achieving the
above research purposes included literature review, survey and statistical analysis.
Moreover, case studies are used to provide evidence for interpretation of statistical
results rathar than to induce any theory. In case studies, interviews are the main strategy
for primary data collection while secondary data from publicly accessible sources are
also used for analysis.
5.4.4 Reliability and validity
Reliability and validity are two considerations concerning the quality control of a
research project. Reliability refers to the extent to which a measurement procedure
yields the same results on repeated trial while validity is the degree to which a measure
accurately represents what it is supposed to (Carmines & Zeller 1979, Kirk & Miller
1986, Litwin 2003, Hair et al. 2010). In other words, reliability is about consistency in
repeated measurement of the same phenomenon and validity is about correctness and
accuracy.
Related to reliability, any research measurement contains a certain amount of chance
error. Therefore repeated measurements of the same phenomenon will never exactly
equal one another and ‘unreliability is always present to at least a limited extent’
(Carmines & Zeller 1979: 12). There are two basic categories of errors in survey
research which cause problems of non-reliability and non-validity, namely, random
error and non-random error. If sampling is strictly random, the sampling error which is
related to measures and measurement of constructs and therefore can be reliably
estimated. Three commonly used forms of assessment are test-retest, alternate-form and
internal consistency (Litwin 2003). This study assesses the internal consistency (Details
in Chapter 6.4.4). The non-random error cannot be estimated but researchers should not
overlook it and should seek to avoid it as far as possible. Sources of non-random error
are related to the sampling process and include sampling-frame defects, non-response,
inaccurate or incomplete response and defective data collection or management
(Schofield 1996).
This study attempts to avoid these non-sampling errors by taking care of all stages from
design of the survey instrument (e.g., clear wording and structure) to the data collection
process (e.g., sampling criteria clearly specified and strictly implemented) and further to
the data analysis technique and process (Details in Chapters 6&7). For example, those
copies of replies which are inconsistent with the sampling criteria are deleted; a
well-structured, clearly-termed self-completion questionnaire is used, through which

112
quantitative data are collected to ensure of the research objectivity as far as possible.
During data collection, assertion of confidentiality and anonymity to participants via a
Participant Consent Form encourages honest and unbiased data and thus helps to ensure
the quality of the data. Quantitative data collected is then analysed with SPSS and
AMOS software and the results are displayed in figures and tables, all of which enables
to avoid arbitrary interpretation and subjective distortion from the researcher or
misrepresentation in reporting the research results.
There are three main types of validity, namely, criterion validity, content validity and
construct validity (Carmines & Zeller 1979, Litwin 2003). Content validity is a
subjective measure of how appropriate items or scales seem to a set of reviewers who
have some knowledge of the subject matter (Litwin 2003). As discussed in the
preceding paragraph, informants and respondents are chosen based on strict criteria
which ensure they have knowledge in the research subject. In addition, they are aware
that the survey is anonymous and no personal risks are involved and therefore they feel
free to provide honest and true information. All of these provide a good foundation to
build a rigorous assessment of content validity. Criterion validity is defined as a
measurement of how well one instrument in comparison with another instrument
(Litwin 2003). This is not applicable for this study because there is no generally
accepted model or measure of the concepts involved in this research. Construct validity
concerns ‘the extent to which a particular measure relates to other measures consistent
with theoretically derived hypotheses concerning the concepts (or constructs) that are
being measured’ (Carmines & Zeller 1979: 23). Construct validity is the most valuable
way to the measurement of abstract theoretical concepts as it is in this study ((Carmines
& Zeller 1979, Litwin 2003). Constructs are validated in this study by assessing
convergent validity and discriment validity (Details in Chapter 6.4.4).
The case studies in this research are used to help interpret and illustrate the statistical
results rather than to generate knowledge or theories. In this context, internal validity
mainly depends on objectivity, authenticity and accuracy of the evidence, which are
achieved largely through a trust-building process before and during interviews in this
study. Reliability concerns repeatability of case studies, that is, every research step can
be repeated with similar results. To this end, an interview protocol was designed and
used (Appendix 5-6) to guide conduct of all interviews. This was followed by careful
implementation of individual interviews, e.g., keeping digital recordings while taking
notes during interviews so as to capture the original interview discourse. In addition,
these recordings are translated from Chinese into English version with double checks. In
this way, interpretation errors are kept to a minimum.

113
5.4.5 Research ethics
Ethical behaviour is as important in social research as in any other field of human
activity. To recognise and anticipate ethical issues is helpful for tackling possible
challenges and risks resulting from research activities. Research activities through all
the research stages, including choice of a research topic, design of the research methods
and research settings, conduct of the research and the final report, are expected to be
conducted in a moral and responsible way (Saunders, Lewis & Thornhill 2007:178).
Research ethics mainly concerns relationships between researchers (e.g., researchers’
obligations) and participants (e.g., participants’ rights). Informed and Consent forms are
a commonly-used vehicle for ensuring that participants are fully aware of the nature of
their involvement.
This research follows ethical conduct through all research stages, in line with research
ethics principles (Cavana, Delahaye & Sekaran 2001). Prior to the planned data
collection procedure, two ethics projects (Appendix 5-1) were created in which possible
ethical risks involved in this study were evaluated to ensure that no harm could come to
participants or researchers. This was submitted online, sought and approval by Coventry
University ethics committee. The checklist in the ethics project provides a guidance
concerning ethics for the research.
During data collection, a Participant Information Sheet was provided to the respondents,
in which the research project and its purposes were briefly stated and from which
participants were clearly aware of their free choice. In addition, assertion of
confidentiality and anonymity to participants via the Participant Consent Form
encourages honest and unbiased data and thus ensures the quality of the data. A
Statement of Anonymity is also a procedure to avoid common method bias by reducing
respondents’ evaluation apprehension (Podsakoff et al. 2003).
5.5 Research data
5.5.1 Data generation procedure
Both primary and secondary data were used in this study. The secondary data were
collected via various public available sources including companies’ official websites
and governmental and organisational databases, which mainly generate factual data;
newspapers and magazines, which mainly generate opinion data; and academic journal
papers and books, which mainly generate theoretical data. The primary data were
collected through interviews and a questionnaire survey in the Chinese clothing industry
during a four-month period from early November 2011 to late February 2012. The data
generation procedure was conducted in three phases (Table 5-3). However, these phases
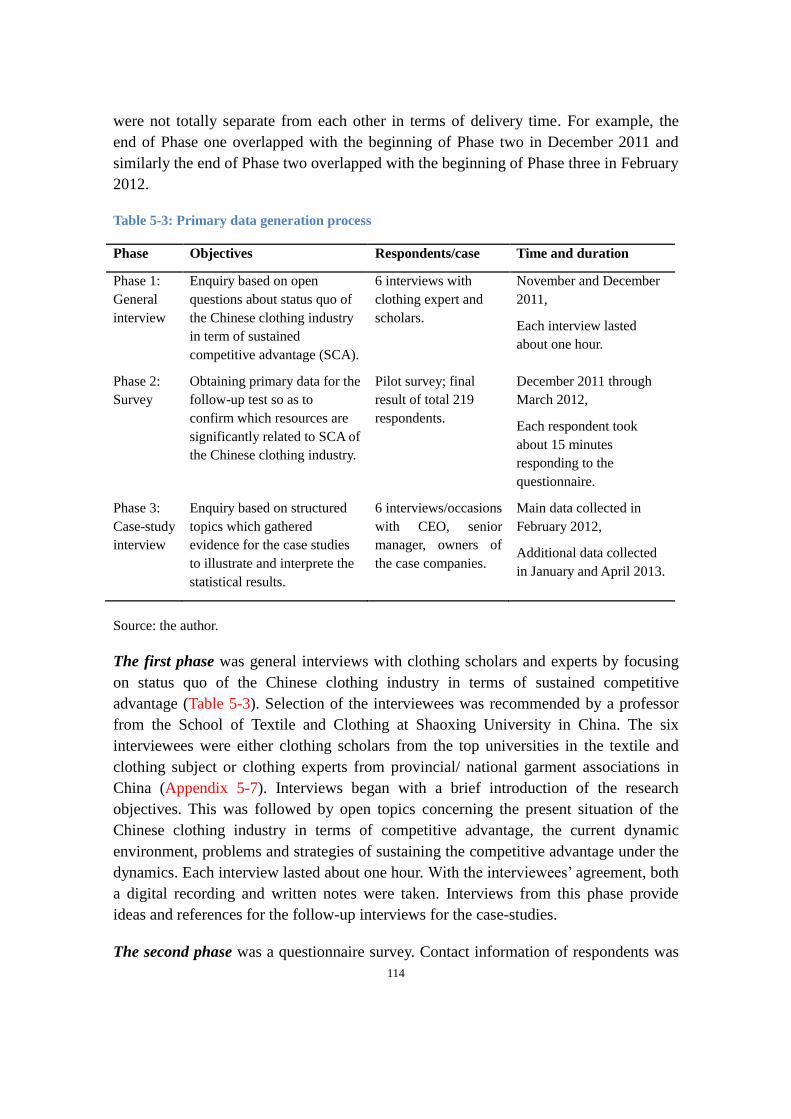
114
were not totally separate from each other in terms of delivery time. For example, the
end of Phase one overlapped with the beginning of Phase two in December 2011 and
similarly the end of Phase two overlapped with the beginning of Phase three in February
2012.
Table 5-3: Primary data generation process 1
Phase Objectives Respondents/case Time and duration
Phase 1:
General
interview
Enquiry based on open
questions about status quo of
the Chinese clothing industry
in term of sustained
competitive advantage (SCA).
6 interviews with
clothing expert and
scholars.
November and December
2011,
Each interview lasted
about one hour.
Phase 2:
Survey
Obtaining primary data for the
follow-up test so as to
confirm which resources are
significantly related to SCA of
the Chinese clothing industry.
Pilot survey; final
result of total 219
respondents.
December 2011 through
March 2012,
Each respondent took
about 15 minutes
responding to the
questionnaire.
Phase 3:
Case-study
interview
Enquiry based on structured
topics which gathered
evidence for the case studies
to illustrate and interprete the
statistical results.
6 interviews/occasions
with CEO, senior
manager, owners of
the case companies.
Main data collected in
February 2012,
Additional data collected
in January and April 2013.
Source: the author.
The first phase was general interviews with clothing scholars and experts by focusing
on status quo of the Chinese clothing industry in terms of sustained competitive
advantage (Table 5-3). Selection of the interviewees was recommended by a professor
from the School of Textile and Clothing at Shaoxing University in China. The six
interviewees were either clothing scholars from the top universities in the textile and
clothing subject or clothing experts from provincial/ national garment associations in
China (Appendix 5-7). Interviews began with a brief introduction of the research
objectives. This was followed by open topics concerning the present situation of the
Chinese clothing industry in terms of competitive advantage, the current dynamic
environment, problems and strategies of sustaining the competitive advantage under the
dynamics. Each interview lasted about one hour. With the interviewees’ agreement, both
a digital recording and written notes were taken. Interviews from this phase provide
ideas and references for the follow-up interviews for the case-studies.
The second phase was a questionnaire survey. Contact information of respondents was

115
obtained from both Zhejiang Garment Association and Zhejiang Provincial
Administration for Industry and Commerce. The survey was conducted during a
4-month period from December 2011 through March 2012. A pilot survey was
conducted within the first month to check feasibility and the possibility of accessing the
data. Based on the pilot, the questionnaire was refined in terms of wording, terminology,
structure and order of questions, etc.
The formal survey lasted about 3 months from mid-January to mid-March 2012. A
hundred and fifty six copies of reply were collected through interview-administered
delivery by the researcher and 52 research assistants. The research assistants were
identified from the final-year students in the subject of business management at
Shaoxing University and were then chosen based on the location of their home towns in
the main clothing LICs (Details in Section 6.2). Prior to fieldwork commencing, and for
the purposes of quality assurance, the research assistants were divided into two groups
with each being trained by the researcher in terms of the data-collection process and the
structure and logic of the questionnaire and its items. This process was designed to
ensure both the validity, and quality of data collected, (e.g., checking that questionnaires
were fully answered, asking for contact emails or phone numbers for further
clarification of answers) as well as compliance with ethical standards. Original
questionnaire replies were required to be handed in to the researcher within one week of
completion without exposure to any other third party. In addition, the research assistants
were supported by the researcher during the interview process with respondents to
ensure that any enquiries could be promptly answered.
Questionnaires were also distributed via email. To maximize responses to the
email-administered survey, repeated emailing and phone contact were followed, but still
the response rate was low. 78 out of 300 email contacts replied so the response rate was
about 26%. However, 15 of the 78 responses were identified as invalid either because
they were not completed by appropriate people (i.e. senior to top managers, owner or
CEOs from the designated companies) or the responses were internally inconsistent. For
instance, in Part one of the questionnaire, concerning the item of “Years of operation
with own brand name”, the tick was “n/a”, which mean “not applicable or no own
brand”, but in Part three concerning the statement “This company has strong capabilities
in brand development and brand management”, “7” was selected, which meant “most
agreed”. Therefore, only 63 of the 78 email responses were retained as valid. All 156
interview-administered responses were retained as valid. As a result, total sample size
was 219 and these observations were defined as valid because the responses met the
criteria of completeness, coherence, and completed by an appropriate respondent.
The third phase was in-depth interviews with CEOs, senior managers or owners for
three case studies (Appendix 5-7). Based on recommendations from the first-phase

116
interviewers and also taking account of the research objectives, cost, time and feasibility,
three clothing companies, namely, Youngor, Tedelon and Kaiqi, were selected as the
cases for study. Interviews were based on semi-structured questions (Appendix 5-6).
The interviews were mainly conducted during February 2012 and two additional
interviews (to the same interviewee as before) were conducted for clarification of the
original information or for seeking further information (Appendix 5-7). With
interviewees’ agreement, digital records were taken in addition to written notes during
the interviews, which ensured that the original information was captured as accurately
as possible for later transcription and analysis.
5.5.2 Survey design
A questionnaire survey was adopted in this study to generate primary data in order to
test hypothesised relationships related to research question 3, that is, which of the
identified resources are significantly related to SCA of the Chinese clothing industry.
This section focuses on survey design in terms of instrument design and sampling
methods.
5.5.2.1 Instrument design
Questionnaire development
A three-part survey questionnaire (Appendix 5-2) was designed, initially based on the
literature review in terms of the conceptual framework (Figure 4-2) and measured
variables for the concepts (i.e., resources and SCA) involved in the framework (Details
in Chapter 4.3). It was then revised twice prior to the formal survey. The first
modification was mainly to the contents of Part three, following recommendations from
a panel of domain experts and scholars. During the first-phase interviews with these
experts and scholars, the open questions mainly focused on firm-level resources which
contribute to sustained competitive advantage. In addition, these experts and scholars
were also invited to provide comments on the designed questionnaire in terms of
terminology and wording, structure, layout, etc. According to their comments, the
original version of Part three was over simple. Therefore, more detailed information was
added in this part including firm strategies and firm performance items since these items
reflect dependent variable measures. In designing the performance items in Part three,
the specific context of the clothing industry have been taken into account (Details in
Chapter 4.3.2). As a result, Part three of the revised questionnaire consists of three
subsections (Appendix 5-3), namely, 12 statements about firm resources, 12 statements
about firm strategies and 8 statements about firm performance. Some of the
interviewees suggested that more variables, such as distribution channels and corporate
culture should be included. However, this suggestion was not taken up because the term
“Branding” broadly covers most aspects of the the suggested items.

117
The revised questionnaire was used in a pilot survey to assess the appropriateness of the
research instrument in terms of expressions used, construct, timing, ordering of
questions and the questionnaire layout, length, readability, etc. The pilot questionnaire
was delivered through both interviews and emails. According to respondents’
recommendations and to my reflection on the responses, the questionnaire was further
polished, for example, adding a cover page, improving layout and readability, adding
flexibility (e.g., tick or color the choice) to the instructions, etc. The final version
(Appendix 5-4) was then ready for the subsequent formal data collection.
Questionnaire language and wording
This research, particularly throughout the primary data generation process, involves
language translation between Chinese and English. A fundamental principle for
translation of ‘functional equivalence’ both in language and culture rather than merely
‘literally identical’, was followed (Litwin 1995: 58). In addition, avoiding jargon or
ambiguity and instead specific questions are suggested techniques for controlling
common-method biases (Podsakoff et al. 2003), which were also followed in both
survey and case study.
The survey questionnaire was initially developed in English. The English version was
first examined by the supervisory team and then the translated Chinese version was
delivered to the Chinese respondents for data collection. Before conducting the survey,
the Chinese version of the questionnaire was examined by both clothing and English
Language scholars. The English Language scholar checked translation in terms of
functional equivalence and the clothing scholar checked terminology and expressions.
Special attention was paid to terminology translation in the questionnaire. For instance,
the questionnaire items concerning export patterns such as OEA, OEM, ODM and
OBM were interpreted into Chinese equivalences by consulting with the clothing
scholar (in Part 1 of Questionnaire) and terms like “branding” and “entrepreneurship”
(items 9 and 12 respectively in Subsection 1 of Part 3) have broad connotations, which
were translated into Chinese using more specific expressions and statements (Appendix
5-5).
Questionnaire structure
The questionnaire consists of a cover page and three-part main body. Each part has a
title summarising the main message of the part. For example, Part one is “General
information about you and your company”; Part two is “Key firm-level resources
required for sustained competitive advantage of the Chinese clothing industry”; Part
three is “Status quo of the sustained competitiveness of your clothing firm” (Appendix
5-4).

118
A 7-point Likert scale is adopted for the items. Likert Scale is one of the most widely
used techniques of scaling response in survey questionnaire of the social science
research. Respondents are required to choose a number from figure “7” (indicating
“most agree” to a corresponding item) to figure “1” (indicating “least agree” to a
corresponding item) (Appendix 5-4).
Though pilot test, it was estimated that respondents would take about 10-15 minutes to
fill in the questionnaire.
5.5.2.2 Survey sampling
It is generally presumed that research follow randomly sampling criteria that would be
considered rigorous and representative. However, in addition to the criterion of rigor,
choice of a sampling method may also be substantially affected by other factors, e.g.,
accessibility, cost and time. In this context, researchers have to balance considerations
among these factors.
This study aims to address the issue of sustaining competitiveness of the Chinese
clothing industry. Therefore, the intended research population for this study is all
Chinese clothing firms. However, taking account of representativeness, feasibility, cost
and time, this research is based on a sample of clothing companies that are situated in
Zhejiang province.
There are at least three considerations in choosing this sampling criterion. ⑴ Zhejiang
province, geographically belonging to the Yangtze River Delta region, is one of the
most developed regions in China, where there are many specialised local industrial
clusters (LICs) in clothing. It is the major source of Chinese clothing exporters and
manufacturers, e.g., about 13% of the national clothing revenue by retail sales (details in
Chapter 3.2). Private clothing firms are the most robust and fastest growing group in
terms of firm size and number in these LICs. Hence this region provides a rich source of
data for the study and to some extent is in a position to be representative of the research
population, i.e., the Chinese clothing industry. ⑵ This place is where the researcher is
based. The proximity advantage makes it easier to get access to the research data with
least cost because the researcher can leverage an already-established network with the
sample firms there. ⑶ Since the sample firms are situated in one region, they share
relatively similar external environment. Given the fact that these sample firms
performed quite differently in such similar external environment, this design enables the
research to focus on internal factors to explore the source for sustaining competitive
advantage of the Chinese clothing industry.
Moreover, not all clothing companies in Zhejiang province were in the sampling units.

119
Only those above the designated size with annual revenue equal to or exceeding 5
million RMB from the principal business were included. This company-size criterion is
in line with the statistical standard of the National Bureau of Statistics of China.
According to Zhejiang Provincial Bureau of Statistics, about 3300 clothing companies
in Zhejiang province were identified in this group in 2011. Therefore, the sampling
units were from these 3300 clothing companies.
Initially, an attempt delivered the survey questionnaire to the sample firms by utilising a
simple random sampling method through email. Based on the sampling criteria, contact
information of the sample units and target respondents was obtained from Zhejiang
Garment Industry Association and Zhejiang Administration for Industry & Commerce.
However, the initial response rate from the 100 e-mail pilot was disappointing and there
were no responses to the survey within one week after the first email delivery. There
were only 2 responses one more week after the repeated email delivery. Given the time
limitation of data collection, it seemed that this method was not feasible. This strict
random sampling procedure was therefore abandoned.
The academic research context in the Chinese clothing industry is still dominated with
personal networks. Under these circumstances, it was hard to implement the strict
random sampling in practice, and therefore a compromise between research theory and
research practice had to be made. That is, to take full advantage of a personal network,
or Chinese Guanxi, was a practical and feasible way to collect primary data for this
study. However, personal contacts are subject to “opportunity” and “convenience”
sampling, and hence might result in bias or deviation from traditional random sampling
guidelines which enable the achievement of scientific rigor. However, data collected
through the not-strict random sampling method could be used for analysis and this is not
uncommon in this research domain (e.g., Podsakoff et al. 2003, Watson 2004).
In view of the above considerations and based on the above sampling criteria, the
intended sampling units were then organised into the sampling frame, that is, allocating
the target respondents from the sampling units (clothing firms) located in the selected
main cities of Zhejiang province such as Hangzhou, Ningbo, Wenzhou, Shaoxing, Yiwu,
Zhuji, etc. Then with help from the research assistants (i.e., final-year undergraduates
based in these cities), questionnaires were delivered mainly through interviews and
some through emails. The senior and top clothing managers and owners were selected
as respondents because they were believed to be well-informed about the strategic
management issues and the clothing industry, especially strategic management of the
Chinese clothing firms. In this way, the related response-bias could be minimized.

120
5.6 Chapter summary
In summary, the research methods adopted in this study are based on the writer’s
understanding of research philosophy in terms of epistemology, ontology and axiology.
The research questions are the main determinant in the design of the research methods.
This study is fundamentally based on a positivist stance on research philosophy.
However, to find answers to the defined research questions, this study adopts multiple
research purposes and research strategies, which reflects a pragmatist research paradigm
(Table 5-2). For example, this study examines and reveals the SCA problems of the
Chinese clothing industry via l archive study; explores resources for SCA via literature
review; confirms resources-SCA relationships via statistical anlysis; explains in detail
the statistical results via case studies.
This chapter also elaborated the research design and data collection procedure.
Questionnaire survey and interviews are the main methods for the data collection in the
Chinese clothing industry. The survey data will be used for statistical analysis in the
following Chapter 6 and the data from the interviews will be used in the case studies in
the following Chapter 7. Next chapter focuses on statistical analysis by using data
generated through the survey which was elaborated in this chapter.

121
CHAPTER SIX: STATISTICAL ANALYSIS
6.1 Chapter introduction
Source: The author.
This chapter focuses on data analysis. The data analysis follows a series of sequential
steps from descriptive statistics to inferential statistics and this is illustrated in Figure
Chapter2: Chinese clothing
industry in the global value chain
Chapter3: Sources of sustained
competitive advantage
Chapter5: Research methodology
Based on a positivist position, the study adopts pragmatism research methods.
That is, questionnaire survey and
statistical analysis are the main
methods, Moreover, multiple research
purposes and strategies such as case studies and interviews are also
employed.
Chapter6: Statistical analysis
Chapter7: Case studies
Chapter8: Discussion and conclusions
Chapter1: Introduction
STATISTISTICAL ANALYSIS
Descriptive statistics
Exploratory Factor Analysis
to derive constructs
Confirmatory Factor Analysis
to validate the constructs
Structural Equation Modeling
to test hypothesis
Comparison of alternative
models
Chapter 4: Conceptual framework
THESIS STRUCTURE
Figure 6-1: Thesis structure and focuses of Chapter 6 1
122
6-1. The descriptive analysis consistes of three subsections, namely, demographic data
of respondents and the sample units (subsection 6.2.1), descriptive statistics of
“resources” items (subsection 6.2.2) and descriptive statistics of “performance” items
(subsection 6.2.3). In the descriptive analysis, the means, standard deviations and and
frequencies of the data distributions are presented in tables with textual interpretations.
Inferential statistics are the main body of this chapter and the inferential statistical
analysis follows subsequent steps. It starts from deriving factors for measures of
resources and Sustained Competitive Advantage (SCA) via Exploratory Factor Analysis
(EFA). This is followed by a two-step approach of Structural Equation Modeling (SEM),
namely, Confirmatory Factor Analysis (CFA) and test of the structural model. Finally,
alternative models are compared so as to further verify the appropriateness of the
hypothesised model for this study.
6.2 Descriptive statistics
Descriptive statistics of the sample were obtained by using SPSS software (Version 20).
These statistics concern data obtained from the questionnaire survey on both resources
and performance of the sample companies. Frequencies, means and standard deviations
(s.d.) are presented to indicate the data distributions, central tendency and dispersion.
As a result of data collection, a total 219 copies of valid replies were obtained. Among
them 156 copies (about 71%) were delivered via interviews and the rest, 63 copies
(about 29%), via email. Among them, 180 responses were from 6 major clothing cities,
i.e., clothing LICs (Discussed in Chapter 2.3.7), in Zhejiang province, namely,
Hangzhou (30), Ningbo (30), Wenzhou (30), Shaoxing (30), Yiwu (30), and Zhuji (30).
The remaining 39 responses were from other 7 cities, namely Huzhou (6), Jiaxing (6),
Cixi (6), Jinghua (6), Lishui (5), Taizhou (5) and Haining (5) (Figure 6-2).

123
Figure 6-2: Sample distribution of the respondents 1
Note: The omitted sources of figures and tables in this chapter are either directly
statistical output or edited statictical output by the author40
.
40 The distribution map was generated through the software Arc GIS 10.1 version. The data concerning geographic

124
6.2.1 Demographic data of respondents and the sample units
Respondents’ demographics and the profile of the sample units are illustrated below.
The demographic information indicates that the sample reflects the general
characteristics of the Chinese clothing industry in terms of managers’ qualifications,
companies’ history, size, profits, branding, exports and business development.
This study assumes that the qualifications of the respondents are sufficient for them to
understand the research topic concerning sustained competitive advantage (SCA) of the
Chinese clothing industry, which in turn leads to robustness of the data. Concerning the
levels of educational attainment, the majority of respondents (59.8%) possesses higher
education degrees, e.g., Bachelor (43.8%), Master (12.8%) and Doctor (3.2%) though a
significant number (40.2%) do not have any degree but instead have various certificates
from professional training or educational institutions (Table 6-1). In addition to the
educational background, working experience is also a relevant aspect of the managers’
qualification. In this sample, more than 60% of the respondents have been working in
the clothing industry for more than 5 years and nearly 75% for more than 3 years.
Table 6-1: Educational background of the respondents 1
Educational background Working years in the clothing industry
Professional certificate 40.2% ≤2 years 10.5%
Bachelor 43.8% 2-3 years 14.6%
Master 12.8% 3-5 years 14.2%
Doctor 3.2% >5 years 60.7%
Total 100.0% Total 100.0%
Note: The upper range value is always included in the range, e.g., “3” included in the range “2-3
years” and “5” included in the range “3-5 years”. This rule applies to the whole thesis where tables
contain range values.
Because of the relatively low entry barriers and low technology requirement, plus the
intensified competitive situation, life spans of the firms, particularly of the small and
medium-sized enterprises (SMEs), are not long. According to the domain experts, many
of the clothing firms have less than a 5-year history from establishment to exit.
However, since the sample is delimited to the designated size, many SMEs may not be
included. Therefore, this sample may reflect relatively longer periods of existence, that
is, only 6.8% of them have a history of 5 years or less and 35.2% of them between 5-10
location, i.e., longitude and latitude, were gained by referring to China gazeteer.

125
years (10 years included) while the rest 58% have a history of more than 10 years
(Table 6-2).
Table 6-2: Firms’ history in the clothing industry 1
Year(s) Frequency Percent Cumulative Percent
≤5 15 6.8 6.8
5-10 77 35.2 42.0
10-20 96 43.8 85.8
20-50 29 13.2 99.0
>50 2 1.0 100.0
Total 219 100.0 100.0
According to the Chinese Statistics Yearbooks in 2010 and 2011, the average number of
employed persons in the private clothing enterprises was about 150 to 200 and about
300-350 persons in the foreign-invested enterprises (FIEs) and the national average
number was about 200-250. Table 6-3 reflects the corresponding structure of the sample.
Over 51% of the firms fall into the small-size group with 100-200 employed persons;
about 20% are of the medium size with about 200-300 employed persons; about 13%
are of the medium-to-large size with about 300-500 employed persons. The remaining
16% fell into the large-size group with more than 500 employed persons.
Table 6-3: Employed persons in the clothing firms 1
Employed persons (Ge) Frequency Percent Cumulative Percent
100-200 112 51.1 51.1
200-300 44 20.1 71.2
300-500 28 12.8 84.0
>500 35 16.0 100.0
Total 219 100.0
Table 6-4 shows the gross sales profit margins of the clothing firms in this sample.
About 46.6% of the sample firms achieve gross sales profit margins at the 5-10
percentage level (5% included); 39.3% of the firms achieve 10% and above; the
remaining 14.2% are below 5% profit margins. According to an interviewer’s viewpoint,
the higher profit margins are related to the own-brand strategy.

126
From purely processing exports, the clothing firms can achieve below 5% profit
margins while with own brand the profit margins are definitely higher, usually
more than 10%. (Han 3rd
November 2011)
Table 6-4: Gross sales profit margin of the clothing firms 1
Percentage Frequency Percent Cumulative Percent
<=0 1 .5 .5
0-5 30 13.7 14.2
5-10 102 46.6 60.7
10-20 69 31.5 92.2
>20 17 7.8 100.0
Total 219 100.0
In addition to profit margin, labour productivity is another indicator reflecting
competitiveness of the sample companies. This also varies among these firms (Table
6-5). It was estimated that about 37.9% of companies achieved a productivity range of
about 100, 000 RMB to 200,000 RMB average annual revenue per person and that
about 42% of firms achieved productivity below this level with the remaining 20.1%
achieving productivity above this level. In other words, only about one fifth of the
sample firms achieved relatively higher labour productivity, therby gaining competitive
advantage in comparison with the others.
Table 6-5: Labour productivity of the clothing firms (unit: 10,000 RMB) 1
Productivity range* Frequency Percent Cumulative Percent
<=50 30 13.7 13.7
50-100 62 28.3 42.0
100-200 83 37.9 79.9
200-300 20 9.1 89.0
>300 24 11.0 100.0
Total 219 100.0
Note*: Productivity is measured by annual output per person; 100,000 RMB is equal to about 15,949
USD and 200,000 RMB to about 31,898USD based on the middle exchange rate on 27th June 2014,
i.e., RMB/USD=6.27.

127
Table 6-6 is about own brand-operation among the sample. On a static basis, the table
shows that about 75% of the clothing firms have developed their own brands and this is
much more optimistic than estimations from some earlier secondary sources (e.g.,
20%)41
. However, about 30.6% of firms just developed their own brands within the last
5 years, that is, after the year 2007, the year that the global economic recession started.
This might suggest that the external market recession gave an impetus for many existing
Chinese clothing firms to move away from their price-based and export-oriented
processing and manufacturing competition strategy toward a more domestic-oriented
and value-added branding strategy within the last 5 years. The data also suggest that few
Chinese clothing firms (1.4%) developed their own brands 20 years ago and that in the
period between 10 and 20 years ago own-brand companies increased to about 15.1%
and then 5-10 years ago went up to 28.3%. These data indicate that a branding strategy
has been increasingly adopted by a growing number of Chinese clothing companies.
Table 6-6: Years of operation with own clothing brand of the firms 1
Own brand Year(s) Frequency Percent Cumulative Percent
n/a 54 24.7 24.7
0-5 67 30.6 55.3
5-10 62 28.3 83.6
10-20 33 15.1 98.6
>20 3 1.4 100.0
Total 219 100.0
Further information about the own-brand companies is provided in Table 6-7. Among
the 75.3% of firms which have developed their own brands (refer to Table 6-6), there
are only 28.7% where own-brand represents more than 50% of their sales (Table 6-7).
From the remaining 46.6% of the firms, own-brand products represent less than a half
of the sales value. In summary, the total of own-brand sales is calculated to be
approximately 33%42
with the remaining 67% being non-own-brand sales.
41 Concerning the proportion of the clothing companies with their own brands in China, there is no exact data source
to refer to, neither from official statistics nor from other institutions. 42 33% (20.1% 5%) (26.5% 30%) (13.2% 70%) (15.5% 95%)

128
Table 6-7: Sales proportion with own clothing brand of the firms 1
Sales proportion Frequency Percent Cumulative Percent
n/a 54 24.7 24.7
0-10 44 20.1 44.8
10-50 58 26.5 71.3
50-90 29 13.2 84.5
90-100 34 15.5 100.0
Total 219 100.0
Concerning clothing exports (Table 6-8), 82.2% of the sample firms have entered into
the export business. For nearly half of the firms in the sample, clothing exports make up
over 50% of their sales, leaving just over a third of the firms (34.7%) where clothing
exports are positive but comprise less than 50% of sales. The total exports proportion of
the sample can be roughly calculated as about 39% of the total sales value.
Table 6-8: Exports sales revenue as a proportion of the total sales revenue 1
Exports proportion Frequency Percent Cumulative Percent
No export 39 17.8 17.8
0-10 27 12.3 30.1
10-50 49 22.4 52.5
50-90 61 27.9 80.4
90-100 43 19.6 100.0
Total 219 100.0
Table 6-9 concerns export patterns, e.g. OEA, OEM, ODM and OBM, of the clothing
manufacturers. Excluding no exports (17.8%) and exports via non-manufacture firms
(0.9%), 81.3% of the clothing firms entered into various patterns of manufacture exports.
Among them, 11.0% of their exports business involves only OEA, and the remaining
70.3% have updated to OEM or further functions of ODM and/or OBM. Total OEM
exports accounts for 44.9%; total ODM exports accounts for 26.5%; total OBM exports
account for 22.8%.
However, it was reported that about 10% of the Chinese clothing exports were of the
firms’ own brand. Two plausible reasons may explain the difference of the reported

129
figure (i.e., 10%) with the figure of this research (i.e., 22.8%). One reason may refer to a
Professor’s remark: ‘Among the three major clothing export regions in China, in
comparison with Jiangsu province and Guangzhou province, Zhejiang province is more
own brand oriented’ (Liu, 2nd
Novembe 2011). That is to say, the national average
proportion of exports is about 10% but it may vary in terms of different geographic
regions. In this survey region, Zhejiang province, it may be higher than the national
average figure since this is a more own-brand-oriented region. The other reason is that
since the sample was delimited to the designated size, some SMEs which only involve
OEA exports without their own brand may not be included in the figure. As a result, the
proportion of own-brand exports of this sample (i.e., 22.8%) may be higher than the
total population level (10%).
Table 6-9: Export pattern(s) of the clothing firms 1
Export pattern OEA OEM ODM OBM n/a
Percentage 11.0 44.9 26.5 22.8 18.7
Notes: ⑴ Initials used here represent terms of different export patterns for the clothing
manufacturers: OEA=Original Equipment Assembly, OEM=Original Equipment Manufacturing,
ODM=Original Design Manufacture, and OBM=Original Brand Manufacture. ⑵ Total sample is
219 but sum of percentage is not equal to 100 because some of the companies have combined
patterns, e.g., OEM + OEA or OEM + OBM + ODM. ⑶ “n/a” includes those companies which have
not involved export manufacturing, or exports, or manufacturing.
Table 6-10 indicates that manufacturing is still the dominant segment of the Chinese
clothing industry since 88.6% of the clothing firms engage in manufacturing, among
which 42.9% engage solely in the function of manufacture and the remaining 45.7%
engage in additional functions such as design and marketing in addition to manufacture.
For example, about 43.3% of the firms have developed their own design to some extent
and 26% of the firms have developed the marketing function. These two figures seem
low in comparison with the proportion of firms that have developed their own brands
(i.e., 75% in Table 6-6). Therefore, as a whole, upgrading to the high-value added
segments such as design and marketing is still on the top of the Chinese clothing firms’
agenda.
Table 6-10: Business function of the clothing firms 1
Business function Manufacturing Design Marketing Others*
Percentage 88.6 43.3 26 6.5
Notes: Total sample is 219 but sum of percentage is not equal to 100 because some of the companies
engage combined business functions such as manufacturing and marketing; *Others include those

130
companies which involve business functions other than manufacturing, design and marketing, e.g.
clothing trade as a middleman.
6.2.2 Descriptive statistics for resources
Table 6-11 displays the descriptive statistics for resources. All 12 variables have
distributions to the left. The means range from 4.58 to 5.91, which exceed the average
value (i.e., 3.5) of the 7-point Likert scale. This result indicates that the respondents
mostly hold a positive attitude concerning the significance of these resources
contributing to SCA of the firms. Particularly, the highest mean (5.91) with the lowest
standard deviation (s.d. =1.084) indicates that Quality Control is the most agreed
resource. The next three variables which have similar distribution attributes to Quality
Control are Customer Relationship (m=5.79, s.d. =1.194), Quick Response (m=5.75, s.d
=1.274) and Experienced Staff (m=5.74, s.d. =1.196). In other words, the results suggest
that the respondents generally agreed that these three variables are also important in
terms of contributing to SCA of the firms. In contrast, Branding has the lowest mean
(m=4.58) but with the highest standard deviation (s.d. =1.541), which suggests that
respondents’ points of view vary concerning the significance of Branding contributing
to SCA. For example, 27.4% of respondents hold a negative attitude (i.e., score 1, 2 or
3), 61.2% positive (i.e., score 5, 6 or 7) and 12.3% neutral (score 4).
Table 6-11: Descriptive statistics for resources 1
R&C mean s. d. Distribution frequency in percentage
1 2 3 4 5 6 7
Skillful worker 5.74 1.196 .5 .5 3.7 10.5 22.4 29.7 32.9
Plant & equipment 5.13 1.328 1.4 3.2 5.9 16.4 32.0 26.0 15.1
Information technology 5.04 1.328 .5 1.4 10.0 26.0 22.8 22.4 16.9
Customer relationship 5.79 1.194 0 .5 4.1 12.8 16.4 31.5 34.7
Supplier relationship 5.71 1.124 0 .9 1.8 11.9 26.0 29.7 29.7
HRM 5.26 1.284 .5 .5 10.0 17.4 23.3 30.6 17.8
Quick response 5.75 1.272 1.4 .9 2.7 9.1 22.4 28.8 34.7
Quality control 5.91 1.084 0 .5 1.8 8.7 21.9 29.7 37.4
Branding 4.58 1.541 4.6 5.0 17.8 12.3 28.3 25.1 6.8
Organisational learning 5.17 1.240 0 1.4 8.7 19.6 27.4 27.4 15.5
Entrepreneurship 5.34 1.316 .9 1.8 5.9 15.5 26.5 27.9 21.5
Innovation 5.37 1.423 1.8 1.4 9.1 11.4 21.5 31.1 23.7
By comparing resources required for SCA of Chinese clothing industry with the status
quo of the sample companies, the results are that all the mean values of the actual

131
resources in the sample companies are lower than the corresponding values of the
required resources for the industry, which indicates that there is space for the actual
resources to be improved so as to contribute to SCA more than they have actually done
(Table 6-12). Particularly, the biggest differences between the corresponding means
(DOM) exist in three resources, i.e., Branding (DOM=1.42), Information Technology
(DOM=1.11), and Human Resource Management (DOM=0.94). This implies to the
Chinese firms that more investment and efforts should be made in these three key
factors. The result that the s. d. values for the industry are lower than the corresponding
figures for the firms suggest that the respondents hold more unified views in terms of
significance of the resources contributing to sustained competitive advantage of the
Chinese clothing industry.
Table 6-12: Comparing descriptive statistics for resources between firm and industry 1
R&C
Firm statistics Industry statistics Differences
mean s. d. mean s. d. mean s. d.
Skillful worker 5.74 1.196 6.47 .774 .67 .422
Plant & equipment 5.13 1.328 5.89 .937 .76 .391
Information technology 5.04 1.328 6.15 .924 1.11 .404
Customer relationship 5.79 1.194 6.62 .620 .83 .574
Supplier relationship 5.71 1.124 6.25 .786 .54 .338
Human resource
management
5.26 1.284 6.20 .925 .94 .359
Quick response 5.75 1.272 6.13 .868 .38 .404
Quality control 5.91 1.084 6.62 .626 .71 .458
Branding 4.58 1.541 6.00 1.058 1.42 .483
Organisational learning 5.17 1.240 5.84 .997 .67 .243
Entrepreneurship 5.34 1.316 6.13 .831 .79 .485
Innovation 5.37 1.423 6.25 .917 .88 .506
6.2.3 Descriptive statistics for performance
Descriptive statistics for performance displays in the following Table 6-13.

132
Table 6-13: Descriptive statistics for performance 1
Performance mean s. d. Distribution frequency in percentage
1 2 3 4 5 6 7
Strategy adaptability 5.30 1.289 .5 2.3 4.6 18.3 30.1 22.4 21.9
20.5 Order acquisition 5.35 1.302 .5 1.8 7.3 15.1 24.2 30.6
Cost control
External communication
5.20
5.47
1.209
1.201
.9
.0
.5
1.4
5.9
3.7
21.5
15.5
26.9
29.7
30.6
25.1
13.7
24.7
Internal cohesion 5.58 1.240 1.4 .5 4.1 9.6 27.9 30.6 26.0
Sales growth
Sale performance increase
5.09
4.78
1.574
1.567
3.2
3.2
3.7
4.6
11.0
11.4
12.8
24.2
21.5
22.8
28.3
16.0
19.6
17.8
The distributions for all seven performance indicators are skewed negatively and the
means range from 4.78 to 5.58, which exceed the average value (i.e., 3.5) of the 7-point
Likert scale (Table 6-13). This result indicates that the respondents generally hold
positive attitudes about the firms’ performance over recent years. The highest mean
(m=5.58), with a standard deviation of 1.240 indicates that Internal Cohesion is the
performance indicator in which the respondents display the greatest confidence.
Interestingly, lower means with higher s.d. values are displayed by the two financial
performance indicators, namely, Sales Growth (SG) (m=5.09, s.d.=1.574) and Sales
Performance Increase (SPI) (m=4.78, s.d.=1.567). This suggests that respondents show
greater discrepancy in their opinions concerning the importance of financial
performance, as captured by the 2 terms SG and SPI than they do about the remaining 5
process performance indicators of External Communication, Internal Cohesion, Cost
Control, Strategic Adaptability and Order Acquisition. In fact, these five process
performance indicators exhibit similar distributions, with means ranging from 5.20 to
5.58 and standard deviations ranging from 1.201 to 1.240.
6.3 Exploratory factor analysis
To develop better measures for constructs, Churchill (1979) suggests an 8-step
procedure (Figure 6-3). However, this is not a uni-directional procedure but rather there
are some returns and repeats of some of the steps. The first two steps are mainly based
on literature while the later steps may lead back to steps 2 or 1 based on statistical
results. For example, steps 4 or 6 can lead back to steps 2 or 1 based on factor analysis
for purification of measures. That is, in the case of too low an alpha coefficient(s), or
unproductive structure of the items occurs, the appropriate strategy is to loop back and
repeat the previous steps.

133
Source: (Churchill 1979)
Churchill’s eight-step procedure combines both theoretical foundations with empirical
results and statistical methods of Exploratory Factor Analysis (EFA) and of
Confirmatory Factor Analysis (CFA). EFA is used to extract factors or constructs and
CFA is used to assess and validate the constructs extracted via EFA43
. Thus this
procedure enables to avoid arbitrary in developing measures of constructs.
Since there is no existing literature to refer to concerning holistic measures of resources
or SCA in the resource-based view of the firm, this study follows Churchill’s (1979)
suggested steps to develop constructs and corresponding measures of the constructs.
Steps 1 to 3 have been followed in the preceding research and this section follows Step
4. That is, EFA is adopted to extract constructs of two concepts, i.e., resources and SCA.
The remaining steps, i.e., Steps 6-8, are followed in the subsequent Sections 6.4 & 6.5.
43 Term ‘factor’ or ‘component’ is used in factor analysis while construct is termed in structural equation modeling.
The three terms refer to the same thing so they are used interchangeably in this research.
2: Generate sample of items
3: Collect data
4: Purify measure
5: Collect additional data
6: Assess reliability
7: Assess validity
8: Develop norms
1: Specify domain of construct Steps 1 & 2:
Literature search
Steps 3 to 5:
Experience survey
Insight stimulating examples
Critical incidents
Focus groups
Exploratory Factor Analysis
Steps 6 to 8
Confirmatory Factor Analysis
Eight steps for developing a better measure Corresponding techniques
Figure 6-3: Procedure for developing better measure for constructs 1

134
6.3.1 Assessing the appropriateness of factor analysis
In addition to the conceptual requirements for the measured variables, it is also required
to justify the application of factor analysis (Hair et al. 2007). Correlations, overall
Measure of Sampling Adequacy (MSA) and individual MSA are examined in this
respect.
Inter-item correlations indicate that each of all the 22 variables has at least one
significant correlation and that 206 of the 231 correlations (89%) are statistically
significant at the 0.001 level (Appendix 6-1a). In addition, there are a substantial
number of correlations greater than .30 (about 72%). All of these results are an adequate
basis for proceeding to examine the adequacy of factor analysis. The Bartlett test of
sphericity tests the overall significance of the correlation matrix and its result suggests
the presence of significant correlations among at least some of the variables, which is
another index to indicate the appropriateness of factor analysis for these variables. Also,
the overall MSA value is 0.906, which is much higher than the acceptable level (i.e.,
0.50).
By examining individual MSA values, one factor “Plant & Equipment (PE)” (MSA
value=.412 <.5) is identified as an unacceptable variable according to the guidelines
(Hair et al. 2007: 104) (Appendix 6-1b: MSA 1). Therefore this variable is deleted and
subsequent recalculation suggests that each of the remaining variables have individual
MSA values greater than 0.5, ranging from .517 to .834, which indicate sufficient
degrees of inter-correlation for factor analysis (Appendix 6-1b: MSA2). In the
correlation matrix for the revised set of variables with the variable PE deleted
(Appendix 6-1c), 193 of the 210 correlations (92%) are statistically significant. Of the
remaining 17 insignificant correlations, 13 are related to two variables, Sales Profit and
Labour Productivity, which may imply possible problems with the two variables.
However, the Bartlett test shows that nonzero correlations exist at the .001 significance
level; the overall MSA value is .909. All the above results suggest that these 21
variables can proceed to principal component analysis.
6.3.2 Deriving factors via principal component analysis
Principal Component Analysis (PCA) is applied to extract components44
representing
key dimensions of concepts. These extracted components reflect both common and
unique variance of the variables. In contrast, Factor Anylsis, which is similar to PCA in
terms of linear combinations of variables, focuses only on common variance of
variables excluding unique variance (Varraso et al. 2012).
44 Terms of component (in principal component analysis), factor (in factor analysis), or construct (in SEM) are used
interchangeably in this study.

135
The results indicate that the cumulative variance of 4 components is over 65% of that of
all variables, which is sufficiently representative and summarising the original
information in the social science research (Appendix 6-2a). In addition, the fourth
component extracted has a latent root or eigenvalue (i.e. 1.154) greater than 1, which is
considered significant according to the latent root criterion for the number of factors to
be extracted (Hair et al. 2010).
The unrotated factor matrix of loadings is first checked to examine the degree of
association of each variable with its corresponding factors, to identify the significance
of loadings in the factor matrix, and also to determine whether a rotated method is
necessary (Appendix 6-2b). Factor 1 accounts for the greatest proportion of the variance
of the variables with eigenvalue accounting for 41.6%; eigenvalue of Factor 2, 10.4%;
eigenvalue of factor 3, 7.5% and eigenvalue of factor 4, 5.5%. The overall four factors
extracted represent over 65% of the total variance related to the 21 variables in the
factor matrix which is sufficiently representative in social science research. The
communality column indicates how well each variable is explained by the four factors
and all communalities, ranging from .52 to .83, exceeds the threshold level of .50,
which is sufficiently high to proceed with the rotation of the factor matrix.
The varimax rotation method is applied and the results suggest that there is no change in
comparison with the unrotated factor matrix of the same 21 variables in terms of overall
factor eigenvalues and communalities extracted (Appendix 6-2c). All variables with
loading over .5 are listed in the table based on the assumption that loadings .50 or
greater are considered practically significant at the .05 level (Hair et al. 2010:117).
However, by examining this initial factor rotation matrix, three variables, i.e.,
Information Technology, Organisational Learning and Entrepreneurship, are identified
as lacking any significant loading over .5 while two other variables, namely, Human
Resource Management (HRM) and Market Share Increase (MSI), are found to have
cross-loadings. However, the communalities of these three variables (communalities
ranging from .57 to .59) meet the acceptable level of explanation (i.e., 0.5) and there are
no significant loading problem with them. Therefore, there is no sufficient reason to
delete these three variables at this early stage. Concerning the two cross-loading
variables, an alternative rotation method (i.e., the oblique instead of orthogonal method)
is employed but the cross-loadings persist. Therefore, it seems that deleting these two
variables (i.e., HRM and MSI) may be a solution for the cross-loadings problem but it is
not the best choice from a theoretical perspective.
Meanwhile, there is another potential problem to be noted. That is, the fourth factor
consists of only one variable, Labour Productivity (LP). However, LP is one of the five
variables measuring financial performance but here it is picked out as a single-item
factor, which is hard to explain from a theoretical perspective. In addition, LP is a static

136
financial performance indicator. Recalling the preceding discussion about longitudinal
versus cross-sectional data in Chapter 4.3.2, longitudinal data is suggested for testing
SCA since resources developed in one period will result in changes of performance in
subsequent periods rather than the same period due to time lags. Recalling the preceding
discussion about longitudinal versus cross-sectional data in Chapter 4.3.2, longitudinal
data is suggested for testing SCA since resources developed in one period will result in
changes of performance in subsequent periods rather than the same period due to time
lags. Based on comprehensive consideration of the above aspects, LP is deleted and the
recalculation results are shown in Appendix 6-2d.
The cross-loadings problem happens again to two other variables, namely, Sales Growth
(SG) and Market Share Increase (MSI). In addition, the fourth factor also implies a
possible problem, which consists of superior performance, a static performance
indicator, and 2 other Resource indicators, Br and IT. In addition, in the preceding
inter-item correlation matrix, 13 of the 17 insignificant correlations are related to these
two factors, i.e., SP and LP (Appendix 6-1c). Based on these considerations and the fact
that LP has been deleted in the 1st re-specifying factor (Appendix 6-2d), it is decided
now to delete the variable SP.
Concerning the cross-loading problem with the two variables, namely, Sales Growth
(SG) and Market Share Increase (MSI), MSI is a financial performance indicator which
cannot be independent from the other two financial performance indicators, namely SG
and Sales Profit Increase (SPI). Moreover, from a measurement perspective, there are
some overlaps in the three indicators. For example, sales profit increase may result
either from cost decrease or from sales growth and the sales growth surely includes
market share increase. Due to these considerations, MSI is first deleted.
After deletion of the two variables, SP and MSI, 18 variables remain. With the 18
indicators, extraction is rerun and the result in Scree Plot shows in Figure 6-4.

137
Figure 6-4: Scree test for factor number extracted 1
According to the latent root criterion of retaining factors with eigenvalues greater than
1.0, only 3 factors can be retained. However, the result of the scree plot test suggests
that the fourth factor can be appropriately retained though its eigenvalue is .881, which
is only slightly less than 1.0 (Figure 6-4). Therefore combining the two criteria, four
factors are eventually retained. The rotated component matrix is calculated again and
the results are displayed below in Table 6-14.
Table 6-14: Deriving factors via PCA- 2nd
re-specifying factors (SP and MSI further deleted) 1
18 indicators
4 factors derived
Communality
extracted Performance
Fundamental
Resource
Dynamic
Capability
Upgrading
Capability
Internal cohesion .752 .634
Sales profit increase .724 .790
Order acquisition .703 .599
Cost control .700 .561
Sales growth .690 .763
External communication .673 .634
Strategic adaptability .670 .634

138
Customer relationship .768 .719
Skillful worker .739 .666
Quality control .693 .724
Supplier relationship .560 .634
Entrepreneurship .713 .669
Organisation learning .677 .681
Innovation .650 .735
Quick response .594 .697
Human resource management .562 .644
Branding .716 .679
Information technology .683 .739
Total
Eigenvalue 7.989 1.886 1.385 .881 12.141
Percentage of trace 44.381 10.478 7.692 4.894 67.446
Notes: Rotation Method- Varimax with Kaiser Normalisation; rotation converged in 9 iterations.
The total eigenvalues represent 67.45% of the variance of the 18 indicators, which is
sufficiently representative of the total variance explained (Table 6-14). By examining
the factor matrix, each indicator has at least one and only one significant factor loading.
The communalities extracted for each indicator range from .57 to .79, which exhibit no
substantial change (Appendix 6-2d).
Now the 4 factors derived via PCA are labeled as follows: Factor 1 “Performance”
(reflected by the 7 variables, Internal Cohesion, Sales Profit Increase, Cost Control,
Order Acquisition, Sales Growth, Strategic Adaptability and External Communication),
Factor 2 “Fundamental Resource” (reflected by Customer Relationship, Skillful Worker,
Quality Control and Supplier Relationship), Factor 3 “Dynamic Capability” (reflected
by Entrepreneurship, Organisational Learning, Innovation and Quick Response) and
Factor 4 “Upgrading Capability” (reflected by Branding and Information Technology).
In summary, through the above EFA procedure, the two concepts, resources and SCA,
gain their measures via the factors extracted. Next section validates the results through
Confirmatory Factor Analysis (CFA) and conceptual underpinnings for these 4 factors
are also discussed in the following sections.
139
6.4 Structural equation modeling
6.4.1 Rationale for adopting structural equation modeling
Researchers can address research questions with a wide range of statistical tools.
However, to the question as to which statistical technique is more appropriate and
efficient in comparison with others, there seems no clear answer. An important principle
is to select an appropriate technique which enables the researcher questions to be
addressed (Hair et al. 2010). Also, the most commonly used practice is to refer to
literature in the domain. The conventional techniques such as regression analysis are
commonly used in this research domain (e.g., Powell & Dent-Micallef 1997, Ray,
Barney & Muhanna 2004, Zhu 2004, Armstrong & Schimizu 2007, Wiklund &
Shepherd 2009). However, this study adopts Structural Equation Modeling (SEM)
which is more appropriate to address the research questions than the conventional
techniques. The rationale is elaborated as follows.
6.4.1.1 Advantages of SEM
SEM is considered to be a more appropriate technique for this study on the basis of
three judgments concerning the research questions and the nature of the data as follows
(Hair et al. 2010). (1) What type of relationship is being examined (e.g., dependence or
interdependence)? (2) How many relationships are being predicted (e.g., a single
relationship with one dependent variable or with several dependent variables, or
multiple relationships of dependent and independent variables)? (3) How are the
variables, both dependent and independent, measured (metric or non-metric)?
The uniqueness and most unique attribute of SEM is that it can be applied to analyse
dependence relationships involving unobserved or latent constructs, which this study
deals with and which conventional techniques such as regression analysis, factor
analysis, or path analysis are not capable of dealing with. Conventional factor analysis
such as EFA is a statistical method for dimension deduction but not for analysis of
causal relationships between constructs. Both path analysis and regression are
conventional techniques for analysis of causal relationships between observed variables
but not conceptual variables or constructs (Hair et al. 2010).
Firstly, this study involves constructs which cannot be observed directly. Therefore,
these conceptual variables have to be measured through observed variables or indicators.
Four constructs are involved in this study, namely, Fundamental Resource, Dynamic
Capability, Upgrading Capability and Performance and these are developed based on the
theoretical foundations and through statistical purification (i.e., EFA). These constructs
are then represented by 18 observed variables. In this context, issues about the
appropriateness of the constructs, quality of measurement, data errors and subsequent

140
measurement model fit have to be taken into considerations before the final analysis of
the relationships between these constructs.
Secondly, to explain the dependence relationships among multiple variables as this
study does, the commonly used models among researchers in this domain are multiple
regression analysis (a single dependent relationship with metric data) and multivariate
analysis of variance (a single dependent relationship with non-metric data). However,
each of these traditional techniques can examine only a separate relationship at a time
while SEM can examine a series of dependent and independent multiple relationships
simultaneously, which is required in this study.
Thirdly, SEM allows evaluation of measurement quality by examining the measurement
model fit via Confirmatory Factor Analysis (CFA). This is especially useful in social
science where researchers often use constructs representing theoretical concepts that are
not measured directly. Since most of these concepts are relatively complex, containing
many meanings, the researchers often design multi-dimensional items to represent the
abstract concepts.
Moreover, in comparison to conventional regression analysis, SEM can improve
statistical estimation of the strength of the relationship between constructs because with
SEM the researcher can estimate the true structural coefficient rather than the observed
regression coefficient which is actually composed of the true structural coefficient and
the reliability of the predictor variables (Hair et al. 2010; Tabachnick & Fidell 2007).
Conventional regression analysis assumes that independent variables are measured
without errors, which is almost impossible in most social and behavioral science
research. This implies that the regression coefficients are always either overestimated
when a positive relationship exists between an unmeasured and a measured independent
variable, or underestimated in the case of a negative relationship. In SEM, measurement
errors are taken into considerations and analysed in the measurement model and when
relationships among constructs are examined without the measurement error and leaving
only common variance.
In summary, SEM meets the requirements of this research, whereas it is not possible to
meet these requirements using conventional techniques. Therefore SEM is more
appropriate in comparison to those conventional statistical techniques.
6.4.1.2 Limitations of SEM
There are a number of advantages to apply the SEM technique and they are discussed in
the above section. However, there is the other side of the coin, which is ‘a small price to
pay for the flexibility that SEM offers’ (Tabachnick & Fidell 2007).
141
Theoretically, SEM is a confirmatory technique which may be applied to test
hypotheses about the potential relationships among variables rather than to induce or
predict theories. Therefore, without prior knowledge one cannot apply SEM to test the
potential relationships among variables (Tabachnick & Fidell 2007). And also, one can
use SEM only to confirm but it is ‘rarely, if ever, used to validate theoretical predictions’
and this function of confirmation often results in limitations since ‘when the focus of a
modeling exercise is post hoc fitting to data, such a strategy is bound to lead to
disappointment because it ignores the actual process that generates the observed data…’
(Kaplan 2000: 7).
Critics also express reservations about the post hoc model modification as ‘better fit
may suggest closer alignment with the data, but not necessarily with the theory’ (Kaplan
2000:7). Moreover, if numerous modifications are carried out for finding the best-fitting
model, the researcher has moved to exploratory analysis (e.g., EFA), which tends to
entail risks of increasing TypeⅠerror levels (Tabachnick & Fidell 2007).
In addition to the theoretical limitations, SEM also involves some practical limitations.
For example, SEM is based on multivariate analysis and needs a comparatively large
and sufficient sample size to achieve greater power and statistical significance for the
statistical testing (Hair et al. 2010). Other estimation assumptions, such as multivariate
normality, linearity, freedom from outliers and multicollinearity, are fundamental issues
which cannot be neglected. Despite the critics, SEM has gained its popularity in a
number of empirical applications, some of which are examined in the next sub-section.
6.4.1.3 Empirical applications and references
Structural Equation Modeling (SEM) has been developed from two main separate
statistical origins (Kaplan 2000), namely, the use of factor analysis in psychometrics and
simultaneous equation modeling in econometrics or even earlier in the genetic field.
Since the 1980s, SEM techniques have been applied extensively in the social sciences
because of contributions and breakthroughs by Joreskog (1969, 1978) in the Maximum
Likelihood estimation method, CFA and the software LISREL. SEM is widely used in
the Educational Testing Service (ETS), such as in learning of disabled people (Nelson et
al. 2004), education differences between universities (Wert, Linn & Joreskog 1974),
emotional health (Pillow, Zautra & Sandler 1996), social psychology attitude (Small &
Judd 1998), memory and intelligence (Hultsch, Hertzog & Dixon 1990).
Recently, SEM has been extensively applied in the field of business management. For
example, Skerlavaj et al. (2007) empirically study the effects of organisational learning
culture on organisational performance; Koufteros and Marcoulides (2006) study
relationships between key product development practices and company performance;

142
Gunday et al. (2011) empirically test relationships of innovations and firm performance.
6.4.2 Adoption of a two-step analytical approach
The SEM programme can implement an overall data analysis simultaneously in a single
analysis (i.e., one-step approach) or alternatively it can be conducted in a two-step
approach. In the two-step approach, the first step is Confirmatory Factor Analysis (CFA),
testing the measurement model to determine whether the model fits the data. If the
initial measurement model is not acceptable or not satisfactory, model respecifications
may follow until the model is acceptable. Based on an acceptable measurement model,
the second stage is to analyse the structural model.
The two-step approach was developed by Anderson and Gerbing (1988). The authors
argue that the measurement model (i.e., CFA) as the first step may be used as the basis
for testing structural relationships (i.e., SEM) at the second step. In addition to the
theoretical underpinnings, statistical assessment of the measurement model’s fit to the
data is also fundamental and critical for building up confidence in the overall analysis
(Hair et al. 2010).
A valid measurement model is essential because with poor measures we would not
know what the constructs truly mean. Therefore, if a measurement model cannot be
validated, researchers should first refine their measures and collect new data. If the
revised measurement model can be validated, then and only then do we advice
proceeding with a test of the full structural model. (Hair et al. 2010: 730)
Mulaik and Millsap (2000) describe a more complicated method involving four-step
modelling. Like the two-step method, the four-step method also involves testing the
measurement model’s fit and diagnosing specification error in the measurement model.
However, the four-step method tests a sequence of at least four hierarchical models and
each factor in the original SEM model should have at least four indicators (Kline 2005:
217). The first step is in fact an EFA model, and the second step is actually a CFA model
test, in which the factor loadings of indicators on certain factors are fixed to zero. Once
the measurement model is acceptable, the third step is to examine the fit of the whole
model and the last step is to test hypotheses. The third and fourth steps are ‘basically a
more specific statement of activities that could fall under the last step of two-step
modelling’ (Kline 2005: 218).
It is well agreed that the two-step or four-step approach is better than the one-step
approach due to the reasons discussed above (Kline 2005, Hair et al. 2010) but there is
no clear judgement as to which of these two approaches is best. However, two-step
modelling has the advantage of simplicity in comparison to the four-step approach and
therefore this study prefers to follow the two-step approach.

143
6.4.3 Data screening and evaluation of underlying assumptions
Like other multiple analyses, underlying assumptions such as random sampling,
linearity and homoscedasticity are required for SEM. Sufficient sample size,
multivariate normality, freedom from outliers and multicollinearity are especially
important in SEM. Selecting the maximum likelihood estimation method is in fact the
default with the Amos programme (Tabachnick & Fidell 2007).
In addition to avoiding data-related problems for SEM, a preliminary examination is
preferred although some assumption assessments can accompany the major analysis
since Amos provides tests of these assumptions in the output options. In this way, the
underlying assumptions required by SEM are ensured not being violated and this also
enables the follow-up major analysis to focus on the main concerns under discussion.
The sequential order for the examination takes place as follows.
Screening for missing data and input accuracy (through SPSS descriptives)
Sample size
Multivariate normality (through SPSS descriptives)
Outliers (though SPSS outliers statistics)
Multicollinearity and singularity (through SPSS collinearity diagnostics)
Linearity (through SPSS graphs scatter)
However, prior to assessment of the assumptions, overall data screening is necessary to
check for accuracy of data entered into the data file and to check against missing data.
6.4.3.1 Data screening
Data screening is used to check the accuracy of the data input. If data sets have missing
observations, especially if a large number of data miss in a systematic way rather than
randomly, this may have a serious impact on the results of the analysis. For a large
sample, this check can be conducted through the descriptive statistics using SPSS
FREQUENCIES, e.g., plausible means, standard deviations and value ranges between
maximum and minimum (Table 6-15).

144
Table 6-15: SPSS frequencies output 1
SW IT CR SR HRM QR QC Br OL En In SA OA CC EC IC SG SPI
N Valid 219 219 219 219 219 219 219 219 219 219 219 219 219 219 219 219 219 219
Missing 0 0 0 0 0 0 0 0 0 0 0 0 0 0 0 0 0 0
Mean 5.74 5.04 5.79 5.71 5.26 5.75 5.91 4.58 5.17 5.34 5.37 5.30 5.35 5.20 5.47 5.58 5.09 4.78
Std. Deviation 1.196 1.328 1.194 1.124 1.284 1.272 1.084 1.541 1.240 1.316 1.423 1.289 1.302 1.209 1.201 1.240 1.574 1.567
Variance 1.430 1.764 1.426 1.263 1.650 1.618 1.175 2.374 1.539 1.731 2.024 1.661 1.696 1.461 1.443 1.538 2.478 2.456
Skewness -.875 -.159 -.785 -.617 -.449 -1.201 -.798 -.538 -.290 -.678 -.876 -.474 -.629 -.493 -.437 -1.007 -.743 -.324
Std. Error of
Skewness
.164 .164 .164 .164 .164 .164 .164 .164 .164 .164 .164 .164 .164 .164 .164 .164 .164 .164
Kurtosis .566 -.681 -.235 -.055 -.467 1.754 .103 -.441 -.619 .231 .356 -.062 -.086 .202 -.329 1.451 -.121 -.445
Std. Error of
Kurtosis
.327 .327 .327 .327 .327 .327 .327 .327 .327 .327 .327 .327 .327 .327 .327 .327 .327 .327
Minimum 1 1 2 2 1 1 2 1 2 1 1 1 1 1 2 1 1 1
Maximum 7 7 7 7 7 7 7 7 7 7 7 7 7 7 7 7 7 7
Note: Items are abbreviated as: SW for Skillful Worker, IT for Information Technology, CR for
Customer Relationship, SR for Supplier Relationship, QR for Quick Response, QC for Quality
Control, Br for Branding, OL for Organisational Learning, En for Entrepreneurship, In for
Innovation, SG for Sales Growth, SPI for Sales Profit Increase, SA for Strategic Adaptatability, OA
for Order Acquisition, CC for Cost Control, HRM for Human Resource Management, EC for
External Communication and IC for Internal Cohesion.
Table 6-15 shows descriptive statistics in terms of missing data, mean and std. deviation,
variance, skewness and kurtosis, etc. There is no missing values in this data set (valid
number = 219 and missing number = 0) so there is no need to consider how to handle
the problem of missing values, e.g., deleting the cases, ignoring or substituting the
missing data. The means of 18 variables range from 4.58 to 5.91 and standard
deviations range from 1.084 to 1.574, both of which are plausible. The lowest mean
(4.58) is for variable Branding (Br), which is possible since this is the weakest resource
for the majority of Chinese clothing firms. The highest mean (m=5.91, s. d. = 1.084)) is
for variable Quality Control (QC), which is also possible since the majority of the
companies has built up this capability. Values of the variables range from 1 or 2
(minimum value) to 7 (maximum value) and thus the input accuracy is basically
confirmed.
6.4.3.2 Assumption 1- Sample size
The SEM technique is sensitive to sample size because its estimation methods,
particularly maximum likelihood estimation adopted in this study, are based on

145
covariance. That is to say, a minimum sample size is necessary to achieve adequate
power for a planned hypothesis test. General guidelines about the absolute sample size
are offered as: small size with n<100, medium size with n between 100 and 200 and
large size with n>200 (Kline 2000: 110). When SEM path models are involved, the
minimum sample size is recommended to be a case-to-variable ratio of 5:1 and a more
acceptable sample size would be a 10:1 ratio (Hair et al. 2010: 202). Sample sizes in
SEM are also related to goodness of fit, power and degree of freedom. Research results
suggest that an increase in the number of degree of freedom (d.f.) decreases the
requirement for the minimum sample size. For example, with a given degree of power
and significance level (e.g., power=.80 at the .05 significant level), in case of ‘d. f. = 50’,
minimum number for test of close fit is ‘n= 214’ whereas for ‘d. f. = 100’, n= 132
(MacCallum, Brown & Sugawara 1996).
For this study, there are 219 cases with 18 observed variables (originally there were 22
variables but 4 variables were dropped through EFA). The case-to-variable ratio is about
12:1. Degrees of freedom are 113 for the initial measurement model. The ratios are
adequate given that there is no problem in the other conditions (e.g., construct reliability
and no missing data).
6.4.3.3 Assumption 2- Multivariate normality
Multivariate normality is a required assumption for SEM, which assumes that each
variable and all linear combinations of the variables are normally distributed, consisting
of univariate and bivariate normality (Kline 2005: 48-49). Due to the difficulty in
assessing all aspects of multivariate normality, multivariate non-normality is detected
through the univariate distribution by examining standardised skew or kurtosis indexes.
Skewness is about symmetry of a distribution while kurtosis is about peakness of the
distribution. Assuming normality, both the values of skewness and Kurtosis are zero.
Positive skewness implies a pileup to the left in the distribution diagram while negative
skewness implies the same to the right. Positive kurtosis indicates a peaked distribution
with short and thick tails while the negative kurtosis indicates a flat distribution with
many cases in the tails.
For small and moderate samples (e.g., less than 200), a conservative method to assess
skewness and kurtosis is a statistical significance level (.01 or .001). However, for a
large sample size (e.g., more than 200), the fact of statistically significant skewness or
kurtosis of a variable often does not affect the analysis substantively (Tabachnich &
Fidel 2007: 79-80). Therefore, it is suggested that variables with absolute values of the
skewed index greater than 3.0 be defined as extremely skewed while those with absolute
values from about 8.0 to over 20.0 indicate extreme kurtosis (Kline 2005: 50).

146
SPSS frequencies analysis has options for the assessment of univariate normal
distributions and the results are displayed in Table 6-15. All the 18 variables are
negatively skewed with statistics ranging from -1.201 to -0.159. However, none of the
18 variables is extremely skewed (i.e., the absolute skewness value >3.0).
Critical ratio (c.r.) or z score is calculated as the sample skewness divided by its
standard error. Taking the variable Skillful Worker for instance, it has a skewness of
-0.875 and the std. error of skewness 0.164, so the c.r. is calculated as -5.335. It has a
sample kurtosis of 0.566, with a std. error of 0.327, which makes the corresponding c.r.
equal to 1.731 (1.731=.566/.327). Although there are 15 variables where skewness is
statistically significantly from zero (i.e., absolute c.r. > 1.96), it does not affect the
analysis substantively due to the large sample size. The 3 exceptions are IT, SPI and OL
(i.e., absolute c.r. < 1.96).
In comparison, 13 variables have negative kurtosis, ranging from -.693 (IT) to -.081(SR)
and the other 5 variables (i.e., SW, CC, In, En, and QC) with positive kurtosis statistics
ranging from .073 to .526. Three out of the 18 variables have statistically significant
kurtosis values (i.e., absolute c.r. > 1.96), namely IC (kurtosis = 1.451, c.r. = 4.437), QR
(kurtosis = 1.754, c.r. = 5.364) and IT (kurtosis = -.681, c.r. = -2.083); IC and QR are
peaked while IT slightly flat in distribution. None of the remaining 15 variables is
statistically significant from zero and none of the total 18 variables has extremely
kurtosis value (i.e., the absolute kurtosis value from about 8.0 to over 20.0).
The standard error for Skewness is approximately calculated with equation =
while the standard error for Kurtosis is approximately calculated with equation =
where N is the number of cases. Based on the equations, the null hypothesis of
zero is likely to be rejected with large samples even under some minor deviation from
normality (Tabachnick & Fidell 2007: 80). In other words, with a large sample the
actual value of skewness and kurtosis may be more important than the significance level.
In this study, the sample size is 219, which is sufficiently large that even quite a small
degree of skewness or kurtosis are likely to show as statistically significant.
Furthermore, recalling the data collection criteria, only those designated companies with
annual revenue over 5 million RMB are included in the sample and those with revenue
below the designated line are excluded. This constraint of the sampling surely affected
the data collected and hence the data distribution (e.g. the negative skewness).
Therefore, a certain degree of non-normality is understandable and there is no need to
take special actions (e.g., data transformation) to deal with it.
6.4.3.4 Assumption 3- Outliers
An outlier is defined as an observation with an extreme score in comparison with other

147
observations in the dataset. Outliers may be univariate or multivariate. Univariate
outliers are cases with an extreme value on one variable, while multivariate outliers are
cases of extreme scores on two or more variables is atypical. The presence of outliers
may violate the assumption of a normal distribution and impact on statistical results
(Kline 2005).
Univariate outliers can be identified by inspecting descriptive statistics such as extreme
values, histograms and Boxplot. By inspecting the Boxplots, extreme points identified
are cases 95 and 200, both of which have extreme points, i.e., extending more than 3
box-lengths from the edge of the box. However, the two cases are retained for
double-checking for multivariate outliers before they are removed.
The Mahalanobis distance ( ) statistic is useful for detection of multivariate outliers.
The Mahalanobit distance indicates the distance in standard deviation units between a
set of scores for an individual case and the sample means for all variables (centroids).
For each case, the Mahalanobis distance is evaluated by using the Pearson with
degrees of freedom equal to the number of variables. The conservative significance
level for detecting multivariate outliers is ρ<.001.
Appendix 6-3a lists those unusual observations with relatively furthest Mahalanobis
distances ( ) from the centroid in this research. Taking for instance, observation
number 106 in the table shows that its Mahalanobis d-square is = 77.984. Given
normality, the probability of (or any individual
) exceeding 77.984 is .000.
Similarly, still under the assumption of a normal distribution, observation number 200
has = 74.311 and the probability of
(or any individual ) exceeding that
Mahalanobis distance value is .000. To this study, there are 219 observations and 18
variables so any case with a Mahalanobis distance greater than (18) = 42.318
(Appendix 6-3b) is defined as a multivariate outlier (Tabachnick & Fidell 2007). Ten
cases in this research data set are identified as the outliers, namely, cases 106, 200, 91,
95, 139, 111, 73, 114, 122, and 69. That is, the Mahalanobis distances of these 10 cases,
including two cases (i.e., 95 and 200), which are suspicious of being multivariate
outliers, are greater than chi-square (18) = 42.318, which is statistically significant
(Appendix 6-3c).
Prior to deletion, these 10 potential outliers are checked to ensure that they were within
the members of the intended population and that the data were also correctly entered.
Therefore, these 10 cases are finally determined as genuine outliers.
If the 10 outliers remain in the analysis, steps have to be taken to reduce their impact,
e.g., to change the scores or transform variables. However, the problem is that the
outliers come from a combination of scores on two or more variables so it is difficult to

148
decide which scores or which variables to be transformed and shifted. Considering that
deleting outliers can contribute to normality and that little will be lost by deleting them
(about 4.5% of the sample cases). The decision was made to remove these from the data
set. Therefore, after the 10 outliers are excluded, a new data file is created with the
remaining 209 cases used for the subsequent analysis.
6.4.3.5 Assumption 4- Multicollinearity and singularity
Multicollinearity refers to the instance that the variables (could be latent or observed
variables) in the set are very highly correlated, say, .90 and above, while singularity
refers to the case that the variables are redundant or that one of the variables is a
combination of two or more of the other variables (Tabachnick & Fidel 2007: 88-90).
Multicollinearity and singularity may cause statistical problems in matrix inversion,
which is required in calculations (Appendix 6-3c). With multicollinearity or singularity,
a near-zero determinant renders very unstable inverted matrix, which results in unstable
multivariate solutions, e.g., so large error terms without any significant coefficient.
Multicollinearity and singularity also cause logical problems because they inflate the
size of error terms and weaken the analysis.
In this study, the singularity problem was prevented during extraction of constructs.
Through EFA, one measured variable, Market Share Increase, was deleted because it
was realised that it is somewhat overlapped of two other indicators (i.e., Sales Growth
and Sales Profit Increase). Therefore, deleting this variable is to avoid the singularity
problem, particularly to avoid the case that one of the variables is a combination of two
or more of the other variables.
SPSS provides collinearity diagnostics, which suggest criteria for multicollinearity as a
conditional index greater than 30 for a given dimension together with variance
proportions greater than .50 for at least two different observed variables (Belsely, Kuh
& Welsch 1980).
After deleting the 10 outliers, multicollinearity is assessed for this dataset and the
results are represented in Appendix 6-3d through the SPSS collinearity diagnostics
output. Although the last 8 eigenvalues have condition indexes (dimensions 12-19)
greater than 30 (ranging from 30.008 to 43.515), there is no dimension that has one
variance proportion greater than .50 within these 8 eigenvalues. Therefore, there is no
evidence to suggest that multicolinearity is present in this data set. This result is only for
the observed variables but not for the constructs. Multicollinearity for latent variables
can be spotted only with the structural modeling in SEM.

149
6.4.3.6 Assumption 5- Linearity
Linearity is also one of the fundamental assumptions in SEM. Linearity refers to the
instance that there is a straight-line relationship between more than two variables.
Linearity between two variables is assessed roughly by inspection of bivariate
scatterplots. If it is not feasible to examine all pairwise scatterplots (e.g. to a large
number of indicators) for linearity assessment, practically randomly selected pairs of
scatterplots are examined (Tabachnick & Fidell 2007). Therefore, through analysis of
SPSS graphs scatter, some of the randomly selected pairs of scatterplots are examined
and all observed variables appear to be linearly related.
In summary, based on the above examination and after deletion of the 10 outliers
identified, there is no further violation of the main assumptions of SEM. Therefore next
proceed to SEM analysis.
6.4.4 SEM step one: Measurement modeling
This study adopts a two-step approach to structural equation modeling as discussed
above (Anderson & Gerbing 1988). In the two-step approach, measurement modeling is
the first step, linking observed variables to latent constructs while the second step is
structural modeling involving relationships between constructs. Measurement modeling
involves Confirmatory Factor Analysis (CFA) by specifying indicators for each
construct and assessing the construct validity and model fit (Churchill 1979). In addition,
the CFA output also provides additional diagnostic information that may suggest
modifications for improving the measurement model.
6.4.4.1 Reflective versus formative
Basically, there are two alternative measurement models to choose from, namely, the
Formative Measurement Model (FMM) or the Reflective Measurement Model (RMM).
The differences between the two measurement models are simply summarised by the
following three aspects (Coltman et al. 2008).
1) In terms of the nature of the construct, RMM assumes that the construct exists
independently of its indicators while FMM assumes that the construct is formed by
combining its indicators.
2) In terms of the direction of causality between indicators and the corresponding
construct, variation in the construct cause variations in the corresponding indicators in
RMM whereas variations in the indicators affect the corresponding construct in FMM.
3) There are differences in the characteristics of the indicators used to measure the

150
construct. Indicators reflect or manifest the construct in RMM whereas indicators form
or define the construct in FMM.
Therefore, those indicators which link to a particular construct in RMM are correlated
with one another whereas there is little correlation between the indicators in FMM.
According to the above considerations, this study adopts the reflective model.
6.4.4.2 Defining individual constructs
According to the RBV theory, the VRIN resources bundle contributes to Sustained
Competitive Advantage (SCA). Following Churchill’s (1979) paradigm (Discussed in
Chapter 6.3), SCA is measured by the construct of Performance and the resources
bundle is measured by three conceptual constructs, namely, Fundamental Resource (FR),
Dynamic Capability (DC) and Upgrading Capability (UC). Among the three constructs
measuring resources, FR is the survival and fundamental construct which generates
competitive parity; UC is the urgent and strategic construct which is required for
updating the original competitive advantage for SCA (Humphrey & Schmitz 2000, Bair
& Gereffi 2003); DC is required to reconfigure the existing resources so as to adjust to
the external dynamics for SCA (Teece, Pisano & Shuen 1997, Eisenhardt & Martin
2000). Therefore, the whole measurement framework consists of 4 constructs which are
reflected by 18 indicators (Appendix 6-4).
Fundamental Resource (FR) refers to the resources which can help ensure a firm’s
survival when they are exploited to create competitive parity in an industry (Barney
1989). There is a variety of FR indicators highlighted in the RBV literature, e.g., quality
control, firm-specific labour, customer loyalty, capital and machinery (Barney 1989,
Dierickx & Cool 1989) yet there is no one agreed criterion for selection. Based on the
research background, the conceptual construct of FR in this study is reflected by 4
variables, namely, Customer Relationship (Boyd, Bergh & Ketchen 2010), Supplier
Relationship (Bonaccorsi & Lipparini 1994, Koufteros, Vonderembse & Doll 2002),
Skillful Worker (Wernerfelt 1984, Barney 1991) and Quality Control (Powell 1995,
Tuan & Yoshi 2010) (Figure 6-5). Stable quality control is a general and fundamental
requirement for a company to survive in a competitive market and skillful workers are
particularly required by the current Chinese clothing manufacturing companies due to a
combination of a shortage of skillful workers and rising labour costs. Most Chinese
clothing companies manufacture fairly homogenous products using similar inputs. Also,
clothes are consumer goods. In this context, good customer relationships are
fundamental for survival. For similar reasons, good supplier relationships are also
required to ensure a stable and timely supply of inputs.

151
Note: CR=Customer Relationship, SR=Supply Relationship, SW= Skillful Work and QC=Quality
Control.
Dynamic Capability (DC) is defined as ‘the firm’s ability to integrate, build and
reconfigure internal and external competences to address rapidly changing environment’
(Teece, Pisano & Shuen 1997:516). DC is also about the organisational process which
enables organisations to address rapidly changing environment and to renew and
reconfigure resources so as to achieve SCA (Eisenhardt & Marti 2000). During the
organisational processes, information about external market dynamics could be accessed
through organisational learning. Concurrently, quick response to the dynamics requires
the company involved to effectively make and implement appropriate decisions, for
example, about which new resource or capability should be developed or acquired. Both
entrepreneurship and Human Resource Management (HRM) are key elements for
decision making and for the follow-up implementation process. Entrepreneurship
motivates effective communication and facilitates innovative decisions. Strong and
effective HRM ensures coherence of the organisation’s aims with maximized personal
development of its employees, which in turn ensures effective implementation of
decisions. Quick response to the external dynamics also involves innovation
(Lengnick-Hall 1992, Camison & Villar-Lopez 2011), for example, innovation of new
products, new markets and new production processes. Based on these insights, the
construct of DC in this research is reflected by five indicators, namely, HRM (Amit &
Belcourt 1999, Chadwick & Dabu 2009), Organisational Learning (DeGeus 1988,
Crossan & Berdrow 2003), Quick Response (Womack & Jones 2005, Lewis 2000),
Innovation (Lengnick-Hall 1992, Damanpour, Walter & Avellaneda 2009, Terziovski 2010,
Camison & Villar-Lopez 2011) and Entrepreneurship (Simon 2010) (Figure 6-6).
Fundamental Resource
CR
SR
SW
QC
Figure 6-5: Construct of Fundamental Resource 1

152
Note: HRM=Human Resource Management, OL=Organisational Learning, In=Innovation,
QR=Quick Response and En=Entrepreneurship.
Upgrading Capability (UC) enables a firm to move to more profitable and/or
technologically sophisticated capital-intensive or skill-intensive economic niches
(Gereffi 1999). According to the fieldwork of this research, functional upgrading (e.g.,
branding) and technology upgrading (e.g., information technology) are the two most
discussed and practiced means for gaining SCA in the current Chinese clothing industry.
Functional upgrading can be defined as sequential role shifts, and these shifts typically
follow the trajectory of OEA, OEM and ODM to OBM (Humphrey & Schmitz 2001,
Gereffi et al. 2001). Functional upgrading for the majority of the Chinese clothing
companies entails moving towards the branding stage. Branding contributes to diversity
and individuality and enables the clothing company to transform and upgrade its present
competitive advantage based on low prices and homogenous products. Information
technology contributes to more effective and more efficient production by improving
coordination and communication among the value chain activities such as design,
supply, production, inventory, sales and distribution. Thus based on the above insights,
the construct of UC in this research is operationalised as two measured variables,
namely, Branding (Aaker 1989, Keller 2009) and Information Technology (Mata,
Fuerest & Barney 1995, Powell & Dent-Micallef 1997) (Figure 6-7).
Note: IT=Information Technology and Br=Branding.
Sustained competitive advantage is measured and reflected by Performance in terms of
Dynamic Capability
OL
In
QR
En
HRM
Upgrading Capability IT
Br
Figure 6-7: Construct of Upgrading Capability 1
Figure 6-6: Construct of Dynamic Capability 1

153
efficiency and effectiveness of business actions (Neely, Gregory & Platts 1996, Bititci,
Carrie & McDevitt 1997, Bititci et al. 2011). Effectiveness refers to the extent to which
customer requirements are met and therefore may be better measured using process
performance indicators such as Cost Control (Zhu 2004), Strategic Adaptability (Wu
2010), Order Acquisition (Bititci et al. 2011), Internal Cohesion (Lee, C., Lee, K. &
Pennin 2001; Bititci et al., 2011) and External Communication (Lee, C., Lee, K. &
Pennin 2001, Bititci et al. 2011).
Efficiency refers to how economically the firm's resources are utilised when providing a
given level of customer satisfaction and is therefore appropriately measured using
financial performance indicators such as Sales Profit Increase (Powell & Dent-Micallef
1997) and Sales Growth (Lee, C., Lee, K. & Pennin 2001, Wiklund & Shepherd 2009).
Therefore, drawn from the theoretical grounds and derived from the preceding EFA
results, the construct of Performance is reflected in this research by 7 variables (Details
in preceding Chapter 4), namely, Sales Profit Increase, Sales Growth, Cost Control,
Strategic Adaptability, Order Acquisition, Internal Cohesion and External
Communication (Figure 6-8).
Note: IC=Internal cohesion, SPI= Sales Profit Increase, CC=Cost Control, OA=Order Acquisition,
SG=Sales Growth, SA=Strategic Adaptability and EC=External Communication.
In summary, 4 constructs specified for the further confirmatory factor analysis consist of
7-indicator Performance, 5-indicator Dynamic Capability, 4-indicator Fundamental
Resource, and 2-indicator Upgrading Capability (Appendix 6-4).
Performance
IC
SPI
CC
OA
SG
SA
EC
Figure 6-8: Construct of Performance 1

154
6.4.4.3 Specifying the measurement model
With the 4 constructs defined, the next step is to specify the measurement model. The
AMOS software (Version 20) is applied to draw the measurement model in a graphic
diagram. The measurement model specifies two types of relationships, one is
relationships between the 4 constructs and the other is relationships between each
construct and its reflective indicators (Figure 6-9).
Figure 6-9: Measurement model 1 1
In the hypothesised measurement model (Figure 6-9), the four constructs or latent
variables are correlated to one another and they are represented by ellipses or circles.
Each of the 18 indicators, represented by a rectangle or square, is assumed to be
explained by only one underlying construct. So each individual indicator links to the
corresponding construct with a single-headed arrow pointing from the corresponding
construct to each indicator, which is based on the reflective measurement assumption

155
that latent constructs cause the measured variables.
Curves with double arrowheads between constructs represent covariance and symbol
“Cov” denotes the covariance. The symbol “L” denotes the loading estimate (or
interpreted as regression coefficients in CFA), that is, the extent to which the construct
is reflected by the corresponding observed variable or to which the observed variable is
explained by the correlated construct.
Each measured variable or indicator in Figure 6-9 also links to a measurement error
(designated with the symbol “e” in the circle or ellipse). The measurement errors are
independent of each other and of the construct and each of this error variance is an
unmeasured variable. Generally, two types of unique variance are represented by
measurement error terms. One is random error which reflects score unreliability and the
other is all sources of systematic variance not due to the constructs. In SEM, the
measurement error refers to the latter statement, i.e., the extent of inability of the
construct to fully explain its corresponding measured variables.
The constant “1s” that appear in this diagram are to set a scale to each construct or
unobserved variable. For each construct, one of the loadings is assigned as the unit one
for determining the construct’s measurement scale or metric, which it also does for each
error term.
The identification problem
Prior to assessing the model, the issue of identification should be considered.
Identification refers to whether the parameters of the model can be uniquely determined
by the sample data. Therefore, identification of the parameters is a prerequisite for
estimation of the parameters of a model (Kaplan 2000). Two necessary conditions plus
sufficient requirements have to be met for identification (Kline 2005: 169-175). The two
necessary conditions are (1) degrees of freedom ≥0 and (2) setting a scale for each latent
variable (including the measurement errors and constructs).
In this measurement model, a total of eighteen measured variables produce 18 error
variances. The four constructs with the eighteen variables result in 14 loadings as each
construct fixes a value of 1.0 to “set the scale”, which is the default by AMOS. Also the
four constructs will produce 10 construct covariances and variances, that is, one
variance for each construct plus the 6 unique covariances between constructs. Therefore,
the total number of estimated parameters in this model is 42 (42=14 construct loadings
+ 10 construct variances and covariances + 18 error terms variances). The total number
of unique variance and covariance terms is 171 (171 = 19×18÷2) and thus the degrees of

156
free (d. f.) are 129 (129=171-42)45
.
However, meeting the two necessary requirements does not 100 percent guarantee that
the measurement model is free from the identification problem. There are, however,
sufficient conditions for identification as follows: at least 3 indicators in a single-factor
CFA model and at least 2 indicators for each factor in a two- or more- factor CFA model
(Kline 2005: 172). The sufficient requirements for identification are met in this CFA
model. That is, there are 4 factors with 2 or more indicators for each factor. Therefore,
this is an over-identified measurement model.
Estimation method
Now the measurement model has been fully specified. The next step is to use a
computer programme to estimate the measurement model and to determine how well the
model fits the data. Estimation is based on the covariance matrix with the estimation
method of Maximum Likelihood, which is the most common approach to parameter
estimation and is also the default method in the AMOS programme for quite a few
reasons.
One major reason for the selection is that Maximum Likelihood results in a simpler
weight matrix than other estimators (e.g., Weighted Least Square) both conceptually and
computationally (Cortina, Chen & Dunlap 2001). However, Maximum Likelihood is
subject to the assumption of the multivariate normality distribution and violation of the
assumption may produce incorrect standard errors (Bollen 1989). In contrast, Weighted
Least Square is a distribution-free estimation technique but Weighted Least Square
requires much larger samples than Maximum Likelihood does, which often leads to
impractical implementation of research. Nevertheless, it is evidenced considerably that
Maximum Likelihood is more robust than other alternative approaches such as
Generalised Least Squares in case of violation (not extreme violation) of multivariate
normality (Bollen 1989). In addition, Maximum Likelihood is superior in terms of bias
in parameter estimates, TypeⅠerror rates and power (Jaccard & Wan 1995).
6.4.4.4 Assessing the measurement model
Measurement model validity depends on two facets, namely, measurement model fit
and construct validity. The measurement model fit is assessed through multiple indices
including Goodness-of-fit indices, absolute fit indices, comparative fit indices and
parsimony fit indices while the construct validity is examined through convergent
validity, discriminant validity and nomological validity.
45 Degree of freedomdom (DF) is determined by the equation (Hair et al. 2010): DF =
〔(p)(p+1) - k, where p is the
total number of observed variables and k is the number of estimated parameters (free). In this case, p equals to18.

157
Measurement model fit
SEM’s statistical goal is to test a set of relationships representing multiple equations
rather than any single relationship. Therefore, the overall measurement model fit instead
of any single construct fit is to be assessed based on the correspondence between the
estimated covariance matrix and the observed covariance matrix. To this end, some of
the most commonly used fit indices are selected for the assessment such as the basics of
Goodness-of-fit indices (e.g., and d.f.), absolute fit indices (e.g., RMSEA and GFI),
incremental fit indices (NFI and CFI) and parsimony fit indices (PARTIO and PNFI).
Chi-square ( ), termed CMIN in AMOS output, is the fundamental statistical measure
used to estimate the goodness-of-fit (GOF). It tests the difference between the observed
covariance matrix (termed S) and the estimated covariance matrix, termed , derived
from a theoretically specified model. That is, chi-square is the fundamental index in
SEM to test the correspondence between the hypothesised model and the observed data.
However, the test for model fit has limitations. The underlying null hypothesis ( )
of the chi-square test is the assumption of a perfect model fit and no difference between
the two matrices (i.e. : S = ). This is a stringent null hypothesis and thus easily
rejected for any overidentified model in practical application (MacCallum, Brown &
Sugawara 1996). However, in most applications of significance testing, the Null
Hypothesis is set up so that rejection of the Null Hypothesis supports the theory (Fornell
& Larcker 1981). Then the alternative hypothesis ( ) is that the observed covariance
matrix is any positive definite matrix. In this context, a relatively small with large ρ
value generally supports the theoretical model being tested, which implies that the
specified model with closely resembles the real-world relationships and effects. Another
limitation to using the chi-square test for model fit is that the power of chi-square is
unknown (Fornell & Larcker 1981). The power of a test is the ability to reject the null
hypothesis when it is false. However, when the power is low, the null hypothesis may
not be rejected when it is false, thus resulting in the risk of a TypeⅡerror.
Furthermore, complete reliance on for testing model fit is also not suggested
because chi-square itself has problematic properties (i.e., it is sensitive to sample size)
as implied by the following equation (Hair et al. 2010: 665):
= (n-1) (S- )
where n represents the overall sample size, S is the observed covariance matrix, and
the estimated covariance matrix. Therefore, the value of is influenced by either
the sample size (n) or the difference between the two matrices (S- ). Therefore,
adequately large sample sizes tend to result in rejection of the model via the test of exact
model fit. That is, a TypeⅠerror is committed and the null hypothesis is rejected when

158
it is true. Also in the second part of the function, the model degrees of freedom (k)
impact the number of the estimated covariance matrix and thus influence the value of
.
In this context, GOF easily creates biased output against large samples with a large
number of observed variables. It is a widely accepted view that any model is bound to
be rejected on statistical grounds if it is tested with a big enough sample or/and a large
number of variables. Therefore rejection of a proposed model particularly with a large
number of variables on purely statistical grounds is not necessarily over-worrying
(Arbuckle 1995).
In view of the above considerations, it would be useful to use Chi-square alongside
some other complementary fit measures such as the Goodness-of-Fit Index (GFI) and
Rooted Mean Square Error of Approximation (RMSEA) (Table 6-16). GFI is less
sensitive to the sample size. The higher is the value of the GFI, the better is the fit,
within the possible range of 0 to 1. GFI values greater than .90 are typically considered
good. Hair et al. (2010: 667) suggest .95 should be used. RMSEA indicates discrepancy
per degree of freedom and is widely used not only because it corrects the GOF bias
due to large samples and a large number of observed variables but also because it
provides a confidence interval, which provides additional information about precision of
the estimate. For instance, given a sample size and degrees of freedom, narrower
confidence intervals indicate more precise estimates than the broader ones. Generally, a
lower value of RMSEA suggests a better fit. Past research provided a cutoff value of .05
or .08 to support a good fit. For example, values less than .05 are considered as
indicative of close fit and values ranging from .05 to .08 suggest fair fit while values
greater than 1.0 are indicative of poor fit (MacCallum, Brown & Sugawara 1996). RMR
(Root Mean Square Residual) is another absolute fit measure, in which low values are
indicative of good fit. Normed is another absolute fit index and it is the chi-square
value divided by d. f., termed as CMIN/DF in AMOS output. CMIN/DF between 1 and
2 is considered very good fit and between 2.0 and 5.0 is acceptable (Hair 2010: 721).
Incremental or comparative fit indices are another class of indices. This class of indices
assess how well the estimated model ( ) fits the data in comparison to some
alternative baseline model, e.g., a null model that assumes all observed variables are
uncorrelated (independent model, ) or assumes that all observed variables are
correlated (saturated model, ). The Normed Fit Index (NFI) is the basis of the
incremental fit indices. Within the value range between 0 and 1, a higher value suggests
a better fit and an NFI of 1 is a perfect fit, with high values, greater than .95, being
indicative of a good-fitting model (Tabachnick & Fidel 2007: 716). The Comparative Fit
Index (CFI) is the most widely used indicator and a higher value of CFI suggests a

159
better fit within the value range between 0 and 1. CFI values greater than .95 are often
indicative of good-fitting models (Hair et al. 2010).
Parsimony fit indices identify the best model by comparing a set of competing models
in terms of either a better fit or a simpler model. The simpler model refers to the one
with fewer estimated parameters. Therefore, this group of indices is better used for
comparing the fit of more than one model in terms of complexity between them rather
than for assessing the fit of a single model. The Parsimony Ratio (PRATIO) is the
original measure and the lower values of the ratio indicate the simpler model. The
Parsimony Normed Fit Index (PNFI) is the most widely used parsimony fit index and
generally a higher PNFI value indicates a relatively better fit.
Based on an understanding of the chosen indicates, the estimation results are examined
in terms of a number of different model fit indicates for the specified measured model
(CFA1) (Appendix 6-5a). Some chosen fit indices from the results are presented in
Table 6-16 (CFA1). The value for Chi-square seems a quite large (CMIN = 387.772,
DF=129, ρ >.001). Considering the quite large sample size (n = 209) and the number of
variables (18), the statistical significance is acceptable, that is, the model is still
supported even though the null hypothesis is rejected (Hair et al. 2010, Kline 2005).
Values of absolute fit indices (GFI= .817, RMR=.099, and RMSEA=.098) suggest that
the model could be improved though normed (CMIN/DF=3.006) is acceptable. Two
incremental fit indices, NFI=.834 and CFI=.882, also imply the similar suggestion.
Model modification
It is argued that the model modification process is a post hoc exercise for fitting to data
and therefore this strategy is bound to lead to disappointment because it ignores the
actual process that generates the observed data (Spanos 1986). So researchers need to be
clear on the point that better fit may suggest closer alignment with the data but not
necessarily with the theory (Kaplan 2000: 9). However, SEM is a priori but being a
priori does not mean that it is exclusively confirmatory (Kline 2005). In practice, many
applications of SEM are a blend of exploratory and confirmatory analyses. When an
initial model does not fit the data, the researcher subsequently carries out a modification
process to achieve at least an acceptable model fit. The goal of this process is to make
theoretical sense but also to achieve a statistically reasonable correspondence to the data.
In the light of this understanding, several overall model fit indices suggest that the
measurement model for this study could be improved and therefore modifying the
measurement model is carried out prior to any further analysis.
Modification step 1: from CFA1 to CFA2
Loadings of individual items should meet the suggested cut-off value, otherwise they

160
could be candidates for elimination (Discussed in Chapter 6.3.1). Appendix 6-5b shows
that all the standardised loadings (ranging from .641 to .801) exceed the acceptable
guideline value of 0.5 (i.e., standard regression weights in the first column). However,
two items are identified as problematic. That is, both SG (S.E.= 0.116 with C.R.=11.692)
and SPI (S.E. = 0.118 with C.R. = 11.283) have very high S.E. values and very large
error variances (error variances = 0.782 and 0.874 respectively) at the 0.001 significant
level of C.R. >3.99246
for a two-tailed test with 18 degrees of freedom, which mean
over 78% of the variance of SG and over 87% of the variance of SPI cannot be explaned
by their construct of performance. In addition to this diagnosis, recalling that the two
variables (i.e., SP and SPI) are financial performance indicators whereas the remaining
5 in the same construct are process performance indicators, and also recalling that the
earlier discussion in Chapter 5 suggests that process performance might be a better
measure of sustained competitive advantage (SCA), the two variables may be
considered as candidates for removal even though both standard regression weights
exceeded the ideal loading cutoff of 0.7 (SG loading=.793, and SPI loading=.773). To
be cautious, it is also necessary to check the modification indices before the action of
deletion.
Values in the Modification index column suggest ways of improving a model by
decreasing the chi-square statistic faster than the increase in its degrees of freedom.
However, this device can be misused if there are no theoretical grounds for the
modification, though it does have a legitimate place in exploratory studies. When
financial performance data is adopted, researchers are suggested to use longitudinal data
rather than cross-sectional data for test the resources-SCA relationships because it is
argued that by adopting time-series approaches, how resources developed and acquired
in one period affects competitive advantages of firms in subsequent periods could be
examined while it would be difficult to demonstrate in cross-sectional settings (Barney
& Arikan 2001, Armstrong & Schimizu 2007). For example, Wiggins and Ruefli (2002)
use longitudinal design of 5-year data on return on assets (ROA) to test sustained
superior performance. Accordingly in line with this idea, this study only chooses the 5
process performance indicators by giving up the other 5 cross-sectional financial
performance indicators (Details in Chapter 6.3). This idea can theoretically back up the
following model modification process.
Modification indices for selected values are shown in Appendix 6-5c. The highest M.I.
score is relate to e12 and e13, which suggests correlation of e12↔e13 would decrease
the chi-square by M.I.= 42.410 (e12 linking SG and e13 linking SPI, referring to Figure
6-9). The next highest M.I suggests that correlation of e13↔FR would decrease the
46 C.R. is defined as critical ratio, i.e., the ratio of the parameter estimate to its estimate standard error. It indicates
whether individual parameter estimates are statistically different from zero. It is the traditional t-test.

161
chi-square by M.I.= 40.086. Correspondingly modification indices for regression
weights suggest that the highest M.I. score is related to the two indicators of SPI and
QC. That is, suggested regression from QC to SPI would decrease the chi-square by M.I.
= 26.754. Taking account of all the statistical indices but also of theoretical
considerations, instead of allowing modification of the suggested correlation or
regression, the two indicators of SG and SPI are deleted.
With the remainling 16 variables, the modified measurement model is tested again and
the results show in Table 6-16 (CFA2).
Table 6-16: Goodness of fit statistics and the guidelines 1
CFA1
(n=209, m=18)
CFA2
(n=209, m=16)
CFA3
(n=209, m=15)
Guidelines for a good fit
(n<250, 12<m<30)*
Basics of GOF
CMIN=387.772
(ρ= .000)
DF= 129
Basics of GOF
CMIN=203.069
(ρ= .000)
DF= 98
Basics of GOF
CMIN=158.243
(ρ= .000)
DF= 84
Significant ρ-values even
with good fit
--
Absolute fit indices
GFI= 0.817
RMSEA=0.098
(.087, .110)
RMR=0.099
CMIN/DF= 3.006
Absolute fit indices
GFI= 0.891
RMSEA=0.072
(.058, .086)
RMR=0.076
CMIN/DF= 2.072
Absolute fit indices
GFI= 0.906
RMSEA=0.065
(.049,.081)
RMR=0.066
CMIN/DF= 1.884
Absolute fit indices
GFI ≥.90
RMSEA ≤.08 with CFI
≥ .95
--
1≤ CMIN/DF 2
Incremental fit
indices
Incremental fit
indices
Incremental fit
indices
Incremental fit indices
NFI= 0.834
CFI= 0.882
IFI =
NFI= 0.891
CFI= 0.940
IFI = 0.940
NFI=0 .908
CFI= 0.957
IFI= 0.952
NFI≥.90
CFI or TLI ≥ .95
--
Parsimony fit
indices
Parsimony fit
indices
Parsimony fit
indices
Parsimony fit indices
PRATIO=0 .843
PNFI= 0.703
PRATIO=0 .817
PNFI= 0.728
PRATIO=0.800
PNFI= 0.723
--
--
Note*: n = sample size; m = number of observed variables; the guideline is based on Hair et al.
(2010:672).
The results suggest that the modified measurement model fit does improve substantially

162
(Appendix 6-5d). Selected fit indices are presented in Table 6-16 (CFA2). For example,
three GOF indices are improved by having lower values, i.e., CMIN/DF (reduced from
3.006 to 2.072), RMR (reduced from 0.099 to 0.076) and RMSEA (reduced from 0.098
to 0.072). Also the other three GOF index values are improved by having increased
values, i.e., GFI (increased from 0.817 to 0.891), NFI (increased from 0.834 to 0.891)
and CFI (increased from 0.882 to 0.940). Now most of the modified model fit indices
reach values that satisfy our guideline rules of thumb. However, the model modification
indices show that there is still room for further improvement.
Modification step 2: from CFA2 to CFA3
From the modification indices (Appendix 6-5e), the highest M.I. is 27.768 (which is a
conservative estimate of the decrease in chi-square that will occur in the case of the
suggested correlation) for the suggested covariance of the error terms between e8
(linking In) and e11 (linking Br). Correspondingly, the highest M.I. value is 17.663 for
the suggested regression from Br to In, which is relates to the suggested error term
correlation. There will be only a small gain in chi-square decrease at a cost of one less
degree of freedom. However, to allow the error terms correlation would be hard to
justify on theoretical grounds and it would also be difficult to interpret the results.
Therefore, instead of allowing modification of the suggested correlation or regression, it
is decided to delete the observed variable In, with the understanding that deleting the
indicator would entail a cost in terms of the model’s ability to reflect the relevant
construct. That is, the original 5-indicator Dynamic Capability becomes a 4-indicator
construct.
The measurement model is further modified resulting in 15 remaining indicators (Table
6-17). This further modified measurement model (i.e., Measurement Model 3) is then
estimated and the results of the model fit indices are presented in Appendix 6-5f and
selected indices are displayed in Table 6-16 (CFA3). Now the fit indices are further
improved and a good model fit is achieved. For example, the basic GOF index CMIN
( ) (171.780, DF= 97, ρ< .001) suggests a good fit. The CMIN/DF score (1.771) is
considered as a very good fit. Absolute model fit indices such as GFI (.904), RMR (.066)
and RMSEA (.061) also indicate a good fit. Comparative fit indices such as CFI (.957)
and NFI (.908) also reflect a good model fit. There is no reference guideline for the
parsimony fit indices but in comparison with the previous two models, this class of
indices is generally improved, e.g., the PRATIO value gradually decreased which shows
a better fit. Now the overall measurement model has a good fit and thus this up-to-date
measurement is suitable to proceed to examine the construct validity.
Construct validity

163
Construct validity reflects how well the conceptual construct is actually reflected by a
set of measured items. Three measures for construct validity are convergent validity,
discriminant validity, and nomological validity (Hair et al. 2010).
Indices in the following tables are calculated or edited based on Amos output estimates
of the measurement model (CFA3) (Appendix 6-5g), including regression weights,
standardised regression weights, covariances, correlations, variances and squared
multiple correlations.
Construct validity 1: Convergence validity
Convergence validity refers to the situation where there is a relatively high proportion
of shared variance in common among the measured items of each construct.
Convergence validity is assessed in this study by applying factor loadings, Average
Variance Extracted (AVE) and construct reliability (Table 6 -17).
Table 6-17: Convergence validity- Loadings estimates, S.E., t-value, standardised loadings,
AVE, construct reliability and Chronbach’s Alpha 1
Construct Measured
variable
Loading
estimates S.E. t-value
Standardised
loadings
AVE
Construct
reliability
Chronbach’s
Alpha
Upgrading
Capability
Br 1.000 -- -- .609 53.5% .518 .669
IT 1.164 .158 7.365 .836
Fundamental
Resource
QC 1.000 -- -- .692 56.5% .793
.821
SW 1.109 .124 8.970 .708
SR 1.065 .119 8.918 .728
CR 1.293 .126 10.255 .804
Dynamic
Capability
HRM 1.000 -- -- .742 56.8% .761 .823
OL 1.014 .097 10.495 .764
En 1.059 .099 10.713 .785
QR 0.842 .094 8.966 .645
Process
Performance
IC 1.000 -- -- .756 58.0% .833 .874
OA 1.127 .104 10.809 .771
EC 0.988 .093 10.593 .738
CC 0.985 .093 10.600 .729
SA 1.169 .101 11.586 .817

164
Factor loading is an important indicator for convergent validity. A minimum
requirement is that the loadings should be statistically significant. It is also suggested
that the standardised loading estimates should be over .5 and ideally over .7 (Hair et al.
2010:709). Results in this research indicate that all the loading estimates are statistically
significant with t-values exceeding 1.96. Eight standardised loadings exceed the ideal
value of 0.7 and the remaining seven standardised loadings are acceptably over .6
(Table 6-17).
AVE is a summary indicator of measurement convergence and Hair et al. (2010) suggest
that .5 or higher AVE scores indicate adequate convergence. AVE is calculated as the
average squared factor loadings on a construct, reflecting average communality of a
construct. This study’s results indicate adequate convergence with all the four constructs,
namely, Fundamental Resource (AVE=.565), Upgrading Capability (AVE=.535),
Dynamic Capability (AVE=.568) and Process Performance (AVE=.580) (Table 6-17).
Therefore, all the four constructs have AVE values greater than 0.05, which suggests a
good measurement convergence.
Construct reliability is also an indicator of convergent validity and measures how highly
the indicators are interrelated with each other. A high value of Construct Reliability
(CR)47
indicates a high degree of internal consistency. 0.7 or higher CR values suggest
good reliability while an estimate value between 0.6 and 0.7 is considered acceptable
(Hair et al. 2010: 710, Kline 2005:59). For this study, 3 of the 4 constructs have high
CR values of over .7, which is considered “good reliability”, whilst the remaining one,
Upgrading Capability, has a low CR value of 0.518 (Table 6-17). However, since both
the standardised loadings ( = .609 and = .836) and the AVE value (AVE = .535)
are adequate, this construct is retained as one of the dimensions of resources for the
subsequent analysis.
Cronbach's Alpha is widely used in social science and business for testing internal
consistency of the survey items, which is also somehow related to AVE (Cronbach
1951). The results are in line with CR and each construct has a slightly higher value
than the corresponding CR value, which also indicates high reliability among the items
(Table 6-17).
Construct validity 2: Discriminant validity
Discriminant validity refers to the degree of distinction of one construct from other
constructs involved in a SEM model. A rigorous test is to compare the average AVE
values for any two constructs with the corresponding squared correlation estimates
47 CR is computed from the squared sum of factor loadings ( ) for each construct and the sum of the error variance
terms for a construct ( ) as: CR = /
(Hair et al., 2007: 710).

165
between two corresponding constructs. Good evidence of discriminant validity would
be that the average AVE value is greater than the corresponding squared correlation
estimate. In Table 6-18, all the estimated correlations (i.e., ranging from .645 to .831)
between the four constructs are not excessively high, i.e., <.85 (Kline 2005: 73), which
is indicative of discriminant validity. By comparing the average AVE values and the
corresponding squared correlations, 4 out of the 6 AVE values are greater than the
corresponding inter-construct squared correlation estimates, namely, DC-PP (.574>.521),
FR-UC (.550>.416), FR-PP (.573>.473) and UC-PP (.558>.482). This result is
supportive of the discriminant validity of the model while discriminant validity is not
supported by the remaining 2 inter-construct relationships. That is, the AVE values are
less than the corresponding inter-construct squared correlation estimates, i.e., DC-FR
(.567<.691) and DC-UC (.552<.629). This lack of support for discriminant validity
between Dynamic Capability & Fundamental Resource and between Dynamic
Capability & Upgrading Capability may imply that these inter-constructs have more
commonality than distinction. However, considering that the inter-construct correlations
are not extremely high, this study proceeds to the subsequent analysis.
Table 6-18: Construct correlation matrix (standardised) and construct variance 1
DC FR UC PP
DC .823 .691(.567) .629(.552) .521(.574)
FR .831 *** .530 .416(.550) .473(.573)
UC .793 *** .645 *** .859 .482(.558)
PP .722 *** .688*** .693 *** .731
Note: Values below the diagonal are correlation estimates among constructs, diagonal elements are
construct variance, and values above the diagonal are squared correlations, with the average AVE
values of the two relevant constructs (in brackets). Significance level: ***=.001
Construct validity 3: Nomological validity
Nomological validity tests whether the correlations among the constructs make sense
from the theoretical perspective, normally by examining the path estimates and their
significance. The RBV theory suggests that resources (measured by Dynamic Capability,
Fundamental Resource and Upgrading Capability in this study) positively contribute to
SCA (measured by Process Performance in this study). The correlation matrix indicates
that all the four constructs are positively and significantly correlated to one another,
including Process Performance to the other three constructs measuring resources. The
correlations range from .645 to .859, all of which are significant at the 0.001
significance level (Table 6-18). Therefore, these correlations are consistent with the
theoretical foundation, though it is understood that not all of these correlations imply

166
causation.
Taking all results into consideration, construct validity in terms of convergent validity,
discriminant validity and nomological validity is generally supported and now this study
is validated to proceed to the second step of the SEM test.
6.4.4.5 Summary of the confirmatory factor analysis
In summary, with a sample of 209 cases, Confirmatory Factor Analysis (CFA) is first
performed through the Amos programme; maximum likelihood estimation is employed
to estimate and modify the measurement model. The initial measurement model is
specified in Figure 6-9 and post hoc model modifications result in 4 constructs reflected
by 15 indicators:
1) Fundamental Resource reflected by Skillful Worker, Customer Relationship, Supplier
Relationship and Quality Control,
2) Dynamic Capability reflected by Organisational Learning, Entrepreneurship, Quick
Response and Human Resource Management,
3) Upgrading Capability represented by Information Technology and Branding, and
4) Process Performance reflected by Strategic Adaptability, Order Acquisition, Cost
Control, External Communication and Internal Cohesion.
The modified measurement model has achieved a good fit and the constructs have been
supportively validated, which are ready to proceed to the next step of the analysis.
6.4.5 SEM step two: Structural modeling
This section proceeds to the second step of structural modeling which focuses on the
relationships between constructs. It starts from development of hypotheses and
specification of structural relationships. This is followed by estimating the fit of the
structural model and testing the hypothesised relationships.
6.4.5.1 Developing research hypotheses and specifying the structural model
The structural model and corresponding hypotheses are formulated based on the
theoretical underpinnings of RBV (Wernerfelt 1984, Barney 1991, Dierickx & Cool
1989, Peteraf 1993, Prahalad & Hamel 1990, Teece, Pisano & Shuen 1997). RBV
explores how firm-specific resources may achieve and sustain competitive advantage
(Amit & Schoemaker, 1993, Teece, Pisano & Shuen 1997, Lockett, Thompson &
Morgenstern 2009). According to the theory, resources with VRIN attributes are a

167
source of SCA , where the “value/V” comes from improved efficiency and effectiveness
in terms of lower cost, neutralized competition, or/and enhanced benefits; the
“rareness/R” attribute ensures a value creating strategy not simultaneously being
implemented by any current or potential competitor; the “inimitability/I” and
“non-substitutability/N” result from one or more of three reasons - history, causal
ambiguity and social complexity - and those attributes ensure that a firm’s competitive
advantage will not be replicated or replaced by the other firms, thereby ensuring that it
is sustained (Barney 1991).
In theory, the VRIN resources are assumed to contribute to SCA in the form of bundling.
Bundling refers to correlation and integration of the various resources that make it
extremely difficult for competitors to imitate them, which underpins SCA (Powell 1995).
Thus it is generally accepted that a specific or single resource is insufficient to create
SCA alone but rather it is combined or bundled resources that generate SCA (Ray,
Barney & Muhanna 2004, Wiklund & Sheperd 2009). In this study, the VRIN resources
are measured by three constructs, i.e., Fundamental Resource (FR), Dynamic Capability
(DC) and Upgrading Capability (UC), and the relationships between them are
hypothesised as follows (Figure 6-10).
: Fundamental Resource and Dynamic Capability are significantly and positively
correlated
: Fundamental Resource and Upgrading Capability are significantly and positively
correlated
: Dynamic Capability and Upgrading Capability are significantly and positively
correlated
As discussed above, FR is the fundamental factor for the firm to survive and can be
viewed as a prerequisite for competitive advantage. Therefore, FR is assumed to be
positively and significantly related to SCA (Barney 1989).
Further, FR is a source of SCA in a static situation according to the theory. However,
business conditions are rarely static but challenged by the external dynamics. Therefore,
given dynamic environment, SCA is conditional upon a firm’s Dynamic Capability as it
enables the firm to sustain its competitive advantage attained by renewing and
reconfiguring resources (Teece, Pisano & Shuen 1997, Eisenhardt & Martin 2000,
Teece 2007).
China is the world’s largest clothing manufacturer and exporter. The Chinese clothing
industry is now challenged by both domestic rising costs and global competitors, e.g.,
India, Turkey, Bangladesh and Vietnam, to list a few. The intensified global competition

168
is particularly felt in the labour-intensive and non-brand manufacturing segment, where
over-production of homogenous products without own brands inevitably results in
competition based on low price and low added value. Therefore, functional upgrading
via branding or/and technology leads to higher value-added ends with product diversity
and heterogeneity, which is a practical way to avoid the competitive advantage trap in
the low value-added manufacturing segment so as to achieve SCA. Hence, in the
present situation, upgrading capability is a strategic and critical source of SCA for the
Chinese clothing companies (Gereffi 1996, Bair & Gereffi 2003, Kaplinsky 2000).
In the earlier discussion, Process Performance measures SCA while Fundamental
Resource, Upgrading Capability and Dynamic Capability measure resource in three
dimensions. Based on the theoretical assertions of RBV, three more hypotheses are
formulated to specify the dependence relationships between resources and SCA as
follows (Figure 6-10).
: Fundamental Resource is significantly and positively related to Process
Performance (PP)
: Dynamic capability is significantly and positively related to PP
: Upgrading capability is significantly and positively related to PP
Figure 6-10: Structural model for SCA of the Chinese clothing industry 1
Note: In the diagram, the hypothesised causal relationships are depicted by straight lines with

169
single-headed arrows from exogenous construct to endogenous construct while correlations are
depicted by double-arrowed curves between two exogenous constructs. As a result, 3 path
parameters are to be estimated together with 3 construct covariances or correlations. Dependence
relationships are denotated by “P” (path coefficients); the notation “Cov” expresses covariance or
correlation. The endogenous construct of process performance also links to a disturbance variance
(denoted by “D”), representing the extent of the inability to be fully explained by the exogenous
constructs within the model.
6.4.5.2 Assessing the structural model and testing structural relationships
Assessing the validity of the structural model is based on comparison of the structural
model’s fit with the previous measurement model’s fit, so to assess the degree to which
the structural model decreases the model fit due to its specified structural relationships.
SEM also provides examination of the model diagnostics to examine if any model
re-specification is indicated.
Identification issue
The identification problem also pertains to the structural model, just as it does to the
measurement model. The structural model used for this study is defined as a recursive
model, where the paths between constructs all proceed only from the predictor construct
to the dependent construct and there is no feedback loop. A recursive SEM model never
has fewer degrees of freedom than its corresponding CFA model involving the same
constructs and variables (Hair et al. 2010: 734). This is true when examining the overall
structural model in terms of the degrees of freedom. The total number of unique values
in the structural model is 120 and the total number of estimated parameters is 36. This
gives a total of 84 degrees of freedom (84=120-36), which is exactly the same as those
of the Measurement Model 3 and thus the entire model is still identified.
Assessing the structural model’s Validity
Assessing the structural model’s validity involves comparison of the structural model
with the previous corresponding measurement model in terms of overall fit indices,
loading estimates, construct reliability and structural relationships. For a good structural
model fit, there should not be significant difference between the structural model and
the previous corresponding measurement model, i.e., Measurement Model 3 (Hair et al.
2010). For this dataset, a converged solution was obtained for the specified structural
model.
The results of overall model fit indices are shown in Appendix 6-6a. By comparing the
two models (Appendix 6-6b), there is no change in the selected fit indices, e.g, the
chi-square ( = 158.243 with 84 degrees of freedom and ρ<.001), the normed
chi-square (CMIN/DF= 1.884), the CFI (.952), RMR (.066), GFI (.906), RMSEA (.065

170
with 90% confidence interval between .049 and .081) and the PRATIO (.800). All of
these indices suggest a good structural model fit.
Examining the path coefficients and the loadings estimates also provides useful
information to support the overall model validity. The results of comparing the loadings
estimates of the two models indicate that this structural model has not changed, which
further confirms the measurement model’s stability (Appendix 6-6a). Comparison of the
construct reliabilities of the two models results in the same story and there is no
difference between the structural model and the previous corresponding measurement
model. Therefore, it can be concluded that structural validity is further confirmed in
terms of factor loadings and construct reliabilities.
Testing the structural relationships
From the above tests, the structural model is validated. However, failure to reject the
model does not necessarily mean that the individual hypotheses are confirmed. Also the
testing of hypotheses is the important part in assessing the structural model’s fit (Table
6-19).
Table 6-19: Structural parameter estimate- standardised and unstandardised, t-value, and ρ
value 1
Unstandardised
parameter
estimate
S.E. t-value ρ
Standardised
parameter
estimate
Hypotheses
confirmed (yes)
or rejected (no)
: FR PP .350 .176 1.996 .046 .298 Yes
: UC PP .311 .139 2.237 .025 .337 Yes
: DC→PP .195 .207 .942 .346 .207 No
:FR↔DC .549 .086 6.421 *** .831 Yes
:UC↔DC .666 .122 5.441 *** .793 Yes
:FR↔UC .435 .084 5.170 *** .645 Yes
Note: *** represents statistical significance at the 0.001 level (two-tailed test); the single-headed
arrow “→” shows dependence relationship while double-headed arrow “↔” shows correlation or
covariance relationship.
Table 6-19 shows the test results in terms of parameter estimates both in unstandardised
and standardised forms. All three path parameter estimates are positive, amongst which,
two parameters, i.e., FR→PP and UC→PP, are statistically significant at the .05 level (t >

171
1.960 for the two-tailed test) while the remaining one, i.e., DC→PP, is statistically
insignificant. All three covariance estimates, namely, FR↔UC, FR↔DC and UC↔DC,
are statistically significant at the .001 level. These empirical results in direction and
statistical significance are largely consistent with RBV theory.
However, the path parameter between Dynamic Capability and Process Performance
(i.e., DC→PP: ρ=.346)) is not statistically significant, which is not what would be
expected from RBV theory. Given the validity and robustness of the study, this
insignificant relationship requires further investigation and interpretation.
Figure 6-11 shows the standardised overall output in form of a path diagram, which
provides additional information relating to structural model fit. The results indicate that
59% of the variance of the endogenous construct (i.e., Process Performance) can be
explained by the three exogenous constructs, which suggests that Process Performance
is measured reasonably well in this model.
Figure 6-11: Standardised output in path diagram for the overall model 1
Next, comparison of factor loadings and standardised estimates between the structural
172
model and the Measurement Model 3 ensures that they have not changed substantially.
Otherwise there could be potential implications for the model re-specification (Hair et al.
2010). The factor loadings and correlations in both models remains unchanged
(Appendix 6-6c) while the standardised regression weights in the structural model have
decreased substantively from the corresponding correlations in the measurement model,
e.g., .688 (FR↔PP) down to .298 (FR→PP), .693 (UC↔PP) down to .337 (UC→PP),
and .722 (DC↔PP) to .207 (DC→PP) (Appendix 6-6d). The result that correlations in
the measurement model are much stronger than the corresponding regressions in the
structural model suggests that there might be some scope for possible model
improvement. Therefore, next to examine the model diagnostics for the possible model
re-specification.
Model diagnostics
Model diagnostics are used to examine whether there is any possibility that the model
could be improved through re-specification. At the first step, the measurement model
has been validated and therefore the focus at the second step is on the diagnostic
information about relationships between constructs. The construct model diagnostics
follows a series of steps from fit indices to standardised residuals and modification
indices to determine whether there is a need for the model re-specification (Hair et al.
2010).
Comparisons of the goodness-of-fitness indices between the structural model and the
measurement model has been discussed previously and the results presented in
Appendix 6-6b. The overall fit indices between the two models are no different, which
suggests a good structural model fit without any specific implication for structural
model respecification.
Then the next diagnostic step is to check the standardised residuals and modification
indices of the structural model to see whether the largest values suggest scope for
possible model improvement. On examining the residuals, no significant standardised
residual covariance exceeds and the largest two values are 1.610 (SW↔Br) and
-1.768 (SR↔HRM) (Appendix 6-6e). Also, there is no presence of any M.I. among the
structural relationships greater than the default threshold (i.e., M.I. = 4). Therefore,
there is no suggestion of any need for re-specification of the structural model.
In summary, the structural model has been validated and the results suggest a good
overall model fit. Results of testing the structural relationships are largely consistent
with the RBV theory.
173
6.5 Comparison of models
In the above section, the hypothesised model has been validated and the hypothesised
relationships tested. Now this section compares the original hypothesised model with
three alternative models and the comparison provides a way to avoid inference based on
the only selected model and “to increase the ‘fruitfulness of SEM research’ (Rigdon
1999: 220).
All three alternative models are tested by applying the same estimation method as applied
to the original model (i.e., Maximum Likelihood), using the same dataset. As for the
model selection method, a Chi-Square difference test is commonly used for the nested
models comparison (Steiger, Shapiro & Browne 1985). Meanwhile, Information criteria
indices such as the Akaike Information Criteria (AIC)48
and Bayesian Information
Criteria (BIC) are commonly used for comparison of both nested and non-nested models
and these criteria also allow for the simultaneous comparison of multiple models (Akaike
1983, Schwarz 1978). In comparison to AIC, BIC assigns a greater penalty to model
complexity, and therefore it has a greater tendency to pick parsimonious or simpler
models. The Expected Cross-Validation Index (ECVI) is similar to AIC except for a
constant scale factor. In addition, ECVI also provides the upper limit and lower limit of
a 90% confidence interval for the population. Based on the above understanding, this
research adopts AIC, BIC and ECVI for selection of the best-fitting model (Elster 1989,
Burnham & Anderson 2004) 49
.
6.5.1 Alternative model 1
According to the RBV theory, Dynamic Capability intervenes in the effects of the other
resources on SCA under external dynamics (Teece, Pisano & Shuen 1997, Collis 1991,
Teece 2000, Winter 2003) (discussed in Chapter 3.3.3). Dynamic Capability enables
firms to realise sustained competitive advantage by updating and reconfiguring
firm-level resources in dynamic environment (Discussed in Chapter 3.3.3.5). Given that
the present Chinese clothing industry is challenged by its dynamic environment (Details
in Chapter 2), therefore, this study proposes alternative model 1 (Figure 6-12). In
alternative model 1, the effects of both Fundamental Resource (FR) and Upgrading
Capability (UC) on Process Performance (PP) are hypothesised to be fully mediated by
Dynamic Capability (Ndofor, Sirmon & He 2011). These mediated relationships are
depicted as FR→DC→PP and UC→DC→PP. There is no direct relationship of FR→PP
or UC→PP, or in other words, both the direct relationships are hypothesised to be zero.
In this context, Dynamic Capability (DC) becomes an endogenous construct and the two
48 AIC = – 2df. Generally, the model with the lowest value (or, in some formulation, the highest value) is the one
having better fit with the data used. 49 ECVI is a similar index with AIC except for a constant scale factor.

174
exogenous constructs, i.e., FR and UC, are correlated to each other. Alternative model 1
then is tested by using the same dataset as was used in testing the original model.
Figure 6-12: Alternative model 1 1
The results suggest that alternative model 1 itself is acceptable according to the fit
indices (selected), e.g., = 165.122 (df = 86), RMR = .069 and RMSEA = .067
(Table 6-20). However, the results also suggest that except for a slightly lower BIC
value (346.761<350.567), alternative model 1 is no better than the original model in
terms of the selected model fit indices, e.g., both AIC (233.122>230.243) and ECVI
(1.121>1.107) values are higher in comparison to those of the original model. Therefore,
the next continues to seek possible better-fitting models.

175
Table 6-20: Comparisons of fit indices of the three hypothesised models 1
Original model Alt. model 1 Alt. model 2 Alt. model 3
Model fit indices
(chi-square)
Degree of freedomdom
/ df
RMR
GFI
RMSEA
CFI
AIC
BIC
ECVI
158.243
84
1.884
.066
.906
.065
.952
230.243
350.567
1.107
165.122
86
1.920
.069
.902
.067
.949
233.122
346.761
1.121
169.983
86
1.977
.075
.897
.069
.970
237.983
351.622
1.144
162.088
85
1.907
.069
.903
.066
.950
232.088
349.070
1.116
6.5.2 Alternative model 2
Alternative model 1 (Figure 6-12) is based on the logic of the Dynamic Capability
Approach, in which Dynamic Capability fully mediates the relationships between the
other resources (e.g., Fundamental Resource and Upgrading Capability) and Process
Performance. In comparison, the GVC scholars hold that industrial upgrading and
particularly functional upgrading are practical strategies for SCA of the clothing
companies, particularly manufacturing companies in developing economies (Detailed
discussion in Chapter 3.2.2). In this context, Upgrading Capability leads to sustained
competitive advantage by exploiting other resources (Gereffi 1999, Bair & Gereffi 2003,
Humphrey & Schumitz 2002, Tokatli 2003, Bair 2005, Gibbon 2008, Gibbon & Ponte
2008). In view of these theoretical underpinnings, it is assumes that Upgrading
Capability intervenes in the effects of other resources on Process Performance (Figure
6-13). The causal relationships are depicted as FR→UC→PP and DC→UC→PP.
Therefore, UC together with PP becomes an endogenous construct. Meanwhile, the two
exogenous constructs, namely, FR and DC, are correlated to each other.

176
Figure 6-13: Alternative model 2 1
Estimation results suggest that alternative model 2 itself turns out to be acceptable, e.g.,
=169.983 (df = 86), CFI=.970 and RMSEA=.069 (Table 6-20). However, except for a
slightly higher CFI (.970>.952), the over model fit indices (selected) are no better than
the original model, e.g., all values of AIC (237.983>230.243), BIC (351.622>350.567)
and ECVI (1.144>1.107) are higher in comparison with those of the original model.
Therefore, the study continues to seek possible models which may have better model fit.
6.5.3 Alternative model 3
Alternative model 3 is developed by combining theoretical considerations from those in
both Alternative model 1 and Alternative model 2. Theoretically, valuable and unique
firm assets are the potential sources of competitive advantage and firms can attain
competitive advantage only after deploying those assets effectively through the
organisational capabilities (both DC and UC included) (Barney 1997). Therefore, the
firm’s unique and valuable assets function as a base for organisational capabilities
which lead to services and products, and in turn the services and products generate
economic performance and possible SCA if the resources are subject to the VRIN
attributes (Hansen, Perry & Reese 2004).
In alternative model 3, UC is assumed to be directly related to PP; DC is assumed to be
both directly and indirectly related to PP, i.e., DC→PP and DC→UC→PP; FR, as a
fundamental factor but not necessarily leading to sustained competitive advantage, is

177
only indirectly related to PP via three paths, i.e., FR→DC→PP, FR→UC→PP and
FR→DC→UC→PP (Figure 6-14). Therefore, in alternative model 3, both Dynamic
Capability and Upgrading Capability are assumed to directly contribute to Process
Performance and at the same time partly mediate the relationships between other
resources and Process Performance.
Figure 6-14: Alternative model 3 1
Alternative model 3 is tested using the same dataset as before. The results suggest that
the model itself is acceptable in terms of the selected fit indices, e.g., =162.088 (df =
85), RMR=.069, CFI=.950, and RMSEA=.066 (Table 6-19). However, again, alternative
model 3 is no better than the original model in terms of the selected model fit indices,
e.g., both AIC (232.088>230.243) and ECVI (1.116>1.107) values are higher than those
of the original model though BIC (349.070>350.567) value is slightly better than that of
the original model.
In summary, the three alternative models are individually acceptable in terms of the
selected model fit indexes. However, by comparing the original model with the
alternatives for model selection, the results sufficiently suggest that the original model
still is the best one (Table 6-20). For example, both AIC and ECVI values for the
original model are lower than those for the alternative models. As for the BIC value, the
original model is not the lowest value, i.e., =350.567 versus =346.761,
=351.622 and =349.070. However, BIC penalizes the number of

178
parameters strongly, which may be the main explanation for the differences in the case
of these models. That is, the original model has 6 parameters while the alternative
models have 4 to 5. In addition, it is noted that AIC has theoretical advantages over BIC
(Burnham & Anderson 2002). Considering all the results, it can be concluded that the
original model is the best one in comparison to the other three alternative models.
6.6 Chapter summary
This chapter focuses on statistical analysis by using 219 responses collected for the
Chinese clothing industry. The analysis follows a series of sequential steps: 4 constructs,
namely, Fundamental Resource (FR), Dynamic Capability (DC), Upgrading Capability
(UC) and Process Performance (PP), are firstly extracted via exploratory factor analysis
(Chapter 6.3); the constructs are then modified and validated via confirmatory factor
analysis (Chapter 6.4.4); further, hypothsised relationships between the 4 constructs are
examined via structural modeling and the results suggest that FR, DC and UC are
significantly correlated to each other and that both FR and UC are significantly related
to PP while DC is not (Chapter 6.4.5); finally, the results via comparative analysis of the
hypothesised model with 3 alternative models further confirm that the original model is
the most appropriate one (Chapter 6.5).
Statistical analysis has confirmed hypothesised relationships in this chapter. That is,
whether and which of the suggested resources significantly lead to sustained
competitive advantage. However, social science and its detailed information of a social
phenomenon are always embodied in a rich context. The context in which social
phenomena are observed is sometimes too rich and too complex to be captured by those
measurable variables which comprise the statistical data. Therefore, the next chapter
provides further interpretation to the statistical results by studying three cases.

179
CHAPTER SEVEN: CASE STUDIES
7.1 Chapter introduction
Figure 7-1: Thesis structure and focuses of Chapter 7 1
Source: The author.
In the previous chapters, the statistical results suggest which of the resources
significantly contribute to SCA. To contextualize and illustrate the statistical results, this
Chapter2: Chinese clothing
industry in the global value chain
Chapter3: Sources of sustained
competitive advantage
Chapter5: Research methodology
Chapter6: Statistical analysis
Statistical results suggest that Fundamental Resource, Dynamic
Capability and Upgrading capability are correlated with each other; FR and UC
are significantly related to SCA
individually while DC is not.
Chapter7: Case studies
Chapter8: Discussion and conclusions
Chapter1: Introduction
CASE STUDIES
Rationales for case studies
Evidence of sustained
competitive advantage (SCA)
in each of the three cases
Cross- case evidence of
resources contributing to SCA
Cross-case evidence of the
resource-bundling effect Chapter 4: Conceptual framework
THESIS STRUCTURE
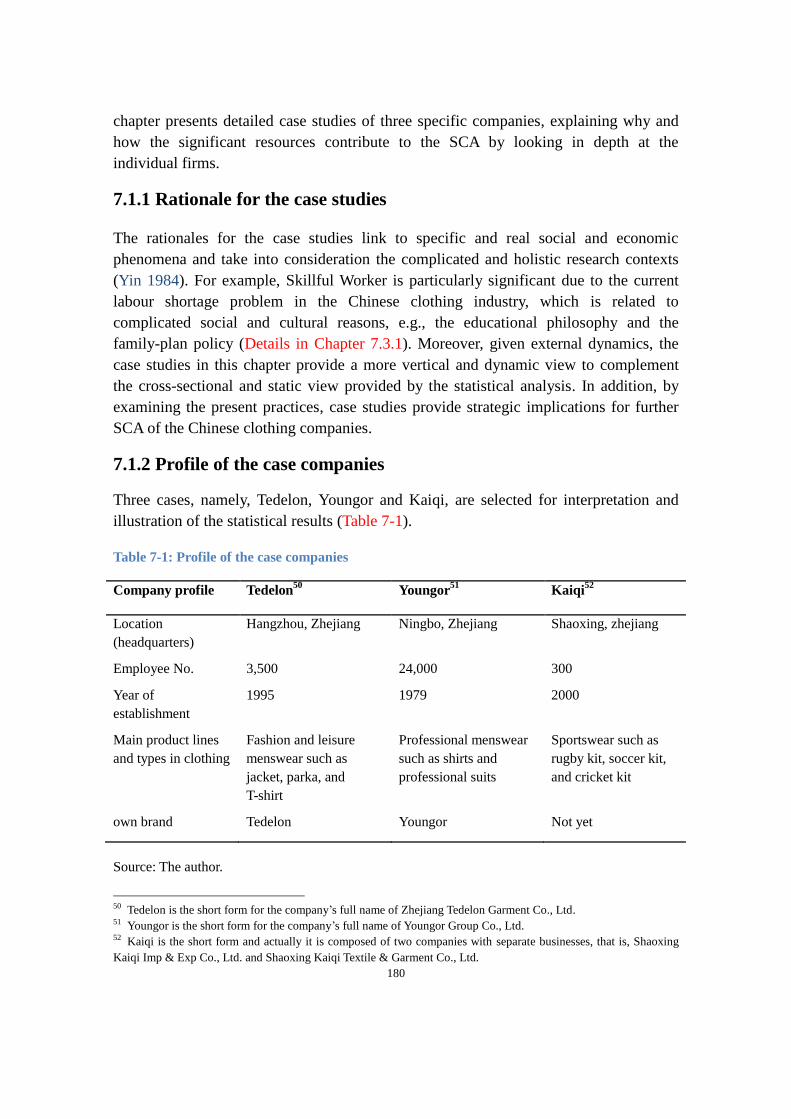
180
chapter presents detailed case studies of three specific companies, explaining why and
how the significant resources contribute to the SCA by looking in depth at the
individual firms.
7.1.1 Rationale for the case studies
The rationales for the case studies link to specific and real social and economic
phenomena and take into consideration the complicated and holistic research contexts
(Yin 1984). For example, Skillful Worker is particularly significant due to the current
labour shortage problem in the Chinese clothing industry, which is related to
complicated social and cultural reasons, e.g., the educational philosophy and the
family-plan policy (Details in Chapter 7.3.1). Moreover, given external dynamics, the
case studies in this chapter provide a more vertical and dynamic view to complement
the cross-sectional and static view provided by the statistical analysis. In addition, by
examining the present practices, case studies provide strategic implications for further
SCA of the Chinese clothing companies.
7.1.2 Profile of the case companies
Three cases, namely, Tedelon, Youngor and Kaiqi, are selected for interpretation and
illustration of the statistical results (Table 7-1).
Table 7-1: Profile of the case companies 1
Company profile Tedelon50
Youngor51
Kaiqi52
Location
(headquarters)
Hangzhou, Zhejiang Ningbo, Zhejiang Shaoxing, zhejiang
Employee No. 3,500 24,000 300
Year of
establishment
1995 1979 2000
Main product lines
and types in clothing
Fashion and leisure
menswear such as
jacket, parka, and
T-shirt
Professional menswear
such as shirts and
professional suits
Sportswear such as
rugby kit, soccer kit,
and cricket kit
own brand Tedelon Youngor Not yet
Source: The author.
50 Tedelon is the short form for the company’s full name of Zhejiang Tedelon Garment Co., Ltd. 51 Youngor is the short form for the company’s full name of Youngor Group Co., Ltd. 52 Kaiqi is the short form and actually it is composed of two companies with separate businesses, that is, Shaoxing
Kaiqi Imp & Exp Co., Ltd. and Shaoxing Kaiqi Textile & Garment Co., Ltd.

181
Note: Data in this table are based on conditions of the case companies at the end of 2011.
Selection of the three cases is based on several considerations. First of all, the case
companies are located in the main clothing clustered cities of Zhejiang Province along
the eastern coast region and this region is in a position to be representative to some
extent for the research population (Detailed discussion in Chapter 5.5.2). Secondly, all
cases are in the same region where the survey questionnaire is delivered, which makes
sense to provide illustration to the statistical results. Thirdly, all three case companies
achieved superior performance and established themselves quite well, which is useful
for interpretation of effects of resources on SCA (Details in section 7.2). Fourthly, the
structure of the companies’ size, i.e., one big, one medium-to-big and one medium, is
also important to be more representative to the research population.
The three companies vary in history, e.g., Youngor, a relatively old one, founded in 1979,
Tedelon founded in 1995, and Kaiqi, a relatively new one, founded in 2003. However,
they have all built up their competitive advantages, which are sustained up to date
(Details in Chapter 7.2).
All the companies began small and have grown to their current sizes. The number of
employees varies among the companies but they all exceed the national average level.
For example, Youngor employs over 20,000, which is a giant company with few
comparable in China, Tedelon about 3,500, which also is a big size, and Kaiqi about 300,
which is relative small however still over the national average size53
. Companies of this
size have to manage their resources in a relatively more standardised and strategic way,
which is helpful for the analysis of the resources in the individual case studies.
Clothing manufacturing and exports was the original and remains the main and core
business for all the three companies, though Youngor and Tedelon have also developed
and diversified into other industries. For example, Youngor has extended into property
development and financial investment; Tedelon has extended into animation production;
Kaiqi retains its specialisation in clothing manufacturing and exports.
All the three companies focus on a wide range of menswear though their main product
lines and marketing segmentations vary. For example, Tedelon originally positioned
itself in fashion and leisure menswear such as jackets, parkas and T-shirts; Youngor
originally targeted the professional menswear such as shirts and professional suits,
while Kaiqi specialises in sportswear.
In summary, the three cases share similar external environment and the dynamics in
53 According to the national bureau of statistics, the national average size is about 250 in 2010 (Details in Chapter
2.3.4).

182
terms of location, historical background and the industrial contexts. Therefore, given the
similar external environment, the superior performance or competitive advantage of the
three cases mainly results from the internal firm-level resources based on the RBV
theory (Penrose 1959, Wernerfelt 1984, Barney 1991, Teece, Pisano & Shuen 1997). In
addition, it should be noted that the three clothing companies chosen for the case studies
have been included in the previous data for the statistical analysis. This background
consistency enables the case studies in a better situation to provide reasonable
interpretations to the statistics results.
7.1.3 Analysis logic and structure
Figure 7-2: Recap of the research model for SCA of Chinese clothing industry 1
Source: The author.
Note: SW=Skillful Worker, CR=Customer Relationship, SR=Supplier Relationship, QC=Quality
Control, QR=Quick Response, OL=Organisational Learning, En= Entrepreneurship, HRM= Human
Resource Management, IT=Information Technology, Br=Branding, IC=Internal Cohesion,
EC=External Communication, CC=Cost Control, OA=Order Acquisition, SA=Strategic Adaptability.
The case studies aim to provide evidence illustrative of the statistical results rather than
to confirm the relationships and therefore the data analysis follow the hypothesised
model in term of the RBV logic and the corresponding indicators (Figure 7-2). That is,
given the similar external environment as the analytical premise, superior Process
SW
CR
SR
QC
Br
IT
En
HRM
OL
QR
CC
OA
SA
EC
IC
Fundamental
Resource
Upgrading
Capability
Dynamic
Capability
Process
Performance
183
Performance (measuring SCA) is attributable to the firm-level resources, i.e.,
Fundamental Resource, Dynamic Capability and Upgrading Capability. However
evidence of Dynamic Capability is not included in the examination of the cases due to
the statistical results that Dynamic Capability is insignificantly related to Process
Performance.
To study the cases, interviews with senior manager, CEOs and owners of the case
companies are conducted (Table 5-3). The interviews gather evidence and information
for illustration and interpretion of the statistical results.
Following the statistics logic, therefore, the cases studies are structured as follows: first
examining evidence of the superior performance of the cases (Chapter 7.2), proceeding
to illustrate resources which contribute to the superior performance (Chapter 7.3), and
ending with summary of the chapter (Chapter 7.4).
7.2 Sustained competitive advantage of the case companies
Linking back to the statistical model, SCA is measured by Process Performance which
is reflected in the statistical model by 5 indicators, i.e., Cost Control, Order Acquisition,
Strategic Adaptability, Internal Cohesion and External Communication (Figure 7-2).
Business process itself is the source of SCA and when it exploits the resources with the
VRIN (Value, Rareness, Imperfect imitability and Non-substitutability) attributes it
results in superior Process Performance (Barney 1991, Ray, Barney & Muhanna 2004).
The remaining parts of this section examine evidence of the superior Process
Performance from the cases. Three indicators of Process Performance are selected,
namely Strategic Adaptability, Cost Control and Order Acquisition, while the remaining
two are not selected. This selection is based on two considerations. Firstly, this is a
reasonable selection since each component of Process Performance has a representive
indicator in this selection, e.g., operational processes represented by Order Acquisition,
supportive processes represented by Cost Control and managerial processes represented
by Strategic Adaptability (Bititci et al. 2011). Secondly, this chapter focuses on the
resources perspective rather than the performance one. That is, the focus is on
illustration and interpretation of how and why the resources contributing to the superior
performance rather than the converse. Therefore, the other two indicators, i.e., External
Communication and Internal Cohesion, are not selected to avoid repetition and to keep
focused of this chapter. In view of the two considerations, the selected indicators are
sufficient to provide the evidence required for the analysis.
7.2.1 Evidence of SCA inTedelon
Tedelon was honoured with “Top 10 most competitive enterprises in the Chinese
184
clothing industry” in 2005 and once again in 201154
(Appendix 7-1). Tedelon’s sustained
competitive advantage is reflected in both stable sales (reflection of Order Acquisition)
and stable profits (reflection of Cost Control). For example, Tedelon remains among the
top 100 national clothing enterprises by both sales and total profits ever since 2002. The
sales ranked no. 82 and the total profits ranked no. 64 in 2002. The rankings by sales for
the latest 4 years from 2008 to 2011 were 63, 59, 48, and 61 respectively while ranking
by the corresponding profits were 38, 29, 31, and 41 respectively.
Tedelon’s SCA is also reflected in Strategic Adaptability throughout its development
stages. From a small and privately owned clothing factory in 1995 to a diversified group
company at present, Tedelon experienced four stages of evolution, with different
business focus and strategy at each stage (Appendix 7-2).
During the first stage (1995-2001), Tedelon established itself as a clothing company
with the original name of “Zhejiang Taizilong Clothing Limited Company” in 1995.
Taizilong was registered as the original clothing brand name and the corresponding
trademark was registered in 1997. During this period the main business focused on
clothing manufacturing and processing.
During the second stage (2002- 2004), Tedelon began its brand marketing campaigns,
e.g., employing a nationally popular movie star as the brand spokesperson in 2002 to
build up the brand image and brand popularity, setting up its own-operation selling
stores to control its distribution channel. The updated business strategy resulted from
adaptation to the contextual dynamics. That is, through nearly 20 years of fast
development, the Chinese clothing industry has entered into the branding operation era
since the late 1990s (Chen 2008: 3-4). In addition, Tedelon has built up its production
capability at that time so it was the time for Tedelon to further strengthen its market
through the branding strategy.
For the third stage (2005 to 2008), the business focus was further adapted to the
environmental changes. For example, Tedelon started animation production in 2005 and
this business diversification in the cultural industry intended to enhance the brand
connotation. The reason for this strategic adaptation was that through over 10 years’
discovery of the branding operation, Tedelon realised that in comparison of the hard
aspects (e.g., product and services), the soft aspects (e.g., brand culture and brand image)
were more important for sustainability of its competitive advantage (Ji 2004).
For the fourth stage (from 2009 up to date, by 2013), Tedelon focused on brand
extension (i.e., multiple brands and brand internationalisation). For example, Tedelon
54 According to the annual report by National Bureau of Statisitcs China, the number of large- and medium-sized
manufacturers of apparel, footwear and caps is 11,865 and 11,750 by the end of 2005 and 2011 respectively.

185
signed cooperative agreement with a famous Italian design company, Riccardo Rami
Studio, to improve its capability in product design towards the international level
(Appendix 7-2). This strategic adaptation responded to the effects of the global
recession and the intensified competition in the global market.
The four stages of Tedelon’s development are a clear example of continuously strategic
adaptation to the external environmental dynamics. As a result, Tedelon has now
established itself not only as a successful clothing manufacturer but also as a clothing
brand developer and operator.
7.2.2 Evidence of SCA in Youngor
Similar to Tedelon, Youngor’s sustained competitive advantage is firstly reflected in
both its sales revenue (reflection of Order Acquisition) and profits (reflection of Cost
Control). Both Youngor’s product sales revenue and gross profits have remained as no.1
among the top 100 Chinese clothing enterprises since 200155
(Appendix 7-3). Also
Youngor has enjoyed the largest market share in China’s shirt sales ever since 1994 and
the largest suit market share since 2000, e.g., 13.22% of the shirt market share and
13.54% of the suit market share in 2012 (Appendix 7-4).
Similar to Tedelon, Younger’s superior process performance is also evidenced
throughout the five development stages in terms of Strategic Adaptability to the
dynamics of external environment (Appendix 7-5). The first four stages were gradual
development of its manufacturing capability, expansion in quantity and size, e.g.,
horizontal cooperation with Kaikai Shirt Factory in 1983 (1st stage), establishment of
Youngor Clothing Company Limited in 1990, a joint venture with Namkwong Trading
Company Lmited (2nd
stage), business diversification into property development and
financial investment and vertical integration among the value chain activities (3rd
stage)
and international expansion (4th
stage). After the 4 stages’ development, Youngor has
established as a giant “aircraft carrier” in the Chinese clothing industry as well as a
group company with diversified businesses. However during the latest years since the
globally economic downturn in 2008, Youngor’s competitive advantage is challenged by
more intensified competition both at home and abroad. For example, the total revenue
year-to-year decreased by 18.20% in 2010 and by 20.49% in 2011; the gross operating
profits year-to-year decreased by 10.66% in 2010 and by 28.29% in 201156
. To adapt to
the external challenges and also to sustain the competitive advantage, the company is
further updating the development strategy (5th
stage), e.g., cutting the OEM exporting
business and restructuring the old brand image through brand extension from single
brand to multiple brands.
55 Source: China National Garment Association. 56 Source: Youngor Group annual reports, 1979-2011.

186
7.2.3 Evidence of SCA in Kaiqi
Kaiqi has also developed its competitive advantage. However, due to its relatively small
size, Kaiqi’s competitive advantage cannot be evidenced in comparable figures like
national rankings by sales or profits as Tedelon and Youngor do. Kaiqi’s competitive
advantage is reflected in the following remark by its manager-owner.
…In 2000, I left the company (refer to where he worked before) and started my own
foreign business together with my brother and the other two partners. At that time
there were quite a lot of people like us engaging in clothing exports. But till now only
less than 10% of them (like Kaiqi) are still doing well and 20%-30% just surviving
while the rest majority was eliminated due to competition. (Shen 5th
April 2013)
Kaiqi is a 100% export-oriented and now medium-sized clothing manufacturer and the
evidence of its SCA in term of Process Performance (e.g., Order Acquisition, Cost
Control and Strategic Adaptability) can be revealed by examining its development story.
Kaiqi experienced continuous business expansion in both clothing production and
clothing exports. Hence, unlike Tedelon or Youngor, there seems to be no clear division
of stages across its development. Actually Kaiqi’s business did not start booming until
2005 because the textile and clothing exports in China were subject to quota restriction
under the Multi-fibre Agreement (MFA) before. After MFA abolishment in 2005,
Kaiqi’s year-to-year exports doubled (i.e., reflection of Order Acquisition).
… from 100,000 (RMB) to 200,000 (RMB) and then from 200,000 (RMB) to 400,000
(RMB) … until up to 3 million (RMB) later on. It is relatively stable during recent
years… now about 80% are regular customers mainly in the UK and the US. Of
course we are also developing new markets and new customers mainly through
international fairs and via the internet platform. (Shen 5th
April 2013)
Therefore, to meet the increasing orders, Kaiqi gradually expanded its production
capacity. Meanwhile, Kaiqi developed its expertise in higher value-added ends
including upstream design and R&D to downstream customer services. As a result of
the strategic adaptation, Kaiqi has updated functionally from a mere export-oriented
assebly to now a full-package supplier in the GVC.
However, Kaiqi still remains in the clothing manufacturing segment without
establishment of its own brand. In recent years, to respond to the global recession and
dynamics in the clothing industry (details in Chapters 2.2.3 and 2.3.7), Kaiqi has started
to work on developing its own brand and moving further up the functional upgrading

187
ladder57
. Meanwhile, to react to the increasingly rising manufacturing costs at home,
Kaiqi is planning to move part of its manufacturing location to Vietnam, where the costs
are much lower than in China (Shen 5th
April 2013).
In summary, evidence suggests that all the three cases have developed some competitive
advantages at the national and even at the international level. The competitive
advantages were sustained up at the time when the research was conducted. The next is
to examine the internal resources which contribute to the SCA.
7.3 Resources contributing to sustained competitive advantage
The external environment, both national (e.g., China’s opening up and reform policy
and relevant incentives) and international (e.g., the accelerating transfer of the world
clothing production from high-cost developed economies to low-cost developing ones),
provides opportunities and possibilities for the fast and stable development of the three
cases. To turn these opportunities and possibilities into reality requires favourable
internal conditions. In other words, during the course of development there are many
competitors but the majority of these have now vanished or are still struggling for
survival. In this sense, the stable and fast development history of the three case
companies suggests that they possess some competitive advantage against their
competitors and that the competitive advantage must be significantly related to the
firm-level resources.
Referring back to the statistics in Chapter Seven, resources are measured by three
exogenous constructs, namely, Fundamental Resource, Dynamic Capability and
Upgrading Capability while SCA is measured by the endogenous construct of Process
Performance. After the SCA evidence has been examined in the three cases, the coming
section examines the evidence of the resources in relation to the proposed relationships
(Figure 7-3).
57 Source: Kaiqi’s website [online] available from <http://www.kaiqisports.com/> [5th May 2013]

188
Figure 7-3: Recap of the structural relationships of the research model 1
Source: The author.
7.3.1 Evidence of Fundamental Resource
The preceding statistical results indicate that Fundamental Resource is significantly
related to Process Performance. In this section, evidence of Fundamental Resource in
the three case companies is examined in terms of the 4 reflective indicators used in the
previous statistics, i.e., quality control, supplier relationship, customer relationship and
skillful worker.
Quality Control (QC)
QC is ensured through various means in all three companies, e.g., by improving
employees’ working skills and attitudes, by introducing updated machines and
equipments, by updating advanced processing technology and by adopting strict quality
control standards and processing management.
Tedelon introduced the most advanced production equipment from Germany (e.g.,
Durkopp sewing machines) and Japan (e.g., Brother sewing machines) and
production technology from Italy. The production process is guided by strictly
implementing the international quality management standard ISO9001: 2000 and the
environmental system ISO14000… From selection of raw materials and accessories
to production processes and further to final product packing, Tedelon always pursues
‘perfection’ in quality. (Yu 23rd
Feb 2012)
In 2002, Tedelon jackets, shirts and T-shirts were awarded “Zhejiang Quality Trust
worthy Products” and in 2007 Tedelon was awarded “National Inspection-free
Products”. There awards tell that Tedelon’s efforts in quality control were recognised at
both provincial and national levels.
Fundamental Resource
Dynamic Capability
Upgrading Capability
Process Performance

189
Similar to Tedelon, Youngor emphasises QC and proposes “Total Quality
Consciousness”58
as Chairman Li comments, ‘A famous brand is not created from just
advertisements… it is based on product quality, which can compete with the world
brands. Quality is an eternal theme and it is etched on every employee’s master
consciousness and the sense of responsibility’ (Li 2011). Youngor’s quality control is
ensured through strict manufacturing process, a four-tier system of management, and
quality control procedure and very strict quality control strandards that are more
stringent than the national standards. For example, Youngor’s textile quality exceeds the
standard Uster 2001 bulletin by 5%. In 2004, Youngor’s shirt was awarded “National
Inspection-Exempt Product” by the State Quality Inspection Administration.
Similarly, quality control (QC) is also strictly implemented in Kaiqi.
…We (Kaiqi) implement quality control via the responsibility system all through the
manufacturing process and also via the reward and punishment system… for
example, the monthly bonus will be taken away from who is responsible for if a
certain proportion of defective products come out. (Shen 5th
April 2013)
In addition, from the very beginning of its establishment, Kaiqi has continually been
updating to the most advanced machines and equipment as remarks by the owner, ‘…by
2008, we almost possess the world most advanced equipment for the clothing
manufacture… advanced machines and equipment enable us not only to save costs but
also to improve product quality’ (Shen 5th
April 2013).
Customer Relationship (CR)
Customer Relationship is another key prerequisite for the companies’ success and
competitive advantage. For example, during the early period when there were many
other small competitors engaged in clothing exports, Kaiqi’s strategy was to manage
customer relationships by cutting out all the intermediaries so as to keep direct links
with the foreign customers (Shen 15th
January 2013). That is, Kaiqi acquires orders and
organises the manufacture by itself and then exports directly. Kaiqi is still a family
business and the manager-owner contacts these customers himself. He visits them
regularly and has developed effective communication and built up mutual trust for
further business cooperation. In recent years, Kaiqi has developed strategic cooperation
with its customers and provides more extensive services beyond clothing manufacture
and export.
The strategic cooperation takes two steps. At the first step, Kaiqi establishes a
58 Scource: Yougor’s website available at
http://en.youngor.com/business.do?action=info&pid=200811190950271540&cid=200811211010001550 [18th Feb
2014]

190
horizontal collaboration or alliance with some domestic, often small and medium,
clothing manufacturers who are specialised in different lines of product manufacturing,
e.g., some in sweaters, some in trousers, some in jeanswears, some in accessories (e.g.,
buttons, zips, gloves and scarves), etc. Then at the second step, based on the domestic
alliance, Kaiqi can provide a package of products and services to its customers. The
foreign customers can acquire almost everything they need by dealing with just one
supplier and one order. Of course this also implies a double-edged sword to the buyers.
On the one hand, they could save transaction-related costs (e.g., costs of searching,
negotiation and communication) and on the other hand it could be costly for them to
shift to other suppliers. In this way, Kaiqi retains 80% stable and loyal customers and
Customer Relationship becomes a unique and valuable resource (Shen 15th
Jan 2013).
Customer Relationship to the clothing OBMs (e.g., Tedelon and Youngor) is different
from that to the non-brand OEMs (e.g., Kaiqi). As a non-brand clothing manufacturer,
there is no need to work on marketing because there are no end users. In contrast, when
the clothing manufacturer develops its own brand, customer relationship management
involves a broader range of issues, including, inter alia, product design, distribution
channel, brand positioning, brand culture, product pricing, promotion and marketing.
Taking Tedelon as an example, the company established and developed a unique
approach to customer relationship management, involving a number of aspects,
including 1) building of brand reputation through various media and social activities, 2)
terminal image maintenance via fashion store decoration and ingenious product
exhibitions, 3)keeping up to date with the latest fashions, 4) ensuring a rapid process of
product design, development and delivery, and 5) particularly high levels of customer
service. High levels of customer service include pre-sale, in-sale and after-sale services,
e.g., effective pre-sale advertisement, organiseing product release and order conferences,
dealing with sales contracts and in-sale delivery and shipping services promptly,
learning customers’ feedback, actively and practically dealing with their complaints, etc.
(Yu 23rd
Feb 2012).
Skillful Worker (SW)
Recruiting and retaining skillful workers is particularly important to SCA of the
clothing manufacturers. However, due to the widely perceived “labour shortage”
problem, particularly in the eastern coast region, recruitment difficulties are currently
quite common, exacerbated by rapidly rising labour costs.
In Huangshan Industrial Park (Tedelon’s old manufacturing base), most skillful
workers are aged and some have to work by putting on glasses (thus replacement in
urgent need but)… currently it is difficult to recruit experienced youngsters here. (Yu

191
23rd
Feb 2012).
The recruitment difficulty results from the relatively shortage of potential available
workers, which has its causes rooted at least in part in China’s policies and cultural
context (Zhang 4 Nov 2013). For example, China has adopted the “One couple, One
child” family-plan policy since the early 1980s.
Majority of the new generation grows up in a single-child family where they could be
over-cared for at home from their childhood. Later on from their education, they
naturally cultivate a special mental attitude towards their work. That is, they have to
get a well-paid and non-physical job which they think is more decent than physical
one. In other words, they are unwilling to pick up any “tough” and less-paid job like
working in a clothing factory. (Yu Nov 2013)
Actually most of the workers, predominantly female, in the clothing factories of the
eastern coast regions are immigrants from the less-developed central and western
regions. Most of them start as non-experienced and non-skilled workers and then build
up their skills and experiences while working. In this context, investment in training
these new workers and then retaining them is important for the SCA strategy of the
clothing firms. Here is the description of Tedelon case as an example.
All new workers recruited accept induction training. The technicians and
administrative staff have access to regular and on-the-job trainings while the
production staff, more often than not, builds up their skills and experiences through
regular activities such as team work and communication for 30 minutes every
morning at the work place. The promotion and salary incentive systems, as well as the
company culture, are effective at retaining the old and experienced workers. (Yu 23rd
Feb 2012)
Youngor has similar employees’ training and retention systems to Tedelon59
. For
example, Youngor has regular training programmes to improve employees’ professional
knowledge and capabilities concerning store decoration, goods display, marketing
techniques, logistics, etc. Moreover, Youngor has established cooperation with some
universities and high educational institutes, e.g., Donghua University and Zhejiang
Textile College, where young graduates provide labour force reserve for the brand
studios, first-line store management and new product development. By the end of 2012,
the total 24,583 employees consist of different professional skills: 36.48% production
workers, 41.37% sales persons, 2.02% technicians, 1.48% financial staff and 18.67%
59 Source: Youngor website at
http://www.youngor.com/job.do?pid=200811190230552627&cid=200811190230552627.

192
administrative personnel60
.
Supplier Relationship (SR)
Good relationships with suppliers are also fundamental for the clothing company and
therefore the case companies manage good relationships with their suppliers. For
example, Tedelon develops stable relationships with the regular suppliers based on the
principle of mutual benefits.
Tedelon has about 60-70 regular textile and accessory suppliers all over the country.
We have to keep regular contact and effective communication with them to ensure that
their supplies exactly meet our demand at the exact time… (This is important because)
Tedelon produces fashion products and this requires for quick response and frequent
changes in design, fabric, and textile color on the seasonal base… particularly the
‘Fashion China’ product line is designed mainly for embellishment of our flagship
stores and the textile for the production are mainly exported from foreign suppliers.
(Zhang 9th
Mar 2012)
In contrast to Tedelon, Youngor establishes its own complete value chain system within
the company from the upward material supply to the downward marketing. In this way,
Youngor manages the supplier relationship between its own different subsidiaries or
departments which avoids market dysfunctions and also save supply related costs
(discussed in Chapter 8.4.4).
7.3.2 Evidence of Upgrading Capability
The preceding statistical results indicate that Upgrading Capability is significantly
related to Process Performance (Figure 6-9). This section examines the case companies
to find out evidence of Upgrading Capability in terms of its two indicators, namely
Branding and InformationTechnology (IT).
7.3.2.1 Upgrading via Branding
The two big companies, i.e., Youngor and Tedelon, have already built their branding
capabilities and successfully established their own brands through many years of effort
and practice while Kaiqi has not yet established its own brand but the owner-manager
has realised the importance of this and is working on its development.
Branding inYoungor
Youngor established its own brands (e.g., Beilun in 1986 and Youngor in 1990) at the 60 Source: Youngor’s yearly reports available at the company website at
http://www.youngor.com/investors.do?pid=200811180618348600&cid=200811180619446440.

193
early development stage (Appendix 7-5). Since the Youngor brand was born it has
become popular nationally and gained a series of achievements. For instance, both
Youngor shirts (since 1994) and Youngor suits (since 2000) have enjoyed the no.1
market share in China for consecutive years; Youngor was award numerous titles and
honors including ‘China Famous Brand’ in 1994, ‘Well-known Chinese Trademark’ in
1997, ‘Top China 500 Manufacturing Enterprises’ in 2006, and ‘Most Protected
National Brands’ on quite a few occasions (Appendix 7-3). In 2007, the Youngor brand
ranked no. 52 on the World Brand Lab’s list of China’s top 500 most valuable brands,
with estimated brand asset at 9.18 billion RMB (about 1.46 billion USD)61
.
The purpose of branding is set out in Youngor’s corporate vision as ‘to create an
international brand, to build a century enterprise’62
. Through many years’ continuous
efforts in brand management and brand development, Youngor brand successfully
achieved popularity throughout Mainland China, particularly during the 1990s and the
early 2000s. However, according to Chairman Li’s reflection on the early success,
Youngor was not really a brand company at that time.
During the course of China’s transformation from a planned economy towards a
socialist market economy, ‘Famous Brand’ often contained the specific contextual
meanings, e.g., a large sum of investment in advertising and Guanxi. However, brand
is fundamentally based on market acceptance. A strong and competitive brand needs
further advancement and support in all aspects.That is, in addition to those at the
material level such as premium quality, unique product design and effective customer
service, those at the spiritual level such as brand culture, brand image, brand
personality and core brand entity are more important. Youngor was merely a clothing
company winning “China’s Famous Brand” but not yet a “Chinese brand company”
at that time. Therefore, to be a brand company and to establish an internationally
strong brand, Youngor still has a long way to go. (Li 2010)
In view of the above considerations, Youngor has never ceased efforts at brand
management and brand development, which are particularly reflected in developing its
distribution channel at an early stage, investing in R&D and in extending its multiple
brands in recent years.
Branding in Youngor: Distribution channel
In menswear, product style, design and quality can quite easily be imitated, whereas
those company specific resources such as brand and distribution channel are a more
61 World Brand Lab evaluates the Chinese brands, which is based on the three key indicators reflecting brand impact
power, i.e., market share, brand loyalty, and the leading power in the globe. 62 Source: Youngor’s office website available at http://www.youngor.com/about.do?cid=200811180345589700.

194
effective source of SCA (Guo 2009). Youngor realised the significance of its distribution
channel for SCA in the late 1990s and from 1998 onwards it started to develop its
self-operated distribution channels mainly by setting up outlets in shopping malls and
specialty shops in almost all the first-tier and second-tier cities across the nation. By the
end of 2005, Youngor had established this new distribution system. During recent years,
Youngor continuously decreased the number of small stores and franchising outlets
whilst setting up large flagship stores in Hangzhou, Shanghai and other provincial and
municipal cities. Most of these flagship stores are properties invested in by the company
and are luxuriously decorated (Zheng 2011). In this way, these stores enhance the brand
image and facilitate customers’ enjoyable purchasing experience in the pleasant
shopping environment (Zheng 2011). By the end of 2011, Youngor possessed 2302 sales
terminals, amongst which self-operated specialty stores (573) and shopping mall outlets
(1302) account for 80% of all domestic sales with franchising stores (480) and group
purchase63
as supplementary (20% of the total sales) (Table 7-2).
Table 7-2: Youngor’s distribution channel, 2011 1
Self-operated
stores
Shopping
mall outlets
Franchising
stores
Group
purchases
Sum
Store number 573 1302 480 n/a 2302
Percentage of the
total domestic sales
43% 37% 9% 11% 100%
Source: author’s creation based on Youngor’s annual reports, 2011.
Branding in Youngor: R&D investment
The most important and also generally neglected problem for the Chinese
manufacturing industry is Research and Development (R&D). Youngor took 5 years
to reach the advanced world standard in the clothing manufacturing but R&D is still
at the primary stage. Made-in-China as a whole is standing at the primary stage in
R&D. (Li 2008)
Youngor is a leading clothing enterprise in China in terms of R&D investment and there
is no doubt that Youngor has now achieved distinctive edges in technology, e.g., the
non-iron shirt processing technology and the hemp textile technology.
Youngor has invested about 3%-5% of its sales revenue in R&D each year since 2005,
which is far more than the national average level, i.e., less than 0.5% (Guo 2009a).
63 Group purchase normally refers to the consumer is an organiseation instead of individuals, e.g., a hotel purchasing
uniforms for its employees.

195
Youngor’s R&D focuses on high-grade textile and fabric, new processing technology
and product design.
Youngor successively introduced HP non-iron technology, VP non-iron technology and
the nanotechnology from Japan and America. Based on introduction, digestion and
absorption, and through R&D and innovation, Youngor successively developed and
updated its non-iron shirt processing technology (Figure 7-4).
.
Figure 7-4: Youngor's timeline of non-iron technology development 1
Source: (Guo 2009b)
HP is a Japanese patent, which is suitable for general cotton fabric but not for
high-count64
cotton and the non-iron effect tends to be unstable after repeated washes.
Based on the introduction of HP technology, Youngor launched its wrinkle-free and HP
non-iron cotton shirt in 1996.
The VP processing technology was originally a patent of ATP, an American company,
suitable for the mixed fabric of cotton with polyster. By combining the nano technology
with the VP technology, Youngor developed the “processing method of non-iron nano
shirts (nano VP)” and successfully applied for the patent in 2004 but this was
abandoned later because it tends to cause high formaldehyde content.
64 Cotton count measures linear density. It is the number of hanks within a fixed yard of a fixed weigh of the material.
In this measure, the higher the number, the finer the yarn is.
HP
(Pure cotton
fabric)
VP
(Cotton-Polys
ter shirt)
Nano VP
(Cotton shirt)
DP
(Pure cotton shirt)
Tech
no
log
y
1996 1999 2004 2005
HP
(Pure cotton
fabric)
VP
(Cotton-Polys
ter shirt)
Nano VP
(Cotton shirt)
DP
(Pure cotton shirt)

196
DP is a new non-iron processing technology for pure cotton shirts and the patent was
initially owned by Youngor in 2005. It solved all the disadvantages inherent in the
previous HP and VP technologies. DP non-iron pure premium cotton (used for shirts) is
a high-grade product and soon was awarded “State Key New Product”.
Youngor’s investment in R&D has already led to benefits, including a stable market
share in shirts and suits (Appendices 7-3 and 7-5) and has contributed to the company’s
rapid development and hence sustained competitive advantage.
Branding in Youngor: Multiple brands
Youngor has established its brand and won brand reputation nationwide over the past 20
years. The brand is popular in China, particularly among middle-aged businessmen and
the brand is associated with images such as successful businessmen, traditional and
favorite suit, middle-aged menswear, etc. Unfortunately, these perceptions also contain
some challenging connotations like conservative, lack of fashion, too much Chinese
style, lack of international taste, etc. (Dai 2010). Therefore, strategically the company
has to address the issues of how to keep the existing customer group whilst attracting
new consumers in order to achieve sustained development. To this end, Youngor
launched its multi-brand strategy in Beijing in 2010. The five brands are CEO, MAYOR,
GY, HEMP and HSM. The first three are subdivisions of the original YOUNGOR brand.
Each brand is specifically positioned to cater for a different market segmentation
serving distinctive product styles to satisfy different customers’ demands.
CEO follows the original brand style in the new field of business and leisure. MAYOR
is positioned at the high-end of the market and its targeted customers are successful
businessmen. Customised marketing is the main type of sales with ready-made clothing
stores as the second sales. By the end of 2011, there were about 25 stores and 23
customised selling spots in China. GY targets youngsters in the 25-35 age-group who
pursue the latest fashions. Brand awareness is enhanced through the GY official website
and GY blog. By the end of 2011, there were about 112 GY stores all over the country.
China HEMP is a brand advocating a healthy and comfortable life. Hemp products are
made from Youngor’s self-innovated and environmental-friendly hemp materials. By
the end of 2011, there were 10 HEMP stores in China in addition to the brand flagship
shop on the web. According to the 2011 annual report, 90% HEMP products are sold on
online rather than in the real shops. Hart Schaffner Marx (HSM) is a famous American
menswear brand. Youngor gained the brand operation and management in Mainland
China, HongKong SAR (Special Administrative Region) and Macao SAR. HSM
positions at American-style business and casual wears, through which the company
aims to gain experiences to build and manage a world-class brand. By the end of 2011,
there were 86 HSM stores in China.

197
Through brand development and brand operations, including its distribution channel,
R&D investment and multiple brands, Youngor is transforming its business mode from
the previous quantity expansion towards quality enhancement and from the previous
manufacturing-based towards brand-based enterprise. Branding is firm-specific and also
hard to be imitated by competitors, and therefore brand-related resources are the source
of Youngor’s SCA.
Branding inTedelon
Brand culture refers to a combination of those elements including brand name,
logos, design, and all cultural traits and phenomena, in which the product or
service is operated (Yang 2010).
Since it was first established, Tedelon has gradually built up its nationwide popularity
by continually investing in the development of its distribution channels and in brand
marketing, via, for example, advertising on CCTV (China Centre TV) and local TVs, in
magazines and newspapers, light boxes and billboards. Tedelon aimed to become an
international clothing company via brand development, e.g., adopting the new
trademark and the corresponding logo (Figure 7-5), proposing the ‘5153’ strategy for
developing multiple brands and brand internationalisation and cooperating with the
famous Italian design company, Riccardo Remi Studio, for improving capability in
design. Through the cooperation, ‘Rami Studio provides updated fashion elements and
fashion trends for Tedelon to digest and absorb and then to turn them into fashion design
and put into manufacture (Yu 23rd
Feb 2012)’. Moreover, Tedelon’s unique branding is
particularly reflected in construction of the brand culture.
Branding in Tedelon: Brand culture
Brand culture is an important part of corporate culture. Brand culture is the carrier of
corporate culture and contains ideas, values and aesthetic appreciations of the company,
which the customers appreciate and identify with so that they enjoy the products and
services and share the corporate culture at the same time (Wang 2009). That is to say,
brand culture contributes to effective communication with customers and thus enhances
brand popularity, brand reputation and customers’ loyalty. Also, in a similar way the
brand culture contributes to more effective internal cohesion, which integrates
employees’ personal development with the mission of the company. For instance, when
talking about effects of the brand culture on the employees, Yu told the following story:
By the end of the first year (2010), we found the employee turnover here (in Anhui
industrial park) was quite serious. We reflected later that the main reason was
probably insufficient communication with the workers… The following year (2011),
we improved in this respect and our staff learned more about Tedelon and the brand

198
culture. As a result, the employee turnover dropped dramatically, being only about 3%
by the end of the year. (Yu 23rd
Feb 2012)
Tedelon adopted a new brand name and the corresponding brand logo in 2008.
The new brand “Tedelon” is in English letters while the original name “太子龙”
comprising three Chinese characters written beneath (Figure 7-5). The new brand
name “Tedelon” sounds very similar to the original name, which would be written
in Chinese Pinyin as “Tezilong”. However, the new version in English letters is
more suitable for the international market. The new logo looks like an ancient
Chinese shield, giving a kind of beautiful aesthetic feeling and conveying the
unique brand benefit to the customers.
Source: Google image65
.
Practically, based on the corporate culture, Tedelon built up its brand culture in a series
of sequential steps (Appendix 7-1). At the initial stage (1995-2000), the company
adopted a corporate mission ‘to carry forward the national brand culture and to enhance
the national brand competitiveness’ (弘扬民族品牌文化,提升民族品牌竞争力). The
corresponding brand advertisement was ‘confidence, naturalness, and fineness’ (自信、
自然、极致), which expresses the initial prototype of the brand culture. At the second
stage (2001-2006), based on the previous company mission and the advertisement, the
leadership team gradually put forward the basic concepts about the company aims,
management ideas, quality guidelines, company slogan, new advertisements, etc., which
comprised the key elements of the company culture. The company’s spirit ‘confidence,
naturalness, fineness’ (自信、自然、极致) formalises the core idea of Tedelon’s culture
65 Source: Online available from <
https://www.google.co.uk/search?q=tedelon+%E5%A4%AA%E5%AD%90%E9%BE%99&rlz=2C1GGGE_zhGB05
37GB0537&es_sm=93&source=lnms&tbm=isch&sa=X&ei=qIh0VPmoFI6P7AbT3YHIBA&ved=0CAkQ_AUoAg
&biw=1366&bih=667#tbm=isch&q=TEDDLON+%E5%A4%AA%E5%AD%90%E9%BE%99&facrc=_&imgdii=_
&imgrc=Lu-v_zdD05ZkxM%253A%3B-RCnCp4qdja3BM%3Bhttp%253A%252F%252Fwww.kansp.com%252Fupl
oads%252Fallimg%252Fc141011%252F1412a3463c0-1c012.jpg%3Bhttp%253A%252F%252Fwww.kansp.com%25
2Fzixun%252Fzonghe%252F2014%252F1011%252F165835.html%3B612%3B293 > [24th May 2012].
Figure 7-5: Tedelon’s new brand name and new logo 1

199
system. At the third stage (since 2007 till now), the company is scientifically and
systematically developing the brand culture, by for example adopting the new name and
the new logo, developing multiple brands and brand internationalisation in design.
Consequently, publication of the book ‘Scientific View of Brand Development’ (科学品
牌发展观) in 2009 marks a mature stage for construction of the brand culture.
In summary, the business philosophy of Tedelon is to create competitive advantage
through brand management and brand development, where the brand culture is at the
core. In other words, Tedelon gains its competitive advantage and SCA through
development of its brand culture.
Branding in Kaiqi
Kaiqi’s development has involved continual upgrading, including ⑴ product upgrading
from simple and general products to more sophisticated and complicated ones, and ⑵
process upgrading by introducing more advanced processing technologies and advanced
machines and equipments. However, Kaiqi has not consciously adopted any strategy to
sustain its present competitive advantage either in the manufacturing segment or for the
foreign trade. However, in recent years the owner-manager has realised the importance
of own brand.
Given the increasing competition in the manufacturing segment, those who are based
on low price and homogeneity are easily eliminated and only heterogeneity and
uniqueness may be the core source for sustainable development. Own brand is the key
path for heterogeneity and uniqueness. (Shen 5th
April 2013)
Although Kaiqi still remains as a non-brand clothing manufacturer, it is no longer
merely an OEM. As Sheng claims, Kaiqi now has the capability to develop its own
brand.
.… Actually we have developed strategic cooperation with our customers… Besides
clothing manufactureing, We provide a broad range of packages including investment
in product and processing R&D, product design and manufacturing, exchange of
market information, etc. (Shen 5th
April 2013).
The main reasons why Kaiqi has not yet established its own brand are concerned with
the costs and the risks. As the manager-owner reflected, ‘Kaiqi is setting about
establishing its own brand… thinking of the web-brand as a start which is less costly
and less risky’ (Shen 5th
April 2013).

200
7.3.2.2 Upgrading via Information Technology (IT)
To gain and retain competitiveness, the clothing companies need upgrading via
Information Technology (IT) in addition to upgrading via branding. IT resources vary
amongst the three companies. Both Youngor and Tedelon have developed their own
resources in IT while Kaiqi’s Upgrading Capability in IT is vague and implicit.
IT in Youngor
Youngor started to implement a ten-year information management strategy in 2000 and
invested 1200 million RMB during the first 5-year implementation. As a result by the
end of 2005, the company’s inventory decreased by over 30% which saved stock cost of
over 1000 million RMB; order processing and procurement management became
automatic and more effective so that the production cycle was shortened to 45 days
from the previous 90 days; the internal communication operated more smoothly; losses
caused by human errors decreased by 20%66
.
Youngor has also established its comprehensive and nationwide information
management systems, including an ERP (Enterprise Resource Planning) production
management system, a DRP (Distribution Resource Planning) distribution system, a
POS (Point of Sale) retailing system, an integrated platform system for supply chain
management and a database searching system67
. Implementation of the ERP system
decreased stock by 30%, increased the production-to-selling rate by 3%, and shortened
the production cycle by 7-10 days amd reduced production costs by 3.8%. The DRP and
POS systems led to prompt feedbacks of sales, finance and stock information, which
consequently reduced stocks, improved the capital turnover rate and reduced financial
risk. Implementation of the integrated platform for supply chain management made
every step of production, stock and sales transparent and as a result improved the
cooperative effect between production and sales.
IT in Tedelon
Tedelon built up its information management systems linking customers, suppliers,
business partners and different departments within the company. For example, the OA
system is for internal communication between different departments, such as finance,
manufacturing, sales, service and customer relationship management. The ERP system
integrates internal and external communications.
Tedelon is positioned to manufacture fashion and leisure menswear and also intends to
become an international brand company. Therefore, information concerning the 66 Source: Youngor’s website available at http://www.youngor.com/news.do?cid=200811190204542569 . 67 Source: Youngor’s website available at http://www.youngor.com/ .

201
forefront of world fashion is critical. That’s the reason why Tedelon established
cooperation with Remi Studio, a famous Italian design company (Appendix 7-1). In this
way, Tedelon can acquire the latest fashions in the world clothing arena.
In summary, evidence of Upgrading Capability in terms of branding and IT are quite
clear in Youngor and Tedelon but there is no significant evidence of IT in Kaiqi. This
result suggests that whether Kaiqi’s development and the present competitive advantage
will sustain in the future is questionable and needs further study, which in turn opens a
further potential research direction.
7.3.3 Evidence of resource bundling effect
Linking back to the statistics model in Chapter 6, resources are composed of three
constructs, i.e., Fundamental Resource (FR), Dynamic Capability (DC) and Upgrading
Capability (UC). The statistical results suggest that the three exogenous constructs are
significantly correlated to each other, which confirms the resource bundling effect on
Process Performance (measuring SCA) of the Chinese clothing companies. Now
evidence from the three companies shows in detail how the bundling effect works in the
real businesses.
Customer Relationship and Branding capability are bundled together contributing to
SCA of the companies. Both Tedelon and Youngor provide the evidence in this point.
For example, both have built up their own distribution channels to provide better
services to and built up better communication with their end users. They established
flagship stores to enhance their brand images through unique decoration, product
display and premium services. They also developed their brand cultures to enhance the
brand connotations. In this way, Youngor and Tedelon secured their customers and built
customer loyalty. At the same time, both companies developed multiple brands,
targeting new market segmentations and strengthening their product design and
marketing capabilities so as to capture new customers. Brand culture and brand services
are firm-specific resources contributing to SCA of the companies.
In Tedelon, HRM is deeply embedded in the company’s corporate and brand culture,
which shows bundling of HRM and Branding (detailed discussion in Chapter 8.4.2).
There is a very low employee turnover in Tedelon. As Wang proudly states, ‘…those
who have once been working with me at the very beginning of the business all stay with
the company, trusting and supporting me, and they are the most valuable wealth of the
company’ (Wang 200668
).
The most distinctive feature of Youngor’s successful and sustained development is the
68 Source: Tedelon’s website available at http://www.tedelon.com.cn/.
202
vertical integration of the whole value chain within the company. However, this has
been suggested that the upstream expansion is not necessary since this could be replaced
by strategic cooperation with the suppliers (Cheng 17th
May 2010). Actually, too long a
value chain can easily result in response lags. To tackle this problem, Youngor
developed information systems in cooperation with the Chinese Academy of Sciences.
Through its information systems, the company links all information across value chain
activities, including sales, finance, supply, inventory, manufacture and retailing stores.
In addition, Youngor successfully invests in the textile innovation, e.g., Hemp material
and Hemp products, which contribute to Youngor’s overall strengths and competitive
advantage. In this context, it is the resource bundle, i.e., the bundle of Customer
Relationship, Supplier Relationship, IT and Branding, that creates Youngor’s
competitive advantage and enables it to be sustained.
Unlike the branded companies, Kaiqi’s most distinctive resource lies in its Customer
Relationship. This is reflected in the way that Kaiqi develops its Customer Relationship.
⑴ Kaiqi directly contacts its customers and deals with their orders (i.e., manufacturing
and exports) without any intermediary involved. ⑵The manager-owner has built up
trust and stable relationships with his customers and controls their contacts and detailed
information. ⑶ In recent years, Kaiqi has developed strategic cooperation with its
regular customers, which further secures its Customer Relationship.
However, SCA is attributable to the resources bundle rather than to a single resource or
capability. One key reason is that a single resource or capability may not necessarily be
of the VRIN attribute while when the resources are bundled together they create the
attribute due to history, casual ambiguity and social complexity involved during the
formulation of the bundle (Barney 1991). In this context, it could be argued that
Customer Relationship alone may not produce SCA for Kaiqi. In addition, Customer
Relationship is a fundamental resource which generally produces only competitive
parity. However, in addition to the unique Customer Relationship, Kaiqi also possesses
other Fundamental Resource like Quality Control and Skillful Worker (Details in
Chapter 7.3.1). Moreover, throughout its development, Kaiqi has continually built up its
Upgrading Capability, e.g., updating the processing technology, manufacturing more
sophisticated products and developing capabilities of product design. Therefore, Kaiqi’s
unique Customer Relationship bundling with its Upgrading Capability contributes to its
superior performance so far.
The above examples in the three companies are some of evidence to illustrate the
bundling effects of resources on SCA, which has been confirmed in the statistical
results.

203
7.4 Chapter Summary
This chapter offers insights into what lies behind the statistical results through the study
of three specific cases.
There is strong evidence of Fundamental Resource across the cases, particularly in
terms of Quality Control and Skillful Worker. Customer Relationship in Kaiqi is
remarkable and unique due to Kaiqi’s unique way of developing and managing it.
Supply Relationship in Youngor becomes more about relationships between different
departments and between different subsidiaries within the company because the
company itself developed its own vertical value chain. That is, main suppliers for its
clothing production come from the internal departments or subsidiaries rather than the
traditional external sources. This is also unique and firm specific resources.
Upgrading strategy, particularly upgrading via branding, has been widely practiced in
the Chinese clothing industry since the late 1990s. Branding capabilities, e.g.,
distribution, marketing and design, are strongly evidenced in Youngor and Tedelon.
Both have well-established brands for more than a decade in China. In comparison,
Kaiqi’s upgrading strategy has remained fairly basic comprising mainly product and
process upgrading, though recently it has just developed its own-brand intention and to
an extent has implicit branding capabilities. As for Upgrading via IT, both Youngor and
Tedelon have developed their own information management systems while Kaiqi has
not. Two reasons may explain why Kaiqi has insufficient IT. One reason may be that
Kaiqi has not developed its own brand and therefore the company does not need to face
endusers. In this context, IT is less required due to no endusers to be managered. The
other reason may be that Kaiqi is a relatively smaller size which involves less complex
relationships and therefore there is less requirment for management of relationships via
IT. As a matter of fact, the owner-manager himself dominates external contacts and
communications.
Moreover, evidence from the cases also illustrates the bundling effect of resources on
sustained competitive advantage (SCA). That is, Fundamental Resource has to combine
with Upgrading Capability and it is this combined effect or bundling effect that
contributes to the SCA of the companies.
Having followed and conducted all the research steps, next chapter discusses and
concludes the research.

204
CHAPTER EIGHT: DISCUSSION & CONCLUSIONS
8.1 Chapter introduction
This thesis aims to explore and examine the sources of sustained competitive advantage
(SCA) of the Chinese clothing industry. To this end, the research objectives and
corresponding questions are set and sequential research activities are conducted. This
chapter discusses and concludes the findings (Figure 8-1).
RESEARCH STARTED
Specify research questions based on the set research aim
Q1: What are the main problems concerning sustained competitive advantage (SCA) of the
Chinese clothing industry?
Q2: What are the main firm-level resources for SCA?
Q3: Which of the potential resources are significant in leading to SCA in the Chinese
clothing industry?
Q4: How and why do the identified resources contribute to SCA of the Chinese clothing
companies?
RESEARCH CONDUCTED
Examine background Review literature Survey and study
cases
RESEARCH FINDINGS
Finding 1 to Q1:
(Main problems)
1. Rising
production costs
2. Lack of strong
brand
3. Price-based
competition
Finding 2 to Q2:
(Main resources)
1. Customer Relationship (CR)
2. Supplier Relationship (SR)
3. Quality Control (QC)
4. Skillful Worker (SW)
5. Plant & Equipment (PE)
6. Branding (Br)
7. Information Technology (IT)
8. HRM
9. Quick Response (QR)
10.Organisational Learning (OL)
11. Innovation (In)
12. Entrepreneurship (En)
Findings 3&4 to Qs 3&4:
(Significant resources and their
bundling)
1. Both Fundamental Resource
(FR) and Upgrading Capability
(UC) are significantly related to
Process Performance (PP) while
Dynamic Capability (DC) is
insignificantly related to PP
2. FR, UC and DC are
significantly correlated with
each other.
Figure 8-1: Executive summary of the research 1

205
Source: The author.
Figure 8-1 sums up the research procedure. The four research questions are raised in the
introduction chapter and they are answered step by step through the series of sequential
studies described as follows.
Firstly, by examining the research background and by referring to the GVC framework,
it is revealed (Finding 1) that the main problems to sustain competitive advantage of
the Chinese clothing industry are rising production costs, lack of strong brand and
price-based competition (Gereffi 1999, 2001, Gereffi, Humphrey & Sturgeon 2005, Bair
2005, Dicken 2007, Appelbaum 2008). Thus Question One has been answered.
Secondly, according to the resource-based view, valuable, rare, inimitable and
non-substitute (VRIN) resources are the source of sustained competitive advantage;
dynamic capabilities enable companies to reconfigure and retain competitive advantage
in the dynamic environment (Wernerfelt 1984, Barney 1991, 1997, Teece, Pisano &
Shuen 1997, Ray, Barney & Muhanna 2004, Newbert 2007, Wiklund & Shepherd 2009).
Drawn from the literature, a list of twelve specific resources is identified as the potential
source for SCA of the Chinese clothing industry (Finding 2). Thus Question Two has
been answered.
Thirdly, statistical results suggest that two constructs of resources, i.e., Fundamental
Resource (FR) and Upgrading Capability (UC), are significantly related to sustained
competitive advantage of the Chinese clothing industry while the remaining one, i.e.,
Dynamic Capability, is not (Finding 3). All three constructs of resources are
significantly correlated with each other, which suggests the bundling effect of resources
on SCA (Finding 4). The statistical analysis is complemented by three case studies
which illustrate and interpret how and why the resources act and interact to generate and
sustain competitive advantage in three specific firms. Questions Three & Four have
been answered.
The rest of this chapter is organised into 5 sections. Sections 8.2 & 8.3 discuss and
conclude whether and how the research questions have been answered; section 8.4
provides recommendations of SCA strategies for the Chinese clothing industry; the
remainder of the chapter reflects on the contributions of this research to knowledge,
theory and practice (section 8.5) and its limitations (section 8.6).
8.2 Problems with sustaining competitive advantage - To research
Q1
The primary research aim is to explore and examine the sources of sustained

206
competitive advantage of the Chinese clothing industry. Firstly, as a precondition for the
research aim, it should be clear to the question as to what are the problems concerning
sustainability of the present competitive advantage? This question (i.e., Q1) has been
explored by examining the Chinese clothing industry in the global value chain (Chapter
2).
8.2.1 Competitive advantage of the Chinese clothing industry
The combination of high-skilled production, relative technological savvy and low
wages ultimately leads to further concentration of global apparel production in
East Asia and in China in particular. (Cammett 2006:14)
The Chinese clothing industry has developed at a fast pace since the early 1980s when
China started the opening-up and reform policy. Now China has become the world’s
largest clothing manufacturer and exporter. China’s mode of development has some
similarities with the East Asian NIEs such as Hong Kong, Taiwan and South Korea
during the 1960s through the 1980s, in that it has benefitted from the transfer of the
global apparel production from the developed economies.
Therefore, the competitive advantage of the Chinese clothing industry, from the GVC
perspective, is in the manufacturing sector and primarily based on low labor costs and
hence cheap prices. In addition to the favorable external environments, the source of the
competitive advantage can be summarised as follows:
From the industry’s perspective
Clothing value chain and
Local industrial clusters
From the company’s perspective
Established customer relationships
Manufacturing capabilities
Skillful workers
The Chinese clothing industry has quite complete value chain, including supportive
supply of raw materials, fabric and textile. Some big companies possess world’s most
advanced technologies and largest production capacities, e.g., hemp fibre and textile and
PTT69
(polytrimethylene terephthalate) fibres and textile. Hemp textile and hemp
production are based on Youngor’s independent R&D and the company owns
intellectual property rights (Details in Chapter 7.4.2). Similarly, Shenghong Corp.70
69 PTT fiber has both stability of polyester fiber and softness of nylon fiber and therefore it is estimated that the PTT
fiber will replace both polyester and nylon in the near future (Houck et al. 2001). Source: [Online] available from
http://www.fbi.gov/about-us/lab/forensic-science-communications/fsc/july2001/index.htm/houck.htm [20 May 2014] 70 Sources: http://www.shenghong-cf.com/en/ and http://en.youngor.com/index.do.

207
possesses the PTT technology with its own intellectual property rights and now is the
third company in the world, after Shell Chemical and American Dupont, to own this
technology. Shenghong is also only the second company in the world to put the
technology into production of PTT fibre and textile (Yi 2013).
The geographic distribution of the Chinese clothing companies is characterised by local
industrial clusters (LICs), where a large number of companies, including competitors
and supportive companies of upstream and downstream industries, gather together and
interact with each other, which is an important contributory factor for the whole
industry and the region to gain competitive advantage (Hill & Brennan 2000).
From the company’s perspective, the competitive advantage of the Chinese clothing
industry is attributable to the firm-level resources, e.g., long-established customer
relationships with global buyers, skillful workers and manufacturing capabilities such as
stable quality control and flexible production in terms of capacity and delivery.
However, these resources are not sufficient for sustained development of the whole
industry. Problems with sustained competitive advantage and the corresponding
solutions are discussed next.
8.2.2 Problems with sustainability of the competitive advantage
Based on this research, main problems mitigating against sustained competitive
advantage of the Chinese clothing industry include rising production costs, lack of
strong brand and price-based competitive strategy.
8.2.2.1 Rising production costs
The competitive advantage of the Chinese clothing industry has been increasingly
challenged by external dynamics. Continued appreciation of the China Yuan since 2005
has started to undermine China’s export advantage in the global market and the global
economic recession ever since 2008 has further highlighted the sustainability issue of
the development mode in China. Moreover, the already-thin profit margins in the
clothing manufacturing segment have been further squeezed from both sides, i.e. rising
production costs71
on the one side and downward pressure of unit prices on the other.
Fast and continuously rising costs is one of the main challenges to sustaining
competitive advantage for the Chinese clothing industry, particularly for the clothing
manufacturers due to the nature of the labour-intensive input (Taplin 1997, Gereffi 1999,
Dicken 2007). The key reason for the rising production costs is the continuous and rapid
71 The main costs along the manufacturing processes include costs of raw materials, labour costs, land costs,
environmental resource costs, financing costs, and energy-saving and emission-reduction costs, etc.

208
economic development. Correspondingly with the economic development, costs of land,
materials, components and labour inevitably go up. In addition, required costs
associated with better environmental protection are also going up. Therefore, cost
control is a key issue for SCA of the Chinese clothing industry.
In addition to the external challenges (i.e., the rising production costs) and dynamics for
sustained competitive advantage in the global value chain, the main internal (i.e.,
firm-level) problems have been revealed, namely, lack of strong brand at the
international level and price-based competition.
8.2.2.2 Lack of strong brand
As Chinese clothing companies have evolved, they have generally realised the
importance of having their own brands and some have registered their own brands
(Details in Chapter 7.2.2). However, ‘to register’ a brand name or trademark is not the
same as ‘to establish’ a brand. Brand is not just a legal action, or a name, or a logo, or a
symbol. None of these is sufficient for establishment and strengthening of a brand.
Actually many of these companies have just registered their brand names with
trademarks and logos but neither properly established nor strengthened their brands.
Therefore, the major branding problem is clear, that is, there is no strong brand and it is
particularly rare for a Chinese clothing brand to be popular in the global market. China
does have the clothing brands and some of these are very popular at the national level,
but few, if any, of these are strong enough to compete in the global market (Dai 2010).
Then why is it hard to build strong brands? Aaker (1996: 26-34) reflects on the question
and summarises 8 key barriers as follows:
1) Pressure of competing on price which discourages brand building,
2) Proliferation of competitors which minimizes positioning space,
3) Fragmented markets & media which makes it more difficult to match brand
marketing with effective media,
4) Complex brand strategies (e.g., corporate brand, ingredient brand, brand extension,
multiple brand and sub-brand, etc.), which make building and managing brands difficult
(e.g., difficulty in clear brand identities for each brand and the relationships between
them),
5) Bias toward changing strategies (e.g., changing a brand identity while it may still be
effective or not yet established),

209
6) Bias against innovation, e.g., minimized reaction (in term of product or service
innovation) to external opportunities and competitive challenges which results in
vulnerable SCA),
7) Pressure to invest elsewhere, thereby reducing commitment and supports to the core
business, which often undermines the original strengths and competitiveness of the
brand, and
8) Strategy for short-term results, leading to long-term brand-building programmes
being sacrificed.
The first four are the exogenous to the firms and hence less controllable by them while
the last four are the endogenous factors which can be managed by the brand builders.
These barriers and challenges can partly explain why Chinese clothing brands are rare
in the global market. Taking Kaiqi for example, the fact that the company has not yet
developed its own brand is due to two main reasons, namely, enormous pressure of
competition on price (i.e., above barrier 1) and adopting a strategy which focuses on
short-term results (i.e., above barrier 8). Retailers are powerful force putting downward
pressure on price and there is also pressure from overcapacity and homogeneous
products and price-sensitive customers. Building a successful brand requires high levels
of long-term investment and entails substantial risks. In this context, like the majority of
SMEs, Kaiqi focuses on the short-term activities as clothing manufacturers, particularly
when the companies has not yet run out of competitive advantage in this role.
The Youngor case illustrates well why China lacks strong brands. This is related to the
above three identified barriers, viz., ‘innovation’, ‘internationalisation’, and
‘diversification’. For example, for many years, up until 2010, Youngor had only one
brand serving all of its customers without segmentation in terms of age, incomes, or life
style; yet the core products covered both professional suits and T-shirts with lack of
innovation in product design and services. Furthermore, the main business focused on
the domestic markets. At the same time, particularly during the 1990s, Youngor was
attracted to invest in financial markets and real estate and this business diversification
caused the company to divert limited resources away from its main business, which to
an extent, undermined brand management before the brand had met its goal of
“internationalisation” and being a “century brand”.
8.2.2.3 Price-based competition
In addition to the problems of rising production costs and lack of strong brand, another
major problem with SCA of the Chinese clothing industry is price-based competition. It
is generally agreed that original design is one of the weakest aspects of the Chinese

210
clothing industry. The main reasons for this are related to insufficient investment on
R&D and lack of adoption of IT management systems. Lack of motivation for original
design, R&D and IT definitely results in a lack of product diversity and overproduction
of homogenous products. All these consequently lead to another big problem for the
Chinese clothing companies, namely, price-based competition. Therefore, the problem
of price-based competition is relevant to a broader range of issues such as design, R&D
and IT.
Product design involves broader aspects, including for example, collecting market
information and analysing the corresponding responses. Market information among
them is particularly important in relation to market demand and demand dynamics to
assist the firm in predicting trends both home and abroad in terms of colors, fabrics,
fashion styles, price and competition states, etc.
R&D is particularly used for development and innovation in relation to the functional
performance of a product, for production processes and for original designs. IT is used
for communication and information flow among parties involved (i.e., external
stakeholders and internal departments) and hence has a key role in ensuring effective
and efficient coordination of activities among them.
In summary, the revealed SCA problems include both external challenges (i.e., rising
production costs) and internal weaknesses (i.e., lack of strong brand and price-based
competition). These problems are not totally separated but rather they are related to or
correlated with one another. Given the GVC framework, next section discusses and
concludes practical solutions based on the significant resources.
8.3 Significant resources for sustained competitive advantage
8.3.1 Main resources for SCA - To research Q2
Keeping in view the revealed problems, this research then investigates significant
resources for SCA of the Chinese clothing industry as solutions to the identified
problem. Firstly, drawn from the literature, 12 indicators of resources are selected
(Figure 8-1). This is followed by subsequent exploratory and confirmatory factor
analysis. As a result, 10 indicators are left representing three constructs of resources
(Figure 6-9). That is, Fundamental Resource is represented by ⑴ skillful worker, ⑵
quality control, ⑶ supplier relationship, and ⑷customer relationship; Dynamic
Capability represented by ⑸ quick response, ⑹ entrepreneurship, ⑺ organisational
learning and ⑻ human resource management; Upgrading Capability by ⑼ branding and
⑽information and technology. Thus the research Question 2 is answered.

211
8.3.2 Significant resources for SCA of the Chinese clothing industry -
To research Q3
To test and examine which of those identified potential resources are significant for
SCA of the Chinese clothing industry, this study formulates a hypothesised model. In
this model, resources are measured by three constructs, namely, Fundamental Resource,
Dynamic Capability and Upgrading Capability, while SCA is measured by Process
Performance (Figure 6-10). Then the hypothesised relationships are tested by using a
survey dataset of the Chinese clothing industry.
The statistical results suggest that two of the constructs, Fundamental Resource and
Upgrading Capability are significantly related to Process Performance (measuring SCA)
and these findings are consistent with the RBV theory (Figure 6-10). However, the
results also indicate that the third construct, Dynamic Capability is statistically
insignificantly related to Process Performance. This insignificant result is not in
accordance with the theoretical expectation and any conclusive explanation of this result
cannot be provided until further study is conducted in the future.
The findings of the significant relationships are subsequently illustrated through study
of three cases. All three cases show strong evidence of Fundamental Resource. However,
Upgrading Capability varies among them. For example, Youngor and Tedelon have
established their own brands while Kaiqi has not yet done so, though all the cases are
relatively successful by performance. Moreover, detailed study of the three cases
provides insights into the significant resources concerning how and why they contribute
to SCA of the companies, which are discussed and concluded as follows.
There is no doubt that China has a labour-cost advantage in comparison with the
industrialised economies such as the USA and the UK and this is the reason why the
industrialised economies outsource to or directly invest in China. Also the Chinese
clothing industry retains the competitive advantage in comparison with the other even
lower-cost global manufacturers like Bangladesh, Cambodia and Vietnam. A key reason
(among others) for the SCA is Fundamental Resource, which is reflected, for example,
in skillful workers, quality control, supplier relationships and customer relationships
(Gereffi 1999, Humprey & Schmitz 2002, Appelbaum 2008). For example, ⑴ in
Vietnam and Cambodia, labour costs are cheaper than in China but workers there are
generally not as abundant or skillful as in China, which in turn influences performance
such as labour productivity and production flexibility; ⑵ product quality produced in
Vietnam and Cambodia generally cannot compete with China, which is a main reason
why global buyers still prefer ordering from China for their high-end products; ⑶ the
Chinese manufacturers have established relationships and trust with their global

212
customers for quite some time while Vietnam and Cambodia are latecomers with less
experience; ⑷ China has developed quite a complete value chain, particularly
involving competitive supply industries such as accessories and textiles, while Vietnam
and Cambodia have not.
Upgrading Capability is a key source for the whole Chinese clothing industry to sustain
competitive advantage in the global market. Two terms in this statement need further
interpretation. One is “Upgrading Capability” and the other is “the whole Chinese
clothing industry”. Humphrey and Schmitz (2002: 1020) define upgrading as
‘improving a firm’s position within the chain’, which results in higher competitiveness
and greater added-value. Upgrading is an urgent and a must strategy for the companies
to adopt in order for the industry to sustain competitive advantage. Correspondingly
“Upgrading Capability” is the key element to enable implementation of the upgrading
strategy and therefore it is the source of the SCA (Gerrefi, Humprey & Sturgeon 2005).
Concerning the second term, China’s global competitive advantage is currently
labour-cost based in the clothing manufacturing segment, which is not sustainable.
Therefore, sustainable development requires for upgrading and extending the
competitive advantage from the manufacturing segment to “the whole Chinese clothing
industry”, to the high value-added segments such as design, brand and marketing.
This study suggests that the Chinese companies are on the way towards transforming
and upgrading the cost-based competitive advantage. However, Upgrading Capability
varies amongst the companies. For example, some have established their own brands
while others have not; some branded companies are quite successful while other
branded companies are still struggling or barely surviving and generally China lacks of
strong brand in the clothing industry.
In summary, Fundament Resource and Upgrading Capability are the two main
significant resources for SCA of the Chinese clothing industry. Moreover, according to
RBV, a specific or single resource is insufficient to create SCA but instead it is
combined or bundled resources that generate SCA (Ray, Barney & Muhanna 2004,
Wiklund & Sheperd 2009). This implies that Dynamic Capability might affect SCA
somehow through the bundling although its direct effect has not been confirmed in this
study and the details are discusses in the following subsection.
8.3.3 Resource bundling - To research Q4
The statistical results suggest that all three constructs of resources are significantly
correlated with one another and the correlation coefficients range from medium to high
levels (Figure 6-11). These research findings support the resource bundling effect,
which answers to research question 4.

213
However, to help with further understanding of the results concerning the resources
bundling effect, it is required to put the whole structural model together (Figure 6-11).
Both Fundamental Resource (FR) and Upgrading Capability directly cause SCA which
is measured by Process Performance.
Meanwhile, the two together, along with Dynamic Capability (DC) are significantly
correlated with each other and this result suggests that DC might have indirect effects
on SCA through the resource bundling effect although its direct effect is insignificant.
This indirect effect can be interpreted through studies of the cases. For example, when a
company has developed Fundamental Resource but lacks proper capabilities in human
resource management, which is an aspect of Dynamic Capability, it may result in a
higher labour turnover (i.e., loss of skillful workers) and further problems with stable
quality control, both of which are indicators of Fundamental Resource. Thus, Dynamic
Capability through Fundamental Resource affects Process Performance. This has once
happened in Tedelon’s Anhui Industrial Park and this story illustrates the importance of
resource bundling and the indirect effects of Dynamic capability on SCA. Therefore, the
study comes to conclude that it is the resources bundle rather than individual or specific
resources that contruibutes to the SCA of the Chinese clothing industry so far.
To sum up, all the research questions have now been examined and answered. Next
section provides recommendations for SCA of the Chinese clothing industry.
8.4 Recommendations of SCA strategies
The primary purpose of this research is to explore and examine resources for sustained
competitive advantage of the Chinese clothing industry. To this end, the main problems
were revealed first. To tackle the revealed problems, this study then, based on RBV,
identifed the potential resources that contribute to SCA. These resources have been
examined in the Chinese clothing industry. Now, based on the above research findings,
this section provides the following SCA strategies to the relevant parties of the Chinese
clothing industry such as the government policy makers, strategic decision makers in
the clothing companies and service providers. The strategies are also solutions to tackle
the revealed problems.
Cost-control strategies
Upgrading strategies
The cost-control strategies are the key to retaining existing competitive advantage in the
manufacturing segment whilst the upgrading strategies are the key to upgrading and
sustaining the competitive advantage of the entire industry in the future. Also these
strategies offer solutions to the corresponding revealed problems, namely, rising costs,
lack of strong brand and price-based competition.

214
8.4.1 Cost-control strategies
Due to the importance of rising production costs in the clothing manufacturing segment,
cost-control strategies and the corresponding resources make up a critical difference for
the individual companies. In other words, controlling the rising costs could mean the
difference between surviving and not surviving and is therefore a critical for the
sustained development of the companies. Given the labour-intensive nature of the
industry, cost-control strategies are mainly discussed in terms of control of the labour
costs through subcontract manufacturing, outsource manufacturing and manufacture
relocation.
8.4.1.1 Cost control: Subcontract manufacture and outsource manufacture
Subcontract manufacture or triangular manufacture is one of the practical solutions to
cutting the production costs. This strategy has been adopted in the Chinese clothing
industry where manufacturers get orders from a foreign buyer and then arrange part of
this order to be manufactured by a third party (i.e., subcontractor), usually a ‘global’
rather than ‘local’ subcontractor (Garengo, Biazzo & Bititci 2005). The global
subcontractors are often located in low-cost economies in south Asia or Southeast Asia
such as Vietnam, Thailand and Bangladesh, who take over the clothing production from
the Chinese contractors. Based on the subcontractor’s expertise and technological
autonomy ranging from low to high, their roles and tasks vary accordingly as follows
(Dulbecco & Vagneron 2001): 1) clothing production with pre-cut fabrics and materials
provided by the contractors, often referring to cutting, sewing and trimming, and 2)
clothing production as per samples or patterns provided by the contractors using raw
materials and fabrics purchased by themselves. In this context, the Chinese clothing
manufacturer undertakes more roles and activities than the overseas subcontractor,
including, in addition to part of ready-to-sell manufacturing, product design and
development, quality control and technical assistance, collecting and delivery, and
direct link and communication with both sides, i.e., foreign buyers and subcontractors.
Research suggests that subcontract manufacturing improves competitiveness due to cost
reduction, improved labour productivity and a higher share of value-added
(Subrahmanya 2008, Grandys, E. & Grandys, A. 2008). To achieve and maintain
effective coordination between the principal/contractor and subcontractor it is suggested
that it is necessary to build up mutual trust and to ensure conformance of the
ready-to-use products to specifications of the industrial buyers, given the demand
dynamics (Dulbecco & Vagneron 2001). Concerning the contractor-subcontractor
relationship, the key issue is quality control. Practically, specialised workers sent by the
contractor train in-house quality controllers, verifying, supervising, checking, and
improving the production process.

215
Outsource manufacture is a widespread practice for the developed economies and now
quite a lot of branded clothing companies in China are also adopting this strategy (Han
3rd
Nov 2011). For example, both Youngor and Tedelon outsource part of their
production. Unlike the overseas triangular manufacture, where the primary
consideration is to reduce production costs, the main purpose for the Chinese branded
companies to adopt an outsourcing strategy is as a solution to constraints in production
capacity and/or to enable their own production to focus on what they do best. In practice,
only some products are involved in outsourcing manufacture and the contractors are
often domestic clothing manufacturers with specialised product lines other than that of
the branded company itself. For example, Tedelon focuses on production of its core
product line and outsources its non-core products.
we outsource about two thirds (by output value) of the production and those products
require a different specialty which Tedelon does not have (e.g., knitwear, leatherwear,
embroidery, printing and washing) … We have about 10 regular contractors which
are located in Guangdong, Whenzhou and Fujian… we ourselves still keep
production of our core products like jacket, leisurewear, padded coat and shirt.” (Yu
23rd Feb. 2012)
8.4.1.2 Cost control: Relocation manufacture overseas or inland China
Another solution to controlling the manufacturing costs is relocation of factories. The
general trend since 2008 is that clothing manufacturers, particularly those medium and
large enterprises (MLEs) in the East and Southeast coast Yangtze River Delta and Pearl
River Delta regions, have started to move part of their manufacturing capacity to inland
regions where costs are relatively low (Details in Chapter 2.3.5) and where the local
governments also adopt various favorable policies and incentives in terms of tax,
finance and land usage to attract the investment. The other favored place for the
relocation is in Southeast Asian or the South Asian economies like Bangladesh, Vietnam,
or Cambodia, where manufacturing costs are lower than those in China (Details in
Chapter 2.2.1).
This global relocation option is also reflected in foreign direct investment (FDI) from
outside China, shifting manufacturing out of China. For example, Adidas once had over
30 factories in China but now all of them have been shut down, the last one in Suzhou
of China being moved to Vietnam in March 2012. The reason is clear, that is,
competition in the basic and general products is mainly based on costs and competitive
advantage in production of this category has gradually diminished in China. Therefore
currently the overseas subcontract manufacturing or outflow FDI is mostly linked to the
basic or general products. For example, Kaiqi was establishing a factory in Vietnam in
2013 for production of its basic products while the company would keep manufacturing

216
of the medium-to-high value products in China (Shen 15th
January 2013).
However, international buyers still keep sourcing the medium-to-high value products
from China because the Chinese clothing manufacturers still retain competitive edges in
this product spectrum, e.g., production capacity, flexibility, quality, logistics and
network (Gu 21st November 2011, Han 3
rd November 2011).
For Chinese clothing companies to adopt a cost controlling strategy of overseas
manufacturing either through China’s outflow FDI (i.e., relocating manufacture
overseas) or through global subcontracting, relevant risks and challenges should not be
neglected. One big concern is to ensure safety of the investment environment, including
political and economic stabilities and relevant investment infrastructure and legal issues.
Current examples include the continuous reports about clothing factory fires and the
double-digit inflation rates causing labour disturbance in Bangladesh72
. In Vietnam, the
infrastructure problems, particularly in logistics, communication and power, and
continual violent demonstrations and subsequent strikes, influence daily business
operations73
. In this context, it is suggested that the clothing companies have to be fully
aware of the investment environment and make corresponding preparations. One
practical suggestion is that the domestic companies, particularly SMEs, could form an
investment group, or consortium, to establish a local industrial park in the host countries.
In this way, they become more powerful and obtain better protection and support from
the host governments.
In summary, the Chinese clothing manufacturers have to deal with the rising-costs
problem which is a main challenge to sustaining competitive advantage for the industry.
Strategic and practical solutions include outsourcing or subcontracting manufacture
overseas and relocating manufacture overseas or inland. However, from the global value
chain perspective, production costs are not the only concern for SCA of the industry.
From the GVC perspective, upgrading strategies are urgently required for competitive
advantage to be sustained (Gereffi 1999, Bair & Gereffi 2003, Humphrey &Schumitz
2002, Tokatli 2003, Bair 2005, Gibbon 2008, Reinecke 2010).
Industrial upgrading, broadly comprising product upgrading, process upgrading,
intra-chain and inter-chain upgrading (Humphrey & Schmitz 2002), is a typical
evolution pattern of the global clothing industry, particularly in the East Asian NIEs and
some developing economies (Details in Chapter 3.2.3)74
. At the early development stage
of the industry, the focus was on the labour-intensive manufacturing segment and
72 Source: [online] available from <http://www.voacantonese.com/content/bangladesh-fire-20131009/1766103.html>
[4th May 2014]. 73 Source: [online] available from <http://www.voacantonese.com/content/asia-manufacturing/1829712.html> [4th
May 2014]. 74 The inter-chain upgrading is beyond the scope of this research and therefore it is not covered.

217
therefore the clothing companies developed and acquired corresponding resources in
terms of scale expansion, stable quality control and continuous upgrading in product
and production process. Later on, based on gradually developed capacity and expertise
in the manufacturing segment, companies extended to intra-chain or functional
upgrading. That is, companies develop their resources in the high value-added activities
such as R&D, design, branding and marketing and distribution channels (Gereffi 1999,
Smith 2003, Liu & Gu 2007, Tokatli 2007a, 2007b, Tokatli, Kizilgun & Cho 2011).
However, this evolution is not an automatic or universal process. For example, the East
Asian NIEs and East European Turkey have successfully gone through the evolution
stage and now have developed their own brands in the global market while the majority
of the Mexican companies still remain half-package suppliers (Bair & Gereffi 2001).
Next section discusses and concludes the upgrading strategy and practices in the
Chinese clothing industry.
8.4.2 Upgrading strategies
Cost-control strategies aim to retain the present competitive advantage in manufacturing;
while upgrading strategies are for updating and thus sustaining competitive advantage
over the entire industry in the global value chain.
Given that the Chinese clothing industry has successfully built up fundamental
resources for upgrading in process and product, this section focuses on upgrading
strategies via branding and IT. These upgrading strategies address the revealed problems
concerning lack of strong brands and price-based competition.
8.4.2.1 Upgrading via branding
The Chinese clothing industry is going through a process of transformation and
functional upgrading. However, upgrading capabilities and performance vary amongst
the business entities. Some have developed their own brands, amongst which some
branded companies are quite successful in the domestic market (e.g., Youngor and
Tedelon) and the other branded companies are still struggling for survival (e.g.,
Shaoxing Cathaya Apparel Co., Ltd.75
) but none of these brands are strong in the global
market. Others have the strategic intension to develop their own brands but still have
not yet started due to various reasons. Therefore, the next discusses the strategy in brand
building (feasibility and difficulty) and brand management (steps and key resources).
Brand building: Feasibility and difficulty
75 Once the author interviewed the CEO of the company in December 2011 and she used the term ‘survival’ to
describe the company’s performance. The company’s website refers to http://www.sxcathaya.com/.

218
Since 2008 the external dynamics have been challenging the Chinese clothing
companies, particularly those exporting-oriented manufacturers. The challenges have
included continuous global market recession; domestic rising costs, particularly in raw
materials and labour; competition from the global low-cost manufacturers and
continuous appreciation of the China Yuan. In this context, more and more Chinese
clothing manufacturers are trying to develop their own brands so as to sell their own
branded products in the domestic market instead of relying on export oriented
manufacturing. This strategic intent of establishing an own brand is an initiative to
achieve successful upgrading (Humphrey & Schmitz 2002, Tokatli & Kizilgun 2004).
But not all of them are going to be successful in the transformation. Only those who
have accumulated the required resources and who properly manage the resources for
this transformation are likely to succeed.
During the last 30 years, the Chinese clothing industry has gradually integrated into the
clothing GVC, through which it has built up the required resources such as customer
relationships, distribution channels and even product design and marketing as well as
building resources in the manufacturing segment, such as production capacity,
production flexibility, stable quality control and upgrading in product and process.
Therefore, integration into the clothing GVC, which enables resources accumulation on
the learning curve, provides feasibility for industrial upgrading of the Chinese clothing
industry (Bair & Gereffi 2003).
For individual companies which have not yet established their own brands, in addition
to the difficulties discussed in the preceding Chapter 8.2.2, one more key reason is
financial weakness and deficiency. To establish a successful brand requires a large sum
of investment in, amongst other things, R&D, marketing, inventory and distribution
network. For example, a successful distribution network is essential for a branded
clothing enterprise and it is, particularly expensive to set up self-operation stores, which
are the most effective way to enhance brand image and awareness. However, at present
only a few of the branded clothing companies have established their own distribution
networks. A long inventory cycle is also required when the company runs its own brand.
The cycle may take as long as 6 months and includes cooperation with the textile
manufacturer, order processing, manufacturing, inventory and delivery. This makes
heavy demands on cash flow for the company involved. For example, it was reported
that the inventory value of Metersbonwe was nearly 1.1 billion RMB in March/April
2012. Youngor has for a long time suffered a similar problem, with the inventory value
of branded clothing reported to be about 1.34 billion RMB at the end of 201276
.
Notwithstanding the above problems, the Chinese clothing industry has now established
76 Source: Beijing Commercial Daily on 27 August 2013 [online] available from
http://finance.people.com.cn/n/2013/0827/c1004-22701574.html [14th March 2014].

219
sufficient feasibility that the individual companies are in a position to develop their own
brands if the difficulties can be properly managed.
Brand management: Steps and key resources
To create a brand is one thing but to make the brand successful and strong is quite
another. Next discussion focuses on brand management by considering the key steps of
strategic brand management, namely, brand positioning, brand marketing and sustaining
brand equity (Keller 2003).
Brand management: Step 1-- brand positioning
Brand positioning is a significant element in brand management (Vukasovic 2009).
Position of a brand is defined as ‘…the part of the brand identity and value proposition
that is to be actively communicated to the target audience and that demonstrates an
advantage over competing brand’ (Aaker 1996: 176). The key terms in this definition
are ‘brand identity and value proposition’. Core brand identity is ‘the central, timeless
essence of the brand’, based on which a cluster of brand identity elements can be
developed for active communication to target audience. The identity elements include
product (e.g., product design, quality, uses, users and country of origin), organisation
(e.g., local vs. global), person (e.g., brand personality/imagery and brand-customer
relationships), and symbol (e.g., brand image and brand heritage). Value proposition
links market with consumers’ perceptions and it is based on the functional and
emotional benefits to the target audience or market segmentation (Vukasovic 2009).
The target audence can be specified mainly in terms of customer demographic character
(e.g., customer income, age, sex and race) or psychographic attributes (e.g., attitudes,
lifestyle, values, and activities). Active communication to the target customers refers to
changing and/or strengthening the brand image based on the core brand identity. A
unique brand position enables the brand to differentiate itself from its competitors
which consequently result in brand values over its competitors and thus create
competitive advantage.
The key implementation of brand positioning is to specify core brand identity/ values
through a set of abstract associations (e.g., product attributes, celebrity, endorsement,
life-style, geographic area, etc.) and by using brand mantra (e.g., a short three-to
five-word expression) to capture the core brand values (Keller 2003).
However, it is common in China that the brand position is broadly categorised in terms
of market segmentation, which is particularly reflected in the predominance of
homogeneous products and thus competition based on price. Chinese clothing brands
generally lack effective brand positioning and the core brand identity and value
proposition are not clearly specified. As a result, advantage of these brands over

220
competitors is not noticeable in either functional (e.g., product heterogeneity) or
emotional values or benefits (e.g., brand personality).
Brand management: Step 2-- brand marketing
In addition to promoting direct transactions (i.e., short-term effect on brand behavior),
brand marketing or brand communication also influences not-directly-buying (NDB)
consumer behavior (i.e., long-term effect on brand behavior). The NDB brand
communication creates more competitive advantage and underlies strong brands
(Feldwick 2003). The NDB communication gives information about the brand, creates
brand awareness, creates involvement and creates association that will influence
consumer behavior.
To market or communicate brand equity depends on three sets of factors, namely, brand
elements (e.g., brand name, logos, symbols and slogans), marketing programmes and
activities (e.g., flagship decoration, event and sponsorship programmes and advertising
media of TV, radio, and magazine) and leveraging secondary associations (Keller 2003).
These secondary associations include details such as ‘promises, images, personalities,
emotional characteristics, social characteristics, and various other objective and
subjective qualities…’ and to make the point more succinctly, ‘everything you say and
do’ distinguishes and brands you (Jones & Bonevac 2013:118).
Since the late 1990s, directly-leading-sale advertisements and brand marketing
programmes, such as those using media, sponsorship and celebrity endorsements, have
been widely adopted by branded companies in China, including, for example, Tedelon
and Youngor. However, these activities are less effective at creating strong brand
identities. More recently, some pioneering companies have begun to adopt
not-directly-leading-sale brand marketing programmes and activities. Taking Tedelon
for example, the company adopted the new brand name and new logo in 2008,
improved the brand image via flagship stores in the big cities, and since 2009
interpreted the brand essence through cultural enhancement combining with life styles
(detailed discussion in Chapter 8.2.4).
Moreover, for the branded companies in the Chinese clothing industry, brand identity
elements in the product aspects, such as quality, price, and even design, have reached a
certain level of homogeneity while core brand identity concerning emotional brand
value, e.g., premium after-sale services, personality, and life style, is a particular
weakness of many Chinese clothing enterprises and needs to be enhanced.
Brand management: Step 3-- sustaining brand equity
Successful brands start by specifying brand positioning and defining core brand identity

221
and brand values, and are supported with brand marketing and communication
programmes and activities. Moreover, successful brands need to adapt to external
dynamics over time so as to achieve SCA and such adaptation involves updating
branding strategies (e.g., multiple brand and brand internationalisation) and
corresponding reconfiguration of companies’ resources (e.g., R&D and design) (Chailan
2008: 259). Based on an empirical research, the author proposes a three-phase
transformation model which generates a brand portfolio. The first phase focuses on
brand accumulation which is based on external customer needs and develops required
resources; the second phase is reformation process which is based on internal
stakeholder needs and develops branding skills; the third phase focuses on competitive
conceptualisation which is based on definition of a company-specific and
non-reproducible model and thus achieves sustained competitive advantage. The brand
portfolio contributes to sustainable competitive advantage due to a powerful causal
ambiguity involved in the brand management process (Chailan 2008: 260). Based on
Chailan, the brand management of portfolio is discussed in the following four aspects,
namely, R&D, design, multi-brands and brand internationalisation.
R&D
For sustainable development of the Chinese manufacturing industries, the most
important and also universally neglected issues are R&D and innovation. Youngor
has reached the world’s most advanced level in clothing manufacturing technology
within 5 years whilst its R&D is still at the primary stage. (Li 2008:10).
The reason for lack of R&D in the Chinese clothing industry is mainly due to the nature
and structure of the industry. As discussed earlier in this study, this is a buyer-driven and
price-sensitive industry, which is mostly comprised of small and medium sized
enterprises (SMEs). Due to budget constraints, SMEs tend to seek short-term returns
while R&D requires long-term investment before it returns a profit. This situation is
particularly reflected in China. That is, the majority of Chinese clothing companies
comfortably take over global clothing manufacturing without motivation for R&D
investment.
R&D in the clothing industry covers a wide range of activities which can be classified
roughly into two groups. One group of R&D is about market knowledge, relating for
example to fashions and styles, which lead to the development or modification of
business strategies, such as developing new products or new market access. The other
group of R&D relates to the development of new products, new processes, new
management techniques or new services. R&D can be conducted by a special unit of the
company or outsourced to universities or professional agencies. For the SMEs which
have budget constraints, outsourcing is a practical option. Another alternative way to do

222
R&D is to establish cooperation with universities and other research organisations.
Some clothing companies in China started these types of R&D activities several years
ago but they are normally confined to short-term projects and are still at an early stage
of development.
Design
Do the Chinese clothing companies have design resources? The answer is “Yes, we
have”. How much original design do we have? The answer is surely that the Chinese
clothing industry generally suffers from a lack of original design. This is one of the
significant reasons explaining why there are no strong Chinese clothing brands to stand
on the international T-show arena to date (Details in Chapter 8.2.2).
Practically, these companies attend international fashion fairs, where they absorb some
fashion elements and then work out their brand designs based on these fashion elements.
This is a kind of mixture of innovation with imitation.
Top clothing companies in China, such as Youngor and Tedelon, have developed their
design capabilities through many years’ learning, practicing and improving. However,
both companies realise that there is still a long way to go before their designed products
become popular in the international market. Therefore, both companies have been
strengthening investment in their design capabilities during recent years. For example,
Tedelon has established three design centers in Hangzhou, Guangzhou, and Wenzhou
and is appointing famous designers to enhance its design capabilities. Also, the
company has established cooperation with famous Italian design companies to enhance
its design capability. In addition, the company has set up a marketing management
center to collect market information to serve design and production.
Multiple brands
A strong brand is sustainable and adaptable, responding to external dynamics. One of
the key strategies is retaining its loyal customers whilst developing new customers
through multiple brands.
The multi-brand strategy is adopted and practiced by quite a few successful branded
companies in China such as Tedelon, Youngor and Progen (Pang 2010). Taking Tedelon
as an example, the multiple-brand development is guided by the company’s strategy,
termed “5153” plan. That is, to build up 15 brands within the next 5 years, of which 3,
i.e., RIAB, RYMA, and TEDELON, will go to the international market. In accordance
with the concept that the brand stands for a life style, RIAB stands for the sophisticated
man’s life; RYMA stands for the life of fashion and vitality targeted at young business
men; TEDELON retains the original positioning, reflecting fashion, leisure, and

223
successful men. Similarly, Youngor also started a multi-brand strategy in 2010,
strengthening its original brand whilst new brands target new market segments. For
example, Golden Youngor (GY) is positioned at the group of 40-55 years old,
successful people (e.g., government officials, entrepreneurs, and senior white collars),
representing mature, passionate, personality, and masculine in style.
Brand internationalisation
Since the opening-up and reform in 1978, international clothing brands have been
increasingly coming into the Chinese market, particularly in recent years. Besides the
top luxury brands like Zegna, DIOR and HERMS, popular brands like H&M, ZARA
and UNIQLO also rushed into the Chinese market. Under this setting, brand
internationalisation is an unavoidable step because in order to sustain competitive
advanatage in the global market, Chinese clothing companies have to compete with the
internationals evern at home.
However, a very limited number of Chinese brands have achieved success in the
overseas markets so far, though ‘Made-in-China’ products have been sold everywhere
in the global market. Then why has China not successfully developed international
brands in the clothing industry? As yet, this question has received little detailed
attention in the academic literature, though there has been some generalised discussion
in newspapers such as The Economist and The New York Times. Amongst these there
has been much gossip about bad reputation with “Made-in-China”. This concern is not
totally without reason. The ‘Made-in-China’ label is often associated with some
negative images such as ‘cheap’, ‘poor quality’ and ‘copy’. However, research suggests
that the willingness to accept Chinese brands is 51%, which is similar with that of South
Korean brands, i.e. 50% (Wang 2013). Moreover, the author’s research results suggest
that among factors affecting overseas consumers’ purchasing decisions, the top three are
product quality, price and after-sale service while brand origin and production origin are
the least important factors. The research results also suggest that among the 12 most
competitive factors of the Chinese brands, ‘internationalisation’ and ‘innovation’ are
relatively weak, being ranked 11th
and 9th
respectively. Therefore, China’s brand
internationalisation should be based on meeting the customers’ universal hopes such as
‘competitive price with good quality’ whilst making improvements in terms of
‘internationalisation’ and ‘innovation’.
Insights into the successful world-class clothing brands such as Chanel and Pierre
Cardin (France), Burberry (UK), Prada and Giorgia Armani (Italy), Levis and Calvin
Klein (USA), and Uniqlo (Japan), may also provide implications for internationalisation
of the Chinese clothing brands as follows (Peng 2013):

224
1) Culture enhancement in brand and cultural elements embedded in brand character
and brand style,
2) A complete industry system consisting of R&D + design + raw material supply +
production and sales + consultancy and medium + exhibition and events,
3) Cluster of fashion design centers, clothing model company, media agency and
exhibition organisation working for clothing related exhibitions,
4) Well-developed higher education in clothing.
However, the industry system for the brand internationalisation in China has not yet
well developed, particularly lack of supporting from fashion media atmosphere and
from model and exhibition services. In addition, clothing education in China just started
not long time ago and therefore it takes time for development itself before it can provide
supports to the clothing industry.
8.4.2.2 Upgrading via Information Technology
For the branded clothing companies, Information Technology (IT) makes particularly
sense because in this case endusers and the corresponding marketing activities are
involved in the company’s business. For example, information about sales from
endusers is needed to determine the other activities and operations along the value chain,
including product design (e.g., style, material and color), production arrangement (e.g.,
volume, batch, time flexibility and cost control), inventory, marketing and promotion,
etc. In this context, therefore, IT plays a critical role for SCA of the branded clothing
companies.
A complete set of information systems generally includes 6 aspects (Shen & Cheng
2013), namely, infrastructure, dataset, application system, portal layer, information
security and information administration. Amongst these, the IT application system is the
core resource, which helps the company to link various resources and activities for more
effective and more efficient operations.
The IT application system mainly includes 6 components as follows (Shen & Cheng
2013):
⑴ ERP (Enterprise Resource Plan), a core information system for managing enterprises’
resources, which helps to effectively integrate main resources by managing every node
along the supply chain including design, R&D, procurement, production, logistics,
distribution and sales,

225
⑵ PLM (Product Life Management), the information system for managing product
processes from new product through product growth and maturity, to product decline
and termination,
⑶ WMS (Warehouse Management System), the inventory and logistics management
system, which helps to reduce costs of inventory and logistics,
⑷ OA (Office Automation), a system for information exchange and communication
among the internal departments, which is also a cooperative office platform among
general staff and managers,
⑸ POS (Point Of Sale), the retail system, which helps to timely and precisely access to
information about sales and the end-users,
⑹ CRM (Customer Relationship Management), the customer relationship management
system, which mainly includes a customer service module, a customer management
module, a VIP customer management module, a sales management module, a
comprehensive analysis module and a call center.
However, Promotion of IT does not merely refer to the adoption of software. The
essence refers to the implementation of dynamic management and the integration of all
business processes, including ordering, stock control, distribution, data collection and
information analysis. Therefore, building up an effective IT system involves a number
of parties (e.g., suppliers, customers, coordinators, retailers, etc) and requires substantial
investment over a relatively long period.
In this context, only relatively large companies like Youngor and Tedelon are in a
position to undertake the necessary investment. Also, the big companies have a greater
need to develop an IT system due to the complicated relationships and business
processes involved. For example, clothing businesses have to deal with large stocks,
data about numerous styles and structures, customer identifications, etc.
Managing all this complicated information requires IT to make an effective value chain
management system including precise forecasts, procurement management, production
planning, distribution management, etc. IT could start from the company’s headquarters
and then extend to the branches and working offices in different regions and districts,
and further extend to the major self-operation stores and franchising stores. In this way,
the whole value chain is included in the IT systems.
For many clothing MLEs, the biggest problem with IT is a shortage of talented human
resources. On the one hand, many software suppliers, due to lack of a clothing

226
background, understand programme development but know little about clothing
production or clothing selling, not to mention company management. Therefore, the
software developed often experiences teething problems during the implementation
phase. On the other hand, amongst the clothing enterprises, those who know about both
clothing management and IT are rare. As a result, human capital is the bottleneck for the
clothing enterprises promoting more efficient exploitation of IT.
In summary, upgrading via branding and IT is a general trend and practical strategy for
the Chinese clothing industry, particularly in the higher value-added segments such as
R&D, branding and marketing, to achieve SCA. At the same time, cost control
strategies through relocation and outsourcing are necessary to retain the present
competitive advantage in the clothing manufacturing segment.
Other SCA strategies
There are some other widely discussed strategies for securing sustainable competitive
advantage of the Chinese clothing industry which are not focused on in this research.
These strategies mainly include diversification of investment, vertical integration, local
industrial clusters (LICs) and horizontal cooperation between the manufacturers. These
are briefly introduced and discussed below.
Diversification
The development of the overall clothing industry in China, particularly of the clothing
manufacturing, is slowing down. To protect against this, some companies have
diversified their investment portfolios but few have been successful. There is no
inherent sin in the diversification strategy itself. However, in many cases, it is the
deficient and unprofessional strategic management and its implementation that cause
limited resources decentralized, which subsequently results in business failure (Di 2013).
Taking Shanshan Group as an example, after Shanshan transformed its no. 1 principal
business from the original textile & clothing into lithium battery materials, the company
has experienced various difficulties including a quality-problem incident, high
management costs and plunging profits. As a result, although clothing is still one of its
principal businesses the competitive advantage of its clothing business has not
continued (Di 2013). For example, the net profits of the company in the clothing
business decreased by 85.60% in 2012.
Vertical integration
Youngor is a typical example of vertical integration. Over more than 30 years of
continual efforts, Youngor Group has developed its complete clothing value chain,
involving integration of the upward supply chain (e.g., fabric and textile supply and

227
even raw materials) and downward distribution channel, including marketing and
services. However, the company has been widely criticised for departing from the
common practice of focusing on what the company can do best. It has also been argued
that vertical integration made Younger a ‘big lump’ causing outstanding inventory
problems in recent years (Chen 2004).
Local industrial clusters
There are dual phenomena in the Chinese clothing industry, namely, geographical
clusters and the dispersal of production. On the one hand, in order to cut production
costs, the MLEs tend to relocate their factories to the low-cost regions of inland China
or overseas. On the other hand, the SMEs would like to converge on one place to enjoy
all the benefits from local industrial clusters (LICs) (Details in Chapter 2.3.7) and in this
way achieve sustained competitive advantage.
Horizontal co-operations
In order to be in a stronger position to attract foreign orders, some Chinese clothing
companies establish strategic alliances. That is, companies with different specialised
capabilities and different product lines organise into a group serving foreign buyers who
need a variety of product lines. The main benefit for the foreign buyers is that it saves
transaction-related costs because they only need to deal with a single trusted partner
instead of all the different dealers.
In summary, companies try different ways to achieve their competitive advantage.
However, none of these can directly tackle the identified problems with SCA of the
industry. In comparison with the cost controlling strategies and upgrading strategies,
these strategies could be looked as supplementary or options but could not replace the
former.
For implementation of the recommended strategies, next section provides an executive
plan specifying stages, possible evolution patterns, focuses for each stage, and estimated
time for each stage.
8.4.3 The executive plan
The competitive advantage of the clothing industry changes with the different stages of
economic development of an individual country (Ha-Brookshire & Lee 2010). The
authors further argue that the countries in the early stages of development may have a
comparative advantage in labour-intensive activities such as clothing manufacturing
whereas in later phases of economic development their comparative advantage tends to
change to capital-intensive activities such as fibre and textile manufacturing while

228
competitive advantage of the developed economies is likely to be in high value-added
activities such as design, branding and marketing. The history of the global clothing
industry has witnessed this pattern of evolution (Barney 1991). For example, since the
1960s clothing manufacturing in America and the EU (e.g., UK) has gradually moved to
the Asian NIEs (e.g., Singapore and South Korea). Later on, with the NIEs’ economic
development, their original cost-based advantage gradually diminished. China has then
gradually taken over the labour-intensive manufacturing from the NIEs since the 1980s.
More recently, global clothing manufacturing is shifting to South and Southeast Asian
economies such as Vietnam, Cambodia and Bangladesh. Correspondingly, SCA of the
Chinese clothing industry is going through transformation and evolution (Figure 8-2).
Figure 8-2: Recommendation of SCA strategies to the Chinese clothing industry in the GVC 1
Source: The author.
Notes: E is the competitive equilibrium between manufacturing advantage and branding advantage
which is at the intersection of dotted lines (manufacturing advantage line) and (branding
advantage line). Therefore, the four quadrants represent different combinations of
strategies/advantages: Quadrant 1 (manufacturing advantage and branding disadvantage), Quadrant 2
(manufacturing advantage and branding advantage), Quadrant 3 (manufacturing disadvantage and
branding advantage), Quadrant 4 (manufacturing disadvantage and branding disadvantage).
The horizontal axis represents upgrading strategies and corresponding investment leading to
branding advantage (including advantage in R&D, design, marketing and brand) while vertical axis
Upgrading strategies
(Branding advantage)
Cost control strategies
(Manufacturing advantage) Year 5
Year 15
Year 10
Quadrant1 Quadrant2
Quadrant3 Quadrant4
Italy
UK
China
E
SCA

229
is cost control strategies and corresponding investment leading to manufacturing advantage.
The dotted arrow line shows the evolution pattern of the Chinese clothing industry. This is from the
perspective of the entire industry rather than from that of the individual companies and therefore a
45-degree solid arrow line shows a balance of investment between cost-control strategies and
branding strategies, while individual companies may experience a more or less steep line, where a
relatively flat line reflects investment more in branding strategies than in cost-controlling strategies
while a steep line reflects more investment in cost-controlling strategies rather than in branding
strategies.
The solid arrow lines represent the estimated number of years taken for implementation of the
strategies and the corresponding development stages.
Figure 8-2 is a strategy matrix for SCA of the Chinese clothing industry. Based on the
GVC literature and on the findings of this research, the executive plan for the
recommended SCA strategies is depicted. The corresponding implementation stages
with specified years are based on the researcher’s optimistically estimation of the
industrial development trend in China. It is estimated that the industrial transformation
and implementation of SCA strategies will take about 10-15 years in three stages.
Through the development stages, the Chinese clothing industry may transform and
upgrade its competitive advantage from the mere clothing manufacturing segment to the
other higher value-added segments such as branding and marketing, and thereby finally
sustains competitive advantage of the entire industry.
Stage 1 in Quadrant 1 within 5 years
Over the next 5 years (i.e., by 2019), China will retain competitive advantage in the
clothing manufacturing segment of the GVC. During this period, cost control strategies
will be widely adopted though the manufacturing competitive advantage will be
undermined whilst companies are adopting more upgrading strategies and developing
more upgrading capabilities.
Stage 2 moving from Quadrant 1 towards Quadrant 3 within year 5 to year 10
In 5 more years from Stage 1 (i.e., by 2024), the Chinese clothing industry will
gradually update its competitive advantage in design, marketing and brand management
by widely adopting upgrading strategies. During this development phase, the industry as
whole will move from Quadrant 1 towards Quadrant 3 along the dotted arrow line,
signified by the smiling face. It is possible that some companies may fail in Quadrant 4,
particularly if they experience disadvantages both in manufacturing and in branding.
This is due to companies being trapped in the relatively labour-intensive manufacturing
segment of the value chain, whilst at the same time not yet applied upgrading strategies
or not having sufficiently invested in upgrading strategies.

230
Quadrant 2 is where the companies become leaders and acquire advantages both in
manufacturing and branding. However, it may be impossible for companies to move
directly from Quadrant 1 to Quadrant 2 because their capabilities in branding, marketing
and design are not yet ready. The most likely way to get access to Quadrant 2 is through
Quadrant 3, where the companies have developed a competitive advantage in designing,
marketing and branding. Manufacturing advantage in Quadrant 2 needs to be
technology-intensive or capital-intensive rather than labour-intensive.
Stage 3 in Quadrant 3 after year10
After about 10 years (i.e., after 2024), the entire Chinese clothing industry will have
established a competitive advantage in the GVC in high value-added segments such as
R&D, design, marketing and branding, whilst the original competitive advantage in the
labour-intensive manufacturing segment will have disappeared. At the same time,
although clothing manufacturing will have lost its competitive advantage in the GVC, it
might to an extent maintain substantial presences, which would be similar to the Italy
mode rather than the non-Italy mode such as the UK or the US (Figure 8-2). As a result,
the entire clothing industry will have sustained its competitive advantage in the global
market.
The evolution pattern described in the above three stages has been similarly experienced
in Japan and South Korea. Companies in these NIEs have evolved and are in a position
to compete at the international market and they pursue “premium” fashion instead of
“fast” fashion and “premium” products instead of mass products. To this end, the
companies need to keep considerable part of manufacturing at home so as to better serve
for the sustainable development pattern. Taking South Korea as an example, the
clothing and textile industry still ‘remains a valuable industry in Korea, accounting for
15.9% of the total manufacturing establishments or 9.6% of the total manufacturing
employment in 2007’ (Ha-Brookshire & Lee 2010: 282). This is also termed the Italian
mode.
Italy is quite different from the many of the other EU members. The clothing industry
there still accommodates substantial employment and production. Many small clothing
manufacturing companies retains competitive advantage because they ‘…have been in
the forefront of industrial upgrading, seeking to compete on the basis of design, quality
and fashion style and hence remain in high value-added market segments’ (Taplin 2006:
180).
As a matter of fact, the Chinese clothing industry has started to follow the above pattern
of development. It is just a matter of time before the competitive advantage of the
industry eventually shifts from the low value-added manufacturing segment to higher

231
value-added segments such as design, branding and marketing operations.
Moreover, people have noticed the significant difference between the development
mode of Italy and the other developed economies, particularly the UK and the US
(Eryurunk et al. 2010). Nevertheless, there are some commonalities between the Italian
mode and the non-Italian mode: ⑴ They all have presence of globally popular brands
while organisation of production differs. ⑵ The luxury brands and high-end spectrum
products retain production at home while production of the price sensitive products such
as fast fashion and mass products is outsourced to the globally low-cost regions and
economies.
Therefore, taking all of the above considerations into account, this thesis holds that
China can have both modes, the Italian mode (R&D/design + manufacturing of
premium products + marketing) and the UK mode (R&D/design + outsourcing
manufacture of mass products + marketing).
8.5 Contributions and implications of the research
8.5.1 Research contributions
8.5.1.1 Theoretical contributions
This research is primarily based on the underpinnings of RBV. From review and
assessment of the existing literature, this study has identified limitations of the theory
(Details in Chapter 3.3.4.3). Table 8-1 summarises contributions of this study by
addressing the identified limitations.
Synthesised research framework
The most common critique about the RBV theory points to its static analytical
framework. However, this study developed a synthesised research framework,
combining internal (RBV) with external (GVC) theories (Figure 4-2). The synthesised
research framework is a dynamic method, in which resources keep adapted to the
external dynamics via dynamic capabilities. Dynamic capabilities enable companies to
updated and reconfigured resources over dynamic environments (Teece, Pisano &
Shuen 1997, Peteraf & Bergen 2003, Winter 2003, Wiklund & Shepherd 2009).
Holistic model testing the RBV logic
According to RBV, the VRIN resource bundle is a source of sustained competitive
advantage (Rumelt 1984, Wernerfelt 1984, Grant 1991, Barney 1991, 1995, 1997, Amit
& Schoemaker 1993, Teece, Pisano & Shuen 1997, Newbert 2008, Armstrong &

232
Shimizu 2007, Wiklund & Shepherd 2003, 2009). However there is no holistic model to
refer to for the testing of relationships between resources and SCA.
This study, therefore, formulates a hypothesised model which is originally designed for
this study (Figure 6-8). In the model, each of three exogenous constructs (measuring
resources), is hypothesised to significantly and positively contributes to process
performance, measure of SCA. The three exogenous constructs are also assumed to
significantly correlate with one another.
Table 8-1: Research contributions 1
Limitations of RBV Contributions of this research
1) critique of static analytical
framework
a) Synthesising internal (RBV) with external (GVC) theories,
b) The synthesised research framework is a dynamic method, in
which resources keep adapted to the external dynamics via
Dynamic Capability.
2) no holistic model to test the
RBV logic
a) Three constructs of resources are correlated to each other,
b) Each of three constructs is related to SCA.
3) insufficient study focusing on
the resource bundling effect
a) Three constructs of resources are assumed to be correlated to
each other and the test result supports the bundling effect,
b) All resources are dynamically bundled because the resources
keep updated and reconfigurated through Dynamic Capability,
which keeps adaptation to the external dynamics.
4) no holistic measures of
concepts “resources” and “SCA”
in RBV
a) Resources are measured by three constructs, namely,
Fundamental Resource, Dyanmic Capability and Upgrading
Capability,
b) SCA is measured by Process Performance.
5) no unified taxonomy of
resources (i.e., operationalisation
of resources)
a) 4 categories of resources (Table 3-2),
b) 12 indicators of resources (3 specific resources for each
category)
Source: The author.
Resource bundling effect
It is a generally accepted that combined or bundled resources contribute to sustained
competitive advantage (Amit & Schoemaker 1993, Barney 1995, Ray, Barney &
Muhanna 2004, Wiklund & Sheperd 2009). This theoretical idea has been tested in a
number of empirical studies (e.g., Peteraf & Reed 2007, Simon, Gove & Hitt 2008,

233
Furlan, DalPont & Vinelli 2011, Srivastava, Franklin & Martinette 2013). However,
there is insufficient study focusing on the resource bundling effect. Therefore, this study
added contribution to this deficiency. In this research model, three constructs of
resources are assumed to be correlated to each other and the test result supports the
bundling effect. Moreover, all resources are dynamically bundled because the resources
keep updated and reconfigured over external dynamic through Dynamic Capability.
Measure and operationalisation of concepts
There lacks reference concerning measures of holistic “resources” or “SCA” in RBV
literature. Also there lack reference for operationalisation of the concepts. In this
context, this study originally develops measures and operationalisation of these two
concepts “resources” and “SCA” by following Churchill’s (1979) procedure. The
original 22 items are drawn from the literature and as a result of Exploratory Factor
Analysis (Chapter 6.3) and Confirmatory Factor Analysis (Chapter 6.4), resources are
measured by 3 constructs, namely, Fundamental Resource, Dyanmic Capability and
Upgrading Capability; SCA is measured by Process Performance (Figure 6-11).
Research methods
Research concerning SCA in the strategic management field, when focusing on a
specific industry in one economy, typically uses qualitative methods due to the inherent
difficulties in undertaking quantitative research in this area. The difficulties result from
both practical data access and measures & conceptualisation of the complicated social
concepts involved.
This study has experienced similar difficulties. For example, financial information is
sensitive to many SMEs so the companies are not willing to provide it. In this context,
this study employs the process performance measure as an alternative, which largely
avoids the practical difficulties of gaining access to performance data.
Also, the study involves measures of social concepts. Based on the theoretical
groundings and by using statistical techniques (Churchill 1979), this study formulates a
model originally for this research and developes corresponding measures (i.e.,
constructs) of the concepts such as SCA and resources. Structural Equation Modeling is
adopted as the analytical technique, bringing in the research results.
8.5.1.2 Empirical contributions
Empirical evidence of RBV in the Chinese clothing industry
In building the research model, developing measures and designing the specific research
234
method, this study has made theoretical contributions. Moreover, beyond that, this study
made some empirical contributions. Empirical study consisted of statistical test and case
studies by using the primary data collected in the Chinese clothing industry. The
research results generally supported RBV. That is, this study has provided empirical
evidence that resources-SCA relationships, which have been drawn from the RBV
theory, actually do exist in the Chinese clothing industry. By doing so, this study made
empirical contribution to the RBV theory.
Resource bundling effect
Rare literature focuses on the resource-bundling topic. This study reviews some relevant
studies (e.g., Dierickx & Cool 1989, Powell 1992, 1995, Amit & Schoemaker 1993,
Macduffe 1995, Wiklund & Sheperd 2009, Furlan, Vinelli & Pont 2011, Srivastava,
Franklin & Martinette 2013) and the hypothesised effect of the resource bundle on SCA
is tested. The statistical results support the resource bundling effect. This is followed by
studies of evidence in the cases in terms of how-and-why issues of the resource
bundling. This research approach makes the resource-bundling effect to be a noticeable
topic of the RBV theory. Also the resource bundling effect provides implications for
business managers in the Chinese clothing industry (to be discussed below).
Primary data and empirical study
The primary data is about resources and performance of the Chinese clothing companies.
In addition to the specific data for this study, the primary data also includes profile and
factual data of the companies such as size, profit margins, export patterns, business
attributes and own brands, which may also facilitate follow-up research in relevant
areas.
8.5.2 Research implications
The empirical estimation and testing uses the dataset collected from the Chinese
clothing industry and therefore the research findings provide insights into this industry.
These insights provide managerial implications in terms of significant resources for
SCA, resource bundling effects and the performance measurement.
8.5.2.1 Implications of significant resources
Significant resources for SCA of the Chinese clothing industry include Fundamental
Resource and Upgrading Capability. The research findings provide the following
implications for managers.
First of all, Fundamental Resource is a significant factor contributing to SCA for the

235
Chinese clothing industry. Understanding and emphasizing this idea and also putting it
into operation practically and strategically are critical if Chinese clothing companies are
to achieve SCA. However, in business practice, some Chinese clothing companies pay
insufficient attention to or even neglect this issue. For instance, they often invest much
money in advertisements or in fashion design aimed at catering for customers’ demand
for fashion. However, customers often end up being disappointed by the basic aspects,
such as the fact that the products are not of good quality, or the fact that they do not
receive satisfactory after-sale services. Some clothing companies always try to squeeze
their suppliers at the skimming price and not realise the significance and potential
benefits of good and long-term relationships with their suppliers. Other companies may
also neglect or pay insufficient attention to the issue of employees’ skills. For example,
they do not like to pay more for skillful workers, or they are reluctant to invest in the
on-the-job employee training. It is true in many industries that staff may be deskilled
due to increased automation and efficiency but not in the clothing industry, particularly
in the manufacturing segment of the value chain, which is still characterised by
labour-intensive input. Skillful workers really matter not only for higher productivity
but also for quality control. Therefore, companies who try to recruit new staff at low
costs but with poor skills and who are also unwilling to provide the on-the-job training
opportunities to their staff are not going to survive, not to mention gain sustained
competitive advantage.
Secondly, having integrated into the clothing global value chain and having developed
competitive advantage in the manufacturing segment of the value chain, the Chinese
clothing industry now reaches the critical stage of transforming from “quantitative
expansion” into “quality development”. The quantitative expansion refers to mass
production of generic and homogenous products which often link to non-branded
manufacturing whereas the quality development refers to higher value-added and
heterogeneous products which often link to branding operations.
Accordingly, the most urgent and practical strategy for the transformation is functional
upgrading via branding. However, not every clothing company is in a position to
establish and develop a successful and strong brand. Establishment of a successful
brand takes time and requires substantial investment in design, R&D, own distribution
channels, information communication systems, etc. Many of the Chinese companies
have agreed that branding is a practical and necessary step for sustained development
but they do not pay sufficient attention to the necessary steps. Sometimes they take
short cuts. For example, they try to establish a successful band merely through
advertising campaigns when the product quality is still problematic, when customer
services or supplier relationships are not satisfactory and when rates of employee
turnover are still high. Also, a successful and strong brand should develop its core brand
entity, which requires proper marketing and communication with stakeholders, which

236
remain weak points for the majority of the Chinese clothing companies (Details in
Chapter 8.4.2). Moreover, a strong brand requires updating and sustained development.
8.5.2.2 Implications of resources bundling
The resource bundling provides insights into practices of the Chinese clothing industry
which can have implications for managers.
In practice, some Chinese clothing companies are moving their factories to the central
and western regions to reduce rising production costs. It is true that costs of the central
and western regions are lower than the eastern coast regions. However, the environment
(e.g., facilities, infrastructure and administrative services) and resources are not as
supportive as in the eastern coast regions due to the relatively lower levels of
development of these regions. For example, it is difficult to find skillful workers in the
local market while those skillful workers now working in the eastern coast companies
are not willing to move to the central and western regions to accept a lower salary.
Since SCA is attributable to the resources bundle of the firm, lack of some resources
may cause malfunction of the whole resources bundle.
Similar to the above practice, nowadays more and more Chinese clothing manufacturers
have relocated their factories to lower-cost Southeast Asian economies such as Vietnam
and Cambodia where labour costs there are much cheaper than in China. However, there
are some risks and challenges in these Southeast Asian economies, including, inter alia,
unstable politics, high management costs due to religious beliefs and cultural
differences, poor infrastructure, lack of supporting upstream and downstream industries,
shortage of power, high logistics costs, etc.
The above analysis actually reveals a complicated situation, that is, the interaction of
external dynamics with internal resource bundling, which actually bears closer
resemblance to the real business world. The original theory concerning the resource
bundling effect focuses more on the interactions between internal assets and capabilities.
In this context, the resources bundling effect reminds the strategic managers of fits and
complementarities of resources when making strategic decisions. Taking Dishang as an
example, clothing manufacturing is the company’s starting point and a base for building
up its own manufacturing brand. To enhance its own brand, the company adopts
overseas mergers and acquisition (M&A) as the platform and channel to integrate
advantages of various resources, e.g., the advantage of Dishang itself in manufacturing,
combined with overseas advantages in design, management experiences and sales
networks77
.
77 Source: web page from China Garment Association, [online] available from
http://www.cnga.org.cn/news/View.asp?NewsID=41499 [14th May 2014].

237
8.5.2.3 Implications of measures of business performance
Concerning business performance measures, the research suggests that in addition to the
traditional financial performance indicators, business process performance indicators
may be used as alternatives (Figure 6-8). These process performance indicators are
linked to firm specific resources so that the managerial team can check and monitor the
company performance in these specified aspects, for example, effectiveness or
efficiency in getting orders, in managing cost control of procurement, managing
communication with customers and within the company, and updating their strategies
against the external dynamics for SCA.
Finally, the above managerial implications are not only limited to the Chinese clothing
industry but also to other Chinese labour-intensive manufacturing industries (e.g.,
furniture and home appliances) and even to other developing economies which may
experience a similar process of industrialisation to China.
8.6 Limitations and future research directions
Several limitations of this study should be addressed. One limitation concerns the
primary data. A non-random sampling method is adopted in this study due to the
practical difficulty in applying random sampling. Hence, it is acknowledged that there is
deviation from traditional random sampling guidelines for achieving scientific rigor.
Again, due to difficulties in collecting objective financial data, this study instead
develops non-financial indicators, and resulting to an extent in subjective and attitudinal
data, which again may imply a lack of robustness. Concerning data for the case studies,
it would have been better to include multiple sources of the primary data. Again, due to
constraints in time, budget, and networks, sources of primary data are limited. For
example, for individual cases, interviewers should ideally have been chosen from
various positions and ideally interviews would have been taken on several occasions.
For future research, randomly sampling methods are suggested, including longitudinal
financial data and obtain access to multiple sources of data.
The next limitation concerns the measured variables and the corresponding research
model used in the study. Only a limited number of variables are selected, e.g., 10
indicators measuring resources and 5 indicators measuring SCA. However, it is
suggested more indicators may capture more dimensions of a phenomenon, which may
improve robustness of the results. This limitation, nevertheless, provides opportunities
for future research, which may provide additional contributions to a better
understanding of RBV theory and more practical recommendations for the Chinese
clothing industry and its managers.

238
For a long time, the media, industrial and academic communities have referred to
upgrading and transformation but the bundling effect has seldom been focused on.
However, this research suggests that the bundling effect does exist, is important and is
significantly related to SCA of the industry. However, there remain many details to be
investigated and further understood, e.g., what bundles what (e.g., bundling sources and
bundling levels), how bundling (e.g., static bundling or animate bundling, through
M&A or through corporate alliance).
Why is dynamic capability statistically insignificant? This could be further research to
answer this question.
How about comparing performance measures of financial and process performance to
obtain a better measure of SCA? This could be another direction for future research.
In summary, despite a few limitations, this thesis unveiled the research topic and made
both theoretical and empirical contributions. The theoretical contributions mainly
include the holistical model testing the RBV logic and measures of constructs
“resources” and “sustained competitive advantage”. The empirical contributions mainly
include evidence of the RBV theory and resource bundling effects in the Chinese
clothing industry. This study also provides implications for sustaining competitive
advantage of the Chinese clothing industry in terms of significant resources, resource
bundle and assessment of business performance. In addition, this study also proposes
recommendations and its executive plan as solutions to the revealed problems.
Moreover, surrounding the unveiled topic, there are still quite a few interested, broadly
and deeply relevant research areas and directions to be investigated in the future.

239
LIST OF REFERENCES
Aaker, D.A. (1989) ‘Managing Assets and Skills: The Key to a Sustainable Competitive
Advantage’. California Management Review 31(2):91-106.
Aaker, D.A. (1991) Managing Brand Equity. New York, NY: The Free Press.
Aaker, D.A. (1996) Building Strong Brands. New York, NY: The Free Press.
Abreu, M. & Grinevich, V. (2013) ‘The Nature of Academic Entrepreneurship in the UK:
Widening the Focus on Entrepreneurial Activities’. Research Policy 42:408-422.
Akaike, H. (1983) ‘Information Measures and Model Selection’. Bulletin of the
International Statistical Institute 22: 277-291.
Al-Qudah, K.A.M. (2012) ‘The Impact of Total Quality Management on Competitive
Advantage of Pharmaceutical Manufacturing Companies in Jordan’. Perspective of
Innovations, Economics & Business 12(3):59-75.
Alvarez, S.A. & Barney, J.B. (2004) ‘How Do Entrepreneurs OrganiseFirms under
Conditions of Uncertainty?’ Journal of Management 31(5):776-793.
Amit, R. & Schoemaker, P.J.H. (1993) ‘Strategic Assets and Organisational Rent’.
Strategic Management Journal 14: 33-46.
Amit, R. & Belcourt, M. (1999) ‘Human Resources Management Processes: A
Value-Creating Source of Competitive Advantage’. European Management Journal
17(2): 174-181.
Anderson, J.C. & Gerbing, D.W. (1988) ‘Structural Equation Modeling in Practice: A
Review and Recommended Two-Step Approach’. Psychological Bulletin
103(3):411-423.
Andrews, K. (1971) The Concept of Corporate Strategy. Homewood: Dow Jones-Irwin.
Appelbaum, R.P. (2008) ‘Giant Transnational Contractors in East Asia: Emergent Trends
in Global Supply Chains’. Competition & Change 12(1): 69-87.
Appelbaum, R.P. & Gereffi, G. ‘Power and Profits in the Apparel Commodity Chain’. in
Hamilton, N. & Ong, P. (eds) (1994) Global production: the Apparel Industry in the
Pacific Rim. Philadelphia, PA: Temple University Press.
Arbuckle, J.L. (1995) IBM SPSS Amos 19 User’s Guide. Amos Development
Corporation.
Argyris, C. & Schon, D.A. (1996) Organisational Learning II: Theory, Method and
Practice. New York: Addison-Wesley.
Armstrong, C.E. & Shimizu, K. (2007) ‘A Review of Approaches to Empirical Research
on the Resource-Based View of the Firm’. Journal of Management 33(6): 959-986.

240
Babbie, E. (1990) Survey Research Methods. 2nd
edn. Belmont, California: Wadsworth
Publishing Company.
Bair, J. & Gereffi, G. (2001) ‘Local Clusters in Global Chains: The Causes and
Consequences of Export Dynamism in Torreon’s Blue Jeans Industry’. World
Development 29(11): 1885-1903.
Bair, J. & Gereffi, G. ‘NAFTA and the Apparel Commodity Chain: Corporate Strategies,
Interfirm Networks, and Industrial Upgrading’. in Gereffi, G., Spener, D. & Bair, J.
(eds.) (2002) Free Trade and Uneven Development: the North American Apparel
Industry after NAFTA. Philadelphia: Temple University Press.
Bair, J. & Gereffi, G. (2003) ‘Upgrading, Uneven Development, and Jobs in the North
American Apparel Industry’. Global Network 3(2):143-169.
Bair, J. (2005) ‘Global Capitalism and Commodity Chains: Looking Back, Going
Forward’. Competition & Change 9(2): 153-180.
Bair, J. & Peters, E.D. (2006) ‘Global Commodity Chains and Endogenous Growth:
Export Dynamism and Development in Mexico and Honduras’. World Development
34(2): 203-221.
Bair, J. (2008) ‘Analysing Economic Organisation: Embedded Networks and Global
Chains Compared’. Economy and Society 37(3): 339-364.
Balasubramanyam, V.N. & Wei, Y. (2005) ‘Textiles and Clothing Exports from India and
China: A Comparative Analysis’. Journal of Chinese Economic and Business Studies
3(1): 23-38.
Barney, J.B. (1986) ‘Strategic Factor Markets: Expectations, Luck and Business
Strategy’. Management Science 42: 1231-1241.
Barney, J.B. (1989) ‘Asset Stocks and Sustained Competitive Advantage: A Comment’
Management Science 35(12): 1511-1513.
Barney, J.B. (1991) ‘Firm Resources and Sustained Competitive Advantage’. Journal of
Management 17 (1): 99-120.
Barney, J.B. (1995) ‘Looking inside for Competitive Advantage’. Academy of
Management Executive 9(4): 49-60.
Barney, J.B. (1997) Gaining and Sustaining Competitive Advantage. Addison-Wesley
Publishing Company: Reading. MA.
Barney, J.B. (2012) ‘Purchasing, Supply Chain Management and Sustained Competitive
Advantage: The Relevance of Resource-based Theory’. Journal of Supply Chain
Management 48(2):3-6.
Barney, J.B. & Arikan, A.M. ‘The Resource-based View: Origins and Implications’. in

241
Hitt, M.A., Freeman, R.E. & Harrison, J.S. (eds.) (2001) Handbook of Strategic
Management. Oxford, U.K.: Blackwell: 124-188.
Barney, J.B., Fuerst, W.L. & Mata, F.J. (1995) ‘Information Technology and Sustained
Competitive Advantage: A Resource-Based Analysis’. Management Information
Systems Quarterly 19(4): 487-506.
Barney, J.B., Ketchen, Jr. D.J. & Wright, P.M. (2011) ‘The Future of Resource-Based
Theory: Revitalisation or Decline?’. Journal of Management 37(5): 1299-1315.
Barney, J.B. & Wright, P.M. (1998) ‘On Becoming a Strategic Partner: The Role of
Human Resource in Gaining Competitive Advantage’. Human Resource Management
37(1): 31-46.
Barney, J.B. & Zajac, E.J. (1994) ‘Competitive Organisational Behavior: Toward an
Organisationally-Based Theory of Competitive advantage’. Strategic Management
Journal 15: 5-9.
Belsley, D.A., Kuh, E. & Welsch, R.E. (1980) Regression Diagostics: Identifying
Influential Data and Sources of Collinearity. New York: John Wiley & Sons.
Bentz, V.M. & Shapiro, J.J. (1998) Mindful Inquiry in Social Research. London: SAGE
PUBLICATIONS.
Berkeley, N. & Steuer, N. (2000) Competitive Analysis of EU and National Trends in the
Textile and Clothing Industry: Summary Report. Coventry University: Coventry.
Bharadwaj, A.S. (2000) ‘A Resource-based Perspective on Information Technology
Capability and Firm Performance: An Empirical Investigation’. MIS Quarterly
24(1):169-196.
Bhaskar, R. (1989) Relaiming Reality: A Critical Introduciton to Contemporary
Philosophy. London, Verso.
Bhatt, G. & Grover, V. (2005) ‘Types of Information and Technology Capabilities and
Their Role in Competitive Advantage: An Empirical Study’. Journal of Management
Information Systems 22(2): 253-277.
Bititci, U.S., Carrie, A.S., & McDevitt, L. (1997) Integrated Performance Measurement
Systems: A Development Guide. International Journal of Operations & Production
Management 17(5): 522-534.
Bititci, U., Ackermann, F., Ates, A., Davies, J., Gibb, S., MacBryde, J., Mackay, D.,
Maguire, C., Van der Meer, R. & Shafti, F. (2010) ‘Managerial Processes: an
Operations Management Perspective towards Dynamic Capabilities’. Production
Planning & Control 22 (2):157-173.
Bititci, U.S., Ackermann, F., Ates A., Davies J., Garengo P., Gibb S., MacBryde J.,

242
Mackay D., Maguire C., Meer R., Shafti F., Bourne M., & Firat S.U. (2011)
Managerial Processes: Business Process That Sustain Performance. International
Journal of Operations & Production Management 31 (8): 851-891.
Bollen, K. (1989) Structural Equations with Latent Variables. New York: John Wiley.
Bonaccorsi, A. & Lipparini, A. (1994) ‘Strategic Partnerships in New Product
Development: An Italian Case Study’. Journal of Product Innovation Management
11(2): 134-145.
Bonacich, E., Cheng, L., Chinchilla, N., Hamilton, N., & Ong, P. ‘The Garment Industry
in the Restructuring Global Economy’. in Bonacich, E., Cheng, L., Chinchilla, N.,
Hamilton, N. & Ong, P. (eds.) (1994) Global Production: The Apparel Industry in the
Pacific Rim. Philadelphia: Temple University Press.
Boyd, B.K., Bergh, D.D. & Ketchen, D.J. (2010) ‘Reconsidering the Reputation-
Performance Relationship: a Resource-based View’. Journal of Management 36(3):
588-609.
Brown, B.C. (2001) ‘Wages and Employment in the US Apparel Industry’.
Contemporary Economic Poilcy 19(4): 454-464.
Bryman, A. (1989) Research Methods and Organisation Studies. London: Routledge &
Kegan Paul.
Bryman, A. (2004) Social Research Methods. 2nd
edn. Oxford: Oxford University Press.
Burnham, K.P. & Anderson, D.R. (2002) Model Selection and Multimodel Inference: A
Practical Information- Theoretic Approach. 2nd
edn. London: Springer-Verlag.
Burnham, K.P. & Anderson, D.R. (2004) ‘Multimodel Inference: Understanding AIC and
BIC in Model Selection’. Sociological Methods & Research 33(2):261-304.
Camison, C. & Villar-Lopez, A. (2011) ‘Non-technical Innovation: Organisational
Memory and Learning Capabilities as Antecedent Factors with Effects on Sustained
Competitive Advantage’. Industrial Marketing Management 40: 1294-1304.
Cammett, M. (2006) ‘Development and the Changing Dynamics of Global Production:
Global Value Chains and Local Clusters’. Competition & Change, 10(1): 23-48.
Carmines, E.G. & Zeller, R.A. (1979) Reliability and Validity Assessment. London:
SAGE Publications.
Carpinetti, L.C.R. Galdamez, E.V.C. & Gerolamo, M.C. (2008) ‘A Measurement System
for Managing Performance of Industrial Clusters: A Conceptual Model and Research
Cases’. International Journal of Productivity and Performance Management
57(7):405-419.
Cavana, R.Y., Delahaye, B.L. & Sekaran, U. (2001) Applied Business Research:

243
Qualitative and Quantitative Methods. Sydney: J ohn Wiley & Sons Australia.
Chadwick, C. & Dabu, A. (2009) ‘Human Resources, Human Resources Management,
and the Competitive Advantage of Firms: Toward a More Comprehensive Model of
Causal Linkages’. Organisation Science, 20(1): 253-272.
Chailan, C. (2008) ‘Brand Portfolios and Competitive Advantage: An Empirical Study’.
Journal of Product & Brand Management 17(4):254-264.
Chennell, A., Dransfield, S., Field, J., Fisher, N., Saunders, I. & Shaw, D. (2000) ‘OPM:
A System for Organisational Performance Measurement’. In Proceedings of
Performance Measurement: Past, Present and Future Conference, Cambridge, 19–21
July.
Chen, G. (ed.) (2008) Blueprint Fable of China’s Clothing: Costumes Observation in
Ningbo [中国服装产业蓝本寓言:宁波服装观察]. Beijing: China Textile press.
Chen, Y. (2004) ‘Youngor: Trouble resulting from vertical integration’ [雅戈尔:扩展带
来 的 烦 恼 ]. 21st Centuary Economics Report [online] available from
<http://www.people.com.cn/GB/paper2086/13397/1200735.html> [9th May 2014].
China National Garment Association (2011) 2010-2011 China Garment Industry
Development Report. Beijing: China Textile Publisher.
China National Garment Association (2012) 2011-2012 China Garment Industry
Development Report. Beijing: China Textile & Apparel Press.
Choi, T.M. & Sethi, S. (2010) ‘Innovative Quick Response Programmes: A Review’. Int.
J. Production Economics 127: 1-12.
Churchill, G.A. JR. (1979) ‘A Paradigm for Developing Better Measures of Marketing
Constructs’. Journal of Marketing Research 15: 64-73.
Collis, D.J. (1991) ‘A Resource-based Analysis of Global Competition: The Case of the
Bearings Industry’. Strategic Management Journal 12: 49-68.
Collis, D.J. & Montgomery, C.A. (1995) ‘Competing on Resources: Strategy in the
1990s’. Harvard Business Review 73(4): 118-128.
Collis, J. & Hussey, R. (2009) Business Research: A Practical Guide for Undergraduate
& Postgraduate Students. 3rd
edn. London: Palgrace Macmillan.
Coltman, T., Devinney, T.M., Midgley, D.F. &Venaik, S. (2008) ‘Formative Versus
Reflective Measurement Models: Two Applications of Formative Measurement’.
Journal of Business Research 61:1250-1262.
Cortina, J.M., Chen, G. & Dunlap, W.P. (2001) ‘Testing Interaction Effects in LISREL:
Examination and Illustration of Available Procedures’. Organisational Research

244
Methods 4(4), 324-360.
Covin, J. G. & Miles, M. P. (1999) ‘Corporate Entrepreneurship and the Pursuit of
Competitive Advantage’. Entrepreneurship Theory and Practice Spring: 47-63.
Covin, J. G. & Slevin, D.P. (1991) ‘A Conceptual Model of Entrepreneurship as Firm
Behavior’. Entrepreneurship: Theory and Practice 16(1):7-14.
Cronbach, L.J. (1951) ‘Coefficient Alpha and the Internal Structure of Tests’.
Psychometrika 16(3): 297-334.
Crossan, M.M. & Lane, H. W. &White, R.E. (1999) ‘An Organisational Learning
Framework: From Intuition to Institution’. Academy of Management Review 24(3):
522-537.
Crossan, M.M. & Berdrow, I. (2003) ‘Organisational Learning and Strategic Renewal’.
Strategic Management Journal 24(11): 1087-1105.
Dai, X. (2010) ‘Research on the Brand Marketing Strategy of Chinese Clothing
Enterprises’. Asia Social Science 6(12): 54-56.
Damanpour, F. (1991) ‘Organisational Innovation: a Meta-analysis of Effects of
Determinants and Moderators. Academic Management Journal 34(3):550–590.
Damanpour. F. & Gopalakrishnan, S. (2001) ‘The Dynamics of the Adoption of Product
and Process Innovation in Organisations’. Journal of Management Studies 38(1):
45-65.
Damanpour, F., Walter, R.M. & Avellaneda, C.N. (2009) ‘Combinative Effects of
Innovation Types and Organisational Performance: A Longitudinal Study of Service
Organisations’. Journal of management Study 46(4):650–675.
Daneshvar, P. & Ramesh, D.R.H.N. (2010) ‘Review of Information Technology Effect on
Competitive Advantage: Strategic Perspective’. International Journal of Engineering
Science and Technology 2(11): 6248-6256.
Deephouse, D. L. (2000) ‘Media Reputation as a Strategic Resource: An Integration of
Mass Communication and Resource-based Theories’. Journal of Management 26(6):
1091-1112.
DeGeus, A.P. (1988) ‘Planning as Learning’. Harvard Business Review 66(2): 70-74.
Di, H. (2013). ‘Diversification Strategy, a Beautiful Gap?’ [多元化战略,一个美丽的陷
阱?]. China Textile 9:56.
Dierickx, I. & Cool, K. (1989) ‘Asset Stock Accumulation and Sustainability of
Competitive Advantage’. Management Science 35(12): 1504-1511.
Dicken, P. (2007) Global Shift: Mapping the Changing Contours of the World Economy.

245
5th
edn. London: SAGE PUBLICATIONS.
Dicken, P. (2011) Global Shift: Mapping the Changing Contours of the World Economy.
6th
edn. London: SAGA .
Dicken, P. & Hassler, M. (2000) ‘Organising the Indonesian Clothing Industry in the
Global Economy: The Role of Business Networks’. Environment and Planning 32:
263-280.
Dierickx, I. & Cool, K. (1989) ‘Asset Stock Accumulation and Sustainability of
Competitive Advantage’. Management Science 35(12): 1504-1511.
Dixon, N.M. (1992) ‘Organisational Learning: A Review of the Literature with
Implications for HRD Professionals’. Human Resource Development Quarterly 3(1):
29-49.
Douglas, W.Q.J. & Judge, Jr. W.Q. (2001) ‘Total Quality Management Implementation
and Competitive Advantage: The Role Of Structural Control And Exploration’.
Academy of Management Journal 4(1): 158-169.
Du, Y. X. (2011) ‘The Laws to Develop a Strong Nation’. Apparel World 196(11):23-25.
Dulbecco, P. & Vagneron, I. (2001) ‘Competition, Co-operation and Subcontracting:
Lessons from the Clothing Industry in Thailand’. The European Journal of
Development Research 13(2): 58-80.
Duncan, R. & Weiss, A. (1979) ‘Organisational Learning: Implications for Organisational
Design’. Research in Organisational behavior 1: 75-123.
Eisenhardt, K.M. & Martin, J.A. (2000) ‘Dynamic Capabilities: What are They?’
Strategic Management Journal 22(10-11): 1105-1121.
Elster, J. (1989) ‘Social Norms and Economic Theory’. Journal of Economic
Perspectives 3(4): 99-117.
Eryurunk, S. H., Kalao, F., Baskak, M. & Rabenasolo, A.B. (2010) ‘Evaluation of
Globalisation Strategies: External Analysis of the Turkish Clothing Industry’. Textile
Research Journal 80(14): 1379-1391.
Feldwick, P. ‘Brand communications’. in Clifton, R. & Simmons, J. (eds) (2003) Brand
and Branding. Princeton, New Jersey: Bloomberg press, 127-142.
Fornell, C. & Larcker, D.F. (1981) ‘Evaluating Structural Equation Models with
Unobservable Variables and Measurement Error’. Journal of Marketing Research 18
(Febuary): 39-50.
Fos, N.J. & Knudseii, T. (2003) ‘The Resource-based Tangle: Towards a Sustainable
Explanation of Competitive Advantage’. Managerial and Decision Economics 24:
291-307.

246
Foss, N.J. & Ishikawa, I. (2007) ‘Towards a Dynamic Resource-based View: Insights
from Austrian Capital and Entrepreneurship Theory’. Organisation Studies 28
(5):749-772.
Furlan, A., Vinelli, A. & Pont, G.D. (2011) ‘Complementarity and Lean Manufacturing
Bundles: An Empirical Analysis’. International Journal of Operation & Production
Management 31 (8): 835-850.
Garengo, P., Biazzo, S., & Bititci, U.S. (2005) ‘Performance Measurement Systems in
Smes: A Review for a Research Agenda’. International Journal of Management
Reviews 7(1): 25-47.
GATT (1995) Agreement on Textile and Clothing (ATC). Geneva:WTO.
Gereffi, G. (1989) ‘Rethinking Development Theory: Insights from East Asia and Latin
America’. Sociological Forum 4(4):505-533.
Gereffi, G. ‘The Organisation of Buyer-Driven Global Commodity Chains: How U.S.
Retailers Shape Overseas Production Networks’. in Gereffi, G. and Korzeniewicz, M.
(eds) (1994) Commodity Chains and Global Capitalism, Westport: Praeger, 95–122.
Gereffi, G. (1996) ‘Commodity Chains and Regional Divisions of Labour in East Asia’.
Journal of Asian Business 12(1): 75-112.
Gereffi, G. (1999) ‘International Trade and Industrial Upgrading in the Apparel
Commodity Chain’. Journal of International Economic, 48(1): 37 –70.
Gereffi, G. ‘The Mexico-US Apparel Connection: Economic Dualism and Transnational
Networks’. in Tardanico, R. & Rosenberg, M. (eds.) (2000) Global Restructuring and
Regional Transformations in the US South and the Mexican South: Poverty or
Development. London: Routledge.
Gereffi, G. (2001) ‘Shifting Governance Structures in Global Commodity Chains, with
Special Reference to the Internet’. American Behaivoral Scientist 44:1616-1637.
Gereffi, G. (2006) ‘The New Offshoring of Jobs and Global Development’. Geneva: The
International Institute for Labour Studies.
Gereffi, G. (2011) ‘Global Value Chains and International Competition’. Antitrust
Bulletin 56(1):37-64.
Gereffi, G., Humphrey, J. Kaplinsky, R. & Sturgeon, T. (2001) ‘Introduction:
Globalisation, Value Chains and Development’, IDS Bulletin 32(3):1–8.
Gereffi, G, Humphrey, J. & Sturgeon, T. (2005) ‘The Governance of Global Value
Chains’. Review of International Political Economy 12: 78-104.
Gereffi, G. & Korzeniewicz, M. (1995) ‘Commodity Chains and Global Capitalism’.
Social Forces 73(3): 1170-71.

247
Gereffi, G., Korzeniewicz, M. & Korzeniewicz, R. ‘Introduction: Global Commodity
Chains’, In Gereffi, G. & Korzeniewicz, M. (eds.) (1994) Commodity chains and
global capitalism. Westport. CT: Greenwood Press.
Gereffi, G. & Memedovic, O. (2003) ‘The Global Apparel Value Chain: What Prospects
for Upgrading by Developing Countries’. Vienna: United Nations Industrial
Development Organisation.
Gereffi, G. & Pan, M. ‘The Globalisation of Taiwan's Garment Industry’. in Bonacich, E.,
Cheng, L., Hamilton, N. & Ong, P. (eds.) (1994) Global Production: The Apparel
Industry in the Pacific Rim. Philadelphia, PA: Temple University Press, 126-146.
Gibbon, P. (2008) ‘Governance, Entry Barriers, Upgrading: a Re-Interpretation of Some
GVC Concepts from the Experience of African Clothing Exports’. Competition &
Chang 12(1):29-48.
Gibbon, P. & Ponte, S. (2008) ‘Global Value Chains: from Governance to
Governmentality?’ Economy and Society 37(3): 365-392.
Gowen III, C.R., McFadden, K.L. & Tallon, W.T. (2006) ‘On the Centrality of Strategic
Human Resource Management for Healthcare Quality Results and Competitive
Advantage’. Journal of Management Development 25(8): 806-826.
Grandys, E. & Grandys, A. (2008) ‘Outsourcing: An Innovation Tool in Clothing
Companies’. Fibres & Textiles in Eastern Europe 16(5):13-16.
Grant, R.M. (1991) ‘The Resource-based Theory of Competitive Advantage:
Implications for Strategy Formulation’. California Management Review 33(3):
114–135.
Guba, E.G. & Lincoln, Y.S. ‘Competing Paradigms in Qualitative Research’. in Denzin,
N.K. and Lincoln, Y.S. (eds.) (1994) Handbook of Qualitative Research. SAGA
Publications: London.
Gunday, G., Ulusoy, G., Kilic, K. & Alpkan, L. (2011) ‘Effects of Innovation Types on
Firm Performance’. International Journal of Production Economics 133(2): 662-676.
Guo, Y. (2009a) ‘Evaluation Index System of Youngor’s Independent Innovation
Capability’. Journal of Beijing Institute of Clothing Technology 29(1):45-52.
Guo, Y. (2009b) ‘Empirical Study on Shirt-product Upgrading Led by Youngor’s
Independent Innovative Technology’. China Textile Leader (1): 22-25
Ha-Brookshire, J. E. & Lee, Y. (2010) ‘Korean Apparel Manufacturing Industry:
Exploration from the Industry Life Cycle’. Clothing and Textiles Research Journal 28
(4):279-294.
Hair, Jr. J.F., Black, W.C., Babin, B.J. & Anderson, R.E. (2007) Multivariate Data

248
Analysis: A Global Perspective. 6th
edn. New Jersey: Pearson Prentice Hall.
Hair, Jr. J.F., Black, W.C., Babin, B.J. & Anderson, R.E. (2010) Multivariate Data
Analysis: A Global Perspective. 7th
edn. New Jersey: Pearson Prentice Hall.
Hall, R. (1993) ‘A Framework Linking Intangible Resources and Capabilities to
Sustainable Competitive Advantage’. Strategic Management Journal 14: 607-618.
Hansen, M.H., Perry, L.T. & Reese, C.S. (2004) ‘A Bayesian Operationalisation of the
Resource-based View’. Strategic Management Journal 25(7): 1279-1295.
Hassler, M. (2003) ‘The Global Clothing Production System: Commodity Chains and
Business Networks’. Global Networks 3(4): 513–531.
Hazen, B.T. & Byrd, T.A. (2012) ‘Toward Creating Competitive Advantage with
Logistics Information Technology’. International Journal of Physical Distribution &
Logistics Management 42 (1): 8-35.
Helfat, C. E., Finkelstein, S., Mitchell, W., Peteraf, M. A., Singh, H. & Teece, D. J. (2007)
Dynamic Capabilities: Understanding Strategic Change in Organisations. USA:
Blackwell Publishing.
Helfat, C. E. & Peteraf, M. A. (2003) ‘The Dynamic Resource-based View: Capability
Lifecycles’. Strategic Management Journal 24: 997-1010.
Hill, C.W.L. & Jones, G.R. (2007) Strategic management theory: an integrated
approach. 7th
ed. Boston, MA: Houghton Mifflin.
Hill, E. W. & Brennan, J. F. (2000) ‘Methodology for Identifying the Drivers of
Industrial Clusters: The Foundation of Regional Competitive Advantage’. Economic
Development Quarterly 14: 65-96.
Harrison, J.S., Hoskisson, R.E. & Ireland, R.D. (2001) ‘Resource Complementarity in
Business Combinations: Extending the Logic to Organisational Alliances’. Journal of
Management 27(6):679-690.
Hoeffler, S. & Keller, K.L. (2003) ‘The Marketing Advantages of Strong Brands’.
Journal of Brand Management 10(6): 421-425.
Hopkins, T. K. & Wallerstein, I. (1977) ‘Patterns of Development of the Modern World
System’. Review 1(2): 11-145.
Hopkins, T. K. & Wallerstein, I. (1986) ‘Commodity Chains in the World-economy prior
to 1800’. Review 10(1): 157-170.
Hult, G.T.M. & Ketchen, J.R. (2001) ‘Does Market Orientation Matter?: A Test of the
Relationship between Positional Advantage and Performance’. Strategic Management
Journal 22:899-906.

249
Hultsch, D.F., Hertzog, C. & Dixon, R.A. (1990) ‘Ability Correlateds of Memory
Performance in Adulthood and Aging’. Psychology and Aging 5(3): 356-368.
Humphrey, J. & Schmitz, H. (2000) ‘Governance and Upgrading: Linking Industrial
Cluster and Global Value Chain Research’. Institute of Development Studies: working
paper 120.
Humphrey, J. & Schmitz, H. (2001) ‘Governance in Global Value Chains’. IDS Bulletin
32(2): 19–29.
Humphrey, J. & Schmitz, H. (2002) ‘How Does Insertion in Global Value Chains Affect
Upgrading in Industrial Clusters?’ Regional Studies 36(9): 10-17.
Humphrey, J. & Schmitz, H. ‘Chain Governance and Upgrading: Taking Stock’, In H.
Schmitz (Ed.) (2003) Local Enterprises in the Global Economy: Issues of Governance
and Upgrading. Cheltenham: Edward Elgar.
Ireland, R.D. & Webb, J.W. (2007) ‘A Multi-theoretic Perspective on Trust and Power in
Strategic Supply Chains’. Journal of Operations Management 25(2):482-497.
Jaccard, J. & Wan, C.K. (1995) ‘Measurement Error in the Analysis of Interaction Effect
between Continuous Predictors Using Multiple Regression: Multiple Indicator and
Structural Equation Approaches’. Psychological Bulletin 117(2): 348-357.
Jia, N. (2013) ‘Competition, Governance and Relationship-Specific Investments: Theory
and Implications for Strategy’. Strategic Management Journal 34: 1551-1567.
Ji, R. (2004) ‘Cover Feture: Wang Peihuo and Tedelon’ [封面特写:王培火与太子龙].
China Quality and Brand, 11: 10-14.
Jiménez-Jiménez, D. & Sanz-Valle, R. (2011) ‘Innovation, Organisational Learning, and
Performance’. Journal of Business Research 64:408-417.
Jones, R.M. (2006) The Apparel Industry. 2nd
edn. Oxford: Blackwell Publishing.
Jones, C. & Bonevac, D. (2013) ‘An Evolved Definition of the Term Brand: Why
Branding Has a Branding Problem’. Journal of Brand Strategy 2(2):12-120.
Jones, R.M. & Hayes, S.G. (2002) ‘The Economic Determinants of Clothing
Consumption in the UK 1987-2000’. Journal of Fashion Marketing and Management
6(4): 326-339.
Jones, R.M. & Hayes, S.G. (2004) ‘The UK Clothing Industry Extinction or Evolution?’
Journal of Fashion Marketing and Management 8(3): 262-278.
Jöreskog, K. G. (1969) ‘A General Approach to Confirmatory Maximum Likelihood
Factor Analysis’. Psychometrika 34(2): 183-202.
Jöreskog, K. G. (1978) ‘Structural Analysis of Covariance and Correlation Matrices’.

250
Psychometrica 43(4): 443-478.
Kaplan, D. (2000) Structural Equation Modeling: Foundations and Extensions. Clifornia:
SAGE Publications Publications.
Kaplan, R.S. & Norton, D.P. (1992) ‘The Balanced Scorecard Measures That Drive
Performance’. Harvard Business Review 70(1): 71-79.
Kaplan, R.S. & Norton, D.P. (1996) ‘Using the Balanced Scorecard as a Strategic
Management System’. Harvard Business Review 74(1): 75-85.
Kaplinsky, R. (1998) ‘Globalisation, Industrialisation and Sustainable Growth: the
Pursuit of the Nth Rent’. Discussion Paper 365, Institute for Development Studies
University of Sussex.
Kaplinsky, R. (2000) ‘Globalisation and Unequalisation: What Can Be Learned from
Value Chain Analysis?’ Journal of Development Studies 37:117-146.
Keegan, D.P., Eiler, R.G. & Jones, C.R. (1989) ‘Are Your Performance Measures
Obsolete?’ Management Accounting June: 45-50.
Keller, K.L. (2003) Strategic Brand Management: Building, Measuring and Managing
Brand Equity .2nd
edn. New Jersey: Pearson Education.
Keller, K.L. (2009) ‘Building Strong Brands in a Modern Marketing Communications
Environment’. Journal of Marketing Communications 15(2-3): 139-155.
Kirk, J. & Miller, M.L. (1986) Reliability and Validity in Qualitative Research. London:
SAGE Publications.
Kline, R.B. (2005) Principles and Practices of Structural Equation Modeling. 2nd
edn.
New York: The Guilford Press.
Knight, K. (1967) ‘A Descriptive Model of the Intra-Firm Innovation Process’. Journal
of Buinesss 40(4): 478-496.
Ko, E., Kincade, D. & Brown, J.R. (2000) ‘Impact of Business Type upon the Adoption
of Quick Response Technologies- The Apparel Industry Experience’. International
journal of operations & production management 20(9): 1093-1111.
Kobia, M. (2010) ‘Towards a Search for the Meaning of Entrepreneurship’. Journal of
European Industrial Training 34(2): 110-127.
Koch, M.J. & McGrath, R.G. (1996) ‘Improving Labour Productivity: Human Resource
Management Policies Do Matter’. Strategic Management Journal 17:335-35.
Koufteros, X.A., Vonderembse, M. & Doll, W. (2002) ‘Examining the Competitive
capabilities of Manufacturing Firms’. Structural Equation Modeling: A
Multidisciplinary Journal 9(2): 256-282.

251
Koufteros, X. & Marcoulides, G.A. (2006) ‘Product Development Practices and
Performance: A Structural Equation Modeling-based Multi-group Analysis’.
International Journal of Production Economics 103: 286-307.
Krishnan, H., Kapuscinskj, R. & Butz, D. A. (2010) ‘Quick Response and Retailer
Effort’. Management Science 56(6): 962-977.
Krugman, P. (1991) ‘History and Industry Location: The Case of the Manufacturing Belt’.
The American Economic Review 81(2): 80-83.
Laframboise, K. & Reyes, F. (2005) ‘Gaining Competitive Advantage from Integrating
Enterprise Resource Planning and Total Quality Management’. The Journal of Supply
Chain Management Summer: 49-64.
Lado, A.A. & Wilson, M.C. (1994) ‘Human Resource Systems and Sustained
Competitive Advantage: A Competency-based Perspective’. Academy of Management
Review 19(4): 699-727.
Laitinen, E.K. (2002) ‘A Dynamic Performance Measurement System: Evidence From
Small Finnish Technology Companies’. Scandinavian Journal of Management 18:
65–99.
Lee, C., Lee, K. & Pennings, J.M. (2001) ‘Internal Capabilities, External Networks and
Performance: A Study on Technology-based Ventures’. Strategic Management Journal
22(6/7):615–40.
Leed, R., Lemak, D.J. & Mero, N.P. (2000) ‘Total Quality Management and Sustainable
Competitive Advantage’. Journal of Quality Management 5:5-26.
Lengnick-Hall, C.A. (1992) ‘Innovation and Competitive Advantage: What We Know
and What We Need to Learn’. Journal of Management 18(2):399-429.
Lewis, M.A. (2000) ‘Lean production and Sustainable Competitive Advantage’.
International Journal of Operation & Production Management 20(8): 959-978.
Li, R.C. (2008) ‘Youngor: To Achieve Competitiveness Only by Building up Corporate
Culture’. [online] available from <http://qywh.qx100.com.cn> [20th
June 2013].
Li, R.C. (2011) ‘To Achieve My Dream from the Principal Business’. Apparel World
196(11): 74-75.
Liu, P. & Gu, Q. (2007) ‘Present Position of China’s Local Industrial Cluster (LICS) in
the Global Value Chain (GVC): Apparel and Textile Industry Case Study’. Canadian
Social Science 3(3): 11-19.
Lippman, S. A. & Rumelt, R. P. (2003) ‘The Payments Perspective: Micro-foundations of
Resource Analysis’. Strategic Management Journal 24: 903-927.
Litwin, M.S. (1995) How to Measure Survey Reliability and Validity. Thousand Oaks,

252
CA: SAGE Publications.
Litwin, M.S. (2003) How to Assess and Interpret Survey Psychometrics. 2nd
edn. London:
SAGE Publications.
Lockett, A., Thompson, S. & Morgenstern, U. (2009) ‘The Development of the
Resource-based View of the Firm: A Critical Appraisal’. International Journal of
Management Reviews 11(1):9-28.
Lumpkin, G.T. & Dess, G.G. (1996) ‘Clarifying the Entrepreneurial Orientation
Construct and Linking It to Performance’. Academic Management Review 1(21):
135-172.
Lynch, R. & Cross, K. (1991) Measure up! Yardsticks for Continuous Improvement.
Cambridge: Blackwell.
MacCallum, R.C., Brown, M.W. & Sugawara, H.M. (1996) ‘Power Analysis and
Determination of Sample Size for Covariance Structure Modelling’. Psychological
Methods 1(2): 130-149.
Macduffie, J.P. (1995) ‘Human Resource Bundles and Manufacturing Performance:
Organisational Logic and Flexible Production Systems in the World Auto Industry’.
Industrial and Labor Relations Review 48(2): 197-221.
Makadok, R. (1999) ‘Interfirm Differences in Scale Economies and the Evolution of
Market Shares’. Strategic Management Journal, 20: 935-952.
Makadok, R. (2001) ‘Toward a Synthesis of the Resource-based and Dynamic- capability
Views of Rent Creation’. Strategic Management Journal 22(5): 387-401.
Mata, F.J., Fuerst, W.L. & Barney, J.B. (1995) ‘Information and Technology and
Sustained Competitive Advantage: A Resource-Based Analysis’. MIS Quarterly
December: 487-507.
Moon, P. & Fitzgerald, L. (1996) ‘Delivering the Goods at TNT: the Role of the
Performance Measurement System’. Management Accounting Research 7:431-457.
Morgan, R.M. ‘Relationship Marketing and Marketing Strategy: the Evolution of
Relationship Strategy within the Organisation’. in Sheth, J. & Parvatiyar, A. (eds.)
(1999) Handbook of Relationship Marketing. California: SAGE Publications.
Mulaik, S.A. & Millsap, R.E. (2000) ‘Doing the Four-step right’. Structural Equation
Modeling 7(1): 36-73.
Munizu, M. (2013) ‘The Impact of Total Quality Management Practices towards
Competitive Advantage and Organisational Performance: Case of Fishery Industry in
South Sulawesi Province of Indonesisa’. Pakistan Journal of Commerce and Social
Sciences 7(1):184-197.

253
Ndofor, H.A., Sirmon, D.G. & He, X. (2011) ‘Firm Resources, Competitive Actions and
Performance: Investigating a Mediated Model with Evidence from the In-Vitro
Diagnostics Industry’. Strategic Management Journal 32: 640-657.
Neely, A., Gregory, M., & Platts, K. (1996) ‘Performance Measurement System Design:
Should Process Based Approaches Be Adopted?’ International Journal of Production
Economics 46-47(1):423-431.
Neidik, B. & Gereffi, G. (2006) ‘Explaining Turkey’s Emergence and Sustained
Competitiveness as a Full-package Supplier of Apparel. Environment and Planning A,
38: 2285-2303.
Nelson, J.R., Benner, G.J., Lane, K. & Smith, B.W. (2004) ‘An Investigation of the
Academic Achievement of K-12 Students with Emotional and Behavior disorders in
Public School Settings’. Exceptional Children 71:59-74.
Nelson, R.R. (1991) ‘Why Do Firms Differ and How Does It Matter?’ Strategic
Management Journal 12(2): 61-74.
Newbert, S.L. (2007) ‘Empirical Research on the Resource-based View of the Firm: An
Assessment and Suggestions for Future Research’. Strategic Management Journal 28:
121–146.
Newbert, S.L. (2008) ‘Value, Rareness, Competitive Advantage and Performance: a
Conceptual-level Empirical Investigation of the Resource-based View of the Firm’.
Strategic Management Journal 29: 745–768.
Pang, Y. (2010) ‘Study on Internationalisation Strategies of Famous Ningbo Clothing
Brands’ [宁波知名品牌国际化经营策略研究]. Journal of Zhejiang Wanli University
23 (3):10-13.
Parayitam, S. & Guru-Gharana, K. (2010) ‘Economics of Resource Based and Dynamic
Capabilities View: A Contemporary Framework’. Academy of Strategic Management
Journal 9(1): 83-93.
Peng, J. (2013) ‘Branding and Transformation of Chinese Clothing Industry:
International Experiences and Implementation Path’ [中国服装产业品牌化转型:国际
经验与实施路径]. Development Research 1: 69-74.
Penrose, E. (1959) The Theory of the Growth of the Firm. Wiley: New York.
Peteraf, M.A. (1993) ‘The Cornerstones of Competitive Advantage: A Resource-Based
View’. Strategic Management Journal 14:179-191.
Pereira, C.A.B., Ferreira, J.J.M. & Alves, H.M.B. (2012) ‘Tacit Knowledge as
Competitive Advantage in Relationship Marketing: A Literature Review and
Theoretical Implications’. Journal of Relationship Marketing 11:172-197.

254
Peterar, M.A. & Barney, J. B. (2003) ‘Unraveling the Resource-based Tangle’.
Managerial and Decision Economics 24:309-323.
Peteraf, M. A. & Bergen, M.E. (2003) ‘Scanning Dynamic Competitive Landscapes: A
Market-based and Resource-based Framework’. Strategic Management Journal
24(10):1027-1041.
Peteraf, M. & Reed, R. (2007) ‘Managerial Discretion and Internal Alignment under
Regulatory Constraints and Change’. Strategic Management Journal 28: 1089–1112.
Phillips, E.M. & Pugh, D.S. (2000) How to Get a PhD — A Handbook for Students and
Their Supervisors. 3rd
edn. New York, NY: Open University Press.
Pillow, D.R., Zautra, A.J. & Sandler, I. (1996) ‘Major Life Events and Minor Stressors:
Identifying Mediational Links in the Stress Process’. Journal of Personality and Social
Psychology 70(2): 381-394.
Pisano, G.P. & Wheelwright, S.C. (1995) ‘The New Logic of High-tech R&D’. Harvard
Business Review 73(5): 93-105.
Podsakoff, P.M., MacKenzie, S.B., Lee, J.Y. & Podsakoff, N.P. (2003) ‘Common
Method Biases in Behavioral Research: A Critical Review of the Literature and
Recommended Remedies’. Journal of Applied Psychology 88(5): 879-903.
Ponte, S. & Gibbon, P. (2005) ‘Quality Standards, Conventions and the Governance of
Global Value Chains’. Economy and Society 34(1): 1-31.
Porter, M.E. (1980) Competitive Strategy: Techniques for Analyzing Industries and
Competitors. New York: Free Press.
Porter, M.E. (1986) Competition in Global Industries. Boston: Harvard Business School
Press.
Powell, T.C. (1992) ‘Organisational Alignment as Competitive Advantage’. Strategic
Management Journal 13: 119-134.
Powell, T.C. (1995) ‘Total Quality Management as Competitive Advantage: A Review
and Empirical Study’. Strategic Management Journal 16:15-37.
Powell, T.C. & Dent-Micallef, A. (1997) ‘Information and Technology as Competitive
Advantage: The Roll of Human, Business and Technology Resources’. Strategic
Management Journal 18(5): 375-405.
Powell, T.C. (2001) ‘Competitive Advantage: Logical and Philosophical Considerations’.
Strategic Management Journal 22(9): 875–888.
Prahalad, C.K. & Hamel, G. (1990) ‘The Core Competence of the Corporation’. Harvard
Business Review May-June: 79-91.

255
Priem, R.L. & Butler, J.E. (2001) ‘Tautology in the Resource-based View and the
Implications of Externally Determined Resource Value: Further Comments’. Academy
of Management Review 26: 57–66.
Progoulaki, M. & Theotokas, I. (2010) ‘Human Resource Management and Competitive
Advantage: An Application of Resource-Based View in the Shipping Industry’. Marine
Policy 34: 575-582.
Quinn, J. B., Doorley, T. L. & Paquette, P. C. (1990) ‘Beyond Products: Services-based
Strategy’. Harvard Business Review 58-67.
Rabellotti, R. (1999) ‘The Internal Heterogeneity of Industrial Districts in Italy, Brazil
and Mexico’. Regional Studies 33(2): 97-108.
Ramaswamy, K.V. & Gereffi, G. (2000) ‘India’s Apparel Exports: The Challenge of
Global Markets’. The Developing Economies 38(2): 186-210.
Ray G., Barney, J. B. & Muhanna, W. A. (2004) ‘Capabilities, Business Processes and
Competitive Advantage: Choosing the Dependent Variable in Empirical Tests of the
Resource Based View’. Strategic Management Journal 25: 23-37.
Reinecke, G. (2010) ‘Upgrading or Decline? Globalisation, Retail Structure and Labour
in the Chilean Textile and Clothing Industry’. Competition and Change 14(1):23-47.
Remenyi, D., Williams, B., Money, A. & Swartz, E. (1998) Doing Tesearch in Business
and Management: An Introduction to Process and Method. Lonon: SAGE
Publications.
Ricardo, D. (1821) On the Principles of Political Economy and Taxation. 3rd
edn. [online]
available from <http://www.econlib.org/library/Ricardo/ricPCover.html> [21st
December 2012].
Rigdon, E. E. (1999) ‘Using the Friedman Method of Ranks for Model Comparison in
Structural Equation Modeling’. Structural Equation Modeling 6(3): 219-232.
Robson, C. (2002) Real World Research. 2nd
edn. Oxford: Blackwell.
Rumelt, R.P. ‘Toward a Strategic Theory of the Firm’. in Lamb, R. (ed.) (1984)
Competitive Strategic Management. Englewood Cliffs, NJ: Prentice Hall, 556-570.
Rumelt, R.P.‘Theory, Strategy and Entrepreneurship’. in Teece, D.J. (ed.) (1987) The
Competitive Challenge, Cambridge, MA: Ballinger, 137-158.
Rumelt, R.P. (1991) ‘How Much Does Industry Matter?’ Strategic Management Journal
12: 167-185.
Sakchutchawan, S., Hong, P.C., Callaway, S.K. & Kunnathur, A. (2011) ‘Innovation and
Competitive Advantage: Model and Implementation for Global Logistics’.
International Business Research, 4(3): 10-21.

256
Saunders, M., Lewis, P. & Thornhill, A. (2007) Research Methods for Business Students.
4th
edn. London: Pearson Education Limited.
Saunders, M., Lewis P. & Thornhill, A. (2010) Research Methods for Business Students.
5th
edn. London: Pearson Education Limited.
Schmitz, H. & Nadvi, K. (1999) ‘Clustering and Industrialisation: Introduction’. World
Development 27(9): 1503-1514.
Schofield, W. ‘Survey Sampling’. in Sapsford, R. & Jupp, V. (eds.) (1996) Data
Collection and Analysis. London: SAGE Publications.
Schumpeter, J.A. (1934) The Theory of Economic Development: An Inquiry into Profits,
Capital, credit, Interes and the Business Cycle. Cambridge: Harvard University Press.
Schwarz, G. (1978) ‘Estimating the dimension of a model’. The Annals of Statistics 6(2):
461-464.
Shen, L. & Cheng, G. (2013) ‘Building up IT Application Systems for fhe Branded
Clothing Operators’ [服装品牌运营商的 IT 应用系统搭建]. China Textile 9: 138-139.
Simon, A. (2010) ‘Resources, Dynamic Capabilities and Australian Business Success’.
Journal of Global Business and Technology 6(2):12-31.
Sirmon, D.G., Gove, S. & Hitt, M.A. (2008) ‘Resource Management in Dyadic
Competitive Rivalry: the Effects of Resource Bundling and Deployment’. Academy of
Management Journal 51(5): 919–935.
Siqueira, A.C.O. & Cosh, A.D. (2008) ‘Effects of Product Innovation and Organisational
Capabilities on Competitive Advantage: Evidence from UK Small and Medium
Manufacturing Enterprises’. International Journal of Innovation Management 12(2):
113–137.
Skerlavaj, M., Stemberger, M. I., Skrinjar, R. & Dimovski, V. (2007) ‘Organisational
Learning Culture: The Missing Link between Business Process Change and
Organisational Performance’. International Journal of Production Economics 106:
346-367.
Small, M. & Judd, K. (1998) ‘Comparisons of New Nonlinear Modeling Techniques with
Applications to Infant Respiration’. Physica D 117: 283-298.
Smith, A. (2003) ‘Power Relations, Industrial Clusters and Regional Transformations:
Pan-European Integration and Outward Processing in the Slovak Clothing Industry’.
Economic Geography 79(1): 17-40.
Spanos, A. (1986) Statistical Foundations of Econometric Modeling. Cambridge, UK:
Cambridge University Press.
Spitzer, R.D. (1993) ‘TQM: The Only Source of Competitive Advantage.’ Quality

257
Progress 26(6): 59-64.
Srivastava, M., Franklin, A. & Martinette, L. (2013) ‘Building a Sustainable Competitive
Advantage’. Journal of Technology Management & Innovation 8(2): 47-60.
Steiger, J.H., Shapiro, A. & Browne, M.W. (1985) ‘On the Multivariate Asymptotic
Distribution of Sequential Chi-square Statistics’. Psychometrika 50(3): 253-264
Sturgeon, T.J. (2002) ‘Modular Manufacturing Networks: A New American Model of
Industrial Organisation’. Industrial and Corporate Change 11(3): 451-96.
Sturgeon, T.J. (2008) ‘From Commodity Chains to Value Chains: Interdesciplinary
Theory Building in an Age of Globalisation’. Industry Studies Working Paper [online]
available from <http://isapapers.pitt.edu/84/ > [15th
May 2014].
Subrahamanya, M.H.B. (2008) ‘Industrial Subcontracting and Structuring in Japan:
Evolution and Recent Trends’. Journal of Management History 14(1):23-38.
Tabachnick, B. G. & Fidell, L. S. (2007) Using multivariate statistics. 4th
edn. London:
Pearson Education, Inc.
Talaja, A. (2012) ‘Testing VRIN Framework: Resource Value and Rareness as Sources
of Competitive Advantage and above Average Performance’. Management
17(2):51-64.
Taplin, I.M. & Winterton, J. (1995) ‘New Clothes from Old Techniques: Restructuring
and Flexibility in the US and UK Clothing Industries’. Industrial and Corporate
Change 4(3): 615-638.
Taplin, I.M. (1996) Rethinking Flexibility: The Case of the Apparel Industry. Review of
Social Economy 2: 191-220.
Taplin, I.M. ‘Backwards into the Future: New Technologies and Old Work Organisation
in the US Clothing Industry’. in Taplin, I.M. & Winterton, J. (eds.) (1997) Rethinking
Global Production. Brookfield, VT: Ashgate.
Taplin, I.M. (2002) ‘Strategic Initiatives in a Transitional Economy: A Hungarian
Clothing Company Struggles to Compete’. Journal of Fashion Marketing and
Management 6(1): 44-52.
Taplin, I.M. (2003) ‘The Politics of Industrial Restructuring: NAFTA and beyond’.
Journal of Fashion Marketing and Management 7(2): 111-118.
Tapli, I.M. (2006) ‘Restructuring and Reconfiguration the EU Textile and Clothing
Industry Adapts To Change’. European Business Review 18(3): 172-186.
Taplin, I.M., Winterton, J. & Winterton, R. (2003) ‘Understanding Labour Turnover in a
Labour Intensive Industry: Evidence from the British Clothing Industry’. Journal of
Management Studies 40(4): 1022-1046.

258
Taplin, I.M. & Winterton, J. (2004) ‘The European Clothing Industry: Meeting the
Competitive Challenge’. Journal of Fashion Marketing and Management 8(3):
256-261.
Teece, D. J. (2007) ‘Explicating Dynamic Capabilities: The Nature and
Micro-foundations of (Sustainable) Enterprise Performance’. Strategic Management
Journal 28: 1319-1350.
Teece, D. & Pisano, G. (1994) ‘The Dynamic Capabilities of Firms: An Introduction’.
Industrial and Corporate Change 3(3): 537-556.
Teece, D. J., Pisano, G. & Shuen, A. (1997) ‘Dynamic Capabilities and Strategic
Management’. Strategic Management Journal 18(7): 509-533.
Teece, D. J. (2000) ‘Strategies for Managing Knowledge Assets: The Role of Firm
Structure and Industrial Context’. Long Range Planning 33: 35-54.
Terziovski, M. (2010) ‘Innovation Practice and its Performance Implications in Small
and Medium Enterprises (SMEs) in the Manufacturing segment: A Resource-based
View’. Strategic Management Journal 31: 892–902.
TMS (1996) Boom, Bust, Better: The UK Clothing Market 1987-96. London: TMS.
Tokatli, N. (2003) ‘Globalisation and the Changing Clothing Industry in Turkey’.
Environment and Planning 35:1877-1894.
Tokatli, N. & Eldener, Y. B. (2004) ‘Upgrading in the Global Clothing Industry: the
Transformation of Boyner Holding’. Competition and Change 8: 173- 193.
Tokatli, N. & Kizligun O. (2004) ‘Upgrading in the Global Clothing Industry: Mavi
Jeans and the Transformation of a Turkish Firm from Full-package to Brand Name
Manufacturing and Retailing’. Economic Geography 80: 221-240.
Tokatli, N. (2007a) ‘Networks, Firms and Upgrading within the Blue-jeans Industry:
Evidence from Turkey’. Global Networks 7(1): 51-68.
Tokatli, N. (2007b) ‘Asymmetrical Power Relations and Upgrading among Suppliers of
Global Clothing Brand: Hugo Boss in Turkey’. Journal of Economic Geography 7(1):
67-92.
Tokatli, N. (2008) ‘Global Sourcing: Insights from the Global Clothing Industry- the
Case of Zara, a Fast Fashion Retailer’. Journal of Economic Geography 8: 21-38.
Tokatli, N., Kizilgun, O. & Cho, J.E. (2011) ‘The Clothing industry in Istanbul in the Era
of Globalisation and Fast Fashion’. Urban Studies 48(6):1201-1215.
Tokatli, N., Wrigley, N. & Kizilgun, O. (2008) ‘Shifting Global Supply Networks and
Fast Fashion: Made in Turkey for Marks & Spencer’. Global Networks 8(3): 261-280.

259
Tuan, N.P. & Yoshi, T. (2010) ‘Organisation Capabilities, Competitive Advantage and
Performance in Supporting Industries in Vietnam’. Asian Academy of Management
Journal 15(1): 1-21.
Tully, J. & Berkeley, N. (2004) ‘Visualising the Operating Behaviour of SMEs in Sector
and Cluster: Evidence from the West Midlands’. Local Economy 19(1): 38-54.
Ussahawanitchakit, P. (2012) ‘Effects of Organisational Learning and Strategic
Leadership on Competitive Advantage of Electronics Businesses in Thailand via
Competitive Environment as a Moderator’. Journal of International Business and
Economics 12(1):1-11.
Varraso, R., Garcia-Aymerich, J., Monier, F., Le Moual, N., De Batlle, J., Miranda, G.,
Pison, C., Romieu, I., Kauffmann, F., Maccario, J. (2012) ‘Assessment of dietary
patterns in nutritional epidemiology: Principal component analysis compared with
confirmatory factor analysis’. American Journal of Clinical Nutrition
96(5):1079-1092.
Vukasovic, T. (2009) ‘Searching for Competitive Advantage with the Aid of the Brand
Potential Index’. Journal of Product & Brand Management 18(3):165-176.
Watson, R. (2004) ‘Response to Misrepresenting Random Sampling’. Journal of
Advanced Nursing 46(2): 220-223.
Wang, L. (2013) ‘Construction and Deconstruction of Internationalisation of the Chinese
Brand ’ [中国品牌国际化的解构与结构]. China Textile 9:132-135.
Wang, P. (2009) Scientific Concept of Brand Development. Beijing: People’s Publishing
House.
Wernerfelt, B. (1984) ‘A Resource-based View of the Firm’. Strategic Management
Journal 5(2): 171-180.
Wert, C.E., Linnm R.L. & Joreskog, K.G. (1974) ‘Intraclass Reliability Estimates:
Testing Structural Assumptions’. Educational and Psychological Measurement
34:25-33.
Wiggins, R.R. & Ruefli, T.W. (2002) ‘Sustained Competitive Advantage: Temporal
Dynamics and the Incidence and Persistence of Superior Economic Performance’.
Organisation Science 13: 82-105.
Wiklund, J. & Shepherd, D. (2003) ‘Knowledge-based Resources, Entrepreneurial
Orientation and the Performance of Small and Medium-sized Businesses’. Strategic
Management Journal 24(13): 1307-1314.
Wiklund, J. & Shepherd, D. (2009) ‘The Effectiveness of Alliances and Acquisitions: The
Role of Resource Combination Activities’. Entrepreneurship: Theory and Practice

260
33(1):193-212.
Winter, S.G. ‘Four Rs of Profitability: Rents, Resources, Routines and Replication’. in
Montgomery, C (ed.) (1995) Resource- Based and Evolutionary Theories of the Firm
Boston, MA: Kluwer: 147-178.
Winter, S. G. (2003) ‘Understanding Dynamic Capabilities’. Strategic Management
Journal 24: 991-995.
Winterton, J. & Winterton, R. (2002) ‘Forecasting Skill Needs in the UK Clothing
Industry’. Journal of Fashion Marketing and Management 6(4): 352-362.
Wolfe, R.A. (1994) ‘Organisational Innovation: Review, Critique and Suggested
Research Directions’. Journal of Management Study 31(3):405–431.
Womack, J.P. & Jones, D.T. (1996) ‘Beyond Toyota: How to Root Out Waste and Pursue
Perfection’. Harvard Business Review September-October: 4-16.
Wu, L.Y. (2010) ‘Applicability of the Resource-Based and Dynamic-Capability Views
under Environmental Volatility’. Journal of Business Research 63(1): 27-31.
Wu, H.Y., Lin, Y.J., Chien, F.L. & Hung, Y.M. (2011) ‘A Study on the Relationship
among Supplier Capability, Partnership and Competitive Advantage in Taiwan’s
Semiconductor Industry’. International Journal of Electronic Business Management
9(2): 122-138.
Yang, H.L. & Lin, S. (2008) ‘Brand - Building on the OEM Garment Enterprises Based
on the Core Competence’. Journal of Harbin Institute of Technology 11: 82-89 (in
Chinese).
Yang, Y. (2010) ‘Theconstruction of Brand Culture Based on Corporate Culture’.
International Journal of Business and Management, 5(4): 223-226.
Yi, F. (2013) ‘Shenghon: Complete a Jigsaw Puzzle of the Industrial Chain’ [盛虹:完成
产业链拼图]. China Textile 9:44-45.
Yin, R.K. (1984) Case Study Research: Design and Methods. Newbury Park, CA: SAGE
Publications.
Zhang, M.J. (2007) ‘Assessing the Performance Impacts of Information Systems from
the Resource-Based Perspective: An Empirical Test of the Indirect Effect of IS’.
Journal of Business Strategies 24(2): 141-164.
Zheng, L. (2011) ‘Youngor’s Mode of Brand Operation’ [雅戈尔的品牌经营模式].
China Brand & Anti-counterfeiting 1:38-41.
Zhu, K. (2004) ‘The Complementarity of Information and Technology Infrastructure and
E-commerce Capability: A Resource-based Assessment of Their Business Value’.

261
Journal of Management Information Systems 21(1): 167–202.

262
APPENDIXES
Appendix 2-1: China clothing brand annual awards (with brand name in Chinese),
2004-2013
奖项
1st year
(03-04)
Brand
2nd
year
(04-05)
Brand
3rd
year
(05-06)
Brand
4th
year
(06-07)
Brand
5th
year
(07-08)
Brand
6th
year
(08-09)
Brand
7th
year
(09-10)
Brand
8th
year
(11-12)
Brand
9th
year
(12-13)
Brand
风 格
大奖 白领 思凡 例外 歌力思 江南布衣 艺之卉 GXG 速写 芝禾
品 质
大奖 报喜鸟 红领 乔顿 创新 创世 耶莉娅 美尔雅 罗蒙
领秀﹒梦舒
乐雅
策 划
大奖 杉杉
美特斯邦
威 爱慕 应大 利郎 劲霸 特步 歌莉娅 十月妈咪
创新 依文 派克兰帝 太平鸟 白领 卡宾 凡客诚品 诺奇 舒朗 比因勒芬
潜 力
大奖 康博 希努尔 海澜之家 巴拉巴拉 诺丁山 唐狮 南茜﹒高 雷迪波尔 黛诺
营 销
大奖
美特斯邦
威 海澜之家 白领 雅戈尔 森马 太平鸟 音儿 雅莹 朗姿
公 众
大奖 雅戈尔 七匹狼 波司登
美特斯邦
威 真维斯 鄂尔多斯 安踏 利郎 爱登堡
价 值
大奖 波司登 红豆 七匹狼 报喜鸟 李宁 安踏 爱慕 太平鸟 歌力思
成 就
大奖 杉杉 雅戈尔 红豆 波司登 七匹狼
美特斯邦
威 真维斯 爱慕 报喜鸟
Source: The author.
Appendix 4-1: Main dimensions of the contemporary BPMS models
Dimensions Definitions of the dimensions
1.Strategy
alignment The PMS must ensure the measures adopted are coherent with the strategy.
2.Strategy
development Performance measurement helps improve pre-defined objectives and strategy.
3.Stakeholders’
satisfaction
Stakeholders’ requirements are one of the main starting points in the design of
the PMS.
4.Balance
The PMS uses different perspectives that are based on the type of measure
(financial and non-financial) and/or the object of the measures (internal and
external).
5.Dynamic
adaptability
Review systems of measures and objectives are included in the PMS. These
review systems aim to ensure the PMS quickly responds to the changes in
internal and external contexts.
6.Process
orientation
The organisation is not seen as a hierarchical structure but as a whole set of
co-ordinated processes which create a system.
7.Depth & breadth
Depth: Measures are disaggregated into detailed indicators (the single
operational activities involved in each process are measured).
Breadth: The whole organisation is the object of the performance measure. A
broad number of functions (or macro-processed) are included.

263
8.Causal
relationships
Results and their determinants have to be measured to quantify the “causal
relationship” between them, and to support the control of actions and the
improvement process.
9.Clarity &
simplicity
The fixed objectives and measures and methodology to be used to gather and
process information are clearly defined and communicated to those involved
in the PMS.
Source: Extract from Garengo et al. (2005: 37).
Appendix 4-2: Check the measures based on dimensions of BPMS models
Measurement
dimensions
Accordance with
the measured items
Interpretations
1. Stakeholder Yes --All stakeholders’ requirements are reflected, e.g.,
customers’, employees’, and employers’.
2.Balance Yes --Balance by using both financial and non-financial indicators
--Balanced indicators of internal and external performance
3.Dynamics Yes --Subjective based indicators of “quick response”, “sale
growth”, “sales profit growth”, and “market share increase”
reflecting change over a period time
--Indicators of process performance reflecting dynamic
response to the environment volatility
4.Process Yes -- Indicators of measuring multiple processes used: quick
response, order acquisition, cost control, external
communication, and internal cohesion
5.Causality Yes --Based on RBV, VRIN resources are source of the firm’s
performance, which are measured by the 10 items
Source: The author.
Appendix 5-1: Summary of two ethics projects
First-stage ethics project (Ref No.: 1415) was created on 29th
September 2011 and
approved on 4th
October. This is a Low Risk Project because no risk would be involved
to participants and the researcher in this research conduct.
Project Information: The primary purpose of the research is to find out key resources
and strategy for sustained competitive advantage of Chinese clothing industry. To this
end, a series research will be conducted in the specific context of Chinese clothing
industry. At this first phase, interviews with 3-5 experts in this domain are to help with

264
design of the phases two and three researches. Open questions are asked about the
general situations of sustained competitive advantage of Chinese clothing industry in
terms of present situations and challenges, and about main resources and capabilities for
the sustained competitive advantage and for the industrial upgrading.
Second/ third-stage ethics project (Ref No.: 3374) was created on 15th
January 2012 and
approved on 20th
January 2012. This is a Medium to High Risk Project due to the
primary research involving questionnaire survey to human individuals.
Project summary: The primary purpose of the research is to find out key resources and
strategy for sustained competitiveness of Chinese clothing industry. To this end, a series
research will be conducted in the specific context of Chinese clothing industry. At this
second-phase research, a questionnaire will be delivered to about 500 above senior
managers in Chinese clothing firms. These firms should be above the designated size
with annual revenue over 5 million RMB from the principal businesses. The third stage
research is interviews with managers in three case companies and the semi-structured
questions concern these companies’ resources and sustained competitive advantages.
For consideration of convenience and costs, the survey will mainly focus on the
geographical location of Zhejiang province in China, where many clothing firms cluster
and which situates in the Southeast part of China, one of most developed economic
regions.
Appendix 5-2: Questionnaire in English version 1
Part one: General information about you and your company
Please choose the appropriate number(s) concerning general information about you and your
company. Please note that the answers could be single choice or multiple ones. You can also use “n/a”
to indicate no choice since some resource may be not applicable in your clothing company. (to
whom in the company is this survey going to be given to? Will they all have equal access or
knowledge to the information that you are asking for, e.g., profit margins? Will they all understand
the terms that you are using or do you need to rephrase or provide a small glossary, e.g., the
definition of own brand? What happens if they don’t have this information?
Item 1 2 3 4 5
Chose
n
No(s).
About you:

265
Gender Female Male
Highest
education
attainment
High school Bachelor’s degree Master’s degree Doctoral degree
Other
(specify
)
Work years in the
clothing industry Below 1 year 1-2 years* 2-3 years 3-4 years
Over 5
years
Employment
status Ordinary staff Technician
Intermediate or
Senior manager CEO/Owner
Other
(specify
)
Other things you may want to tell:
About your clothing company:
Length of time
that your
company has
operated in the
clothing industry
<5 years 5-10 years 10-20 years 20 -50 years >50 years
Employment
numbers <50 persons 50-200 persons 200-300 persons
300-500
persons
>500
persons
Retail profit
margin <0 <5% 5%-10% 10-15% >15%
Operation years
with own brand
name
0 < 5 years 5-10 years 10-20 years >20 years
Proportion of
sales with own
brand to total
sales
0 < 10% 10%-50% 50%-90% 90%-100
%
Proportion of
exports to total
sales
0 < 10% 10%-50% 50%-90% 90%-100
%
Pattern(s) of
export business
Original
equipment
Assembly/OEA
Original
equipment
manufacturing/OE
M
Original design
manufacturing/OD
M
Own brand
manufacturing
/OBM
Other
(specify)
Business breadth Apparel design Apparel
manufacture Branding Marketing
Other
(specify)
Business
extension
Clothing
industry
The other industry
or industries Commercial service
Financial
service
Other
(specify)
Business scope Womenswear Menswear Childrenswear Knitting
apparel
Weaving
apparel
Other things you may want to describe your company?:
*Note: To group variables, the lower limit is included in the lower number group. Take an example,
to a variable group “50-200 persons”, the variable “=50person” is included in the lower group “<50
persons”, and the variable “=200 persons” is included in the group “50-200 persons” but not
included in its higher group “200-300 persons”. This principle is applied to the other similar matter
in this table. (I don’t follow this at all. Is it just lost in translation or am I being simply dumb?)
Part two: Key firm-level resources required for sustained competitiveness of the
Chinese clothing industry
The first column of the following table shows the various firm-level resources associated with the
Chinese clothing industry. Please indicate the degree of importance that you attach to the various
resources listed below in terms of their contribution to the sustained competitiveness of the Chinese

266
clothing industry. Please tick (√) in the appropriate box below, using the scale ranging from 1(very
little importantance) to 5 (extremely important). Please also assess the degree of importance attached
to the same resources in your company by choosing the corresponding number. In this way it may
provide information about any differences between your company and your industry.
Firm
resource/capability
1=of very
little
importance
2=slight
important
3=quite
important
4=very
important
5=extremely
important
Degree of
importance
in your
company
by choosing
a no.*
Productive
resources
(Vr)
Vr1: Skillful
worker
Vr2: Plant &
equipment
Vr3: Technological
know-how
Internal
and
external
integrative
capability
(Vc)
Vc4: Customer
relationship
Vc5: Supplier
relationship
Vc6: Human
resource
management
Functional
capability
(Vc)
Vc7: Quick
response
Vc8: Quality
control
Vc9: Brand
development &
management
Dynamic
capability
(Vd)
Vd10: Organisational
learning
Vd11: Leadership
skills and
capabilities
Vd12: Innovation
*Note: You can use “n/a” to indicate no choice since some resources may be not applicable in your
clothing company.
Part three:Key influential factors required for the industrial upgrading
Please measure degree of importance of the various influential factors below on successful
implementation of the industrial upgrading strategy of the Chinese clothing industry generally.
Please tick (√) in the corresponding square frame below by using the scale ranging from 1(very little
importantance) to point 5 (extremely important). Please also assess the degree of importance of the
relevant factors in your company by choosing the corresponding number.
Influential factors 1=of very 2=significant 3=quite 4=very 5=extremely Importance

267
little
importance
but not very
important
important important important degree (chosen
no.) in your
company*
(Vf1)
Strategic intent of
developing own
brand
(Vf2)
Brand positioning
(Vf3)
Capability of
brand
development and
management
(Vf4)
Foreign business
involvement
(Vf5)
Organisational
Learning and
absorption
capability
(Vf6)
Innovation
capability
(Vf7)
Quality control
(Vf8)
Quick response
(Vf9)
Adaptability to
dynamics
(vf10)
Financial
capability
*Note: You can use “n/a” to indicate no choice since some factors may be not applicable in your
clothing company.
Source: The author.
Appendix 5-3: Questionnaire in English version 2
Part one: General information about you and your company
Please tick (√) the descriptions concerning general information about you and your company in the
appropriate box below. Please note that the answers could be single choice or multiple ones. Please
use the last column for specifications or for the mark “n/a” in case of no choice.
item 1 2 3 4 5
Specifi
cation(
s)
About you:
Highest
education
attainment
High school Bachelor’s degree Master’s degree Doctoral degree
Other
(specify
)
Working years in
the clothing
industry <= 1 year 1-2 years 2-3 years* 3-4 years
Over 5
years

268
Employment
status Ordinary staff technician
Intermediate or
Senior manager CEO/Owner
Other
(specify
)
Other things you may want to add:
About your clothing company:
years operated in
the clothing
industry <=5 years 5-10 years 10-20 years 20 -50 years
>50 years
(specify)
Employment
numbers <=50 persons 50-200 persons 200-300 persons
300-500
persons
>500
persons
(specify)
Gross profit
margin of sales <=0 0-5% 5%-10% 10-20% >20%
Labour
productivity
(10,000RMB/per
capita output)
<=5 5-10 10-20 20-30 >30
Years of
operation with
own brand name
0 0- 5 years 5-10 years 10-20 years >20 years
Proportion of
sales with own
brand to total
sales
0 <0-10% 10%-50% 50%-90% 90%-100
%
Proportion of
exports to total
sales
0 0- 10% 10%-50% 50%-90% 90%-100
%
Patten(s) of
export business
Original
equipment
Assembly/OEA
Original
equipment
manufacturing/OE
M
Original design
manufacturing/OD
M
Own brand
manufacturing
/OBM
Other
(specify)
Business breadth Apparel design Apparel
manufacture Branding Marketing
Other
(specify)
Business
extension
Clothing
industry
The other
industry/industries Commercial service
Financial
service
Other
(specify)
Business scope Womenswear Menswear Childrenswear Knitting
apparel
Weaving
apparel
Other things you may want to add:
*Note: To group variables, the lower limit is included in a lower number group. Take an example, to
a variable group “2-3 years”, the variable “=2 years” is included in the lower-number group “1-2
years”, and the variable “=3 years” is included in the group “2-3 years” but not included in its
higher-number group “3-4 years”. This principle is applied to the other similar matter in this table.
Part two: Key firm-level resources required for sustained competitiveness of The Chinese
clothing industry
The second column of the following table shows the various firm-level resources associated with
THE CHINESE CLOTHING INDUSTRY. Please indicate the degree of importance that you attach
to the various resources listed below in terms of their contribution to the sustained competitiveness
of the Chinese clothing industry. Please tick (√) in the appropriate box below, using the scale ranging
from 1(very little importance) to 7(extremely important).

269
Resource group Firm resource/capability
1 2 3 4 5 6 7
Productive resources
(Vr)
Vr1: Skillful worker
Vr2: Plant & equipment
Vr3: Technological know-how
Internal and external
integrative capability
(Vc)
Vc4: Customer relationship
Vc5: Supplier relationship
Vc6: Human resource management
Functional capability
(Vc)
Vc7: Quick response
Vc8: Quality control
Vc9: Brand marketing &
management
Dynamic capability
(Vd)
Vd10: Organisational learning
Vd11: Leadership skills and
capabilities
Vd12: Innovation
Part Three: Status quo of the sustained competitiveness of your clothing firm
Ⅰ Firm resources required for sustained competitiveness: Please tick “√”the corresponding
figures to the following statements based on your understanding of your clothing company.
Figure“7” means that you most agree and figure “1”, least agree.
1 The equipments in this company have specialised functions in addition to general and
extensive usages
2 The company has a stable number of professional technicians and skillful employees
3 The productive process in this company is efficient with support of advanced
technology and information
4 The company possesses a stable and high-quality customer group
5 Good relationship with the suppliers ensures the company can acquire stable inputs
1 2 3 4 5 6 7
1 2 3 4 5 6 7
1 2 3 4 5 6 7
1 2 3 4 5 6 7
1 2 3 4 5 6 7
6 Human resource management in this company is strong enough to ensure coherence
of the aim of the organisation with maximized personal development of the employees
7 The company is able to meet customers’ demands in terms of product design, quality,
price, output elasticity, delivery, and placement in a timely manner
8 This company is able to provide products with satisfactory quality to the customers, and
the quality is steady.
9 This company has strong capabilities in brand development, brand management, and
marketing operation
10 The strong organisational learning capability of the company ensures effective
adjustment to the dynamics of external environment.
11 The company is consistently improving and innovating in terms of products, design,
1 2 3 4 5 6 7
1 2 3 4 5 6 7
1 2 3 4 5 6 7
1 2 3 4 5 6 7
1 2 3 4 5 6 7
1 2 3 4 5 6 7

270
business management, and process flow.
12 The leadership team members in this company are effective in decision-making, team
motivation and communication
1 2 3 4 5 6 7
Ⅱ Firm strategies for sustained competitiveness: Please tick “√”the corresponding figures
to the following statements based on your understanding of your clothing company.
Figure“7”means that you most agree and figure “1”, least agree.
1 The original core competitiveness of the company has been weakened so it is necessary
to develop a new one
2 The company should seek to acquire sustained competitiveness by focusing on special
products or market segments
3 The company should seek to acquire sustained competitiveness by consistently lowering
costs
4 The company should seek to lower costs through expansion of production to achieve
scale economies
5 The company should seek to lower costs through integration of the upstream and
downstream chains
6 The company should seek to acquire sustained competitiveness through good quality of
products and services
7 The company should seek to acquire sustained competitiveness through consistent
product innovation resulting in high value-added products
8 The company should seek to acquire sustained competitiveness through consistent
innovation and upgrading in the process flow to enhance efficiency
9 The company should seek to acquire sustained competitiveness through gradual function
shift from the lower value-added and lower technology-embedded manufacturing segment
to the higher value-added design and marketing segments
10 The company should seek to acquire sustained competitiveness by gradually developing
its own brand
11 The company should seek to acquire sustained competitiveness through gradual asset
shift from the apparel industry to the other industries with higher ROA
12 The company should seek to acquire sustained competitiveness by strengthening
organisational learning and by quickening response to external dynamics
1 2 3 4 5 6 7
1 2 3 4 5 6 7
1 2 3 4 5 6 7
1 2 3 4 5 6 7
1 2 3 4 5 6 7
1 2 3 4 5 6 7
1 2 3 4 5 6 7
1 2 3 4 5 6 7
1 2 3 4 5 6 7
1 2 3 4 5 6 7
1 2 3 4 5 6 7
1 2 3 4 5 6 7
Ⅲ Dynamic capabilities and its organisational performance: Please tick “√”the
corresponding figures to the following statements based on your understanding of your
clothing company. Figure“7”means that you most agree and figure “1”, least agree.
1 Since the financial crisis, the company has been able to quickly react to the global market
recession in strategy
2 Since the financial crisis, the company has still been able to receive stable orders
successfully
3 Since the financial crisis, the company has been able to control costs properly, including
costs of raw material, labour, and land, etc.
4 Since the financial crisis, the company has developed effective external communication
channels and has been able to pass sales information smoothly
5 Since the financial crisis, the company has developed strong team cohesion and all the staff
has been confident to the future
1 2 3 4 5 6 7
1 2 3 4 5 6 7
1 2 3 4 5 6 7
1 2 3 4 5 6 7
1 2 3 4 5 6 7

271
6 Since the financial crisis, the sales value has been rather stable and even increased annually
7 Since the financial crisis, the sales profit margin has been rather stable and even increased
annually
8 Since the financial crisis, the market share has been rather stable and even increased
annually
1 2 3 4 5 6 7
1 2 3 4 5 6 7
1 2 3 4 5 6 7
Source: The author.
Appendix 5-4: Questionnaire in English version 3 (Final version)
Dear Participant,
My name is Dongmei Cao and now a PhD student at Coventry University in the UK. The
subject of the PhD research is “Sustaining Competitiveness of THE CHINESE CLOTHING
INDUSTRY”.
Presently I am collecting data for the research. The purpose of this survey is to explore the
major firm-level resources required for sustained competitiveness in the special context of the
Chinese clothing industry. The potential informants include senior managers, CEOs, and owners
of the clothing companies.
The information you provide will only be used for the academic research and the data are
collected anonymously. I can guarantee that all the information you provide will be treated in the
strictest confidence.
I also want you to know that I am willing to share with you the research findings and will be
able to email these to you after the data is analysed. This may be helpful with your
decision-making in relation to the sustained development of your company.
The survey should take you about 15 minutes to complete. I sincerely appreciate your time and
help with this research.
Part one: General information about you and your company
Please tick (√) or color the descriptions concerning general information about you and your
company in the appropriate box below. Please note that the answers could be single choice or
multiple ones. Please use the last column for specifications or for the mark “n/a” in case of no
choice.
item 1 2 3 4 5
Specifi
cation(
s)
About you:
Highest
education
attained
High school Bachelor’s degree Master’s degree Doctoral degree
Other
(specify
)
Working years in
the clothing
industry
≤1 year 1-2 years 2-3 years* 3-5 years >5
years
Employment
status Ordinary staff technician Senior manager CEO/Owner
Other
(specify
)
Other things you may want to add:

272
About your clothing company:
Years operated in
the clothing
industry
≤5 years 5-10 years 10-20 years 20 -50 years >50 years
(specify)
Employment
number ≤50 persons 50-200 persons 200-300 persons
300-500
persons
>500
persons
(specify)
Gross profit
margin of sales ≤0 0-5% 5%-10% 10-20% >20%
Labour
productivity
(100,000
RMB/annual
output per
person)
≤5 5-10 10-20 20-30 >30
Years of
operation with
own brand name
n/a 0- 5 years 5-10 years 10-20 years >20 years
Proportion of
sales with own
brand to total
sales
n/a 0-10% 10%-50% 50%-90% 90%-100
%
Proportion of
exports to total
sales
n/a 0- 10% 10%-50% 50%-90% 90%-100
%
Export pattern
Original
equipment
Assembly/OEA
Original
equipment
manufacturing/OE
M
Original design
manufacturing/OD
M
Own brand
manufacturing
/OBM
Other
(specify)
Business
extension Design Manufacture Branding Marketing
Other
(specify)
Business
diversification
Clothing
industry
The other
industry/industries Commerce Finance
Other
(specify)
Product line Womenswear Menswear Childrenswear Knitting
apparel
Weaving
apparel
Other things you may want to add:
*Note: To group variables, the lower limit is included in a lower number group. Take an example, to a
variable group “2-3 years”, the variable “=2 years” is included in the lower-number group “1-2 years”,
and the variable “=3 years” is included in the group “2-3 years” but not included in its higher-number
group “3-4 years”. This principle is applied to the other similar matter in this table.
Part two: Key firm-level resources required for sustained competitive advantage of the
Chinese clothing industry
The second column of the following table shows the various firm-level resources associated
with the Chinese clothing industry. Please indicate the degree of importance that you attach to
the various resources listed below in terms of their contribution to the sustained
competitiveness of the Chinese clothing industry. Please tick (√) or color the appropriate box
below, using the scale ranging from 1(very little importance) to 7(extreme importance).
Resource group Firm resource/capability
1 2 3 4 5 6 7
Productive resources
(PR)
Vr1: Skillful worker
Vr2: Plant & equipment

273
Vr3: Technological know-how
Internal and external
integrative capability
(IC)
Vc4: Customer relationship
Vc5: Supplier relationship
Vc6: Human resource management
Functional capability
(FC)
Vc7: Quick response
Vc8: Quality control
Vc9: Branding
Dynamic capability
(DC)
Vd10: Organisational learning
Vd11:entrepreneurship
Vd12: Innovation
Part Three: Status quo of the sustained competitiveness of your clothing firm
Ⅰ Firm resources required for sustained competitiveness: Please tick “√” or color the
corresponding figures to the following statements based on your understanding of your
clothing company. Figure“7” means that you most agree and figure “1”, least agree.
1 The equipments in this company have specialised functions in addition to general and
extensive usages
2 The company has a stable number of professional technicians or skillful employees
3 The productive process in this company is efficient with support of advanced
technology and information
4 The company possesses a stable and high-quality customer group
5 Good relationship with the suppliers ensures the company can acquire stable inputs
1 2 3 4 5 6 7
1 2 3 4 5 6 7
1 2 3 4 5 6 7
1 2 3 4 5 6 7
1 2 3 4 5 6 7
6 Human resource management in this company is strong enough to ensure coherence of
the aim of the organisation with maximized personal development of the employees
7 The company is able to meet customers’ demands in terms of product design, quality,
price, output elasticity, delivery, and placement in a timely manner
8 This company is able to provide products with satisfactory quality to the customers, and
the quality is steady
9 This company has strong capabilities in brand development and brand management
10 The strong organisational learning capability of the company ensures effective
adjustment to the dynamics of external environment
11 The company is consistently improving and innovating in terms of products, design,
business management, and process flow
12 The leaders’ team in this company are effective in decision-making, team motivation and
effective communication
1 2 3 4 5 6 7
1 2 3 4 5 6 7
1 2 3 4 5 6 7
1 2 3 4 5 6 7
1 2 3 4 5 6 7
1 2 3 4 5 6 7
1 2 3 4 5 6 7
Ⅱ Firm strategies for sustained competitiveness: Please tick “√” or color the
corresponding figures to the following statements based on your understanding of your
clothing company. Figure“7” means that you most agree and figure “1”, least agree.

274
1 The original core competitiveness of the company has been weakened so it is necessary
to develop a new one
2 The company should seek to acquire sustained competitiveness by focusing on special
products or market segments
3 The company should seek to acquire sustained competitiveness by consistently lowering
costs
4 The company should seek to lower costs through expansion of production to achieve
scale economy
5 The company should seek to lower costs through integration of the upstream and
downstream chains
6 The company should seek to acquire sustained competitiveness through stable and good
quality of products and services
7 The company should seek to acquire sustained competitiveness through consistent
product innovation resulting in high value-added products
8 The company should seek to acquire sustained competitiveness through consistent
innovation and upgrading in the process flow to enhance the efficiency
9 The company should seek to acquire sustained competitiveness through gradual function
shift from the lower value-added and lower technology-embedded manufacturing segment
to the higher value-added design and marketing segments
10 The company should seek to acquire sustained competitiveness by gradually developing
its own brand
11 The company should seek to acquire sustained competitiveness through gradual asset
shift from the apparel industry to the other industries with higher return on assets (ROA)
12 The company should seek to acquire sustained competitiveness by strengthening
organisational learning and by quickening response to external dynamics
1 2 3 4 5 6 7
1 2 3 4 5 6 7
1 2 3 4 5 6 7
1 2 3 4 5 6 7
1 2 3 4 5 6 7
1 2 3 4 5 6 7
1 2 3 4 5 6 7
1 2 3 4 5 6 7
1 2 3 4 5 6 7
1 2 3 4 5 6 7
1 2 3 4 5 6 7
1 2 3 4 5 6 7
Ⅲ Dynamic capabilities and organisational performance in your company: Please tick “√”
or color the corresponding figures to the following statements based on your
understanding of your clothing company. Figure“7” means that you most agree and figure
“1”, least agree.
1 Since the financial crisis, the company has been able to quickly react to the global market
recession in terms of strategy
2 Since the financial crisis, the company has still been able to receive stable orders
successfully
3 Since the financial crisis, the company has been able to control costs properly, including
costs of raw material, labour, and land, etc.
4 Since the financial crisis, the company has developed effective external communication
channels and has been able to pass sales information smoothly
5 Since the financial crisis, the company has developed strong team cohesion and all the
staff has been confident to the future
6 Since the financial crisis, the sales value has been rather stable and even increased
annually
7 Since the financial crisis, the sales profit margin has been rather stable and even
increased annually
8 Since the financial crisis, the market share has been rather stable and even increased
1 2 3 4 5 6 7
1 2 3 4 5 6 7
1 2 3 4 5 6 7
1 2 3 4 5 6 7
1 2 3 4 5 6 7
1 2 3 4 5 6 7
1 2 3 4 5 6 7
1 2 3 4 5 6 7

275
annually
Please check again to make sure that you have not skipped any questions!
Source: The author.
Appendix 5-5:Questionnaire in Chinese version 3
调研问卷
致问卷参与者:亲爱的朋友 您好!
我是曹冬梅,现在英国考文垂大学攻读博士学位,博士研究课题是:中国服装产业的持续竞
争力研究。
现对您进行的问卷调查是课题第二阶段数据收集工作。该问卷设计的主要目的是,从企业层
面探索中国服装产业持续竞争力所需要的主要企业资源。问卷调研的对象是中国服装企业中
高级管理人员,也包括总经理和企业主等。
声明并保证:数据收集是匿名的,所提供的信息只用来做学术研究,并执行严格的隐私保护。
本项研究的分析结果将愿意与您分享。如果您需要并发邮件告知,我会用电子邮件发送调研
分析结果,这将有助于有关企业持续发展方面的决策。
这份问卷大约需要您 15分钟时间,诚挚感谢您的宝贵时间和对调研的帮助!
第一部分:您和您所在公司的一般信息
下表反映您和您所在公司的一般信息,请在适当的选项上打“√”号或涂色。请注意选项可
以是单选也可以是多选。最后一列是“其他说明”项,请给出相应的具体说明;或标注“n/a”
表示该选项不适合您所在公司。
1 2 3 4 5 其他
说明
关于您:
最高教育程度 高中 学士学位 硕士学位 博士学位 其他(具体说明)
在服装行业从业时间 <=1 年 1-2 年 2-3 年* 3-4 年 >5 年
工作级别 一般员工 科研/技术人员 中高级管理人
员 总经理或企业主 其他(具体说明)
其它您愿意反映的内容:
关于您所在的公司:
主营服装年数 <=5 年 5-10 年 10-20 年 20-50 年 >50 年
在职工人数 <=50 人 50-200 人 200-300 人 300-500 人
>500 人(具体说
明)
销售毛利率 <=0 0-5% 5%-10% 10%-20% >20%

276
劳动生产率(万元/人均
年产值) <=5 5-10 10-20 20-30 >30
自主品牌年数 0 0-5 年 5-10 年 10-20 年 >20 年
自主品牌销售占总销
量比 0 0-10% 10%-50% 50%-90% 90%-100%
出口占总销量比 0 0-10% 10%-50% 50%-90% 90%-100%
出口业务方式
组装加工
(OEA)
贴牌加工
(OEM)
设计加工
(ODM)
自有品牌加工
(OBM) 其他(具体说明)
业务延伸 服装设计 服装生产 品牌经营 服装零售 其他 (具体说明)
业务多元化 服装产业 其他行业 商业服务 金融服务 其他 (具体说明)
产品范围 女装 男装 童装 针织 机织
其它您愿意反映的内容:
2*注:对于分组变量来说,下限包含在低数量组中。例如,对于“2-3 年”这一组,变量“=2
年”包含在它的低一级数量组“1-2 年”这一组中,而变量“=3 年”包含在“2-3 年”这一组
中,而不是包含在它的高一级数量组“3-4 年”这一组中。表中其他类似分组变量的上下限变
量的确定以此类推。
第二部分:中国服装行业持续竞争力所需的主要企业资源
下表第二列是中国服装企业的各种资源和能力,请根据它们对中国服装行业持续竞争力方面
的贡献,评价它们的相对重要程度,并依次在相应的方框里打钩号(√) :7 表示最重要,1 表
示最不重要。
企业资源分类 企业资源/能力 1 2 3 4 5 6 7
生产性资源
(Vr)
Vr1:熟练技工
Vr2:厂房与机器设备
Vr3:技术知识
内外部整合能力
(Vc)
Vc4:与客户关系
Vc5:与供应商关系
Vc6:人力资源管理
功能性能力
(Vc)
Vc7:快速反应能力
Vc8:质量控制能力
Vc9:品牌开发与管理
动态变化能力
(Vd)
Vd10:组织学习能力
Vd11:领导艺术与能力
Vd12:创新能力

277
第三部分:您所在服装企业的持续竞争力状况
一、企业持续竞争力的资源与能力(请根据您所了解的情况,给下列指标打分,可以打“√”或涂色表示选项:1 为最不支持,7
为最支持)
1 贵公司生产设备比较先进,除了一般的广泛的用途外,兼有特定的功能
2 贵公司有较稳定数量的专业技工和熟练职工团队
3 贵公司生产过程是有效率的,体现高度技术化与信息化
4 贵公司有稳定而高质量的客户群
5 贵公司具有良好的供货商关系,使资源取得不虞匮乏
6 贵公司人力资源管理能力较强,能保证组织目标实现与成员发展的最大化
1 2 3 4 5 6 7
1 2 3 4 5 6 7
1 2 3 4 5 6 7
1 2 3 4 5 6 7
1 2 3 4 5 6 7
1 2 3 4 5 6 7
7 贵公司有能力及时配合顾客的需求 (包括:产品设计、质量、价格、生产弹性、交货、渠道等方面)
8 贵公司有能力提供令客户满意的产品质量,且保证这种质量持续稳定。
9 贵公司具有较强的品牌开发与管理能力
10 贵公司有较强的组织学习能力,能及时应对外界环境变化进行有效的调整
11 贵公司坚持持续的产品、设计、管理、工艺流程等方面改良与创新
12 贵公司领导团队具有创新精神的,在决策、激励团队、有效沟通方面的能力和技巧尤其突出
1 2 3 4 5 6 7
1 2 3 4 5 6 7
1 2 3 4 5 6 7
1 2 3 4 5 6 7
1 2 3 4 5 6 7
1 2 3 4 5 6 7
二、企业持续竞争力策略(请根据您所了解的情况,给下列指标打分,打“√”或涂色表示选项:1 为最不支持,7 为最支持)
1 贵公司的原有核心竞争力已渐弱势,必须逐步重建新的核心竞争力
2 贵公司应把资源集中在特定产品或细分市场上经营以取得持续竞争力
3 贵公司应通过不断降低成本来取得持续竞争力
4 贵公司应扩大产能通过经济规模来降低成本
5 贵公司应通过整合上下游产业链降低成本
6 贵公司应以优良稳定的产品和服务质量来取得持续竞争力
7 贵公司应以不断的产品创新,生产出更高附加值产品来取得持续竞争力
8 贵公司应以不断的工艺流程方面的创新与升级,通过提高效率来取得持续竞争力
9 贵公司应逐步转移出低附加值、低技术的生产功能,通过发展设计和市场营销等高附加值功能来取
得持续竞争力
10 贵公司应逐步发展自主品牌来取得持续竞争力
11 贵公司资产应逐步转移到其他回报率较高的行业来取得持续竞争力
12 贵公司应加强组织学习、提高动态反应能力,通过快速有效应对外界变化来取得持续竞争力
1 2 3 4 5 6 7
1 2 3 4 5 6 7
1 2 3 4 5 6 7
1 2 3 4 5 6 7
1 2 3 4 5 6 7
1 2 3 4 5 6 7
1 2 3 4 5 6 7
1 2 3 4 5 6 7
1 2 3 4 5 6 7
1 2 3 4 5 6 7
1 2 3 4 5 6 7
1 2 3 4 5 6 7
三、企业动态竞争力及其组织绩效(请根据您所了解的情况,给下列指标打分,可以打“√”或涂色表示选项:1 为最不支持,7
为最支持)
1 金融危机以来贵公司有能力应对市场萎缩的变化,并能迅速反应
2 金融危机以来贵公司仍能接单顺畅
3 金融危机以来贵公司对于成本控制适宜,包括原材料成本、劳动力成本和用地等成本
4 金融危机以来贵公司对外沟通渠道通畅,能充分传递销售信息
5 金融危机以来贵公司员工间凝聚力强,仍充满信心
6 金融危机以来贵公司的销售额相当稳定甚至逐年提高
7 金融危机以来贵公司的销售利润率相当稳定甚至逐年提高
8 金融危机以来贵公司的市场占有率率相当稳定甚至逐年提高
1 2 3 4 5 6 7
1 2 3 4 5 6 7
1 2 3 4 5 6 7
1 2 3 4 5 6 7
1 2 3 4 5 6 7
1 2 3 4 5 6 7
1 2 3 4 5 6 7
1 2 3 4 5 6 7
最后,请再次检查以上问卷回答的完整性,确定没有遗漏或跳过某个问题。

278
再次感谢您对该项调研的支持!
Source: The author.
Appendix 5-6: Interview questions and protocol
1. General questions to start with
Topic 1: Problems with the SCA of the Chinese clothing industry
Topic 2: Practical solutions/strategies against the problems (i.e., topics):
about Industrial Upgrading
about Branding (brand development and brand management)
about Cost Control
2. SCA and evidence in the following variables
Order Acquistion, Cost Control, Strategic Adaptability, External
Communication and Internal Cohesion
3. Resources leading to SCA
Fundamental Resouce: CR, SR, ES and QC
Dynamic Capability: HRM, Entrepreneurship, Organisational Learning and
Quick Response
Upgrading Capability: Branding and IT
Interview with Mingjie Zhang, CEO of Youngor
Time: 3:00-4:30pm on 4th
Novemver 2011
Place: No. 10 Building, Youngor headquarter, Ningbo
Q1: About the status quo, problems, and solution to the current clothing industry
in China
--The global economic and industrial background
--solution—government or companies themselves?
Q2:About resources required for SCAof the Chinese clothing industry
--Global manufacturing shift?
Q3: About value chain, marketing, and supply chain
--to meet customers’ requirement
Q4: Global manufacturing shift outwards?
Q5: Other firm-level elements/resources for SCA?
--distribution
--e-business
Interview with Kaifagn Shen, owner-manager of Kaiqi
Time: 15th
January 2013 (1st time)

279
Place: his office at Shaoxing
--Customer relationship—to meet their need?
--Quick response
--Entrepreneurship role in Kaiqi
--Brand building and Brand development
-- Quality control
--How far can the clothing processing?
--About Kaiqi’s strategic cooperation?
--Inter-industry transformation
--Move inland for cost control strategy
--About sustained competitive advantage, how
Time: 5th
April 2013 (2nd
time)
Place: his office at Shaoxing
1. Company profile and background
2. Firm resources and SCA
--The role of the industrial cluster?
--Customer relationship
--Enterpreneurship in Kaiqi
3. Company practice and development strategy
--Oversea outsourcing manufacturing
--Own brand development
--Hrizontal cooperation
Interview with Mingfei Yu, CEO of Tedelon
Time: 23rd
February 2012
Place: Yaohai Industry Park, Hefei
1. Brand: innovation, management and development
2. Corporate culture and brand culture
3. Internationalisation development
4. Clothing design, manufacturing, and brand
5. About enrollment and employment management
6. Processing technology
7. Organisational learning
8. Entrepreneurship
9. Own manufacturing and outsourcing
10. Internationalisation
Interview with Di Zhang, Senior Managr of Tedelon
Time: 9th
March 2012
Place: Tedelon headquarter, Xiaoshan district, Hangzhou city
--About supplier relationships

280
--About human resource management
Appendix 5-7: Demographic data of the interviewees
Interviewee
City Date Status Company/university/organisation
Han Hangzhou 03/11/2011 General sectary,
vice-chairman
Zhejiang Garment Industry
Association
Zhang Ningbo 04/11/2011 General manager Youngor Group
Sheng Shaoxing 05/11/2011
15/01/2013
05/04/2013
CEO, Owner Shao Kaiqi Textile & Garment Co.,
Ltd.
Liu Shuzhou 10/11/2011 Professor Shuzhou University
Gu Shanghai 17/11/2011 Professor Donghua University
Gu Shaoxing 21/11/2011 CEO, Chairman of
Board
Zhejiang Langshaer Clothing Co.
Wu Hangzhou 26/11/2011 Professor Zhejiang Sci-tech University
Xie Beijing 30/11/2012 Vice-president China Garment Association
Yu Hefei 23/02/2012 General manager Tedelon Group
Zhang Hangzhou 28/02/2012 Senior manager Tedelon Group
Source: The author.
Appendix 6-1: Assessing appropriateness of factor analysis
Appendix 6-1a: Assessing appropriateness of factor analysis: correlations and overall
MSA
SW PE IT CR SR HRM QR QC Br OL En In SP LP SA OA CC EC IC SG SPI MSI
SW 1.000
PE .379 1.000
IT .469 .525 1.000
CR .585 .364 .419 1.000
SR .504 .406 .500 .558 1.000
HRM .428 .457 .515 .520 .589 1.000
QR .435 .356 .424 .388 .476 .536 1.000
QC .446 .397 .315 .580 .377 .439 .459 1.000
Br .202 .316 .513 .212 .344 .400 .356 .139 1.000
OL .361 .371 .477 .462 .405 .565 .443 .459 .411 1.000
En .374 .308 .378 .427 .450 .494 .434 .408 .350 .616 1.000
In .431 .443 .523 .439 .488 .597 .540 .382 .604 .621 .576 1.000
SP .057 .159 .290 .141 .286 .290 .099 .028 .394 .223 .181 .346 1.000
LP .078 .090 .312 .176 .115 .171 .056 .060 .282 .257 .142 .164 .300 1.000

281
SA .449 .315 .531 .424 .359 .377 .309 .384 .347 .418 .366 .371 .193 .322 1.000
OA .355 .194 .334 .429 .261 .322 .235 .367 .245 .369 .420 .303 .053 .360 .563 1.000
CC .273 .253 .401 .258 .313 .340 .240 .283 .240 .427 .347 .416 .198 .168 .468 .440 1.000
EC .344 .244 .379 .452 .270 .391 .368 .435 .261 .452 .407 .400 .145 .279 .562 .531 .469 1.000
IC .320 .278 .417 .335 .303 .330 .202 .340 .249 .480 .395 .357 .125 .176 .519 .409 .615 .550 1.000
SG .207 .317 .393 .220 .228 .422 .355 .137 .440 .492 .474 .499 .320 .313 .488 .569 .441 .506 .497 1.000
SPI .156 .285 .438 .141 .297 .358 .290 .066 .410 .480 .457 .393 .297 .218 .462 .471 .551 .440 .566 .754 1.000
MSI .227 .286 .473 .228 .309 .455 .379 .116 .478 .500 .509 .521 .316 .275 .472 .525 .448 .465 .478 .861 .826 1.000
Note: Bolded values indicate correlations not significant at the 0.01 level.
Kaiser-Meyer-Olkin Measure of Sampling Adequacy: .906
Bartlett test of sphericity: 2845.351
Significance: .000
Number of correlations significant at .001 level: 206
Appendix 6-1b: Assessing the appropriateness of factor analysis: MSA for individual
variable
Measured variable MSA 1 MSA 2
Skillful worker .584 .585
Plant & equipment .412 ---
Information technology .598 .581
Customer relationship .701 .709
Supplier relationship .586 .596
Human resource management .640 .644
Quick response .565 .583
Quality control .658 .654
Branding .618 .622
Organisation learning .582 .590
Entrepreneurship .556 .572
Innovation .710 .720
Sales profit .583 .589
Labour productivity .719 .713
Strategic adapatability .649 .653
Order acquisition .652 .645
Cost control .514 .517

282
External communication .618 .614
Internal cohesion .604 .609
sales growth .797 .798
sales profit .824 .826
market share increase .833 .834
Note: Extraction Method- Principal Component Analysis.
Appendix 6-1c: Assessing the appropriateness of factor analysis with revised set of
variables (ES deleted): correlations and overall MSA
Variable ES IT CR SR HRM QR QC Br OL En In SP LP SA OA CC EC IC SG SPI MSI
ES 1.000
IT .469 1.000
CR .585 .419 1.000
SR .504 .500 .558 1.000
HRM .428 .515 .520 .589 1.000
QR .435 .424 .388 .476 .536 1.000
QC .446 .315 .580 .377 .439 .459 1.000
Br .202 .513 .212 .344 .400 .356 .139 1.000
OL .361 .477 .462 .405 .565 .443 .459 .411 1.000
En .374 .378 .427 .450 .494 .434 .408 .350 .616 1.000
In .431 .523 .439 .488 .597 .540 .382 .604 .621 .576 1.000
SP .057 .290 .141 .286 .290 .099 .028 .394 .223 .181 .346 1.000
LP .078 .312 .176 .115 .171 .056 .060 .282 .257 .142 .164 .300 1.000
SA .449 .531 .424 .359 .377 .309 .384 .347 .418 .366 .371 .193 .322 1.000
OA .355 .334 .429 .261 .322 .235 .367 .245 .369 .420 .303 .053 .360 .563 1.000
CC .273 .401 .258 .313 .340 .240 .283 .240 .427 .347 .416 .198 .168 .468 .440 1.000
EC .344 .379 .452 .270 .391 .368 .435 .261 .452ta .407 .400 .145 .279 .562 .531 .469 1.000
IC .320 .417 .335 .303 .330 .202 .340 .249 .480 .395 .357 .125 .176 .519 .409 .615 .550 1.000
SG .207 .393 .220 .228 .422 .355 .137 .440 .492 .474 .499 .320 .313 .488 .569 .441 .506 .497 1.000
SPI .156 .438 .141 .297 .358 .290 .066 .410 .480 .457 .393 .297 .218 .462 .471 .551 .440 .566 .754 1.000
MSI .227 .473 .228 .309 .455 .379 .116 .478 .500 .509 .521 .316 .275 .472 .525 .448 .465 .478 .861 .826 1.000
Note: Bolded values indicate correlations not significant at the 0.01 level.
Kaiser-Meyer-Olkin Measure of Sampling Adequacy: .909
Bartlett test of sphericity: 2734.905
Significance: .000

283
Number of correlations significant at .001 level: 214
Appendix 6-2: Exploratory Factor Analysis
Appendix 6-2a: Deriving factors via PCA- total variance explained
Component
Initial Eigenvalues
Extraction Sums of Squared
Loadings
Rotation Sums of Squared
Loadings
Total
% of
Variance Cumulative % Total
% of
Variance Cumulative % Total
% of
Variance Cumulative %
1 8.737 41.605 41.605 8.737 41.605 41.605 4.799 22.854 22.854
2 2.182 10.390 51.995 2.182 10.390 51.995 4.348 20.703 43.556
3 1.578 7.515 59.509 1.578 7.515 59.509 3.184 15.160 58.717
4 1.154 5.495 65.004 1.154 5.495 65.004 1.320 6.287 65.004
Appendix 6-2b: Deriving factors via PCA- unrotated factor matrix and communality
21 variables
Factor
1 2 3 4 Communality
Skillful worker .572 .487 -.118 .086 .585
Information technology .708 .065 .176 .211 .581
Customer relationship .620 .516 -.135 .199 .709
Supplier relationship .624 .384 .239 .040 .596
Human resource management .716 .258 .247 -.067 .644
Quick response .603 .331 .202 .-.263 .583
Quality control .533 .551 -.257 .000 .654
Branding .582 -.160 .494 .112 .622
Organisation learning .749 .071 .066 -.140 .590
Entrepreneurship .698 .093 .053 -.143 .572
Innovation .750 .120 .350 -.143 .720
Sales profit .365 -.233 .528 .350 .589
Labour productivity .359 -.275 .023 .712 .713
Strategic adapatability .701 -.056 -.296 .265 .653
Order acquisition .641 -.144 -.432 .163 .645
Cost control .627 -.196 -.275 -.095 .517
External communication .683 -.043 -.375 .074 .614

284
Internal cohesion .655 -.174 -.374 -.096 .609
Sales growth .730 -.496 -.005 -.139 .798
Sales profit increase .691 -.543 -.022 -.022 .826
Market share increase .750 -.477 .076 -.192 .834
Total
Eigenvalue 8.737 2.182 1.578 1.154 13.651
Percentage of trace 41.605 10.390 7.515 5.495 65.004
Note: Trace= 21 (sum of eigenvalues)
Appendix 6-2c: Deriving factors via PCA - rotated factor matrix and communality
21 variable
Factor Communality
1 2 3 4 Extracted
Sales profit increase .811
.826
Sales growth .781
.798
Market share increase .759
.506
.834
Internal cohesion .723
.609
Cost control .669
.517
Order acquisition .660
.645
External communication .629
.614
Strategic adapatability .562
.653
Customer relationship
.802
.709
Quality control
.786
.583
Skillful worker
.742
.585
Supplier relationship
.637
.596
Human resource management
.582 .500
.644
Quick response
.570
.653
Organisation learning
.590
Entrepreneurship
.572
Branding
.732
.622
Sales profit
.675
.589
Innovation
.630
.720
Information technology
.581
Labour productivity
.782 .713
Total

285
Eigenvalue 8.737 2.182 1.578 1.154 13.651
Percentage of trace 41.605 10.390 7.515 5.495 65.004
Notes: Rotation method- VARIMAX with Kaiser Normalisation; rotation converged in 16 iterations.
Appendix 6-2d: Deriving factors via PCA- 1st re-specifying factors (LP deleted)
20 variables
factor communality
1 2 3 4 extracted
Internal cohesion .748 .639
Sales profit increase .717 .810
Order acquisition .698 .611
Cost control .692 .567
Sales growth .676 .544 .823
Strategic adapatability .675 .669
External communication .657 .606
Market share increase .639 .574 .846
Customer relationship .783 .692
Quality control .737 .667
Skillful worker .732 .603
Supplier relationship .617 .630
Entrepreneurship .668 .638
Quick response .640 .622
Innovation .614 .718
Organisation learning .593 .624
Human resource management .516 .645
Sales profit .793 .641
Branding .633 .611
Information technology .535 .633
Total
Eigenvalue 8.622 2.137 1.579 .959 13.297
Percentage of trace 43.108 10.686 7.889 4.793 66.476
Notes: Rotation Method- VARIMAX with Kaiser Normalisation; rotation converged in 10 iterations.
Appendix 6-3: SEM- Assumption tests
Appendix 6-3a: SPSS multivariate outlier statistics
Case Number Statistic
Mahal. Distance 1 106 77.984
2 200 74.311
3 91 65.126

286
4 95 53.681
5 139 53.398
6 111 48.884
7 73 48.686
8 114 47.783
9 122 46.294
10 69 45.849
Notes: Dependent variable, SCA component is extracted via principal component analysis (PCA)
from the original 7 indicator measuring SCA.
Appendix 6-3b: Critical values of Chi Squasre ( ) ( Tabachnick & Fidell 2007: 949)
df 0.100 0.050 0.025 0.010 0.005 0.001
…
14 21.0642 31.3193 36.123
15 22.3072 32.8013 37.697
16 23.5418 34.2672 39.253
17 24.7690 35.7185 40.790
18 25.9894 37.1564 42.318
19 27.2036 38.5822 43.820
20 28.4120 39.9968 45.315
21 29.6151 41.4010 46.797
22 30.8133 42.7956 48.268
23 32.0069 44.1813 49.728
24 33.1963 45.5585 51.179
25 34.3816 46.9278 52.620
…
Appendix 6-3c: Matrix inverses and determinants
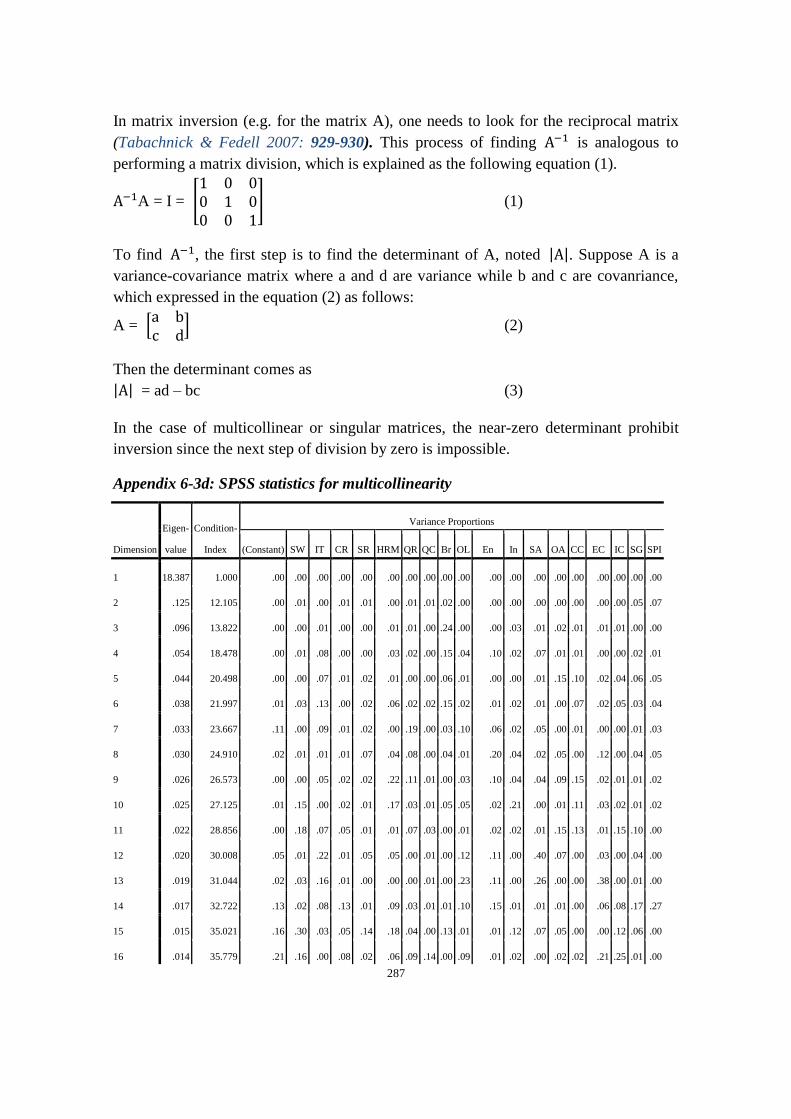
287
In matrix inversion (e.g. for the matrix A), one needs to look for the reciprocal matrix
(Tabachnick & Fedell 2007: 929-930). This process of finding is analogous to
performing a matrix division, which is explained as the following equation (1).
A = I =
(1)
To find , the first step is to find the determinant of A, noted . Suppose A is a
variance-covariance matrix where a and d are variance while b and c are covanriance,
which expressed in the equation (2) as follows:
A =
(2)
Then the determinant comes as
= ad – bc (3)
In the case of multicollinear or singular matrices, the near-zero determinant prohibit
inversion since the next step of division by zero is impossible.
Appendix 6-3d: SPSS statistics for multicollinearity
Dimension
Eigen-
value
Condition-
Index
Variance Proportions
(Constant) SW IT CR SR HRM QR QC Br OL En In SA OA CC EC IC SG SPI
1 18.387 1.000 .00 .00 .00 .00 .00 .00 .00 .00 .00 .00 .00 .00 .00 .00 .00 .00 .00 .00 .00
2 .125 12.105 .00 .01 .00 .01 .01 .00 .01 .01 .02 .00 .00 .00 .00 .00 .00 .00 .00 .05 .07
3 .096 13.822 .00 .00 .01 .00 .00 .01 .01 .00 .24 .00 .00 .03 .01 .02 .01 .01 .01 .00 .00
4 .054 18.478 .00 .01 .08 .00 .00 .03 .02 .00 .15 .04 .10 .02 .07 .01 .01 .00 .00 .02 .01
5 .044 20.498 .00 .00 .07 .01 .02 .01 .00 .00 .06 .01 .00 .00 .01 .15 .10 .02 .04 .06 .05
6 .038 21.997 .01 .03 .13 .00 .02 .06 .02 .02 .15 .02 .01 .02 .01 .00 .07 .02 .05 .03 .04
7 .033 23.667 .11 .00 .09 .01 .02 .00 .19 .00 .03 .10 .06 .02 .05 .00 .01 .00 .00 .01 .03
8 .030 24.910 .02 .01 .01 .01 .07 .04 .08 .00 .04 .01 .20 .04 .02 .05 .00 .12 .00 .04 .05
9 .026 26.573 .00 .00 .05 .02 .02 .22 .11 .01 .00 .03 .10 .04 .04 .09 .15 .02 .01 .01 .02
10 .025 27.125 .01 .15 .00 .02 .01 .17 .03 .01 .05 .05 .02 .21 .00 .01 .11 .03 .02 .01 .02
11 .022 28.856 .00 .18 .07 .05 .01 .01 .07 .03 .00 .01 .02 .02 .01 .15 .13 .01 .15 .10 .00
12 .020 30.008 .05 .01 .22 .01 .05 .05 .00 .01 .00 .12 .11 .00 .40 .07 .00 .03 .00 .04 .00
13 .019 31.044 .02 .03 .16 .01 .00 .00 .00 .01 .00 .23 .11 .00 .26 .00 .00 .38 .00 .01 .00
14 .017 32.722 .13 .02 .08 .13 .01 .09 .03 .01 .01 .10 .15 .01 .01 .01 .00 .06 .08 .17 .27
15 .015 35.021 .16 .30 .03 .05 .14 .18 .04 .00 .13 .01 .01 .12 .07 .05 .00 .00 .12 .06 .00
16 .014 35.779 .21 .16 .00 .08 .02 .06 .09 .14 .00 .09 .01 .02 .00 .02 .02 .21 .25 .01 .00

288
17 .012 38.709 .07 .01 .00 .01 .12 .04 .14 .24 .03 .13 .01 .27 .00 .00 .13 .00 .02 .12 .43
18 .012 39.613 .00 .00 .00 .36 .20 .00 .00 .05 .05 .06 .07 .14 .00 .32 .25 .02 .15 .10 .01
19 .010 43.515 .19 .08 .00 .22 .29 .03 .16 .45 .02 .01 .01 .05 .04 .04 .02 .06 .09 .17 .01
Appendix 6-4: The measured variables and constructs for this study
4 constructs 18 variables Description
Fundamental
Resource
SW The company has a stable number of skillful workers
QC This company is able to provide products with satisfactory quality to
the customers, and the quality is steady
CR The company possesses a stable and high-quality customer
relationship
SR Good relationship with the suppliers ensures the company can
acquire stable inputs
Upgrading
Capability
Br
IT
This company has strong capabilities in brand development and
brand management
The productive process in this company is efficient with support of
advanced technology and information
Dynamic
Capability
HRM Human resource management in this company is strong enough to
ensure coherence of the aim of the organisation with maximized
personal development of the employees
QR The company is able to meet customers’ demands in terms of product
design, quality, price, output elasticity, delivery, and placement in a
timely manner
OL The strong organisational learning capability of the company
ensures effective adjustment to the dynamics of external
environment
EN The entrepreneurs in this company are effective in decision-making,
team motivation and effective communication
IN The company is consistently improving and innovating in terms of
products, design, business management, and process flow
Performance SG Since the financial crisis, the sales value has been rather stable and
even increased annually
SPI Since the financial crisis, the sales profit margin has been rather
stable and even increased annually
SA Since the financial crisis, the company has been able to effectively
adtapt its strategies to the global market recession
OA Since the financial crisis, the company has still been able to receive
stable orders successfully
CC Since the financial crisis, the company has been able to control costs
properly, including costs of raw material, labour, and land, etc.
EC Since the financial crisis, the company has developed effective
external communication channels and has been able to pass sales
information smoothly
IC Since the financial crisis, the company has developed strong team

289
cohesion and all the staff has been confident to the future
Appendix 6-5: Confirmatory Factor Analysis
Appendix 6-5a: Model fit indices (Measurement model 1)
CMIN
Model NPAR CMIN DF P CMIN/DF
Default model 42 387.772 129 .000 3.006
Saturated model 171 .000 0
Independence model 18 2341.113 153 .000 15.301
RMR, GFI
Model RMR GFI AGFI PGFI
Default model .099 .817 .757 .616
Saturated model .000 1.000
Independence model .667 .223 .132 .200
Baseline Comparisons
Model NFI
Delta1
RFI
rho1
IFI
Delta2
TLI
rho2 CFI
Default model .834 .804 .883 .860 .882
Saturated model 1.000
1.000
1.000
Independence model .000 .000 .000 .000 .000
Parsimony-Adjusted Measures
Model PRATIO PNFI PCFI
Default model .843 .703 .743
Saturated model .000 .000 .000
Independence model 1.000 .000 .000
NCP
Model NCP LO 90 HI 90
Default model 258.772 203.396 321.779
Saturated model .000 .000 .000
Independence model 2188.113 2035.192 2348.400
FMIN
Model FMIN F0 LO 90 HI 90
Default model 1.864 1.244 .978 1.547
Saturated model .000 .000 .000 .000
Independence model 11.255 10.520 9.785 11.290

290
RMSEA
Model RMSEA LO 90 HI 90 PCLOSE
Default model .098 .087 .110 .000
Independence model .262 .253 .272 .000
AIC
Model AIC BCC BIC CAIC
Default model 471.772 480.217 612.150 654.150
Saturated model 342.000 376.381 913.539 1084.539
Independence model 2377.113 2380.732 2437.275 2455.275
ECVI
Model ECVI LO 90 HI 90 MECVI
Default model 2.268 2.002 2.571 2.309
Saturated model 1.644 1.644 1.644 1.810
Independence model 11.428 10.693 12.199 11.446
HOELTER
Model HOELTER
.05
HOELTER
.01
Default model 84 91
Independence model 17 18
Appendix 6-5b: Path estimates of CFA1
Standard
regression
weight
Regression
weight S.E. C.R.
Error
variance S.E. C.R.
Br <-- Upgrading Capability .647 1.000 1.345 .164 8.210
IT <-- Upgrading Capability .787 1.030 .129 8.016 .635 .121 5.267
CR <-- Fundamental Resource .801 1.300 .129 10.082 .491 .071 6.945
ES <-- Fundamental Resource .709 1.120 .126 8.855 .646 .076 8.484
SR <-- Fundamental Resource .735 1.084 .123 8.808 .522 .065 7.989
QC <-- Fundamental Resource .686 1.000 .586 .068 8.589
En <-- Dynamic Capability .793 1.079 .097 11.120 .558 .067 8.307
OL <-- Dynamic Capability .770 1.030 .095 10.838 .591 .069 8.600
In <-- Dynamic Capability .800 1.216 .108 11.274 .673 .082 8.188
QR <-- Dynamic Capability .641 .845 .093 9.046 .826 .088 9.433
SA <-- Performance .793 1.133 .096 11.805 .549 .066 8.381
HRM <-- Dynamic Capability .736 1.000 .685 .077 8.908
SPI <-- Performance .773 1.326 .118 11.283 .874 .104 8.398
SG <-- Performance .797 1.358 .116 11.692 .782 .096 8.180
IC <-- Performance .760 1.000 .540 .061 8.860
EC <-- Performance .723 .963 .090 10.664 .626 .069 9.102
CC <-- Performance .716 .963 .091 10.633 .650 .071 9.133
OA <-- Performance .743 1.086 .100 10.866 .707 .080 8.872

291
Appendix 6-5c: Modification indices of CFA1 (highest M.I. values selected)
Covariances M.I. Par Change
e13 <--> Fundamental Resource 40.086 -.251
e12 <--> Fundamental Resource 25.555 -.192
e12 <--> e13 42.410 .427
e11 <--> e8 27.842 .408
Regression weights
SPI <--- SW 15.289 -.238
SPI <--- CR 18.510 -.255
SPI <--- QC 26.754 -.341
SG <--- SPI 15.280 .176
In <--- Br 17.670 .172
Appendix 6-5d: Model fit indices (Measurement model 2)
CMIN
Model NPAR CMIN DF P CMIN/DF Default model 38 203.069 98 .000 2.072 Saturated model 136 .000 0
Independence model 16 1862.806 120 .000 15.523
RMR, GFI
Model RMR GFI AGFI PGFI Default model .076 .891 .849 .642 Saturated model .000 1.000
Independence model .622 .246 .146 .217
Baseline Comparisons
Model NFI
Delta1 RFI
rho1 IFI
Delta2 TLI
rho2 CFI
Default model .891 .867 .940 .926 .940 Saturated model 1.000
1.000
1.000
Independence model .000 .000 .000 .000 .000
Parsimony-Adjusted Measures
Model PRATIO PNFI PCFI Default model .817 .728 .767 Saturated model .000 .000 .000 Independence model 1.000 .000 .000
NCP
Model NCP LO 90 HI 90
Default model 105.069 68.064 149.841 Saturated model .000 .000 .000 Independence model 1742.806 1606.773 1886.224

292
FMIN
Model FMIN F0 LO 90 HI 90 Default model .976 .505 .327 .720 Saturated model .000 .000 .000 .000 Independence model 8.956 8.379 7.725 9.068
RMSEA
Model RMSEA LO 90 HI 90 PCLOSE Default model .072 .058 .086 .006 Independence model .264 .254 .275 .000
AIC
Model AIC BCC BIC CAIC Default model 279.069 285.834 406.078 444.078 Saturated model 272.000 296.209 726.557 862.557
Independence model 1894.806 1897.654 1948.283 1964.283
ECVI
Model ECVI LO 90 HI 90 MECVI Default model 1.342 1.164 1.557 1.374 Saturated model 1.308 1.308 1.308 1.424 Independence model 9.110 8.456 9.799 9.123
HOELTER
Model HOELTER
.05 HOELTER
.01 Default model 126 137 Independence model 17 18
Appendix 6-5e: Modification indices of CFA2 (highest M.I. values selected)
Covariances M.I. Par Change
e11 <--> Fundamental Resource 9.113 -.146
e11 <--> e8 27.768 .408
e6 <--> e18 9.090 .139
e3 <--> Upgrading Capability 9.892 .149
Regression weight
M.I. Par Change
In <--- Br 17.663 .172
Br <--- In 8.259 .182
SR <--- HRM 8.305 .130
Appendix 6-5f: Model fit indices ( Measurement model 3)
CMIN
Model NPAR CMIN DF P CMIN/DF
Default model 39 171.780 97 .000 1.771

293
Model NPAR CMIN DF P CMIN/DF Saturated model 136 .000 0
Independence model 16 1862.806 120 .000 15.523
RMR, GFI
Model RMR GFI AGFI PGFI
Default model .066 .904 .865 .645 Saturated model .000 1.000
Independence model .622 .246 .146 .217
Baseline Comparisons
Model NFI
Delta1 RFI
rho1 IFI
Delta2 TLI
rho2 CFI
Default model .908 .886 .958 .947 .957 Saturated model 1.000
1.000
1.000
Independence model .000 .000 .000 .000 .000
Parsimony-Adjusted Measures
Model PRATIO PNFI PCFI Default model .808 .734 .774 Saturated model .000 .000 .000 Independence model 1.000 .000 .000
NCP
Model NCP LO 90 HI 90
Default model 74.780 42.122 115.290 Saturated model .000 .000 .000 Independence model 1742.806 1606.773 1886.224
FMIN
Model FMIN F0 LO 90 HI 90 Default model .826 .360 .203 .554 Saturated model .000 .000 .000 .000 Independence model 8.956 8.379 7.725 9.068
RMSEA
Model RMSEA LO 90 HI 90 PCLOSE Default model .061 .046 .076 .114 Independence model .264 .254 .275 .000
AIC
Model AIC BCC BIC CAIC
Default model 249.780 256.723 380.131 419.131
Saturated model 272.000 296.209 726.557 862.557 Independence model 1894.806 1897.654 1948.283 1964.283

294
ECVI
Model ECVI LO 90 HI 90 MECVI Default model 1.201 1.044 1.396 1.234 Saturated model 1.308 1.308 1.308 1.424 Independence model 9.110 8.456 9.799 9.123
HOELTER
Model HOELTER
.05 HOELTER
.01 Default model 147 161 Independence model 17 18
Appendix 6-5g: Estimates of Measurement model 3
Regression Weights (Measurement model 3)
Estimate S.E. C.R. P Label Br <--- Upgrading Capability 1.000
IT <--- Upgrading Capability 1.173 .158 7.406 *** L10 CR <--- Fundamental Resource 1.291 .126 10.262 *** L2 ES <--- Fundamental Resource 1.114 .123 9.024 *** L1 SR <--- Fundamental Resource 1.059 .119 8.907 *** L3
QC <--- Fundamental Resource 1.000
En <--- Dynamic Capability 1.081 .098 11.081 *** L7 OL <--- Dynamic Capability 1.026 .095 10.762 *** L6 In <--- Dynamic Capability 1.191 .108 11.060 *** L8 QR <--- Dynamic Capability .844 .094 9.025 *** L5 SA <--- Performance 1.164 .101 11.580 *** L14 HRM <--- Dynamic Capability 1.000
IC <--- Performance 1.000
EC <--- Performance .988 .093 10.626 *** L17
CC <--- Performance .986 .093 10.648 *** L16 OA <--- Performance 1.127 .104 10.809 *** L15
Standardised Regression Weights (Measurement model 3)
Estimate Br <--- Upgrading Capability .606 IT <--- Upgrading Capability .837 CR <--- Fundamental Resource .803 ES <--- Fundamental Resource .712 SR <--- Fundamental Resource .724 QC <--- Fundamental Resource .693
En <--- Dynamic Capability .795 OL <--- Dynamic Capability .768
In <--- Dynamic Capability .786 QR <--- Dynamic Capability .642 SA <--- Performance .815 HRM <--- Dynamic Capability .737

295
Estimate IC <--- Performance .758 EC <--- Performance .739
CC <--- Performance .731 OA <--- Performance .769
Covariances (Measurement model 3)
Estimate S.E. C.R. P Label Fundamental
Resource <--> Dynamic capability .537 .084 6.422 *** Cov-rd
Fundamental
Resource <--> Performance .429 .071 6.024 *** Cov-rp
Upgrading capability <--> Fundamental
Resource .435 .084 5.163 *** Cov-ru
Dynamic capability <--> Performance .557 .087 6.412 *** Cov-dp Upgrading capability <--> Performance .547 .101 5.407 *** Cov-up Upgrading capability <--> Dynamic capability .656 .119 5.490 *** Cov-du e11 <--> e8 .447 .091 4.932 *** Cov-e8e11
Correlations (Measurement model 3)
Estimate Fundamental Resource <--> Dynamic capability .818 Fundamental Resource <--> Performance .688 Upgrading capability <--> Fundamental Resource .649
Dynamic capability <--> Performance .722 Upgrading capability <--> Performance .694 Upgrading capability <--> Dynamic capability .791 e11 <--> e8 .438
Variances (Measurement model 3)
Estimate S.E. C.R. P Label Upgrading capability
.847 .197 4.311 *** par_20
Fundamental Resource
.531 .099 5.352 *** par_21 Dynamic capability
.812 .136 5.964 *** par_22
Performance
.734 .119 6.154 *** par_23 e4
.576 .067 8.636 *** par_24
e3
.539 .065 8.249 *** par_25
e7
.552 .067 8.183 *** par_26 e6
.595 .070 8.518 *** par_27
e5
.825 .088 9.378 *** par_28 e11
1.462 .170 8.597 *** par_29
e10
.500 .128 3.916 *** par_30 e8
.711 .086 8.284 *** par_31
e18
.545 .065 8.404 *** par_32 e16
.621 .072 8.668 *** par_33
e15
.645 .078 8.276 *** par_34 e14
.502 .066 7.550 *** par_35

296
Estimate S.E. C.R. P Label e2
.486 .069 7.082 *** par_36
e1
.640 .075 8.539 *** par_37
e17
.596 .069 8.660 *** par_38 e9
.683 .078 8.800 *** par_39
Squared Multiple Correlations (Measurement model 3)
Estimate
HRM
.543
EC
.546
ES
.507
CR
.646
SA
.665
OA
.591
CC
.535
IC
.574
In
.618
IT
.700
Br
.367
QR
.412
OL
.590
En
.632
SR
.525
QC
.480
Appendix 6-6: Structural model statistics
Appendix 6-6a: Model Fit Summary (original structural model)
CMIN
Model NPAR CMIN DF P CMIN/DF Original structural model 36 158.243 84 .000 1.884 Saturated model 120 .000 0
Independence model 15 1645.680 105 .000 15.673
RMR, GFI
Model RMR GFI AGFI PGFI Original structural model .066 .906 .865 .634 Saturated model .000 1.000
Independence model .593 .266 .161 .233
Baseline Comparisons
Model NFI
Delta1 RFI
rho1 IFI
Delta2 TLI
rho2 CFI
Original structural model .904 .880 .952 .940 .952

297
Model NFI
Delta1 RFI
rho1 IFI
Delta2 TLI
rho2 CFI
Saturated model 1.000
1.000
1.000 Independence model .000 .000 .000 .000 .000
Parsimony-Adjusted Measures
Model PRATIO PNFI PCFI
Original structural model .800 .723 .761 Saturated model .000 .000 .000 Independence model 1.000 .000 .000
NCP
Model NCP LO 90 HI 90 Original structural model 74.243 42.621 113.680 Saturated model .000 .000 .000 Independence model 1540.680 1413.027 1675.729
FMIN
Model FMIN F0 LO 90 HI 90 Original structural model .761 .357 .205 .547 Saturated model .000 .000 .000 .000 Independence model 7.912 7.407 6.793 8.056
RMSEA
Model RMSEA LO 90 HI 90 PCLOSE
Original structural model .065 .049 .081 .056 Independence model .266 .254 .277 .000
AIC
Model AIC BCC BIC CAIC Original structural model 230.243 236.243 350.567 386.567 Saturated model 240.000 260.000 641.080 761.080 Independence model 1675.680 1678.180 1725.815 1740.815
ECVI
Model ECVI LO 90 HI 90 MECVI Original structural model 1.107 .955 1.297 1.136 Saturated model 1.154 1.154 1.154 1.250 Independence model 8.056 7.442 8.705 8.068
HOELTER
Model HOELTER
.05 HOELTER
.01 Original structural model 140 154 Independence model 17 18

298
Appendix 6-6b: Comparison of Goodness-of-fit measures between the measurement
model and the structural model
GOF indexes Structural model Measurement model
Absolute measures
CMIN 158.243 158.243
Degree of freedomdom 84 84
Probability .000 .000
GFI .906 .906
RMSEA .065 .065
90% confidence interval of RMSEA .049-.081 .049-.081
RMR .066 .066
CMIN/DF 1.884 1.884
Baseline comparisons
NFI .904 .904
IFI .952 .952
CFI .952 .952
Parsimony measures/ Parsimony-Adjusted measures
PRATIO .800 .800
PNFI .723 .723
Appendx 6-6c: Comparison of standardised factor loadings and construct reliabilities
between the measurement model 3 and the original structural model
Construct
Indicator Standardised factor loading
Structural model Measurement model
Upgrading capability
(UC)
Br .609 .609
IT .836 .836
Fundamental resources
(FR)
QC .692 .692
SW .708 .708

299
SR .728 .728
CR .804 .804
Dynamic capability
(DC)
OL .764 .764
En .785 .785
QR .645 .645
HRM .742 .742
Performance
(PF)
IC .756 .756
OA .771 .771
EC .738 .738
CC .729 .729
SA .817 .817
Construct Construct reliabilities
UC 0.517 0.517
FR 0.793 0.793
DC 0.762 0.762
PF 0.834 0.834
Appendix 6-6d: Comparison of constructal relationships l between the structural
model and the measurement model
Structural model measurement
Structural
relationship
Standardised parameter
estimate
Correlations Standardised parameter
estimate
: FR↔DC .831*** RC ↔DC .831***
: FR↔UC .645*** RC ↔UC .645***
↔UC .793*** UC ↔DC .793***
: FR→PF .298* RC ↔PF .688***
: DC→PF .207 DC↔PF .722***
: UC→PF .337* UC ↔PF .693***

300
Note: *** statistical significance at the 0.001 level; * statistical significance at the 0.05 level.
Appendix 6-6e: Standardised residual covariances of the structural model
HRM SW CR OA IC Br IT QR SR
Br .310 -1.610 -1.550 -.550 -.238 .000
QR .383 .255 -.367 -1.208 -1.107 .479 -.465 .000
OL -.124 -.938 -.405 -.168 1.633 .488 .145 -.741
SR 1.768 .358 -.149 -.197 -1.004 1.114 1.559 1.224 .000
QC .326 -.167 .614 .314 .178 -1.513 -.448 1.417 -1.049
Note: Columns and rows with values < are not listed here.
Appendix 7-1: Tedelon’s main awards and honors, 1995-2011
Year Award and honor
2000 Shaoxing Famous Trademark with a validity period of 4 years
2002 Zhejiang Famous Trademark (with a validity period of 3 years and regaining the award in 2005, 2008, and
2010 respectively)
Among the Top100 National Clothing Enterprises in both sales and total profit for 2001 (the honor kept ever
since then)
2004 Among the national top ten sales of the leisure jackets
2005 China Well-known Trademark (awarded by the State Administration for Industry and Commerce)
2006 Among the top 10 most competitive enterprises in THE CHINESE CLOTHING INDUSTRY for 2004-2005
2007 National Inspection-free of Product quality
2009 Among 500 Most Valuable Brands in China (ranked no.339 with brand value of 2.17 billion RMB, which is
about 0.35 billion USD, by World Brand Laboratory)
2010 Most competitive brand in China for 2010
2011 Most competitive international brand in China’s industries
500 most valuable brand in China
Among the top 10 most competitive enterprises in the The Chinese clothing industry for 2010-2011
Source: The author’s creation based on data from Tedelon’s website, [online] available from
<www.tedelon.cn> [24 May 2014].
Appendix 7-2: Tedelon’s four stages of development, 1995-2010
Year Development stage and major event
Stage 1 from 1995: Establishing company and manufacturing with own brand

301
1995 Establishment of Zhejiang Taizilong Clothing Limited Company
1997 ‘Taizilong’ trademark registration approved by the State Trademark Office
2000 Huangshan Industry Park is the original specialised manufacturing base with advanced production equipment
from Germany and Japan and production technology from Italy
2001 Shareholding system transformation
Stage 2 from 2002: Brand marketing
2002 Brand image spokesperson project started, marking the formal beginning of the brand marketing campaign
2003 The Yan’an Road image store opened at Hangzhou in May 2003 marking the beginning of the direct selling
model in addition to the original agent selling and franchising selling mode
Stage 3 from 2005: Diversifying businesses and developing brand via the culture
2005 Tedelon Culture Communication Company established formally
Tedelon signed contracts with three consulting management companies to enhance brand management
2006 Release of the cartoon character “Dragon prince” marking the beginning of the business expansion into the
animation industry
Tedelon Holding Group established with 7 subsidiaries marking the diversified businesses formally (now 8
subsidiaries with the last one set up in 2010)
2007 Opening of Zhuji flagship store marks image improvement of its terminal
Implementing the marketing management of the direct selling mode all over the country
2008 Tedelon’s creative advertising campaign through cultural trains
The new trademark replacing the old one for building up the image of brand internationalisation
Stage 4 from 2009: Vogue industry and brand design
2009 Headquarter moved to Jiangdong Tedelon Vogue Industry Park
Published the theoretic book of Scientific Development View of Brand, which guiding the company’s
sustained development towards a world famous international brand
Signed contract with the Italian design company Riccardo Rami Studio
2010 The new manufacturing center, Yaohai Industry Park, started to operate at Hefei, capital city of Anhui
province
Signed cooperation agreement again with the famous Italian design company Riccardo Rami Studio, marking
a new stage into the brand internationalisation
Source: The author’s creation based on data from Tedelon’s website, [online] available from
<www.tedelon.cn> [24 May 2014].

302
Appendix 7-3: Youngor’s main awards and honors, 1995-2011
Year Awards and honors
1994
Youngor shirts sales won the largest comprehensive market share in China and remains the top position till
now (2012) ever since 1994
1997
Youngor trademark selected as one of “Well-known Chinese Trademarks” by the State Administration
Bureau of Industry and Commerce.
2000
Youngor suit sales won the largest comprehensive market share in China and remains the top position till
now (2012) ever since 2000
2001
No. 1 of top 100 Chinese clothing enterprises both in the sales and profits in 2001 and keep to be so ever
since
2004 Rank no. 66 listed on “500 China’s most valuable brands” by the World Brand Lab
2006 Among the list of China’s Top 500 Manufacturing Enterprises by the State Statistical Bureau
2007
“Acclaimed Product” distinction awarded successively to Youngor shirts, suits, trousers, jackets, t-shirts
and ties by China’s Acclaimed Brand Promotion Committee
Rank no. 52 listed on “500 China’s most valuable brands” by the World Brand Lab
2011* Ranks no. 1 among the top 100 product sales and gross profits in the The Chinese clothing industry
Source: The author created based on data from Youngor website Youngor’s website available at
http://www.youngor.com/ and from *China Garment Industry Development Report. Beijing: China
Textile Publisher, 2011.
Appendix 7-4: Comprehensive market share of Youngor’s shirts in China,
1997-2011
Year 1997 1998 1999 2000 2001 2002 2003 2004
MS* (%) 12.7 10.6 15.9 14.1 14.9 12.4 11.0 11.0
Year 2005 2006 2007 2008 2009 2010 2011 2012
MS (%) 11.8 12.3 14.2 13.3 -- -- 13.2 13.2
Note: * MS=market share calculated based on average months of each year
Source: CNCIC (China National Commerce and Information Center).
Appendix 7-5: Youngor’s development stages, 1979-2011
Year Development stage and major event
1979 Ningbo Youth Garment factory sets up, the predecessor of Youngor Group
Stage 1: Horizontal cooperation

303
1983 The factory starts business relationship with Kaikai Shirts Factory
1986 The factory creates the first brand named ‘Beilun Port’
Stage 2: Joint adventure
1990 Youngor Clothing Company Limited is established as a joint venture and hence the Youngor brand is born
1992 Youngor Starts property development
Stage3: Establishment of Youngor Group Co., Ltd.
1993
Youngor Group Co., Ltd. establishes through internal fundraising within the three merged companies
Youngor starts financial investment
1995
Youngor starts to implement its new marketing network in terms of brand recognition, promotion strategies,
and profit maximisation
1998 55 million tradable shares of Youngor Group Co., Ltd are listed on Shanghai Stock Exchange
2001
Youngor International Garment City completes. This is a multi-functional building that integrates design,
production, display and sales.
Youngor starts to set up large flagship stores in Hangzhou, Shanghai, and other Chinese provincial cities
and municipals.
2002 Youngor Textile City opens where it is an important production base for high-end textile fabrics and thus
Youngor Group further moves towards establishing a vertically integrated industrial value chain from
upstream textile and fabric to midstream manufacturing and further to downstream end-user sales.
2004 Youngor Group takes steps to regionaliseits market system and flatten its management.
Youngor invests 500 million RMB (i.e. 73.5 million USD) to build Youngor West Production Base in
Chongqing’s Tea Garden.
Stage 4: International expansion and upgrading towards ODM
2005
Abolition of MFA allows Youngor to expand further and Youngor Sets up oversea branches for oversea
marketing in America
2007 Through brand cooperation with Hartmarx, Youngor gained the brand operation and management in
mainland China, Hongkong SAR and Macao SAR.
2008 Shanghai Kaishi Investment Co. sets up for investment management and consultancy
Acquisition of Smart Shirt Limited at the cost of US$120 million, a menswear business operation under the
US Kellwood Company in the hope for the further internationalized development
Stage 5: Transformation and upgrading towards OBM
2009
Introducing multi-brand strategy and gradually cut down the OEM export business so as to speed up the
industrial upgrading and transformation
Youngor Garments Holding Co. and Youngor Property Holding Co. set up
Youngor’s Hanp fibre line put into production in 2009

304
2010 Youngor launches five brands
2011
After sold Smart shares Youngor further minifies the low value-added OEM business and focuses on own
brand operation in terms of the design, R&D, manufacturing and management so as to further speed up the
industrial upgrading and transformation.
Source: The author’s creation based on data from Youngor website, [online] available from
<http://en.youngor.com/about.do?cid=200811070246144574> [20th May 2012].

305
Publications and Research project
Tao, H & Cao, D. (2014) ‘Automation Technology and Equipment Acceptance Model:
Survey of the Chinese Labor-Intensive Manufacturing Industries’. (This is an
unpublished paper and has submitted to a journal on 21st September and we are waiting
for the result).
Wang, J., Wu, J. & Cao, D. (2014) ‘Strategies of enhancing cooperation with and
Integration into Shanghai Free Trade Zone: From the industry and local government
perspective’. (This research report is in writing and it is funded by Shaoxing Philosophy
and Social Science Research "12th
Five-Year Plan" with funding code: 125368).
Cao, D., Berkeley, N. & Finlay, D (2014) ‘Measuring Sustained Competitive Advantage
from Resource-based View: Survey of Chinese Clothing Companies’. Journal of
Sustainable Development, 7(2):89-104, URL: http://dx.doi.org/10.5539/jsd.v7n2p89.
Cao, D. (2012) ‘Transformation and Upgrading for Sustainable Development Of Yu
Merchant Clothing Companies: Example Of Shaoxing County’ (in Chinese). Journal of
Shaoxing University 32(3): 49-53.
Conference and Seminar
Cao, D. ‘Sustaining Competitive Advantage of China’s Clothing Industry: A
resource-based perspective’, presented on “EFA research seminars” on 15th
May 2013.
The seminars were organised by Department of Economy, Finance and Accountancy of
The Business School of Coventry University”.
Cao, D. ‘Literature Review on Resource-Based View’. Annual Internal Conference by
Faculty of Business, Environment and Society, Coventry University on 13th
-14th
July
2011.