BALANCED ADVANTAGE FUND
88
December 2021 Mutual Fund investments are subject to market risks, read all scheme related documents carefully. This product is suitable for investors who are seeking*: • Predominant investment in equity and equity related instruments as well as in debt and money market instruments. • Capital Appreciation along with generation of income over medium to long term period. *Investors should consult their financial advisors if in doubt about whether the product is suitable for them. BALANCED ADVANTAGE FUND (An Open Ended Dynamic Asset Allocation Fund) THE MARKET MIGHT BE TOPSY-TURVY. YOUR PORTFOLIO NEED NOT BE.
-
Upload
khangminh22 -
Category
Documents
-
view
4 -
download
0
Transcript of BALANCED ADVANTAGE FUND

December 2021
Mutual Fund investments are subject to market risks, read all scheme related documents carefully.
This product is suitable for investors who are seeking*:
• Predominant investment in equity and equity related instruments as well as in debt and money
market instruments.
• Capital Appreciation along with generation of income over medium to long term period.
*Investors should consult their financial advisors if in doubt about whether the product is suitable
for them.
BALANCED ADVANTAGE FUND(An Open Ended Dynamic Asset Allocation Fund)
THE MARKET
MIGHT BE
TOPSY-TURVY.
YOUR PORTFOLIO
NEED NOT BE.

THEMATIC FUNDS
2www.tatamutualfund.com TATA MUTUAL FUND
INDEX
MARKET OUTLOOKEquityDebt
67
EQUITYTata Large Cap FundTata Flexi Cap FundTata Large & Mid Cap FundTata Equity P/E FundTata Mid Cap Growth FundTata India Tax Savings FundTata Small Cap FundTata Focused Equity FundTata Index Fund - Nifty PlanTata Index Fund - Sensex PlanTata Nifty Exchange Traded FundTata Nifty Private Bank Exchange Traded FundTata Dividend Yield Fund
89
1011121314151617181920
212223242526272829
HYBRID
38394041424344454647
Tata Hybrid Equity Fund Tata Equity Savings Fund Tata Balanced Advantage FundTata Arbitrage FundTata Multi Asset Opportunities Fund
3031
32 - 3334 - 3536 - 37
DEBTTata Dynamic Bond FundTata Medium Term FundTata Income FundTata Short Term Bond FundTata Treasury Advantage FundTata Money Market FundTata Ultra Short Term Fund Tata Corporate Bond Fund Tata Banking & PSU Debt FundTata Floating Rate Fund
LIQUID4849
Tata Liquid Fund Tata Overnight Fund
GILT50Tata Gilt Securities Fund
SOLUTIONS51525354
55 - 6970
72 - 757677
Tata Retirement Savings Fund - ProgressiveTata Retirement Savings Fund - ModerateTata Retirement Savings Fund - ConservativeTata Young Citizens’ FundSCHEMES PERFORMANCESCHEME AND BENCHMARK RISKOMETERINCOME DISTRIBUTION CUM CAPITAL WITHDRAWAL OPTIONS/PLANS / BONUS HISTORYANNEXURE FOR ALL POTENTIAL RISK CLASSHOW TO READ FACT SHEET
Tata Business Cycle FundTata Ethical FundTata Banking & Financial Services FundTata Digital India FundTata India Consumer FundTata India Pharma & Healthcare FundTata Resources & Energy FundTata Infrastructure FundTata Quant Fund

Name of the Schemes Investment Objective Riskometer
3www.tatamutualfund.com TATA MUTUAL FUND
RISKOMETER*
Name of the Schemes Investment Objective Riskometer
Name of the Schemes Investment Objective Riskometer
Tata Short Term Bond Fund Investment Objective: Regular Fixed Income for Short Term.Investment in Debt/Money market instruments /Government Securities.
Investment in Debt & Money Market instruments
Tata Overnight Fund The objective of the scheme is to seek to generate returns commensurate with low risk and providing high level of liquidity, through investments made primarily in overnight securities having maturity of 1 business day. However, there is no assurance or guaran-tee that the investment objective of the Scheme will be achieved. The scheme does not assure or guarantee any returns.
Tata Arbitrage Fund Investment Objective: The investment objective of the Scheme is to seek to generate reasonable returns by investing predominantly in arbitrage opportunities in the cash and derivatives segments of the equity markets and by investing balance in debt and money market instruments. There is no assurance that the objective of the Scheme will be realised and the Scheme does not assure or guarantee any returns.
Tata Treasury Advantage Fund
Investment in Debt & Money Market instrumentsTata Liquid Fund
Tata Dynamic Bond Fund Investment Objective: Short Term to Medium Capital Appreciation.Investment in Debt / Money Market Instruments / Government Securities
Tata Gilt Securities Fund Investment Objective: Long Term Capital Appreciation & Regular Income.Investment predominantly in Government Securities.
Low
Lo
w to
Mod
erate
Moderate ModeratelyHighHigh
Very High
RiskometerInvestors understand that their principal
will be at Low Risk
Low
Lo
w to
Mod
erate
Moderate ModeratelyHighHigh
Very High
RiskometerInvestors understand that their principal
will be at Low to Moderate Risk
Low
Lo
w to
Mod
erate
Moderate ModeratelyHighHigh
Very High
RiskometerInvestors understand that their principal
will be at Moderate RiskTata Income Fund Investment Objective: Long Term Capital Appreciation & Regular Income.
Investment in Debt/Money Market instruments/Government Securities.
Tata Ultra Short Term Fund Investment Objective: The investment objective of the Scheme is to generate returns through investment in Debt & Money Market instruments such that the Macaulay duration of the portfolio is between 3 months - 6 months.
Tata Floating Rate Fund Investment Objective: The objective of the scheme is to generate income through investment primarily in floating rate debt instruments, fixed rate debt instruments swapped for floating rate returns and money market instruments.However, there is no assurance or guarantee that the investment objective of the Scheme will be achieved. The scheme does not assure or guarantee any returns.
Tata Money Market Fund Investment in Money Market instruments.
Tata Equity Savings Fund Predominantly investing in equity and equity related instruments, equity arbitrage opportunities and debt and money market instruments.
Tata Banking & PSU Debt Fund Investment Objective: The investment objective of the scheme is to generate reasonable income, with low risk and high level of liquidity from a portfolio of predominantly debt & money market securities issued by Banks, Public Sector Undertakings (PSUs), Public Financial Institutions (PFIs) and Municipal Bonds. However, there is no assurance or guarantee that the investment objective of the Scheme will be achieved. The scheme does not assure or guarantee any returns.
Investment Objective: The investment objective of the scheme is to generate returns over short to medium term by investing predominantly in corporate debt instruments. However, there is no guarantee or assurance that the investment objective of the scheme will be achieved. The scheme doesn’t assure or guarantee any returns.
Tata Corporate Bond Fund
Tata Medium Term Fund Investment Objective: Income/Capital Appreciation over medium term.Investment in Debt / Money Market Instruments / Government Securities.

Tata Business Cycle Fund Investment Objective: To generate long-term capital appreciation by investing with focus on riding business cycles through allocation between sectors and stocks at different stages of business cycles.
Tata Retirement Savings Fund-Conservative Plan
Investment Objective: Long Term Capital Appreciation & Current Income.A debt oriented (between 70%-100%) savings scheme which provides tool for retirement planning to individual investors.
Primarily focuses on investment in at least 80% of its net assets in equity/equity related instruments of the companies in the Banking and Financial Services sector in India.
Tata Banking & Financial Services Fund
The investment objective is to provide capital appreciation and/or dividend distribution by predominantly investing in a well-diversified portfolio of equity and equity relatedinstruments of dividend yielding companies. However, there is no assurance or guarantee that the investment objective of the Scheme will be achieved. The scheme does not assure or guarantee any returns.
Tata Dividend Yield Fund
Primarily focuses on investment in at least 80% of its net assets in equity/equity related instruments of the companies in the Information Technology sector in India.
Tata Digital India Fund
Name of the Schemes Investment Objective Riskometer
Tata Balanced Advantage Fund Investment Objective: The investment objective of the Scheme is to provide capital appreciation and income distribution to the investors by using equity derivatives strategies, arbitrage opportunities and pure equity investments.
4www.tatamutualfund.com TATA MUTUAL FUND
RISKOMETER*
Long Term Capital Appreciation.Investment predominantly in equity & equity related instruments (65% - 80%) & some portion (between 20% to 35%) in fixed income instruments.
Low
Lo
w to
Mod
erate
Moderate ModeratelyHighHigh
Very High
RiskometerInvestors understand that their principal
will be at Moderately High Risk
Name of the Schemes Investment Objective: Long Term Capital Appreciation Riskometer
Tata Hybrid Equity Fund
Investment (minimum 70%) in equity & equity related instruments of companies whose rolling P/E is lower than rolling P/E of BSE Sensex.
Tata Equity P/E Fund
Investment Objective: The investment objective of the scheme is to generate long term capital appreciation by investing in equity & equity related instruments of maximum 30 stocks across market caps. However, there is no assurance or guarantee that the investment objective of the Scheme will be achieved. The scheme does not assure or guarantee any returns.
Tata Focused Equity Fund
Investment Objective: The investment objective of the Scheme is to reflect/mirror the market returns with a minimum tracking error. The scheme does not assure or guarantee any returns.
Tata Index Fund - Nifty Plan
Low
Lo
w to
Mod
erate
Moderate ModeratelyHighHigh
Very High
RiskometerInvestors understand that their principal
will be at Very High Risk
Investment in equity and equity related instruments of Shariah Principles compliant companies and in other instruments allowed under Shariah principles.
Tata Ethical Fund
Investment Objective: The investment objective of the Scheme is to generate capital appreciation over medium to long term. However, there is no assurance or guarantee that the investment objective of the Scheme will be achieved. The scheme does not assure or guarantee any returns.
Tata Flexi Cap Fund
Investment Objective: The investment objective of the Scheme is to reflect/mirror the market returns with a minimum tracking error. The scheme does not assure or guarantee any returns.
Tata Index Fund - Sensex Plan
Primarily focuses on investment in at least 80% of its net assets in equity/equity related instruments of the companies in the Consumption Oriented sectors in India.
Tata India Consumer Fund

Low
Lo
w to
Mod
erate
Moderate ModeratelyHighHigh
Very High
RiskometerInvestors understand that their principal
will be at Very High Risk
Primarily focuses on investment in at least 80% of its net assets in equity/equity related instruments of the companies in the Resources & Energy sectors in India.
Tata Resources & Energy Fund
Investment Predominantly in equity / equity related instruments of the companies in the Infrastructure sector in India.
Tata Infrastructure Fund
The investment objective of the scheme is to provide returns that is closely correspond to the total returns of the securities as represented by the Nifty Private Bank index, subject to tracking error. However, there is no assurance or guarantee that the investment objective of the Scheme will be achieved.
Tata Nifty Private Bank Exchange Traded Fund
The investment objective of the scheme is to generate medium to long-term capital appreciation by investing in equity and equity related instruments selected based on a quantitative model (Quant Model).
However, there is no assurance or guarantee that the investment objective of the Scheme will be achieved. The scheme does not assure or guarantee any returns.
Tata Quant Fund
Investment Objective: The investment objective of the scheme is to provide returns that is closely correspond to the total returns of the securities as represented by the Nifty 50 index, subject to tracking error. However, there is no assurance or guarantee that the investment objective of the Scheme will be achieved.
Tata Nifty Exchange Traded Fund
*Investors should consult their financial advisors if in doubt about whether the product is suitable for them.
Name of the Schemes Investment Objective: Long Term Capital Appreciation Riskometer
5www.tatamutualfund.com TATA MUTUAL FUND
RISKOMETER*
Investment in equity and equity related instruments of well researched value and growth oriented companies across all market capitalization.
Tata Large & Mid Cap Fund
Investment predominantly in equity & equity related instruments of growth oriented mid cap companies.
Tata Mid Cap Growth Fund
Investment predominantly in equity & equity securities related securities of large cap companies.
Tata Large Cap Fund
A predominantly equity oriented (between 65%-85%) savings scheme which provides tool for retirement planning to individual investors.
Tata Retirement Savings Fund-Moderate Plan
An equity oriented (between 85%-100%) savings scheme which provides tool for retirement planning to individual investors.
Tata Retirement Savings Fund-Progressive Plan
An equity linked savings scheme (ELSS) Investing predominantly in Equity & Equity related instruments.
Tata India Tax Savings Fund
Investment Objective: Long Term Capital Appreciation & Current Income.Long Term Capital Appreciation by investing predominantly in equity & equity related instruments.
Tata Young Citizens Fund
Investment Objective: The investment objective of the scheme is to generate long term capital appreciation by predominantly investing in equity & equity related instruments of small cap companies.
Tata Small Cap Fund
Primarily focuses on investment in at least 80% of its net assets in equity/equity related instruments of the companies in the Pharma & Healthcare sectors in India.
Tata India Pharma & Healthcare Fund
Investment Objective: The investment objective of the scheme is to generate long term capital appreciation. However, there is no assurance or guarantee that the investment objective of the Scheme will be achieved. The scheme does not assure or guarantee any returns.
Tata Multi Asset Opportunities Fund

The Macro picture
December 2021 November 2021
WPICPI Index of Industrial ProductionRepo rateMarginal Standing Facility Rate
14.23% (November 2021)4.91% (November 2021)3.16% (October 2021)
4.0% (as on December 31, 2021)4.25% (as on December 31, 2021)
12.54% (October 2021)4.48% (October 2021)
3.06% (September 2021)4.0% (as on November 30, 2021)
4.25% (as on November 30, 2021)
Source: RBI, Bloomberg
Index NameReturn in %As on
31-Dec-21 30-Nov-21 31-Dec-20 1 Month 1 Year
5825424970294587537
24818404094476828751137852620637844192461750834823841
5706524688279377386
23989407794310126893136892550234382182181750234573800
4775117941180985907
20811358883039418745126092168124248115991409020622478
2.11.15.42.03.5
-0.93.96.90.72.8
10.15.60.00.71.1
22.039.262.827.619.212.647.353.49.3
20.956.165.924.368.855.0
S&P BSE SensexS&P BSE MID CAPS&P BSE SMALL CAPS&P BSE 200S&P BSE AUTOS&P BSE BankexS&P BSE Consumer DurableS&P BSE Capital GoodS&P BSE FMCGS&P BSE Health CareS&P BSE ITS&P BSE METALS&P BSE Oil & GasS&P BSE Power IndexS&P BSE Realty
Index NameReturn in %As on
31-Dec-21 30-Nov-21 31-Dec-20 1 Month 1 Year
173549218
10937354825581
22632173313758070524950
387015522
3044314223
48411289
169839028
10604356955399
22823175353738770064959
350445202
2965113663
48810661
1398272329194
312643801
16923152083417759133651
242513255
2084312916
3147088
2.22.13.1
-0.63.4
-0.8-1.20.50.6
-0.210.4
6.22.74.1
-0.75.9
24.127.519.013.546.833.714.010.019.335.659.669.746.110.154.359.3
Nifty 50Nifty 200Nifty AutoNifty BankNifty CommoditiesNifty EnergyNifty Financial ServicesNifty FMCGNifty India ConsumptionNifty InfrastructureNifty ITNifty MetalNifty Midcap 100Nifty PharmaNifty RealtyNifty Smallcap 100
6www.tatamutualfund.com TATA MUTUAL FUND
MARKET OUTLOOKEquity market
Disclaimer: The views expressed are in no way trying to predict the markets or to time them. The views expressed are for information purpose only and do not construe to be any investment, legal or taxation advice. Please consult your Financial/Investment Adviser before investing. The views expressed may not reflect in the scheme portfolios of Tata Mutual Fund. This note has been prepared using information believed to be accurate at the time of its use.
Equity markets rebounded from the lows of November 2021 with BSE Sensex up by 2.1%, CNX Nifty by 2.2%. The broader market: the BSE Midcap was up by 1.1% while the BSE Small Cap was up 5.4%. In terms of sectors IT, Capital Goods, Metals, Auto and Healthcare were the major outperformers whilst other sectors underperformed the BSE Sensex. FIIs flows for the month was negative with net selling of ~USD 1.7bn. Net equity buying by domestic institutions in the market were ~USD 4 bn.
Accenture results in the US markets provided a booster for the IT sector during the month with sharp 10.1% positive performance. Yearend phenomenon meant the small cap index was once again a sharp outperformer during the month.
Inflation: India’s Wholesale Price Inflation (WPI) Index came in at 14.23% YoY during the current month as compared to 12.54% for the previous month on account of rising fuel, food and commodity prices.
The Consumer Price Inflation index remained in a range from previous months and came at 4.91% YoY in the current month as compared to 4.48% in the previous month due to higher fuel, commodity prices and lower fruits and vegetable inflation. Inflation is likely to remain in a range for some time going ahead.
Growth: India’s Real Gross Domestic Product (GDP) growth for FY21 came at -7.3% compared to estimated -8% with 2H growth turning positive. Q2FY22 GDP growth was reported at 8.4% compared to 20% for Q1FY22 which was on a low base of Q1FY21. GDP growth for FY22 is estimated at 9-10% range.
Other macro developments (fiscal deficit and household savings)
India’s Q2FY22 current account balance registered a deficit of US$9.6bn (1.3% of GDP) from a surplus of US$6.5bn (0.9% of GDP) in Q1FY22. The deficit represents gradual widening of the trade deficit, as imports pick-up with revival in domestic demand.
India’s fiscal deficit for FY21 ended at 9.3% slightly lower than the estimates number of 9.5% due to better economic recovery during the 2HFY21 and the resultant higher tax revenues.
FY20 net household financial savings rate improved to 7.7% from 7.2% in FY19 (revised up from the previously reported 6.5%).
Market Outlook
Covid and its new variant remains top of the mind for market participants with developed world showing extremely high daily fresh cases. Early indicators suggest, the new variant is much less harmful than the Delta variant providing hope of the Pandemic turning into an Endemic. However, one needs to keep a close watch on the developments on this front going ahead.
India has been insulated till date on fresh covid cases, however the last 7 days of December 2021 suggest a possibility of third wave starting with cities like Mumbai and Delhi. Learnings of the past two waves imply that business activity will continue without much impact, and it seems, the population has now accepted the new way of life with consumption spending remaining more or less stable.
Fiscal spending by Government of India remains very measured till November 2021 end. As of the latest data, central government fiscal deficit stands at 46.2% of the budgeted estimate for 8 months ending November 2021, lowest in 25 years for this period. In a strong recovery phase Government has remained on the sidelines and has lot of ammunition to spend over the course of remaining 3-4 months along with reporting lower than budgeted fiscal deficit.
CY21 turned out to be a strong year for investors with Nifty delivering 24.1% and the BSE Sensex 22%. India markets were among the better performing markets inspite of Covid led disruptions. A key reason for strong markets has been healthy 30%+ earnings growth being delivered till date by corporate India.
Long-term structural drivers like demographic advantage, low household debt, limited penetration across different consumer categories, increased potential for financial savings and urbanization makes India a compelling equity story from medium to long term perspective.
We believe investors would be well advised to invest with medium to long term perspective and systematically increase exposure to Indian equity markets.

7www.tatamutualfund.com TATA MUTUAL FUND
MARKET OUTLOOK
Disclaimer: The views expressed are in no way trying to predict the markets or to time them. The views expressed are for information purpose only and do not construe to be any investment, legal or taxation advice. Please consult your Financial/Investment Adviser before investing. The views expressed may not reflect in the scheme portfolios of Tata Mutual Fund. This note has been prepared using information believed to be accurate at the time of its use.
Debt market
31-12-21 30-11-21
10 Year Benchmark Yield (s.a)10 Year AAA (PSU) (ann)5 Year AAA (PSU) (ann)3 Year AAA (PSU) (ann)1 Year AAA (PSU) (ann)3 Month T Bill3 Month CD6 Month CD9 Month CD12 Month CD10 Year AAA Spread5 Year AAA Spread
6.457.036.225.764.733.633.684.204.454.620.550.43
6.326.955.905.454.453.523.554.054.304.410.630.25
Change (bps)
130832
31281113151521
-0818
After the initial rally in levels across segment, levels went gradually on higher side throughout the curve. 5-10 Year G-sec segment saw 10-15 bps spike in yield levels compare to month starting. Corporate bond segment in 3yrs and 5yrs also tracked the longer segment and yields hardened even more (going up by 25-35 bps). Shorter segment also got marginally impacted by RBI trying to suck out additional liquidity by doing smaller maturities VRR auctions. 3M to 1-yr rate also went up by 12-18 basis points in T-bills, CPs and CDs.
The MPC Policy outcome surprised the market which was expecting reverse repo rate hike of 20 basis points. However, RBI statement of using VRR to suck out excess liquidity and make it a operation rate was a dampener. RBI introduced 3-day and 4-day VRR auction of 2 lakh crs for sucking out additional liquidity and increased the 14-day VRR auction amount to 7.5 lakh crs by month end. RBI also continued the 7-day and 28-day VRR auctions as scheduled.
November Consumer Price Index (CPI) inflation at 4.91% was marginally lower than market expectations of 5%+ CPI levels. Base effect, supply side shock (in vegetable prices) as well as supply side interventions by the government have shaped the CPI inflation trajectory in November. Although it is well within the Reserve Bank of India target of 2-6 per cent, cause of concern is that the core inflation was 6.2 per cent in November 2021.
Post middle of the month again rise in Omicron virus cases globally and within India started to buildup and scare again. Many European countries have re-imposed restrictions, curfews to tame the virus down. FPI sell out and weak demand by local players due to uncertainty with new COVID variant pushed levels upwards across curve and segment of the fixed income market.
In 4th G-sec auction of the month RBI did Devolvement on Primary Dealers for most of the amount of 2023, 2026 papers and small amount of 2035 paper. In last G-sec auction of the month RBI cancelled the auction for GOI FRB 2028 paper and 10-yr Benchmark paper. Showing its dislike for higher ytm (lower prices) bids received for auction papers.
Still banking system liquidity remains hugely positive on upwards of 7 lakh crs. Going forward RBI is expected to suck out additional liquidity from market by doing different maturities VRR. The year as such ended with the benchmark 10-year G sec yields moving up by 50 basis points. However, the corporate bond market and state government papers was a clear outlier with spread reducing in these segments. We also saw the spread in AA+ and below paper reducing due to excess liquidity in the system which touched a high of Rs 10 Lakh crores. Supply of corporate papers was also significantly lower than last year. Credit growth in the banking system continued to be low, credit growth of banks is 7 % year on year. In the absence of credit growth, Banks coming and buying in corporate bonds to shore up their credit book.
Next year, we expect RBI to hike the reverse repo rates to 3.75 % levels from 3.35 % levels prevailing currently. The repo rates are also expected to be hiked by 25 to 50 basis points depending upon the impact of Omicron on GDP growth. Government finances continued to be strong with Fiscal deficit till November at 36.2 % of target, reflects buoyancy in tax collection plus the increase in GST in many items should lead to higher GST collections in the next financial year also. However, the flip side is higher GST rates and increase in mobile tariff rates should led to CPI inflation continuing to remain in the 5 – 5.5 % band next year also. This is within RBI tolerance band of 2 %- 6 % levels. Monetary policy members are of the view of keeping real rates negative by 1 % to 1.5 % to support growth. Service sector has still not come back to the pre pandemic levels.
There is a spread of 50 basis points in Government securities from one year to 3 years and 30 basis points in the 4 and 5-year segment. The market is pricing the terminal Repo rates at 5.50 %. 50 basis points in 2022, 50 basis points in 2023 and 50 basis points in 2024. If RBI sticks to this schedule of rate hikes next year, the short end of the yield curve is expected to be range bound next year also as it is on expected lines.
The long end of the yield curve may move up due to supply of G securities and lower intervention by RBI through OMO, GSAP in the next year. The ten-year G sec is expected to move towards 6.60 % to 6.80 % in the next financial year from 6.50 % prevailing at present.

Mutual Fund Investments are subject to market risks, read all Scheme related documents carefully.
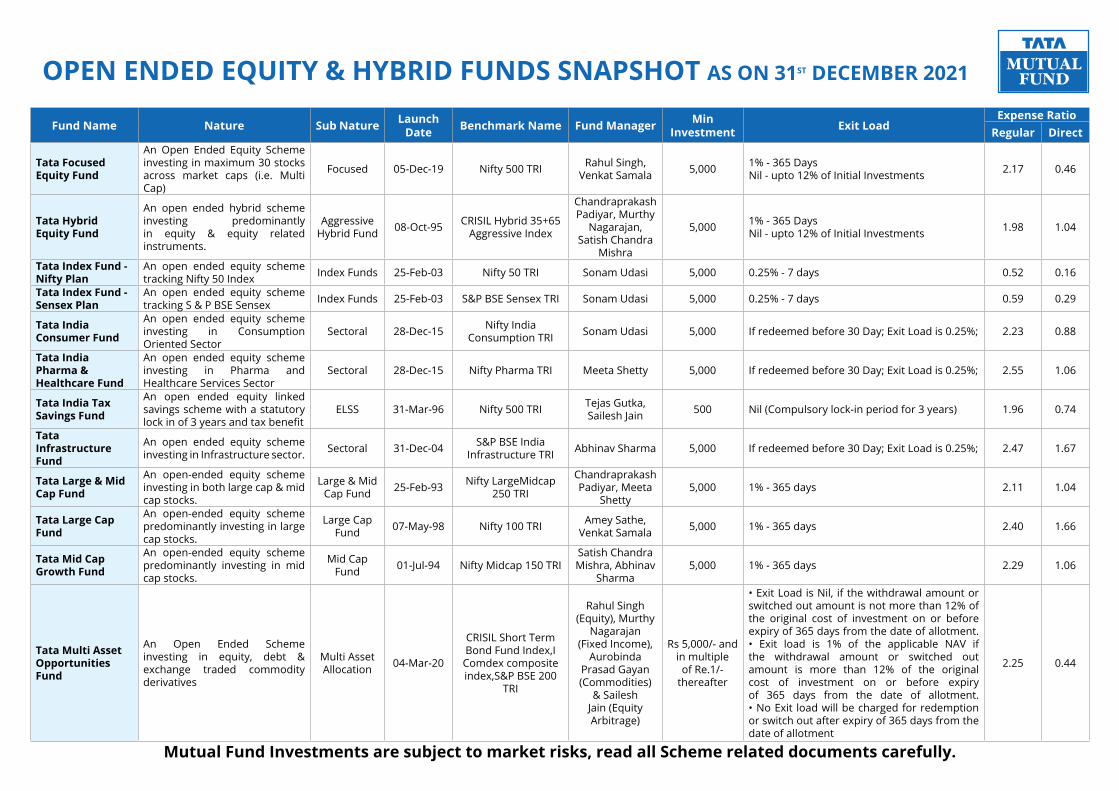
OPEN ENDED EQUITY & HYBRID FUNDS SNAPSHOT AS ON 31st DECEMBER 2021
Fund Name Nature Sub Nature Launch Date Benchmark Name Fund Manager Min
Investment Exit LoadExpense Ratio
Regular DirectTata Arbitrage Fund
An open ended scheme investing in arbitrage opportunities.
Arbitrage Fund 18-Dec-18 Nifty 50 Arbitrage
Index Sailesh Jain 5,000 0.25 % -30 Days 1.09 0.32
Tata Balanced Advantage Fund
An open ended dynamic asset allocation fund.
Dynamic Asset
Allocation or Balanced Advantage
28-Jan-19 CRISIL Hybrid 50+50 - Moderate Index
Rahul Singh, Sailesh Jain, Akhil Mittal
5,000 1% - 365 Days Nil - upto 12% of Initial Investments 1.95 0.29
Tata Banking & Financial Services Fund
An open ended equity scheme investing in Banking & Financial Services Sector
Sectoral 28-Dec-15 Nifty Financial Services TRI
Sonam Udasi, Amey Sathe 5,000 If redeemed before 30 Day; Exit Load is 0.25%; 2.44 0.85
Tata Business Cycle Fund
An open-ended equity scheme following business cycles based investing theme
Thematic 04-Aug-21 Nifty 500 TRI
Rahul Singh, Murthy
Nagarajan, Venkat Samala,
Sailesh Jain
5,000
Redemption/Switch-out/SWP/STP on or before expiry of 365 days from the date of allotment: If the withdrawal amount or switched out amount is not more than 12% of the original cost of investment-NIL Redemption/Switch-out/SWP/STP on or before expiry of 365 days from the date of allotment: If the withdrawal amount or switched out amount is more than 12%of the original cost of investment-1% Redemption/Switch-out/SWP/STP after expiry of 365 days from the date of allotment-NIL
2.30 0.70
Tata Digital India Fund
An open ended equity scheme investing in companies in Information Technology Sector
Sectoral 28-Dec-15 NIFTY IT Meeta Shetty, Venkat Samala 5,000 If redeemed before 30 Day; Exit Load is 0.25%; 1.97 0.38
Tata Dividend Yield Fund
An open ended equity scheme that aims for growth by primarily investing in equity and equity related instruments of dividend yielding companies
Dividend Yield Fund 20-May-21 Nifty 500 TRI
"Sailesh Jain, Rahul
Singh, Murthy Nagarajan
Venkat Samala"
5,000 1% -365 Days 2.43 0.74
Tata Equity P/E Fund
An open ended equity scheme following a value investment strategy
Value Fund 29-Jun-04 Nifty 500 TRI Sonam Udasi, Amey Sathe 5,000 1% - 12 Months.
Nil - upto 12% of Initial Investments 1.96 0.89
Tata Equity Savings Fund
An open-ended scheme investing in equity, arbitrage and debt.
Equity Savings 27-Apr-00 NIFTY Equity Savings
Index
Sailesh Jain, Murthy
Nagarajan5,000 0.25% - 90 Days
Nil - upto 12% of Initial Investments 2.41 1.31
Tata Ethical Fund An open ended equity scheme following Shariah principles Thematic 24-May-96 Nifty 500 Shariah TRI Abhinav Sharma 5,000 1% - 365 Days
Nil - upto 12% of Initial Investments 2.28 1.17
Tata Flexi Cap Fund
An open ended dynamic equity scheme investing across large cap, mid cap, small cap stocks.
Flexi Cap Fund 06-Sep-18 Nifty 500 TRI Sonam Udasi,
Abhinav Sharma 5,000 1% - 12 Months Nil - upto 12% of Initial Investments 2.13 0.73
Mutual Fund Investments are subject to market risks, read all Scheme related documents carefully.
OPEN ENDED EQUITY & HYBRID FUNDS SNAPSHOT AS ON 31st DECEMBER 2021
Fund Name Nature Sub Nature Launch Date Benchmark Name Fund Manager Min
Investment Exit LoadExpense Ratio
Regular Direct
Tata Focused Equity Fund
An Open Ended Equity Scheme investing in maximum 30 stocks across market caps (i.e. Multi Cap)
Focused 05-Dec-19 Nifty 500 TRI Rahul Singh, Venkat Samala 5,000 1% - 365 Days
Nil - upto 12% of Initial Investments 2.17 0.46
Tata Hybrid Equity Fund
An open ended hybrid scheme investing predominantly in equity & equity related instruments.
Aggressive Hybrid Fund 08-Oct-95 CRISIL Hybrid 35+65
Aggressive Index
Chandraprakash Padiyar, Murthy
Nagarajan, Satish Chandra
Mishra
5,000 1% - 365 Days Nil - upto 12% of Initial Investments 1.98 1.04
Tata Index Fund - Nifty Plan
An open ended equity scheme tracking Nifty 50 Index Index Funds 25-Feb-03 Nifty 50 TRI Sonam Udasi 5,000 0.25% - 7 days 0.52 0.16
Tata Index Fund - Sensex Plan
An open ended equity scheme tracking S & P BSE Sensex Index Funds 25-Feb-03 S&P BSE Sensex TRI Sonam Udasi 5,000 0.25% - 7 days 0.59 0.29
Tata India Consumer Fund
An open ended equity scheme investing in Consumption Oriented Sector
Sectoral 28-Dec-15 Nifty India Consumption TRI Sonam Udasi 5,000 If redeemed before 30 Day; Exit Load is 0.25%; 2.23 0.88
Tata India Pharma & Healthcare Fund
An open ended equity scheme investing in Pharma and Healthcare Services Sector
Sectoral 28-Dec-15 Nifty Pharma TRI Meeta Shetty 5,000 If redeemed before 30 Day; Exit Load is 0.25%; 2.55 1.06
Tata India Tax Savings Fund
An open ended equity linked savings scheme with a statutory lock in of 3 years and tax benefit
ELSS 31-Mar-96 Nifty 500 TRI Tejas Gutka, Sailesh Jain 500 Nil (Compulsory lock-in period for 3 years) 1.96 0.74
Tata Infrastructure Fund
An open ended equity scheme investing in Infrastructure sector. Sectoral 31-Dec-04 S&P BSE India
Infrastructure TRI Abhinav Sharma 5,000 If redeemed before 30 Day; Exit Load is 0.25%; 2.47 1.67
Tata Large & Mid Cap Fund
An open-ended equity scheme investing in both large cap & mid cap stocks.
Large & Mid Cap Fund 25-Feb-93 Nifty LargeMidcap
250 TRI
Chandraprakash Padiyar, Meeta
Shetty5,000 1% - 365 days 2.11 1.04
Tata Large Cap Fund
An open-ended equity scheme predominantly investing in large cap stocks.
Large Cap Fund 07-May-98 Nifty 100 TRI Amey Sathe,
Venkat Samala 5,000 1% - 365 days 2.40 1.66
Tata Mid Cap Growth Fund
An open-ended equity scheme predominantly investing in mid cap stocks.
Mid Cap Fund 01-Jul-94 Nifty Midcap 150 TRI
Satish Chandra Mishra, Abhinav
Sharma5,000 1% - 365 days 2.29 1.06
Tata Multi Asset Opportunities Fund
An Open Ended Scheme investing in equity, debt & exchange traded commodity derivatives
Multi Asset Allocation 04-Mar-20
CRISIL Short Term Bond Fund Index,I
Comdex composite index,S&P BSE 200
TRI
Rahul Singh (Equity), Murthy
Nagarajan (Fixed Income),
Aurobinda Prasad Gayan (Commodities)
& Sailesh Jain (Equity Arbitrage)
Rs 5,000/- and in multiple
of Re.1/- thereafter
• Exit Load is Nil, if the withdrawal amount or switched out amount is not more than 12% of the original cost of investment on or before expiry of 365 days from the date of allotment. • Exit load is 1% of the applicable NAV if the withdrawal amount or switched out amount is more than 12% of the original cost of investment on or before expiry of 365 days from the date of allotment. • No Exit load will be charged for redemption or switch out after expiry of 365 days from the date of allotment
2.25 0.44

Mutual Fund Investments are subject to market risks, read all Scheme related documents carefully.
OPEN ENDED EQUITY & HYBRID FUNDS SNAPSHOT AS ON 31st DECEMBER 2021
Fund Name Nature Sub Nature Launch Date Benchmark Name Fund Manager Min
Investment Exit LoadExpense Ratio
Regular Direct
Tata Nifty Exchange Traded Fund
An open ended Exchange Traded Fund tracking Nifty 50 Index.
ETFs - Others 01-Jan-19 Nifty 50 TRI Sailesh Jain
50,000 units and
in multiples thereof
Nil 0.00 0.08
Tata Nifty Private Bank Exchange Traded Fund
An Open-Ended Exchange Traded Fund replicating/ tracking -Nifty Private Bank Index
ETFs - Others 30-Aug-19 Nifty Private Bank
TRI Sailesh Jain
15,000 units and
in multiples thereof
Nil 0.00 0.14
Tata Quant FundAn Open Ended Equity Scheme following quant based investing theme
Thematic 22-Jan-20 S&P BSE 200 TRI Sailesh Jain
Rs 5,000/- and in multiple
of Re.1/- thereafter
1% - 365 Days Nil - upto 12% of Initial Investments 2.45 0.79
Tata Resources & Energy Fund
An open ended equity scheme investing in Resources and Energy Sector
Sectoral 28-Dec-15 Nifty Commodities TRI
Satish Chandra Mishra 5,000 If redeemed before 30 Day; Exit Load is 0.25%; 2.64 1.01
Tata Retirement Savings Fund-Conservative Plan
An open ended retirement solution oriented scheme having a lock-in of 5 years or till retirement age (whichever is earlier)
Retirement Fund 01-Nov-11
CRISIL Short Term Debt Hybrid 75+25
Fund Index
Sonam Udasi, Murthy
Nagarajan5,000
1) Nil – If redemption or switch out on or after attainment of retirement age i.e. 60years.2) Nil – In case of Auto switch out of units on occurrence of Auto switch trigger event.3 ) Exit Load is 1% – If redeemed before 61 months from the date of allotment
2.21 1.05
Tata Retirement Savings Fund-Moderate Plan
An open ended retirement solution oriented scheme having a lock-in of 5 years or till retirement age (whichever is earlier)
Retirement Fund 01-Nov-11 Crisil Hybrid 25+75 -
Aggressive Index
Sonam Udasi, Murthy
Nagarajan5,000
1) Nil – If redemption or switch out on or after attainment of retirement age i.e. 60years.2) Nil – In case of Auto switch out of units on occurrence of Auto switch trigger event.3 ) Exit Load is 1% – If redeemed before 61 months from the date of allotment
2.12 0.64
Tata Retirement Savings Fund-Progressive Plan
An open ended retirement solution oriented scheme having a lock-in of 5 years or till retirement age (whichever is earlier)
Retirement Fund 01-Nov-11 S&P BSE 200 TRI
Sonam Udasi, Murthy
Nagarajan5,000
1) Nil – If redemption or switch out on or after attainment of retirement age i.e. 60years.2) Nil – In case of Auto switch out of units on occurrence of Auto switch trigger event.3 ) Exit Load is 1% – If redeemed before 61 months from the date of allotment
2.22 0.65
Tata Small Cap Fund
An open-ended Equity Scheme predominantly investing in small cap stocks
Small cap Fund 12-Nov-18 Nifty Smallcap 250
TRI
Chandraprakash Padiyar, Satish
Chandra Mishra5,000 1% - 12 Months
Nil - upto 12% of Initial Investments 2.14 0.35
Tata Young Citizens Fund
An open ended fund for investment for children having a lock-in for at least 5 years or till the child attains age of majority (whichever is earlier)
Childrens Fund 14-Oct-95 Nifty 500 TRI Amey Sathe 500
Compulsory Lock-in Option 5 years or till the child attains age of majority (whichever is earlier). 1% - If redeemed before child attains 18 years of age.
2.58 2.03
Expense ratio excludes Borrowing cost

Scheme Scheme CategoryRecommended
Investment Horizon
Month end AUM (Rs Crs)
YTM (%) Macaulay Duration
Modified Duration (Years)
Avg. Portfolio Maturity (Years)
Expense Ratio
Exit LoadRegular Direct
Tata Banking & PSU Debt Fund Banking & PSU Fund Above 3 years 436.51 5.22 2.13 Years 2.02 Years 2.47 Years 0.71 0.26 Nil
Tata Dynamic Bond Fund Dynamic Bond 3 years and more 184.57 4.92 1.23 Years 1.17 Years 1.31 Years 0.73 0.31 Nil
Tata Corporate Bond Fund
Corporate Bond Fund 1 year to 3 years 574.01 5.47 2.28 Years 2.19 Years 2.50 Years 0.86 0.21 Nil
Tata Floating Rate Fund Floater Fund Above 1 year 514.71 5.22 1.27 Years 2.67 Years 3.39 Years 0.72 0.27 Nil
Tata Gilt Securities Fund Gilt Fund
3 years and more, tactical play for a shorter duration on clarity on the
direction
194.51 5.92 5.30 Years 5.13 Years 7.30 Years 1.74 1.07 Nil
Tata Income Fund Medium to Long Duration Fund 3 years and more 55.06 6.10 4.37 Years 4.13 Years 5.76 Years 1.96 1.28 Nil
Tata Liquid Fund Liquid Fund 1 day to 3 months 11,424.68 3.71 1.40 Months
1.40 Months
1.40 Months 0.33 0.22
1 day - 0.0070% of redemption proceeds 2 days - 0.0065% of redemption proceeds 3 days - 0.0060% of redemption proceeds 4 days - 0.0055% of redemption proceeds 5 days - 0.0050% of redemption proceeds 6 days - 0.0045% of redemption proceeds 7 days or more - Nil
Tata Medium Term Fund Medium Duration Fund 3 years and more 84.20 6.14 2.73 Years 2.61 Years 3.27 Years 1.40 0.51 1% - 365 Days
Nil - upto 12% of Initial Investments
Tata Money Market Fund Money Market Fund 3 months to 1 year 6,477.61 4.08 3.10 Months
3.09 Months
3.10 Months 0.43 0.25 NIL
Tata Overnight Fund Overnight Fund 1 day to 7 days 1,999.26 3.48 0.10 Month
0.10 Month
0.10 Month 0.21 0.11 NIL
Tata Short Term Bond Fund Short Duration Fund 1 year to 3 years 3,047.19 5.29 1.92 Years 1.84 Years 2.20 Years 1.21 0.29 NIL
Tata Treasury Advantage Fund Low Duration Fund 3 months to 1 year 2,421.41 4.46 9.09
Months8.74
Months9.53
Months 0.60 0.34 NIL
Tata Ultra Short Term Fund
Ultra Short Duration Fund 1 month to 3 months 1,066.20 4.30 4.74
Months4.58
Months4.83
Months 1.02 0.29 NIL
Note: YTM is including NCA adjustment
Expense ratio excludes Borrowing cost
Mutual Fund Investments are subject to market risks, read all Scheme related documents carefully.
OPEN ENDED DEBT FUNDS SNAPSHOT AS ON 31st DECEMBER 2021

Tax Reckoner 2021-22
Mutual Fund investments are subject to market risks, read all scheme related documents carefully.
Snapshot of Tax rates specific to Mutual FundsThe rates are applicable for the financial year 2021-22 as per Finance Act, 2021
Income-tax implications on income in respect of units of Mutual FundType of Investor Withholding tax rate
Resident*** 10%*
NRI 20%*** Tax not deductible if dividend income in respect of units of a mutual fund is below Rs. 5,000 in a financial year. ** The base tax is to be further increased by surcharge at the rate of: • 37% on base tax where income or aggregate of such income exceeds Rs. 5 crore;• 25% where income or aggregate of such income exceeds Rs. 2 crore but does not exceed Rs. 5 crore;• 15% where income or aggregate of such income exceeds Rs. 1 crore but does not exceed Rs. 2 crore; and• 10% where income or aggregate of such income exceeds Rs. 50 lakhs but does not exceed Rs. 1 croreFurther, “Health and Education Cess” is to be levied at 4% on aggregate of base tax and surcharge. *** As per section 139AA of the Income tax Act, 1961 (‘the Act’) read with rule 114AAA of the Income-tax Rules, 1962, in the case of a resident person, whose PAN has become inoperative due to PAN – Aadhaar not being linked on or before 30 June 2021, it shall be deemed that he has not furnished the PAN and tax could be withheld at a higher rate of 20% as per section 206AA of the Act
CAPITAL GAINS TAXATIONIndividual/ HUF $ Domestic Company @ NRI $
Equity Oriented Schemes • Long Term Capital Gains (units held for more than 12 months) • Short Term Capital Gains (units held for 12 months or less)
Long term capital gains 10%* 10%* 10%*
Short term capital gains 15% 15% 15%
Other Than Equity Oriented Schemes • Long Term Capital Gains (units held for more than 36 months) • Short Term Capital Gains (units held for 36 months or less)
Long term capital gains 20%& 20%& Listed - 20%& Unlisted - 10%**
Short term capital gains 30%^ 30%/25%^^/22%^^^/15%^^^^ 30%^
Tax deductible at source (Applicable to NRI Investors) #
Short term capital gains $ Long term capital gains$
Equity oriented schemes 15% 10%*
Other than equity oriented schemes 30%^ 10%** (for unlisted) & 20%& (for listed)
* Income-tax at the rate of 10% (without indexation benefit and foreign exchange fluctuation) to be levied on long-term capital gains exceeding Rs. 1 lakh provided transfer of such units is subject to Securities Transaction Tax (‘STT’).
$ Surcharge to be levied at: • 37% on base tax where specified income exceeds Rs. 5 crore; • 25% where specified income exceeds Rs. 2 crore but does not exceed Rs. 5 crore; • 15% where total income exceeds Rs. 1 crore but does not exceed Rs. 2 crore; and • 10% where total income exceeds Rs. 50 lakhs but does not exceed Rs. 1 crore. Specified income – Total income excluding income by way of dividend or income under the provisions of section 111A and 112A of the Act. Further, Health and Education Cess to be levied at the rate of 4% on aggregate of base tax and surcharge. @ Surcharge at 7% on base tax is applicable where total income of domestic corporate unit holders exceeds Rs 1 crore but does not exceed 10 crores and at 12% where total income exceeds 10
crores. However, surcharge at flat rate of 10 percent to be levied on base tax for the companies opting for lower rate of tax of 22%/15%. Further, “Health and Education Cess” to be levied at the rate of 4% on aggregate of base tax and surcharge.
# Short term/ long term capital gain tax (along with applicable Surcharge and Health and Education Cess) will be deducted at the time of redemption of units in case of NRI investors.& After providing indexation. ** Without indexation. ^ Assuming the investor falls into highest tax bracket.^^ If total turnover or gross receipts in the financial year 2019-20 does not exceed Rs. 400 crores.^^^ This lower rate is optional and subject to fulfillment of certain conditions as provided in section 115BAA.^^^^ This lower rate is optional for companies engaged in manufacturing business (set-up & registered on or after 1 October 2019) subject to fulfillment of certain conditions as provided in section
115BAB.
Further, the domestic companies are subject to minimum alternate tax (except for those who opt for lower rate of tax of 22%/15%) not specified in above tax rates.
Transfer of units upon consolidation of mutual fund schemes of two or more schemes of equity oriented fund or two or more schemes of a fund other than equity oriented fund in accordance with SEBI (Mutual Funds) Regulations, 1996 is exempt from capital gains.
Transfer of units upon consolidation of plans within mutual fund schemes in accordance with SEBI (Mutual Funds) Regulations, 1996 is exempt from capital gains.
Relaxation to non-residents from deduction of tax at higher rate (except income distributed by mutual fund) in the absence of PAN subject to them providing specified information and documents.

The Finance Act, 2021 introduced section 206AB (applicable from 1 July 2021) stating that tax to be deducted at twice the applicable rate in case of payments to specified person (except non-resident not having permanent establishment in India) who have not filed return of income for past two assessment years for which time limit for filing return has expired and the aggregate of tax deducted at source in his case is Rs. 50,000 or more in each of these two years. Additionally, if provisions of section 206AA are also applicable then tax to be deducted at higher of the two rates provided i.e. rate as per section 206AB or section 206AA.
Bonus Stripping: The loss due to sale of original units in the schemes, where bonus units are issued, will not be available for set off; if original units are: (A) bought within three months prior to the record date fixed for allotment of bonus units; and (B) sold within nine months after the record date fixed for allotment of bonus units. However, the amount of loss so ignored shall be deemed to be the cost of purchase or acquisition of such unsold bonus units.
1. Income Tax Rates
Option A For Individuals, Hindu Undivided Family, Association of Persons, Body of Individuals and Artificial juridical persons
Total Income Tax Rates
Up to Rs. 2,50,000 (a) (b) NIL
Rs. 2,50,001 to Rs. 5,00,000(d) (e) 5%
Rs. 5,00,001 to Rs. 10,00,000(d) 20%
Rs. 10,00,001 and above(c)(d) 30%
(a) (a) In case of a resident individual of the age of 60 years or above but below 80 years, the basic exemption limit is Rs. 300,000.
(b) In case of a resident individual of age of 80 years or above, the basic exemption limit is Rs 500,000.
(c) Rate of surcharge:
• 37% on base tax where specified income exceeds Rs. 5 crore;
• 25% where specified income exceeds Rs. 2 crore but does not exceed Rs. 5 crore
• 15% where total income exceeds Rs. 1 crore but does not exceed Rs. 2 crore; and
• 10% where total income exceeds Rs 50 lakhs but does not exceed Rs. 1 crore.
Specified income – Total income excluding income by way of dividend or income under the provisions of section 111A and 112A of the Act.
Marginal relief for such person is available.
d) Health and Education cess @ 4% on aggregate of base tax and surcharge.
(e) Individuals having total income not exceeding Rs. 500,000 can avail rebate of lower of actual tax liability or Rs. 12,500
Option B For Individuals and Hindu Undivided Family
Total Income Tax Rates
Up to 2,50,000 Nil
From 2,50,001 to 5,00,000 5%
From 5,00,001 to 7,50,000 10%
From 7,50,001 to 10,00,000 15%
From 10,00,001 to 12,50,000 20%
From 12,50,001 to 15,00,000 25%
From 15,00,001 and above 30%
For adopting Option B, most of the deductions/exemptions such as section 80C, 80D, etc. are to be foregone. The aforesaid regime is optional. Accordingly, Individuals and HUFs have the option to be taxed under either of the options. Option B once exercised can be changed in subsequent years (not applicable for business income).
2. Securities Transaction Tax (STT) STT is levied on the value of taxable securities transactions as under:
Transaction Rates Payable by
Purchase/ Sale of equity shares (delivery based) 0.1% Purchaser/ Seller
Purchase of units of equity oriented mutual fund Nil Purchaser
Sale of units of equity oriented mutual fund (delivery based) 0.001% Seller
Sale of equity shares, units of business trust, units of equity oriented mutual fund (non-delivery based) 0.025% Seller
¬¬¬Sale of an option in securities 0.05% Seller
Sale of an option in securities, where option is exercised 0.125% Purchaser
Sale of a futures in securities 0.01% Seller
Sale or surrender or redemption of a unit of an equity oriented fund to an insurance company, on maturity or partial withdrawal, with respect to unit linked insurance policy issued by such insurance company on or after the first day of February, 2021
0.001% Seller
Sale of units of an equity oriented fund to the Mutual Fund 0.001% Seller
Sale of unlisted equity shares and units of business trust under an initial offer 0.2% Seller

3. Special rates for non-residents as per domestic provisions
(1) The following incomes in the case of non-resident are taxed at special rates on gross basis
Transaction Rates(a)
Dividend 20%
Interest received on loans given in foreign currency to Indian concern or Government of India (not being interest referred to in section 194LB or section 194LC)
20%
Income received in respect of units purchased in foreign currency of specified Mutual Funds / UTI 20%
Royalty or fees for technical services (b) 10%
Interest income from a notified infrastructure debt fund, specified loan agreement, specified long-term bonds, rupee denominated bonds(c) and business trust
5%
Interest on FCCB, Dividend on GDRs 10%
(a) These rates will be further increased by applicable surcharge and health and education cess.
(b) In case the non-resident has a Permanent Establishment (PE) in India and the royalty/ fees for technical services paid is effectively connected with such PE, the same is taxable at 40% (plus applicable surcharge and health and education cess) on net basis.
(c) Interest payable to a non-resident in respect of monies borrowed by any Indian company or business trust from a source outside India by way of issue of rupee denominated bond during the period 17 September 2018 to 31 March 2019 is exempt from tax.
(2) Tax on non-resident sportsmen or sports association on specified income @20% plus applicable surcharge and health and education cess.
4. Capital Gains
Transaction Short-term capital gains(a) Long-term capital gains(a)(b)
Sale transactions of equity shares/ unit of an equity oriented fund which attract STT 15% 10%*
Sale transaction other than mentioned above:
Individuals (resident and non-residents) Progressive slab rates
20% / 10% (b)Firms 30%
Resident companies 30% /25%(d)/22%(e)/15%(f)
Overseas financial organi-zations specified in sec-tion115AB 40% (corporate) 30% (non corporate) 10%
FIIs 30% 10%
Foreign companies other than ones mentioned above 40% 20% / 10% (C)
Local authority 30%20% / 10%
Co-operative society rates Progressive slab or 20%(g)
* Income-tax at the rate of 10% to be levied on long-term capital gains exceeding Rs. 1 lakh (without indexation benefit and foreign exchange fluctuation).
(a) These rates will further increase by applicable surcharge & health and education cess.
(b) Income-tax rate of 20% with indexation and 10% without indexation.
(c) Long term capital gains arising to a non-resident from transfer of unlisted securities or shares of a company, not being a company in which the public are substantially interested, subject to 10 per cent tax (without benefit of indexation and foreign currency fluctuation).
(d) If total turnover or gross receipts in the financial year 2019-20 does not exceed Rs. 400 crores.
(e) This lower rate is optional and subject to fulfillment of certain conditions as provided in section 115BAA.
(f) This lower rate is optional for companies engaged in manufacturing business (set-up & registered on or after 1 October 2019) subject to fulfillment of certain conditions as provided in section 115BAB.
(g) Co-operative societies have the option to be taxed at progressive slab rates or 20% subject to fulfillment of certain conditions as provided in section 115BAD.

5. Personal Income-tax Scenario
IndividualTotal Income
475,000 825,000 1,000,000 1,200,000 1,500,000 5,650,000 11,150,000 21,150,000 #
51,150,000 #
Tax in FY 2021-22 (Option A)*
NIL*** 49,400 85,800 132,600 226,200 1,673,100 3,722,550 7,946,250 21,532,290
Tax in FY 2021-22 (Option B) **
NIL*** 50,700 78,000 119,600 195,000 1,638,780 3,686,670 7,907,250 21,489,546
Additional Tax burden/ (Sav-ings)
- 1,300 (7,800) (13,000) (31,200) (34,320) (35,880) (39,000) (42,744)
Additional Tax burden/ (Savings) (%) in Option B
- 2.63% (9.09%) (9.80%) (13.79%) (2.05%) (0.96%) (0.49%) (0.20%)
Resident senior citizen (age of 60 years but below 80 years)
Total Income
475,000 825,000 1,000,000 1,200,000 1,500,000 5,650,000 11,150,000 21,150,000 #
51,150,000 #
Tax in FY 2021-22 (Option A) *
NIL*** 46,800 83,200 130,000 223,600 1,670,240 3,719,560 7,943,000 21,528,728
Tax in FY 2021-22 (Option B) **
NIL*** 50,700 78,000 119,600 195,000 1,638,780 3,686,670 7,907,250 21,489,546
Additional Tax burden/ (Savings) in Option B
- 3,900 (5,200) (10,400) (28,600) (31,460) (32,890) (35,750) (39,182)
Additional Tax burden/ (Savings) (%) in Option B
- 8.33% (6.25%) (8.00%) (12.79%) (1.88%) (0.88%) (0.45%) (0.18%)
Resident senior citizen (age 80 years and above)
Total Income
475,000 825,000 1,000,000 1,200,000 1,500,000 5,650,000 11,150,000 21,150,000 #
51,150,000 #
Tax in FY 2021-22 (Option A) *
NIL 36,400 72,800 119,600 213,200 1,658,800 3,707,600 7,930,000 21,514,480
Tax in FY 2021-22 (Option B) **
NIL 50,700 78,000 119,600 195,000 1,638,780 3,686,670 7,907,250 21,489,546
Additional Tax burden/ (Savings) in Option B
- 14,300 5,200 - (18,200) (20,020) (20,930) (22,750) (24,934)
Additional Tax burden/ (Savings) (%) in Option B
- 39.29% 7.14% - (8.54%) (1.21%) (0.56%) (0.29%) (0.12%)
* For purpose of tax calculation under Option A, ad hoc deduction of INR 150,000 has been claimed. The ad hoc deduction is only illustrative in nature. Basis actual deduction, the tax amount will vary.
** For purpose of tax calculation under Option B, no exemption/ deductions have been claimed.*** NIL tax on account of rebate under section 87A.# If the said taxable income includes income by way of dividend or capital gains under section 111A and section 112A of the Act, then enhanced surcharge of 37% and 25%
would not be applicable and accordingly effective tax rate would be lower.
Disclaimer : The information set out above is included for general information purposes only and does not constitute legal or tax advice. In view of the individual nature of the tax consequences, each investor is advised to consult his or her own tax consultant with respect to specific tax implications arising out of their participation in the Scheme. Income Tax benefits to the mutual fund & to the unit holder is in accordance with the prevailing tax laws as certified by the mutual funds tax consultant. Any action taken by you on the basis of the information contained herein is your responsibility alone. Tata Mutual Fund will not be liable in any manner for the consequences of such action taken by you. The information contained herein is not intended as an offer or solicitation for the purchase and sales of any schemes of Tata Mutual Fund.
www.tatamutualfund.com TATA MUTUAL FUNDMutual Fund investments are subject to market risks, read all scheme related documents carefully
Market Capitalisation wise Exposure
Large Cap
Mid Cap
Small Cap
Market Capitalisation is as per list provided by AMFI.
8
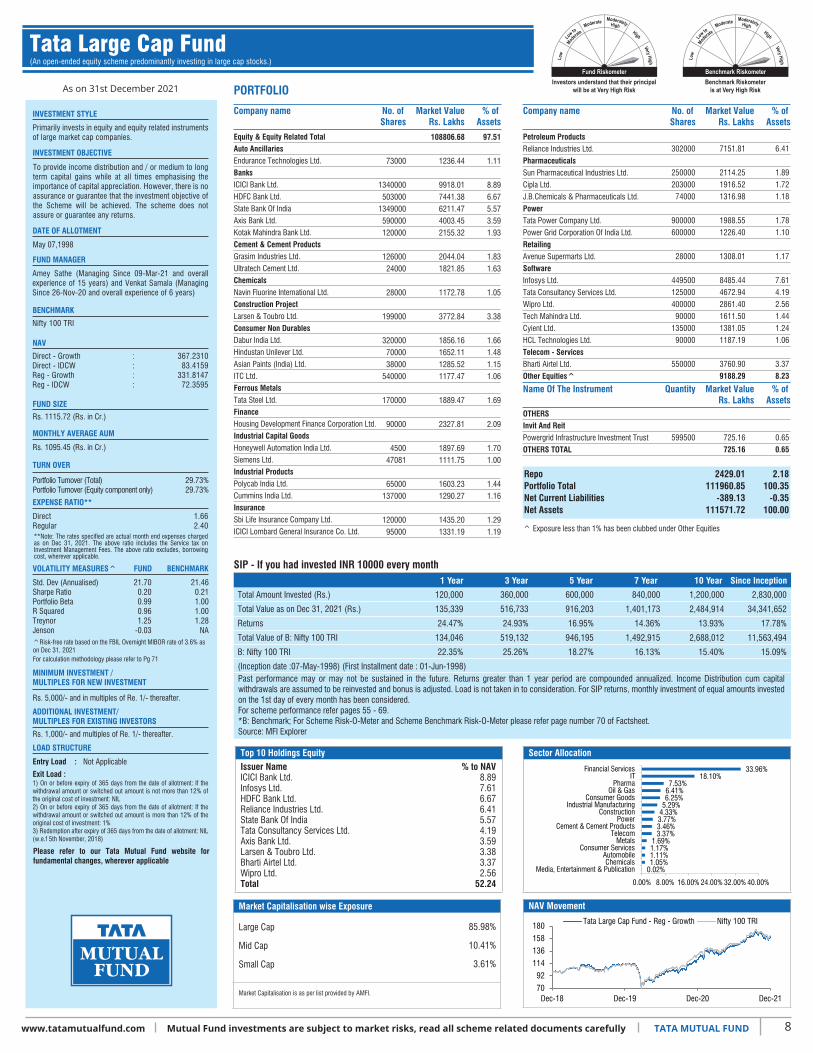
As on 31st December 2021
INVESTMENT STYLE
INVESTMENT OBJECTIVE
DATE OF ALLOTMENT
May 07,1998
FUND MANAGER
NAV
FUND SIZE
Rs. 1115.72 (Rs. in Cr.)
MONTHLY AVERAGE AUM
Rs. 1095.45 (Rs. in Cr.)
TURN OVER
Portfolio Turnover (Total)Portfolio Turnover (Equity component only)
29.73%29.73%
EXPENSE RATIO**
DirectRegular
1.662.40
VOLATILITY MEASURES^ FUND BENCHMARK
Std. Dev (Annualised)Sharpe RatioPortfolio BetaR SquaredTreynorJenson
21.460.211.001.001.28
NA
21.700.200.990.961.25
-0.03
MINIMUM INVESTMENT /MULTIPLES FOR NEW INVESTMENT
Rs. 5,000/- and in multiples of Re. 1/- thereafter.
ADDITIONAL INVESTMENT/MULTIPLES FOR EXISTING INVESTORS
Rs. 1,000/- and multiples of Re. 1/- thereafter.
LOAD STRUCTURE
Entry Load : Not Applicable
Exit Load :
PORTFOLIO
Company name No. of Shares
Market ValueRs. Lakhs
% of Assets
97.51
1.11
8.89
6.67
5.57
3.59
1.93
1.83
1.63
1.05
3.38
1.66
1.48
1.15
1.06
1.69
2.09
1.70
1.00
1.44
1.16
1.29
1.19
73000
1340000
503000
1349000
590000
120000
126000
24000
28000
199000
320000
70000
38000
540000
170000
90000
4500
47081
65000
137000
120000
95000
108806.68
1236.44
9918.01
7441.38
6211.47
4003.45
2155.32
2044.04
1821.85
1172.78
3772.84
1856.16
1652.11
1285.52
1177.47
1889.47
2327.81
1897.69
1111.75
1603.23
1290.27
1435.20
1331.19
SIP - If you had invested INR 10000 every month1 Year 3 Year 5 Year 7 Year 10 Year Since Inception
Total Amount Invested (Rs.)
Total Value as on Dec 31, 2021 (Rs.)
Returns
Total Value of B: Nifty 100 TRI
B: Nifty 100 TRI
(Inception date :07-May-1998) (First Installment date : 01-Jun-1998)
120,000
135,339
24.47%
134,046
22.35%
360,000
516,733
24.93%
519,132
25.26%
600,000
916,203
16.95%
946,195
18.27%
840,000
1,401,173
14.36%
1,492,915
16.13%
1,200,000
2,484,914
13.93%
2,688,012
15.40%
2,830,000
34,341,652
17.78%
11,563,494
15.09%
Company name
Petroleum ProductsReliance Industries Ltd.
PharmaceuticalsSun Pharmaceutical Industries Ltd.
Cipla Ltd.
J.B.Chemicals & Pharmaceuticals Ltd.
PowerTata Power Company Ltd.
Power Grid Corporation Of India Ltd.
RetailingAvenue Supermarts Ltd.
SoftwareInfosys Ltd.
Tata Consultancy Services Ltd.
Wipro Ltd.
Tech Mahindra Ltd.
Cyient Ltd.
HCL Technologies Ltd.
Telecom - ServicesBharti Airtel Ltd.
Other Equities^
302000
250000
203000
74000
900000
600000
28000
449500
125000
400000
90000
135000
90000
550000
7151.81
2114.25
1916.52
1316.98
1988.55
1226.40
1308.01
8485.44
4672.94
2861.40
1611.50
1381.05
1187.19
3760.90
9188.29
6.41
1.89
1.72
1.18
1.78
1.10
1.17
7.61
4.19
2.56
1.44
1.24
1.06
3.37
8.23
OTHERSInvit And ReitPowergrid Infrastructure Investment Trust
OTHERS TOTAL
599500 725.16
725.160.65
0.65
RepoPortfolio TotalNet Current LiabilitiesNet Assets
2429.01111960.85
-389.13111571.72
2.18100.35
-0.35100.00
Top 10 Holdings Equity Sector Allocation
NAV Movement
Primarily invests in equity and equity related instruments of large market cap companies.
To provide income distribution and / or medium to long term capital gains while at all times emphasising the importance of capital appreciation. However, there is no assurance or guarantee that the investment objective of the Scheme will be achieved. The scheme does not assure or guarantee any returns.
Amey Sathe (Managing Since 09-Mar-21 and overall experience of 15 years) and Venkat Samala (Managing Since 26-Nov-20 and overall experience of 6 years)
BENCHMARK
Nifty 100 TRI
Direct - GrowthDirect - IDCWReg - GrowthReg - IDCW
::::
367.231083.4159
331.814772.3595
^Risk-free rate based on the FBIL Overnight MIBOR rate of 3.6% as on Dec 31, 2021 For calculation methodology please refer to Pg 71
Please refer to our Tata Mutual Fund website for fundamental changes, wherever applicable
1) On or before expiry of 365 days from the date of allotment: If the withdrawal amount or switched out amount is not more than 12% of the original cost of investment: NIL2) On or before expiry of 365 days from the date of allotment: If the withdrawal amount or switched out amount is more than 12% of the original cost of investment: 1%3) Redemption after expiry of 365 days from the date of allotment: NIL (w.e.f 5th November, 2018)
Equity & Equity Related TotalAuto AncillariesEndurance Technologies Ltd.
BanksICICI Bank Ltd.
HDFC Bank Ltd.
State Bank Of India
Axis Bank Ltd.
Kotak Mahindra Bank Ltd.
Cement & Cement ProductsGrasim Industries Ltd.
Ultratech Cement Ltd.
ChemicalsNavin Fluorine International Ltd.
Construction ProjectLarsen & Toubro Ltd.
Consumer Non DurablesDabur India Ltd.
Hindustan Unilever Ltd.
Asian Paints (India) Ltd.
ITC Ltd.
Ferrous MetalsTata Steel Ltd.
FinanceHousing Development Finance Corporation Ltd.
Industrial Capital GoodsHoneywell Automation India Ltd.
Siemens Ltd.
Industrial ProductsPolycab India Ltd.
Cummins India Ltd.
InsuranceSbi Life Insurance Company Ltd.
ICICI Lombard General Insurance Co. Ltd.
Issuer NameICICI Bank Ltd.Infosys Ltd.HDFC Bank Ltd.Reliance Industries Ltd.State Bank Of IndiaTata Consultancy Services Ltd.Axis Bank Ltd.Larsen & Toubro Ltd.Bharti Airtel Ltd.Wipro Ltd.Total
% to NAV8.897.616.676.415.574.193.593.383.372.56
52.24
No. of Shares
Market ValueRs. Lakhs
% of Assets
Name Of The Instrument Quantity Market ValueRs. Lakhs
% of Assets
Past performance may or may not be sustained in the future. Returns greater than 1 year period are compounded annualized. Income Distribution cum capital withdrawals are assumed to be reinvested and bonus is adjusted. Load is not taken in to consideration. For SIP returns, monthly investment of equal amounts invested on the 1st day of every month has been considered.For scheme performance refer pages 55 - 69.*B: Benchmark; For Scheme Risk-O-Meter and Scheme Benchmark Risk-O-Meter please refer page number 70 of Factsheet.Source: MFI Explorer
85.98%
10.41%
3.61%
**Note: The rates specified are actual month end expenses charged as on Dec 31, 2021. The above ratio includes the Service tax on Investment Management Fees. The above ratio excludes, borrowing cost, wherever applicable.
Tata Large Cap Fund(An open-ended equity scheme predominantly investing in large cap stocks.)
33.96%18.10%
7.53%6.41%6.25%
5.29%4.33%3.77%3.46%3.37%
1.69%1.17%1.11%1.05%
0.02%
0.00% 8.00% 16.00% 24.00% 32.00% 40.00%
Financial ServicesIT
PharmaOil & Gas
Consumer GoodsIndustrial Manufacturing
ConstructionPower
Cement & Cement ProductsTelecom
MetalsConsumer Services
AutomobileChemicals
Media, Entertainment & Publication
70
92
114
136
158
180
Dec-18 Dec-19 Dec-20 Dec-21
Tata Large Cap Fund - Reg - Growth Nifty 100 TRI
^ Exposure less than 1% has been clubbed under Other Equities

www.tatamutualfund.com TATA MUTUAL FUNDMutual Fund investments are subject to market risks, read all scheme related documents carefully
Market Capitalisation wise Exposure
Large Cap
Mid Cap
Small Cap
Market Capitalisation is as per list provided by AMFI.
SIP - If you had invested INR 10000 every month
1 Year 3 Year 5 Year 7 Year 10 Year Since Inception
Total Amount Invested (Rs.)
Total Value as on Dec 31, 2021 (Rs.)
Returns
Total Value of B: Nifty 500 TRI
B: Nifty 500 TRI
Total Value of AB: S&P BSE Sensex TRI
AB: S&P BSE Sensex TRI
(Inception date :06-Sep-2018) (First Installment date : 01-Oct-2018)
120,000
135,581
24.87%
136,377
26.19%
133,372
21.25%
360,000
510,982
24.11%
540,076
28.18%
515,112
24.70%
NA
NA
NA
NA
NA
NA
NA
NA
NA
NA
NA
NA
NA
NA
NA
NA
NA
NA
NA
NA
NA
390,000
560,310
22.91%
591,698
26.57%
565,773
23.56%
Top 10 Holdings Equity Sector Allocation
NAV Movement
Issuer NameICICI Bank Ltd.HDFC Bank Ltd.Reliance Industries Ltd.Tata Consultancy Services Ltd.Infosys Ltd.Ambuja Cements Ltd.ITC Ltd.HCL Technologies Ltd.Sbi Cards & Payment Services Ltd.Titan Company Ltd.Total
% to NAV8.045.815.404.754.353.273.193.162.442.36
42.77
Past performance may or may not be sustained in the future. Returns greater than 1 year period are compounded annualized. Income Distribution cum capital withdrawals are assumed to be reinvested and bonus is adjusted. Load is not taken in to consideration. For SIP returns, monthly investment of equal amounts invested on the 1st day of every month has been considered.For scheme performance refer pages 55 - 69.B: Benchmark; AB: Additonal Benchmark; For Scheme Risk-O-Meter and Scheme Benchmark Risk-O-Meter please refer page number 70 of Factsheet. Source: MFI Explorer
69.47%
16.00%
14.53%
PORTFOLIO
Company name No. of Shares
Market ValueRs. Lakhs
% of Assets
97.95
1.59
8.045.812.36
3.27
1.11
2.362.041.851.671.261.05
3.192.001.631.101.061.04
2.441.42
1.03
2.251.72
4750
2383000861000761500
1900000
494000
20550081400
965000300000461600165000
321000017340
48000071000
370000387000
577500120220
45000
200000197000
214788.20
3483.56
17637.7712737.63
5167.16
7172.50
2427.76
5183.534484.774051.073657.452759.912305.05
6999.414397.563568.562401.892324.712287.94
5360.073109.43
2256.03
4933.003776.49
Company name
Other Equities^RepoPortfolio TotalNet Current LiabilitiesNet Assets
16737.644946.85
219735.05-396.33
219338.72
7.642.26
100.19-0.19
100.00
Equity & Equity Related TotalAuto AncillariesMRF Ltd.BanksICICI Bank Ltd.HDFC Bank Ltd.Axis Bank Ltd.Cement & Cement ProductsAmbuja Cements Ltd.ConstructionSunteck Realty Ltd.Consumer DurablesTitan Company Ltd.Dixon Technologies (India) Ltd.Greenpanel Industries Ltd.Voltas Ltd.Century Plyboards (India) Ltd.Havells India Ltd.Consumer Non DurablesITC Ltd.3M India Ltd.Tata Consumer Products Ltd.Asian Paints (India) Ltd.Godrej Industries Ltd.Kansai Nerolac Paints Ltd.FinanceSbi Cards And Payment Services Ltd.Housing Development Finance Corporation Ltd.Healthcare ServicesApollo Hospitals Enterprise Ltd.Industrial ProductsPolycab India Ltd.Grindwell Norton Ltd.
1.451.141.02
1.97
1.13
5.40
1.20
1.96
1.771.741.341.26
4.754.353.161.881.321.131.05
490000445000187000
120500
173000
500000
49400
2106666
282229768470
31600059000
278500506000525000756000
73200148000
48000
3182.802495.562236.52
4327.28
2477.97
11840.75
2637.17
4306.03
3877.843818.372929.482756.16
10411.309552.026925.284117.932899.602480.852294.40
InsuranceHDFC Life Insurance Co. Ltd.ICICI Prudential Life Insurance Company Ltd.Sbi Life Insurance Company Ltd.Leisure ServicesJubilant Foodworks Ltd.PesticidesAstec Lifesciences Ltd.Petroleum ProductsReliance Industries Ltd.PharmaceuticalsProcter & Gamble Health Ltd.PowerPower Grid Corporation Of India Ltd.RetailingZomato Ltd.Info Edge (India) Ltd.Matrimony.Com Ltd.Avenue Supermarts Ltd.SoftwareTata Consultancy Services Ltd.Infosys Ltd.HCL Technologies Ltd.Birlasoft Ltd.Oracle Financials Services Soft Ltd.C.E. Info Systems Ltd.Mindtree Ltd.
No. of Shares
Market ValueRs. Lakhs
% of Assets
As on 31st December 2021
INVESTMENT STYLE
DATE OF ALLOTMENT
September 06,2018
NAV
FUND SIZE
Rs. 2193.39 (Rs. in Cr.)
MONTHLY AVERAGE AUM
Rs. 2150.91 (Rs. in Cr.)
TURN OVER
Portfolio Turnover (Total)Portfolio Turnover (Equity component only)
59.50%59.50%
EXPENSE RATIO**
DirectRegular
0.732.13
VOLATILITY MEASURES^ FUND BENCHMARK
Std. Dev (Annualised)Sharpe RatioPortfolio BetaR SquaredTreynorJenson
22.110.221.001.001.38
NA
18.470.220.810.941.430.04
MINIMUM INVESTMENT /MULTIPLES FOR NEW INVESTMENT
Rs. 5,000/- and in multiples of Re. 1/- thereafter.
ADDITIONAL INVESTMENT/MULTIPLES FOR EXISTING INVESTORS
Rs. 1,000/- and in multiples of Re. 1/- thereafter.
LOAD STRUCTURE
Entry Load : Not Applicable
Exit Load :
Primarily focuses on investing in equity and equity related instruments of well researched companies across market capitalization.
INVESTMENT OBJECTIVE
The investment objective of the Scheme is to generate capital appreciation over medium to long term. However, there is no assurance or guarantee that the investment objective of the Scheme will be achieved. The scheme does not assure or guarantee any returns.
FUND MANAGER
Sonam Udasi (Managing Since 17-Aug-18 and overall experience of 24 years)
Abhinav Sharma (Managing Since 01-Nov-19 and overall experience of 15 years)
BENCHMARK
Nifty 500 TRI
Direct - IDCWDirect - GrowthRegular - IDCWRegular - Growth
::::
17.237917.237916.263716.2637
^Risk-free rate based on the FBIL Overnight MIBOR rate of 3.6% as on Dec 31, 2021 For calculation methodology please refer to Pg 71
Please refer to our Tata Mutual Fund website for fundamental changes, wherever applicable
1) Redemption/Switch-out/SWP/STP on or before expiry of 12 Months from the date of allotment: If the withdrawal amount or switched out amount is not more than 12% of the original cost of investment - NIL2) Redemption/Switch-out/SWP/STP on or before expiry of 12 Months from the date of allotment: If the withdrawal amount or switched out amount is more than 12% of the original cost of investment - 1%3) Redemption/Switch-out/SWP/STP after expiry of 12 Months from the date of allotment - NIL (w.e.f. 03 June, 2019)
**Note: The rates specified are actual month end expenses charged as on Dec 31, 2021. The above ratio includes the Service tax on Investment Management Fees. The above ratio excludes, borrowing cost, wherever applicable.
9
Tata Flexi Cap Fund(An open ended dynamic equity scheme investing across large cap, mid cap, small cap stocks.)
^ Exposure less than 1% has been clubbed under Other Equities
ASSISTANT FUND MANAGER
27.10%21.44%
17.64%9.22%
6.38%3.97%
3.27%2.48%
1.96%1.20%1.13%1.11%1.03%
0.00% 6.00% 12.00% 18.00% 24.00% 30.00%
Financial ServicesConsumer Goods
ITConsumer Services
Oil & GasIndustrial Manufacturing
Cement & Cement ProductsAutomobile
PowerPharma
Fertilisers & PesticidesConstruction
Healthcare Services
60
84
108
132
156
180
Dec-18 Dec-19 Dec-20 Dec-21
Tata Flexi Cap Fund - Reg - Growth Nifty 500 TRI

Past performance may or may not be sustained in the future. Returns greater than 1 year period are compounded annualized. Income Distribution cum capital withdrawals are assumed to be reinvested and bonus is adjusted. Load is not taken in to consideration. For SIP returns, monthly investment of equal amounts invested on the 1st day of every month has been considered.For scheme performance refer pages 55 - 69.*B: Benchmark, AB: Additional Benchmark; For Scheme Risk-O-Meter and Scheme Benchmark Risk-O-Meter please refer page number 70 of Factsheet.Source: MFI Explorer
www.tatamutualfund.com TATA MUTUAL FUNDMutual Fund investments are subject to market risks, read all scheme related documents carefully
Market Capitalisation wise Exposure
Large Cap
Mid Cap
Small Cap
Market Capitalisation is as per list provided by AMFI.
10
As on 31st December 2021
INVESTMENT STYLE
INVESTMENT OBJECTIVE
PORTFOLIO
Company name No. of Shares
Market ValueRs. Lakhs
% of Assets
268285.16
3139.31
12723.74
8369.52
22944.65
15533.70
14734.40
6769.00
5208.69
4250.99
3988.35
3245.78
6123.16
4471.14
11636.73
5021.69
3718.63
4922.01
8411.78
5088.97
3114.33
3216.42
94.01
1.10
4.46
2.93
8.04
5.44
5.16
2.37
1.83
1.49
1.40
1.14
2.15
1.57
4.08
1.76
1.30
1.72
2.95
1.78
1.09
1.13
375000
1393924
476950
3100000
1050000
3200000
14000000
290000
56000
180000
650000
202011
235832
1310000
2303000
181800
190300
2850000
1711730
502392
180000
Company name No. of Shares
Market ValueRs. Lakhs
% of Assets
Other Equities^TrepsRepoPortfolio TotalNet Current LiabilitiesNet Assets
6592.4214997.133085.50
286367.79-985.26
285382.53
2.315.261.08
100.35-0.35
100.00
SIP - If you had invested INR 10000 every month1 Year 3 Year 5 Year 7 Year 10 Year Since Inception
Total Amount Invested (Rs.)
Total Value as on Dec 31, 2021 (Rs.)
Returns
Total Value of B: Nifty Large Midcap 250 TRI
B: Nifty Large Midcap 250 TRI
Total Value of AB: S&P BSE Sensex TRI
AB: S&P BSE Sensex TRI
(Inception date :25-Feb-1993) (First Installment date : 01-Mar-1993)
360,000
520,785
25.50%
564,280
31.46%
515,112
24.70%
120,000
132,828
20.36%
138,378
29.51%
133,372
21.25%
600,000
941,103
18.04%
1,009,089
20.91%
961,699
18.93%
840,000
1,457,165
15.45%
1,612,036
18.29%
1,519,571
16.63%
1,200,000
2,746,730
15.80%
3,093,255
18.01%
2,692,720
15.43%
2,560,000
24,350,242
18.01%
8,421,011
15.37%
17,868,511
15.72%
Primarily focuses on investing in equity and equity related instruments of well researched value and growth oriented Large & Mid Cap Companies.
To provide income distribution and / or medium to long term capital gains while at all times emphasizing the importance of capital appreciation. However, there is no assurance or guarantee that the investment objective of the Scheme will be achieved. The scheme does not assure or guarantee any returns.
Equity & Equity Related Total
Auto
Mahindra & Mahindra Ltd.
Auto Ancillaries
Sundram Fasteners Ltd.
Tube Investments Of India Ltd..
Banks
ICICI Bank Ltd.
HDFC Bank Ltd.
State Bank Of India
IDFC First Bank Ltd.
Kotak Mahindra Bank Ltd.
Cement & Cement Products
Ultratech Cement Ltd.
ACC Ltd.
Nuvoco Vistas Corporation Ltd.
Chemicals
Basf India Ltd.
Construction Project
Larsen & Toubro Ltd.
Consumer Non Durables
Varun Beverages Ltd.
ITC Ltd.
Akzo Nobel India Ltd.
Finance
Housing Development Finance Corporation Ltd.
Gas
Gujarat State Petronet Ltd.
Healthcare Services
Fortis Healthcare Ltd.
Syngene International Ltd.
Industrial Capital Goods
Thermax Ltd.
Top 10 Holdings Equity Sector Allocation
NAV Movement
Issuer NameICICI Bank Ltd.Reliance Industries Ltd.HDFC Bank Ltd.State Bank Of IndiaSundaramfastners Ltd.Tata Consultancy Services Ltd.Varun Beverages Ltd.Bharti Airtel Ltd.Gujarat State Petronet Ltd.Tube Investments Of India Ltd.Total
% to NAV8.046.225.445.164.464.324.083.602.952.93
47.20
Industrial Products
Aia Engineering Ltd.
Cummins India Ltd.
Elantas Beck India Ltd.
Insurance
Sbi Life Insurance Company Ltd.
Other Services
Quess Corp Ltd.
Pesticides
Pi Industries Ltd.
Petroleum Products
Reliance Industries Ltd.
Pharmaceuticals
Natco Pharma Ltd.
Ajanta Pharma Ltd.
Retailing
Aditya Birla Fashion & Retail Ltd.
Software
Tata Consultancy Services Ltd.
Infosys Ltd.
Oracle Financials Services Soft Ltd.
Telecom - Services
Bharti Airtel Ltd.
Trading
Redington (India) Ltd.
300000
575000
91250
450000
489385
210000
750000
600100
227500
3000000
330000
350000
110000
1450000
3500000
5617.35
5415.35
3353.21
5382.00
4190.85
6371.82
17761.13
5428.80
5085.88
8167.50
12336.56
6607.13
4357.32
9915.10
5069.75
1.97
1.90
1.17
1.89
1.47
2.23
6.22
1.90
1.78
2.86
4.32
2.32
1.53
3.47
1.78
51.74%
39.89%
8.37%
**Note: The rates specified are actual month end expenses charged as on Dec 31, 2021. The above ratio includes the Service tax on Investment Management Fees. The above ratio excludes, borrowing cost, wherever applicable.
Please refer to our Tata Mutual Fund website for fundamental changes, wherever applicable
VOLATILITY MEASURES^ FUND BENCHMARK
Std. Dev (Annualised)Sharpe RatioPortfolio BetaR SquaredTreynorJenson
23.120.231.001.001.51
NA
22.210.220.940.961.47
-0.04
DATE OF ALLOTMENT
February 25,1993
FUND MANAGER
ASSISTANT FUND MANAGER
NAV
Direct - GrowthDirect - IDCWReg - GrowthReg - IDCW
::::
357.068069.9295
325.648952.5374
FUND SIZE
Rs. 2853.83 (Rs. in Cr.)
TURN OVER
Portfolio Turnover (Total)Portfolio Turnover (Equity component only)
13.13%13.13%
MINIMUM INVESTMENT/ MULTIPLES FOR NEW INVESTMENT
Rs. 5,000/- and in multiples of Re. 1/- thereafter. ADDITIONAL INVESTMENT/ MULTIPLES FOR EXISTING INVESTORS
Rs. 1,000/- and multiples of Re. 1/- thereafter.
LOAD STRUCTURE
Entry Load : Not ApplicableExit Load :
Chandraprakash Padiyar (Managing Since 3-Sep-18 and overall experience of 21 years)
Meeta Shetty (Managing Since 1-Nov-19 and overall experience of 15 years)
^Risk-free rate based on the FBIL Overnight MIBOR rate of 3.6% as on Dec 31, 2021
1) On or before expiry of 365 days from the date of allotment: If the withdrawal amount or switched out amount is not more than 12% of the original cost of investment: NIL2) On or before expiry of 365 days from the date of allotment: If the withdrawal amount or switched out amount is more than 12% of the original cost of investment: 1%3) Redemption after expiry of 365 days from the date of allotment: NIL (w.e.f 5th November, 2018)
For calculation methodology please refer to Pg 71
MONTHLY AVERAGE AUM
Rs. 2787.46 (Rs. in Cr.)
EXPENSE RATIO**
DirectRegular
1.042.11
BENCHMARKNifty Large Midcap 250 TRI
Tata Large & Mid Cap Fund(An open-ended equity scheme investing in both large cap & mid cap stocks.)
^ Exposure less than 1% has been clubbed under Other Equities
26.45%9.27%9.17%
8.16%8.09%
6.17%4.13%4.02%3.60%3.24%2.87%2.86%
2.23%2.15%
1.57%0.00%
0.00% 6.00% 12.00% 18.00% 24.00% 30.00%
Financial ServicesAutomobile
Oil & GasIT
Consumer GoodsIndustrial Manufacturing
PharmaCement & Cement Products
TelecomServices
Healthcare ServicesConsumer Services
Fertilisers & PesticidesChemicals
ConstructionMedia, Entertainment & Publication
60
86
112
138
164
190
Dec-18 Dec-19 Dec-20 Dec-21
Tata Large & Mid Cap Fund - Reg - GrowthNifty Large Midcap 250 TRI

Petroleum ProductsReliance Industries Ltd.PharmaceuticalsAlembic Pharmaceuticals Ltd.PowerPower Grid Corporation Of India Ltd.Tata Power Company Ltd.SoftwareInfosys Ltd.HCL Technologies Ltd.Tech Mahindra Ltd.Tata Consultancy Services Ltd.Oracle Financials Services Soft Ltd.Mindtree Ltd.Other Equities^
Market Capitalisation wise Exposure
Large Cap
Mid Cap
Small Cap
Market Capitalisation is as per list provided by AMFI.
Please refer to our Tata Mutual Fund website for fundamental changes, wherever applicable
VOLATILITY MEASURES^ FUND BENCHMARK
11www.tatamutualfund.com TATA MUTUAL FUND
As on 31st December 2021
INVESTMENT STYLE
INVESTMENT OBJECTIVE
DATE OF ALLOTMENT
June 29, 2004
FUND MANAGER
ASSISTANT FUND MANAGER
NAV
Direct - GrowthDirect - IDCW (Trigger Option A 5%)Direct - IDCW (Trigger Option B 10%)Reg - GrowthReg - IDCW (Trigger Option A 5%)Reg - IDCW (Trigger Option B 10%)
215.967387.627083.2223
198.668981.704575.4660
FUND SIZE
Rs. 5090.66 (Rs. in Cr.)
TURN OVER
Portfolio Turnover (Total)Portfolio Turnover (Equity component only)
43.19%43.19%
MINIMUM INVESTMENT/ MULTIPLES FOR NEW INVESTMENT
Rs. 5,000/- and in multiples of Re. 1/- thereafter.
ADDITIONAL INVESTMENT/MULTIPLES FOR EXISTING INVESTORS
Rs. 1,000/- and multiples of Re. 1/- thereafter.
LOAD STRUCTURE
Entry Load : Not Applicable
Exit Load :
PORTFOLIO
Company name No. of Shares
Market ValueRs. Lakhs
% of Assets
492320.76
11372.387453.17
8507.21
42410.6037872.6414453.1213675.37
15007.3912001.84
19498.60
13013.805644.66
28346.5018171.417458.61
8101.62
26570.60
5234.78
5212.03
5386.65
5918.40
96.73
2.231.46
1.67
8.337.442.842.69
2.952.36
3.83
2.561.11
5.573.571.47
1.59
5.22
1.03
1.02
1.06
1.16
350000390484
11600
5730000256000021300002970000
14250001515862
880000
3100000463000
130000001470000
29410
1620000
1027300
350000
1108000
150000
2160000
Company name
1202000
905000
102666662350000
14800001635000650000300000264000113500
28465.16
7257.20
20985.075192.33
27938.7021567.2911638.5811215.0510457.575425.30
30867.13
5.59
1.43
4.121.02
5.494.242.292.202.051.076.07
TrepsRepoPortfolio TotalNet Current LiabilitiesNet Assets
14997.132546.33
509864.22-798.36
509065.86
2.950.50
100.16-0.16
100.00
SIP - If you had invested INR 10000 every month1 Year 3 Year 5 Year 7 Year 10 Year Since Inception
Total Amount Invested (Rs.)
Total Value as on Dec 31, 2021 (Rs.)
Returns
Total Value of B: Nifty 500 TRI
B: Nifty 500 TRI
(Inception date :29-Jun-2004) (First Installment date : 01-Jul-2004)
120,000
135,694
25.06%
136,377
26.19%
360,000
507,752
23.65%
540,076
28.18%
600,000
876,893
15.16%
970,498
19.31%
840,000
1,409,016
14.51%
1,531,455
16.85%
1,200,000
2,826,448
16.33%
2,789,182
16.09%
2,100,000
10,005,106
15.89%
8,294,884
14.10%
Primarily invests at least 70% of the net assets in equity shares whose rolling P/E ratio on past four quarter earnings for individual companies is less than rolling P/E of the S&P BSE SENSEX stocks.
The investment objective of the Scheme is to provide reasonable and regular income and/or possible capital appreciation to its Unitholder. However, there is no assurance or guarantee that the investment objective of the Scheme will be achieved. The scheme does not assure or guarantee any returns.
Std. Dev (Annualised)Sharpe RatioPortfolio BetaR SquaredTreynorJensonPE
22.110.221.001.001.38
NA27.87
20.890.180.930.961.14
-0.2330.46
^Risk-free rate based on the FBIL Overnight MIBOR rate of 3.6% as on Dec 31, 2021For calculation methodology please refer to Pg 71
1) On or before expiry of 12 months from the date of allotment: If the withdrawal amount or switched out amount is not more than 12% of the original cost of investment: NIL2) On or before expiry of 12 months from the date of allotment: If the withdrawal amount or switched out amount is more than 12% of the original cost of investment: 1% 3) Redemption after expiry of 12 months from the date of allotment: NIL (w.e.f. 3rd May, 2019)
Equity & Equity Related TotalAutoBajaj Auto Ltd.Escorts Ltd.Auto AncillariesMRF Ltd.BanksICICI Bank Ltd.HDFC Bank Ltd.Axis Bank Ltd.State Bank Of IndiaCapital MarketsUti Asset Management Company Ltd.ICICI Securities Ltd.Cement & Cement ProductsACC Ltd.Consumer DurablesGreenpanel Industries Ltd.Voltas Ltd.Consumer Non DurablesITC Ltd.Radico Khaitan Ltd.3M India Ltd.EntertainmentSun Tv Network Ltd.FinanceHousing Development Finance Corporation Ltd.Muthoot Finance Ltd.GasIndraprastha Gas Ltd.Leisure ServicesJubilant Foodworks Ltd.PesticidesRallis India Ltd.
Top 10 Holdings Equity Sector Allocation
NAV Movement
Issuer NameICICI Bank Ltd.HDFC Bank Ltd.Reliance Industries Ltd.ITC Ltd.Infosys Ltd.HDFC Ltd.HCL Technologies Ltd.Power Grid Corporation Of India Ltd.ACC Ltd.Radico Khaitan Ltd.Total
% to NAV8.337.445.595.575.495.224.244.123.833.57
53.40
No. of Shares
Market ValueRs. Lakhs
% of Assets
69.02%
18.10%
12.88%
Past performance may or may not be sustained in the future. Returns greater than 1 year period are compounded annualized. Income Distribution cum capital withdrawals are assumed to be reinvested and bonus is adjusted. Load is not taken in to consideration. For SIP returns, monthly investment of equal amounts invested on the 1st day of every month has been considered.For scheme performance refer pages 55-69.*B: Benchmark; For Scheme Risk-O-Meter and Scheme Benchmark Risk-O-Meter please refer page number 70 of Factsheet.Source: MFI Explorer
BENCHMARKNifty 500 TRI
MONTHLY AVERAGE AUM
Rs. 5038.79 (Rs. in Cr.)
EXPENSE RATIO**
DirectRegular 0.89
1.96
::::::
Sonam Udasi (Managing Since 1-Apr-16 and overall experience of 24 years)
Amey Sathe (Managing Since 18-Jun-18 and overall experience of 15 years)
**Note: The rates specified are actual month end expenses charged as on Dec 31, 2021. The above ratio includes the Service tax on Investment Management Fees. The above ratio excludes, borrowing cost, wherever applicable.
Tata Equity P/E Fund(An open ended equity scheme following a value investment strategy)
Mutual Fund investments are subject to market risks, read all scheme related documents carefully
^ Exposure less than 1% has been clubbed under Other Equities
35.49%17.33%
15.17%7.40%
6.15%5.14%
3.83%1.59%1.43%1.16%1.06%0.95%
0.00% 8.00% 16.00%24.00%32.00%40.00%
Financial ServicesIT
Consumer GoodsOil & Gas
AutomobilePower
Cement & Cement ProductsMedia, Entertainment & Publication
PharmaFertilisers & Pesticides
Consumer ServicesIndustrial Manufacturing
60
84
108
132
156
180
Dec-18 Dec-19 Dec-20 Dec-21
Tata Equity P/E Fund - Reg - Growth Nifty 500 TRI

Industrial Capital GoodsThermax Ltd.Industrial ProductsCummins India Ltd.Supreme Industries Ltd.Bharat Forge Ltd.Aia Engineering Ltd.Astral Ltd. (Erstwhile Astral Poly Technik Ltd.)Vesuvius India Ltd.InsuranceMax Financial Services Ltd.Leisure ServicesJubilant Foodworks Ltd.PesticidesPi Industries Ltd.PharmaceuticalsIpca Laboratories Ltd.Alkem Laboratories Ltd.Laurus Labs Ltd.PowerTata Power Company Ltd.Cesc Ltd.RetailingV-Mart Retail Ltd.Trent Ltd.Info Edge (India) Ltd.SoftwareMphasis Ltd.Persistent Systems Ltd.Tech Mahindra Ltd.Cyient Ltd.Textile ProductsPage Industries Ltd.Other Equities^
www.tatamutualfund.com TATA MUTUAL FUNDMutual Fund investments are subject to market risks, read all scheme related documents carefully
Market Capitalisation wise Exposure
Large Cap
Mid Cap
Small Cap
Market Capitalisation is as per list provided by AMFI.
17.42%
61.14%
21.44%
Please refer to our Tata Mutual Fund website for fundamental changes, wherever applicable
12
As on 31st December 2021
INVESTMENT STYLE
INVESTMENT OBJECTIVE
MINIMUM INVESTMENT/MULTIPLES FOR NEW INVESTMENT
Rs. 5,000/- and in multiples of Re. 1/- thereafter.
ADDITIONAL INVESTMENT/MULTIPLES FOR EXISTING INVESTORS
Rs. 1,000/- and multiples of Re. 1/- thereafter.
LOAD STRUCTURE
Entry Load : Not Applicable
Exit Load :
PORTFOLIO
Company name No. of Shares
Market ValueRs. Lakhs
% of Assets
146947.45
1836.75
3797.062218.811643.63
3478.712490.001696.381687.731584.83
3098.37
3545.201606.56
4942.43
3781.112950.89
5242.354440.12
2100.681788.44
4149.75
2985.36
2602.002234.25
2493.121626.63
2657.101989.48
96.88
1.21
2.501.461.08
2.291.641.121.111.04
2.04
2.341.06
3.26
2.491.95
3.462.93
1.391.18
2.74
1.97
1.721.47
1.641.07
1.751.31
1500000
310002131000750000
4700003000000
25000013273501177000
294200
160000160000
118000
1261000601854
4300001015000
1027007052
1100000
394863
5000001500000
5300001259000
53000311100
Company name
161700
300000120798387000126000
81999146670
389137
85000
135000
14500086400
300000
17300001750000
85000235000
42000
12000077660
160000235000
8000
2889.42
2825.402692.412700.682359.291871.051589.10
3814.90
3052.44
4096.17
3141.863131.181616.70
3822.441531.25
3174.922502.752342.21
4076.043808.722864.882404.05
3233.726738.13
1.91
1.861.781.781.561.231.05
2.52
2.01
2.70
2.072.061.07
2.521.01
2.091.651.54
2.692.511.891.59
2.134.44
TrepsRepoPortfolio TotalNet Current LiabilitiesNet Assets
2999.432350.62
152297.50-636.33
151661.17
1.981.55
100.42-0.42
100.00
An equity scheme with focus towards mid cap stocks.
To provide income distribution and / or medium to long term capital gains. Investments would be focused towards mid-cap stocks. However, there is no assurance or guarantee that the investment objective of the Scheme will be achieved. The scheme does not assure or guarantee any returns.
^Risk-free rate based on the FBIL Overnight MIBOR rate of 3.6% as on Dec 31, 2021
For calculation methodology please refer to Pg 71
1) On or before expiry of 365 days from the date of allotment: If the withdrawal amount or switched out amount is not more than 12% of the original cost of investment: NIL2) On or before expiry of 365 days from the date of allotment: If the withdrawal amount or switched out amount is more than 12% of the original cost of investment: 1%3) Redemption after expiry of 365 days from the date of allotment: NIL (w.e.f 5th November, 2018)
Top 10 Holdings Equity Sector Allocation
NAV Movement
Issuer NameVoltas Ltd.Navin Fluorine International Ltd.Crompton Greaves Consumer Electricals Ltd.Jindal Steel & Power Ltd.P.i. Industries Ltd.Mphasis Ltd.Max Financial Services Ltd.Tata Power Company Ltd.Persistent Systems Ltd.Minda Industries Ltd.Total
% to NAV3.463.262.932.742.702.692.522.522.512.50
27.83
Equity & Equity Related TotalAutoAshok Leyland Ltd.Auto AncillariesMinda Industries Ltd.Endurance Technologies Ltd.Apollo Tyres Ltd.BanksICICI Bank Ltd.Federal Bank Ltd.Axis Bank Ltd.Rbl Bank Ltd.City Union Bank Ltd.Capital MarketsUti Asset Management Company Ltd.Cement & Cement ProductsACC Ltd.The Ramco Cements Ltd.ChemicalsNavin Fluorine International Ltd.ConstructionKnr Constructions Ltd.Brigade Enterprises Ltd.Consumer DurablesVoltas Ltd.Crompton Greaves Consumer Electricals Ltd.Consumer Non DurablesAkzo Nobel India Ltd.3M India Ltd.Ferrous MetalsJindal Steel & Power Ltd.FertilisersCoromandel International Ltd.FinanceCholamandalam Investment & Finance Co Ltd.Mahindra And Mahindra Financial Services Ltd.GasIndraprastha Gas Ltd.Gail ( India ) Ltd.Healthcare ServicesApollo Hospitals Enterprise Ltd.Narayana Hrudayalaya Ltd.
No. of Shares
Market ValueRs. Lakhs
% of Assets
SIP - If you had invested INR 10000 every month
1 Year 3 Year 5 Year 7 Year 10 Year Since Inception
Total Amount Invested (Rs.)
Total Value as on Dec 31, 2021 (Rs.)
Returns
Total Value of B: Nifty Midcap 150 TRI
B: Nifty Midcap 150 TRI
Total Value of AB: Nifty 50 TRI
AB: Nifty 50 TRI
(Inception date :01-Jul-1994) (First Installment date : 01-Jul-1994)
120,000
139,474
31.34%
142,770
36.88%
133,658
21.71%
360,000
574,592
32.83%
612,047
37.67%
518,153
25.13%
600,000
1,046,537
22.42%
1,072,271
23.42%
952,649
18.54%
840,000
1,667,714
19.24%
1,728,865
20.25%
1,498,767
16.24%
1,200,000
3,594,698
20.79%
3,527,186
20.44%
2,652,526
15.15%
2,140,000
13,310,744
17.56%
9,907,484
17.00%
8,363,461
13.84%
Past performance may or may not be sustained in the future. Returns greater than 1 year period are compounded annualized. Income Distribution cum capital withdrawals are assumed to be reinvested and bonus is adjusted. Load is not taken in to consideration. For SIP returns, monthly investment of equal amounts invested on the 1st day of every month has been considered.For scheme performace refer pages 55 - 69.*B: Benchmark, AB: Additional Benchmark; For Scheme Risk-O-Meter and Scheme Benchmark Risk-O-Meter please refer page number 70 of Factsheet.Source: MFI Explorer
**Note: The rates specified are actual month end expenses charged as on Dec 31, 2021. The above ratio includes the Service tax on Investment Management Fees. The above ratio excludes, borrowing cost, wherever applicable.
VOLATILITY MEASURES^ FUND BENCHMARK
DATE OF ALLOTMENT
July 1, 1994
FUND MANAGER
NAV
Direct - GrowthDirect - IDCWReg - GrowthReg - IDCW
::::
267.624588.3471
245.754567.9135
FUND SIZE
Rs. 1516.61 (Rs. in Cr.)
TURN OVER
Portfolio Turnover (Total)Portfolio Turnover (Equity component only)
59.41%59.41%
ASSISTANT FUND MANAGER
Satish Chandra Mishra (Managing Since 09-Mar-21 and overall experience of 15 years )
Abhinav Sharma (Managing Since 09-Mar-21 and overall experience of 15 years)
Std. Dev (Annualised)Sharpe RatioPortfolio BetaR SquaredTreynorJenson
25.790.241.001.001.75
NA
23.250.250.880.951.900.13
BENCHMARK
Nifty Midcap 150 TRI
MONTHLY AVERAGE AUM
Rs. 1478.97 (Rs. in Cr.)
EXPENSE RATIO**
DirectRegular 1.06
2.29
Tata Mid Cap Growth Fund(An open-ended equity scheme predominantly investing in mid cap stocks.)
^ Exposure less than 1% has been clubbed under Other Equities
16.68%11.16%
8.95%8.67%
7.30%6.26%
5.50%5.39%5.20%
3.66%3.53%3.40%3.26%3.06%
2.74%2.13%
0.00% 4.00% 8.00% 12.00% 16.00% 20.00%
Financial ServicesIndustrial Manufacturing
Consumer GoodsIT
Consumer ServicesAutomobile
Fertilisers & PesticidesConstruction
PharmaOil & Gas
PowerCement & Cement Products
ChemicalsHealthcare Services
MetalsTextiles
60
88
116
144
172
200
Dec-18 Dec-19 Dec-20 Dec-21
Tata Mid Cap Growth Fund - Reg - IDCWNifty Midcap 150 TRI

www.tatamutualfund.com TATA MUTUAL FUNDMutual Fund investments are subject to market risks, read all scheme related documents carefully
**Note: The rates specified are actual month end expenses charged as on Dec 31, 2021. The above ratio includes the Service tax on Investment Management Fees. The above ratio excludes, borrowing cost, wherever applicable.
Market Capitalisation wise Exposure
Large Cap
Mid Cap
Small Cap
Market Capitalisation is as per list provided by AMFI.
Please refer to our Tata Mutual Fund website for fundamental changes, wherever applicable
VOLATILITY MEASURES^ FUND BENCHMARK
22.110.221.001.001.38
NA
Std. Dev (Annualised)Sharpe RatioPortfolio BetaR SquaredTreynorJenson
22.130.200.990.971.29
-0.09
13
As on 31st December 2021
INVESTMENT STYLE
INVESTMENT OBJECTIVE
DATE OF ALLOTMENT
March 31,1996
FUND MANAGER
NAV
Direct- IDCWReg - IDCWDirect- GrowthReg- Growth
::::
FUND SIZE
Rs. 2986.48 (Rs. in Cr.)
TURN OVER
Portfolio Turnover (Total)Portfolio Turnover (Equity component only)
45.78%45.78%
MINIMUM INVESTMENT/MULTIPLES FOR NEW INVESTMENT
Rs. 500/- and in multiples of Rs. 500/- thereafter.
ADDITIONAL INVESTMENT/MULTIPLES FOR EXISTING INVESTORS
Rs. 500/- and multiples of Rs. 500/- thereafter.
LOAD STRUCTURE
Entry Load : Not Applicable
Exit Load :
PORTFOLIO
Company name No. of Shares
Market ValueRs. Lakhs
% of Assets
No. of Shares
Market ValueRs. Lakhs
% of Assets
294572.38
7236.005387.80
3509.603307.10
24572.9817036.6516791.19
9940.763366.253112.50
5693.293020.00
4608.822998.50
7394.01
5973.84
3274.77
12156.323248.53
5898.655089.504316.38
6279.003117.18
98.62
2.421.80
1.181.11
8.235.705.623.331.131.04
1.911.01
1.541.00
2.48
2.00
1.10
4.071.09
1.981.701.45
2.101.04
15000004400000
200000270000
332000037000001135000146500025000003750000
75000800000
9400001000000
390000
490000
160100
470000350000
5050001000000
175000
52500019000
Company name
1250000
100000
6750001000000
700000500000512000
3451000
1350000510000260000335000
1275000
5944.38
3034.20
15985.013854.50
5919.904720.503891.46
4293.04
25484.636727.414655.433427.05
8718.45
1.99
1.02
5.351.29
1.981.581.30
1.44
8.532.251.561.15
2.92
Other Equities^TrepsRepoPortfolio TotalNet Current LiabilitiesNet Assets
30586.802999.432528.61
300100.42-1452.56
298647.86
10.231.000.85
100.49-0.49
100.00
An equity linked tax savings scheme (ELSS) that aims to provide medium to long term capital gains along with income tax benefit under Section 80C of the Income Tax Act.
To provide medium to long term capital gains along with income tax relief to its Unitholders, while at all times emphasising the importance of capital appreciation. However, there is no assurance or guarantee that the investment objective of the Scheme will be achieved. The scheme does not assure or guarantee any returns.
Tejas Gutka (Managing Since 09-Mar-21 and overall experience of 15 years)
ASSISTANT FUND MANAGER
Sailesh Jain (Managing Since 16-Dec-21 and overall experience of 17 years)
152.359676.846530.851728.0825
^Risk-free rate based on the FBIL Overnight MIBOR rate of 3.6% as on Dec 31, 2021
For calculation methodology please refer to Pg 71
Nil (Compulsory lock-in period for 3years)
Equity & Equity Related TotalAutoTata Motors Ltd.Ashok Leyland Ltd.Auto AncillariesTube Investments Of India Ltd..Minda Industries Ltd.BanksICICI Bank Ltd.State Bank Of IndiaHDFC Bank Ltd.Axis Bank Ltd.City Union Bank Ltd.Federal Bank Ltd.Cement & Cement ProductsUltratech Cement Ltd.Ambuja Cements Ltd.ConstructionBrigade Enterprises Ltd.Knr Constructions Ltd.Construction ProjectLarsen & Toubro Ltd.Consumer DurablesVoltas Ltd.Consumer Non DurablesAkzo Nobel India Ltd.FinanceHousing Development Finance Corporation Ltd.Sbi Cards And Payment Services Ltd.Industrial ProductsKei Industries Ltd.Graphite India Ltd.Polycab India Ltd.InsuranceSbi Life Insurance Company Ltd.Bajaj Finserv Ltd.
Non - Ferrous MetalsHindalco Industries Ltd.PesticidesPi Industries Ltd.Petroleum ProductsReliance Industries Ltd.Bharat Petroleum Corporation Ltd.PharmaceuticalsSun Pharmaceutical Industries Ltd.Cipla Ltd.Eris Lifesciences Ltd.PowerNTPC Ltd.SoftwareInfosys Ltd.HCL Technologies Ltd.Tech Mahindra Ltd.Cyient Ltd.Telecom - ServicesBharti Airtel Ltd.
Top 10 Holdings Equity Sector Allocation
NAV Movement
Issuer NameInfosys Ltd.ICICI Bank Ltd.State Bank Of IndiaHDFC Bank Ltd.Reliance Industries Ltd.HDFC Ltd.Axis Bank Ltd.Bharti Airtel Ltd.Larsen & Toubro Ltd.Tata Motors Ltd.Total
% to NAV8.538.235.705.625.354.073.333.032.482.42
48.76
69.70%
14.75%
15.54%
SIP - If you had invested INR 10000 every month1 Year 3 Year 5 Year 7 Year 10 Year Since Inception
Total Amount Invested (Rs.)
Total Value as on Dec 31, 2021 (Rs.)
Returns
Total Value of B: Nifty 500 TRI
B: Nifty 500 TRI
(Inception date :31-Mar-1996) (First Installment date : 01-Jul-1996)
120,000
135,730
25.12%
136,377
26.19%
360,000
515,729
24.78%
540,076
28.18%
600,000
919,518
17.10%
970,498
19.31%
840,000
1,459,497
15.50%
1,531,455
16.85%
1,200,000
2,860,198
16.55%
2,789,182
16.09%
2,980,000
49,236,485
18.70%
30,841,983
15.83%
Past performance may or may not be sustained in the future. Returns greater than 1 year period are compounded annualized. Income Distribution cum capital withdrawals are assumed to be reinvested and bonus is adjusted. Load is not taken in to consideration. For SIP returns, monthly investment of equal amounts invested on the 1st day of every month has been considered.For scheme performance refer pages 55 - 69.*B: Benchmark; For Scheme Risk-O-Meter and Scheme Benchmark Risk-O-Meter please refer page number 70 of Factsheet.Source: MFI Explorer
BENCHMARK
Nifty 500 TRI
MONTHLY AVERAGE AUM
Rs. 2928.83 (Rs. in Cr.)
EXPENSE RATIO**
DirectRegular
0.741.96
Tata India Tax Savings Fund (An open ended equity linked savings scheme with a statutory lock in of 3 years and tax benefit)
^ Exposure less than 1% has been clubbed under Other Equities
35.16%13.49%
7.66%7.26%7.05%
5.65%5.02%
4.05%3.03%2.92%
1.99%1.68%1.44%1.02%0.81%0.41%
0.00% 8.00% 16.00% 24.00% 32.00% 40.00%
Financial ServicesIT
Industrial ManufacturingOil & Gas
AutomobilePharma
ConstructionConsumer Goods
TelecomCement & Cement Products
MetalsTextilesPower
Fertilisers & PesticidesConsumer Services
Media, Entertainment & Publication
60
84
108
132
156
180
Dec-18 Dec-19 Dec-20 Dec-21
Tata India Tax Savings Fund - Reg - IDCWNifty 500 TRI

www.tatamutualfund.com TATA MUTUAL FUNDMutual Fund investments are subject to market risks, read all scheme related documents carefully
Market Capitalisation wise Exposure
Large Cap
Mid Cap
Small Cap
Market Capitalisation is as per list provided by AMFI.
Please refer to our Tata Mutual Fund website for fundamental changes, wherever applicable
14
As on 31st December 2021
INVESTMENT STYLE
DATE OF ALLOTMENT
November 12,2018
FUND MANAGER
PORTFOLIO
168665.53
6845.72
2166.51
4716.00
2632.88
4113.94
7880.86
2042.65
2743.65
8355.33
7416.90
6069.42
3539.71
2578.03
2380.06
3306.42
2331.00
3541.80
4758.43
3992.14
5129.19
88.91
3.61
1.14
2.49
1.39
2.17
4.16
1.08
1.45
4.41
3.91
3.20
1.87
1.36
1.25
1.74
1.23
1.87
2.51
2.10
2.70
Name of the Instrument No. of Shares Market ValueRs. Lakhs
% to Assets
TrepsRepoPortfolio TotalNet Current LiabilitiesNet Assets
17496.653128.24
190552.64-887.54
189665.10
9.231.65
100.47-0.47
100.00
SIP - If you had invested INR 10000 every month1 Year 3 Year 5 Year 7 Year 10 Year Since Inception
Total Amount Invested (Rs.)Total Value as on Dec 31, 2021 (Rs.)ReturnsTotal Value of B: Nifty Smallcap 250 TRIB: Nifty Smallcap 250 TRITotal Value of AB: Nifty 50 TRIAB: Nifty 50 TRI(Inception date :12-Nov-2018) (First Installment date : 01-Dec-2018)
120,000153,80655.93%
150,87050.79%
133,65821.71%
NANANANANANANA
NANANANANANANA
NANANANANANANA
NANANANANANANA
370,000701,95144.86%
688,17243.33%
534,68324.67%
An equity scheme with focus towards small cap stocks
INVESTMENT OBJECTIVE
The investment objective of the scheme is to generate long term capital appreciation by predominantly investing in equity and equity related instruments of small cap companies. However, there is no assurance or guarantee that the investment objective of the Scheme will be achieved. The Scheme does not assure or guarantee any returns.
Chandraprakash Padiyar (Managing Since 19-Oct-18 and overall experience of 21 years)
ASSISTANT FUND MANAGER
Satish Chandra Mishra (Managing Since 1-Nov-19 and overall experience of 15 years)
Equity & Equity Related Total
Auto Ancillaries
Tube Investments Of India Ltd..
Craftsman Automation Ltd.
Banks
Dcb Bank Ltd.
Capital Markets
Uti Asset Management Company Ltd.
Cement & Cement Products
Ramco Industries Ltd.
Chemicals
Basf India Ltd.
Fine Organic Industries Ltd.
Construction Project
NCC Ltd.
Consumer Durables
Greenply Industries Ltd.
Consumer Non Durables
Radico Khaitan Ltd.
Agro Tech Foods Ltd.
Akzo Nobel India Ltd.
S H Kelkar And Company Ltd.
Eveready Industries India Ltd.
Entertainment
Saregama India Ltd.
Finance
IDFC Ltd.
Gas
Gujarat State Petronet Ltd.
Healthcare Services
Krsnaa Diagnostics Ltd.
Healthcare Global Enterprises Ltd.
Industrial Capital Goods
Honda India Power Products Ltd.
Top 10 Holdings Equity Sector Allocation
NAV Movement
Issuer NameAllcargo Logistics Ltd.Greenply Industries Ltd.Redington (india) Ltd.Basf India Ltd.Radico Khaitan Ltd.Tube Investments Of India Ltd.Quess Corp Ltd.Kirloskar Pneumatic Company Ltd.Agro Tech Foods Ltd.Elantas Beck India Ltd.Total
% to NAV6.354.414.354.163.913.613.503.393.202.94
39.82
390114
95823
6000000
250000
1640000
260000
55000
3900000
4055000
600000
613011
173053
1663248
812167
63055
3700000
1200000
645254
1670000
392530
6433.89
5585.22
3981.40
3802.32
2965.28
2903.65
2123.24
3929.76
6634.02
3589.40
4381.43
2037.60
8256.45
12043.20
4955.57
4439.95
4062.51
1262.22
1262.22
3.39
2.94
2.10
2.00
1.56
1.53
1.12
2.07
3.50
1.89
2.31
1.07
4.35
6.35
2.61
2.34
2.14
0.67
0.67
Industrial Products
Kirloskar Pneumatic Company Ltd.
Elantas Beck India Ltd.
Mahindra Cie Automotive Ltd.
Finolex Cables Ltd.
Finolex Industries Ltd.
Vesuvius India Ltd.
Ksb Ltd.
Leisure Services
Devyani International Ltd.
Other Services
Quess Corp Ltd.
Pesticides
Rallis India Ltd.
Textile Products
Gokaldas Exports Ltd.
Textiles - Synthetic
Ganesha Ecosphere Ltd.
Trading
Redington (India) Ltd.
Transportation
Allcargo Global Logistics Ltd.
Gujarat Pipavav Port Ltd.
Transport Corporation Of India Ltd.
Other Equities^
Invit And Reit
Powergrid Infrastructure Investment Trust
OTHERS TOTAL
1500090
151989
1700000
720000
1432500
268000
174000
2380950
774686
1310000
1350000
400000
5700000
3088000
4965500
594650
1043500
Past performance may or may not be sustained in the future. Returns greater than 1 year period are compounded annualized. Income Distribution cum capital withdrawals are assumed to be reinvested and bonus is adjusted. Load is not taken in to consideration. For SIP returns, monthly investment of equal amounts invested on the 1st day of every month has been considered.For scheme performance refer pages 55 - 69.*B: Benchmark; For Scheme Risk-O-Meter and Scheme Benchmark Risk-O-Meter please refer page number 70 of Factsheet.Source: MFI Explorer
0.00%
8.49%
91.51%
Company Name No. of SharesMarket Value
Rs. Lakhs% of
Assets
Tata Small Cap Fund(An open-ended Equity Scheme predominantly investing in small cap stocks)
VOLATILITY MEASURES^ FUND BENCHMARK
NAV
Direct - IDCWDirect - GrowthRegular - IDCWRegular - Growth
::::
23.444823.444822.093222.0932
FUND SIZE
Rs. 1896.65 (Rs. in Cr.)
TURN OVER
Portfolio Turnover (Total)Portfolio Turnover (Equity component only)
33.31%33.31%
MINIMUM INVESTMENT/MULTIPLES FOR NEW INVESTMENT
Rs. 5,000/- and in multiples of Re. 1/- thereafter.
ADDITIONAL INVESTMENT/MULTIPLES FOR EXISTING INVESTORS
Rs. 1,000/- and in multiples of Re. 1/- thereafter.
LOAD STRUCTURE
Entry Load : Not ApplicableExit Load :
Std. Dev (Annualised)Sharpe RatioPortfolio BetaR SquaredTreynorJenson
30.290.221.001.001.94
NA
24.800.300.800.952.660.58
^Risk-free rate based on the FBIL Overnight MIBOR rate of 3.6% as on Dec 31, 2021 For calculation methodology please refer to Pg 71
1) Redemption/Switch-out/SWP/STP on or before expiry of 12 Months from the date of allotment: If the withdrawal amount or switched out amount is not more than 12% of the original cost of investment - NIL2) Redemption/Switch-out/SWP/STP on or before expiry of 12 Months from the date of allotment: If the withdrawal amount or switched out amount is more than 12% of the original cost of investment - 1%3) Redemption/Switch-out/SWP/STP after expiry of 12 Months from the date of allotment - NIL (w.e.f. 03 June, 2019)
BENCHMARKNifty Smallcap 250 TRI
MONTHLY AVERAGE AUM
Rs. 1808.20 (Rs. in Cr.)
EXPENSE RATIO**DirectRegular
0.352.14
**Note: The rates specified are actual month end expenses charged as on Dec 31, 2021. The above ratio includes the Service tax on Investment Management Fees. The above ratio excludes, borrowing cost, wherever applicable.
^ Exposure less than 1% has been clubbed under Other Equities
19.15%18.27%
16.50%5.23%5.10%4.75%4.61%
3.38%2.17%2.13%2.07%1.89%1.87%
1.45%0.34%
0.00% 6.00% 12.00% 18.00% 24.00%
ServicesIndustrial Manufacturing
Consumer GoodsChemicals
Financial ServicesAutomobile
Healthcare ServicesTextiles
Cement & Cement ProductsMedia, Entertainment & Publication
Consumer ServicesFertilisers & Pesticides
Oil & GasConstruction
IT
5086
122158194230
Dec-18 Dec-19 Dec-20 Dec-21
Tata Small Cap Fund - Reg - GrowthNifty Smallcap 250 TRI

www.tatamutualfund.com TATA MUTUAL FUNDMutual Fund investments are subject to market risks, read all scheme related documents carefully
Market Capitalisation wise Exposure
Large Cap
Mid Cap
Small Cap
Market Capitalisation is as per list provided by AMFI.
Please refer to our Tata Mutual Fund website for fundamental changes, wherever applicable
15
As on 31st December 2021
INVESTMENT STYLE
DATE OF ALLOTMENT
December 05,2019
FUND MANAGER
PORTFOLIO
117163.77
11791.12
11050.80
6760.86
2669.62
2653.27
1581.32
6066.88
2388.11
3328.46
2812.66
5043.58
2069.78
2539.14
2394.45
3591.60
1874.54
98.25
9.88
9.26
5.67
2.24
2.22
1.33
5.09
2.00
2.79
2.36
4.23
1.74
2.13
2.01
3.01
1.57
Name of the Instrument Market ValueRs. Lakhs
% to Assets
Other Equities^
Repo
Portfolio Total
Net Current Liabilities
Net Assets
199.56
2471.68
119635.45
-347.96
119287.49
0.17
2.07
100.29
-0.29
100.00
SIP - If you had invested INR 10000 every month1 Year 3 Year 5 Year 7 Year 10 Year Since Inception
Total Amount Invested (Rs.)Total Value as on Dec 31, 2021 (Rs.)ReturnsTotal Value of B: Nifty 500 TRIB: Nifty 500 TRITotal Value of AB: S&P BSE Sensex TRIAB: S&P BSE Sensex TRI(Inception date :05-Dec-2019) (First Installment date : 01-Jan-2020)
120,000135,84325.30%
136,37726.19%
133,37221.25%
NANANANANANANA
NANANANANANANA
NANANANANANANA
NANANANANANANA
240,000338,19936.90%
342,87238.55%
326,98532.91%
Primarily focuses on investing in equity and equity related instruments of well researched companies across market capitalization.
INVESTMENT OBJECTIVE
The investment objective of the scheme is to generate long term capital appreciation by investing in equity & equity related instruments of maximum 30 stocks across market caps. However, there is no assurance or guarantee that the investment objective of the Scheme will be achieved. The scheme does not assure or guarantee any returns.
Rahul Singh (Managing Since 09-Mar-21 and overall experience of 26 years) & Venkat Samala (Managing Since 26-Nov-20 and overall experience of 6 years)
Equity & Equity Related Total
Banks
ICICI Bank Ltd.
State Bank Of India
HDFC Bank Ltd.
Cement & Cement Products
Ultratech Cement Ltd.
ACC Ltd.
Construction
Dlf Ltd.
Construction Project
Larsen & Toubro Ltd.
Consumer Durables
Voltas Ltd.
Consumer Non Durables
Kansai Nerolac Paints Ltd.
Ferrous Metals
Tata Steel Ltd.
Finance
Housing Development Finance Corporation Ltd.
Gas
Gail ( India ) Ltd.
Healthcare Services
Apollo Hospitals Enterprise Ltd.
Industrial Capital Goods
Thermax Ltd.
Industrial Products
Bharat Forge Ltd.
Polycab India Ltd.
Top 10 Holdings Equity Sector Allocation
NAV Movement
Issuer NameICICI Bank Ltd.State Bank Of IndiaInfosys Ltd.Reliance Industries Ltd.HDFC Bank Ltd.Larsen & Toubro Ltd.Bharti Airtel Ltd.HDFC Ltd.HCL Technologies Ltd.Bharat Forge Ltd.Total
% to NAV9.889.268.807.015.675.094.714.233.523.01
61.18
1593071
2400000
457000
35168
119746
405000
320000
195883
563000
253062
195000
1602000
50647
134000
514666
76000
2810.60
2208.53
2537.41
2833.76
8358.95
3469.05
3487.21
2537.10
10493.30
4194.74
5417.37
2.36
1.85
2.13
2.38
7.01
2.91
2.92
2.13
8.80
3.52
4.54
Insurance
Sbi Life Insurance Company Ltd.
Leisure Services
Jubilant Foodworks Ltd.
Non - Ferrous Metals
Hindalco Industries Ltd.
Pesticides
Pi Industries Ltd.
Petroleum Products
Reliance Industries Ltd.
Bharat Petroleum Corporation Ltd.
Pharmaceuticals
Cipla Ltd.
Sun Pharmaceutical Industries Ltd.
Software
Infosys Ltd.
HCL Technologies Ltd.
Telecom - Services
Bharti Airtel Ltd.
235000
61500
533573
93394
352974
900000
369369
300000
555863
318000
792245
Past performance may or may not be sustained in the future. Returns greater than 1 year period are compounded annualized. Income Distribution cum capital withdrawals are assumed to be reinvested and bonus is adjusted. Load is not taken in to consideration. For SIP returns, monthly investment of equal amounts invested on the 1st day of every month has been considered.For scheme performance refer pages 55 - 69.*B: Benchmark; For Scheme Risk-O-Meter and Scheme Benchmark Risk-O-Meter please refer page number 70 of Factsheet.Source: MFI Explorer
83.74%
16.26%
0.00%
Company Name No. of Shares No. of SharesMarket Value
Rs. Lakhs% of
Assets
Tata Focused Equity Fund(An Open Ended Equity Scheme investing in maximum 30 stocks across market caps (i.e. Multi Cap))
VOLATILITY MEASURES^ FUND BENCHMARK
NAV
Direct - IDCWDirect - GrowthRegular - IDCWRegular - Growth
::::
15.606615.606615.011615.0116
FUND SIZE
Rs. 1192.87 (Rs. in Cr.)
TURN OVER
Portfolio Turnover (Total)Portfolio Turnover (Equity component only)
26.27%26.27%
MINIMUM INVESTMENT/MULTIPLES FOR NEW INVESTMENT
Rs. 5,000/- and in multiples of Re. 1/- thereafter.
ADDITIONAL INVESTMENT/MULTIPLES FOR EXISTING INVESTORS
Rs. 1,000/- and in multiples of Re. 1/- thereafter.
LOAD STRUCTURE
Entry Load : Not ApplicableExit Load :
Std. Dev (Annualised)Sharpe RatioPortfolio BetaR SquaredTreynorJenson
25.780.251.001.001.83
NA
25.890.220.990.981.68
-0.16^Risk-free rate based on the FBIL Overnight MIBOR rate of 3.6% as on Dec 31, 2021For calculation methodology please refer to Pg 71
• Exit Load is Nil, if the withdrawal amount or switched out amount is not more than 12% of the original cost of investment on or before expiry of 365 days from the date of allotment.• Exit load is 1% of the applicable NAV if the withdrawal amount or switched out amount is more than 12% of the original cost of investment on or before expiry of 365 days from the date of allotment.• No Exit load will be charged for redemption or switch out after expiry of 365 days from the date of allotment.
BENCHMARKNifty 500 TRI
MONTHLY AVERAGE AUM
Rs. 1181.21 (Rs. in Cr.)
EXPENSE RATIO**DirectRegular
0.462.17
**Note: The rates specified are actual month end expenses charged as on Dec 31, 2021. The above ratio includes the Service tax on Investment Management Fees. The above ratio excludes, borrowing cost, wherever applicable.
31.40%12.31%
11.65%6.59%6.41%
5.05%4.79%4.71%4.49%4.46%
2.38%2.13%1.85%
0.00% 8.00% 16.00% 24.00% 32.00% 40.00%
Financial ServicesIT
Oil & GasIndustrial Manufacturing
ConstructionPharma
Consumer GoodsTelecom
MetalsCement & Cement Products
Fertilisers & PesticidesHealthcare ServicesConsumer Services
6082
104126148170
Dec-19 Aug-20 Apr-21 Dec-21
Tata Focused Equity Fund - Reg - GrowthNifty 500 TRI

www.tatamutualfund.com TATA MUTUAL FUNDMutual Fund investments are subject to market risks, read all scheme related documents carefully
Market Capitalisation wise Exposure
Large Cap
Mid Cap
Small Cap
Market Capitalisation is as per list provided by AMFI.
Please refer to our Tata Mutual Fund website for fundamental changes, wherever applicable
16
As on 31st December 2021
INVESTMENT STYLE
DATE OF ALLOTMENT
February 25, 2003
FUND MANAGER
PORTFOLIO
22246.48
293.05
257.34
236.44
1911.38
1521.12
780.85
523.47
518.84
258.48
676.55
310.89
624.38
565.14
451.35
255.70
1382.15
546.39
294.49
2270.84
271.11
2072.75
1147.49
99.76
1.31
1.15
1.06
8.57
6.82
3.50
2.35
2.33
1.16
3.03
1.39
2.80
2.54
2.02
1.15
6.20
2.45
1.32
10.19
1.22
9.30
5.15
Company Name No. of Shares Market ValueRs. Lakhs
% to Assets
Name of the Instrument Ratings Market ValueRs. Lakhs
% to Assets
RepoPortfolio TotalNet Current LiabilitiesNet Assets
164.4422411.65
-119.5222292.13
0.74100.54
-0.54100.00
SIP - If you had invested INR 10000 every month1 Year 3 Year 5 Year 7 Year 10 Year Since Inception
Total Amount Invested (Rs.)Total Value as on Dec 31, 2021 (Rs.)ReturnsTotal Value of B: Nifty 50 TRIB: Nifty 50 TRI(Inception date :25-Feb-2003) (First Installment date : 01-Apr-2003)
120,000133,12420.84%
133,65821.71%
360,000510,32824.01%
518,15325.13%
600,000931,09117.61%
952,64918.54%
840,0001,449,214
15.30%1,498,767
16.24%
1,200,0002,504,989
14.09%2,652,526
15.15%
2,250,0009,003,928
13.22%10,364,539
14.46%
An index fund that seeks to track returns by investing in Nifty 50 Index stocks and aims to achieve returns of the stated index, subject to tracking error.
INVESTMENT OBJECTIVE
The investment objective of the Scheme is to reflect/mirror the market returns with a minimum tracking error. The scheme does not assure or guarantee any returns.
Sonam Udasi (Managing Since 1-Apr-16 and overall experience of 24 years)
Equity & Equity Related Total
Auto
Maruti Suzuki India Ltd.
Tata Motors Ltd.
Mahindra & Mahindra Ltd.
Banks
HDFC Bank Ltd.
ICICI Bank Ltd.
Kotak Mahindra Bank Ltd.
State Bank Of India
Axis Bank Ltd.
Cement & Cement Products
Ultratech Cement Ltd.
Construction Project
Larsen & Toubro Ltd.
Consumer Durables
Titan Company Ltd.
Consumer Non Durables
Hindustan Unilever Ltd.
ITC Ltd.
Asian Paints (India) Ltd.
Ferrous Metals
Tata Steel Ltd.
Finance
Housing Development Finance Corporation Ltd.
Bajaj Finance Ltd.
Insurance
Bajaj Finserv Ltd.
Petroleum Products
Reliance Industries Ltd.
Pharmaceuticals
Sun Pharmaceutical Industries Ltd.
Software
Infosys Ltd.
Tata Consultancy Services Ltd.
32253
18361
43727
70350
425.45
328.76
312.80
481.05
3528.22
1.91
1.47
1.40
2.16
15.81
HCL Technologies Ltd.
Tech Mahindra Ltd.
Wipro Ltd.
Telecom - Services
Bharti Airtel Ltd.
Other Equities^
CRISIL AAA 0.73
0.73
0.00
0.00
Non-Convertible Debentures/Bonds
05.50 % Britannia Industries Ltd.
Non-Convertible Debentures/Bonds Total
V
Top 10 Holdings Equity Sector Allocation
NAV Movement
Issuer NameReliance Industries Ltd.Infosys Ltd.HDFC Bank Ltd.ICICI Bank Ltd.HDFC Ltd.Tata Consultancy Services Ltd.Kotak Mahindra BankLarsen & Toubro Ltd.Hindustan Unilever Ltd.ITC Ltd.Total
% to NAV10.19
9.308.576.826.205.153.503.032.802.54
58.10
3946
53346
28243
129200
205515
43475
113687
76463
3405
35685
12325
26455
259180
13342
23006
53438
7831
1795
95891
32057
109800
30695
Past performance may or may not be sustained in the future. Returns greater than 1 year period are compounded annualized. Income Distribution cum capital withdrawals are assumed to be reinvested and bonus is adjusted. Load is not taken in to consideration. For SIP returns, monthly investment of equal amounts invested on the 1st day of every month has been considered.For scheme performance refer pages 55-69.*B: Benchmark; For Scheme Risk-O-Meter and Scheme Benchmark Risk-O-Meter please refer page number 70 of Factsheet.Source: MFI Explorer
100.00%
0.00%
0.00%
Company Name No. of SharesMarket Value
Rs. Lakhs% of
Assets
Tata Index Fund - Nifty Plan(An open ended equity scheme tracking Nifty 50 Index)
VOLATILITY MEASURES^ FUND BENCHMARK
NAV
Direct - GrowthRegular - Growth
::
113.0512105.4962
FUND SIZE
Rs. 222.92 (Rs. in Cr.)
TURN OVER
Portfolio Turnover (Total)Portfolio Turnover (Equity component only)
10.82%10.82%
MINIMUM INVESTMENT/MULTIPLES FOR NEW INVESTMENT
Rs. 5,000/- and in multiples of Re. 1/- thereafter
TRACKING ERROR
0.64%
ADDITIONAL INVESTMENT/MULTIPLES FOR EXISTING INVESTORS
Rs. 1,000/- and in multiples of Re. 1/- thereafter.
LOAD STRUCTURE
Entry Load : Not ApplicableExit Load :
Std. Dev (Annualised)Sharpe RatioPortfolio BetaR SquaredTreynorJenson
21.810.211.001.001.31
NA
21.310.200.981.001.26
-0.05^Risk-free rate based on the FBIL Overnight MIBOR rate of 3.6% as on Dec 31, 2021 For calculation methodology please refer to Pg 71
BENCHMARKNifty 50 TRI
MONTHLY AVERAGE AUM
Rs. 215.29 (Rs. in Cr.)
EXPENSE RATIO**DirectRegular
0.160.52
**Note: The rates specified are actual month end expenses charged as on Dec 31, 2021. The above ratio includes the Service tax on Investment Management Fees. The above ratio excludes, borrowing cost, wherever applicable.
0.25% of the applicable NAV, if redeemed on or before 7 days from the date of allotment.
Note: As per the guidance issued by AMFI vide correspondence 35P/MEM-COR/57/2019-20,any realization of proceeds from the locked-in shares of Yes Bank Ltd. (which is 3 years from the commencement of the Revival scheme i.e March 13,2020) shall be distributed (post conclusion of the lock in period) among the set of investors existing in the unit holders’ register / BENPOS as on end of March 13, 2020.For further details refer our website
https://www.tatamutualfund.com/docs/default-source/statutory-disclosures/valuation-current-update/valu ation-update-17-03-2020.pdf?sfvrsn=aa8cd899_2
^ Exposure less than 1% has been clubbed under Other Equities
35.74%19.23%
11.71%10.83%
4.99%3.42%3.31%3.03%
2.46%2.16%1.68%
0.69%0.54%
0.00% 8.00% 16.00% 24.00% 32.00% 40.00%
Financial ServicesIT
Oil & GasConsumer Goods
AutomobilePharmaMetals
ConstructionCement & Cement Products
TelecomPower
ServicesFertilisers & Pesticides
7092
114136158180
Dec-18 Dec-19 Dec-20 Dec-21
Tata Index Fund - Nifty Plan - Reg Nifty 50 TRI

www.tatamutualfund.com TATA MUTUAL FUNDMutual Fund investments are subject to market risks, read all scheme related documents carefully
Market Capitalisation wise Exposure
Large Cap
Mid Cap
Small Cap
Market Capitalisation is as per list provided by AMFI.
TRACKING ERROR
0.63%
Please refer to our Tata Mutual Fund website for fundamental changes, wherever applicable
17
As on 31st December 2021
INVESTMENT STYLE
DATE OF ALLOTMENT
February 25, 2003
FUND MANAGER
PORTFOLIO
11195.49
167.55
137.87
1107.75
878.85
401.67
317.14
302.05
149.79
391.62
178.45
359.72
325.36
260.00
117.86
148.05
799.44
316.47
167.67
1363.30
99.73
1.49
1.23
9.87
7.83
3.58
2.83
2.69
1.33
3.49
1.59
3.20
2.90
2.32
1.05
1.32
7.12
2.82
1.49
12.14
Name of the Instrument Market ValueRs. Lakhs
Other Equities^
Repo
Portfolio Total
Net Current Liabilities
Net Assets
291.11
146.28
11341.77
-116.27
11225.50
2.59
1.30
101.03
-1.03
100.00
SIP - If you had invested INR 10000 every month1 Year 3 Year 5 Year 7 Year 10 Year Since Inception
Total Amount Invested (Rs.)Total Value as on Dec 31, 2021 (Rs.)ReturnsTotal Value of B: S&P BSE Sensex TRIB: S&P BSE Sensex TRI(Inception date :25-Feb-2003) (First Installment date : 01-Apr-2003)
120,000132,42119.70%
133,37221.25%
360,000503,28923.00%
515,11224.70%
600,000932,05517.65%
961,69918.93%
840,0001,456,988
15.45%1,519,571
16.63%
1,200,0002,514,580
14.16%2,692,720
15.43%
2,250,0008,783,625
13.00%10,805,911
14.83%
An index fund that seeks to track returns by investing in S&P BSE SENSEX Index stocks and aims to achieve returns of the stated index, subject to tracking error.
INVESTMENT OBJECTIVE
The investment objective of the Scheme is to reflect/mirror the market returns with a minimum tracking error. The scheme does not assure or guarantee any returns.
Sonam Udasi (Managing Since 1-Apr-16 and overall experience of 24 years)
Equity & Equity Related Total
Auto
Maruti Suzuki India Ltd.
Mahindra & Mahindra Ltd.
Banks
HDFC Bank Ltd.
ICICI Bank Ltd.
Kotak Mahindra Bank Ltd.
Axis Bank Ltd.
State Bank Of India
Cement & Cement Products
Ultratech Cement Ltd.
Construction Project
Larsen & Toubro Ltd.
Consumer Durables
Titan Company Ltd.
Consumer Non Durables
Hindustan Unilever Ltd.
ITC Ltd.
Asian Paints (India) Ltd.
Nestle India Ltd.
Ferrous Metals
Tata Steel Ltd.
Finance
Housing Development Finance Corporation Ltd.
Bajaj Finance Ltd.
Insurance
Bajaj Finserv Ltd.
Petroleum Products
Reliance Industries Ltd.
Top 10 Holdings Equity Sector Allocation
NAV Movement
Issuer NameReliance Industries Ltd.Infosys Ltd.HDFC Bank Ltd.ICICI Bank Ltd.HDFC Ltd.Tata Consultancy Services Ltd.Kotak Mahindra BankLarsen & Toubro Ltd.Hindustan Unilever Ltd.ITC Ltd.Total
% to NAV12.1410.52
9.877.837.125.903.583.493.202.90
66.55
2256
16466
74858
118723
22361
46738
65599
1973
20666
7069
15244
149247
7688
598
13320
30904
4536
1023
57568
154.70
119.70
1181.28
662.21
244.01
191.07
178.34
282.46
1.38
1.07
10.52
5.90
2.17
1.70
1.59
2.52
Pharmaceuticals
Sun Pharmaceutical Industries Ltd.
Power
Power Grid Corporation Of India Ltd.
Software
Infosys Ltd.
Tata Consultancy Services Ltd.
HCL Technologies Ltd.
Tech Mahindra Ltd.
Wipro Ltd.
Telecom - Services
Bharti Airtel Ltd.
18299
58575
62513
17721
18508
10671
24935
41304
Past performance may or may not be sustained in the future. Returns greater than 1 year period are compounded annualized. Income Distribution cum capital withdrawals are assumed to be reinvested and bonus is adjusted. Load is not taken in to consideration. For SIP returns, monthly investment of equal amounts invested on the 1st day of every month has been considered.For scheme performance refer pages 55 - 69.*B: Benchmark; For Scheme Risk-O-Meter and Scheme Benchmark Risk-O-Meter please refer page number 70 of Factsheet.Source: MFI Explorer
100.00%
0.00%
0.00%
Company Name No. of Shares No. of SharesMarket Value
Rs. Lakhs% of
Assets% of
Assets
Tata Index Fund - Sensex Plan(An open ended equity scheme tracking S & P BSE Sensex)
VOLATILITY MEASURES^ FUND BENCHMARK
NAV
Direct - GrowthRegular - Growth
::
149.5573142.8690
FUND SIZE
Rs. 112.26 (Rs. in Cr.)
TURN OVER
Portfolio Turnover (Total)Portfolio Turnover (Equity component only)
6.80%6.80%
MINIMUM INVESTMENT/MULTIPLES FOR NEW INVESTMENT
Rs. 5,000/- and in multiples of Re. 1/- thereafter.
ADDITIONAL INVESTMENT/MULTIPLES FOR EXISTING INVESTORS
Rs. 1,000/- and in multiples of Re. 1/- thereafter.
LOAD STRUCTURE
Entry Load : Not ApplicableExit Load :
Std. Dev (Annualised)Sharpe RatioPortfolio BetaR SquaredTreynorJenson
21.840.211.001.001.34
NA
21.220.200.971.001.27
-0.07^Risk-free rate based on the FBIL Overnight MIBOR rate of 3.6% as on Dec 31, 2021For calculation methodology please refer to Pg 71
BENCHMARKS&P BSE Sensex TRI
MONTHLY AVERAGE AUM
Rs. 108.88 (Rs. in Cr.)
EXPENSE RATIO**DirectRegular
0.290.59
**Note: The rates specified are actual month end expenses charged as on Dec 31, 2021. The above ratio includes the Service tax on Investment Management Fees. The above ratio excludes, borrowing cost, wherever applicable.
0.25% of the applicable NAV, if redeemed on or before 7 days from the date of allotment
^ Exposure less than 1% has been clubbed under Other Equities
39.02%21.89%
12.14%11.06%
3.49%2.72%2.52%2.27%1.97%1.33%1.32%
0.00% 8.00% 16.00%24.00%32.00%40.00%48.00%
Financial ServicesIT
Oil & GasConsumer Goods
ConstructionAutomobile
TelecomPharma
PowerCement & Cement Products
Metals
70
92
114
136
158
180
Dec-18 Dec-19 Dec-20 Dec-21
Tata Index Fund - Sensex Plan - RegS&P BSE Sensex TRI

Past performance may or may not be sustained in the future. Returns greater than 1 year period are compounded annualized. Income Distribution cum capital withdrawals are assumed to be reinvested and bonus is adjusted. Load is not taken in to consideration. For SIP returns, monthly investment of equal amounts invested on the 1st day of every month has been considered.For scheme performance refer pages 55 - 69.*B: Benchmark, AB: Additional Benchmark; For Scheme Risk-O-Meter and Scheme Benchmark Risk-O-Meter please refer page number 70 of Factsheet.Source: MFI Explorer
www.tatamutualfund.com TATA MUTUAL FUNDMutual Fund investments are subject to market risks, read all scheme related documents carefully
Market Capitalisation wise Exposure
Large Cap
Mid Cap
Small Cap
Market Capitalisation is as per list provided by AMFI.
18
As on 31st December 2021
INVESTMENT STYLE
INVESTMENT OBJECTIVE
PORTFOLIO
Company name No. of Shares
Market ValueRs. Lakhs
% of Assets
39462.94
517.55449.40416.88
3408.242700.671385.76927.13914.81
459.71
1201.28
549.48
1106.39998.90796.82
452.66
2456.56972.50
517.45
4028.70
476.32
3685.442035.38750.04578.03553.77
99.43
1.301.131.05
8.596.813.492.342.31
1.16
3.03
1.38
2.792.522.01
1.14
6.192.45
1.30
10.15
1.20
9.295.131.891.461.40
69699316049797
23038036488177154
201354134818
6056
63362
21784
4687845810823554
40727
9497813938
3154
170120
56322
19522954446568603228277412
Company name No. of Shares
Market ValueRs. Lakhs
% of Assets
RepoPortfolio TotalNet Current LiabilitiesNet Assets
647.4040112.00
-434.6739677.33
1.63101.09
-1.09100.00
SIP - If you had invested INR 10000 every month1 Year 3 Year 5 Year 7 Year 10 Year Since Inception
Total Amount Invested (Rs.)
Total Value as on Dec 31, 2021 (Rs.)
Returns
Total Value of B: Nifty 50 TRI
B: Nifty 50 TRI
(Inception date :01-Jan-2019) (First Installment date : 01-Feb-2019)
NA
NA
NA
NA
NA
120,000
133,534
21.51%
133,658
21.71%
NA
NA
NA
NA
NA
NA
NA
NA
NA
NA
NA
NA
NA
NA
NA
350,000
500,926
25.48%
501,674
25.60%
Exchange Traded Fund tracking Nifty 50 Index.
The investment objective of the scheme is to provide returns that is closely correspond to the total returns of the securities as represented by the Nifty 50 index, subject to tracking error. However, there is no assurance or guarantee that the investment objective of the Scheme will be achieved.
Equity & Equity Related TotalAutoMaruti Suzuki India Ltd.Tata Motors Ltd.Mahindra & Mahindra Ltd.BanksHDFC Bank Ltd.ICICI Bank Ltd.Kotak Mahindra Bank Ltd.State Bank Of IndiaAxis Bank Ltd.Cement & Cement ProductsUltratech Cement Ltd.Construction ProjectLarsen & Toubro Ltd.Consumer DurablesTitan Company Ltd.Consumer Non DurablesHindustan Unilever Ltd.ITC Ltd.Asian Paints (India) Ltd.Ferrous MetalsTata Steel Ltd.FinanceHousing Development Finance Corporation Ltd.Bajaj Finance Ltd.InsuranceBajaj Finserv Ltd.Petroleum ProductsReliance Industries Ltd.PharmaceuticalsSun Pharmaceutical Industries Ltd.SoftwareInfosys Ltd.Tata Consultancy Services Ltd.HCL Technologies Ltd.Tech Mahindra Ltd.Wipro Ltd.
846.766276.31
2.1315.79
123832Telecom - ServicesBharti Airtel Ltd.Other Equities^
Name Of The InstrumentRatings
Market ValueRs. Lakhs
% of Assets
1.661.66
0.000.00
CRISIL AAANon-Convertible Debentures/Bonds05.50 % Britannia Industries Ltd.Non-Convertible Debentures/Bonds Total
Top 10 Holdings Equity Sector Allocation
NAV Movement
Issuer NameReliance Industries Ltd.Infosys Ltd.HDFC Bank Ltd.ICICI Bank Ltd.HDFC Ltd.Tata Consultancy Services Ltd.Kotak Mahindra BankLarsen & Toubro Ltd.Hindustan Unilever Ltd.ITC Ltd.Total
% to NAV10.159.298.596.816.195.133.493.032.792.52
57.99
100.00%
0.00%
0.00%
**Note: The rates specified are actual month end expenses charged as on Dec 31, 2021. The above ratio includes the Service tax on Investment Management Fees. The above ratio excludes, borrowing cost, wherever applicable.
Please refer to our Tata Mutual Fund website for fundamental changes, wherever applicable
VOLATILITY MEASURES^ FUND BENCHMARK
Std. Dev (Annualised)Sharpe RatioPortfolio BetaR SquaredTreynorJenson
21.810.221.001.001.37
NA
22.100.221.001.001.360.00
DATE OF ALLOTMENT
January 01, 2019
FUND MANAGER
NAV
Direct - Growth : 179.3881
FUND SIZE
Rs. 396.77 (Rs. in Cr.)
TURN OVER
Portfolio Turnover (Total)Portfolio Turnover (Equity component only)
9.63%9.63%
MINIMUM INVESTMENT/ MULTIPLES FOR NEW INVESTMENT
50,000 units and in multiples thereof
ADDITIONAL INVESTMENT/ MULTIPLES FOR EXISTING INVESTORS
50,000 units and in multiples thereof
LOAD STRUCTURE
Entry Load : Not ApplicableNilExit Load :
Sailesh Jain (Managing Since 17-Dec-18 and overall experience of 19 years)
^Risk-free rate based on the FBIL Overnight MIBOR rate of 3.6% as on Dec 31, 2021
For calculation methodology please refer to Pg 71
MONTHLY AVERAGE AUM
Rs. 380.20 (Rs. in Cr.)
EXPENSE RATIO**
DirectRegular
0.08N.A
BENCHMARK
Nifty 50 TRI
Tata Nifty Exchange Traded Fund(An open ended Exchange Traded Fund tracking Nifty 50 Index.)
^ Exposure less than 1% has been clubbed under Other Equities
35.68%19.16%
11.69%10.76%
4.92%3.39%3.31%3.03%
2.46%2.13%1.69%
0.71%0.53%
0.00% 8.00% 16.00% 24.00% 32.00% 40.00%
Financial ServicesIT
Oil & GasConsumer Goods
AutomobilePharmaMetals
ConstructionCement & Cement Products
TelecomPower
ServicesFertilisers & Pesticides
70
92
114
136
158
180
Jan-19 Jan-20 Dec-20 Dec-21
Tata Nifty Exchange Traded Fund Nifty 50 TRI
Note: As per the guidance issued by AMFI vide correspondence
35P/MEM-COR/57/2019-20,any realization of proceeds from the locked-in shares of Yes Bank Ltd. (which is 3 years from the commencement of the Revival scheme i.e March 13,2020) shall be distributed (post conclusion of the lock in period) among the set of investors existing in the unit holders’ register / BENPOS as on end of March 13, 2020.For further details refer our website
https://www.tatamutualfund.com/docs/defaul t-source/statutory-disclosures/valuat ion-c urrent-update/valuation-update-17-03-2020.pdf?sfvrsn=aa8cd899_2

Past performance may or may not be sustained in the future. Returns greater than 1 year period are compounded annualized. Income Distribution cum capital withdrawals are assumed to be reinvested and bonus is adjusted. Load is not taken in to consideration. For SIP returns, monthly investment of equal amounts invested on the 1st day of every month has been considered.For scheme performance refer pages 55 - 69.*B: Benchmark, AB: Additional Benchmark; For Scheme Risk-O-Meter and Scheme Benchmark Risk-O-Meter please refer page number 70 of Factsheet. Source: MFI Explorer
www.tatamutualfund.com TATA MUTUAL FUNDMutual Fund investments are subject to market risks, read all scheme related documents carefully
Market Capitalisation wise Exposure
Large Cap
Mid Cap
Small Cap
Market Capitalisation is as per list provided by AMFI.
19
As on 31st December 2021
INVESTMENT STYLE
INVESTMENT OBJECTIVE
PORTFOLIO
Company name No. of Shares
Market ValueRs. Lakhs
% of Assets
1574.80
405.90
403.89
207.45
199.66
162.96
51.89
49.93
45.28
28.99
18.85
99.71
25.70
25.57
13.13
12.64
10.32
3.29
3.16
2.87
1.84
1.19
27437
54569
11550
29424
18348
20536
60160
93650
21533
14824
Company name No. of Shares
Market ValueRs. Lakhs
% of Assets
Other Equities^RepoPortfolio TotalCash / Net Current AssetNet Assets
0.001.02
1575.823.79
1579.61
0.000.06
99.760.24
100.00
SIP - If you had invested INR 10000 every month1 Year 3 Year 5 Year 7 Year 10 Year Since Inception
Total Amount Invested (Rs.)
Total Value as on Dec 31, 2021 (Rs.)
Returns
Total Value of B: Nifty Private Bank TRI
B: Nifty Private Bank TRI
Total Value of AB: Nifty 50 TRI
AB: Nifty 50 TRI
(Inception date :30-Aug-2019) (First Installment date : 01-Oct-2019)
NA
NA
NA
NA
NA
NA
NA
120,000
117,863
-3.28%
117,618
-3.65%
133,658
21.71%
NA
NA
NA
NA
NA
NA
NA
NA
NA
NA
NA
NA
NA
NA
NA
NA
NA
NA
NA
NA
NA
270,000
318,535
14.84%
317,958
14.67%
375,429
30.97%
Exchange Traded Fund replicating / tracking Nifty Private Bank Index.
The investment objective of the scheme is to provide returns that is closely correspond to the total returns of the securities as represented by the Nifty Private Bank index, subject to tracking error. However, there is no assurance or guarantee that the investment objective of the Scheme will be achieved.
Equity & Equity Related Total
Banks
HDFC Bank Ltd.
ICICI Bank Ltd.
Kotak Mahindra Bank Ltd.
Axis Bank Ltd.
Indusind Bank Ltd.
Bandhan Bank Ltd.
Federal Bank Ltd.
IDFC First Bank Ltd.
City Union Bank Ltd.
Rbl Bank Ltd.
Top 10 Holdings Equity Sector Allocation
NAV Movement
Issuer NameHDFC Bank Ltd.ICICI Bank Ltd.Kotak Mahindra BankAxis Bank Ltd.Indusind Bank Ltd.Bandhan Bank Ltd.Federal Bank Ltd.IDFC First Bank Ltd.City Union Bank Ltd.Rbl Bank Ltd.Total
% to NAV25.7025.5713.1312.6410.323.293.162.871.841.19
99.71
87.61%
9.35%
3.04%
**Note: The rates specified are actual month end expenses charged as on Dec 31, 2021. The above ratio includes the Service tax on Investment Management Fees. The above ratio excludes, borrowing cost, wherever applicable.
Please refer to our Tata Mutual Fund website for fundamental changes, wherever applicable
VOLATILITY MEASURES^ FUND BENCHMARK
Std. Dev (Annualised)Sharpe RatioPortfolio BetaR SquaredTreynorJenson
37.710.071.001.000.75
NA
38.360.071.001.000.74
-0.01
DATE OF ALLOTMENT
August 30, 2019
FUND MANAGER
NAV
Direct - Growth : 182.8688
FUND SIZE
Rs. 15.80 (Rs. in Cr.)
TURN OVER
Portfolio Turnover (Total)Portfolio Turnover (Equity component only)
42.91%42.91%
MINIMUM INVESTMENT/ MULTIPLES FOR NEW INVESTMENT
15000 Units and in multiples thereof
ADDITIONAL INVESTMENT/ MULTIPLES FOR EXISTING INVESTORS
15000 Units and in multiples thereof
LOAD STRUCTURE
Entry Load : Not ApplicableNilExit Load :
Sailesh Jain (Managing Since 16-Aug-19 and overall experience of 19 years)
^Risk-free rate based on the FBIL Overnight MIBOR rate of 3.6% as on Dec 31, 2021
For calculation methodology please refer to Pg 71
MONTHLY AVERAGE AUM
Rs. 16.01 (Rs. in Cr.)
EXPENSE RATIO**
DirectRegular
0.14NA
BENCHMARK
Nifty Private Bank TRI
Tata Nifty Private Bank Exchange Traded Fund(An Open-Ended Exchange Traded Fund replicating/ tracking -Nifty Private Bank Index)
Note: As per the guidance issued by AMFI vide correspondence 35P/MEM-COR/57/2019-20,any realization of proceeds from the locked-in shares of Yes Bank Ltd. (which is 3 years from the commencement of the Revival scheme i.e March 13,2020) shall be distributed (post conclusion of the lock in period) among the set of investors existing in the unit holders’ register / BENPOS as on end of March 13, 2020.For further details refer our website
https://www.tatamutualfund.com/docs/default-source/statutory-disclosures/valuation-current-update/valuation-update-17-03-2020.pdf?sfvrsn=aa8cd899_2
99.70%
0.00% 25.00% 50.00% 75.00% 100.00%
Financial Services
^ Exposure less than 1% has been clubbed under Other Equities
50
70
90
110
130
150
Sep-19 Jun-20 Mar-21 Dec-21
Tata Nifty Private Bank Exchange Traded FundNifty Private Bank TRI

Non - Ferrous MetalsNational Aluminium Co. Ltd.Hindalco Industries Ltd.PesticidesPi Industries Ltd.Petroleum ProductsBharat Petroleum Corporation Ltd.Indian Oil Corporation Ltd.Reliance Industries Ltd.PharmaceuticalsIpca Laboratories Ltd.Pfizer Ltd.Divi Laboratories Ltd.Sanofi India Ltd.PowerCesc Ltd.Tata Power Company Ltd.Torrent Power Ltd.Power Grid Corporation Of India Ltd.NTPC Ltd.SoftwareTata Consultancy Services Ltd.Infosys Ltd.Wipro Ltd.Coforge Ltd.Mindtree Ltd.Mphasis Ltd.Cyient Ltd.
Market Capitalisation wise Exposure
Large Cap
Mid Cap
Small Cap
Market Capitalisation is as per list provided by AMFI.
Please refer to our Tata Mutual Fund website for fundamental changes, wherever applicable
VOLATILITY MEASURES^ FUND BENCHMARK
20www.tatamutualfund.com TATA MUTUAL FUND
As on 31st December 2021
INVESTMENT STYLE
INVESTMENT OBJECTIVE
DATE OF ALLOTMENT
May 20,2021
FUND MANAGER
NAV
Direct - GrowthDirect - IDCWReg - GrowthReg - IDCW
11.487311.487311.356511.3565
FUND SIZE
Rs. 632.79 (Rs. in Cr.)
TURN OVER
Portfolio Turnover (Total)Portfolio Turnover (Equity component only)
20.26%9.27%
MINIMUM INVESTMENT/ MULTIPLES FOR NEW INVESTMENT
Rs. 5,000/- and in multiples of Re. 1/- thereafter.
ADDITIONAL INVESTMENT/MULTIPLES FOR EXISTING INVESTORS
Rs. 1,000/- and multiples of Re. 1/- thereafter.
LOAD STRUCTURE
Entry Load : Not Applicable
Exit Load :
PORTFOLIO
Company name No. of Shares
Market ValueRs. Lakhs
% of Assets
62377.46
2205.5415.00
1022.34
488.38
2384.312054.37
1272.57508.81462.32
1871.16
1124.70
273.32
2235.59
881.53180.81
1888.591854.971602.47903.99
1167.02756.12
625.26
730.30
1330.85649.04
1079.43715.29
533.20
98.56
3.490.02
1.62
0.77
3.773.25
2.010.800.73
2.96
1.78
0.43
3.53
1.390.29
2.982.932.531.43
1.841.19
0.99
1.15
2.101.03
1.711.13
0.84
10505071974
31464
21020
322139446165
804003392558392
84448
26852
70000
117917
1600039460
80020850707
813225069
105000705337
158374
565247
120162218313
11461429000
400000
Company name
1461705310100
25544
26786185000021000
4576418595132267469
2376335885751256130592477180728
9173215228029611327961312423132561564
1476.321474.68
775.06
1032.47947.75497.31
991.61940.03618.74589.09
2079.291957.071417.811211.02224.83
3429.262874.672118.241647.001493.371064.02629.80
2.332.33
1.22
1.631.500.79
1.571.490.980.93
3.293.092.241.910.36
5.424.543.352.602.361.681.00
Government SecuritiesGOI - 7.37% (16/04/2023)Government Securities TotalNon-Convertible Debentures/Bonds05.50 % Britannia Industries Ltd.Non-Convertible Debentures/Bonds Total
SOV
CRISIL AAA
1033.641033.64
1.731.73
1.631.63
0.000.00
RepoPortfolio TotalCash / Net Current AssetNet Assets
1899.2563241.34
37.6263278.96
3.0099.940.06
100.00
Predominantly investing in a well-diversified portfolio of equity and equity related instruments of dividend yielding companies.
The investment objective is to provide capital appreciation and/or dividend distribution by predominantly investing in a well-diversified portfolio of equity and equity related instruments of dividend yielding companies. However, there is no assurance or guarantee that the investment objective of the Scheme will be achieved. The scheme does not assure or guarantee any returns.
Std. Dev (Annualised)Sharpe RatioPortfolio BetaR SquaredTreynorJenson
11.270.511.001.001.65
NA
8.150.640.650.652.290.42
^Risk-free rate based on the FBIL Overnight MIBOR rate of 3.6% as on Dec 31, 2021
For calculation methodology please refer to Pg 71
Redemption/Switch-out/SWP/STP on or before expiry of 365 days from the date of allotment: If the withdrawal amount or switched out amount is not more than 12% of the original cost of investment - NILRedemption/Switch-out/SWP/STP on or before expiry of 365 days from the date of allotment: If the withdrawal amount or switched out amount is more than 12%of the original cost of investment-1%Redemption/Switch-out/SWP/STP after expiry of 365 days from the date of allotment - NIL
Equity & Equity Related TotalAerospace & DefenseBharat Electronics Ltd.Data Patterns (India) Ltd.AutoBajaj Auto Ltd.Auto AncillariesBalkrishna Industries Ltd.BanksICICI Bank Ltd.State Bank Of IndiaCapital MarketsMulti Commodity Exchange Of Ind Ltd.Central Depository Services (India) Ltd.ICICI Securities Ltd.Cement & Cement ProductsACC Ltd.ChemicalsNavin Fluorine International Ltd.ConstructionDlf Ltd.Construction ProjectLarsen & Toubro Ltd.Consumer DurablesDixon Technologies (India) Ltd.Metro Brands Ltd.Consumer Non DurablesHindustan Unilever Ltd.ITC Ltd.Nestle India Ltd.Britannia Industries Ltd.Ferrous MetalsTata Steel Ltd.Steel Authority India Ltd.FertilisersChambal Fertiliser & Chemicals Ltd.GasGail ( India ) Ltd.Healthcare ServicesThyrocare Technologies Ltd.Fortis Healthcare Ltd.Industrial ProductsCummins India Ltd.Polycab India Ltd.Minerals/MiningNMDC Ltd.
Top 10 Holdings Equity Sector Allocation
NAV Movement
Issuer NameTata Consultancy Services Ltd.Infosys Ltd.ICICI Bank Ltd.Larsen & Toubro Ltd.Bharat Electronics Ltd.Wipro Ltd.Cesc Ltd.State Bank Of IndiaTata Power Company Ltd.Hindustan Unilever Ltd.Total
% to NAV5.424.543.773.533.493.353.293.253.092.98
36.71
No. of Shares
Market ValueRs. Lakhs
% of Assets
Name Of The Instrument
Ratings Market ValueRs. Lakhs
% to Nav
63.04%
25.94%
11.02%
For Scheme Risk-O-Meter and Scheme Benchmark Risk-O-Meter please refer page number 70 of Factsheet.
BENCHMARKNifty 500 TRI
MONTHLY AVERAGE AUM
Rs. 624.77 (Rs. in Cr.)
EXPENSE RATIO**
DirectRegular 0.74
2.43
::::
Sailesh Jain (overall experience of 19 years), Murthy Nagarajan (overall experience of 25 years) (Debt), Venkat Samala (overall experience of 06 years) Managing Since 03-May-21
**Note: The rates specified are actual month end expenses charged as on Dec 31, 2021. The above ratio includes the Service tax on Investment Management Fees. The above ratio excludes, borrowing cost, wherever applicable.
Tata Dividend Yield Fund(An open ended equity scheme that aims for growth by primarily investing in equity and equity related instruments of dividend yielding companies.)
Mutual Fund investments are subject to market risks, read all scheme related documents carefully
^ Exposure less than 1% has been clubbed under Other Equities
20.95%11.56%
10.89%10.56%
8.55%6.35%
5.07%4.96%
3.96%3.13%2.96%
2.39%2.21%
1.78%
0.00% 6.00% 12.00% 18.00% 24.00%
ITConsumer Goods
PowerFinancial Services
MetalsIndustrial Manufacturing
Oil & GasPharma
ConstructionHealthcare Services
Cement & Cement ProductsAutomobile
Fertilisers & PesticidesChemicals
100
106
112
118
124
130
May-21 Aug-21 Oct-21 Dec-21
Tata Dividend Yield Fund - Reg - GrowthNifty 500 TRI

Petroleum ProductsReliance Industries Ltd.Hindustan Petroleum Corporation Ltd.PharmaceuticalsSun Pharmaceutical Industries Ltd.Cipla Ltd.Dr Reddys Laboratories Ltd.PowerNTPC Ltd.Kec International Ltd.Power Grid Corporation Of India Ltd.Cesc Ltd.SoftwareTata Consultancy Services Ltd.HCL Technologies Ltd.Tech Mahindra Ltd.Infosys Ltd.Telecom - ServicesBharti Airtel Ltd.Other Equities^OTHERSInvit And ReitBrookfield India Real Estate TrustOTHERS TOTAL
Market Capitalisation wise Exposure
Large Cap
Mid Cap
Small Cap
Market Capitalisation is as per list provided by AMFI.Please refer to our Tata Mutual Fund website for fundamental changes, wherever applicable
VOLATILITY MEASURES^ FUND BENCHMARK
21www.tatamutualfund.com TATA MUTUAL FUND
As on 31st December 2021
INVESTMENT STYLE
INVESTMENT OBJECTIVE
DATE OF ALLOTMENT
August 04, 2021
FUND MANAGER
NAV
Direct - IDCWDirect - GrowthRegular - IDCWRegular - Growth
10.505810.505810.431910.4319
FUND SIZE
Rs. 939.34 (Rs. in Cr.)
TURN OVER
Portfolio Turnover (Total)Portfolio Turnover (Equity component only)
2.66%2.66%
MINIMUM INVESTMENT/ MULTIPLES FOR NEW INVESTMENT
Rs. 5,000/- and in multiples of Re. 1/- thereafter.
ADDITIONAL INVESTMENT/MULTIPLES FOR EXISTING INVESTORS
Rs. 1,000/- and multiples of Re. 1/- thereafter.
LOAD STRUCTURE
Entry Load : Not Applicable
Exit Load :
PORTFOLIO
Company name No. of Shares
Market ValueRs. Lakhs
% of Assets
90683.31
1812.261326.601231.15
5699.163578.272514.982510.642200.361079.00
1881.811661.81
1943.551737.501251.68
4123.58
1019.26
1089.22961.99
1681.191099.68
1689.52
1864.221180.681094.46
3161.261553.971275.14
2734.411061.38
96.54
1.931.411.31
6.073.812.682.672.341.15
2.001.77
2.071.851.33
4.39
1.09
1.161.02
1.791.17
1.80
1.981.261.17
3.371.651.36
2.911.13
148000027500047500
770000777125170000370000
26850001300000
11600075000
396400445000101470
217500
233000
98000255000
65000222000
33700
1043275000049000
45300016500068100
5750001050874
Company name
194000455000
36397726850031656
1755000360000825000
1816880
7229918800011800485000
385000
267000
4594.211330.19
3078.152534.911553.36
2183.221724.761686.301589.77
2702.792479.912112.921604.59
2632.632856.87
792.80792.80
4.891.42
3.282.701.65
2.321.841.801.69
2.882.642.251.71
2.803.03
0.840.84
RepoPortfolio TotalCash / Net Current AssetNet Assets
2291.7193767.82
166.3893934.20
2.4499.820.18
100.00
To follow investment strategy with focus on riding business cycles through allocation between sectors and stocks at different stages of business cycles.
To generate long-term capital appreciation by investing with focus on riding business cycles through allocation between sectors and stocks at different stages of business cycles.
Std. Dev (Annualised)Sharpe RatioPortfolio BetaR SquaredTreynorJenson
9.700.201.001.000.55
NA
9.000.150.900.950.42
-0.12^Risk-free rate based on the FBIL Overnight MIBOR rate of 3.6% as on Dec 31, 2021
For calculation methodology please refer to Pg 71
Redemption/Switch-out/SWP/STP on or before expiry of 365 days from the date of allotment: If the withdrawal amount or switched out amount is not more than 12% of the original cost of investment-NIL Redemption/Switch-out/SWP/STP on or before expiry of 365 days from the date of allotment: If the withdrawal amount or switched out amount is more than 12%of the original cost of investment-1% Redemption/Switch-out/SWP/STP after expiry of 365 days from the date of allotment-NIL
Equity & Equity Related TotalAutoAshok Leyland Ltd.Tata Motors Ltd.Eicher Motors Ltd.BanksICICI Bank Ltd.State Bank Of IndiaHDFC Bank Ltd.Axis Bank Ltd.Bank Of BarodaFederal Bank Ltd.Cement & Cement ProductsGrasim Industries Ltd.ACC Ltd.ConstructionBrigade Enterprises Ltd.Dlf Ltd.Macrotech Developers Ltd.Construction ProjectLarsen & Toubro Ltd.Consumer DurablesCrompton Greaves Consumer Electricals Ltd.Ferrous MetalsTata Steel Ltd.Jindal Steel & Power Ltd.FinanceHousing Development Finance Corporation Ltd.Pnb Housing Finance Ltd.Healthcare ServicesApollo Hospitals Enterprise Ltd.Industrial Capital GoodsThermax Ltd.Siemens Ltd.Abb India Ltd.Industrial ProductsBharat Forge Ltd.Cummins India Ltd.AIA Engineering Ltd.Non - Ferrous MetalsHindalco Industries Ltd.National Aluminium Co. Ltd.
Top 10 Holdings Equity Sector Allocation
NAV Movement
Issuer NameICICI Bank Ltd.Reliance Industries Ltd.Larsen & Toubro Ltd.State Bank Of IndiaBharti Airtel Ltd.Bharat Forge Ltd.Sun Pharmaceutical Industries Ltd.Hindalco Industries Ltd.Tata Consultancy Services Ltd.Cipla Ltd.Total
% to NAV6.074.894.393.813.563.373.282.912.882.70
37.86
No. of Shares
Market ValueRs. Lakhs
% of Assets
69.02%
22.15%
8.84%
For Scheme Risk-O-Meter and Scheme Benchmark Risk-O-Meter please refer page number 70 of Factsheet.
BENCHMARKNifty 500 TRI
ASSISTANT FUND MANAGERSailesh Jain (Managing Since 16-Dec-21 and overall experience of 17 years)
MONTHLY AVERAGE AUM
Rs. 931.70 (Rs. in Cr.)
EXPENSE RATIO**
DirectRegular 0.70
2.30
::::
Rahul Singh (Managing Since 16-Jul-21 and overall experience of 25 years),Murthy Nagarajan (Debt Portfolio) (Managing Since 16-Jul-21 and overall experience of 25 years),Venkat Samala (Overseas Investment) (Managing Since 16-Jul-21 and overall experienc
**Note: The rates specified are actual month end expenses charged as on Dec 31, 2021. The above ratio includes the Service tax on Investment Management Fees. The above ratio excludes, borrowing cost, wherever applicable.
Tata Business Cycle Fund(An open-ended equity scheme following business cycles based investing theme)
Mutual Fund investments are subject to market risks, read all scheme related documents carefully
^ Exposure less than 1% has been clubbed under Other Equities
23.44%10.78%
9.64%9.47%
7.65%7.63%
6.31%6.22%
5.17%3.77%3.56%
1.80%1.09%
0.00% 6.00% 12.00% 18.00% 24.00% 30.00%
Financial ServicesIndustrial Manufacturing
ConstructionIT
PowerPharma
Oil & GasMetals
AutomobileCement & Cement Products
TelecomHealthcare Services
Consumer Goods
90
96
102
108
114
120
Aug-21 Sep-21 Nov-21 Dec-21
Tata Business Cycle Fund - Reg - GrowthNifty 500 TRI

www.tatamutualfund.com TATA MUTUAL FUNDMutual Fund investments are subject to market risks, read all scheme related documents carefully
Market Capitalisation wise Exposure
Large Cap
Mid Cap
Small Cap
Market Capitalisation is as per list provided by AMFI.
Please refer to our Tata Mutual Fund website for fundamental changes, wherever applicable
VOLATILITY MEASURES^ FUND BENCHMARK
Std. Dev (Annualised)Sharpe RatioPortfolio BetaR SquaredTreynorJenson
17.370.341.001.001.70
NA
16.870.330.950.961.67
-0.03
22
As on 31st December 2021
INVESTMENT STYLE
INVESTMENT OBJECTIVE
DATE OF ALLOTMENT
May 24,1996
FUND MANAGER
NAV
Direct - GrowthDirect - IDCWReg - GrowthReg - IDCW
::::
321.3782176.4406294.0836119.9546
FUND SIZE
Rs. 1217.86 (Rs. in Cr.)
TURN OVER
Portfolio Turnover (Total)Portfolio Turnover (Equity component only)
34.08%34.08%
MINIMUM INVESTMENT/MULTIPLES FOR NEW INVESTMENT
Rs. 5,000/- and in multiples of Re. 1/- thereafter.
ADDITIONAL INVESTMENT/MULTIPLES FOR EXISTING INVESTORS
Rs. 1,000/- and multiples of Re. 1/- thereafter.
LOAD STRUCTURE
Entry Load : Not Applicable
Exit Load :
PORTFOLIO
Company name
118977.36
1788.891706.94
3133.252019.65
2345.56
2272.021227.20
4602.293122.492165.091596.241511.22
1360.89
1777.58
3046.14
3808.802137.891947.131529.231225.87
2070.50
97.69
1.471.40
2.571.66
1.93
1.871.01
3.782.561.781.311.24
1.12
1.46
2.50
3.131.761.601.261.01
1.70
146050187000
830000124497
56000
380000326600
19500042000064000
270000102020
180000
280000
129000
388000227000853336200055000
2050000
Company name No. of Shares
Market ValueRs. Lakhs
% of Assets
No. of Shares
Market ValueRs. Lakhs
% of Assets
45000
530001600007350035000
42000
6050002650006020003050007700070000
300000260000
4708823600
204000
1365.39
2600.711510.561308.081268.42
1962.01
11420.899906.637940.985461.184518.362377.691838.851416.22
3151.611455.18
1253.68
1.12
2.141.241.071.04
1.61
9.388.136.524.483.711.951.511.16
2.591.19
1.03
Other Equities^Portfolio TotalCash / Net Current AssetNet Assets
9.7197.692.31
100.00
11826.05118977.36
2808.55121785.91
SIP - If you had invested INR 10000 every month1 Year 3 Year 5 Year 7 Year 10 Year Since Inception
Total Amount Invested (Rs.)
Total Value as on Dec 31, 2021 (Rs.)
Returns
Total Value of B: Nifty 500 Shariah TRI
B: Nifty 500 Shariah TRI
Total Value of AB: Nifty 50 TRI
AB: Nifty 50 TRI
(Inception date :24-May-1996) (First Installment date : 01-Sep-1996)
120,000
146,473
43.19%
142,989
37.25%
133,658
21.71%
360,000
594,271
35.40%
602,031
36.40%
518,153
25.13%
600,000
1,066,553
23.20%
1,095,692
24.32%
952,649
18.54%
840,000
1,613,534
18.31%
1,752,968
20.64%
1,498,767
16.24%
1,200,000
2,983,839
17.34%
3,308,149
19.25%
2,652,526
15.15%
3,040,000
53,849,463
18.73%
6,853,335
16.21%
19,122,531
14.97%
An equity scheme which invests primarily in equities of Shariah compliant companies and other instrument if allowed under Shariah principles.
To provide medium to long- term capital gains by investing in Shariah compliant equity and equity related instruments of well-researched value and growth - oriented companies. Tata Ethical Fund aims to generate medium to long term capital growth by investing in equity and equity related instruments of shariah compliant companies.
^Risk-free rate based on the FBIL Overnight MIBOR rate of 3.6% as on Dec 31, 2021
Abhinav Sharma (Managing Since 06-Sep-21 and overall experience of 15 years)
For calculation methodology please refer to Pg 71
• Exit Load is Nil, if the withdrawal amount or switched out amount is not more than 12% of the original cost of investment on or before expiry of 365 days from the date of allotment.• Exit load is 1% of the applicable NAV if the withdrawal amount or switched out amount is more than 12% of the original cost of investment on or before expiry of 365 days from the date of allotment.• No Exit load will be charged for redemption or switch out after expiry of 365 days from the date of allotment.
Equity & Equity Related TotalAuto AncillariesMinda Industries Ltd.Sundram Fasteners Ltd.Cement & Cement ProductsAmbuja Cements Ltd.Grasim Industries Ltd.ChemicalsNavin Fluorine International Ltd.Consumer DurablesCentury Plyboards (India) Ltd.Orient Electric Ltd.Consumer Non DurablesHindustan Unilever Ltd.Tata Consumer Products Ltd.Asian Paints (India) Ltd.Kansai Nerolac Paints Ltd.Colgate-Palmolive India Ltd.FertilisersCoromandel International Ltd.GasGujarat Gas Ltd.Industrial Capital GoodsSiemens Ltd.Industrial ProductsCarborundum Universal Ltd.Cummins India Ltd.Astral Ltd. (Erstwhile Astral Poly Technik Ltd.)Polycab India Ltd.Supreme Industries Ltd.Non - Ferrous MetalsNational Aluminium Co. Ltd.
Top 10 Holdings Equity Sector Allocation
NAV Movement
Issuer NameInfosys Ltd.Tata Consultancy Services Ltd.HCL Technologies Ltd.Tech Mahindra Ltd.Hindustan Unilever Ltd.Tata Elxsi India Ltd.Carborundum Universal Ltd.K.p.r. Mill Ltd.Ambuja Cements Ltd.Tata Consumer Products Ltd.Total
% to NAV9.388.136.524.483.783.713.132.592.572.56
46.85
PesticidesPi Industries Ltd.PharmaceuticalsDr Reddys Laboratories Ltd.Cipla Ltd.J.B.Chemicals & Pharmaceuticals Ltd.Alkem Laboratories Ltd.RetailingAvenue Supermarts Ltd.SoftwareInfosys Ltd.Tata Consultancy Services Ltd.HCL Technologies Ltd.Tech Mahindra Ltd.Tata Elxsi Ltd.Mphasis Ltd.Kpit Technologies Ltd.Birlasoft Ltd.Textile ProductsK.P.R. Mill Ltd.Page Industries Ltd.TransportationContainer Corporation Of India Ltd.
51.89%
32.58%
15.53%
Past performance may or may not be sustained in the future. Returns greater than 1 year period are compounded annualized. Income Distribution cum capital withdrawals are assumed to be reinvested and bonus is adjusted. Load is not taken in to consideration. For SIP returns, monthly investment of equal amounts invested on the 1st day of every month has been considered.For scheme performance refer pages 55 - 69.*B: Benchmark, AB: Additional Benchmark; For Scheme Risk-O-Meter and Scheme Benchmark Risk-O-Meter please refer page number 70 of Factsheet.Source: MFI Explorer
BENCHMARK
Nifty 500 Shariah TRI
MONTHLY AVERAGE AUM
Rs. 1164.25 (Rs. in Cr.)
EXPENSE RATIO**
DirectRegular
1.172.28
**Note: The rates specified are actual month end expenses charged as on Dec 31, 2021. The above ratio includes the Service tax on Investment Management Fees. The above ratio excludes, borrowing cost, wherever applicable.
Tata Ethical Fund(An open ended equity scheme following Shariah principles)
^ Exposure less than 1% has been clubbed under Other Equities
36.85%17.71%
12.66%7.93%
4.23%3.78%3.77%
2.72%2.24%1.70%1.61%1.46%1.03%
0.00% 8.00% 16.00% 24.00% 32.00% 40.00%
ITConsumer Goods
Industrial ManufacturingPharma
Cement & Cement ProductsTextiles
AutomobileChemicals
Fertilisers & PesticidesMetals
Consumer ServicesOil & GasServices
70
96
122
148
174
200
Dec-18 Dec-19 Dec-20 Dec-21
Tata Ethical Fund - Reg - GrowthNifty 500 Shariah TRI

www.tatamutualfund.com TATA MUTUAL FUNDMutual Fund investments are subject to market risks, read all scheme related documents carefully
Market Capitalisation wise Exposure
Large Cap
Mid Cap
Small Cap
Market Capitalisation is as per list provided by AMFI.
SIP - If you had invested INR 10000 every month
1 Year 3 Year 5 Year 7 Year 10 Year Since Inception
Total Amount Invested (Rs.)
Total Value as on Dec 31, 2021 (Rs.)
Returns
Total Value of B: Nifty Financial Services TRI
B: Nifty Financial Services TRI
Total Value of AB: Nifty 50 TRI
AB: Nifty 50 TRI
(Inception date :28-Dec-2015) (First Installment date : 01-Jan-2016)
120,000
121,274
1.97%
124,942
7.71%
133,658
21.71%
360,000
450,815
15.16%
474,649
18.79%
518,153
25.13%
600,000
817,786
12.34%
900,126
16.23%
952,649
18.54%
NA
NA
NA
NA
NA
NA
NA
NA
NA
NA
NA
NA
NA
NA
720,000
1,082,492
13.45%
1,200,238
16.89%
1,227,666
17.64%
Top 10 Holdings Equity Sector Allocation
NAV Movement
Issuer NameICICI Bank Ltd.HDFC Bank Ltd.HDFC Ltd.Axis Bank Ltd.State Bank Of IndiaKotak Mahindra BankSbi Cards & Payment Services Ltd.HDFC Life Insurance Co. Ltd.Sbi Life Insurance Company Ltd.Uti Asset Management Company Ltd.Total
% to NAV17.0216.229.579.057.877.594.353.433.253.14
81.49
Past performance may or may not be sustained in the future. Returns greater than 1 year period are compounded annualized. Income Distribution cum capital withdrawals are assumed to be reinvested and bonus is adjusted. Load is not taken in to consideration. For SIP returns, monthly investment of equal amounts invested on the 1st day of every month has been considered. For scheme performance refer pages 55 - 69.*B: Benchmark, AB: Additional Benchmark; For Scheme Risk-O-Meter and Scheme Benchmark Risk-O-Meter please refer page number 70 of Factsheet.Source: MFI Explorer
83.62%
6.55%
9.83%
PORTFOLIO
Company name No. of Shares
Market ValueRs. Lakhs
% of Assets
98.40
17.0216.229.057.877.591.441.241.201.191.08
3.14
9.57
4.351.221.01
3.433.252.95
1.73
1965000937000
11400001460000361000
2700000129000013000001230000660000
255000
316000
40000021000030000
451000232000180000
150500
84064.87
14543.9513861.987735.476722.576483.921229.851057.161021.801020.90921.36
2685.53
8173.18
3712.601040.24865.34
2929.472774.722522.25
1475.43
Company name
Other Equities^RepoPortfolio TotalNet Current LiabilitiesNet Assets
3287.152557.86
86622.73-1185.6285437.11
3.852.99
101.38-1.38
100.00
Equity & Equity Related TotalBanksICICI Bank Ltd.HDFC Bank Ltd.Axis Bank Ltd.State Bank Of IndiaKotak Mahindra Bank Ltd.Karur Vysa Bank Ltd.Bank Of BarodaDcb Bank Ltd.Federal Bank Ltd.Indian BankCapital MarketsUti Asset Management Company Ltd.FinanceHousing Development Finance Corporation Ltd.Sbi Cards And Payment Services Ltd.Pnb Housing Finance Ltd.CrisilInsuranceHDFC Life Insurance Co. Ltd.Sbi Life Insurance Company Ltd.ICICI Lombard General Insurance Co. Ltd.Max Financial Services Ltd.
No. of Shares
Market ValueRs. Lakhs
% of Assets
As on 31st December 2021
INVESTMENT STYLE
DATE OF ALLOTMENT
December 28,2015
NAV
FUND SIZE
Rs. 854.37 (Rs. in Cr.)
MONTHLY AVERAGE AUM
Rs. 846.36 (Rs. in Cr.)
TURN OVER
Portfolio Turnover (Total)Portfolio Turnover (Equity component only)
22.86%22.86%
EXPENSE RATIO**
DirectRegular
0.852.44
VOLATILITY MEASURES^ FUND BENCHMARK
Std. Dev (Annualised)Sharpe RatioPortfolio BetaR SquaredTreynorJenson
30.640.141.001.001.27
NA
27.530.130.890.981.19
-0.07
MINIMUM INVESTMENT /MULTIPLES FOR NEW INVESTMENT
Rs. 5,000/- and in multiples of Re. 1/- thereafter.
ADDITIONAL INVESTMENT/MULTIPLES FOR EXISTING INVESTORS
Rs. 1,000/- and in multiples of Re. 1/- thereafter.
LOAD STRUCTURE
Entry Load : Not Applicable
Exit Load :
Primarily focuses on investment in at least 80% of its net assets in equity/equity related instruments of the companies in the Banking and Financial Services sector in India.
INVESTMENT OBJECTIVEThe investment objective of the scheme is to seek long term capital appreciation by investing atleast 80% of its net assets in equity/equity related instruments of the companies in the Banking and Financial Services sector in India.
FUND MANAGER
Amey Sathe (Managing Since 14-Oct-2021 and overall experience of 15 years)
BENCHMARK
Nifty Financial Services TRI
Direct - IDCWDirect - GrowthRegular - IDCWRegular - Growth
::::
27.318427.318422.797324.7753
^Risk-free rate based on the FBIL Overnight MIBOR rate of 3.6% as on Dec 31, 2021
For calculation methodology please refer to Pg 71
Please refer to our Tata Mutual Fund website for fundamental changes, wherever applicable
0.25% of NAV if redeemed/switched out before 30 days from the date of allotment.
**Note: The rates specified are actual month end expenses charged as on Dec 31, 2021. The above ratio includes the Service tax on Investment Management Fees. The above ratio excludes, borrowing cost, wherever applicable.
23
Tata Banking & Financial Services Fund(An open ended equity scheme investing in Banking & Financial Services Sector)
98.39%
0.00% 25.00% 50.00% 75.00% 100.00%
FinancialServices
^ Exposure less than 1% has been clubbed under Other Equities
70
92
114
136
158
180
Dec-18 Dec-19 Dec-20 Dec-21
Tata Banking And Financial Services Fund - Reg - GrowthNifty Financial Services TRI

www.tatamutualfund.com TATA MUTUAL FUNDMutual Fund investments are subject to market risks, read all scheme related documents carefully
Market Capitalisation wise Exposure
Large Cap
Mid Cap
Small Cap
Market Capitalisation is as per list provided by AMFI.
SIP - If you had invested INR 10000 every month
1 Year 3 Year 5 Year 7 Year 10 Year Since Inception
Total Amount Invested (Rs.)
Total Value as on Dec 31, 2021 (Rs.)
Returns
Total Value of B: NIFTY IT TRI
B: NIFTY IT TRI
Total Value of AB: S&P BSE Sensex TRI
AB: S&P BSE Sensex TRI
(Inception date :28-Dec-2015) (First Installment date : 01-Jan-2016)
120,000
166,682
79.00%
163,354
72.95%
133,372
21.25%
360,000
807,741
60.20%
771,693
56.35%
515,112
24.70%
600,000
1,681,432
42.63%
1,617,631
40.93%
961,699
18.93%
NA
NA
NA
NA
NA
NA
NA
NA
NA
NA
NA
NA
NA
NA
720,000
2,178,115
37.17%
2,097,622
35.86%
1,243,986
18.09%
Top 10 Holdings Equity Sector Allocation
NAV Movement
Issuer NameInfosys Ltd.Tata Consultancy Services Ltd.HCL Technologies Ltd.Tech Mahindra Ltd.Bharti Airtel Ltd.Wipro Ltd.Larsen & Toubro Infotech Ltd.Mphasis Ltd.L&t Technology Services Ltd.Cyient Ltd.Total
% to NAV21.8010.749.499.374.394.023.373.202.842.63
71.85
Past performance may or may not be sustained in the future. Returns greater than 1 year period are compounded annualized. Income Distribution cum capital withdrawals are assumed to be reinvested and bonus is adjusted. Load is not taken in to consideration. For SIP returns, monthly investment of equal amounts invested on the 1st day of every month has been considered.For scheme performance refer pages 55 - 69.*B: Benchmark, AB: Additional Benchmark; For Scheme Risk-O-Meter and Scheme Benchmark Risk-O-Meter please refer page number 70 of Factsheet.Source: MFI Explorer
78.12%
11.76%
10.13%
PORTFOLIO
Company name No. of Shares
Market ValueRs. Lakhs
% of Assets
90.84
1.93
21.8010.749.499.374.023.373.202.842.632.322.221.32
4.391.459.75
169830
56591001408126352471325643342750000225300462278248500
1259279231857184703
3535000
3144200486700
445163.63
9470.91
106829.6652640.6846494.4945915.6819672.1316519.0015702.2013913.3912882.4211371.0810879.656472.59
21500.047127.48
47772.23
Company name
TrepsRepoPortfolio TotalNet Current LiabilitiesNet Assets
19996.172571.13
493494.97-3539.08
489955.89
4.080.52
100.72-0.72
100.00
Equity & Equity Related TotalRetailingInfo Edge (India) Ltd.SoftwareInfosys Ltd.Tata Consultancy Services Ltd.HCL Technologies Ltd.Tech Mahindra Ltd.Wipro Ltd.Larsen & Toubro Infotech Ltd.Mphasis Ltd.L&T Technology Services Ltd.Cyient Ltd.Persistent Systems Ltd.Coforge Ltd.Firstsource Solutions Ltd.Telecom - ServicesBharti Airtel Ltd.Tata Communications Ltd.Other Equities^
No. of Shares
Market ValueRs. Lakhs
% of Assets
As on 31st December 2021
INVESTMENT STYLE
1.751.40
0.780.480.440.415.26
359000104000
1530100008500
925
8562.556872.80
3834.402341.572143.052009.67
25764.04
Foreign Securities And /Or Overseas Etf(S)SoftwareGlobal X Cybersecurity Etf (Bug)Cognizant Technology Solutions Corporation (Class Amazon.Com Inc.Globant S.AMicrosoft Corporation (Msft)Alphabet Inc. - Class A Common StockEquity & Equity Related Total
DATE OF ALLOTMENT
December 28,2015
NAV
FUND SIZE
Rs. 4899.56 (Rs. in Cr.)
MONTHLY AVERAGE AUM
Rs. 4499.15 (Rs. in Cr.)
TURN OVER
Portfolio Turnover (Total)Portfolio Turnover (Equity component only)
40.32%40.32%
EXPENSE RATIO**
DirectRegular
0.381.97
VOLATILITY MEASURES^ FUND BENCHMARK
Std. Dev (Annualised)Sharpe RatioPortfolio BetaR SquaredTreynorJenson
23.180.401.001.002.69
NA
21.550.470.900.943.200.46
MINIMUM INVESTMENT /MULTIPLES FOR NEW INVESTMENT
Rs. 5,000/- and in multiples of Re. 1/- thereafter.
ADDITIONAL INVESTMENT/MULTIPLES FOR EXISTING INVESTORS
Rs. 1,000/- and in multiples of Re. 1/- thereafter.
LOAD STRUCTURE
Entry Load : Not Applicable
Exit Load :
Primarily focuses on investment in at least 80% of its net assets in equity/equity related instruments of the companies in the Information Technology sector in India.
INVESTMENT OBJECTIVEThe investment objective of the scheme is to seek long term capital appreciation by investing atleast 80% of its net assets in equity/equity related instruments of the companies in Information Technology Sector in India.However, there is no assurance or guarantee that the investment objective of the Scheme will be achieved.The Scheme does not assure or guarantee any returns.
FUND MANAGER
Meeta Shetty (Managing Since 09-Mar-21 and overall experience of 15 years) & Venkat Samala (Managing Since 26-Nov-20 and overall experience of 6 years)
BENCHMARK
NIFTY IT TRI
Direct - IDCWDirect - GrowthRegular - IDCWRegular - Growth
::::
45.161445.161440.800840.8008
^Risk-free rate based on the FBIL Overnight MIBOR rate of 3.6% as on Dec 31, 2021
For calculation methodology please refer to Pg 71
Please refer to our Tata Mutual Fund website for fundamental changes, wherever applicable
0.25% of NAV if redeemed/switched out before 30 days from the date of allotment.
**Note: The rates specified are actual month end expenses charged as on Dec 31, 2021. The above ratio includes the Service tax on Investment Management Fees. The above ratio excludes, borrowing cost, wherever applicable.
24
Tata Digital India Fund(An open ended equity scheme investing in companies in Information Technology Sector)
^ Exposure less than 1% has been clubbed under Other Equities
83.17%
6.54%
3.37%
2.20%
0.69%
0.14%
0.00% 18.00% 36.00% 54.00% 72.00% 90.00%
IT
Telecom
Consumer Services
Industrial Manufacturing
Services
Media, Entertainment & Publication
70
116
162
208
254
300
Dec-18 Dec-19 Dec-20 Dec-21
Tata Digital India Fund - Reg - Growth NIFTY IT TRI

www.tatamutualfund.com TATA MUTUAL FUNDMutual Fund investments are subject to market risks, read all scheme related documents carefully
Market Capitalisation wise Exposure
Large Cap
Mid Cap
Small Cap
Market Capitalisation is as per list provided by AMFI.
SIP - If you had invested INR 10000 every month
1 Year 3 Year 5 Year 7 Year 10 Year Since Inception
Total Amount Invested (Rs.)
Total Value as on Dec 31, 2021 (Rs.)
Returns
Total Value of B: Nifty India Consumption TRI
B: Nifty India Consumption TRI
Total Value of AB: Nifty 50 TRI
AB: Nifty 50 TRI
(Inception date :28-Dec-2015) (First Installment date : 01-Jan-2016)
120,000
137,315
27.74%
133,619
21.65%
133,658
21.71%
360,000
516,321
24.87%
493,277
21.55%
518,153
25.13%
600,000
928,241
17.48%
881,617
15.38%
952,649
18.54%
NA
NA
NA
NA
NA
NA
NA
NA
NA
NA
NA
NA
NA
NA
720,000
1,237,632
17.91%
1,130,250
14.89%
1,227,666
17.64%
Top 10 Holdings Equity Sector Allocation
NAV Movement
Issuer NameITC Ltd.Titan Company Ltd.Asian Paints (india) Ltd.Radico Khaitan Ltd.Hindustan Unilever Ltd.Tata Consumer Products Ltd.Jubilant Foodworks Ltd.Dabur India Ltd.Havells India Ltd.Voltas Ltd.Total
% to NAV8.777.496.736.155.425.065.034.574.294.19
57.70
Past performance may or may not be sustained in the future. Returns greater than 1 year period are compounded annualized. Income Distribution cum capital withdrawals are assumed to be reinvested and bonus is adjusted. Load is not taken in to consideration. For SIP returns, monthly investment of equal amounts invested on the 1st day of every month has been considered. For scheme performance refer pages 55 - 69.*B: Benchmark, AB: Additional Benchmark; For Scheme Risk-O-Meter and Scheme Benchmark Risk-O-Meter please refer page number 70 of Factsheet.Source: MFI Explorer
57.84%
19.40%
22.76%
PORTFOLIO
Company name No. of Shares
Market ValueRs. Lakhs
% of Assets
96.68
1.77
7.494.294.193.943.441.361.331.131.101.02
8.776.736.155.425.064.573.882.712.211.971.751.38
3300
406000420000470000
128250085400
105500303000120000117000164000
5500000272000680000314000930000
107600026900
102770705000300000404400100000
132192.83
2420.15
10240.945867.405730.015383.944705.161858.651811.641541.101509.241394.90
11992.759201.628405.827410.876914.096241.345300.833705.893026.212694.752390.811884.50
Company name
TrepsRepoPortfolio TotalNet Current LiabilitiesNet Assets
2999.432110.51
137318.01-598.04
136719.97
2.191.54
100.43-0.43
100.00
Equity & Equity Related TotalAuto AncillariesMRF Ltd.Consumer DurablesTitan Company Ltd.Havells India Ltd.Voltas Ltd.Greenpanel Industries Ltd.Dixon Technologies (India) Ltd.Whirlpool Of India Ltd.Century Plyboards (India) Ltd.Bajaj Electricals Ltd.Kajaria Ceramics Ltd.Somany Ceramics Ltd.Consumer Non DurablesITC Ltd.Asian Paints (India) Ltd.Radico Khaitan Ltd.Hindustan Unilever Ltd.Tata Consumer Products Ltd.Dabur India Ltd.Nestle India Ltd.Britannia Industries Ltd.Ccl Products India Ltd.United Spirits Ltd.Kansai Nerolac Paints Ltd.Zydus Wellness Ltd.
No. of Shares
Market ValueRs. Lakhs
% of Assets
Name Of The Instrument Market ValueRatingsRs. Lakhs
% of Assets
1.26
1.32
5.03
3.893.52
194000
79000
191500
500000
1723.30
1808.39
6876.96
5325.004826.57
Varun Beverages Ltd.EntertainmentNazara Technologies Ltd.Leisure ServicesJubilant Foodworks Ltd.RetailingTrent Ltd.Other Equities^
0.010.01
15.2415.24
CRISIL AAANon-Convertible Debentures/Bonds05.50 % Britannia Industries Ltd.Non-Convertible Debentures/Bonds Total
As on 31st December 2021
INVESTMENT STYLE
DATE OF ALLOTMENT
December 28, 2015
NAV
FUND SIZE
Rs. 1367.20 (Rs. in Cr.)
MONTHLY AVERAGE AUM
Rs. 1338.86 (Rs. in Cr.)
TURN OVER
Portfolio Turnover (Total)Portfolio Turnover (Equity component only)
39.30%39.30%
EXPENSE RATIO**
DirectRegular
0.882.23
VOLATILITY MEASURES^ FUND BENCHMARK
Std. Dev (Annualised)Sharpe RatioPortfolio BetaR SquaredTreynorJenson
17.120.181.001.000.89
NA
16.920.200.920.861.070.16
MINIMUM INVESTMENT /MULTIPLES FOR NEW INVESTMENT
Rs. 5,000/- and in multiples of Re. 1/- thereafter.
ADDITIONAL INVESTMENT/MULTIPLES FOR EXISTING INVESTORS
Rs. 1,000/- and in multiples of Re. 1/- thereafter.
LOAD STRUCTURE
Entry Load : Not Applicable
Exit Load :
Primarily focuses on investment in at least 80% of its net assets in equity/equity related instruments of the companies in the Consumption Oriented sectors in India.
INVESTMENT OBJECTIVE
The investment objective of the scheme is to seek long term capital appreciation by investing atleast 80% of its assets in equity/equity related instruments of the companies in the Consumption Oriented sectors in India.However, there is no assurance or guarantee that the investment objective of the Scheme will be achieved.The Scheme does not assure or guarantee any returns.
FUND MANAGER
Sonam Udasi (Managing Since 1-Apr-16 and overall experience of 24 years)
BENCHMARK
Nifty India Consumption TRI
Direct - IDCWDirect - GrowthRegular - IDCWRegular - Growth
::::
29.352129.352124.615126.6924
^Risk-free rate based on the FBIL Overnight MIBOR rate of 3.6% as on Dec 31, 2021
For calculation methodology please refer to Pg 71
Please refer to our Tata Mutual Fund website for fundamental changes, wherever applicable
0.25% of NAV if redeemed/switched out before 30 days from the date of allotment.
**Note: The rates specified are actual month end expenses charged as on Dec 31, 2021. The above ratio includes the Service tax on Investment Management Fees. The above ratio excludes, borrowing cost, wherever applicable.
25
Tata India Consumer Fund(An open ended equity scheme investing in Consumption Oriented Sector)
^ Exposure less than 1% has been clubbed under Other Equities
84.67%
8.92%
1.77%
1.32%
0.00% 18.00% 36.00% 54.00% 72.00% 90.00%
Consumer Goods
Consumer Services
Automobile
Media, Entertainment & Publication
70
90
110
130
150
170
Dec-18 Dec-19 Dec-20 Dec-21
Tata India Consumer Fund - Reg - GrowthNifty India Consumption TRI

www.tatamutualfund.com TATA MUTUAL FUNDMutual Fund investments are subject to market risks, read all scheme related documents carefully
Market Capitalisation wise Exposure
Large Cap
Mid Cap
Small Cap
Market Capitalisation is as per list provided by AMFI.
SIP - If you had invested INR 10000 every month
1 Year 3 Year 5 Year 7 Year 10 Year Since Inception
Total Amount Invested (Rs.)
Total Value as on Dec 31, 2021 (Rs.)
Returns
Total Value of B: Nifty Pharma TRI
B: Nifty Pharma TRI
Total Value of AB: Nifty 50 TRI
AB: Nifty 50 TRI
(Inception date :28-Dec-2015) (First Installment date : 01-Jan-2016)
120,000
132,126
19.22%
127,069
11.08%
133,658
21.71%
360,000
569,891
32.21%
515,723
24.78%
518,153
25.13%
600,000
1,064,438
23.12%
886,666
15.61%
952,649
18.54%
NA
NA
NA
NA
NA
NA
NA
NA
NA
NA
NA
NA
NA
NA
720,000
1,289,498
19.29%
1,041,823
12.18%
1,227,666
17.64%
Top 10 Holdings Equity Sector Allocation
NAV Movement
Issuer NameSun Pharmaceutical Industries Ltd.Dr. Reddys Labaratories Ltd.Cipla Ltd.Divi Laboratories Ltd.Apollo Hospitals Enterprise Ltd.Alkem Laboratories Ltd.Ipca LabsNarayana Hrudayalaya Ltd.Fortis Healthcare Ltd.Lupin Laboratories Ltd.Total
% to NAV12.578.898.097.427.256.405.905.544.054.04
70.15
Past performance may or may not be sustained in the future. Returns greater than 1 year period are compounded annualized. Income Distribution cum capital withdrawals are assumed to be reinvested and bonus is adjusted. Load is not taken in to consideration. For SIP returns, monthly investment of equal amounts invested on the 1st day of every month has been considered.For scheme performance refer pages 55 - 69.*B: Benchmark, AB: Additional Benchmark; For Scheme Risk-O-Meter and Scheme Benchmark Risk-O-Meter please refer page number 70 of Factsheet.Source: MFI Explorer
47.60%
30.05%
22.35%
PORTFOLIO
Company name No. of Shares
Market ValueRs. Lakhs
% of Assets
98.17
7.255.544.052.862.131.68
12.578.898.097.426.405.904.043.142.462.382.031.761.701.511.491.32
84300505198795000116982200000410000
86710010570050000092500
1030491587262480001030004712832600030662
2257725100
16700038753
105000
57267.16
4226.303230.742363.541667.751239.80980.11
7333.065186.704720.504327.343734.553439.272357.861833.091433.641387.981184.951025.68993.77882.68866.34771.07
Company name
Other Equities^RepoPortfolio TotalNet Current LiabilitiesNet Assets
2080.441392.21
58659.37-335.47
58323.90
3.562.39
100.58-0.58
100.00
Equity & Equity Related TotalHealthcare ServicesApollo Hospitals Enterprise Ltd.Narayana Hrudayalaya Ltd.Fortis Healthcare Ltd.Krishna Institute Of Medical Sciences Ltd.Syngene International Ltd.Healthcare Global Enterprises Ltd.PharmaceuticalsSun Pharmaceutical Industries Ltd.Dr Reddys Laboratories Ltd.Cipla Ltd.Divi Laboratories Ltd.Alkem Laboratories Ltd.Ipca Laboratories Ltd.Lupin Ltd.J.B.Chemicals & Pharmaceuticals Ltd.Fdc Ltd.Procter & Gamble Health Ltd.Gland Pharma Ltd.Indoco Remedies Ltd.Abbott India Ltd.Glenmark Pharmaceuticals Ltd.Ajanta Pharma Ltd.Aurobindo Pharma Ltd.
No. of Shares
Market ValueRs. Lakhs
% of Assets
As on 31st December 2021
INVESTMENT STYLE
DATE OF ALLOTMENT
December 28, 2015
NAV
FUND SIZE
Rs. 583.24 (Rs. in Cr.)
MONTHLY AVERAGE AUM
Rs. 556.27 (Rs. in Cr.)
TURN OVER
Portfolio Turnover (Total)Portfolio Turnover (Equity component only)
35.00%35.00%
EXPENSE RATIO**
DirectRegular
1.062.55
VOLATILITY MEASURES^ FUND BENCHMARK
Std. Dev (Annualised)Sharpe RatioPortfolio BetaR SquaredTreynorJenson
23.930.191.001.001.29
NA
17.920.360.690.852.690.97
MINIMUM INVESTMENT /MULTIPLES FOR NEW INVESTMENT
Rs. 5,000/- and in multiples of Re. 1/- thereafter.
ADDITIONAL INVESTMENT/MULTIPLES FOR EXISTING INVESTORS
Rs. 1,000/- and in multiples of Re. 1/- thereafter.
LOAD STRUCTURE
Entry Load : Not Applicable
Exit Load :
Primarily focuses on investment in at least 80% of its net assets in equity/equity related instruments of the companies in the Pharma & Healthcare sectors in India.
INVESTMENT OBJECTIVE
The investment objective of the scheme is to seek long term capital appreciation by investing atleast 80% of its net assets in equity/equity related instruments of the companies in the pharma & healthcare sectors in India.However, there is no assurance or guarantee that the investment objective of the Scheme will be achieved.The Scheme does not assure or guarantee any returns.
FUND MANAGER
Meeta Shetty (Managing Since 09-Mar-21 and overall experience of 15 years)
BENCHMARKNifty Pharma TRI
Direct - IDCWDirect - GrowthRegular - IDCWRegular - Growth
::::
19.877119.877118.017618.0176
^Risk-free rate based on the FBIL Overnight MIBOR rate of 3.6% as on Dec 31, 2021
For calculation methodology please refer to Pg 71
Please refer to our Tata Mutual Fund website for fundamental changes, wherever applicable
0.25% of NAV if redeemed/switched out before 30 days from the date of allotment.
**Note: The rates specified are actual month end expenses charged as on Dec 31, 2021. The above ratio includes the Service tax on Investment Management Fees. The above ratio excludes, borrowing cost, wherever applicable.
26
Tata India Pharma & Healthcare Fund(An open ended equity scheme investing in Pharma and Healthcare Services Sector)
^ Exposure less than 1% has been clubbed under Other Equities
72.84%
24.87%
0.48%
0.00% 16.00% 32.00% 48.00% 64.00% 80.00%
Pharma
Healthcare Services
Financial Services
70
100
130
160
190
220
Dec-18 Dec-19 Dec-20 Dec-21
Tata India Pharma And Healthcare Fund - Reg - GrowthNifty Pharma TRI

www.tatamutualfund.com TATA MUTUAL FUNDMutual Fund investments are subject to market risks, read all scheme related documents carefully
Market Capitalisation wise Exposure
Large Cap
Mid Cap
Small Cap
Market Capitalisation is as per list provided by AMFI.
SIP - If you had invested INR 10000 every month
1 Year 3 Year 5 Year 7 Year 10 Year Since Inception
Total Amount Invested (Rs.)
Total Value as on Dec 31, 2021 (Rs.)
Returns
Total Value of B: Nifty Commodities TRI
B: Nifty Commodities TRI
Total Value of AB: Nifty 50 TRI
AB: Nifty 50 TRI
(Inception date :28-Dec-2015) (First Installment date : 01-Jan-2016)
120,000
137,944
28.79%
139,186
30.86%
133,658
21.71%
360,000
614,508
37.98%
576,566
33.09%
518,153
25.13%
600,000
1,090,801
24.14%
976,141
19.54%
952,649
18.54%
NA
NA
NA
NA
NA
NA
NA
NA
NA
NA
NA
NA
NA
NA
720,000
1,396,845
21.97%
1,258,983
18.49%
1,227,666
17.64%
Top 10 Holdings Equity Sector Allocation
NAV Movement
Issuer NameReliance Industries Ltd.Ultratech Cement Ltd.Tata Steel Ltd.Hindalco Industries Ltd.Vedanta Ltd.Jindal Steel & Power Ltd.Jindal Stainless Ltd.H.p.c.l.National Aluminium Company Ltd.Grasim Industries Ltd.Total
% to NAV7.146.876.035.454.324.324.183.883.653.42
49.26
Past performance may or may not be sustained in the future. Returns greater than 1 year period are compounded annualized. Income Distribution cum capital withdrawals are assumed to be reinvested and bonus is adjusted. Load is not taken in to consideration. For SIP returns, monthly investment of equal amounts invested on the 1st day of every month has been considered. For scheme performance refer pages 55 - 69.*B: Benchmark, AB: Additional Benchmark; For Scheme Risk-O-Meter and Scheme Benchmark Risk-O-Meter please refer page number 70 of Factsheet.Source: MFI Explorer
51.68%
30.82%
17.50%
PORTFOLIO
Company name No. of Shares
Market ValueRs. Lakhs
% of Assets
95.59
1.75
6.873.423.002.422.071.711.631.02
3.163.002.21
6.034.324.18
2.281.55
2.981.99
160000
1500035000350004000015500750001000
75000
1250020000
100000
90000190000350000
5000065000
105000255000
15854.26
289.84
1138.66567.79497.58401.64343.44283.13269.87169.76
523.56498.04367.20
1000.31716.78693.70
378.03256.62
493.92329.46
Company name
RepoPortfolio TotalCash / Net Current AssetNet Assets
712.4416566.70
14.2616580.96
4.3099.920.08
100.00
Equity & Equity Related TotalAerospace & DefenseMishra Dhatu Nigam Ltd.Cement & Cement ProductsUltratech Cement Ltd.Grasim Industries Ltd.Birla Corporation Ltd.The Ramco Cements Ltd.ACC Ltd.Ambuja Cements Ltd.Shree Cement Ltd.Heidelberg Cement India Ltd.ChemicalsNavin Fluorine International Ltd.Deepak Nitrite Ltd.Chemcon Speciality Chemicals Ltd.Ferrous MetalsTata Steel Ltd.Jindal Steel & Power Ltd.Jindal Stainless Ltd.FertilisersCoromandel International Ltd.Chambal Fertiliser & Chemicals Ltd.GasIndraprastha Gas Ltd.Gail ( India ) Ltd.
No. of Shares
Market ValueRs. Lakhs
% of Assets
2.42
5.454.323.65
3.021.801.70
7.143.881.86
2.632.13
275000
190000210000600000
34979400009300
5000022000080000
213333160000
401.64
903.55716.52606.00
501.02298.84282.18
1184.08643.17308.36
436.05353.52
Minerals/MiningCoal India Ltd.Non - Ferrous MetalsHindalco Industries Ltd.Vedanta Ltd.National Aluminium Co. Ltd.PesticidesAstec Lifesciences Ltd.Upl Ltd.Pi Industries Ltd.Petroleum ProductsReliance Industries Ltd.Hindustan Petroleum Corporation Ltd.Bharat Petroleum Corporation Ltd.PowerPower Grid Corporation Of India Ltd.Tata Power Company Ltd.
As on 31st December 2021
INVESTMENT STYLE
DATE OF ALLOTMENT
December 28, 2015
NAV
FUND SIZE
Rs. 165.81 (Rs. in Cr.)
MONTHLY AVERAGE AUM
Rs. 160.99 (Rs. in Cr.)
TURN OVER
Portfolio Turnover (Total)Portfolio Turnover (Equity component only)
26.12%26.12%
EXPENSE RATIO**
DirectRegular
1.012.64
VOLATILITY MEASURES^ FUND BENCHMARK
Std. Dev (Annualised)Sharpe RatioPortfolio BetaR SquaredTreynorJenson
25.450.201.001.001.49
NA
22.820.310.860.912.330.72
MINIMUM INVESTMENT /MULTIPLES FOR NEW INVESTMENT
Rs. 5,000/- and in multiples of Re. 1/- thereafter.
ADDITIONAL INVESTMENT/MULTIPLES FOR EXISTING INVESTORS
Rs. 1,000/- and in multiples of Re. 1/- thereafter.
LOAD STRUCTURE
Entry Load : Not Applicable
Exit Load :
Primarily focuses on investment in at least 80% of its net assets in equity/equity related instruments of the companies in the Resources & Energy sectors in India.
INVESTMENT OBJECTIVE
The investment objective of the scheme is to provide long term capital appreciation by investing atleast 80% of it’s net assets in equity/equity related instruments of the companies in the Resources& Energy sectors in India.However, there is no assurance or guarantee that the investment objective of the Scheme will be achieved.The Scheme does not assure or guarantee any returns.
FUND MANAGER
Satish Chandra Mishra (Managing Since 09-Mar-21 and overall experience of 15 years)
BENCHMARK
Nifty Commodities TRI
Direct - IDCWDirect - GrowthRegular - IDCWRegular - Growth
::::
31.669531.669526.164528.5861
^Risk-free rate based on the FBIL Overnight MIBOR rate of 3.6% as on Dec 31, 2021
For calculation methodology please refer to Pg 71
Please refer to our Tata Mutual Fund website for fundamental changes, wherever applicable
0.25% of NAV if redeemed/switched out before 30 days from the date of allotment.
**Note: The rates specified are actual month end expenses charged as on Dec 31, 2021. The above ratio includes the Service tax on Investment Management Fees. The above ratio excludes, borrowing cost, wherever applicable.
27
Tata Resources & Energy Fund(An open ended equity scheme investing in Resources and Energy Sector)
30.39%
22.15%
17.85%
10.35%
8.38%
4.76%
1.75%
0.00% 6.00% 12.00% 18.00% 24.00% 30.00% 36.00%
Metals
Cement & Cement Products
Oil & Gas
Fertilisers & Pesticides
Chemicals
Power
Industrial Manufacturing
60
96
132
168
204
240
Dec-18 Dec-19 Dec-20 Dec-21
Tata Resources & Energy Fund - Reg - GrowthNifty Commodities TRI
^ Exposure less than 1% has been clubbed under Other Equities

www.tatamutualfund.com TATA MUTUAL FUNDMutual Fund investments are subject to market risks, read all scheme related documents carefully
Market Capitalisation wise Exposure
Large Cap
Mid Cap
Small Cap
Market Capitalisation is as per list provided by AMFI.
28
VOLATILITY MEASURES^ FUND BENCHMARK
INVESTMENT STYLE
INVESTMENT OBJECTIVE
DATE OF ALLOTMENT
December 31, 2004
FUND MANAGER
NAV
Direct - GrowthDirect - IDCWReg - GrowthReg - IDCW
::::
98.092051.399793.226344.2231
FUND SIZE
Rs. 809.21 (Rs. in Cr.)
TURN OVER
Portfolio Turnover (Total)Portfolio Turnover (Equity component only)
39.76%39.76%
MINIMUM INVESTMENT/MULTIPLES FOR NEW INVESTMENT
Rs. 5,000/- and in multiples of Re. 1/- thereafter.
ADDITIONAL INVESTMENT/MULTIPLES FOR EXISTING INVESTORS
Rs. 1,000/- and multiples of Re. 1/- thereafter.
LOAD STRUCTURE
Entry Load : Not Applicable
Exit Load :
PORTFOLIO
Company name No. of Shares
Market ValueRs. Lakhs
% of Assets
78755.41
2376.002222.482104.961605.75
4654.692167.001241.541160.52
7346.61
1978.14
1682.351011.36
3211.442523.972042.431775.40
3929.853561.112241.082137.892067.681655.251366.68
1414.00
97.33
2.942.752.601.98
5.752.681.531.43
9.08
2.44
2.081.25
3.973.122.522.19
4.864.402.772.642.562.051.69
1.75
31300137000950005950
155234055500012600062000
387500
7800
265000215000
136000113000114300
4210
20500015606625512
22700010400088400
112000
1400000
Company name No. of Shares
Market ValueRs. Lakhs
% of Assets
Name Of The Instrument Quantity Market ValueRs. Lakhs
% of NAV
SIP - If you had invested INR 10000 every month1 Year 3 Year 5 Year 7 Year 10 Year Since Inception
Total Amount Invested (Rs.)
Total Value as on Dec 31, 2021 (Rs.)
Returns
Total Value of B: S&P BSE India Infrastructure TRI
B: S&P BSE India Infrastructure TRI
Total Value of AB: Nifty 50 TRI
AB: Nifty 50 TRI
(Inception date :31-Dec-2004) (First Installment date : 01-Feb-2005)
120,000
146,327
42.94%
141,436
34.63%
133,658
21.71%
360,000
588,220
34.62%
564,309
31.47%
518,153
25.13%
600,000
999,197
20.50%
898,373
16.15%
952,649
18.54%
840,000
1,516,558
16.57%
1,338,759
13.08%
1,498,767
16.24%
1,200,000
2,713,043
15.57%
2,265,582
12.21%
2,652,526
15.15%
2,030,000
6,149,699
11.96%
3,472,592
10.18%
7,118,416
13.43%
Primarily focuses on equity / equity related instruments of the companies in the Infrastructure sector in India.
Abhinav Sharma (Managing Since 09-Mar-21 and overall experience of 15 years)
To provide income distribution and / or medium to long term capital gains by investing predominantly in equity / equity related instruments of the companies in the infrastructure sector. The scheme does not assure or guarantee any returns.
Std. Dev (Annualised)Sharpe RatioPortfolio BetaR SquaredTreynorJenson
29.210.141.001.001.17
NA
24.560.220.790.881.940.60
^Risk-free rate based on the FBIL Overnight MIBOR rate of 3.6% as on Dec 31, 2021 For calculation methodology please refer to Pg 71
0.25% of NAV if redeemed/switched out before 30 days from the date of allotment.
Top 10 Holdings Equity Sector Allocation
NAV Movement
Issuer NameLarsen & Toubro Ltd.Knr ConstructionGrindwell Norton Ltd.Astral Ltd. (erstwhile Astral Poly Technik Ltd.)Siemens India Ltd.Power Grid Corporation Of India Ltd.Abb India Ltd.Ultratech Cement Ltd.NTPC Ltd.Century Textiles & Industries Ltd.Total
% to NAV9.085.754.864.403.973.693.122.942.842.78
43.43
PaperCentury Textiles & Industries Ltd.Petroleum ProductsReliance Industries Ltd.PowerPower Grid Corporation Of India Ltd.NTPC Ltd.Tata Power Company Ltd.Kec International Ltd.Cesc Ltd.TransportationAdani Ports And Special Economic Zone Ltd.Gujarat Pipavav Port Ltd.Transport Corporation Of India Ltd.Other Equities^
245000
82000
14623331845000800000300000
1370000
2520001130000132800
2248.00
1941.88
2989.012295.181767.601437.301198.75
1840.361127.74991.55
3439.86
2.78
2.40
3.692.842.181.781.48
2.271.391.234.26
OTHERSInvit And ReitPowergrid Infrastructure Investment TrustOTHERS TOTAL
699600 846.24846.24
1.051.05
RepoPortfolio TotalNet Current LiabilitiesNet Assets
1459.8081061.45
-140.7880920.67
1.80100.17
-0.17100.00
39.26%
36.40%
24.34%
Past performance may or may not be sustained in the future. Returns greater than 1 year period are compounded annualized. Income Distribution cum capital withdrawals are assumed to be reinvested and bonus is adjusted. Load is not taken in to consideration. For SIP returns, monthly investment of equal amounts invested on the 1st day of every month has been considered.For scheme performance refer pages 55 - 69.*B: Benchmark, AB: Additional Benchmark: For Scheme Risk-O-Meter and Scheme Benchmark Risk-O-Meter please refer page number 70 of Factsheet.Source: MFI Explorer
BENCHMARK
S&P BSE India Infrastructure TRI
MONTHLY AVERAGE AUM
Rs. 790.49 (Rs. in Cr.)
EXPENSE RATIO**DirectRegular
1.672.47
**Note: The rates specified are actual month end expenses charged as on Dec 31, 2021. The above ratio includes the Service tax on Investment Management Fees. The above ratio excludes, borrowing cost, wherever applicable.
As on 31st December 2021
Tata Infrastructure Fund(An open ended equity scheme investing in Infrastructure sector.)
Equity & Equity Related TotalCement & Cement ProductsUltratech Cement Ltd.Grasim Industries Ltd.ACC Ltd.Shree Cement Ltd.ConstructionKnr Constructions Ltd.Dlf Ltd.The Phoenix Mills Ltd.Godrej Properties Ltd.Construction ProjectLarsen & Toubro Ltd.Consumer Non Durables3M India Ltd.GasGujarat Gas Ltd.Indraprastha Gas Ltd.Industrial Capital GoodsSiemens Ltd.Abb India Ltd.Thermax Ltd.Honeywell Automation India Ltd.Industrial ProductsGrindwell Norton Ltd.Astral Ltd. (Erstwhile Astral Poly Technik Ltd.)Schaeffler Ltd.Cummins India Ltd.Timken India Ltd.Aia Engineering Ltd.Ksb Ltd.Non - Ferrous MetalsNational Aluminium Co. Ltd.
Please refer to our Tata Mutual Fund website for fundamental changes, wherever applicable
^ Exposure less than 1% has been clubbed under Other Equities
35.45%20.48%
12.78%10.27%
5.73%4.89%
2.78%2.44%
1.75%0.76%
0.00% 8.00% 16.00% 24.00% 32.00% 40.00%
Industrial ManufacturingConstruction
PowerCement & Cement Products
Oil & GasServices
Paper And JuteConsumer Goods
MetalsChemicals
50
76
102
128
154
180
Dec-18 Dec-19 Dec-20 Dec-21
Tata Infrastructure Fund - Reg - GrowthS&P BSE India Infrastructure TRI

www.tatamutualfund.com TATA MUTUAL FUNDMutual Fund investments are subject to market risks, read all scheme related documents carefully
Market Capitalisation wise Exposure
Large Cap
Mid Cap
Small Cap
Market Capitalisation is as per list provided by AMFI.
29
VOLATILITY MEASURES^ FUND BENCHMARK
INVESTMENT STYLE
INVESTMENT OBJECTIVE
DATE OF ALLOTMENT
January 22, 2020
FUND MANAGER
NAV
Direct - IDCWDirect - GrowthRegular - IDCWRegular - Growth
::::
10.679910.679910.338110.3381
FUND SIZE
Rs. 50.69 (Rs. in Cr.)
TURN OVER
Portfolio Turnover (Total)Portfolio Turnover (Equity component only)
929.04%929.04%
MINIMUM INVESTMENT/MULTIPLES FOR NEW INVESTMENT
ADDITIONAL INVESTMENT/MULTIPLES FOR EXISTING INVESTORS
Rs.1000/-& in multiples of Re.1/-thereafter.
LOAD STRUCTURE
Entry Load : Not Applicable
Exit Load :
PORTFOLIO
Company name Market ValueRs. Lakhs
% ofAssets
4930.87
426.14274.97223.74
318.49
274.77
240.37184.27140.1299.25
68.48
58.61
166.6956.24
162.53
473.23
220.6253.26
315.70
No. ofShares
5757513751948591
16799
10893
468878451024156
642
2590
1169
10164702
114136
19983
3985524104
6758
97.27
8.415.424.41
6.28
5.42
4.743.642.761.96
1.35
1.16
3.291.11
3.21
9.34
4.351.05
6.23
SIP - If you had invested INR 10000 every month1 Year 3 Year 5 Year 7 Year 10 Year Since Inception
Total Amount Invested (Rs.)
Total Value as on Dec 31, 2021 (Rs.)
Returns
Total Value of B: S&P BSE 200 TRI
B: S&P BSE 200 TRI
Total Value of AB: S&P BSE Sensex TRI
AB: S&P BSE Sensex TRI
(Inception date :22-Jan-2020) (First Installment date : 01-Feb-2020)
120,000
121,432
2.22%
134,909
23.77%
133,372
21.25%
NA
NA
NA
NA
NA
NA
NA
NA
NA
NA
NA
NA
NA
NA
NA
NA
NA
NA
NA
NA
NA
NA
NA
NA
NA
NA
NA
NA
230,000
264,313
14.62%
322,274
38.01%
312,563
34.19%
Primarily focuses on investing in equity and equity related instruments following quant based investing theme.
Sailesh Jain (Managing Since 28-Jan-20 and overall experience of 19 years)
The investment objective of the scheme is to generate medium to long-term capital appreciation by investing in equity and equity related instruments selected based on a quantitative model (Quant Model).However, there is no assurance or guarantee that the investment objective of the Scheme will be achieved. The scheme does not assure or guarantee any returns.
Std. Dev (Annualised)Sharpe RatioPortfolio BetaR SquaredTreynorJenson
25.480.261.001.001.86
NA
25.170.020.900.870.13
-1.57
^Risk-free rate based on the FBIL Overnight MIBOR rate of 3.6% as on Dec 31, 2021 For calculation methodology please refer to Pg 71
• Exit Load is Nil, if the withdrawal amount or switched out amount is not more than 12% of the original cost of investment on or before expiry of 365 days from the date of allotment.• Exit load is 1% of the applicable NAV if the withdrawal amount or switched out amount is more than 12% of the original cost of investment on or before expiry of 365 days from the date of allotment.• No Exit load will be charged for redemption or switch out after expiry of 365 days from the date of allotment.
Top 10 Holdings Equity Sector Allocation
NAV Movement
Issuer NameReliance Industries Ltd.Bharti Airtel Ltd.ICICI Bank Ltd.Larsen & Toubro Ltd.Avenue Supermarts Ltd.Titan Company Ltd.Canara BankPage Industries Ltd.Marico Ltd.State Bank Of IndiaTotal
% to NAV9.348.878.416.286.235.425.425.134.744.41
64.25
RepoPortfolio TotalNet Current LiabilitiesNet Assets
2.87100.19
-0.19100.00
145.335078.69
-9.685069.01
80.19%
19.81%
0.00%
Past performance may or may not be sustained in the future. Returns greater than 1 year period are compounded annualized. Income Distribution cum capital withdrawals are assumed to be reinvested and bonus is adjusted. Load is not taken in to consideration. For SIP returns, monthly investment of equal amounts invested on the 1st day of every month has been considered.For scheme performance refer pages 55- 69.*B: Benchmark, AB: Additional Benchmark; For Scheme Risk-O-Meter and Scheme Benchmark Risk-O-Meter please refer page number 70 of Factsheet.Source: MFI Explorer
BENCHMARK
S&P BSE 200 TRI
MONTHLY AVERAGE AUM
Rs. 51.11 (Rs. in Cr.)
EXPENSE RATIO**DirectRegular
0.792.45
**Note: The rates specified are actual month end expenses charged as on Dec 31, 2021. The above ratio includes the Service tax on Investment Management Fees. The above ratio excludes, borrowing cost, wherever applicable.
As on 31st December 2021
Tata Quant Fund(An Open Ended Equity Scheme following quant based investing theme)
Equity & Equity Related TotalBanksICICI Bank Ltd.Canara BankState Bank Of IndiaConstruction ProjectLarsen & Toubro Ltd.Consumer DurablesTitan Company Ltd.Consumer Non DurablesMarico Ltd.ITC Ltd.Dabur India Ltd.P & G Hygiene & Health Care Ltd.FinancePiramal Enterprises Ltd.Healthcare ServicesApollo Hospitals Enterprise Ltd.InsuranceBajaj Finserv Ltd.Sbi Life Insurance Company Ltd.OilOil & Natural Gas Co.Petroleum ProductsReliance Industries Ltd.PowerTorrent Power Ltd.Tata Power Company Ltd.RetailingAvenue Supermarts Ltd.
Company name Market ValueRs. Lakhs
% ofAssets
208.07
449.46
259.91255.95
No. ofShares
4353
65730
643
4.10
8.87
5.135.04
SoftwareMindtree Ltd.Telecom - ServicesBharti Airtel Ltd.Textile ProductsPage Industries Ltd.Other Equities^
Name of the Instrument Market ValueRs. Lakhs
% ofAssets
2.492.49
Ratings
CRISIL AAA 0.050.05
Non-Convertible Debentures/Bonds05.50 % Britannia Industries Ltd.Non-Convertible Debentures/Bonds Total
Please refer to our Tata Mutual Fund website for fundamental changes, wherever applicable
Growth option: Rs 5,000/- and in multiple of Re.1/- thereafterIDCW (payout): Rs 5,000/- and in multiple of Re.1/- thereafter
^ Exposure less than 1% has been clubbed under Other Equities
24.21%19.05%
13.12%8.87%
6.74%6.28%6.23%
5.45%5.13%
1.16%0.95%
0.09%
0.00% 6.00% 12.00% 18.00% 24.00% 30.00%
Financial ServicesConsumer Goods
Oil & GasTelecom
PowerConstruction
Consumer ServicesIT
TextilesHealthcare Services
Media, Entertainment & PublicationServices
60
82
104
126
148
170
Jan-20 Sep-20 May-21 Dec-21
Tata Quant Fund - Reg - Growth S&P BSE 200 TRI

www.tatamutualfund.com TATA MUTUAL FUNDMutual Fund investments are subject to market risks, read all scheme related documents carefully
Market Capitalisation wise Exposure (Equity component only)
Large Cap
Mid Cap
Small Cap
Market Capitalisation is as per list provided by AMFI.
Please refer to our Tata Mutual Fund website for fundamental changes, wherever applicable
30
As on 31st December 2021
INVESTMENT STYLE
INVESTMENT OBJECTIVE
DATE OF ALLOTMENT
October 8, 1995
FUND MANAGER
ASSISTANT FUND MANAGER
PORTFOLIO
253888.66
4185.75
3692.98
30716.2321871.3818492.50
5927.13
6072.84
12673.85
8436.76
8503.957080.456839.91
10604.45
5637.37
4468.49
21313.35
3579.01
17570.2516612.20
3961.20
10257.00
5794.0019597.61
76.93
1.27
1.12
9.316.635.601.80
1.84
3.84
2.56
2.582.152.07
3.21
1.71
1.35
6.46
1.08
5.325.031.20
3.11
1.765.93
Name of the Instrument Ratings Market ValueRs. Lakhs
% to NAV
RepoPortfolio TotalCash / Net Current AssetNet Assets
5422.84329572.32
495.27330067.59
1.6499.85
0.15100.00
SIP - If you had invested INR 10000 every month1 Year 3 Year 5 Year 7 Year 10 Year Since Inception
Total Amount Invested (Rs.)Total Value as on Dec 31, 2021 (Rs.)ReturnsTotal Value of B: Crisil Hybrid 35+65 - Aggressive IndexB: Crisil Hybrid 35+65 - Aggressive IndexTotal Value of AB: S&P BSE Sensex TRIAB: S&P BSE Sensex TRI(Inception date :08-Oct-1995) (First Installment date : 01-Feb-1996)
120,000131,36917.99%
130,64116.81%
133,37221.25%
360,000481,51819.82%
485,94720.47%
515,11224.70%
600,000841,02113.47%
889,21615.73%
961,69918.93%
840,0001,262,961
11.45%1,395,044
14.23%1,519,571
16.63%
1,200,0002,339,538
12.81%2,466,837
13.80%2,692,720
15.43%
3,110,00039,429,990
16.32%10,306,825
13.21%28,734,793
14.95%
Invests 65% to 80% investment in Equity & equity related instruments & 20% to 35% in debt & money market instruments. For taxation purpose, it is treated as an equity scheme. (Monthly Income is not assured and is subject to availability of distributable surplus.)
The investment objective of the Scheme is to provide income distribution and or capital appreciation over medium to long term. However, there is no assurance or guarantee that the investment objective of the Scheme will be achieved. The scheme does not assure or guarantee any returns.
Chandraprakash Padiyar (Managing Since 3-Sep-18 and overall experience of 21 years) (Equity) & Murthy Nagarajan (Managing since 1-Apr-17 and overall experience of 25 years) (Debt)
Satish Chandra Mishra (Managing Since 1-Nov-19 and overall experience of 15 years)
Equity & Equity Related TotalAutoMahindra & Mahindra Ltd.Auto AncillariesTube Investments Of India Ltd..BanksICICI Bank Ltd.State Bank Of IndiaHDFC Bank Ltd.Kotak Mahindra Bank Ltd.Cement & Cement ProductsUltratech Cement Ltd.ChemicalsBasf India Ltd.Construction ProjectLarsen & Toubro Ltd.Consumer Non DurablesITC Ltd.Hindustan Unilever Ltd.Varun Beverages Ltd.FinanceHousing Development Finance Corporation Ltd.GasGujarat State Petronet Ltd.Other ServicesQuess Corp Ltd.Petroleum ProductsReliance Industries Ltd.PharmaceuticalsNatco Pharma Ltd.SoftwareTata Consultancy Services Ltd.Infosys Ltd.Oracle Financials Services Soft Ltd.Telecom - ServicesBharti Airtel Ltd.TradingRedington (India) Ltd.Other Equities^
Top 10 Holdings Equity Sector Allocation
NAV Movement
Issuer NameICICI Bank Ltd.State Bank Of IndiaReliance Industries Ltd.HDFC Bank Ltd.Tata Consultancy Services Ltd.Infosys Ltd.Basf India Ltd.Bharti Airtel Ltd.HDFC Ltd.ITC Ltd.Total
% to NAV9.316.636.465.605.325.033.843.223.212.58
51.20
Goi - 6.19% (16/09/2034)Goi - 7.26% (14/01/2029)Goi - 6.57% (05/12/2033)Sdl Maharashtra 7.33% (13/09/2027) Non-Convertible Debentures/Bonds09.15 % Green Infra Wind Energy Ltd. (Sembcorp Group)06.92 % Indian Railways Finance Corporation Ltd.09.75 % Jamnagar Utilities & Power Pvt. Ltd. (Mukesh Ambani Group)09.05 % Punjab National Bank (Basel III Tier II Bonds)Rec Ltd. - Frb05.69 % Rec Ltd.06.40 % Jamnagar Utilities & Power Pvt. Ltd. (Mukesh Ambani Group)05.70 % Bajaj Housing Finance Ltd.07.70 % Tata Steel Ltd.Varanasi Sangam Expressway Pvt. Ltd. - Frb (Vinod Kumar Agarwal, Ajendra Kumar Agarwal, Purshottam Agarwal And Lokesh Builders Pvt Ltd.)07.95 % Sikka Ports And Terminals Ltd. (Mukesh Ambani Group)07.55 % Rec Ltd.07.13 % Nhpc Ltd.07.90 % INDIA INFRADEBT LTD. (ICICI Group)07.25 % Nuvoco Vistas Corporation Ltd.07.70 % Jamnagar Utilities & Power Pvt. Ltd. (Mukesh Ambani Group)07.00 % H.p.c.l.06.75 % Sikka Ports And Terminals Ltd. (Mukesh Ambani Group)08.23 % Housing & Urban Development Corporation Ltd.08.45 % Rec Ltd.Money Market InstrumentsCan Fin Homes Ltd. - CpAxis Bank Ltd. - CdCholamandalam Invt & Fin Co Ltd. - CpBahadur Chand Investments Pvt. Ltd. - Cp (Munjal Group)Panatone Finvest Ltd. (TATA Group) - CpMutual Fund UnitsTata Ultra Short Term Fund
29.9530.58
1.9813.57
37234.256572.933887.802729.16
2571.692502.932520.912468.40
2486.712233.142146.91
1579.89
1531.001031.73
611.16608.19516.89
508.45402.66
303.5020.20
19721.804980.174966.374895.912459.242420.115031.475031.47
SOVSOVSOVSOV
IND AACRISIL AAACRISIL AAA
CRISIL- AA+CRISIL AAACRISIL AAACRISIL AAA
CRISIL AAACARE AA+
IND AAA
CRISIL AAA
CRISIL AAAICRA AAA
CRISIL AAACRISIL AA
CRISIL AAA
CRISIL AAACRISIL AAA
ICRA AAACRISIL AAA
ICRA A1+CRISIL A1+CRISIL A1+
ICRA A1+CRISIL A1+
500000
210450
415000047500001250000
330000
80000
418127
445000
3900000300000770000
410000
1910000
521806
900000
395624
470000880000100000
1500000
4000000
8256.673823.372484.11
976.14467.8
197.01100.84
79.2152.11
2.501.160.75
0.30.140.060.030.020.02
Government SecuritiesGoi - 5.09% (13/04/2022)Goi - 5.63% (12/04/2026)Goi - 6.64% (16/06/2035)Goi - 7.27% (08/04/2026)Goi - 8.30% (02/07/2040)Goi - 8.13% (22/06/2045)Goi - 7.68% (15/12/2023)Sdl Tamilnadu 8.14% (27/05/2025)
SOVSOVSOVSOVSOVSOVSOVSOV
0.010.01
00
11.281.991.180.83
0.780.760.760.75
0.750.680.65
0.48
0.460.310.190.180.16
0.150.12
0.090.015.971.511.501.480.750.731.531.53
Past performance may or may not be sustained in the future. Returns greater than 1 year period are compounded annualized. Income Distribution cum capital withdrawals are assumed to be reinvested and bonus is adjusted. Load is not taken in to consideration. For SIP returns, monthly investment of equal amounts invested on the 1st day of every month has been considered.For scheme performance refer pages 55 - 69.*B: Benchmark, AB: Additional Benchmark; For Scheme Risk-O-Meter and Scheme Benchmark Risk-O-Meter please refer page number 70 of Factsheet.Source: MFI Explorer
75.29%
13.83%
10.88%
Company Name No. of SharesMarket Value
Rs. Lakhs% of
Assets
Tata Hybrid Equity Fund (An open ended hybrid scheme investing predominantly in equity & equity related instruments.)
VOLATILITY MEASURES^ FUND BENCHMARK
NAV
Direct - GrowthDirect - IDCWDirect - Monthly IDCWReg - GrowthReg - IDCWReg - Monthly IDCW
: 326.290992.861480.6450
300.607482.937472.1884
: : :
:
FUND SIZE
Rs. 3300.68 (Rs. in Cr.)
TURN OVERPortfolio Turnover (Total)Portfolio Turnover (Equity component only)
59.80%4.80%
MINIMUM INVESTMENT/MULTIPLES FOR NEW INVESTMENT
Rs. 5,000/- and in multiples of Re. 1/- thereafter.
ADDITIONAL INVESTMENT/MULTIPLES FOR EXISTING INVESTORS
Rs. 1,000/- and multiples of Re. 1/- thereafter. LOAD STRUCTURE
Entry Load : Not ApplicableExit Load :
Std. Dev (Annualised)Sharpe RatioPortfolio BetaR SquaredTreynorJenson
14.120.251.001.001.01
NA
16.690.191.120.970.79
-0.25^Risk-free rate based on the FBIL Overnight MIBOR rate of 3.6% as on Dec 31, 2021For calculation methodology please refer to Pg 71
1) On or before expiry of 365 days from the date of allotment: If the withdrawal amount or switched out amount is not more than 12% of the original cost of investment: NIL2) On or before expiry of 365 days from the date of allotment: If the withdrawal amount or switched out amount is more than 12% of the original cost of investment: 1%3) Redemption after expiry of 365 days from the date of allotment: NIL (w.e.f 5th November, 2018)
BENCHMARKCrisil Hybrid 35+65 - Aggressive Index
MONTHLY AVERAGE AUM
Rs. 3297.64 (Rs. in Cr.)
EXPENSE RATIO**DirectRegular
1.041.98
**Note: The rates specified are actual month end expenses charged as on Dec 31, 2021. The above ratio includes the Service tax on Investment Management Fees. The above ratio excludes, borrowing cost, wherever applicable.
Portfolio Macaulay DurationModified DurationAverage Maturity
: 2.00 Years1.90 Years2.41 Years
Total stock in Portfolio : 33
5.54%
::
:* Computed on the invested amount for debt portfolio.
Gross Yield to Maturity (For Debt Component)*- Including Net Current Assets
Name of the Instrument Ratings Market ValueRs. Lakhs
% to NAV
^ Exposure less than 1% has been clubbed under Other Equities
26.54%11.56%
8.17%7.67%
4.11%3.84%3.65%
3.22%2.56%2.41%2.39%
0.76%0.04%
0.00% 6.00% 12.00% 18.00% 24.00% 30.00%
Financial ServicesIT
Oil & GasConsumer Goods
AutomobileChemicals
ServicesTelecom
ConstructionCement & Cement Products
PharmaIndustrial Manufacturing
Consumer Services
7090
110130150170
Dec-18 Dec-19 Dec-20 Dec-21
Tata Hybrid Equity Fund - Reg - Growth Crisil Hybrid 35+65 - Aggressive Index

1 Year 3 Year 5 Year 7 Year 10 Year Since Inception
Equity & Equity Related TotalUnhedge PositionsAutoTata Motors Ltd.Mahindra & Mahindra Ltd.BanksICICI Bank Ltd.HDFC Bank Ltd.State Bank Of IndiaCement & Cement ProductsJ K Cement Ltd.Ultratech Cement Ltd.Birla Corporation Ltd.ChemicalsAtul Ltd.ConstructionDlf Ltd.Construction ProjectLarsen & Toubro Ltd.Consumer DurablesVoltas Ltd.Titan Company Ltd.Consumer Non DurablesHindustan Unilever Ltd.Tata Consumer Products Ltd.Ferrous MetalsJsw Steel Ltd.Steel Authority India Ltd.FinanceHousing Development Finance Corporation Ltd.Cholamandalam Investment & Finance Co Ltd.Industrial ProductsBharat Forge Ltd.InsuranceSbi Life Insurance Company Ltd.Leisure ServicesJubilant Foodworks Ltd.Petroleum ProductsReliance Industries Ltd.PharmaceuticalsDivi Laboratories Ltd.Sun Pharmaceutical Industries Ltd.Ipca Laboratories Ltd.PowerTorrent Power Ltd.Tata Power Company Ltd.Power Grid Corporation Of India Ltd.NTPC Ltd.SoftwareInfosys Ltd.Tata Consultancy Services Ltd.Larsen & Toubro Infotech Ltd.HCL Technologies Ltd.Telecom - ServicesBharti Airtel Ltd.Bharti Airtel Ltd. (Right 14/10/2021) (Partly Paid)Nifty 50 - January 2022 Future
www.tatamutualfund.com TATA MUTUAL FUNDMutual Fund investments are subject to market risks, read all scheme related documents carefully
* Computed on the invested amount for debt portfolio.
Please refer to our Tata Mutual Fund website for fundamental changes, wherever applicable
VOLATILITY MEASURES^ FUND BENCHMARK
31
As on 31st December 2021
INVESTMENT STYLE
INVESTMENT OBJECTIVE
DATE OF ALLOTMENT
April 27, 2000
FUND MANAGER
NAV
Monthly IDCWGrowthPeriodic IDCWDirect - GrowthDirect - Monthly IDCWDirect - Periodic IDCW
15.165841.157819.726745.128517.656222.0595
FUND SIZE
Rs. 133.12 (Rs. in Cr.)
MINIMUM INVESTMENT/MULTIPLES FOR NEW INVESTMENT
ADDITIONAL INVESTMENT/MULTIPLES FOR EXISTING INVESTORS
Rs. 1,000/- and multiples of Re. 1/- thereafter.
LOAD STRUCTURE
Entry Load : Not Applicable
Exit Load :
PORTFOLIO% toNAVCompany name
Predominantly investing in equity and equity related instruments, equity arbitrage opportunities and debt and money market instruments.
The investment objective of the scheme is to provide long term capital appreciation and income distribution to the investors by predominantly investing in equity and equity related instruments, equity arbitrage opportunities and investments in debt and money market instruments. However, there is no assurance or guarantee that the investment objective of the Scheme will be achieved. The scheme does not assure or guarantee any returns.
Sailesh Jain (Managing Since 9-Nov-18 and overall experience of 19 years) (for equity portfolio) & Murthy Nagarajan (Managing since 1-Apr-17 and overall experience of 25 years) (for Debt Portfolio)
::::::
Std. Dev (Annualised)Sharpe RatioPortfolio BetaR SquaredTreynorJenson
7.770.271.001.000.60
NA
7.250.210.920.970.48
-0.11
^Risk-free rate based on the FBIL Overnight MIBOR rate of 3.6% as on Dec 31, 2021
Growth Option: Rs 5,000/- and in multiple of Re.1/- thereafterIDCW Option : Rs 5,000/- and in multiple of Re.1/- thereafter
For calculation methodology please refer Pg 71
1) Redemption/Switch-out/SWP/STP on or before expiry of 90 days from the date of allotment: If the withdrawal amount or switched out amount is not more than 12% of the original cost of investment - NIL2) Redemption/Switch-out/SWP/STP on or before expiry of 90 days from the date of allotment: If the withdrawal amount or switched out amount is more than 12% of the original cost of investment - 0.25%3) Redemption/Switch-out/SWP/STP after expiry of 90 days from the date of allotment - NIL(w.e.f. 03 June, 2019)
Portfolio Macaulay DurationModified DurationAverage Maturity
Gross Yield to Maturity (For Debt Component)*- Including Net Current Assets
:::
:
0.84 Years0.81 Years0.89 Years
70.3636.22
0.760.50
3.773.490.71
0.530.460.30
0.64
0.98
0.81
0.840.76
0.830.55
0.250.24
2.140.70
0.61
0.73
0.31
3.20
0.930.510.33
0.670.330.310.27
3.971.830.720.57
0.920.030.72
Total stock in Portfolio 45:
BENCHMARK
NIFTY Equity Savings Index
MONTHLY AVERAGE AUM
Rs. 130.19 (Rs. in Cr.)
TURN OVER
Portfolio Turnover (Total) Portfolio Turnover (Equity component only)
779.84%178.35%
EXPENSE RATIO**DirectRegular
1.312.41
**Note: The rates specified are actual month end expenses charged as on Dec 31, 2021. The above ratio includes the Service tax on Investment Management Fees. The above ratio excludes, borrowing cost, wherever applicable.
Tata Equity Savings Fund (An open-ended scheme investing in equity, arbitrage and debt)
SIP - If you had invested INR 10000 every month
Total Amount Invested (Rs.)Total Value as on Dec 31, 2021 (Rs.)ReturnsTotal Value of B: NIFTY Equity Savings IndexB: NIFTY Equity Savings IndexTotal Value of AB: CRISIL 10 Year Gilt IndexAB: CRISIL 10 Year Gilt Index(Inception date :27-Apr-2000) (First Installment date : 01-May-2000)
120,000126,128
9.58%126,49310.16%
121,0401.61%
360,000423,26710.80%
433,78812.48%
387,0964.77%
600,000741,883
8.42%785,61610.72%
696,8465.92%
840,0001,100,101
7.58%1,201,678
10.06%1,050,620
6.29%
1,200,0001,748,005
7.30%2,012,123
9.97%1,702,320
6.80%
2,600,0005,858,004
6.90%4,709,772
9.42%4,966,348
6.50%
For scheme performance refer pages 55 - 69.*B: Benchmark; AB: Additional Benchmark; For Scheme Risk-O-Meter and Scheme Benchmark Risk-O-Meter please refer page number 70 of Factsheet.Source: MFI Explorer
Past performance may or may not be sustained in the future. Returns greater than 1 year period are compounded annualized. Income Distribution cum capital withdrawals are assumed to be reinvested and bonus is adjusted. Load is not taken in to consideration. For SIP returns, monthly investment of equal amounts invested on the 1st day of every month has been considered.
4.32%
-34.27
-3.94
-3.70
-3.66
-2.89
-2.89
-2.74
-2.56
-2.35
-2.32
-2.08
-1.95
-1.27
-1.16
-0.76
34.143.95
3.69
3.63
2.88
2.88
2.73
2.55
2.33
2.32
2.07
1.94
1.27
1.15
0.75
Hedge PositionsHCL Technologies Ltd.HCL Technologies Ltd.- FutureTata Consumer Products Ltd.Tata Consumer Products Ltd.- FutureAdani Ports And Special Economic Zone Ltd.Adani Ports And Special Economic Zone Ltd.- FutureDivi Laboratories Ltd.Divi Laboratories Ltd.- FutureITC Ltd.ITC Ltd.- FutureTata Steel Ltd.Tata Steel Ltd.- FutureHindustan Unilever Ltd.Hindustan Unilever Ltd.- FutureUpl Ltd.Upl Ltd.- FutureTata Consultancy Services Ltd.Tata Consultancy Services Ltd.- FutureAurobindo Pharma Ltd.Aurobindo Pharma Ltd.- FutureKotak Mahindra Bank Ltd.Kotak Mahindra Bank Ltd.- FutureUnited Spirits Ltd.United Spirits Ltd.- FutureAmbuja Cements Ltd.Ambuja Cements Ltd.- FutureGrasim Industries Ltd.Grasim Industries Ltd.- Future
Market Capitalisation wise Exposure (Equity component only)
Large Cap
Mid Cap
Small Cap
Market Capitalisation is as per list provided by AMFI.
Top 10 Holdings Equity Sector Allocation
NAV Movement
Issuer NameInfosys Ltd.ICICI Bank Ltd.HDFC Bank Ltd.Reliance Industries Ltd.Housing Development Finance Corporation Ltd.Tata Consultancy Services Ltd.Dlf Ltd.Divi Laboratories Ltd.Bharti Airtel Ltd.Voltas Ltd.Total
% to NAV3.973.773.493.202.141.830.980.930.920.84
22.07
86.99%
12.17%
0.85%
Company name % toNAV
% to NAVDerivative
Name of the Instrument Ratings % toNAV
Debt InstrumentsGovernment SecuritiesGOI - 8.08% (02/08/2022)GOI - 8.15% (11/06/2022)GOI - 7.37% (16/04/2023)GOI - 8.13% (21/09/2022)GOI - 5.09% (13/04/2022)GOI - 7.32% (28/01/2024)GOI - 6.84% (19/12/2022)Non-Convertible Debentures/Bonds09.75 % Jamnagar Utilities & Power Pvt. Ltd. (Mukesh Ambani Group)06.40 % Nabard
17.673.843.822.332.312.261.571.545.634.10
1.53
SOVSOVSOVSOVSOVSOVSOV
CRISIL AAA
CRISIL AAA
RepoPortfolio TotalNet Current LiabilitiesNet Assets
6.78100.46
-0.46100.00
13.48%13.38%13.36%
6.72%3.63%
3.22%3.20%3.19%
2.33%1.79%
1.57%1.26%
0.96%0.64%0.61%
0.31%
0.00% 4.00% 8.00% 12.00% 16.00%
Financial ServicesConsumer Goods
ITPharma
ServicesMetals
Oil & GasCement & Cement Products
Fertilisers & PesticidesConstruction
PowerAutomobile
TelecomChemicals
Industrial ManufacturingConsumer Services
90100110120130140
Dec-18 Dec-19 Dec-20 Dec-21
Tata Equity Savings Fund - Reg - Mthly IDCWNIFTY Equity Savings Index

www.tatamutualfund.com TATA MUTUAL FUNDMutual Fund investments are subject to market risks, read all scheme related documents carefully
% toNAV
Company name
68.8544.13
0.570.520.44
2.661.771.730.72
0.42
0.860.590.59
0.680.260.22
1.55
0.480.480.32
0.820.590.580.330.280.23
0.38
0.58
1.180.42
0.370.31
0.71
0.620.32
0.550.210.13
0.530.41
0.850.32
0.43
2.410.61
0.950.850.730.60
0.890.750.510.440.44
2.111.311.110.84
1.810.05
0.241.47
Equity & Equity Related TotalUnhedge PositionsAutoTata Motors Ltd.Eicher Motors Ltd.Mahindra & Mahindra Ltd.BanksICICI Bank Ltd.HDFC Bank Ltd.State Bank Of IndiaAxis Bank Ltd.Capital MarketsHDFC Asset Management Company Ltd.Cement & Cement ProductsGrasim Industries Ltd.Ultratech Cement Ltd.ACC Ltd.ConstructionDlf Ltd.Godrej Properties Ltd.Knr Constructions Ltd.Construction ProjectLarsen & Toubro Ltd.Consumer DurablesCrompton Greaves Consumer Electricals Ltd.Bata India Ltd.Amber Enterprises India Ltd.Consumer Non DurablesITC Ltd.Marico Ltd.Hindustan Unilever Ltd.Akzo Nobel India Ltd.Varun Beverages Ltd.3M India Ltd.Ferrous MetalsTata Steel Ltd.FertilisersCoromandel International Ltd.FinanceHousing Development Finance Corporation Ltd.IDFC Ltd.GasMahanagar Gas Ltd.Gujarat State Petronet Ltd.Healthcare ServicesApollo Hospitals Enterprise Ltd.Industrial Capital GoodsAbb India Ltd.Siemens Ltd.Industrial ProductsCummins India Ltd.Polycab India Ltd.Supreme Industries Ltd.InsuranceICICI Lombard General Insurance Co. Ltd.ICICI Prudential Life Insurance Company Ltd.Non - Ferrous MetalsHindalco Industries Ltd.National Aluminium Co. Ltd.PesticidesPi Industries Ltd.Petroleum ProductsReliance Industries Ltd.Bharat Petroleum Corporation Ltd.PharmaceuticalsCipla Ltd.Sun Pharmaceutical Industries Ltd.Dr Reddys Laboratories Ltd.Divi Laboratories Ltd.PowerPower Grid Corporation Of India Ltd.NTPC Ltd.Tata Power Company Ltd.Cesc Ltd.Kec International Ltd.SoftwareInfosys Ltd.Tata Consultancy Services Ltd.HCL Technologies Ltd.Tech Mahindra Ltd.Telecom - ServicesBharti Airtel Ltd.Bharti Airtel Ltd. (Right 14/10/2021) (Partly Paid)TransportationAdani Ports And Special Economic Zone Ltd.Bank Nifty January 2022 Future
Please refer to our Tata Mutual Fund website for fundamental changes, wherever applicable
32
As on 31st December 2021
INVESTMENT STYLE
INVESTMENT OBJECTIVE
DATE OF ALLOTMENTJanuary 28,2019
FUND MANAGER
PORTFOLIO
Dynamically investing in equity and equity related instruments, equity arbitrage opportunities and debt and money market instruments.
The investment objective of the Scheme is to provide capital appreciation and income distribution to the investors by using equity derivatives strategies, arbitrage opportunities and pure equity investments. However, there is no assurance or guarantee that the investment objective of the Scheme will be achieved. The scheme does not assure or guarantee any returns.
Rahul Singh (Managing Since 09-Jan-19 and overall experience of 26 years), Sailesh Jain (Managing Since 09-Jan-19 and overall experience of 19 years), Akhil Mittal (Managing Since 09-Jan-19 and overall experience of 20 years)
Tata Balanced Advantage Fund(An open ended dynamic asset allocation fund.)
VOLATILITY MEASURES^ FUND BENCHMARK
NAVDirect - IDCWDirect - GrowthRegular - IDCWRegular - Growth
15.296715.296714.526814.5268
::::
FUND SIZERs. 4196.42 (Rs. in Cr.)
TURN OVERPortfolio Turnover (Total)Portfolio Turnover (Equity component only)
452.07%57.48%
MINIMUM INVESTMENT/MULTIPLES FOR NEW INVESTMENT
Rs. 5,000/- and in multiples of Re. 1/- thereafter.
ADDITIONAL INVESTMENT/MULTIPLES FOR EXISTING INVESTORSRs. 1,000/- and in multiples of Re. 1/- thereafter.
LOAD STRUCTURE
Entry Load : Not Applicable
Exit Load :
Std. Dev (Annualised)Sharpe RatioPortfolio BetaR SquaredTreynorJenson
10.870.301.001.000.95
NA
11.110.261.020.950.80
-0.14^Risk-free rate based on the FBIL Overnight MIBOR rate of 3.6% as on Dec 31, 2021For calculation methodology please refer to Pg 71
1) Redemption/Switch-out/SWP/STP on orbefore expiry of 365 days from the date of allotment: If the withdrawal amount or switched out amount is not more than 12% of the original cost of investment - NIL. 2) Redemption/Switch-out/SWP/STP on or before expiry of 365 days from the date of allotment: If the withdrawal amount or switched out amount is more than 12% of the original cost of investment - 1%.3) Redemption / Switch-out/SWP/STP after expiry of 365 days from the date of allotment - NIL. (w.e.f. 03 June, 2019)
BENCHMARKCRISIL Hybrid 50+50 - Moderate Index
MONTHLY AVERAGE AUMRs. 4099.16 (Rs. in Cr.)
EXPENSE RATIO**DirectRegular
0.291.95
**Note: The rates specified are actual month end expenses charged as on Dec 31, 2021. The above ratio includes the Service tax on Investment Management Fees. The above ratio excludes, borrowing cost, wherever applicable.
Portfolio Macaulay DurationModified DurationAverage Maturity
Total stock in Portfolio
: 1.52 Years1.45 Years1.65 Years
4.98%
70
::
:* Computed on the invested amount for debt portfolio.
Gross Yield to Maturity (For Debt Component)*- Including Net Current Assets
8.643.431.440.980.610.480.380.360.350.250.240.120.00
SOVSOVSOVSOVSOVSOVSOVSOVSOVSOVSOVSOV
Debt InstrumentsGovernment SecuritiesGoi - 5.63% (12/04/2026)Goi 8.20% (15/02/2022)Goi - 7.16% (20/05/2023)Goi 8.35% 14/5/2022Goi - 3.96% (09/11/2022)Goi - 7.68% (15/12/2023)Goi - 8.15% (11/06/2022)Goi - 5.22% (15/06/2025)Sdl Maharashtra 8.62% (20/02/2023)Goi - 8.13% (21/09/2022)Goi - 6.97% (06/09/2026)Goi - 5.77% (03/08/2030)
Name Of The Instrument Ratings
0.600.60
REITSBrookfield India Real Estate Trust
2523.912523.91
% To Nav
Name Of The Instrument Market Value(Rs. Lacs) % To Nav
Hedge PositionsSun Pharmaceutical Industries Ltd.Sun Pharmaceutical Industries Ltd.- FutureTata Consultancy Services Ltd.Tata Consultancy Services Ltd.- FutureTata Steel Ltd.Tata Steel Ltd.- FutureITC Ltd.ITC Ltd.- FutureAxis Bank Ltd.Axis Bank Ltd.- FutureDivi Laboratories Ltd.Divi Laboratories Ltd.- FutureState Bank Of India.State Bank Of India.- FutureBajaj Auto Ltd.Bajaj Auto Ltd.- FutureGrasim Industries Ltd.Grasim Industries Ltd.- FutureAsian Paints (India) Ltd.Asian Paints (India) Ltd.- FutureUltratech Cement Ltd.Ultratech Cement Ltd.- FutureHCL Technologies Ltd.HCL Technologies Ltd.- FutureTata Power Company Ltd.Tata Power Company Ltd.- FutureTata Consumer Products Ltd.Tata Consumer Products Ltd.- FutureApollo Hospitals Enterprise Ltd.Apollo Hospitals Enterprise Ltd.- FutureUnited Spirits Ltd.United Spirits Ltd.- FutureACC Ltd.ACC Ltd.- FutureAdani Ports And Special Economic Zone Ltd.Adani Ports And Special Economic Zone Ltd.- FutureEicher Motors Ltd.Eicher Motors Ltd.- FutureAmbuja Cements Ltd.Ambuja Cements Ltd.- FutureDabur India Ltd.Dabur India Ltd.- FutureKotak Mahindra Bank Ltd.Kotak Mahindra Bank Ltd.- FutureHero Motocorp Ltd.Hero Motocorp Ltd.- FutureLupin Ltd.Lupin Ltd.- FutureSbi Life Insurance Company Ltd.Sbi Life Insurance Company Ltd.- FutureMahindra & Mahindra Ltd.Mahindra & Mahindra Ltd.- FutureBharat Petroleum Corporation Ltd.Bharat Petroleum Corporation Ltd.- FutureHindustan Unilever Ltd.Hindustan Unilever Ltd.- FutureLarsen & Toubro Ltd.Larsen & Toubro Ltd.- FutureTitan Company Ltd.Titan Company Ltd.- FutureBharti Airtel Ltd.Bharti Airtel Ltd.- FutureReliance Industries Ltd.Reliance Industries Ltd.- FutureHousing Development Finance Corporation Ltd.Housing Development Finance Corporation Ltd.- Future
Company name
24.721.58
1.55
1.48
1.46
1.45
1.27
1.25
1.23
1.23
1.12
1.00
0.87
0.86
0.83
0.79
0.76
0.68
0.66
0.57
0.54
0.49
0.44
0.41
0.41
0.35
0.35
0.28
0.28
0.17
0.16
0.11
0.05
0.04
-24.81
-1.58
-1.55
-1.49
-1.46
-1.46
-1.27
-1.25
-1.23
-1.24
-1.13
-1.01
-0.87
-0.86
-0.83
-0.79
-0.77
-0.69
-0.66
-0.57
-0.54
-0.49
-0.44
-0.41
-0.42
-0.36
-0.35
-0.28
-0.28
-0.17
-0.16
-0.11
-0.05
-0.04
% toNAV
% to NAVDerivatives

www.tatamutualfund.com TATA MUTUAL FUNDMutual Fund investments are subject to market risks, read all scheme related documents carefully 33
Tata Balanced Advantage Fund(An open ended dynamic asset allocation fund.)
SIP - If you had invested INR 10000 every month
1 Year 3 Year 5 Year 7 Year 10 Year Since Inception
Total Amount Invested (Rs.)
Total Value as on Dec 31, 2021 (Rs.)
Returns
Total Value of B: CRISIL Hybrid 50+50 - Moderate Index
B: CRISIL Hybrid 50+50 - Moderate Index
Total Value of AB: S&P BSE Sensex TRI
AB: S&P BSE Sensex TRI
(Inception date :28-Jan-2019) (First Installment date : 01-Feb-2019)
120,000
128,344
13.11%
128,844
13.92%
133,372
21.25%
NA
NA
NA
NA
NA
NA
NA
NA
NA
NA
NA
NA
NA
NA
NA
NA
NA
NA
NA
NA
NA
NA
NA
NA
NA
NA
NA
NA
350,000
444,830
16.68%
451,015
17.69%
498,500
25.12%
Past performance may or may not be sustained in the future. Returns greater than 1 year period are compounded annualized. Income Distribution cum capital withdrawals are assumed to be reinvested and bonus is adjusted. Load is not taken in to consideration. For SIP returns, monthly investment of equal amounts invested on the 1st day of every month has been considered.For scheme performance refer pages 55 - 69.*B: Benchmark: **AB: Additional Benchmark; For Scheme Risk-O-Meter and Scheme Benchmark Risk-O-Meter please refer page number 70 of Factsheet.Source: MFI Explorer
Market Capitalisation wise Exposure (Equity component only)
Market Capitalisation is as per list provided by AMFI.
V
Top 10 Holdings Equity Sector Allocation
NAV Movement
Large Cap
Mid Cap
Small Cap
Issuer Name
ICICI Bank Ltd.
Reliance Industries Ltd.
Infosys Ltd.
Bharti Airtel Ltd.
HDFC Bank Ltd.
State Bank Of India
Larsen & Toubro Ltd.
Tata Consultancy Services Ltd.
Housing Development Finance Corporation Ltd.
HCL Technologies Ltd.
Total
% to NAV
2.66
2.41
2.11
1.81
1.77
1.73
1.55
1.31
1.18
1.11
17.64
81.83%
12.21%
5.95%
Treps
Repo
Portfolio Total
Net Current Liabilities
Net Assets
12497.61
2104.86
427113.95
-7471.83
419642.12
2.98
0.50
101.75
-1.75
100.00
Name of the Instrument Name of the Instrument Ratings % to NAV
Non-convertible Debentures/bonds/zcb05.00 % Nabard06.40 % Jamnagar Utilities & Power Pvt. Ltd. (Mukesh Ambani Group)07.15 % Muthoot Finance Ltd.08.30 % Muthoot Finance Ltd.06.44 % Indian Oil Corp Ltd.05.69 % Rec Ltd.08.20 % Power Finance Corporation06.83 % Power Finance Corporation06.92 % Rec Ltd.04.23 % HDFC Ltd.05.84 % Tata Capital Financial Services Ltd.05.35 % Telesonic Networks Ltd. (Bharti Group)06.45 % L&t Finance Ltd.05.70 % Nabard05.14 % NabardVaranasi Sangam Expressway Pvt. Ltd. - Frb (Vinod Kumar Agarwal, Ajendra Kumar Agarwal, Purshottam Agarwal And Lokesh Builders Pvt Ltd.)09.25 % Tata Capital Financial Services Ltd.07.70 % Bajaj Finance Ltd.Power Finance Corporation - Frb06.80 % H.p.c.l.04.71 % HDFC Ltd.Sundaram Fin Ltd. - Zcb06.50 % Nabard07.04 % Power Finance Corporation06.49 % Yarrow Infrastructure Pvt Ltd. (Vector Green)07.65 % Jamnagar Utilities & Power Pvt. Ltd. (Mukesh Ambani Group)07.55 % Rec Ltd.10.21 % Bajaj Finance Ltd.07.13 % Nhpc Ltd.07.00 % HDFC Ltd.05.32 % National Housing Bank06.49 % Sepset Construction Ltd.
15.961.791.180.970.850.730.720.640.610.610.600.600.600.600.590.590.58
0.380.370.360.360.350.260.240.240.230.120.120.120.120.120.120.07
CRISIL AAACRISIL AAA
CRISIL AA+CRISIL AA+CRISIL AAACRISIL AAACRISIL AAACRISIL AAACRISIL AAACRISIL AAACRISIL AAA
CRISIL AA+CRISIL AAACRISIL AAACRISIL AAA
IND AAA
CRISIL AAACRISIL AAACRISIL AAACRISIL AAACRISIL AAACRISIL AAACRISIL AAACRISIL AAACRISIL AAACRISIL AAACRISIL AAACRISIL AAA
ICRA AAACRISIL AAACRISIL AAACRISIL AAA
06.49 % Citra Real Estate Ltd. (Vector Green)06.65 % Motherson Sumi Systems Ltd.07.35 % Power Finance CorporationMoney Market InstrumentsAxis Bank Ltd. - CdIndusind Bank Ltd. - CdPanatone Finvest Ltd. - Cp (TATA Group)Treasury Bill 364 Days (27/01/2022)
0.050.050.022.000.590.590.580.24
CRISIL AAAIND AAA
CRISIL AAA
CRISIL A1+CRISIL A1+CRISIL A1+SOVRN SOV
Ratings % to NAV
2.182.180.040.04
9152.479152.47150.00150.00
Tata Ultra Short Term FundOTHERS TOTALMargin Money DepositHDFC Bank Ltd.
Name Of The Instrument Mkt Val (Rs. Lacs) % to Nav
13.38%9.21%
7.80%6.38%
5.50%4.09%4.04%3.90%
3.04%2.88%
1.97%1.83%
1.50%1.00%0.90%
0.00% 4.00% 8.00% 12.00% 16.00%
Financial ServicesConsumer Goods
ITPharma
Cement & Cement ProductsAutomobile
Oil & GasPowerMetals
ConstructionTelecom
Industrial ManufacturingHealthcare Services
Fertilisers & PesticidesServices
8096
112128144160
Jan-19 Jan-20 Jan-21 Dec-21
Tata Balanced Advantage Fund - Reg - GrowthCRISIL Hybrid 50+50 - Moderate Index

Debt InstrumentsGovernment SecuritiesGoi - 6.84% (19/12/2022)Goi - 5.09% (13/04/2022)Goi - 8.08% (02/08/2022)Goi - 8.15% (11/06/2022)Goi 8.35% 14/5/2022Goi - 3.96% (09/11/2022)Goi - 8.13% (21/09/2022)Goi 8.20% (15/02/2022)Goi - 7.37% (16/04/2023) Goi - 4.48% (02/11/2023)Goi - 7.16% (20/05/2023)Goi - 4.26% (17/05/2023)Goi - 8.83% (25/11/2023)Goi - 7.32% (28/01/2024)Goi 6.30% 9/4/2023Non-convertible Debentures/bonds04.95 % HDFC Ltd.07.67 % L&t Finance Ltd.07.18 % Nabard08.60 % Nabard04.50 % HDFC Ltd.07.00 % HDFC Ltd.07.61 % Housing & Urban Development Corporation Ltd.08.60 % LIC Housing Finance Ltd.07.39 % LIC Housing Finance Ltd.07.62 % Housing & Urban Development Corporation Ltd.07.90 % India Infradebt Ltd. (ICICI Group)08.45 % Sikka Ports And Terminals Ltd.Money Market InstrumentsStandard Chartered Capital Ltd. (erstwhile Stdchtd Inv & Loans (india) Ltd.) - CpTreasury Bill 364 Days (06/01/2022)Treasury Bill 364 Days (30/03/2022)Treasury Bill 364 Days (24/03/2022)Treasury Bill 364 Days (17/03/2022)Treasury Bill 364 Days (03/02/2022)Treasury Bill 364 Days (10/02/2022)Treasury Bill 364 Days (13/01/2022)Treasury Bill 364 Days (24/02/2022)
www.tatamutualfund.com TATA MUTUAL FUNDMutual Fund investments are subject to market risks, read all scheme related documents carefully
Equity & Equity Related TotalHedge PositionsAxis Bank Ltd.Tata Steel Ltd.ITC Ltd.Hindustan Unilever Ltd.Tata Consultancy Services Ltd.Bajaj Auto Ltd.Apollo Hospitals Enterprise Ltd.Adani Ports And Special Economic Zone Ltd.Adani Enterprises Ltd.Grasim Industries Ltd.Reliance Industries Ltd.Divi Laboratories Ltd.Tata Consumer Products Ltd.HCL Technologies Ltd.State Bank Of IndiaBajaj Finserv Ltd.Aurobindo Pharma Ltd.Info Edge (India) Ltd.Sun Pharmaceutical Industries Ltd.Kotak Mahindra Bank Ltd.Upl Ltd.Housing Development Finance Corporation Ltd.Asian Paints (India) Ltd.Hero Motocorp Ltd.Tata Power Company Ltd.Eicher Motors Ltd.Zee Entertainment Enterprises Ltd.ICICI Bank Ltd.Ambuja Cements Ltd.Bharti Airtel Ltd.Larsen & Toubro Infotech Ltd.Dabur India Ltd.Larsen & Toubro Ltd.Infosys Ltd.United Spirits Ltd.Jsw Steel Ltd.Marico Ltd.HDFC Asset Management Company Ltd.NMDC Ltd.Ipca Laboratories Ltd.Rec Ltd.Escorts Ltd.Siemens Ltd.Federal Bank Ltd.Jubilant Foodworks Ltd.Steel Authority India Ltd.Godrej Properties Ltd.Godrej Consumer Products Ltd.Colgate-Palmolive India Ltd.Lupin Ltd.National Aluminium Co. Ltd.Container Corporation Of India Ltd.Balkrishna Industries Ltd.Pidilite Industries Ltd.Deepak Nitrite Ltd.Ultratech Cement Ltd.Jindal Steel & Power Ltd.Berger Paints India Ltd.Titan Company Ltd.Shree Cement Ltd.Dlf Ltd.Cadila Healthcare Ltd.Coal India Ltd.Bharat Electronics Ltd.Bajaj Finance Ltd.Dr Reddys Laboratories Ltd.ACC Ltd.Cholamandalam Investment & Finance Co Ltd.ICICI Lombard General Insurance Co. Ltd.Indian Energy Exchange Ltd.Bank Of BarodaBharat Heavy Electricals Ltd.Tata Motors Ltd.Glenmark Pharmaceuticals Ltd.HDFC Life Insurance Co. Ltd.Indian Railway Catering And Tourism Corporation Ltd.Muthoot Finance Ltd.ICICI Prudential Life Insurance Company Ltd.Pi Industries Ltd.Mahanagar Gas Ltd.Trent Ltd.Canara BankLIC Housing Finance Ltd.Granules India Ltd.Bandhan Bank Ltd.Shriram Transport Finance Co Ltd.Biocon Ltd.L&T Technology Services Ltd.Alkem Laboratories Ltd.Punjab National BankHavells India Ltd.Gail ( India ) Ltd.Vodafone Idea Ltd.
68.19-68.54
-2.58-2.58-2.45-2.15-2.13-1.63-1.56-1.55-1.43-1.41-1.32-1.25-1.23-1.20-1.16-1.08-1.06-1.02-1.00-0.96-0.93-0.85-0.85-0.86-0.83-0.80-0.77-0.73-0.70-0.71-0.70-0.70-0.69-0.68-0.64-0.65-0.63-0.60-0.60-0.58-0.57-0.57-0.55-0.53-0.53-0.51-0.49-0.49-0.47-0.47-0.46-0.46-0.46-0.46-0.46-0.45-0.44-0.44-0.41-0.41-0.41-0.39-0.39-0.37-0.36-0.36-0.35-0.35-0.33-0.33-0.31-0.31-0.30-0.29-0.29-0.29-0.30-0.28-0.28-0.28-0.25-0.25-0.24-0.25-0.24-0.22-0.23-0.22-0.21-0.20-0.20-0.19-0.18
68.192.582.562.442.142.131.621.561.541.421.401.321.251.221.211.151.071.061.021.000.960.920.850.850.850.820.800.770.720.700.700.700.690.680.670.640.640.620.600.590.580.570.560.550.530.530.510.490.480.470.470.460.460.460.460.460.450.440.440.410.410.410.390.390.370.360.360.350.340.330.320.310.310.300.290.290.290.290.280.270.270.250.250.240.240.230.220.220.220.200.200.190.190.18
-0.18-0.18-0.17-0.16-0.15-0.15-0.15-0.14-0.13-0.13-0.13-0.12-0.12-0.11-0.12-0.11-0.11-0.11-0.10-0.10-0.10-0.09-0.09-0.08-0.08-0.08-0.08-0.08-0.07-0.07-0.07-0.07-0.06-0.06-0.06-0.05-0.05-0.05-0.04-0.04-0.04-0.03-0.02-0.02-0.02-0.01-0.01-0.01-0.010.000.00
0.180.170.170.160.150.150.150.140.130.130.130.120.120.110.110.110.110.110.100.100.100.090.090.080.080.080.080.080.070.070.070.070.060.060.060.050.050.050.040.040.040.030.020.020.020.010.010.010.010.000.00
Multi Commodity Exchange Of Ind Ltd.Britannia Industries Ltd.Amara Raja Batteries Ltd.MRF Ltd.Astral Ltd. (Erstwhile Astral Poly Technik Ltd.)Bharat Forge Ltd.Hindalco Industries Ltd.Exide Industries Ltd.Sun Tv Network Ltd.Mindtree Ltd.Tata Chemicals Ltd.Page Industries Ltd.Persistent Systems Ltd.Sbi Cards And Payment Services Ltd.Indiabulls Housing Finance Ltd.Indian Oil Corporation Ltd.Laurus Labs Ltd.Ashok Leyland Ltd.Mahindra And Mahindra Financial Services Ltd.Mphasis Ltd.Indus Towers Ltd.Aditya Birla Fashion & Retail Ltd.Dixon Technologies (India) Ltd.L&T Finance Holdings Ltd.Oracle Financials Services Soft Ltd.IDFC First Bank Ltd.Indusind Bank Ltd.Tech Mahindra Ltd.Manappuram Finance Ltd.Interglobe Aviation Ltd.City Union Bank Ltd.Dr. Lal Path Labs Ltd.Can Fin Homes Ltd.Oil & Natural Gas Co.Mahindra & Mahindra Ltd.Indian Hotels Co. Ltd.Indiamart Intermesh Ltd.Vedanta Ltd.Sbi Life Insurance Company Ltd.Nestle India Ltd.Power Finance Corporation Ltd.Indraprastha Gas Ltd.Apollo Tyres Ltd.Au Small Finance Bank Ltd.Cipla Ltd.Petronet Lng Ltd.Bata India Ltd.Wipro Ltd.Srf Ltd.Torrent Pharmaceuticals Ltd.Pvr Ltd.
Company name Company name % toNAV
% to NAVDerivative
Name of the Instrument Ratings % toNAV
11.151.521.241.241.241.141.030.990.770.480.360.320.310.240.220.052.150.450.230.230.230.220.180.140.140.140.09
0.050.053.470.89
0.760.620.360.220.180.180.130.13
Portfolio Macauley DurationModified DurationAverage Maturity
: 0.49 Years0.48 Years0.50 Years
4.16%
::
:* Computed on the invested amount for debt portfolio.
Gross Yield to Maturity (For Debt Component)*- Including Net Current Assets
Please refer to our Tata Mutual Fund website for fundamental changes, wherever applicable
34
As on 31st December 2021
INVESTMENT STYLE
INVESTMENT OBJECTIVE
DATE OF ALLOTMENTDecember 18,2018
FUND MANAGER
PORTFOLIO
The scheme invests in equity and equity related instruments that tries to take advantage of the difference in prices of a security in the cash segment and derivatives segment by turning market volatility to its advantage.
The investment objective of the Scheme is to seek to generate reasonable returns by investing predominantly in arbitrage opportunities in the cash and derivatives segments of the equity markets and by investing balance in debt and money market instruments. There is no assurance that the objective of the Scheme will be realised and the Scheme does not assure or guarantee any returns.
Sailesh Jain (Managing Since 10-Dec-18 and overall experience of 19 years)
Tata Arbitrage Fund(An open ended scheme investing in arbitrage opportunities.)
VOLATILITY MEASURES^ FUND BENCHMARK
NAVDirect - GrowthDirect - Monthly IDCWRegular - GrowthRegular - Monthly IDCW
11.867911.377011.597411.0877
::::
FUND SIZERs. 11118.88 (Rs. in Cr.)
TURN OVERPortfolio Turnover (Total) Portfolio Turnover (Equity component only)
1632.68%407.34%
MINIMUM INVESTMENT/MULTIPLES FOR NEW INVESTMENT
Rs. 5,000/- and in multiples of Re. 1/- thereafter.
ADDITIONAL INVESTMENT/MULTIPLES FOR EXISTING INVESTORSRs. 1,000/- and in multiples of Re. 1/- thereafter.
LOAD STRUCTURE
Entry Load : Not Applicable
Exit Load :
Std. Dev (Annualised)Sharpe RatioPortfolio BetaR SquaredTreynorJenson
0.940.231.001.000.06
NA
0.840.470.590.430.190.08
^Risk-free rate based on the FBIL Overnight MIBOR rate of 3.6% as on Dec 31, 2021
For calculation methodology please refer to Pg 71
0.25 % of the applicable NAV, if redeemed/switched out/withdrawn on or before expiry of 30 Days from the date of allotment.
BENCHMARKNifty 50 Arbitrage Index
MONTHLY AVERAGE AUMRs. 11368.93 (Rs. in Cr.)
EXPENSE RATIO**DirectRegular
0.321.09
**Note: The rates specified are actual month end expenses charged as on Dec 31, 2021. The above ratio includes the Service tax on Investment Management Fees. The above ratio excludes, borrowing cost, wherever applicable.
Total stock in Portfolio 144
SOVSOVSOVSOVSOVSOVSOVSOVSOVSOVSOVSOVSOVSOVSOV
CRISIL AAACRISIL AAACRISIL AAACRISIL AAACRISIL AAACRISIL AAA
ICRA AAACRISIL AAACRISIL AAA
ICRA AAA
CRISIL AAACRISIL AAA
CRISIL A1+
SOVRN SOVSOVRN SOVSOVRN SOVSOVRN SOVSOVRN SOVSOVRN SOVSOVRN SOVSOVRN SOV
% toNAV
% to NAVDerivative

www.tatamutualfund.com TATA MUTUAL FUNDMutual Fund investments are subject to market risks, read all scheme related documents carefully 35
Tata Arbitrage Fund(An open ended scheme investing in arbitrage opportunities.)
Name of the Instrument Market Value (Rs. Lacs)
% toNAV
Mutual FundTata Money Market FundTata Liquid FundTata Treasury Advantage FundMARGIN MONEY DEPOSITSFederal Bank Ltd.HDFC Bank Ltd.
11.146.552.572.021.040.510.53
123937.0072861.4828623.1822452.3411573.00
5700.005873.00
Past performance may or may not be sustained in the future. Returns greater than 1 year period are compounded annualized. Income Distribution cum capital withdrawals are assumed to be reinvested and bonus is adjusted. Load is not taken in to consideration. For SIP returns, monthly investment of equal amounts invested on the 1st day of every month has been considered. For scheme performance refer pages 55 - 69.*B: Benchmark; For Scheme Risk-O-Meter and Scheme Benchmark Risk-O-Meter please refer page number 70 of Factsheet.Source: MFI Explorer
Market Capitalisation wise Exposure
Large Cap
Mid Cap
Small Cap
Market Capitalisation is as per list provided by AMFI.
SIP - If you had invested INR 10000 every month
1 Year 3 Year 5 Year 7 Year 10 Year Since InceptionTotal Amount Invested (Rs.)Total Value as on Dec 31, 2021 (Rs.)ReturnsTotal Value of B: Nifty 50 Arbitrage IndexB: Nifty 50 Arbitrage IndexTotal Value of AB: CRISIL 1 Year T-Bill IndexAB: CRISIL 1 Year T-Bill Index(Inception date :18-Dec-2018) (First Installment date : 01-Jan-2019)
120,000122,359
3.66%122,531
3.93%122,183
3.38%
360,000384,482
4.32%381,050
3.72%386,080
4.59%
NANANANANANANA
NANANANANANANA
NANANANANANANA
360,000384,482
4.32%381,050
3.72%386,080
4.59%
Top 10 Holdings Equity Sector Allocation
NAV Movement
Issuer NameAxis Bank Ltd.Tata Steel Ltd.ITC Ltd.Hindustan Unilever Ltd.Tata Consultancy Services Ltd.Bajaj Auto Ltd.Apollo Hospitals Enterprise Ltd.Adani Ports & Special Economic Zone Ltd.Adani Enterprises Ltd.Grasim Industries Ltd.Total
% to NAV2.582.562.442.142.131.621.561.541.421.40
19.39
77.14%
20.49%
2.38%
TrepsRepoPortfolio TotalNet Current LiabilitiesNet Assets
2.150.95
100.24-0.24
100.00
23895.4910517.991114577-2689.051111888
13.72%10.91%
7.21%6.20%
5.45%5.26%
3.30%2.36%
1.99%1.99%
1.63%1.57%1.53%
1.20%1.06%0.99%0.90%0.82%
0.12%
0.00% 4.00% 8.00% 12.00% 16.00%
Financial ServicesConsumer Goods
MetalsPharma
ITAutomobile
Cement & Cement ProductsServices
Oil & GasConsumer ServicesHealthcare Services
ConstructionIndustrial Manufacturing
Fertilisers & PesticidesChemicals
TelecomMedia, Entertainment & Publication
PowerTextiles
100
104
108
112
116
120
Dec-18 Dec-19 Dec-20 Dec-21
Tata Arbitrage Fund - Reg - Growth Nifty 50 Arbitrage Index

Portfolio Macauley DurationModified DurationAverage Maturity
: 1.34 Years1.28 Years1.48 Years
4.11%
::
:* Computed on the invested amount for debt portfolio.
Gross Yield to Maturity (For Debt Component)*- Including Net Current Assets
Total stock in Portfolio 63
www.tatamutualfund.com TATA MUTUAL FUNDMutual Fund investments are subject to market risks, read all scheme related documents carefully
% ofAssets
Hedge PositionsUltratech Cement Ltd.Ultratech Cement Ltd.- FutureHousing Development Finance Corporation Ltd.Housing Development Finance Corporation Ltd.- FutureTata Consultancy Services Ltd.Tata Consultancy Services Ltd.- FutureBharti Airtel Ltd.Bharti Airtel Ltd.- FutureMaruti Suzuki India Ltd.Maruti Suzuki India Ltd.- FutureReliance Industries Ltd.Reliance Industries Ltd.- FutureState Bank Of India.State Bank Of India.- FutureJsw Steel Ltd.Jsw Steel Ltd.- FutureWipro Ltd.Wipro Ltd.- FutureInfosys Ltd.Infosys Ltd.- FutureHindustan Unilever Ltd.Hindustan Unilever Ltd.- FutureICICI Bank Ltd.ICICI Bank Ltd.- FutureLupin Ltd.Lupin Ltd.- FutureCOMMODITY & EXCHANGE TRADED COMMODITY DERIVATIVESCOMMODITIES PHYSICALSILVER (30 K COMMODITYALUMINIUM (5 MT-5000 GMS) COMMODITYGOLD MINI (100 GRAMS) COMMODITYLISTED ON COMMODITY EXCHANGES (Quantity In Lots)ALUMINIUM (5 MT-5000 GMS) COMMODITY - ALUMINIUMFMCXJAN2022CFUTCOTTON SEED OIL CAKE AKOLA (10 MT 100 QTLS) COMM - COCUDAKLFUNCXFEB2022CFUTCOTTON SEED OIL CAKE AKOLA (10 MT 100 QTLS) COMM - COCUDAKLFUNCXJAN2022CFUTCRUDE OIL (100 BARRELS) COMMODITY - CRUDEOILFUMCXFEB2022CFUTCRUDE OIL (100 BARRELS) COMMODITY - CRUDEOILFUMCXJAN2022CFUTGOLD (1 KG-1000 GMS) COMMODITY - GOLDFUTMCXFEB2022CFUTGOLD (1 KG-1000 GMS) COMMODITY - GOLDFUTMCXAPR2022CFUTGOLD (1 KG-1000 GMS) COMMODITY - GOLDFUTMCXAPR2022CFUTGOLD MINI (100 GRAMS) COMMODITY - GOLDMFUTMCXFEB2022CFUTMCXBULLDEX - MCXBULLDEXMCXFEB2022CFUTMCXBULLDEX - MCXBULLDEXMCXJAN2022CFUTMCXENRGDEXVMMCXFEB2022CFUT - MCXENRGDEXVMMCXFEB2022CFUTMCXMETDEX - MCXMETDEXMCXFEB2022CFUTMCXMETDEX - MCXMETDEXMCXJAN2022CFUTNATURAL GAS (1250 Mmbtu) COMMODITY - NATURALGAFMCXFEB2022CFUTNATURAL GAS (1250 Mmbtu) COMMODITY - NATURALGAFMCXJAN2022CFUTNICKEL (1500 KGS) COMMODITY - NICKELFUTMCXFEB2022CFUTNICKEL (1500 KGS) COMMODITY - NICKELFUTMCXJAN2022CFUTSILVER MICRO (1 KGS) COMMODITY - SILVERMICMCXFEB2022FUTSILVER (30 K COMMODITY - SILVERMCXMAR2022FUTSILVER (30 K COMMODITY - SILVERMCXMAR2022FUTSILVER (30 K COMMODITY - SILVERMCXMAY2022FUTSILVER MINI (5 KGS) COMMODITY - SILVERMMCXAPR2022FUT
-9.80
-1.79
-1.57
-1.13
-0.95
-0.86
-0.85
-0.50
-0.49
-0.46
-0.39
-0.33
-0.29
-0.19-8.31
-1.53
-0.08
-0.39-1.31
-0.19
-3.39-1.41
9.781.78
1.57
1.13
0.95
0.86
0.85
0.50
0.49
0.46
0.38
0.33
0.29
0.19
15.88
5.891.531.24
0.08
0.39
1.310.441.590.120.430.410.410.080.010.04
0.190.30
1.020.41
Company name
67.8858.10
0.06
0.76
3.942.712.411.000.860.47
0.62
1.150.930.29
0.52
0.990.83
1.86
0.66
0.800.750.440.41
0.47
0.64
1.770.65
0.45
1.21
0.810.770.65
0.760.640.47
0.650.64
0.46
0.860.63
0.66
3.660.44
1.080.850.85
1.081.050.760.650.63
0.46
3.161.831.450.970.58
2.140.11
0.27
0.43
Equity & Equity Related TotalUnhedge PositionsAerospace & DefenseData Patterns (India) Ltd.AutoMahindra & Mahindra Ltd.BanksICICI Bank Ltd.State Bank Of IndiaHDFC Bank Ltd.Axis Bank Ltd.Bank Of BarodaRbl Bank Ltd.Capital MarketsHDFC Asset Management Company Ltd.Cement & Cement ProductsUltratech Cement Ltd.ACC Ltd.Grasim Industries Ltd.ChemicalsNavin Fluorine International Ltd.ConstructionBrigade Enterprises Ltd.Dlf Ltd.Construction ProjectLarsen & Toubro Ltd.Consumer DurablesCrompton Greaves Consumer Electricals Ltd.Consumer Non DurablesITC Ltd.Marico Ltd.Akzo Nobel India Ltd.3M India Ltd.Ferrous MetalsTata Steel Ltd.FertilisersChambal Fertiliser & Chemicals Ltd.FinanceHousing Development Finance Corporation Ltd.Pnb Housing Finance Ltd.GasGujarat State Petronet Ltd.Healthcare ServicesApollo Hospitals Enterprise Ltd.Industrial Capital GoodsThermax Ltd.Abb India Ltd.Tega Industries Ltd.Industrial ProductsCummins India Ltd.Bharat Forge Ltd.Polycab India Ltd.InsuranceICICI Prudential Life Insurance Company Ltd.ICICI Lombard General Insurance Co. Ltd.Minerals/MiningNMDC Ltd.Non - Ferrous MetalsNational Aluminium Co. Ltd.Hindalco Industries Ltd.PesticidesPi Industries Ltd.Petroleum ProductsReliance Industries Ltd.Bharat Petroleum Corporation Ltd.PharmaceuticalsSun Pharmaceutical Industries Ltd.Dr Reddys Laboratories Ltd.Cipla Ltd.PowerPower Grid Corporation Of India Ltd.Tata Power Company Ltd.Kec International Ltd.NTPC Ltd.Cesc Ltd.RetailingFsn E Commerce Ventures Ltd.SoftwareInfosys Ltd.Tata Consultancy Services Ltd.HCL Technologies Ltd.Tech Mahindra Ltd.Mastek Ltd.Telecom - ServicesBharti Airtel Ltd.Bharti Airtel Ltd. (Right 14/10/2021) (Partly Paid)Textiles - SyntheticGanesha Ecosphere Ltd.TransportationAdani Ports And Special Economic Zone Ltd.
% toNAV
% to NAVDerivative
Company name
Please refer to our Tata Mutual Fund website for fundamental changes, wherever applicable
36
As on 31st December 2021
INVESTMENT STYLE
INVESTMENT OBJECTIVE
DATE OF ALLOTMENTMarch 04, 2020
FUND MANAGER
PORTFOLIO
Fund invests in a mix of equity and equity related instruments, Fixed Income and Commodities & Exchange traded Commodity derivatives.
The investment objective of the scheme is to generate long term capital appreciation. However, there is no assurance or guarantee that the investment objective of the Scheme will be achieved. The scheme does not assure or guarantee any returns.
Rahul Singh (Managing Since 12-Mar-20 and overall experience of 26 years), Sailesh Jain (Managing Since 12-Mar-20 and overall experience of 19 years), Murthy Nagarajan (Managing Since 12-Mar-20 and overall experience of 25 years) and Aurobinda Prasad Gaya
Tata Multi Asset Opportunities Fund(An Open Ended Scheme investing in equity, debt & exchange traded commodity derivatives)
VOLATILITY MEASURES^ FUND BENCHMARK
NAVDirect - IDCWDirect - GrowthRegular - IDCWRegular - Growth
15.897415.897415.365315.3653
::::
FUND SIZERs. 1213.10 (Rs. in Cr.)
TURN OVERPortfolio Turnover (Total) Portfolio Turnover (Equity component only)
514.15%17.47%
MINIMUM INVESTMENT/MULTIPLES FOR NEW INVESTMENT
Growth option: Rs 5,000/- and in multiple of Re.1/- thereafterIDCW (payout): Rs 5,000/- and in multiple of Re.1/- thereafter
ADDITIONAL INVESTMENT/MULTIPLES FOR EXISTING INVESTORSRs.1000/-& in multiples of Re.1/-thereafter.
LOAD STRUCTURE
Entry Load : Not Applicable
Exit Load :
Std. Dev (Annualised)Sharpe RatioPortfolio BetaR SquaredTreynorJenson
19.070.631.001.003.45
NA
9.380.860.290.278.101.33
^Risk-free rate based on the FBIL Overnight MIBOR rate of 3.6% as on Dec 31, 2021
For calculation methodology please refer to Pg 70
• Exit Load is Nil, if the withdrawal amount or switched out amount is not more than 12% of the original cost of investment on or before expiry of 365 days from the date of allotment.
• Exit load is 1% of the applicable NAV if the withdrawal amount or switched out amount is more than 12% of the original cost of investment on or before expiry of 365 days from the date of allotment.
• No Exit load will be charged for redemption or switch out after expiry of 365 days from the date of allotment
BENCHMARK65% S&P BSE 200 TRI + 15% CRISIL Short Term Bond Fund Index + 20% iCOMDEX Composite Index
MONTHLY AVERAGE AUMRs. 1185.79 (Rs. in Cr.)
EXPENSE RATIO**DirectRegular
0.442.25
**Note: The rates specified are actual month end expenses charged as on Dec 31, 2021. The above ratio includes the Service tax on Investment Management Fees. The above ratio excludes, borrowing cost, wherever applicable.
Debt InstrumentsGovernment SecuritiesGOI - 5.63% (12/04/2026)GOI - 7.27% (08/04/2026)GOI - 7.32% (28/01/2024)GOI - 5.77% (03/08/2030)Non-Convertible Debentures/BondsHDFC Ltd. - Frb04.90 % Small Indust Devlop Bank Of India08.50 % Nabard06.45 % ICICI Bank Ltd.06.40 % Nabard
6024.522484.111896.051567.90
76.466308.642494.162497.02519.34491.85306.27
4.962.051.561.290.065.212.062.060.430.410.25
SOVSOVSOVSOV
CRISIL AAAICRA AAA
CRISIL AAACRISIL AAACRISIL AAA
Mutual Fund Units
Tata Liquid Fund
Name of the Instrument Market ValueRs. Lakhs
2938.00
2938.00
% toNAV2.42
2.42
Name of the Instrument Market ValueRs. Lakhs
Ratings % toNAV
Repo
Portfolio Total
Net Current Liabilities
Net Assets
10256.24
127123.29
-5813.48
121309.81
8.45
104.79
-4.79
100.00

Market Capitalisation wise Exposure
Large Cap
Mid Cap
Small Cap
Market Capitalisation is as per list provided by AMFI.
SIP - If you had invested INR 10000 every month1 Year 3 Year 5 Year 7 Year 10 Year Since Inception
Total Amount Invested (Rs.)
Total Value as on Dec 31, 2021 (Rs.)
Returns
Total Value of B: 65% S&P BSE 200 TRI + 15% CRISIL Short Term Bond Fund Index
+ 20% iCOMDEX Composite Index
B: 65% S&P BSE 200 TRI + 15% CRISIL Short Term Bond Fund Index
+ 20% iCOMDEX Composite Index
Total Value of AB: S&P BSE Sensex TRI
AB: S&P BSE Sensex TRI
(Inception date :04-Mar-2020) (First Installment date : 01-Apr-2020)
120,000
131,590
18.35%
154,455
57.07%
133,372
21.25%
NA
NA
NA
NA
NA
NA
NA
NA
NA
NA
NA
NA
NA
NA
NA
NA
NA
NA
NA
NA
NA
NA
NA
NA
NA
NA
NA
NA
210,000
265,030
27.88%
315,133
52.08%
282,026
36.21%
Top 10 Holdings Equity Sector Allocation
NAV Movement
Issuer NameReliance Industries Ltd.ICICI Bank Ltd.Infosys Ltd.HDFC Ltd.State Bank Of IndiaBharti Airtel Ltd.Tata Consultancy Services Ltd.Ultratech Cement Ltd.HDFC Bank Ltd.Larsen & Toubro Ltd.Total
% to NAV4.514.233.543.343.213.192.962.932.411.86
32.18
Past performance may or may not be sustained in the future. Returns greater than 1 year period are compounded annualized. Income Distribution cum capital withdrawals are assumed to be reinvested and bonus is adjusted. Load is not taken in to consideration. For SIP returns, monthly investment of equal amounts invested on the 1st day of every month has been considered.For scheme performance refer pages 55 - 69.*B: Benchmark; For Scheme Risk-O-Meter and Scheme Benchmark Risk-O-Meter please refer page number 70 of Factsheet.Source: MFI Explorer
73.48%
15.95%
10.57%
www.tatamutualfund.com TATA MUTUAL FUNDMutual Fund investments are subject to market risks, read all scheme related documents carefully 37
Tata Multi Asset Opportunities Fund(An Open Ended Scheme investing in equity, debt & exchange traded commodity derivatives)
18.06%9.97%
5.40%4.17%4.17%4.15%
3.68%3.39%3.19%
2.97%2.91%
1.62%1.30%1.21%
0.52%0.46%0.43%0.27%
0.00% 4.00% 8.00% 12.00% 16.00% 20.00%
Financial ServicesIT
Oil & GasIndustrial Manufacturing
PowerCement & Cement Products
ConstructionConsumer Goods
TelecomPharmaMetals
AutomobileFertilisers & Pesticides
Healthcare ServicesChemicals
Consumer ServicesServicesTextiles
80104128152176200
Mar-20 Oct-20 May-21 Dec-21
Tata Multi Asset Opportunities Fund - Reg - Growth65% S&P BSE 200 TRI + 15% CRISIL Short Term Bond Fund Index + 20% iCOMDEX CompositeIndex

www.tatamutualfund.com TATA MUTUAL FUNDMutual Fund investments are subject to market risks, read all scheme related documents carefully
VOLATILITY MEASURES^ FUND BENCHMARK
38
As on 31st December 2021
INVESTMENT STYLE
INVESTMENT OBJECTIVE
Portfolio Macaulay DurationModified DurationAverage Maturity
:::
:
1.23 Years1.17 Years1.31 Years
Gross Yield to Maturity (For Debt Component)*- Including Net Current Assets 4.92%
MINIMUM INVESTMENT/MULTIPLES FOR NEW INVESTMENT
Rs. 5,000/- and in multiples of Re. 1/- thereafter.
ADDITIONAL INVESTMENT/MULTIPLES FOR EXISTING INVESTORS
Rs. 1,000/- and multiples of Re. 1/- thereafter.
LOAD STRUCTURE
Entry Load : Not Applicable
Exit Load :
PORTFOLIO
Name of the Instrument
2592.042580.26
11.7810865.70
2016.731537.541518.941486.171022.241019.27987.36
655.00
520.6991.3010.46
1489.841489.84
14.0413.980.06
58.8710.938.338.238.055.545.525.35
3.55
2.820.490.06
8.078.07
SOVSOV
CRISIL AAACRISIL AAA
CRISIL AA+CRISIL AAACRISIL AAACRISIL AAACRISIL AAA
CRISIL AAA
ICRA AAACRISIL AAACRISIL AAA
CRISIL A1+
Name of the InstrumentRs. Lakhs
% to NAV
Repo
Portfolio Total
Cash / Net Current Asset
Net Assets
3044.97
17992.55
464.44
18456.99
16.50
97.49
2.51
100.00
SIP - If you had invested INR 10000 every month
1 Year 3 Year 5 Year 7 Year 10 Year Since Inception
Total Amount Invested (Rs.)
Total Value as on Dec 31, 2021 (Rs.)
Returns
Total Value of B: CRISIL Composite Bond Fund Index
B: CRISIL Composite Bond Fund Index
Total Value of AB: CRISIL 10 Year Gilt Index
AB: CRISIL 10 Year Gilt Index
(Inception date :03-Sep-2003) (First Installment date : 01-Oct-2003)
120,000
122,835
4.41%
122,962
4.61%
121,013
1.57%
360,000
393,735
5.90%
401,091
7.14%
387,126
4.77%
600,000
699,431
6.07%
729,510
7.75%
696,829
5.92%
840,000
1,051,532
6.32%
1,113,959
7.93%
1,050,545
6.29%
1,200,000
1,732,932
7.14%
1,845,341
8.34%
1,702,245
6.80%
2,190,000
4,394,873
7.13%
4,716,368
7.81%
4,130,385
6.52%
[ICRA]AAA mfs rating by ICRA$
Aims to create a liquid portfolio of good quality debt as well as Money Market Instruments so as to provide reasonable returns and liquidity.
To provide reasonable returns and high level of liquidity by investing in debt instruments including bonds, debentures and Government securities; and money market instruments such as treasury bills, commercial papers, certificates of deposit, including repos in permitted securities of different maturities, as permitted by regulation so as to spread the risk across different kinds of issuers in the debt markets. The investment objective is to create a liquid portfolio of good quality debt as well as Money Market Instruments so as to provide reasonable returns and liquidity to the Unitholders.
Std. Dev (Annualised)Portfolio BetaR SquaredTreynorJenson
3.071.001.000.37
NA
2.530.780.780.33
-0.03
^Risk-free rate based on the FBIL Overnight MIBOR rate of 3.6% as on Dec 31, 2021
* Computed on the invested amount for debt portfolio.
For calculation methodology please refer Pg 71
Nil
Debt InstrumentsGovernment SecuritiesGOI - 7.16% (20/05/2023)GOI - 7.37% (16/04/2023)Non-Convertible Debentures/Bonds05.69 % Rec Ltd.07.04 % Power Finance Corporation07.15 % Muthoot Finance Ltd.04.96 % LIC Housing Finance Ltd.07.20 % HDFC Ltd.07.10 % Bajaj Finance Ltd.06.40 % Jamnagar Utilities & Power Pvt. Ltd. (Mukesh Ambani Group)09.75 % Jamnagar Utilities & Power Pvt. Ltd. (Mukesh Ambani Group)07.13 % Nhpc Ltd.07.10 % Power Finance Corporation09.25 % India Infradebt Ltd. (ICICI Group)Money Market InstrumentsTata Teleservices (Maharashtra) Ltd. - CP
Market ValueRatingsRs. Lakhs
% to NAV
Market Value
Maturity Ladder
Composition by Ratings Instrument Wise Composition
NAV Movement
Past performance may or may not be sustained in the future. Returns greater than 1 year period are compounded annualized. Income Distribution cum capital withdrawals are assumed to be reinvested and bonus is adjusted. Load is not taken in to consideration. For SIP returns, monthly investment of equal amounts invested on the 1st day of every month has been considered.For scheme performance refer pages 55 - 69.*B: Benchmark, AB: Additional Benchmark; For Scheme Risk-O-Meter and Scheme Benchmark Risk-O-Meter please refer page number 70 of Factsheet.Source: MFI Explorer
DATE OF ALLOTMENT
September 03,2003
FUND MANAGER
NAV
Direct - GrowthDirect - IDCWReg - GrowthReg - IDCW
36.443821.628533.352619.2178
FUND SIZE
Rs. 184.57 (Rs. in Cr.)
MONTHLY AVERAGE AUM
Rs. 207.53 (Rs. in Cr.)
EXPENSE RATIO**
DirectRegular
Akhil Mittal (Managing Since 26-Jun-14 and overall experience of 20 years)
BENCHMARK
CRISIL Composite Bond Fund Index
0.310.73
::::
**Note: The rates specified are actual month end expenses charged as on Dec 31, 2021. The above ratio includes the Service tax on Investment Management Fees. The above ratio excludes, borrowing cost, wherever applicable.
Tata Dynamic Bond Fund
Please refer to our Tata Mutual Fund website for fundamental changes, wherever applicable
(An open ended dynamic debt scheme investing across duration. A Relatively High Interest Rate Risk and Moderate Credit Risk.)
58.71%19.02%
14.04%
8.23%A1+ / AAA
Cash & Cash Equivalents
SOV
AA+ / AA
58.87%19.02%
14.04%
8.07%
Ncd - Non Convertible Deb
Cash & Cash Equivalents
Government Securities
Commercial Papers
33.29%
56.02%
8.17%
0.00%
0.00%
2.52%
0.00% 10.00% 20.00% 30.00% 40.00% 50.00% 60.00%
0 - 1 Yrs
1 - 3 Yrs
3 - 7 Yrs
7 - 10 Yrs
Abv 10 Yrs
Cash & Others
100
106
112
118
124
130
Dec-18 Dec-19 Dec-20 Dec-21
Tata Dynamic Bond Fund - Reg - GrowthCRISIL Composite Bond Fund Index

www.tatamutualfund.com TATA MUTUAL FUNDMutual Fund investments are subject to market risks, read all scheme related documents carefully
MAIN PORTFOLIO
Name of the Instrument RatingsRs. Lakhs
% to NAV
Market Value Name of the Instrument RatingsRs. Lakhs
% to NAV
Market Value
Debt InstrumentsGovernment SecuritiesGOI - 5.63% (12/04/2026)GOI - 6.68% (17/09/2031)Non-Convertible Debentures/BondsVaranasi Sangam Expressway Pvt. Ltd. - Frb (Vinod Kumar Agarwal, Ajendra Kumar Agarwal, Purshottam Agarwal And Lokesh Builders Pvt Ltd.)07.75 % Tmf Holdings Ltd. (TATA Group)09.15 % Green Infra Wind Energy Ltd. (Sembcorp Group)08.00 % Ongc Petro-Additions Ltd.07.90 % India Infradebt Ltd. (ICICI Group)07.25 % Nuvoco Vistas Corporation Ltd.06.49 % Sepset Construction Ltd.08.35 % Indian Railways Finance Corporation Ltd.07.70 % Tata Steel Ltd.07.20 % Sikka Ports And Terminals Ltd. (Mukesh Ambani Group)06.65 % Motherson Sumi Systems Ltd.06.49 % Malwa Solar Power Generation Pvt Ltd. (Vector Green)07.97 % LIC Housing Finance Ltd.06.75 % Sikka Ports And Terminals Ltd. (Mukesh Ambani Group)06.25 % Embassy Office Parks Reit06.92 % Indian Railways Finance Corporation Ltd.
SOVSOV
IND AAA
CRISIL AA-IND AA
ICRA AAA(CE)CRISIL AAA
CRISIL AACRISIL AAACRISIL AAA
CARE AA+CRISIL AAA
IND AAACRISIL AAA
CRISIL AAACRISIL AAA
CRISIL AAACRISIL AAA
1702.74993.64709.10
5250.01585.52
500.41469.50
417.56407.44405.46389.61381.35
363.53308.03
304.51291.29
125.45100.67
99.9999.69
20.2211.808.42
62.376.95
5.945.58
4.964.844.824.634.53
4.323.66
3.623.46
1.491.20
1.191.18
Privately Placed/Unlisted08.30 % Sbi Cards & Payment Services Ltd.
CRISIL AAA410.90410.90
4.884.88
RepoPortfolio TotalCash / Net Current AssetNet Assets
857.068220.71199.38
8420.09
10.1897.632.37
100.00
Portfolio TotalCash / Net Current AssetNet Assets
207.504.36
211.86
97.942.06
100.00
SEGREGATED PORTFOLIO (No. 1)
Name of the InstrumentRs. Lakhs
% to NAV
Market ValueRating
Main PortfolioSegregated Portfolio
Rs. 80.42 (Rs. in Cr.)Rs. 2.10 (Rs. in Cr.)
::
Main PortfolioSegregated Portfolio
Rs. 84.20 (Rs. in Cr.)Rs. 2.12 (Rs. in Cr.)
::
NANA
Segregated Portfolio0.511.40
Main Portfolio
Segregated PortfolioMain Portfolio
(Below information is applicable for the Main Portfolio)
VOLATILITY MEASURES^ FUND BENCHMARK
Std. Dev (Annualised)Portfolio BetaR SquaredTreynorJenson
2.881.001.000.38
NA
9.220.620.44
-0.17-0.34
39
As on 31st December 2021
INVESTMENT STYLE
INVESTMENT OBJECTIVE
DATE OF ALLOTMENT
November 11,2002
FUND MANAGER
NAV
Direct - GrowthDirect - BonusReg - GrowthReg - IDCW
2.39311.09512.24461.0238
32.252514.993129.523013.4329
MINIMUM INVESTMENT/MULTIPLES FOR NEW INVESTMENT
Rs. 5,000/- and in multiples of Re. 1/- thereafter.
ADDITIONAL INVESTMENT/MULTIPLES FOR EXISTING INVESTORS
Rs. 1,000/- and multiples of Re. 1/- thereafter.
LOAD STRUCTURE
Entry Load : Not ApplicableExit Load :
The aim of the Fund Manager is to identify and allocate the assets of the scheme between various fixed income securities with the objective of generate reasonable returns at moderate risk. The security will be identified based on various parameters such as issuer's credit rating history, financial track record of the issuer, corporate governance track record of the issuer, liquidity of the security, maturity of the security, interest rate scenario etc. Depending upon prevailing market conditions & interest rate scenario, the portfolio duration and average maturity can be increased or decreased within the range of three to seven years. In case of a rising interest rate environment the duration/average maturity of the fund may be reduced whereas in a falling interest rate scenario the holding in medium/long securities may be maximized.
The investment objective of the scheme is to generate income and capital appreciation over a medium term. However, there can be no assurance that the investment objective of the scheme will be realized.
Abhishek Sonthalia (Managing Since 06-Feb-20 and overall experience of 13 years) & Murthy Nagarajan (Managing Since 06-Feb-20 and overall experience of 25 years)
FUND SIZE
^Risk-free rate based on the FBIL Overnight MIBOR rate of 3.6% as on Dec 31, 2021
For calculation methodology please refer Pg 71
1) On or before expiry of 365 days from the date of allotment: If the withdrawal amount or switched out amount is not more than 12% of the original cost of investment: NIL2) On or before expiry of 365 days from the date of allotment: If the withdrawal amount or switched out amount is more than 12% of the original cost of investment: 1%3) Redemption after expiry of 365 days from the date of allotment: NIL (w.e.f 5th November, 2018)
Non-Convertible Debentures/bonds06.75 % Piramal Capital & Housing Finance Ltd.
ICRA AA 97.94207.5
Name of the InstrumentRs. Lakhs
% to NAV
Market Value
Maturity Ladder - Main Portfolio
Composition by Ratings - Main Portfolio Instrument Wise Composition - Main Portfolio
NAV Movement - Main Portfolio
Portfolio Macaulay DurationModified DurationAverage Maturity
:
:
2.73 Years2.61 Years3.27 Years
Gross Yield to Maturity (For Debt Component)*- Including Net Current Assets 6.14%
::
BENCHMARK
Crisil Medium Term Debt Index
MONTHLY AVERAGE AUM
EXPENSE RATIO**
DirectRegular**Note: The rates specified are actual month end expenses charged as on Dec 31, 2021. The above ratio includes the Service tax on Investment Management Fees. The above ratio excludes, borrowing cost, wherever applicable.
Tata Medium Term Fund
Not Applicable for Segregated PortfolioPlease refer to our Tata Mutual Fund website for fundamental changes, wherever applicable
*Computed on the invested amount for debt portfolio.
(Number of Segregated portfolios in the scheme 1)
For Scheme Risk-O-Meter and Scheme Benchmark Risk-O-Meter please refer page number 69 of Factsheet.
For Update on recovery from DHFL please refer the table incorporated in the month end portfolio of the scheme.
(An open ended medium term debt scheme investing in instruments such that the Macaulay duration of the portfolio is between 3 years & 4 years (Refer to page no. 15 of SID). A Relatively High Interest Rate Risk and Moderate Credit Risk.)
41.62%
20.22%
14.71%
12.55%
5.94%4.96%
A1+ / AAA
SOV
AA+ / AA
Cash & Cash Equivalents
AA-
AAA(CE)
60.28%20.22%
12.55%
6.95%
Ncd - Non Convertible Deb
Government Securities
Cash & Cash Equivalents
Floating Rate Bonds
15.02%
31.82%
22.27%
15.62%
12.90%
2.37%
0.00% 10.00% 20.00% 30.00% 40.00%
0 - 1 Yrs
1 - 3 Yrs
3 - 7 Yrs
7 - 10 Yrs
Abv 10 Yrs
Cash & Others
80
92
104
116
128
140
Dec-18 Dec-19 Dec-20 Dec-21
Tata Medium Term Fund - Reg - GrowthCrisil Medium Term Debt Index

www.tatamutualfund.com TATA MUTUAL FUNDMutual Fund investments are subject to market risks, read all scheme related documents carefully
VOLATILITY MEASURES^ FUND BENCHMARK
40
As on 31st December 2021
INVESTMENT STYLE
INVESTMENT OBJECTIVE
DATE OF ALLOTMENT
April 28, 1997
FUND MANAGER
NAVDirect - GrowthDirect - Half Yearly IDCWDir- IDCWReg - GrowthReg - Half Yearly IDCWReg- IDCW
::::::
71.960516.789740.958166.759915.380538.7470
FUND SIZE
Rs. 55.06 (Rs. in Cr.)
MINIMUM INVESTMENT/ MULTIPLES FOR NEW INVESTMENT
ADDITIONAL INVESTMENT/MULTIPLES FOR EXISTING INVESTORS
Rs. 1,000/- and multiples of Re. 1/- thereafter.
LOAD STRUCTURE
Entry Load ::
Not ApplicableExit Load
PORTFOLIO
Name of the Instrument
1057.29491.49487.4776.182.15
2983.26556.68550.03
518.93515.88515.83
325.91513.62513.62
19.208.938.851.380.04
54.1810.119.99
9.429.379.37
5.929.339.33
Name of the Instrument RatingsRs. Lakhs
% to NAV
Repo
Portfolio Total
Cash / Net Current Asset
Net Assets
771.89
5326.06
180.33
5506.39
14.02
96.73
3.27
100.00
SIP - If you had invested INR 10000 every month
1 Year 3 Year 5 Year 7 Year 10 Year Since Inception
Total Amount Invested (Rs.)
Total Value as on Dec 31, 2021 (Rs.)
Returns
Total Value of B: Crisil Composite Bond Fund Index
B: Crisil Composite Bond Fund Index
Total Value of AB: CRISIL 10 Year Gilt Index
AB: CRISIL 10 Year Gilt Index
(Inception date :28-Apr-1997) (First Installment date : 01-Aug-1997)
120,000
122,090
3.24%
122,962
4.61%
121,013
1.57%
360,000
394,689
6.06%
401,091
7.14%
387,126
4.77%
2,930,000
7,627,760
7.11%
5,380,172
7.66%
4,966,274
6.50%
1,200,000
1,727,820
7.08%
1,845,341
8.34%
1,702,245
6.80%
840,000
1,057,695
6.48%
1,113,959
7.93%
1,050,545
6.29%
600,000
703,979
6.33%
729,510
7.75%
696,829
5.92%
An income scheme with exposure to rated debt instruments with medium to long term maturity.
The investment objective of the Scheme is to provide income distribution/capital appreciation over medium to long term.
Akhil Mittal (Managing Since 26-Jun-14 and overall experience of 20 years)
Half Yearly IDCW Plan, Periodic IDCW Plan, Growth Plan, Bonus Plan: Rs. 5,000/- and in multiples of Re. 1/- thereafter. Quarterly IDCW Plan: Rs. 10,000/- and in multiples of Re. 1/- thereafter.
Std. Dev (Annualised)Portfolio BetaR SquaredTreynorJenson
3.071.001.000.37
NA
3.130.960.920.33
-0.04
^Risk-free rate based on the FBIL Overnight MIBOR rate of 3.6% as on Dec 31, 2021
Nil
Market ValueRatingsRs. Lakhs
% to NAV
Market Value
Debt InstrumentsGovernment SecuritiesGOI - 5.15% (09/11/2025)GOI - 6.10% (12/07/2031)GOI - 7.69% (17/06/2043)GOI - 6.84% (19/12/2022)Non-Convertible Debentures/Bonds09.10 % Power Finance Corporation08.55 % Indian Railways Finance Corporation Ltd.07.32 % NTPC Ltd.07.55 % Rec Ltd.07.35 % National Highways Authority Of India08.70 % LIC Housing Finance Ltd.Privately Placed/Unlisted08.30 % Sbi Cards & Payment Services Ltd.
SOVSOVSOVSOV
CRISIL AAACRISIL AAA
CRISIL AAACRISIL AAACRISIL AAA
CRISIL AAA
CRISIL AAA
Maturity Ladder
Composition by Ratings Instrument Wise Composition
NAV Movement
For calculation methodology please refer Pg 71Past performance may or may not be sustained in the future. Returns greater than 1 year period are compounded annualized. Income Distribution cum capital withdrawals are assumed to be reinvested and bonus is adjusted. Load is not taken in to consideration. For SIP returns, monthly investment of equal amounts invested on the 1st day of every month has been considered.For scheme performance refer pages 55 - 69. *B: Benchmark, AB: Additional Benchmark; For Scheme Risk-O-Meter and Scheme Benchmark Risk-O-Meter please refer page number 70 of Factsheet.Source: MFI Explorer
Portfolio Macaulay DurationModified DurationAverage Maturity
:: :
:
4.37 Years4.13 Years5.76 Years
Gross Yield to Maturity (For Debt Component)*- Including Net Current Assets 6.10%
BENCHMARK
Crisil Composite Bond Fund Index
MONTHLY AVERAGE AUM
Rs. 54.93 (Rs. in Cr.)
EXPENSE RATIO**
DirectRegular
1.281.96
**Note: The rates specified are actual month end expenses charged as on Dec 31, 2021. The above ratio includes the Service tax on Investment Management Fees. The above ratio excludes, borrowing cost, wherever applicable.
Tata Income Fund
Please refer to our Tata Mutual Fund website for fundamental changes, wherever applicable
*Computed on the invested amount for debt portfolio.
[ICRA]AAA mfs rating by ICRA$(An open ended medium term debt scheme investing in instruments such that the Macaulay duration of the portfolio is between 4 year & 7 years (Refer to page no. 15 of SID). A Relatively High Interest Rate Risk and Moderate Credit Risk.)
63.51%
19.20%
17.29%A1+ / AAA
SOV
Cash & Cash Equivalents63.51%
19.20%
17.29%
Ncd - Non Convertible Deb
Government Securities
Cash & Cash Equivalents
14.06%
9.33%
8.93%
63.03%
1.38%
3.27%
0.00% 10.00% 20.00% 30.00% 40.00% 50.00% 60.00% 70.00%
0 - 1 Yrs
1 - 3 Yrs
3 - 7 Yrs
7 - 10 Yrs
Abv 10 Yrs
Cash & Others
100
106
112
118
124
130
Dec-18 Dec-19 Dec-20 Dec-21
Tata Income Fund - Reg - GrowthCrisil Composite Bond Fund Index

Debt Instruments Government SecuritiesGOI - 5.63% (12/04/2026)GOI - 7.68% (15/12/2023)GOI - 7.16% (20/05/2023)GOI - 7.37% (16/04/2023)SDL Gujarat 5.39% (31/03/2024)GOI - 6.10% (12/07/2031)GOI - 7.32% (28/01/2024)GOI - 7.26% (14/01/2029)GOI - 7.27% (08/04/2026)GOI - 6.79% (15/05/2027)GOI - 6.84% (19/12/2022)GOI - 5.79% (11/05/2030)GOI - 5.77% (03/08/2030)GOI - 6.19% (16/09/2034)SDL Tamilnadu 8.18% (19/12/2028) Non-Convertible Debentures/Bonds 06.40 % Jamnagar Utilities & Power Pvt. Ltd. (Mukesh Ambani Group) 05.05 % Indian Oil Corp Ltd. 06.95 % Reliance Industries Ltd. 07.24 % Rec Ltd. 06.44 % Indian Oil Corp Ltd. 06.45 % L&T Finance Ltd. 05.00 % Nabard 04.71 % HDFC Ltd. 06.64 % Mangalore Refinery & Petrochemicals Ltd. 08.25 % Indian Railways Finance Corporation Ltd. Reliance Industries Ltd. - Frb 07.45 % LIC Housing Finance Ltd. 07.85 % LIC Housing Finance Ltd. 07.00 % Reliance Industries Ltd. 07.42 % LIC Housing Finance Ltd. 05.05 % Bajaj Finance Ltd. 06.25 % Embassy Office Parks Reit 06.44 % HDFC Bank Ltd.06.49 % Yarrow Infrastructure Pvt Ltd. (Vector Green)07.20 % Sikka Ports And Terminals Ltd. (Mukesh Ambani Group)07.09 % Rec Ltd.07.40 % LIC Housing Finance Ltd.07.18 % Nabard07.05 % Housing & Urban Development Corporation Ltd.06.90 % Rec Ltd.
www.tatamutualfund.com TATA MUTUAL FUNDMutual Fund investments are subject to market risks, read all scheme related documents carefully
VOLATILITY MEASURES^ FUND BENCHMARK
Std. Dev (Annualised)Portfolio BetaR SquaredTreynorJenson
1.691.001.000.32
NA
1.991.170.890.24
-0.10
41
As on 31st December 2021
INVESTMENT STYLE
INVESTMENT OBJECTIVE
DATE OF ALLOTMENT
August 8, 2002
FUND MANAGER
NAV
Direct - GrowthDirect - Monthly IDCWDirect -IDCWReg - GrowthReg - Monthly IDCWReg -IDCW
::::::
41.859319.009922.209538.942517.590820.6450
FUND SIZE
Rs. 3047.19 (Rs. in Cr.)
MINIMUM INVESTMENT/MULTIPLES FOR NEW INVESTMENT
Rs. 5,000/- and in multiples of Re. 1/- thereafter.
ADDITIONAL INVESTMENT/MULTIPLES FOR EXISTING INVESTORS
Rs. 1,000/- and multiples of Re. 1/- thereafter.
LOAD STRUCTURE
Entry Load : Not Applicable
Exit Load :
PORTFOLIO
Name of the Instrument
79346.8546701.1711087.976708.675168.213513.653412.27583.47550.37506.14515.02306.94197.4858.5736.490.43
186083.3414810.39
13552.3012790.607683.987650.077541.087519.827418.616624.015308.635190.325115.525104.845075.065066.534972.724899.444912.314877.964825.73
3576.503112.093045.262544.832530.98
26.0415.333.642.201.701.151.120.190.180.170.170.100.060.020.010.00
61.044.86
4.454.202.522.512.472.472.432.171.741.701.681.681.671.661.631.611.611.601.58
1.171.021.000.840.83
SOVSOVSOVSOVSOVSOVSOVSOVSOVSOVSOVSOVSOVSOVSOV
CRISIL AAA
CRISIL AAACRISIL AAACRISIL AAACRISIL AAACRISIL AAACRISIL AAACRISIL AAACRISIL AAACRISIL AAACRISIL AAACRISIL AAACRISIL AAACRISIL AAACRISIL AAACRISIL AAACRISIL AAACRISIL AAACRISIL AAACRISIL AAA
CRISIL AAACRISIL AAACRISIL AAA
ICRA AAACRISIL AAA
Name of the Instrument Ratings Market ValueRs. Lakhs
% to NAV
RepoPortfolio TotalCash / Net Current AssetNet Assets
10910.34297267.71
7450.88304718.59
3.5897.552.45
100.00
SIP - If you had invested INR 10000 every month1 Year 3 Year 5 Year 7 Year 10 Year Since Inception
Total Amount Invested (Rs.)Total Value as on Dec 31, 2021 (Rs.)ReturnsTotal Value of B: Crisil Short Term Bond Fund IndexB: Crisil Short Term Bond Fund IndexTotal Value of AB: CRISIL 10 Year Gilt IndexAB: CRISIL 10 Year Gilt Index(Inception date :08-Aug-2002) (First Installment date : 01-Sep-2002)
120,000
121,909
2.96%
123,071
4.78%
121,013
1.57%
360,000
391,965
5.60%
399,600
6.89%
387,126
4.77%
600,000
688,164
5.42%
723,612
7.43%
696,829
5.92%
840,000
1,027,160
5.66%
1,100,373
7.59%
1,050,545
6.29%
1,200,000
1,665,621
6.38%
1,808,874
7.96%
1,702,245
6.80%
2,320,000
4,893,242
7.17%
5,226,537
7.77%
4,526,039
6.46%
[ICRA]AAA mfs rating by ICRA$
A debt scheme that invests in short term debt instruments having high level of liquidity.
The investment objective is to generate regular income/appreciation over a short term period. There can be no assurance that the investment objective of the Scheme will be realised.
Murthy Nagarajan (Managing Since 1-Apr-17 and overall experience of 25 years) & Abhishek Sonthalia (Managing Since 06-Feb-20 and overall experience of 13 years)
^Risk-free rate based on the FBIL Overnight MIBOR rate of 3.6% as on Dec 31, 2021
For calculation methodology please refer Pg 71
Nil (w.e.f 24th January, 2019)
Ratings Market ValueRs. Lakhs
% to NAV
Composition by Ratings Instrument Wise Composition
NAV MovementMaturity Ladder
06.70 % Nabard05.69 % Rec Ltd.04.95 % HDFC Ltd.05.70 % Bajaj Housing Finance Ltd.HDFC Ltd. - FrbRec Ltd. - Frb05.27 % Nabard06.49 % Rattanindia Solar 2 Pvt Ltd. (Vector Green)08.10 % Tata Capital Housing Finance Ltd.07.35 % HDFC Ltd.07.50 % Nhpc Ltd.06.40 % Nabard04.78 % Housing & Urban Development Corporation Ltd. 07.75 % India Infradebt Ltd. (ICICI Group) 07.13 % Nhpc Ltd. 09.25 % India Infradebt Ltd. (ICICI Group) 08.35 % Indian Railways Finance Corporation Ltd. 08.37 % India Infradebt Ltd. (ICICI Group) 07.90 % India Infradebt Ltd. (ICICI Group) 08.50 % Nabard 08.27 % National Highways Authority Of IndiaPrivately Placed/Unlisted08.30 % Sbi Cards & Payment Services Ltd.08.10 % Sbi Cards & Payment Services Ltd.Money Market InstrumentsPanatone Finvest Ltd. - CP (TATA Group)Standard Chartered Capital Ltd. (Erstwhile Stdchtd Inv & Loans (India) Ltd.) - CP
CRISIL AAACRISIL AAACRISIL AAACRISIL AAACRISIL AAACRISIL AAACRISIL AAACRISIL AAACRISIL AAACRISIL AAA
ICRA AAACRISIL AAA
ICRA AAA
CRISIL AAAICRA AAA
CRISIL AAACRISIL AAACRISIL AAACRISIL AAACRISIL AAACRISIL AAA
CRISIL AAACRISIL AAA
CRISIL A1+CRISIL A1+
2542.562520.912503.382486.712494.162502.932484.602445.712360.442079.841588.121531.35990.28
507.04520.69345.33108.96102.9081.49
103.8732.49
15541.348834.306707.045385.842904.132481.71
0.830.830.820.820.820.820.820.800.770.680.520.500.32
0.170.170.110.040.030.030.030.015.102.902.201.760.950.81
Past performance may or may not be sustained in the future. Returns greater than 1 year period are compounded annualized. Income Distribution cum capital withdrawals are assumed to be reinvested and bonus is adjusted. Load is not taken in to consideration. For SIP returns, monthly investment of equal amounts invested on the 1st day of every month has been considered.For scheme performance refer pages 55 - 69.*B: Benchmark, AB: Additional Benchmark; For Scheme Risk-O-Meter and Scheme Benchmark Risk-O-Meter please refer page number 70 of Factsheet.Source: MFI Explorer
Portfolio Macaulay DurationModified DurationAverage Maturity
:::
:
1.92 Years1.84 Years2.20 Years
Gross Yield to Maturity (For Debt Component)*- Including Net Current Assets 5.29%
BENCHMARK
Crisil Short Term Bond Fund Index
MONTHLY AVERAGE AUM
Rs. 3090.64 (Rs. in Cr.)
EXPENSE RATIO**DirectRegular
0.291.21
**Note: The rates specified are actual month end expenses charged as on Dec 31, 2021. The above ratio includes the Service tax on Investment Management Fees. The above ratio excludes, borrowing cost, wherever applicable.
Tata Short Term Bond Fund
Please refer to our Tata Mutual Fund website for fundamental changes, wherever applicable
*Computed on the invested amount for debt portfolio.
NoteSundry Debtors: Rs 195 crs. due against redemption of Commercial Paper of Infrastructure Leasing & Financial Services Ltd matured respectively on 26/09/2018 , 27/11/2018 and 08/11/2019 respectively, the same is not included in the above portfolio statement.
(An open ended short term debt scheme investing in instruments with Macaulay duration between 1 year and 3 years (Refer to page no. 15 of SID). A Relatively High Interest Rate Risk and Moderate Credit Risk.)
67.94%
26.04%
6.02%
A1+ / AAA
SOV
Cash & Cash Equivalents
62.82%
24.89%
6.03%3.34%1.77% 1.15%
Ncd - Non Convertible Deb
Government Securities
Cash & Cash Equivalents
Floating Rate Bonds
Commercial Papers
State Development Loans
23.11%49.49%
23.51%1.43%
0.01%2.45%
0.00% 10.00% 20.00% 30.00% 40.00% 50.00%
0 - 1 Yrs1 - 3 Yrs3 - 7 Yrs
7 - 10 YrsAbv 10 Yrs
Cash & Others
100106112118124130
Dec-18 Dec-19 Dec-20 Dec-21
Tata Short Term Bond Fund - Reg - GrowthCrisil Short Term Bond Fund Index

www.tatamutualfund.com TATA MUTUAL FUNDMutual Fund investments are subject to market risks, read all scheme related documents carefully
(Below information is applicable for the Main Portfolio)
NANA
Segregated Portfolio0.340.60
Main PortfolioDirectRegular
Rs. 2720.46 (Rs. in Cr.)Rs. 14.79 (Rs. in Cr.)
::
Main PortfolioSegregated Portfolio
Main PortfolioSegregated Portfolio
Rs. 2421.41 (Rs. in Cr.)Rs. 14.93 (Rs. in Cr.)
::
SegregatedPortfolio
MainPortfolio
MAIN PORTFOLIO
Name of the Instrument RatingsRs. Lakhs
% to NAV
Market Value Name of the Instrument RatingsRs. Lakhs
% to NAV
Market Value
Debt Instruments Government SecuritiesGOI - 6.84% (19/12/2022)GOI - 5.09% (13/04/2022)GOI 8.20% (15/02/2022)SDL Karnataka 8.62% (20/02/2023)SDL Maharashtra 4.54% (03/06/2022)SDL Andhra Pradesh 9.12% (23/05/2022)SDL Kerala 4.77% (24/03/2023)SDL Kerala 8.75% (22/02/2022) Non-Convertible Debentures/Bonds/Zcb Rec Ltd. - Frb 08.30 % Reliance Industries Ltd. 07.60 % National Highways Authority Of India 06.80 % H.P.C.L. 05.00 % Nabard 07.45 % LIC Housing Finance Ltd. 07.09 % Rec Ltd. 05.05 % Indian Oil Corp Ltd. 04.55 % LIC Housing Finance Ltd. 04.23 % HDFC Ltd. 06.25 % Embassy Office Parks Reit 05.99 % LIC Housing Finance Ltd. 06.45 % L&T Finance Ltd. 07.99 % Rec Ltd. 07.10 % Bajaj Finance Ltd. 07.50 % Sundaram Fin Ltd. 06.55 % NTPC Ltd. 05.44 % Nabard 05.09 % Nabard06.40 % Jamnagar Utilities & Power Pvt. Ltd. (Mukesh Ambani Group)08.45 % Sikka Ports And Terminals Ltd. (Mukesh Ambani Group)Bajaj Housing Finance Ltd. - Zcb05.84 % Tata Capital Financial Services Ltd.07.62 % Housing & Urban Development Corporation Ltd.07.10 % Power Finance Corporation07.28 % HDFC Ltd.04.66 % Bajaj Finance Ltd.08.83 % Indian Railways Finance Corporation Ltd.07.00 % Reliance Industries Ltd.08.27 % Rec Ltd.ICICI Home Finance Co.Ltd. - Frb07.29 % Small Indust Devlop Bank Of India08.23 % Housing & Urban Development Corporation Ltd.08.50 % Nhpc Ltd.06.50 % Nabard08.60 % Nabard
SOVSOVSOVSOVSOVSOVSOVSOV
CRISIL AAACRISIL AAACRISIL AAACRISIL AAACRISIL AAACRISIL AAACRISIL AAACRISIL AAACRISIL AAACRISIL AAACRISIL AAACRISIL AAACRISIL AAACRISIL AAACRISIL AAACRISIL AAACRISIL AAACRISIL AAACRISIL AAACRISIL AAA
CRISIL AAA
CRISIL AAACRISIL AAA
ICRA AAACRISIL AAACRISIL AAACRISIL AAACRISIL AAACRISIL AAACRISIL AAACRISIL AAA
ICRA AAAICRA AAAICRA AAA
CRISIL AAACRISIL AAA
37954.1110231.3410037.7210055.852603.182503.881019.37999.31503.46
114734.5410011.737557.866650.466628.536517.176134.616129.216023.245005.775002.244999.434995.423016.432584.302548.182552.382552.872506.232508.702468.40
2086.88
2023.402010.431524.901521.671526.781495.221047.671015.011008.041007.59507.79505.83510.33509.6840.16
15.684.234.154.151.081.030.420.410.21
47.404.133.122.752.742.692.532.532.492.072.072.062.061.251.071.051.051.051.041.041.02
0.86
0.840.830.630.630.630.620.430.420.420.420.210.210.210.210.02
RepoPortfolio TotalCash / Net Current AssetNet Assets
2380.61238007.56
4133.46242141.02
0.9898.291.71
100.00
Money Market Instruments Rbl Bank Ltd. - CD Indusind Bank Ltd. - CD Axis Bank Ltd. - CD Barclays Investments & Loans (India) Ltd. - CP Small Indust Devlop Bank Of India - CD IDFC First Bank Ltd. - CD Reliance Industries Ltd. - CP Axis Bank Ltd. - CDStandard Chartered Capital Ltd. (Erstwhile Stdchtd Inv & Loans (India) Ltd.) - CPAxis Bank Ltd. - CDTata Teleservices (Maharashtra) Ltd. - CPTata Teleservices (Maharashtra) Ltd. - CPAxis Bank Ltd. - CDNetwork 18 Media & Investments Ltd. - CPNABARD - CDL&T Finance Ltd. - CPStandard Chartered Capital Ltd. (Erstwhile Stdchtd Inv & Loans (India) Ltd.) - CP Reliance Industries Ltd. - CP Piramal Enterprises Ltd. - CP Hero Housing Finance Ltd. - CP Tata Teleservices Ltd. - CP NABARD - CP Tata Teleservices (Maharashtra) Ltd. - CP
ICRA A1+CRISIL A1+CRISIL A1+CRISIL A1+CRISIL A1+CRISIL A1+CRISIL A1+CRISIL A1+CRISIL A1+
CRISIL A1+CRISIL A1+CRISIL A1+CRISIL A1+
ICRA A1+CRISIL A1+CRISIL A1+CRISIL A1+
CRISIL A1+CRISIL A1+CRISIL A1+CRISIL A1+CRISIL A1+CRISIL A1+
82938.297452.464977.574986.964985.184959.214962.834973.114931.604925.79
4792.544773.522944.582483.192486.212488.452487.272481.71
2481.942452.902432.901488.05997.09993.23
34.253.082.062.062.062.052.052.052.042.03
1.981.971.221.031.031.031.031.02
1.021.011.000.610.410.41
Portfolio TotalCash / Net Current AssetNet Assets
1461.8330.68
1492.51
97.942.06
100.00
SEGREGATED PORTFOLIO (No. 1)Name of the Instrument
Rs. LakhsRating% to NAV
Market Value Name of the InstrumentRs. Lakhs
% to NAV
Market Value
Non-Convertible Debentures/bonds06.75 % Piramal Capital & Housing Finance Ltd. 1461.83ICRA AA 97.94
VOLATILITY MEASURES^ FUND BENCHMARK
42
As on 31st December 2021
INVESTMENT STYLE
INVESTMENT OBJECTIVE
DATE OF ALLOTMENT
September 06,2005
FUND MANAGER
NAV
Direct - GrowthDirect - IDCWDirect - Weekly DivDirect - Daily IDCWReg - GrowthReg - IDCWReg - Weekly DivReg - Daily IDCW
79.728350.557727.695827.526678.855450.028527.692827.5250
3215.98082039.76461008.57901003.53163164.22102006.37281008.54841003.5288
FUND SIZE
MINIMUM INVESTMENT/MULTIPLES FOR NEW INVESTMENT
Rs. 5,000/- and in multiples of Re. 1/- thereafter.
ADDITIONAL INVESTMENT/MULTIPLES FOR EXISTING INVESTORS
Rs. 1,000/- and multiples of Re. 1/- thereafter.
LOAD STRUCTURE
Entry Load : Not ApplicableExit Load :
[ICRA]AA+mfs rating by ICRA$
The Scheme will invest in various money market and fixed income securities with objective of providing liquidity and generating reasonable returns with lower interest rate risk. The average maturity of the portfolio shall be between three months to one year
The investment objective of the scheme is to generate regular income & capital appreciation by investing in a portfolio of debt & money market instruments with relatively lower interest rate risk. However, there is no assurance or guarantee that the investment objective of the Scheme will be achieved. The Scheme does not assure or guarantee any returns.
Std. Dev (Annualised)Portfolio BetaR SquaredTreynorJenson
0.861.001.000.24
NA
3.290.930.630.07
-0.15
^Risk-free rate based on the FBIL Overnight MIBOR rate of 3.6% as on Dec 31, 2021
For calculation methodology please refer Pg 71
Maturity Ladder - Main Portfolio
Composition by Ratings - Main Portfolio Instrument Wise Composition - Main Portfolio
NAV Movement - Main Portfolio
NIL
Portfolio Macaulay DurationModified DurationAverage Maturity
:::
:
9.09 Months8.74 Months9.53 Months
Gross Yield to Maturity (For Debt Component)*- Including Net Current Assets 4.46%
BENCHMARK
Crisil Low Duration Debt Index
MONTHLY AVERAGE AUM
EXPENSE RATIO**
**Note: The rates specified are actual month end expenses charged as on Dec 31, 2021. The above ratio includes the Service tax on Investment Management Fees. The above ratio excludes, borrowing cost, wherever applicable.
Tata Treasury Advantage Fund
Akhil Mittal (Managing Since 26-Jun-14 and overall experience of 20 years) & Abhishek Sonthalia (Managing Since 06-Feb-20 and overall experience of 13 years)
Not Applicable for Segregated Portfolio
Please refer to our Tata Mutual Fund website for fundamental changes, wherever applicable
* Computed on the invested amount for debt portfolio.
(Number of Segregated portfolios in the scheme 1)
For Scheme Risk-O-Meter and Scheme Benchmark Risk-O-Meter please refer page number 70 of Factsheet.
For Update on recovery from DHFL please refer the table incorporated in the month end portfolio of the scheme.
(An open ended low duration debt scheme investing in instruments such that the Macaulay duration of portfolio is between 6 months and 12 months. (Refer page 15 of the SID).A Moderate Interest Rate Risk and Moderate Credit Risk.)
81.63%
15.67%2.70%
A1+ / AAA
SOV
Cash & Cash Equivalents
42.00%
17.36%
16.89%
12.52%
4.55%3.15%
2.69%0.84%Ncd - Non Convertible Deb
Certificate Of Deposit
Commercial Papers
Government Securities
Floating Rate Bonds
State Development Loans
Cash & Cash Equivalents
Zero Coupon Bonds
5.10%33.67%
12.94%21.76%
9.11%12.62%
3.08%0%
1.72%
0.00% 10.00% 20.00% 30.00% 40.00%
0 - 1 Mths1 - 3 Mths3 - 6 Mths
6 - 12 Mths1 - 2 Yrs2 - 3 Yrs3 - 5 Yrs
Abv 5 YrsCash & Others
90
98
106
114
122
130
Dec-18 Dec-19 Dec-20 Dec-21
Tata Treasury Advantage Fund - Reg - GrowthCrisil Low Duration Debt Index

www.tatamutualfund.com TATA MUTUAL FUNDMutual Fund investments are subject to market risks, read all scheme related documents carefully
VOLATILITY MEASURES^ FUND BENCHMARK
43
As on 31st December 2021
INVESTMENT STYLE
INVESTMENT OBJECTIVE
DATE OF ALLOTMENT
May 22, 2003
FUND MANAGER
NAV
Direct - GrowthDirect - Daily IDCWReg - GrowthReg - Daily IDCW
::::
3781.97851114.52003745.65221114.5200
0.250.43
FUND SIZE
Rs. 6477.61 (Rs. in Cr.)
MONTHLY AVERAGE AUM
Rs. 7110.77 (Rs. in Cr.)
EXPENSE RATIO**
DirectRegular
MINIMUM INVESTMENT/MULTIPLES FOR NEW INVESTMENT
Rs. 5,000/- and in multiples of Re. 1/- thereafter.
ADDITIONAL INVESTMENT/MULTIPLES FOR EXISTING INVESTORS
Rs. 1,000/- and multiples of Re. 1/- thereafter.
LOAD STRUCTURE
Entry Load : Not Applicable
Exit Load :
PORTFOLIO
TrepsRepoPortfolio TotalNet Current LiabilitiesNet Assets
42841.941858.92
651419.03-3657.58
647761.45
6.610.29
100.56-0.56
100.00
SIP - If you had invested INR 10000 every month1 Year 3 Year 5 Year 7 Year 10 Y ear Since Inception
Total Amount Invested (Rs.)Total Value as on Dec 31, 2021 (Rs.)ReturnsTotal Value of B: Crisil Money Market IndexB: Crisil Money Market IndexTotal Value of AB: CRISIL 1 Year T-Bill IndexAB: CRISIL 1 Year T-Bill Index(Inception date :22-May-2003) (First Installment date : 01-Jun-2003)
120,000122,475
3.85%122,599
4.04%122,176
3.38%
360,000388,843
5.07%387,569
4.85%386,066
4.59%
600,000677,789
4.82%693,801
5.75%689,067
5.47%
840,0001,007,988
5.13%1,046,993
6.19%1,034,173
5.85%
1,200,0001,620,865
5.86%1,703,812
6.81%1,641,834
9.38%
2,230,0004,341,449
6.71%4,568,669
7.19%4,135,057
6.80%
For scheme performance refer pages 55 - 69.*B: Benchmark, AB: Additional Benchmark; For Scheme Risk-O-Meter and Scheme Benchmark Risk-O-Meter please refer page number 70 of Factsheet.Source: MFI Explorer
[ICRA]A1+mfs rating by ICRA$
The investment objective is to generate returns with reasonable liquidity to the unitholders by investing in money market instruments.
A money market scheme (liquid fund category) that invests 100% of its net assets in Money market securities.
Amit Somani (Managing Since 16-Oct-13 and overall experience of 20 years)
BENCHMARK
Crisil Money Market Index
Std. Dev (Annualised)Portfolio BetaR SquaredTreynorJenson
0.511.001.000.17
NA
0.761.230.850.160.00
^Risk-free rate based on the FBIL Overnight MIBOR rate of 3.6% as on Dec 31, 2021
For calculation methodology please refer to Pg 71
Debt InstrumentsGovernment SecuritiesGOI - 5.09% (13/04/2022)GOI 8.20% (15/02/2022)GOI - 8.08% (02/08/2022)GOI 8.35% 14/5/2022SDL Maharashtra 8.95% (07/03/2022)SDL West Bengal 8.80% (22/02/2022)SDL Tamilnadu 8.72% (11/01/2022)SDL Gujarat 8.94% (07/03/2022)SDL Himachal Pradesh 7.52% (27/02/2022)SDL Rajasthan 9.24% (30/03/2022)SDL Tamilnadu 8.71% (08/02/2022)GOI - 8.13% (21/09/2022)SDL Uttar Pradesh 8.76% (22/02/2022)SDL Rajasthan Uday 8.27% (23/06/2022)SDL Andhra Pradesh 8.71% (08/02/2022)SDL West Bengal 9.22% (23/05/2022)SDL Kerala 9.25% (30/03/2022)SDL Tamilnadu 9.10% (09/05/2022)SDL Gujarat 8.99% (14/03/2022)SDL Kerala 8.69% (08/02/2022)Money Market Instruments Tata Steel Ltd. - CP Rbl Bank Ltd. - CD Bank Of Baroda - CD Sikka Ports And Terminals Ltd. - CP (Mukesh Ambani Group) Reliance Jio Infocomm Ltd. - CP IDFC First Bank Ltd. - CD Tata Teleservices Ltd. - CP Piramal Enterprises Ltd. - CP Jamnagar Utilities & Power Pvt. Ltd. - CP (Mukesh Ambani Group) LIC Housing Finance Ltd. - CP Barclays Investments & Loans (India) Ltd. - CP Network 18 Media & Investments Ltd. - CP Treasury Bill 91 Days (03/03/2022) Indusind Bank Ltd. - CD Bharat Heavy Electricals Ltd. - CP Reliance Industries Ltd. - CP Ultratech Cement Ltd. - CP ICICI Bank Ltd. - CD HDFC Ltd. - CP Treasury Bill 91 Days (17/03/2022) Iifl Wealth Prime Ltd. - CP ICICI Securities Ltd. - CP
SOVSOVSOVSOVSOVSOVSOVSOVSOVSOVSOVSOVSOVSOVSOVSOVSOVSOVSOVSOV
ICRA A1+ICRA A1+
IND A1+CRISIL A1+
CRISIL A1+CRISIL A1+CRISIL A1+CRISIL A1+CRISIL A1+CRISIL A1+CRISIL A1+
ICRA A1+SOVRN SOV
CRISIL A1+CRISIL A1+CRISIL A1+CRISIL A1+
ICRA A1+CRISIL A1+SOVRN SOVCRISIL A1+CRISIL A1+
141411.0595860.2315158.8910218.2810162.192423.061107.681101.541009.601005.75690.66502.49513.30503.47305.51301.49193.73120.22101.74101.0730.15
465307.1239736.7627325.6824735.7024475.55
19976.3019851.3216707.3214717.3914679.1514658.3012462.9412431.0610936.04
9976.229956.619961.109926.449915.669941.559928.609930.799869.39
21.8614.802.341.581.570.370.170.170.160.160.110.080.080.080.050.050.030.020.020.020.00
71.806.134.223.823.78
3.083.062.582.272.272.261.921.921.69
1.541.541.541.531.531.531.531.531.52
Axis Bank Ltd. - CD Cholamandalam Invt & Fin Co Ltd. - CP Sundaram Home Finance Ltd. - CP Deutsche Investment India Pvt Ltd. - CP Treasury Bill 182 Days (12/05/2022) Bahadur Chand Investments Pvt. Ltd. - CP (Munjal Group) Standard Chartered Capital Ltd. (Erstwhile Stdchtd Inv & Loans (India) Ltd.) - CP LIC Housing Finance Ltd. - CP Julius Baer Capital Ind Pvt Ltd. - CP L&T Finance Ltd. - CP Can Fin Homes Ltd. - CP Iifl Wealth Management Ltd. - CP Tata Teleservices (Maharashtra) Ltd. - CP Standard Chartered Capital Ltd. (Erstwhile Stdchtd Inv & Loans (India) Ltd.) - CPCholamandalam Invt & Fin Co Ltd. - CPTata Teleservices (Maharashtra) Ltd. - CPCan Fin Homes Ltd. - CPStandard Chartered Capital Ltd. (Erstwhile Stdchtd Inv & Loans (India) Ltd.) - CPTata Motors Finance Solutions Ltd. - CPNetwork 18 Media & Investments Ltd. - CPTata Teleservices (Maharashtra) Ltd. - CPTata Teleservices Ltd. - CPTata Teleservices (Maharashtra) Ltd. - CP
CRISIL A1+CRISIL A1+CRISIL A1+CRISIL A1+SOVRN SOV
ICRA A1+CRISIL A1+
CRISIL A1+CRISIL A1+CRISIL A1+
ICRA A1+CRISIL A1+CRISIL A1+CRISIL A1+
CRISIL A1+CRISIL A1+
ICRA A1+CRISIL A1+
CRISIL A1+ICRA A1+
CRISIL A1+CRISIL A1+CRISIL A1+
9863.209791.819691.267438.977398.837377.725459.75
4977.954993.794974.544991.194953.794906.964907.50
4930.874907.634826.424408.53
2481.092482.572483.072480.082479.73
1.521.511.501.151.141.140.84
0.770.770.770.770.760.760.76
0.760.760.750.68
0.380.380.380.380.38
Composition by Ratings
Maturity Ladder NAV Movement
Instrument Wise Composition
Name of the Instrument Ratings Market ValueRs. Lakhs
% to NAV
Name of the Instrument Ratings Market ValueRs. Lakhs
% to NAV
Portfolio Macaulay DurationModified DurationAverage Maturity
:::
:
3.10 Months3.09 Months3.10 Months
Gross Yield to Maturity (For Debt Component)*- Including Net Current Assets 4.08%
**Note: The rates specified are actual month end expenses charged as on Dec 31, 2021. The above ratio includes the Service tax on Investment Management Fees. The above ratio excludes, borrowing cost, wherever applicable.
Tata Money Market Fund(An open ended debt scheme investing in money market instruments. A Relatively Low Interest Rate Risk and Moderate Credit Risk.)
Please refer to our Tata Mutual Fund website for fundamental changes, wherever applicable
*Computed on the invested amount for debt portfolio.
Nil (w.e.f 24th January, 2019)
Past performance may or may not be sustained in the future. Returns greater than 1 year period are compounded annualized. Income Distribution cum capital withdrawals are assumed to be reinvested and bonus is adjusted. Load is not taken in to consideration. For SIP returns, monthly investment of equal amounts invested on the 1st day of every month has been considered.
67.47%
26.19%
6.34%
A1+ / AAA
SOV
Cash & Cash Equivalents
51.77%
20.36%
15.70%
6.34%4.36% 1.47%
Commercial Papers
Government Securities
Certificate Of Deposit
Cash & Cash Equivalents
Treasury Bills
State Development Loans
8.55%37.51%
39.15%8.74%
0.00%0.00%0.00%0%
0.00% 10.00% 20.00% 30.00% 40.00% 50.00%
0 - 1 Mths1 - 3 Mths3 - 6 Mths
6 - 12 Mths1 - 2 Yrs2 - 3 Yrs3 - 5 Yrs
Abv 5 Yrs
100106112118124130
Dec-18 Dec-19 Dec-20 Dec-21
Tata Money Market Fund - Reg - GrowthCrisil Money Market Index

www.tatamutualfund.com TATA MUTUAL FUNDMutual Fund investments are subject to market risks, read all scheme related documents carefully 44
As on 31st December 2021
INVESTMENT STYLE
INVESTMENT OBJECTIVE
MINIMUM INVESTMENT/MULTIPLES FOR NEW INVESTMENT
Rs. 5,000/- and in multiples of Re. 1/- thereafter.
ADDITIONAL INVESTMENT/MULTIPLES FOR EXISTING INVESTORS
Rs. 1,000/- and in multiples of Re. 1/- thereafter.
LOAD STRUCTURE
Entry Load : Not Applicable
Exit Load : Nil
PORTFOLIO
Name of the Instrument Name of the Instrument RatingsRs. Lakhs
% to NAV
TrepsRepoPortfolio TotalNet Current LiabilitiesNet Assets
10997.891918.54
114342.11-7722.32
106619.79
10.321.80
107.25-7.25
100.00
SIP - If you had invested INR 10000 every month
1 Year 3 Year 5 Year 7 Year 10 Year Since Inception
Total Amount Invested (Rs.)Total Value as on Dec 31, 2021 (Rs.)ReturnsTotal Value of B: Crisil Ultra Short Term Debt IndexB: Crisil Ultra Short Term Debt IndexTotal Value of AB: CRISIL 1 Year T-Bill IndexAB: CRISIL 1 Year T-Bill Index(Inception date :22-Jan-2019) (First Installment date : 01-Feb-2019)
120,000122,023
3.14%122,686
4.18%122,176
3.38%
NANANANANANANA
NANANANANANANA
NANANANANANANA
NANANANANANANA
350,000371,499
4.02%377,489
5.11%374,280
4.53%
Maturity Ladder
Composition by Ratings Instrument Wise Composition
NAV Movement
The Scheme will invest in various money market and fixed income securities with objective of providing liquidity and generating reasonable returns with lower interest rate risk. The average maturity of the portfolio shall be between three months to six months.
The investment objective of the Scheme is to generate returns through investment in Debt & Money Market instruments such that the Macaulay duration of the portfolio is between 3 months - 6 months. However, there is no assurance or guarantee that the investment objective of the Scheme will be achieved. The scheme does not assure or guarantee any returns.
^Risk-free rate based on the FBIL Overnight MIBOR rate of 3.6% as on Dec 31, 2021
For calculation methodology please refer Pg 71
Market ValueRatingsRs. Lakhs
% to NAV
Market Value
Debt InstrumentsGovernment SecuritiesGOI - 6.84% (19/12/2022)Non-Convertible Debentures/Bonds06.99 % HDFC Ltd.07.09 % Rec Ltd.04.60 % Nabard07.03 % Rec Ltd.07.55 % Hdb Financial Services Ltd. (HDFC Limited)07.17 % Reliance Industries Ltd.Shriram Trans. Fin. Co. Ltd. - Frb08.90 % Bharti Telecom Ltd.04.23 % HDFC Ltd.08.30 % Muthoot Finance Ltd.07.15 % Muthoot Finance Ltd.08.00 % Hdb Financial Services Ltd. (HDFC Limited)06.60 % Rec Ltd.Money Market InstrumentsTreasury Bill 91 Days (20/01/2022)Treasury Bill 364 Days (03/03/2022)Axis Bank Ltd. - CDReliance Industries Ltd. - CP
SOV
CRISIL AAACRISIL AAACRISIL AAACRISIL AAACRISIL AAA
CRISIL AAACRISIL AA+CRISIL AA+CRISIL AAA
CRISIL AA+CRISIL AA+CRISIL AAA
CRISIL AAA
SOVRN SOVSOVRN SOVCRISIL A1+CRISIL A1+
511.57511.57
37492.635608.045099.625002.033555.082557.22
2550.202524.002515.662501.122032.432025.251019.09
502.8963421.47
9983.016462.204986.964963.87
0.480.48
35.175.264.784.693.332.40
2.392.372.362.351.911.900.96
0.4759.48
9.366.064.684.66
IDFC First Bank Ltd. - CDSmall Indust Devlop Bank Of India - CDNABARD - CPBarclays Investments & Loans (India) Ltd. - CPIndusind Bank Ltd. - CDRbl Bank Ltd. - CDBahadur Chand Investments Pvt. Ltd. - CP (Munjal Group)Piramal Enterprises Ltd. - CPAxis Bank Ltd. - CDHero Housing Finance Ltd. - CPAxis Bank Ltd. - CDTata Teleservices (Maharashtra) Ltd. - CPTata Teleservices (Maharashtra) Ltd. - CP
CRISIL A1+CARE A1+
CRISIL A1+CRISIL A1+
CRISIL A1+ICRA A1+ICRA A1+
CRISIL A1+CRISIL A1+CRISIL A1+CRISIL A1+CRISIL A1+
CRISIL A1+
4962.834962.803988.362492.59
2488.792484.152459.24
2452.902453.422432.902396.561963.05
1487.84
4.654.653.742.34
2.332.332.31
2.302.302.282.251.84
1.40
Past performance may or may not be sustained in the future. Returns greater than 1 year period are compounded annualized. Income Distribution cum capitalwithdrawals are assumed to be reinvested and bonus is adjusted. Load is not taken in to consideration. For SIP returns, monthly investment of equal amounts invested on the 1st day of every month has been considered.For scheme performance refer pages 55 - 69.*B: Benchmark; For Scheme Risk-O-Meter and Scheme Benchmark Risk-O-Meter please refer page number 70 of Factsheet.Source: MFI Explorer
VOLATILITY MEASURES^ FUND BENCHMARK0.571.001.000.18
NA
Std. Dev (Annualised)Portfolio BetaR SquaredTreynorJenson
0.621.070.920.10
-0.08
DATE OF ALLOTMENT
January 22,2019
FUND MANAGER
NAV
Direct - GrowthDirect - Monthly IDCWDirect - Weekly IDCWRegular - GrowthRegular - Monthly IDCWRegular - Weekly IDCW
11.778011.848010.406611.535011.537310.3795
FUND SIZE
Rs. 1066.20 (Rs. in Cr.)
BENCHMARK
Crisil Ultra Short Term Debt Index
Akhil Mittal (Managing Since 11-Jan-19 and overall experience of 20 years)
MONTHLY AVERAGE AUM
Rs. 1119.98 (Rs. in Cr.)
EXPENSE RATIO**DirectRegular
0.291.02
Portfolio Macaulay DurationModified DurationAverage Maturity
Gross Yield to Maturity (For Debt Component)*- Including Net Current Assets
: ::
:
4.74 Months4.58 Months4.83 Months
**Note: The rates specified are actual month end expenses charged as on Dec 31, 2021. The above ratio includes the Service tax on Investment Management Fees. The above ratio excludes, borrowing cost, wherever applicable.
Tata Ultra Short Term Fund
::::::
Please refer to our Tata Mutual Fund website for fundamental changes, wherever applicable
*Computed on the invested amount for debt portfolio.
4.30%
[ICRA]A1+mfs rating by ICRA$(An open ended ultra‐short term debt scheme investing in instruments such that the Macaulay duration (Refer page 17 of SID) of the portfolio is between 3 months and 6 months. A Relatively Low Interest Rate Risk and Moderate Credit Risk.
70.69%
15.90%
8.53%4.88%
A1+ / AAA
SOV
AA+ / AA
Cash & Cash Equivalents
32.80%
23.20%
20.86%
15.42%
4.87%2.37% 0.48%
Ncd - Non Convertible Deb
Certificate Of Deposit
Commercial Papers
Treasury Bills
Cash & Cash Equivalents
Floating Rate Bonds
Government Securities
18.18%35.00%
8.75%20.28%
10.03%4.69%
0.00%0%
0.00% 10.00% 20.00% 30.00% 40.00%
0 - 1 Mths1 - 3 Mths3 - 6 Mths
6 - 12 Mths1 - 2 Yrs2 - 3 Yrs3 - 5 Yrs
Abv 5 Yrs
100
104
108
112
116
120
Jan-19 Jan-20 Jan-21 Dec-21
Tata Ultra Short Term Fund - Reg - GrowthCrisil Ultra Short Term Debt Index

www.tatamutualfund.com TATA MUTUAL FUNDMutual Fund investments are subject to market risks, read all scheme related documents carefully
VOLATILITY MEASURES^ FUND BENCHMARK
45
As on 31st December 2021
INVESTMENT STYLE
INVESTMENT OBJECTIVE
DATE OF ALLOTMENT
December 01,2021
FUND MANAGER
NAVDirect - GrowthDirect - Monthly IDCWDirect - Periodic IDCWDirect - Quarterly IDCWReg - GrowthReg - Monthly IDCWReg - Periodic IDCWReg - Quarterly IDCW
::::::::
10.024010.024010.024010.024010.015910.015910.015910.0159
FUND SIZE
Rs. 574.01 (Rs. in Cr.)
MINIMUM INVESTMENT/ MULTIPLES FOR NEW INVESTMENT
ADDITIONAL INVESTMENT/MULTIPLES FOR EXISTING INVESTORS
Rs. 1,000/- and in multiples of Re. 1/- thereafter.
LOAD STRUCTURE
Entry Load ::
Not ApplicableExit Load
PORTFOLIO
Name of the Instrument
12446.179936.422509.75
40767.475226.955027.285026.705012.454995.423016.432553.162501.98
2499.722468.40
2438.98
21.6817.314.37
71.029.118.768.768.738.705.254.454.36
4.354.30
4.25
Name of the Instrument RatingsRs. Lakhs
% to NAV
RepoPortfolio TotalCash / Net Current AssetNet Assets
2759.6455973.281428.07
57401.35
4.8197.512.49
100.00
Predominantly investing in AA+ & above rated corporate bonds, with flexibility of any Macaulay Duration
The investment objective of the scheme is to generate returns over short to medium term by investing predominantly in corporate debt instruments. However, there is no guarantee or assurance that the investment objective of the scheme will be achieved. The scheme doesn’t assure or guarantee any returns.
Abhishek Sonthalia (Managing Since 22-Nov-21 and overall experience of 13 years)
Rs. 5,000/- and in multiples of Re. 1/- thereafter.
Std. Dev (Annualised)Portfolio BetaR SquaredTreynorJenson
2.661.001.00
NANA
NA0.000.000.00
NA
^Risk-free rate based on the FBIL Overnight MIBOR rate of 3.6% as on Dec 31, 2021
Nil
Market ValueRatingsRs. Lakhs
% to NAV
Market Value
Debt InstrumentsGovernment SecuritiesGOI - 5.63% (12/04/2026)SDL Gujarat 5.39% (31/03/2024)Non-Convertible Debentures/Bonds08.82 % Rec Ltd.05.32 % National Housing Bank05.47 % Power Finance Corporation05.44 % Nabard05.99 % LIC Housing Finance Ltd.06.45 % L&T Finance Ltd.06.39 % Indian Oil Corp Ltd.05.24 % Small Indust Devlop Bank Of India06.25 % Embassy Office Parks Reit06.40 % Jamnagar Utilities & Power Pvt. Ltd. (Mukesh Ambani Group)06.49 % Yarrow Infrastructure Pvt Ltd. (Vector Green)
SOVSOV
ICRA AAACRISIL AAACRISIL AAACRISIL AAACRISIL AAACRISIL AAACRISIL AAA
ICRA AAA
CRISIL AAACRISIL AAA
CRISIL AAA
Maturity Ladder
Composition by Ratings Instrument Wise Composition
NAV Movement
For calculation methodology please refer Pg 71
Portfolio Macaulay DurationModified DurationAverage Maturity
:: :
:
2.28 Years2.19 Years2.5 Years
Gross Yield to Maturity (For Debt Component)*- Including Net Current Assets 5.47%
BENCHMARK
Crisil Corporate Bond Composite Index
MONTHLY AVERAGE AUM
Rs. 593.49 (Rs. in Cr.)
EXPENSE RATIO**
DirectRegular
0.210.86
**Note: The rates specified are actual month end expenses charged as on Dec 31, 2021. The above ratio includes the Service tax on Investment Management Fees. The above ratio excludes, borrowing cost, wherever applicable.
Tata Corporate Bond Fund
Please refer to our Tata Mutual Fund website for fundamental changes, wherever applicable
*Computed on the invested amount for debt portfolio.
(An open-ended debt scheme predominantly investing in AA+ & above rated corporate bonds, with flexibility of any Macaulay Duration & relatively high interest rate risk & moderate credit risk.)
71.02%
21.68%
7.30%
A1+ / AAA
SOV
Cash & Cash Equivalents 71.02%
17.31%
7.30%4.37%
Ncd - Non Convertible Deb
Government Securities
Cash & Cash Equivalents
State Development Loans
4.81%
57.94%
34.76%
0.00%
0.00%
2.49%
0.00% 10.00% 20.00% 30.00% 40.00% 50.00% 60.00%
0 - 1 Yrs
1 - 3 Yrs
3 - 7 Yrs
7 - 10 Yrs
Abv 10 Yrs
Cash & Others
99.5
100
100.5
7-Dec-21 15-Dec-21 23-Dec-21 31-Dec-21
Tata Corporate Bond Fund - Reg - GrowthCrisil Corporate Bond Composite Index
*B: Benchmark, AB: Additional Benchmark. For Scheme Risk-O-Meter and Scheme Benchmark Risk-O-Meter please refer page number 70 of Factsheet.

www.tatamutualfund.com TATA MUTUAL FUNDMutual Fund investments are subject to market risks, read all scheme related documents carefully
VOLATILITY MEASURES^ FUND BENCHMARK
46
As on 31st December 2021
INVESTMENT STYLE
INVESTMENT OBJECTIVE
DATE OF ALLOTMENT
October 10,2019
FUND MANAGER
NAVDirect - IDCWDirect - GrowthRegular - IDCWRegular - Growth
::::
11.761511.761511.628011.6280
FUND SIZE
Rs. 436.51 (Rs. in Cr.)
MINIMUM INVESTMENT/ MULTIPLES FOR NEW INVESTMENT
ADDITIONAL INVESTMENT/MULTIPLES FOR EXISTING INVESTORS
Rs. 1,000/- and in multiples of Re. 1/- thereafter.
LOAD STRUCTURE
Entry Load ::
Not ApplicableExit Load
PORTFOLIO
Name of the Instrument
8406.153463.68519.85490.31378.05
354.46322.76319.73320.71301.40269.38250.43215.07208.26206.59115.33107.34108.69106.8591.7453.1753.6054.0144.2739.9010.57
30906.854021.823060.032779.58
2614.212562.642552.872541.142540.29
2491.812192.201037.57
990.28
909.05
532.3381.03
2458.272458.27
70.819.217.016.37
5.995.875.855.825.82
5.715.022.382.27
2.08
1.220.19
5.635.63
19.227.931.191.120.87
0.810.740.730.730.690.620.570.490.480.470.260.250.250.240.210.120.120.120.100.090.02
Name of the Instrument RatingsRs. Lakhs
% to NAV
TrepsRepoPortfolio TotalCash / Net Current AssetNet Assets
899.8359.62
42730.72920.00
43650.72
2.060.14
97.892.11
100.00
SIP - If you had invested INR 10000 every month
1 Year 3 Year 5 Year 7 Year 10 Year Since Inception
Total Amount Invested (Rs.)
Total Value as on Dec 31, 2021 (Rs.)
Returns
Total Value of B: CRISIL Banking and PSU Debt Index
B: CRISIL Banking and PSU Debt Index
Total Value of AB: CRISIL 10 Year Gilt Index
AB: CRISIL 10 Year Gilt Index
(Inception date :10-Oct-2019) (First Installment date : 01-Nov-2019)
120,000
122,718
4.23%
123,204
4.99%
121,013
1.57%
NA
NA
NA
NA
NA
NA
NA
260,000
276,568
5.60%
277,544
5.93%
269,408
3.20%
NA
NA
NA
NA
NA
NA
NA
NA
NA
NA
NA
NA
NA
NA
NA
NA
NA
NA
NA
NA
NA
Debt Fund predominantly investing in debt instruments of Banks, Public Sector Undertakings, Public Financial Institutions and Municipal Bonds.
The investment objective of the scheme is to generate reasonable income, with low risk and high level of liquidity from a portfolio of predominantly debt & money market securities issued by Banks, Public Sector Undertakings (PSUs), Public Financial Institutions (PFIs) and Municipal Bonds. However, there is no assurance or guarantee that the investment objective of the Scheme will be achieved. The scheme does not assure or guarantee any returns.
Amit Somani (Managing Since 06-Sep-19 and overall experience of 20 years)
Rs. 5,000/- and in multiples of Re. 1/- thereafter.
Std. Dev (Annualised)Portfolio BetaR SquaredTreynorJenson
2.301.001.000.18
NA
2.610.990.710.260.07
^Risk-free rate based on the FBIL Overnight MIBOR rate of 3.6% as on Dec 31, 2021
Nil
Market ValueRatingsRs. Lakhs
% to NAV
Market Value
Debt Instruments Government SecuritiesGOI - 5.22% (15/06/2025)SDL West Bengal 7.82% (19/06/2023)SDL Kerala 9.75% (26/02/2024)SDL Uttar Pradesh SDL Special 8.55% (04/10/2022)SDL Gujarat 8.58% (23/01/2023)SDL Gujarat 9.39% (20/11/2023)SDL Madhya Pradesh 9.53% (01/08/2023)SDL Maharashtra 9.60% (14/08/2023)SDL Rajasthan 8.29% (29/07/2025)SDL Karnataka 9.39% (04/12/2023)SDL Karnataka 9.55% (12/02/2024)SDL Andhra Pradesh 9.39% (20/11/2023)SDL Maharashtra 8.62% (20/02/2023)SDL Gujarat 8.84% (17/10/2022)SDL Kerala 4.85% (03/02/2023)SDL West Bengal 9.84% (28/08/2023)SDL Kerala 9.46% (26/03/2024)SDL West Bengal 9.72% (01/08/2023)SDL Karnataka 8.22% (09/12/2025)SDL Punjab 8.50% (30/03/2024)SDL Kerala 9.72% (28/08/2023)SDL Kerala 9.41% (30/01/2024)SDL Tamilnadu 8.00% (28/10/2025)SDL Tamilnadu 8.25% (25/04/2023)SDL Rajasthan 8.21% (31/03/2024)
SOVSOVSOVSOV
SOVSOVSOVSOVSOVSOVSOVSOVSOVSOVSOVSOVSOVSOVSOVSOVSOVSOVSOVSOVSOV
Non-Convertible Debentures/Bonds05.32 % National Housing Bank06.44 % Indian Oil Corp Ltd.06.24 % State Bank Of India (Basel III Tier II Bonds)07.42 % Power Finance Corporation06.80 % Rec Ltd.06.55 % NTPC Ltd.06.91 % Nhpc Ltd.06.19 % Indian Railways Finance Corporation Ltd.05.14 % Nabard08.00 % Ongc Petro-Additions Ltd.07.13 % Nhpc Ltd.04.78 % Housing & Urban Development Corporation Ltd.09.20 % ICICI Bank Ltd. (Basel III Tier I Bonds)08.49 % NTPC Ltd.08.85 % HDFC Bank Ltd. (Basel III Tier I Bonds)Money Market InstrumentsKotak Mahindra Bank - CD
CRISIL AAACRISIL AAACRISIL AAA
CRISIL AAACRISIL AAACRISIL AAA
ICRA AAACRISIL AAA
CRISIL AAAICRA AAA(CE)
ICRA AAAICRA AAA
ICRA AA+
CRISIL AAACRISIL AA+
CRISIL A1+
Maturity Ladder
Composition by Ratings Instrument Wise Composition
NAV Movement
For calculation methodology please refer Pg 71
Past performance may or may not be sustained in the future. Returns greater than 1 year period are compounded annualized. Income Distribution cum capital withdrawals are assumed to be reinvested and bonus is adjusted. Load is not taken in to consideration. For SIP returns, monthly investment of equal amounts invested on the 1st day of every month has been considered. For scheme performance refer pages 55- 69.*B: Benchmark, AB: Additional Benchmark; For Scheme Risk-O-Meter and Scheme Benchmark Risk-O-Meter please refer page number 70 of Factsheet.Source: MFI Explorer
Portfolio Macaulay DurationModified DurationAverage Maturity
:: :
:
2.13 Years2.02 Years2.47 Years
Gross Yield to Maturity (For Debt Component)*- Including Net Current Assets 5.22%
BENCHMARK
CRISIL Banking and PSU Debt Index
MONTHLY AVERAGE AUM
Rs. 443.42 (Rs. in Cr.)
EXPENSE RATIO**
DirectRegular
0.260.71
**Note: The rates specified are actual month end expenses charged as on Dec 31, 2021. The above ratio includes the Service tax on Investment Management Fees. The above ratio excludes, borrowing cost, wherever applicable.
Tata Banking & PSU Debt Fund
Please refer to our Tata Mutual Fund website for fundamental changes, wherever applicable
*Computed on the invested amount for debt portfolio.
(An open ended debt scheme predominantly investing in debt instruments of Banks, Public Sector Undertakings, Public Financial Institutions and Municipal Bonds. A Relatively High Interest Rate Risk and Moderate Credit Risk.)
69.14%
19.26%
5.02%4.31%2.27%
A1+ / AAA
SOV
AAA(CE)
Cash & Cash Equivalents
AA+ / AA
62.17%11.32%
7.93%
6.37%
5.63%4.31%2.27%
Ncd - Non Convertible Deb
State Development Loans
Government Securities
Tier 2 Bonds (t2 Bonds)
Certificate Of Deposit
Cash & Cash Equivalents
Tier 1 Bonds (at1 Bonds)
12.93%
56.71%
17.56%
6.37%
2.27%
4.16%
0.00% 10.00% 20.00% 30.00% 40.00% 50.00% 60.00%
0 - 1 Yrs
1 - 3 Yrs
3 - 7 Yrs
7 - 10 Yrs
Abv 10 Yrs
Cash & Others
90
96
102
108
114
120
Oct-19 Jul-20 Apr-21 Dec-21
Tata Banking & PSU Debt Fund - Reg - GrowthCRISIL Banking and PSU Debt Index

www.tatamutualfund.com TATA MUTUAL FUNDMutual Fund investments are subject to market risks, read all scheme related documents carefully
VOLATILITY MEASURES^ FUND BENCHMARK
47
As on 31st December 2021
INVESTMENT STYLE
INVESTMENT OBJECTIVE
DATE OF ALLOTMENT
July 07, 2021
FUND MANAGER
NAVDirect - GrowthDirect - Monthly IDCWDirect - Periodic IDCWDirect - Quarterly IDCWRegular - GrowthRegular - Monthly IDCWRegular - Periodic IDCWRegular - Quarterly IDCW
::::::::
10.181110.181110.181110.181110.157910.157910.157910.1579
FUND SIZE
Rs. 514.71 (Rs. in Cr.)
MINIMUM INVESTMENT/ MULTIPLES FOR NEW INVESTMENT
ADDITIONAL INVESTMENT/MULTIPLES FOR EXISTING INVESTORS
Rs. 1,000/- and multiples of Re. 1/- thereafter.
LOAD STRUCTURE
Entry Load ::
Not ApplicableExit Load
PORTFOLIO
Name of the Instrument
16490.714990.844950.604951.391089.77508.11
31399.105005.874522.463317.95
2557.762501.85
2477.09
2019.201511.381500.321488.671481.04
32.059.709.629.622.120.99
61.019.738.796.45
4.974.86
4.81
3.922.942.912.892.88
Name of the Instrument RatingsRs. Lakhs
% to NAV
RepoPortfolio TotalCash / Net Current AssetNet Assets
2537.1250426.931043.63
51470.56
4.9397.972.03
100.00
An open-ended debt scheme investing predominantly in floating rate instruments (including fixed rate instruments converted to floating rate exposures using swaps/ derivatives)
The objective of the scheme is to generate income through investment primarily in floating rate debt instruments, fixed rate debt instruments swapped for floating rate returns and money market instruments.However, there is no assurance or guarantee that the investment objective of the Scheme will be achieved. The scheme does not assure or guarantee any returns.
Akhil Mittal (Managing Since 21-Jun-21 and overall experience of 20 years)
Rs. 5,000/- and in multiples of Re. 1/- thereafter.
Std. Dev (Annualised)Portfolio BetaR SquaredTreynorJenson
1.691.001.000.12
NA
0.330.200.24
-0.13-0.05
For calculation methodology please refer Pg 71
YTM, Macaulay Duration and Modified Duration is post adjustment of IRS positions in the Fund. For details of IRS positions please refer to Monthly Portfolio.
Portfolio Macaulay DurationModified DurationAverage Maturity
:: :
:
1.27 Years2.67 Years3.39 Years
Gross Yield to Maturity (For Debt Component)*- Including Net Current Assets 5.22%
*Computed on the invested amount for debt portfolio.
^Risk-free rate based on the FBIL Overnight MIBOR rate of 3.6% as on Dec 31, 2021
Nil
Market ValueRatingsRs. Lakhs
% to NAV
Market Value
Debt InstrumentsGovernment SecuritiesGOI Floating Rate Bond -4.59% (07/12/2031)GOI Floating Rate Bond 4.04% (04/10/2028)GOI Floating Rate Bond -3.51% (07/11/2024)SDL Haryana 9.71% (12/03/2024)GOI 8.35% 14/5/2022Non-Convertible Debentures/BondsRec Ltd. - FrbPower Finance Corporation - FrbVaranasi Sangam Expressway Pvt. Ltd. - Frb (Vinod Kumar Agarwal, Ajendra Kumar Agarwal, Purshottam Agarwal And Lokesh Builders Pvt Ltd.)07.45 % LIC Housing Finance Ltd.05.35 % Telesonic Networks Ltd.(Bharti Group)05.85 % Tata Capital Financial Services Ltd.Shriram Trans. Fin. Co. Ltd. - FrbICICI Home Finance Co.Ltd. - FrbHero Fincorp Ltd. - Frb05.60 % Bajaj Housing Finance Ltd.06.40 % Jamnagar Utilities & Power Pvt. Ltd. (Mukesh Ambani Group)
SOVSOVSOVSOVSOV
CRISIL AAACRISIL AAA
IND AAA
CRISIL AAACRISIL AA+
CRISIL AAA
CRISIL AA+CRISIL AAA
CRISIL AA+CRISIL AAACRISIL AAA
1463.39
1048.62
503.50
2.84
2.04
0.98
06.49 % Yarrow Infrastructure Pvt Ltd.(Vector Green)08.90 % Tata Capital Financial Services Ltd.06.60 % Muthoot Finance Ltd.
CRISIL AAA
CRISIL AAA
CRISIL AA+
Maturity Ladder
Composition by Ratings Instrument Wise Composition
NAV Movement
BENCHMARK
CRISIL Short Term Bond Fund Index
MONTHLY AVERAGE AUM
Rs. 519.81 (Rs. in Cr.)
EXPENSE RATIO**
DirectRegular
0.270.72
**Note: The rates specified are actual month end expenses charged as on Dec 31, 2021. The above ratio includes the Service tax on Investment Management Fees. The above ratio excludes, borrowing cost, wherever applicable.
Tata Floating Rate Fund
Please refer to our Tata Mutual Fund website for fundamental changes, wherever applicable
For Scheme Risk-O-Meter and Scheme Benchmark Risk-O-Meter please refer page number 70 of Factsheet.
(An open ended debt scheme investing predominantly in floating rate instruments (including fixed rate instruments converted to floating rate exposures using swaps/ derivatives), A Relatively High Interest Rate Risk and Moderate Credit Risk.)
48.33%
32.04%
12.68%
6.95%A1+ / AAA
SOV
AA+ / AA
Cash & Cash Equivalents
34.73%
28.93%
26.27%
6.96% 2.12%0.99%Floating Rate Bonds
Goi Frn-reset
Ncd - Non Convertible Deb
Cash & Cash Equivalents
State Development Loans
Government Securities
5.92%
63.42%
12.50%
9.70%
6.45%
2.01%
0.00% 10.00% 20.00% 30.00% 40.00% 50.00% 60.00% 70.00%
0 - 1 Yrs
1 - 3 Yrs
3 - 7 Yrs
7 - 10 Yrs
Abv 10 Yrs
Cash & Others
100
102
104
Jul-21 Sep-21 Nov-21 Dec-21
Tata Floating Rate Fund - Reg - GrowthCRISIL Short Term Bond Fund Index

www.tatamutualfund.com TATA MUTUAL FUNDMutual Fund investments are subject to market risks, read all scheme related documents carefully
Please refer to our Tata Mutual Fund website for fundamental changes, wherever applicable
VOLATILITY MEASURES^ FUND BENCHMARK
Std. Dev (Annualised)Portfolio BetaR SquaredTreynorJenson
The investment objective is to generate reasonable returns with high liquidity to the unitholders.
Amit Somani (Managing Since 16-Oct-13 and overall experience of 20 years) & Abhishek Sonthalia (Managing Since 06-Feb-20 and overall experience of 13 years)
48
As on 31st December 2021
INVESTMENT STYLE
INVESTMENT OBJECTIVE
DATE OF ALLOTMENT
September 01,2004
FUND MANAGER
Crisil Liquid Fund IndexBENCHMARK
NAV
Direct - GrowthDirect - Daily IDCWReg - GrowthReg - Daily IDCW
::::
3330.28051001.51873304.01751001.5157
FUND SIZE
Rs. 11424.68 (Rs. in Cr.)
MONTHLY AVERAGE AUM
Rs. 12797.32 (Rs. in Cr.)
EXPENSE RATIO**
DirectRegular
MINIMUM INVESTMENT/MULTIPLES FOR NEW INVESTMENT
Rs. 5,000/- and in multiples of Re. 1/- thereafter.
ADDITIONAL INVESTMENT/MULTIPLES FOR EXISTING INVESTORS
Rs. 1,000/- and multiples of Re. 1/- thereafter.
LOAD STRUCTURE
Entry Load : Not Applicable
Exit Load :
PORTFOLIO
200621.25195586.28
5034.97822203.87
89476.6549547.6546591.6644622.5439976.3639934.5234908.7229961.1529857.6827274.8624853.8819991.0419973.4819954.2419892.4419922.3414984.3014944.6514975.6114867.2114898.87
9982.389907.93
9916.979907.579971.089980.949907.579970.919988.15
17.5617.12
0.4471.97
7.834.344.083.913.503.503.062.622.612.392.181.751.751.751.741.741.311.311.311.301.300.870.87
0.870.870.870.870.870.870.87
TrepsRepoPortfolio TotalCash / Net Current AssetNet Assets
87833.47727.17
1111385.7631082.42
1142468.18
7.690.06
97.282.72
100.00
SIP - If you had invested INR 10000 every month1 Year 3 Year 5 Year 7 Year 10 Year Since Inception
Total Amount Invested (Rs.)Total Value as on Dec 31, 2021 (Rs.)ReturnsTotal Value of B: Crisil Liquid Fund IndexB: Crisil Liquid Fund IndexTotal Value of AB: CRISIL 1 Year T-Bill IndexAB: CRISIL 1 Year T-Bill Index(Inception date :01-Sep-2004) (First Installment date : 01-Oct-2004)
120,000122,129
3.30%122,337
3.62%122,185
3.38%
360,000381,932
3.87%384,037
4.24%386,114
4.59%
600,000678,367
4.85%683,568
5.15%689,121
5.47%
840,0001,019,633
5.45%1,027,964
5.68%1,034,227
5.85%
1,200,0001,654,408
6.25%1,665,975
6.38%1,641,887
9.38%
2,070,0003,937,982
7.00%3,882,365
6.85%3,682,205
7.00%
[ICRA]A1+mfs rating by ICRA$
A high liquidity income scheme that aims to generate reasonable returns.
0.481.070.930.08
-0.03
0.431.001.000.11
NA
0.220.33
^Risk-free rate based on the FBIL Overnight MIBOR rate of 3.6% as on Dec 31, 2021
For calculation methodology please refer to Pg 71
Name of the Instrument RatingsRs. Lakhs
% toNAV
Market Value Name of the Instrument RatingsRs. Lakhs
% toNAV
Market Value
Debt InstrumentsGovernment SecuritiesGOI 8.20% (15/02/2022)SDL Punjab 8.79% (22/02/2022)Money Market Instruments Treasury Bill 91 Days (03/03/2022) Adani Ports & Special Economic Zone Ltd. - CP Treasury Bill 91 Days (31/03/2022) Reliance Retail Ventures Ltd. - CP Reliance Jio Infocomm Ltd. - CP Chennai Petroleum Corporation Ltd. - CP Axis Bank Ltd. - CD HDFC Ltd. - CP Chennai Petroleum Corporation Ltd. - CP Reliance Retail Ventures Ltd. - CP HDFC Ltd. - CP Sharekhan Ltd. - CP Gic Housing Finance Ltd. - CP HDFC Ltd. - CP Reliance Industries Ltd. - CP Axis Bank Ltd. - CD Bharat Heavy Electricals Ltd. - CP Axis Bank Ltd. - CD ICICI Home Finance Co.Ltd. - CP NTPC Ltd. - CP Motilal Oswal Financial Serv. Ltd. - CP Can Fin Homes Ltd. - CP Sharekhan Bnp Paribas Financial Services Pvt. Ltd. - CP ICICI Securities Ltd. - CP Iifl Wealth Management Ltd. - CP Cholamandalam Invt & Fin Co Ltd. - CP Piramal Enterprises Ltd. - CP Iifl Wealth Prime Ltd. - CP NABARD - CP Reliance Jio Infocomm Ltd. - CP
Composition by Ratings
Maturity Ladder NAV Movement
Instrument Wise Composition
SOVSOV
SOVRN SOVICRA A1+
SOVRN SOVCRISIL A1+CRISIL A1+CRISIL A1+CRISIL A1+CRISIL A1+CRISIL A1+CRISIL A1+CRISIL A1+
ICRA A1+CRISIL A1+CRISIL A1+CRISIL A1+CRISIL A1+CRISIL A1+CRISIL A1+
ICRA A1+CRISIL A1+CRISIL A1+
ICRA A1+ICRA A1+
CRISIL A1+CRISIL A1+CRISIL A1+CRISIL A1+CRISIL A1+CRISIL A1+CRISIL A1+
CRISIL A1+
CRISIL A1+CRISIL A1+CRISIL A1+CRISIL A1+CRISIL A1+CRISIL A1+CRISIL A1+CRISIL A1+CRISIL A1+CRISIL A1+CRISIL A1+CRISIL A1+CRISIL A1+CRISIL A1+CRISIL A1+SOVRN SOV
9905.99
9976.719963.699948.287492.617444.325966.774973.394992.714980.294967.104963.474961.834965.872976.092488.98
292.42
0.87
0.870.870.870.660.650.520.440.440.440.430.430.430.430.260.220.03
Birla Group Holdings Private Ltd. - CP (A Key Promoter Group Company Of Aditya Birla Group Promoters Holding Stakes In Companies Like Hindalco, Grasim, ABFRL, And Aditya Birla Capital Ltd.) NABARD - CP Ultratech Cement Ltd. - CP Barclays Investments & Loans (India) Ltd. - CP Reliance Industries Ltd. - CP Axis Finance Ltd. - CP Aditya Birla Money Ltd. - CP Tata Power Renewable Energy Ltd. - CP Jm Financial Services Ltd. - CP Deutsche Investment India Pvt Ltd. - CP Reliance Retail Ventures Ltd. - CP Dabur India Ltd. - CP ICICI Securities Ltd. - CP Aditya Birla Money Ltd. - CP Tata Teleservices Ltd. - CP LIC Housing Finance Ltd. - CP Treasury Bill 91 Days (10/02/2022)
Past performance may or may not be sustained in the future. Returns greater than 1 year period are compounded annualized. Income Distribution cum capital withdrawals are assumed to be reinvested and bonus is adjusted. Load is not taken in to consideration. For SIP returns, monthly investment of equal amounts invested on the 1st day of every month has been considered.For scheme performance refer pages 55 - 69.*B: Benchmark, AB: Additional Benchmark: For Scheme Risk-O-Meter and Scheme Benchmark Risk-O-Meter please refer page number 70 of Factsheet.Source: MFI Explorer
Portfolio Macaulay DurationModified DurationAverage MaturityGross Yield to Maturity (For Debt Component)*
- Including Net Current Assets 3.71%
: ::
:
43 Days43 Days43 Days
**Note: The rates specified are actual month end expenses charged as on Dec 31, 2021. The above ratio includes the Service tax on Investment Management Fees. The above ratio excludes, borrowing cost, wherever applicable.
Tata Liquid Fund(An open ended Liquid Scheme. A Relatively Low Interest Rate Risk and Moderate Credit Risk.)
*Computed on the invested amount for debt portfolio.
1 day - 0.0070% of redemption proceeds2 days - 0.0065% of redemption proceeds3 days - 0.0060% of redemption proceeds4 days - 0.0055% of redemption proceeds5 days - 0.0050% of redemption proceeds6 days - 0.0045% of redemption proceeds7 days or more - Nil 60.03%
29.50%
10.47%
A1+ / AAA
SOV
Cash & Cash Equivalents
53.92%
17.12%
11.94%
10.47%6.11% 0.44%
Commercial Papers
Government Securities
Treasury Bills
Cash & Cash Equivalents
Certificate Of Deposit
State Development Loans
5.31%
8.52%
12.23%
33.13%
30.39%
10.42%
0.00% 10.00% 20.00% 30.00% 40.00%
1 - 7 Days
Abv 7 - 15 Days
Abv 15 - 30 Days
1 - 2 Mths
2 - 3 Mths
Cash & Others
100
104
108
112
116
120
Dec-18 Dec-19 Dec-20 Dec-21
Tata Liquid Fund - Reg - GrowthCrisil Liquid Fund Index

www.tatamutualfund.com TATA MUTUAL FUNDMutual Fund investments are subject to market risks, read all scheme related documents carefully
TrepsRepoPortfolio TotalCash / Net Current AssetNet Assets
146972.2952050.86
199023.15902.74
199925.89
73.5126.0499.550.45
100.00
Please refer to our Tata Mutual Fund website for fundamental changes, wherever applicable
VOLATILITY MEASURES^ FUND BENCHMARK
Std. Dev (Annualised)Portfolio BetaR SquaredTreynorJenson
Amit Somani (Managing Since 25-Mar-19 and overall experience of 20 years)
49
As on 31st December 2021
INVESTMENT STYLE
DATE OF ALLOTMENT
March 27,2019
FUND MANAGER
Crisil Overnight Index
BENCHMARK
NAV
Direct - IDCWDirect - GrowthRegular - IDCWRegular - Growth
::::
1000.00001112.09281000.00001108.8651
FUND SIZE
Rs. 1999.26 (Rs. in Cr.)
MONTHLY AVERAGE AUM
Rs. 1848.79 (Rs. in Cr.)
EXPENSE RATIO**
DirectRegular
MINIMUM INVESTMENT/MULTIPLES FOR NEW INVESTMENT
Rs. 5,000/- and in multiples of Re. 1/- thereafter.
ADDITIONAL INVESTMENT/MULTIPLES FOR EXISTING INVESTORS
Rs. 1,000/- and multiples of Re. 1/- thereafter.
LOAD STRUCTURE
Entry Load : Not Applicable
Exit Load : Nil
PORTFOLIO
SIP - If you had invested INR 10000 every month
1 Year 3 Year 5 Year 7 Year 10 Year Since Inception
Total Amount Invested (Rs.)Total Value as on Dec 31, 2021 (Rs.)ReturnsTotal Value of B: Crisil Overnight IndexB: Crisil Overnight IndexTotal Value of AB: CRISIL 1 Year T-Bill IndexAB: CRISIL 1 Year T-Bill Index(Inception date :27-Mar-2019) (First Installment date : 01-Apr-2019)
120,000122,012
3.11%122,143
3.32%122,185
3.38%
NANANANANANANA
NANANANANANANA
NANANANANANANA
NANANANANANANA
330,000345,599
3.29%346,406
3.46%351,013
4.41%
Investment in overnight securities having maturity of 1 day.
INVESTMENT OBJECTIVE
The objective of the scheme is to seek to generate returns commensurate with low risk and providing high level of liquidity, through investments made primarily in overnight securities having maturity of 1 business day. However, there is no assurance or guarantee that the investment objective of the Scheme will be achieved. The scheme does not assure or guarantee any returns.
0.311.011.000.01
-0.01
0.351.001.000.03
NA
0.110.21
Portfolio Macaulay DurationModified DurationAverage MaturityGross Yield to Maturity (For Debt Component)*
- Including Net Current Assets 3.48%
: ::
:
3 Days3 Days3 Days
^Risk-free rate based on the FBIL Overnight MIBOR rate of 3.6% as on Dec 31, 2021
For calculation methodology please refer to Pg 71
Name of the Instrument RatingsRs. Lakhs
% toNAV
Market Value Name of the Instrument RatingsRs. Lakhs
% toNAV
Market Value
Maturity Ladder
NAV MovementInstrument Wise Composition
Past performance may or may not be sustained in the future. Returns greater than 1 year period are compounded annualized. Income Distribution cum capitalwithdrawals are assumed to be reinvested and bonus is adjusted. Load is not taken in to consideration. For SIP returns, monthly investment of equal amounts invested on the 1st day of every month has been considered.For scheme performance refer pages 55 - 69.*B: Benchmark, AB: Additional Benchmark; For Scheme Risk-O-Meter and Scheme Benchmark Risk-O-Meter please refer page number 70 of Factsheet.Source: MFI Explorer
**Note: The rates specified are actual month end expenses charged as on Dec 31, 2021. The above ratio includes the Service tax on Investment Management Fees. The above ratio excludes, borrowing cost, wherever applicable.
Tata Overnight Fund(An open ended Debt scheme investing in Overnight Securities. A Relatively Low Interest Rate Risk and Relatively Low Credit Risk.)
*Computed on the invested amount for debt portfolio.
100.00%
Cash & Cash Equivalents
100
104
108
112
116
120
Mar-19 Feb-20 Jan-21 Dec-21
Tata Overnight Fund - Reg - GrowthCrisil Overnight Index
26.04%
0.00%
0.00%
0.00%
0.00%
73.96%
0.00% 20.00% 40.00% 60.00% 80.00%
1 - 7 Days
Abv 7 - 15 Days
Abv 15 - 30 Days
1 - 2 Mths
2 - 3 Mths
Cash & Others

As on 31st December 2021
www.tatamutualfund.com TATA MUTUAL FUNDMutual Fund investments are subject to market risks, read all scheme related documents carefully 50
INVESTMENT STYLE
INVESTMENT OBJECTIVE
DATE OF ALLOTMENT
September 6, 1999
FUND MANAGER
NAV
Direct - GrowthDirect - IDCWReg -GrowthReg -IDCW
::::
FUND SIZE
Rs. 194.51 (Rs. in Cr.)
MONTHLY AVERAGE AUM
Rs. 195.85 (Rs. in Cr.)
EXPENSE RATIO**
DirectRegular
MINIMUM INVESTMENT/ MULTIPLES FOR NEW INVESTMENT
Rs. 5,000/- and in multiples of Re. 1/- thereafter.
ADDITIONAL INVESTMENT/ MULTIPLES FOR EXISTING INVESTORS
Rs. 1,000/- and multiples of Re. 1/- thereafter.
LOAD STRUCTURE
Entry Load : Not Applicable
Exit Load :
PORTFOLIO
Name of the Instrument Ratings Market ValueRs. Lakhs
% to NAV
Debt InstrumentsGovernment SecuritiesGOI - 5.63% (12/04/2026)GOI - 6.67% (15/12/2035)GOI - 6.68% (17/09/2031)SDL Maharashtra 9.39% (20/11/2023)GOI - 7.59% (11/01/2026)GOI - 6.64% (16/06/2035)SDL Maharashtra 9.79% (25/09/2023)SDL Goa 9.77 % (26/02/2024).SDL Maharashtra 8.62% (20/02/2023)GOI - 5.77% (03/08/2030)SDL Haryana 9.71% (12/03/2024)GOI - 6.10% (12/07/2031)SDL Andhra Pradesh 9.48% (26/03/2024)GOI 8.24% 15/02/2027
17237.807452.326366.09810.40538.03532.25488.07233.62207.08203.05154.7693.7261.4257.6239.37
88.6338.3132.734.172.772.742.511.201.061.040.800.480.320.300.20
SOVSOVSOVSOVSOVSOVSOVSOVSOVSOVSOVSOVSOVSOV
Name of the Instrument RatingsRs. Lakhs
% to NAV
Repo
Portfolio Total
Cash / Net Current Asset
Net Assets
1955.81
19193.61
257.02
19450.63
10.06
98.68
1.32
100.00
SIP - If you had invested INR 10000 every month
1 Year 3 Year 5 Year 7 Year 10 Year Since Inception
Total Amount Invested (Rs.)
Total Value as on Dec 31, 2021 (Rs.)
Returns
Total Value of B: Crisil Dynamic Gilt Index
B: Crisil Dynamic Gilt Index
Total Value of AB: CRISIL 10 Year Gilt Index
AB: CRISIL 10 Year Gilt Index
(Inception date :06-Sep-1999) (First Installment date : 01-Oct-1999)
120,000
121,560
2.42%
122,697
4.19%
121,013
1.57%
360,000
386,159
4.61%
398,011
6.63%
387,126
4.77%
600,000
692,343
5.66%
723,498
7.42%
696,829
5.92%
840,000
1,042,970
6.09%
1,100,184
7.59%
1,050,545
6.29%
1,200,000
1,722,255
7.02%
1,819,966
8.07%
1,702,245
6.80%
2,670,000
6,427,040
7.23%
7,087,168
7.98%
4,967,261
6.50%
A debt scheme that invests in Government securities to generate reasonable returns emphasising the importance of captial preservation.
The investment objective of the Scheme is to generate medium to long term capital appreciation and income distribution by investing predominantly in Government Securities.
Murthy Nagarajan (Managing Since 14-Sep-19 and overall experience of 25 years)
BENCHMARK
Crisil Dynamic Gilt Index
68.065919.163362.923917.4487
VOLATILITY MEASURES^ FUND BENCHMARK
Std. Dev (Annualised)Portfolio BetaR SquaredTreynorJenson
^Risk-free rate based on the FBIL Overnight MIBOR rate of 3.6% as on Dec 31, 2021
For calculation methodology please refer to Pg 71
Composition by Ratings
Maturity Ladder
Instrument Wise Composition
NAV Movement
Market Value
Past performance may or may not be sustained in the future. Returns greater than 1 year period are compounded annualized. Income Distribution cum capital withdrawals are assumed to be reinvested and bonus is adjusted. Load is not taken in to consideration. For SIP returns, monthly investment of equal amounts invested on the 1st day of every month has been considered.
3.991.130.930.22
-0.20
For scheme performance refer pages 55 - 69.*B: Benchmark, AB: Additional Benchmark; For Scheme Risk-O-Meter and Scheme Benchmark Risk-O-Meter please refer page number 70 of Factsheet.Source: MFI Explorer
3.371.001.000.40
NA
Nil (w.e.f. 2nd November, 2018)
Portfolio Macaulay DurationModified DurationAverage Maturity
:::
5.30 Years5.13 Years7.30 Years
Gross Yield to Maturity (For Debt Component)*- Including Net Current Assets : 5.92%
1.071.74
**Note: The rates specified are actual month end expenses charged as on Dec 31, 2021. The above ratio includes the Service tax on Investment Management Fees. The above ratio excludes, borrowing cost, wherever applicable.
Tata Gilt Securities Fund(An open‐ended debt scheme investing predominantly in government securities across maturity. A Relatively High Interest Rate Risk and Relatively Low Credit Risk.)
Please refer to our Tata Mutual Fund website for fundamental changes, wherever applicable
*Computed on the invested amount for debt portfolio.
88.62%
11.38%
SOV
Cash & Cash Equivalents
81.77%
11.38%
6.85%
Government Securities
Cash & Cash Equivalents
State Development Loans
10.06%
6.85%
41.25%
5.28%
35.24%
1.32%
0.00% 10.00% 20.00% 30.00% 40.00% 50.00%
0 - 1 Yrs
1 - 3 Yrs
3 - 7 Yrs
7 - 10 Yrs
Abv 10 Yrs
Cash & Others
90
98
106
114
122
130
Dec-18 Dec-19 Dec-20 Dec-21
Tata Gilt Securities Fund - Reg - GrowthCrisil Dynamic Gilt Index

1) Nil – If redemption or switch out on or after attainment of retirement age i.e. 60years.
2) Nil – In case of Auto switch out of units on occurrence of Auto switch trigger event.
3) Exit Load is 1% – If redeemed before 61 months from the date of allotment. The above condtions applicable (w.e.f. 3rd May, 2019)
www.tatamutualfund.com TATA MUTUAL FUNDMutual Fund investments are subject to market risks, read all scheme related documents carefully
Please refer to our Tata Mutual Fund website for fundamental changes, wherever applicable
VOLATILITY MEASURES^ FUND BENCHMARK
Std. Dev (Annualised)Sharpe RatioPortfolio BetaR SquaredTreynorJenson
18.960.210.830.951.34
-0.03
22.110.221.001.001.38
NA
51
As on 31st December 2021
INVESTMENT STYLE
INVESTMENT OBJECTIVE
DATE OF ALLOTMENTNovember 1, 2011
FUND MANAGER
NAV
Direct - GrowthReg - Growth
: 50.621443.9541:
FUND SIZE
Rs. 1243.68 (Rs. in Cr.)
TURN OVER
Portfolio Turnover (Total)Portfolio Turnover (Equity component only)
48.56%48.56%
MINIMUM INVESTMENT/MULTIPLES FOR NEW INVESTMENT
Rs. 5,000/- and in multiples of Re. 1/- thereafter.
ADDITIONAL INVESTMENT/MULTIPLES FOR EXISTING INVESTORS
Rs. 1,000/- and multiples of Re. 1/- thereafter.
LOAD STRUCTURE
Entry Load : Not Applicable
Exit Load :
PORTFOLIO
Company name
119543.06
9999.437189.882856.70
2095.131506.71
1380.97
2938.602556.431934.931889.681606.55
3990.323572.471932.971800.621353.181282.90
2923.671784.65
1303.48
2831.54
1799.251413.221273.74
96.11
8.045.782.30
1.681.21
1.11
2.362.061.561.521.29
3.212.871.551.451.091.03
2.351.43
1.05
2.28
1.451.141.02
1351000486000421000
55500068000
281000
11650046400
150000155000115000
1830000289000260000
710040000
217000
31500069000
26000
114800
277000252000106500
68000
89910
284000
35600
1546666
160187538660
178600
158000286000298000427936
4863527160
2441.95
1287.83
6725.55
1665.44
3161.39
2200.982155.951655.71
5906.595398.973930.922330.971926.531298.25
1.96
1.04
5.41
1.34
2.54
1.771.731.33
4.754.343.161.871.551.04
Company name
A Fund that aims to provide an investment tool for retirement planning to suit the risk profile of the investor.
To provide a financial planning tool for long term financial security for investors based on their retirement planning goals. However, there can be no assurance that the investment objective of the fund will be realized, as actual market movements may be at variance with anticipated trends.
^Risk-free rate based on the FBIL Overnight MIBOR rate of 3.6% as on Dec 31, 2021
**Note: The rates specified are actual month end expenses charged as on Dec 31, 2021. The above ratio includes the Service tax on Investment Management Fees. The above ratio excludes, borrowing cost, wherever applicable.
For calculation methodology please refer to Pg 71
No. of Shares Rs. Lakhs
% of Assets
Market ValueNo. of Shares Rs. Lakhs
% of Assets
Market Value
Equity & Equity Related TotalBanksICICI Bank Ltd.HDFC Bank Ltd.Axis Bank Ltd.Cement & Cement ProductsAmbuja Cements Ltd.ACC Ltd.ConstructionSunteck Realty Ltd.Consumer DurablesTitan Company Ltd.Dixon Technologies (India) Ltd.Kajaria Ceramics Ltd.Voltas Ltd.Havells India Ltd.Consumer Non DurablesITC Ltd.Radico Khaitan Ltd.Tata Consumer Products Ltd.3M India Ltd.Asian Paints (India) Ltd.Kansai Nerolac Paints Ltd.FinanceSbi Cards And Payment Services Ltd.Housing Development Finance Corporation Ltd.Healthcare ServicesApollo Hospitals Enterprise Ltd.Industrial ProductsPolycab India Ltd.InsuranceHDFC Life Insurance Co. Ltd.ICICI Prudential Life Insurance Company Ltd.Sbi Life Insurance Company Ltd.
Leisure ServicesJubilant Foodworks Ltd.PesticidesAstec Lifesciences Ltd.Petroleum ProductsReliance Industries Ltd.PharmaceuticalsDivi Laboratories Ltd.PowerPower Grid Corporation Of India Ltd.RetailingZomato Ltd.Info Edge (India) Ltd.Matrimony.Com Ltd.SoftwareTata Consultancy Services Ltd.Infosys Ltd.HCL Technologies Ltd.Birlasoft Ltd.Oracle Financials Services Soft Ltd.Mindtree Ltd.
14239.015095.83
124638.89-270.70
124368.19
11.454.10
100.22-0.22
100.00
Other Equities^RepoPortfolio TotalNet Current LiabilitiesNet Assets
Market Capitalisation wise Exposure
Top 10 Holdings Equity Sector Allocation
NAV Movement
Issuer NameICICI Bank Ltd.HDFC Bank Ltd.Reliance Industries Ltd.Tata Consultancy Services Ltd.Infosys Ltd.ITC Ltd.HCL Technologies Ltd.Radico Khaitan Ltd.Power Grid Corporation Of India Ltd.Titan Company Ltd.Total
% to NAV8.045.785.414.754.343.213.162.872.542.36
42.46
Large Cap
Mid Cap
Small Cap
1 Year 3 Year 5 Year 7 Year 10 Year Since Inception
SIP - If you had invested INR 10000 every month
Total Amount Invested (Rs.)
Total Value as on Dec 31, 2021 (Rs.)
Returns
Total Value of B: Nifty 500 TRI
B: Nifty 500 TRI
Total Value of AB: S&P BSE Sensex TRI
AB: S&P BSE Sensex TRI
(Inception date :01-Nov-2011) (First Installment date : 01-Dec-2011)
1,210,000
2,798,633
15.85%
2,832,074
16.07%
2,732,811
15.42%
120,000
133,261
21.07%
136,377
26.19%
133,372
21.25%
360,000
497,816
22.21%
540,076
28.18%
515,112
24.70%
600,000
892,808
15.89%
970,498
19.31%
961,699
18.93%
840,000
1,440,348
15.13%
1,531,455
16.85%
1,519,571
16.63%
1,200,000
2,755,136
15.86%
2,788,693
16.08%
2,692,311
15.43%
70.19%
16.86%
12.95%
Sonam Udasi (Managing Since 1-Apr-16 and overall experience of 24 years) (Equity) & Murthy Nagarajan (Managing since 1-Apr-17 and overall experience of 25 years) (Debt)
BENCHMARKNifty 500 TRI
MONTHLY AVERAGE AUM
Rs. 1219.08 (Rs. in Cr.)
EXPENSE RATIO**
DirectRegular 0.65
2.22
Tata Retirement Savings Fund - Progressive Plan(An open ended retirement solution oriented scheme having a lock-in of 5 years or till retirement age (whichever is earlier))
Past performance may or may not be sustained in the future. Returns greater than 1 year period are compounded annualized. Income Distribution cum capital withdrawals are assumed to be reinvested and bonus is adjusted. Load is not taken in to consideration. For SIP returns, monthly investment of equal amounts invested on the 1st day of every month has been considered For scheme performance refer pages 55 - 69.*B: Benchmark; For Scheme Risk-O-Meter and Scheme Benchmark Risk-O-Meter please refer page number 70 of Factsheet.Source: MFI Explorer
Market Capitalisation is as per list provided by AMFI.
^ Exposure less than 1% has been clubbed under Other Equities
27.85%21.18%
17.33%6.80%
6.39%3.12%3.03%2.90%2.54%
1.80%1.11%1.05%1.04%
0.00% 6.00% 12.00% 18.00% 24.00% 30.00%
Financial ServicesConsumer Goods
ITConsumer Services
Oil & GasIndustrial Manufacturing
PharmaCement & Cement Products
PowerAutomobile
ConstructionHealthcare Services
Fertilisers & Pesticides
60
84
108
132
156
180
Dec-18 Dec-19 Dec-20 Dec-21
Tata Retirement Savings Fund - Progressive Plan - RegNifty 500 TRI

Government SecuritiesGOI - 7.27% (08/04/2026)GOI - 6.79% (26/12/2029)GOI - 6.10% (12/07/2031)GOI - 7.26% (14/01/2029)Government Securities TotalNon-Convertible Debentures/Bonds06.49 % Malwa Solar Power Generation Pvt Ltd.(Vector Green)07.13 % Nhpc Ltd.05.70 % Bajaj Housing Finance Ltd.06.45 % ICICI Bank Ltd.06.40 % Jamnagar Utilities & Power Pvt. Ltd. (Mukesh Ambani Group)06.49 % Yarrow Infrastructure Pvt Ltd. (Vector Green)06.49 % Sepset Construction Ltd.05.90 % Bharti Hexacom Ltd.06.75 % Piramal Capital & Housing Finance Ltd.07.42 % Power Finance Corporation06.49 % Priapus Infrastructure Ltd.(Vector Green)08.20 % Power Grid Corporation Of India Ltd.08.81 % Small Indust Devlop Bank Of IndiaNon-Convertible Debentures/Bonds TotalPrivately Placed/Unlisted08.10 % Sbi Cards & Payment Services Ltd.Non-Convertible Debentures/Bonds/Frn's TotalMoney Market InstrumentsBahadur Chand Investments Pvt. Ltd. - CP (Munjal Group)Cholamandalam Invt & Fin Co Ltd. - CPPanatone Finvest Ltd. - CP (TATA Group)Money Market Instruments Total
Equity & Equity Related TotalBanksICICI Bank Ltd.HDFC Bank Ltd.Axis Bank Ltd.Cement & Cement ProductsAmbuja Cements Ltd.ACC Ltd.Consumer DurablesTitan Company Ltd.Dixon Technologies (India) Ltd.Voltas Ltd.Kajaria Ceramics Ltd.Havells India Ltd.Consumer Non DurablesITC Ltd.Radico Khaitan Ltd.3M India Ltd.Tata Consumer Products Ltd.FinanceSbi Cards And Payment Services Ltd.Housing Development Finance Corporation Ltd.Industrial ProductsPolycab India Ltd.InsuranceHDFC Life Insurance Co. Ltd.Leisure ServicesJubilant Foodworks Ltd.Petroleum ProductsReliance Industries Ltd.PharmaceuticalsDivi Laboratories Ltd.PowerPower Grid Corporation Of India Ltd.RetailingInfo Edge (India) Ltd.Matrimony.Com Ltd.SoftwareTata Consultancy Services Ltd.Infosys Ltd.HCL Technologies Ltd.Birlasoft Ltd.Oracle Financials Services Soft Ltd.Other Equities^
1) Nil – If redemption or switch out on or after attainment of retirement age i.e. 60years.2) Nil – In case of Auto switch out of units on occurrence of Auto switch trigger event.3) Exit Load is 1% – If redeemed before 61 months from the date of allotment. The above condtions applicable (w.e.f. 3rd May, 2019)
www.tatamutualfund.com TATA MUTUAL FUNDMutual Fund investments are subject to market risks, read all scheme related documents carefully
Market Capitalisation wise Exposure (Equity component only)
Large Cap
Mid Cap
Small Cap
Market Capitalisation is as per list provided by AMFI.
Please refer to our Tata Mutual Fund website for fundamental changes, wherever applicable
1 Year 3 Year 5 Year 7 Year 10 Year Since Inception
VOLATILITY MEASURES^ FUND BENCHMARK
Std. Dev (Annualised)Sharpe RatioPortfolio BetaR SquaredTreynorJenson
16.270.210.990.960.97
-0.14
16.290.241.001.001.11
NA
52
As on 31st December 2021
INVESTMENT STYLE
INVESTMENT OBJECTIVE
DATE OF ALLOTMENTNovember 1, 2011
FUND MANAGER
NAV
Direct - GrowthReg - Growth
: 49.538443.7455:
FUND SIZE
Rs. 1628.91 (Rs. in Cr.)
TURN OVER
Portfolio Turnover (Total)Portfolio Turnover (Equity component only)
62.15%44.09%
0.642.12
MINIMUM INVESTMENT/MULTIPLES FOR NEW INVESTMENT
Rs. 5,000/- and in multiples of Re. 1/- thereafter.
ADDITIONAL INVESTMENT/MULTIPLES FOR EXISTING INVESTORS
Rs. 1,000/- and multiples of Re. 1/- thereafter.
LOAD STRUCTURE
Entry Load : Not Applicable
Exit Load :
PORTFOLIO
Company name
130007.81
11176.277983.693290.97
2378.251728.29
3279.122837.422560.222128.421816.10
4439.504181.902333.192185.74
3397.031991.57
3240.98
2000.61
2756.17
7507.04
1922.74
2695.35
2412.591854.10
6579.506003.054392.602598.222347.41
25989.77
79.82
6.864.902.02
1.461.06
2.011.741.571.311.11
2.732.571.431.34
2.091.22
1.99
1.23
1.69
4.61
1.18
1.65
1.481.14
4.043.692.701.601.44
15.96
1510000539657485000
63000078000
13000051500
210000165000130000
2036000338300
9200294000
36600077000
131400
308000
76750
317000
41100
1318666
43262200000
17600031800033300047700059260
Name Of The Instrument Quantity Market ValueRs. Lakhs
% of Assets
SIP - If you had invested INR 10000 every month
Total Amount Invested (Rs.)Total Value as on Dec 31, 2021 (Rs.)ReturnsTotal Value of B: Crisil Hybrid 25+75 - Aggressive IndexB: Crisil Hybrid 25+75 - Aggressive IndexTotal Value of AB: S&P BSE Sensex TRIAB: S&P BSE Sensex TRI(Inception date :01-Nov-2011) (First Installment date : 01-Dec-2011)
A Fund that aims to provide an investment tool for retirement planning to suit the risk profile of the investor.
To provide a financial planning tool for long term financial security for investors based on their retirement planning goals. However, there can be no assurance that the investment objective of the fund will be realized, as actual market movements may be at variance with anticipated trends.
^Risk-free rate based on the FBIL Overnight MIBOR rate of 3.6% as on Dec 31, 2021
**Note: The rates specified are actual month end expenses charged as on Dec 31, 2021. The above ratio includes the Service tax on Investment Management Fees. The above ratio excludes, borrowing cost, wherever applicable.
For calculation methodology please refer to Pg 71
Top 10 Holdings Equity Sector Allocation
NAV Movement
Issuer NameICICI Bank Ltd.HDFC Bank Ltd.Reliance Industries Ltd.Tata Consultancy Services Ltd.Infosys Ltd.ITC Ltd.HCL Technologies Ltd.Radico Khaitan Ltd.Sbi Cards & Payment Services Ltd.Axis Bank Ltd.Total
% to NAV6.864.904.614.043.692.732.702.572.092.02
36.21
OTHERS Invit And ReitPowergrid Infrastructure Investment TrustOTHERS TOTAL
850300 1028.521028.52
0.630.63
No. of Shares
Market ValueRs. Lakhs
% of Assets
120,000132,08519.15%
131,85118.77%
133,37221.25%
360,000483,22220.07%
499,22722.42%
515,11224.70%
600,000862,32414.48%
912,33916.78%
961,69918.93%
840,0001,368,930
13.70%1,435,309
15.03%1,519,571
16.63%
1,200,0002,666,391
15.25%2,559,668
14.49%2,692,311
15.43%
1,210,0002,709,784
15.26%2,597,885
14.48%2,732,811
15.42%
Past performance may or may not be sustained in the future. Returns greater than 1 year period are compounded annualized. Income Distribution cum capital withdrawals are assumed to be reinvested and bonus is adjusted. Load is not taken in to consideration. For SIP returns, monthly investment of equal amounts invested on the 1st day of every month has been considered.For scheme performance refer pages 55 - 69. *B: Benchmark, AB: Additional Benchmark; For Scheme Risk-O-Meter and Scheme Benchmark Risk-O-Meter please refer page number 70 of Factsheet. Source: MFI Explorer
Name of the Instrument Rating Market ValueRs. Lakhs
% toNAV
3160.092044.031133.75209.46
6547.33
1553.55
1552.351492.021475.541481.04
1170.711071.41998.65597.18522.8495.5940.1020.07
12071.05
411.47411.47
2459.24
1468.771452.065380.07
SOVSOVSOVSOV
CRISIL AAA
ICRA AAACRISIL AAACRISIL AAACRISIL AAA
CRISIL AAACRISIL AAA
CRISIL AA+ICRA AA
CRISIL AAACRISIL AAACRISIL AAA
ICRA AAA
CRISIL AAA
ICRA A1+
CRISIL A1+CRISIL A1+
1.941.250.700.134.02
0.95
0.950.920.910.91
0.720.660.610.370.320.060.020.017.41
0.250.25
1.51
0.900.893.30
Repo
Portfolio Total
Cash / Net Current Asset
Net Assets
7257.79
162704.05
187.42
162891.47
4.46
99.89
0.11
100.00
69.82%
18.24%
11.94%
Sonam Udasi (Managing Since 1-Apr-16 and overall experience of 24 years) (Equity) & Murthy Nagarajan (Managing since 1-Apr-17 and overall experience of 25 years) (Debt)
BENCHMARK
Crisil Hybrid 25+75 - Aggressive Index
MONTHLY AVERAGE AUM
Rs. 1601.04 (Rs. in Cr.)
EXPENSE RATIO**DirectRegular
Tata Retirement Savings Fund - Moderate Plan(An open ended retirement solution oriented scheme having a lock-in of 5 years or till retirement age (whichever is earlier))
^ Exposure less than 1% has been clubbed under Other Equities
For Update on recovery from DHFL please refer the table incorporated in the month end portfolio of the scheme.
23.39%18.43%
14.34%5.45%
4.31%2.71%2.71%2.52%
1.65%1.56%
0.94%0.91%0.89%
0.00% 6.00% 12.00% 18.00% 24.00% 30.00%
Financial ServicesConsumer Goods
ITOil & Gas
Consumer ServicesPharma
Industrial ManufacturingCement & Cement Products
PowerAutomobile
ConstructionFertilisers & Pesticides
Healthcare Services
70
90
110
130
150
170
Dec-18 Dec-19 Dec-20 Dec-21
Tata Retirement Savings Fund - Moderate Plan - RegCrisil Hybrid 25+75 - Aggressive Index

*Computed on the invested amount for debt portfolio.
www.tatamutualfund.com TATA MUTUAL FUNDMutual Fund investments are subject to market risks, read all scheme related documents carefully
1 Year 3 Year 5 Year 7 Year 10 Year Since Inception
VOLATILITY MEASURES^ FUND BENCHMARK
Std. Dev (Annualised)Portfolio BetaR SquaredTreynorJenson
5.661.000.940.44
-0.15
5.601.001.000.59
NA
1.052.21
53
As on 31st December 2021
INVESTMENT STYLE
INVESTMENT OBJECTIVE
DATE OF ALLOTMENTNovember 01, 2011
FUND MANAGER
NAVDirect - GrowthReg - Growth
: 28.124125.0492:
FUND SIZE
Rs. 188.50 (Rs. in Cr.)
MONTHLY AVERAGE AUM
Rs. 187.80 (Rs. in Cr.)
EXPENSE RATIO**
DirectRegular
MINIMUM INVESTMENT/MULTIPLES FOR NEW INVESTMENT
Rs. 5,000/- and in multiples of Re. 1/- thereafter.
ADDITIONAL INVESTMENT/MULTIPLES FOR EXISTING INVESTORS
Rs. 1,000/- and multiples of Re. 1/- thereafter.
LOAD STRUCTURE
Entry Load Not Applicable
Exit Load
PORTFOLIO
Company name
5374.85
467.03328.43
307.86
272.90249.18
3749.45
28.48
2.481.74
1.63
1.451.32
19.86
Name of the Instrument
RepoPortfolio TotalCash / Net Current AssetNet Assets
307.6918615.90
233.8718849.77
1.6398.761.24
100.00
SIP - If you had invested INR 10000 every month
Total Amount Invested (Rs.)Total Value as on Dec 31, 2021 (Rs.)ReturnsTotal Value of B: CRISIL Short Term Debt Hybrid 75+25 Fund IndexB: CRISIL Short Term Debt Hybrid 75+25 Fund IndexTotal Value of AB: CRISIL 10 Year Gilt IndexAB: CRISIL 10 Year Gilt Index(Inception date :01-Nov-2011) (First Installment date : 01-Dec-2011)
1,210,0001,945,467
9.10%2,077,939
10.34%1,722,619
6.81%
A Fund that aims to provide an investment tool for retirement planning to suit the risk profile of the investor
To provide a financial planning tool for long term financial security for investors based on their retirement planning goals. However, there can be no assurance that the investment objective of the fund will be realized, as actual market movements may be at variance with anticipated trends.
^Risk-free rate based on the FBIL Overnight MIBOR rate of 3.6% as on Dec 31, 2021 For calculation methodology please refer to Pg 71
No. of Shares
No. of SharesRs. Lakhs
% to NAV
Market Value
Company nameRatings Rs. Lakhs
% to NAV
Market Value
Rs. Lakhs% toNAV
Market Value
Equity & Equity Related TotalBanksICICI Bank Ltd.HDFC Bank Ltd.Petroleum ProductsReliance Industries Ltd.SoftwareTata Consultancy Services Ltd.Infosys Ltd.Other Equities^
6310022200
13000
730013200
6664.532613.171053.36
938.01601.53541.37539.64377.45
4805.631045.69
994.68987.36
780.69
505.36491.85
1463.20979.18484.02
35.3513.86
5.594.983.192.872.862.00
25.505.555.285.24
4.14
2.682.617.765.192.57
Debt InstrumentsGovernment SecuritiesGOI - 7.32% (28/01/2024)GOI - 7.27% (08/04/2026)GOI - 6.84% (19/12/2022)GOI 8.24% 15/02/2027GOI - 8.20% (24/09/2025)GOI - 7.73% (19/12/2034)SDL Maharashtra 8.44% (26/11/2024)Non-Convertible Debentures/Bonds07.42 % Power Finance Corporation05.70 % Bajaj Housing Finance Ltd.06.40 % Jamnagar Utilities & Power Pvt. Ltd. (Mukesh Ambani Group)Varanasi Sangam Expressway Pvt. Ltd. - Frb (Vinod Kumar Agarwal, Ajendra Kumar Agarwal, Purshottam Agarwal And Lokesh Builders Pvt Ltd.)09.95 % Food Corporation Of India Ltd.06.45 % ICICI Bank Ltd.Money Market InstrumentsCholamandalam Invt & Fin Co Ltd. - CPPanatone Finvest Ltd. - CP (TATA Group)
SOVSOVSOVSOVSOVSOVSOV
CRISIL AAACRISIL AAACRISIL AAA
IND AAA
CRISIL AAA(CE)CRISIL AAA
CRISIL A1+CRISIL A1+
NAV Movement
Instrument Wise Composition
Past performance may or may not be sustained in the future. Returns greater than 1 year period are compounded annualized. Income Distribution cum capital withdrawals are assumed to be reinvested and bonus is adjusted. Load is not taken in to consideration. For SIP returns, monthly investment of equal amounts invested on the 1st day of every month has been considered.For scheme performance refer pages 55 - 69.*B: Benchmark, AB: Additional Benchmark; For Scheme Risk-O-Meter and Scheme Benchmark Risk-O-Meter please refer page number 70 of Factsheet.Source: MFI Explorer
120,000124,854
7.58%125,993
9.39%121,013
1.57%
360,000416,939
9.77%431,986
12.20%387,126
4.77%
600,000741,116
8.38%787,034
10.79%696,829
5.92%
840,0001,133,561
8.42%1,212,371
10.31%1,050,545
6.29%
1,200,0001,920,604
9.09%2,050,677
10.33%1,702,221
6.80%
Composition by Ratings
Maturity Ladder
1) Nil – If redemption or switch out on or after attainment of retirement age i.e. 60years.2) Nil – In case of Auto switch out of units on occurrence of Auto switch trigger event.3) Exit Load is 1% – If redeemed before 61 months from the date of allotment. The above condtions applicable (w.e.f. 3rd May, 2019)
::
Sonam Udasi (Managing Since 1-Apr-16 and overall experience of 24 years) (Equity) & Murthy Nagarajan (Managing since 1-Apr-17 and overall experience of 25 years) (Debt)
BENCHMARKCRISIL Short Term Debt Hybrid 75+25 Fund Index
**Note: The rates specified are actual month end expenses charged as on Dec 31, 2021. The above ratio includes the Service tax on Investment Management Fees. The above ratio excludes, borrowing cost, wherever applicable.
Tata Retirement Savings Fund - Conservative Plan(An open ended retirement solution oriented scheme having a lock-in of 5 years or till retirement age (whichever is earlier))
Portfolio Macaulay DurationModified DurationAverage MaturityGross Yield to Maturity (For Debt Component)*
- Including Net Current Assets
: 2.53 Years2.43 Years2.98 Years
5.40%
: :
:
Please refer to our Tata Mutual Fund website for fundamental changes, wherever applicable
^ Exposure less than 1% has been clubbed under Other Equities
35.36%
30.57%
28.51%
2.88% 2.68%
SOV
A1+ / AAA
Equity
Cash & Cash Equivalents
AAA(CE)
33.35%
28.51%
21.35%
7.76%4.14%
2.89% 2.00% Government Securities
Equity Shares
Ncd - Non Convertible Deb
Commercial Papers
Floating Rate Bonds
Cash & Cash Equivalents
State Development Loans
17.05%26.69%
19.50%0.00%
7.00%29.76%
0.00% 10.00% 20.00% 30.00% 40.00%
0 - 1 Yrs1 - 3 Yrs3 - 7 Yrs
7 - 10 YrsAbv 10 Yrs
Cash & Others
90
100
110
120
130
140
Dec-18 Dec-19 Dec-20 Dec-21
Tata Retirement Savings Fund - Reg - Conservative PlanCRISIL Short Term Debt Hybrid 75+25 Fund Index

www.tatamutualfund.com TATA MUTUAL FUNDMutual Fund investments are subject to market risks, read all scheme related documents carefully 54
As on 31st December 2021
INVESTMENT STYLE
INVESTMENT OBJECTIVE
DATE OF ALLOTMENT
October 14, 1995
FUND MANAGER
NAVDirectReg
: 45.807042.0492:
FUND SIZE
Rs. 277.12 (Rs. in Cr.)
TURN OVER
Portfolio Turnover (Total)Portfolio Turnover (Equity component only)
15.24%15.24%
MINIMUM INVESTMENT/ MUL TIPLES FOR NEW INVESTMENTRs. 500/- and in multiples of Rs. 500/- thereafter.
ADDITIONAL INVESTMENT/ MUL TIPLES FOR EXISTING INVESTORSRs. 500/- and in multiples of Rs. 500/- thereafter.LOAD STRUCTURE
Entry Load : Not ApplicableExit Load :
PORTFOLIO
27198.14
528.03
2050.221511.95783.10559.80330.24279.20
526.58
447.87376.68
485.59
492.93
832.39461.55381.36
545.13526.31458.11371.73369.11304.33
693.17
296.35
98.17
1.91
7.405.462.832.021.191.01
1.90
1.621.36
1.75
1.78
3.001.671.38
1.971.901.651.341.331.10
2.50
1.07
720
2770001022004360082500
725000200000
50000
590017000
19500
26000
3300022400011500
250000223005100050000720001200
26800
63000
24050
29000
2700044000
54000
5900
76000
104009600
52000107004000
9700
8750032000
100000103009200010400
88000
340000
429.75
555.93
378.34285.80
495.48
292.95
1799.79
486.53471.07439.76387.77315.49
453.13
1651.781196.27
715.35505.15501.12497.12
601.74
339.32
1.55
2.01
1.371.03
1.79
1.06
6.49
1.761.701.591.401.14
1.64
5.964.322.581.821.811.79
2.17
1.22
SIP - If you had invested INR 10000 every month1 Year 3 Year 5 Year 7 Year 10 Year Since Inception
Total Amount Invested (Rs.)Total Value as on Dec 31, 2021 (Rs.)ReturnsTotal Value of B: Nifty 500 TRIB: Nifty 500 TRITotal Value of AB: S&P BSE Sensex TRIAB: S&P BSE Sensex TRI(Inception date :14-Oct-1995) (First Installment date : 01-Feb-1996)
120,000138,10429.05%
136,37726.19%
133,37221.25%
360,000546,11329.01%
540,07628.18%
515,11224.70%
600,000946,45318.28%
970,49819.31%
961,69918.93%
840,0001,422,066
14.77%1,531,455
16.85%1,519,571
16.63%
1,200,0002,429,508
13.51%2,789,182
16.09%2,692,720
15.43%
3,110,00022,306,557
12.96%35,186,358
15.65%28,720,763
14.95%
For scheme performance refer pages 55 - 69.*B: Benchmark, AB: Additional Benchmark; For Scheme Risk-O-Meter and Scheme Benchmark Risk-O-Meter please refer page number 70 of Factsheet.Source: MFI Explorer
An equity-oriented scheme that aims to create long term wealth through quality companies providing long term growth opportunities. The debt portion aims to generate regular income through quality debt securities.
The investment objective of the Scheme is to generate long term capital growth. However, there is no assurance or guarantee that the investment objective of the Scheme will be achieved. The scheme does not assure or guarantee any return.
^Risk-free rate based on the FBIL Overnight MIBOR rate of 3.6% as on Dec 31, 2021For calculation methodology please refer to Pg 71
Compulsory Lock-in Option: 5 years or till the child attains age of majority (whichever is earlier). If redeemed before child attains 18 years of age, Exit load is 1% (Effective from May 3, 2018)
Top 10 Holdings Equity Sector Allocation
NAV Movement
Issuer NameICICI Bank Ltd.Reliance Industries Ltd.Infosys Ltd.HDFC Bank Ltd.Tata Consultancy Services Ltd.Titan Company Ltd.Kotak Mahindra BankWipro Ltd.HDFC Ltd.Bharti Airtel Ltd.Total
% to NAV7.406.495.965.464.323.002.832.582.502.17
42.71
Equity & Equity Related TotalAuto AncillariesMRF Ltd.BanksICICI Bank Ltd.HDFC Bank Ltd.Kotak Mahindra Bank Ltd.Axis Bank Ltd.Karur Vysa Bank Ltd.Indian BankCapital MarketsUti Asset Management Company Ltd.Cement & Cement ProductsUltratech Cement Ltd.ACC Ltd.ChemicalsDeepak Nitrite Ltd.Construction ProjectLarsen & Toubro Ltd.Consumer DurablesTitan Company Ltd.Greenply Industries Ltd.Amber Enterprises India Ltd.Consumer Non DurablesITC Ltd.Hindustan Unilever Ltd.United Spirits Ltd.Tata Consumer Products Ltd.Marico Ltd.3M India Ltd.FinanceHousing Development Finance Corporation Ltd.GasIndraprastha Gas Ltd.
Industrial Capital GoodsThermax Ltd.Industrial ProductsGrindwell Norton Ltd.InsuranceICICI Lombard General Insurance Co. Ltd.HDFC Life Insurance Co. Ltd.PaperCentury Textiles & Industries Ltd.PesticidesBayer Cropscience Ltd.Petroleum ProductsReliance Industries Ltd.PharmaceuticalsDivi Laboratories Ltd.Dr Reddys Laboratories Ltd.Sun Pharmaceutical Industries Ltd.Alkem Laboratories Ltd.Sanofi India Ltd.RetailingAvenue Supermarts Ltd.SoftwareInfosys Ltd.Tata Consultancy Services Ltd.Wipro Ltd.Persistent Systems Ltd.Birlasoft Ltd.Mindtree Ltd.Telecom - ServicesBharti Airtel Ltd.TransportationGujarat Pipavav Port Ltd.
Past performance may or may not be sustained in the future. Returns greater than 1 year period are compounded annualized. Income Distribution cum capital withdrawals are assumed to be reinvested and bonus is adjusted. Load is not taken in to consideration. For SIP returns, monthly investment of equal amounts invested on the 1st day of every month has been considered.
786.77461.41
27659.5552.45
27712.00
Other Equities^RepoPortfolio TotalCash / Net Current AssetNet Assets
2.831.67
99.820.18
100.00
Large Cap
Mid Cap
Small Cap
68.45%
17.50%
14.05%
Market Capitalisation wise Exposure (Equity component only)
Company name No. of Shares Market ValueRs. Lakhs
% of Assets
Company name No. of Shares Market ValueRs. Lakhs
% of Assets
VOLATILITY MEASURES^ FUND BENCHMARK
Std. Dev (Annualised)Sharpe RatioPortfolio BetaR SquaredTreynorJenson
19.420.240.870.971.560.15
22.110.221.001.001.38
NA
Amey Sathe (Managing Since 09-Mar-21 and overall experience of 15 years)
BENCHMARKNifty 500 TRI
MONTHLY AVERAGE AUM
Rs. 271.63 (Rs. in Cr.)
EXPENSE RATIO**DirectRegular
2.032.58
**Note: The rates specified are actual month end expenses charged as on Dec 31, 2021. The above ratio includes the Service tax on Investment Management Fees. The above ratio excludes, borrowing cost, wherever applicable.
Tata Young Citizens’ Fund(An open ended fund for investment for children having a lock-in for at least 5 years or till the child attains age of majority (whichever is earlier))
Please refer to our Tata Mutual Fund website for fundamental changes, wherever applicable
Market Capitalisation is as per list provided by AMFI.
^ Exposure less than 1% has been clubbed under Other Equities
27.65%18.28%
15.34%7.58%7.56%
5.44%2.98%
2.17%1.91%1.79%1.78%1.75%1.64%
1.22%1.06%
0.00% 6.00% 12.00% 18.00% 24.00% 30.00%
Financial ServicesIT
Consumer GoodsPharma
Oil & GasIndustrial Manufacturing
Cement & Cement ProductsTelecom
AutomobilePaper And Jute
ConstructionChemicals
Consumer ServicesServices
Fertilisers & Pesticides
60
84
108
132
156
180
Dec-18 Dec-19 Dec-20 Dec-21
Tata Young Citizens Fund - Reg Nifty 500 TRI

SCHEME PERFORMANCE
www.tatamutualfund.com TATA MUTUAL FUND 55Note: * Benchmark;# Additional benchmark; Amount in rupees denotes Value of Standard Investment of Rs. 10,000. Refer to page number 68 for disclaimer on scheme performance.
Lumpsum Performance of Open Ended SchemesLumpsum Performance of schemes managed by Abhinav Sharma
Tata Infrastructure Fund S&P BSE India Infrastructure TRI* Nifty 50 TRI#
Period Return % Rs. Return % Rs. Return % Rs.
1 Year 53.54% 15,354 51.72% 15,172 25.59% 12,559
3 Year 20.56% 17,533 14.38% 14,968 18.27% 16,552
5 Year 15.99% 21,011 10.59% 16,549 17.65% 22,561
Since Inception 14.02% 93,226 NA NA 14.69% 102,976
Inception date: 31-Dec-04 Managing since: 09-Mar-21
Tata Mid Cap Growth Fund$ Nifty Midcap 150 TRI* Nifty 50 TRI#
Period Return % Rs. Return % Rs. Return % Rs.
1 Year 39.92% 13,992 48.16% 14,816 25.59% 12,559
3 Year 22.73% 18,497 23.22% 18,718 18.27% 16,552
5 Year 20.99% 25,953 20.54% 25,471 17.65% 22,561
Since Inception 13.42% 319,971 NA NA 11.22% 186,578
Inception date: 01-Jul-94 Managing since: 09-Mar-21$Abhinav Sharma is the Assistant Fund Manager since Mar 9, 2021
Tata Indian Sharia Equity Fund
Nifty 500 Shariah TRI* Nifty 50 TRI#
Period Return % Rs. Return % Rs. Return % Rs.
1 Year 41.34% 14,134 39.90% 13,990 25.59% 12,559
3 Year NA NA NA NA NA NA
5 Year NA NA NA NA NA NA
Since Inception 53.51% 21,477 60.66% 23,295 48.54% 20,253
Inception date: 09-Mar-21 Managing since: 20-Mar-20
Lumpsum Performance of schemes managed by Akhil Mittal
Tata Balanced Advantage Fund
CRISIL Hybrid 50+50 - Moderate Index* S&P BSE Sensex TRI#
Period Return % Rs. Return % Rs. Return % Rs.
1 Year 16.47% 11,647 15.85% 11,585 23.23% 12,323
3 Year NA NA NA NA NA NA
5 Year NA NA NA NA NA NA
Since Inception 13.61% 14,527 15.55% 15,265 19.61% 16,889
Inception date: 28-Jan-19 Managing since: 09-Jan-19
Tata Dynamic Bond Fund CRISIL Composite Bond Fund Index*
CRISIL 10 Year Gilt Index#
Period Return % Rs. Return % Rs. Return % Rs.
1 Year 4.10% 10,410 3.44% 10,344 1.35% 10,135
3 Year 6.78% 12,177 8.74% 12,859 6.94% 12,232
5 Year 5.71% 13,206 7.35% 14,263 5.32% 12,963
Since Inception 6.79% 33,353 6.90% 34,025 5.75% 27,861
Inception date: 3-Sep-03 Managing since: 26-Jun-14
Tata TreasuryAdvantage Fund## &
Crisil Low Duration Debt Index*
CRISIL 1 Year T-Bill Index#
Period Return % Rs. Return % Rs. Return % Rs.
1 Year 3.63% 10,363 4.23% 10,423 3.49% 10,349
3 Year 4.39% 11,378 6.75% 12,165 5.63% 11,788
5 Year 5.50% 13,074 6.94% 13,994 5.92% 13,336
Since Inception 7.31% 31,642 7.47% 32,438 6.12% 26,389
Inception date: 06-Sep-05 Managing since: 26-Jun-14The creation of Segregrated Portfolio 1 in the scheme has impacted the NAV of the scheme to the extent of (-1.66% ) of NAV on 14th June 2019; & Abhishek Sonthalia is the Co-Fund Manager since Feb 6, 2020
Tata Income Fund Crisil Composite Bond Fund Index*
CRISIL 10 Year Gilt Index#
Period Return % Rs. Return % Rs. Return % Rs.
1 Year 2.20% 10,220 3.44% 10,344 1.35% 10,135
3 Year 7.57% 12,449 8.74% 12,859 6.94% 12,232
5 Year 5.89% 13,320 7.35% 14,263 5.32% 12,963
Since Inception 7.99% 66,760 NA NA NA NA
Inception date: 28-Apr-97 Managing since: 26-Jun-14
Tata Ultra Short Term Fund
Crisil Ultra Short Term Debt Index*
CRISIL 1 Year T-Bill Index#
Period Return % Rs. Return % Rs. Return % Rs.
1 Year 3.09% 10,309 4.16% 10,416 3.49% 10,349
3 Year NA NA NA NA NA NA
5 Year NA NA NA NA NA NA
Since Inception 4.97% 11,535 5.99% 11,868 5.57% 11,728
Inception date: 22-Jan-19 Managing since: 11-Jan-19
Tata Treasury Advantage Fund (Segregated Portfolio 1) &
CRISIL Low Duration Debt Index*
CRISIL 1 Year T-Bill Index#
Period Return % Rs. Return % Rs. Return % Rs.
1 Year 153.38% 25,338 4.23% 10,423 3.49% 10,349
3 Year NA NA NA NA NA NA
5 Year NA NA NA NA NA NA
Since Inception 23.48% 17,115 6.31% 11,688 5.19% 11,375
Inception date: 15-Jun-19 Managing since: 14-Jun-19 & Abhishek Sonthalia is the Co-Fund Manager since Feb 6, 2020
Tata Flexi Cap Fund$ Nifty 500 TRI* S&P BSE Sensex TRI#
Period Return % Rs. Return % Rs. Return % Rs.
1 Year 26.57% 12,657 31.60% 13,160 23.23% 12,323
3 Year 16.92% 15,989 19.11% 16,906 18.62% 16,698
5 Year NA NA NA NA NA NA
Since Inception 15.77% 16,264 14.83% 15,829 14.75% 15,792
Inception date: 06-Sep-18 Managing since: 01-Nov-19$Abhinav Sharma is the Assistant Fund Manager since Nov 1, 2019
Tata Ethical Fund Nifty 500 Shariah TRI* Nifty 50 TRI#
Period Return % Rs. Return % Rs. Return % Rs.
1 Year 44.91% 14,491 39.90% 13,990 25.59% 12,559
3 Year 23.47% 18,834 24.99% 19,540 18.27% 16,552
5 Year 19.24% 24,129 21.19% 26,166 17.65% 22,561
Since Inception 17.06% 566,357 NA NA 12.76% 217,015
Inception date: 24-May-96 Managing since: 06-Sep-21

SCHEME PERFORMANCE
www.tatamutualfund.com TATA MUTUAL FUND 56Note: * Benchmark;# Additional benchmark; Amount in rupees denotes Value of Standard Investment of Rs. 10,000. Refer to page number 68 for disclaimer on scheme performance.
Lumpsum Performance of Open Ended Schemes
Tata Money Market Fund Crisil Money Market Index*
CRISIL 1 Year T-Bill Index#
Period Return % Rs. Return % Rs. Return % Rs.7 Day 4.46% 10,008 4.34% 10,008 4.06% 10,00815 Day 4.00% 10,015 3.78% 10,014 2.77% 10,01030 Day 3.64% 10,028 3.81% 10,030 2.88% 10,0231 Year 3.93% 10,393 4.03% 10,403 3.49% 10,3493 Year 6.11% 11,951 5.70% 11,812 5.63% 11,7885 Year 4.95% 12,733 6.34% 13,598 5.92% 13,334Since Inception 6.74% 33,709 6.97% 35,069 5.91% 29,147Inception date: 22-May-03 Managing since: 16-Oct-13
Tata Corporate Bond Fund (Segregated Portfolio 1)
CRISIL Corporate Bond Composite Index*
CRISIL 10 Year Gilt Index#
Period Return % Rs. Return % Rs. Return % Rs.1 Year 115.49% 21,549 4.91% 10,491 3.49% 10,3493 Year NA NA NA NA NA NA5 Year NA NA NA NA NA NASince Inception 23.47% 17,113 8.93% 12,436 5.19% 11,375Inception date: 15-Jun-19 Managing since: 14-Jun-19
Tata Banking & PSU Debt Fund
CRISIL Banking and PSU Debt Index*
CRISIL 10 Year Gilt Index#
Period Return % Rs. Return % Rs. Return % Rs.1 Year 3.42% 10,342 4.21% 10,421 1.35% 10,1353 Year NA NA NA NA NA NA5 Year NA NA NA NA NA NASince Inception 7.01% 11,628 7.43% 11,730 5.23% 11,202Inception date: 10-Oct-19 Managing since: 06-Sep-19
Lumpsum Performance of schemes managed by Amey Sathe
Tata Overnight Fund Crisil Overnight Index* CRISIL 1 Year T-Bill Index#
Period Return % Rs. Return % Rs. Return % Rs.7 Day 3.29% 10,005 3.44% 10,006 4.05% 10,00715 Day 3.28% 10,012 3.48% 10,013 2.77% 10,01030 Day 3.22% 10,025 3.44% 10,027 2.88% 10,0231 Year 3.08% 10,308 3.27% 10,327 3.49% 10,3493 Year NA NA NA NA NA NA5 Year NA NA NA NA NA NASince Inception 3.81% 11,089 3.94% 11,130 5.34% 11,549Inception date: 27-Mar-19 Managing since: 25-Mar-19
Tata Liquid Fund& Crisil Liquid Fund Index* CRISIL 1 Year T-Bill Index#
Period Return % Rs. Return % Rs. Return % Rs.7 Day 4.18% 10,007 3.83% 10,006 4.05% 10,00715 Day 3.81% 10,014 3.73% 10,014 2.77% 10,01030 Day 3.53% 10,028 3.60% 10,028 2.88% 10,0231 Year 3.23% 10,323 3.60% 10,360 3.49% 10,3493 Year 4.69% 11,475 5.01% 11,582 5.63% 11,7885 Year 5.63% 13,151 5.85% 13,289 5.92% 13,334Since Inception 7.13% 33,040 6.79% 31,225 6.05% 27,681Inception date: 01-Sep-04 Managing since: 16-Oct-13
&Abhishek Sonthalia is the Co-Fund Manager since Feb 6, 2020
Tata Small Cap Fund Nifty Smallcap 250 TRI* Nifty 50 TRI#
Period Return % Rs. Return % Rs. Return % Rs.1 Year 70.52% 17,052 63.34% 16,334 25.59% 12,5593 Year 29.07% 21,519 24.17% 19,155 18.27% 16,5525 Year NA NA NA NA NA NASince Inception 28.75% 22,093 23.77% 19,521 18.79% 17,163Inception date: 12-Nov-18 Managing since: 19-Oct-18
Tata Hybrid Equity Fund CRISIL Hybrid 35+65 Aggressive Index* S&P BSE Sensex TRI#
Period Return % Rs. Return % Rs. Return % Rs.1 Year 23.63% 12,363 19.74% 11,974 23.23% 12,3233 Year 13.58% 14,656 16.05% 15,634 18.62% 16,6985 Year 11.26% 17,061 14.71% 19,877 18.31% 23,198Since Inception 15.47% 436,516 NA NA 12.90% 241,571Inception date: 08-Oct-95 Managing since: 03-Sep-18
(Manages equity portfolio)
TataLarge & Mid Cap Fund
Nifty Large Midcap 250 TRI* S&P BSE Sensex TRI#
Period Return % Rs. Return % Rs. Return % Rs.1 Year 28.53% 12,853 37.04% 13,704 23.23% 12,3233 Year 19.10% 16,902 20.63% 17,564 18.62% 16,6985 Year 16.10% 21,115 19.11% 23,997 18.31% 23,198Since Inception 12.83% 325,651 NA NA 12.64% 310,529Inception date: 25-Feb-93 Managing since: 03-Sep-18
Lumpsum Performance of schemes managed by Chandraprakash Padiyar
Lumpsum Performance of schemes managed by Amit Somani
Tata Large Cap Fund Nifty 100 TRI*
Period Return % Rs. Return % Rs. Return % Rs.1 Year 32.67% 13,267 26.45% 12,645 NA NA3 Year 17.22% 16,113 17.94% 16,414 NA NA5 Year 14.98% 20,111 17.45% 22,370 NA NASince Inception 19.86% 727,792 NA NA NA NAInception date: 07-May-98 Managing since: 09-Mar-21
Tata Young Citizens Fund Nifty 500 TRI* S&P BSE Sensex TRI#
Period Return % Rs. Return % Rs. Return % Rs.1 Year 33.44% 13,344 31.60% 13,160 23.23% 12,3233 Year 19.40% 17,029 19.11% 16,906 18.62% 16,6985 Year 13.86% 19,153 17.87% 22,775 18.31% 23,198Since Inception 13.09% 252,298 13.89% 303,141 12.93% 242,678Inception date: 14-Oct-95 Managing since: 09-Mar-21
Tata Indian Opportunities Fund (Japan) S&P BSE Sensex TRI
Period Return % Rs. Return % Rs. Return % Rs.1 Year 24.91% 12,491 23.23% 12,323 NA NA3 Year NA NA NA NA NA NA5 Year NA NA NA NA NA NASince Inception 41.11% 18,482 46.95% 19,869 NA NAInception date: 20-Mar-20 Managing since: 20-Mar-20
Tata Banking AndFinancial Services Fund$
Nifty Financial Services TRI*
Nifty 50 TRI#
Period Return % Rs. Return % Rs. Return % Rs.1 Year 11.86% 11,186 14.55% 11,455 25.59% 12,5593 Year 13.00% 14,435 14.87% 15,163 18.27% 16,5525 Year 15.89% 20,921 19.19% 24,080 17.65% 22,561Since Inception 16.28% 24,775 17.01% 25,724 15.36% 23,616Inception date: 28-Dec-15 Managing since: 18-Jun-18
$Amey Sathe is the Assistant Fund Manager since June 18, 2018
Tata Equity P/E Fund$ Nifty 500 TRI*
Period Return % Rs. Return % Rs. Return % Rs.1 Year 28.00% 12,800 31.60% 13,160 NA NA3 Year 14.87% 15,163 19.11% 16,906 NA NA5 Year 14.44% 19,642 17.87% 22,775 NA NASince Inception 18.61% 198,668 16.70% 149,563 NA NAInception date: 29-Jun-04 Managing since: 18-Jun-18
$Amey Sathe is the Assistant Fund Manager since June 18, 2018

SCHEME PERFORMANCE
www.tatamutualfund.com TATA MUTUAL FUND 57Note: * Benchmark;# Additional benchmark; Amount in rupees denotes Value of Standard Investment of Rs. 10,000. Refer to page number 68 for disclaimer on scheme performance.
Lumpsum Performance of Open Ended SchemesLumpsum Performance of schemes managed by Chandraprakash Padiyar (Contd.)
TataLarge & Mid Cap Fund$
Nifty Large Midcap 250 TRI*
S&P BSE Sensex TRI#
Period Return % Rs. Return % Rs. Return % Rs.1 Year 28.53% 12,853 37.04% 13,704 23.23% 12,3233 Year 19.10% 16,902 20.63% 17,564 18.62% 16,6985 Year 16.10% 21,115 19.11% 23,997 18.31% 23,198Since Inception 12.83% 325,651 NA NA 12.64% 310,529Inception date: 25-Feb-93 Managing since: 01-Nov-19
$Meeta Shetty is the Assistant Fund Manager since Nov 1, 2019
Tata Digital India Fund NIFTY IT TRI* S&P BSE Sensex TRI#
Period Return % Rs. Return % Rs. Return % Rs.1 Year 74.44% 17,444 62.35% 16,235 23.23% 12,3233 Year 42.60% 29,025 41.71% 28,484 18.62% 16,6985 Year 34.06% 43,377 32.65% 41,139 18.31% 23,198Since Inception 26.34% 40,801 25.26% 38,736 15.73% 24,079Inception date: 28-Dec-15 Managing since: 09-Mar-21
Tata India Pharma AndHealthcare Fund Nifty Pharma TRI* Nifty 50 TRI#
Period Return % Rs. Return % Rs. Return % Rs.1 Year 19.07% 11,907 10.88% 11,088 25.59% 12,5593 Year 27.31% 20,650 17.87% 16,383 18.27% 16,5525 Year 16.03% 21,043 7.44% 14,322 17.65% 22,561Since Inception 10.29% 18,018 3.50% 12,296 15.36% 23,616Inception date: 28-Dec-15 Managing since: 09-Mar-21
Lumpsum Performance of schemes managed by Murthy Nagarajan
Tata Equity Savings Fund NIFTY Equity Savings Index*
CRISIL 10 Year Gilt Index#
Period Return % Rs. Return % Rs. Return % Rs.1 Year 10.77% 11,077 11.52% 11,152 1.35% 10,1353 Year 8.86% 12,904 10.94% 13,659 6.94% 12,2325 Year 7.08% 14,082 10.37% 16,388 5.32% 12,963Since Inception 7.30% 46,096 NA NA NA NAInception date: 27-Apr-00 Managing since: 01-Apr-17
(Manages debt portfolio)
Tata Gilt Securities Fund Crisil Dynamic Gilt Index*
CRISIL 10 Year Gilt Index#
Period Return % Rs. Return % Rs. Return % Rs.1 Year 0.80% 10,080 2.78% 10,278 1.35% 10,1353 Year 6.69% 12,148 8.34% 12,720 6.94% 12,2325 Year 5.52% 13,087 6.78% 13,889 5.32% 12,963Since Inception 8.58% 62,923 8.99% 68,362 NA NAInception date: 06-Sep-99 Managing since: 14-Sep-19
Tata Medium Term Fund (Segregated Portfolio 1)&
CRISIL Medium Term Debt Index*
CRISIL 10 Year Gilt Indeax#
Period Return % Rs. Return % Rs. Return % Rs.
1 Year 185.83% 28,583 4.59% 10,459 1.35% 10,135
3 Year NA NA NA NA NA NA
5 Year NA NA NA NA NA NA
Since Inception 23.48% 17,116 9.19% 12,510 6.05% 11,614
Inception date: 15-Jun-19 Managing since: 06-Feb-20&Murthy Nagarajan is the Co-Fund Manager since Feb 6, 2020
Tata Hybrid Equity Fund CRISIL Hybrid 35+65 Aggressive Index* S&P BSE Sensex TRI#
Period Return % Rs. Return % Rs. Return % Rs.
1 Year 23.63% 12,363 19.74% 11,974 23.23% 12,323
3 Year 13.58% 14,656 16.05% 15,634 18.62% 16,698
5 Year 11.26% 17,061 14.71% 19,877 18.31% 23,198
Since Inception 15.47% 436,516 NA NA 12.90% 241,571
Inception date: 08-Oct-95 Managing since: 01-Apr-17
(Manages debt portfolio)
Tata Multi Asset Opportunities Fund
65% S&P BSE 200 TRI + 15% CRISIL Short Term Bond Fund
Index + 20% iCOMDEX Composite Index*
S&P BSE Sensex TRI#
Period Return % Rs. Return % Rs. Return % Rs.
1 Year 22.40% 12,240 43.42% 14,342 23.23% 12,323
3 Year NA NA NA NA NA NA
5 Year NA NA NA NA NA NA
Since Inception 26.50% 15,365 34.65% 17,224 27.05% 15,489
Inception date: 04-Mar-20 Managing since: 12-Mar-20
TataMedium Term Fund## &
Crisil Medium Term Debt Index*
CRISIL 10 Year Gilt Index#
Period Return % Rs. Return % Rs. Return % Rs.
1 Year 5.01% 10,501 4.59% 10,459 1.35% 10,135
3 Year 1.88% 10,576 9.36% 13,084 6.94% 12,232
5 Year 3.09% 11,645 8.04% 14,725 5.32% 12,963
Since Inception 5.82% 29,523 NA NA 6.29% 32,166
Inception date: 11-Nov-02 Managing since: 06-Feb-20The creation of Segregrated Portfolio 1 in the scheme has impacted the NAV of the scheme to the extent of (-5.15% ) of NAV on 14th June 2019.&Murthy Nagarajan is the Co-Fund Manager since Feb 6, 2020
Lumpsum Performance of schemes managed by Meeta Shetty
Tata India Equity Fund (UCITS) - Plan B
MSCI India Nifty 50 TRI
Period Return % Rs. Return % Rs. Return % Rs.1 Year 36.48% 13,648 28.39% 12,839 25.59% 12,5593 Year NA NA NA NA NA NA5 Year NA NA NA NA NA NASince Inception 37.98% 18,888 22.82% 15,008 20.62% 14,481Inception date: 10-Jan-20 Managing since: 10-Jan-20

SCHEME PERFORMANCE
www.tatamutualfund.com TATA MUTUAL FUND 58Note: * Benchmark;# Additional benchmark; Amount in rupees denotes Value of Standard Investment of Rs. 10,000. Refer to page number 68 for disclaimer on scheme performance.
Lumpsum Performance of Open Ended SchemesLumpsum Performance of schemes managed by Murthy Nagarajan (Contd.)
Tata Short TermBond Fund&
Crisil Short Term Bond Fund Index*
CRISIL 10 Year Gilt Index#
Period Return % Rs. Return % Rs. Return % Rs.
1 Year 2.53% 10,253 4.38% 10,438 1.35% 10,135
3 Year 7.05% 12,270 8.07% 12,624 6.94% 12,232
5 Year 5.27% 12,929 7.38% 14,280 5.32% 12,963
Since Inception 7.25% 38,943 7.28% 39,128 6.43% 33,514
Inception date: 08-Aug-02 Managing since: 01-Apr-17&Abhishek Sonthalia is the Co-Fund Manager since Feb 6, 2020
Tata Retirement SavingsFund- Conservative Plan
CRISIL Short Term Debt Hybrid 75+25 Fund Index*
CRISIL 10 Year Gilt Index#
Period Return % Rs. Return % Rs. Return % Rs.
1 Year 7.58% 10,758 10.26% 11,026 1.35% 10,135
3 Year 8.98% 12,947 11.29% 13,788 6.94% 12,232
5 Year 8.46% 15,019 10.36% 16,380 5.32% 12,963
Since Inception 9.45% 25,049 10.23% 26,942 7.38% 20,633
Inception date: 01-Nov-11 Managing since: 01-Apr-17
Lumpsum Performance of schemes managed by Sailesh Jain
Tata Balanced Advantage Fund
CRISIL Hybrid 50+50 - Moderate Index* S&P BSE Sensex TRI#
Period Return % Rs. Return % Rs. Return % Rs.
1 Year 16.47% 11,647 15.85% 11,585 23.23% 12,3233 Year NA NA NA NA NA NA5 Year NA NA NA NA NA NASince Inception 13.61% 14,527 15.55% 15,265 19.61% 16,889Inception date: 28-Jan-19 Managing since: 09-Jan-19
Tata Arbitrage Fund Nifty 50 Arbitrage Index*
CRISIL 1 Year T-Bill Index#
Period Return % Rs. Return % Rs. Return % Rs.
1 Year 3.73% 10,373 4.16% 10,416 3.49% 10,3493 Year 5.03% 11,588 4.37% 11,370 5.63% 11,7885 Year NA NA NA NA NA NASince Inception 5.00% 11,597 4.36% 11,385 5.67% 11,825Inception date: 18-Dec-18 Managing since: 10-Dec-18
Tata Equity Savings Fund NIFTY Equity Savings Index*
CRISIL 10 Year Gilt Index#
Period Return % Rs. Return % Rs. Return % Rs.
1 Year 10.77% 11,077 11.52% 11,152 1.35% 10,1353 Year 8.86% 12,904 10.94% 13,659 6.94% 12,2325 Year 7.08% 14,082 10.37% 16,388 5.32% 12,963Since Inception 7.30% 46,096 NA NA NA NAInception date: 27-Apr-00 Managing since: 09-Nov-18
Tata India Tax Savings Fund Nifty 500 TRI*
Period Return % Rs. Return % Rs. Return % Rs.
1 Year 29.66% 12,966 31.60% 13,1603 Year 17.57% 16,259 19.11% 16,9065 Year 16.78% 21,738 17.87% 22,775Since Inception 18.85% 857,375 14.42% 321,835Inception date: 31-Mar-96 Managing since: 16-Dec-21
Tata Nifty Exchange Traded Fund Nifty 50 TRI*
Period Return % Rs. Return % Rs. Return % Rs.
1 Year 25.44% 12,544 25.59% 12,559 NA NA3 Year NA NA NA NA NA NA5 Year NA NA NA NA NA NASince Inception 18.03% 16,443 18.12% 16,480 NA NA
Inception date: 01-Jan-19 Managing since: 17-Dec-18
Tata Nifty Private Bank Exchange Traded Fund Nifty Private Bank TRI* Nifty 50 TRI#
Period Return % Rs. Return % Rs. Return % Rs.
1 Year 5.42% 10,542 4.88% 10,488 25.59% 12,5593 Year NA NA NA NA NA NA5 Year NA NA NA NA NA NASince Inception 8.26% 12,042 7.42% 11,823 22.68% 16,132
Inception date: 30-Aug-19 Managing since: 16-Aug-19
Tata Quant Fund S&P BSE 200 TRI* S&P BSE Sensex TRI#
Period Return % Rs. Return % Rs. Return % Rs.
1 Year 13.83% 11,383 29.11% 12,911 23.23% 12,3233 Year NA NA NA NA NA NA5 Year NA NA NA NA NA NASince Inception 1.73% 10,338 23.96% 15,178 21.02% 14,486
Inception date: 22-Jan-20 Managing since: 03-Jan-20
Tata Retirement SavingsFund - Moderate Plan
Crisil Hybrid 25+75 - Aggressive Index*
S&P BSE Sensex TRI#
Period Return % Rs. Return % Rs. Return % Rs.
1 Year 20.48% 12,048 22.38% 12,238 23.23% 12,323
3 Year 14.61% 15,060 16.94% 16,000 18.62% 16,698
5 Year 15.02% 20,147 15.70% 20,749 18.31% 23,198
Since Inception 15.61% 43,746 13.54% 36,387 14.08% 38,200
Inception date: 01-Nov-11 Managing since: 01-Apr-17
Tata Retirement SavingsFund - Progressive Plan
Nifty 500 TRI* S&P BSE Sensex TRI#
Period Return % Rs. Return % Rs. Return % Rs.
1 Year 23.27% 12,327 31.60% 13,160 23.23% 12,323
3 Year 16.28% 15,728 19.11% 16,906 18.62% 16,698
5 Year 17.09% 22,028 17.87% 22,775 18.31% 23,198
Since Inception 15.67% 43,954 14.70% 40,356 14.08% 38,200
Inception date: 1-Nov-11 Managing since: 01-Apr-17
(Manages debt portfolio)
Tata Multi Asset Opportunities Fund
65% S&P BSE 200 TRI + 15% CRISIL Short Term Bond Fund Index + 20%
iCOMDEX Composite Index*
S&P BSE Sensex TRI#
Period Return % Rs. Return % Rs. Return % Rs.
1 Year 22.40% 12,240 43.42% 14,342 23.23% 12,3233 Year NA NA NA NA NA NA5 Year NA NA NA NA NA NASince Inception 26.50% 15,365 34.65% 17,224 27.05% 15,489
Inception date: 04-Mar-20 Managing since: 12-Mar-20
(Manages Equity- Arbitrage portfolio)

SCHEME PERFORMANCE
www.tatamutualfund.com TATA MUTUAL FUND 59Note: * Benchmark;# Additional benchmark; Amount in rupees denotes Value of Standard Investment of Rs. 10,000. Refer to page number 68 for disclaimer on scheme performance.
Lumpsum Performance of Open Ended SchemesLumpsum Performance of schemes managed by Satish Chandra Mishra
Tata Small Cap Fund$ Nifty Smallcap 250 TRI* Nifty 50 TRI#
Period Return % Rs. Return % Rs. Return % Rs.
1 Year 70.52% 17,052 63.34% 16,334 25.59% 12,559
3 Year 29.07% 21,519 24.17% 19,155 18.27% 16,552
5 Year NA NA NA NA NA NA
Since Inception 28.75% 22,093 23.77% 19,521 18.79% 17,163
Inception date: 12-Nov-18 Managing since: 01-Nov-19$Satish Chandra Mishra is the Assistant Fund Manager since Nov 1, 2019
Tata Hybrid Equity Fund$ CRISIL Hybrid 35+65 Aggressive Index*
S&P BSE Sensex TRI#
Period Return % Rs. Return % Rs. Return % Rs.
1 Year 23.63% 12,363 19.74% 11,974 23.23% 12,323
3 Year 13.58% 14,656 16.05% 15,634 18.62% 16,698
5 Year 11.26% 17,061 14.71% 19,877 18.31% 23,198
Since Inception 15.47% 436,516 NA NA 12.90% 241,571
Inception date: 08-Oct-95 Managing since: 01-Nov-19$Satish Chandra Mishra is the Assistant Fund Manager since Nov 1, 2019
Tata Mid Cap Growth Fund
Nifty Midcap 150 TRI* Nifty 50 TRI#
Period Return % Rs. Return % Rs. Return % Rs.
1 Year 39.92% 13,992 48.16% 14,816 25.59% 12,559
3 Year 22.73% 18,497 23.22% 18,718 18.27% 16,552
5 Year 20.99% 25,953 20.54% 25,471 17.65% 22,561
Since Inception 13.42% 319,971 NA NA 11.22% 186,578
Inception date: 01-Jul-94 Managing since: 09-Mar-21
Tata Resources& Energy Fund
Nifty Commodities TRI* Nifty 50 TRI#
Period Return % Rs. Return % Rs. Return % Rs.
1 Year 46.64% 14,664 49.79% 14,979 25.59% 12,559
3 Year 28.05% 21,010 19.85% 17,224 18.27% 16,552
5 Year 18.59% 23,474 15.52% 20,586 17.65% 22,561
Since Inception 19.08% 28,586 17.52% 26,399 15.36% 23,616
Inception date: 28-Dec-15 Managing since: 09-Mar-21
Lumpsum Performance of schemes managed by Sonam Udasi
Tata Equity P/E Fund Nifty 500 TRI*
Period Return % Rs. Return % Rs. Return % Rs.1 Year 28.00% 12,800 31.60% 13,160 NA NA3 Year 14.87% 15,163 19.11% 16,906 NA NA5 Year 14.44% 19,642 17.87% 22,775 NA NASince Inception 18.61% 198,668 16.70% 149,563 NA NAInception date: 29-Jun-04 Managing since: 01-Apr-16
Tata Index Fund- Nifty Plan Nifty 50 TRI*
Period Return % Rs. Return % Rs. Return % Rs.1 Year 24.61% 12,461 25.59% 12,559 NA NA3 Year 17.27% 16,136 18.27% 16,552 NA NA5 Year 16.68% 21,646 17.65% 22,561 NA NASince Inception 16.26% 171,340 17.60% 212,888 NA NAInception date: 25-Feb-03 Managing since: 01-Apr-16
Tata Flexi Cap Fund Nifty 500 TRI* S&P BSE Sensex TRI#
Period Return % Rs. Return % Rs. Return % Rs.1 Year 26.57% 12,657 31.60% 13,160 23.23% 12,3233 Year 16.92% 15,989 19.11% 16,906 18.62% 16,6985 Year NA NA NA NA NA NASince Inception 15.77% 16,264 14.83% 15,829 14.75% 15,792Inception date: 06-Sep-18 Managing since: 17-Aug-18
Tata India Consumer Fund
Nifty India Consumption TRI* Nifty 50 TRI#
Period Return % Rs. Return % Rs. Return % Rs.
1 Year 27.46% 12,746 20.82% 12,082 25.59% 12,559
3 Year 14.74% 15,112 13.54% 14,641 18.27% 16,552
5 Year 20.69% 25,628 16.25% 21,249 17.65% 22,561
Since Inception 17.73% 26,692 13.27% 21,161 15.36% 23,616
Inception date: 28-Dec-15 Managing since: 01-Apr-16
Tata Retirement SavingsFund - Moderate Plan
Crisil Hybrid 25+75 - Aggressive Index* S&P BSE Sensex TRI#
Period Return % Rs. Return % Rs. Return % Rs.
1 Year 20.48% 12,048 22.38% 12,238 23.23% 12,323
3 Year 14.61% 15,060 16.94% 16,000 18.62% 16,698
5 Year 15.02% 20,147 15.70% 20,749 18.31% 23,198
Since Inception 15.61% 43,746 13.54% 36,387 14.08% 38,200
Inception date: 01-Nov-11 Managing since: 01-Apr-16
Tata Index Fund- Sensex Plan S&P BSE Sensex TRI*
Period Return % Rs. Return % Rs. Return % Rs.
1 Year 21.43% 12,143 23.23% 12,323 NA NA
3 Year 17.27% 16,134 18.62% 16,698 NA NA
5 Year 17.13% 22,062 18.31% 23,198 NA NA
Since Inception 16.10% 166,990 18.20% 234,274 NA NA
Inception date: 25-Feb-03 Managing since: 01-Apr-16
Tata Retirement SavingsFund - Progressive Plan
Nifty 500 TRI* S&P BSE Sensex TRI#
Period Return % Rs. Return % Rs. Return % Rs.
1 Year 23.27% 12,327 31.60% 13,160 23.23% 12,323
3 Year 16.28% 15,728 19.11% 16,906 18.62% 16,698
5 Year 17.09% 22,028 17.87% 22,775 18.31% 23,198
Since Inception 15.67% 43,954 14.70% 40,356 14.08% 38,200
Inception date: 01-Nov-11 Managing since: 01-Apr-16
Tata Retirement SavingsFund - Conservative Plan
CRISIL Short Term Debt Hybrid 75+25 Fund Index*
CRISIL 10 Year Gilt Index#
Period Return % Rs. Return % Rs. Return % Rs.
1 Year 7.58% 10,758 10.26% 11,026 1.35% 10,135
3 Year 8.98% 12,947 11.29% 13,788 6.94% 12,232
5 Year 8.46% 15,019 10.36% 16,380 5.32% 12,963
Since Inception 9.45% 25,049 10.23% 26,942 7.38% 20,633
Inception date: 01-Nov-11 Managing since: 01-Apr-16
(Manages equity portfolio)

SCHEME PERFORMANCE
www.tatamutualfund.com TATA MUTUAL FUND 60Note: * Benchmark;# Additional benchmark; Amount in rupees denotes Value of Standard Investment of Rs. 10,000. Refer to page number 68 for disclaimer on scheme performance.
Lumpsum Performance of Open Ended SchemesLumpsum Performance of schemes managed by Rahul Singh
Tata Balanced Advantage Fund
CRISIL Hybrid 50+50 - Moderate Index*
S&P BSE Sensex TRI#
Period Return % Rs. Return % Rs. Return % Rs.
1 Year 16.47% 11,647 15.85% 11,585 23.23% 12,323
3 Year NA NA NA NA NA NA
5 Year NA NA NA NA NA NA
Since Inception 13.61% 14,527 15.55% 15,265 19.61% 16,889
Inception date: 28-Jan-19 Managing since: 09-Jan-19
Tata Multi Asset Opportunities Fund
65% S&P BSE 200 TRI + 15% CRISIL Short Term Bond Fund Index + 20%
iCOMDEX Composite Index*
S&P BSE Sensex TRI#
Period Return % Rs. Return % Rs. Return % Rs.
1 Year 22.40% 12,240 43.42% 14,342 23.23% 12,323
3 Year NA NA NA NA NA NA
5 Year NA NA NA NA NA NA
Since Inception 26.50% 15,365 34.65% 17,224 27.05% 15,489
Inception date: 04-Mar-20 Managing since: 12-Mar-20Tata Focused Equity
FundNifty 500 TRI* S&P BSE Sensex TRI#
Period Return % Rs. Return % Rs. Return % Rs.
1 Year 33.18% 13,318 31.60% 13,160 23.23% 12,323
3 Year NA NA NA NA NA NA
5 Year NA NA NA NA NA NA
Since Inception 21.64% 15,012 24.29% 15,698 20.04% 14,605
Inception date: 05-Dec-19 Managing since: 09-Mar-21
Tata Liquid Fund& Crisil Liquid Fund Index* CRISIL 1 Year T-Bill Index#
Period Return % Rs. Return % Rs. Return % Rs.7 Day 4.18% 10,007 3.83% 10,006 4.05% 10,00715 Day 3.81% 10,014 3.73% 10,014 2.77% 10,01030 Day 3.53% 10,028 3.60% 10,028 2.88% 10,0231 Year 3.23% 10,323 3.60% 10,360 3.49% 10,3493 Year 4.69% 11,475 5.01% 11,582 5.63% 11,7885 Year 5.63% 13,151 5.85% 13,289 5.92% 13,334Since Inception 7.13% 33,040 6.79% 31,225 6.05% 27,681Inception date: 01-Sep-04 Managing since: 06-Feb-20
&Abhishek Sonthalia is the Co-Fund Manager since Feb 6, 2020
Lumpsum Performance of schemes managed by Abhishek Sonthalia
Tata Medium Term Fund& Crisil Medium Term Debt Index*
CRISIL 10 Year Gilt Index#
Period Return % Rs. Return % Rs. Return % Rs.
1 Year 5.01% 10,501 4.59% 10,459 1.35% 10,135
3 Year 1.88% 10,576 9.36% 13,084 6.94% 12,232
5 Year 3.09% 11,645 8.04% 14,725 5.32% 12,963
Since Inception 5.82% 29,523 NA NA 6.29% 32,166
Inception date: 11-Nov-02 Managing since: 06-Feb-20& Murthy Nagarajan is the Co-Fund Manager since Feb 6, 2020
Tata Medium Term Fund (Segregated Portfolio 1)&
CRISIL Medium Term Debt Index*
CRISIL 10 Year Gilt Index#
Period Return % Rs. Return % Rs. Return % Rs.
1 Year 185.83% 28,583 4.59% 10,459 1.35% 10,135
3 Year NA NA NA NA NA NA
5 Year NA NA NA NA NA NA
Since Inception 23.48% 17,116 9.19% 12,510 6.05% 11,614
Inception date: 15-Jun-19 Managing since: 06-Feb-20&Abhishek Sonthalia is the Co-Fund Manager since Feb 6, 2020
Tata Short Term Bond Fund&
Crisil Short Term Bond Fund Index*
CRISIL 10 Year Gilt Index#
Period Return % Rs. Return % Rs. Return % Rs.
1 Year 2.53% 10,253 4.38% 10,438 1.35% 10,135
3 Year 7.05% 12,270 8.07% 12,624 6.94% 12,232
5 Year 5.27% 12,929 7.38% 14,280 5.32% 12,963
Since Inception 7.25% 38,943 7.28% 39,128 6.43% 33,514
Inception date: 08-Aug-02 Managing since: 06-Feb-20&Abhishek Sonthalia is the Co-Fund Manager since Feb 6, 2020
Tata Treasury Advantage Fund&
Crisil Low Duration Debt Index*
CRISIL 1 Year T-Bill Index#
Period Return % Rs. Return % Rs. Return % Rs.
1 Year 3.63% 10,363 4.23% 10,423 3.49% 10,349
3 Year 4.39% 11,378 6.75% 12,165 5.63% 11,788
5 Year 5.50% 13,074 6.94% 13,994 5.92% 13,336
Since Inception 7.31% 31,642 7.47% 32,438 6.12% 26,389
Inception date: 06-Sep-05 Managing since: 06-Feb-20&Abhishek Sonthalia is the Co-Fund Manager since Feb 6, 2020
Tata Treasury Advantage Fund (Segregated Portfolio 1)&
CRISIL Low Duration Debt Index*
CRISIL 1 Year T-Bill Index#
Period Return % Rs. Return % Rs. Return % Rs.
1 Year 153.38% 25,338 4.23% 10,423 3.49% 10,349
3 Year NA NA NA NA NA NA
5 Year NA NA NA NA NA NA
Since Inception 23.48% 17,115 6.31% 11,688 5.19% 11,375
Inception date: 15-Jun-19 Managing since: 06-Feb-20&Abhishek Sonthalia is the Co-Fund Manager since Feb 6, 2020

SCHEME PERFORMANCE
www.tatamutualfund.com TATA MUTUAL FUND 61Note: * Benchmark;# Additional benchmark; Amount in rupees denotes Value of Standard Investment of Rs. 10,000. Refer to page number 68 for disclaimer on scheme performance.
Lumpsum Performance of Open Ended SchemesLumpsum Performance of schemes managed by Venkat Samala
Tata Digital India Fund& NIFTY IT TRI* S&P BSE Sensex TRI#
Period Return % Rs. Return % Rs. Return % Rs.
1 Year 74.44% 17,444 62.35% 16,235 23.23% 12,323
3 Year 42.60% 29,025 41.71% 28,484 18.62% 16,698
5 Year 34.06% 43,377 32.65% 41,139 18.31% 23,198
Since Inception 26.34% 40,801 25.26% 38,736 15.73% 24,079
Inception date: 28-Dec-15 Managing since: 26-Nov-20&Venkat Samala is the Fund Manager - Overseas Investment since Nov 26, 2020
Tata Focused Equity Fund
Nifty 500 TRI* S&P BSE Sensex TRI#
Period Return % Rs. Return % Rs. Return % Rs.
1 Year 33.18% 13,318 31.60% 13,160 23.23% 12,323
3 Year NA NA NA NA NA NA
5 Year NA NA NA NA NA NA
Since Inception 21.64% 15,012 24.29% 15,698 20.04% 14,605
Inception date: 05-Dec-19 Managing since: 26-Nov-20&Venkat Samala is the Fund Manager - Overseas Investment since Nov 26, 2020
Tata Large Cap Fund& Nifty 100 TRI*
Period Return % Rs. Return % Rs. Return % Rs.
1 Year 32.67% 13,267 26.45% 12,645 NA NA
3 Year 17.22% 16,113 17.94% 16,414 NA NA
5 Year 14.98% 20,111 17.45% 22,370 NA NA
Since Inception 19.86% 727,792 NA NA NA NA
Inception date: 07-May-98 Managing since: 26-Nov-20& Venkat Samala is the Fund Manager - Overseas Investment since Nov 26, 2020
Lumpsum Performance of schemes managed by Aurobinda Prasad Gayan
Tata Multi Asset Opportunities Fund
65% S&P BSE 200 TRI + 15% CRISIL Short Term Bond Fund Index + 20%
iCOMDEX Composite Index*
S&P BSE Sensex TRI#
Period Return % Rs. Return % Rs. Return % Rs.
1 Year 22.40% 12,240 43.42% 14,342 23.23% 12,323
3 Year NA NA NA NA NA NA
5 Year NA NA NA NA NA NA
Since Inception 26.50% 15,365 34.65% 17,224 27.05% 15,489
Inception date: 04-Mar-20 Managing since: 12-Mar-20(Manages Commodity portfolio)
Tata India Tax Savings Fund Nifty 500 TRI*
Period Return % Rs. Return % Rs. Return % Rs.
1 Year 29.66% 12,966 31.60% 13,160 NA NA
3 Year 17.57% 16,259 19.11% 16,906 NA NA
5 Year 16.78% 21,738 17.87% 22,775 NA NA
Since Inception 18.85% 857,375 14.42% 321,835 NA NA
Inception date: 31-Mar-96 Managing since: 09-Mar-21
Lumpsum Performance of schemes managed by Tejas Gutka

SCHEME PERFORMANCE
www.tatamutualfund.com TATA MUTUAL FUND 62Note: * Benchmark;# Additional benchmark; Amount in rupees denotes Value of Standard Investment of Rs. 10,000. Refer to page number 68 for disclaimer on scheme performance.
Lumpsum Performance of Close Ended SchemesLumpsum Performance of schemes managed by Akhil Mittal
Tata FMP - Series 56 - Scheme F
Crisil Medium Term Debt Index*
CRISIL 10 Year Gilt Index#
Period Return % Rs. Return % Rs. Return % Rs.
1 Year 3.78% 10,378 4.59% 10,459 1.35% 10,135
3 Year 8.04% 12,613 9.36% 13,084 6.94% 12,232
5 Year NA NA NA NA NA NA
Since Inception 8.27% 12,791 9.62% 13,288 7.76% 12,603
Inception date: 27-Nov-18 Managing since: 19-Nov-18

SCHEME PERFORMANCE
www.tatamutualfund.com TATA MUTUAL FUND 63Note: * Benchmark;# Additional benchmark; Amount in rupees denotes Value of Standard Investment of Rs. 10,000. Refer to page number 68 for disclaimer on scheme performance.
SIP Performance of Open Ended SchemesSIP Performance of schemes managed by Abhinav Sharma
Tata Treasury Advantage Fund
(Segregated Portfolio 1)
CRISIL Low Duration Debt Index*
CRISIL 1 Year T-Bill Index#
Period Amt. Invested Return % Rs. Return % Rs. Return % Rs.
1 Year 120,000 266.42% 258,932 4.27% 122,749 3.38% 122,176
3 Year NA NA NA NA NA NA NA
5 Year NA NA NA NA NA NA NA
Since Inception 300,000 69.51% 636,586 5.33% 321,016 4.21% 316,540
Inception date: 15-Jun-19 First Installment date: 01-Jul-19 Managing since: 14-Jun-19
Tata Ultra Short Term Fund
Crisil Ultra Short Term Debt Index*
CRISIL 1 Year T-Bill Index#
Period Amt. Invested Return % Rs. Return % Rs. Return % Rs.
1 Year 120,000 3.14% 122,023 4.18% 122,686 3.38% 122,176
3 Year NA NA NA NA NA NA NA
5 Year NA NA NA NA NA NA NA
Since Inception 350,000 4.02% 371,499 5.11% 377,489 4.53% 374,280
Inception date: 22-Jan-19 First Installment date: 01-Feb-19 Managing since: 11-Jan-19
TataInfrastructure Fund
S&P BSE India Infrastructure TRI*
Nifty 50 TRI#
Period Amt. Invested Return % Rs. Return % Rs. Return % Rs.
1 Year 120,000 42.94% 146,327 34.63% 141,436 21.71% 133,658
3 Year 360,000 34.62% 588,220 31.47% 564,309 25.13% 518,153
5 Year 600,000 20.50% 999,197 16.15% 898,373 18.54% 952,649
Since Inception 2,030,000 11.96% 6,149,699 10.18% 3,472,592 13.43% 7,118,416
Inception date: 31-Dec-04 First Installment date: 01-Feb-05 Managing since: 09-Mar-21
Tata Mid Cap Growth Fund
Nifty Midcap 150 TRI*
Nifty 50 TRI#
Period Amt. Invested Return % Rs. Return % Rs. Return % Rs.
1 Year 120,000 31.34% 139,474 36.88% 142,770 21.71% 133,658
3 Year 360,000 32.83% 574,592 37.67% 612,047 25.13% 518,153
5 Year 600,000 22.42% 1,046,537 23.42% 1,072,271 18.54% 952,649
Since Inception 2,140,000 17.56% 13,310,744 17% 9,907,484 13.84% 8,363,461
Inception date: 01-Jul-94 First Installment date: 01-Jul-94 Managing since: 09-Mar-21
Tata Flexi Cap Fund Nifty 500 TRI*S&P BSE Sensex
TRI#
Period Amt. Invested Return % Rs. Return % Rs. Return % Rs.
1 Year 120,000 24.87% 135,581 26.19% 136,377 21.25% 133,372
3 Year 360,000 24.11% 510,982 28.18% 540,076 24.70% 515,112
5 Year NA NA NA NA NA NA NA
Since Inception 390,000 22.91% 560,310 26.57% 591,698 23.56% 565,773
Inception date: 06-Sep-18 First Installment date: 01-Oct-18 Managing since: 01-Nov-19
SIP Performance of schemes managed by Akhil Mittal
Tata Balanced Advantage Fund
CRISIL Hybrid 50+50 - Moderate Index*
S&P BSE Sensex TRI#
Period Amt. Invested Return % Rs. Return % Rs. Return % Rs.
1 Year 120,000 13.11% 128,344 13.92% 128,844 21.25% 133,372
3 Year NA NA NA NA NA NA NA
5 Year NA NA NA NA NA NA NA
Since Inception 350,000 16.68% 444,830 17.69% 451,015 25.12% 498,500
Inception date: 28-Jan-19 First Installment date: 01-Feb-19 Managing since: 09-Jan-19
TataDynamic Bond Fund
CRISIL Composite Bond Fund Index*
CRISIL 10 Year Gilt Index#
Period Amt. Invested Return % Rs. Return % Rs. Return % Rs.
1 Year 120,000 4.41% 122,835 4.61% 122,962 1.57% 121,013
3 Year 360,000 5.90% 393,735 7.14% 401,091 4.77% 387,126
5 Year 600,000 6.07% 699,431 7.75% 729,510 5.92% 696,829
Since Inception 2,190,000 7.13% 4,394,873 7.81% 4,716,368 6.52% 4,130,385
Inception date: 03-Sep-03 First Installment date: 01-Oct-03 Managing since: 26-Jun-14
Tata Income Fund Crisil Composite Bond Fund Index*
CRISIL 10 Year Gilt Index#
Period Amt. Invested Return % Rs. Return % Rs. Return % Rs.
1 Year 120,000 3.24% 122,090 4.61% 122,962 1.57% 121,013
3 Year 360,000 6.06% 394,689 7.14% 401,091 4.77% 387,126
5 Year 600,000 6.33% 703,979 7.75% 729,510 5.92% 696,829
Since Inception 2,930,000 7.11% 7,627,760 7.66% 5,380,172 6.50% 4,966,274
Inception date: 28-Apr-97 First Installment date: 01-Aug-97 Managing since: 26-Jun-14
Tata Treasury Advantage Fund##
Crisil Low Duration Debt Index*
CRISIL 1 Year T-Bill Index#
Period Amt. Invested Return % Rs. Return % Rs. Return % Rs.
1 Year 120,000 3.71% 122,391 4.27% 122,749 3.38% 122,176
3 Year 360,000 4.69% 386,666 5.72% 392,670 4.59% 386,066
5 Year 600,000 4.99% 680,741 6.53% 707,489 5.47% 689,008
Since Inception 1,950,000 7.06% 3,581,323 7.58% 3,755,838 6.33% 3,354,499
Inception date: 06-Sep-05 First Installment date: 01-Oct-05 Managing since: 26-Jun-14
SIP Performance of schemes managed by Amey Sathe
Tata Banking andFinancial Services Fund
Nifty Financial Services TRI* Nifty 50 TRI#
Period Amt. Invested Return % Rs. Return % Rs. Return % Rs.
1 Year 120,000 1.97% 121,274 7.71% 124,942 21.71% 133,658
3 Year 360,000 15.16% 450,815 18.79% 474,649 25.13% 518,153
5 Year 600,000 12.34% 817,786 16.23% 900,126 18.54% 952,649
Since Inception 720,000 13.45% 1,082,492 16.89% 1,200,238 17.64% 1,227,666
Inception date: 28-Dec-15 First Installment date: 01-Jan-16 Managing since: 18-Jun-18
TataEquity P/E Fund Nifty 500 TRI*
Period Amt. Invested Return % Rs. Return % Rs. Return % Rs.
1 Year 120,000 25.06% 135,694 26.19% 136,377 NA NA
3 Year 360,000 23.65% 507,752 28.18% 540,076 NA NA
5 Year 600,000 15.16% 876,893 19.31% 970,498 NA NA
Since Inception 2,100,000 15.89% 10,005,106 14.10% 8,294,884 NA NA
Inception date: 29-Jun-04 First Installment date: 01-Jul-04 Managing since: 18-Jun-18
Tata Ethical FundNifty 500 Shariah
TRI*Nifty 50 TRI#
Period Amt. Invested Return % Rs. Return % Rs. Return % Rs.
1 Year 120,000 43.19% 146,473 37.25% 142,989 21.71% 133,658
3 Year 360,000 35.40% 594,271 36.40% 602,031 25.13% 518,153
5 Year 600,000 23.20% 1,066,553 24.32% 1,095,692 18.54% 952,649
Since Inception 3,040,000 18.73% 53,849,463 16.21% 6,853,335 14.97% 19,122,531
Inception date: 24-May-96 First Installment date: 01-Sep-96 Managing since: 06-Sep-21

SCHEME PERFORMANCE
www.tatamutualfund.com TATA MUTUAL FUND 64Note: * Benchmark;# Additional benchmark; Amount in rupees denotes Value of Standard Investment of Rs. 10,000. Refer to page number 68 for disclaimer on scheme performance.
Tata Banking & PSU Debt Fund
CRISIL Banking and PSU Debt Index*
CRISIL 10 Year Gilt Index#
Period Amt. Invested Return % Rs. Return % Rs. Return % Rs.
1 Year 120,000 4.23% 122,718 4.99% 123,204 1.57% 121,013
3 Year NA NA NA NA NA NA NA
5 Year NA NA NA NA NA NA NA
Since Inception 260,000 5.60% 276,568 5.93% 277,544 3.20% 269,408
Inception date: 10-Oct-19 First Installment date: 01-Nov-19 Managing since: 06-Sep-19
Tata Corporate Bond Fund (Segregated Portfolio 1)
CRISIL Corporate Bond Composite Index*
CRISIL 1 Year T-Bill Index#
Period Amt. Invested Return % Rs. Return % Rs. Return % Rs.
1 Year 120,000 193.36% 224,831 5.44% 123,491 3.38% 122,176
3 Year NA NA NA NA NA NA NA
5 Year NA NA NA NA NA NA NA
Since Inception 300,000 57.06% 566,029 7.42% 329,450 4.21% 316,540
Inception date: 15-Jun-19 First Installment date: 01-Jul-19 Managing since: 14-Jun-19
SIP Performance of schemes managed by Amey Sathe (Contd.)
TataMoney Market Fund
Crisil Money Market Index*
CRISIL 1 Year T-Bill Index#
Period Amt. Invested Return % Rs. Return % Rs. Return % Rs.
1 Year 120,000 3.85% 122,475 4.04% 122,599 3.38% 122,176
3 Year 360,000 5.07% 388,843 4.85% 387,569 4.59% 386,066
5 Year 600,000 4.82% 677,789 5.75% 693,801 5.47% 689,067
Since Inception 2,230,000 6.71% 4,341,449 7.19% 4,568,669 6.80% 4,135,057
Inception date: 22-May-03 First Installment date: 01-Jun-03 Managing since: 16-Oct-13
Tata Liquid Fund Crisil Liquid Fund Index*
CRISIL 1 Year T-Bill Index#
Period Amt. Invested Return % Rs. Return % Rs. Return % Rs.
1 Year 120,000 3.30% 122,129 3.62% 122,337 3.38% 122,185
3 Year 360,000 3.87% 381,932 4.24% 384,037 4.59% 386,114
5 Year 600,000 4.85% 678,367 5.15% 683,568 5.47% 689,121
Since Inception 2,070,000 7% 3,937,982 6.85% 3,882,365 7% 3,682,205
Inception date: 01-Sep-04 First Installment date: 01-Oct-04 Managing since: 16-Oct-13
Tata Overnight Fund Crisil Overnight Index*
CRISIL 1 Year T-Bill Index#
Period Amt. Invested Return % Rs. Return % Rs. Return % Rs.
1 Year 120,000 3.11% 122,012 3.32% 122,143 3.38% 122,185
3 Year NA NA NA NA NA NA NA
5 Year NA NA NA NA NA NA NA
Since Inception 330,000 3.29% 345,599 3.46% 346,406 4.41% 351,013
Inception date: 27-Mar-19 First Installment date: 01-Apr-19 Managing since: 25-Mar-19
SIP Performance of schemes managed by Chandraprakash Padiyar
TataHybrid Equity Fund
CRISIL Hybrid 35+65 Aggressive Index*
S&P BSE Sensex TRI#
Period Amt. Invested Return % Rs. Return % Rs. Return % Rs.
1 Year 120,000 17.99% 131,369 16.81% 130,641 21.25% 133,372
3 Year 360,000 19.82% 481,518 20.47% 485,947 24.70% 515,112
5 Year 600,000 13.47% 841,021 15.73% 889,216 18.93% 961,699
Since Inception 3,110,000 16.32% 39,429,990 13.21% 10,306,825 14.95% 28,734,793
Inception date: 08-Oct-95 First Installment date: 01-Feb-96 Managing since: 03-Sep-18
Tata Large & Mid Cap Fund
Nifty Large Midcap 250 TRI*
S&P BSE Sensex TRI#
Period Amt. Invested Return % Rs. Return % Rs. Return % Rs.
1 Year 120,000 20.36% 132,828 29.51% 138,378 21.25% 133,372
3 Year 360,000 25.50% 520,785 31.46% 564,280 24.70% 515,112
5 Year 600,000 18.04% 941,103 20.91% 1,009,089 18.93% 961,699
Since Inception 2,560,000 18.01% 24,350,242 15.37% 8,421,011 15.72% 17,868,511
Inception date: 25-Feb-93 First Installment date: 01-Mar-93 Managing since: 03-Sep-18
Tata Small Cap Fund Nifty Smallcap 250 TRI* Nifty 50 TRI#
Period Amt. Invested Return % Rs. Return % Rs. Return % Rs.
1 Year 120,000 55.93% 153,806 50.79% 150,870 21.71% 133,658
3 Year 360,000 45.97% 679,956 44.61% 668,498 25.13% 518,153
5 Year NA NA NA NA NA NA NA
Since Inception 370,000 44.86% 701,951 43.33% 688,172 24.67% 534,683
Inception date: 12-Nov-18 First Installment date: 01-Dec-18 Managing since: 19-Oct-18
Tata Large Cap Fund Nifty 100 TRI*
Period Amt. Invested Return % Rs. Return % Rs. Return % Rs.
1 Year 120,000 24.47% 135,339 22.35% 134,046 NA NA
3 Year 360,000 24.93% 516,733 25.26% 519,132 NA NA
5 Year 600,000 16.95% 916,203 18.27% 946,195 NA NA
Since Inception 2,830,000 17.78% 34,341,652 15.09% 11,563,494 NA NA
Inception date: 07-May-98 First Installment date: 01-Jun-98 Managing since: 09-Mar-21
SIP Performance of schemes managed by Amit Somani
Tata Young Citizens Fund
Nifty 500 TRI*S&P BSE Sensex
TRI#
Period Amt. Invested Return % Rs. Return % Rs. Return % Rs.
1 Year 120,000 29.05% 138,104 26.19% 136,377 21.25% 133,372
3 Year 360,000 29.01% 546,113 28.18% 540,076 24.70% 515,112
5 Year 600,000 18.28% 946,453 19.31% 970,498 18.93% 961,699
Since Inception 3,110,000 12.96% 22,306,557 15.65% 35,186,358 14.95% 28,720,763
Inception date: 14-Oct-95 First Installment date: 01-Feb-96 Managing since: 09-Mar-21

SCHEME PERFORMANCE
www.tatamutualfund.com TATA MUTUAL FUND 65Note: * Benchmark;# Additional benchmark; Amount in rupees denotes Value of Standard Investment of Rs. 10,000. Refer to page number 68 for disclaimer on scheme performance.
SIP Performance of schemes managed by Meeta Shetty
Tata Large &Mid Cap Fund
Nifty Large Midcap 250 TRI*
S&P BSE Sensex TRI#
Period Amt. Invested Return % Rs. Return % Rs. Return % Rs.
1 Year 120,000 20.36% 132,828 29.51% 138,378 21.25% 133,372
3 Year 360,000 25.50% 520,785 31.46% 564,280 24.70% 515,112
5 Year 600,000 18.04% 941,103 20.91% 1,009,089 18.93% 961,699
Since Inception 2,560,000 18.01% 24,350,242 15.37% 8,421,011 15.72% 17,868,511
Inception date: 25-Feb-93 First Installment date: 01-Mar-93 Managing since: 01-Nov-19
Tata Digital India Fund
NIFTY IT TRI*S&P BSE Sensex
TRI#
Period Amt. Invested Return % Rs. Return % Rs. Return % Rs.
1 Year 120,000 79% 166,682 72.95% 163,354 21.25% 133,372
3 Year 360,000 60.20% 807,741 56.35% 771,693 24.70% 515,112
5 Year 600,000 42.63% 1,681,432 40.93% 1,617,631 18.93% 961,699
Since Inception 720,000 37.17% 2,178,115 35.86% 2,097,622 18.09% 1,243,986
Inception date: 28-Dec-15 First Installment date: 01-Jan-16 Managing since: 09-Mar-21
Tata India PharmaAnd Healthcare Fund
Nifty Pharma TRI* Nifty 50 TRI#
Period Amt. Invested Return % Rs. Return % Rs. Return % Rs.
1 Year 120,000 19.22% 132,126 11.08% 127,069 21.71% 133,658
3 Year 360,000 32.21% 569,891 24.78% 515,723 25.13% 518,153
5 Year 600,000 23.12% 1,064,438 15.61% 886,666 18.54% 952,649
Since Inception 720,000 19.29% 1,289,498 12.18% 1,041,823 17.64% 1,227,666
Inception date: 28-Dec-15 First Installment date: 01-Jan-16 Managing since: 09-Mar-21
SIP Performance of schemes managed by Murthy Nagarajan
Tata Medium Term Fund (Segregated Portfolio 1)
CRISIL Medium Term Debt Index*
CRISIL 10 Year Gilt Index#
Period Amt. Invested Return % Rs. Return % Rs. Return % Rs.
1 Year 120,000 331.93% 288,135 5.38% 123,454 1.57% 121,013
3 Year NA NA NA NA NA NA NA
5 Year NA NA NA NA NA NA NA
Since Inception 300,000 79.64% 697,332 7.49% 329,752 3.69% 314,454
Inception date: 15-Jun-19 First Installment date: 01-Jul-19 Managing since: 06-Feb-20
TataHybrid Equity Fund
CRISIL Hybrid 35+65 Aggressive
Index*
S&P BSE Sensex TRI#
Period Amt. Invested Return % Rs. Return % Rs. Return % Rs.
1 Year 120,000 17.99% 131,369 16.81% 130,641 21.25% 133,372
3 Year 360,000 19.82% 481,518 20.47% 485,947 24.70% 515,112
5 Year 600,000 13.47% 841,021 15.73% 889,216 18.93% 961,699
Since Inception 3,110,000 16.32% 39,429,990 13.21% 10,306,825 14.95% 28,734,793
Inception date: 08-Oct-95 First Installment date: 01-Feb-96 Managing since: 01-Apr-17
Tata Medium Term Fund## &
Crisil Medium Term Debt Index*
CRISIL 10 Year Gilt Index#
Period Amt. Invested Return % Rs. Return % Rs. Return % Rs.
1 Year 120,000 5.47% 123,514 5.38% 123,454 1.57% 121,013
3 Year 360,000 5.43% 390,956 8.12% 406,917 4.77% 387,126
5 Year 600,000 3.68% 658,547 8.34% 740,393 5.92% 696,829
Since Inception 2,280,000 5.70% 4,053,190 8.82% 4,700,661 6.47% 4,396,284
Inception date: 11-Nov-02 First Installment date: 01-Jan-03 Managing since: 06-Feb-20
TataEquity Savings Fund
NIFTY Equity Savings Index*
CRISIL 10 Year Gilt Index#
Period Amt. Invested Return % Rs. Return % Rs. Return % Rs.
1 Year 120,000 9.58% 126,128 10.16% 126,493 1.61% 121,040
3 Year 360,000 10.80% 423,267 12.48% 433,788 4.77% 387,096
5 Year 600,000 8.42% 741,883 10.72% 785,616 5.92% 696,846
Since Inception 2,600,000 6.90% 5,858,004 9.42% 4,709,772 6.50% 4,966,348
Inception date: 27-Apr-00 First Installment date: 01-May-00 Managing since: 01-Apr-17
TataGilt Securities Fund
Crisil Dynamic Gilt Index*
CRISIL 10 Year Gilt Index#
Period Amt. Invested Return % Rs. Return % Rs. Return % Rs.
1 Year 120,000 2.42% 121,560 4.19% 122,697 1.57% 121,013
3 Year 360,000 4.61% 386,159 6.63% 398,011 4.77% 387,126
5 Year 600,000 5.66% 692,343 7.42% 723,498 5.92% 696,829
Since Inception 2,670,000 7.23% 6,427,040 7.98% 7,087,168 6.50% 4,967,261
Inception date: 06-Sep-99 First Installment date: 01-Oct-99 Managing since: 14-Sep-19
Tata Multi Asset Opportunities Fund
65% S&P BSE 200 TRI + 15% CRISIL Short Term Bond Fund Index + 20% iCOMDEX
Composite Index*
S&P BSE Sensex TRI#
Period Amt. Invested Return % Rs. Return % Rs. Return % Rs.
1 Year 120,000 18.35% 131,590 57.07% 154,455 21.25% 133,372
3 Year NA NA NA NA NA NA NA
5 Year NA NA NA NA NA NA NA
Since Inception 210,000 27.88% 265,030 52.08% 315,133 36.21% 282,026
Inception date: 04-Mar-20 First Installment date: 01-Apr-20 Managing since: 12-Mar-20

SCHEME PERFORMANCE
www.tatamutualfund.com TATA MUTUAL FUND 66Note: * Benchmark;# Additional benchmark; Amount in rupees denotes Value of Standard Investment of Rs. 10,000. Refer to page number 68 for disclaimer on scheme performance.
SIP Performance of schemes managed by Murthy Nagarajan
Tata Retirement SavingsFund - Progressive Plan
Nifty 500 TRI* S&P BSE Sensex TRI#
Period Amt. Invested Return % Rs. Return % Rs. Return % Rs.
1 Year 120,000 21.07% 133,261 26.19% 136,377 21.25% 133,372
3 Year 360,000 22.21% 497,816 28.18% 540,076 24.70% 515,112
5 Year 600,000 15.89% 892,808 19.31% 970,498 18.93% 961,699
Since Inception 1,210,000 15.85% 2,798,633 16.07% 2,832,074 15.42% 2,732,811
Inception date: 01-Nov-11 First Installment date: 01-Dec-11 Managing since: 01-Apr-17
Tata Retirement SavingsFund - Conservative Plan
CRISIL Short Term Debt Hybrid 75+25 Fund Index*
CRISIL 10 Year Gilt Index#
Period Amt. Invested Return % Rs. Return % Rs. Return % Rs.
1 Year 120,000 7.58% 124,854 9.39% 125,993 1.57% 121,013
3 Year 360,000 9.77% 416,939 12.20% 431,986 4.77% 387,126
5 Year 600,000 8.38% 741,116 10.79% 787,034 5.92% 696,829
Since Inception 1,210,000 9.10% 1,945,467 10.34% 2,077,939 6.81% 1,722,619
Inception date: 01-Nov-11 First Installment date: 01-Dec-11 Managing since: 01-Apr-17
Tata Short TermBond Fund
Crisil Short Term Bond Fund Index*
CRISIL 10 Year Gilt Index#
Period Amt. Invested Return % Rs. Return % Rs. Return % Rs.
1 Year 120,000 2.96% 121,909 4.78% 123,071 1.57% 121,013
3 Year 360,000 5.60% 391,965 6.89% 399,600 4.77% 387,126
5 Year 600,000 5.42% 688,164 7.43% 723,612 5.92% 696,829
Since Inception 2,320,000 7.17% 4,893,242 7.77% 5,226,537 6.46% 4,526,039
Inception date: 08-Aug-02 First Installment date: 01-Sep-02 Managing since: 01-Apr-17
Tata Retirement SavingsFund - Moderate Plan
Crisil Hybrid 25+75 - Aggressive Index*
S&P BSE Sensex TRI#
Period Amt. Invested Return % Rs. Return % Rs. Return % Rs.
1 Year 120,000 19.15% 132,085 18.77% 131,851 21.25% 133,372
3 Year 360,000 20.07% 483,222 22.42% 499,227 24.70% 515,112
5 Year 600,000 14.48% 862,324 16.78% 912,339 18.93% 961,699
Since Inception 1,210,000 15.26% 2,709,784 14.48% 2,597,885 15.42% 2,732,811
Inception date: 01-Nov-11 First Installment date: 01-Dec-11 Managing since: 01-Apr-17
SIP Performance of schemes managed by Sailesh Jain
Tata Arbitrage Fund Nifty 50 Arbitrage Index*
CRISIL 1 Year T-Bill Index#
Period Amt. Invested Return % Rs. Return % Rs. Return % Rs.
1 Year 120,000 3.66% 122,359 3.93% 122,531 3.38% 122,183
3 Year 360,000 4.32% 384,482 3.72% 381,050 4.59% 386,080
5 Year NA NA NA NA NA NA NA
Since Inception 360,000 4.32% 384,482 3.72% 381,050 4.59% 386,080
Inception date: 18-Dec-18 First Installment date: 01-Jan-19 Managing since: 10-Dec-18
TataEquity Savings Fund
NIFTY Equity Savings Index*
CRISIL 10 Year Gilt Index#
Period Amt. Invested Return % Rs. Return % Rs. Return % Rs.
1 Year 120,000 9.58% 126,128 10.16% 126,493 1.61% 121,040
3 Year 360,000 10.80% 423,267 12.48% 433,788 4.77% 387,096
5 Year 600,000 8.42% 741,883 10.72% 785,616 5.92% 696,846
Since Inception 2,600,000 6.90% 5,858,004 9.42% 4,709,772 6.50% 4,966,348
Inception date: 27-Apr-00 First Installment date: 01-May-00 Managing since: 09-Nov-18
Tata Balanced Advantage Fund
CRISIL Hybrid 50+50 - Moderate Index*
S&P BSE Sensex TRI#
Period Amt. Invested Return % Rs. Return % Rs. Return % Rs.
1 Year 120,000 13.11% 128,344 13.92% 128,844 21.25% 133,372
3 Year NA NA NA NA NA NA NA
5 Year NA NA NA NA NA NA NA
Since Inception 350,000 16.68% 444,830 17.69% 451,015 25.12% 498,500
Inception date: 28-Jan-19 First Installment date: 01-Feb-19 Managing since: 09-Jan-19
Tata Multi Asset Opportunities Fund
65% S&P BSE 200 TRI + 15% CRISIL Short Term Bond Fund Index + 20% iCOMDEX
Composite Index*
S&P BSE Sensex TRI#
Period Amt. Invested Return % Rs. Return % Rs. Return % Rs.
1 Year 120,000 18.35% 131,590 57.07% 154,455 21.25% 133,372
3 Year NA NA NA NA NA NA NA
5 Year NA NA NA NA NA NA NA
Since Inception 210,000 27.88% 265,030 52.08% 315,133 36.21% 282,026
Inception date: 04-Mar-20 First Installment date: 01-Apr-20 Managing since: 12-Mar-20
Tata Nifty Exchange Traded Fund Nifty 50 TRI*
Period Amt. Invested Return % Rs. Return % Rs. Return % Rs.
1 Year 120,000 21.51% 133,534 21.71% 133,658 NA NA
3 Year NA NA NA NA NA NA NA
5 Year NA NA NA NA NA NA NA
Since Inception 350,000 25.48% 500,926 25.60% 501,674 NA NA
Inception date: 01-Jan-19 First Installment date: 01-Feb-19 Managing since: 17-Dec-18
Tata India Tax Savings Fund Nifty 500 TRI*
Period Amt. Invested Return % Rs. Return % Rs. Return % Rs.
1 Year 120,000 25.12% 135,730 26.19% 136,377 NA NA
3 Year 360,000 24.78% 515,729 28.18% 540,076 NA NA
5 Year 600,000 17.10% 919,518 19.31% 970,498 NA NA
Since Inception 2,980,000 18.70% 49,236,485 15.83% 30,841,983 NA NA
Inception date: 31-Mar-96 First Installment date: 01-Jul-96 Managing since: 16-Dec-21

SCHEME PERFORMANCE
www.tatamutualfund.com TATA MUTUAL FUND 67Note: * Benchmark;# Additional benchmark; Amount in rupees denotes Value of Standard Investment of Rs. 10,000. Refer to page number 68 for disclaimer on scheme performance.
SIP Performance of schemes managed by Sailesh Jain (Contd.)
Tata Quant Fund S&P BSE 200 TRI*S&P BSE Sensex
TRI#
Period Amt. Invested Return % Rs. Return % Rs. Return % Rs.
1 Year 120,000 2.22% 121,432 23.77% 134,909 21.25% 133,372
3 Year NA NA NA NA NA NA NA
5 Year NA NA NA NA NA NA NA
Since Inception 230,000 14.62% 264,313 38.01% 322,274 34.19% 312,563
Inception date: 22-Jan-20 First Installment date: 01-Feb-20 Managing since: 03-Jan-20
SIP Performance of schemes managed by Satish Chandra Mishra
TataHybrid Equity Fund
CRISIL Hybrid 35+65 Aggressive
Index*
S&P BSE Sensex TRI#
Period Amt. Invested Return % Rs. Return % Rs. Return % Rs.
1 Year 120,000 17.99% 131,369 16.81% 130,641 21.25% 133,372
3 Year 360,000 19.82% 481,518 20.47% 485,947 24.70% 515,112
5 Year 600,000 13.47% 841,021 15.73% 889,216 18.93% 961,699
Since Inception 3,110,000 16.32% 39,429,990 13.21% 10,306,825 14.95% 28,734,793
Inception date: 08-Oct-95 First Installment date: 01-Feb-96 Managing since: 01-Nov-19
Tata Resources &Energy Fund
Nifty Commodities TRI*
Nifty 50 TRI#
Period Amt. Invested Return % Rs. Return % Rs. Return % Rs.
1 Year 120,000 28.79% 137,944 30.86% 139,186 21.71% 133,658
3 Year 360,000 37.98% 614,508 33.09% 576,566 25.13% 518,153
5 Year 600,000 24.14% 1,090,801 19.54% 976,141 18.54% 952,649
Since Inception 720,000 21.97% 1,396,845 18.49% 1,258,983 17.64% 1,227,666
Inception date: 28-Dec-15 First Installment date: 01-Jan-16 Managing since: 09-Mar-21
Tata Small Cap Fund Nifty Smallcap 250 TRI* Nifty 50 TRI#
Period Amt. Invested Return % Rs. Return % Rs. Return % Rs.
1 Year 120,000 55.93% 153,806 50.79% 150,870 21.71% 133,658
3 Year 360,000 45.97% 679,956 44.61% 668,498 25.13% 518,153
5 Year NA NA NA NA NA NA NA
Since Inception 370,000 44.86% 701,951 43.33% 688,172 24.67% 534,683
Inception date: 12-Nov-18 First Installment date: 01-Dec-18 Managing since: 01-Nov-19
Tata Mid Cap Growth Fund
Nifty Midcap 150 TRI* Nifty 50 TRI#
Period Amt. Invested Return % Rs. Return % Rs. Return % Rs.
1 Year 120,000 31.34% 139,474 36.88% 142,770 21.71% 133,658
3 Year 360,000 32.83% 574,592 37.67% 612,047 25.13% 518,153
5 Year 600,000 22.42% 1,046,537 23.42% 1,072,271 18.54% 952,649
Since Inception 2,140,000 17.56% 13,310,744 17% 9,907,484 13.84% 8,363,461
Inception date: 01-Jul-94 First Installment date: 01-Jul-94 Managing since: 09-Mar-21
SIP Performance of schemes managed by Sonam Udasi
Tata Equity P/E Fund Nifty 500 TRI*
Period Amt. Invested Return % Rs. Return % Rs. Return % Rs.1 Year 120,000 25.06% 135,694 26.19% 136,377 NA NA3 Year 360,000 23.65% 507,752 28.18% 540,076 NA NA5 Year 600,000 15.16% 876,893 19.31% 970,498 NA NASince Inception 2,100,000 15.89% 10,005,106 14.10% 8,294,884 NA NAInception date: 29-Jun-04 First Installment date: 01-Jul-04 Managing since: 01-Apr-16
Tata Index Fund- Sensex Plan
S&P BSE Sensex TRI*
Period Amt. Invested Return % Rs. Return % Rs. Return % Rs.1 Year 120,000 19.70% 132,421 21.25% 133,372 NA NA3 Year 360,000 23% 503,289 24.70% 515,112 NA NA5 Year 600,000 17.65% 932,055 18.93% 961,699 NA NASince Inception 2,250,000 13.00% 8,783,625 14.83% 10,805,911 NA NAInception date: 25-Feb-03 First Installment date: 01-Apr-03 Managing since: 01-Apr-16
Tata IndiaConsumer Fund
Nifty IndiaConsumption TRI* Nifty 50 TRI#
Period Amt. Invested Return % Rs. Return % Rs. Return % Rs.1 Year 120,000 27.74% 137,315 21.65% 133,619 21.71% 133,6583 Year 360,000 24.87% 516,321 21.55% 493,277 25.13% 518,1535 Year 600,000 17.48% 928,241 15.38% 881,617 18.54% 952,649Since Inception 720,000 17.91% 1,237,632 14.89% 1,130,250 17.64% 1,227,666Inception date: 28-Dec-15 First Installment date: 01-Jan-16 Managing since: 01-Apr-16
Tata Flexi Cap Fund Nifty 500 TRI* S&P BSE Sensex TRI#
Period Amt. Invested Return % Rs. Return % Rs. Return % Rs.1 Year 120,000 24.87% 135,581 26.19% 136,377 21.25% 133,3723 Year 360,000 24.11% 510,982 28.18% 540,076 24.70% 515,1125 Year NA NA NA NA NA NA NASince Inception 390,000 22.91% 560,310 26.57% 591,698 23.56% 565,773Inception date: 06-Sep-18 First Installment date: 01-Oct-18 Managing since: 17-Aug-18
Tata Index Fund- Nifty Plan Nifty 50 TRI*
Period Amt. Invested Return % Rs. Return % Rs. Return % Rs.1 Year 120,000 20.84% 133,124 21.71% 133,658 NA NA3 Year 360,000 24.01% 510,328 25.13% 518,153 NA NA5 Year 600,000 17.61% 931,091 18.54% 952,649 NA NASince Inception 2,250,000 13.22% 9,003,928 14.46% 10,364,539 NA NAInception date: 25-Feb-03 First Installment date: 01-Apr-03 Managing since: 01-Apr-16
Tata Retirement Savings Fund - Moderate Plan
Crisil Hybrid 25+75 - Aggressive Index*
S&P BSE Sensex TRI#
Period Amt. Invested Return % Rs. Return % Rs. Return % Rs.1 Year 120,000 19.15% 132,085 18.77% 131,851 21.25% 133,3723 Year 360,000 20.07% 483,222 22.42% 499,227 24.70% 515,1125 Year 600,000 14.48% 862,324 16.78% 912,339 18.93% 961,699Since Inception 1,210,000 15.26% 2,709,784 14.48% 2,597,885 15.42% 2,732,811Inception date: 01-Nov-11 First Installment date: 01-Dec-11 Managing since: 01-Apr-16
Tata Nifty Private Bank Exchange Traded Fund
Nifty Private Bank TRI*
Nifty 50 TRI#
Period Amt. Invested Return % Rs. Return % Rs. Return % Rs.
1 Year 120,000 -3.28% 117,863 -3.65% 117,618 21.71% 133,658
3 Year NA NA NA NA NA NA NA
5 Year NA NA NA NA NA NA NA
Since Inception 270,000 14.84% 318,535 14.67% 317,958 30.97% 375,429
Inception date: 30-Aug-19 First Installment date: 01-Oct-19 Managing since: 16-Aug-19

SCHEME PERFORMANCE
www.tatamutualfund.com TATA MUTUAL FUND 68Note: * Benchmark;# Additional benchmark; Amount in rupees denotes Value of Standard Investment of Rs. 10,000. Refer to page number 68 for disclaimer on scheme performance.
SIP Performance of schemes managed by Sonam Udasi
Tata Retirement Savings Fund - Conservative Plan
CRISIL Short Term Debt Hybrid 75+25 Fund Index*
CRISIL 10 Year Gilt Index#
Period Amt. Invested Return % Rs. Return % Rs. Return % Rs.1 Year 120,000 7.58% 124,854 9.39% 125,993 1.57% 121,0133 Year 360,000 9.77% 416,939 12.20% 431,986 4.77% 387,1265 Year 600,000 8.38% 741,116 10.79% 787,034 5.92% 696,829Since Inception 1,210,000 9.10% 1,945,467 10.34% 2,077,939 6.81% 1,722,619Inception date: 01-Nov-11 First Installment date: 01-Dec-11 Managing since: 01-Apr-16
Tata Retirement Savings Fund - Progressive Plan
Nifty 500 TRI* S&P BSE Sensex TRI#
Period Amt. Invested Return % Rs. Return % Rs. Return % Rs.1 Year 120,000 21.07% 133,261 26.19% 136,377 21.25% 133,3723 Year 360,000 22.21% 497,816 28.18% 540,076 24.70% 515,1125 Year 600,000 15.89% 892,808 19.31% 970,498 18.93% 961,699Since Inception 1,210,000 15.85% 2,798,633 16.07% 2,832,074 15.42% 2,732,811Inception date: 01-Nov-11 First Installment date: 01-Dec-11 Managing since: 01-Apr-16
Tata Balanced Advantage Fund
CRISIL Hybrid 50+50 - Moderate Index*
S&P BSE Sensex TRI#
Period Amt. Invested Return % Rs. Return % Rs. Return % Rs.
1 Year 120,000 13.11% 128,344 13.92% 128,844 21.25% 133,372
3 Year NA NA NA NA NA NA NA
5 Year NA NA NA NA NA NA NA
Since Inception 350,000 16.68% 444,830 17.69% 451,015 25.12% 498,500
Inception date: 28-Jan-19 First Installment date: 01-Feb-19 Managing since: 09-Jan-19
Tata Focused Equity Fund
Nifty 500 TRI*S&P BSE Sensex
TRI#
Period Amt. Invested Return % Rs. Return % Rs. Return % Rs.
1 Year 120,000 25.30% 135,843 26.19% 136,377 21.25% 133,372
3 Year NA NA NA NA NA NA NA
5 Year NA NA NA NA NA NA NA
Since Inception 240,000 36.90% 338,199 38.55% 342,872 32.91% 326,985
Inception date: 05-Dec-19 First Installment date: 01-Jan-20 Managing since: 09-Mar-21
SIP Performance of schemes managed by Rahul Singh
Tata Multi Asset Opportunities Fund
65% S&P BSE 200 TRI + 15% CRISIL Short Term Bond Fund Index + 20% iCOMDEX
Composite Index*
S&P BSE Sensex TRI#
Period Amt. Invested Return % Rs. Return % Rs. Return % Rs.
1 Year 120,000 18.35% 131,590 57.07% 154,455 21.25% 133,372
3 Year NA NA NA NA NA NA NA
5 Year NA NA NA NA NA NA NA
Since Inception 210,000 27.88% 265,030 52.08% 315,133 36.21% 282,026
Inception date: 04-Mar-20 First Installment date: 01-Apr-20 Managing since: 12-Mar-20
SIP Performance of schemes managed by Abhishek Sonthalia
Tata Liquid Fund Crisil Liquid Fund Index*
CRISIL 1 Year T-Bill Index#
Period Amt. Invested Return % Rs. Return % Rs. Return % Rs.
1 Year 120,000 3.30% 122,129 3.62% 122,337 3.38% 122,185
3 Year 360,000 3.87% 381,932 4.24% 384,037 4.59% 386,114
5 Year 600,000 4.85% 678,367 5.15% 683,568 5.47% 689,121
Since Inception 2,070,000 7.00% 3,937,982 6.85% 3,882,365 7.00% 3,682,205
Inception date: 01-Sep-04 First Installment date: 01-Oct-04 Managing since: 06-Feb-20
Tata Medium Term Fund
Crisil Medium Term Debt Index*
CRISIL 10 Year Gilt Index#
Period Amt. Invested Return % Rs. Return % Rs. Return % Rs.
1 Year 120,000 5.47% 123,514 5.38% 123,454 1.57% 121,013
3 Year 360,000 5.43% 390,956 8.12% 406,917 4.77% 387,126
5 Year 600,000 3.68% 658,547 8.34% 740,393 5.92% 696,829
Since Inception 2,280,000 5.70% 4,053,190 8.82% 4,700,661 6.47% 4,396,284
Inception date: 11-Nov-02 First Installment date: 01-Jan-03 Managing since: 06-Feb-20
Tata Medium Term Fund (Segregated
Portfolio 1)
CRISIL Medium Term Debt Index*
CRISIL 10 Year Gilt Index#
Period Amt. Invested Return % Rs. Return % Rs. Return % Rs.
1 Year 120,000 331.93% 288,135 5.38% 123,454 1.57% 121,013
3 Year NA NA NA NA NA NA NA
5 Year NA NA NA NA NA NA NA
Since Inception 300,000 79.64% 697,332 7.49% 329,752 3.69% 314,454
Inception date: 15-Jun-19 First Installment date: 01-Jul-19 Managing since: 06-Feb-20
Tata Short Term Bond Fund
Crisil Short Term Bond Fund Index*
CRISIL 10 Year Gilt Index#
Period Amt. Invested Return % Rs. Return % Rs. Return % Rs.
1 Year 120,000 2.96% 121,909 4.78% 123,071 1.57% 121,013
3 Year 360,000 5.60% 391,965 6.89% 399,600 4.77% 387,126
5 Year 600,000 5.42% 688,164 7.43% 723,612 5.92% 696,829
Since Inception 2,320,000 7.17% 4,893,242 7.77% 5,226,537 6.46% 4,526,039
Inception date: 08-Aug-02 First Installment date: 01-Sep-02 Managing since: 06-Feb-20
Tata Treasury Advantage Fund
Crisil Low Duration Debt Index*
CRISIL 1 Year T-Bill Index#
Period Amt. Invested Return % Rs. Return % Rs. Return % Rs.
1 Year 120,000 3.71% 122,391 4.27% 122,749 3.38% 122,176
3 Year 360,000 4.69% 386,666 5.72% 392,670 4.59% 386,066
5 Year 600,000 4.99% 680,741 6.53% 707,489 5.47% 689,008
Since Inception 1,950,000 7.06% 3,581,323 7.58% 3,755,838 6.33% 3,354,499
Inception date: 06-Sep-05 First Installment date: 01-Oct-05 Managing since: 06-Feb-20
Tata Treasury Advantage Fund (Segregated
Portfolio 1)
CRISIL Low Duration Debt Index*
CRISIL 1 Year T-Bill Index#
Period Amt. Invested Return % Rs. Return % Rs. Return % Rs.
1 Year 120,000 266.42% 258,932 4.27% 122,749 3.38% 122,176
3 Year NA NA NA NA NA NA NA
5 Year NA NA NA NA NA NA NA
Since Inception 300,000 69.51% 636,586 5.33% 321,016 4.21% 316,540
Inception date: 15-Jun-19 First Installment date: 01-Jul-19 Managing since: 06-Feb-20

SCHEME PERFORMANCE
www.tatamutualfund.com TATA MUTUAL FUND 69Note: * Benchmark;# Additional benchmark; Amount in rupees denotes Value of Standard Investment of Rs. 10,000. Refer to page number 68 for disclaimer on scheme performance.
SIP Performance of schemes managed by Venkat Samala
Tata Digital India Fund
NIFTY IT TRI*S&P BSE Sensex
TRI#
Period Amt. Invested Return % Rs. Return % Rs. Return % Rs.1 Year 120,000 79% 166,682 72.95% 163,354 21.25% 133,372
3 Year 360,000 60.20% 807,741 56.35% 771,693 24.70% 515,112
5 Year 600,000 42.63% 1,681,432 40.93% 1,617,631 18.93% 961,699
Since Inception 720,000 37.17% 2,178,115 35.86% 2,097,622 18.09% 1,243,986
Inception date: 28-Dec-15 First Installment date: 01-Jan-16 Managing since: 26-Nov-20
Tata Large Cap Fund Nifty 100 TRI*
Period Amt. Invested Return % Rs. Return % Rs. Return % Rs.1 Year 120,000 24.47% 135,339 22.35% 134,046 NA NA
3 Year 360,000 24.93% 516,733 25.26% 519,132 NA NA
5 Year 600,000 16.95% 916,203 18.27% 946,195 NA NA
Since Inception 2,830,000 17.78% 34,341,652 15.09% 11,563,494 NA NA
Inception date: 07-May-98 First Installment date: 01-Jun-98 Managing since: 26-Nov-20
Tata Focused Equity Fund
Nifty 500 TRI*S&P BSE Sensex
TRI#
Period Amt. Invested Return % Rs. Return % Rs. Return % Rs.1 Year 120,000 25.30% 135,843 26.19% 136,377 21.25% 133,372
3 Year NA NA NA NA NA NA NA
5 Year NA NA NA NA NA NA NA
Since Inception 240,000 36.90% 338,199 38.55% 342,872 32.91% 326,985
Inception date: 05-Dec-19 First Installment date: 01-Jan-20 Managing since: 26-Nov-20
SIP Performance of schemes managed by Aurobinda Prasad Gayan
Tata Multi Asset Opportunities Fund
65% S&P BSE 200 TRI + 15% CRISIL Short Term Bond Fund Index + 20% iCOMDEX
Composite Index*
S&P BSE Sensex TRI#
Period Amt. Invested Return % Rs. Return % Rs. Return % Rs.
1 Year 120,000 18.35% 131,590 57.07% 154,455 21.25% 133,372
3 Year NA NA NA NA NA NA NA
5 Year NA NA NA NA NA NA NA
Since Inception 210,000 27.88% 265,030 52.08% 315,133 36.21% 282,026
Inception date: 04-Mar-20 First Installment date: 01-Apr-20 Managing since: 12-Mar-20
SIP Performance of schemes managed by Tejas Gutka
Tata India Tax Savings Fund Nifty 500 TRI*
Period Amt. Invested Return % Rs. Return % Rs. Return % Rs.
1 Year 120,000 25.12% 135,730 26.19% 136,377 NA NA
3 Year 360,000 24.78% 515,729 28.18% 540,076 NA NA
5 Year 600,000 17.10% 919,518 19.31% 970,498 NA NA
Since Inception 2,980,000 18.70% 49,236,485 15.83% 30,841,983 NA NA
Inception date: 31-Mar-96 First Installment date: 01-Jul-96 Managing since: 09-Mar-21
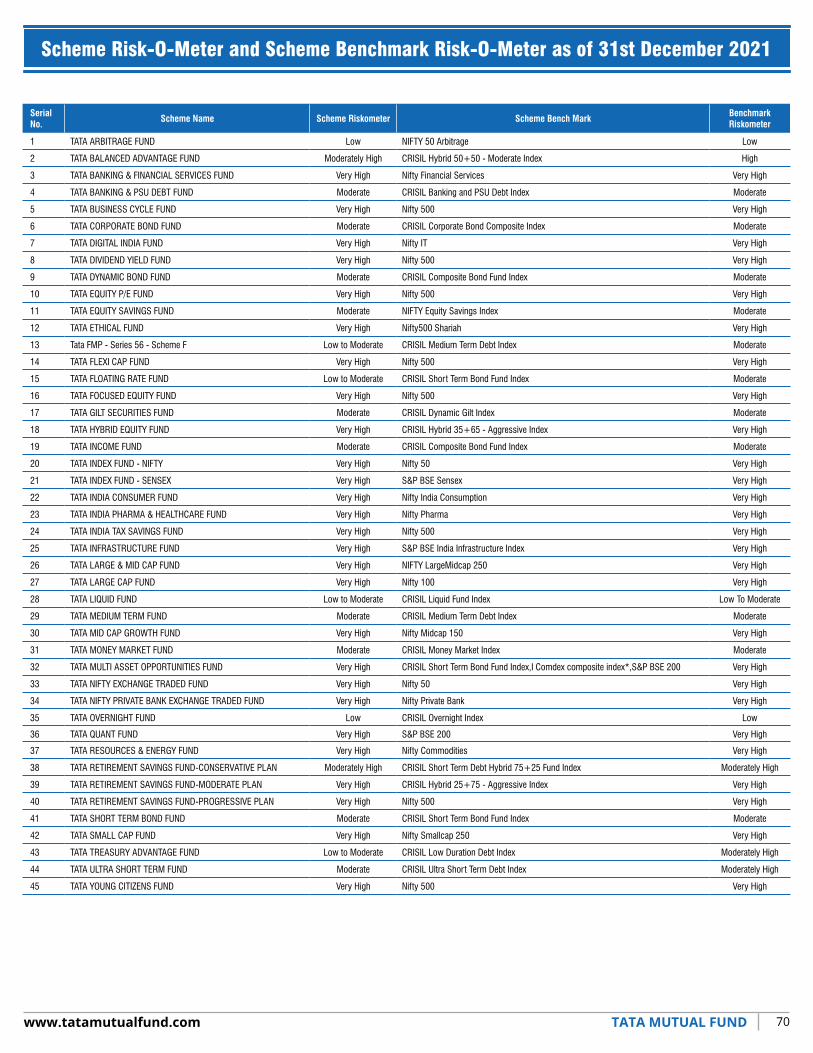
Scheme Risk-O-Meter and Scheme Benchmark Risk-O-Meter as of 31st December 2021
www.tatamutualfund.com TATA MUTUAL FUND 70
Serial No.
Scheme Name Scheme Riskometer Scheme Bench MarkBenchmark Riskometer
1 TATA ARBITRAGE FUND Low NIFTY 50 Arbitrage Low
2 TATA BALANCED ADVANTAGE FUND Moderately High CRISIL Hybrid 50+50 - Moderate Index High
3 TATA BANKING & FINANCIAL SERVICES FUND Very High Nifty Financial Services Very High
4 TATA BANKING & PSU DEBT FUND Moderate CRISIL Banking and PSU Debt Index Moderate
5 TATA BUSINESS CYCLE FUND Very High Nifty 500 Very High
6 TATA CORPORATE BOND FUND Moderate CRISIL Corporate Bond Composite Index Moderate
7 TATA DIGITAL INDIA FUND Very High Nifty IT Very High
8 TATA DIVIDEND YIELD FUND Very High Nifty 500 Very High
9 TATA DYNAMIC BOND FUND Moderate CRISIL Composite Bond Fund Index Moderate
10 TATA EQUITY P/E FUND Very High Nifty 500 Very High
11 TATA EQUITY SAVINGS FUND Moderate NIFTY Equity Savings Index Moderate
12 TATA ETHICAL FUND Very High Nifty500 Shariah Very High
13 Tata FMP - Series 56 - Scheme F Low to Moderate CRISIL Medium Term Debt Index Moderate
14 TATA FLEXI CAP FUND Very High Nifty 500 Very High
15 TATA FLOATING RATE FUND Low to Moderate CRISIL Short Term Bond Fund Index Moderate
16 TATA FOCUSED EQUITY FUND Very High Nifty 500 Very High
17 TATA GILT SECURITIES FUND Moderate CRISIL Dynamic Gilt Index Moderate
18 TATA HYBRID EQUITY FUND Very High CRISIL Hybrid 35+65 - Aggressive Index Very High
19 TATA INCOME FUND Moderate CRISIL Composite Bond Fund Index Moderate
20 TATA INDEX FUND - NIFTY Very High Nifty 50 Very High
21 TATA INDEX FUND - SENSEX Very High S&P BSE Sensex Very High
22 TATA INDIA CONSUMER FUND Very High Nifty India Consumption Very High
23 TATA INDIA PHARMA & HEALTHCARE FUND Very High Nifty Pharma Very High
24 TATA INDIA TAX SAVINGS FUND Very High Nifty 500 Very High
25 TATA INFRASTRUCTURE FUND Very High S&P BSE India Infrastructure Index Very High
26 TATA LARGE & MID CAP FUND Very High NIFTY LargeMidcap 250 Very High
27 TATA LARGE CAP FUND Very High Nifty 100 Very High
28 TATA LIQUID FUND Low to Moderate CRISIL Liquid Fund Index Low To Moderate
29 TATA MEDIUM TERM FUND Moderate CRISIL Medium Term Debt Index Moderate
30 TATA MID CAP GROWTH FUND Very High Nifty Midcap 150 Very High
31 TATA MONEY MARKET FUND Moderate CRISIL Money Market Index Moderate
32 TATA MULTI ASSET OPPORTUNITIES FUND Very High CRISIL Short Term Bond Fund Index,I Comdex composite index*,S&P BSE 200 Very High
33 TATA NIFTY EXCHANGE TRADED FUND Very High Nifty 50 Very High
34 TATA NIFTY PRIVATE BANK EXCHANGE TRADED FUND Very High Nifty Private Bank Very High
35 TATA OVERNIGHT FUND Low CRISIL Overnight Index Low
36 TATA QUANT FUND Very High S&P BSE 200 Very High
37 TATA RESOURCES & ENERGY FUND Very High Nifty Commodities Very High
38 TATA RETIREMENT SAVINGS FUND-CONSERVATIVE PLAN Moderately High CRISIL Short Term Debt Hybrid 75+25 Fund Index Moderately High
39 TATA RETIREMENT SAVINGS FUND-MODERATE PLAN Very High CRISIL Hybrid 25+75 - Aggressive Index Very High
40 TATA RETIREMENT SAVINGS FUND-PROGRESSIVE PLAN Very High Nifty 500 Very High
41 TATA SHORT TERM BOND FUND Moderate CRISIL Short Term Bond Fund Index Moderate
42 TATA SMALL CAP FUND Very High Nifty Smallcap 250 Very High
43 TATA TREASURY ADVANTAGE FUND Low to Moderate CRISIL Low Duration Debt Index Moderately High
44 TATA ULTRA SHORT TERM FUND Moderate CRISIL Ultra Short Term Debt Index Moderately High
45 TATA YOUNG CITIZENS FUND Very High Nifty 500 Very High

71www.tatamutualfund.com TATA MUTUAL FUND
SCHEME PERFORMANCE
Scheme NameScheme Name Index Name Since Inception
Tata Large & Mid Cap Fund - Reg - Growth S&P BSE Sensex TRIAs TRI data is not available since Since Inception of the scheme, benchmark performance is calculated using composite CAGR of S&P BSE Sensex PRI values from date 25-Feb-1993 to date 19-Aug-1996 and TRI values since date 19-Aug-1996
Tata Hybrid Equity Fund - Reg - Growth S&P BSE Sensex TRIAs TRI data is not available since Since Inception of the scheme, benchmark performance is calculated using composite CAGR of S&P BSE Sensex PRI values from date 06-Oct-1995 to date 19-Aug-1996 and TRI values since date 19-Aug-1996
Tata Ethical Fund - Reg - Growth Nifty 50 TRIAs TRI data is not available since Since Inception of the scheme, benchmark performance is calculated using composite CAGR of Nifty 50 PRI values from date 24-May-1996 to date 30-Jun-1999 and TRI values since date 30-Jun-1999
Tata Mid Cap Growth Fund - Reg - IDCW Nifty 50 TRIAs TRI data is not available since Since Inception of the scheme, benchmark performance is calculated using composite CAGR of Nifty 50 PRI values from date 01-Jul-1994 to date 30-Jun-1999 and TRI values since date 30-Jun-1999
• The Std. Dev., Sharpe Ratio, Jensen’s Alpha, Treynor, Portfolio Beta & R-squared are based on one month return calculated using last 3 years data.•
Price/Earning Ratio, Price/Book Value Ratio, are based on the historical earnings and accounting numbers, and have been computed only for the invested portion of the portfolio.
• Portfolio turnover has been computed as the ratio of the lower value of average purchase and average sales to the average net assets in the past one year (For schemes that have not completed one year, since
inception is considered)• Cash & Cash Equivalents includes CBLO, REPO, Fixed Deposits and Cash & Bank Balance.
Past performance may or may not be sustained in future.• After payment of IDCW the NAV will fall to the extent of IDCW payout and statutory levy, if any. (Unit face value - ` 10/-).• Pursuant to allotment of bonus units, the NAV of the scheme would fall in proportion to the bonus units allotted & as a result the total value of units held by investor would remain the same.
$-ICRA’s mutual fund rating methodology is based on evaluating the inherent credit quality of the fund’s portfolio. As a measure of the credit quality of a debt fund’s assets. ICRA uses the concept of ‘credit scores’. These scores are based on ICRA’s estimates of credit risk associated with each exposure of the portfolio taking into account its maturity. To quantify the credit risk scores, ICRA uses its database of historical default rates for various rating categories for various maturity buckets. The credit risk ratings incorporate ICRA’s assessment of a debt fund’s published investment objectives and policies, its management characteristics, and the creditworthiness of its investment portfolio. ICRA reviews relevant fund information on an ongoing basis to support its published rating opinions. If the portfolio credit score meets the benchmark of the assigned rating during the review, the rating is retained. In an event that the benchmark credit score is breached, ICRA gives a month’s time to the debt fund manager to bring the portfolio credit score within the benchmark credit score. If the debt fund manager is able to reduce the portfolio credit score within the benchmark credit score, the rating is retained. If the portfoliostill continues to breach the benchmark credit score, the rating is revised to reflect the change in credit quality.
Disclaimer:
1) Scheme returns in terms of CAGR are provided for past 1 year, 3 years, 5 years and since inception.
2) Point-to-point returns on a standard investment of Rs. 10,000/- are in addition to CAGR for the schemes.
3) Different plans shall have a different expense structure. The performance details provided herein are of regular plan growth option except for Tata India Tax Savings Fund , TATA Mid Cap Growth Fund & TATA Equity Savings Fund where performance details given is for regular plan IDCW option.
4) NA stands for schemes in existence for more than 1 year but less than 3 years or 5 years, or instances where benchmark data for corresponding period not available. 5) Period for which schemes performance has been provided is computed basis last day of the month - ended preceding the date of advertisement. 6) Past performance may or may not be sustained in future. For computation of since inception returns the allotment NAV has been taken as Rs. 10.00 (Except for Tata Liquid Fund, Tata Treasury Advantage Fund, Tata Corporate Bond Fund & Tata Money Market Fund where NAV is taken as Rs. 1,000). *All payouts during the period have been reinvested in the units of the scheme at the then prevailing NAV. Load is not considered for computation of returns. While calculating returns IDCW distribution tax is excluded. Schemes in existence for less than 1 year, performance details for the same are not provided.
7) For Benchmark Indices Calculations , Total Return Index(TRI) has been used. Where ever TRI not available Composite CAGR has been disclosed .Please refer Disclaimer sheet for composite CAGR disclosure
8) ##The Scheme Returns are inclusive of the impact of Segregation of portfolio in the respective schemes.
9) Scheme in existence for more than six months but less than one year, simple annualized growth rate of the scheme for the past 6 months from the last day of month-end is provided.
10) In case of Overnight funds, Liquid funds and Money Market funds, the performance by way of simple annualisation of yields for 7 days, 15 days and 30 days is included.
11) a) Offshore Funds performance may differ from performance of other domestic funds managed by the Fund Manager. The Offshore Fund strategies are independent of the Domestic Funds managed by the same Fund Manager
b) The difference in returns of domestic Funds and the Offshore Funds can be attributed to several factors including impact of Currency exchange rate fluctuations, Fund flows and timing of portfolio investments. Foreign Portfolio Investment Schemes are also subject to Company and Sector level limits imposed by RBI & SEBI which can be different from domestic funds leading to difference in portfolio of similar strategy in domestic fund and FPI Funds.
12) Please refer the Addendums which are available on our web site for changes in Schemes Benchmarks which are effective 1st December 2021
NA - data are not available for the period

72
INCOME DISTRIBUTION CUM CAPITAL WITHDRAWAL OPTIONS/PLANS / BONUS HISTORY
Past performance may or may not be sustained in future.• After payment of IDCW the NAV will fall to the extent of IDCW payout and statutory levy, if any. (Unit face value - ` 10/-).• Pursuant to allotment of bonus units, the NAV of the scheme would fall in proportion to the bonus units allotted & as a result the total value of units held by investor would remain the same.
Tata Equity P/E Fund
(Before 30th September 2009)
Date of Declaration of IDCW IDCW p.u. (`) on Face Value of ` 10
Reg. Reg. NAV Direct Direct NAV
23-09-2004 0.50 11.444925-03-2008 0.50 31.1969
(After Split under IDCW Option w.e.f. 1st Oct. 2009 - IDCW Trigger Option A (5%))
26-11-2009 1.80 39.853515-01-2010 1.50 41.214827-08-2010 1.50 41.042603-09-2010 1.00 40.427611-10-2010 1.75 43.092510-01-2011 1.75 38.162713-04-2011 1.50 36.978911-07-2011 1.50 34.372408-11-2011 1.25 30.713620-01-2012 1.00 27.937316-04-2012 1.00 29.145211-07-2012 1.00 27.399812-10-2012 0.40 28.660411-01-2013 0.50 29.9969 0.50 30.001428-05-2013 0.50 27.0385 0.50 27.093230-09-2013 0.25 24.9834 0.25 25.100224-10-2013 0.32 26.5125 0.32 26.649110-01-2014 0.35 27.7315 0.35 27.922509-04-201411-07-201416-10-201412-01-201517-04-201511-07-201617-08-201614-10-201603-11-201608-02-201715-02-201713-04-201721-07-201717-10-201718-01-201826-11-202015-12-202013-01-202119-01-202104-06-202111-10-2021
0.350.400.500.500.600.60
2.42
1.101.201.201.251.35
0.85
0.900.951.05
31.135238.298040.464946.116247.364448.8502
53.5858
53.202357.424959.321562.445163.2670
66.7471
69.776774.414584.2998
0.350.400.500.500.600.602.50
1.051.06
1.201.201.251.350.85
0.90
0.951.05
31.405538.298040.983446.790048.153250.043252.7728
52.130954.3130
57.940360.002263.316364.321467.5555
74.9502
79.119990.1235
(After Split under IDCW Option w.e.f. 1st Oct. 2009 - IDCW Trigger Option B (10%))
15-01-2010 3.00 43.170327-08-2010 1.50 41.502311-10-2010 3.50 44.682513-04-2011 3.00 38.589802-02-2012 2.25 32.122316-04-2012 2.00 30.79530-08-2012 1.00 28.129412-10-2012 0.80 29.361928-01-2013 0.80 30.1694 0.80 30.177309-04-2014 0.75 32.8529 0.75 33.122329-05-201411-07-201420-10-201412-01-201501-08-201613-02-201701-05-201707-11-201723-11-202015-12-202019-01-202123-02-202128-07-202116-08-202111-10-202122-10-2021
0.800.950.951.004.753.051.101.20
1.60
1.75
1.85
2.05
37.361139.090441.109146.607151.190451.8642
54.5858*58.7785
64.0826
67.1435
74.153
79.5334
0.800.950.951.004.603.051.101.201.65
1.85
1.95
2.15
37.709939.496941.641045.917652.371453.5812
56.6123*61.310666.8493
72.1207
77.8774
86.7554
Date of Declaration of IDCW IDCW p.u. (`) on Face Value of ` 10
Reg. Reg. NAV Direct Direct NAV
27-04-2005 1.50 16.762617-01-2006 1.00 21.908501-06-2007 3.00 31.581617-04-2009 2.00 22.965609-07-2010 2.00 38.293602-03-2012 2.50 35.784922-02-2013 3.00 37.1119 3.00 37.134227-01-201419-01-201518-03-201617-02-201716-02-2018
2.004.003.353.704.00
36.771449.591142.665046.086349.3188
2.004.002.154.004.00
37.029650.292144.139649.953654.3209
02-12-2004 2.00 17.362025-03-2004 1.50 15.173807-01-2004 2.00 17.763303-12-2003 1.50 17.510230-09-2003 2.50 16.1903
www.tatamutualfund.com TATA MUTUAL FUND
Tata Large Cap Fund
15-06-1999 1.60 14.393130-12-1999 10.00 24.81319-07-2000 2.00 14.2437
*as on 28 April, 2017
Tata India Tax Savings Fund
Date of Declaration of IDCW IDCW p.u. (`) on Face Value of ` 10
Reg. Reg. NAV Direct Direct NAV
15-06-1999 2.00 16.89114-01-2000 2.00 41.49210-12-2003 1.00 23.97720-10-2005 10.10 40.192314-12-2007 3.00 63.722804-09-2009 3.00 44.4002
22-01-2010 5.00 46.98123-12-2011 2.00 41.071108-02-2012 1.50 43.244503-12-2012 1.50 47.443923-12-201319-12-201406-02-201526-02-201617-03-201721-03-201825-03-201925-03-202015-04-2021
2.002.752.859.009.00
10.0010.003.705.15
48.718168.675070.707361.835172.385873.961267.097543.297567.6559
2.00
2.009.007.501.00
5.15
48.9612
69.009692.820099.055097.3232
128.0000Bonus History
Bonus Units in March’ 2000 01:01
Bonus HistoryBonus Units in March’ 2000 01:02
Tata Ethical Fund
Date of Declaration of IDCW IDCW p.u. (`) on Face Value of ` 10
Reg. Reg. NAV Direct Direct NAV
09-08-1999 1.00 13.398507-03-2000 2.50 29.709323-01-2004 1.50 16.660217-11-2006 2.50 41.843220-07-2007 2.00 49.394121-09-2007 4.00 49.7288
31-07-2009 2.00 36.70722-10-2010 5.00 50.587326-04-2012 2.00 40.100607-12-2012 1.00 44.87721-03-201405-12-201430-12-201529-12-201725-01-2019
3.005.504.756.355.50
52.613668.559166.838280.254767.4621
104.154993.4907
3.005.50

05-11-201304-12-201306-01-2014
0.2300 46.0275 0.2300 46.30880.2000 45.7847 0.2000 46.08230.2500 47.1149 0.2500 47.5278
05-02-201405-03-201403-04-201405-05-201404-06-201403-07-201405-08-201403-09-201430-09-201403-11-201403-12-201405-01-201504-02-201503-03-201501-04-201505-05-201503-06-201503-07-201505-08-201503-09-201501-10-201503-11-201509-12-2015
0.2000 45.4166 0.2000 45.84040.2000 47.378 0.2000 47.84590.2500 49.2444 0.2500 49.74250.2500 49.7024 0.2500 50.23740.30000.30000.30000.35000.30000.30000.30000.30000.30000.47000.48000.46000.46000.45000.46000.46000.44000.45000.4300
55.811359.410558.793761.484561.792863.573566.869867.005869.815972.646071.505768.995167.639069.175770.708966.604567.102166.687764.1480
0.30000.30000.30000.35000.30000.30000.30000.30000.30000.47000.48000.46000.46000.45000.46000.46000.44000.45000.4300
56.436760.118459.535762.284862.625464.460467.829468.001370.884873.783072.661570.144068.792870.401371.993667.840068.360467.969665.4071
04-01-201603-02-201601-03-2016
0.41000.39000.3900
65.562461.775759.3893
0.41000.39000.3900
66.867363.027560.6055
04-04-201603-05-201602-06-201604-07-201604-08-201601-09-201607-10-201603-11-201609-12-201606-01-201707-02-201710-03-201717-04-201705-05-201702-06-201707-07-201704-08-201708-09-201706-10-201703-11-201730-11-201710-01-201805-02-201805-03-201803-04-201804-05-201804-06-201804-07-201806-08-201804-09-201804-10-201801-11-201804-12-201803-01-201904-02-201905-03-201904-04-2019
0.41000.42000.42000.40000.42000.44000.49000.49000.46000.45000.47000.47000.46000.46000.46000.46000.47000.46000.45000.46000.46000.70000.72000.67000.64000.67000.65000.65000.65000.65000.62000.60000.60000.60000.60000.57000.4000
62.749562.858564.461465.910667.854468.940169.314367.365264.829164.102766.898565.941468.347168.718468.828668.795969.885668.745468.210769.924268.502370.542768.449666.099565.674666.053864.416463.474964.860464.412159.608959.077760.638359.577358.748358.211960.0092
0.41000.42000.42000.40000.42000.44000.49000.49000.46000.45000.47000.47000.46000.46000.46000.46000.47000.46000.45000.46000.46000.70000.72000.67000.64000.67000.65000.65000.65000.65000.62000.60000.60000.60000.60000.57000.4000
64.058164.192165.850967.355769.368370.526270.990069.059266.537565.853868.797867.883670.441870.873171.054471.117472.344471.287170.829172.710771.328673.597671.527169.192368.873069.395067.795166.919368.509768.152963.187962.734864.518663.502562.740062.281564.3178
03-10-2013 0.2500 44.5623 0.2500 44.8567
73
Past performance may or may not be sustained in future.• After payment of IDCW the NAV will fall to the extent of IDCW payout and statutory levy, if any. (Unit face value - ` 10/-).• Pursuant to allotment of bonus units, the NAV of the scheme would fall in proportion to the bonus units allotted & as a result the total value of units held by investor would remain the same.
www.tatamutualfund.com TATA MUTUAL FUND
IDCW Option
Date of Declaration of IDCW IDCW p.u. (`) on Face Value of ` 10
Reg. Reg. NAV Direct Direct NAV
15-02-2012 3.00 53.687705-03-2013 5.50 56.8898 5.50 56.934221-03-201413-02-201508-03-201610-02-201709-02-201815-03-201920-03-202022-04-2021
3.258.605.756.306.755.854.955.75
58.746187.081967.025079.102280.761674.856245.545675.4842
3.258.605.756.306.755.854.955.75
59.276788.317268.481981.316184.321179.789749.587483.3178
24-04-2009 1.00 32.522719-03-2010 3.00 50.937
13-07-2007 2.00 42.753307-12-2007 1.00 52.4219
Tata Hybrid Equity Fund
15-07-1999 1.25 12.902703-04-2000 2.50 20.006209-09-2003 1.25 19.008411-03-2004 1.50 22.669112-01-2005 3.00 24.755401-12-2006 4.00 40.5078
Tata Hybrid Equity Fund
Monthly IDCW Option
Date of Declaration of IDCW IDCW p.u. (`) on Face Value of ` 10
Reg. Reg. NAV Direct Direct NAV
Monthly IDCW Option
Date of Declaration of IDCW IDCW p.u. (`) on Face Value of ` 10
Reg. Reg. NAV Direct Direct NAV
13-09-2010 0.5173 53.163808-10-201012-11-201010-12-201014-01-201111-02-201111-03-201108-04-201113-05-201110-06-201108-07-201112-08-201109-09-201114-10-201111-11-201109-12-201113-01-201210-02-201209-03-201213-04-201211-05-201208-06-201213-07-201210-08-201214-09-201212-10-201209-11-201214-12-2012
0.5329 53.95290.5482 54.01930.5300 50.83910.5135 49.19850.4804 46.22260.4697 46.62440.4835 48.80050.4705 47.99530.4770 47.49980.4795 48.15930.8000 45.50270.8000 44.52550.2500 43.6410.3000 43.71910.3000 41.60130.3000 41.41990.3000 44.15510.3000 44.34620.3000 43.97820.3000 42.27650.3000 42.68310.3000 44.16810.3000 44.55140.3000 45.76620.3500 46.84670.3500 46.64360.3500 47.8167
13-08-2010 0.1000 51.3412
14-01-201308-02-201305-03-201303-04-201303-05-201305-06-2013
0.3500 48.4127 0.3500 48.44040.3500 46.4548 0.3500 46.49360.3500 45.3818 0.3500 45.43220.3500 44.7321 0.3500 44.73210.3500 45.7388 0.3500 45.83460.3500 46.1426 0.3500 46.2644
03-07-201305-08-201304-09-2013
0.3500 44.5114 0.3500 44.64940.3500 42.8851 0.3500 43.07350.2500 41.9112 0.2500 42.1607
03-05-201903-06-201904-07-201905-08-2019
0.40000.41000.41000.4000
60.262361.964861.099756.9666
0.40000.41000.41000.4000
64.669266.581065.738461.3766
INCOME DISTRIBUTION CUM CAPITAL WITHDRAWAL OPTIONS/PLANS / BONUS HISTORY
03-09-201903-10-201904-11-201904-12-2019
0.40000.40000.40000.4000
56.039657.432159.100959.4714
0.40000.40000.40000.4000
60.457962.045663.940464.4294

28-11-201321-11-2014
1.002.75
19.35834.7881
1.00 19.4794
74www.tatamutualfund.com TATA MUTUAL FUND
Past performance may or may not be sustained in future.• After payment of IDCW the NAV will fall to the extent of IDCW payout and statutory levy, if any. (Unit face value - ` 10/-).• Pursuant to allotment of bonus units, the NAV of the scheme would fall in proportion to the bonus units allotted & as a result the total value of units held by investor would remain the same.
Tata Infrastructure FundDate of Declaration of IDCW IDCW p.u. (`) on Face Value of ` 10
Reg. Reg. NAV Direct Direct NAV
07-07-2005 0.45 11.42310-11-2006 1.50 22.0409-03-2007 2.00 19.054614-09-2007 2.00 24.072611-03-2008 1.00 24.678725-09-2009 1.00 30.998423-03-201009-03-201511-03-201603-03-201723-02-2018
0.602.301.752.252.50
1.752.502.50
22.287129.967522.993727.294930.6214
25.263730.382134.2323
Tata Large & Mid Cap Fund (Data provided since 2005)
Date of Declaration of IDCW IDCW p.u. (`) on Face Value of ` 10
Reg. Reg. NAV Direct Direct NAV
11-05-2005 1.00 15.818329-11-2005 1.00 20.13520-03-2006 5.00 25.229912-04-2006 1.00 21.12905-05-2006 1.00 21.437529-06-2007 1.00 23.304930-11-2007 1.00 31.151726-06-2009 1.50 18.997426-03-2010 2.00 24.174722-06-2010 0.50 22.075730-09-2010 1.00 23.989931-12-2010 0.50 22.491
Tata Equity Savings Fund (Data provided since 2008)
Monthly IDCW Option
Date of Declaration of IDCW IDCW p.u. (`) on Face Value of ` 10
Reg. Reg. NAV Direct Direct NAV
16-01-2008 0.0468 12.195514-02-2008 0.0452 11.996217-03-2008 0.0499 11.87315-04-2008 0.0452 11.891115-05-2008 0.0468 11.919316-06-2008 0.0499 11.7853
15-01-2009 0.0595 12.028416-02-2009 0.0384 11.863816-03-2009 0.0336 11.92415-04-2009 0.0432 12.310114-05-2009 0.0418 12.278115-06-2009 0.0614 12.444616-07-2009 0.0447 12.438714-08-2009 0.0557 12.397415-09-2009 0.0614 12.415614-10-2009 0.0418 12.347816-11-2009 0.0475 12.426715-12-2009 0.0418 12.39615-01-2010 0.0447 12.487815-02-2010 0.0447 12.317115-03-2010 0.0403 12.280915-04-2010 0.0448 12.334914-05-2010 0.0419 12.326615-06-2010 0.0462 12.322915-07-2010 0.0505 12.334816-08-2010 0.0462 12.27215-09-2010 0.0433 12.332914-10-2010 0.0419 12.30515-11-2010 0.0400 12.309415-12-2010 0.0433 12.169717-01-2011 0.0400 12.133515-02-2011 0.0419 12.0581
14-11-2008 0.0230 11.399915-12-2008 0.0595 12.004
29-10-2008 0.0187 11.290114-10-2008 0.0348 11.4095
18-08-2008 0.0515 11.652315-09-2008 0.0336 11.6441
13-03-201815-06-2018
1.4000.9500
33.373831.5371
1.40000.9500
42.342540.5604
1.40 44.3907
12-02-201620-01-201715-12-2017
2.352.501.40
27.740031.497435.3947
23-03-2012 1.00 19.954507-03-201430-01-2015
1.202.75
24.058834.9030
1.202.75
24.206235.4231
Tata Mid Cap Growth FundDate of Declaration of IDCW IDCW p.u. (`) on Face Value of ` 10
Reg. Reg. NAV Direct Direct NAV
16-09-2004 0.80 13.921125-08-2006 2.00 24.546523-03-2007 10.00 26.73116-11-2007 2.00 25.276321-12-2007 3.00 23.546114-05-2010 2.00 18.4055
15-03-2012 0.042 12.181716-04-2012 0.0463 12.226315-05-2012 0.042 12.187915-06-2012 0.0449 12.243716-07-2012 0.0449 12.319216-08-2012 0.0449 12.39817-09-2012 0.0463 12.5021
15-12-2011 0.0434 11.970016-01-2012 0.0463 12.035615-02-2012 0.0434 12.2860
17-10-2011 0.0463 11.902415-11-2011 0.042 11.8737
15-09-2011 0.058 12.002316-08-2011 0.0463 12.0332
16-06-2011 0.0434 11.91315-07-2011 0.0434 12.0924
15-03-2011 0.0337 11.99615-04-2011 0.0598 12.102616-05-2011 0.0449 11.9725
Monthly IDCW Option
Date of Declaration of IDCW IDCW p.u. (`) on Face Value of ` 10
Reg. Reg. NAV Direct Direct NAV
03-01-202003-02-202003-03-202023-04-202006-05-202004-06-202003-07-202004-08-202003-09-202005-10-202003-11-202003-12-202005-01-202105-02-202103-03-202105-04-202104-05-202103-06-202106-07-202103-08-202103-09-202104-10-202102-11-202102-12-2021
0.40000.40000.40000.20000.20000.20000.21000.23000.23000.22000.23000.25000.26000.26000.28000.28000.28000.28000.30000.30000.30000.32000.32000.3100
59.028857.372555.422947.515846.817049.249551.553552.905553.975453.582854.522459.012962.127465.300067.055364.246963.606667.844668.416870.378273.761974.142675.025972.7021
0.40000.40000.40000.20000.20000.20000.21000.23000.23000.22000.23000.25000.26000.26000.28000.28000.28000.28000.30000.30000.30000.32000.32000.3100
64.037362.329360.294151.774351.049453.765856.347057.897459.142058.786759.888064.901668.416472.002074.019571.009670.383975.163775.917078.150182.007782.530783.613181.1215
INCOME DISTRIBUTION CUM CAPITAL WITHDRAWAL OPTIONS/PLANS / BONUS HISTORY
Tata Mid Cap Growth FundDate of Declaration of IDCW IDCW p.u. (`) on Face Value of ` 10
Reg. Reg. NAV Direct Direct NAV
30-12-201521-12-201718-01-2019
2.503.803.20
36.385449.187239.0353
0.253.803.20
40.450559.137148.0546

75www.tatamutualfund.com TATA MUTUAL FUND
Past performance may or may not be sustained in future.• After payment of IDCW the NAV will fall to the extent of IDCW payout and statutory levy, if any. (Unit face value - ` 10/-).• Pursuant to allotment of bonus units, the NAV of the scheme would fall in proportion to the bonus units allotted & as a result the total value of units held by investor would remain the same.
Monthly IDCW Option
Date of Declaration of IDCW IDCW p.u. (`) on Face Value of ` 10
Reg. Reg. NAV Direct Direct NAV
15-05-2014 0.0513 12.839112-06-201415-07-201412-08-201415-09-201416-10-201413-11-201414-01-201512-02-201512-03-201515-04-201514-05-201512-06-201515-07-201507-10-201603-11-201609-12-201606-01-201707-02-201710-03-201717-04-201705-05-201702-06-201707-07-201704-08-201708-09-201706-10-201703-11-201730-11-201710-01-201805-02-201805-03-201803-04-201804-05-201804-06-2018
0.04780.05630.04780.05810.05090.04460.04780.04620.04460.05410.04590.04590.05220.10000.10000.10000.10000.10000.10000.07500.07500.07500.08500.08500.08500.08500.08500.08500.08500.09000.09000.08200.08300.0830
13.141313.082713.060213.254813.292713.522613.842214.027114.042114.041313.844113.673013.825314.728014.611214.490814.430014.562114.471614.625914.647714.601814.600614.581414.553614.484714.435814.378014.409214.227314.118214.095614.096413.9992
0.04780.05630.04780.05810.05090.04460.04780.04620.04460.05410.04590.04590.05220.10000.10000.10000.10000.10000.1000
0.07500.08500.08500.08500.0850
0.09000.08200.08300.0830
13.143013.094
13.079213.281313.330413.570413.905814.101414.126114.122213.934313.767313.928115.032314.932014.827814.780214.932114.8550
15.180615.196015.193515.183915.1268
15.168915.167915.189015.1041
12-03-2014 0.0461 12.669415-04-2014 0.0581 12.6933
13-02-2014 0.0496 12.551115-01-2014 0.0513 12.7377
14-02-2013 0.0580 12.856914-03-2013 0.0541 12.821115-04-2013 0.0523 12.801315-05-2013 0.0576 13.169514-06-2013 0.0513 13.057115-07-2013 0.0529 12.969416-08-2013 0.0546 12.406616-09-2013 0.0529 12.564115-10-2013 0.0496 12.7097
Quarterly IDCW Option
Date of Declaration of IDCW
Reg. Reg. NAV Direct Direct NAV
16-12-201617-03-201715-06-2017
0.30000.30000.2200
14.663014.776314.8165
0.30000.30000.2200
15.405815.574115.6701
IDCW p.u. (`) on Face Value of ` 10
Monthly IDCW Option
Date of Declaration of IDCW IDCW p.u. (`) on Face Value of ` 10
Reg. Reg. NAV Direct Direct NAV
23-04-202006-05-202004-06-202003-07-202004-08-202003-09-202005-10-202003-11-202003-12-202005-01-202105-02-202103-03-202105-04-202104-05-202103-06-202106-07-202103-08-202103-09-202104-10-202102-11-202102-12-2021
0.04000.04200.04200.04300.04500.04500.04500.04500.04700.04800.04800.04900.04900.04900.04900.04900.05000.05000.05200.05200.0520
0.04500.04500.04500.04500.04700.04800.04800.04900.04900.04900.04900.04900.05000.05000.05200.05200.0520
12.568012.499412.791013.012013.226013.438813.363313.546513.949714.335414.609014.712014.482714.368914.712214.706814.908615.197015.215415.363415.2033
15.046215.302915.238115.466915.950216.415416.752616.891916.652916.542816.960916.985917.234217.592117.638917.834817.6758
Tata Young Citizens’ FundBonus History
Bonus Units in March’ 1999 01:03Bonus Units in March’ 2000 01:02Bonus Units in Nov’ 2003 01:04Bonus Units in Nov’ 2007 01:02Bonus Units in Nov’ 2010 01:03Bonus Units in Nov’ 2011 01:05
Tata Banking & Financial Services FundDate of Declaration of IDCW IDCW p.u. (`) on Face Value of ` 10
Reg. Reg. NAV Direct Direct NAV
19-01-2018 1.40 17.5941
Tata India Consumer FundDate of Declaration of IDCW IDCW p.u. (`) on Face Value of ` 10
Reg. Reg. NAV Direct Direct NAV
19-01-2018 1.45 18.0181
Tata Resources & Energy Fund
Date of Declaration of IDCW IDCW p.u. (`) on Face Value of ` 10Reg. Reg. NAV Direct Direct NAV
19-01-2018 1.30 16.0031
Tata Arbitrage FundDate of Declaration of IDCW IDCW p.u. (`) on Face Value of ` 10
Reg. Reg. NAV Direct Direct NAV
19-06-201922-07-201916-08-201919-09-201922-10-201920-11-201920-12-201921-01-202018-02-202020-03-2020
0.03000.03000.04000.04000.04000.04000.05000.04000.06000.1000
10.344810.372110.392710.402510.410310.416910.422410.411410.421010.4373
0.03000.03000.04000.04000.04000.04000.05000.04000.06000.1000
10.379110.414110.440410.458410.474310.487910.500510.497210.513410.5376
04-07-201806-08-201804-09-201804-10-201801-11-201804-12-201803-01-201904-02-201905-03-201904-04-201903-05-201903-06-201904-07-201905-08-201903-09-201903-10-201904-11-201904-12-201903-01-202003-02-202003-03-2020
0.08300.08300.08300.08000.08000.08000.08000.08000.08000.08000.08000.08100.08100.07000.07000.07000.07000.07000.07000.07000.0700
13.889714.091914.082313.437613.414313.624213.521913.531013.524513.759713.728313.931213.894313.462213.368113.484913.690813.712913.714313.575913.4117
0.08300.08300.08300.0800
0.08000.08000.08000.08000.08000.08000.08100.08100.07000.07000.07000.07000.07000.07000.07000.0700
15.004015.242015.249914.5698
14.892214.800414.829814.844615.123515.109715.355115.337114.882514.798414.948615.199015.245015.268015.135814.9729
INCOME DISTRIBUTION CUM CAPITAL WITHDRAWAL OPTIONS/PLANS / BONUS HISTORY
15-10-201215-11-201217-12-201215-01-2013
0.04050.04490.04630.0560
12.620412.620512.749312.9512

Annexure for All Potential Risk Class
www.tatamutualfund.com TATA MUTUAL FUND 76
As per SEBI Circular dated, June 07, 2021; the potential risk class (PRC) matrix based on interest rate risk and credit risk, is mentioned below :
SR No. Scheme Name Potential Risk Class
1 Tata Overnight Fund
2
Tata Liquid Fund
Tata Money Market Fund
Tata Ultra Short Term Fund
3
Tata Fixed Maturity Plan Series 56 Scheme F
Tata Treasury Advantage Fund(The scheme is having one segregated portfolio).
4
Tata Banking & PSU Debt Fund
Tata Corporate Bond Fund
Tata Dynamic Bond Fund
Tata Floating Rate Fund
Tata Income Fund
Tata Medium Term Fund (The scheme is having one segregated portfolio)
Tata Short Term Bond Fund(The scheme has 1 segregated portfolio which was created under Tata Corporate Bond Fund. Main portfolio Tata Corporate Bond Fund was merged with Tata Short Term Bond Fund wef 14th December 2019).
5 Tata Gilt Securities Fund
Potential Risk Class
Credit Risk →Relatively Low
(Class A)Moderate (Class B)
Relatively High
(Class C)Interest Rate Risk ↓
Relatively Low (Class I)
A-I
Moderate (Class II)
Relatively High (Class III)
Potential Risk Class
Credit Risk →Relatively Low
(Class A)Moderate (Class B)
Relatively High
(Class C)Interest Rate Risk ↓
Relatively Low (Class I)
B-I
Moderate (Class II)
Relatively High (Class III)
Potential Risk Class
Credit Risk →Relatively Low
(Class A)Moderate (Class B)
Relatively High
(Class C)Interest Rate Risk ↓
Relatively Low (Class I)
Moderate (Class II)
B-II
Relatively High (Class III)
Potential Risk Class
Credit Risk →Relatively Low
(Class A)Moderate (Class B)
Relatively High
(Class C)Interest Rate Risk ↓
Relatively Low (Class I)
Moderate (Class II)
Relatively High (Class III)
B-III
Potential Risk Class
Credit Risk →Relatively Low
(Class A)Moderate (Class B)
Relatively High
(Class C)Interest Rate Risk ↓
Relatively Low (Class I)
Moderate (Class II)
Relatively High (Class III)
A-III

77www.tatamutualfund.com TATA MUTUAL FUND
HOW TO READ A FACT SHEET
SCHEDULE 3
Fund Manager: An employee of the asset management company such as a mutual fund or life insurer, who manages investments of the scheme. He is usually part of a larger team of fund managers and research analysts.
Application Amount for Fresh Subscription: This is the minimum investment amount for a new investor in a mutual fund scheme.
Minimum Additional Amount: This is the minimum investment amount for an existing investor in a mutual fund scheme.
Yield to Maturity: The Yield to Maturity or the YTM is the rate of return anticipated on a bond if held until maturity. YTM is expressed as an annual rate. The YTM factors in the bond’s current market price, par value, coupon interest rate and time to maturity.
SIP: SIP or systematic investment plan works on the principle of making periodic investments of a fixed sum. It works similar to a recurring bank deposit. For instance, an investor may opt for an SIP that invests Rs 500 every 15th of the month in an equity fund for a period of three years.
NAV: The NAV or the net asset value is the total asset value per unit of the mutual fund after deducting all related and permissible expenses. The NAV is calculated at the end of every business day. It is the value at which the investor enters or exits the mutual fund.
Benchmark: A group of securities, usually a market index, whose performance is used as a standard or benchmark to measure investment performance of mutual funds, among other investments. Some typical benchmarks include the Nifty, Sensex, BSE200, BSE500, 10-Year Gsec.
Entry Load: A mutual fund may have a sales charge or load at the time of entry and/or exit to compensate the distributor/agent.
Entry load is charged at the time an investor purchases the units of a mutual fund. The entry load is added to the prevailing NAV at the time of investment. For instance, if the NAV is Rs. 100 and the entry load is 1%, the investor will enter the fund at Rs 101.
Exit Load: Exit load is charged at the time an investor redeems the units of a mutual fund. The exit load is reduced from the prevailing NAV at the time of redemption The investor will receive redemption proceeds at net value of NAV less Exit Load. For instance, if the NAV is Rs 100 and the exit load is 1%, the investor will receive Rs 99.
Modified Duration: Modified duration is the price sensitivity and the percentage change in price for a unit change in yield.
Standard Deviation: Standard deviation is a statistical measure of the range of an investment’s performance. When a mutual fund has a high standard deviation, its means its range of performance is wide, implying greater volatility.
Sharpe Ratio: The Sharpe Ratio, named after its founder, the Nobel Laureate William Sharpe, is a measure of risk-adjusted returns. It is calculated using standard deviation and excess return to determine reward per unit of risk.
Beta: Beta is a measure of an investment’s volatility vis-à-vis the market. Beta of less than 1 means that the security will be less volatile than the market. A beta of greater than 1 implies that the security’s price will be more volatile than the market.
AUM: AUM or assets under management refers to the recent / updated cumulative market value of investments managed by a mutual fund or any investment firm.
Holdings: The holdings or the portfolio is a mutual fund’s latest or updated reported statement of investments/securities. These are usually displayed in terms of percentage to net assets or the rupee value or both. The objective is to give investors an idea of where their money is being invested by the fund manager.
Nature of Scheme: The investment objective and underlying investments determine the nature of the mutual fund scheme. For instance, a mutual fund that aims at generating capital appreciation by investing in stock markets is an equity fund or growth fund. Likewise, a mutual fund that aims at capital preservation by investing in debt markets is a debt fund or income fund. Each of these categories may have sub-categories.
Rating Profile: Mutual funds invest in securities after evaluating their creditworthiness as disclosed by the ratings. A depiction of the mutual fund in various investments based on their ratings becomes the rating profile of the fund. Typically, this is a feature of debt funds.
R-Squared: R-squared measures the relationship between a portfolio and its benchmark. It is simply a measure of the correlation of the portfolio’s returns to the benchmark’s returns.
Treynor Ratio: Treynor Ratio is a measurement of efficiency utilizing the relationship between annualized risk-adjusted return and risk. Unlike Sharpe Ratio, Treynor Ratio utilizes “market” risk (beta) instead of tatal risk (standard deviation).
Jensen Alpha: A measure of the difference between a fund’s actual returns and its expected performance, given its level of risk as measured by beta. Jensen’s Alpha is equivalent to the alpha derived from regressing the same or portfolio’s returns in excess of the risk free rate against the market return in excess of the risk free rate.

Investment Manager: TATA ASSET MANAGEMENT LTD. Trustee: TATA TRUSTEE COMPANY LTD.
E-mail: [email protected] Website: www.tatamutualfund.comCorporate Identity Number: TAML – U65990-MH-1994-PLC-077090, TTCL – U65991-MH-1995-PLC-087722
BRANCH CONTACT DETAILS
SMS: ‘TMF’ to 57575West Zone: Mumbai: Mulla House, Gr. Floor, 51, M. G. Road, Near Flora Fountain, Mumbai - 400 001. Tel.: 022-66505243 / 66505201, Fax: 022- 66315194. Borivali: Shop No. 1
and 2, Ground Floor, Ganjawalla Residency, Ganjawalla Lane, Borivali West, Mumbai - 400 092. Tel.: 022-28945923 / 8655421234. Thane: Shop No. 9, Konark Tower, Ghantali
Devi Road, Thane (W) – 400 602. Tel.: 022 – 25300912. Ahmedabad: 402, 'Megha House', Mithakhali - Law Garden Road, Netaji Marg, Ahmedabad - 380 006. Tel.: 079 -
26466080 / 40076949. Pune: Office No 33, 3rd Floor, Yashwant, Opp. Lane No. 9, Prabhat Road, Pune – 411 004. Tel.: 020-41204949 / 50, Telefax: 41204953. Surat: Ground
floor, G - 18, ITC Building, Near Majuragate, Ring road, Surat – 395 002. Tel.: 0261 - 4012140, Fax: 0261-2470326. Vadodara: Emerald One, 314, 3rd Floor, Jetalpur Main Road,
Before Jetalpur Bridge, Jetalpur, Vadodara - 390 007. Tel.: . Rajkot: 402, The Imperia, Opp Shastri Maidan, Limda Chowk, Rajkot – 360 001. Tel.: 0281 - 2964848 / 0265 - 2991037
2964849. Indore: 204, D M Tower, 21/1 Race Course Road, Near Janjeerwala Chourha, Indore - 452 003. Tel.: 0731-4201806 / 4201807, Fax: 0731 - 4201807. Bhopal: MF-12,
Block-A, Mansarovar Complex, Near Habibganj Railway Station, Bhopal - 462 016. Tel.: 0755 - 4209752 / 2574198. Nashik: 5, Samriddhi Residency, Opp Hotel City Pride,
Tilakwadi, Nashik - 422 002. Tel.: 0253 - 6605138, Fax: 0253 - 2579098. Goa: F- 4, 1st Floor, Edcon Tower, Next to Hotel Salida Del Sol, Near Apple Corner, Menezes Braganza
Road, Panaji - Goa 403 001. Tel.: 7888051135. Jabalpur: Office No. 4, 1178 , Napier Town, Home Science College Road, Jabalpur - 482 001(M.P.). Tel.: 0761-4074263. Nagpur:
102, Shivaji Complex, Near Times of India, Dharampeth, WHC Road, Nagpur – 440 010. Tel.: 0712-6630425 / 7420015757. Navsari: Shop No. 1, Swiss Cottage, Ashanagar Main
Road, Navsari - 396 445. Tel.: 02637-281991. Aurangabad: Plot No. 66, Bhagya Nagar, Near S T Office, Kranti Chowk Police Station-to-Employment Office Road, Aurangabad -
431 001. Tel.: 0240 - 2351591 / 2351590. Kolhapur: Shop No. 49/50, Ground Floor, Gemstone Building, Beside Lokmangal pathsansta, Raobahadur Vichare Complex, Near Parikh
Pool, Landmark-CBS Bus Stand, Kolhapur - 416003. Tel.: 0231 - 299 1650.
North Zone: Agra: Unit No. 2, First Floor, Block No. 54/4, Prateek Tower, Commercial Complex, Sanjay Place, Agra - 282 002. Tel.: 0562 - 2525195. Allahabad: Shop No. 10, Upper
Ground Floor, Vashistha Vinayak Tower, Tashkand Marg, Civil Lines, Allahabad - 211 001. Tel. : 0532 - 2260974. Amritsar: Mezzanine floor, SCO – 25, B Block, District Shopping
Complex, Ranjit Avenue, Amritsar – 143 001. Tel.: 0183 - 5011181 / 5011190. Chandigarh: SCO 2473-74, 1st Floor, Sector 22C, Chandigarh – 160 022. Tel.: 0172 - 5057322 /
5037205, Fax: 0172 - 2603770. Dehradun: Shop No. 19, Ground Floor, Shree Radha Palace, 78, Rajpur Road, Dehradun - 248 001, Uttarakhand. Tel.: 0135 - 2740877 / 2741877.
Gurgaon : Unit No. 209, 2nd Floor, Vipul Agora Mall, Sector 28, M. G. Road, Gurgaon - 122 001. Tel.: 0124 - 4227052. Jaipur: Office No. 52-53, 1st Floor, Laxmi Complex, Subhash
Marg, M.I. Road Corner, C Scheme, Jaipur – 302 001. Tel.: 0141 - 2389387, Fax: 5105178. Kanpur: 4th Floor, Office No. 412-413, KAN Chambers, 14/113, Civil Lines, Kanpur -
208 001. Tel.: 0512 - 2306065 / 2306066, Fax: 0512 - 2306065. Delhi: Flat No. 506-507, Kailash Building, 26, Kasturba Gandhi Marg, Connaught Place, New Delhi - 110 001. Tel.:
011 - 66324114 / 4136 / 4117 / 4130 / 4140, Fax: 011 - 66303202. Lucknow: 11 B & 12, Ground Floor, Saran Chamber II, Vikramaditya Marg, 5 Park Road, Lucknow – 226 001
Tel.: 0522 - 4001731 / 4308904. Ludhiana: Cabin No. 201, 2nd. Floor, SCO 18, Opp Ludhiana Stock Exchange, Feroze Gandhi Market, Ludhiana - 141 001. Tel.: 0161 - 5089667 /
68, Fax: 0161 - 2413498. Moradabad: 2nd floor, Near Hotel Rajmahal, Civil Lines, Moradabad – 244 001, Tel.: 0591 - 2410667. Jodhpur: Sanskriti Plaza, 840, Mazinine Floor,
Devendra Singhvi Marg, Opp. HDFC Bank, 9th Chopasani Road, Sardarpura, Jodhpur - 342 003. Tel.: 0291 - 2631257, Fax: 0291-2631257. Udaipur: Office No. 4, 2nd Floor,
Madhav Appartment, Opp. GPO, Chetak Circle, Udaipur - 313 001. Tel.: 0294 - 2429371 / 7230029371, Fax: 0294-2429371. Varanasi : D-64/127, 2nd Floor, C-H Arihant
Complex, Sigra, Varanasi - 221 010 Tel .: 0542 - 2222179. Jalandhar : Premises No.32, 5th Floor, City Square Building, EH - 197, Civil Lines, Jalandhar- 144 001. Tel.: 0181 -
500124. Ajmer: 2nd Floor, Opposite Hotel Payal, P R Marg, Agra Gate Circle, Ajmer - 305 001. Tel.: 0145 - 2625316. Meerut: G-13, Rama Plaza, Near Bachha Park, Western
Kutchery Road, Meerut (U.P.) – 250 001. Tel.: 0121 - 4035585.
East Zone: Bhubaneswar: Room-309, 3rd Floor, Janpath Tower, Ashok Nagar, Bhubaneswar - 751 009. Tel.: 0674-2533818 / 7064678888. Dhanbad: Shri Ram Plaza, Room No.
202 (B), 2nd Floor, Bank more, Dhanbad, Jharkhand - 826 001.Tel.: 0326 - 2300304 / 9234302478. Durgapur: 8C, 8th Floor, Pushpanjali, C-71/A, Saheed Khudiram Sarani, City
Centre, Durgapur - 713 216. Tel.: 0343 - 2544463/65. Guwahati: Jain Complex, 4th Floor, Beside Axis Bank, G.S. Road, Guwahati - 781 005 (Assam). Tel.: 0361-2343084.
Kolkata: Apeejay House, Ground Floor, 15, Park Street, Kolkata -700 016. Tel.: 033 - 4406 3300 / 3333 / 3319. Fax: 033-4406 3315. Jamshedpur: Voltas House, Mezzanine Floor,
Main Road, Bistupur, Jamshedpur - 831 001. Tel.: 0657-2321302 / 2321363 / 9031076911. Patna: 301, 3rd Floor, Grand Plaza, Frazer Road, Patna - 800 001. Tel.: 0612 -
2206497. Raipur: Shop No. S-10, 2ndFloor, Raheja Towers, Near Fafadhi Chowk, Jail Road, Raipur (Chhattisgarh) - 492 001. Tel.: 0771 - 4040069. Ranchi: 406-A, 4th Floor, Satya
Ganga Arcade, Sarjana Chowk, Lalji Hirji Road, Ranchi – 834 001. Tel.: 0651-2210223 / 8235050200.
South Zone: Bangalore: Unit 3A, 4th Floor, Sobha Alexander, 16 / 2 - 6, Commissariat Road, Bangalore - 560 025. Tel.: 080 - 4557 0100, Fax: 080 - 22370512. Calicut: Ground
Floor, Door No. 6/296 A & B, Karuppali Square, YMCA Cross Road, Calicut - 673 001. Tel.: 0495-4850508. Chennai: 3rd Floor, Sri Bala Vinayagar Square, No.2, North Boag Road,
(Near AGS Complex), T.Nagar, Chennai 600 017. Tel.: 044 - 4864 1878 / 4863 1868 / 4867 6454. Cochin: 2nd Floor, Ajay Vihar, JOS Junction, M. G. Road, Cochin - 682 016. Tel.:
0484 - 4865813 / 14. Fax: 0484 - 237 7581. Coimbatore: Tulsi Chambers, 195 F, Ground Floor, West T V Swamy Road, R S Puram, Coimbatore – 641 002. Tel.: 0422 - 4365635,
Fax: 2546585. Hyderabad: 1st Floor, Nerella House, Nagarjuna Hills, Above Kotak Mahindra Bank, Punjagutta, Hyderabad - 500 082. Tel.: 040 - 67308989 / 901 / 902, Fax: 040 -
67308990. Hubli: No. 19 & 20, 1st Floor, Eureka Junction, T B Road, Hubli – 580 029. Tel.: 0836 - 4251510, Fax: 4251510. Kottayam: C S I Ascention Square, Collectrorate P. O.
Kottayam - 686 002. Tel.: 0481 - 2568450. Mangalore: Essel Towers, 1st Floor, Bunts Hostel Circle, Above Axis Bank, Mangalore - 575 003. Tel.: 9483398311 / 0824 - 4260308.
Madurai: 1st Floor, 11B Old, Goods Shed Street Rear, Opp. Sethupathy Higher Secondary School, North Veli Street, Madurai – 625 001. Tel.: 0452 - 4246315, Fax: 0452-4246315.
Mysore: CH-16, 1st Floor, Prashanth Plaza, 4th Main, 5th Cross, Saraswathipuram, Mysore - 570 009. Tel.: 9972353456 / 0821 - 4246676, Fax: 4246676. Salem: Raj Towers,
Ground Floor, No. 4, Brindavan Road, Fairlands, Salem - 636 016. Tel.: 0427 - 4042028 Fax: 4042028. Trivandrum: Ground Floor, Sai Kripa Building, TC-1956/3, Ganapthi Temple
Road, Vazhuthacaud, Trivandrum – 695 014. Tel.: 0471 - 4851430 / 31. Fax: 0471-2319139. Trichy: No.60/3, 'Krishna', 2nd Floor, Sastri Main Road, Tennur, Trichy - 620 017. Tel.:
0431 - 4024060. Thrissur: 4th Floor, Pathayappura buildings, Round South, Thrissur - 680 001. Tel.: 0487-2423330. Vijaywada: D. No-38-8-42, 3rd Floor, White House Complex,
Beside Passport Office, Opp. All India Radio Station, M. G. Road, Vijayawada - 520 010. Tel.: 0866 - 6632010. Vishakapatnam: Door no. 47-15-14 & 15, Shop no. 102 B, Ground
floor, V R C Complex, Opp. T S R Complex, Next to Andhra Bank, Visakhapatnam – 530 016. Tel.: 0891 - 2503292.
Mutual Fund investments are subject to market risks, read all scheme related documents carefully.
Call: (022) 6282 7777 (Mon to Sat 9:00 am to 5:30 pm)

Say #NoToKatauti
ARE TAXES BURNING AHOLE IN YOUR SALARY?
• Long Term Capital Appreciation.
*Investors should consult their financial advisors if in doubt about whether the product is
suitable for them.
• An equity linked savings scheme (ELSS) Investing predominantly in Equity & Equity related
instruments.
This product is suitable for investors who are seeking*:
Mutual Fund investments are subject to market risks, read all scheme related documents carefully.
XYZ Corp

• Investment in equity & equity related instruments, debt instruments, exchange traded
commodity derivatives and other instruments.
*Investors should consult their financial advisors if in doubt about whether the product is
suitable for them.
• Long Term Capital Appreciation.
This product is suitable for investors who are seeking*:
Mutual Fund investments are subject to market risks, read all scheme related documents carefully.
MULTI ASSET OPPORTUNITIES FUND(An open-ended scheme investing in equity, debt & exchange traded commodity derivatives)
RISK - O - METER
Investors understand that their principalwill be at Very High Risk